UNITED STATES
SECURITIES AND EXCHANGE COMMISSION
Washington, D.C. 20549
FORM N-CSR
CERTIFIED SHAREHOLDER REPORT OF REGISTERED
MANAGEMENT INVESTMENT COMPANIES
| | |
Investment Company Act file number | | 811-08282 |
Loomis Sayles Funds I
|
| (Exact name of Registrant as specified in charter) |
| | |
| 399 Boylston Street, Boston, Massachusetts | | 02116 |
| (Address of principal executive offices) | | (Zip code) |
Coleen Downs Dinneen, Esq.
Natixis Distributors, L.P.
399 Boylston Street
Boston, Massachusetts 02116
|
| (Name and address of agent for service) |
Registrant’s telephone number, including area code: (617) 449-2810
Date of fiscal year end: September 30
Date of reporting period: March 31, 2009
| Item 1. | Reports to Stockholders. |
The Registrant’s semi-annual report transmitted to shareholders pursuant to Rule 30e-1 under the Investment Company Act of 1940 is as follows:

Loomis Sayles Small Cap Growth Fund
Loomis Sayles Small Cap Value Fund
SEMI ANNUAL REPORT
MARCH 31, 2009 (Unaudited)
FUND AND MANAGER REVIEW
Loomis Sayles Small Cap Growth Fund

Mark F. Burns, CFA
Manager since January 2005

John Slavik, CFA
Manager since April 2005
FUND FACTS
Symbol | Institutional: LSSIX;
Retail: LCGRX
Objective | Long-term capital growth from investments in common stocks or other equity securities
Strategy | Invests at least 80% of its net assets (plus any borrowings made for investment purposes) in equity securities of companies with market capitalizations that fall within the capitalization range of the Russell 2000 Index. Unlike the Index, the Fund may invest in companies of any size
Fund Inception Date | 12/31/96
Total Net Assets | $79.8 million
PORTFOLIO REVIEW
For the six months ended March 31, 2009, the Fund outperformed its Benchmark, the Russell 2000 Growth Index, primarily due to strong stock selection in the technology, utilities, producer durables and energy sectors. In addition, an overweight position in technology helped relative performance.
Throughout the six-month period, we shifted allocations in an effort to adapt the Fund to the current market environment. In particular, we increased the Fund’s technology weighting in anticipation of an improving economic environment in the second half of 2009. Many technology stocks were priced in anticipation of a worst-case scenario. This gave us the opportunity to buy stocks of companies with strong balance sheets and excellent fundamentals at reduced prices. NetLogic Microsystems, a semiconductor company, was one of the Fund’s top performing stocks, advancing with the semiconductor industry’s inventory re-build cycle.
In the utilities sector, we added exposure to the telecommunication services industry as fundamentals improved. Neutral Tandem Inc. was the industry’s top performer, reporting solid earnings in January and providing better-than-expected guidance driven by higher-than-forecasted billed minutes.
Additional allocation changes included reducing our health care weighting in search of more growth-oriented names. Health care had a negative impact on the portfolio as a result of poor performance from a handful of holdings. We also trimmed the Fund’s materials and processing exposure, waiting for economic conditions to improve. The sector detracted from Fund performance, primarily due to disappointing results from Hill International, a construction consulting firm that declined
as the construction industry continued to struggle. Hill International was sold.
Consumer staples was one of the few sectors in the Fund that had a positive absolute return for the period. On a relative basis, our stock selection within this sector was helpful. However, the Fund’s holdings in the consumer discretionary sector were among the largest detractors to performance, reflecting poor stock selection and an underweight position.
OUTLOOK
With the market rallying in the final weeks of the quarter, there are many reasons to believe that the worst is behind us. There is an unprecedented amount of stimulus being pumped into the global economy, the credit markets are starting to thaw, financial companies’ balance sheets are being repaired and consumer companies are reporting news that matters are not as dire as feared. It is our belief that we are more than half way through the recession and we’ve seen the lows in the market. However, we think the market’s strength will be retested. With this as a backdrop, we expect new leadership to emerge in the market and we are structuring the portfolio for this scenario, in pursuit of strong results over the long term.
1
AVERAGE ANNUAL TOTAL RETURNS
Periods Ended March 31, 2009
| | | | | | | | | | | | | |
| 6 Months | | | 1 Year | | | 5 Years | | | 10 Years | | | Since
Inception | |
| Loomis Sayles Small Cap Growth: Institutional | |
| -33.05 | % | | -34.55 | % | | -1.55 | % | | -3.96 | % | | -0.14 | % |
| Loomis Sayles Small Cap Growth: Retail | |
| -33.18 | | | -34.77 | | | -1.81 | | | -4.21 | | | -0.40 | |
| Russell 2000 Growth Index(c) | |
| -34.51 | | | -36.36 | | | -5.37 | | | -1.60 | | | -0.36 | |
| Russell 2000 Index(c) | |
| -37.17 | | | -37.50 | | | -5.24 | | | 1.93 | | | 2.58 | |
| Lipper Small-Cap Growth Funds Index(c) | |
| -31.12 | | | -36.88 | | | -5.94 | | | 0.61 | | | 1.18 | |
| Gross expense ratio (before reductions and reimbursements)* | |
| Institutional: 1.01% | | | Retail: 1.42% | |
| Net expense ratio (after reductions and reimbursements)* | |
| Institutional: 1.00% | | | Retail: 1.25% | |
* As stated in the most recent prospectus
CUMULATIVE PERFORMANCE
Inception to March 31, 2009(a)(b)
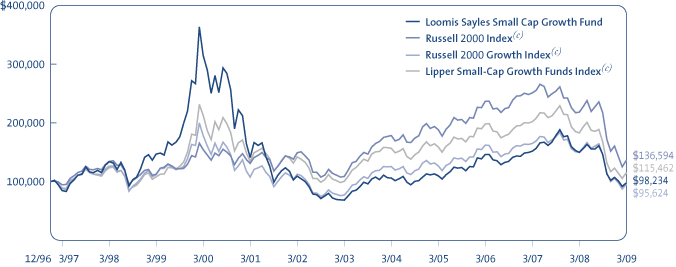
Data quoted reflects past performance and cannot guarantee future results. Average annual total returns assume reinvestment of dividends and capital gains distributions. Investment return and principal value will fluctuate so that shares, when redeemed, may be worth more or less than their original cost. For performance current to the most recent month end, please visit the Loomis Sayles website. Current performance may be higher or lower than quoted.
Returns do not reflect the taxes that a shareholder would pay on fund distributions or the redemption of shares. Periods of less than one year are not annualized. Performance data reflects certain fee reductions and reimbursements, if any, without which performance would be lower.
(a) Cumulative performance is shown for the Institutional Class of Shares. Performance of the Retail Class would be lower due to higher fees. (b) The mountain chart is based on the initial investment minimum of $100,000 for the Institutional Class. (c) See page 5 for a description of the Indices.
WHAT YOU SHOULD KNOW
Small- and mid-cap stocks may be more volatile than larger, more established companies. The secondary market for these stocks may be less liquid, which could adversely impact the Fund’s value. Growth funds involve increased risks, in part, because the value of the underlying securities is based on future expectations that may or may not be met.
The Fund can invest a significant percentage of assets in foreign securities and the value of the fund shares can be adversely affected by changes in currency exchange rates, political, and economic developments. In emerging markets these risks can be significant. The Fund is subject to currency risk, which is the risk that fluctuations in exchange rates between the US dollar and foreign currencies may cause the value of a Fund’s investments to decline. Fund shares should be viewed as a long-term investment.
2
FUND AND MANAGER REVIEW
Loomis Sayles Small Cap Value Fund

Joseph Gatz, CFA
Manager since January 2000

Daniel Thelen, CFA
Manager since April 2000
FUND FACTS
Symbol | Institutional: LSSCX;
Retail: LSCRX; Admin: LSVAX
Objective | Long-term capital growth from investments in common stocks or other equity securities
Strategy | Invests at least 80% of its net assets (plus any borrowings made for investment purposes) in equity securities of companies with market capitalizations that fall within the capitalization range of the Russell 2000 Index. Unlike the Index, the Fund may invest in companies of any size
Fund Inception Date | 5/13/91
Class Inception Date | Institutional: 5/13/91
Retail: 12/31/96
Admin: 1/2/98
Total Net Assets | $696.3 million
PORTFOLIO REVIEW
The Fund outperformed its Benchmark, the Russell 2000 Value Index, for the six months ended March 31, 2009, primarily due to stock selection in the financial services and consumer discretionary sectors.
Financial services, the largest sector in the Fund and the Benchmark, was one of the weakest performing sectors in the market. Our cautious view of the fundamentals of bank stocks and our significant weighting in non-credit-sensitive financial data service companies resulted in exceptionally strong stock selection and significant outperformance relative to the Benchmark. Broadridge Financial Solutions Inc., a provider of trade processing and investor communication services to the financial services industry, was the Fund’s top performer for the period. The company’s stable business model was a key attraction for investors during the recent market upheaval. PHH Corp., an outsource provider of mortgage services and vehicle fleet management, was another top performer.
Although consumer discretionary was another weak sector in the market for the six-month period, the Fund’s consumer holdings emphasized less-cyclical companies, such as services companies and discount stores, which held up reasonably well during the market downturn. In addition, we made timely additions to the restaurant industry just before the stocks rebounded in March.
Technology was among the Fund’s weakest sectors for the period, primarily due to our holdings in semiconductors and electronics, which declined sharply on weakened demand and reduced earnings estimates. Health care also performed poorly, as reimbursement and regulatory concerns lead to negative earnings estimates and lower valuations throughout the sector.
Substantial volatility during the period provided opportunities to add to certain sectors and reduce others. With economic prospects declining, we actively reduced or eliminated several of our most economically sensitive holdings in the basic materials and energy sectors, replacing them with less-cyclical consumer staples and utility stocks. Throughout the period, we selectively added to financial services stocks, while maintaining an underweight relative to the Benchmark. We also reduced our health care exposure, due to mounting reimbursement and regulatory uncertainty stemming from November’s election results.
OUTLOOK
In light of the stock market rally in the March 2009, the inevitable question is whether the recent rally is a breather or the start of a new trend. The stock market is often considered a forward-looking indicator, and historically it has recovered before all the negative economic news dissipated. Indeed, we are encouraged by recent economic data that suggest the economy may be bottoming, at least for some of the hardest hit sectors. However, we recognize that market bottoms never progress evenly. Nevertheless, bumpy scenarios historically have often provided investment opportunities for those who do their homework.
3
AVERAGE ANNUAL TOTAL RETURNS
Periods Ended March 31, 2009
| | | | | | | | | | | | | |
| 6 Months | | | 1 Year | | | 5 Years | | | 10 Years | | | Since Fund
Inception(a)(b) | |
| Loomis Sayles Small Cap Value: Institutional | |
| -32.29 | % | | -33.29 | % | | -1.99 | % | | 5.92 | % | | 10.23 | % |
| Loomis Sayles Small Cap Value: Retail(a) | |
| -32.39 | | | -33.46 | | | -2.24 | | | 5.66 | | | 10.03 | |
| Loomis Sayles Small Cap Value: Admin(a) | |
| -32.45 | | | -33.60 | | | 2.49 | | | 5.39 | | | 9.70 | |
| Russell 2000 Value Index(c) | |
| -39.64 | | | -38.89 | | | -5.30 | | | 4.87 | | | 9.02 | |
| Russell 2000 Index(c) | |
| -37.17 | | | -37.50 | | | -5.24 | | | 1.93 | | | 6.68 | |
| Lipper Small-Cap Core Funds Index(b)(c) | |
| -34.02 | | | -37.19 | | | -4.53 | | | 3.71 | | | N/A | |
| | | | | | | | |
| Gross expense ratio (before reductions and reimbursements)* |
| Institutional: 0.90% | | Retail: 1.27% | | Admin: 1.69% |
| Net expense ratio (after reductions and reimbursements)* |
| Institutional: 0.90% | | Retail: 1.15% | | Admin: 1.41% |
* As stated in the most recent prospectus
CUMULATIVE PERFORMANCE
Inception to March 31, 2009(d)(e)
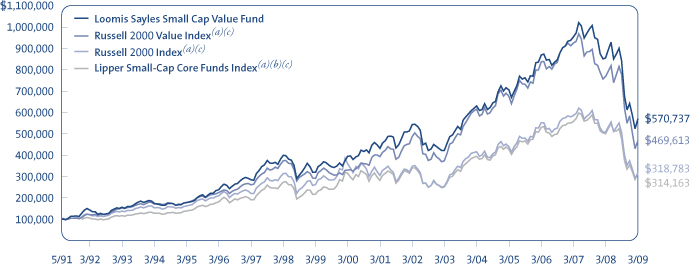
Data quoted reflects past performance and cannot guarantee future results. Average annual total returns assume reinvestment of dividends and capital gains distributions. Investment return and principal value will fluctuate so that shares, when redeemed, may be worth more or less than their original cost. For performance current to the most recent month end, please visit the Loomis Sayles website. Current performance may be higher or lower than quoted.
Returns do not reflect the taxes that a shareholder would pay on fund distributions or the redemption of shares. Periods of less than one year are not annualized. Performance data reflects certain fee reductions and reimbursements, if any, without which performance would be lower.
(a) Performance shown for periods prior to the inception date of the Retail Class (12/31/96) and Admin Class (1/02/98) represents the performance of the Institutional Class of shares during the periods shown, adjusted to reflect current levels of 12b-1 fees payable by the respective Classes. Since index performance data is not available coincident with the Fund’s inception date, the beginning value of the index is the value as of the month end closest to the Fund’s inception date. (b) The Lipper Small-Cap Core Funds Index performance data is not available prior to January 1, 1992. (c) See page 5 for a description of the Indices. (d) Cumulative performance is shown for the Institutional Class of Shares. Performance of the Retail and Admin Classes would be lower due to higher fees and expenses. (e) The mountain chart is based on the initial investment minimum of $100,000 for the Institutional Class.
WHAT YOU SHOULD KNOW
Value stocks may fall out of favor with investors and underperform the overall equity market during any given period. Small- and mid-cap stocks may be more volatile than larger, more established companies. The secondary market for these stocks may be less liquid, which could adversely impact the Fund’s value.
The Fund can invest a significant percentage of assets in foreign securities and the value of the fund shares can be adversely affected by changes in currency exchange rates, political, and economic developments. In emerging markets these risks can be significant. The Fund is subject to currency risk, which is the risk that fluctuations in exchange rates between the US dollar and foreign currencies may cause the value of a Fund’s investments to decline. Fund shares should be viewed as a long-term investment.
4
ADDITIONAL INFORMATION
Index Definitions
Indexes are unmanaged and do not have expenses that affect results, unlike mutual funds. Index returns are adjusted for the reinvestment of capital gain distributions and income dividends. It is not possible to invest directly in an index.
Lipper Small-Cap Core Funds Index is an equally weighted index of typically the 30 largest mutual funds within the small-cap core funds investment objective.
Lipper Small-Cap Growth Funds Index is an equally weighted index of typically the 30 largest mutual funds within the small-cap growth funds investment objective.
Source: Lipper, Inc.
Russell 2000 Growth Index is an index comprised of those Russell 2000 companies with higher price-to-book ratios and higher forecasted growth values.
Russell 2000 Index is an index comprised of the 2,000 smallest companies in the Russell 3000 Index (a broad market index), representing approximately 10% of the Russell 3000 total market capitalization.
Russell 2000 Value Index is an index comprised of those Russell 2000 companies with lower price-to-book ratios and lower forecasted growth values.
Proxy Voting Information
A description of the Funds’ proxy voting policies and procedures is available without charge, upon request, (i) by calling Loomis Sayles at 800-633-3330; (ii) on the Funds’ website, www.loomissayles.com, and (iii) on the SEC’s website, www.sec.gov. Information about how the Funds voted proxies relating to portfolio securities during the 12 months ended June 30, 2008 is available on (i) the Funds’ website and (ii) the SEC’s website.
Quarterly Portfolio Schedules
The Funds file a complete schedule of portfolio holdings with the SEC for the first and third quarters of each fiscal year on Form N-Q. The Funds’ Forms N-Q are available on the SEC’s website at www.sec.gov and may be reviewed and copied at the SEC’s Public Reference Room in Washington, DC. Information on the operation of the Public Reference Room may be obtained by calling 800-SEC-0330.
UNDERSTANDING YOUR FUND’S EXPENSES
As a mutual fund shareholder you incur two types of costs: (1) transaction costs, including redemption fees and certain exchange fees; and (2) ongoing costs, including management fees, distribution and/or service fees (12b-1 fees), and other Fund expenses. These costs are described in more detail in the Funds’ prospectus. The examples below are intended to help you understand the ongoing costs of investing in the Funds and help you compare these with the ongoing costs of investing in other mutual funds.
The first line in the table of each Fund shows the actual amount of Fund expenses you would have paid on a $1,000 investment in the Fund from October 1, 2008 through March 31, 2009. It also shows how much a $1,000 investment would be worth at the close of the period, assuming actual fund returns and expenses. To estimate the expenses you paid over the period, simply divide your account value by $1,000 (for example $8,600 account value divided by $1,000 = 8.6) and multiply the result by the number in the Expenses Paid During the Period column as shown below for your class.
The second line in the table of each Fund provides information about hypothetical account values and hypothetical expenses based on the Fund’s actual expense ratios and an assumed rate of return of 5% per year before expenses, which is not the Fund’s actual return. The hypothetical account values and expenses may not be used to estimate the actual ending account balance or expenses you paid on your investment for the period. You may use this information to compare the ongoing costs of investing in the Funds and other funds. To do so, compare this 5% hypothetical example with the 5% hypothetical examples that appear in the shareholder reports of other funds.
5
Please note that the expenses shown reflect ongoing costs only, and do not include any transaction costs. Therefore, the second line in the table is useful in comparing ongoing costs only, and will not help you determine the relative costs of owning different funds. If transaction costs were included, total costs would be higher.
Loomis Sayles Small Cap Growth Fund
| | | | | | |
Institutional Class | | Beginning
Account Value
10/1/2008 | | Ending
Account Value
3/31/2009 | | Expenses Paid
During Period*
10/1/2008 – 3/31/2009 |
Actual | | $1,000.00 | | $ 669.50 | | $4.16 |
Hypothetical (5% return before expenses) | | $1,000.00 | | $1,019.95 | | $5.04 |
| | | |
Retail Class | | | | | | |
Actual | | $1,000.00 | | $ 668.20 | | $5.20 |
Hypothetical (5% return before expenses) | | $1,000.00 | | $1,018.70 | | $6.29 |
* Expenses are equal to the Fund’s annualized expense ratio (after fee reduction/reimbursement): 1.00% and 1.25% for Institutional and Retail Class, respectively, multiplied by the average account value over the period, multiplied by the number of days in the most recent fiscal half-year, divided by 365 (to reflect the half-year period). |
Loomis Sayles Small Cap Value Fund
| | | | | | |
Institutional Class | | Beginning
Account Value
10/1/2008 | | Ending
Account Value
3/31/2009 | | Expenses Paid
During Period*
10/1/2008 – 3/31/2009 |
Actual | | $1,000.00 | | $ 677.10 | | $3.76 |
Hypothetical (5% return before expenses) | | $1,000.00 | | $1,020.44 | | $4.53 |
| | | |
Retail Class | | | | | | |
Actual | | $1,000.00 | | $ 676.10 | | $4.81 |
Hypothetical (5% return before expenses) | | $1,000.00 | | $1,019.20 | | $5.79 |
|
Admin Class |
Actual | | $1,000.00 | | $ 675.50 | | $5.85 |
Hypothetical (5% return before expenses) | | $1,000.00 | | $1,017.95 | | $7.04 |
* Expenses are equal to the Fund’s annualized expense ratio (after fee reduction/reimbursement): 0.90%, 1.15% and 1.40% for Institutional, Retail and Admin Class, respectively, multiplied by the average account value over the period, multiplied by the number of days in the most recent fiscal half-year, divided by 365 (to reflect the half-year period). |
6
PORTFOLIO OF INVESTMENTS – as of March 31, 2009 (Unaudited)
Loomis Sayles Small Cap Growth Fund
| | | | | | | |
| | | | | Shares | | Value (†) |
| | | | | | | |
| | | |
| COMMON STOCKS – 96.5% of Net Assets | | | | | | | |
| | | |
| Aerospace & Defense – 1.8% | | | | | | | |
Curtiss-Wright Corp. | | | | 28,105 | | $ | 788,345 |
Orbital Sciences Corp.(b) | | | | 57,693 | | | 685,970 |
| | | | | | | |
| | | | | | | 1,474,315 |
| | | | | | | |
| Beverages – 0.7% | | | | | | | |
Heckmann Corp.(b) | | | | 108,343 | | | 522,213 |
| | | | | | | |
| Biotechnology – 6.3% | | | | | | | |
Acorda Therapeutics, Inc.(b) | | | | 20,104 | | | 398,260 |
Alexion Pharmaceuticals, Inc.(b) | | | | 18,083 | | | 681,006 |
Array Biopharma, Inc.(b) | | | | 130,512 | | | 344,552 |
Genomic Health, Inc.(b) | | | | 32,213 | | | 785,353 |
Isis Pharmaceuticals, Inc.(b) | | | | 49,143 | | | 737,636 |
Onyx Pharmaceuticals, Inc.(b) | | | | 21,222 | | | 605,888 |
OSI Pharmaceuticals, Inc.(b) | | | | 13,981 | | | 534,913 |
Osiris Therapeutics, Inc.(b) | | | | 29,987 | | | 413,821 |
Regeneron Pharmaceuticals, Inc.(b) | | | | 35,963 | | | 498,447 |
| | | | | | | |
| | | | | | | 4,999,876 |
| | | | | | | |
| Capital Markets – 4.2% | | | | | | | |
Greenhill & Co., Inc. | | | | 12,328 | | | 910,423 |
KBW, Inc.(b) | | | | 33,264 | | | 676,922 |
Riskmetrics Group, Inc.(b) | | | | 55,793 | | | 797,282 |
Stifel Financial Corp.(b) | | | | 21,893 | | | 948,186 |
| | | | | | | |
| | | | | | | 3,332,813 |
| | | | | | | |
| Commercial Banks – 1.7% | | | | | | | |
IBERIABANK Corp. | | | | 12,131 | | | 557,298 |
Signature Bank(b) | | | | 27,211 | | | 768,167 |
| | | | | | | |
| | | | | | | 1,325,465 |
| | | | | | | |
| Commercial Services & Supplies – 2.9% | | | | | | | |
Clean Harbors, Inc.(b) | | | | 16,878 | | | 810,144 |
Sykes Enterprises, Inc.(b) | | | | 44,296 | | | 736,642 |
Waste Connections, Inc.(b) | | | | 30,888 | | | 793,822 |
| | | | | | | |
| | | | | | | 2,340,608 |
| | | | | | | |
| Communications Equipment – 8.2% | | | | | | | |
Brocade Communications Systems, Inc.(b) | | | | 196,425 | | | 677,666 |
Ciena Corp.(b) | | | | 50,373 | | | 391,902 |
DG FastChannel, Inc.(b) | | | | 68,387 | | | 1,283,624 |
F5 Networks, Inc.(b) | | | | 33,707 | | | 706,162 |
Neutral Tandem, Inc.(b) | | | | 46,850 | | | 1,152,978 |
Nice Systems Ltd., ADR(b) | | | | 26,055 | | | 647,727 |
Riverbed Technology, Inc.(b) | | | | 74,272 | | | 971,478 |
Tellabs, Inc.(b) | | | | 157,846 | | | 722,935 |
| | | | | | | |
| | | | | | | 6,554,472 |
| | | | | | | |
| Construction & Engineering – 2.6% | | | | | | | |
MasTec, Inc.(b) | | | | 103,119 | | | 1,246,709 |
Northwest Pipe Co.(b) | | | | 29,316 | | | 834,626 |
| | | | | | | |
| | | | | | | 2,081,335 |
| | | | | | | |
7
| | | | | | | |
| | | | | Shares | | Value (†) |
| | | | | | | |
| | | |
| COMMON STOCKS – continued | | | | | | | |
| | | |
| Diversified Consumer Services – 4.0% | | | | | | | |
American Public Education, Inc.(b) | | | | 23,806 | | $ | 1,001,280 |
Capella Education Co.(b) | | | | 13,938 | | | 738,714 |
DeVry, Inc. | | | | 16,809 | | | 809,858 |
Grand Canyon Education, Inc.(b) | | | | 38,094 | | | 657,503 |
| | | | | | | |
| | | | | | | 3,207,355 |
| | | | | | | |
| Diversified Telecommunication Services – 2.4% | | | | | | | |
Cbeyond, Inc.(b) | | | | 56,760 | | | 1,068,791 |
NTELOS Holdings Corp. | | | | 46,069 | | | 835,692 |
| | | | | | | |
| | | | | | | 1,904,483 |
| | | | | | | |
| Electric Utilities – 1.1% | | | | | | | |
ITC Holdings Corp. | | | | 20,749 | | | 905,071 |
| | | | | | | |
| Electronic Equipment Instruments & Components – 1.5% | | | | | | | |
Cogent, Inc.(b) | | | | 44,299 | | | 527,158 |
IPG Photonics Corp.(b) | | | | 75,336 | | | 634,329 |
| | | | | | | |
| | | | | | | 1,161,487 |
| | | | | | | |
| Energy Equipment & Services – 3.7% | | | | | | | |
Dresser-Rand Group, Inc.(b) | | | | 33,182 | | | 733,322 |
Hornbeck Offshore Services, Inc.(b) | | | | 42,787 | | | 652,074 |
Oceaneering International, Inc.(b) | | | | 19,956 | | | 735,778 |
Tesco Corp.(b) | | | | 97,800 | | | 764,796 |
| | | | | | | |
| | | | | | | 2,885,970 |
| | | | | | | |
| Food Products – 3.1% | | | | | | | |
Diamond Foods, Inc. | | | | 27,052 | | | 755,562 |
Green Mountain Coffee Roasters, Inc.(b) | | | | 22,525 | | | 1,081,200 |
Smart Balance, Inc.(b) | | | | 100,314 | | | 605,897 |
| | | | | | | |
| | | | | | | 2,442,659 |
| | | | | | | |
| Health Care Equipment & Supplies – 6.4% | | | | | | | |
Haemonetics Corp.(b) | | | | 11,017 | | | 606,816 |
Masimo Corp.(b) | | | | 24,302 | | | 704,272 |
Merit Medical Systems, Inc.(b) | | | | 48,280 | | | 589,499 |
NuVasive, Inc.(b) | | | | 19,586 | | | 614,609 |
ResMed, Inc.(b) | | | | 11,505 | | | 406,587 |
SonoSite, Inc.(b) | | | | 42,904 | | | 767,123 |
Vnus Medical Technologies(b) | | | | 36,254 | | | 771,122 |
Volcano Corp.(b) | | | | 42,883 | | | 623,948 |
| | | | | | | |
| | | | | | | 5,083,976 |
| | | | | | | |
| Health Care Providers & Services – 4.0% | | | | | | | |
Bio-Reference Labs, Inc.(b) | | | | 27,497 | | | 574,962 |
CardioNet, Inc.(b) | | | | 39,150 | | | 1,098,549 |
Catalyst Health Solutions, Inc.(b) | | | | 47,622 | | | 943,868 |
Sun Healthcare Group, Inc.(b) | | | | 71,659 | | | 604,802 |
| | | | | | | |
| | | | | | | 3,222,181 |
| | | | | | | |
| Health Care Technology – 3.3% | | | | | | | |
athenahealth, Inc.(b) | | | | 25,308 | | | 610,176 |
MedAssets, Inc.(b) | | | | 71,662 | | | 1,021,184 |
Phase Forward, Inc.(b) | | | | 78,828 | | | 1,008,210 |
| | | | | | | |
| | | | | | | 2,639,570 |
| | | | | | | |
8
PORTFOLIO OF INVESTMENTS – as of March 31, 2009 (Unaudited)
Loomis Sayles Small Cap Growth Fund – continued
| | | | | | | |
| | | | | Shares | | Value (†) |
| | | | | | | |
| | | |
| COMMON STOCKS – continued | | | | | | | |
| | | |
| Hotels, Restaurants & Leisure – 2.4% | | | | | | | |
Buffalo Wild Wings, Inc.(b) | | | | 16,389 | | $ | 599,509 |
Panera Bread Co., Class A(b) | | | | 11,112 | | | 621,161 |
Texas Roadhouse, Inc., Class A(b) | | | | 75,824 | | | 722,603 |
| | | | | | | |
| | | | | | | 1,943,273 |
| | | | | | | |
| Insurance – 0.9% | | | | | | | |
AmTrust Financial Services, Inc. | | | | 73,092 | | | 698,029 |
| | | | | | | |
| Internet Software & Services – 2.3% | | | | | | | |
Constant Contact, Inc.(b) | | | | 54,217 | | | 758,496 |
SkillSoft PLC, ADR(b) | | | | 99,923 | | | 668,485 |
Vocus, Inc.(b) | | | | 31,899 | | | 423,937 |
| | | | | | | |
| | | | | | | 1,850,918 |
| | | | | | | |
| IT Services – 1.1% | | | | | | | |
CyberSource Corp.(b) | | | | 57,594 | | | 852,967 |
| | | | | | | |
| Machinery – 3.1% | | | | | | | |
Energy Recovery, Inc.(b) | | | | 83,988 | | | 638,309 |
ESCO Technologies, Inc.(b) | | | | 18,848 | | | 729,418 |
Freightcar America, Inc. | | | | 32,738 | | | 573,897 |
Wabtec Corp. | | | | 21,133 | | | 557,488 |
| | | | | | | |
| | | | | | | 2,499,112 |
| | | | | | | |
| Oil, Gas & Consumable Fuels – 3.1% | | | | | | | |
Arena Resources, Inc.(b) | | | | 30,780 | | | 784,275 |
Comstock Resources, Inc.(b) | | | | 23,453 | | | 698,899 |
Concho Resources, Inc.(b) | | | | 38,498 | | | 985,164 |
| | | | | | | |
| | | | | | | 2,468,338 |
| | | | | | | |
| Pharmaceuticals – 2.0% | | | | | | | |
Auxilium Pharmaceuticals, Inc.(b) | | | | 20,703 | | | 573,887 |
Eurand NV(b) | | | | 62,127 | | | 692,095 |
Inspire Pharmaceuticals, Inc.(b) | | | | 89,653 | | | 363,991 |
| | | | | | | |
| | | | | | | 1,629,973 |
| | | | | | | |
| Professional Services – 3.9% | | | | | | | |
Huron Consulting Group, Inc.(b) | | | | 17,435 | | | 739,767 |
ICF International, Inc.(b) | | | | 61,027 | | | 1,401,790 |
IHS, Inc., Class A(b) | | | | 23,968 | | | 987,002 |
| | | | | | | |
| | | | | | | 3,128,559 |
| | | | | | | |
| Semiconductors & Semiconductor Equipment – 6.4% | | | | | | | |
Cavium Network, Inc.(b) | | | | 62,011 | | | 715,607 |
Hittite Microwave Corp.(b) | | | | 18,665 | | | 582,348 |
Lam Research Corp.(b) | | | | 34,753 | | | 791,326 |
Netlogic Microsystems, Inc.(b) | | | | 29,821 | | | 819,481 |
Power Integrations, Inc. | | | | 30,816 | | | 530,035 |
Silicon Laboratories, Inc.(b) | | | | 30,976 | | | 817,767 |
Varian Semiconductor Equipment Associates, Inc.(b) | | | | 41,102 | | | 890,269 |
| | | | | | | |
| | | | | | | 5,146,833 |
| | | | | | | |
| Software – 8.6% | | | | | | | |
Ariba, Inc.(b) | | | | 106,344 | | | 928,383 |
Blackboard, Inc.(b) | | | | 33,198 | | | 1,053,704 |
Concur Technologies, Inc.(b) | | | | 26,477 | | | 508,094 |
DemandTec, Inc.(b) | | | | 75,858 | | | 663,757 |
9
| | | | | | | | |
| | | | | Shares | | Value (†) |
| | | | | | | | |
| | | |
| COMMON STOCKS – continued | | | | | | | | |
| | | |
| Software – continued | | | | | | | | |
Informatica Corp.(b) | | | | | 72,191 | | $ | 957,253 |
Solera Holdings, Inc.(b) | | | | | 37,587 | | | 931,406 |
Tyler Technologies, Inc.(b) | | | | | 73,820 | | | 1,079,987 |
Ultimate Software Group, Inc. (The)(b) | | | | | 43,670 | | | 753,744 |
| | | | | | | | |
| | | | | | | | 6,876,328 |
| | | | | | | | |
| Specialty Retail – 3.0% | | | | | | | | |
American Eagle Outfitters, Inc. | | | | | 50,774 | | | 621,474 |
Hibbett Sports, Inc.(b) | | | | | 42,596 | | | 818,695 |
Lumber Liquidators, Inc.(b) | | | | | 34,742 | | | 442,960 |
Monro Muffler Brake, Inc. | | | | | 19,357 | | | 529,027 |
| | | | | | | | |
| | | | | | | | 2,412,156 |
| | | | | | | | |
| Textiles, Apparel & Luxury Goods – 1.8% | | | | | | | | |
Phillips-Van Heusen Corp. | | | | | 35,336 | | | 801,421 |
Under Armour, Inc., Class A(b) | | | | | 38,670 | | | 635,348 |
| | | | | | | | |
| | | | | | | | 1,436,769 |
| | | | | | | | |
| | | |
| TOTAL COMMON STOCKS | | | | | | | | |
(Identified Cost $87,549,107) | | | | | | | | 77,027,104 |
| | | | | | | | |
| | | | | Principal Amount | | |
| | | |
| SHORT-TERM INVESTMENTS – 3.2% | | | | | | | | |
Tri-Party Repurchase Agreement with Fixed Income Clearing Corporation, dated 3/31/09 at 0.000% to be repurchased at $2,594,744 on 4/01/09 collateralized by $2,550,000 Federal National Mortgage Association, 4.750% due 3/12/10 valued at $2,646,900 including accrued interest (Note 2g of Notes to Financial Statements)
(Identified Cost $2,594,744) | | | | $ | 2,594,744 | | | 2,594,744 |
| | | | | | | | |
| | | |
| TOTAL INVESTMENTS – 99.7% | | | | | | | | |
(Identified Cost $90,143,851)(a) | | | | | | | | 79,621,848 |
Other assets less liabilities—0.3% | | | | | | | | 210,788 |
| | | | | | | | |
| | | |
| NET ASSETS – 100.0% | | | | | | | $ | 79,832,636 |
| | | | | | | | |
| |
(†) See Note 2a of Notes to Financial Statements. | | | |
(a) Federal Tax Information (Amounts exclude certain adjustments made at the end of the Fund’s fiscal year for tax purposes. Such adjustments are primarily due to wash sales.): | | | |
At March 31, 2009, the net unrealized depreciation on investments based on a cost of $89,992,009 for federal income tax purposes was as follows: | | | |
Aggregate gross unrealized appreciation for all investments in which there is an excess of value over tax cost | | $ | 4,596,476 |
Aggregate gross unrealized depreciation for all investments in which there is an excess of tax cost over value | | | (14,966,637) |
| | | | | | | | |
Net unrealized depreciation | | $ | (10,370,161) |
| | | | | | | | |
(b) Non-income producing security. | | | |
ADR An American Depositary Receipt is a certificate issued by a custodian bank representing the right to receive securities of the foreign issuer described. The values of ADRs are significantly influenced by trading on exchanges not located in the United States. |
10
PORTFOLIO OF INVESTMENTS – as of March 31, 2009 (Unaudited)
Loomis Sayles Small Cap Growth Fund – continued
NET ASSET SUMMARY AT MARCH 31, 2009 (Unaudited)
| | | |
Software | | 8.6 | % |
Communications Equipment | | 8.2 | |
Semiconductors & Semiconductor Equipment | | 6.4 | |
Health Care Equipment & Supplies | | 6.4 | |
Biotechnology | | 6.3 | |
Capital Markets | | 4.2 | |
Health Care Providers & Services | | 4.0 | |
Diversified Consumer Services | | 4.0 | |
Professional Services | | 3.9 | |
Energy Equipment & Services | | 3.7 | |
Health Care Technology | | 3.3 | |
Machinery | | 3.1 | |
Oil, Gas & Consumable Fuels | | 3.1 | |
Food Products | | 3.1 | |
Specialty Retail | | 3.0 | |
Commercial Services & Supplies | | 2.9 | |
Construction & Engineering | | 2.6 | |
Hotels, Restaurants & Leisure | | 2.4 | |
Diversified Telecommunication Services | | 2.4 | |
Internet Software & Services | | 2.3 | |
Pharmaceuticals | | 2.0 | |
Other Investments, less than 2% each | | 10.6 | |
Short-Term Investments | | 3.2 | |
| | | |
Total Investments | | 99.7 | |
Other assets less liabilities | | 0.3 | |
| | | |
Net Assets | | 100.0 | % |
| | | |
See accompanying notes to financial statements.
11
PORTFOLIO OF INVESTMENTS – as of March 31, 2009 (Unaudited)
Loomis Sayles Small Cap Value Fund
| | | | | | | |
| | | | | Shares | | Value (†) |
| | | | | | | |
| | | |
| COMMON STOCKS – 98.4% of Net Assets | | | | | | | |
| | | |
| Aerospace & Defense – 1.3% | | | | | | | |
Ducommun, Inc. | | | | 213,213 | | $ | 3,100,117 |
Teledyne Technologies, Inc.(b) | | | | 217,796 | | | 5,810,797 |
| | | | | | | |
| | | | | | | 8,910,914 |
| | | | | | | |
| Air Freight & Logistics – 0.8% | | | | | | | |
Atlas Air Worldwide Holdings, Inc.(b) | | | | 236,556 | | | 4,104,247 |
Hub Group, Inc., Class A(b) | | | | 77,936 | | | 1,324,912 |
| | | | | | | |
| | | | | | | 5,429,159 |
| | | | | | | |
| Auto Components – 1.1% | | | | | | | |
Gentex Corp. | | | | 404,821 | | | 4,032,017 |
Goodyear Tire & Rubber Co. (The)(b) | | | | 543,160 | | | 3,400,182 |
| | | | | | | |
| | | | | | | 7,432,199 |
| | | | | | | |
| Building Products – 0.3% | | | | | | | |
Armstrong World Industries, Inc.(b) | | | | 220,314 | | | 2,425,657 |
| | | | | | | |
| Capital Markets – 2.1% | | | | | | | |
Investment Technology Group, Inc.(b) | | | | 176,321 | | | 4,499,712 |
JMP Group, Inc. | | | | 161,713 | | | 777,840 |
Stifel Financial Corp.(b) | | | | 214,727 | | | 9,299,826 |
| | | | | | | |
| | | | | | | 14,577,378 |
| | | | | | | |
| Chemicals – 1.4% | | | | | | | |
Koppers Holdings, Inc. | | | | 173,959 | | | 2,525,885 |
LSB Industries, Inc.(b) | | | | 264,500 | | | 2,615,905 |
Lubrizol Corp. (The) | | | | 89,693 | | | 3,050,459 |
Minerals Technologies, Inc. | | | | 42,169 | | | 1,351,516 |
| | | | | | | |
| | | | | | | 9,543,765 |
| | | | | | | |
| Commercial Banks – 7.8% | | | | | | | |
Bank of the Ozarks, Inc. | | | | 303,976 | | | 7,015,766 |
Comerica, Inc. | | | | 261,183 | | | 4,782,261 |
First Horizon National Corp. | | | | 405,057 | | | 4,350,316 |
Glacier Bancorp, Inc. | | | | 228,082 | | | 3,583,168 |
Hancock Holding Co. | | | | 85,415 | | | 2,671,781 |
IBERIABANK Corp. | | | | 151,907 | | | 6,978,608 |
Pennsylvania Commerce Bancorp, Inc.(b) | | | | 119,404 | | | 2,197,034 |
Prosperity Bancshares, Inc. | | | | 228,423 | | | 6,247,369 |
Signature Bank(b) | | | | 281,675 | | | 7,951,685 |
Sterling Bancshares, Inc. | | | | 899,189 | | | 5,880,696 |
SVB Financial Group(b) | | | | 138,774 | | | 2,776,868 |
| | | | | | | |
| | | | | | | 54,435,552 |
| | | | | | | |
| Commercial Services & Supplies – 7.2% | | | | | | | |
ABM Industries, Inc. | | | | 391,160 | | | 6,415,024 |
American Ecology Corp. | | | | 172,703 | | | 2,407,480 |
Brink’s Co. (The) | | | | 155,422 | | | 4,112,466 |
Geo Group, Inc. (The)(b) | | | | 192,380 | | | 2,549,035 |
McGrath Rentcorp | | | | 191,717 | | | 3,021,460 |
Rollins, Inc. | | | | 833,861 | | | 14,300,716 |
Standard Parking Corp.(b) | | | | 537,509 | | | 8,815,148 |
Waste Connections, Inc.(b) | | | | 342,932 | | | 8,813,352 |
| | | | | | | |
| | | | | | | 50,434,681 |
| | | | | | | |
12
PORTFOLIO OF INVESTMENTS – as of March 31, 2009 (Unaudited)
Loomis Sayles Small Cap Value Fund – continued
| | | | | | | |
| | | | | Shares | | Value (†) |
| | | | | | | |
| | | |
| COMMON STOCKS – continued | | | | | | | |
| | | |
| Communications Equipment – 2.6% | | | | | | | |
ADC Telecommunications, Inc.(b) | | | | 977,555 | | $ | 4,291,466 |
ADTRAN, Inc. | | | | 236,180 | | | 3,828,478 |
Anaren, Inc.(b) | | | | 214,118 | | | 2,342,451 |
CommScope, Inc.(b) | | | | 208,323 | | | 2,366,549 |
Tekelec(b) | | | | 402,900 | | | 5,330,367 |
| | | | | | | |
| | | | | | | 18,159,311 |
| | | | | | | |
| Computers & Peripherals – 1.2% | | | | | | | |
Intevac, Inc.(b) | | | | 313,197 | | | 1,631,757 |
NCR Corp.(b) | | | | 159,882 | | | 1,271,062 |
Teradata Corp.(b) | | | | 332,688 | | | 5,396,199 |
| | | | | | | |
| | | | | | | 8,299,018 |
| | | | | | | |
| Construction & Engineering – 0.6% | | | | | | | |
MYR Group, Inc.(b) | | | | 277,270 | | | 4,228,367 |
| | | | | | | |
| Construction Materials – 0.7% | | | | | | | |
Eagle Materials, Inc. | | | | 193,956 | | | 4,703,433 |
| | | | | | | |
| Consumer Finance – 0.7% | | | | | | | |
Dollar Financial Corp.(b) | | | | 519,036 | | | 4,941,223 |
| | | | | | | |
| Containers & Packaging – 1.0% | | | | | | | |
Myers Industries, Inc. | | | | 260,956 | | | 1,602,270 |
Rock-Tenn Co., Class A | | | | 191,835 | | | 5,189,137 |
| | | | | | | |
| | | | | | | 6,791,407 |
| | | | | | | |
| Distributors – 0.2% | | | | | | | |
Core-Mark Holding Co., Inc.(b) | | | | 61,813 | | | 1,126,233 |
| | | | | | | |
| Diversified Consumer Services – 0.9% | | | | | | | |
Hillenbrand, Inc. | | | | 383,099 | | | 6,133,415 |
| | | | | | | |
| Diversified Financial Services – 1.2% | | | | | | | |
PHH Corp.(b) | | | | 604,906 | | | 8,498,929 |
| | | | | | | |
| Electric Utilities – 2.7% | | | | | | | |
ALLETE, Inc. | | | | 175,546 | | | 4,685,323 |
ITC Holdings Corp. | | | | 147,590 | | | 6,437,876 |
Portland General Electric Co. | | | | 425,252 | | | 7,480,182 |
| | | | | | | |
| | | | | | | 18,603,381 |
| | | | | | | |
| Electrical Equipment – 0.6% | | | | | | | |
II-VI, Inc.(b) | | | | 207,444 | | | 3,563,888 |
LaBarge, Inc.(b) | | | | 49,401 | | | 413,486 |
Polypore International, Inc.(b) | | | | 136,892 | | | 550,306 |
| | | | | | | |
| | | | | | | 4,527,680 |
| | | | | | | |
| Electronic Equipment Instruments & Components – 1.9% | | | | | | | |
Amphenol Corp., Class A | | | | 106,393 | | | 3,031,136 |
Daktronics, Inc. | | | | 226,280 | | | 1,482,134 |
Littelfuse, Inc.(b) | | | | 271,237 | | | 2,980,895 |
Mettler-Toledo International, Inc.(b) | | | | 42,357 | | | 2,174,185 |
Scansource, Inc.(b) | | | | 90,860 | | | 1,688,179 |
TTM Technologies, Inc.(b) | | | | 321,945 | | | 1,867,281 |
| | | | | | | |
| | | | | | | 13,223,810 |
| | | | | | | |
13
| | | | | | | |
| | | | | Shares | | Value (†) |
| | | | | | | |
| | | |
| COMMON STOCKS – continued | | | | | | | |
| | | |
| Energy Equipment & Services – 1.1% | | | | | | | |
Hornbeck Offshore Services, Inc.(b) | | | | 115,082 | | $ | 1,753,850 |
Oceaneering International, Inc.(b) | | | | 158,835 | | | 5,856,246 |
| | | | | | | |
| | | | | | | 7,610,096 |
| | | | | | | |
| Food & Staples Retailing – 0.9% | | | | | | | |
Spartan Stores, Inc. | | | | 416,992 | | | 6,425,847 |
| | | | | | | |
| Food Products – 3.1% | | | | | | | |
Flowers Foods, Inc. | | | | 231,281 | | | 5,430,478 |
J & J Snack Foods Corp. | | | | 201,646 | | | 6,974,935 |
J.M.Smucker Co. (The) | | | | 98,421 | | | 3,668,151 |
Ralcorp Holdings, Inc.(b) | | | | 109,245 | | | 5,886,120 |
| | | | | | | |
| | | | | | | 21,959,684 |
| | | | | | | |
| Gas Utilities – 2.5% | | | | | | | |
ONEOK, Inc. | | | | 195,907 | | | 4,433,376 |
UGI Corp. | | | | 550,215 | | | 12,990,576 |
| | | | | | | |
| | | | | | | 17,423,952 |
| | | | | | | |
| Health Care Equipment & Supplies – 2.0% | | | | | | | |
Hill-Rom Holdings, Inc. | | | | 133,631 | | | 1,321,611 |
Medical Action Industries, Inc.(b) | | | | 261,297 | | | 2,166,152 |
Teleflex, Inc. | | | | 156,254 | | | 6,107,969 |
West Pharmaceutical Services, Inc. | | | | 144,562 | | | 4,743,079 |
| | | | | | | |
| | | | | | | 14,338,811 |
| | | | | | | |
| Health Care Providers & Services – 2.3% | | | | | | | |
Amedisys, Inc.(b) | | | | 101,773 | | | 2,797,740 |
CorVel Corp.(b) | | | | 140,317 | | | 2,837,210 |
MEDNAX, Inc.(b) | | | | 119,792 | | | 3,530,270 |
MWI Veterinary Supply, Inc.(b) | | | | 109,983 | | | 3,132,316 |
Skilled Healthcare Group, Inc., Class A(b) | | | | 424,170 | | | 3,482,435 |
| | | | | | | |
| | | | | | | 15,779,971 |
| | | | | | | |
| Hotels, Restaurants & Leisure – 2.5% | | | | | | | |
Bob Evans Farms, Inc. | | | | 181,897 | | | 4,078,131 |
California Pizza Kitchen, Inc.(b) | | | | 251,170 | | | 3,285,304 |
Cracker Barrel Old Country Store, Inc. | | | | 123,285 | | | 3,530,882 |
Dover Downs Gaming & Entertainment, Inc. | | | | 301,983 | | | 927,088 |
Penn National Gaming, Inc.(b) | | | | 232,242 | | | 5,608,644 |
| | | | | | | |
| | | | | | | 17,430,049 |
| | | | | | | |
| Household Durables – 0.6% | | | | | | | |
Leggett & Platt, Inc. | | | | 310,132 | | | 4,028,615 |
| | | | | | | |
| Household Products – 0.6% | | | | | | | |
Church & Dwight Co., Inc. | | | | 85,136 | | | 4,446,653 |
| | | | | | | |
| Insurance – 8.7% | | | | | | | |
American Physicians Capital, Inc. | | | | 109,698 | | | 4,488,842 |
Aspen Insurance Holdings Ltd. | | | | 187,545 | | | 4,212,261 |
Fidelity National Financial, Inc., Class A | | | | 267,137 | | | 5,211,843 |
Hanover Insurance Group Inc. (The) | | | | 134,037 | | | 3,862,946 |
HCC Insurance Holdings, Inc. | | | | 334,373 | | | 8,422,856 |
Markel Corp.(b) | | | | 6,522 | | | 1,851,465 |
Navigators Group, Inc.(b) | | | | 116,894 | | | 5,515,059 |
PartnerRe Ltd. | | | | 76,466 | | | 4,746,244 |
14
PORTFOLIO OF INVESTMENTS – as of March 31, 2009 (Unaudited)
Loomis Sayles Small Cap Value Fund – continued
| | | | | | | |
| | | | | Shares | | Value (†) |
| | | | | | | |
| | | |
| COMMON STOCKS – continued | | | | | | | |
| | | |
| Insurance – continued | | | | | | | |
ProAssurance Corp.(b) | | | | 77,083 | | $ | 3,593,609 |
Reinsurance Group of America, Inc. | | | | 139,456 | | | 4,516,980 |
RLI Corp. | | | | 113,569 | | | 5,701,164 |
W.R. Berkley Corp. | | | | 216,756 | | | 4,887,848 |
Zenith National Insurance Corp. | | | | 139,933 | | | 3,373,785 |
| | | | | | | |
| | | | | | | 60,384,902 |
| | | | | | | |
| Internet & Catalog Retail – 0.4% | | | | | | | |
HSN, Inc.(b) | | | | 598,882 | | | 3,078,253 |
| | | | | | | |
| Internet Software & Services – 0.2% | | | | | | | |
United Online, Inc. | | | | 291,792 | | | 1,301,392 |
| | | | | | | |
| IT Services – 6.0% | | | | | | | |
Alliance Data Systems Corp.(b) | | | | 103,751 | | | 3,833,600 |
Broadridge Financial Solutions, Inc. | | | | 570,804 | | | 10,622,662 |
Global Payments, Inc. | | | | 124,931 | | | 4,173,945 |
Lender Processing Services, Inc. | | | | 262,910 | | | 8,047,675 |
Perot Systems Corp., Class A(b) | | | | 465,246 | | | 5,992,369 |
SRA International, Inc., Class A(b) | | | | 200,139 | | | 2,942,043 |
Wright Express Corp.(b) | | | | 345,664 | | | 6,297,998 |
| | | | | | | |
| | | | | | | 41,910,292 |
| | | | | | | |
| Life Sciences Tools & Services – 0.2% | | | | | | | |
PerkinElmer, Inc. | | | | 100,578 | | | 1,284,381 |
| | | | | | | |
| Machinery – 2.3% | | | | | | | |
Altra Holdings, Inc.(b) | | | | 310,114 | | | 1,203,242 |
Badger Meter, Inc. | | | | 63,477 | | | 1,833,851 |
CLARCOR, Inc. | | | | 81,919 | | | 2,063,540 |
John Bean Technologies Corp. | | | | 430,098 | | | 4,498,825 |
Middleby Corp. (The)(b) | | | | 101,259 | | | 3,283,829 |
Wabtec Corp. | | | | 114,115 | | | 3,010,354 |
| | | | | | | |
| | | | | | | 15,893,641 |
| | | | | | | |
| Marine – 0.6% | | | | | | | |
Kirby Corp.(b) | | | | 153,324 | | | 4,084,551 |
| | | | | | | |
| Media – 3.5% | | | | | | | |
Alloy, Inc.(b) | | | | 244,628 | | | 1,027,438 |
Interactive Data Corp. | | | | 387,591 | | | 9,635,512 |
John Wiley & Sons, Inc. Class A | | | | 345,554 | | | 10,290,598 |
Scholastic Corp. | | | | 211,104 | | | 3,181,337 |
| | | | | | | |
| | | | | | | 24,134,885 |
| | | | | | | |
| Metals & Mining – 0.7% | | | | | | | |
Reliance Steel & Aluminum Co. | | | | 180,242 | | | 4,745,772 |
| | | | | | | |
| Multi-Utilities & Unregulated Power – 0.6% | | | | | | | |
NorthWestern Corp. | | | | 193,268 | | | 4,151,397 |
| | | | | | | |
| Multiline Retail – 1.2% | | | | | | | |
Dollar Tree, Inc.(b) | | | | 187,582 | | | 8,356,778 |
| | | | | | | |
| Oil, Gas & Consumable Fuels – 1.6% | | | | | | | |
Comstock Resources, Inc.(b) | | | | 108,339 | | | 3,228,502 |
Mariner Energy, Inc.(b) | | | | 214,418 | | | 1,661,739 |
15
| | | | | | | |
| | | | | Shares | | Value (†) |
| | | | | | | |
| | | |
| COMMON STOCKS – continued | | | | | | | |
| | | |
| Oil, Gas & Consumable Fuels – continued | | | | | | | |
Newfield Exploration Co.(b) | | | | 72,847 | | $ | 1,653,627 |
Penn Virginia Corp. | | | | 447,071 | | | 4,908,840 |
| | | | | | | |
| | | | | | | 11,452,708 |
| | | | | | | |
| Paper & Forest Products – 0.2% | | | | | | | |
Clearwater Paper Corp.(b) | | | | 200,371 | | | 1,608,979 |
| | | | | | | |
| Personal Products – 1.1% | | | | | | | |
Alberto-Culver Co. | | | | 329,152 | | | 7,442,127 |
| | | | | | | |
| Pharmaceuticals – 2.2% | | | | | | | |
Endo Pharmaceuticals Holdings, Inc.(b) | | | | 217,094 | | | 3,838,222 |
Obagi Medical Products, Inc.(b) | | | | 385,567 | | | 2,074,351 |
Perrigo Co. | | | | 375,698 | | | 9,328,581 |
| | | | | | | |
| | | | | | | 15,241,154 |
| | | | | | | |
| Professional Services – 0.3% | | | | | | | |
Duff & Phelps Corp., Class A(b) | | | | 131,386 | | | 2,069,329 |
| | | | | | | |
| Real Estate Management & Development – 0.6% | | | | | | | |
Forestar Group, Inc.(b) | | | | 548,186 | | | 4,193,623 |
| | | | | | | |
| REITs – 4.9% | | | | | | | |
American Campus Communities, Inc. | | | | 286,358 | | | 4,971,175 |
Capstead Mortgage Corp. | | | | 673,066 | | | 7,228,729 |
Chimera Investment Corp. | | | | 484,728 | | | 1,628,686 |
Digital Realty Trust, Inc. | | | | 174,840 | | | 5,801,191 |
Health Care REIT, Inc. | | | | 229,884 | | | 7,032,152 |
Potlatch Corp. | | | | 309,934 | | | 7,187,369 |
| | | | | | | |
| | | | | | | 33,849,302 |
| | | | | | | |
| Road & Rail – 0.4% | | | | | | | |
Genesee & Wyoming, Inc., Class A(b) | | | | 128,810 | | | 2,737,212 |
| | | | | | | |
| Semiconductors & Semiconductor Equipment – 2.1% | | | | | | | |
Atmel Corp.(b) | | | | 852,355 | | | 3,094,049 |
Cohu, Inc. | | | | 230,704 | | | 1,661,069 |
ON Semiconductor Corp.(b) | | | | 630,040 | | | 2,457,156 |
Semtech Corp.(b) | | | | 191,765 | | | 2,560,063 |
Teradyne, Inc.(b) | | | | 693,254 | | | 3,036,452 |
TriQuint Semiconductor, Inc.(b) | | | | 783,377 | | | 1,934,941 |
| | | | | | | |
| | | | | | | 14,743,730 |
| | | | | | | |
| Software – 2.5% | | | | | | | |
Informatica Corp.(b) | | | | 168,353 | | | 2,232,361 |
Mentor Graphics Corp.(b) | | | | 651,777 | | | 2,893,890 |
Progress Software Corp.(b) | | | | 156,761 | | | 2,721,371 |
Quest Software, Inc.(b) | | | | 227,499 | | | 2,884,687 |
Sybase, Inc.(b) | | | | 214,720 | | | 6,503,869 |
| | | | | | | |
| | | | | | | 17,236,178 |
| | | | | | | |
| Specialty Retail – 1.8% | | | | | | | |
Genesco, Inc.(b) | | | | 166,373 | | | 3,132,804 |
Jo-Ann Stores, Inc.(b) | | | | 200,926 | | | 3,283,131 |
Sally Beauty Holdings, Inc.(b) | | | | 1,127,717 | | | 6,405,432 |
| | | | | | | |
| | | | | | | 12,821,367 |
| | | | | | | |
16
PORTFOLIO OF INVESTMENTS – as of March 31, 2009 (Unaudited)
Loomis Sayles Small Cap Value Fund – continued
| | | | | | | | | |
| | | | | Shares | | Value (†) | |
| | | | | | | | | |
| | | |
| COMMON STOCKS – continued | | | | | | | | | |
| | | |
| Textiles, Apparel & Luxury Goods – 2.0% | | | | | | | | | |
Carter’s, Inc.(b) | | | | | 388,247 | | $ | 7,302,926 | |
FGX International Holdings Ltd.(b) | | | | | 275,446 | | | 3,200,683 | |
Fossil, Inc.(b) | | | | | 202,625 | | | 3,181,212 | |
| | | | | | | | | |
| | | | | | | | 13,684,821 | |
| | | | | | | | | |
| Thrifts & Mortgage Finance – 1.2% | | | | | | | | | |
Beneficial Mutual Bancorp, Inc.(b) | | | | | 480,075 | | | 4,728,739 | |
Westfield Financial, Inc. | | | | | 407,901 | | | 3,589,529 | |
| | | | | | | | | |
| | | | | | | | 8,318,268 | |
| | | | | | | | | |
| Water Utilities – 1.2% | | | | | | | | | |
American States Water Co. | | | | | 122,345 | | | 4,443,570 | |
Middlesex Water Co. | | | | | 272,189 | | | 3,919,522 | |
| | | | | | | | | |
| | | | | | | | 8,363,092 | |
| | | | | | | | | |
| | | |
| TOTAL COMMON STOCKS | | | | | | | | | |
(Identified Cost $862,998,879) | | | | | | | | 684,957,324 | |
| | | | | | | | | |
| | | |
| | | | | Principal Amount | | | |
|
| SHORT-TERM INVESTMENTS – 1.0% | |
Tri-Party Repurchase Agreement with Fixed Income Clearing Corporation, dated 3/31/2009 at 0.000% to be repurchased at $7,314,430 on 4/01/2009 collateralized by $7,310,000 Federal National Mortgage Association, 4.500% due 4/29/2013 with a value of $7,465,338 including accrued interest (Note 2g of Notes to Financial Statements)
(Identified Cost $7,314,430) | | | | $ | 7,314,430 | | | 7,314,430 | |
| |
| TOTAL INVESTMENTS – 99.4% | | | | |
(Identified Cost $870,313,309)(a) | | | 692,271,754 | |
Other assets less liabilities—0.6% | | | 4,028,132 | |
| | | | | | | | | |
| |
| NET ASSETS – 100.0% | | $ | 696,299,886 | |
| | | | | | | | | |
| | | |
(†) See Note 2a of Notes to Financial Statements. | | | | | | | | | |
(a) Federal Tax Information (Amounts exclude certain adjustments made at the end of the Fund’s fiscal year for tax purposes. Such adjustments are primarily due to wash sales.): At March 31, 2009, the net unrealized depreciation on investments based on a cost of $870,169,125 for federal income tax purposes was as follows: | | | | |
Aggregate gross unrealized appreciation for all investments in which there is an excess of value over tax cost | | $ | 27,888,272 | |
Aggregate gross unrealized depreciation for all investments in which there is an excess of tax cost over value | | | (205,785,643 | ) |
| | | | | | | | | |
Net unrealized depreciation | | | | | | | $ | (177,897,371 | ) |
| | | | | | | | | |
(b) Non-income producing security. | | | | | | | | | |
REITsReal Estate Investment Trusts | | | | | | | | | |
17
NET ASSET SUMMARY AT MARCH 31, 2009 (Unaudited)
| | | |
Insurance | | 8.7 | % |
Commercial Banks | | 7.8 | |
Commercial Services & Supplies | | 7.2 | |
IT Services | | 6.0 | |
REITs | | 4.9 | |
Media | | 3.5 | |
Food Products | | 3.1 | |
Electric Utilities | | 2.7 | |
Communications Equipment | | 2.6 | |
Hotels, Restaurants & Leisure | | 2.5 | |
Gas Utilities | | 2.5 | |
Software | | 2.5 | |
Machinery | | 2.3 | |
Health Care Providers & Services | | 2.3 | |
Pharmaceuticals | | 2.2 | |
Capital Markets | | 2.1 | |
Semiconductors & Semiconductor Equipment | | 2.1 | |
Health Care Equipment & Supplies | | 2.0 | |
Textiles, Apparel & Luxury Goods | | 2.0 | |
Other Investments, less than 2% each | | 29.4 | |
Short-Term Investments | | 1.0 | |
| | | |
Total Investments | | 99.4 | |
Other assets less liabilities | | 0.6 | |
| | | |
Net Assets | | 100.0 | % |
| | | |
See accompanying notes to financial statements.
18
STATEMENTS OF ASSETS AND LIABILITIES
March 31, 2009 (Unaudited)
| | | | | | | | |
| | | Small Cap
Growth Fund | | | Small Cap
Value Fund | |
| | | | | | | | |
Assets | | | | | | | | |
Investments at cost | | $ | 90,143,851 | | | $ | 870,313,309 | |
Net unrealized depreciation | | | (10,522,003 | ) | | | (178,041,555 | ) |
| | | | | | | | |
Investments at value | | | 79,621,848 | | | | 692,271,754 | |
Receivable for Fund shares sold | | | 150,040 | | | | 1,373,658 | |
Receivable for securities sold | | | 2,153,110 | | | | 6,768,115 | |
Dividends receivable | | | 24,834 | | | | 963,531 | |
Receivable from investment adviser (Note 5) | | | 7,872 | | | | 87,708 | |
| | | | | | | | |
Total Assets | | | 81,957,704 | | | | 701,464,766 | |
| | | | | | | | |
| | |
| Liabilities | | | | | | | | |
Payable for securities purchased | | | 1,634,556 | | | | 4,128,013 | |
Payable for Fund shares redeemed | | | 354,212 | | | | 378,097 | |
Management fees payable (Note 5) | | | 48,874 | | | | 414,699 | |
Administrative fees payable (Note 5) | | | 2,701 | | | | 22,761 | |
Deferred Trustees’ fees (Note 5) | | | 39,462 | | | | 99,504 | |
Service and distribution fees payable (Note 5) | | | 331 | | | | 2,615 | |
Other accounts payable and accrued expenses | | | 44,932 | | | | 119,191 | |
| | | | | | | | |
Total Liabilities | | | 2,125,068 | | | | 5,164,880 | |
| | | | | | | | |
Net Assets | | $ | 79,832,636 | | | $ | 696,299,886 | |
| | | | | | | | |
Net Assets consist of: | | | | | | | | |
Paid-in capital | | $ | 329,214,858 | | | $ | 1,074,657,076 | |
Accumulated net investment (loss)/Undistributed net investment income | | | (331,381 | ) | | | 599,727 | |
Accumulated net realized loss on investments | | | (238,528,838 | ) | | | (200,915,362 | ) |
Net unrealized depreciation on investments | | | (10,522,003 | ) | | | (178,041,555 | ) |
| | | | | | | | |
Net Assets | | $ | 79,832,636 | | | $ | 696,299,886 | |
| | | | | | | | |
| | |
| Net Asset Value and Offering Price | | | | | | | | |
Institutional Class | | | | | | | | |
Net assets | | $ | 31,364,377 | | | $ | 359,476,601 | |
| | | | | | | | |
Shares of beneficial interest | | | 3,586,171 | | | | 24,299,604 | |
| | | | | | | | |
Net asset value, offering and redemption price per share | | $ | 8.75 | | | $ | 14.79 | |
| | | | | | | | |
Retail Class | | | | | | | | |
Net assets | | $ | 48,468,259 | | | $ | 283,656,602 | |
| | | | | | | | |
Shares of beneficial interest | | | 5,714,722 | | | | 19,332,325 | |
| | | | | | | | |
Net asset value, offering and redemption price per share | | $ | 8.48 | | | $ | 14.67 | |
| | | | | | | | |
Admin Class | | | | | | | | |
Net assets | | $ | — | | | $ | 53,166,683 | |
| | | | | | | | |
Shares of beneficial interest | | | — | | | | 3,682,521 | |
| | | | | | | | |
Net asset value, offering and redemption price per share | | $ | — | | | $ | 14.44 | |
| | | | | | | | |
See accompanying notes to financial statements.
19
STATEMENTS OF OPERATIONS
For the Six Months Ended March 31, 2009 (Unaudited)
| | | | | | | | |
| | | Small Cap
Growth Fund | | | Small Cap
Value Fund | |
| | | | | | | | |
Investment Income | | | | | | | | |
Dividends | | $ | 205,733 | | | $ | 6,273,797 | |
Interest | | | 2,360 | | | | 21,622 | |
Securities lending income (Note 2) | | | 7,998 | | | | 49,006 | |
| | | | | | | | |
| | | 216,091 | | | | 6,344,425 | |
| | | | | | | | |
Expenses | | | | | | | | |
Management fees (Note 5) | | | 329,014 | | | | 2,824,151 | |
Distribution fees—Retail Class (Note 5) | | | 68,684 | | | | 394,212 | |
Service and distribution fees—Admin Class (Note 5) | | | — | | | | 137,046 | |
Trustees’ fees and expenses (Note 5) | | | 5,627 | | | | 12,412 | |
Administrative fees (Note 5) | | | 22,403 | | | | 192,274 | |
Custodian fees and expenses | | | 11,376 | | | | 21,047 | |
Transfer agent fees and expenses—Institutional Class (Note 5) | | | 9,124 | | | | 203,740 | |
Transfer agent fees and expenses—Retail Class (Note 5) | | | 63,218 | | | | 390,485 | |
Transfer agent fees and expenses—Admin Class (Note 5) | | | — | | | | 132,941 | |
Audit and tax services fees | | | 19,496 | | | | 23,724 | |
Registration fees | | | 31,081 | | | | 56,137 | |
Shareholder reporting expenses | | | 11,427 | | | | 98,874 | |
Legal fees | | | 1,780 | | | | 15,692 | |
Miscellaneous expenses (Note 5) | | | (2,824 | ) | | | 5,877 | |
| | | | | | | | |
Total expenses | | | 570,406 | | | | 4,508,612 | |
Less fee reduction and/or expense reimbursement (Note 5) | | | (63,037 | ) | | | (588,374 | ) |
| | | | | | | | |
Net expenses | | | 507,369 | | | | 3,920,238 | |
| | | | | | | | |
Net investment income (loss) | | | (291,278 | ) | | | 2,424,187 | |
| | | | | | | | |
| | |
| Net Realized and Unrealized Loss on Investments | | | | | | | | |
Net Realized Loss | | | (33,540,315 | ) | | | (150,978,022 | ) |
Net Change in Unrealized Appreciation (Depreciation) | | | (7,981,921 | ) | | | (203,880,583 | ) |
| | | | | | | | |
Net realized and unrealized loss on investments | | | (41,522,236 | ) | | | (354,858,605 | ) |
| | | | | | | | |
| | |
| Net Decrease in Net Assets Resulting from Operations | | $ | (41,813,514 | ) | | $ | (352,434,418 | ) |
| | | | | | | | |
See accompanying notes to financial statements.
20
STATEMENTS OF CHANGES IN NET ASSETS
Small Cap Growth Fund
| | | | | | | | |
| | | Six Months Ended
March 31, 2009
(Unaudited) | | | Year Ended
September 30, 2008 | |
From Operations: | | | | | | | | |
Net investment loss | | $ | (291,278 | ) | | $ | (584,280 | ) |
Net realized loss on investments | | | (33,540,315 | ) | | | (6,171,517 | ) |
Net change in unrealized appreciation (depreciation) on investments | | | (7,981,921 | ) | | | (10,322,096 | ) |
| | | | | | | | |
Net decrease in net assets resulting from operations | | | (41,813,514 | ) | | | (17,077,893 | ) |
| | | | | | | | |
From Distributions to Shareholders: | | | | | | | | |
Net Investment Income: | | | | | | | | |
Institutional Class | | | — | | | | — | |
Retail Class | | | — | | | | — | |
Capital Gains: | | | | | | | | |
Institutional Class | | | — | | | | — | |
Retail Class | | | — | | | | — | |
| | | | | | | | |
Total distributions | | | — | | | | — | |
| | | | | | | | |
Increase (Decrease) in Net Assets Derived from Capital Share Transactions (Note 9) | | | (2,790,950 | ) | | | 92,473,941 | |
| | | | | | | | |
Redemption Fees | | | | | | | | |
Institutional Class | | | — | | | | 11,629 | |
Retail Class | | | — | | | | 17,229 | |
| | | | | | | | |
Total Redemption Fees | | | — | | | | 28,858 | |
| | | | | | | | |
Total increase (decrease) in net assets | | | (44,604,464 | ) | | | 75,424,906 | |
Net Assets | | | | | | | | |
Beginning of period | | | 124,437,100 | | | | 49,012,194 | |
| | | | | | | | |
End of period | | $ | 79,832,636 | | | $ | 124,437,100 | |
| | | | | | | | |
Accumulated Net Investment Loss | | $ | (331,381 | ) | | $ | (40,103 | ) |
| | | | | | | | |
Small Cap Value Fund
| | | | | | | | |
| | | Six Months Ended
March 31, 2009
(Unaudited) | | | Year Ended
September 30, 2008 | |
From Operations: | | | | | | | | |
Net investment income | | $ | 2,424,187 | | | $ | 3,447,311 | |
Net realized loss on investments | | | (150,978,022 | ) | | | (37,271,375 | ) |
Net change in unrealized appreciation (depreciation) on investments | | | (203,880,583 | ) | | | (141,209,963 | ) |
| | | | | | | | |
Net decrease in net assets resulting from operations | | | (352,434,418 | ) | | | (175,034,027 | ) |
| | | | | | | | |
From Distributions to Shareholders: | | | | | | | | |
Net Investment Income: | | | | | | | | |
Institutional Class | | | (2,585,541 | ) | | | (1,132,960 | ) |
Retail Class | | | (1,071,277 | ) | | | — | |
Admin Class | | | (9,660 | ) | | | — | |
Capital Gains: | | | | | | | | |
Institutional Class | | | (167,987 | ) | | | (51,944,175 | ) |
Retail Class | | | (141,335 | ) | | | (47,065,282 | ) |
Admin Class | | | (24,687 | ) | | | (8,031,853 | ) |
| | | | | | | | |
Total distributions | | | (4,000,487 | ) | | | (108,174,270 | ) |
| | | | | | | | |
Increase (Decrease) in Net Assets Derived from Capital Share Transactions (Note 9) | | | (42,940,893 | ) | | | 302,201,210 | |
| | | | | | | | |
Redemption Fees | | | | | | | | |
Institutional Class | | | 13,620 | | | | 20,568 | |
Retail Class | | | 11,287 | | | | 18,348 | |
Admin Class | | | 1,950 | | | | 3,084 | |
| | | | | | | | |
Total Redemption Fees | | | 26,857 | | | | 42,000 | |
| | | | | | | | |
Total increase (decrease) in net assets | | | (399,348,941 | ) | | | 19,034,913 | |
Net Assets | | | | | | | | |
Beginning of period | | | 1,095,648,827 | | | | 1,076,613,914 | |
| | | | | | | | |
End of period | | $ | 696,299,886 | | | $ | 1,095,648,827 | |
| | | | | | | | |
Undistributed Net Investment Income | | $ | 599,727 | | | $ | 1,842,018 | |
| | | | | | | | |
See accompanying notes to financial statements.
21
THIS PAGE INTENTIONALLY LEFT BLANK
22
FINANCIAL HIGHLIGHTS
For a share outstanding throughout each period.
| | | | | | | | | | | | | | | | | | | | | | | | | | | | | |
| | | | | Income (Loss) from Investment Operations: | | | | | Less Distributions: | |
| | | Net asset
value,
beginning
of the period | | Net
investment
income
(loss)(a)(b) | | | Net realized
and
unrealized
gain (loss) | | | Total from
investment
operations | | | | | Dividends
from
net investment
income(b) | | | Distributions
from net
realized
capital gains | | | Total
distributions | |
| Small Cap Growth Fund | | | | | | | | | | | | | | | | | | | | | | | |
| | | | | | | |
| Institutional Class | | | | | | | | | | | | | | | | | | | | | | | | | | |
3/31/2009(g) | | $ | 13.07 | | $ | (0.02 | ) | | $ | (4.30 | ) | | $ | (4.32 | ) | | | | $ | — | | | $ | — | | | $ | — | |
9/30/2008 | | | 15.87 | | | (0.07 | ) | | | (2.73 | ) | | | (2.80 | ) | | | | | — | | | | — | | | | — | |
9/30/2007 | | | 12.00 | | | (0.06 | )(f) | | | 3.93 | | | | 3.87 | | | | | | — | | | | — | | | | — | |
9/30/2006 | | | 11.08 | | | (0.08 | ) | | | 0.99 | | | | 0.91 | | | | | | — | | | | — | | | | — | |
9/30/2005 | | | 8.96 | | | (0.08 | ) | | | 2.20 | | | | 2.12 | | | | | | — | | | | — | | | | — | |
9/30/2004 | | | 8.59 | | | (0.09 | ) | | | 0.46 | | | | 0.37 | | | | | | — | | | | — | | | | — | |
| | | | | | | |
| Retail Class | | | | | | | | | | | | | | | | | | | | | | | | | | |
3/31/2009(g) | | | 12.69 | | | (0.03 | ) | | | (4.18 | ) | | | (4.21 | ) | | | | | — | | | | — | | | | — | |
9/30/2008 | | | 15.45 | | | (0.10 | ) | | | (2.66 | ) | | | (2.76 | ) | | | | | — | | | | — | | | | — | |
9/30/2007 | | | 11.71 | | | (0.09 | )(f) | | | 3.83 | | | | 3.74 | | | | | | — | | | | — | | | | — | |
9/30/2006 | | | 10.84 | | | (0.11 | ) | | | 0.97 | | | | 0.86 | | | | | | — | | | | — | | | | — | |
9/30/2005 | | | 8.78 | | | (0.11 | ) | | | 2.17 | | | | 2.06 | | | | | | — | | | | — | | | | — | |
9/30/2004 | | | 8.45 | | | (0.11 | ) | | | 0.44 | | | | 0.33 | | | | | | — | | | | — | | | | — | |
| | | | | | | |
| Small Cap Value Fund | | | | | | | | | | | | | | | | | | | | | | | | | | |
| | | | | | | |
| Institutional Class | | | | | | | | | | | | | | | | | | | | | | | | | | |
3/31/2009(g) | | $ | 22.01 | | $ | 0.06 | | | $ | (7.17 | ) | | $ | (7.11 | ) | | | | $ | (0.10 | ) | | $ | (0.01 | ) | | $ | (0.11 | ) |
9/30/2008 | | | 28.77 | | | 0.11 | (h) | | | (4.03 | ) | | | (3.92 | ) | | | | | (0.06 | ) | | | (2.78 | ) | | | (2.84 | ) |
9/30/2007 | | | 27.69 | | | 0.12 | (f)(i) | | | 4.29 | | | | 4.41 | | | | | | (0.17 | ) | | | (3.16 | ) | | | (3.33 | ) |
9/30/2006 | | | 27.43 | | | 0.13 | | | | 2.70 | | | | 2.83 | | | | | | (0.15 | ) | | | (2.42 | ) | | | (2.57 | ) |
9/30/2005 | | | 25.75 | | | 0.13 | | | | 4.22 | | | | 4.35 | | | | | | (0.02 | ) | | | (2.65 | ) | | | (2.67 | ) |
9/30/2004 | | | 21.34 | | | 0.04 | | | | 4.97 | | | | 5.01 | | | | | | (0.05 | ) | | | (0.55 | ) | | | (0.60 | ) |
| | | | | | | |
| Retail Class | | | | | | | | | | | | | | | | | | | | | | | | | | |
3/31/2009(g) | | | 21.79 | | | 0.04 | | | | (7.10 | ) | | | (7.06 | ) | | | | | (0.05 | ) | | | (0.01 | ) | | | (0.06 | ) |
9/30/2008 | | | 28.52 | | | 0.05 | (h) | | | (4.00 | ) | | | (3.95 | ) | | | | | — | | | | (2.78 | ) | | | (2.78 | ) |
9/30/2007 | | | 27.46 | | | 0.04 | (f)(i) | | | 4.28 | | | | 4.32 | | | | | | (0.10 | ) | | | (3.16 | ) | | | (3.26 | ) |
9/30/2006 | | | 27.23 | | | 0.06 | | | | 2.67 | | | | 2.73 | | | | | | (0.08 | ) | | | (2.42 | ) | | | (2.50 | ) |
9/30/2005 | | | 25.62 | | | 0.06 | | | | 4.20 | | | | 4.26 | | | | | | — | | | | (2.65 | ) | | | (2.65 | ) |
9/30/2004 | | | 21.25 | | | (0.02 | ) | | | 4.95 | | | | 4.93 | | | | | | (0.01 | ) | | | (0.55 | ) | | | (0.56 | ) |
| | | | | | | |
| Admin Class | | | | | | | | | | | | | | | | | | | | | | | | | | |
3/31/2009(g) | | | 21.40 | | | 0.02 | | | | (6.97 | ) | | | (6.95 | ) | | | | | (0.00 | ) | | | (0.01 | ) | | | (0.01 | ) |
9/30/2008 | | | 28.13 | | | (0.01 | )(h) | | | (3.94 | ) | | | (3.95 | ) | | | | | — | | | | (2.78 | ) | | | (2.78 | ) |
9/30/2007 | | | 27.14 | | | (0.03 | )(f)(i) | | | 4.22 | | | | 4.19 | | | | | | (0.04 | ) | | | (3.16 | ) | | | (3.20 | ) |
9/30/2006 | | | 26.94 | | | (0.01 | ) | | | 2.65 | | | | 2.64 | | | | | | (0.02 | ) | | | (2.42 | ) | | | (2.44 | ) |
9/30/2005 | | | 25.43 | | | (0.00 | ) | | | 4.16 | | | | 4.16 | | | | | | — | | | | (2.65 | ) | | | (2.65 | ) |
9/30/2004 | | | 21.13 | | | (0.08 | ) | | | 4.93 | | | | 4.85 | | | | | | — | | | | (0.55 | ) | | | (0.55 | ) |
(a) Per share net investment income (loss) has been calculated using the average shares outstanding during the period.
(b) Amount rounds to less than $0.01 per share, if applicable.
(c) Had certain expenses not been reduced during the period, if applicable, total returns would have been lower. Periods less than one year, if applicable, are not annualized.
(d) The investment adviser and/or administrator agreed to reimburse a portion of the Fund’s expenses and/or reduce its fees during the period. Without this reimbursement/fee reduction, if applicable, expenses would have been higher.
(e) Computed on an annualized basis for periods less than one year, if applicable.
(f) Includes a non-recurring payment of $0.01 per share and $0.00 per share for Small Cap Growth Fund and Small Cap Value Fund, respectively.
(g) For the six months ended March 31, 2009 (Unaudited).
(h) Includes a non-recurring dividend of $0.02 per share.
(i) Includes a non-recurring dividend of $0.05 per share.
(j) Includes fee/expense recovery of 0.02%.
See accompanying notes to financial statements.
23
| | | | | | | | | | | | | | | | | | | | | |
| | | | | | | | | | Ratios to Average Net Assets: | | | |
Redemption
fees(b) | | Net asset
value,
end of
the period | | Total
return (%)(c) | | | Net assets,
end of
the period
(000’s) | | Net
expenses (%)(d)(e) | | | Gross
expenses (%)(e) | | | Net
investment
income
(loss) (%)(e) | | | Portfolio
turnover
rate (%) |
| | | | | | | | | | | | | | | | | | | | | |
| | | | | | | |
| | | | | | | | | | | | | | | | | | | | | |
| $ | — | | $ | 8.75 | | (33.1 | ) | | $ | 31,364 | | 1.00 | | | 1.03 | | | (0.51 | ) | | 57 |
| | 0.00 | | | 13.07 | | (17.6 | ) | | | 44,540 | | 1.00 | | | 1.01 | | | (0.47 | ) | | 92 |
| | 0.00 | | | 15.87 | | 32.3 | | | | 28,088 | | 1.00 | | | 1.23 | | | (0.47 | ) | | 83 |
| | 0.01 | | | 12.00 | | 8.3 | | | | 20,414 | | 1.00 | | | 1.38 | | | (0.69 | ) | | 100 |
| | 0.00 | | | 11.08 | | 23.7 | | | | 15,785 | | 1.00 | | | 1.70 | | | (0.85 | ) | | 227 |
| | 0.00 | | | 8.96 | | 4.3 | | | | 15,867 | | 1.00 | | | 1.31 | | | (0.95 | ) | | 217 |
| | | | | | | |
| | | | | | | | | | | | | | | | | | | | | |
| | — | | | 8.48 | | (33.2 | ) | | | 48,468 | | 1.25 | | | 1.46 | | | (0.76 | ) | | 57 |
| | 0.00 | | | 12.69 | | (17.9 | ) | | | 79,897 | | 1.25 | | | 1.42 | | | (0.70 | ) | | 92 |
| | 0.00 | | | 15.45 | | 31.9 | | | | 20,924 | | 1.25 | | | 1.50 | | | (0.66 | ) | | 83 |
| | 0.01 | | | 11.71 | | 8.0 | | | | 2,981 | | 1.25 | | | 1.92 | | | (0.94 | ) | | 100 |
| | 0.00 | | | 10.84 | | 23.5 | | | | 3,592 | | 1.25 | | | 1.87 | | | (1.14 | ) | | 227 |
| | 0.00 | | | 8.78 | | 3.9 | | | | 14,589 | | 1.25 | | | 1.52 | | | (1.19 | ) | | 217 |
| | | | | | | |
| | | | | | | | | | | | | | | | | | | | | |
| | | | | | | |
| | | | | | | | | | | | | | | | | | | | | |
| $ | 0.00 | | $ | 14.79 | | (32.3 | ) | | $ | 359,477 | | 0.90 | | | 0.97 | | | 0.79 | | | 28 |
| | 0.00 | | | 22.01 | | (15.0 | ) | | | 553,268 | | 0.89 | | | 0.89 | | | 0.47 | | | 61 |
| | 0.00 | | | 28.77 | | 17.0 | | | | 534,776 | | 0.89 | | | 0.89 | | | 0.43 | | | 57 |
| | 0.00 | | | 27.69 | | 11.2 | | | | 442,714 | | 0.89 | (j) | | 0.89 | (j) | | 0.47 | | | 62 |
| | 0.00 | | | 27.43 | | 18.0 | | | | 403,110 | | 0.90 | | | 0.93 | | | 0.48 | | | 59 |
| | 0.00 | | | 25.75 | | 23.8 | | | | 346,356 | | 0.90 | | | 0.93 | | | 0.16 | | | 70 |
| | | | | | | |
| | | | | | | | | | | | | | | | | | | | | |
| | 0.00 | | | 14.67 | | (32.4 | ) | | | 283,657 | | 1.15 | | | 1.36 | | | 0.53 | | | 28 |
| | 0.00 | | | 21.79 | | (15.2 | ) | | | 464,525 | | 1.15 | | | 1.27 | | | 0.21 | | | 61 |
| | 0.00 | | | 28.52 | | 16.7 | | | | 465,055 | | 1.15 | | | 1.24 | | | 0.15 | | | 57 |
| | 0.00 | | | 27.46 | | 10.9 | | | | 291,690 | | 1.15 | | | 1.20 | | | 0.21 | | | 62 |
| | 0.00 | | | 27.23 | | 17.7 | | | | 235,948 | | 1.15 | | | 1.20 | | | 0.24 | | | 59 |
| | 0.00 | | | 25.62 | | 23.5 | | | | 173,411 | | 1.15 | | | 1.18 | | | (0.08 | ) | | 70 |
| | | | | | | |
| | | | | | | | | | | | | | | | | | | | | |
| | 0.00 | | | 14.44 | | (32.5 | ) | | | 53,167 | | 1.40 | | | 1.85 | | | 0.30 | | | 28 |
| | 0.00 | | | 21.40 | | (15.4 | ) | | | 77,855 | | 1.40 | | | 1.68 | | | (0.04 | ) | | 61 |
| | 0.00 | | | 28.13 | | 16.4 | | | | 76,783 | | 1.40 | | | 1.56 | | | (0.10 | ) | | 57 |
| | 0.00 | | | 27.14 | | 10.6 | | | | 64,367 | | 1.40 | | | 1.46 | | | (0.04 | ) | | 62 |
| | 0.00 | | | 26.94 | | 17.4 | | | | 67,505 | | 1.40 | | | 1.43 | | | (0.01 | ) | | 59 |
| | 0.00 | | | 25.43 | | 23.3 | | | | 62,680 | | 1.40 | | | 1.43 | | | (0.33 | ) | | 70 |
See accompanying notes to financial statements.
24
NOTES TO FINANCIAL STATEMENTS
March 31, 2009 (Unaudited)
1. Organization. Loomis Sayles Funds I and Loomis Sayles Funds II (the “Trusts” and each a “Trust”) are each organized as a Massachusetts business trust. Each Trust is registered under the Investment Company Act of 1940, as amended (the “1940 Act”), as an open-end management investment company. Each Declaration of Trust permits the Board of Trustees to authorize the issuance of an unlimited number of shares of the Trusts in multiple series. Information presented in these financial statements pertains to certain equity funds of the Trusts; the financial statements for the remaining equity funds and the fixed income funds of the Trusts are presented in separate reports. The following funds (individually, a “Fund” and collectively, the “Funds”) are included in this report:
Loomis Sayles Funds I:
Loomis Sayles Small Cap Value Fund (the “Small Cap Value Fund”)
Loomis Sayles Funds II:
Loomis Sayles Small Cap Growth Fund (the “Small Cap Growth Fund”)
Each Fund offers Institutional Class Shares and Retail Class Shares. In addition, Small Cap Value Fund offers Admin Class Shares.
Most expenses of the Trusts can be directly attributed to a fund. Expenses which cannot be directly attributed to a fund are generally apportioned based on the relative net assets of each of the funds in the Trusts. Expenses of a fund are borne pro rata by the holders of each class of shares, except that each class bears expenses unique to that class (including the Rule 12b-1 service and distribution fees and transfer agent fees applicable to such class). In addition, each class votes as a class only with respect to its own Rule 12b-1 Plan. Shares of each class would receive their pro rata share of the net assets of a fund if the fund were liquidated. The Trustees approve separate dividends from net investment income on each class of shares.
2. Significant Accounting Policies. The following is a summary of significant accounting policies consistently followed by each Fund in the preparation of its financial statements. The Funds’ financial statements are prepared in accordance with accounting principles generally accepted in the United States of America which require the use of management estimates that affect the reported amounts and disclosures in the financial statements. Actual results could differ from those estimates.
a. Valuation. Equity securities, including closed-end investment companies and exchange-traded funds, for which market quotations are readily available are valued at market value, as reported by pricing services recommended by the investment adviser and approved by the Board of Trustees. Such pricing services generally use the security’s last sale price on the exchange or market where the security is primarily traded or, if there is no reported sale during the day, the closing bid price. Securities traded on the NASDAQ Global Select Market, NASDAQ Global Market and NASDAQ Capital Market are valued at the NASDAQ Official Closing Price (“NOCP”), or if lacking a NOCP, at the most recent bid quotation on the applicable NASDAQ Market. Debt securities (other than short-term obligations purchased with an original or remaining maturity of sixty days or less) are generally valued on the basis of evaluated bids furnished to the Funds by a pricing service recommended by the investment adviser and approved by the Board of Trustees, which service determines valuations for normal, institutional-size trading units of such securities using market information, transactions for comparable securities and various relationships between securities which are generally recognized by institutional traders. Broker-dealer bid quotations may also be used to value debt and equity securities where a pricing service does not price a security or where a pricing service does not provide a reliable price for the security. In instances where broker-dealer bid quotations are not available, certain securities held by the Funds may be valued on the basis of a price provided by a principal market maker. Forward foreign currency contracts are “marked-to-market” daily utilizing interpolated prices determined from information provided by an independent pricing service. Short-term obligations purchased with an original or remaining maturity of sixty days or less are valued at amortized cost, which approximates market value. Securities for which market quotations are not readily available are valued at fair value as determined in good faith by the Funds’ investment adviser using consistently applied procedures under the general supervision of the Board of Trustees. Investments in other open-end investment companies are valued at their net asset value each day.
The Funds may hold securities traded in foreign markets. Foreign securities are valued at the market price in the foreign market. However, if events occurring after the close of the foreign market (but before the close of regular trading on the New York Stock Exchange) are believed to materially affect the value of those securities, such securities are fair valued pursuant to procedures approved by the Board of Trustees. When fair valuing securities, the Funds may, among other things, use modeling tools or other processes that may take into account factors such as securities market activity and/or significant events that occur after the close of the foreign market and before the Funds calculate their net asset values.
b. Security Transactions and Related Investment Income. Security transactions are accounted for on trade date. Dividend income is recorded on ex-dividend date, or in the case of certain foreign securities, as soon as the Fund is notified, and interest income
25
is recorded on an accrual basis. Interest income is increased by the accretion of discount and decreased by the amortization of premium. Distributions received from investments in securities that represent a return of capital or capital gain are recorded as a reduction of cost of investments or as a realized gain, respectively. The calendar year-end amounts of ordinary income, capital gains, and return of capital included in distributions received from the Funds’ investments in real estate investment trusts (“REITs”) are reported to the Funds after the end of the fiscal year; accordingly, the Funds estimate these amounts for accounting purposes until the characterization of REIT distributions is reported to the Funds after the end of the fiscal year. Estimates are based on the most recent REIT distribution information available. Investment income is recorded net of foreign taxes withheld when applicable. In determining net gain or loss on securities sold, the cost of securities has been determined on an identified cost basis. Investment income, non-class specific expenses and realized and unrealized gains and losses are allocated on a pro rata basis to each class based on the relative net assets of each class to the total net assets of the Fund.
c. Foreign Currency Translation. The books and records of the Funds are maintained in U.S. dollars. The value of securities, currencies and other assets and liabilities denominated in currencies other than U.S. dollars are translated into U.S. dollars based upon foreign exchange rates prevailing at the end of the period. Purchases and sales of investment securities, income and expenses are translated on the respective dates of such transactions.
Since the values of investment securities are presented at the foreign exchange rates prevailing at the end of the period, it is not practical to isolate that portion of the results of operations arising from changes in exchange rates from fluctuations which arise due to changes in market prices of the investment securities. Such changes are included with the net realized and unrealized gain or loss on investments.
Net realized foreign exchange gains or losses arise from sales of foreign currency, currency gains or losses realized between the trade and settlement dates on securities transactions and the difference between the amounts of dividends, interest and foreign withholding taxes recorded on the Funds’ books and the U.S. dollar equivalent of the amounts actually received or paid. Net unrealized foreign exchange gains and losses arise from changes in the value of assets and liabilities, other than investment securities, at the end of the fiscal period, resulting from changes in exchange rates.
Each Fund may use foreign currency exchange contracts to facilitate transactions in foreign-denominated investments. Losses may arise from changes in the value of the foreign currency or if the counterparties do not perform under the contracts’ terms.
Each Fund may purchase investments of foreign issuers. Investing in securities of foreign issuers involves special risks and considerations not typically associated with investing in U.S. companies and securities of the U.S. government. These risks include revaluation of currencies and the risk of expropriation. Moreover, the markets for securities of many foreign issuers may be less liquid and the price of such securities may be more volatile than those of comparable U.S. companies and the U.S. government.
d. Forward Foreign Currency Contracts. Each Fund may enter into forward foreign currency contracts. Contracts generally are used to acquire exposure to foreign currencies and may also be used for hedging purposes. Also, a contract to buy or sell can offset a previous contract. These contracts involve market risk in excess of the unrealized gain or loss reflected in the Fund’s Statement of Assets and Liabilities. The U.S. dollar value of the currencies a Fund has committed to buy or sell represents the aggregate exposure to each currency the Fund has acquired or hedged through currency contracts outstanding at period end. Gains or losses are recorded for financial statement purposes as unrealized until settlement date. Risks may arise upon entering into these contracts from the potential inability of counterparties to meet the terms of their contracts and from unanticipated movements in the value of a foreign currency relative to the U.S. dollar.
At March 31, 2009, there were no open forward foreign currency contracts.
e. Federal and Foreign Income Taxes. Each Trust treats each Fund as a separate entity for federal income tax purposes. Each Fund intends to meet the requirements of the Internal Revenue Code applicable to regulated investment companies, and to distribute to its shareholders substantially all of its net investment income and any net realized capital gains at least annually. Management has performed an analysis of the Funds’ tax positions taken on federal and state tax returns that remain subject to examination (tax years ended September 30, 2005-2008) and has concluded that no provisions for income tax are required. Fund management is not aware of any events that are reasonably possible to occur in the next six months that would result in the amounts of any unrecognized tax benefits significantly increasing or decreasing for the Funds. However, management’s conclusions regarding tax positions taken may be subject to review and adjustment at a later date based on factors including, but not limited to, new tax laws and accounting regulations and interpretations thereof.
A Fund may be subject to foreign taxes on income and gains on investments that are accrued based upon the Fund’s understanding of the tax rules and regulations that exist in the countries in which the Fund invests. Foreign governments may also
26
NOTES TO FINANCIAL STATEMENTS – continued
March 31, 2009 (Unaudited)
impose taxes or other payments on investments with respect to foreign securities. Such taxes are accrued as applicable, and are reflected as foreign taxes payable on the Statements of Assets and Liabilities.
f. Dividends and Distributions to Shareholders. Dividends and distributions are recorded on ex-dividend date. The timing and characterization of certain income and capital gain distributions are determined annually in accordance with federal tax regulations, which may differ from accounting principles generally accepted in the United States of America. Permanent differences are primarily due to differing treatments for book and tax purposes for items such as distributions from REITs, foreign currency transactions and net operating losses. Permanent book and tax basis differences relating to shareholder distributions will result in reclassifications to capital accounts. Temporary differences between book and tax distributable earnings are primarily due to securities lending collateral gain/loss adjustment, deferred Trustees’ fees, REIT basis adjustments and wash sales. Distributions from net investment income and short-term capital gains are considered to be distributed from ordinary income for tax purposes.
The tax characterization of distributions is determined on an annual basis. The tax character of distributions paid to shareholders during the year ended September 30, 2008 was as follows:
| | | | | | | | | |
| | | 2008 Distributions Paid From: |
Fund | | Ordinary
Income | | Long-Term
Capital Gains | | Total |
Small Cap Growth Fund | | $ | — | | $ | — | | $ | — |
Small Cap Value Fund | | | 16,873,484 | | | 91,300,786 | | | 108,174,270 |
Differences between these amounts and those reported in the Statements of Changes in Net Assets, if any, are primarily attributable to different book and tax treatment for short-term capital gains.
As of September 30, 2008, capital loss carryforwards and post-October losses were as follows:
| | | | | | | | |
Capital loss carryforward: | | Small Cap
Growth Fund | | | Small Cap
Value Fund | |
Expires September 30, 2010 | | $ | (138,314,515 | ) | | $ | — | |
Expires September 30, 2011 | | | (59,283,040 | ) | | | — | |
| | | | | | | | |
Total capital loss carryforward | | $ | (197,597,555 | ) | | $ | — | |
| | | | | | | | |
Deferred net capital losses (post-October 2007) | | $ | (7,364,469 | ) | | $ | (47,743,728 | ) |
| | | | | | | | |
g. Repurchase Agreements. It is each Fund’s policy that the market value of the collateral for repurchase agreements be at least equal to 102% of the repurchase price, including interest. The repurchase agreements are tri-party arrangements whereby the collateral is held in a segregated account for the benefit of the Fund and on behalf of the counterparty. Repurchase agreements could involve certain risks in the event of default or insolvency of the counterparty including possible delays or restrictions upon a Fund’s ability to dispose of the underlying securities.
h. Securities Lending. The Funds have entered into an agreement with State Street Bank and Trust Company (“State Street Bank”), as agent of the Funds, to lend securities to certain designated borrowers. The loans are collateralized with cash or securities in an amount equal to at least 105% or 102% of the market value (including accrued interest) of the loaned international or domestic securities, respectively, when the loan is initiated. Thereafter, the value of the collateral must remain at least 102% of the market value (including accrued interest) of loaned securities for U.S. equities and U.S. corporate debt; at least 105% of the market value (including accrued interest) of loaned securities for non-U.S. equities; and at least 100% of the market value (including accrued interest) of loaned securities for U.S. government securities, sovereign debt issued by non-U.S. governments and non-U.S. corporate debt. In the event that the market value of the collateral falls below the required percentages described above, the borrower will deliver additional collateral on the next business day. As with other extensions of credit, the Funds bear the risk of loss with respect to the investment of the collateral. The Funds invest cash collateral in short-term investments, a portion of the income from which is remitted to the borrowers and the remainder allocated between the Funds and State Street Bank as lending agent.
As of March 31, 2009, there were no securities on loan.
27
i. Indemnifications. Under the Trusts’ organizational documents, their officers and Trustees are indemnified against certain liabilities arising out of the performance of their duties to the Funds. Additionally, in the normal course of business, the Funds enter into contracts with service providers that contain general indemnification clauses. The Funds’ maximum exposure under these arrangements is unknown as this would involve future claims that may be made against the Funds that have not yet occurred. However, based on experience, the Funds expect the risk of loss to be remote.
j. New Accounting Pronouncement. In March 2008, Statement of Financial Accounting Standards No. 161, Disclosures about Derivative Instruments and Hedging Activities (“FAS 161”), was issued and will be effective for fiscal years and interim periods beginning after November 15, 2008. FAS 161 requires enhanced disclosures about funds’ derivative and hedging activities. Management is currently evaluating the impact the adoption of FAS 161 may have on the Funds’ financial statement disclosures.
3. Fair Value Measurements. The Funds adopted Financial Accounting Standards Board Statement of Financial Accounting Standards No. 157 (“FAS 157”), Fair Value Measurements, effective October 1, 2008. FAS 157 establishes a hierarchy for net asset value determination purposes in which various inputs are used in determining the value of the Fund’s investments. These inputs are summarized in the three broad levels listed below:
| | • | | Level 1—quoted prices in active markets for identical investments; |
| | • | | Level 2—prices determined using other significant observable inputs that are observable either directly, or indirectly through corroboration with observable market data (which could include quoted prices for similar investments, interest rates, credit risk, etc.); |
| | • | | Level 3—prices determined using significant unobservable inputs for situations where quoted prices or observable inputs are unavailable such as when there is little or no market activity for an investment (unobservable inputs reflect the Fund’s own assumptions in determining the fair value of investments and would be based on the best information available). |
The inputs or methodology used for valuing securities are not necessarily an indication of the risk associated with investing in those securities.
The following is a summary of the inputs used to value the Funds’ investments as of March 31, 2009:
Small Cap Growth Fund
| | | |
Valuation Inputs | | Investments in
Securities |
Level 1 – Quoted Prices | | $ | 79,621,848 |
Level 2 – Other Significant Observable Inputs | | | — |
Level 3 – Significant Unobservable Inputs | | | — |
| | | |
Total | | $ | 79,621,848 |
| | | |
Small Cap Value Fund
| | | |
Valuation Inputs | | Investments in
Securities |
Level 1 – Quoted Prices | | $ | 692,271,754 |
Level 2 – Other Significant Observable Inputs | | | — |
Level 3 – Significant Unobservable Inputs | | | — |
| | | |
Total | | $ | 692,271,754 |
| | | |
In April 2009, the Financial Accounting Standards Board (“FASB”) issued FASB Staff Position No. 157-4, Determining Fair Value When the Volume and Level of Activity for the Asset or Liability Have Significantly Decreased and Identifying Transactions That Are Not Orderly (“FSP 157-4”). FSP 157-4 provides additional guidance for estimating fair value in accordance with FAS 157, when the volume and level of activity for the asset or liability have significantly decreased as well as guidance on identifying circumstances that indicate a transaction is not orderly. FSP 157-4 is effective for fiscal years and interim periods ending after June 15, 2009. Management is currently evaluating the impact the adoption of FSP 157-4 will have on the Funds’ financial statement disclosures.
4. Purchases and Sales of Securities. For the six months ended March 31, 2009, purchases and sales of securities (excluding short-term investments) were as follows:
| | | | | | |
Fund | | Purchases | | Sales |
Small Cap Growth Fund | | $ | 50,712,748 | | $ | 53,755,781 |
Small Cap Value Fund | | | 218,290,842 | | | 249,613,897 |
28
NOTES TO FINANCIAL STATEMENTS – continued
March 31, 2009 (Unaudited)
5. Management Fees and Other Transactions with Affiliates.
a. Management Fees. Loomis, Sayles & Company, L.P. (“Loomis Sayles”) serves as investment adviser to each Fund. Under the terms of the management agreements, each Fund pays a management fee at the following annual rates, calculated daily and payable monthly, based on each Fund’s average daily net assets:
| | |
Fund | | Percentage of
Average Daily
Net Assets |
Small Cap Growth Fund | | 0.75% |
Small Cap Value Fund | | 0.75% |
Loomis Sayles has given binding undertakings to the Funds to reduce management fees and/or reimburse certain expenses associated with the Funds to limit their operating expenses, exclusive of brokerage expenses, interest expense, taxes and extraordinary expenses. These undertakings are in effect until January 31, 2010 and will be reevaluated on an annual basis. For the six months ended March 31, 2009, the expense limits as a percentage of average daily net assets under the expense limitation agreements were as follows:
| | | | | | |
| | | Expense Limit as a Percentage of
Average Daily Net Assets |
Fund | | Institutional
Class | | Retail
Class | | Admin
Class |
Small Cap Growth Fund | | 1.00% | | 1.25% | | — |
Small Cap Value Fund | | 0.90% | | 1.15% | | 1.40% |
For the six months ended March 31, 2009, the management fees for each Fund were as follows:
| | | |
Fund | | Management
Fee |
Small Cap Growth Fund | | $ | 329,014 |
Small Cap Value Fund | | | 2,824,151 |
For the six months ended March 31, 2009, class specific expenses have been reimbursed as follows:
| | | |
Fund | | Reimbursement |
Small Cap Growth Fund | | $ | 63,037 |
Small Cap Value Fund | | | 588,374 |
Loomis Sayles shall be permitted to recover expenses it has borne under the expense limitation agreement (whether through reduction of its management fees or otherwise) on a class by class basis in later periods to the extent the expenses of a class fall below a class’ expense limits, provided, however, that a class is not obligated to pay such reduced fees/expenses more than one year after the end of the fiscal year in which the fee/expense was reduced. The amounts subject to possible recovery under the expense limitation agreements at March 31, 2009 were as follows:
| | | | | | | | | | | | |
| | | Expenses Subject to Possible Recovery Until
September 30, 2009 |
Fund | | Institutional Class | | Retail Class | | Admin Class | | Total |
Small Cap Growth Fund | | $ | 2,492 | | $ | 92,689 | | $ | — | | $ | 95,181 |
Small Cap Value Fund | | | — | | | 546,480 | | | 220,966 | | | 767,446 |
| | | | | | | | | | | | |
| | | Expenses Subject to Possible Recovery Until
September 30, 2010 |
Fund | | Institutional Class | | Retail Class | | Admin Class | | Total |
Small Cap Growth Fund | | $ | 5,718 | | $ | 57,319 | | $ | — | | $ | 63,037 |
Small Cap Value Fund | | | 133,834 | | | 331,457 | | | 123,083 | | | 588,374 |
Certain officers and employees of Loomis Sayles are also officers or Trustees of the Trust. Loomis Sayles’ general partner is indirectly owned by Natixis Global Asset Management, L.P. (“Natixis US”), which is part of Natixis Global Asset Management, an international asset management group based in Paris, France.
29
b. Administrative Fees. Natixis Asset Management Advisors, L.P. (“Natixis Advisors”) provides certain administrative services for the Funds and subcontracts with State Street Bank to serve as sub-administrator. Natixis Advisors is a wholly-owned subsidiary of Natixis US. Pursuant to an agreement among Natixis Funds Trust I, Natixis Funds Trust II, Natixis Funds Trust III, Natixis Funds Trust IV, Natixis Cash Management Trust, Gateway Trust (“Natixis Funds Trusts”), Loomis Sayles Funds I, Loomis Sayles Funds II (“Loomis Sayles Funds Trusts”), Hansberger International Series and Natixis Advisors, each Fund pays Natixis Advisors monthly its pro rata portion of fees equal to an annual rate of 0.0575% of the first $15 billion of the average daily net assets of the Natixis Funds Trusts, Loomis Sayles Funds Trusts and the Hansberger International Series, 0.0500% of the next $15 billion, 0.0425% of the next $30 billion and 0.0375% of such assets in excess of $60 billion, subject to an annual aggregate minimum fee for the Natixis Funds Trusts, Loomis Sayles Funds Trusts and the Hansberger International Series of $10 million, which is reevaluated on an annual basis. New funds are subject to a fee for the first twelve months of operations of $75,000 plus $12,500 per class and an additional $75,000 if managed by multiple subadvisors.
For the six months ended March 31, 2009, each Fund paid the following for administrative fees to Natixis Advisors:
| | | |
Fund | | Administrative
Fees |
Small Cap Growth Fund | | $ | 22,403 |
Small Cap Value Fund | | | 192,274 |
c. Service and Distribution Fees. Natixis Distributors, L.P. (“Natixis Distributors”), a wholly owned subsidiary of Natixis US, has entered into a distribution agreement with the Trusts. Pursuant to this agreement, Natixis Distributors serves as principal underwriter of each Fund.
Pursuant to Rule 12b-1 under the 1940 Act, the Small Cap Growth Fund and the Small Cap Value Fund have adopted a Distribution Plan relating to their Retail Class shares (the “Retail Class Plans”) and the Small Cap Value Fund has adopted a separate Distribution Plan relating to its Admin Class shares (the “Admin Class Plan”).
Under the respective Retail Class and Admin Class Plans, each Fund pays Natixis Distributors a monthly distribution fee at an annual rate not to exceed 0.25% of the average daily net assets attributable to the Fund’s Retail Class and Admin Class Shares, as reimbursement for expenses incurred by Natixis Distributors in providing personal services to investors in Retail Class and Admin Class Shares and/or maintenance of shareholder accounts. In addition, the Admin Class shares of the Small Cap Value Fund may pay an administrative service fee, at an annual rate not to exceed 0.25% of the average daily net assets attributable to Admin Class shares, to securities dealers or financial intermediaries for providing personal service and account maintenance for their customers who hold such shares.
For the six months ended March 31, 2009, the Funds paid the following service and distribution fees:
| | | | | | | | | |
| | | Service Fees | | Distribution Fees |
Fund | | Admin
Class | | Retail
Class | | Admin
Class |
Small Cap Growth Fund | | $ | — | | $ | 68,684 | | $ | — |
Small Cap Value Fund | | | 68,523 | | | 394,212 | | | 68,523 |
d. Sub-Transfer Agent Fees. Natixis Distributors has entered into agreements with financial intermediaries to provide certain recordkeeping, processing, shareholder communications and other services to customers of the intermediaries and has agreed to compensate the intermediaries for providing those services. Certain services would be provided by the Funds if the shares of those customers were registered directly with the Funds’ transfer agent. Accordingly, the Funds agreed to pay a portion of the intermediary fees attributable to shares of the Fund held by the intermediaries (which generally is a percentage of the value of shares held) not exceeding what the Funds would have paid its transfer agent had each customer’s shares been registered directly with the transfer agent instead of held through the intermediaries. Natixis Distributors pays the remainder of the fees. Listed below are the fees incurred by the Funds which are included in the transfer agent fees and expenses in the Statements of Operations.
| | | | | | | | | |
| | | Sub-Transfer Agent Fees |
Fund | | Institutional
Class | | Retail
Class | | Admin
Class |
Small Cap Growth Fund | | $ | 8,531 | | $ | 26,518 | | $ | — |
Small Cap Value Fund | | | 163,381 | | | 352,268 | | | 130,763 |
30
NOTES TO FINANCIAL STATEMENTS – continued
March 31, 2009 (Unaudited)
e. Trustees Fees and Expenses. The Funds do not pay any compensation directly to their officers or Trustees who are directors, officers or employees of Natixis Advisors, Natixis Distributors, Natixis US, or their affiliates. The Chairperson of the Board receives a retainer fee at the annual rate of $200,000. The Chairperson does not receive any meeting attendance fees for Board of Trustees meetings or committee meetings that she attends. Each Independent Trustee (other than the Chairperson) receives, in the aggregate, a retainer fee at the annual rate of $65,000. Each Independent Trustee also receives a meeting attendance fee of $7,500 for each meeting of the Board of Trustees that he or she attends in person and $3,750 for each meeting of the Board of Trustees that he or she attends telephonically. In addition, each committee chair receives an additional retainer fee at the annual rate of $10,000. Each Contract Review and Governance Committee member is compensated $5,000 for each Committee meeting that he or she attends in person and $2,500 for each meeting that he or she attends telephonically. Each Audit Committee member is compensated $6,250 for each Committee meeting that he or she attends in person and $3,125 for each meeting that he or she attends telephonically. These fees are allocated among the funds in the Natixis Funds Trusts, Loomis Sayles Funds Trusts and the Hansberger International Series based on a formula that takes into account, among other factors, the relative net assets of each Fund. Trustees are reimbursed for travel expenses in connection with attendance at meetings.
A deferred compensation plan (the “Plan”) is available to the Trustees on a voluntary basis. Deferred amounts remain in the Funds until distributed in accordance with the provisions of the Plan. The value of a participating Trustee’s deferral account is based on theoretical investments of deferred amounts, on the normal payment dates, in certain funds of the Natixis Funds Trusts, Loomis Sayles Funds Trusts and Hansberger International Series as designated by the participating Trustees. Changes in the value of participants’ deferral accounts are allocated pro rata among the funds in the Natixis Funds Trusts, Loomis Sayles Funds Trusts, and Hansberger International Series, and are normally reflected as Trustees’ fees and expenses in the Statements of Operations. The portions of the accrued obligations allocated to the Funds under the Plan are reflected as Deferred Trustees’ fees in the Statements of Assets and Liabilities.
For the six months ended March 31, 2009, net depreciation in the value of participants’ deferral accounts has been included in Miscellaneous expenses in the Statements of Operations, as follows:
| | | |
Fund | | Amount |
Small Cap Growth Fund | | $ | 8,037 |
Small Cap Value Fund | | | 14,867 |
f. Redemption Fees. Shareholders of Small Cap Growth Fund and Small Cap Value Fund are charged a 2% redemption fee if they redeem, including redeeming by exchange, any class of shares of such Funds within 60 days of their acquisition (including acquisition by exchange). The redemption fee is intended to offset the costs to the Funds of short-term trading, such as portfolio transaction and market impact costs associated with redemption activity and administrative costs associated with processing redemptions. The redemption fee is deducted from the shareholder’s redemption or exchange proceeds and is paid to the Fund.
The “first-in, first-out” method is used to determine the holding period of redeemed or exchanged shares, which means that if a shareholder acquired shares on different days, the shares acquired first will be redeemed or exchanged first for purposes of determining whether the redemption fee applies. A new holding period begins with each purchase or exchange. These fees are accounted for as an addition to paid-in capital and are presented in the Statements of Changes in Net Assets.
On March 27, 2009, the Trustees approved the elimination of redemption fees on Small Cap Growth Fund and Small Cap Value Fund effective June 1, 2009.
6. Line of Credit. Each Fund, together with certain other funds of Natixis Funds Trusts, Loomis Sayles Funds Trusts and the Hansberger International Series, participates in a $200,000,000 committed line of credit provided by State Street Bank, with an individual limit of $125,000,000 for each Fund that participates in the line of credit. Interest is charged to each participating fund based on its borrowings at a rate per annum equal to the greater of the Federal Funds rate or overnight LIBOR, plus 0.75%. In addition, a commitment fee of 0.125% per annum, payable at the end of each calendar quarter, is accrued and apportioned among the participating funds based on their average daily unused portion of the line of credit.
Prior to March 11, 2009, each Fund, together with certain other funds of Natixis Funds Trusts, Loomis Sayles Funds Trusts and Hansberger International Series, participated in a $200,000,000 committed line of credit provided by State Street Bank, with an individual limit of $125,000,000 for each Fund that participated in the line of credit. Interest was charged to each participating fund based on its borrowings at a rate per annum equal to the Federal Funds rate plus 0.50%. In addition, a commitment fee of 0.09% per annum, payable at the end of each calendar quarter, was accrued and apportioned among the participating funds based on their average daily unused portion of the line of credit.
31
For the six months ended March 31, 2009, the Funds had no borrowings under these agreements.
7. Brokerage Commission Recapture. Each Fund has entered into agreements with certain brokers whereby the brokers will rebate a portion of brokerage commissions. All amounts rebated by the brokers are returned to the Funds under such agreements and are included in realized gains in the Statements of Operations. For the six months ended March 31, 2009, amounts rebated under these agreements were as follows:
| | | |
Fund | | Rebates |
Small Cap Growth Fund | | $ | 9,340 |
Small Cap Value Fund | | | 38,679 |
8. Shareholders. At March 31, 2009, the Loomis Sayles Funded Pension Plan and the Loomis Sayles Employees’ Profit Sharing Retirement Plan held Institutional Class shares of beneficial interest in the Funds as follows:
| | | | |
Fund | | Pension Plan | | Profit Sharing
Retirement Plan |
Small Cap Growth Fund | | 368,786 | | 367,113 |
Small Cap Value Fund | | 362,408 | | 751,956 |
9. Capital Shares. Each Fund may issue an unlimited number of shares of beneficial interest, without par value. Transactions in capital shares were as follows:
| | | | | | | | | | | | | | |
| | | Small Cap Growth Fund | |
| | |
| | | Six Months Ended March 31, 2009 | | | Year Ended September 30, 2008 | |
| | | | |
| Institutional Class | | Shares | | | Amount | | | Shares | | | Amount | |
Issued from the sale of shares | | 1,189,564 | | | $ | 11,077,773 | | | 2,094,507 | | | $ | 30,602,699 | |
Issued in connection with the
reinvestment of distributions | | — | | | | — | | | — | | | | — | |
Redeemed | | (1,011,198 | ) | | | (9,103,938 | ) | | (456,742 | ) | | | (6,441,388 | ) |
| | | | | | | | | | | | | | |
Net change | | 178,366 | | | $ | 1,973,835 | | | 1,637,765 | | | $ | 24,161,311 | |
| | | | | | | | | | | | | | |
| | | | |
| Retail Class | | Shares | | | Amount | | | Shares | | | Amount | |
Issued from the sale of shares | | 1,004,037 | | | $ | 9,188,291 | | | 6,898,095 | | | $ | 94,809,730 | |
Issued in connection with the reinvestment of distributions | | — | | | | — | | | — | | | | — | |
Redeemed | | (1,585,593 | ) | | | (13,953,076 | ) | | (1,956,386 | ) | | | (26,497,100 | ) |
| | | | | | | | | | | | | | |
Net change | | (581,556 | ) | | $ | (4,764,785 | ) | | 4,941,709 | | | $ | 68,312,630 | |
| | | | | | | | | | | | | | |
Increase (decrease) from capital
share transactions | | (403,190 | ) | | $ | (2,790,950 | ) | | 6,579,474 | | | $ | 92,473,941 | |
| | | | | | | | | | | | | | |
| |
| | | Small Cap Value Fund | |
| | |
| | | Six Months Ended March 31, 2009 | | | Year Ended September 30, 2008 | |
| | | | |
| Institutional Class | | Shares | | | Amount | | | Shares | | | Amount | |
Issued from the sale of shares | | 2,539,102 | | | $ | 41,335,220 | | | 9,681,674 | | | $ | 228,728,526 | |
Issued in connection with the reinvestment of distributions | | 156,833 | | | | 2,488,947 | | | 1,942,239 | | | | 49,352,283 | |
Redeemed | | (3,528,623 | ) | | | (57,105,563 | ) | | (5,076,716 | ) | | | (120,789,687 | ) |
| | | | | | | | | | | | | | |
Net change | | (832,688 | ) | | $ | (13,281,396 | ) | | 6,547,197 | | | $ | 157,291,122 | |
| | | | | | | | | | | | | | |
32
NOTES TO FINANCIAL STATEMENTS – continued
March 31, 2009 (Unaudited)
| | | | | | | | | | | | | | |
| | | Small Cap Value Fund — continued | |
| | |
| | | Six Months Ended March 31, 2009 | | | Year Ended September 30, 2008 | |
| | | | |
| Retail Class | | Shares | | | Amount | | | Shares | | | Amount | |
Issued from the sale of shares | | 2,749,459 | | | $ | 47,397,068 | | | 10,268,147 | | | $ | 242,357,595 | |
Issued in connection with the reinvestment of distributions | | 76,628 | | | | 1,206,896 | | | 1,850,508 | | | | 46,632,804 | |
Redeemed | | (4,812,609 | ) | | | (78,633,739 | ) | | (7,108,230 | ) | | | (166,486,060 | ) |
| | | | | | | | | | | | | | |
Net change | | (1,986,522 | ) | | $ | (30,029,775 | ) | | 5,010,425 | | | $ | 122,504,339 | |
| | | | | | | | | | | | | | |
| | | | |
| Admin Class | | Shares | | | Amount | | | Shares | | | Amount | |
Issued from the sale of shares | | 901,058 | | | $ | 13,680,755 | | | 2,168,929 | | | $ | 51,105,918 | |
Issued in connection with the reinvestment of distributions | | 1,691 | | | | 26,231 | | | 271,955 | | | | 6,747,215 | |
Redeemed | | (858,256 | ) | | | (13,336,708 | ) | | (1,532,487 | ) | | | (35,447,384 | ) |
| | | | | | | | | | | | | | |
Net change | | 44,493 | | | $ | 370,278 | | | 908,397 | | | $ | 22,405,749 | |
| | | | | | | | | | | | | | |
Increase (decrease) from capital
share transactions | | (2,774,717 | ) | | $ | (42,940,893 | ) | | 12,466,019 | | | $ | 302,201,210 | |
| | | | | | | | | | | | | | |
33

Loomis Sayles Bond Fund
Loomis Sayles Fixed Income Fund
Loomis Sayles Global Bond Fund
Loomis Sayles Inflation Protected Securities Fund
Loomis Sayles Institutional High Income Fund
Loomis Sayles Intermediate Duration Fixed Income Fund
Loomis Sayles Investment Grade Fixed Income Fund
SEMIANNUAL REPORT
MARCH 31, 2009 (Unaudited)
FUND AND MANAGER REVIEW
Loomis Sayles Bond Fund
| | |
 Daniel Fuss, CFA, CIC Manager since May 1991 | | 
Matthew Eagan, CFA Associate Manager since February 2007 |

Kathleen Gaffney, CFA Manager since October 1997 | | 
Elaine Stokes Associate Manager since February 2007 |
PORTFOLIO REVIEW
For the six months ended March 31, 2009, the Fund underperformed its Benchmark, Barclays Capital US Government/Credit Index, primarily due to its exposure to high yield and non-US-dollar debt.
Security selection was the foremost driver of underperformance, primarily among high yield and investment grade industrial credits. In particular, the global recession and increasing liquidity fears drove losses on highly levered names, including telecommunication and health care, along with specific names in autos. In the investment grade utilities segment, our overweight allocation, coupled with liquidity issues and the seasonal nature of revenues, led to lagging results. High yield convertible bonds also declined sharply, but a rally in the first quarter of 2009 helped mitigate our losses.
As the global recession continued, the US dollar gained on its peers, as investors sought protection from currencies impacted by faltering commodity prices. Our foreign exposure, primarily in Canada, Indonesia, Mexico, New Zealand and Brazil, weighed heavily on portfolio returns. Despite a positive shift in the market during the first quarter of 2009, losses from the closing quarter of 2008 were too large to be offset.
Risk aversion and a massive flight to quality inflated US Treasury prices and yields sank to historic lows. As a result, our underweight allocations to US Treasury and agency securities also contributed to the Fund’s underperformance for the period.
On a positive note, we maintained a longer-than-Benchmark duration during the period, primarily in investment grade corporate bonds and government agency securities. As yields on US Treasury securities declined amid the massive flight to quality, the Fund’s relatively long term positioning enabled it to capitalize on rising prices. In addition, our exposure to financial credits benefited from the introduction of several US Treasury department lending programs. In particular, our non-investment-grade positioning gained ground early in the period, primarily due to the credit arm of a major US automaker that received access to federal funding.
OUTLOOK
We believe high yield issues will continue to be volatile, as defaults continue to increase over the course of the year. We remain underweight in the CCC-rated portion of the market, as we believe most defaults will come from this space. We believe investment grade credit continues to offer strong relative value, as spreads remain at relatively wide levels. As the markets grow more convinced the global recovery has taken hold, we eventually expect to see
FUND FACTS
Symbol | Institutional: LSBDX;
Retail: LSBRX; Admin: LBFAX
Objective | High total investment return through a combination of current income and capital appreciation
Strategy | Invests primarily in investment-grade fixed-income securities, although it may invest up to 35% of assets in lower rated fixed-income securities and up to 20% of its assets in preferred stocks. The Fund may invest any portion of its assets in Canadian securities and up to 20% of assets in other foreign securities, including emerging markets securities.
Fund Inception Date | 5/16/91
Class Inception Date Institutional: 5/16/91; Retail: 12/31/96; Admin: 1/2/98
Total Net Assets | $13,130.4 million
1
more demand for riskier assets, such as high yield and investment grade bonds, as well as commodity currencies.
AVERAGE ANNUAL TOTAL RETURNS
Periods Ended March 31, 2009
| | | | | | | | | | | | |
| 6 Months | | 1 Year | | | 5 Years | | | 10 Years | | | Since Fund
Inception(a) | |
| Loomis Sayles Bond: Institutional | |
| -8.99% | | -20.48 | % | | 1.37 | % | | 5.65 | % | | 8.77 | % |
| Loomis Sayles Bond: Retail(c) | |
| -9.07 | | -20.70 | | | 1.10 | | | 5.38 | | | 8.50 | |
| Loomis Sayles Bond: Admin(c) | |
| -9.12 | | -20.87 | | | 0.84 | | | 5.12 | | | 8.03 | |
| Barclays Capital US Government/Credit Index(d) | |
| 5.06 | | 1.78 | | | 3.74 | | | 5.64 | | | 6.80 | |
| Lipper BBB-Rated Funds Index(d) | |
| -3.01 | | -10.65 | | | 0.79 | | | 3.72 | | | 5.79 | |
| | | | | | |
| Gross expense ratio (before reductions and reimbursements)* | |
| Institutional: 0.64% | | Retail: 0.94 | % | | Admin: 1.24 | % |
| Net expense ratio (after reductions and reimbursements)* | |
| Institutional: 0.64% | | Retail: 0.94 | % | | Admin: 1.20 | % |
* As stated in the most recent prospectus
CUMULATIVE PERFORMANCE(e)
Inception to March 31, 2009(b)
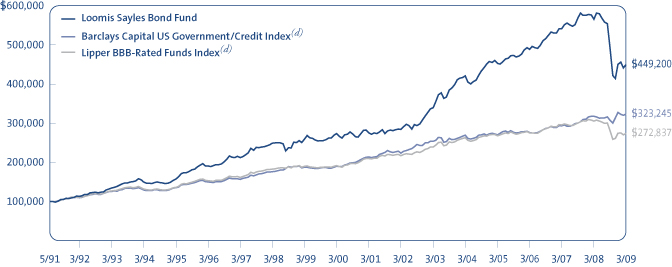
Data quoted reflects past performance and cannot guarantee future results. Average annual total returns assume reinvestment of dividends and capital gains distributions. Investment return and principal value will fluctuate so that shares, when redeemed, may be worth more or less than their original cost. For performance current to the most recent month-end, please visit the Loomis Sayles website. Current performance may be higher or lower than quoted.
Returns do not reflect the taxes that a shareholder would pay on Fund distributions or the redemption of shares. Periods of less than one year are not annualized. Performance data reflects certain fee reductions and reimbursements, if any, without which performance would be lower.
(a) Inception dates of the Institutional, Retail and Admin Classes of shares are May 16, 1991, December 31, 1996 and January 2, 1998, respectively. (b) The mountain chart is based on the initial minimum investment of $100,000 for the Institutional Class. (c) Performance shown for periods prior to the inception date of the Retail Class and the Admin Class represents the performance of the Institutional Class during the periods shown, adjusted to reflect the current levels of 12b-1 fees payable by the respective classes of shares. (d) See page 15 for a description of the indices. Index performance data is not available coincident with the Fund’s inception date; the beginning value of the index is the value as of the month end closest to the Fund’s inception date. (e) Cumulative performance is shown for the Institutional Class of shares. Performance of the Retail and Admin Classes would be lower, due to higher fees.
WHAT YOU SHOULD KNOW
The Fund can invest a significant percentage of assets in debt securities that are rated below investment grade and the value of fund shares can be adversely affected by changes in economic conditions or other circumstances. Lower rated debt securities have speculative characteristics and may be subject to greater price volatility than higher rated investments. In addition, the secondary market for these securities may lack liquidity. Fund shares should be viewed as a long-term investment. Securities issued by US government agencies are not insured by and may not be guaranteed by the US government. The Fund can invest a significant percentage of assets in foreign securities and the value of the fund shares can be adversely affected by changes in currency exchange rates, political, and economic developments. In emerging markets these risks can be significant. The Fund is subject to currency risk, which is the risk that fluctuations in exchange rates between the US dollar and foreign currencies may cause the value of a Fund’s investments to decline. Accordingly, the purchase of fund shares should be viewed as a long-term investment.
2
FUND AND MANAGER REVIEW
Loomis Sayles Fixed Income Fund
| | |
Daniel Fuss, CFA, CIC Manager since January 1995 | |
Matthew Eagan, CFA Associate Manager since
February 2007 |
Kathleen Gaffney, CFA Associate Manager since February 2007 | |
Elaine Stokes Associate Manager since February 2007 |
PORTFOLIO REVIEW
For the six months ended March 31, 2009, the Fund underperformed its Benchmark, Barclays Capital US Government/Credit Index, primarily due to specific security selection, duration positioning in investment grade industrials and preferred securities and sector allocation.
Exceptional market volatility spurred a flight to quality in the fourth quarter of 2008, which impaired access to capital for many businesses, particularly those with direct ties to the US consumer. Our high yield industrial bonds fell victim to this crisis of confidence. In addition, our underweight in US Treasurys, which benefited during the flight to quality, also weighed on returns in the first quarter of 2009.
The increasingly grim global economic outlook sent most major currencies lower versus the US dollar, which led to lagging results for our foreign currency holdings. In particular, falling prices in the commodities market, stemming from depressed global demand, had a substantial impact on several currencies, including the Brazilian real, New Zealand dollar and Canadian dollar. The Indonesian rupiah and the Icelandic krona also lagged, as instability in the US financial markets gripped foreign institutions. Our allocation to convertible securities put additional downward pressure on returns. Much of this underperformance was due to the Fund’s exposure to several firms that declared bankruptcy or were severely distressed during the period, including Nortel, Epix and Ford Motor Co.
For most of the period, we maintained a longer-than-Benchmark duration strategy, concentrated largely in long term, investment grade industrials and preferred securities. This positioning detracted modestly from performance as the yield curve steepened.
From a sector perspective, our investment grade industrials made the greatest contribution to relative performance, led by strong results from individual companies in the telecommunication industry. The Fund’s allocation to high yield financials also fared well, following the successful conversion of GMAC into a bank holding company.
OUTLOOK
We believe high yield issues will continue to be volatile, as defaults continue to increase over the course of the year. We remain underweight in the CCC-rated portion of the market, as we believe most defaults will come from this space. We believe investment grade credit continues to offer strong relative value, as spreads remain at relatively wide levels. As the markets grow more convinced the global recovery has taken hold, we eventually expect to see
FUND FACTS
Symbol | LSFIX
Objective | High total investment return through a combination of current income and capital appreciation
Strategy | Invests primarily in fixed-income securities, may invest up to 35% of its assets in lower-rated fixed-income securities and up to 20% of its assets in preferred stocks. The Fund may invest any portion of its assets in Canadian securities and up to 20% of assets in other foreign securities, including emerging markets securities.
Fund Inception Date | 1/17/95
Fund Registration Date | 3/7/97
Total Net Assets | $596.6 million
3
more demand for riskier assets, such as high yield and investment grade bonds, as well as commodity currencies.
AVERAGE ANNUAL TOTAL RETURNS
Periods Ended March 31, 2009
| | | | | | | | | | | | | | | |
| 6 Months | | 1 Year | | | 5 Years | | | 10 Years | | | Since
Registration(a) | | | Since Fund
Inception(a) | |
| Loomis Sayles Fixed Income: Institutional | |
| -7.52% | | -16.34 | % | | 2.69 | % | | 6.39 | % | | 6.78 | % | | 8.41 | % |
| Barclays Capital US Government/Credit Index(b) | |
| 5.06 | | 1.78 | | | 3.74 | | | 5.64 | | | 6.11 | | | 6.60 | |
| Lipper BBB-Rated Funds Index(b) | |
| -3.01 | | -10.65 | | | 0.79 | | | 3.72 | | | 4.31 | | | 5.27 | |
| | | | | |
| Gross expense ratio (before reductions and reimbursements)* |
| Institutional: 0.58 | % | | | | |
| Net expense ratio (after reductions and reimbursements)* |
| Institutional: 0.58 | % | | | | |
* As stated in the most recent prospectus
CUMULATIVE PERFORMANCE
Registration to March 31, 2009(c)

Inception to March 31, 2009(c)
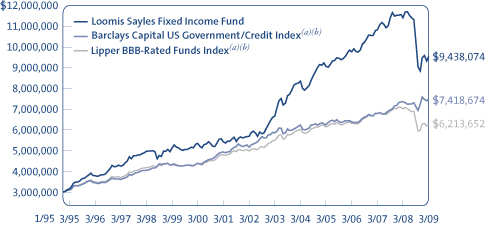
Data quoted reflects past performance and cannot guarantee future results. Average annual total returns assume reinvestment of dividends and capital gains distributions. Investment return and principal value will fluctuate so that shares, when redeemed, may be worth more or less than their original cost. For performance current to the most recent month end, please visit the Loomis Sayles website. Current performance may be higher or lower than quoted.
Returns do not reflect the taxes that a shareholder would pay on Fund distributions or the redemption of shares. Periods of less than one year are not annualized. Performance data reflects certain fee reductions and reimbursements, if any, without which performance would be lower.
(a) Shares of the Fund were registered for offer and sale under the Securities Act of 1933 on March 7, 1997. In accordance with regulations, performance information is provided for the period beginning on March 7, 1997 (“Registration”). Performance from inception is also provided for the convenience of our long-term shareholders. Since index performance data is not available coincident with the Fund’s inception and registration dates, comparative performance is presented from the month end closest to the Fund’s inception and registration dates. (b) See page 15 for a description of the indices. (c) The mountain chart is based on the Fund’s minimum initial investment of $3,000,000.
WHAT YOU SHOULD KNOW
The Fund can invest a significant percentage of assets in debt securities that are rated below investment grade and the value of fund shares can be adversely affected by changes in economic conditions or other circumstances. Lower rated debt securities have speculative characteristics and may be subject to greater price volatility than higher rated investments. In addition, the secondary market for these securities may lack liquidity. Fund shares should be viewed as a long-term investment. Securities issued by US government agencies are not insured by and may not be guaranteed by the US government. The Fund can invest a significant percentage of assets in foreign securities and the value of the fund shares can be adversely affected by changes in currency exchange rates, political, and economic developments. In emerging markets these risks can be significant. The Fund is subject to currency risk, which is the risk that fluctuations in exchange rates between the US dollar and foreign currencies may cause the value of a Fund’s investments to decline. Accordingly, the purchase of fund shares should be viewed as a long-term investment.
4
FUND AND MANAGER REVIEW
Loomis Sayles Global Bond Fund

Ken Buntrock, CFA, CIC
Manager since September 2000

David Rolley, CFA
Manager since September 2000

Lynda Schweitzer, CFA
Manager since February 2007
PORTFOLIO REVIEW
For the six months ended March 31, 2009, the Fund underperformed its Benchmark, Barclays Capital Global Aggregate Bond Index, primarily due to its overweight positions in US and European corporate bonds.
Most of the Fund’s underperformance occurred during the first three months of the fiscal period, as the credit crisis deepened and investors’ flight to safety accelerated. The global recession, illiquid capital markets, and depleted investor confidence caused corporate spreads to widen to record levels during the period. The Fund’s worst performing individual issues included banks, brokers and finance companies, which struggled as concern about the global banking system weighed on investors. In addition, our out-of-Benchmark position in the Iceland krona dampened returns, as the extraordinary collapse of that nation’s banking system led to large losses in the value of its currency.
In December and January the Fund benefitted from corporate spread tightening. Positive fund flows and a healthy supply of new issues, combined with widespread sentiment that corporate credit could offer value, encouraged investors. In addition, interest rates fell in most markets, and the Fund’s long duration in credit securities helped performance.
Our underweight positions in the euro and Canadian dollar led to positive performance results. Concerns surrounding the European banking sector and its exposure to Eastern Europe caused the euro to weaken, while weaker economic data, falling commodity prices, and the spillover from deteriorating US fundamentals undermined support for the Canadian dollar. In the first quarter of 2009, we added to the Fund’s position in the Norwegian krona, which rallied against the greenback as commodity prices stabilized.
OUTLOOK
We have positioned the portfolio for a global recovery that we see ahead in the months to come, with relatively few US Treasurys, an underweight in the Japanese yen, and overweight positions in high-grade and high yield credit.
Given the market’s buying enthusiasm this spring, we are inclined to look for a slight pullback from the recent optimism. If this occurs, we will take advantage of any attractive re-pricing to add to “recovery” positions. Specifically, we plan to increase the Fund’s position in currencies tied to commodity prices, emerging market securities, and high yield bonds.
FUND FACTS
Symbol | Institutional: LSGBX;
Retail: LSGLX
Objective | High total investment return through a combination of high current income and capital appreciation
Strategy | Invests primarily in investment-grade fixed-income securities worldwide, although it may invest up to 20% of assets in lower-rated fixed-income securities.
Fund Inception Date | 5/10/91
Class Inception Date Institutional: 5/10/91; Retail: 12/31/96
Total Net Assets | $1,436.7 million
5
AVERAGE ANNUAL TOTAL RETURNS
Periods Ended March 31, 2009
| | | | | | | | | | | | |
| 6 Months | | 1 Year | | | 5 Years | | | 10 Years | | | Since
Inception(a) | |
| Loomis Sayles Global Bond: Institutional | |
| -4.72% | | -14.52 | % | | 1.48 | % | | 5.32 | % | | 7.20 | % |
| Loomis Sayles Global Bond: Retail(b) | |
| -4.91 | | -14.81 | | | 1.18 | | | 5.04 | | | 7.01 | |
| Barclays Capital Global Aggregate Bond Index(c) | |
| 1.83 | | -4.93 | | | 3.90 | | | 5.22 | | | 6.72 | |
| Lipper Global Income Funds Index(c) | |
| -3.99 | | -11.41 | | | 1.74 | | | 4.03 | | | 5.35 | |
| | | | | | |
| Gross expense ratio (before reductions and reimbursements)* |
| Institutional: 0.64 | % | | Retail: 1.00 | % | | |
| Net expense ratio (after reductions and reimbursements)* |
| Institutional: 0.64 | % | | Retail: 1.00 | % | | |
* As stated in the most recent prospectus
CUMULATIVE PERFORMANCE(d)
Inception to March 31, 2009(e)
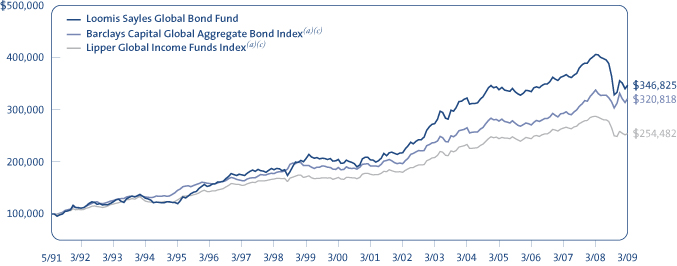
Data quoted reflects past performance and cannot guarantee future results. Average annual total returns assume reinvestment of dividends and capital gains distributions. Investment return and principal value will fluctuate so that shares, when redeemed, may be worth more or less than their original cost. For performance current to the most recent month-end, please visit the Loomis Sayles website. Current performance may be higher or lower than quoted.
Returns do not reflect the taxes that a shareholder would pay on Fund distributions or the redemption of shares. Periods of less than one year are not annualized. Performance data reflects certain fee reductions and reimbursements, if any, without which performance would be lower.
(a) Since index performance data is not available coincident with the Fund’s inception date, the beginning value of the index is the value as of the month end closest to the Fund’s inception date. (b) Performance shown for periods prior to the inception date of the Retail Class (12/31/96) represents the performance of the Institutional Class during the periods shown, adjusted to reflect the current levels of 12b-1 fees payable by the respective Classes of shares. (c) See page 15 for a description of the indices. (d) Cumulative performance is shown for the Institutional Class. Performance of the Retail Class would be lower due to higher fees. (e) The mountain chart is based on the Institutional Class minimum initial investment of $100,000.
WHAT YOU SHOULD KNOW
The Fund can invest a significant percentage of assets in debt securities that are rated below investment grade and the value of fund shares can be adversely affected by changes in economic conditions or other circumstances. Lower rated debt securities have speculative characteristics and may be subject to greater price volatility than higher rated investments. In addition, the secondary market for these securities may lack liquidity. Fund shares should be viewed as a long-term investment. Securities issued by US government agencies are not insured by and may not be guaranteed by the US government. The Fund can invest a significant percentage of assets in foreign securities and the value of the fund shares can be adversely affected by changes in currency exchange rates, political, and economic developments. In emerging markets these risks can be significant. The Fund is subject to currency risk, which is the risk that fluctuations in exchange rates between the US dollar and foreign currencies may cause the value of a Fund’s investments to decline. Accordingly, the purchase of fund shares should be viewed as a long-term investment.
6
FUND AND MANAGER REVIEW
Loomis Sayles Inflation Protected Securities Fund

John Hyll
Manager since January 2003

Cliff Rowe, CFA
Manager since January 2003
PORTFOLIO REVIEW
For the six months ended March 31, 2009, the Fund lagged its Benchmark, Barclays Capital US TIPS Index, primarily as a result of security selection. During the period, the real yield on ten-year TIPS (Treasury Inflation-Protected Securities) decreased to 1.43% at March 31, 2009, from 2.25% on September 30, 2008. The yield on five-year TIPS slid to 0.9% at the end of March 2009.
Although the nominal US Treasury curve continued to steepen amidst the accelerating credit crisis and significant Federal Reserve rate cuts, the TIPS curve flattened during much of the period. Investors quickly replaced their inflation fears with fears of deflation, as commodities retreated from their third-quarter peaks. Our longer-than-Benchmark duration strategy helped buoy returns as the TIPS curve flattened.
TIPS, which comprised 85% of the Fund, were battered during much of the period, as deflation fears and gloomy economic news prompted investors to flee to the relative safety of nominal Treasuries. Inflation concerns reappeared late in the first quarter of 2009, due to a spike in oil prices and a rapidly ballooning Federal Reserve balance sheet. These concerns provided a measure of relief for TIPS, but the sector still ended the period lagging nominal Treasurys.
Out-of-Benchmark positions accounted for the bulk of the Fund’s relative underperformance. Exceptional market volatility spurred a flight to quality in the first half of the period. This led to impaired access to capital for much of the credit market, particularly firms with direct ties to the domestic consumer. The Fund’s industrial holdings, particularly in the high yield sector, fell victim to this crisis of confidence. The market’s appetite for risk tentatively re-emerged late in the first quarter of 2009, but the resulting rally was not sufficient to offset earlier losses.
In addition, the increasingly grim global economic outlook sent most major currencies lower versus the US dollar. In this environment, our non-US-dollar holdings, including those denominated in the Mexican peso and Singapore dollar, detracted from performance.
OUTLOOK
Although our near-term outlook for inflation remains relatively tame, the longer term outlook suggests inflation may soar due to the considerable amount of government stimulus in the system and the massive expansion of the Federal Reserve’s balance sheet. In this environment, we believe TIPS continue to offer good value.
Investment grade credit spreads appear ample relative to the credit problems we see ahead in coming quarters and in light of likely improvements in market liquidity. We are less enthusiastic about high yield, though, due to the potential for rising defaults this year and next.
FUND FACTS
Symbol | LSGSX
Objective | High total investment return through a combination of current income and capital appreciation
Strategy | Invests primarily in inflation-protected securities with emphasis on debt securities issued by the US Treasury
Fund Inception Date | 5/20/91
Total Net Assets | $13.3 million
7
AVERAGE ANNUAL TOTAL RETURNS
Periods Ended March 31, 2009
| | | | | | | | | | | | |
| 6 Months | | 1 Year | | | 5 Years | | | 10 Years | | | Since
Inception(a) | |
| Loomis Sayles Inflation Protected Securities: Institutional | |
| 0.80% | | -4.77 | % | | 2.67 | % | | 5.19 | % | | 7.08 | % |
| Barclays Capital US TIPS Index(b) | |
| 1.84 | | -2.04 | | | 4.15 | | | 7.32 | | | N/A | |
| Lipper Treasury Inflation Protected Securities Funds Index(b) | |
| 0.06 | | -4.92 | | | 3.22 | | | N/A | | | N/A | |
| | | | | |
| Gross expense ratio (before reductions and reimbursements)* |
| Institutional: 0.95 | % | | | | |
| Net expense ratio (after reductions and reimbursements)* |
| Institutional: 0.40 | % | | | | |
* As stated in the most recent prospectus
CUMULATIVE PERFORMANCE
Inception to March 31, 2009(c)

Data quoted reflects past performance and cannot guarantee future results. Average annual total returns assume reinvestment of dividends and capital gains distributions. Investment return and principal value will fluctuate so that shares, when redeemed, may be worth more or less than their original cost. For performance current to the most recent month end, please visit the Loomis Sayles website. Current performance may be higher or lower than quoted.
For illustrative purposes, the chart above reflects the growth of a hypothetical investment of $100,000 in the Fund, since its inception. The chart above also reflects the growth of a hypothetical investment in the former primary benchmark of the Fund, the Barclays Capital US Government Bond Index (the “Former Benchmark”), compared to the performance of the Fund from the Fund’s inception date through December 31, 2004. On December 15, 2004, in connection with a change of the Fund’s investment objective, the Fund changed its primary benchmark to the Barclays Capital US TIPS Index (the “New Benchmark”). Since index performance data is not available coincident with the date of the Fund’s strategy change, comparative data for the Fund’s New Benchmark begins on December 31, 2004. The chart above reflects the growth of a hypothetical investment in the New Benchmark, compared to the performance of the Fund, from December 31, 2004, through March 31, 2009. The chart above also compares the performance of the Fund to the Lipper Treasury Inflation Protected Securities Funds Index from December 31, 2004 through March 31, 2009. The performance of the New Benchmark and of the Lipper Treasury Inflation Protected Securities Funds Index was linked to the performance of the Former Benchmark as of December 31, 2004.
Returns do not reflect the taxes that a shareholder would pay on fund distributions or the redemption of shares. Periods of less than one year are not annualized. Performance data reflects certain fee reductions and reimbursements, if any, without which performance would be lower.
(a) Since index performance data is not available coincident with the Fund’s inception date, comparative performance is presented from the month end closest to the Fund’s inception date. (b) See page 15 for a description of the indices. Return data is not available for the Barclays Capital US TIPS Index prior to March 1, 1997. Similarly, return data is not available for the Lipper Treasury Inflation Protected Securities Funds Index prior to July 1, 2003. (c) The mountain chart is based on the Fund’s minimum initial investment of $100,000.
WHAT YOU SHOULD KNOW
Securities issued by US government agencies are not insured by and may not be guaranteed by the US government. The Fund can invest a significant percentage of assets in foreign securities and the value of the fund shares can be adversely affected by changes in currency exchange rates, political, and economic developments. In emerging markets these risks can be significant. The Fund is subject to currency risk, which is the risk that fluctuations in exchange rates between the US dollar and foreign currencies may cause the value of a Fund’s investments to decline. Accordingly, the purchase of fund shares should be viewed as a long-term investment.
Effective December 15, 2004, the Fund’s name and investment strategy changed. The Fund’s strategy emphasizes inflation-protected debt securities issued by the US Treasury (TIPS). The principal value of the types of securities are periodically adjusted according to the rate of inflation and repayment of the original bonds is guaranteed by the US government.
8
FUND AND MANAGER REVIEW
Loomis Sayles Institutional High Income Fund
| | |
Daniel Fuss, CFA, CIC Manager since June 1996 | |
Matthew Eagan, CFA Associate Manager since
February 2007 |
Kathleen Gaffney, CFA Associate Manager since February 2007 | |
Elaine Stokes Associate Manager since February 2007 |
PORTFOLIO REVIEW
For the six months ended March 31, 2009, the Fund performed in line with its Benchmark, Barclays Capital High Yield Index, during a period when the acceleration of the credit crisis and uptick in defaults continued to assault the high yield market.
The lack of liquidity and an absence of dealers significantly affected valuations across the credit spectrum. Fears of a systemic meltdown drove dramatic volatility in the high yield market, as the credit crisis sent investors running for less risky assets. High yield bonds and highly leveraged loans did not perform well in this environment and significantly detracted from the Fund’s returns. Lower quality credits in the industrials and utilities sectors were particularly hard hit, as balance sheets were constrained and defaults increased. Furthermore, rising unemployment and economic weakness weighed on lower quality bonds in the consumer sectors.
However, the Fund’s high quality corporate bonds provided a source of relative returns in this environment. In particular, the US government’s injection of capital into the banking system, through a variety of programs and extraordinary measures, alleviated our concerns of financial collapse, and we subsequently increased exposure to higher quality banking issues. This strategy was effective, as our out-of-Benchmark allocation to investment grade financial companies boosted relative returns due to the rebound in this sector.
Government programs, such as the recent expansion of the TALF (Term Asset-Backed Securities Loan Facility) and the announcement of PPIP (Public-Private Investment Program) were significantly supportive of the CMBS (commercial mortgage-backed securities) market. Our small addition of super senior CMBS with AAA ratings boosted absolute and relative returns.
OUTLOOK
We believe high yield issues will continue to be volatile, as defaults continue to increase over the course of the year. We remain underweight in the CCC-rated portion of the market, as we believe most defaults will come from this space. We believe investment grade credit continues to offer strong relative value, as spreads remain at relatively wide levels. As the markets grow more convinced the global recovery has taken hold, we eventually expect to see more demand for riskier assets, such as high yield and investment grade bonds, as well as commodity currencies.
FUND FACTS
Symbol | LSHIX
Objective | High total investment return through a combination of current income and capital appreciation
Strategy | Invests in primarily lower-rated fixed-income securities and other securities that are expected to produce a relatively high level of income, (including income-producing preferred and common stocks).
The Fund may invest any portion of its assets in Canadian securities and up to 50% of assets in other foreign securities, including emerging markets securities.
Fund Inception Date | 6/5/96
Fund Registration Date | 3/7/97
Total Net Assets | $249.5 million
9
AVERAGE ANNUAL TOTAL RETURNS
Periods Ended March 31, 2009
| | | | | | | | | | | | | | | |
| 6 Months | | 1 Year | | | 5 Years | | | 10 Years | | | Since
Registration(a) | | | Since
Inception(a) | |
| Loomis Sayles Institutional High Income: Institutional | |
| -13.47% | | -21.68 | % | | 2.00 | % | | 5.59 | % | | 5.11 | % | | 5.39 | % |
| Barclays Capital High Yield Index(b) | |
| -12.97 | | -19.31 | | | -0.10 | | | 2.58 | | | 3.24 | | | 3.92 | |
| Lipper High Current Yield Funds Index(b) | |
| -17.85 | | -23.71 | | | -1.55 | | | 0.52 | | | 1.50 | | | 2.26 | |
| | | | | |
| Gross expense ratio (before reductions and reimbursements)* |
| Institutional: 0.74 | % | | | | |
| Net expense ratio (after reductions and reimbursements)* |
| Institutional: 0.74 | % | | | | |
* As stated in the most recent prospectus
CUMULATIVE PERFORMANCE
Registration to March 31, 2009(c)
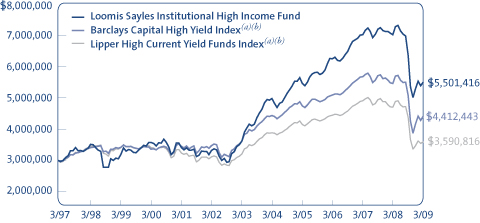
Inception to March 31, 2009(c)
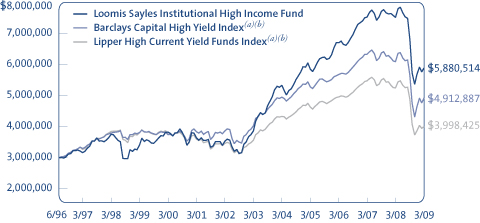
Data quoted reflects past performance and cannot guarantee future results. Average annual total returns assume reinvestment of dividends and capital gains distributions. Investment return and principal value will fluctuate so that shares, when redeemed, may be worth more or less than their original cost. For performance current to the most recent month end, please visit the Loomis Sayles website. Current performance may be higher or lower than quoted.
Returns do not reflect the taxes that a shareholder would pay on Fund distributions or the redemption of shares. Periods of less than one year are not annualized. Performance data reflects certain fee reductions and reimbursements, if any, without which performance would be lower.
(a) Shares of the Fund were registered for offer and sale under the Securities Act of 1933 on March 7, 1997. In accordance with regulations, performance information is provided for the period beginning on March 7, 1997 (“Registration”). Performance from inception is also provided for the convenience of our long-term shareholders. Since index performance data is not available coincident with the Fund’s inception and registration dates, comparative performance is presented from the month end closest to the Fund’s inception and registration dates. (b) See page 15 for a description of the indices. (c) The mountain chart is based on the Fund’s minimum initial investment of $3,000,000.
WHAT YOU SHOULD KNOW
The Fund can invest a significant percentage of assets in debt securities that are rated below investment grade and the value of fund shares can be adversely affected by changes in economic conditions or other circumstances. Lower rated debt securities have speculative characteristics and may be subject to greater price volatility than higher rated investments. In addition, the secondary market for these securities may lack liquidity. Fund shares should be viewed as a long-term investment. Securities issued by US government agencies are not insured by and may not be guaranteed by the US government. The Fund can invest a significant percentage of assets in foreign securities and the value of the fund shares can be adversely affected by changes in currency exchange rates, political, and economic developments. In emerging markets these risks can be significant. The Fund is subject to currency risk, which is the risk that fluctuations in exchange rates between the US dollar and foreign currencies may cause the value of a Fund’s investments to decline. Accordingly, the purchase of fund shares should be viewed as a long-term investment.
10
FUND AND MANAGER REVIEW
Loomis Sayles Intermediate Duration Fixed Income Fund

Neil Burke
Manager since December 2005
Cliff Rowe, CFA
Manager since December 2005

Richard Raczkowski
Manager since December 2005
PORTFOLIO REVIEW
For the six months ended March 31, 2009, the Fund underperformed its Benchmark, Barclays Capital US Government/Credit Intermediate Index, primarily due to sector allocation and holdings in the high yield and non-US-dollar credit space.
Risk aversion and a massive flight to quality characterized the six month period, inflating US Treasury prices, pushing yields to historic lows. Our underweight allocations to US Treasury and agency securities were key drivers of underperformance, as these high quality sectors generated strong relative returns.
As global economic conditions worsened, investors sought protection from currencies impacted by faltering commodity prices, and the US dollar gained ground. Our exposure to bonds denominated in the Singapore dollar weighed negatively upon returns. Although market sentiment shifted in the first quarter of 2009, the subsequent gains were not enough to offset previous losses.
Security selection, combined with out-of-Benchmark investments, were also a key driver of the Fund’s underperformance, primarily among high yield industrial credits. The global recession, combined with increasing liquidity concerns, had a negative impact on already battered names in the telecommunication, homebuilding and lodging industries. In addition, investment grade utility bonds suffered from liquidity issues and the seasonal nature of the industry’s revenues. Our overweight to these sectors detracted from results.
Other investment grade credits, including consumer non-cyclical and financial names, contributed positively to performance. The introduction of several US Treasury department lending programs added support to higher quality issues in the banking, finance and brokerage industries. Similarly, the new TALF (Term Asset-Backed Securities Loan Facility) and PPIP (Public-Private Investment Program) helped boost the performance of the Fund’s agency and commercial mortgage-backed securities, but not enough to offset earlier losses.
We maintained a longer-than-Benchmark duration by focusing on long term agencies and government related securities, and this contributed positively to performance. As the massive flight to quality caused US Treasury yields to decline, causing prices to rise, the Fund benefited from its relatively long duration.
OUTLOOK
We believe high yield issues will continue to be volatile, as defaults continue to increase over the course of the year. We remain underweight in the CCC-rated portion of the market, as we believe most defaults will come from this space. We believe investment grade credit continues to offer strong relative value, as spreads remain at relatively wide levels. As the markets grow more convinced the global recovery has taken hold, we eventually expect to see more demand for riskier assets, such as high yield and investment grade credit, as well as commodity currencies.
FUND FACTS
Symbol | LSDIX
Objective | Above-average total return through a combination of current income and capital appreciation
Strategy | Invests only in investment-grade fixed-income securities. The Fund’s weighted average duration generally is two to five years
Fund Inception Date | 1/28/98
Total Net Assets | $26.4 million
11
AVERAGE ANNUAL TOTAL RETURNS
Periods Ended March 31, 2009
| | | | | | | | | | | | |
| 6 Months | | 1 Year | | | 5 Years | | | 10 Years | | | Since
Inception(a) | |
| Loomis Sayles Intermediate Duration Fixed Income Fund: Institutional | |
| 2.20% | | -1.48 | % | | 2.34 | % | | 4.72 | % | | 4.64 | % |
| Barclays Capital US Gov’t/Credit Intermediate Index(b) | |
| 4.79 | | 1.96 | | | 3.70 | | | 5.44 | | | 5.48 | |
| Lipper Intermediate Investment Grade Debt Funds Index(b) | |
| 0.29 | | -4.25 | | | 1.90 | | | 4.34 | | | 4.42 | |
| | | | | | |
| Gross expense ratio (before reductions and reimbursements)* |
| Institutional: 0.59% | | | | | | |
| Net expense ratio (after reductions and reimbursements)* |
| Institutional 0.40% | | | | | | |
* As stated in the most recent prospectus
CUMULATIVE PERFORMANCE
Inception to March 31, 2009(c)
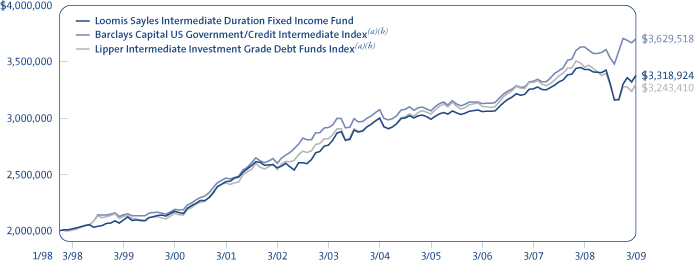
Data quoted reflects past performance and cannot guarantee future results. Average annual total returns assume reinvestment of dividends and capital gains distributions. Investment return and principal value will fluctuate so that shares, when redeemed, may be worth more or less than their original cost. For performance current to the most recent month-end, please visit the Loomis Sayles website. Current performance may be higher or lower than quoted.
Returns do not reflect the taxes that a shareholder would pay on fund distributions or the redemption of shares. Periods of less than one year are not annualized. Performance data reflects certain fee reductions and reimbursements, if any, without which performance would be lower.
(a) Since index performance data is not available coincident with the Fund’s inception date, comparative performance is presented from the month end closest to the Fund’s inception date. (b) See page 15 for a description of the indices. (c) The mountain chart is based on the Fund’s minimum initial investment of $2,000,000.
WHAT YOU SHOULD KNOW
If the credit rating of a security held by the Fund falls below investment grade, the Fund may continue to hold it if Loomis Sayles believes the investment is appropriate. The secondary market for securities that fall below investment grade may lack liquidity and such securities may incur greater risk of default, which may adversely affect the value of the Fund. Foreign countries may have different accounting standards than those of the US. Securities issued by US government agencies are not insured by and may not be guaranteed by the US government. The Fund can invest a significant percentage of assets in foreign securities and the value of the fund shares can be adversely affected by changes in currency exchange rates, political, and economic developments. In emerging markets these risks can be significant. The Fund is subject to currency risk, which is the risk that fluctuations in exchange rates between the US dollar and foreign currencies may cause the value of a Fund’s investments to decline. The Fund can invest a significant percentage of assets in debt securities that are rated below investment grade and the value of fund shares can be adversely affected by changes in economic conditions or other circumstances. Lower rated debt securities have speculative characteristics and may be subject to greater price volatility than higher rated investments. In addition, the secondary market for these securities may lack liquidity. Accordingly, the purchase of fund shares should be viewed as a long-term investment.
12
FUND AND MANAGER REVIEW
Loomis Sayles Investment Grade Fixed Income Fund
| | |
Daniel Fuss, CFA, CIC Manager since July 1994 | |
Matthew Eagan, CFA Associate Manager
since September 2006 |
Kathleen Gaffney, CFA Associate Manager since
September 2006 | |
Elaine Stokes Associate Manager since
September 2006 |
PORTFOLIO REVIEW
For the six months ended March 31, 2009, the Fund underperformed its Benchmark, Barclays Capital US Government/Credit Index, primarily due to its security selection within high yield industrials and its non-US-dollar exposure.
Risk aversion and a massive flight to quality characterized the six month period, inflating US Treasury prices and pushing yields to historic lows. Our underweight allocations to US Treasury and agency securities were key drivers of the Fund’s underperformance.
As global economic conditions worsened, investors sought protection from faltering commodity currencies. Our exposure to the currencies of Canada, Indonesia, Mexico, New Zealand and Brazil weighed heavily on performance. Although market sentiment shifted in the first quarter of 2009, the subsequent gains were not enough to offset the prior losses.
The global recession, combined with increasing liquidity concerns, drove already battered companies in the high yield telecommunication, homebuilding and lodging sectors even lower. In addition, bonds in the investment grade utilities segment suffered from liquidity issues and the seasonal nature of the industry’s revenues. The Fund’s overweight to this sector detracted from results.
On the other hand, our strong security selection in the investment grade technology and telecommunication sectors contributed positively to performance. The introduction of several US Treasury department lending programs added support to higher quality issues in the banking, finance and brokerage industries, while our high yield financials benefited when the credit arm of a major US automaker received federal funds. Similarly, the government’s TALF (Term Asset-Backed Securities Loan Facility) and PPIP (Public-Private Investment Program) helped boost the performance of the Fund’s agency and commercial mortgage-backed securities.
We maintained a longer-than-Benchmark duration throughout the six-month period, including long term agencies and government related securities, and these contributed positively to performance. As US Treasury yields declined in the massive flight to quality, the Fund’s relatively long duration enabled it to benefit from rising prices.
OUTLOOK
We believe high yield issues will continue to be volatile, as defaults continue to increase over the course of the year. We remain underweight in the CCC-rated portion of the market, as we believe most defaults will come from this space. We believe investment grade credit continues to offer strong relative value, as spreads remain at relatively wide levels. As the markets grow more convinced the
FUND FACTS
Symbol | LSIGX
Objective | Above-average total investment return through a combination of current income and capital appreciation
Strategy | Invests in primarily investment-grade fixed-income securities, although it may invest up to 10% of its assets in lower rated fixed-income securities and up to 10% of its assets in preferred stocks. The Fund may invest any portion of its assets in securities of Canadian issuers and up to 20% of assets in securities of other foreign issuers, including emerging markets.
Fund Inception Date | 7/1/94
Fund Registration Date | 3/7/97
Total Net Assets | $385.8 million
13
global recovery has taken hold, we eventually expect to see more demand for riskier assets, such as high yield and investment grade bonds, as well as commodity currencies.
AVERAGE ANNUAL TOTAL RETURNS
Periods Ended March 31, 2009
| | | | | | | | | | | | | | | |
| 6 Months | | 1 Year | | | 5 Years | | | 10 Years | | | Since
Registration(a) | | | Since
Inception(a) | |
| Loomis Sayles Investment Grade Fixed Income: Institutional | |
| -3.35% | | -11.47 | % | | 3.10 | % | | 7.17 | % | | 7.26 | % | | 8.62 | % |
| Barclays Capital US Government/Credit Index(b) | |
| 5.06 | | 1.78 | | | 3.74 | | | 5.64 | | | 6.11 | | | 6.53 | |
| Lipper BBB-Rated Funds Index(b) | |
| -3.01 | | -10.65 | | | 0.79 | | | 3.72 | | | 4.31 | | | 5.22 | |
| | | | | | |
| Gross expense ratio (before reductions and reimbursements)* |
| Institutional: 0.50% | | | | | | |
| Net expense ratio (after reductions and reimbursements)* |
| Institutional 0.50% | | | | | | |
* As stated in the most recent prospectus
CUMULATIVE PERFORMANCE
Registration to March 31, 2009(c)
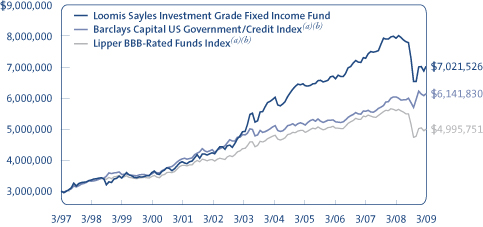
Inception to March 31, 2009(c)
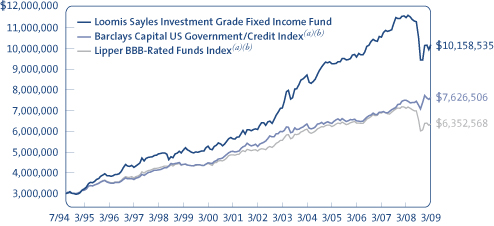
Data quoted reflects past performance and cannot guarantee future results. Average annual total returns assume reinvestment of dividends and capital gains distributions. Investment return and principal value will fluctuate so that shares, when redeemed, may be worth more or less than their original cost. For performance current to the most recent month end, please visit the Loomis Sayles website. Current performance may be higher or lower than quoted.
Returns do not reflect the taxes that a shareholder would pay on Fund distributions or the redemption of shares. Periods of less than one year are not annualized. Performance data reflects certain fee reductions and reimbursements, if any, without which performance would be lower.
(a) Shares of the Fund were registered for offer and sale under the Securities Act of 1933 on March 7, 1997. In accordance with regulations, performance information is provided for the period beginning on March 7, 1997 (“Registration”). Performance from inception is also provided for the convenience of our long-term shareholders. Since index performance data is not available coincident with the Fund’s inception and registration dates, comparative performance is presented from the month end closest to the Fund’s inception and registration dates. (b) See page 15 for a description of the indices. (c) The mountain chart is based on the Fund’s minimum initial investment of $3,000,000.
WHAT YOU SHOULD KNOW
The Fund can invest a significant percentage of assets in debt securities that are rated below investment grade and the value of fund shares can be adversely affected by changes in economic conditions or other circumstances. Lower rated debt securities have speculative characteristics and may be subject to greater price volatility than higher rated investments. In addition, the secondary market for these securities may lack liquidity. Fund shares should be viewed as a long-term investment. Securities issued by US government agencies are not insured by and may not be guaranteed by the US government. The Fund can invest a significant percentage of assets in foreign securities and the value of the fund shares can be adversely affected by changes in currency exchange rates, political, and economic developments. In emerging markets these risks can be significant. The Fund is subject to currency risk, which is the risk that fluctuations in exchange rates between the US dollar and foreign currencies may cause the value of a Fund’s investments to decline. The Fund can invest a significant percentage of assets in debt securities that are rated below investment grade and the value of fund shares can be adversely affected by changes in economic conditions or other circumstances. Lower rated debt securities have speculative characteristics and may be subject to greater price volatility than higher rated investments. In addition, the secondary market for these securities may lack liquidity. Accordingly, the purchase of fund shares should be viewed as a long-term investment.
14
ADDITIONAL INFORMATION
Index Definitions
Indexes are unmanaged and do not have expenses that affect results, unlike mutual funds. Index returns are adjusted for the reinvestment of capital gain distributions and income dividends. It is not possible to invest directly in an index.
Lipper BBB-Rated Funds Index is an equally weighted index of typically the 30 largest mutual funds within the corporate debt funds BBB-rated investment objective.
Lipper Global Income Funds Index is an equally weighted index of typically the 30 largest mutual funds within the global income funds investment objective.
Lipper High Current Yield Funds Index is an equally weighted unmanaged index of typically the 30 largest mutual funds within the high current yield funds investment objective.
Lipper Intermediate Investment Grade Debt Funds Index is an equally weighted unmanaged index of the 30 largest mutual funds within the intermediate investment grade debt funds investment objective.
Lipper Treasury Inflation Protected Securities Funds Index is an equally weighted index of typically the 30 largest mutual funds within the treasury inflation protected securities funds investment objective.
Source: Lipper, Inc.
Barclays Capital US Government/Credit Index includes treasuries (public obligations of the US Treasury that have remaining maturities of more than one year) and agencies (publicly issued debt of US Government agencies, quasi-federal corporations, and corporate or foreign debt guaranteed by the US Government) as well as other publicly issued investment grade corporate and foreign debentures that meet specified maturity, liquidity, and quality requirements.
Barclays Capital US Government/Credit Intermediate Index includes securities which have a remaining maturity of 1-10 years and includes Treasuries (public obligations of the US Treasury that have remaining maturities of more than one year) and agencies (publicly issued debt of US Government agencies, quasi-federal corporations, and corporate or foreign debt guaranteed by the US Government), as well as other publicly issued investment grade corporate and non-corporate debentures that meet specified maturity, liquidity, and quality requirements.
Barclays Capital Global Aggregate Bond Index covers the most liquid portion of the global investment grade fixed-rate bond market, including government, credit and collateralized securities.
Barclays Capital High Yield Index covers the universe of fixed rate, non-investment grade debt. Pay-in-kind bonds, Eurobonds, and debt issues from countries designated as emerging markets (e.g., Argentina, Brazil, Venezuela, etc.) are excluded, but Canadian and global bonds (SEC registered) of issuers in non-emerging market countries are included. Original issue zeroes, step-up coupon structures, and 144As are also included.
Barclays Capital US TIPS Index measures the performance of the inflation protected securities issued by the US Treasury.
Effective 11/3/08, the Lehman indices were rebranded to the Barclays Capital indices. There has been no change in the calculation or definition of the index data.
Proxy Voting Information
A description of the Funds’ proxy voting policies and procedures is available without charge, upon request, (i) by calling Loomis Sayles at 800-633-3330; (ii) on the Funds’ website, www.loomissayles.com, and (iii) on the SEC’s website, www.sec.gov. Information about how the Funds voted proxies relating to portfolio securities during the 12 months ended June 30, 2008 is available on (i) the Funds’ website and (ii) the SEC’s website.
Quarterly Portfolio Schedules
The Funds file a complete schedule of portfolio holdings with the SEC for the first and third quarters of each fiscal year on Form N-Q. The Funds’ Forms N-Q are available on the SEC’s website at www.sec.gov and may be reviewed and copied at the SEC’s Public Reference Room in Washington, DC. Information on the operation of the Public Reference Room may be obtained by calling 1-800-SEC-0330.
UNDERSTANDING YOUR FUND’S EXPENSES
As a mutual fund shareholder you incur two types of costs: (1) transaction costs, including certain exchange fees; and (2) ongoing costs, including management fees, distribution and/or service fees (12b-1 fees), and other Fund expenses. These costs are described in more detail in each Fund’s prospectus. The examples below are intended to help you understand the ongoing costs of investing in the Funds and help you compare these with the ongoing costs of investing in other mutual funds.
The first line in the table for each Class of Fund shares shows the actual amount of Fund expenses you would have paid on a $1,000 investment in the Fund from October 1, 2008 through March 31, 2009. It also shows how much a $1,000 investment would be worth at the close of the period, assuming actual Fund returns and expenses. To estimate the expenses you paid over the period, simply divide your account value by $1,000 (for example $8,600 account value divided by $1,000 = 8.6) and multiply the result by the number in the Expenses Paid During Period column as shown below for your Class.
The second line in the table for each Class of Fund shares provides information about hypothetical account values and hypothetical expenses based on the Fund’s actual expense ratios and an assumed rate of return of 5% per year before expenses, which is not the Fund’s actual return. The hypothetical account values and expenses may not be used to estimate the actual ending account balance or expenses you paid on your investment for the period. You may use this information to compare the ongoing costs of investing in the Fund and other funds. To do so, compare this 5% hypothetical example with the 5% hypothetical examples that appear in the shareholder reports of the other funds.
15
Loomis Sayles Bond Fund
| | | | | | | | | |
Institutional Class | | Beginning
Account Value
10/1/2008 | | Ending
Account Value
3/31/2009 | | Expenses Paid
During Period*
10/1/2008 – 3/31/2009 |
Actual | | $ | 1,000.00 | | $ | 910.10 | | $ | 3.14 |
Hypothetical (5% return before expenses) | | $ | 1,000.00 | | $ | 1,021.64 | | $ | 3.33 |
| | | |
Retail Class | | | | | | |
Actual | | $ | 1,000.00 | | $ | 909.30 | | $ | 4.52 |
Hypothetical (5% return before expenses) | | $ | 1,000.00 | | $ | 1,020.19 | | $ | 4.78 |
| | | |
Admin Class | | | | | | |
Actual | | $ | 1,000.00 | | $ | 908.80 | | $ | 5.71 |
Hypothetical (5% return before expenses) | | $ | 1,000.00 | | $ | 1,018.95 | | $ | 6.04 |
* Expenses are equal to the Fund’s annualized expense ratio (after fee reduction/reimbursement): 0.66%, 0.95%, and 1.20%, for Institutional, Retail and Admin Class, respectively, multiplied by the average account value over the period, multiplied by the number of days in the most recent fiscal half-year, divided by 365 (to reflect the half-year period). |
Loomis Sayles Fixed Income Fund
| | | | | | | | | |
Institutional Class | | Beginning
Account Value
10/1/2008 | | Ending
Account Value
3/31/2009 | | Expenses Paid
During Period*
10/1/2008 – 3/31/2009 |
Actual | | $ | 1,000.00 | | $ | 924.80 | | $ | 2.78 |
Hypothetical (5% return before expenses) | | $ | 1,000.00 | | $ | 1,022.04 | | $ | 2.92 |
* Expenses are equal to the Fund’s annualized expense ratio: 0.58%, multiplied by the average account value over the period, multiplied by the number of days in the most recent fiscal half-year, divided by 365 (to reflect the half-year period). |
Loomis Sayles Global Bond Fund
| | | | | | | | | |
Institutional Class | | Beginning
Account Value
10/1/2008 | | Ending
Account Value
3/31/2009 | | Expenses Paid
During Period*
10/1/2008 – 3/31/2009 |
Actual | | $ | 1,000.00 | | $ | 952.80 | | $ | 3.36 |
Hypothetical (5% return before expenses) | | $ | 1,000.00 | | $ | 1,021.49 | | $ | 3.48 |
| | | |
Retail Class | | | | | | |
Actual | | $ | 1,000.00 | | $ | 950.90 | | $ | 4.86 |
Hypothetical (5% return before expenses) | | $ | 1,000.00 | | $ | 1,019.95 | | $ | 5.04 |
* Expenses are equal to the Fund’s annualized expense ratio (after fee reduction/reimbursement): 0.69% and 1.00% for the Institutional and Retail Class, respectively, multiplied by the average account value over the period, multiplied by the number of days in the most recent fiscal half-year, divided by 365 (to reflect the half-year period). |
Loomis Sayles Inflation Protected Securities Fund
| | | | | | | | | |
Institutional Class | | Beginning
Account Value
10/1/2008 | | Ending
Account Value
3/31/2009 | | Expenses Paid
During Period*
10/1/2008 – 3/31/2009 |
Actual | | $ | 1,000.00 | | $ | 1,008.00 | | $ | 2.00 |
Hypothetical (5% return before expenses) | | $ | 1,000.00 | | $ | 1,022.94 | | $ | 2.02 |
* Expenses are equal to the Fund’s annualized expense ratio (after fee reduction/reimbursement): 0.40%, multiplied by the average account value over the period, multiplied by the number of days in the most recent fiscal half-year, divided by 365 (to reflect the half-year period). |
Loomis Sayles Institutional High Income Fund
| | | | | | | | | |
Institutional Class | | Beginning
Account Value
10/1/2008 | | Ending
Account Value
3/31/2009 | | Expenses Paid
During Period*
10/1/2008 – 3/31/2009 |
Actual | | $ | 1,000.00 | | $ | 865.30 | | $ | 3.39 |
Hypothetical (5% return before expenses) | | $ | 1,000.00 | | $ | 1,021.29 | | $ | 3.68 |
* Expenses are equal to the Fund’s annualized expense ratio: 0.73%, multiplied by the average account value over the period, multiplied by the number of days in the most recent fiscal half-year, divided by 365 (to reflect the half-year period). |
16
Loomis Sayles Intermediate Duration Fixed Income Fund
| | | | | | | | | |
Institutional Class | | Beginning
Account Value
10/1/2008 | | Ending
Account Value
3/31/2009 | | Expenses Paid
During Period*
10/1/08 – 3/31/09 |
Actual | | $ | 1,000.00 | | $ | 1,022.00 | | $ | 2.02 |
Hypothetical (5% return before expenses) | | $ | 1,000.00 | | $ | 1,022.94 | | $ | 2.02 |
* Expenses are equal to the Fund’s annualized expense ratio (after fee reduction/reimbursement): 0.40%, multiplied by the average account value over the period, multiplied by the number of days in the most recent fiscal half-year, divided by 365 (to reflect the half-year period). |
Loomis Sayles Investment Grade Fixed Income Fund
| | | | | | | | | |
Institutional Class | | Beginning
Account Value
10/1/2008 | | Ending
Account Value
3/31/2009 | | Expenses Paid
During Period*
10/1/2008 – 3/31/2009 |
Actual | | $ | 1,000.00 | | $ | 966.50 | | $ | 2.45 |
Hypothetical (5% return before expenses) | | $ | 1,000.00 | | $ | 1,022.44 | | $ | 2.52 |
* Expenses are equal to the Fund’s annualized expense ratio: 0.50%, multiplied by the average account value over the period, multiplied by the number of days in the most recent fiscal half-year, divided by 365 (to reflect the half-year period). |
17
PORTFOLIO OF INVESTMENTS – as of March 31, 2009 (Unaudited)
Loomis Sayles Bond Fund
| | | | | | | | |
| | | | | Principal Amount (‡) | | Value (†) |
| | | | | | | | |
| | | |
| BONDS AND NOTES – 91.4% of Net Assets | | | | | | | | |
| | | |
| NON-CONVERTIBLE BONDS – 87.4% | | | | | | | | |
| | | |
| ABS Credit Card – 0.5% | | | | | | | | |
Citibank Credit Card Issuance Trust, Series 2008-C6, Class C6, 6.300%, 6/20/2014 | | | | $ | 113,710,000 | | $ | 71,637,300 |
MBNA Credit Card Master Note Trust, Series 03A5, 4.150%, 9/19/2012 | | EUR | | | 300,000 | | | 391,992 |
| | | | | | | | |
| | | | | | | | 72,029,292 |
| | | | | | | | |
| Aerospace & Defense – 0.1% | | | | | | | | |
Bombardier, Inc., 6.300%, 5/01/2014, 144A | | | | | 1,590,000 | | | 1,120,950 |
Bombardier, Inc., 6.750%, 5/01/2012, 144A | | | | | 200,000 | | | 159,000 |
Bombardier, Inc., 7.350%, 12/22/2026 | | CAD | | | 6,785,000 | | | 3,497,978 |
Bombardier, Inc., 7.450%, 5/01/2034, 144A | | | | | 13,464,000 | | | 7,809,120 |
| | | | | | | | |
| | | | | | | | 12,587,048 |
| | | | | | | | |
| Airlines – 1.3% | | | | | | | | |
American Airlines, Inc., Series 1999-1, Class B,
7.324%, 4/15/2011 | | | | | 1,255,000 | | | 1,167,150 |
American Airlines, Inc., Series 93A6, 8.040%, 9/16/2011 | | | | | 1,522,568 | | | 974,443 |
Continental Airlines, Inc., Series 1997-4B,
6.900%, 7/02/2018 | | | | | 3,692,144 | | | 2,584,501 |
Continental Airlines, Inc., Series 1998-1, Class B,
6.748%, 9/15/2018 | | | | | 5,450,423 | | | 4,033,313 |
Continental Airlines, Inc., Series 1999-1B,
6.795%, 2/02/2020 | | | | | 7,089,025 | | | 5,033,208 |
Continental Airlines, Inc., Series 1999-1C,
6.954%, 2/02/2011 | | | | | 1,989,267 | | | 1,914,670 |
Continental Airlines, Inc., Series 1999-2, Class B,
7.566%, 9/15/2021 | | | | | 4,663,063 | | | 3,497,297 |
Continental Airlines, Inc., Series 2000-2, Class B,
8.307%, 10/02/2019 | | | | | 7,421,946 | | | 5,306,692 |
Continental Airlines, Inc., Series 2001-1, Class B,
7.373%, 6/15/2017 | | | | | 3,533,598 | | | 2,190,831 |
Continental Airlines, Inc., Series 2007-1, Class A,
5.983%, 4/19/2022 | | | | | 17,701,000 | | | 13,098,740 |
Continental Airlines, Inc., Series 2007-1, Class B,
6.903%, 4/19/2022 | | | | | 23,877,000 | | | 12,654,810 |
Continental Airlines, Inc., Series 96-A, Class B,
6.940%, 4/15/2015 | | | | | 254,073 | | | 217,868 |
Continental Airlines, Inc., Series 971A,
7.461%, 10/01/2016 | | | | | 7,542,014 | | | 5,279,410 |
Delta Air Lines, Inc., Series 2007-1, Class A,
6.821%, 2/10/2024 | | | | | 2,268,902 | | | 1,531,508 |
Delta Air Lines, Inc., Series 2007-1, Class B,
8.021%, 2/10/2024 | | | | | 5,512,620 | | | 3,059,504 |
Delta Air Lines, Inc., Series 2007-1, Class C,
8.954%, 8/10/2014 | | | | | 42,212,104 | | | 24,905,141 |
Northwest Airlines, Inc., Series 07-1, Class B,
8.028%, 11/01/2017 | | | | | 37,035,000 | | | 21,295,125 |
Qantas Airways Ltd., 5.125%, 6/20/2013, 144A | | | | | 2,000,000 | | | 1,834,886 |
Qantas Airways Ltd., 6.050%, 4/15/2016, 144A | | | | | 44,235,000 | | | 37,467,576 |
United Air Lines, Inc., Series 2007-1, Class A,
6.636%, 1/02/2024 | | | | | 25,575,410 | | | 17,391,278 |
| | | | | | | | |
| | | | | | | | 165,437,951 |
| | | | | | | | |
18
PORTFOLIO OF INVESTMENTS – as of March 31, 2009 (Unaudited)
Loomis Sayles Bond Fund – continued
| | | | | | | | |
| | | | | Principal Amount (‡) | | Value (†) |
| | | | | | | | |
| | | |
| BONDS AND NOTES – continued | | | | | | | | |
| | | |
| Automotive – 2.0% | | | | | | | | |
Cummins, Inc., 6.750%, 2/15/2027 | | | | $ | 2,547,000 | | $ | 1,604,610 |
Cummins, Inc., 7.125%, 3/01/2028 | | | | | 3,000,000 | | | 2,066,298 |
FCE Bank PLC, EMTN, 7.125%, 1/16/2012 | | EUR | | | 9,800,000 | | | 8,853,790 |
FCE Bank PLC, EMTN, 7.125%, 1/15/2013 | | EUR | | | 6,550,000 | | | 5,787,049 |
Ford Motor Co., 6.375%, 2/01/2029 | | | | | 1,195,000 | | | 337,588 |
Ford Motor Co., 6.500%, 8/01/2018 | | | | | 2,240,000 | | | 649,600 |
Ford Motor Co., 6.625%, 2/15/2028 | | | | | 500,000 | | | 141,250 |
Ford Motor Co., 6.625%, 10/01/2028 | | | | | 62,435,000 | | | 17,637,888 |
Ford Motor Co., 7.125%, 11/15/2025 | | | | | 1,960,000 | | | 529,200 |
Ford Motor Co., 7.450%, 7/16/2031 | | | | | 114,780,000 | | | 36,442,650 |
Ford Motor Co., 7.500%, 8/01/2026 | | | | | 795,000 | | | 222,600 |
Ford Motor Credit Co. LLC, 5.700%, 1/15/2010 | | | | | 66,163,000 | | | 56,672,645 |
Ford Motor Credit Co. LLC, 7.000%, 10/01/2013 | | | | | 13,765,000 | | | 9,204,132 |
Ford Motor Credit Co. LLC, 7.250%, 10/25/2011 | | | | | 18,760,000 | | | 13,356,295 |
Ford Motor Credit Co. LLC, 7.375%, 10/28/2009 | | | | | 500,000 | | | 448,425 |
Ford Motor Credit Co. LLC, 7.875%, 6/15/2010 | | | | | 1,320,000 | | | 1,090,855 |
Ford Motor Credit Co. LLC, 8.000%, 12/15/2016 | | | | | 19,070,000 | | | 12,533,395 |
Ford Motor Credit Co. LLC, 8.625%, 11/01/2010 | | | | | 29,945,000 | | | 23,851,222 |
Ford Motor Credit Co. LLC, 9.750%, 9/15/2010 | | | | | 2,150,000 | | | 1,768,689 |
Ford Motor Credit Co. LLC, EMTN,
4.875%, 1/15/2010 | | EUR | | | 12,200,000 | | | 13,534,448 |
General Motors Corp., 7.250%, 7/03/2013 | | EUR | | | 2,805,000 | | | 670,810 |
General Motors Corp., 7.400%, 9/01/2025 | | | | | 9,805,000 | | | 1,127,575 |
General Motors Corp., 8.250%, 7/15/2023 | | | | | 73,945,000 | | | 9,150,694 |
General Motors Corp., 8.375%, 7/15/2033 | | | | | 3,455,000 | | | 431,875 |
GMAC LLC, 5.375%, 6/06/2011, 144A | | | | | 61,815,000 | | | 43,888,650 |
Goodyear Tire & Rubber Co. (The),
7.000%, 3/15/2028 | | | | | 6,041,000 | | | 3,382,960 |
| | | | | | | | |
| | | | | | | | 265,385,193 |
| | | | | | | | |
| Banking – 4.1% | | | | | | | | |
BAC Capital Trust VI, 5.625%, 3/08/2035 | | | | | 35,170,000 | | | 14,951,400 |
Barclays Financial LLC, 4.060%, 9/16/2010, 144A | | KRW | | | 38,510,000,000 | | | 28,547,373 |
Barclays Financial LLC, 4.160%, 2/22/2010, 144A | | THB | | | 2,824,000,000 | | | 78,815,598 |
Barclays Financial LLC, 4.460%, 9/23/2010, 144A | | KRW | | | 48,070,000,000 | | | 35,835,738 |
Barclays Financial LLC, EMTN,
4.100%, 3/22/2010, 144A | | THB | | | 247,000,000 | | | 6,828,803 |
Bear Stearns Cos., Inc. (The), 4.650%, 7/02/2018 | | | | | 3,260,000 | | | 2,716,538 |
Bear Stearns Cos., Inc. (The), 5.300%, 10/30/2015 | | | | | 1,445,000 | | | 1,339,709 |
Bear Stearns Cos., Inc. (The), 6.400%, 10/02/2017 | | | | | 3,160,000 | | | 3,075,457 |
Bear Stearns Cos., Inc. (The), 7.250%, 2/01/2018 | | | | | 18,135,000 | | | 18,728,268 |
BNP Paribas SA, EMTN, Zero Coupon Bond, 6/13/2011, 144A | | IDR | | | 274,980,870,000 | | | 15,389,886 |
Capital One Financial Corp., 6.150%, 9/01/2016 | | | | | 3,223,000 | | | 2,040,169 |
Citigroup, Inc., 5.000%, 9/15/2014 | | | | | 1,290,000 | | | 855,142 |
Countrywide Home Loans, Inc., Series L, MTN, 4.000%, 3/22/2011 | | | | | 24,000 | | | 21,358 |
Goldman Sachs Group, Inc. (The),
5.000%, 10/01/2014 | | | | | 8,015,000 | | | 7,246,193 |
Goldman Sachs Group, Inc. (The), 5.150%, 1/15/2014 | | | | | 4,065,000 | | | 3,709,963 |
Goldman Sachs Group, Inc. (The), 6.125%, 2/15/2033 | | | | | 60,000 | | | 49,969 |
Goldman Sachs Group, Inc. (The),
6.750%, 10/01/2037 | | | | | 13,015,000 | | | 8,802,578 |
19
| | | | | | | | |
| | | | | Principal Amount (‡) | | Value (†) |
| | | | | | | | |
| | | |
| BONDS AND NOTES – continued | | | | | | | | |
| | | |
| Banking – continued | | | | | | | | |
ICICI Bank Ltd., (fixed rate to 4/30/2017, variable rate thereafter), 6.375%, 4/30/2022, 144A | | | | $ | 12,345,000 | | $ | 6,941,100 |
JPMorgan Chase & Co., Zero Coupon Bond, 3/28/2011, 144A | | IDR | | | 48,817,518,000 | | | 2,819,629 |
JPMorgan Chase & Co., Zero Coupon Bond, 3/28/2011, 144A | | IDR | | | 699,525,000,000 | | | 40,403,547 |
JPMorgan Chase & Co., Zero Coupon Bond, 3/28/2011, 144A | | IDR | | | 250,225,920,000 | | | 14,452,685 |
JPMorgan Chase & Co., Zero Coupon Bond, 4/12/2012, 144A | | IDR | | | 599,419,948,660 | | | 27,831,138 |
JPMorgan Chase & Co., Zero Coupon Bond, 5/17/2010, 144A | | BRL | | | 241,667,000 | | | 87,060,231 |
JPMorgan Chase London, EMTN, Zero Coupon Bond, 10/21/2010, 144A | | IDR | | | 153,708,294,250 | | | 9,952,795 |
Kaupthing Bank, 1/15/2010(b), 144A | | | | | 3,635,000 | | | 186,294 |
Kaupthing Bank, Series D, 5.750%, 10/04/2011(b), 144A | | | | | 52,942,000 | | | 2,713,277 |
Kaupthing Bank, Series E, 6.125%, 10/04/2016(b), 144A | | | | | 13,245,000 | | | 678,806 |
Kreditanstalt fuer Wiederaufbau, EMTN, 10.750%, 2/01/2010 | | ISK | | | 95,000,000 | | | 467,590 |
Merrill Lynch & Co., Inc., 6.110%, 1/29/2037 | | | | | 9,710,000 | | | 4,825,987 |
Merrill Lynch & Co., Inc., 10.710%, 3/08/2017 | | BRL | | | 100,400,000 | | | 35,490,031 |
Merrill Lynch & Co., Inc., EMTN, 4.625%, 9/14/2018 | | EUR | | | 4,887,000 | | | 3,622,124 |
Morgan Stanley, 4.750%, 4/01/2014 | | | | | 38,951,000 | | | 31,845,442 |
Morgan Stanley, 5.375%, 10/15/2015 | | | | | 900,000 | | | 813,078 |
Morgan Stanley, 6.750%, 4/15/2011 | | | | | 355,000 | | | 355,273 |
Morgan Stanley, EMTN, 5.450%, 1/09/2017 | | | | | 295,000 | | | 258,125 |
Morgan Stanley, GMTN, 5.125%, 11/30/2015 | | GBP | | | 7,500,000 | | | 8,519,479 |
Morgan Stanley, MTN, 6.250%, 8/09/2026 | | | | | 800,000 | | | 661,686 |
Morgan Stanley, Series F, MTN, 5.950%, 12/28/2017 | | | | | 1,595,000 | | | 1,448,903 |
Rabobank Nederland, EMTN, 10.250%, 9/10/2009, 144A | | ISK | | | 4,660,000,000 | | | 22,163,415 |
| | | | | | | | |
| | | | | | | | 532,464,777 |
| | | | | | | | |
| Brokerage – 0.0% | | | | | | | | |
Lehman Brothers Holdings, Inc., 6.875%, 7/17/2037(b) | | | | | 117,760,000 | | | 11,776 |
Lehman Brothers Holdings, Inc., MTN, (fixed rate to 5/03/2027, variable rate thereafter), 6.000%, 5/03/2032(b) | | | | | 8,010,000 | | | 801 |
| | | | | | | | |
| | | | | | | | 12,577 |
| | | | | | | | |
| Building Materials – 0.6% | | | | | | | | |
Owens Corning, Inc., 6.500%, 12/01/2016 | | | | | 24,785,000 | | | 18,183,639 |
Owens Corning, Inc., 7.000%, 12/01/2036 | | | | | 51,180,000 | | | 28,680,351 |
Ply Gem Industries, Inc., 9.000%, 2/15/2012(c)(k) | | | | | 287,000 | | | 66,728 |
USG Corp., 6.300%, 11/15/2016 | | | | | 34,370,000 | | | 18,216,100 |
USG Corp., 9.250%, 1/15/2018 | | | | | 17,605,000 | | | 10,739,050 |
| | | | | | | | |
| | | | | | | | 75,885,868 |
| | | | | | | | |
20
PORTFOLIO OF INVESTMENTS – as of March 31, 2009 (Unaudited)
Loomis Sayles Bond Fund – continued
| | | | | | | | |
| | | | | Principal Amount (‡) | | Value (†) |
| | | | | | | | |
| | | |
| BONDS AND NOTES – continued | | | | | | | | |
| | | |
| Chemicals – 0.3% | | | | | | | | |
Borden, Inc., 7.875%, 2/15/2023 | | | | $ | 30,054,000 | | $ | 3,005,400 |
Borden, Inc., 8.375%, 4/15/2016 | | | | | 2,886,000 | | | 288,600 |
Borden, Inc., 9.200%, 3/15/2021 | | | | | 11,305,000 | | | 1,130,500 |
Georgia Gulf Corp., 10.750%, 10/15/2016 | | | | | 145,000 | | | 9,425 |
Hercules, Inc., 6.500%, 6/30/2029(c) | | | | | 19,619,000 | | | 6,866,650 |
Hexion US Finance Corp/Hexion Nova Scotia Finance ULC, 9.750%, 11/15/2014 | | | | | 2,450,000 | | | 539,000 |
Methanex Corp., 6.000%, 8/15/2015 | | | | | 10,565,000 | | | 7,183,925 |
Mosaic Global Holdings, Inc., 7.300%, 1/15/2028 | | | | | 9,415,000 | | | 7,061,250 |
Mosaic Global Holdings, Inc., 7.375%, 8/01/2018 | | | | | 9,095,000 | | | 8,594,775 |
| | | | | | | | |
| | | | | | | | 34,679,525 |
| | | | | | | | |
| Construction Machinery – 1.4% | | | | | | | | |
Caterpillar Financial Services Corp., MTN, 5.450%, 4/15/2018 | | | | | 8,540,000 | | | 7,326,859 |
Caterpillar Financial Services Corp., MTN, 6.125%, 2/17/2014 | | | | | 144,875,000 | | | 140,691,300 |
Caterpillar Financial Services Corp., Series F, MTN, 5.850%, 9/01/2017 | | | | | 4,155,000 | | | 3,610,034 |
Joy Global, Inc., 6.625%, 11/15/2036 | | | | | 1,975,000 | | | 1,317,852 |
Toro Co., 6.625%, 5/01/2037(c) | | | | | 27,030,000 | | | 16,218,000 |
United Rentals North America, Inc., 7.000%, 2/15/2014 | | | | | 26,139,000 | | | 13,200,195 |
United Rentals North America, Inc., 7.750%, 11/15/2013 | | | | | 2,335,000 | | | 1,272,575 |
| | | | | | | | |
| | | | | | | | 183,636,815 |
| | | | | | | | |
| Consumer Cyclical Services – 0.9% | | | | | | | | |
Western Union Co. (The), 6.200%, 11/17/2036 | | | | | 154,180,000 | | | 123,160,834 |
| | | | | | | | |
| Consumer Products – 0.1% | | | | | | | | |
Snap-on, Inc., 5.850%, 3/01/2014 | | | | | 6,130,000 | | | 6,202,352 |
Snap-on, Inc., 6.700%, 3/01/2019 | | | | | 7,210,000 | | | 7,318,612 |
| | | | | | | | |
| | | | | | | | 13,520,964 |
| | | | | | | | |
| Distributors – 0.0% | | | | | | | | |
ONEOK, Inc., 6.000%, 6/15/2035 | | | | | 3,805,000 | | | 2,600,790 |
| | | | | | | | |
| Electric – 3.6% | | | | | | | | |
AES Corp. (The), 7.750%, 3/01/2014 | | | | | 4,875,000 | | | 4,363,125 |
AES Corp. (The), 8.375%, 3/01/2011 | | GBP | | | 2,090,000 | | | 2,698,953 |
AES Ironwood LLC, 8.857%, 11/30/2025 | | | | | 8,646,152 | | | 7,608,613 |
AES Red Oak LLC, Series A, 8.540%, 11/30/2019 | | | | | 1,664,289 | | | 1,514,503 |
Bruce Mansfield Unit, 6.850%, 6/01/2034(c) | | | | | 96,010,000 | | | 71,321,989 |
CE Generation LLC, 7.416%, 12/15/2018 | | | | | 5,401,830 | | | 5,001,722 |
Cleveland Electric Illuminating Co. (The), 5.950%, 12/15/2036 | | | | | 64,200,000 | | | 49,497,237 |
Commonwealth Edison Co., 4.750%, 12/01/2011(c) | | | | | 268,000 | | | 261,855 |
Dominion Resources, Inc., 5.950%, 6/15/2035 | | | | | 5,980,000 | | | 5,060,647 |
Dynegy Holdings, Inc., 7.125%, 5/15/2018 | | | | | 5,295,000 | | | 2,806,350 |
Dynegy Holdings, Inc., 7.625%, 10/15/2026 | | | | | 11,835,000 | | | 4,970,700 |
Dynegy Holdings, Inc., 7.750%, 6/01/2019 | | | | | 1,504,000 | | | 977,600 |
Dynegy Holdings, Inc., 8.375%, 5/01/2016 | | | | | 2,000,000 | | | 1,355,000 |
Edison Mission Energy, 7.625%, 5/15/2027 | | | | | 23,200,000 | | | 13,920,000 |
21
| | | | | | | | |
| | | | | Principal Amount (‡) | | Value (†) |
| | | | | | | | |
| | | |
| BONDS AND NOTES – continued | | | | | | | | |
| | | |
| Electric – continued | | | | | | | | |
Empresa Nacional de Electricidad SA
(Endesa-Chile), 7.875%, 2/01/2027 | | | | $ | 11,581,000 | | $ | 11,875,864 |
Enersis SA, 7.400%, 12/01/2016 | | | | | 4,250,000 | | | 4,403,344 |
Illinois Power Co., 6.250%, 4/01/2018 | | | | | 3,105,000 | | | 2,838,051 |
ITC Holdings Corp., 5.875%, 9/30/2016, 144A | | | | | 25,460,000 | | | 23,972,754 |
ITC Holdings Corp., 6.375%, 9/30/2036, 144A | | | | | 37,955,000 | | | 31,978,416 |
MidAmerican Energy Holdings Co., 6.125%, 4/01/2036 | | | | | 6,540,000 | | | 5,799,790 |
MidAmerican Energy Holdings Co., 6.500%, 9/15/2037 | | | | | 54,485,000 | | | 50,386,039 |
NGC Corp. Capital Trust I, Series B, 8.316%, 6/01/2027 | | | | | 23,775,000 | | | 9,510,000 |
NiSource Finance Corp., 5.400%, 7/15/2014 | | | | | 2,230,000 | | | 1,784,919 |
NiSource Finance Corp., 6.150%, 3/01/2013 | | | | | 2,626,000 | | | 2,293,575 |
NiSource Finance Corp., 6.400%, 3/15/2018 | | | | | 57,010,000 | | | 46,130,040 |
NiSource Finance Corp., 6.800%, 1/15/2019 | | | | | 1,235,000 | | | 992,473 |
Power Receivables Finance LLC, 6.290%, 1/01/2012, 144A | | | | | 1,641,664 | | | 1,606,647 |
Quezon Power Philippines Co., 8.860%, 6/15/2017 | | | | | 5,709,375 | | | 5,138,437 |
Salton Sea Funding Corp., Series E, 8.300%, 5/30/2011 | | | | | 1,382,006 | | | 1,428,428 |
Salton Sea Funding Corp., Series F, 7.475%, 11/30/2018 | | | | | 213,911 | | | 223,954 |
Southern California Edison Co., 7.625%, 1/15/2010 | | | | | 2,000,000 | | | 2,066,862 |
SP Powerassets Ltd., EMTN, 3.730%, 10/22/2010 | | SGD | | | 1,000,000 | | | 653,881 |
Toledo Edison Co., 6.150%, 5/15/2037 | | | | | 13,195,000 | | | 9,296,155 |
TXU Corp., Series P, 5.550%, 11/15/2014 | | | | | 62,501,000 | | | 21,562,845 |
TXU Corp., Series Q, 6.500%, 11/15/2024 | | | | | 139,736,000 | | | 39,199,441 |
TXU Corp., Series R, 6.550%, 11/15/2034 | | | | | 8,271,000 | | | 2,241,689 |
White Pine Hydro LLC, 6.310%, 7/10/2017(c) | | | | | 9,175,000 | | | 8,164,034 |
White Pine Hydro LLC, 6.960%, 7/10/2037(c) | | | | | 14,695,000 | | | 11,242,748 |
White Pine Hydro Portfolio LLC, 7.260%, 7/20/2015(c) | | | | | 5,000,000 | | | 4,499,895 |
| | | | | | | | |
| | | | | | | | 470,648,575 |
| | | | | | | | |
| Entertainment – 0.3% | | | | | | | | |
Six Flags, Inc., 9.625%, 6/01/2014 | | | | | 12,705,000 | | | 1,048,163 |
Six Flags, Inc., 9.750%, 4/15/2013 | | | | | 2,360,000 | | | 194,700 |
Time Warner, Inc., 6.500%, 11/15/2036 | | | | | 30,000 | | | 24,676 |
Time Warner, Inc., 6.625%, 5/15/2029 | | | | | 15,000 | | | 12,663 |
Time Warner, Inc., 7.625%, 4/15/2031 | | | | | 10,000 | | | 8,935 |
Viacom, Inc., Class B, 6.875%, 4/30/2036 | | | | | 58,600,000 | | | 42,754,970 |
| | | | | | | | |
| | | | | | | | 44,044,107 |
| | | | | | | | |
| Food & Beverage – 1.0% | | | | | | | | |
Anheuser-Busch Cos., Inc., 6.450%, 9/01/2037 | | | | | 55,000 | | | 45,644 |
Anheuser-Busch Cos., Inc., 6.500%, 5/01/2042 | | | | | 15,000 | | | 11,667 |
Aramark Services, Inc., 5.000%, 6/01/2012 | | | | | 2,115,000 | | | 1,850,625 |
Corn Products International, Inc., 6.625%, 4/15/2037 | | | | | 31,590,000 | | | 26,040,932 |
Kraft Foods, Inc., 6.500%, 8/11/2017 | | | | | 42,708,000 | | | 43,978,051 |
Kraft Foods, Inc., 6.500%, 11/01/2031 | | | | | 14,990,000 | | | 13,905,114 |
Kraft Foods, Inc., 7.000%, 8/11/2037 | | | | | 36,985,000 | | | 36,665,265 |
Sara Lee Corp., 6.125%, 11/01/2032 | | | | | 18,615,000 | | | 15,676,585 |
| | | | | | | | |
| | | | | | | | 138,173,883 |
| | | | | | | | |
22
PORTFOLIO OF INVESTMENTS – as of March 31, 2009 (Unaudited)
Loomis Sayles Bond Fund – continued
| | | | | | | | |
| | | | | Principal Amount (‡) | | Value (†) |
| | | | | | | | |
| | | |
| BONDS AND NOTES – continued | | | | | | | | |
| | | |
| Government Owned – No Guarantee – 0.1% | | | | | | | | |
DP World Ltd., 6.850%, 7/02/2037, 144A | | | | $ | 24,185,000 | | $ | 11,571,289 |
| | | | | | | | |
| Health Insurance – 1.4% | | | | | | | | |
CIGNA Corp., 6.150%, 11/15/2036 | | | | | 20,530,000 | | | 14,439,570 |
WellPoint, Inc., 6.375%, 6/15/2037 | | | | | 191,190,000 | | | 164,694,699 |
| | | | | | | | |
| | | | | | | | 179,134,269 |
| | | | | | | | |
| Healthcare – 3.9% | | | | | | | | |
Boston Scientific Corp., 5.450%, 6/15/2014 | | | | | 3,725,000 | | | 3,408,375 |
Boston Scientific Corp., 6.400%, 6/15/2016 | | | | | 14,330,000 | | | 13,326,900 |
Boston Scientific Corp., 7.000%, 11/15/2035 | | | | | 22,142,000 | | | 18,820,700 |
HCA, Inc., 5.750%, 3/15/2014 | | | | | 13,400,000 | | | 8,777,000 |
HCA, Inc., 6.250%, 2/15/2013 | | | | | 7,800,000 | | | 5,850,000 |
HCA, Inc., 6.300%, 10/01/2012 | | | | | 2,500,000 | | | 2,087,500 |
HCA, Inc., 6.375%, 1/15/2015 | | | | | 17,380,000 | | | 11,383,900 |
HCA, Inc., 6.500%, 2/15/2016 | | | | | 63,735,000 | | | 41,746,425 |
HCA, Inc., 6.750%, 7/15/2013 | | | | | 3,045,000 | | | 2,276,138 |
HCA, Inc., 7.050%, 12/01/2027 | | | | | 26,685,000 | | | 13,876,200 |
HCA, Inc., 7.190%, 11/15/2015 | | | | | 19,445,000 | | | 13,135,875 |
HCA, Inc., 7.500%, 12/15/2023 | | | | | 24,335,000 | | | 12,893,462 |
HCA, Inc., 7.500%, 11/06/2033 | | | | | 19,830,000 | | | 9,915,000 |
HCA, Inc., 7.690%, 6/15/2025 | | | | | 65,763,000 | | | 34,249,765 |
HCA, Inc., 8.360%, 4/15/2024 | | | | | 38,274,000 | | | 21,461,112 |
HCA, Inc., MTN, 7.580%, 9/15/2025 | | | | | 18,003,000 | | | 9,237,537 |
HCA, Inc., MTN, 7.750%, 7/15/2036 | | | | | 11,606,000 | | | 5,870,280 |
Hospira, Inc., 6.050%, 3/30/2017 | | | | | 15,175,000 | | | 13,543,521 |
Medco Health Solutions, Inc., 7.125%, 3/15/2018 | | | | | 250,270,000 | | | 248,383,965 |
Owens & Minor, Inc., 6.350%, 4/15/2016(c) | | | | | 4,710,000 | | | 4,235,797 |
Tenet Healthcare Corp., 6.500%, 6/01/2012 | | | | | 3,660,000 | | | 3,114,397 |
Tenet Healthcare Corp., 6.875%, 11/15/2031 | | | | | 30,578,000 | | | 15,136,110 |
Tenet Healthcare Corp., 7.375%, 2/01/2013 | | | | | 2,236,000 | | | 1,777,620 |
Tenet Healthcare Corp., 9.250%, 2/01/2015 | | | | | 560,000 | | | 431,200 |
| | | | | | | | |
| | | | | | | | 514,938,779 |
| | | | | | | | |
| Home Construction – 1.7% | | | | | | | | |
Centex Corp., 5.250%, 6/15/2015 | | | | | 5,180,000 | | | 3,885,000 |
D.R. Horton, Inc., 5.250%, 2/15/2015 | | | | | 70,965,000 | | | 54,376,931 |
D.R. Horton, Inc., 5.625%, 9/15/2014 | | | | | 7,235,000 | | | 5,679,475 |
D.R. Horton, Inc., 5.625%, 1/15/2016 | | | | | 26,345,000 | | | 20,022,200 |
D.R. Horton, Inc., 6.500%, 4/15/2016 | | | | | 1,975,000 | | | 1,550,375 |
K. Hovnanian Enterprises, Inc., 6.250%, 1/15/2015 | | | | | 6,430,000 | | | 1,639,650 |
K. Hovnanian Enterprises, Inc., 6.250%, 1/15/2016 | | | | | 19,270,000 | | | 5,202,900 |
K. Hovnanian Enterprises, Inc., 6.375%, 12/15/2014 | | | | | 6,249,000 | | | 1,718,475 |
K. Hovnanian Enterprises, Inc., 6.500%, 1/15/2014 | | | | | 4,050,000 | | | 1,053,000 |
K. Hovnanian Enterprises, Inc., 7.500%, 5/15/2016 | | | | | 1,650,000 | | | 453,750 |
K. Hovnanian Enterprises, Inc., 7.750%, 5/15/2013 | | | | | 2,865,000 | | | 701,925 |
K. Hovnanian Enterprises, Inc., 8.875%, 4/01/2012 | | | | | 1,690,000 | | | 591,500 |
KB Home, 5.875%, 1/15/2015 | | | | | 895,000 | | | 693,178 |
Lennar Corp., Series B, 5.125%, 10/01/2010 | | | | | 3,495,000 | | | 3,058,125 |
Lennar Corp., Series B, 5.500%, 9/01/2014 | | | | | 22,940,000 | | | 16,516,800 |
Lennar Corp., Series B, 5.600%, 5/31/2015 | | | | | 9,282,000 | | | 6,613,425 |
Lennar Corp., Series B, 6.500%, 4/15/2016 | | | | | 40,845,000 | | | 29,408,400 |
Pulte Homes, Inc., 5.200%, 2/15/2015 | | | | | 6,800,000 | | | 5,380,500 |
Pulte Homes, Inc., 6.000%, 2/15/2035 | | | | | 63,855,000 | | | 38,951,550 |
23
| | | | | | | | |
| | | | | Principal Amount (‡) | | Value (†) |
| | | | | | | | |
| | | |
| BONDS AND NOTES – continued | | | | | | | | |
| | | |
| Home Construction – continued | | | | | | | | |
Pulte Homes, Inc., 6.375%, 5/15/2033 | | | | $ | 17,240,000 | | $ | 10,516,400 |
Toll Brothers Finance Corp., 5.150%, 5/15/2015 | | | | | 8,100,000 | | | 6,832,334 |
Toll Corp., 8.250%, 12/01/2011 | | | | | 5,550,000 | | | 5,383,500 |
| | | | | | | | |
| | | | | | | | 220,229,393 |
| | | | | | | | |
| Independent Energy – 1.7% | | | | | | | | |
Anadarko Petroleum Corp., 5.950%, 9/15/2016 | | | | | 50,010,000 | | | 43,072,613 |
Anadarko Petroleum Corp., 6.450%, 9/15/2036 | | | | | 80,585,000 | | | 56,326,094 |
Chesapeake Energy Corp., 6.250%, 1/15/2017 | | EUR | | | 5,925,000 | | | 5,825,247 |
Chesapeake Energy Corp., 6.500%, 8/15/2017 | | | | | 2,615,000 | | | 2,131,225 |
Chesapeake Energy Corp., 6.875%, 11/15/2020 | | | | | 13,805,000 | | | 10,802,412 |
Connacher Oil and Gas Ltd., 10.250%, 12/15/2015, 144A | | | | | 20,226,000 | | | 6,371,190 |
Pioneer Natural Resources Co., 5.875%, 7/15/2016 | | | | | 10,275,000 | | | 7,581,727 |
Pioneer Natural Resources Co., 6.875%, 5/01/2018 | | | | | 2,125,000 | | | 1,561,900 |
Pioneer Natural Resources Co., 7.200%, 1/15/2028 | | | | | 8,782,000 | | | 5,386,607 |
Questar Market Resources, Inc., 6.800%, 4/01/2018 | | | | | 51,955,000 | | | 46,505,700 |
Talisman Energy, Inc., 5.850%, 2/01/2037 | | | | | 12,190,000 | | | 8,227,202 |
Talisman Energy, Inc., 6.250%, 2/01/2038 | | | | | 32,560,000 | | | 22,968,736 |
XTO Energy, Inc., 6.100%, 4/01/2036 | | | | | 2,165,000 | | | 1,831,525 |
XTO Energy, Inc., 6.750%, 8/01/2037 | | | | | 11,225,000 | | | 10,216,052 |
| | | | | | | | |
| | | | | | | | 228,808,230 |
| | | | | | | | |
| Industrial Other – 0.1% | | | | | | | | |
Great Lakes Dredge & Dock Corp., 7.750%, 12/15/2013 | | | | | 3,590,000 | | | 2,872,000 |
Ranhill Labuan Ltd., 12.500%, 10/26/2011, 144A | | | | | 26,410,000 | | | 15,053,700 |
| | | | | | | | |
| | | | | | | | 17,925,700 |
| | | | | | | | |
| Integrated Energy – 0.0% | | | | | | | | |
PF Export Receivables Master Trust, Series A, 6.436%, 6/01/2015, 144A | | | | | 1,513,009 | | | 1,528,139 |
| | | | | | | | |
| Life Insurance – 0.3% | | | | | | | | |
Mutual of Omaha Insurance Co.,
6.800%, 6/15/2036, 144A | | | | | 57,985,000 | | | 40,445,001 |
| | | | | | | | |
| Local Authorities – 2.4% | | | | | | | | |
New South Wales Treasury Corp., Series 10RG, 7.000%, 12/01/2010 | | AUD | | | 110,620,000 | | | 81,301,171 |
New South Wales Treasury Corp., Series 12RG, 6.000%, 5/01/2012 | | AUD | | | 15,305,000 | | | 11,192,410 |
New South Wales Treasury Corp., Series 17RG, 5.500%, 3/01/2017 | | AUD | | | 95,840,000 | | | 67,834,827 |
Ontario Hydro, Zero Coupon Bond, 11/27/2020 | | CAD | | | 1,507,000 | | | 684,867 |
Province of Alberta, 5.930%, 9/16/2016 | | CAD | | | 17,221,875 | | | 15,426,063 |
Province of British Columbia, 5.750%, 1/09/2012 | | CAD | | | 730,000 | | | 640,348 |
Province of Ontario, 4.400%, 12/02/2011 | | CAD | | | 760,000 | | | 643,137 |
Queensland Treasury Corp., 7.125%, 9/18/2017, 144A | | NZD | | | 84,345,000 | | | 52,159,804 |
Queensland Treasury Corp., Series 11G, 6.000%, 6/14/2011 | | AUD | | | 60,000 | | | 43,756 |
Virginia Tobacco Settlement Financing Corp., Series A-1, 6.706%, 6/01/2046(c) | | | | | 183,235,000 | | | 90,226,746 |
| | | | | | | | |
| | | | | | | | 320,153,129 |
| | | | | | | | |
24
PORTFOLIO OF INVESTMENTS – as of March 31, 2009 (Unaudited)
Loomis Sayles Bond Fund – continued
| | | | | | | | |
| | | | | Principal Amount (‡) | | Value (†) |
| | | | | | | | |
| | | |
| BONDS AND NOTES – continued | | | | | | | | |
| | | |
| Media Cable – 2.8% | | | | | | | | |
Comcast Corp., 5.500%, 3/15/2011 | | | | $ | 3,000,000 | | $ | 3,043,134 |
Comcast Corp., 5.650%, 6/15/2035 | | | | | 71,195,000 | | | 56,379,392 |
Comcast Corp., 6.450%, 3/15/2037 | | | | | 53,020,000 | | | 46,320,923 |
Comcast Corp., 6.500%, 11/15/2035 | | | | | 23,100,000 | | | 20,403,468 |
Comcast Corp., 6.950%, 8/15/2037 | | | | | 192,208,000 | | | 178,986,396 |
CSC Holdings, Inc., 7.875%, 2/15/2018 | | | | | 1,550,000 | | | 1,418,250 |
CSC Holdings, Inc., 8.500%, 4/15/2014, 144A | | | | | 15,000,000 | | | 14,775,000 |
Shaw Communications, Inc., 5.700%, 3/02/2017 | | CAD | | | 12,775,000 | | | 9,264,003 |
Shaw Communications, Inc.,, 7.500%, 11/20/2013 | | CAD | | | 275,000 | | | 231,202 |
Time Warner Cable, Inc., 6.750%, 7/01/2018 | | | | | 26,541,000 | | | 24,914,143 |
Virgin Media Finance PLC, 9.125%, 8/15/2016 | | | | | 1,700,000 | | | 1,581,000 |
Virgin Media Finance PLC, 9.750%, 4/15/2014 | | GBP | | | 6,605,000 | | | 8,387,307 |
| | | | | | | | |
| | | | | | | | 365,704,218 |
| | | | | | | | |
| Media Non-Cable – 0.6% | | | | | | | | |
Clear Channel Communications, Inc.,
4.900%, 5/15/2015 | | | | | 20,075,000 | | | 2,810,500 |
Clear Channel Communications, Inc.,
5.500%, 9/15/2014 | | | | | 5,195,000 | | | 779,250 |
Clear Channel Communications, Inc.,
5.500%, 12/15/2016 | | | | | 17,050,000 | | | 2,387,000 |
Clear Channel Communications, Inc., 5.750%, 1/15/2013 | | | | | 2,080,000 | | | 312,000 |
Clear Channel Communications, Inc., 6.875%, 6/15/2018 | | | | | 1,095,000 | | | 158,775 |
News America, Inc., 6.150%, 3/01/2037 | | | | | 54,025,000 | | | 39,390,276 |
News America, Inc., 6.200%, 12/15/2034 | | | | | 17,785,000 | | | 12,793,800 |
News America, Inc., 6.400%, 12/15/2035 | | | | | 29,275,000 | | | 21,688,120 |
R.H. Donnelley Corp., Series A-1, 6.875%, 1/15/2013 | | | | | 4,713,000 | | | 200,302 |
R.H. Donnelley Corp., Series A-2, 6.875%, 1/15/2013 | | | | | 2,840,000 | | | 120,700 |
R.H. Donnelley Corp., Series A-3, 8.875%, 1/15/2016 | | | | | 927,000 | | | 53,303 |
R.H. Donnelley Corp., Series A-4, 8.875%, 10/15/2017 | | | | | 3,564,000 | | | 187,110 |
| | | | | | | | |
| | | | | | | | 80,881,136 |
| | | | | | | | |
| Metals & Mining – 0.4% | | | | | | | | |
Algoma Acquisition Corp., 9.875%, 6/15/2015, 144A | | | | | 13,180,000 | | | 5,074,300 |
ArcelorMittal, 5.375%, 6/01/2013 | | | | | 10,190,000 | | | 7,909,580 |
ArcelorMittal, 6.125%, 6/01/2018 | | | | | 90,000 | | | 65,111 |
Ispat Inland, Inc., 9.750%, 4/01/2014 | | | | | 15,477,000 | | | 14,084,070 |
Newmont Mining Corp., 5.875%, 4/01/2035 | | | | | 5,621,000 | | | 3,917,837 |
United States Steel Corp., 6.050%, 6/01/2017 | | | | | 11,175,000 | | | 6,914,252 |
United States Steel Corp., 6.650%, 6/01/2037 | | | | | 9,625,000 | | | 5,423,495 |
United States Steel Corp., 7.000%, 2/01/2018 | | | | | 23,520,000 | | | 16,050,424 |
| | | | | | | | |
| | | | | | | | 59,439,069 |
| | | | | | | | |
| Mortgage Related – 0.0% | | | | | | | | |
FHLMC, 5.000%, 12/01/2031 | | | | | 343,358 | | | 356,078 |
| | | | | | | | |
25
| | | | | | | | | |
| | | | | Principal Amount (‡) | | | Value (†) |
| | | | | | | | | |
| | | |
| BONDS AND NOTES – continued | | | | | | | | | |
| | | |
| Non-Captive Consumer – 2.6% | | | | | | | | | |
American General Finance Corp., Series J, MTN, 6.900%, 12/15/2017 | | | | $ | 322,970,000 | | | $ | 119,498,900 |
Residential Capital LLC, 8.375%, 6/30/2010 | | | | | 5,000 | | | | 2,300 |
SLM Corp., 6.000%, 12/15/2043 | | | | | 150,125 | (††) | | | 1,379,273 |
SLM Corp., EMTN, 4.750%, 3/17/2014 | | EUR | | | 9,200,000 | | | | 5,928,213 |
SLM Corp., MTN, 5.050%, 11/14/2014 | | | | | 27,310,000 | | | | 14,456,603 |
SLM Corp., MTN, 5.125%, 8/27/2012 | | | | | 1,955,000 | | | | 1,053,425 |
SLM Corp., Series A, MTN, 4.000%, 1/15/2010 | | | | | 5,285,000 | | | | 4,459,779 |
SLM Corp., Series A, MTN, 4.500%, 7/26/2010 | | | | | 5,015,000 | | | | 3,761,250 |
SLM Corp., Series A, MTN, 5.000%, 10/01/2013 | | | | | 72,850,000 | | | | 38,739,299 |
SLM Corp., Series A, MTN, 5.000%, 4/15/2015 | | | | | 53,696,000 | | | | 24,163,200 |
SLM Corp., Series A, MTN, 5.000%, 6/15/2018 | | | | | 22,293,000 | | | | 11,541,086 |
SLM Corp., Series A, MTN, 5.375%, 1/15/2013 | | | | | 28,262,000 | | | | 15,507,840 |
SLM Corp., Series A, MTN, 5.375%, 5/15/2014 | | | | | 31,385,000 | | | | 16,263,644 |
SLM Corp., Series A, MTN, 5.400%, 10/25/2011 | | | | | 1,785,000 | | | | 1,106,700 |
SLM Corp., Series A, MTN, 5.625%, 8/01/2033 | | | | | 38,535,000 | | | | 14,257,950 |
SLM Corp., Series A, MTN, 6.500%, 6/15/2010(c)(d) | | NZD | | | 8,020,000 | | | | 3,325,654 |
SLM Corp., Series A, MTN, 8.450%, 6/15/2018 | | | | | 125,010,000 | | | | 67,521,401 |
| | | | | | | | | |
| | | | | | | | | 342,966,517 |
| | | | | | | | | |
| Non-Captive Diversified – 6.1% | | | | | | | | | |
CIT Group Funding Co. of Canada, 5.200%, 6/01/2015 | | | | | 8,328,000 | | | | 4,871,880 |
CIT Group, Inc., 4.750%, 12/15/2010 | | | | | 130,000 | | | | 104,836 |
CIT Group, Inc., 5.400%, 2/13/2012 | | | | | 652,000 | | | | 420,354 |
CIT Group, Inc., 5.400%, 1/30/2016 | | | | | 476,000 | | | | 285,297 |
CIT Group, Inc., 5.500%, 12/01/2014 | | GBP | | | 29,029,000 | | | | 17,493,948 |
CIT Group, Inc., 5.600%, 4/27/2011 | | | | | 7,206,000 | | | | 5,259,847 |
CIT Group, Inc., 5.800%, 10/01/2036 | | | | | 5,017,000 | | | | 2,763,313 |
CIT Group, Inc., 5.850%, 9/15/2016 | | | | | 10,000 | | | | 5,656 |
CIT Group, Inc., 12.000%, 12/18/2018, 144A | | | | | 181,625,000 | | | | 93,990,937 |
CIT Group, Inc., EMTN, 3.800%, 11/14/2012 | | EUR | | | 21,270,000 | | | | 12,999,288 |
CIT Group, Inc., EMTN, 4.650%, 9/19/2016 | | EUR | | | 21,250,000 | | | | 11,857,755 |
CIT Group, Inc., EMTN, 5.000%, 5/13/2014 | | EUR | | | 6,450,000 | | | | 3,684,872 |
CIT Group, Inc., EMTN, 5.500%, 12/20/2016 | | GBP | | | 16,050,000 | | | | 9,672,323 |
CIT Group, Inc., GMTN, 4.250%, 2/01/2010 | | | | | 85,000 | | | | 72,862 |
CIT Group, Inc., GMTN, 4.250%, 9/22/2011 | | EUR | | | 25,450,000 | | | | 20,287,722 |
CIT Group, Inc., GMTN, 5.000%, 2/13/2014 | | | | | 5,817,000 | | | | 3,432,030 |
CIT Group, Inc., GMTN, 5.000%, 2/01/2015 | | | | | 476,000 | | | | 289,813 |
CIT Group, Inc., MTN, 4.250%, 3/17/2015 | | EUR | | | 29,370,000 | | | | 18,730,071 |
CIT Group, Inc., MTN, 5.125%, 9/30/2014 | | | | | 4,107,000 | | | | 2,482,628 |
CIT Group, Inc., Series A, GMTN, 6.000%, 4/01/2036 | | | | | 165,000 | | | | 77,791 |
CIT Group, Inc., Series A, MTN, 5.650%, 2/13/2017 | | | | | 1,117,000 | | | | 646,883 |
CIT Group, Inc., Series A, MTN, 7.625%, 11/30/2012 | | | | | 105,438,000 | | | | 77,605,637 |
General Electric Capital Australia Funding, EMTN, 8.000%, 2/13/2012 | | AUD | | | 44,525,000 | | | | 29,033,876 |
General Electric Capital Corp., Series A, EMTN, 6.750%, 9/26/2016(c)(d) | | NZD | | | 89,985,000 | | | | 42,082,754 |
General Electric Capital Corp., Series A, GMTN, 2.960%, 5/18/2012 | | SGD | | | 15,000,000 | | | | 8,234,669 |
26
PORTFOLIO OF INVESTMENTS – as of March 31, 2009 (Unaudited)
Loomis Sayles Bond Fund – continued
| | | | | | | |
| | | | | Principal Amount (‡) | | Value (†) |
| | | | | | | |
| | | |
| BONDS AND NOTES – continued | | | | | | | |
| | | |
| Non-Captive Diversified – continued | | | | | | | |
General Electric Capital Corp., Series A, GMTN, 3.485%, 3/08/2012 | | SGD | | 150,000,000 | | $ | 84,608,797 |
General Electric Capital Corp., Series A, MTN, 6.500%, 9/28/2015(c)(d) | | NZD | | 266,643,000 | | | 125,508,277 |
GMAC LLC, 4.750%, 9/14/2009, 144A | | | | 10,727,000 | | | 9,134,791 |
GMAC LLC, 5.625%, 5/15/2009 | | | | 1,085,000 | | | 1,026,976 |
GMAC LLC, 5.750%, 9/27/2010, 144A | | | | 7,263,000 | | | 5,519,880 |
GMAC LLC, 6.000%, 12/15/2011, 144A | | | | 52,305,000 | | | 35,609,767 |
GMAC LLC, 6.625%, 12/17/2010, 144A | | | | 464,000 | | | 343,360 |
GMAC LLC, 6.625%, 5/15/2012, 144A | | | | 20,461,000 | | | 13,725,853 |
GMAC LLC, 6.750%, 12/01/2014, 144A | | | | 30,190,000 | | | 17,544,617 |
GMAC LLC, 6.875%, 9/15/2011, 144A | | | | 5,664,000 | | | 4,024,952 |
GMAC LLC, 6.875%, 8/28/2012, 144A | | | | 4,229,000 | | | 2,840,070 |
GMAC LLC, 6.875%, 8/28/2012 | | | | 10,000 | | | 5,521 |
GMAC LLC, 7.000%, 2/01/2012, 144A | | | | 10,637,000 | | | 7,347,189 |
GMAC LLC, 7.250%, 3/02/2011, 144A | | | | 25,000 | | | 18,511 |
GMAC LLC, 7.500%, 12/31/2013, 144A | | | | 23,588,000 | | | 11,338,280 |
GMAC LLC, 8.000%, 12/31/2018, 144A | | | | 44,981,000 | | | 13,058,434 |
GMAC LLC, 8.000%, 11/01/2031, 144A | | | | 35,442,000 | | | 17,053,273 |
International Lease Finance Corp., 4.750%, 7/01/2009 | | | | 365,000 | | | 343,134 |
International Lease Finance Corp., Series R, MTN, 5.625%, 9/15/2010 | | | | 120,000 | | | 88,591 |
iStar Financial, Inc., 5.150%, 3/01/2012 | | | | 52,875,000 | | | 19,035,000 |
iStar Financial, Inc., 5.375%, 4/15/2010 | | | | 6,905,000 | | | 4,419,200 |
iStar Financial, Inc., 5.500%, 6/15/2012 | | | | 3,865,000 | | | 1,314,100 |
iStar Financial, Inc., 5.650%, 9/15/2011 | | | | 30,335,000 | | | 12,437,350 |
iStar Financial, Inc., 5.800%, 3/15/2011 | | | | 5,305,000 | | | 2,267,887 |
iStar Financial, Inc., 5.850%, 3/15/2017 | | | | 6,565,000 | | | 1,903,850 |
iStar Financial, Inc., 5.875%, 3/15/2016 | | | | 11,605,000 | | | 3,365,450 |
iStar Financial, Inc., 6.050%, 4/15/2015 | | | | 5,655,000 | | | 1,639,950 |
iStar Financial, Inc., 8.625%, 6/01/2013 | | | | 46,795,000 | | | 14,623,437 |
iStar Financial, Inc., Series B, 5.125%, 4/01/2011 | | | | 2,330,000 | | | 961,125 |
iStar Financial, Inc., Series B, 5.700%, 3/01/2014 | | | | 7,645,000 | | | 2,217,050 |
iStar Financial, Inc., Series B, 5.950%, 10/15/2013 | | | | 60,205,000 | | | 18,362,525 |
| | | | | | | |
| | | | | | | 798,074,239 |
| | | | | | | |
| Oil Field Services – 2.6% | | | | | | | |
Nabors Industries, Inc., 6.150%, 2/15/2018 | | | | 2,740,000 | | | 2,143,702 |
Nabors Industries, Inc., 9.250%, 1/15/2019, 144A | | | | 182,660,000 | | | 173,203,326 |
North American Energy Partners, Inc., 8.750%, 12/01/2011 | | | | 12,685,000 | | | 9,260,050 |
Weatherford International Ltd., 6.500%, 8/01/2036 | | | | 25,600,000 | | | 18,021,555 |
Weatherford International Ltd., 6.800%, 6/15/2037 | | | | 4,250,000 | | | 3,014,585 |
Weatherford International Ltd., 7.000%, 3/15/2038 | | | | 13,670,000 | | | 9,938,377 |
Weatherford International Ltd., 9.625%, 3/01/2019 | | | | 120,080,000 | | | 124,200,305 |
| | | | | | | |
| | | | | | | 339,781,900 |
| | | | | | | |
27
| | | | | | | |
| | | | | Principal Amount (‡) | | Value (†) |
| | | | | | | |
| | | |
| BONDS AND NOTES – continued | | | | | | | |
| | | |
| Packaging – 0.2% | | | | | | | |
OI European Group BV, 6.875%, 3/31/2017, 144A | | EUR | | 3,450,000 | | $ | 3,941,956 |
Owens Brockway Glass Container, Inc., 6.750%, 12/01/2014 | | EUR | | 2,500,000 | | | 2,989,350 |
Owens-Illinois, Inc., 7.800%, 5/15/2018 | | | | 18,644,000 | | | 18,084,680 |
| | | | | | | |
| | | | | | | 25,015,986 |
| | | | | | | |
| Paper – 2.6% | | | | | | | |
Abitibi-Consolidated, Inc., 6.000%, 6/20/2013 | | | | 150,000 | | | 12,000 |
Abitibi-Consolidated, Inc., 7.400%, 4/01/2018 | | | | 11,675,000 | | | 1,050,750 |
Abitibi-Consolidated, Inc., 7.500%, 4/01/2028 | | | | 14,820,000 | | | 1,185,600 |
Abitibi-Consolidated, Inc., 8.500%, 8/01/2029 | | | | 4,215,000 | | | 337,200 |
Abitibi-Consolidated, Inc., 8.850%, 8/01/2030 | | | | 47,185,000 | | | 3,774,800 |
Avenor, Inc., 10.850%, 11/30/2014 | | CAD | | 450,000 | | | 32,122 |
Bowater, Inc., 6.500%, 6/15/2013 | | | | 975,000 | | | 78,000 |
Georgia-Pacific LLC, 7.250%, 6/01/2028 | | | | 25,907,000 | | | 18,005,365 |
Georgia-Pacific LLC, 7.375%, 12/01/2025 | | | | 31,317,000 | | | 22,313,363 |
Georgia-Pacific LLC, 7.700%, 6/15/2015 | | | | 470,000 | | | 425,350 |
Georgia-Pacific LLC, 7.750%, 11/15/2029 | | | | 80,840,000 | | | 59,821,600 |
Georgia-Pacific LLC, 8.000%, 1/15/2024 | | | | 21,284,000 | | | 16,920,780 |
Georgia-Pacific LLC, 8.875%, 5/15/2031 | | | | 27,237,000 | | | 21,789,600 |
International Paper Co., 7.950%, 6/15/2018 | | | | 211,710,000 | | | 161,362,610 |
International Paper Co., 8.700%, 6/15/2038 | | | | 3,517,000 | | | 2,338,386 |
Jefferson Smurfit Corp., 7.500%, 6/01/2013(b) | | | | 5,540,000 | | | 644,025 |
Smurfit-Stone Container Enterprises, Inc., 8.000%, 3/15/2017(b) | | | | 1,115,000 | | | 129,619 |
Stone Container Finance, 7.375%, 7/15/2014(b) | | | | 90,000 | | | 13,050 |
Westvaco Corp., 7.950%, 2/15/2031 | | | | 21,466,000 | | | 16,409,791 |
Westvaco Corp., 8.200%, 1/15/2030 | | | | 23,594,000 | | | 18,600,589 |
| | | | | | | |
| | | | | | | 345,244,600 |
| | | | | | | |
| Pharmaceuticals – 1.5% | | | | | | | |
Astrazeneca PLC, 6.450%, 9/15/2037 | | | | 82,240,000 | | | 85,306,072 |
Elan Financial PLC, 7.750%, 11/15/2011 | | | | 72,911,000 | | | 61,245,240 |
Elan Financial PLC, 8.875%, 12/01/2013 | | | | 58,330,000 | | | 46,664,000 |
| | | | | | | |
| | | | | | | 193,215,312 |
| | | | | | | |
| Pipelines – 2.2% | | | | | | | |
Colorado Interstate Gas Co., 5.950%, 3/15/2015 | | | | 1,099,000 | | | 992,179 |
Colorado Interstate Gas Co., 6.800%, 11/15/2015 | | | | 20,000 | | | 18,748 |
DCP Midstream LP, 6.450%, 11/03/2036, 144A | | | | 27,325,000 | | | 17,713,541 |
El Paso Corp., 6.950%, 6/01/2028 | | | | 12,209,000 | | | 8,419,546 |
El Paso Corp., 7.420%, 2/15/2037 | | | | 2,045,000 | | | 1,423,026 |
El Paso Corp., 7.750%, 1/15/2032 | | | | 1,500,000 | | | 1,117,555 |
El Paso Corp., MTN, 7.800%, 8/01/2031 | | | | 1,000,000 | | | 747,201 |
Energy Transfer Partners LP, 6.125%, 2/15/2017 | | | | 7,325,000 | | | 6,535,394 |
Energy Transfer Partners LP, 6.625%, 10/15/2036 | | | | 11,435,000 | | | 8,502,860 |
Enterprise Products Operating LLP, 6.300%, 9/15/2017 | | | | 25,030,000 | | | 23,070,727 |
Kinder Morgan Energy Partners LP, 5.800%, 3/15/2035 | | | | 843,000 | | | 625,458 |
Kinder Morgan Finance Co., 5.700%, 1/05/2016 | | | | 14,210,000 | | | 11,936,400 |
Knight, Inc., Senior Note, 5.150%, 3/01/2015 | | | | 15,415,000 | | | 12,948,600 |
NGPL PipeCo LLC, 7.119%, 12/15/2017, 144A | | | | 116,405,000 | | | 106,732,327 |
28
PORTFOLIO OF INVESTMENTS – as of March 31, 2009 (Unaudited)
Loomis Sayles Bond Fund – continued
| | | | | | | | |
| | | | | Principal Amount (‡) | | Value (†) |
| | | | | | | | |
| | | |
| BONDS AND NOTES – continued | | | | | | | | |
| | | |
| Pipelines – continued | | | | | | | | |
ONEOK Partners LP, 6.650%, 10/01/2036 | | | | $ | 9,450,000 | | $ | 7,073,703 |
Plains All American Pipeline LP, 6.125%, 1/15/2017 | | | | | 28,845,000 | | | 24,508,327 |
Plains All American Pipeline LP, 6.650%, 1/15/2037 | | | | | 62,130,000 | | | 45,032,072 |
Tennessee Gas Pipeline Co., 7.000%, 10/15/2028 | | | | | 5,290,000 | | | 4,499,976 |
Williams Cos., Inc. (The), 7.500%, 1/15/2031 | | | | | 6,655,000 | | | 5,257,450 |
| | | | | | | | |
| | | | | | | | 287,155,090 |
| | | | | | | | |
| Property & Casualty Insurance – 1.3% | | | | | | | | |
Allstate Corp., 5.950%, 4/01/2036 | | | | | 7,790,000 | | | 5,636,143 |
Marsh & McLennan Cos., Inc., 5.375%, 7/15/2014 | | | | | 46,320,000 | | | 40,843,633 |
Marsh & McLennan Cos., Inc., 5.750%, 9/15/2015 | | | | | 34,729,000 | | | 30,964,619 |
Marsh & McLennan Cos., Inc., 5.875%, 8/01/2033 | | | | | 49,522,000 | | | 32,863,294 |
Marsh & McLennan Cos., Inc., 9.250%, 4/15/2019 | | | | | 7,990,000 | | | 8,145,070 |
MBIA Insurance Corp., (fixed rate to 1/15/2013, variable rate thereafter), 14.000%, 1/15/2033, 144A | | | | | 8,600,000 | | | 2,666,000 |
St. Paul Travelers Co., Inc., 6.750%, 6/20/2036 | | | | | 6,850,000 | | | 6,614,237 |
Travelers Cos., Inc. (The), MTN, 6.250%, 6/15/2037 | | | | | 42,880,000 | | | 39,233,828 |
Travelers Property Casualty Corp., 6.375%, 3/15/2033 | | | | | 1,000,000 | | | 932,275 |
White Mountains RE Group, 6.375%, 3/20/2017, 144A | | | | | 75,000 | | | 54,716 |
Willis North America, Inc., 6.200%, 3/28/2017 | | | | | 12,000,000 | | | 8,411,100 |
| | | | | | | | |
| | | | | | | | 176,364,915 |
| | | | | | | | |
| Railroads – 0.4% | | | | | | | | |
Canadian Pacific Railway Co., 5.750%, 3/15/2033 | | | | | 3,830,000 | | | 2,723,559 |
Canadian Pacific Railway Co., 5.950%, 5/15/2037 | | | | | 24,475,000 | | | 17,079,634 |
CSX Corp., 6.250%, 3/15/2018 | | | | | 5,000,000 | | | 4,307,300 |
CSX Corp., MTN, 6.000%, 10/01/2036 | | | | | 41,249,000 | | | 28,971,400 |
Missouri Pacific Railroad Co., 5.000%, 1/01/2045(c) | | | | | 7,944,000 | | | 4,369,200 |
Missouri Pacific Railroad Co., Series A, 4.750%, 1/01/2020(c) | | | | | 63,300 | | | 42,569 |
| | | | | | | | |
| | | | | | | | 57,493,662 |
| | | | | | | | |
| Refining – 0.0% | | | | | | | | |
Valero Energy Corp., 6.625%, 6/15/2037 | | | | | 1,782,000 | | | 1,259,658 |
| | | | | | | | |
| REITs – 0.9% | | | | | | | | |
Camden Property Trust, 5.700%, 5/15/2017 | | | | | 40,075,000 | | | 29,420,661 |
Colonial Realty LP, 6.050%, 9/01/2016 | | | | | 3,980,000 | | | 2,414,563 |
Duke Realty LP, 5.950%, 2/15/2017 | | | | | 5,720,000 | | | 3,420,800 |
ERP Operating LP, 5.125%, 3/15/2016 | | | | | 4,680,000 | | | 3,692,796 |
ERP Operating LP, 5.375%, 8/01/2016 | | | | | 3,000,000 | | | 2,364,267 |
First Industrial LP, 5.950%, 5/15/2017 | | | | | 7,750,000 | | | 3,720,984 |
Highwoods Properties, Inc., 5.850%, 3/15/2017 | | | | | 57,890,000 | | | 35,797,729 |
Highwoods Properties, Inc., 7.500%, 4/15/2018 | | | | | 5,640,000 | | | 3,716,737 |
29
| | | | | | | | | |
| | | | | Principal Amount (‡) | | | Value (†) |
| | | | | | | | | |
| | | |
| BONDS AND NOTES – continued | | | | | | | | | |
| | | |
| REITs – continued | | | | | | | | | |
ProLogis, 5.625%, 11/15/2015 | | | | $ | 4,315,000 | | | $ | 2,330,100 |
ProLogis, 5.625%, 11/15/2016 | | | | | 2,155,000 | | | | 1,077,073 |
ProLogis, 5.750%, 4/01/2016 | | | | | 2,175,000 | | | | 1,195,291 |
Simon Property Group LP, 5.000%, 3/01/2012 | | | | | 200,000 | | | | 170,245 |
Simon Property Group LP, 5.250%, 12/01/2016 | | | | | 3,825,000 | | | | 2,849,101 |
Simon Property Group LP, 5.750%, 5/01/2012 | | | | | 150,000 | | | | 129,748 |
Simon Property Group LP, 5.750%, 12/01/2015 | | | | | 7,480,000 | | | | 5,775,046 |
Simon Property Group LP, 5.875%, 3/01/2017 | | | | | 3,145,000 | | | | 2,425,924 |
Simon Property Group LP, 6.125%, 5/30/2018 | | | | | 1,690,000 | | | | 1,328,479 |
Simon Property Group LP, 10.350%, 4/01/2019 | | | | | 10,965,000 | | | | 10,656,653 |
| | | | | | | | | |
| | | | | | | | | 112,486,197 |
| | | | | | | | | |
| Restaurants – 0.0% | | | | | | | | | |
McDonald’s Corp., EMTN, 3.628%, 10/10/2010 | | SGD | | | 3,750,000 | | | | 2,522,941 |
| | | | | | | | | |
| Retailers – 3.9% | | | | | | | | | |
Dillard’s, Inc., 6.625%, 1/15/2018 | | | | | 1,920,000 | | | | 691,200 |
Dillard’s, Inc., 7.000%, 12/01/2028 | | | | | 4,680,000 | | | | 1,591,200 |
Dillard’s, Inc., 7.130%, 8/01/2018 | | | | | 1,740,000 | | | | 609,000 |
Dillard’s, Inc., 7.750%, 7/15/2026 | | | | | 7,182,000 | | | | 2,370,060 |
Dillard’s, Inc., 7.750%, 5/15/2027 | | | | | 1,000,000 | | | | 330,000 |
Foot Locker, Inc., 8.500%, 1/15/2022 | | | | | 14,269,000 | | | | 11,486,545 |
Home Depot, Inc. (The), 5.400%, 3/01/2016 | | | | | 2,329,000 | | | | 2,093,540 |
Home Depot, Inc. (The), 5.875%, 12/16/2036 | | | | | 168,575,000 | | | | 119,381,612 |
J.C. Penney Corp., Inc., 5.750%, 2/15/2018 | | | | | 5,160,000 | | | | 3,628,786 |
J.C. Penney Corp., Inc., 6.375%, 10/15/2036 | | | | | 98,218,000 | | | | 61,401,768 |
J.C. Penney Corp., Inc., 7.125%, 11/15/2023 | | | | | 2,798,000 | | | | 1,954,269 |
J.C. Penney Corp., Inc., 7.400%, 4/01/2037 | | | | | 4,655,000 | | | | 2,956,325 |
J.C. Penney Corp., Inc., 7.625%, 3/01/2097 | | | | | 5,580,000 | | | | 3,538,897 |
Lowe’s Cos., Inc., 5.500%, 10/15/2035 | | | | | 1,470,000 | | | | 1,290,259 |
Lowe’s Cos., Inc., 6.650%, 9/15/2037 | | | | | 54,235,000 | | | | 53,348,421 |
Macy’s Retail Holdings, Inc., 6.375%, 3/15/2037 | | | | | 36,772,000 | | | | 20,477,628 |
Macy’s Retail Holdings, Inc., 6.790%, 7/15/2027 | | | | | 14,133,000 | | | | 7,226,655 |
Macy’s Retail Holdings, Inc., 6.900%, 4/01/2029 | | | | | 2,098,000 | | | | 1,058,370 |
Macy’s Retail Holdings, Inc., 7.875%, 7/15/2015 | | | | | 1,485,000 | | | | 1,096,015 |
Marks & Spencer PLC, 7.125%, 12/01/2037, 144A | | | | | 9,245,000 | | | | 5,403,813 |
Target Corp., 6.500%, 10/15/2037 | | | | | 10,959,000 | | | | 9,711,088 |
Target Corp., 7.000%, 1/15/2038 | | | | | 190,270,000 | | | | 178,231,807 |
Toys R Us, Inc., 7.375%, 10/15/2018 | | | | | 39,965,000 | | | | 12,788,800 |
Toys R Us, Inc., 7.875%, 4/15/2013 | | | | | 11,255,000 | | | | 3,953,319 |
| | | | | | | | | |
| | | | | | | | | 506,619,377 |
| | | | | | | | | |
| Sovereigns – 3.8% | | | | | | | | | |
Indonesia Treasury Bond, 9.500%, 7/15/2023 | | IDR | | | 10,000,000,000 | | | | 671,078 |
Indonesia Treasury Bond, 10.250%, 7/15/2027 | | IDR | | | 25,000,000,000 | | | | 1,723,419 |
Indonesia Treasury Bond, Series FR43, 10.250%, 7/15/2022 | | IDR | | | 145,156,000,000 | | | | 10,463,116 |
Indonesia Treasury Bond, Series ZC3,
Zero Coupon Bond, 11/20/2012 | | IDR | | | 378,003,000,000 | | | | 22,292,559 |
Mexico Government International Bond, Series A, MTN, 6.050%, 1/11/2040 | | | | | 44,000 | | | | 37,620 |
Mexican Fixed Rate Bonds, Series M-20, 8.000%, 12/07/2023 | | MXN | | | 28,585,700 | (†††) | | | 200,380,409 |
30
PORTFOLIO OF INVESTMENTS – as of March 31, 2009 (Unaudited)
Loomis Sayles Bond Fund – continued
| | | | | | | | | |
| | | | | Principal Amount (‡) | | | Value (†) |
| | | | | | | | | |
| | | |
| BONDS AND NOTES – continued | | | | | | | | | |
| | | |
| Sovereigns – continued | | | | | | | | | |
Mexican Fixed Rate Bonds, Series MI-10, 9.000%, 12/20/2012 | | | | $ | 9,230,000 | (†††) | | $ | 69,643,657 |
Republic of Brazil, 7.125%, 1/20/2037 | | | | | 20,000 | | | | 20,050 |
Republic of Brazil, 8.250%, 1/20/2034 | | | | | 690,000 | | | | 765,900 |
Republic of Brazil, 8.875%, 4/15/2024 | | | | | 25,580,000 | | | | 29,480,950 |
Republic of Brazil, 10.250%, 1/10/2028 | | BRL | | | 98,690,000 | | | | 38,927,191 |
Republic of Brazil, 12.500%, 1/05/2016 | | BRL | | | 17,305,000 | | | | 7,832,848 |
Republic of Brazil, 12.500%, 1/05/2022 | | BRL | | | 114,735,000 | | | | 51,685,774 |
Republic of Iceland, Zero Coupon Bond, 4/15/2009 | | ISK | | | 4,983,000,000 | | | | 24,145,642 |
Republic of Iceland, 7.000%, 3/17/2010 | | ISK | | | 4,024,483,000 | | | | 19,170,281 |
Republic of Iceland, 8.500%, 6/12/2009 | | ISK | | | 1,969,530,000 | | | | 9,501,781 |
Republic of Iceland, 13.750%, 12/10/2010 | | ISK | | | 2,483,463,000 | | | | 12,806,189 |
| | | | | | | | | |
| | | | | | | | | 499,548,464 |
| | | | | | | | | |
| Supermarkets – 1.0% | | | | | | | | | |
American Stores Co., 7.900%, 5/01/2017 | | | | | 3,000,000 | | | �� | 2,722,500 |
American Stores Co., Series B, MTN, 7.100%, 3/20/2028 | | | | | 13,145,000 | | | | 10,187,375 |
New Albertson’s, Inc., 7.450%, 8/01/2029 | | | | | 100,590,000 | | | | 83,489,700 |
New Albertson’s, Inc., 7.750%, 6/15/2026 | | | | | 20,550,000 | | | | 17,210,625 |
New Albertson’s, Inc., 8.000%, 5/01/2031 | | | | | 9,715,000 | | | | 7,942,013 |
New Albertson’s, Inc., 8.700%, 5/01/2030 | | | | | 2,995,000 | | | | 2,560,725 |
New Albertson’s, Inc., Series C, MTN, 6.625%, 6/01/2028 | | | | | 17,575,000 | | | | 12,917,625 |
| | | | | | | | | |
| | | | | | | | | 137,030,563 |
| | | | | | | | | |
| Supranational – 4.0% | | | | | | | | | |
Eurofima, EMTN, 11.000%, 2/05/2010 | | ISK | | | 290,000,000 | | | | 1,449,632 |
European Investment Bank, Zero Coupon Bond, 3/10/2021 | | AUD | | | 149,830,000 | | | | 53,670,213 |
European Investment Bank, 11.250%, 2/14/2013 | | BRL | | | 11,505,000 | | | | 5,148,547 |
European Investment Bank, EMTN, Zero Coupon Bond, 4/24/2013, 144A | | IDR | | | 615,006,960,000 | | | | 26,431,195 |
European Investment Bank, EMTN, 4.600%, 1/30/2037, 144A | | CAD | | | 200,000,000 | | | | 145,658,312 |
European Investment Bank, EMTN, 7.000%, 1/18/2012 | | NZD | | | 16,500,000 | | | | 9,935,904 |
Inter-American Development Bank, EMTN, Zero Coupon Bond, 5/11/2009 | | BRL | | | 297,000,000 | | | | 126,110,572 |
Inter-American Development Bank, EMTN, Zero Coupon Bond, 5/20/2013 | | IDR | | | 345,270,000,000 | | | | 17,357,624 |
Inter-American Development Bank, EMTN, 6.000%, 12/15/2017 | | NZD | | | 185,840,000 | | | | 104,824,546 |
International Bank for Reconstruction & Development, 1.430%, 3/05/2014 | | SGD | | | 40,000,000 | | | | 25,693,152 |
International Bank for Reconstruction & Development, 9.500%, 5/27/2010 | | ISK | | | 2,126,200,000 | | | | 10,443,687 |
Nordic Investment Bank, EMTN, 11.250%, 4/16/2009 | | ISK | | | 89,400,000 | | | | 436,276 |
| | | | | | | | | |
| | | | | | | | | 527,159,660 |
| | | | | | | | | |
31
| | | | | | | | |
| | | | | Principal Amount (‡) | | Value (†) |
| | | | | | | | |
| | | |
| BONDS AND NOTES – continued | | | | | | | | |
| | | |
| Technology – 2.5% | | | | | | | | |
Affiliated Computer Services, Inc., 5.200%, 6/01/2015 | | | | $ | 1,579,000 | | $ | 1,298,727 |
Agilent Technologies, Inc., 6.500%, 11/01/2017 | | | | | 65,276,000 | | | 53,488,786 |
Alcatel-Lucent, EMTN, 6.375%, 4/07/2014 | | EUR | | | 1,000,000 | | | 763,945 |
Amkor Technology, Inc., 7.125%, 3/15/2011 | | | | | 8,960,000 | | | 8,299,200 |
Amkor Technology, Inc., 7.750%, 5/15/2013 | | | | | 11,870,000 | | | 9,555,350 |
Arrow Electronics, Inc., 6.875%, 7/01/2013 | | | | | 14,165,000 | | | 13,488,926 |
Arrow Electronics, Inc., 6.875%, 6/01/2018 | | | | | 2,630,000 | | | 2,332,258 |
Avnet, Inc., 5.875%, 3/15/2014 | | | | | 36,145,000 | | | 31,087,989 |
Avnet, Inc., 6.000%, 9/01/2015 | | | | | 50,915,000 | | | 41,895,459 |
Avnet, Inc., 6.625%, 9/15/2016 | | | | | 15,245,000 | | | 12,697,789 |
Corning, Inc., 5.900%, 3/15/2014 | | | | | 9,330,000 | | | 8,728,924 |
Corning, Inc., 6.200%, 3/15/2016 | | | | | 5,155,000 | | | 4,610,838 |
Corning, Inc., 6.850%, 3/01/2029 | | | | | 10,821,000 | | | 8,168,383 |
Corning, Inc., 7.250%, 8/15/2036 | | | | | 5,645,000 | | | 4,252,870 |
Equifax, Inc., 7.000%, 7/01/2037 | | | | | 19,270,000 | | | 13,687,019 |
Freescale Semiconductor, Inc., 10.125%, 12/15/2016 | | | | | 30,004,000 | | | 5,400,720 |
Lucent Technologies, Inc., 6.450%, 3/15/2029 | | | | | 67,787,000 | | | 25,759,060 |
Lucent Technologies, Inc., 6.500%, 1/15/2028 | | | | | 2,216,000 | | | 842,080 |
Motorola, Inc., 5.220%, 10/01/2097 | | | | | 13,780,000 | | | 5,546,037 |
Motorola, Inc., 6.500%, 9/01/2025 | | | | | 12,730,000 | | | 8,083,588 |
Motorola, Inc., 6.500%, 11/15/2028 | | | | | 24,175,000 | | | 15,230,250 |
Motorola, Inc., 6.625%, 11/15/2037 | | | | | 26,630,000 | | | 16,843,475 |
Nortel Networks Capital Corp., 7.875%, 6/15/2026(b) | | | | | 12,035,000 | | | 1,925,600 |
Nortel Networks Corp., 1.750%, 4/15/2012(b) | | | | | 1,045,000 | | | 148,913 |
Nortel Networks Ltd., 6.875%, 9/01/2023(b) | | | | | 18,622,000 | | | 1,210,430 |
Nortel Networks Ltd., 10.125%, 7/15/2013(b) | | | | | 22,825,000 | | | 4,279,687 |
Samsung Electronics Co. Ltd., 7.700%, 10/01/2027, 144A | | | | | 4,807,000 | | | 4,602,121 |
Xerox Capital Trust I, 8.000%, 2/01/2027 | | | | | 25,890,000 | | | 18,233,550 |
Xerox Corp., 5.500%, 5/15/2012 | | | | | 1,170,000 | | | 1,013,302 |
Xerox Corp., 6.350%, 5/15/2018 | | | | | 1,230,000 | | | 916,350 |
Xerox Corp., MTN, 7.200%, 4/01/2016 | | | | | 615,000 | | | 473,550 |
| | | | | | | | |
| | | | | | | | 324,865,176 |
| | | | | | | | |
| Textile – 0.0% | | | | | | | | |
Kellwood Co., 7.625%, 10/15/2017(c) | | | | | 11,070,000 | | | 498,150 |
| | | | | | | | |
| Tobacco – 2.0% | | | | | | | | |
Altria Group, Inc., 8.500%, 11/10/2013 | | | | | 81,665,000 | | | 88,569,776 |
Altria Group, Inc., 9.250%, 8/06/2019 | | | | | 88,840,000 | | | 94,987,195 |
Reynolds American, Inc., 6.750%, 6/15/2017 | | | | | 71,085,000 | | | 60,684,767 |
Reynolds American, Inc., 7.250%, 6/15/2037 | | | | | 17,990,000 | | | 13,135,758 |
| | | | | | | | |
| | | | | | | | 257,377,496 |
| | | | | | | | |
| Transportation Services – 0.7% | | | | | | | | |
APL Ltd., 8.000%, 1/15/2024(c) | | | | | 20,469,000 | | | 14,380,905 |
Atlas Air, Inc., Series 1999-1, Class A-1, 7.200%, 7/02/2020 | | | | | 12,925,532 | | | 9,306,383 |
Atlas Air, Inc., Series 1999-1A, 6.880%, 1/02/2011 | | | | | 1,105,039 | | | 850,880 |
Atlas Air, Inc., Series 1999-1B, 7.630%, 7/02/2016(e) | | | | | 18,164,300 | | | 12,170,081 |
32
PORTFOLIO OF INVESTMENTS – as of March 31, 2009 (Unaudited)
Loomis Sayles Bond Fund – continued
| | | | | | | | |
| | | | | Principal Amount (‡) | | Value (†) |
| | | | | | | | |
| | | |
| BONDS AND NOTES – continued | | | | | | | | |
| | | |
| Transportation Services – continued | | | | | | | | |
Atlas Air, Inc., Series 1999-1C, 8.770%, 7/02/2012(e) | | | | $ | 15,689,997 | | $ | 7,374,299 |
Atlas Air, Inc., Series 2000-1, Class B, 9.057%, 7/02/2017(e) | | | | | 9,260,147 | | | 9,074,944 |
Atlas Air, Inc., Series 2000-1, Class C,
9.702%, 7/02/2011(e) | | | | | 201,720 | | | 100,860 |
Atlas Air, Inc., Series B, 7.680%, 1/02/2014(e) | | | | | 39,925,752 | | | 29,944,314 |
Atlas Air, Inc., Series C, 8.010%, 1/02/2010(e) | | | | | 6,552,024 | | | 2,817,370 |
| | | | | | | | |
| | | | | | | | 86,020,036 |
| | | | | | | | |
| Treasuries – 9.3% | | | | | | | | |
Canadian Government, 2.750%, 12/01/2010 | | CAD | | | 245,000 | | | 200,096 |
Canadian Government, 3.750%, 9/01/2011 | | CAD | | | 1,535,000 | | | 1,291,687 |
Canadian Government, 3.750%, 6/01/2012 | | CAD | | | 108,410,000 | | | 92,349,705 |
Canadian Government, 3.750%, 6/01/2019 | | CAD | | | 246,645,000 | | | 212,588,506 |
Canadian Government, 4.250%, 9/01/2009 | | CAD | | | 74,325,000 | | | 59,864,402 |
Canadian Government, 4.250%, 6/01/2018 | | CAD | | | 297,760,000 | | | 266,141,893 |
Canadian Government, 5.250%, 6/01/2012 | | CAD | | | 286,105,000 | | | 254,256,303 |
Canadian Government, 5.500%, 6/01/2009 | | CAD | | | 1,000,000 | | | 799,810 |
New Zealand Government, 6.000%, 12/15/2017 | | NZD | | | 33,000,000 | | | 19,781,422 |
Norwegian Government, 4.250%, 5/19/2017 | | NOK | | | 668,075,000 | | | 103,915,874 |
Norwegian Government, 5.000%, 5/15/2015 | | NOK | | | 319,620,000 | | | 52,067,022 |
Norwegian Government, 6.000%, 5/16/2011 | | NOK | | | 530,990,000 | | | 85,275,957 |
Norwegian Government, 6.500%, 5/15/2013 | | NOK | | | 379,945,000 | | | 64,657,025 |
| | | | | | | | |
| | | | | | | | 1,213,189,702 |
| | | | | | | | |
| Wireless – 1.8% | | | | | | | | |
ALLTEL Corp., 6.800%, 5/01/2029 | | | | | 13,027,000 | | | 11,998,935 |
ALLTEL Corp., 7.875%, 7/01/2032 | | | | | 79,594,000 | | | 80,902,526 |
Nextel Communications, Inc., Series D,
7.375%, 8/01/2015 | | | | | 38,349,000 | | | 20,324,970 |
Nextel Communications, Inc., Series E,
6.875%, 10/31/2013 | | | | | 19,698,000 | | | 11,227,860 |
Nextel Communications, Inc., Series F,
5.950%, 3/15/2014 | | | | | 53,899,000 | | | 29,913,945 |
Rogers Wireless, Inc., 6.375%, 3/01/2014 | | | | | 1,895,000 | | | 1,918,458 |
Rogers Wireless, Inc., 7.625%, 12/15/2011 | | CAD | | | 6,990,000 | | | 5,814,651 |
Sprint Capital Corp., 6.875%, 11/15/2028 | | | | | 29,634,000 | | | 18,076,740 |
Sprint Capital Corp., 6.900%, 5/01/2019 | | | | | 23,845,000 | | | 16,810,725 |
Sprint Capital Corp., 8.750%, 3/15/2032 | | | | | 8,390,000 | | | 5,621,300 |
Sprint Nextel Corp., 6.000%, 12/01/2016 | | | | | 15,252,000 | | | 10,905,180 |
True Move Co. Ltd., 10.750%, 12/16/2013, 144A | | | | | 36,610,000 | | | 17,235,988 |
Vodafone Group PLC, 6.150%, 2/27/2037 | | | | | 2,120,000 | | | 1,998,901 |
| | | | | | | | |
| | | | | | | | 232,750,179 |
| | | | | | | | |
| Wirelines – 6.4% | | | | | | | | |
AT&T Corp., 6.500%, 3/15/2029 | | | | | 27,859,000 | | | 24,426,325 |
AT&T, Inc., 6.150%, 9/15/2034 | | | | | 14,755,000 | | | 12,927,210 |
AT&T, Inc., 6.500%, 9/01/2037 | | | | | 150,305,000 | | | 135,638,539 |
AT&T, Inc., 6.550%, 2/15/2039 | | | | | 78,000 | | | 70,745 |
AT&T, Inc., 6.700%, 11/15/2013 | | | | | 66,840,000 | | | 71,388,729 |
Bell Canada, MTN, 5.000%, 2/15/2017 | | CAD | | | 7,868,000 | | | 5,720,026 |
Bell Canada, MTN, 6.550%, 5/01/2029, 144A | | CAD | | | 5,790,000 | | | 3,837,620 |
Bell Canada, MTN, 7.300%, 2/23/2032 | | CAD | | | 12,705,000 | | | 9,110,557 |
Bell Canada, Series M-17, 6.100%, 3/16/2035 | | CAD | | | 45,835,000 | | | 28,725,763 |
33
| | | | | | | | |
| | | | | Principal Amount (‡) | | Value (†) |
| | | | | | | | |
| | | |
| BONDS AND NOTES – continued | | | | | | | | |
| | | |
| Wirelines – continued | | | | | | | | |
BellSouth Corp., 6.550%, 6/15/2034 | | | | $ | 1,525,000 | | $ | 1,415,264 |
BellSouth Telecommunications, Inc., 7.000%, 12/01/2095 | | | | | 3,940,000 | | | 3,109,152 |
Embarq Corp., 7.995%, 6/01/2036 | | | | | 8,735,000 | | | 6,551,250 |
Frontier Communications Corp., 9.000%, 8/15/2031 | | | | | 730,000 | | | 500,963 |
GTE Corp., 6.940%, 4/15/2028 | | | | | 17,975,000 | | | 16,095,570 |
Hawaiian Telcom Communications, Inc., Series B, 12.500%, 5/01/2015(b) | | | | | 640,000 | | | 3,200 |
Koninklijke (Royal) KPN NV, 8.375%, 10/01/2030 | | | | | 10,505,000 | | | 10,884,115 |
Koninklijke (Royal) KPN NV, EMTN,
5.750%, 3/18/2016 | | GBP | | | 1,600,000 | | | 2,307,170 |
Koninklijke (Royal) KPN NV, GMTN,
4.000%, 6/22/2015 | | EUR | | | 2,750,000 | | | 3,401,877 |
Level 3 Financing, Inc., 8.750%, 2/15/2017 | | | | | 43,605,000 | | | 27,907,200 |
Level 3 Financing, Inc., 9.250%, 11/01/2014 | | | | | 17,580,000 | | | 12,130,200 |
New England Telephone & Telegraph,
7.875%, 11/15/2029 | | | | | 2,905,000 | | | 2,710,746 |
Qwest Capital Funding, Inc., 6.500%, 11/15/2018 | | | | | 30,365,000 | | | 20,648,200 |
Qwest Capital Funding, Inc., 6.875%, 7/15/2028 | | | | | 64,147,000 | | | 40,412,610 |
Qwest Capital Funding, Inc., 7.625%, 8/03/2021 | | | | | 15,025,000 | | | 10,667,750 |
Qwest Capital Funding, Inc., 7.750%, 2/15/2031 | | | | | 40,420,000 | | | 26,677,200 |
Qwest Corp., 6.875%, 9/15/2033 | | | | | 40,555,000 | | | 26,563,525 |
Qwest Corp., 7.200%, 11/10/2026 | | | | | 1,505,000 | | | 1,023,400 |
Qwest Corp., 7.250%, 9/15/2025 | | | | | 9,920,000 | | | 6,547,200 |
Qwest Corp., 7.500%, 6/15/2023 | | | | | 3,275,000 | | | 2,472,625 |
Telecom Italia Capital SA, 5.250%, 11/15/2013 | | | | | 1,430,000 | | | 1,284,191 |
Telecom Italia Capital SA, 5.250%, 10/01/2015 | | | | | 1,575,000 | | | 1,327,968 |
Telecom Italia Capital SA, 6.000%, 9/30/2034 | | | | | 39,844,000 | | | 27,183,728 |
Telecom Italia Capital SA, 6.375%, 11/15/2033 | | | | | 26,495,000 | | | 19,304,416 |
Telefonica Emisiones SAU, 7.045%, 6/20/2036 | | | | | 153,917,000 | | | 158,154,027 |
Telus Corp., 4.950%, 3/15/2017 | | CAD | | | 45,415,000 | | | 33,451,418 |
Verizon Communications, Inc., 5.850%, 9/15/2035 | | | | | 70,136,000 | | | 59,588,668 |
Verizon Communications, Inc., 6.400%, 2/15/2038 | | | | | 15,000 | | | 13,598 |
Verizon Maryland, Inc., 5.125%, 6/15/2033 | | | | | 10,305,000 | | | 7,138,665 |
Verizon New York, Inc., Series B, 7.375%, 4/01/2032 | | | | | 18,170,000 | | | 16,858,780 |
| | | | | | | | |
| | | | | | | | 838,180,190 |
| | | | | | | | |
| | | |
| TOTAL NON-CONVERTIBLE BONDS | | | | | | | | |
(Identified Cost $14,887,174,771) | | | | | | | | 11,480,202,639 |
| | | | | | | | |
| | | |
| CONVERTIBLE BONDS – 2.9% | | | | | | | | |
| | | |
| Healthcare – 0.2% | | | | | | | | |
Affymetrix, Inc., 3.500%, 1/15/2038 | | | | | 18,449,000 | | | 9,685,725 |
Epix Pharmaceuticals, Inc., 3.000%, 6/15/2024(c)(d) | | | | | 7,122,000 | | | 1,424,400 |
Hologic, Inc., (Step to Zero Coupon on 12/15/2013), 2.000%, 12/15/2037(f) | | | | | 440,000 | | | 300,300 |
Life Technologies Corp., 1.500%, 2/15/2024 | | | | | 14,480,000 | | | 12,905,300 |
| | | | | | | | |
| | | | | | | | 24,315,725 |
| | | | | | | | |
34
PORTFOLIO OF INVESTMENTS – as of March 31, 2009 (Unaudited)
Loomis Sayles Bond Fund – continued
| | | | | | | | |
| | | | | Principal Amount (‡) | | Value (†) |
| | | | | | | | |
| | | |
| BONDS AND NOTES – continued | | | | | | | | |
| | | |
| Industrial Other – 0.1% | | | | | | | | |
Incyte Corp., 3.500%, 2/15/2011 | | | | $ | 24,646,000 | | $ | 12,199,770 |
| | | | | | | | |
| Lodging – 0.2% | | | | | | | | |
Host Hotels & Resorts, Inc., 2.625%, 4/15/2027, 144A | | | | | 29,500,000 | | | 20,502,500 |
| | | | | | | | |
| Media Non-Cable – 0.0% | | | | | | | | |
Liberty Media LLC, 3.500%, 1/15/2031 | | | | | 10,222,149 | | | 3,654,418 |
Sinclair Broadcast Group, Inc., 3.000%, 5/15/2027 | | | | | 365,000 | | | 208,963 |
Sinclair Broadcast Group, Inc., (Step to 2.000% on 1/15/2011), 4.875%, 7/15/2018(f) | | | | | 4,048,000 | | | 1,700,160 |
| | | | | | | | |
| | | | | | | | 5,563,541 |
| | | | | | | | |
| Non-Captive Diversified – 0.1% | | | | | | | | |
iStar Financial, Inc., 1.935%, 10/01/2012(g) | | | | | 60,585,000 | | | 18,175,500 |
| | | | | | | | |
| Oil Field Services – 0.1% | | | | | | | | |
Transocean Ltd., 1.500%, 12/15/2037 | | | | | 10,990,000 | | | 8,998,062 |
Transocean Ltd., 1.500%, 12/15/2037 | | | | | 1,315,000 | | | 1,127,613 |
| | | | | | | | |
| | | | | | | | 10,125,675 |
| | | | | | | | |
| Pharmaceuticals – 0.9% | | | | | | | | |
Human Genome Sciences, Inc., 2.250%, 10/15/2011 | | | | | 940,000 | | | 345,450 |
Human Genome Sciences, Inc., 2.250%, 8/15/2012 | | | | | 51,585,000 | | | 17,152,013 |
Nektar Therapeutics, 3.250%, 9/28/2012 | | | | | 26,120,000 | | | 16,912,700 |
Valeant Pharmaceuticals International, 3.000%, 8/16/2010 | | | | | 34,125,000 | | | 32,674,687 |
Valeant Pharmaceuticals International, 4.000%, 11/15/2013 | | | | | 34,079,000 | | | 30,159,915 |
Vertex Pharmaceuticals, Inc., 4.750%, 2/15/2013 | | | | | 11,201,000 | | | 14,715,314 |
| | | | | | | | |
| | | | | | | | 111,960,079 |
| | | | | | | | |
| Technology – 0.2% | | | | | | | | |
Kulicke & Soffa Industries, Inc., 0.875%, 6/01/2012 | | | | | 10,025,000 | | | 4,749,344 |
Kulicke & Soffa Industries, Inc., 1.000%, 6/30/2010 | | | | | 5,915,000 | | | 4,665,456 |
Maxtor Corp., 5.750%, 3/01/2012(c) | | | | | 8,415,000 | | | 6,311,250 |
Nortel Networks Corp., 2.125%, 4/15/2014(b) | | | | | 49,636,000 | | | 7,073,130 |
Richardson Electronics Ltd., 7.750%, 12/15/2011 | | | | | 395,000 | | | 316,000 |
| | | | | | | | |
| | | | | | | | 23,115,180 |
| | | | | | | | |
| Textile – 0.0% | | | | | | | | |
Dixie Yarns, Inc., 7.000%, 5/15/2012 | | | | | 144,000 | | | 130,140 |
| | | | | | | | |
| Wireless – 0.1% | | | | | | | | |
Nextel Communications, Inc., 5.250%, 1/15/2010 | | | | | 3,595,000 | | | 3,464,681 |
NII Holdings, Inc., 3.125%, 6/15/2012 | | | | | 21,974,000 | | | 15,271,930 |
| | | | | | | | |
| | | | | | | | 18,736,611 |
| | | | | | | | |
| Wirelines – 1.0% | | | | | | | | |
Level 3 Communications, Inc., 2.875%, 7/15/2010 | | | | | 41,565,000 | | | 30,394,406 |
Level 3 Communications, Inc., 3.500%, 6/15/2012 | | | | | 46,770,000 | | | 19,409,550 |
Level 3 Communications, Inc., 5.250%, 12/15/2011 | | | | | 19,145,000 | | | 9,763,950 |
35
| | | | | | | | |
| | | | | Principal Amount (‡) | | Value (†) |
| | | | | | | | |
| | | |
| BONDS AND NOTES – continued | | | | | | | | |
| | | |
| Wirelines – continued | | | | | | | | |
Level 3 Communications, Inc., 6.000%, 9/15/2009 | | | | $ | 39,230,000 | | $ | 37,856,950 |
Level 3 Communications, Inc., 6.000%, 3/15/2010 | | | | | 43,124,000 | | | 36,655,400 |
Level 3 Communications, Inc., 10.000%, 5/01/2011 | | | | | 3,655,000 | | | 2,371,181 |
Qwest Communications International, Inc., 3.500%, 11/15/2025 | | | | | 700,000 | | | 645,750 |
| | | | | | | | |
| | | | | | | | 137,097,187 |
| | | | | | | | |
| | | |
| TOTAL CONVERTIBLE BONDS | | | | | | | | |
(Identified Cost $573,623,316) | | | | | | | | 381,921,908 |
| | | | | | | | |
| | | |
| MUNICIPALS – 1.1% | | | | | | | | |
| | | |
| Alabama – 0.0% | | | | | | | | |
Alabama Public School & College Authority (Capital Improvement), 4.500%, 12/01/2026 | | | | | 4,640,000 | | | 4,475,234 |
| | | | | | | | |
| California – 0.5% | | | | | | | | |
San Diego Unified School District (Election 1998), 4.500%, 7/01/2029, Series F-1 (FSA insured) | | | | | 4,870,000 | | | 4,399,607 |
San Jose California Redevelopment Agency Tax Allocation (Merged Area Redevelopment), 3.750%, 8/01/2028, Series C (MBIA insured) | | | | | 5,425,000 | | | 3,713,901 |
San Jose California Redevelopment Agency Tax Allocation (Merged Area Redevelopment), 3.750%, 8/01/2028, Series C, (Registered) (MBIA insured) | | | | | 2,165,000 | | | 1,544,468 |
State of California, 4.500%, 8/01/2027 (AMBAC insured) | | | | | 7,340,000 | | | 6,229,385 |
State of California, 4.500%, 10/01/2029 | | | | | 20,455,000 | | | 16,955,149 |
State of California, 4.500%, 8/01/2030 (AMBAC insured) | | | | | 5,945,000 | | | 4,884,769 |
State of California, 4.500%, 8/01/2030 | | | | | 5,140,000 | | | 4,223,332 |
State of California (Various Purpose), 3.250%, 12/01/2027 (MBIA insured) | | | | | 3,805,000 | | | 2,548,969 |
State of California (Various Purpose), 4.500%, 12/01/2033 (AMBAC insured) | | | | | 17,945,000 | | | 14,269,505 |
University of California Regents Medical Center, 4.750%, 5/15/2031, Series A (MBIA insured) | | | | | 1,260,000 | | | 1,121,728 |
| | | | | | | | |
| | | | | | | | 59,890,813 |
| | | | | | | | |
| District Of Columbia – 0.0% | | | | | | | | |
District of Columbia, 4.750%, 6/01/2036, Series A (FGIC insured) | | | | | 4,640,000 | | | 4,142,082 |
| | | | | | | | |
| Florida – 0.1% | | | | | | | | |
Florida State Turnpike Authority (Department of Transportation), 3.500%, 7/01/2027, Series A (MBIA insured) | | | | | 4,640,000 | | | 3,571,454 |
Jacksonville Electric Authority, Florida Water & Sewer Systems Revenue, 4.750%, 10/01/2041, Series B (MBIA insured) | | | | | 7,355,000 | | | 6,390,760 |
| | | | | | | | |
| | | | | | | | 9,962,214 |
| | | | | | | | |
36
PORTFOLIO OF INVESTMENTS – as of March 31, 2009 (Unaudited)
Loomis Sayles Bond Fund – continued
| | | | | | | | |
| | | | | Principal Amount (‡) | | Value (†) |
| | | | | | | | |
| | | |
| BONDS AND NOTES – continued | | | | | | | | |
| | | |
| Illinois – 0.1% | | | | | | | | |
Chicago Board of Education, 4.750%, 12/01/2031, Series B (FSA insured) | | | | $ | 8,020,000 | | $ | 7,264,596 |
Chicago O’Hare International Airport, 4.500%, 1/01/2038, Series A (FSA insured) | | | | | 2,440,000 | | | 2,130,559 |
| | | | | | | | |
| | | | | | | | 9,395,155 |
| | | | | | | | |
| Louisiana – 0.0% | | | | | | | | |
State of Louisiana, 3.250%, 5/01/2026, Series C (FSA insured) | | | | | 4,640,000 | | | 3,307,438 |
| | | | | | | | |
| Massachusetts – 0.0% | | | | | | | | |
Massachusetts School Building Authority, 4.750%, 8/15/2032, Series A (AMBAC insured) | | | | | 4,645,000 | | | 4,346,001 |
| | | | | | | | |
| Michigan – 0.1% | | | | | | | | |
Grosse Pointe Public School System, 3.000%, 5/01/2027 (FGIC insured) | | | | | 2,800,000 | | | 2,064,608 |
Michigan Tobacco Settlement Finance Authority, 7.309%, 6/01/2034(c) | | | | | 21,670,000 | | | 12,649,862 |
| | | | | | | | |
| | | | | | | | 14,714,470 |
| | | | | | | | |
| Nebraska – 0.1% | | | | | | | | |
Omaha Public Power District, 4.500%, 2/01/2034, Series AA (FGIC insured) | | | | | 11,595,000 | | | 10,398,163 |
| | | | | | | | |
| Ohio – 0.0% | | | | | | | | |
Buckeye Tobacco Settlement Financing Authority, Series A-2, 5.875%, 6/01/2047(c) | | | | | 10,390,000 | | | 5,695,175 |
| | | | | | | | |
| Texas – 0.1% | | | | | | | | |
Harris County, TX, 4.500%, 10/01/2031, Series B | | | | | 13,125,000 | | | 12,169,631 |
| | | | | | | | |
| Wisconsin – 0.1% | | | | | | | | |
Green Bay Wisconsin Water System Revenue, 3.500%, 11/01/2026 (FSA insured) | | | | | 3,170,000 | | | 2,609,322 |
Green Bay Wisconsin Water System Revenue, 3.500%, 11/01/2029 (FSA insured) | | | | | 3,415,000 | | | 2,639,863 |
Wisconsin Housing & Economic Development Authority, 4.900%, 11/01/2035, Series E | | | | | 1,185,000 | | | 1,069,475 |
| | | | | | | | |
| | | | | | | | 6,318,660 |
| | | | | | | | |
| | | |
| TOTAL MUNICIPALS | | | | | | | | |
(Identified Cost $165,319,320) | | | | | | | | 144,815,036 |
| | | | | | | | |
| | | |
| TOTAL BONDS AND NOTES | | | | | | | | |
(Identified Cost $15,626,117,407) | | | | | | | | 12,006,939,583 |
| | | | | | | | |
| | | |
| BANK LOANS – 0.9% | | | | | | | | |
| | | |
| Automotive – 0.2% | | | | | | | | |
Chrysler LLC, First Lien Term Loan, 5.260%, 8/03/2013(h) | | | | | 156,337,665 | | | 24,102,578 |
| | | | | | | | |
| Consumer Products – 0.0% | | | | | | | | |
Mega Brands, Inc., Term Loan B, 8.750%, 7/26/2012(h) | | | | | 8,429,486 | | | 2,290,038 |
| | | | | | | | |
37
| | | | | | | | |
| | | | | Principal Amount (‡) | | Value (†) |
| | | | | | | | |
| | | |
| BANK LOANS – continued | | | | | | | | |
| | | |
| Food & Beverage – 0.1% | | | | | | | | |
Dole Food Co., Inc., Credit Link Deposit, 2.790%, 4/12/2013(h) | | | | $ | 819,260 | | $ | 753,212 |
Dole Food Co., Inc., Tranche B Term Loan, 7.960%, 4/12/2013(h) | | | | | 1,598,896 | | | 1,469,993 |
Dole Food Co., Inc., Tranche C Term Loan, 7.969%, 4/12/2013(h) | | | | | 5,531,290 | | | 5,085,357 |
| | | | | | | | |
| | | | | | | | 7,308,562 |
| | | | | | | | |
| Media Non-Cable – 0.1% | | | | | | | | |
Idearc, Inc., Term Loan B, 6.250%, 11/17/2014(b)(h) | | | | | 43,686,570 | | | 17,024,220 |
Tribune Co., Term Loan X, 5.000%, 6/04/2009(b)(h) | | | | | 4,666,005 | | | 1,217,547 |
| | | | | | | | |
| | | | | | | | 18,241,767 |
| | | | | | | | |
| Oil Field Services – 0.0% | | | | | | | | |
Dresser, Inc., Second Lien Term Loan, 6.988%, 5/04/2015(h) | | | | | 3,515,000 | | | 1,370,850 |
Dresser, Inc., Term Loan, 3.456%, 5/04/2014(h) | | | | | 1,734,381 | | | 1,274,770 |
| | | | | | | | |
| | | | | | | | 2,645,620 |
| | | | | | | | |
| Paper – 0.1% | | | | | | | | |
Georgia Pacific Corp., New Term Loan B, 3.258%, 12/20/2012(h) | | | | | 6,736,016 | | | 5,957,736 |
Georgia Pacific Corp., Term Loan B1, 2.982%, 12/20/2012(h) | | | | | 2,592,948 | | | 2,293,359 |
| | | | | | | | |
| | | | | | | | 8,251,095 |
| | | | | | | | |
| Retailers – 0.0% | | | | | | | | |
Harbor Freight Tools USA, Inc., Tranche C Term Loan, 9.581%, 2/12/2013(h) | | | | | 2,369,559 | | | 1,676,463 |
| | | | | | | | |
| Supranational – 0.1% | | | | | | | | |
Level 3 Financing, Inc., New Term Loan, 3.309%, 3/13/2014(h) | | | | | 7,875,000 | | | 5,911,211 |
| | | | | | | | |
| Technology – 0.2% | | | | | | | | |
Nuance Communications, Inc., Incremental Term Loan, 2.520%, 3/29/2013(h) | | | | | 16,781,465 | | | 14,641,828 |
Nuance Communications, Inc., Term Loan,
2.520%, 3/31/2013(h) | | | | | 777,995 | | | 678,801 |
Sungard Data Systems, Inc., Term Loan B,
2.697%, 2/28/2014(h) | | | | | 18,248,329 | | | 15,373,122 |
| | | | | | | | |
| | | | | | | | 30,693,751 |
| | | | | | | | |
| Wirelines – 0.1% | | | | | | | | |
Hawaiian Telcom Communications, Inc., Tranche C Term Loan, 4.750%, 6/01/2014(h)(i) | | | | | 23,877,293 | | | 10,673,150 |
| | | | | | | | |
| | | |
| TOTAL BANK LOANS | | | | | | | | |
(Identified Cost $233,419,580) | | | | | | | | 111,794,235 |
| | | | | | | | |
38
PORTFOLIO OF INVESTMENTS – as of March 31, 2009 (Unaudited)
Loomis Sayles Bond Fund – continued
| | | | | | | |
| | | | | Shares | | Value (†) |
| | | | | | | |
| | | |
| PREFERRED STOCKS – 0.9% | | | | | | | |
| | | |
| CONVERTIBLE PREFERRED STOCKS – 0.6% | | | | | | | |
| | | |
| Automotive – 0.1% | | | | | | | |
Ford Motor Co. Capital Trust II, 6.500% | | | | 1,957,111 | | $ | 15,715,602 |
General Motors Corp., 6.250% | | | | 104,656 | | | 265,826 |
| | | | | | | |
| | | | | | | 15,981,428 |
| | | | | | | |
| Capital Markets – 0.0% | | | | | | | |
Newell Financial Trust I, 5.250% | | | | 217,377 | | | 3,912,786 |
| | | | | | | |
| Commercial Banks – 0.0% | | | | | | | |
Wells Fargo & Co., Class A, Series L, 7.500% | | | | 8,193 | | | 3,924,365 |
| | | | | | | |
| Construction Materials – 0.0% | | | | | | | |
Williams Cos., Inc., 5.500% | | | | 25,000 | | | 1,343,750 |
| | | | | | | |
| Diversified Consumer Services – 0.0% | | | | | | | |
Six Flags, Inc., 7.250% | | | | 124,486 | | | 84,650 |
| | | | | | | |
| Diversified Financial Services – 0.1% | | | | | | | |
CIT Group, Inc., 8.750% | | | | 12,500 | | | 227,500 |
Sovereign Capital Trust, 4.375% | | | | 222,632 | | | 4,396,982 |
| | | | | | | |
| | | | | | | 4,624,482 |
| | | | | | | |
| Electric Utilities – 0.2% | | | | | | | |
AES Trust III, 6.750% | | | | 346,577 | | | 11,783,618 |
CMS Energy Trust I, 7.750%(c)(d) | | | | 208,375 | | | 6,251,250 |
| | | | | | | |
| | | | | | | 18,034,868 |
| | | | | | | |
| Machinery – 0.0% | | | | | | | |
United Rentals Trust, 6.500% | | | | 206,396 | | | 2,270,356 |
| | | | | | | |
| Oil, Gas & Consumable Fuels – 0.1% | | | | | | | |
Chesapeake Energy Corp., 4.500% | | | | 87,351 | | | 5,372,087 |
El Paso Energy Capital Trust I, 4.750% | | | | 189,879 | | | 4,746,975 |
| | | | | | | |
| | | | | | | 10,119,062 |
| | | | | | | |
| REITs – 0.0% | | | | | | | |
FelCor Lodging Trust, Inc., Series A, 1.950% | | | | 53,600 | | | 201,000 |
| | | | | | | |
| Semiconductors & Semiconductor Equipment – 0.1% | | | | | | | |
Lucent Technologies Capital Trust, 7.750% | | | | 44,266 | | | 12,839,287 |
| | | | | | | |
| | | |
| TOTAL CONVERTIBLE PREFERRED STOCKS | | | | | | | |
(Identified Cost $188,704,938) | | | | | | | 73,336,034 |
| | | | | | | |
| | | |
| NON-CONVERTIBLE PREFERRED STOCKS – 0.3% | | | | | | | |
| | | |
| Banking – 0.1% | | | | | | | |
Bank of America Corp., 7.250% | | | | 21,799 | | | 8,883,092 |
| | | | | | | |
| Capital Markets – 0.0% | | | | | | | |
Lehman Brothers Holdings Capital Trust I, 6.000%(b) | | | | 55,575 | | | 1,111 |
Lehman Brothers Holdings, Inc., 5.670%(b) | | | | 103,114 | | | 619 |
Lehman Brothers Holdings, Inc., 5.940%(b) | | | | 109,313 | | | 109 |
Lehman Brothers Holdings, Inc., 6.500%(b) | | | | 479,083 | | | 1,198 |
Lehman Brothers Holdings, Inc., 7.250%(b) | | | | 40,860 | | | 30,236 |
Lehman Brothers Holdings, Inc., 7.950%(b) | | | | 513,734 | | | 2,826 |
| | | | | | | |
| | | | | | | 36,099 |
| | | | | | | |
39
| | | | | | | |
| | | | | Shares | | Value (†) |
| | | | | | | |
| | | |
| PREFERRED STOCKS – continued | | | | | | | |
| | | |
| Diversified Financial Services – 0.1% | | | | | | | |
Bank of America Corp., 6.375% | | | | 53,000 | | $ | 431,950 |
CIT Group, Inc., Series A, 6.350% | | | | 779,310 | | | 4,956,411 |
Preferred Blocker, Inc., 144A, 7.000% | | | | 52,843 | | | 10,520,714 |
| | | | | | | |
| | | | | | | 15,909,075 |
| | | | | | | |
| Electric Utilities – 0.0% | | | | | | | |
Connecticut Light & Power Co., 1.900% | | | | 2,925 | | | 77,056 |
Entergy Arkansas, Inc., 4.320% | | | | 100 | | | 6,387 |
Entergy Mississippi, Inc., 4.360% | | | | 5,000 | | | 307,812 |
Entergy New Orleans, Inc., 4.360% | | | | 665 | | | 44,181 |
Entergy New Orleans, Inc., 4.750% | | | | 200 | | | 13,844 |
MDU Resources Group, Inc., 5.100% | | | | 1,091 | | | 109,305 |
Public Service Company of Oklahoma, 4.000% | | | | 360 | | | 24,795 |
Southern California Edison Co., 4.780% | | | | 50,100 | | | 1,024,545 |
Xcel Energy, Inc., 3.600% | | | | 1,100 | | | 67,375 |
| | | | | | | |
| | | | | | | 1,675,300 |
| | | | | | | |
| Thrifts & Mortgage Finance – 0.1% | | | | | | | |
Countrywide Capital IV, 6.750% | | | | 534,725 | | | 5,111,971 |
Federal Home Loan Mortgage Corp., 5.000%(e)(j) | | | | 104,800 | | | 94,320 |
Federal Home Loan Mortgage Corp., 5.570%(e)(j) | | | | 2,451,457 | | | 931,554 |
Federal Home Loan Mortgage Corp., 5.660%(e)(j) | | | | 624,479 | | | 249,792 |
Federal Home Loan Mortgage Corp., 5.700%(e)(j) | | | | 171,050 | | | 141,971 |
Federal Home Loan Mortgage Corp., 5.790%(e)(j) | | | | 399,250 | | | 307,422 |
Federal Home Loan Mortgage Corp., 5.810%(e)(j) | | | | 115,450 | | | 90,051 |
Federal Home Loan Mortgage Corp., 5.900%(e)(j) | | | | 310,023 | | | 142,611 |
Federal Home Loan Mortgage Corp., 6.000%(e)(j) | | | | 134,800 | | | 119,972 |
Federal Home Loan Mortgage Corp., 6.420%(e)(j) | | | | 125,980 | | | 100,784 |
Federal Home Loan Mortgage Corp., 6.550%(e)(j) | | | | 541,540 | | | 222,031 |
Federal Home Loan Mortgage Corp., 8.375%(e)(j) | | | | 5,366,843 | | | 2,468,748 |
Federal National Mortgage Association, 4.750%(e)(j) | | | | 270,954 | | | 197,796 |
Federal National Mortgage Association, 5.125%(e)(j) | | | | 204,700 | | | 141,243 |
Federal National Mortgage Association, 5.375%(e)(j) | | | | 146,350 | | | 209,280 |
Federal National Mortgage Association, 5.810%(e)(j) | | | | 79,850 | | | 91,828 |
Federal National Mortgage Association, 6.750%(e)(j) | | | | 123,143 | | | 61,572 |
Federal National Mortgage Association, 8.250%(e)(j) | | | | 9,415,246 | | | 6,684,825 |
Federal National Mortgage Association, 8.250%(e)(j) | | | | 250,000 | | | 175,000 |
| | | | | | | |
| | | | | | | 17,542,771 |
| | | | | | | |
| | | |
| TOTAL NON-CONVERTIBLE PREFERRED STOCKS | | | | | | | |
(Identified Cost $503,102,066) | | | | | | | 44,046,337 |
| | | | | | | |
| | | |
| TOTAL PREFERRED STOCKS | | | | | | | |
(Identified Cost $691,807,004) | | | | | | | 117,382,371 |
| | | | | | | |
| | | |
| COMMON STOCKS – 0.5% | | | | | | | |
| | | |
| Biotechnology – 0.2% | | | | | | | |
Vertex Pharmaceuticals, Inc.(e) | | | | 894,548 | | | 25,700,364 |
| | | | | | | |
| Communications Equipment – 0.1% | | | | | | | |
Corning, Inc. | | | | 630,490 | | | 8,366,602 |
| | | | | | | |
| Containers & Packaging – 0.1% | | | | | | | |
Owens-Illinois, Inc.(e) | | | | 645,508 | | | 9,321,135 |
| | | | | | | |
40
PORTFOLIO OF INVESTMENTS – as of March 31, 2009 (Unaudited)
Loomis Sayles Bond Fund – continued
| | | | | | | | |
| | | | | Shares/Principal Amount (‡) | | Value (†) |
| | | | | | | | |
| | | |
| COMMON STOCKS – continued | | | | | | | | |
| | | |
| Oil, Gas & Consumable Fuels – 0.1% | | | | | | | | |
Chesapeake Energy Corp. | | | | | 1,026,979 | | $ | 17,520,262 |
| | | | | | | | |
| Thrifts & Mortgage Finance – 0.0% | | | | | | | | |
Federal Home Loan Mortgage Corp.(e)(j) | | | | | 6,751,988 | | | 5,131,511 |
| | | | | | | | |
| | | |
| TOTAL COMMON STOCKS | | | | | | | | |
(Identified Cost $170,527,543) | | | | | | | | 66,039,874 |
| | | | | | | | |
| | |
| CLOSED END INVESTMENT COMPANIES – 0.2% | | | | | | |
BlackRock Senior High Income Fund, Inc. | | | | | 191,806 | | | 441,154 |
Dreyfus High Yield Strategies Fund | | | | | 1,033,274 | | | 2,531,521 |
DWS High Income Trust | | | | | 177,909 | | | 523,052 |
Highland Credit Strategies Fund | | | | | 860,000 | | | 3,990,400 |
Morgan Stanley Emerging Markets Debt Fund, Inc. | | | | | 356,954 | | | 2,541,513 |
Van Kampen High Income Trust II | | | | | 141,611 | | | 269,061 |
Western Asset High Income Opportunity Fund, Inc. | | | | | 2,217,450 | | | 9,224,592 |
Western Asset Managed High Income Fund, Inc. | | | | | 1,218,442 | | | 5,154,010 |
| | | | | | | | |
| | | |
| TOTAL CLOSED END INVESTMENT COMPANIES | | | | | | | | |
(Identified Cost $44,128,623) | | | | | | | | 24,675,303 |
| | | | | | | | |
| | | |
| SHORT-TERM INVESTMENTS – 3.8% | | | | | | | | |
State Street Navigator Securities Lending Prime Portfolio(l) | | | | | 620,713 | | | 620,713 |
| Repurchase Agreement with State Street Corp., dated 3/31/2009 at 0.000%, to be repurchased at $238,831 on 4/01/2009 collateralized by $245,000 U.S. Treasury Bill, due 5/28/2009 valued at $244,932 including accrued interest (Note 2h of Notes to Financial Statements) | | | | $ | 238,831 | | | 238,831 |
| Tri-Party Repurchase Agreement with Fixed Income Clearing Corporation, dated 3/31/2009 at 0.000%, to be repurchased at $502,824,400 on 4/01/2009 collateralized by $20,865,000 Federal Home Loan Mortgage Corp., 2.680% due 11/16/2009 valued at $21,282,300; $24,395,000 Federal Home Loan Bank, 5.250% due 6/12/2009 valued at $25,014,633; $466,820,000 Federal National Mortgage Association Discount Note, due 6/30/2009 valued at $466,586,590 including accrued interest (Note 2h of Notes to Financial Statements) | | | | | 502,824,400 | | | 502,824,400 |
| | | | | | | | |
| | | |
| TOTAL SHORT-TERM INVESTMENTS | | | | | | | | |
(Identified Cost $503,683,944) | | | | | | | | 503,683,944 |
| | | | | | | | |
| | | |
| TOTAL INVESTMENTS – 97.7% | | | | | | | | |
(Identified Cost $17,269,684,101)(a) | | | | | | | | 12,830,515,310 |
Other Assets Less Liabilities—2.3% | | | | | | | | 300,039,965 |
| | | | | | | | |
| | | |
| NET ASSETS – 100.0% | | | | | | | $ | 13,130,555,275 |
| | | | | | | | |
41
| | | | | | | |
| |
(‡) Principal amount stated in U.S. dollars unless otherwise noted. | | | |
(†) See Note 2a of Notes to Financial Statements. | | | |
(††) Amount shown represents units. One unit represents a principal amount of 25. | | | |
(†††) Amount shown represents units. One unit represents a principal amount of 100. | | | |
(a) Federal Tax Information (Amounts exclude certain adjustments made at the end of the Fund’s fiscal year for tax purposes. Such adjustments are primarily due to wash sales. Amortization of premium on debt securities is excluded for tax purposes): At March 31, 2009, the net unrealized depreciation on investments based on a cost of $17,280,466,454 for federal income tax purposes was as follows: | | | |
Aggregate gross unrealized appreciation for all investments in which there is an excess of value over tax cost | | $ | 140,356,615 |
Aggregate gross unrealized depreciation for all investments in which there is an excess of tax cost over value | | | (4,590,307,759) |
| | | | | | | |
Net unrealized depreciation | | $ | (4,449,951,144) |
| | | | | | | |
| (b) | Non-income producing due to bankruptcy filing. |
| (c) | Illiquid security. At March 31, 2009, the value of these securities amounted to $435,643,888 or 3.3% of net assets. |
| (d) | Valued by management. At March 31, 2009 the value of these securities amounted to $178,592,335 or 1.4% of net assets. |
| (e) | Non-income producing security. |
| (f) | Step Bond: Coupon is a fixed rate for an initial period then resets at a specified date and rate. |
| (g) | Variable rate security. Rate as of March 31, 2009 is disclosed. |
| (h) | Variable rate security. Rate shown represents the weighted average rate at March 31, 2009. |
| (i) | All or a portion of interest payment is paid in-kind. |
| (j) | Future dividend payments have been eliminated as the issuer has been placed in conservatorship. |
| (k) | All or a portion of this security was on loan to brokers at March 31, 2009. |
| (l) | Represents investment of securities lending collateral. |
| 144A | Securities exempt from registration under Rule 144A of the Securities Act of 1933. These securities may be resold in transactions exempt from registration, normally to qualified institutional buyers. At March 31, 2009, the total value of these securities amounted to $1,447,490,780 or 11.0% of net assets. |
| ABS | Asset-Backed Securities |
| AMBAC | American Municipal Bond Assurance Corp. |
| EMTN | Euro Medium Term Note |
| FGIC | Financial Guaranty Insurance Company |
| FHLMC | Federal Home Loan Mortgage Corporation |
| FSA | Financial Security Assurance, Inc. |
| GMTN | Global Medium Term Note |
| MBIA | Municipal Bond Investor Assurance Corp. |
| REITs | Real Estate Investment Trusts |
Key to Abbreviations: AUD: Australian Dollar; BRL: Brazilian Real; CAD: Canadian Dollar; EUR: Euro; GBP: British Pound; IDR: Indonesian Rupiah; ISK: Icelandic Krona; KRW: South Korean Won; MXN: Mexican Peso; NOK: Norwegian Krone; NZD: New Zealand Dollar; SGD: Singapore Dollar; THB: Thai Baht
NET ASSET SUMMARY AT MARCH 31, 2009 (Unaudited)
| | | |
Treasuries | | 9.3 | % |
Wirelines | | 7.5 | |
Non-Captive Diversified | | 6.2 | |
Banking | | 4.1 | |
Healthcare | | 4.1 | |
Supranational | | 4.1 | |
Retailers | | 3.9 | |
Sovereigns | | 3.8 | |
Electric | | 3.6 | |
Technology | | 2.9 | |
Media Cable | | 2.8 | |
Paper | | 2.7 | |
Oil Field Services | | 2.7 | |
Non-Captive Consumer | | 2.6 | |
Local Authorities | | 2.4 | |
Automotive | | 2.3 | |
Pharmaceuticals | | 2.3 | |
Pipelines | | 2.2 | |
Other Investments, less than 2% each | | 24.4 | |
Short-Term Investments | | 3.8 | |
| | | |
Total Investments | | 97.7 | |
Other assets less liabilities | | 2.3 | |
| | | |
Net Assets | | 100.0 | % |
| | | |
42
PORTFOLIO OF INVESTMENTS – as of March 31, 2009 (Unaudited)
Loomis Sayles Bond Fund – continued
CURRENCY EXPOSURE AT MARCH 31, 2009 AS A PERCENTAGE OF NET ASSETS (Unaudited)
| | | |
United States Dollar | | 71.7 | % |
Canadian Dollar | | 8.8 | |
New Zealand Dollar | | 2.7 | |
Brazilian Real | | 2.7 | |
Norwegian Krone | | 2.3 | |
Mexican Peso | | 2.1 | |
Other, less than 2% each | | 7.4 | |
| | | |
Total Investments | | 97.7 | |
Other assets less liabilities | | 2.3 | |
| | | |
Net Assets | | 100.0 | % |
| | | |
See accompanying notes to financial statements.
43
PORTFOLIO OF INVESTMENTS – as of March 31, 2009 (Unaudited)
Loomis Sayles Fixed Income Fund
| | | | | | | | |
| | | | | Principal Amount (‡) | | Value (†) |
| | | | | | | | |
| | | |
| BONDS AND NOTES – 90.6% of Net Assets | | | | | | | | |
| | | |
| NON-CONVERTIBLE BONDS – 87.2% | | | | | | | | |
| | | |
| ABS Credit Card – 0.5% | | | | | | | | |
Citibank Credit Card Issuance Trust,
Series 2008-C6, Class C6, 6.300%, 6/20/2014 | | | | $ | 4,265,000 | | $ | 2,686,950 |
| | | | | | | | |
| ABS Other – 0.1% | | | | | | | | |
Community Program Loan Trust, Series 1987-A, Class A5, 4.500%, 4/01/2029 | | | | | 725,000 | | | 668,229 |
| | | | | | | | |
| Aerospace & Defense – 0.0% | | | | | | | | |
Bombardier, Inc., 7.450%, 5/01/2034, 144A | | | | | 175,000 | | | 101,500 |
| | | | | | | | |
| Airlines – 0.4% | | | | | | | | |
American Airlines, Inc., Series 1999-1, Class B,
7.324%, 4/15/2011 | | | | | 250,000 | | | 232,500 |
American Airlines, Inc., Series 93A6,
8.040%, 9/16/2011 | | | | | 23,424 | | | 14,991 |
Continental Airlines, Inc., Series 2000-2, Class B, 8.307%, 10/02/2019 | | | | | 121,026 | | | 86,534 |
Continental Airlines, Inc., Series 2001-1, Class B, 7.373%, 6/15/2017 | | | | | 191,808 | | | 118,921 |
Continental Airlines, Inc., Series 971A,
7.461%, 10/01/2016 | | | | | 452,605 | | | 316,824 |
Delta Air Lines, Inc., Series 2007-1, Class C,
8.954%, 8/10/2014 | | | | | 1,779,089 | | | 1,049,663 |
United Air Lines, Inc., Series 2007-1, Class A,
6.636%, 1/02/2024 | | | | | 1,205,685 | | | 819,865 |
| | | | | | | | |
| | | | | | | | 2,639,298 |
| | | | | | | | |
| Automotive – 1.5% | | | | | | | | |
Cummins, Inc., 7.125%, 3/01/2028 | | | | | 2,400,000 | | | 1,653,038 |
FCE Bank PLC, EMTN, 7.125%, 1/16/2012 | | EUR | | | 300,000 | | | 271,034 |
FCE Bank PLC, EMTN, 7.125%, 1/15/2013 | | EUR | | | 200,000 | | | 176,704 |
Ford Motor Co., 6.375%, 2/01/2029 | | | | | 730,000 | | | 206,225 |
Ford Motor Co., 6.500%, 8/01/2018 | | | | | 50,000 | | | 14,500 |
Ford Motor Co., 6.625%, 10/01/2028 | | | | | 2,435,000 | | | 687,888 |
Ford Motor Co., 7.125%, 11/15/2025 | | | | | 595,000 | | | 160,650 |
Ford Motor Co., 7.450%, 7/16/2031 | | | | | 5,065,000 | | | 1,608,137 |
Ford Motor Credit Co. LLC, 5.700%, 1/15/2010 | | | | | 750,000 | | | 642,421 |
Ford Motor Credit Co. LLC, 7.000%, 10/01/2013 | | | | | 230,000 | | | 153,792 |
Ford Motor Credit Co. LLC, 7.875%, 6/15/2010 | | | | | 500,000 | | | 413,203 |
Ford Motor Credit Co. LLC, 8.000%, 12/15/2016 | | | | | 565,000 | | | 371,336 |
General Motors Corp., 7.400%, 9/01/2025 | | | | | 250,000 | | | 28,750 |
General Motors Corp., 8.250%, 7/15/2023 | | | | | 4,435,000 | | | 548,831 |
General Motors Corp., 8.375%, 7/15/2033 | | | | | 275,000 | | | 34,375 |
GMAC LLC, 5.375%, 6/06/2011, 144A | | | | | 2,268,000 | | | 1,610,280 |
Goodyear Tire & Rubber Co. (The),
7.000%, 3/15/2028 | | | | | 375,000 | | | 210,000 |
| | | | | | | | |
| | | | | | | | 8,791,164 |
| | | | | | | | |
| Banking – 6.2% | | | | | | | | |
BAC Capital Trust VI, 5.625%, 3/08/2035 | | | | | 2,385,000 | | | 1,013,906 |
Bank of America Corp., 4.850%, 11/15/2014 | | | | | 500,000 | | | 348,669 |
Barclays Financial LLC, 4.060%, 9/16/2010, 144A | | KRW | | | 2,340,000,000 | | | 1,734,637 |
Barclays Financial LLC, 4.160%, 2/22/2010, 144A | | THB | | | 175,000,000 | | | 4,884,111 |
Barclays Financial LLC, EMTN,
4.100%, 3/22/2010, 144A | | THB | | | 45,000,000 | | | 1,244,114 |
44
PORTFOLIO OF INVESTMENTS – as of March 31, 2009 (Unaudited)
Loomis Sayles Fixed Income Fund – continued
| | | | | | | |
| | | | | Principal Amount (‡) | | Value (†) |
| | | | | | | |
| | | |
| BONDS AND NOTES – continued | | | | | | | |
| | | |
| Banking – continued | | | | | | | |
BNP Paribas SA, EMTN, Zero Coupon Bond,
6/13/2011, 144A | | IDR | | 18,710,000,000 | | $ | 1,047,145 |
Countrywide Home Loans, Inc., Series L, MTN,
4.000%, 3/22/2011 | | | | 84,000 | | | 74,751 |
Goldman Sachs Group, Inc. (The),
5.000%, 10/01/2014 | | | | 3,855,000 | | | 3,485,225 |
Goldman Sachs Group, Inc. (The),
5.150%, 1/15/2014 | | | | 1,955,000 | | | 1,784,250 |
Goldman Sachs Group, Inc. (The),
6.125%, 2/15/2033 | | | | 560,000 | | | 466,378 |
Goldman Sachs Group, Inc. (The),
6.750%, 10/01/2037 | | | | 910,000 | | | 615,470 |
JPMorgan Chase & Co., Zero Coupon Bond, 5/17/2010, 144A | | BRL | | 16,585,000 | | | 5,974,725 |
JPMorgan Chase & Co., Zero Coupon Bond, 3/28/2011, 144A | | IDR | | 24,502,029,000 | | | 1,415,202 |
JPMorgan Chase & Co., Zero Coupon Bond, 3/28/2011, 144A | | IDR | | 17,920,000,000 | | | 1,035,033 |
JPMorgan Chase & Co., Zero Coupon Bond, 4/12/2012, 144A | | IDR | | 21,194,634,240 | | | 984,069 |
JPMorgan Chase London, EMTN, Zero Coupon Bond, 10/21/2010, 144A | | IDR | | 18,824,303,000 | | | 1,218,896 |
Kaupthing Bank, 1/15/2010, 144A(b) | | | | 200,000 | | | 10,250 |
Kaupthing Bank, Series D, 5.750%, 10/04/2011, 144A(b) | | | | 2,700,000 | | | 138,375 |
Kaupthing Bank, Series E, 6.125%, 10/04/2016, 144A(b) | | | | 500,000 | | | 25,625 |
Merrill Lynch & Co., Inc., 6.110%, 1/29/2037 | | | | 900,000 | | | 447,311 |
Merrill Lynch & Co., Inc., EMTN,
4.625%, 9/14/2018 | | EUR | | 1,000,000 | | | 741,175 |
Morgan Stanley, 4.750%, 4/01/2014 | | | | 1,795,000 | | | 1,467,551 |
Morgan Stanley, 5.375%, 10/15/2015 | | | | 1,700,000 | | | 1,535,814 |
Morgan Stanley, 6.750%, 4/15/2011 | | | | 1,290,000 | | | 1,290,993 |
Morgan Stanley, EMTN, 5.450%, 1/09/2017 | | | | 370,000 | | | 323,750 |
Morgan Stanley, GMTN, 5.125%, 11/30/2015 | | GBP | | 350,000 | | | 397,576 |
Morgan Stanley, MTN, 6.250%, 8/09/2026 | | | | 400,000 | | | 330,843 |
Morgan Stanley, Series F, MTN,
5.550%, 4/27/2017 | | | | 500,000 | | | 444,922 |
Morgan Stanley, Series F, MTN,
5.950%, 12/28/2017 | | | | 925,000 | | | 840,273 |
Rabobank Nederland, EMTN,
10.250%, 9/10/2009, 144A | | ISK | | 360,000,000 | | | 1,712,195 |
| | | | | | | |
| | | | | | | 37,033,234 |
| | | | | | | |
| Brokerage – 0.0% | | | | | | | |
Lehman Brothers Holdings, Inc.,
6.875%, 7/17/2037(b) | | | | 4,895,000 | | | 489 |
Lehman Brothers Holdings, Inc., MTN, (fixed rate to 5/03/2027, variable rate thereafter), 6.000%, 5/03/2032(b) | | | | 390,000 | | | 39 |
| | | | | | | |
| | | | | | | 528 |
| | | | | | | |
| Building Materials – 0.4% | | | | | | | |
Owens Corning, Inc., 6.500%, 12/01/2016 | | | | 805,000 | | | 590,592 |
Owens Corning, Inc., 7.000%, 12/01/2036 | | | | 2,050,000 | | | 1,148,783 |
45
| | | | | | | | |
| | | | | Principal Amount (‡) | | Value (†) |
| | | | | | | | |
| | | |
| BONDS AND NOTES – continued | | | | | | | | |
| | | |
| Building Materials – continued | | | | | | | | |
USG Corp., 6.300%, 11/15/2016 | | | | $ | 1,680,000 | | $ | 890,400 |
| | | | | | | | |
| | | | | | | | 2,629,775 |
| | | | | | | | |
| Chemicals – 0.5% | | | | | | | | |
Borden, Inc., 7.875%, 2/15/2023 | | | | | 5,240,000 | | | 524,000 |
Borden, Inc., 8.375%, 4/15/2016 | | | | | 55,000 | | | 5,500 |
Borden, Inc., 9.200%, 3/15/2021 | | | | | 905,000 | | | 90,500 |
ICI Wilmington, Inc., 5.625%, 12/01/2013 | | | | | 115,000 | | | 110,463 |
Lubrizol Corp., 5.500%, 10/01/2014 | | | | | 365,000 | | | 335,375 |
Lubrizol Corp., 6.500%, 10/01/2034 | | | | | 1,170,000 | | | 893,471 |
Methanex Corp., 6.000%, 8/15/2015 | | | | | 1,565,000 | | | 1,064,159 |
| | | | | | | | |
| | | | | | | | 3,023,468 |
| | | | | | | | |
| Commercial Mortgage-Backed Securities – 0.1% | | | | | | | | |
GS Mortgage Securities Corp. II, Series 2005-GG4, Class A4A, 4.751%, 7/10/2039 | | | | | 95,000 | | | 70,274 |
Merrill Lynch/Countrywide Commercial Mortgage Trust, Series 2007-6, Class A4, 5.485%, 3/12/2051 | | | | | 1,000,000 | | | 537,500 |
| | | | | | | | |
| | | | | | | | 607,774 |
| | | | | | | | |
| Construction Machinery – 0.3% | | | | | | | | |
Caterpillar Financial Services Corp., MTN,
5.450%, 4/15/2018 | | | | | 100,000 | | | 85,795 |
Caterpillar Financial Services Corp., MTN,
6.125%, 2/17/2014 | | | | | 1,295,000 | | | 1,257,603 |
Toro Co., 6.625%, 5/01/2037(c) | | | | | 965,000 | | | 579,000 |
United Rentals North America, Inc.,
7.000%, 2/15/2014 | | | | | 55,000 | | | 27,775 |
| | | | | | | | |
| | | | | | | | 1,950,173 |
| | | | | | | | |
| Distributors – 0.1% | | | | | | | | |
ONEOK, Inc., 6.000%, 6/15/2035 | | | | | 1,000,000 | | | 683,519 |
| | | | | | | | |
| Electric – 3.7% | | | | | | | | |
AES Corp. (The), 7.750%, 3/01/2014 | | | | | 730,000 | | | 653,350 |
Bruce Mansfield Unit, 6.850%, 6/01/2034(c) | | | | | 4,255,000 | | | 3,160,869 |
Dynegy Holdings, Inc., 7.125%, 5/15/2018 | | | | | 380,000 | | | 201,400 |
Dynegy Holdings, Inc., 7.625%, 10/15/2026 | | | | | 810,000 | | | 340,200 |
Empresa Nacional de Electricidad SA (Endesa-Chile), 7.875%, 2/01/2027 | | | | | 1,589,000 | | | 1,629,458 |
Enersis SA, 7.375%, 1/15/2014 | | | | | 275,000 | | | 285,540 |
Enersis SA, 7.400%, 12/01/2016 | | | | | 4,000,000 | | | 4,144,324 |
Mackinaw Power LLC, 6.296%, 10/31/2023, 144A | | | | | 3,920,347 | | | 3,417,562 |
NGC Corp. Capital Trust I, Series B,
8.316%, 6/01/2027 | | | | | 695,000 | | | 278,000 |
NiSource Finance Corp., 5.250%, 9/15/2017 | | | | | 250,000 | | | 186,355 |
NiSource Finance Corp., 6.150%, 3/01/2013 | | | | | 850,000 | | | 742,399 |
NiSource Finance Corp., 6.400%, 3/15/2018 | | | | | 2,855,000 | | | 2,310,143 |
Power Receivables Finance LLC, 6.290%, 1/01/2012, 144A | | | | | 688,810 | | | 674,118 |
Quezon Power Philippines Co., 8.860%, 6/15/2017 | | | | | 1,319,500 | | | 1,187,550 |
TXU Corp., Series P, 5.550%, 11/15/2014 | | | | | 765,000 | | | 263,925 |
TXU Corp., Series Q, 6.500%, 11/15/2024 | | | | | 1,515,000 | | | 424,995 |
TXU Corp., Series R, 6.550%, 11/15/2034 | | | | | 1,275,000 | | | 345,563 |
White Pine Hydro LLC, 6.310%, 7/10/2017(c) | | | | | 450,000 | | | 400,416 |
46
PORTFOLIO OF INVESTMENTS – as of March 31, 2009 (Unaudited)
Loomis Sayles Fixed Income Fund – continued
| | | | | | | | |
| | | | | Principal Amount (‡) | | Value (†) |
| | | | | | | | |
| | | |
| BONDS AND NOTES – continued | | | | | | | | |
| | | |
| Electric – continued | | | | | | | | |
White Pine Hydro LLC, 6.960%, 7/10/2037(c) | | | | $ | 670,000 | | $ | 512,599 |
White Pine Hydro Portfolio LLC,
7.260%, 7/20/2015(c) | | | | | 1,280,000 | | | 1,151,973 |
| | | | | | | | |
| | | | | | | | 22,310,739 |
| | | | | | | | |
| Entertainment – 1.4% | | | | | | | | |
Six Flags, Inc., 9.625%, 6/01/2014 | | | | | 100,000 | | | 8,250 |
Time Warner, Inc., 6.500%, 11/15/2036 | | | | | 910,000 | | | 748,497 |
Time Warner, Inc., 6.625%, 5/15/2029 | | | | | 2,065,000 | | | 1,743,318 |
Time Warner, Inc., 6.950%, 1/15/2028 | | | | | 875,000 | | | 773,225 |
Time Warner, Inc., 7.625%, 4/15/2031 | | | | | 730,000 | | | 652,273 |
Time Warner, Inc., 7.700%, 5/01/2032 | | | | | 1,155,000 | | | 1,038,618 |
Viacom, Inc., Class B, 6.875%, 4/30/2036 | | | | | 4,880,000 | | | 3,560,482 |
| | | | | | | | |
| | | | | | | | 8,524,663 |
| | | | | | | | |
| Food & Beverage – 0.3% | | | | | | | | |
Corn Products International, Inc.,
6.625%, 4/15/2037 | | | | | 1,540,000 | | | 1,269,485 |
Sara Lee Corp., 6.125%, 11/01/2032 | | | | | 295,000 | | | 248,434 |
| | | | | | | | |
| | | | | | | | 1,517,919 |
| | | | | | | | |
| Government Owned – No Guarantee – 0.2% | | | | | | | | |
DP World Ltd., 6.850%, 7/02/2037, 144A | | | | | 2,000,000 | | | 956,898 |
| | | | | | | | |
| Healthcare – 2.2% | | | | | | | | |
Boston Scientific Corp., 5.450%, 6/15/2014 | | | | | 290,000 | | | 265,350 |
Boston Scientific Corp., 6.400%, 6/15/2016 | | | | | 860,000 | | | 799,800 |
Boston Scientific Corp., 7.000%, 11/15/2035 | | | | | 860,000 | | | 731,000 |
HCA, Inc., 5.750%, 3/15/2014 | | | | | 455,000 | | | 298,025 |
HCA, Inc., 6.250%, 2/15/2013 | | | | | 2,345,000 | | | 1,758,750 |
HCA, Inc., 6.375%, 1/15/2015 | | | | | 410,000 | | | 268,550 |
HCA, Inc., 6.500%, 2/15/2016 | | | | | 610,000 | | | 399,550 |
HCA, Inc., 6.750%, 7/15/2013 | | | | | 115,000 | | | 85,963 |
HCA, Inc., 7.050%, 12/01/2027 | | | | | 3,545,000 | | | 1,843,400 |
HCA, Inc., 7.190%, 11/15/2015 | | | | | 560,000 | | | 378,302 |
HCA, Inc., 7.500%, 12/15/2023 | | | | | 840,000 | | | 445,059 |
HCA, Inc., 7.500%, 11/06/2033 | | | | | 1,440,000 | | | 720,000 |
HCA, Inc., 7.690%, 6/15/2025 | | | | | 2,660,000 | | | 1,385,344 |
HCA, Inc., 8.360%, 4/15/2024 | | | | | 1,775,000 | | | 995,283 |
HCA, Inc., MTN, 7.580%, 9/15/2025 | | | | | 2,930,000 | | | 1,503,415 |
HCA, Inc., MTN, 7.750%, 7/15/2036 | | | | | 430,000 | | | 217,493 |
Owens & Minor, Inc., 6.350%, 4/15/2016(c) | | | | | 320,000 | | | 287,782 |
Tenet Healthcare Corp., 6.500%, 6/01/2012 | | | | | 105,000 | | | 89,348 |
Tenet Healthcare Corp., 6.875%, 11/15/2031 | | | | | 1,075,000 | | | 532,125 |
Tenet Healthcare Corp., 7.375%, 2/01/2013 | | | | | 85,000 | | | 67,575 |
| | | | | | | | |
| | | | | | | | 13,072,114 |
| | | | | | | | |
| Home Construction – 1.1% | | | | | | | | |
K. Hovnanian Enterprises, Inc., 6.250%, 1/15/2016 | | | | | 115,000 | | | 31,050 |
K. Hovnanian Enterprises, Inc., 6.375%, 12/15/2014 | | | | | 155,000 | | | 42,625 |
K. Hovnanian Enterprises, Inc., 6.500%, 1/15/2014 | | | | | 115,000 | | | 29,900 |
Lennar Corp., Series B, 5.600%, 5/31/2015 | | | | | 1,700,000 | | | 1,211,250 |
Pulte Homes, Inc., 5.200%, 2/15/2015 | | | | | 1,305,000 | | | 1,032,581 |
Pulte Homes, Inc., 6.000%, 2/15/2035 | | | | | 3,920,000 | | | 2,391,200 |
Pulte Homes, Inc., 6.375%, 5/15/2033 | | | | | 1,960,000 | | | 1,195,600 |
47
| | | | | | | | |
| | | | | Principal Amount (‡) | | Value (†) |
| | | | | | | | |
| | | |
| BONDS AND NOTES – continued | | | | | | | | |
| | | |
| Home Construction – continued | | | | | | | | |
Toll Brothers Finance Corp., 5.150%, 5/15/2015 | | | | $ | 565,000 | | $ | 476,577 |
| | | | | | | | |
| | | | | | | | 6,410,783 |
| | | | | | | | |
| Independent Energy – 2.1% | | | | | | | | |
Anadarko Petroleum Corp., 5.950%, 9/15/2016 | | | | | 3,230,000 | | | 2,781,934 |
Anadarko Petroleum Corp., 6.450%, 9/15/2036 | | | | | 2,845,000 | | | 1,988,556 |
Chesapeake Energy Corp., 6.500%, 8/15/2017 | | | | | 380,000 | | | 309,700 |
Chesapeake Energy Corp., 6.875%, 1/15/2016 | | | | | 200,000 | | | 168,000 |
Chesapeake Energy Corp., 6.875%, 11/15/2020 | | | | | 900,000 | | | 704,250 |
Connacher Oil and Gas Ltd.,
10.250%, 12/15/2015, 144A | | | | | 792,000 | | | 249,480 |
Pioneer Natural Resources Co., 5.875%, 7/15/2016 | | | | | 435,000 | | | 320,978 |
Pioneer Natural Resources Co., 7.200%, 1/15/2028 | | | | | 1,465,000 | | | 898,586 |
Questar Market Resources, Inc.,
6.800%, 4/01/2018 | | | | | 3,820,000 | | | 3,419,339 |
Talisman Energy, Inc., 5.850%, 2/01/2037 | | | | | 550,000 | | | 371,203 |
Talisman Energy, Inc., 6.250%, 2/01/2038 | | | | | 1,485,000 | | | 1,047,561 |
XTO Energy, Inc., 6.100%, 4/01/2036 | | | | | 155,000 | | | 131,125 |
| | | | | | | | |
| | | | | | | | 12,390,712 |
| | | | | | | | |
| Industrial Other – 0.2% | | | | | | | | |
Ranhill Labuan Ltd., 12.500%, 10/26/2011, 144A | | | | | 1,575,000 | | | 897,750 |
| | | | | | | | |
| Integrated Energy – 0.2% | | | | | | | | |
PF Export Receivables Master Trust, Series A, 6.436%, 6/01/2015, 144A | | | | | 1,260,841 | | | 1,273,449 |
| | | | | | | | |
| Life Insurance – 0.3% | | | | | | | | |
Hartford Life Insurance Co.,
2.230%, 9/15/2011(d) | | | | | 500,000 | | | 392,945 |
John Hancock Insurance Co.,
1.880%, 4/15/2009(d) | | | | | 500,000 | | | 498,090 |
Principal Life Income Funding Trust,
5.000%, 10/15/2014 | | | | | 500,000 | | | 499,968 |
Protective Life Secured Trust,
1.760%, 9/10/2014(d) | | | | | 1,000,000 | | | 441,560 |
| | | | | | | | |
| | | | | | | | 1,832,563 |
| | | | | | | | |
| Local Authorities – 6.1% | | | | | | | | |
New South Wales Treasury Corp., Series 10RG, 7.000%, 12/01/2010 | | AUD | | | 3,240,000 | | | 2,381,267 |
New South Wales Treasury Corp., Series 12RG, 6.000%, 5/01/2012 | | AUD | | | 845,000 | | | 617,941 |
New South Wales Treasury Corp., Series 17RG, 5.500%, 3/01/2017 | | AUD | | | 4,280,000 | | | 3,029,352 |
Province of Alberta, 5.930%, 9/16/2016 | | CAD | | | 868,201 | | | 777,670 |
Province of British Columbia, Zero Coupon Bond, 8/23/2013 | | CAD | | | 11,700,000 | | | 8,221,830 |
Province of Ontario, Canada, 4.200%, 3/08/2018 | | CAD | | | 19,825,000 | | | 15,869,277 |
Queensland Treasury Corp., Series 11G,
6.000%, 6/14/2011 | | AUD | | | 2,150,000 | | | 1,567,909 |
Virginia Tobacco Settlement Financing Corp., Series A-1, 6.706%, 6/01/2046(c) | | | | | 7,910,000 | | | 3,894,963 |
| | | | | | | | |
| | | | | | | | 36,360,209 |
| | | | | | | | |
48
PORTFOLIO OF INVESTMENTS – as of March 31, 2009 (Unaudited)
Loomis Sayles Fixed Income Fund – continued
| | | | | | | | | |
| | | | | Principal Amount (‡) | | | Value (†) |
| | | | | | | | | |
| | | |
| BONDS AND NOTES – continued | | | | | | | | | |
| | | |
| Lodging – 0.0% | | | | | | | | | |
Host Marriott LP, Series O, 6.375%, 3/15/2015 | | | | $ | 150,000 | | | $ | 111,000 |
| | | | | | | | | |
| Media Cable – 4.1% | | | | | | | | | |
Comcast Corp., 5.650%, 6/15/2035 | | | | | 2,660,000 | | | | 2,106,457 |
Comcast Corp., 6.450%, 3/15/2037 | | | | | 2,645,000 | | | | 2,310,804 |
Comcast Corp., 6.500%, 11/15/2035 | | | | | 3,240,000 | | | | 2,861,785 |
Comcast Corp., 6.950%, 8/15/2037 | | | | | 7,695,000 | | | | 7,165,676 |
CSC Holdings, Inc., 6.750%, 4/15/2012 | | | | | 200,000 | | | | 192,500 |
CSC Holdings, Inc., 7.625%, 4/01/2011 | | | | | 50,000 | | | | 49,625 |
CSC Holdings, Inc., 7.875%, 2/15/2018 | | | | | 170,000 | | | | 155,550 |
CSC Holdings, Inc., 8.500%, 4/15/2014, 144A | | | | | 1,000,000 | | | | 985,000 |
TCI Communications, Inc., 7.875%, 2/15/2026 | | | | | 550,000 | | | | 505,173 |
Time Warner Cable, Inc., 6.550%, 5/01/2037 | | | | | 1,500,000 | | | | 1,262,402 |
Time Warner Cable, Inc., 6.750%, 7/01/2018 | | | | | 6,500,000 | | | | 6,101,576 |
Virgin Media Finance PLC, 9.125%, 8/15/2016 | | | | | 400,000 | | | | 372,000 |
Virgin Media Finance PLC, 9.750%, 4/15/2014 | | GBP | | | 250,000 | | | | 317,461 |
| | | | | | | | | |
| | | | | | | | | 24,386,009 |
| | | | | | | | | |
| Media Non-Cable – 0.5% | | | | | | | | | |
Clear Channel Communications, Inc.,
4.250%, 5/15/2009 | | | | | 85,000 | | | | 75,650 |
Clear Channel Communications, Inc.,
4.900%, 5/15/2015 | | | | | 785,000 | | | | 109,900 |
Clear Channel Communications, Inc.,
5.500%, 12/15/2016 | | | | | 50,000 | | | | 7,000 |
News America, Inc., 6.150%, 3/01/2037 | | | | | 2,630,000 | | | | 1,917,565 |
News America, Inc., 6.200%, 12/15/2034 | | | | | 795,000 | | | | 571,890 |
| | | | | | | | | |
| | | | | | | | | 2,682,005 |
| | | | | | | | | |
| Non-Captive Consumer – 1.5% | | | | | | | | | |
SLM Corp., 6.000%, 12/15/2043 | | | | | 31,725 | (††) | | | 291,473 |
SLM Corp., MTN, 5.125%, 8/27/2012 | | | | | 420,000 | | | | 226,311 |
SLM Corp., Series A, MTN, 4.000%, 1/15/2010 | | | | | 475,000 | | | | 400,832 |
SLM Corp., Series A, MTN, 4.500%, 7/26/2010 | | | | | 455,000 | | | | 341,250 |
SLM Corp., Series A, MTN, 5.000%, 10/01/2013 | | | | | 1,600,000 | | | | 850,829 |
SLM Corp., Series A, MTN, 5.000%, 4/15/2015 | | | | | 200,000 | | | | 90,000 |
SLM Corp., Series A, MTN, 5.375%, 1/15/2013 | | | | | 2,920,000 | | | | 1,602,254 |
SLM Corp., Series A, MTN, 5.375%, 5/15/2014 | | | | | 235,000 | | | | 121,776 |
SLM Corp., Series A, MTN, 5.400%, 10/25/2011 | | | | | 405,000 | | | | 251,100 |
SLM Corp., Series A, MTN, 8.450%, 6/15/2018 | | | | | 7,511,000 | | | | 4,056,901 |
SLM Corp., Series B, MTN,
2.241%, 9/15/2009(d) | | | | | 500,000 | | | | 482,925 |
| | | | | | | | | |
| | | | | | | | | 8,715,651 |
| | | | | | | | | |
| Non-Captive Diversified – 3.4% | | | | | | | | | |
CIT Group Funding Co. of Canada,
5.200%, 6/01/2015 | | | | | 845,000 | | | | 494,325 |
CIT Group, Inc., 4.750%, 12/15/2010 | | | | | 135,000 | | | | 108,868 |
CIT Group, Inc., 5.050%, 9/15/2014 | | | | | 500,000 | | | | 117,654 |
CIT Group, Inc., 5.400%, 2/13/2012 | | | | | 10,000 | | | | 6,447 |
CIT Group, Inc., 5.400%, 1/30/2016 | | | | | 108,000 | | | | 64,731 |
CIT Group, Inc., 5.500%, 12/01/2014 | | GBP | | | 800,000 | | | | 482,110 |
CIT Group, Inc., 5.600%, 4/27/2011 | | | | | 432,000 | | | | 315,328 |
CIT Group, Inc., 5.800%, 10/01/2036 | | | | | 561,000 | | | | 308,993 |
CIT Group, Inc., 5.850%, 9/15/2016 | | | | | 10,000 | | | | 5,656 |
49
| | | | | | | | |
| | | | | Principal Amount (‡) | | Value (†) |
| | | | | | | | |
| | | |
| BONDS AND NOTES – continued | | | | | | | | |
| | | |
| Non-Captive Diversified – continued | | | | | | | | |
CIT Group, Inc., 12.000%, 12/18/2018, 144A | | | | $ | 4,237,000 | | $ | 2,192,647 |
CIT Group, Inc., EMTN, 3.800%, 11/14/2012 | | EUR | | | 750,000 | | | 458,367 |
CIT Group, Inc., EMTN, 4.650%, 9/19/2016 | | EUR | | | 1,150,000 | | | 641,714 |
CIT Group, Inc., EMTN, 5.000%, 5/13/2014 | | EUR | | | 550,000 | | | 314,214 |
CIT Group, Inc., EMTN, 5.500%, 12/20/2016 | | GBP | | | 600,000 | | | 361,582 |
CIT Group, Inc., GMTN, 4.250%, 2/01/2010 | | | | | 85,000 | | | 72,862 |
CIT Group, Inc., GMTN, 4.250%, 9/22/2011 | | EUR | | | 400,000 | | | 318,864 |
CIT Group, Inc., GMTN, 5.000%, 2/13/2014 | | | | | 673,000 | | | 397,070 |
CIT Group, Inc., GMTN, 5.000%, 2/01/2015 | | | | | 263,000 | | | 160,128 |
CIT Group, Inc., MTN, 4.250%, 3/17/2015 | | EUR | | | 1,000,000 | | | 637,728 |
CIT Group, Inc., MTN, 5.125%, 9/30/2014 | | | | | 762,000 | | | 460,619 |
CIT Group, Inc., Series A, GMTN, 6.000%, 4/01/2036 | | | | | 265,000 | | | 124,937 |
CIT Group, Inc., Series A, MTN,
5.650%, 2/13/2017 | | | | | 304,000 | | | 176,054 |
General Electric Capital Australia Funding, EMTN, 8.000%, 2/13/2012 | | AUD | | | 830,000 | | | 541,227 |
General Electric Capital Corp., 5.625%, 5/01/2018 | | | | | 120,000 | | | 104,343 |
General Electric Capital Corp., MTN, 5.875%, 1/14/2038 | | | | | 85,000 | | | 60,714 |
General Electric Capital Corp., Series A, EMTN,
6.750%, 9/26/2016(c)(e) | | NZD | | | 1,345,000 | | | 629,008 |
General Electric Capital Corp., Series A, MTN,
4.875%, 3/04/2015 | | | | | 1,145,000 | | | 1,016,319 |
General Electric Capital Corp., Series A, MTN,
6.500%, 9/28/2015(c)(e) | | NZD | | | 9,210,000 | | | 4,335,127 |
GMAC LLC, 4.750%, 9/14/2009, 144A | | | | | 874,000 | | | 744,272 |
GMAC LLC, 5.625%, 5/15/2009 | | | | | 800,000 | | | 757,218 |
GMAC LLC, 5.750%, 9/27/2010, 144A | | | | | 309,000 | | | 234,840 |
GMAC LLC, 6.000%, 12/15/2011, 144A | | | | | 1,305,000 | | | 888,457 |
GMAC LLC, 6.875%, 8/28/2012, 144A | | | | | 224,000 | | | 150,432 |
GMAC LLC, 7.000%, 2/01/2012, 144A | | | | | 253,000 | | | 174,752 |
GMAC LLC, 7.500%, 12/31/2013, 144A | | | | | 682,000 | | | 327,824 |
GMAC LLC, 8.000%, 12/31/2018, 144A | | | | | 1,460,000 | | | 423,853 |
GMAC LLC, 8.000%, 11/01/2031, 144A | | | | | 181,000 | | | 87,090 |
iStar Financial, Inc., 5.500%, 6/15/2012 | | | | | 85,000 | | | 28,900 |
iStar Financial, Inc., 5.650%, 9/15/2011 | | | | | 135,000 | | | 55,350 |
iStar Financial, Inc., 5.875%, 3/15/2016 | | | | | 30,000 | | | 8,700 |
iStar Financial, Inc., 6.050%, 4/15/2015 | | | | | 30,000 | | | 8,700 |
iStar Financial, Inc., 8.625%, 6/01/2013 | | | | | 2,495,000 | | | 779,687 |
iStar Financial, Inc., Series B, 5.700%, 3/01/2014 | | | | | 95,000 | | | 27,550 |
iStar Financial, Inc., Series B, 5.950%, 10/15/2013 | | | | | 1,245,000 | | | 379,725 |
| | | | | | | | |
| | | | | | | | 19,984,986 |
| | | | | | | | |
| Oil Field Services – 0.1% | | | | | | | | |
North American Energy Partners, Inc.,
8.750%, 12/01/2011 | | | | | 1,000,000 | | | 730,000 |
| | | | | | | | |
| Packaging – 0.3% | | | | | | | | |
Owens-Illinois, Inc., 7.800%, 5/15/2018 | | | | | 2,000,000 | | | 1,940,000 |
| | | | | | | | |
| Paper – 1.8% | | | | | | | | |
Abitibi-Consolidated, Inc., 7.500%, 4/01/2028 | | | | | 650,000 | | | 52,000 |
Georgia-Pacific LLC, 7.250%, 6/01/2028 | | | | | 2,000,000 | | | 1,390,000 |
Georgia-Pacific LLC, 7.375%, 12/01/2025 | | | | | 2,868,000 | | | 2,043,450 |
50
PORTFOLIO OF INVESTMENTS – as of March 31, 2009 (Unaudited)
Loomis Sayles Fixed Income Fund – continued
| | | | | | | | |
| | | | | Principal Amount (‡) | | Value (†) |
| | | | | | | | |
| | | |
| BONDS AND NOTES – continued | | | | | | | | |
| | | |
| Paper – continued | | | | | | | | |
Georgia-Pacific LLC, 7.750%, 11/15/2029 | | | | $ | 6,005,000 | | $ | 4,443,700 |
Georgia-Pacific LLC, 8.000%, 1/15/2024 | | | | | 132,000 | | | 104,940 |
Jefferson Smurfit Corp., 7.500%, 6/01/2013(b) | | | | | 335,000 | | | 38,944 |
Westvaco Corp., 7.950%, 2/15/2031 | | | | | 1,045,000 | | | 798,855 |
Westvaco Corp., 8.200%, 1/15/2030 | | | | | 1,080,000 | | | 851,430 |
Weyerhaeuser Co., 7.375%, 3/15/2032 | | | | | 1,565,000 | | | 1,045,766 |
| | | | | | | | |
| | | | | | | | 10,769,085 |
| | | | | | | | |
| Pharmaceuticals – 0.6% | | | | | | | | |
Elan Financial PLC, 7.750%, 11/15/2011 | | | | | 4,235,000 | | | 3,557,400 |
Elan Financial PLC, 8.875%, 12/01/2013 | | | | | 335,000 | | | 268,000 |
| | | | | | | | |
| | | | | | | | 3,825,400 |
| | | | | | | | |
| Pipelines – 1.9% | | | | | | | | |
DCP Midstream LP, 6.450%, 11/03/2036, 144A | | | | | 1,740,000 | | | 1,127,962 |
El Paso Corp., 6.950%, 6/01/2028 | | | | | 925,000 | | | 637,897 |
El Paso Corp., 12.000%, 12/12/2013 | | | | | 2,195,000 | | | 2,310,237 |
El Paso Corp., MTN, 7.800%, 8/01/2031 | | | | | 250,000 | | | 186,800 |
Enterprise Products Operating LLP,
6.300%, 9/15/2017 | | | | | 1,550,000 | | | 1,428,671 |
Knight, Inc., 6.500%, 9/01/2012 | | | | | 90,000 | | | 83,925 |
Knight, Inc., Senior Note, 5.150%, 3/01/2015 | | | | | 305,000 | | | 256,200 |
Plains All American Pipeline LP,
6.125%, 1/15/2017 | | | | | 1,785,000 | | | 1,516,636 |
Plains All American Pipeline LP,
6.650%, 1/15/2037 | | | | | 3,850,000 | | | 2,790,495 |
Williams Cos., Inc. (The), 7.500%, 1/15/2031 | | | | | 1,000,000 | | | 790,000 |
| | | | | | | | |
| | | | | | | | 11,128,823 |
| | | | | | | | |
| Property & Casualty Insurance – 2.0% | | | | | | | | |
Allstate Corp., 5.950%, 4/01/2036 | | | | | 540,000 | | | 390,695 |
Axis Capital Holdings Ltd., 5.750%, 12/01/2014 | | | | | 80,000 | | | 66,534 |
Marsh & McLennan Cos., Inc.,
5.375%, 7/15/2014 | | | | | 1,190,000 | | | 1,049,308 |
Marsh & McLennan Cos., Inc.,
5.750%, 9/15/2015 | | | | | 775,000 | | | 690,995 |
Marsh & McLennan Cos., Inc.,
5.875%, 8/01/2033 | | | | | 180,000 | | | 119,450 |
Marsh & McLennan Cos., Inc.,
9.250%, 4/15/2019 | | | | | 4,570,000 | | | 4,658,695 |
MBIA Insurance Corp., (fixed rate to 1/15/2013, variable rate thereafter), 14.000%, 1/15/2033, 144A | | | | | 1,545,000 | | | 478,950 |
Travelers Cos., Inc. (The), 6.250%, 6/15/2037 | | | | | 1,925,000 | | | 1,761,313 |
Travelers Property Casualty Corp.,
6.375%, 3/15/2033 | | | | | 1,400,000 | | | 1,305,185 |
White Mountains RE Group,
6.375%, 3/20/2017, 144A | | | | | 2,140,000 | | | 1,561,237 |
| | | | | | | | |
| | | | | | | | 12,082,362 |
| | | | | | | | |
| Railroads – 0.2% | | | | | | | | |
CSX Corp., MTN, 6.000%, 10/01/2036 | | | | | 1,575,000 | | | 1,106,208 |
Missouri Pacific Railroad Co.,
5.000%, 1/01/2045(c) | | | | | 500,000 | | | 275,000 |
| | | | | | | | |
| | | | | | | | 1,381,208 |
| | | | | | | | |
51
| | | | | | | | | |
| | | | | Principal Amount (‡) | | | Value (†) |
| | | | | | | | | |
| | | |
| BONDS AND NOTES – continued | | | | | | | | | |
| | | |
| REITs – 1.4% | | | | | | | | | |
Camden Property Trust, 5.700%, 5/15/2017 | | | | $ | 1,495,000 | | | $ | 1,097,539 |
Colonial Realty LP, 4.750%, 2/01/2010 | | | | | 15,000 | | | | 14,424 |
Duke Realty LP, 5.950%, 2/15/2017 | | | | | 210,000 | | | | 125,589 |
ERP Operating LP, 5.125%, 3/15/2016 | | | | | 70,000 | | | | 55,234 |
Highwoods Properties, Inc., 5.850%, 3/15/2017 | | | | | 3,485,000 | | | | 2,155,037 |
Highwoods Properties, Inc., 7.500%, 4/15/2018 | | | | | 475,000 | | | | 313,023 |
ProLogis, 5.625%, 11/15/2015 | | | | | 100,000 | | | | 54,000 |
ProLogis, 5.750%, 4/01/2016 | | | | | 80,000 | | | | 43,965 |
Realty Income Corp., 6.750%, 8/15/2019 | | | | | 1,000,000 | | | | 690,284 |
Simon Property Group LP, 5.250%, 12/01/2016 | | | | | 1,000,000 | | | | 744,863 |
Simon Property Group LP, 5.300%, 5/30/2013 | | | | | 685,000 | | | | 559,319 |
Simon Property Group LP, 5.750%, 12/01/2015 | | | | | 65,000 | | | | 50,184 |
Simon Property Group LP, 5.875%, 3/01/2017 | | | | | 200,000 | | | | 154,272 |
Simon Property Group LP, 10.350%, 4/01/2019 | | | | | 2,030,000 | | | | 1,972,914 |
| | | | | | | | | |
| | | | | | | | | 8,030,647 |
| | | | | | | | | |
| Restaurants – 0.1% | | | | | | | | | |
McDonald’s Corp., EMTN, 3.628%, 10/10/2010 | | SGD | | | 1,000,000 | | | | 672,784 |
| | | | | | | | | |
| Retailers – 1.5% | | | | | | | | | |
Dillard’s, Inc., 7.750%, 7/15/2026 | | | | | 1,025,000 | | | | 338,250 |
Foot Locker, Inc., 8.500%, 1/15/2022 | | | | | 1,100,000 | | | | 885,500 |
Home Depot, Inc. (The), 5.875%, 12/16/2036 | | | | | 6,693,000 | | | | 4,739,855 |
J.C. Penney Corp., Inc., 6.375%, 10/15/2036 | | | | | 2,110,000 | | | | 1,319,083 |
J.C. Penney Corp., Inc., 7.125%, 11/15/2023 | | | | | 575,000 | | | | 401,610 |
Toys R Us, Inc., 7.375%, 10/15/2018 | | | | | 3,240,000 | | | | 1,036,800 |
Toys R Us, Inc., 7.875%, 4/15/2013 | | | | | 750,000 | | | | 263,438 |
| | | | | | | | | |
| | | | | | | | | 8,984,536 |
| | | | | | | | | |
| Sovereigns – 3.0% | | | | | | | | | |
Indonesia Treasury Bond, Series FR43,
10.250%, 7/15/2022 | | IDR | | | 2,915,000,000 | | | | 210,119 |
Indonesia Treasury Bond, Series ZC3,
Zero Coupon Bond, 11/20/2012 | | IDR | | | 7,590,000,000 | | | | 447,617 |
Mexican Fixed Rate Bonds, Series M-10,
8.000%, 12/17/2015 | | MXN | | | 125,000 | (†††) | | | 901,694 |
Mexican Fixed Rate Bonds, Series M-20,
8.000%, 12/07/2023 | | MXN | | | 305,000 | (†††) | | | 2,137,993 |
Mexican Fixed Rate Bonds, Series MI-10,
9.000%, 12/20/2012 | | MXN | | | 1,015,000 | (†††) | | | 7,658,539 |
Republic of Brazil, 10.250%, 1/10/2028 | | BRL | | | 14,885,000 | | | | 5,871,225 |
Republic of Brazil, 12.500%, 1/05/2022 | | BRL | | | 625,000 | | | | 281,550 |
Republic of Iceland, Zero Coupon Bond, 4/15/2009 | | ISK | | | 50,000,000 | | | | 242,280 |
Republic of Iceland, 7.000%, 3/17/2010 | | ISK | | | 21,715,000 | | | | 103,438 |
Republic of Iceland, 8.500%, 6/12/2009 | | ISK | | | 29,080,000 | | | | 140,293 |
| | | | | | | | | |
| | | | | | | | | 17,994,748 |
| | | | | | | | | |
| Supermarkets – 1.4% | | | | | | | | | |
American Stores Co., 8.000%, 6/01/2026 | | | | | 25,000 | | | | 21,375 |
New Albertson’s, Inc., 7.450%, 8/01/2029 | | | | | 6,515,000 | | | | 5,407,450 |
New Albertson’s, Inc., 7.750%, 6/15/2026 | | | | | 1,470,000 | | | | 1,231,125 |
New Albertson’s, Inc., 8.000%, 5/01/2031 | | | | | 565,000 | | | | 461,887 |
New Albertson’s, Inc., 8.700%, 5/01/2030 | | | | | 5,000 | | | | 4,275 |
52
PORTFOLIO OF INVESTMENTS – as of March 31, 2009 (Unaudited)
Loomis Sayles Fixed Income Fund – continued
| | | | | | | | |
| | | | | Principal Amount (‡) | | Value (†) |
| | | | | | | | |
| | | |
| BONDS AND NOTES – continued | | | | | | | | |
| | | |
| Supermarkets – continued | | | | | | | | |
New Albertson’s, Inc., Series C, MTN,
6.625%, 6/01/2028 | | | | $ | 1,745,000 | | $ | 1,282,575 |
| | | | | | | | |
| | | | | | | | 8,408,687 |
| | | | | | | | |
| Supranational – 6.8% | | | | | | | | |
Eurofima, EMTN, 11.000%, 2/05/2010 | | ISK | | | 20,000,000 | | | 99,975 |
European Investment Bank, EMTN,
4.600%, 1/30/2037, 144A | | CAD | | | 6,000,000 | | | 4,369,749 |
Inter-American Development Bank, EMTN, Zero Coupon Bond, 5/11/2009 | | BRL | | | 30,000,000 | | | 12,738,442 |
Inter-American Development Bank, EMTN,
6.000%, 12/15/2017 | | NZD | | | 19,735,000 | | | 11,131,685 |
International Bank for Reconstruction & Development, 1.430%, 3/05/2014 | | SGD | | | 17,000,000 | | | 10,919,590 |
International Bank for Reconstruction & Development, 9.500%, 5/27/2010 | | ISK | | | 210,000,000 | | | 1,031,499 |
Nordic Investment Bank, EMTN,
11.250%, 4/16/2009 | | ISK | | | 4,800,000 | | | 23,424 |
| | | | | | | | |
| | | | | | | | 40,314,364 |
| | | | | | | | |
| Technology – 2.3% | | | | | | | | |
Agilent Technologies, Inc., 6.500%, 11/01/2017 | | | | | 5,215,000 | | | 4,273,301 |
Amkor Technology, Inc., 7.125%, 3/15/2011 | | | | | 725,000 | | | 671,531 |
Amkor Technology, Inc., 7.750%, 5/15/2013 | | | | | 470,000 | | | 378,350 |
Arrow Electronics, Inc., 6.875%, 7/01/2013 | | | | | 2,850,000 | | | 2,713,974 |
Avnet, Inc., 6.000%, 9/01/2015 | | | | | 1,645,000 | | | 1,353,590 |
Avnet, Inc., 6.625%, 9/15/2016 | | | | | 130,000 | | | 108,279 |
Corning, Inc., 6.200%, 3/15/2016 | | | | | 250,000 | | | 223,610 |
Corning, Inc., 6.850%, 3/01/2029 | | | | | 450,000 | | | 339,689 |
Corning, Inc., 7.250%, 8/15/2036 | | | | | 1,175,000 | | | 885,230 |
Lucent Technologies, Inc., 6.450%, 3/15/2029 | | | | | 250,000 | | | 95,000 |
Motorola, Inc., 5.220%, 10/01/2097 | | | | | 515,000 | | | 207,272 |
Motorola, Inc., 6.500%, 11/15/2028 | | | | | 815,000 | | | 513,450 |
Motorola, Inc., 6.625%, 11/15/2037 | | | | | 995,000 | | | 629,337 |
Nortel Networks Capital Corp.,
7.875%, 6/15/2026(b) | | | | | 150,000 | | | 24,000 |
Nortel Networks Ltd., 6.875%, 9/01/2023(b) | | | | | 1,325,000 | | | 86,125 |
Nortel Networks Ltd., 10.125%, 7/15/2013(b) | | | | | 1,000,000 | | | 187,500 |
Samsung Electronics Co. Ltd.,
7.700%, 10/01/2027, 144A | | | | | 1,100,100 | | | 1,053,213 |
| | | | | | | | |
| | | | | | | | 13,743,451 |
| | | | | | | | |
| Textile – 0.0% | | | | | | | | |
Kellwood Co., 7.625%, 10/15/2017(c) | | | | | 3,250,000 | | | 146,250 |
| | | | | | | | |
| Tobacco – 1.7% | | | | | | | | |
Altria Group, Inc., 9.250%, 8/06/2019 | | | | | 6,465,000 | | | 6,912,339 |
Reynolds American, Inc., 6.750%, 6/15/2017 | | | | | 3,320,000 | | | 2,834,261 |
Reynolds American, Inc., 7.250%, 6/15/2037 | | | | | 810,000 | | | 591,438 |
| | | | | | | | |
| | | | | | | | 10,338,038 |
| | | | | | | | |
| Transportation Services – 0.7% | | | | | | | | |
APL Ltd., 8.000%, 1/15/2024(c) | | | | | 2,500,000 | | | 1,756,425 |
Atlas Air, Inc., Series 1999-1B,
7.630%, 7/02/2016(f) | | | | | 1,326,184 | | | 888,543 |
53
| | | | | | | | |
| | | | | Principal Amount (‡) | | Value (†) |
| | | | | | | | |
| | | |
| BONDS AND NOTES – continued | | | | | | | | |
| | | |
| Transportation Services – continued | | | | | | | | |
Atlas Air, Inc., Series 2000-1, Class B,
9.057%, 7/02/2017(f) | | | | $ | 394,351 | | $ | 386,464 |
Atlas Air, Inc., Series B, 7.680%, 1/02/2014(f) | | | | | 1,500,291 | | | 1,125,219 |
| | | | | | | | |
| | | | | | | | 4,156,651 |
| | | | | | | | |
| Treasuries – 16.7% | | | | | | | | |
Canadian Government, 2.750%, 12/01/2010 | | CAD | | | 12,760,000 | | | 10,421,341 |
Canadian Government, 3.750%, 9/01/2011 | | CAD | | | 18,145,000 | | | 15,268,828 |
Canadian Government, 3.750%, 6/01/2012 | | CAD | | | 14,255,000 | | | 12,143,207 |
Canadian Government, 3.750%, 6/01/2019 | | CAD | | | 7,385,000 | | | 6,365,287 |
Canadian Government, 4.250%, 9/01/2009 | | CAD | | | 16,520,000 | | | 13,305,885 |
Canadian Government, 4.250%, 6/01/2018 | | CAD | | | 9,615,000 | | | 8,594,016 |
Canadian Government, 5.250%, 6/01/2012 | | CAD | | | 22,355,000 | | | 19,866,481 |
Norwegian Government, 4.250%, 5/19/2017 | | NOK | | | 56,415,000 | | | 8,775,084 |
Norwegian Government, 5.000%, 5/15/2015 | | NOK | | | 9,425,000 | | | 1,535,360 |
Norwegian Government, 6.000%, 5/16/2011 | | NOK | | | 11,705,000 | | | 1,879,800 |
Norwegian Government, 6.500%, 5/15/2013 | | NOK | | | 8,410,000 | | | 1,431,169 |
| | | | | | | | |
| | | | | | | | 99,586,458 |
| | | | | | | | |
| Wireless – 1.4% | | | | | | | | |
ALLTEL Corp., 6.800%, 5/01/2029 | | | | | 150,000 | | | 138,162 |
ALLTEL Corp., 7.875%, 7/01/2032 | | | | | 2,230,000 | | | 2,266,661 |
Nextel Communications, Inc., Series D,
7.375%, 8/01/2015 | | | | | 4,585,000 | | | 2,430,050 |
Nextel Communications, Inc., Series E,
6.875%, 10/31/2013 | | | | | 745,000 | | | 424,650 |
Nextel Communications, Inc., Series F,
5.950%, 3/15/2014 | | | | | 1,745,000 | | | 968,475 |
Rogers Cable, Inc., 5.500%, 3/15/2014 | | | | | 150,000 | | | 146,648 |
Sprint Capital Corp., 6.875%, 11/15/2028 | | | | | 1,262,000 | | | 769,820 |
Sprint Capital Corp., 6.900%, 5/01/2019 | | | | | 870,000 | | | 613,350 |
Sprint Capital Corp., 8.750%, 3/15/2032 | | | | | 300,000 | | | 201,000 |
Sprint Nextel Corp., 6.000%, 12/01/2016 | | | | | 898,000 | | | 642,070 |
| | | | | | | | |
| | | | | | | | 8,600,886 |
| | | | | | | | |
| Wirelines – 5.9% | | | | | | | | |
AT&T Corp., 6.500%, 3/15/2029 | | | | | 355,000 | | | 311,258 |
AT&T, Inc., 6.500%, 9/01/2037 | | | | | 6,600,000 | | | 5,955,985 |
Bell Canada, MTN, 5.000%, 2/15/2017 | | CAD | | | 155,000 | | | 112,685 |
Bell Canada, MTN, 6.550%, 5/01/2029, 144A | | CAD | | | 195,000 | | | 129,246 |
Bell Canada, MTN, 7.300%, 2/23/2032 | | CAD | | | 690,000 | | | 494,788 |
Bell Canada, Series M-17, 6.100%, 3/16/2035 | | CAD | | | 600,000 | | | 376,033 |
Embarq Corp., 7.082%, 6/01/2016 | | | | | 235,000 | | | 211,500 |
Embarq Corp., 7.995%, 6/01/2036 | | | | | 200,000 | | | 150,000 |
GTE Corp., 6.940%, 4/15/2028 | | | | | 350,000 | | | 313,405 |
Hawaiian Telcom Communications, Inc., Series B, 12.500%, 5/01/2015(b) | | | | | 75,000 | | | 375 |
Level 3 Financing, Inc., 9.250%, 11/01/2014 | | | | | 500,000 | | | 345,000 |
Qwest Capital Funding, Inc., 6.500%, 11/15/2018 | | | | | 3,305,000 | | | 2,247,400 |
Qwest Capital Funding, Inc., 6.875%, 7/15/2028 | | | | | 7,205,000 | | | 4,539,150 |
Qwest Capital Funding, Inc., 7.625%, 8/03/2021 | | | | | 350,000 | | | 248,500 |
Qwest Capital Funding, Inc., 7.750%, 2/15/2031 | | | | | 775,000 | | | 511,500 |
Qwest Corp., 6.875%, 9/15/2033 | | | | | 790,000 | | | 517,450 |
Qwest Corp., 7.200%, 11/10/2026 | | | | | 1,780,000 | | | 1,210,400 |
Qwest Corp., 7.250%, 9/15/2025 | | | | | 1,220,000 | | | 805,200 |
54
PORTFOLIO OF INVESTMENTS – as of March 31, 2009 (Unaudited)
Loomis Sayles Fixed Income Fund – continued
| | | | | | | | |
| | | | | Principal Amount (‡) | | Value (†) |
| | | | | | | | |
| | | |
| BONDS AND NOTES – continued | | | | | | | | |
| | | |
| Wirelines – continued | | | | | | | | |
Telecom Italia Capital SA, 6.000%, 9/30/2034 | | | | $ | 1,330,000 | | $ | 907,398 |
Telecom Italia Capital SA, 6.375%, 11/15/2033 | | | | | 1,320,000 | | | 961,760 |
Telefonica Emisiones SAU, 7.045%, 6/20/2036 | | | | | 11,330,000 | | | 11,641,892 |
Verizon Communications, Inc.,
5.850%, 9/15/2035 | | | | | 3,975,000 | | | 3,377,224 |
| | | | | | | | |
| | | | | | | | 35,368,149 |
| | | | | | | | |
| | | |
| TOTAL NON-CONVERTIBLE BONDS | | | | | | | | |
(Identified Cost $641,164,064) | | | | | | | | 520,445,589 |
| | | | | | | | |
| | | |
| CONVERTIBLE BONDS – 3.1% | | | | | | | | |
| | | |
| Construction Machinery – 0.0% | | | | | | | | |
United Rentals North America, Inc.,
1.875%, 10/15/2023 | | | | | 50,000 | | | 37,000 |
| | | | | | | | |
| Healthcare – 0.1% | | | | | | | | |
Affymetrix, Inc., 3.500%, 1/15/2038 | | | | | 604,000 | | | 317,100 |
Epix Pharmaceuticals, Inc.,
3.000%, 6/15/2024(c)(e) | | | | | 250,000 | | | 50,000 |
| | | | | | | | |
| | | | | | | | 367,100 |
| | | | | | | | |
| Industrial Other – 0.1% | | | | | | | | |
Incyte Corp., 3.500%, 2/15/2011 | | | | | 1,290,000 | | | 638,550 |
| | | | | | | | |
| Lodging – 0.2% | | | | | | | | |
Host Hotels & Resorts, Inc., 2.625%, 4/15/2027, 144A | | | | | 1,430,000 | | | 993,850 |
| | | | | | | | |
| Media Non-Cable – 0.1% | | | | | | | | |
Liberty Media LLC, 3.500%, 1/15/2031 | | | | | 454,134 | | | 162,353 |
Sinclair Broadcast Group, Inc., (Step to 2.000% on 1/15/2011), 4.875%, 7/15/2018(g) | | | | | 500,000 | | | 210,000 |
| | | | | | | | |
| | | | | | | | 372,353 |
| | | | | | | | |
| Non-Captive Diversified – 0.0% | | | | | | | | |
iStar Financial, Inc., 1.935%, 10/01/2012(d) | | | | | 380,000 | | | 114,000 |
| | | | | | | | |
| Pharmaceuticals – 1.1% | | | | | | | | |
Human Genome Sciences, Inc.,
2.250%, 10/15/2011 | | | | | 175,000 | | | 64,313 |
Human Genome Sciences, Inc.,
2.250%, 8/15/2012 | | | | | 205,000 | | | 68,163 |
Nektar Therapeutics, 3.250%, 9/28/2012 | | | | | 1,065,000 | | | 689,587 |
Valeant Pharmaceuticals International,
3.000%, 8/16/2010 | | | | | 1,035,000 | | | 991,012 |
Valeant Pharmaceuticals International,
4.000%, 11/15/2013 | | | | | 1,095,000 | | | 969,075 |
Vertex Pharmaceuticals, Inc., 4.750%, 2/15/2013 | | | | | 2,770,000 | | | 3,639,087 |
| | | | | | | | |
| | | | | | | | 6,421,237 |
| | | | | | | | |
| Pipelines – 0.2% | | | | | | | | |
CenterPoint Energy Resources Corp.,
6.000%, 3/15/2012 | | | | | 1,467,700 | | | 1,449,354 |
| | | | | | | | |
55
| | | | | | | | |
| | | | | Principal Amount (‡) | | Value (†) |
| | | | | | | | |
| | | |
| BONDS AND NOTES – continued | | | | | | | | |
| | | |
| Technology – 0.4% | | | | | | | | |
Kulicke & Soffa Industries, Inc.,
0.875%, 6/01/2012 | | | | $ | 3,585,000 | | $ | 1,698,394 |
Kulicke & Soffa Industries, Inc.,
1.000%, 6/30/2010 | | | | | 380,000 | | | 299,725 |
Maxtor Corp., 5.750%, 3/01/2012(c) | | | | | 363,000 | | | 272,250 |
Nortel Networks Corp., 2.125%, 4/15/2014(b) | | | | | 248,000 | | | 35,340 |
Richardson Electronics Ltd., 7.750%, 12/15/2011 | | | | | 263,000 | | | 210,400 |
| | | | | | | | |
| | | | | | | | 2,516,109 |
| | | | | | | | |
| Textile – 0.0% | | | | | | | | |
Dixie Yarns, Inc., 7.000%, 5/15/2012 | | | | | 74,000 | | | 66,878 |
| | | | | | | | |
| Wirelines – 0.9% | | | | | | | | |
Level 3 Communications, Inc., 2.875%, 7/15/2010 | | | | | 3,870,000 | | | 2,829,937 |
Level 3 Communications, Inc., 6.000%, 9/15/2009 | | | | | 2,685,000 | | | 2,591,025 |
Level 3 Communications, Inc., 6.000%, 3/15/2010 | | | | | 125,000 | | | 106,250 |
Qwest Communications International, Inc., 3.500%, 11/15/2025 | | | | | 250,000 | | | 230,625 |
| | | | | | | | |
| | | | | | | | 5,757,837 |
| | | | | | | | |
| | | |
| TOTAL CONVERTIBLE BONDS | | | | | | | | |
(Identified Cost $22,342,709) | | | | | | | | 18,734,268 |
| | | | | | | | |
| | | |
| MUNICIPALS – 0.3% | | | | | | | | |
| | | |
| Michigan – 0.3% | | | | | | | | |
Michigan Tobacco Settlement Finance Authority,
7.309%, 6/01/2034(c)
(Identified Cost $2,479,857) | | | | | 2,480,000 | | | 1,447,700 |
| | | | | | | | |
| | | |
| TOTAL BONDS AND NOTES | | | | | | | | |
(Identified Cost $665,986,630) | | | | | | | | 540,627,557 |
| | | | | | | | |
| | | |
| BANK LOANS – 0.3% | | | | | | | | |
| | | |
| Consumer Products – 0.0% | | | | | | | | |
Mega Brands, Inc., Term Loan B,
8.750%, 7/26/2012(h) | | | | | 332,416 | | | 90,308 |
| | | | | | | | |
| Food & Beverage – 0.0% | | | | | | | | |
Dole Food Co., Inc., Credit Link Deposit,
2.790%, 4/12/2013(h) | | | | | 17,547 | | | 16,132 |
Dole Food Co., Inc., Tranche B Term Loan,
7.960%, 4/12/2013(h) | | | | | 11,401 | | | 10,482 |
Dole Food Co., Inc., Tranche C Term Loan,
7.969%, 4/12/2013(h) | | | | | 55,443 | | | 50,973 |
| | | | | | | | |
| | | | | | | | 77,587 |
| | | | | | | | |
| Media Non-Cable – 0.1% | | | | | | | | |
Idearc, Inc., Term Loan B,
6.250%, 11/17/2014(b)(h) | | | | | 1,658,463 | | | 646,286 |
Tribune Co., Term Loan X,
5.000%, 6/04/2009(b)(h) | | | | | 74,971 | | | 19,563 |
| | | | | | | | |
| | | | | | | | 665,849 |
| | | | | | | | |
56
PORTFOLIO OF INVESTMENTS – as of March 31, 2009 (Unaudited)
Loomis Sayles Fixed Income Fund – continued
| | | | | | | | |
| | | | | Principal Amount (‡) | | Value (†) |
| | | | | | | | |
| | | |
| BANK LOANS – continued | | | | | | | | |
| | | |
| Supranational – 0.1% | | | | | | | | |
Level 3 Financing, Inc., New Term Loan,
3.309%, 3/13/2014(h) | | | | $ | 345,000 | | $ | 258,968 |
| | | | | | | | |
| Technology – 0.1% | | | | | | | | |
Sungard Data Systems, Inc., Term Loan B,
2.697%, 2/28/2014(h) | | | | | 802,946 | | | 676,434 |
| | | | | | | | |
| Wirelines – 0.0% | | | | | | | | |
Hawaiian Telcom Communications, Inc., Tranche C Term Loan, 4.750%, 6/01/2014(h)(i) | | | | | 475,911 | | | 212,732 |
| | | | | | | | |
| | | |
| TOTAL BANK LOANS | | | | | | | | |
(Identified Cost $3,029,860) | | | | | | | | 1,981,878 |
| | | | | | | | |
| | | |
| | | | | Shares | | |
| | | |
| PREFERRED STOCKS – 1.2% | | | | | | | | |
| | | |
| CONVERTIBLE PREFERRED STOCKS – 0.8% | | | | | | | | |
| | | |
| Automotive – 0.1% | | | | | | | | |
Ford Motor Co. Capital Trust II, 6.500% | | | | | 79,845 | | | 641,155 |
| | | | | | | | |
| Capital Markets – 0.1% | | | | | | | | |
Newell Financial Trust I, 5.250% | | | | | 25,075 | | | 451,350 |
| | | | | | | | |
| Diversified Financial Services – 0.2% | | | | | | | | |
Sovereign Capital Trust, 4.375% | | | | | 55,343 | | | 1,093,024 |
| | | | | | | | |
| Electric Utilities – 0.1% | | | | | | | | |
AES Trust III, 6.750% | | | | | 10,000 | | | 340,000 |
| | | | | | | | |
| Machinery – 0.1% | | | | | | | | |
United Rentals Trust, 6.500% | | | | | 30,199 | | | 332,189 |
| | | | | | | | |
| Oil, Gas & Consumable Fuels – 0.1% | | | | | | | | |
Chesapeake Energy Corp., 4.500% | | | | | 775 | | | 47,663 |
El Paso Energy Capital Trust I, 4.750% | | | | | 20,200 | | | 505,000 |
| | | | | | | | |
| | | | | | | | 552,663 |
| | | | | | | | |
| REITs – 0.0% | | | | | | | | |
FelCor Lodging Trust, Inc., Series A, 7.800% | | | | | 2,500 | | | 9,375 |
| | | | | | | | |
| Semiconductors & Semiconductor Equipment – 0.1% | | | | | | | | |
Lucent Technologies Capital Trust, 7.750% | | | | | 3,715 | | | 1,077,530 |
| | | | | | | | |
| | | |
| TOTAL CONVERTIBLE PREFERRED STOCKS | | | | | | | | |
(Identified Cost $10,672,629) | | | | | | | | 4,497,286 |
| | | | | | | | |
| | | |
| NON-CONVERTIBLE PREFERRED STOCKS – 0.4% | | | | | | | | |
| | | |
| Capital Markets – 0.0% | | | | | | | | |
Lehman Brothers Holdings Capital Trust I, 6.000%(b) | | | | | 2,075 | | | 42 |
Lehman Brothers Holdings, Inc., 5.670%(b) | | | | | 3,878 | | | 23 |
Lehman Brothers Holdings, Inc., 5.940%(b) | | | | | 4,120 | | | 4 |
Lehman Brothers Holdings, Inc., 6.500%(b) | | | | | 18,030 | | | 45 |
Lehman Brothers Holdings, Inc., 7.250%(b) | | | | | 2,025 | | | 1,499 |
Lehman Brothers Holdings, Inc., 7.950%(b) | | | | | 18,522 | | | 102 |
| | | | | | | | |
| | | | | | | | 1,715 |
| | | | | | | | |
57
| | | | | | | |
| | | | | Shares | | Value (†) |
| | | | | | | |
| | |
| NON-CONVERTIBLE PREFERRED STOCKS – continued | | | | | |
| | | |
| Diversified Financial Services – 0.2% | | | | | | | |
Bank of America Corp., 6.375% | | | | 5,000 | | $ | 40,750 |
Bank of America Corp., Series L, 7.250% | | | | 2,844 | | | 1,158,930 |
Preferred Blocker, Inc., 7.000%, 144A | | | | 1,121 | | | 223,184 |
| | | | | | | |
| | | | | | | 1,422,864 |
| | | | | | | |
| Electric Utilities – 0.1% | | | | | | | |
Entergy New Orleans, Inc., 4.360% | | | | 90 | | | 5,979 |
Entergy New Orleans, Inc., 4.750% | | | | 2,876 | | | 199,073 |
MDU Resources Group, Inc., 5.100% | | | | 254 | | | 25,448 |
Public Service Electric & Gas Co., 4.180% | | | | 1,950 | | | 136,539 |
Union Electric Co., 4.500% | | | | 4,670 | | | 312,890 |
Xcel Energy, Inc., 4.110% | | | | 100 | | | 6,947 |
| | | | | | | |
| | | | | | | 686,876 |
| | | | | | | |
| Thrifts & Mortgage Finance – 0.1% | | | | | | | |
Countrywide Capital IV, 6.750% | | | | 20,975 | | | 200,521 |
Federal Home Loan Mortgage Corp., 5.000%(f)(j) | | | | 4,150 | | | 3,735 |
Federal Home Loan Mortgage Corp., 5.570%(f)(j) | | | | 63,750 | | | 24,225 |
Federal Home Loan Mortgage Corp., 5.660%(f)(j) | | | | 18,900 | | | 7,560 |
Federal Home Loan Mortgage Corp., 5.700%(f)(j) | | | | 6,550 | | | 5,437 |
Federal Home Loan Mortgage Corp., 5.790%(f)(j) | | | | 12,100 | | | 9,317 |
Federal Home Loan Mortgage Corp., 5.810%(f)(j) | | | | 4,250 | | | 3,315 |
Federal Home Loan Mortgage Corp., 5.900%(f)(j) | | | | 9,400 | | | 4,324 |
Federal Home Loan Mortgage Corp., 6.000%(f)(j) | | | | 5,350 | | | 4,762 |
Federal Home Loan Mortgage Corp., 6.420%(f)(j) | | | | 3,800 | | | 3,040 |
Federal Home Loan Mortgage Corp., 6.550%(f)(j) | | | | 24,825 | | | 10,178 |
Federal Home Loan Mortgage Corp., 8.375%(f)(j) | | | | 88,575 | | | 40,744 |
Federal National Mortgage Association, 4.750%(f)(j) | | | | 8,200 | | | 5,986 |
Federal National Mortgage Association, 5.125%(f)(j) | | | | 2,900 | | | 2,001 |
Federal National Mortgage Association, 5.375%(f)(j) | | | | 5,800 | | | 8,294 |
Federal National Mortgage Association, 5.810%(f)(j) | | | | 2,400 | | | 2,760 |
Federal National Mortgage Association, 6.750%(f)(j) | | | | 3,750 | | | 1,875 |
Federal National Mortgage Association, 8.250%(f)(j) | | | | 119,675 | | | 84,969 |
| | | | | | | |
| | | | | | | 423,043 |
| | | | | | | |
| | | |
| TOTAL NON-CONVERTIBLE PREFERRED STOCKS | | | | | | | |
(Identified Cost $11,523,389) | | | | | | | 2,534,498 |
| | | | | | | |
| | | |
| TOTAL PREFERRED STOCKS | | | | | | | |
(Identified Cost $22,196,018) | | | | | | | 7,031,784 |
| | | | | | | |
| | | |
| COMMON STOCKS – 0.7% | | | | | | | |
| | | |
| Communications Equipment – 0.5% | | | | | | | |
Corning, Inc. | | | | 205,167 | | | 2,722,566 |
| | | | | | | |
| Containers & Packaging – 0.1% | | | | | | | |
Owens-Illinois, Inc.(f) | | | | 35,353 | | | 510,497 |
| | | | | | | |
| Oil, Gas & Consumable Fuels – 0.1% | | | | | | | |
Chesapeake Energy Corp. | | | | 54,259 | | | 925,659 |
| | | | | | | |
| | | |
| TOTAL COMMON STOCKS | | | | | | | |
(Identified Cost $5,011,989) | | | | | | | 4,158,722 |
| | | | | | | |
58
PORTFOLIO OF INVESTMENTS – as of March 31, 2009 (Unaudited)
Loomis Sayles Fixed Income Fund – continued
| | | | | | | | | |
| | | | | Principal Amount (‡) | | Value (†) | |
| | | | | | | | | |
| | | |
| SHORT-TERM INVESTMENTS – 5.5% | | | | | | | | | |
Repurchase Agreement with State Street Corp.,
dated 3/31/2009 at 0.000%, to be repurchased at $3,331 on 4/01/2009 collateralized by $5,000 U.S. Treasury Bill, due 5/28/2009 valued at $4,999 including accrued interest (Note 2h of Notes to Financial Statements) | | | | $ | 3,331 | | $ | 3,331 | |
Tri-Party Repurchase Agreement with Fixed
Income Clearing Corporation, dated 3/31/2009 at 0.000% to be repurchased at $32,510,155, on 4/01/2009 collateralized by $33,180,000 Federal National Mortgage Association Discount Note, due 6/30/2009 valued at $33,163,410 including accrued interest (Note 2h of Notes to Financial Statements) | | | | | 32,510,155 | | | 32,510,155 | |
| | | | | | | | | |
| | | |
| TOTAL SHORT-TERM INVESTMENTS | | | | | | | | | |
(Identified Cost $32,513,486) | | | | | | | | 32,513,486 | |
| | | | | | | | | |
| | | |
| TOTAL INVESTMENTS – 98.3% | | | | | | | | | |
(Identified Cost $728,737,983)(a) | | | | | | | | 586,313,427 | |
Other assets less liabilities—1.7% | | | | | | | | 10,291,348 | |
| | | | | | | | | |
| | | |
| NET ASSETS – 100.0% | | | | | | | $ | 596,604,775 | |
| | | | | | | | | |
| | |
(†) See Note 2a of Notes to Financial Statements. | | | | | | | |
(‡) Principal amount stated in U.S. dollars unless otherwise noted. | | | | | | | |
(††) Amount shown represents units. One unit represents a principal amount of 25. | | | | |
(†††) Amount shown represents units. One unit represents a principal amount of 100. | | | | |
(a) Federal Tax Information (Amounts exclude certain adjustments made at the end of the Fund’s fiscal year for tax purposes. Such adjustments are primarily due to wash. Amortization of premium on debt securities is excluded for tax purposes.): At March 31, 2009, the net unrealized depreciation on investments based on a cost of $730,189,194 for federal income tax purposes was as follows: | | | | |
Aggregate gross unrealized appreciation for all investments in which there is an excess of value over tax cost | | $ | 10,996,086 | |
Aggregate gross unrealized depreciation for all investments in which there is an excess of tax cost over value | | | (154,871,853 | ) |
| | | | | | | | | |
Net unrealized depreciation | | | | | $ | (143,875,767 | ) |
| | | | | | | | | |
| (b) | Non-income producing due to bankruptcy filing. |
| (c) | Illiquid security. At March 31, 2009, the value of these securities amounted to $18,899,362 or 3.2% of net assets. |
| (d) | Variable rate security. Rate as of March 31, 2009 is disclosed. |
| (e) | Valued by management. At March 31, 2009 the value of these securities amounted to $5,014,135 or 0.8% of net assets. |
| (f) | Non-income producing security. |
| (g) | Step Bond: Coupon is a fixed rate for an initial period then resets at a specified date and rate. |
| (h) | Variable rate security. Rate shown represents the weighted average rate at March 31, 2009. |
| (i) | All or a portion of interest payment is paid in-kind. |
| (j) | Future dividend payments have been eliminated as the issuer has been placed in conservatorship. |
| 144A | Securities exempt from registration under Rule 144A of the Securities Act of 1933. These securities may be resold in transactions exempt from registration, normally to qualified institutional buyers. At March 31, 2009, the total value of these securities amounted to $46,751,972 or 7.8% of net assets. |
| ABS | Asset-Backed Securities |
| EMTN | Euro Medium Term Note |
| GMTN | Global Medium Term Note |
| REITs | Real Estate Investment Trusts |
| | Key to Abbreviations: AUD: Australian Dollar; BRL: Brazilian Real; CAD: Canadian Dollar; EUR: Euro; GBP: British Pound; IDR: Indonesian Rupiah; ISK: Icelandic Krona; KRW: South Korean Won; MXN: Mexican Peso; NOK: Norwegian Krone; NZD: New Zealand Dollar; SGD: Singapore Dollar; THB: Thai Baht |
59
NET ASSET SUMMARY AT MARCH 31, 2009 (Unaudited)
| | | |
Treasuries | | 16.7 | % |
Supranational | | 6.9 | |
Wirelines | | 6.8 | |
Banking | | 6.2 | |
Local Authorities | | 6.1 | |
Media Cable | | 4.1 | |
Electric | | 3.7 | |
Non-Captive Diversified | | 3.4 | |
Sovereigns | | 3.0 | |
Technology | | 2.8 | |
Healthcare | | 2.3 | |
Pipelines | | 2.1 | |
Independent Energy | | 2.1 | |
Property & Casualty Insurance | | 2.0 | |
Other Investments, less than 2% each | | 24.6 | |
Short-Term Investments | | 5.5 | |
| | | |
Total Investments | | 98.3 | |
Other assets less liabilities | | 1.7 | |
| | | |
Net Assets | | 100.0 | % |
| | | |
CURRENCY EXPOSURE AT MARCH 31, 2009 AS A PERCENTAGE OF NET ASSETS (Unaudited)
| | | |
United States Dollar | | 60.7 | % |
Canadian Dollar | | 19.5 | |
Brazilian Real | | 4.2 | |
New Zealand Dollar | | 2.7 | |
Norwegian Krone | | 2.3 | |
Other, less than 2% each | | 8.9 | |
| | | |
Total Investments | | 98.3 | |
Other assets less liabilities | | 1.7 | |
| | | |
Net Assets | | 100.0 | % |
| | | |
See accompanying notes to financial statements.
60
PORTFOLIO OF INVESTMENTS – as of March 31, 2009 (Unaudited)
Loomis Sayles Global Bond Fund
| | | | | | | | |
| | | | | Principal Amount (‡) | | Value (†) |
| | | | | | | | |
| | | |
| BONDS AND NOTES – 93.8% of Net Assets | | | | | | | | |
| | | |
| NON-CONVERTIBLE BONDS – 93.7% | | | | | | | | |
| | | |
| Argentina – 0.3% | | | | | | | | |
Transportadora de Gas del Sur SA,
7.875%, 5/14/2017, 144A | | | | $ | 8,050,000 | | $ | 4,588,500 |
| | | | | | | | |
| Australia – 0.9% | | | | | | | | |
New South Wales Treasury Corp., Series 10RG, 7.000%, 12/01/2010 | | AUD | | | 16,675,000 | | | 12,255,442 |
| | | | | | | | |
| Austria – 1.6% | | | | | | | | |
Oesterreichische Kontrollbank AG,
1.800%, 3/22/2010 | | JPY | | | 1,944,000,000 | | | 19,721,137 |
Sappi Papier Holding AG,
7.500%, 6/15/2032, 144A | | | | | 7,350,000 | | | 3,307,500 |
| | | | | | | | |
| | | | | | | | 23,028,637 |
| | | | | | | | |
| Belgium – 2.7% | | | | | | | | |
Kingdom of Belgium, 5.500%, 9/28/2017 | | EUR | | | 25,555,000 | | | 38,053,819 |
| | | | | | | | |
| Bermuda – 0.5% | | | | | | | | |
Noble Group Ltd., 8.500%, 5/30/2013, 144A | | | | | 4,805,000 | | | 3,771,925 |
White Mountains RE Group,
6.375%, 3/20/2017, 144A | | | | | 5,000,000 | | | 3,647,750 |
| | | | | | | | |
| | | | | | | | 7,419,675 |
| | | | | | | | |
| Brazil – 0.4% | | | | | | | | |
ISA Capital Do Brasil SA,
7.875%, 1/30/2012, 144A | | | | | 1,100,000 | | | 1,050,500 |
Republic of Brazil, 10.250%, 1/10/2028 | | BRL | | | 11,250,000 | | | 4,437,439 |
| | | | | | | | |
| | | | | | | | 5,487,939 |
| | | | | | | | |
| Canada – 2.7% | | | | | | | | |
Bell Aliant Regional Communications,
5.410%, 9/26/2016 | | CAD | | | 4,280,000 | | | 3,088,878 |
Bell Canada, MTN, 5.000%, 2/15/2017 | | CAD | | | 4,035,000 | | | 2,933,440 |
Bell Canada, MTN, 6.550%, 5/01/2029, 144A | | CAD | | | 160,000 | | | 106,048 |
Bell Canada, MTN, 7.300%, 2/23/2032 | | CAD | | | 385,000 | | | 276,078 |
Bell Canada, Series M-17, 6.100%, 3/16/2035 | | CAD | | | 3,090,000 | | | 1,936,568 |
Bombardier, Inc., 7.250%, 11/15/2016, 144A | | EUR | | | 1,000,000 | | | 863,590 |
Canadian Government, 4.250%, 9/01/2009 | | CAD | | | 600,000 | | | 483,265 |
Canadian Government, 4.500%, 6/01/2015 | | CAD | | | 18,813,000 | | | 17,112,996 |
Canadian Pacific Railway Co., 5.750%, 3/15/2033 | | | | | 810,000 | | | 576,001 |
Canadian Pacific Railway Co., 5.950%, 5/15/2037 | | | | | 1,745,000 | | | 1,217,731 |
Kinder Morgan Finance Co., 5.700%, 1/05/2016 | | | | | 2,600,000 | | | 2,184,000 |
Province of Quebec, 1.600%, 5/09/2013 | | JPY | | | 766,000,000 | | | 7,299,306 |
| | | | | | | | |
| | | | | | | | 38,077,901 |
| | | | | | | | |
| Cayman Islands – 2.2% | | | | | | | | |
Embraer Overseas Ltd., 6.375%, 1/24/2017 | | | | | 5,580,000 | | | 4,519,800 |
LPG International, Inc., 7.250%, 12/20/2015 | | | | | 3,010,000 | | | 2,776,725 |
Marfrig Overseas Ltd., 9.625%, 11/16/2016, 144A | | | | | 1,170,000 | | | 702,000 |
Odebrecht Finance Ltd.,
7.500%, 10/18/2017, 144A | | | | | 4,650,000 | | | 4,045,500 |
61
| | | | | | | | |
| | | | | Principal Amount (‡) | | Value (†) |
| | | | | | | | |
| | | |
| BONDS AND NOTES – continued | | | | | | | | |
| | | |
| Cayman Islands – continued | | | | | | | | |
Petrobras International Finance Co.,
5.875%, 3/01/2018 | | | | $ | 15,600,000 | | $ | 14,512,259 |
Vale Overseas Ltd., 6.875%, 11/21/2036 | | | | | 6,578,000 | | | 5,680,359 |
| | | | | | | | |
| | | | | | | | 32,236,643 |
| | | | | | | | |
| France – 5.2% | | | | | | | | |
France Telecom SA, EMTN, 4.750%, 2/21/2017 | | EUR | | | 4,010,000 | | | 5,228,165 |
Government of France, 5.000%, 10/25/2016 | | EUR | | | 20,070,000 | | | 29,770,407 |
Lafarge SA, EMTN, 4.750%, 3/23/2020 | | EUR | | | 3,335,000 | | | 2,789,239 |
Lafarge SA, EMTN, 5.375%, 6/26/2017 | | EUR | | | 2,950,000 | | | 2,814,151 |
PPR SA, EMTN, 4.000%, 1/29/2013 | | EUR | | | 3,235,000 | | | 3,880,713 |
Veolia Environment, 6.000%, 6/01/2018(b) | | | | | 9,900,000 | | | 9,371,855 |
Veolia Environment, EMTN, 5.125%, 5/24/2022 | | EUR | | | 3,970,000 | | | 4,444,630 |
Vivendi, 3.875%, 2/15/2012 | | EUR | | | 2,405,000 | | | 3,136,586 |
Wendel, 4.375%, 8/09/2017 | | EUR | | | 4,550,000 | | | 3,173,693 |
Wendel, 4.875%, 5/26/2016 | | EUR | | | 10,150,000 | | | 7,147,203 |
WPP Finance SA, 5.250%, 1/30/2015 | | EUR | | | 2,400,000 | | | 2,423,239 |
| | | | | | | | |
| | | | | | | | 74,179,881 |
| | | | | | | | |
| Germany – 11.9% | | | | | | | | |
Bertelsmann AG, EMTN, 3.625%, 10/06/2015 | | EUR | | | 9,620,000 | | | 10,570,763 |
Bundesrepublik Deutschland, Series 06,
3.750%, 1/04/2017 | | EUR | | | 10,840,000 | | | 15,343,196 |
Bundesrepublik Deutschland, Series 97,
6.500%, 7/04/2027 | | EUR | | | 5,040,000 | | | 8,823,710 |
Kreditanstalt fuer Wiederaufbau,
1.350%, 1/20/2014 | | JPY | | | 1,494,000,000 | | | 14,972,903 |
Kreditanstalt fuer Wiederaufbau,
1.750%, 3/23/2010 | | JPY | | | 923,000,000 | | | 9,421,351 |
Kreditanstalt fuer Wiederaufbau,
2.500%, 10/11/2010 | | EUR | | | 15,925,000 | | | 21,437,959 |
Kreditanstalt fuer Wiederaufbau,
2.600%, 6/20/2037 | | JPY | | | 1,140,000,000 | | | 11,136,263 |
Kreditanstalt fuer Wiederaufbau, Series INTL, 1.850%, 9/20/2010 | | JPY | | | 834,000,000 | | | 8,559,409 |
Muenchener Hypothekenbank eG,
5.000%, 1/16/2012 | | EUR | | | 11,515,000 | | | 16,250,752 |
Republic of Germany, 4.000%, 1/04/2037 | | EUR | | | 7,639,000 | | | 10,266,398 |
Republic of Germany, 4.000%, 4/13/2012 | | EUR | | | 31,325,000 | | | 44,481,324 |
| | | | | | | | |
| | | | | | | | 171,264,028 |
| | | | | | | | |
| India – 1.2% | | | | | | | | |
Canara Bank Ltd., (fixed rate to 11/28/2016, variable rate thereafter), 6.365%, 11/28/2021 | | | | | 17,350,000 | | | 13,266,973 |
ICICI Bank Ltd., (fixed rate to 4/30/2017, variable rate thereafter), 6.375%, 4/30/2022, 144A | | | | | 7,800,000 | | | 4,385,628 |
| | | | | | | | |
| | | | | | | | 17,652,601 |
| | | | | | | | |
| Indonesia – 0.7% | | | | | | | | |
Indonesia Government International Bond, 7.750%, 1/17/2038, 144A | | | | | 13,125,000 | | | 10,106,250 |
| | | | | | | | |
62
PORTFOLIO OF INVESTMENTS – as of March 31, 2009 (Unaudited)
Loomis Sayles Global Bond Fund – continued
| | | | | | | | |
| | | | | Principal Amount (‡) | | | Value (†) |
| | | | | | | | |
| | | |
| BONDS AND NOTES – continued | | | | | | | | |
| | | |
| Ireland – 2.3% | | | | | | | | |
Depfa ACS Bank, EMTN, 1.650%, 12/20/2016 | | JPY | | 5,200,000,000 | | | $ | 33,506,681 |
| | | | | | | | |
| Italy – 0.6% | | | | | | | | |
Finmeccanica SpA, EMTN, 4.875%, 3/24/2025 | | EUR | | 6,900,000 | | | | 6,839,083 |
Telecom Italia SpA, EMTN, 5.375%, 1/29/2019 | | EUR | | 1,500,000 | | | | 1,623,217 |
| | | | | | | | |
| | | | | | | | 8,462,300 |
| | | | | | | | |
| Japan – 2.5% | | | | | | | | |
Development Bank of Japan, 1.750%, 3/17/2017 | | JPY | | 1,400,000,000 | | | | 14,458,591 |
Japan Government, 0.900%, 9/15/2009 | | JPY | | 1,500,000,000 | | | | 15,197,757 |
Japan Government, 1.400%, 6/20/2011 | | JPY | | 660,000,000 | | | | 6,807,271 |
| | | | | | | | |
| | | | | | | | 36,463,619 |
| | | | | | | | |
| Korea – 1.1% | | | | | | | | |
Export-Import Bank of Korea, 8.125%, 1/21/2014 | | | | 5,000,000 | | | | 5,168,145 |
SK Broadband Co. Ltd., 7.000%, 2/01/2012, 144A | | | | 1,610,000 | | | | 1,440,950 |
SK Telecom Co. Ltd., 6.625%, 7/20/2027, 144A | | | | 11,225,000 | | | | 9,313,955 |
| | | | | | | | |
| | | | | | | | 15,923,050 |
| | | | | | | | |
| Luxembourg – 0.4% | | | | | | | | |
Telecom Italia Capital SA, 4.950%, 9/30/2014 | | | | 3,990,000 | | | | 3,445,090 |
Telecom Italia Capital SA, 5.250%, 10/01/2015 | | | | 1,660,000 | | | | 1,399,636 |
Telecom Italia Capital SA, 6.375%, 11/15/2033 | | | | 1,910,000 | | | | 1,391,637 |
| | | | | | | | |
| | | | | | | | 6,236,363 |
| | | | | | | | |
| Mexico – 1.2% | | | | | | | | |
Axtel SAB de CV, 7.625%, 2/01/2017, 144A | | | | 3,920,000 | | | | 2,587,200 |
Desarrolladora Homex SAB de CV,
7.500%, 9/28/2015 | | | | 8,210,000 | | | | 5,418,600 |
Mexican Fixed Rate Bonds, Series M-20,
8.000%, 12/07/2023 | | MXN | | 1,373,000 | (††) | | | 9,624,473 |
| | | | | | | | |
| | | | | | | | 17,630,273 |
| | | | | | | | |
| Netherlands – 4.0% | | | | | | | | |
Bite Finance International, 5.150%, 3/15/2014, 144A(c) | | EUR | | 2,820,000 | | | | 1,498,661 |
Cemex Finance Europe BV, 4.750%, 3/05/2014 | | EUR | | 12,717,000 | | | | 7,687,592 |
Kingdom of Netherlands, 5.500%, 1/15/2028 | | EUR | | 12,995,000 | | | | 20,163,113 |
Koninklijke KPN NV, 6.500%, 1/15/2016 | | EUR | | 400,000 | | | | 550,742 |
Koninklijke KPN NV, GMTN, 4.750%, 1/17/2017 | | EUR | | 13,445,000 | | | | 16,506,866 |
Linde Finance BV, EMTN, 4.750%, 4/24/2017 | | EUR | | 3,865,000 | | | | 4,771,411 |
Majapahit Holding BV, 7.250%, 6/28/2017, 144A | | | | 3,340,000 | | | | 2,338,000 |
OI European Group BV, 6.875%, 3/31/2017, 144A | | EUR | | 1,000,000 | | | | 1,142,596 |
Wolters Kluwer NV, 5.125%, 1/27/2014 | | EUR | | 1,635,000 | | | | 2,175,085 |
| | | | | | | | |
| | | | | | | | 56,834,066 |
| | | | | | | | |
63
| | | | | | | |
| | | | | Principal Amount (‡) | | Value (†) |
| | | | | | | |
| | | |
| BONDS AND NOTES – continued | | | | | | | |
| | | |
| Norway – 3.6% | | | | | | | |
Norwegian Government, 4.250%, 5/19/2017 | | NOK | | 40,055,000 | | $ | 6,230,364 |
Norwegian Government, 5.500%, 5/15/2009 | | NOK | | 134,220,000 | | | 20,034,235 |
Norwegian Government, 6.500%, 5/15/2013 | | NOK | | 151,560,000 | | | 25,791,677 |
| | | | | | | |
| | | | | | | 52,056,276 |
| | | | | | | |
| Poland – 0.8% | | | | | | | |
Republic of Poland, Series 2BR,
1.020%, 6/09/2009 | | JPY | | 1,200,000,000 | | | 12,033,508 |
| | | | | | | |
| South Africa – 1.0% | | | | | | | |
Edcon Proprietary Ltd.,
4.900%, 6/15/2014, 144A(c) | | EUR | | 8,335,000 | | | 4,152,705 |
Republic of South Africa, EMTN,
4.500%, 4/05/2016 | | EUR | | 9,090,000 | | | 10,009,396 |
| | | | | | | |
| | | | | | | 14,162,101 |
| | | | | | | |
| Spain – 0.1% | | | | | | | |
Telefonica Emisiones SAU, EMTN,
4.375%, 2/02/2016 | | EUR | | 1,100,000 | | | 1,378,917 |
| | | | | | | |
| Supranational – 6.7% | | | | | | | |
Asia Development Bank, 2.350%, 6/21/2027 | | JPY | | 1,700,000,000 | | | 16,602,947 |
European Investment Bank, 1.250%, 9/20/2012 | | JPY | | 684,000,000 | | | 6,907,242 |
European Investment Bank, 1.400%, 6/20/2017 | | JPY | | 6,989,300,000 | | | 68,930,096 |
European Investment Bank, EMTN, Zero Coupon Bond, 4/24/2013, 144A | | IDR | | 90,681,660,000 | | | 3,897,232 |
| | | | | | | |
| | | | | | | 96,337,517 |
| | | | | | | |
| United Arab Emirates – 1.9% | | | | | | | |
Abu Dhabi National Energy Co.,
7.250%, 8/01/2018, 144A(b) | | | | 15,445,000 | | | 14,704,768 |
DP World Ltd., 6.850%, 7/02/2037, 144A(b) | | | | 26,000,000 | | | 12,439,674 |
| | | | | | | |
| | | | | | | 27,144,442 |
| | | | | | | |
| United Kingdom – 4.2% | | | | | | | |
British Sky Broadcasting Group PLC,
6.100%, 2/15/2018, 144A | | | | 9,150,000 | | | 7,962,037 |
BSKYB Finance UK PLC, 5.750%, 10/20/2017 | | GBP | | 4,300,000 | | | 5,644,121 |
Imperial Tobacco Finance PLC, EMTN,
4.375%, 11/22/2013 | | EUR | | 3,300,000 | | | 3,910,525 |
Lloyds TSB Group PLC, 5.875%, 7/08/2014 | | EUR | | 1,235,000 | | | 1,473,444 |
Rexam PLC, 6.750%, 6/01/2013(d) | | | | 13,775,000 | | | 11,950,377 |
Standard Chartered Bank, EMTN,
6.750%, 4/27/2009 | | GBP | | 800,000 | | | 1,147,792 |
United Kingdom Treasury, 4.250%, 6/07/2032 | | GBP | | 6,340,000 | | | 9,408,519 |
United Kingdom Treasury, 5.000%, 3/07/2025 | | GBP | | 11,045,000 | | | 17,901,808 |
Vodafone Group PLC, 5.750%, 3/15/2016 | | | | 435,000 | | | 435,329 |
| | | | | | | |
| | | | | | | 59,833,952 |
| | | | | | | |
| United States – 32.3% | | | | | | | |
Ahold Finance USA, Inc., EMTN,
6.500%, 3/14/2017 | | GBP | | 5,960,000 | | | 7,953,086 |
Altria Group, Inc., 9.250%, 8/06/2019 | | | | 255,000 | | | 272,644 |
American Express Co., 6.150%, 8/28/2017 | | | | 995,000 | | | 824,590 |
American Express Issuance Trust, Series 2005-2, Class A, 0.626%, 8/15/2013(c) | | | | 9,680,000 | | | 8,444,150 |
64
PORTFOLIO OF INVESTMENTS – as of March 31, 2009 (Unaudited)
Loomis Sayles Global Bond Fund – continued
| | | | | | | | |
| | | | | Principal Amount (‡) | | Value (†) |
| | | | | | | | |
| | | |
| BONDS AND NOTES – continued | | | | | | | | |
| | | |
| United States – continued | | | | | | | | |
American Stores Co., Series B, MTN,
7.100%, 3/20/2028 | | | | $ | 1,590,000 | | $ | 1,232,250 |
Biogen Idec, Inc., 6.000%, 3/01/2013 | | | | | 10,850,000 | | | 10,995,108 |
Bristol-Myers Squibb Co., 4.625%, 11/15/2021 | | EUR | | | 3,700,000 | | | 4,509,409 |
Cargill, Inc., 5.600%, 9/15/2012, 144A | | | | | 5,595,000 | | | 5,574,768 |
Chesapeake Energy Corp., 6.250%, 1/15/2017 | | EUR | | | 250,000 | | | 245,791 |
Chesapeake Energy Corp., 6.500%, 8/15/2017 | | | | | 1,990,000 | | | 1,621,850 |
Chesapeake Energy Corp., 6.875%, 11/15/2020 | | | | | 5,615,000 | | | 4,393,737 |
CHS/Community Health Systems, Inc.,
8.875%, 7/15/2015 | | | | | 3,490,000 | | | 3,298,050 |
CIT Group, Inc., 5.500%, 12/01/2014 | | GBP | | | 11,655,000 | | | 7,023,734 |
CIT Group, Inc., EMTN, 3.800%, 11/14/2012 | | EUR | | | 1,100,000 | | | 672,272 |
CIT Group, Inc., EMTN, 4.650%, 9/19/2016 | | EUR | | | 1,000,000 | | | 558,012 |
CIT Group, Inc., EMTN, 5.000%, 5/13/2014 | | EUR | | | 450,000 | | | 257,084 |
CIT Group, Inc., EMTN, 5.500%, 12/20/2016 | | GBP | | | 4,150,000 | | | 2,500,943 |
CIT Group, Inc., GMTN, 4.250%, 9/22/2011 | | EUR | | | 2,100,000 | | | 1,674,036 |
CIT Group, Inc., MTN, 4.250%, 3/17/2015 | | EUR | | | 1,200,000 | | | 765,274 |
Citi Credit Card Issuance Trust, Series 2001-A4, Class A4, 5.375%, 4/10/2013 | | EUR | | | 5,130,000 | | | 6,573,644 |
Citigroup, Inc., 5.000%, 9/15/2014(b) | | | | | 19,620,000 | | | 13,006,118 |
Comcast Corp., 4.950%, 6/15/2016(b) | | | | | 6,300,000 | | | 5,715,914 |
Comcast Corp., 5.900%, 3/15/2016 | | | | | 3,360,000 | | | 3,245,639 |
Comcast Corp., Class A, 5.650%, 6/15/2035 | | | | | 444,000 | | | 351,604 |
Corning, Inc., 5.900%, 3/15/2014 | | | | | 1,675,000 | | | 1,567,090 |
Corning, Inc., 6.200%, 3/15/2016 | | | | | 3,670,000 | | | 3,282,595 |
Couche-Tard US/Finance, 7.500%, 12/15/2013 | | | | | 3,775,000 | | | 3,708,937 |
CSX Corp., 5.600%, 5/01/2017 | | | | | 859,000 | | | 722,581 |
CSX Corp., 6.250%, 3/15/2018 | | | | | 8,075,000 | | | 6,956,289 |
CSX Corp., MTN, 6.000%, 10/01/2036 | | | | | 5,358,000 | | | 3,763,213 |
CVS Caremark Corp., 5.750%, 6/01/2017(b) | | | | | 7,548,000 | | | 7,360,523 |
Delta Air Lines, Inc., Series 2007-1, Class A, 6.821%, 2/10/2024 | | | | | 7,069,897 | | | 4,772,181 |
Delta Air Lines, Inc., Series 2007-1, Class B, 8.021%, 2/10/2024 | | | | | 1,938,605 | | | 1,075,926 |
Embarq Corp., 7.995%, 6/01/2036 | | | | | 3,605,000 | | | 2,703,750 |
Energy Transfer Partners LP, 6.700%, 7/01/2018 | | | | | 9,230,000 | | | 8,354,341 |
Erac USA Finance Co.,
6.375%, 10/15/2017, 144A(b) | | | | | 9,110,000 | | | 5,865,965 |
Erac USA Finance Co.,
7.000%, 10/15/2037, 144A(b) | | | | | 7,227,000 | | | 4,206,562 |
Frontier Communications Corp.,
6.250%, 1/15/2013 | | | | | 6,175,000 | | | 5,596,094 |
Frontier Communications Corp.,
7.125%, 3/15/2019 | | | | | 1,205,000 | | | 945,925 |
Frontier Communications Corp.,
9.000%, 8/15/2031 | | | | | 1,795,000 | | | 1,231,819 |
General Electric Capital Corp., EMTN,
1.000%, 3/21/2012 | | JPY | | | 2,035,000,000 | | | 17,026,506 |
General Electric Capital Corp., EMTN,
1.500%, 4/26/2012 | | JPY | | | 276,000,000 | | | 2,327,746 |
General Electric Capital Corp., Series A, EMTN, 2.960%, 5/18/2012 | | SGD | | | 800,000 | | | 439,182 |
Georgia-Pacific LLC, 7.125%, 1/15/2017, 144A | | | | | 815,000 | | | 753,875 |
65
| | | | | | | | |
| | | | | Principal Amount (‡) | | Value (†) |
| | | | | | | | |
| | | |
| BONDS AND NOTES – continued | | | | | | | | |
| | | |
| United States – continued | | | | | | | | |
Georgia-Pacific LLC, 7.250%, 6/01/2028(b) | | | | $ | 4,540,000 | | $ | 3,155,300 |
Georgia-Pacific LLC, 8.000%, 1/15/2024 | | | | | 180,000 | | | 143,100 |
Georgia-Pacific LLC, 8.875%, 5/15/2031 | | | | | 1,805,000 | | | 1,444,000 |
Goldman Sachs Group, Inc. (The),
2.238%, 5/23/2016(c) | | EUR | | | 8,500,000 | | | 7,796,937 |
Goldman Sachs Group, Inc. (The),
6.875%, 1/18/2038 | | GBP | | | 4,555,000 | | | 4,208,364 |
Goldman Sachs Group, Inc. (The),
7.250%, 4/10/2028 | | GBP | | | 2,050,000 | | | 2,659,590 |
Greenwich Capital Commercial Funding Corp., Series 2005-GG5, Class A2,
5.117%, 4/10/2037(b) | | | | | 11,075,000 | | | 9,926,847 |
Harley-Davidson Funding Corp., Series C,
6.800%, 6/15/2018, 144A(b) | | | | | 13,795,000 | | | 8,950,610 |
HCA, Inc., 5.750%, 3/15/2014 | | | | | 765,000 | | | 501,075 |
HCA, Inc., 6.250%, 2/15/2013 | | | | | 500,000 | | | 375,000 |
HCA, Inc., 6.375%, 1/15/2015 | | | | | 1,170,000 | | | 766,350 |
HCA, Inc., 6.500%, 2/15/2016 | | | | | 2,360,000 | | | 1,545,800 |
HCA, Inc., 7.690%, 6/15/2025 | | | | | 625,000 | | | 325,504 |
HCA, Inc., MTN, 7.580%, 9/15/2025 | | | | | 614,000 | | | 315,050 |
Hilcorp Energy I LP, 7.750%, 11/01/2015, 144A | | | | | 5,680,000 | | | 4,146,400 |
Home Depot, Inc. (The), 5.875%, 12/16/2036 | | | | | 7,900,000 | | | 5,594,630 |
Host Hotels & Resorts LP, 6.875%, 11/01/2014 | | | | | 4,255,000 | | | 3,276,350 |
Host Marriott LP, Series O, 6.375%, 3/15/2015 | | | | | 6,040,000 | | | 4,469,600 |
Host Marriott LP, Series Q, 6.750%, 6/01/2016 | | | | | 3,745,000 | | | 2,733,850 |
International Paper Co., 7.950%, 6/15/2018 | | | | | 7,630,000 | | | 5,815,487 |
JPMorgan Chase & Co., 5.150%, 10/01/2015 | | | | | 6,000,000 | | | 5,289,294 |
Kinder Morgan Energy Partners LP,
5.950%, 2/15/2018(b) | | | | | 10,800,000 | | | 9,832,990 |
KLA-Tencor Corp., 6.900%, 5/01/2018 | | | | | 9,750,000 | | | 7,706,985 |
Kraft Foods, Inc., 6.875%, 2/01/2038 | | | | | 8,065,000 | | | 7,920,128 |
Lucent Technologies, Inc., 6.450%, 3/15/2029 | | | | | 7,950,000 | | | 3,021,000 |
Marsh & McLennan Cos, Inc., 9.250%, 4/15/2019 | | | | | 4,620,000 | | | 4,709,665 |
Medco Health Solutions, Inc., 7.125%, 3/15/2018 | | | | | 9,465,000 | | | 9,393,672 |
Merrill Auto Trust Securitization, Series 2008-1, Class A4A, 6.150%, 4/15/2015 | | | | | 8,155,000 | | | 8,264,495 |
Merrill Lynch/Countrywide Commercial Mortgage Trust, Series 2006-1, Class A2,
5.439%, 2/12/2039 | | | | | 5,755,000 | | | 5,230,812 |
Morgan Stanley, 4.750%, 4/01/2014 | | | | | 9,080,000 | | | 7,423,599 |
Morgan Stanley, 5.375%, 11/14/2013 | | GBP | | | 2,010,000 | | | 2,449,725 |
Motorola, Inc., 6.625%, 11/15/2037 | | | | | 6,000,000 | | | 3,795,000 |
Nabors Industries, Inc., 6.150%, 2/15/2018 | | | | | 6,235,000 | | | 4,878,096 |
National Semiconductor Corp., 6.150%, 6/15/2012 | | | | | 9,275,000 | | | 6,678,000 |
New Albertson’s, Inc., 7.450%, 8/01/2029 | | | | | 5,544,000 | | | 4,601,520 |
New Albertson’s, Inc., 7.750%, 6/15/2026 | | | | | 50,000 | | | 41,875 |
New Albertson’s, Inc., 8.000%, 5/01/2031 | | | | | 1,000,000 | | | 817,500 |
New Albertson’s, Inc., Series C, MTN,
6.625%, 6/01/2028 | | | | | 830,000 | | | 610,050 |
News America, Inc., 6.150%, 3/01/2037 | | | | | 5,730,000 | | | 4,177,812 |
66
PORTFOLIO OF INVESTMENTS – as of March 31, 2009 (Unaudited)
Loomis Sayles Global Bond Fund – continued
| | | | | | | | |
| | | | | Principal Amount (‡) | | Value (†) |
| | | | | | | | |
| | | |
| BONDS AND NOTES – continued | | | | | | | | |
| | | |
| United States – continued | | | | | | | | |
Nextel Communications, Inc., Series D,
7.375%, 8/01/2015 | | | | $ | 5,475,000 | | $ | 2,901,750 |
NGPL Pipeco LLC, 6.514%, 12/15/2012, 144A | | | | | 8,320,000 | | | 7,947,771 |
NGPL PipeCo LLC, 7.119%, 12/15/2017, 144A | | | | | 1,740,000 | | | 1,595,415 |
NGPL PipeCo LLC, 7.768%, 12/15/2037, 144A | | | | | 1,740,000 | | | 1,517,325 |
NiSource Finance Corp., 6.400%, 3/15/2018 | | | | | 5,925,000 | | | 4,794,255 |
Owens & Minor, Inc., 6.350%, 4/15/2016(d) | | | | | 5,630,000 | | | 5,063,172 |
Owens Brockway Glass Container, Inc.,
6.750%, 12/01/2014 | | EUR | �� | | 2,170,000 | | | 2,594,756 |
Philip Morris International, Inc., GMTN,
5.875%, 9/04/2015 | | EUR | | | 8,100,000 | | | 11,018,153 |
ProLogis, 6.625%, 5/15/2018 | | | | | 15,685,000 | | | 7,950,774 |
Qwest Capital Funding, Inc., 6.500%, 11/15/2018 | | | | | 855,000 | | | 581,400 |
Qwest Capital Funding, Inc., 6.875%, 7/15/2028 | | | | | 250,000 | | | 157,500 |
Qwest Capital Funding, Inc., 7.750%, 2/15/2031 | | | | | 1,845,000 | | | 1,217,700 |
Qwest Corp., 6.875%, 9/15/2033 | | | | | 1,815,000 | | | 1,188,825 |
Qwest Corp., 7.200%, 11/10/2026 | | | | | 100,000 | | | 68,000 |
Qwest Corp., 7.250%, 9/15/2025 | | | | | 1,656,000 | | | 1,092,960 |
Qwest Corp., 7.250%, 10/15/2035 | | | | | 5,165,000 | | | 3,357,250 |
Qwest Corp., 7.500%, 6/15/2023 | | | | | 5,285,000 | | | 3,990,175 |
Reynolds American, Inc., 6.750%, 6/15/2017 | | | | | 9,755,000 | | | 8,327,775 |
SLM Corp., Series A, MTN, 5.000%, 10/01/2013 | | | | | 6,465,000 | | | 3,437,880 |
Sprint Capital Corp., 6.900%, 5/01/2019 | | | | | 1,895,000 | | | 1,335,975 |
Sprint Capital Corp., 8.750%, 3/15/2032 | | | | | 655,000 | | | 438,850 |
Textron, Inc., 3.875%, 3/11/2013 | | EUR | | | 11,350,000 | | | 7,549,003 |
Time Warner, Inc., 6.625%, 5/15/2029 | | | | | 7,255,000 | | | 6,124,831 |
Time Warner, Inc., 6.950%, 1/15/2028 | | | | | 2,055,000 | | | 1,815,975 |
TXU Corp., Series P, 5.550%, 11/15/2014 | | | | | 1,390,000 | | | 479,550 |
TXU Corp., Series Q, 6.500%, 11/15/2024 | | | | | 12,560,000 | | | 3,523,394 |
TXU Corp., Series R, 6.550%, 11/15/2034 | | | | | 2,700,000 | | | 731,781 |
U.S. Treasury Note, 1.500%, 12/31/2013 | | | | | 8,000,000 | | | 7,980,000 |
Union Pacific Corp., 5.375%, 6/01/2033 | | | | | 1,198,000 | | | 953,225 |
Union Pacific Corp., 5.650%, 5/01/2017 | | | | | 4,190,000 | | | 4,037,811 |
UnitedHealth Group, Inc., 5.800%, 3/15/2036 | | | | | 2,495,000 | | | 1,931,931 |
UnitedHealth Group, Inc., 6.000%, 2/15/2018(b) | | | | | 6,269,000 | | | 6,023,004 |
Wells Fargo & Co., 4.625%, 11/02/2035 | | GBP | | | 12,030,000 | | | 12,474,373 |
| | | | | | | | |
| | | | | | | | 463,565,408 |
| | | | | | | | |
| Uruguay – 0.7% | | | | | | | | |
Republic of Uruguay, 4.250%, 4/05/2027 | | UYU | | | 467,071,227 | | | 10,260,761 |
| | | | | | | | |
| | | |
| TOTAL NON-CONVERTIBLE BONDS | | | | | | | | |
(Identified Cost $1,595,041,214) | | | | | | | | 1,346,180,550 |
| | | | | | | | |
67
| | | | | | | | |
| | | | | Principal Amount (‡) | | Value (†) |
| | | | | | | | |
| | | |
| CONVERTIBLE BONDS – 0.1% | | | | | | | | |
| | | |
| United States – 0.1% | | | | | | | | |
Hologic, Inc., (Step to Zero Coupon on 12/15/2013), 2.000%, 12/15/2037(e) | | | | $ | 1,920,000 | | $ | 1,310,400 |
| | | | | | | | |
| | | |
| TOTAL CONVERTIBLE BONDS | | | | | | | | |
(Identified Cost $1,321,922) | | | | | | | | 1,310,400 |
| | | | | | | | |
| | | |
| TOTAL BONDS AND NOTES | | | | | | | | |
(Identified Cost $1,596,363,136) | | | | | | | | 1,347,490,950 |
| | | | | | | | |
| | | |
| | | | | | Shares | | | |
| | | |
| PREFERRED STOCKS – 0.1% | | | | | | | | |
| | | |
| NON-CONVERTIBLE PREFERRED STOCKS – 0.1% | | | | | | | | |
| | | |
| United States – 0.1% | | | | | | | | |
Federal Home Loan Mortgage Corp., 8.375%(f)(g) | | | | | 505,450 | | | 232,507 |
Federal National Mortgage Association, 8.250%(f)(g) | | | | | 998,425 | | | 708,882 |
| | | | | | | | |
| | | |
| TOTAL NON-CONVERTIBLE PREFERRED STOCKS | | | | | | | | |
(Identified Cost $38,218,902) | | | | | | | | 941,389 |
| | | | | | | | |
| | | |
| TOTAL PREFERRED STOCKS | | | | | | | | |
(Identified Cost $38,218,902) | | | | | | | | 941,389 |
| | | | | | | | |
| | | |
| | | | | | Principal Amount (‡) | | | |
| | | |
| SHORT-TERM INVESTMENTS – 0.3% | | | | | | | | |
| Tri-Party Repurchase Agreement with Fixed Income Clearing Corporation, dated 3/31/2009 at 0.000% to be repurchased at $5,537,974 on 4/01/2009 collateralized by $65,000 Federal Home Loan Bank, 0.950% due 3/30/2010 valued at $64,838; $5,380,000 Federal National Mortgage Association, 4.750% due 3/12/2010 valued at $5,584,440 including accrued interest (Note 2h of Notes to Financial Statements) (Identified Cost $5,537,974) | | | | $ | 5,537,974 | | | 5,537,974 |
| | | | | | | | |
| | | |
| TOTAL INVESTMENTS – 94.2% | | | | | | | | |
(Identified Cost $1,640,120,012)(a) | | | | | | | | 1,353,970,313 |
Other Assets Less Liabilities—5.8% | | | | | | | | 82,717,329 |
| | | | | | | | |
| | | |
| NET ASSETS – 100.0% | | | | | | | $ | 1,436,687,642 |
| | | | | | | | |
| | |
(‡) Principal amount stated in U.S. dollars unless otherwise noted. | | | | | | |
(†) See Note 2a of Notes to Financial Statements. | | | | | | | | |
(††) Amount shown represents units. One unit represents a principal amount of 100. | | | |
(a) Federal Tax Information (Amounts exclude certain adjustments made at the end of the Fund’s fiscal year for tax purposes. Such adjustments are primarily due to wash sales. Amortization of premium on debt securities is excluded for tax purposes.): At March 31, 2009, the net unrealized depreciation on investments based on a cost of $1,643,276,405 for federal income tax purposes was as follows: | | | |
Aggregate gross unrealized appreciation for all investments in which there is an excess of value over tax cost | | $ | 18,052,881 |
Aggregate gross unrealized depreciation for all investments in which there is an excess of tax cost over value | | | (307,358,973) |
| | | | | | | | |
Net unrealized depreciation | | $ | (289,306,092) |
| | | | | | | | |
68
PORTFOLIO OF INVESTMENTS – as of March 31, 2009 (Unaudited)
Loomis Sayles Global Bond Fund – continued
| (b) | All or portion of this security is held as collateral for open forward foreign currency contracts. |
| (c) | Variable rate security. Rate as of March 31, 2009 is disclosed. |
| (d) | Illiquid security. At March 31, 2009, the value of these securities amounted to $17,013,549 or 1.2% of net assets. |
| (e) | Step Bond: Coupon is a fixed rate for an initial period then resets at a specified date and rate. |
| (f) | Future dividend payments have been eliminated as the issuer has been placed in conservatorship. |
| (g) | Non-income producing security. |
| 144A | Securities exempt from registration under Rule 144A of the Securities Act of 1933. These securities may be resold in transactions exempt from registration, normally to qualified institutional buyers. At March 31, 2009, the total value of these securities amounted to $138,611,660 or 9.6% of net assets. |
| EMTN | Euro Medium Term Note |
| GMTN | Global Medium Term Note |
| | Key to Abbreviations: AUD: Australian Dollar; BRL: Brazilian Real; CAD: Canadian Dollar; EUR: Euro; GBP: British Pound; IDR: Indonesian Rupiah; JPY: Japanese Yen; MXN: Mexican Peso; NOK: Norwegian Krone; SGD: Singapore Dollar; UYU: Uruguayan Peso |
At March 31, 2009, the Fund had the following open forward foreign currency contracts:
| | | | | | | | | | | | | | | |
| Counterparty | | Contract
to
Buy/
Sell | | Delivery
Date | | Currency | | Units | | Value | | Unrealized
Appreciation
(Depreciation) | |
JPMorgan Chase | | Buy | | 6/15/2009 | | Chinese Yuan Renminbi | | 173,000,000 | | $ | 25,326,957 | | $ | (1,117,556 | ) |
JPMorgan Chase | | Sell | | 6/15/2009 | | Chinese Yuan Renminbi | | 173,000,000 | | | 25,326,957 | | | 670,735 | |
UBS | | Sell | | 4/14/2009 | | Japanese Yen | | 1,520,000,000 | | | 15,358,107 | | | 184,292 | |
Barclays Bank | | Sell | | 6/17/2009 | | Japanese Yen | | 2,892,000,000 | | | 29,251,685 | | | 738,205 | |
Barclays Bank | | Sell | | 6/17/2009 | | Japanese Yen | | 1,430,000,000 | | | 14,464,007 | | | (18,833 | ) |
UBS | | Buy | | 4/14/2009 | | South Korean Won | | 21,500,000,000 | | | 15,551,959 | | | 1,568,219 | |
| | | | | | | | | | | | | | | |
| | Total | | | | | | | | | | | $ | 2,025,062 | |
| | | | | | | | | | | | | | | |
NET ASSET SUMMARY AT MARCH 31, 2009 (Unaudited)
| | | |
Treasuries | | 20.4 | % |
Banking | | 9.8 | |
Supranational | | 6.7 | |
Wirelines | | 4.6 | |
Government Guaranteed | | 4.6 | |
Sovereigns | | 4.5 | |
Government Owned—No Guarantee | | 3.3 | |
Pipelines | | 2.5 | |
Non-Captive Diversified | | 2.2 | |
Healthcare | | 2.0 | |
Other Investments, less than 2% each | | 33.3 | |
Short-Term Investments | | 0.3 | |
| | | |
Total Investments | | 94.2 | |
Other assets less liabilities (including open Forward Foreign Currency Contracts) | | 5.8 | |
| | | |
Net Assets | | 100.0 | % |
| | | |
CURRENCY EXPOSURE AT MARCH 31, 2009 AS A PERCENTAGE OF NET ASSETS (Unaudited)
| | | |
United States Dollar | | 37.4 | % |
Euro | | 25.0 | |
Japanese Yen | | 18.4 | |
British Pound | | 5.1 | |
Norwegian Krone | | 3.6 | |
Other, less than 2% each | | 4.7 | |
| | | |
Total Investments | | 94.2 | |
Other assets less liabilities (including open Forward Foreign Currency Contracts) | | 5.8 | |
| | | |
Net Assets | | 100.0 | % |
| | | |
See accompanying notes to financial statements.
69
PORTFOLIO OF INVESTMENTS – as of March 31, 2009 (Unaudited)
Loomis Sayles Inflation Protected Securities Fund
| | | | | | | | |
| | | | | Principal Amount (‡) | | Value (†) |
| | | | | | | | |
| | | |
| BONDS AND NOTES – 96.9% of Net Assets | | | | | | | | |
| | | |
| Automotive – 0.8% | | | | | | | | |
Ford Motor Co., 6.625%, 2/15/2028 | | | | $ | 20,000 | | $ | 5,650 |
Ford Motor Co., 6.625%, 10/01/2028 | | | | | 185,000 | | | 52,263 |
Ford Motor Co., 7.450%, 7/16/2031 | | | | | 140,000 | | | 44,450 |
Ford Motor Co., 7.500%, 8/01/2026 | | | | | 15,000 | | | 4,200 |
| | | | | | | | |
| | | | | | | | 106,563 |
| | | | | | | | |
| Banking – 0.8% | | | | | | | | |
Goldman Sachs Group, Inc. (The),
6.125%, 2/15/2033 | | | | | 10,000 | | | 8,328 |
Goldman Sachs Group, Inc. (The),
6.750%, 10/01/2037 | | | | | 145,000 | | | 98,070 |
| | | | | | | | |
| | | | | | | | 106,398 |
| | | | | | | | |
| Construction Machinery – 0.8% | | | | | | | | |
Joy Global, Inc., 6.625%, 11/15/2036 | | | | | 165,000 | | | 110,099 |
| | | | | | | | |
| Electric – 0.3% | | | | | | | | |
Texas Competitive Electric Holdings Co. LLC, Series A, 10.250%, 11/01/2015 | | | | | 80,000 | | | 40,000 |
TXU Corp., Series Q, 6.500%, 11/15/2024 | | | | | 10,000 | | | 2,805 |
| | | | | | | | |
| | | | | | | | 42,805 |
| | | | | | | | |
| Food & Beverage – 0.8% | | | | | | | | |
Bottling Group LLC, 5.125%, 1/15/2019 | | | | | 40,000 | | | 40,257 |
Dean Foods Co., 6.900%, 10/15/2017 | | | | | 75,000 | | | 66,000 |
| | | | | | | | |
| | | | | | | | 106,257 |
| | | | | | | | |
| Independent Energy – 0.2% | | | | | | | | |
Chesapeake Energy Corp., 6.500%, 8/15/2017 | | | | | 35,000 | | | 28,525 |
| | | | | | | | |
| Lodging – 0.2% | | | | | | | | |
Royal Caribbean Cruises Ltd., 7.500%, 10/15/2027 | | | | | 50,000 | | | 22,500 |
| | | | | | | | |
| Metals & Mining – 0.2% | | | | | | | | |
United States Steel Corp., 6.650%, 6/01/2037 | | | | | 55,000 | | | 30,991 |
| | | | | | | | |
| Non-Captive Consumer – 0.5% | | | | | | | | |
SLM Corp., MTN, 5.050%, 11/14/2014 | | | | | 25,000 | | | 13,234 |
SLM Corp., Series A, MTN, 5.000%, 10/01/2013 | | | | | 30,000 | | | 15,953 |
SLM Corp., Series A, MTN, 5.000%, 4/15/2015 | | | | | 45,000 | | | 20,250 |
SLM Corp., Series A, MTN, 5.375%, 5/15/2014 | | | | | 5,000 | | | 2,591 |
SLM Corp., Series A, MTN, 5.625%, 8/01/2033 | | | | | 45,000 | | | 16,650 |
| | | | | | | | |
| | | | | | | | 68,678 |
| | | | | | | | |
| Non-Captive Diversified – 2.1% | | | | | | | | |
General Electric Capital Corp., Series A, GMTN, 2.960%, 5/18/2012 | | SGD | | | 200,000 | | | 109,796 |
General Electric Capital Corp., Series A, GMTN, 3.485%, 3/08/2012 | | SGD | | | 300,000 | | | 169,217 |
| | | | | | | | |
| | | | | | | | 279,013 |
| | | | | | | | |
| Paper – 0.5% | | | | | | | | |
Georgia-Pacific LLC, 7.700%, 6/15/2015 | | | | | 70,000 | | | 63,350 |
| | | | | | | | |
| Pipelines – 0.2% | | | | | | | | |
Colorado Interstate Gas Co., 5.950%, 3/15/2015 | | | | | 3,000 | | | 2,708 |
Southern Natural Gas Co., 7.350%, 2/15/2031 | | | | | 30,000 | | | 25,248 |
| | | | | | | | |
| | | | | | | | 27,956 |
| | | | | | | | |
70
PORTFOLIO OF INVESTMENTS – as of March 31, 2009 (Unaudited)
Loomis Sayles Inflation Protected Securities Fund – continued
| | | | | | | | |
| | | | | Principal Amount (‡) | | | Value (†) |
| | | | | | | | |
| | | |
| BONDS AND NOTES – continued | | | | | | | | |
| | | |
| Sovereigns – 0.8% | | | | | | | | |
Mexican Fixed Rate Bonds, Series M-10,
8.000%, 12/17/2015 | | MXN | | 15,000 | (††) | | $ | 108,203 |
| | | | | | | | |
| Technology – 1.0% | | | | | | | | |
Agilent Technologies, Inc., 6.500%, 11/01/2017 | | | | 105,000 | | | | 86,040 |
Lucent Technologies, Inc., 6.450%, 3/15/2029 | | | | 90,000 | | | | 34,200 |
Lucent Technologies, Inc., 6.500%, 1/15/2028 | | | | 15,000 | | | | 5,700 |
| | | | | | | | |
| | | | | | | | 125,940 |
| | | | | | | | |
| Textile – 0.1% | | | | | | | | |
Jones Apparel Group, Inc., 6.125%, 11/15/2034 | | | | 10,000 | | | | 5,000 |
| | | | | | | | |
| Tobacco – 1.0% | | | | | | | | |
Altria Group, Inc., 9.950%, 11/10/2038 | | | | 130,000 | | | | 129,728 |
| | | | | | | | |
| Treasuries – 83.9% | | | | | | | | |
U.S. Treasury Inflation Indexed Bond,
1.375%, 7/15/2018 | | | | 269,228 | | | | 267,040 |
U.S. Treasury Inflation Indexed Bond,
1.625%, 1/15/2018 | | | | 846,485 | | | | 855,479 |
U.S. Treasury Inflation Indexed Bond,
1.750%, 1/15/2028 | | | | 226,737 | | | | 217,101 |
U.S. Treasury Inflation Indexed Bond,
2.000%, 1/15/2026 | | | | 143,594 | | | | 141,979 |
U.S. Treasury Inflation Indexed Bond,
2.125%, 1/15/2019 | | | | 186,827 | | | | 198,912 |
U.S. Treasury Inflation Indexed Bond,
2.375%, 1/15/2017 | | | | 847,949 | | | | 900,415 |
U.S. Treasury Inflation Indexed Bond,
2.375%, 1/15/2025(b) | | | | 380,793 | | | | 395,668 |
U.S. Treasury Inflation Indexed Bond,
2.500%, 7/15/2016 | | | | 256,116 | | | | 273,724 |
U.S. Treasury Inflation Indexed Bond,
3.375%, 4/15/2032 | | | | 1,403,457 | | | | 1,803,004 |
U.S. Treasury Inflation Indexed Note,
0.625%, 4/15/2013 | | | | 194,766 | | | | 192,757 |
U.S. Treasury Inflation Indexed Note,
1.625%, 1/15/2015 | | | | 530,698 | | | | 536,005 |
U.S. Treasury Inflation Indexed Note,
1.875%, 7/15/2013 | | | | 672,428 | | | | 689,239 |
U.S. Treasury Inflation Indexed Note,
1.875%, 7/15/2015 | | | | 466,705 | | | | 478,810 |
U.S. Treasury Inflation Indexed Note,
2.000%, 1/15/2014 | | | | 622,690 | | | | 641,565 |
U.S. Treasury Inflation Indexed Note,
2.000%, 7/15/2014 | | | | 632,789 | | | | 653,354 |
U.S. Treasury Inflation Indexed Note,
2.000%, 1/15/2016 | | | | 792,427 | | | | 817,437 |
U.S. Treasury Inflation Indexed Note,
2.375%, 1/15/2027 | | | | 350,695 | | | | 366,257 |
U.S. Treasury Inflation Indexed Note,
2.625%, 7/15/2017 | | | | 998,238 | | | | 1,084,024 |
U.S. Treasury Inflation Indexed Note,
3.000%, 7/15/2012 | | | | 575,338 | | | | 612,196 |
| | | | | | | | |
| | | | | | | | 11,124,966 |
| | | | | | | | |
71
| | | | | | | | |
| | | | | Principal Amount (‡) | | Value (†) |
| | | | | | | | |
| | | |
| BONDS AND NOTES – continued | | | | | | | | |
| | | |
| Wireless – 0.7% | | | | | | | | |
ALLTEL Corp., 7.875%, 7/01/2032 | | | | $ | 20,000 | | $ | 20,328 |
Nextel Communications, Inc., Series D,
7.375%, 8/01/2015 | | | | | 20,000 | | | 10,600 |
Nextel Communications, Inc., Series E,
6.875%, 10/31/2013 | | | | | 5,000 | | | 2,850 |
Nextel Communications, Inc., Series F,
5.950%, 3/15/2014 | | | | | 10,000 | | | 5,550 |
Sprint Capital Corp., 6.875%, 11/15/2028 | | | | | 85,000 | | | 51,850 |
| | | | | | | | |
| | | | | | | | 91,178 |
| | | | | | | | |
| Wirelines – 2.0% | | | | | | | | |
AT&T Corp., 8.000%, 11/15/2031 | | | | | 80,000 | | | 86,895 |
Bell Canada, MTN, 5.000%, 2/15/2017 | | CAD | | | 30,000 | | | 21,810 |
Bell Canada, MTN, 6.550%, 5/01/2029, 144A | | CAD | | | 5,000 | | | 3,314 |
Bell Canada, MTN, 7.300%, 2/23/2032 | | CAD | | | 15,000 | | | 10,756 |
Bell Canada, Series M-17, 6.100%, 3/16/2035 | | CAD | | | 35,000 | | | 21,935 |
Embarq Corp., 7.995%, 6/01/2036 | | | | | 165,000 | | | 123,750 |
| | | | | | | | |
| | | | | | | | 268,460 |
| | | | | | | | |
| | | |
| TOTAL BONDS AND NOTES | | | | | | | | |
(Identified Cost $13,627,252) | | | | | | | | 12,846,610 |
| | | | | | | | |
| | | |
| | | | | Shares | | |
| | | |
| PREFERRED STOCKS – 0.0% | | | | | | | | |
| | | |
| NON-CONVERTIBLE PREFERRED STOCKS – 0.0% | | | | | | | | |
| | | |
| Thrifts & Mortgage Finance – 0.0% | | | | | | | | |
Federal Home Loan Mortgage Corp., 8.375%(c)(d) | | | | | 1,160 | | | 534 |
Federal National Mortgage Association, 8.250%(c)(d) | | | | | 3,500 | | | 2,485 |
| | | | | | | | |
| | | |
| TOTAL NON-CONVERTIBLE PREFERRED STOCKS | | | | | | | | |
(Identified Cost $116,500) | | | | | | | | 3,019 |
| | | | | | | | |
| | | |
| TOTAL PREFERRED STOCKS | | | | | | | | |
(Identified Cost $116,500) | | | | | | | | 3,019 |
| | | | | | | | |
| | | |
| | | | | Principal Amount (‡) | | |
| | | |
| SHORT-TERM INVESTMENTS – 4.1% | | | | | | | | |
| Tri-Party Repurchase Agreement with Fixed Income Clearing Corporation, dated 3/31/2009 at 0.000% to be repurchased at $539,822 on 4/01/2009 collateralized by $555,000 Federal Home Loan Bank, 0.950% due 3/30/2010 valued at $553,613 including accrued interest (Note 2h of Notes to Financial Statements) (Identified Cost $539,822) | | | | $ | 539,822 | | | 539,822 |
| | | | | | | | |
| | | |
| TOTAL INVESTMENTS – 101.0% | | | | | | | | |
(Identified Cost $14,283,574)(a) | | | | | | | | 13,389,451 |
Other assets less liabilities—(1.0)% | | | | | | | | (132,565) |
| | | | | | | | |
| | | |
| NET ASSETS – 100.0% | | | | | | | $ | 13,256,886 |
| | | | | | | | |
72
PORTFOLIO OF INVESTMENTS – as of March 31, 2009 (Unaudited)
Loomis Sayles Inflation Protected Securities Fund – continued
| | | | | | | |
(‡) Principal amount stated in U.S. dollars unless otherwise noted. | | | | | |
(†) See Note 2a of Notes to Financial Statements. | | | | | |
(††) Amount shown represents units. One unit represents a principal amount of 100. | | | |
(a) Federal Tax Information (Amounts exclude certain adjustments made at the end of the Fund’s fiscal year for tax purposes. Such adjustments are primarily due to wash sales. Amortization of premium on debt securities is excluded for tax purposes.): At March 31, 2009, the net unrealized depreciation on investments based on a cost of $14,087,855 for federal income tax purposes was as follows: | | | |
Aggregate gross unrealized appreciation for all investments in which there is an excess of value over tax cost | | $ | 168,511 |
Aggregate gross unrealized depreciation for all investments in which there is an excess of tax cost over value | | | (866,915) |
| | | | | | | |
Net unrealized depreciation | | | | | | $ | (698,404) |
| | | | | | | |
| (b) | All or a portion of this security is held as collateral for open forward foreign currency contracts. |
| (c) | Future dividend payments have been eliminated as the issuer has been placed in conservatorship. |
| (d) | Non-income producing security. |
| 144A | Securities exempt from registration under Rule 144A of the Securities Act of 1933. These securities may be resold in transactions exempt from registration, normally to qualified institutional buyers. At March 31, 2009, the total value of these securities amounted to $3,314 or 0.0% of net assets. |
| GMTN | Global Medium Term Note |
Key to Abbreviations: CAD: Canadian Dollar; MXN: Mexican Peso; SGD: Singapore Dollar
At March 31, 2009, the Fund had the following open forward foreign currency contract:
| | | | | | | | | | | | | | |
| Counterparty | | Contract to
Buy/Sell | | Delivery
Date | | Currency | | Units | | Value | | Unrealized Appreciation |
Barclays Bank | | Sell | | 4/23/2009 | | Singapore Dollar | | 400,000 | | $ | 262,852 | | $ | 3,231 |
NET ASSET SUMMARY AT MARCH 31, 2009 (Unaudited)
| | | |
Treasuries | | 83.9 | % |
Non-Captive Diversified | | 2.1 | |
Wirelines | | 2.0 | |
Other Investments, less than 2% each | | 8.9 | |
Short-Term Investments | | 4.1 | |
| | | |
Total Investments | | 101.0 | |
Other assets less liabilities (including open Forward Foreign Currency Contracts) | | (1.0 | ) |
| | | |
Net Assets | | 100.0 | % |
| | | |
See accompanying notes to financial statements.
73
PORTFOLIO OF INVESTMENTS – as of March 31, 2009 (Unaudited)
Loomis Sayles Institutional High Income Fund
| | | | | | | | |
| | | | | Principal Amount (‡) | | Value (†) |
| | | | | | | | |
| | | |
| BONDS AND NOTES – 80.2% of Net Assets | | | | | | | | |
| | | |
| NON-CONVERTIBLE BONDS – 73.5% | | | | | | | | |
| | | |
| ABS Home Equity – 0.6% | | | | | | | | |
Soundview Home Equity Loan Trust, Series 2006-OPT5, Class 2A3, 0.672%, 7/25/2036(b) | | | | $ | 3,000,000 | | $ | 1,590,000 |
| | | | | | | | |
| Aerospace & Defense – 0.4% | | | | | | | | |
Bombardier, Inc., 7.350%, 12/22/2026 | | CAD | | | 600,000 | | | 309,327 |
Bombardier, Inc., 7.450%, 5/01/2034, 144A | | | | | 1,075,000 | | | 623,500 |
| | | | | | | | |
| | | | | | | | 932,827 |
| | | | | | | | |
| | | |
| Airlines – 0.4% | | | | | | | | |
American Airlines, Inc., Series 93A6,
8.040%, 9/16/2011 | | | | | 23,424 | | | 14,991 |
Continental Airlines, Inc., Series 2000-2, Class B, 8.307%, 10/02/2019 | | | | | 326,771 | | | 233,641 |
Continental Airlines, Inc., Series 2001-1, Class B, 7.373%, 6/15/2017 | | | | | 170,196 | | | 105,522 |
Delta Air Lines, Inc., Series 2007-1, Class B, 8.021%, 2/10/2024 | | | | | 459,385 | | | 254,959 |
Delta Air Lines, Inc., Series 2007-1, Class C, 8.954%, 8/10/2014 | | | | | 550,234 | | | 324,638 |
| | | | | | | | |
| | | | | | | | 933,751 |
| | | | | | | | |
| | | |
| Automotive – 3.1% | | | | | | | | |
Cummins, Inc., 7.125%, 3/01/2028 | | | | | 350,000 | | | 241,068 |
FCE Bank PLC, EMTN, 7.125%, 1/16/2012 | | EUR | | | 150,000 | | | 135,517 |
Ford Motor Co., 6.500%, 8/01/2018 | | | | | 20,000 | | | 5,800 |
Ford Motor Co., 6.625%, 2/15/2028 | | | | | 30,000 | | | 8,475 |
Ford Motor Co., 6.625%, 10/01/2028 | | | | | 1,510,000 | | | 426,575 |
Ford Motor Co., 7.125%, 11/15/2025 | | | | | 190,000 | | | 51,300 |
Ford Motor Co., 7.450%, 7/16/2031 | | | | | 1,685,000 | | | 534,987 |
Ford Motor Co., 7.500%, 8/01/2026 | | | | | 30,000 | | | 8,400 |
Ford Motor Credit Co. LLC, 5.700%, 1/15/2010 | | | | | 2,980,000 | | | 2,552,552 |
Ford Motor Credit Co. LLC, 8.000%, 12/15/2016 | | | | | 940,000 | | | 617,797 |
Ford Motor Credit Co. LLC, 8.625%, 11/01/2010 | | | | | 70,000 | | | 55,755 |
Ford Motor Credit Co. LLC, 9.750%, 9/15/2010 | | | | | 155,000 | | | 127,510 |
Ford Motor Credit Co. LLC, EMTN, 4.875%, 1/15/2010 | | EUR | | | 130,000 | | | 144,220 |
General Motors Corp., 7.400%, 9/01/2025 | | | | | 5,110,000 | | | 587,650 |
General Motors Corp., 8.250%, 7/15/2023 | | | | | 645,000 | | | 79,819 |
GMAC LLC, 5.375%, 6/06/2011, 144A | | | | | 442,000 | | | 313,820 |
Goodyear Tire & Rubber Co. (The), 7.000%, 3/15/2028 | | | | | 2,090,000 | | | 1,170,400 |
Goodyear Tire & Rubber Co. (The), 7.857%, 8/15/2011 | | | | | 135,000 | | | 110,700 |
Goodyear Tire & Rubber Co. (The), 9.000%, 7/01/2015 | | | | | 633,000 | | | 487,410 |
| | | | | | | | |
| | | | | | | | 7,659,755 |
| | | | | | | | |
| | | |
| Banking – 5.7% | | | | | | | | |
Barclays Financial LLC, 4.160%, 2/22/2010, 144A | | THB | | | 50,000,000 | | | 1,395,460 |
Barclays Financial LLC, EMTN, 4.100%, 3/22/2010, 144A | | THB | | | 11,000,000 | | | 304,117 |
Bear Stearns Cos., Inc. (The), 4.650%, 7/02/2018 | | | | | 20,000 | | | 16,666 |
Bear Stearns Cos., Inc. (The), 6.400%, 10/02/2017 | | | | | 5,000 | | | 4,866 |
74
PORTFOLIO OF INVESTMENTS – as of March 31, 2009 (Unaudited)
Loomis Sayles Institutional High Income Fund – continued
| | | | | | | |
| | | | | Principal Amount (‡) | | Value (†) |
| | | | | | | |
| | | |
| BONDS AND NOTES – continued | | | | | | | |
| | | |
| Banking – continued | | | | | | | |
BNP Paribas SA, EMTN, Zero Coupon Bond, 6/13/2011, 144A | | IDR | | 10,477,600,000 | | $ | 586,401 |
Citigroup, Inc., 5.000%, 9/15/2014 | | | | 1,490,000 | | | 987,722 |
Countrywide Home Loans, Inc., Series L, MTN, 4.000%, 3/22/2011 | | | | 120,000 | | | 106,788 |
Goldman Sachs Group, Inc. (The), 5.000%, 10/01/2014 | | | | 1,305,000 | | | 1,179,823 |
Goldman Sachs Group, Inc. (The), 5.150%, 1/15/2014 | | | | 665,000 | | | 606,919 |
Goldman Sachs Group, Inc. (The), 6.125%, 2/15/2033 | | | | 192,000 | | | 159,901 |
Goldman Sachs Group, Inc. (The), 6.750%, 10/01/2037 | | | | 313,000 | | | 211,695 |
JPMorgan Chase & Co., Zero Coupon Bond, 5/17/2010, 144A | | BRL | | 2,200,000 | | | 792,547 |
JPMorgan Chase & Co., Zero Coupon Bond, 3/28/2011, 144A | | IDR | | 18,504,768,000 | | | 1,068,809 |
JPMorgan Chase & Co., Zero Coupon Bond, 3/28/2011, 144A | | IDR | | 5,376,000,000 | | | 310,510 |
JPMorgan Chase London, EMTN, Zero Coupon Bond, 10/21/2010, 144A | | IDR | | 9,533,078,500 | | | 617,278 |
Kaupthing Bank, 1/15/2010, 144A(c) | | | | 200,000 | | | 10,250 |
Kaupthing Bank, Series D, 5.750%, 10/04/2011, 144A(c) | | | | 1,600,000 | | | 82,000 |
Merrill Lynch & Co., Inc., 6.110%, 1/29/2037 | | | | 700,000 | | | 347,908 |
Morgan Stanley, 4.750%, 4/01/2014 | | | | 2,715,000 | | | 2,219,722 |
Morgan Stanley, 5.375%, 10/15/2015 | | | | 100,000 | | | 90,342 |
Morgan Stanley, 6.750%, 4/15/2011 | | | | 315,000 | | | 315,243 |
Morgan Stanley, EMTN, 5.450%, 1/09/2017 | | | | 5,000 | | | 4,375 |
Morgan Stanley, MTN, 6.250%, 8/09/2026 | | | | 615,000 | | | 508,671 |
Morgan Stanley, Series F, MTN, 5.950%, 12/28/2017 | | | | 2,110,000 | | | 1,916,730 |
Rabobank Nederland, EMTN, 10.250%, 9/10/2009, 144A | | ISK | | 71,000,000 | | | 337,683 |
| | | | | | | |
| | | | | | | 14,182,426 |
| | | | | | | |
| Building Materials – 0.9% | | | | | | | |
Masco Corp., 4.800%, 6/15/2015 | | | | 420,000 | | | 270,658 |
Masco Corp., 5.850%, 3/15/2017 | | | | 440,000 | | | 275,216 |
Masco Corp., 6.500%, 8/15/2032 | | | | 400,000 | | | 202,346 |
USG Corp., 6.300%, 11/15/2016 | | | | 2,680,000 | | | 1,420,400 |
| | | | | | | |
| | | | | | | 2,168,620 |
| | | | | | | |
| Chemicals – 1.1% | | | | | | | |
Borden, Inc., 7.875%, 2/15/2023 | | | | 1,824,000 | | | 182,400 |
Borden, Inc., 9.200%, 3/15/2021 | | | | 2,641,000 | | | 264,100 |
Georgia Gulf Corp., 10.750%, 10/15/2016 | | | | 70,000 | | | 4,550 |
Hercules, Inc., 6.500%, 6/30/2029(d) | | | | 1,743,000 | | | 610,050 |
Hexion US Finance Corp/Hexion Nova Scotia Finance ULC, 9.750%, 11/15/2014 | | | | 1,600,000 | | | 352,000 |
Mosaic Global Holdings, Inc., 7.300%, 1/15/2028 | | | | 1,405,000 | | | 1,053,750 |
Mosaic Global Holdings, Inc., 7.375%, 8/01/2018 | | | | 400,000 | | | 378,000 |
| | | | | | | |
| | | | | | | 2,844,850 |
| | | | | | | |
75
| | | | | | | | |
| | | | | Principal Amount (‡) | | Value (†) |
| | | | | | | | |
| | | |
| BONDS AND NOTES – continued | | | | | | | | |
| | | |
| Commercial Mortgage-Backed Securities – 0.3% | | | | | | | | |
Credit Suisse Mortgage Capital Certificates, Series 2007-C5, Class A4, 5.695%, 9/15/2040 | | | | $ | 555,000 | | $ | 362,522 |
JP Morgan Chase Commercial Mortgage Securities Corp., Series 2007-LD11, Class A4, 6.007%, 6/15/2049(b) | | | | | 415,000 | | | 285,420 |
JP Morgan Chase Commercial Mortgage Securities Corp., Series 2007-LDPX, Class A3, 5.420%, 1/15/2049 | | | | | 205,000 | | | 138,543 |
| | | | | | | | |
| | | | | | | | 786,485 |
| | | | | | | | |
| Construction Machinery – 0.5% | | | | | | | | |
United Rentals North America, Inc., 7.000%, 2/15/2014 | | | | | 2,425,000 | | | 1,224,625 |
United Rentals North America, Inc., 7.750%, 11/15/2013 | | | | | 175,000 | | | 95,375 |
| | | | | | | | |
| | | | | | | | 1,320,000 |
| | | | | | | | |
| Electric – 4.2% | | | | | | | | |
AES Corp. (The), 7.750%, 3/01/2014 | | | | | 1,185,000 | | | 1,060,575 |
AES Corp. (The), 7.750%, 10/15/2015 | | | | | 645,000 | | | 562,763 |
Dynegy Holdings, Inc., 7.125%, 5/15/2018 | | | | | 100,000 | | | 53,000 |
Dynegy Holdings, Inc., 7.625%, 10/15/2026 | | | | | 490,000 | | | 205,800 |
Dynegy Holdings, Inc., 7.750%, 6/01/2019 | | | | | 1,250,000 | | | 812,500 |
Dynegy Holdings, Inc., 8.375%, 5/01/2016 | | | | | 250,000 | | | 169,375 |
Midwest Generation LLC, Series B, 8.560%, 1/02/2016 | | | | | 121,046 | | | 112,270 |
NGC Corp. Capital Trust I, Series B, 8.316%, 6/01/2027 | | | | | 1,685,000 | | | 674,000 |
NiSource Finance Corp., 5.250%, 9/15/2017 | | | | | 894,000 | | | 666,406 |
NiSource Finance Corp., 5.400%, 7/15/2014 | | | | | 1,165,000 | | | 932,480 |
NiSource Finance Corp., 6.150%, 3/01/2013 | | | | | 425,000 | | | 371,199 |
NRG Energy, Inc., 7.375%, 2/01/2016 | | | | | 575,000 | | | 534,750 |
Oncor Electric Delivery Co., 6.800%, 9/01/2018, 144A | | | | | 1,000,000 | | | 980,511 |
Quezon Power Philippines Co., 8.860%, 6/15/2017 | | | | | 362,500 | | | 326,250 |
Reliant Energy, Inc., 7.875%, 6/15/2017 | | | | | 1,025,000 | | | 809,750 |
Texas Competitive Electric Holdings Co. LLC, Series A, 10.250%, 11/01/2015 | | | | | 670,000 | | | 335,000 |
TXU Corp., Series P, 5.550%, 11/15/2014 | | | | | 920,000 | | | 317,400 |
TXU Corp., Series Q, 6.500%, 11/15/2024 | | | | | 1,515,000 | | | 424,995 |
TXU Corp., Series R, 6.550%, 11/15/2034 | | | | | 420,000 | | | 113,833 |
White Pine Hydro Portfolio LLC, 7.260%, 7/20/2015(d) | | | | | 1,000,000 | | | 899,979 |
| | | | | | | | |
| | | | | | | | 10,362,836 |
| | | | | | | | |
| Entertainment – 0.0% | | | | | | | | |
Six Flags, Inc., 9.625%, 6/01/2014 | | | | | 140,000 | | | 11,550 |
| | | | | | | | |
| Food & Beverage – 1.1% | | | | | | | | |
Chiquita Brands International, Inc., 7.500%, 11/01/2014 | | | | | 940,000 | | | 686,200 |
Dole Food Co., Inc., 7.250%, 6/15/2010 | | | | | 415,000 | | | 381,800 |
Sara Lee Corp., 6.125%, 11/01/2032 | | | | | 690,000 | | | 581,082 |
Tyson Foods, Inc., Class A, 10.500%, 3/01/2014, 144A | | | | | 1,080,000 | | | 1,101,600 |
| | | | | | | | |
| | | | | | | | 2,750,682 |
| | | | | | | | |
| Government Owned – No Guarantee – 0.0% | | | | | | | | |
DP World Ltd., 6.850%, 7/02/2037, 144A | | | | | 200,000 | | | 95,690 |
| | | | | | | | |
76
PORTFOLIO OF INVESTMENTS – as of March 31, 2009 (Unaudited)
Loomis Sayles Institutional High Income Fund – continued
| | | | | | | | |
| | | | | Principal Amount (‡) | | Value (†) |
| | | | | | | | |
| | | |
| BONDS AND NOTES – continued | | | | | | | | |
| | | |
| Healthcare – 4.3% | | | | | | | | |
HCA, Inc., 5.750%, 3/15/2014 | | | | $ | 410,000 | | $ | 268,550 |
HCA, Inc., 6.250%, 2/15/2013 | | | | | 30,000 | | | 22,500 |
HCA, Inc., 6.300%, 10/01/2012 | | | | | 625,000 | | | 521,875 |
HCA, Inc., 6.375%, 1/15/2015 | | | | | 560,000 | | | 366,800 |
HCA, Inc., 6.500%, 2/15/2016 | | | | | 550,000 | | | 360,250 |
HCA, Inc., 6.750%, 7/15/2013 | | | | | 20,000 | | | 14,950 |
HCA, Inc., 7.050%, 12/01/2027 | | | | | 1,000,000 | | | 520,000 |
HCA, Inc., 7.190%, 11/15/2015 | | | | | 265,000 | | | 179,018 |
HCA, Inc., 7.500%, 12/15/2023 | | | | | 395,000 | | | 209,283 |
HCA, Inc., 7.500%, 11/06/2033 | | | | | 4,200,000 | | | 2,100,000 |
HCA, Inc., 7.690%, 6/15/2025 | | | | | 970,000 | | | 505,182 |
HCA, Inc., 8.360%, 4/15/2024 | | | | | 170,000 | | | 95,323 |
HCA, Inc., 9.125%, 11/15/2014 | | | | | 3,000,000 | | | 2,820,000 |
HCA, Inc., MTN, 7.580%, 9/15/2025 | | | | | 560,000 | | | 287,342 |
HCA, Inc., MTN, 7.750%, 7/15/2036 | | | | | 1,445,000 | | | 730,877 |
Tenet Healthcare Corp., 6.875%, 11/15/2031 | | | | | 3,355,000 | | | 1,660,725 |
| | | | | | | | |
| | | | | | | | 10,662,675 |
| | | | | | | | |
| Home Construction – 1.8% | | | | | | | | |
K. Hovnanian Enterprises, Inc., 6.250%, 1/15/2015 | | | | | 185,000 | | | 47,175 |
K. Hovnanian Enterprises, Inc., 6.250%, 1/15/2016 | | | | | 1,068,000 | | | 288,360 |
K. Hovnanian Enterprises, Inc., 6.375%, 12/15/2014 | | | | | 425,000 | | | 116,875 |
K. Hovnanian Enterprises, Inc., 6.500%, 1/15/2014 | | | | | 272,000 | | | 70,720 |
K. Hovnanian Enterprises, Inc., 7.500%, 5/15/2016 | | | | | 755,000 | | | 207,625 |
K. Hovnanian Enterprises, Inc., 7.750%, 5/15/2013 | | | | | 10,000 | | | 2,450 |
KB Home, 7.250%, 6/15/2018 | | | | | 1,260,000 | | | 951,300 |
Lennar Corp., Series B, 5.125%, 10/01/2010 | | | | | 1,320,000 | | | 1,155,000 |
Lennar Corp., Series B, 5.500%, 9/01/2014 | | | | | 95,000 | | | 68,400 |
Lennar Corp., Series B, 5.600%, 5/31/2015 | | | | | 2,000,000 | | | 1,425,000 |
Pulte Homes, Inc., 6.000%, 2/15/2035 | | | | | 400,000 | | | 244,000 |
| | | | | | | | |
| | | | | | | | 4,576,905 |
| | | | | | | | |
| Independent Energy – 1.3% | | | | | | | | |
Chesapeake Energy Corp., 6.250%, 1/15/2017 | | EUR | | | 250,000 | | | 245,791 |
Chesapeake Energy Corp., 6.500%, 8/15/2017 | | | | | 155,000 | | | 126,325 |
Chesapeake Energy Corp., 6.875%, 11/15/2020 | | | | | 515,000 | | | 402,988 |
Connacher Oil and Gas Ltd., 10.250%, 12/15/2015, 144A | | | | | 704,000 | | | 221,760 |
Hilcorp Energy I LP, 7.750%, 11/01/2015, 144A | | | | | 985,000 | | | 719,050 |
Pioneer Natural Resources Co., 5.875%, 7/15/2016 | | | | | 335,000 | | | 247,190 |
Pioneer Natural Resources Co., 6.875%, 5/01/2018 | | | | | 910,000 | | | 668,861 |
Pioneer Natural Resources Co., 7.200%, 1/15/2028 | | | | | 920,000 | | | 564,299 |
| | | | | | | | |
| | | | | | | | 3,196,264 |
| | | | | | | | |
| Industrial Other – 0.1% | | | | | | | | |
Great Lakes Dredge & Dock Corp., 7.750%, 12/15/2013 | | | | | 300,000 | | | 240,000 |
| | | | | | | | |
| Local Authorities – 3.9% | | | | | | | | |
Province of Ontario, Canada, 4.200%, 3/08/2018 | | CAD | | | 12,200,000 | | | 9,765,709 |
| | | | | | | | |
77
| | | | | | | | |
| | | | | Principal Amount (‡) | | Value (†) |
| | | | | | | | |
| | | |
| BONDS AND NOTES – continued | | | | | | | | |
| | | |
| Lodging – 0.4% | | | | | | | | |
Felcor Lodging LP, 9.000%, 6/01/2011 | | | | $ | 1,540,000 | | $ | 924,000 |
| | | | | | | | |
| Media Cable – 0.7% | | | | | | | | |
CSC Holdings, Inc., 8.500%, 4/15/2014, 144A | | | | | 1,200,000 | | | 1,182,000 |
Virgin Media Finance PLC, 9.125%, 8/15/2016 | | | | | 685,000 | | | 637,050 |
| | | | | | | | |
| | | | | | | | 1,819,050 |
| | | | | | | | |
| Media Non-Cable – 0.2% | | | | | | | | |
Clear Channel Communications, Inc., 4.900%, 5/15/2015 | | | | | 805,000 | | | 112,700 |
Clear Channel Communications, Inc., 5.500%, 9/15/2014 | | | | | 500,000 | | | 75,000 |
Clear Channel Communications, Inc., 5.500%, 12/15/2016 | | | | | 1,285,000 | | | 179,900 |
Clear Channel Communications, Inc., 5.750%, 1/15/2013 | | | | | 225,000 | | | 33,750 |
Clear Channel Communications, Inc., 6.875%, 6/15/2018 | | | | | 790,000 | | | 114,550 |
R.H. Donnelley Corp., Series A-2, 6.875%, 1/15/2013 | | | | | 510,000 | | | 21,675 |
R.H. Donnelley Corp., Series A-4, 8.875%, 10/15/2017 | | | | | 1,460,000 | | | 76,650 |
| | | | | | | | |
| | | | | | | | 614,225 |
| | | | | | | | |
| Metals & Mining – 2.1% | | | | | | | | |
Algoma Acquisition Corp., 9.875%, 6/15/2015, 144A | | | | | 1,245,000 | | | 479,325 |
Ryerson, Inc., 12.250%, 11/01/2015, 144A | | | | | 775,000 | | | 399,125 |
United States Steel Corp., 6.050%, 6/01/2017 | | | | | 4,155,000 | | | 2,570,802 |
United States Steel Corp., 6.650%, 6/01/2037 | | | | | 1,095,000 | | | 617,011 |
United States Steel Corp., 7.000%, 2/01/2018 | | | | | 1,845,000 | | | 1,259,058 |
| | | | | | | | |
| | | | | | | | 5,325,321 |
| | | | | | | | |
| Non-Captive Consumer – 1.2% | | | | | | | | |
American General Finance Corp., MTN, 5.750%, 9/15/2016 | | | | | 700,000 | | | 253,203 |
SLM Corp., Series A, MTN, 6.500%, 6/15/2010(d)(e) | | NZD | | | 4,720,000 | | | 1,957,243 |
SLM Corp., Series A, MTN, 8.450%, 6/15/2018 | | | | | 1,620,000 | | | 875,008 |
| | | | | | | | |
| | | | | | | | 3,085,454 |
| | | | | | | | |
| Non-Captive Diversified – 4.1% | | | | | | | | |
CIT Group Funding Co. of Canada, 5.200%, 6/01/2015 | | | | | 115,000 | | | 67,275 |
CIT Group, Inc., 4.750%, 12/15/2010 | | | | | 205,000 | | | 165,318 |
CIT Group, Inc., 5.400%, 2/13/2012 | | | | | 16,000 | | | 10,315 |
CIT Group, Inc., 5.400%, 1/30/2016 | | | | | 88,000 | | | 52,744 |
CIT Group, Inc., 5.800%, 10/01/2036 | | | | | 200,000 | | | 110,158 |
CIT Group, Inc., 5.850%, 9/15/2016 | | | | | 16,000 | | | 9,049 |
CIT Group, Inc., 12.000%, 12/18/2018, 144A | | | | | 1,112,000 | | | 575,460 |
CIT Group, Inc., EMTN, 3.800%, 11/14/2012 | | EUR | | | 300,000 | | | 183,347 |
CIT Group, Inc., EMTN, 4.650%, 9/19/2016 | | EUR | | | 1,050,000 | | | 585,913 |
CIT Group, Inc., EMTN, 5.000%, 5/13/2014 | | EUR | | | 200,000 | | | 114,260 |
CIT Group, Inc., EMTN, 5.500%, 12/20/2016 | | GBP | | | 300,000 | | | 180,791 |
CIT Group, Inc., GMTN, 4.250%, 2/01/2010 | | | | | 130,000 | | | 111,437 |
78
PORTFOLIO OF INVESTMENTS – as of March 31, 2009 (Unaudited)
Loomis Sayles Institutional High Income Fund – continued
| | | | | | | |
| | | | | Principal Amount (‡) | | Value (†) |
| | | | | | | |
| | | |
| BONDS AND NOTES – continued | | | | | | | |
| | | |
| Non-Captive Diversified – continued | | | | | | | |
CIT Group, Inc., GMTN, 4.250%, 9/22/2011 | | EUR | | 1,750,000 | | $ | 1,395,030 |
CIT Group, Inc., GMTN, 5.000%, 2/13/2014 | | | | 64,000 | | | 37,760 |
CIT Group, Inc., GMTN, 5.000%, 2/01/2015 | | | | 130,000 | | | 79,150 |
CIT Group, Inc., MTN, 4.250%, 3/17/2015 | | EUR | | 1,260,000 | | | 803,537 |
CIT Group, Inc., MTN, 5.125%, 9/30/2014 | | | | 26,000 | | | 15,717 |
CIT Group, Inc., Series A, GMTN, 6.000%, 4/01/2036 | | | | 22,000 | | | 10,372 |
CIT Group, Inc., Series A, MTN, 5.650%, 2/13/2017 | | | | 171,000 | | | 99,030 |
General Electric Capital Corp., 5.625%, 5/01/2018 | | | | 40,000 | | | 34,781 |
General Electric Capital Corp., MTN, 5.875%, 1/14/2038 | | | | 30,000 | | | 21,429 |
General Electric Capital Corp., Series A, EMTN, 6.750%, 9/26/2016(d)(e) | | NZD | | 250,000 | | | 116,916 |
General Electric Capital Corp., Series A, MTN, 4.875%, 3/04/2015 | | | | 205,000 | | | 181,961 |
General Electric Capital Corp., Series A, MTN, 6.500%, 9/28/2015(d)(e) | | NZD | | 3,035,000 | | | 1,428,568 |
GMAC LLC, 6.000%, 12/15/2011, 144A | | | | 937,000 | | | 637,919 |
GMAC LLC, 6.625%, 12/17/2010, 144A | | | | 23,000 | | | 17,020 |
GMAC LLC, 6.625%, 5/15/2012, 144A | | | | 47,000 | | | 31,529 |
GMAC LLC, 6.750%, 12/01/2014, 144A | | | | 149,000 | | | 86,590 |
GMAC LLC, 6.875%, 9/15/2011, 144A | | | | 53,000 | | | 37,663 |
GMAC LLC, 6.875%, 8/28/2012, 144A | | | | 94,000 | | | 63,128 |
GMAC LLC, 7.000%, 2/01/2012, 144A | | | | 110,000 | | | 75,979 |
GMAC LLC, 7.500%, 12/31/2013, 144A | | | | 314,000 | | | 150,934 |
GMAC LLC, 8.000%, 12/31/2018, 144A | | | | 585,000 | | | 169,831 |
GMAC LLC, 8.000%, 11/01/2031, 144A | | | | 208,000 | | | 100,081 |
International Lease Finance Corp., 3.500%, 4/01/2009 | | | | 385,000 | | | 385,000 |
International Lease Finance Corp., 4.750%, 7/01/2009 | | | | 745,000 | | | 700,369 |
International Lease Finance Corp., 5.000%, 4/15/2010 | | | | 335,000 | | | 266,103 |
International Lease Finance Corp., 5.000%, 9/15/2012 | | | | 125,000 | | | 67,967 |
International Lease Finance Corp., Series R, MTN, 5.625%, 9/15/2010 | | | | 250,000 | | | 184,565 |
iStar Financial, Inc., 5.500%, 6/15/2012 | | | | 65,000 | | | 22,100 |
iStar Financial, Inc., 5.650%, 9/15/2011 | | | | 100,000 | | | 41,000 |
iStar Financial, Inc., 5.875%, 3/15/2016 | | | | 20,000 | | | 5,800 |
iStar Financial, Inc., 6.050%, 4/15/2015 | | | | 20,000 | | | 5,800 |
iStar Financial, Inc., 8.625%, 6/01/2013 | | | | 1,770,000 | | | 553,125 |
iStar Financial, Inc., Series B, 5.700%, 3/01/2014 | | | | 70,000 | | | 20,300 |
iStar Financial, Inc., Series B, 5.950%, 10/15/2013 | | | | 565,000 | | | 172,325 |
| | | | | | | |
| | | | | | | 10,185,446 |
| | | | | | | |
| Oil Field Services – 0.1% | | | | | | | |
Complete Production Services, Inc., 8.000%, 12/15/2016 | | | | 195,000 | | | 123,825 |
| | | | | | | |
| Packaging – 0.6% | | | | | | | |
Owens-Illinois, Inc., 7.800%, 5/15/2018 | | | | 1,555,000 | | | 1,508,350 |
| | | | | | | |
79
| | | | | | | | |
| | | | | Principal Amount (‡) | | Value (†) |
| | | | | | | | |
| | | |
| BONDS AND NOTES – continued | | | | | | | | |
| | | |
| Paper – 5.2% | | | | | | | | |
Abitibi Consolidated Co. of Canada, 15.500%, 7/15/2010, 144A | | | | $ | 110,000 | | $ | 17,600 |
Abitibi-Consolidated, Inc., 6.000%, 6/20/2013 | | | | | 250,000 | | | 20,000 |
Abitibi-Consolidated, Inc., 7.400%, 4/01/2018 | | | | | 15,000 | | | 1,350 |
Abitibi-Consolidated, Inc., 7.500%, 4/01/2028 | | | | | 140,000 | | | 11,200 |
Abitibi-Consolidated, Inc., 8.500%, 8/01/2029 | | | | | 15,000 | | | 1,200 |
Abitibi-Consolidated, Inc., 8.850%, 8/01/2030 | | | | | 90,000 | | | 7,200 |
Georgia-Pacific LLC, 7.125%, 1/15/2017, 144A | | | | | 110,000 | | | 101,750 |
Georgia-Pacific LLC, 7.250%, 6/01/2028 | | | | | 1,240,000 | | | 861,800 |
Georgia-Pacific LLC, 7.750%, 11/15/2029 | | | | | 3,425,000 | | | 2,534,500 |
Georgia-Pacific LLC, 8.000%, 1/15/2024 | | | | | 510,000 | | | 405,450 |
Georgia-Pacific LLC, 8.125%, 5/15/2011 | | | | | 2,130,000 | | | 2,116,687 |
Georgia-Pacific LLC, 8.875%, 5/15/2031 | | | | | 2,230,000 | | | 1,784,000 |
Georgia-Pacific LLC, 9.500%, 12/01/2011 | | | | | 470,000 | | | 469,412 |
International Paper Co., 8.700%, 6/15/2038 | | | | | 3,344,000 | | | 2,223,362 |
Jefferson Smurfit Corp., 7.500%, 6/01/2013(c) | | | | | 515,000 | | | 59,869 |
Smurfit-Stone Container Enterprises, Inc., 8.000%, 3/15/2017(c) | | | | | 2,800,000 | | | 325,500 |
Stone Container Finance, 7.375%, 7/15/2014(c) | | | | | 980,000 | | | 142,100 |
Westvaco Corp., 7.950%, 2/15/2031 | | | | | 320,000 | | | 244,626 |
Westvaco Corp., 8.200%, 1/15/2030 | | | | | 1,335,000 | | | 1,052,462 |
Weyerhaeuser Co., 7.375%, 3/15/2032 | | | | | 845,000 | | | 564,647 |
| | | | | | | | |
| | | | | | | | 12,944,715 |
| | | | | | | | |
| Pharmaceuticals – 2.1% | | | | | | | | |
Elan Financial PLC, 7.750%, 11/15/2011 | | | | | 4,525,000 | | | 3,801,000 |
Elan Financial PLC, 8.875%, 12/01/2013 | | | | | 1,735,000 | | | 1,388,000 |
| | | | | | | | |
| | | | | | | | 5,189,000 |
| | | | | | | | |
| Pipelines – 3.5% | | | | | | | | |
Colorado Interstate Gas Co., 5.950%, 3/15/2015 | | | | | 22,000 | | | 19,862 |
El Paso Corp., 6.950%, 6/01/2028 | | | | | 15,000 | | | 10,344 |
El Paso Corp., 7.420%, 2/15/2037 | | | | | 1,055,000 | | | 734,128 |
El Paso Corp., 12.000%, 12/12/2013 | | | | | 2,000,000 | | | 2,105,000 |
El Paso Corp., MTN, 7.800%, 8/01/2031 | | | | | 500,000 | | | 373,601 |
Kinder Morgan Finance Co., 5.700%, 1/05/2016 | | | | | 345,000 | | | 289,800 |
Knight, Inc., 6.500%, 9/01/2012 | | | | | 775,000 | | | 722,687 |
Knight, Inc., Senior Note, 5.150%, 3/01/2015 | | | | | 50,000 | | | 42,000 |
Southern Natural Gas Co., 7.350%, 2/15/2031 | | | | | 95,000 | | | 79,951 |
Tennessee Gas Pipeline Co., 7.000%, 10/15/2028 | | | | | 890,000 | | | 757,085 |
Williams Cos., Inc. (The), 7.500%, 1/15/2031 | | | | | 4,125,000 | | | 3,258,750 |
Williams Cos., Inc. (The), 7.750%, 6/15/2031 | | | | | 70,000 | | | 56,700 |
Williams Cos., Inc. (The), 8.750%, 3/15/2032 | | | | | 430,000 | | | 390,225 |
| | | | | | | | |
| | | | | | | | 8,840,133 |
| | | | | | | | |
| Property & Casualty Insurance – 0.1% | | | | | | | | |
MBIA Insurance Corp., (fixed rate to 1/15/2013, variable rate thereafter), 14.000%, 1/15/2033, 144A | | | | | 690,000 | | | 213,900 |
| | | | | | | | |
| Railroads – 0.1% | | | | | | | | |
Missouri Pacific Railroad Co., 5.000%, 1/01/2045(d) | | | | | 314,000 | | | 172,700 |
Missouri Pacific Railroad Co., Series A, 4.750%, 1/01/2020(d) | | | | | 30,000 | | | 20,175 |
| | | | | | | | |
| | | | | | | | 192,875 |
| | | | | | | | |
80
PORTFOLIO OF INVESTMENTS – as of March 31, 2009 (Unaudited)
Loomis Sayles Institutional High Income Fund – continued
| | | | | | | | | |
| | | | | Principal Amount (‡) | | | Value (†) |
| | | | | | | | | |
| | | |
| BONDS AND NOTES – continued | | | | | | | | | |
| | | |
| REITs – 1.7% | | | | | | | | | |
Highwoods Properties, Inc., 5.850%, 3/15/2017 | | | | $ | 470,000 | | | $ | 290,636 |
ProLogis, 5.500%, 4/01/2012 | | | | | 1,385,000 | | | | 864,782 |
ProLogis, 5.625%, 11/15/2015 | | | | | 100,000 | | | | 54,000 |
ProLogis, 5.625%, 11/15/2016 | | | | | 1,090,000 | | | | 544,784 |
ProLogis, 6.625%, 5/15/2018 | | | | | 1,935,000 | | | | 980,857 |
Simon Property Group LP, 5.250%, 12/01/2016 | | | | | 500,000 | | | | 372,432 |
Simon Property Group LP, 5.750%, 12/01/2015 | | | | | 460,000 | | | | 355,150 |
Simon Property Group LP, 5.875%, 3/01/2017 | | | | | 550,000 | | | | 424,247 |
Simon Property Group LP, 6.125%, 5/30/2018 | | | | | 450,000 | | | | 353,737 |
| | | | | | | | | |
| | | | | | | | | 4,240,625 |
| | | | | | | | | |
| Retailers – 3.5% | | | | | | | | | |
Dillard’s, Inc., 6.625%, 1/15/2018 | | | | | 500,000 | | | | 180,000 |
Dillard’s, Inc., 7.000%, 12/01/2028 | | | | | 450,000 | | | | 153,000 |
Dillard’s, Inc., 7.130%, 8/01/2018 | | | | | 750,000 | | | | 262,500 |
Dillard’s, Inc., 7.750%, 7/15/2026 | | | | | 1,500,000 | | | | 495,000 |
Foot Locker, Inc., 8.500%, 1/15/2022 | | | | | 1,679,000 | | | | 1,351,595 |
Home Depot, Inc. (The), 5.400%, 3/01/2016 | | | | | 1,140,000 | | | | 1,024,747 |
Home Depot, Inc. (The), 5.875%, 12/16/2036 | | | | | 1,110,000 | | | | 786,081 |
Macy’s Retail Holdings, Inc., 6.375%, 3/15/2037 | | | | | 1,738,000 | | | | 967,859 |
Macy’s Retail Holdings, Inc., 7.875%, 7/15/2015 | | | | | 2,365,000 | | | | 1,745,505 |
Toys R Us, Inc., 7.375%, 10/15/2018 | | | | | 5,185,000 | | | | 1,659,200 |
Toys R Us, Inc., 7.875%, 4/15/2013 | | | | | 197,000 | | | | 69,196 |
| | | | | | | | | |
| | | | | | | | | 8,694,683 |
| | | | | | | | | |
| Sovereigns – 4.3% | | | | | | | | | |
Indonesia Government International Bond, 7.750%, 1/17/2038, 144A | | | | | 650,000 | | | | 500,500 |
Indonesia Treasury Bond, Series FR43, 10.250%, 7/15/2022 | | IDR | | | 1,881,000,000 | | | | 135,586 |
Indonesia Treasury Bond, Series ZC3, Zero Coupon Bond, 11/20/2012 | | IDR | | | 4,897,000,000 | | | | 288,799 |
Mexican Fixed Rate Bonds, Series M-20, 8.000%, 12/07/2023 | | MXN | | | 95,000 | (††) | | | 665,932 |
Mexican Fixed Rate Bonds, Series MI-10, 9.000%, 12/20/2012 | | MXN | | | 365,000 | (††) | | | 2,754,056 |
Mexico Government International Bond, Series A, MTN, 6.050%, 1/11/2040 | | | | | 112,000 | | | | 95,760 |
Republic of Brazil, 10.250%, 1/10/2028 | | BRL | | | 4,170,000 | | | | 1,644,811 |
Republic of Iceland, 7.000%, 3/17/2010 | | ISK | | | 18,085,000 | | | | 86,146 |
Republic of Iceland, 8.500%, 6/12/2009 | | ISK | | | 24,240,000 | | | | 116,943 |
Republic of Indonesia, 6.625%, 2/17/2037, 144A | | | | | 3,132,000 | | | | 2,114,100 |
Republic of Indonesia, 11.625%, 3/04/2019, 144A | | | | | 2,100,000 | | | | 2,283,750 |
| | | | | | | | | |
| | | | | | | | | 10,686,383 |
| | | | | | | | | |
| Supermarkets – 1.4% | | | | | | | | | |
American Stores Co., 8.000%, 6/01/2026 | | | | | 110,000 | | | | 94,050 |
American Stores Co., Series B, MTN, 7.100%, 3/20/2028 | | | | | 1,865,000 | | | | 1,445,375 |
New Albertson’s, Inc., 7.450%, 8/01/2029 | | | | | 1,525,000 | | | | 1,265,750 |
New Albertson’s, Inc., 8.000%, 5/01/2031 | | | | | 480,000 | | | | 392,400 |
New Albertson’s, Inc., 8.700%, 5/01/2030 | | | | | 180,000 | | | | 153,900 |
New Albertson’s, Inc., Series C, MTN, 6.625%, 6/01/2028 | | | | | 240,000 | | | | 176,400 |
| | | | | | | | | |
| | | | | | | | | 3,527,875 |
| | | | | | | | | |
81
| | | | | | | |
| | | | | Principal Amount (‡) | | Value (†) |
| | | |
| BONDS AND NOTES – continued | | | | | | | |
| | | |
| Supranational – 2.1% | | | | | | | |
Inter-American Development Bank, EMTN, Zero Coupon Bond, 5/11/2009 | | BRL | | 11,000,000 | | $ | 4,670,762 |
Inter-American Development Bank, EMTN, Zero Coupon Bond, 5/20/2013 | | IDR | | 8,600,000,000 | | | 432,344 |
International Bank for Reconstruction & Development, 9.500%, 5/27/2010 | | ISK | | 42,500,000 | | | 208,756 |
| | | | | | | |
| | | | | | | 5,311,862 |
| | | | | | | |
| Technology – 2.9% | | | | | | | |
Affiliated Computer Services, Inc., 5.200%, 6/01/2015 | | | | 496,000 | | | 407,960 |
Agilent Technologies, Inc., 6.500%, 11/01/2017 | | | | 1,560,000 | | | 1,278,303 |
Amkor Technology, Inc., 7.125%, 3/15/2011 | | | | 785,000 | | | 727,106 |
Amkor Technology, Inc., 7.750%, 5/15/2013 | | | | 2,120,000 | | | 1,706,600 |
Corning, Inc., 6.850%, 3/01/2029 | | | | 701,000 | | | 529,160 |
Freescale Semiconductor, Inc., 10.125%, 12/15/2016 | | | | 1,047,000 | | | 188,460 |
Lucent Technologies, Inc., 6.450%, 3/15/2029 | | | | 4,615,000 | | | 1,753,700 |
Motorola, Inc., 5.220%, 10/01/2097 | | | | 80,000 | | | 32,198 |
Motorola, Inc., 6.500%, 11/15/2028 | | | | 70,000 | | | 44,100 |
Motorola, Inc., 6.625%, 11/15/2037 | | | | 70,000 | | | 44,275 |
Nortel Networks Capital Corp., 7.875%, 6/15/2026(c) | | | | 2,280,000 | | | 364,800 |
Nortel Networks Ltd., 6.875%, 9/01/2023(c) | | | | 1,000,000 | | | 65,000 |
Nortel Networks Ltd., 10.125%, 7/15/2013(c) | | | | 400,000 | | | 75,000 |
| | | | | | | |
| | | | | | | 7,216,662 |
| | | | | | | |
| Textile – 0.2% | | | | | | | |
Jones Apparel Group, Inc., 6.125%, 11/15/2034 | | | | 890,000 | | | 445,000 |
Kellwood Co., 7.625%, 10/15/2017(d) | | | | 500,000 | | | 22,500 |
| | | | | | | |
| | | | | | | 467,500 |
| | | | | | | |
| Transportation Services – 1.7% | | | | | | | |
APL Ltd., 8.000%, 1/15/2024(d) | | | | 2,685,000 | | | 1,886,400 |
Atlas Air, Inc., Series 1999-1B, 7.630%, 7/02/2016(f) | | | | 397,855 | | | 266,563 |
Atlas Air, Inc., Series 1999-1C, 8.770%, 7/02/2012(f) | | | | 399,542 | | | 187,785 |
Atlas Air, Inc., Series 2000-1, Class C, 9.702%, 7/02/2011(f) | | | | 40,344 | | | 20,172 |
Atlas Air, Inc., Series B, 7.680%, 1/02/2014(f) | | | | 2,207,572 | | | 1,655,679 |
Atlas Air, Inc., Series C, 8.010%, 1/02/2010(f) | | | | 289,324 | | | 124,409 |
| | | | | | | |
| | | | | | | 4,141,008 |
| | | | | | | |
| Wireless – 2.0% | | | | | | | |
ALLTEL Corp., 6.800%, 5/01/2029 | | | | 500,000 | | | 460,541 |
ALLTEL Corp., 7.875%, 7/01/2032 | | | | 540,000 | | | 548,878 |
Fairpoint Communications, Inc., 13.125%, 4/01/2018, 144A | | | | 720,000 | | | 165,600 |
Nextel Communications, Inc., Series D, 7.375%, 8/01/2015 | | | | 1,995,000 | | | 1,057,350 |
Nextel Communications, Inc., Series E, 6.875%, 10/31/2013 | | | | 765,000 | | | 436,050 |
Nextel Communications, Inc., Series F, 5.950%, 3/15/2014 | | | | 805,000 | | | 446,775 |
82
PORTFOLIO OF INVESTMENTS – as of March 31, 2009 (Unaudited)
Loomis Sayles Institutional High Income Fund – continued
| | | | | | | | |
| | | | | Principal Amount (‡) | | Value (†) |
| | | | | | | | |
| | | |
| BONDS AND NOTES – continued | | | | | | | | |
| | | |
| Wireless – continued | | | | | | | | |
NII Holdings, Inc., 2.750%, 8/15/2025 | | | | $ | 160,000 | | $ | 145,800 |
Sprint Capital Corp., 6.875%, 11/15/2028 | | | | | 1,325,000 | | | 808,250 |
Sprint Capital Corp., 6.900%, 5/01/2019 | | | | | 615,000 | | | 433,575 |
Sprint Capital Corp., 8.750%, 3/15/2032 | | | | | 215,000 | | | 144,050 |
True Move Co. Ltd., 10.750%, 12/16/2013, 144A | | | | | 600,000 | | | 282,480 |
| | | | | | | | |
| | | | | | | | 4,929,349 |
| | | | | | | | |
| Wirelines – 3.6% | | | | | | | | |
Bell Canada, MTN, 5.000%, 2/15/2017 | | CAD | | | 105,000 | | | 76,335 |
Bell Canada, MTN, 7.300%, 2/23/2032 | | CAD | | | 275,000 | | | 197,198 |
Bell Canada, Series M-17, 6.100%, 3/16/2035 | | CAD | | | 220,000 | | | 137,879 |
Frontier Communications Corp., 7.875%, 1/15/2027 | | | | | 1,830,000 | | | 1,235,250 |
Frontier Communications Corp., 9.000%, 8/15/2031 | | | | | 680,000 | | | 466,650 |
Hawaiian Telcom Communications, Inc., Series B, 12.500%, 5/01/2015(c) | | | | | 50,000 | | | 250 |
Level 3 Financing, Inc., 8.750%, 2/15/2017 | | | | | 590,000 | | | 377,600 |
Level 3 Financing, Inc., 9.250%, 11/01/2014 | | | | | 290,000 | | | 200,100 |
Qwest Capital Funding, Inc., 6.500%, 11/15/2018 | | | | | 1,034,000 | | | 703,120 |
Qwest Capital Funding, Inc., 6.875%, 7/15/2028 | | | | | 800,000 | | | 504,000 |
Qwest Capital Funding, Inc., 7.625%, 8/03/2021 | | | | | 290,000 | | | 205,900 |
Qwest Capital Funding, Inc., 7.750%, 2/15/2031 | | | | | 1,550,000 | | | 1,023,000 |
Qwest Corp., 6.500%, 6/01/2017 | | | | | 210,000 | | | 174,300 |
Qwest Corp., 6.875%, 9/15/2033 | | | | | 1,936,000 | | | 1,268,080 |
Qwest Corp., 7.200%, 11/10/2026 | | | | | 500,000 | | | 340,000 |
Qwest Corp., 7.250%, 9/15/2025 | | | | | 515,000 | | | 339,900 |
Qwest Corp., 7.250%, 10/15/2035 | | | | | 1,407,000 | | | 914,550 |
Qwest Corp., 7.500%, 6/15/2023 | | | | | 1,115,000 | | | 841,825 |
| | | | | | | | |
| | | | | | | | 9,005,937 |
| | | | | | | | |
| | | |
| TOTAL NON-CONVERTIBLE BONDS | | | | | | | | |
(Identified Cost $241,619,913) | | | | | | | | 183,269,203 |
| | | | | | | | |
| | | |
| CONVERTIBLE BONDS – 6.7% | | | | | | | | |
| | | |
| Construction Machinery – 0.0% | | | | | | | | |
United Rentals North America, Inc., 1.875%, 10/15/2023 | | | | | 40,000 | | | 29,600 |
| | | | | | | | |
| Healthcare – 0.4% | | | | | | | | |
Affymetrix, Inc., 3.500%, 1/15/2038 | | | | | 1,216,000 | | | 638,400 |
Epix Pharmaceuticals, Inc., 3.000%, 6/15/2024(d)(e) | | | | | 230,000 | | | 46,000 |
Hologic, Inc., (Step to Zero Coupon on 12/15/2013), 2.000%, 12/15/2037(g) | | | | | 565,000 | | | 385,612 |
| | | | | | | | |
| | | | | | | | 1,070,012 |
| | | | | | | | |
| Industrial Other – 0.2% | | | | | | | | |
Incyte Corp., 3.500%, 2/15/2011 | | | | | 1,100,000 | | | 544,500 |
| | | | | | | | |
| Lodging – 0.4% | | | | | | | | |
Host Hotels & Resorts, Inc., 2.625%, 4/15/2027, 144A | | | | | 1,250,000 | | | 868,750 |
| | | | | | | | |
83
| | | | | | | | |
| | | | | Principal Amount (‡) | | Value (†) |
| | | | | | | | |
| | | |
| BONDS AND NOTES – continued | | | | | | | | |
| | | |
| Media Non-Cable – 0.5% | | | | | | | | |
Liberty Media LLC, 3.500%, 1/15/2031 | | | | $ | 61,927 | | $ | 22,139 |
Sinclair Broadcast Group, Inc., 3.000%, 5/15/2027 | | | | | 603,000 | | | 345,218 |
Sinclair Broadcast Group, Inc., (Step to 2.000% on 1/15/2011), 4.875%, 7/15/2018(g) | | | | | 1,885,000 | | | 791,700 |
| | | | | | | | |
| | | | | | | | 1,159,057 |
| | | | | | | | |
| Pharmaceuticals – 2.4% | | | | | | | | |
Human Genome Sciences, Inc., 2.250%, 10/15/2011 | | | | | 175,000 | | | 64,312 |
Human Genome Sciences, Inc., 2.250%, 8/15/2012 | | | | | 1,290,000 | | | 428,925 |
Nektar Therapeutics, 3.250%, 9/28/2012 | | | | | 1,610,000 | | | 1,042,475 |
Valeant Pharmaceuticals International, 3.000%, 8/16/2010 | | | | | 1,230,000 | | | 1,177,725 |
Valeant Pharmaceuticals International, 4.000%, 11/15/2013 | | | | | 1,080,000 | | | 955,800 |
Vertex Pharmaceuticals, Inc., 4.750%, 2/15/2013 | | | | | 1,805,000 | | | 2,371,319 |
| | | | | | | | |
| | | | | | | | 6,040,556 |
| | | | | | | | |
| Technology – 1.3% | | | | | | | | |
Kulicke & Soffa Industries, Inc., 0.875%, 6/01/2012 | | | | | 1,190,000 | | | 563,762 |
Kulicke & Soffa Industries, Inc., 1.000%, 6/30/2010 | | | | | 425,000 | | | 335,219 |
Maxtor Corp., 5.750%, 3/01/2012(d) | | | | | 1,324,000 | | | 993,000 |
Nortel Networks Corp., 2.125%, 4/15/2014(c) | | | | | 795,000 | | | 113,288 |
Richardson Electronics Ltd., 7.750%, 12/15/2011 | | | | | 132,000 | | | 105,600 |
Teradyne, Inc., 4.500%, 3/15/2014 | | | | | 1,050,000 | | | 1,050,000 |
| | | | | | | | |
| | | | | | | | 3,160,869 |
| | | | | | | | |
| Textile – 0.0% | | | | | | | | |
Dixie Yarns, Inc., 7.000%, 5/15/2012 | | | | | 19,000 | | | 17,171 |
| | | | | | | | |
| Wirelines – 1.5% | | | | | | | | |
Level 3 Communications, Inc., 2.875%, 7/15/2010 | | | | | 2,005,000 | | | 1,466,156 |
Level 3 Communications, Inc., 3.500%, 6/15/2012 | | | | | 155,000 | | | 64,325 |
Level 3 Communications, Inc., 6.000%, 9/15/2009 | | | | | 1,820,000 | | | 1,756,300 |
Level 3 Communications, Inc., 6.000%, 3/15/2010 | | | | | 615,000 | | | 522,750 |
| | | | | | | | |
| | | | | | | | 3,809,531 |
| | | | | | | | |
| | | |
| TOTAL CONVERTIBLE BONDS | | | | | | | | |
(Identified Cost $20,002,109) | | | | | | | | 16,700,046 |
| | | | | | | | |
| | | |
| TOTAL BONDS AND NOTES | | | | | | | | |
(Identified Cost $261,622,022) | | | | | | | | 199,969,249 |
| | | | | | | | |
| | | |
| BANK LOANS – 1.7% | | | | | | | | |
| | | |
| Consumer Products – 0.0% | | | | | | | | |
Mega Brands, Inc., Term Loan B, 8.750%, 7/26/2012(h) | | | | | 99,229 | | | 26,958 |
| | | | | | | | |
| Food & Beverage – 1.1% | | | | | | | | |
Dole Food Co., Inc., Credit Link Deposit, 2.790%, 4/12/2013(h) | | | | | 312,472 | | | 287,280 |
Dole Food Co., Inc., Tranche B Term Loan, 7.960%, 4/12/2013(h) | | | | | 533,068 | | | 490,093 |
Dole Food Co., Inc., Tranche C Term Loan, 7.969%, 4/12/2013(h) | | | | | 1,956,605 | | | 1,798,863 |
| | | | | | | | |
| | | | | | | | 2,576,236 |
| | | | | | | | |
84
PORTFOLIO OF INVESTMENTS – as of March 31, 2009 (Unaudited)
Loomis Sayles Institutional High Income Fund – continued
| | | | | | | | |
| | | | | Principal Amount (‡) | | Value (†) |
| | | | | | | | |
| | | |
| BANK LOANS – continued | | | | | | | | |
| | | |
| Media Non-Cable – 0.1% | | | | | | | | |
Idearc, Inc., Term Loan B, 6.250%, 11/17/2014(c)(h) | | | | $ | 526,353 | | $ | 205,114 |
Tribune Co., Term Loan X, 5.000%, 6/04/2009(c)(h) | | | | | 25,600 | | | 6,680 |
| | | | | | | | |
| | | | | | | | 211,794 |
| | | | | | | | |
| Paper – 0.4% | | | | | | | | |
Smurfit-Stone Container Enterprises, Inc., Offering-CL Deposit, 4.500%, 11/01/2010(h) | | | | | 307,219 | | | 201,357 |
Smurfit-Stone Container Enterprises, Inc., Tranche B Term Loan, 2.750%, 11/01/2011(h) | | | | | 344,626 | | | 225,875 |
Smurfit-Stone Container Enterprises, Inc., Tranche C Term Loan, 2.750%, 11/01/2011(h) | | | | | 649,564 | | | 428,712 |
Smurfit-Stone Container Enterprises, Inc., Tranche C1 Term Loan, 2.750%, 11/01/2011(h) | | | | | 196,392 | | | 129,619 |
| | | | | | | | |
| | | | | | | | 985,563 |
| | | | | | | | |
| Supranational – 0.0% | | | | | | | | |
Level 3 Financing, Inc., New Term Loan, 3.309%, 3/13/2014(h) | | | | | 70,000 | | | 52,544 |
| | | | | | | | |
| Technology – 0.1% | | | | | | | | |
Sungard Data Systems, Inc., Term Loan B, 2.697%, 2/28/2014(h) | | | | | 314,196 | | | 264,692 |
| | | | | | | | |
| Wirelines – 0.0% | | | | | | | | |
Hawaiian Telcom Communications, Inc., Tranche C Term Loan, 4.750%, 6/01/2014(h)(j) | | | | | 155,297 | | | 69,418 |
| | | | | | | | |
| | | |
| TOTAL BANK LOANS | | | | | | | | |
(Identified Cost $4,183,010) | | | | | | | | 4,187,205 |
| | | | | | | | |
| | | |
| | | | | | Shares | | | |
| | | |
| COMMON STOCKS – 2.1% | | | | | | | | |
| | | |
| Biotechnology – 1.0% | | | | | | | | |
Vertex Pharmaceuticals, Inc.(f) | | | | | 82,587 | | | 2,372,725 |
| | | | | | | | |
| Communications Equipment – 0.4% | | | | | | | | |
Corning, Inc. | | | | | 69,766 | | | 925,795 |
| | | | | | | | |
| Containers & Packaging – 0.2% | | | | | | | | |
Owens-Illinois, Inc.(f) | | | | | 40,621 | | | 586,567 |
| | | | | | | | |
| Food Products – 0.0% | | | | | | | | |
ConAgra Foods, Inc. | | | | | 3,100 | | | 52,297 |
| | | | | | | | |
| Household Durables – 0.0% | | | | | | | | |
KB Home | | | | | 6,775 | | | 89,294 |
| | | | | | | | |
| Oil, Gas & Consumable Fuels – 0.0% | | | | | | | | |
Chesapeake Energy Corp. | | | | | 2,846 | | | 48,553 |
| | | | | | | | |
| Pharmaceuticals – 0.4% | | | | | | | | |
Bristol-Myers Squibb Co. | | | | | 43,200 | | | 946,944 |
| | | | | | | | |
| REITs – 0.1% | | | | | | | | |
Apartment Investment & Management Co. | | | | | 6,185 | | | 33,894 |
Associated Estates Realty Corp. | | | | | 32,565 | | | 184,969 |
Developers Diversified Realty Corp. | | | | | 7,125 | | | 15,176 |
| | | | | | | | |
| | | | | | | | 234,039 |
| | | | | | | | |
| | | |
| TOTAL COMMON STOCKS | | | | | | | | |
(Identified Cost $5,183,846) | | | | | | | | 5,256,214 |
| | | | | | | | |
85
| | | | | | | |
| | | | | Shares | | Value (†) |
| | | | | | | |
| | | |
| PREFERRED STOCKS – 1.2% | | | | | | | |
| | | |
| CONVERTIBLE PREFERRED STOCKS – 0.9% | | | | | | | |
| | | |
| Automotive – 0.1% | | | | | | | |
Ford Motor Co. Capital Trust II, 6.500% | | | | 27,177 | | $ | 218,231 |
General Motors Corp., 6.250% | | | | 11,236 | | | 28,540 |
| | | | | | | |
| | | | | | | 246,771 |
| | | | | | | |
| Commercial Banks – 0.0% | | | | | | | |
Wells Fargo & Co., Series L, Class A, 7.500% | | | | 138 | | | 66,100 |
| | | | | | | |
| Diversified Consumer Services – 0.0% | | | | | | | |
Six Flags, Inc., 7.250% | | | | 9,619 | | | 6,541 |
| | | | | | | |
| Diversified Financial Services – 0.2% | | | | | | | |
CIT Group, Inc., 8.750% | | | | 27,994 | | | 509,491 |
| | | | | | | |
| Electric Utilities – 0.3% | | | | | | | |
AES Trust III, 6.750% | | | | 17,119 | | | 582,046 |
CMS Energy Trust I, 7.750%(d)(e) | | | | 4,150 | | | 124,500 |
| | | | | | | |
| | | | | | | 706,546 |
| | | | | | | |
| Machinery – 0.1% | | | | | | | |
United Rentals Trust, 6.500%(f) | | | | 14,328 | | | 157,608 |
| | | | | | | |
| Oil, Gas & Consumable Fuels – 0.1% | | | | | | | |
El Paso Energy Capital Trust I, 4.750% | | | | 5,700 | | | 142,500 |
| | | | | | | |
| REITs – 0.0% | | | | | | | |
FelCor Lodging Trust, Inc., Series A, 7.800% | | | | 1,100 | | | 4,125 |
| | | | | | | |
| Semiconductors & Semiconductor Equipment – 0.1% | | | | | | | |
Lucent Technologies Capital Trust, 7.750% | | | | 1,150 | | | 333,556 |
| | | | | | | |
| | | |
| TOTAL CONVERTIBLE PREFERRED STOCKS | | | | | | | |
(Identified Cost $4,941,578) | | | | | | | 2,173,238 |
| | | | | | | |
| | | |
| NON-CONVERTIBLE PREFERRED STOCKS – 0.3% | | | | | | | |
| | | |
| Capital Markets – 0.0% | | | | | | | |
Lehman Brothers Holdings Capital Trust I, 6.000%(c) | | | | 725 | | | 14 |
Lehman Brothers Holdings, Inc., 5.670%(c) | | | | 1,362 | | | 8 |
Lehman Brothers Holdings, Inc., 5.940%(c) | | | | 1,535 | | | 2 |
Lehman Brothers Holdings, Inc., 6.500%(c) | | | | 6,334 | | | 16 |
Lehman Brothers Holdings, Inc., 7.950%(c) | | | | 14,011 | | | 77 |
| | | | | | | |
| | | | | | | 117 |
| | | �� | | | | |
| Diversified Financial Services – 0.1% | | | | | | | |
Bank of America Corp., 6.375%, | | | | 18,000 | | | 146,700 |
Preferred Blocker, Inc., 7.000%, 144A | | | | 448 | | | 89,194 |
| | | | | | | |
| | | | | | | 235,894 |
| | | | | | | |
| Thrifts & Mortgage Finance – 0.2% | | | | | | | |
Countrywide Capital IV, 6.750%, 4/01/2033 | | | | 7,075 | | | 67,637 |
Federal Home Loan Mortgage Corp., 5.000%(f)(i) | | | | 1,350 | | | 1,215 |
Federal Home Loan Mortgage Corp., 5.570%(f)(i) | | | | 31,000 | | | 11,780 |
Federal Home Loan Mortgage Corp., 5.660%(f)(i) | | | | 986,100 | | | 394,440 |
Federal Home Loan Mortgage Corp., 5.700%(f)(i) | | | | 2,200 | | | 1,826 |
Federal Home Loan Mortgage Corp., 5.790%(f)(i) | | | | 7,100 | | | 5,467 |
Federal Home Loan Mortgage Corp., 5.810%(f)(i) | | | | 1,600 | | | 1,248 |
Federal Home Loan Mortgage Corp., 5.900%(f)(i) | | | | 4,700 | | | 2,162 |
86
PORTFOLIO OF INVESTMENTS – as of March 31, 2009 (Unaudited)
Loomis Sayles Institutional High Income Fund – continued
| | | | | | | | |
| | | | | Shares | | Value (†) |
| | | | | | | | |
| | | |
| PREFERRED STOCKS – continued | | | | | | | | |
| | | |
| Thrifts & Mortgage Finance – continued | | | | | | | | |
Federal Home Loan Mortgage Corp., 6.000%(f)(i) | | | | | 1,700 | | $ | 1,513 |
Federal Home Loan Mortgage Corp., 6.420%(f)(i) | | | | | 151,250 | | | 121,000 |
Federal Home Loan Mortgage Corp., 6.550%(f)(i) | | | | | 4,150 | | | 1,702 |
Federal Home Loan Mortgage Corp., 8.375%(f)(i) | | | | | 28,100 | | | 12,926 |
Federal National Mortgage Association, 4.750%(f)(i) | | | | | 4,850 | | | 3,540 |
Federal National Mortgage Association, 5.125%(f)(i) | | | | | 900 | | | 621 |
Federal National Mortgage Association, 5.375%(f)(i) | | | | | 1,850 | | | 2,646 |
Federal National Mortgage Association, 5.810%(f)(i) | | | | | 1,400 | | | 1,610 |
Federal National Mortgage Association, 6.750%(f)(i) | | | | | 2,200 | | | 1,100 |
Federal National Mortgage Association, 8.250%(f)(i) | | | | | 73,150 | | | 51,936 |
| | | | | | | | |
| | | | | | | | 684,369 |
| | | | | | | | |
| | | |
| TOTAL NON-CONVERTIBLE PREFERRED STOCKS | | | | | | | | |
(Identified Cost $3,547,280) | | | | | | | | 920,380 |
| | | | | | | | |
| | | |
| TOTAL PREFERRED STOCKS | | | | | | | | |
(Identified Cost $8,488,858) | | | | | | | | 3,093,618 |
| | | | | | | | |
| | | |
| CLOSED END INVESTMENT COMPANIES – 0.8% | | | | | | | | |
Western Asset High Income Opportunity Fund, Inc. | | | | | 176,050 | | | 732,368 |
Western Asset Managed High Income Fund, Inc. | | | | | 197,293 | | | 834,549 |
BlackRock Senior High Income Fund, Inc. | | | | | 14,183 | | | 32,621 |
DWS High Income Trust | | | | | 22,522 | | | 66,215 |
Dreyfus High Yield Strategies Fund | | | | | 78,008 | | | 191,120 |
Highland Credit Strategies Fund | | | | | 31,505 | | | 146,183 |
Van Kampen High Income Trust II | | | | | 42,002 | | | 79,804 |
| | | | | | | | |
| | | |
| TOTAL CLOSED END INVESTMENT COMPANIES | | | | | | | | |
(Identified Cost $3,351,576) | | | | | | | | 2,082,860 |
| | | | | | | | |
| | | |
| | | | | Principal Amount (‡) | | |
| | | |
| SHORT-TERM INVESTMENTS – 9.2% | | | | | | | | |
| Repurchase Agreement with State Street Corp., dated 3/31/2009 at 0.000% to be repurchased at $20,927 on 4/01/2009 collateralized by $25,000 U.S. Treasury Bill, due 5/28/09 with a value of $24,993 including accrued interest (Note 2h of Notes to Financial Statements) | | | | $ | 20,927 | | | 20,927 |
| Tri-Party Repurchase Agreement with Fixed Income Clearing Corporation, dated 3/31/2009 at 0.000% to be repurchased at $22,784,395 on 4/01/2009 collateralized by $22,785,000 Federal Home Loan Mortgage Corp., 2.680% due 11/16/2009 with a value of $23,240,700 including accrued interest (Note 2h of Notes to Financial Statements) | | | | | 22,784,395 | | | 22,784,395 |
| | | | | | | | |
| | | | | | | | |
| | | |
| TOTAL SHORT-TERM INVESTMENTS | | | | | | | | |
(Identified Cost $22,805,322) | | | | | | | | 22,805,322 |
| | | | | | | | |
| | | |
| TOTAL INVESTMENTS – 95.2% | | | | | | | | |
(Identified Cost $305,634,634)(a) | | | | | | | | 237,394,468 |
Other Assets Less Liabilities—4.8% | | | | | | | | 12,080,732 |
| | | | | | | | |
| | | |
| NET ASSETS – 100.0% | | | | | | | $ | 249,475,200 |
| | | | | | | | |
87
| | | | | | | |
(‡) Principal amount stated in U.S. dollars unless otherwise noted. | | | |
(†) See Note 2a of Notes to Financial Statements. | | | |
(††) Amount shown represents units. One unit represents a principal amount of 100. | | | |
(a) Federal Tax Information (Amounts exclude certain adjustments made at the end of the Fund’s fiscal year for tax purposes. Such adjustments are primarily due to wash sales. Amortization of premium on debt securities is excluded for tax purposes.): At March 31, 2009, the net unrealized depreciation on investments based on a cost of $305,681,542 for federal income tax purposes was as follows: | | | |
Aggregate gross unrealized appreciation for all investments in which there is an excess of value over tax cost | | $ | 8,494,324 |
Aggregate gross unrealized depreciation for all investments in which there is an excess of tax cost over value | | | (76,781,398) |
| | | | | | | |
Net unrealized depreciation | | $ | (68,287,074) |
| | | | | | | |
| (b) | Variable rate security. Rate as of March 31, 2009 is disclosed. |
| (c) | Non-income producing due to bankruptcy filing. |
| (d) | Illiquid security. At March 31, 2009, the value of these securities amounted to $8,278,031 or 3.3% of net assets. |
| (e) | Valued by management. At March 31, 2009 the value of these securities amounted to $3,673,227 or 1.5% of net assets. |
| (f) | Non-income producing security. |
| (g) | Step Bond: Coupon is a fixed rate for an initial period then resets at a specified date and rate. |
| (h) | Variable rate security. Rate shown represents the weighted average rate at March 31, 2009. |
| (i) | Future dividend payments have been eliminated as the issuer has been placed in conservatorship. |
| (j) | All or a portion of interest payment is paid-in-kind. |
| 144A | Securities exempt from registration under Rule 144A of the Securities Act of 1933. These securities may be resold in transactions exempt from registration, normally to qualified institutional buyers. At March 31, 2009, the total value of these securities amounted to $20,205,194 or 8.1% of net assets. |
| ABS | Asset-Backed Securities |
| EMTN | Euro Medium Term Note |
| GMTN | Global Medium Term Note |
| REITs | Real Estate Investment Trusts |
Key to Abbreviations: BRL: Brazilian Real; CAD: Canadian Dollar; EUR: Euro; GBP: British Pound; IDR: Indonesian Rupiah; ISK: Icelandic Krona; MXN: Mexican Peso; NZD: New Zealand Dollar; THB: Thai Baht
NET ASSET SUMMARY AT MARCH 31, 2009 (Unaudited)
| | | |
Banking | | 5.7 | % |
Paper | | 5.6 | |
Wirelines | | 5.1 | |
Pharmaceuticals | | 4.9 | |
Healthcare | | 4.7 | |
Sovereigns | | 4.3 | |
Technology | | 4.3 | |
Electric | | 4.2 | |
Non-Captive Diversified | | 4.1 | |
Local Authorities | | 3.9 | |
Pipelines | | 3.5 | |
Retailers | | 3.5 | |
Automotive | | 3.2 | |
Food & Beverage | | 2.2 | |
Supranational | | 2.1 | |
Metals & Mining | | 2.1 | |
Wireless | | 2.0 | |
Other Investments, less than 2% each | | 20.6 | |
Short-Term Investments | | 9.2 | |
| | | |
Total Investments | | 95.2 | |
Other assets less liabilities | | 4.8 | |
| | | |
Net Assets | | 100.0 | % |
| | | |
See accompanying notes to financial statements.
88
PORTFOLIO OF INVESTMENTS – as of March 31, 2009 (Unaudited)
Loomis Sayles Intermediate Duration Fixed Income Fund
| | | | | | | | |
| | | | | Principal Amount (‡) | | Value (†) |
| | | | | | | | |
| | | |
| BONDS AND NOTES – 97.3% of Net Assets | | | | | | | | |
| | | |
| NON-CONVERTIBLE BONDS – 96.4% | | | | | | | | |
| | | |
| ABS Car Loan – 0.5% | | | | | | | | |
Americredit Automobile Receivables Trust,
Series 2004-DF, Class A4, 3.430%, 7/06/2011 | | | | $ | 46,190 | | $ | 44,561 |
Navistar Financial Corp. Owner Trust, Series 2004-B, Class A4, 3.530%, 10/15/2012 | | | | | 95,473 | | | 93,575 |
USAA Auto Owner Trust, Series 2006-1, Class A3, 5.010%, 9/15/2010 | | | | | 6,228 | | | 6,235 |
| | | | | | | | |
| | | | | | | | 144,371 |
| | | | | | | | |
| ABS Credit Card – 3.6% | | | | | | | | |
BA Credit Card Trust, Series 2008-A5, Class A5, 1.756%, 12/16/2013(b) | | | | | 260,000 | | | 244,454 |
Capital One Multi-Asset Execution Trust,
Series 2004-A4, Class A4, 0.776%, 3/15/2017(b) | | | | | 60,000 | | | 46,839 |
Chase Issuance Trust, Series 2007-A16, Class A16, 1.620%, 6/16/2014(b) | | | | | 315,000 | | | 284,578 |
Citibank Credit Card Issuance Trust, Series 2008-C6, Class C6, 6.300%, 6/20/2014 | | | | | 255,000 | | | 160,650 |
Discover Card Master Trust I, Series 2007-3, Class A2, 0.606%, 10/16/2014(b) | | | | | 150,000 | | | 128,362 |
MBNA Credit Card Master Note Trust, Series 2004-A3, Class A3, 0.816%, 8/16/2021(b) | | | | | 140,000 | | | 94,923 |
| | | | | | | | |
| | | | | | | | 959,806 |
| | | | | | | | |
| ABS Home Equity – 1.1% | | | | | | | | |
Countrywide Asset-Backed Certificates, Series 2004-S1, Class A2, 3.872%, 3/25/2020 | | | | | 16,281 | | | 15,863 |
Countrywide Asset-Backed Certificates, Series 2004-S1, Class A3, 4.615%, 2/25/2035 | | | | | 135,000 | | | 81,500 |
Countrywide Asset-Backed Certificates, Series 2006-S1, Class A2, 5.549%, 8/25/2021 | | | | | 216,363 | | | 127,459 |
GSAMP Trust, Series 2005-WMC3, Class A2B,
0.762%, 12/25/2035(b) | | | | | 73,250 | | | 53,839 |
| | | | | | | | |
| | | | | | | | 278,661 |
| | | | | | | | |
| Aerospace & Defense – 1.1% | | | | | | | | |
Boeing Co. (The), 5.000%, 3/15/2014 | | | | | 115,000 | | | 117,882 |
General Dynamics Corp., 5.250%, 2/01/2014 | | | | | 155,000 | | | 165,300 |
| | | | | | | | |
| | | | | | | | 283,182 |
| | | | | | | | |
| Automotive – 0.6% | | | | | | | | |
Ford Motor Credit Co. LLC, 7.000%, 10/01/2013 | | | | | 235,000 | | | 157,136 |
| | | | | | | | |
| Banking – 9.7% | | | | | | | | |
American Express Co., 5.500%, 9/12/2016 | | | | | 85,000 | | | 69,746 |
American Express Co., 6.150%, 8/28/2017 | | | | | 45,000 | | | 37,293 |
Bank of America Corp., 5.650%, 5/01/2018 | | | | | 105,000 | | | 87,598 |
Bank One Corp., 5.900%, 11/15/2011 | | | | | 5,000 | | | 4,901 |
Bear Stearns Cos., Inc. (The), 5.350%, 2/01/2012 | | | | | 130,000 | | | 128,639 |
Bear Stearns Cos., Inc. (The), 7.250%, 2/01/2018 | | | | | 280,000 | | | 289,160 |
Citigroup, Inc., 5.300%, 10/17/2012 | | | | | 325,000 | | | 286,457 |
Credit Suisse NY, 6.000%, 2/15/2018 | | | | | 110,000 | | | 95,942 |
Goldman Sachs Group, Inc. (The), 4.500%, 6/15/2010 | | | | | 210,000 | | | 209,550 |
Goldman Sachs Group, Inc. (The), 5.300%, 2/14/2012 | | | | | 10,000 | | | 9,649 |
Goldman Sachs Group, Inc. (The), 5.450%, 11/01/2012 | | | | | 155,000 | | | 149,186 |
89
| | | | | | | | |
| | | | | Principal Amount (‡) | | Value (†) |
| | | | | | | | |
| | | |
| BONDS AND NOTES – continued | | | | | | | | |
| | | |
| Banking – continued | | | | | | | | |
Merrill Lynch & Co., Inc., 5.450%, 2/05/2013 | | | | $ | 350,000 | | $ | 286,916 |
Morgan Stanley, 5.300%, 3/01/2013 | | | | | 400,000 | | | 384,624 |
Suntrust Banks, Inc., 5.250%, 11/05/2012 | | | | | 190,000 | | | 184,688 |
Wachovia Corp., 5.300%, 10/15/2011 | | | | | 45,000 | | | 44,423 |
Wells Fargo & Co., 5.250%, 10/23/2012 | | | | | 305,000 | | | 296,372 |
| | | | | | | | |
| | | | | | | | 2,565,144 |
| | | | | | | | |
| Collateralized Mortgage Obligations – 2.2% | | | | | | | | |
Countrywide Alternative Loan Trust, Series 2006-J5, Class 4A1, 6.013%, 7/25/2021(b) | | | | | 257,335 | | | 166,384 |
Federal Home Loan Mortgage Corp.,
5.000%, 8/15/2024 | | | | | 392,932 | | | 402,877 |
| | | | | | | | |
| | | | | | | | 569,261 |
| | | | | | | | |
| Commercial Mortgage-Backed Securities – 9.1% | | | | | | | | |
Banc of America Commercial Mortgage, Inc.,
Series 2006-2, Class A4, 5.929%, 5/10/2045(b) | | | | | 205,000 | | | 151,964 |
Banc of America Commercial Mortgage, Inc.,
Series 2007-2, Class A2, 5.634%, 4/10/2049 | | | | | 490,000 | | | 400,202 |
Bear Stearns Commercial Mortgage Securities,
Series 2007-PW16, Class A4, 5.909%, 6/11/2040(b) | | | | | 250,000 | | | 185,697 |
Citigroup/Deutsche Bank Commercial Mortgage Trust, Series 2006-CD2, Class A2, 5.408%, 1/15/2046 | | | | | 140,000 | | | 127,342 |
GS Mortgage Securities Corp. II, Series 2006-GG8,
Class A2, 5.479%, 11/10/2039 | | | | | 410,000 | | | 361,843 |
JPMorgan Chase Commercial Mortgage Securities Corp., Series 2006-LDP7, Class A2, 6.051%, 4/15/2045(b) | | | | | 375,000 | | | 333,643 |
LB-UBS Commercial Mortgage Trust, Series 2005-C3, Class A3, 4.647%, 7/15/2030 | | | | | 230,000 | | | 207,145 |
Merrill Lynch/Countrywide Commercial Mortgage Trust, Series 2006-1, Class A4, 5.600%, 2/12/2039(b) | | | | | 320,000 | | | 226,848 |
Merrill Lynch/Countrywide Commercial Mortgage Trust, Series 2006-2, Class A4, 6.104%, 6/12/2046(b) | | | | | 210,000 | | | 149,544 |
Morgan Stanley Capital I, Series 2006-T23, Series A2, 5.915%, 8/12/2041(b) | | | | | 205,000 | | | 185,155 |
Morgan Stanley Capital I, Series 2007-T27, Class A4, 5.803%, 6/11/2042(b) | | | | | 100,000 | | | 75,390 |
| | | | | | | | |
| | | | | | | | 2,404,773 |
| | | | | | | | |
| Construction Machinery – 0.7% | | | | | | | | |
Caterpillar Financial Services Corp., MTN,
6.125%, 2/17/2014 | | | | | 90,000 | | | 87,401 |
John Deere Capital Corp., MTN, 4.500%, 4/03/2013 | | | | | 90,000 | | | 88,289 |
| | | | | | | | |
| | | | | | | | 175,690 |
| | | | | | | | |
| Consumer Products – 0.7% | | | | | | | | |
Koninklijke (Royal) Philips Electronics NV,
4.625%, 3/11/2013 | | | | | 175,000 | | | 173,425 |
| | | | | | | | |
| Electric – 3.9% | | | | | | | | |
Carolina Power & Light Co., 6.500%, 7/15/2012 | | | | | 5,000 | | | 5,282 |
Consolidated Edison Co. of NY, Inc.,
7.125%, 12/01/2018 | | | | | 125,000 | | | 132,959 |
Duke Energy Corp., 5.625%, 11/30/2012 | | | | | 150,000 | | | 158,587 |
Nisource Finance Corp., 7.875%, 11/15/2010 | | | | | 145,000 | | | 142,484 |
90
PORTFOLIO OF INVESTMENTS – as of March 31, 2009 (Unaudited)
Loomis Sayles Intermediate Duration Fixed Income Fund – continued
| | | | | | | | |
| | | | | Principal Amount (‡) | | Value (†) |
| | | | | | | | |
| | | |
| BONDS AND NOTES – continued | | | | | | | | |
| | | |
| Electric – continued | | | | | | | | |
Pacific Gas & Electric Co., 6.250%, 12/01/2013 | | | | $ | 135,000 | | $ | 144,368 |
PacifiCorp, 5.500%, 1/15/2019 | | | | | 50,000 | | | 51,188 |
Southern California Edison Co., 5.750%, 3/15/2014 | | | | | 165,000 | | | 178,401 |
Virginia Electric and Power Co., 5.100%, 11/30/2012 | | | | | 205,000 | | | 209,941 |
| | | | | | | | |
| | | | | | | | 1,023,210 |
| | | | | | | | |
| Entertainment – 1.9% | | | | | | | | |
Time Warner, Inc., 5.875%, 11/15/2016 | | | | | 165,000 | | | 156,159 |
Time Warner, Inc., 6.500%, 11/15/2036 | | | | | 45,000 | | | 37,014 |
Viacom, Inc., Class B, 6.875%, 4/30/2036 | | | | | 205,000 | | | 149,569 |
Walt Disney Co., 5.700%, 7/15/2011 | | | | | 145,000 | | | 155,251 |
| | | | | | | | |
| | | | | | | | 497,993 |
| | | | | | | | |
| Environmental – 0.2% | | | | | | | | |
Waste Management, Inc., 6.375%, 3/11/2015 | | | | | 40,000 | | | 40,005 |
| | | | | | | | |
| Food & Beverage – 4.3% | | | | | | | | |
Anheuser-Busch Cos., Inc., 6.450%, 9/01/2037 | | | | | 200,000 | | | 165,980 |
Coca-Cola Enterprises, Inc., 7.375%, 3/03/2014 | | | | | 110,000 | | | 124,946 |
Diageo Capital PLC, 7.375%, 1/15/2014 | | | | | 160,000 | | | 175,793 |
General Mills, Inc., 5.650%, 9/10/2012 | | | | | 225,000 | | | 237,683 |
HJ Heinz Finance Co., 6.000%, 3/15/2012 | | | | | 100,000 | | | 104,453 |
Kellogg Co., 5.125%, 12/03/2012 | | | | | 175,000 | | | 184,913 |
Kraft Foods, Inc., 6.750%, 2/19/2014 | | | | | 130,000 | | | 140,547 |
| | | | | | | | |
| | | | | | | | 1,134,315 |
| | | | | | | | |
| Government Owned – No Guarantee – 2.1% | | | | | | | | |
Federal National Mortgage Association,
5.375%, 6/12/2017 | | | | | 505,000 | | | 563,784 |
| | | | | | | | |
| Health Insurance – 1.1% | | | | | | | | |
UnitedHealth Group, Inc., 4.875%, 2/15/2013 | | | | | 180,000 | | | 175,317 |
WellPoint, Inc., 5.250%, 1/15/2016 | | | | | 100,000 | | | 91,246 |
WellPoint, Inc., 6.000%, 2/15/2014 | | | | | 35,000 | | | 35,025 |
| | | | | | | | |
| | | | | | | | 301,588 |
| | | | | | | | |
| Healthcare – 1.8% | | | | | | | | |
Hospira, Inc., 5.550%, 3/30/2012 | | | | | 250,000 | | | 253,158 |
McKesson Corp., 6.500%, 2/15/2014 | | | | | 45,000 | | | 46,546 |
Medco Health Solutions, Inc., 6.125%, 3/15/2013 | | | | | 170,000 | | | 168,884 |
| | | | | | | | |
| | | | | | | | 468,588 |
| | | | | | | | |
| Hybrid ARMs – 0.8% | | | | | | | | |
Indymac Index Mortgage Loan Trust, Series 2006-AR25, Class 3A1, 6.088%, 9/25/2036(b) | | | | | 539,514 | | | 218,780 |
| | | | | | | | |
| Independent Energy – 1.3% | | | | | | | | |
Devon Energy Corp., 5.625%, 1/15/2014 | | | | | 125,000 | | | 126,789 |
Talisman Energy, Inc., 5.850%, 2/01/2037 | | | | | 15,000 | | | 10,124 |
Talisman Energy, Inc., 6.250%, 2/01/2038 | | | | | 55,000 | | | 38,799 |
XTO Energy, Inc., 4.900%, 2/01/2014 | | | | | 5,000 | | | 4,857 |
XTO Energy, Inc., 5.750%, 12/15/2013 | | | | | 170,000 | | | 171,863 |
| | | | | | | | |
| | | | | | | | 352,432 |
| | | | | | | | |
| Integrated Energy – 2.5% | | | | | | | | |
BP Capital Markets PLC, 3.875%, 3/10/2015 | | | | | 190,000 | | | 190,570 |
ConocoPhillips, 5.750%, 2/01/2019 | | | | | 130,000 | | | 130,862 |
91
| | | | | | | | |
| | | | | Principal Amount (‡) | | Value (†) |
| | | | | | | | |
| | | |
| BONDS AND NOTES – continued | | | | | | | | |
| | | |
| Integrated Energy – continued | | | | | | | | |
Hess Corp., 7.000%, 2/15/2014 | | | | $ | 35,000 | | $ | 35,963 |
Marathon Oil Corp., 6.500%, 2/15/2014 | | | | | 35,000 | | | 35,535 |
Shell International Finance, 4.000%, 3/21/2014 | | | | | 255,000 | | | 258,578 |
| | | | | | | | |
| | | | | | | | 651,508 |
| | | | | | | | |
| Media Cable – 2.4% | | | | | | | | |
Comcast Cable Communications, 7.125%, 6/15/2013 | | | | | 110,000 | | | 114,488 |
Comcast Corp., 4.950%, 6/15/2016 | | | | | 160,000 | | | 145,166 |
Cox Communications, Inc., 4.625%, 1/15/2010 | | | | | 5,000 | | | 4,953 |
Cox Communications, Inc., 5.450%, 12/15/2014 | | | | | 215,000 | | | 193,379 |
Time Warner Cable, Inc., 6.200%, 7/01/2013 | | | | | 170,000 | | | 165,493 |
| | | | | | | | |
| | | | | | | | 623,479 |
| | | | | | | | |
| Media Non-Cable – 1.1% | | | | | | | | |
Reed Elsevier Capital, Inc., 7.750%, 1/15/2014 | | | | | 125,000 | | | 127,317 |
Thomson Reuters Corp., 5.950%, 7/15/2013 | | | | | 175,000 | | | 170,934 |
| | | | | | | | |
| | | | | | | | 298,251 |
| | | | | | | | |
| Metals & Mining – 1.0% | | | | | | | | |
United States Steel Corp., 6.050%, 6/01/2017 | | | | | 175,000 | | | 108,277 |
Vale Overseas Ltd., 6.250%, 1/23/2017 | | | | | 165,000 | | | 162,625 |
| | | | | | | | |
| | | | | | | | 270,902 |
| | | | | | | | |
| Mortgage Related – 6.2% | | | | | | | | |
FHLMC, 4.500%, 12/01/2019 | | | | | 14,168 | | | 14,656 |
FHLMC, 5.500%, 3/01/2013 | | | | | 8,222 | | | 8,635 |
FHLMC, 6.000%, 11/01/2012 | | | | | 14,331 | | | 14,930 |
FHLMC, 6.500%, 1/01/2024 | | | | | 4,134 | | | 4,409 |
FHLMC, 8.000%, 7/01/2025 | | | | | 449 | | | 492 |
FNMA, 5.500%, 1/01/2017 | | | | | 43,776 | | | 45,989 |
FNMA, 5.500%, 1/01/2017 | | | | | 47,995 | | | 50,391 |
FNMA, 5.500%, 2/01/2017 | | | | | 26,436 | | | 27,772 |
FNMA, 5.500%, 8/01/2017 | | | | | 619,062 | | | 649,964 |
FNMA, 5.500%, 9/01/2017 | | | | | 132,544 | | | 139,160 |
FNMA, 5.500%, 11/01/2017 | | | | | 901 | | | 946 |
FNMA, 5.500%, 1/01/2020 | | | | | 605,949 | | | 634,681 |
FNMA, 6.000%, 9/01/2021 | | | | | 9,136 | | | 9,575 |
FNMA, 7.500%, 6/01/2016 | | | | | 2,331 | | | 2,450 |
FNMA, 8.000%, 6/01/2015 | | | | | 3,269 | | | 3,463 |
GNMA, 6.500%, 12/15/2023 | | | | | 10,011 | | | 10,526 |
GNMA, 8.500%, 9/15/2022 | | | | | 1,924 | | | 2,079 |
GNMA, 9.500%, 1/15/2019 | | | | | 6,945 | | | 7,622 |
| | | | | | | | |
| | | | | | | | 1,627,740 |
| | | | | | | | |
| Non-Captive Consumer – 0.9% | | | | | | | | |
American General Finance Corp., Series H, MTN, 5.375%, 10/01/2012 | | | | | 5,000 | | | 2,009 |
HSBC Finance Corp., 4.750%, 4/15/2010 | | | | | 205,000 | | | 191,994 |
SLM Corp., Series A, MTN, 5.000%, 10/01/2013 | | | | | 10,000 | | | 5,318 |
SLM Corp., Series A, MTN, 5.375%, 5/15/2014 | | | | | 10,000 | | | 5,182 |
SLM Corp., Series A, MTN, 8.450%, 6/15/2018 | | | | | 80,000 | | | 43,210 |
| | | | | | | | |
| | | | | | | | 247,713 |
| | | | | | | | |
| Non-Captive Diversified – 2.8% | | | | | | | | |
CIT Group, Inc., 5.850%, 9/15/2016 | | | | | 7,000 | | | 3,959 |
92
PORTFOLIO OF INVESTMENTS – as of March 31, 2009 (Unaudited)
Loomis Sayles Intermediate Duration Fixed Income Fund – continued
| | | | | | | | |
| | | | | Principal Amount (‡) | | Value (†) |
| | | | | | | | |
| | | |
| BONDS AND NOTES – continued | | | | | | | | |
| | | |
| Non-Captive Diversified – continued | | | | | | | | |
CIT Group, Inc., 12.000%, 12/18/2018, 144A | | | | $ | 126,000 | | $ | 65,205 |
CIT Group, Inc., Series A, MTN,
5.650%, 2/13/2017 | | | | | 78,000 | | | 45,172 |
General Electric Capital Corp., MTN,
5.875%, 1/14/2038 | | | | | 20,000 | | | 14,286 |
General Electric Capital Corp., Series A, GMTN,
3.485%, 3/08/2012 | | SGD | | | 500,000 | | | 282,029 |
General Electric Capital Corp., Series A, MTN,
4.875%, 3/04/2015 | | | | | 140,000 | | | 124,266 |
International Lease Finance Corp., Series Q, MTN,
5.750%, 6/15/2011 | | | | | 205,000 | | | 133,178 |
iStar Financial, Inc., 5.150%, 3/01/2012 | | | | | 170,000 | | | 61,200 |
| | | | | | | | |
| | | | | | | | 729,295 |
| | | | | | | | |
| Oil Field Services – 1.7% | | | | | | | | |
Baker Hughes, Inc., 7.500%, 11/15/2018 | | | | | 155,000 | | | 176,157 |
Halliburton Co., 6.150%, 9/15/2019 | | | | | 110,000 | | | 111,774 |
Weatherford International Ltd., 5.150%, 3/15/2013 | | | | | 175,000 | | | 162,824 |
| | | | | | | | |
| | | | | | | | 450,755 |
| | | | | | | | |
| Pharmaceuticals – 2.2% | | | | | | | | |
Abbott Laboratories, 5.150%, 11/30/2012 | | | | | 190,000 | | | 206,393 |
Eli Lilly & Co., 4.200%, 3/06/2014 | | | | | 155,000 | | | 159,658 |
Pfizer, Inc., 6.200%, 3/15/2019 | | | | | 190,000 | | | 202,487 |
Schering-Plough Corp., 5.550%, 12/01/2013 | | | | | 5,000 | | | 5,255 |
| | | | | | | | |
| | | | | | | | 573,793 |
| | | | | | | | |
| Pipelines – 3.0% | | | | | | | | |
Energy Transfer Partners LP, 6.000%, 7/01/2013 | | | | | 170,000 | | | 160,734 |
Enterprise Products Operating LLP,
9.750%, 1/31/2014 | | | | | 125,000 | | | 137,350 |
Kinder Morgan Energy Partners LP,
5.000%, 12/15/2013 | | | | | 185,000 | | | 174,683 |
ONEOK Partners LP, 8.625%, 3/01/2019 | | | | | 95,000 | | | 95,861 |
Spectra Energy Capital LLC, 5.668%, 8/15/2014 | | | | | 175,000 | | | 168,610 |
TransCanada Pipelines Ltd., 7.125%, 1/15/2019 | | | | | 55,000 | | | 57,388 |
| | | | | | | | |
| | | | | | | | 794,626 |
| | | | | | | | |
| Railroads – 2.0% | | | | | | | | |
Burlington Northern Santa Fe Corp.,
7.000%, 2/01/2014 | | | | | 175,000 | | | 187,279 |
Canadian Pacific Railway Co., 5.750%, 5/15/2013 | | | | | 170,000 | | | 163,210 |
CSX Corp., 6.150%, 5/01/2037 | | | | | 30,000 | | | 21,208 |
Union Pacific Corp., 5.750%, 11/15/2017 | | | | | 160,000 | | | 152,750 |
| | | | | | | | |
| | | | | | | | 524,447 |
| | | | | | | | |
| Refining – 0.5% | | | | | | | | |
Valero Energy Corp., 9.375%, 3/15/2019 | | | | | 125,000 | | | 129,046 |
| | | | | | | | |
| REITs – 2.4% | | | | | | | | |
Colonial Realty LP, 4.800%, 4/01/2011 | | | | | 125,000 | | | 108,772 |
ERP Operating LP, 6.625%, 3/15/2012 | | | | | 165,000 | | | 157,771 |
Federal Realty Investment Trust,
5.400%, 12/01/2013 | | | | | 105,000 | | | 82,253 |
ProLogis, 5.500%, 4/01/2012 | | | | | 255,000 | | | 159,220 |
Simon Property Group LP, 5.300%, 5/30/2013 | | | | | 170,000 | | | 138,809 |
| | | | | | | | |
| | | | | | | | 646,825 |
| | | | | | | | |
93
| | | | | | | | |
| | | | | Principal Amount (‡) | | Value (†) |
| | | | | | | | |
| | | |
| BONDS AND NOTES – continued | | | | | | | | |
| Retailers – 1.0% | | | | | | | | |
CVS Caremark Corp., 5.750%, 6/01/2017 | | | | $ | 160,000 | | $ | 156,026 |
Macy’s Retail Holdings, Inc., 5.350%, 3/15/2012 | | | | | 130,000 | | | 102,044 |
| | | | | | | | |
| | | | | | | | 258,070 |
| | | | | | | | |
| Supermarkets – 0.6% | | | | | | | | |
Kroger Co., 6.200%, 6/15/2012 | | | | | 50,000 | | | 52,526 |
Kroger Co., 6.400%, 8/15/2017 | | | | | 35,000 | | | 35,930 |
Kroger Co., 6.750%, 4/15/2012 | | | | | 65,000 | | | 68,772 |
| | | | | | | | |
| | | | | | | | 157,228 |
| | | | | | | | |
| Technology – 4.1% | | | | | | | | |
Agilent Technologies, Inc., 6.500%, 11/01/2017 | | | | | 120,000 | | | 98,331 |
Corning, Inc., 6.200%, 3/15/2016 | | | | | 45,000 | | | 40,250 |
Equifax, Inc., 7.000%, 7/01/2037 | | | | | 85,000 | | | 60,373 |
Hewlett Packard Co., 6.125%, 3/01/2014 | | | | | 125,000 | | | 133,119 |
IBM International Group Capital, 5.050%, 10/22/2012 | | | | | 230,000 | | | 243,142 |
National Semiconductor Corp., 6.600%, 6/15/2017 | | | | | 175,000 | | | 115,244 |
Oracle Corp., 4.950%, 4/15/2013 | | | | | 170,000 | | | 179,654 |
Pitney Bowes, Inc., 5.250%, 1/15/2037 | | | | | 95,000 | | | 92,265 |
Xerox Corp., 6.400%, 3/15/2016 | | | | | 170,000 | | | 129,619 |
| | | | | | | | |
| | | | | | | | 1,091,997 |
| | | | | | | | |
| Tobacco – 1.9% | | | | | | | | |
Altria Group, Inc., 9.700%, 11/10/2018 | | | | | 265,000 | | | 288,453 |
Philip Morris International, Inc., 6.875%, 3/17/2014 | | | | | 185,000 | | | 200,222 |
| | | | | | | | |
| | | | | | | | 488,675 |
| | | | | | | | |
| Transportation Services – 0.5% | | | | | | | | |
United Parcel Service, Inc., 3.875%, 4/01/2014 | | | | | 130,000 | | | 130,318 |
| | | | | | | | |
| Treasuries – 8.8% | | | | | | | | |
U.S. Treasury Inflation Indexed Bond,
1.375%, 7/15/2018 | | | | | 587,406 | | | 582,633 |
U.S. Treasury Inflation Indexed Bond,
1.625%, 1/15/2018(c) | | | | | 725,558 | | | 733,267 |
U.S. Treasury Note, 3.375%, 11/30/2012 | | | | | 460,000 | | | 493,602 |
U.S. Treasury Note, 4.750%, 8/15/2017(c) | | | | | 45,000 | | | 52,636 |
U.S. Treasury STRIPS, Zero Coupon Bond, 2/15/2015 | | | | | 535,000 | | | 471,890 |
| | | | | | | | |
| | | | | | | | 2,334,028 |
| | | | | | | | |
| Wireless – 1.1% | | | | | | | | |
Nextel Communications, Inc., Series F,
5.950%, 3/15/2014 | | | | | 5,000 | | | 2,775 |
Sprint Nextel Corp., 6.000%, 12/01/2016 | | | | | 170,000 | | | 121,550 |
Vodafone Group PLC, 5.350%, 2/27/2012 | | | | | 175,000 | | | 177,672 |
| | | | | | | | |
| | | | | | | | 301,997 |
| | | | | | | | |
| Wirelines – 3.0% | | | | | | | | |
AT&T, Inc., 5.100%, 9/15/2014 | | | | | 180,000 | | | 180,606 |
Embarq Corp., 7.995%, 6/01/2036 | | | | | 155,000 | | | 116,250 |
Qwest Corp., 6.875%, 9/15/2033 | | | | | 260,000 | | | 170,300 |
Telecom Italia Capital SA, 4.950%, 9/30/2014 | | | | | 185,000 | | | 159,735 |
Verizon Communications, Inc., 6.350%, 4/01/2019 | | | | | 175,000 | | | 172,889 |
| | | | | | | | |
| | | | | | | | 799,780 |
| | | | | | | | |
| | | |
| TOTAL NON-CONVERTIBLE BONDS | | | | | | | | |
(Identified Cost $27,314,446) | | | | | | | | 25,442,617 |
| | | | | | | | |
94
PORTFOLIO OF INVESTMENTS – as of March 31, 2009 (Unaudited)
Loomis Sayles Intermediate Duration Fixed Income Fund – continued
| | | | | | | | | |
| | | | | Principal Amount (‡) | | Value (†) | |
| | | | | | | | | |
| | | |
| CONVERTIBLE BONDS – 0.9% | | | | | | | | | |
| | | |
| Hybrid ARMs – 0.9% | | | | | | | | | |
Federal Home Loan Mortgage Corp.,
4.662%, 1/01/2035(b) | | | | $ | 240,151 | | $ | 242,655 | |
| | | | | | | | | |
| | | |
| TOTAL CONVERTIBLE BONDS | | | | | | | | | |
(Identified Cost $240,359) | | | | | | | | 242,655 | |
| | | | | | | | | |
| | | |
| TOTAL BONDS AND NOTES | | | | | | | | | |
(Identified Cost $27,554,805) | | | | | | | | 25,685,272 | |
| | | | | | | | | |
| | | |
| SHORT-TERM INVESTMENTS – 0.9% | | | | | | | | | |
| Tri-Party Repurchase Agreement with Fixed Income Clearing Corporation, dated 3/31/2009 at 0.000% to be repurchased at $255,403 on 4/01/2009 collateralized by $265,000 Federal Home Loan Bank, 0.950% due 3/30/2010 valued at $264,338 including accrued interest (Note 2h of Notes to Financial Statements) (Identified Cost $255,403) | | | | | 255,403 | | | 255,403 | |
| | | |
| TOTAL INVESTMENTS – 98.2% | | | | | | | | | |
(Identified Cost $27,810,208)(a) | | | | | | | | 25,940,675 | |
Other Assets Less Liabilities—1.8% | | | | | | | | 462,469 | |
| | | | | | | | | |
| | | |
| NET ASSETS – 100.0% | | | | | | | $ | 26,403,144 | |
| | | | | | | | | |
| | |
(‡) Principal amount stated in U.S. dollars unless otherwise noted. | | | | | | | |
(†) See Note 2a of Notes to Financial Statements. | | | | | | | |
(a) Federal Tax Information (Amounts exclude certain adjustments made at the end of the Fund’s fiscal year for tax purposes. Such adjustments are primarily due to wash sales. Amortization of premium on debt securities is excluded for tax purposes.): | | | | |
At March 31, 2009, the net unrealized depreciation on investments based on a cost of $27,836,624 for federal income tax purposes was as follows: | | | | |
Aggregate gross unrealized appreciation for all investments in which there is an excess of value over tax cost | | $ | 625,530 | |
Aggregate gross unrealized depreciation for all investments in which there is an excess of tax cost over value | | | (2,521,479 | ) |
| | | | | | | | | |
Net unrealized depreciation | | | | | | | $ | (1,895,949 | ) |
| | | | | | | | | |
| (b) | Variable rate security. Rate as of March 31, 2009 is disclosed. |
| (c) | All or portion of this security is held as collateral for open futures contracts. |
| 144A | Securities exempt from registration under Rule 144A of the Securities Act of 1933. These securities may be resold in transactions exempt from registration, normally to qualified institutional buyers. At March 31, 2009, the total value of this security amounted to $65,205 or 0.2% of net assets. |
| ABS | Asset-Backed Securities |
| ARMs | Adjustable Rate Mortgages |
| FHLMC | Federal Home Loan Mortgage Corp. |
| FNMA | Federal National Mortgage Association |
| GMTN | Global Medium Term Note |
| GNMA | Government National Mortgage Association |
| REITs | Real Estate Investment Trusts |
| STRIPS | Separate Trading of Registered Interest and Principal of Securities |
Key to Abbreviation: SGD: Singapore Dollar
At March 31, 2009, open futures contracts purchased were as follows:
| | | | | | | | | | |
| Futures | | Expiration
Date | | Contracts | | Notional
Value | | Unrealized
Appreciation |
10 Year U.S. Treasury Note | | 6/19/2009 | | 4 | | $ | 496,313 | | $ | 16,899 |
95
NET ASSET SUMMARY AT MARCH 31, 2009 (Unaudited)
| | | |
Banking | | 9.7 | % |
Commercial Mortgage-Backed Securities | | 9.1 | |
Treasuries | | 8.8 | |
Mortgage Related | | 6.2 | |
Food & Beverage | | 4.3 | |
Technology | | 4.1 | |
Electric | | 3.9 | |
ABS Credit Card | | 3.6 | |
Wirelines | | 3.0 | |
Pipelines | | 3.0 | |
Non-Captive Diversified | | 2.8 | |
Integrated Energy | | 2.5 | |
REITs | | 2.4 | |
Media Cable | | 2.4 | |
Pharmaceuticals | | 2.2 | |
Collateralized Mortgage Obligations | | 2.2 | |
Government Owned – No Guarantee | | 2.1 | |
Railroads | | 2.0 | |
Other Investments, less than 2% each | | 23.0 | |
Short-Term Investments | | 0.9 | |
| | | |
Total Investments | | 98.2 | |
Other assets less liabilities (including open Futures Contracts) | | 1.8 | |
| | | |
Net Assets | | 100.0 | % |
| | | |
See accompanying notes to financial statements.
96
PORTFOLIO OF INVESTMENTS – as of March 31, 2009 (Unaudited)
Loomis Sayles Investment Grade Fixed Income Fund
| | | | | | | | |
| | | | | Principal Amount (‡) | | Value (†) |
| | | | | | | | |
| | | |
| BONDS AND NOTES – 88.8% of Net Assets | | | | | | | | |
| | | |
| NON-CONVERTIBLE BONDS – 88.4% | | | | | | | | |
| | | |
| ABS Car Loan – 0.7% | | | | | | | | |
ARG Funding Corp., Series 2005-2A, Class A5, 0.682%, 5/20/2011, 144A(b) | | | | $ | 3,245,000 | | $ | 2,580,392 |
| | | | | | | | |
| ABS Credit Card – 0.2% | | | | | | | | |
Bank One Issuance Trust, Series 2004-C2, Class C2, 1.356%, 2/15/2017(b) | | | | | 200,000 | | | 78,000 |
World Financial Network Credit Card, Series 2008-B, Class M, 7.800%, 10/15/2013 | | | | | 732,000 | | | 692,904 |
| | | | | | | | |
| | | | | | | | 770,904 |
| | | | | | | | |
| ABS Home Equity – 0.1% | | | | | | | | |
Countrywide Asset-Backed Certificates, Series 2006-S1, Class A2, 5.549%, 8/25/2021 | | | | | 250,664 | | | 147,666 |
Countrywide Asset-Backed Certificates, Series 2006-S3, Class A3, 6.287%, 6/25/2021 | | | | | 452,917 | | | 104,941 |
Countrywide Asset-Backed Certificates, Series 2006-S4, Class A3, 5.804%, 7/25/2034 | | | | | 488,766 | | | 123,120 |
| | | | | | | | |
| | | | | | | | 375,727 |
| | | | | | | | |
| ABS Other – 0.6% | | | | | | | | |
Community Program Loan Trust, Series 1987-A, Class A5, 4.500%, 4/01/2029 | | | | | 2,500,000 | | | 2,304,237 |
| | | | | | | | |
| Aerospace & Defense – 0.0% | | | | | | | | |
Boeing Capital Corp., 6.500%, 2/15/2012 | | | | | 165,000 | | | 174,014 |
| | | | | | | | |
| Airlines – 1.1% | | | | | | | | |
Delta Air Lines, Inc., Series 2007-1, Class B, 8.021%, 2/10/2024 | | | | | 2,246,393 | | | 1,246,748 |
Qantas Airways Ltd., 6.050%, 4/15/2016, 144A | | | | | 3,455,000 | | | 2,926,426 |
| | | | | | | | |
| | | | | | | | 4,173,174 |
| | | | | | | | |
| Automotive – 0.3% | | | | | | | | |
Cummins, Inc., 5.650%, 3/01/2098 | | | | | 1,000,000 | | | 418,700 |
Ford Motor Co., 6.375%, 2/01/2029 | | | | | 2,665,000 | | | 752,862 |
Ford Motor Credit Co. LLC, 7.375%, 10/28/2009 | | | | | 150,000 | | | 134,528 |
General Motors Corp., 8.250%, 7/15/2023 | | | | | 50,000 | | | 6,188 |
| | | | | | | | |
| | | | | | | | 1,312,278 |
| | | | | | | | |
| Banking – 6.7% | | | | | | | | |
BAC Capital Trust VI, 5.625%, 3/08/2035 | | | | | 1,045,000 | | | 444,248 |
Bank of America Corp., 5.420%, 3/15/2017 | | | | | 230,000 | | | 146,387 |
Barclays Financial LLC, 4.060%, 9/16/2010, 144A | | KRW | | | 940,000,000 | | | 696,820 |
Barclays Financial LLC, 4.160%, 2/22/2010, 144A | | THB | | | 70,000,000 | | | 1,953,644 |
Barclays Financial LLC, 4.460%, 9/23/2010, 144A | | KRW | | | 1,950,000,000 | | | 1,453,707 |
Barclays Financial LLC, EMTN, 4.100%, 3/22/2010, 144A | | THB | | | 17,000,000 | | | 469,999 |
Bear Stearns Co., Inc. (The), 5.550%, 1/22/2017 | | | | | 230,000 | | | 193,385 |
BNP Paribas SA, EMTN, Zero Coupon Bond, 6/13/2011, 144A | | IDR | | | 7,484,000,000 | | | 418,858 |
Citibank NA, 15.000%, 7/02/2010, 144A | | BRL | | | 4,000,000 | | | 1,814,661 |
Countrywide Home Loans, Inc., Series L, MTN, 4.000%, 3/22/2011 | | | | | 144,000 | | | 128,145 |
Goldman Sachs Group, Inc. (The), 5.000%, 10/01/2014 | | | | | 1,725,000 | | | 1,559,536 |
97
| | | | | | | | |
| | | | | Principal Amount (‡) | | Value (†) |
| | | | | | | | |
| | | |
| BONDS AND NOTES – continued | | | | | | | | |
| | | |
| Banking – continued | | | | | | | | |
Goldman Sachs Group, Inc. (The), 5.150%, 1/15/2014 | | | | $ | 870,000 | | $ | 794,014 |
Goldman Sachs Group, Inc. (The), 6.125%, 2/15/2033 | | | | | 250,000 | | | 208,205 |
Goldman Sachs Group, Inc. (The), 6.750%, 10/01/2037 | | | | | 1,085,000 | | | 733,830 |
JPMorgan Chase & Co., Zero Coupon Bond, 5/17/2010, 144A | | BRL | | | 8,035,000 | | | 2,894,599 |
JPMorgan Chase & Co., Zero Coupon Bond, 3/28/2011, 144A | | IDR | | | 8,972,574,000 | | | 518,243 |
JPMorgan Chase & Co., Zero Coupon Bond, 3/28/2011, 144A | | IDR | | | 5,376,000,000 | | | 310,510 |
JPMorgan Chase & Co., 4.750%, 5/01/2013 | | | | | 60,000 | | | 58,159 |
JPMorgan Chase London, EMTN, Zero Coupon Bond, 10/21/2010, 144A | | IDR | | | 9,533,078,500 | | | 617,278 |
Merrill Lynch & Co., Inc., 6.110%, 1/29/2037 | | | | | 3,770,000 | | | 1,873,735 |
Merrill Lynch & Co., Inc., Series C, MTN,
5.000%, 1/15/2015 | | | | | 235,000 | | | 182,076 |
Morgan Stanley, 4.750%, 4/01/2014 | | | | | 3,550,000 | | | 2,902,398 |
Morgan Stanley, 5.375%, 10/15/2015 | | | | | 1,300,000 | | | 1,174,446 |
Morgan Stanley, 6.750%, 4/15/2011 | | | | | 1,310,000 | | | 1,311,009 |
Morgan Stanley, EMTN, 5.450%, 1/09/2017 | | | | | 260,000 | | | 227,500 |
Morgan Stanley, MTN, 6.250%, 8/09/2026 | | | | | 500,000 | | | 413,554 |
Morgan Stanley, Series F, MTN,
5.550%, 4/27/2017 | | | | | 800,000 | | | 711,874 |
Morgan Stanley, Series F, MTN,
5.950%, 12/28/2017 | | | | | 995,000 | | | 903,861 |
National City Bank of Indiana, 4.250%, 7/01/2018 | | | | | 420,000 | | | 331,855 |
Rabobank Nederland, EMTN,
10.250%, 9/10/2009, 144A | | ISK | | | 65,000,000 | | | 309,146 |
Washington Mutual Finance Corp.,
6.875%, 5/15/2011 | | | | | 135,000 | | | 122,622 |
| | | | | | | | |
| | | | | | | | 25,878,304 |
| | | | | | | | |
| Brokerage – 0.0% | | | | | | | | |
Lehman Brothers Holdings, Inc.,
6.875%, 7/17/2037(c) | | | | | 2,030,000 | | | 203 |
Lehman Brothers Holdings, Inc., MTN, (fixed rate to 5/03/2027, variable rate thereafter),
6.000%, 5/03/2032(c) | | | | | 155,000 | | | 16 |
| | | | | | | | |
| | | | | | | | 219 |
| | | | | | | | |
| Building Materials – 0.1% | | | | | | | | |
Masco Corp., 5.850%, 3/15/2017 | | | | | 500,000 | | | 312,745 |
| | | | | | | | |
| Chemicals – 1.2% | | | | | | | | |
Lubrizol Corp., 6.500%, 10/01/2034 | | | | | 2,255,000 | | | 1,722,031 |
Methanex Corp., 6.000%, 8/15/2015 | | | | | 980,000 | | | 666,375 |
PPG Industries, Inc., 6.650%, 3/15/2018 | | | | | 2,410,000 | | | 2,356,970 |
| | | | | | | | |
| | | | | | | | 4,745,376 |
| | | | | | | | |
| Collateralized Mortgage Obligations – 0.3% | | | | | | | | |
CS First Boston Mortgage Securities Corp.,
Series 2005-7, Class 3A1, 5.000%, 8/25/2020 | | | | | 307,899 | | | 289,425 |
98
PORTFOLIO OF INVESTMENTS – as of March 31, 2009 (Unaudited)
Loomis Sayles Investment Grade Fixed Income Fund – continued
| | | | | | | | |
| | | | | Principal Amount (‡) | | Value (†) |
| | | | | | | | |
| | | |
| BONDS AND NOTES – continued | | | | | | | | |
| | |
| Collateralized Mortgage Obligations – continued | | | | | | |
Federal Home Loan Mortgage Corp., Series 2912, Class EH, 5.500%, 1/15/2035 | | | | $ | 675,000 | | $ | 706,418 |
| | | | | | | | |
| | | | | | | | 995,843 |
| | | | | | | | |
| Commercial Mortgage-Backed Securities – 4.9% | | | | | | | | |
Banc of America Commercial Mortgage, Inc.,
Series 2005-6, Class A4, 5.351%, 9/10/2047(b) | | | | | 160,000 | | | 122,999 |
Banc of America Commercial Mortgage, Inc.,
Series 2006-1, Class A2, 5.334%, 9/10/2045 | | | | | 220,000 | | | 199,729 |
Bear Stearns Commercial Mortgage Securities,
5.540%, 9/11/2041 | | | | | 600,000 | | | 498,038 |
Bear Stearns Commercial Mortgage Securities,
Series 2005-PW10, Class A2,
5.270%, 12/11/2040 | | | | | 280,000 | | | 258,200 |
Bear Stearns Commercial Mortgage Securities,
Series 2006-T24, Class A4, 5.537%, 10/12/2041 | | | | | 360,000 | | | 296,724 |
Bear Stearns Commercial Mortgage Securities,
Series 2007-PW15, Class A4, 5.331%, 2/11/2044 | | | | | 600,000 | | | 437,346 |
Bear Stearns Commercial Mortgage Securities,
Series 2007-PW16, Class A4, 5.909%, 6/11/2040(b) | | | | | 407,000 | | | 302,314 |
Citigroup/Deutsche Bank Commercial Mortgage Trust, Series 2006-CD2, Class A2, 5.408%, 1/15/2046 | | | | | 155,000 | | | 140,985 |
Commercial Mortgage Pass Through Certificates,
Series 2006-C7, Class A4, 5.961%, 6/10/2046(b) | | | | | 480,000 | | | 366,733 |
Credit Suisse Mortgage Capital Certificates,
Series 2007-C3, Class A4, 5.912%, 6/15/2039(b) | | | | | 3,525,000 | | | 2,114,534 |
Credit Suisse Mortgage Capital Certificates,
Series 2007-C4, Class A4, 6.004%, 9/15/2039(b) | | | | | 2,030,000 | | | 1,288,291 |
Credit Suisse Mortgage Capital Certificates,
Series 2007-C5, Class A4, 5.695%, 9/15/2040 | | | | | 685,000 | | | 447,437 |
Greenwich Capital Commercial Funding Corp.,
Series 2005-GG5, Class A2, 5.117%, 4/10/2037 | | | | | 485,000 | | | 434,720 |
Greenwich Capital Commercial Funding Corp.,
Series 2007-GG11, Class A4, 5.736%, 12/10/2049 | | | | | 1,500,000 | | | 1,079,007 |
Greenwich Capital Commercial Funding Corp.,
Series 2007-GG9, Class A4, 5.444%, 3/10/2039 | | | | | 1,003,000 | | | 722,527 |
GS Mortgage Securities Corp. II, Series 2005-GG4,
Class A4A, 4.751%, 7/10/2039 | | | | | 805,000 | | | 595,476 |
GS Mortgage Securities Corp. II, Series 2006-GG8,
Class A4, 5.560%, 11/10/2039 | | | | | 350,000 | | | 262,801 |
JP Morgan Chase Commercial Mortgage Securities Corp., Series 2006-LDP6, Class A4,
5.475%, 4/15/2043 | | | | | 1,180,000 | | | 854,794 |
JP Morgan Chase Commercial Mortgage Securities Corp., Series 2006-LDP7, Class A4,
6.065%, 4/15/2045(b) | | | | | 1,100,000 | | | 829,846 |
JP Morgan Chase Commercial Mortgage Securities Corp., Series 2007-LD11, Class A4,
6.007%, 6/15/2049(b) | | | | | 4,055,000 | | | 2,788,866 |
JP Morgan Chase Commercial Mortgage Securities Corp., Series 2007-LDPX, Class A3,
5.420%, 1/15/2049 | | | | | 1,405,000 | | | 949,530 |
LB-UBS Commercial Mortgage Trust, Series 2005-C3, Class A5, 4.739%, 7/15/2030 | | | | | 480,000 | | | 369,135 |
99
| | | | | | | | |
| | | | | Principal Amount (‡) | | Value (†) |
| | | | | | | | |
| | | |
| BONDS AND NOTES – continued | | | | | | | | |
| | | |
| Commercial Mortgage-Backed Securities – continued | | | | | | | | |
LB-UBS Commercial Mortgage Trust, Series 2006-C4, Class A4, 6.080%, 6/15/2038(b) | | | | $ | 380,000 | | $ | 287,954 |
LB-UBS Commercial Mortgage Trust, Series 2006-C6, Class A4, 5.372%, 9/15/2039 | | | | | 390,000 | | | 280,670 |
LB-UBS Commercial Mortgage Trust, Series 2007-C2, Class A2, 5.303%, 2/15/2040 | | | | | 915,000 | | | 757,257 |
Merrill Lynch/Countrywide Commercial Mortgage Trust, Series 2006-1, Class A2, 5.439%, 2/12/2039 | | | | | 335,000 | | | 304,487 |
Merrill Lynch/Countrywide Commercial Mortgage Trust, Series 2006-2, Class A4, 6.104%, 6/12/2046(b) | | | | | 235,000 | | | 167,347 |
Morgan Stanley Capital I, Series 2005-HQ6, Class A4A, 4.989%, 8/13/2042 | | | | | 350,000 | | | 281,566 |
Morgan Stanley Capital I, Series 2005-T19, Class A4A, 4.890%, 6/12/2047 | | | | | 425,000 | | | 333,273 |
Morgan Stanley Capital I, Series 2006-HQ10, Class A4, 5.328%, 11/12/2041 | | | | | 300,000 | | | 230,847 |
Morgan Stanley Capital I, Series 2008-T29, Class A4, 6.458%, 1/11/2043(b) | | | | | 800,000 | | | 621,002 |
Wachovia Bank Commercial Mortgage Trust, Series 2006-C29, Class A4, 5.308%, 11/15/2048 | | | | | 200,000 | | | 132,810 |
| | | | | | | | |
| | | | | | | | 18,757,245 |
| | | | | | | | |
| Construction Machinery – 0.9% | | | | | | | | |
Caterpillar Financial Services Corp., MTN,
5.450%, 4/15/2018 | | | | | 200,000 | | | 171,589 |
Caterpillar Financial Services Corp., MTN,
6.125%, 2/17/2014 | | | | | 3,195,000 | | | 3,102,735 |
Caterpillar Financial Services Corp., Series F, MTN, 5.850%, 9/01/2017 | | | | | 100,000 | | | 86,884 |
| | | | | | | | |
| | | | | | | | 3,361,208 |
| | | | | | | | |
| Consumer Cyclical Services – 2.0% | | | | | | | | |
Western Union Co. (The), 5.930%, 10/01/2016 | | | | | 3,965,000 | | | 3,675,769 |
Western Union Co. (The), 6.500%, 2/26/2014 | | | | | 4,000,000 | | | 4,078,388 |
| | | | | | | | |
| | | | | | | | 7,754,157 |
| | | | | | | | |
| Consumer Products – 1.1% | | | | | | | | |
Koninklijke (Royal) Philips Electronics N.V.,
6.875%, 3/11/2038 | | | | | 2,745,000 | | | 2,662,842 |
Snap-on, Inc., 5.850%, 3/01/2014 | | | | | 660,000 | | | 667,790 |
Snap-on, Inc., 6.700%, 3/01/2019 | | | | | 780,000 | | | 791,750 |
| | | | | | | | |
| | | | | | | | 4,122,382 |
| | | | | | | | |
| Distributors – 0.5% | | | | | | | | |
Equitable Resources, Inc., 6.500%, 4/01/2018 | | | | | 2,150,000 | | | 1,897,409 |
| | | | | | | | |
| Electric – 3.5% | | | | | | | | |
AmerenEnergy Generating Co., Series H,
7.000%, 4/15/2018 | | | | | 2,800,000 | | | 2,633,137 |
Baltimore Gas & Electric Co., 5.200%, 6/15/2033 | | | | | 500,000 | | | 329,122 |
Bruce Mansfield Unit, 6.850%, 6/01/2034(d) | | | | | 1,550,000 | | | 1,151,433 |
Cleveland Electric Illuminating Co. (The),
5.950%, 12/15/2036 | | | | | 960,000 | | | 740,145 |
Commonwealth Edison Co., 4.700%, 4/15/2015 | | | | | 555,000 | | | 507,437 |
Commonwealth Edison Co., 4.750%, 12/01/2011(d) | | | | | 41,000 | | | 40,060 |
Commonwealth Edison Co., 5.875%, 2/01/2033 | | | | | 1,180,000 | | | 971,795 |
100
PORTFOLIO OF INVESTMENTS – as of March 31, 2009 (Unaudited)
Loomis Sayles Investment Grade Fixed Income Fund – continued
| | | | | | | | |
| | | | | Principal Amount (‡) | | Value (†) |
| | | | | | | | |
| | | |
| BONDS AND NOTES – continued | | | | | | | | |
| | | |
| Electric – continued | | | | | | | | |
Dominion Resources, Inc., 5.950%, 6/15/2035 | | | | $ | 385,000 | | $ | 325,811 |
Empresa Nacional de Electricidad SA (Endesa-Chile),
7.875%, 2/01/2027 | | | | | 1,000,000 | | | 1,025,461 |
Illinois Power Co., 6.250%, 4/01/2018 | | | | | 3,385,000 | | | 3,093,978 |
MidAmerican Energy Holdings Co., 6.125%, 4/01/2036 | | | | | 445,000 | | | 394,634 |
MidAmerican Energy Holdings Co., 6.500%, 9/15/2037 | | | | | 1,035,000 | | | 957,136 |
NiSource Finance Corp., 6.150%, 3/01/2013 | | | | | 195,000 | | | 170,315 |
NiSource Finance Corp., 6.400%, 3/15/2018 | | | | | 1,255,000 | | | 1,015,492 |
| | | | | | | | |
| | | | | | | | 13,355,956 |
| | | | | | | | |
| Entertainment – 0.7% | | | | | | | | |
Time Warner, Inc., 6.500%, 11/15/2036 | | | | | 410,000 | | | 337,235 |
Time Warner, Inc., 6.625%, 5/15/2029 | | | | | 870,000 | | | 734,473 |
Time Warner, Inc., 6.950%, 1/15/2028 | | | | | 375,000 | | | 331,382 |
Time Warner, Inc., 7.625%, 4/15/2031 | | | | | 245,000 | | | 218,914 |
Time Warner, Inc., 7.700%, 5/01/2032 | | | | | 160,000 | | | 143,878 |
Viacom, Inc., Class B, 6.875%, 4/30/2036 | | | | | 1,325,000 | | | 966,729 |
| | | | | | | | |
| | | | | | | | 2,732,611 |
| | | | | | | | |
| Food & Beverage – 1.0% | | | | | | | | |
Anheuser-Busch Cos., Inc., 5.950%, 1/15/2033 | | | | | 995,000 | | | 769,000 |
Anheuser-Busch Cos., Inc., 6.450%, 9/01/2037 | | | | | 1,270,000 | | | 1,053,970 |
Cia Brasileira de Bebidas, 8.750%, 9/15/2013 | | | | | 1,025,000 | | | 1,117,250 |
Kraft Foods, Inc., 6.250%, 6/01/2012 | | | | | 210,000 | | | 221,579 |
Kraft Foods, Inc., 6.500%, 11/01/2031 | | | | | 960,000 | | | 890,521 |
| | | | | | | | |
| | | | | | | | 4,052,320 |
| | | | | | | | |
| Government Owned-No Guarantee – 1.1% | | | | | | | | |
Abu Dhabi National Energy Co.,
7.250%, 8/01/2018, 144A | | | | | 2,565,000 | | | 2,442,067 |
DP World Ltd., 6.850%, 7/02/2037, 144A | | | | | 3,800,000 | | | 1,818,106 |
| | | | | | | | |
| | | | | | | | 4,260,173 |
| | | | | | | | |
| Healthcare – 0.9% | | | | | | | | |
Covidien International Finance SA, 6.000%, 10/15/2017 | | | | | 900,000 | | | 912,803 |
Covidien International Finance SA, 6.550%, 10/15/2037 | | | | | 900,000 | | | 886,268 |
HCA, Inc., 5.750%, 3/15/2014 | | | | | 1,020,000 | | | 668,100 |
HCA, Inc., 6.250%, 2/15/2013 | | | | | 195,000 | | | 146,250 |
HCA, Inc., 6.375%, 1/15/2015 | | | | | 95,000 | | | 62,225 |
HCA, Inc., 6.500%, 2/15/2016 | | | | | 55,000 | | | 36,025 |
HCA, Inc., 6.750%, 7/15/2013 | | | | | 30,000 | | | 22,425 |
HCA, Inc., 7.050%, 12/01/2027 | | | | | 100,000 | | | 52,000 |
HCA, Inc., 7.190%, 11/15/2015 | | | | | 190,000 | | | 128,353 |
HCA, Inc., 7.500%, 12/15/2023 | | | | | 75,000 | | | 39,737 |
HCA, Inc., 7.690%, 6/15/2025 | | | | | 175,000 | | | 91,141 |
HCA, Inc., 8.360%, 4/15/2024 | | | | | 305,000 | | | 171,021 |
HCA, Inc., MTN, 7.580%, 9/15/2025 | | | | | 10,000 | | | 5,131 |
HCA, Inc., MTN, 7.750%, 7/15/2036 | | | | | 305,000 | | | 154,268 |
| | | | | | | | |
| | | | | | | | 3,375,747 |
| | | | | | | | |
| Home Construction – 1.8% | | | | | | | | |
Centex Corp., 5.250%, 6/15/2015 | | | | | 380,000 | | | 285,000 |
Lennar Corp., Series B, 5.600%, 5/31/2015 | | | | | 1,250,000 | | | 890,625 |
Lennar Corp., Series B, 6.500%, 4/15/2016 | | | | | 770,000 | | | 554,400 |
Pulte Homes, Inc., 5.200%, 2/15/2015 | | | | | 1,265,000 | | | 1,000,931 |
101
| | | | | | | | |
| | | | | Principal Amount (‡) | | Value (†) |
| | | | | | | | |
| | | |
| BONDS AND NOTES – continued | | | | | | | | |
| | | |
| Home Construction – continued | | | | | | | | |
Pulte Homes, Inc., 6.000%, 2/15/2035 | | | | $ | 3,340,000 | | $ | 2,037,400 |
Pulte Homes, Inc., 6.375%, 5/15/2033 | | | | | 1,455,000 | | | 887,550 |
Toll Brothers Finance Corp., 5.150%, 5/15/2015 | | | | | 1,725,000 | | | 1,455,034 |
| | | | | | | | |
| | | | | | | | 7,110,940 |
| | | | | | | | |
| Hybrid ARMs – 0.3% | | | | | | | | |
FNMA, 5.730%, 9/01/2036(b) | | | | | 378,238 | | | 391,928 |
FNMA, 6.039%, 2/01/2037(b) | | | | | 381,310 | | | 396,302 |
Morgan Stanley Mortgage Loan Trust, Series 2005-3AR, Class 5A,
5.592%, 7/25/2035(b) | | | | | 414,586 | | | 243,472 |
Wells Fargo Mortgage Backed Securities Trust, Series 2005-AR16, Class 3A2,
4.927%, 10/25/2035(b) | | | | | 289,189 | | | 200,388 |
| | | | | | | | |
| | | | | | | | 1,232,090 |
| | | | | | | | |
| Independent Energy – 2.8% | | | | | | | | |
Anadarko Petroleum Corp., 5.950%, 9/15/2016 | | | | | 1,260,000 | | | 1,085,213 |
Anadarko Petroleum Corp., 6.450%, 9/15/2036 | | | | | 1,320,000 | | | 922,634 |
Apache Corp., 6.000%, 1/15/2037 | | | | | 1,940,000 | | | 1,871,269 |
Noble Energy, Inc., 8.250%, 3/01/2019 | | | | | 3,520,000 | | | 3,605,508 |
Questar Market Resources, Inc.,
6.800%, 4/01/2018 | | | | | 3,365,000 | | | 3,012,062 |
Talisman Energy, Inc., 5.850%, 2/01/2037 | | | | | 15,000 | | | 10,124 |
XTO Energy, Inc., 6.100%, 4/01/2036 | | | | | 65,000 | | | 54,988 |
XTO Energy, Inc., 6.750%, 8/01/2037 | | | | | 435,000 | | | 395,900 |
| | | | | | | | |
| | | | | | | | 10,957,698 |
| | | | | | | | |
| Local Authorities – 3.0% | | | | | | | | |
Manitoba (Province of), GMTN,
6.375%, 9/01/2015 | | NZD | | | 4,635,000 | | | 2,655,945 |
New South Wales Treasury Corp., Series 10RG,
7.000%, 12/01/2010 | | AUD | | | 2,625,000 | | | 1,929,268 |
New South Wales Treasury Corp., Series 12RG,
6.000%, 5/01/2012 | | AUD | | | 685,000 | | | 500,934 |
New South Wales Treasury Corp., Series 17RG,
5.500%, 3/01/2017 | | AUD | | | 4,000,000 | | | 2,831,170 |
Province of Alberta, 5.930%, 9/16/2016 | | CAD | | | 391,052 | | | 350,275 |
Quebec Province, Series QC, 6.750%, 11/09/2015 | | NZD | | | 1,185,000 | | | 671,901 |
Queensland Treasury Corp., Series 11G,
6.000%, 6/14/2011 | | AUD | | | 1,735,000 | | | 1,265,266 |
Virginia Tobacco Settlement Financing Corp., Series A-1, 6.706%, 6/01/2046(d) | | | | | 2,880,000 | | | 1,418,141 |
| | | | | | | | |
| | | | | | | | 11,622,900 |
| | | | | | | | |
| Media Cable – 2.1% | | | | | | | | |
Comcast Corp., 5.650%, 6/15/2035 | | | | | 2,090,000 | | | 1,655,073 |
Comcast Corp., 6.450%, 3/15/2037 | | | | | 1,230,000 | | | 1,074,590 |
Comcast Corp., 6.500%, 11/15/2035 | | | | | 1,570,000 | | | 1,386,729 |
Comcast Corp., 6.950%, 8/15/2037 | | | | | 1,925,000 | | | 1,792,583 |
Time Warner Cable, Inc., 6.750%, 7/01/2018 | | | | | 2,500,000 | | | 2,346,760 |
| | | | | | | | |
| | | | | | | | 8,255,735 |
| | | | | | | | |
| Media Non-Cable – 0.6% | | | | | | | | |
Clear Channel Communications, Inc.,
5.750%, 1/15/2013 | | | | | 250,000 | | | 37,500 |
102
PORTFOLIO OF INVESTMENTS – as of March 31, 2009 (Unaudited)
Loomis Sayles Investment Grade Fixed Income Fund – continued
| | | | | | | | |
| | | | | Principal Amount (‡) | | Value (†) |
| | | | | | | | |
| | | |
| BONDS AND NOTES – continued | | | | | | | | |
| | | |
| Media Non-Cable – continued | | | | | | | | |
News America, Inc., 6.200%, 12/15/2034 | | | | $ | 950,000 | | $ | 683,391 |
News America, Inc., 6.400%, 12/15/2035 | | | | | 1,980,000 | | | 1,466,865 |
| | | | | | | | |
| | | | | | | | 2,187,756 |
| | | | | | | | |
| Metals & Mining – 0.0% | | | | | | | | |
Teck Cominco Ltd., 7.000%, 9/15/2012 | | | | | 100,000 | | | 75,000 |
| | | | | | | | |
| Mortgage Related – 2.7% | | | | | | | | |
Federal Home Loan Mortgage Corp., MTN,
5.000%, 12/14/2018 | | | | | 281,000 | | | 271,329 |
Federal National Mortgage Association,
7.000%, 4/25/2020 | | | | | 40,278 | | | 43,102 |
FHLMC, 4.000%, 7/01/2019 | | | | | 294,424 | | | 300,662 |
FHLMC, 4.500%, 4/01/2019 | | | | | 610,813 | | | 631,860 |
FHLMC, 5.000%, 5/01/2034 | | | | | 198,402 | | | 205,113 |
FHLMC, 5.500%, 8/01/2033 | | | | | 488,446 | | | 509,000 |
FHLMC, 5.500%, 2/01/2037 | | | | | 520,190 | | | 540,372 |
FHLMC, 6.000%, 2/01/2020 | | | | | 209,828 | | | 220,007 |
FHLMC, 6.000%, 6/01/2035 | | | | | 389,732 | | | 409,299 |
FHLMC, 10.000%, 8/01/2018 | | | | | 3,391 | | | 3,833 |
FHLMC, 10.000%, 10/01/2018 | | | | | 2,155 | | | 2,432 |
FNMA, 4.000%, 1/01/2020 | | | | | 169,133 | | | 172,928 |
FNMA, 4.500%, 3/01/2035 | | | | | 254,201 | | | 260,524 |
FNMA, 4.500%, 9/01/2035 | | | | | 353,998 | | | 362,257 |
FNMA, 5.000%, 2/01/2018 | | | | | 101,556 | | | 106,230 |
FNMA, 5.000%, 6/01/2020 | | | | | 289,846 | | | 301,645 |
FNMA, 5.000%, 4/01/2034 | | | | | 190,570 | | | 197,106 |
FNMA, 5.000%, 5/01/2034 | | | | | 192,433 | | | 199,033 |
FNMA, 5.000%, 5/01/2035 | | | | | 344,823 | | | 356,595 |
FNMA, 5.000%, 6/01/2035 | | | | | 243,862 | | | 252,188 |
FNMA, 5.000%, 6/01/2035 | | | | | 140,874 | | | 145,684 |
FNMA, 5.000%, 8/01/2035 | | | | | 350,430 | | | 362,394 |
FNMA, 5.500%, 9/01/2016 | | | | | 68,049 | | | 71,489 |
FNMA, 5.500%, 8/01/2019 | | | | | 45,372 | | | 47,524 |
FNMA, 5.500%, 12/01/2032 | | | | | 114,062 | | | 118,918 |
FNMA, 5.500%, 1/01/2033 | | | | | 233,822 | | | 243,778 |
FNMA, 5.500%, 6/01/2033 | | | | | 360,905 | | | 377,051 |
FNMA, 5.500%, 7/01/2033 | | | | | 538,228 | | | 560,976 |
FNMA, 5.500%, 9/01/2034 | | | | | 211,460 | | | 220,133 |
FNMA, 5.500%, 3/01/2035 | | | | | 73,773 | | | 76,798 |
FNMA, 5.500%, 3/01/2035 | | | | | 56,530 | | | 58,796 |
FNMA, 5.500%, 5/01/2035 | | | | | 73,007 | | | 75,933 |
FNMA, 5.500%, 8/01/2035 | | | | | 141,095 | | | 146,750 |
FNMA, 5.500%, 12/01/2035 | | | | | 305,842 | | | 318,100 |
FNMA, 5.500%, 1/01/2036 | | | | | 16,361 | | | 17,017 |
FNMA, 5.500%, 2/01/2036 | | | | | 6,940 | | | 7,218 |
FNMA, 5.500%, 4/01/2036 | | | | | 379,506 | | | 394,716 |
FNMA, 5.500%, 6/01/2036 | | | | | 87,470 | | | 90,894 |
FNMA, 6.000%, 12/01/2018 | | | | | 25,191 | | | 26,650 |
FNMA, 6.000%, 12/01/2020 | | | | | 32,885 | | | 34,465 |
FNMA, 6.000%, 3/01/2021 | | | | | 290,322 | | | 305,678 |
FNMA, 6.000%, 10/01/2028 | | | | | 28,567 | | | 30,117 |
FNMA, 6.000%, 10/01/2033 | | | | | 548,098 | | | 575,444 |
FNMA, 6.500%, 2/01/2011 | | | | | 2,894 | | | 2,972 |
FNMA, 6.500%, 10/01/2031 | | | | | 81,261 | | | 86,352 |
103
| | | | | | | | |
| | | | | Principal Amount (‡) | | Value (†) |
| | | | | | | | |
| | | |
| BONDS AND NOTES – continued | | | | | | | | |
| | | |
| Mortgage Related – continued | | | | | | | | |
FNMA, 6.500%, 10/01/2033 | | | | $ | 43,987 | | $ | 46,632 |
FNMA, 6.500%, 10/01/2033 | | | | | 68,933 | | | 73,079 |
FNMA, 6.500%, 10/01/2033 | | | | | 58,705 | | | 62,235 |
FNMA, 6.500%, 11/01/2033 | | | | | 85,676 | | | 90,829 |
GNMA, 6.500%, 2/20/2028 | | | | | 130,003 | | | 138,727 |
GNMA, 7.000%, 11/20/2025 | | | | | 5,431 | | | 5,802 |
GNMA, 10.000%, 5/15/2018 | | | | | 14,729 | | | 16,157 |
GNMA, 10.000%, 8/15/2018 | | | | | 9,473 | | | 10,398 |
GNMA, 10.000%, 12/15/2018 | | | | | 45,846 | | | 50,324 |
| | | | | | | | |
| | | | | | | | 10,235,545 |
| | | | | | | | |
| Non-Captive Consumer – 0.9% | | | | | | | | |
American General Finance Corp., Series H, MTN, 5.375%, 10/01/2012 | | | | | 45,000 | | | 18,084 |
American General Finance Corp., Series J, MTN, 6.900%, 12/15/2017 | | | | | 2,815,000 | | | 1,041,550 |
HSBC Finance Corp., 8.000%, 7/15/2010 | | | | | 205,000 | | | 193,338 |
SLM Corp., Series A, MTN, 5.000%, 4/15/2015 | | | | | 70,000 | | | 31,500 |
SLM Corp., Series A, MTN, 5.375%, 1/15/2013 | | | | | 680,000 | | | 373,128 |
SLM Corp., Series A, MTN,
6.500%, 6/15/2010(d)(e) | | NZD | | | 970,000 | | | 402,230 |
SLM Corp., Series A, MTN, 8.450%, 6/15/2018 | | | | | 2,385,000 | | | 1,288,205 |
| | | | | | | | |
| | | | | | | | 3,348,035 |
| | | | | | | | |
| Non-Captive Diversified – 2.5% | | | | | | | | |
CIT Group Funding Co. of Canada,
5.200%, 6/01/2015 | | | | | 255,000 | | | 149,175 |
CIT Group, Inc., 5.400%, 2/13/2012 | | | | | 10,000 | | | 6,447 |
CIT Group, Inc., 5.400%, 1/30/2016 | | | | | 19,000 | | | 11,388 |
CIT Group, Inc., 5.800%, 7/28/2011 | | | | | 240,000 | | | 173,074 |
CIT Group, Inc., 5.800%, 10/01/2036 | | | | | 185,000 | | | 101,896 |
CIT Group, Inc., 5.850%, 9/15/2016 | | | | | 5,000 | | | 2,828 |
CIT Group, Inc., 12.000%, 12/18/2018, 144A | | | | | 1,275,000 | | | 659,813 |
CIT Group, Inc., EMTN, 4.650%, 9/19/2016 | | EUR | | | 350,000 | | | 195,304 |
CIT Group, Inc., GMTN, 5.000%, 2/13/2014 | | | | | 102,000 | | | 60,180 |
CIT Group, Inc., GMTN, 5.000%, 2/01/2015 | | | | | 17,000 | | | 10,350 |
CIT Group, Inc., MTN, 5.125%, 9/30/2014 | | | | | 155,000 | | | 93,696 |
CIT Group, Inc., Series A, GMTN,
6.000%, 4/01/2036 | | | | | 280,000 | | | 132,009 |
CIT Group, Inc., Series A, MTN,
5.650%, 2/13/2017 | | | | | 65,000 | | | 37,643 |
General Electric Capital Australia Funding, EMTN, 8.000%, 2/13/2012 | | AUD | | | 670,000 | | | 436,894 |
General Electric Capital Corp., 5.625%, 5/01/2018 | | | | | 215,000 | | | 186,947 |
General Electric Capital Corp., MTN,
5.875%, 1/14/2038 | | | | | 150,000 | | | 107,143 |
General Electric Capital Corp., Series A, EMTN, 6.750%, 9/26/2016(d)(e) | | NZD | | | 470,000 | | | 219,802 |
General Electric Capital Corp., Series A, GMTN, 7.625%, 12/10/2014(d)(e) | | NZD | | | 1,405,000 | | | 724,474 |
General Electric Capital Corp., Series A, MTN, 4.875%, 3/04/2015 | | | | | 2,230,000 | | | 1,979,381 |
General Electric Capital Corp., Series A, MTN, 6.500%, 9/28/2015(d)(e) | | NZD | | | 5,650,000 | | | 2,659,443 |
104
PORTFOLIO OF INVESTMENTS – as of March 31, 2009 (Unaudited)
Loomis Sayles Investment Grade Fixed Income Fund – continued
| | | | | | | | |
| | | | | Principal Amount (‡) | | Value (†) |
| | | | | | | | |
| | | |
| BONDS AND NOTES – continued | | | | | | | | |
| | | |
| Non-Captive Diversified – continued | | | | | | | | |
GMAC LLC, 5.625%, 5/15/2009 | | | | $ | 1,330,000 | | $ | 1,258,874 |
GMAC LLC, 6.000%, 12/15/2011, 144A | | | | | 763,000 | | | 519,458 |
GMAC LLC, 7.500%, 12/31/2013, 144A | | | | | 41,000 | | | 19,708 |
GMAC LLC, 8.000%, 12/31/2018, 144A | | | | | 97,000 | | | 28,160 |
| | | | | | | | |
| | | | | | | | 9,774,087 |
| | | | | | | | |
| Oil Field Services – 0.1% | | | | | | | | |
Weatherford International Ltd.,
6.500%, 8/01/2036 | | | | | 235,000 | | | 165,432 |
Weatherford International Ltd.,
6.800%, 6/15/2037 | | | | | 105,000 | | | 74,478 |
| | | | | | | | |
| | | | | | | | 239,910 |
| | | | | | | | |
| Paper – 0.4% | | | | | | | | |
Georgia-Pacific LLC, 7.250%, 6/01/2028 | | | | | 1,500,000 | | | 1,042,500 |
International Paper Co., 4.000%, 4/01/2010 | | | | | 500,000 | | | 475,752 |
Westvaco Corp., 8.200%, 1/15/2030 | | | | | 200,000 | | | 157,672 |
| | | | | | | | |
| | | | | | | | 1,675,924 |
| | | | | | | | |
| Pharmaceuticals – 1.8% | | | | | | | | |
Elan Financial PLC, 7.750%, 11/15/2011 | | | | | 60,000 | | | 50,400 |
Elan Financial PLC, 8.875%, 12/01/2013 | | | | | 170,000 | | | 136,000 |
Roche Holdings, Inc., 5.000%, 3/01/2014, 144A | | | | | 6,500,000 | | | 6,652,925 |
| | | | | | | | |
| | | | | | | | 6,839,325 |
| | | | | | | | |
| Pipelines – 2.3% | | | | | | | | |
DCP Midstream LP, 6.450%, 11/03/2036, 144A | | | | | 635,000 | | | 411,641 |
El Paso Corp., 6.950%, 6/01/2028 | | | | | 350,000 | | | 241,366 |
Enterprise Products Operating LLP,
6.300%, 9/15/2017 | | | | | 680,000 | | | 626,772 |
Kinder Morgan Energy Partners LP,
5.125%, 11/15/2014 | | | | | 145,000 | | | 137,739 |
Kinder Morgan Energy Partners LP,
5.950%, 2/15/2018 | | | | | 5,300,000 | | | 4,825,448 |
NGPL Pipeco LLC, 6.514%, 12/15/2012, 144A | | | | | 850,000 | | | 811,972 |
NGPL PipeCo LLC, 7.119%, 12/15/2017, 144A | | | | | 965,000 | | | 884,813 |
Southern Natural Gas Co.,
5.900%, 4/01/2017, 144A | | | | | 810,000 | | | 705,916 |
Spectra Energy Capital LLC, 5.500%, 3/01/2014 | | | | | 230,000 | | | 220,632 |
| | | | | | | | |
| | | | | | | | 8,866,299 |
| | | | | | | | |
| Property & Casualty Insurance – 1.4% | | | | | | | | |
Allstate Corp., 5.950%, 4/01/2036 | | | | | 470,000 | | | 340,050 |
Marsh & McLennan Cos., Inc.,
5.375%, 7/15/2014 | | | | | 65,000 | | | 57,315 |
Marsh & McLennan Cos., Inc.,
5.750%, 9/15/2015 | | | | | 1,842,000 | | | 1,642,340 |
Marsh & McLennan Cos., Inc.,
5.875%, 8/01/2033 | | | | | 2,360,000 | | | 1,566,120 |
Marsh & McLennan Cos., Inc.,
9.250%, 4/15/2019 | | | | | 1,390,000 | | | 1,416,977 |
MBIA Insurance Corp., (fixed rate to 1/15/2013, variable rate thereafter), 14.000%, 1/15/2033, 144A | | | | | 60,000 | | | 18,600 |
Progressive Corp., 7.000%, 10/01/2013 | | | | | 150,000 | | | 146,293 |
105
| | | | | | | | | |
| | | | | Principal Amount (‡) | | | Value (†) |
| | | | | | | | | |
| | | |
| BONDS AND NOTES – continued | | | | | | | | | |
| | | |
| Property & Casualty Insurance – continued | | | | | | | | | |
Willis North America, Inc., 6.200%, 3/28/2017 | | | | $ | 225,000 | | | $ | 157,708 |
| | | | | | | | | |
| | | | | | | | | 5,345,403 |
| | | | | | | | | |
| Railroads – 0.5% | | | | | | | | | |
Canadian Pacific Railway Co., 5.950%, 5/15/2037 | | | | | 215,000 | | | | 150,036 |
Canadian Pacific Railway Ltd., MTN,
4.900%, 6/15/2010, 144A | | CAD | | | 1,000,000 | | | | 798,937 |
CSX Corp., 6.250%, 3/15/2018 | | | | | 670,000 | | | | 577,178 |
CSX Corp., MTN, 6.000%, 10/01/2036 | | | | | 210,000 | | | | 147,495 |
Missouri Pacific Railroad Co.,
5.000%, 1/01/2045(d) | | | | | 190,000 | | | | 104,500 |
Union Pacific Corp., 5.375%, 6/01/2033 | | | | | 415,000 | | | | 330,207 |
| | | | | | | | | |
| | | | | | | | | 2,108,353 |
| | | | | | | | | |
| Refining – 0.9% | | | | | | | | | |
Valero Energy Corp., 9.375%, 3/15/2019 | | | | | 3,500,000 | | | | 3,613,295 |
| | | | | | | | | |
| REITs – 2.0% | | | | | | | | | |
Camden Property Trust, 5.700%, 5/15/2017 | | | | | 640,000 | | | | 469,849 |
Colonial Realty LP, 4.800%, 4/01/2011 | | | | | 1,840,000 | | | | 1,601,116 |
Colonial Realty LP, 5.500%, 10/01/2015 | | | | | 290,000 | | | | 173,975 |
Duke Realty LP, 5.950%, 2/15/2017 | | | | | 90,000 | | | | 53,824 |
Equity One, Inc., 6.000%, 9/15/2017 | | | | | 1,000,000 | | | | 650,000 |
ERP Operating LP, 5.125%, 3/15/2016 | | | | | 30,000 | | | | 23,672 |
ERP Operating LP, 5.750%, 6/15/2017 | | | | | 180,000 | | | | 142,465 |
Highwoods Properties, Inc., 5.850%, 3/15/2017 | | | | | 80,000 | | | | 49,470 |
Highwoods Properties, Inc., 7.500%, 4/15/2018 | | | | | 1,075,000 | | | | 708,421 |
ProLogis, 5.625%, 11/15/2015 | | | | | 40,000 | | | | 21,600 |
ProLogis, 5.750%, 4/01/2016 | | | | | 35,000 | | | | 19,234 |
Realty Income Corp., 6.750%, 8/15/2019 | | | | | 500,000 | | | | 345,142 |
Simon Property Group LP, 5.250%, 12/01/2016 | | | | | 75,000 | | | | 55,865 |
Simon Property Group LP, 5.300%, 5/30/2013 | | | | | 1,200,000 | | | | 979,829 |
Simon Property Group LP, 5.750%, 5/01/2012 | | | | | 45,000 | | | | 38,924 |
Simon Property Group LP, 5.750%, 12/01/2015 | | | | | 290,000 | | | | 223,899 |
Simon Property Group LP, 5.875%, 3/01/2017 | | | | | 740,000 | | | | 570,806 |
Simon Property Group LP, 6.350%, 8/28/2012 | | | | | 250,000 | | | | 214,184 |
Simon Property Group LP, 10.350%, 4/01/2019 | | | | | 1,300,000 | | | | 1,263,443 |
| | | | | | | | | |
| | | | | | | | | 7,605,718 |
| | | | | | | | | |
| Retailers – 1.6% | | | | | | | | | |
Home Depot, Inc. (The), 5.875%, 12/16/2036 | | | | | 3,305,000 | | | | 2,340,538 |
J.C. Penney Corp., Inc., 6.375%, 10/15/2036 | | | | | 230,000 | | | | 143,787 |
Lowe’s Cos., Inc., 5.500%, 10/15/2035 | | | | | 25,000 | | | | 21,943 |
Lowe’s Cos., Inc., 5.800%, 10/15/2036 | | | | | 950,000 | | | | 835,622 |
Macy’s Retail Holdings, Inc., 5.350%, 3/15/2012 | | | | | 355,000 | | | | 278,659 |
Macy’s Retail Holdings, Inc., 5.875%, 1/15/2013 | | | | | 980,000 | | | | 744,493 |
Macy’s Retail Holdings, Inc., 6.375%, 3/15/2037 | | | | | 3,465,000 | | | | 1,929,593 |
| | | | | | | | | |
| | | | | | | | | 6,294,635 |
| | | | | | | | | |
| Sovereigns – 1.4% | | | | | | | | | |
Republic of Iceland, 7.000%, 3/17/2010 | | ISK | | | 99,510,000 | | | | 474,007 |
Republic of Iceland, 8.500%, 6/12/2009 | | ISK | | | 133,290,000 | | | | 643,043 |
Mexican Fixed Rate Bonds, Series M-20,
8.000%, 12/07/2023 | | MXN | | | 140,000 | (††) | | | 981,374 |
106
PORTFOLIO OF INVESTMENTS – as of March 31, 2009 (Unaudited)
Loomis Sayles Investment Grade Fixed Income Fund – continued
| | | | | | | | |
| | | | | Principal Amount (‡) | | | Value (†) |
| | | | | | | | |
| | | |
| BONDS AND NOTES – continued | | | | | | | | |
| | | |
| Sovereigns – continued | | | | | | | | |
Mexican Fixed Rate Bonds, Series MI-10,
9.000%, 12/20/2012 | | MXN | | 460,000 | (††) | | $ | 3,470,865 |
| | | | | | | | |
| | | | | | | | 5,569,289 |
| | | | | | | | |
| Supranational – 2.6% | | | | | | | | |
European Investment Bank, EMTN,
4.600%, 1/30/2037, 144A | | CAD | | 1,900,000 | | | | 1,383,754 |
Inter-American Development Bank, EMTN,
Zero Coupon Bond, 5/11/2009 | | BRL | | 9,000,000 | | | | 3,821,533 |
Inter-American Development Bank, EMTN,
Zero Coupon Bond, 9/23/2013 | | IDR | | 45,300,000,000 | | | | 2,195,021 |
Inter-American Development Bank, EMTN, 6.000%, 12/15/2017 | | NZD | | 4,375,000 | | | | 2,467,754 |
| | | | | | | | |
| | | | | | | | 9,868,062 |
| | | | | | | | |
| Technology – 2.6% | | | | | | | | |
Avnet, Inc., 6.000%, 9/01/2015 | | | | 1,970,000 | | | | 1,621,016 |
Avnet, Inc., 6.625%, 9/15/2016 | | | | 270,000 | | | | 224,887 |
Corning, Inc., 6.850%, 3/01/2029 | | | | 10,000 | | | | 7,549 |
Corning, Inc., 7.250%, 8/15/2036 | | | | 3,565,000 | | | | 2,685,825 |
Dun & Bradstreet Corp., 6.000%, 4/01/2013 | | | | 1,970,000 | | | | 2,009,831 |
International Business Machines Corp.,
4.750%, 11/29/2012 | | | | 795,000 | | | | 842,627 |
Intuit, Inc., 5.750%, 3/15/2017 | | | | 635,000 | | | | 552,988 |
KLA-Tencor Corp., 6.900%, 5/01/2018 | | | | 1,370,000 | | | | 1,082,930 |
Motorola, Inc., 5.220%, 10/01/2097 | | | | 1,000,000 | | | | 402,470 |
Motorola, Inc., 6.500%, 9/01/2025 | | | | 190,000 | | | | 120,651 |
Samsung Electronics Co. Ltd.,
7.700%, 10/01/2027, 144A | | | | 475,000 | | | | 454,755 |
| | | | | | | | |
| | | | | | | | 10,005,529 |
| | | | | | | | |
| Textile – 0.0% | | | | | | | | |
Kellwood Co., 7.625%, 10/15/2017(d) | | | | 1,000,000 | | | | 45,000 |
| | | | | | | | |
| Tobacco – 1.4% | | | | | | | | |
Altria Group, Inc., 9.250%, 8/06/2019 | | | | 4,190,000 | | | | 4,479,923 |
Reynolds American, Inc., 6.750%, 6/15/2017 | | | | 735,000 | | | | 627,464 |
Reynolds American, Inc., 7.250%, 6/15/2037 | | | | 195,000 | | | | 142,383 |
| | | | | | | | |
| | | | | | | | 5,249,770 |
| | | | | | | | |
| Transportation Services – 2.1% | | | | | | | | |
APL Ltd., 8.000%, 1/15/2024(d) | | | | 100,000 | | | | 70,257 |
Atlas Air, Inc., Series B, 7.680%, 1/02/2014 | | | | 3,429,237 | | | | 2,571,928 |
Erac USA Finance Co., 6.700%, 6/01/2034, 144A | | | | 945,000 | | | | 522,235 |
Erac USA Finance Co.,
7.000%, 10/15/2037, 144A | | | | 8,661,000 | | | | 5,041,239 |
| | | | | | | | |
| | | | | | | | 8,205,659 |
| | | | | | | | |
| Treasuries – 16.4% | | | | | | | | |
Canadian Government, 2.750%, 12/01/2010 | | CAD | | 5,410,000 | | | | 4,418,452 |
Canadian Government, 3.750%, 9/01/2011 | | CAD | | 2,000,000 | | | | 1,682,979 |
Canadian Government, 3.750%, 6/01/2012 | | CAD | | 3,340,000 | | | | 2,845,199 |
Canadian Government, 3.750%, 6/01/2019 | | CAD | | 31,580,000 | | | | 27,219,465 |
Canadian Government, 4.000%, 6/01/2016 | | CAD | | 1,000,000 | | | | 886,913 |
Canadian Government, 4.250%, 9/01/2009 | | CAD | | 4,070,000 | | | | 3,278,145 |
107
| | | | | | | |
| | | | | Principal Amount (‡) | | Value (†) |
| | | | | | | |
| | | |
| BONDS AND NOTES – continued | | | | | | | |
| | | |
| Treasuries – continued | | | | | | | |
Canadian Government, 5.250%, 6/01/2012 | | CAD | | 11,565,000 | | $ | 10,277,605 |
Norwegian Government, 4.250%, 5/19/2017 | | NOK | | 23,620,000 | | | 3,673,978 |
Norwegian Government, 6.500%, 5/15/2013 | | NOK | | 50,000,000 | | | 8,508,735 |
U.S. Treasury Note, 4.250%, 11/15/2013 | | | | 330,000 | | | 370,064 |
| | | | | | | |
| | | | | | | 63,161,535 |
| | | | | | | |
| Wireless – 0.9% | | | | | | | |
ALLTEL Corp., 7.875%, 7/01/2032 | | | | 705,000 | | | 716,590 |
Nextel Communications, Inc., Series D,
7.375%, 8/01/2015 | | | | 60,000 | | | 31,800 |
Nextel Communications, Inc., Series E,
6.875%, 10/31/2013 | | | | 165,000 | | | 94,050 |
Nextel Communications, Inc., Series F,
5.950%, 3/15/2014 | | | | 510,000 | | | 283,050 |
Sprint Capital Corp., 6.875%, 11/15/2028 | | | | 234,000 | | | 142,740 |
Sprint Nextel Corp., 6.000%, 12/01/2016 | | | | 366,000 | | | 261,690 |
Telefonica Emisones SAU, 6.421%, 6/20/2016 | | | | 185,000 | | | 191,278 |
Vodafone Group PLC, 6.150%, 2/27/2037 | | | | 1,725,000 | | | 1,626,464 |
| | | | | | | |
| | | | | | | 3,347,662 |
| | | | | | | |
| Wirelines – 5.4% | | | | | | | |
AT&T Corp., 6.500%, 3/15/2029 | | | | 1,310,000 | | | 1,148,587 |
AT&T, Inc., 6.150%, 9/15/2034 | | | | 1,785,000 | | | 1,563,881 |
AT&T, Inc., 6.500%, 9/01/2037 | | | | 965,000 | | | 870,837 |
BellSouth Corp., 6.000%, 11/15/2034 | | | | 530,000 | | | 474,729 |
BellSouth Corp., 6.550%, 6/15/2034 | | | | 105,000 | | | 97,444 |
BellSouth Telecommunications, Inc.,
5.850%, 11/15/2045 | | | | 2,000,000 | | | 1,394,396 |
GTE Corp., 6.940%, 4/15/2028 | | | | 205,000 | | | 183,566 |
New England Telephone & Telegraph,
7.875%, 11/15/2029 | | | | 2,170,000 | | | 2,024,894 |
Qwest Capital Funding, Inc., 6.500%, 11/15/2018 | | | | 500,000 | | | 340,000 |
Telecom Italia Capital SA, 5.250%, 11/15/2013 | | | | 225,000 | | | 202,058 |
Telecom Italia Capital SA, 5.250%, 10/01/2015 | | | | 1,980,000 | | | 1,669,445 |
Telecom Italia Capital SA, 6.000%, 9/30/2034 | | | | 1,880,000 | | | 1,282,638 |
Telefonica Emisiones SAU, 7.045%, 6/20/2036 | | | | 4,075,000 | | | 4,187,177 |
Verizon Communications, Inc.,
5.850%, 9/15/2035 | | | | 3,715,000 | | | 3,156,324 |
Verizon Maryland, Inc., 5.125%, 6/15/2033 | | | | 290,000 | | | 200,894 |
Verizon New York, Inc., Series B,
7.375%, 4/01/2032 | | | | 1,610,000 | | | 1,493,816 |
Verizon Virginia, Inc., Series A,
4.625%, 3/15/2013 | | | | 505,000 | | | 489,870 |
| | | | | | | |
| | | | | | | 20,780,556 |
| | | | | | | |
| | | |
| TOTAL NON-CONVERTIBLE BONDS | | | | | | | |
(Identified Cost $381,607,322) | | | | | | | 340,914,131 |
| | | | | | | |
108
PORTFOLIO OF INVESTMENTS – as of March 31, 2009 (Unaudited)
Loomis Sayles Investment Grade Fixed Income Fund – continued
| | | | | | | | |
| | | | | Principal Amount (‡) | | Value (†) |
| | | | | | | | |
| | | |
| CONVERTIBLE BONDS – 0.2% | | | | | | | | |
| | | |
| Pharmaceuticals – 0.1% | | | | | | | | |
Vertex Pharmaceuticals, Inc., 4.750%, 2/15/2013 | | | | $ | 298,000 | | $ | 391,497 |
Watson Pharmaceuticals, Inc., 1.750%, 3/15/2023 | | | | | 125,000 | | | 120,469 |
| | | | | | | | |
| | | | | | | | 511,966 |
| | | | | | | | |
| REITs – 0.1% | | | | | | | | |
ERP Operating LP, 3.850%, 8/15/2026 | | | | | 180,000 | | | 159,084 |
| | | | | | | | |
| Technology – 0.0% | | | | | | | | |
Maxtor Corp., 5.750%, 3/01/2012(d) | | | | | 48,000 | | | 36,000 |
Richardson Electronics Ltd., 7.750%, 12/15/2011 | | | | | 44,000 | | | 35,200 |
| | | | | | | | |
| | | | | | | | 71,200 |
| | | | | | | | |
| | | |
| TOTAL CONVERTIBLE BONDS | | | | | | | | |
(Identified Cost $657,703) | | | | | | | | 742,250 |
| | | | | | | | |
| | | |
| MUNICIPALS – 0.2% | | | | | | | | |
| | | |
| Michigan – 0.1% | | | | | | | | |
Michigan Tobacco Settlement Finance Authority,
7.309%, 6/01/2034(d) | | | | | 1,085,000 | | | 633,369 |
| | | | | | | | |
| Ohio – 0.1% | | | | | | | | |
Buckeye Tobacco Settlement Financing Authority,
Series A-2, 5.875%, 6/01/2047(d) | | | | | 750,000 | | | 411,105 |
| | | | | | | | |
| | | |
| TOTAL MUNICIPALS | | | | | | | | |
(Identified Cost $1,813,253) | | | | | | | | 1,044,474 |
| | | | | | | | |
| | | |
| TOTAL BONDS AND NOTES | | | | | | | | |
(Identified Cost $384,078,278) | | | | | | | | 342,700,855 |
| | | | | | | | |
| | | |
| | | | | | Shares | | | |
| | | |
| PREFERRED STOCKS – 0.5% | | | | | | | | |
| | | |
| NON-CONVERTIBLE PREFERRED STOCKS – 0.2% | | | | | | | | |
| | | |
| Banking – 0.1% | | | | | | | | |
Bank of America Corp., 7.250% | | | | | 940 | | | 383,050 |
| | | | | | | | |
| Capital Markets – 0.0% | | | | | | | | |
Lehman Brothers Holdings, Inc., 7.250%(c) | | | | | 860 | | | 637 |
Lehman Brothers Holdings, Inc., 7.950%(c) | | | | | 570 | | | 3 |
| | | | | | | | |
| | | | | | | | 640 |
| | | | | | | | |
| Diversified Financial Services – 0.0% | | | | | | | | |
CIT Group, Inc., Series A, 6.350% | | | | | 12,023 | | | 76,466 |
Preferred Blocker, Inc., 7.000%, 144A | | | | | 161 | | | 32,054 |
| | | | | | | | |
| | | | | | | | 108,520 |
| | | | | | | | |
| Electric Utilities – 0.1% | | | | | | | | |
Connecticut Light & Power Co., 4.400% | | | | | 263 | | | 9,246 |
MDU Resources Group, Inc., 5.100%, 1/01/2011 | | | | | 254 | | | 25,448 |
Public Service Electric & Gas Co., 4.080% | | | | | 400 | | | 28,200 |
San Diego Gas & Electric Co., 4.500% | | | | | 100 | | | 1,550 |
Union Electric Co., 4.500% | | | | | 3,160 | | | 211,720 |
| | | | | | | | |
| | | | | | | | 276,164 |
| | | | | | | | |
109
| | | | | | | | |
| | | | | Shares | | Value (†) |
| | | | | | | | |
| | | |
| PREFERRED STOCKS – continued | | | | | | | | |
| | | |
| Thrifts & Mortgage Finance – 0.0% | | | | | | | | |
Federal Home Loan Mortgage Corp., 5.000%, (f)(g) | | | | | 1,850 | | $ | 1,665 |
Federal Home Loan Mortgage Corp., 5.570%, (f)(g) | | | | | 28,450 | | | 10,811 |
Federal Home Loan Mortgage Corp., 5.660%, (f)(g) | | | | | 8,500 | | | 3,400 |
Federal Home Loan Mortgage Corp., 5.700%, (f)(g) | | | | | 2,900 | | | 2,407 |
Federal Home Loan Mortgage Corp., 5.790%, (f)(g) | | | | | 5,400 | | | 4,158 |
Federal Home Loan Mortgage Corp., 5.810%, (f)(g) | | | | | 1,900 | | | 1,482 |
Federal Home Loan Mortgage Corp., 5.900%, (f)(g) | | | | | 4,200 | | | 1,932 |
Federal Home Loan Mortgage Corp., 6.000%, (f)(g) | | | | | 2,400 | | | 2,136 |
Federal Home Loan Mortgage Corp., 6.420%, (f)(g) | | | | | 1,700 | | | 1,360 |
Federal Home Loan Mortgage Corp., 6.550%, (f)(g) | | | | | 11,075 | | | 4,541 |
Federal Home Loan Mortgage Corp., 8.375%, (f)(g) | | | | | 39,400 | | | 18,124 |
Federal National Mortgage Association, 4.750%, (f)(g) | | | | | 3,650 | | | 2,664 |
Federal National Mortgage Association, 5.125%, (f)(g) | | | | | 1,300 | | | 897 |
Federal National Mortgage Association, 5.375%, (f)(g) | | | | | 2,600 | | | 3,718 |
Federal National Mortgage Association, 5.810%, (f)(g) | | | | | 1,050 | | | 1,208 |
Federal National Mortgage Association, 6.750%, (f)(g) | | | | | 1,650 | | | 825 |
Federal National Mortgage Association, 8.250%, (f)(g) | | | | | 53,575 | | | 38,038 |
| | | | | | | | |
| | | | | | | | 99,366 |
| | | | | | | | |
| | | |
| TOTAL NON-CONVERTIBLE PREFERRED STOCKS | | | | | | | | |
(Identified Cost $4,375,329) | | | | | | | | 867,740 |
| | | | | | | | |
| | | |
| CONVERTIBLE PREFERRED STOCKS – 0.3% | | | | | | | | |
| | | |
| Capital Markets – 0.2% | | | | | | | | |
Newell Financial Trust I, 5.250%, 12/01/2027 | | | | | 33,050 | | | 594,900 |
| | | | | | | | |
| Diversified Financial Services – 0.1% | | | | | | | | |
Sovereign Capital Trust, 4.375%, 3/01/2034 | | | | | 25,000 | | | 493,750 |
| | | | | | | | |
| | | |
| TOTAL CONVERTIBLE PREFERRED STOCKS | | | | | | | | |
(Identified Cost $1,794,828) | | | | | | | | 1,088,650 |
| | | | | | | | |
| | | |
| TOTAL PREFERRED STOCKS | | | | | | | | |
(Identified Cost $6,170,157) | | | | | | | | 1,956,390 |
| | | | | | | | |
| | | |
| | | | | | Principal Amount (‡) | | | |
| | | |
| SHORT-TERM INVESTMENTS – 9.3% | | | | | | | | |
Tri-Party Repurchase Agreement with Fixed Income Clearing Corporation, dated 3/31/2009 at 0.000%
to be repurchased at $35,738,597 on 4/01/2009 collateralized by $35,740,000 Federal Home Loan Mortgage Corp., 2.680% due 11/16/2009 with a value of $36,454,800 including accrued interest
(Note 2h of Notes to Financial Statements) | | | | | | | | |
| (Identified Cost $35,738,597) | | | | $ | 35,738,597 | | | 35,738,597 |
| | | | | | | | |
| | | |
| TOTAL INVESTMENTS – 98.6% | | | | | | | | |
(Identified Cost $425,987,032)(a) | | | | | | | | 380,395,842 |
Other Assets Less Liabilities—1.4% | | | | | | | | 5,369,638 |
| | | | | | | | |
| | | |
| NET ASSETS – 100.0% | | | | | | | $ | 385,765,480 |
| | | | | | | | |
110
PORTFOLIO OF INVESTMENTS – as of March 31, 2009 (Unaudited)
Loomis Sayles Investment Grade Fixed Income Fund – continued
| | | | | | | |
(‡) Principal amount stated in U.S. dollars unless otherwise noted. | | | | | |
(†) See Note 2a of Notes to Financial Statements. | | | | | |
(††) Amount shown represents units. One unit represents a principal amount of 100. | | | | | |
(a) Federal Tax Information (Amounts exclude certain adjustments made at the end of the Fund’s fiscal year for tax purposes. Such adjustments are primarily due to wash sales. Amortization of premium on debt securities is excluded for tax purposes.): | | | | | |
At March 31, 2009, the net unrealized depreciation on investments based on a cost of $426,346,276 for federal income tax purposes was as follows: | | | |
Aggregate gross unrealized appreciation for all investments in which there is an excess of value over tax cost | | $ | 7,693,947 |
Aggregate gross unrealized depreciation for all investments in which there is an excess of tax cost over value | | | (53,644,381) |
| | | | | | | |
Net unrealized depreciation | | $ | (45,950,434) |
| | | | | | | |
| (b) | Variable rate security. Rate as of March 31, 2009 is disclosed. |
| (c) | Non-income producing security due to default or bankruptcy filing. |
| (d) | Illiquid security. At March 31, 2009, the value of these securities amounted to $7,915,814 or 2.1% of net assets. |
| (e) | Valued by management. At March 31, 2009 the value of these securities amounted to $4,005,949 or 1.0% of net assets. |
| (f) | Future dividend payments have been eliminated as the issuer has been placed in conservatorship. |
| (g) | Non-income producing security. |
| 144A | Securities exempt from registration under Rule 144A of the Securities Act of 1933. These securities may be resold in transactions exempt from registration, normally to qualified institutional buyers. At March 31, 2009, the total value of these securities amounted to $40,170,436 or 10.4% of net assets. |
| ABS | Asset-Backed Securities |
| ARM | Adjustable-Rate Mortgage |
| EMTN | Euro Medium Term Note |
| FHLMC | Federal Home Loan Mortgage Corporation |
| FNMA | Federal National Mortgage Association |
| GMTN | Global Medium Term Note |
| GNMA | Government National Mortgage Association |
| REITs | Real Estate Investment Trusts |
| | Key to Abbreviations: AUD: Australian Dollar; BRL: Brazilian Real; CAD: Canadian Dollar; EUR: Euro; IDR: Indonesian Rupiah; ISK: Icelandic Krona; KRW: South Korean Won; MXN: Mexican Peso; NOK: Norwegian Krone; NZD: New Zealand Dollar; THB: Thai Baht |
NET ASSET SUMMARY AT MARCH 31, 2009 (Unaudited)
| | | |
Treasuries | | 16.4 | % |
Banking | | 6.8 | |
Wirelines | | 5.4 | |
Commercial Mortgage-Backed Securities | | 4.9 | |
Electric | | 3.5 | |
Local Authorities | | 3.0 | |
Independent Energy | | 2.8 | |
Mortgage Related | | 2.7 | |
Technology | | 2.6 | |
Supranational | | 2.6 | |
Non-Captive Diversified | | 2.5 | |
Pipelines | | 2.3 | |
Media Cable | | 2.1 | |
Transportation Services | | 2.1 | |
REITs | | 2.1 | |
Consumer Cyclical Services | | 2.0 | |
Other Investments, less than 2% each | | 25.5 | |
Short-Term Investments | | 9.3 | |
| | | |
Total Investments | | 98.6 | |
Other assets less liabilities | | 1.4 | |
| | | |
Net Assets | | 100.0 | % |
| | | |
111
CURRENCY EXPOSURE AT MARCH 31, 2009 AS A PERCENTAGE OF NET ASSETS (Unaudited)
| | | |
United States Dollar | | 71.3 | % |
Canadian Dollar | | 13.8 | |
Norwegian Krone | | 3.2 | |
New Zealand Dollar | | 2.5 | |
Brazilian Real | | 2.2 | |
Other, less than 2% each | | 5.6 | |
| | | |
Total Investments | | 98.6 | |
Other assets less liabilities | | 1.4 | |
| | | |
Net Assets | | 100.0 | % |
| | | |
See accompanying notes to financial statements.
112
STATEMENTS OF ASSETS AND LIABILITIES
March 31, 2009 (Unaudited)
| | | | | | | | |
| | | Bond Fund | | | Fixed
Income Fund | |
| | | | | | | | |
Assets | | | | | | | | |
Investments at cost | | $ | 17,269,684,101 | | | $ | 728,737,983 | |
Net unrealized depreciation | | | (4,439,168,791 | ) | | | (142,424,556 | ) |
| | | | | | | | |
Investments at value | | | 12,830,515,310 | | | | 586,313,427 | |
Cash | | | 450,052 | | | | — | |
Foreign currency at value (identified cost $6,911,165, $219,977, $32,660,217, $0, $66,547, $0, $121,978) | | | 6,975,665 | | | | 222,460 | |
Receivable for Fund shares sold | | | 56,090,169 | | | | 214,717 | |
Receivable for securities sold | | | 285,180 | | | | 11,565 | |
Receivable for currency sold (identified cost $2,451,924, $13,230, $0, $0, $11,227, $0, $61,775) | | | 1,374,214 | | | | 7,415 | |
Unrealized appreciation on forward foreign currency contracts (Note 2) | | | — | | | | — | |
Dividends and interest receivable | | | 260,161,034 | | | | 10,269,487 | |
Tax reclaims receivable | | | — | | | | 2,924 | |
Receivable from investment adviser (Note 5) | | | 61,174 | | | | — | |
Receivable from broker—variation margin on open futures contracts | | | — | | | | — | |
Other assets | | | 12,087 | | | | — | |
| | | | | | | | |
Total Assets | | | 13,155,924,885 | | | | 597,041,995 | |
| | | | | | | | |
| | |
| Liabilities | | | | | | | | |
Payable for securities purchased | | | 1,561,140 | | | | — | |
Payable for Fund shares redeemed | | | 15,954,386 | | | | 68,094 | |
Management fees payable (Note 5) | | | 5,680,823 | | | | 248,297 | |
Administrative fees payable (Note 5) | | | 472,211 | | | | 23,541 | |
Deferred Trustees’ fees (Note 5) | | | 554,331 | | | | 73,355 | |
Service and distribution fees payable (Note 5) | | | 40,555 | | | | — | |
Unrealized depreciation on forward foreign currency contracts (Note 2) | | | — | | | | — | |
Other accounts payable and accrued expenses | | | 1,106,164 | | | | 23,933 | |
| | | | | | | | |
Total Liabilities | | | 25,369,610 | | | | 437,220 | |
| | | | | | | | |
Net Assets | | $ | 13,130,555,275 | | | $ | 596,604,775 | |
| | | | | | | | |
Net Assets consist of: | | | | | | | | |
Paid-in capital | | $ | 17,998,291,359 | | | $ | 740,096,212 | |
Undistributed net investment income (Distributions in excess of net investment income) | | | 107,769,893 | | | | 9,920,329 | |
Accumulated net realized loss on investments, futures contracts and foreign currency transactions | | | (535,868,665 | ) | | | (10,975,955 | ) |
Net unrealized depreciation on investments, futures contracts and foreign currency translations | | | (4,439,637,312 | ) | | | (142,435,811 | ) |
| | | | | | | | |
Net Assets | | $ | 13,130,555,275 | | | $ | 596,604,775 | |
| | | | | | | | |
| | |
| Net Asset Value and Offering Price | | | | | | | | |
Institutional Class | | | | | | | | |
Net assets | | $ | 7,353,074,331 | | | $ | 596,604,775 | |
| | | | | | | | |
Shares of beneficial interest | | | 721,450,184 | | | | 59,609,467 | |
| | | | | | | | |
Net asset value, offering and redemption price per share | | $ | 10.19 | | | $ | 10.01 | |
| | | | | | | | |
Retail Class | | | | | | | | |
Net assets | | $ | 5,605,362,247 | | | | — | |
| | | | | | | | |
Shares of beneficial interest | | | 551,788,449 | | | | — | |
| | | | | | | | |
Net asset value, offering and redemption price per share | | $ | 10.16 | | | | — | |
| | | | | | | | |
Admin Class | | | | | | | | |
Net assets | | $ | 172,118,697 | | | | — | |
| | | | | | | | |
Shares of beneficial interest | | | 16,981,508 | | | | — | |
| | | | | | | | |
Net asset value, offering and redemption price per share | | $ | 10.14 | | | | — | |
| | | | | | | | |
See accompanying notes to financial statements.
113
| | | | | | | | | | | | | | | | | | |
Global
Bond Fund | | | Inflation Protected
Securities Fund | | | Institutional High
Income Fund | | | Intermediate Duration
Fixed Income Fund | | | Investment Grade
Fixed Income Fund | |
| | | | | | | | | | | | | | | | | | |
| | | | | | | | | | | | | | | | | | |
| $ | 1,640,120,012 | | | $ | 14,283,574 | | | $ | 305,634,634 | | | $ | 27,810,208 | | | $ | 425,987,032 | |
| | (286,149,699 | ) | | | (894,123 | ) | | | (68,240,166 | ) | | | (1,869,533 | ) | | | (45,591,190 | ) |
| | 1,353,970,313 | | | | 13,389,451 | | | | 237,394,468 | | | | 25,940,675 | | | | 380,395,842 | |
| | — | | | | — | | | | 38,190 | | | | 5,141 | | | | — | |
| | | | |
| | 30,436,777 | | | | — | | | | 67,393 | | | | — | | | | 123,553 | |
| | 2,696,708 | | | | 47,927 | | | | 9,000,000 | | | | — | | | | 105,431 | |
| | 26,620,201 | | | | — | | | | 133,239 | | | | 229,533 | | | | — | |
| | | | |
| | — | | | | — | | | | 6,175 | | | | — | | | | 33,979 | |
| | 3,161,451 | | | | 3,231 | | | | — | | | | — | | | | — | |
| | 24,854,142 | | | | 116,719 | | | | 5,103,785 | | | | 289,081 | | | | 5,821,681 | |
| | 812 | | | | — | | | | 2,181 | | | | 1,135 | | | | 1,006 | |
| | — | | | | 7,025 | | | | — | | | | 5,050 | | | | — | |
| | — | | | | — | | | | — | | | | 1,250 | | | | — | |
| | — | | | | — | | | | — | | | | — | | | | — | |
| | 1,441,740,404 | | | | 13,564,353 | | | | 251,745,431 | | | | 26,471,865 | | | | 386,481,492 | |
| | | | |
| | | | | | | | | | | | | | | | | | |
| | 662,325 | | | | — | | | | 2,074,752 | | | | — | | | | — | |
| | 2,190,535 | | | | 250,000 | | | | 535 | | | | — | | | | 500,000 | |
| | 716,599 | | | | 2,693 | | | | 112,719 | | | | 5,514 | | | | 126,535 | |
| | 51,158 | | | | 464 | | | | 8,426 | | | | 950 | | | | 14,593 | |
| | 132,062 | | | | 34,221 | | | | 44,605 | | | | 36,647 | | | | 50,618 | |
| | 4,867 | | | | — | | | | — | | | | — | | | | — | |
| | 1,136,389 | | | | — | | | | — | | | | — | | | | — | |
| | 158,827 | | | | 20,089 | | | | 29,194 | | | | 25,610 | | | | 24,266 | |
| | 5,052,762 | | | | 307,467 | | | | 2,270,231 | | | | 68,721 | | | | 716,012 | |
| $ | 1,436,687,642 | | | $ | 13,256,886 | | | $ | 249,475,200 | | | $ | 26,403,144 | | | $ | 385,765,480 | |
| | | | | | | | | | | | | | | | | | |
| $ | 1,818,005,594 | | | $ | 14,707,487 | | | $ | 316,846,286 | | | $ | 29,767,046 | | | $ | 434,359,151 | |
| | | | |
| | 1,434,218 | | | | 3,206 | | | | 5,441,213 | | | | (54,240 | ) | | | 758,382 | |
| | | | |
| | (96,332,725 | ) | | | (562,915 | ) | | | (4,569,718 | ) | | | (1,457,029 | ) | | | (3,785,337 | ) |
| | | | |
| | (286,419,445 | ) | | | (890,892 | ) | | | (68,242,581 | ) | | | (1,852,633 | ) | | | (45,566,716 | ) |
| $ | 1,436,687,642 | | | $ | 13,256,886 | | | $ | 249,475,200 | | | $ | 26,403,144 | | | $ | 385,765,480 | |
| | | | |
| | | | | | | | | | | | | | | | | | |
| | | | | | | | | | | | | | | | | | |
| $ | 732,703,221 | | | $ | 13,256,886 | | | $ | 249,475,200 | | | $ | 26,403,144 | | | $ | 385,765,480 | |
| | 56,203,659 | | | | 1,340,368 | | | | 47,047,897 | | | | 2,970,155 | | | | 37,418,460 | |
| $ | 13.04 | | | $ | 9.89 | | | $ | 5.30 | | | $ | 8.89 | | | $ | 10.31 | |
| | | | | | | | | | | | | | | | | | |
| $ | 703,984,421 | | | | — | | | | — | | | | — | | | | — | |
| | 54,455,217 | | | | — | | | | — | | | | — | | | | — | |
| $ | 12.93 | | | | — | | | | — | | | | — | | | | — | |
| | | | | | | | | | | | | | | | | | |
| | — | | | | — | | | | — | | | | — | | | | — | |
| | — | | | | — | | | | — | | | | — | | | | — | |
| | — | | | | — | | | | — | | | | — | | | | — | |
See accompanying notes to financial statements.
114
STATEMENTS OF OPERATIONS
For the Six Months Ended March 31, 2009 (Unaudited)
| | | | | | | | |
| | | Bond Fund | | | Fixed
Income Fund | |
| | | | | | | | |
Investment Income | | | | | | | | |
Dividends | | $ | 10,846,640 | | | $ | 581,266 | |
Interest | | | 556,688,698 | | | | 22,379,739 | |
Securities lending income (Note 2) | | | 158,686 | | | | 2,341 | |
Less net foreign taxes withheld | | | (75,132 | ) | | | (1,892 | ) |
| | | | | | | | |
| | | 567,618,892 | | | | 22,961,454 | |
| | | | | | | | |
| | |
| Expenses | | | | | | | | |
Management fees (Note 5) | | | 32,297,791 | | | | 1,398,066 | |
Distribution fees—Retail Class (Note 5) | | | 6,863,447 | | | | — | |
Service and distribution fees—Admin Class (Note 5) | | | 435,240 | | | | — | |
Trustees’ fees and expenses (Note 5) | | | 117,434 | | | | 9,871 | |
Administrative fees (Note 5) | | | 3,146,920 | | | | 144,487 | |
Custodian fees and expenses | | | 307,901 | | | | 25,085 | |
Transfer agent fees and expenses—Institutional Class (Note 5) | | | 1,668,129 | | | | 1,099 | |
Transfer agent fees and expenses—Retail Class (Note 5) | | | 3,261,747 | | | | — | |
Transfer agent fees and expenses—Admin Class (Note 5) | | | 138,581 | | | | — | |
Audit and tax services fees | | | 28,064 | | | | 22,976 | |
Registration fees | | | 273,567 | | | | 21,709 | |
Shareholder reporting expenses | | | 869,442 | | | | 1,473 | |
Legal fees | | | 246,836 | | | | 9,308 | |
Miscellaneous expenses (Note 5) | | | 153,591 | | | | 187 | |
| | | | | | | | |
Total expenses | | | 49,808,690 | | | | 1,634,261 | |
Less fee reduction and/or expense reimbursement (Note 5) | | | (778,349 | ) | | | — | |
| | | | | | | | |
Net expenses | | | 49,030,341 | | | | 1,634,261 | |
| | | | | | | | |
Net investment income | | | 518,588,551 | | | | 21,327,193 | |
| | | | | | | | |
| | |
| Net Realized And Unrealized Gain (Loss) on Investments, Futures Contracts and Foreign Currency Transactions | | | | | | | | |
Net Realized Gain (Loss) on: | | | | | | | | |
Investments | | | (520,752,075 | ) | | | (8,383,508 | ) |
Futures contracts | | | — | | | | — | |
Foreign currency transactions | | | (4,817,715 | ) | | | (784,717 | ) |
| | |
| Net Change in Unrealized Appreciation (Depreciation) on: | | | | | | | | |
Investments | | | (1,363,697,519 | ) | | | (61,711,686 | ) |
Futures contracts | | | — | | | | — | |
Foreign currency translations | | | 8,919,095 | | | | 186,015 | |
| | | | | | | | |
Net realized and unrealized gain (loss) on investments, futures contracts and foreign currency transactions | | | (1,880,348,214 | ) | | | (70,693,896 | ) |
| | | | | | | | |
| | |
| Net Increase (Decrease) in Net Assets Resulting from Operations | | $ | (1,361,759,663 | ) | | $ | (49,366,703 | ) |
| | | | | | | | |
(a) Includes income reductions resulting from principal deflation adjustments during the period in the amount of $125,540. See Note 2b of Notes to Financial Statements.
See accompanying notes to financial statements.
115
| | | | | | | | | | | | | | | | | | |
Global
Bond Fund | | | Inflation Protected
Securities Fund | | | Institutional High
Income Fund | | | Intermediate��Duration
Fixed Income Fund | | | Investment Grade
Fixed Income Fund | |
| | | | | | | | | | | | | | | | | | |
| | | | | | | | | | | | | | | | | | |
| $ | 1,214,902 | | | $ | — | | | $ | 441,649 | | | $ | — | | | $ | 111,259 | |
| | 47,178,548 | | | | 66,446 | (a) | | | 11,663,318 | | | | 743,020 | | | | 10,117,357 | |
| | 13,763 | | | | 1,297 | | | | 3,940 | | | | 1,975 | | | | 2,633 | |
| | (26,515 | ) | | | — | | | | (2,688 | ) | | | — | | | | — | |
| | 48,380,698 | | | | 67,743 | | | | 12,106,219 | | | | 744,995 | | | | 10,231,249 | |
| | | | |
| | | | | | | | | | | | | | | | | | |
| | 4,654,100 | | | | 16,873 | | | | 613,840 | | | | 33,208 | | | | 569,050 | |
| | 1,026,854 | | | | — | | | | — | | | | — | | | | — | |
| | — | | | | — | | | | — | | | | — | | | | — | |
| | 20,832 | | | | 4,888 | | | | 6,577 | | | | 5,010 | | | | 7,212 | |
| | 424,392 | | | | 3,448 | | | | 52,304 | | | | 6,779 | | | | 72,687 | |
| | 85,304 | | | | 8,446 | | | | 24,676 | | | | 10,256 | | | | 15,940 | |
| | 151,366 | | | | 3,468 | | | | 3,225 | | | | 518 | | | | 670 | |
| | 532,393 | | | | — | | | | — | | | | — | | | | — | |
| | — | | | | — | | | | — | | | | — | | | | — | |
| | 24,617 | | | | 20,657 | | | | 21,999 | | | | 20,555 | | | | 21,316 | |
| | 73,321 | | | | 11,944 | | | | 21,327 | | | | 18,007 | | | | 20,740 | |
| | 98,917 | | | | 596 | | | | 4,281 | | | | 890 | | | | 953 | |
| | 32,154 | | | | 232 | | | | 3,140 | | | | 466 | | | | 4,081 | |
| | 15,700 | | | | (3,065 | ) | | | (1,801 | ) | | | (3,796 | ) | | | (1,625 | ) |
| | 7,139,950 | | | | 67,487 | | | | 749,568 | | | | 91,893 | | | | 711,024 | |
| | (136,227 | ) | | | (40,490 | ) | | | — | | | | (38,760 | ) | | | — | |
| | 7,003,723 | | | | 26,997 | | | | 749,568 | | | | 53,133 | | | | 711,024 | |
| | 41,376,975 | | | | 40,746 | | | | 11,356,651 | | | | 691,862 | | | | 9,520,225 | |
| | | | |
| | | | | | | | | | | | | | | | | | |
| | | | | | | | | | | | | | | | | | |
| | (47,821,181 | ) | | | (271,076 | ) | | | (4,402,190 | ) | | | (397,401 | ) | | | (3,474,065 | ) |
| | 321,385 | | | | — | | | | — | | | | (8,048 | ) | | | — | |
| | (24,266,602 | ) | | | 279 | | | | (118,874 | ) | | | (180 | ) | | | (110,219 | ) |
| | | | | | | | | | | | | | | | | | |
| | (92,886,847 | ) | | | 228,715 | | | | (32,736,301 | ) | | | 14,671 | | | | (14,936,336 | ) |
| | (235,349 | ) | | | — | | | | — | | | | 25,634 | | | | — | |
| | 8,715,698 | | | | 3,474 | | | | 44,817 | | | | 14 | | | | 153,201 | |
| | | | |
| | (156,172,896 | ) | | | (38,608 | ) | | | (37,212,548 | ) | | | (365,310 | ) | | | (18,367,419 | ) |
| | | | |
| $ | (114,795,921 | ) | | $ | 2,138 | | | $ | (25,855,897 | ) | | $ | 326,552 | | | $ | (8,847,194 | ) |
See accompanying notes to financial statements.
116
STATEMENTS OF CHANGES IN NET ASSETS
Bond Fund
| | | | | | | | |
| | | Six Months Ended
March 31, 2009
(Unaudited) | | | Year Ended
September 30, 2008 | |
From Operations: | | | | | | | | |
Net investment income | | $ | 518,588,551 | | | $ | 1,109,707,513 | |
Net realized gain (loss) on investments and foreign currency transactions | | | (525,569,790 | ) | | | 299,760,675 | |
Net change in unrealized appreciation (depreciation) on investments and foreign
currency translations | | | (1,354,778,424 | ) | | | (3,781,876,874 | ) |
| | | | | | | | |
Net decrease in net assets resulting from operations | | | (1,361,759,663 | ) | | | (2,372,408,686 | ) |
| | | | | | | | |
From Distributions to Shareholders: | | | | | | | | |
Net Investment Income: | | | | | | | | |
Institutional Class | | | (313,683,158 | ) | | | (618,954,427 | ) |
Retail Class | | | (251,639,625 | ) | | | (540,831,022 | ) |
Admin Class | | | (7,866,903 | ) | | | (15,164,699 | ) |
Capital Gains: | | | | | | | | |
Institutional Class | | | (64,404,701 | ) | | | — | |
Retail Class | | | (54,894,455 | ) | | | — | |
Admin Class | | | (1,827,140 | ) | | | — | |
| | | | | | | | |
Total distributions | | | (694,315,982 | ) | | | (1,174,950,148 | ) |
| | | | | | | | |
Increase in Net Assets Derived from Capital Share Transactions (Note 8) | | | 495,921,753 | | | | 3,895,007,552 | |
| | | | | | | | |
Redemption Fees | | | | | | | | |
Institutional Class | | | — | | | | 423,395 | |
Retail Class | | | — | | | | 381,530 | |
Admin Class | | | — | | | | 11,120 | |
| | | | | | | | |
Total increase (decrease) in net assets | | | (1,560,153,892 | ) | | | 348,464,763 | |
Net Assets | | | | | | | | |
Beginning of period | | | 14,690,709,167 | | | | 14,342,244,404 | |
| | | | | | | | |
End of period | | $ | 13,130,555,275 | | | $ | 14,690,709,167 | |
| | | | | | | | |
Undistributed Net Investment Income | | $ | 107,769,893 | | | $ | 162,371,028 | |
| | | | | | | | |
Fixed Income Fund
| | | | | | | | |
| | | Six Months Ended
March 31, 2009
(Unaudited) | | | Year Ended
September 30, 2008 | |
From Operations: | | | | | | | | |
Net investment income | | $ | 21,327,193 | | | $ | 41,194,607 | |
Net realized gain (loss) on investments and foreign currency transactions | | | (9,168,225 | ) | | | 15,081,715 | |
Net change in unrealized appreciation (depreciation) on investments and foreign
currency translations | | | (61,525,671 | ) | | | (123,121,599 | ) |
| | | | | | | | |
Net decrease in net assets resulting from operations | | | (49,366,703 | ) | | | (66,845,277 | ) |
| | | | | | | | |
From Distributions to Shareholders: | | | | | | | | |
Net Investment Income: | | | | | | | | |
Institutional Class | | | (44,598,887 | ) | | | (43,626,372 | ) |
Capital Gains: | | | | | | | | |
Institutional Class | | | (12,700,279 | ) | | | (643,688 | ) |
| | | | | | | | |
Total distributions | | | (57,299,166 | ) | | | (44,270,060 | ) |
| | | | | | | | |
Increase in Net Assets Derived from Capital Share Transactions (Note 8) | | | 78,784,827 | | | | 130,500,717 | |
| | | | | | | | |
Total increase (decrease) in net assets | | | (27,881,042 | ) | | | 19,385,380 | |
Net Assets | | | | | | | | |
Beginning of period | | | 624,485,817 | | | | 605,100,437 | |
| | | | | | | | |
End of period | | $ | 596,604,775 | | | $ | 624,485,817 | |
| | | | | | | | |
Undistributed Net Investment Income | | $ | 9,920,329 | | | $ | 33,192,023 | |
| | | | | | | | |
See accompanying notes to financial statements.
117
STATEMENTS OF CHANGES IN NET ASSETS
Global Bond Fund
| | | | | | | | |
| | | Six Months Ended
March 31, 2009
(Unaudited) | | | Year Ended
September 30, 2008 | |
From Operations: | | | | | | | | |
Net investment income | | $ | 41,376,975 | | | $ | 98,323,123 | |
Net realized gain (loss) on investments, futures contracts and foreign
currency transactions | | | (71,766,398 | ) | | | 37,132,573 | |
Net change in unrealized appreciation (depreciation) on investments, futures contracts and foreign currency translations | | | (84,406,498 | ) | | | (255,358,439 | ) |
| | | | | | | | |
Net decrease in net assets resulting from operations | | | (114,795,921 | ) | | | (119,902,743 | ) |
| | | | | | | | |
From Distributions to Shareholders: | | | | | | | | |
Net Investment Income: | | | | | | | | |
Institutional Class | | | (43,166,352 | ) | | | (61,946,579 | ) |
Retail Class | | | (40,691,267 | ) | | | (52,697,573 | ) |
Capital Gains: | | | | | | | | |
Institutional Class | | | — | | | | — | |
Retail Class | | | — | | | | — | |
| | | | | | | | |
Total distributions | | | (83,857,619 | ) | | | (114,644,152 | ) |
| | | | | | | | |
Increase (Decrease) in Net Assets Derived from Capital Share Transactions (Note 8) | | | (595,299,622 | ) | | | 594,419,506 | |
| | | | | | | | |
Redemption Fees | | | | | | | | |
Institutional Class | | | — | | | | 77,878 | |
Retail Class | | | — | | | | 69,167 | |
| | | | | | | | |
Total increase (decrease) in net assets | | | (793,953,162 | ) | | | 360,019,656 | |
Net Assets | | | | | | | | |
Beginning of period | | | 2,230,640,804 | | | | 1,870,621,148 | |
| | | | | | | | |
End of period | | $ | 1,436,687,642 | | | $ | 2,230,640,804 | |
| | | | | | | | |
Undistributed Net Investment Income | | $ | 1,434,218 | | | $ | 43,914,862 | |
| | | | | | | | |
Inflation Protected Securities Fund
| | | | | | | | |
| | | Six Months Ended
March 31, 2009
(Unaudited) | | | Year Ended
September 30, 2008 | |
From Operations: | | | | | | | | |
Net investment income | | $ | 40,746 | | | $ | 1,075,804 | |
Net realized gain (loss) on investments and foreign currency transactions | | | (270,797 | ) | | | 118,138 | |
Net change in unrealized appreciation (depreciation) on investments and
foreign currency translations | | | 232,189 | | | | (953,298 | ) |
| | | | | | | | |
Net increase in net assets resulting from operations | | | 2,138 | | | | 240,644 | |
| | | | | | | | |
From Distributions to Shareholders: | | | | | | | | |
Net Investment Income: | | | | | | | | |
Institutional Class | | | (66,751 | ) | | | (1,129,818 | ) |
Capital Gains: | | | | | | | | |
Institutional Class | | | — | | | | — | |
| | | | | | | | |
Total distributions | | | (66,751 | ) | | | (1,129,818 | ) |
| | | | | | | | |
Increase (Decrease) in Net Assets Derived from Capital Share Transactions (Note 8) | | | (2,711,607 | ) | | | 3,454,672 | |
| | | | | | | | |
Total increase (decrease) in net assets | | | (2,776,220 | ) | | | 2,565,498 | |
Net Assets | | | | | | | | |
Beginning of period | | | 16,033,106 | | | | 13,467,608 | |
| | | | | | | | |
End of period | | $ | 13,256,886 | | | $ | 16,033,106 | |
| | | | | | | | |
Undistributed Net Investment Income | | $ | 3,206 | | | $ | 29,211 | |
| | | | | | | | |
See accompanying notes to financial statements.
118
STATEMENTS OF CHANGES IN NET ASSETS – continued
Institutional High Income Fund
| | | | | | | | |
| | | Six Months Ended
March 31, 2009
(Unaudited) | | | Year Ended
September 30, 2008 | |
From Operations: | | | | | | | | |
Net investment income | | $ | 11,356,651 | | | $ | 16,406,305 | |
Net realized gain (loss) on investments and foreign currency transactions | | | (4,521,064 | ) | | | 3,305,382 | |
Net change in unrealized appreciation (depreciation) on investments and foreign
currency translations | | | (32,691,484 | ) | | | (48,410,556 | ) |
| | | | | | | | |
Net decrease in net assets resulting from operations | | | (25,855,897 | ) | | | (28,698,869 | ) |
| | | | | | | | |
From Distributions to Shareholders: | | | | | | | | |
Net Investment Income: | | | | | | | | |
Institutional Class | | | (17,646,157 | ) | | | (12,543,920 | ) |
Capital Gains: | | | | | | | | |
Institutional Class | | | (3,337,874 | ) | | | (3,556,542 | ) |
| | | | | | | | |
Total distributions | | | (20,984,031 | ) | | | (16,100,462 | ) |
| | | | | | | | |
Increase in Net Assets Derived from Capital Share Transactions (Note 8) | | | 82,114,177 | | | | 71,431,847 | |
| | | | | | | | |
Total increase in net assets | | | 35,274,249 | | | | 26,632,516 | |
Net Assets | | | | | | | | |
Beginning of period | | | 214,200,951 | | | | 187,568,435 | |
| | | | | | | | |
End of period | | $ | 249,475,200 | | | $ | 214,200,951 | |
| | | | | | | | |
Undistributed Net Investment Income | | $ | 5,441,213 | | | $ | 11,730,719 | |
| | | | | | | | |
Intermediate Duration Fixed Income Fund
| | | | | | | | |
| | | Six Months Ended
March 31, 2009
(Unaudited) | | | Year Ended
September 30, 2008 | |
From Operations: | | | | | | | | |
Net investment income | | $ | 691,862 | | | $ | 1,710,957 | |
Net realized loss on investments, futures contracts and foreign currency transactions | | | (405,629 | ) | | | (209,781 | ) |
Net change in unrealized appreciation (depreciation) on investments, futures contracts and foreign currency translations | | | 40,319 | | | | (1,630,849 | ) |
| | | | | | | | |
Net increase (decrease) in net assets resulting from operations | | | 326,552 | | | | (129,673 | ) |
| | | | | | | | |
From Distributions to Shareholders: | | | | | | | | |
Net Investment Income: | | | | | | | | |
Institutional Class | | | (752,503 | ) | | | (1,768,089 | ) |
Capital Gains: | | | | | | | | |
Institutional Class | | | — | | | | — | |
| | | | | | | | |
Total distributions | | | (752,503 | ) | | | (1,768,089 | ) |
| | | | | | | | |
Increase (Decrease) in Net Assets Derived from Capital Share Transactions (Note 8) | | | (5,918,749 | ) | | | 3,200,454 | |
| | | | | | | | |
Total increase (decrease) in net assets | | | (6,344,700 | ) | | | 1,302,692 | |
Net Assets | | | | | | | | |
Beginning of period | | | 32,747,844 | | | | 31,445,152 | |
| | | | | | | | |
End of period | | $ | 26,403,144 | | | $ | 32,747,844 | |
| | | | | | | | |
(Distributions in Excess of Net Investment Income) Undistributed Net Investment Income | | $ | (54,240 | ) | | $ | 6,401 | |
| | | | | | | | |
See accompanying notes to financial statements.
119
STATEMENTS OF CHANGES IN NET ASSETS
Investment Grade Fixed Income Fund
| | | | | | | | |
| | | Six Months Ended
March 31, 2009
(Unaudited) | | | Year Ended
September 30, 2008 | |
From Operations: | | | | | | | | |
Net investment income | | $ | 9,520,225 | | | $ | 16,556,515 | |
Net realized gain (loss) on investments and foreign currency transactions | | | (3,584,284 | ) | | | 8,215,732 | |
Net change in unrealized appreciation (depreciation) on investments and foreign
currency translations | | | (14,783,135 | ) | | | (43,421,522 | ) |
| | | | | | | | |
Net decrease in net assets resulting from operations | | | (8,847,194 | ) | | | (18,649,275 | ) |
| | | | | | | | |
From Distributions to Shareholders: | | | | | | | | |
Net Investment Income: | | | | | | | | |
Institutional Class | | | (12,837,457 | ) | | | (19,088,772 | ) |
Capital Gains: | | | | | | | | |
Institutional Class | | | (3,479,011 | ) | | | — | |
| | | | | | | | |
Total distributions | | | (16,316,468 | ) | | | (19,088,772 | ) |
| | | | | | | | |
Increase in Net Assets Derived from Capital Share Transactions (Note 8) | | | 133,066,324 | | | | 53,860,153 | |
| | | | | | | | |
Total increase in net assets | | | 107,902,662 | | | | 16,122,106 | |
Net Assets | | | | | | | | |
Beginning of period | | | 277,862,818 | | | | 261,740,712 | |
| | | | | | | | |
End of period | | $ | 385,765,480 | | | $ | 277,862,818 | |
| | | | | | | | |
Undistributed Net Investment Income | | $ | 758,382 | | | $ | 4,075,614 | |
| | | | | | | | |
See accompanying notes to financial statements.
120
FINANCIAL HIGHLIGHTS
For a share outstanding throughout each period.
| | | | | | | | | | | | | | | | | | | | | | | | |
| | | | | Income (Loss) from Investment Operations: | | | | | Less Distributions: | |
| | | Net asset
value,
beginning
of the period | | Net
investment
income(a) | | Net realized
and unrealized
gain (loss) | | | Total from
investment
operations | | | | | Dividends
from
net investment
income | | | Distributions
from net
realized
capital gains | |
| Bond Fund | | | | | | | | | | | | | | | | | | | | | | | | |
| | | | | | |
| Institutional Class | | | | | | | | | | | | | | | | | | | | | |
3/31/2009(g) | | $ | 11.89 | | $ | 0.44 | | $ | (1.54 | ) | | $ | (1.10 | ) | | | | $ | (0.49 | ) | | $ | (0.11 | ) |
9/30/2008 | | | 14.71 | | | 0.96 | | | (2.77 | ) | | | (1.81 | ) | | | | | (1.01 | ) | | | — | |
9/30/2007 | | | 14.13 | | | 0.83 | | | 0.58 | | | | 1.41 | | | | | | (0.83 | ) | | | — | |
9/30/2006 | | | 13.81 | | | 0.72 | | | 0.47 | | | | 1.19 | | | | | | (0.87 | ) | | | — | |
9/30/2005 | | | 13.46 | | | 0.67 | | | 0.57 | | | | 1.24 | | | | | | (0.89 | ) | | | — | |
9/30/2004 | | | 12.66 | | | 0.72 | | | 0.82 | | | | 1.54 | | | | | | (0.74 | ) | | | — | |
| | | | | | | |
| Retail Class | | | | | | | | | | | | | | | | | | | | | | | | |
3/31/2009(g) | | $ | 11.85 | | $ | 0.42 | | $ | (1.53 | ) | | $ | (1.11 | ) | | | | $ | (0.47 | ) | | $ | (0.11 | ) |
9/30/2008 | | | 14.67 | | | 0.92 | | | (2.77 | ) | | | (1.85 | ) | | | | | (0.97 | ) | | | — | |
9/30/2007 | | | 14.10 | | | 0.79 | | | 0.57 | | | | 1.36 | | | | | | (0.79 | ) | | | — | |
9/30/2006 | | | 13.78 | | | 0.69 | | | 0.47 | | | | 1.16 | | | | | | (0.84 | ) | | | — | |
9/30/2005 | | | 13.44 | | | 0.64 | | | 0.57 | | | | 1.21 | | | | | | (0.87 | ) | | | — | |
9/30/2004 | | | 12.65 | | | 0.69 | | | 0.82 | | | | 1.51 | | | | | | (0.72 | ) | | | — | |
| | | | | | | |
| Admin Class | | | | | | | | | | | | | | | | | | | | | | | | |
3/31/2009(g) | | $ | 11.82 | | $ | 0.41 | | $ | (1.52 | ) | | $ | (1.11 | ) | | | | $ | (0.46 | ) | | $ | (0.11 | ) |
9/30/2008 | | | 14.64 | | | 0.88 | | | (2.76 | ) | | | (1.88 | ) | | | | | (0.94 | ) | | | — | |
9/30/2007 | | | 14.07 | | | 0.75 | | | 0.58 | | | | 1.33 | | | | | | (0.76 | ) | | | — | |
9/30/2006 | | | 13.75 | | | 0.65 | | | 0.48 | | | | 1.13 | | | | | | (0.81 | ) | | | — | |
9/30/2005 | | | 13.42 | | | 0.60 | | | 0.56 | | | | 1.16 | | | | | | (0.83 | ) | | | — | |
9/30/2004 | | | 12.64 | | | 0.65 | | | 0.82 | | | | 1.47 | | | | | | (0.69 | ) | | | — | |
(a) Per share net investment income has been calculated using the average shares outstanding during the period.
(b) Amount rounds to less than $0.01 per share, if applicable.
(c) Effective June 2, 2008, redemption fees were eliminated.
(d) Had certain expenses not been reduced during the period, if applicable, total returns would have been lower. Periods less than one year, if applicable, are not annualized.
(e) The investment adviser and/or administrator agreed to reimburse a portion of the Fund’s expenses and/or reduce its fees during the period. Without this reimbursement/fee reduction, if applicable, expenses would have been higher.
(f) Computed on an annualized basis for periods less than one year, if applicable.
(g) For the six months ended March 31, 2009 (Unaudited).
(h) Effective July 1, 2007, the Fund decreased its net expense limitations to 0.70%, 0.95% and 1.20% from 0.75%, 1.00% and 1.25% for the Institutional Class, Retail Class and Admin Class, respectively.
(i) Includes fee/expense recovery of 0.02%.
(j) Includes fee/expense recovery of less than 0.01%.
See accompanying notes to financial statements.
121
| | | | | | | | | | | | | | | | | | | | | | | | |
| | | | | | | | | | | | | Ratios to Average Net Assets: | | |
Total
distributions | | | Redemption
fees(b)(c) | | Net asset
value,
end of
the period | | Total
return (%)(d) | | | Net assets,
end of
the period
(000’s) | | Net
expenses (%)(e)(f) | | | Gross
expenses (%)(f) | | | Net
investment
income (%)(f) | | Portfolio
turnover
rate (%) |
| | | | | | | | | | | | | | | | | | | | | | | | |
| | | | | | | | |
| | | | | | | | | | | | | | | | | | | | | | | | |
| $ | (0.60 | ) | | $ | — | | $ | 10.19 | | (9.0 | ) | | $ | 7,353,074 | | 0.66 | | | 0.66 | | | 8.55 | | 21 |
| | (1.01 | ) | | | 0.00 | | | 11.89 | | (13.1 | ) | | | 7,616,621 | | 0.64 | | | 0.64 | | | 6.78 | | 26 |
| | (0.83 | ) | | | 0.00 | | | 14.71 | | 10.3 | | | | 7,716,061 | | 0.67 | (h) | | 0.67 | | | 5.75 | | 20 |
| | (0.87 | ) | | | 0.00 | | | 14.13 | | 9.0 | | | | 4,742,622 | | 0.75 | (i) | | 0.75 | (i) | | 5.20 | | 26 |
| | (0.89 | ) | | | 0.00 | | | 13.81 | | 9.5 | | | | 3,303,997 | | 0.75 | | | 0.79 | | | 4.91 | | 22 |
| | (0.74 | ) | | | — | | | 13.46 | | 12.5 | | | | 2,365,199 | | 0.75 | | | 0.79 | | | 5.48 | | 42 |
| | | | | | | | |
| | | | | | | | | | | | | | | | | | | | | | | | |
| $ | (0.58 | ) | | $ | — | | $ | 10.16 | | (9.1 | ) | | $ | 5,605,362 | | 0.95 | | | 0.98 | | | 8.27 | | 21 |
| | (0.97 | ) | | | 0.00 | | | 11.85 | | (13.4 | ) | | | 6,863,594 | | 0.94 | (j) | | 0.94 | (j) | | 6.49 | | 26 |
| | (0.79 | ) | | | 0.00 | | | 14.67 | | 9.9 | | | | 6,432,333 | | 0.97 | (h) | | 0.97 | | | 5.49 | | 20 |
| | (0.84 | ) | | | 0.00 | | | 14.10 | | 8.8 | | | | 2,232,632 | | 1.00 | | | 1.01 | | | 4.99 | | 26 |
| | (0.87 | ) | | | 0.00 | | | 13.78 | | 9.2 | | | | 707,394 | | 1.00 | | | 1.05 | | | 4.64 | | 22 |
| | (0.72 | ) | | | — | | | 13.44 | | 12.2 | | | | 275,349 | | 1.00 | | | 1.04 | | | 5.24 | | 42 |
| | | | | | | | |
| | | | | | | | | | | | | | | | | | | | | | | | |
| $ | (0.57 | ) | | $ | — | | $ | 10.14 | | (9.1 | ) | | $ | 172,119 | | 1.20 | | | 1.27 | | | 8.03 | | 21 |
| | (0.94 | ) | | | 0.00 | | | 11.82 | | (13.7 | ) | | | 210,494 | | 1.20 | | | 1.24 | | | 6.23 | | 26 |
| | (0.76 | ) | | | 0.00 | | | 14.64 | | 9.7 | | | | 193,850 | | 1.23 | (h)(j) | | 1.23 | (j) | | 5.20 | | 20 |
| | (0.81 | ) | | | 0.00 | | | 14.07 | | 8.5 | | | | 106,941 | | 1.25 | | | 1.29 | | | 4.71 | | 26 |
| | (0.83 | ) | | | 0.00 | | | 13.75 | | 8.9 | | | | 64,263 | | 1.25 | | | 1.31 | | | 4.39 | | 22 |
| | (0.69 | ) | | | — | | | 13.42 | | 11.9 | | | | 27,299 | | 1.25 | | | 1.29 | | | 4.99 | | 42 |
See accompanying notes to financial statements.
122
FINANCIAL HIGHLIGHTS – continued
For a share outstanding throughout each period.
| | | | | | | | | | | | | | | | | | | | | | | | |
| | | | | Income (Loss) from Investment Operations: | | | | | Less Distributions: | |
| | | Net asset
value,
beginning
of the period | | Net
investment
income(a) | | Net realized
and unrealized
gain (loss) | | | Total from
investment
operations | | | | | Dividends
from
net investment
income | | | Distributions
from net
realized
capital gains | |
| Fixed Income Fund | | | | | | | | | | | | | | | | | | | | | | | | |
| | | | | | | |
| Institutional Class | | | | | | | | | | | | | | | | | | | | | | | | |
3/31/2009(i) | | $ | 12.15 | | $ | 0.39 | | $ | (1.39 | ) | | $ | (1.00 | ) | | | | $ | (0.89 | ) | | $ | (0.25 | ) |
9/30/2008 | | | 14.49 | | | 0.88 | | | (2.14 | ) | | | (1.26 | ) | | | | | (1.06 | ) | | | (0.02 | ) |
9/30/2007 | | | 13.89 | | | 0.83 | | | 0.67 | | | | 1.50 | | | | | | (0.90 | ) | | | — | |
9/30/2006 | | | 13.88 | | | 0.74 | | | 0.30 | | | | 1.04 | | | | | | (1.03 | ) | | | — | |
9/30/2005 | | | 13.93 | | | 0.75 | | | 0.58 | | | | 1.33 | | | | | | (1.38 | ) | | | — | |
9/30/2004 | | | 13.24 | | | 0.82 | | | 0.79 | | | | 1.61 | | | | | | (0.92 | ) | | | — | |
| | | | | | | |
| Global Bond Fund | | | | | | | | | | | | | | | | | | | | | | | | |
| | | | | | | |
| Institutional Class | | | | | | | | | | | | | | | | | | | | | | | | |
3/31/2009(i) | | $ | 14.42 | | $ | 0.34 | | $ | (1.03 | ) | | $ | (0.69 | ) | | | | $ | (0.69 | ) | | $ | — | |
9/30/2008 | | | 15.83 | | | 0.70 | | | (1.30 | ) | | | (0.60 | ) | | | | | (0.81 | ) | | | — | |
9/30/2007 | | | 15.43 | | | 0.60 | | | 0.70 | | | | 1.30 | | | | | | (0.90 | ) | | | — | |
9/30/2006 | | | 15.57 | | | 0.48 | | | 0.16 | | | | 0.64 | | | | | | (0.70 | ) | | | (0.08 | ) |
9/30/2005 | | | 15.59 | | | 0.44 | | | 0.05 | | | | 0.49 | | | | | | (0.46 | ) | | | (0.05 | ) |
9/30/2004 | | | 14.93 | | | 0.48 | | | 0.78 | | | | 1.26 | | | | | | (0.60 | ) | | | — | |
| | | | | | | |
| Retail Class | | | | | | | | | | | | | | | | | | | | | | | | |
3/31/2009(i) | | $ | 14.31 | | $ | 0.32 | | $ | (1.04 | ) | | $ | (0.72 | ) | | | | $ | (0.66 | ) | | $ | — | |
9/30/2008 | | | 15.71 | | | 0.64 | | | (1.29 | ) | | | (0.65 | ) | | | | | (0.75 | ) | | | — | |
9/30/2007 | | | 15.29 | | | 0.54 | | | 0.70 | | | | 1.24 | | | | | | (0.82 | ) | | | — | |
9/30/2006 | | | 15.43 | | | 0.44 | | | 0.15 | | | | 0.59 | | | | | | (0.65 | ) | | | (0.08 | ) |
9/30/2005 | | | 15.46 | | | 0.40 | | | 0.05 | | | | 0.45 | | | | | | (0.43 | ) | | | (0.05 | ) |
9/30/2004 | | | 14.83 | | | 0.43 | | | 0.79 | | | | 1.22 | | | | | | (0.59 | ) | | | — | |
(a) Per share net investment income has been calculated using the average shares outstanding during the period.
(b) Amount rounds to less than $0.01 per share, if applicable.
(c) Had certain expenses not been reduced during the period, if applicable, total returns would have been lower. Periods less than one year, if applicable, are not annualized.
(d) The investment adviser and/or administrator agreed to reimburse a portion of the Fund’s expenses and/or reduce its fees during the period. Without this reimbursement/fee reduction, if applicable, expenses would have been higher.
(e) Computed on an annualized basis for periods less than one year, if applicable.
(f) Includes fee/expense recovery of less than 0.01% and 0.03% for Fixed Income Fund and Global Bond Fund, respectively.
(g) Effective June 2, 2008, redemption fees were eliminated.
(h) Includes fee/expense recovery of 0.02%.
(i) For the six months ended March 31, 2009 (Unaudited).
See accompanying notes to financial statements.
123
| | | | | | | | | | | | | | | | | | | | | | | | | |
| | | | | | | | | | | | | | Ratios to Average Net Assets: | | |
Total
distributions | | | Redemption
fees(b) | | | Net asset
value,
end of
the period | | Total
return (%)(c) | | | Net assets,
end of the
period
(000’s) | | Net
expenses (%)(d)(e) | | | Gross
expenses (%)(e) | | | Net
investment
income (%)(e) | | Portfolio
turnover
rate (%) |
| | | | | | | | | | | | | | | | | | | | | | | | | |
| | | | | | | | |
| | | | | | | | | | | | | | | | | | | | | | | | | |
| $ | (1.14 | ) | | $ | — | | | $ | 10.01 | | (7.5 | ) | | $ | 596,605 | | 0.58 | | | 0.58 | | | 7.63 | | 10 |
| | (1.08 | ) | | | — | | | | 12.15 | | (9.4 | ) | | | 624,486 | | 0.58 | | | 0.58 | | | 6.43 | | 30 |
| | (0.90 | ) | | | — | | | | 14.49 | | 11.3 | | | | 605,100 | | 0.60 | | | 0.60 | | | 5.96 | | 22 |
| | (1.03 | ) | | | — | | | | 13.89 | | 8.1 | | | | 456,011 | | 0.60 | (f) | | 0.60 | (f) | | 5.48 | | 40 |
| | (1.38 | ) | | | — | | | | 13.88 | | 9.9 | | | | 444,552 | | 0.65 | | | 0.65 | | | 5.47 | | 34 |
| | (0.92 | ) | | | — | | | | 13.93 | | 12.6 | | | | 358,652 | | 0.65 | | | 0.66 | | | 6.17 | | 35 |
| | | | | | | | |
| | | | | | | | | | | | | | | | | | | | | | | | | |
| | | | | | | | |
| | | | | | | | | | | | | | | | | | | | | | | | | |
| $ | (0.69 | ) | | $ | — | | | $ | 13.04 | | (4.7 | ) | | $ | 732,703 | | 0.69 | | | 0.69 | | | 5.13 | | 23 |
| | (0.81 | ) | | | 0.00 | (g) | | | 14.42 | | (4.1 | ) | | | 1,157,175 | | 0.64 | | | 0.64 | | | 4.36 | | 60 |
| | (0.90 | ) | | | 0.00 | | | | 15.83 | | 8.7 | | | | 996,046 | | 0.68 | | | 0.68 | | | 3.84 | | 95 |
| | (0.78 | ) | | | 0.00 | | | | 15.43 | | 4.3 | | | | 643,991 | | 0.74 | (f) | | 0.74 | (f) | | 3.21 | | 77 |
| | (0.51 | ) | | | 0.00 | | | | 15.57 | | 3.1 | | | | 553,704 | | 0.75 | | | 0.80 | | | 2.75 | | 63 |
| | (0.60 | ) | | | 0.00 | | | | 15.59 | | 8.6 | | | | 287,830 | | 0.80 | | | 0.85 | | | 3.15 | | 61 |
| | | | | | | | |
| | | | | | | | | | | | | | | | | | | | | | | | | |
| $ | (0.66 | ) | | $ | — | | | $ | 12.93 | | (4.9 | ) | | $ | 703,984 | | 1.00 | | | 1.03 | | | 4.82 | | 23 |
| | (0.75 | ) | | | 0.00 | (g) | | | 14.31 | | (4.5 | ) | | | 1,073,466 | | 1.00 | (h) | | 1.00 | (h) | | 4.02 | | 60 |
| | (0.82 | ) | | | 0.00 | | | | 15.71 | | 8.4 | | | | 874,575 | | 1.00 | | | 1.04 | | | 3.53 | | 95 |
| | (0.73 | ) | | | 0.00 | | | | 15.29 | | 4.0 | | | | 540,697 | | 1.00 | | | 1.09 | | | 2.93 | | 77 |
| | (0.48 | ) | | | 0.00 | | | | 15.43 | | 2.8 | | | | 699,498 | | 1.00 | | | 1.09 | | | 2.57 | | 63 |
| | (0.59 | ) | | | 0.00 | | | | 15.46 | | 8.4 | | | | 413,652 | | 1.04 | | | 1.10 | | | 2.88 | | 61 |
See accompanying notes to financial statements.
124
FINANCIAL HIGHLIGHTS – continued
For a share outstanding throughout each period.
| | | | | | | | | | | | | | | | | | | | | | | | | |
| | | | | Income (Loss) from Investment Operations: | | | | | Less Distributions: | |
| | | Net asset
value,
beginning
of the period | | Net
investment
income(a) | | | Net realized
and unrealized
gain (loss) | | | Total from
investment
operations | | | | | Dividends
from
net investment
income | | | Distributions
from net
realized
capital gains | |
| Inflation Protected Securities Fund | | | | | | | | | | | | | | | | | | | |
| | | | | | | |
| Institutional Class | | | | | | | | | | | | | | | | | | | | | | | | | |
3/31/2009(e) | | $ | 9.86 | | $ | 0.03 | (i) | | $ | 0.05 | | | $ | 0.08 | | | | | $ | (0.05 | ) | | $ | — | |
9/30/2008 | | | 10.31 | | | 0.73 | | | | (0.43 | ) | | | 0.30 | | | | | | (0.75 | ) | | | — | |
9/30/2007 | | | 10.30 | | | 0.47 | | | | 0.03 | | | | 0.50 | | | | | | (0.49 | ) | | | — | |
9/30/2006 | | | 10.84 | | | 0.52 | | | | (0.38 | ) | | | 0.14 | | | | | | (0.63 | ) | | | (0.05 | ) |
9/30/2005 | | | 11.02 | | | 0.42 | | | | (0.08 | ) | | | 0.34 | | | | | | (0.52 | ) | | | — | |
9/30/2004 | | | 11.60 | | | 0.37 | | | | (0.12 | ) | | | 0.25 | | | | | | (0.54 | ) | | | (0.29 | ) |
| | | | | |
| Institutional High Income Fund | | | | | | | | | | | | | | | | | | | |
| | | | | | | |
| Institutional Class | | | | | | | | | | | | | | | | | | | | | | | | | |
3/31/2009(e) | | $ | 6.87 | | $ | 0.30 | | | $ | (1.29 | ) | | $ | (0.99 | ) | | | | $ | (0.49 | ) | | $ | (0.09 | ) |
9/30/2008 | | | 8.45 | | | 0.60 | | | | (1.52 | ) | | | (0.92 | ) | | | | | (0.51 | ) | | | (0.15 | ) |
9/30/2007 | | | 8.11 | | | 0.55 | | | | 0.30 | | | | 0.85 | | | | | | (0.51 | ) | | | — | |
9/30/2006 | | | 7.80 | | | 0.50 | | | | 0.34 | | | | 0.84 | | | | | | (0.53 | ) | | | — | |
9/30/2005 | | | 7.50 | | | 0.55 | | | | 0.39 | | | | 0.94 | | | | | | (0.64 | ) | | | — | |
9/30/2004 | | | 6.91 | | | 0.55 | | | | 0.66 | | | | 1.21 | | | | | | (0.62 | ) | | | — | |
| | | | |
| Intermediate Duration Fixed Income Fund | | | | | | | | | | | | | | | |
| | | | | | | |
| Institutional Class | | | | | | | | | | | | | | | | | | | | | | | | | |
3/31/2009(e) | | $ | 8.95 | | $ | 0.23 | | | $ | (0.04 | ) | | $ | 0.19 | | | | | $ | (0.25 | ) | | $ | — | |
9/30/2008 | | | 9.47 | | | 0.47 | | | | (0.50 | ) | | | (0.03 | ) | | | | | (0.49 | ) | | | — | |
9/30/2007 | | | 9.50 | | | 0.45 | | | | (0.01 | ) | | | 0.44 | | | | | | (0.47 | ) | | | — | |
9/30/2006 | | | 9.60 | | | 0.42 | | | | (0.07 | ) | | | 0.35 | | | | | | (0.45 | ) | | | — | |
9/30/2005 | | | 9.92 | | | 0.40 | | | | (0.25 | ) | | | 0.15 | | | | | | (0.45 | ) | | | (0.02 | ) |
9/30/2004 | | | 10.10 | | | 0.45 | | | | (0.10 | ) | | | 0.35 | | | | | | (0.53 | ) | | | — | |
| | | | | |
| Investment Grade Fixed Income Fund | | | | | | | | | | | | | | | | | | | |
| | | | | | | |
| Institutional Class | | | | | | | | | | | | | | | | | | | | | | | | | |
3/31/2009(e) | | $ | 11.36 | | $ | 0.34 | | | $ | (0.76 | ) | | $ | (0.42 | ) | | | | $ | (0.49 | ) | | $ | (0.14 | ) |
9/30/2008 | | | 12.96 | | | 0.76 | | | | (1.47 | ) | | | (0.71 | ) | | | | | (0.89 | ) | | | — | |
9/30/2007 | | | 12.63 | | | 0.70 | | | | 0.53 | | | | 1.23 | | | | | | (0.90 | ) | | | — | |
9/30/2006 | | | 13.28 | | | 0.60 | | | | 0.22 | | | | 0.82 | | | | | | (0.92 | ) | | | (0.55 | ) |
9/30/2005 | | | 13.54 | | | 0.57 | | | | 0.27 | | | | 0.84 | | | | | | (0.83 | ) | | | (0.27 | ) |
9/30/2004 | | | 13.38 | | | 0.67 | | | | 0.75 | | | | 1.42 | | | | | | (0.88 | ) | | | (0.38 | ) |
(a) Per share net investment income has been calculated using the average shares outstanding during the period.
(b) Had certain expenses not been reduced during the period, if applicable, total returns would have been lower. Periods less than one year, if applicable, are not annualized.
(c) The investment adviser and/or administrator agreed to reimburse a portion of the Fund’s expenses and/or reduce its fees during the period. Without this reimbursement/fee reduction, if applicable, expenses would have been higher.
(d) Computed on an annualized basis for periods less than one year, if applicable.
(e) For the six months ended March 31, 2009 (Unaudited).
(f) Effective July 1, 2005, the Intermediate Duration Fixed Income Fund and the Inflation Protected Securities Fund decreased their net expense limitations to 0.40% and 0.45%, respectively, from 0.45% and 0.50%, respectively.
(g) Includes fee/expense recovery of 0.01%.
(h) Includes fee/expense recovery of less than 0.01%.
(i) Includes income reductions resulting from principal deflation adjustments during the period in the amount of $0.09 per share. See Note 2b of Notes to Financial Statements.
See accompanying notes to financial statements.
125
| | | | | | | | | | | | | | | | | | | | | |
| | | | | | | | | | | Ratios to Average Net Assets: | | |
Total
distributions | | | Net asset
value,
end of
the period | | Total
return (%)(b) | | | Net assets,
end of the
period
(000’s) | | Net
expenses (%)(c)(d) | | | Gross
expenses (%)(d) | | | Net
investment
income (loss) (%)(d) | | Portfolio
turnover
rate (%) |
| | | | | | | | | | | | | | | | | | | | | |
| | | | | | | |
| | | | | | | | | | | | | | | | | | | | | |
| $ | (0.05 | ) | | $ | 9.89 | | 0.8 | | | $ | 13,257 | | 0.40 | | | 1.00 | | | 0.60 | | 8 |
| | (0.75 | ) | | | 9.86 | | 2.6 | | | | 16,033 | | 0.40 | | | 0.95 | | | 6.85 | | 22 |
| | (0.49 | ) | | | 10.31 | | 5.1 | | | | 13,468 | | 0.40 | | | 1.28 | | | 4.60 | | 26 |
| | (0.68 | ) | | | 10.30 | | 1.5 | | | | 9,053 | | 0.40 | | | 1.69 | | | 4.96 | | 41 |
| | (0.52 | ) | | | 10.84 | | 3.1 | | | | 9,298 | | 0.49 | (f) | | 1.54 | | | 3.81 | | 141 |
| | (0.83 | ) | | | 11.02 | | 2.3 | | | | 7,390 | | 0.50 | | | 1.73 | | | 3.33 | | 99 |
| | | | | | | |
| | | | | | | | | | | | | | | | | | | | | |
| | | | | | | |
| | | | | | | | | | | | | | | | | | | | | |
| $ | (0.58 | ) | | $ | 5.30 | | (13.5 | ) | | $ | 249,475 | | 0.73 | | | 0.73 | | | 11.10 | | 6 |
| | (0.66 | ) | | | 6.87 | | (11.7 | ) | | | 214,201 | | 0.72 | | | 0.72 | | | 7.70 | | 35 |
| | (0.51 | ) | | | 8.45 | | 10.8 | | | | 187,568 | | 0.75 | (g) | | 0.75 | (g) | | 6.60 | | 31 |
| | (0.53 | ) | | | 8.11 | | 11.6 | | | | 141,318 | | 0.75 | | | 0.79 | | | 6.40 | | 23 |
| | (0.64 | ) | | | 7.80 | | 13.0 | | | | 110,533 | | 0.75 | | | 0.82 | | | 7.24 | | 22 |
| | (0.62 | ) | | | 7.50 | | 18.1 | | | | 97,109 | | 0.75 | | | 0.88 | | | 7.66 | | 59 |
| | | | | | | |
| | | | | | | | | | | | | | | | | | | | | |
| | | | | | | |
| | | | | | | | | | | | | | | | | | | | | |
| $ | (0.25 | ) | | $ | 8.89 | | 2.2 | | | $ | 26,403 | | 0.40 | | | 0.69 | | | 5.21 | | 35 |
| | (0.49 | ) | | | 8.95 | | (0.5 | ) | | | 32,748 | | 0.40 | | | 0.59 | | | 5.00 | | 65 |
| | (0.47 | ) | | | 9.47 | | 4.8 | | | | 31,445 | | 0.40 | | | 0.61 | | | 4.71 | | 87 |
| | (0.45 | ) | | | 9.50 | | 3.8 | | | | 41,851 | | 0.40 | | | 0.62 | | | 4.48 | | 62 |
| | (0.47 | ) | | | 9.60 | | 1.5 | | | | 40,628 | | 0.44 | (f) | | 0.68 | | | 4.10 | | 50 |
| | (0.53 | ) | | | 9.92 | | 3.6 | | | | 31,051 | | 0.45 | | | 0.76 | | | 4.48 | | 48 |
| | | | | | | |
| | | | | | | | | | | | | | | | | | | | | |
| | | | | | | |
| | | | | | | | | | | | | | | | | | | | | |
| $ | (0.63 | ) | | $ | 10.31 | | (3.4 | ) | | $ | 385,765 | | 0.50 | | | 0.50 | | | 6.69 | | 8 |
| | (0.89 | ) | | | 11.36 | | (6.0 | ) | | | 277,863 | | 0.50 | | | 0.50 | | | 5.98 | | 32 |
| | (0.90 | ) | | | 12.96 | | 10.2 | | | | 261,741 | | 0.53 | | | 0.53 | | | 5.52 | | 23 |
| | (1.47 | ) | | | 12.63 | | 6.8 | | | | 173,549 | | 0.55 | (h) | | 0.55 | (h) | | 4.79 | | 50 |
| | (1.10 | ) | | | 13.28 | | 6.4 | | | | 186,749 | | 0.55 | | | 0.58 | | | 4.28 | | 42 |
| | (1.26 | ) | | | 13.54 | | 11.1 | | | | 177,094 | | 0.55 | | | 0.60 | | | 5.03 | | 34 |
See accompanying notes to financial statements.
126
NOTES TO FINANCIAL STATEMENTS
March 31, 2009 (Unaudited)
1. Organization. Loomis Sayles Funds I (the “Trust”) is organized as a Massachusetts business trust. The Trust is registered under the Investment Company Act of 1940, as amended (the “1940 Act”) as an open-end management investment company. The Declaration of Trust permits the Board of Trustees to authorize the issuance of an unlimited number of shares of the Trust in multiple series. Shares of certain funds in the Trust were first registered under the Securities Act of 1933 (the “1933 Act”) effective March 7, 1997 (subsequent to their commencement of investment operations). Information presented in these financial statements pertains to the fixed income funds of the Trust; the financial statements for the equity funds of the Trust are presented in a separate report. The following funds (individually, a “Fund” and collectively, the “Funds”) are included in this report:
Loomis Sayles Bond Fund (the “Bond Fund”)
Loomis Sayles Fixed Income Fund (the “Fixed Income Fund”)
Loomis Sayles Global Bond Fund (the “Global Bond Fund”)
Loomis Sayles Inflation Protected Securities Fund (the “Inflation Protected Securities Fund”)
Loomis Sayles Institutional High Income Fund (the “Institutional High Income Fund”)
Loomis Sayles Intermediate Duration Fixed Income Fund (the “Intermediate Duration Fixed Income Fund”)
Loomis Sayles Investment Grade Fixed Income Fund (the “Investment Grade Fixed Income Fund”)
Each Fund offers Institutional Class Shares. Bond Fund and Global Bond Fund also offer Retail Class Shares. In addition, Bond Fund offers Admin Class Shares.
Most expenses of the Trust can be directly attributed to a fund. Expenses which cannot be directly attributed to a fund are generally apportioned based on the relative net assets of each of the funds in the Trust. Expenses of a fund are borne pro rata by the holders of each class of shares, except that each class bears expenses unique to that class (including the Rule 12b-1 service and distribution fees and transfer agent fees applicable to such class). In addition, each class votes as a class only with respect to its own Rule 12b-1 Plan. Shares of each class would receive their pro rata share of the net assets of a fund if the fund were liquidated. The Trustees approve separate dividends from net investment income on each class of shares.
2. Significant Accounting Policies. The following is a summary of significant accounting policies consistently followed by each Fund in the preparation of its financial statements. The Funds’ financial statements are prepared in accordance with accounting principles generally accepted in the United States of America which require the use of management estimates that affect the reported amounts and disclosures in the financial statements. Actual results could differ from those estimates.
a. Valuation. Debt securities (other than short-term obligations purchased with an original or remaining maturity of sixty days or less) are generally valued on the basis of evaluated bids furnished to the Funds by a pricing service recommended by the investment adviser and approved by the Board of Trustees, which service determines valuations for normal, institutional size-trading units of such securities using market information, transactions for comparable securities and various relationships between securities which are generally recognized by institutional traders. Equity securities, including closed-end investment companies and exchange traded funds, for which market quotations are readily available are valued at market value, as reported by pricing services recommended by the investment adviser and approved by the Board of Trustees. Such pricing services generally use the security’s last sale price on the exchange or market where the security is primarily traded or, if there is no reported sale during the day, the closing bid price. Securities traded on the NASDAQ Global Select Market, NASDAQ Global Market and NASDAQ Capital Market are valued at the NASDAQ Official Closing Price (“NOCP”), or if lacking a NOCP, at the most recent bid quotation on the applicable NASDAQ Market. Broker-dealer bid quotations may also be used to value debt and equity securities where a pricing service does not price a security or where a pricing service does not provide a reliable price for the security. In instances where broker-dealer bid quotations are not available, certain securities held by the Funds may be valued on the basis of a price provided by a principal market maker. Forward foreign currency contracts are “marked-to-market” daily using interpolated prices determined by an independent pricing service. Futures contracts are priced at their most recent settlement price. Short-term obligations purchased with an original or remaining maturity of sixty days or less are valued at amortized cost, which approximates market value. Securities for which market quotations are not readily available are valued at fair value as determined in good faith by the Funds’ investment adviser using consistently applied procedures under the general supervision of the Board of Trustees. Investments in other open-end investment companies are valued at their net asset value each day.
The Funds may hold securities traded in foreign markets. Foreign securities are valued at the market price in the foreign market. However, if events occurring after the close of the foreign market (but before the close of regular trading on the New York Stock Exchange) are believed to materially affect the value of those securities, such securities are fair valued pursuant to procedures approved by the Board of Trustees. When fair valuing securities, the Funds may, among other things, use modeling tools or other processes that may take into account factors such as securities market activity and/or significant events that occur after the close of the foreign market and before the Funds calculate their net asset values.
127
b. Security Transactions and Related Investment Income. Security transactions are accounted for on trade date. Dividend income is recorded on ex-dividend date, or in the case of certain foreign securities, as soon as the Fund is notified, and interest income is recorded on an accrual basis. Interest income is increased by the accretion of discount and decreased by the amortization of premium. Periodic principal adjustments for inflation-protected securities are recorded to interest income. Principal adjustments (in the event of deflation) are recorded as reductions of interest income to the extent of interest income earned. The amount by which deflationary principal adjustments exceed interest income earned is recorded as an increase to the cost basis of the security. Additionally, the amount by which deflationary principal adjustments exceed rising inflationary principal adjustments on a cumulative basis, if any, is recorded as an increase to the cost basis of the security. Distributions received from investments in securities that represent a return of capital or capital gain are recorded as a reduction of cost of investments or as a realized gain, respectively. The calendar year-end amounts of ordinary income, capital gains, and return of capital included in distributions received from the Funds’ investments in real estate investment trusts (“REITs”) are reported to the Funds after the end of the fiscal year; accordingly, the Funds estimate these amounts for accounting purposes until the characterization of REIT distributions is reported to the Funds after the end of the fiscal year. Estimates are based on the most recent REIT distribution information available. Investment income is recorded net of foreign taxes withheld when applicable. In determining net gain or loss on securities sold, the cost of securities has been determined on an identified cost basis. Investment income, non-class specific expenses and realized and unrealized gains and losses are allocated on a pro rata basis to each class based on the relative net assets of each class to the total net assets of the Fund.
c. Foreign Currency Translation. The books and records of the Funds are maintained in U.S. dollars. The value of securities, currencies and other assets and liabilities denominated in currencies other than U.S. dollars are translated into U.S. dollars based upon foreign exchange rates prevailing at the end of the period. Purchases and sales of investment securities, income and expenses are translated on the respective dates of such transactions.
Since the values of investment securities are presented at the foreign exchange rates prevailing at the end of the period, it is not practical to isolate that portion of the results of operations arising from changes in exchange rates from fluctuations which arise due to changes in market prices of the investment securities. Such changes are included with the net realized and unrealized gain or loss on investments.
Net realized foreign exchange gains or losses arise from sales of foreign currency, currency gains or losses realized between the trade and settlement dates on securities transactions and the difference between the amounts of dividends, interest and foreign withholding taxes recorded on the Funds’ books and the U.S. dollar equivalent of the amounts actually received or paid. Net unrealized foreign exchange gains and losses arise from changes in the value of assets and liabilities, other than investment securities, at the end of the fiscal period, resulting from changes in exchange rates.
Certain Funds may use foreign currency exchange contracts to facilitate transactions in foreign-denominated investments. Losses may arise from changes in the value of the foreign currency or if the counterparties do not perform under the contracts’ terms.
Each Fund may purchase investments of foreign issuers. Investing in securities of foreign issuers involves special risks and considerations not typically associated with investing in U.S. companies and securities of the U.S. government. These risks include revaluation of currencies and the risk of expropriation. Moreover, the markets for securities of many foreign issuers may be less liquid and the prices of such securities may be more volatile than those of comparable U.S. companies and the U.S. government.
d. Forward Foreign Currency Contracts. Each Fund that may invest in foreign investments may enter into forward foreign currency contracts. Contracts generally are used to acquire exposure to foreign currencies and may also be used for hedging purposes. Also, a contract to buy or sell may offset a previous contract. These contracts involve market risk in excess of the unrealized gain or loss reflected in the Fund’s Statement of Assets and Liabilities. The U.S. dollar value of the currencies a Fund has committed to buy or sell represents the aggregate exposure to each currency the Fund has acquired or hedged through currency contracts outstanding at period end. Gains or losses are recorded for financial statement purposes as unrealized until settlement date. Risks may arise upon entering into these contracts from the potential inability of counterparties to meet the terms of their contracts and from unanticipated movements in the value of a foreign currency relative to the U.S. dollar.
e. Futures Contracts. The Funds may enter into futures contracts. A futures contract is an agreement between two parties to buy and sell a particular commodity, instrument or index (e.g., an interest-bearing security) for a specified price on a specified future date.
When a Fund enters into a futures contract, it is required to deposit with (or for the benefit of) its broker as “initial margin” an amount of cash or liquid securities. As the value of the contract changes, the value of the futures contract position increases or
128
NOTES TO FINANCIAL STATEMENTS – continued
March 31, 2009 (Unaudited)
declines. Subsequent payments, known as “variation margin”, are made or received by a Fund, depending on the price fluctuations in the fair value of the contract and the value of the collateral held. The aggregate principal amounts of the contracts are not recorded in the financial statements. Fluctuations in the value of the contracts are recorded in the Statements of Assets and Liabilities as an asset (liability) and in the Statements of Operations as unrealized appreciation (depreciation) until the contracts are closed, when they are recorded as realized gains (losses). Realized gain or loss on a futures position is equal to the difference between the value of the contract at the time it was opened and the value at the time it was closed, minus brokerage commissions. When a Fund enters into a futures contract certain risks may arise such as illiquidity in the futures market, which may limit a Fund’s ability to close out a futures contract prior to settlement date, and unanticipated movements in the value of securities or interest rates.
f. Federal and Foreign Income Taxes. The Trust treats each Fund as a separate entity for federal income tax purposes. Each Fund intends to meet the requirements of the Internal Revenue Code applicable to regulated investment companies, and to distribute to its shareholders substantially all of its net investment income and any net realized capital gains at least annually. Management has performed an analysis of the Funds’ tax positions taken on federal and state tax returns that remain subject to examination (tax years ended September 30, 2005-2008) and has concluded that no provisions for income tax are required. Fund management is not aware of any events that are reasonably possible to occur in the next six months that would result in the amounts of any unrecognized tax benefits significantly increasing or decreasing for the Funds. However, management’s conclusions regarding tax positions taken may be subject to review and adjustment at a later date based on factors including, but not limited to, new tax laws and accounting regulations and interpretations thereof.
A Fund may be subject to foreign taxes on income and gains on investments that are accrued based upon the Fund’s understanding of the tax rules and regulations that exist in the countries in which the Fund invests. Foreign governments may also impose taxes or other payments on investments with respect to foreign securities. Such taxes are accrued as applicable, and are reflected as foreign taxes payable on the Statements of Assets and Liabilities.
g. Dividends and Distributions to Shareholders. Dividends and distributions are recorded on ex-dividend date. The timing and characterization of certain income and capital gain distributions are determined annually in accordance with federal tax regulations, which may differ from accounting principles generally accepted in the United States of America. Permanent differences are primarily due to differing treatments for book and tax purposes for items such as foreign currency transactions, defaulted bond adjustments, discount adjustments on inflation-protected securities, paydown gains and losses and premium amortization accruals. Permanent book and tax basis differences relating to shareholder distributions will result in reclassifications to capital accounts. Temporary differences between book and tax distributable earnings are primarily due to deferred Trustees’ fees, wash sales, premium amortization accruals, securities lending collateral gain/loss adjustments, forward contracts mark to market, futures contracts mark to market, and defaulted bond interest. Distributions from net investment income and short-term capital gains are considered to be distributed from ordinary income for tax purposes.
The tax characterization of distributions is determined on an annual basis. The tax character of distributions paid to shareholders during the year ended September 30, 2008 was as follows:
| | | | | | | | | |
| | | 2008 Distributions Paid From: |
Fund | | Ordinary
Income | | Long-Term
Capital
Gains | | Total |
Bond Fund | | $ | 1,174,950,148 | | $ | — | | $ | 1,174,950,148 |
Fixed Income Fund | | | 43,626,372 | | | 643,688 | | | 44,270,060 |
Global Bond Fund | | | 114,644,152 | | | — | | | 114,644,152 |
Inflation Protected Securities Fund | | | 1,129,818 | | | — | | | 1,129,818 |
Institutional High Income Fund | | | 12,782,158 | | | 3,318,304 | | | 16,100,462 |
Intermediate Duration Fixed Income Fund | | | 1,768,089 | | | — | | | 1,768,089 |
Investment Grade Fixed Income Fund | | | 19,088,772 | | | — | | | 19,088,772 |
Differences between these amounts and those reported in the Statements of Changes in Net Assets, if any, are primarily attributable to different book and tax treatment for short-term capital gains.
129
As of September 30, 2008, the capital loss carryforwards and post-October losses were as follows:
| | | | | | | | | | | | | | |
Capital loss carryforward: | | Bond Fund | | Fixed Income
Fund | | Global
Bond Fund | | | Inflation Protected
Securities Fund | |
Expires September 30, 2013 | | $ | — | | $ | — | | $ | — | | | $ | — | |
Expires September 30, 2014 | | | — | | | — | | | (1,046,616 | ) | | | (19,853 | ) |
Expires September 30, 2015 | | | — | | | — | | | (5,497,643 | ) | | | (155,005 | ) |
Expires September 30, 2016 | | | — | | | — | | | (3,309,847 | ) | | | — | |
| | | | | | | | | | | | | | |
Total capital loss carryforward | | | — | | | — | | $ | (9,854,106 | ) | | | (174,858 | ) |
| | | | | | | | | | | | | | |
Deferred net capital losses (post-October 2007) | | | — | | | — | | | (9,216,441 | ) | | | — | |
| | | | | | | | | | | | | | |
| | | | | | | | | | |
Capital loss carryforward: | | Institutional High
Income Fund | | Intermediate Duration
Fixed Income Fund | | | Investment Grade
Fixed Income Fund |
Expires September 30, 2013 | | $ | — | | $ | (3,797 | ) | | $ | — |
Expires September 30, 2014 | | | — | | | (186,919 | ) | | | — |
Expires September 30, 2015 | | | — | | | (326,220 | ) | | | — |
Expires September 30, 2016 | | | — | | | (222,423 | ) | | | — |
| | | | | | | | | | |
Total capital loss carryforward | | | — | | | (739,359 | ) | | | — |
| | | | | | | | | | |
Deferred net capital losses (post-October 2007) | | | — | | | (257,177 | ) | | | — |
| | | | | | | | | | |
h. Repurchase Agreements. It is each Fund’s policy that the market value of the collateral for repurchase agreements be at least equal to 100% of the repurchase price, including interest. Certain repurchase agreements are tri-party arrangements whereby the collateral is held in a segregated account for the benefit of the Fund and on behalf of the counterparty. It is each Fund’s policy, regarding tri-party arrangements, that the market value of the collateral be at least equal to 102% of the repurchase price, including interest. Repurchase agreements could involve certain risks in the event of default or insolvency of the counterparty including possible delays or restrictions upon a Fund’s ability to dispose of the underlying securities.
i. Delayed Delivery Commitments. Certain transactions, such as futures and forward transactions, or purchases of when-issued or delayed delivery instruments may have a similar effect on a Fund’s net asset value as if the Fund had created a degree of leverage in its portfolio. The price of the underlying instruments and the date when they will be paid for are fixed at the time the transaction is negotiated. If a Fund enters into such a transaction, collateral consisting of liquid securities or cash and cash equivalents will be maintained in an amount at least equal to the commitment with the custodian and/ or broker. Losses may arise due to changes in the market value of the underlying instruments or if the counterparty does not perform under the contract.
j. Securities Lending. The Funds have entered into an agreement with State Street Bank and Trust Company (“State Street Bank”), as agent of the Funds, to lend securities to certain designated borrowers. The loans are collateralized with cash or securities in an amount equal to at least 105% or 102% of the market value (including accrued interest) of the loaned international or domestic securities, respectively, when the loan is initiated. Thereafter, the value of the collateral must remain at least 102% of the market value (including accrued interest) of loaned securities for U.S. equities and U.S. corporate debt; at least 105% of the market value (including accrued interest) of loaned securities for non-U.S. equities; and at least 100% of the market value (including accrued interest) of loaned securities for U.S. government securities, sovereign debt issued by non-U.S. governments and non-U.S. corporate debt. In the event that the market value of the collateral falls below the required percentages described above, the borrower will deliver additional collateral on the next business day. As with other extensions of credit, the Funds bear the risk of loss with respect to the investment of the collateral. The Funds invest cash collateral in short-term investments, a portion of the income from which is remitted to the borrowers and the remainder allocated between the Funds and State Street Bank as lending agent. The value of securities on loan to borrowers and the value of collateral held by the Bond Fund with respect to such loans at March 31, 2009 were $26,393 and $620,713, respectively. There were no securities on loan for the other Funds.
k. Indemnifications. Under the Trust’s organizational documents, its officers and Trustees are indemnified against certain liabilities arising out of the performance of their duties to the Funds. Additionally, in the normal course of business, the Funds enter into contracts with service providers that contain general indemnification clauses. The Funds’ maximum exposure under these arrangements is unknown as this would involve future claims that may be made against the Funds that have not yet occurred. However, based on experience, the Funds expect the risk of loss to be remote.
130
NOTES TO FINANCIAL STATEMENTS – continued
March 31, 2009 (Unaudited)
l. New Accounting Pronouncement. In March 2008, Statement of Financial Accounting Standards No. 161, Disclosures about Derivative Instruments and Hedging Activities (“FAS 161”), was issued and will be effective for fiscal years and interim periods beginning after November 15, 2008. FAS 161 requires enhanced disclosures about funds’ derivative and hedging activities. Management is currently evaluating the impact the adoption of FAS 161 may have on the Funds’ financial statement disclosures.
3. Fair Value Measurements. The Funds adopted Financial Accounting Standards Board Statement of Financial Accounting Standards No. 157 (“FAS 157”), Fair Value Measurements, effective October 1, 2008. FAS 157 establishes a hierarchy for net asset value determination purposes in which various inputs are used in determining the value of the Fund’s investments. These inputs are summarized in the three broad levels listed below:
| | • | | Level 1—quoted prices in active markets for identical investments; |
| | • | | Level 2—prices determined using other significant observable inputs that are observable either directly, or indirectly through corroboration with observable market data (which could include quoted prices for similar investments, interest rates, credit risk, etc.); |
| | • | | Level 3—prices determined using significant unobservable inputs for situations where quoted prices or observable inputs are unavailable such as when there is little or no market activity for an investment (unobservable inputs reflect the Fund’s own assumptions in determining the fair value of investments and would be based on the best information available). |
The inputs or methodology used for valuing securities are not necessarily an indication of the risk associated with investing in those securities.
Other financial instruments are derivative instruments not reflected in investments carried at value and may include such instruments as futures contracts and forward contracts, which are valued at the unrealized appreciation/depreciation on the instrument.
The following is a summary of the inputs used to value the Funds’ investments as of March 31, 2009:
Bond Fund
| | | |
Valuation Inputs | | Investments in
Securities |
Level 1—Quoted Prices | | $ | 635,642,490 |
Level 2—Other Significant Observable Inputs | | | 11,096,509,761 |
Level 3—Significant Unobservable Inputs | | | 1,098,363,059 |
| | | |
Total | | $ | 12,830,515,310 |
| | | |
| |
| Fixed Income Fund | | | |
| |
Valuation Inputs | | Investments in
Securities |
Level 1—Quoted Prices | | $ | 38,151,653 |
Level 2—Other Significant Observable Inputs | | | 501,081,439 |
Level 3—Significant Unobservable Inputs | | | 47,080,335 |
| | | |
Total | | $ | 586,313,427 |
| | | |
| |
| Global Bond Fund | | | |
| |
Securities Purchased Valuation Inputs | | Investments in
Securities |
Level 1—Quoted Prices | | $ | 5,770,481 |
Level 2—Other Significant Observable Inputs | | | 1,295,959,860 |
Level 3—Significant Unobservable Inputs | | | 52,239,972 |
| | | |
Total | | $ | 1,353,970,313 |
| | | |
| |
Forward Currency Contracts Valuation Inputs | | Other Financial
Instruments |
Level 1—Quoted Prices | | $ | — |
Level 2—Other Significant Observable Inputs | | | 2,025,062 |
Level 3—Significant Unobservable Inputs | | | — |
| | | |
Total | | $ | 2,025,062 |
| | | |
131
Inflation Protected Securities Fund
| | | |
Securities Purchased Valuation Inputs | | Investments in
Securities |
Level 1—Quoted Prices | | $ | 540,355 |
Level 2—Other Significant Observable Inputs | | | 12,719,092 |
Level 3—Significant Unobservable Inputs | | | 130,004 |
| | | |
Total | | $ | 13,389,451 |
| | | |
| |
Forward Currency Contracts Valuation Inputs | | Other Financial
Instruments |
Level 1—Quoted Prices | | $ | — |
Level 2—Other Significant Observable Inputs | | | 3,231 |
Level 3—Significant Unobservable Inputs | | | — |
| | | |
Total | | $ | 3,231 |
| | | |
| |
| Institutional High Income Fund | | | |
| |
Valuation Inputs | | Investments in
Securities |
Level 1—Quoted Prices | | $ | 31,342,465 |
Level 2—Other Significant Observable Inputs | | | 186,897,177 |
Level 3—Significant Unobservable Inputs | | | 19,154,826 |
| | | |
Total | | $ | 237,394,468 |
| | | |
| |
| Intermediate Duration Fixed Income Fund | | | |
| |
Securities Purchased Valuation Inputs | | Investments in
Securities |
Level 1—Quoted Prices | | $ | 255,403 |
Level 2—Other Significant Observable Inputs | | | 25,237,869 |
Level 3—Significant Unobservable Inputs | | | 447,403 |
| | | |
Total | | $ | 25,940,675 |
| | | |
| |
Futures Valuation Inputs | | Other Financial
Instruments |
Level 1—Quoted Prices | | $ | 16,899 |
Level 2—Other Significant Observable Inputs | | | — |
Level 3—Significant Unobservable Inputs | | | — |
| | | |
Total | | $ | 16,899 |
| | | |
| |
| Investment Grade Fixed Income Fund | | | |
| |
Valuation Inputs | | Investments in
Securities |
Level 1—Quoted Prices | | $ | 36,097,817 |
Level 2—Other Significant Observable Inputs | | | 332,276,499 |
Level 3—Significant Unobservable Inputs | | | 12,021,526 |
| | | |
Total | | $ | 380,395,842 |
| | | |
132
NOTES TO FINANCIAL STATEMENTS – continued
March 31, 2009 (Unaudited)
The following is a reconciliation of Level 3 investments for which significant unobservable inputs were used to determine fair value as of March 31, 2009:
Bond Fund
| | | | |
Assets | | Investments in
Securities | |
Balance as of September 30, 2008 | | $ | 327,930,892 | |
Realized gain (loss) | | | (13,779,370 | ) |
Change in unrealized appreciation (depreciation)(a) | | | (494,826,118 | ) |
Net purchases (sales) | | | 243,045,766 | |
Net reclassifications to/from Level 3 | | | 1,035,991,889 | |
| | | | |
Balance as of March 31, 2009 | | $ | 1,098,363,059 | |
| | | | |
| |
| Fixed Income Fund | | | | |
| |
Assets | | Investments in
Securities | |
Balance as of September 30, 2008 | | $ | 14,822,184 | |
Realized gain (loss) | | | 702,725 | |
Change in unrealized appreciation (depreciation)(a) | | | (10,482,401 | ) |
Net purchases (sales) | | | 4,470,307 | |
Net reclassifications to/from Level 3 | | | 37,567,520 | |
| | | | |
Balance as of March 31, 2009 | | $ | 47,080,335 | |
| | | | |
| |
| Global Bond Fund | | | | |
| |
Assets | | Investments in
Securities | |
Balance as of September 30, 2008 | | $ | 48,132,296 | |
Realized gain (loss) | | | 451,580 | |
Change in unrealized appreciation (depreciation)(a) | | | (19,044,229 | ) |
Net purchases (sales) | | | (26,484,811 | ) |
Net reclassifications to/from Level 3 | | | 49,185,136 | |
| | | | |
Balance as of March 31, 2009 | | $ | 52,239,972 | |
| | | | |
| |
| Inflation Protected Securities Fund | | | | |
| |
Assets | | Investments in
Securities | |
Balance as of September 30, 2008 | | $ | — | |
Realized gain (loss) | | | — | |
Change in unrealized appreciation (depreciation)(a) | | | (44,625 | ) |
Net purchases (sales) | | | — | |
Net reclassifications to/from Level 3 | | | 174,629 | |
| | | | |
Balance as of March 31, 2009 | | $ | 130,004 | |
| | | | |
| |
| Institutional High Income Fund | | | | |
| |
Assets | | Investments in
Securities | |
Balance as of September 30, 2008 | | $ | 10,040,606 | |
Realized gain (loss) | | | (317,047 | ) |
Change in unrealized appreciation (depreciation)(a) | | | (13,424,508 | ) |
Net purchases (sales) | | | 4,427,965 | |
Net reclassifications to/from Level 3 | | | 18,427,810 | |
| | | | |
Balance as of March 31, 2009 | | $ | 19,154,826 | |
| | | | |
133
Intermediate Duration Fixed Income Fund
| | | | |
Assets | | Investments in
Securities | |
Balance as of September 30, 2008 | | $ | 387,534 | |
Realized gain (loss) | | | (34,594 | ) |
Change in unrealized appreciation (depreciation)(a) | | | (167,299 | ) |
Net purchases (sales) | | | (90,490 | ) |
Net reclassifications to/from Level 3 | | | 352,252 | |
| | | | |
Balance as of March 31, 2009 | | $ | 447,403 | |
| | | | |
| |
| Investment Grade Fixed Income Fund | | | | |
| |
Assets | | Investments in
Securities | |
Balance as of September 30, 2008 | | $ | 4,180,727 | |
Realized gain (loss) | | | (80,201 | ) |
Change in unrealized appreciation (depreciation)(a) | | | (4,063,824 | ) |
Net purchases (sales) | | | 1,287,945 | |
Net reclassifications to/from Level 3 | | | 10,696,879 | |
| | | | |
Balance as of March 31, 2009 | | $ | 12,021,526 | |
| | | | |
(a) Change in unrealized appreciation (depreciation) is included in net change in unrealized appreciation (depreciation) on investments within the Statement of Operations.
In April 2009, the Financial Accounting Standards Board (“FASB”) issued FASB Staff Position No. 157-4, Determining Fair Value When the Volume and Level of Activity for the Asset or Liability Have Significantly Decreased and Identifying Transactions That Are Not Orderly (“FSP 157-4”). FSP 157-4 provides additional guidance for estimating fair value in accordance with FAS 157, when the volume and level of activity for the asset or liability have significantly decreased as well as guidance on identifying circumstances that indicate a transaction is not orderly. FSP 157-4 is effective for fiscal years and interim periods ending after June 15, 2009. Management is currently evaluating the impact the adoption of FSP 157-4 will have on the Funds’ financial statement disclosures.
4. Purchases and Sales of Securities. For the six months ended March 31, 2009, purchases and sales of securities (excluding short-term investments and including paydowns) were as follows:
| | | | | | | | | | | | |
| | | U.S. Government/Agency Securities | | Other Securities |
Fund | | Purchases | | Sales | | Purchases | | Sales |
Bond Fund | | $ | 91,170 | | $ | 134,551,301 | | $ | 2,569,849,108 | | $ | 2,340,121,196 |
Fixed Income Fund | | | — | | | — | | | 124,621,493 | | | 50,727,052 |
Global Bond Fund | | | 30,880,729 | | | 213,235,618 | | | 341,680,194 | | | 796,701,505 |
Inflation Protected Securities Fund | | | 810,226 | | | 3,661,233 | | | 224,000 | | | 100,975 |
Institutional High Income Fund | | | — | | | — | | | 85,284,712 | | | 12,014,991 |
Intermediate Duration Fixed Income Fund | | | 2,770,408 | | | 7,982,161 | | | 6,314,706 | | | 5,563,971 |
Investment Grade Fixed Income Fund | | | — | | | 850,046 | | | 125,822,215 | | | 20,020,624 |
134
NOTES TO FINANCIAL STATEMENTS – continued
March 31, 2009 (Unaudited)
5. Management Fees and Other Transactions with Affiliates.
a. Management Fees. Loomis, Sayles & Company, L.P. (“Loomis Sayles”) serves as investment adviser to each Fund. Separate management agreements for each Fund in effect for the six months ended March 31, 2009, provided for fees at the following annual percentage rates of each Fund’s average daily net assets:
| | | | | | | | | | |
| | | Percentage of Average Daily Net Assets |
Fund | | First
$1 billion | | Next
$1 billion | | Next
$1 billion | | Next
$12 billion | | Over
$15 billion |
Bond Fund | | 0.60% | | 0.60% | | 0.60% | | 0.50% | | 0.49% |
Fixed Income Fund | | 0.50% | | 0.50% | | 0.50% | | 0.50% | | 0.50% |
Global Bond Fund | | 0.60% | | 0.50% | | 0.48% | | 0.48% | | 0.48% |
Inflation Protected Securities Fund | | 0.25% | | 0.25% | | 0.25% | | 0.25% | | 0.25% |
Institutional High Income Fund | | 0.60% | | 0.60% | | 0.60% | | 0.60% | | 0.60% |
Intermediate Duration Fixed Income Fund | | 0.25% | | 0.25% | | 0.25% | | 0.25% | | 0.25% |
Investment Grade Fixed Income Fund | | 0.40% | | 0.40% | | 0.40% | | 0.40% | | 0.40% |
Loomis Sayles has given binding undertakings to the Funds to reduce management fees and/or reimburse certain expenses associated with the Funds to limit their operating expenses, exclusive of brokerage expenses, interest expense, taxes and extraordinary expense. These undertakings are in effect until January 31, 2010 and will be reevaluated on an annual basis. For the six months ended March 31, 2009, the expense limits as a percentage of average daily net assets under the expense limitation agreements were as follows:
| | | | | | |
| | | Expense Limit as a Percentage of
Average Daily Net Assets |
Fund | | Institutional Class | | Retail Class | | Admin Class |
Bond Fund | | 0.70% | | 0.95% | | 1.20% |
Fixed Income Fund | | 0.65% | | — | | — |
Global Bond Fund | | 0.75% | | 1.00% | | — |
Inflation Protected Securities Fund | | 0.40% | | — | | — |
Institutional High Income Fund | | 0.75% | | — | | — |
Intermediate Duration Fixed Income Fund | | 0.40% | | — | | — |
Investment Grade Fixed Income Fund | | 0.55% | | — | | — |
For the six months ended March 31, 2009, the management fees for each Fund were as follows:
| | | | | |
Fund | | Management
Fee | | Percentage of
Average Daily Net Assets |
Bond Fund | | $ | 32,297,791 | | 0.52% |
Fixed Income Fund | | | 1,398,066 | | 0.50% |
Global Bond Fund | | | 4,654,100 | | 0.56% |
Inflation Protected Securities Fund | | | 16,873 | | 0.25% |
Institutional High Income Fund | | | 613,840 | | 0.60% |
Intermediate Duration Fixed Income Fund | | | 33,208 | | 0.25% |
Investment Grade Fixed Income Fund | | | 569,050 | | 0.40% |
For the six months ended March 31, 2009, class specific expenses have been reimbursed as follows:
| | | |
Fund | | Reimbursement |
Bond Fund | | $ | 778,349 |
Fixed Income Fund | | | — |
Global Bond Fund | | | 136,227 |
Inflation Protected Securities Fund | | | 40,490 |
Institutional High Income Fund | | | — |
Intermediate Duration Fixed Income | | | 38,760 |
Investment Grade Fixed Income Fund | | | — |
135
Loomis Sayles shall be permitted to recover expenses it has borne under the expense limitation agreement (whether through reduction of its management fees or otherwise) on a class by class basis in later periods to the extent the expenses of a class fall below a class’ expense limits, provided, however, that a class is not obligated to pay such reduced fees/expenses more than one year after the end of the fiscal year in which the fee/expense was reduced. The amounts subject to possible recovery under the expense limitation agreements at March 31, 2009 were as follows:
| | | | | | | | | | | | |
| | | Expenses Subject to Possible Recovery Until
September 30, 2009 |
Fund | | Institutional Class | | Retail Class | | Admin Class | | Total |
Bond Fund | | $ | — | | $ | — | | $ | 81,414 | | $ | 81,414 |
Fixed Income Fund | | | — | | | — | | | — | | | — |
Global Bond Fund | | | — | | | — | | | — | | | — |
Inflation Protected Securities Fund | | | 85,963 | | | — | | | — | | | 85,963 |
Institutional High Income Fund | | | — | | | — | | | — | | | — |
Intermediate Duration Fixed Income Fund | | | 63,574 | | | — | | | — | | | 63,574 |
Investment Grade Fixed Income Fund | | | — | | | — | | | — | | | — |
| | | | | | | | | | | | |
| | | Expenses Subject to Possible Recovery Until
September 30, 2010 |
Fund | | Institutional Class | | Retail Class | | Admin Class | | Total |
Bond Fund | | $ | — | | $ | 720,335 | | $ | 58,014 | | $ | 778,349 |
Fixed Income Fund | | | — | | | — | | | — | | | — |
Global Bond Fund | | | — | | | 136,227 | | | — | | | 136,227 |
Inflation Protected Securities Fund | | | 40,490 | | | — | | | — | | | 40,490 |
Institutional High Income Fund | | | — | | | — | | | — | | | — |
Intermediate Duration Fixed Income Fund | | | 38,760 | | | — | | | — | | | 38,760 |
Investment Grade Fixed Income Fund | | | — | | | — | | | — | | | — |
Certain officers and employees of Loomis Sayles are also officers or Trustees of the Trust. Loomis Sayles’ general partner is indirectly owned by Natixis Global Asset Management, L.P. (“Natixis US”), which is part of Natixis Global Asset Management, an international asset management group based in Paris, France.
b. Administrative Fees. Natixis Asset Management Advisors, L.P. (“Natixis Advisors”) provides certain administrative services for the Funds and subcontracts with State Street Bank to serve as sub-administrator. Natixis Advisors is a wholly-owned subsidiary of Natixis US. Pursuant to an agreement among Natixis Funds Trust I, Natixis Funds Trust II, Natixis Funds Trust III, Natixis Funds Trust IV, Natixis Cash Management Trust, Gateway Trust (“Natixis Funds Trusts”), Loomis Sayles Funds I, Loomis Sayles Funds II (“Loomis Sayles Funds Trusts”), Hansberger International Series and Natixis Advisors, each Fund pays Natixis Advisors monthly its pro rata portion of fees equal to an annual rate of 0.0575% of the first $15 billion of the average daily net assets of the Natixis Funds Trusts, Loomis Sayles Funds Trusts and the Hansberger International Series, 0.0500% of the next $15 billion, 0.0425% of the next $30 billion and 0.0375% of such assets in excess of $60 billion, subject to an annual aggregate minimum fee for the Natixis Funds Trusts, Loomis Sayles Funds Trusts and the Hansberger International Series of $10 million, which is reevaluated on an annual basis. New funds are subject to a fee for the first twelve months of operations of $75,000 plus $12,500 per class and an additional $75,000 if managed by multiple subadvisors.
For the six months ended March 31, 2009, each Fund paid the following for administrative fees to Natixis Advisors:
| | | |
Fund | | Administrative
Fees |
Bond Fund | | $ | 3,146,920 |
Fixed Income Fund | | | 144,487 |
Global Bond Fund | | | 424,392 |
Inflation Protected Securities Fund | | | 3,448 |
Institutional High Income Fund | | | 52,304 |
Intermediate Duration Fixed Income Fund | | | 6,779 |
Investment Grade Fixed Income Fund | | | 72,687 |
136
NOTES TO FINANCIAL STATEMENTS – continued
March 31, 2009 (Unaudited)
c. Service and Distribution Fees. Natixis Distributors, L.P. (“Natixis Distributors”), a wholly owned subsidiary of Natixis US, has entered into a distribution agreement with the Trust. Pursuant to this agreement, Natixis Distributors serves as principal underwriter of each fund.
Pursuant to Rule 12b-1 under the 1940 Act, Bond Fund and Global Bond Fund have adopted a Distribution Plan relating to each Fund’s Retail Class shares (the “Retail Class Plans”) and Bond Fund has adopted a separate Distribution Plan relating to its Admin Class shares (the “Admin Class Plan”).
Under the respective Retail Class and Admin Class Plans, each Fund pays Natixis Distributors a monthly distribution fee at an annual rate not to exceed 0.25% of the average daily net assets attributable to the Fund’s Retail Class and Admin Class Shares, as reimbursement for expenses incurred by Natixis Distributors in providing personal services to investors in Retail Class and Admin Class Shares and/or maintenance of shareholder accounts. In addition, the Admin Class shares of the Bond Fund may pay an administrative service fee at an annual rate not to exceed 0.25% of the average daily net assets attributable to Admin Class shares to securities dealers or financial intermediaries for providing personal service and account maintenance for their customers who hold such shares.
For the six months ended March 31, 2009, the Funds paid the following service and distribution fees:
| | | | | | | | | | | | |
| | | Service Fees | | Distribution Fees |
Fund | | Admin Class | | Retail Class | | Admin Class | | Retail Class |
Bond Fund | | $ | 217,620 | | $ | — | | $ | 217,620 | | $ | 6,863,447 |
Fixed Income Fund | | | — | | | — | | | — | | | — |
Global Bond Fund | | | — | | | — | | | — | | | 1,026,854 |
Inflation Protected Securities Fund | | | — | | | — | | | — | | | — |
Institutional High Income Fund | | | — | | | — | | | — | | | — |
Intermediate Duration Fixed Income Fund | | | — | | | — | | | — | | | — |
Investment Grade Fixed Income Fund | | | — | | | — | | | — | | | — |
d. Sub-Transfer Agent Fees. Natixis Distributors has entered into agreements with financial intermediaries to provide certain recordkeeping, processing, shareholder communications and other services to customers of the intermediaries and has agreed to compensate the intermediaries for providing those services. Certain services would be provided by the Funds if the shares of those customers were registered directly with the Funds’ transfer agent. Accordingly, the Funds agreed to pay a portion of the intermediary fees attributable to shares of the Fund held by the intermediaries (which generally is a percentage of the value of shares held) not exceeding what the Funds would have paid its transfer agent had each customer’s shares been registered directly with the transfer agent instead of held through the intermediaries. Natixis Distributors pays the remainder of the fees. Listed below are the fees incurred by the Funds which are included in the transfer agent fees and expenses in the Statements of Operations.
| | | | | | | | | |
| | | Sub-Transfer Agent Fees |
Fund | | Institutional
Class | | Retail
Class | | Admin
Class |
Bond Fund | | $ | 1,631,215 | | $ | 2,927,667 | | $ | 133,984 |
Fixed Income Fund | | | — | | | — | | | — |
Global Bond Fund | | | 118,309 | | | 512,180 | | | — |
Inflation Protected Securities Fund | | | 2,729 | | | — | | | — |
Institutional High Income Fund | | | 2,308 | | | — | | | — |
Intermediate Duration Fixed Income Fund | | | 187 | | | — | | | — |
Investment Grade Fixed Income Fund | | | — | | | — | | | — |
e. Trustees Fees and Expenses. The Funds do not pay any compensation directly to their officers or Trustees who are directors, officers or employees of Natixis Advisors, Natixis Distributors, Natixis US, or their affiliates. The Chairperson of the Board receives a retainer fee at the annual rate of $200,000. The Chairperson does not receive any meeting attendance fees for Board of Trustees meetings or committee meetings that she attends. Each Independent Trustee (other than the Chairperson) receives, in the aggregate, a retainer fee at the annual rate of $65,000. Each Independent Trustee also receives a meeting attendance fee of $7,500 for each meeting of the Board of Trustees that he or she attends in person and $3,750 for each meeting of the Board of Trustees that he or she attends telephonically. In addition, each committee chair receives an additional retainer fee at the annual rate of $10,000. Each Contract Review and Governance Committee member is compensated $5,000 for each Committee meeting that
137
he or she attends in person and $2,500 for each meeting that he or she attends telephonically. Each Audit Committee member is compensated $6,250 for each Committee meeting that he or she attends in person and $3,125 for each meeting that he or she attends telephonically. These fees are allocated among the funds in the Natixis Funds Trusts, Loomis Sayles Funds Trusts and the Hansberger International Series based on a formula that takes into account, among other factors, the relative net assets of each Fund. Trustees are reimbursed for travel expenses in connection with attendance at meetings.
A deferred compensation plan (the “Plan”) is available to the Trustees on a voluntary basis. Deferred amounts remain in the Funds until distributed in accordance with the provisions of the Plan. The value of a participating Trustee’s deferral account is based on theoretical investments of deferred amounts, on the normal payment dates, in certain funds of the Natixis Funds Trusts, Loomis Sayles Funds Trusts and Hansberger International Series as designated by the participating Trustees. Changes in the value of participants’ deferral accounts are allocated pro rata among the funds in the Natixis Funds Trusts, Loomis Sayles Funds Trusts, and Hansberger International Series, and are normally reflected as Trustees’ fees and expenses in the Statements of Operations. The portions of the accrued obligations allocated to the Funds under the Plan are reflected as Deferred Trustees’ fees in the Statements of Assets and Liabilities.
For the six months ended March 31, 2009, net depreciation in the value of participants’ deferral accounts has been included in Miscellaneous expenses on the Statements of Operations, as follows:
| | | |
Fund | | Amount |
Bond Fund | | $ | 84,704 |
Fixed Income Fund | | | 12,049 |
Global Bond Fund | | | 21,072 |
Inflation Protected Securities Fund | | | 5,227 |
Institutional High Income Fund | | | 7,125 |
Intermediate Duration Fixed Income Fund | | | 6,230 |
Investment Grade Fixed Income Fund | | | 7,962 |
6. Line of Credit. Each Fund, together with certain other funds of Natixis Funds Trusts, Loomis Sayles Funds Trusts and the Hansberger International Series, participates in a $200,000,000 committed line of credit provided by State Street Bank, with an individual limit of $125,000,000 for each fund that participates in the line of credit. Interest is charged to each participating fund based on its borrowings at a rate per annum equal to the greater of the Federal Funds rate or overnight LIBOR, plus 0.75%. In addition, a commitment fee of 0.125% per annum, payable at the end of each calendar quarter, is accrued and apportioned among the participating funds based on their average daily unused portion of the line of credit.
Prior to March 11, 2009, each Fund, together with certain other funds of Natixis Funds Trusts, Loomis Sayles Funds Trusts and Hansberger International Series, participated in a $200,000,000 committed line of credit provided by State Street Bank, with an individual limit of $125,000,000 for each fund that participated in the line of credit. Interest was charged to each participating fund based on its borrowings at a rate per annum equal to the Federal Funds rate plus 0.50%. In addition, a commitment fee of 0.09% per annum, payable at the end of each calendar quarter, was accrued and apportioned among the participating funds based on their average daily unused portion of the line of credit.
For the six months ended March 31, 2009, the Funds had no borrowings under these agreements.
7. Shareholders. At March 31, 2009, Loomis Sayles Distributors, L.P. and Loomis Sayles Trust Co. LLC owned 248,233 shares, equal to 18.2% of Inflation Protected Securities Fund’s shares outstanding. At March 31, 2009, the Loomis Sayles Funded Pension Plan and Trust (“Pension Plan”) and the Loomis Sayles Employees’ Profit Sharing Retirement Plan held shares of beneficial interest in the Funds as follows:
| | | | |
Fund | | Pension Plan | | Profit Sharing
Retirement Plan |
Bond Fund | | 1,114,420 | | 2,042,832 |
Fixed Income Fund | | — | | — |
Global Bond Fund | | 2,262 | | 417,060 |
Inflation Protected Securities Fund | | — | | 150,661 |
Institutional High Income Fund | | — | | 1,082,312 |
Intermediate Duration Fixed Income Fund | | — | | 31,759 |
Investment Grade Fixed Income Fund | | — | | — |
138
NOTES TO FINANCIAL STATEMENTS – continued
March 31, 2009 (Unaudited)
At March 31, 2009, three shareholders individually owned more than 5% of the Fixed Income Fund’s total outstanding shares, representing, in aggregate, 17.2% of the Fund; two shareholders individually owned more than 5% of the Inflation Protected Securities Fund’s total outstanding shares, representing, in aggregate, 18.2% of the Fund; two shareholders individually owned more than 5% of the Institutional High Income Fund’s total outstanding shares, representing, in aggregate, 11.2% of the Fund; five shareholders individually owned more than 5% of the Intermediate Duration Fixed Income Fund’s total outstanding shares, representing, in aggregate 90.2% of the Fund; and six shareholders individually owned more than 5% of the Investment Grade Fixed Income Fund’s total outstanding shares representing in aggregate, 46.9% of the Fund.
8. Capital Shares. Each Fund may issue an unlimited number of shares of beneficial interest, without par value. Transactions in capital shares were as follows:
| | | | | | | | | | | | | | |
| |
| | | Bond Fund | |
| | |
| | | Six Months Ended March 31, 2009 | | | Year Ended September 30, 2008 | |
| | | | |
| Institutional Class | | Shares | | | Amount | | | Shares | | | Amount | |
Issued from the sale of shares | | 248,195,412 | | | $ | 2,550,732,047 | | | 251,570,447 | | | $ | 3,582,639,853 | |
Issued in connection with the
reinvestment of distributions | | 32,639,891 | | | | 323,429,122 | | | 38,067,200 | | | | 533,833,567 | |
Issued from subscriptions-in-kind* | | 2,661,512 | | | | 27,012,678 | | | — | | | | — | |
Redeemed | | (202,835,833 | ) | | | (2,092,892,635 | ) | | (173,399,411 | ) | | | (2,388,845,785 | ) |
| | | | | | | | | | | | | | |
Net change | | 80,660,982 | | | $ | 808,281,212 | | | 116,238,236 | | | $ | 1,727,627,635 | |
| | | | | | | | | | | | | | |
| * | Issued in exchange for portfolio securities contributed to the Fund in-kind by such shareholders on February 11, 2009 and March 6, 2009. Contributions included $8,628,801 of securities and $120,933 in receivables on February 11, 2009, and $17,854,274 of securities and $408,670 in receivables on March 6, 2009. These securities contributed on both dates were part of a portfolio that was previously managed by Loomis Sayles. |
| | | | | | | | | | | | | | |
| | | | |
| Retail Class | | Shares | | | Amount | | | Shares | | | Amount | |
Issued from the sale of shares | | 148,524,636 | | | $ | 1,525,904,526 | | | 289,365,734 | | | $ | 4,136,823,680 | |
Issued in connection with the
reinvestment of distributions | | 28,947,867 | | | | 285,500,781 | | | 36,275,158 | | | | 506,995,862 | |
Redeemed | | (204,948,020 | ) | | | (2,114,742,068 | ) | | (184,939,337 | ) | | | (2,542,156,728 | ) |
| | | | | | | | | | | | | | |
Net change | | (27,475,517 | ) | | $ | (303,336,761 | ) | | 140,701,555 | | | $ | 2,101,662,814 | |
| | | | | | | | | | | | | | |
| | | | |
| Admin Class | | Shares | | | Amount | | | Shares | | | Amount | |
Issued from the sale of shares | | 3,783,046 | | | $ | 38,924,485 | | | 9,933,305 | | | $ | 141,062,361 | |
Issued in connection with the reinvestment of distributions | | 864,850 | | | | 8,503,633 | | | 936,366 | | | | 13,050,988 | |
Redeemed | | (5,468,016 | ) | | | (56,450,816 | ) | | (6,310,368 | ) | | | (88,396,246 | ) |
| | | | | | | | | | | | | | |
Net change | | (820,120 | ) | | $ | (9,022,698 | ) | | 4,559,303 | | | $ | 65,717,103 | |
| | | | | | | | | | | | | | |
Increase (decrease) from capital share transactions | | 52,365,345 | | | $ | 495,921,753 | | | 261,499,094 | | | $ | 3,895,007,552 | |
| | | | | | | | | | | | | | |
| |
| | | Fixed Income Fund | |
| | |
| | | Six Months Ended March 31, 2009 | | | Year Ended September 30, 2008 | |
| | | | |
| Institutional Class | | Shares | | | Amount | | | Shares | | | Amount | |
Issued from the sale of shares | | 7,332,887 | | | $ | 74,564,708 | | | 20,684,018 | | | $ | 285,477,865 | |
Issued in connection with the reinvestment of distributions | | 5,247,997 | | | | 48,963,817 | | | 3,076,075 | | | | 41,096,367 | |
Redeemed | | (4,355,366 | ) | | | (44,743,698 | ) | | (14,148,613 | ) | | | (196,073,515 | ) |
| | | | | | | | | | | | | | |
Increase (decrease) from capital share transactions | | 8,225,518 | | | $ | 78,784,827 | | | 9,611,480 | | | $ | 130,500,717 | |
| | | | | | | | | | | | | | |
139
| | | | | | | | | | | | | | |
| |
| | | Global Bond Fund | |
| | |
| | | Six Months Ended March 31, 2009 | | | Year Ended September 30, 2008 | |
| | | | |
| Institutional Class | | Shares | | | Amount | | | Shares | | | Amount | |
Issued from the sale of shares | | 7,765,244 | | | $ | 102,919,345 | | | 35,619,497 | | | $ | 570,769,864 | |
Issued in connection with the reinvestment of distributions | | 2,995,387 | | | | 38,847,389 | | | 3,416,152 | | | | 54,204,619 | |
Redeemed | | (34,797,348 | ) | | | (465,070,121 | ) | | (21,704,761 | ) | | | (345,126,532 | ) |
| | | | | | | | | | | | | | |
Net change | | (24,036,717 | ) | | $ | (323,303,387 | ) | | 17,330,888 | | | $ | 279,847,951 | |
| | | | | | | | | | | | | | |
| | | | |
| Retail Class | | Shares | | | Amount | | | Shares | | | Amount | |
Issued from the sale of shares | | 7,573,866 | | | $ | 99,846,972 | | | 41,004,039 | | | $ | 653,696,591 | |
Issued in connection with the reinvestment of distributions | | 3,021,340 | | | | 38,870,950 | | | 3,149,153 | | | | 49,533,904 | |
Redeemed | | (31,178,952 | ) | | | (410,714,157 | ) | | (24,777,028 | ) | | | (388,658,940 | ) |
| | | | | | | | | | | | | | |
Net change | | (20,583,746 | ) | | $ | (271,996,235 | ) | | 19,376,164 | | | $ | 314,571,555 | |
| | | | | | | | | | | | | | |
Increase (decrease) from capital share transactions | | (44,620,463 | ) | | $ | (595,299,622 | ) | | 36,707,052 | | | $ | 594,419,506 | |
| | | | | | | | | | | | | | |
| |
| | | Inflation Protected Securities Fund | |
| | |
| | | Six Months Ended March 31, 2009 | | | Year Ended September 30, 2008 | |
| | | | |
| Institutional Class | | Shares | | | Amount | | | Shares | | | Amount | |
Issued from the sale of shares | | 313,145 | | | $ | 2,974,121 | | | 644,995 | | | $ | 6,931,326 | |
Issued in connection with the
reinvestment of distributions | | 6,128 | | | | 56,623 | | | 89,564 | | | | 936,772 | |
Redeemed | | (605,184 | ) | | | (5,742,351 | ) | | (414,633 | ) | | | (4,413,426 | ) |
| | | | | | | | | | | | | | |
Increase (decrease) from capital share transactions | | (285,911 | ) | | $ | (2,711,607 | ) | | 319,926 | | | $ | 3,454,672 | |
| | | | | | | | | | | | | | |
| |
| | | Institutional High Income Fund | |
| | |
| | | Six Months Ended March 31, 2009 | | | Year Ended September 30, 2008 | |
| | | | |
| Institutional Class | | Shares | | | Amount | | | Shares | | | Amount | |
Issued from the sale of shares | | 19,809,205 | | | $ | 107,799,969 | | | 13,115,043 | | | $ | 104,688,742 | |
Issued in connection with the
reinvestment of distributions | | 3,472,385 | | | | 16,528,551 | | | 1,889,032 | | | | 14,526,657 | |
Redeemed | | (7,402,127 | ) | | | (42,214,343 | ) | | (6,046,047 | ) | | | (47,783,552 | ) |
| | | | | | | | | | | | | | |
Increase (decrease) from capital share transactions | | 15,879,463 | | | $ | 82,114,177 | | | 8,958,028 | | | $ | 71,431,847 | |
| | | | | | | | | | | | | | |
140
NOTES TO FINANCIAL STATEMENTS – continued
March 31, 2009 (Unaudited)
| | | | | | | | | | | | | | |
| |
| | | Intermediate Duration Fixed Income Fund | |
| | |
| | | Six Months Ended March 31, 2009 | | | Year Ended September 30, 2008 | |
| | | | |
| Institutional Class | | Shares | | | Amount | | | Shares | | | Amount | |
Issued from the sale of shares | | 45,055 | | | $ | 394,898 | | | 464,596 | | | $ | 4,429,364 | |
Issued in connection with the
reinvestment of distributions | | 72,462 | | | | 627,612 | | | 128,620 | | | | 1,209,983 | |
Redeemed | | (804,335 | ) | | | (6,941,259 | ) | | (257,694 | ) | | | (2,438,893 | ) |
| | | | | | | | | | | | | | |
Increase (decrease) from capital share transactions | | (686,818 | ) | | $ | (5,918,749 | ) | | 335,522 | | | $ | 3,200,454 | |
| | | | | | | | | | | | | | |
| |
| | | Investment Grade Fixed Income Fund | |
| | |
| | | Six Months Ended March 31, 2009 | | | Year Ended September 30, 2008 | |
| | | | |
| Institutional Class | | Shares | | | Amount | | | Shares | | | Amount | |
Issued from the sale of shares | | 13,351,108 | | | $ | 138,219,352 | | | 7,579,953 | | | $ | 95,580,515 | |
Issued in connection with the
reinvestment of distributions | | 1,258,338 | | | | 12,522,623 | | | 1,021,690 | | | | 12,868,000 | |
Redeemed | | (1,646,829 | ) | | | (17,675,651 | ) | | (4,336,110 | ) | | | (54,588,362 | ) |
| | | | | | | | | | | | | | |
Increase (decrease) from capital share transactions | | 12,962,617 | | | $ | 133,066,324 | | | 4,265,533 | | | $ | 53,860,153 | |
| | | | | | | | | | | | | | |
141

Loomis Sayles High Income Opportunities Fund
Loomis Sayles Securitized Asset Fund
SEMI-ANNUAL REPORT
MARCH 31, 2009 (Unaudited)
FUND AND MANAGER REVIEW
Loomis Sayles High Income Opportunities Fund

Matthew Eagan, CFA
Manager Since April 2004

Kathleen Gaffney, CFA
Manager Since April 2004

Dan Fuss, CFA, CIC
Manager Since April 2004

Elaine Stokes
Manager Since April 2004
KEY FUND FACTS
Symbol | LSIOX
Objective | High current income. Capital appreciation is the Fund’s secondary objective.
Strategy | Invests substantially all of its assets, and may invest up to 100% of its assets, in high income securities. High income securities are fixed-income securities that Loomis Sayles believes have the potential to generate relatively high levels of current income.
Fund Inception Date | 4/12/04
Total Net Assets | $55.8 million
PORTFOLIO REVIEW
The Fund underperformed its Benchmark, Barclays Capital High Yield Index (formerly “Lehman High Yield Index”) for the six months ended March 31, 2009, primarily due to poor performance in the high yield utility sector and the Fund’s underweight in high yield financials. Following the unprecedented events of 2008, which seized up credit markets and spoiled investors’ risk appetite, performance was weak for most sectors on an absolute basis. On a relative basis, though, the Fund benefited from gains in out-of-benchmark allocations to investment-grade credit and securitized assets.
The dramatic drop in natural gas prices from last year’s peak levels, coupled with the recession, greatly compressed earnings and the credit metrics of electric utility players. Returns from this sector were among the worst in the six-month period. The high yield financial sector posted solid absolute performance, primarily due to the auto finance segment. But our underweight to this segment limited the Fund’s ability to participate in this market. In addition, our preferred and convertible holdings detracted from performance, due to volatility in the equity market and issue-specific weakness. Preferred and convertible holdings were badly bruised for the period, as volatility in the equity market and issue-specific weakness depressed performance. Most notable losses stemmed from financial and pharmaceutical names.
Despite its negative absolute performance, investment grade credit posted the largest contribution to the Fund’s relative performance. Certain financial companies were the biggest gainers, followed by select technology bonds within the industrial sector. Continued government intervention helped finance-related firms retrace some of their earlier losses, while the sector’s favorable yield-curve positioning advanced overall performance.
Within the high yield industrials sector, holdings in the telecommunication, chemical, and paper industries lagged during the period. Our underweight to this slumped sector was a positive for the Fund’s relative performance. Late in the period, securitized assets received a performance boost from the Federal Reserve’s expansion of the TALF (Term Asset-Backed Securities Loan Facility) program and the Treasury’s new Public-Private Investment Partnership (PPIP). Our allocations to AAA-rated super senior CMBS (commercial mortgage-backed securities) and subordinated credit card ABS (asset-backed securities) contributed positively to performance.
OUTLOOK
We believe high yield issues will continue to be volatile, as defaults continue to increase over the course of the year. We remain underweight in the CCC-rated portion of the market, as we believe most defaults will come from this
1
space. We believe investment grade credit continues to offer strong relative value, as spreads remain at relatively wide levels. As the markets grow more convinced that the global recovery has taken hold, we eventually expect to see more demand for riskier assets, such as high yield and investment grade bonds, as well as commodity currencies.
AVERAGE ANNUAL TOTAL RETURNS
Periods Ended March 31, 2009
| | | | | | | | | | |
| 6 Months | | | 1 Year | | | 3 Years | | | Since
Inception(a) | |
|
| Loomis Sayles High Income Opportunities Fund | |
| -13.87 | % | | -22.07 | % | | -6.07 | % | | -0.11 | % |
|
| Barclays Capital High Yield Index(b) | |
| -12.97 | | | -19.31 | | | -4.66 | | | -0.10 | |
|
| Lipper High Current Yield Funds Index(b) | |
| -17.85 | | | -23.71 | | | -6.87 | | | -1.55 | |
|
| Expense Ratio(c) | |
| Institutional Class: 0.00% | | | | |
CUMULATIVE PERFORMANCE
Inception to March 31, 2009
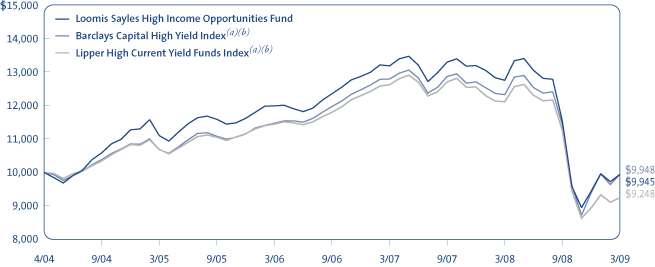
Data quoted reflects past performance and cannot guarantee future results. Total returns assume reinvestment of dividends and capital gains distributions. Investment return and principal value will fluctuate so that shares, when redeemed, may be worth more or less than their original cost. Current performance may be higher or lower than quoted.
Returns do not reflect the taxes that a shareholder would pay on fund distributions or the redemption of shares. Periods of less than one year are not annualized. Index performance data is not available coincident with the Fund’s inception date.
(a) Since Index performance data is not available coincident with the Fund’s inception date, the beginning value of the index is the value of the month-end closest to the Fund’s inception date. (b) See page 5 for a description of the Indices. (c) The amount shown under Expense Ratio is 0.00% to reflect the fact that the Fund does not pay any advisory, administration or distribution and service fees, and that Loomis Sayles has agreed to pay certain expenses of the Fund.
WHAT YOU SHOULD KNOW
High yield securities are subject to a high degree of market and credit risk. The secondary market for these securities may lack liquidity, which may adversely affect the value of the Fund. Securities issued by US government agencies are not insured by and may not be guaranteed by the US government.
2
FUND AND MANAGER REVIEW
Loomis Sayles Securitized Asset Fund

Clifton Rowe, CFA
Manager since March 2006

Fan Hu, CFA
Manager since April 2006
KEY FUND FACTS
Symbol | LSSAX
Objective | High current income consistent with capital preservation.
Strategy | Invest at least 80% of its net assets (plus any borrowings made for investment purposes) in a diversified portfolio of securitized assets, such as mortgage-backed and other asset-backed securities.
Fund Inception Date | 3/2/06
Total Net Assets | $270.2 million
PORTFOLIO REVIEW
The Fund lagged its Benchmark, the Barclays Capital Securitized Index (formerly “Lehman Securitized Index”) for the six months ended March 31, 2009, primarily due to its holdings in residential and commercial mortgage-backed securities (MBS and CMBS) issued by entities other than the government-sponsored entities (GSEs). These securities do not have the benefit of implied government support, and they were among the fixed-income market’s worst relative performers. Throughout most of the period, quality was king, and investors favored the safety and liquidity of US Treasury and other government-backed securities.
The Federal Reserve continued its efforts to lower private market interest rates by purchasing MBS issued by the GSEs and launching the TALF (Term Asset-Backed Securities Loan Facility) to provide financing to buyers of asset-backed securities (ABS). These actions led to relative outperformance for MBS issued by the GSEs and to a partial recovery in the ABS market.
We maintained overweight positions in CMBS and private labeled residential MBS. These securities suffered as the real estate market deteriorated during the period. In addition, at the height of the credit crisis and in the wake of last fall’s bankruptcy of Lehman Brothers, liquidity in the securitized markets effectively dried up. Since then, liquidity has slowly returned, and the securitized sectors experienced a partial recovery toward the end of the Fund’s six-month fiscal period. Nevertheless, investors’ risk appetite remained relatively weak.
OUTLOOK
Looking ahead, we expect the Federal Reserve to keep the federal funds target rate unchanged at its historic low range of 0.0% to 0.25%. However, we think longer-term rates may move modestly higher, so we are maintaining our focus on income opportunities rather than seeking significant appreciation potential. We are purchasing securities that we believe will be able to withstand further weakness in the housing market, have strong credit protection, are priced at a significant discount, and offer strong return potential.
We are also maintaining our overweight in the most senior CMBS, which we believe have ample credit protection. We continue to hold MBS issued by the GSEs, but we are maintaining a neutral weighting because we believe their upside potential is limited at this time. The Fund remains overweight in ABS backed by residential mortgage loans, automobile loans and credit card receivables. We believe these securities offer attractive yields and have strong credit quality due to their secured status and additional credit enhancements.
3
AVERAGE ANNUAL TOTAL RETURNS
Periods Ended March 31, 2009
| | | | | | | | | | |
| 6 Months | | | 1 Year | | | 3 Years | | | Since
Inception(a) | |
|
| Loomis Sayles Securitized Asset Fund | |
| -3.31 | % | | -4.05 | % | | 1.87 | % | | 1.72 | % |
|
| Barclays Capital Securitized Index(b) | |
| 4.33 | | | 4.86 | | | 6.19 | | | 5.74 | |
|
| Lipper US Mortgage Funds Index(b) | |
| 3.65 | | | 3.42 | | | 4.73 | | | 4.38 | |
| | |
| Expense Ratio(c) | | | | | | | |
| Institutional Class: 0.00% | | | | |
CUMULATIVE PERFORMANCE
Inception to March 31, 2009
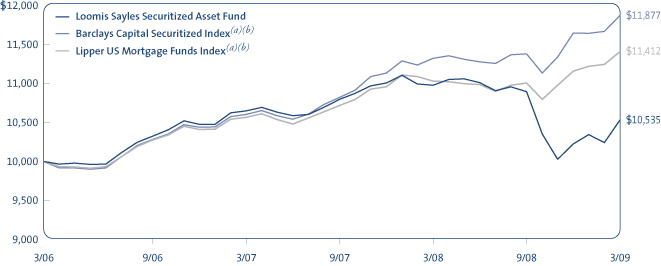
Data quoted reflects past performance and cannot guarantee future results. Total returns assume reinvestment of dividends and capital gains distributions. Investment return and principal value will fluctuate so that shares, when redeemed, may be worth more or less than their original cost. Current performance may be higher or lower than quoted.
Returns do not reflect the taxes that a shareholder would pay on fund distributions or the redemption of shares. Periods of less than one year are not annualized.
(a) Since Index performance data is not available coincident with the Fund’s inception date, the beginning value of the index is the value of the month-end closest to the Fund’s inception date. (b) See page 5 for a description of the Indices. (c) The amount shown under Expense Ratio is 0.00% to reflect the fact that the Fund does not pay any advisory, administration or distribution and service fees, and that Loomis Sayles has agreed to pay certain expenses of the Fund.
WHAT YOU SHOULD KNOW
High yield securities are subject to a high degree of market and credit risk. The secondary market for these securities may lack liquidity, which may adversely affect the value of the Fund. Securities issued by US government agencies are not insured by and may not be guaranteed by the US government.
4
ADDITIONAL INFORMATION
Index Definitions
Lipper High Current Yield Funds Index is an equally weighted, unmanaged index of typically the 30 largest mutual funds within the high current yield funds investment objective.
Lipper US Mortgage Funds Index is an equally weighted, unmanaged index of typically the 30 largest mutual funds within the US mortgage funds investment objective.
Source: Lipper, Inc.
Barclays Capital High Yield Index covers the universe of fixed rate, non-investment grade debt. Pay-in-kind (PIK) bonds, Eurobonds, and debt issues from countries designated as emerging markets (e.g., Argentina, Brazil, Venezuela, etc.) are excluded, but Canadian and global bonds (SEC registered) of issuers in non-emerging market countries are included. Original issue zeroes, step-up coupon structures, and 144As are also included.
Barclays Capital Securitized Index is an unmanaged index of asset-backed securities, collateralized mortgage-backed securities (ERISA eligible) and fixed rate mortgage-backed securities.
Returns are adjusted for the reinvestment of capital gains distributions and income dividends. Indices are unmanaged and do not have expenses that affect results, unlike most mutual funds. It is not possible to invest directly in an index.
Effective 11/3/08, the Lehman indices were rebranded to the Barclays Capital indices. There has been no change in the calculation or definition of the index data.
Proxy Voting Information
A description of the Funds’ proxy voting policies and procedures is available without charge, upon request, (i) by calling Loomis Sayles at 800-633-3330; (ii) on the Funds’ website, www.loomissayles.com, and (iii) on the SEC’s website at www.sec.gov. Information about how the Funds voted proxies relating to portfolio securities during the 12-month period ended June 30, 2008 is available on (i) the Funds’ website and (ii) the SEC’s website.
Quarterly Portfolio Schedules
The Funds file a complete schedule of portfolio holdings with the SEC for the first and third quarters of each fiscal year on Form N-Q. The Funds’ Forms N-Q are available on the SEC’s website at www.sec.gov and may be reviewed and copied at the SEC’s Public Reference Room in Washington, DC. Information on the operation of the Public Reference Room may be obtained by calling 800-SEC-0330.
UNDERSTANDING FUND EXPENSES
Typically, mutual fund shareholders incur two types of costs: (1) transaction costs, including sales charges (loads) on purchases, redemption fees and certain exchange fees; and (2) ongoing costs, including management fees, distribution fees (12b-1 fees), and other fund expenses. However, the Funds are unlike other mutual funds; they do not charge any fees or expenses.
You should be aware that shares in the Funds are available only to institutional investment advisory clients of Loomis, Sayles & Company, L.P. (“Loomis Sayles”) and Natixis Asset Management Advisors, L.P. (“Natixis Advisors”) and to participants in “wrap-fee” programs sponsored by broker dealers and investment advisers that may be affiliated or unaffiliated with the Funds, Loomis Sayles or Natixis Advisors. The institutional investment advisory clients of Loomis Sayles and Natixis Advisors pay Loomis Sayles or Natixis Advisors a fee for their investment advisory services, while participants in “wrap fee” programs pay a “wrap fee” to the program’s sponsor. The “wrap fee” program sponsors, in turn, pay a fee to Natixis Advisors. “Wrap fee” program participants should read carefully the wrap fee brochure provided to them by their program’s sponsor and the fees paid by such sponsor to Natixis Advisors. Shareholders pay no additional fees or expenses to purchase shares of the Funds. However, shareholders will indirectly pay a proportionate share of those costs, such as brokerage commissions, taxes and extraordinary expenses, that are borne by the Funds through a reduction in each Fund’s net asset value.
The first line in each Fund’s table below shows the actual amount of Fund expenses ($0) you would have paid on a $1,000 investment in the Fund from October 1, 2008 through March 31, 2009. It also shows how much a $1,000 investment would be worth at the close of the period, assuming actual Fund returns and expenses.
The second line in each Fund’s table provides information about hypothetical account values and hypothetical expenses based on the Fund’s actual expense ratio (0%) and an assumed rate of return of 5% per year before expenses, which is not the Fund’s actual return. The hypothetical account values and expenses may not be used to estimate the actual ending account balance or expenses you paid on your investment for the period. You may use this information to compare the ongoing costs of investing in the Funds and other funds. To do so, compare this 5% hypothetical example with the 5% hypothetical examples that appear in the shareholder reports of the other funds.
Loomis Sayles High Income Opportunities Fund
| | | | | | |
Institutional Class | | Beginning
Account Value
10/1/2008 | | Ending
Account Value
3/31/2009 | | Expenses Paid
During Period*
10/1/2008 –3/31/2009 |
Actual | | $1,000.00 | | $ 861.30 | | $0.00 |
Hypothetical (5% return before expenses) | | $1,000.00 | | $1,024.93 | | $0.00 |
* Expenses are equal to the Fund’s annualized expense ratio: 0.00%, multiplied by the average account value over the period, multiplied by the number of days in the most recent fiscal half-year, divided by 365 (to reflect the half-year period). |
Loomis Sayles Securitized Asset Fund
| | | | | | |
Institutional Class | | Beginning
Account Value
10/1/2008 | | Ending
Account Value
3/31/2009 | | Expenses Paid
During Period*
10/1/2008 –3/31/2009 |
Actual | | $1,000.00 | | $ 966.90 | | $0.00 |
Hypothetical (5% return before expenses) | | $1,000.00 | | $1,024.93 | | $0.00 |
* Expenses are equal to the Fund’s annualized expense ratio: 0.00%, multiplied by the average account value over the period, multiplied by the number of days in the most recent fiscal half-year, divided by 365 (to reflect the half-year period). |
5
PORTFOLIO OF INVESTMENTS – as of March 31, 2009 (Unaudited)
Loomis Sayles High Income Opportunities Fund
| | | | | | | | |
| | | | | Principal Amount | | Value (†) |
| | | | | | | | |
| | | |
| BONDS AND NOTES – 92.7% of Net Assets | | | | | | | | |
| | | |
| NON-CONVERTIBLE BONDS – 88.3% | | | | | | | | |
| | | |
| ABS Car Loan – 1.2% | | | | | | | | |
Capital One Auto Finance Trust, Series 2006-C, Class A4,
0.586%, 5/15/2013(b) | | | | $ | 170,000 | | $ | 124,471 |
Capital One Auto Finance Trust, Series 2007-C, Class A3B,
1.066%, 4/16/2012(b) | | | | | 451,226 | | | 405,471 |
Capital One Auto Finance Trust, Series 2007-C, Class A4,
5.230%, 7/15/2014 | | | | | 185,000 | | | 138,322 |
| | | | | | | | |
| | | | | | | | 668,264 |
| | | | | | | | |
| | | |
| ABS Credit Card – 1.1% | | | | | | | | |
Citibank Credit Card Issuance Trust, Series 2005-C3, Class C3, 0.966%, 7/15/2014(b) | | | | | 715,000 | | | 414,665 |
Citibank Credit Card Issuance Trust, Series 2006-C1,
Class C1, 0.945%, 2/20/2015(b) | | | | | 235,000 | | | 118,612 |
MBNA Credit Card Master Note Trust, Series 2006-C3, Class C3, 0.846%, 10/15/2013(b) | | | | | 80,000 | | | 54,910 |
| | | | | | | | |
| | | | | | | | 588,187 |
| | | | | | | | |
| | | |
| Aerospace & Defense – 1.2% | | | | | | | | |
Bombardier, Inc., 6.300%, 5/01/2014, 144A | | | | | 200,000 | | | 141,000 |
Bombardier, Inc., 7.450%, 5/01/2034, 144A | | | | | 885,000 | | | 513,300 |
| | | | | | | | |
| | | | | | | | 654,300 |
| | | | | | | | |
| | | |
| Airlines – 2.4% | | | | | | | | |
American Airlines, Inc., Series 93A6, 8.040%, 9/16/2011 | | | | | 76,128 | | | 48,722 |
Continental Airlines, Inc., Series 1997-4B,
6.900%, 7/02/2018 | | | | | 67,448 | | | 47,213 |
Continental Airlines, Inc., Series 1998-1, Class B,
6.748%, 9/15/2018 | | | | | 158,766 | | | 117,487 |
Continental Airlines, Inc., Series 1999-1B,
6.795%, 2/02/2020 | | | | | 154,067 | | | 109,388 |
Continental Airlines, Inc., Series 2000-2, Class B,
8.307%, 10/02/2019 | | | | | 15,128 | | | 10,817 |
Continental Airlines, Inc., Series 2001-1, Class B,
7.373%, 6/15/2017 | | | | | 70,240 | | | 43,549 |
Continental Airlines, Inc., Series 971A, 7.461%, 10/01/2016 | | | | | 175,428 | | | 122,800 |
Delta Air Lines, Inc., Series 2007-1, Class A,
6.821%, 2/10/2024 | | | | | 226,890 | | | 153,151 |
Delta Air Lines, Inc., Series 2007-1, Class B,
8.021%, 2/10/2024 | | | | | 707,453 | | | 392,636 |
Northwest Airlines, Inc., Series 07-1, Class B,
8.028%, 11/01/2017 | | | | | 540,000 | | | 310,500 |
| | | | | | | | |
| | | | | | | | 1,356,263 |
| | | | | | | | |
| | | |
| Automotive – 3.0% | | | | | | | | |
Cummins, Inc., 6.750%, 2/15/2027 | | | | | 139,000 | | | 87,570 |
Ford Motor Co., 6.625%, 2/15/2028 | | | | | 165,000 | | | 46,612 |
Ford Motor Co., 6.625%, 10/01/2028 | | | | | 1,470,000 | | | 415,275 |
Ford Motor Co., 7.125%, 11/15/2025 | | | | | 35,000 | | | 9,450 |
Ford Motor Co., 7.500%, 8/01/2026 | | | | | 110,000 | | | 30,800 |
See accompanying notes to financial statements.
6
PORTFOLIO OF INVESTMENTS – as of March 31, 2009 (Unaudited)
Loomis Sayles High Income Opportunities Fund – continued
| | | | | | | | |
| | | | | Principal Amount | | Value (†) |
| | | | | | | | |
| | | |
| BONDS AND NOTES – continued | | | | | | | | |
| | | |
| Automotive – continued | | | | | | | | |
Ford Motor Credit Co. LLC, 7.000%, 10/01/2013 | | | | $ | 825,000 | | $ | 551,646 |
Ford Motor Credit Co. LLC, 7.250%, 10/25/2011 | | | | | 370,000 | | | 263,424 |
Ford Motor Credit Co. LLC, 8.000%, 12/15/2016 | | | | | 100,000 | | | 65,723 |
Goodyear Tire & Rubber Co. (The), 7.000%, 3/15/2028 | | | | | 320,000 | | | 179,200 |
| | | | | | | | |
| | | | | | | | 1,649,700 |
| | | | | | | | |
| | | |
| Brokerage – 0.3% | | | | | | | | |
Lehman Brothers Holdings, Inc., 6.875%, 7/17/2037(c) | | | | | 245,000 | | | 25 |
Lehman Brothers Holdings, Inc., MTN, (fixed rate to 5/03/2027, variable rate thereafter), 6.000%, 5/03/2032(c) | | | | | 60,000 | | | 6 |
Nuveen Investments, Inc., 10.500%, 11/15/2015, 144A | | | | | 550,000 | | | 154,000 |
| | | | | | | | |
| | | | | | | | 154,031 |
| | | | | | | | |
| Building Materials – 0.9% | | | | | | | | |
Masco Corp., 4.800%, 6/15/2015 | | | | | 95,000 | | | 61,220 |
Masco Corp., 6.500%, 8/15/2032 | | | | | 90,000 | | | 45,528 |
Owens Corning, Inc., 6.500%, 12/01/2016 | | | | | 85,000 | | | 62,361 |
Owens Corning, Inc., 7.000%, 12/01/2036 | | | | | 130,000 | | | 72,850 |
Texas Industries, Inc., 7.250%, 7/15/2013 | | | | | 70,000 | | | 52,850 |
USG Corp., 6.300%, 11/15/2016 | | | | | 365,000 | | | 193,450 |
| | | | | | | | |
| | | | | | | | 488,259 |
| | | | | | | | |
| Chemicals – 2.3% | | | | | | | | |
Borden, Inc., 7.875%, 2/15/2023 | | | | | 610,000 | | | 61,000 |
Borden, Inc., 8.375%, 4/15/2016 | | | | | 175,000 | | | 17,500 |
Borden, Inc., 9.200%, 3/15/2021 | | | | | 220,000 | | | 22,000 |
Chemtura Corp., 6.875%, 6/01/2016(c) | | | | | 924,000 | | | 415,800 |
Georgia Gulf Corp., 10.750%, 10/15/2016 | | | | | 50,000 | | | 3,250 |
Hercules, Inc., 6.500%, 6/30/2029(d) | | | | | 675,000 | | | 236,250 |
Methanex Corp., 6.000%, 8/15/2015 | | | | | 150,000 | | | 101,996 |
Mosaic Global Holdings, Inc., 7.300%, 1/15/2028 | | | | | 235,000 | | | 176,250 |
Mosaic Global Holdings, Inc., 7.375%, 8/01/2018 | | | | | 275,000 | | | 259,875 |
| | | | | | | | |
| | | | | | | | 1,293,921 |
| | | | | | | | |
| Commercial Mortgage-Backed Securities – 2.0% | | | | | | | | |
Bear Stearns Commercial Mortgage Securities,
Series 2007-PW15, Class A4, 5.331%, 2/11/2044 | | | | | 100,000 | | | 72,891 |
Credit Suisse Mortgage Capital Certificates,
Series 2007-C4, Class A4, 6.004%, 9/15/2039(b) | | | | | 100,000 | | | 63,463 |
Greenwich Capital Commercial Funding Corp.,
Series 2007-GG11, Class A4, 5.736%, 12/10/2049 | | | | | 300,000 | | | 215,801 |
Greenwich Capital Commercial Funding Corp.,
Series 2007-GG9, Class A4, 5.444%, 3/10/2039 | | | | | 300,000 | | | 216,110 |
JP Morgan Chase Commercial Mortgage Securities Corp., Series 2007-LD11, Class A4, 6.007%, 6/15/2049(b) | | | | | 400,000 | | | 275,104 |
JP Morgan Chase Commercial Mortgage Securities Corp., Series 2007-LDPX, Class A3, 5.420%, 1/15/2049 | | | | | 100,000 | | | 67,582 |
LB-UBS Commercial Mortgage Trust, Series 2006-C4,
Class A4, 6.080%, 6/15/2038(b) | | | | | 100,000 | | | 75,777 |
Morgan Stanley Capital I, Series 2008-T29, Class A4,
6.458%, 1/11/2043(b) | | | | | 200,000 | | | 155,251 |
| | | | | | | | |
| | | | | | | | 1,141,979 |
| | | | | | | | |
See accompanying notes to financial statements.
7
| | | | | | | | |
| | | | | Principal Amount | | Value (†) |
| | | | | | | | |
| | | |
| BONDS AND NOTES – continued | | | | | | | | |
| | | |
| Construction Machinery – 0.4% | | | | | | | | |
United Rentals North America, Inc., 7.000%, 2/15/2014 | | | | $ | 400,000 | | $ | 202,000 |
| | | | | | | | |
| | | |
| Consumer Cyclical Services – 0.1% | | | | | | | | |
Kar Holdings, Inc., 10.000%, 5/01/2015 | | | | | 165,000 | | | 71,775 |
| | | | | | | | |
| Consumer Products – 0.0% | | | | | | | | |
Jostens IH Corp., 7.625%, 10/01/2012 | | | | | 25,000 | | | 23,688 |
| | | | | | | | |
| Electric – 6.8% | | | | | | | | |
AES Corp. (The), 8.000%, 10/15/2017 | | | | | 20,000 | | | 17,150 |
AES Corp. (The), 8.000%, 6/01/2020, 144A | | | | | 325,000 | | | 263,250 |
Allegheny Generating Co., 6.875%, 9/01/2023 | | | | | 100,000 | | | 79,027 |
CE Generation LLC, 7.416%, 12/15/2018 | | | | | 60,900 | | | 56,389 |
Dynegy Holdings, Inc., 7.125%, 5/15/2018 | | | | | 195,000 | | | 103,350 |
Dynegy Holdings, Inc., 7.500%, 6/01/2015 | | | | | 100,000 | | | 68,250 |
Dynegy Holdings, Inc., 7.625%, 10/15/2026 | | | | | 325,000 | | | 136,500 |
Dynegy Holdings, Inc., 7.750%, 6/01/2019 | | | | | 350,000 | | | 227,500 |
Dynegy Holdings, Inc., 8.375%, 5/01/2016 | | | | | 280,000 | | | 189,700 |
Dynegy Roseton/Danskammer Pass Through Trust, Series A, 7.270%, 11/08/2010 | | | | | 258,943 | | | 243,406 |
Edison Mission Energy, 7.625%, 5/15/2027 | | | | | 525,000 | | | 315,000 |
NGC Corp. Capital Trust I, Series B, 8.316%, 6/01/2027 | | | | | 460,000 | | | 184,000 |
NRG Energy, Inc., 7.375%, 1/15/2017 | | | | | 435,000 | | | 404,550 |
NSG Holdings LLC, 7.750%, 12/15/2025, 144A | | | | | 355,000 | | | 280,450 |
Reliant Energy, Inc., 7.875%, 6/15/2017 | | | | | 410,000 | | | 323,900 |
TXU Corp., Series P, 5.550%, 11/15/2014 | | | | | 160,000 | | | 55,200 |
TXU Corp., Series Q, 6.500%, 11/15/2024 | | | | | 1,415,000 | | | 396,943 |
TXU Corp., Series R, 6.550%, 11/15/2034 | | | | | 515,000 | | | 139,581 |
White Pine Hydro Portfolio LLC, 7.260%, 7/20/2015(d) | | | | | 365,000 | | | 328,492 |
| | | | | | | | |
| | | | | | | | 3,812,638 |
| | | | | | | | |
| Food & Beverage – 2.2% | | | | | | | | |
Aramark Services, Inc., 5.000%, 6/01/2012 | | | | | 950,000 | | | 831,250 |
Marfrig Overseas Ltd., 9.625%, 11/16/2016, 144A | | | | | 110,000 | | | 66,000 |
Tyson Foods, Inc., 7.850%, 4/01/2016 | | | | | 400,000 | | | 344,598 |
| | | | | | | | |
| | | | | | | | 1,241,848 |
| | | | | | | | |
| Gaming – 0.1% | | | | | | | | |
Harrah’s Operating Co., Inc., 5.750%, 10/01/2017 | | | | | 270,000 | | | 43,200 |
Harrah’s Operating Co., Inc., 10.750%, 2/01/2016 | | | | | 220,000 | | | 41,800 |
| | | | | | | | |
| | | | | | | | 85,000 |
| | | | | | | | |
| Healthcare – 5.6% | | | | | | | | |
Alliance HealthCare Services, Inc., 7.250%, 12/15/2012 | | | | | 320,000 | | | 307,200 |
Boston Scientific Corp., 5.450%, 6/15/2014 | | | | | 20,000 | | | 18,300 |
Boston Scientific Corp., 7.000%, 11/15/2035 | | | | | 250,000 | | | 212,500 |
CHS/Community Health Systems, Inc., 8.875%, 7/15/2015 | | | | | 295,000 | | | 278,775 |
DASA Finance Corp., 8.750%, 5/29/2018, 144A | | | | | 200,000 | | | 154,000 |
HCA, Inc., 5.750%, 3/15/2014 | | | | | 15,000 | | | 9,825 |
HCA, Inc., 6.375%, 1/15/2015 | | | | | 510,000 | | | 334,050 |
HCA, Inc., 6.500%, 2/15/2016 | | | | | 720,000 | | | 471,600 |
HCA, Inc., 7.050%, 12/01/2027 | | | | | 430,000 | | | 223,600 |
HCA, Inc., 7.500%, 12/15/2023 | | | | | 30,000 | | | 15,895 |
HCA, Inc., 7.500%, 11/06/2033 | | | | | 840,000 | | | 420,000 |
See accompanying notes to financial statements.
8
PORTFOLIO OF INVESTMENTS – as of March 31, 2009 (Unaudited)
Loomis Sayles High Income Opportunities Fund – continued
| | | | | | | | |
| | | | | Principal Amount | | Value (†) |
| | | | | | | | |
| | | |
| BONDS AND NOTES – continued | | | | | | | | |
| | | |
| Healthcare – continued | | | | | | | | |
HCA, Inc., 7.690%, 6/15/2025 | | | | $ | 160,000 | | $ | 83,329 |
HCA, Inc., 8.360%, 4/15/2024 | | | | | 40,000 | | | 22,429 |
HCA, Inc., MTN, 7.580%, 9/15/2025 | | | | | 200,000 | | | 102,622 |
HCA, Inc., MTN, 7.750%, 7/15/2036 | | | | | 20,000 | | | 10,116 |
Health Management Associates, Inc., 6.125%, 4/15/2016 | | | | | 300,000 | | | 245,250 |
Tenet Healthcare Corp., 6.875%, 11/15/2031 | | | | | 450,000 | | | 222,750 |
| | | | | | | | |
| | | | | | | | 3,132,241 |
| | | | | | | | |
| Home Construction – 3.9% | | | | | | | | |
Centex Corp., 5.250%, 6/15/2015 | | | | | 125,000 | | | 93,750 |
D.R. Horton, Inc., 5.625%, 9/15/2014 | | | | | 65,000 | | | 51,025 |
Desarrolladora Homex SAB de CV, 7.500%, 9/28/2015 | | | | | 1,030,000 | | | 679,800 |
KB Home, 5.750%, 2/01/2014 | | | | | 90,000 | | | 71,212 |
KB Home, 5.875%, 1/15/2015 | | | | | 390,000 | | | 302,055 |
KB Home, 6.250%, 6/15/2015 | | | | | 265,000 | | | 205,375 |
KB Home, 7.250%, 6/15/2018 | | | | | 290,000 | | | 218,950 |
Lennar Corp., Series B, 5.600%, 5/31/2015 | | | | | 250,000 | | | 178,125 |
Pulte Homes, Inc., 6.000%, 2/15/2035 | | | | | 475,000 | | | 289,750 |
Pulte Homes, Inc., 6.375%, 5/15/2033 | | | | | 100,000 | | | 61,000 |
Toll Brothers Finance Corp., 5.150%, 5/15/2015 | | | | | 40,000 | | | 33,740 |
| | | | | | | | |
| | | | | | | | 2,184,782 |
| | | | | | | | |
| Independent Energy – 5.9% | | | | | | | | |
Encore Acquisition Co., 6.000%, 7/15/2015 | | | | | 275,000 | | | 202,125 |
Encore Acquisition Co., 7.250%, 12/01/2017 | | | | | 115,000 | | | 84,956 |
Forest Oil Corp., 7.250%, 6/15/2019 | | | | | 715,000 | | | 564,850 |
Hilcorp Energy I LP, 7.750%, 11/01/2015, 144A | | | | | 595,000 | | | 434,350 |
Hilcorp Energy I LP, 9.000%, 6/01/2016, 144A | | | | | 185,000 | | | 136,900 |
PetroHawk Energy Corp., 7.875%, 6/01/2015, 144A | | | | | 300,000 | | | 264,000 |
PetroHawk Energy Corp., 9.125%, 7/15/2013 | | | | | 15,000 | | | 14,400 |
Pioneer Natural Resources Co., 5.875%, 7/15/2016 | | | | | 20,000 | | | 14,758 |
Pioneer Natural Resources Co., 6.875%, 5/01/2018 | | | | | 260,000 | | | 191,103 |
Pioneer Natural Resources Co., 7.200%, 1/15/2028 | | | | | 1,640,000 | | | 1,005,925 |
Swift Energy Co., 7.125%, 6/01/2017 | | | | | 600,000 | | | 348,000 |
Swift Energy Co., 7.625%, 7/15/2011 | | | | | 20,000 | | | 15,200 |
| | | | | | | | |
| | | | | | | | 3,276,567 |
| | | | | | | | |
| Industrial Other – 1.0% | | | | | | | | |
Baldor Electric Co., 8.625%, 2/15/2017 | | | | | 325,000 | | | 260,000 |
Chart Industries, Inc., 9.125%, 10/15/2015 | | | | | 305,000 | | | 222,650 |
Ranhill Labuan Ltd., 12.500%, 10/26/2011, 144A | | | | | 155,000 | | | 88,350 |
| | | | | | | | |
| | | | | | | | 571,000 |
| | | | | | | | |
| Lodging – 1.1% | | | | | | | | |
Felcor Lodging LP, 9.000%, 6/01/2011 | | | | | 710,000 | | | 426,000 |
Host Marriott LP, Series O, 6.375%, 3/15/2015 | | | | | 50,000 | | | 37,000 |
Royal Caribbean Cruises Ltd., 7.250%, 6/15/2016 | | | | | 315,000 | | | 148,050 |
| | | | | | | | |
| | | | | | | | 611,050 |
| | | | | | | | |
| Media Cable – 4.7% | | | | | | | | |
Charter Communications Operating LLC/CAP,
10.000%, 4/30/2012, 144A(k) | | | | | 170,000 | | | 155,550 |
Comcast Corp., 5.650%, 6/15/2035 | | | | | 80,000 | | | 63,352 |
See accompanying notes to financial statements.
9
| | | | | | | | |
| | | | | Principal Amount | | Value (†) |
| | | | | | | | |
| | | |
| BONDS AND NOTES – continued | | | | | | | | |
| | | |
| Media Cable – continued | | | | | | | | |
CSC Holdings, Inc., 7.625%, 7/15/2018 | | | | $ | 1,260,000 | | $ | 1,134,000 |
CSC Holdings, Inc., 7.875%, 2/15/2018 | | | | | 310,000 | | | 283,650 |
Virgin Media Finance PLC, 8.750%, 4/15/2014 | | | | | 870,000 | | | 822,150 |
Virgin Media Finance PLC, 9.125%, 8/15/2016 | | | | | 175,000 | | | 162,750 |
| | | | | | | | |
| | | | | | | | 2,621,452 |
| | | | | | | | |
| | | |
| Media Non-Cable – 1.2% | | | | | | | | |
Clear Channel Communications, Inc., 4.900%, 5/15/2015 | | | | | 5,000 | | | 700 |
Clear Channel Communications, Inc., 5.500%, 12/15/2016 | | | | | 390,000 | | | 54,600 |
Clear Channel Communications, Inc., 5.750%, 1/15/2013 | | | | | 75,000 | | | 11,250 |
Intelsat Corp., 6.875%, 1/15/2028 | | | | | 235,000 | | | 159,800 |
Intelsat Subsidiary Holding Co. Ltd.,
8.500%, 1/15/2013 144A | | | | | 405,000 | | | 381,712 |
R.H. Donnelley Corp., Series A-1, 6.875%, 1/15/2013 | | | | | 405,000 | | | 17,213 |
R.H. Donnelley Corp., Series A-2, 6.875%, 1/15/2013 | | | | | 340,000 | | | 14,450 |
R.H. Donnelley Corp., Series A-4, 8.875%, 10/15/2017 | | | | | 160,000 | | | 8,400 |
| | | | | | | | |
| | | | | | | | 648,125 |
| | | | | | | | |
| Metals & Mining – 1.0% | | | | | | | | |
ArcelorMittal, 5.375%, 6/01/2013 | | | | | 350,000 | | | 271,673 |
ArcelorMittal, 6.125%, 6/01/2018 | | | | | 5,000 | | | 3,617 |
International Steel Group, Inc., 6.500%, 4/15/2014 | | | | | 75,000 | | | 58,935 |
United States Steel Corp., 6.050%, 6/01/2017 | | | | | 80,000 | | | 49,498 |
United States Steel Corp., 6.650%, 6/01/2037 | | | | | 275,000 | | | 154,957 |
| | | | | | | | |
| | | | | | | | 538,680 |
| | | | | | | | |
| Non-Captive Consumer – 2.4% | | | | | | | | |
SLM Corp., MTN, 5.050%, 11/14/2014 | | | | | 60,000 | | | 31,761 |
SLM Corp., Series A, MTN, 5.000%, 10/01/2013 | | | | | 55,000 | | | 29,247 |
SLM Corp., Series A, MTN, 5.000%, 6/15/2018 | | | | | 65,000 | | | 33,651 |
SLM Corp., Series A, MTN, 5.375%, 1/15/2013 | | | | | 470,000 | | | 257,897 |
SLM Corp., Series A, MTN, 5.375%, 5/15/2014 | | | | | 70,000 | | | 36,274 |
SLM Corp., Series A, MTN, 5.625%, 8/01/2033 | | | | | 850,000 | | | 314,500 |
SLM Corp., Series A, MTN, 8.450%, 6/15/2018 | | | | | 1,135,000 | | | 613,045 |
| | | | | | | | |
| | | | | | | | 1,316,375 |
| | | | | | | | |
| Non-Captive Diversified – 5.1% | | | | | | | | |
CIT Group Funding Co. of Canada, 5.200%, 6/01/2015 | | | | | 372,000 | | | 217,620 |
CIT Group, Inc., 4.750%, 12/15/2010 | | | | | 148,000 | | | 119,352 |
CIT Group, Inc., 5.400%, 2/13/2012 | | | | | 11,000 | | | 7,092 |
CIT Group, Inc., 5.400%, 1/30/2016 | | | | | 66,000 | | | 39,558 |
CIT Group, Inc., 5.800%, 10/01/2036 | | | | | 146,000 | | | 80,415 |
CIT Group, Inc., 5.850%, 9/15/2016 | | | | | 11,000 | | | 6,221 |
CIT Group, Inc., 12.000%, 12/18/2018, 144A | | | | | 680,000 | | | 351,900 |
CIT Group, Inc., GMTN, 4.250%, 2/01/2010 | | | | | 95,000 | | | 81,435 |
CIT Group, Inc., GMTN, 5.000%, 2/13/2014 | | | | | 13,000 | | | 7,670 |
CIT Group, Inc., GMTN, 5.000%, 2/01/2015 | | | | | 88,000 | | | 53,579 |
CIT Group, Inc., Series A, GMTN, 6.000%, 4/01/2036 | | | | | 10,000 | | | 4,715 |
CIT Group, Inc., Series A, MTN, 5.650%, 2/13/2017 | | | | | 104,000 | | | 60,229 |
GMAC LLC, 6.000%, 12/15/2011, 144A | | | | | 316,000 | | | 215,136 |
GMAC LLC, 6.625%, 5/15/2012, 144A | | | | | 539,000 | | | 361,577 |
GMAC LLC, 6.750%, 12/01/2014, 144A | | | | | 620,000 | | | 360,307 |
See accompanying notes to financial statements.
10
PORTFOLIO OF INVESTMENTS – as of March 31, 2009 (Unaudited)
Loomis Sayles High Income Opportunities Fund – continued
| | | | | | | | |
| | | | | Principal Amount | | Value (†) |
| | | | | | | | |
| | | |
| BONDS AND NOTES – continued | | | | | | | | |
| | | |
| Non-Captive Diversified – continued | | | | | | | | |
GMAC LLC, 6.875%, 9/15/2011, 144A | | | | $ | 110,000 | | $ | 78,168 |
GMAC LLC, 6.875%, 8/28/2012, 144A | | | | | 41,000 | | | 27,534 |
GMAC LLC, 7.000%, 2/01/2012, 144A | | | | | 63,000 | | | 43,515 |
GMAC LLC, 7.250%, 3/02/2011, 144A | | | | | 63,000 | | | 46,648 |
GMAC LLC, 8.000%, 11/01/2031, 144A | | | | | 141,000 | | | 67,844 |
International Lease Finance Corp., Series Q, MTN,
5.250%, 1/10/2013 | | | | | 330,000 | | | 171,600 |
International Lease Finance Corp., Series R, MTN,
5.650%, 6/01/2014 | | | | | 185,000 | | | 96,394 |
International Lease Finance Corp., Series R, MTN,
6.625%, 11/15/2013 | | | | | 340,000 | | | 188,326 |
iStar Financial, Inc., 5.150%, 3/01/2012 | | | | | 130,000 | | | 46,800 |
iStar Financial, Inc., 5.650%, 9/15/2011 | | | | | 45,000 | | | 18,450 |
iStar Financial, Inc., 5.800%, 3/15/2011 | | | | | 20,000 | | | 8,550 |
iStar Financial, Inc., Series B, 5.950%, 10/15/2013 | | | | | 190,000 | | | 57,950 |
| | | | | | | | |
| | | | | | | | 2,818,585 |
| | | | | | | | |
| Oil Field Services – 2.2% | | | | | | | | |
Basic Energy Services, Inc., 7.125%, 4/15/2016 | | | | | 700,000 | | | 406,000 |
Nabors Industries, Inc., 9.250%, 1/15/2019, 144A | | | | | 395,000 | | | 374,550 |
North American Energy Partners, Inc., 8.750%, 12/01/2011 | | | | | 620,000 | | | 452,600 |
| | | | | | | | |
| | | | | | | | 1,233,150 |
| | | | | | | | |
| Paper – 3.9% | | | | | | | | |
Georgia-Pacific LLC, 7.250%, 6/01/2028 | | | | | 215,000 | | | 149,425 |
Georgia-Pacific LLC, 7.375%, 12/01/2025 | | | | | 495,000 | | | 352,688 |
Georgia-Pacific LLC, 7.700%, 6/15/2015 | | | | | 125,000 | | | 113,125 |
Georgia-Pacific LLC, 7.750%, 11/15/2029 | | | | | 525,000 | | | 388,500 |
Georgia-Pacific LLC, 8.000%, 1/15/2024 | | | | | 260,000 | | | 206,700 |
Georgia-Pacific LLC, 8.875%, 5/15/2031 | | | | | 225,000 | | | 180,000 |
Mercer International, Inc., 9.250%, 2/15/2013 | | | | | 140,000 | | | 43,050 |
Sappi Papier Holding AG, 7.500%, 6/15/2032, 144A | | | | | 290,000 | | | 130,500 |
Stone Container Finance, 7.375%, 7/15/2014(c) | | | | | 590,000 | | | 85,550 |
Westvaco Corp., 7.950%, 2/15/2031 | | | | | 190,000 | | | 145,246 |
Westvaco Corp., 8.200%, 1/15/2030 | | | | | 455,000 | | | 358,704 |
| | | | | | | | |
| | | | | | | | 2,153,488 |
| | | | | | | | |
| Pharmaceuticals – 2.3% | | | | | | | | |
Elan Financial PLC, 7.750%, 11/15/2011 | | | | | 800,000 | | | 672,000 |
Elan Financial PLC, 8.875%, 12/01/2013 | | | | | 770,000 | | | 616,000 |
| | | | | | | | |
| | | | | | | | 1,288,000 |
| | | | | | | | |
| Refining – 0.8% | | | | | | | | |
Petroplus Finance Ltd., 6.750%, 5/01/2014, 144A | | | | | 500,000 | | | 370,000 |
Petroplus Finance Ltd., 7.000%, 5/01/2017, 144A | | | | | 75,000 | | | 54,000 |
| | | | | | | | |
| | | | | | | | 424,000 |
| | | | | | | | |
| Retailers – 2.9% | | | | | | | | |
Dillard’s, Inc., 6.625%, 1/15/2018 | | | | | 155,000 | | | 55,800 |
Dillard’s, Inc., 7.000%, 12/01/2028 | | | | | 480,000 | | | 163,200 |
Dillard’s, Inc., 7.130%, 8/01/2018 | | | | | 175,000 | | | 61,250 |
Dillard’s, Inc., 7.875%, 1/01/2023 | | | | | 75,000 | | | 24,750 |
Foot Locker, Inc., 8.500%, 1/15/2022 | | | | | 280,000 | | | 225,400 |
See accompanying notes to financial statements.
11
| | | | | | | | |
| | | | | Principal Amount | | Value (†) |
| | | | | | | | |
| | | |
| BONDS AND NOTES – continued | | | | | | | | |
| | | |
| Retailers – continued | | | | | | | | |
Home Depot, Inc. (The), 5.875%, 12/16/2036 | | | | $ | 785,000 | | $ | 555,922 |
Macy’s Retail Holdings, Inc., 6.790%, 7/15/2027 | | | | | 180,000 | | | 92,040 |
Macy’s Retail Holdings, Inc., 6.900%, 4/01/2029 | | | | | 300,000 | | | 151,340 |
Toys R Us, Inc., 7.375%, 10/15/2018 | | | | | 985,000 | | | 315,200 |
| | | | | | | | |
| | | | | | | | 1,644,902 |
| | | | | | | | |
| Sovereigns – 1.0% | | | | | | | | |
Republic of Indonesia, 11.625%, 3/04/2019, 144A | | | | | 500,000 | | | 543,750 |
| | | | | | | | |
| Super Markets – 2.9% | | | | | | | | |
American Stores Co., 8.000%, 6/01/2026 | | | | | 70,000 | | | 59,850 |
New Albertson’s, Inc., 7.450%, 8/01/2029 | | | | | 1,075,000 | | | 892,250 |
New Albertson’s, Inc., 7.750%, 6/15/2026 | | | | | 220,000 | | | 184,250 |
New Albertson’s, Inc., 8.000%, 5/01/2031 | | | | | 30,000 | | | 24,525 |
New Albertson’s, Inc., Series C, MTN, 6.625%, 6/01/2028 | | | | | 605,000 | | | 444,675 |
| | | | | | | | |
| | | | | | | | 1,605,550 |
| | | | | | | | |
| | | |
| Technology – 4.9% | | | | | | | | |
Activant Solutions, Inc., 9.500%, 5/01/2016 | | | | | 90,000 | | | 55,125 |
Agilent Technologies, Inc., 6.500%, 11/01/2017 | | | | | 370,000 | | | 303,187 |
Amkor Technology, Inc., 7.750%, 5/15/2013 | | | | | 305,000 | | | 245,525 |
Amkor Technology, Inc., 9.250%, 6/01/2016 | | | | | 60,000 | | | 46,200 |
Freescale Semiconductor, Inc., 10.125%, 12/15/2016 | | | | | 480,000 | | | 86,400 |
Lucent Technologies, Inc., 6.450%, 3/15/2029 | | | | | 3,020,000 | | | 1,147,600 |
Lucent Technologies, Inc., 6.500%, 1/15/2028 | | | | | 290,000 | | | 110,200 |
Motorola, Inc., 6.500%, 9/01/2025 | | | | | 165,000 | | | 104,776 |
Nortel Networks Capital Corp., 7.875%, 6/15/2026(c) | | | | | 860,000 | | | 137,600 |
Nortel Networks Ltd., 6.875%, 9/01/2023(c) | | | | | 125,000 | | | 8,125 |
Nortel Networks Ltd., 10.125%, 7/15/2013(c) | | | | | 370,000 | | | 69,375 |
Seagate Technology HDD Holdings, 6.800%, 10/01/2016 | | | | | 750,000 | | | 435,000 |
| | | | | | | | |
| | | | | | | | 2,749,113 |
| | | | | | | | |
| Textile – 0.4% | | | | | | | | |
Jones Apparel Group, Inc., 6.125%, 11/15/2034 | | | | | 425,000 | | | 212,500 |
| | | | | | | | |
| Transportation Services – 0.7% | | | | | | | | |
APL Ltd., 8.000%, 1/15/2024(d) | | | | | 185,000 | | | 129,976 |
Atlas Air, Inc., Series B, 7.680%, 1/02/2014(e) | | | | | 34,292 | | | 25,719 |
Atlas Air, Inc., Series C, 8.010%, 1/02/2010(e) | | | | | 347,188 | | | 149,291 |
Overseas Shipholding Group, 7.500%, 2/15/2024 | | | | | 155,000 | | | 91,450 |
| | | | | | | | |
| | | | | | | | 396,436 |
| | | | | | | | |
| Wireless – 1.5% | | | | | | | | |
ALLTEL Corp., 7.000%, 7/01/2012 | | | | | 5,000 | | | 5,208 |
Crown Castle International Corp., 9.000%, 1/15/2015 | | | | | 130,000 | | | 130,325 |
Nextel Communications, Inc., Series D, 7.375%, 8/01/2015 | | | | | 170,000 | | | 90,100 |
Nextel Communications, Inc., Series E, 6.875%, 10/31/2013 | | | | | 40,000 | | | 22,800 |
Nextel Communications, Inc., Series F, 5.950%, 3/15/2014 | | | | | 65,000 | | | 36,075 |
Sprint Capital Corp., 6.875%, 11/15/2028 | | | | | 311,000 | | | 189,710 |
Sprint Nextel Corp., 6.000%, 12/01/2016 | | | | | 502,000 | | | 358,930 |
| | | | | | | | |
| | | | | | | | 833,148 |
| | | | | | | | |
See accompanying notes to financial statements.
12
PORTFOLIO OF INVESTMENTS – as of March 31, 2009 (Unaudited)
Loomis Sayles High Income Opportunities Fund – continued
| | | | | | | | |
| | | | | Principal Amount | | Value (†) |
| | | | | | | | |
| | | |
| BONDS AND NOTES – continued | | | | | | | | |
| | | |
| Wirelines – 8.9% | | | | | | | | |
Axtel SAB de CV, 7.625%, 2/01/2017, 144A | | | | $ | 765,000 | | $ | 504,900 |
Cincinnati Bell Telephone Co., 6.300%, 12/01/2028 | | | | | 185,000 | | | 125,800 |
Cincinnati Bell, Inc., 8.375%, 1/15/2014 | | | | | 800,000 | | | 752,000 |
Frontier Communications Corp., 7.000%, 11/01/2025 | | | | | 15,000 | | | 8,512 |
Frontier Communications Corp., 7.125%, 3/15/2019 | | | | | 80,000 | | | 62,800 |
Frontier Communications Corp., 7.450%, 7/01/2035 | | | | | 325,000 | | | 177,125 |
Frontier Communications Corp., 7.875%, 1/15/2027 | | | | | 805,000 | | | 543,375 |
Level 3 Financing, Inc., 8.750%, 2/15/2017 | | | | | 790,000 | | | 505,600 |
Level 3 Financing, Inc., 9.250%, 11/01/2014 | | | | | 835,000 | | | 576,150 |
Qwest Capital Funding, Inc., 6.500%, 11/15/2018 | | | | | 1,030,000 | | | 700,400 |
Qwest Capital Funding, Inc., 6.875%, 7/15/2028 | | | | | 480,000 | | | 302,400 |
Qwest Capital Funding, Inc., 7.250%, 2/15/2011 | | | | | 200,000 | | | 191,000 |
Qwest Capital Funding, Inc., 7.625%, 8/03/2021 | | | | | 315,000 | | | 223,650 |
Qwest Capital Funding, Inc., 7.750%, 2/15/2031 | | | | | 280,000 | | | 184,800 |
Qwest Corp., 6.875%, 9/15/2033 | | | | | 190,000 | | | 124,450 |
Qwest Corp., 7.250%, 9/15/2025 | | | | | 10,000 | | | 6,600 |
| | | | | | | | |
| | | | | | | | 4,989,562 |
| | | | | | | | |
| | | |
| TOTAL NON-CONVERTIBLE BONDS | | | | | | | | |
(Identified Cost $73,101,049) | | | | | | | | 49,224,309 |
| | | | | | | | |
| | | |
| CONVERTIBLE BONDS – 4.4% | | | | | | | | |
| | | |
| Healthcare – 0.7% | | | | | | | | |
Affymetrix, Inc., 3.500%, 1/15/2038 | | | | | 480,000 | | | 252,000 |
Epix Pharmaceuticals, Inc., 3.000%, 6/15/2024(d)(f) | | | | | 45,000 | | | 9,000 |
Hologic, Inc., (Step to Zero Coupon on 12/15/2013),
2.000%, 12/15/2037(g) | | | | | 135,000 | | | 92,137 |
Life Technologies Corp., 1.500%, 2/15/2024 | | | | | 50,000 | | | 44,563 |
| | | | | | | | |
| | | | | | | | 397,700 |
| | | | | | | | |
| Industrial Other – 0.2% | | | | | | | | |
Incyte Corp., 3.500%, 2/15/2011 | | | | | 165,000 | | | 81,675 |
| | | | | | | | |
| Lodging – 0.5% | | | | | | | | |
Host Hotels & Resorts, Inc., 2.625%, 4/15/2027, 144A | | | | | 435,000 | | | 302,325 |
| | | | | | | | |
| Media Non-Cable – 0.2% | | | | | | | | |
Liberty Media LLC, 3.500%, 1/15/2031 | | | | | 152,754 | | | 54,610 |
Sinclair Broadcast Group, Inc., (Step to 2.000% on 1/15/2011), 4.875%, 7/15/2018(g) | | | | | 190,000 | | | 79,800 |
| | | | | | | | |
| | | | | | | | 134,410 |
| | | | | | | | |
| Non-Captive Diversified – 0.0% | | | | | | | | |
iStar Financial, Inc., 1.935%, 10/01/2012(b) | | | | | 5,000 | | | 1,500 |
| | | | | | | | |
| Pharmaceuticals – 0.2% | | | | | | | | |
Human Genome Sciences, Inc., 2.250%, 8/15/2012 | | | | | 325,000 | | | 108,062 |
| | | | | | | | |
| Technology – 0.4% | | | | | | | | |
JDS Uniphase Corp., 1.000%, 5/15/2026 | | | | | 200,000 | | | 122,750 |
Kulicke & Soffa Industries, Inc., 1.000%, 6/30/2010 | | | | | 45,000 | | | 35,494 |
Maxtor Corp., 5.750%, 3/01/2012(d) | | | | | 109,000 | | | 81,750 |
| | | | | | | | |
| | | | | | | | 239,994 |
| | | | | | | | |
See accompanying notes to financial statements.
13
| | | | | | | | |
| | | | | Principal Amount | | Value (†) |
| | | | | | | | |
| | | |
| BONDS AND NOTES – continued | | | | | | | | |
| | | |
| Wirelines – 2.2% | | | | | | | | |
Level 3 Communications, Inc., 2.875%, 7/15/2010 | | | | $ | 270,000 | | $ | 197,437 |
Level 3 Communications, Inc., 6.000%, 9/15/2009 | | | | | 105,000 | | | 101,325 |
Level 3 Communications, Inc., 6.000%, 3/15/2010 | | | | | 1,062,000 | | | 902,700 |
| | | | | | | | |
| | | | | | | | 1,201,462 |
| | | | | | | | |
| | | |
| TOTAL CONVERTIBLE BONDS | | | | | | | | |
(Identified Cost $3,406,565) | | | | | | | | 2,467,128 |
| | | | | | | | |
| | | |
| TOTAL BONDS AND NOTES | | | | | | | | |
(Identified Cost $76,507,614) | | | | | | | | 51,691,437 |
| | | | | | | | |
| | | |
| BANK LOANS – 1.0% | | | | | | | | |
| | | |
| Consumer Products – 0.0% | | | | | | | | |
Mega Brands, Inc., Term Loan B, 8.750%, 7/26/2012(h) | | | | | 44,653 | | | 12,131 |
| | | | | | | | |
| Electric – 0.6% | | | | | | | | |
Calpine Corp., First Priority Term Loan,
4.095%, 3/29/2014(h) | | | | | 431,722 | | | 328,424 |
| | | | | | | | |
| Food & Beverage – 0.0% | | | | | | | | |
Dole Food Co., Inc., Credit Link Deposit,
2.790%, 4/12/2013(h) | | | | | 2,041 | | | 1,876 |
Dole Food Co., Inc., Tranche B Term Loan,
7.960%, 4/12/2013(h) | | | | | 1,326 | | | 1,219 |
Dole Food Co., Inc., Tranche C Term Loan,
7.969%, 4/12/2013(h) | | | | | 6,502 | | | 5,977 |
| | | | | | | | |
| | | | | | | | 9,072 |
| | | | | | | | |
| Media Non-Cable – 0.2% | | | | | | | | |
Idearc, Inc., Term Loan B, 6.250%, 11/17/2014(c)(h) | | | | | 203,569 | | | 79,329 |
Tribune Co., Term Loan X, 5.000%, 6/04/2009(c)(h) | | | | | 181,970 | | | 47,483 |
| | | | | | | | |
| | | | | | | | 126,812 |
| | | | | | | | |
| Technology – 0.1% | | | | | | | | |
Sungard Data Systems, Inc., Term Loan B, 2.697%, 2/28/2014(h) | | | | | 74,809 | | | 63,022 |
| | | | | | | | |
| Wirelines – 0.1% | | | | | | | | |
Hawaiian Telcom Communications, Inc., Tranche C Term Loan, 4.750%, 6/01/2014(h)(i) | | | | | 60,115 | | | 26,871 |
| | | | | | | | |
| | | |
| TOTAL BANK LOANS | | | | | | | | |
(Identified Cost $931,107) | | | | | | | | 566,332 |
| | | | | | | | |
| | | | | Shares | | |
| | | |
| PREFERRED STOCKS – 1.3% | | | | | | | | |
| | | |
| Automotive – 0.1% | | | | | | | | |
Ford Motor Co. Capital Trust II, 6.500% | | | | | 6,225 | | | 49,987 |
| | | | | | | | |
| Capital Markets – 0.2% | | | | | | | | |
Lehman Brothers Holdings Capital Trust I, 6.000%(c) | | | | | 250 | | | 5 |
Lehman Brothers Holdings, Inc., 5.670%(c) | | | | | 230 | | | 2 |
See accompanying notes to financial statements.
14
PORTFOLIO OF INVESTMENTS – as of March 31, 2009 (Unaudited)
Loomis Sayles High Income Opportunities Fund – continued
| | | | | | | |
| | | | | Shares | | Value (†) |
| | | | | | | |
| | | |
| PREFERRED STOCKS – continued | | | | | | | |
| | | |
| Capital Markets – continued | | | | | | | |
Lehman Brothers Holdings, Inc., 5.940%(c) | | | | 201 | | $ | — |
Lehman Brothers Holdings, Inc., 6.500%(c) | | | | 1,182 | | | 3 |
Lehman Brothers Holdings, Inc., 7.250%(c) | | | | 30 | | | 22 |
Lehman Brothers Holdings, Inc., 7.950%(c) | | | | 1,819 | | | 10 |
Newell Financial Trust I, 5.250% | | | | 5,724 | | | 103,032 |
| | | | | | | |
| | | | | | | 103,074 |
| | | | | | | |
| Diversified Consumer Services – 0.0% | | | | | | | |
Six Flags, Inc., 7.250% | | | | 497 | | | 338 |
| | | | | | | |
| Diversified Financial Services – 0.1% | | | | | | | |
Preferred Blocker, Inc., 144A, 7.000% | | | | 428 | | | 85,212 |
| | | | | | | |
| Electric Utilities – 0.5% | | | | | | | |
AES Trust III, 6.750% | | | | 7,975 | | | 271,150 |
| | | | | | | |
| Oil, Gas & Consumable Fuels – 0.4% | | | | | | | |
El Paso Energy Capital Trust I, 4.750% | | | | 8,050 | | | 201,250 |
| | | | | | | |
| | | |
| Thrifts & Mortgage Finance – 0.0% | | | | | | | |
Federal Home Loan Mortgage Corp., 5.000%(e)(j) | | | | 500 | | | 450 |
Federal Home Loan Mortgage Corp., 5.570%(e)(j) | | | | 7,750 | | | 2,945 |
Federal Home Loan Mortgage Corp., 5.660%(e)(j) | | | | 2,300 | | | 920 |
Federal Home Loan Mortgage Corp., 5.700%(e)(j) | | | | 800 | | | 664 |
Federal Home Loan Mortgage Corp., 5.790%(e)(j) | | | | 1,450 | | | 1,116 |
Federal Home Loan Mortgage Corp., 5.810%(e)(j) | | | | 550 | | | 429 |
Federal Home Loan Mortgage Corp., 5.900%(e)(j) | | | | 1,100 | | | 506 |
Federal Home Loan Mortgage Corp., 6.000%(e)(j) | | | | 650 | | | 579 |
Federal Home Loan Mortgage Corp., 6.420%(e)(j) | | | | 450 | | | 360 |
Federal Home Loan Mortgage Corp., 6.550%(e)(j) | | | | 1,550 | | | 635 |
Federal Home Loan Mortgage Corp., 8.375%(e)(j) | | | | 9,450 | | | 4,347 |
Federal National Mortgage Association, 4.750%(e)(j) | | | | 1,000 | | | 730 |
Federal National Mortgage Association, 5.125%(e)(j) | | | | 350 | | | 242 |
Federal National Mortgage Association, 5.375%(e)(j) | | | | 700 | | | 1,001 |
Federal National Mortgage Association, 5.810%(e)(j) | | | | 300 | | | 345 |
Federal National Mortgage Association, 6.750%(e)(j) | | | | 450 | | | 225 |
Federal National Mortgage Association, 8.250%(e)(j) | | | | 14,200 | | | 10,082 |
| | | | | | | |
| | | | | | | 25,576 |
| | | | | | | |
| | | |
| TOTAL PREFERRED STOCKS | | | | | | | |
(Identified Cost $1,865,319) | | | | | | | 736,587 |
| | | | | | | |
| | | |
| COMMON STOCKS – 0.4% | | | | | | | |
| | | |
| Containers & Packaging – 0.1% | | | | | | | |
Owens-Illinois, Inc.(e) | | | | 3,321 | | | 47,955 |
| | | | | | | |
| Oil, Gas & Consumable Fuels – 0.3% | | | | | | | |
Chesapeake Energy Corp. | | | | 9,278 | | | 158,283 |
| | | | | | | |
| | | |
| TOTAL COMMON STOCKS | | | | | | | |
(Identified Cost $478,096) | | | | | | | 206,238 |
| | | | | | | |
See accompanying notes to financial statements.
15
| | | | | | | | |
| | | |
| | | | | Principal Amount | | Value (†) |
| | | | | | | | |
| | | |
| SHORT-TERM INVESTMENTS – 1.7% | | | | | | | | |
| Repurchase Agreement with State Street Corp. dated 3/31/2009 at 0.000%, to be repurchased at $6,133 on 4/01/2009 collateralized by $10,000 U.S. Treasury Bill, due 5/28/2009 valued at $9,997 including accrued interest (Note 2h of Notes to Financial Statements) | | | | $ | 6,133 | | $ | 6,133 |
Tri-Party Repurchase Agreement with Fixed Income Clearing Corporation, dated 3/31/2009 at 0.000% to be repurchased at $956,172 on 4/01/2009 collateralized by $740,000 Federal National Mortgage Association,
6.625% due 11/15/2030 valued at $981,425 including accrued interest (Note 2h of Notes to Financial Statements) | | | | | 956,172 | | | 956,172 |
| | | | | | | | |
| | | |
| TOTAL SHORT-TERM INVESTMENTS | | | | | | | | |
(Identified Cost $962,305) | | | | | | | | 962,305 |
| | | | | | | | |
| | | |
| TOTAL INVESTMENTS – 97.1% | | | | | | | | 54,162,899 |
(Identified Cost $80,744,441)(a) | | | | | | | | |
Other Assets Less Liabilities—2.9% | | | | | | | | 1,617,536 |
| | | | | | | | |
| | | |
| NET ASSETS – 100.0% | | | | | | | $ | 55,780,435 |
| | | | | | | | |
| |
(†) See Note 2a of Notes to Financial Statements. | | | |
(a) Federal Tax Information (Amounts exclude certain adjustments made at the end of the Fund’s fiscal year for tax purposes. Amortization of premium on debt securities is excluded for tax purposes.): | | | |
At March 31, 2009, the net unrealized depreciation on investments based on a cost of $80,838,362 for federal income tax purposes was as follows: | | | |
Aggregate gross unrealized appreciation for all investments in which there is an excess of value over tax cost | | $ | 601,153 |
Aggregate gross unrealized depreciation for all investments in which there is an excess of tax cost over value | | | (27,276,616) |
| | | | | | | | |
Net unrealized depreciation | | $ | (26,675,463) |
| | | | | | | | |
| (b) | Variable rate security. Rate as of March 31, 2009 is disclosed. |
| (c) | Non-income producing due to bankruptcy filing. |
| (d) | Illiquid security. At March 31, 2009, the value of these securities amounted to $785,468 or 1.4% of net assets. |
| (e) | Non-income producing security. |
| (f) | Valued by management. At March 31, 2009, the value of this security amounted to $9,000 or 0.0% of net assets. |
| (g) | Step Bond: Coupon is a fixed rate for an initial period then resets at a specified date and rate. |
| (h) | Variable rate security. Rate shown represents the weighted average rate at March 31, 2009. |
| (i) | All or a portion of interest payment is paid in-kind. |
| (j) | Future dividend payments have been eliminated as the issuer has been placed in conservatorship. |
| (k) | Issuer has filed for bankruptcy. |
| 144A | Securities exempt from registration under Rule 144A of the Securities Act of 1933. These securities may be resold in transactions exempt from registration, normally to qualified institutional buyers. At March 31, 2009, the total value of these securities amounted to $6,950,728 or 12.5% of net assets. |
| ABS | Asset-Backed Securities |
| GMTN | Global Medium Term Note |
See accompanying notes to financial statements.
16
PORTFOLIO OF INVESTMENTS – as of March 31, 2009 (Unaudited)
Loomis Sayles High Income Opportunities Fund – continued
NET ASSET SUMMARY AT MARCH 31, 2009 (Unaudited)
| | | |
Wirelines | | 11.2 | % |
Electric | | 7.4 | |
Healthcare | | 6.3 | |
Independent Energy | | 5.9 | |
Technology | | 5.4 | |
Non-Captive Diversified | | 5.1 | |
Media Cable | | 4.7 | |
Home Construction | | 3.9 | |
Paper | | 3.9 | |
Automotive | | 3.1 | |
Retailers | | 2.9 | |
Supermarkets | | 2.9 | |
Pharmaceuticals | | 2.5 | |
Airlines | | 2.4 | |
Non-Captive Consumer | | 2.4 | |
Chemicals | | 2.3 | |
Food & Beverage | | 2.2 | |
Oil Field Services | | 2.2 | |
Commercial Mortgage-Backed Securities | | 2.0 | |
Other Investments, less than 2% each | | 16.7 | |
Short-Term Investments | | 1.7 | |
| | | |
Total Investments | | 97.1 | |
Other assets less liabilities | | 2.9 | |
| | | |
Net Assets | | 100.0 | % |
| | | |
See accompanying notes to financial statements.
17
PORTFOLIO OF INVESTMENTS – as of March 31, 2009 (Unaudited)
Loomis Sayles Securitized Asset Fund
| | | | | | | | |
| | | | | Principal Amount | | Value (†) |
| | | | | | | | |
| | | |
| BONDS AND NOTES – 135.9% of Net Assets | | | | | | | | |
| | | |
| NON-CONVERTIBLE BONDS – 135.8% | | | | | | | | |
| | | |
| ABS Car Loan – 2.6% | | | | | | | | |
Americredit Prime Automobile Receivables, Series 2007-2M, Class A2B, 0.913%, 11/08/2010(b)(c) | | | | $ | 215,602 | | $ | 214,429 |
ARG Funding Corp., Series 2005-2A, Class A5, 0.682%, 5/20/2011, 144A(b)(c) | | | | | 1,700,000 | | | 1,351,823 |
Capital Auto Receivables Asset Trust, Series 2008-1,
Class A2B, 1.256%, 9/15/2010(b)(c) | | | | | 1,761,201 | | | 1,750,327 |
Capital One Auto Finance Trust, Series 2006-C, Class A4, 0.586%, 5/15/2013(b)(c) | | | | | 845,000 | | | 618,694 |
Capital One Auto Finance Trust, Series 2007-C, Class A4, 5.230%, 7/15/2014(c) | | | | | 800,000 | | | 598,149 |
Merrill Auto Trust Securitization Asset, Series 2008-1,
Class B, 6.750%, 4/15/2015(c) | | | | | 1,305,000 | | | 1,055,155 |
Nissan Auto Receivables Owner Trust, Series 2008-B, Class A3, 4.460%, 4/16/2012(c) | | | | | 1,330,000 | | | 1,354,171 |
| | | | | | | | |
| | | | | | | | 6,942,748 |
| | | | | | | | |
| ABS Credit Card – 11.4% | | | | | | | | |
American Express Issuance Trust, Series 2005-2, Class A, 0.626%, 8/15/2013(b)(c) | | | | | 4,225,000 | | | 3,685,592 |
BA Credit Card Trust, Series 2006-C4, Class C4, 0.786%, 11/15/2011(b)(c) | | | | | 2,000,000 | | | 1,953,111 |
BA Credit Card Trust, Series 2008-A5, Class A5, 1.756%, 12/16/2013(b)(c) | | | | | 1,445,000 | | | 1,358,599 |
Bank One Issuance Trust, Series 2004-C2, Class C2, 1.356%, 2/15/2017(b)(c) | | | | | 2,310,000 | | | 900,900 |
Capital One Multi-Asset Execution Trust, Series 2004-A4, Class A4, 0.776%, 3/15/2017(b)(c) | | | | | 1,895,000 | | | 1,479,339 |
Capital One Multi-Asset Execution Trust, Series 2004-B6, Class B6, 4.150%, 7/16/2012(c) | | | | | 2,065,000 | | | 1,974,920 |
Capital One Multi-Asset Execution Trust, Series 2007-A5, Class A5, 0.596%, 7/15/2020(b)(c) | | | | | 2,140,000 | | | 1,393,218 |
Chase Issuance Trust, Series 2007-B1, Class B1, 0.806%, 4/15/2019(b)(c) | | | | | 2,300,000 | | | 871,445 |
Chase Issuance Trust, Series 2007-C1, Class C1, 1.016%, 4/15/2019(b)(c) | | | | | 1,750,000 | | | 506,193 |
Citibank Credit Card Issuance Trust, Series 2005-C2, Class C2, 0.992%, 3/24/2017(b)(c) | | | | | 1,150,000 | | | 418,447 |
Citibank Credit Card Issuance Trust, Series 2006-C4, Class C4, 0.753%, 1/09/2012(b)(c) | | | | | 300,000 | | | 268,464 |
Citibank Credit Card Issuance Trust, Series 2007-A8, Class A8, 5.650%, 9/20/2019(c) | | | | | 4,215,000 | | | 4,008,293 |
Citibank Credit Card Issuance Trust, Series 2008-C6, Class C6, 6.300%, 6/20/2014(c) | | | | | 1,895,000 | | | 1,193,850 |
Discover Card Master Trust, Series 2007-A1, Class A1, 5.650%, 3/16/2020(c) | | | | | 3,305,000 | | | 2,897,824 |
Discover Card Master Trust, Series 2008-A3, Class A3, 5.100%, 10/15/2013(c) | | | | | 3,650,000 | | | 3,581,707 |
MBNA Credit Card Master Note Trust, Series 2002-C1, Class C1, 6.800%, 7/15/2014(c) | | | | | 1,000,000 | | | 717,590 |
MBNA Credit Card Master Note Trust, Series 2004-A3, Class A3, 0.816%, 8/16/2021(b)(c) | | | | | 1,490,000 | | | 1,010,253 |
See accompanying notes to financial statements.
18
PORTFOLIO OF INVESTMENTS – as of March 31, 2009 (Unaudited)
Loomis Sayles Securitized Asset Fund – continued
| | | | | | | | |
| | | | | Principal Amount | | Value (†) |
| | | | | | | | |
| | | |
| BONDS AND NOTES – continued | | | | | | | | |
| | | |
| ABS Credit Card – continued | | | | | | | | |
World Financial Network Credit Card Master Trust,
Series 2004-A, Class C, 1.556%, 3/15/2013(b)(c) | | | | $ | 2,000,000 | | $ | 1,892,629 |
World Financial Network Credit Card Master Trust,
Series 2008-A, Class M, 5.563%, 6/15/2014(b)(c) | | | | | 706,000 | | | 616,655 |
| | | | | | | | |
| | | | | | | | 30,729,029 |
| | | | | | | | |
| ABS Home Equity – 4.5% | | | | | | | | |
Bear Stearns Asset Backed Securities Trust, Series 2006-HE3, Class A3, 0.802%, 4/25/2036(b)(c) | | | | | 2,228,800 | | | 441,525 |
Bear Stearns Asset Backed Securities Trust, Series 2007-HE5, Class 1A2, 0.702%, 6/25/2047(b)(c) | | | | | 2,495,000 | | | 1,067,289 |
Citigroup Mortgage Loan Trust, Inc., Series 2007-WFH1, Class A2, 0.622%, 1/25/2037(b)(c) | | | | | 2,000,000 | | | 1,685,887 |
Countrywide Asset-Backed Certificates, Series 2004-S1, Class A3, 4.615%, 2/25/2035(c) | | | | | 995,000 | | | 600,687 |
Countrywide Asset-Backed Certificates, Series 2006-BC4, Class 2A2, 0.682%, 11/25/2036(b)(c) | | | | | 2,835,000 | | | 1,674,470 |
Countrywide Asset-Backed Certificates, Series 2006-S1, Class A2, 5.549%, 8/25/2021(c) | | | | | 480,220 | | | 282,898 |
Countrywide Asset-Backed Certificates, Series 2006-S3, Class A1, 0.632%, 6/25/2021(b)(c) | | | | | 2,459,194 | | | 1,173,773 |
Countrywide Asset-Backed Certificates, Series 2006-S3, Class A3, 6.287%, 6/25/2021(c) | | | | | 890,902 | | | 206,422 |
Countrywide Asset-Backed Certificates, Series 2006-S7, Class A3, 5.712%, 11/25/2035(b)(c) | | | | | 2,355,000 | | | 514,803 |
GSAMP Trust, Series 2005-WMC3, Class A2B,
0.762%, 12/25/2035(b)(c) | | | | | 1,831,245 | | | 1,345,965 |
Ownit Mortgage Loan Asset-Backed Certificates, Series 2005-2, Class M3, 0.992%, 3/25/2036(b)(c) | | | | | 1,000,000 | | | 564,889 |
Residential Asset Mortgage Products, Inc., Series 2004-RZ1, Class AI5, 4.070%, 7/25/2032(c) | | | | | 143,192 | | | 134,026 |
Soundview Home Equity Loan Trust, Series 2006-OPT5, Class 2A3, 0.672%, 7/25/2036(b)(c) | | | | | 2,685,000 | | | 1,423,050 |
Soundview Home Equity Loan Trust, Series 2006-WF2, Class A2C, 0.662%, 12/25/2036(b)(c) | | | | | 1,750,000 | | | 1,051,070 |
| | | | | | | | |
| | | | | | | | 12,166,754 |
| | | | | | | | |
| ABS Other – 1.1% | | | | | | | | |
CIT Equipment Collateral, Series 2008-VT1, Class A3,
6.590%, 12/22/2014(c) | | | | | 3,020,000 | | | 2,973,428 |
CNH Equipment Trust, Series 2007-B, Class A2A,
5.460%, 6/15/2010(c) | | | | | 72,723 | | | 72,851 |
| | | | | | | | |
| | | | | | | | 3,046,279 |
| | | | | | | | |
| Collateralized Mortgage Obligations – 8.6% | | | | | | | | |
Countrywide Alternative Loan Trust, Series 2006-15CB, Class A1, 6.500%, 6/25/2036(c) | | | | | 1,245,928 | | | 626,858 |
Countrywide Alternative Loan Trust, Series 2006-J5,
Class 4A1, 6.013%, 7/25/2021(b)(c) | | | | | 1,295,758 | | | 837,789 |
CS First Boston Mortgage Securities Corp., Series 2005-7, Class 3A1, 5.000%, 8/25/2020(c) | | | | | 298,662 | | | 280,742 |
Federal Home Loan Mortgage Corp., Series 2613, Class HI, 5.500%, 2/15/2033(c) | | | | | 1,025,293 | | | 7,449 |
See accompanying notes to financial statements.
19
| | | | | | | | |
| | | | | Principal Amount | | Value (†) |
| | | | | | | | |
| | | |
| BONDS AND NOTES – continued | | | | | | | | |
| | | |
| Collateralized Mortgage Obligations – continued | | | | | | | | |
Federal Home Loan Mortgage Corp., Series 2912, Class EH, 5.500%, 1/15/2035(c) | | | | $ | 2,797,000 | | $ | 2,927,188 |
Federal National Mortgage Association, Series 2003-26, Class OI, 5.500%, 11/25/2032(c) | | | | | 20,928,795 | | | 2,067,593 |
Federal National Mortgage Association, Series 2004-2,
Class QK, 4.000%, 9/25/2017(c) | | | | | 10,000,000 | | | 10,382,969 |
Residential Accredit Loans, Inc., Series 2006-QS13,
Class 2A1, 5.750%, 9/25/2021(c) | | | | | 629,484 | | | 407,001 |
Residential Accredit Loans, Inc., Series 2006-QS18,
Class 3A3, 5.750%, 12/25/2021(c) | | | | | 2,626,543 | | | 1,829,553 |
Residential Accredit Loans, Inc., Series 2006-QS6,
Class 2A1, 6.000%, 6/25/2021(c) | | | | | 135,498 | | | 90,318 |
Washington Mutual Mortgage Pass Through Certificates,
Series 2007-HY6, Class 2A1, 5.674%, 6/25/2037(b)(c) | | | | | 7,116,059 | | | 3,713,807 |
| | | | | | | | |
| | | | | | | | 23,171,267 |
| | | | | | | | |
| Commercial Mortgage-Backed Securities – 28.2% | | | | | | | | |
Banc of America Commercial Mortgage, Inc., Series 2005-6, Class A2, 5.165%, 9/10/2047(c) | | | | | 120,000 | | | 110,201 |
Banc of America Commercial Mortgage, Inc., Series 2005-6, Class A4, 5.351%, 9/10/2047(b)(c) | | | | | 189,000 | | | 145,293 |
Banc of America Commercial Mortgage, Inc., Series 2006-2, Class A4, 5.929%, 5/10/2045(b)(c) | | | | | 350,000 | | | 259,451 |
Banc of America Commercial Mortgage, Inc., Series 2006-4, Class A2, 5.522%, 7/10/2046(c) | | | | | 460,000 | | | 408,366 |
Banc of America Commercial Mortgage, Inc., Series 2007-2, Class A2, 5.634%, 4/10/2049(c) | | | | | 5,375,000 | | | 4,389,974 |
Bank of America-First Union NB Commercial Mortgage, Series 2001-3, Class A2, 5.464%, 4/11/2037(c) | | | | | 430,000 | | | 415,100 |
Bear Stearns Commercial Mortgage Securities,
Series 2001-TOP2, Class A2, 6.480%, 2/15/2035(c) | | | | | 175,000 | | | 175,736 |
Bear Stearns Commercial Mortgage Securities,
Series 2005-PW10, Class A2, 5.270%, 12/11/2040(c) | | | | | 1,601,000 | | | 1,476,353 |
Bear Stearns Commercial Mortgage Securities,
Series 2005-T18, Class A2, 4.556%, 2/13/2042(c) | | | | | 171,000 | | | 164,470 |
Bear Stearns Commercial Mortgage Securities,
Series 2006-PW12, Class A2, 5.688%, 9/11/2038(c) | | | | | 1,000,000 | | | 901,165 |
Bear Stearns Commercial Mortgage Securities,
Series 2007-PW15, Class A4, 5.331%, 2/11/2044(c) | | | | | 225,000 | | | 164,005 |
Bear Stearns Commercial Mortgage Securities,
Series 2007-PW16, Class A4, 5.909%, 6/11/2040(b)(c) | | | | | 150,000 | | | 111,418 |
Citigroup/Deutsche Bank Commercial Mortgage Trust, Series 2006-CD2, Class A2, 5.408%, 1/15/2046(c) | | | | | 1,057,000 | | | 961,429 |
Citigroup/Deutsche Bank Commercial Mortgage Trust, Series 2006-CD3, Class A5, 5.617%, 10/15/2048(c) | | | | | 5,000,000 | | | 3,686,745 |
Commercial Mortgage Pass Through Certificates,
Series 2006-C7, Class A4, 5.961%, 6/10/2046(b)(c) | | | | | 250,000 | | | 191,007 |
Credit Suisse Mortgage Capital Certificates, Series 2007-C3, Class A4, 5.912%, 6/15/2039(b)(c) | | | | | 2,342,000 | | | 1,404,891 |
Credit Suisse Mortgage Capital Certificates, Series 2008-C1, Class A3, 6.425%, 2/15/2041(b)(c) | | | | | 1,508,000 | | | 1,032,845 |
Greenwich Capital Commercial Funding Corp.,
Series 2007-GG9, Class A2, 5.381%, 3/10/2039(c) | | | | | 2,005,000 | | | 1,679,230 |
See accompanying notes to financial statements.
20
PORTFOLIO OF INVESTMENTS – as of March 31, 2009 (Unaudited)
Loomis Sayles Securitized Asset Fund – continued
| | | | | | | | |
| | | | | Principal Amount | | Value (†) |
| | | | | | | | |
| | | |
| BONDS AND NOTES – continued | | | | | | | | |
| | | |
| Commercial Mortgage-Backed Securities – continued | | | | | | | | |
Greenwich Capital Commercial Funding Corp.,
Series 2007-GG9, Class A4, 5.444%, 3/10/2039(c) | | | | $ | 5,000,000 | | $ | 3,601,830 |
GS Mortgage Securities Corp. II, Series 2004-GG2,
Class A6, 5.396%, 8/10/2038(c) | | | | | 125,000 | | | 102,533 |
GS Mortgage Securities Corp. II, Series 2005-GG4,
Class A2, 4.475%, 7/10/2039(c) | | | | | 1,130,000 | | | 1,064,009 |
GS Mortgage Securities Corp. II, Series 2005-GG4,
Class A4A, 4.751%, 7/10/2039(c) | | | | | 7,495,000 | | | 5,544,215 |
GS Mortgage Securities Corp. II, Series 2006-GG6,
Class A2, 5.506%, 4/10/2038(c) | | | | | 500,000 | | | 455,789 |
GS Mortgage Securities Corp. II, Series 2006-GG8,
Class A2, 5.479%, 11/10/2039(c) | | | | | 4,449,000 | | | 3,926,440 |
JP Morgan Chase Commercial Mortgage Securities Corp., Series 2007-LDPX, Class A3, 5.420%, 1/15/2049(c) | | | | | 4,085,000 | | | 2,760,732 |
JPMorgan Chase Commercial Mortgage Securities Corp., Series 2001-CIBC, Class A3, 6.260%, 3/15/2033(c) | | | | | 173,289 | | | 175,264 |
JPMorgan Chase Commercial Mortgage Securities Corp., Series 2005-LDP5, Class A4, 5.344%, 12/15/2044(b)(c) | | | | | 7,000,000 | | | 5,396,104 |
JPMorgan Chase Commercial Mortgage Securities Corp., Series 2006-LDP7, Class A2, 6.051%, 4/15/2045(b)(c) | | | | | 1,065,000 | | | 947,546 |
LB-UBS Commercial Mortgage Trust, Series 2005-C3,
Class A3, 4.647%, 7/15/2030(c) | | | | | 275,000 | | | 247,674 |
LB-UBS Commercial Mortgage Trust, Series 2006-C3,
Class A4, 5.661%, 3/15/2039(c) | | | | | 2,440,000 | | | 1,858,278 |
LB-UBS Commercial Mortgage Trust, Series 2006-C7,
Class A2, 5.300%, 11/15/2038(c) | | | | | 2,460,000 | | | 2,064,901 |
LB-UBS Commercial Mortgage Trust, Series 2007-C2,
Class A2, 5.303%, 2/15/2040(c) | | | | | 11,060,000 | | | 9,153,295 |
Merrill Lynch Mortgage Trust, Series 2006-C1, Class A2, 5.795%, 5/12/2039(b)(c) | | | | | 1,000,000 | | | 894,334 |
Merrill Lynch/Countrywide Commercial Mortgage Trust, Series 2006-1, Class A2, 5.439%, 2/12/2039(c) | | | | | 4,895,000 | | | 4,449,144 |
Merrill Lynch/Countrywide Commercial Mortgage Trust, Series 2006-1, Class A4, 5.600%, 2/12/2039(b)(c) | | | | | 1,000,000 | | | 708,901 |
Merrill Lynch/Countrywide Commercial Mortgage Trust, Series 2006-2, Class A4, 6.104%, 6/12/2046(b)(c) | | | | | 250,000 | | | 178,028 |
Merrill Lynch/Countrywide Commercial Mortgage Trust, Series 2006-3, Class A4, 5.414%, 7/12/2046(c) | | | | | 1,000,000 | | | 658,390 |
Morgan Stanley Capital I, Series 2005-HQ6, Class A4A, 4.989%, 8/13/2042(c) | | | | | 5,280,000 | | | 4,247,623 |
Morgan Stanley Capital I, Series 2005-HQ7, Class A4, 5.378%, 11/14/2042(b)(c) | | | | | 5,965,000 | | | 4,658,488 |
Morgan Stanley Capital I, Series 2005-T19, Class A4A, 4.890%, 6/12/2047(c) | | | | | 1,267,000 | | | 993,546 |
Morgan Stanley Capital I, Series 2006-HQ10, Class A4, 5.328%, 11/12/2041(c) | | | | | 5,000,000 | | | 3,847,448 |
Morgan Stanley Capital I, Series 2006-T23, Series A2, 5.915%, 8/12/2041(b)(c) | | | | | 555,000 | | | 501,275 |
Wachovia Bank Commercial Mortgage Trust,
Series 2005-C16, Class A2, 4.380%, 10/15/2041(c) | | | | | 76,468 | | | 73,682 |
| | | | | | | | |
| | | | | | | | 76,187,148 |
| | | | | | | | |
See accompanying notes to financial statements.
21
| | | | | | | | |
| | | | | Principal Amount | | Value (†) |
| | | | | | | | |
| | | |
| BONDS AND NOTES – continued | | | | | | | | |
| | | |
| Hybrid ARMs – 14.6% | | | | | | | | |
Countrywide Home Loans, Series 2004-HYB5, Class 6A2,
5.449%, 4/20/2035(b)(c) | | | | $ | 642,910 | | $ | 123,182 |
| FHLMC, 5.949%, 11/01/2036(b)(c) | | | | | 6,111,038 | | | 6,311,752 |
| FHLMC, 5.970%, 2/01/2037(b)(c) | | | | | 8,572,070 | | | 8,913,612 |
First Horizon Alternative Mortgage Securities,
Series 2006-AA3, Class A1, 6.294%, 6/25/2036(b)(c) | | | | | 5,623,475 | | | 2,703,894 |
| FNMA, 5.730%, 9/01/2036(b)(c) | | | | | 3,678,079 | | | 3,811,214 |
| FNMA, 6.039%, 2/01/2037(b)(c) | | | | | 7,327,205 | | | 7,615,291 |
Indymac Index Mortgage Loan Trust, Series 2006-AR25,
Class 3A1, 6.088%, 9/25/2036(b)(c) | | | | | 6,644,153 | | | 2,694,293 |
JPMorgan Mortgage Trust, Series 2006-A7, Class 1A3,
5.874%, 1/25/2037(b)(c) | | | | | 642,343 | | | 470,195 |
Morgan Stanley Mortgage Loan Trust, Series 2005-3AR,
Class 5A, 5.592%, 7/25/2035(b)(c) | | | | | 1,024,505 | | | 601,656 |
Washington Mutual Mortgage Pass-Through Certificates, Series 2007-HY2, Class 2A2, 6.417%, 11/25/2036(b)(c) | | | | | 10,822,090 | | | 5,764,198 |
Wells Fargo Mortgage Backed Securities Trust,
Series 2005-AR16, Class 3A2, 4.927%, 10/25/2035(b)(c) | | | | | 799,214 | | | 553,799 |
| | | | | | | | |
| | | | | | | | 39,563,086 |
| | | | | | | | |
| | | |
| Mortgage Related – 64.8% | | | | | | | | |
| FHLMC, 5.000%, 7/01/2035(c) | | | | | 574,640 | | | 594,152 |
| FHLMC, 5.000%, 9/01/2035(c) | | | | | 767,979 | | | 794,055 |
| FHLMC, 5.000%, 12/01/2035(c) | | | | | 147,586 | | | 152,598 |
| FHLMC, 5.000%, 2/01/2036(c) | | | | | 309,630 | | | 320,144 |
| FHLMC, 5.000%, 2/01/2036(c) | | | | | 620,522 | | | 641,591 |
| FHLMC, 5.500%, 5/01/2035(c) | | | | | 436,421 | | | 453,831 |
| FHLMC, 6.000%, 6/01/2037(c) | | | | | 4,168,851 | | | 4,363,167 |
| FHLMC, 6.000%, 6/01/2037(c) | | | | | 10,259,758 | | | 10,737,979 |
| FHLMC, 6.000%, 8/01/2037(c) | | | | | 4,457,409 | | | 4,665,175 |
| FHLMC, 6.000%, 10/01/2037(c) | | | | | 3,993,925 | | | 4,180,087 |
| FHLMC, 6.000%, 12/01/2037(c) | | | | | 1,826,203 | | | 1,911,325 |
| FHLMC, 6.500%, 1/01/2038(c) | | | | | 175,879 | | | 185,628 |
| FHLMC (TBA), 5.500%, 7/01/2035(d) | | | | | 14,910,000 | | | 15,469,125 |
| FNMA, 4.500%, 10/01/2035(c) | | | | | 800,423 | | | 819,097 |
| FNMA, 5.500%, 5/01/2035(c) | | | | | 139,665 | | | 145,262 |
| FNMA, 5.500%, 12/01/2035(c) | | | | | 215,608 | | | 224,249 |
| FNMA, 5.500%, 4/01/2036(c) | | | | | 143,520 | | | 149,138 |
| FNMA, 5.500%, 4/01/2036(c) | | | | | 334,907 | | | 348,015 |
| FNMA, 5.500%, 4/01/2036(c) | | | | | 71,091 | | | 73,874 |
| FNMA, 5.500%, 4/01/2036(c) | | | | | 2,223,330 | | | 2,312,437 |
| FNMA, 5.500%, 5/01/2036(c) | | | | | 358,360 | | | 372,387 |
| FNMA, 5.500%, 5/01/2036(c) | | | | | 574,152 | | | 596,625 |
| FNMA, 5.500%, 6/01/2036(c) | | | | | 731,449 | | | 760,078 |
| FNMA, 5.500%, 6/01/2036(c) | | | | | 1,284,124 | | | 1,334,385 |
| FNMA, 5.500%, 6/01/2036(c) | | | | | 528,462 | | | 549,146 |
| FNMA, 6.000%, 10/01/2034(c) | | | | | 68,527 | | | 71,860 |
See accompanying notes to financial statements.
22
PORTFOLIO OF INVESTMENTS – as of March 31, 2009 (Unaudited)
Loomis Sayles Securitized Asset Fund – continued
| | | | | | | | | |
| | | | | Principal Amount | | Value (†) | |
| | | | | | | | | |
| | | |
| BONDS AND NOTES – continued | | | | | | | | | |
| | | |
| Mortgage Related – continued | | | | | | | | | |
| FNMA, 6.000%, 4/01/2036(c) | | | | $ | 304,599 | | $ | 318,702 | |
| FNMA, 6.000%, 6/01/2036(c) | | | | | 4,515,725 | | | 4,724,797 | |
| FNMA, 6.000%, 6/01/2036(c) | | | | | 1,572,975 | | | 1,645,802 | |
| FNMA, 6.000%, 9/01/2036(c) | | | | | 1,111,251 | | | 1,162,700 | |
FNMA, 6.000%, 11/01/2036(c) | | | | | 3,563,879 | | | 3,728,882 | |
FNMA, 6.000%, 1/01/2037(c) | | | | | 878,141 | | | 918,798 | |
FNMA, 6.000%, 10/01/2037(c) | | | | | 2,030,701 | | | 2,123,337 | |
FNMA, 6.000%, 7/01/2038(c) | | | | | 7,048,256 | | | 7,369,780 | |
FNMA, 6.000%, 10/01/2038(c) | | | | | 7,199,866 | | | 7,528,307 | |
FNMA, 7.000%, 12/01/2037(c) | | | | | 159,350 | | | 169,708 | |
FNMA (TBA), 5.000%, 3/01/2035(d) | | | | | 33,900,000 | | | 34,980,563 | |
FNMA (TBA), 5.500%, 6/01/2035(d) | | | | | 6,445,000 | | | 6,688,698 | |
FNMA (TBA), 6.500%, 4/01/2035(d) | | | | | 12,000,000 | | | 12,637,500 | |
GNMA, 5.500%, 8/15/2033(c) | | | | | 72,970 | | | 76,273 | |
GNMA, 5.500%, 12/15/2035(c) | | | | | 326,799 | | | 341,081 | |
GNMA, 5.500%, 9/15/2036(c) | | | | | 1,979,132 | | | 2,063,152 | |
GNMA, 6.000%, 6/15/2036(c) | | | | | 197,083 | | | 206,373 | |
GNMA, 6.500%, 9/15/2036(c) | | | | | 804,436 | | | 845,347 | |
GNMA (TBA), 5.500%, 6/01/2036(d) | | | | | 34,000,000 | | | 35,381,250 | |
| | | | | | | | | |
| | | | | | | | 175,136,460 | |
| | | | | | | | | |
| | | |
| TOTAL NON-CONVERTIBLE BONDS | | | | | | | | | |
(Identified Cost $411,755,484) | | | | | | | | 366,942,771 | |
| | | | | | | | | |
| | | |
| CONVERTIBLE BONDS – 0.1% | | | | | | | | | |
| | | |
| Hybrid ARMs – 0.1% | | | | | | | | | |
FHLMC, 4.662%, 1/01/2035(b)(c) | | | | | | | | | |
(Identified Cost $354,042) | | | | | 353,710 | | | 357,399 | |
| | | | | | | | | |
| | | |
| TOTAL BONDS AND NOTES | | | | | | | | | |
(Identified Cost $412,109,526) | | | | | | | | 367,300,170 | |
| | | | | | | | | |
| | | |
| SHORT-TERM INVESTMENTS – 1.8% | | | | | | | | | |
Federal Home Loan Mortgage Corp., Discount Notes, 1.652%, 5/11/2009(c)(e) | | | | | 1,000,000 | | | 999,811 | |
Tri-Party Repurchase Agreement with Fixed Income Clearing Corporation dated 3/31/2009 at 0.000% to be repurchased at $3,694,060 on 4/01/2009 collateralized by $3,635,000 Federal National Mortgage Association,
4.750% due 3/12/2010 valued at $3,773,130 including accrued interest (Note 2h of Notes to Financial Statements) | | | | | 3,694,060 | | | 3,694,060 | |
| | | | | | | | | |
| | | |
| TOTAL SHORT-TERM INVESTMENTS | | | | | | | | | |
(Identified Cost $4,692,224) | | | | | | | | 4,693,871 | |
| | | | | | | | | |
| | | |
| TOTAL INVESTMENTS – 137.7% | | | | | | | | | |
(Identified Cost $416,801,750)(a) | | | | | | | | 371,994,041 | |
Other assets less liabilities—(37.7)% | | | | | | | | (101,794,656 | ) |
| | | | | | | | | |
| | | |
| NET ASSETS – 100.0% | | | | | | | $ | 270,199,385 | |
| | | | | | | | | |
| |
(†) See Note 2a of Notes to Financial Statements. | | | | |
See accompanying notes to financial statements.
23
| | | | | | | |
(a) Federal Tax Information (Amounts exclude certain adjustments made at the end of the Fund’s fiscal year for tax purposes. Such adjustments are primarily due to wash sales.): | | | |
At March 31, 2009, the net unrealized depreciation on investments based on a cost of $416,801,750 for federal income tax purposes was as follows: | | | |
Aggregate gross unrealized appreciation for all investments in which there is an excess of value over tax cost | | $ | 6,461,575 |
Aggregate gross unrealized depreciation for all investments in which there is an excess of tax cost over value | | | (51,269,284) |
| | | | | | | |
Net unrealized depreciation | | $ | (44,807,709) |
| | | | | | | |
| (b) | Variable rate security. Rate as of March 31, 2009 is disclosed. |
| (c) | All or a portion of this security has been segregated to cover requirements on TBA obligations and future contracts. |
| (d) | Delayed delivery (See Note 2i of Notes to Financial Statements). |
| (e) | Rate represents discount rate at time of purchase. |
| 144A | Securities exempt from registration under Rule 144A of the Securities Act of 1933. These securities may be resold in transactions exempt from registration, normally to qualified institutional buyers. At March 31, 2009, the total value of these securities amounted to $1,351,823 or 0.5% of net assets. |
| ABS | Asset-Backed Securities. |
| ARM | Adjustable Rate Mortgage. |
| FHLMC | Federal Home Loan Mortgage Corp. |
| FNMA | Federal National Mortgage Association. |
| GNMA | Government National Mortgage Association. |
At March 31, 2009, open futures contracts sold were as follows:
| | | | | | | | | | | |
| Futures | | Expiration
Date | | Contracts | | Notional
Value | | Unrealized
Depreciation | |
5 Year U.S. Treasury Note | | 6/30/2009 | | 155 | | $ | 18,408,672 | | $ | (380,518 | ) |
10 Year U.S. Treasury Note | | 6/19/2009 | | 50 | | | 6,203,906 | | | (211,810 | ) |
| | | | | | | | | | | |
Total | | | | | | | | | $ | (592,328 | ) |
| | | | | | | | | | | |
NET ASSET SUMMARY AT MARCH 31, 2009 (Unaudited)
| | | |
Mortgage Related | | 64.8 | % |
Commercial Mortgage-Backed Securities | | 28.2 | |
Hybrid ARMs | | 14.7 | |
ABS Credit Card | | 11.4 | |
Collateralized Mortgage Obligations | | 8.6 | |
ABS Home Equity | | 4.5 | |
ABS Car Loan | | 2.6 | |
ABS Other | | 1.1 | |
Short-Term Investments | | 1.8 | |
| | | |
Total Investments | | 137.7 | |
Other assets less liabilities (including open futures contracts) | | (37.7 | ) |
| | | |
Net Assets | | 100.0 | % |
| | | |
See accompanying notes to financial statements.
24
STATEMENTS OF ASSETS AND LIABILITIES
March 31, 2009 (Unaudited)
| | | | | | | | |
| | | High Income
Opportunities Fund | | | Securitized
Asset Fund | |
| | | | | | | | |
Assets | | | | | | | | |
Investments at cost | | $ | 80,744,441 | | | $ | 416,801,750 | |
Net unrealized depreciation | | | (26,581,542 | ) | | | (44,807,709 | ) |
| | | | | | | | |
Investments at value | | | 54,162,899 | | | | 371,994,041 | |
Receivable for Fund shares sold | | | 27,989 | | | | 918,355 | |
Receivable for securities sold | | | 164,161 | | | | 20,719,479 | |
Dividends and interest receivable | | | 1,570,578 | | | | 1,910,771 | |
Tax reclaims receivable | | | 7,020 | | | | — | |
| | | | | | | | |
Total Assets | | | 55,932,647 | | | | 395,542,646 | |
| | | | | | | | |
| | |
| Liabilities | | | | | | | | |
Payable for securities purchased | | | 138,505 | | | | — | |
Payable for delayed delivery securities purchased (Note 2) | | | — | | | | 124,648,735 | |
Payable for Fund shares redeemed | | | 13,707 | | | | 636,518 | |
Payable to broker—variation margin on open futures contracts | | | — | | | | 58,008 | |
| | | | | | | | |
Total Liabilities | | | 152,212 | | | | 125,343,261 | |
| | | | | | | | |
Net Assets | | $ | 55,780,435 | | | $ | 270,199,385 | |
| | | | | | | | |
Net Assets consist of: | | | | | | | | |
Paid-in capital | | $ | 86,913,151 | | | $ | 314,372,080 | |
Undistributed net investment income | | | 481,030 | | | | 1,403,854 | |
Accumulated net realized loss on investments and futures contracts | | | (5,032,204 | ) | | | (176,512 | ) |
Net unrealized depreciation on investments and futures contracts | | | (26,581,542 | ) | | | (45,400,037 | ) |
| | | | | | | | |
Net Assets | | $ | 55,780,435 | | | $ | 270,199,385 | |
| | | | | | | | |
| | |
| Net Asset Value and Offering Price | | | | | | | | |
Institutional Class | | | | | | | | |
Net assets | | $ | 55,780,435 | | | $ | 270,199,385 | |
| | | | | | | | |
Shares of beneficial interest | | | 8,363,725 | | | | 30,195,256 | |
| | | | | | | | |
Net asset value, offering and redemption price per share | | $ | 6.67 | | | $ | 8.95 | |
| | | | | | | | |
See accompanying notes to financial statements.
25
STATEMENTS OF OPERATIONS
For the Six Months Ended March 31, 2009 (Unaudited)
| | | | | | | | |
| | | High Income
Opportunities Fund | | | Securitized
Asset Fund | |
| | | | | | | | |
Investment Income | | | | | | | | |
Dividends | | $ | 38,474 | | | $ | — | |
Interest | | | 3,257,175 | | | | 9,489,303 | |
Securities lending income (Note 2) | | | 392 | | | | — | |
Less net foreign taxes withheld | | | (436 | ) | | | — | |
| | | | | | | | |
Net investment income | | | 3,295,605 | | | | 9,489,303 | |
| | | | | | | | |
| | |
| Net Realized and Unrealized Gain (Loss) on Investments and Futures Contracts | | | | | | | | |
Net Realized Gain (Loss) on: | | | | | | | | |
Investments | | | (4,928,229 | ) | | | 6,687,660 | |
Futures contracts | | | — | | | | (3,114,277 | ) |
| | |
| Net Change in Unrealized Appreciation (Depreciation) on: | | | | | | | | |
Investments | | | (7,227,429 | ) | | | (26,266,130 | ) |
Futures contracts | | | — | | | | (802,203 | ) |
| | | | | | | | |
Net realized and unrealized loss on investments and futures contracts | | | (12,155,658 | ) | | | (23,494,950 | ) |
| | | | | | | | |
| | |
| Net Decrease in Net Assets Resulting from Operations | | $ | (8,860,053 | ) | | $ | (14,005,647 | ) |
| | | | | | | | |
See accompanying notes to financial statements.
26
STATEMENTS OF CHANGES IN NET ASSETS
High Income Opportunities Fund
| | | | | | | | |
| | | Six Months Ended
March 31, 2009
(Unaudited) | | | Year Ended
September 30, 2008 | |
From Operations: | | | | | | | | |
Net investment income | | $ | 3,295,605 | | | $ | 6,881,020 | |
Net realized gain (loss) on investments | | | (4,928,229 | ) | | | 17,115 | |
Net change in unrealized appreciation (depreciation) on investments | | | (7,227,429 | ) | | | (18,349,158 | ) |
| | | | | | | | |
Net decrease in net assets resulting from operations | | | (8,860,053 | ) | | | (11,451,023 | ) |
| | | | | | | | |
From Distributions to Shareholders: | | | | | | | | |
Net Investment Income: | | | | | | | | |
Institutional Class | | | (3,443,677 | ) | | | (6,813,880 | ) |
Capital Gains: | | | | | | | | |
Institutional Class | | | (85,819 | ) | | | (543,232 | ) |
| | | | | | | | |
Total distributions | | | (3,529,496 | ) | | | (7,357,112 | ) |
| | | | | | | | |
Increase (Decrease) in Net Assets Derived from Capital Share Transactions (Note 8) | | | 3,219,688 | | | | (314,836 | ) |
| | | | | | | | |
Total decrease in net assets | | | (9,169,861 | ) | | | (19,122,971 | ) |
Net Assets | | | | | | | | |
Beginning of period | | | 64,950,296 | | | | 84,073,267 | |
| | | | | | | | |
End of period | | $ | 55,780,435 | | | $ | 64,950,296 | |
| | | | | | | | |
Undistributed Net Investment Income | | $ | 481,030 | | | $ | 629,102 | |
| | | | | | | | |
See accompanying notes to financial statements.
27
STATEMENTS OF CHANGES IN NET ASSETS
Securitized Asset Fund
| | | | | | | | |
| | | Six Months Ended
March 31, 2009
(Unaudited) | | | Year Ended
September 30, 2008 | |
From Operations: | | | | | | | | |
Net investment income | | $ | 9,489,303 | | | $ | 20,385,139 | |
Net realized gain on investments and futures contracts | | | 3,573,383 | | | | 145,330 | |
Net change in unrealized appreciation (depreciation) on investments and futures contracts | | | (27,068,333 | ) | | | (17,675,141 | ) |
| | | | | | | | |
Net increase (decrease) in net assets resulting from operations | | | (14,005,647 | ) | | | 2,855,328 | |
| | | | | | | | |
From Distributions to Shareholders: | | | | | | | | |
Net Investment Income: | | | | | | | | |
Institutional Class | | | (10,227,071 | ) | | | (20,848,572 | ) |
Capital Gains: | | | | | | | | |
Institutional Class | | | (1,038,001 | ) | | | — | |
| | | | | | | | |
Total distributions | | | (11,265,072 | ) | | | (20,848,572 | ) |
| | | | | | | | |
Increase (Decrease) in Net Assets Derived from Capital Share Transactions (Note 8) | | | (86,583,839 | ) | | | 52,893,796 | |
| | | | | | | | |
Total increase (decrease) in net assets | | | (111,854,558 | ) | | | 34,900,552 | |
Net Assets | | | | | | | | |
Beginning of period | | | 382,053,943 | | | | 347,153,391 | |
| | | | | | | | |
End of period | | $ | 270,199,385 | | | $ | 382,053,943 | |
| | | | | | | | |
Undistributed Net Investment Income | | $ | 1,403,854 | | | $ | 2,141,622 | |
| | | | | | | | |
See accompanying notes to financial statements.
28
FINANCIAL HIGHLIGHTS
For a share outstanding throughout each period.
| | | | | | | | | | | | | | | | | | | | | | | | |
| | | | | Income (Loss) from Investment Operations: | | | | | Less Distributions: | |
| | | | | | | |
| | | Net asset
value,
beginning
of the period | | Net
investment
income(a) | | Net realized
and unrealized
gain (loss) | | | Total from
investment
operations | | | | | Dividends
from
net investment
income | | | Distributions
from net
realized
capital gains(b) | |
| High Income Opportunities Fund | |
| | | | | | | |
| Institutional Class | | | | | | | | | | | | | | | | | | | | | | | | |
3/31/2009(f) | | $ | 8.26 | | $ | 0.40 | | $ | (1.56 | ) | | $ | (1.16 | ) | | | | $ | (0.42 | ) | | $ | (0.01 | ) |
9/30/2008 | | | 10.42 | | | 0.82 | | | (2.09 | ) | | | (1.27 | ) | | | | | (0.82 | ) | | | (0.07 | ) |
9/30/2007 | | | 10.39 | | | 0.77 | | | 0.01 | (j) | | | 0.78 | | | | | | (0.75 | ) | | | (0.00 | ) |
9/30/2006 | | | 10.50 | | | 0.76 | | | (0.10 | ) | | | 0.66 | | | | | | (0.73 | ) | | | (0.04 | ) |
9/30/2005 | | | 10.32 | | | 0.78 | | | 0.17 | | | | 0.95 | | | | | | (0.77 | ) | | | — | |
9/30/2004(g) | | | 10.00 | | | 0.33 | | | 0.25 | | | | 0.58 | | | | | | (0.26 | ) | | | — | |
| | | | | | |
| Securitized Asset Fund | | | | | | | | | | | | | | | | | | | | | |
| | | | | | | |
| Institutional Class | | | | | | | | | | | | | | | | | | | | | | | | |
3/31/2009(f) | | $ | 9.60 | | $ | 0.28 | | $ | (0.61 | ) | | $ | (0.33 | ) | | | | $ | (0.29 | ) | | $ | (0.03 | ) |
9/30/2008 | | | 10.07 | | | 0.55 | | | (0.45 | ) | | | 0.10 | | | | | | (0.57 | ) | | | — | |
9/30/2007 | | | 10.13 | | | 0.55 | | | (0.10 | ) | | | 0.45 | | | | | | (0.51 | ) | | | (0.00 | ) |
9/30/2006(h) | | | 10.00 | | | 0.30 | | | 0.02 | | | | 0.32 | | | | | | (0.19 | ) | | | — | |
(a) Per share net investment income has been calculated using the average shares outstanding during the period.
(b) Amount rounds to less than $0.01 per share, if applicable.
(c) Periods less than one year, if applicable, are not annualized.
(d) Loomis Sayles has agreed to pay, without reimbursement from the Fund, all expenses associated with the operations of the Fund.
(e) Computed on an annualized basis for periods less than one year, if applicable.
(f) For the six months ended March 31, 2009 (Unaudited).
(g) For the period April 12, 2004 (commencement of operations) through September 30, 2004.
(h) For the period March 2, 2006 (commencement of operations) through September 30, 2006.
(i) Portfolio turnover rate has been recalculated to conform with current presentation.
(j) The amount shown for a share outstanding does not correspond with the aggregate realized and unrealized gain (loss) on investments for the period due to the timing of sales and redemptions of fund shares in relation to fluctuating market values of investments of the fund.
See accompanying notes to financial statements.
29
| | | | | | | | | | | | | | | | | | | | |
| | | | | | | | | | | Ratios to Average Net Assets: | | | |
Total
distributions | | | Net asset
value,
end of
the
period | | Total
return (%)(c) | | | Net assets,
end of the
period
(000’s) | | Net
expenses (%)(d) | | Gross
expenses (%)(d) | | Net
investment
income (%)(e) | | Portfolio
turnover
rate (%) | |
| | | | | | | | | | | | | | | | | | | | |
| | | | | | | |
| | | | | | | | | | | | | | | | | | | | |
| $ | (0.43 | ) | | $ | 6.67 | | (13.9 | ) | | $ | 55,780 | | — | | — | | 12.15 | | 18 | |
| | (0.89 | ) | | | 8.26 | | (13.2 | ) | | | 64,950 | | — | | — | | 8.47 | | 24 | |
| | (0.75 | ) | | | 10.42 | | 7.7 | | | | 84,073 | | — | | — | | 7.35 | | 29 | |
| | (0.77 | ) | | | 10.39 | | 6.6 | | | | 42,847 | | — | | — | | 7.36 | | 26 | |
| | (0.77 | ) | | | 10.50 | | 9.5 | | | | 13,115 | | — | | — | | 7.40 | | 22 | |
| | (0.26 | ) | | | 10.32 | | 5.9 | | | | 9,079 | | — | | — | | 7.03 | | 45 | |
| | | | | | | |
| | | | | | | | | | | | | | | | | | | | |
| | | | | | | |
| | | | | | | | | | | | | | | | | | | | |
| $ | (0.32 | ) | | $ | 8.95 | | (3.3 | ) | | $ | 270,199 | | — | | — | | 6.24 | | 207 | |
| | (0.57 | ) | | | 9.60 | | 0.9 | | | | 382,054 | | — | | — | | 5.55 | | 430 | |
| | (0.51 | ) | | | 10.07 | | 4.6 | | | | 347,153 | | — | | — | | 5.43 | | 73 | |
| | (0.19 | ) | | | 10.13 | | 3.3 | | | | 70,993 | | — | | — | | 3.02 | | 55 | (i) |
See accompanying notes to financial statements.
30
NOTES TO FINANCIAL STATEMENTS
March 31, 2009 (Unaudited)
1. Organization. Loomis Sayles Funds I (the “Trust”) is organized as a Massachusetts business trust. The Trust is registered under the Investment Company Act of 1940, as amended (the “1940 Act”), as an open-end management investment company. The Declaration of Trust permits the Board of Trustees to authorize the issuance of an unlimited number of shares of the Trust in multiple series. The following funds (individually, a “Fund” and collectively, the “Funds”) are included in this report:
Loomis Sayles High Income Opportunities Fund (the “High Income Opportunities Fund”)
Loomis Sayles Securitized Asset Fund (the “Securitized Asset Fund”)
Each Fund offers Institutional Class Shares. The Funds’ shares are offered exclusively to investors in “wrap fee” programs approved by Natixis Asset Management Advisors, L.P. (“Natixis Advisors”) and/or Loomis, Sayles & Company, L.P. (“Loomis Sayles”) and to institutional advisory clients of Natixis Advisors or Loomis Sayles that, in each case, meet the Funds’ policies as established by Loomis Sayles.
2. Significant Accounting Policies. The following is a summary of significant accounting policies consistently followed by each Fund in the preparation of its financial statements. Each Fund’s financial statements are prepared in accordance with accounting principles generally accepted in the United States of America which require the use of management estimates that affect the reported amounts and disclosures in the financial statements. Actual results could differ from those estimates.
a. Valuation. Debt securities (other than short-term obligations purchased with an original or remaining maturity of sixty days or less) are generally valued on the basis of evaluated bids furnished to the Funds by a pricing service recommended by the investment adviser and approved by the Board of Trustees, which service determines valuations for normal, institutional size-trading units of such securities using market information, transactions for comparable securities and various relationships between securities which are generally recognized by institutional traders. Equity securities, including closed-end investment companies and exchange traded funds, for which market quotations are readily available are valued at market value, as reported by pricing services recommended by the investment adviser and approved by the Board of Trustees. Such pricing services generally use the security’s last sale price on the exchange or market where the security is primarily traded or, if there is no reported sale during the day, the closing bid price. Securities traded on the NASDAQ Global Select Market, NASDAQ Global Market and NASDAQ Capital Markets are valued at the NASDAQ Official Closing Price (“NOCP”), or if lacking a NOCP, at the most recent bid quotation on the applicable NASDAQ Market. Broker-dealer bid quotations may also be used to value debt and equity securities where a pricing service does not price a security or where a pricing service does not provide a reliable price for the security. In instances where broker-dealer bid quotations are not available, certain securities held by the Funds may be valued on the basis of a price provided by a principal market maker. Forward foreign currency contracts are “marked-to-market” daily utilizing interpolated prices determined by an independent pricing service. Futures contracts are priced at their most recent settlement price. Short-term obligations purchased with an original or remaining maturity of sixty days or less are valued at amortized cost, which approximates market value. Securities for which market quotations are not readily available are valued at fair value as determined in good faith by the Funds’ investment adviser using consistently applied procedures under the general supervision of the Board of Trustees. Investments in other open-end investment companies are valued at their net asset value each day.
The High Income Opportunities Fund may hold securities traded in foreign markets. Foreign securities are valued at the market price in the foreign market. However, if events occurring after the close of the foreign market (but before the close of regular trading on the New York Stock Exchange) are believed to materially affect the value of those securities, such securities are fair valued pursuant to procedures approved by the Board of Trustees. When fair valuing securities, the Fund may, among other things, use modeling tools or other processes that may take into account factors such as securities market activity and/or significant events that occur after the close of the foreign market and before the Fund calculates its net asset value.
b. Security Transactions and Related Investment Income. Security transactions are accounted for on trade date. Dividend income is recorded on ex-dividend date, or in the case of certain foreign securities, as soon as a Fund is notified, and interest income is recorded on an accrual basis. Interest income is increased by the accretion of discount and decreased by the amortization of premium. Investment income is recorded net of foreign taxes withheld when applicable. In determining net gain or loss on securities sold, the cost of securities has been determined on an identified cost basis.
c. Foreign Currency Translation. The books and records of the Funds are maintained in U.S. dollars. The value of securities, currencies and other assets and liabilities denominated in currencies other than U.S. dollars are translated into U.S. dollars based upon foreign exchange rates prevailing at the end of the period. Purchases and sales of investment securities, income and expenses are translated on the respective dates of such transactions.
31
Since the values of investment securities are presented at the foreign exchange rates prevailing at the end of the period, it is not practical to isolate that portion of the results of operations arising from changes in exchange rates from fluctuations which arise due to changes in market prices of the investment securities. Such changes are included with the net realized and unrealized gain or loss on investments.
Net realized foreign exchange gains or losses arise from sales of foreign currency, currency gains or losses realized between the trade and settlement dates on securities transactions and the difference between the amounts of dividends, interest and foreign withholding taxes recorded on the High Income Opportunities Fund’s books and the U.S. dollar equivalent of the amounts actually received or paid. Net unrealized foreign exchange gains and losses arise from changes in the value of assets and liabilities, other than investment securities, at the end of the fiscal period, resulting from changes in exchange rates.
The High Income Opportunities Fund may use foreign currency exchange contracts to facilitate transactions in foreign denominated investments. Losses may arise from changes in the value of the foreign currency or if the counterparties do not perform under the contracts’ terms.
The High Income Opportunities Fund may purchase investments of foreign issuers. Investing in securities of foreign issuers involves special risks and considerations not typically associated with investing in U.S. companies and securities of the U.S. government. These risks include revaluation of currencies and the risk of expropriation. Moreover, the markets for securities of many foreign issuers may be less liquid and the prices of such securities may be more volatile than those of comparable U.S. companies and the U.S. government.
d. Forward Foreign Currency Contracts. The High Income Opportunities Fund may enter into forward foreign currency exchange contracts. Contracts generally are used to acquire exposure to foreign currencies and may also be used for hedging purposes. Also, a contract to buy or sell can offset a previous contract. These contracts involve market risk in excess of the unrealized gain or loss reflected in the Fund’s Statement of Assets and Liabilities. The U.S. dollar value of the currencies the Fund has committed to buy or sell represents the aggregate exposure to each currency the Fund has acquired or hedged through currency contracts outstanding at period end. Gains or losses are recorded for financial statement purposes as unrealized until settlement date. Risks may arise upon entering into these contracts from the potential inability of counterparties to meet the terms of their contracts and from unanticipated movements in the value of a foreign currency relative to the U.S. dollar. At March, 31 2009, there were no open forward foreign currency contracts.
e. Futures Contracts. The Funds may enter into futures contracts. A futures contract is an agreement between two parties to buy and sell a particular commodity, instrument or index (e.g., an interest-bearing security) for a specified price on a specified future date.
When a Fund enters into a futures contract, it is required to deposit with (or for the benefit of) its broker as “initial margin” an amount of cash or short-term high-quality securities (such as U.S. Treasury bills or high-quality tax exempt bonds acceptable to the broker). As the value of the contract changes, the value of the futures contract position increases or declines. Subsequent payments, known as “variation margin”, are made or received by a Fund, depending on the price fluctuations in the fair value of the contract and the value of the collateral held. The aggregate principal amounts of the contracts are not recorded in the financial statements. Fluctuations in the value of the contracts are recorded in the Statement of Assets and Liabilities as an asset (liability) and in the Statement of Operations as unrealized appreciation (depreciation) until the contracts are closed, when they are recorded as realized gains (losses). Realized gain or loss on a futures position is equal to the difference between the value of the contract at the time it was opened and the value at the time it was closed, minus brokerage commissions. When a Fund enters into a futures contract, certain risks may arise, such as illiquidity in the futures market, which may limit a Fund’s ability to close out a futures contract prior to settlement date, and unanticipated movements in the value of securities or interest rates.
f. Federal and Foreign Income Taxes. The Trust treats each Fund as a separate entity for federal income tax purposes. Each Fund intends to meet the requirements of the Internal Revenue Code applicable to regulated investment companies, and to distribute to its shareholders substantially all of its net investment income and any net realized capital gains at least annually. Management has performed an analysis of each Fund’s tax positions taken on federal and state tax returns that remain subject to examination (tax years ended September 30, 2005—2008), where applicable, and has concluded that no provisions for income tax are required. Fund management is not aware of any events that are reasonably possible to occur in the next six months that would result in the amounts of any unrecognized tax benefits significantly increasing or decreasing for the Funds. However, management’s conclusions regarding tax positions taken may be subject to review and adjustment at a later date based on factors including, but not limited to, new tax laws and accounting regulations and interpretations thereof.
32
NOTES TO FINANCIAL STATEMENTS – continued
March 31, 2009 (Unaudited)
The High Income Opportunities Fund may be subject to foreign taxes on income and gains on investments that are accrued based upon the Fund’s understanding of the tax rules and regulations that exist in the countries in which the Fund invests. Foreign governments may also impose taxes or other payments on investments with respect to foreign securities. Such taxes are accrued as applicable, and are reflected as foreign tax payable on the Statement of Assets and Liabilities.
g. Dividends and Distributions to Shareholders. Dividends and distributions are recorded on ex-dividend date. The timing and characterization of certain income and capital gain distributions are determined annually in accordance with federal tax regulations, which may differ from accounting principles generally accepted in the United States of America. Permanent differences are primarily due to differing treatments for book and tax purposes for items such as premium amortization and paydown gains and losses. Permanent book and tax basis differences relating to shareholder distributions will result in reclassifications to capital accounts. Temporary differences between book and tax distributable earnings are primarily due to defaulted bond income accruals, premium amortization accruals, securities lending collateral gain/loss adjustments, wash sales and futures contracts marked to market. Distributions from net investment income and short-term capital gains are considered to be distributed from ordinary income for tax purposes.
The tax characterization of distributions is determined on an annual basis. The tax character of distributions paid to shareholders during the year ended September 30, 2008 was as follows:
| | | | | | | | | |
| | | 2008 Distributions Paid From: |
| Fund | | Ordinary
Income | | Long-Term
Capital Gains | | Total |
High Income Opportunities Fund | | $ | 7,183,035 | | $ | 174,077 | | $ | 7,357,112 |
Securitized Asset Fund | | | 20,848,572 | | | — | | | 20,848,572 |
Differences between these amounts and those reported in the Statements of Changes in Net Assets, if any, are primarily attributable to different book and tax treatment for short-term capital gains.
As of September 30, 2008, the post-October losses were as follows:
| | | | | | | |
| | | High Income
Opportunities Fund | | Securitized
Asset Fund | |
Deferred net capital losses (post-October 2007) | | $ | — | | $ | (3,534,625 | ) |
| | | | | | | |
h. Repurchase Agreements. It is each Fund’s policy that the market value of the collateral for repurchase agreements be at least equal to 100% of the repurchase price, including interest. Certain repurchase agreements are tri-party arrangements whereby the collateral is held in a segregated account for the benefit of the Fund and on behalf of the counterparty. It is each Fund’s policy, regarding tri-party arrangements, that the market value of the collateral be at least equal to 102% of the repurchase price, including interest. Repurchase agreements could involve certain risks in the event of default or insolvency of the counterparty including possible delays or restrictions upon a Fund’s ability to dispose of the underlying securities.
i. Delayed Delivery Commitments. Certain transactions, such as futures and forward transactions, or purchases of when-issued or delayed delivery instruments may have a similar effect on a Fund’s net asset value as if the Fund had created a degree of leverage in its portfolio. The price of the underlying instruments and the date when they will be paid for are fixed at the time the transaction is negotiated. If a Fund enters into such a transaction, collateral consisting of liquid securities or cash and cash equivalents will be maintained in an amount at least equal to the commitment with the custodian and/or broker. Losses may arise due to changes in the market value of the underlying instruments or if the counterparty does not perform under the contract.
j. Securities Lending. The Funds have entered into an agreement with State Street Bank and Trust Company (“State Street Bank”), as agent of the Funds, to lend securities to certain designated borrowers. The loans are collateralized with cash or securities in an amount equal to at least 105% or 102% of the market value (including accrued interest) of the loaned international or domestic securities, respectively, when the loan is initiated. Thereafter, the value of the collateral must remain at least 102% of the market value (including accrued interest) of loaned securities for U.S. equities and U.S. corporate debt; at least 105% of the market value (including accrued interest) of loaned securities for non-U.S. equities; and at least 100% of the market value (including accrued interest) of loaned securities for U.S. government securities, sovereign debt issued by non-U.S. governments and non-U.S. corporate debt. In the event that the market value of the collateral falls below the required percentages described above, the borrower will deliver additional collateral on the next business day. As with other extensions of credit, the Funds bear
33
the risk of loss with respect to the investment of the collateral. The Funds invest cash collateral in short-term investments, a portion of the income from which is remitted to the borrowers and the remainder allocated between the Funds and State Street Bank as lending agent.
As of March, 31, 2009, there were no securities on loan.
k. Indemnifications. Under the Trust’s organizational documents, its officers and Trustees are indemnified against certain liabilities arising out of the performance of their duties to the Funds. Additionally, in the normal course of business, the Funds enter into contracts with service providers that contain general indemnification clauses. The Funds’ maximum exposure under these arrangements is unknown as this would involve future claims that may be made against the Funds that have not yet occurred. However, based on experience, the Funds expect the risk of loss to be remote.
l. New Accounting Pronouncement. In March 2008, Statement of Financial Accounting Standards No. 161, Disclosures about Derivative Instruments and Hedging Activities (“FAS 161”), was issued and is effective for fiscal years and interim periods beginning after November 15, 2008. FAS 161 requires enhanced disclosures about funds’ derivative and hedging activities. Management is currently evaluating the impact the adoption of FAS 161 may have on the Funds’ financial statement disclosures.
3. Fair Value Measurements. The Funds adopted Financial Accounting Standards Board Statement of Financial Accounting Standards No. 157 (“FAS 157”), Fair Value Measurements, effective October 1, 2008. FAS 157 establishes a hierarchy for net asset value determination purposes in which various inputs are used in determining the value of each Fund’s investments. These inputs are summarized in the three broad levels listed below:
| | • | | Level 1—quoted prices in active markets for identical investments; |
| | • | | Level 2—prices determined using other significant observable inputs that are observable either directly, or indirectly through corroboration with observable market data (which could include quoted prices for similar investments, interest rates, credit risk, etc.); |
| | • | | Level 3—prices determined using significant unobservable inputs for situations where quoted prices or observable inputs are unavailable such as when there is little or no market activity for an investment (unobservable inputs reflect each Fund’s own assumptions in determining the fair value of investments and would be based on the best information available). |
The inputs or methodology used for valuing securities are not necessarily an indication of the risk associated with investing in those securities.
Other financial instruments are derivative instruments not reflected in investments carried at value and may include such instruments as futures contracts and forward contracts, which are valued at the unrealized appreciation (depreciation) on the instrument.
The following is a summary of the inputs used to value the Funds’ investments as of March 31, 2009:
High Income Opportunities Fund
| | | |
Valuation Inputs | | Investments in
Securities |
Level 1—Quoted Prices | | $ | 1,229,397 |
Level 2—Other Significant Observable Inputs | | | 47,988,658 |
Level 3—Significant Unobservable Inputs | | | 4,944,844 |
| | | |
Total | | $ | 54,162,899 |
| | | |
Securitized Asset Fund
| | | |
Securities Purchased Valuation Inputs | | Investments in
Securities |
Level 1—Quoted Prices | | $ | 3,694,060 |
Level 2—Other Significant Observable Inputs | | | 355,685,579 |
Level 3—Significant Unobservable Inputs | | | 12,614,402 |
| | | |
Total | | $ | 371,994,041 |
| | | |
34
NOTES TO FINANCIAL STATEMENTS – continued
March 31, 2009 (Unaudited)
| | | | |
Futures Valuation Inputs | | Other Financial
Instruments | |
Level 1—Quoted Prices | | $ | (592,328 | ) |
Level 2—Other Significant Observable Inputs | | | — | |
Level 3—Significant Unobservable Inputs | | | — | |
| | | | |
Total | | $ | (592,328 | ) |
| | | | |
The following is a reconciliation of Level 3 investments for which significant unobservable inputs were used to determine fair value as of March 31, 2009:
High Income Opportunities Fund
| | | | |
Assets | | Investments in
Securities | |
Balance as of September 30, 2008 | | $ | 1,452,450 | |
Realized gain (loss) | | | (1,097,260 | ) |
Change in unrealized appreciation (depreciation)(a) | | | (2,187,998 | ) |
Net purchases (sales) | | | 693,510 | |
Net reclassifications to/from Level 3 | | | 6,084,142 | |
| | | | |
Balance as of March 31, 2009 | | $ | 4,944,844 | |
| | | | |
Securitized Asset Fund
| | | | |
Assets | | Investments in
Securities | |
Balance as of September 30, 2008 | | $ | 7,255,476 | |
Realized gain (loss) | | | 92,768 | |
Change in unrealized appreciation (depreciation)(a) | | | (5,345,660 | ) |
Net purchases (sales) | | | 2,784,122 | |
Net reclassifications to/from Level 3 | | | 7,827,696 | |
| | | | |
Balance as of March 31, 2009 | | $ | 12,614,402 | |
| | | | |
| (a) | Change in unrealized appreciation (depreciation) is included in net change in unrealized appreciation (depreciation) on investments within the Statement of Operations |
In April 2009, the Financial Accounting Standards Board (“FASB”) issued FASB Staff Position No. 157-4, Determining Fair Value When the Volume and Level of Activity for the Asset or Liability Have Significantly Decreased and Identifying Transactions That Are Not Orderly (“FSP 157-4”). FSP 157-4 provides additional guidance for estimating fair value in accordance with FAS 157, when the volume and level of activity for the asset or liability have significantly decreased as well as guidance on identifying circumstances that indicate a transaction is not orderly. FSP 157-4 is effective for fiscal years and interim periods ending after June 15, 2009. Management is currently evaluating the impact the adoption of FSP 157-4 will have on the Funds’ financial statement disclosures.
4. Purchases and Sales of Securities. For the six months ended March 31, 2009, purchases and sales of securities (excluding short-term investments and including paydowns) were as follows:
| | | | | | | | | | | | |
| | | U.S. Government/Agency Securities | | Other Securities |
Fund | | Purchases | | Sales | | Purchases | | Sales |
High Income Opportunities Fund | | $ | — | | $ | — | | $ | 9,590,084 | | $ | 10,909,315 |
Securitized Asset Fund | | | 910,965,453 | | | 1,103,575,422 | | | 18,877,578 | | | 14,107,550 |
5. Management Fees and Other Transactions with Affiliates.
a. Management Fees. Loomis Sayles has agreed to pay, without reimbursement from the Funds or the Trust, the following expenses of the Funds: compensation to Trustees of the Trust who are not “interested persons” (as defined in the 1940 Act) of the Trust; registration, filing and other fees in connection with requirements of regulatory authorities; the charges and expenses of any entity appointed by the Funds for custodial, paying agent, shareholder servicing and plan agent services; charges and expenses of the independent registered public accounting firm retained by the Funds; charges and expenses of any transfer agents and registrars appointed by the Funds; any cost of certificates representing shares of the Funds; legal fees and expenses in connection with the
35
day-to-day affairs of the Funds, including registering and qualifying its shares with Federal and State regulatory authorities; expenses of meetings of shareholders and Trustees of the Trust; the costs of services, including services of counsel, required in connection with the preparation of the Funds’ registration statements and prospectuses, including amendments and revisions thereto, annual, semi-annual and other periodic reports of the Funds, and notices and proxy solicitation material furnished to shareholders of the Funds or regulatory authorities, and any costs of printing or mailing these items; and the Funds’ expenses of bookkeeping, accounting and financial reporting, including related clerical expenses.
Loomis Sayles serves as investment adviser to each Fund. Under the terms of each management agreement, Loomis Sayles does not charge the Funds an investment advisory fee, also known as a management fee, or any other fee for those services or for bearing those expenses. Although the Funds do not compensate Loomis Sayles directly for services under the advisory agreement, Loomis Sayles will typically receive an advisory fee from the sponsors of “wrap programs,” who in turn charge the programs’ participants.
Certain officers and employees of Loomis Sayles are also officers or Trustees of the Trust. Loomis Sayles’ general partner is indirectly owned by Natixis Global Asset Management, L.P. (“Natixis US”), which is part of Natixis Global Asset Management, an international asset management group based in Paris, France.
b. Administrative Fees. Natixis Advisors provides certain administrative services for the Funds and subcontracts with State Street Bank to serve as sub-administrator. Natixis Advisors is a wholly-owned subsidiary of Natixis US. Loomis Sayles has agreed to pay, without reimbursement from the Trust or Funds, fees to Natixis Advisors for services to the Funds under each agreement.
c. Service and Distribution Fees. The Trust has entered into a distribution agreement with Natixis Distributors, L.P. (“Natixis Distributors”), a wholly-owned subsidiary of Natixis US. Pursuant to this agreement, Natixis Distributors serves as principal underwriter of the Funds. Natixis Distributors currently is not paid a fee for serving as distributor for the Funds. Loomis Sayles has agreed to reimburse Natixis Distributors to the extent that Natixis Distributors incurs expenses in connection with any redemption of Fund shares.
d. Trustees Fees and Expenses. The Funds do not pay any compensation directly to their officers or Trustees who are directors, officers or employees of Natixis Advisors, Natixis Distributors, Natixis US, or their affiliates. The Chairperson of the Board receives a retainer fee at the annual rate of $200,000. The Chairperson does not receive any meeting attendance fees for Board of Trustees meetings or committee meetings that she attends. Each Independent Trustee (other than the Chairperson) receives, in the aggregate, a retainer fee at the annual rate of $65,000. Each Independent Trustee also receives a meeting attendance fee of $7,500 for each meeting of the Board of Trustees that he or she attends in person and $3,750 for each meeting of the Board of Trustees that he or she attends telephonically. In addition, each committee chair receives an additional retainer fee at the annual rate of $10,000. Each Contract Review and Governance Committee member is compensated $5,000 for each Committee meeting that he or she attends in person and $2,500 for each meeting that he or she attends telephonically. Each Audit Committee member is compensated $6,250 for each Committee meeting that he or she attends in person and $3,125 for each meeting that he or she attends telephonically. These fees are allocated among the funds in Natixis Funds Trust I, Natixis Funds Trust II, Natixis Funds Trust III, Natixis Funds Trust IV, Natixis Cash Management Trust, Gateway Trust (“Natixis Funds Trusts”), Loomis Sayles Funds I, Loomis Sayles Funds II (“Loomis Sayles Funds Trusts”) and the Hansberger International Series based on a formula that takes into account, among other factors, the relative net assets of each Fund. Trustees are reimbursed for travel expenses in connection with attendance at meetings. Loomis Sayles has agreed to pay the pro rata portion of Trustees fees and expenses for each Fund, without reimbursement from the Trust or Funds.
6. Line of Credit. Each Fund, together with certain other funds of Natixis Funds Trusts, Loomis Sayles Funds Trusts and the Hansberger International Series, participates in a $200,000,000 committed line of credit provided by State Street Bank, with an individual limit of $125,000,000 for each fund that participates in the line of credit. Interest is charged to each participating fund based on its borrowings at a rate per annum equal to the greater of the Federal Funds rate or overnight LIBOR, plus 0.75%. In addition, a commitment fee of 0.125% per annum, payable at the end of each calendar quarter, is accrued and apportioned among the participating funds based on their average daily unused portion of the line of credit.
Prior to March 11, 2009, each Fund, together with certain other funds of Natixis Funds Trusts, Loomis Sayles Funds Trusts and Hansberger International Series, participated in a $200,000,000 committed line of credit provided by State Street Bank, with an individual limit of $125,000,000 for each fund that participated in the line of credit. Interest was charged to each participating fund based on its borrowings at a rate per annum equal to the Federal Funds rate plus 0.50%. In addition, a commitment fee of 0.09% per annum, payable at the end of each calendar quarter, was accrued and apportioned among the participating funds based on their average daily unused portion of the line of credit.
36
NOTES TO FINANCIAL STATEMENTS – continued
March 31, 2009 (Unaudited)
For the six months ended March 31, 2009, the Funds had no borrowings under these agreements.
7. Shareholders. At March 31, 2009, five shareholders individually owned more than 5% of the High Income Opportunities Fund’s total outstanding shares, representing, in aggregate, 42.72% of the Fund.
8. Capital Shares. Each Fund may issue an unlimited number of shares of beneficial interest, without par value. Transactions in capital shares were as follows:
| | | | | | | | | | | | | | |
| | | High Income Opportunities Fund | |
| | |
| | | Six Months Ended March 31, 2009 | | | Year Ended September 30, 2008 | |
| | | | |
| | | Shares | | | Amount | | | Shares | | | Amount | |
Issued from the sale of shares | | 1,620,809 | | | $ | 10,732,584 | | | 1,980,419 | | | $ | 19,260,155 | |
Issued in connection with the reinvestment of distributions | | 300,200 | | | | 1,998,678 | | | 380,809 | | | | 3,709,039 | |
Redeemed | | (1,418,507 | ) | | | (9,511,574 | ) | | (2,571,913 | ) | | | (23,284,030 | ) |
| | | | | | | | | | | | | | |
Increase (decrease) from capital share transactions | | 502,502 | | | $ | 3,219,688 | | | (210,685 | ) | | $ | (314,836 | ) |
| | | | | | | | | | | | | | |
| |
| | | Securitized Asset Fund | |
| | |
| | | Six Months Ended March 31, 2009 | | | Year Ended September 30, 2008 | |
| | | | |
| | | Shares | | | Amount | | | Shares | | | Amount | |
Issued from the sale of shares | | 5,426,181 | | | $ | 48,666,374 | | | 14,774,496 | | | $ | 146,455,592 | |
Issued in connection with the reinvestment of distributions | | 84,387 | | | | 736,685 | | | 20,764 | | | | 205,641 | |
Redeemed | | (15,120,121 | ) | | | (135,986,898 | ) | | (9,456,660 | ) | | | (93,767,437 | ) |
| | | | | | | | | | | | | | |
Increase (decrease) from capital share transactions | | (9,609,553 | ) | | $ | (86,583,839 | ) | | 5,338,600 | | | $ | 52,893,796 | |
| | | | | | | | | | | | | | |
37
Not applicable.
| Item 3. | Audit Committee Financial Expert. |
Not applicable.
| Item 4. | Principal Accountant Fees and Services. |
Not applicable.
| Item 5. | Audit Committee of Listed Registrants. |
Not applicable.
| Item 6. | Schedule of Investments. |
Included as part of the Report to Shareholders filed as Item 1 herewith.
| Item 7. | Disclosure of Proxy Voting Policies and Procedures for Closed-End Management Investment Companies. |
Not applicable.
| Item 8. | Portfolio Managers of Closed-End Management Investment Companies. |
Not applicable.
| Item 9. | Purchases of Equity Securities by Closed-End Management Investment Companies and Affiliated Purchasers. |
Not applicable.
| Item 10. | Submission of Matters to a Vote of Securities Holders. |
There were no material changes to the procedures by which shareholders may recommend nominees to the Trust’s Board of Trustees.
| Item 11. | Controls and Procedures. |
The Registrant’s principal executive officer and principal financial officer have concluded that the Registrant’s disclosure controls and procedures are sufficient to ensure that information required to be disclosed by the Registrant in this Form N-CSR was recorded, processed, summarized and reported within the time periods specified in the Securities and Exchange Commission’s rules and forms, based upon such officers’ evaluation of these controls and procedures as of a date within 90 days of the filing date of the report.
There was no change in the Registrant’s internal control over financial reporting that occurred during the Registrant’s last fiscal quarter of the period covered by the report that has materially affected, or is reasonably likely to materially affect, the Registrant’s internal control over financial reporting.
| | | | |
| (a) | | (1) | | Not applicable. |
| (a) | | (2) | | Certifications of Principal Executive Officer and Principal Financial Officer pursuant to Rule 30a-2(a) under the Investment Company Act of 1940 (17 CFR 270.30a-2(a)), filed herewith as Exhibits (a)(2)(1) and (a)(2)(2), respectively. |
| (a) | | (3) | | Not applicable. |
| (b) | | | | Certifications of Principal Executive Officer and Principal Financial Officer pursuant to Section 906 of Sarbanes-Oxley Act of 2002 are filed herewith as Exhibit (b). |
SIGNATURES
Pursuant to the requirements of the Securities Exchange Act of 1934 and the Investment Company Act of 1940, the Registrant has duly caused this report to be signed on its behalf by the undersigned, thereunto duly authorized.
| | |
| Loomis Sayles Funds I |
| |
| By: | | /s/ Robert J. Blanding |
| |
Name: Title: Date: | | Robert J. Blanding President and Chief Executive Officer May 27, 2009 |
Pursuant to the requirements of the Securities Exchange Act of 1934 and the Investment Company Act of 1940, this report has been signed by the following persons on behalf of the Registrant and in the capacities and on the dates indicated.
| | |
| By: | | /s/ Robert J. Blanding |
| |
Name: Title: Date: | | Robert J. Blanding President and Chief Executive Officer May 27, 2009 |
| | |
| |
| By: | | /s/ Michael C. Kardok |
| |
Name: Title: Date: | | Michael C. Kardok Treasurer May 27, 2009 |