UNITED STATES
SECURITIES AND EXCHANGE COMMISSION
Washington, D.C. 20549
FORM N-CSR
CERTIFIED SHAREHOLDER REPORT OF REGISTERED
MANAGEMENT INVESTMENT COMPANIES
Investment Company Act file number: 811-08282
Loomis Sayles Funds I
(Exact name of Registrant as specified in charter)
| 888 Boylston Street, Suite 800 Boston, Massachusetts | 02199-8197 | |
| (Address of principal executive offices) | (Zip code) |
Susan McWhan Tobin, Esq.
Natixis Distribution, LLC
888 Boylston Street, Suite 800
Boston, Massachusetts 02199-8197
(Name and address of agent for service)
Registrant’s telephone number, including area code: (617) 449-2139
Date of fiscal year end: December 31
Date of reporting period: December 31, 2022
Item 1. Reports to Stockholders.
| (a) | The Registrant’s annual report transmitted to shareholders pursuant to Rule 30e-1 under the Investment Company Act of 1940 is as follows: |

Loomis Sayles Bond Fund
Loomis Sayles Investment Grade Fixed Income Fund
Annual Report
December 31, 2022
| TABLE OF CONTENTS | ||||
| Portfolio Review | 1 | |||
| Portfolio of Investments | 9 | |||
| Financial Statements | 39 | |||
| Notes to Financial Statements | 47 | |||

| Managers | Symbols | |||
| Matthew J. Eagan, CFA® | Institutional Class | LSBDX | ||
| Brian P. Kennedy | Retail Class | LSBRX | ||
| Elaine M. Stokes | Admin Class | LBFAX | ||
| Class N | LSBNX | |||
Investment Objective
The Fund’s investment objective is high total investment return through a combination of current income and capital appreciation.
Market Conditions
The global bond market suffered pronounced weakness in 2022. Coming into the year, investors were already on edge as the investment community slowly began to understand that inflation would not be as “transitory” as initially expected. The outlook grew even more challenging after Russia’s invasion of Ukraine caused a jump in commodity prices and additional disruptions in global supply chains. Consumer price inflation (CPI) further increased as a result, with year-over-year gains of more than 8% in each monthly report of the second quarter. Inflation stayed elevated for the rest of the year before showing signs of cooling in the fourth quarter. Still, CPI remained above 6% through the last three quarters of the year, well above the US Federal Reserve’s (Fed’s) 2% target.
These developments prompted the Fed and other major central banks to tighten monetary policy aggressively. The Fed, in addition to ending its stimulative quantitative easing policy, raised interest rates at seven consecutive meetings from March onward. The benchmark fed funds rate, which stood in a range of 0% to 0.25% at the start of 2022, finished the year at 4.25% to 4.50%. This represented the most aggressive increase in short-term rates since the early 1980s.
The backdrop of high inflation and rising rates weighed heavily on US Treasuries. The yield on the two-year note surged from 0.39% to 4.41% over the course of 2022, while the 10-year yield climbed from 1.44% to 3.88%. The Treasury market suffered its second consecutive year of negative returns in 2022 – the first time this has happened since 1958–59. One result of these moves was that the yield curve inverted significantly (meaning that short-term yields traded above those on longer-term debt), an unusual event that typically precedes a recession.
Investment grade corporate bonds posted a double-digit loss and lagged US Treasuries. In addition to suffering from the uptrend in prevailing yields, corporates experienced a large increase in yield spreads relative to government debt. Rising spreads were the result of investors’ declining appetite for risk and concerns about the impact slowing economic growth could have on corporations’ earnings and balance sheets.
High yield bonds, while finishing 2022 in the red, outperformed US Treasuries and other segments of the investment grade market. The category was helped by its higher income, lower interest rate sensitivity, and a relatively large representation of the energy sector. Senior loans, which experienced elevated demand due to their floating rate feature, were the best-performing segment of the fixed income market for the year with a return just below the break-even mark.
Securitized assets – including agency mortgage-backed securities (MBS), asset-backed securities (ABS), and commercial mortgage-backed securities (CMBS) – posted negative total returns but outperformed the broader US bond market due to the category’s shorter duration (lower interest rate sensitivity). ABS, particularly credit card and auto ABS, were the strongest performers among securitized assets due to their higher quality, better liquidity, and shorter duration.
Emerging market bonds underperformed the US due to the combination of growth fears, investors’ increased aversion to risk, the conflict in Ukraine, and negative headlines out of China. US-based investors were also hurt by a meaningful decline in emerging market currencies in relation to the US dollar.
Performance Results
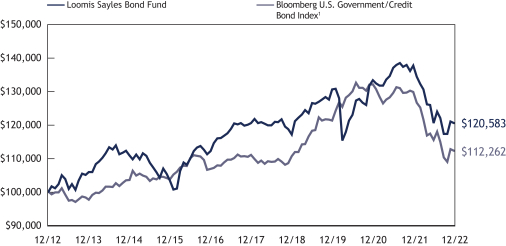
For the 12 months ended December 31, 2022, Institutional Class shares of the Loomis Sayles Bond Fund returned -12.49% at net asset value. The Fund outperformed its benchmark, the Bloomberg U.S. Government/Credit Bond Index, which returned -13.58%.
Explanation of Fund Performance
Despite an extremely challenging year for fixed income markets, the Fund posted positive relative returns versus its benchmark. Yield curve positioning was the primary source of outperformance. The Fund has been targeting an overall duration shorter than that of the benchmark, which has been a positive contributor given the sharp upward movement in interest rates. We utilized Treasury futures to assist with meeting this objective. We have added back duration over the course of the year, but on a relative basis, remain short versus the benchmark. Securitized credit was also beneficial given the sector’s shorter duration profile. Here, holdings in asset-backed securities (ABS) and collateralized loan obligations (CLOs) aided returns. An allocation to equities was also positive for relative returns. For equities, the team has employed a basket approach – seeking a diversified allocation that provides attractive dividend yields and capital appreciation potential versus fixed income. This exposure was reduced during the year as fixed income yields increased. Finally, performance was aided by defensive, reserve-like positions as risk-off sentiment prevailed.
1 |
Exposure to high yield credit was the primary source of underperformance for the Fund. High yield has lagged as aggressive central bank policy and an increasingly slower growth outlook have put pressure on risk assets. In addition, a handful of our higher conviction positions, particularly in the communications sector, have underperformed the broader market. The team’s investment thesis for these higher conviction positions started to play out in the second half of the year, but was not enough to offset the drawdown experienced earlier in the period. An allocation to emerging market credit was also a detractor of relative returns, with holdings in Chinese property developers as the main sources of underperformance. Extended Covid-related lockdowns in China had exacerbated already-declining housing sales and government measures taken thus far to alleviate stresses on this sector had been limited, resulting in further bond price erosion. More recently, however, we have started to see coordinated efforts here as Chinese authorities release rounds of policies to support the property sector. Finally, convertible securities weighed on returns given the tumultuous equity market backdrop. Here, selected communications holdings were performance laggards.
Outlook
Initial inflation data in the beginning of the fourth quarter of 2022 came in above expectations; however, subsequent readings were moderately positive, suggesting we may have passed peak inflation. The positive news appeared to usher in optimism that perhaps the Fed’s aggressive rate hiking cycle is finally working to bring inflation down. As we moved closer to the potential peak in Fed policy, risk assets stabilized and spreads on investment grade and high yield corporates finished the quarter at tighter levels.
In our view, the credit cycle1 is firmly in the late cycle stage and the risk of downturn has become more balanced. We expect growth to continue to trend lower as manufacturing and housing metrics have deteriorated; however, in our view the US consumer appears on solid footing, maintaining strong levels of excess savings and continuing to spend at a healthy rate. Labor markets remain tight. We’ve observed higher wages, cost of living adjustments, an elevated number of job openings and employers who are reluctant to shed workers in industries where they may have trouble getting them back, which could help to support consumer confidence. We believe a healthy consumer combined with positive corporate fundamentals and a strong banking system should help provide a floor to economic activity and support credit fundamentals to some degree.
While inflation has likely peaked and positive real rates should have the effect of slowing growth and rolling inflation down over time, we believe inflation will likely remain sticky and above the Fed’s target throughout 2023, primarily as result of wage pressure. We now believe much of the movement from the Fed has occurred or is currently being priced into the market, which in turn may also put a cap on the Treasury curve. We’re currently expecting an additional 50 bps of tightening in the first quarter of 2023, which would bring the policy rate up to 5.00% after the March meeting. In our view, the market continues to want to compress this cycle and lean towards a Fed pivot, but we believe inflation is structural at this point. We find it difficult for the Fed to begin cutting rates when inflation remains above their target. As a result, we’re anticipating a Fed pause after the March meeting which would likely extend into the latter stage of 2023. Throughout the year, the Fed will likely be driven by the extent to which there is firm evidence of inflation moderating, and at this point, we have not eliminated the possibility that the next Fed move could be a rate hike. We expect the US 10-year bond yield to move only modestly higher from here and we continue to be positioned defensively on rate risk, but to a lesser extent than earlier in 2022.
We believe that value has returned to US fixed income markets. Bond structures (price, yield and spread) appear relatively attractive. While corporate bond spreads in both investment grade and high yield are currently tighter than their long-term averages, we believe overall yields remain favorable post the 2008 Great Financial Crisis (GFC). Dollar prices on bonds are also currently at post-GFC lows. We believe the combination of discount-to-par and attractive yield could be increasing the potential value opportunity in bonds. We remain mindful of the risks to the global economy, such as tighter financial conditions, slowing Chinese growth, the Eastern Europe conflict, disruptions to the global supply chain and the lingering effects of the Covid pandemic. All of the turmoil around the world leaves us with a wide range of potential outcomes for growth, inflation, and central bank policy response. With the likelihood of downturn in 2023 rising, we have been holding larger than average liquid reserves and seeking to maintain an up-in-quality bias. If volatility increases and we see what we view as more attractive yields and spreads, we would consider redeploying reserves. At the same time, short-term yields have risen meaningfully and we are comfortable with how we are being compensated as we wait for opportunities to potentially develop.
| 1 | A credit cycle is a cyclical pattern that follows credit availability and corporate health. |
| 2
LOOMIS SAYLES BOND FUND
Hypothetical Growth of $100,000 Investment in Institutional Class Shares2
December 31, 2012 through December 31, 2022
Average Annual Total Returns — December 31, 20222
Life of | Expense Ratios3 | |||||||||||||||||||||||
1 Year | 5 Years | 10 Years | Class N | Gross | Net | |||||||||||||||||||
Institutional Class | -12.49 | % | 0.00 | % | 1.89 | % | — | % | 0.68 | % | 0.67 | % | ||||||||||||
Retail Class | -12.78 | -0.26 | 1.63 | — | 0.93 | 0.92 | ||||||||||||||||||
Admin Class | -12.91 | -0.49 | 1.39 | — | 1.16 | 1.15 | ||||||||||||||||||
Class N (Inception 2/1/13) | -12.46 | 0.05 | — | 1.78 | 0.61 | 0.61 | ||||||||||||||||||
Comparative Performance | ||||||||||||||||||||||||
Bloomberg U.S. Government/Credit Bond Index1 | -13.58 | 0.21 | 1.16 | 1.26 | ||||||||||||||||||||
Performance data shown represents past performance and is no guarantee of, and not necessarily indicative of, future results. Total return and value will vary, and you may have a gain or loss when shares are sold. Current performance may be lower or higher than quoted. For most recent month-end performance, visit loomissayles.com. Performance for other share classes will be greater or less than shown based on differences in fees and sales charges. You may not invest directly in an index. Performance for periods less than one year is cumulative, not annualized. Returns reflect changes in share price and reinvestment of dividends and capital gains, if any. The table(s) do not reflect taxes shareholders might owe on any fund distributions or when they redeem their shares.
| 1 | Bloomberg U.S. Government/Credit Bond Index is the non-securitized component of the U.S. Aggregate Index. The U.S. Government/Credit Bond Index includes investment grade, U.S. dollar-denominated, fixed rate Treasuries (i.e., public obligations of the U.S. Treasury that have remaining maturities of more than one year), government-related issues (i.e., agency, sovereign, supranational, and local authority debt), and corporate securities. The U.S. Government/Credit Index was launched on January 1, 1979, with index history backfilled to 1973, and is a subset of the U.S. Aggregate Index. |
| 2 | Fund performance has been increased by fee waivers and/or expense reimbursements, if any, without which performance would have been lower. |
| 3 | Expense ratios are as shown in the Fund’s prospectus in effect as of the date of this report. The expense ratios for the current reporting period can be found in the Financial Highlights section of this report under Ratios to Average Net Assets. Net expenses reflect contractual expense limitations set to expire on 4/30/23. When a Fund’s expenses are below the limitation, gross and net expense ratios will be the same. See Note 6 of the Notes to Financial Statements for more information about the Fund’s expense limitations. |
3 |
LOOMIS SAYLES INVESTMENT GRADE FIXED INCOME FUND
| Managers | Symbols | |||
| Matthew J. Eagan, CFA® | Institutional Class | LSIGX | ||
| Brian P. Kennedy | ||||
| Elaine M. Stokes | ||||
Investment Objective
The Fund’s investment objective is above-average total investment return through a combination of current income and capital appreciation.
Market Conditions
The global bond market suffered pronounced weakness in 2022. Coming into the year, investors were already on edge as the investment community slowly began to understand that inflation would not be as “transitory” as initially expected. The outlook grew even more challenging after Russia’s invasion of Ukraine caused a jump in commodity prices and additional disruptions in global supply chains. Consumer price inflation (CPI) further increased as a result, with year-over-year gains of more than 8% in each monthly report of the second quarter. Inflation stayed elevated for the rest of the year before showing signs of cooling in the fourth quarter. Still, CPI remained above 6% through the last three quarters of the year, well above the US Federal Reserve’s (Fed’s) 2% target.
These developments prompted the Fed and other major central banks to tighten monetary policy aggressively. The Fed, in addition to ending its stimulative quantitative easing policy, raised interest rates at seven consecutive meetings from March onward. The benchmark fed funds rate, which stood in a range of 0% to 0.25% at the start of 2022, finished the year at 4.25% to 4.50%. This represented the most aggressive increase in short-term rates since the early 1980s.
The backdrop of high inflation and rising rates weighed heavily on US Treasuries. The yield on the two-year note surged from 0.39% to 4.41% over the course of 2022, while the 10-year yield climbed from 1.44% to 3.88%. The Treasury market suffered its second consecutive year of negative returns in 2022 – the first time this has happened since 1958–59. One result of these moves was that the yield curve inverted significantly (meaning that short-term yields traded above those on longer-term debt), an unusual event that typically precedes a recession.
Investment grade corporate bonds posted a double-digit loss and lagged US Treasuries. In addition to suffering from the uptrend in prevailing yields, corporates experienced a large increase in yield spreads relative to government debt. Rising spreads were the result of investors’ declining appetite for risk and concerns about the impact slowing economic growth could have on corporations’ earnings and balance sheets.
High yield bonds, while finishing 2022 in the red, outperformed US Treasuries and other segments of the investment grade market. The category was helped by its higher income, lower interest rate sensitivity, and a relatively large representation of the energy sector. Senior loans, which experienced elevated demand due to their floating rate feature, were the best-performing segment of the fixed income market for the year with a return just below the break-even mark.
Securitized assets – including agency mortgage-backed securities (MBS), asset-backed securities (ABS), and commercial mortgage-backed securities (CMBS) – posted negative total returns but outperformed the broader US bond market due to the category’s shorter duration (lower interest rate sensitivity). ABS, particularly credit card and auto ABS, were the strongest performers among securitized assets due to their higher quality, better liquidity, and shorter duration.
Emerging market bonds underperformed the US due to the combination of growth fears, investors’ increased aversion to risk, the conflict in Ukraine, and negative headlines out of China. US-based investors were also hurt by a meaningful decline in emerging market currencies in relation to the US dollar.
Performance Results
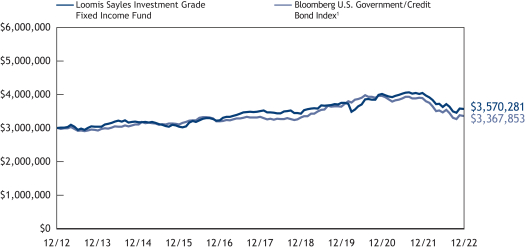
For the 12 months ended December 31, 2022, Institutional Class shares of the Loomis Sayles Investment Grade Fixed Income Fund returned -11.98% at net asset value. The Fund outperformed its benchmark, the Bloomberg U.S. Government/Credit Bond Index, which returned -13.58%.
Explanation of Fund Performance
Despite an extremely challenging year for fixed income markets, the Fund posted positive relative returns versus its benchmark. Yield curve positioning was the primary source of outperformance. The Fund has been targeting an overall duration shorter than that of the benchmark, which has been a positive contributor given the sharp upward movement in interest rates. We utilized Treasury futures to assist with meeting this objective. We have added back duration over the course of the year, but on a relative basis remain moderately short versus the benchmark. Securitized credit was a larger contributor given the sector’s shorter duration profile. Here, holdings in asset-backed securities (ABS) and collateralized loan obligations (CLOs) aided returns. An allocation to equities was also positive for relative returns. For equities, the team has employed a basket approach – seeking a diversified allocation that provides attractive dividend yields and capital appreciation potential versus
| 4
LOOMIS SAYLES INVESTMENT GRADE FIXED INCOME FUND
fixed income. This exposure was reduced during the year as fixed income yields increased. Finally, performance was aided by defensive, reserve-like positions as risk-off sentiment prevailed.
An allocation to emerging market credit was a detractor of relative returns, with holdings in Chinese property developers as the main sources of underperformance. Extended Covid-related lockdowns in China had exacerbated already-declining housing sales and government measures taken thus far to alleviate stresses on this sector had been limited, resulting in further bond price erosion. More recently, however, we have started to see coordinated efforts here as Chinese authorities release rounds of policies to support the property sector. Exposure to high yield was also a source of underperformance for the Fund. High yield has lagged as aggressive central bank policy and an increasingly slower growth outlook has put pressure on risk assets. In addition, a handful of our higher conviction positions, particularly in the communications sector, have underperformed the broader market. The team’s investment thesis for these higher conviction positions started to play out in the second half of the year but was not enough to offset the drawdown experienced earlier in the period.
Outlook
Initial inflation data in the beginning of the fourth quarter of 2022 came in above expectations; however, subsequent readings were moderately positive, suggesting we may have passed peak inflation. The positive news appeared to usher in optimism that perhaps the Fed’s aggressive rate hiking cycle is finally working to bring inflation down. As we moved closer to the potential peak in Fed policy, risk assets stabilized and spreads on investment grade and high yield corporates finished the quarter at tighter levels.
In our view, the credit cycle1 is firmly in the late cycle stage and the risk of downturn has become more balanced. We expect growth to continue to trend lower as manufacturing and housing metrics have deteriorated; however, in our view the US consumer appears on solid footing, maintaining strong levels of excess savings and continuing to spend at a healthy rate. Labor markets remain tight. We’ve observed higher wages, cost of living adjustments, an elevated number of job openings and employers who are reluctant to shed workers in industries where they may have trouble getting them back, which could help to support consumer confidence. We believe a healthy consumer combined with positive corporate fundamentals and a strong banking system should help provide a floor to economic activity and support credit fundamentals to some degree. While inflation has likely peaked and positive real rates should have the effect of slowing growth and rolling inflation down over time, we believe inflation will likely remain sticky and above the Fed’s target throughout 2023, primarily as result of wage pressure. We now believe much of the movement from the Fed has occurred or is currently being priced into the market, which in turn may also put a cap on the Treasury curve. We’re currently expecting an additional 50 bps of tightening in the first quarter of 2023, which would bring the policy rate up to 5.00% after the March meeting. In our view, the market continues to want to compress this cycle and lean towards a Fed pivot, but we believe inflation is structural at this point. We find it difficult for the Fed to begin cutting rates when inflation remains above their target. As a result, we’re anticipating a Fed pause after the March meeting which would likely extend into the latter stage of 2023. Throughout the year, the Fed will likely be driven by the extent to which there is firm evidence of inflation moderating, and at this point, we have not eliminated the possibility that the next Fed move could be a rate hike. We expect the US 10-year bond yield to move only modestly higher from here and we continue to be positioned defensively on rate risk, but to a lesser extent than earlier in 2022.
We believe that value has returned to US fixed income markets. Bond structures (price, yield and spread) appear relatively attractive. While corporate bond spreads in both investment grade and high yield are currently tighter than their long-term averages, we believe overall yields remain favorable post the 2008 Great Financial Crisis (GFC). Dollar prices on bonds are also currently at post-GFC lows. We believe the combination of discount-to-par and attractive yield could be increasing the potential value opportunity in bonds. We remain mindful of the risks to the global economy, such as tighter financial conditions, slowing Chinese growth, the Eastern Europe conflict, disruptions to the global supply chain and the lingering effects of the Covid pandemic. All of the turmoil around the world leaves us with a wide range of potential outcomes for growth, inflation, and central bank policy response. With the likelihood of downturn in 2023 rising, we have been holding larger than average liquid reserves and seeking to maintain an up-in-quality bias. If volatility increases and we see what we view as more attractive yields and spreads, we would consider redeploying reserves. At the same time, short-term yields have risen meaningfully and we are comfortable with how we are being compensated as we wait for opportunities to potentially develop.
| 1 | A credit cycle is a cyclical pattern that follows credit availability and corporate health. |
5 |
Hypothetical Growth of $3,000,000 Investment in Institutional Class Shares2
December 31, 2012 through December 31, 2022
Average Annual Total Returns — December 31, 20222
| Expense Ratios3 | ||||||||||||||||||||
1 Year | 5 Years | 10 Years | Gross | Net | ||||||||||||||||
Institutional Class | -11.98 | % | 0.36 | % | 1.75 | % | 0.52 | % | 0.52 | % | ||||||||||
Comparative Performance | ||||||||||||||||||||
Bloomberg U.S. Government/Credit Bond Index1 | -13.58 | 0.21 | 1.16 | |||||||||||||||||
Performance data shown represents past performance and is no guarantee of, and not necessarily indicative of, future results. Total return and value will vary, and you may have a gain or loss when shares are sold. Current performance may be lower or higher than quoted. For most recent month-end performance, visit loomissayles.com. Performance for other share classes will be greater or less than shown based on differences in fees and sales charges. You may not invest directly in an index. Performance for periods less than one year is cumulative, not annualized. Returns reflect changes in share price and reinvestment of dividends and capital gains, if any. The table(s) do not reflect taxes shareholders might owe on any fund distributions or when they redeem their shares.
| 1 | Bloomberg U.S. Government/Credit Bond Index is the non-securitized component of the U.S. Aggregate Index. The U.S. Government/Credit Bond Index includes investment grade, U.S. dollar-denominated, fixed-rate Treasuries (i.e., public obligations of the U.S. Treasury that have remaining maturities of more than one year), government-related issues (i.e., agency, sovereign, supranational, and local authority debt), and corporate securities. The U.S. Government/Credit Index was launched on January 1, 1979, with index history backfilled to 1973, and is a subset of the Bloomberg U.S. Aggregate Index. |
| 2 | Fund performance has been increased by fee waivers and/or expense reimbursements, if any, without which performance would have been lower. |
| 3 | Expense ratios are as shown in the Fund’s prospectus in effect as of the date of this report. The expense ratios for the current reporting period can be found in the Financial Highlights section of this report under Ratios to Average Net Assets. Net expenses reflect contractual expense limitations set to expire on 4/30/23. When a Fund’s expenses are below the limitation, gross and net expense ratios will be the same. See Note 6 of the Notes to Financial Statements for more information about the Fund’s expense limitations. |
| 6
ADDITIONAL INFORMATION
The views expressed in this report reflect those of the portfolio managers as of the dates indicated. The managers’ views are subject to change at any time without notice based on changes in market or other conditions. References to specific securities or industries should not be regarded as investment advice. Because the Fund is actively managed, there is no assurance that they will continue to invest in the securities or industries mentioned.
All investing involves risk, including the risk of loss. There is no assurance that any investment will meet its performance objectives or that losses will be avoided.
Additional Index Information
This document may contain references to third party copyrights, indexes, and trademarks, each of which is the property of its respective owner. Such owner is not affiliated with Natixis Investment Managers or any of its related or affiliated companies (collectively “Natixis Affiliates”) and does not sponsor, endorse or participate in the provision of any Natixis Affiliates services, funds or other financial products.
The index information contained herein is derived from third parties and is provided on an “as is” basis. The user of this information assumes the entire risk of use of this information. Each of the third party entities involved in compiling, computing or creating index information disclaims all warranties (including, without limitation, any warranties of originality, accuracy, completeness, timeliness, non-infringement, merchantability and fitness for a particular purpose) with respect to such information.
Proxy Voting Information
A description of the Fund’s proxy voting policies and procedures is available without charge upon request, by calling Loomis Sayles Funds at 800-633-3330; on the Fund’s website at www.loomissayles.com, and on the Securities and Exchange Commission’s (“SEC’s”) website at www.sec.gov. Information about how the Fund voted proxies relating to portfolio securities during the most recent 12-month period ended June 30 is available from the Fund’s website and the SEC’s website.
Quarterly Portfolio Schedules
The Loomis Sayles Funds file a complete schedule of portfolio holdings with the SEC for the first and third quarters of each fiscal year as an exhibit to its reports on Form N-PORT. The Funds’ Form N-PORT reports are available on the SEC’s website at www.sec.gov. First and third quarter schedules of portfolio holdings are also available at loomissayles.com. A hard copy may be requested from the Fund at no charge by calling 800-633-3330.
CFA® and Chartered Financial Analyst® are registered trademarks owned by the CFA Institute.
UNDERSTANDING YOUR FUND’S EXPENSES
As a mutual fund shareholder you incur two types of costs: (1) transaction costs, and (2) ongoing costs, including management fees, distribution and/or service fees (12b-1 fees), and other fund expenses. Certain exemptions may apply. These costs are described in more detail in the Fund’s prospectus. The following examples are intended to help you understand the ongoing costs of investing in the Fund and help you compare these with the ongoing costs of investing in other mutual funds.
The first line in the table for each class of Fund shares shows the actual amount of Fund expenses you would have paid on a $1,000 investment in the Fund from July 1, 2022 through December 31, 2022. To estimate the expenses you paid over the period, simply divide your account value by $1,000 (for example $8,600 account value divided by $1,000 = 8.6) and multiply the result by the number in the Expenses Paid During Period column as shown below for your class.
The second line in the table for each class of Fund shares provides information about hypothetical account values and hypothetical expenses based on the Fund’s actual expense ratios and an assumed rate of return of 5% per year before expenses, which is not the Fund’s actual return. The hypothetical account values and expenses may not be used to estimate the actual ending account balance or expenses you paid on your investment for the period. You may use this information to compare the ongoing costs of investing in the Fund to other funds. To do so, compare this 5% hypothetical example with the 5% hypothetical examples that appear in the shareholder reports of the other funds.
7 |
Please note that the expenses shown reflect ongoing costs only, and do not include any transaction costs. Therefore, the second line in the table is useful in comparing ongoing costs only, and will not help you determine the relative costs of owning different funds. If transaction costs were included, total costs would be higher.
Loomis Sayles Bond Fund
Institutional Class | Beginning Account Value 7/1/2022 | Ending Account Value 12/31/2022 | Expenses Paid During Period* 7/1/2022 – 12/31/2022 | |||||||||
Actual | $1,000.00 | $1,000.20 | $3.38 | |||||||||
Hypothetical (5% return before expenses) | $1,000.00 | $1,021.83 | $3.41 | |||||||||
Retail Class | ||||||||||||
Actual | $1,000.00 | $998.90 | $4.64 | |||||||||
Hypothetical (5% return before expenses) | $1,000.00 | $1,020.57 | $4.69 | |||||||||
Admin Class | ||||||||||||
Actual | $1,000.00 | $998.50 | $5.89 | |||||||||
Hypothetical (5% return before expenses) | $1,000.00 | $1,019.31 | $5.96 | |||||||||
Class N | ||||||||||||
Actual | $1,000.00 | $1,000.50 | $3.18 | |||||||||
Hypothetical (5% return before expenses) | $1,000.00 | $1,022.03 | $3.21 | |||||||||
* Expenses are equal to the Fund’s annualized expense ratio (after waiver/reimbursement): 0.67%, 0.92%, 1.17% and 0.63% for Institutional Class, Retail Class, Admin Class and Class N, respectively, multiplied by the average account value over the period, multiplied by the number of days in the most recent fiscal half-year (184), divided by 365 (to reflect the half-year period). |
| |||||||||||
Loomis Sayles Investment Grade Fixed Income Fund
Institutional Class | Beginning Account Value 7/1/2022 | Ending Account Value 12/31/2022 | Expenses Paid During Period* 7/1/2022 – 12/31/2022 | |||||||||
Actual | $1,000.00 | $983.70 | $2.70 | |||||||||
Hypothetical (5% return before expenses) | $1,000.00 | $1,022.48 | $2.75 | |||||||||
* Expenses are equal to the Fund’s annualized expense ratio of 0.54%, multiplied by the average account value over the period, multiplied by the number of days in the most recent fiscal half-year (184), divided by 365 (to reflect the half-year period). |
| |||||||||||
| 8
Portfolio of Investments – as of December 31, 2022
Loomis Sayles Bond Fund
Principal Amount | Description | Value (†) | ||||||
| Bonds and Notes – 91.0% of Net Assets | ||||||||
| Non-Convertible Bonds – 83.8% | ||||||||
| ABS Car Loan – 4.2% | ||||||||
| $ | 12,980,000 | American Credit Acceptance Receivables Trust, Series 2021-4, Class D, 1.820%, 2/14/2028, 144A | $ | 11,882,048 | ||||
| 3,685,000 | American Credit Acceptance Receivables Trust, Series 2022-1, Class D, 2.460%, 3/13/2028, 144A | 3,315,558 | ||||||
| 1,470,000 | American Credit Acceptance Receivables Trust, Series 2022-4, Class C, 7.860%, 2/15/2029, 144A | 1,488,599 | ||||||
| 13,000,000 | Avis Budget Rental Car Funding AESOP LLC, 3.040%, 3/20/2025, 144A | 12,164,594 | ||||||
| 1,680,000 | Avis Budget Rental Car Funding AESOP LLC, Series 2019-2A, Class C, 4.240%, 9/22/2025, 144A | 1,602,771 | ||||||
| 6,300,000 | Avis Budget Rental Car Funding AESOP LLC, Series 2019-3A, Class C, 3.150%, 3/20/2026, 144A | 5,776,735 | ||||||
| 3,880,000 | Avis Budget Rental Car Funding AESOP LLC, Series 2020-2A, Class C, 4.250%, 2/20/2027, 144A | 3,463,979 | ||||||
| 1,745,000 | Avis Budget Rental Car Funding AESOP LLC, Series 2021-1A, Class C, 2.130%, 8/20/2027, 144A | 1,450,524 | ||||||
| 3,470,000 | Avis Budget Rental Car Funding AESOP LLC, Series 2021-2A, Class C, 2.350%, 2/20/2028, 144A | 2,869,490 | ||||||
| 1,255,000 | CarMax Auto Owner Trust, Series 2022-1, Class D, 2.470%, 7/17/2028 | 1,092,192 | ||||||
| 6,243,116 | Carvana Auto Receivables Trust, Series 2021-N3, Class C, 1.020%, 6/12/2028 | 6,034,336 | ||||||
| 2,825,000 | Carvana Auto Receivables Trust, Series 2021-N4, Class C, 1.720%, 9/11/2028 | 2,696,611 | ||||||
| 6,410,000 | Carvana Auto Receivables Trust, Series 2021-N4, Class D, 2.300%, 9/11/2028 | 5,820,010 | ||||||
| 6,400,000 | Carvana Auto Receivables Trust, Series 2021-P3, Class C, 1.930%, 10/12/2027 | 5,095,489 | ||||||
| 3,032,000 | Carvana Auto Receivables Trust, 2.330%, 2/10/2028 | 2,492,395 | ||||||
| 4,020,000 | Credit Acceptance Auto Loan Trust, 1.630%, 9/16/2030, 144A | 3,624,334 | ||||||
| ABS Car Loan – continued | ||||||||
| $ | 8,080,000 | Credit Acceptance Auto Loan Trust, Series 2021-4, Class C, 1.940%, 2/18/2031, 144A | $ | 7,278,908 | ||||
| 3,680,000 | DT Auto Owner Trust, Series 2020-3A, Class C, 1.470%, 6/15/2026, 144A | 3,560,323 | ||||||
| 7,980,000 | DT Auto Owner Trust, Series 2021-4A, Class D, 1.990%, 9/15/2027, 144A | 7,014,524 | ||||||
| 11,340,000 | Exeter Automobile Receivables Trust, Series 2021-2A, Class D, 1.400%, 4/15/2027 | 10,360,902 | ||||||
| 15,295,000 | Exeter Automobile Receivables Trust, Series 2021-3A, Class D, 1.550%, 6/15/2027 | 13,880,347 | ||||||
| 2,010,000 | Exeter Automobile Receivables Trust, Series 2022-6A, Class C, 6.320%, 5/15/2028 | 2,010,915 | ||||||
| 2,820,000 | First Investors Auto Owner Trust, Series 2022-2A, Class D, 8.710%, 10/16/2028, 144A | 2,915,970 | ||||||
| 5,245,000 | Flagship Credit Auto Trust, Series 2021-2, Class D, 1.590%, 6/15/2027, 144A | 4,671,388 | ||||||
| 6,565,000 | Flagship Credit Auto Trust, Series 2021-3, Class D, 1.650%, 9/15/2027, 144A | 5,692,995 | ||||||
| 5,951,000 | Flagship Credit Auto Trust, Series 2021-4, Class C, 1.960%, 12/15/2027, 144A | 5,440,603 | ||||||
| 5,260,000 | Foursight Capital Automobile Receivables Trust, Series 2021-2, Class D, 1.920%, 9/15/2027, 144A | 4,763,089 | ||||||
| 8,425,000 | GLS Auto Receivables Issuer Trust, Series 2021-2A, Class D, 1.420%, 4/15/2027, 144A | 7,643,306 | ||||||
| 10,265,000 | GLS Auto Receivables Issuer Trust, Series 2021-3A, Class D, 1.480%, 7/15/2027, 144A | 9,179,605 | ||||||
| 16,820,000 | GLS Auto Receivables Issuer Trust, Series 2021-4A, Class D, 2.480%, 10/15/2027, 144A | 14,859,076 | ||||||
| 11,029,000 | Hertz Vehicle Financing III LLC, Series 2022-1A, 4.850%, 6/25/2026, 144A | 9,701,715 | ||||||
| 8,512,000 | Hertz Vehicle Financing III LLC, Series 2022-3A, 6.310%, 3/25/2025, 144A | 8,115,749 | ||||||
| 6,205,000 | Hertz Vehicle Financing LLC, Class D, Series 2022-4A, 6.560%, 9/25/2026, 144A | 5,719,515 | ||||||
| 1,814,743 | JPMorgan Chase Bank NA, Series 2021-3, Class D, 1.009%, 2/26/2029, 144A | 1,690,467 | ||||||
| 8,375,000 | Prestige Auto Receivables Trust, Series 2022-1A, Class D, 8.080%, 8/15/2028, 144A | 8,342,423 | ||||||
| 2,305,615 | Santander Bank NA, Series 2021-1A, Class B, 1.833%, 12/15/2031, 144A | 2,217,617 | ||||||
See accompanying notes to financial statements.
9 |
Portfolio of Investments – as of December 31, 2022
Loomis Sayles Bond Fund – continued
Principal Amount | Description | Value (†) | ||||||
| Bonds and Notes – continued | ||||||||
| ABS Car Loan – continued | ||||||||
| $ | 10,510,000 | Westlake Automobile Receivables Trust, Series 2021-3A, Class D, 2.120%, 1/15/2027, 144A | $ | 9,329,033 | ||||
|
| |||||||
| 215,258,135 | ||||||||
|
| |||||||
| ABS Credit Card – 0.1% | ||||||||
| 1,445,000 | Brex Commercial Charge Card Master Trust, Series 2021-1, Class A, 2.090%, 7/15/2024, 144A | 1,429,322 | ||||||
| 5,000,000 | Mercury Financial Credit Card Master Trust, Series 2021-1A, Class C, 4.210%, 3/20/2026, 144A | 4,573,401 | ||||||
| 1,245,000 | Mission Lane Credit Card Master Trust, Series 2021-A, Class B, 2.240%, 9/15/2026, 144A | 1,205,548 | ||||||
|
| |||||||
| 7,208,271 | ||||||||
|
| |||||||
| ABS Home Equity – 4.5% | ||||||||
| 10,690,423 | 510 Asset Backed Trust, Series 2021-NPL1, Class A1, 2.240%, 6/25/2061, 144A(a) | 9,752,542 | ||||||
| 12,850,000 | CAFL Issuer LLC, Series 2021-RTL1, Class A1, 2.239%, 3/28/2029, 144A(a) | 11,685,086 | ||||||
| 2,715,000 | CoreVest American Finance Trust, Series 2021-1, Class C, 2.800%, 4/15/2053, 144A | 2,088,553 | ||||||
| 4,647,000 | CoreVest American Finance Trust, Series 2021-2, Class C, 2.478%, 7/15/2054, 144A | 3,397,365 | ||||||
| 2,280,000 | CoreVest American Finance Trust, Series 2021-3, Class D, 3.469%, 10/15/2054, 144A | 1,723,985 | ||||||
| 16,825,792 | Credit Suisse Mortgage Trust, Series 2021-RPL4, Class A1, 1.796%, 12/27/2060, 144A(a) | 14,974,887 | ||||||
| 3,716,673 | Credit Suisse Mortgage Trust, Series 2021-RPL6, Class M2, 3.125%, 10/25/2060, 144A | 2,812,488 | ||||||
| 7,995,000 | FirstKey Homes Trust, Series 2021-SFR1, Class E1, 2.389%, 8/17/2038, 144A | 6,666,243 | ||||||
| 5,272,000 | FirstKey Homes Trust, Series 2021-SFR2, Class E1, 2.258%, 9/17/2038, 144A | 4,368,388 | ||||||
| 3,120,000 | FirstKey Homes Trust, Series 2021-SFR2, Class E2, 2.358%, 9/17/2038, 144A | 2,563,513 | ||||||
| 2,210,000 | FRTKL, Series 2021-SFR1, Class E1, 2.372%, 9/17/2038, 144A | 1,837,982 | ||||||
| 1,930,000 | FRTKL, Series 2021-SFR1, Class E2, 2.522%, 9/17/2038, 144A | 1,600,671 | ||||||
| 1,284,185 | Home Partners of America Trust, Series 2021-1, Class E, 2.577%, 9/17/2041, 144A | 980,525 | ||||||
| 12,687,594 | Home Partners of America Trust, Series 2021-2, Class E1, 2.852%, 12/17/2026, 144A | 10,354,585 | ||||||
| ABS Home Equity – continued | ||||||||
| $ | 6,348,658 | Home Partners of America Trust, Series 2021-2, Class E2, 2.952%, 12/17/2026, 144A | $ | 5,180,209 | ||||
| 1,783,620 | Legacy Mortgage Asset Trust, Series 2020-GS5, Class A1, 3.250%, 6/25/2060, 144A(a) | 1,754,606 | ||||||
| 7,921,840 | Legacy Mortgage Asset Trust, Series 2021-GS2, Class A1, 1.750%, 4/25/2061, 144A(a) | 7,160,480 | ||||||
| 2,595,718 | Legacy Mortgage Asset Trust, Series 2021-GS4, Class A1, 1.650%, 11/25/2060, 144A(a) | 2,320,291 | ||||||
| 1,720,000 | Mill City Mortgage Loan Trust, Series 2019-GS1, Class M2, 3.250%, 7/25/2059, 144A(a) | 1,384,448 | ||||||
| 1,635,000 | Progress Residential Trust, Series 2021-SFR4, Class E1, 2.409%, 5/17/2038, 144A | 1,365,190 | ||||||
| 1,145,000 | Progress Residential Trust, Series 2021-SFR4, Class E2, 2.559%, 5/17/2038, 144A | 955,105 | ||||||
| 3,535,000 | Progress Residential Trust, Series 2021-SFR5, Class E1, 2.209%, 7/17/2038, 144A | 2,943,620 | ||||||
| 925,000 | Progress Residential Trust, Series 2021-SFR5, Class E2, 2.359%, 7/17/2038, 144A | 765,948 | ||||||
| 4,495,000 | Progress Residential Trust, Series 2021-SFR6, Class E1, 2.425%, 7/17/2038, 144A | 3,726,254 | ||||||
| 2,300,000 | Progress Residential Trust, Series 2021-SFR6, Class E2, 2.525%, 7/17/2038, 144A | 1,882,826 | ||||||
| 5,280,000 | Progress Residential Trust, Series 2021-SFR7, Class E1, 2.591%, 8/17/2040, 144A | 4,063,876 | ||||||
| 1,445,000 | Progress Residential Trust, Series 2021-SFR7, Class E2, 2.640%, 8/17/2040, 144A | 1,106,531 | ||||||
| 1,705,000 | Progress Residential Trust, Series 2021-SFR9, Class E1, 2.811%, 11/17/2040, 144A | 1,323,971 | ||||||
| 1,175,000 | Progress Residential Trust, Series 2021-SFR9, Class E2, 3.010%, 11/17/2040, 144A | 916,329 | ||||||
| 6,952,591 | PRPM LLC, Series 2021-10, Class A1, 2.487%, 10/25/2026, 144A(a) | 6,303,045 | ||||||
| 11,574,090 | PRPM LLC, Series 2021-3, Class A1, 1.867%, 4/25/2026, 144A(a) | 10,318,430 | ||||||
| 11,634,360 | PRPM LLC, Series 2021-4, Class A1, 1.867%, 4/25/2026, 144A(a) | 10,417,815 | ||||||
| 10,422,699 | PRPM LLC, Series 2021-5, Class A1, 1.793%, 6/25/2026, 144A(a) | 9,428,895 | ||||||
| 7,279,208 | PRPM LLC, Series 2021-8, Class A1, 1.743%, 9/25/2026, 144A(a) | 6,521,739 | ||||||
See accompanying notes to financial statements.
| 10
Portfolio of Investments – as of December 31, 2022
Loomis Sayles Bond Fund – continued
Principal Amount | Description | Value (†) | ||||||
| Bonds and Notes – continued | ||||||||
| ABS Home Equity – continued | ||||||||
| $ | 7,867,146 | PRPM LLC, Series 2021-9, Class A1, 2.363%, 10/25/2026, 144A(a) | $ | 7,082,094 | ||||
| 9,753,207 | PRPM LLC, Series 2022-5, Class A1, 6.900%, 9/27/2027, 144A(a) | 9,679,362 | ||||||
| 12,050,000 | Toorak Mortgage Corp., Series 2021-1, Class A1, 2.240%, 6/25/2024, 144A(a) | 11,395,608 | ||||||
| 170,000 | Towd Point Mortgage Trust, Series 2015-4, Class M2, 3.750%, 4/25/2055, 144A(a) | 164,795 | ||||||
| 3,660,000 | Towd Point Mortgage Trust, Series 2016-3, Class M2, 4.000%, 4/25/2056, 144A(a) | 3,529,941 | ||||||
| 430,000 | Towd Point Mortgage Trust, Series 2017-3, Class A2, 3.000%, 7/25/2057, 144A(a) | 402,555 | ||||||
| 1,690,000 | Towd Point Mortgage Trust, Series 2017-4, Class M2, 3.250%, 6/25/2057, 144A(a) | 1,368,144 | ||||||
| 1,960,000 | Towd Point Mortgage Trust, Series 2018-5, Class M1, 3.250%, 7/25/2058, 144A(a) | 1,566,975 | ||||||
| 1,195,000 | Towd Point Mortgage Trust, Series 2019-4, Class M1, 3.500%, 10/25/2059, 144A(a) | 969,646 | ||||||
| 905,000 | Towd Point Mortgage Trust, Series 2020-1, Class A2B, 3.250%, 1/25/2060, 144A(a) | 735,085 | ||||||
| 495,000 | Towd Point Mortgage Trust, Series 2020-2, Class A2B, 3.000%, 4/25/2060, 144A(a) | 387,795 | ||||||
| 2,015,000 | Tricon Residential Trust, Series 2021-SFR1, Class E1, 2.794%, 7/17/2038, 144A | 1,692,118 | ||||||
| 5,360,000 | Tricon Residential Trust, Series 2021-SFR1, Class E2, 2.894%, 7/17/2038, 144A | 4,468,936 | ||||||
| 250,853 | VCAT LLC, Series 2021-NPL1, Class A1, 2.289%, 12/26/2050, 144A(a) | 236,795 | ||||||
| 9,676,683 | VCAT LLC, Series 2021-NPL5, Class A1, 1.868%, 8/25/2051, 144A(a) | 8,525,635 | ||||||
| 15,479,206 | VCAT LLC, Series 2021-NPL6, Class A1, 1.917%, 9/25/2051, 144A(a) | 13,475,675 | ||||||
| 8,812,314 | VOLT XCIV LLC, Series 2021-NPL3, Class A1, 2.240%, 2/27/2051, 144A(a) | 7,966,445 | ||||||
|
| |||||||
| 228,294,025 | ||||||||
|
| |||||||
| ABS Other – 3.0% | ||||||||
| 1,290,000 | Affirm Asset Securitization Trust, Series 2021-B, Class C, 1.400%, 8/17/2026, 144A | 1,172,526 | ||||||
| 6,993,753 | Apollo Aviation Securitization Equity Trust, Series 2021-1A, Class A, 2.950%, 11/16/2041, 144A | 5,586,126 | ||||||
| ABS Other – continued | ||||||||
| $ | 2,410,000 | Aqua Finance Trust, Series 2021-A, Class B, 2.400%, 7/17/2046, 144A | $ | 2,028,672 | ||||
| 13,505,000 | BHG Securitization Trust, Series 2022-A, Class B, 2.700%, 2/20/2035, 144A | 11,738,164 | ||||||
| 11,522,588 | CLI Funding VIII LLC, Series 2021-1A, Class A, 1.640%, 2/18/2046, 144A | 9,825,010 | ||||||
| 10,751,400 | DB Master Finance LLC, Series 2021-1A, Class A2II, 2.493%, 11/20/2051, 144A | 8,836,866 | ||||||
| 759,600 | Elara HGV Timeshare Issuer LLC, Series 2021-A, Class C, 2.090%, 8/27/2035, 144A | 673,466 | ||||||
| 3,565,000 | FREED ABS Trust, Series 2022-1FP, Class D, 3.350%, 3/19/2029, 144A | 3,259,651 | ||||||
| 1,630,000 | Freedom Financial Trust, Series 2021-2, Class C, 1.940%, 6/19/2028, 144A | 1,582,841 | ||||||
| 3,495,000 | Freedom Financial Trust, Series 2021-3FP, Class D, 2.370%, 11/20/2028, 144A | 3,179,774 | ||||||
| 68,231 | HIN Timeshare Trust, Series 2020-A, Class C, 3.420%, 10/09/2039, 144A | 62,541 | ||||||
| 3,980,000 | HPEFS Equipment Trust, Series 2021-1A, Class D, 1.030%, 3/20/2031, 144A | 3,754,083 | ||||||
| 3,645,000 | HPEFS Equipment Trust, Series 2022-1A, Class D, 2.400%, 11/20/2029, 144A | 3,302,035 | ||||||
| 10,066,726 | Lunar Structured Aircraft Portfolio Notes, Series 2021-1, Class A, 2.636%, 10/15/2046, 144A | 8,227,515 | ||||||
| 18,189,677 | MAPS Trust, Series 2021-1A, Class A, 2.521%, 6/15/2046, 144A | 14,739,586 | ||||||
| 1,733,000 | Marlette Funding Trust, Series 2021-2A, Class C, 1.500%, 9/15/2031, 144A | 1,601,714 | ||||||
| 3,210,000 | Marlette Funding Trust, Series 2021-3A, Class C, 1.810%, 12/15/2031, 144A | 2,874,252 | ||||||
| 12,050,722 | MVW LLC, Series 2021-2A, Class C, 2.230%, 5/20/2039, 144A | 10,859,279 | ||||||
| 15,350,996 | Navigator Aircraft ABS Ltd., Series 2021-1, Class A, 2.771%, 11/15/2046, 144A(a) | 12,894,096 | ||||||
| 3,250,000 | Nelnet Student Loan Trust, Series 2021-A, Class B2, 2.850%, 4/20/2062, 144A | 2,582,823 | ||||||
| 1,145,000 | OneMain Financial Issuance Trust, Series 2018-2A, Class A, 3.570%, 3/14/2033, 144A | 1,122,491 | ||||||
| 1,835,000 | OneMain Financial Issuance Trust, Series 2020-2A, Class A, 1.750%, 9/14/2035, 144A | 1,603,002 | ||||||
| 5,485,000 | OneMain Financial Issuance Trust, Series 2021-1A, Class D, 2.470%, 6/16/2036, 144A | 4,201,606 | ||||||
See accompanying notes to financial statements.
11 |
Portfolio of Investments – as of December 31, 2022
Loomis Sayles Bond Fund – continued
Principal Amount | Description | Value (†) | ||||||
| Bonds and Notes – continued | ||||||||
| ABS Other – continued | ||||||||
| $ | 800,000 | Republic Finance Issuance Trust, Series 2021-A, Class C, 3.530%, 12/22/2031, 144A | $ | 694,966 | ||||
| 1,128,492 | S-Jets Ltd., Series 2017-1, Class A, 3.967%, 8/15/2042, 144A | 874,592 | ||||||
| 725,000 | SCF Equipment Leasing LLC, Series 2021-1A, Class D, 1.930%, 9/20/2030, 144A | 632,387 | ||||||
| 4,060,000 | SCF Equipment Leasing LLC, Series 2022-2A, Class C, 6.500%, 8/20/2032, 144A | 3,959,436 | ||||||
| 899,626 | Shenton Aircraft Investment I Ltd., Series 2015-1A, Class A, 4.750%, 10/15/2042, 144A | 688,223 | ||||||
| 14,961,362 | SLAM Ltd., Series 2021-1A, Class A, 2.434%, 6/15/2046, 144A | 12,378,133 | ||||||
| 1,440,000 | SoFi Consumer Loan Program Trust, Series 2021-1, Class D, 2.040%, 9/25/2030, 144A | 1,304,882 | ||||||
| 3,500,000 | Towd Point Mortgage Trust, Series 2017-1, Class M1, 3.750%, 10/25/2056, 144A(a) | 3,262,654 | ||||||
| 2,746,206 | Wave Trust, Series 2017-1A, Class A, 3.844%, 11/15/2042, 144A | 2,073,413 | ||||||
| 12,327,772 | Willis Engine Structured Trust VI, Series 2021-A, Class A, 3.104%, 5/15/2046, 144A | 9,022,561 | ||||||
|
| |||||||
| 150,599,366 | ||||||||
|
| |||||||
| ABS Student Loan – 0.5% | ||||||||
| 2,760,000 | College Ave Student Loans LLC, Series 2021-A, Class C, 2.920%, 7/25/2051, 144A | 2,476,177 | ||||||
| 2,157,000 | College Ave Student Loans LLC, Series 2021-C, Class D, 4.110%, 7/26/2055, 144A | 1,679,771 | ||||||
| 763,709 | ELFI Graduate Loan Program LLC, Series 2021-A, Class B, 2.090%, 12/26/2046, 144A(a) | 652,841 | ||||||
| 2,565,000 | Navient Private Education Refi Loan Trust, Series 2021-EA, Class B, 2.030%, 12/16/2069, 144A | 1,634,218 | ||||||
| 5,895,000 | Navient Private Education Refi Loan Trust, Series 2021-FA, Class B, 2.120%, 2/18/2070, 144A | 3,798,442 | ||||||
| 2,120,000 | Nelnet Student Loan Trust, Series 2021-DA, Class C, 3.500%, 4/20/2062, 144A | 1,714,234 | ||||||
| 863,000 | Nelnet Student Loan Trust, Series 2021-DA, Class D, 4.380%, 4/20/2062, 144A | 702,445 | ||||||
| 5,735,000 | SMB Private Education Loan Trust, Series 2021-B, Class B, 2.650%, 7/17/2051, 144A | 4,566,955 | ||||||
| 7,070,000 | SMB Private Education Loan Trust, Series 2021-E, Class B, 2.490%, 2/15/2051, 144A | 5,426,134 | ||||||
| 630,000 | SoFi Professional Loan Program LLC, Series 2017-A, Class C, 4.430%, 3/26/2040, 144A(a) | 578,168 | ||||||
|
| |||||||
| 23,229,385 | ||||||||
|
| |||||||
| ABS Whole Business – 0.4% | ||||||||
| 1,673,775 | DB Master Finance LLC, Series 2019-1A, Class A23, 4.352%, 5/20/2049, 144A | 1,526,121 | ||||||
| 7,229,900 | Domino’s Pizza Master Issuer LLC, Series 2021-1A, Class A2I, 2.662%, 4/25/2051, 144A | 6,082,088 | ||||||
| 3,422,875 | Hardee’s Funding LLC, Series 2021-1A, Class A2, 2.865%, 6/20/2051, 144A | 2,728,589 | ||||||
| 1,144,600 | Planet Fitness Master Issuer LLC, Series 2019-1A, Class A2, 3.858%, 12/05/2049, 144A | 950,805 | ||||||
| 203,463 | Planet Fitness Master Issuer LLC, Series 2022-1A, Class A2I, 3.251%, 12/05/2051, 144A | 178,404 | ||||||
| 11,081,250 | Wendy’s Funding LLC, Series 2021-1A, Class A2I, 2.370%, 6/15/2051, 144A | 8,946,159 | ||||||
|
| |||||||
| 20,412,166 | ||||||||
|
| |||||||
| Aerospace & Defense – 1.0% | ||||||||
| 22,105,000 | Boeing Co. (The), 3.625%, 2/01/2031 | 19,367,671 | ||||||
| 2,995,000 | Boeing Co. (The), 3.625%, 3/01/2048 | 1,959,524 | ||||||
| 3,525,000 | Boeing Co. (The), 3.750%, 2/01/2050 | 2,429,783 | ||||||
| 6,180,000 | Boeing Co. (The), 3.825%, 3/01/2059 | 3,950,872 | ||||||
| 1,200,000 | Boeing Co. (The), 3.850%, 11/01/2048 | 823,676 | ||||||
| 8,855,000 | Boeing Co. (The), 3.900%, 5/01/2049 | 6,217,671 | ||||||
| 4,830,000 | Boeing Co. (The), 5.150%, 5/01/2030 | 4,712,338 | ||||||
| 4,055,000 | Embraer Netherlands Finance BV, 5.400%, 2/01/2027 | 3,882,662 | ||||||
| 5,995,000 | TransDigm, Inc., 6.250%, 3/15/2026, 144A | 5,912,209 | ||||||
|
| |||||||
| 49,256,406 | ||||||||
|
| |||||||
| Airlines – 1.9% | ||||||||
| 21,828,987 | Air Canada Pass Through Trust, Series 2020-2A, 5.250%, 10/01/2030, 144A | 20,477,336 | ||||||
| 2,910,400 | American Airlines Pass Through Trust, Series 2016-3, Class B, 3.750%, 4/15/2027 | 2,585,366 | ||||||
| 2,673,333 | American Airlines Pass Through Trust, Series 2017-2, Class B, 3.700%, 4/15/2027 | 2,402,142 | ||||||
| 37,797,936 | Mileage Plus Holdings LLC/Mileage Plus Intellectual Property Assets Ltd., 6.500%, 6/20/2027, 144A | 37,578,778 | ||||||
| 4,070,441 | United Airlines Pass Through Trust, Series 2014-1, Class A, 4.000%, 10/11/2027 | 3,781,729 | ||||||
| 25,478,007 | United Airlines Pass Through Trust, Series 2020-1, Class A, 5.875%, 4/15/2029 | 25,096,601 | ||||||
See accompanying notes to financial statements.
| 12
Portfolio of Investments – as of December 31, 2022
Loomis Sayles Bond Fund – continued
Principal Amount | Description | Value (†) | ||||||
| Bonds and Notes – continued | ||||||||
| Airlines – continued | ||||||||
| $ | 3,665,220 | United Airlines Pass Through Trust, Series 2020-1, Class B, 4.875%, 7/15/2027 | $ | 3,450,365 | ||||
|
| |||||||
| 95,372,317 | ||||||||
|
| |||||||
| Automotive – 1.2% | ||||||||
| 2,355,000 | Ford Motor Co., 3.250%, 2/12/2032 | 1,766,113 | ||||||
| 14,465,000 | Ford Motor Co., 4.750%, 1/15/2043 | 10,382,874 | ||||||
| 1,560,000 | Ford Motor Co., 6.625%, 2/15/2028 | 1,567,005 | ||||||
| 1,580,000 | Ford Motor Co., 7.500%, 8/01/2026 | 1,644,701 | ||||||
| 3,505,000 | General Motors Co., 5.200%, 4/01/2045 | 2,848,760 | ||||||
| 1,750,000 | General Motors Co., 6.250%, 10/02/2043 | 1,617,925 | ||||||
| 44,900,000 | General Motors Financial Co., Inc., 3.600%, 6/21/2030 | 37,786,155 | ||||||
| 815,000 | General Motors Financial Co., Inc., Series A, (fixed rate to 9/30/2027, variable rate thereafter), 5.750%(b) | 686,146 | ||||||
| 1,305,000 | General Motors Financial Co., Inc., Series C, (fixed rate to 9/30/2030, variable rate thereafter), 5.700%(b) | 1,104,519 | ||||||
|
| |||||||
| 59,404,198 | ||||||||
|
| |||||||
| Banking – 4.1% | ||||||||
| 20,700,000 | Ally Financial, Inc., Series B, (fixed rate to 5/15/2026, variable rate thereafter), 4.700%(b) | 13,843,125 | ||||||
| 15,605,000 | Ally Financial, Inc., Series C, (fixed rate to 5/15/2028, variable rate thereafter), 4.700%(b) | 9,772,631 | ||||||
| 17,805,000 | Barclays PLC, (fixed rate to 3/15/2028, variable rate thereafter), 4.375%(b) | 13,576,312 | ||||||
| 47,298,000 | Barclays PLC, (fixed rate to 9/23/2030, variable rate thereafter), 3.564%, 9/23/2035 | 35,991,159 | ||||||
| 14,253,000 | BNP Paribas S.A., (fixed rate to 8/12/2030, variable rate thereafter), 2.588%, 8/12/2035, 144A | 10,451,155 | ||||||
| 8,140,000 | Credit Agricole S.A., (fixed rate to 1/10/2028, variable rate thereafter), EMTN, 4.000%, 1/10/2033 | 7,092,219 | ||||||
| 605,000 | Credit Suisse Group AG, (fixed rate to 1/12/2028, variable rate thereafter), 3.869%, 1/12/2029, 144A | 484,937 | ||||||
| 5,470,000 | Credit Suisse Group AG, (fixed rate to 11/15/2032, variable rate thereafter), 9.016%, 11/15/2033, 144A | 5,600,553 | ||||||
| 510,000 | Credit Suisse Group AG, (fixed rate to 5/14/2031, variable rate thereafter), 3.091%, 5/14/2032, 144A | 352,383 | ||||||
| 8,165,000 | Credit Suisse Group AG, (fixed rate to 6/05/2025, variable rate thereafter), 2.193%, 6/05/2026, 144A | 6,973,659 | ||||||
| Banking – continued | ||||||||
| 11,755,000 | Credit Suisse Group AG, (fixed rate to 7/15/2025, variable rate thereafter), 6.373%, 7/15/2026, 144A | 11,036,172 | ||||||
| 11,645,000 | Credit Suisse Group AG, (fixed rate to 8/11/2027, variable rate thereafter), 6.442%, 8/11/2028, 144A | 10,606,965 | ||||||
| 5,690,000 | Credit Suisse Group AG, (fixed rate to 8/12/2032, variable rate thereafter), 6.537%, 8/12/2033, 144A | 4,998,551 | ||||||
| 4,195,000 | Deutsche Bank AG, (fixed rate to 10/07/2031, variable rate thereafter), 3.742%, 1/07/2033 | 2,979,187 | ||||||
| 25,209,000 | Deutsche Bank AG, (fixed rate to 10/14/2030, variable rate thereafter), 3.729%, 1/14/2032 | 18,483,586 | ||||||
| 2,275,000 | Deutsche Bank AG, (fixed rate to 12/01/2027, variable rate thereafter), 4.875%, 12/01/2032 | 1,901,487 | ||||||
| 3,380,000 | Intesa Sanpaolo SpA, (fixed rate to 6/01/2031, variable rate thereafter), 4.198%, 6/01/2032, 144A | 2,491,297 | ||||||
| 22,550,000 | NatWest Group PLC, (fixed rate to 8/28/2030, variable rate thereafter), 3.032%, 11/28/2035 | 16,635,811 | ||||||
| 2,900,000 | NatWest Group PLC, (fixed rate to 9/30/2027, variable rate thereafter), 5.516%, 9/30/2028 | 2,864,277 | ||||||
| 4,370,000 | Synchrony Bank, 5.400%, 8/22/2025 | 4,311,005 | ||||||
| 8,885,000 | Synchrony Bank, 5.625%, 8/23/2027 | 8,675,758 | ||||||
| 22,400,000 | UniCredit SpA, (fixed rate to 6/30/2030, variable rate thereafter), 5.459%, 6/30/2035, 144A | 18,198,837 | ||||||
|
| |||||||
| 207,321,066 | ||||||||
|
| |||||||
| Brokerage – 0.1% | ||||||||
| 5,731,000 | Jefferies Financial Group, Inc., 6.250%, 1/15/2036 | 5,779,778 | ||||||
|
| |||||||
| Building Materials – 1.5% | ||||||||
| 57,099,000 | Cemex SAB de CV, 3.875%, 7/11/2031, 144A | 48,193,549 | ||||||
| 3,605,000 | Cemex SAB de CV, 5.200%, 9/17/2030, 144A | 3,363,058 | ||||||
| 9,035,000 | Cemex SAB de CV, (fixed rate to 6/08/2026, variable rate thereafter), 5.125%, 144A(b) | 8,348,430 | ||||||
| 4,057,000 | Masco Corp., 6.500%, 8/15/2032 | 4,153,024 | ||||||
| 4,534,000 | Masco Corp., 7.750%, 8/01/2029 | 4,955,757 | ||||||
| 6,344,000 | Owens Corning, 7.000%, 12/01/2036 | 6,713,760 | ||||||
|
| |||||||
| 75,727,578 | ||||||||
|
| |||||||
| Cable Satellite – 4.1% | ||||||||
| 36,985,000 | CCO Holdings LLC/CCO Holdings Capital Corp., 4.250%, 1/15/2034, 144A | 27,296,594 | ||||||
| 11,015,000 | Charter Communications Operating LLC/Charter Communications Operating Capital, 2.300%, 2/01/2032 | 8,113,081 | ||||||
See accompanying notes to financial statements.
13 |
Portfolio of Investments – as of December 31, 2022
Loomis Sayles Bond Fund – continued
Principal Amount | Description | Value (†) | ||||||
| Bonds and Notes – continued | ||||||||
| Cable Satellite – continued | ||||||||
| $ | 35,342,000 | Charter Communications Operating LLC/Charter Communications Operating Capital, 2.800%, 4/01/2031 | $ | 27,514,021 | ||||
| 24,940,000 | Charter Communications Operating LLC/Charter Communications Operating Capital, 3.700%, 4/01/2051 | 15,165,210 | ||||||
| 1,438,000 | Charter Communications Operating LLC/Charter Communications Operating Capital, 3.850%, 4/01/2061 | 831,682 | ||||||
| 46,770,000 | Charter Communications Operating LLC/Charter Communications Operating Capital, 3.950%, 6/30/2062 | 27,589,626 | ||||||
| 6,805,000 | Charter Communications Operating LLC/Charter Communications Operating Capital, 4.400%, 4/01/2033 | 5,822,761 | ||||||
| 5,935,000 | Charter Communications Operating LLC/Charter Communications Operating Capital, 5.125%, 7/01/2049 | 4,487,821 | ||||||
| 45,882,000 | CSC Holdings LLC, 4.625%, 12/01/2030, 144A | 25,355,956 | ||||||
| 1,875,000 | CSC Holdings LLC, 5.000%, 11/15/2031, 144A | 1,047,563 | ||||||
| 22,585,000 | CSC Holdings LLC, 5.375%, 2/01/2028, 144A | 18,209,156 | ||||||
| 1,390,000 | CSC Holdings LLC, 5.750%, 1/15/2030, 144A | 783,946 | ||||||
| 9,430,000 | DISH DBS Corp., 5.125%, 6/01/2029 | 6,083,387 | ||||||
| 26,600,000 | DISH DBS Corp., 5.250%, 12/01/2026, 144A | 22,406,111 | ||||||
| 14,719,000 | DISH DBS Corp., 7.750%, 7/01/2026 | 11,869,255 | ||||||
| 6,190,000 | Time Warner Cable LLC, 4.500%, 9/15/2042 | 4,531,727 | ||||||
| 535,000 | Time Warner Cable LLC, 5.875%, 11/15/2040 | 466,106 | ||||||
|
| |||||||
| 207,574,003 | ||||||||
|
| |||||||
| Chemicals – 0.4% | ||||||||
| 5,450,000 | Alpek SAB de CV, 3.250%, 2/25/2031, 144A | 4,541,220 | ||||||
| 1,995,000 | Braskem Netherlands Finance BV, 4.500%, 1/31/2030, 144A | 1,696,665 | ||||||
| 10,170,000 | Braskem Netherlands Finance BV, 5.875%, 1/31/2050, 144A | 7,878,357 | ||||||
| 4,310,000 | Celanese U.S. Holdings LLC, 6.330%, 7/15/2029 | 4,187,775 | ||||||
| 3,175,000 | Celanese U.S. Holdings LLC, 6.379%, 7/15/2032 | 3,019,260 | ||||||
| 1,360,000 | INEOS Quattro Finance 2 PLC, 3.375%, 1/15/2026, 144A | 1,249,500 | ||||||
|
| |||||||
| 22,572,777 | ||||||||
|
| |||||||
| Construction Machinery – 0.6% | ||||||||
| 2,300,000 | Ashtead Capital, Inc., 5.500%, 8/11/2032, 144A | 2,199,879 | ||||||
| 27,030,000 | Toro Co. (The), 6.625%, 5/01/2037 | 27,621,023 | ||||||
|
| |||||||
| 29,820,902 | ||||||||
|
| |||||||
| Consumer Cyclical Services – 2.2% |
| |||||||
| 2,700,000 | Expedia Group, Inc., 2.950%, 3/15/2031 | 2,171,154 | ||||||
| 2,255,000 | Expedia Group, Inc., 3.250%, 2/15/2030 | 1,912,906 | ||||||
| 14,700,000 | TriNet Group, Inc., 3.500%, 3/01/2029, 144A | 12,086,340 | ||||||
| 33,255,000 | Uber Technologies, Inc., 4.500%, 8/15/2029, 144A | 28,973,585 | ||||||
| 20,723,000 | Uber Technologies, Inc., 6.250%, 1/15/2028, 144A | 19,894,077 | ||||||
| 44,403,000 | Uber Technologies, Inc., 7.500%, 9/15/2027, 144A | 44,434,082 | ||||||
| 1,720,000 | Uber Technologies, Inc., 8.000%, 11/01/2026, 144A | 1,725,920 | ||||||
|
| |||||||
| 111,198,064 | ||||||||
|
| |||||||
| Consumer Products – 0.4% | ||||||||
| 12,778,000 | Avon Products, Inc., 8.450%, 3/15/2043 | 12,233,657 | ||||||
| 9,385,000 | Natura Cosmeticos S.A., 4.125%, 5/03/2028, 144A | 7,658,254 | ||||||
|
| |||||||
| 19,891,911 | ||||||||
|
| |||||||
| Diversified Manufacturing – 0.0% |
| |||||||
| 2,080,000 | General Electric Co., Series D, 3-month LIBOR + 3.330%, 8.099%(b)(c) | 2,043,480 | ||||||
|
| |||||||
| Electric – 1.0% | ||||||||
| 27,504,380 | Alta Wind Holdings LLC, 7.000%, 6/30/2035, 144A | 27,182,351 | ||||||
| 8,663,000 | Enel Generacion Chile S.A., 7.875%, 2/01/2027 | 9,139,465 | ||||||
| 9,495,000 | Pacific Gas & Electric Co., 4.300%, 3/15/2045 | 6,731,841 | ||||||
| 6,825,000 | Pacific Gas & Electric Co., 4.750%, 2/15/2044 | 5,221,699 | ||||||
| 3,790,000 | Pacific Gas & Electric Co., 5.450%, 6/15/2027 | 3,737,352 | ||||||
|
| |||||||
| 52,012,708 | ||||||||
|
| |||||||
| Finance Companies – 5.0% | ||||||||
| 12,050,000 | AerCap Ireland Capital DAC/AerCap Global Aviation Trust, 3.300%, 1/30/2032 | 9,420,217 | ||||||
| 3,100,000 | AGFC Capital Trust I, 3-month LIBOR + 1.750%, 5.829%, 1/15/2067, 144A(c) | 1,668,265 | ||||||
| 6,606,000 | Air Lease Corp., 4.625%, 10/01/2028 | 6,178,860 | ||||||
| 17,166,000 | Air Lease Corp., Series B, (fixed rate to 6/15/2026, variable rate thereafter), 4.650%(b) | 14,345,968 | ||||||
| 5,325,000 | Aircastle Ltd., Series A (fixed rate to 6/15/2026, variable rate thereafter), 5.250%, 144A(b) | 4,100,250 | ||||||
See accompanying notes to financial statements.
| 14
Portfolio of Investments – as of December 31, 2022
Loomis Sayles Bond Fund – continued
Principal Amount | Description | Value (†) | ||||||
| Bonds and Notes – continued | ||||||||
| Finance Companies – continued | ||||||||
| $ | 12,465,000 | Ares Capital Corp., 2.875%, 6/15/2028 | $ | 9,994,799 | ||||
| 17,495,000 | Ares Capital Corp., 3.200%, 11/15/2031 | 12,838,706 | ||||||
| 3,260,000 | Aviation Capital Group LLC, 1.950%, 1/30/2026, 144A | 2,838,085 | ||||||
| 9,790,000 | Barings BDC, Inc., 3.300%, 11/23/2026 | 8,297,791 | ||||||
| 22,260,000 | Blackstone Secured Lending Fund, 2.125%, 2/15/2027 | 18,431,636 | ||||||
| 11,475,000 | FS KKR Capital Corp., 3.125%, 10/12/2028 | 9,250,796 | ||||||
| 8,178,000 | FS KKR Capital Corp., 3.400%, 1/15/2026 | 7,251,868 | ||||||
| 445,000 | Navient Corp., 5.000%, 3/15/2027 | 389,559 | ||||||
| 9,706,000 | Navient Corp., 6.750%, 6/15/2026 | 9,199,217 | ||||||
| 5,750,000 | Navient Corp., Series A, 5.625%, 8/01/2033 | 4,096,216 | ||||||
| 10,145,000 | OneMain Finance Corp., 7.125%, 3/15/2026 | 9,646,678 | ||||||
| 7,975,000 | Owl Rock Capital Corp., 2.875%, 6/11/2028 | 6,261,765 | ||||||
| 14,750,000 | Owl Rock Capital Corp., 4.250%, 1/15/2026 | 13,540,772 | ||||||
| 13,420,000 | Owl Rock Technology Finance Corp., 4.750%, 12/15/2025, 144A | 12,151,540 | ||||||
| 30,029,000 | Rocket Mortgage LLC/Rocket Mortgage Co-Issuer, Inc., 2.875%, 10/15/2026, 144A | 25,739,729 | ||||||
| 19,614,000 | Rocket Mortgage LLC/Rocket Mortgage Co-Issuer, Inc., 3.625%, 3/01/2029, 144A | 15,542,880 | ||||||
| 53,876,000 | Rocket Mortgage LLC/Rocket Mortgage Co-Issuer, Inc., 3.875%, 3/01/2031, 144A | 41,122,227 | ||||||
| 15,738,000 | Rocket Mortgage LLC/Rocket Mortgage Co-Issuer, Inc., 4.000%, 10/15/2033, 144A | 11,754,083 | ||||||
|
| |||||||
| 254,061,907 | ||||||||
|
| |||||||
| Financial Other – 1.5% | ||||||||
| 9,560,000 | Agile Group Holdings Ltd., 6.050%, 10/13/2025 | 4,423,221 | ||||||
| 2,700,000 | Central China Real Estate Ltd., 7.250%, 4/24/2023 | 1,163,766 | ||||||
| 3,680,000 | Central China Real Estate Ltd., 7.250%, 7/16/2024 | 1,043,758 | ||||||
| 1,455,000 | Central China Real Estate Ltd., 7.250%, 8/13/2024 | 407,124 | ||||||
| 3,675,000 | Central China Real Estate Ltd., 7.500%, 7/14/2025 | 1,010,089 | ||||||
| 945,000 | Central China Real Estate Ltd., 7.650%, 8/27/2023 | 337,951 | ||||||
| 730,000 | Central China Real Estate Ltd., 7.750%, 5/24/2024 | 225,490 | ||||||
| 2,815,000 | CIFI Holdings Group Co. Ltd., 6.000%, 7/16/2025 | 725,678 | ||||||
| 990,000 | CIFI Holdings Group Co. Ltd., 6.450%, 11/07/2024 | 259,875 | ||||||
| 7,770,000 | Country Garden Holdings Co. Ltd., 3.300%, 1/12/2031 | 4,110,874 | ||||||
| Financial Other – continued | ||||||||
| 36,625,000 | Icahn Enterprises LP/Icahn Enterprises Finance Corp., 4.375%, 2/01/2029 | 30,971,931 | ||||||
| 19,485,000 | Kaisa Group Holdings Ltd., 9.375%, 6/30/2024(d) | 2,652,103 | ||||||
| 1,845,000 | Kaisa Group Holdings Ltd., 9.950%, 7/23/2025(d) | 249,795 | ||||||
| 2,400,000 | Kaisa Group Holdings Ltd., 10.500%, 1/15/2025(d) | 325,128 | ||||||
| 24,005,000 | Kaisa Group Holdings Ltd., 11.250%, 4/16/2025(d) | 3,249,797 | ||||||
| 1,305,000 | Kaisa Group Holdings Ltd., 11.650%, 6/01/2026(d) | 176,449 | ||||||
| 1,735,000 | Kaisa Group Holdings Ltd., 11.700%, 11/11/2025(d) | 235,318 | ||||||
| 5,965,000 | Logan Group Co. Ltd., 4.250%, 7/12/2025(e) | 1,331,507 | ||||||
| 5,148,000 | Logan Group Co. Ltd., 4.850%, 12/14/2026(e) | 1,159,227 | ||||||
| 14,125,000 | Nationstar Mortgage Holdings, Inc., 5.500%, 8/15/2028, 144A | 11,517,685 | ||||||
| 6,195,000 | Shimao Group Holdings Ltd., 3.450%, 1/11/2031(d) | 1,108,905 | ||||||
| 400,000 | Shimao Group Holdings Ltd., 4.600%, 7/13/2030(d) | 73,624 | ||||||
| 1,515,000 | Shimao Group Holdings Ltd., 5.200%, 1/16/2027(d) | 272,700 | ||||||
| 4,675,000 | Shimao Group Holdings Ltd., 5.600%, 7/15/2026(d) | 865,997 | ||||||
| 1,465,000 | Shimao Group Holdings Ltd., 6.125%, 2/21/2024(d) | 273,486 | ||||||
| 575,000 | Sunac China Holdings Ltd., 5.950%, 4/26/2024(d) | 123,527 | ||||||
| 6,810,000 | Sunac China Holdings Ltd., 6.500%, 1/10/2025(d) | 1,455,978 | ||||||
| 3,575,000 | Sunac China Holdings Ltd., 6.500%, 1/26/2026(d) | 761,511 | ||||||
| 460,000 | Sunac China Holdings Ltd., 6.650%, 8/03/2024(d) | 98,592 | ||||||
| 5,930,000 | Sunac China Holdings Ltd., 7.000%, 7/09/2025(d) | 1,267,715 | ||||||
| 1,120,000 | Times China Holdings Ltd., 5.750%, 1/14/2027 | 182,011 | ||||||
| 7,485,000 | Times China Holdings Ltd., 6.200%, 3/22/2026 | 1,213,393 | ||||||
| 440,000 | Times China Holdings Ltd., 6.750%, 7/08/2025 | 72,745 | ||||||
| 3,175,000 | Yuzhou Group Holdings Co. Ltd., 6.350%, 1/13/2027(d) | 293,243 | ||||||
| 6,250,000 | Yuzhou Group Holdings Co. Ltd., 7.700%, 2/20/2025(d) | 579,000 | ||||||
| 1,585,000 | Yuzhou Group Holdings Co. Ltd., 7.850%, 8/12/2026(d) | 146,660 | ||||||
| 4,025,000 | Yuzhou Group Holdings Co. Ltd., 8.300%, 5/27/2025(d) | 372,876 | ||||||
|
| |||||||
| 74,738,729 | ||||||||
|
| |||||||
| Food & Beverage – 0.4% | ||||||||
| 965,000 | Darling Ingredients, Inc., 6.000%, 6/15/2030, 144A | 943,288 | ||||||
| 5,695,000 | JBS USA LUX S.A./JBS USA Food Co./JBS USA Finance, Inc., 3.000%, 2/02/2029, 144A | 4,713,436 | ||||||
See accompanying notes to financial statements.
15 |
Portfolio of Investments – as of December 31, 2022
Loomis Sayles Bond Fund – continued
Principal Amount | Description | Value (†) | ||||||
| Bonds and Notes – continued | ||||||||
| Food & Beverage – continued | ||||||||
| $ | 17,905,000 | Pilgrim’s Pride Corp., 3.500%, 3/01/2032, 144A | $ | 13,995,622 | ||||
| 995,000 | Pilgrim’s Pride Corp., 4.250%, 4/15/2031, 144A | 846,302 | ||||||
|
| |||||||
| 20,498,648 | ||||||||
|
| |||||||
| Gaming – 1.0% | ||||||||
| 19,755,000 | Genm Capital Labuan Ltd., 3.882%, 4/19/2031, 144A | 14,708,527 | ||||||
| 5,810,000 | GLP Capital LP/GLP Financing II, Inc., 3.250%, 1/15/2032 | 4,644,426 | ||||||
| 415,000 | Scientific Games International, Inc., 7.250%, 11/15/2029, 144A | 398,400 | ||||||
| 10,488,000 | VICI Properties LP/VICI Note Co., Inc., 4.250%, 12/01/2026, 144A | 9,784,504 | ||||||
| 8,621,000 | VICI Properties LP/VICI Note Co., Inc., 4.500%, 9/01/2026, 144A | 8,113,029 | ||||||
| 7,500,000 | VICI Properties LP/VICI Note Co., Inc., 4.625%, 6/15/2025, 144A | 7,190,625 | ||||||
| 6,163,000 | VICI Properties LP/VICI Note Co., Inc., 5.625%, 5/01/2024, 144A | 6,102,972 | ||||||
|
| |||||||
| 50,942,483 | ||||||||
|
| |||||||
| Government Owned – No Guarantee – 1.3% |
| |||||||
| 27,210,000 | Antares Holdings LP, 8.500%, 5/18/2025, 144A | 27,778,430 | ||||||
| 6,170,000 | EcoPetrol S.A., 4.625%, 11/02/2031 | 4,712,892 | ||||||
| 8,465,000 | Pertamina Persero PT, 6.450%, 5/30/2044, 144A | 8,435,684 | ||||||
| 28,145,000 | Petroleos Mexicanos, 5.950%, 1/28/2031 | 21,301,487 | ||||||
| 2,735,000 | Sino-Ocean Land Treasure IV Ltd., 4.750%, 8/05/2029 | 1,482,917 | ||||||
| 5,250,000 | Sino-Ocean Land Treasure IV Ltd., 4.750%, 1/14/2030 | 2,674,875 | ||||||
|
| |||||||
| 66,386,285 | ||||||||
|
| |||||||
| Health Insurance – 0.7% | ||||||||
| 23,625,000 | Centene Corp., 2.500%, 3/01/2031 | 18,485,927 | ||||||
| 8,940,000 | Centene Corp., 2.625%, 8/01/2031 | 7,025,052 | ||||||
| 6,921,000 | Centene Corp., 3.000%, 10/15/2030 | 5,673,484 | ||||||
| 6,470,000 | Molina Healthcare, Inc., 3.875%, 5/15/2032, 144A | 5,372,943 | ||||||
|
| |||||||
| 36,557,406 | ||||||||
|
| |||||||
| Healthcare – 0.2% | ||||||||
| 9,725,000 | HCA, Inc., 4.125%, 6/15/2029 | 8,877,866 | ||||||
|
| |||||||
| Home Construction – 0.9% | ||||||||
| 50,680,000 | PulteGroup, Inc., 6.000%, 2/15/2035 | 48,458,269 | ||||||
|
| |||||||
| Independent Energy – 4.2% | ||||||||
| 17,555,000 | Aker BP ASA, 4.000%, 1/15/2031, 144A | 15,385,148 | ||||||
| 12,960,000 | Continental Resources, Inc., 2.875%, 4/01/2032, 144A | 9,599,319 | ||||||
| 56,135,000 | Continental Resources, Inc., 5.750%, 1/15/2031, 144A | 52,253,844 | ||||||
| 3,985,000 | Devon Energy Corp., 4.500%, 1/15/2030 | 3,710,009 | ||||||
| Independent Energy – continued | ||||||||
| 9,555,000 | Energean Israel Finance Ltd., 5.375%, 3/30/2028, 144A | 8,551,725 | ||||||
| 12,510,000 | Energean Israel Finance Ltd., 5.875%, 3/30/2031, 144A | 10,899,338 | ||||||
| 2,690,000 | EQT Corp., 3.125%, 5/15/2026, 144A | 2,472,204 | ||||||
| 11,721,000 | EQT Corp., 3.625%, 5/15/2031, 144A | 9,932,799 | ||||||
| 11,753,000 | EQT Corp., 3.900%, 10/01/2027 | 10,849,961 | ||||||
| 2,329,000 | EQT Corp., 5.000%, 1/15/2029 | 2,186,368 | ||||||
| 2,215,000 | EQT Corp., 5.700%, 4/01/2028 | 2,203,098 | ||||||
| 620,000 | Occidental Petroleum Corp., 6.125%, 1/01/2031 | 625,698 | ||||||
| 37,985,000 | Occidental Petroleum Corp., 6.625%, 9/01/2030 | 39,252,939 | ||||||
| 985,000 | Occidental Petroleum Corp., 7.875%, 9/15/2031 | 1,087,440 | ||||||
| 980,000 | Occidental Petroleum Corp., 8.875%, 7/15/2030 | 1,106,424 | ||||||
| 15,296,000 | Ovintiv, Inc., 6.500%, 8/15/2034 | 15,391,559 | ||||||
| 828,000 | Ovintiv, Inc., 6.500%, 2/01/2038 | 820,336 | ||||||
| 4,156,000 | Ovintiv, Inc., 6.625%, 8/15/2037 | 4,179,882 | ||||||
| 553,000 | Ovintiv, Inc., 7.200%, 11/01/2031 | 580,431 | ||||||
| 1,815,000 | Ovintiv, Inc., 7.375%, 11/01/2031 | 1,931,862 | ||||||
| 2,285,000 | Ovintiv, Inc., 8.125%, 9/15/2030 | 2,507,461 | ||||||
| 190,000 | Range Resources Corp., 4.875%, 5/15/2025 | 180,482 | ||||||
| 27,050,000 | Sanchez Energy Corp., 6.125%, 1/15/2023(d) | 371,938 | ||||||
| 12,420,000 | Sanchez Energy Corp., 7.750%, 6/15/2021(d) | 170,775 | ||||||
| 2,150,000 | Southwestern Energy Co., 4.750%, 2/01/2032 | 1,837,369 | ||||||
| 4,695,000 | Var Energi ASA, 7.500%, 1/15/2028, 144A | 4,782,335 | ||||||
| 10,345,000 | Var Energi ASA, 8.000%, 11/15/2032, 144A | 10,683,466 | ||||||
|
| |||||||
| 213,554,210 | ||||||||
|
| �� | ||||||
| Industrial Other – 0.1% |
| |||||||
| 5,995,000 | TopBuild Corp., 4.125%, 2/15/2032, 144A | 4,871,597 | ||||||
|
| |||||||
| Leisure – 0.9% |
| |||||||
| 13,160,000 | Carnival Corp., 5.750%, 3/01/2027, 144A | 9,396,767 | ||||||
| 3,415,000 | Carnival Corp., 6.000%, 5/01/2029, 144A | 2,275,694 | ||||||
| 10,030,000 | NCL Corp. Ltd., 5.875%, 3/15/2026, 144A | 7,878,264 | ||||||
| 7,630,000 | NCL Corp. Ltd., 5.875%, 2/15/2027, 144A | 6,604,223 | ||||||
| 3,695,000 | NCL Finance Ltd., 6.125%, 3/15/2028, 144A | 2,727,728 | ||||||
| 18,780,000 | Royal Caribbean Cruises Ltd., 5.500%, 4/01/2028, 144A | 14,987,285 | ||||||
|
| |||||||
| 43,869,961 | ||||||||
|
| |||||||
| Life Insurance – 3.3% |
| |||||||
| 5,935,000 | Athene Global Funding, 1.716%, 1/07/2025, 144A | 5,475,698 | ||||||
| 6,099,000 | Brighthouse Financial, Inc., 4.700%, 6/22/2047 | 4,461,459 | ||||||
See accompanying notes to financial statements.
| 16
Portfolio of Investments – as of December 31, 2022
Loomis Sayles Bond Fund – continued
Principal Amount | Description | Value (†) | ||||||
| Bonds and Notes – continued | ||||||||
| Life Insurance – continued |
| |||||||
| $ | 20,335,000 | Brighthouse Financial, Inc., 5.625%, 5/15/2030 | $ | 19,340,130 | ||||
| 2,030,000 | MetLife, Inc., 9.250%, 4/08/2068, 144A | 2,364,825 | ||||||
| 10,175,000 | MetLife, Inc., 10.750%, 8/01/2069 | 13,499,071 | ||||||
| 57,985,000 | Mutual of Omaha Insurance Co., 6.800%, 6/15/2036, 144A | 60,335,097 | ||||||
| 38,476,000 | National Life Insurance Co., 10.500%, 9/15/2039, 144A | 50,217,721 | ||||||
| 12,950,000 | NLV Financial Corp., 7.500%, 8/15/2033, 144A | 14,220,654 | ||||||
|
| |||||||
| 169,914,655 | ||||||||
|
| |||||||
| Lodging – 1.0% |
| |||||||
| 11,490,000 | Hilton Domestic Operating Co., Inc., 3.625%, 2/15/2032, 144A | 9,201,192 | ||||||
| 2,475,000 | Hilton Grand Vacations Borrower Escrow LLC/Hilton Grand Vacations Borrower Escrow, 4.875%, 7/01/2031, 144A | 2,019,979 | ||||||
| 8,090,000 | Hilton Grand Vacations Borrower Escrow LLC/Hilton Grand Vacations Borrower Escrow, 5.000%, 6/01/2029, 144A | 6,957,400 | ||||||
| 11,290,000 | Marriott International, Inc., Series HH, 2.850%, 4/15/2031 | 9,142,446 | ||||||
| 6,155,000 | Marriott Ownership Resorts, Inc., 4.500%, 6/15/2029, 144A | 5,106,350 | ||||||
| 10,440,000 | Travel & Leisure Co., 4.500%, 12/01/2029, 144A | 8,506,826 | ||||||
| 11,584,000 | Travel & Leisure Co., 4.625%, 3/01/2030, 144A | 9,606,268 | ||||||
|
| |||||||
| 50,540,461 | ||||||||
|
| |||||||
| Media Entertainment – 1.7% |
| |||||||
| 5,896,000 | iHeartCommunications, Inc., 4.750%, 1/15/2028, 144A | 4,801,349 | ||||||
| 2,905,000 | iHeartCommunications, Inc., 5.250%, 8/15/2027, 144A | 2,460,777 | ||||||
| 6,670,000 | iHeartCommunications, Inc., 8.375%, 5/01/2027 | 5,672,352 | ||||||
| 2,110,000 | Netflix, Inc., 4.875%, 4/15/2028 | 2,037,387 | ||||||
| 22,040,000 | Netflix, Inc., 4.875%, 6/15/2030, 144A | 20,554,482 | ||||||
| 2,757,000 | Netflix, Inc., 5.375%, 11/15/2029, 144A | 2,674,290 | ||||||
| 13,137,000 | Netflix, Inc., 5.875%, 11/15/2028 | 13,314,744 | ||||||
| 17,879,000 | Netflix, Inc., 6.375%, 5/15/2029 | 18,402,629 | ||||||
| 4,640,000 | Warnermedia Holdings, Inc., 4.054%, 3/15/2029, 144A | 4,021,534 | ||||||
| 16,368,000 | Warnermedia Holdings, Inc., 4.279%, 3/15/2032, 144A | 13,495,743 | ||||||
|
| |||||||
| 87,435,287 | ||||||||
|
| |||||||
| Metals & Mining – 3.4% |
| |||||||
| 22,660,000 | Anglo American Capital PLC, 2.875%, 3/17/2031, 144A | 18,502,112 | ||||||
| 19,906,000 | ArcelorMittal S.A., 6.750%, 3/01/2041 | 19,195,350 | ||||||
| Metals & Mining – continued |
| |||||||
| 1,145,000 | ArcelorMittal S.A., 7.000%, 10/15/2039 | 1,161,992 | ||||||
| 3,950,000 | Barrick Gold Corp., Series A, 5.800%, 11/15/2034 | 3,940,835 | ||||||
| 7,370,000 | First Quantum Minerals Ltd., 6.875%, 3/01/2026, 144A | 6,979,549 | ||||||
| 31,810,000 | First Quantum Minerals Ltd., 6.875%, 10/15/2027, 144A | 29,844,882 | ||||||
| 9,200,000 | First Quantum Minerals Ltd., 7.500%, 4/01/2025, 144A | 8,954,730 | ||||||
| 14,665,000 | FMG Resources August 2006 Pty Ltd., 4.375%, 4/01/2031, 144A | 12,196,638 | ||||||
| 34,855,000 | Freeport-McMoRan, Inc., 5.400%, 11/14/2034 | 32,916,440 | ||||||
| 18,565,000 | Glencore Funding LLC, 2.500%, 9/01/2030, 144A | 15,073,852 | ||||||
| 28,195,000 | Glencore Funding LLC, 2.850%, 4/27/2031, 144A | 23,072,677 | ||||||
| 2,865,000 | Volcan Cia Minera SAA, 4.375%, 2/11/2026, 144A | 2,468,329 | ||||||
|
| |||||||
| 174,307,386 | ||||||||
|
| |||||||
| Midstream – 1.0% |
| |||||||
| 7,685,000 | DCP Midstream Operating LP, 3.250%, 2/15/2032 | 6,356,494 | ||||||
| 55,000 | DCP Midstream Operating LP, 5.125%, 5/15/2029 | 53,005 | ||||||
| 9,050,000 | DCP Midstream Operating LP, 6.450%, 11/03/2036, 144A | 8,868,304 | ||||||
| 13,095,000 | Energy Transfer LP, 5.750%, 2/15/2033 | 12,811,624 | ||||||
| 3,745,000 | Hess Midstream Operations LP, 4.250%, 2/15/2030, 144A | 3,201,679 | ||||||
| 205,000 | NGPL PipeCo LLC, 7.768%, 12/15/2037, 144A | 213,306 | ||||||
| 480,000 | Targa Resources Corp., 5.200%, 7/01/2027 | 470,463 | ||||||
| 5,300,000 | Targa Resources Partners LP/Targa Resources Partners Finance Corp., 4.000%, 1/15/2032 | 4,455,498 | ||||||
| 1,365,000 | Targa Resources Partners LP/Targa Resources Partners Finance Corp., 4.875%, 2/01/2031 | 1,232,527 | ||||||
| 1,380,000 | Targa Resources Partners LP/Targa Resources Partners Finance Corp., 5.500%, 3/01/2030 | 1,298,470 | ||||||
| 2,635,000 | Western Midstream Operating LP, 4.300%, 2/01/2030 | 2,300,144 | ||||||
| 6,105,000 | Western Midstream Operating LP, 5.300%, 3/01/2048 | 5,019,695 | ||||||
| 1,130,000 | Western Midstream Operating LP, 5.450%, 4/01/2044 | 938,714 | ||||||
| 840,000 | Western Midstream Operating LP, 5.500%, 8/15/2048 | 697,177 | ||||||
| 3,495,000 | Western Midstream Operating LP, 5.500%, 2/01/2050 | 2,879,181 | ||||||
|
| |||||||
| 50,796,281 | ||||||||
|
| |||||||
| Mortgage Related – 0.0% |
| |||||||
| 3,903 | FHLMC, 5.000%, 12/01/2031 | 3,880 | ||||||
|
| |||||||
See accompanying notes to financial statements.
17 |
Portfolio of Investments – as of December 31, 2022
Loomis Sayles Bond Fund – continued
Principal Amount | Description | Value (†) | ||||||
| Bonds and Notes – continued | ||||||||
| Non-Agency Commercial Mortgage-Backed Securities – 2.1% |
| |||||||
| $ | 10,990,000 | BANK, Series 2021-BN35, Class AS, 2.457%, 6/15/2064 | $ | 8,482,181 | ||||
| 505,000 | BBSG Mortgage Trust, Series 2016-MRP, Class A, 3.275%, 6/05/2036, 144A | 437,376 | ||||||
| 11,095,000 | BPR Trust, Series 2021-NRD, Class F, 1-month SOFR + 6.870%, 11.196%, 12/15/2038, 144A(c) | 9,758,092 | ||||||
| 7,790,000 | BPR Trust, Series 2022-STAR, Class A, 1-month SOFR + 3.232%, 7.568%, 8/15/2024, 144A(c) | 7,665,962 | ||||||
| 1,819,488 | Commercial Mortgage Pass Through Certificates, Series 2012-CR3, Class AM, 3.416%, 10/15/2045, 144A | 1,635,666 | ||||||
| 181,047 | Commercial Mortgage Pass Through Certificates, Series 2012-LTRT, Class A2, 3.400%, 10/05/2030, 144A | 155,228 | ||||||
| 2,429,303 | Commercial Mortgage Trust, Series 2012-LC4, Class B, 4.934%, 12/10/2044(a) | 2,424,777 | ||||||
| 6,710,000 | Credit Suisse Mortgage Trust, Series 2014-USA, Class B, 4.185%, 9/15/2037, 144A | 5,695,717 | ||||||
| 630,000 | Credit Suisse Mortgage Trust, Series 2014-USA, Class C, 4.336%, 9/15/2037, 144A | 508,696 | ||||||
| 2,530,000 | Credit Suisse Mortgage Trust, Series 2014-USA, Class D, 4.373%, 9/15/2037, 144A | 1,860,786 | ||||||
| 4,217,150 | Extended Stay America Trust, Series 2021-ESH, Class C, 1-month LIBOR + 1.700%, 6.018%, 7/15/2038, 144A(c) | 4,047,884 | ||||||
| 3,031,077 | Extended Stay America Trust, Series 2021-ESH, Class D, 1-month LIBOR + 2.250%, 6.568%, 7/15/2038, 144A(c) | 2,901,818 | ||||||
| 3,760,000 | GS Mortgage Securities Corp. Trust, Series 2013-PEMB, Class B, 3.550%, 3/05/2033, 144A(a) | 3,283,439 | ||||||
| 3,815,000 | GS Mortgage Securities Trust, Series 2013-G1, Class B, 3.650%, 4/10/2031, 144A(a) | 3,690,087 | ||||||
| 435,000 | JPMorgan Chase Commercial Mortgage Securities Trust, Series 2012-LC9, Class D, 4.064%, 12/15/2047, 144A(a) | 403,326 | ||||||
| 1,905,000 | MedTrust, Series 2021-MDLN, Class B, 1-month LIBOR + 1.450%, 5.768%, 11/15/2038, 144A(c) | 1,814,229 | ||||||
| 6,060,000 | MedTrust, Series 2021-MDLN, Class C, 1-month LIBOR + 1.800%, 6.118%, 11/15/2038, 144A(c) | 5,757,321 | ||||||
| Non-Agency Commercial Mortgage-Backed Securities – continued |
| |||||||
| 2,500,000 | MedTrust, Series 2021-MDLN, Class D, 1-month LIBOR + 2.000%, 6.318%, 11/15/2038, 144A(c) | 2,362,077 | ||||||
| 1,380,537 | Morgan Stanley Bank of America Merrill Lynch Commercial Mortgage Securities Trust, Series 2012-CKSV, Class A2, 3.277%, 10/15/2030, 144A | 1,111,332 | ||||||
| 11,786,000 | Morgan Stanley Bank of America Merrill Lynch Trust, Series 2013-C11, Class A4, 4.198%, 8/15/2046(a) | 11,614,740 | ||||||
| 1,705,000 | Morgan Stanley Bank of America Merrill Lynch Trust, Series 2013-C11, Class B, 4.398%, 8/15/2046(a) | 1,258,320 | ||||||
| 5,770,000 | RBS Commercial Funding Trust, Series 2013-GSP, Class A, 3.834%, 1/15/2032, 144A(a) | 5,553,469 | ||||||
| 594,598 | UBS-Barclays Commercial Mortgage Trust, Series 2012-TFT, Class A, 2.892%, 6/05/2030, 144A | 578,584 | ||||||
| 9,076,751 | Wells Fargo Commercial Mortgage Trust, Series 2013-LC12, Class B, 4.296%, 7/15/2046(a) | 8,606,159 | ||||||
| 4,970,000 | Wells Fargo Commercial Mortgage Trust, Series 2016-C36, Class B, 3.671%, 11/15/2059(a) | 4,132,553 | ||||||
| 1,955,000 | WFRBS Commercial Mortgage Trust, Series 2012-C10, Class B, 3.744%, 12/15/2045 | 1,813,521 | ||||||
| 7,750,000 | WFRBS Commercial Mortgage Trust, Series 2013-C15, Class B, 4.529%, 8/15/2046(a) | 6,610,614 | ||||||
| 2,915,000 | WFRBS Commercial Mortgage Trust, Series 2014-C20, Class B, 4.378%, 5/15/2047 | 2,508,389 | ||||||
|
| |||||||
| 106,672,343 | ||||||||
|
| |||||||
| Paper – 0.1% |
| |||||||
| 3,445,000 | WestRock MWV LLC, 7.950%, 2/15/2031 | 3,870,846 | ||||||
| 2,252,000 | Weyerhaeuser Co., 7.375%, 3/15/2032 | 2,489,324 | ||||||
|
| |||||||
| 6,360,170 | ||||||||
|
| |||||||
| Pharmaceuticals – 1.3% |
| |||||||
| 11,605,000 | Bausch Health Cos., Inc., 4.875%, 6/01/2028, 144A | 7,381,265 | ||||||
| 5,560,000 | Bausch Health Cos., Inc., 5.000%, 1/30/2028, 144A | 2,668,769 | ||||||
| 580,000 | Bausch Health Cos., Inc., 5.000%, 2/15/2029, 144A | 277,964 | ||||||
| 4,435,000 | Bausch Health Cos., Inc., 5.250%, 1/30/2030, 144A | 2,127,292 | ||||||
| 3,015,000 | Bausch Health Cos., Inc., 5.250%, 2/15/2031, 144A | 1,460,979 | ||||||
| 640,000 | Bausch Health Cos., Inc., 6.250%, 2/15/2029, 144A | 308,120 | ||||||
See accompanying notes to financial statements.
| 18
Portfolio of Investments – as of December 31, 2022
Loomis Sayles Bond Fund – continued
Principal Amount | Description | Value (†) | ||||||
| Bonds and Notes – continued | ||||||||
| Pharmaceuticals – continued |
| |||||||
| $ | 1,045,000 | Bausch Health Cos., Inc., 7.000%, 1/15/2028, 144A | $ | 505,099 | ||||
| 9,370,000 | Teva Pharmaceutical Finance Co. LLC, 6.150%, 2/01/2036 | 8,236,855 | ||||||
| 5,031,000 | Teva Pharmaceutical Finance Netherlands III BV, 3.150%, 10/01/2026 | 4,399,609 | ||||||
| 25,967,000 | Teva Pharmaceutical Finance Netherlands III BV, 4.100%, 10/01/2046 | 15,876,880 | ||||||
| 15,545,000 | Teva Pharmaceutical Finance Netherlands III BV, 4.750%, 5/09/2027 | 14,051,121 | ||||||
| 10,545,000 | Teva Pharmaceutical Finance Netherlands III BV, 5.125%, 5/09/2029 | 9,390,820 | ||||||
|
| |||||||
| 66,684,773 | ||||||||
|
| |||||||
| Property & Casualty Insurance – 0.3% |
| |||||||
| 13,985,000 | MBIA Insurance Corp., 3-month LIBOR + 11.260%, 15.339%, 1/15/2033, 144A(e)(f) | 1,398,500 | ||||||
| 80,000 | MBIA Insurance Corp., 3-month LIBOR + 11.260%, 16.027%, 1/15/2033(e)(f) | 8,000 | ||||||
| 17,110,000 | Stewart Information Services Corp., 3.600%, 11/15/2031 | 13,111,859 | ||||||
|
| |||||||
| 14,518,359 | ||||||||
|
| |||||||
| REITs – Diversified – 0.1% |
| |||||||
| 4,125,000 | EPR Properties, 3.600%, 11/15/2031 | 2,988,568 | ||||||
|
| |||||||
| Retailers – 0.5% |
| |||||||
| 4,680,000 | Dillard’s, Inc., 7.000%, 12/01/2028 | 4,632,264 | ||||||
| 7,182,000 | Dillard’s, Inc., 7.750%, 7/15/2026 | 7,411,609 | ||||||
| 2,250,000 | Dillard’s, Inc., 7.750%, 5/15/2027 | 2,253,983 | ||||||
| 5,975,000 | Lithia Motors, Inc., 3.875%, 6/01/2029, 144A | 4,924,535 | ||||||
| 9,245,000 | Marks & Spencer PLC, 7.125%, 12/01/2037, 144A | 8,169,344 | ||||||
|
| |||||||
| 27,391,735 | ||||||||
|
| |||||||
| Technology – 3.9% |
| |||||||
| 15,580,000 | Avnet, Inc., 5.500%, 6/01/2032 | 14,386,568 | ||||||
| 8,675,000 | Block, Inc., 3.500%, 6/01/2031 | 6,921,999 | ||||||
| 5,785,000 | Broadcom, Inc., 3.137%, 11/15/2035, 144A | 4,253,515 | ||||||
| 13,741,000 | Broadcom, Inc., 4.150%, 11/15/2030 | 12,314,027 | ||||||
| 2,346,000 | CDW LLC/CDW Finance Corp., 2.670%, 12/01/2026 | 2,082,821 | ||||||
| 2,739,000 | CDW LLC/CDW Finance Corp., 3.250%, 2/15/2029 | 2,332,779 | ||||||
| 27,510,000 | CDW LLC/CDW Finance Corp., 3.569%, 12/01/2031 | 22,669,236 | ||||||
| 637,000 | CDW LLC/CDW Finance Corp., 4.250%, 4/01/2028 | 586,250 | ||||||
| 14,400,000 | CommScope Technologies LLC, 5.000%, 3/15/2027, 144A | 9,780,503 | ||||||
| 16,765,000 | CommScope, Inc., 4.750%, 9/01/2029, 144A | 13,515,943 | ||||||
| Technology – continued |
| |||||||
| 19,780,000 | Entegris Escrow Corp., 4.750%, 4/15/2029, 144A | 18,038,120 | ||||||
| 945,000 | Gartner, Inc., 3.625%, 6/15/2029, 144A | 830,390 | ||||||
| 2,250,000 | Global Payments, Inc., 2.900%, 11/15/2031 | 1,774,279 | ||||||
| 3,460,000 | Global Payments, Inc., 5.300%, 8/15/2029 | 3,345,026 | ||||||
| 7,515,000 | Global Payments, Inc., 5.400%, 8/15/2032 | 7,156,914 | ||||||
| 13,265,000 | Iron Mountain, Inc., 4.875%, 9/15/2029, 144A | 11,569,733 | ||||||
| 8,630,000 | Marvell Technology, Inc., 2.950%, 4/15/2031 | 6,941,443 | ||||||
| 19,330,000 | Micron Technology, Inc., 6.750%, 11/01/2029 | 19,634,967 | ||||||
| 2,080,000 | NXP BV/NXP Funding LLC/NXP USA, Inc., 4.400%, 6/01/2027 | 1,993,458 | ||||||
| 4,150,000 | Open Text Corp., 6.900%, 12/01/2027, 144A | 4,150,000 | ||||||
| 18,900,000 | Oracle Corp., 3.950%, 3/25/2051 | 13,465,102 | ||||||
| 5,830,000 | Oracle Corp., 6.150%, 11/09/2029 | 6,051,341 | ||||||
| 845,000 | Seagate HDD Cayman, 4.091%, 6/01/2029 | 699,398 | ||||||
| 615,825 | Seagate HDD Cayman, 9.625%, 12/01/2032 | 675,437 | ||||||
| 6,775,000 | Western Digital Corp., 2.850%, 2/01/2029 | 5,241,614 | ||||||
| 10,601,000 | Western Digital Corp., 4.750%, 2/15/2026 | 9,983,174 | ||||||
|
| |||||||
| 200,394,037 | ||||||||
|
| |||||||
| Transportation Services – 0.5% |
| |||||||
| 5,895,000 | Adani Ports & Special Economic Zone Ltd., 3.100%, 2/02/2031, 144A | 4,324,100 | ||||||
| 19,345,000 | Adani Ports & Special Economic Zone Ltd., 4.200%, 8/04/2027, 144A | 16,980,517 | ||||||
| 1,845,000 | GMR Hyderabad International Airport Ltd., 4.250%, 10/27/2027, 144A | 1,599,320 | ||||||
| 315,000 | GMR Hyderabad International Airport Ltd., 4.750%, 2/02/2026, 144A | 292,994 | ||||||
|
| |||||||
| 23,196,931 | ||||||||
|
| |||||||
| Treasuries – 15.6% |
| |||||||
| 222,380,000 | U.S. Treasury Bond, 3.250%, 5/15/2042 | 194,964,716 | ||||||
| 149,270,000 | U.S. Treasury Note, 0.125%, 2/28/2023(g) | 148,274,262 | ||||||
| 213,830,000 | U.S. Treasury Note, 0.125%, 6/30/2023 | 209,085,647 | ||||||
| 76,545,000 | U.S. Treasury Note, 0.500%, 11/30/2023 | 73,644,662 | ||||||
| 73,585,000 | U.S. Treasury Note, 0.875%, 1/31/2024 | 70,604,233 | ||||||
| 103,730,000 | U.S. Treasury Note, 1.500%, 2/29/2024 | 99,985,995 | ||||||
|
| |||||||
| 796,559,515 | ||||||||
|
| |||||||
See accompanying notes to financial statements.
19 |
Portfolio of Investments – as of December 31, 2022
Loomis Sayles Bond Fund – continued
Principal Amount | Description | Value (†) | ||||||
| Bonds and Notes – continued | ||||||||
| Wireless – 1.3% | ||||||||
| $ | 9,835,000 | IHS Holding Ltd., 5.625%, 11/29/2026, 144A | $ | 8,118,793 | ||||
| 8,000,000 | SoftBank Group Corp., 4.625%, 7/06/2028 | 6,568,320 | ||||||
| 3,695,000 | SoftBank Group Corp., 5.250%, 7/06/2031 | 2,956,000 | ||||||
| 35,370,000 | T-Mobile USA, Inc., 3.375%, 4/15/2029 | 31,152,817 | ||||||
| 20,890,000 | T-Mobile USA, Inc., 3.500%, 4/15/2031 | 18,044,770 | ||||||
|
| |||||||
| 66,840,700 | ||||||||
|
| |||||||
| Wirelines – 0.3% | ||||||||
| 3,825,000 | Cincinnati Bell Telephone Co. LLC, 6.300%, 12/01/2028 | 3,336,968 | ||||||
| 5,545,000 | Telecom Italia Capital S.A., 6.000%, 9/30/2034 | 4,190,357 | ||||||
| 11,370,000 | Telecom Italia Capital S.A., 6.375%, 11/15/2033 | 9,301,683 | ||||||
|
| |||||||
| 16,829,008 | ||||||||
|
| |||||||
| Total Non-Convertible Bonds | ||||||||
| (Identified Cost $4,958,929,073) | 4,267,227,986 | |||||||
|
| |||||||
| Convertible Bonds – 5.6% | ||||||||
| Airlines – 0.5% | ||||||||
| 5,645,000 | JetBlue Airways Corp., 0.500%, 4/01/2026 | 4,115,640 | ||||||
| 17,869,000 | Southwest Airlines Co., 1.250%, 5/01/2025 | 21,460,669 | ||||||
|
| |||||||
| 25,576,309 | ||||||||
|
| |||||||
| Cable Satellite – 2.3% | ||||||||
| 195,000 | Cable One, Inc., Zero Coupon 6.042%, 3/15/2026(h) | 153,173 | ||||||
| 184,765,000 | DISH Network Corp., 3.375%, 8/15/2026 | 115,755,272 | ||||||
|
| |||||||
| 115,908,445 | ||||||||
|
| |||||||
| Consumer Cyclical Services – 0.3% | ||||||||
| 1,520,000 | Peloton Interactive, Inc., Zero Coupon 0.519%-0.987%, 2/15/2026(i) | 1,075,993 | ||||||
| 18,940,000 | Uber Technologies, Inc., Zero Coupon, 0.000%-5.582%, 12/15/2025(i) | 15,996,534 | ||||||
|
| |||||||
| 17,072,527 | ||||||||
|
| |||||||
| Gaming – 0.1% | ||||||||
| 3,339,000 | Penn Entertainment, Inc., 2.750%, 5/15/2026 | 4,921,686 | ||||||
|
| |||||||
| Healthcare – 0.6% | ||||||||
| 36,387,000 | Teladoc Health, Inc., 1.250%, 6/01/2027 | 27,952,304 | ||||||
|
| |||||||
| Leisure – 0.2% | ||||||||
| 16,620,000 | NCL Corp. Ltd., 1.125%, 2/15/2027 | 11,383,703 | ||||||
|
| |||||||
| Media Entertainment – 0.2% | ||||||||
| 8,590,000 | Snap, Inc., Zero Coupon 6.697%-7.641%, 5/01/2027(i) | 6,000,115 | ||||||
| 7,780,000 | Spotify USA, Inc., Zero Coupon 5.189%-5.873%, 3/15/2026(i) | 6,262,900 | ||||||
|
| |||||||
| 12,263,015 | ||||||||
|
| |||||||
| Pharmaceuticals – 1.0% | ||||||||
| 13,963,000 | BioMarin Pharmaceutical, Inc., 0.599%, 8/01/2024 | 14,818,932 | ||||||
| 27,688,000 | BioMarin Pharmaceutical, Inc., 1.250%, 5/15/2027 | 29,752,440 | ||||||
| 6,370,000 | Livongo Health, Inc., 0.875%, 6/01/2025 | 5,576,171 | ||||||
|
| |||||||
| 50,147,543 | ||||||||
|
| |||||||
| Technology – 0.4% | ||||||||
| 475,000 | Bentley Systems, Inc., 0.375%, 7/01/2027 | 386,650 | ||||||
| 6,935,000 | RingCentral, Inc., Zero Coupon 7.146%-8.016%, 3/15/2026(i) | 5,443,975 | ||||||
| 7,165,000 | Splunk, Inc., 1.125%, 6/15/2027 | 6,045,827 | ||||||
| 7,845,000 | Unity Software, Inc., Zero Coupon 7.084%-8.213%, 11/15/2026(i) | 5,871,983 | ||||||
|
| |||||||
| 17,748,435 | ||||||||
|
| |||||||
| Total Convertible Bonds | ||||||||
| (Identified Cost $386,146,449) | 282,973,967 | |||||||
|
| |||||||
| Municipals – 1.6% | ||||||||
| Virginia – 1.6% | ||||||||
| 89,440,000 | Tobacco Settlement Financing Corp., Series A-1, 6.706%, 6/01/2046 (Identified Cost $88,795,062) | 80,571,210 | ||||||
|
| |||||||
| Total Bonds and Notes | ||||||||
| (Identified Cost $5,433,870,584) | 4,630,773,163 | |||||||
|
| |||||||
| Senior Loans – 0.3% | ||||||||
| Independent Energy – 0.3% | ||||||||
| 16,469,000 | Ascent Resources - Utica, 2020 Fixed 2nd Lien Term Loan, (Identified Cost $16,469,450) | 17,358,326 | ||||||
|
| |||||||
| Collateralized Loan Obligations – 4.5% | ||||||||
| 9,977,000 | 522 Funding CLO Ltd., Series 2018-3A, Class DR, 3-month LIBOR + 3.100%, 7.343%, 10/20/2031, 144A(c) | 9,295,411 | ||||||
| 7,140,000 | AGL CLO 12 Ltd., Series 2021-12A, Class B, 3-month LIBOR + 1.600%, 5.843%, 7/20/2034, 144A(c) | 6,809,504 | ||||||
| 7,240,000 | AGL CLO 12 Ltd., Series 2021-12A, Class D, 3-month LIBOR + 2.850%, 7.093%, 7/20/2034, 144A(c) | 6,540,152 | ||||||
See accompanying notes to financial statements.
| 20
Portfolio of Investments – as of December 31, 2022
Loomis Sayles Bond Fund – continued
Principal Amount | Description | Value (†) | ||||||
| Collateralized Loan Obligations – continued | ||||||||
| $ | 1,805,000 | AGL CLO 7 Ltd., Series 2020-7A, Class DR, 3-month LIBOR + 3.100%, 7.179%, 7/15/2034, 144A(c) | $ | 1,668,639 | ||||
| 10,050,000 | AIG CLO LLC, Series 2021-1A, Class D, 3-month LIBOR + 2.950%, 7.275%, 4/22/2034, 144A(c) | 9,278,934 | ||||||
| 5,605,000 | AIG CLO LLC, Series 2021-2A, Class D, 3-month LIBOR + 3.050%, 7.293%, 7/20/2034, 144A(c) | 5,175,231 | ||||||
| 7,810,000 | AIMCO CLO Ltd., Series 2020-12A, Class AR, 3-month SOFR + 1.170%, 5.034%, 1/17/2032, 144A(c) | 7,659,689 | ||||||
| 3,955,000 | ARES Loan Funding I Ltd., Series 2021-ALFA, Class D, 3-month LIBOR +3.000%, 7.079%, 10/15/2034, 144A(c) | 3,657,086 | ||||||
| 5,225,000 | Bain Capital Credit CLO Ltd, Series 2017-2A, Class DR2, 3-month LIBOR + 3.100%, 7.458%, 7/25/2034, 144A(c) | 4,811,990 | ||||||
| 1,340,000 | Ballyrock CLO Ltd., Series 2019-2A, Class A2R, 3-month LIBOR + 1.400%, 6.075%, 11/20/2030, 144A(c) | 1,289,395 | ||||||
| 10,720,000 | Benefit Street Partners CLO XVI Ltd., Series 2018-16A, Class CR, 3-month LIBOR + 2.000%, 6.079%, 1/17/2032, 144A(c) | 10,136,253 | ||||||
| 2,245,000 | Benefit Street Partners CLO XVI Ltd., Series 2018-16A, Class DR, 3-month LIBOR + 3.000%, 7.079%, 1/17/2032, 144A(c) | 2,062,356 | ||||||
| 5,225,000 | CarVal CLO III Ltd., Series 2019-2A, Class DR, 3-month LIBOR + 2.950%, 7.193%, 7/20/2032, 144A(c) | 4,767,713 | ||||||
| 4,305,000 | CIFC Funding Ltd., Series 2021-5A, Class D, 3-month LIBOR + 3.250%, 7.329%, 7/15/2034, 144A(c) | 4,065,457 | ||||||
| 6,075,000 | Crown City CLO I, Series 2020-1A, Class CR, 3-month LIBOR + 3.420%, 7.663%, 7/20/2034, 144A(c) | 5,326,451 | ||||||
| 7,745,000 | Elmwood CLO V Ltd., Series 2020-2A, Class DR, 3-month LIBOR + 3.100%, 7.343%, 10/20/2034, 144A(c) | 7,332,308 | ||||||
| 4,085,000 | Elmwood CLO VIII Ltd., Series 2021-1A, Class D2, 3-month LIBOR + 2.850%, 7.093%, 1/20/2034, 144A(c) | 3,828,687 | ||||||
| 8,760,000 | LCM 30 Ltd., Series 30A, Class BR, 3-month LIBOR + 1.500%, 5.743%, 4/20/2031, 144A(c) | 8,368,139 | ||||||
| 1,470,000 | LCM 30 Ltd., Series 30A, Class CR, 3-month LIBOR + 2.000%, 6.243%, 4/20/2031, 144A(c) | 1,339,498 | ||||||
| Collateralized Loan Obligations – continued | ||||||||
| 4,215,000 | LCM 30 Ltd., Series 30A, Class DR, 3-month LIBOR + 3.000%, 7.243%, 4/20/2031, 144A(c) | 3,597,873 | ||||||
| 15,835,000 | Madison Park Funding XXIII Ltd., Series 2017-23A, Class DR, 3-month LIBOR + 3.200%, 7.558%, 7/27/2031, 144A(c) | 14,751,047 | ||||||
| 1,260,000 | Madison Park Funding XXXI Ltd., Series 2018-31A, Class D, 3-month LIBOR + 3.000%, 7.325%, 1/23/2031, 144A(c) | 1,175,201 | ||||||
| 9,225,000 | Neuberger Berman CLO XX Ltd., Series 2015-20A, Class BRR, 3-month LIBOR + 1.650%, 5.729%, 7/15/2034, 144A(c) | 8,879,902 | ||||||
| 11,920,000 | OCP CLO Ltd., Series 2019-17A, Class DR, 3-month LIBOR + 3.100%, 7.343%, 7/20/2032, 144A(c) | 10,728,930 | ||||||
| 10,585,000 | Octagon Investment Partners 42 Ltd., Series 2019-3A, Class DR, 3-month LIBOR + 3.150%, 7.229%, 7/15/2034, 144A(c) | 10,019,179 | ||||||
| 4,920,000 | Octagon Investment Partners 46 Ltd., Series 2020-2A, Class DR, 3-month LIBOR + 3.300%, 7.379%, 7/15/2036, 144A(c) | 4,425,097 | ||||||
| 12,430,000 | OHA Credit Funding 3 Ltd., Series 2019-3A, Class BR, 3-month LIBOR + 1.650%, 5.893%, 7/02/2035, 144A(c) | 11,996,156 | ||||||
| 9,720,000 | OHA Credit Funding 3 Ltd., Series 2019-3A, Class DR, 3-month LIBOR + 2.900%, 7.143%, 7/02/2035, 144A(c) | 9,082,650 | ||||||
| 12,640,000 | Palmer Square CLO Ltd., Series 2013-2A, Class A2R3, 3-month LIBOR + 1.500%, 5.727%, 10/17/2031, 144A(c) | 12,208,685 | ||||||
| 5,120,000 | Palmer Square CLO Ltd., Series 2013-2A, Class CR3, 3-month LIBOR + 2.700%, 6.927%, 10/17/2031, 144A(c) | 4,668,134 | ||||||
| 2,970,000 | Palmer Square CLO Ltd., Series 2015-1A, Class A2R4, 3-month LIBOR + 1.700%, 6.375%, 5/21/2034, 144A(c) | 2,840,546 | ||||||
| 11,585,000 | Rockford Tower CLO Ltd., Series 2018-1A, Class A, 3-month LIBOR + 1.100%, 5.775%, 5/20/2031, 144A(c) | 11,390,604 | ||||||
| 6,015,447 | Shackleton CLO Ltd., Series 2017-10A, Class AR2, 3-month LIBOR + 0.890%, 5.133%, 4/20/2029, 144A(c) | 5,924,560 | ||||||
| 6,075,000 | Signal Peak CLO 1 Ltd., Series 2014-1A, Class AR3, 3-month LIBOR + 1.160%, 5.239%, 4/17/2034, 144A(c) | 5,925,202 | ||||||
See accompanying notes to financial statements.
21 |
Portfolio of Investments – as of December 31, 2022
Loomis Sayles Bond Fund – continued
Principal Amount | Description | Value (†) | ||||||
| Collateralized Loan Obligations – continued | ||||||||
| $ | 700,000 | THL Credit Wind River CLO Ltd., Series 2018-3A, Class D, 3-month LIBOR + 2.950%, 7.193%, 1/20/2031, 144A(c) | $ | 600,160 | ||||
| 5,300,000 | VERDE CLO Ltd., Series 2019-1A, Class AR, 3-month LIBOR + 1.100%, 5.179%, 4/15/2032, 144A(c) | 5,204,033 | ||||||
| 2,135,000 | Vibrant CLO XIV Ltd., Series 2021-14A, Class C, 3-month LIBOR + 3.750%, 7.993%, 10/20/2034, 144A(c) | 1,908,429 | ||||||
|
| |||||||
| Total Collateralized Loan Obligations |
| |||||||
| (Identified Cost $242,767,867) | 228,739,281 | |||||||
|
| |||||||
| Shares | ||||||||
| Common Stocks – 1.5% | ||||||||
| Aerospace & Defense – 0.0% |
| |||||||
| 4,520 | Lockheed Martin Corp. | 2,198,935 | ||||||
|
| |||||||
| Air Freight & Logistics – 0.0% |
| |||||||
| 10,447 | United Parcel Service, Inc., Class B | 1,816,106 | ||||||
|
| |||||||
| Beverages – 0.0% |
| |||||||
| 30,600 | Coca-Cola Co. (The) | 1,946,466 | ||||||
|
| |||||||
| Biotechnology – 0.1% |
| |||||||
| 17,775 | AbbVie, Inc. | 2,872,618 | ||||||
|
| |||||||
| Capital Markets – 0.1% |
| |||||||
| 1,376 | BlackRock, Inc. | 975,075 | ||||||
| 14,559 | Morgan Stanley | 1,237,806 | ||||||
|
| |||||||
| 2,212,881 | ||||||||
|
| |||||||
| Communications Equipment – 0.0% |
| |||||||
| 17,920 | Cisco Systems, Inc. | 853,709 | ||||||
|
| |||||||
| Containers & Packaging – 0.0% |
| |||||||
| 6,067 | Packaging Corp. of America | 776,030 | ||||||
|
| |||||||
| Electric Utilities – 0.1% |
| |||||||
| 11,847 | Duke Energy Corp. | 1,220,122 | ||||||
| 21,018 | NextEra Energy, Inc. | 1,757,105 | ||||||
|
| |||||||
| 2,977,227 | ||||||||
|
| |||||||
| Electrical Equipment – 0.0% |
| |||||||
| 9,193 | Emerson Electric Co. | 883,080 | ||||||
|
| |||||||
| Food & Staples Retailing – 0.1% |
| |||||||
| 1,663 | Costco Wholesale Corp. | 759,159 | ||||||
| 11,239 | Walmart, Inc. | 1,593,578 | ||||||
|
| |||||||
| 2,352,737 | ||||||||
|
| |||||||
| Health Care Equipment & Supplies – 0.0% |
| |||||||
| 13,744 | Abbott Laboratories | 1,508,954 | ||||||
|
| |||||||
| Health Care Providers & Services – 0.1% |
| |||||||
| 3,090 | Elevance Health, Inc. | 1,585,077 | ||||||
| 2,931 | UnitedHealth Group, Inc. | 1,553,958 | ||||||
|
| |||||||
| 3,139,035 | ||||||||
|
| |||||||
| Hotels, Restaurants & Leisure – 0.0% |
| |||||||
| 20,119 | Starbucks Corp. | 1,995,805 | ||||||
|
| |||||||
| Household Products – 0.1% |
| |||||||
| 17,070 | Procter & Gamble Co. (The) | 2,587,129 | ||||||
|
| |||||||
| IT Services – 0.0% |
| |||||||
| 4,264 | Accenture PLC, Class A | 1,137,806 | ||||||
|
| |||||||
| Life Sciences Tools & Services – 0.0% |
| |||||||
| 2,144 | Thermo Fisher Scientific, Inc. | 1,180,679 | ||||||
|
| |||||||
| Machinery – 0.1% |
| |||||||
| 3,497 | Cummins, Inc. | 847,288 | ||||||
| 3,955 | Deere & Co. | 1,695,746 | ||||||
|
| |||||||
| 2,543,034 | ||||||||
|
| |||||||
| Media – 0.3% |
| |||||||
| 2,006,877 | Altice USA, Inc., Class A(e) | 9,231,634 | ||||||
| 52,164 | Comcast Corp., Class A | 1,824,175 | ||||||
| 705,779 | iHeartMedia, Inc., Class A(e) | 4,326,426 | ||||||
|
| |||||||
| 15,382,235 | ||||||||
|
| |||||||
| Metals & Mining – 0.0% |
| |||||||
| 23,710 | Newmont Corp. | 1,119,112 | ||||||
|
| |||||||
| Oil, Gas & Consumable Fuels – 0.1% |
| |||||||
| 93,585 | Battalion Oil Corp.(e) | 908,710 | ||||||
| 4,546 | Devon Energy Corp. | 279,625 | ||||||
| 6,719 | Pioneer Natural Resources Co. | 1,534,552 | ||||||
| 37,203 | Williams Cos., Inc. (The) | 1,223,979 | ||||||
|
| |||||||
| 3,946,866 | ||||||||
|
| |||||||
| Pharmaceuticals – 0.1% |
| |||||||
| 15,366 | Bristol-Myers Squibb Co. | 1,105,584 | ||||||
| 14,316 | Johnson & Johnson | 2,528,921 | ||||||
| 14,093 | Merck & Co., Inc. | 1,563,618 | ||||||
|
| |||||||
| 5,198,123 | ||||||||
|
| |||||||
| Professional Services – 0.0% |
| |||||||
| 7,905 | Clarivate PLC(e) | 65,928 | ||||||
|
| |||||||
| REITs – Diversified – 0.1% |
| |||||||
| 6,679 | American Tower Corp. | 1,415,013 | ||||||
| 170,568 | NexPoint Diversified Real Estate Trust | 1,912,067 | ||||||
|
| |||||||
| 3,327,080 | ||||||||
|
| |||||||
| Road & Rail – 0.0% |
| |||||||
| 5,980 | Union Pacific Corp. | 1,238,279 | ||||||
|
| |||||||
| Semiconductors & Semiconductor Equipment – 0.1% |
| |||||||
| 3,545 | Broadcom, Inc. | 1,982,116 | ||||||
| 22,248 | Microchip Technology, Inc. | 1,562,922 | ||||||
| 15,974 | QUALCOMM, Inc. | 1,756,181 | ||||||
|
| |||||||
| 5,301,219 | ||||||||
|
| |||||||
| Software – 0.0% |
| |||||||
| 17,622 | IQOR U.S., Inc.(e) | 123,354 | ||||||
| 7,925 | Microsoft Corp. | 1,900,573 | ||||||
|
| |||||||
| 2,023,927 | ||||||||
|
| |||||||
| Specialty Retail – 0.0% |
| |||||||
| 4,153 | Home Depot, Inc. (The) | 1,311,767 | ||||||
|
| |||||||
See accompanying notes to financial statements.
| 22
Portfolio of Investments – as of December 31, 2022
Loomis Sayles Bond Fund – continued
| Shares | Description | Value (†) | ||||||
| Common Stocks – continued | ||||||||
| Technology Hardware, Storage & Peripherals – 0.0% |
| |||||||
| 12,644 | Apple, Inc. | $ | 1,642,835 | |||||
|
| |||||||
| Wireless Telecommunication Services – 0.1% |
| |||||||
| 30,481 | T-Mobile US, Inc.(e) | 4,267,340 | ||||||
|
| |||||||
| Total Common Stocks | ||||||||
| (Identified Cost $131,808,820) | 77,806,942 | |||||||
|
| |||||||
| Preferred Stocks – 1.9% | ||||||||
| Convertible Preferred Stocks – 1.6% | ||||||||
| Banking – 0.8% |
| |||||||
| 20,983 | Bank of America Corp., Series L, 7.250% | 24,340,280 | ||||||
| 11,335 | Wells Fargo & Co., Class A, Series L, 7.500% | 13,431,975 | ||||||
|
| |||||||
| 37,772,255 | ||||||||
|
| |||||||
| Midstream – 0.3% |
| |||||||
| 369,422 | El Paso Energy Capital Trust I, 4.750% | 16,638,434 | ||||||
|
| |||||||
| Technology – 0.1% |
| |||||||
| 170,945 | Clarivate PLC, Series A, 5.250% | 6,475,397 | ||||||
|
| |||||||
| Wireless – 0.4% |
| |||||||
| 19,569 | 2020 Cash Mandatory Exchangeable Trust, 5.250%, 144A | 22,387,327 | ||||||
|
| |||||||
| Total Convertible Preferred Stocks |
| |||||||
| (Identified Cost $99,503,988) | 83,273,413 | |||||||
|
| |||||||
| Non-Convertible Preferred Stocks – 0.3% | ||||||||
| Home Construction – 0.0% |
| |||||||
| 52,867 | Hovnanian Enterprises, Inc., 7.625% | 1,004,473 | ||||||
|
| |||||||
| REITs – Diversified – 0.0% |
| |||||||
| 16,004 | iStar, Inc., Series G, 7.650% | 392,578 | ||||||
|
| |||||||
| REITs – Office Property – 0.1% |
| |||||||
| 2,318 | Highwoods Properties, Inc., Series A, 8.625%(f) | 2,398,869 | ||||||
|
| |||||||
| REITs – Warehouse/Industrials – 0.2% |
| |||||||
| 169,007 | Prologis, Inc., Series Q, 8.540% | 9,320,736 | ||||||
|
| |||||||
| Total Non-Convertible Preferred Stocks |
| |||||||
| (Identified Cost $11,029,387) | 13,116,656 | |||||||
|
| |||||||
| Total Preferred Stocks | ||||||||
| (Identified Cost $110,533,375) | 96,390,069 | |||||||
|
| |||||||
| Principal Amount | Description | Value (†) | ||||||
| Short-Term Investments – 0.1% | ||||||||
| $ | 2,941,726 | Tri-Party Repurchase Agreement with Fixed Income Clearing Corporation, dated 12/30/2022 at 1.800% to be repurchased at $2,942,315 on 1/03/2023 collateralized by $3,429,600 U.S. Treasury Note, 1.250% due 3/31/2028 valued at $3,000,632 including accrued interest (Note 2 of Notes to Financial Statements) (Identified Cost $2,941,726) | $ | 2,941,726 | ||||
|
| |||||||
| Total Investments – 99.3% | ||||||||
| (Identified Cost $5,938,391,822) | 5,054,009,507 | |||||||
| Other assets less liabilities–0.7% | 37,178,205 | |||||||
|
| |||||||
| Net Assets – 100.0% | $ | 5,091,187,712 | ||||||
|
| |||||||
| (†) | See Note 2 of Notes to Financial Statements. | |||
| (a) | Variable rate security. The interest rate adjusts periodically based on; (i) changes in current interest rates and/or prepayments on underlying pools of assets, if applicable, (ii) reference to a base lending rate plus or minus a margin, and/or (iii) reference to a base lending rate adjusted by a multiplier and/or subject to certain floors or caps. Rate as of December 31, 2022 is disclosed. | |||
| (b) | Perpetual bond with no specified maturity date. | |||
| (c) | Variable rate security. Rate as of December 31, 2022 is disclosed. | |||
| (d) | The issuer is in default with respect to interest and/or principal payments. Income is not being accrued. | |||
| (e) | Non-income producing security. | |||
| (f) | Level 3 security. Value has been determined using significant unobservable inputs. See Note 3 of Notes to Financial Statements. | |||
| (g) | Security (or a portion thereof) has been pledged as collateral for open derivative contracts. | |||
| (h) | Interest rate represents annualized yield at time of purchase; not a coupon rate. | |||
| (i) | Interest rate represents annualized yield at time of purchase; not a coupon rate. The Fund’s investment in this security is comprised of various lots with differing annualized yields. | |||
| (j) | Stated interest rate has been determined in accordance with the provisions of the loan agreement and is subject to a minimum benchmark floor rate of 1.00%, to which the spread is added. | |||
| 144A | All or a portion of these securities are exempt from registration under Rule 144A of the Securities Act of 1933. These securities may be resold in transactions exempt from registration, normally to qualified institutional buyers. At December 31, 2022, the value of Rule 144A holdings amounted to $2,237,745,553 or 44.0% of net assets. | |||
| ABS | Asset-Backed Securities | |||
| EMTN | Euro Medium Term Note | |||
| FHLMC | Federal Home Loan Mortgage Corp. | |||
| LIBOR | London Interbank Offered Rate | |||
| REITs | Real Estate Investment Trusts | |||
| SOFR | Secured Overnight Financing Rate | |||
See accompanying notes to financial statements.
23 |
Portfolio of Investments – as of December 31, 2022
Loomis Sayles Bond Fund – continued
At December 31, 2022, open long futures contracts were as follows:
Financial Futures | Expiration Date | Contracts | Notional Amount | Value | Unrealized Appreciation (Depreciation) | |||||||||||||||
10 Year U.S. Treasury Note | 3/22/2023 | 3,994 | $ | 451,197,895 | 448,513,719 | $ | (2,684,176 | ) | ||||||||||||
Ultra Long U.S. Treasury Bond | 3/22/2023 | 1,082 | 149,097,726 | 145,326,125 | (3,771,601 | ) | ||||||||||||||
|
| |||||||||||||||||||
Total |
| $ | (6,455,777 | ) | ||||||||||||||||
|
| |||||||||||||||||||
Industry Summary at December 31, 2022
Treasuries | 15.6 | % | ||
Cable Satellite | 6.4 | |||
Finance Companies | 5.0 | |||
Banking | 4.9 | |||
Independent Energy | 4.5 | |||
ABS Home Equity | 4.5 | |||
Technology | 4.4 | |||
ABS Car Loan | 4.2 | |||
Metals & Mining | 3.4 | |||
Life Insurance | 3.3 | |||
ABS Other | 3.0 | |||
Consumer Cyclical Services | 2.5 | |||
Pharmaceuticals | 2.4 | |||
Airlines | 2.4 | |||
Non-Agency Commercial Mortgage-Backed Securities | 2.1 | |||
Other Investments, less than 2% each | 26.1 | |||
Collateralized Loan Obligations | 4.5 | |||
Short-Term Investments | 0.1 | |||
|
| |||
Total Investments | 99.3 | |||
Other assets less liabilities (including futures contracts) | 0.7 | |||
|
| |||
Net Assets | 100.0 | % | ||
|
|
See accompanying notes to financial statements.
| 24
Portfolio of Investments – as of December 31, 2022
Loomis Sayles Investment Grade Fixed Income Fund
| Principal Amount | Description | Value (†) | ||||||
| Bonds and Notes – 92.4% of Net Assets | ||||||||
| Non-Convertible Bonds – 90.7% | ||||||||
| ABS Car Loan – 8.5% |
| |||||||
| $ | 100,000 | American Credit Acceptance Receivables Trust, Series 2020-3, Class D, 2.400%, 6/15/2026, 144A | $ | 96,445 | ||||
| 335,000 | American Credit Acceptance Receivables Trust, Series 2021-3, Class D, 1.340%, 11/15/2027, 144A | 310,982 | ||||||
| 100,000 | American Credit Acceptance Receivables Trust, Series 2022-1, Class D, 2.460%, 3/13/2028, 144A | 89,974 | ||||||
| 60,000 | American Credit Acceptance Receivables Trust, Series 2022-4, Class C, 7.860%, 2/15/2029, 144A | 60,759 | ||||||
| 230,000 | AmeriCredit Automobile Receivables Trust, Series 2018-3, Class D, 4.040%, 11/18/2024 | 228,335 | ||||||
| 235,000 | AmeriCredit Automobile Receivables Trust, Series 2021-1, Class D, 1.210%, 12/18/2026 | 209,142 | ||||||
| 100,000 | Avis Budget Rental Car Funding AESOP LLC, Series 2019-2A, Class A, 3.350%, 9/22/2025, 144A | 96,618 | ||||||
| 620,000 | Avis Budget Rental Car Funding AESOP LLC, Series 2019-3A, Class A, 2.360%, 3/20/2026, 144A | 577,039 | ||||||
| 100,000 | Avis Budget Rental Car Funding AESOP LLC, Series 2020-1A, Class B, 2.680%, 8/20/2026, 144A | 90,463 | ||||||
| 600,000 | Avis Budget Rental Car Funding AESOP LLC, Series 2020-2A, Class A, 2.020%, 2/20/2027, 144A | 543,738 | ||||||
| 100,000 | CarMax Auto Owner Trust, Series 2021-3, Class D, 1.500%, 1/18/2028 | 87,204 | ||||||
| 100,000 | CarMax Auto Owner Trust, Series 2022-1, Class D, 2.470%, 7/17/2028 | 87,027 | ||||||
| 109,395 | CPS Auto Receivables Trust, Series 2020-C, Class C, 1.710%, 8/17/2026, 144A | 108,631 | ||||||
| 370,000 | Credit Acceptance Auto Loan Trust, Series 2020-2A, Class C, 2.730%, 11/15/2029, 144A | 353,741 | ||||||
| 250,000 | Credit Acceptance Auto Loan Trust, Series 2020-3A, Class C, 2.280%, 2/15/2030, 144A | 235,586 | ||||||
| 260,000 | Credit Acceptance Auto Loan Trust, Series 2021-2A, Class C, 1.640%, 6/17/2030, 144A | 235,863 | ||||||
| 250,000 | Credit Acceptance Auto Loan Trust, Series 2021-3A, Class C, 1.630%, 9/16/2030, 144A | 225,394 | ||||||
| 69,623 | Drive Auto Receivables Trust, Series 2018-5, Class D, 4.300%, 4/15/2026 | 69,561 | ||||||
| 42,359 | Drive Auto Receivables Trust, Series 2019-1, Class D, 4.090%, 6/15/2026 | 42,255 | ||||||
| 340,000 | Drive Auto Receivables Trust, Series 2021-1, Class D, 1.450%, 1/16/2029 | 318,621 | ||||||
| ABS Car Loan – continued | ||||||||
| $ | 690,000 | Drive Auto Receivables Trust, Series 2021-2, Class D, 1.390%, 3/15/2029 | $ | 635,790 | ||||
| 115,000 | DT Auto Owner Trust, Series 2021-2A, Class D, 1.500%, 2/16/2027, 144A | 105,620 | ||||||
| 690,000 | DT Auto Owner Trust, Series 2021-3A, Class D, 1.310%, 5/17/2027, 144A | 604,533 | ||||||
| 254,637 | Exeter Automobile Receivables Trust, Series 2019-4A, Class D, 2.580%, 9/15/2025, 144A | 250,363 | ||||||
| 150,000 | Exeter Automobile Receivables Trust, Series 2021-1A, Class D, 1.080%, 11/16/2026 | 139,847 | ||||||
| 495,000 | Exeter Automobile Receivables Trust, Series 2021-3A, Class D, 1.550%, 6/15/2027 | 449,217 | ||||||
| 105,000 | Exeter Automobile Receivables Trust, Series 2022-2A, Class D, 4.560%, 7/17/2028 | 98,397 | ||||||
| 75,000 | Exeter Automobile Receivables Trust, Series 2022-6A, Class C, 6.320%, 5/15/2028 | 75,034 | ||||||
| 201,662 | First Investors Auto Owner Trust, Series 2019-1A, Class D, 3.550%, 4/15/2025, 144A | 200,771 | ||||||
| 285,000 | First Investors Auto Owner Trust, Series 2021-1A, Class D, 1.620%, 3/15/2027, 144A | 258,332 | ||||||
| 165,000 | Flagship Credit Auto Trust, Series 2021-1, Class D, 1.270%, 3/15/2027, 144A | 148,649 | ||||||
| 175,000 | Flagship Credit Auto Trust, Series 2021-2, Class D, 1.590%, 6/15/2027, 144A | 155,861 | ||||||
| 210,000 | Flagship Credit Auto Trust, Series 2021-3, Class D, 1.650%, 9/15/2027, 144A | 182,107 | ||||||
| 862,153 | Ford Credit Auto Owner Trust, Series 2021-A, Class A3, 0.300%, 8/15/2025 | 837,475 | ||||||
| 270,000 | Foursight Capital Automobile Receivables Trust, Series 2021-1, Class D, 1.320%, 3/15/2027, 144A | 249,517 | ||||||
| 170,000 | Foursight Capital Automobile Receivables Trust, Series 2021-2, Class D, 1.920%, 9/15/2027, 144A | 153,940 | ||||||
| 285,000 | GLS Auto Receivables Issuer Trust, Series 2021-2A, Class D, 1.420%, 4/15/2027, 144A | 258,557 | ||||||
| 132,642 | GLS Auto Receivables Trust, Series 2019-2A, Class C, 3.540%, 2/18/2025, 144A | 131,699 | ||||||
| 196,904 | GM Financial Consumer Automobile Receivables Trust, Series 2020-1, Class A3, 1.840%, 9/16/2024 | 195,587 | ||||||
| 294,922 | GM Financial Consumer Automobile Receivables Trust, Series 2021-1, Class A3, 0.350%, 10/16/2025 | 285,318 | ||||||
| 805,183 | GM Financial Consumer Automobile Receivables Trust, Series 2021-2, Class A3, 0.510%, 4/16/2026 | 773,661 | ||||||
See accompanying notes to financial statements.
25 |
Portfolio of Investments – as of December 31, 2022
Loomis Sayles Investment Grade Fixed Income Fund – continued
| Principal Amount | Description | Value (†) | ||||||
| Bonds and Notes – continued | ||||||||
| ABS Car Loan – continued | ||||||||
| $ | 548,000 | Hertz Vehicle Financing III LLC, Series 2022-1A, 4.850%, 6/25/2026, 144A | $ | 482,051 | ||||
| 305,000 | Hertz Vehicle Financing III LLC, Series 2022-3A, 6.310%, 3/25/2025, 144A | 290,802 | ||||||
| 250,000 | Hertz Vehicle Financing LLC, Class D, Series 2022-4A, 6.560%, 9/25/2026, 144A | 230,440 | ||||||
| 1,300,000 | Honda Auto Receivables Owner Trust, Series 2020-1, Class A4, 1.630%, 10/21/2026 | 1,276,655 | ||||||
| 469,832 | Honda Auto Receivables Owner Trust, Series 2021-1, Class A3, 0.270%, 4/21/2025 | 454,472 | ||||||
| 317,724 | Honda Auto Receivables Owner Trust, Series 2021-2, Class A3, 0.330%, 8/15/2025 | 306,664 | ||||||
| 90,758 | JPMorgan Chase Bank NA, Series 2021-1, Class D, 1.174%, 9/25/2028, 144A | 87,245 | ||||||
| 170,000 | Prestige Auto Receivables Trust, Series 2020-1A, Class E, 3.670%, 2/15/2028, 144A | 166,219 | ||||||
| 229,235 | Santander Drive Auto Receivables Trust, Series 2019-2, Class D, 3.220%, 7/15/2025 | 227,791 | ||||||
| 129,218 | Santander Drive Auto Receivables Trust, Series 2020-1, Class C, 4.110%, 12/15/2025 | 128,598 | ||||||
| 225,000 | Santander Drive Auto Receivables Trust, Series 2020-2, Class D, 2.220%, 9/15/2026 | 218,934 | ||||||
| 315,000 | Santander Drive Auto Receivables Trust, Series 2021-1, Class D, 1.130%, 11/16/2026 | 297,628 | ||||||
| 485,000 | Santander Drive Auto Receivables Trust, Series 2021-3, Class D, 1.330%, 9/15/2027 | 449,354 | ||||||
| 141,773 | Toyota Auto Receivables Owner Trust, Series 2020-A, Class A3, 1.660%, 5/15/2024 | 140,945 | ||||||
| 125,000 | Westlake Automobile Receivables Trust, Series 2020-3A, Class D, 1.650%, 2/17/2026, 144A | 118,450 | ||||||
| 275,000 | Westlake Automobile Receivables Trust, Series 2021-2A, Class D, 1.230%, 12/15/2026, 144A | 248,881 | ||||||
| 1,085,000 | World Omni Auto Receivables Trust, Series 2021-B, Class A3, 0.420%, 6/15/2026 | 1,040,643 | ||||||
|
| |||||||
| 16,423,425 | ||||||||
|
| |||||||
| ABS Credit Card – 0.3% |
| |||||||
| 240,000 | Brex Commercial Charge Card Master Trust, Series 2021-1, Class A, 2.090%, 7/15/2024, 144A | 237,396 | ||||||
| 265,000 | Mercury Financial Credit Card Master Trust, Series 2021-1A, Class A, 1.540%, 3/20/2026, 144A | 252,825 | ||||||
|
| |||||||
| 490,221 | ||||||||
|
| |||||||
| ABS Home Equity – 5.0% |
| |||||||
| $ | 300,000 | BINOM Securitization Trust, Series 2022-RPL1, Class M1, 3.000%, 2/25/2061, 144A(a) | $ | 214,779 | ||||
| 338,042 | CIM Trust, Series 2021-NR2, Class A1, 2.568%, 7/25/2059, 144A(a) | 311,035 | ||||||
| 100,000 | CoreVest American Finance Trust, Series 2021-1, Class C, 2.800%, 4/15/2053, 144A | 76,926 | ||||||
| 160,000 | CoreVest American Finance Trust, Series 2021-2, Class C, 2.478%, 7/15/2054, 144A | 116,974 | ||||||
| 100,000 | CoreVest American Finance Trust, Series 2021-3, Class D, 3.469%, 10/15/2054, 144A | 75,613 | ||||||
| 211,239 | Credit Suisse Mortgage Trust, Series 2021-RPL1, Class A1, 1.668%, 9/27/2060, 144A(a) | 199,288 | ||||||
| 100,000 | Credit Suisse Mortgage Trust, Series 2021-RPL3, Class M2, 3.750%, 1/25/2060, 144A | 70,532 | ||||||
| 535,727 | Credit Suisse Mortgage Trust, Series 2021-RPL4, Class A1, 1.796%, 12/27/2060, 144A(a) | 476,795 | ||||||
| 246,571 | Federal Home Loan Mortgage Corp., Series 2022-DNA3, Class M1A, 30-day Average SOFR + 2.000%, 5.928%, 4/25/2042, 144A(b) | 245,338 | ||||||
| 260,000 | FirstKey Homes Trust, Series 2021-SFR1, Class E1, 2.389%, 8/17/2038, 144A | 216,788 | ||||||
| 205,000 | FirstKey Homes Trust, Series 2021-SFR2, Class E1, 2.258%, 9/17/2038, 144A | 169,863 | ||||||
| 105,000 | FirstKey Homes Trust, Series 2021-SFR2, Class E2, 2.358%, 9/17/2038, 144A | 86,272 | ||||||
| 360,000 | FirstKey Homes Trust, Series 2022- SFR2, Class D, 4.500%, 7/17/2039, 144A | 315,436 | ||||||
| 100,000 | FRTKL, Series 2021-SFR1, Class E1, 2.372%, 9/17/2038, 144A | 83,167 | ||||||
| 100,000 | FRTKL, Series 2021-SFR1, Class E2, 2.522%, 9/17/2038, 144A | 82,936 | ||||||
| 152,681 | GCAT Trust, Series 2019-RPL1, Class A1, 2.650%, 10/25/2068, 144A(a) | 143,192 | ||||||
| 87,360 | Home Partners of America Trust, Series 2021-1, Class E, 2.577%, 9/17/2041, 144A | 66,702 | ||||||
| 403,475 | Home Partners of America Trust, Series 2021-2, Class E1, 2.852%, 12/17/2026, 144A | 329,284 | ||||||
| 209,029 | Home Partners of America Trust, Series 2021-2, Class E2, 2.952%, 12/17/2026, 144A | 170,558 | ||||||
| 86,857 | Legacy Mortgage Asset Trust, Series 2019-GS7, Class A1, 6.250%, 11/25/2059, 144A(a) | 86,702 | ||||||
| 463,231 | Legacy Mortgage Asset Trust, Series 2020-GS5, Class A1, 3.250%, 6/25/2060, 144A(a) | 455,695 | ||||||
| 485,000 | Legacy Mortgage Asset Trust, Series 2020-RPL1, Class A2, 3.250%, 9/25/2059, 144A(a) | 411,394 | ||||||
See accompanying notes to financial statements.
| 26
Portfolio of Investments – as of December 31, 2022
Loomis Sayles Investment Grade Fixed Income Fund – continued
| Principal Amount | Description | Value (†) | ||||||
| Bonds and Notes – continued | ||||||||
| ABS Home Equity – continued | ||||||||
| $ | 234,721 | Legacy Mortgage Asset Trust, Series 2021-GS2, Class A1, 1.750%, 4/25/2061, 144A(a) | $ | 212,162 | ||||
| 4,490 | Morgan Stanley Mortgage Loan Trust, Series 2005-3AR, Class 5A, 4.285%, 7/25/2035(a)(c) | 3,824 | ||||||
| 235,000 | Progress Residential Trust, Series 2021-SFR2, Class E1, 2.547%, 4/19/2038, 144A | 198,820 | ||||||
| 100,000 | Progress Residential Trust, Series 2021-SFR3, Class E1, 2.538%, 5/17/2026, 144A | 84,606 | ||||||
| 100,000 | Progress Residential Trust, Series 2021-SFR3, Class E2, 2.688%, 5/17/2026, 144A | 84,388 | ||||||
| 100,000 | Progress Residential Trust, Series 2021-SFR4, Class E1, 2.409%, 5/17/2038, 144A | 83,498 | ||||||
| 100,000 | Progress Residential Trust, Series 2021-SFR4, Class E2, 2.559%, 5/17/2038, 144A | 83,415 | ||||||
| 120,000 | Progress Residential Trust, Series 2021-SFR5, Class E1, 2.209%, 7/17/2038, 144A | 99,925 | ||||||
| 150,000 | Progress Residential Trust, Series 2021-SFR6, Class E1, 2.425%, 7/17/2038, 144A | 124,347 | ||||||
| 100,000 | Progress Residential Trust, Series 2021-SFR6, Class E2, 2.525%, 7/17/2038, 144A | 81,862 | ||||||
| 165,000 | Progress Residential Trust, Series 2021-SFR7, Class E1, 2.591%, 8/17/2040, 144A | 126,996 | ||||||
| 100,000 | Progress Residential Trust, Series 2021-SFR7, Class E2, 2.640%, 8/17/2040, 144A | 76,577 | ||||||
| 100,000 | Progress Residential Trust, Series 2021-SFR9, Class E1, 2.811%, 11/17/2040, 144A | 77,652 | ||||||
| 343,319 | PRPM LLC, Series 2021-1, Class A1, 2.115%, 1/25/2026, 144A(a) | 321,006 | ||||||
| 130,406 | PRPM LLC, Series 2021-2, Class A1, 2.115%, 3/25/2026, 144A(a) | 120,062 | ||||||
| 275,574 | PRPM LLC, Series 2021-3, Class A1, 1.867%, 4/25/2026, 144A(a) | 245,677 | ||||||
| 100,482 | PRPM LLC, Series 2021-4, Class A1, 1.867%, 4/25/2026, 144A(a) | 89,975 | ||||||
| 356,857 | PRPM LLC, Series 2021-5, Class A1, 1.793%, 6/25/2026, 144A(a) | 322,831 | ||||||
| 519,051 | PRPM LLC, Series 2022-5, Class A1, 6.900%, 9/27/2027, 144A(a) | 515,121 | ||||||
| 390,000 | Toorak Mortgage Corp., Series 2021-1, Class A1, 2.240%, 6/25/2024, 144A(a) | 368,821 | ||||||
| 120,000 | Towd Point Mortgage Trust, Series 2016-3, Class M2, 4.000%, 4/25/2056, 144A(a) | 115,736 | ||||||
| 240,000 | Towd Point Mortgage Trust, Series 2018-5, Class M1, 3.250%, 7/25/2058, 144A(a) | 191,874 | ||||||
| ABS Home Equity – continued | ||||||||
| $ | 258,180 | Towd Point Mortgage Trust, Series 2019-4, Class A1, 2.900%, 10/25/2059, 144A(a) | $ | 239,730 | ||||
| 102,042 | VCAT LLC, Series 2021-NPL1, Class A1, 2.289%, 12/26/2050, 144A(a) | 96,323 | ||||||
| 313,880 | VCAT LLC, Series 2021-NPL5, Class A1, 1.868%, 8/25/2051, 144A(a) | 276,544 | ||||||
| 113,797 | VOLT XCII LLC, Series 2021-NPL1, Class A1, 1.893%, 2/27/2051, 144A(a) | 98,193 | ||||||
| 283,562 | VOLT XCIII LLC, Series 2021-NPL2, Class A1, 1.893%, 2/27/2051, 144A(a) | 255,096 | ||||||
| 253,811 | VOLT XCIV LLC, Series 2021-NPL3, Class A1, 2.240%, 2/27/2051, 144A(a) | 229,448 | ||||||
| 176,546 | VOLT XCVI LLC, Series 2021-NPL5, Class A1, 2.116%, 3/27/2051, 144A(a) | 160,048 | ||||||
| 354,838 | VOLT XCVII LLC, Series 2021-NPL6, Class A1, 2.240%, 4/25/2051, 144A(a) | 312,122 | ||||||
|
| |||||||
| 9,701,948 | ||||||||
|
| |||||||
| ABS Other – 2.8% |
| |||||||
| 100,000 | Affirm Asset Securitization Trust, Series 2021-B, Class C, 1.400%, 8/17/2026, 144A | 90,894 | ||||||
| 230,112 | Apollo Aviation Securitization Equity Trust, Series 2021-1A, Class A, 2.950%, 11/16/2041, 144A | 183,797 | ||||||
| 100,000 | Aqua Finance Trust, Series 2021-A, Class B, 2.400%, 7/17/2046, 144A | 84,177 | ||||||
| 430,000 | BHG Securitization Trust, Series 2022-A, Class B, 2.700%, 2/20/2035, 144A | 373,744 | ||||||
| 136,889 | Business Jet Securities LLC, Series 2021-1A, Class A, 2.162%, 4/15/2036, 144A | 120,196 | ||||||
| 351,450 | DB Master Finance LLC, Series 2021-1A, Class A2II, 2.493%, 11/20/2051, 144A | 288,866 | ||||||
| 155,000 | Dell Equipment Finance Trust, Series 2020-2, Class D, 1.920%, 3/23/2026, 144A | 152,128 | ||||||
| 100,000 | Freedom Financial Trust, Series 2021-2, Class C, 1.940%, 6/19/2028, 144A | 97,107 | ||||||
| 215,000 | Freedom Financial Trust, Series 2021-3FP, Class D, 2.370%, 11/20/2028, 144A | 195,608 | ||||||
| 148,413 | Hardee’s Funding LLC, Series 2018-1A, Class A2II, 4.959%, 6/20/2048, 144A | 139,381 | ||||||
| 115,000 | HPEFS Equipment Trust, Series 2021-1A, Class D, 1.030%, 3/20/2031, 144A | 108,472 | ||||||
| 319,093 | Lunar Structured Aircraft Portfolio Notes, Series 2021-1, Class A, 2.636%, 10/15/2046, 144A | 260,794 | ||||||
| 100,000 | Marlette Funding Trust, Series 2021-2A, Class C, 1.500%, 9/15/2031, 144A | 92,424 | ||||||
| 105,000 | Marlette Funding Trust, Series 2021-3A, Class C, 1.810%, 12/15/2031, 144A | 94,018 | ||||||
See accompanying notes to financial statements.
27 |
Portfolio of Investments – as of December 31, 2022
Loomis Sayles Investment Grade Fixed Income Fund – continued
| Principal Amount | Description | Value (†) | ||||||
| Bonds and Notes – continued | ||||||||
| ABS Other – continued | ||||||||
| $ | 86,912 | Merlin Aviation Holdings DAC, Series 2016-1, Class A, 4.500%, 12/15/2032, 144A(a) | $ | 66,490 | ||||
| 56,796 | MVW LLC, Series 2021-1WA, Class C, 1.940%, 1/22/2041, 144A | 50,834 | ||||||
| 145,000 | OneMain Financial Issuance Trust, Series 2018-2A, Class B, 3.890%, 3/14/2033, 144A | 137,750 | ||||||
| 240,000 | OneMain Financial Issuance Trust, Series 2021-1A, Class D, 2.470%, 6/16/2036, 144A | 183,844 | ||||||
| 310,000 | OneMain Financial Issuance Trust, Series 2022-S1, Class D, 5.200%, 5/14/2035, 144A | 285,511 | ||||||
| 427,322 | S-Jets Ltd., Series 2017-1, Class A, 3.967%, 8/15/2042, 144A | 331,179 | ||||||
| 100,000 | SCF Equipment Leasing LLC, Series 2022-1A, Class D, 3.790%, 11/20/2031, 144A | 88,564 | ||||||
| 115,000 | SCF Equipment Leasing LLC, Series 2022-2A, Class C, 6.500%, 8/20/2032, 144A | 112,152 | ||||||
| 59,186 | Shenton Aircraft Investment I Ltd., Series 2015-1A, Class A, 4.750%, 10/15/2042, 144A | 45,278 | ||||||
| 54,259 | Sierra Timeshare Receivables Funding LLC, Series 2019-2A, Class C, 3.120%, 5/20/2036, 144A | 50,654 | ||||||
| 36,032 | Sierra Timeshare Receivables Funding LLC, Series 2019-3A, Class C, 3.000%, 8/20/2036, 144A | 33,918 | ||||||
| 38,283 | Sierra Timeshare Receivables Funding LLC, Series 2021-1A, Class C, 1.790%, 11/20/2037, 144A | 34,996 | ||||||
| 493,879 | SLAM Ltd., Series 2021-1A, Class A, 2.434%, 6/15/2046, 144A | 408,606 | ||||||
| 353,418 | Sunnova Helios X Issuer LLC, Series 2022-C, Class A, 5.300%, 11/22/2049, 144A | 339,741 | ||||||
| 226,133 | Textainer Marine Containers VII Ltd., Series 2021-1A, Class A, 1.680%, 2/20/2046, 144A | 189,936 | ||||||
| 364,000 | Textainer Marine Containers VII Ltd., Series 2021-2A, Class A, 2.230%, 4/20/2046, 144A | 309,423 | ||||||
| 246,923 | TIF Funding II LLC, Series 2021-1A, Class A, 1.650%, 2/20/2046, 144A | 204,785 | ||||||
| 115,000 | Towd Point Mortgage Trust, Series 2017-1, Class M1, 3.750%, 10/25/2056, 144A(a) | 107,202 | ||||||
| 155,341 | Wave Trust, Series 2017-1A, Class A, 3.844%, 11/15/2042, 144A | 117,284 | ||||||
|
| |||||||
| 5,379,753 | ||||||||
|
| |||||||
| ABS Student Loan – 0.8% |
| |||||||
| 100,000 | College Ave Student Loans LLC, Series 2021-A, Class C, 2.920%, 7/25/2051, 144A | 89,717 | ||||||
| ABS Student Loan – continued |
| |||||||
| $ | 95,253 | Commonbond Student Loan Trust, Series 2019-AGS, Class B, 3.040%, 1/25/2047, 144A | $ | 84,150 | ||||
| 38,212 | Navient Private Education Refi Loan Trust, Series 2020-HA, Class A, 1.310%, 1/15/2069, 144A | 34,295 | ||||||
| 191,684 | Navient Private Education Refi Loan Trust, Series 2021-A, Class A, 0.840%, 5/15/2069, 144A | 165,731 | ||||||
| 135,000 | Navient Private Education Refi Loan Trust, Series 2021-A, Class B, 2.240%, 5/15/2069, 144A | 95,153 | ||||||
| 100,000 | Navient Private Education Refi Loan Trust, Series 2021-EA, Class B, 2.030%, 12/16/2069, 144A | 63,712 | ||||||
| 195,000 | Navient Private Education Refi Loan Trust, Series 2021-FA, Class B, 2.120%, 2/18/2070, 144A | 125,648 | ||||||
| 130,962 | SMB Private Education Loan Trust, Series 2018-C, Class A2A, 3.630%, 11/15/2035, 144A | 123,098 | ||||||
| 460,223 | SMB Private Education Loan Trust, Series 2020-A, Class A2A, 2.230%, 9/15/2037, 144A | 419,896 | ||||||
| 168,750 | SMB Private Education Loan Trust, Series 2021-A, Class A2A2, 1-month LIBOR + 0.730%, 5.048%, 1/15/2053, 144A(b) | 161,454 | ||||||
| 210,000 | SMB Private Education Loan Trust, Series 2021-B, Class B, 2.650%, 7/17/2051, 144A | 167,229 | ||||||
| 100,000 | SoFi Professional Loan Program LLC, Series 2017-A, Class C, 4.430%, 3/26/2040, 144A(a) | 91,773 | ||||||
|
| |||||||
| 1,621,856 | ||||||||
|
| |||||||
| ABS Whole Business – 1.0% |
| |||||||
| 238,125 | DB Master Finance LLC, Series 2017-1A, Class A2II, 4.030%, 11/20/2047, 144A | 216,521 | ||||||
| 58,050 | DB Master Finance LLC, Series 2019-1A, Class A23, 4.352%, 5/20/2049, 144A | 52,929 | ||||||
| 162,240 | Domino’s Pizza Master Issuer LLC, Series 2018-1A, Class A2II, 4.328%, 7/25/2048, 144A | 150,006 | ||||||
| 97,250 | Domino’s Pizza Master Issuer LLC, Series 2019-1A, Class A2, 3.668%, 10/25/2049, 144A | 84,008 | ||||||
| 600,850 | Domino’s Pizza Master Issuer LLC, Series 2021-1A, Class A2I, 2.662%, 4/25/2051, 144A | 505,460 | ||||||
| 98,500 | Hardee’s Funding LLC, Series 2021-1A, Class A2, 2.865%, 6/20/2051, 144A | 78,520 | ||||||
| 191,500 | Planet Fitness Master Issuer LLC, Series 2018-1A, Class A2II, 4.666%, 9/05/2048, 144A | 179,323 | ||||||
| 455,400 | Taco Bell Funding LLC, Series 2021-1A, Class A2II, 2.294%, 8/25/2051, 144A | 365,854 | ||||||
See accompanying notes to financial statements.
| 28
Portfolio of Investments – as of December 31, 2022
Loomis Sayles Investment Grade Fixed Income Fund – continued
| Principal Amount | Description | Value (†) | ||||||
| Bonds and Notes – continued | ||||||||
| ABS Whole Business – continued |
| |||||||
| $ | 261,025 | Wendy’s Funding LLC, Series 2021-1A, Class A2I, 2.370%, 6/15/2051, 144A | $ | 210,732 | ||||
|
| |||||||
| 1,843,353 | ||||||||
|
| |||||||
| Aerospace & Defense – 1.7% |
| |||||||
| 1,215,000 | Boeing Co. (The), 2.196%, 2/04/2026 | 1,103,904 | ||||||
| 85,000 | Boeing Co. (The), 3.100%, 5/01/2026 | 79,982 | ||||||
| 510,000 | Boeing Co. (The), 3.625%, 2/01/2031 | 446,845 | ||||||
| 85,000 | Boeing Co. (The), 3.625%, 3/01/2048 | 55,613 | ||||||
| 45,000 | Boeing Co. (The), 3.750%, 2/01/2050 | 31,018 | ||||||
| 390,000 | Boeing Co. (The), 3.850%, 11/01/2048 | 267,695 | ||||||
| 225,000 | Boeing Co. (The), 3.950%, 8/01/2059 | 151,092 | ||||||
| 115,000 | Boeing Co. (The), 5.150%, 5/01/2030 | 112,199 | ||||||
| 111,000 | Embraer Netherlands Finance BV, 5.400%, 2/01/2027 | 106,282 | ||||||
| 1,125,000 | Textron, Inc., 3.000%, 6/01/2030 | 956,055 | ||||||
|
| |||||||
| 3,310,685 | ||||||||
|
| |||||||
| Airlines – 1.3% |
| |||||||
| 1,115,404 | Air Canada Pass Through Trust, Series 2020-2A, 5.250%, 10/01/2030, 144A | 1,046,338 | ||||||
| 39,066 | American Airlines Pass Through Trust, Series 2016-3, Class B, 3.750%, 4/15/2027 | 34,703 | ||||||
| 409,526 | Mileage Plus Holdings LLC/Mileage Plus Intellectual Property Assets Ltd., 6.500%, 6/20/2027, 144A | 407,152 | ||||||
| 164,465 | U.S. Airways Pass Through Trust, Series 2011-1, Class A, 7.125%, 4/22/2025 | 164,848 | ||||||
| 380,845 | U.S. Airways Pass Through Trust, Series 2012-2A, Class A, 4.625%, 12/03/2026 | 346,894 | ||||||
| 200,116 | United Airlines Pass Through Trust, Series 2016-2, Class B, 3.650%, 4/07/2027 | 179,272 | ||||||
| 403,096 | United Airlines Pass Through Trust, Series 2020-1, Class A, 5.875%, 4/15/2029 | 397,061 | ||||||
|
| |||||||
| 2,576,268 | ||||||||
|
| |||||||
| Automotive – 1.0% |
| |||||||
| 1,614,000 | General Motors Co., 5.200%, 4/01/2045 | 1,311,811 | ||||||
| 250,000 | General Motors Co., 6.250%, 10/02/2043 | 231,132 | ||||||
| 315,000 | General Motors Financial Co., Inc., 1.050%, 3/08/2024 | 299,125 | ||||||
|
| |||||||
| 1,842,068 | ||||||||
|
| |||||||
| Banking – 11.1% |
| |||||||
| 200,000 | Ally Financial, Inc., 2.200%, 11/02/2028 | 155,934 | ||||||
| 245,000 | Ally Financial, Inc., 5.750%, 11/20/2025 | 237,343 | ||||||
| 385,000 | American Express Co., 5.850%, 11/05/2027 | 400,797 | ||||||
| 420,000 | Banco Santander Mexico S.A. Institucion de Banca Multiple Grupo Financiero Santander, 5.375%, 4/17/2025, 144A | 415,590 | ||||||
| Banking – continued |
| |||||||
| $ | 370,000 | Bank of America Corp., (fixed rate to 10/24/2030, variable rate thereafter), MTN, 1.922%, 10/24/2031 | $ | 282,638 | ||||
| 1,244,000 | Bank of America Corp., (fixed rate to 12/20/2027, variable rate thereafter), 3.419%, 12/20/2028 | 1,126,479 | ||||||
| 335,000 | Bank of America Corp., (fixed rate to 4/29/2030, variable rate thereafter), 2.592%, 4/29/2031 | 272,836 | ||||||
| 235,000 | Bank of America Corp., (fixed rate to 7/23/2030, variable rate thereafter), MTN, 1.898%, 7/23/2031 | 180,364 | ||||||
| 391,000 | Bank of America Corp., (fixed rate to 9/21/2031, variable rate thereafter), 2.482%, 9/21/2036 | 287,291 | ||||||
| 314,000 | Bank of America Corp., MTN, 4.250%, 10/22/2026 | 303,308 | ||||||
| 536,000 | Bank of America Corp., Series L, MTN, 4.183%, 11/25/2027 | 508,396 | ||||||
| 950,000 | Barclays PLC, (fixed rate to 11/24/2026, variable rate thereafter), 2.279%, 11/24/2027 | 821,158 | ||||||
| 555,000 | Barclays PLC, (fixed rate to 3/15/2028, variable rate thereafter), 4.375%(d) | 423,187 | ||||||
| 1,245,000 | Barclays PLC, (fixed rate to 9/23/2030, variable rate thereafter), 3.564%, 9/23/2035 | 947,376 | ||||||
| 1,145,000 | BNP Paribas S.A., 2.824%, 1/26/2041, 144A | 710,358 | ||||||
| 415,000 | BNP Paribas S.A., (fixed rate to 1/20/2027, variable rate thereafter), 2.591%, 1/20/2028, 144A | 364,994 | ||||||
| 1,040,000 | BNP Paribas S.A., (fixed rate to 3/01/2028, variable rate thereafter), 4.375%, 3/01/2033, 144A | 919,043 | ||||||
| 1,060,000 | Citigroup, Inc., (fixed rate to 3/31/2030, variable rate thereafter), 4.412%, 3/31/2031 | 973,394 | ||||||
| 80,000 | Citigroup, Inc., (fixed rate to 6/03/2030, variable rate thereafter), 2.572%, 6/03/2031 | 64,703 | ||||||
| 640,000 | Credit Agricole S.A., 2.811%, 1/11/2041, 144A | 395,311 | ||||||
| 250,000 | Credit Agricole S.A., (fixed rate to 1/10/2028, variable rate thereafter), EMTN, 4.000%, 1/10/2033 | 217,820 | ||||||
| 250,000 | Credit Suisse Group AG, (fixed rate to 11/15/2032, variable rate thereafter), 9.016%, 11/15/2033, 144A | 255,967 | ||||||
| 250,000 | Credit Suisse Group AG, (fixed rate to 6/05/2025, variable rate thereafter), 2.193%, 6/05/2026, 144A | 213,523 | ||||||
| 405,000 | Credit Suisse Group AG, (fixed rate to 7/15/2025, variable rate thereafter), 6.373%, 7/15/2026, 144A | 380,234 | ||||||
| 395,000 | Credit Suisse Group AG, (fixed rate to 8/11/2027, variable rate thereafter), 6.442%, 8/11/2028, 144A | 359,790 | ||||||
| 500,000 | Credit Suisse Group AG, (fixed rate to 8/12/2032, variable rate thereafter), 6.537%, 8/12/2033, 144A | 439,240 | ||||||
See accompanying notes to financial statements.
29 |
Portfolio of Investments – as of December 31, 2022
Loomis Sayles Investment Grade Fixed Income Fund – continued
| Principal Amount | Description | Value (†) | ||||||
| Bonds and Notes – continued | ||||||||
| Banking – continued | ||||||||
| $ | 265,000 | Deutsche Bank AG, (fixed rate to 10/07/2031, variable rate thereafter), 3.742%, 1/07/2033 | $ | 188,197 | ||||
| 400,000 | Deutsche Bank AG, (fixed rate to 10/14/2030, variable rate thereafter), 3.729%, 1/14/2032 | 293,286 | ||||||
| 2,125,000 | Goldman Sachs Group, Inc. (The), (fixed rate to 8/23/2027, variable rate thereafter), 4.482%, 8/23/2028 | 2,036,631 | ||||||
| 220,000 | JPMorgan Chase & Co., (fixed rate to 10/15/2029, variable rate thereafter), 2.739%, 10/15/2030 | 184,496 | ||||||
| 740,000 | JPMorgan Chase & Co., (fixed rate to 11/19/2030, variable rate thereafter), 1.764%, 11/19/2031 | 560,971 | ||||||
| 200,000 | Morgan Stanley, 3.950%, 4/23/2027 | 188,879 | ||||||
| 1,205,000 | Morgan Stanley, (fixed rate to 2/13/2031, variable rate thereafter), MTN, 1.794%, 2/13/2032 | 905,630 | ||||||
| 533,000 | Morgan Stanley, GMTN, 4.350%, 9/08/2026 | 517,139 | ||||||
| 1,727,000 | Morgan Stanley, MTN, 6.250%, 8/09/2026 | 1,803,461 | ||||||
| 655,000 | NatWest Group PLC, (fixed rate to 6/14/2026, variable rate thereafter), 1.642%, 6/14/2027 | 566,877 | ||||||
| 200,000 | NatWest Group PLC, (fixed rate to 9/30/2027, variable rate thereafter), 5.516%, 9/30/2028 | 197,536 | ||||||
| 1,685,000 | Societe Generale S.A., (fixed rate to 7/08/2030, variable rate thereafter), 3.653%, 7/08/2035, 144A | 1,322,889 | ||||||
| 255,000 | Synchrony Bank, 5.400%, 8/22/2025 | 251,557 | ||||||
| 330,000 | Synchrony Bank, 5.625%, 8/23/2027 | 322,228 | ||||||
| 540,000 | UniCredit SpA, (fixed rate to 6/30/2030, variable rate thereafter), 5.459%, 6/30/2035, 144A | 438,722 | ||||||
|
| |||||||
| 21,435,573 | ||||||||
|
| |||||||
| Brokerage – 0.4% |
| |||||||
| 733,000 | Jefferies Financial Group, Inc., 6.250%, 1/15/2036 | 739,239 | ||||||
|
| |||||||
| Building Materials – 1.2% |
| |||||||
| 1,045,000 | Cemex SAB de CV, 3.875%, 7/11/2031, 144A | 882,017 | ||||||
| 310,000 | Cemex SAB de CV, (fixed rate to 6/08/2026, variable rate thereafter), 5.125%, 144A(d) | 286,443 | ||||||
| 211,000 | Masco Corp., 6.500%, 8/15/2032 | 215,994 | ||||||
| 104,000 | Masco Corp., 7.750%, 8/01/2029 | 113,674 | ||||||
| 778,000 | Owens Corning, 7.000%, 12/01/2036 | 823,346 | ||||||
|
| |||||||
| 2,321,474 | ||||||||
|
| |||||||
| Cable Satellite – 2.0% |
| |||||||
| 265,000 | Charter Communications Operating LLC/Charter Communications Operating Capital, 2.300%, 2/01/2032 | 195,185 | ||||||
| Cable Satellite – continued |
| |||||||
| $ | 1,285,000 | Charter Communications Operating LLC/Charter Communications Operating Capital, 2.800%, 4/01/2031 | $ | 1,000,382 | ||||
| 890,000 | Charter Communications Operating LLC/Charter Communications Operating Capital, 3.700%, 4/01/2051 | 541,180 | ||||||
| 30,000 | Charter Communications Operating LLC/Charter Communications Operating Capital, 3.850%, 4/01/2061 | 17,351 | ||||||
| 1,580,000 | Charter Communications Operating LLC/Charter Communications Operating Capital, 3.950%, 6/30/2062 | 932,042 | ||||||
| 220,000 | Charter Communications Operating LLC/Charter Communications Operating Capital, 4.400%, 4/01/2033 | 188,245 | ||||||
| 165,000 | Charter Communications Operating LLC/Charter Communications Operating Capital, 5.125%, 7/01/2049 | 124,767 | ||||||
| 800,000 | CSC Holdings LLC, 4.625%, 12/01/2030, 144A | 442,107 | ||||||
| 125,000 | DISH DBS Corp., 5.125%, 6/01/2029 | 80,639 | ||||||
| 170,000 | DISH DBS Corp., 5.250%, 12/01/2026, 144A | 143,197 | ||||||
| 145,000 | Time Warner Cable LLC, 5.500%, 9/01/2041 | 120,332 | ||||||
|
| |||||||
| 3,785,427 | ||||||||
|
| |||||||
| Chemicals – 0.6% |
| |||||||
| 200,000 | Alpek SAB de CV, 3.250%, 2/25/2031, 144A | 166,650 | ||||||
| 200,000 | Braskem Netherlands Finance BV, 4.500%, 1/31/2030, 144A | 170,092 | ||||||
| 400,000 | Braskem Netherlands Finance BV, 5.875%, 1/31/2050, 144A | 309,867 | ||||||
| 80,000 | Celanese U.S. Holdings LLC, 6.330%, 7/15/2029 | 77,731 | ||||||
| 60,000 | Celanese U.S. Holdings LLC, 6.379%, 7/15/2032 | 57,057 | ||||||
| 525,000 | Orbia Advance Corp. SAB de CV, 2.875%, 5/11/2031, 144A | 412,167 | ||||||
|
| |||||||
| 1,193,564 | ||||||||
|
| |||||||
| Collateralized Mortgage Obligations – 0.1% |
| |||||||
| 134,997 | Federal Home Loan Mortgage Corp., Series 2912, 5.500%, 1/15/2035 | 136,869 | ||||||
|
| |||||||
| Construction Machinery – 2.1% | ||||||||
| 200,000 | Ashtead Capital, Inc., 5.500%, 8/11/2032, 144A | 191,294 | ||||||
| 2,680,000 | Caterpillar Financial Services Corp., MTN, 0.450%, 5/17/2024 | 2,524,552 | ||||||
| 895,000 | Caterpillar Financial Services Corp., MTN, 0.950%, 1/10/2024 | 863,375 | ||||||
| 220,000 | John Deere Capital Corp., MTN, 0.900%, 1/10/2024 | 211,827 | ||||||
| 340,000 | John Deere Capital Corp., MTN, 1.250%, 1/10/2025 | 318,012 | ||||||
|
| |||||||
| 4,109,060 | ||||||||
|
| |||||||
| Consumer Cyclical Services – 0.9% |
| |||||||
| 275,000 | Expedia Group, Inc., 2.950%, 3/15/2031 | 221,136 | ||||||
| 1,210,000 | Expedia Group, Inc., 3.250%, 2/15/2030 | 1,026,437 | ||||||
See accompanying notes to financial statements.
| 30
Portfolio of Investments – as of December 31, 2022
Loomis Sayles Investment Grade Fixed Income Fund – continued
| Principal Amount | Description | Value (†) | ||||||
| Bonds and Notes ��� continued | ||||||||
| Consumer Cyclical Services – continued |
| |||||||
| $ | 210,000 | Uber Technologies, Inc., 4.500%, 8/15/2029, 144A | $ | 182,964 | ||||
| 375,000 | Uber Technologies, Inc., 7.500%, 9/15/2027, 144A | 375,262 | ||||||
|
| |||||||
| 1,805,799 | ||||||||
|
| |||||||
| Consumer Products – 0.3% |
| |||||||
| 360,000 | Hasbro, Inc., 6.600%, 7/15/2028 | 363,829 | ||||||
| 300,000 | Natura Cosmeticos S.A., 4.125%, 5/03/2028, 144A | 244,803 | ||||||
|
| |||||||
| 608,632 | ||||||||
|
| |||||||
| Diversified Manufacturing – 0.1% |
| |||||||
| 274,000 | GE Capital Funding LLC, 4.550%, 5/15/2032 | 260,091 | ||||||
|
| |||||||
| Electric – 0.4% |
| |||||||
| 95,000 | Edison International, 4.950%, 4/15/2025 | 93,423 | ||||||
| 140,000 | Pacific Gas & Electric Co., 3.250%, 6/01/2031 | 113,799 | ||||||
| 225,000 | Pacific Gas & Electric Co., 4.250%, 3/15/2046 | 156,487 | ||||||
| 250,000 | Pacific Gas & Electric Co., 4.300%, 3/15/2045 | 177,247 | ||||||
| 190,000 | Pacific Gas & Electric Co., 4.750%, 2/15/2044 | 145,366 | ||||||
| 100,000 | Pacific Gas & Electric Co., 5.450%, 6/15/2027 | 98,611 | ||||||
|
| |||||||
| 784,933 | ||||||||
|
| |||||||
| Finance Companies – 4.1% |
| |||||||
| 315,000 | AerCap Ireland Capital DAC/AerCap Global Aviation Trust, 3.000%, 10/29/2028 | 263,899 | ||||||
| 400,000 | AerCap Ireland Capital DAC/AerCap Global Aviation Trust, 3.300%, 1/30/2032 | 312,704 | ||||||
| 290,000 | Air Lease Corp., 3.125%, 12/01/2030 | 240,322 | ||||||
| 196,000 | Air Lease Corp., 4.625%, 10/01/2028 | 183,327 | ||||||
| 125,000 | Air Lease Corp., MTN, 3.000%, 2/01/2030 | 104,247 | ||||||
| 395,000 | Ares Capital Corp., 2.875%, 6/15/2028 | 316,723 | ||||||
| 565,000 | Ares Capital Corp., 3.200%, 11/15/2031 | 414,625 | ||||||
| 350,000 | Aviation Capital Group LLC, 1.950%, 1/30/2026, 144A | 304,702 | ||||||
| 310,000 | Barings BDC, Inc., 3.300%, 11/23/2026 | 262,749 | ||||||
| 1,110,000 | Blackstone Secured Lending Fund, 2.125%, 2/15/2027 | 919,098 | ||||||
| 390,000 | FS KKR Capital Corp., 3.125%, 10/12/2028 | 314,406 | ||||||
| 29,000 | Navient Corp., Series A, 5.625%, 8/01/2033 | 20,659 | ||||||
| 155,000 | Oaktree Specialty Lending Corp., 2.700%, 1/15/2027 | 131,614 | ||||||
| Finance Companies – continued | ||||||||
| $ | 440,000 | Owl Rock Capital Corp., 2.875%, 6/11/2028 | $ | 345,477 | ||||
| 1,920,000 | Owl Rock Capital Corp., 4.250%, 1/15/2026 | 1,762,595 | ||||||
| 110,000 | Owl Rock Technology Finance Corp., 2.500%, 1/15/2027 | 89,671 | ||||||
| 375,000 | Rocket Mortgage LLC/Rocket Mortgage Co-Issuer, Inc., 2.875%, 10/15/2026, 144A | 321,436 | ||||||
| 330,000 | Rocket Mortgage LLC/Rocket Mortgage Co-Issuer, Inc., 3.625%, 3/01/2029, 144A | 261,505 | ||||||
| 995,000 | Rocket Mortgage LLC/Rocket Mortgage Co-Issuer, Inc., 3.875%, 3/01/2031, 144A | 759,459 | ||||||
| 865,000 | Rocket Mortgage LLC/Rocket Mortgage Co-Issuer, Inc., 4.000%, 10/15/2033, 144A | 646,034 | ||||||
|
| |||||||
| 7,975,252 | ||||||||
|
| |||||||
| Financial Other – 0.2% |
| |||||||
| 200,000 | CIFI Holdings Group Co. Ltd., 6.450%, 11/07/2024 | 52,500 | ||||||
| 200,000 | Country Garden Holdings Co. Ltd., 3.300%, 1/12/2031 | 105,814 | ||||||
| 200,000 | Logan Group Co. Ltd., 4.850%, 12/14/2026(e) | 45,036 | ||||||
| 200,000 | Shimao Group Holdings Ltd., 4.750%, 7/03/2022(f) | 37,058 | ||||||
| 200,000 | Shimao Group Holdings Ltd., 5.200%, 1/16/2027(f) | 36,000 | ||||||
| 200,000 | Shimao Group Holdings Ltd., 5.600%, 7/15/2026(f) | 37,048 | ||||||
| 200,000 | Shimao Group Holdings Ltd., 6.125%, 2/21/2024(f) | 37,336 | ||||||
| 200,000 | Times China Holdings Ltd., 5.750%, 1/14/2027 | 32,502 | ||||||
| 200,000 | Times China Holdings Ltd., 6.200%, 3/22/2026 | 32,422 | ||||||
|
| |||||||
| 415,716 | ||||||||
|
| |||||||
| Food & Beverage – 0.3% |
| |||||||
| 185,000 | JBS USA LUX S.A./JBS USA Food Co./JBS USA Finance, Inc., 3.000%, 2/02/2029, 144A | 153,114 | ||||||
| 225,000 | JBS USA LUX S.A./JBS USA Food Co./JBS USA Finance, Inc., 3.750%, 12/01/2031, 144A | 183,803 | ||||||
| 300,000 | Pilgrim’s Pride Corp., 3.500%, 3/01/2032, 144A | 234,498 | ||||||
| 5,000 | Pilgrim’s Pride Corp., 4.250%, 4/15/2031, 144A | 4,253 | ||||||
|
| |||||||
| 575,668 | ||||||||
|
| |||||||
| Gaming – 0.8% |
| |||||||
| 425,000 | Genm Capital Labuan Ltd., 3.882%, 4/19/2031, 144A | 316,432 | ||||||
| 190,000 | GLP Capital LP/GLP Financing II, Inc., 3.250%, 1/15/2032 | 151,883 | ||||||
| 365,000 | VICI Properties LP/VICI Note Co., Inc., 4.250%, 12/01/2026, 144A | 340,517 | ||||||
See accompanying notes to financial statements.
31 |
Portfolio of Investments – as of December 31, 2022
Loomis Sayles Investment Grade Fixed Income Fund – continued
| Principal Amount | Description | Value (†) | ||||||
| Bonds and Notes – continued | ||||||||
| Gaming – continued |
| |||||||
| $ | 295,000 | VICI Properties LP/VICI Note Co., Inc., 4.500%, 9/01/2026, 144A | $ | 277,618 | ||||
| 265,000 | VICI Properties LP/VICI Note Co., Inc., 4.625%, 6/15/2025, 144A | 254,069 | ||||||
| 215,000 | VICI Properties LP/VICI Note Co., Inc., 5.625%, 5/01/2024, 144A | 212,906 | ||||||
|
| |||||||
| 1,553,425 | ||||||||
|
| |||||||
| Government Owned – No Guarantee – 0.9% |
| |||||||
| 955,000 | Antares Holdings LP, 3.750%, 7/15/2027, 144A | 772,019 | ||||||
| 780,000 | Pertamina Persero PT, 6.450%, 5/30/2044, 144A | 777,299 | ||||||
| 200,000 | Sino-Ocean Land Treasure IV Ltd., 4.750%, 1/14/2030 | 101,900 | ||||||
|
| |||||||
| 1,651,218 | ||||||||
|
| |||||||
| Health Insurance – 0.4% |
| |||||||
| 810,000 | Centene Corp., 2.500%, 3/01/2031 | 633,803 | ||||||
| 155,000 | Centene Corp., 2.625%, 8/01/2031 | 121,799 | ||||||
| 110,000 | Centene Corp., 3.000%, 10/15/2030 | 90,173 | ||||||
|
| |||||||
| 845,775 | ||||||||
|
| |||||||
| Healthcare – 0.8% |
| |||||||
| 200,000 | Alcon Finance Corp., 5.375%, 12/06/2032, 144A | 201,016 | ||||||
| 10,000 | Cigna Corp., 7.875%, 5/15/2027 | 11,023 | ||||||
| 195,000 | HCA, Inc., 3.500%, 9/01/2030 | 168,183 | ||||||
| 1,192,000 | HCA, Inc., 4.500%, 2/15/2027 | 1,148,822 | ||||||
|
| |||||||
| 1,529,044 | ||||||||
|
| |||||||
| Home Construction – 1.0% |
| |||||||
| 195,000 | MDC Holdings, Inc., 3.966%, 8/06/2061 | 108,972 | ||||||
| 510,000 | MDC Holdings, Inc., 6.000%, 1/15/2043 | 414,340 | ||||||
| 260,000 | Meritage Homes Corp., 3.875%, 4/15/2029, 144A | 220,494 | ||||||
| 1,226,000 | PulteGroup, Inc., 6.000%, 2/15/2035 | 1,172,254 | ||||||
|
| |||||||
| 1,916,060 | ||||||||
|
| |||||||
| Hybrid ARMs – 0.0% |
| |||||||
| 1,673 | FNMA, 6-month LIBOR + 1.460%, 3.737%, 2/01/2037(b) | 1,686 | ||||||
| 6,933 | FNMA, 12-month LIBOR + 1.810%, 4.041%, 9/01/2036(b) | 7,083 | ||||||
|
| |||||||
| 8,769 | ||||||||
|
| |||||||
| Independent Energy – 2.9% |
| |||||||
| 1,160,000 | Aker BP ASA, 3.750%, 1/15/2030, 144A | 1,020,444 | ||||||
| 765,000 | Continental Resources, Inc., 2.875%, 4/01/2032, 144A | 566,626 | ||||||
| 13,000 | Continental Resources, Inc., 4.500%, 4/15/2023 | 12,969 | ||||||
| 960,000 | Continental Resources, Inc., 5.750%, 1/15/2031, 144A | 893,626 | ||||||
| 190,000 | Diamondback Energy, Inc., 3.125%, 3/24/2031 | 157,332 | ||||||
| Independent Energy – continued |
| |||||||
| $ | 280,000 | Energean Israel Finance Ltd., 5.375%, 3/30/2028, 144A | $ | 250,600 | ||||
| 370,000 | Energean Israel Finance Ltd., 5.875%, 3/30/2031, 144A | 322,363 | ||||||
| 100,000 | EQT Corp., 3.125%, 5/15/2026, 144A | 91,904 | ||||||
| 385,000 | EQT Corp., 3.625%, 5/15/2031, 144A | 326,263 | ||||||
| 430,000 | EQT Corp., 3.900%, 10/01/2027 | 396,961 | ||||||
| 75,000 | EQT Corp., 5.000%, 1/15/2029 | 70,407 | ||||||
| 125,000 | EQT Corp., 5.678%, 10/01/2025 | 124,392 | ||||||
| 85,000 | EQT Corp., 5.700%, 4/01/2028 | 84,543 | ||||||
| 95,000 | EQT Corp., 6.125%, 2/01/2025 | 95,223 | ||||||
| 440,000 | Ovintiv, Inc., 6.500%, 8/15/2034 | 442,749 | ||||||
| 40,000 | Ovintiv, Inc., 7.375%, 11/01/2031 | 42,575 | ||||||
| 65,000 | Southwestern Energy Co., 4.750%, 2/01/2032 | 55,548 | ||||||
| 220,000 | Var Energi ASA, 7.500%, 1/15/2028, 144A | 224,092 | ||||||
| 385,000 | Var Energi ASA, 8.000%, 11/15/2032, 144A | 397,596 | ||||||
|
| |||||||
| 5,576,213 | ||||||||
|
| |||||||
| Leisure – 0.2% |
| |||||||
| 80,000 | NCL Corp. Ltd., 5.875%, 3/15/2026, 144A | 62,837 | ||||||
| 250,000 | NCL Corp. Ltd., 5.875%, 2/15/2027, 144A | 216,390 | ||||||
| 110,000 | Royal Caribbean Cruises Ltd., 5.500%, 4/01/2028, 144A | 87,785 | ||||||
|
| |||||||
| 367,012 | ||||||||
|
| |||||||
| Life Insurance – 2.6% |
| |||||||
| 490,000 | Athene Global Funding, 1.608%, 6/29/2026, 144A | 422,660 | ||||||
| 975,000 | Athene Global Funding, 1.716%, 1/07/2025, 144A | 899,546 | ||||||
| 159,000 | Brighthouse Financial, Inc., 4.700%, 6/22/2047 | 116,309 | ||||||
| 1,488,000 | National Life Insurance Co., 10.500%, 9/15/2039, 144A | 1,942,093 | ||||||
| 1,560,000 | NLV Financial Corp., 7.500%, 8/15/2033, 144A | 1,713,067 | ||||||
|
| |||||||
| 5,093,675 | ||||||||
|
| |||||||
| Lodging – 0.2% |
| |||||||
| 165,000 | Marriott International, Inc., Series HH, 2.850%, 4/15/2031 | 133,614 | ||||||
| 40,000 | Marriott Ownership Resorts, Inc., 4.500%, 6/15/2029, 144A | 33,185 | ||||||
| 190,000 | Travel & Leisure Co., 4.500%, 12/01/2029, 144A | 154,818 | ||||||
| 65,000 | Travel & Leisure Co., 4.625%, 3/01/2030, 144A | 53,902 | ||||||
| 10,000 | Travel & Leisure Co., 6.000%, 4/01/2027 | 9,491 | ||||||
| 10,000 | Travel & Leisure Co., 6.625%, 7/31/2026, 144A | 9,783 | ||||||
|
| |||||||
| 394,793 | ||||||||
|
| |||||||
| Media Entertainment – 1.6% |
| |||||||
| 55,000 | iHeartCommunications, Inc., 4.750%, 1/15/2028, 144A | 44,789 | ||||||
See accompanying notes to financial statements.
| 32
Portfolio of Investments – as of December 31, 2022
Loomis Sayles Investment Grade Fixed Income Fund – continued
| Principal Amount | Description | Value (†) | ||||||
| Bonds and Notes – continued | ||||||||
| Media Entertainment – continued | ||||||||
| $ | 25,000 | iHeartCommunications, Inc., 5.250%, 8/15/2027, 144A | $ | 21,177 | ||||
| 110,000 | Netflix, Inc., 4.875%, 4/15/2028 | 106,215 | ||||||
| 935,000 | Netflix, Inc., 4.875%, 6/15/2030, 144A | 871,980 | ||||||
| 60,000 | Netflix, Inc., 5.375%, 11/15/2029, 144A | 58,200 | ||||||
| 425,000 | Netflix, Inc., 5.875%, 11/15/2028 | 430,750 | ||||||
| 645,000 | Netflix, Inc., 6.375%, 5/15/2029 | 663,890 | ||||||
| 415,000 | Warnermedia Holdings, Inc., 3.755%, 3/15/2027, 144A | 374,554 | ||||||
| 155,000 | Warnermedia Holdings, Inc., 4.054%, 3/15/2029, 144A | 134,340 | ||||||
| 430,000 | Warnermedia Holdings, Inc., 4.279%, 3/15/2032, 144A | 354,544 | ||||||
|
| |||||||
| 3,060,439 | ||||||||
|
| |||||||
| Metals & Mining – 1.7% |
| |||||||
| 735,000 | Anglo American Capital PLC, 2.875%, 3/17/2031, 144A | 600,135 | ||||||
| 200,000 | First Quantum Minerals Ltd., 6.875%, 10/15/2027, 144A | 187,645 | ||||||
| 275,000 | Freeport-McMoRan, Inc., 4.250%, 3/01/2030 | 249,675 | ||||||
| 255,000 | Freeport-McMoRan, Inc., 4.625%, 8/01/2030 | 237,506 | ||||||
| 500,000 | Freeport-McMoRan, Inc., 5.400%, 11/14/2034 | 472,191 | ||||||
| 1,250,000 | Glencore Funding LLC, 2.500%, 9/01/2030, 144A | 1,014,937 | ||||||
| 645,000 | Glencore Funding LLC, 2.850%, 4/27/2031, 144A | 527,820 | ||||||
| 85,000 | Volcan Cia Minera SAA, 4.375%, 2/11/2026, 144A | 73,231 | ||||||
|
| |||||||
| 3,363,140 | ||||||||
|
| |||||||
| Midstream – 1.0% |
| |||||||
| 240,000 | DCP Midstream Operating LP, 3.250%, 2/15/2032 | 198,511 | ||||||
| 50,000 | DCP Midstream Operating LP, 5.125%, 5/15/2029 | 48,187 | ||||||
| 125,000 | DCP Midstream Operating LP, 6.450%, 11/03/2036, 144A | 122,490 | ||||||
| 588,000 | Energy Transfer LP, 5.000%, 5/15/2044 | 480,978 | ||||||
| 330,000 | Energy Transfer LP, 5.750%, 2/15/2033 | 322,859 | ||||||
| 43,000 | ONEOK Partners LP, 6.200%, 9/15/2043 | 40,824 | ||||||
| 27,000 | Plains All American Pipeline LP/PAA Finance Corp., 2.850%, 1/31/2023 | 26,958 | ||||||
| 55,000 | Plains All American Pipeline LP/PAA Finance Corp., 3.800%, 9/15/2030 | 47,800 | ||||||
| 10,000 | Plains All American Pipeline LP/PAA Finance Corp., 4.300%, 1/31/2043 | 7,250 | ||||||
| 25,000 | Targa Resources Corp., 5.200%, 7/01/2027 | 24,503 | ||||||
| 70,000 | Targa Resources Partners LP/Targa Resources Partners Finance Corp., 4.875%, 2/01/2031 | 63,207 | ||||||
| 80,000 | Targa Resources Partners LP/Targa Resources Partners Finance Corp., 5.500%, 3/01/2030 | 75,274 | ||||||
| Midstream – continued |
| |||||||
| $ | 85,000 | Western Midstream Operating LP, 4.300%, 2/01/2030 | $ | 74,198 | ||||
| 195,000 | Western Midstream Operating LP, 5.300%, 3/01/2048 | 160,334 | ||||||
| 35,000 | Western Midstream Operating LP, 5.450%, 4/01/2044 | 29,075 | ||||||
| 25,000 | Western Midstream Operating LP, 5.500%, 8/15/2048 | 20,749 | ||||||
| 120,000 | Western Midstream Operating LP, 5.500%, 2/01/2050 | 98,856 | ||||||
|
| |||||||
| 1,842,053 | ||||||||
|
| |||||||
| Non-Agency Commercial Mortgage-Backed Securities – 2.4% |
| |||||||
| 345,000 | BANK, Series 2021-BN35, Class AS, 2.457%, 6/15/2064 | 266,274 | ||||||
| 95,000 | BPR Trust, Series 2021-NRD, Class B, 1-month SOFR + 2.124%, 6.450%, 12/15/2038, 144A(b) | 87,546 | ||||||
| 105,000 | BPR Trust, Series 2021-NRD, Class C, 1-month SOFR + 2.424%, 6.750%, 12/15/2038, 144A(b) | 95,972 | ||||||
| 65,000 | BPR Trust, Series 2021-NRD, Class D, 1-month SOFR + 3.723%, 8.049%, 12/15/2038, 144A(b) | 59,144 | ||||||
| 290,000 | BPR Trust, Series 2022-STAR, Class A, 1-month SOFR + 3.232%, 7.568%, 8/15/2024, 144A(b) | 285,382 | ||||||
| 112,573 | Commercial Mortgage Pass Through Certificates, Series 2012-CR3, Class AM, 3.416%, 10/15/2045, 144A | 101,200 | ||||||
| 100,000 | Credit Suisse Mortgage Trust, Series 2014-USA, Class B, 4.185%, 9/15/2037, 144A | 84,884 | ||||||
| 136,667 | Extended Stay America Trust, Series 2021-ESH, Class C, 1-month LIBOR + 1.700%, 6.018%, 7/15/2038, 144A(b) | 131,181 | ||||||
| 97,619 | Extended Stay America Trust, Series 2021-ESH, Class D, 1-month LIBOR + 2.250%, 6.568%, 7/15/2038, 144A(b) | 93,456 | ||||||
| 115,000 | GS Mortgage Securities Corp. Trust, Series 2013-PEMB, Class A, 3.550%, 3/05/2033, 144A(a) | 104,317 | ||||||
| 125,000 | GS Mortgage Securities Corp. Trust, Series 2013-PEMB, Class B, 3.550%, 3/05/2033, 144A(a) | 109,157 | ||||||
| 125,000 | GS Mortgage Securities Trust, Series 2014-GC18, Class AS, 4.383%, 1/10/2047 | 119,581 | ||||||
| 185,000 | GS Mortgage Securities Trust, Series 2014-GC18, Class B, 4.885%, 1/10/2047(a) | 169,365 | ||||||
| 105,000 | JPMBB Commercial Mortgage Securities Trust, Series 2015-C32, Class A5, 3.598%, 11/15/2048 | 98,726 | ||||||
| 420,000 | JPMorgan Chase Commercial Mortgage Securities Trust, Series 2012-LC9, Class C, 4.064%, 12/15/2047, 144A(a) | 396,843 | ||||||
See accompanying notes to financial statements.
33 |
Portfolio of Investments – as of December 31, 2022
Loomis Sayles Investment Grade Fixed Income Fund – continued
| Principal Amount | Description | Value (†) | ||||||
| Bonds and Notes – continued | ||||||||
| Non-Agency Commercial Mortgage-Backed Securities – continued |
| |||||||
| $ | 100,000 | MedTrust, Series 2021-MDLN, Class B, 1-month LIBOR + 1.450%, 5.768%, 11/15/2038, 144A(b) | $ | 95,235 | ||||
| 200,000 | MedTrust, Series 2021-MDLN, Class C, 1-month LIBOR + 1.800%, 6.118%, 11/15/2038, 144A(b) | 190,011 | ||||||
| 100,000 | MedTrust, Series 2021-MDLN, Class D, 1-month LIBOR + 2.000%, 6.318%, 11/15/2038, 144A(b) | 94,483 | ||||||
| 97,564 | Morgan Stanley Bank of America Merrill Lynch Commercial Mortgage Securities Trust, Series 2012-CKSV, Class A2, 3.277%, 10/15/2030, 144A | 78,539 | ||||||
| 55,000 | Morgan Stanley Bank of America Merrill Lynch Trust, Series 2013-C12, Class C, 4.756%, 10/15/2046(a) | 52,127 | ||||||
| 495,000 | Morgan Stanley Bank of America Merrill Lynch Trust, Series 2016-C30, Class C, 4.095%, 9/15/2049(a) | 417,751 | ||||||
| 350,000 | RBS Commercial Funding Trust, Series 2013-GSP, Class A, 3.834%, 1/15/2032, 144A(a) | 336,866 | ||||||
| 38,736 | UBS-Barclays Commercial Mortgage Trust, Series 2012-TFT, Class A, 2.892%, 6/05/2030, 144A | 37,693 | ||||||
| 110,000 | Wells Fargo Commercial Mortgage Trust, Series 2013-LC12, Class B, 4.296%, 7/15/2046(a) | 104,297 | ||||||
| 155,000 | Wells Fargo Commercial Mortgage Trust, Series 2014-LC16, Class AS, 4.020%, 8/15/2050 | 148,204 | ||||||
| 72,926 | WFRBS Commercial Mortgage Trust, Series 2011-C3, Class D, 5.378%, 3/15/2044, 144A(a) | 29,069 | ||||||
| 145,000 | WFRBS Commercial Mortgage Trust, Series 2013-C15, Class B, 4.529%, 8/15/2046(a) | 123,683 | ||||||
| 175,000 | WFRBS Commercial Mortgage Trust, Series 2014-C20, Class B, 4.378%, 5/15/2047 | 150,589 | ||||||
| 655,000 | WFRBS Commercial Mortgage Trust, Series 2014-C24, Class B, 4.204%, 11/15/2047(a) | 594,651 | ||||||
|
| |||||||
| 4,656,226 | ||||||||
|
| |||||||
| Paper – 0.5% |
| |||||||
| 552,000 | Georgia-Pacific LLC, 7.250%, 6/01/2028 | 596,406 | ||||||
| 137,000 | WestRock MWV LLC, 7.550%, 3/01/2047 | 152,129 | ||||||
| 104,000 | WestRock MWV LLC, 8.200%, 1/15/2030 | 117,270 | ||||||
|
| |||||||
| 865,805 | ||||||||
|
| |||||||
| Pharmaceuticals – 0.4% |
| |||||||
| 100,000 | Bausch Health Cos., Inc., 4.875%, 6/01/2028, 144A | 63,604 | ||||||
| Pharmaceuticals – continued |
| |||||||
| $ | 150,000 | Teva Pharmaceutical Finance Co. LLC, 6.150%, 2/01/2036 | $ | 131,860 | ||||
| 425,000 | Teva Pharmaceutical Finance Netherlands III BV, 4.100%, 10/01/2046 | 259,856 | ||||||
| 240,000 | Teva Pharmaceutical Finance Netherlands III BV, 4.750%, 5/09/2027 | 216,936 | ||||||
| 200,000 | Teva Pharmaceutical Finance Netherlands III BV, 5.125%, 5/09/2029 | 178,109 | ||||||
|
| |||||||
| 850,365 | ||||||||
|
| |||||||
| Property & Casualty Insurance – 0.2% |
| |||||||
| 555,000 | Stewart Information Services Corp., 3.600%, 11/15/2031 | 425,312 | ||||||
|
| |||||||
| REITs – Apartments – 0.0% |
| |||||||
| 85,000 | American Homes 4 Rent, 2.375%, 7/15/2031 | 65,563 | ||||||
|
| |||||||
| REITs – Office Property – 0.0% |
| |||||||
| 85,000 | Corporate Office Properties LP, 2.750%, 4/15/2031 | 63,614 | ||||||
|
| |||||||
| REITs – Shopping Centers – 0.0% |
| |||||||
| 70,000 | Brixmor Operating Partnership LP, 2.250%, 4/01/2028 | 57,767 | ||||||
|
| |||||||
| Retailers – 1.7% |
| |||||||
| 2,680,000 | Amazon.com, Inc., 0.450%, 5/12/2024 | 2,524,287 | ||||||
| 650,000 | AutoZone, Inc., 4.000%, 4/15/2030 | 601,866 | ||||||
| 125,000 | Tapestry, Inc., 3.050%, 3/15/2032 | 97,288 | ||||||
|
| |||||||
| 3,223,441 | ||||||||
|
| |||||||
| Supermarkets – 0.0% |
| |||||||
| 39,000 | Koninklijke Ahold Delhaize NV, 5.700%, 10/01/2040 | 38,631 | ||||||
|
| |||||||
| Technology – 4.8% |
| |||||||
| 225,000 | Broadcom, Inc., 3.137%, 11/15/2035, 144A | 165,435 | ||||||
| 240,000 | Broadcom, Inc., 3.187%, 11/15/2036, 144A | 172,389 | ||||||
| 380,000 | Broadcom, Inc., 4.150%, 11/15/2030 | 340,538 | ||||||
| 85,000 | Broadcom, Inc., 4.300%, 11/15/2032 | 74,914 | ||||||
| 105,000 | CDW LLC/CDW Finance Corp., 2.670%, 12/01/2026 | 93,221 | ||||||
| 120,000 | CDW LLC/CDW Finance Corp., 3.250%, 2/15/2029 | 102,203 | ||||||
| 890,000 | CDW LLC/CDW Finance Corp., 3.569%, 12/01/2031 | 733,392 | ||||||
| 25,000 | CDW LLC/CDW Finance Corp., 4.250%, 4/01/2028 | 23,008 | ||||||
| 155,000 | CommScope Technologies LLC, 5.000%, 3/15/2027, 144A | 105,276 | ||||||
| 250,000 | CommScope, Inc., 4.750%, 9/01/2029, 144A | 201,550 | ||||||
| 670,000 | Entegris Escrow Corp., 4.750%, 4/15/2029, 144A | 610,998 | ||||||
| 885,000 | Equinix, Inc., 2.000%, 5/15/2028 | 747,072 | ||||||
| 1,175,000 | Equinix, Inc., 2.150%, 7/15/2030 | 934,759 | ||||||
See accompanying notes to financial statements.
| 34
Portfolio of Investments – as of December 31, 2022
Loomis Sayles Investment Grade Fixed Income Fund – continued
| Principal Amount | Description | Value (†) | ||||||
| Bonds and Notes – continued | ||||||||
| Technology – continued | ||||||||
| $ | 175,000 | Fidelity National Information Services, Inc., 5.100%, 7/15/2032 | $ | 168,564 | ||||
| 170,000 | FLEX Ltd., 6.000%, 1/15/2028 | 169,631 | ||||||
| 85,000 | Global Payments, Inc., 2.900%, 11/15/2031 | 67,028 | ||||||
| 130,000 | Global Payments, Inc., 5.300%, 8/15/2029 | 125,680 | ||||||
| 280,000 | Global Payments, Inc., 5.400%, 8/15/2032 | 266,658 | ||||||
| 130,000 | Jabil, Inc., 1.700%, 4/15/2026 | 115,199 | ||||||
| 375,000 | Jabil, Inc., 3.600%, 1/15/2030 | 329,261 | ||||||
| 330,000 | Jabil, Inc., 3.950%, 1/12/2028 | 307,219 | ||||||
| 295,000 | Marvell Technology, Inc., 2.450%, 4/15/2028 | 249,700 | ||||||
| 250,000 | Marvell Technology, Inc., 2.950%, 4/15/2031 | 201,085 | ||||||
| 295,000 | Microchip Technology, Inc., 0.983%, 9/01/2024 | 273,158 | ||||||
| 120,000 | Micron Technology, Inc., 4.663%, 2/15/2030 | 108,837 | ||||||
| 155,000 | Micron Technology, Inc., 5.327%, 2/06/2029 | 148,787 | ||||||
| 580,000 | Micron Technology, Inc., 6.750%, 11/01/2029 | 589,151 | ||||||
| 75,000 | NXP BV/NXP Funding LLC/NXP USA, Inc., 4.400%, 6/01/2027 | 71,879 | ||||||
| 165,000 | Open Text Corp., 6.900%, 12/01/2027, 144A | 165,000 | ||||||
| 600,000 | Oracle Corp., 3.950%, 3/25/2051 | 427,464 | ||||||
| 275,000 | Oracle Corp., 6.150%, 11/09/2029 | 285,441 | ||||||
| 545,000 | TD SYNNEX Corp., 1.750%, 8/09/2026 | 463,233 | ||||||
| 140,000 | Western Digital Corp., 2.850%, 2/01/2029 | 108,314 | ||||||
| 310,000 | Western Digital Corp., 4.750%, 2/15/2026 | 291,933 | ||||||
|
| |||||||
| 9,237,977 | ||||||||
|
| |||||||
| Transportation Services – 0.5% |
| |||||||
| 300,000 | Adani Ports & Special Economic Zone Ltd., 3.100%, 2/02/2031, 144A | 220,056 | ||||||
| 210,000 | Adani Ports & Special Economic Zone Ltd., 4.200%, 8/04/2027, 144A | 184,332 | ||||||
| 562,000 | ERAC USA Finance LLC, 6.700%, 6/01/2034, 144A | 590,059 | ||||||
|
| |||||||
| 994,447 | ||||||||
|
| |||||||
| Treasuries – 18.2% |
| |||||||
| 6,495,000 | U.S. Treasury Bond, 2.250%, 2/15/2052 | 4,516,562 | ||||||
| 7,125,000 | U.S. Treasury Bond, 3.250%, 5/15/2042 | 6,246,621 | ||||||
| 1,120,000 | U.S. Treasury Note, 0.125%, 8/31/2023 | 1,086,181 | ||||||
| 4,890,000 | U.S. Treasury Note, 0.500%, 11/30/2023 | 4,704,715 | ||||||
| 4,225,000 | U.S. Treasury Note, 0.875%, 1/31/2024 | 4,053,855 | ||||||
| 15,220,000 | U.S. Treasury Note, 1.500%, 2/29/2024(g) | 14,670,653 | ||||||
|
| |||||||
| 35,278,587 | ||||||||
|
| |||||||
| Wireless – 1.7% |
| |||||||
| $ | 1,415,000 | Crown Castle, Inc., 2.250%, 1/15/2031 | $ | 1,135,158 | ||||
| 55,000 | Crown Castle, Inc., 3.300%, 7/01/2030 | 48,114 | ||||||
| 100,000 | T-Mobile USA, Inc., 2.400%, 3/15/2029 | 84,393 | ||||||
| 180,000 | T-Mobile USA, Inc., 2.700%, 3/15/2032 | 145,430 | ||||||
| 620,000 | T-Mobile USA, Inc., 3.375%, 4/15/2029 | 546,077 | ||||||
| 305,000 | T-Mobile USA, Inc., 3.500%, 4/15/2031 | 263,459 | ||||||
| 1,120,000 | T-Mobile USA, Inc., 3.875%, 4/15/2030 | 1,014,512 | ||||||
|
| |||||||
| 3,237,143 | ||||||||
|
| |||||||
| Total Non-Convertible Bonds | ||||||||
| (Identified Cost $199,101,525) | 175,533,368 | |||||||
|
| |||||||
| Convertible Bonds – 1.3% | ||||||||
| Airlines – 0.1% |
| |||||||
| 210,000 | Southwest Airlines Co., 1.250%, 5/01/2025 | 252,210 | ||||||
|
| |||||||
| Cable Satellite – 0.4% |
| |||||||
| 965,000 | DISH Network Corp., 3.375%, 8/15/2026 | 604,572 | ||||||
| 180,000 | DISH Network Corp., Zero Coupon, 6.944%-9.514%, 12/15/2025(h) | 115,220 | ||||||
|
| |||||||
| 719,792 | ||||||||
|
| |||||||
| Consumer Cyclical Services – 0.1% |
| |||||||
| 45,000 | Peloton Interactive, Inc., Zero Coupon, 0.519%-0.798%, 2/15/2026(h) | 31,855 | ||||||
| 245,000 | Uber Technologies, Inc., Zero Coupon, 0.000%-1.922%, 12/15/2025(h) | 206,925 | ||||||
|
| |||||||
| 238,780 | ||||||||
|
| |||||||
| Healthcare – 0.3% |
| |||||||
| 600,000 | Teladoc Health, Inc., 1.250%, 6/01/2027 | 460,917 | ||||||
|
| |||||||
| Pharmaceuticals – 0.4% |
| |||||||
| 150,000 | BioMarin Pharmaceutical, Inc., 0.599%, 8/01/2024 | 159,195 | ||||||
| 465,000 | BioMarin Pharmaceutical, Inc., 1.250%, 5/15/2027 | 499,671 | ||||||
| 130,000 | Livongo Health, Inc., 0.875%, 6/01/2025 | 113,799 | ||||||
|
| |||||||
| 772,665 | ||||||||
|
| |||||||
| Total Convertible Bonds | ||||||||
| (Identified Cost $3,107,426) | 2,444,364 | |||||||
|
| |||||||
| Municipals – 0.4% | ||||||||
| Virginia – 0.4% |
| |||||||
| 825,000 | Tobacco Settlement Financing Corp., Series A-1, 6.706%, 6/01/2046 (Identified Cost $816,953) | 743,194 | ||||||
|
| |||||||
| Total Bonds and Notes | ||||||||
| (Identified Cost $203,025,904) | 178,720,926 | |||||||
|
| |||||||
See accompanying notes to financial statements.
35 |
Portfolio of Investments – as of December 31, 2022
Loomis Sayles Investment Grade Fixed Income Fund – continued
| Principal Amount | Description | Value (†) | ||||||
| Collateralized Loan Obligations – 4.5% | ||||||||
| $ | 395,000 | 522 Funding CLO Ltd., Series 2021-7A, Class D, 3-month LIBOR + 2.900%, 7.225%, 4/23/2034, 144A(b) | $ | 351,972 | ||||
| 250,000 | AGL CLO 5 Ltd., Series 2020-5A, Class BR, 3-month LIBOR + 1.700%, 5.943%, 7/20/2034, 144A(b) | 238,452 | ||||||
| 430,000 | AIG CLO LLC, Series 2021-1A, Class D, 3-month LIBOR + 2.950%, 7.275%, 4/22/2034, 144A(b) | 397,009 | ||||||
| 675,000 | AIMCO CLO Ltd., Series 2021-14A, Class D, 3-month LIBOR + 2.900%, 7.143%, 4/20/2034, 144A(b) | 620,725 | ||||||
| 355,000 | AIMCO CLO Ltd., Series 2017-AA, Class DR, 3-month LIBOR + 3.150%, 7.393%, 4/20/2034, 144A(b) | 323,367 | ||||||
| 600,000 | Alinea CLO Ltd., Series 2018-1A, Class B, 3-month LIBOR + 1.650%, 5.893%, 7/20/2031, 144A(b) | 578,857 | ||||||
| 250,000 | Battalion CLO VIII Ltd., Series 2015-8A, Class A2R2, 3-month LIBOR + 1.550%, 5.744%, 7/18/2030, 144A(b) | 240,644 | ||||||
| 250,000 | Canyon CLO Ltd., Series 2021-4A, Class B, 3-month LIBOR + 1.700%, 5.779%, 10/15/2034, 144A(b) | 238,385 | ||||||
| 270,000 | Carlyle U.S. CLO Ltd., Series 2021-9A, Class B, 3-month LIBOR + 1.650%, 5.893%, 10/20/2034, 144A(b) | 259,108 | ||||||
| 250,000 | CIFC Funding Ltd., Series 2021-6A, Class B, 3-month LIBOR + 1.650%, 5.729%, 10/15/2034, 144A(b) | 240,732 | ||||||
| 455,000 | Dryden 53 CLO Ltd., Series 2017-53A, Class B, 3-month LIBOR + 1.400%, 5.479%, 1/15/2031, 144A(b) | 438,503 | ||||||
| 275,000 | Elmwood CLO VIII Ltd., Series 2021-1A, Class D2, 3-month LIBOR + 2.850%, 7.093%, 1/20/2034, 144A(b) | 257,745 | ||||||
| 250,000 | Galaxy XXV CLO Ltd., Series 2018-25A, Class B, 3-month LIBOR + 1.650%, 6.008%, 10/25/2031, 144A(b) | 240,751 | ||||||
| 250,000 | Galaxy XXVI CLO Ltd., Series 2018-26A, Class B, 3-month LIBOR + 1.700%, 6.365%, 11/22/2031, 144A(b) | 240,975 | ||||||
| 255,000 | Invesco CLO Ltd., Series 2021-1A, Class D,, 3-month LIBOR + 3.050% 7.129%, 4/15/2034, 144A(b) | 233,078 | ||||||
| 310,418 | Madison Park Funding XXV Ltd., Series 2017-25A, Class A1R, 3-month LIBOR + 0.970%, 5.328%, 4/25/2029, 144A(b) | 306,439 | ||||||
| Collateralized Loan Obligations – continued | ||||||||
| $ | 250,000 | Magnetite XIV-R Ltd., Series 2015-14RA, Class B, 3-month LIBOR + 1.600%, 5.794%, 10/18/2031, 144A(b) | $ | 242,500 | ||||
| 250,000 | Magnetite XV Ltd., Series 2015-15A, Class AR, 3-month LIBOR + 1.010%, 5.368%, 7/25/2031, 144A(b) | 245,448 | ||||||
| 530,000 | Morgan Stanley Eaton Vance CLO Ltd., Series 2022-16A, Class B, 3-month SOFR + 1.950%, 5.814%, 4/15/2035, 144A(b) | 503,472 | ||||||
| 250,000 | Neuberger Berman CLO XX Ltd., Series 2015-20A, Class BRR, 3-month LIBOR + 1.650%, 5.729%, 7/15/2034, 144A(b) | 240,648 | ||||||
| 300,000 | Octagon Investment Partners Ltd., Series 2018-18A, Class A2, 3-month LIBOR + 1.470%, 5.549%, 4/16/2031, 144A(b) | 288,404 | ||||||
| 315,000 | Octagon Investment Partners XV Ltd., Series 2013-1A, Class A1RR, 3-month LIBOR + 0.970%, 5.197%, 7/19/2030, 144A(b) | 311,219 | ||||||
| 250,000 | Palmer Square CLO Ltd., Series 2013-2A, Class A2R3, 3-month LIBOR + 1.500%, 5.727%, 10/17/2031, 144A(b) | 241,469 | ||||||
| 250,000 | Palmer Square CLO Ltd., Series 2013-2A, Class CR3, 3-month LIBOR + 2.700%, 6.927%, 10/17/2031, 144A(b) | 227,936 | ||||||
| 136,623 | Palmer Square Loan Funding Ltd., Series 2021-3A, Class A1, 3-month LIBOR + 0.800%, 5.043%, 7/20/2029, 144A(b) | 134,707 | ||||||
| 250,000 | Rad CLO Ltd., Series 2021-15A, Class B, 3-month LIBOR + 1.650%, 5.893%, 1/20/2034, 144A(b) | 238,791 | ||||||
| 360,000 | Recette CLO Ltd., Series 2015-1A, Class BRR, 3-month LIBOR + 1.400%, 5.643%, 4/20/2034, 144A(b) | 337,694 | ||||||
| 310,000 | Sixth Street CLO XVIII Ltd., Series 2021-18A, Class D, 3-month LIBOR + 2.900%, 7.143%, 4/20/2034, 144A(b) | 290,632 | ||||||
| 255,000 | Voya CLO Ltd., Series 2018-3A, Class B, 3-month LIBOR + 1.650%, 5.729%, 10/15/2031, 144A(b) | 244,093 | ||||||
|
| |||||||
| Total Collateralized Loan Obligations |
| |||||||
| (Identified Cost $9,199,221) | 8,753,755 | |||||||
|
| |||||||
| Shares | ||||||||
| Common Stocks – 0.1% | ||||||||
| Wireless Telecommunication Services – 0.1% |
| |||||||
| 1,641 | T-Mobile US, Inc.(e) (Identified Cost $201,920) | 229,740 | ||||||
|
| |||||||
See accompanying notes to financial statements.
| 36
Portfolio of Investments – as of December 31, 2022
Loomis Sayles Investment Grade Fixed Income Fund – continued
Shares | Description | Value (†) | ||||||
| Preferred Stocks – 1.3% | ||||||||
| Convertible Preferred Stocks – 1.3% | ||||||||
| Banking – 0.9% |
| |||||||
| 1,095 | Bank of America Corp., Series L, 7.250% | $ | 1,270,200 | |||||
| 317 | Wells Fargo & Co., Class A, Series L, 7.500% | 375,645 | ||||||
|
| |||||||
| 1,645,845 | ||||||||
|
| |||||||
| Midstream – 0.3% |
| |||||||
| 12,375 | El Paso Energy Capital Trust I, 4.750% | 557,359 | ||||||
|
| |||||||
| Wireless – 0.1% |
| |||||||
| 250 | 2020 Cash Mandatory Exchangeable Trust, 5.250%, 144A | 286,005 | ||||||
|
| |||||||
| Total Convertible Preferred Stocks | ||||||||
| (Identified Cost $2,382,327) | 2,489,209 | |||||||
|
| |||||||
| Total Preferred Stocks | ||||||||
| (Identified Cost $2,382,327) | 2,489,209 | |||||||
|
| |||||||
| | Principal Amount | |||||||
| Short-Term Investments – 0.9% | ||||||||
| $ | 1,813,093 | Tri-Party Repurchase Agreement with Fixed Income Clearing Corporation, dated 12/30/2022 at 1.800% to be repurchased at $1,813,456 on 1/03/2023 collateralized by $1,926,600 U.S. Treasury Note, 3.250% due 6/30/2029 valued at $1,849,386 including accrued interest (Note 2 of Notes to Financial Statements) (Identified Cost $1,813,093) | 1,813,093 | |||||
|
| |||||||
| Total Investments – 99.2% | ||||||||
| (Identified Cost $216,622,465) | 192,006,723 | |||||||
| Other assets less liabilities – 0.8% | 1,481,862 | |||||||
|
| |||||||
| Net Assets – 100.0% | $ | 193,488,585 | ||||||
|
| |||||||
| (†) | See Note 2 of Notes to Financial Statements. | |||||||
| (a) | Variable rate security. The interest rate adjusts periodically based on; (i) changes in current interest rates and/or prepayments on underlying pools of assets, if applicable, (ii) reference to a base lending rate plus or minus a margin, and/or (iii) reference to a base lending rate adjusted by a multiplier and/or subject to certain floors or caps. Rate as of December 31, 2022 is disclosed. | |||||||
| (b) | Variable rate security. Rate as of December 31, 2022 is disclosed. | |||||||
| (c) | Level 3 security. Value has been determined using significant unobservable inputs. See Note 3 of Notes to Financial Statements. | |||||||
| (d) | Perpetual bond with no specified maturity date. | |||||||
| (e) | Non-income producing security. | |||||||
| (f) | The issuer is in default with respect to interest and/or principal payments. Income is not being accrued. | |||||||
| (g) | Security (or a portion thereof) has been pledged as collateral for open derivative contracts. | |||||||
| (h) | Interest rate represents annualized yield at time of purchase; not a coupon rate. The Fund’s investment in this security is comprised of various lots with differing annualized yields. | |||||||
| 144A | All or a portion of these securities are exempt from registration under Rule 144A of the Securities Act of 1933. These securities may be resold in transactions exempt from registration, normally to qualified institutional buyers. At December 31, 2022, the value of Rule 144A holdings amounted to $72,104,624 or 37.3% of net assets. | |||||||
| ABS | Asset-Backed Securities | |||||||
| ARMs | Adjustable Rate Mortgages | |||||||
| EMTN | Euro Medium Term Note | |||||||
| FNMA | Federal National Mortgage Association | |||||||
| GMTN | Global Medium Term Note | |||||||
| LIBOR | London Interbank Offered Rate | |||||||
| MTN | Medium Term Note | |||||||
| REITs | Real Estate Investment Trusts | |||||||
| SOFR | Secured Overnight Financing Rate | |||||||
At December 31, 2022, open long futures contracts were as follows:
Financial Futures | Expiration Date | Contracts | Notional Amount | Value | Unrealized Appreciation (Depreciation) | |||||||||||||||
Ultra 10 Year U.S. Treasury Note | 3/22/2023 | 76 | $ | 9,049,118 | $ | 8,989,375 | $ | (59,743 | ) | |||||||||||
Ultra Long U.S. Treasury Bond | 3/22/2023 | 84 | 11,436,059 | 11,282,250 | (153,809 | ) | ||||||||||||||
|
| |||||||||||||||||||
Total | $ | (213,552 | ) | |||||||||||||||||
|
| |||||||||||||||||||
See accompanying notes to financial statements.
37 |
Portfolio of Investments – as of December 31, 2022
Loomis Sayles Investment Grade Fixed Income Fund – continued
Industry Summary at December 31, 2022
Treasuries | 18.2 | % | ||
Banking | 12.0 | |||
ABS Car Loan | 8.5 | |||
ABS Home Equity | 5.0 | |||
Technology | 4.8 | |||
Finance Companies | 4.1 | |||
Independent Energy | 2.9 | |||
ABS Other | 2.8 | |||
Life Insurance | 2.6 | |||
Non-Agency Commercial Mortgage-Backed Securities | 2.4 | |||
Cable Satellite | 2.4 | |||
Construction Machinery | 2.1 | |||
Other Investments, less than 2% each | 26.0 | |||
Collateralized Loan Obligations | 4.5 | |||
Short-Term Investments | 0.9 | |||
|
| |||
Total Investments | 99.2 | |||
Other assets less liabilities (including futures contracts) | 0.8 | |||
|
| |||
Net Assets | 100.0 | % | ||
|
|
See accompanying notes to financial statements.
| 38
Statements of Assets And Liabilities
December 31, 2022
| Bond Fund | Investment Grade Fixed Income Fund | |||||||
ASSETS |
| |||||||
Investments at cost | $ | 5,938,391,822 | $ | 216,622,465 | ||||
Net unrealized depreciation | (884,382,315 | ) | (24,615,742 | ) | ||||
|
|
|
| |||||
Investments at value | 5,054,009,507 | 192,006,723 | ||||||
Cash | 3,064,084 | 42,191 | ||||||
Receivable for Fund shares sold | 8,719,116 | 148,119 | ||||||
Dividends and interest receivable | 50,738,551 | 1,677,012 | ||||||
Prepaid expenses (Note 8) | 1,095 | 573 | ||||||
|
|
|
| |||||
TOTAL ASSETS | 5,116,532,353 | 193,874,618 | ||||||
|
|
|
| |||||
LIABILITIES |
| |||||||
Payable for Fund shares redeemed | 19,050,850 | — | ||||||
Payable for variation margin on futures contracts (Note 2) | 1,102,590 | 46,734 | ||||||
Management fees payable (Note 6) | 2,237,209 | 67,452 | ||||||
Deferred Trustees’ fees (Note 6) | 2,334,065 | 190,172 | ||||||
Administrative fees payable (Note 6) | 207,920 | 7,835 | ||||||
Payable to distributor (Note 6d) | 43,889 | — | ||||||
Other accounts payable and accrued expenses | 368,118 | 73,840 | ||||||
|
|
|
| |||||
TOTAL LIABILITIES | 25,344,641 | 386,033 | ||||||
|
|
|
| |||||
NET ASSETS | $ | 5,091,187,712 | $ | 193,488,585 | ||||
|
|
|
| |||||
NET ASSETS CONSIST OF: | ||||||||
Paid-in capital | $ | 6,427,479,845 | $ | 222,053,168 | ||||
Accumulated loss | (1,336,292,133 | ) | (28,564,583 | ) | ||||
|
|
|
| |||||
NET ASSETS | $ | 5,091,187,712 | $ | 193,488,585 | ||||
|
|
|
| |||||
COMPUTATION OF NET ASSET VALUE AND OFFERING PRICE: | ||||||||
Institutional Class: | ||||||||
Net assets | $ | 3,759,887,914 | $ | 193,488,585 | ||||
|
|
|
| |||||
Shares of beneficial interest | 331,245,703 | 19,263,399 | ||||||
|
|
|
| |||||
Net asset value, offering and redemption price per share | $ | 11.35 | $ | 10.04 | ||||
|
|
|
| |||||
Retail Class: | ||||||||
Net assets | $ | 861,223,106 | $ | — | ||||
|
|
|
| |||||
Shares of beneficial interest | 76,326,835 | — | ||||||
|
|
|
| |||||
Net asset value, offering and redemption price per share | $ | 11.28 | $ | — | ||||
|
|
|
| |||||
Admin Class shares: | ||||||||
Net assets | $ | 30,677,593 | $ | — | ||||
|
|
|
| |||||
Shares of beneficial interest | 2,729,836 | — | ||||||
|
|
|
| |||||
Net asset value, offering and redemption price per share | $ | 11.24 | $ | — | ||||
|
|
|
| |||||
Class N shares: | ||||||||
Net assets | $ | 439,399,099 | $ | — | ||||
|
|
|
| |||||
Shares of beneficial interest | 38,768,030 | — | ||||||
|
|
|
| |||||
Net asset value, offering and redemption price per share | $ | 11.33 | $ | — | ||||
|
|
|
| |||||
See accompanying notes to financial statements.
39 |
Statements of Operations
For the Year Ended December 31, 2022
| Bond Fund | Investment Grade Fixed Income Fund | |||||||
INVESTMENT INCOME | ||||||||
Interest | $ | 241,192,582 | $ | 6,855,437 | ||||
Dividends | 11,593,164 | 251,297 | ||||||
|
|
|
| |||||
| 252,785,746 | 7,106,734 | |||||||
|
|
|
| |||||
Expenses | ||||||||
Management fees (Note 6) | 33,713,301 | 879,328 | ||||||
Service and distribution fees (Note 6) | 2,705,064 | — | ||||||
Administrative fees (Note 6) | 2,768,894 | 99,253 | ||||||
Trustees’ fees and expenses (Note 6) | 195,551 | 18,443 | ||||||
Trustees’ fees deferred compensation (Note 6) | (319,076 | ) | (25,110 | ) | ||||
Transfer agent fees and expenses (Notes 6 and 7) | 4,270,567 | 3,013 | ||||||
Audit and tax services fees | 67,898 | 60,232 | ||||||
Custodian fees and expenses | 192,829 | 19,062 | ||||||
Legal fees (Note 8) | 219,445 | 7,790 | ||||||
Registration fees | 118,876 | 18,928 | ||||||
Shareholder reporting expenses | 322,217 | 11,499 | ||||||
Miscellaneous expenses | 218,194 | 40,061 | ||||||
|
|
|
| |||||
Total expenses | 44,473,760 | 1,132,499 | ||||||
Less waiver and/or expense reimbursement (Note 6) | (878,360 | ) | — | |||||
|
|
|
| |||||
Net expenses | 43,595,400 | 1,132,499 | ||||||
|
|
|
| |||||
Net investment income | 209,190,346 | 5,974,235 | ||||||
|
|
|
| |||||
| NET REALIZED AND UNREALIZED GAIN (LOSS) ON INVESTMENTS, FUTURES CONTRACTS, FORWARD FOREIGN CURRENCY CONTRACTS AND FOREIGN CURRENCY TRANSACTIONS | ||||||||
Net realized gain (loss) on: | ||||||||
Investments | (43,077,660 | ) | (2,974,199 | ) | ||||
Futures contracts | 24,798,105 | (58,019 | ) | |||||
Forward foreign currency contracts (Note 2d) | (565,055 | ) | (16,829 | ) | ||||
Foreign currency transactions (Note 2c) | (546,307 | ) | (3,409 | ) | ||||
Net change in unrealized appreciation (depreciation) on: | ||||||||
Investments | (1,101,034,927 | ) | (32,378,645 | ) | ||||
Futures contracts | 1,411,296 | 84,269 | ||||||
Forward foreign currency contracts (Note 2d) | 380,188 | 11,323 | ||||||
Foreign currency translations (Note 2c) | 580,578 | 6,319 | ||||||
|
|
|
| |||||
Net realized and unrealized loss on investments, futures contracts, forward foreign currency contracts and foreign currency transactions | (1,118,053,782 | ) | (35,329,190 | ) | ||||
|
|
|
| |||||
| NET DECREASE IN NET ASSETS RESULTING FROM OPERATIONS | $ | (908,863,436 | ) | $ | (29,354,955 | ) | ||
|
|
|
| |||||
See accompanying notes to financial statements.
| 40
Statements of Changes in Net Assets
| Bond Fund | Investment Grade Fixed Income Fund | |||||||||||||||
| Year Ended December 31, 2022 | Year Ended December 31, 2021 | Year Ended December 31, 2022 | Year Ended December 31, 2021 | |||||||||||||
| FROM OPERATIONS: | ||||||||||||||||
Net investment income | $ | 209,190,346 | $ | 198,020,987 | $ | 5,974,235 | $ | 5,896,323 | ||||||||
Net realized gain (loss) on investments, futures contracts, forward foreign currency contracts and foreign currency transactions | (19,390,917 | ) | (43,126,883 | ) | (3,052,456 | ) | 11,364,352 | |||||||||
Net change in unrealized appreciation (depreciation) on investments, futures contracts, forward foreign currency contracts and foreign currency translations | (1,098,662,865 | ) | 91,374,759 | (32,276,734 | ) | (15,128,479 | ) | |||||||||
|
|
|
|
|
|
|
| |||||||||
Net increase (decrease) in net assets resulting from operations | (908,863,436 | ) | 246,268,863 | (29,354,955 | ) | 2,132,196 | ||||||||||
|
|
|
|
|
|
|
| |||||||||
| FROM DISTRIBUTIONS TO SHAREHOLDERS: | ||||||||||||||||
Institutional Class | (211,847,206 | ) | (175,075,070 | ) | (8,575,864 | ) | (14,203,351 | ) | ||||||||
Retail Class | (44,765,024 | ) | (35,087,605 | ) | — | — | ||||||||||
Admin Class | (1,526,364 | ) | (1,118,112 | ) | — | — | ||||||||||
Class N | (22,836,367 | ) | (19,142,811 | ) | — | — | ||||||||||
|
|
|
|
|
|
|
| |||||||||
Total distributions | (280,974,961 | ) | (230,423,598 | ) | (8,575,864 | ) | (14,203,351 | ) | ||||||||
|
|
|
|
|
|
|
| |||||||||
| NET INCREASE (DECREASE) IN NET ASSETS FROM CAPITAL SHARE TRANSACTIONS (NOTE 11) | (1,308,389,706 | ) | (1,479,856,346 | ) | (12,070,679 | ) | 2,871,287 | |||||||||
|
|
|
|
|
|
|
| |||||||||
Net decrease in net assets | (2,498,228,103 | ) | (1,464,011,081 | ) | (50,001,498 | ) | (9,199,868 | ) | ||||||||
| NET ASSETS | ||||||||||||||||
Beginning of the year | 7,589,415,815 | 9,053,426,896 | 243,490,083 | 252,689,951 | ||||||||||||
|
|
|
|
|
|
|
| |||||||||
End of the year | $ | 5,091,187,712 | $ | 7,589,415,815 | $ | 193,488,585 | $ | 243,490,083 | ||||||||
|
|
|
|
|
|
|
| |||||||||
See accompanying notes to financial statements.
41 |
Financial Highlights
For a share outstanding throughout each period.
| Bond Fund – Institutional Class | ||||||||||||||||||||||||
| Year Ended December 31, 2022 | Year Ended December 31, 2021 | Period Ended December 31, 2020* | Year Ended September 30, 2020 | Year Ended September 30, 2019 | Year Ended September 30, 2018 | |||||||||||||||||||
Net asset value, beginning of the period | $ | 13.62 | $ | 13.58 | $ | 13.10 | $ | 13.66 | $ | 13.57 | $ | 14.28 | ||||||||||||
|
|
|
|
|
|
|
|
|
|
|
| |||||||||||||
INCOME (LOSS) FROM INVESTMENT OPERATIONS: | ||||||||||||||||||||||||
Net investment income(a) | 0.42 | 0.34 | 0.10 | 0.48 | 0.55 | 0.49 | ||||||||||||||||||
Net realized and unrealized gain (loss) | (2.11 | ) | 0.09 | 0.59 | (0.57 | ) | 0.08 | (0.37 | ) | |||||||||||||||
|
|
|
|
|
|
|
|
|
|
|
| |||||||||||||
Total from Investment Operations | (1.69 | ) | 0.43 | 0.69 | (0.09 | ) | 0.63 | 0.12 | ||||||||||||||||
|
|
|
|
|
|
|
|
|
|
|
| |||||||||||||
LESS DISTRIBUTIONS FROM: | ||||||||||||||||||||||||
Net investment income | (0.58 | ) | (0.39 | ) | (0.14 | ) | (0.45 | ) | (0.50 | ) | (0.54 | ) | ||||||||||||
Net realized capital gains | — | — | (0.07 | ) | (0.02 | ) | (0.04 | ) | (0.29 | ) | ||||||||||||||
|
|
|
|
|
|
|
|
|
|
|
| |||||||||||||
Total Distributions | (0.58 | ) | (0.39 | ) | (0.21 | ) | (0.47 | ) | (0.54 | ) | (0.83 | ) | ||||||||||||
|
|
|
|
|
|
|
|
|
|
|
| |||||||||||||
Net asset value, end of the period | $ | 11.35 | $ | 13.62 | $ | 13.58 | $ | 13.10 | $ | 13.66 | $ | 13.57 | ||||||||||||
|
|
|
|
|
|
|
|
|
|
|
| |||||||||||||
Total return | (12.49 | )%(b) | 3.23 | %(b) | 5.35 | %(c) | (0.73 | )% | 4.88 | % | 0.97 | % | ||||||||||||
RATIOS TO AVERAGE NET ASSETS: | ||||||||||||||||||||||||
Net assets, end of the period (000’s) | $ | 3,759,888 | $ | 5,776,109 | $ | 6,630,032 | $ | 6,668,481 | $ | 8,071,961 | $ | 9,025,850 | ||||||||||||
Net expenses | 0.67 | %(d) | 0.67 | %(d) | 0.67 | %(e) | 0.67 | % | 0.67 | % | 0.66 | % | ||||||||||||
Gross expenses | 0.69 | % | 0.68 | % | 0.67 | %(e) | 0.67 | % | 0.67 | % | 0.66 | % | ||||||||||||
Net investment income | 3.44 | % | 2.47 | % | 3.02 | %(e) | 3.65 | % | 4.12 | % | 3.59 | % | ||||||||||||
Portfolio turnover rate | 23 | % | 87 | %(f) | 26 | %(g) | 25 | % | 17 | % | 7 | % | ||||||||||||
| * | For the three month period ended December 31, 2020 due to change in fiscal year. |
| (a) | Per share net investment income has been calculated using the average shares outstanding during the period. |
| (b) | Had certain expenses not been waived/reimbursed during the period, total returns would have been lower. |
| (c) | Periods less than one year are not annualized. |
| (d) | The investment adviser agreed to waive its fees and/or reimburse a portion of the Fund’s expenses during the period. Without this waiver/reimbursement, expenses would have been higher. |
| (e) | Computed on an annualized basis for periods less than one year. |
| (f) | The variation in the Fund’s turnover rate from the year ended September 30, 2020 to the year ended December 31, 2021 was primarily due to a repositioning of the portfolio. |
| (g) | The variation in the Fund’s turnover rate, if annualized, from the year ended September 30, 2020 to the period ended December 31, 2020 was primarily due to the disposition and realignment of certain foreign currency-denominated positions. |
See accompanying notes to financial statements.
| 42
Financial Highlights – continued
For a share outstanding throughout each period.
| Bond Fund – Retail Class | ||||||||||||||||||||||||
| Year Ended December 31, 2022 | Year Ended December 31, 2021 | Period Ended December 31, 2020* | Year Ended September 30, 2020 | Year Ended September 30, 2019 | Year Ended September 30, 2018 | |||||||||||||||||||
Net asset value, beginning of the period | $ | 13.55 | $ | 13.51 | $ | 13.03 | $ | 13.59 | $ | 13.49 | $ | 14.21 | ||||||||||||
|
|
|
|
|
|
|
|
|
|
|
| |||||||||||||
INCOME (LOSS) FROM INVESTMENT OPERATIONS: | ||||||||||||||||||||||||
Net investment income(a) | 0.39 | 0.30 | 0.09 | 0.45 | 0.52 | 0.46 | ||||||||||||||||||
Net realized and unrealized gain (loss) | (2.11 | ) | 0.10 | 0.59 | (0.57 | ) | 0.08 | (0.38 | ) | |||||||||||||||
|
|
|
|
|
|
|
|
|
|
|
| |||||||||||||
Total from Investment Operations | (1.72 | ) | 0.40 | 0.68 | (0.12 | ) | 0.60 | 0.08 | ||||||||||||||||
|
|
|
|
|
|
|
|
|
|
|
| |||||||||||||
LESS DISTRIBUTIONS FROM: | ||||||||||||||||||||||||
Net investment income | (0.55 | ) | (0.36 | ) | (0.13 | ) | (0.42 | ) | (0.46 | ) | (0.51 | ) | ||||||||||||
Net realized capital gains | — | — | (0.07 | ) | (0.02 | ) | (0.04 | ) | (0.29 | ) | ||||||||||||||
|
|
|
|
|
|
|
|
|
|
|
| |||||||||||||
Total Distributions | (0.55 | ) | (0.36 | ) | (0.20 | ) | (0.44 | ) | (0.50 | ) | (0.80 | ) | ||||||||||||
|
|
|
|
|
|
|
|
|
|
|
| |||||||||||||
Net asset value, end of the period | $ | 11.28 | $ | 13.55 | $ | 13.51 | $ | 13.03 | $ | 13.59 | $ | 13.49 | ||||||||||||
|
|
|
|
|
|
|
|
|
|
|
| |||||||||||||
Total return | (12.78 | )%(b) | 2.98 | %(b) | 5.31 | %(c) | (0.99 | )% | 4.72 | %(b) | 0.64 | % | ||||||||||||
RATIOS TO AVERAGE NET ASSETS: | ||||||||||||||||||||||||
Net assets, end of the period (000’s) | $ | 861,223 | $ | 1,248,925 | $ | 1,469,489 | $ | 1,474,316 | $ | 2,019,828 | $ | 2,520,105 | ||||||||||||
Net expenses | 0.92 | %(d) | 0.92 | %(d) | 0.92 | %(e) | 0.92 | % | 0.91 | %(f) | 0.91 | % | ||||||||||||
Gross expenses | 0.94 | % | 0.93 | % | 0.92 | %(e) | 0.92 | % | 0.92 | % | 0.91 | % | ||||||||||||
Net investment income | 3.20 | % | 2.22 | % | 2.77 | %(e) | 3.41 | % | 3.88 | % | 3.33 | % | ||||||||||||
Portfolio turnover rate | 23 | % | 87 | %(g) | 26 | %(h) | 25 | % | 17 | % | 7 | % | ||||||||||||
| * | For the three month period ended December 31, 2020 due to change in fiscal year. |
| (a) | Per share net investment income has been calculated using the average shares outstanding during the period. |
| (b) | Had certain expenses not been waived/reimbursed during the period, total returns would have been lower. |
| (c) | Periods less than one year are not annualized. |
| (d) | The investment adviser agreed to waive its fees and/or reimburse a portion of the Fund’s expenses during the period. Without this waiver/reimbursement, expenses would have been higher. |
| (e) | Computed on an annualized basis for periods less than one year. |
| (f) | The administrator agreed to waive its fees and/or reimburse a portion of the Fund’s expenses during the period. Without this waiver/reimbursement, expenses would have been higher. |
| (g) | The variation in the Fund’s turnover rate from the year ended September 30, 2020 to the year ended December 31, 2021 was primarily due to a repositioning of the portfolio. |
| (h) | The variation in the Fund’s turnover rate, if annualized, from the year ended September 30, 2020 to the period ended December 31, 2020 was primarily due to the disposition and realignment of certain foreign currency-denominated positions. |
See accompanying notes to financial statements.
43 |
Financial Highlights – continued
For a share outstanding throughout each period.
| Bond Fund – Admin Class | ||||||||||||||||||||||||
| Year Ended December 31, 2022 | Year Ended December 31, 2021 | Period Ended December 31, 2020* | Year Ended September 30, 2020 | Year Ended September 30, 2019 | Year Ended September 30, 2018 | |||||||||||||||||||
Net asset value, beginning of the period | $ | 13.49 | $ | 13.45 | $ | 12.97 | $ | 13.53 | $ | 13.44 | $ | 14.16 | ||||||||||||
|
|
|
|
|
|
|
|
|
|
|
| |||||||||||||
INCOME (LOSS) FROM INVESTMENT OPERATIONS: | ||||||||||||||||||||||||
Net investment income(a) | 0.36 | 0.27 | 0.08 | 0.42 | 0.48 | 0.42 | ||||||||||||||||||
Net realized and unrealized gain (loss) | (2.09 | ) | 0.09 | 0.60 | (0.58 | ) | 0.08 | (0.38 | ) | |||||||||||||||
|
|
|
|
|
|
|
|
|
|
|
| |||||||||||||
Total from Investment Operations | (1.73 | ) | 0.36 | 0.68 | (0.16 | ) | 0.56 | 0.04 | ||||||||||||||||
|
|
|
|
|
|
|
|
|
|
|
| |||||||||||||
LESS DISTRIBUTIONS FROM: | ||||||||||||||||||||||||
Net investment income | (0.52 | ) | (0.32 | ) | (0.13 | ) | (0.38 | ) | (0.43 | ) | (0.47 | ) | ||||||||||||
Net realized capital gains | — | — | (0.07 | ) | (0.02 | ) | (0.04 | ) | (0.29 | ) | ||||||||||||||
|
|
|
|
|
|
|
|
|
|
|
| |||||||||||||
Total Distributions | (0.52 | ) | (0.32 | ) | (0.20 | ) | (0.40 | ) | (0.47 | ) | (0.76 | ) | ||||||||||||
|
|
|
|
|
|
|
|
|
|
|
| |||||||||||||
Net asset value, end of the period | $ | 11.24 | $ | 13.49 | $ | 13.45 | $ | 12.97 | $ | 13.53 | $ | 13.44 | ||||||||||||
|
|
|
|
|
|
|
|
|
|
|
| |||||||||||||
Total return | (12.91 | )%(b) | 2.74 | %(b) | 5.26 | %(c) | (1.24 | )% | 4.40 | %(b) | 0.38 | % | ||||||||||||
RATIOS TO AVERAGE NET ASSETS: | ||||||||||||||||||||||||
Net assets, end of the period (000’s) | $ | 30,678 | $ | 44,562 | $ | 50,062 | $ | 51,040 | $ | 84,028 | $ | 121,683 | ||||||||||||
Net expenses | 1.13 | %(d)(e) | 1.15 | %(d)(f) | 1.17 | %(g) | 1.17 | % | 1.16 | %(h) | 1.16 | % | ||||||||||||
Gross expenses | 1.15 | % | 1.16 | %(f) | 1.17 | %(g) | 1.17 | % | 1.17 | % | 1.16 | % | ||||||||||||
Net investment income | 2.99 | % | 1.99 | % | 2.52 | %(g) | 3.19 | % | 3.63 | % | 3.08 | % | ||||||||||||
Portfolio turnover rate | 23 | % | 87 | %(i) | 26 | %(j) | 25 | % | 17 | % | 7 | % | ||||||||||||
| * | For the three month period ended December 31, 2020 due to change in fiscal year. |
| (a) | Per share net investment income has been calculated using the average shares outstanding during the period. |
| (b) | Had certain expenses not been waived/reimbursed during the period, total returns would have been lower. |
| (c) | Periods less than one year are not annualized. |
| (d) | The investment adviser agreed to waive its fees and/or reimburse a portion of the Fund’s expenses during the period. Without this waiver/reimbursement, expenses would have been higher. |
| (e) | Includes refund of prior year service fee of 0.04%. See Note 6b of Notes to Financial Statements. |
| (f) | Includes refund of prior year service fee of 0.02%. |
| (g) | Computed on an annualized basis for periods less than one year. |
| (h) | The administrator agreed to waive its fees and/or reimburse a portion of the Fund’s expenses during the period. Without this waiver/reimbursement, expenses would have been higher. |
| (i) | The variation in the Fund’s turnover rate from the year ended September 30, 2020 to the year ended December 31, 2021 was primarily due to a repositioning of the portfolio. |
| (j) | The variation in the Fund’s turnover rate, if annualized, from the year ended September 30, 2020 to the period ended December 31, 2020 was primarily due to the disposition and realignment of certain foreign currency-denominated positions. |
See accompanying notes to financial statements.
| 44
Financial Highlights – continued
For a share outstanding throughout each period.
| Bond Fund – Class N | ||||||||||||||||||||||||
| Year Ended December 31, 2022 | Year Ended December 31, 2021 | Period Ended December 31, 2020* | Year Ended September 30, 2020 | Year Ended September 30, 2019 | Year Ended September 30, 2018 | |||||||||||||||||||
Net asset value, beginning of the period | $ | 13.60 | $ | 13.57 | $ | 13.08 | $ | 13.64 | $ | 13.55 | $ | 14.27 | ||||||||||||
|
|
|
|
|
|
|
|
|
|
|
| |||||||||||||
INCOME (LOSS) FROM INVESTMENT OPERATIONS: | ||||||||||||||||||||||||
Net investment income(a) | 0.43 | 0.35 | 0.10 | 0.48 | 0.56 | 0.50 | ||||||||||||||||||
Net realized and unrealized gain (loss) | (2.11 | ) | 0.08 | 0.61 | (0.56 | ) | 0.08 | (0.38 | ) | |||||||||||||||
|
|
|
|
|
|
|
|
|
|
|
| |||||||||||||
Total from Investment Operations | (1.68 | ) | 0.43 | 0.71 | (0.08 | ) | 0.64 | 0.12 | ||||||||||||||||
|
|
|
|
|
|
|
|
|
|
|
| |||||||||||||
LESS DISTRIBUTIONS FROM: | ||||||||||||||||||||||||
Net investment income | (0.59 | ) | (0.40 | ) | (0.15 | ) | (0.46 | ) | (0.51 | ) | (0.55 | ) | ||||||||||||
Net realized capital gains | — | — | (0.07 | ) | (0.02 | ) | (0.04 | ) | (0.29 | ) | ||||||||||||||
|
|
|
|
|
|
|
|
|
|
|
| |||||||||||||
Total Distributions | (0.59 | ) | (0.40 | ) | (0.22 | ) | (0.48 | ) | (0.55 | ) | (0.84 | ) | ||||||||||||
|
|
|
|
|
|
|
|
|
|
|
| |||||||||||||
Net asset value, end of the period | $ | 11.33 | $ | 13.60 | $ | 13.57 | $ | 13.08 | $ | 13.64 | $ | 13.55 | ||||||||||||
|
|
|
|
|
|
|
|
|
|
|
| |||||||||||||
Total return | (12.46 | )% | 3.22 | % | 5.45 | %(b) | (0.66 | )% | 4.97 | % | 0.97 | % | ||||||||||||
RATIOS TO AVERAGE NET ASSETS: | ||||||||||||||||||||||||
Net assets, end of the period (000’s) | $ | 439,399 | $ | 519,821 | $ | 903,844 | $ | 853,559 | $ | 469,234 | $ | 443,609 | ||||||||||||
Net expenses | 0.61 | % | 0.61 | % | 0.60 | %(c) | 0.60 | % | 0.59 | % | 0.59 | % | ||||||||||||
Gross expenses | 0.61 | % | 0.61 | % | 0.60 | %(c) | 0.60 | % | 0.59 | % | 0.59 | % | ||||||||||||
Net investment income | 3.54 | % | 2.56 | % | 3.08 | %(c) | 3.65 | % | 4.20 | % | 3.68 | % | ||||||||||||
Portfolio turnover rate | 23 | % | 87 | %(d) | 26 | %(e) | 25 | % | 17 | % | 7 | % | ||||||||||||
| * | For the three month period ended December 31, 2020 due to change in fiscal year. |
| (a) | Per share net investment income has been calculated using the average shares outstanding during the period. |
| (b) | Periods less than one year are not annualized. |
| (c) | Computed on an annualized basis for periods less than one year. |
| (d) | The variation in the Fund’s turnover rate from the year ended September 30, 2020 to the year ended December 31, 2021 was primarily due to a repositioning of the portfolio. |
| (e) | The variation in the Fund’s turnover rate, if annualized, from the year ended September 30, 2020 to the period ended December 31, 2020 was primarily due to the disposition and realignment of certain foreign currency-denominated positions. |
See accompanying notes to financial statements.
45 |
Financial Highlights – continued
For a share outstanding throughout each period.
| Investment Grade Fixed Income Fund – Institutional Class | ||||||||||||||||||||||||
| Year Ended December 31, 2022 | Year Ended December 31, 2021 | Period Ended December 31, 2020* | Year Ended September 30, 2020 | Year Ended September 30, 2019 | Year Ended September 30, 2018 | |||||||||||||||||||
Net asset value, beginning of the period | $ | 11.86 | $ | 12.47 | $ | 12.48 | $ | 12.30 | $ | 12.20 | $ | 12.43 | ||||||||||||
|
|
|
|
|
|
|
|
|
|
|
| |||||||||||||
INCOME (LOSS) FROM INVESTMENT OPERATIONS: | ||||||||||||||||||||||||
Net investment income(a) | 0.29 | 0.29 | 0.08 | 0.36 | 0.39 | 0.37 | ||||||||||||||||||
Net realized and unrealized gain (loss) | (1.70 | ) | (0.19 | ) | 0.46 | 0.18 | 0.14 | (0.22 | ) | |||||||||||||||
|
|
|
|
|
|
|
|
|
|
|
| |||||||||||||
Total from Investment Operations | (1.41 | ) | 0.10 | 0.54 | 0.54 | 0.53 | 0.15 | |||||||||||||||||
|
|
|
|
|
|
|
|
|
|
|
| |||||||||||||
LESS DISTRIBUTIONS FROM: | ||||||||||||||||||||||||
Net investment income | (0.31 | ) | (0.30 | ) | (0.12 | ) | (0.32 | ) | (0.24 | ) | (0.30 | ) | ||||||||||||
Net realized capital gains | (0.10 | ) | (0.41 | ) | (0.43 | ) | (0.04 | ) | (0.19 | ) | (0.08 | ) | ||||||||||||
|
|
|
|
|
|
|
|
|
|
|
| |||||||||||||
Total Distributions | (0.41 | ) | (0.71 | ) | (0.55 | ) | (0.36 | ) | (0.43 | ) | (0.38 | ) | ||||||||||||
|
|
|
|
|
|
|
|
|
|
|
| |||||||||||||
Net asset value, end of the period | $ | 10.04 | $ | 11.86 | $ | 12.47 | $ | 12.48 | $ | 12.30 | $ | 12.20 | ||||||||||||
|
|
|
|
|
|
|
|
|
|
|
| |||||||||||||
Total return | (11.98 | )% | 0.80 | % | 4.38 | %(b)(c) | 4.53 | % | 4.46 | % | 1.27 | % | ||||||||||||
RATIOS TO AVERAGE NET ASSETS: | ||||||||||||||||||||||||
Net assets, end of the period (000’s) | $ | 193,489 | $ | 243,490 | $ | 252,690 | $ | 229,129 | $ | 289,056 | $ | 272,725 | ||||||||||||
Net expenses | 0.52 | % | 0.52 | % | 0.55 | %(d)(e) | 0.52 | % | 0.50 | % | 0.49 | % | ||||||||||||
Gross expenses | 0.52 | % | 0.52 | % | 0.67 | %(d) | 0.52 | % | 0.50 | % | 0.49 | % | ||||||||||||
Net investment income | 2.72 | % | 2.33 | % | 2.53 | %(d) | 2.93 | % | 3.26 | % | 3.03 | % | ||||||||||||
Portfolio turnover rate | 35 | % | 85 | %(f) | 30 | %(g) | 29 | % | 11 | % | 1 | % | ||||||||||||
| * | For the three month period ended December 31, 2020 due to change in fiscal year. |
| (a) | Per share net investment income has been calculated using the average shares outstanding during the period. |
| (b) | Periods less than one year are not annualized. |
| (c) | Had certain expenses not been waived/reimbursed during the period, total returns would have been lower. |
| (d) | Computed on an annualized basis for periods less than one year. |
| (e) | The investment adviser agreed to waive its fees and/or reimburse a portion of the Fund’s expenses during the period. Without this waiver/reimbursement, expenses would have been higher. |
| (f) | The variation in the Fund’s turnover rate from the year ended September 30, 2020 to the year ended December 31, 2021 was primarily due to a repositioning of the portfolio. |
| (g) | The variation in the Fund’s turnover rate, if annualized, from the year ended September 30, 2020 to the period ended December 31, 2020 was primarily due to the disposition and realignment of certain foreign currency-denominated positions. |
See accompanying notes to financial statements.
| 46
December 31, 2022
1. Organization. Loomis Sayles Funds I (the “Trust”) is organized as a Massachusetts business trust. The Trust is registered under the Investment Company Act of 1940, as amended (the “1940 Act”) as an open-end management investment company. The Declaration of Trust permits the Board of Trustees to authorize the issuance of an unlimited number of shares of the Trust in multiple series. The financial statements for certain funds of the Trust are presented in separate reports. The following funds (individually, a “Fund” and collectively, the “Funds”) are included in this report:
Loomis Sayles Bond Fund (the “Bond Fund”)
Loomis Sayles Investment Grade Fixed Income Fund (the “Investment Grade Fixed Income Fund”)
Each Fund is a diversified investment company.
Each Fund offers Institutional Class shares. In addition, Bond Fund also offers Retail Class, Admin Class and Class N shares.
Each share class is sold without a sales charge. Retail Class and Admin Class shares pay a Rule 12b-1 fee. Admin Class shares are primarily intended for employer-sponsored retirement plans and are offered exclusively through intermediaries. Class N shares do not pay a front-end sales charge, a contingent deferred sales charge (“CDSC”) or Rule 12b-1 fees. Class N shares are offered with an initial minimum investment of $1,000,000. Institutional Class shares are intended for institutional investors with a minimum initial investment of $100,000 for Bond Fund and $3,000,000 for Investment Grade Fixed Income Fund. Certain categories of investors are exempted from the minimum investment amounts for Class N and Institutional Class as outlined in the relevant Fund’s prospectus.
Most expenses can be directly attributed to a Fund. Expenses which cannot be directly attributed to a Fund are generally apportioned based on the relative net assets of each of the Funds in Natixis Funds Trust I, Natixis Funds Trust II, Natixis Funds Trust IV, and Gateway Trust (“Natixis Funds Trusts”), and Loomis Sayles Funds I and Loomis Sayles Funds II (“Loomis Sayles Funds Trusts”), and Natixis ETF Trust and Natixis ETF Trust II (“Natixis ETF Trusts”). Expenses of a Fund are borne pro rata by the holders of each class of shares, except that each class bears expenses unique to that class (such as the Rule 12b-1 fees applicable to Retail Class and Admin Class) and transfer agent fees are borne collectively for Institutional Class, Retail Class, and Admin Class, and individually for Class N. In addition, each class votes as a class only with respect to its own Rule 12b-1 Plan. Shares of each class would receive their pro rata share of the net assets of a Fund if the Fund were liquidated. The Trustees approve separate distributions from net investment income on each class of shares.
2. Significant Accounting Policies. The following is a summary of significant accounting policies consistently followed by each Fund in the preparation of its financial statements. The Funds’ financial statements follow the accounting and reporting guidelines provided for investment companies and are prepared in accordance with accounting principles generally accepted in the United States of America which require the use of management estimates that affect the reported amounts and disclosures in the financial statements. Actual results could differ from those estimates. Management has evaluated the events and transactions subsequent to year-end through the date the financial statements were issued and has determined that there were no material events that would require disclosure in the Funds’ financial statements.
a. Valuation. Registered investment companies are required to value portfolio investments using an unadjusted, readily available market quotation. Each Fund obtains readily available market quotations from independent pricing services. Fund investments for which readily available market quotations are not available are priced at fair value pursuant to the Funds’ Valuation Procedures. The Board of Trustees has approved a valuation designee who is subject to the Board’s oversight.
Unadjusted readily available market quotations that are utilized for exchange traded equity securities (including shares of closed-end investment companies and exchange-traded funds) include the last sale price quoted on the exchange where the security is traded most extensively. Futures contracts are valued at the closing settlement price on the exchange on which the valuation designee believes that, over time, they are traded most extensively. Shares of open-end investment companies are valued at net asset value per share.
Exchange traded equity securities for which there is no reported sale during the day are fair valued at the closing bid quotation as reported by an independent pricing service. Unlisted equity securities (except unlisted preferred equity securities) are fair valued at the last sale price quoted in the market where they are traded most extensively or, if there is no reported sale during the day, the closing bid quotation as reported by an independent pricing service. If there is no last sale price or closing bid quotation available, unlisted equity securities will be fair valued using evaluated bids furnished by an independent pricing service, if available.
Debt securities and unlisted preferred equity securities are fair valued based on evaluated bids furnished to the Fund by an independent pricing service or bid prices obtained from broker-dealers. Senior loans and collateralized loan obligations are fair valued at bid prices supplied by an independent pricing service, if available. Broker-dealer bid prices may be used to fair value debt, unlisted equities, senior loans and collateralized loan obligations where an independent pricing service is unable to price an investment or where an independent pricing service does not provide a reliable price for the investment. Forward foreign currency contracts are fair valued utilizing interpolated rates determined based on information provided by an independent pricing service.
The Funds may also fair value investments in other circumstances such as when extraordinary events occur after the close of a foreign market, but prior to the close of the New York Stock Exchange. This may include situations relating to a single issuer (such as a declaration of
47 |
Notes to Financial Statements – continued
December 31, 2022
bankruptcy or a delisting of the issuer’s security from the primary market on which it has traded) as well as events affecting the securities markets in general (such as market disruptions or closings and significant fluctuations in U.S. and/or foreign markets). When fair valuing a Fund’s investments, the valuation designee may, among other things, use modeling tools or other processes that may take into account factors such as issuer specific information, or other related market activity and/or information that occurred after the close of the foreign market but before the time the Fund’s net asset value (“NAV”) is calculated. Fair valuation by the Fund(s) valuation designee may require subjective determinations about the value of the investment, and fair values used to determine a Fund’s NAV may differ from quoted or published prices, or from prices that are used by others, for the same investments. In addition, the use of fair value pricing may not always result in adjustments to the prices of investments held by a Fund.
b. Investment Transactions and Related Investment Income. Investment transactions are accounted for on a trade date plus one day basis for daily NAV calculation. However, for financial reporting purposes, investment transactions are reported on trade date. Dividend income (including income reinvested) and foreign withholding tax, if applicable, are recorded on the ex-dividend date, or in the case of certain foreign securities, as soon as a Fund is notified, and interest income is recorded on an accrual basis. Loan consent fees, upfront origination fees and/or amendment fees are recorded when received and included in interest income on the Statements of Operations. Interest income is increased by the accretion of discount and decreased by the amortization of premium, if applicable. For securities with paydown provisions, principal payments received are treated as a proportionate reduction to the cost basis of the securities, and excess or shortfall amounts are recorded as income. Distributions received from investments in securities that represent a return of capital or capital gain are recorded as a reduction of cost of investments or as a realized gain, respectively. In determining net gain or loss on securities sold, the cost of securities has been determined on an identified cost basis. Investment income, non-class specific expenses and realized and unrealized gains and losses are allocated on a pro rata basis to each class based on the relative net assets of each class to the total net assets of the Fund.
c. Foreign Currency Translation. The books and records of the Funds are maintained in U.S. dollars. The values of securities, currencies and other assets and liabilities denominated in currencies other than U.S. dollars, if any, are translated into U.S. dollars based upon foreign exchange rates prevailing at the end of the period. Purchases and sales of investment securities, income and expenses are translated into U.S. dollars on the respective dates of such transactions.
Net realized foreign exchange gains or losses arise from sales of foreign currency, changes in exchange rates between the trade and settlement dates on securities transactions and the difference between the amounts of dividends, interest and foreign withholding taxes recorded in the Funds’ books and records and the U.S. dollar equivalent of the amounts actually received or paid. Net unrealized foreign exchange gains or losses arise from changes in the value of assets and liabilities, other than investment securities, as of the end of the fiscal period, resulting from changes in exchange rates. Net realized foreign exchange gains or losses and the net change in unrealized foreign exchange gains or losses are disclosed in the Statements of Operations. For federal income tax purposes, net realized foreign exchange gains or losses are characterized as ordinary income, and may, if the Funds have net losses, reduce the amount of income available to be distributed by the Funds.
The values of investment securities are presented at the foreign exchange rates prevailing at the end of the period for financial reporting purposes. Net realized and unrealized gains or losses on investments reported in the Statements of Operations reflect gains or losses resulting from changes in exchange rates and fluctuations which arise due to changes in market prices of investment securities. For federal income tax purposes, a portion of the net realized gain or loss on investments arising from changes in exchange rates, which is reflected in the Statements of Operations, may be characterized as ordinary income and may, if the Funds have net losses, reduce the amount of income available to be distributed by the Funds.
The Funds may use foreign currency exchange contracts to facilitate transactions in foreign-denominated investments. Losses may arise from changes in the value of the foreign currency or if the counterparties do not perform under the contracts’ terms.
d. Forward Foreign Currency Contracts. A Fund may enter into forward foreign currency contracts, including forward foreign cross currency contracts, to acquire exposure to foreign currencies or to hedge the Fund’s investments against currency fluctuation. A contract can also be used to offset a previous contract. These contracts involve market risk in excess of the unrealized appreciation (depreciation) reflected in the Funds’ Statements of Assets and Liabilities. The U.S. dollar value of the currencies a Fund has committed to buy or sell represents the aggregate exposure to each currency a Fund has acquired or hedged through currency contracts outstanding at period end. Gains or losses are recorded for financial statement purposes as unrealized until settlement date. Contracts are traded over-the-counter directly with a counterparty. Risks may arise upon entering into these contracts from the potential inability of counterparties to meet the terms of their contracts and from unanticipated movements in the value of a foreign currency relative to the U.S. dollar. Certain contracts may require the movement of cash and/or securities as collateral for the Fund’s or counterparty’s net obligations under the contracts. Forward foreign currency contracts outstanding at the end of the period, if any, are listed in each applicable Fund’s Portfolio of Investments.
e. Futures Contracts. A Fund may enter into futures contracts. Futures contracts are agreements between two parties to buy and sell a particular instrument or index for a specified price on a specified future date.
| 48
Notes to Financial Statements – continued
December 31, 2022
When a Fund enters into a futures contract, it is required to deposit with (or for the benefit of) its broker an amount of cash or short-term high-quality securities as “initial margin.” As the value of the contract changes, the value of the futures contract position increases or declines. Subsequent payments, known as “variation margin,” are made or received by a Fund, depending on the price fluctuations in the fair value of the contract and the value of cash or securities on deposit with the broker. The aggregate principal amounts of the contracts are not recorded in the financial statements. Daily fluctuations in the value of the contracts are recorded in the Statements of Assets and Liabilities as a receivable (payable) and in the Statements of Operations as unrealized appreciation (depreciation) until the contracts are closed, when they are recorded as realized gains (losses). Realized gain or loss on a futures position is equal to the difference between the value of the contract at the time it was opened and the value at the time it was closed, minus brokerage commissions. When a Fund enters into a futures contract certain risks may arise, such as illiquidity in the futures market, which may limit a Fund’s ability to close out a futures contract prior to settlement date, and unanticipated movements in the value of securities or interest rates. Futures contracts outstanding at the end of the period, if any, are listed in each applicable Fund’s Portfolio of Investments.
Futures contracts are exchange-traded. Exchange-traded futures contracts are standardized and are settled through a clearing house with fulfillment supported by the credit of the exchange. Therefore, counterparty credit risks to the Funds are reduced; however, in the event that a counterparty enters into bankruptcy, a Fund’s claim against initial/variation margin on deposit with the counterparty may be subject to terms of a final settlement in bankruptcy court.
f. When-Issued and Delayed Delivery Transactions. A Fund may enter into when-issued or delayed delivery transactions. When-issued refers to transactions made conditionally because a security, although authorized, has not been issued. Delayed delivery refers to transactions for which delivery or payment will occur at a later date, beyond the normal settlement period. The price of when-issued and delayed delivery securities and the date when the securities will be delivered and paid for are fixed at the time the transaction is negotiated. The security and the obligation to pay for it are recorded by the Funds at the time the commitment is entered into. The value of the security may vary with market fluctuations during the time before the Funds take delivery of the security. No interest accrues to the Funds until the transaction settles.
Delayed delivery transactions include those designated as To Be Announced (“TBAs”) in the Portfolios of Investments. For TBAs, the actual security that will be delivered to fulfill the transaction is not designated at the time of the trade. The security is “to be announced” 48 hours prior to the established trade settlement date. Certain transactions require the Funds or counterparty to post cash and/or securities as collateral for the net mark-to-market exposure to the other party. The Funds cover their net obligations under outstanding delayed delivery commitments by segregating or earmarking cash or securities.
Purchases of when-issued or delayed delivery securities may have a similar effect on the Funds’ NAV as if the Funds’ had created a degree of leverage in the portfolio. Risks may arise upon entering into such transactions from the potential inability of counterparties to meet their obligations under the transactions. Additionally, losses may arise due to changes in the value of the underlying securities.
There were no when-issued or delayed delivery securities held by the Funds as of December 31, 2022.
g. Federal and Foreign Income Taxes. The Trust treats each Fund as a separate entity for federal income tax purposes. Each Fund intends to meet the requirements of the Internal Revenue Code of 1986, as amended, applicable to regulated investment companies, and to distribute to its shareholders substantially all of its net investment income and any net realized capital gains at least annually. Management has performed an analysis of each Fund’s tax positions for the open tax years as of December 31, 2022 and has concluded that no provisions for income tax are required. The Funds’ federal tax returns for the prior three fiscal years remain subject to examination by the Internal Revenue Service. Management is not aware of any events that are reasonably possible to occur in the next twelve months that would result in the amounts of any unrecognized tax benefits significantly increasing or decreasing for the Funds. However, management’s conclusions regarding tax positions taken may be subject to review and adjustment at a later date based on factors including, but not limited to, new tax laws and accounting regulations and interpretations thereof.
A Fund may be subject to foreign withholding taxes on investment income and taxes on capital gains on investments that are accrued and paid based upon the Fund’s understanding of the tax rules and regulations that exist in the countries in which the Fund invests. Foreign withholding taxes on dividend and interest income are reflected on the Statements of Operations as a reduction of investment income, net of amounts that have been or are expected to be reclaimed and paid. Dividends and interest receivable on the Statements of Assets and Liabilities are net of foreign withholding taxes. Foreign withholding taxes where reclaims have been or are expected to be filed and paid are reflected on the Statements of Assets and Liabilities as tax reclaims receivable. Capital gains taxes paid are included in net realized gain (loss) on investments in the Statements of Operations. Accrued but unpaid capital gains taxes are reflected as foreign taxes payable on the Statements of Assets and Liabilities, if applicable, and reduce unrealized gains on investments. In the event that realized gains on investments are subsequently offset by realized losses, taxes paid on realized gains may be returned to a Fund. Such amounts, if applicable, are reflected as foreign tax rebates receivable on the Statements of Assets and Liabilities and are recorded as a realized gain when received.
49 |
Notes to Financial Statements – continued
December 31, 2022
h. Dividends and Distributions to Shareholders. Dividends and distributions are recorded on the ex-dividend date. The timing and characterization of certain income and capital gain distributions are determined in accordance with federal tax regulations, which may differ from accounting principles generally accepted in the United States of America. Permanent differences are primarily due to differing treatments for book and tax purposes of items such as defaulted and/or non-income producing securities, premium amortization, distribution re-designations, trust preferred securities, return of capital distributions received, capital gain distributions received, and paydown gains and losses. Permanent book and tax basis differences relating to shareholder distributions, net investment income and net realized gains will result in reclassifications to capital accounts reported on the Statements of Assets and Liabilities. Temporary differences between book and tax distributable earnings are primarily due to deferred Trustees’ fees, wash sales, defaulted and/or non-income producing securities, return of capital distributions received, trust preferred securities, corporate actions, capital gain distributions received, premium amortization, foreign currency gains and losses and futures contract mark-to-market. Amounts of income and capital gain available to be distributed on a tax basis are determined annually, and at other times during the Funds’ fiscal year as may be necessary to avoid knowingly declaring and paying a return of capital distribution. Distributions from net investment income and net realized short-term capital gains are reported as distributed from ordinary income for tax purposes.
The tax characterization of distributions is determined on an annual basis. The tax character of distributions paid to shareholders during the years ended December 31, 2022 and 2021 was as follows:
| 2022 Distributions | 2021 Distributions | |||||||||||||||||||||||
Fund | Ordinary Income | Long-Term Capital Gains | Total | Ordinary Income | Long-Term Capital Gains | Total | ||||||||||||||||||
Bond Fund | $ | 280,974,961 | $ | — | $ | 280,974,961 | $ | 230,423,598 | $ | — | $ | 230,423,598 | ||||||||||||
Investment Grade Fixed Income Fund | 6,401,061 | 2,174,803 | 8,575,864 | 6,166,342 | 8,037,009 | 14,203,351 | ||||||||||||||||||
Distributions paid to shareholders from net investment income and net realized capital gains, based on accounting principles generally accepted in the United States of America, are consolidated and reported on the Statements of Changes in Net Assets as Distributions to Shareholders. Distributions paid to shareholders from net investment income and net realized capital gains expressed in per-share amounts, based on accounting principles generally accepted in the United States of America, are separately stated and reported within the Financial Highlights.
As of December 31, 2022, the components of distributable earnings on a tax basis were as follows:
| Bond Fund | Investment Grade Fixed Income Fund | |||||||
Undistributed ordinary income | $ | 435,358 | $ | 20,228 | ||||
|
| |||||||
Capital loss carryforward: |
| |||||||
Short-term: |
| |||||||
No expiration date | (37,067,279 | ) | (1,473,853 | ) | ||||
Long-term: |
| |||||||
No expiration date | (369,287,237 | ) | (1,733,808 | ) | ||||
|
| |||||||
Total capital loss carryforward | (406,354,516 | ) | (3,207,661 | ) | ||||
|
| |||||||
Unrealized depreciation | (900,844,554 | ) | (25,141,207 | ) | ||||
|
| |||||||
Total accumulated losses | $ | (1,306,763,712 | ) | $ | (28,328,640 | ) | ||
|
| |||||||
As of December 31, 2022, the tax cost of investments (including derivatives, if applicable) and unrealized appreciation (depreciation) on a federal tax basis were as follows:
| Bond Fund | Investment Grade Fixed Income Fund | |||||||
Federal tax cost | $ | 5,954,854,061 | $ | 217,147,930 | ||||
|
| |||||||
Gross tax appreciation | $ | 47,606,066 | $ | 1,659,876 | ||||
Gross tax depreciation | (948,450,620 | ) | (26,801,083 | ) | ||||
|
| |||||||
Net tax depreciation | $ | (900,844,554 | ) | $ | (25,141,207 | ) | ||
|
| |||||||
| 50
Notes to Financial Statements – continued
December 31, 2022
i. Senior Loans. A Fund’s investment in senior loans may be to corporate, governmental or other borrowers. Senior loans, which include both secured and unsecured loans made by banks and other financial institutions to corporate customers, typically hold the most senior position in a borrower’s capital structure, may be secured by the borrower’s assets and have interest rates that reset frequently. Senior Loans can include term loans, revolving credit facility loans and second lien loans. A senior loan is often administered by a bank or other financial institution that acts as agent for all holders. The agent administers the terms of the senior loan, as specified in the loan agreement. Large loans may be shared or syndicated among several lenders. A Fund may enter into the primary syndicate for a loan or it may also purchase all or a portion of loans from other lenders (sometimes referred to as loan assignments), in either case becoming a direct lender. The settlement period for senior loans is uncertain as there is no standardized settlement schedule applicable to such investments. Senior loans outstanding at the end of the period, if any, are listed in each applicable Fund’s Portfolio of Investments.
j. Collateralized Loan Obligations. A Fund may invest in collateralized loan obligations (“CLOs”). A CLO is a type of asset-backed security designed to redirect the cash flows from a pool of leveraged loans to investors based on their risk preferences. Cash flows from a CLO are split into two or more portions, called tranches, varying in risk and yield. The risk of an investment in a CLO depends largely on the type of the collateralized securities and the class of the instrument in which the Fund invests. CLOs outstanding at the end of the period, if any, are listed in each applicable Fund’s Portfolio of Investments.
k. Repurchase Agreements. Each Fund may enter into repurchase agreements, under the terms of a Master Repurchase Agreement, under which each Fund acquires securities as collateral and agrees to resell the securities at an agreed upon time and at an agreed upon price. It is each Fund’s policy that the market value of the collateral for repurchase agreements be at least equal to 102% of the repurchase price, including interest. Certain repurchase agreements are tri-party arrangements whereby the collateral is held in a segregated account for the benefit of the Fund and on behalf of the counterparty. Repurchase agreements could involve certain risks in the event of default or insolvency of the counterparty, including possible delays or restrictions upon a Fund’s ability to dispose of the underlying securities. As of December 31, 2022, each Fund, as applicable, had investments in repurchase agreements for which the value of the related collateral exceeded the value of the repurchase agreement. The gross value of repurchase agreements is included in the Statements of Assets and Liabilities for financial reporting purposes.
l. Securities Lending. The Funds have entered into an agreement with State Street Bank and Trust Company (“State Street Bank”), as agent of the Funds, to lend securities to certain designated borrowers. The loans are collateralized with cash or securities in an amount equal to at least 105% or 102% of the market value (including accrued interest) of the loaned international or domestic securities, respectively, when the loan is initiated. Thereafter, the value of the collateral must remain at least 102% of the market value (including accrued interest) of loaned securities for U.S. equities and U.S. corporate debt; at least 105% of the market value (including accrued interest) of loaned securities for non-U.S. equities; and at least 100% of the market value (including accrued interest) of loaned securities for U.S. Government securities, sovereign debt issued by non-U.S. Governments and non-U.S. corporate debt. In the event that the market value of the collateral falls below the required percentages described above, the borrower will deliver additional collateral on the next business day. As with other extensions of credit, the Funds may bear the risk of loss with respect to the investment of the collateral. The Funds invest cash collateral in short-term investments, a portion of the income from which is remitted to the borrowers and the remainder allocated between the Funds and State Street Bank as lending agent.
For the year ended December 31, 2022, neither Fund had loaned securities under this agreement.
m. Indemnifications. Under the Trust’s organizational documents, its officers and Trustees are indemnified against certain liabilities arising out of the performance of their duties to the Funds. Additionally, in the normal course of business, the Funds enter into contracts with service providers that contain general indemnification clauses. The Funds’ maximum exposure under these arrangements is unknown as this would involve future claims that may be made against the Funds that have not yet occurred. However, based on experience, the Funds expect the risk of loss to be remote.
n. New Accounting Pronouncement. In June 2022, the Financial Accounting Standards Board issued Accounting Standards Update 2022-03, “Fair Value Measurement of Equity Securities Subject to Contractual Sale Restrictions” (“ASU 2022-03”). ASU 2022-03 clarifies the guidance in ASC 820 related to the measurement of fair value of an equity security subject to contractual sale restrictions, eliminating the ability to apply a discount to the fair value of such securities, and introducing related disclosure requirements. The guidance is effective for fiscal years, and interim periods within those fiscal years, beginning after December 15, 2023, and allows for early adoption. Management is currently evaluating the impact of applying this update.
In January 2021, the Financial Accounting Standards Board issued Accounting Standard Update 2021-01, Reference Rate Reform (Topic 848) (“ASU 2021-01”). ASU 2021-01 is an update of ASU 2020-04, which was issued in response to concerns about structural risks of interbank offered rates, and particularly the risk of cessation of the London Interbank Offered Rate (“LIBOR”), expected to occur no later than June 30, 2023. Regulators have undertaken reference rate reform initiatives to identify alternative reference rates that are more observable or transaction based and less susceptible to manipulation. ASU 2020-04 provides temporary guidance to ease the potential burden in accounting for (or recognizing the effects of) reference rate reform on financial reporting. ASU 2020-04 is elective and applies to all entities,
51 |
Notes to Financial Statements – continued
December 31, 2022
subject to meeting certain criteria, that have contracts that reference LIBOR or another reference rate expected to be discontinued because of reference rate reform. ASU 2020-04 amendments offer optional expedients for contract modifications that would allow an entity to account for such modifications by prospectively adjusting the effective interest rate, instead of evaluating each contract, in accordance with existing accounting standards, as to whether reference rate modifications constitute the establishment of new contracts or the continuation of existing contracts. ASU 2021-01 clarifies that certain provisions in Topic 848, if elected by an entity, apply to derivative instruments that use an interest rate for margining, discounting, or contract price alignment that is modified as a result of reference rate reform. The amendments are currently effective and an entity may elect to apply its provisions as of any date from the beginning of an interim period that includes or is subsequent to March 12, 2020. In December 2022, the Financial Accounting Standards Board issued a further update to Topic 848 under ASU 2022-06, which defers the sunset date of Topic 848 from December 31, 2022, to December 31, 2024, after which entities will no longer be permitted to apply the optional expedients provided in Topic 848. Management expects to apply the optional expedients when appropriate.
3. Fair Value Measurements. In accordance with accounting standards related to fair value measurements and disclosures, the Funds have categorized the inputs utilized in determining the value of each Fund’s assets or liabilities. These inputs are summarized in the three broad levels listed below:
| • | Level 1—quoted prices in active markets for identical assets or liabilities; |
| • | Level 2—prices determined using other significant inputs that are observable either directly, or indirectly through corroboration with observable market data (which could include quoted prices for similar assets or liabilities, interest rates, credit risk, etc.); and |
| • | Level 3—prices determined using significant unobservable inputs when quoted prices or observable inputs are unavailable such as when there is little or no market activity for an asset or liability (unobservable inputs reflect each Fund’s own assumptions in determining the fair value of assets or liabilities and would be based on the best information available). |
The inputs or methodology used for valuing securities are not necessarily an indication of the risk associated with investing in those securities.
The Funds’ pricing policies have been approved by the Board of Trustees. Investments for which market quotations are readily available are categorized in Level 1. Other investments for which an independent pricing service is utilized are categorized in Level 2. Broker-dealer bid prices for which the Funds have knowledge of the inputs used by the broker-dealer are categorized in Level 2. All other investments, including broker-dealer bid prices for which the Funds do not have knowledge of the inputs used by the broker-dealer, as well as investments fair valued by the valuation designee, are categorized in Level 3. All Level 2 and 3 securities are defined as being fair valued.
Under certain conditions and based upon specific facts and circumstances, the Fund’s valuation designee may determine that a fair valuation should be made for portfolio investment(s). These valuation designee fair valuations will be based upon a significant amount of Level 3 inputs.
| 52
Notes to Financial Statements – continued
December 31, 2022
The following is a summary of the inputs used to value the Funds’ investments as of December 31, 2022, at value:
Bond Fund
Asset Valuation Inputs
Description | Level 1 | Level 2 | Level 3 | Total | ||||||||||||
Bonds and Notes | ||||||||||||||||
Non-Convertible Bonds | ||||||||||||||||
Property & Casualty Insurance | $ | — | $ | 13,111,859 | $ | 1,406,500 | $ | 14,518,359 | ||||||||
All Other Non-Convertible Bonds(a) | — | 4,252,709,627 | — | 4,252,709,627 | ||||||||||||
|
| |||||||||||||||
Total Non-Convertible Bonds | — | 4,265,821,486 | 1,406,500 | 4,267,227,986 | ||||||||||||
|
| |||||||||||||||
Convertible Bonds(a) | — | 282,973,967 | — | 282,973,967 | ||||||||||||
Municipals(a) | — | 80,571,210 | — | 80,571,210 | ||||||||||||
|
| |||||||||||||||
Total Bonds and Notes | — | 4,629,366,663 | 1,406,500 | 4,630,773,163 | ||||||||||||
|
| |||||||||||||||
Senior Loans(a) | — | 17,358,326 | — | 17,358,326 | ||||||||||||
Collateralized Loan Obligations | — | 228,739,281 | — | 228,739,281 | ||||||||||||
Common Stocks | ||||||||||||||||
Software | 1,900,573 | 123,354 | — | 2,023,927 | ||||||||||||
All Other Common Stocks(a) | 75,783,015 | — | — | 75,783,015 | ||||||||||||
|
| |||||||||||||||
Total Common Stocks | 77,683,588 | 123,354 | — | 77,806,942 | ||||||||||||
|
| |||||||||||||||
Preferred Stocks | ||||||||||||||||
Convertible Preferred Stocks | ||||||||||||||||
Wireless | — | 22,387,327 | — | 22,387,327 | ||||||||||||
All Other Convertible Preferred Stocks(a) | 60,886,086 | — | — | 60,886,086 | ||||||||||||
|
| |||||||||||||||
Total Convertible Preferred Stocks | 60,886,086 | 22,387,327 | — | 83,273,413 | ||||||||||||
|
| |||||||||||||||
Non-Convertible Preferred Stocks | ||||||||||||||||
REITs – Office Property | — | — | 2,398,869 | 2,398,869 | ||||||||||||
REITs – Warehouse/Industrials | — | 9,320,736 | — | 9,320,736 | ||||||||||||
All Other Non-Convertible Preferred Stocks(a) | 1,397,051 | — | — | 1,397,051 | ||||||||||||
|
| |||||||||||||||
Total Non-Convertible Preferred Stocks | 1,397,051 | 9,320,736 | 2,398,869 | 13,116,656 | ||||||||||||
|
| |||||||||||||||
Total Preferred Stocks | 62,283,137 | 31,708,063 | 2,398,869 | 96,390,069 | ||||||||||||
|
|
|
|
|
|
|
| |||||||||
Short-Term Investments | — | 2,941,726 | — | 2,941,726 | ||||||||||||
|
| |||||||||||||||
Total | $ | 139,966,725 | $ | 4,910,237,413 | $ | 3,805,369 | $ | 5,054,009,507 | ||||||||
|
| |||||||||||||||
Liability Valuation Inputs
| ||||||||||||||||
Description | Level 1 | Level 2 | Level 3 | Total | ||||||||||||
Futures Contracts (unrealized depreciation) | $ | (6,455,777 | ) | $ | — | $ | — | $ | (6,455,777 | ) | ||||||
|
| |||||||||||||||
(a) Details of the major categories of the Fund’s investments are reflected within the Portfolio of Investments.
53 |
Notes to Financial Statements – continued
December 31, 2022
Investment Grade Fixed Income Fund
Asset Valuation Inputs
Description | Level 1 | Level 2 | Level 3 | Total | ||||||||||||
Bonds and Notes | ||||||||||||||||
Non-Convertible Bonds | ||||||||||||||||
ABS Home Equity | $ | — | $ | 9,698,124 | $ | 3,824 | $ | 9,701,948 | ||||||||
All Other Non-Convertible Bonds(a) | — | 165,831,420 | — | 165,831,420 | ||||||||||||
|
| |||||||||||||||
Total Non-Convertible Bonds | — | 175,529,544 | 3,824 | 175,533,368 | ||||||||||||
|
| |||||||||||||||
Convertible Bonds(a) | — | 2,444,364 | — | 2,444,364 | ||||||||||||
Municipals(a) | — | 743,194 | — | 743,194 | ||||||||||||
|
| |||||||||||||||
Total Bonds and Notes | — | 178,717,102 | 3,824 | 178,720,926 | ||||||||||||
|
| |||||||||||||||
Collateralized Loan Obligations | — | 8,753,755 | — | 8,753,755 | ||||||||||||
Common Stocks(a) | 229,740 | — | — | 229,740 | ||||||||||||
Preferred Stocks | ||||||||||||||||
Convertible Preferred Stocks | ||||||||||||||||
Wireless | — | 286,005 | — | 286,005 | ||||||||||||
All Other Convertible Preferred Stocks(a) | 2,203,204 | — | — | 2,203,204 | ||||||||||||
|
| |||||||||||||||
Total Convertible Preferred Stocks | 2,203,204 | 286,005 | — | 2,489,209 | ||||||||||||
|
| |||||||||||||||
Total Preferred Stocks | 2,203,204 | 286,005 | — | 2,489,209 | ||||||||||||
|
| |||||||||||||||
Short-Term Investments | — | 1,813,093 | — | 1,813,093 | ||||||||||||
|
| |||||||||||||||
Total | $ | 2,432,944 | $ | 189,569,955 | $ | 3,824 | $ | 192,006,723 | ||||||||
|
| |||||||||||||||
Liability Valuation Inputs | ||||||||||||||||
Description | Level 1 | Level 2 | Level 3 | Total | ||||||||||||
Futures Contracts (unrealized depreciation) | $ | (213,552 | ) | $ | — | $ | — | $ | (213,552 | ) | ||||||
|
| |||||||||||||||
(a) Details of the major categories of the Fund’s investments are reflected within the Portfolio of Investments.
The following is a reconciliation of Level 3 investments for which significant unobservable inputs were used to determine fair value as of December 31, 2021 and/or December 31, 2022:
Bond Fund
Asset Valuation Inputs
Investments in Securities | Balance as of December 31, 2021 | Accrued Discounts (Premiums) | Realized Gain (Loss) | Change in Unrealized Appreciation (Depreciation) | Purchases | Sales | Transfers into Level 3 | Transfers out of Level 3 | Balance as of December 31, 2022 | Change in Unrealized Appreciation (Depreciation) from Investments Still Held at December 31, 2022 | ||||||||||||||||||||||||||||||
Bonds and Notes | ||||||||||||||||||||||||||||||||||||||||
Non-Convertible Bonds | ||||||||||||||||||||||||||||||||||||||||
Independent Energy | $ | 2,636,596 | $ | — | $ | — | $ | — | $ | — | $ | — | $ | — | $ | (2,636,596 | ) | $ | — | $ | — | |||||||||||||||||||
Property & Casualty Insurance | 1,687,800 | 81,812 | — | (363,112 | ) | — | — | — | — | 1,406,500 | (363,112 | ) | ||||||||||||||||||||||||||||
Preferred Stocks | ||||||||||||||||||||||||||||||||||||||||
Non-Convertible Preferred Stocks | ||||||||||||||||||||||||||||||||||||||||
REITs—Office Property | — | — | — | (498,631 | ) | — | — | 2,897,500 | — | 2,398,869 | (498,631 | ) | ||||||||||||||||||||||||||||
|
| |||||||||||||||||||||||||||||||||||||||
Total | $ | 4,324,396 | $ | 81,812 | $ | — | $ | (861,743 | ) | $ | — | $ | — | $ | 2,897,500 | $ | (2,636,596 | ) | $ | 3,805,369 | $ | (861,743 | ) | |||||||||||||||||
|
| |||||||||||||||||||||||||||||||||||||||
Debt securities valued at $2,636,596 were transferred from Level 3 to Level 2 during the period ended December 31, 2022. At December 31, 2021, these securities were valued at fair value as determined in good faith by the Fund’s adviser as an independent pricing service was unable to price the securities. At December 31, 2022, these securities were fair valued based on evaluated bids furnished to the Fund by an independent pricing service in accordance with the Fund’s valuation policies.
| 54
Notes to Financial Statements – continued
December 31, 2022
A preferred stock valued at $2,897,500 was transferred from Level 2 to Level 3 during the period ended December 31, 2022. At December 31, 2021, this security was valued based on evaluated bids furnished to the Fund by an independent pricing service in accordance with the Fund’s valuation policies. At December 31, 2022, this security was valued at fair value as determined in good faith by the Fund’s adviser as an independent pricing service was unable to price the security.
Investment Grade Fixed Income Fund
Asset Valuation Inputs
Investments in Securities | Balance as of December 31, 2021 | Accrued Discounts (Premiums) | Realized Gain (Loss) | Change in Unrealized Appreciation (Depreciation) | Purchases | Sales | Transfers into Level 3 | Transfers out of Level 3 | Balance as of December 31, 2022 | Change in Unrealized Appreciation (Depreciation) from Investments Still Held at December 31, 2022 | ||||||||||||||||||||||||||||||
Bonds and Notes | ||||||||||||||||||||||||||||||||||||||||
Non-Convertible Bonds | ||||||||||||||||||||||||||||||||||||||||
ABS Home Equity | $ | 8,643 | $ | — | $ | 99 | $ | 11 | $ | — | $ | (4,929 | ) | $ | — | $ | — | $ | 3,824 | $ | (296 | ) | ||||||||||||||||||
|
|
|
|
|
|
|
|
|
|
|
|
|
|
|
|
|
|
|
| |||||||||||||||||||||
4. Derivatives. Derivative instruments are defined as financial instruments whose value and performance are based on the value and performance of an underlying asset, reference rate or index. Derivative instruments that the Funds used during the period include forward foreign currency contracts and futures contracts.
The Funds are subject to the risk that changes in foreign currency exchange rates will have an unfavorable effect on the value of Fund assets denominated in foreign currencies. The Funds may enter into forward foreign currency exchange contracts for hedging purposes to protect the value of the Funds’ holdings of foreign securities. The Funds may also use forward foreign currency contracts to gain exposure to foreign currencies, regardless of whether securities denominated in such currencies are held in the Funds. During the year ended December 31, 2022, the Funds engaged in forward foreign currency contracts for hedging purposes.
The Funds are subject to the risk that changes in interest rates will affect the value of the Funds’ investments in fixed-income securities. The Funds will be subject to increased interest rate risk to the extent that they invest in fixed-income securities with longer maturities or durations, as compared to investing in fixed-income securities with shorter maturities or durations. The Funds may use futures contracts to hedge against changes in interest rates and to manage duration without having to buy or sell portfolio securities. The Funds may also use futures contracts to gain investment exposure. During the year ended December 31, 2022, the Funds used futures contracts to manage duration.
The following is a summary of derivative instruments for Bond Fund as of December 31, 2022, as reflected within the Statements of Assets and Liabilities:
Liabilities | Unrealized depreciation on futures contracts1 | |||
Exchange-traded liability derivatives |
| |||
Interest rate contracts | $ | (6,455,777 | ) | |
1 Represents cumulative unrealized appreciation (depreciation) on futures contracts. Only the current day’s variation margin on futures contracts is reported within the Statements of Assets and Liabilities as receivable or payable for variation margin, as applicable.
Transactions in derivative instruments for Bond Fund during the year ended December 31, 2022, as reflected within the Statements of Operations were as follows:
Net Realized Gain (Loss) on: | Forward foreign currency contracts | Futures contracts | ||||||
Interest rate contracts | $ | — | $ | 24,798,105 | ||||
Foreign exchange contracts | (565,055 | ) | — | |||||
|
| |||||||
Total | $ | (565,055 | ) | $ | 24,798,105 | |||
|
| |||||||
Net Change in Unrealized | Forward foreign currency contracts | Futures contracts | ||||||
Interest rate contracts | $ | — | $ | 1,411,296 | ||||
Foreign exchange contracts | 380,188 | — | ||||||
|
| |||||||
Total | $ | 380,188 | $ | 1,411,296 | ||||
|
| |||||||
55 |
Notes to Financial Statements – continued
December 31, 2022
The following is a summary of derivative instruments for Investment Grade Fixed Income Fund as of December 31, 2022, as reflected within the Statements of Assets and Liabilities:
Liabilities | Unrealized depreciation on futures contracts1 | |||
Exchange-traded liability derivatives |
| |||
Interest rate contracts | $ | (213,552 | ) | |
1 Represents cumulative unrealized appreciation (depreciation) on futures contracts. Only the current day’s variation margin on futures contracts is reported within the Statements of Assets and Liabilities as receivable or payable for variation margin, as applicable.
Transactions in derivative instruments for Investment Grade Fixed Income Fund during the year ended December 31, 2022, as reflected within the Statements of Operations were as follows:
Net Realized Gain (Loss) on: | Forward foreign currency contracts | Futures contracts | ||||||
Interest rate contracts | $ | — | $ | (58,019 | ) | |||
Foreign exchange contracts | (16,829 | ) | — | |||||
|
| |||||||
Total | $ | (16,829 | ) | $ | (58,019 | ) | ||
|
| |||||||
Net Change in Unrealized | Forward foreign currency contracts | Futures contracts | ||||||
Interest rate contracts | $ | — | $ | 84,269 | ||||
Foreign exchange contracts | 11,323 | — | ||||||
|
| |||||||
Total | $ | 11,323 | $ | 84,269 | ||||
|
| |||||||
As the Funds value their derivatives at fair value and recognize changes in fair value through the Statements of Operations, they do not qualify for hedge accounting under authoritative guidance for derivative instruments. The Funds’ investments in derivatives may represent an economic hedge; however, they are considered to be non-hedge transactions for the purpose of these disclosures.
The volume of forward foreign currency contract and futures contract activity, as a percentage of net assets for the Funds, based on gross month-end or daily (as applicable) notional amounts outstanding during the period, including long and short positions at absolute value, was as follows for the year ended December 31, 2022:
Bond Fund | Forwards | Futures | ||||||
Average Notional Amount Outstanding | 0.14% | 17.73% | ||||||
Highest Notional Amount Outstanding | 0.63% | 22.00% | ||||||
Lowest Notional Amount Outstanding | 0.00% | 9.76% | ||||||
Notional Amount Outstanding as of December 31, 2022 | 0.00% | 11.66% | ||||||
Investment Grade Fixed Income Fund | Forwards | Futures | ||||||
Average Notional Amount Outstanding | 0.11% | 5.83% | ||||||
Highest Notional Amount Outstanding | 0.57% | 10.48% | ||||||
Lowest Notional Amount Outstanding | 0.00% | 1.14% | ||||||
Notional Amount Outstanding as of December 31, 2022 | 0.00% | 10.48% | ||||||
Notional amounts outstanding at the end of the prior period, if applicable, are included in the average notional amount outstanding.
Unrealized gain and/or loss on open futures is recorded in the Statements of Assets and Liabilities. The aggregate notional values of futures contracts are not recorded in the Statements of Assets and Liabilities, and therefore are not included in the Funds’ net assets.
The actual collateral received or pledged, if any, may exceed the amounts shown in the table due to overcollateralization. Timing differences may exist between when contracts under the ISDA agreements are marked-to-market and when collateral moves. The ISDA agreements include tri-party control agreements under which collateral is held for the benefit of the secured party at a third party custodian, State Street Bank.
Counterparty risk is managed based on policies and procedures established by each Fund’s adviser. Such policies and procedures may include, but are not limited to, minimum counterparty credit rating requirements, monitoring of counterparty credit default swap spreads and posting of collateral. A Fund’s risk of loss from counterparty credit risk on over-the-counter derivatives is generally limited to the Fund’s aggregated unrealized gains and the amount of any collateral pledged to the counterparty, which may be offset by any collateral posted to the Fund by the
| 56
Notes to Financial Statements – continued
December 31, 2022
counterparty. ISDA master agreements can help to manage counterparty risk by specifying collateral posting arrangements at pre-arranged exposure levels. Under these ISDA agreements, collateral is routinely transferred if the total net exposure in respect of certain transactions, net of existing collateral already in place, exceeds a specified amount (typically $250,000, depending on the counterparty). With exchange-traded derivatives, there is minimal counterparty credit risk to the Fund because the exchange’s clearing house, as counterparty to these instruments, stands between the buyer and the seller of the contract. Credit risk still exists in exchange-traded derivatives with respect to initial and variation margin that is held in a broker’s customer accounts. While brokers typically are required to segregate customer margin for exchange-traded derivatives from their own assets, in the event that a broker becomes insolvent or goes into bankruptcy and at that time there is a shortfall in the aggregate amount of margin held by the broker for all its customers, U.S. bankruptcy laws will typically allocate that shortfall on a pro rata basis across all of the broker’s customers, potentially resulting in losses to the Fund. Based on balances reflected on each Fund’s Statement of Assets and Liabilities, the following table shows (i) the maximum amount of loss due to credit risk that, based on the gross fair value of the financial instrument, the Fund would incur if parties (including OTC derivative counterparties and brokers holding margin for exchange-traded derivatives) to the relevant financial instruments failed completely to perform according to the terms of the contracts and the collateral or other security, if any, for the amount due proved to be of no value to the Fund, and (ii) the amount of loss that the Fund would incur after taking into account master netting provisions pursuant to ISDA agreements, as of December 31, 2022:
Fund | Maximum Amount of Loss — Gross | Maximum Amount of Loss — Net | ||||||
Bond Fund | $ | 76,655,221 | $ | 76,655,221 | ||||
Investment Grade Fixed Income Fund | 790,403 | 790,403 | ||||||
5. Purchases and Sales of Securities. For the year ended December 31, 2022, purchases and sales of securities (excluding short-term investments and including paydowns) were as follows:
| U.S. Government/Agency Securities | Other Securities | |||||||||||||||
Fund | Purchases | Sales | Purchases | Sales | ||||||||||||
Bond Fund | $ | 400,269,199 | $ | 293,906,489 | $ | 954,162,580 | $ | 2,281,224,717 | ||||||||
Investment Grade Fixed Income Fund | 36,642,853 | 14,628,117 | 37,188,048 | 70,382,132 | ||||||||||||
6. Management Fees and Other Transactions with Affiliates.
a. Management Fees. Loomis, Sayles & Company, L.P. (“Loomis Sayles”) serves as investment adviser to each Fund. Loomis Sayles is a limited partnership whose sole general partner, Loomis, Sayles & Company, Inc., is indirectly owned by Natixis Investment Managers, LLC, which is part of Natixis Investment Managers, an international asset management group based in Paris, France.
Under the terms of the management agreements, each Fund pays a management fee at the following annual rates, calculated daily and payable monthly, based on each Fund’s average daily net assets:
| Percentage of Average Daily Net Assets | ||||||||||||||||
Fund | First $3 Billion | Next $12 Billion | Next $10 Billion | Over $25 Billion | ||||||||||||
Bond Fund | 0.60% | 0.50% | 0.49% | 0.48% | ||||||||||||
Investment Grade Fixed Income Fund | 0.40% | 0.40% | 0.40% | 0.40% | ||||||||||||
Loomis Sayles has given binding undertakings to the Funds to waive management fees and/or reimburse certain expenses to limit the Funds’ operating expenses, exclusive of acquired fund fees and expenses, brokerage expenses, interest expense, taxes, organizational and extraordinary expenses such as litigation and indemnification expenses. These undertakings are in effect until April 30, 2023, may be terminated before then only with the consent of the Funds’ Board of Trustees, and are reevaluated on an annual basis. Management fees payable, as reflected on the Statements of Assets and Liabilities, are net of waivers and/or expense reimbursements, if any, pursuant to these undertakings. Waivers/reimbursements that exceed management fees payable are reflected on the Statements of Assets and Liabilities as receivable from investment adviser.
For the year ended December 31, 2022, the expense limits as a percentage of average daily net assets under the expense limitation agreements were as follows:
| Expense Limit as a Percentage of Average Daily Net Assets | ||||||||||||||||
Fund | Institutional Class | Retail Class | Admin Class | Class N | ||||||||||||
Bond Fund | 0.67% | 0.92% | 1.17% | 0.62% | ||||||||||||
Investment Grade Fixed Income Fund | 0.55% | — | — | — | ||||||||||||
57 |
Notes to Financial Statements – continued
December 31, 2022
Loomis Sayles shall be permitted to recover expenses borne under the expense limitation agreements (whether through waiver of management fees or otherwise) on a class by class basis in later periods to the extent the annual operating expenses of a class fall below both (1) a class’ expense limitation ratio in place at the time such amounts were waived/reimbursed and (2) a class’ current applicable expense limitation ratio, provided, however, that a class is not obligated to pay such waived/reimbursed fees or expenses more than one year after the end of the fiscal year in which the fees or expenses were waived/reimbursed.
For the year ended December 31, 2022, the management fees for each Fund were as follows:
Fund | Gross Management Fees | Percentage of Average Daily Net Assets | ||||||
Bond Fund | $ | 33,713,301 | 0.55% | |||||
Investment Grade Fixed Income Fund | 879,328 | 0.40% | ||||||
For the year ended December 31, 2022, class-specific expenses have been reimbursed as follows:
| Reimbursement1 | ||||||||||||||||||||
Fund | Institutional Class | Retail Class | Admin Class | Class N | Total | |||||||||||||||
Bond Fund | $ | 711,683 | $ | 160,839 | $ | 5,838 | $ | — | $ | 878,360 | ||||||||||
1 Expense reimbursements are subject to possible recovery until December 31, 2023.
No expenses were recovered for either Fund during the year ended December 31, 2022 under the terms of the expense limitation agreements.
b. Service and Distribution Fees. Natixis Distribution, LLC (“Natixis Distribution”), which is a wholly-owned subsidiary of Natixis Investment Managers, LLC, has entered into a distribution agreement with the Trust. Pursuant to this agreement, Natixis Distribution serves as principal underwriter of the Funds of the Trust.
Pursuant to Rule 12b-1 under the 1940 Act, Bond Fund has adopted Distribution Plans relating to the Fund’s Retail Class shares (the “Retail Class Plan”) and Admin Class shares (the “Admin Class Plan”).
Under the Retail Class Plan, Bond Fund pays Natixis Distribution a monthly distribution fee at an annual rate not to exceed 0.25% of the average daily net assets attributable to the Fund’s Retail Class shares, as compensation for services provided by Natixis Distribution in connection with the marketing or sale of Retail Class shares or for payments made by Natixis Distribution to securities dealers or other financial intermediaries as commissions, asset-based sales charges or other compensation with respect to the sale of Retail Class shares, or for providing personal services to investors and/or the maintenance of shareholder accounts.
Under the Admin Class Plan, Bond Fund pays Natixis Distribution a monthly distribution fee at an annual rate not to exceed 0.25% of the average daily net assets attributable to the Fund’s Admin Class shares, as compensation for services provided by Natixis Distribution in connection with the marketing or sale of Admin Class shares or for payments made by Natixis Distribution to securities dealers or other financial intermediaries as commissions, asset-based sales charges or other compensation with respect to the sales of Admin Class shares, or for providing personal services to investors and/or the maintenance of shareholder accounts.
In addition, the Admin Class shares of Bond Fund may pay Natixis Distribution an administrative service fee, at an annual rate not to exceed 0.25% of the average daily net assets attributable to Admin Class shares. These fees are subsequently paid to securities dealers or financial intermediaries for providing personal services and/or account maintenance for their customers who hold such shares.
For the year ended December 31, 2022, the service and distribution fees for Bond Fund were as follows:
| Service Fees | Distribution Fees | |||||||||||
Fund | Admin Class | Retail Class | Admin Class | |||||||||
Bond Fund | $ | 78,523 | $ | 2,534,477 | $ | 92,064 | ||||||
For the year ended December 31, 2022, Natixis Distribution refunded Bond Fund $13,541 of prior year Admin Class service fees paid to Natixis Distribution in excess of amounts subsequently paid to securities dealers or financial intermediaries. Service and distribution fees on the Statements of Operations have been reduced by these amounts.
c. Administrative Fees. Natixis Advisors, LLC (“Natixis Advisors”) provides certain administrative services for the Funds and contracts with State Street Bank to serve as sub-administrator. Natixis Advisors is a wholly-owned subsidiary of Natixis Investment Managers, LLC. Pursuant to an agreement among Natixis Funds Trusts, Loomis Sayles Funds Trusts, Natixis ETF Trusts and Natixis Advisors, each Fund pays Natixis Advisors monthly its pro rata portion of fees equal to an annual rate of 0.0540% of the first $15 billion of the average daily net assets of the Natixis Funds Trusts, Loomis Sayles Funds Trusts and Natixis ETF Trusts, 0.0500% of the next $15 billion, 0.0400% of the next
| 58
Notes to Financial Statements – continued
December 31, 2022
$30 billion, 0.0275% of the next $30 billion and 0.0225% of such assets in excess of $90 billion, subject to an annual aggregate minimum fee for the Natixis Funds Trusts, Loomis Sayles Funds Trusts and Natixis ETF Trusts of $10 million, which is reevaluated on an annual basis.
For the year ended December 31, 2022, the administrative fees for each Fund were as follows:
Fund | Administrative Fees | |||
Bond Fund | $ | 2,768,894 | ||
Investment Grade Fixed Income Fund | 99,253 | |||
d. Sub-Transfer Agent Fees. Natixis Distribution has entered into agreements, which include servicing agreements, with financial intermediaries that provide recordkeeping, processing, shareholder communications and other services to customers of the intermediaries that hold positions in the Funds and has agreed to compensate the intermediaries for providing those services. Intermediaries transact with the Funds primarily through the use of omnibus accounts on behalf of their customers who hold positions in the Funds. These services would have been provided by the Funds’ transfer agent and other service providers if the shareholders’ accounts were maintained directly at the Funds’ transfer agent. Accordingly, the Funds have agreed to reimburse Natixis Distribution for all or a portion of the servicing fees paid to these intermediaries. The reimbursement amounts (sub-transfer agent fees) paid to Natixis Distribution are subject to a current per-account equivalent fee limit approved by the Funds’ Board of Trustees, which is based on fees for similar services paid to the Funds’ transfer agent and other service providers. Class N shares do not bear such expenses.
For the year ended December 31, 2022, the sub-transfer agent fees (which are reflected in transfer agent fees and expenses in the Statements of Operations) for Bond Fund were $4,007,644.
As of December 31, 2022, Bond Fund owes Natixis Distribution $43,889 in reimbursements for sub-transfer agent fees (which are reflected in the Statements of Assets and Liabilities as payable to distributor).
Sub-transfer agent fees attributable to Institutional Class, Retail Class and Admin Class are allocated on a pro rata basis to each class based on the relative net assets of each class to the total net assets of those classes.
e. Trustees Fees and Expenses. The Trust does not pay any compensation directly to its officers or Trustees who are directors, officers or employees of Natixis Advisors, Natixis Distribution, Natixis Investment Managers, LLC or their affiliates. The Chairperson of the Board of Trustees receives a retainer fee at the annual rate of $369,000. The Chairperson does not receive any meeting attendance fees for Board of Trustees meetings or committee meetings that he attends. Each Independent Trustee (other than the Chairperson) receives, in the aggregate, a retainer fee at the annual rate of $210,000. Each Independent Trustee also receives a meeting attendance fee of $10,000 for each meeting of the Board of Trustees that he or she attends in person and $5,000 for each meeting of the Board of Trustees that he or she attends telephonically. In addition, the chairperson of the Contract Review Committee, the chairperson of the Audit Committee and the chairperson of the Governance Committee each receive an additional retainer fee at the annual rate of $20,000. Each Contract Review Committee member is compensated $6,000 for each Committee meeting that he or she attends in person and $3,000 for each meeting that he or she attends telephonically. Each Audit Committee member is compensated $6,000 for each Committee meeting that he or she attends in person and $3,000 for each meeting that he or she attends telephonically. These fees are allocated among the funds in the Natixis Funds Trusts, Loomis Sayles Funds Trusts and Natixis ETF Trusts based on a formula that takes into account, among other factors, the relative net assets of each fund. Trustees are reimbursed for travel expenses in connection with attendance at meetings.
Effective January 1, 2023, each Governance Committee member is compensated $2,500 for each Committee meeting that he or she attends either in person or telephonically.
A deferred compensation plan (the “Plan”) is available to the Trustees on a voluntary basis. The value of a participating Trustee’s deferral account is based on theoretical investments of deferred amounts, on the normal payment dates, in certain funds of the Natixis Funds Trusts, Loomis Sayles Funds Trusts and Natixis ETF Trusts as designated by the participating Trustees. Changes in the value of participants’ deferral accounts are allocated pro rata among the funds in the Natixis Funds Trusts, Loomis Sayles Funds Trusts and Natixis ETF Trusts and are normally reflected as Trustees’ fees and expenses in the Statements of Operations. Deferred amounts remain in the funds until distributed in accordance with the provisions of the Plan. The portions of the accrued obligations allocated to the Funds under the Plan are reflected as Deferred Trustees’ fees in the Statements of Assets and Liabilities.
For the year ended December 31, 2022, net depreciation in the value of participants’ deferral accounts are reflected on the Statements of Operations as a reduction to expenses, as follows:
Fund | Amount | |||
Bond Fund | $ | (319,076 | ) | |
Investment Grade Fixed Income Fund | (25,110 | ) | ||
59 |
Notes to Financial Statements – continued
December 31, 2022
Certain officers and employees of Natixis Advisors and Loomis Sayles are also officers and/or Trustees of the Trust.
f. Affiliated Ownership. As of December 31, 2022, Loomis Sayles Employees’ Profit Sharing Retirement Plan held shares of Bond Fund representing 0.51% of the Fund’s net assets.
Investment activities of affiliated shareholders could have material impacts on the Fund.
7. Class-Specific Transfer Agent Fees and Expenses. Transfer agent fees and expenses for Bond Fund attributable to Institutional Class, Retail Class and Admin Class are allocated on a pro rata basis to each class based on relative net assets of each class to the total net assets of those classes. Transfer agent fees and expenses attributable to Class N are allocated to Class N.
For year ended December 31, 2022, Bond Fund incurred the following class-specific transfer agent fees and expenses (including sub-transfer agent fees, where applicable):
| Transfer Agent Fees and Expenses | ||||||||||||||||
Fund | Institutional Class | Retail Class | Admin Class | Class N | ||||||||||||
Bond Fund | $ | 3,475,089 | $ | 762,885 | $ | 27,710 | $ | 4,883 | ||||||||
8. Line of Credit. Each Fund, together with certain other funds of Natixis Funds Trusts, Loomis Sayles Funds Trusts and Natixis ETF Trusts, entered into a $500,000,000 committed unsecured line of credit provided by State Street Bank. Any one Fund may borrow up to $350,000,000 under the line of credit agreement (as long as all borrowings by all Funds in the aggregate do not exceed the $500,000,000 limit at any time), subject to each Fund’s investment restrictions and its contractual obligations under the line of credit. Interest is charged to the Funds based upon the terms set forth in the agreement. In addition, a commitment fee of 0.15% per annum, payable at the end of each calendar quarter, is accrued and apportioned among the participating funds based on their average daily unused portion of the line of credit. The Funds paid certain legal fees in connection with the line of credit agreement, which are being amortized over a period of 364 days and are reflected in legal fees on the Statements of Operations. The unamortized balance is reflected as prepaid expenses on the Statements of Assets and Liabilities.
For the year ended December 31, 2022, neither Fund had borrowings under this agreement.
9. Risk. Russia’s military invasion of Ukraine in February 2022, the resulting responses by the United States and other countries, and the potential for wider conflict could increase volatility and uncertainty in the financial markets and adversely affect regional and global economies. These and any related events could significantly impact a Fund’s performance and the value of an investment in the Fund, even if the Fund does not have direct exposure to Russian issuers or issuers in other countries affected by the invasion.
10. Concentration of Ownership. From time to time, a Fund may have a concentration of one or more accounts constituting a significant percentage of shares outstanding. Investment activities by holders of such accounts could have material impacts on the Funds. As of December 31, 2022, based on management’s evaluation of the shareholder account base, the Funds had accounts representing controlling ownership of more than 5% of the Fund’s total outstanding shares. The number of such accounts, based on accounts that represent more than 5% of an individual class of shares, and the aggregate percentage of net assets represented by such holdings were as follows:
Fund | Number of 5% Account Holders | Percentage of Ownership | ||||
Investment Grade Fixed Income Fund | 9 | 77.83% | ||||
Omnibus shareholder accounts for which Natixis Advisors understands that the intermediary has discretion over the underlying shareholder accounts or investment models where a shareholder account may be invested for a non-discretionary customer are included in the table above. For other omnibus accounts, the Fund does not have information on the individual shareholder accounts underlying the omnibus accounts; therefore, there could be other 5% shareholders in addition to those disclosed in the table above.
| 60
Notes to Financial Statements – continued
December 31, 2022
11. Capital Shares. Each Fund may issue an unlimited number of shares of beneficial interest, without par value. Transactions in capital shares were as follows:
| Bond Fund | ||||||||||||||||
| Year Ended December 31, 2022 | Year Ended December 31, 2021 | |||||||||||||||
| Shares | Amount | Shares | Amount | |||||||||||||
| Institutional Class | ||||||||||||||||
Issued from the sale of shares | 60,178,494 | $ | 731,035,905 | 63,430,292 | $ | 861,382,436 | ||||||||||
Issued in connection with the reinvestment of distributions | 16,400,210 | 195,503,283 | 11,763,240 | 159,634,336 | ||||||||||||
Redeemed | (169,323,595 | ) | (2,042,242,993 | ) | (139,302,701 | ) | (1,889,100,821 | ) | ||||||||
|
| |||||||||||||||
Net change | (92,744,891 | ) | $ | (1,115,703,805 | ) | (64,109,169 | ) | $ | (868,084,049 | ) | ||||||
|
| |||||||||||||||
| Retail Class | ||||||||||||||||
Issued from the sale of shares | 4,320,525 | $ | 52,713,946 | 7,703,691 | $ | 104,256,812 | ||||||||||
Issued in connection with the reinvestment of distributions | 3,642,478 | 43,087,038 | 2,512,309 | 33,903,326 | ||||||||||||
Redeemed | (23,840,273 | ) | (288,995,987 | ) | (26,803,210 | ) | (361,269,436 | ) | ||||||||
|
| |||||||||||||||
Net change | (15,877,270 | ) | $ | (193,195,003 | ) | (16,587,210 | ) | $ | (223,109,298 | ) | ||||||
|
| |||||||||||||||
| Admin Class | ||||||||||||||||
Issued from the sale of shares | 787,529 | $ | 9,363,411 | 662,627 | $ | 8,899,931 | ||||||||||
Issued in connection with the reinvestment of distributions | 128,111 | 1,508,431 | 82,224 | 1,104,976 | ||||||||||||
Redeemed | (1,489,367 | ) | (17,743,200 | ) | (1,163,258 | ) | (15,642,177 | ) | ||||||||
|
| |||||||||||||||
Net change | (573,727 | ) | $ | (6,871,358 | ) | (418,407 | ) | $ | (5,637,270 | ) | ||||||
|
| |||||||||||||||
| Class N | ||||||||||||||||
Issued from the sale of shares | 8,276,717 | $ | 101,606,037 | 14,325,543 | $ | 193,905,266 | ||||||||||
Issued in connection with the reinvestment of distributions | 1,841,516 | 21,847,127 | 1,373,194 | 18,565,045 | ||||||||||||
Redeemed | (9,561,799 | ) | (116,072,704 | ) | (44,112,725 | ) | (595,496,040 | ) | ||||||||
|
| |||||||||||||||
Net change | 556,434 | $ | 7,380,460 | (28,413,988 | ) | $ | (383,025,729 | ) | ||||||||
|
| |||||||||||||||
Decrease from capital share transactions | (108,639,454 | ) | $ | (1,308,389,706 | ) | (109,528,774 | ) | $ | (1,479,856,346 | ) | ||||||
|
| |||||||||||||||
| Investment Grade Fixed Income Fund | ||||||||||||||||
| Year Ended December 31, 2022 | Year Ended December 31, 2021 | |||||||||||||||
| Shares | Amount | Shares | Amount | |||||||||||||
| Institutional Class | ||||||||||||||||
Issued from the sale of shares | 582,596 | $ | 6,328,414 | 2,889,240 | $ | 35,421,008 | ||||||||||
Issued in connection with the reinvestment of distributions | 799,752 | 8,493,158 | 1,176,233 | 14,112,526 | ||||||||||||
Redeemed | (2,641,549 | ) | (26,892,251 | ) | (3,812,371 | ) | (46,662,247 | ) | ||||||||
|
| |||||||||||||||
Net change | (1,259,201 | ) | $ | (12,070,679 | ) | 253,102 | $ | 2,871,287 | ||||||||
|
| |||||||||||||||
Increase (decrease) from capital share transactions | (1,259,201 | ) | $ | (12,070,679 | ) | 253,102 | $ | 2,871,287 | ||||||||
|
| |||||||||||||||
61 |
Report of Independent Registered Public Accounting Firm
To the Board of Trustees of Loomis Sayles Funds I and Shareholders of Loomis Sayles Bond Fund and Loomis Sayles Investment Grade Fixed Income Fund
Opinions on the Financial Statements
We have audited the accompanying statements of assets and liabilities, including the portfolios of investments, of Loomis Sayles Bond Fund and Loomis Sayles Investment Grade Fixed Income Fund (two of the funds constituting Loomis Sayles Funds I, hereafter collectively referred to as the “Funds”) as of December 31, 2022, the related statements of operations for the year ended December 31, 2022, the statements of changes in net assets for each of the two years in the period ended December 31, 2022, including the related notes, and the financial highlights for each of the two years in the period ended December 31, 2022, the three month period ended December 31, 2020 and for each of the three years in the period ended September 30, 2020 (collectively referred to as the “financial statements”). In our opinion, the financial statements present fairly, in all material respects, the financial position of each of the Funds as of December 31, 2022, the results of each of their operations for the year then ended, the changes in each of their net assets for each of the two years in the period ended December 31, 2022, and each of the financial highlights for each of the two years in the period ended December 31, 2022, the three month period ended December 31, 2020 and for each of the three years in the period ended September 30, 2020 in conformity with accounting principles generally accepted in the United States of America.
Basis for Opinions
These financial statements are the responsibility of the Funds’ management. Our responsibility is to express an opinion on the Funds’ financial statements based on our audits. We are a public accounting firm registered with the Public Company Accounting Oversight Board (United States) (PCAOB) and are required to be independent with respect to the Funds in accordance with the U.S. federal securities laws and the applicable rules and regulations of the Securities and Exchange Commission and the PCAOB.
We conducted our audits of these financial statements in accordance with the standards of the PCAOB. Those standards require that we plan and perform the audit to obtain reasonable assurance about whether the financial statements are free of material misstatement, whether due to error or fraud.
Our audits included performing procedures to assess the risks of material misstatement of the financial statements, whether due to error or fraud, and performing procedures that respond to those risks. Such procedures included examining, on a test basis, evidence regarding the amounts and disclosures in the financial statements. Our audits also included evaluating the accounting principles used and significant estimates made by management, as well as evaluating the overall presentation of the financial statements. Our procedures included confirmation of securities owned as of December 31, 2022 by correspondence with the custodian, agent banks and brokers; when replies were not received from brokers, we performed other auditing procedures. We believe that our audits provide a reasonable basis for our opinions.
/s/PricewaterhouseCoopers LLP
Boston, Massachusetts
February 22, 2023
We have served as the auditor of one or more of the investment companies in the Natixis Investment Company Complex since at least 1995. We have not been able to determine the specific year we began serving as auditor.
| 62
2022 U.S. Tax Distribution Information to Shareholders (unaudited)
Corporate Dividends Received Deduction. For the fiscal year ended December 31, 2022, a percentage of dividends distributed by the Funds listed below qualify for the dividends received deduction for corporate shareholders. These percentages are as follows:
Fund | Qualifying Percentage | |||
Bond Fund | 5.54% | |||
Investment Grade Fixed Income Fund | 4.21% | |||
Capital Gains Distributions. Pursuant to Internal Revenue Section 852(b), the following Funds paid distributions, which have been designated as capital gains distributions for the fiscal year ended December 31, 2022.
Fund | Amount | |||
Investment Grade Fixed Income Fund | $ | 2,174,803 | ||
Qualified Dividend Income. For the fiscal year ended December 31, 2022, the Funds below will designate up to the maximum amount allowable pursuant to the Internal Revenue Code as qualified dividend income eligible for reduced tax rates. These lower rates range from 0% to 20% depending on an individual’s tax bracket. If the Funds pay a distribution during calendar year 2022, complete information will be reported in conjunction with Form 1099-DIV. These percentages are noted below:
Fund | Qualifying Percentage | |||
Bond Fund | 4.09% | |||
Investment Grade Fixed Income Fund | 4.27% | |||
63 |
Trustee and Officer Information
The tables below provide certain information regarding the Trustees and officers of Loomis Sayles Funds I (the “Trust”. Unless otherwise indicated, the address of all persons below is 888 Boylston Street, Suite 800, Boston, MA 02199-8197. The Funds’ Statement of Additional Information includes additional information about the Trustees of the Trust and is available by calling Loomis Sayles Funds at 800-633-3330.
| Name and Year of Birth | Position(s) Term of Office1 | Principal Occupation(s) During Past 5 Years | Number of Portfolios in and Other Directorships | Experience, Qualifications, Attributes, Skills for Board Membership | ||||
Independent Trustees | ||||||||
| Edmond J. English (1953) | Trustee since 2013 Chairperson of the Governance Committee and Contract Review Committee Member | Executive Chairman of Bob’s Discount Furniture (retail) | 54 Director, Burlington Stores, Inc. (retail) and Director, Rue Gilt Groupe, Inc. (e-commerce retail) | Significant experience on the Board and on the boards of other business organizations (including retail companies and a bank); executive experience (including at a retail company) | ||||
Richard A. Goglia (1951) | Trustee since 2015 Audit Committee Member and Governance Committee Member | Retired | 54 Formerly, Director of Triumph Group (aerospace industry) | Significant experience on the Board and executive experience (including his role as vice president and treasurer of a defense company and experience at a financial services company) | ||||
Wendell J. Knox (1948) | Trustee since 2009 Chairperson of the Contract Review Committee | Retired | 54 Director, Abt Associates Inc. (research and consulting); Director, The Hanover Insurance Group (property and casualty insurance); Formerly, Director, Eastern Bank (bank) | Significant experience on the Board and on the boards of other business organizations (including at a bank and at a property and casualty insurance firm); executive experience (including roles as president and chief executive officer of a research and consulting company) | ||||
| Martin T. Meehan (1956) | Trustee since 2012 Contract Review Committee Member and Governance Committee Member | President, University of Massachusetts | 54 None | Significant experience on the Board and on the boards of other business organizations; experience as President of the University of Massachusetts; government experience (including as a member of the U.S. House of Representatives); academic experience | ||||
| 64
| Name and Year of Birth | Position(s) Term of Office1 | Principal Occupation(s) During Past 5 Years | Number of Portfolios in and Other Directorships | Experience, Qualifications, Attributes, Skills for Board Membership | ||||
| Maureen B. Mitchell (1951) | Trustee since 2017 Contract Review Committee Member and Governance Committee Member | Retired | 54 Director, Sterling Bancorp (bank) | Significant experience on the Board; financial services industry and executive experience (including role as president of global sales and marketing at a financial services company) | ||||
James P. Palermo (1955) | Trustee since 2016 Audit Committee Member | Founding Partner, Breton Capital Management, LLC (private equity); Partner, STEP Partners, LLC (private equity) | 54 Director, FutureFuel.io (chemicals and biofuels) | Significant experience on the Board; financial services industry and executive experience (including roles as chief executive officer of client management and asset servicing for a banking and financial services company) | ||||
Erik R. Sirri (1958) | Chairperson of the Board of Trustees since 2021 Trustee since 2009 Ex Officio member of the Audit Committee, Contract Review Committee and Governance Committee | Professor of Finance at Babson College | 54 None | Significant experience on the Board; experience as Director of the Division of Trading and Markets at the Securities and Exchange Commission; academic experience; training as an economist | ||||
Peter J. Smail (1952) | Trustee since 2009 Audit Committee Member | Retired | 54 None | Significant experience on the Board; mutual fund industry and executive experience (including roles as president and chief executive officer for an investment adviser) | ||||
Kirk A. Sykes (1958) | Trustee since 2019 Audit Committee Member and Governance Committee Member | Managing Director of Accordia Partners, LLC (real estate development); President of Primary Corporation (real estate development); Managing Principal of Merrick Capital Partners (infrastructure finance) | 54 Advisor Eastern Bank (bank); Director, Apartment Investment and Management Company (real estate investment trust); formerly Director, Ares Commercial Real Estate Corporation (real estate investment trust) | Experience on the Board and significant experience on the boards of other business organizations (including real estate companies and banks) | ||||
Cynthia L. Walker (1956) | Trustee since 2005 Chairperson of the Audit Committee | Retired; Formerly, Deputy Dean for Finance and Administration, Yale University School of Medicine | 54 None | Significant experience on the Board; executive experience in a variety of academic organizations (including roles as dean for finance and administration) | ||||
65 |
| Name and Year of Birth | Position(s) Term of Office1 | Principal Occupation(s) During Past 5 Years | Number of Portfolios in and Other Directorships | Experience, Qualifications, Attributes, Skills for Board Membership | ||||
Interested Trustees | ||||||||
Kevin P. Charleston3 (1965) One Financial Center Boston, MA 02111 | Trustee since 2015 President and Chief Executive Officer of Loomis Sayles Funds I since 2015 | President, Chief Executive Officer and Chairman of the Board of Directors, Loomis, Sayles & Company, L.P. | 54 None | Significant experience on the Board; continuing service as President, Chief Executive Officer and Chairman of the Board of Directors of Loomis, Sayles & Company, L.P. | ||||
| David L. Giunta4 (1965) | Trustee since 2011 Executive Vice President of Loomis Sayles Funds I since 2008 | President and Chief Executive Officer, Natixis Advisors, LLC and Natixis Distribution, LLC | 54 None | Significant experience on the Board; experience as President and Chief Executive Officer of Natixis Advisors, LLC and Natixis Distribution, LLC | ||||
| 1 | Each Trustee serves until retirement, resignation or removal from the Board. The current retirement age is 75. The position of Chairperson of the Board is appointed for a three-year term. |
| 2 | The Trustees of the Trust serve as Trustees of a fund complex that includes all series of the Natixis Funds Trust I, Natixis Funds Trust II, Natixis Funds Trust IV, Gateway Trust, Loomis Sayles Funds I, Loomis Sayles Funds II, Natixis ETF Trust and Natixis ETF Trust II (collectively, the “Fund Complex”). |
| 3 | Mr. Charleston is deemed an “interested person” of the Trust because he holds the following positions with an affiliated person of the Trust: President, Chief Executive Officer and Chairman of the Board of Directors of Loomis, Sayles & Company, L.P. |
| 4 | Mr. Giunta is deemed an “interested person” of the Trust because he holds the following positions with an affiliated person of the Trust: President and Chief Executive Officer, Natixis Advisors, LLC and Natixis Distribution, LLC. |
| Name and Year of Birth | Position(s) Held with the Trust | Term of Office1 and Length of Time Served | Principal Occupation(s) During Past 5 Years2 | |||
Officers of the Trust | ||||||
Matthew Block (1981) | Treasurer, Principal Financial and Accounting Officer | Since 2022 | Senior Vice President, Natixis Advisors, LLC and Natixis Distribution, LLC; formerly, Vice President, Natixis Advisors, LLC and Natixis Distribution, LLC; Assistant Treasurer of the Fund Complex; Managing Director, State Street Bank and Trust Company | |||
Susan McWhan Tobin (1963) | Secretary and Chief Legal Officer | Since 2022 | Executive Vice President, General Counsel and Secretary, Natixis Advisors, LLC and Natixis Distribution, LLC; formerly, Executive Vice President and Chief Compliance Officer of Natixis Investment Managers (March 2019– May 2022) and Senior Vice President and Head of Compliance, US for Natixis Investment Managers (July 2011–March 2019) | |||
Natalie R. Wagner (1979) | Chief Compliance Officer, Assistant Secretary and Anti-Money Laundering Officer | Since 2021 | Senior Vice President, Natixis Advisors, LLC and Natixis Distribution, LLC; formerly, Vice President, Head of Corporate Compliance, Global Atlantic Financial Group | |||
| 1 | Each officer of the Trust serves for an indefinite term in accordance with the Trust’s current by-laws until the date his or her successor is elected and qualified, or until he or she sooner dies, retires, is removed or becomes disqualified. |
| 2 | Each person listed above, except as noted, holds the same position(s) with the Fund Complex. Previous positions during the past five years with Natixis Distribution, LLC, Natixis Advisors, LLC or Loomis, Sayles & Company, L.P. are omitted, if not materially different from an officer’s current position with such entity. |
| 66
(b) Not Applicable.
Item 2. Code of Ethics.
The Registrant has adopted a code of ethics that applies to the Registrant’s principal executive officer, principal financial officer and persons performing similar functions. There have been no amendments or waivers of the Registrant’s code of ethics during the period.
Item 3. Audit Committee Financial Expert.
The Board of Trustees of the Registrant has established an audit committee. Mr. Richard A. Goglia, Mr. James Palermo, Mr. Peter J. Smail, Mr. Kirk A Sykes and Ms. Cynthia L. Walker are members of the audit committee and have been designated as “audit committee financial experts” by the Board of Trustees. Each of these individuals is also an Independent Trustee of the Registrant.
Item 4. Principal Accountant Fees and Services.
Fees billed by the Principal Accountant for services rendered to the Registrant.
The table below sets forth fees billed by the principal accountant, PricewaterhouseCoopers LLP, for the past two fiscal years for professional services rendered in connection with a) the audit of the Registrant’s annual financial statements and services provided in connection with regulatory filings; b) audit-related services (including services that are reasonably related to the performance of the audit of the Registrant’s financial statements but not reported under “Audit Fees”); c) tax compliance, tax advice and tax planning and d) all other fees billed for professional services rendered by the principal accountant to the Registrant, other than the services reported as a part of (a) through (c) of this Item.
| Audit fees | Audit-related fees1 | Tax fees2 | All other fees | |||||||||||||||||||||||||||||
| 10/1/21-12/31/21 | 1/1/22-12/31/22 | 10/1/21-12/31/21 | 1/1/22-12/31/22 | 10/1/21-12/31/21 | 1/1/22-12/31/22 | 10/1/21-12/31/21 | 1/1/22-12/31/22 | |||||||||||||||||||||||||
Loomis Sayles Bond Fund and Loomis Sayles Investment Grade Fixed Income Fund | $ | 103,285 | $ | 109,483 | $ | 189 | $ | 1,220 | $ | 16,208 | $ | 17,180 | $ | — | $ | — | ||||||||||||||||
| 1. | Audit-related fees consist of: |
2021 & 2022 – performance of agreed-upon procedures related to the Registrant’s deferred compensation plan.
| 2. | Tax fees consist of: |
2021 & 2022 – review of the Registrant’s tax returns.
Aggregate fees billed to the Registrant for non-audit services during 2021 and 2022 were $16,397 and $18,400, respectively.
Fees billed by the Principal Accountant for services rendered to the Adviser and Control Affiliates.
The following table sets forth the fees billed by the Registrant’s principal accountant for non-audit services rendered to Loomis, Sayles & Company, L.P. (“Loomis Sayles”) and entities controlling, controlled by or under common control with Loomis Sayles (“Control Affiliates”) that provide ongoing services to the Registrant, for engagements that related directly to the operations and financial reporting of the Registrant for the last two fiscal years.
| Audit-related fees | Tax fees | All other fees | ||||||||||||||||||||||
| 10/1/21-12/31/21 | 1/1/22-12/31/22 | 10/1/21-12/31/21 | 1/1/22-12/31/22 | 10/1/21-12/31/21 | 1/1/22-12/31/22 | |||||||||||||||||||
Control Affiliates | $ | — | $ | — | $ | — | $ | — | $ | — | $ | 50,000 | ||||||||||||
The following table sets forth the aggregate fees billed by the Registrant’s principal accountant for non-audit services rendered to Loomis Sayles and Control Affiliates that provide ongoing services to the Registrant, for the last two fiscal years, including the fees disclosed in the table above.
| Aggregate Non-Audit Fees | ||||||||
| 10/1/21-12/31/21 | 1/1/22-12/31/22 | |||||||
Control Affiliates | $ | 972 | $ | 50,000 | ||||
None of the services described above were approved pursuant to paragraph (c)(7)(i)(C) of Regulation S-X.
Audit Committee Pre Approval Policies.
Annually, the Registrant’s Audit Committee reviews the audit, audit-related, tax and other non-audit services together with the projected fees, for services proposed to be rendered to the Registrant and/or other entities for which pre-approval is required during the upcoming year. Any subsequent revisions to already pre-approved services or fees (including fee increases) and requests for pre-approval of new services would be presented for consideration quarterly as needed.
If, in the opinion of management, a proposed engagement by the Registrant’s independent accountants needs to commence before the next regularly scheduled Audit Committee meeting, any member of the Audit Committee who is an independent Trustee of the Registrant is authorized to pre-approve the engagement, but only for engagements to provide audit, audit-related and tax services. This approval is subject to review by the full Audit Committee at its next quarterly meeting. All other engagements require the approval of all the members of the Audit Committee.
Item 5. Audit Committee of Listed Registrants.
Not applicable.
Item 6. Schedule of Investments.
Included as part of the Report to Shareholders filed as Item 1 herewith.
Item 7. Disclosure of Proxy Voting Policies and Procedures for Closed-End Management Investment Companies.
Not applicable.
Item 8. Portfolio Managers of Closed-End Management Investment Companies
Not applicable.
Item 9. Purchases of Equity Securities by Closed-End Management Investment Companies and Affiliated Purchasers.
Not applicable.
Item 10. Submission of Matters to a Vote of Securities Holders.
There were no material changes to the procedures by which shareholders may recommend nominees to the Registrant’s Board of Trustees.
Item 11. Controls and Procedures.
The Registrant’s principal executive officer and principal financial officer have concluded that the Registrant’s disclosure controls and procedures are sufficient to ensure that information required to be disclosed by the Registrant in this Form N-CSR was recorded, processed, summarized and reported within the time periods specified in the Securities and Exchange Commission’s rules and forms, based upon such officers’ evaluation of these controls and procedures as of a date within 90 days of the filing date of the report.
There were no changes in the Registrant’s internal control over financial reporting that occurred during the period covered by the report that have materially affected, or is reasonably likely to materially affect, the Registrant’s internal control over financial reporting.
Item 12. Disclosure of Securities Lending Activities for Closed-End Management Investment Companies.
Not applicable.
Item 13. Exhibits.
SIGNATURES
Pursuant to the requirements of the Securities Exchange Act of 1934 and the Investment Company Act of 1940, the Registrant has duly caused this report to be signed on its behalf by the undersigned, thereunto duly authorized.
| Loomis Sayles Funds I | ||
| By: | /s/ Kevin Charleston | |
| Name: | Kevin Charleston | |
| Title: | President and Chief Executive Officer | |
| Date: | February 22, 2023 | |
Pursuant to the requirements of the Securities Exchange Act of 1934 and the Investment Company Act of 1940, this report has been signed by the following persons on behalf of the Registrant and in the capacities and on the dates indicated.
| By: | /s/ Kevin Charleston | |
| Name: | Kevin Charleston | |
| Title: | President and Chief Executive Officer | |
| Date: | February 22, 2023 | |
| By: | /s/ Matthew Block | |
| Name: | Matthew Block | |
| Title: | Treasurer and Principal Financial and | |
| Accounting Officer | ||
| Date: | February 22, 2023 | |