UNITED STATES
SECURITIES AND EXCHANGE COMMISSION
Washington, D.C. 20549
FORM N-CSR
CERTIFIED SHAREHOLDER REPORT OF REGISTERED
MANAGEMENT INVESTMENT COMPANIES
Investment Company Act file number: 811-08282
Loomis Sayles Funds I
(Exact name of Registrant as specified in charter)
888 Boylston Street, Suite 800 Boston, Massachusetts 02199-8197
(Address of principal executive offices) (Zip code)
Susan McWhan Tobin, Esq.
Natixis Distribution, LLC
888 Boylston Street, Suite 800
Boston, Massachusetts 02199-8197
(Name and address of agent for service)
Registrant’s telephone number, including area code: (617) 449-2139
Date of fiscal year end: December 31
Date of reporting period: December 31, 2023
Item 1. Reports to Stockholders.
(a) The Registrant’s annual report transmitted to shareholders pursuant to Rule 30e-1 under the Investment Company Act of 1940 is as follows:
|
Loomis Sayles Investment Grade Fixed Income Fund |
Annual Report
December 31, 2023
IMPORTANT NOTICE TO SHAREHOLDERS
The Securities and Exchange Commission (SEC) has adopted new regulations that will result in changes to the design and delivery of annual and semiannual shareholder reports. Beginning in July 2024, Funds will be required by the SEC to send shareholders a paper copy of a new tailored shareholder report in place of the full shareholder report that is currently being provided. If you would like to receive shareholder reports and other communications from the Funds electronically, instead of by mail, you may make that request at www.icsdelivery.com/loomissayles. If you have already elected to receive shareholder reports electronically, you will not be affected by this change, and you need not take any action.
| Effective December 31, 2023, Elaine M. Stokes no longer serves as portfolio manager of the Fund. |
Investment ObjectiveThe Fund's investment objective is high total investment return through a combination of current income and capital appreciation.
Market Conditions
The bond market finished 2023 with positive total returns, but the favorable end result obscures the elevated volatility that occurred along the way. For most of the year, bonds were under pressure from concerns about persistent inflation and the US Federal Reserve’s (Feds) continued interest rate increases. As late as October, the headline US investment-grade bond indexes were in negative territory on a year-to-date basis amid worries that the Fed would have to keep interest rates “higher for longer.”
This backdrop changed considerably in November and December, as the concerns that had weighed on the market throughout 2023 dissipated rapidly. Inflation continued to decline unabated, despite concerns about rising oil prices in the third quarter. In November, the headline Consumer Price Index came in at inflation rates not seen since early 2021. With inflation receding, the markets grew comfortable with the idea that the Fed was finished raising rates. In December, Fed Chairman Jerome Powell added to the upbeat tone with comments suggesting that rate cuts could begin as early as the first half of 2024. Bond prices took another leg higher in response, erasing all previous losses and helping the fixed-income market close with solid gains for the full year. Income also made a meaningful contribution to total returns thanks to the increase in yields over the past two years.
US Treasuries registered gains for the year, albeit with unusually high volatility brought about by the shifting interest rate outlook. The yield on the two-year note, which came into 2023 at 4.41%, rose as high as 5.19% in mid-October before falling sharply to finish December at 4.23%. The ten-year issue took a similar path, moving from 3.88% at the end of 2022 to 4.99% in October and ultimately closing at the same 3.88% level where it began. The yield curve remained inverted for all of 2023, meaning that short-term debt offered higher yields than longer-term issues – an unusual condition that is often seen as a precursor to a recession. However, through the remainder of the year the extent of the inversion gradually receded from its July high.
Corporate bonds delivered a robust gain and outperformed US Treasuries. In addition to benefiting from the drop in Treasury yields in the fourth quarter, the asset class was boosted by the environment of positive economic growth, continued strength in corporate earnings, and investors’ hearty appetite for risk. Corporates’ above-average yield was an additional factor in their positive relative performance.
High-yield corporate bonds logged a double-digit gain in 2023 and strongly outpaced the investment grade market. A large contribution from yield helped results, as did a decline in yield spreads brought about by better-than-expected corporate earnings and investors’ elevated appetite for risk. Senior loans, which typically feature floating rates, benefited from the rising-rate environment in the first ten months of the year and finished as one of the top-performing segments of the bond market.
Securitized assets produced largely positive total returns in 2023. Collateralized loan obligations (CLOs) and commercial asset-backed securities (ABS) delivered particularly strong gains. Portions of the residential mortgage-backed securities (RMBS) market also outperformed. Headwinds facing the commercial real estate sector emerged in the first half of 2023, negatively impacting non-agency commercial mortgage-backed securities’ (CMBS) performance for the full year. Generally, the higher-yielding securitized credit sectors performed best. A challenging supply-and-demand backdrop negatively impacted agency mortgage-backed securities (MBS) as elevated levels of interest-rate volatility continued and historically large buyers of agency MBS (banks and the Fed) pulled back from the market. Still, agency MBS outperformed US Treasuries for the year.
Developed market government bonds generated gains in 2023, although weakness in foreign currencies dampened returns somewhat for US dollar investors. Emerging markets debt outperformed US investment grade bonds thanks to investors’ hearty appetite for risk and the positive economic growth trends for many countries in the asset class.
Performance Results
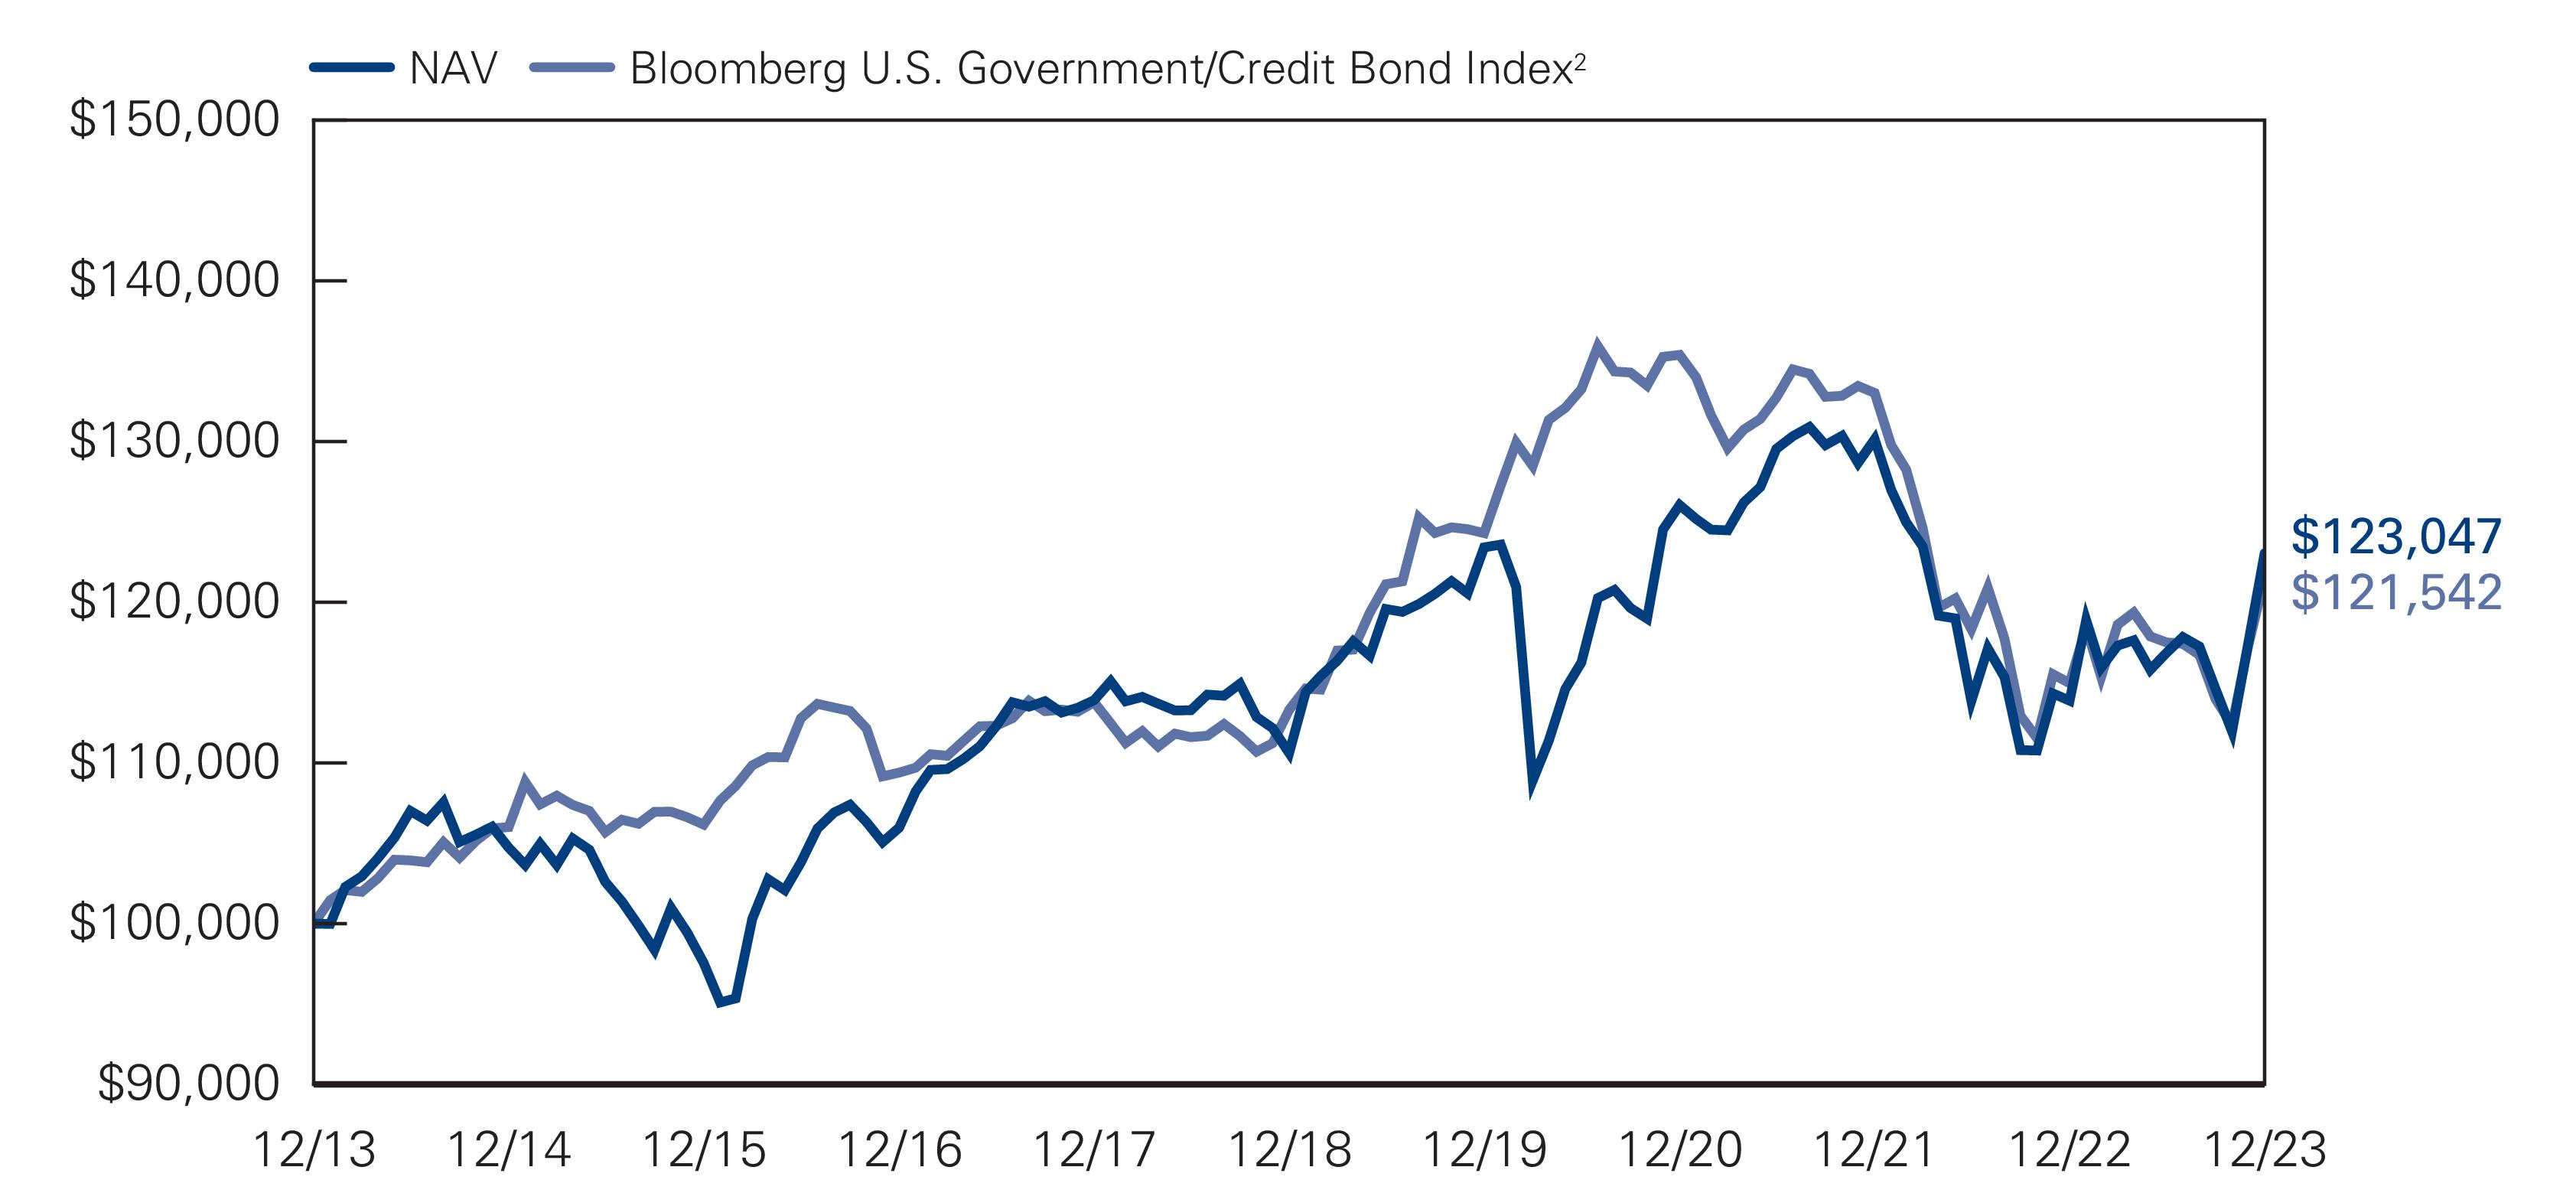
For the 12 months ended December 31, 2023, Institutional Class shares of the Loomis Sayles Bond Fund returned 8.05% at net asset value. The Fund outperformed its benchmark, the Bloomberg U.S. Government/Credit Bond Index, which returned 5.72%.
Explanation of Fund Performance
The overall fixed income markets posted strong returns in 2023 with the Fund outperforming its index, mostly due to positive security selection. Both high yield and investment grade credit were contributors to performance over the year. Within high yield credit, our higher conviction names in the communication and consumer cyclical space were positive. For investment grade credit, select names in the energy, banking and insurance were positive. Securitized credit was also beneficial given the asset class’s shorter duration profile, where holdings in ABS and CLOs aided returns.
Exposure to emerging market credit was negative during the year. Underperformance was derived primarily from holdings in Chinese property names as this sector has remained under continued pressure. An allocation to convertibles was also a detractor, led by select names in the communications and transportation space.
Outlook
US inflation — while still above the Fed’s 2% target — continued to decline from its mid-2022 peak and provided the Fed with enough flexibility in December 2023 to signal the tightening cycle is over. Fed Chair Jerome Powell sent a clear message to investors that he did not want to restrict the economy longer than necessary and stated that interest rate cuts would occur over the next year. This fueled a bond market rally in the second half of the fourth quarter, which saw the 10-year US Treasury yield fall to 3.88% at year-end after peaking at 4.99% on October 19, 2023. Optimism for Fed cuts and the potential for a soft landing also drove a rally in risk assets. We saw tighter investment grade and high yield spreads, coupled with declining interest rates, which helped to boost fixed income returns, resulting in positive calendar year returns in most fixed income sectors.
In our view, the credit cycle1 is firmly in the ‘late cycle’ stage. Monetary policy is in restrictive territory and lending standards have tightened. Up to this point, the US labor market has been resilient and underpinned consumer spending, while corporate fundamentals have remained stable and supportive of economic activity. Looking forward, we believe that economic growth is decelerating. Our base case calls for below-trend US growth in 2024, however, we do not anticipate a technical recession of back-to-back quarters with negative gross domestic product (GDP). We expect European economic growth to remain stagnant while economic growth in China is showing signs of bottoming, but continues to remain sluggish.
We believe that inflation has peaked and positive real rates should have the effect of slowing growth and continuing to lower inflation over time. The Fed appears to be satisfied with the progress it has made against inflation and now sees labor market/economic softening as an equal risk to inflation, thus the pivot. We believe the market may be too aggressive in pricing in rate cuts for 2024, as we believe it will take longer for core inflation to hit the Fed’s target and that Fed easing may ultimately come in some combination of rate cuts and a slowing of balance sheet normalization. Our view is that inflation will be ‘unstable’ over the long term as secular trends, such as deglobalization, decarbonization and the greenification of energy sources, aging demographics, and growing government deficits, have the potential to keep a floor under inflation but also have the potential to make it more volatile going forward. We expect to see dips in inflation as the cycles progress, but believe we're likely to experience higher lows than what we've experienced over the last 15 years. From an interest rate risk perspective, we believe the 10-year US Treasury range is currently 3.50% - 4.50% and have structured our portfolios for a steeper yield curve, likely driven by a fall in short-term rates as inflation moderates combined with secular trends that could potentially keep a floor under long-term yields.
Corporate fundamentals appear stable and while there has been some recent weakness in broader fundamentals, factors such as leverage and interest coverage ratios remain strong in a historical context, and specific to the high yield market, the maturity wall seems manageable in our opinion through 2025. Our Credit Health Index (CHIN) suggests defaults/losses will remain relatively low, while slowly increasing to more normal levels associated with a ‘late-cycle’ environment. Throughout 2023, we have been monitoring the pace of corporate earnings growth as an indicator of future economic activity. Positive earnings growth in the third quarter of 2023 confirmed our view that earnings would likely trough by the end of the year. The earnings recession experienced over the first half of 2023 was not deep enough to drive the credit cycle into downturn and improving earnings growth should alleviate some pressure for companies to aggressively cut costs through job cuts, in our opinion. Under this scenario, the economic downside is likely a mild or shallow recession, as we believe unemployment will remain low and a healthy consumer combined with stable corporate fundamentals should serve to minimize the potential for a hard landing by providing a floor to economic activity.
We believe that value has returned to fixed income markets and a combination of discount-to-par (positive convexity), favorable yields and an increase in issuer performance dispersion is helping to create opportunities in the bond markets. In our view, bond markets will likely be supported with strong demand as investors sit on record levels of cash that will be seeking yield as the Fed potentially cuts rates on the front end. We are mindful of the risks going forward, such as tighter financial conditions and their impact on the financial system, slower Chinese economic growth, geopolitical risk, the broader economic impact of a further decline in the commercial real estate market, and the upcoming US Presidential election. We believe that much of the turmoil leaves us with a wide range of potential outcomes for growth, inflation and central bank policy response. Based on the uncertain backdrop, we feel it is prudent to maintain a balanced risk profile between interest rate and spread risk. While our average position in liquid reserves was reduced in 2023, we continue to maintain liquidity as we patiently wait for
opportunities to potentially develop. If volatility increases and we see what we view as more attractive yields and spreads, we would consider redeploying reserves.
1 A credit cycle is a cyclical pattern that follows credit availability and corporate health.
Hypothetical Growth of $100,000 Investment in Institutional Class Shares1 |
December 31, 2013 through December 31, 2023 |
Average Annual Total Returns —December 31, 20231 |
| | | | |
| | |
| | | | | |
| | | | | |
| | | | | |
| | | | | |
| | | | | |
Bloomberg U.S. Government/Credit Bond Index2 | | | | | |
Performance data shown represents past performance and is no guarantee of, and not necessarily indicative of, future results. Total return and value will vary, and you may have a gain or loss when shares are sold. Current performance may be lower or higher than quoted. For most recent month-end performance, visit loomissayles.com. Performance for other share classes will be greater or less than shown based on differences in fees and sales charges. You may not invest directly in an index. Performance for periods less than one year is cumulative, not annualized. Returns reflect changes in share price and reinvestment of dividends and capital gains, if any. The table(s) do not reflect taxes shareholders might owe on any fund distributions or when they redeem their shares.
| Fund performance has been increased by fee waivers and/or expense reimbursements, if any, without which performance would have been lower. |
| Bloomberg U.S. Government/Credit Bond Index is the non-securitized component of the Bloomberg U.S. Aggregate Bond Index. The Index includes investment grade, U.S. dollar-denominated, fixed rate Treasuries (i.e., public obligations of the U.S. Treasury that have remaining maturities of more than one year), government-related issues (i.e., agency, sovereign, supranational, and local authority debt), and corporate securities. |
| Expense ratios are as shown in the Fund’s prospectus in effect as of the date of this report. The expense ratios for the current reporting period can be found in the Financial Highlights section of this report under Ratios to Average Net Assets. Net expenses reflect contractual expense limitations set to expire on 4/30/25. When a Fund’s expenses are below the limitation, gross and net expense ratios will be the same. See Note 6 of the Notes to Financial Statements for more information about the Fund’s expense limitations. |
Loomis Sayles Investment Grade Fixed Income Fund
| Effective December 31, 2023, Elaine M. Stokes no longer serves as portfolio manager of the Fund. |
Investment ObjectiveThe Fund's investment objective is above-average total investment return through a combination of current income and capital appreciation.
Market Conditions
The bond market finished 2023 with positive total returns, but the favorable end result obscures the elevated volatility that occurred along the way. For most of the year, bonds were under pressure from concerns about persistent inflation and the US Federal Reserve’s (Feds) continued interest rate increases. As late as October, the headline US investment-grade bond indexes were in negative territory on a year-to-date basis amid worries that the Fed would have to keep interest rates “higher for longer.”
This backdrop changed considerably in November and December, as the concerns that had weighed on the market throughout 2023 dissipated rapidly. Inflation continued to decline unabated, despite concerns about rising oil prices in the third quarter. In November, the headline Consumer Price Index came in at inflation rates not seen since early 2021. With inflation receding, the markets grew comfortable with the idea that the Fed was finished raising rates. In December, Fed Chairman Jerome Powell added to the upbeat tone with comments suggesting that rate cuts could begin as early as the first half of 2024. Bond prices took another leg higher in response, erasing all previous losses and helping the fixed-income market close with solid gains for the full year. Income also made a meaningful contribution to total returns thanks to the increase in yields over the past two years.
US Treasuries registered gains for the year, albeit with unusually high volatility brought about by the shifting interest rate outlook. The yield on the two-year note, which came into 2023 at 4.41%, rose as high as 5.19% in mid-October before falling sharply to finish December at 4.23%. The ten-year issue took a similar path, moving from 3.88% at the end of 2022 to 4.99% in October and ultimately closing at the same 3.88% level where it began. The yield curve remained inverted for all of 2023, meaning that short-term debt offered higher yields than longer-term issues – an unusual condition that is often seen as a precursor to a recession. However, through the remainder of the year the extent of the inversion gradually receded from its July high.
Corporate bonds delivered a robust gain and outperformed US Treasuries. In addition to benefiting from the drop in Treasury yields in the fourth quarter, the asset class was boosted by the environment of positive economic growth, continued strength in corporate earnings, and investors’ hearty appetite for risk. Corporates’ above-average yield was an additional factor in their positive relative performance.
High-yield corporate bonds logged a double-digit gain in 2023 and strongly outpaced the investment grade market. A large contribution from yield helped results, as did a decline in yield spreads brought about by better-than-expected corporate earnings and investors’ elevated appetite for risk. Senior loans, which typically feature floating rates, benefited from the rising-rate environment in the first ten months of the year and finished as one of the top-performing segments of the bond market.
Securitized assets produced largely positive total returns in 2023. Collateralized loan obligations (CLOs) and commercial asset-backed securities (ABS) delivered particularly strong gains. Portions of the residential mortgage-backed securities (RMBS) market also outperformed. Headwinds facing the commercial real estate sector emerged in the first half of 2023, negatively impacting non-agency commercial mortgage-backed securities’ (CMBS) performance for the full year. Generally, the higher-yielding securitized credit sectors performed best. A challenging supply-and-demand backdrop negatively impacted agency mortgage-backed securities (MBS) as elevated levels of interest-rate volatility continued and historically large buyers of agency MBS (banks and the Fed) pulled back from the market. Still, agency MBS outperformed US Treasuries for the year.
Developed market government bonds generated gains in 2023, although weakness in foreign currencies dampened returns somewhat for US dollar investors. Emerging markets debt outperformed US investment grade bonds thanks to investors’ hearty appetite for risk and the positive economic growth trends for many countries in the asset class.
Performance Results
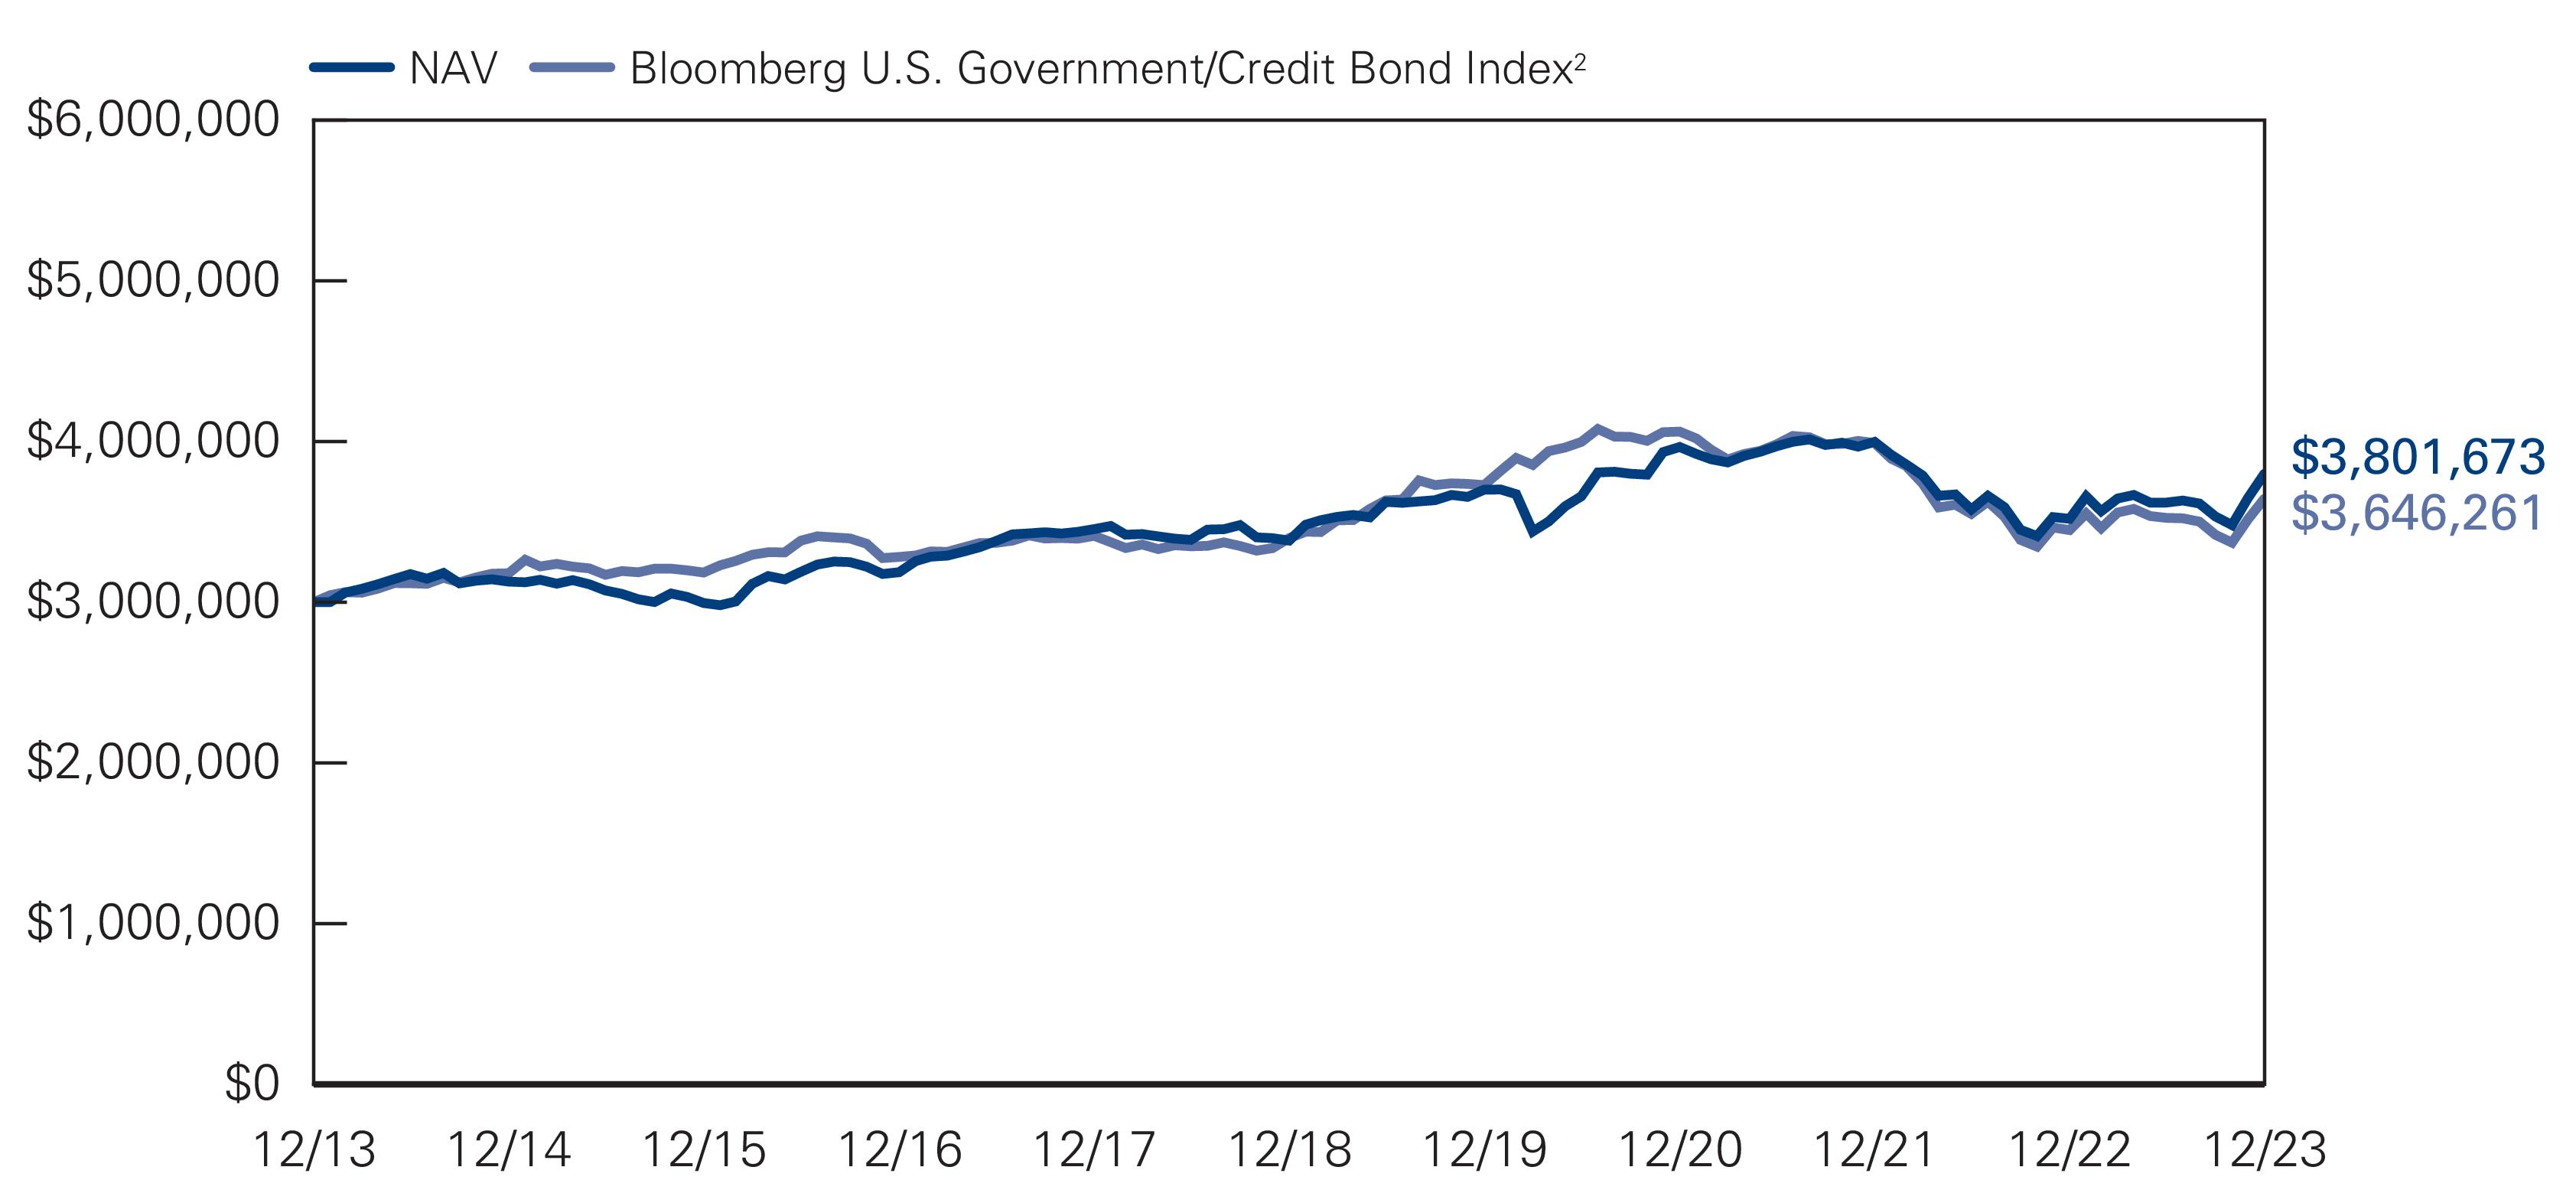
For the 12 months ended December 31, 2023, Institutional Class shares of the Loomis Sayles Investment Grade Fixed Income Fund returned 8.00% at net asset value. The Fund outperformed its benchmark, the Bloomberg U.S. Government/Credit Bond Index, which returned 5.72%.
Loomis Sayles Investment Grade Fixed Income Fund
Explanation of Fund Performance
The overall fixed income markets posted strong returns in 2023 with the Fund outperforming its index, mostly due to positive security selection. Bond selection in investment grade corporate credit was a contributor to performance over the year, with select names in the consumer cyclical and banking sectors providing positive returns. Securitized credit was also beneficial given the asset class's shorter duration profile, where holdings in ABS and CLOs aided returns. Within high yield credit, select names in the finance companies sector along with our higher conviction names in the communication space were positive contributors.
Exposure to emerging market credit was negative during the year. Underperformance was derived primarily from holdings in Chinese property names as this sector has remained under continued pressure. An allocation to convertibles was also a detractor, led by select names in the communications and transportation space. The overall allocation to US Treasuries was positive as the Fund was underweight throughout the year. However, treasury futures were used to manage duration, and these positions were detractors.
Outlook
US inflation — while still above the Fed’s 2% target — continued to decline from its mid-2022 peak and provided the Fed with enough flexibility in December 2023 to signal the tightening cycle is over. Fed Chair Jerome Powell sent a clear message to investors that he did not want to restrict the economy longer than necessary and stated that interest rate cuts would occur over the next year. This fueled a bond market rally in the second half of the fourth quarter, which saw the 10-year US Treasury yield fall to 3.88% at year-end after peaking at 4.99% on October 19, 2023. Optimism for Fed cuts and the potential for a soft landing also drove a rally in risk assets. We saw tighter investment grade and high yield spreads, coupled with declining interest rates, which helped to boost fixed income returns, resulting in positive calendar year returns in most fixed income sectors.
In our view, the credit cycle1 is firmly in the ‘late cycle’ stage. Monetary policy is in restrictive territory and lending standards have tightened. Up to this point, the US labor market has been resilient and underpinned consumer spending, while corporate fundamentals have remained stable and supportive of economic activity. Looking forward, we believe that economic growth is decelerating. Our base case calls for below-trend US growth in 2024, however, we do not anticipate a technical recession of back-to-back quarters with negative gross domestic product (GDP). We expect European economic growth to remain stagnant while economic growth in China is showing signs of bottoming, but continues to remain sluggish.
We believe that inflation has peaked and positive real rates should have the effect of slowing growth and continuing to lower inflation over time. The Fed appears to be satisfied with the progress it has made against inflation and now sees labor market/economic softening as an equal risk to inflation, thus the pivot. We believe the market may be too aggressive in pricing in rate cuts for 2024, as we believe it will take longer for core inflation to hit the Fed’s target and that Fed easing may ultimately come in some combination of rate cuts and a slowing of balance sheet normalization. Our view is that inflation will be ‘unstable’ over the long term as secular trends, such as deglobalization, decarbonization and the greenification of energy sources, aging demographics, and growing government deficits, have the potential to keep a floor under inflation but also have the potential to make it more volatile going forward. We expect to see dips in inflation as the cycles progress, but believe we're likely to experience higher lows than what we've experienced over the last 15 years. From an interest rate risk perspective, we believe the 10-year US Treasury range is currently 3.50% - 4.50% and have structured our portfolios for a steeper yield curve, likely driven by a fall in short-term rates as inflation moderates combined with secular trends that could potentially keep a floor under long-term yields.
Corporate fundamentals appear stable and while there has been some recent weakness in broader fundamentals, factors such as leverage and interest coverage ratios remain strong in a historical context, and specific to the high yield market, the maturity wall seems manageable in our opinion through 2025. Our Credit Health Index (CHIN) suggests defaults/losses will remain relatively low, while slowly increasing to more normal levels associated with a ‘late-cycle’ environment. Throughout 2023, we have been monitoring the pace of corporate earnings growth as an indicator of future economic activity. Positive earnings growth in the third quarter of 2023 confirmed our view that earnings would likely trough by the end of the year. The earnings recession experienced over the first half of 2023 was not deep enough to drive the credit cycle into downturn and improving earnings growth should alleviate some pressure for companies to aggressively cut costs through job cuts, in our opinion. Under this scenario, the economic downside is likely a mild or shallow recession, as we believe unemployment will remain low and a healthy consumer combined with stable corporate fundamentals should serve to minimize the potential for a hard landing by providing a floor to economic activity.
We believe that value has returned to fixed income markets and a combination of discount-to-par (positive convexity), favorable yields and an increase in issuer performance dispersion is helping to create opportunities in the bond markets. In our view, bond markets will likely be supported with strong demand as investors sit on record levels of cash that will be seeking yield as the Fed potentially cuts rates on the front end. We are mindful of the risks going forward, such as tighter financial conditions and their impact on the financial system, slower Chinese economic growth, geopolitical risk, the broader economic impact of a further decline in the commercial real estate market, and the upcoming US Presidential election. We believe that much of the turmoil leaves us with a wide range of potential outcomes for growth, inflation and central bank policy response. Based on the uncertain backdrop, we feel it is prudent to maintain a balanced risk profile between interest rate and spread risk. While our average position in liquid reserves was reduced in 2023, we continue to maintain liquidity as we patiently wait for
opportunities to potentially develop. If volatility increases and we see what we view as more attractive yields and spreads, we would consider redeploying reserves.
1 A credit cycle is a cyclical pattern that follows credit availability and corporate health.
Hypothetical Growth of $3,000,000 Investment in Institutional Class Shares1 |
December 31, 2013 through December 31, 2023 |
Average Annual Total Returns —December 31, 20231 |
| | | | |
| | |
| | | | | |
| | | | | |
Bloomberg U.S. Government/Credit Bond Index2 | | | | | |
Performance data shown represents past performance and is no guarantee of, and not necessarily indicative of, future results. Total return and value will vary, and you may have a gain or loss when shares are sold. Current performance may be lower or higher than quoted. For most recent month-end performance, visit loomissayles.com. Performance for other share classes will be greater or less than shown based on differences in fees and sales charges. You may not invest directly in an index. Performance for periods less than one year is cumulative, not annualized. Returns reflect changes in share price and reinvestment of dividends and capital gains, if any. The table(s) do not reflect taxes shareholders might owe on any fund distributions or when they redeem their shares.
| Fund performance has been increased by fee waivers and/or expense reimbursements, if any, without which performance would have been lower. |
| Bloomberg U.S. Government/Credit Bond Index is the non-securitized component of the Bloomberg U.S. Aggregate Bond Index. The Index includes investment grade, U.S. dollar-denominated, fixed rate Treasuries (i.e., public obligations of the U.S. Treasury that have remaining maturities of more than one year), government-related issues (i.e., agency, sovereign, supranational, and local authority debt), and corporate securities. |
| Expense ratios are as shown in the Fund’s prospectus in effect as of the date of this report. The expense ratios for the current reporting period can be found in the Financial Highlights section of this report under Ratios to Average Net Assets. Net expenses reflect contractual expense limitations set to expire on 4/30/25. When a Fund’s expenses are below the limitation, gross and net expense ratios will be the same. See Note 6 of the Notes to Financial Statements for more information about the Fund’s expense limitations. |
ADDITIONAL INFORMATION
The views expressed in this report reflect those of the portfolio managers as of the dates indicated. The managers’ views are subject to change at any time without notice based on changes in market or other conditions. References to specific securities or industries should not be regarded as investment advice. Because the Funds are actively managed, there is no assurance that they will continue to invest in the securities or industries mentioned.
All investing involves risk, including the risk of loss. There is no assurance that any investment will meet its performance objectives or that losses will be avoided.
Additional Index Information
This document may contain references to third party copyrights, indexes, and trademarks, each of which is the property of its respective owner. Such owner is not affiliated with Natixis Investment Managers or any of its related or affiliated companies (collectively “Natixis Affiliates”) and does not sponsor, endorse or participate in the provision of any Natixis Affiliates services, funds or other financial products.
The index information contained herein is derived from third parties and is provided on an “as is” basis. The user of this information assumes the entire risk of use of this information. Each of the third party entities involved in compiling, computing or creating index information disclaims all warranties (including, without limitation, any warranties of originality, accuracy, completeness, timeliness, non-infringement, merchantability and fitness for a particular purpose) with respect to such information.
Proxy Voting Information
A description of the Funds' proxy voting policies and procedures is available without charge, upon request, by calling Loomis Sayles Funds at 800-633-3330; on the Funds’ website at www.loomissayles.com, and on the Securities and Exchange Commission (“SEC”) website at www.sec.gov. Information regarding how the Funds voted proxies relating to portfolio securities during the most recent 12-month period ended June 30 is available through the Funds’ website and the SEC website.
Quarterly Portfolio Schedules
The Loomis Sayles Funds file a complete schedule of portfolio holdings with the SEC for the first and third quarters of each fiscal year as an exhibit to its reports on Form N-PORT. The Funds’ Form N-PORT reports are available on the SEC website at www.sec.gov. First and third quarter schedules of portfolio holdings are also available at loomissayles.com. A hard copy may be requested from the Fund at no charge by calling 800-633-3330.
Tailored Shareholder Reports for Mutual Funds and Exchange-Traded Funds
In October 2022, the SEC adopted rule and form amendments requiring mutual funds and exchange-traded funds to transmit concise and visually engaging streamlined annual and semiannual reports that highlight key information to shareholders. Other information, including financial statements, will no longer appear in the funds’ shareholder reports but will be available online, delivered free of charge upon request, and filed with the SEC on a semiannual basis on Form N-CSR. The rule and form amendments have a compliance date of July 24, 2024.
CFA® and Chartered Financial Analyst® are registered trademarks owned by the CFA Institute.
Understanding Your Fund's Expenses
As a mutual fund shareholder, you incur two types of costs: (1) transaction costs, and (2) ongoing costs, including management fees, distribution and/or service fees ("12b-1 fees"), and other fund expenses. Certain exemptions may apply. These costs are described in more detail in the Funds’ prospectus. The following examples are intended to help you understand the ongoing costs of investing in the Funds and help you compare these with the ongoing costs of investing in other mutual funds.
The first line in the table of each class of Fund shares shows the actual account values and actual Fund expenses you would have paid on a $1,000 investment in the Fund from July 1, 2023 through December 31, 2023. To estimate the expenses you paid over the period, simply divide your account value by $1,000 (for example $8,600 account value divided by $1,000 = 8.60) and multiply the result by the number in the Expenses Paid During Period column as shown for your class.
The second line in the table for each class of fund shares provides information about hypothetical account values and hypothetical expenses based on the Fund’s actual expense ratios and an assumed rate of return of 5% per year before expenses, which is not the Fund’s actual return. The hypothetical account values and expenses may not be used to estimate the actual ending account balance or expenses you paid on your investment for the period. You may use this information to compare the ongoing costs of investing in each Fund and other funds. To do so, compare this 5% hypothetical example with the 5% hypothetical examples that appear in the shareholder reports of the other funds.
Please note that the expenses shown reflect ongoing costs only, and do not include any transaction costs, such as sales charges. Therefore, the second line in the table of each fund is useful in comparing ongoing costs only, and will not help you determine the relative costs of owning funds. If transaction costs were included, total costs would be higher.
| Beginning
Account Value
7/1/2023 | Ending
Account Value
12/31/2023 | Expenses Paid
7/1/2023 – 12/31/2023 |
| | | |
| | | |
Hypothetical (5% return before expenses) | | | |
| | | |
| | | |
Hypothetical (5% return before expenses) | | | |
| | | |
| | | |
Hypothetical (5% return before expenses) | | | |
| | | |
| | | |
Hypothetical (5% return before expenses) | | | |
| Expenses are equal to the Fund's annualized expense ratio (after waiver/reimbursement): 0.66%, 0.91%, 1.16% and 0.61% for Institutional Class, Retail Class, Admin Class and Class N, respectively, multiplied by the average account value over the period, multiplied by the number of days in the most recent fiscal half–year (184), divided by 365 (to reflect the half–year period). |
Loomis Sayles Investment Grade Fixed Income Fund | Beginning
Account Value
7/1/2023 | Ending
Account Value
12/31/2023 | Expenses Paid
7/1/2023 – 12/31/2023 |
| | | |
| | | |
Hypothetical (5% return before expenses) | | | |
| Expenses are equal to the Fund's annualized expense ratio (after waiver/reimbursement) of 0.53%, multiplied by the average account value over the period, multiplied by the number of days in the most recent fiscal half–year (184), divided by 365 (to reflect the half–year period). |
Portfolio of Investments – as of December 31, 2023Loomis Sayles Bond Fund
| | |
Bonds and Notes — 87.3% of Net Assets |
|
|
Non-Convertible Bonds — 79.9% |
| |
| American Credit Acceptance Receivables Trust, Series 2022-1, Class D, 2.460%, 3/13/2028(a) | |
| American Credit Acceptance Receivables Trust, Series 2022-4, Class C, 7.860%, 2/15/2029(a) | |
| Avis Budget Rental Car Funding AESOP LLC, Series 2018-2A, Class D, 3.040%, 3/20/2025(a) | |
| Avis Budget Rental Car Funding AESOP LLC, Series 2020-2A, Class C, 4.250%, 2/20/2027(a) | |
| Avis Budget Rental Car Funding AESOP LLC, Series 2021-1A, Class C, 2.130%, 8/20/2027(a) | |
| Avis Budget Rental Car Funding AESOP LLC, Series 2021-2A, Class C, 2.350%, 2/20/2028(a) | |
| Avis Budget Rental Car Funding AESOP LLC, Series 2023-8A, Class C, 7.340%, 2/20/2030(a) | |
| CarMax Auto Owner Trust, Series 2022-1, Class D, 2.470%, 7/17/2028 | |
| Carvana Auto Receivables Trust, Series 2021-N3, Class C, 1.020%, 6/12/2028 | |
| Carvana Auto Receivables Trust, Series 2021-N4, Class C, 1.720%, 9/11/2028 | |
| Carvana Auto Receivables Trust, Series 2021-N4, Class D, 2.300%, 9/11/2028 | |
| Carvana Auto Receivables Trust, Series 2021-P3, Class C, 1.930%, 10/12/2027 | |
| Carvana Auto Receivables Trust, Series 2021-P4, Class C, 2.330%, 2/10/2028 | |
| Carvana Auto Receivables Trust, Series 2023-N4, Class D, 7.220%, 2/11/2030(a) | |
| Credit Acceptance Auto Loan Trust, Series 2021-3A, Class C, 1.630%, 9/16/2030(a) | |
| Credit Acceptance Auto Loan Trust, Series 2021-4, Class C, 1.940%, 2/18/2031(a) | |
| Exeter Automobile Receivables Trust, Series 2022-6A, Class C, 6.320%, 5/15/2028 | |
| | |
|
| |
| Exeter Automobile Receivables Trust, Series 2023-2A, Class D, 6.320%, 8/15/2029 | |
| First Investors Auto Owner Trust, Series 2022-2A, Class D, 8.710%, 10/16/2028(a) | |
| Ford Credit Auto Lease Trust, Series 2023-B, Class D, 6.970%, 6/15/2028 | |
| Foursight Capital Automobile Receivables Trust, Series 2021-2, Class D, 1.920%, 9/15/2027(a) | |
| GLS Auto Receivables Issuer Trust, Series 2021-3A, Class D, 1.480%, 7/15/2027(a) | |
| GLS Auto Receivables Issuer Trust, Series 2021-4A, Class D, 2.480%, 10/15/2027(a) | |
| GLS Auto Receivables Issuer Trust, Series 2023-2A, Class D, 6.310%, 3/15/2029(a) | |
| Hertz Vehicle Financing III LLC, Series 2022-1A, Class D, 4.850%, 6/25/2026(a) | |
| Hertz Vehicle Financing III LLC, Series 2022-3A, Class D, 6.310%, 3/25/2025(a) | |
| Hertz Vehicle Financing III LLC, Series 2023-1A, Class D2, 9.130%, 6/25/2027(a) | |
| Hertz Vehicle Financing III LLC, Series 2023-2A, Class D, 9.400%, 9/25/2029(a) | |
| Hertz Vehicle Financing LLC, Series 2022-2A, Class D, 5.160%, 6/26/2028(a) | |
| Hertz Vehicle Financing LLC, Series 2022-4A, Class D, 6.560%, 9/25/2026(a) | |
| JPMorgan Chase Bank N.A, Series 2021-3, Class D, 1.009%, 2/26/2029(a) | |
| Prestige Auto Receivables Trust, Series 2022-1A, Class D, 8.080%, 8/15/2028(a) | |
| Santander Bank Auto Credit-Linked Notes, Series 2021-1A, Class B, 1.833%, 12/15/2031(a) | |
| Westlake Automobile Receivables Trust, Series 2021-3A, Class D, 2.120%, 1/15/2027(a) | |
| Westlake Automobile Receivables Trust, Series 2023-4A, Class D, 7.190%, 7/16/2029(a) | |
| | |
See accompanying notes to financial statements.
Portfolio of Investments – as of December 31, 2023Loomis Sayles Bond Fund (continued) | | |
|
| |
| Mission Lane Credit Card Master Trust, Series 2023-B, Class A, 7.690%, 11/15/2028(a) | |
| |
| 510 Asset-Backed Trust, Series 2021-NPL1, Class A1, 2.240%, 6/25/2061(a)(b) | |
| CoreVest American Finance Ltd., Series 2021-1, Class C, 2.800%, 4/15/2053(a) | |
| CoreVest American Finance Ltd., Series 2021-2, Class C, 2.478%, 7/15/2054(a) | |
| CoreVest American Finance Ltd., Series 2021-3, Class D, 3.469%, 10/15/2054(a) | |
| CoreVest American Finance Ltd., Series 2023-RTL1, Class A1, 7.553%, 12/28/2030(a)(b) | |
| Credit Suisse Mortgage Trust, Series 2021-RPL6, Class M2, 3.125%, 10/25/2060(a) | |
| FirstKey Homes Trust, Series 2021-SFR1, Class E1, 2.389%, 8/17/2038(a) | |
| FirstKey Homes Trust, Series 2021-SFR2, Class E1, 2.258%, 9/17/2038(a) | |
| FirstKey Homes Trust, Series 2021-SFR2, Class E2, 2.358%, 9/17/2038(a) | |
| GITSIT Mortgage Loan Trust, Series 2023-NPL1, Class A1, 8.353%, 5/25/2053(a)(b) | |
| Home Partners of America Trust, Series 2021-1, Class E, 2.577%, 9/17/2041(a) | |
| Home Partners of America Trust, Series 2021-2, Class E1, 2.852%, 12/17/2026(a) | |
| Home Partners of America Trust, Series 2021-2, Class E2, 2.952%, 12/17/2026(a) | |
| Legacy Mortgage Asset Trust, Series 2021-GS2, Class A1, 1.750%, 4/25/2061(a)(b) | |
| Legacy Mortgage Asset Trust, Series 2021-GS4, Class A1, 1.650%, 11/25/2060(a)(b) | |
| Mill City Mortgage Loan Trust, Series 2019-GS1, Class M2, 3.250%, 7/25/2059(a)(b) | |
| Progress Residential Trust, Series 2021-SFR4, Class E1, 2.409%, 5/17/2038(a) | |
| | |
|
| ABS Home Equity — continued |
| Progress Residential Trust, Series 2021-SFR4, Class E2, 2.559%, 5/17/2038(a) | |
| Progress Residential Trust, Series 2021-SFR5, Class E1, 2.209%, 7/17/2038(a) | |
| Progress Residential Trust, Series 2021-SFR5, Class E2, 2.359%, 7/17/2038(a) | |
| Progress Residential Trust, Series 2021-SFR6, Class E1, 2.425%, 7/17/2038(a) | |
| Progress Residential Trust, Series 2021-SFR6, Class E2, 2.525%, 7/17/2038(a) | |
| Progress Residential Trust, Series 2021-SFR7, Class E1, 2.591%, 8/17/2040(a) | |
| Progress Residential Trust, Series 2021-SFR7, Class E2, 2.640%, 8/17/2040(a) | |
| Progress Residential Trust, Series 2021-SFR9, Class E1, 2.811%, 11/17/2040(a) | |
| Progress Residential Trust, Series 2021-SFR9, Class E2, 3.010%, 11/17/2040(a) | |
| Progress Residential Trust, Series 2023-SFR2, Class B, 4.500%, 10/17/2028(a) | |
| PRPM LLC, Series 2021-10, Class A1, 2.487%, 10/25/2026(a)(b) | |
| PRPM LLC, Series 2021-4, Class A1, 1.867%, 4/25/2026(a)(b) | |
| PRPM LLC, Series 2021-5, Class A1, 1.793%, 6/25/2026(a)(b) | |
| PRPM LLC, Series 2021-8, Class A1, 1.743%, 9/25/2026(a)(b) | |
| PRPM LLC, Series 2021-9, Class A1, 2.363%, 10/25/2026(a)(b) | |
| PRPM LLC, Series 2022-5, Class A1, 6.900%, 9/27/2027(a)(b) | |
| Redwood Funding Trust, Series 2023-1, Class A, 7.500%, 7/25/2059(a)(b) | |
| Toorak Mortgage Corp. Ltd., Series 2021-1, Class A1, 3.240%, 6/25/2024(a)(b) | |
| Towd Point Mortgage Trust, Series 2015-4, Class M2, 3.750%, 4/25/2055(a)(b) | |
| Towd Point Mortgage Trust, Series 2016-3, Class M2, 4.000%, 4/25/2056(a)(b) | |
See accompanying notes to financial statements.
Portfolio of Investments – as of December 31, 2023Loomis Sayles Bond Fund (continued) | | |
|
| ABS Home Equity — continued |
| Towd Point Mortgage Trust, Series 2017-3, Class A2, 3.000%, 7/25/2057(a)(b) | |
| Towd Point Mortgage Trust, Series 2019-4, Class M1, 3.500%, 10/25/2059(a)(b) | |
| Towd Point Mortgage Trust, Series 2020-1, Class A2B, 3.250%, 1/25/2060(a)(b) | |
| Towd Point Mortgage Trust, Series 2020-2, Class A2B, 3.000%, 4/25/2060(a)(b) | |
| Tricon Residential Trust, Series 2021-SFR1, Class E1, 2.794%, 7/17/2038(a) | |
| Tricon Residential Trust, Series 2021-SFR1, Class E2, 2.894%, 7/17/2038(a) | |
| VCAT LLC, Series 2021-NPL1, Class A1, 5.289%, 12/26/2050(a)(b) | |
| VCAT LLC, Series 2021-NPL5, Class A1, 1.868%, 8/25/2051(a)(b) | |
| VCAT LLC, Series 2021-NPL6, Class A1, 1.917%, 9/25/2051(a)(b) | |
| VOLT XCIV LLC, Series 2021-NPL3, Class A1, 2.240%, 2/27/2051(a)(b) | |
| | |
| |
| Affirm Asset Securitization Trust, Series 2023-B, Class A, 6.820%, 9/15/2028(a) | |
| Aqua Finance Trust, Series 2019-A, Class C, 4.010%, 7/16/2040(a) | |
| Aqua Finance Trust, Series 2021-A, Class B, 2.400%, 7/17/2046(a) | |
| BHG Securitization Trust, Series 2022-A, Class B, 2.700%, 2/20/2035(a) | |
| Castlelake Aircraft Securitization Trust, Series 2018-1, Class B, 5.300%, 6/15/2043(a) | |
| Castlelake Aircraft Structured Trust, Series 2019-1A, Class A, 3.967%, 4/15/2039(a) | |
| Elara HGV Timeshare Issuer LLC, Series 2021-A, Class C, 2.090%, 8/27/2035(a) | |
| Foundation Finance Trust, Series 2023-2A, Class B, 6.970%, 6/15/2049(a) | |
| FREED ABS Trust, Series 2021-2, Class C, 1.940%, 6/19/2028(a) | |
| FREED ABS Trust, Series 2021-3FP, Class D, 2.370%, 11/20/2028(a) | |
| | |
|
| |
| FREED ABS Trust, Series 2022-1FP, Class D, 3.350%, 3/19/2029(a) | |
| Frontier Issuer LLC, Series 2023-1, Class A2, 6.600%, 8/20/2053(a) | |
| HIN Timeshare Trust, Series 2020-A, Class C, 3.420%, 10/09/2039(a) | |
| HPEFS Equipment Trust, Series 2022-1A, Class D, 2.400%, 11/20/2029(a) | |
| HPEFS Equipment Trust, Series 2023-2A, Class D, 6.970%, 7/21/2031(a) | |
| Jack in the Box Funding LLC, Series 2019-1A, Class A2II, 4.476%, 8/25/2049(a) | |
| JOL Air Ltd., Series 2019-1, Class A, 3.967%, 4/15/2044(a) | |
| MAPS Trust, Series 2021-1A, Class A, 2.521%, 6/15/2046(a) | |
| Marlette Funding Trust, Series 2021-2A, Class C, 1.500%, 9/15/2031(a) | |
| Marlette Funding Trust, Series 2021-3A, Class C, 1.810%, 12/15/2031(a) | |
| MVW LLC, Series 2021-2A, Class C, 2.230%, 5/20/2039(a) | |
| Navigator Aircraft ABS Ltd., Series 2021-1, Class A, 2.771%, 11/15/2046(a)(b) | |
| Nelnet Student Loan Trust, Series 2021-A, Class B2, 2.850%, 4/20/2062(a) | |
| OneMain Financial Issuance Trust, Series 2021-1A, Class D, 2.470%, 6/16/2036(a) | |
| Republic Finance Issuance Trust, Series 2021-A, Class C, 3.530%, 12/22/2031(a) | |
| SCF Equipment Leasing LLC, Series 2021-1A, Class D, 1.930%, 9/20/2030(a) | |
| SCF Equipment Leasing LLC, Series 2022-2A, Class C, 6.500%, 8/20/2032(a) | |
| Shenton Aircraft Investment I Ltd., Series 2015-1A, Class A, 4.750%, 10/15/2042(a) | |
| Slam Ltd., Series 2021-1A, Class A, 2.434%, 6/15/2046(a) | |
| SoFi Consumer Loan Program Trust, Series 2021-1, Class D, 2.040%, 9/25/2030(a) | |
See accompanying notes to financial statements.
Portfolio of Investments – as of December 31, 2023Loomis Sayles Bond Fund (continued) | | |
|
| |
| WAVE Trust, Series 2017-1A, Class A, 3.844%, 11/15/2042(a) | |
| Willis Engine Structured Trust VI, Series 2021-A, Class A, 3.104%, 5/15/2046(a) | |
| | |
| |
| College Avenue Student Loans LLC, Series 2021-A, Class C, 2.920%, 7/25/2051(a) | |
| College Avenue Student Loans LLC, Series 2021-C, Class D, 4.110%, 7/26/2055(a) | |
| College Avenue Student Loans LLC, Series 2023-B, Class C, 7.580%, 6/25/2054(a) | |
| ELFI Graduate Loan Program LLC, Series 2021-A, Class B, 2.090%, 12/26/2046(a)(b) | |
| Navient Private Education Refi Loan Trust, Series 2021-EA, Class B, 2.030%, 12/16/2069(a) | |
| Navient Private Education Refi Loan Trust, Series 2021-FA, Class B, 2.120%, 2/18/2070(a) | |
| Nelnet Student Loan Trust, Series 2021-DA, Class C, 3.500%, 4/20/2062(a) | |
| Nelnet Student Loan Trust, Series 2021-DA, Class D, 4.380%, 4/20/2062(a) | |
| SMB Private Education Loan Trust, Series 2021-B, Class B, 2.650%, 7/17/2051(a) | |
| SMB Private Education Loan Trust, Series 2021-E, Class B, 2.490%, 2/15/2051(a) | |
| | |
| ABS Whole Business — 0.4% |
| Applebee's Funding LLC/IHOP Funding LLC, Series 2023-1A, Class A2, 7.824%, 3/05/2053(a) | |
| FOCUS Brands Funding, Series 2023-2, Class A2, 8.241%, 10/30/2053(a) | |
| Hardee's Funding LLC, Series 2021-1A, Class A2, 2.865%, 6/20/2051(a) | |
| | |
|
| ABS Whole Business — continued |
| Planet Fitness Master Issuer LLC, Series 2019-1A, Class A2, 3.858%, 12/05/2049(a) | |
| Planet Fitness Master Issuer LLC, Series 2022-1A, Class A2I, 3.251%, 12/05/2051(a) | |
| | |
| Aerospace & Defense — 0.5% |
| Embraer Netherlands Finance BV, 7.000%, 7/28/2030(a) | |
| RTX Corp., 2.375%, 3/15/2032 | |
| RTX Corp., 5.150%, 2/27/2033 | |
| | |
| |
| American Airlines Pass-Through Trust, Series 2016-3, Class B, 3.750%, 4/15/2027 | |
| American Airlines Pass-Through Trust, Series 2017-2, Class B, 3.700%, 4/15/2027 | |
| | |
| |
| General Motors Financial Co., Inc., 3.100%, 1/12/2032 | |
| General Motors Financial Co., Inc., 3.600%, 6/21/2030 | |
| General Motors Financial Co., Inc., 5.850%, 4/06/2030 | |
| General Motors Financial Co., Inc., 6.400%, 1/09/2033 | |
| General Motors Financial Co., Inc., Series A, (fixed rate to 9/30/2027, variable rate thereafter), 5.750%(c) | |
| General Motors Financial Co., Inc., Series C, (fixed rate to 9/30/2030, variable rate thereafter), 5.700%(c) | |
| ZF North America Capital, Inc., 6.875%, 4/14/2028(a) | |
| ZF North America Capital, Inc., 7.125%, 4/14/2030(a) | |
| | |
| |
| AIB Group PLC, (fixed rate to 9/13/2028, variable rate thereafter), 6.608%, 9/13/2029(a) | |
| Ally Financial, Inc., Series B, (fixed rate to 5/15/2026, variable rate thereafter), 4.700%(c) | |
| Ally Financial, Inc., Series C, (fixed rate to 5/15/2028, variable rate thereafter), 4.700%(c) | |
See accompanying notes to financial statements.
Portfolio of Investments – as of December 31, 2023Loomis Sayles Bond Fund (continued) | | |
|
| |
| Bank of America Corp., (fixed rate to 9/15/2033, variable rate thereafter), 5.872%, 9/15/2034 | |
| Barclays PLC, (fixed rate to 3/15/2028, variable rate thereafter), 4.375%(c) | |
| Barclays PLC, (fixed rate to 9/23/2030, variable rate thereafter), 3.564%, 9/23/2035 | |
| BNP Paribas SA, (fixed rate to 8/12/2030, variable rate thereafter), 2.588%, 8/12/2035(a) | |
| CaixaBank SA, (fixed rate to 9/13/2033, variable rate thereafter), 6.840%, 9/13/2034(a) | |
| Deutsche Bank AG, (fixed rate to 10/07/2031, variable rate thereafter), 3.742%, 1/07/2033 | |
| Deutsche Bank AG, (fixed rate to 10/14/2030, variable rate thereafter), 3.729%, 1/14/2032 | |
| Deutsche Bank AG, (fixed rate to 12/01/2027, variable rate thereafter), 4.875%, 12/01/2032 | |
| ING Groep NV, (fixed rate to 9/11/2033, variable rate thereafter), 6.114%, 9/11/2034 | |
| Intesa Sanpaolo SpA, 7.200%, 11/28/2033(a) | |
| Intesa Sanpaolo SpA, (fixed rate to 6/1/2031, variable rate thereafter), 4.198%, 6/01/2032(a) | |
| Morgan Stanley, (fixed rate to 1/19/2033, variable rate thereafter), 5.948%, 1/19/2038 | |
| NatWest Group PLC, (fixed rate to 8/28/2030, variable rate thereafter), 3.032%, 11/28/2035 | |
| Synchrony Bank, 5.625%, 8/23/2027 | |
| UBS Group AG, (fixed rate to 1/12/2028, variable rate thereafter), 3.869%, 1/12/2029(a) | |
| UBS Group AG, (fixed rate to 11/15/2032, variable rate thereafter), 9.016%, 11/15/2033(a) | |
| UBS Group AG, (fixed rate to 5/14/2031, variable rate thereafter), 3.091%, 5/14/2032(a) | |
| UBS Group AG, (fixed rate to 8/11/2027, variable rate thereafter), 6.442%, 8/11/2028(a) | |
| | |
|
| |
| UBS Group AG, (fixed rate to 8/12/2032, variable rate thereafter), 6.537%, 8/12/2033(a) | |
| UniCredit SpA, (fixed rate to 6/30/2030, variable rate thereafter), 5.459%, 6/30/2035(a) | |
| | |
| |
| Jefferies Financial Group, Inc., 6.250%, 1/15/2036 | |
| Building Materials — 1.3% |
| Cemex SAB de CV, 3.875%, 7/11/2031(a) | |
| Cemex SAB de CV, (fixed rate to 3/14/2028, variable rate thereafter), 9.125%(a)(c) | |
| Cemex SAB de CV, (fixed rate to 6/08/2026, variable rate thereafter), 5.125%(a)(c) | |
| Masco Corp., 6.500%, 8/15/2032 | |
| | |
| |
| CCO Holdings LLC/CCO Holdings Capital Corp., 4.250%, 1/15/2034(a) | |
| Charter Communications Operating LLC/Charter Communications Operating Capital, 2.300%, 2/01/2032 | |
| Charter Communications Operating LLC/Charter Communications Operating Capital, 2.800%, 4/01/2031 | |
| Charter Communications Operating LLC/Charter Communications Operating Capital, 3.700%, 4/01/2051 | |
| Charter Communications Operating LLC/Charter Communications Operating Capital, 3.850%, 4/01/2061 | |
| Charter Communications Operating LLC/Charter Communications Operating Capital, 3.950%, 6/30/2062 | |
| Charter Communications Operating LLC/Charter Communications Operating Capital, 4.400%, 4/01/2033 | |
| Charter Communications Operating LLC/Charter Communications Operating Capital, 5.125%, 7/01/2049 | |
| CSC Holdings LLC, 3.375%, 2/15/2031(a) | |
See accompanying notes to financial statements.
Portfolio of Investments – as of December 31, 2023Loomis Sayles Bond Fund (continued) | | |
|
| Cable Satellite — continued |
| CSC Holdings LLC, 4.125%, 12/01/2030(a) | |
| CSC Holdings LLC, 4.500%, 11/15/2031(a) | |
| CSC Holdings LLC, 4.625%, 12/01/2030(a) | |
| CSC Holdings LLC, 5.000%, 11/15/2031(a) | |
| CSC Holdings LLC, 5.375%, 2/01/2028(a) | |
| CSC Holdings LLC, 5.750%, 1/15/2030(a) | |
| DISH DBS Corp., 5.125%, 6/01/2029 | |
| DISH DBS Corp., 5.250%, 12/01/2026(a) | |
| DISH DBS Corp., 5.750%, 12/01/2028(a) | |
| DISH DBS Corp., 7.750%, 7/01/2026 | |
| Time Warner Cable LLC, 4.500%, 9/15/2042 | |
| Time Warner Cable LLC, 5.875%, 11/15/2040 | |
| | |
| |
| Braskem Netherlands Finance BV, 4.500%, 1/31/2030(a) | |
| Braskem Netherlands Finance BV, 5.875%, 1/31/2050(a) | |
| Braskem Netherlands Finance BV, 8.500%, 1/12/2031(a) | |
| Celanese U.S. Holdings LLC, 6.330%, 7/15/2029 | |
| Celanese U.S. Holdings LLC, 6.550%, 11/15/2030 | |
| Celanese U.S. Holdings LLC, 6.700%, 11/15/2033 | |
| | |
| Construction Machinery — 0.1% |
| Ashtead Capital, Inc., 5.500%, 8/11/2032(a) | |
| Ashtead Capital, Inc., 5.550%, 5/30/2033(a) | |
| | |
| Consumer Cyclical Services — 1.3% |
| TriNet Group, Inc., 3.500%, 3/01/2029(a) | |
| Uber Technologies, Inc., 4.500%, 8/15/2029(a) | |
| Uber Technologies, Inc., 6.250%, 1/15/2028(a) | |
| | |
| | |
|
| |
| Natura Cosmeticos SA, 4.125%, 5/03/2028(a) | |
| Diversified Manufacturing — 0.4% |
| Ingersoll Rand, Inc., 5.700%, 8/14/2033 | |
| Nordson Corp., 5.800%, 9/15/2033 | |
| Veralto Corp., 5.450%, 9/18/2033(a) | |
| | |
| |
| Alta Wind Holdings LLC, 7.000%, 6/30/2035(a) | |
| Enel Generacion Chile SA, 7.875%, 2/01/2027 | |
| Southern Co., 5.700%, 3/15/2034 | |
| | |
| |
| AerCap Ireland Capital DAC/AerCap Global Aviation Trust, 3.000%, 10/29/2028 | |
| AerCap Ireland Capital DAC/AerCap Global Aviation Trust, 3.300%, 1/30/2032 | |
| AerCap Ireland Capital DAC/AerCap Global Aviation Trust, 3.400%, 10/29/2033 | |
| AerCap Ireland Capital DAC/AerCap Global Aviation Trust, 6.150%, 9/30/2030 | |
| AGFC Capital Trust I, 3 mo. USD SOFR + 2.012%, 7.406%, 1/15/2067(a)(b) | |
| Air Lease Corp., Series B, (fixed rate to 6/15/2026, variable rate thereafter), 4.650%(c) | |
| Aircastle Ltd., Series A, (fixed rate to 6/15/2026, variable rate thereafter), 5.250%(a)(c) | |
| Ares Capital Corp., 2.875%, 6/15/2028 | |
| Ares Capital Corp., 3.200%, 11/15/2031 | |
| Aviation Capital Group LLC, 1.950%, 1/30/2026(a) | |
| Aviation Capital Group LLC, 6.250%, 4/15/2028(a) | |
| Aviation Capital Group LLC, 6.750%, 10/25/2028(a) | |
| Barings BDC, Inc., 3.300%, 11/23/2026 | |
| Blackstone Secured Lending Fund, 2.125%, 2/15/2027 | |
| Blue Owl Capital Corp., 2.625%, 1/15/2027 | |
See accompanying notes to financial statements.
Portfolio of Investments – as of December 31, 2023Loomis Sayles Bond Fund (continued) | | |
|
| Finance Companies — continued |
| Blue Owl Capital Corp., 2.875%, 6/11/2028 | |
| Blue Owl Capital Corp., 4.250%, 1/15/2026 | |
| GATX Corp., 5.450%, 9/15/2033 | |
| GATX Corp., 6.050%, 3/15/2034 | |
| Nationstar Mortgage Holdings, Inc., 5.000%, 2/01/2026(a) | |
| Nationstar Mortgage Holdings, Inc., 5.125%, 12/15/2030(a) | |
| Nationstar Mortgage Holdings, Inc., 5.500%, 8/15/2028(a) | |
| OneMain Finance Corp., 3.500%, 1/15/2027 | |
| OneMain Finance Corp., 3.875%, 9/15/2028 | |
| OneMain Finance Corp., 4.000%, 9/15/2030 | |
| OneMain Finance Corp., 5.375%, 11/15/2029 | |
| OneMain Finance Corp., 7.125%, 3/15/2026 | |
| Rocket Mortgage LLC/Rocket Mortgage Co-Issuer, Inc., 2.875%, 10/15/2026(a) | |
| Rocket Mortgage LLC/Rocket Mortgage Co-Issuer, Inc., 3.625%, 3/01/2029(a) | |
| Rocket Mortgage LLC/Rocket Mortgage Co-Issuer, Inc., 3.875%, 3/01/2031(a) | |
| Rocket Mortgage LLC/Rocket Mortgage Co-Issuer, Inc., 4.000%, 10/15/2033(a) | |
| | |
| |
| Agile Group Holdings Ltd., 6.050%, 10/13/2025 | |
| Central China Real Estate Ltd., 7.250%, 7/16/2024(d) | |
| Central China Real Estate Ltd., 7.250%, 8/13/2024(d) | |
| Central China Real Estate Ltd., 7.250%, 4/28/2025(d) | |
| Central China Real Estate Ltd., 7.500%, 7/14/2025(d) | |
| Central China Real Estate Ltd., 7.650%, 8/27/2025(d) | |
| Central China Real Estate Ltd., 7.750%, 5/24/2024(d) | |
| CIFI Holdings Group Co. Ltd., 6.000%, 7/16/2025(d) | |
| CIFI Holdings Group Co. Ltd., 6.450%, 11/07/2024(d) | |
| | |
|
| Financial Other — continued |
| Country Garden Holdings Co. Ltd., 3.300%, 1/12/2031(d) | |
| Icahn Enterprises LP/Icahn Enterprises Finance Corp., 4.375%, 2/01/2029 | |
| Kaisa Group Holdings Ltd., 9.375%, 6/30/2024(d) | |
| Kaisa Group Holdings Ltd., 9.950%, 7/23/2025(d) | |
| Kaisa Group Holdings Ltd., 10.500%, 1/15/2025(d) | |
| Kaisa Group Holdings Ltd., 11.250%, 4/16/2025(d) | |
| Kaisa Group Holdings Ltd., 11.650%, 6/01/2026(d) | |
| Kaisa Group Holdings Ltd., 11.700%, 11/11/2025(d) | |
| Logan Group Co. Ltd., 4.250%, 7/12/2025(d) | |
| Logan Group Co. Ltd., 4.850%, 12/14/2026(d) | |
| Shimao Group Holdings Ltd., 3.450%, 1/11/2031(d) | |
| Shimao Group Holdings Ltd., 4.600%, 7/13/2030(d) | |
| Shimao Group Holdings Ltd., 5.200%, 1/16/2027(d) | |
| Shimao Group Holdings Ltd., 5.600%, 7/15/2026(d) | |
| Shimao Group Holdings Ltd., 6.125%, 2/21/2024(d) | |
| Sunac China Holdings Ltd., 6.000% PIK or 5.000% Cash, 9/30/2026(a)(e) | |
| Sunac China Holdings Ltd., 6.250% PIK or 5.250% Cash, 9/30/2027(a)(e) | |
| Sunac China Holdings Ltd., 6.500% PIK or 5.500% Cash, 9/30/2027(a)(e) | |
| Sunac China Holdings Ltd., 6.750% PIK or 5.750% Cash, 9/30/2028(a)(e) | |
| Sunac China Holdings Ltd., 7.000% PIK or 6.000% Cash, 9/30/2029(a)(e) | |
| Sunac China Holdings Ltd., 7.250% PIK or 6.250% Cash, 9/30/2030(a)(e) | |
| Times China Holdings Ltd., 5.750%, 1/14/2027(d) | |
| Times China Holdings Ltd., 6.200%, 3/22/2026(d) | |
| Times China Holdings Ltd., 6.750%, 7/08/2025(d) | |
| Yuzhou Group Holdings Co. Ltd., 6.350%, 1/13/2027(d) | |
| Yuzhou Group Holdings Co. Ltd., 7.700%, 2/20/2025(d) | |
See accompanying notes to financial statements.
Portfolio of Investments – as of December 31, 2023Loomis Sayles Bond Fund (continued) | | |
|
| Financial Other — continued |
| Yuzhou Group Holdings Co. Ltd., 7.850%, 8/12/2026(d) | |
| Yuzhou Group Holdings Co. Ltd., 8.300%, 5/27/2025(d) | |
| | |
| |
| JBS USA LUX SA/JBS USA Food Co./JBS USA Finance, Inc., 3.000%, 2/02/2029 | |
| Pilgrim's Pride Corp., 3.500%, 3/01/2032 | |
| Pilgrim's Pride Corp., 4.250%, 4/15/2031 | |
| | |
| |
| Genm Capital Labuan Ltd., 3.882%, 4/19/2031(a) | |
| GLP Capital LP/GLP Financing II, Inc., 3.250%, 1/15/2032 | |
| Light & Wonder International, Inc., 7.000%, 5/15/2028(a) | |
| Light & Wonder International, Inc., 7.250%, 11/15/2029(a) | |
| Light & Wonder International, Inc., 7.500%, 9/01/2031(a) | |
| VICI Properties LP/VICI Note Co., Inc., 4.500%, 9/01/2026(a) | |
| | |
| Government Owned - No Guarantee — 0.5% |
| Petroleos Mexicanos, 5.950%, 1/28/2031 | |
| Sino-Ocean Land Treasure IV Ltd., 4.750%, 8/05/2029(d) | |
| Sino-Ocean Land Treasure IV Ltd., 4.750%, 1/14/2030(d) | |
| | |
| |
| Centene Corp., 2.500%, 3/01/2031 | |
| Centene Corp., 2.625%, 8/01/2031 | |
| Centene Corp., 3.000%, 10/15/2030 | |
| Centene Corp., 3.375%, 2/15/2030 | |
| Centene Corp., 4.625%, 12/15/2029 | |
| Molina Healthcare, Inc., 3.875%, 5/15/2032(a) | |
| | |
| |
| Bausch & Lomb Escrow Corp., 8.375%, 10/01/2028(a) | |
| HCA, Inc., 5.500%, 6/01/2033 | |
| | |
| | |
|
| |
| PulteGroup, Inc., 6.000%, 2/15/2035 | |
| Independent Energy — 3.3% |
| Aker BP ASA, 4.000%, 1/15/2031(a) | |
| Civitas Resources, Inc., 8.625%, 11/01/2030(a) | |
| Continental Resources, Inc., 2.875%, 4/01/2032(a) | |
| Continental Resources, Inc., 5.750%, 1/15/2031(a) | |
| Energian Israel Finance Ltd., 5.875%, 3/30/2031(a) | |
| EQT Corp., 3.625%, 5/15/2031(a) | |
| EQT Corp., 5.000%, 1/15/2029 | |
| EQT Corp., 7.000%, 2/01/2030 | |
| Matador Resources Co., 6.875%, 4/15/2028(a) | |
| Ovintiv, Inc., 6.500%, 8/15/2034 | |
| Ovintiv, Inc., 6.500%, 2/01/2038 | |
| Ovintiv, Inc., 6.625%, 8/15/2037 | |
| Ovintiv, Inc., 7.200%, 11/01/2031 | |
| Ovintiv, Inc., 7.375%, 11/01/2031 | |
| Ovintiv, Inc., 8.125%, 9/15/2030 | |
| Sanchez Energy Corp., 6.125%, 1/15/2023(d) | |
| Sanchez Energy Corp., 7.750%, 6/15/2021(d) | |
| Southwestern Energy Co., 4.750%, 2/01/2032 | |
| Var Energi ASA, 8.000%, 11/15/2032(a) | |
| Viper Energy, Inc., 7.375%, 11/01/2031(a) | |
| | |
| |
| TopBuild Corp., 4.125%, 2/15/2032(a) | |
| |
| Carnival Corp., 5.750%, 3/01/2027(a) | |
| Carnival Corp., 6.000%, 5/01/2029(a) | |
| Carnival Corp., 7.000%, 8/15/2029(a) | |
| NCL Corp. Ltd., 5.875%, 3/15/2026(a) | |
| NCL Corp. Ltd., 5.875%, 2/15/2027(a) | |
| NCL Corp. Ltd., 8.125%, 1/15/2029(a) | |
| NCL Finance Ltd., 6.125%, 3/15/2028(a) | |
| Royal Caribbean Cruises Ltd., 5.500%, 4/01/2028(a) | |
| | |
See accompanying notes to financial statements.
Portfolio of Investments – as of December 31, 2023Loomis Sayles Bond Fund (continued) | | |
|
| |
| Brighthouse Financial, Inc., 4.700%, 6/22/2047 | |
| Brighthouse Financial, Inc., 5.625%, 5/15/2030 | |
| MetLife, Inc., 9.250%, 4/08/2068(a) | |
| MetLife, Inc., 10.750%, 8/01/2069 | |
| Mutual of Omaha Insurance Co., 6.800%, 6/15/2036(a) | |
| National Life Insurance Co., 10.500%, 9/15/2039(a) | |
| NLV Financial Corp., 7.500%, 8/15/2033(a) | |
| | |
| |
| Hilton Domestic Operating Co., Inc., 3.625%, 2/15/2032(a) | |
| Hilton Grand Vacations Borrower Escrow LLC/Hilton Grand Vacations Borrower Escrow, Inc., 4.875%, 7/01/2031(a) | |
| Hilton Grand Vacations Borrower Escrow LLC/Hilton Grand Vacations Borrower Escrow, Inc., 5.000%, 6/01/2029(a) | |
| Marriott Ownership Resorts, Inc., 4.500%, 6/15/2029(a) | |
| Travel & Leisure Co., 4.500%, 12/01/2029(a) | |
| Travel & Leisure Co., 4.625%, 3/01/2030(a) | |
| | |
| Media Entertainment — 1.6% |
| iHeartCommunications, Inc., 4.750%, 1/15/2028(a) | |
| iHeartCommunications, Inc., 5.250%, 8/15/2027(a) | |
| Netflix, Inc., 4.875%, 6/15/2030(a) | |
| Netflix, Inc., 5.375%, 11/15/2029(a) | |
| Netflix, Inc., 6.375%, 5/15/2029 | |
| Outfront Media Capital LLC/Outfront Media Capital Corp., 7.375%, 2/15/2031(a) | |
| Warnermedia Holdings, Inc., 4.279%, 3/15/2032 | |
| | |
| |
| ArcelorMittal SA, 6.750%, 3/01/2041 | |
| ArcelorMittal SA, 7.000%, 10/15/2039 | |
| First Quantum Minerals Ltd., 6.875%, 3/01/2026(a) | |
| First Quantum Minerals Ltd., 6.875%, 10/15/2027(a) | |
| | |
|
| Metals & Mining — continued |
| First Quantum Minerals Ltd., 7.500%, 4/01/2025(a) | |
| Glencore Funding LLC, 2.500%, 9/01/2030(a) | |
| Glencore Funding LLC, 5.700%, 5/08/2033(a) | |
| Glencore Funding LLC, 6.125%, 10/06/2028(a) | |
| Glencore Funding LLC, 6.375%, 10/06/2030(a) | |
| Glencore Funding LLC, 6.500%, 10/06/2033(a) | |
| Volcan Cia Minera SAA, 4.375%, 2/11/2026(a) | |
| | |
| |
| Cheniere Energy Partners LP, 3.250%, 1/31/2032 | |
| Cheniere Energy Partners LP, 4.000%, 3/01/2031 | |
| Cheniere Energy Partners LP, 4.500%, 10/01/2029 | |
| DCP Midstream Operating LP, 6.450%, 11/03/2036(a) | |
| Hess Midstream Operations LP, 4.250%, 2/15/2030(a) | |
| NGPL PipeCo LLC, 7.768%, 12/15/2037(a) | |
| Targa Resources Partners LP/Targa Resources Partners Finance Corp., 4.000%, 1/15/2032 | |
| Targa Resources Partners LP/Targa Resources Partners Finance Corp., 4.875%, 2/01/2031 | |
| Western Midstream Operating LP, 4.050%, 2/01/2030 | |
| Western Midstream Operating LP, 5.250%, 2/01/2050 | |
| Western Midstream Operating LP, 5.300%, 3/01/2048 | |
| Western Midstream Operating LP, 5.450%, 4/01/2044 | |
| Western Midstream Operating LP, 5.500%, 8/15/2048 | |
| Western Midstream Operating LP, 6.150%, 4/01/2033 | |
| Western Midstream Operating LP, 6.350%, 1/15/2029 | |
| | |
| | |
| Federal Home Loan Mortgage Corp., 5.000%, 12/01/2031 | |
See accompanying notes to financial statements.
Portfolio of Investments – as of December 31, 2023Loomis Sayles Bond Fund (continued) | | |
|
| |
| Southern Co. Gas Capital Corp., 5.750%, 9/15/2033 | |
| Non-Agency Commercial Mortgage-Backed |
| BBSG Mortgage Trust, Series 2016-MRP, Class A, 3.275%, 6/05/2036(a) | |
| BPR Trust, Series 2021-NRD, Class F, 1 mo. USD SOFR + 6.870%, 12.232%, 12/15/2038(a)(b) | |
| BPR Trust, Series 2022-STAR, Class A, 1 mo. USD SOFR + 3.232%, 8.594%, 8/15/2024(a)(b) | |
| Commercial Mortgage Pass-Through Certificates, Series 2012-CR3, Class AM, 3.416%, 10/15/2045(a) | |
| Commercial Mortgage Pass-Through Certificates, Series 2012-LTRT, Class A2, 3.400%, 10/05/2030(a) | |
| Credit Suisse Mortgage Trust, Series 2014-USA, Class B, 4.185%, 9/15/2037(a) | |
| Credit Suisse Mortgage Trust, Series 2014-USA, Class C, 4.336%, 9/15/2037(a) | |
| Credit Suisse Mortgage Trust, Series 2014-USA, Class D, 4.373%, 9/15/2037(a) | |
| DC Commercial Mortgage Trust, Series 2023-DC, Class C, 7.141%, 9/12/2040(a)(b) | |
| Extended Stay America Trust, Series 2021-ESH, Class C, 1 mo. USD SOFR + 1.814%, 7.177%, 7/15/2038(a)(b) | |
| Extended Stay America Trust, Series 2021-ESH, Class D, 1 mo. USD SOFR + 2.364%, 7.727%, 7/15/2038(a)(b) | |
| GS Mortgage Securities Corp. Trust, Series 2013-G1, Class B, 3.721%, 4/10/2031(a)(b) | |
| GS Mortgage Securities Corp. Trust, Series 2013-PEMB, Class B, 3.550%, 3/05/2033(a)(b) | |
| JP Morgan Chase Commercial Mortgage Securities Trust, Series 2012-LC9, Class D, 3.784%, 12/15/2047(a)(b) | |
| Med Trust, Series 2021-MDLN, Class C, 1 mo. USD SOFR + 1.914%, 7.277%, 11/15/2038(a)(b) | |
| Med Trust, Series 2021-MDLN, Class D, 1 mo. USD SOFR + 2.114%, 7.477%, 11/15/2038(a)(b) | |
| | |
|
| Non-Agency Commercial Mortgage-Backed Securities — continued |
| Morgan Stanley Bank of America Merrill Lynch Trust, Series 2013-C11, Class B, 4.077%, 8/15/2046(b) | |
| MSBAM Commercial Mortgage Securities Trust, Series 2012-CKSV, Class A2, 3.277%, 10/15/2030(a) | |
| Wells Fargo Commercial Mortgage Trust, Series 2013-LC12, Class B, 3.954%, 7/15/2046(b) | |
| Wells Fargo Commercial Mortgage Trust, Series 2016-C36, Class B, 3.671%, 11/15/2059(b) | |
| WFRBS Commercial Mortgage Trust, Series 2012-C10, Class B, 3.744%, 12/15/2045 | |
| WFRBS Commercial Mortgage Trust, Series 2013-C15, Class B, 4.204%, 8/15/2046(b) | |
| WFRBS Commercial Mortgage Trust, Series 2014-C20, Class B, 4.378%, 5/15/2047 | |
| | |
| |
| EPR Properties, 3.600%, 11/15/2031 | |
| |
| Bausch Health Cos., Inc., 4.875%, 6/01/2028(a) | |
| Teva Pharmaceutical Finance Co. LLC, 6.150%, 2/01/2036 | |
| Teva Pharmaceutical Finance Netherlands II BV, 7.375%, 9/15/2029, (EUR) | |
| Teva Pharmaceutical Finance Netherlands II BV, 7.875%, 9/15/2031, (EUR) | |
| Teva Pharmaceutical Finance Netherlands III BV, 3.150%, 10/01/2026 | |
| Teva Pharmaceutical Finance Netherlands III BV, 4.100%, 10/01/2046 | |
| Teva Pharmaceutical Finance Netherlands III BV, 4.750%, 5/09/2027 | |
| Teva Pharmaceutical Finance Netherlands III BV, 5.125%, 5/09/2029 | |
| Teva Pharmaceutical Finance Netherlands III BV, 7.875%, 9/15/2029 | |
| Teva Pharmaceutical Finance Netherlands III BV, 8.125%, 9/15/2031 | |
| | |
See accompanying notes to financial statements.
Portfolio of Investments – as of December 31, 2023Loomis Sayles Bond Fund (continued) | | |
|
| Property & Casualty Insurance — 0.3% |
| MBIA Insurance Corp., 3 mo. USD SOFR + 11.522%, 16.853%, 1/15/2033(f) | |
| MBIA Insurance Corp., 3 mo. USD SOFR + 11.522%, 16.916%, 1/15/2033(a)(f) | |
| Stewart Information Services Corp., 3.600%, 11/15/2031 | |
| | |
| |
| Dillard's, Inc., 7.000%, 12/01/2028 | |
| Dillard's, Inc., 7.750%, 7/15/2026 | |
| Dillard's, Inc., 7.750%, 5/15/2027 | |
| Lithia Motors, Inc., 3.875%, 6/01/2029(a) | |
| Marks & Spencer PLC, 7.125%, 12/01/2037(a) | |
| | |
| |
| Republic of Uzbekistan International Bonds, 7.850%, 10/12/2028(a) | |
| |
| Avnet, Inc., 5.500%, 6/01/2032 | |
| Block, Inc., 3.500%, 6/01/2031 | |
| Broadcom, Inc., 2.450%, 2/15/2031(a) | |
| Broadcom, Inc., 2.600%, 2/15/2033(a) | |
| Broadcom, Inc., 3.137%, 11/15/2035(a) | |
| Broadcom, Inc., 3.419%, 4/15/2033(a) | |
| Broadcom, Inc., 3.469%, 4/15/2034(a) | |
| Broadcom, Inc., 4.150%, 11/15/2030 | |
| Broadcom, Inc., 4.150%, 4/15/2032(a) | |
| CDW LLC/CDW Finance Corp., 3.250%, 2/15/2029 | |
| CDW LLC/CDW Finance Corp., 3.276%, 12/01/2028 | |
| CDW LLC/CDW Finance Corp., 3.569%, 12/01/2031 | |
| CDW LLC/CDW Finance Corp., 4.250%, 4/01/2028 | |
| CommScope Technologies LLC, 5.000%, 3/15/2027(a) | |
| CommScope, Inc., 4.750%, 9/01/2029(a) | |
| Entegris Escrow Corp., 4.750%, 4/15/2029(a) | |
| Gartner, Inc., 3.625%, 6/15/2029(a) | |
| Gartner, Inc., 3.750%, 10/01/2030(a) | |
| | |
|
| |
| Global Payments, Inc., 2.900%, 11/15/2031 | |
| Global Payments, Inc., 5.400%, 8/15/2032 | |
| GTCR W-2 Merger Sub LLC, 7.500%, 1/15/2031(a) | |
| Iron Mountain, Inc., 4.875%, 9/15/2029(a) | |
| Leidos, Inc., 5.750%, 3/15/2033 | |
| Marvell Technology, Inc., 2.950%, 4/15/2031 | |
| Marvell Technology, Inc., 5.950%, 9/15/2033 | |
| Micron Technology, Inc., 5.875%, 2/09/2033 | |
| Micron Technology, Inc., 5.875%, 9/15/2033 | |
| Seagate HDD Cayman, 4.091%, 6/01/2029 | |
| Seagate HDD Cayman, 9.625%, 12/01/2032 | |
| Sensata Technologies BV, 5.875%, 9/01/2030(a) | |
| Sensata Technologies, Inc., 3.750%, 2/15/2031(a) | |
| VMware LLC, 2.200%, 8/15/2031 | |
| Western Digital Corp., 2.850%, 2/01/2029 | |
| Western Digital Corp., 4.750%, 2/15/2026 | |
| | |
| Transportation Services — 0.1% |
| Rand Parent LLC, 8.500%, 2/15/2030(a) | |
| |
| Brazil Notas do Tesouro Nacional, Series NTNF, 10.000%, 1/01/2029, (BRL) | |
| Indonesia Treasury Bonds, Series 101, 6.875%, 4/15/2029, (IDR) | |
| Indonesia Treasury Bonds, Series FR95, 6.375%, 8/15/2028, (IDR) | |
| Mexico Bonos, Series M, 7.500%, 5/26/2033, (MXN) | |
| Republic of South Africa Government Bonds, Series 2035, 8.875%, 2/28/2035, (ZAR) | |
| U.S. Treasury Bonds, 3.250%, 5/15/2042(i) | |
| U.S. Treasury Notes, 4.625%, 6/30/2025 | |
| | |
See accompanying notes to financial statements.
Portfolio of Investments – as of December 31, 2023Loomis Sayles Bond Fund (continued) | | |
|
| |
| American Tower Corp., 5.900%, 11/15/2033 | |
| IHS Holding Ltd., 5.625%, 11/29/2026(a) | |
| SoftBank Group Corp., 4.625%, 7/06/2028 | |
| Sprint Capital Corp., 8.750%, 3/15/2032 | |
| T-Mobile USA, Inc., 5.750%, 1/15/2034 | |
| | |
| |
| Cincinnati Bell Telephone Co. LLC, 6.300%, 12/01/2028 | |
| Total Non-Convertible Bonds
(Identified Cost $4,039,870,006)
| |
|
|
|
| |
| Southwest Airlines Co., 1.250%, 5/01/2025 | |
| |
| DISH Network Corp., 3.375%, 8/15/2026 | |
| Consumer Cyclical Services — 0.4% |
| Uber Technologies, Inc., Zero Coupon, 0.000%–5.582%, 12/15/2025(j) | |
| |
| PPL Capital Funding, Inc., 2.875%, 3/15/2028(a) | |
| |
| Sunac China Holdings Ltd., 7.800% PIK or 7.800% Cash, 9/30/2032(a)(e) | |
| |
| Penn Entertainment, Inc., 2.750%, 5/15/2026 | |
| |
| Teladoc Health, Inc., 1.250%, 6/01/2027 | |
| |
| NCL Corp. Ltd., 1.125%, 2/15/2027 | |
| Media Entertainment — 0.2% |
| Spotify USA, Inc., Zero Coupon, 5.189%–5.873%, 3/15/2026(j) | |
| |
| BioMarin Pharmaceutical, Inc., 0.599%, 8/01/2024 | |
| | |
|
| Pharmaceuticals — continued |
| BioMarin Pharmaceutical, Inc., 1.250%, 5/15/2027 | |
| Livongo Health, Inc., 0.875%, 6/01/2025 | |
| | |
| |
| Etsy, Inc., 0.125%, 9/01/2027 | |
| Etsy, Inc., 0.250%, 6/15/2028 | |
| | |
| |
| Unity Software, Inc., Zero Coupon, 7.084%–8.213%, 11/15/2026(j) | |
| Total Convertible Bonds
(Identified Cost $379,036,131)
| |
|
|
|
| |
| Tobacco Settlement Financing Corp., 6.706%, 6/01/2046
(Identified Cost $86,294,794) | |
| Total Bonds and Notes
(Identified Cost $4,505,200,931)
| |
|
|
Collateralized Loan Obligations — 4.3% |
| 522 Funding CLO Ltd., Series 2018-3A, Class DR, 3 mo. USD SOFR + 3.362%, 8.777%, 10/20/2031(a)(b) | |
| AGL CLO 12 Ltd., Series 2021-12A, Class B, 3 mo. USD SOFR + 1.862%, 7.277%, 7/20/2034(a)(b) | |
| AGL CLO 12 Ltd., Series 2021-12A, Class D, 3 mo. USD SOFR + 3.112%, 8.527%, 7/20/2034(a)(b) | |
| AGL CLO 7 Ltd., Series 2020-7A, Class DR, 3 mo. USD SOFR + 3.362%, 8.756%, 7/15/2034(a)(b) | |
| AIMCO CLO 12 Ltd., Series 2020-12A, Class AR, 3 mo. USD SOFR + 1.170%, 6.573%, 1/17/2032(a)(b) | |
| ARES Loan Funding I Ltd., Series 2021-ALFA, Class D, 3 mo. USD SOFR + 3.262%, 8.656%, 10/15/2034(a)(b) | |
| Bain Capital Credit CLO Ltd., Series 2017-2A, Class DR2, 3 mo. USD SOFR + 3.362%, 8.740%, 7/25/2034(a)(b) | |
| Ballyrock CLO Ltd., Series 2019-2A, Class A2R, 3 mo. USD SOFR + 1.662%, 7.029%, 11/20/2030(a)(b) | |
See accompanying notes to financial statements.
Portfolio of Investments – as of December 31, 2023Loomis Sayles Bond Fund (continued) | | |
|
| Benefit Street Partners CLO XVI Ltd., Series 2018-16A, Class DR, 3 mo. USD SOFR + 3.262%, 8.664%, 1/17/2032(a)(b) | |
| Carlyle U.S. CLO Ltd., Series 2016-4A, Class A2R, 3 mo. USD SOFR + 1.712%, 7.127%, 10/20/2027(a)(b) | |
| CarVal CLO III Ltd., Series 2019-2A, Class DR, 3 mo. USD SOFR + 3.212%, 8.627%, 7/20/2032(a)(b) | |
| Clover CLO LLC, Series 2021-1A, Class D, 3 mo. USD SOFR + 3.212%, 8.624%, 4/22/2034(a)(b) | |
| Clover CLO LLC, Series 2021-2A, Class D, 3 mo. USD SOFR + 3.312%, 8.727%, 7/20/2034(a)(b) | |
| Crown City CLO I, Series 2020-1A, Class CR, 3 mo. USD SOFR + 3.682%, 9.097%, 7/20/2034(a)(b) | |
| Elmwood CLO VIII Ltd., Series 2021-1A, Class D2, 3 mo. USD SOFR + 3.112%, 8.527%, 1/20/2034(a)(b) | |
| LCM 30 Ltd., Series 30A, Class BR, 3 mo. USD SOFR + 1.762%, 7.177%, 4/20/2031(a)(b) | |
| LCM 30 Ltd., Series 30A, Class CR, 3 mo. USD SOFR + 2.262%, 7.677%, 4/20/2031(a)(b) | |
| LCM 30 Ltd., Series 30A, Class DR, 3 mo. USD SOFR + 3.262%, 8.677%, 4/20/2031(a)(b) | |
| Madison Park Funding XXIII Ltd., Series 2017-23A, Class DR, 3 mo. USD SOFR + 3.462%, 8.849%, 7/27/2031(a)(b) | |
| Madison Park Funding XXXI Ltd., Series 2018-31A, Class D, 3 mo. USD SOFR + 3.262%, 8.674%, 1/23/2031(a)(b) | |
| Neuberger Berman CLO XX Ltd., Series 2015-20A, Class BRR, 3 mo. USD SOFR + 1.912%, 7.306%, 7/15/2034(a)(b) | |
| OCP CLO Ltd., Series 2019-17A, Class DR, 3 mo. USD SOFR + 3.362%, 8.777%, 7/20/2032(a)(b) | |
| Octagon Investment Partners 42 Ltd., Series 2019-3A, Class DR, 3 mo. USD SOFR + 3.412%, 8.806%, 7/15/2034(a)(b) | |
| Octagon Investment Partners 46 Ltd., Series 2020-2A, Class DR, 3 mo. USD SOFR + 3.562%, 8.956%, 7/15/2036(a)(b) | |
| | |
|
| OHA Credit Funding 3 Ltd., Series 2019-3A, Class BR, 3 mo. USD SOFR + 1.912%, 7.327%, 7/02/2035(a)(b) | |
| Palmer Square CLO Ltd., Series 2013-2A, Class CR3, 3 mo. USD SOFR + 2.962%, 8.364%, 10/17/2031(a)(b) | |
| Palmer Square CLO Ltd., Series 2015-1A, Class A2R4, 3 mo. USD SOFR + 1.962%, 7.329%, 5/21/2034(a)(b) | |
| Rockford Tower CLO Ltd., Series 2018-1A, Class A, 3 mo. USD SOFR + 1.362%, 6.729%, 5/20/2031(a)(b) | |
| Signal Peak CLO 1 Ltd., Series 2014-1A, Class AR3, 3 mo. USD SOFR + 1.422%, 6.824%, 4/17/2034(a)(b) | |
| THL Credit Wind River CLO Ltd., Series 2018-3A, Class D, 3 mo. USD SOFR + 3.212%, 8.627%, 1/20/2031(a)(b) | |
| Verde CLO Ltd., Series 2019-1A, Class AR, 3 mo. USD SOFR + 1.362%, 6.756%, 4/15/2032(a)(b) | |
| Vibrant CLO XIV Ltd., Series 2021-14A, Class C, 3 mo. USD SOFR + 4.012%, 9.427%, 10/20/2034(a)(b) | |
| Total Collateralized Loan Obligations
(Identified Cost $196,773,310)
| |
| | |
|
| Aerospace & Defense — 0.1% |
| | |
| Air Freight & Logistics — 0.1% |
| United Parcel Service, Inc., Class B | |
| |
| | |
| |
| | |
| |
| | |
| |
| | |
| | |
| | |
See accompanying notes to financial statements.
Portfolio of Investments – as of December 31, 2023Loomis Sayles Bond Fund (continued) | | |
| |
| | |
| Communications Equipment — 0.0% |
| | |
| Consumer Staples Distribution & Retail — 0.1% |
| | |
| | |
| | |
| Containers & Packaging — 0.0% |
| Packaging Corp. of America | |
| |
| NexPoint Diversified Real Estate Trust | |
| Electric Utilities — 0.0% |
| | |
| Electrical Equipment — 0.0% |
| | |
| Financial Services — 0.0% |
| Mastercard, Inc., Class A | |
| Ground Transportation — 0.0% |
| | |
| Health Care Equipment & Supplies — 0.1% |
| | |
| Health Care Providers & Services — 0.1% |
| | |
| | |
| | |
| Hotels, Restaurants & Leisure — 0.0% |
| | |
| Household Products — 0.1% |
| | |
| |
| | |
| Life Sciences Tools & Services — 0.0% |
| Thermo Fisher Scientific, Inc. | |
| |
| | |
| |
| Altice USA, Inc., Class A(f) | |
| | |
| iHeartMedia, Inc., Class A(f) | |
| | |
| |
| | |
| Oil, Gas & Consumable Fuels — 0.4% |
| | |
| Canadian Natural Resources Ltd. | |
| | |
| Oil, Gas & Consumable Fuels — continued |
| | |
| Pioneer Natural Resources Co. | |
| | |
| | |
| |
| | |
| | |
| | |
| | |
| Professional Services — 0.0% |
| | |
| Semiconductors & Semiconductor |
| | |
| Microchip Technology, Inc. | |
| | |
| | |
| |
| | |
| |
| | |
| |
| | |
| Technology Hardware, Storage & |
| | |
| | |
| | |
| Trading Companies & Distributors — 0.0% |
| | |
| Total Common Stocks
(Identified Cost $143,779,309)
| |
| | |
|
| Aerospace & Defense — 0.0% |
| TransDigm, Inc., 2023 Term Loan J, 2/14/2031(k) | |
| Building Materials — 0.1% |
| Summit Materials LLC, 2023 Incremental Term Loan B, 11/30/2028(k) | |
| Consumer Cyclical Services — 0.1% |
| Uber Technologies, Inc., 2023 Term Loan B, 3 mo. USD SOFR + 2.750%, 8.135%, 3/03/2030(b)(l) | |
See accompanying notes to financial statements.
Portfolio of Investments – as of December 31, 2023Loomis Sayles Bond Fund (continued) | | |
| |
| Star Parent, Inc., Term Loan B, 3 mo. USD SOFR + 4.000%, 9.348%, 9/27/2030(b)(l) | |
| |
| Carnival Corp., 2021 Incremental Term Loan B, 1 mo. USD SOFR + 3.250%, 8.720%, 10/18/2028(b)(l) | |
| Carnival Corp., 2023 Term Loan B, 1 mo. USD SOFR + 3.000%, 8.357%, 8/08/2027(b)(l) | |
| | |
| Property & Casualty Insurance — 0.1% |
| HUB International Ltd., 2023 Term Loan B, 3 mo. USD SOFR + 4.250%, 9.662%, 6/20/2030(b)(l) | |
| |
| 1011778 B.C. Unlimited Liability Co., 2023 Term Loan B5, 1 mo. USD SOFR + 2.250%, 7.606%, 9/20/2030(b)(l) | |
| |
| GTCR W Merger Sub LLC, USD Term Loan B, 9/20/2030(k) | |
| Total Senior Loans
(Identified Cost $43,737,719)
| |
| | |
|
|
|
Convertible Preferred Stocks — 0.6% |
| |
| Bank of America Corp., Series L, 7.250% | |
| Wells Fargo & Co., Series L, Class A, 7.500% | |
| | |
| |
| Clarivate PLC, Series A, 5.250% | |
| Total Convertible Preferred Stocks
(Identified Cost $41,807,482)
| |
|
|
Non-Convertible Preferred Stocks — 0.3% |
| |
| Hovnanian Enterprises, Inc., 7.625% | |
| |
| Highwoods Properties, Inc., Series A, 8.625%(m) | |
| | |
|
| |
| Prologis, Inc., Series Q, 8.540% | |
| Total Non-Convertible Preferred Stocks
(Identified Cost $10,716,140) | |
| Total Preferred Stocks
(Identified Cost $52,523,622)
| |
| | |
Short-Term Investments — 3.8% |
| Tri-Party Repurchase Agreement with Fixed Income Clearing Corporation, dated 12/29/2023 at 2.500% to be repurchased at $60,605,578 on 1/02/2024 collateralized by $64,170,900 U.S. Treasury Note, 2.500% due 3/31/2027 valued at $61,800,530 including accrued interest (Note 2 of Notes to Financial Statements) | |
| U.S. Treasury Bills, 5.242%, 5/02/2024(n) | |
| U.S. Treasury Bills, 5.262%, 5/09/2024(n) | |
| U.S. Treasury Bills, 5.266%–5.270%, 1/25/2024(n)(o) | |
| Total Short-Term Investments
(Identified Cost $172,437,146)
| |
| Total Investments — 99.1%
(Identified Cost $5,114,452,037)
| |
| Other assets less liabilities — 0.9% | |
| | |
| See Note 2 of Notes to Financial Statements. |
| Principal Amount stated in U.S. dollars unless otherwise noted. |
| All or a portion of these securities are exempt from registration under Rule 144A of the Securities Act of 1933. These securities may be resold in transactions exempt from registration, normally to qualified institutional buyers. At December 31, 2023, the value of Rule 144A holdings amounted to $2,006,580,570 or 44.0% of net assets. |
| Variable rate security. Rate as of December 31, 2023 is disclosed. Issuers comprised of various lots with differing coupon rates have been aggregated for the purpose of presentation in the Portfolio of Investments and show a weighted average rate. Certain variable rate securities are not based on a published reference rate and spread, rather are determined by the issuer or agent and are based on current market conditions. These securities may not indicate a reference rate and/or spread in their description. |
| Perpetual bond with no specified maturity date. |
| The issuer is in default with respect to interest and/or principal payments. Income is not being accrued. |
See accompanying notes to financial statements.
Portfolio of Investments – as of December 31, 2023Loomis Sayles Bond Fund (continued) | Payment–in–kind security for which the issuer, at each interest payment date, may make interest payments in cash and/or additional principal. No payments were received during the period. |
| Non-income producing security. |
| Amount shown represents units. One unit represents a principal amount of 1,000. |
| Amount shown represents units. One unit represents a principal amount of 100. |
| Security (or a portion thereof) has been pledged as collateral for open derivative contracts. |
| Interest rate represents annualized yield at time of purchase; not a coupon rate. The Fund’s investment in this security is comprised of various lots with differing annualized yields. |
| Position is unsettled. Contract rate was not determined at December 31, 2023 and does not take effect until settlement date. Maturity date is not finalized until settlement date. |
| Stated interest rate has been determined in accordance with the provisions of the loan agreement and is subject to a minimum benchmark floor rate which may range from 0.00% to 2.50%, to which the spread is added. |
| Level 3 security. Value has been determined using significant unobservable inputs. See Note 3 of Notes to Financial Statements. |
| Interest rate represents discount rate at time of purchase; not a coupon rate. |
| The Fund's investment in U.S. Government/Agency securities is comprised of various lots with differing discount rates. These separate investments, which have the same maturity date, have been aggregated for the purpose of presentation in the Portfolio of Investments. |
| |
| |
| Real Estate Investment Trusts |
| Secured Overnight Financing Rate |
At December 31, 2023, the Fund had the following open forward foreign currency contracts:
| | Currency
Bought/
Sold (B/S) | | | | Unrealized
Appreciation
(Depreciation) |
| | | | | | | |
At December 31, 2023, open long futures contracts were as follows:
| | | | | Unrealized
Appreciation
(Depreciation) |
CBOT 10 Year U.S. Treasury Notes Futures | | | | | |
CBOT 2 Year U.S. Treasury Notes Futures | | | | | |
CBOT 5 Year U.S. Treasury Notes Futures | | | | | |
CBOT U.S. Long Bond Futures | | | | | |
CME Ultra Long Term U.S. Treasury Bond Futures | | | | | |
| | | | | |
At December 31, 2023, open short futures contracts were as follows:
| | | | | Unrealized
Appreciation
(Depreciation) |
Ultra 10-Year U.S. Treasury Notes Futures | | | | | |
See accompanying notes to financial statements.
Portfolio of Investments – as of December 31, 2023Loomis Sayles Bond Fund (continued) Industry Summary at December 31, 2023
| |
| |
| |
| |
| |
| |
| |
| |
| |
| |
| |
| |
Other Investments, less than 2% each | |
Collateralized Loan Obligations | |
| |
| |
Other assets less liabilities (including forward foreign currency and futures contracts) | |
| |
See accompanying notes to financial statements.
Portfolio of Investments – as of December 31, 2023Loomis Sayles Investment Grade Fixed Income Fund
| | |
Bonds and Notes — 87.7% of Net Assets |
|
|
Non-Convertible Bonds — 85.7% |
| |
| American Credit Acceptance Receivables Trust, Series 2020-3, Class D, 2.400%, 6/15/2026(a) | |
| American Credit Acceptance Receivables Trust, Series 2022-1, Class D, 2.460%, 3/13/2028(a) | |
| American Credit Acceptance Receivables Trust, Series 2022-4, Class C, 7.860%, 2/15/2029(a) | |
| American Credit Acceptance Receivables Trust, Series 2023-2, Class C, 5.960%, 8/13/2029(a) | |
| American Credit Acceptance Receivables Trust, Series 2023-3, Class D, 6.820%, 10/12/2029(a) | |
| American Credit Acceptance Receivables Trust, Series 2023-4, Class D, 7.650%, 9/12/2030(a) | |
| Avis Budget Rental Car Funding AESOP LLC, Series 2020-2A, Class A, 2.020%, 2/20/2027(a) | |
| Avis Budget Rental Car Funding AESOP LLC, Series 2023-4A, Class C, 7.240%, 6/20/2029(a) | |
| Avis Budget Rental Car Funding AESOP LLC, Series 2023-8A, Class C, 7.340%, 2/20/2030(a) | |
| Bridgecrest Lending Auto Securitization Trust, Series 2023-1, Class D, 7.840%, 8/15/2029 | |
| CarMax Auto Owner Trust, Series 2021-3, Class D, 1.500%, 1/18/2028 | |
| CarMax Auto Owner Trust, Series 2022-1, Class D, 2.470%, 7/17/2028 | |
| CarMax Auto Owner Trust, Series 2023-2, Class D, 6.550%, 10/15/2029 | |
| CarMax Auto Owner Trust, Series 2023-4, Class D, 7.160%, 4/15/2030 | |
| Credit Acceptance Auto Loan Trust, Series 2020-3A, Class C, 2.280%, 2/15/2030(a) | |
| Credit Acceptance Auto Loan Trust, Series 2021-2A, Class C, 1.640%, 6/17/2030(a) | |
| Credit Acceptance Auto Loan Trust, Series 2021-3A, Class C, 1.630%, 9/16/2030(a) | |
| Drive Auto Receivables Trust, Series 2021-1, Class D, 1.450%, 1/16/2029 | |
| DT Auto Owner Trust, Series 2021-3A, Class D, 1.310%, 5/17/2027(a) | |
| DT Auto Owner Trust, Series 2023-2A, Class D, 6.620%, 2/15/2029(a) | |
| | |
|
| |
| Exeter Automobile Receivables Trust, Series 2019-4A, Class D, 2.580%, 9/15/2025(a) | |
| Exeter Automobile Receivables Trust, Series 2021-1A, Class D, 1.080%, 11/16/2026 | |
| Exeter Automobile Receivables Trust, Series 2021-3A, Class D, 1.550%, 6/15/2027 | |
| Exeter Automobile Receivables Trust, Series 2022-2A, Class D, 4.560%, 7/17/2028 | |
| Exeter Automobile Receivables Trust, Series 2022-6A, Class C, 6.320%, 5/15/2028 | |
| Exeter Automobile Receivables Trust, Series 2023-3A, Class D, 6.680%, 4/16/2029 | |
| Exeter Automobile Receivables Trust, Series 2023-5A, Class D, 7.130%, 2/15/2030 | |
| First Investors Auto Owner Trust, Series 2021-1A, Class D, 1.620%, 3/15/2027(a) | |
| Flagship Credit Auto Trust, Series 2021-1, Class D, 1.270%, 3/15/2027(a) | |
| Flagship Credit Auto Trust, Series 2021-2, Class D, 1.590%, 6/15/2027(a) | |
| Flagship Credit Auto Trust, Series 2021-3, Class D, 1.650%, 9/15/2027(a) | |
| Flagship Credit Auto Trust, Series 2023-2, Class D, 6.620%, 5/15/2029(a) | |
| Flagship Credit Auto Trust, Series 2023-3, Class D, 6.580%, 8/15/2029(a) | |
| Ford Credit Auto Lease Trust, Series 2023-B, Class D, 6.970%, 6/15/2028 | |
| Ford Credit Auto Owner Trust, Series 2021-A, Class A3, 0.300%, 8/15/2025 | |
| Foursight Capital Automobile Receivables Trust, Series 2021-1, Class D, 1.320%, 3/15/2027(a) | |
| Foursight Capital Automobile Receivables Trust, Series 2021-2, Class D, 1.920%, 9/15/2027(a) | |
| GLS Auto Receivables Issuer Trust, Series 2023-3A, Class D, 6.440%, 5/15/2029(a) | |
| GLS Auto Receivables Issuer Trust, Series 2023-4A, Class D, 7.180%, 8/15/2029(a) | |
| GM Financial Consumer Automobile Receivables Trust, Series 2021-1, Class A3, 0.350%, 10/16/2025 | |
See accompanying notes to financial statements.
Portfolio of Investments – as of December 31, 2023Loomis Sayles Investment Grade Fixed Income Fund (continued) | | |
|
| |
| GM Financial Consumer Automobile Receivables Trust, Series 2021-2, Class A3, 0.510%, 4/16/2026 | |
| Hertz Vehicle Financing III LLC, Series 2022-1A, Class D, 4.850%, 6/25/2026(a) | |
| Hertz Vehicle Financing III LLC, Series 2022-3A, Class D, 6.310%, 3/25/2025(a) | |
| Hertz Vehicle Financing LLC, Series 2022-4A, Class D, 6.560%, 9/25/2026(a) | |
| Honda Auto Receivables Owner Trust, Series 2021-1, Class A3, 0.270%, 4/21/2025 | |
| Honda Auto Receivables Owner Trust, Series 2021-2, Class A3, 0.330%, 8/15/2025 | |
| JPMorgan Chase Bank N.A, Series 2021-1, Class D, 1.174%, 9/25/2028(a) | |
| LAD Auto Receivables Trust, Series 2023-3A, Class C, 6.430%, 12/15/2028(a) | |
| LAD Auto Receivables Trust, Series 2023-4A, Class C, 6.760%, 3/15/2029(a) | |
| Prestige Auto Receivables Trust, Series 2023-1A, Class D, 6.330%, 4/16/2029(a) | |
| Santander Drive Auto Receivables Trust, Series 2020-1, Class C, 4.110%, 12/15/2025 | |
| Santander Drive Auto Receivables Trust, Series 2021-3, Class D, 1.330%, 9/15/2027 | |
| Westlake Automobile Receivables Trust, Series 2020-3A, Class D, 1.650%, 2/17/2026(a) | |
| Westlake Automobile Receivables Trust, Series 2023-3A, Class D, 6.470%, 3/15/2029(a) | |
| Westlake Automobile Receivables Trust, Series 2023-4A, Class D, 7.190%, 7/16/2029(a) | |
| World Omni Auto Receivables Trust, Series 2021-B, Class A3, 0.420%, 6/15/2026 | |
| | |
| |
| Mission Lane Credit Card Master Trust, Series 2023-A, Class A, 7.230%, 7/17/2028(a) | |
| Mission Lane Credit Card Master Trust, Series 2023-B, Class A, 7.690%, 11/15/2028(a) | |
| | |
| | |
|
| |
| BINOM Securitization Trust, Series 2022-RPL1, Class M1, 3.000%, 2/25/2061(a)(b) | |
| CIM Trust, Series 2021-NR2, Class A1, 2.568%, 7/25/2059(a)(b) | |
| COLT Mortgage Loan Trust, Series 2021-6, Class A1, 1.907%, 12/25/2066(a)(b) | |
| CoreVest American Finance Ltd., Series 2021-1, Class C, 2.800%, 4/15/2053(a) | |
| CoreVest American Finance Ltd., Series 2021-2, Class C, 2.478%, 7/15/2054(a) | |
| CoreVest American Finance Ltd., Series 2021-3, Class D, 3.469%, 10/15/2054(a) | |
| CoreVest American Finance Ltd., Series 2021-RTL1, Class A1, 2.239%, 3/28/2029(a)(b) | |
| CoreVest American Finance Ltd., Series 2023-RTL1, Class A1, 7.553%, 12/28/2030(a)(b) | |
| Credit Suisse Mortgage Trust, Series 2021-RPL1, Class A1, 1.668%, 9/27/2060(a)(b) | |
| Credit Suisse Mortgage Trust, Series 2021-RPL3, Class M2, 3.750%, 1/25/2060(a) | |
| Credit Suisse Mortgage Trust, Series 2021-RPL4, Class A1, 1.796%, 12/27/2060(a)(b) | |
| Federal Home Loan Mortgage Corp., Series 2022-DNA3, Class M1A, REMICS, 30 day USD SOFR Average + 2.000%, 7.337%, 4/25/2042(a)(b) | |
| Federal Home Loan Mortgage Corp. Structured Agency Credit Risk Debt Notes, Series 2023-DNA2, Class M1A, 30 day USD SOFR Average + 2.100%, 7.437%, 4/25/2043(a)(b) | |
| FirstKey Homes Trust, Series 2021-SFR1, Class E1, 2.389%, 8/17/2038(a) | |
| FirstKey Homes Trust, Series 2021-SFR2, Class E1, 2.258%, 9/17/2038(a) | |
| FirstKey Homes Trust, Series 2021-SFR2, Class E2, 2.358%, 9/17/2038(a) | |
| FirstKey Homes Trust, Series 2022-SFR2, Class D, 4.500%, 7/17/2039(a) | |
| GCAT Trust, Series 2019-RPL1, Class A1, 2.650%, 10/25/2068(a)(b) | |
| GITSIT Mortgage Loan Trust, Series 2023-NPL1, Class A1, 8.353%, 5/25/2053(a)(b) | |
| Home Partners of America Trust, Series 2021-1, Class E, 2.577%, 9/17/2041(a) | |
See accompanying notes to financial statements.
Portfolio of Investments – as of December 31, 2023Loomis Sayles Investment Grade Fixed Income Fund (continued) | | |
|
| ABS Home Equity — continued |
| Home Partners of America Trust, Series 2021-2, Class E1, 2.852%, 12/17/2026(a) | |
| Home Partners of America Trust, Series 2021-2, Class E2, 2.952%, 12/17/2026(a) | |
| Legacy Mortgage Asset Trust, Series 2019-GS7, Class A1, 7.250%, 11/25/2059(a)(b) | |
| Legacy Mortgage Asset Trust, Series 2020-RPL1, Class A2, 3.250%, 9/25/2059(a)(b) | |
| Legacy Mortgage Asset Trust, Series 2021-GS2, Class A1, 1.750%, 4/25/2061(a)(b) | |
| Morgan Stanley Mortgage Loan Trust, Series 2005-3AR, Class 5A, 6.123%, 7/25/2035(b)(c) | |
| NLT Trust, Series 2023-1, Class A1, 3.200%, 10/25/2062(a)(b) | |
| OBX Trust, Series 2021-NQM3, Class A1, 1.054%, 7/25/2061(a)(b) | |
| Progress Residential Trust, Series 2021-SFR2, Class E1, 2.547%, 4/19/2038(a) | |
| Progress Residential Trust, Series 2021-SFR3, Class E1, 2.538%, 5/17/2026(a) | |
| Progress Residential Trust, Series 2021-SFR3, Class E2, 2.688%, 5/17/2026(a) | |
| Progress Residential Trust, Series 2021-SFR4, Class E1, 2.409%, 5/17/2038(a) | |
| Progress Residential Trust, Series 2021-SFR4, Class E2, 2.559%, 5/17/2038(a) | |
| Progress Residential Trust, Series 2021-SFR5, Class E1, 2.209%, 7/17/2038(a) | |
| Progress Residential Trust, Series 2021-SFR6, Class E1, 2.425%, 7/17/2038(a) | |
| Progress Residential Trust, Series 2021-SFR6, Class E2, 2.525%, 7/17/2038(a) | |
| Progress Residential Trust, Series 2021-SFR7, Class E1, 2.591%, 8/17/2040(a) | |
| Progress Residential Trust, Series 2021-SFR7, Class E2, 2.640%, 8/17/2040(a) | |
| Progress Residential Trust, Series 2021-SFR9, Class E1, 2.811%, 11/17/2040(a) | |
| | |
|
| ABS Home Equity — continued |
| PRPM LLC, Series 2021-1, Class A1, 2.115%, 1/25/2026(a)(b) | |
| PRPM LLC, Series 2021-2, Class A1, 2.115%, 3/25/2026(a)(b) | |
| PRPM LLC, Series 2021-4, Class A1, 1.867%, 4/25/2026(a)(b) | |
| PRPM LLC, Series 2021-5, Class A1, 1.793%, 6/25/2026(a)(b) | |
| PRPM LLC, Series 2022-5, Class A1, 6.900%, 9/27/2027(a)(b) | |
| Redwood Funding Trust, Series 2023-1, Class A, 7.500%, 7/25/2059(a)(b) | |
| Toorak Mortgage Corp. Ltd., Series 2021-1, Class A1, 3.240%, 6/25/2024(a)(b) | |
| Towd Point Mortgage Trust, Series 2016-3, Class M2, 4.000%, 4/25/2056(a)(b) | |
| Towd Point Mortgage Trust, Series 2019-4, Class A1, 2.900%, 10/25/2059(a)(b) | |
| VCAT LLC, Series 2021-NPL1, Class A1, 5.289%, 12/26/2050(a)(b) | |
| VCAT LLC, Series 2021-NPL5, Class A1, 1.868%, 8/25/2051(a)(b) | |
| Verus Securitization Trust, Series 2021-3, Class A1, 1.046%, 6/25/2066(a)(b) | |
| VOLT XCII LLC, Series 2021-NPL1, Class A1, 1.893%, 2/27/2051(a)(b) | |
| VOLT XCIII LLC, Series 2021-NPL2, Class A1, 1.893%, 2/27/2051(a)(b) | |
| VOLT XCIV LLC, Series 2021-NPL3, Class A1, 2.240%, 2/27/2051(a)(b) | |
| VOLT XCVI LLC, Series 2021-NPL5, Class A1, 2.116%, 3/27/2051(a)(b) | |
| VOLT XCVII LLC, Series 2021-NPL6, Class A1, 2.240%, 4/25/2051(a)(b) | |
| | |
| |
| AASET Trust, Series 2021-1A, Class A, 2.950%, 11/16/2041(a) | |
| Affirm Asset Securitization Trust, Series 2023-B, Class A, 6.820%, 9/15/2028(a) | |
| Affirm Asset Securitization Trust, Series 2023-X1, Class A, 7.110%, 11/15/2028(a) | |
| Aqua Finance Trust, Series 2021-A, Class B, 2.400%, 7/17/2046(a) | |
| Auxilior Term Funding LLC, Series 2023-1A, Class A2, 6.180%, 12/15/2028(a) | |
| BHG Securitization Trust, Series 2022-A, Class B, 2.700%, 2/20/2035(a) | |
| BHG Securitization Trust, Series 2023-B, Class B, 7.450%, 12/17/2036(a) | |
| Business Jet Securities LLC, Series 2021-1A, Class A, 2.162%, 4/15/2036(a) | |
See accompanying notes to financial statements.
Portfolio of Investments – as of December 31, 2023Loomis Sayles Investment Grade Fixed Income Fund (continued) | | |
|
| |
| Foundation Finance Trust, Series 2023-2A, Class A, 6.530%, 6/15/2049(a) | |
| FREED ABS Trust, Series 2021-2, Class C, 1.940%, 6/19/2028(a) | |
| FREED ABS Trust, Series 2021-3FP, Class D, 2.370%, 11/20/2028(a) | |
| Frontier Issuer LLC, Series 2023-1, Class A2, 6.600%, 8/20/2053(a) | |
| Hardee's Funding LLC, Series 2018-1A, Class A2II, 4.959%, 6/20/2048(a) | |
| Jack in the Box Funding LLC, Series 2019-1A, Class A2II, 4.476%, 8/25/2049(a) | |
| Lunar Structured Aircraft Portfolio Notes, Series 2021-1, Class A, 2.636%, 10/15/2046(a) | |
| Marlette Funding Trust, Series 2021-2A, Class C, 1.500%, 9/15/2031(a) | |
| Marlette Funding Trust, Series 2021-3A, Class C, 1.810%, 12/15/2031(a) | |
| Marlette Funding Trust, Series 2023-2A, Class B, 6.540%, 6/15/2033(a) | |
| Merlin Aviation Holdings DAC, Series 2016-1, Class A, 4.500%, 12/15/2032(a)(b) | |
| MVW LLC, Series 2021-1WA, Class C, 1.940%, 1/22/2041(a) | |
| OneMain Financial Issuance Trust, Series 2018-2A, Class B, 3.890%, 3/14/2033(a) | |
| OneMain Financial Issuance Trust, Series 2021-1A, Class D, 2.470%, 6/16/2036(a) | |
| OneMain Financial Issuance Trust, Series 2022-S1, Class D, 5.200%, 5/14/2035(a) | |
| SCF Equipment Leasing LLC, Series 2022-1A, Class D, 3.790%, 11/20/2031(a) | |
| SCF Equipment Leasing LLC, Series 2022-2A, Class C, 6.500%, 8/20/2032(a) | |
| Shenton Aircraft Investment I Ltd., Series 2015-1A, Class A, 4.750%, 10/15/2042(a) | |
| Sierra Timeshare Receivables Funding LLC, Series 2019-2A, Class C, 3.120%, 5/20/2036(a) | |
| Sierra Timeshare Receivables Funding LLC, Series 2019-3A, Class C, 3.000%, 8/20/2036(a) | |
| Sierra Timeshare Receivables Funding LLC, Series 2021-1A, Class C, 1.790%, 11/20/2037(a) | |
| | |
|
| |
| Sierra Timeshare Receivables Funding LLC, Series 2023-3A, Class C, 7.120%, 9/20/2040(a) | |
| Slam Ltd., Series 2021-1A, Class A, 2.434%, 6/15/2046(a) | |
| Sunnova Helios X Issuer LLC, Series 2022-C, Class A, 5.300%, 11/22/2049(a) | |
| Sunnova Helios XII Issuer LLC, Series 2023-B, Class B, 5.600%, 8/22/2050(a) | |
| Textainer Marine Containers VII Ltd., Series 2021-1A, Class A, 1.680%, 2/20/2046(a) | |
| Textainer Marine Containers VII Ltd., Series 2021-2A, Class A, 2.230%, 4/20/2046(a) | |
| TIF Funding II LLC, Series 2021-1A, Class A, 1.650%, 2/20/2046(a) | |
| WAVE Trust, Series 2017-1A, Class A, 3.844%, 11/15/2042(a) | |
| Willis Engine Structured Trust VII, Series 2023-A, Class A, 8.000%, 10/15/2048(a) | |
| | |
| |
| College Avenue Student Loans LLC, Series 2021-A, Class C, 2.920%, 7/25/2051(a) | |
| College Avenue Student Loans LLC, Series 2023-B, Class C, 7.580%, 6/25/2054(a) | |
| Navient Private Education Refi Loan Trust, Series 2020-HA, Class A, 1.310%, 1/15/2069(a) | |
| Navient Private Education Refi Loan Trust, Series 2021-A, Class A, 0.840%, 5/15/2069(a) | |
| Navient Private Education Refi Loan Trust, Series 2021-A, Class B, 2.240%, 5/15/2069(a) | |
| Navient Private Education Refi Loan Trust, Series 2021-EA, Class B, 2.030%, 12/16/2069(a) | |
| Navient Private Education Refi Loan Trust, Series 2021-FA, Class B, 2.120%, 2/18/2070(a) | |
| Navient Student Loan Trust, Series 2023-BA, Class B, 7.230%, 3/15/2072(a) | |
| SMB Private Education Loan Trust, Series 2018-C, Class A2A, 3.630%, 11/15/2035(a) | |
See accompanying notes to financial statements.
Portfolio of Investments – as of December 31, 2023Loomis Sayles Investment Grade Fixed Income Fund (continued) | | |
|
| ABS Student Loan — continued |
| SMB Private Education Loan Trust, Series 2020-A, Class A2A, 2.230%, 9/15/2037(a) | |
| SMB Private Education Loan Trust, Series 2021-A, Class A2A2, 1 mo. USD SOFR + 0.844%, 6.206%, 1/15/2053(a)(b) | |
| SMB Private Education Loan Trust, Series 2021-B, Class B, 2.650%, 7/17/2051(a) | |
| SMB Private Education Loan Trust, Series 2023-C, Class B, 6.360%, 11/15/2052(a) | |
| | |
| ABS Whole Business — 0.5% |
| Applebee's Funding LLC/IHOP Funding LLC, Series 2023-1A, Class A2, 7.824%, 3/05/2053(a) | |
| DB Master Finance LLC, Series 2017-1A, Class A2II, 4.030%, 11/20/2047(a) | |
| Domino's Pizza Master Issuer LLC, Series 2018-1A, Class A2II, 4.328%, 7/25/2048(a) | |
| Hardee's Funding LLC, Series 2021-1A, Class A2, 2.865%, 6/20/2051(a) | |
| Planet Fitness Master Issuer LLC, Series 2018-1A, Class A2II, 4.666%, 9/05/2048(a) | |
| | |
| Aerospace & Defense — 1.1% |
| Embraer Netherlands Finance BV, 7.000%, 7/28/2030(a) | |
| RTX Corp., 2.375%, 3/15/2032 | |
| RTX Corp., 5.150%, 2/27/2033 | |
| Textron, Inc., 2.450%, 3/15/2031 | |
| Textron, Inc., 3.000%, 6/01/2030 | |
| | |
| |
| American Airlines Pass-Through Trust, Series 2016-3, Class B, 3.750%, 4/15/2027 | |
| U.S. Airways Pass-Through Trust, Series 2012-2, Class A, 4.625%, 12/03/2026 | |
| United Airlines Pass-Through Trust, Series 2016-2, Class B, 3.650%, 4/07/2027 | |
| United Airlines Pass-Through Trust, Series 2020-1, Class A, 5.875%, 4/15/2029 | |
| | |
| |
| American Homes 4 Rent LP, 2.375%, 7/15/2031 | |
| | |
|
| |
| Aptiv PLC/Aptiv Corp., 3.250%, 3/01/2032 | |
| Daimler Truck Finance North America LLC, 5.500%, 9/20/2033(a) | |
| General Motors Co., 5.200%, 4/01/2045 | |
| General Motors Co., 5.600%, 10/15/2032 | |
| General Motors Co., 6.250%, 10/02/2043 | |
| General Motors Financial Co., Inc., 5.850%, 4/06/2030 | |
| General Motors Financial Co., Inc., 6.000%, 1/09/2028 | |
| | |
| |
| Ally Financial, Inc., 2.200%, 11/02/2028 | |
| Bank of America Corp., (fixed rate to 12/20/2027, variable rate thereafter), 3.419%, 12/20/2028 | |
| Bank of America Corp., (fixed rate to 3/08/2032, variable rate thereafter), 3.846%, 3/08/2037 | |
| Bank of America Corp., (fixed rate to 4/29/2030, variable rate thereafter), 2.592%, 4/29/2031 | |
| Bank of America Corp., (fixed rate to 9/21/2031, variable rate thereafter), 2.482%, 9/21/2036 | |
| Bank of America Corp., MTN, (fixed rate to 10/24/2030, variable rate thereafter), 1.922%, 10/24/2031 | |
| Bank of America Corp., MTN, (fixed rate to 7/22/2032, variable rate thereafter), 5.015%, 7/22/2033 | |
| Bank of America Corp., MTN, (fixed rate to 7/23/2030, variable rate thereafter), 1.898%, 7/23/2031 | |
| Bank of America Corp., Series L, 4.183%, 11/25/2027 | |
| Barclays PLC, (fixed rate to 11/24/2026, variable rate thereafter), 2.279%, 11/24/2027 | |
| Barclays PLC, (fixed rate to 3/15/2028, variable rate thereafter), 4.375%(d) | |
| Barclays PLC, (fixed rate to 5/09/2033, variable rate thereafter), 6.224%, 5/09/2034 | |
| Barclays PLC, (fixed rate to 9/23/2030, variable rate thereafter), 3.564%, 9/23/2035 | |
| BNP Paribas SA, 2.824%, 1/26/2041(a) | |
| BNP Paribas SA, (fixed rate to 1/20/2027, variable rate thereafter), 2.591%, 1/20/2028(a) | |
| BNP Paribas SA, (fixed rate to 3/01/2028, variable rate thereafter), 4.375%, 3/01/2033(a) | |
See accompanying notes to financial statements.
Portfolio of Investments – as of December 31, 2023Loomis Sayles Investment Grade Fixed Income Fund (continued) | | |
|
| |
| CaixaBank SA, (fixed rate to 9/13/2033, variable rate thereafter), 6.840%, 9/13/2034(a) | |
| Citigroup, Inc., (fixed rate to 3/31/2030, variable rate thereafter), 4.412%, 3/31/2031 | |
| Citigroup, Inc., (fixed rate to 6/03/2030, variable rate thereafter), 2.572%, 6/03/2031 | |
| Credit Agricole SA, 2.811%, 1/11/2041(a) | |
| Credit Agricole SA, (fixed rate to 1/10/2028, variable rate thereafter), 4.000%, 1/10/2033 | |
| Deutsche Bank AG, (fixed rate to 10/07/2031, variable rate thereafter), 3.742%, 1/07/2033 | |
| Deutsche Bank AG, (fixed rate to 10/14/2030, variable rate thereafter), 3.729%, 1/14/2032 | |
| Deutsche Bank AG, (fixed rate to 11/20/2028, variable rate thereafter), 6.819%, 11/20/2029 | |
| Goldman Sachs Group, Inc., (fixed rate to 2/24/2032, variable rate thereafter), 3.102%, 2/24/2033 | |
| Goldman Sachs Group, Inc., (fixed rate to 8/23/2027, variable rate thereafter), 4.482%, 8/23/2028 | |
| HSBC Holdings PLC, (fixed rate to 3/09/2028, variable rate thereafter), 6.161%, 3/09/2029 | |
| ING Groep NV, (fixed rate to 9/11/2033, variable rate thereafter), 6.114%, 9/11/2034 | |
| Intesa Sanpaolo SpA, 7.200%, 11/28/2033(a) | |
| JPMorgan Chase & Co., (fixed rate to 10/15/2029, variable rate thereafter), 2.739%, 10/15/2030 | |
| JPMorgan Chase & Co., (fixed rate to 7/25/2032, variable rate thereafter), 4.912%, 7/25/2033 | |
| Morgan Stanley, 3.950%, 4/23/2027 | |
| Morgan Stanley, (fixed rate to 1/19/2033, variable rate thereafter), 5.948%, 1/19/2038 | |
| Morgan Stanley, (fixed rate to 10/18/2032, variable rate thereafter), 6.342%, 10/18/2033 | |
| Morgan Stanley, (fixed rate to 4/20/2032, variable rate thereafter), 5.297%, 4/20/2037 | |
| Morgan Stanley, (fixed rate to 9/16/2031, variable rate thereafter), 2.484%, 9/16/2036 | |
| Morgan Stanley, MTN, (fixed rate to 2/13/2031, variable rate thereafter), 1.794%, 2/13/2032 | |
| NatWest Group PLC, (fixed rate to 6/14/2026, variable rate thereafter), 1.642%, 6/14/2027 | |
| | |
|
| |
| NatWest Group PLC, (fixed rate to 9/30/2027, variable rate thereafter), 5.516%, 9/30/2028 | |
| Societe Generale SA, (fixed rate to 7/08/2030, variable rate thereafter), 3.653%, 7/08/2035(a) | |
| Synchrony Bank, 5.400%, 8/22/2025 | |
| Synchrony Bank, 5.625%, 8/23/2027 | |
| UBS Group AG, (fixed rate to 11/15/2032, variable rate thereafter), 9.016%, 11/15/2033(a) | |
| UBS Group AG, (fixed rate to 6/05/2025, variable rate thereafter), 2.193%, 6/05/2026(a) | |
| UBS Group AG, (fixed rate to 8/11/2027, variable rate thereafter), 6.442%, 8/11/2028(a) | |
| UBS Group AG, (fixed rate to 8/12/2032, variable rate thereafter), 6.537%, 8/12/2033(a) | |
| UniCredit SpA, (fixed rate to 6/30/2030, variable rate thereafter), 5.459%, 6/30/2035(a) | |
| | |
| |
| Jefferies Financial Group, Inc., 5.875%, 7/21/2028 | |
| Jefferies Financial Group, Inc., 6.250%, 1/15/2036 | |
| | |
| Building Materials — 1.2% |
| Cemex SAB de CV, 3.875%, 7/11/2031(a) | |
| Cemex SAB de CV, (fixed rate to 6/08/2026, variable rate thereafter), 5.125%(a)(d) | |
| Masco Corp., 6.500%, 8/15/2032 | |
| Owens Corning, 7.000%, 12/01/2036 | |
| | |
| |
| Charter Communications Operating LLC/Charter Communications Operating Capital, 2.300%, 2/01/2032 | |
| Charter Communications Operating LLC/Charter Communications Operating Capital, 2.800%, 4/01/2031 | |
| Charter Communications Operating LLC/Charter Communications Operating Capital, 3.700%, 4/01/2051 | |
| Charter Communications Operating LLC/Charter Communications Operating Capital, 3.850%, 4/01/2061 | |
| Charter Communications Operating LLC/Charter Communications Operating Capital, 3.950%, 6/30/2062 | |
See accompanying notes to financial statements.
Portfolio of Investments – as of December 31, 2023Loomis Sayles Investment Grade Fixed Income Fund (continued) | | |
|
| Cable Satellite — continued |
| Charter Communications Operating LLC/Charter Communications Operating Capital, 4.400%, 4/01/2033 | |
| Charter Communications Operating LLC/Charter Communications Operating Capital, 5.125%, 7/01/2049 | |
| CSC Holdings LLC, 3.375%, 2/15/2031(a) | |
| CSC Holdings LLC, 4.125%, 12/01/2030(a) | |
| CSC Holdings LLC, 4.625%, 12/01/2030(a) | |
| DISH DBS Corp., 5.125%, 6/01/2029 | |
| DISH DBS Corp., 5.250%, 12/01/2026(a) | |
| DISH DBS Corp., 5.750%, 12/01/2028(a) | |
| Time Warner Cable LLC, 5.500%, 9/01/2041 | |
| | |
| |
| Braskem Netherlands Finance BV, 4.500%, 1/31/2030(a) | |
| Braskem Netherlands Finance BV, 5.875%, 1/31/2050(a) | |
| Celanese U.S. Holdings LLC, 6.330%, 7/15/2029 | |
| Celanese U.S. Holdings LLC, 6.379%, 7/15/2032 | |
| Celanese U.S. Holdings LLC, 6.550%, 11/15/2030 | |
| Celanese U.S. Holdings LLC, 6.700%, 11/15/2033 | |
| | |
| Collateralized Mortgage Obligations — 0.1% |
| Federal Home Loan Mortgage Corp., Series 2912, Class EH, REMICS, 5.500%, 1/15/2035 | |
| Construction Machinery — 0.7% |
| Ashtead Capital, Inc., 5.500%, 8/11/2032(a) | |
| Ashtead Capital, Inc., 5.950%, 10/15/2033(a) | |
| Caterpillar Financial Services Corp., MTN, 0.450%, 5/17/2024 | |
| | |
| Consumer Cyclical Services — 1.1% |
| Expedia Group, Inc., 2.950%, 3/15/2031 | |
| Expedia Group, Inc., 3.250%, 2/15/2030 | |
| Uber Technologies, Inc., 4.500%, 8/15/2029(a) | |
| Uber Technologies, Inc., 7.500%, 9/15/2027(a) | |
| | |
| | |
|
| Diversified Manufacturing — 0.8% |
| Carrier Global Corp., 5.900%, 3/15/2034(a) | |
| Ingersoll Rand, Inc., 5.700%, 8/14/2033 | |
| Nordson Corp., 5.800%, 9/15/2033 | |
| Veralto Corp., 5.450%, 9/18/2033(a) | |
| | |
| |
| Pacific Gas & Electric Co., 3.250%, 6/01/2031 | |
| Pacific Gas & Electric Co., 4.300%, 3/15/2045 | |
| Pacific Gas & Electric Co., 4.550%, 7/01/2030 | |
| Pacific Gas & Electric Co., 5.450%, 6/15/2027 | |
| Southern Co., 5.700%, 3/15/2034 | |
| | |
| |
| AerCap Ireland Capital DAC/AerCap Global Aviation Trust, 3.000%, 10/29/2028 | |
| AerCap Ireland Capital DAC/AerCap Global Aviation Trust, 3.300%, 1/30/2032 | |
| AerCap Ireland Capital DAC/AerCap Global Aviation Trust, 3.400%, 10/29/2033 | |
| AerCap Ireland Capital DAC/AerCap Global Aviation Trust, 5.750%, 6/06/2028 | |
| AerCap Ireland Capital DAC/AerCap Global Aviation Trust, 6.150%, 9/30/2030 | |
| Air Lease Corp., 3.125%, 12/01/2030 | |
| Air Lease Corp., 4.625%, 10/01/2028 | |
| Air Lease Corp., MTN, 3.000%, 2/01/2030 | |
| Aircastle Ltd., 6.500%, 7/18/2028(a) | |
| Ares Capital Corp., 2.875%, 6/15/2028 | |
| Ares Capital Corp., 3.200%, 11/15/2031 | |
| Aviation Capital Group LLC, 1.950%, 1/30/2026(a) | |
| Aviation Capital Group LLC, 6.250%, 4/15/2028(a) | |
| Aviation Capital Group LLC, 6.750%, 10/25/2028(a) | |
| Barings BDC, Inc., 3.300%, 11/23/2026 | |
| Blackstone Secured Lending Fund, 2.125%, 2/15/2027 | |
| Blue Owl Capital Corp., 2.625%, 1/15/2027 | |
| Blue Owl Capital Corp., 2.875%, 6/11/2028 | |
| Blue Owl Capital Corp., 4.250%, 1/15/2026 | |
| Blue Owl Technology Finance Corp., 2.500%, 1/15/2027 | |
| GATX Corp., 5.450%, 9/15/2033 | |
| GATX Corp., 6.050%, 3/15/2034 | |
| Oaktree Specialty Lending Corp., 2.700%, 1/15/2027 | |
See accompanying notes to financial statements.
Portfolio of Investments – as of December 31, 2023Loomis Sayles Investment Grade Fixed Income Fund (continued) | | |
|
| Finance Companies — continued |
| Rocket Mortgage LLC/Rocket Mortgage Co-Issuer, Inc., 2.875%, 10/15/2026(a) | |
| Rocket Mortgage LLC/Rocket Mortgage Co-Issuer, Inc., 3.625%, 3/01/2029(a) | |
| Rocket Mortgage LLC/Rocket Mortgage Co-Issuer, Inc., 3.875%, 3/01/2031(a) | |
| Rocket Mortgage LLC/Rocket Mortgage Co-Issuer, Inc., 4.000%, 10/15/2033(a) | |
| SMBC Aviation Capital Finance DAC, 5.450%, 5/03/2028(a) | |
| | |
| |
| CIFI Holdings Group Co. Ltd., 6.450%, 11/07/2024(e) | |
| Country Garden Holdings Co. Ltd., 3.300%, 1/12/2031(e) | |
| Logan Group Co. Ltd., 4.850%, 12/14/2026(e) | |
| Shimao Group Holdings Ltd., 4.750%, 7/03/2022(e) | |
| Shimao Group Holdings Ltd., 5.200%, 1/16/2027(e) | |
| Shimao Group Holdings Ltd., 5.600%, 7/15/2026(e) | |
| Shimao Group Holdings Ltd., 6.125%, 2/21/2024(e) | |
| Times China Holdings Ltd., 5.750%, 1/14/2027(e) | |
| Times China Holdings Ltd., 6.200%, 3/22/2026(e) | |
| | |
| |
| JBS USA LUX SA/JBS USA Food Co./JBS USA Finance, Inc., 3.000%, 2/02/2029 | |
| JBS USA LUX SA/JBS USA Food Co./JBS USA Finance, Inc., 3.750%, 12/01/2031 | |
| Pilgrim's Pride Corp., 3.500%, 3/01/2032 | |
| Pilgrim's Pride Corp., 4.250%, 4/15/2031 | |
| | |
| |
| Genm Capital Labuan Ltd., 3.882%, 4/19/2031(a) | |
| GLP Capital LP/GLP Financing II, Inc., 3.250%, 1/15/2032 | |
| GLP Capital LP/GLP Financing II, Inc., 6.750%, 12/01/2033 | |
| VICI Properties LP, 5.125%, 5/15/2032 | |
| VICI Properties LP/VICI Note Co., Inc., 3.875%, 2/15/2029(a) | |
| VICI Properties LP/VICI Note Co., Inc., 4.250%, 12/01/2026(a) | |
| | |
|
| |
| VICI Properties LP/VICI Note Co., Inc., 4.500%, 9/01/2026(a) | |
| VICI Properties LP/VICI Note Co., Inc., 4.625%, 6/15/2025(a) | |
| | |
| Government Owned - No Guarantee — 0.9% |
| Antares Holdings LP, 3.750%, 7/15/2027(a) | |
| Pertamina Persero PT, 6.450%, 5/30/2044(a) | |
| Sino-Ocean Land Treasure IV Ltd., 4.750%, 1/14/2030(e) | |
| | |
| |
| Centene Corp., 2.450%, 7/15/2028 | |
| Centene Corp., 2.500%, 3/01/2031 | |
| Centene Corp., 2.625%, 8/01/2031 | |
| Centene Corp., 3.000%, 10/15/2030 | |
| Centene Corp., 3.375%, 2/15/2030 | |
| Centene Corp., 4.625%, 12/15/2029 | |
| | |
| |
| Alcon Finance Corp., 5.375%, 12/06/2032(a) | |
| CVS Health Corp., 5.250%, 1/30/2031 | |
| HCA, Inc., 2.375%, 7/15/2031 | |
| HCA, Inc., 3.500%, 9/01/2030 | |
| HCA, Inc., 5.500%, 6/01/2033 | |
| | |
| |
| MDC Holdings, Inc., 3.966%, 8/06/2061 | |
| MDC Holdings, Inc., 6.000%, 1/15/2043 | |
| Meritage Homes Corp., 3.875%, 4/15/2029(a) | |
| PulteGroup, Inc., 6.000%, 2/15/2035 | |
| | |
| |
| Federal National Mortgage Association, 1 yr. RFUCC Treasury + 1.810%, 6.040%, 9/01/2036(b) | |
| Federal National Mortgage Association, 6 mo. RFUCC Treasury + 1.460%, 7.161%, 2/01/2037(b) | |
| | |
| Independent Energy — 3.0% |
| Aker BP ASA, 3.750%, 1/15/2030(a) | |
| Continental Resources, Inc., 2.875%, 4/01/2032(a) | |
| Continental Resources, Inc., 5.750%, 1/15/2031(a) | |
| Energian Israel Finance Ltd., 5.375%, 3/30/2028(a) | |
See accompanying notes to financial statements.
Portfolio of Investments – as of December 31, 2023Loomis Sayles Investment Grade Fixed Income Fund (continued) | | |
|
| Independent Energy — continued |
| Energian Israel Finance Ltd., 5.875%, 3/30/2031(a) | |
| EQT Corp., 3.625%, 5/15/2031(a) | |
| EQT Corp., 5.000%, 1/15/2029 | |
| EQT Corp., 7.000%, 2/01/2030 | |
| Marathon Oil Corp., 6.800%, 3/15/2032 | |
| Occidental Petroleum Corp., 6.125%, 1/01/2031 | |
| Occidental Petroleum Corp., 6.625%, 9/01/2030 | |
| Occidental Petroleum Corp., 7.500%, 5/01/2031 | |
| Ovintiv, Inc., 6.500%, 8/15/2034 | |
| Ovintiv, Inc., 7.375%, 11/01/2031 | |
| Southwestern Energy Co., 4.750%, 2/01/2032 | |
| Var Energi ASA, 8.000%, 11/15/2032(a) | |
| Viper Energy, Inc., 7.375%, 11/01/2031(a) | |
| | |
| |
| Jacobs Engineering Group, Inc., 6.350%, 8/18/2028 | |
| |
| Carnival Corp., 4.000%, 8/01/2028(a) | |
| Carnival Corp., 7.000%, 8/15/2029(a) | |
| NCL Corp. Ltd., 5.875%, 3/15/2026(a) | |
| NCL Corp. Ltd., 5.875%, 2/15/2027(a) | |
| NCL Corp. Ltd., 8.125%, 1/15/2029(a) | |
| Royal Caribbean Cruises Ltd., 5.500%, 4/01/2028(a) | |
| | |
| |
| Athene Global Funding, 1.608%, 6/29/2026(a) | |
| Brighthouse Financial, Inc., 4.700%, 6/22/2047 | |
| National Life Insurance Co., 10.500%, 9/15/2039(a) | |
| NLV Financial Corp., 7.500%, 8/15/2033(a) | |
| | |
| |
| Marriott International, Inc., Series HH, 2.850%, 4/15/2031 | |
| Marriott Ownership Resorts, Inc., 4.500%, 6/15/2029(a) | |
| Travel & Leisure Co., 4.500%, 12/01/2029(a) | |
| Travel & Leisure Co., 4.625%, 3/01/2030(a) | |
| | |
|
| |
| Travel & Leisure Co., 6.000%, 4/01/2027 | |
| Travel & Leisure Co., 6.625%, 7/31/2026(a) | |
| | |
| Media Entertainment — 1.4% |
| iHeartCommunications, Inc., 4.750%, 1/15/2028(a) | |
| iHeartCommunications, Inc., 5.250%, 8/15/2027(a) | |
| Netflix, Inc., 4.875%, 6/15/2030(a) | |
| Netflix, Inc., 5.375%, 11/15/2029(a) | |
| Netflix, Inc., 5.875%, 11/15/2028 | |
| Netflix, Inc., 6.375%, 5/15/2029 | |
| Warnermedia Holdings, Inc., 4.054%, 3/15/2029 | |
| Warnermedia Holdings, Inc., 4.279%, 3/15/2032 | |
| | |
| |
| Anglo American Capital PLC, 2.875%, 3/17/2031(a) | |
| Anglo American Capital PLC, 5.500%, 5/02/2033(a) | |
| ArcelorMittal SA, 6.800%, 11/29/2032 | |
| First Quantum Minerals Ltd., 6.875%, 10/15/2027(a) | |
| Glencore Funding LLC, 2.500%, 9/01/2030(a) | |
| Glencore Funding LLC, 2.850%, 4/27/2031(a) | |
| Glencore Funding LLC, 5.700%, 5/08/2033(a) | |
| Glencore Funding LLC, 6.125%, 10/06/2028(a) | |
| Glencore Funding LLC, 6.375%, 10/06/2030(a) | |
| Glencore Funding LLC, 6.500%, 10/06/2033(a) | |
| Volcan Cia Minera SAA, 4.375%, 2/11/2026(a) | |
| | |
| |
| Cheniere Energy Partners LP, 3.250%, 1/31/2032 | |
| Cheniere Energy Partners LP, 4.000%, 3/01/2031 | |
| Cheniere Energy Partners LP, 4.500%, 10/01/2029 | |
| DCP Midstream Operating LP, 3.250%, 2/15/2032 | |
| DCP Midstream Operating LP, 5.125%, 5/15/2029 | |
| DCP Midstream Operating LP, 6.450%, 11/03/2036(a) | |
See accompanying notes to financial statements.
Portfolio of Investments – as of December 31, 2023Loomis Sayles Investment Grade Fixed Income Fund (continued) | | |
|
| |
| Enbridge, Inc., 5.700%, 3/08/2033 | |
| Energy Transfer LP, 5.000%, 5/15/2044 | |
| Energy Transfer LP, 5.750%, 2/15/2033 | |
| Energy Transfer LP, 6.550%, 12/01/2033 | |
| EnLink Midstream LLC, 6.500%, 9/01/2030(a) | |
| MPLX LP, 5.000%, 3/01/2033 | |
| ONEOK Partners LP, 6.200%, 9/15/2043 | |
| Plains All American Pipeline LP/PAA Finance Corp., 3.550%, 12/15/2029 | |
| Plains All American Pipeline LP/PAA Finance Corp., 3.800%, 9/15/2030 | |
| Plains All American Pipeline LP/PAA Finance Corp., 4.300%, 1/31/2043 | |
| Targa Resources Corp., 6.125%, 3/15/2033 | |
| Targa Resources Partners LP/Targa Resources Partners Finance Corp., 4.000%, 1/15/2032 | |
| Targa Resources Partners LP/Targa Resources Partners Finance Corp., 4.875%, 2/01/2031 | |
| Targa Resources Partners LP/Targa Resources Partners Finance Corp., 5.500%, 3/01/2030 | |
| Venture Global Calcasieu Pass LLC, 3.875%, 11/01/2033(a) | |
| Venture Global Calcasieu Pass LLC, 6.250%, 1/15/2030(a) | |
| Western Midstream Operating LP, 4.050%, 2/01/2030 | |
| Western Midstream Operating LP, 5.250%, 2/01/2050 | |
| Western Midstream Operating LP, 5.300%, 3/01/2048 | |
| Western Midstream Operating LP, 5.450%, 4/01/2044 | |
| Western Midstream Operating LP, 5.500%, 8/15/2048 | |
| Western Midstream Operating LP, 6.150%, 4/01/2033 | |
| Western Midstream Operating LP, 6.350%, 1/15/2029 | |
| Williams Cos., Inc., 4.650%, 8/15/2032 | |
| | |
| |
| Southern Co. Gas Capital Corp., 5.750%, 9/15/2033 | |
| Non-Agency Commercial Mortgage-Backed |
| BB-UBS Trust, Series 2012-TFT, Class A, 2.892%, 6/05/2030(a) | |
| BPR Trust, Series 2021-NRD, Class B, 1 mo. USD SOFR + 2.124%, 7.486%, 12/15/2038(a)(b) | |
| | |
|
| Non-Agency Commercial Mortgage-Backed Securities — continued |
| BPR Trust, Series 2021-NRD, Class C, 1 mo. USD SOFR + 2.424%, 7.786%, 12/15/2038(a)(b) | |
| BPR Trust, Series 2021-NRD, Class D, 1 mo. USD SOFR + 3.723%, 9.085%, 12/15/2038(a)(b) | |
| BPR Trust, Series 2022-STAR, Class A, 1 mo. USD SOFR + 3.232%, 8.594%, 8/15/2024(a)(b) | |
| Commercial Mortgage Pass-Through Certificates, Series 2012-CR3, Class AM, 3.416%, 10/15/2045(a) | |
| Credit Suisse Mortgage Trust, Series 2014-USA, Class B, 4.185%, 9/15/2037(a) | |
| DC Commercial Mortgage Trust, Series 2023-DC, Class B, 6.804%, 9/12/2040(a) | |
| Extended Stay America Trust, Series 2021-ESH, Class B, 1 mo. USD SOFR + 1.494%, 6.857%, 7/15/2038(a)(b) | |
| Extended Stay America Trust, Series 2021-ESH, Class C, 1 mo. USD SOFR + 1.814%, 7.177%, 7/15/2038(a)(b) | |
| Extended Stay America Trust, Series 2021-ESH, Class D, 1 mo. USD SOFR + 2.364%, 7.727%, 7/15/2038(a)(b) | |
| GS Mortgage Securities Corp. Trust, Series 2012-BWTR, Class A, 2.954%, 11/05/2034(a) | |
| GS Mortgage Securities Corp. Trust, Series 2013-PEMB, Class A, 3.550%, 3/05/2033, 144A(a)(b) | |
| GS Mortgage Securities Corp. Trust, Series 2013-PEMB, Class B, 3.550%, 3/05/2033(a)(b) | |
| GS Mortgage Securities Trust, Series 2014-GC18, Class AS, 4.383%, 1/10/2047 | |
| GS Mortgage Securities Trust, Series 2014-GC18, Class B, 4.885%, 1/10/2047(b) | |
| JP Morgan Chase Commercial Mortgage Securities Trust, Series 2012-LC9, Class C, 3.784%, 12/15/2047(a)(b) | |
| JPMBB Commercial Mortgage Securities Trust, Series 2015-C32, Class A5, 3.598%, 11/15/2048 | |
| Med Trust, Series 2021-MDLN, Class B, 1 mo. USD SOFR + 1.564%, 6.927%, 11/15/2038(a)(b) | |
| Med Trust, Series 2021-MDLN, Class C, 1 mo. USD SOFR + 1.914%, 7.277%, 11/15/2038(a)(b) | |
See accompanying notes to financial statements.
Portfolio of Investments – as of December 31, 2023Loomis Sayles Investment Grade Fixed Income Fund (continued) | | |
|
| Non-Agency Commercial Mortgage-Backed Securities — continued |
| Med Trust, Series 2021-MDLN, Class D, 1 mo. USD SOFR + 2.114%, 7.477%, 11/15/2038(a)(b) | |
| Morgan Stanley Bank of America Merrill Lynch Trust, Series 2013-C12, Class C, 7.432%, 10/15/2046(b) | |
| Morgan Stanley Bank of America Merrill Lynch Trust, Series 2016-C30, Class C, 4.087%, 9/15/2049(b) | |
| MSBAM Commercial Mortgage Securities Trust, Series 2012-CKSV, Class A2, 3.277%, 10/15/2030(a) | |
| Wells Fargo Commercial Mortgage Trust, Series 2013-LC12, Class B, 3.954%, 7/15/2046(b) | |
| Wells Fargo Commercial Mortgage Trust, Series 2014-LC16, Class AS, 4.020%, 8/15/2050 | |
| WFRBS Commercial Mortgage Trust, Series 2011-C3, Class D, 5.855%, 3/15/2044(a)(b) | |
| WFRBS Commercial Mortgage Trust, Series 2013-C15, Class B, 4.204%, 8/15/2046(b) | |
| WFRBS Commercial Mortgage Trust, Series 2014-C20, Class B, 4.378%, 5/15/2047 | |
| WFRBS Commercial Mortgage Trust, Series 2014-C24, Class B, 4.204%, 11/15/2047(b) | |
| | |
| |
| Corporate Office Properties LP, 2.750%, 4/15/2031 | |
| |
| Extra Space Storage LP, 5.900%, 1/15/2031 | |
| |
| WestRock MWV LLC, 7.550%, 3/01/2047 | |
| WestRock MWV LLC, 8.200%, 1/15/2030 | |
| | |
| |
| Bausch Health Cos., Inc., 4.875%, 6/01/2028(a) | |
| Teva Pharmaceutical Finance Co. LLC, 6.150%, 2/01/2036 | |
| Teva Pharmaceutical Finance Netherlands III BV, 4.100%, 10/01/2046 | |
| Teva Pharmaceutical Finance Netherlands III BV, 4.750%, 5/09/2027 | |
| Teva Pharmaceutical Finance Netherlands III BV, 5.125%, 5/09/2029 | |
| | |
|
| Pharmaceuticals — continued |
| Teva Pharmaceutical Finance Netherlands III BV, 7.875%, 9/15/2029 | |
| Teva Pharmaceutical Finance Netherlands III BV, 8.125%, 9/15/2031 | |
| | |
| Property & Casualty Insurance — 0.2% |
| Stewart Information Services Corp., 3.600%, 11/15/2031 | |
| |
| Brixmor Operating Partnership LP, 2.250%, 4/01/2028 | |
| |
| Amazon.com, Inc., 0.450%, 5/12/2024 | |
| AutoNation, Inc., 3.850%, 3/01/2032 | |
| Dollar Tree, Inc., 2.650%, 12/01/2031 | |
| Tapestry, Inc., 3.050%, 3/15/2032 | |
| | |
| |
| Arrow Electronics, Inc., 2.950%, 2/15/2032 | |
| Broadcom, Inc., 2.450%, 2/15/2031(a) | |
| Broadcom, Inc., 2.600%, 2/15/2033(a) | |
| Broadcom, Inc., 3.137%, 11/15/2035(a) | |
| Broadcom, Inc., 3.187%, 11/15/2036(a) | |
| Broadcom, Inc., 3.419%, 4/15/2033(a) | |
| Broadcom, Inc., 3.469%, 4/15/2034(a) | |
| Broadcom, Inc., 4.150%, 11/15/2030 | |
| Broadcom, Inc., 4.150%, 4/15/2032(a) | |
| Broadcom, Inc., 4.300%, 11/15/2032 | |
| CDW LLC/CDW Finance Corp., 3.250%, 2/15/2029 | |
| CDW LLC/CDW Finance Corp., 3.276%, 12/01/2028 | |
| CDW LLC/CDW Finance Corp., 3.569%, 12/01/2031 | |
| CDW LLC/CDW Finance Corp., 4.250%, 4/01/2028 | |
| CommScope Technologies LLC, 5.000%, 3/15/2027(a) | |
| CommScope, Inc., 4.750%, 9/01/2029(a) | |
| Dell International LLC/EMC Corp., 5.750%, 2/01/2033 | |
| Entegris Escrow Corp., 4.750%, 4/15/2029(a) | |
| Equinix, Inc., 2.150%, 7/15/2030 | |
| Fiserv, Inc., 5.625%, 8/21/2033 | |
| Flex Ltd., 6.000%, 1/15/2028 | |
| Global Payments, Inc., 2.900%, 5/15/2030 | |
| Global Payments, Inc., 2.900%, 11/15/2031 | |
| Global Payments, Inc., 5.300%, 8/15/2029 | |
| Global Payments, Inc., 5.400%, 8/15/2032 | |
| Jabil, Inc., 3.600%, 1/15/2030 | |
| Leidos, Inc., 2.300%, 2/15/2031 | |
| Leidos, Inc., 4.375%, 5/15/2030 | |
See accompanying notes to financial statements.
Portfolio of Investments – as of December 31, 2023Loomis Sayles Investment Grade Fixed Income Fund (continued) | | |
|
| |
| Leidos, Inc., 5.750%, 3/15/2033 | |
| Marvell Technology, Inc., 2.950%, 4/15/2031 | |
| Marvell Technology, Inc., 5.950%, 9/15/2033 | |
| Micron Technology, Inc., 2.703%, 4/15/2032 | |
| Micron Technology, Inc., 4.663%, 2/15/2030 | |
| Micron Technology, Inc., 5.875%, 2/09/2033 | |
| Micron Technology, Inc., 5.875%, 9/15/2033 | |
| Motorola Solutions, Inc., 5.600%, 6/01/2032 | |
| Oracle Corp., 2.950%, 4/01/2030 | |
| Oracle Corp., 3.950%, 3/25/2051 | |
| Sensata Technologies, Inc., 3.750%, 2/15/2031(a) | |
| SK Hynix, Inc., 6.375%, 1/17/2028(a) | |
| Trimble, Inc., 6.100%, 3/15/2033 | |
| VMware LLC, 2.200%, 8/15/2031 | |
| Western Digital Corp., 2.850%, 2/01/2029 | |
| Western Digital Corp., 4.750%, 2/15/2026 | |
| | |
| Transportation Services — 0.3% |
| ERAC USA Finance LLC, 6.700%, 6/01/2034(a) | |
| |
| Brazil Notas do Tesouro Nacional, Series NTNF, 10.000%, 1/01/2029, (BRL) | |
| Mexico Bonos, Series M, 7.500%, 5/26/2033, (MXN) | |
| Republic of South Africa Government Bonds, Series 2035, 8.875%, 2/28/2035, (ZAR) | |
| U.S. Treasury Bonds, 2.250%, 2/15/2052 | |
| U.S. Treasury Bonds, 3.250%, 5/15/2042 | |
| U.S. Treasury Bonds, 4.125%, 8/15/2053 | |
| U.S. Treasury Notes, 4.625%, 6/30/2025 | |
| | |
| |
| American Tower Corp., 5.900%, 11/15/2033 | |
| Sprint Capital Corp., 8.750%, 3/15/2032 | |
| T-Mobile USA, Inc., 2.400%, 3/15/2029 | |
| T-Mobile USA, Inc., 2.700%, 3/15/2032 | |
| T-Mobile USA, Inc., 3.500%, 4/15/2031 | |
| T-Mobile USA, Inc., 3.875%, 4/15/2030 | |
| T-Mobile USA, Inc., 5.750%, 1/15/2034 | |
| | |
| | |
|
| |
| Verizon Communications, Inc., 2.355%, 3/15/2032 | |
| Total Non-Convertible Bonds
(Identified Cost $177,640,983)
| |
|
|
|
| |
| Southwest Airlines Co., 1.250%, 5/01/2025 | |
| |
| DISH Network Corp., 3.375%, 8/15/2026 | |
| DISH Network Corp., Zero Coupon, 6.944%–9.514%, 12/15/2025(h) | |
| | |
| Consumer Cyclical Services — 0.1% |
| Uber Technologies, Inc., Zero Coupon, 0.000%–1.922%, 12/15/2025(h) | |
| |
| PPL Capital Funding, Inc., 2.875%, 3/15/2028(a) | |
| |
| Teladoc Health, Inc., 1.250%, 6/01/2027 | |
| |
| BioMarin Pharmaceutical, Inc., 0.599%, 8/01/2024 | |
| BioMarin Pharmaceutical, Inc., 1.250%, 5/15/2027 | |
| Livongo Health, Inc., 0.875%, 6/01/2025 | |
| | |
| |
| Etsy, Inc., 0.125%, 9/01/2027 | |
| Etsy, Inc., 0.250%, 6/15/2028 | |
| | |
| Total Convertible Bonds
(Identified Cost $4,010,441)
| |
|
|
|
| |
| Tobacco Settlement Financing Corp., 6.706%, 6/01/2046
(Identified Cost $797,100) | |
| Total Bonds and Notes
(Identified Cost $182,448,524)
| |
|
|
Collateralized Loan Obligations — 3.9% |
| 522 Funding CLO Ltd., Series 2021-7A, Class D, 3 mo. USD SOFR + 3.162%, 8.574%, 4/23/2034(a)(b) | |
See accompanying notes to financial statements.
Portfolio of Investments – as of December 31, 2023Loomis Sayles Investment Grade Fixed Income Fund (continued) | | |
|
| AGL CLO 5 Ltd., Series 2020-5A, Class BR, 3 mo. USD SOFR + 1.962%, 7.377%, 7/20/2034(a)(b) | |
| Alinea CLO Ltd., Series 2018-1A, Class B, 3 mo. USD SOFR + 1.912%, 7.327%, 7/20/2031(a)(b) | |
| Battalion CLO VIII Ltd., Series 2015-8A, Class A2R2, 3 mo. USD SOFR + 1.812%, 7.207%, 7/18/2030(a)(b) | |
| Canyon CLO Ltd., Series 2021-4A, Class B, 3 mo. USD SOFR + 1.962%, 7.356%, 10/15/2034(a)(b) | |
| Carlyle U.S. CLO Ltd., Series 2021-9A, Class B, 3 mo. USD SOFR + 1.912%, 7.327%, 10/20/2034(a)(b) | |
| CIFC Funding Ltd., Series 2021-6A, Class B, 3 mo. USD SOFR + 1.912%, 7.306%, 10/15/2034(a)(b) | |
| Dryden 53 CLO Ltd., Series 2017-53A, Class B, 3 mo. USD SOFR + 1.662%, 7.056%, 1/15/2031(a)(b) | |
| Elmwood CLO VIII Ltd., Series 2021-1A, Class D2, 3 mo. USD SOFR + 3.112%, 8.527%, 1/20/2034(a)(b) | |
| Galaxy XXV CLO Ltd., Series 2018-25A, Class B, 3 mo. USD SOFR + 1.912%, 7.290%, 10/25/2031(a)(b) | |
| Galaxy XXVI CLO Ltd., Series 2018-26A, Class B, 3 mo. USD SOFR + 1.962%, 7.333%, 11/22/2031(a)(b) | |
| Invesco CLO Ltd., Series 2021-1A, Class D, 3 mo. USD SOFR + 3.312%, 8.706%, 4/15/2034(a)(b) | |
| Madison Park Funding XXIV Ltd., Series 2016-24A, Class BR, 3 mo. USD SOFR + 2.012%, 7.427%, 10/20/2029(a)(b) | |
| Madison Park Funding XXV Ltd., Series 2017-25A, Class A1R, 3 mo. USD SOFR + 1.232%, 6.610%, 4/25/2029(a)(b) | |
| Magnetite XIV-R Ltd., Series 2015-14RA, Class B, 3 mo. USD SOFR + 1.862%, 7.257%, 10/18/2031(a)(b) | |
| Magnetite XV Ltd., Series 2015-15A, Class AR, 3 mo. USD SOFR + 1.272%, 6.650%, 7/25/2031(a)(b) | |
| Morgan Stanley Eaton Vance CLO Ltd., Series 2022-16A, Class B, 3 mo. USD SOFR + 1.950%, 7.344%, 4/15/2035(a)(b) | |
| Neuberger Berman CLO XX Ltd., Series 2015-20A, Class BRR, 3 mo. USD SOFR + 1.912%, 7.306%, 7/15/2034(a)(b) | |
| Octagon Investment Partners 18-R Ltd., Series 2018-18A, Class A2, 3 mo. USD SOFR + 1.732%, 7.126%, 4/16/2031(a)(b) | |
| Octagon Investment Partners XV Ltd., Series 2013-1A, Class A1RR, 3 mo. USD SOFR + 1.232%, 6.628%, 7/19/2030(a)(b) | |
| | |
|
| OHA Credit Partners XVI, Series 2021-16A, Class A, 3 mo. USD SOFR + 1.412%, 6.807%, 10/18/2034(a)(b) | |
| Palmer Square Loan Funding Ltd., Series 2021-3A, Class A1, 3 mo. USD SOFR + 1.062%, 6.477%, 7/20/2029(a)(b) | |
| Rad CLO 15 Ltd., Series 2021-15A, Class B, 3 mo. USD SOFR + 1.912%, 7.327%, 1/20/2034(a)(b) | |
| Recette CLO Ltd., Series 2015-1A, Class BRR, 3 mo. USD SOFR + 1.662%, 7.077%, 4/20/2034(a)(b) | |
| Sixth Street CLO XVIII Ltd., Series 2021-18A, Class D, 3 mo. USD SOFR + 3.162%, 8.577%, 4/20/2034(a)(b) | |
| Voya CLO Ltd., Series 2018-3A, Class B, 3 mo. USD SOFR + 1.912%, 7.306%, 10/15/2031(a)(b) | |
| Total Collateralized Loan Obligations
(Identified Cost $7,646,533)
| |
| | |
|
|
|
Convertible Preferred Stocks — 0.8% |
| |
| Bank of America Corp., Series L, 7.250% | |
| Wells Fargo & Co., Series L, Class A, 7.500% | |
| | |
| |
| El Paso Energy Capital Trust I, 4.750% | |
| Total Convertible Preferred Stocks
(Identified Cost $1,471,432)
| |
| Total Preferred Stocks
(Identified Cost $1,471,432)
| |
| | |
|
| Building Materials — 0.1% |
| Summit Materials LLC, 2023 Incremental Term Loan B, 11/30/2028(i) | |
See accompanying notes to financial statements.
Portfolio of Investments – as of December 31, 2023Loomis Sayles Investment Grade Fixed Income Fund (continued) | | |
| |
| Carnival Corp., 2021 Incremental Term Loan B, 1 mo. USD SOFR + 3.250%, 8.720%, 10/18/2028(b)(j) | |
| Carnival Corp., 2023 Term Loan B, 1 mo. USD SOFR + 3.000%, 8.357%, 8/08/2027(b)(j) | |
| | |
| |
| GTCR W Merger Sub LLC, USD Term Loan B, 9/20/2030(i) | |
| Total Senior Loans
(Identified Cost $775,994)
| |
| | |
|
| |
| | |
| Oil, Gas & Consumable Fuels — 0.1% |
| Canadian Natural Resources Ltd. | |
| | |
| | |
| Total Common Stocks
(Identified Cost $563,043)
| |
| | |
Short-Term Investments — 6.5% |
| Tri-Party Repurchase Agreement with Fixed Income Clearing Corporation, dated 12/29/2023 at 2.500% to be repurchased at $4,364,205 on 1/02/2024 collateralized by $4,621,000 U.S. Treasury Note, 2.500% due 3/31/2027 valued at $4,450,308 including accrued interest (Note 2 of Notes to Financial Statements) | |
| | |
| U.S. Treasury Bills, 5.043%, 6/27/2024(k) | |
| U.S. Treasury Bills, 5.262%, 5/09/2024(k)(l) | |
| Total Short-Term Investments
(Identified Cost $12,675,229)
| |
| Total Investments — 99.6%
(Identified Cost $205,580,755)
| |
| Other assets less liabilities — 0.4% | |
| | |
| See Note 2 of Notes to Financial Statements. |
| Principal Amount stated in U.S. dollars unless otherwise noted. |
| All or a portion of these securities are exempt from registration under Rule 144A of the Securities Act of 1933. These securities may be resold in transactions exempt from registration, normally to qualified institutional buyers. At December 31, 2023, the value of Rule 144A holdings amounted to $77,817,338 or 39.8% of net assets. |
| Variable rate security. Rate as of December 31, 2023 is disclosed. Issuers comprised of various lots with differing coupon rates have been aggregated for the purpose of presentation in the Portfolio of Investments and show a weighted average rate. Certain variable rate securities are not based on a published reference rate and spread, rather are determined by the issuer or agent and are based on current market conditions. These securities may not indicate a reference rate and/or spread in their description. |
| Level 3 security. Value has been determined using significant unobservable inputs. See Note 3 of Notes to Financial Statements. |
| Perpetual bond with no specified maturity date. |
| The issuer is in default with respect to interest and/or principal payments. Income is not being accrued. |
| Amount shown represents units. One unit represents a principal amount of 1,000. |
| Amount shown represents units. One unit represents a principal amount of 100. |
| Interest rate represents annualized yield at time of purchase; not a coupon rate. The Fund’s investment in this security is comprised of various lots with differing annualized yields. |
| Position is unsettled. Contract rate was not determined at December 31, 2023 and does not take effect until settlement date. Maturity date is not finalized until settlement date. |
| Stated interest rate has been determined in accordance with the provisions of the loan agreement and is subject to a minimum benchmark floor rate which may range from 0.00% to 2.50%, to which the spread is added. |
| Interest rate represents discount rate at time of purchase; not a coupon rate. |
| The Fund's investment in U.S. Government/Agency securities is comprised of various lots with differing discount rates. These separate investments, which have the same maturity date, have been aggregated for the purpose of presentation in the Portfolio of Investments. |
| |
| Adjustable Rate Mortgages |
| |
| Real Estate Investment Trusts |
| Real Estate Mortgage Investment Conduits |
| Secured Overnight Financing Rate |
See accompanying notes to financial statements.
Portfolio of Investments – as of December 31, 2023Loomis Sayles Investment Grade Fixed Income Fund (continued) At December 31, 2023, open long futures contracts were as follows:
| | | | | Unrealized
Appreciation
(Depreciation) |
CBOT 10 Year U.S. Treasury Notes Futures | | | | | |
CBOT 2 Year U.S. Treasury Notes Futures | | | | | |
CBOT 5 Year U.S. Treasury Notes Futures | | | | | |
CBOT U.S. Long Bond Futures | | | | | |
CME Ultra Long Term U.S. Treasury Bond Futures | | | | | |
| | | | | |
At December 31, 2023, open short futures contracts were as follows:
| | | | | Unrealized
Appreciation
(Depreciation) |
Ultra 10-Year U.S. Treasury Notes Futures | | | | | |
Industry Summary at December 31, 2023
| |
| |
| |
| |
| |
| |
| |
| |
| |
| |
| |
| |
Non-Agency Commercial Mortgage-Backed Securities | |
Other Investments, less than 2% each | |
Collateralized Loan Obligations | |
| |
| |
Other assets less liabilities (including futures contracts) | |
| |
See accompanying notes to financial statements.
Statements of Assets and Liabilities
| | Investment
Grade Fixed
Income Fund |
| | |
| | |
Net unrealized depreciation | | |
| | |
| | |
Due from brokers (Note 2) | | |
Foreign currency at value (identified cost $1,542 and $15, respectively) | | |
Receivable for Fund shares sold | | |
Dividends and interest receivable | | |
Receivable for variation margin on futures contracts (Note 2) | | |
Prepaid expenses (Note 8) | | |
| | |
| | |
Payable for securities purchased | | |
Payable for Fund shares redeemed | | |
Unrealized depreciation on forward foreign currency contracts (Note 2) | | |
Foreign taxes payable (Note 2) | | |
Management fees payable (Note 6) | | |
Deferred Trustees’ fees (Note 6) | | |
Administrative fees payable (Note 6) | | |
Payable to distributor (Note 6d) | | |
Audit and tax services fees payable | | |
Other accounts payable and accrued expenses | | |
| | |
COMMITMENTS AND CONTINGENCIES(a) | | |
| | |
| | |
| | |
| | |
| | |
See accompanying notes to financial statements.
Statements of Assets and Liabilities (continued)
| | Investment Grade Fixed Income Fund |
COMPUTATION OF NET ASSET VALUE AND OFFERING PRICE: | | |
| | |
| | |
Shares of beneficial interest | | |
Net asset value, offering and redemption price per share | | |
| | |
| | |
Shares of beneficial interest | | |
Net asset value, offering and redemption price per share | | |
| | |
| | |
Shares of beneficial interest | | |
Net asset value, offering and redemption price per share | | |
| | |
| | |
Shares of beneficial interest | | |
Net asset value, offering and redemption price per share | | |
| As disclosed in the Notes to Financial Statements, if applicable. |
See accompanying notes to financial statements.
For the Year Ended December 31, 2023
| | Investment
Grade Fixed
Income Fund |
| | |
| | |
| | |
Less net foreign taxes withheld | | |
| | |
| | |
| | |
Service and distribution fees (Note 6) | | |
Administrative fees (Note 6) | | |
Trustees' fees and expenses (Note 6) | | |
Transfer agent fees and expenses (Notes 6 and 7) | | |
Audit and tax services fees | | |
Custodian fees and expenses | | |
| | |
| | |
Shareholder reporting expenses | | |
| | |
| | |
Less waiver and/or expense reimbursement (Note 6) | | |
| | |
| | |
Net realized and unrealized gain (loss) on Investments, Futures contracts, Forward foreign currency contracts and Foreign currency transactions | | |
Net realized gain (loss) on: | | |
| | |
| | |
Forward foreign currency contracts (Note 2d) | | |
Foreign currency transactions (Note 2c) | | |
Net change in unrealized appreciation (depreciation) on: | | |
| | |
| | |
Forward foreign currency contracts (Note 2d) | | |
Foreign currency translations (Note 2c) | | |
Net realized and unrealized gain on Investments, Futures contracts, Forward foreign currency contracts and Foreign currency transactions | | |
NET INCREASE IN NET ASSETS RESULTING FROM OPERATIONS | | |
See accompanying notes to financial statements.
Statements of Changes in Net Assets
| | Investment Grade Fixed Income Fund |
| Year Ended
December 31,2023 | Year Ended
December 31,2022 | Year Ended
December 31,2023 | Year Ended
December 31,2022 |
| | | | |
| | | | |
Net realized loss on investments, futures contracts, forward foreign currency contracts and foreign currency transactions | | | | |
Net change in unrealized appreciation (depreciation) on investments, futures contracts, forward foreign currency contracts and foreign currency translations | | | | |
Net increase (decrease) in net assets resulting from operations | | | | |
FROM DISTRIBUTIONS TO SHAREHOLDERS: | | | | |
| | | | |
| | | | |
| | | | |
| | | | |
| | | | |
NET DECREASE IN NET ASSETS FROM CAPITAL
SHARES TRANSACTIONS (Note 11) | | | | |
Net increase (decrease) in net assets | | | | |
| | | | |
| | | | |
| | | | |
See accompanying notes to financial statements.
For a share outstanding throughout each period.
| Bond Fund – Institutional Class |
| Year Ended
December 31,
2023 | Year Ended
December 31,
2022 | Year Ended
December 31,
2021 | Period Ended
December 31,
2020* | Year Ended
September 30,
2020 | Year Ended
September 30,
2019 |
Net asset value, beginning of the period | | | | | | |
INCOME (LOSS) FROM INVESTMENT OPERATIONS: | | | | | | |
| | | | | | |
Net realized and unrealized gain (loss) | | | | | | |
Total from Investment Operations | | | | | | |
| | | | | | |
| | | | | | |
Net realized capital gains | | | | | | |
| | | | | | |
Net asset value, end of the period | | | | | | |
| | | | | | |
RATIOS TO AVERAGE NET ASSETS: | | | | | | |
Net assets, end of the period (000's) | | | | | | |
| | | | | | |
| | | | | | |
| | | | | | |
| | | | | | |
| For the three month period ended December 31, 2020 due to change in fiscal year. |
| Per share net investment income has been calculated using the average shares outstanding during the period. |
| Had certain expenses not been waived/reimbursed during the period, total returns would have been lower. |
| Periods less than one year are not annualized. |
| The investment adviser agreed to waive its fees and/or reimburse a portion of the Fund’s expenses during the period. Without this waiver/reimbursement, expenses would have been higher. |
| Effective July 1, 2023, the expense limit decreased from 0.67% to 0.66%. See Note 6 of Notes to Financial Statements. |
| Computed on an annualized basis for periods less than one year. |
| The variation in the Fund’s turnover rate from the year ended September 30, 2020 to the year ended December 31, 2021 was primarily due to a repositioning of the portfolio. |
| The variation in the Fund’s turnover rate, if annualized, from the year ended September 30, 2020 to the period ended December 31, 2020 was primarily due to the disposition and realignment of certain foreign currency-denominated positions. |
See accompanying notes to financial statements.
Financial Highlights (continued)
For a share outstanding throughout each period.
| |
| Year Ended
December 31,
2023 | Year Ended
December 31,
2022 | Year Ended
December 31,
2021 | | Year Ended
September 30,
2020 | Year Ended
September 30,
2019 |
Net asset value, beginning of the period | | | | | | |
INCOME (LOSS) FROM INVESTMENT OPERATIONS: | | | | | | |
| | | | | | |
Net realized and unrealized gain (loss) | | | | | | |
Total from Investment Operations | | | | | | |
| | | | | | |
| | | | | | |
Net realized capital gains | | | | | | |
| | | | | | |
Net asset value, end of the period | | | | | | |
| | | | | | |
RATIOS TO AVERAGE NET ASSETS: | | | | | | |
Net assets, end of the period (000's) | | | | | | |
| | | | | | |
| | | | | | |
| | | | | | |
| | | | | | |
| For the three month period ended December 31, 2020 due to change in fiscal year. |
| Per share net investment income has been calculated using the average shares outstanding during the period. |
| Had certain expenses not been waived/reimbursed during the period, total returns would have been lower. |
| Periods less than one year are not annualized. |
| The investment adviser agreed to waive its fees and/or reimburse a portion of the Fund’s expenses during the period. Without this waiver/reimbursement, expenses would have been higher. |
| Effective July 1, 2023, the expense limit decreased from 0.92% to 0.91%. See Note 6 of Notes to Financial Statements. |
| Computed on an annualized basis for periods less than one year. |
| The administrator agreed to waive its fees and/or reimburse a portion of the Fund’s expenses during the period. Without this waiver/reimbursement, expenses would have been higher. |
| The variation in the Fund’s turnover rate from the year ended September 30, 2020 to the year ended December 31, 2021 was primarily due to a repositioning of the portfolio. |
| The variation in the Fund’s turnover rate, if annualized, from the year ended September 30, 2020 to the period ended December 31, 2020 was primarily due to the disposition and realignment of certain foreign currency-denominated positions. |
See accompanying notes to financial statements.
Financial Highlights (continued)
For a share outstanding throughout each period.
| |
| Year Ended
December 31,
2023 | Year Ended
December 31,
2022 | Year Ended
December 31,
2021 | | Year Ended
September 30,
2020 | Year Ended
September 30,
2019 |
Net asset value, beginning of the year | | | | | | |
INCOME (LOSS) FROM INVESTMENT OPERATIONS: |
| | | | | | |
Net realized and unrealized gain (loss) | | | | | | |
Total from Investment Operations | | | | | | |
| | | | | | |
| | | | | | |
Net realized capital gains | | | | | | |
| | | | | | |
Net asset value, end of the period | | | | | | |
| | | | | | |
RATIOS TO AVERAGE NET ASSETS: | | | | | | |
Net assets, end of the period (000's) | | | | | | |
| | | | | | |
| | | | | | |
| | | | | | |
| | | | | | |
| For the three month period ended December 31, 2020 due to change in fiscal year. |
| Per share net investment income has been calculated using the average shares outstanding during the period. |
| Had certain expenses not been waived/reimbursed during the period, total returns would have been lower. |
| Periods less than one year are not annualized. |
| The investment adviser agreed to waive its fees and/or reimburse a portion of the Fund’s expenses during the period. Without this waiver/reimbursement, expenses would have been higher. |
| Includes refund of prior year service fee of 0.04%. See Note 6b of Notes to Financial Statements. |
| Effective July 1, 2023, the expense limit decreased from 1.17% to 1.16%. See Note 6 of Notes to Financial Statements. |
| Includes refund of prior year service fee of 0.04%. |
| Includes refund of prior year service fee of 0.02%. |
| Computed on an annualized basis for periods less than one year. |
| The administrator agreed to waive its fees and/or reimburse a portion of the Fund’s expenses during the period. Without this waiver/reimbursement, expenses would have been higher. |
| The variation in the Fund’s turnover rate from the year ended September 30, 2020 to the year ended December 31, 2021 was primarily due to a repositioning of the portfolio. |
| The variation in the Fund’s turnover rate, if annualized, from the year ended September 30, 2020 to the period ended December 31, 2020 was primarily due to the disposition and realignment of certain foreign currency-denominated positions. |
See accompanying notes to financial statements.
Financial Highlights (continued)
For a share outstanding throughout each period.
| |
| Year Ended
December 31,
2023 | Year Ended
December 31,
2022 | Year Ended
December 31,
2021 | | Year Ended
September 30,
2020 | Year Ended
September 30,
2019 |
Net asset value, beginning of the period | | | | | | |
INCOME (LOSS) FROM INVESTMENT OPERATIONS: | | | | | | |
| | | | | | |
Net realized and unrealized gain (loss) | | | | | | |
Total from Investment Operations | | | | | | |
| | | | | | |
| | | | | | |
Net realized capital gains | | | | | | |
| | | | | | |
Net asset value, end of the period | | | | | | |
| | | | | | |
RATIOS TO AVERAGE NET ASSETS: | | | | | | |
Net assets, end of the period (000's) | | | | | | |
| | | | | | |
| | | | | | |
| | | | | | |
| | | | | | |
| For the three month period ended December 31, 2020 due to change in fiscal year. |
| Per share net investment income has been calculated using the average shares outstanding during the period. |
| Had certain expenses not been waived/reimbursed during the period, total returns would have been lower. |
| Periods less than one year are not annualized. |
| The investment adviser agreed to waive its fees and/or reimburse a portion of the Fund’s expenses during the period. Without this waiver/reimbursement, expenses would have been higher. |
| Effective July 1, 2023, the expense limit decreased from 0.62% to 0.61%. See Note 6 of Notes to Financial Statements. |
| Computed on an annualized basis for periods less than one year. |
| The variation in the Fund’s turnover rate from the year ended September 30, 2020 to the year ended December 31, 2021 was primarily due to a repositioning of the portfolio. |
| The variation in the Fund’s turnover rate, if annualized, from the year ended September 30, 2020 to the period ended December 31, 2020 was primarily due to the disposition and realignment of certain foreign currency-denominated positions. |
See accompanying notes to financial statements.
Financial Highlights (continued)
For a share outstanding throughout each period.
| Investment Grade Fixed Income Fund – Institutional Class |
| Year Ended
December 31,
2023 | Year Ended
December 31,
2022 | Year Ended
December 31,
2021 | Period Ended
December 31,
2020* | Year Ended
September 30,
2020 | Year Ended
September 30,
2019 |
Net asset value, beginning of the period | | | | | | |
INCOME (LOSS) FROM INVESTMENT OPERATIONS: | | | | | | |
| | | | | | |
Net realized and unrealized gain (loss) | | | | | | |
Total from Investment Operations | | | | | | |
| | | | | | |
| | | | | | |
Net realized capital gains | | | | | | |
| | | | | | |
Net asset value, end of the period | | | | | | |
| | | | | | |
RATIOS TO AVERAGE NET ASSETS: | | | | | | |
Net assets, end of the period (000's) | | | | | | |
| | | | | | |
| | | | | | |
| | | | | | |
| | | | | | |
| For the three month period ended December 31, 2020 due to change in fiscal year. |
| Per share net investment income has been calculated using the average shares outstanding during the period. |
| Had certain expenses not been waived/reimbursed during the period, total returns would have been lower. |
| Periods less than one year are not annualized. |
| The investment adviser agreed to waive its fees and/or reimburse a portion of the Fund’s expenses during the period. Without this waiver/reimbursement, expenses would have been higher. |
| Effective July 1, 2023, the expense limit decreased from 0.55% to 0.53%. See Note 6 of Notes to Financial Statements. |
| Computed on an annualized basis for periods less than one year. |
| The variation in the Fund’s turnover rate from the year ended September 30, 2020 to the year ended December 31, 2021 was primarily due to a repositioning of the portfolio. |
| The variation in the Fund’s turnover rate, if annualized, from the year ended September 30, 2020 to the period ended December 31, 2020 was primarily due to the disposition and realignment of certain foreign currency-denominated positions. |
See accompanying notes to financial statements.
Notes to Financial Statements
1.Organization. Loomis Sayles Funds I (the “Trust”) is organized as a Massachusetts business trust. The Trust is registered under the Investment Company Act of 1940, as amended (the “1940 Act”) as an open-end management investment company. The Declaration of Trust permits the Board of Trustees to authorize the issuance of an unlimited number of shares of the Trust in multiple series. The financial statements for certain funds of the Trust are presented in separate reports. The following funds (individually, a “Fund” and collectively, the “Funds”) are included in this report:
Loomis Sayles Bond Fund (“Bond Fund”)
Loomis Sayles Investment Grade Fixed Income Fund ("Investment Grade Fixed Income Fund")
Each Fund is a diversified investment company.
Each Fund offers Institutional Class shares. In addition, Bond Fund also offers Retail Class, Admin Class and Class N shares.
Each share class is sold without a sales charge. Retail Class and Admin Class shares pay a Rule 12b-1 fee. Admin Class shares are primarily intended for employer-sponsored retirement plans and are offered exclusively through intermediaries. Class N shares do not pay a front-end sales charge, a contingent deferred sales charge (“CDSC”) or Rule 12b-1 fees. Class N shares are offered with an initial minimum investment of $1,000,000. Institutional Class shares are intended for institutional investors with a minimum initial investment of $100,000 for Bond Fund and $3,000,000 for Investment Grade Fixed Income Fund. Certain categories of investors are exempted from the minimum investment amounts for Class N and Institutional Class as outlined in the relevant Fund’s prospectus.
Most expenses can be directly attributed to a Fund. Expenses which cannot be directly attributed to a Fund are generally apportioned based on the relative net assets of each of the Funds in Natixis Funds Trust I, Natixis Funds Trust II, Natixis Funds Trust IV, and Gateway Trust (“Natixis Funds Trusts”), and Loomis Sayles Funds I and Loomis Sayles Funds II (“Loomis Sayles Funds Trusts”), and Natixis ETF Trust and Natixis ETF Trust II (“Natixis ETF Trusts”). Expenses of a Fund are borne pro rata by the holders of each class of shares, except that each class bears expenses unique to that class (such as the Rule 12b-1 fees applicable to Retail Class and Admin Class) and transfer agent fees are borne collectively for Institutional Class, Retail Class, and Admin Class, and individually for Class N. In addition, each class votes as a class only with respect to its own Rule 12b-1 Plan. Shares of each class would receive their pro rata share of the net assets of a Fund if the Fund were liquidated. The Trustees approve separate distributions from net investment income on each class of shares.
2.Significant Accounting Policies. The following is a summary of significant accounting policies consistently followed by each Fund in the preparation of its financial statements. The Funds' financial statements follow the accounting and reporting guidelines provided for investment companies and are prepared in accordance with accounting principles generally accepted in the United States of America which require the use of management estimates that affect the reported amounts and disclosures in the financial statements. Actual results could differ from those estimates. Management has evaluated the events and transactions subsequent to year-end through the date the financial statements were issued and has determined that there were no material events that would require disclosure in the Funds' financial statements.
a. Valuation. Registered investment companies are required to value portfolio investments using an unadjusted, readily available market quotation. Each Fund obtains readily available market quotations from independent pricing services. Fund investments for which readily
available market quotations are not available are priced at fair value pursuant to the Funds’ Valuation Procedures. The Board of Trustees has approved a valuation designee who is subject to the Board’s oversight.
Unadjusted readily available market quotations that are utilized for exchange traded equity securities (including shares of closed-end investment companies and exchange-traded funds) include the last sale price quoted on the exchange where the security is traded most extensively. Futures contracts are valued at the closing settlement price on the exchange on which the valuation designee believes that, over time, they are traded most extensively. Shares of open-end investment companies are valued at net asset value ("NAV") per share.
Exchange traded equity securities for which there is no reported sale during the day are fair valued at the closing bid quotation as reported by an independent pricing service. Unlisted equity securities (except unlisted preferred equity securities) are fair valued at the last sale price quoted in the market where they are traded most extensively or, if there is no reported sale during the day, the closing bid quotation as reported by an independent pricing service. If there is no last sale price or closing bid quotation available, unlisted equity securities will be fair valued using evaluated bids furnished by an independent pricing service, if available.
Debt securities and unlisted preferred equity securities are fair valued based on evaluated bids furnished to the Funds by an independent pricing service or bid prices obtained from broker-dealers. Senior loans and collateralized loan obligations ("CLOs") are fair valued at bid prices supplied by an independent pricing service, if available. Broker-dealer bid prices may be used to fair value debt, unlisted equities, senior loans and CLOs where an independent pricing service is unable to price an investment or where an independent pricing service does not provide a reliable price for the investment. Forward foreign currency contracts are fair valued utilizing interpolated rates determined based on information provided by an independent pricing service.
The Funds may also fair value investments in other circumstances such as when extraordinary events occur after the close of a foreign market, but prior to the close of the New York Stock Exchange. This may include situations relating to a single issuer (such as a declaration of
Notes to Financial Statements (continued)
bankruptcy or a delisting of the issuer’s security from the primary market on which it has traded) as well as events affecting the securities markets in general (such as market disruptions or closings and significant fluctuations in U.S. and/or foreign markets). When fair valuing a Fund’s investments, the valuation designee may, among other things, use modeling tools or other processes that may take into account factors such as issuer specific information, or other related market activity and/or information that occurred after the close of the foreign market but before the time the Fund’s NAV is calculated. Fair valuation by the Fund(s) valuation designee may require subjective determinations about the value of the investment, and fair values used to determine a Fund’s NAV may differ from quoted or published prices, or from prices that are used by others, for the same investments. In addition, the use of fair value pricing may not always result in adjustments to the prices of investments held by a Fund.
b. Investment Transactions and Related Investment Income. Investment transactions are accounted for on a trade date plus one day basis for daily NAV calculation. However, for financial reporting purposes, investment transactions are reported on trade date. Dividend income (including income reinvested) and foreign withholding tax, if applicable, are recorded on the ex-dividend date, or in the case of certain foreign securities, as soon as a Fund is notified, and interest income is recorded on an accrual basis. Loan consent fees, upfront origination fees and/or amendment fees are recorded when received and included in interest income on the Statements of Operations. Interest income is increased by the accretion of discount and decreased by the amortization of premium, if applicable. For securities with paydown provisions, principal payments received are treated as a proportionate reduction to the cost basis of the securities, and excess or shortfall amounts are recorded as income. Distributions received from investments in securities that represent a return of capital or capital gain are recorded as a reduction of cost of investments or as a realized gain, respectively. In determining net gain or loss on securities sold, the cost of securities has been determined on an identified cost basis. Investment income, non-class specific expenses and realized and unrealized gains and losses are allocated on a pro rata basis to each class based on the relative net assets of each class to the total net assets of the Fund.
c. Foreign Currency Translation. The books and records of the Funds are maintained in U.S. dollars. The values of securities, currencies and other assets and liabilities denominated in currencies other than U.S. dollars, if any, are translated into U.S. dollars based upon foreign exchange rates prevailing at the end of the period. Purchases and sales of investment securities, income and expenses are translated into U.S. dollars on the respective dates of such transactions.
Net realized foreign exchange gains or losses arise from sales of foreign currency, changes in exchange rates between the trade and settlement dates on securities transactions and the difference between the amounts of dividends, interest and foreign withholding taxes recorded in the Funds’ books and records and the U.S. dollar equivalent of the amounts actually received or paid. Net unrealized foreign exchange gains or losses arise from changes in the value of assets and liabilities, other than investment securities, as of the end of the fiscal period, resulting from changes in exchange rates. Net realized foreign exchange gains or losses and the net change in unrealized foreign exchange gains or losses are disclosed in the Statements of Operations. For federal income tax purposes, net realized foreign exchange gains or losses are characterized as ordinary income and may, if the Funds have net losses, reduce the amount of income available to be distributed by the Funds.
The values of investment securities are presented at the foreign exchange rates prevailing at the end of the period for financial reporting purposes. Net realized and unrealized gains or losses on investments reported in the Statements of Operations reflect gains or losses resulting from changes in exchange rates and fluctuations which arise due to changes in market prices of investment securities. For federal income tax purposes, a portion of the net realized gain or loss on investments arising from changes in exchange rates, which is reflected in the Statements of Operations, may be characterized as ordinary income and may, if the Funds have net losses, reduce the amount of income available to be distributed by the Funds.
The Funds may use foreign currency exchange contracts to facilitate transactions in foreign-denominated investments. Losses may arise from changes in the value of the foreign currency or if the counterparties do not perform under the contracts’ terms.
d. Forward Foreign Currency Contracts. A Fund may enter into forward foreign currency contracts, including forward foreign cross currency contracts, to acquire exposure to foreign currencies or to hedge the Funds’ investments against currency fluctuation. A contract can also be used to offset a previous contract. These contracts involve market risk in excess of the unrealized appreciation (depreciation) reflected in the Funds’ Statements of Assets and Liabilities. The U.S. dollar value of the currencies a Fund has committed to buy or sell represents the aggregate exposure to each currency a Fund has acquired or hedged through currency contracts outstanding at period end. Gains or losses are recorded for financial statement purposes as unrealized until settlement date. Contracts are traded over-the-counter directly with a counterparty. Risks may arise upon entering into these contracts from the potential inability of counterparties to meet the terms of their contracts and from unanticipated movements in the value of a foreign currency relative to the U.S. dollar. Certain contracts may require the movement of cash and/or securities as collateral for the Funds’ or counterparty’s net obligations under the contracts. Forward foreign currency contracts outstanding at the end of the period, if any, are listed in each applicable Fund's Portfolio of Investments.
e. Futures Contracts. A Fund may enter into futures contracts. Futures contracts are agreements between two parties to buy and sell a particular instrument or index for a specified price on a specified future date.
When a Fund enters into a futures contract, it is required to deposit with (or for the benefit of) its broker an amount of cash or short-term high-quality securities as “initial margin.” As the value of the contract changes, the value of the futures contract position increases or declines.
Notes to Financial Statements (continued)
Subsequent payments, known as “variation margin,” are made or received by a Fund, depending on the price fluctuations in the fair value of the contract and the value of cash or securities on deposit with the broker. The aggregate principal amounts of the contracts are not recorded in the financial statements. Daily fluctuations in the value of the contracts are recorded in the Statements of Assets and Liabilities as a receivable (payable) and in the Statements of Operations as unrealized appreciation (depreciation) until the contracts are closed, when they are recorded as realized gains (losses). Realized gain or loss on a futures position is equal to the difference between the value of the contract at the time it was opened and the value at the time it was closed, minus brokerage commissions. When a Fund enters into a futures contract certain risks may arise, such as illiquidity in the futures market, which may limit a Fund’s ability to close out a futures contract prior to settlement date, and unanticipated movements in the value of securities or interest rates. Futures contracts outstanding at the end of the period, if any, are listed in each applicable Fund's Portfolio of Investments.
Futures contracts are exchange-traded. Exchange-traded futures contracts are standardized and are settled through a clearing house with fulfillment supported by the credit of the exchange. Therefore, counterparty credit risks to the Funds are reduced; however, in the event that a counterparty enters into bankruptcy, a Fund’s claim against initial/variation margin on deposit with the counterparty may be subject to terms of a final settlement in bankruptcy court.
f. When-Issued and Delayed Delivery Transactions. A Fund may enter into when-issued or delayed delivery transactions. When-issued refers to transactions made conditionally because a security, although authorized, has not been issued. Delayed delivery refers to transactions for which delivery or payment will occur at a later date, beyond the normal settlement period. The price of when-issued and delayed delivery securities and the date when the securities will be delivered and paid for are fixed at the time the transaction is negotiated. The security and the obligation to pay for it are recorded by the Funds at the time the commitment is entered into. The value of the security may vary with market fluctuations during the time before the Funds take delivery of the security. No interest accrues to the Funds until the transaction settles.
Delayed delivery transactions include those designated as To Be Announced (“TBAs”) in the Portfolios of Investments. For TBAs, the actual security that will be delivered to fulfill the transaction is not designated at the time of the trade. The security is “to be announced” 48 hours prior to the established trade settlement date. Certain transactions require the Funds or counterparty to post cash and/or securities as collateral for the net mark-to-market exposure to the other party.
Purchases of when-issued or delayed delivery securities may have a similar effect on the Funds’ NAV as if the Funds’ had created a degree of leverage in the portfolio. Risks may arise upon entering into such transactions from the potential inability of counterparties to meet their obligations under the transactions. Additionally, losses may arise due to changes in the value of the underlying securities.
There were no when-issued or delayed delivery securities held by the Funds as of December 31, 2023.
g. Federal and Foreign Income Taxes. The Trust treats each Fund as a separate entity for federal income tax purposes. Each Fund intends to meet the requirements of the Internal Revenue Code of 1986, as amended, applicable to regulated investment companies, and to distribute to its shareholders substantially all of its net investment income and any net realized capital gains at least annually. Management has performed an analysis of each Fund’s tax positions for the open tax years as of December 31, 2023 and has concluded that no provisions for income tax are required. The Funds’ federal tax returns for the prior three fiscal years remain subject to examination by the Internal Revenue Service. Management is not aware of any events that are reasonably possible to occur in the next twelve months that would result in the amounts of any unrecognized tax benefits significantly increasing or decreasing for the Funds. However, management’s conclusions regarding tax positions taken may be subject to review and adjustment at a later date based on factors including, but not limited to, new tax laws and accounting regulations and interpretations thereof.
A Fund may be subject to foreign withholding taxes on investment income and taxes on capital gains on investments that are accrued and paid based upon the Fund’s understanding of the tax rules and regulations that exist in the countries in which the Fund invests. Foreign withholding taxes on dividend and interest income are reflected on the Statements of Operations as a reduction of investment income, net of amounts that have been or are expected to be reclaimed and paid. Dividends and interest receivable on the Statements of Assets and Liabilities are net of foreign withholding taxes. Foreign withholding taxes where reclaims have been or are expected to be filed and paid are reflected on the Statements of Assets and Liabilities as tax reclaims receivable. Capital gains taxes paid are included in net realized gain (loss) on investments in the Statements of Operations. Accrued but unpaid capital gains taxes are reflected as foreign taxes payable on the Statements of Assets and Liabilities, if applicable, and reduce unrealized gains on investments. In the event that realized gains on investments are subsequently offset by realized losses, taxes paid on realized gains may be returned to a Fund. Such amounts, if applicable, are reflected as foreign tax rebates receivable on the Statements of Assets and Liabilities and are recorded as a realized gain when received.
h. Dividends and Distributions to Shareholders. Dividends and distributions are recorded on the ex-dividend date. The timing and characterization of certain income and capital gain distributions are determined in accordance with federal tax regulations, which may differ from accounting principles generally accepted in the United States of America. Permanent differences are primarily due to differing treatments for book and tax purposes of items such as defaulted and/or non-income producing securities, premium amortization, convertible bond adjustments, corporate actions, foreign currency gains and losses, forward foreign currency contract mark-to-market, futures contract mark-to-
Notes to Financial Statements (continued)
market, trust preferred securities, return of capital distributions received, capital gain distributions received and paydown gains and losses. Permanent book and tax basis differences relating to shareholder distributions, net investment income and net realized gains will result in reclassifications to capital accounts reported on the Statements of Assets and Liabilities. Temporary differences between book and tax distributable earnings are primarily due to deferred Trustees’ fees, wash sales, defaulted and/or non-income producing securities, return of capital distributions received, trust preferred securities, corporate actions, capital gain distributions received, premium amortization, forward foreign currency contract mark-to-market, perpetual bond adjustments, paydown gains and losses, straddle loss deferral adjustments, convertible bond adjustments and futures contract mark-to-market. Amounts of income and capital gain available to be distributed on a tax basis are determined annually, and at other times during the Funds’ fiscal year as may be necessary to avoid knowingly declaring and paying a return of capital distribution. Distributions from net investment income and net realized short-term capital gains are reported as distributed from ordinary income for tax purposes.
The tax characterization of distributions is determined on an annual basis. The tax character of distributions paid to shareholders during the years ended December 31, 2023 and 2022 was as follows:
| | |
| | | | | | |
| | | | | | |
Investment Grade Fixed Income Fund | | | | | | |
Distributions paid to shareholders from net investment income and net realized capital gains, based on accounting principles generally accepted in the United States of America, are consolidated and reported on the Statements of Changes in Net Assets as Distributions to Shareholders. Distributions paid to shareholders from net investment income and net realized capital gains expressed in per-share amounts, based on accounting principles generally accepted in the United States of America, are separately stated and reported within the Financial Highlights.
As of December 31, 2023, the components of distributable earnings on a tax basis were as follows:
| | Investment
Grade Fixed
Income Fund |
Undistributed ordinary income | | |
Capital loss carryforward: | | |
| | |
| | |
| | |
| | |
Total capital loss carryforward | | |
| | |
| | |
As of December 31, 2023, the tax cost of investments (including derivatives, if applicable) and unrealized appreciation (depreciation) on a federal tax basis were as follows:
| | Investment
Grade Fixed
Income Fund |
| | |
| | |
| | |
| | |
The difference between these amounts and those reported in the preceding table, if any, are primarily attributable to foreign currency mark-to-market.
Notes to Financial Statements (continued)
i. Senior Loans. A Fund’s investment in senior loans may be to corporate, governmental or other borrowers. Senior loans, which include both secured and unsecured loans made by banks and other financial institutions to corporate customers, typically hold the most senior position in a borrower’s capital structure, may be secured by the borrower’s assets and have interest rates that reset frequently. Senior Loans can include term loans, revolving credit facility loans and second lien loans. A senior loan is often administered by a bank or other financial institution that acts as agent for all holders. The agent administers the terms of the senior loan, as specified in the loan agreement. Large loans may be shared or syndicated among several lenders. The Fund may enter into the primary syndicate for a loan or it may also purchase all or a portion of loans from other lenders (sometimes referred to as loan assignments), in either case becoming a direct lender. The settlement period for senior loans is uncertain as there is no standardized settlement schedule applicable to such investments. Senior loans outstanding at the end of the period, if any, are listed in each applicable Fund’s Portfolio of Investments.
j. Collateralized Loan Obligations. A Fund may invest in CLOs. A CLO is a type of asset-backed security designed to redirect the cash flows from a pool of leveraged loans to investors based on their risk preferences. Cash flows from a CLO are split into two or more portions, called tranches, varying in risk and yield. The risk of an investment in a CLO depends largely on the type of the collateralized securities and the class of the instrument in which the Fund invests. CLOs outstanding at the end of the period, if any, are listed in each applicable Fund’s Portfolio of Investments.
k. Repurchase Agreements. Each Fund may enter into repurchase agreements, under the terms of a Master Repurchase Agreement, under which each Fund acquires securities as collateral and agrees to resell the securities at an agreed upon time and at an agreed upon price. It is each Fund’s policy that the market value of the collateral for repurchase agreements be at least equal to 102% of the repurchase price, including interest. Certain repurchase agreements are tri-party arrangements whereby the collateral is held in a segregated account for the benefit of the Fund and on behalf of the counterparty. Repurchase agreements could involve certain risks in the event of default or insolvency of the counterparty, including possible delays or restrictions upon a Fund’s ability to dispose of the underlying securities. As of December 31, 2023, each Fund, as applicable, had investments in repurchase agreements for which the value of the related collateral exceeded the value of the repurchase agreement. The gross value of repurchase agreements is included in the Statements of Assets and Liabilities for financial reporting purposes.
l. Due from Brokers. Transactions and positions in certain forward foreign currency contracts are maintained and cleared by registered U.S. broker/dealers pursuant to customer agreements between the Funds and the various broker/dealers. The due from broker balance in the Statements of Assets and Liabilities for Bond Fund represents cash pledged as collateral for forward foreign currency contracts. In certain circumstances the Funds’ use of cash held at brokers is restricted by regulation or broker mandated limits.
m. Indemnifications. Under the Trust’s organizational documents, its officers and Trustees are indemnified against certain liabilities arising out of the performance of their duties to the Funds. Additionally, in the normal course of business, the Funds enter into contracts with service providers that contain general indemnification clauses. The Funds' maximum exposure under these arrangements is unknown as this would involve future claims that may be made against the Funds that have not yet occurred. However, based on experience, the Funds expect the risk of loss to be remote.
n. Regulatory Update. Effective January 24, 2023, the SEC adopted a release (the “Release”) containing rule and form amendments to require mutual funds and ETFs to transmit concise and visually engaging streamlined annual and semiannual reports to shareholders that highlight key information deemed important for retail investors to assess and monitor their fund investments. Other information, including financial statements, will no longer appear in the new tailored shareholder reports but will be available online, delivered free of charge upon request, and filed with the SEC on a semiannual basis on Form N-CSR. In addition to the removal of financial statements from the new tailored shareholder reports, the Release requires mandatory mailing of the reports, unless a shareholder specifically opts out and chooses electronic delivery. The Release also requires that the new tailored shareholder reports be no longer than 2-4 pages, include only a single share class of a single fund, and use a broad-based securities market index for performance comparison purposes. Management is evaluating the impact of the Release on the content of the current shareholder report and newly created tailored shareholder reports and expects to meet the required compliance date of July 24, 2024.
3.Fair Value Measurements. In accordance with accounting standards related to fair value measurements and disclosures, the Funds have categorized the inputs utilized in determining the value of each Fund’s assets or liabilities. These inputs are summarized in the three broad levels listed below:
• Level 1 — quoted prices in active markets for identical assets or liabilities;
• Level 2 — prices determined using other significant inputs that are observable either directly, or indirectly through corroboration with observable market data (which could include quoted prices for similar assets or liabilities, interest rates, credit risk, etc.); and
• Level 3 — prices determined using significant unobservable inputs when quoted prices or observable inputs are unavailable such as when there is little or no market activity for an asset or liability (unobservable inputs reflect each Fund’s own assumptions in determining the fair value of assets or liabilities and would be based on the best information available).
Notes to Financial Statements (continued)
The inputs or methodology used for valuing securities are not necessarily an indication of the risk associated with investing in those securities.
The Funds' pricing policies have been approved by the Board of Trustees. Investments for which market quotations are readily available are categorized in Level 1. Other investments for which an independent pricing service is utilized are categorized in Level 2. Broker-dealer bid prices for which the Funds have knowledge of the inputs used by the broker-dealer are categorized in Level 2. All other investments, including broker-dealer bid prices for which the Funds do not have knowledge of the inputs used by the broker-dealer, as well as investments fair valued by the valuation designee, are categorized in Level 3. All Level 2 and 3 securities are defined as being fair valued.
Under certain conditions and based upon specific facts and circumstances, the Fund’s valuation designee may determine that a fair valuation should be made for portfolio investment(s). These valuation designee fair valuations will be based upon a significant amount of Level 3 inputs.
The following is a summary of the inputs used to value the Funds' investments as of December 31, 2023, at value:
|
|
| | | | |
| | | | |
| | | | |
| | | | |
| | | | |
| | | | |
Collateralized Loan Obligations | | | | |
| | | | |
Technology Hardware, Storage & Peripherals | | | | |
All Other Common Stocks(a) | | | | |
| | | | |
| | | | |
| | | | |
Convertible Preferred Stocks(a) | | | | |
Non-Convertible Preferred Stocks | | | | |
| | | | |
| | | | |
All Other Non-Convertible Preferred Stocks(a) | | | | |
Total Non-Convertible Preferred Stocks | | | | |
| | | | |
| | | | |
| | | | |
Futures Contracts (unrealized appreciation) | | | | |
| | | | |
Liability Valuation Inputs |
| | | | |
Forward Foreign Currency Contracts (unrealized depreciation) | | | | |
Futures Contracts (unrealized depreciation) | | | | |
| | | | |
| Details of the major categories of the Fund’s investments are reflected within the Portfolio of Investments. |
Notes to Financial Statements (continued)
Investment Grade Fixed Income Fund |
|
| | | | |
| | | | |
| | | | |
| | | | |
All Other Non-Convertible Bonds(a) | | | | |
Total Non-Convertible Bonds | | | | |
| | | | |
| | | | |
| | | | |
Collateralized Loan Obligations | | | | |
| | | | |
| | | | |
| | | | |
| | | | |
| | | | |
Futures Contracts (unrealized appreciation) | | | | |
| | | | |
Liability Valuation Inputs |
| | | | |
Futures Contracts (unrealized depreciation) | | | | |
| Details of the major categories of the Fund’s investments are reflected within the Portfolio of Investments. |
The following is a reconciliation of Level 3 investments for which significant unobservable inputs were used to determine fair value as of December 31, 2022 and/or December 31, 2023:
|
|
Investments in Securities | Balance as of
December 31,
2022 | Accrued
Discounts
(Premiums) | | Change in
Unrealized
Appreciation
(Depreciation) | | | | | Balance as of
December 31,
2023 | Change in
Unrealized
Appreciation
(Depreciation)
from
Investments
Still Held at
December 31,
2023 |
| | | | | | | | | | |
| | | | | | | | | | |
Property & Casualty Insurance | | | | | | | | | | |
| | | | | | | | | | |
Non-Convertible Preferred Stocks | | | | | | | | | | |
| | | | | | | | | | |
| | | | | | | | | | |
Debt securities valued at $1,406,500 were transferred from Level 3 to Level 2 during the period ended December 31, 2023. At December 31, 2022, these securities were fair valued as determined by the Fund's valuation designee as an independent pricing service was unable to price
Notes to Financial Statements (continued)
the securities. At December 31, 2023, these securities were fair valued based on evaluated bids furnished to the Fund by an independent pricing service in accordance with the Fund's valuation policies.
Investment Grade Fixed Income Fund |
|
Investments in Securities | Balance as of
December 31,
2022 | Accrued
Discounts
(Premiums) | | Change in
Unrealized
Appreciation
(Depreciation) | | | | | Balance as of
December 31,
2023 | Change in
Unrealized
Appreciation
(Depreciation)
from
Investments
Still Held at
December 31,
2023 |
| | | | | | | | | | |
| | | | | | | | | | |
| | | | | | | | | | |
4.Derivatives. Derivative instruments are defined as financial instruments whose value and performance are based on the value and performance of an underlying asset, reference rate or index. Derivative instruments that the Funds used during the period include forward foreign currency contracts and futures contracts.
The Funds are subject to the risk that changes in foreign currency exchange rates will have an unfavorable effect on the value of Fund assets denominated in foreign currencies. The Funds may enter into forward foreign currency exchange contracts for hedging purposes to protect the value of the Funds’ holdings of foreign securities. The Funds may also use forward foreign currency contracts to gain exposure to foreign currencies, regardless of whether securities denominated in such currencies are held in the Funds. During the year ended December 31, 2023, Bond Fund engaged in forward foreign currency contracts for hedging purposes and to gain exposure to foreign currencies.
The Funds are subject to the risk that changes in interest rates will affect the value of the Funds’ investments in fixed-income securities. The Funds will be subject to increased interest rate risk to the extent that they invest in fixed-income securities with longer maturities or durations, as compared to investing in fixed-income securities with shorter maturities or durations. The Funds may use futures contracts to hedge against changes in interest rates and to manage duration without having to buy or sell portfolio securities. The Funds may also use futures contracts to gain investment exposure. During the year ended December 31, 2023, the Funds used futures contracts to manage duration.
The following is a summary of derivative instruments for Bond Fund as of December 31, 2023, as reflected within the Statements of Assets and Liabilities:
| Unrealized
appreciation
on futures
|
Exchange-traded asset derivatives | |
| |
| Represents cumulative unrealized appreciation (depreciation) on futures contracts. Only the current day’s variation margin on futures contracts is reported within the Statements of Assets and Liabilities as receivable or payable for variation margin, as applicable. |
Notes to Financial Statements (continued)
| Unrealized
depreciation
on forward
foreign
currency
contracts | Unrealized
depreciation
on futures
| |
Over-the-counter liability derivatives | | | |
Foreign exchange contracts | | | |
Exchange-traded liability derivatives | | | |
| | | |
Total liability derivatives | | | |
| Represents cumulative unrealized appreciation (depreciation) on futures contracts. Only the current day’s variation margin on futures contracts is reported within the Statements of Assets and Liabilities as receivable or payable for variation margin, as applicable. |
Transactions in derivative instruments for Bond Fund during the year ended December 31, 2023, as reflected within the Statements of Operations were as follows:
Net Realized Gain (Loss) on: | Forward
foreign
currency
contracts | |
| | |
Foreign exchange contracts | | |
| | |
Net Change in Unrealized
Appreciation (Depreciation) on: | Forward
foreign
currency
contracts | |
| | |
Foreign exchange contracts | | |
| | |
The following is a summary of derivative instruments for Investment Grade Fixed Income Fund as of December 31, 2023, as reflected within the Statements of Assets and Liabilities:
| Unrealized
appreciation
on futures
|
Exchange-traded asset derivatives | |
| |
| Represents cumulative unrealized appreciation (depreciation) on futures contracts. Only the current day’s variation margin on futures contracts is reported within the Statements of Assets and Liabilities as receivable or payable for variation margin, as applicable. |
| Unrealized
depreciation
on futures
|
Exchange-traded liability derivatives | |
| |
| Represents cumulative unrealized appreciation (depreciation) on futures contracts. Only the current day’s variation margin on futures contracts is reported within the Statements of Assets and Liabilities as receivable or payable for variation margin, as applicable. |
Notes to Financial Statements (continued)
Transactions in derivative instruments for Investment Grade Fixed Income Fund during the year ended December 31, 2023, as reflected within the Statements of Operations were as follows:
Net Realized Gain (Loss) on: | |
| |
Net Change in Unrealized
Appreciation (Depreciation) on: | |
| |
As the Funds value their derivatives at fair value and recognize changes in fair value through the Statements of Operations, they do not qualify for hedge accounting under authoritative guidance for derivative instruments. The Funds’ investments in derivatives may represent an economic hedge; however, they are considered to be non-hedge transactions for the purpose of these disclosures.
The volume of forward foreign currency contract and futures contract activity, as a percentage of net assets for the Funds, based on gross month-end or daily (as applicable) notional amounts outstanding during the period, including long and short positions at absolute value, was as follows for the year ended December 31, 2023:
| | |
Average Notional Amount Outstanding | | |
Highest Notional Amount Outstanding | | |
Lowest Notional Amount Outstanding | | |
Notional Amount Outstanding as of December 31, 2023 | | |
Investment Grade Fixed Income Fund | |
Average Notional Amount Outstanding | |
Highest Notional Amount Outstanding | |
Lowest Notional Amount Outstanding | |
Notional Amount Outstanding as of December 31, 2023 | |
Notional amounts outstanding at the end of the prior period, if applicable, are included in the average notional amount outstanding.
Unrealized gain and/or loss on open forwards and futures is recorded in the Statements of Assets and Liabilities. The aggregate notional values of forwards and futures contracts are not recorded in the Statements of Assets and Liabilities, and therefore are not included in the Funds’ net assets.
Over-the-counter derivatives, including forward foreign currency contracts, are entered into pursuant to International Swaps and Derivatives Association, Inc. (“ISDA”) agreements negotiated between the Funds and their counterparties. ISDA agreements typically contain, among other things, terms for the posting of collateral and master netting provisions in the event of a default or other termination event. Collateral is posted by a Fund or the counterparty to the extent of the net mark-to-market exposure to the other party of all open contracts under the agreement, subject to minimum transfer requirements. Master netting provisions allow the Funds and the counterparty, in the event of a default or other termination event, to offset amounts owed by each related to derivative contracts, including any posted collateral, to one net amount payable by either the Funds or the counterparty. The Funds’ ISDA agreements typically contain provisions that allow a counterparty to terminate open contracts early if the NAV of a Fund declines beyond a certain threshold. For financial reporting purposes, the Funds do not offset derivative assets and liabilities, and any related collateral received or pledged, on the Statements of Assets and Liabilities.
As of December 31, 2023, gross amounts of over-the-counter derivative assets and liabilities not offset in the Statements of Assets and Liabilities and the related net amounts after taking into account master netting arrangements, by counterparty, are as follows:
|
| Gross Amounts of
Liabilities | | | Collateral
(Received)/
Pledged | |
| | | | | |
The actual collateral received or pledged, if any, may exceed the amounts shown in the table due to overcollateralization. Timing differences may exist between when contracts under the ISDA agreements are marked-to-market and when collateral moves. The ISDA agreements include tri-party control agreements under which collateral is held for the benefit of the secured party at a third party custodian, State Street Bank and Trust Company (“State Street Bank”).
Notes to Financial Statements (continued)
Counterparty risk is managed based on policies and procedures established by each Fund’s adviser. Such policies and procedures may include, but are not limited to, minimum counterparty credit rating requirements, monitoring of counterparty credit default swap spreads and posting of collateral. A Fund’s risk of loss from counterparty credit risk on over-the-counter derivatives is generally limited to the Fund’s aggregated unrealized gains and the amount of any collateral pledged to the counterparty, which may be offset by any collateral posted to the Fund by the counterparty. ISDA master agreements can help to manage counterparty risk by specifying collateral posting arrangements at pre-arranged exposure levels. Under these ISDA agreements, collateral is routinely transferred if the total net exposure in respect of certain transactions, net of existing collateral already in place, exceeds a specified amount. With exchange-traded derivatives, there is minimal counterparty credit risk to the Fund because the exchange’s clearing house, as counterparty to these instruments, stands between the buyer and the seller of the contract. Credit risk still exists in exchange-traded derivatives with respect to initial and variation margin that is held in a broker’s customer accounts. While brokers typically are required to segregate customer margin for exchange-traded derivatives from their own assets, in the event that a broker becomes insolvent or goes into bankruptcy and at that time there is a shortfall in the aggregate amount of margin held by the broker for all its customers, U.S. bankruptcy laws will typically allocate that shortfall on a pro rata basis across all of the broker’s customers, potentially resulting in losses to the Fund.
5.Purchases and Sales of Securities. For the year ended December 31, 2023, purchases and sales of securities (excluding short-term investments and including paydowns) were as follows:
| U.S. Government/
Agency Securities | |
| | | | |
| | | | |
Investment Grade Fixed Income Fund | | | | |
6.Management Fees and Other Transactions with Affiliates.
a. Management Fees. Loomis, Sayles & Company, L.P. (“Loomis Sayles”) serves as investment adviser to each Fund. Loomis Sayles is a limited partnership whose sole general partner, Loomis, Sayles & Company, Inc., is indirectly owned by Natixis Investment Managers, LLC, which is part of Natixis Investment Managers, an international asset management group based in Paris, France.
Under the terms of the management agreements, each Fund pays a management fee at the following annual rates, calculated daily and payable monthly, based on the Fund’s average daily net assets:
| Percentage of Average Daily Net Assets |
| | | |
| | | |
Investment Grade Fixed Income Fund | | | |
Prior to July 1, 2023, Bond Fund paid a management fee at the following annual rates, calculated daily and payable monthly, based on the Fund's average daily net assets:
| Percentage of Average Daily Net Assets |
| | | | |
| | | | |
Loomis Sayles has given binding undertakings to the Funds to waive management fees and/or reimburse certain expenses to limit the Funds’ operating expenses, exclusive of acquired fund fees and expenses, brokerage expenses, interest expense, taxes, organizational and extraordinary expenses such as litigation and indemnification expenses. These undertakings are in effect until April 30, 2025, may be terminated before then only with the consent of the Funds’ Board of Trustees, and are reevaluated on an annual basis. Management fees payable, as reflected on the Statements of Assets and Liabilities, are net of waivers and/or expense reimbursements, if any, pursuant to these undertakings. Waivers/reimbursements that exceed management fees payable are reflected on the Statements of Assets and Liabilities as receivable from investment adviser.
Notes to Financial Statements (continued)
For the year ended December 31, 2023, the expense limits as a percentage of average daily net assets under the expense limitation agreements were as follows:
| Expense Limit as a Percentage of
Average Daily Net Assets |
| | | | |
| | | | |
Investment Grade Fixed Income Fund | | | | |
Prior to July 1, 2023, the expense limits as a percentage of average daily net assets under the expense limitation agreements were as follows:
| Expense Limit as a Percentage of
Average Daily Net Assets |
| | | | |
| | | | |
Investment Grade Fixed Income Fund | | | | |
Loomis Sayles shall be permitted to recover expenses borne under the expense limitation agreements (whether through waiver of management fees or otherwise) on a class by class basis in later periods to the extent the annual operating expenses of a class fall below both (1) a class’ expense limitation ratio in place at the time such amounts were waived/reimbursed and (2) a class’ current applicable expense limitation ratio, provided, however, that a class is not obligated to pay such waived/reimbursed fees or expenses more than one year after the end of the fiscal year in which the fees or expenses were waived/reimbursed.
For the year ended December 31, 2023, the management fees for each Fund were as follows:
| | Contractual
Waivers of
Management
| | Percentage of
Average
Daily Net Assets |
| | |
| | | | | |
Investment Grade Fixed Income Fund | | | | | |
| Management fee waivers are subject to possible recovery until December 31, 2024. |
No expenses were recovered for either Fund during the year ended December 31, 2023 under the terms of the expense limitation agreements.
b. Service and Distribution Fees. Natixis Distribution, LLC (“Natixis Distribution”), which is a wholly-owned subsidiary of Natixis Investment Managers, LLC, has entered into a distribution agreement with the Trust. Pursuant to this agreement, Natixis Distribution serves as principal underwriter of the Funds of the Trust.
Pursuant to Rule 12b-1 under the 1940 Act, Bond Fund has adopted Distribution Plans relating to the Fund’s Retail Class shares (the “Retail Class Plan”) and Admin Class shares (the “Admin Class Plan”).
Under the Retail Class Plan, Bond Fund pays Natixis Distribution a monthly distribution fee at an annual rate not to exceed 0.25% of the average daily net assets attributable to the Fund’s Retail Class shares, as compensation for services provided by Natixis Distribution in connection with the marketing or sale of Retail Class shares or for payments made by Natixis Distribution to securities dealers or other financial intermediaries as commissions, asset-based sales charges or other compensation with respect to the sale of Retail Class shares, or for providing personal services to investors and/or the maintenance of shareholder accounts.
Under the Admin Class Plan, Bond Fund pays Natixis Distribution a monthly distribution fee at an annual rate not to exceed 0.25% of the average daily net assets attributable to the Fund’s Admin Class shares, as compensation for services provided by Natixis Distribution in connection with the marketing or sale of Admin Class shares or for payments made by Natixis Distribution to securities dealers or other financial intermediaries as commissions, asset-based sales charges or other compensation with respect to the sales of Admin Class shares, or for providing personal services to investors and/or the maintenance of shareholder accounts.
In addition, the Admin Class shares of Bond Fund may pay Natixis Distribution an administrative service fee, at an annual rate not to exceed 0.25% of the average daily net assets attributable to Admin Class shares. These fees are subsequently paid to securities dealers or financial intermediaries for providing personal services and/or account maintenance for their customers who hold such shares.
Notes to Financial Statements (continued)
For the year ended December 31, 2023, the service and distribution fees for Bond Fund were as follows:
For the year ended December 31, 2023, Natixis Distribution refunded Bond Fund $11,936 of prior year Admin Class service fees paid to Natixis Distribution in excess of amounts subsequently paid to securities dealers or financial intermediaries. Service and distribution fees on the Statements of Operations have been reduced by these amounts.
c. Administrative Fees. Natixis Advisors, LLC (“Natixis Advisors”) provides certain administrative services for the Funds and contracts with State Street Bank to serve as sub-administrator. Natixis Advisors is a wholly-owned subsidiary of Natixis Investment Managers, LLC. Pursuant to an agreement among Natixis Funds Trusts, Loomis Sayles Funds Trusts, Natixis ETF Trusts and Natixis Advisors, each Fund pays Natixis Advisors monthly its pro rata portion of fees equal to an annual rate of 0.0540% of the first $15 billion of the average daily net assets of the Natixis Funds Trusts, Loomis Sayles Funds Trusts and Natixis ETF Trusts, 0.0500% of the next $15 billion, 0.0400% of the next $30 billion, 0.0275% of the next $30 billion and 0.0225% of such assets in excess of $90 billion, subject to an annual aggregate minimum fee for the Natixis Funds Trusts, Loomis Sayles Funds Trusts and Natixis ETF Trusts of $10 million, which is reevaluated on an annual basis.
For the year ended December 31, 2023, the administrative fees for each Fund were as follows:
| |
| |
Investment Grade Fixed Income Fund | |
d. Sub-Transfer Agent Fees. Natixis Distribution has entered into agreements, which include servicing agreements, with financial intermediaries that provide recordkeeping, processing, shareholder communications and other services to customers of the intermediaries that hold positions in the Funds and has agreed to compensate the intermediaries for providing those services. Intermediaries transact with the Funds primarily through the use of omnibus accounts on behalf of their customers who hold positions in the Funds. These services would have been provided by the Funds’ transfer agent and other service providers if the shareholders’ accounts were maintained directly at the Funds’ transfer agent. Accordingly, the Funds have agreed to reimburse Natixis Distribution for all or a portion of the servicing fees paid to these intermediaries. The reimbursement amounts (sub-transfer agent fees) paid to Natixis Distribution are subject to a current per-account equivalent fee limit approved by the Funds’ Board of Trustees, which is based on fees for similar services paid to the Funds’ transfer agent and other service providers. Class N shares do not bear such expenses.
For the year ended December 31, 2023, the sub-transfer agent fees (which are reflected in transfer agent fees and expenses in the Statements of Operations) for Bond Fund were $3,334,865.
As of December 31, 2023, Bond Fund owes Natixis Distribution $35,951 in reimbursements for sub-transfer agent fees (which are reflected in the Statements of Assets and Liabilities as payable to distributor).
Sub-transfer agent fees attributable to Institutional Class, Retail Class and Admin Class are allocated on a pro rata basis to each class based on the relative net assets of each class to the total net assets of those classes.
e. Trustees Fees and Expenses. The Trust does not pay any compensation directly to its officers or Trustees who are directors, officers or employees of Natixis Advisors, Natixis Distribution, Natixis Investment Managers, LLC or their affiliates. The Chairperson of the Board of Trustees receives a retainer fee at the annual rate of $369,000. The Chairperson does not receive any meeting attendance fees for Board of Trustees meetings or committee meetings that he attends. Each Independent Trustee (other than the Chairperson) receives, in the aggregate, a retainer fee at the annual rate of $210,000. Each Independent Trustee also receives a meeting attendance fee of $10,000 for each meeting of the Board of Trustees that he or she attends in person and $5,000 for each meeting of the Board of Trustees that he or she attends telephonically. In addition, the chairperson of the Contract Review Committee, the chairperson of the Audit Committee and the chairperson of the Governance Committee each receive an additional retainer fee at the annual rate of $20,000. Each Contract Review Committee member is compensated $6,000 for each Committee meeting that he or she attends in person and $3,000 for each meeting that he or she attends telephonically. Each Audit Committee member is compensated $6,000 for each Committee meeting that he or she attends in person and $3,000 for each meeting that he or she attends telephonically. Each Governance Committee member is compensated $2,500 for each Committee meeting that he or she attends either in person or telephonically. These fees are allocated among the funds in the Natixis Funds Trusts, Loomis Sayles Funds Trusts and Natixis ETF Trusts based on a formula that takes into account, among other factors, the relative net assets of each fund. Trustees are reimbursed for travel expenses in connection with attendance at meetings.
Notes to Financial Statements (continued)
Effective January 1, 2024, the Chairperson of the Board of Trustees will receive a retainer fee at the annual rate of $385,000 and each Independent Trustee (other than the Chairperson) will receive, in the aggregate, a retainer fee at the annual rate of $225,000. Each Independent Trustee will receive a meeting attendance fee of $10,000 for each meeting of the Board of Trustees that he or she attends in person. The chairperson of the Contract Review Committee and the chairperson of the Audit Committee each will receive an additional retainer fee at the annual rate of $25,000. All other Trustees fees will remain unchanged.
A deferred compensation plan (the “Plan”) is available to the Trustees on a voluntary basis. The value of a participating Trustee’s deferral account is based on theoretical investments of deferred amounts, on the normal payment dates, in certain funds of the Natixis Funds Trusts, Loomis Sayles Funds Trusts and Natixis ETF Trusts as designated by the participating Trustees. Changes in the value of participants’ deferral accounts are allocated pro rata among the funds in the Natixis Funds Trusts, Loomis Sayles Funds Trusts and Natixis ETF Trusts and are normally reflected as Trustees’ fees and expenses in the Statements of Operations. Deferred amounts remain in the funds until distributed in accordance with the provisions of the Plan. The portions of the accrued obligations allocated to the Funds under the Plan are reflected as Deferred Trustees’ fees in the Statements of Assets and Liabilities.
Certain officers and employees of Natixis Advisors and Loomis Sayles are also officers and/or Trustees of the Trust.
f. Affiliated Ownership. As of December 31, 2023, Loomis Sayles Employees’ Profit Sharing Retirement Plan held shares of Bond Fund representing 0.57% of the Fund's net assets.
7.Class-Specific Transfer Agent Fees and Expenses. Transfer agent fees and expenses for Bond Fund attributable to Institutional Class, Retail Class and Admin Class are allocated on a pro rata basis to each class based on relative net assets of each class to the total net assets of those classes. Transfer agent fees and expenses attributable to Class N are allocated to Class N.
For the year ended December 31, 2023, Bond Fund incurred the following class-specific transfer agent fees and expenses (including sub-transfer agent fees, where applicable):
| Transfer Agent Fees and Expenses |
| | | | |
| | | | |
8.Line of Credit. Each Fund, together with certain other funds of Natixis Funds Trusts, Loomis Sayles Funds Trusts and Natixis ETF Trusts, entered into a syndicated, revolving, committed, unsecured line of credit with State Street Bank as administrative agent. The aggregate revolving commitment amount is $575,000,000. Any one Fund may borrow up to $402,500,000 under the line of credit agreement (as long as all borrowings by all Funds in the aggregate do not exceed the $575,000,000 limit at any time), subject to each Fund’s investment restrictions and its contractual obligations under the line of credit. Interest is charged to the Funds based upon the terms set forth in the agreement. In addition, a commitment fee of 0.15% per annum, payable at the end of each calendar quarter, is accrued and apportioned among the participating funds based on their average daily unused portion of the line of credit. The Funds paid certain legal fees in connection with the line of credit agreement, which are being amortized over a period of 364 days and are reflected in legal fees on the Statements of Operations. The unamortized balance is reflected as prepaid expenses on the Statements of Assets and Liabilities.
Prior to April 6, 2023, each Fund, together with certain other funds of Natixis Funds Trusts and Loomis Sayles Funds Trusts and Natixis ETF Trusts, entered into a $500,000,000 committed unsecured line of credit provided by State Street Bank. Any one Fund was able to borrow up to $350,000,000 under the line of credit agreement (as long as all borrowings by all Funds in the aggregate did not exceed the $500,000,000 limit at any time), subject to each Fund’s investment restrictions and its contractual obligations under the line of credit. Interest was charged to the Funds based upon the terms set forth in the agreement. In addition, a commitment fee of 0.15% per annum, payable at the end of each calendar quarter, was accrued and apportioned among the participating funds based on their average daily unused portion of the line of credit.
For the year ended December 31, 2023, neither Fund had borrowings under this agreement.
9.Risk. Geopolitical events (such as trading halts, sanctions or wars) could increase volatility and uncertainty in the financial markets and adversely affect regional and global economies. These, and other related events, could significantly impact a Fund's performance and the value of an investment in the Fund, even if the Fund does not have direct exposure to issuers in the country or countries involved.
10.Concentration of Ownership. From time to time, a Fund may have a concentration of one or more accounts constituting a significant percentage of shares outstanding. Investment activities by holders of such accounts could have material impacts on the Funds. As of
December 31, 2023, based on management’s evaluation of the shareholder account base, the Funds had accounts representing controlling
Notes to Financial Statements (continued)
ownership of more than 5% of the Fund's total outstanding shares. The number of such accounts, based on accounts that represent more than 5% of an individual class of shares, and the aggregate percentage of net assets represented by such holdings were as follows:
| Number of 5%
Account Holders | |
| | |
Investment Grade Fixed Income Fund | | |
Omnibus shareholder accounts for which Natixis Advisors understands that the intermediary has discretion over the underlying shareholder accounts or investment models where a shareholder account may be invested for a non-discretionary customer are included in the table above. For other omnibus accounts, the Fund does not have information on the individual shareholder accounts underlying the omnibus accounts; therefore, there could be other 5% shareholders in addition to those disclosed in the table above.
11.Capital Shares. Each Fund may issue an unlimited number of shares of beneficial interest, without par value. Transactions in capital shares were as follows:
|
| Year Ended
December 31, 2023 | Year Ended
December 31, 2022 |
| | | | |
| | | | |
Issued from the sale of shares | | | | |
Issued in connection with the reinvestment of distributions | | | | |
| | | | |
| | | | |
| | | | |
Issued from the sale of shares | | | | |
Issued in connection with the reinvestment of distributions | | | | |
| | | | |
| | | | |
| | | | |
Issued from the sale of shares | | | | |
Issued in connection with the reinvestment of distributions | | | | |
| | | | |
| | | | |
| | | | |
Issued from the sale of shares | | | | |
Issued in connection with the reinvestment of distributions | | | | |
| | | | |
| | | | |
Decrease from capital share transactions | | | | |
|
| Year Ended
December 31, 2023 | Year Ended
December 31, 2022 |
Investment Grade Fixed Income Fund | | | | |
| | | | |
Issued from the sale of shares | | | | |
Issued in connection with the reinvestment of distributions | | | | |
| | | | |
| | | | |
Decrease from capital share transactions | | | | |
Report of Independent Registered Public Accounting Firm
To the Board of Trustees of Loomis Sayles Funds I and Shareholders of Loomis Sayles Bond Fund and Loomis Sayles Investment Grade Fixed Income Fund
Opinions on the Financial Statements
We have audited the accompanying statements of assets and liabilities, including the portfolios of investments, of Loomis Sayles Bond Fund and Loomis Sayles Investment Grade Fixed Income Fund (two of the funds constituting Loomis Sayles Funds I, hereafter collectively referred to as the "Funds") as of December 31, 2023, the related statements of operations for the year ended December 31, 2023, the statements of changes in net assets for each of the two years in the period ended December 31, 2023, including the related notes, and the financial highlights for each of the three years in the period ended December 31, 2023, the three month period ended December 31, 2020 and for each of the two years in the period ended September 30, 2020 (collectively referred to as the “financial statements”). In our opinion, the financial statements present fairly, in all material respects, the financial position of each of the Funds as of December 31, 2023, the results of each of their operations for the year then ended, the changes in each of their net assets for each of the two years in the period ended December 31, 2023 and each of the financial highlights for each of the three years in the period ended December 31, 2023, the three month period ended December 31, 2020 and for each of the two years in the period ended September 30, 2020 in conformity with accounting principles generally accepted in the United States of America.
Basis for Opinions
These financial statements are the responsibility of the Funds’ management. Our responsibility is to express an opinion on the Funds’ financial statements based on our audits. We are a public accounting firm registered with the Public Company Accounting Oversight Board (United States) (PCAOB) and are required to be independent with respect to the Funds in accordance with the U.S. federal securities laws and the applicable rules and regulations of the Securities and Exchange Commission and the PCAOB.
We conducted our audits of these financial statements in accordance with the standards of the PCAOB. Those standards require that we plan and perform the audit to obtain reasonable assurance about whether the financial statements are free of material misstatement, whether due to error or fraud.
Our audits included performing procedures to assess the risks of material misstatement of the financial statements, whether due to error or fraud, and performing procedures that respond to those risks. Such procedures included examining, on a test basis, evidence regarding the amounts and disclosures in the financial statements. Our audits also included evaluating the accounting principles used and significant estimates made by management, as well as evaluating the overall presentation of the financial statements. Our procedures included confirmation of securities owned as of December 31, 2023 by correspondence with the custodian, agent banks and brokers; when replies were not received from brokers, we performed other auditing procedures. We believe that our audits provide a reasonable basis for our opinions.
/s/PricewaterhouseCoopers LLP
Boston, Massachusetts
February 22, 2024
We have served as the auditor of one or more investment companies in Natixis Investment Company Complex since at least 1995. We have not been able to determine the specific year we began serving as auditor.
2023 U.S. Tax Distribution Information to Shareholders (Unaudited)
Corporate Dividends Received Deduction. For the fiscal year ended December 31, 2023, a percentage of dividends distributed by the Funds listed below qualify for the dividends received deduction for corporate shareholders. These percentages are as follows:
| |
| |
Investment Grade Fixed Income Fund | |
Qualified Dividend Income. For the fiscal year ended December 31, 2023, the Funds below will designate up to the maximum amount allowable pursuant to the Internal Revenue Code as qualified dividend income eligible for reduced tax rates. These lower rates range from 0% to 20% depending on an individual’s tax bracket. If the Funds pay a distribution during calendar year 2023, complete information will be reported in conjunction with Form 1099-DIV. These percentages are noted below:
| |
| |
Investment Grade Fixed Income Fund | |
Trustee and Officer Information
The tables below provide certain information regarding the Trustees and officers of Loomis Sayles Funds I (the "Trust"). Unless otherwise indicated, the address of all persons below is 888 Boylston Street, Suite 800, Boston, MA 02199-8197. The Funds' Statements of Additional Information include additional information about the Trustees of the Trust and are available by calling Loomis Sayles Funds at 800-633-3330.
| Position(s) Held with
the Trust, Length
of Time Served and
| Principal
Occupation(s)
During Past 5 Years | Number of Portfolios
in Fund Complex
Overseen2and Other
Directorships Held
During Past 5 Years | Experience,
Qualifications,
Attributes, Skills for
Board Membership |
| | | | |
| Trustee since 2013
Contract Review
Committee Member | Executive Chairman of Bob’s Discount Furniture (retail) | 51
Director, Burlington Stores, Inc. (retail); Director, Rue La La
(e-commerce retail) | Significant experience on the Board and on the boards of other business organizations (including retail companies and a bank); executive experience (including at a retail company) |
| Trustee since 2015
Chairperson of the
Audit Committee | | 51
Formerly, Director of Triumph Group (aerospace industry) | Significant experience on the Board and executive experience (including his role as Vice President and treasurer of a defense company and experience at a financial services company) |
| Trustee since 2012
Chairperson of the
Governance Committee
and
Contract Review
Committee Member | President, University of Massachusetts | | Significant experience on the Board and on the boards of other business organizations; experience as President of the University of Massachusetts; government experience (including as a member of the U.S. House of Representatives); academic experience |
Maureen B. Mitchell
(1951) | Trustee since 2017
Chairperson of the
Contract Review
Committee | | 51
Director, Sterling Bancorp (bank) | Significant experience on the Board; financial services industry and executive experience (including role as President of global sales and marketing at a financial services company) |
Trustee and Officer Information
| Position(s) Held with the Trust, Length of Time Served and Term of Office1 | Principal Occupation(s) During Past 5 Years | Number of Portfolios in Fund Complex Overseen2and Other Directorships Held During Past 5 Years | Experience, Qualifications, Attributes, Skills for Board Membership |
Independent Trustees − continued |
| Trustee since 2016
Audit Committee
Member and
Governance
Committee
Member | Founding Partner, Breton Capital Management, LLC (private equity); formerly, Partner, STEP Partners, LLC (private equity) | 51
Director, Candidly (chemicals and biofuels) | Significant experience on the Board; financial services industry and executive experience (including roles as Chief Executive Officer of client management and asset servicing for a banking and financial services company) |
| Chairperson of the Board
of Trustees since 2021
Trustee since 2009
Ex Officio Member of the
Audit Committee,
Contract Review
Committee and
Governance Committee | Retired; formerly, Professor of Finance at Babson College | | Significant experience on the Board; experience as Director of the Division of Trading and Markets at the Securities and Exchange Commission; academic experience; training as an economist |
| Trustee since 2009
Contract Review
Committee
Member | | | Significant experience on the Board; mutual fund industry and executive experience (including roles as President and Chief Executive Officer for an investment adviser) |
| Trustee since 2019
Audit Committee
Member and Governance
Committee Member | Managing Director of Accordia Partners, LLC (real estate development); President of Primary Corporation (real estate development); Managing Principal of Merrick Capital Partners (infrastructure finance) | 51
Advisor/Risk Management Committee, Eastern Bank (bank); Director, Apartment Investment and Management Company (real estate investment trust); formerly, Director, Ares Commercial Real Estate Corporation (real estate investment trust) | Experience on the Board and significant experience on the boards of other business organizations (including real estate companies and banks) |
| Trustee since 2005
Audit Committee
and Governance
Committee Member | Retired; formerly, Deputy Dean for Finance and Administration, Yale University School of Medicine | | Significant experience on the Board; executive experience in a variety of academic organizations (including roles as dean for finance and administration) |
Trustee and Officer Information
| Position(s) Held with the Trust, Length of Time Served and Term of Office1 | Principal Occupation(s) During Past 5 Years | Number of Portfolios in Fund Complex Overseen2and Other Directorships Held During Past 5 Years | Experience, Qualifications, Attributes, Skills for Board Membership |
| | | | |
(1965)
One Financial Center
Boston, MA 02111 | Trustee since 2015
President and
Chief Executive
Officer of Loomis
Sayles Funds I
since 2015 | President, Chief Executive Officer and Chairman of the Board of Directors, Loomis, Sayles & Company, L.P. | | Significant experience on the Board; continuing service as President, Chief Executive Officer and Chairman of the Board of Directors of Loomis, Sayles & Company, L.P. |
| Trustee since 2011
Executive Vice President
of Loomis Sayles Funds I
since 2008 | President and Chief Executive Officer, Natixis Advisors, LLC and Natixis Distribution, LLC | | Significant experience on the Board; experience as President and Chief Executive Officer of Natixis Advisors, LLC and Natixis Distribution, LLC |
| Each Trustee serves until retirement, resignation or removal from the Board. The current retirement age is 75. The position of Chairperson of the Board is appointed for a three-year term. |
| The Trustees of the Trust serve as Trustees of a fund complex that includes all series of the Natixis Funds Trust I, Natixis Funds Trust II, Natixis Funds Trust IV, Gateway Trust, Loomis Sayles Funds I, Loomis Sayles Funds II, Natixis ETF Trust and Natixis ETF Trust II (collectively, the “Fund Complex”). |
| Mr. Charleston is deemed an “interested person” of the Trust because he holds the following positions with an affiliated person of the Trust: President, Chief Executive Officer and Chairman of the Board of Directors of Loomis, Sayles & Company, L.P. |
| Mr. Giunta is deemed an “interested person” of the Trust because he holds the following positions with an affiliated person of the Trust: President and Chief Executive Officer, Natixis Advisors, LLC and Natixis Distribution, LLC. |
Trustee and Officer Information
| Position(s) Held
with the Trust | | |
| | | |
| Treasurer, Principal
Financial and
Accounting Officer | | Senior Vice President, Natixis Advisors, LLC and Natixis Distribution, LLC; formerly, Vice President, Natixis Advisors, LLC and Natixis Distribution, LLC; Assistant Treasurer of the Fund Complex |
| Secretary and Chief
Legal Officer | | Executive Vice President, General Counsel and Secretary, Natixis Advisors, LLC and Natixis Distribution, LLC; formerly, Executive Vice President and Chief Compliance Officer of Natixis Investment Managers (March 2019 – May 2022) and Senior Vice President and Head of Compliance, U.S. for Natixis Investment Managers (July 2011 – March 2019) |
| Chief Compliance
Officer, Assistant
Secretary and
Anti-Money
Laundering Officer | | Senior Vice President, Natixis Advisors, LLC and Natixis Distribution, LLC; formerly, Vice President, Head of Corporate Compliance, Global Atlantic Financial Group |
| Each officer of the Trust serves for an indefinite term in accordance with the Trust's current by-laws until the date his or her successor is elected and qualified, or until he or she sooner dies, retires, is removed or becomes disqualified. |
| Each person listed above, except as noted, holds the same position(s) with the Fund Complex. Previous positions during the past five years with Natixis Distribution, LLC, Natixis Advisors, LLC or Loomis, Sayles & Company, L.P. are omitted, if not materially different from an officer’s current position with such entity. |
LOOMIS SAYLES FUNDS
Loomis Sayles Funds, a Boston-based family of mutual funds advised by Loomis, Sayles & Company, L.P., offers a range of fixed income and equity investments to fit the goals of the most demanding investor. Investment minimums and a pricing structure that includes multiple share classes make the funds suitable investments for individual investors, retirement plan participants, high net worth individuals and small institutions, including endowments and foundations.
PHONE 800-633-3330 FOR THE FOLLOWING FUND INFORMATION:
• Net asset values, yields, distribution information, fund information and fund literature
• Speak to a customer service representative regarding new or existing accounts
Before investing, consider the fund’s investment objectives, risks, charges, and expenses. Please visit www.loomissayles.com or call 800-633-3330 for a prospectus and a summary prospectus, if available, containing this and other information.
If you wish to communicate with the funds’ Board of Trustees, you may do so by writing to:
Natixis Advisors, LLC
888 Boylston Street, Suite 800
Boston, MA 02199-8197
The correspondence must be in writing, signed by the shareholder, including the shareholder’s name and address, and should identify the fund(s), account number, class of shares, and number of shares held in the fund(s) as of a recent date.
or by email at:secretaryofthefunds@natixis.comCommunications regarding recommendations for Trustee candidates may not be submitted by e-mail.Please note: Unlike written correspondence, e-mail is not secure. Please do NOT include your account number, social security number, PIN, or any other non-public, personal information in an e-mail communication because this information may be viewed by others.
 Exp. 3/1/20256255552.1.1M-LSIF2A-1223
(b) Not Applicable.
Item 2. Code of Ethics.
The Registrant has adopted a code of ethics that applies to the Registrant’s principal executive officer, principal financial officer and persons performing similar functions. There have been no amendments or waivers of the Registrant’s code of ethics during the period.
Item 3. Audit Committee Financial Expert.
The Board of Trustees of the Registrant has established an audit committee. Mr. Richard A. Goglia, Mr. James P. Palermo, Mr. Kirk A Sykes and Ms. Cynthia L. Walker are members of the audit committee and have been designated as “audit committee financial experts” by the Board of Trustees. Each of these individuals is also an Independent Trustee of the Registrant.
Item 4. Principal Accountant Fees and Services.
Fees billed by the Principal Accountant for services rendered to the Registrant.
The table below sets forth fees billed by the principal accountant, PricewaterhouseCoopers LLP, for the past two fiscal years for professional services rendered in connection with a) the audit of the Registrant’s annual financial statements and services provided in connection with regulatory filings; b) audit-related services (including services that are reasonably related to the performance of the audit of the Registrant’s financial statements but not reported under “Audit Fees”); c) tax compliance, tax advice and tax planning and d) all other fees billed for professional services rendered by the principal accountant to the Registrant, other than the services reported as a part of (a) through (c) of this Item.
| | | | | | | | | | | | | | | | | | | | | | | | | | | | | | | | |
| | | Audit fees | | | Audit-related fees1 | | | Tax fees2 | | | All other fees | |
| | | 10/1/22-
12/31/22 | | | 1/1/23-
12/31/23 | | | 10/1/22-
12/31/22 | | | 1/1/23-
12/31/23 | | | 10/1/22-
12/31/22 | | | 1/1/23-
12/31/23 | | | 10/1/22-
12/31/22 | | | 1/1/23-
12/31/23 | |
Loomis Sayles Bond Fund and Loomis Sayles Investment Grade Fixed Income Fund | | $ | 109,483 | | | $ | 112,768 | | | $ | 1,220 | | | $ | 1,303 | | | $ | 17,180 | | | $ | 19,946 | | | $ | — | | | $ | — | |
| | 1. | Audit-related fees consist of: |
2022 & 2023 – performance of agreed-upon procedures related to the Registrant’s deferred compensation plan.
2022 & 2023 – review of the Registrant’s tax returns (2022 & 2023) and consulting services related to a portfolio investment (2023).
Aggregate fees billed to the Registrant for non-audit services during 2022 and 2023 were $18,400 and $21,249, respectively.
Fees billed by the Principal Accountant for services rendered to the Adviser and Control Affiliates.
The following table sets forth the fees billed by the Registrant’s principal accountant for non-audit services rendered to Loomis, Sayles & Company, L.P. (“Loomis Sayles”) and entities controlling, controlled by or under common control with Loomis Sayles (“Control Affiliates”) that provide ongoing services to the Registrant, for engagements that related directly to the operations and financial reporting of the Registrant for the last two fiscal years.
| | | | | | | | | | | | | | | | | | | | | | | | |
| | | Audit-related fees | | | Tax fees | | | All other fees | |
| | | 10/1/22-
12/31/22 | | | 1/1/23-
12/31/23 | | | 10/1/22-
12/31/22 | | | 1/1/23-
12/31/23 | | | 10/1/22-
12/31/22 | | | 1/1/23-
12/31/23 | |
Control Affiliates | | $ | — | | | $ | — | | | $ | — | | | $ | — | | | $ | 50,000 | | | $ | — | |
The following table sets forth the aggregate fees billed by the Registrant’s principal accountant for non-audit services rendered to Loomis Sayles and Control Affiliates that provide ongoing services to the Registrant, for the last two fiscal years, including the fees disclosed in the table above.
| | | | | | | | |
| | | Aggregate Non-Audit Fees | |
| | | 10/1/22-12/31/22 | | | 1/1/23-12/31/23 | |
Control Affiliates | | $ | 50,000 | | | $ | 110,000 | |
None of the services described above were approved pursuant to paragraph (c)(7)(i)(C) of Regulation S-X.
Audit Committee Pre Approval Policies.
Annually, the Registrant’s Audit Committee reviews the audit, audit-related, tax and other non-audit services together with the projected fees, for services proposed to be rendered to the Registrant and/or other entities for which pre-approval is required during the upcoming year. Any subsequent revisions to already pre-approved services or fees (including fee increases) and requests for pre-approval of new services would be presented for consideration quarterly as needed.
If, in the opinion of management, a proposed engagement by the Registrant’s independent accountants needs to commence before the next regularly scheduled Audit Committee meeting, any member of the Audit Committee who is an independent Trustee of the Registrant is authorized to pre-approve the engagement, but only for engagements to provide audit, audit-related and tax services. This approval is subject to review by the full Audit Committee at its next quarterly meeting. All other engagements require the approval of all the members of the Audit Committee.
Item 5. Audit Committee of Listed Registrants.
Not applicable.
Item 6. Schedule of Investments.
Included as part of the Report to Shareholders filed as Item 1 herewith.
Item 7. Disclosure of Proxy Voting Policies and Procedures for Closed-End Management Investment Companies.
Not applicable.
Item 8. Portfolio Managers of Closed-End Management Investment Companies
Not applicable.
Item 9. Purchases of Equity Securities by Closed-End Management Investment Companies and Affiliated Purchasers.
Not applicable.
Item 10. Submission of Matters to a Vote of Securities Holders.
There were no material changes to the procedures by which shareholders may recommend nominees to the Registrant’s Board of Trustees.
Item 11. Controls and Procedures.
The Registrant’s principal executive officer and principal financial officer have concluded that the Registrant’s disclosure controls and procedures are sufficient to ensure that information required to be disclosed by the Registrant in this Form N-CSR was recorded, processed, summarized and reported within the time periods specified in the Securities and Exchange Commission’s rules and forms, based upon such officers’ evaluation of these controls and procedures as of a date within 90 days of the filing date of the report.
There were no changes in the Registrant’s internal control over financial reporting that occurred during the period covered by the report that have materially affected, or are reasonably likely to materially affect, the Registrant’s internal control over financial reporting.
Item 12. Disclosure of Securities Lending Activities for Closed-End Management Investment Companies.
Not applicable.
Item 13. Recovery of Erroneously Awarded Compensation.
Not applicable.
Item 14. Exhibits.
SIGNATURES
Pursuant to the requirements of the Securities Exchange Act of 1934 and the Investment Company Act of 1940, the Registrant has duly caused this report to be signed on its behalf by the undersigned, thereunto duly authorized.
| | |
| Loomis Sayles Funds I |
| |
| By: | | /s/ Kevin Charleston |
| |
| Name: | | Kevin Charleston |
| Title: | | President and Chief Executive Officer |
| Date: | | February 22, 2024 |
Pursuant to the requirements of the Securities Exchange Act of 1934 and the Investment Company Act of 1940, this report has been signed by the following persons on behalf of the Registrant and in the capacities and on the dates indicated.
| | |
| By: | | /s/ Kevin Charleston |
| |
| Name: | | Kevin Charleston |
| Title: | | President and Chief Executive Officer |
| Date: | | February 22, 2024 |
| |
| By: | | /s/ Matthew Block |
| |
| Name: | | Matthew Block |
| Title: | | Treasurer and Principal Financial and Accounting Officer |
| Date: | | February 22, 2024 |