UNITED STATES
SECURITIES AND EXCHANGE COMMISSION
Washington, D.C. 20549
FORM N-CSR
CERTIFIED SHAREHOLDER REPORT OF REGISTERED
MANAGEMENT INVESTMENT COMPANIES
Investment Company Act file number: 811-08282
Loomis Sayles Funds I
(Exact name of Registrant as specified in charter)
888 Boylston Street, Suite 800 Boston, Massachusetts 02199-8197
(Address of principal executive offices) (Zip code)
Susan McWhan Tobin, Esq.
Natixis Distribution, LLC
888 Boylston Street, Suite 800
Boston, Massachusetts 02199-8197
(Name and address of agent for service)
Registrant’s telephone number, including area code: (617) 449-2139
Date of fiscal year end: September 30
Date of reporting period: September 30, 2023
Item 1. Reports to Stockholders.
(a) The Registrant’s annual report transmitted to shareholders pursuant to Rule 30e-1 under the Investment Company Act of 1940 is as follows:


Loomis Sayles Small Cap Growth Fund |
Loomis Sayles Small Cap Value Fund |
Loomis Sayles Small/Mid Cap Growth Fund |
Managers |
Mark F. Burns, CFA® |
John J. Slavik, CFA® |
Symbols | |
Institutional Class | LSSIX |
Retail Class | LCGRX |
Class N | LSSNX |
Investment Objective
Top Ten Holdings as of September 30, 2023 | |
Security Name | % of Net Assets |
1 Weatherford International PLC | 1.93% |
2 MACOM Technology Solutions Holdings, Inc. | 1.90 |
3 Option Care Health, Inc. | 1.83 |
4 Rambus, Inc. | 1.66 |
5 Casella Waste Systems, Inc., Class A | 1.59 |
6 Kinsale Capital Group, Inc. | 1.55 |
7 BellRing Brands, Inc. | 1.54 |
8 Cactus, Inc., Class A | 1.49 |
9 KBR, Inc. | 1.48 |
10 Merit Medical Systems, Inc. | 1.48 |
The portfolio is actively managed and holdings are subject to change. There is no guarantee the Fund continues to invest in the securities referenced. The holdings listed exclude any temporary cash investments, are presented on an individual security basis and do not represent holdings of the issuer. |
Hypothetical Growth of $100,000 Investment in Institutional Class Shares1 |
September 30, 2013 through September 30, 2023 |
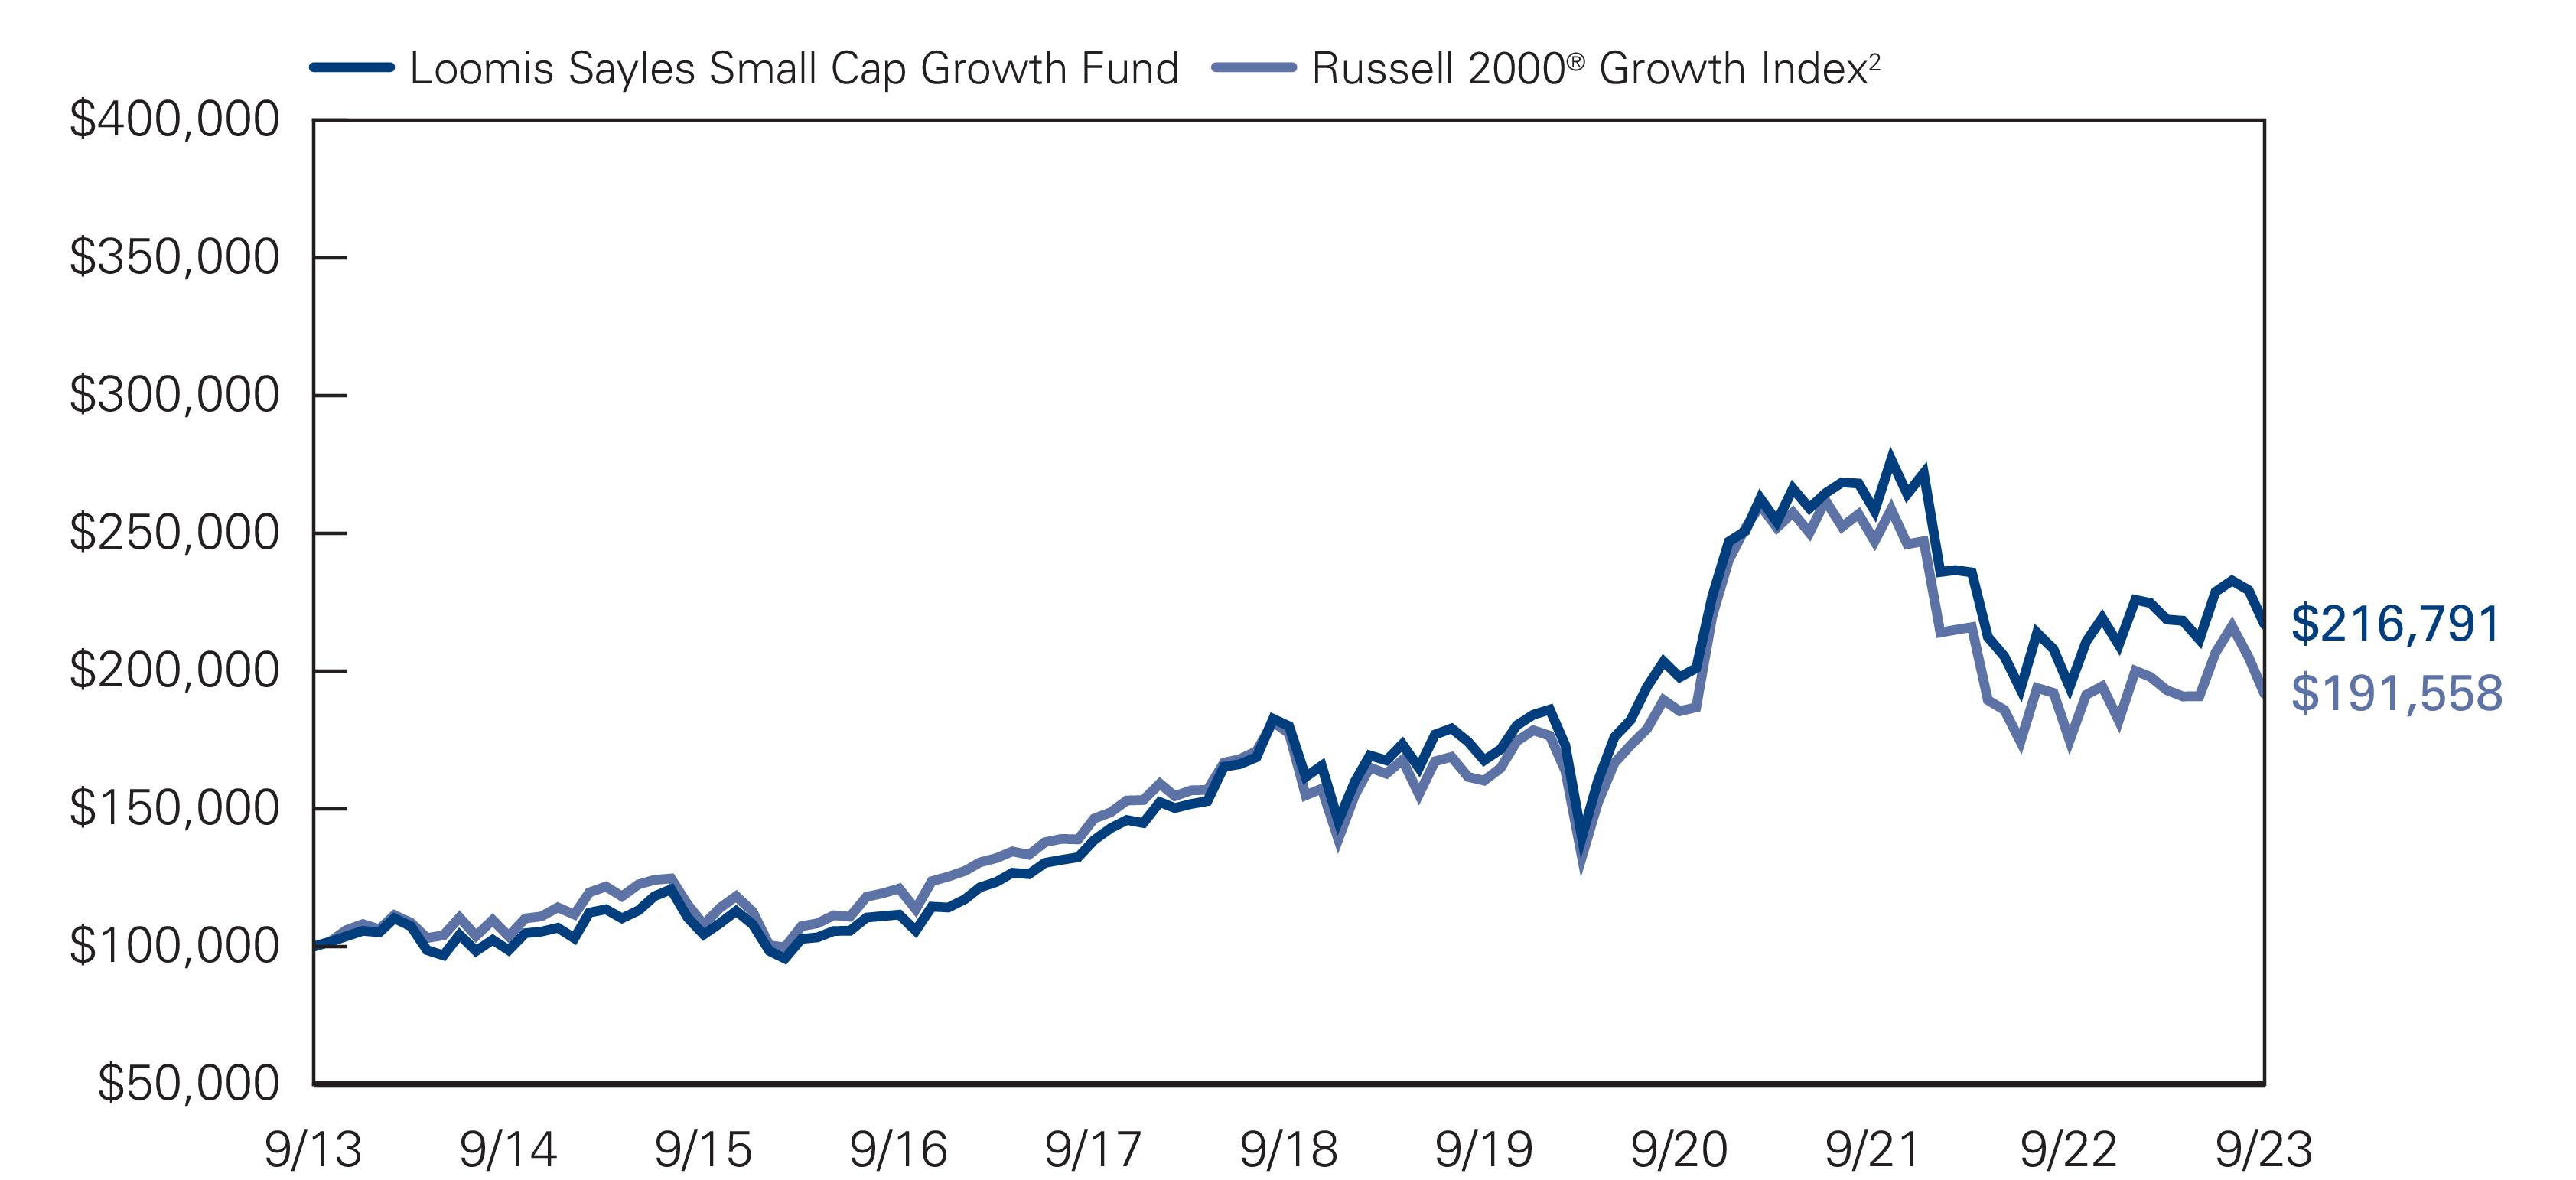
Average Annual Total Returns — September 30, 20231 | |||||
1 Year | 5 Years | 10 Years | Expense Ratios3 | ||
Gross | Net | ||||
Institutional Class | 11.64 % | 3.79 % | 8.04 % | 0.93 % | 0.93 % |
Retail Class | 11.32 | 3.53 | 7.77 | 1.18 | 1.18 |
Class N | 11.77 | 3.90 | 8.16 | 0.82 | 0.82 |
Comparative Performance | |||||
Russell 2000® Growth Index2 | 9.59 | 1.55 | 6.72 | ||
1 | Fund performance has been increased by fee waivers and/or expense reimbursements, if any, without which performance would have been lower. |
2 | Russell 2000® Growth Index is an unmanaged index that measures the performance of the small-cap growth segment of the U.S. equity universe. It includes those Russell 2000® companies with higher price-to-book ratios and higher forecasted growth values. |
3 | Expense ratios are as shown in the Fund’s prospectus in effect as of the date of this report. The expense ratios for the current reporting period can be found in the Financial Highlights section of this report under Ratios to Average Net Assets. Net expenses reflect contractual expense limitations set to expire on 1/31/25. When a Fund’s expenses are below the limitation, gross and net expense ratios will be the same. See Note 5 of the Notes to Financial Statements for more information about the Fund’s expense limitations. |
Managers |
Joseph R. Gatz, CFA® |
Jeffrey Schwartz, CFA® |
Symbols | |
Institutional Class | LSSCX |
Retail Class | LSCRX |
Admin Class | LSVAX |
Class N | LSCNX |
Investment Objective
Top Ten Holdings as of September 30, 2023 | |
Security Name | % of Net Assets |
1 Weatherford International PLC | 2.58% |
2 Northern Oil & Gas, Inc. | 1.74 |
3 Noble Corp. PLC | 1.71 |
4 Clean Harbors, Inc. | 1.63 |
5 Vontier Corp. | 1.55 |
6 Moog, Inc., Class A | 1.48 |
7 Tidewater, Inc. | 1.44 |
8 Federal Agricultural Mortgage Corp., Class C | 1.43 |
9 Kadant, Inc. | 1.39 |
10 U.S. Cellular Corp. | 1.32 |
The portfolio is actively managed and holdings are subject to change. There is no guarantee the Fund continues to invest in the securities referenced. The holdings listed exclude any temporary cash investments, are presented on an individual security basis and do not represent holdings of the issuer. |
Hypothetical Growth of $100,000 Investment in Institutional Class Shares1 |
September 30, 2013 through September 30, 2023 |

Average Annual Total Returns — September 30, 20231 | |||||
1 Year | 5 Years | 10 Years | Expense Ratios4 | ||
Gross | Net | ||||
Institutional Class | 20.73 % | 4.97 % | 7.35 % | 0.93 % | 0.90 % |
Retail Class | 20.47 | 4.71 | 7.08 | 1.18 | 1.15 |
Admin Class | 20.18 | 4.44 | 6.81 | 1.43 | 1.40 |
Class N | 20.80 | 5.02 | 7.41 | 0.84 | 0.84 |
Comparative Performance | |||||
Russell 2000® Value Index2 | 7.84 | 2.59 | 6.19 | ||
Russell 2000® Index3 | 8.93 | 2.40 | 6.65 | ||
1 | Fund performance has been increased by fee waivers and/or expense reimbursements, if any, without which performance would have been lower. |
2 | Russell 2000® Value Index is an unmanaged index that measures the performance of the small-cap value segment of the U.S. equity universe. It includes those Russell 2000® companies with lower price-to-book ratios and lower forecasted growth values. |
3 | Russell 2000® Index is an unmanaged index that measures the performance of the small-cap segment of the U.S. equity universe. |
4 | Expense ratios are as shown in the Fund’s prospectus in effect as of the date of this report. The expense ratios for the current reporting period can be found in the Financial Highlights section of this report under Ratios to Average Net Assets. Net expenses reflect contractual expense limitations set to expire on 1/31/24. When a Fund’s expenses are below the limitation, gross and net expense ratios will be the same. See Note 5 of the Notes to Financial Statements for more information about the Fund’s expense limitations. |
Managers |
Mark F. Burns, CFA® |
John J. Slavik, CFA® |
Symbols | |
Institutional Class | LSMIX |
Class N | LSMNX |
Investment Objective
Top Ten Holdings as of September 30, 2023 | |
Security Name | % of Net Assets |
1 Kinsale Capital Group, Inc. | 2.19% |
2 ChampionX Corp. | 1.95 |
3 KBR, Inc. | 1.88 |
4 Hexcel Corp. | 1.85 |
5 Tetra Tech, Inc. | 1.78 |
6 Pure Storage, Inc., Class A | 1.68 |
7 CyberArk Software Ltd. | 1.66 |
8 Five Below, Inc. | 1.63 |
9 Advanced Energy Industries, Inc. | 1.59 |
10 CONMED Corp. | 1.59 |
The portfolio is actively managed and holdings are subject to change. There is no guarantee the Fund continues to invest in the securities referenced. The holdings listed exclude any temporary cash investments, are presented on an individual security basis and do not represent holdings of the issuer. |
Hypothetical Growth of $100,000 Investment in Institutional Class Shares1 |
June 30, 2015 (inception) through September 30, 2023 |

Average Annual Total Returns — September 30, 20231 | ||||||
1 Year | 5 Years | Life of Class I | Life of Class N | Expense Ratios3 | ||
Gross | Net | |||||
Institutional Class (Inception 6/30/15) | 4.06 % | 3.27 % | 7.55 % | — % | 0.91 % | 0.85 % |
Class N (Inception 10/1/19) | 4.06 | — | — | 5.37 | 0.91 | 0.83 |
Comparative Performance | ||||||
Russell 2500™ Growth Index2 | 10.61 | 4.05 | 7.21 | 6.61 | ||
1 | Fund performance has been increased by fee waivers and/or expense reimbursements, if any, without which performance would have been lower. |
2 | Russell 2500™ Growth Index measures the performance of the small-to-mid-cap growth segment of the U.S. equity universe. It includes those Russell 2500™ Index companies with higher price-to-book ratios and higher forecasted growth values. The Index is constructed to provide a comprehensive and unbiased barometer of the small-to-mid-cap growth market. The Index is completely reconstituted annually to ensure larger stocks do not distort the performance and characteristics of the true small-to-mid-cap opportunity set and that the represented companies continue to reflect growth characteristics. Indices are unmanaged. |
3 | Expense ratios are as shown in the Fund’s prospectus in effect as of the date of this report. The expense ratios for the current reporting period can be found in the Financial Highlights section of this report under Ratios to Average Net Assets. Net expenses reflect contractual expense limitations set to expire on 1/31/24. When a Fund’s expenses are below the limitation, gross and net expense ratios will be the same. See Note 5 of the Notes to Financial Statements for more information about the Fund’s expense limitations. |
Loomis Sayles Small Cap Growth Fund | Beginning Account Value 4/1/2023 | Ending Account Value 9/30/2023 | Expenses Paid During Period* 4/1/2023 – 9/30/2023 |
Institutional Class | |||
Actual | $1,000.00 | $991.20 | $4.69 |
Hypothetical (5% return before expenses) | $1,000.00 | $1,020.36 | $4.76 |
Retail Class | |||
Actual | $1,000.00 | $989.90 | $5.94 |
Hypothetical (5% return before expenses) | $1,000.00 | $1,019.10 | $6.02 |
Class N | |||
Actual | $1,000.00 | $991.30 | $4.14 |
Hypothetical (5% return before expenses) | $1,000.00 | $1,020.91 | $4.20 |
* | Expenses are equal to the Fund's annualized expense ratio: 0.94%, 1.19% and 0.83% for Institutional Class, Retail Class and Class N, respectively, multiplied by the average account value over the period, multiplied by the number of days in the most recent fiscal half–year (183), divided by 365 (to reflect the half–year period). |
Loomis Sayles Small Cap Value Fund | Beginning Account Value 4/1/2023 | Ending Account Value 9/30/2023 | Expenses Paid During Period* 4/1/2023 – 9/30/2023 |
Institutional Class | |||
Actual | $1,000.00 | $1,044.50 | $4.61 |
Hypothetical (5% return before expenses) | $1,000.00 | $1,020.56 | $4.56 |
Retail Class | |||
Actual | $1,000.00 | $1,043.60 | $5.89 |
Hypothetical (5% return before expenses) | $1,000.00 | $1,019.30 | $5.82 |
Admin Class | |||
Actual | $1,000.00 | $1,042.20 | $7.17 |
Hypothetical (5% return before expenses) | $1,000.00 | $1,018.05 | $7.08 |
Class N | |||
Actual | $1,000.00 | $1,044.90 | $4.36 |
Hypothetical (5% return before expenses) | $1,000.00 | $1,020.81 | $4.31 |
* | Expenses are equal to the Fund's annualized expense ratio (after waiver/reimbursement): 0.90%, 1.15%, 1.40% and 0.85% for Institutional Class, Retail Class, Admin Class and Class N, respectively, multiplied by the average account value over the period, multiplied by the number of days in the most recent fiscal half–year (183), divided by 365 (to reflect the half–year period). |
Loomis Sayles Small/Mid Cap Growth Fund | Beginning Account Value 4/1/2023 | Ending Account Value 9/30/2023 | Expenses Paid During Period* 4/1/2023 – 9/30/2023 |
Institutional Class | |||
Actual | $1,000.00 | $952.20 | $4.16 |
Hypothetical (5% return before expenses) | $1,000.00 | $1,020.81 | $4.31 |
Class N | |||
Actual | $1,000.00 | $952.30 | $4.06 |
Hypothetical (5% return before expenses) | $1,000.00 | $1,020.91 | $4.20 |
* | Expenses are equal to the Fund's annualized expense ratio (after waiver/reimbursement): 0.85% and 0.83% for Institutional Class and Class N, respectively, multiplied by the average account value over the period, multiplied by the number of days in the most recent fiscal half–year (183), divided by 365 (to reflect the half–year period). |
One-Year | Three-Year | Five-Year | |
Loomis Sayles Small Cap Growth Fund | 18% | 39% | 37% |
Loomis Sayles Small Cap Value Fund | 17% | 47% | 73% |
Loomis Sayles Small/Mid Cap Growth Fund | 40% | 50% | 62% |
Loomis Sayles Small Cap Growth Fund
Shares | Description | Value (†) |
Common Stocks— 96.5% of Net Assets | ||
Aerospace & Defense — 3.3% | ||
402,065 | AAR Corp.(a) | $23,934,930 |
413,730 | Hexcel Corp. | 26,950,372 |
1,453,547 | Kratos Defense & Security Solutions, Inc.(a) | 21,832,276 |
72,717,578 | ||
Automobile Components — 2.7% | ||
235,893 | Dorman Products, Inc.(a) | 17,871,254 |
353,690 | Gentherm, Inc.(a) | 19,191,219 |
279,658 | Patrick Industries, Inc. | 20,991,130 |
58,053,603 | ||
Banks — 1.1% | ||
690,709 | Bancorp, Inc.(a) | 23,829,461 |
Beverages — 0.7% | ||
616,279 | Vita Coco Co., Inc.(a) | 16,047,905 |
Biotechnology — 4.5% | ||
659,845 | Inhibrx, Inc.(a) | 12,108,156 |
924,815 | Insmed, Inc.(a) | 23,351,579 |
762,757 | Replimune Group, Inc.(a) | 13,050,772 |
695,968 | Vericel Corp.(a) | 23,328,847 |
602,584 | Xencor, Inc.(a) | 12,142,068 |
431,891 | Xenon Pharmaceuticals, Inc.(a) | 14,753,396 |
98,734,818 | ||
Building Products — 1.2% | ||
868,149 | AZEK Co., Inc.(a) | 25,818,751 |
Capital Markets — 2.7% | ||
356,072 | Hamilton Lane, Inc., Class A | 32,203,152 |
329,873 | PJT Partners, Inc., Class A | 26,205,111 |
58,408,263 | ||
Commercial Services & Supplies — 2.5% | ||
1,269,765 | ACV Auctions, Inc., Class A(a) | 19,275,033 |
456,106 | Casella Waste Systems, Inc., Class A(a) | 34,800,888 |
54,075,921 | ||
Communications Equipment — 1.8% | ||
466,923 | Calix, Inc.(a) | 21,403,750 |
763,774 | Extreme Networks, Inc.(a) | 18,490,969 |
39,894,719 | ||
Construction & Engineering — 2.0% | ||
334,934 | Arcosa, Inc. | 24,081,755 |
499,723 | WillScot Mobile Mini Holdings Corp.(a) | 20,783,479 |
44,865,234 | ||
Diversified Consumer Services — 0.8% | ||
156,997 | Grand Canyon Education, Inc.(a) | 18,349,809 |
Electronic Equipment, Instruments & Components — 3.0% | ||
260,405 | Advanced Energy Industries, Inc. | 26,852,964 |
Shares | Description | Value (†) |
Electronic Equipment, Instruments & Components — continued | ||
240,855 | Itron, Inc.(a) | $14,590,996 |
174,219 | Novanta, Inc.(a) | 24,989,973 |
66,433,933 | ||
Energy Equipment & Services — 5.5% | ||
650,814 | Cactus, Inc., Class A | 32,677,371 |
557,628 | Noble Corp. PLC | 28,243,858 |
706,826 | Oceaneering International, Inc.(a) | 18,179,565 |
468,883 | Weatherford International PLC(a) | 42,354,201 |
121,454,995 | ||
Financial Services — 2.6% | ||
858,203 | EVERTEC, Inc. | 31,907,988 |
786,297 | Flywire Corp.(a) | 25,075,011 |
56,982,999 | ||
Food Products — 1.9% | ||
518,329 | Simply Good Foods Co.(a) | 17,892,717 |
1,038,246 | Sovos Brands, Inc.(a) | 23,412,447 |
41,305,164 | ||
Ground Transportation — 0.8% | ||
927,594 | Marten Transport Ltd. | 18,282,878 |
Health Care Equipment & Supplies — 7.9% | ||
508,604 | AtriCure, Inc.(a) | 22,276,855 |
496,993 | Axonics, Inc.(a) | 27,891,247 |
227,259 | CONMED Corp. | 22,919,070 |
118,177 | Inspire Medical Systems, Inc.(a) | 23,451,044 |
351,930 | LivaNova PLC(a) | 18,610,059 |
469,305 | Merit Medical Systems, Inc.(a) | 32,391,431 |
506,520 | PROCEPT BioRobotics Corp.(a) | 16,618,921 |
665,880 | Treace Medical Concepts, Inc.(a) | 8,729,687 |
172,888,314 | ||
Health Care Providers & Services — 5.4% | ||
285,612 | Acadia Healthcare Co., Inc.(a) | 20,081,380 |
285,413 | Ensign Group, Inc. | 26,523,430 |
1,237,321 | Option Care Health, Inc.(a) | 40,027,334 |
597,125 | Progyny, Inc.(a) | 20,314,192 |
387,793 | RadNet, Inc.(a) | 10,931,885 |
117,878,221 | ||
Health Care Technology — 1.4% | ||
803,743 | Evolent Health, Inc., Class A(a) | 21,885,922 |
482,053 | Phreesia, Inc.(a) | 9,004,750 |
30,890,672 | ||
Hotels, Restaurants & Leisure — 3.1% | ||
1,408,708 | Life Time Group Holdings, Inc.(a) | 21,426,449 |
259,810 | Papa John's International, Inc. | 17,724,238 |
297,521 | Texas Roadhouse, Inc. | 28,591,768 |
67,742,455 | ||
Household Durables — 1.2% | ||
212,274 | Installed Building Products, Inc. | 26,510,900 |
Loomis Sayles Small Cap Growth Fund (continued)
Shares | Description | Value (†) |
Insurance — 3.2% | ||
934,144 | BRP Group, Inc., Class A(a) | $21,700,165 |
187,548 | Goosehead Insurance, Inc., Class A(a) | 13,977,953 |
82,170 | Kinsale Capital Group, Inc. | 34,029,062 |
69,707,180 | ||
Leisure Products — 0.7% | ||
326,499 | Malibu Boats, Inc., Class A(a) | 16,004,981 |
Life Sciences Tools & Services — 1.1% | ||
96,064 | Medpace Holdings, Inc.(a) | 23,259,976 |
Machinery — 4.3% | ||
337,018 | Albany International Corp., Class A | 29,077,913 |
205,734 | ESCO Technologies, Inc. | 21,486,859 |
332,453 | Helios Technologies, Inc. | 18,444,492 |
105,889 | RBC Bearings, Inc.(a) | 24,791,792 |
93,801,056 | ||
Oil, Gas & Consumable Fuels — 1.0% | ||
954,984 | Magnolia Oil & Gas Corp., Class A | 21,878,683 |
Personal Care Products — 3.7% | ||
821,506 | BellRing Brands, Inc.(a) | 33,870,692 |
210,312 | elf Beauty, Inc.(a) | 23,098,567 |
173,273 | Inter Parfums, Inc. | 23,277,495 |
80,246,754 | ||
Pharmaceuticals — 1.6% | ||
767,123 | Supernus Pharmaceuticals, Inc.(a) | 21,149,581 |
423,357 | Ventyx Biosciences, Inc.(a) | 14,703,189 |
35,852,770 | ||
Professional Services — 5.5% | ||
122,065 | FTI Consulting, Inc.(a) | 21,777,617 |
280,253 | Huron Consulting Group, Inc.(a) | 29,191,152 |
164,043 | ICF International, Inc. | 19,818,035 |
549,754 | KBR, Inc. | 32,402,501 |
240,855 | WNS Holdings Ltd., ADR(a) | 16,488,933 |
119,678,238 | ||
Semiconductors & Semiconductor Equipment — 5.8% | ||
509,398 | MACOM Technology Solutions Holdings, Inc.(a) | 41,556,689 |
198,182 | Onto Innovation, Inc.(a) | 25,272,169 |
651,509 | Rambus, Inc.(a) | 36,347,687 |
203,243 | Silicon Laboratories, Inc.(a) | 23,553,831 |
126,730,376 | ||
Software — 5.8% | ||
818,132 | Box, Inc., Class A(a) | 19,806,976 |
327,693 | Clearwater Analytics Holdings, Inc., Class A(a) | 6,337,583 |
458,388 | Intapp, Inc.(a) | 15,365,166 |
404,402 | Model N, Inc.(a) | 9,871,453 |
574,462 | Tenable Holdings, Inc.(a) | 25,735,897 |
841,749 | Varonis Systems, Inc.(a) | 25,707,014 |
237,135 | Workiva, Inc.(a) | 24,031,261 |
126,855,350 | ||
Shares | Description | Value (†) |
Specialty Retail — 0.9% | ||
246,809 | Boot Barn Holdings, Inc.(a) | $20,038,423 |
Technology Hardware, Storage & Peripherals — 1.4% | ||
890,523 | Pure Storage, Inc., Class A(a) | 31,720,429 |
Textiles, Apparel & Luxury Goods — 1.6% | ||
217,633 | Columbia Sportswear Co. | 16,126,605 |
187,067 | Oxford Industries, Inc. | 17,982,751 |
34,109,356 | ||
Trading Companies & Distributors — 3.8% | ||
205,922 | Applied Industrial Technologies, Inc. | 31,837,600 |
240,160 | McGrath RentCorp | 24,073,638 |
169,799 | SiteOne Landscape Supply, Inc.(a) | 27,753,647 |
83,664,885 | ||
Total Common Stocks (Identified Cost $1,879,352,008) | 2,114,715,050 | |
Principal Amount | ||
Short-Term Investments — 4.2% | ||
$92,344,958 | Tri-Party Repurchase Agreement with Fixed Income Clearing Corporation, dated 9/29/2023 at 2.500% to be repurchased at $92,364,197 on 10/02/2023 collateralized by $94,907,600 U.S. Treasury Note, 4.375% due 8/15/2026 valued at $94,191,925 including accrued interest (Note 2 of Notes to Financial Statements) (Identified Cost $92,344,958) | 92,344,958 |
Total Investments — 100.7% (Identified Cost $1,971,696,966) | 2,207,060,008 | |
Other assets less liabilities — (0.7)% | (14,738,686 ) | |
Net Assets — 100.0% | $2,192,321,322 | |
(†) | See Note 2 of Notes to Financial Statements. |
(a) | Non-income producing security. |
ADR | An American Depositary Receipt is a certificate issued by a custodian bank representing the right to receive securities of the foreign issuer described. The values of ADRs may be significantly influenced by trading on exchanges not located in the United States. |
Loomis Sayles Small Cap Growth Fund (continued)
Health Care Equipment & Supplies | 7.9 % |
Software | 5.8 |
Semiconductors & Semiconductor Equipment | 5.8 |
Energy Equipment & Services | 5.5 |
Professional Services | 5.5 |
Health Care Providers & Services | 5.4 |
Biotechnology | 4.5 |
Machinery | 4.3 |
Trading Companies & Distributors | 3.8 |
Personal Care Products | 3.7 |
Aerospace & Defense | 3.3 |
Insurance | 3.2 |
Hotels, Restaurants & Leisure | 3.1 |
Electronic Equipment, Instruments & Components | 3.0 |
Capital Markets | 2.7 |
Automobile Components | 2.7 |
Financial Services | 2.6 |
Commercial Services & Supplies | 2.5 |
Construction & Engineering | 2.0 |
Other Investments, less than 2% each | 19.2 |
Short-Term Investments | 4.2 |
Total Investments | 100.7 |
Other assets less liabilities | (0.7 ) |
Net Assets | 100.0 % |
Loomis Sayles Small Cap Value Fund
Shares | Description | Value (†) |
Common Stocks— 98.9% of Net Assets | ||
Aerospace & Defense — 3.5% | ||
222,212 | Leonardo DRS, Inc.(a) | $3,710,940 |
44,777 | Moog, Inc., Class A | 5,058,010 |
63,034 | V2X, Inc.(a) | 3,256,337 |
12,025,287 | ||
Banks — 9.8% | ||
84,723 | Ameris Bancorp | 3,252,516 |
49,485 | Axos Financial, Inc.(a) | 1,873,502 |
116,137 | Cadence Bank | 2,464,427 |
185,456 | Home BancShares, Inc. | 3,883,449 |
187,288 | OceanFirst Financial Corp. | 2,710,057 |
49,165 | Pinnacle Financial Partners, Inc. | 3,296,022 |
55,522 | Popular, Inc. | 3,498,441 |
53,888 | Prosperity Bancshares, Inc. | 2,941,207 |
46,588 | SouthState Corp. | 3,138,168 |
53,141 | Wintrust Financial Corp. | 4,012,145 |
65,775 | WSFS Financial Corp. | 2,400,788 |
33,470,722 | ||
Biotechnology — 1.9% | ||
98,104 | Alkermes PLC(a) | 2,747,893 |
15,919 | United Therapeutics Corp.(a) | 3,595,625 |
6,343,518 | ||
Building Products — 3.5% | ||
61,572 | Griffon Corp. | 2,442,561 |
220,927 | Janus International Group, Inc.(a) | 2,363,919 |
111,350 | Quanex Building Products Corp. | 3,136,730 |
38,611 | UFP Industries, Inc. | 3,953,766 |
11,896,976 | ||
Capital Markets — 1.3% | ||
133,963 | P10, Inc., Class A | 1,560,669 |
49,001 | Stifel Financial Corp. | 3,010,621 |
4,571,290 | ||
Chemicals — 3.1% | ||
28,774 | Ashland, Inc. | 2,350,260 |
44,884 | Cabot Corp. | 3,109,115 |
276,487 | Ecovyst, Inc.(a) | 2,720,632 |
247,262 | LSB Industries, Inc.(a) | 2,529,490 |
10,709,497 | ||
Commercial Services & Supplies — 2.6% | ||
101,333 | CECO Environmental Corp.(a) | 1,618,288 |
33,230 | Clean Harbors, Inc.(a) | 5,561,373 |
36,826 | VSE Corp. | 1,857,503 |
9,037,164 | ||
Communications Equipment — 0.6% | ||
227,920 | Viavi Solutions, Inc.(a) | 2,083,189 |
Construction & Engineering — 1.9% | ||
55,529 | Arcosa, Inc. | 3,992,535 |
127,640 | MDU Resources Group, Inc. | 2,499,191 |
6,491,726 | ||
Shares | Description | Value (†) |
Construction Materials — 0.9% | ||
63,526 | Knife River Corp.(a) | $3,101,975 |
Consumer Staples Distribution & Retail — 1.1% | ||
70,452 | Andersons, Inc. | 3,628,982 |
Electric Utilities — 0.7% | ||
45,865 | ALLETE, Inc. | 2,421,672 |
Electrical Equipment — 1.0% | ||
22,289 | Atkore, Inc.(a) | 3,325,296 |
Electronic Equipment, Instruments & Components — 7.3% | ||
38,832 | Bel Fuse, Inc., Class B | 1,853,063 |
64,778 | Crane NXT Co. | 3,599,713 |
93,273 | Kimball Electronics, Inc.(a) | 2,553,815 |
7,870 | Littelfuse, Inc. | 1,946,408 |
41,719 | Methode Electronics, Inc. | 953,279 |
15,322 | National Instruments Corp. | 913,498 |
11,945 | Rogers Corp.(a) | 1,570,409 |
37,938 | TD SYNNEX Corp. | 3,788,489 |
192,301 | TTM Technologies, Inc.(a) | 2,476,837 |
171,600 | Vontier Corp. | 5,305,872 |
24,961,383 | ||
Energy Equipment & Services — 7.2% | ||
101,752 | ChampionX Corp. | 3,624,406 |
209,933 | Newpark Resources, Inc.(a) | 1,450,637 |
115,215 | Noble Corp. PLC | 5,835,640 |
69,275 | Tidewater, Inc.(a) | 4,923,374 |
97,816 | Weatherford International PLC(a) | 8,835,720 |
24,669,777 | ||
Entertainment — 0.8% | ||
74,161 | Atlanta Braves Holdings, Inc., Class C(a) | 2,649,773 |
Financial Services — 3.2% | ||
75,829 | Cannae Holdings, Inc.(a) | 1,413,453 |
32,125 | Euronet Worldwide, Inc.(a) | 2,550,082 |
31,679 | Federal Agricultural Mortgage Corp., Class C | 4,888,070 |
126,486 | International Money Express, Inc.(a) | 2,141,408 |
10,993,013 | ||
Food Products — 1.0% | ||
9,459 | J & J Snack Foods Corp. | 1,547,965 |
125,036 | Nomad Foods Ltd.(a) | 1,903,048 |
3,451,013 | ||
Health Care Equipment & Supplies — 3.9% | ||
20,359 | CONMED Corp. | 2,053,205 |
49,756 | Embecta Corp. | 748,828 |
84,197 | Inmode Ltd.(a) | 2,564,640 |
63,366 | Lantheus Holdings, Inc.(a) | 4,402,670 |
22,526 | UFP Technologies, Inc.(a) | 3,636,823 |
13,406,166 | ||
Health Care Providers & Services — 3.1% | ||
138,847 | AdaptHealth Corp.(a) | 1,263,508 |
Loomis Sayles Small Cap Value Fund (continued)
Shares | Description | Value (†) |
Health Care Providers & Services — continued | ||
20,432 | AMN Healthcare Services, Inc.(a) | $1,740,398 |
98,648 | Option Care Health, Inc.(a) | 3,191,263 |
67,467 | Tenet Healthcare Corp.(a) | 4,445,400 |
10,640,569 | ||
Health Care Technology — 0.6% | ||
153,503 | Veradigm, Inc.(a) | 2,017,029 |
Hotels, Restaurants & Leisure — 1.6% | ||
26,776 | Churchill Downs, Inc. | 3,107,087 |
23,880 | Marriott Vacations Worldwide Corp. | 2,403,044 |
5,510,131 | ||
Household Durables — 1.8% | ||
65,507 | KB Home | 3,031,664 |
47,289 | Skyline Champion Corp.(a) | 3,013,255 |
6,044,919 | ||
Household Products — 0.8% | ||
35,774 | Spectrum Brands Holdings, Inc. | 2,802,893 |
Industrial REITs — 1.0% | ||
102,993 | STAG Industrial, Inc. | 3,554,288 |
Insurance — 1.5% | ||
71,461 | Employers Holdings, Inc. | 2,854,867 |
50,561 | Kemper Corp. | 2,125,079 |
4,979,946 | ||
Integrated Energy — 0.5% | ||
29,878 | Talen Energy Corp.(a) | 1,580,546 |
Leisure Products — 0.9% | ||
37,804 | Brunswick Corp. | 2,986,516 |
Machinery — 3.3% | ||
34,339 | Albany International Corp., Class A | 2,962,769 |
63,693 | Columbus McKinnon Corp. | 2,223,522 |
21,031 | Kadant, Inc. | 4,743,542 |
71,656 | Wabash National Corp. | 1,513,375 |
11,443,208 | ||
Marine Transportation — 0.8% | ||
188,113 | Genco Shipping & Trading Ltd. | 2,631,701 |
Media — 1.5% | ||
57,261 | John Wiley & Sons, Inc., Class A | 2,128,391 |
47,997 | Scholastic Corp. | 1,830,606 |
71,225 | Thryv Holdings, Inc.(a) | 1,336,893 |
5,295,890 | ||
Office REITs — 1.1% | ||
141,608 | Equity Commonwealth | 2,601,339 |
80,083 | Postal Realty Trust, Inc., Class A | 1,081,120 |
3,682,459 | ||
Oil, Gas & Consumable Fuels — 5.8% | ||
77,798 | Antero Resources Corp.(a) | 1,974,513 |
65,283 | California Resources Corp. | 3,656,501 |
95,682 | Delek U.S. Holdings, Inc. | 2,718,326 |
Shares | Description | Value (†) |
Oil, Gas & Consumable Fuels — continued | ||
62,035 | International Seaways, Inc. | $2,791,575 |
336,716 | Kosmos Energy Ltd.(a) | 2,754,337 |
147,692 | Northern Oil & Gas, Inc. | 5,941,649 |
19,836,901 | ||
Personal Care Products — 1.3% | ||
103,918 | BellRing Brands, Inc.(a) | 4,284,539 |
Pharmaceuticals — 2.2% | ||
38,069 | ANI Pharmaceuticals, Inc.(a) | 2,210,286 |
84,654 | Pacira BioSciences, Inc.(a) | 2,597,185 |
101,850 | Supernus Pharmaceuticals, Inc.(a) | 2,808,004 |
7,615,475 | ||
Professional Services — 3.4% | ||
326,274 | Alight, Inc., Class A(a) | 2,313,283 |
29,290 | Concentrix Corp. | 2,346,422 |
44,648 | CSG Systems International, Inc. | 2,282,406 |
48,683 | Korn Ferry | 2,309,521 |
23,179 | Science Applications International Corp. | 2,446,311 |
11,697,943 | ||
Real Estate Management & Development — 0.8% | ||
30,143 | Colliers International Group, Inc. | 2,871,121 |
Retail REITs — 0.7% | ||
44,145 | Agree Realty Corp. | 2,438,570 |
Semiconductors & Semiconductor Equipment — 2.4% | ||
78,140 | Rambus, Inc.(a) | 4,359,431 |
106,673 | Semtech Corp.(a) | 2,746,830 |
41,645 | Tower Semiconductor Ltd.(a) | 1,022,801 |
8,129,062 | ||
Specialty Retail — 1.1% | ||
34,376 | Academy Sports & Outdoors, Inc. | 1,624,954 |
24,379 | Boot Barn Holdings, Inc.(a) | 1,979,331 |
3,604,285 | ||
Technology Hardware, Storage & Peripherals — 1.2% | ||
15,159 | Super Micro Computer, Inc.(a) | 4,156,901 |
Textiles, Apparel & Luxury Goods — 0.9% | ||
35,459 | Crocs, Inc.(a) | 3,128,548 |
Trading Companies & Distributors — 3.6% | ||
140,338 | Alta Equipment Group, Inc. | 1,692,476 |
206,308 | Custom Truck One Source, Inc.(a) | 1,279,110 |
24,504 | Herc Holdings, Inc. | 2,914,506 |
40,550 | McGrath RentCorp | 4,064,732 |
237,804 | MRC Global, Inc.(a) | 2,437,491 |
12,388,315 | ||
Water Utilities — 0.4% | ||
146,605 | Pure Cycle Corp.(a) | 1,407,408 |
Loomis Sayles Small Cap Value Fund (continued)
Shares | Description | Value (†) |
Wireless Telecommunication Services — 1.3% | ||
105,234 | U.S. Cellular Corp.(a) | $4,521,905 |
Total Common Stocks (Identified Cost $255,533,897) | 338,489,487 | |
Principal Amount | ||
Short-Term Investments — 1.5% | ||
$5,055,918 | Tri-Party Repurchase Agreement with Fixed Income Clearing Corporation, dated 9/29/2023 at 2.500% to be repurchased at $5,056,971 on 10/02/2023 collateralized by $5,791,600 U.S. Treasury Note, 0.750% due 8/31/2026 valued at $5,157,080 including accrued interest (Note 2 of Notes to Financial Statements) (Identified Cost $5,055,918) | 5,055,918 |
Total Investments — 100.4% (Identified Cost $260,589,815) | 343,545,405 | |
Other assets less liabilities — (0.4)% | (1,402,290 ) | |
Net Assets — 100.0% | $342,143,115 | |
(†) | See Note 2 of Notes to Financial Statements. |
(a) | Non-income producing security. |
REITs | Real Estate Investment Trusts |
Banks | 9.8 % |
Electronic Equipment, Instruments & Components | 7.3 |
Energy Equipment & Services | 7.2 |
Oil, Gas & Consumable Fuels | 5.8 |
Health Care Equipment & Supplies | 3.9 |
Trading Companies & Distributors | 3.6 |
Aerospace & Defense | 3.5 |
Building Products | 3.5 |
Professional Services | 3.4 |
Machinery | 3.3 |
Financial Services | 3.2 |
Chemicals | 3.1 |
Health Care Providers & Services | 3.1 |
Commercial Services & Supplies | 2.6 |
Semiconductors & Semiconductor Equipment | 2.4 |
Pharmaceuticals | 2.2 |
Other Investments, less than 2% each | 31.0 |
Short-Term Investments | 1.5 |
Total Investments | 100.4 |
Other assets less liabilities | (0.4 ) |
Net Assets | 100.0 % |
Loomis Sayles Small/Mid Cap Growth Fund
Shares | Description | Value (†) |
Common Stocks— 96.6% of Net Assets | ||
Aerospace & Defense — 5.7% | ||
10,396 | Axon Enterprise, Inc.(a) | $2,068,700 |
16,334 | BWX Technologies, Inc. | 1,224,723 |
13,492 | HEICO Corp. | 2,184,760 |
40,770 | Hexcel Corp. | 2,655,758 |
8,133,941 | ||
Automobile Components — 1.4% | ||
60,919 | Gentex Corp. | 1,982,304 |
Banks — 0.8% | ||
29,617 | Axos Financial, Inc.(a) | 1,121,300 |
Biotechnology — 8.1% | ||
26,871 | Exact Sciences Corp.(a) | 1,833,140 |
57,819 | Insmed, Inc.(a) | 1,459,930 |
39,136 | Natera, Inc.(a) | 1,731,768 |
18,127 | Neurocrine Biosciences, Inc.(a) | 2,039,287 |
140,117 | Roivant Sciences Ltd.(a) | 1,636,566 |
9,552 | United Therapeutics Corp.(a) | 2,157,510 |
34,412 | Xencor, Inc.(a) | 693,402 |
11,551,603 | ||
Broadline Retail — 0.7% | ||
49,177 | Savers Value Village, Inc.(a) | 918,135 |
Building Products — 1.4% | ||
67,692 | AZEK Co., Inc.(a) | 2,013,160 |
Capital Markets — 2.6% | ||
24,550 | Hamilton Lane, Inc., Class A | 2,220,302 |
46,127 | StepStone Group, Inc., Class A | 1,456,691 |
3,676,993 | ||
Commercial Services & Supplies — 2.5% | ||
15,449 | Cimpress PLC(a) | 1,081,584 |
16,763 | Tetra Tech, Inc. | 2,548,479 |
3,630,063 | ||
Communications Equipment — 1.4% | ||
43,348 | Ciena Corp.(a) | 2,048,626 |
Construction & Engineering — 2.0% | ||
16,780 | MasTec, Inc.(a) | 1,207,657 |
37,805 | WillScot Mobile Mini Holdings Corp.(a) | 1,572,310 |
2,779,967 | ||
Consumer Staples Distribution & Retail — 3.6% | ||
23,485 | BJ's Wholesale Club Holdings, Inc.(a) | 1,676,124 |
7,244 | Casey's General Stores, Inc. | 1,966,891 |
26,635 | Performance Food Group Co.(a) | 1,567,736 |
5,210,751 | ||
Electronic Equipment, Instruments & Components — 3.6% | ||
22,171 | Advanced Energy Industries, Inc. | 2,286,274 |
Shares | Description | Value (†) |
Electronic Equipment, Instruments & Components — continued | ||
10,732 | IPG Photonics Corp.(a) | $1,089,727 |
33,222 | Trimble, Inc.(a) | 1,789,337 |
5,165,338 | ||
Energy Equipment & Services — 4.1% | ||
78,747 | ChampionX Corp. | 2,804,968 |
48,218 | Expro Group Holdings NV(a) | 1,120,104 |
94,697 | NOV, Inc. | 1,979,168 |
5,904,240 | ||
Financial Services — 2.4% | ||
48,553 | Remitly Global, Inc.(a) | 1,224,506 |
11,776 | WEX, Inc.(a) | 2,214,948 |
3,439,454 | ||
Food Products — 1.2% | ||
51,266 | Simply Good Foods Co.(a) | 1,769,702 |
Health Care Equipment & Supplies — 6.7% | ||
29,095 | Axonics, Inc.(a) | 1,632,811 |
22,609 | CONMED Corp. | 2,280,118 |
6,028 | Insulet Corp.(a) | 961,406 |
20,082 | LivaNova PLC(a) | 1,061,936 |
16,747 | Merit Medical Systems, Inc.(a) | 1,155,878 |
111,982 | Paragon 28, Inc.(a) | 1,405,374 |
34,486 | PROCEPT BioRobotics Corp.(a) | 1,131,486 |
9,629,009 | ||
Health Care Providers & Services — 3.2% | ||
20,520 | Acadia Healthcare Co., Inc.(a) | 1,442,761 |
28,195 | HealthEquity, Inc.(a) | 2,059,645 |
44,021 | Privia Health Group, Inc.(a) | 1,012,483 |
4,514,889 | ||
Health Care Technology — 0.9% | ||
48,385 | Evolent Health, Inc., Class A(a) | 1,317,524 |
Hotels, Restaurants & Leisure — 4.8% | ||
16,897 | Churchill Downs, Inc. | 1,960,728 |
30,005 | Light & Wonder, Inc.(a) | 2,140,257 |
11,118 | Planet Fitness, Inc., Class A(a) | 546,783 |
23,721 | Texas Roadhouse, Inc. | 2,279,588 |
6,927,356 | ||
Insurance — 3.1% | ||
7,574 | Kinsale Capital Group, Inc. | 3,136,621 |
9,300 | Reinsurance Group of America, Inc. | 1,350,267 |
4,486,888 | ||
Machinery — 2.8% | ||
16,726 | Ingersoll Rand, Inc. | 1,065,781 |
10,681 | Middleby Corp.(a) | 1,367,168 |
6,958 | RBC Bearings, Inc.(a) | 1,629,076 |
4,062,025 | ||
Metals & Mining — 1.5% | ||
50,844 | ATI, Inc.(a) | 2,092,231 |
Loomis Sayles Small/Mid Cap Growth Fund (continued)
Shares | Description | Value (†) |
Oil, Gas & Consumable Fuels — 3.9% | ||
11,321 | Chord Energy Corp. | $1,834,794 |
85,263 | Magnolia Oil & Gas Corp., Class A | 1,953,375 |
31,049 | Matador Resources Co. | 1,846,795 |
5,634,964 | ||
Pharmaceuticals — 0.9% | ||
38,277 | Ventyx Biosciences, Inc.(a) | 1,329,360 |
Professional Services — 5.5% | ||
10,479 | FTI Consulting, Inc.(a) | 1,869,558 |
45,757 | KBR, Inc. | 2,696,918 |
32,987 | Parsons Corp.(a) | 1,792,844 |
8,609 | Paylocity Holding Corp.(a) | 1,564,255 |
7,923,575 | ||
Semiconductors & Semiconductor Equipment — 5.7% | ||
31,212 | Allegro MicroSystems, Inc.(a) | 996,911 |
3,521 | Monolithic Power Systems, Inc. | 1,626,702 |
19,324 | Nova Ltd.(a) | 2,172,791 |
25,439 | Power Integrations, Inc. | 1,941,250 |
12,568 | Silicon Laboratories, Inc.(a) | 1,456,505 |
8,194,159 | ||
Software — 7.9% | ||
69,644 | Box, Inc., Class A(a) | 1,686,081 |
31,941 | Clearwater Analytics Holdings, Inc., Class A(a) | 617,739 |
14,551 | CyberArk Software Ltd.(a) | 2,383,017 |
45,622 | DoubleVerify Holdings, Inc.(a) | 1,275,135 |
52,934 | PowerSchool Holdings, Inc., Class A(a) | 1,199,485 |
5,543 | Tyler Technologies, Inc.(a) | 2,140,374 |
19,947 | Workiva, Inc.(a) | 2,021,429 |
11,323,260 | ||
Specialty Retail — 1.6% | ||
14,522 | Five Below, Inc.(a) | 2,336,590 |
Technology Hardware, Storage & Peripherals — 1.7% | ||
67,507 | Pure Storage, Inc., Class A(a) | 2,404,599 |
Textiles, Apparel & Luxury Goods — 3.4% | ||
18,077 | Columbia Sportswear Co. | 1,339,506 |
3,365 | Deckers Outdoor Corp.(a) | 1,729,913 |
36,626 | Skechers USA, Inc., Class A(a) | 1,792,842 |
4,862,261 | ||
Trading Companies & Distributors — 1.5% | ||
13,478 | SiteOne Landscape Supply, Inc.(a) | 2,202,979 |
Total Common Stocks (Identified Cost $138,419,405) | 138,587,246 | |
Principal Amount | Description | Value (†) |
Short-Term Investments — 3.6% | ||
$5,193,983 | Tri-Party Repurchase Agreement with Fixed Income Clearing Corporation, dated 9/29/2023 at 2.500% to be repurchased at $5,195,065 on 10/02/2023 collateralized by $5,949,800 U.S. Treasury Note, 0.750% due 8/31/2026 valued at $5,297,948 including accrued interest (Note 2 of Notes to Financial Statements) (Identified Cost $5,193,983) | $5,193,983 |
Total Investments — 100.2% (Identified Cost $143,613,388) | 143,781,229 | |
Other assets less liabilities — (0.2)% | (247,629 ) | |
Net Assets — 100.0% | $143,533,600 | |
(†) | See Note 2 of Notes to Financial Statements. |
(a) | Non-income producing security. |
Biotechnology | 8.1 % |
Software | 7.9 |
Health Care Equipment & Supplies | 6.7 |
Semiconductors & Semiconductor Equipment | 5.7 |
Aerospace & Defense | 5.7 |
Professional Services | 5.5 |
Hotels, Restaurants & Leisure | 4.8 |
Energy Equipment & Services | 4.1 |
Oil, Gas & Consumable Fuels | 3.9 |
Consumer Staples Distribution & Retail | 3.6 |
Electronic Equipment, Instruments & Components | 3.6 |
Textiles, Apparel & Luxury Goods | 3.4 |
Health Care Providers & Services | 3.2 |
Insurance | 3.1 |
Machinery | 2.8 |
Capital Markets | 2.6 |
Commercial Services & Supplies | 2.5 |
Financial Services | 2.4 |
Construction & Engineering | 2.0 |
Other Investments, less than 2% each | 15.0 |
Short-Term Investments | 3.6 |
Total Investments | 100.2 |
Other assets less liabilities | (0.2 ) |
Net Assets | 100.0 % |
Small Cap Growth Fund | Small Cap Value Fund | Small/Mid Cap Growth Fund | |
ASSETS | |||
Investments at cost | $1,971,696,966 | $260,589,815 | $143,613,388 |
Net unrealized appreciation | 235,363,042 | 82,955,590 | 167,841 |
Investments at value | 2,207,060,008 | 343,545,405 | 143,781,229 |
Cash | 806,427 | — | — |
Receivable for Fund shares sold | 2,961,819 | 304,292 | 183 |
Receivable for securities sold | — | 974,570 | — |
Dividends and interest receivable | 603,846 | 254,159 | 25,183 |
Prepaid expenses (Note 7) | 813 | 251 | 185 |
TOTAL ASSETS | 2,211,432,913 | 345,078,677 | 143,806,780 |
LIABILITIES | |||
Payable for securities purchased | 15,794,194 | 1,562,087 | 84,061 |
Payable for Fund shares redeemed | 1,351,765 | 731,586 | — |
Management fees payable (Note 5) | 1,392,830 | 232,943 | 80,374 |
Deferred Trustees’ fees (Note 5) | 331,022 | 322,700 | 45,756 |
Administrative fees payable (Note 5) | 86,011 | 13,427 | 5,595 |
Payable to distributor (Note 5d) | 12,959 | 2,560 | 229 |
Audit and tax services fees payable | 44,605 | 45,356 | 44,662 |
Other accounts payable and accrued expenses | 98,205 | 24,903 | 12,503 |
TOTAL LIABILITIES | 19,111,591 | 2,935,562 | 273,180 |
NET ASSETS | $2,192,321,322 | $342,143,115 | $143,533,600 |
NET ASSETS CONSIST OF: | |||
Paid-in capital | $1,916,509,776 | $195,287,203 | $168,025,753 |
Accumulated earnings (loss) | 275,811,546 | 146,855,912 | (24,492,153 ) |
NET ASSETS | $2,192,321,322 | $342,143,115 | $143,533,600 |
COMPUTATION OF NET ASSET VALUE AND OFFERING PRICE: | |||
Institutional Class: | |||
Net assets | $974,539,330 | $201,631,870 | $118,498,529 |
Shares of beneficial interest | 39,316,477 | 8,342,434 | 11,015,432 |
Net asset value, offering and redemption price per share | $24.79 | $24.17 | $10.76 |
Retail Class: | |||
Net assets | $62,965,490 | $68,978,765 | $— |
Shares of beneficial interest | 2,929,534 | 2,943,099 | — |
Net asset value, offering and redemption price per share | $21.49 | $23.44 | $— |
Admin Class shares: | |||
Net assets | $— | $5,811,982 | $— |
Shares of beneficial interest | — | 270,760 | — |
Net asset value, offering and redemption price per share | $— | $21.47 | $— |
Class N shares: | |||
Net assets | $1,154,816,502 | $65,720,498 | $25,035,071 |
Shares of beneficial interest | 45,801,559 | 2,717,454 | 2,325,579 |
Net asset value, offering and redemption price per share | $25.21 | $24.18 | $10.77 |
Small Cap Growth Fund | Small Cap Value Fund | Small/Mid Cap Growth Fund | |
INVESTMENT INCOME | |||
Dividends | $8,601,423 | $4,772,981 | $622,803 |
Interest | 1,443,093 | 162,959 | 76,128 |
Less net foreign taxes withheld | (34,741 ) | (14,880 ) | — |
10,009,775 | 4,921,060 | 698,931 | |
Expenses | |||
Management fees (Note 5) | 16,886,498 | 2,967,496 | 1,105,606 |
Service and distribution fees (Note 5) | 168,708 | 208,834 | — |
Administrative fees (Note 5) | 1,043,399 | 183,393 | 68,319 |
Trustees' fees and expenses (Note 5) | 142,607 | 65,865 | 26,389 |
Transfer agent fees and expenses (Notes 5 and 6) | 1,221,911 | 285,546 | 20,385 |
Audit and tax services fees | 44,715 | 45,349 | 44,709 |
Custodian fees and expenses | 61,102 | 13,984 | 11,235 |
Legal fees | 92,426 | 16,829 | 6,632 |
Registration fees | 86,558 | 63,556 | 47,870 |
Shareholder reporting expenses | 137,706 | 38,231 | 6,070 |
Miscellaneous expenses | 97,904 | 49,176 | 37,079 |
Total expenses | 19,983,534 | 3,938,259 | 1,374,294 |
Less waiver and/or expense reimbursement (Note 5) | — | (203,031 ) | (131,817 ) |
Net expenses | 19,983,534 | 3,735,228 | 1,242,477 |
Net investment income (loss) | (9,973,759 ) | 1,185,832 | (543,546 ) |
Net realized and unrealized gain (loss) on Investments | |||
Net realized gain (loss) on: | |||
Investments | 57,412,374 | 64,347,797 | (14,132,539 ) |
Net change in unrealized appreciation (depreciation) on: | |||
Investments | 183,966,249 | 17,381,687 | 23,117,663 |
Net realized and unrealized gain on Investments | 241,378,623 | 81,729,484 | 8,985,124 |
NET INCREASE IN NET ASSETS RESULTING FROM OPERATIONS | $231,404,864 | $82,915,316 | $8,441,578 |
Small Cap Growth Fund | Small Cap Value Fund | |||
Year Ended September 30, 2023 | Year Ended September 30, 2022 | Year Ended September 30, 2023 | Year Ended September 30, 2022 | |
FROM OPERATIONS: | ||||
Net investment income (loss) | $(9,973,759 ) | $(11,256,808 ) | $1,185,832 | $2,371,925 |
Net realized gain on investments | 57,412,374 | 55,541,403 | 64,347,797 | 53,239,567 |
Net change in unrealized appreciation (depreciation) on investments | 183,966,249 | (710,299,435 ) | 17,381,687 | (140,778,533 ) |
Net increase (decrease) in net assets resulting from operations | 231,404,864 | (666,014,840 ) | 82,915,316 | (85,167,041 ) |
FROM DISTRIBUTIONS TO SHAREHOLDERS: | ||||
Institutional Class | (26,863,859 ) | (225,523,167 ) | (33,629,482 ) | (63,922,055 ) |
Retail Class | (2,219,963 ) | (19,793,925 ) | (7,869,701 ) | (14,932,854 ) |
Admin Class | — | — | (890,318 ) | (1,673,437 ) |
Class N | (32,585,425 ) | (252,701,386 ) | (8,423,867 ) | (19,629,374 ) |
Total distributions | (61,669,247 ) | (498,018,478 ) | (50,813,368 ) | (100,157,720 ) |
NET INCREASE (DECREASE) IN NET ASSETS FROM CAPITAL SHARES TRANSACTIONS (Note 10) | 45,491,029 | 261,184,927 | (111,660,807 ) | 14,383,874 |
Net increase (decrease) in net assets | 215,226,646 | (902,848,391 ) | (79,558,859 ) | (170,940,887 ) |
NET ASSETS | ||||
Beginning of the year | 1,977,094,676 | 2,879,943,067 | 421,701,974 | 592,642,861 |
End of the year | $2,192,321,322 | $1,977,094,676 | $342,143,115 | $421,701,974 |
Small/Mid Cap Growth Fund | ||
Year Ended September 30, 2023 | Year Ended September 30, 2022 | |
FROM OPERATIONS: | ||
Net investment loss | $(543,546 ) | $(596,324 ) |
Net realized loss on investments | (14,132,539 ) | (6,038,711 ) |
Net change in unrealized appreciation (depreciation) on investments | 23,117,663 | (41,617,706 ) |
Net increase (decrease) in net assets resulting from operations | 8,441,578 | (48,252,741 ) |
FROM DISTRIBUTIONS TO SHAREHOLDERS: | ||
Institutional Class | — | (7,348,311 ) |
Class N | — | (901,138 ) |
Total distributions | — | (8,249,449 ) |
NET INCREASE (DECREASE) IN NET ASSETS FROM CAPITAL SHARES TRANSACTIONS (Note 10) | (18,288,186 ) | 130,096,993 |
Net increase (decrease) in net assets | (9,846,608 ) | 73,594,803 |
NET ASSETS | ||
Beginning of the year | 153,380,208 | 79,785,405 |
End of the year | $143,533,600 | $153,380,208 |
Small Cap Growth Fund – Institutional Class | |||||
Year Ended September 30, 2023 | Year Ended September 30, 2022 | Year Ended September 30, 2021 | Year Ended September 30, 2020 | Year Ended September 30, 2019 | |
Net asset value, beginning of the period | $22.88 | $36.57 | $28.51 | $26.30 | $31.55 |
INCOME (LOSS) FROM INVESTMENT OPERATIONS: | |||||
Net investment loss(a) | (0.12 ) | (0.15 )(b) | (0.26 ) | (0.17 ) | (0.16 ) |
Net realized and unrealized gain (loss) | 2.75 | (7.06 ) | 8.94 | 4.73 | (2.51 ) |
Total from Investment Operations | 2.63 | (7.21 ) | 8.68 | 4.56 | (2.67 ) |
LESS DISTRIBUTIONS FROM: | |||||
Net realized capital gains | (0.72 ) | (6.48 ) | (0.62 ) | (2.35 ) | (2.58 ) |
Net asset value, end of the period | $24.79 | $22.88 | $36.57 | $28.51 | $26.30 |
Total return | 11.64 % | (24.77 )%(b) | 30.53 % | 17.98 % | (6.88 )% |
RATIOS TO AVERAGE NET ASSETS: | |||||
Net assets, end of the period (000's) | $974,539 | $883,458 | $1,299,777 | $1,037,625 | $908,616 |
Net expenses | 0.94 % | 0.93 % | 0.92 % | 0.94 % | 0.95 % |
Gross expenses | 0.94 % | 0.93 % | 0.92 % | 0.94 % | 0.95 % |
Net investment loss | (0.50 )% | (0.51 )%(b) | (0.72 )% | (0.66 )% | (0.62 )% |
Portfolio turnover rate | 37 % | 34 % | 52 % | 52 % | 67 % |
(a) | Per share net investment loss has been calculated using the average shares outstanding during the period. |
(b) | Includes a non-recurring dividend. Without this dividend, net investment loss per share would have been $(0.16), total return would have been (24.83%) and the ratio of net investment loss to average net assets would have been (0.56%). |
Small Cap Growth Fund– Retail Class | |||||
Year Ended September 30, 2023 | Year Ended September 30, 2022 | Year Ended September 30, 2021 | Year Ended September 30, 2020 | Year Ended September 30, 2019 | |
Net asset value, beginning of the period | $19.98 | $32.79 | $25.67 | $23.95 | $29.09 |
INCOME (LOSS) FROM INVESTMENT OPERATIONS: | |||||
Net investment loss(a) | (0.16 ) | (0.19 )(b) | (0.30 ) | (0.21 ) | (0.21 ) |
Net realized and unrealized gain (loss) | 2.39 | (6.14 ) | 8.04 | 4.28 | (2.35 ) |
Total from Investment Operations | 2.23 | (6.33 ) | 7.74 | 4.07 | (2.56 ) |
LESS DISTRIBUTIONS FROM: | |||||
Net realized capital gains | (0.72 ) | (6.48 ) | (0.62 ) | (2.35 ) | (2.58 ) |
Net asset value, end of the period | $21.49 | $19.98 | $32.79 | $25.67 | $23.95 |
Total return | 11.32 % | (24.94 )%(b) | 30.20 % | 17.67 % | (7.11 )%(c) |
RATIOS TO AVERAGE NET ASSETS: | |||||
Net assets, end of the period (000's) | $62,965 | $62,909 | $105,027 | $98,205 | $95,635 |
Net expenses | 1.19 % | 1.18 % | 1.17 % | 1.19 % | 1.19 %(d) |
Gross expenses | 1.19 % | 1.18 % | 1.17 % | 1.19 % | 1.20 % |
Net investment loss | (0.75 )% | (0.76 )%(b) | (0.92 )% | (0.91 )% | (0.86 )% |
Portfolio turnover rate | 37 % | 34 % | 52 % | 52 % | 67 % |
(a) | Per share net investment loss has been calculated using the average shares outstanding during the period. |
(b) | Includes a non-recurring dividend. Without this dividend, net investment loss per share would have been $(0.21), total return would have been (25.01%) and the ratio of net investment loss to average net assets would have been (0.81%). |
(c) | Had certain expenses not been waived/reimbursed during the period, total returns would have been lower. |
(d) | The administrator agreed to waive its fees and/or reimburse a portion of the Fund’s expenses during the period. Without this waiver/reimbursement, expenses would have been higher. |
Small Cap Growth Fund– Class N | |||||
Year Ended September 30, 2023 | Year Ended September 30, 2022 | Year Ended September 30, 2021 | Year Ended September 30, 2020 | Year Ended September 30, 2019 | |
Net asset value, beginning of the period | $23.23 | $37.01 | $28.81 | $26.53 | $31.76 |
INCOME (LOSS) FROM INVESTMENT OPERATIONS: | |||||
Net investment loss(a) | (0.10 ) | (0.11 )(b) | (0.22 ) | (0.14 ) | (0.13 ) |
Net realized and unrealized gain (loss) | 2.80 | (7.19 ) | 9.04 | 4.77 | (2.52 ) |
Total from Investment Operations | 2.70 | (7.30 ) | 8.82 | 4.63 | (2.65 ) |
LESS DISTRIBUTIONS FROM: | |||||
Net realized capital gains | (0.72 ) | (6.48 ) | (0.62 ) | (2.35 ) | (2.58 ) |
Net asset value, end of the period | $25.21 | $23.23 | $37.01 | $28.81 | $26.53 |
Total return | 11.77 % | (24.69 )%(b) | 30.66 % | 18.09 % | (6.76 )% |
RATIOS TO AVERAGE NET ASSETS: | |||||
Net assets, end of the period (000's) | $1,154,817 | $1,030,728 | $1,475,139 | $1,066,067 | $629,914 |
Net expenses | 0.83 % | 0.82 % | 0.82 % | 0.82 % | 0.82 % |
Gross expenses | 0.83 % | 0.82 % | 0.82 % | 0.82 % | 0.82 % |
Net investment loss | (0.38 )% | (0.39 )%(b) | (0.62 )% | (0.54 )% | (0.49 )% |
Portfolio turnover rate | 37 % | 34 % | 52 % | 52 % | 67 % |
(a) | Per share net investment loss has been calculated using the average shares outstanding during the period. |
(b) | Includes a non-recurring dividend. Without this dividend, net investment loss per share would have been $(0.13), total return would have been (24.71%) and the ratio of net investment loss to average net assets would have been (0.44%). |
Small Cap Value Fund – Institutional Class | |||||
Year Ended September 30, 2023 | Year Ended September 30, 2022 | Year Ended September 30, 2021 | Year Ended September 30, 2020 | Year Ended September 30, 2019 | |
Net asset value, beginning of the period | $22.57 | $32.05 | $22.34 | $28.66 | $35.27 |
INCOME (LOSS) FROM INVESTMENT OPERATIONS: | |||||
Net investment income(a) | 0.08 | 0.13 | 0.04 | 0.12 | 0.10 |
Net realized and unrealized gain (loss) | 4.37 | (4.18 ) | 11.79 | (4.03 ) | (2.49 ) |
Total from Investment Operations | 4.45 | (4.05 ) | 11.83 | (3.91 ) | (2.39 ) |
LESS DISTRIBUTIONS FROM: | |||||
Net investment income | (0.13 ) | (0.05 ) | (0.13 ) | (0.12 ) | (0.08 ) |
Net realized capital gains | (2.72 ) | (5.38 ) | (1.99 ) | (2.29 ) | (4.14 ) |
Total Distributions | (2.85 ) | (5.43 ) | (2.12 ) | (2.41 ) | (4.22 ) |
Net asset value, end of the period | $24.17 | $22.57 | $32.05 | $22.34 | $28.66 |
Total return(b) | 20.73 % | (16.18 )% | 55.05 % | (15.31 )% | (4.11 )% |
RATIOS TO AVERAGE NET ASSETS: | |||||
Net assets, end of the period (000's) | $201,632 | $276,020 | $378,856 | $295,006 | $433,360 |
Net expenses(c) | 0.90 % | 0.90 % | 0.90 % | 0.90 % | 0.90 % |
Gross expenses | 0.96 % | 0.93 % | 0.94 % | 0.95 % | 0.93 % |
Net investment income | 0.34 % | 0.48 % | 0.12 % | 0.48 % | 0.36 % |
Portfolio turnover rate | 26 % | 28 % | 23 % | 23 % | 24 % |
(a) | Per share net investment income has been calculated using the average shares outstanding during the period. |
(b) | Had certain expenses not been waived/reimbursed during the period, total returns would have been lower. |
(c) | The investment adviser agreed to waive its fees and/or reimburse a portion of the Fund’s expenses during the period. Without this waiver/reimbursement, expenses would have been higher. |
Small Cap Value Fund– Retail Class | |||||
Year Ended September 30, 2023 | Year Ended September 30, 2022 | Year Ended September 30, 2021 | Year Ended September 30, 2020 | Year Ended September 30, 2019 | |
Net asset value, beginning of the period | $21.95 | $31.33 | $21.87 | $28.11 | $34.66 |
INCOME (LOSS) FROM INVESTMENT OPERATIONS: | |||||
Net investment income (loss)(a) | 0.02 | 0.06 | (0.04 ) | 0.05 | 0.03 |
Net realized and unrealized gain (loss) | 4.26 | (4.06 ) | 11.55 | (3.96 ) | (2.44 ) |
Total from Investment Operations | 4.28 | (4.00 ) | 11.51 | (3.91 ) | (2.41 ) |
LESS DISTRIBUTIONS FROM: | |||||
Net investment income | (0.07 ) | — | (0.06 ) | (0.04 ) | — |
Net realized capital gains | (2.72 ) | (5.38 ) | (1.99 ) | (2.29 ) | (4.14 ) |
Total Distributions | (2.79 ) | (5.38 ) | (2.05 ) | (2.33 ) | (4.14 ) |
Net asset value, end of the period | $23.44 | $21.95 | $31.33 | $21.87 | $28.11 |
Total return(b) | 20.47 % | (16.40 )% | 54.69 % | (15.56 )% | (4.33 )% |
RATIOS TO AVERAGE NET ASSETS: | |||||
Net assets, end of the period (000's) | $68,979 | $63,738 | $92,036 | $83,163 | $134,434 |
Net expenses(c) | 1.15 % | 1.15 % | 1.15 % | 1.15 % | 1.15 % |
Gross expenses | 1.21 % | 1.18 % | 1.19 % | 1.20 % | 1.18 % |
Net investment income (loss) | 0.09 % | 0.23 % | (0.12 )% | 0.23 % | 0.10 % |
Portfolio turnover rate | 26 % | 28 % | 23 % | 23 % | 24 % |
(a) | Per share net investment income (loss) has been calculated using the average shares outstanding during the period. |
(b) | Had certain expenses not been waived/reimbursed during the period, total returns would have been lower. |
(c) | The investment adviser agreed to waive its fees and/or reimburse a portion of the Fund’s expenses during the period. Without this waiver/reimbursement, expenses would have been higher. |
Small Cap Value Fund– Admin Class | |||||
Year Ended September 30, 2023 | Year Ended September 30, 2022 | Year Ended September 30, 2021 | Year Ended September 30, 2020 | Year Ended September 30, 2019 | |
Net asset value, beginning of the year | $20.31 | $29.44 | $20.65 | $26.68 | $33.25 |
INCOME (LOSS) FROM INVESTMENT OPERATIONS: | |||||
Net investment loss(a) | (0.03 ) | (0.01 ) | (0.10 ) | (0.01 ) | (0.04 ) |
Net realized and unrealized gain (loss) | 3.92 | (3.74 ) | 10.88 | (3.73 ) | (2.39 ) |
Total from Investment Operations | 3.89 | (3.75 ) | 10.78 | (3.74 ) | (2.43 ) |
LESS DISTRIBUTIONS FROM: | |||||
Net investment income | (0.01 ) | — | — | — | — |
Net realized capital gains | (2.72 ) | (5.38 ) | (1.99 ) | (2.29 ) | (4.14 ) |
Total Distributions | (2.73 ) | (5.38 ) | (1.99 ) | (2.29 ) | (4.14 ) |
Net asset value, end of the period | $21.47 | $20.31 | $29.44 | $20.65 | $26.68 |
Total return(b) | 20.18 % | (16.63 )% | 54.29 % | (15.74 )% | (4.60 )% |
RATIOS TO AVERAGE NET ASSETS: | |||||
Net assets, end of the period (000's) | $5,812 | $6,776 | $9,440 | $7,662 | $13,357 |
Net expenses(c) | 1.40 % | 1.40 % | 1.40 % | 1.40 % | 1.40 % |
Gross expenses | 1.46 % | 1.43 % | 1.43 % | 1.45 % | 1.43 % |
Net investment loss | (0.16 )% | (0.02 )% | (0.38 )% | (0.03 )% | (0.15 )% |
Portfolio turnover rate | 26 % | 28 % | 23 % | 23 % | 24 % |
(a) | Per share net investment loss has been calculated using the average shares outstanding during the period. |
(b) | Had certain expenses not been waived/reimbursed during the period, total returns would have been lower. |
(c) | The investment adviser agreed to waive its fees and/or reimburse a portion of the Fund’s expenses during the period. Without this waiver/reimbursement, expenses would have been higher. |
Small Cap Value Fund– Class N | |||||
Year Ended September 30, 2023 | Year Ended September 30, 2022 | Year Ended September 30, 2021 | Year Ended September 30, 2020 | Year Ended September 30, 2019 | |
Net asset value, beginning of the period | $22.58 | $32.07 | $22.35 | $28.68 | $35.31 |
INCOME (LOSS) FROM INVESTMENT OPERATIONS: | |||||
Net investment income(a) | 0.10 | 0.15 | 0.05 | 0.13 | 0.12 |
Net realized and unrealized gain (loss) | 4.37 | (4.19 ) | 11.80 | (4.03 ) | (2.50 ) |
Total from Investment Operations | 4.47 | (4.04 ) | 11.85 | (3.90 ) | (2.38 ) |
LESS DISTRIBUTIONS FROM: | |||||
Net investment income | (0.15 ) | (0.07 ) | (0.14 ) | (0.14 ) | (0.11 ) |
Net realized capital gains | (2.72 ) | (5.38 ) | (1.99 ) | (2.29 ) | (4.14 ) |
Total Distributions | (2.87 ) | (5.45 ) | (2.13 ) | (2.43 ) | (4.25 ) |
Net asset value, end of the period | $24.18 | $22.58 | $32.07 | $22.35 | $28.68 |
Total return | 20.80 %(b) | (16.16 )% | 55.15 % | (15.28 )% | (4.07 )% |
RATIOS TO AVERAGE NET ASSETS: | |||||
Net assets, end of the period (000's) | $65,720 | $75,168 | $112,310 | $92,818 | $141,821 |
Net expenses | 0.85 %(c) | 0.84 % | 0.85 % | 0.85 % | 0.83 % |
Gross expenses | 0.87 % | 0.84 % | 0.85 % | 0.85 % | 0.83 % |
Net investment income | 0.40 % | 0.53 % | 0.17 % | 0.53 % | 0.43 % |
Portfolio turnover rate | 26 % | 28 % | 23 % | 23 % | 24 % |
(a) | Per share net investment income has been calculated using the average shares outstanding during the period. |
(b) | Had certain expenses not been waived/reimbursed during the period, total returns would have been lower. |
(c) | The investment adviser agreed to waive its fees and/or reimburse a portion of the Fund’s expenses during the period. Without this waiver/reimbursement, expenses would have been higher. |
Small/Mid Cap Growth Fund – Institutional Class | |||||
Year Ended September 30, 2023 | Year Ended September 30, 2022 | Year Ended September 30, 2021 | Year Ended September 30, 2020 | Year Ended September 30, 2019 | |
Net asset value, beginning of the period | $10.34 | $15.25 | $11.81 | $10.03 | $15.49 |
INCOME (LOSS) FROM INVESTMENT OPERATIONS: | |||||
Net investment loss(a) | (0.04 ) | (0.06 ) | (0.02 )(b) | (0.04 ) | (0.04 ) |
Net realized and unrealized gain (loss) | 0.46 | (3.37 ) | 3.56 | 2.06 | (1.55 )(c) |
Total from Investment Operations | 0.42 | (3.43 ) | 3.54 | 2.02 | (1.59 ) |
LESS DISTRIBUTIONS FROM: | |||||
Net realized capital gains | — | (1.48 ) | (0.10 ) | (0.24 ) | (3.87 ) |
Net asset value, end of the period | $10.76 | $10.34 | $15.25 | $11.81 | $10.03 |
Total return(d) | 4.06 % | (25.43 )% | 30.00 %(b) | 20.38 % | (3.27 )% |
RATIOS TO AVERAGE NET ASSETS: | |||||
Net assets, end of the period (000's) | $118,499 | $106,566 | $70,526 | $52,170 | $34,312 |
Net expenses(e) | 0.85 % | 0.84 %(f) | 0.84 %(f) | 0.84 % | 0.85 % |
Gross expenses | 0.93 % | 0.91 % | 0.99 % | 1.21 % | 1.30 % |
Net investment loss | (0.37 )% | (0.45 )% | (0.14 )%(b) | (0.34 )% | (0.35 )% |
Portfolio turnover rate | 63 % | 50 % | 50 % | 60 % | 67 % |
(a) | Per share net investment loss has been calculated using the average shares outstanding during the period. |
(b) | Includes a non-recurring dividend. Without this dividend, net investment loss per share would have been $(0.08), total return would have been 29.49% and the ratio of net investment loss to average net assets would have been (0.52%). |
(c) | The amount shown for a share outstanding does not correspond with the aggregate realized and unrealized gain (loss) on investments for the period due to the timing of sales and redemptions of fund shares in relation to fluctuating market values of investments of the Fund. |
(d) | Had certain expenses not been waived/reimbursed during the period, total returns would have been lower. |
(e) | The investment adviser agreed to waive its fees and/or reimburse a portion of the Fund’s expenses during the period. Without this waiver/reimbursement, expenses would have been higher. |
(f) | Includes additional voluntary waiver of advisory fee of 0.01%. |
Small/Mid Cap Growth Fund– Class N | ||||
Year Ended September 30, 2023 | Year Ended September 30, 2022 | Year Ended September 30, 2021 | Period Ended September 30, 2020* | |
Net asset value, beginning of the period | $10.35 | $15.26 | $11.81 | $9.89 |
INCOME (LOSS) FROM INVESTMENT OPERATIONS: | ||||
Net investment loss(a) | (0.04 ) | (0.05 ) | (0.01 )(b) | (0.04 ) |
Net realized and unrealized gain (loss) | 0.46 | (3.38 ) | 3.56 | 2.20 |
Total from Investment Operations | 0.42 | (3.43 ) | 3.55 | 2.16 |
LESS DISTRIBUTIONS FROM: | ||||
Net realized capital gains | — | (1.48 ) | (0.10 ) | (0.24 ) |
Net asset value, end of the period | $10.77 | $10.35 | $15.26 | $11.81 |
Total return(c) | 4.06 % | (25.41 )% | 30.08 %(b) | 22.08 %(d) |
RATIOS TO AVERAGE NET ASSETS: | ||||
Net assets, end of the period (000's) | $25,035 | $46,814 | $9,260 | $1 |
Net expenses(e) | 0.83 % | 0.83 % | 0.83 % | 0.83 %(f) |
Gross expenses | 0.92 % | 0.91 % | 1.00 % | 107.49 %(f) |
Net investment loss | (0.37 )% | (0.44 )% | (0.08 )%(b) | (0.34 )%(f) |
Portfolio turnover rate | 63 % | 50 % | 50 % | 60 %(g) |
* | Class operations commenced on October 1, 2019. |
(a) | Per share net investment loss has been calculated using the average shares outstanding during the period. |
(b) | Includes a non-recurring dividend. Without this dividend, net investment loss per share would have been $(0.07), total return would have been 29.66% and the ratio of net investment loss to average net assets would have been (0.50%). |
(c) | Had certain expenses not been waived/reimbursed during the period, total returns would have been lower. |
(d) | Periods less than one year are not annualized. |
(e) | The investment adviser agreed to waive its fees and/or reimburse a portion of the Fund’s expenses during the period. Without this waiver/reimbursement, expenses would have been higher. |
(f) | Computed on an annualized basis for periods less than one year. |
(g) | Represents the Fund’s portfolio turnover rate for the year ended September 30, 2020. |
available market quotations are not available are priced at fair value pursuant to the Funds’ Valuation Procedures. The Board of Trustees has approved a valuation designee who is subject to the Board’s oversight.
2023 Distributions | 2022 Distributions | |||||
Fund | Ordinary Income | Long-Term Capital Gains | Total | Ordinary Income | Long-Term Capital Gains | Total |
Small Cap Growth Fund | $— | $61,669,247 | $61,669,247 | $14,122,150 | $483,896,328 | $498,018,478 |
Small Cap Value Fund | 2,223,346 | 48,590,022 | 50,813,368 | 8,282,886 | 91,874,834 | 100,157,720 |
Small/Mid Cap Growth Fund | — | — | — | — | 8,249,449 | 8,249,449 |
Small Cap Growth Fund | Small Cap Value Fund | Small/Mid Cap Growth Fund | |
Undistributed ordinary income | $— | $4,286,082 | $— |
Undistributed long-term capital gains | 51,627,814 | 60,625,448 | — |
Total undistributed earnings | 51,627,814 | 64,911,530 | — |
Capital loss carryforward: | |||
Short-term: | |||
No expiration date | — | — | (23,696,151 ) |
Late-year ordinary and post-October capital loss deferrals* | (7,358,605 ) | — | (392,335 ) |
Unrealized appreciation (depreciation) | 231,873,359 | 82,267,082 | (357,911 ) |
Total accumulated earnings (losses) | $276,142,568 | $147,178,612 | $(24,446,397 ) |
* | Under current tax law, net operating losses, capital losses, foreign currency losses, and losses on passive foreign investment companies and contingent payment debt instruments after October 31 or December 31, as applicable, may be deferred and treated as occurring on the first day of the following taxable year. Small Cap Growth Fund and Small/Mid Cap Growth Fund are deferring net operating losses. |
Small Cap Growth Fund | Small Cap Value Fund | Small/Mid Cap Growth Fund | |
Federal tax cost | $1,975,186,649 | $261,278,323 | $144,139,140 |
Gross tax appreciation | $358,240,863 | $94,947,492 | $9,620,827 |
Gross tax depreciation | (126,367,504 ) | (12,680,410 ) | (9,978,738 ) |
Net tax appreciation (depreciation) | $231,873,359 | $82,267,082 | $(357,911 ) |
each Fund’s policy that the market value of the collateral for repurchase agreements be at least equal to 102% of the repurchase price, including interest. Certain repurchase agreements are tri-party arrangements whereby the collateral is held in a segregated account for the benefit of the Fund and on behalf of the counterparty. Repurchase agreements could involve certain risks in the event of default or insolvency of the counterparty, including possible delays or restrictions upon a Fund’s ability to dispose of the underlying securities. As of September 30, 2023, each Fund, as applicable, had investments in repurchase agreements for which the value of the related collateral exceeded the value of the repurchase agreement. The gross value of repurchase agreements is included in the Statements of Assets and Liabilities for financial reporting purposes.
Small Cap Growth Fund | ||||
Asset Valuation Inputs | ||||
Description | Level 1 | Level 2 | Level 3 | Total |
Common Stocks(a) | $2,114,715,050 | $— | $— | $2,114,715,050 |
Short-Term Investments | — | 92,344,958 | — | 92,344,958 |
Total Investments | $2,114,715,050 | $92,344,958 | $— | $2,207,060,008 |
(a) | Details of the major categories of the Fund’s investments are reflected within the Portfolio of Investments. |
Small Cap Value Fund | ||||
Asset Valuation Inputs | ||||
Description | Level 1 | Level 2 | Level 3 | Total |
Common Stocks(a) | $338,489,487 | $— | $— | $338,489,487 |
Short-Term Investments | — | 5,055,918 | — | 5,055,918 |
Total Investments | $338,489,487 | $5,055,918 | $— | $343,545,405 |
(a) | Details of the major categories of the Fund’s investments are reflected within the Portfolio of Investments. |
Small/Mid Cap Growth Fund | ||||
Asset Valuation Inputs | ||||
Description | Level 1 | Level 2 | Level 3 | Total |
Common Stocks(a) | $138,587,246 | $— | $— | $138,587,246 |
Short-Term Investments | — | 5,193,983 | — | 5,193,983 |
Total Investments | $138,587,246 | $5,193,983 | $— | $143,781,229 |
(a) | Details of the major categories of the Fund’s investments are reflected within the Portfolio of Investments. |
Fund | Purchases | Sales |
Small Cap Growth Fund | $801,067,679 | $858,992,603 |
Small Cap Value Fund | 100,958,901 | 256,366,058 |
Small/Mid Cap Growth Fund | 91,613,540 | 110,707,861 |
monthly, based on each Fund’s average daily net assets:
Fund | Percentage of Average Daily Net Assets |
Small Cap Growth Fund | 0.75% |
Small Cap Value Fund | 0.75% |
Small/Mid Cap Growth Fund | 0.75% |
Expense Limit as a Percentage of Average Daily Net Assets | ||||
Fund | Institutional Class | Retail Class | Admin Class | Class N |
Small Cap Growth Fund | 0.95 % | 1.20 % | — % | 0.90 % |
Small Cap Value Fund | 0.90 % | 1.15 % | 1.40 % | 0.85 % |
Small/Mid Cap Growth Fund | 0.85 % | — % | — % | 0.83 % |
Expense Limit as a Percentage of Average Daily Net Assets | |||
Fund | Institutional Class | Retail Class | Class N |
Small Cap Growth Fund | 1.00 % | 1.25 % | 0.95 % |
Gross Management Fees | Contractual Waivers of Management Fees1 | Voluntary Waivers of Management Fees2 | Net Management Fees | Percentage of Average Daily Net Assets | ||
Fund | Gross | Net | ||||
Small Cap Growth Fund | $16,886,498 | $— | $— | $16,886,498 | 0.75 % | 0.75 % |
Small Cap Value Fund | 2,967,496 | 203,031 | — | 2,764,465 | 0.75 % | 0.70 % |
Small/Mid Cap Growth Fund | 1,105,606 | 125,657 | 4,771 | 975,178 | 0.75 % | 0.66 % |
1 | Waiver/expense reimbursements are subject to possible recovery until September 30, 2024. |
2 | In order to ensure that the total annual fund operating expenses after fee waiver and/or expense reimbursement do not exceed limitations, the Adviser may voluntarily waive additional advisory fees for Small/Mid Cap Growth Fund. Voluntary management fee waivers are not subject to recovery under the expense limitation agreement described above. |
as principal underwriter of the Funds of the Trusts.
Class shares (the “Admin Class Plan”).
connection with the marketing or sale of Retail Class shares or for payments made by Natixis Distribution to securities dealers or other financial intermediaries as commissions, asset-based sales charges or other compensation with respect to the sale of Retail Class shares, or for
providing personal services to investors and/or the maintenance of shareholder accounts.
Distribution in connection with the marketing or sale of Admin Class shares or for payments made by Natixis Distribution to securities dealers or other financial intermediaries as commissions, asset-based sales charges or other compensation with respect to the sale of Admin
Class shares, or for providing personal services to investors and/or the maintenance of shareholder accounts.
financial intermediaries for providing personal services and/or account maintenance for their customers who hold such shares.
Service Fees | Distribution Fees | |||
Fund | Admin Class | Retail Class | Admin Class | |
Small Cap Growth Fund | $— | $168,708 | $— | |
Small Cap Value Fund | 16,168 | 176,498 | 16,168 | |
Natixis Investment Managers, LLC. Pursuant to an agreement among Natixis Funds Trusts, Loomis Sayles Funds Trusts, Natixis ETF Trusts and Natixis Advisors, each Fund pays Natixis Advisors monthly its pro rata portion of fees equal to an annual rate of 0.0540% of the first $15 billion of the average daily net assets of the Natixis Funds Trusts, Loomis Sayles Funds Trusts and Natixis ETF Trusts, 0.0500% of the next $15 billion, 0.0400% of the next $30 billion, 0.0275% of the next $30 billion and 0.0225% of such assets in excess of $90 billion, subject to an annual aggregate minimum fee for the Natixis Funds Trusts, Loomis Sayles Funds Trusts and Natixis ETF Trusts of $10 million, which is reevaluated on an annual basis.
Fund | Administrative Fees |
Small Cap Growth Fund | $1,043,399 |
Small Cap Value Fund | 183,393 |
Small/Mid Cap Growth Fund | 68,319 |
Fund | Sub-Transfer Agent Fees |
Small Cap Growth Fund | $1,182,735 |
Small Cap Value Fund | 260,539 |
Small/Mid Cap Growth Fund | 15,956 |
Fund | Reimbursements of Sub-Transfer Agent Fees |
Small Cap Growth Fund | $12,959 |
Small Cap Value Fund | 2,560 |
Small/Mid Cap Growth Fund | 229 |
Fund | Pension Plan | Retirement Plan | Non-Qualified Retirement Plans | Total Affiliated Onwership |
Small Cap Growth Fund | 0.11% | 1.08% | —% | 1.19% |
Small Cap Value Fund | 0.71% | 7.43% | 8.88% | 17.02% |
Transfer Agent Fees and Expenses | ||||
Fund | Institutional Class | Retail Class | Admin Class | Class N |
Small Cap Growth Fund | $1,133,352 | $77,437 | $— | $11,122 |
Small Cap Value Fund | 216,547 | 61,694 | 5,645 | 1,660 |
Small/Mid Cap Growth Fund | 18,996 | — | — | 1,389 |
Fund | Number of 5% Non-Affiliated Account Holders | Percentage of Non-Affiliated Ownership | Percentage of Affiliated Ownership (Note 5f) | Total Percentage of Ownership |
Small Cap Value Fund | 4 | 24.16 % | 17.02 % | 41.18 % |
Small/Mid Cap Growth Fund | 6 | 67.32 % | — | 67.32 % |
accounts or investment models where a shareholder account may be invested for a non-discretionary customer are included in the table above.
For other omnibus accounts, the Funds do not have information on the individual shareholder accounts underlying the omnibus accounts;
therefore, there could be other 5% shareholders in addition to those disclosed in the table above.
Year Ended September 30, 2023 | Year Ended September 30, 2022 | |||
Small Cap Growth Fund | Shares | Amount | Shares | Amount |
Institutional Class | ||||
Issued from the sale of shares | 10,078,079 | $253,544,183 | 8,017,172 | $223,956,965 |
Issued in connection with the reinvestment of distributions | 1,053,561 | 25,137,956 | 6,623,931 | 211,700,835 |
Redeemed | (10,430,137 ) | (261,851,616 ) | (11,564,237 ) | (328,676,465 ) |
Net change | 701,503 | $16,830,523 | 3,076,866 | $106,981,335 |
Retail Class | ||||
Issued from the sale of shares | 441,299 | $9,585,279 | 320,387 | $7,927,984 |
Issued in connection with the reinvestment of distributions | 106,298 | 2,203,548 | 703,528 | 19,670,652 |
Redeemed | (767,180 ) | (16,756,037 ) | (1,078,080 ) | (27,258,549 ) |
Net change | (219,583 ) | $(4,967,210 ) | (54,165 ) | $340,087 |
Class N | ||||
Issued from the sale of shares | 9,639,101 | $247,068,462 | 8,143,108 | $239,198,836 |
Issued in connection with the reinvestment of distributions | 1,325,324 | 32,139,099 | 7,685,869 | 249,252,745 |
Redeemed | (9,524,898 ) | (245,579,845 ) | (11,325,816 ) | (334,588,076 ) |
Net change | 1,439,527 | $33,627,716 | 4,503,161 | $153,863,505 |
Increase from capital share transactions | 1,921,447 | $45,491,029 | 7,525,862 | $261,184,927 |
Year Ended September 30, 2023 | Year Ended September 30, 2022 | |||
Small Cap Value Fund | Shares | Amount | Shares | Amount |
Institutional Class | ||||
Issued from the sale of shares | 1,324,531 | $31,971,280 | 1,638,952 | $45,506,016 |
Issued in connection with the reinvestment of distributions | 1,479,594 | 33,157,704 | 2,209,266 | 63,052,444 |
Redeemed | (6,693,582 ) | (160,024,024 ) | (3,438,164 ) | (92,106,055 ) |
Net change | (3,889,457 ) | $(94,895,040 ) | 410,054 | $16,452,405 |
Retail Class | ||||
Issued from the sale of shares | 142,091 | $3,321,439 | 118,433 | $3,328,950 |
Issued in connection with the reinvestment of distributions | 360,879 | 7,859,942 | 535,511 | 14,897,926 |
Redeemed | (463,598 ) | (10,809,533 ) | (687,758 ) | (19,095,126 ) |
Net change | 39,372 | $371,848 | (33,814 ) | $(868,250 ) |
Admin Class | ||||
Issued from the sale of shares | 18,912 | $402,032 | 41,072 | $1,112,201 |
Issued in connection with the reinvestment of distributions | 44,560 | 890,318 | 64,887 | 1,673,437 |
Redeemed | (126,310 ) | (2,691,370 ) | (93,082 ) | (2,413,386 ) |
Net change | (62,838 ) | $(1,399,020 ) | 12,877 | $372,252 |
Class N | ||||
Issued from the sale of shares | 214,302 | $5,164,913 | 719,077 | $21,151,505 |
Issued in connection with the reinvestment of distributions | 375,730 | 8,423,867 | 687,544 | 19,629,374 |
Redeemed | (1,201,179 ) | (29,327,375 ) | (1,580,215 ) | (42,353,412 ) |
Net change | (611,147 ) | $(15,738,595 ) | (173,594 ) | $(1,572,533 ) |
Increase (decrease) from capital share transactions | (4,524,070 ) | $(111,660,807 ) | 215,523 | $14,383,874 |
Year Ended September 30, 2023 | Year Ended September 30, 2022 | |||
Small/Mid Cap Growth Fund | Shares | Amount | Shares | Amount |
Institutional Class | ||||
Issued from the sale of shares | 1,806,894 | $20,331,352 | 6,066,124 | $75,764,451 |
Issued in connection with the reinvestment of distributions | — | — | 493,838 | 7,348,311 |
Redeemed | (1,093,292 ) | (12,121,065 ) | (882,881 ) | (10,629,212 ) |
Net change | 713,602 | $8,210,287 | 5,677,081 | $72,483,550 |
Class N | ||||
Issued from the sale of shares | 1,539,241 | $16,805,054 | 4,203,057 | $60,895,993 |
Issued in connection with the reinvestment of distributions | — | — | 60,520 | 901,138 |
Redeemed | (281,892 ) | (3,176,860 ) | (348,878 ) | (4,183,688 ) |
Redeemed in-kind (Note 11) | (3,453,242 ) | (40,126,667 ) | — | — |
Net change | (2,195,893 ) | $(26,498,473 ) | 3,914,699 | $57,613,443 |
Increase (decrease) from capital share transactions | (1,482,291 ) | $(18,288,186 ) | 9,591,780 | $130,096,993 |
Boston, Massachusetts
November 21, 2023
Fund | Qualifying Percentage |
Small Cap Value Fund | 83.39% |
Small Cap Value Fund
Fund | Amount |
Small Cap Growth Fund | $61,669,247 |
Small Cap Value Fund | 48,590,022 |
Name and Year of Birth | Position(s) Held with the Trusts, Length of Time Served and Term of Office1 | Principal Occupation(s) During Past 5 Years | Number of Portfolios in Fund Complex Overseen2and Other Directorships Held During Past 5 Years | Experience, Qualifications, Attributes, Skills for Board Membership |
Independent Trustees | ||||
Edmond J. English (1953) | Trustee since 2013 Contract Review Committee Member and Governance Committee Member | Executive Chairman of Bob’s Discount Furniture (retail) | 52 Director, Burlington Stores, Inc. (retail); Director, Rue Gilt Groupe, Inc. (e-commerce retail) | Significant experience on the Board and on the boards of other business organizations (including retail companies and a bank); executive experience (including at a retail company) |
Richard A. Goglia (1951) | Trustee since 2015 Audit Committee Member and Governance Committee Member | Retired | 52 Formerly, Director of Triumph Group (aerospace industry) | Significant experience on the Board and executive experience (including his role as Vice President and treasurer of a defense company and experience at a financial services company) |
Martin T. Meehan (1956) | Trustee since 2012 Chairperson of the Governance Committee and Contract Review Committee Member | President, University of Massachusetts | 52 None | Significant experience on the Board and on the boards of other business organizations; experience as President of the University of Massachusetts; government experience (including as a member of the U.S. House of Representatives); academic experience |
Maureen B. Mitchell (1951) | Trustee since 2017 Chairperson of the Contract Review Committee | Retired | 52 Director, Sterling Bancorp (bank) | Significant experience on the Board; financial services industry and executive experience (including role as President of global sales and marketing at a financial services company) |
Name and Year of Birth | Position(s) Held with the Trusts, Length of Time Served and Term of Office1 | Principal Occupation(s) During Past 5 Years | Number of Portfolios in Fund Complex Overseen2and Other Directorships Held During Past 5 Years | Experience, Qualifications, Attributes, Skills for Board Membership |
Independent Trustees − continued | ||||
James P. Palermo (1955) | Trustee since 2016 Audit Committee Member and Governance Committee Member | Founding Partner, Breton Capital Management, LLC (private equity); Partner, STEP Partners, LLC (private equity) | 52 Director, FutureFuel.io (chemicals and biofuels) | Significant experience on the Board; financial services industry and executive experience (including roles as Chief Executive Officer of client management and asset servicing for a banking and financial services company) |
Erik R. Sirri (1958) | Chairperson of the Board of Trustees since 2021 Trustee since 2009 Ex Officio Member of the Audit Committee, Contract Review Committee and Governance Committee | Professor of Finance at Babson College | 52 None | Significant experience on the Board; experience as Director of the Division of Trading and Markets at the Securities and Exchange Commission; academic experience; training as an economist |
Peter J. Smail (1952) | Trustee since 2009 Contract Review Committee Member | Retired | 52 None | Significant experience on the Board; mutual fund industry and executive experience (including roles as President and Chief Executive Officer for an investment adviser) |
Kirk A. Sykes (1958) | Trustee since 2019 Audit Committee Member and Governance Committee Member | Managing Director of Accordia Partners, LLC (real estate development); President of Primary Corporation (real estate development); Managing Principal of Merrick Capital Partners (infrastructure finance) | 52 Advisor/Risk Management Committee, Eastern Bank (bank); Director, Apartment Investment and Management Company (real estate investment trust); formerly, Director, Ares Commercial Real Estate Corporation (real estate investment trust) | Experience on the Board and significant experience on the boards of other business organizations (including real estate companies and banks) |
Cynthia L. Walker (1956) | Trustee since 2005 Chairperson of the Audit Committee | Retired; formerly, Deputy Dean for Finance and Administration, Yale University School of Medicine | 52 None | Significant experience on the Board; executive experience in a variety of academic organizations (including roles as dean for finance and administration) |
Name and Year of Birth | Position(s) Held with the Trusts, Length of Time Served and Term of Office1 | Principal Occupation(s) During Past 5 Years | Number of Portfolios in Fund Complex Overseen2and Other Directorships Held During Past 5 Years | Experience, Qualifications, Attributes, Skills for Board Membership |
Interested Trustees | ||||
Kevin P. Charleston3 (1965) One Financial Center Boston, MA 02111 | Trustee since 2015 President and Chief Executive Officer of Loomis Sayles Funds I since 2015 | President, Chief Executive Officer and Chairman of the Board of Directors, Loomis, Sayles & Company, L.P. | 52 None | Significant experience on the Board; continuing service as President, Chief Executive Officer and Chairman of the Board of Directors of Loomis, Sayles & Company, L.P. |
David L. Giunta4 (1965) | Trustee since 2011 President of Loomis Sayles Funds II and Executive Vice President of Loomis Sayles Funds I since 2008; Chief Executive Officer of Loomis Sayles Funds II since 2015 | President and Chief Executive Officer, Natixis Advisors, LLC and Natixis Distribution, LLC | 52 None | Significant experience on the Board; experience as President and Chief Executive Officer of Natixis Advisors, LLC and Natixis Distribution, LLC |
1 | Each Trustee serves until retirement, resignation or removal from the Board. The current retirement age is 75. The position of Chairperson of the Board is appointed for a three-year term. |
2 | The Trustees of the Trusts serve as Trustees of a fund complex that includes all series of the Natixis Funds Trust I, Natixis Funds Trust II, Natixis Funds Trust IV, Gateway Trust, Loomis Sayles Funds I, Loomis Sayles Funds II, Natixis ETF Trust and Natixis ETF Trust II (collectively, the “Fund Complex”). |
3 | Mr. Charleston is deemed an “interested person” of the Trusts because he holds the following positions with an affiliated person of the Trusts: President, Chief Executive Officer and Chairman of the Board of Directors of Loomis, Sayles & Company, L.P. |
4 | Mr. Giunta is deemed an “interested person” of the Trusts because he holds the following positions with an affiliated person of the Trusts: President and Chief Executive Officer, Natixis Advisors, LLC and Natixis Distribution, LLC. |
Name and Year of Birth | Position(s) Held with the Trusts | Term of Office1 and Length of Time Served | Principal Occupation(s) During Past 5 Years2 |
Officers of the Trusts | |||
Matthew J. Block (1981) | Treasurer, Principal Financial and Accounting Officer | Since 2022 | Senior Vice President, Natixis Advisors, LLC and Natixis Distribution, LLC; formerly, Vice President, Natixis Advisors, LLC and Natixis Distribution, LLC; Assistant Treasurer of the Fund Complex; Managing Director, State Street Bank and Trust Company |
Susan McWhan Tobin (1963) | Secretary and Chief Legal Officer | Since 2022 | Executive Vice President, General Counsel and Secretary, Natixis Advisors, LLC and Natixis Distribution, LLC; formerly, Executive Vice President and Chief Compliance Officer of Natixis Investment Managers (March 2019 – May 2022) and Senior Vice President and Head of Compliance, U.S. for Natixis Investment Managers (July 2011 – March 2019) |
Natalie R. Wagner (1979) | Chief Compliance Officer, Assistant Secretary and Anti-Money Laundering Officer | Since 2021 | Senior Vice President, Natixis Advisors, LLC and Natixis Distribution, LLC; formerly, Vice President, Head of Corporate Compliance, Global Atlantic Financial Group |
1 | Each officer of the Trusts serves for an indefinite term in accordance with the Trusts' current by-laws until the date his or her successor is elected and qualified, or until he or she sooner dies, retires, is removed or becomes disqualified. |
2 | Each person listed above, except as noted, holds the same position(s) with the Fund Complex. Previous positions during the past five years with Natixis Distribution, LLC, Natixis Advisors, LLC or Loomis, Sayles & Company, L.P. are omitted, if not materially different from an officer’s current position with such entity. |
Natixis Advisors, LLC
888 Boylston Street, Suite 800
Boston, MA 02199-8197
secretaryofthefunds@natixis.com
Communications regarding recommendations for Trustee candidates may not be submitted by e-mail.
Please note: Unlike written correspondence, e-mail is not secure. Please do NOT include your account number, social security number, PIN, or any other non-public, personal information in an e-mail communication because this information may be viewed by others.

 Exp. 11/30/24
6031442.1.1
M-LSEFA-0923


Loomis Sayles High Income Opportunities Fund |
Loomis Sayles Securitized Asset Fund |
Managers |
Matthew J. Eagan, CFA® |
Brian P. Kennedy |
Peter Sheehan* |
Elaine M. Stokes** |
Todd P. Vandam, CFA® |
Symbol | |
Institutional Class | LSIOX |
* | Effective June 30, 2023, Peter Sheehan serves as portfolio manager of the Fund. |
** | Effective December 31, 2023, Elaine Stokes will no longer serve as portfolio manager of the Fund. |
Investment Objective
Hypothetical Growth of $10,000 Investment in Institutional Class Shares |
September 30, 2013 through September 30, 2023 |

Average Annual Total Returns — September 30, 2023 | |||||
1 Year | 5 Years | 10 Years | Expense Ratios2 | ||
Gross | Net | ||||
Institutional Class | 8.98 % | 2.32 % | 4.29 % | 0.00 % | 0.00 % |
Comparative Performance | |||||
Bloomberg U.S. Corporate High-Yield Bond Index1 | 10.28 | 2.96 | 4.24 | ||
1 | Bloomberg U.S. Corporate High-Yield Bond Index measures the market of U.S. dollar-denominated, non-investment grade, fixed-rate, taxable corporate bonds. Securities are classified as high yield if the middle rating of Moody’s, Fitch, and S&P is Ba1/BB+/BB+ or below, excluding emerging market debt. The Index was created in 1986, with history backfilled to July 1, 1983, and rolls up into the Bloomberg U.S. Universal and Global High-Yield Indices. |
2 | The amount shown under Gross and Net Expense Ratio is 0.00% to reflect the fact that the Fund does not pay any advisory, administration or distribution and service fees, and that Loomis Sayles has agreed to pay certain expenses of the Fund. All fees are paid by investors indirectly through separately negotiated advisory relationships with the Fund’s Adviser or through “wrap fee” programs sponsored by broker dealers and investment advisers that may be affiliated or unaffiliated with the Fund, Loomis Sayles or Natixis Advisors, LLC. |
Managers |
Ian Anderson |
Stephen M. LaPlante, CFA® |
Alessandro Pagani, CFA® |
Barath W. Sankaran, CFA® |
Jennifer M. Thomas |
Symbol | |
Institutional Class | LSSAX |
Investment Objective
Hypothetical Growth of $10,000 Investment in Institutional Class Shares |
September 30, 2013 through September 30, 2023 |
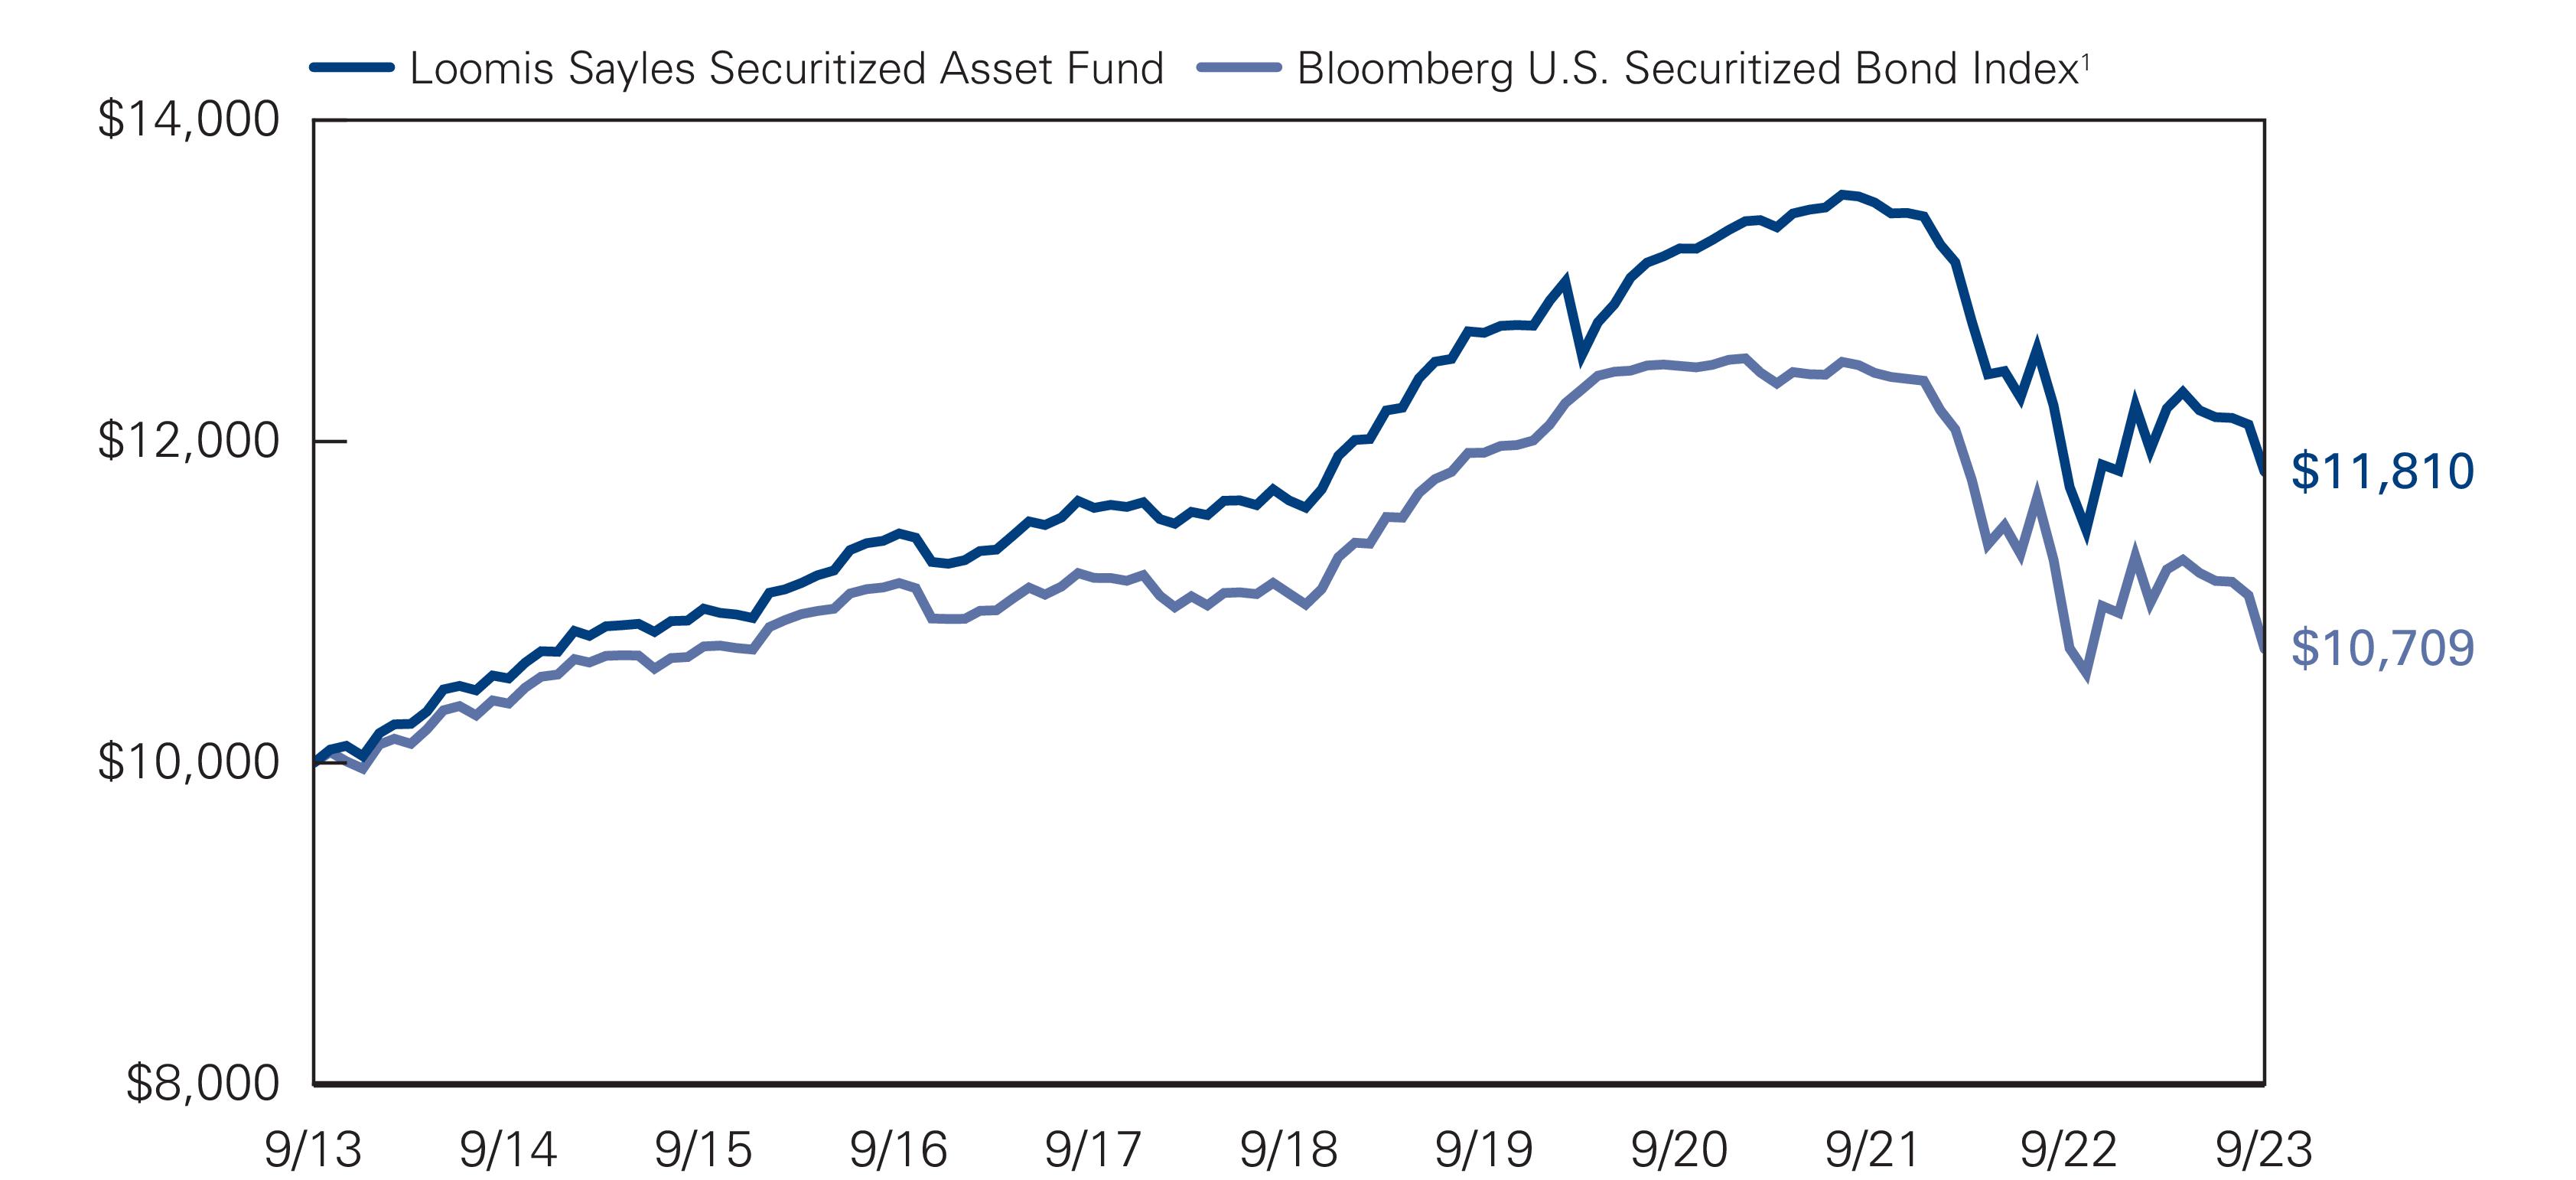
Average Annual Total Returns — September 30, 2023 | |||||
1 Year | 5 Years | 10 Years | Expense Ratios2 | ||
Gross | Net | ||||
Institutional Class | 0.77 % | 0.30 % | 1.67 % | 0.00 % | 0.00 % |
Comparative Performance | |||||
Bloomberg U.S. Securitized Bond Index1 | -0.04 | -0.63 | 0.69 | ||
1 | Bloomberg U.S. Securitized Bond Index is an unmanaged index of asset-backed securities, collateralized mortgage-backed securities (ERISA eligible), and fixed-rate mortgage-backed securities. |
2 | The amount shown under Gross and Net Expense Ratio is 0.00% to reflect the fact that the Fund does not pay any advisory, administration or distribution and service fees, and that Loomis Sayles has agreed to pay certain expenses of the Fund. All fees are paid by investors indirectly through separately negotiated advisory relationships with the Fund’s Adviser or through “wrap fee” programs sponsored by broker dealers and investment advisers that may be affiliated or unaffiliated with the Fund, Loomis Sayles or Natixis Advisors, LLC. |
Loomis Sayles High Income Opportunities Fund | Beginning Account Value 4/1/2023 | Ending Account Value 9/30/2023 | Expenses Paid During Period* 4/1/2023 – 9/30/2023 |
Institutional Class | |||
Actual | $1,000.00 | $1,018.40 | $0.00 |
Hypothetical (5% return before expenses) | $1,000.00 | $1,025.07 | $0.00 |
* | Expenses are equal to the Fund's annualized expense ratio of 0.00%, multiplied by the average account value over the period, multiplied by the number of days in the most recent fiscal half–year (183), divided by 365 (to reflect the half–year period). |
Loomis Sayles Securitized Asset Fund | Beginning Account Value 4/1/2023 | Ending Account Value 9/30/2023 | Expenses Paid During Period* 4/1/2023 – 9/30/2023 |
Institutional Class | |||
Actual | $1,000.00 | $967.50 | $0.00 |
Hypothetical (5% return before expenses) | $1,000.00 | $1,025.07 | $0.00 |
* | Expenses are equal to the Fund's annualized expense ratio of 0.00%, multiplied by the average account value over the period, multiplied by the number of days in the most recent fiscal half–year (183), divided by 365 (to reflect the half–year period). |
One-Year | Three-Year | Five-Year | |
Loomis Sayles High Income Opportunities Fund | 93% | 52% | 52% |
Loomis Sayles Securitized Asset Fund | 11% | 30% | 17% |
Loomis Sayles High Income Opportunities Fund
Principal Amount | Description | Value (†) |
Bonds and Notes — 89.0% of Net Assets | ||
Non-Convertible Bonds — 84.8% | ||
ABS Car Loan — 0.7% | ||
$297,000 | Hertz Vehicle Financing III LLC, Series 2022-1A, Class D, 4.850%, 6/25/2026(a) | $277,878 |
325,000 | Hertz Vehicle Financing III LLC, Series 2022-3A, Class D, 6.310%, 3/25/2025(a) | 322,388 |
270,000 | Hertz Vehicle Financing III LLC, Series 2023-1A, Class D2, 9.130%, 6/25/2027(a) | 266,518 |
260,000 | Hertz Vehicle Financing III LLC, Series 2023-2A, Class D, 9.400%, 9/25/2029(a) | 261,483 |
290,000 | Hertz Vehicle Financing LLC, Series 2022-4A, Class D, 6.560%, 9/25/2026(a) | 276,874 |
150,000 | Prestige Auto Receivables Trust, Series 2019-1A, Class E, 3.900%, 5/15/2026(a) | 149,095 |
1,554,236 | ||
ABS Home Equity — 0.2% | ||
88,404 | DSLA Mortgage Loan Trust, Series 2005-AR5, Class 2A1A, 1 mo. USD SOFR + 0.774%, 6.102%, 9/19/2045(b) | 46,575 |
458,706 | PRPM LLC, Series 2022-5, Class A1, 6.900%, 9/27/2027(a)(c) | 455,346 |
501,921 | ||
Aerospace & Defense — 1.5% | ||
310,000 | Bombardier, Inc., 6.000%, 2/15/2028(a) | 281,231 |
1,335,000 | Bombardier, Inc., 7.125%, 6/15/2026(a) | 1,293,427 |
410,000 | Embraer Netherlands Finance BV, 7.000%, 7/28/2030(a) | 406,702 |
470,000 | TransDigm, Inc., 6.250%, 3/15/2026(a) | 461,813 |
625,000 | TransDigm, Inc., 6.750%, 8/15/2028(a) | 615,305 |
90,000 | TransDigm, Inc., 6.875%, 12/15/2030(a) | 88,249 |
3,146,727 | ||
Airlines — 1.1% | ||
295,000 | Allegiant Travel Co., 7.250%, 8/15/2027(a) | 277,669 |
2,350,000 | American Airlines, Inc./AAdvantage Loyalty IP Ltd., 5.750%, 4/20/2029(a) | 2,185,618 |
2,463,287 | ||
Automotive — 2.9% | ||
45,000 | Allison Transmission, Inc., 4.750%, 10/01/2027(a) | 41,528 |
255,000 | American Axle & Manufacturing, Inc., 5.000%, 10/01/2029 | 206,242 |
55,000 | Ford Motor Co., 3.250%, 2/12/2032 | 42,386 |
1,645,000 | Ford Motor Credit Co. LLC, 2.300%, 2/10/2025 | 1,542,956 |
800,000 | Ford Motor Credit Co. LLC, 3.375%, 11/13/2025 | 742,253 |
Principal Amount | Description | Value (†) |
Automotive — continued | ||
$200,000 | Ford Motor Credit Co. LLC, 4.542%, 8/01/2026 | $187,742 |
795,000 | Ford Motor Credit Co. LLC, 6.950%, 6/10/2026 | 794,026 |
400,000 | Ford Motor Credit Co. LLC, GMTN, 4.389%, 1/08/2026 | 377,532 |
810,000 | General Motors Financial Co., Inc., Series A, (fixed rate to 9/30/2027, variable rate thereafter), 5.750%(d) | 652,285 |
485,000 | General Motors Financial Co., Inc., Series B, (fixed rate to 9/30/2028, variable rate thereafter), 6.500%(d) | 412,848 |
545,000 | General Motors Financial Co., Inc., Series C, (fixed rate to 9/30/2030, variable rate thereafter), 5.700%(d) | 465,761 |
200,000 | Jaguar Land Rover Automotive PLC, 5.500%, 7/15/2029(a) | 170,999 |
220,000 | Jaguar Land Rover Automotive PLC, 5.875%, 1/15/2028(a) | 197,831 |
190,000 | Wheel Pros, Inc., 6.500%, 5/15/2029(a) | 63,641 |
155,000 | ZF North America Capital, Inc., 6.875%, 4/14/2028(a) | 151,753 |
155,000 | ZF North America Capital, Inc., 7.125%, 4/14/2030(a) | 151,993 |
6,201,776 | ||
Banking — 1.8% | ||
665,000 | Barclays PLC, (fixed rate to 6/27/2033, variable rate thereafter), 7.119%, 6/27/2034 | 640,484 |
270,000 | Barclays PLC, (fixed rate to 9/23/2030, variable rate thereafter), 3.564%, 9/23/2035 | 208,470 |
1,235,000 | Deutsche Bank AG, (fixed rate to 12/01/2027, variable rate thereafter), 4.875%, 12/01/2032 | 1,053,620 |
1,150,000 | Intesa Sanpaolo SpA, 6.625%, 6/20/2033(a) | 1,080,689 |
960,000 | UniCredit SpA, (fixed rate to 6/30/2030, variable rate thereafter), 5.459%, 6/30/2035(a) | 804,772 |
3,788,035 | ||
Brokerage — 0.5% | ||
180,000 | Coinbase Global, Inc., 3.375%, 10/01/2028(a) | 129,661 |
140,000 | Coinbase Global, Inc., 3.625%, 10/01/2031(a) | 92,892 |
290,000 | Jefferies Finance LLC/JFIN Co-Issuer Corp., 5.000%, 8/15/2028(a) | 244,182 |
60,000 | NFP Corp., 4.875%, 8/15/2028(a) | 52,821 |
360,000 | NFP Corp., 6.875%, 8/15/2028(a) | 308,404 |
300,000 | NFP Corp., 8.500%, 10/01/2031(a) | 300,455 |
1,128,415 | ||
Building Materials — 2.4% | ||
285,000 | ACProducts Holdings, Inc., 6.375%, 5/15/2029(a) | 188,100 |
300,000 | Advanced Drainage Systems, Inc., 6.375%, 6/15/2030(a) | 288,135 |
Loomis Sayles High Income Opportunities Fund (continued)
Principal Amount | Description | Value (†) |
Building Materials — continued | ||
$525,000 | Beacon Roofing Supply, Inc., 6.500%, 8/01/2030(a) | $508,783 |
265,000 | Builders FirstSource, Inc., 4.250%, 2/01/2032(a) | 217,317 |
315,000 | Builders FirstSource, Inc., 5.000%, 3/01/2030(a) | 280,856 |
210,000 | Camelot Return Merger Sub, Inc., 8.750%, 8/01/2028(a) | 202,577 |
720,000 | Cemex SAB de CV, (fixed rate to 3/14/2028, variable rate thereafter), 9.125%(a)(d) | 749,523 |
320,000 | Cemex SAB de CV, (fixed rate to 6/08/2026, variable rate thereafter), 5.125%(a)(d) | 299,582 |
265,000 | Cornerstone Building Brands, Inc., 6.125%, 1/15/2029(a) | 200,895 |
870,000 | Foundation Building Materials, Inc., 6.000%, 3/01/2029(a) | 724,054 |
395,000 | LBM Acquisition LLC, 6.250%, 1/15/2029(a) | 323,900 |
255,000 | MIWD Holdco II LLC/MIWD Finance Corp., 5.500%, 2/01/2030(a) | 210,692 |
275,000 | Patrick Industries, Inc., 4.750%, 5/01/2029(a) | 229,625 |
540,000 | Specialty Building Products Holdings LLC/SBP Finance Corp., 6.375%, 9/30/2026(a) | 504,978 |
225,000 | Standard Industries, Inc., 4.375%, 7/15/2030(a) | 186,345 |
5,115,362 | ||
Cable Satellite — 9.1% | ||
665,000 | Altice Financing SA, 5.000%, 1/15/2028(a) | 567,832 |
95,000 | Block Communications, Inc., 4.875%, 3/01/2028(a) | 78,612 |
295,000 | CCO Holdings LLC/CCO Holdings Capital Corp., 4.250%, 2/01/2031(a) | 234,911 |
3,035,000 | CCO Holdings LLC/CCO Holdings Capital Corp., 4.250%, 1/15/2034(a) | 2,234,604 |
630,000 | CCO Holdings LLC/CCO Holdings Capital Corp., 4.500%, 6/01/2033(a) | 482,038 |
2,155,000 | CCO Holdings LLC/CCO Holdings Capital Corp., 4.750%, 3/01/2030(a) | 1,809,018 |
790,000 | CCO Holdings LLC/CCO Holdings Capital Corp., 5.000%, 2/01/2028(a) | 717,429 |
50,000 | CCO Holdings LLC/CCO Holdings Capital Corp., 5.125%, 5/01/2027(a) | 46,586 |
95,000 | CCO Holdings LLC/CCO Holdings Capital Corp., 5.500%, 5/01/2026(a) | 91,763 |
605,000 | CSC Holdings LLC, 3.375%, 2/15/2031(a) | 412,270 |
200,000 | CSC Holdings LLC, 4.500%, 11/15/2031(a) | 141,556 |
6,090,000 | CSC Holdings LLC, 4.625%, 12/01/2030(a) | 3,237,768 |
585,000 | CSC Holdings LLC, 5.000%, 11/15/2031(a) | 313,546 |
Principal Amount | Description | Value (†) |
Cable Satellite — continued | ||
$1,790,000 | CSC Holdings LLC, 5.750%, 1/15/2030(a) | $1,002,929 |
280,000 | CSC Holdings LLC, 6.500%, 2/01/2029(a) | 231,962 |
1,695,000 | Directv Financing LLC/Directv Financing Co-Obligor, Inc., 5.875%, 8/15/2027(a) | 1,498,685 |
2,140,000 | DISH DBS Corp., 5.125%, 6/01/2029 | 1,186,373 |
705,000 | DISH DBS Corp., 5.250%, 12/01/2026(a) | 599,145 |
555,000 | DISH DBS Corp., 5.750%, 12/01/2028(a) | 426,656 |
175,000 | DISH DBS Corp., 7.375%, 7/01/2028 | 110,266 |
1,355,000 | DISH DBS Corp., 7.750%, 7/01/2026 | 1,016,250 |
480,000 | Radiate Holdco LLC/Radiate Finance, Inc., 6.500%, 9/15/2028(a) | 252,000 |
1,205,000 | Sirius XM Radio, Inc., 3.875%, 9/01/2031(a) | 912,741 |
275,000 | Telesat Canada/Telesat LLC, 5.625%, 12/06/2026(a) | 189,062 |
260,000 | Viasat, Inc., 6.500%, 7/15/2028(a) | 180,050 |
755,000 | Virgin Media Secured Finance PLC, 5.500%, 5/15/2029(a) | 672,618 |
920,000 | Ziggo Bond Co. BV, 6.000%, 1/15/2027(a) | 842,251 |
19,488,921 | ||
Chemicals — 1.4% | ||
80,000 | Ashland, Inc., 3.375%, 9/01/2031(a) | 62,211 |
560,000 | ASP Unifrax Holdings, Inc., 5.250%, 9/30/2028(a) | 398,801 |
750,000 | Braskem Netherlands Finance BV, 8.500%, 1/12/2031(a) | 743,212 |
150,000 | Consolidated Energy Finance SA, 5.625%, 10/15/2028(a) | 123,938 |
805,000 | Hercules LLC, 6.500%, 6/30/2029 | 737,573 |
200,000 | INEOS Quattro Finance 2 PLC, 3.375%, 1/15/2026(a) | 182,189 |
605,000 | Olympus Water U.S. Holding Corp., 4.250%, 10/01/2028(a) | 493,205 |
305,000 | Olympus Water U.S. Holding Corp., 9.750%, 11/15/2028(a) | 304,341 |
40,000 | WR Grace Holdings LLC, 5.625%, 8/15/2029(a) | 32,350 |
3,077,820 | ||
Consumer Cyclical Services — 2.8% | ||
1,120,000 | ADT Security Corp., 4.125%, 8/01/2029(a) | 946,971 |
260,000 | ANGI Group LLC, 3.875%, 8/15/2028(a) | 203,444 |
230,000 | Arches Buyer, Inc., 4.250%, 6/01/2028(a) | 196,096 |
110,000 | Arches Buyer, Inc., 6.125%, 12/01/2028(a) | 89,320 |
70,000 | Match Group Holdings II LLC, 3.625%, 10/01/2031(a) | 55,238 |
210,000 | Match Group Holdings II LLC, 5.000%, 12/15/2027(a) | 193,687 |
55,000 | Prime Security Services Borrower LLC/Prime Finance, Inc., 3.375%, 8/31/2027(a) | 48,185 |
90,000 | Realogy Group LLC/Realogy Co-Issuer Corp., 5.250%, 4/15/2030(a) | 62,472 |
545,000 | Realogy Group LLC/Realogy Co-Issuer Corp., 5.750%, 1/15/2029(a) | 394,008 |
Loomis Sayles High Income Opportunities Fund (continued)
Principal Amount | Description | Value (†) |
Consumer Cyclical Services — continued | ||
$760,000 | Uber Technologies, Inc., 4.500%, 8/15/2029(a) | $679,331 |
715,000 | Uber Technologies, Inc., 6.250%, 1/15/2028(a) | 699,174 |
1,080,000 | Uber Technologies, Inc., 7.500%, 9/15/2027(a) | 1,088,968 |
940,000 | Uber Technologies, Inc., 8.000%, 11/01/2026(a) | 951,050 |
300,000 | VT Topco, Inc., 8.500%, 8/15/2030(a) | 297,165 |
5,905,109 | ||
Consumer Products — 1.2% | ||
240,000 | Coty, Inc., 5.000%, 4/15/2026(a) | 230,550 |
255,000 | Coty, Inc./HFC Prestige Products, Inc./HFC Prestige International U.S. LLC, 4.750%, 1/15/2029(a) | 229,951 |
455,000 | Coty, Inc./HFC Prestige Products, Inc./HFC Prestige International U.S. LLC, 6.625%, 7/15/2030(a) | 444,235 |
1,250,000 | Energizer Holdings, Inc., 4.375%, 3/31/2029(a) | 1,043,188 |
510,000 | Newell Brands, Inc., 5.200%, 4/01/2026 | 480,620 |
140,000 | Prestige Brands, Inc., 3.750%, 4/01/2031(a) | 112,700 |
2,541,244 | ||
Diversified Manufacturing — 0.5% | ||
215,000 | Chart Industries, Inc., 7.500%, 1/01/2030(a) | 216,178 |
285,000 | Madison IAQ LLC, 5.875%, 6/30/2029(a) | 229,494 |
640,000 | Resideo Funding, Inc., 4.000%, 9/01/2029(a) | 525,811 |
971,483 | ||
Electric — 1.0% | ||
1,235,000 | Calpine Corp., 4.500%, 2/15/2028(a) | 1,113,015 |
130,000 | Calpine Corp., 5.250%, 6/01/2026(a) | 126,214 |
340,000 | NRG Energy, Inc., 3.875%, 2/15/2032(a) | 255,235 |
105,000 | NRG Energy, Inc., 5.250%, 6/15/2029(a) | 92,690 |
135,000 | NRG Energy, Inc., 5.750%, 1/15/2028 | 126,576 |
320,000 | PG&E Corp., 5.000%, 7/01/2028 | 289,849 |
70,000 | PG&E Corp., 5.250%, 7/01/2030 | 60,834 |
150,000 | Talen Energy Supply LLC, 8.625%, 6/01/2030(a) | 153,765 |
2,218,178 | ||
Environmental — 0.7% | ||
20,000 | Clean Harbors, Inc., 5.125%, 7/15/2029(a) | 18,398 |
170,000 | Clean Harbors, Inc., 6.375%, 2/01/2031(a) | 165,303 |
935,000 | Covanta Holding Corp., 4.875%, 12/01/2029(a) | 767,074 |
530,000 | GFL Environmental, Inc., 4.000%, 8/01/2028(a) | 463,096 |
1,413,871 | ||
Finance Companies — 4.9% | ||
255,000 | Aircastle Ltd., 6.500%, 7/18/2028(a) | 250,073 |
Principal Amount | Description | Value (†) |
Finance Companies — continued | ||
$155,000 | Aircastle Ltd., Series A, (fixed rate to 6/15/2026, variable rate thereafter), 5.250%(a)(d) | $121,884 |
105,000 | Blackstone Secured Lending Fund, 2.750%, 9/16/2026 | 92,300 |
520,000 | Blackstone Secured Lending Fund, 3.625%, 1/15/2026 | 480,394 |
585,000 | Blue Owl Capital Corp., 3.400%, 7/15/2026 | 524,489 |
95,000 | Cobra AcquisitionCo LLC, 6.375%, 11/01/2029(a) | 70,300 |
331,600 | Global Aircraft Leasing Co. Ltd., 7.250% PIK or 6.500% Cash, 9/15/2024(a)(e) | 315,849 |
345,000 | Nationstar Mortgage Holdings, Inc., 5.000%, 2/01/2026(a) | 322,263 |
245,000 | Nationstar Mortgage Holdings, Inc., 5.125%, 12/15/2030(a) | 198,922 |
565,000 | Nationstar Mortgage Holdings, Inc., 5.750%, 11/15/2031(a) | 467,380 |
685,000 | Nationstar Mortgage Holdings, Inc., 6.000%, 1/15/2027(a) | 647,272 |
1,015,000 | Navient Corp., 4.875%, 3/15/2028 | 860,213 |
845,000 | Navient Corp., 5.000%, 3/15/2027 | 759,537 |
335,000 | OneMain Finance Corp., 3.500%, 1/15/2027 | 286,844 |
870,000 | OneMain Finance Corp., 4.000%, 9/15/2030 | 652,809 |
80,000 | OneMain Finance Corp., 5.375%, 11/15/2029 | 67,000 |
990,000 | OneMain Finance Corp., 7.125%, 3/15/2026 | 969,588 |
410,000 | Provident Funding Associates LP/PFG Finance Corp., 6.375%, 6/15/2025(a) | 364,900 |
370,000 | Rocket Mortgage LLC/Rocket Mortgage Co-Issuer, Inc., 2.875%, 10/15/2026(a) | 325,855 |
360,000 | Rocket Mortgage LLC/Rocket Mortgage Co-Issuer, Inc., 3.625%, 3/01/2029(a) | 297,625 |
1,465,000 | Rocket Mortgage LLC/Rocket Mortgage Co-Issuer, Inc., 3.875%, 3/01/2031(a) | 1,168,147 |
1,645,000 | Rocket Mortgage LLC/Rocket Mortgage Co-Issuer, Inc., 4.000%, 10/15/2033(a) | 1,242,276 |
10,485,920 | ||
Financial Other — 1.2% | ||
400,000 | Agile Group Holdings Ltd., 6.050%, 10/13/2025 | 43,772 |
200,000 | Central China Real Estate Ltd., 7.250%, 8/13/2024(f) | 8,114 |
205,000 | Central China Real Estate Ltd., 7.650%, 8/27/2025(f) | 7,464 |
353,395 | CFLD Cayman Investment Ltd., 2.500%, 1/31/2031(a)(g) | 30,572 |
429,065 | CFLD Cayman Investment Ltd., 2.500%, 1/31/2031(a)(g) | 12,941 |
Loomis Sayles High Income Opportunities Fund (continued)
Principal Amount | Description | Value (†) |
Financial Other — continued | ||
$44,015 | CFLD Cayman Investment Ltd., Zero Coupon, 0.000%–13.124%, 1/31/2031(a)(h) | $440 |
405,000 | China Aoyuan Group Ltd., 6.200%, 3/24/2026(f) | 6,217 |
200,000 | China Evergrande Group, 8.750%, 6/28/2025(f) | 4,000 |
200,000 | China Evergrande Group, 9.500%, 4/11/2022(f) | 4,000 |
448,246 | Easy Tactic Ltd., 7.500% PIK or 6.500% Cash, 7/11/2027(i) | 24,551 |
200,000 | Fantasia Holdings Group Co. Ltd., 11.875%, 6/01/2023(f) | 6,000 |
20,000 | Icahn Enterprises LP/Icahn Enterprises Finance Corp., 4.750%, 9/15/2024 | 19,263 |
1,840,000 | Icahn Enterprises LP/Icahn Enterprises Finance Corp., 5.250%, 5/15/2027 | 1,617,323 |
475,000 | Icahn Enterprises LP/Icahn Enterprises Finance Corp., 6.375%, 12/15/2025 | 451,851 |
400,000 | Kaisa Group Holdings Ltd., 9.375%, 6/30/2024(f) | 23,356 |
400,000 | Kaisa Group Holdings Ltd., 11.250%, 4/16/2025(f) | 22,980 |
400,000 | Kaisa Group Holdings Ltd., 11.650%, 6/01/2026(f) | 22,000 |
610,000 | Kaisa Group Holdings Ltd., 11.700%, 11/11/2025(f) | 34,819 |
210,000 | KWG Group Holdings Ltd., 6.300%, 2/13/2026(f) | 16,800 |
205,000 | Shimao Group Holdings Ltd., 3.450%, 1/11/2031(f) | 8,200 |
200,000 | Shimao Group Holdings Ltd., 4.750%, 7/03/2022(f) | 7,498 |
200,000 | Shimao Group Holdings Ltd., 6.125%, 2/21/2024(f) | 8,000 |
605,000 | Sunac China Holdings Ltd., 6.500%, 1/26/2026(f) | 93,775 |
200,000 | Sunac China Holdings Ltd., 6.650%, 8/03/2024(f) | 25,012 |
205,000 | Times China Holdings Ltd., 5.750%, 1/14/2027(f) | 6,150 |
630,000 | Times China Holdings Ltd., 6.200%, 3/22/2026(f) | 18,900 |
800,000 | Yuzhou Group Holdings Co. Ltd., 6.350%, 1/13/2027(f) | 48,352 |
200,000 | Yuzhou Group Holdings Co. Ltd., 7.700%, 2/20/2025(f) | 13,100 |
820,000 | Zhenro Properties Group Ltd., 6.630%, 1/07/2026(f) | 4,305 |
210,000 | Zhenro Properties Group Ltd., 6.700%, 8/04/2026(f) | 1,772 |
2,591,527 | ||
Food & Beverage — 0.9% | ||
80,000 | Aramark Services, Inc., 5.000%, 2/01/2028(a) | 73,987 |
Principal Amount | Description | Value (†) |
Food & Beverage — continued | ||
$335,000 | Central American Bottling Corp./CBC Bottling Holdco SL/Beliv Holdco SL, 5.250%, 4/27/2029(a) | $302,337 |
275,000 | HLF Financing Sarl LLC/Herbalife International, Inc., 4.875%, 6/01/2029(a) | 195,250 |
670,000 | Lamb Weston Holdings, Inc., 4.375%, 1/31/2032(a) | 561,284 |
555,000 | Post Holdings, Inc., 4.625%, 4/15/2030(a) | 475,235 |
15,000 | Post Holdings, Inc., 5.750%, 3/01/2027(a) | 14,407 |
260,000 | Simmons Foods, Inc./Simmons Prepared Foods, Inc./Simmons Pet Food, Inc./Simmons Feed, 4.625%, 3/01/2029(a) | 213,285 |
1,835,785 | ||
Gaming — 2.3% | ||
350,000 | Boyd Gaming Corp., 4.750%, 6/15/2031(a) | 297,842 |
865,000 | Light & Wonder International, Inc., 7.000%, 5/15/2028(a) | 850,217 |
775,000 | Light & Wonder International, Inc., 7.250%, 11/15/2029(a) | 759,500 |
175,000 | Light & Wonder International, Inc., 7.500%, 9/01/2031(a) | 172,961 |
630,000 | Melco Resorts Finance Ltd., 5.375%, 12/04/2029(a) | 516,776 |
30,000 | Penn Entertainment, Inc., 4.125%, 7/01/2029(a) | 24,516 |
525,000 | Sands China Ltd., 5.650%, 8/08/2028 | 494,196 |
450,000 | Studio City Finance Ltd., 5.000%, 1/15/2029(a) | 338,782 |
290,000 | Wynn Macau Ltd., 5.125%, 12/15/2029(a) | 239,238 |
465,000 | Wynn Macau Ltd., 5.500%, 1/15/2026(a) | 434,675 |
415,000 | Wynn Macau Ltd., 5.625%, 8/26/2028(a) | 359,785 |
420,000 | Wynn Resorts Finance LLC/Wynn Resorts Capital Corp., 5.125%, 10/01/2029(a) | 367,133 |
4,855,621 | ||
Government Owned - No Guarantee — 0.4% | ||
325,000 | Antares Holdings LP, 7.950%, 8/11/2028(a) | 323,073 |
365,000 | Petroleos Mexicanos, 5.950%, 1/28/2031 | 261,249 |
285,000 | Petroleos Mexicanos, 6.625%, 6/15/2035 | 190,893 |
775,215 | ||
Health Care REITs — 0.2% | ||
530,000 | MPT Operating Partnership LP/MPT Finance Corp., 3.500%, 3/15/2031 | 330,969 |
Health Insurance — 0.5% | ||
675,000 | Centene Corp., 2.450%, 7/15/2028 | 570,270 |
60,000 | Molina Healthcare, Inc., 3.875%, 11/15/2030(a) | 49,656 |
550,000 | Molina Healthcare, Inc., 3.875%, 5/15/2032(a) | 441,092 |
1,061,018 | ||
Healthcare — 2.4% | ||
125,000 | AdaptHealth LLC, 4.625%, 8/01/2029(a) | 95,938 |
680,000 | AdaptHealth LLC, 5.125%, 3/01/2030(a) | 526,577 |
Loomis Sayles High Income Opportunities Fund (continued)
Principal Amount | Description | Value (†) |
Healthcare — continued | ||
$675,000 | Bausch & Lomb Escrow Corp., 8.375%, 10/01/2028(a) | $677,005 |
940,000 | CHS/Community Health Systems, Inc., 5.250%, 5/15/2030(a) | 714,566 |
610,000 | DaVita, Inc., 3.750%, 2/15/2031(a) | 463,453 |
100,000 | Fortrea Holdings, Inc., 7.500%, 7/01/2030(a) | 97,301 |
340,000 | Garden Spinco Corp., 8.625%, 7/20/2030(a) | 354,911 |
145,000 | Hologic, Inc., 3.250%, 2/15/2029(a) | 122,482 |
210,000 | Hologic, Inc., 4.625%, 2/01/2028(a) | 193,233 |
675,000 | LifePoint Health, Inc., 5.375%, 1/15/2029(a) | 471,232 |
435,000 | Medline Borrower LP, 3.875%, 4/01/2029(a) | 367,759 |
185,000 | RP Escrow Issuer LLC, 5.250%, 12/15/2025(a) | 134,196 |
750,000 | Star Parent, Inc., 9.000%, 10/01/2030(a) | 757,877 |
190,000 | U.S. Acute Care Solutions LLC, 6.375%, 3/01/2026(a) | 163,400 |
5,139,930 | ||
Home Construction — 0.1% | ||
255,000 | Brookfield Residential Properties, Inc./Brookfield Residential U.S. LLC, 4.875%, 2/15/2030(a) | 207,388 |
200,000 | Corp. GEO SAB de CV, 8.875%, 3/27/2022(a)(f)(j) | — |
25,000 | Meritage Homes Corp., 3.875%, 4/15/2029(a) | 21,506 |
228,894 | ||
Independent Energy — 6.2% | ||
390,000 | Antero Resources Corp., 5.375%, 3/01/2030(a) | 359,061 |
10,000 | Apache Corp., 4.375%, 10/15/2028 | 9,044 |
135,000 | Apache Corp., 4.750%, 4/15/2043 | 98,329 |
645,000 | Ascent Resources Utica Holdings LLC/ARU Finance Corp., 7.000%, 11/01/2026(a) | 629,953 |
160,000 | Baytex Energy Corp., 8.500%, 4/30/2030(a) | 161,892 |
625,000 | Baytex Energy Corp., 8.750%, 4/01/2027(a) | 634,766 |
840,000 | Chesapeake Energy Corp., 5.500%, 2/01/2026(a) | 812,812 |
275,000 | Chesapeake Energy Corp., 6.750%, 4/15/2029(a) | 269,116 |
695,000 | Civitas Resources, Inc., 8.375%, 7/01/2028(a) | 707,162 |
1,025,000 | Continental Resources, Inc., 2.875%, 4/01/2032(a) | 767,570 |
355,000 | Continental Resources, Inc., 4.900%, 6/01/2044 | 260,795 |
605,000 | Continental Resources, Inc., 5.750%, 1/15/2031(a) | 568,370 |
320,000 | Crescent Energy Finance LLC, 7.250%, 5/01/2026(a) | 313,600 |
390,000 | Crescent Energy Finance LLC, 9.250%, 2/15/2028(a) | 398,170 |
Principal Amount | Description | Value (†) |
Independent Energy — continued | ||
$100,000 | Energian Israel Finance Ltd., 4.875%, 3/30/2026(a) | $92,880 |
200,000 | Energian Israel Finance Ltd., 5.375%, 3/30/2028(a) | 179,370 |
200,000 | Gulfport Energy Corp., 8.000%, 5/17/2026(a) | 200,250 |
785,000 | Leviathan Bond Ltd., 6.750%, 6/30/2030(a) | 721,479 |
505,000 | Matador Resources Co., 5.875%, 9/15/2026 | 487,389 |
330,000 | Matador Resources Co., 6.875%, 4/15/2028(a) | 324,008 |
115,000 | MEG Energy Corp., 5.875%, 2/01/2029(a) | 107,396 |
300,000 | Murphy Oil Corp., 5.875%, 12/01/2042 | 242,541 |
690,000 | Northern Oil & Gas, Inc., 8.125%, 3/01/2028(a) | 689,172 |
300,000 | Northern Oil & Gas, Inc., 8.750%, 6/15/2031(a) | 302,250 |
565,000 | Occidental Petroleum Corp., 6.125%, 1/01/2031 | 556,889 |
280,000 | Occidental Petroleum Corp., 6.625%, 9/01/2030 | 283,710 |
110,000 | Occidental Petroleum Corp., 7.500%, 5/01/2031 | 116,737 |
50,000 | Occidental Petroleum Corp., 7.875%, 9/15/2031 | 54,105 |
205,000 | Occidental Petroleum Corp., 8.875%, 7/15/2030 | 230,484 |
220,000 | Permian Resources Operating LLC, 5.875%, 7/01/2029(a) | 206,951 |
260,000 | Permian Resources Operating LLC, 6.875%, 4/01/2027(a) | 256,288 |
255,000 | Permian Resources Operating LLC, 7.000%, 1/15/2032(a) | 251,484 |
180,000 | Range Resources Corp., 8.250%, 1/15/2029 | 184,541 |
955,000 | Sitio Royalties Operating Partnership LP/Sitio Finance Corp., 7.875%, 11/01/2028(a) | 957,387 |
240,000 | SM Energy Co., 5.625%, 6/01/2025 | 234,888 |
35,000 | SM Energy Co., 6.625%, 1/15/2027 | 34,300 |
230,000 | SM Energy Co., 6.750%, 9/15/2026 | 225,773 |
195,000 | Southwestern Energy Co., 5.375%, 2/01/2029 | 179,593 |
225,000 | Strathcona Resources Ltd., 6.875%, 8/01/2026(a) | 212,062 |
13,322,567 | ||
Industrial Other — 0.2% | ||
315,000 | Brundage-Bone Concrete Pumping Holdings, Inc., 6.000%, 2/01/2026(a) | 299,631 |
150,000 | Installed Building Products, Inc., 5.750%, 2/01/2028(a) | 138,066 |
437,697 | ||
Leisure — 3.6% | ||
1,405,000 | Carnival Corp., 5.750%, 3/01/2027(a) | 1,271,840 |
25,000 | Carnival Corp., 6.000%, 5/01/2029(a) | 21,325 |
75,000 | Carnival Corp., 7.000%, 8/15/2029(a) | 73,952 |
40,000 | Carnival Corp., 9.875%, 8/01/2027(a) | 41,757 |
Loomis Sayles High Income Opportunities Fund (continued)
Principal Amount | Description | Value (†) |
Leisure — continued | ||
$265,000 | Cinemark USA, Inc., 5.250%, 7/15/2028(a) | $235,230 |
1,735,000 | NCL Corp. Ltd., 5.875%, 3/15/2026(a) | 1,601,827 |
20,000 | NCL Corp. Ltd., 5.875%, 3/15/2026 | 18,465 |
165,000 | NCL Finance Ltd., 6.125%, 3/15/2028(a) | 145,612 |
425,000 | Royal Caribbean Cruises Ltd., 3.700%, 3/15/2028 | 359,609 |
780,000 | Royal Caribbean Cruises Ltd., 4.250%, 7/01/2026(a) | 715,175 |
1,495,000 | Royal Caribbean Cruises Ltd., 5.500%, 4/01/2028(a) | 1,370,903 |
265,000 | SeaWorld Parks & Entertainment, Inc., 5.250%, 8/15/2029(a) | 232,776 |
335,000 | Speedway Motorsports LLC/Speedway Funding II, Inc., 4.875%, 11/01/2027(a) | 304,012 |
355,000 | Viking Cruises Ltd., 5.875%, 9/15/2027(a) | 324,008 |
150,000 | Viking Cruises Ltd., 7.000%, 2/15/2029(a) | 138,000 |
550,000 | Viking Ocean Cruises Ship VII Ltd., 5.625%, 2/15/2029(a) | 497,750 |
295,000 | VOC Escrow Ltd., 5.000%, 2/15/2028(a) | 268,305 |
7,620,546 | ||
Lodging — 1.8% | ||
145,000 | Hilton Domestic Operating Co., Inc., 3.625%, 2/15/2032(a) | 116,898 |
845,000 | Hilton Grand Vacations Borrower Escrow LLC/Hilton Grand Vacations Borrower Escrow, Inc., 4.875%, 7/01/2031(a) | 688,862 |
725,000 | Hilton Grand Vacations Borrower Escrow LLC/Hilton Grand Vacations Borrower Escrow, Inc., 5.000%, 6/01/2029(a) | 628,898 |
1,875,000 | Marriott Ownership Resorts, Inc., 4.500%, 6/15/2029(a) | 1,571,063 |
725,000 | Travel & Leisure Co., 4.500%, 12/01/2029(a) | 608,094 |
205,000 | Travel & Leisure Co., 4.625%, 3/01/2030(a) | 172,512 |
5,000 | Travel & Leisure Co., 6.000%, 4/01/2027 | 4,757 |
120,000 | Travel & Leisure Co., 6.625%, 7/31/2026(a) | 116,760 |
3,907,844 | ||
Media Entertainment — 1.3% | ||
555,000 | Diamond Sports Group LLC/Diamond Sports Finance Co., 5.375%, 8/15/2026(a)(f) | 11,100 |
310,000 | Diamond Sports Group LLC/Diamond Sports Finance Co., 6.625%, 8/15/2027(a)(f) | 6,200 |
1,455,000 | iHeartCommunications, Inc., 4.750%, 1/15/2028(a) | 1,112,314 |
475,000 | iHeartCommunications, Inc., 5.250%, 8/15/2027(a) | 376,446 |
570,000 | iHeartCommunications, Inc., 6.375%, 5/01/2026 | 491,160 |
Principal Amount | Description | Value (†) |
Media Entertainment — continued | ||
$150,000 | Playtika Holding Corp., 4.250%, 3/15/2029(a) | $125,250 |
640,000 | Stagwell Global LLC, 5.625%, 8/15/2029(a) | 517,075 |
145,000 | Warnermedia Holdings, Inc., 4.279%, 3/15/2032 | 123,079 |
2,762,624 | ||
Metals & Mining — 3.2% | ||
270,000 | ATI, Inc., 4.875%, 10/01/2029 | 237,528 |
325,000 | ATI, Inc., 5.875%, 12/01/2027 | 307,937 |
390,000 | ATI, Inc., 7.250%, 8/15/2030 | 387,075 |
350,000 | Commercial Metals Co., 4.125%, 1/15/2030 | 304,696 |
2,405,000 | First Quantum Minerals Ltd., 6.875%, 3/01/2026(a) | 2,334,499 |
410,000 | First Quantum Minerals Ltd., 6.875%, 10/15/2027(a) | 393,345 |
795,000 | GrafTech Finance, Inc., 4.625%, 12/15/2028(a) | 614,769 |
320,000 | GrafTech Global Enterprises, Inc., 9.875%, 12/15/2028(a) | 303,517 |
235,000 | Mineral Resources Ltd., 8.000%, 11/01/2027(a) | 230,594 |
475,000 | Mineral Resources Ltd., 8.125%, 5/01/2027(a) | 468,578 |
470,000 | Mineral Resources Ltd., 9.250%, 10/01/2028(a) | 474,700 |
785,000 | Novelis Corp., 4.750%, 1/30/2030(a) | 679,378 |
76,000 | U.S. Steel Corp., 6.875%, 3/01/2029 | 74,712 |
90,000 | Volcan Cia Minera SAA, 4.375%, 2/11/2026(a) | 51,371 |
6,862,699 | ||
Midstream — 4.9% | ||
225,000 | Antero Midstream Partners LP/Antero Midstream Finance Corp., 5.375%, 6/15/2029(a) | 206,007 |
285,000 | Antero Midstream Partners LP/Antero Midstream Finance Corp., 7.875%, 5/15/2026(a) | 287,029 |
545,000 | Blue Racer Midstream LLC/Blue Racer Finance Corp., 7.625%, 12/15/2025(a) | 547,033 |
185,000 | Buckeye Partners LP, 5.600%, 10/15/2044 | 131,633 |
130,000 | Buckeye Partners LP, 5.850%, 11/15/2043 | 94,899 |
260,000 | CQP Holdco LP/BIP-V Chinook Holdco LLC, 5.500%, 6/15/2031(a) | 230,451 |
275,000 | Crestwood Midstream Partners LP/Crestwood Midstream Finance Corp., 6.000%, 2/01/2029(a) | 265,458 |
1,130,000 | Energy Transfer LP, Series A, 3 mo. USD LIBOR + 4.028%, 9.654%(b)(d) | 1,056,301 |
360,000 | EnLink Midstream LLC, 6.500%, 9/01/2030(a) | 349,261 |
70,000 | EnLink Midstream Partners LP, 5.050%, 4/01/2045 | 52,566 |
Loomis Sayles High Income Opportunities Fund (continued)
Principal Amount | Description | Value (†) |
Midstream — continued | ||
$255,000 | EnLink Midstream Partners LP, 5.450%, 6/01/2047 | $199,239 |
360,000 | EnLink Midstream Partners LP, 5.600%, 4/01/2044 | 298,800 |
105,000 | Enterprise Products Operating LLC, Series E, (fixed rate to 8/16/2027, variable rate thereafter), 5.250%, 8/16/2077 | 92,398 |
155,000 | EQM Midstream Partners LP, 4.125%, 12/01/2026 | 143,476 |
167,000 | EQM Midstream Partners LP, 6.000%, 7/01/2025(a) | 164,407 |
470,000 | EQM Midstream Partners LP, 6.500%, 7/01/2027(a) | 458,944 |
95,000 | EQM Midstream Partners LP, 6.500%, 7/15/2048 | 83,544 |
575,000 | EQM Midstream Partners LP, 7.500%, 6/01/2027(a) | 576,145 |
135,000 | EQM Midstream Partners LP, 7.500%, 6/01/2030(a) | 135,573 |
100,000 | EQM Midstream Partners LP, Series 10Y, 5.500%, 7/15/2028 | 93,847 |
275,000 | Ferrellgas LP/Ferrellgas Finance Corp., 5.375%, 4/01/2026(a) | 257,756 |
775,000 | Hess Midstream Operations LP, 4.250%, 2/15/2030(a) | 653,510 |
335,000 | Hess Midstream Operations LP, 5.125%, 6/15/2028(a) | 308,138 |
420,000 | Hess Midstream Operations LP, 5.625%, 2/15/2026(a) | 405,825 |
215,000 | Holly Energy Partners LP/Holly Energy Finance Corp., 5.000%, 2/01/2028(a) | 197,809 |
245,000 | Holly Energy Partners LP/Holly Energy Finance Corp., 6.375%, 4/15/2027(a) | 240,536 |
475,000 | Kinetik Holdings LP, 5.875%, 6/15/2030(a) | 445,313 |
265,000 | Suburban Propane Partners LP/Suburban Energy Finance Corp., 5.000%, 6/01/2031(a) | 221,203 |
220,000 | Sunoco LP/Sunoco Finance Corp., 4.500%, 5/15/2029 | 193,089 |
1,035,000 | Venture Global Calcasieu Pass LLC, 3.875%, 11/01/2033(a) | 803,600 |
600,000 | Venture Global Calcasieu Pass LLC, 4.125%, 8/15/2031(a) | 492,373 |
80,000 | Western Midstream Operating LP, 4.500%, 3/01/2028 | 74,433 |
275,000 | Western Midstream Operating LP, 4.750%, 8/15/2028 | 257,196 |
190,000 | Western Midstream Operating LP, 5.250%, 2/01/2050 | 148,017 |
270,000 | Western Midstream Operating LP, 5.300%, 3/01/2048 | 210,746 |
20,000 | Western Midstream Operating LP, 6.150%, 4/01/2033 | 19,288 |
10,395,843 | ||
Principal Amount | Description | Value (†) |
Non-Agency Commercial Mortgage-Backed Securities — 1.7% | ||
$94,621 | CG-CCRE Commercial Mortgage Trust, Series 2014-FL2, Class COL1, 1 mo. USD SOFR + 3.614%, 8.947%, 11/15/2031(a)(b) | $79,269 |
331,175 | CG-CCRE Commercial Mortgage Trust, Series 2014-FL2, Class COL2, 1 mo. USD SOFR + 4.614%, 9.947%, 11/15/2031(a)(b) | 246,047 |
590,000 | Citigroup Commercial Mortgage Trust, Series 2014-GC21, Class D, 5.105%, 5/10/2047(a)(c) | 363,500 |
405,000 | Commercial Mortgage Trust, Series 2012-CR3, Class B, 3.922%, 10/15/2045(a) | 323,595 |
795,000 | Credit Suisse Mortgage Trust, Series 2014-USA, Class E, 4.373%, 9/15/2037(a) | 423,907 |
110,000 | GS Mortgage Securities Trust, Series 2011-GC5, Class C, 5.299%, 8/10/2044(a)(c) | 77,002 |
935,000 | GS Mortgage Securities Trust, Series 2011-GC5, Class D, 5.299%, 8/10/2044(a)(c) | 276,234 |
100,000 | GS Mortgage Securities Trust, Series 2013-GC13, Class C, 3.965%, 7/10/2046(a)(c) | 70,000 |
170,000 | GS Mortgage Securities Trust, Series 2014-GC22, Class D, 4.842%, 6/10/2047(a)(c) | 76,958 |
465,000 | JP Morgan Chase Commercial Mortgage Securities Trust, Series 2011-C3, Class C, 5.360%, 2/15/2046(a)(c) | 390,774 |
275,000 | Morgan Stanley Capital I Trust, Series 2011-C2, Class E, 5.385%, 6/15/2044(a)(c) | 192,135 |
295,000 | MSBAM Commercial Mortgage Securities Trust, Series 2012-CKSV, Class C, 4.305%, 10/15/2030(a)(c) | 181,721 |
97,150 | Starwood Retail Property Trust, Series 2014-STAR, Class A, PRIME + 0.000%, 8.500%, 11/15/2027(a)(b) | 69,462 |
320,000 | Starwood Retail Property Trust, Series 2014-STAR, Class D, PRIME + 0.000%, 8.500%, 11/15/2027(a)(b)(g)(j) | 68,512 |
350,000 | Starwood Retail Property Trust, Series 2014-STAR, Class E, PRIME + 0.000%, 8.500%, 11/15/2027(a)(b)(g)(j) | 17,500 |
325,000 | Wells Fargo Commercial Mortgage Trust, Series 2014-LC16, Class C, 4.458%, 8/15/2050 | 120,352 |
145,000 | Wells Fargo Commercial Mortgage Trust, Series 2016-C36, Class C, 4.256%, 11/15/2059(c) | 98,802 |
Loomis Sayles High Income Opportunities Fund (continued)
Principal Amount | Description | Value (†) |
Non-Agency Commercial Mortgage-Backed Securities — continued | ||
$158,612 | WFRBS Commercial Mortgage Trust, Series 2011-C3, Class D, 6.050%, 3/15/2044(a)(c) | $45,298 |
205,000 | WFRBS Commercial Mortgage Trust, Series 2011-C4, Class E, 4.993%, 6/15/2044(a)(c) | 141,064 |
530,000 | WFRBS Commercial Mortgage Trust, Series 2012-C10, Class C, 4.484%, 12/15/2045(c) | 363,047 |
3,625,179 | ||
Oil Field Services — 1.7% | ||
280,000 | Diamond Foreign Asset Co./Diamond Finance LLC, 8.500%, 10/01/2030(a) | 280,039 |
115,000 | Oceaneering International, Inc., 6.000%, 2/01/2028(a) | 108,212 |
180,000 | Precision Drilling Corp., 6.875%, 1/15/2029(a) | 170,496 |
30,000 | Precision Drilling Corp., 7.125%, 1/15/2026(a) | 29,707 |
220,000 | Seadrill Finance Ltd., 8.375%, 8/01/2030(a) | 223,986 |
240,000 | Solaris Midstream Holdings LLC, 7.625%, 4/01/2026(a) | 231,611 |
275,000 | Transocean Aquila Ltd., 8.000%, 9/30/2028(a) | 275,000 |
1,282,500 | Transocean Poseidon Ltd., 6.875%, 2/01/2027(a) | 1,262,699 |
245,000 | Transocean Titan Financing Ltd., 8.375%, 2/01/2028(a) | 249,287 |
415,000 | Transocean, Inc., 7.500%, 1/15/2026(a) | 405,588 |
395,000 | Weatherford International Ltd., 8.625%, 4/30/2030(a) | 398,024 |
3,634,649 | ||
Other REITs — 0.3% | ||
100,000 | Service Properties Trust, 3.950%, 1/15/2028 | 77,895 |
380,000 | Service Properties Trust, 4.750%, 10/01/2026 | 325,890 |
330,000 | Service Properties Trust, 7.500%, 9/15/2025 | 324,204 |
727,989 | ||
Packaging — 0.4% | ||
259,274 | ARD Finance SA, 7.250% PIK or 6.500% Cash, 6/30/2027(a)(e) | 195,607 |
170,000 | Graham Packaging Co., Inc., 7.125%, 8/15/2028(a) | 142,418 |
300,000 | LABL, Inc., 5.875%, 11/01/2028(a) | 269,316 |
215,000 | Sealed Air Corp./Sealed Air Corp. U.S., 6.125%, 2/01/2028(a) | 208,232 |
815,573 | ||
Pharmaceuticals — 3.7% | ||
1,945,000 | Bausch Health Cos., Inc., 4.875%, 6/01/2028(a) | 1,106,095 |
915,000 | Bausch Health Cos., Inc., 5.250%, 1/30/2030(a) | 343,493 |
Principal Amount | Description | Value (†) |
Pharmaceuticals — continued | ||
$285,000 | Bausch Health Cos., Inc., 6.125%, 2/01/2027(a) | $177,259 |
385,000 | Cheplapharm Arzneimittel GmbH, 5.500%, 1/15/2028(a) | 350,616 |
280,000 | Grifols SA, 4.750%, 10/15/2028(a) | 238,731 |
1,035,000 | Organon & Co./Organon Foreign Debt Co-Issuer BV, 5.125%, 4/30/2031(a) | 829,400 |
485,000 | Perrigo Finance Unlimited Co., 4.650%, 6/15/2030 | 413,455 |
230,000 | Teva Pharmaceutical Finance Co. LLC, 6.150%, 2/01/2036 | 203,958 |
1,400,000 | Teva Pharmaceutical Finance Netherlands III BV, 3.150%, 10/01/2026 | 1,247,778 |
3,200,000 | Teva Pharmaceutical Finance Netherlands III BV, 4.100%, 10/01/2046 | 2,003,090 |
545,000 | Teva Pharmaceutical Finance Netherlands III BV, 5.125%, 5/09/2029 | 492,680 |
220,000 | Teva Pharmaceutical Finance Netherlands III BV, 7.875%, 9/15/2029 | 222,874 |
200,000 | Teva Pharmaceutical Finance Netherlands III BV, 8.125%, 9/15/2031 | 206,910 |
7,836,339 | ||
Property & Casualty Insurance — 1.4% | ||
270,000 | Acrisure LLC/Acrisure Finance, Inc., 4.250%, 2/15/2029(a) | 226,883 |
95,000 | Acrisure LLC/Acrisure Finance, Inc., 4.250%, 2/15/2029 | 79,829 |
400,000 | Acrisure LLC/Acrisure Finance, Inc., 6.000%, 8/01/2029(a) | 336,138 |
25,000 | Alliant Holdings Intermediate LLC/Alliant Holdings Co-Issuer, 4.250%, 10/15/2027(a) | 22,383 |
440,000 | AmWINS Group, Inc., 4.875%, 6/30/2029(a) | 385,541 |
339,426 | Ardonagh Midco 2 PLC, 12.750% PIK or 11.500% Cash, 1/15/2027(a)(e) | 331,595 |
255,000 | AssuredPartners, Inc., 5.625%, 1/15/2029(a) | 220,760 |
275,000 | BroadStreet Partners, Inc., 5.875%, 4/15/2029(a) | 242,638 |
650,000 | HUB International Ltd., 7.250%, 6/15/2030(a) | 648,810 |
705,000 | Liberty Mutual Group, Inc., 4.300%, 2/01/2061(a) | 417,078 |
2,911,655 | ||
Refining — 0.5% | ||
590,000 | CVR Energy, Inc., 5.250%, 2/15/2025(a) | 575,563 |
340,000 | Parkland Corp., 4.500%, 10/01/2029(a) | 291,150 |
215,000 | PBF Holding Co. LLC/PBF Finance Corp., 7.875%, 9/15/2030(a) | 214,263 |
1,080,976 | ||
Restaurants — 1.5% | ||
85,000 | 1011778 BC ULC/New Red Finance, Inc., 3.500%, 2/15/2029 | 72,765 |
Loomis Sayles High Income Opportunities Fund (continued)
Principal Amount | Description | Value (†) |
Restaurants — continued | ||
$55,000 | 1011778 BC ULC/New Red Finance, Inc., 3.500%, 2/15/2029(a) | $47,083 |
1,635,000 | 1011778 BC ULC/New Red Finance, Inc., 3.875%, 1/15/2028(a) | 1,466,661 |
230,000 | Bloomin' Brands, Inc./OSI Restaurant Partners LLC, 5.125%, 4/15/2029(a) | 201,547 |
820,000 | KFC Holding Co./Pizza Hut Holdings LLC/Taco Bell of America LLC, 4.750%, 6/01/2027(a) | 779,000 |
575,000 | Papa John's International, Inc., 3.875%, 9/15/2029(a) | 474,628 |
140,000 | Yum! Brands, Inc., 3.625%, 3/15/2031 | 115,244 |
3,156,928 | ||
Retailers — 1.7% | ||
306,000 | Asbury Automotive Group, Inc., 4.500%, 3/01/2028 | 273,935 |
715,000 | Asbury Automotive Group, Inc., 4.625%, 11/15/2029(a) | 614,099 |
99,000 | Asbury Automotive Group, Inc., 4.750%, 3/01/2030 | 84,607 |
145,000 | Bath & Body Works, Inc., 5.250%, 2/01/2028 | 134,191 |
90,000 | Bath & Body Works, Inc., 6.625%, 10/01/2030(a) | 84,376 |
545,000 | Bath & Body Works, Inc., 6.875%, 11/01/2035 | 486,730 |
45,000 | Crocs, Inc., 4.125%, 8/15/2031(a) | 34,816 |
480,000 | Dillard's, Inc., 7.000%, 12/01/2028 | 474,840 |
130,000 | Ken Garff Automotive LLC, 4.875%, 9/15/2028(a) | 111,019 |
120,000 | Lithia Motors, Inc., 4.375%, 1/15/2031(a) | 99,278 |
200,000 | Michaels Cos., Inc., 7.875%, 5/01/2029(a) | 130,569 |
275,000 | NMG Holding Co., Inc./Neiman Marcus Group LLC, 7.125%, 4/01/2026(a) | 257,980 |
120,000 | Nordstrom, Inc., 4.250%, 8/01/2031 | 87,027 |
525,000 | Sonic Automotive, Inc., 4.625%, 11/15/2029(a) | 435,201 |
345,000 | Sonic Automotive, Inc., 4.875%, 11/15/2031(a) | 274,684 |
30,000 | Victoria's Secret & Co., 4.625%, 7/15/2029(a) | 21,743 |
3,605,095 | ||
Supermarkets — 0.3% | ||
25,000 | Albertsons Cos., Inc./Safeway, Inc./New Albertsons LP/Albertsons LLC, 3.250%, 3/15/2026(a) | 23,157 |
635,000 | Albertsons Cos., Inc./Safeway, Inc./New Albertsons LP/Albertsons LLC, 4.625%, 1/15/2027(a) | 599,578 |
622,735 | ||
Technology — 5.9% | ||
575,000 | Broadcom, Inc., 4.300%, 11/15/2032 | 501,653 |
515,000 | CDW LLC/CDW Finance Corp., 3.250%, 2/15/2029 | 439,135 |
Principal Amount | Description | Value (†) |
Technology — continued | ||
$80,000 | CDW LLC/CDW Finance Corp., 3.276%, 12/01/2028 | $69,022 |
20,000 | CDW LLC/CDW Finance Corp., 4.250%, 4/01/2028 | 18,230 |
555,000 | Cloud Software Group, Inc., 6.500%, 3/31/2029(a) | 490,804 |
2,205,000 | CommScope Technologies LLC, 5.000%, 3/15/2027(a) | 1,251,448 |
50,000 | CommScope, Inc., 4.750%, 9/01/2029(a) | 36,777 |
160,000 | Dun & Bradstreet Corp., 5.000%, 12/15/2029(a) | 137,942 |
540,000 | Elastic NV, 4.125%, 7/15/2029(a) | 459,894 |
140,000 | Everi Holdings, Inc., 5.000%, 7/15/2029(a) | 120,496 |
360,000 | Gartner, Inc., 3.750%, 10/01/2030(a) | 302,113 |
575,000 | GoTo Group, Inc., 5.500%, 9/01/2027(a) | 319,529 |
756,000 | GTCR W-2 Merger Sub LLC, 7.500%, 1/15/2031(a) | 757,058 |
480,000 | Iron Mountain, Inc., 4.500%, 2/15/2031(a) | 394,783 |
740,000 | Iron Mountain, Inc., 4.875%, 9/15/2029(a) | 648,569 |
225,000 | Iron Mountain, Inc., 5.250%, 7/15/2030(a) | 196,570 |
75,000 | Iron Mountain, Inc., 5.250%, 7/15/2030 | 65,523 |
990,000 | Micron Technology, Inc., 6.750%, 11/01/2029 | 1,005,885 |
730,000 | NCR Atleos Escrow Corp., 9.500%, 4/01/2029(a) | 706,056 |
470,000 | NCR Corp., 5.000%, 10/01/2028(a) | 420,696 |
330,000 | NCR Corp., 5.125%, 4/15/2029(a) | 290,749 |
25,000 | NCR Corp., 5.250%, 10/01/2030(a) | 21,545 |
440,000 | Neptune Bidco U.S., Inc., 9.290%, 4/15/2029(a) | 398,337 |
850,000 | Newfold Digital Holdings Group, Inc., 6.000%, 2/15/2029(a) | 641,767 |
455,000 | Open Text Corp., 6.900%, 12/01/2027(a) | 456,036 |
25,000 | Open Text Holdings, Inc., 4.125%, 2/15/2030(a) | 20,915 |
150,000 | Paysafe Finance PLC/Paysafe Holdings U.S. Corp., 4.000%, 6/15/2029(a) | 125,882 |
85,000 | Paysafe Finance PLC/Paysafe Holdings U.S. Corp., 4.000%, 6/15/2029 | 71,333 |
130,000 | Presidio Holdings, Inc., 4.875%, 2/01/2027(a) | 120,180 |
130,000 | Presidio Holdings, Inc., 8.250%, 2/01/2028(a) | 124,241 |
135,000 | Sabre Global, Inc., 11.250%, 12/15/2027(a) | 123,876 |
175,000 | Seagate HDD Cayman, 4.091%, 6/01/2029 | 150,906 |
100,000 | Seagate HDD Cayman, 4.875%, 6/01/2027 | 94,447 |
375,000 | Seagate HDD Cayman, 8.250%, 12/15/2029(a) | 385,124 |
970,000 | Sensata Technologies, Inc., 3.750%, 2/15/2031(a) | 785,045 |
80,000 | Sensata Technologies, Inc., 4.375%, 2/15/2030(a) | 69,080 |
100,000 | Western Digital Corp., 3.100%, 2/01/2032 | 73,641 |
130,000 | Western Digital Corp., 4.750%, 2/15/2026 | 123,870 |
222,000 | Ziff Davis, Inc., 4.625%, 10/15/2030(a) | 187,956 |
12,607,113 | ||
Loomis Sayles High Income Opportunities Fund (continued)
Principal Amount | Description | Value (†) |
Transportation Services — 0.6% | ||
$1,320,000 | Rand Parent LLC, 8.500%, 2/15/2030(a) | $1,220,802 |
Wireless — 1.5% | ||
445,000 | Altice France Holding SA, 10.500%, 5/15/2027(a) | 277,863 |
1,285,000 | Altice France SA, 5.125%, 1/15/2029(a) | 913,668 |
200,000 | Altice France SA, 8.125%, 2/01/2027(a) | 177,359 |
315,000 | IHS Holding Ltd., 5.625%, 11/29/2026(a) | 259,188 |
300,000 | IHS Holding Ltd., 6.250%, 11/29/2028(a) | 227,514 |
225,000 | IHS Netherlands Holdco BV, 8.000%, 9/18/2027 | 188,433 |
1,150,000 | SoftBank Group Corp., 4.625%, 7/06/2028 | 1,003,111 |
100,000 | Vodafone Group PLC, (fixed rate to 12/04/2050, variable rate thereafter), 5.125%, 6/04/2081 | 67,849 |
3,114,985 | ||
Wirelines — 1.7% | ||
220,000 | Cincinnati Bell Telephone Co. LLC, 6.300%, 12/01/2028 | 182,301 |
825,000 | Frontier Communications Holdings LLC, 5.000%, 5/01/2028(a) | 704,404 |
690,000 | Frontier Communications Holdings LLC, 5.875%, 10/15/2027(a) | 627,533 |
225,000 | Frontier Communications Holdings LLC, 8.750%, 5/15/2030(a) | 213,632 |
455,000 | Iliad Holding SASU, 6.500%, 10/15/2026(a) | 427,478 |
450,000 | Level 3 Financing, Inc., 3.625%, 1/15/2029(a) | 252,000 |
155,000 | Level 3 Financing, Inc., 4.250%, 7/01/2028(a) | 96,570 |
310,000 | Lumen Technologies, Inc., 4.000%, 2/15/2027(a) | 204,120 |
100,000 | Telecom Italia Capital SA, 6.000%, 9/30/2034 | 83,378 |
330,000 | Telecom Italia Capital SA, 6.375%, 11/15/2033 | 286,134 |
265,000 | Telecom Italia Capital SA, 7.200%, 7/18/2036 | 235,793 |
485,000 | Uniti Group LP/Uniti Group Finance, Inc./CSL Capital LLC, 4.750%, 4/15/2028(a) | 396,042 |
3,709,385 | ||
Total Non-Convertible Bonds (Identified Cost $207,628,323) | 180,800,487 | |
Convertible Bonds — 4.2% | ||
Airlines — 0.4% | ||
865,000 | Southwest Airlines Co., 1.250%, 5/01/2025 | 858,512 |
Cable Satellite — 1.5% | ||
4,830,000 | DISH Network Corp., 3.375%, 8/15/2026 | 2,902,830 |
340,000 | DISH Network Corp., Zero Coupon, 0.000%–33.748%, 12/15/2025(h) | 229,055 |
3,131,885 | ||
Principal Amount | Description | Value (†) |
Consumer Cyclical Services — 0.0% | ||
$55,000 | Zillow Group, Inc., 1.375%, 9/01/2026 | $65,533 |
Consumer Products — 0.1% | ||
380,000 | Beauty Health Co., 1.250%, 10/01/2026(a) | 295,450 |
Gaming — 0.1% | ||
115,000 | Penn Entertainment, Inc., 2.750%, 5/15/2026 | 139,576 |
Healthcare — 1.0% | ||
565,000 | Envista Holdings Corp., 1.750%, 8/15/2028(a) | 520,365 |
225,000 | Lantheus Holdings, Inc., 2.625%, 12/15/2027(a) | 260,865 |
1,655,000 | Teladoc Health, Inc., 1.250%, 6/01/2027 | 1,318,869 |
2,100,099 | ||
Leisure — 0.1% | ||
365,000 | NCL Corp. Ltd., 1.125%, 2/15/2027 | 302,738 |
Pharmaceuticals — 0.8% | ||
1,330,000 | BioMarin Pharmaceutical, Inc., 1.250%, 5/15/2027 | 1,317,498 |
495,000 | Livongo Health, Inc., 0.875%, 6/01/2025 | 452,083 |
1,769,581 | ||
Technology — 0.2% | ||
355,000 | Unity Software, Inc., Zero Coupon, 7.197%–7.662%, 11/15/2026(h) | 280,982 |
65,000 | Wolfspeed, Inc., 0.250%, 2/15/2028 | 43,810 |
135,000 | Wolfspeed, Inc., 1.875%, 12/01/2029(a) | 87,818 |
412,610 | ||
Total Convertible Bonds (Identified Cost $12,108,869) | 9,075,984 | |
Total Bonds and Notes (Identified Cost $219,737,192) | 189,876,471 | |
Senior Loans — 2.0% | ||
Chemicals — 0.2% | ||
366,000 | Chemours Co., 2023 USD Term Loan B, 1 mo. USD SOFR + 3.500%, 8.816%, 8/18/2028(b)(k) | 361,425 |
Electric — 0.1% | ||
132,668 | Talen Energy Supply LLC, 2023 Term Loan B, 3 mo. USD SOFR + 4.500%, 9.877%, 5/17/2030(b)(k) | 133,083 |
Healthcare — 0.1% | ||
335,000 | Star Parent, Inc., 2023 Term Loan B, 9/19/2030(l) | 327,138 |
Leisure — 0.4% | ||
298,281 | Carnival Corp., 2021 Incremental Term Loan B, 1 mo. USD SOFR + 3.250%, 8.681%, 10/18/2028(b)(m) | 296,417 |
Loomis Sayles High Income Opportunities Fund (continued)
Principal Amount | Description | Value (†) |
Leisure — continued | ||
$390,964 | Carnival Corp., 2021 Incremental Term Loan B, 10/18/2028(l) | $388,520 |
39,839 | Carnival Corp., 2023 Term Loan B, 8/08/2027(l) | 39,690 |
247,198 | Carnival Corp., 2023 Term Loan B, 1 mo. USD SOFR + 3.000%, 8.327%, 8/08/2027(b)(m) | 246,271 |
970,898 | ||
Media Entertainment — 0.5% | ||
1,027,425 | MH Sub I LLC, 2023 Term Loan, 1 mo. USD SOFR + 4.250%, 9.566%, 5/03/2028(b)(k) | 992,585 |
Property & Casualty Insurance — 0.2% | ||
75,000 | AssuredPartners, Inc., 2023 Term Loan B4, 2/12/2027(l) | 74,953 |
256,704 | USI, Inc., 2022 Incremental Term Loan, 3 mo. USD SOFR + 3.750%, 9.140%, 11/22/2029(b)(k) | 256,311 |
37,575 | USI, Inc., 2023 Acquisition Term Loan, 9/27/2030(l) | 37,465 |
25,050 | USI, Inc., 2023 Refi Term Loan, 9/27/2030(l) | 24,966 |
393,695 | ||
Restaurants — 0.1% | ||
316,576 | 1011778 BC Unlimited Liability Co., 2023 Term Loan B5, 1 mo. USD SOFR + 2.250%, 7.566%, 9/23/2030(n) | 315,192 |
Technology — 0.4% | ||
418,816 | Gen Digital, Inc., 2022 Term Loan B, 1 mo. USD SOFR + 2.000%, 7.416%, 9/12/2029(b)(k) | 417,140 |
477,362 | Neptune Bidco U.S., Inc., 2022 USD Term Loan B, 3 mo. USD SOFR + 5.000%, 10.399%, 4/11/2029(b)(k) | 428,633 |
845,773 | ||
Total Senior Loans (Identified Cost $4,351,499) | 4,339,789 | |
Collateralized Loan Obligations — 1.4% | ||
250,000 | Battalion CLO XVI Ltd., Series 2019-16A, Class ER, 3 mo. USD SOFR + 6.862%, 12.188%, 12/19/2032(a)(b) | 212,132 |
670,000 | Clover CLO LLC, Series 2021-2A, Class E, 3 mo. USD SOFR + 6.762%, 12.088%, 7/20/2034(a)(b) | 657,196 |
665,000 | OHA Credit Funding 3 Ltd., Series 2019-3A, Class ER, 3 mo. USD SOFR + 6.512%, 11.838%, 7/02/2035(a)(b) | 654,915 |
Principal Amount | Description | Value (†) |
$340,000 | Palmer Square CLO Ltd., Series 2021-3A, Class E, 3 mo. USD SOFR + 6.412%, 11.720%, 1/15/2035(a)(b) | $326,880 |
530,000 | Palmer Square CLO Ltd., Series 2021-4A, Class E, 3 mo. USD SOFR + 6.312%, 11.620%, 10/15/2034(a)(b) | 503,074 |
275,000 | PPM CLO 5 Ltd., Series 2021-5A, Class E, 3 mo. USD SOFR + 6.762%, 12.072%, 10/18/2034(a)(b) | 247,431 |
320,000 | Whetstone Park CLO Ltd., Series 2021-1A, Class E, 3 mo. USD SOFR + 6.412%, 11.738%, 1/20/2035(a)(b) | 297,564 |
Total Collateralized Loan Obligations (Identified Cost $3,050,000) | 2,899,192 | |
Shares | ||
Common Stocks— 0.6% | ||
Biotechnology — 0.2% | ||
2,125 | AbbVie, Inc. | 316,752 |
Energy Equipment & Services — 0.0% | ||
11,343 | McDermott International Ltd.(g) | 2,836 |
Media — 0.1% | ||
68,328 | Altice USA, Inc., Class A(g) | 223,433 |
Oil, Gas & Consumable Fuels — 0.3% | ||
2,801 | Battalion Oil Corp.(g) | 17,310 |
5,003 | Canadian Natural Resources Ltd. | 323,544 |
2,021 | Diamondback Energy, Inc. | 313,013 |
653,867 | ||
Professional Services — 0.0% | ||
265 | Clarivate PLC(g) | 1,778 |
Total Common Stocks (Identified Cost $2,491,047) | 1,198,666 | |
Preferred Stocks — 0.2% | ||
Convertible Preferred Stock — 0.2% | ||
Technology — 0.2% | ||
15,312 | Clarivate PLC, Series A, 5.250% (Identified Cost $954,658) | 447,570 |
Warrants — 0.0% | ||
22,710 | McDermott International Ltd., Tranche A, Expiration on 5/1/2024, (g)(j) | — |
25,233 | McDermott International Ltd., Tranche B, Expiration on 5/1/2024, (g)(j) | — |
Total Warrants (Identified Cost $35,226) | — | |
Loomis Sayles High Income Opportunities Fund (continued)
Principal Amount | Description | Value (†) |
Short-Term Investments — 6.8% | ||
$4,772,891 | Tri-Party Repurchase Agreement with Fixed Income Clearing Corporation, dated 9/29/2023 at 2.500% to be repurchased at $4,773,886 on 10/02/2023 collateralized by $5,467,400 U.S. Treasury Note, 0.750% due 8/31/2026 valued at $4,868,399 including accrued interest (Note 2 of Notes to Financial Statements) | $4,772,891 |
9,835,000 | U.S. Treasury Bills, 5.170%–5.210%, 10/17/2023(o)(p) | 9,813,394 |
Total Short-Term Investments (Identified Cost $14,585,279) | 14,586,285 | |
Total Investments — 100.0% (Identified Cost $245,204,901) | 213,347,973 | |
Other assets less liabilities — (0.0)% | (25,773 ) | |
Net Assets — 100.0% | $213,322,200 | |
(†) | See Note 2 of Notes to Financial Statements. |
(a) | All or a portion of these securities are exempt from registration under Rule 144A of the Securities Act of 1933. These securities may be resold in transactions exempt from registration, normally to qualified institutional buyers. At September 30, 2023, the value of Rule 144A holdings amounted to $143,165,976 or 67.1% of net assets. |
(b) | Variable rate security. Rate as of September 30, 2023 is disclosed. |
(c) | Variable rate security. The interest rate adjusts periodically based on; (i) changes in current interest rates and/or prepayments on underlying pools of assets, if applicable, (ii) reference to a base lending rate plus or minus a margin, and/or (iii) reference to a base lending rate adjusted by a multiplier and/or subject to certain floors or caps. Rate as of September 30, 2023 is disclosed. |
(d) | Perpetual bond with no specified maturity date. |
(e) | Payment-in-kind security for which the issuer, at each interest payment date, may make interest payments in cash and/or additional principal. For the period ended September 30, 2023, interest payments were made in cash. |
(f) | The issuer is in default with respect to interest and/or principal payments. Income is not being accrued. |
(g) | Non-income producing security. |
(h) | Interest rate represents annualized yield at time of purchase; not a coupon rate. The Fund’s investment in this security is comprised of various lots with differing annualized yields. |
(i) | Payment–in–kind security for which the issuer, at each interest payment date, may make interest payments in cash and/or additional principal. For the period ended September 30, 2023, interest payments were made in principal. |
(j) | Level 3 security. Value has been determined using significant unobservable inputs. See Note 3 of Notes to Financial Statements. |
(k) | Stated interest rate has been determined in accordance with the provisions of the loan agreement and is subject to a minimum benchmark floor rate of 0.50%, to which the spread is added. |
(l) | Position is unsettled. Contract rate was not determined at September 30, 2023 and does not take effect until settlement date. Maturity date is not finalized until settlement date. |
(m) | Stated interest rate has been determined in accordance with the provisions of the loan agreement and is subject to a minimum benchmark floor rate of 0.75%, to which the spread is added. |
(n) | Stated interest rate has been determined in accordance with the provisions of the loan agreement and is subject to a minimum benchmark floor rate of 0.00%, to which the spread is added. |
(o) | The Fund's investment in U.S. Government/Agency securities is comprised of various lots with differing discount rates. These separate investments, which have the same maturity date, have been aggregated for the purpose of presentation in the Portfolio of Investments. |
(p) | Interest rate represents discount rate at time of purchase; not a coupon rate. |
ABS | Asset-Backed Securities |
GMTN | Global Medium Term Note |
LIBOR | London Interbank Offered Rate |
PIK | Payment-in-Kind |
REITs | Real Estate Investment Trusts |
SOFR | Secured Overnight Financing Rate |
Cable Satellite | 10.6 % |
Technology | 6.7 |
Independent Energy | 6.2 |
Finance Companies | 4.9 |
Midstream | 4.9 |
Pharmaceuticals | 4.5 |
Leisure | 4.1 |
Healthcare | 3.5 |
Metals & Mining | 3.2 |
Automotive | 2.9 |
Consumer Cyclical Services | 2.8 |
Building Materials | 2.4 |
Gaming | 2.4 |
Other Investments, less than 2% each | 32.7 |
Collateralized Loan Obligations | 1.4 |
Short-Term Investments | 6.8 |
Total Investments | 100.0 |
Other assets less liabilities | (0.0 ) |
Net Assets | 100.0 % |
Loomis Sayles Securitized Asset Fund
Principal Amount | Description | Value (†) |
Bonds and Notes — 90.2% of Net Assets | ||
ABS Car Loan — 6.1% | ||
$3,185,000 | AmeriCredit Automobile Receivables Trust, Series 2022-2, Class B, 4.810%, 4/18/2028 | $3,107,811 |
3,860,000 | Avis Budget Rental Car Funding AESOP LLC, Series 2020-2A, Class A, 2.020%, 2/20/2027(a) | 3,522,426 |
4,318,000 | Avis Budget Rental Car Funding AESOP LLC, Series 2023-5A, Class A, 5.780%, 4/20/2028(a) | 4,273,205 |
1,255,000 | Avis Budget Rental Car Funding AESOP LLC, Series 2023-8A, Class A, 6.020%, 2/20/2030(a) | 1,249,758 |
800,000 | Carmax Auto Owner Trust, Series 2023-3, Class C, 5.610%, 2/15/2029 | 788,526 |
500,000 | CarMax Auto Owner Trust, Series 2020-3, Class C, 1.690%, 4/15/2026 | 481,956 |
1,485,000 | CarMax Auto Owner Trust, Series 2021-1, Class C, 0.940%, 12/15/2026 | 1,367,764 |
3,030,000 | CarMax Auto Owner Trust, Series 2022-3, Class D, 6.200%, 1/16/2029 | 2,954,850 |
1,101,959 | Carvana Auto Receivables Trust, Series 2021-N1, Class C, 1.300%, 1/10/2028 | 1,032,267 |
436,393 | Carvana Auto Receivables Trust, Series 2021-N2, Class C, 1.070%, 3/10/2028 | 403,879 |
4,455,000 | Carvana Auto Receivables Trust, Series 2021-P1, Class C, 1.530%, 3/10/2027 | 3,969,401 |
5,410,000 | Carvana Auto Receivables Trust, Series 2021-P2, Class C, 1.600%, 6/10/2027 | 4,752,310 |
820,000 | Carvana Auto Receivables Trust, Series 2022-P3, Class A4, 4.850%, 6/12/2028 | 790,402 |
2,610,000 | Carvana Auto Receivables Trust, Series 2023-P1, Class A3, 5.980%, 12/10/2027(a) | 2,595,117 |
1,605,000 | Carvana Auto Receivables Trust, Series 2023-P4, Class A4, 6.160%, 9/10/2029(a) | 1,606,804 |
3,025,000 | Citizens Auto Receivables Trust, Series 2023-1, Class A4, 5.780%, 10/15/2030(a) | 3,020,459 |
4,270,000 | Credit Acceptance Auto Loan Trust, Series 2023-1A, Class B, 7.020%, 5/16/2033(a) | 4,262,209 |
380,000 | Credit Acceptance Auto Loan Trust, Series 2023-3A, Class A, 6.390%, 8/15/2033(a) | 379,041 |
570,000 | DT Auto Owner Trust, Series 2021-2A, Class C, 1.100%, 2/16/2027(a) | 557,387 |
Principal Amount | Description | Value (†) |
ABS Car Loan — continued | ||
$745,000 | DT Auto Owner Trust, Series 2023-2A, Class B, 5.410%, 2/15/2029(a) | $734,026 |
73,135 | Flagship Credit Auto Trust, Series 2020-2, Class C, 3.800%, 4/15/2026(a) | 73,050 |
885,000 | Flagship Credit Auto Trust, Series 2021-2, Class B, 0.930%, 6/15/2027(a) | 864,754 |
1,740,000 | Ford Credit Auto Owner Trust, Series 2018-1, Class B, 3.340%, 7/15/2031(a) | 1,673,285 |
330,000 | Ford Credit Floorplan Master Owner Trust A, Series 2023-1, Class C, 5.750%, 5/15/2028(a) | 320,265 |
2,375,000 | Foursight Capital Automobile Receivables Trust, Series 2021-2, Class C, 1.570%, 7/15/2027(a) | 2,240,261 |
1,750,000 | Foursight Capital Automobile Receivables Trust, Series 2023-2, Class B, 6.110%, 11/15/2028(a) | 1,742,282 |
2,440,000 | GECU Auto Receivables Trust, Series 2023-1A, Class A4, 5.790%, 10/15/2029(a) | 2,411,462 |
1,220,000 | GM Financial Automobile Leasing Trust, Series 2023-2, Class B, 5.540%, 5/20/2027 | 1,204,584 |
1,725,000 | GM Financial Consumer Automobile Receivables Trust, Series 2020-3, Class D, 1.910%, 9/16/2027 | 1,666,566 |
565,000 | Hertz Vehicle Financing III LLC, Series 2023-3A, Class A, 5.940%, 2/25/2028(a) | 564,476 |
1,776,000 | Hyundai Auto Lease Securitization Trust, Series 2021-B, Class B, 0.620%, 3/16/2026(a) | 1,754,256 |
800,000 | Hyundai Auto Receivables Trust, Series 2020-B, Class C, 1.600%, 12/15/2026 | 769,930 |
4,230,000 | Hyundai Auto Receivables Trust, Series 2021-C, Class C, 1.660%, 6/15/2028 | 3,808,162 |
891,261 | JPMorgan Chase Bank N.A, Series 2021-1, Class B, 0.875%, 9/25/2028(a) | 869,543 |
3,485,000 | OneMain Direct Auto Receivables Trust, Series 2022-1A, Class A2, 30 day USD SOFR Average + 1.600%, 6.913%, 3/14/2029(a)(b) | 3,499,030 |
1,339,191 | Santander Bank Auto Credit-Linked Notes, Series 2022-A, Class B, 5.281%, 5/15/2032(a) | 1,322,897 |
673,947 | Santander Bank Auto Credit-Linked Notes, Series 2022-B, Class B, 5.721%, 8/16/2032(a) | 668,875 |
176,319 | Santander Consumer Auto Receivables Trust, Series 2020-AA, Class C, 3.710%, 2/17/2026(a) | 175,946 |
Loomis Sayles Securitized Asset Fund (continued)
Principal Amount | Description | Value (†) |
ABS Car Loan — continued | ||
$125,000 | SFS Auto Receivables Securitization Trust, Series 2023-1A, Class C, 5.970%, 2/20/2031(a) | $123,113 |
530,000 | World Omni Auto Receivables Trust, Series 2020-B, Class B, 1.220%, 3/16/2026 | 513,648 |
1,980,000 | World Omni Auto Receivables Trust, Series 2021-A, Class C, 0.890%, 8/16/2027 | 1,838,493 |
2,610,000 | World Omni Auto Receivables Trust, Series 2021-B, Class C, 1.290%, 12/15/2027 | 2,339,432 |
455,000 | World Omni Automobile Lease Securitization Trust, Series 2023-A, Class A4, 5.040%, 7/17/2028 | 449,168 |
1,490,000 | World Omni Select Auto Trust, Series 2020-A, Class C, 1.250%, 10/15/2026 | 1,429,797 |
74,172,873 | ||
ABS Credit Card — 0.6% | ||
3,700,000 | Mercury Financial Credit Card Master Trust, Series 2023-1A, Class A, 8.040%, 9/20/2027(a) | 3,713,292 |
595,000 | Mission Lane Credit Card Master Trust, Series 2023-A, Class A, 7.230%, 7/17/2028(a) | 590,351 |
3,065,000 | World Financial Network Credit Card Master Trust, Series 2023-A, 5.020%, 3/15/2030 | 3,013,719 |
7,317,362 | ||
ABS Home Equity — 6.4% | ||
1,448,850 | Citigroup Mortgage Loan Trust, Inc., Series 2019-RP1, Class M2, 4.000%, 1/25/2066(a)(c) | 1,215,809 |
390,054 | CoreVest American Finance Ltd., Series 2019-2, Class A, 2.835%, 6/15/2052(a) | 381,202 |
1,379,374 | CoreVest American Finance Ltd., Series 2019-3, Class A, 2.705%, 10/15/2052(a) | 1,312,323 |
11,324 | Countrywide Asset-Backed Certificates, Series 2004-S1, Class A3, 5.115%, 2/25/2035(c) | 11,138 |
1,551,065 | Credit Suisse Mortgage Trust, Series 2021-RPL1, Class A1, 1.668%, 9/27/2060(a)(c) | 1,427,708 |
910,000 | FirstKey Homes Trust, Series 2020-SFR1, Class B, 1.740%, 8/17/2037(a) | 833,950 |
3,730,000 | FirstKey Homes Trust, Series 2021-SFR1, Class B, 1.788%, 8/17/2038(a) | 3,276,720 |
2,495,000 | FirstKey Homes Trust, Series 2021-SFR1, Class C, 1.888%, 8/17/2038(a) | 2,191,408 |
5,430,000 | FirstKey Homes Trust, Series 2021-SFR2, Class C, 1.707%, 9/17/2038(a) | 4,708,953 |
Principal Amount | Description | Value (†) |
ABS Home Equity — continued | ||
$754,912 | HarborView Mortgage Loan Trust, Series 2004-3, Class 1A, 4.278%, 5/19/2034(c) | $717,321 |
1,428,100 | Home Partners of America Trust, Series 2021-1, Class C, 2.078%, 9/17/2041(a) | 1,163,792 |
5,974,724 | Invitation Homes Trust, Series 2018-SFR4, Class B, 1 mo. USD SOFR + 1.364%, 6.698%, 1/17/2038(a)(b) | 5,952,329 |
9,894,715 | JP Morgan Mortgage Trust, Series 2017-4, Class AX1, IO, 0.363%, 11/25/2048(a)(c)(d)(e) | 115,811 |
4,515,000 | Legacy Mortgage Asset Trust, Series 2020-RPL1, Class A2, 3.250%, 9/25/2059(a)(c) | 3,721,760 |
539,187 | Mill City Mortgage Loan Trust, Series 2018-2, Class M1, 3.750%, 5/25/2058(a)(c) | 502,429 |
591,760 | Mill City Mortgage Loan Trust, Series 2018-3, Class A1, 3.500%, 8/25/2058(a)(c) | 566,547 |
1,646,966 | Mill City Mortgage Loan Trust, Series 2019-1, Class M1, 3.500%, 10/25/2069(a)(c) | 1,439,313 |
923,105 | Mill City Mortgage Loan Trust, Series 2021-NMR1, Class A1, 1.125%, 11/25/2060(a)(c) | 828,914 |
4,006,000 | Mill City Mortgage Trust, Series 2015-2, Class B1, 3.704%, 9/25/2057(a)(c) | 3,640,933 |
16,231 | Morgan Stanley Mortgage Loan Trust, Series 2005-3AR, Class 5A, 5.406%, 7/25/2035(c)(e) | 13,750 |
185,598 | OBX Trust, Series 2018-EXP1, Class 1A3, 4.000%, 4/25/2048(a)(c) | 165,052 |
84,189 | OBX Trust, Series 2019-EXP1, Class 1A3, 4.000%, 1/25/2059(a)(c) | 80,116 |
1,120,000 | Progress Residential Trust, Series 2020-SFR3, Class B, 1.495%, 10/17/2027(a) | 1,017,918 |
2,670,000 | Progress Residential Trust, Series 2021-SFR2, Class C, 1.997%, 4/19/2038(a) | 2,379,612 |
1,892,000 | Progress Residential Trust, Series 2021-SFR3, Class B, 1.888%, 5/17/2026(a) | 1,681,770 |
3,450,000 | Progress Residential Trust, Series 2021-SFR4, Class C, 2.039%, 5/17/2038(a) | 3,070,778 |
830,000 | Progress Residential Trust, Series 2021-SFR5, Class C, 1.808%, 7/17/2038(a) | 728,626 |
1,715,000 | Progress Residential Trust, Series 2021-SFR6, Class C, 1.855%, 7/17/2038(a) | 1,499,623 |
Loomis Sayles Securitized Asset Fund (continued)
Principal Amount | Description | Value (†) |
ABS Home Equity — continued | ||
$5,450,000 | Progress Residential Trust, Series 2021-SFR9, Class C, 2.362%, 11/17/2040(a) | $4,459,533 |
880 | Residential Accredit Loans, Inc. Trust, Series 2006-QS13, Class 2A1, 5.750%, 10/25/2023(e) | 485 |
9,798 | Residential Accredit Loans, Inc. Trust, Series 2006-QS18, Class 3A3, 5.750%, 10/25/2023(e) | 5,174 |
112 | Residential Accredit Loans, Inc. Trust, Series 2006-QS6, Class 2A1, 6.000%, 10/25/2023(e) | — |
5,570,000 | Towd Point Mortgage Trust, Series 2017-3, Class A2, 3.000%, 7/25/2057(a)(c) | 5,205,219 |
4,036,054 | Towd Point Mortgage Trust, Series 2017-4, Class A2, 3.000%, 6/25/2057(a)(c) | 3,529,545 |
684,362 | Towd Point Mortgage Trust, Series 2018-3, Class A1, 3.750%, 5/25/2058(a)(c) | 647,663 |
2,325,000 | Towd Point Mortgage Trust, Series 2018-4, Class A2, 3.000%, 6/25/2058(a)(c) | 1,779,841 |
5,530,000 | Towd Point Mortgage Trust, Series 2019-2, Class A2, 3.750%, 12/25/2058(a)(c) | 4,658,242 |
5,555,000 | Towd Point Mortgage Trust, Series 2020-2, Class A2B, 3.000%, 4/25/2060(a)(c) | 4,179,515 |
5,000,000 | Towd Point Mortgage Trust, Series 2020-4, Class A2, 2.500%, 10/25/2060(a) | 3,726,142 |
1,275,000 | Tricon American Homes, Series 2020-SFR1, Class C, 2.249%, 7/17/2038(a) | 1,144,134 |
1,683,511 | Tricon American Homes Trust, Series 2019-SFR1, Class A, 2.750%, 3/17/2038(a) | 1,563,159 |
1,305,000 | Tricon American Homes Trust, Series 2020-SFR2, Class B, 1.832%, 11/17/2039(a) | 1,102,310 |
704,968 | WaMu Mortgage Pass-Through Certificates Trust, Series 2007-HY2, Class 2A2, 4.572%, 11/25/2036(c) | 627,942 |
77,274,509 | ||
ABS Other — 6.2% | ||
1,398,184 | Accelerated Assets LLC, Series 2018-1, Class A, 3.870%, 12/02/2033(a) | 1,353,409 |
2,340,219 | BHG Securitization Trust, Series 2021-A, Class A, 1.420%, 11/17/2033(a) | 2,182,369 |
610,202 | BHG Securitization Trust, Series 2022-C, Class A, 5.320%, 10/17/2035(a) | 605,986 |
1,825,000 | BHG Securitization Trust, Series 2023-A, Class B, 6.350%, 4/17/2036(a) | 1,774,577 |
Principal Amount | Description | Value (†) |
ABS Other — continued | ||
$2,914,923 | Blackbird Capital Aircraft Lease Securitization Ltd., Series 2016-1A, Class A, 4.213%, 12/16/2041(a)(c) | $2,683,682 |
2,786,300 | CAL Funding IV Ltd., Series 2020-1A, Class A, 2.220%, 9/25/2045(a) | 2,425,281 |
2,516,026 | Castlelake Aircraft Structured Trust, Series 2019-1A, Class A, 3.967%, 4/15/2039(a) | 2,237,538 |
235,542 | Castlelake Aircraft Structured Trust, Series 2021-1A, Class A, 3.474%, 1/15/2046(a) | 214,425 |
550,000 | Chesapeake Funding II LLC, Series 2020-1A, Class C, 2.140%, 8/15/2032(a) | 536,516 |
2,225,000 | Chesapeake Funding II LLC, Series 2021-1A, Class B, 0.990%, 4/15/2033(a) | 2,104,073 |
2,041,550 | CLI Funding VI LLC, Series 2020-3A, Class A, 2.070%, 10/18/2045(a) | 1,772,060 |
2,645,005 | CLI Funding VIII LLC, Series 2023-1A, Class A, 6.310%, 6/18/2048(a) | 2,617,476 |
720,000 | Daimler Trucks Retail Trust, Series 2023-1, Class A4, 5.930%, 12/16/2030 | 719,322 |
565,000 | Dell Equipment Finance Trust, Series 2023-2, Class A3, 5.650%, 1/22/2029(a) | 564,960 |
1,815,000 | Elara HGV Timeshare Issuer LLC, Series 2023-A, Class A, 6.160%, 2/25/2038(a) | 1,812,107 |
1,635,000 | Enterprise Fleet Financing LLC, Series 2023-2, Class A3, 5.500%, 4/22/2030(a) | 1,610,622 |
435,000 | Foundation Finance Trust, Series 2023-2A, Class B, 6.970%, 6/15/2049(a) | 434,883 |
812,000 | GreatAmerica Leasing Receivables Funding LLC, Series 2021-1, Class B, 0.720%, 12/15/2026(a) | 757,840 |
2,325,000 | Hertz Vehicle Financing III LP, Series 2021-2A, Class A, 1.680%, 12/27/2027(a) | 2,035,842 |
2,261,121 | Hilton Grand Vacations Trust, Series 2020-AA, Class A, 2.740%, 2/25/2039(a) | 2,110,969 |
688,091 | Hilton Grand Vacations Trust, Series 2023-1A, Class A, 5.720%, 1/25/2038(a) | 691,037 |
556,437 | Horizon Aircraft Finance II Ltd., Series 2019-1, Class A, 3.721%, 7/15/2039(a) | 479,839 |
3,176,221 | HPEFS Equipment Trust, Series 2021-1A, Class C, 0.750%, 3/20/2031(a) | 3,160,189 |
1,455,000 | HPEFS Equipment Trust, Series 2021-2A, Class C, 0.880%, 9/20/2028(a) | 1,425,168 |
Loomis Sayles Securitized Asset Fund (continued)
Principal Amount | Description | Value (†) |
ABS Other — continued | ||
$1,456,974 | Kestrel Aircraft Funding Ltd., Series 2018-1A, Class A, 4.250%, 12/15/2038(a) | $1,259,510 |
970,802 | MACH 1 Cayman Ltd., Series 2019-1, Class A, 3.474%, 10/15/2039(a) | 817,629 |
687,971 | MAPS Ltd., Series 2018-1A, Class A, 4.212%, 5/15/2043(a) | 619,031 |
693,543 | MAPS Trust, Series 2021-1A, Class A, 2.521%, 6/15/2046(a) | 594,385 |
333,794 | Marlette Funding Trust, Series 2021-2A, Class B, 1.060%, 9/15/2031(a) | 331,029 |
639,281 | Merlin Aviation Holdings DAC, Series 2016-1, Class A, 4.500%, 12/15/2032(a)(c) | 557,095 |
305,000 | MMAF Equipment Finance LLC, Series 2020-A, Class A5, 1.560%, 10/09/2042(a) | 262,724 |
344,173 | MVW LLC, Series 2021-1WA, Class B, 1.440%, 1/22/2041(a) | 310,474 |
945,000 | Navient Private Education Refi Loan Trust, Series 2020-HA, Class B, 2.780%, 1/15/2069(a) | 746,922 |
5,400,000 | OneMain Financial Issuance Trust, Series 2021-1A, Class B, 1.950%, 6/16/2036(a) | 4,485,436 |
570,315 | Orange Lake Timeshare Trust, Series 2018-A, Class A, 3.100%, 11/08/2030(a) | 548,425 |
1,635,000 | SCF Equipment Leasing LLC, Series 2021-1A, Class B, 1.370%, 8/20/2029(a) | 1,524,504 |
329,750 | Sierra Timeshare Receivables Funding LLC, Series 2020-2A, Class B, 2.320%, 7/20/2037(a) | 311,574 |
264,587 | Sierra Timeshare Receivables Funding LLC, Series 2021-1A, Class B, 1.340%, 11/20/2037(a) | 239,401 |
816,740 | Sierra Timeshare Receivables Funding LLC, Series 2023-1A, Class A, 5.200%, 1/20/2040(a) | 799,894 |
2,754,377 | Slam Ltd., Series 2021-1A, Class A, 2.434%, 6/15/2046(a) | 2,341,287 |
210,000 | SLM Private Credit Student Loan Trust, Series 2003-C, Class A3, 28 day Auction Rate Security, 8.943%, 9/15/2032(b) | 209,879 |
135,000 | SLM Private Credit Student Loan Trust, Series 2003-C, Class A4, 28 day Auction Rate Security, 8.939%, 9/15/2032(b) | 131,966 |
5,485,000 | SMB Private Education Loan Trust, Series 2019-B, Class B, 3.560%, 6/15/2043(a) | 4,736,034 |
2,100,565 | SpringCastle America Funding LLC, Series 2020-AA, Class A, 1.970%, 9/25/2037(a) | 1,902,938 |
Principal Amount | Description | Value (†) |
ABS Other — continued | ||
$1,290,723 | Sunnova Helios XII Issuer LLC, Series 2023-B, Class A, 5.300%, 8/22/2050(a) | $1,228,660 |
460,840 | Textainer Marine Containers VII Ltd., Series 2020-1A, Class A, 2.730%, 8/21/2045(a) | 418,589 |
1,607,667 | TIF Funding II LLC, Series 2020-1A, Class A, 2.090%, 8/20/2045(a) | 1,395,480 |
4,182,099 | Triumph Rail Holdings LLC, Series 2021-2, Class A, 2.150%, 6/19/2051(a) | 3,629,857 |
3,347,711 | WAVE Trust, Series 2017-1A, Class A, 3.844%, 11/15/2042(a) | 2,691,124 |
731,464 | Welk Resorts LLC, Series 2019-AA, Class A, 2.800%, 6/15/2038(a) | 696,237 |
2,340,000 | Wheels Fleet Lease Funding 1 LLC, Series 2023-1A, Class A, 5.800%, 4/18/2038(a) | 2,321,919 |
2,978,905 | Willis Engine Structured Trust V, Series 2020-A, Class A, 3.228%, 3/15/2045(a) | 2,523,490 |
2,240,566 | Willis Engine Structured Trust VI, Series 2021-A, Class A, 3.104%, 5/15/2046(a) | 1,796,730 |
75,742,393 | ||
ABS Student Loan — 2.3% | ||
492,944 | College Avenue Student Loans LLC, Series 2021-A, Class A2, 1.600%, 7/25/2051(a) | 423,485 |
662,174 | Commonbond Student Loan Trust, Series 2020-AGS, Class A, 1.980%, 8/25/2050(a) | 576,417 |
1,255,675 | Education Funding Trust, Series 2020-A, Class A, 2.790%, 7/25/2041(a) | 1,151,095 |
681,655 | EDvestinU Private Education Loan Issue No. 3 LLC, Series 2021-A, Class A, 1.800%, 11/25/2045(a) | 589,954 |
935,064 | Massachusetts Educational Financing Authority, Series 2018-A, Class A, 3.850%, 5/25/2033 | 858,247 |
1,057,710 | Navient Private Education Refi Loan Trust, Series 2019-CA, Class A2, 3.130%, 2/15/2068(a) | 1,001,908 |
850,426 | Navient Private Education Refi Loan Trust, Series 2019-GA, Class A, 2.400%, 10/15/2068(a) | 791,363 |
724,096 | Navient Private Education Refi Loan Trust, Series 2020-BA, Class A2, 2.120%, 1/15/2069(a) | 656,581 |
1,262,833 | Navient Private Education Refi Loan Trust, Series 2020-DA, Class A, 1.690%, 5/15/2069(a) | 1,137,413 |
1,565,000 | Navient Private Education Refi Loan Trust, Series 2020-DA, Class B, 3.330%, 5/15/2069(a) | 1,230,961 |
Loomis Sayles Securitized Asset Fund (continued)
Principal Amount | Description | Value (†) |
ABS Student Loan — continued | ||
$1,256,468 | Navient Private Education Refi Loan Trust, Series 2020-GA, Class A, 1.170%, 9/16/2069(a) | $1,106,696 |
1,428,263 | Navient Private Education Refi Loan Trust, Series 2021-A, Class A, 0.840%, 5/15/2069(a) | 1,235,466 |
1,101,014 | Navient Private Education Refi Loan Trust, Series 2021-BA, Class A, 0.940%, 7/15/2069(a) | 952,712 |
1,676,053 | Navient Private Education Refi Loan Trust, Series 2023-A, Class A, 5.510%, 10/15/2071(a) | 1,641,280 |
1,630,000 | Nelnet Student Loan Trust, Series 2021-A, Class B1, 2.850%, 4/20/2062(a) | 1,301,292 |
415,000 | SLM Private Credit Student Loan Trust, Series 2003-A, Class A3, 28 day Auction Rate Security, 8.941%, 6/15/2032(b) | 405,663 |
68,000 | SLM Private Credit Student Loan Trust, Series 2003-A, Class A4, 28 day Auction Rate Security, 8.939%, 6/15/2032(b) | 66,470 |
138,000 | SLM Private Credit Student Loan Trust, Series 2003-B, Class A3, 28 day Auction Rate Security, 8.942%, 3/15/2033(b) | 136,768 |
2,070,000 | SLM Private Credit Student Loan Trust, Series 2003-B, Class A4, 28 day Auction Rate Security, 8.938%, 3/15/2033(b) | 2,018,567 |
235,690 | SMB Private Education Loan Trust, Series 2016-C, Class A2A, 2.340%, 9/15/2034(a) | 228,714 |
2,364,299 | SMB Private Education Loan Trust, Series 2018-A, Class A2B, 1 mo. USD SOFR + 0.914%, 6.247%, 2/15/2036(a)(b) | 2,344,685 |
1,134,275 | SMB Private Education Loan Trust, Series 2018-B, Class A2A, 3.600%, 1/15/2037(a) | 1,084,631 |
3,235,724 | SMB Private Education Loan Trust, Series 2018-C, Class A2A, 3.630%, 11/15/2035(a) | 3,099,425 |
713,264 | SMB Private Education Loan Trust, Series 2021-A, Class APT2, 1.070%, 1/15/2053(a) | 609,785 |
370,826 | SoFi Professional Loan Program LLC, Series 2017-F, Class A2FX, 2.840%, 1/25/2041(a) | 356,816 |
3,520,238 | SoFi Professional Loan Program LLC, Series 2020-A, Class A2FX, 2.540%, 5/15/2046(a) | 3,222,170 |
28,228,564 | ||
Principal Amount | Description | Value (†) |
ABS Whole Business — 0.3% | ||
$844,312 | EWC Master Issuer LLC, Series 2022-1A, Class A2, 5.500%, 3/15/2052(a) | $776,273 |
3,880,800 | Planet Fitness Master Issuer LLC, Series 2019-1A, Class A2, 3.858%, 12/05/2049(a) | 3,260,174 |
4,036,447 | ||
Agency Commercial Mortgage-Backed Securities — 13.2% | ||
4,522,570 | Federal Home Loan Mortgage Corp., 3.450%, 5/01/2037 | 3,780,740 |
1,655,246 | Federal Home Loan Mortgage Corp., 3.700%, 5/01/2037 | 1,429,094 |
2,845,930 | Federal Home Loan Mortgage Corp. Multifamily Structured Pass-Through Certificates, Series K036, Class X1, IO, 1.123%, 10/25/2023(c)(d)(e) | 145 |
31,115,456 | Federal Home Loan Mortgage Corp. Multifamily Structured Pass-Through Certificates, Series K038, Class X1, IO, 1.229%, 3/25/2024(c)(d)(e) | 65,314 |
34,084,780 | Federal Home Loan Mortgage Corp. Multifamily Structured Pass-Through Certificates, Series K040, Class X1, IO, 0.787%, 9/25/2024(c)(d)(e) | 158,563 |
66,683,632 | Federal Home Loan Mortgage Corp. Multifamily Structured Pass-Through Certificates, Series K047, Class X1, IO, 0.219%, 5/25/2025(c)(d)(e) | 118,857 |
37,166,289 | Federal Home Loan Mortgage Corp. Multifamily Structured Pass-Through Certificates, Series K051, Class X1, IO, 0.632%, 9/25/2025(c)(d)(e) | 295,998 |
15,847,413 | Federal Home Loan Mortgage Corp. Multifamily Structured Pass-Through Certificates, Series K052, Class X1, IO, 0.763%, 11/25/2025(c)(d)(e) | 170,288 |
9,161,880 | Federal Home Loan Mortgage Corp. Multifamily Structured Pass-Through Certificates, Series K053, Class X1, IO, 1.010%, 12/25/2025(c)(d)(e) | 143,949 |
15,847,898 | Federal Home Loan Mortgage Corp. Multifamily Structured Pass-Through Certificates, Series K054, Class X1, IO, 1.289%, 1/25/2026(c)(d)(e) | 335,961 |
6,994,312 | Federal Home Loan Mortgage Corp. Multifamily Structured Pass-Through Certificates, Series K055, Class X1, IO, 1.473%, 3/25/2026(c)(d)(e) | 195,900 |
26,320,522 | Federal Home Loan Mortgage Corp. Multifamily Structured Pass-Through Certificates, Series K057, Class X1, IO, 1.298%, 7/25/2026(c)(d) | 661,082 |
Loomis Sayles Securitized Asset Fund (continued)
Principal Amount | Description | Value (†) |
Agency Commercial Mortgage-Backed Securities — continued | ||
$8,148,474 | Federal Home Loan Mortgage Corp. Multifamily Structured Pass-Through Certificates, Series K058, Class X1, IO, 1.038%, 8/25/2026(c)(d)(e) | $172,061 |
24,319,804 | Federal Home Loan Mortgage Corp. Multifamily Structured Pass-Through Certificates, Series K059, Class X1, IO, 0.421%, 9/25/2026(c)(d)(e) | 171,926 |
88,678,354 | Federal Home Loan Mortgage Corp. Multifamily Structured Pass-Through Certificates, Series K060, Class X1, IO, 0.186%, 10/25/2026(c)(d)(e) | 193,414 |
18,318,331 | Federal Home Loan Mortgage Corp. Multifamily Structured Pass-Through Certificates, Series K103, Class X1, IO, 0.757%, 11/25/2029(c)(d) | 575,489 |
17,488,482 | Federal Home Loan Mortgage Corp. Multifamily Structured Pass-Through Certificates, Series K105, Class X1, IO, 1.644%, 1/25/2030(c)(d) | 1,299,779 |
11,566,913 | Federal Home Loan Mortgage Corp. Multifamily Structured Pass-Through Certificates, Series K107, Class X1, IO, 1.709%, 1/25/2030(c)(d) | 903,711 |
13,727,252 | Federal Home Loan Mortgage Corp. Multifamily Structured Pass-Through Certificates, Series K108, Class X1, IO, 1.810%, 3/25/2030(c)(d) | 1,158,717 |
14,504,227 | Federal Home Loan Mortgage Corp. Multifamily Structured Pass-Through Certificates, Series K117, Class X1, IO, 1.334%, 8/25/2030(c)(d) | 920,522 |
254,663,788 | Federal Home Loan Mortgage Corp. Multifamily Structured Pass-Through Certificates, Series K138, Class X1, IO, 0.251%, 1/25/2032(c)(d) | 2,823,967 |
32,673,759 | Federal Home Loan Mortgage Corp. Multifamily Structured Pass-Through Certificates, Series K141, Class X1, IO, 0.407%, 2/25/2032(c)(d) | 703,237 |
79,192,716 | Federal Home Loan Mortgage Corp. Multifamily Structured Pass-Through Certificates, Series K142, Class X1, IO, 0.403%, 3/25/2032(c)(d) | 1,650,535 |
35,905,414 | Federal Home Loan Mortgage Corp. Multifamily Structured Pass-Through Certificates, Series K143, Class X1, IO, 0.450%, 4/25/2055(c)(d) | 875,539 |
46,026,698 | Federal Home Loan Mortgage Corp. Multifamily Structured Pass-Through Certificates, Series K144, Class X1, IO, 0.436%, 4/25/2032(c)(d) | 1,103,960 |
Principal Amount | Description | Value (†) |
Agency Commercial Mortgage-Backed Securities — continued | ||
$19,778,820 | Federal Home Loan Mortgage Corp. Multifamily Structured Pass-Through Certificates, Series K145, Class X1, IO, 0.430%, 6/25/2055(c)(d) | $460,844 |
66,581,887 | Federal Home Loan Mortgage Corp. Multifamily Structured Pass-Through Certificates, Series K146, Class X1, IO, 0.352%, 6/25/2054(c)(d) | 1,216,451 |
51,552,534 | Federal Home Loan Mortgage Corp. Multifamily Structured Pass-Through Certificates, Series K147, Class X1, IO, 0.488%, 6/25/2032(c)(d) | 1,391,661 |
82,360,493 | Federal Home Loan Mortgage Corp. Multifamily Structured Pass-Through Certificates, Series K149, Class X1, IO, 0.403%, 8/25/2032(c)(d) | 1,765,232 |
103,146,315 | Federal Home Loan Mortgage Corp. Multifamily Structured Pass-Through Certificates, Series K-150, Class X1, IO, 0.446%, 9/25/2032(c)(d) | 2,543,516 |
100,000,000 | Federal Home Loan Mortgage Corp. Multifamily Structured Pass-Through Certificates, Series K-151, Class XAM, IO, 0.330%, 11/25/2032(c)(d) | 1,646,520 |
3,368,748 | Federal Home Loan Mortgage Corp. Multifamily Structured Pass-Through Certificates, Series K-1513, Class X1, IO, 0.992%, 8/25/2034(c)(d)(e) | 195,448 |
20,606,502 | Federal Home Loan Mortgage Corp. Multifamily Structured Pass-Through Certificates, Series K-1514, Class X1, IO, 0.700%, 10/25/2034(c)(d) | 883,772 |
52,149,787 | Federal Home Loan Mortgage Corp. Multifamily Structured Pass-Through Certificates, Series K-1516, Class X1, IO, 1.629%, 5/25/2035(c)(d) | 5,910,135 |
53,805,477 | Federal Home Loan Mortgage Corp. Multifamily Structured Pass-Through Certificates, Series K-1517, Class X1, IO, 1.436%, 7/25/2035(c)(d) | 5,437,958 |
14,179,537 | Federal Home Loan Mortgage Corp. Multifamily Structured Pass-Through Certificates, Series K152, Class X1, IO, 1.100%, 1/25/2031(c)(d) | 700,573 |
95,874,630 | Federal Home Loan Mortgage Corp. Multifamily Structured Pass-Through Certificates, Series K-1521, Class X1, IO, 1.095%, 8/25/2036(c)(d) | 7,657,833 |
123,147,948 | Federal Home Loan Mortgage Corp. Multifamily Structured Pass-Through Certificates, Series K157, Class X1, IO, 0.156%, 8/25/2033(c)(d) | 530,891 |
Loomis Sayles Securitized Asset Fund (continued)
Principal Amount | Description | Value (†) |
Agency Commercial Mortgage-Backed Securities — continued | ||
$23,116,103 | Federal Home Loan Mortgage Corp. Multifamily Structured Pass-Through Certificates, Series KS03, Class X, IO, 0.307%, 8/25/2025(c)(d)(e) | $81,555 |
30,134,034 | Federal Home Loan Mortgage Corp. Multifamily Structured Pass-Through Certificates, Series KW02, Class X1, IO, 0.416%, 12/25/2026(c)(d)(e) | 95,226 |
24,000,000 | Federal National Mortgage Association, 3.850%, 9/01/2037 | 20,245,065 |
5,792,129 | Federal National Mortgage Association, 4.030%, 10/01/2033 | 5,270,090 |
1,665,000 | Federal National Mortgage Association, 4.090%, 7/01/2034 | 1,489,870 |
23,123,806 | Federal National Mortgage Association, Series 2019-M17, Class X, IO, 0.417%, 8/25/2034(c)(d) | 378,405 |
13,919,638 | Federal National Mortgage Association, Series 2020-M33, Class X, IO, 1.997%, 6/25/2028(c)(d) | 753,338 |
16,225,120 | Federal National Mortgage Association, Series 2020-M37, Class X, IO, 1.117%, 4/25/2032(c)(d) | 783,154 |
15,891,509 | Federal National Mortgage Association, Series 2020-M43, Class X1, IO, 2.026%, 8/25/2034(c)(d) | 1,164,875 |
324,688,308 | FREMF Mortgage Trust, Series 2018-K156, Class X2A, IO, 0.100%, 7/25/2036(a)(d) | 1,980,891 |
15,466,969 | FRESB Mortgage Trust, Series 2021-SB90, Class X1, IO, 0.747%, 6/25/2041(c)(d) | 374,604 |
24,191,523 | FRESB Mortgage Trust, Series 2021-SB91, Class X1, IO, 0.681%, 8/25/2041(c)(d) | 661,343 |
91,443,180 | FRESB Mortgage Trust, Series 2022-SB95, Class X1, IO, 0.103%, 11/25/2041(c)(d) | 528,724 |
3,277,483 | Government National Mortgage Association, Series 2006-46, Class IO, 0.476%, 4/16/2046(c)(d)(e) | 31,381 |
1,386,360 | Government National Mortgage Association, Series 2006-51, Class IO, 0.939%, 8/16/2046(c)(d)(e) | 27,615 |
4,000,000 | Government National Mortgage Association, Series 2008-52, Class E, 6.041%, 8/16/2042(c) | 3,737,605 |
379,288 | Government National Mortgage Association, Series 2008-80, Class E, 5.674%, 8/16/2042(c) | 370,296 |
4,021,867 | Government National Mortgage Association, Series 2009-114, Class IO, 0.011%, 10/16/2049(c)(d)(e) | 33 |
Principal Amount | Description | Value (†) |
Agency Commercial Mortgage-Backed Securities — continued | ||
$1,645,510 | Government National Mortgage Association, Series 2010-124, Class X, IO, 1.020%, 12/16/2052(c)(d)(e) | $26,398 |
231,608 | Government National Mortgage Association, Series 2010-49, Class IA, IO, 1.450%, 10/16/2052(c)(d)(e) | 8,846 |
1,479,655 | Government National Mortgage Association, Series 2011-119, Class IO, 0.193%, 8/16/2051(c)(d)(e) | 2,575 |
3,265,327 | Government National Mortgage Association, Series 2011-121, Class ZA, 6.500%, 8/16/2051 | 3,080,666 |
11,646 | Government National Mortgage Association, Series 2011-161, Class IO, 0.313%, 4/16/2045(c)(d)(e) | — |
619,172 | Government National Mortgage Association, Series 2011-38, Class IO, 0.530%, 4/16/2053(c)(d)(e) | 4,541 |
1 | Government National Mortgage Association, Series 2012-100, Class IC, IO, 0.000%, 9/16/2050(c)(d)(e) | — |
1 | Government National Mortgage Association, Series 2012-111, Class IC, IO, 0.000%, 9/16/2050(c)(d)(e) | — |
18,485,195 | Government National Mortgage Association, Series 2012-142, Class IO, 0.192%, 4/16/2054(c)(d)(e) | 62,750 |
3,653,141 | Government National Mortgage Association, Series 2012-23, Class IO, 0.243%, 6/16/2053(c)(d)(e) | 23,278 |
4,592,678 | Government National Mortgage Association, Series 2012-55, Class IO, 0.000%, 4/16/2052(c)(d)(e) | 45 |
668,917 | Government National Mortgage Association, Series 2012-70, Class IO, 0.094%, 8/16/2052(c)(d)(e) | 320 |
5,157,864 | Government National Mortgage Association, Series 2012-79, Class IO, 0.353%, 3/16/2053(c)(d)(e) | 45,740 |
20,016,366 | Government National Mortgage Association, Series 2012-85, Class IO, 0.349%, 9/16/2052(c)(d)(e) | 165,650 |
771,638 | Government National Mortgage Association, Series 2013-175, Class IO, 0.173%, 5/16/2055(c)(d)(e) | 1,990 |
2,135,589 | Government National Mortgage Association, Series 2014-101, Class IO, 0.593%, 4/16/2056(c)(d)(e) | 28,507 |
9,768,357 | Government National Mortgage Association, Series 2014-130, Class IB, IO, 0.218%, 8/16/2054(c)(d)(e) | 66,525 |
7,983,273 | Government National Mortgage Association, Series 2014-24, Class IX, IO, 0.123%, 1/16/2054(c)(d)(e) | 30,517 |
Loomis Sayles Securitized Asset Fund (continued)
Principal Amount | Description | Value (†) |
Agency Commercial Mortgage-Backed Securities — continued | ||
$5,237,055 | Government National Mortgage Association, Series 2014-70, Class IO, 0.453%, 3/16/2049(c)(d)(e) | $60,873 |
3,354,367 | Government National Mortgage Association, Series 2014-86, Class IO, 0.449%, 4/16/2056(c)(d)(e) | 35,821 |
13,705,129 | Government National Mortgage Association, Series 2015-120, Class IO, 0.619%, 3/16/2057(c)(d)(e) | 240,288 |
9,547,918 | Government National Mortgage Association, Series 2015-146, Class IB, IO, 0.198%, 7/16/2055(c)(d)(e) | 59,476 |
5,681,408 | Government National Mortgage Association, Series 2015-171, Class IO, 0.840%, 11/16/2055(c)(d)(e) | 156,214 |
5,468,671 | Government National Mortgage Association, Series 2015-189, Class IG, IO, 0.623%, 1/16/2057(c)(d)(e) | 132,193 |
3,676,218 | Government National Mortgage Association, Series 2015-21, Class IO, 0.709%, 7/16/2056(c)(d)(e) | 88,893 |
11,132,412 | Government National Mortgage Association, Series 2015-32, Class IO, 0.579%, 9/16/2049(c)(d)(e) | 203,904 |
7,115,082 | Government National Mortgage Association, Series 2015-6, Class IO, 0.475%, 2/16/2051(c)(d)(e) | 74,418 |
2,736,864 | Government National Mortgage Association, Series 2015-68, Class IO, 0.341%, 7/16/2057(c)(d)(e) | 38,085 |
11,201,069 | Government National Mortgage Association, Series 2015-70, Class IO, 0.568%, 12/16/2049(c)(d)(e) | 192,329 |
5,862,247 | Government National Mortgage Association, Series 2015-73, Class IO, 0.439%, 11/16/2055(c)(d)(e) | 79,619 |
17,089,554 | Government National Mortgage Association, Series 2016-132, Class IO, 0.633%, 7/16/2056(c)(d)(e) | 360,031 |
8,775,906 | Government National Mortgage Association, Series 2016-143, Class IO, 0.858%, 10/16/2056(d)(e) | 377,583 |
23,876,281 | Government National Mortgage Association, Series 2017-168, Class IO, 0.577%, 12/16/2059(c)(d) | 788,404 |
24,139,424 | Government National Mortgage Association, Series 2017-90, Class IO, 0.724%, 1/16/2059(c)(d) | 920,267 |
4,799,669 | Government National Mortgage Association, Series 2018-133, Class IO, 1.114%, 6/16/2058(c)(d) | 312,031 |
10,818,143 | Government National Mortgage Association, Series 2018-2, Class IO, 0.706%, 12/16/2059(c)(d) | 444,024 |
Principal Amount | Description | Value (†) |
Agency Commercial Mortgage-Backed Securities — continued | ||
$32,974,277 | Government National Mortgage Association, Series 2018-82, Class IO, 0.483%, 5/16/2058(c)(d) | $1,008,271 |
19,302,314 | Government National Mortgage Association, Series 2018-96, Class IO, 0.461%, 8/16/2060(c)(d) | 633,676 |
9,549,613 | Government National Mortgage Association, Series 2019-75, Class IO, 0.855%, 12/16/2060(c)(d)(e) | 489,820 |
7,258,980 | Government National Mortgage Association, Series 2019-94, Class IO, 0.958%, 8/16/2061(c)(d)(e) | 413,957 |
39,092,371 | Government National Mortgage Association, Series 2020-108, Class IO, 0.847%, 6/16/2062(c)(d) | 2,205,091 |
19,178,123 | Government National Mortgage Association, Series 2020-128, Class IO, 0.914%, 10/16/2062(c)(d) | 1,177,048 |
40,618,686 | Government National Mortgage Association, Series 2020-136, Class IO, 1.013%, 8/16/2062(c)(d) | 2,829,087 |
37,445,312 | Government National Mortgage Association, Series 2020-172, Class IO, 1.150%, 9/16/2062(c)(d) | 2,890,490 |
15,928,791 | Government National Mortgage Association, Series 2020-174, Class IO, 0.845%, 1/16/2063(c)(d) | 941,223 |
36,668,327 | Government National Mortgage Association, Series 2020-179, Class IO, 1.009%, 9/16/2062(c)(d) | 2,553,894 |
44,189,623 | Government National Mortgage Association, Series 2020-197, Class IO, 0.948%, 10/16/2062(c)(d) | 2,785,192 |
34,699,145 | Government National Mortgage Association, Series 2020-26, Class IO, 0.705%, 10/15/2061(c)(d) | 1,593,277 |
9,223,368 | Government National Mortgage Association, Series 2021-10, Class IO, 0.986%, 5/16/2063(c)(d) | 635,730 |
41,437,193 | Government National Mortgage Association, Series 2021-106, Class IO, 0.859%, 4/16/2063(c)(d) | 2,700,006 |
40,791,345 | Government National Mortgage Association, Series 2021-12, Class IO, 0.954%, 3/16/2063(c)(d) | 2,660,615 |
44,984,065 | Government National Mortgage Association, Series 2021-128, Class IO, 1.002%, 6/16/2061(c)(d) | 2,855,220 |
55,036,269 | Government National Mortgage Association, Series 2021-132, Class BI, IO, 0.923%, 4/16/2063(c)(d) | 3,596,240 |
52,874,894 | Government National Mortgage Association, Series 2021-133, Class IO, 0.880%, 7/16/2063(c)(d) | 3,414,608 |
Loomis Sayles Securitized Asset Fund (continued)
Principal Amount | Description | Value (†) |
Agency Commercial Mortgage-Backed Securities — continued | ||
$54,488,540 | Government National Mortgage Association, Series 2021-144, Class IO, 0.825%, 4/16/2063(c)(d) | $3,138,594 |
11,238,099 | Government National Mortgage Association, Series 2021-145, Class IO, 0.771%, 7/16/2061(c)(d) | 650,349 |
47,960,109 | Government National Mortgage Association, Series 2021-151, Class IO, 0.917%, 4/16/2063(c)(d) | 3,297,162 |
50,937,642 | Government National Mortgage Association, Series 2021-163, Class IO, 0.801%, 3/16/2064(c)(d) | 2,976,882 |
20,486,647 | Government National Mortgage Association, Series 2021-180, Class IO, 0.911%, 11/16/2063(c)(d) | 1,452,360 |
56,812,248 | Government National Mortgage Association, Series 2021-186, Class IO, 0.765%, 5/16/2063(c)(d) | 3,259,688 |
37,865,193 | Government National Mortgage Association, Series 2021-20, Class IO, 1.149%, 8/16/2062(c)(d) | 2,880,594 |
34,510,643 | Government National Mortgage Association, Series 2021-33, Class IO, 0.841%, 10/16/2062(c)(d) | 2,079,342 |
30,306,854 | Government National Mortgage Association, Series 2021-40, Class IO, 0.824%, 2/16/2063(c)(d) | 1,932,698 |
46,035,481 | Government National Mortgage Association, Series 2021-52, Class IO, 0.719%, 4/16/2063(c)(d) | 2,479,407 |
49,609,419 | Government National Mortgage Association, Series 2022-166, Class IO, 0.792%, 4/16/2065(c)(d) | 3,177,215 |
28,211,778 | Government National Mortgage Association, Series 2022-17, Class IO, 0.802%, 6/16/2064(c)(d) | 1,772,213 |
160,816,402 | ||
Collateralized Mortgage Obligations — 5.8% | ||
1,570,795 | Ajax Mortgage Loan Trust, Series 2019-D, Class A1, 2.956%, 9/25/2065(a)(c) | 1,435,391 |
933 | Federal Home Loan Mortgage Corp., Series 1673, Class SE, REMIC, 8.390%, 2/15/2024(c)(e) | 904 |
174,100 | Federal Home Loan Mortgage Corp., Series 224, Class IO, 6.000%, 3/01/2033(d)(e) | 25,727 |
54,091 | Federal Home Loan Mortgage Corp., Series 2649, Class IM, IO, REMIC, 7.000%, 7/15/2033(d)(e) | 9,368 |
4,371 | Federal Home Loan Mortgage Corp., Series 2725, Class SC, REMIC, 0.936%, 11/15/2033(c)(e) | 4,190 |
Principal Amount | Description | Value (†) |
Collateralized Mortgage Obligations — continued | ||
$457,688 | Federal Home Loan Mortgage Corp., Series 3013, Class AS, REMIC, 3.636%, 5/15/2035(c)(e) | $435,843 |
2,414,473 | Federal Home Loan Mortgage Corp., Series 3149, Class LS, REMIC, 1.772%, 5/15/2036(c)(d)(e) | 198,672 |
750,753 | Federal Home Loan Mortgage Corp., Series 3229, Class BI, REMIC, 1.192%, 10/15/2036(c)(d)(e) | 48,780 |
782,937 | Federal Home Loan Mortgage Corp., Series 3416, Class BI, REMIC, 0.822%, 2/15/2038(c)(d)(e) | 45,255 |
311,193 | Federal Home Loan Mortgage Corp., Series 3417, Class VS, REMIC, 2.406%, 2/15/2038(c)(e) | 289,265 |
292,516 | Federal Home Loan Mortgage Corp., Series 3417, Class WS, REMIC, 3.582%, 2/15/2038(c)(e) | 260,051 |
888,938 | Federal Home Loan Mortgage Corp., Series 3561, Class W, IO, REMIC, 2.600%, 6/15/2048(c)(d) | 787,915 |
374,636 | Federal Home Loan Mortgage Corp., Series 3620, Class AT, REMIC, 3.841%, 12/15/2036(c)(d) | 365,467 |
1,069,731 | Federal Home Loan Mortgage Corp., Series 3747, Class CS, REMIC, 1.072%, 10/15/2040(c)(d)(e) | 79,517 |
6,865 | Federal Home Loan Mortgage Corp., Series 3792, Class DF, REMIC, 30 day USD SOFR Average + 0.514%, 5.828%, 11/15/2040(b)(e) | 6,656 |
183,907 | Federal Home Loan Mortgage Corp., Series 3808, Class SH, REMIC, 0.000%, 2/15/2041(c)(e) | 96,961 |
944,145 | Federal Home Loan Mortgage Corp., Series 3922, Class SH, REMIC, 0.472%, 9/15/2041(c)(d)(e) | 44,314 |
1,272,386 | Federal Home Loan Mortgage Corp., Series 4041, Class ES, REMIC, 0.000%, 8/15/2040(c) | 1,016,450 |
878,181 | Federal Home Loan Mortgage Corp., Series 4097, Class US, REMIC, 0.722%, 8/15/2032(c)(d)(e) | 33,967 |
4,587,867 | Federal Home Loan Mortgage Corp., Series 4136, Class SG, REMIC, 0.722%, 11/15/2042(c)(d)(e) | 369,985 |
2,819,878 | Federal Home Loan Mortgage Corp., Series 4321, Class BS, REMIC, 0.000%, 6/15/2039(c)(d)(e) | 149,678 |
1,135,526 | Federal Home Loan Mortgage Corp., Series 4512, Class IE, IO, REMIC, 4.500%, 3/15/2044(d)(e) | 209,308 |
3,397,913 | Federal Home Loan Mortgage Corp., Series 4672, Class SP, REMIC, 0.672%, 4/15/2047(c)(d)(e) | 245,322 |
Loomis Sayles Securitized Asset Fund (continued)
Principal Amount | Description | Value (†) |
Collateralized Mortgage Obligations — continued | ||
$1,304,715 | Federal Home Loan Mortgage Corp., Series 4749, Class IO, REMIC, 4.000%, 12/15/2047(d)(e) | $218,033 |
3,123,336 | Federal Home Loan Mortgage Corp., Series 5048, Class HI, IO, REMIC, 4.500%, 1/15/2042(d) | 505,891 |
7,714,663 | Federal Home Loan Mortgage Corp., Series 5065, Class HI, IO, REMIC, 4.883%, 4/15/2042(c)(d) | 1,322,009 |
157,224 | Federal Home Loan Mortgage Corp., Series 5065, Class EI, IO, REMIC, 5.405%, 11/25/2044(c)(d) | 32,656 |
1,166,239 | Federal Home Loan Mortgage Corp., Series 5078, Class MI, IO, REMIC, 4.000%, 9/25/2043(d)(e) | 285,499 |
15,468,214 | Federal Home Loan Mortgage Corp., Series 5094, Class IO, REMIC, 1.504%, 12/15/2048(c)(d) | 1,157,046 |
315,152 | Federal Home Loan Mortgage Corp., Series 5214, Class BI, IO, REMIC, 0.897%, 4/25/2052(c)(d) | 12,588 |
125,000 | Federal Home Loan Mortgage Corp., Series 5214, Class BY, REMIC, 3.000%, 4/25/2052 | 93,822 |
2,211 | Federal National Mortgage Association, Series 1996-45, Class SC, REMIC, 1.821%, 1/25/2024(c)(d)(e) | 5 |
641,109 | Federal National Mortgage Association, Series 2005-22, Class DG, REMIC, 6.810%, 4/25/2035(c)(e) | 597,650 |
958,594 | Federal National Mortgage Association, Series 2005-45, Class DA, REMIC, 4.512%, 6/25/2035(c)(e) | 951,505 |
1,801,419 | Federal National Mortgage Association, Series 2005-62, Class GZ, REMIC, 5.750%, 7/25/2035 | 1,778,320 |
816,238 | Federal National Mortgage Association, Series 2006-46, Class SK, REMIC, 4.292%, 6/25/2036(c)(e) | 809,752 |
33,051 | Federal National Mortgage Association, Series 2006-69, Class KI, REMIC, 1.871%, 8/25/2036(c)(d)(e) | 2,759 |
223,429 | Federal National Mortgage Association, Series 2008-15, Class AS, REMIC, 5.853%, 8/25/2036(c)(e) | 243,970 |
580,964 | Federal National Mortgage Association, Series 2008-86, Class LA, REMIC, 3.492%, 8/25/2038(c) | 543,072 |
154,780 | Federal National Mortgage Association, Series 2008-87, Class LD, REMIC, 4.041%, 11/25/2038(c)(e) | 143,407 |
632,725 | Federal National Mortgage Association, Series 2009-11, Class VP, REMIC, 2.423%, 3/25/2039(c)(e) | 557,987 |
Principal Amount | Description | Value (†) |
Collateralized Mortgage Obligations — continued | ||
$58,573 | Federal National Mortgage Association, Series 2010-75, Class MT, REMIC, 1.590%, 12/25/2039(c)(e) | $46,981 |
2,504,778 | Federal National Mortgage Association, Series 2010-80, Class PZ, REMIC, 5.000%, 7/25/2040 | 2,440,558 |
282,244 | Federal National Mortgage Association, Series 2011-100, Class SH, REMIC, 3.000%, 11/25/2040(c)(e) | 219,407 |
2,277,775 | Federal National Mortgage Association, Series 2011-51, Class SM, REMIC, 0.421%, 6/25/2041(c)(d)(e) | 138,497 |
1,273,816 | Federal National Mortgage Association, Series 2012-14, Class MS, REMIC, 1.071%, 3/25/2042(c)(d)(e) | 99,158 |
931,489 | Federal National Mortgage Association, Series 2012-21, Class SB, REMIC, 0.521%, 3/25/2042(c)(d)(e) | 43,100 |
2,967,389 | Federal National Mortgage Association, Series 2012-97, Class SB, REMIC, 0.571%, 9/25/2042(c)(d)(e) | 215,752 |
396,352 | Federal National Mortgage Association, Series 2013-109, Class US, REMIC, 0.000%, 7/25/2043(c)(e) | 261,478 |
1,445,255 | Federal National Mortgage Association, Series 2013-117, Class S, REMIC, 1.171%, 11/25/2043(c)(d)(e) | 126,504 |
1,555,784 | Federal National Mortgage Association, Series 2013-34, Class PS, REMIC, 0.721%, 8/25/2042(c)(d)(e) | 72,708 |
4,752,750 | Federal National Mortgage Association, Series 2013-66, Class LI, IO, REMIC, 7.000%, 7/25/2043(d)(e) | 729,827 |
10,345,188 | Federal National Mortgage Association, Series 2014-15, Class SA, REMIC, 0.621%, 4/25/2044(c)(d)(e) | 751,089 |
818,465 | Federal National Mortgage Association, Series 2014-28, Class SD, REMIC, 0.621%, 5/25/2044(c)(d)(e) | 35,162 |
327,764 | Federal National Mortgage Association, Series 2015-55, Class KT, REMIC, 0.000%, 5/25/2041(c)(e) | 279,479 |
7,056,082 | Federal National Mortgage Association, Series 2016-22, Class ST, REMIC, 0.671%, 4/25/2046(c)(d)(e) | 357,974 |
1,238,832 | Federal National Mortgage Association, Series 2016-26, Class KL, REMIC, 0.000%, 11/25/2042(c) | 747,993 |
7,704,239 | Federal National Mortgage Association, Series 2016-32, Class SA, REMIC, 0.671%, 10/25/2034(c)(d) | 418,867 |
9,444,299 | Federal National Mortgage Association, Series 2016-60, Class ES, REMIC, 0.671%, 9/25/2046(c)(d) | 499,511 |
Loomis Sayles Securitized Asset Fund (continued)
Principal Amount | Description | Value (†) |
Collateralized Mortgage Obligations — continued | ||
$6,227,806 | Federal National Mortgage Association, Series 2016-60, Class QS, REMIC, 0.671%, 9/25/2046(c)(d) | $311,982 |
3,880,085 | Federal National Mortgage Association, Series 2016-82, Class SC, REMIC, 0.671%, 11/25/2046(c)(d)(e) | 211,609 |
3,995,427 | Federal National Mortgage Association, Series 2016-82, Class SG, REMIC, 0.671%, 11/25/2046(c)(d)(e) | 206,420 |
4,592,898 | Federal National Mortgage Association, Series 2016-93, Class SL, REMIC, 1.221%, 12/25/2046(c)(d)(e) | 275,386 |
6,369,373 | Federal National Mortgage Association, Series 2017-26, Class SA, REMIC, 0.721%, 4/25/2047(c)(d)(e) | 322,046 |
37,515,754 | Federal National Mortgage Association, Series 2017-57, Class SD, REMIC, 0.000%, 8/25/2047(c)(d)(e) | 414,530 |
10,800,847 | Federal National Mortgage Association, Series 2020-37, Class QJ, IO, REMIC, 4.500%, 6/25/2050(d) | 2,091,970 |
3,153,176 | Federal National Mortgage Association, Series 2020-72, Class LI, IO, REMIC, 5.000%, 12/25/2040(d) | 671,252 |
13,391,102 | Federal National Mortgage Association, Series 2021-24, Class IO, REMIC, 1.136%, 3/25/2059(c)(d) | 843,926 |
234,287 | Federal National Mortgage Association, Series 334, Class 11, IO, 6.000%, 3/25/2033(d)(e) | 33,699 |
62,271 | Federal National Mortgage Association, Series 334, Class 19, IO, 7.000%, 2/25/2033(c)(d)(e) | 11,405 |
250,597 | Federal National Mortgage Association, Series 339, Class 13, IO, 6.000%, 6/25/2033(d)(e) | 39,458 |
159,097 | Federal National Mortgage Association, Series 339, Class 7, IO, 5.500%, 11/25/2033(d)(e) | 24,272 |
570,048 | Federal National Mortgage Association, Series 356, Class 13, IO, 5.500%, 6/25/2035(d)(e) | 107,646 |
239,310 | Federal National Mortgage Association, Series 359, Class 17, IO, 6.000%, 7/25/2035(d)(e) | 45,220 |
131,700 | Federal National Mortgage Association, Series 374, Class 18, IO, 6.500%, 8/25/2036(d)(e) | 25,411 |
289,191 | Federal National Mortgage Association, Series 374, Class 20, IO, 6.500%, 9/25/2036(d)(e) | 57,170 |
129,201 | Federal National Mortgage Association, Series 374, Class 22, IO, 7.000%, 10/25/2036(d)(e) | 27,622 |
Principal Amount | Description | Value (†) |
Collateralized Mortgage Obligations — continued | ||
$139,487 | Federal National Mortgage Association, Series 374, Class 23, IO, 7.000%, 10/25/2036(d)(e) | $25,405 |
194,713 | Federal National Mortgage Association, Series 374, Class 24, IO, 7.000%, 6/25/2037(d)(e) | 42,416 |
178,266 | Federal National Mortgage Association, Series 381, Class 12, IO, 6.000%, 11/25/2035(d)(e) | 30,988 |
83,796 | Federal National Mortgage Association, Series 381, Class 13, IO, 6.000%, 11/25/2035(c)(d)(e) | 14,749 |
110,442 | Federal National Mortgage Association, Series 381, Class 18, IO, 7.000%, 3/25/2037(d)(e) | 20,802 |
65,220 | Federal National Mortgage Association, Series 381, Class 19, IO, 7.000%, 3/25/2037(c)(d)(e) | 12,977 |
19,943 | Federal National Mortgage Association, Series 383, Class 32, IO, 6.000%, 1/25/2038(d)(e) | 3,822 |
614,313 | Federal National Mortgage Association, Series 384, Class 20, IO, 5.500%, 5/25/2036(c)(d)(e) | 109,421 |
211,673 | Federal National Mortgage Association, Series 384, Class 31, IO, 6.500%, 7/25/2037(d)(e) | 43,087 |
127,745 | Federal National Mortgage Association, Series 384, Class 36, IO, 7.000%, 7/25/2037(c)(d)(e) | 16,019 |
145,603 | Federal National Mortgage Association, Series 384, Class 4, IO, 4.500%, 9/25/2036(c)(d)(e) | 9,687 |
92,323 | Federal National Mortgage Association, Series 385, Class 23, IO, 7.000%, 7/25/2037(d)(e) | 18,270 |
15,806 | Federal National Mortgage Association, Series 386, Class 25,IO, 7.000%, 3/25/2038(c)(d)(e) | 3,613 |
359,531 | Government National Mortgage Association, Series 2009-65, Class NZ, 5.500%, 8/20/2039(e) | 350,701 |
125,969 | Government National Mortgage Association, Series 2010-H02, Class FA, 1 mo. USD SOFR + 0.794%, 6.123%, 2/20/2060(b)(e) | 124,082 |
61,191 | Government National Mortgage Association, Series 2010-H22, Class FE, 1 mo. USD SOFR + 0.464%, 5.782%, 5/20/2059(b)(e) | 60,152 |
83,214 | Government National Mortgage Association, Series 2010-H24, Class FA, 1 mo. USD SOFR + 0.464%, 5.782%, 10/20/2060(b) | 82,674 |
Loomis Sayles Securitized Asset Fund (continued)
Principal Amount | Description | Value (†) |
Collateralized Mortgage Obligations — continued | ||
$98,790 | Government National Mortgage Association, Series 2011-H05, Class FB, 1 mo. USD SOFR + 0.614%, 5.932%, 12/20/2060(b) | $98,302 |
40,781 | Government National Mortgage Association, Series 2011-H11, Class FA, 1 mo. USD SOFR + 0.614%, 5.932%, 3/20/2061(b) | 40,598 |
43,665 | Government National Mortgage Association, Series 2011-H21, Class FA, 1 mo. USD SOFR + 0.714%, 6.032%, 10/20/2061(b)(e) | 43,092 |
113,298 | Government National Mortgage Association, Series 2011-H21, Class FT, 1 yr. CMT + 0.700%, 6.063%, 10/20/2061(b)(e) | 111,952 |
4,080 | Government National Mortgage Association, Series 2012-H11, Class BA, 2.000%, 5/20/2062(e) | 3,578 |
284,341 | Government National Mortgage Association, Series 2012-H22, Class HD, 5.310%, 1/20/2061(c)(e) | 277,774 |
2,857 | Government National Mortgage Association, Series 2012-H24, Class FE, 1 mo. USD SOFR + 0.714%, 4.600%, 10/20/2062(b)(e) | 2,760 |
102,349 | Government National Mortgage Association, Series 2012-H24, Class HI, IO, 1.192%, 10/20/2062(c)(d)(e) | 6,426 |
125,497 | Government National Mortgage Association, Series 2013-H01, Class JA, 1 mo. USD SOFR + 0.434%, 5.752%, 1/20/2063(b)(e) | 122,996 |
27,281 | Government National Mortgage Association, Series 2013-H11, Class JA, 3.500%, 4/20/2063(e) | 25,646 |
1,233,712 | Government National Mortgage Association, Series 2013-H13, Class SI, IO, 1.278%, 6/20/2063(c)(d)(e) | 35,620 |
3,871,975 | Government National Mortgage Association, Series 2013-H16, Class AI, IO, 1.491%, 7/20/2063(c)(d)(e) | 72,257 |
1,760,336 | Government National Mortgage Association, Series 2013-H18, Class EI, IO, 1.864%, 7/20/2063(c)(d)(e) | 85,581 |
536,885 | Government National Mortgage Association, Series 2013-H18, Class JI, IO, 1.214%, 8/20/2063(c)(d)(e) | 8,340 |
103,640 | Government National Mortgage Association, Series 2013-H20, Class FA, 1 mo. USD SOFR + 0.714%, 6.032%, 8/20/2063(b)(e) | 102,187 |
8,870,791 | Government National Mortgage Association, Series 2014-H24, Class HI, IO, 0.999%, 9/20/2064(c)(d)(e) | 166,860 |
Principal Amount | Description | Value (†) |
Collateralized Mortgage Obligations — continued | ||
$2,917,573 | Government National Mortgage Association, Series 2015-152, Class PI, IO, 4.000%, 10/20/2045(d)(e) | $468,772 |
16,160,893 | Government National Mortgage Association, Series 2015-H01, Class XZ, 4.534%, 10/20/2064(c) | 15,921,639 |
299,507 | Government National Mortgage Association, Series 2015-H04, Class HA, 3.500%, 11/20/2064(c)(e) | 288,279 |
3,555 | Government National Mortgage Association, Series 2015-H05, Class FA, 1 mo. USD SOFR + 0.414%, 4.741%, 4/20/2061(b)(e) | 3,440 |
1,434,604 | Government National Mortgage Association, Series 2015-H10, Class JA, 2.250%, 4/20/2065 | 1,381,397 |
9,281 | Government National Mortgage Association, Series 2015-H13, Class FL, 1 mo. USD SOFR + 0.394%, 4.908%, 5/20/2063(b)(e) | 8,388 |
10,593 | Government National Mortgage Association, Series 2015-H19, Class FA, 1 mo. USD SOFR + 0.314%, 4.927%, 4/20/2063(b)(e) | 10,104 |
358,475 | Government National Mortgage Association, Series 2015-H28, Class JZ, 5.004%, 3/20/2065(c)(e) | 347,181 |
1,813 | Government National Mortgage Association, Series 2015-H29, Class FA, 1 mo. USD SOFR + 0.814%, 4.629%, 10/20/2065(b)(e) | 1,739 |
143,169 | Government National Mortgage Association, Series 2015-H29, Class HZ, 4.581%, 9/20/2065(c)(e) | 131,016 |
2,834 | Government National Mortgage Association, Series 2015-H30, Class FA, 1 mo. USD SOFR + 0.794%, 4.810%, 8/20/2061(b)(e) | 2,694 |
1,444,312 | Government National Mortgage Association, Series 2016-17, Class GT, 0.000%, 8/20/2045(c) | 1,036,908 |
454,319 | Government National Mortgage Association, Series 2016-23, Class PA, 5.605%, 7/20/2037(c)(e) | 437,891 |
9,232,037 | Government National Mortgage Association, Series 2016-H01, Class AI, IO, 0.024%, 1/20/2066(c)(d)(e) | 203,761 |
13,620,636 | Government National Mortgage Association, Series 2016-H09, Class JI, IO, 0.039%, 4/20/2066(c)(d)(e) | 377,267 |
90,648 | Government National Mortgage Association, Series 2016-H14, Class JZ, 4.424%, 8/20/2063(c)(e) | 84,363 |
274,154 | Government National Mortgage Association, Series 2016-H19, Class CZ, 4.754%, 8/20/2066(c)(e) | 267,410 |
Loomis Sayles Securitized Asset Fund (continued)
Principal Amount | Description | Value (†) |
Collateralized Mortgage Obligations — continued | ||
$36,896 | Government National Mortgage Association, Series 2016-H19, Class EZ, 5.172%, 6/20/2061(c)(e) | $34,425 |
4,327,738 | Government National Mortgage Association, Series 2017-128, Class IO, 0.979%, 12/16/2056(c)(d)(e) | 197,993 |
4,666,452 | Government National Mortgage Association, Series 2017-26, Class IM, IO, 6.500%, 2/20/2047(d)(e) | 670,257 |
1,770,612 | Government National Mortgage Association, Series 2017-H05, Class AI, IO, 0.054%, 1/20/2067(c)(d)(e) | 71,881 |
7,489,932 | Government National Mortgage Association, Series 2018-110, Class IO, 0.604%, 1/16/2060(c)(d)(e) | 323,216 |
11,877,084 | Government National Mortgage Association, Series 2018-129, Class IO, 0.618%, 7/16/2060(c)(d) | 481,313 |
11,890,467 | Government National Mortgage Association, Series 2018-143, Class IO, 0.491%, 10/16/2060(c)(d) | 553,573 |
4,698 | Government National Mortgage Association, Series 2018-H02, Class FJ, 1 mo. USD SOFR + 0.314%, 4.408%, 10/20/2064(b)(e) | 4,543 |
4,477,465 | Government National Mortgage Association, Series 2018-H16, Class CZ, 4.269%, 5/20/2068(c) | 4,069,871 |
280,000 | Government National Mortgage Association, Series 2019-111, Class LP, 3.500%, 9/20/2049(e) | 202,262 |
17,469,815 | Government National Mortgage Association, Series 2019-116, Class IO, 0.622%, 12/16/2061(c)(d) | 812,329 |
324,000 | Government National Mortgage Association, Series 2019-132, Class LP, 3.500%, 10/20/2049(e) | 233,228 |
8,447,001 | Government National Mortgage Association, Series 2019-152, Class LI, 0.111%, 2/20/2044(c)(d)(e) | 693,835 |
2,138,710 | Government National Mortgage Association, Series 2019-44, Class BS, 0.611%, 4/20/2049(c)(d)(e) | 117,146 |
9,261,407 | Government National Mortgage Association, Series 2019-70, Class SK, 0.561%, 8/20/2043(c)(d) | 697,816 |
2,153,685 | Government National Mortgage Association, Series 2019-H02, Class BZ, 4.262%, 1/20/2069(c) | 1,876,947 |
4,075,853 | Government National Mortgage Association, Series 2020-148, Class IJ, IO, 3.000%, 6/20/2049(d)(e) | 895,062 |
22,940,411 | Government National Mortgage Association, Series 2020-34, Class IO, 5.000%, 12/20/2039(d) | 4,615,682 |
Principal Amount | Description | Value (†) |
Collateralized Mortgage Obligations — continued | ||
$11,096,300 | Government National Mortgage Association, Series 2020-47, Class IQ, IO, 3.500%, 3/20/2050(d) | $2,613,094 |
46,703,453 | Government National Mortgage Association, Series 2021-H03, Class IO, 0.000%, 4/20/2070(c)(d)(e) | 32,296 |
7,756,568 | Government National Mortgage Association, Series 2021-H08, Class IA, IO, 0.008%, 1/20/2068(c)(d)(e) | 18,291 |
3,512,487 | Government National Mortgage Association, Series 2021-H17, Class IO, 0.020%, 3/20/2070(c)(d)(e) | 16,129 |
70,996,298 | ||
Mortgage Related — 37.2% | ||
17,412,790 | Federal Home Loan Mortgage Corp., 2.500%, with various maturities from 2050 to 2052(f) | 13,675,368 |
7,875,568 | Federal Home Loan Mortgage Corp., 3.500%, 6/01/2052 | 6,780,870 |
1,700,944 | Federal National Mortgage Association, 2.000%, with various maturities in 2050(f) | 1,249,108 |
411,404,488 | Federal National Mortgage Association, 2.500%, with various maturities from 2050 to 2062(f) | 319,725,849 |
107,349,396 | Federal National Mortgage Association, 3.000%, with various maturities from 2047 to 2052(f) | 89,136,511 |
461,714 | Federal National Mortgage Association, 4.000%, 1/01/2052 | 408,643 |
9 | Government National Mortgage Association, 5.470%, 11/20/2059(c) | 8 |
126,314 | Government National Mortgage Association, Series 2018-H12, Class HZ, 4.625%, 8/20/2068(c)(e) | 113,942 |
2,500,542 | Government National Mortgage Association, Series 2019-H02, Class JA, 3.500%, 12/20/2068 | 2,322,245 |
9,563,379 | Government National Mortgage Association, Series 2020-148, Class EI, IO, 3.000%, 11/20/2049(d) | 2,009,444 |
18,000,000 | Uniform Mortgage-Backed Security, TBA, 5.500%, 11/01/2053(g) | 17,390,390 |
452,812,378 | ||
Non-Agency Commercial Mortgage-Backed Securities — 12.1% | ||
3,720,000 | BANK, Series 2019-BN20, Class A3, 3.011%, 9/15/2062 | 3,095,724 |
3,525,000 | BANK, Series 2019-BN22, Class A4, 2.978%, 11/15/2062 | 2,974,543 |
1,770,000 | BANK, Series 2020-BN25, Class A5, 2.649%, 1/15/2063 | 1,456,592 |
3,649,000 | BANK, Series 2020-BN26, Class A4, 2.403%, 3/15/2063 | 2,942,299 |
Loomis Sayles Securitized Asset Fund (continued)
Principal Amount | Description | Value (†) |
Non-Agency Commercial Mortgage-Backed Securities — continued | ||
$785,000 | BANK, Series 2020-BN28, Class AS, 2.140%, 3/15/2063 | $592,870 |
5,300,000 | BANK, Series 2022-BNK39, Class A4, 2.928%, 2/15/2055(c) | 4,257,925 |
1,000,000 | Bank of America Merrill Lynch Commercial Mortgage Trust, Series 2016-UB10, Class A4, 3.170%, 7/15/2049 | 921,895 |
4,045,000 | BBCMS Mortgage Trust, Series 2020-BID, Class A, 1 mo. USD SOFR + 2.254%, 7.588%, 10/15/2037(a)(b) | 3,851,698 |
3,330,000 | Benchmark Mortgage Trust, Series 2019-B10, Class A4, 3.717%, 3/15/2062 | 2,972,335 |
5,185,000 | Benchmark Mortgage Trust, Series 2019-B13, Class A4, 2.952%, 8/15/2057 | 4,411,386 |
4,970,000 | BMO Mortgage Trust, Series 2022-C1, Class A5, 3.374%, 2/15/2055(c) | 4,108,272 |
2,235,000 | BPR Trust, Series 2022-OANA, Class A, 1 mo. USD SOFR + 1.898%, 7.230%, 4/15/2037(a)(b) | 2,194,630 |
1,860,000 | BPR Trust, Series 2022-STAR, Class A, 1 mo. USD SOFR + 3.232%, 8.564%, 8/15/2024(a)(b) | 1,846,388 |
2,770,000 | BX Commercial Mortgage Trust, Series 2022-AHP, Class B, 1 mo. USD SOFR + 1.840%, 7.172%, 1/17/2039(a)(b) | 2,713,320 |
510,000 | CALI Mortgage Trust, Series 2019-101C, Class A, 3.957%, 3/10/2039(a) | 387,516 |
10,643 | Commercial Mortgage Pass-Through Certificates, Series 2012-CR3, Class AM, 3.416%, 10/15/2045(a) | 9,835 |
1,991,226 | Commercial Mortgage Pass-Through Certificates, Series 2012-LTRT, Class A2, 3.400%, 10/05/2030(a) | 1,643,558 |
1,520,597 | Commercial Mortgage Pass-Through Certificates, Series 2013-CR13, Class A4, 4.194%, 11/10/2046(c) | 1,515,582 |
95,871 | Commercial Mortgage Pass-Through Certificates, Series 2014-CR16, Class ASB, 3.653%, 4/10/2047 | 95,547 |
208,749 | Commercial Mortgage Pass-Through Certificates, Series 2014-UBS2, Class A4, 3.691%, 3/10/2047 | 207,590 |
1,300,000 | Commercial Mortgage Pass-Through Certificates, Series 2014-UBS2, Class A5, 3.961%, 3/10/2047 | 1,290,133 |
2,520,000 | Commercial Mortgage Pass-Through Certificates, Series 2014-UBS5, Class A4, 3.838%, 9/10/2047 | 2,443,444 |
Principal Amount | Description | Value (†) |
Non-Agency Commercial Mortgage-Backed Securities — continued | ||
$3,110,000 | Commercial Mortgage Pass-Through Certificates, Series 2015-DC1, Class A5, 3.350%, 2/10/2048 | $2,975,381 |
540,063 | Commercial Mortgage Pass-Through Certificates, Series 2016-DC2, Class ASB, 3.550%, 2/10/2049 | 525,672 |
6,160,000 | Credit Suisse Mortgage Trust, Series 2014-USA, Class A2, 3.953%, 9/15/2037(a) | 5,256,487 |
2,110,000 | Credit Suisse Mortgage Trust, Series 2014-USA, Class B, 4.185%, 9/15/2037(a) | 1,666,388 |
2,045,000 | Credit Suisse Mortgage Trust, Series 2014-USA, Class C, 4.336%, 9/15/2037(a) | 1,539,318 |
2,405,000 | CSAIL Commercial Mortgage Trust, Series 2019-C18, Class A4, 2.968%, 12/15/2052 | 2,019,899 |
2,420,000 | DC Commercial Mortgage Trust, Series 2023-DC, Class A, 6.314%, 9/12/2040(a) | 2,412,382 |
5,365,000 | DROP Mortgage Trust, Series 2021-FILE, Class A, 1 mo. USD SOFR + 1.264%, 6.597%, 10/15/2043(a)(b) | 5,001,139 |
3,469,280 | Extended Stay America Trust, Series 2021-ESH, Class C, 1 mo. USD SOFR + 1.814%, 7.147%, 7/15/2038(a)(b) | 3,417,417 |
360,000 | GS Mortgage Securities Corp. II, Series 2023- SHIP, Class A, 4.466%, 9/10/2038(a)(c) | 342,836 |
3,690,000 | GS Mortgage Securities Corp. Trust, Series 2012-BWTR, Class A, 2.954%, 11/05/2034(a) | 2,702,061 |
5,775,000 | GS Mortgage Securities Corportation Trust, Series 2013-PEMB, Class A, 3.668%, 3/05/2033(a)(c) | 4,970,046 |
2,457,319 | GS Mortgage Securities Trust, Series 2013-GC16, Class B, 5.161%, 11/10/2046(c) | 2,434,754 |
5,100,000 | GS Mortgage Securities Trust, Series 2014-GC18, Class AS, 4.383%, 1/10/2047 | 4,820,516 |
1,295,000 | GS Mortgage Securities Trust, Series 2014-GC18, Class B, 4.885%, 1/10/2047(c) | 1,077,085 |
1,416,000 | GS Mortgage Securities Trust, Series 2014-GC20, Class A5, 3.998%, 4/10/2047 | 1,402,307 |
2,373,000 | GS Mortgage Securities Trust, Series 2014-GC22, Class C, 4.842%, 6/10/2047(c) | 1,765,213 |
5,000,000 | GS Mortgage Securities Trust, Series 2019-GSA1, Class A4, 3.048%, 11/10/2052 | 4,173,390 |
Loomis Sayles Securitized Asset Fund (continued)
Principal Amount | Description | Value (†) |
Non-Agency Commercial Mortgage-Backed Securities — continued | ||
$2,555,000 | GS Mortgage Securities Trust, Series 2020-GC45, Class A5, 2.911%, 2/13/2053 | $2,136,481 |
5,885,000 | Hudsons Bay Simon JV Trust, Series 2015-HB10, Class A10, 4.155%, 8/05/2034(a) | 5,021,645 |
1,513,720 | JP Morgan Chase Commercial Mortgage Securities Trust, Series 2012-LC9, Class C, 3.910%, 12/15/2047(a)(c) | 1,351,914 |
2,405,000 | JPMBB Commercial Mortgage Securities Trust, Series 2014-C19, Class AS, 4.243%, 4/15/2047(c) | 2,348,358 |
105,940 | JPMBB Commercial Mortgage Securities Trust, Series 2014-C19, Class ASB, 3.584%, 4/15/2047 | 105,352 |
730,000 | JPMBB Commercial Mortgage Securities Trust, Series 2014-C25, Class AS, 4.065%, 11/15/2047 | 700,381 |
3,134,955 | Med Trust, Series 2021-MDLN, Class A, 1 mo. USD SOFR + 1.064%, 6.397%, 11/15/2038(a)(b) | 3,056,276 |
930,000 | Morgan Stanley Bank of America Merrill Lynch Trust, Series 2014-C16, Class B, 4.438%, 6/15/2047(c) | 842,827 |
558,182 | Morgan Stanley Capital I Trust, Series 2011-C2, Class D, 5.385%, 6/15/2044(a)(c) | 502,364 |
3,285,000 | Morgan Stanley Capital I Trust, Series 2013-ALTM, Class A2, 3.828%, 2/05/2035(a)(c) | 3,050,125 |
5,780,000 | Morgan Stanley Capital I Trust, Series 2019-L3, Class A4, 3.127%, 11/15/2052 | 4,869,836 |
2,085,000 | Morgan Stanley Capital I Trust, Series 2021-L5, Class A4, 2.728%, 5/15/2054 | 1,669,122 |
1,212,827 | MSBAM Commercial Mortgage Securities Trust, Series 2012-CKSV, Class A2, 3.277%, 10/15/2030(a) | 1,000,582 |
3,475,000 | RBS Commercial Funding, Inc. Trust, Series 2013-SMV, Class C, 3.704%, 3/11/2031(a)(c) | 2,997,836 |
1,700,120 | Starwood Retail Property Trust, Series 2014-STAR, Class A, PRIME + 0.000%, 8.500%, 11/15/2027(a)(b) | 1,215,586 |
6,500,000 | Starwood Retail Property Trust, Series 2014-STAR, Class B, PRIME + 0.000%, 8.500%, 11/15/2027(a)(b)(e)(h) | 3,825,900 |
1,350,000 | UBS Commercial Mortgage Trust, Series 2019-C16, Class A4, 3.605%, 4/15/2052 | 1,182,832 |
4,000,000 | Wells Fargo Commercial Mortgage Trust, Series 2014-LC16, Class AS, 4.020%, 8/15/2050 | 3,864,646 |
Principal Amount | Description | Value (†) |
Non-Agency Commercial Mortgage-Backed Securities — continued | ||
$1,200,919 | Wells Fargo Commercial Mortgage Trust, Series 2015-C29, Class ASB, 3.400%, 6/15/2048 | $1,176,158 |
5,000,000 | Wells Fargo Commercial Mortgage Trust, Series 2018-C48, Class A5, 4.302%, 1/15/2052 | 4,605,530 |
5,012,000 | Wells Fargo Commercial Mortgage Trust, Series 2019-C54, Class A4, 3.146%, 12/15/2052 | 4,263,428 |
1,091,059 | WFRBS Commercial Mortgage Trust, Series 2013-C15, Class AS, 4.358%, 8/15/2046(c) | 1,025,596 |
790,000 | WFRBS Commercial Mortgage Trust, Series 2014-C20, Class AS, 4.176%, 5/15/2047 | 739,810 |
277,838 | WFRBS Commercial Mortgage Trust, Series 2014-C20, Class ASB, 3.638%, 5/15/2047 | 275,883 |
535,000 | WFRBS Commercial Mortgage Trust, Series 2014-C24, Class B, 4.204%, 11/15/2047(c) | 458,627 |
146,722,468 | ||
Total Bonds and Notes (Identified Cost $1,315,749,995) | 1,098,119,694 | |
Collateralized Loan Obligations — 7.3% | ||
2,225,000 | AGL CLO 12 Ltd., Series 2021-12A, Class B, 3 mo. USD SOFR + 1.862%, 7.188%, 7/20/2034(a)(b) | 2,195,379 |
3,000,000 | AGL CLO 3 Ltd., Series 2020-3A, Class A, 3 mo. USD SOFR + 1.562%, 6.870%, 1/15/2033(a)(b) | 2,990,670 |
5,255,000 | Alinea CLO Ltd., Series 2018-1A, Class B, 3 mo. USD SOFR + 1.912%, 7.238%, 7/20/2031(a)(b) | 5,213,911 |
595,000 | Allegro CLO VIII Ltd., Series 2018-2A, Class B1, 3 mo. USD SOFR + 1.932%, 7.240%, 7/15/2031(a)(b) | 586,666 |
3,835,000 | Dryden 53 CLO Ltd., Series 2017-53A, Class B, 3 mo. USD SOFR + 1.662%, 6.970%, 1/15/2031(a)(b) | 3,775,109 |
4,275,000 | Elmwood CLO VIII Ltd., Series 2021-1A, Class B1, 3 mo. USD SOFR + 1.812%, 7.138%, 1/20/2034(a)(b) | 4,240,911 |
1,565,000 | Galaxy XXVI CLO Ltd., Series 2018-26A, Class B, 3 mo. USD SOFR + 1.962%, 7.345%, 11/22/2031(a)(b) | 1,544,843 |
2,675,000 | Greystone CRE Notes Ltd., Series 2021-HC2, Class A, 1 mo. USD SOFR + 1.914%, 7.247%, 12/15/2039(a)(b) | 2,617,838 |
Loomis Sayles Securitized Asset Fund (continued)
Principal Amount | Description | Value (†) |
$3,497,500 | Hayfin U.S. XII Ltd., Series 2018-8A, Class B, 3 mo. USD SOFR + 1.742%, 7.068%, 4/20/2031(a)(b) | $3,433,184 |
3,005,000 | LCM 30 Ltd., Series 30A, Class BR, 3 mo. USD SOFR + 1.762%, 7.088%, 4/20/2031(a)(b) | 2,953,236 |
4,930,000 | Madison Park Funding XXIV Ltd., Series 2016-24A, Class BR, 3 mo. USD SOFR + 2.012%, 7.338%, 10/20/2029(a)(b) | 4,918,922 |
2,350,000 | Magnetite XXIX Ltd., Series 2021-29A, Class B, 3 mo. USD SOFR + 1.662%, 6.970%, 1/15/2034(a)(b) | 2,320,446 |
2,075,000 | Neuberger Berman CLO XX Ltd., Series 2015-20A, Class BRR, 3 mo. USD SOFR + 1.912%, 7.220%, 7/15/2034(a)(b) | 2,048,677 |
2,560,000 | Neuberger Berman Loan Advisers CLO 40 Ltd., Series 2021-40A, Class B, 3 mo. USD SOFR + 1.662%, 6.970%, 4/16/2033(a)(b) | 2,522,012 |
5,280,000 | OCP CLO Ltd., Series 2020-8RA, Class A2, 3 mo. USD SOFR + 1.812%, 7.120%, 1/17/2032(a)(b) | 5,237,459 |
2,040,000 | Octagon Investment Partners 18-R Ltd., Series 2018-18A, Class A2, 3 mo. USD SOFR + 1.732%, 7.040%, 4/16/2031(a)(b) | 2,014,057 |
4,045,000 | OHA Credit Funding 2 Ltd., Series 2019-2A, Class BR, 3 mo. USD LIBOR + 1.600%, 7.195%, 4/21/2034(a)(b) | 4,019,901 |
4,205,000 | OHA Credit Funding 3 Ltd., Series 2019-3A, Class BR, 3 mo. USD SOFR + 1.912%, 7.238%, 7/02/2035(a)(b) | 4,165,772 |
5,300,000 | OHA Credit Funding 8 Ltd., Series 2021-8A, Class B1, 3 mo. USD SOFR + 1.762%, 7.072%, 1/18/2034(a)(b) | 5,249,274 |
575,000 | Palmer Square CLO Ltd., Series 2015-1A, Class A2R4, 3 mo. USD SOFR + 1.962%, 7.341%, 5/21/2034(a)(b) | 568,439 |
3,800,000 | Post CLO Ltd., Series 2022-1A, Class A, 3 mo. USD SOFR + 1.380%, 6.706%, 4/20/2035(a)(b) | 3,759,370 |
1,035,000 | Recette CLO Ltd., Series 2015-1A, Class BRR, 3 mo. USD SOFR + 1.662%, 6.988%, 4/20/2034(a)(b) | 1,015,956 |
7,650,000 | Rockland Park CLO Ltd., Series 2021-1A, Class B, 3 mo. USD SOFR + 1.912%, 7.238%, 4/20/2034(a)(b) | 7,535,166 |
5,900,000 | TICP CLO VII Ltd., Series 2017-7A, Class BR, 3 mo. USD SOFR + 1.962%, 7.270%, 4/15/2033(a)(b) | 5,818,639 |
3,830,000 | Verde CLO Ltd., Series 2019-1A, Class BR, 3 mo. USD SOFR + 1.862%, 7.170%, 4/15/2032(a)(b) | 3,779,069 |
Principal Amount | Description | Value (†) |
$3,000,000 | Vibrant CLO X Ltd., Series 2018-10A, Class A1, 3 mo. USD SOFR + 1.462%, 6.788%, 10/20/2031(a)(b) | $2,983,845 |
1,315,000 | Voya CLO Ltd., Series 2013-3A, Class A2RR, 3 mo. USD SOFR + 1.961%, 7.271%, 10/18/2031(a)(b) | 1,298,168 |
Total Collateralized Loan Obligations (Identified Cost $89,363,385) | 88,806,919 | |
Loan Participations — 0.3% | ||
ABS Other — 0.1% | ||
1,899,681 | Harbour Aircraft Investments Ltd., Series 2017-1, Class A, 4.000%, 11/15/2037 | 1,654,896 |
Agency Commercial Mortgage-Backed Securities — 0.2% | ||
32,942,855 | Government National Mortgage Association, Series 2020-130, Class IO, 1.014%, 8/16/2060(c)(d) | 2,135,929 |
Total Loan Participations (Identified Cost $4,904,648) | 3,790,825 | |
Short-Term Investments — 3.3% | ||
12,651,136 | Tri-Party Repurchase Agreement with Fixed Income Clearing Corporation, dated 9/29/2023 at 2.500% to be repurchased at $12,653,772, on 10/02/2023 collateralized by $13,002,300 U.S. Treasury Note, 4.375% due 8/15/2026 valued at $12,904,253 including accrued interest (Note 2 of Notes to Financial Statements) | 12,651,136 |
12,000,000 | U.S. Treasury Bills, 5.233%, 10/05/2023(i) | 11,994,730 |
15,730,000 | U.S. Treasury Bills, 5.308%, 3/21/2024(i)(j) | 15,332,428 |
Total Short-Term Investments (Identified Cost $39,975,277) | 39,978,294 | |
Total Investments — 101.1% (Identified Cost $1,449,993,305) | 1,230,695,732 | |
Other assets less liabilities — (1.1)% | (12,912,599 ) | |
Net Assets — 100.0% | $1,217,783,133 | |
(†) | See Note 2 of Notes to Financial Statements. |
(a) | All or a portion of these securities are exempt from registration under Rule 144A of the Securities Act of 1933. These securities may be resold in transactions exempt from registration, normally to qualified institutional buyers. At September 30, 2023, the value of Rule 144A holdings amounted to $378,367,239 or 31.1% of net assets. |
(b) | Variable rate security. Rate as of September 30, 2023 is disclosed. |
Loomis Sayles Securitized Asset Fund (continued)
(c) | Variable rate security. The interest rate adjusts periodically based on; (i) changes in current interest rates and/or prepayments on underlying pools of assets, if applicable, (ii) reference to a base lending rate plus or minus a margin, and/or (iii) reference to a base lending rate adjusted by a multiplier and/or subject to certain floors or caps. Rate as of September 30, 2023 is disclosed. |
(d) | Interest only security. Security represents right to receive monthly interest payments on an underlying pool of mortgages. Principal shown is the outstanding par amount of the pool held as of the end of the period. |
(e) | Level 3 security. Value has been determined using significant unobservable inputs. See Note 3 of Notes to Financial Statements. |
(f) | The Fund’s investment in mortgage related securities of Federal Home Loan Mortgage Corporation and Federal National Mortgage Association are interests in separate pools of mortgages. All separate investments in securities of each issuer which have the same coupon rate have been aggregated for the purpose of presentation in the Portfolio of Investments. |
(g) | When-issued/delayed delivery. |
(h) | Non-income producing security. |
(i) | Interest rate represents discount rate at time of purchase; not a coupon rate. |
(j) | Security (or a portion thereof) has been pledged as collateral for open derivative contracts. |
ABS | Asset-Backed Securities |
CMT | Constant Maturity Treasury |
LIBOR | London Interbank Offered Rate |
REMIC | Real Estate Mortgage Investment Conduit |
SLM | Sallie Mae |
SOFR | Secured Overnight Financing Rate |
TBA | To Be Announced |
Financial Futures | Expiration Date | Contracts | Notional Amount | Value | Unrealized Appreciation (Depreciation) |
CBOT 10 Year U.S. Treasury Notes Futures | 12/19/2023 | 983 | $108,323,036 | $106,225,437 | $(2,097,599 ) |
CBOT U.S. Long Bond Futures | 12/19/2023 | 140 | 16,816,059 | 15,929,375 | (886,684 ) |
CME Ultra Long Term U.S. Treasury Bond Futures | 12/19/2023 | 192 | 24,440,367 | 22,788,000 | (1,652,367 ) |
Ultra 10-Year U.S. Treasury Notes Futures | 12/19/2023 | 329 | 37,823,269 | 36,704,063 | (1,119,206 ) |
Total | $(5,755,856 ) |
Mortgage Related | 37.2 % |
Agency Commercial Mortgage-Backed Securities | 13.4 |
Non-Agency Commercial Mortgage-Backed Securities | 12.1 |
ABS Home Equity | 6.4 |
ABS Other | 6.3 |
ABS Car Loan | 6.1 |
Collateralized Mortgage Obligations | 5.8 |
ABS Student Loan | 2.3 |
Other Investments, less than 2% each | 0.9 |
Collateralized Loan Obligations | 7.3 |
Short-Term Investments | 3.3 |
Total Investments | 101.1 |
Other assets less liabilities (including futures contracts) | (1.1 ) |
Net Assets | 100.0 % |
High Income Opportunities Fund | Securitized Asset Fund | |
ASSETS | ||
Investments at cost | $245,204,901 | $1,449,993,305 |
Net unrealized depreciation | (31,856,928 ) | (219,297,573 ) |
Investments at value | 213,347,973 | 1,230,695,732 |
Cash | 313,579 | 169 |
Due from brokers (Note 2) | — | 310,000 |
Foreign currency at value (identified cost $47 and $0, respectively) | 47 | — |
Receivable for Fund shares sold | 331,093 | 1,754,798 |
Receivable for securities sold | 436,073 | 3,750,377 |
Receivable for when-issued/delayed delivery securities sold (Note 2) | — | 34,875,031 |
Dividends and interest receivable | 2,964,786 | 6,144,385 |
Receivable for variation margin on futures contracts (Note 2) | — | 388,132 |
TOTAL ASSETS | 217,393,551 | 1,277,918,624 |
LIABILITIES | ||
Payable for securities purchased | 3,969,756 | 7,082,065 |
Payable for when-issued/delayed delivery securities purchased (Note 2) | — | 52,559,984 |
Payable for Fund shares redeemed | 101,595 | 493,442 |
TOTAL LIABILITIES | 4,071,351 | 60,135,491 |
NET ASSETS | $213,322,200 | $1,217,783,133 |
NET ASSETS CONSIST OF: | ||
Paid-in capital | $254,342,704 | $1,718,308,543 |
Accumulated loss | (41,020,504 ) | (500,525,410 ) |
NET ASSETS | $213,322,200 | $1,217,783,133 |
COMPUTATION OF NET ASSET VALUE AND OFFERING PRICE: | ||
Institutional Class: | ||
Net assets | $213,322,200 | $1,217,783,133 |
Shares of beneficial interest | 25,300,575 | 166,634,872 |
Net asset value, offering and redemption price per share | $8.43 | $7.31 |
High Income Opportunities Fund | Securitized Asset Fund | |
INVESTMENT INCOME | ||
Interest | $13,817,379 | $45,130,723 |
Dividends | 110,569 | — |
Less net foreign taxes withheld | (1,352 ) | — |
Investment income | 13,926,596 | 45,130,723 |
Net realized and unrealized gain (loss) on Investments, Futures contracts, Swap agreements and Foreign currency transactions | ||
Net realized gain (loss) on: | ||
Investments | (8,791,938 ) | (52,228,320 ) |
Futures contracts | — | (13,043,398 ) |
Swap agreements | 97,593 | — |
Foreign currency transactions (Note 2c) | 22 | — |
Net change in unrealized appreciation (depreciation) on: | ||
Investments | 11,721,711 | 24,453,184 |
Futures contracts | — | 6,411,748 |
Swap agreements | (2,604 ) | — |
Foreign currency translations (Note 2c) | (11 ) | — |
Net realized and unrealized gain (loss) on Investments, Futures contracts, Swap agreements and Foreign currency transactions | 3,024,773 | (34,406,786 ) |
NET INCREASE IN NET ASSETS RESULTING FROM OPERATIONS | $16,951,369 | $10,723,937 |
High Income Opportunities Fund | Securitized Asset Fund | |||
Year Ended September 30, 2023 | Year Ended September 30, 2022 | Year Ended September 30, 2023 | Year Ended September 30, 2022 | |
FROM OPERATIONS: | ||||
Investment income | $13,926,596 | $13,807,731 | $45,130,723 | $43,874,591 |
Net realized gain (loss) on investments, futures contracts, swap agreements and foreign currency transactions | (8,694,323 ) | 205,745 | (65,271,718 ) | (25,468,100 ) |
Net change in unrealized appreciation (depreciation) on investments, futures contracts, swap agreements and foreign currency translations | 11,719,096 | (54,629,888 ) | 30,864,932 | (218,280,870 ) |
Net increase (decrease) in net assets resulting from operations | 16,951,369 | (40,616,412 ) | 10,723,937 | (199,874,379 ) |
FROM DISTRIBUTIONS TO SHAREHOLDERS: | ||||
Institutional Class | (14,571,242 ) | (22,166,300 ) | (70,940,296 ) | (90,356,043 ) |
NET INCREASE (DECREASE) IN NET ASSETS FROM CAPITAL SHARES TRANSACTIONS (Note 10) | 17,532,958 | (11,510,929 ) | 2,056,823 | 1,295,674 |
Net increase (decrease) in net assets | 19,913,085 | (74,293,641 ) | (58,159,536 ) | (288,934,748 ) |
NET ASSETS | ||||
Beginning of the year | 193,409,115 | 267,702,756 | 1,275,942,669 | 1,564,877,417 |
End of the year | $213,322,200 | $193,409,115 | $1,217,783,133 | $1,275,942,669 |
High Income Opportunities Fund – Institutional Class | |||||
Year Ended September 30, 2023 | Year Ended September 30, 2022 | Year Ended September 30, 2021 | Year Ended September 30, 2020 | Year Ended September 30, 2019 | |
Net asset value, beginning of the period | $8.32 | $10.94 | $10.29 | $10.45 | $10.69 |
INCOME (LOSS) FROM INVESTMENT OPERATIONS: | |||||
Investment income(a) | 0.59 | 0.58 | 0.59 | 0.58 | 0.60 |
Net realized and unrealized gain (loss) | 0.14 | (2.28 ) | 0.67 | (0.16 )(b) | (0.08 ) |
Total from Investment Operations | 0.73 | (1.70 ) | 1.26 | 0.42 | 0.52 |
LESS DISTRIBUTIONS FROM: | |||||
Investment income | (0.62 ) | (0.59 ) | (0.61 ) | (0.58 ) | (0.62 ) |
Net realized capital gains | — | (0.33 ) | — | — | (0.14 ) |
Total Distributions | (0.62 ) | (0.92 ) | (0.61 ) | (0.58 ) | (0.76 ) |
Net asset value, end of the period | $8.43 | $8.32 | $10.94 | $10.29 | $10.45 |
Total return | 8.98 % | (16.59 )% | 12.55 % | 4.28 % | 5.14 % |
RATIOS TO AVERAGE NET ASSETS: | |||||
Net assets, end of the period (000's) | $213,322 | $193,409 | $267,703 | $255,019 | $174,103 |
Gross expenses(c) | — | — | — | — | — |
Net investment income | 6.93 % | 5.96 % | 5.49 % | 5.76 % | 5.78 % |
Portfolio turnover rate | 48 % | 45 % | 62 % | 96 %(d) | 48 % |
(a) | Per share net investment income has been calculated using the average shares outstanding during the period. |
(b) | The amount shown for a share outstanding does not correspond with the aggregate realized and unrealized gain (loss) on investments for the period due to the timing of sales and redemptions of fund shares in relation to fluctuating market values of investments of the Fund. |
(c) | Loomis Sayles has agreed to pay, without reimbursement from the Fund, all expenses associated with the operations of the Fund. |
(d) | The variation in the Fund's turnover rate from 2019 to 2020 was primarily due to significant shareholder flows and repositioning of the portfolio. |
Securitized Asset Fund – Institutional Class | |||||
Year Ended September 30, 2023 | Year Ended September 30, 2022 | Year Ended September 30, 2021 | Year Ended September 30, 2020 | Year Ended September 30, 2019 | |
Net asset value, beginning of the period | $7.68 | $9.39 | $9.77 | $9.94 | $9.65 |
INCOME (LOSS) FROM INVESTMENT OPERATIONS: | |||||
Investment income(a) | 0.28 | 0.26 | 0.26 | 0.34 | 0.39 |
Net realized and unrealized gain (loss) | (0.21 ) | (1.43 ) | (0.06 ) | 0.06 | 0.45 |
Total from Investment Operations | 0.07 | (1.17 ) | 0.20 | 0.40 | 0.84 |
LESS DISTRIBUTIONS FROM: | |||||
Investment income | (0.44 ) | (0.54 ) | (0.58 ) | (0.57 ) | (0.55 ) |
Net asset value, end of the period | $7.31 | $7.68 | $9.39 | $9.77 | $9.94 |
Total return | 0.77 % | (13.03 )% | 2.07 % | 4.13 % | 8.97 % |
RATIOS TO AVERAGE NET ASSETS: | |||||
Net assets, end of the period (000's) | $1,217,783 | $1,275,943 | $1,564,877 | $1,500,680 | $1,239,135 |
Gross expenses(b) | — | — | — | — | — |
Net investment income | 3.63 % | 3.02 % | 2.68 % | 3.50 % | 3.98 % |
Portfolio turnover rate | 106 % | 140 % | 98 %(c) | 283 % | 369 % |
(a) | Per share net investment income has been calculated using the average shares outstanding during the period. |
(b) | Loomis Sayles has agreed to pay, without reimbursement from the Fund, all expenses associated with the operations of the Fund. |
(c) | The variation in the Fund’s turnover rate from 2020 to 2021 was primarily due to a decrease in the volume of TBA transactions (see Note 2g of Notes to Financial Statements). |
amendment fees are recorded when received and included in interest income on the Statements of Operations. Interest income is increased by the accretion of discount and decreased by the amortization of premium, if applicable. For payment-in-kind securities, income received in-kind is reflected as an increase to the principal and cost basis of the securities. For securities with paydown provisions, principal payments received are treated as a proportionate reduction to the cost basis of the securities, and excess or shortfall amounts are recorded as income. In determining net gain or loss on securities sold, the cost of securities has been determined on an identified cost basis.
dates on securities transactions and the difference between the amounts of dividends, interest and foreign withholding taxes recorded in the
Funds’ books and records and the U.S. dollar equivalent of the amounts actually received or paid. Net unrealized foreign exchange gains or
losses arise from changes in the value of assets and liabilities, other than investment securities, as of the end of the fiscal period, resulting from
changes in exchange rates. Net realized foreign exchange gains or losses and the net change in unrealized foreign exchange gains or losses are
disclosed in the Statements of Operations. For federal income tax purposes, net realized foreign exchange gains or losses are characterized as ordinary income, and may, if the Funds have net losses, reduce the amount of income available to be distributed by the Funds.
purposes. Net realized and unrealized gains or losses on investments reported in the Statements of Operations reflect gains or losses resulting
from changes in exchange rates and fluctuations which arise due to changes in market prices of investment securities. For federal income tax
purposes, a portion of the net realized gain or loss on investments arising from changes in exchange rates, which is reflected in the Statements
of Operations, may be characterized as ordinary income and may, if the Funds have net losses, reduce the amount of income available to be
distributed by the Funds.
changes in the value of the foreign currency or if the counterparties do not perform under the contracts’ terms.
2023 Distributions | 2022 Distributions | |||||
Fund | Ordinary Income | Long-Term Capital Gains | Total | Ordinary Income | Long-Term Capital Gains | Total |
High Income Opportunities Fund | $14,571,242 | $— | $14,571,242 | $21,850,538 | $315,762 | $22,166,300 |
Securitized Asset Fund | 70,940,296 | — | 70,940,296 | 90,356,043 | — | 90,356,043 |
High Income Opportunities Fund | Securitized Asset Fund | |
Undistributed ordinary income | $1,954,727 | $6,701,277 |
Capital loss carryforward: | ||
Short-term: | ||
No expiration date | (3,003,187 ) | (55,647,187 ) |
Long-term: | ||
No expiration date | (6,399,175 ) | (232,523,059 ) |
Total capital loss carryforward | (9,402,362 ) | (288,170,246 ) |
Unrealized depreciation | (32,368,021 ) | (218,398,168 ) |
Total accumulated losses | $(39,815,656 ) | $(499,867,137 ) |
High Income Opportunities Fund | Securitized Asset Fund | |
Federal tax cost | $245,715,979 | $1,449,093,900 |
Gross tax appreciation | $1,218,843 | $1,204,161 |
Gross tax depreciation | (33,586,849 ) | (219,602,329 ) |
Net tax depreciation | $(32,368,006 ) | $(218,398,168 ) |
each Fund’s policy that the market value of the collateral for repurchase agreements be at least equal to 102% of the repurchase price, including interest. Certain repurchase agreements are tri-party arrangements whereby the collateral is held in a segregated account for the benefit of the Fund and on behalf of the counterparty. Repurchase agreements could involve certain risks in the event of default or insolvency of the counterparty, including possible delays or restrictions upon a Fund’s ability to dispose of the underlying securities. As of September 30, 2023, each Fund, as applicable, had investments in repurchase agreements for which the value of the related collateral exceeded the value of the repurchase agreement. The gross value of repurchase agreements is included in the Statements of Assets and Liabilities for financial reporting purposes.
particularly the risk of cessation of the London Interbank Offered Rate (“LIBOR”), which was expected to occur no later than June 30, 2023. In January 2021, FASB issued Accounting Standard Update 2021-01 (“ASU 2021-01”), which is an update of ASU 2020-04. Regulators have undertaken reference rate reform initiatives to identify alternative reference rates that are more observable or transaction based and less susceptible to manipulation than LIBOR. ASU 2020-04 provides temporary guidance to ease the potential burden in accounting for (or recognizing the effects of) reference rate reform on financial reporting. ASU 2020-04 is elective and applies to all entities, subject to meeting certain criteria, that have contracts that reference LIBOR or another reference rate expected to be discontinued because of reference rate reform. ASU 2020-04 amendments offer optional expedients for contract modifications that would allow an entity to account for such modifications by prospectively adjusting the effective interest rate, instead of evaluating each contract, in accordance with existing accounting standards, as to whether reference rate modifications constitute the establishment of new contracts or the continuation of existing contracts. ASU 2021-01 clarifies that certain provisions in Topic 848, if elected by an entity, apply to derivative instruments that use an interest rate for margining, discounting, or contract price alignment that is modified as a result of reference rate reform. In December 2022, FASB issued a further update to Topic 848 under ASU 2022-06, which defers the sunset date of Topic 848 to December 31, 2024, after which entities will no longer be permitted to apply the optional expedients provided in Topic 848. As of June 30, 2023, LIBOR had ceased to be published on a representative basis, and will be replaced by an alternative reference rate at the next reset date subsequent to June 30, 2023 for all investments for which LIBOR is the current reference rate. Management has elected to apply the optional expedients when appropriate and account for such modifications by prospectively adjusting the effective interest rate. There is no material impact to the Funds' financial statements.
High Income Opportunities Fund | ||||
Asset Valuation Inputs | ||||
Description | Level 1 | Level 2 | Level 3 | Total |
Bonds and Notes | ||||
Non-Convertible Bonds | ||||
Non-Agency Commercial Mortgage-Backed Securities | $— | $3,539,167 | $86,012 | $3,625,179 |
All Other Non-Convertible Bonds(a) | — | 177,175,308 | — | 177,175,308 |
Total Non-Convertible Bonds | — | 180,714,475 | 86,012 | 180,800,487 |
Convertible Bonds(a) | — | 9,075,984 | — | 9,075,984 |
Total Bonds and Notes | — | 189,790,459 | 86,012 | 189,876,471 |
Senior Loans(a) | — | 4,339,789 | — | 4,339,789 |
Collateralized Loan Obligations | — | 2,899,192 | — | 2,899,192 |
Common Stocks(a) | 1,198,666 | — | — | 1,198,666 |
Preferred Stocks(a) | 447,570 | — | — | 447,570 |
Warrants | — | — | — | — |
Short-Term Investments | — | 14,586,285 | — | 14,586,285 |
Total Investments | $1,646,236 | $211,615,725 | $86,012 | $213,347,973 |
(a) | Details of the major categories of the Fund’s investments are reflected within the Portfolio of Investments. |
Securitized Asset Fund | ||||
Asset Valuation Inputs | ||||
Description | Level 1 | Level 2 | Level 3 | Total |
Bonds and Notes | ||||
ABS Home Equity | $— | $77,139,289 | $135,220 | $77,274,509 |
Agency Commercial Mortgage-Backed Securities | — | 154,891,582 | 5,924,820 | 160,816,402 |
Collateralized Mortgage Obligations | — | 51,358,829 | 19,637,469 | 70,996,298 |
Mortgage Related | — | 452,698,436 | 113,942 | 452,812,378 |
Non-Agency Commercial Mortgage-Backed Securities | — | 142,896,568 | 3,825,900 | 146,722,468 |
All Other Bonds and Notes(a) | — | 189,497,639 | — | 189,497,639 |
Total Bonds and Notes | — | 1,068,482,343 | 29,637,351 | 1,098,119,694 |
Collateralized Loan Obligations | — | 88,806,919 | — | 88,806,919 |
Loan Participations(a) | — | 3,790,825 | — | 3,790,825 |
Short-Term Investments | — | 39,978,294 | — | 39,978,294 |
Total Investments | $— | $1,201,058,381 | $29,637,351 | $1,230,695,732 |
Liability Valuation Inputs | ||||
Description | Level 1 | Level 2 | Level 3 | Total |
Futures Contracts (unrealized depreciation) | $(5,755,856 ) | $— | $— | $(5,755,856 ) |
(a) | Details of the major categories of the Fund’s investments are reflected within the Portfolio of Investments. |
High Income Opportunities Fund | ||||||||||
Asset Valuation Inputs | ||||||||||
Investments in Securities | Balance as of September 30, 2022 | Accrued Discounts (Premiums) | Realized Gain (Loss) | Change in Unrealized Appreciation (Depreciation) | Purchases | Sales | Transfers into Level 3 | Transfers out of Level 3 | Balance as of September 30, 2023 | Change in Unrealized Appreciation (Depreciation) from Investments Still Held at September 30, 2023 |
Bonds and Notes | ||||||||||
Non-Convertible Bonds | ||||||||||
Home Construction | $— | $— | $— | $— | $— | $— | $— | $— | $— | $— |
Non-Agency Commercial Mortgage- Backed Securities | 129,288 | — | — | (43,276 ) | — | — | — | — | 86,012 | (43,276 ) |
Warrants | 107 | — | — | (107 ) | — | — | — | — | — | (107 ) |
Total | $129,395 | $— | $— | $(43,383 ) | $— | $— | $— | $— | $86,012 | $(43,383 ) |
Securitized Asset Fund | ||||||||||
Asset Valuation Inputs | ||||||||||
Investments in Securities | Balance as of September 30, 2022 | Accrued Discounts (Premiums) | Realized Gain (Loss) | Change in Unrealized Appreciation (Depreciation) | Purchases | Sales | Transfers into Level 3 | Transfers out of Level 3 | Balance as of September 30, 2023 | Change in Unrealized Appreciation (Depreciation) from Investments Still Held at September 30, 2023 |
Bonds and Notes | ||||||||||
ABS Home Equity | $120,729 | $— | $(34,086 ) | $51,849 | $— | $(3,272 ) | $— | $— | $135,220 | $51,351 |
Agency Commercial Mortgage-Backed Securities | 7,314,851 | — | (11,053,813 ) | 8,156,301 | — | (859 ) | 1,794,788 | (286,448 ) | 5,924,820 | 1,147,916 |
Collateralized Mortgage Obligations | 18,129,628 | 8,107 | (6,550,951 ) | 344,745 | 2,437,061 | (2,744,948 ) | 8,013,827 | — | 19,637,469 | (459,429 ) |
Mortgage Related | 114,303 | — | — | (6,056 ) | 5,695 | — | — | — | 113,942 | (6,056 ) |
Non-Agency Commercial Mortgage-Backed Securities | 4,270,703 | — | — | (444,803 ) | — | — | — | — | 3,825,900 | (444,803 ) |
Total | $29,950,214 | $8,107 | $(17,638,850 ) | $8,102,036 | $2,442,756 | $(2,749,079 ) | $9,808,615 | $(286,448 ) | $29,637,351 | $288,979 |
Description | Valuation Technique(s) | Unobservable Input | Unobservable Input Value(s) | Value | |
Bonds and Notes | |||||
ABS Home Equity1 | 1.00% | $115,811 | |||
Market Discount | Discount Rate | 5.00% | 19,409 | ||
Agency Commercial Mortgage-Backed Securities1 | 1.00% | 5,663,738 | |||
Market Discount | Discount Rate | 3.00% | 261,082 | ||
Collateralized Mortgage Obligations1 | 1.00% | 18,384,354 | |||
Market Discount | Discount Rate | 3.00% | 1,253,115 | ||
Mortgage Related1 | Market Discount | Discount Rate | 1.00% | 113,942 | |
Non-Agency Commercial Mortgage-Backed Securities2 | Discounted Cash Flows | Constant Default Rate | 100% | ||
Loss Severity | 40% | ||||
Lag Time | 24 months | ||||
Loss Adjusted Spread | 10% | 3,825,900 | |||
Total | $29,637,351 | ||||
1 | “Odd lot” securities (those with current principal below the normal trading size) are valued using a discount to the “round lot” price for the same security. The significant unobservable input used in the fair value measurement is the discount rate. Discount rates are set at a specific fixed rate depending on the size of the odd lot. A significant change in the discount rate could have a material effect on the fair value measurement. There is an inverse relationship between the discount rate and the fair value measurement, meaning a significant increase in the discount rate would have resulted in a lower fair value measurement, and vice versa. |
2 | Security is valued using a discounted cash flow model. The significant unobservable inputs used in the fair value measurement are the constant default rate, loss severity, lag time, and loss adjusted spread. Significant changes in input values could have a material effect on the fair value measurement. There is an inverse relationship between the loss severity, lag time, and loss adjusted spread and the fair value measurement, meaning a significant increase in any of those input values in isolation would have resulted in a lower fair value measurement, and vice versa. The constant default rate of 100% is based on the fact that the underlying loan is in default. |
Net Realized Gain (Loss) on: | Swap agreements |
Credit contracts | $97,593 |
Net Change in Unrealized Appreciation (Depreciation) on: | Swap agreements |
Credit contracts | $(2,604 ) |
Liabilities | Unrealized depreciation on futures contracts1 |
Exchange-traded liability derivatives | |
Interest rate contracts | $(5,755,856 ) |
1 | Represents cumulative unrealized appreciation (depreciation) on futures contracts. Only the current day’s variation margin on futures contracts is reported within the Statements of Assets and Liabilities as receivable or payable for variation margin, as applicable. |
Net Realized Gain (Loss) on: | Futures contracts |
Interest rate contracts | $(13,043,398 ) |
Net Change in Unrealized Appreciation (Depreciation) on: | Futures contracts |
Interest rate contracts | $6,411,748 |
High Income Opportunities Fund | Credit Default Swaps |
Average Notional Amount Outstanding | 0.22 % |
Highest Notional Amount Outstanding | 1.01 % |
Lowest Notional Amount Outstanding | 0.00 % |
Notional Amount Outstanding as of September 30, 2023 | 0.00 % |
Securitized Asset Fund | Futures |
Average Notional Amount Outstanding | 13.57 % |
Highest Notional Amount Outstanding | 24.24 % |
Lowest Notional Amount Outstanding | 5.82 % |
Notional Amount Outstanding as of September 30, 2023 | 14.92 % |
U.S. Government/ Agency Securities | Other Securities | |||
Fund | Purchases | Sales | Purchases | Sales |
High Income Opportunities Fund | $— | $2,225,000 | $104,466,826 | $87,477,421 |
Securitized Asset Fund | 1,201,694,156 | 1,136,710,215 | 97,523,741 | 196,436,244 |
Fund | Number of 5% Account Holders | Percentage of Ownership |
High Income Opportunities Fund | 3 | 88.86 % |
Securitized Asset Fund | 4 | 96.06 % |
Year Ended September 30, 2023 | Year Ended September 30, 2022 | |||
High Income Opportunities Fund | Shares | Amount | Shares | Amount |
Institutional Class | ||||
Issued from the sale of shares | 5,345,697 | $45,532,916 | 2,467,178 | $24,263,725 |
Issued in connection with the reinvestment of distributions | 649,422 | 5,529,256 | 858,035 | 8,481,268 |
Redeemed | (3,933,361 ) | (33,529,214 ) | (4,563,249 ) | (44,255,922 ) |
Increase (decrease) from capital share transactions | 2,061,758 | $17,532,958 | (1,238,036 ) | $(11,510,929 ) |
Year Ended September 30, 2023 | Year Ended September 30, 2022 | |||
Securitized Asset Fund | Shares | Amount | Shares | Amount |
Institutional Class | ||||
Issued from the sale of shares | 34,092,926 | $259,745,905 | 32,594,894 | $285,501,462 |
Issued in connection with the reinvestment of distributions | 2,439,063 | 18,628,449 | 2,659,711 | 23,198,484 |
Redeemed | (36,095,261 ) | (276,317,531 ) | (35,629,171 ) | (307,404,272 ) |
Increase (decrease) from capital share transactions | 436,728 | $2,056,823 | (374,566 ) | $1,295,674 |
Boston, Massachusetts
November 21, 2023
Fund | Qualifying Percentage |
High Income Opportunities Fund | 0.31% |
High Income Opportunities Fund
Name and Year of Birth | Position(s) Held with the Trust, Length of Time Served and Term of Office1 | Principal Occupation(s) During Past 5 Years | Number of Portfolios in Fund Complex Overseen2and Other Directorships Held During Past 5 Years | Experience, Qualifications, Attributes, Skills for Board Membership |
Independent Trustees | ||||
Edmond J. English (1953) | Trustee since 2013 Contract Review Committee Member and Governance Committee Member | Executive Chairman of Bob’s Discount Furniture (retail) | 52 Director, Burlington Stores, Inc. (retail); Director, Rue Gilt Groupe, Inc. (e-commerce retail) | Significant experience on the Board and on the boards of other business organizations (including retail companies and a bank); executive experience (including at a retail company) |
Richard A. Goglia (1951) | Trustee since 2015 Audit Committee Member and Governance Committee Member | Retired | 52 Formerly, Director of Triumph Group (aerospace industry) | Significant experience on the Board and executive experience (including his role as Vice President and treasurer of a defense company and experience at a financial services company) |
Martin T. Meehan (1956) | Trustee since 2012 Chairperson of the Governance Committee and Contract Review Committee Member | President, University of Massachusetts | 52 None | Significant experience on the Board and on the boards of other business organizations; experience as President of the University of Massachusetts; government experience (including as a member of the U.S. House of Representatives); academic experience |
Maureen B. Mitchell (1951) | Trustee since 2017 Chairperson of the Contract Review Committee | Retired | 52 Director, Sterling Bancorp (bank) | Significant experience on the Board; financial services industry and executive experience (including role as President of global sales and marketing at a financial services company) |
Name and Year of Birth | Position(s) Held with the Trust, Length of Time Served and Term of Office1 | Principal Occupation(s) During Past 5 Years | Number of Portfolios in Fund Complex Overseen2and Other Directorships Held During Past 5 Years | Experience, Qualifications, Attributes, Skills for Board Membership |
Independent Trustees − continued | ||||
James P. Palermo (1955) | Trustee since 2016 Audit Committee Member and Governance Committee Member | Founding Partner, Breton Capital Management, LLC (private equity); Partner, STEP Partners, LLC (private equity) | 52 Director, FutureFuel.io (chemicals and biofuels) | Significant experience on the Board; financial services industry and executive experience (including roles as Chief Executive Officer of client management and asset servicing for a banking and financial services company) |
Erik R. Sirri (1958) | Chairperson of the Board of Trustees since 2021 Trustee since 2009 Ex Officio Member of the Audit Committee, Contract Review Committee and Governance Committee | Professor of Finance at Babson College | 52 None | Significant experience on the Board; experience as Director of the Division of Trading and Markets at the Securities and Exchange Commission; academic experience; training as an economist |
Peter J. Smail (1952) | Trustee since 2009 Contract Review Committee Member | Retired | 52 None | Significant experience on the Board; mutual fund industry and executive experience (including roles as President and Chief Executive Officer for an investment adviser) |
Kirk A. Sykes (1958) | Trustee since 2019 Audit Committee Member and Governance Committee Member | Managing Director of Accordia Partners, LLC (real estate development); President of Primary Corporation (real estate development); Managing Principal of Merrick Capital Partners (infrastructure finance) | 52 Advisor/Risk Management Committee, Eastern Bank (bank); Director, Apartment Investment and Management Company (real estate investment trust); formerly, Director, Ares Commercial Real Estate Corporation (real estate investment trust) | Experience on the Board and significant experience on the boards of other business organizations (including real estate companies and banks) |
Cynthia L. Walker (1956) | Trustee since 2005 Chairperson of the Audit Committee | Retired; formerly, Deputy Dean for Finance and Administration, Yale University School of Medicine | 52 None | Significant experience on the Board; executive experience in a variety of academic organizations (including roles as dean for finance and administration) |
Name and Year of Birth | Position(s) Held with the Trust, Length of Time Served and Term of Office1 | Principal Occupation(s) During Past 5 Years | Number of Portfolios in Fund Complex Overseen2and Other Directorships Held During Past 5 Years | Experience, Qualifications, Attributes, Skills for Board Membership |
Interested Trustees | ||||
Kevin P. Charleston3 (1965) One Financial Center Boston, MA 02111 | Trustee since 2015 President and Chief Executive Officer of Loomis Sayles Funds I since 2015 | President, Chief Executive Officer and Chairman of the Board of Directors, Loomis, Sayles & Company, L.P. | 52 None | Significant experience on the Board; continuing service as President, Chief Executive Officer and Chairman of the Board of Directors of Loomis, Sayles & Company, L.P. |
David L. Giunta4 (1965) | Trustee since 2011 Executive Vice President of Loomis Sayles Funds I since 2008 | President and Chief Executive Officer, Natixis Advisors, LLC and Natixis Distribution, LLC | 52 None | Significant experience on the Board; experience as President and Chief Executive Officer of Natixis Advisors, LLC and Natixis Distribution, LLC |
1 | Each Trustee serves until retirement, resignation or removal from the Board. The current retirement age is 75. The position of Chairperson of the Board is appointed for a three-year term. |
2 | The Trustees of the Trust serve as Trustees of a fund complex that includes all series of the Natixis Funds Trust I, Natixis Funds Trust II, Natixis Funds Trust IV, Gateway Trust, Loomis Sayles Funds I, Loomis Sayles Funds II, Natixis ETF Trust and Natixis ETF Trust II (collectively, the “Fund Complex”). |
3 | Mr. Charleston is deemed an “interested person” of the Trust because he holds the following positions with an affiliated person of the Trust: President, Chief Executive Officer and Chairman of the Board of Directors of Loomis, Sayles & Company, L.P. |
4 | Mr. Giunta is deemed an “interested person” of the Trust because he holds the following positions with an affiliated person of the Trust: President and Chief Executive Officer, Natixis Advisors, LLC and Natixis Distribution, LLC. |
Name and Year of Birth | Position(s) Held with the Trust | Term of Office1 and Length of Time Served | Principal Occupation(s) During Past 5 Years2 |
Officers of the Trusts | |||
Matthew J. Block (1981) | Treasurer, Principal Financial and Accounting Officer | Since 2022 | Senior Vice President, Natixis Advisors, LLC and Natixis Distribution, LLC; formerly, Vice President, Natixis Advisors, LLC and Natixis Distribution, LLC; Assistant Treasurer of the Fund Complex; Managing Director, State Street Bank and Trust Company |
Susan McWhan Tobin (1963) | Secretary and Chief Legal Officer | Since 2022 | Executive Vice President, General Counsel and Secretary, Natixis Advisors, LLC and Natixis Distribution, LLC; formerly, Executive Vice President and Chief Compliance Officer of Natixis Investment Managers (March 2019 – May 2022) and Senior Vice President and Head of Compliance, U.S. for Natixis Investment Managers (July 2011 – March 2019) |
Natalie R. Wagner (1979) | Chief Compliance Officer, Assistant Secretary and Anti-Money Laundering Officer | Since 2021 | Senior Vice President, Natixis Advisors, LLC and Natixis Distribution, LLC; formerly, Vice President, Head of Corporate Compliance, Global Atlantic Financial Group |
1 | Each officer of the Trust serves for an indefinite term in accordance with the Trust's current by-laws until the date his or her successor is elected and qualified, or until he or she sooner dies, retires, is removed or becomes disqualified. |
2 | Each person listed above, except as noted, holds the same position(s) with the Fund Complex. Previous positions during the past five years with Natixis Distribution, LLC, Natixis Advisors, LLC or Loomis, Sayles & Company, L.P. are omitted, if not materially different from an officer’s current position with such entity. |
Natixis Advisors, LLC
888 Boylston Street, Suite 800
Boston, MA 02199-8197
secretaryofthefunds@natixis.com
Communications regarding recommendations for Trustee candidates may not be submitted by e-mail.
Please note: Unlike written correspondence, e-mail is not secure. Please do NOT include your account number, social security number, PIN, or any other non-public, personal information in an e-mail communication because this information may be viewed by others.

 Exp. 11/30/24
6031444.1.1
M-LSHIA-0923


Loomis Sayles Fixed Income Fund |
Loomis Sayles Global Bond Fund |
Loomis Sayles Inflation Protected Securities Fund |
Loomis Sayles Institutional High Income Fund |
Managers |
Matthew J. Eagan, CFA® |
Brian P. Kennedy |
Elaine M. Stokes* |
Symbol | |
Institutional Class | LSFIX |
* | Effective December 31, 2023, Elaine Stokes will no longer serve as portfolio manager of the Fund. |
Investment Objective
Hypothetical Growth of $3,000,000 Investment in Institutional Class Shares1 |
September 30, 2013 through September 30, 2023 |

Average Annual Total Returns — September 30, 20231 | |||||
1 Year | 5 Years | 10 Years | Expense Ratios3 | ||
Gross | Net | ||||
Institutional Class | 3.26 % | 1.03 % | 2.48 % | 0.58 % | 0.58 % |
Comparative Performance | |||||
Bloomberg U.S. Government/Credit Bond Index2 | 0.93 | 0.41 | 1.31 | ||
1 | Fund performance has been increased by fee waivers and/or expense reimbursements, if any, without which performance would have been lower. |
2 | Bloomberg U.S. Government/Credit Bond Index is a broad-based flagship benchmark that measures the non-securitized component of the U.S. Aggregate Index. The Index includes investment grade, U.S. dollar-denominated, fixed rate Treasuries (i.e., public obligations of the U.S. Treasury that have remaining maturities of more than one year), government-related issues (i.e., agency, sovereign, supranational, and local authority debt), and corporate securities. The Index was launched on January 1, 1979, with index history backfilled to 1973, and is a subset of the U.S. Aggregate Index. |
3 | Expense ratios are as shown in the Fund’s prospectus in effect as of the date of this report. The expense ratios for the current reporting period can be found in the Financial Highlights section of this report under Ratios to Average Net Assets. Net expenses reflect contractual expense limitations set to expire on 1/31/24. When a Fund’s expenses are below the limitation, gross and net expense ratios will be the same. See Note 6 of the Notes to Financial Statements for more information about the Fund’s expense limitations. |
Managers |
David W. Rolley, CFA® |
Lynda L. Schweitzer, CFA® |
Scott M. Service, CFA® |
Symbols | |
Institutional Class | LSGBX |
Retail Class | LSGLX |
Class N | LSGNX |
Investment Objective
Hypothetical Growth of $100,000 Investment in Institutional Class Shares1 |
September 30, 2013 through September 30, 2023 |

Average Annual Total Returns — September 30, 20231 | |||||
1 Year | 5 Years | 10 Years | Expense Ratios3 | ||
Gross | Net | ||||
Institutional Class | 1.89 % | -1.48 % | -0.31 % | 0.75 % | 0.70 % |
Retail Class | 1.62 | -1.71 | -0.56 | 1.00 | 0.95 |
Class N | 1.96 | -1.43 | -0.24 | 0.66 | 0.65 |
Comparative Performance | |||||
Bloomberg Global Aggregate Bond Index2 | 2.24 | -1.62 | -0.44 | ||
1 | Fund performance has been increased by fee waivers and/or expense reimbursements, if any, without which performance would have been lower. |
2 | Bloomberg Global Aggregate Bond Index provides a broad-based measure of the global investment-grade fixed income markets. The four major components of this index are the U.S. Aggregate, the Pan-European Aggregate, the Asian-Pacific Aggregate, and the Canadian Aggregate Indices. The Index also includes Eurodollar and Euro-Yen corporate bonds, Canadian government, agency and corporate securities, and USD investment grade 144A securities. |
3 | Expense ratios are as shown in the Fund’s prospectus in effect as of the date of this report. The expense ratios for the current reporting period can be found in the Financial Highlights section of this report under Ratios to Average Net Assets. Net expenses reflect contractual expense limitations set to expire on 1/31/24. When a Fund’s expenses are below the limitation, gross and net expense ratios will be the same. See Note 6 of the Notes to Financial Statements for more information about the Fund’s expense limitations. |
Managers |
Elaine Kan, CFA® |
Kevin P. Kearns |
Symbols | |
Institutional Class | LSGSX |
Retail Class | LIPRX |
Class N | LIPNX |
Investment Objective
Hypothetical Growth of $100,000 Investment in Institutional Class Shares1 |
September 30, 2013 through September 30, 2023 |

Average Annual Total Returns — September 30, 20231 | ||||||
1 Year | 5 Years | 10 Years | Life of Class N | Expense Ratios3 | ||
Gross | Net | |||||
Institutional Class | 0.99 % | 2.18 % | 1.60 % | — % | 0.49 % | 0.40 % |
Retail Class | 0.74 | 1.95 | 1.34 | — | 0.74 | 0.65 |
Class N (Inception 2/1/17) | 1.05 | 2.25 | — | 1.98 | 0.41 | 0.35 |
Comparative Performance | ||||||
Bloomberg U.S. Treasury Inflation Protected Securities Index (Series L)2 | 1.25 | 2.12 | 1.74 | 1.79 | ||
1 | Fund performance has been increased by fee waivers and/or expense reimbursements, if any, without which performance would have been lower. |
2 | Bloomberg U.S. Treasury Inflation Protected Securities Index (Series-L) is an unmanaged index that tracks inflation protected securities issued by the U.S. Treasury. The Index is a rules-based, market value weighted index that tracks inflation protected securities issued by the U.S. Treasury. The liquidity constraint for all securities in the Index is $300 million. |
3 | Expense ratios are as shown in the Fund’s prospectus in effect as of the date of this report. The expense ratios for the current reporting period can be found in the Financial Highlights section of this report under Ratios to Average Net Assets. Net expenses reflect contractual expense limitations set to expire on 1/31/24. When a Fund’s expenses are below the limitation, gross and net expense ratios will be the same. See Note 6 of the Notes to Financial Statements for more information about the Fund’s expense limitations. |
Managers |
Matthew J. Eagan, CFA® |
Brian P. Kennedy |
Peter Sheehan* |
Elaine M. Stokes** |
Todd P. Vandam, CFA® |
Symbol | |
Institutional Class | LSHIX |
* | Effective June 30, 2023, Peter Sheehan serves as portfolio manager of the Fund. |
** | Effective December 31, 2023, Elaine Stokes will no longer serve as portfolio manager of the Fund. |
Investment Objective
Hypothetical Growth of $3,000,000 Investment in Institutional Class Shares1 |
September 30, 2013 through September 30, 2023 |
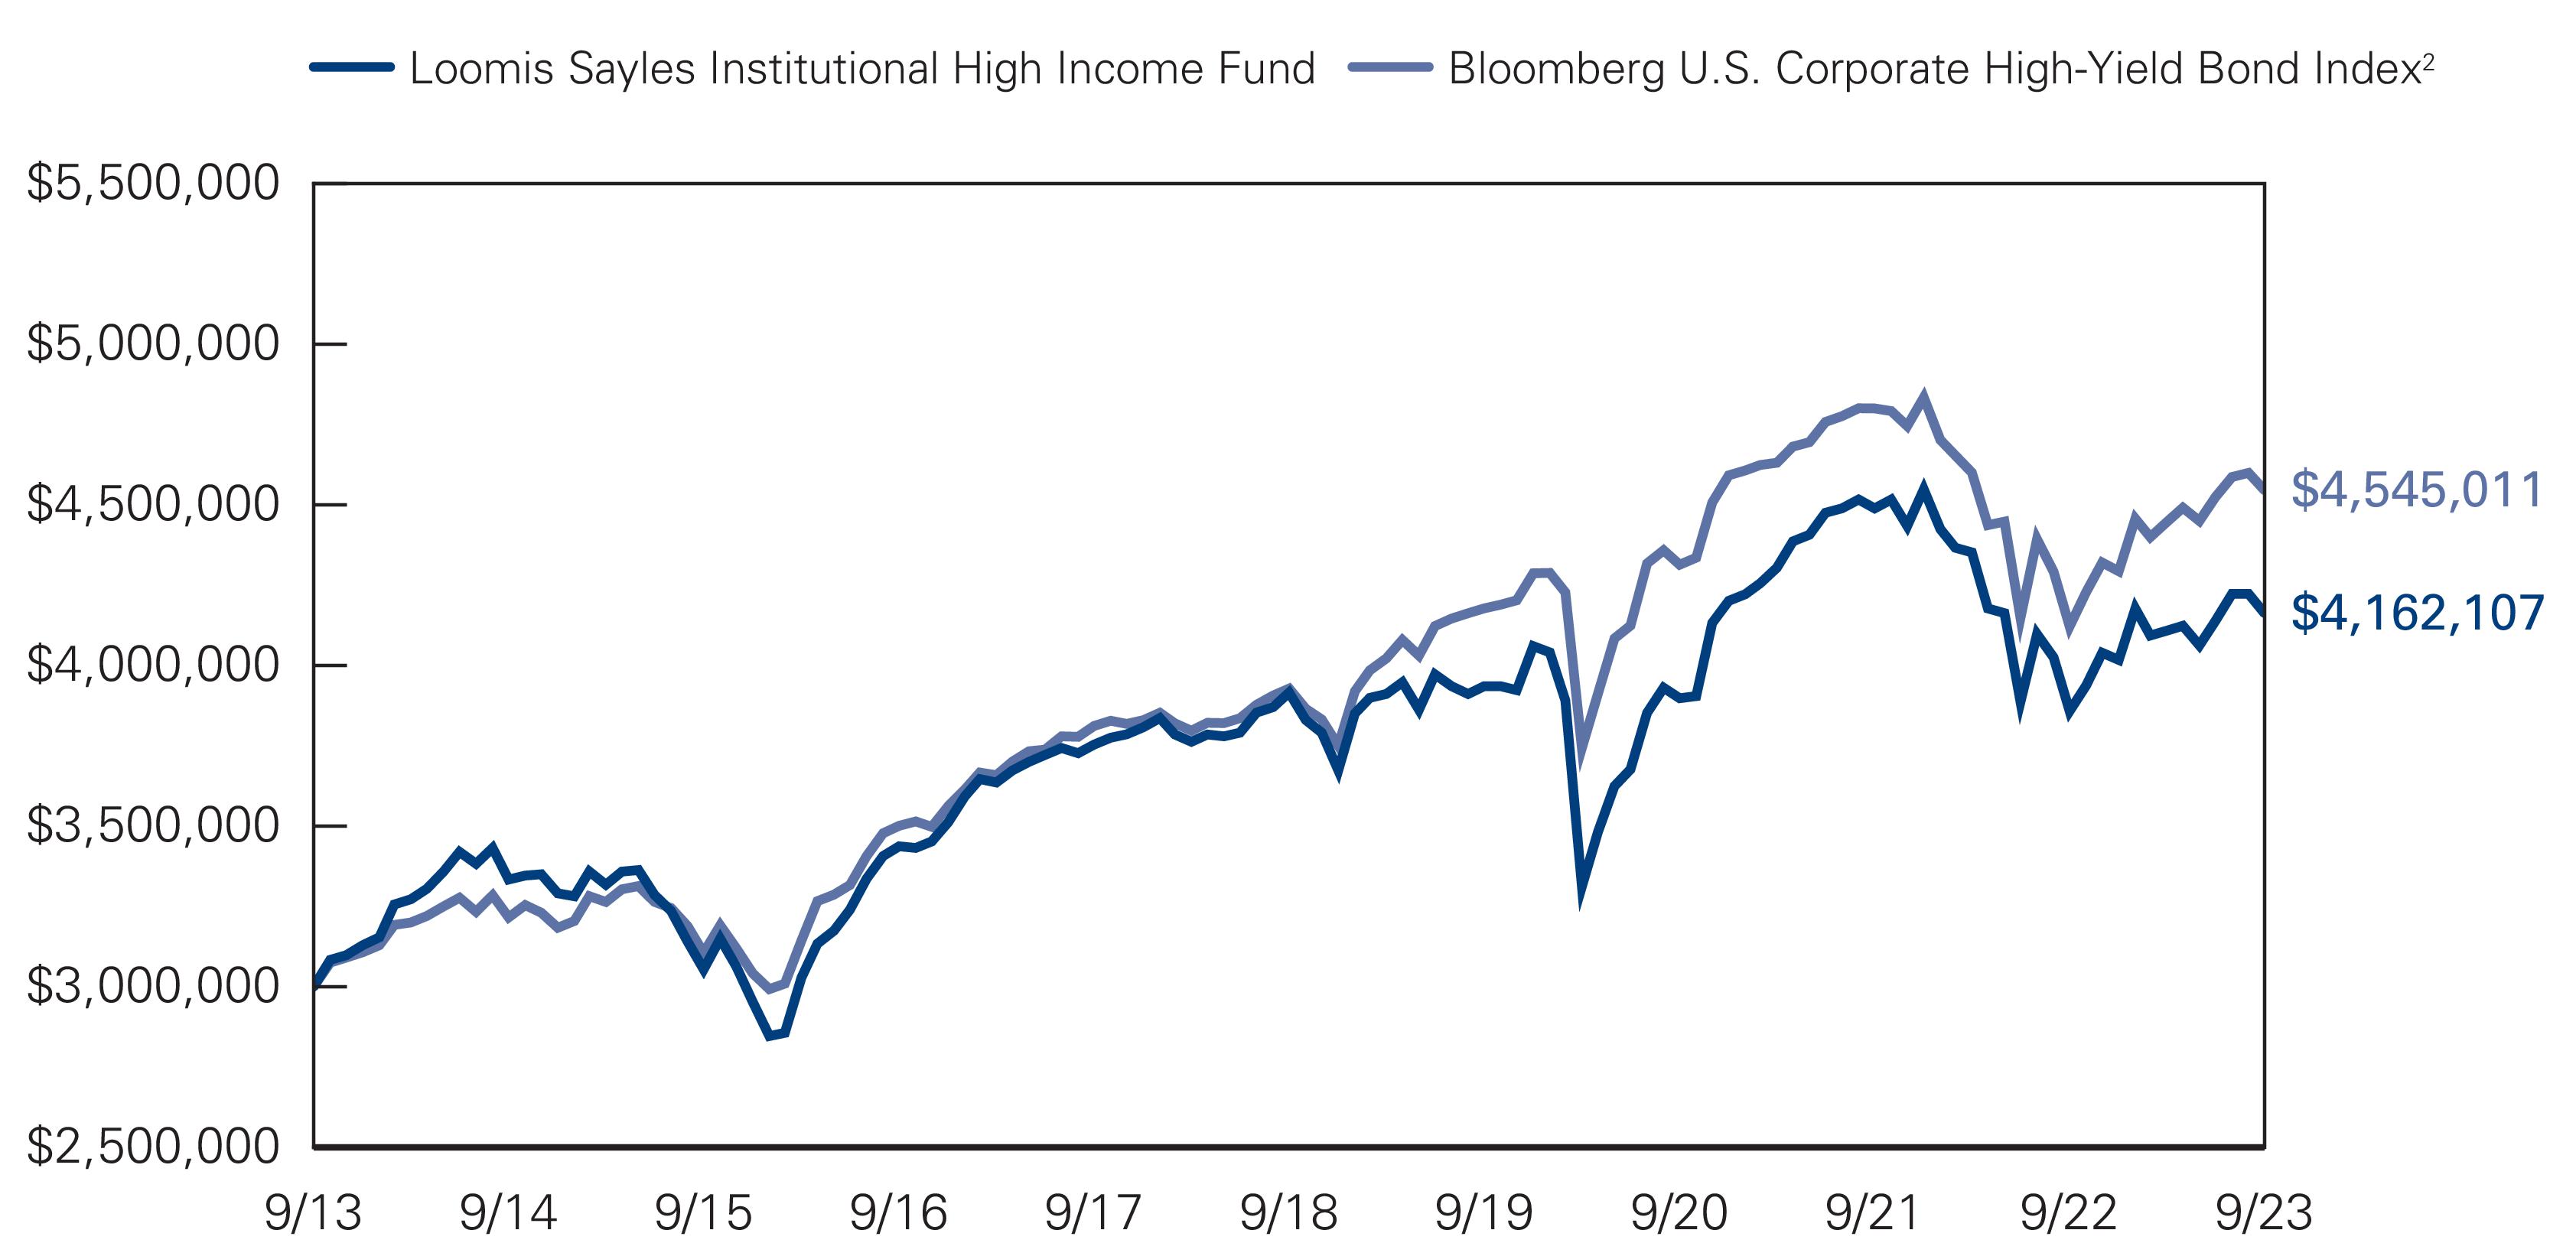
Average Annual Total Returns — September 30, 20231 | |||||
1 Year | 5 Years | 10 Years | Expense Ratios3 | ||
Gross | Net | ||||
Institutional Class | 7.88 % | 1.23 % | 3.33 % | 0.68 % | 0.68 % |
Comparative Performance | |||||
Bloomberg U.S. Corporate High-Yield Bond Index2 | 10.28 | 2.96 | 4.24 | ||
1 | Fund performance has been increased by fee waivers and/or expense reimbursements, if any, without which performance would have been lower. |
2 | Bloomberg U.S. Corporate High-Yield Bond Index measures the market of U.S. dollar-denominated, non-investment grade, fixed-rate, taxable corporate bonds. Securities are classified as high yield if the middle rating of Moody’s, Fitch, and S&P is Ba1/BB+/BB+ or below, excluding emerging market debt. The Index was created in 1986, with history backfilled to July 1, 1983, and rolls up into the Bloomberg U.S. Universal and Global High-Yield Indices. |
3 | Expense ratios are as shown in the Fund’s prospectus in effect as of the date of this report. The expense ratios for the current reporting period can be found in the Financial Highlights section of this report under Ratios to Average Net Assets. Net expenses reflect contractual expense limitations set to expire on 1/31/25. When a Fund’s expenses are below the limitation, gross and net expense ratios will be the same. See Note 6 of the Notes to Financial Statements for more information about the Fund’s expense limitations. |
Loomis Sayles Fixed Income Fund | Beginning Account Value 4/1/2023 | Ending Account Value 9/30/2023 | Expenses Paid During Period* 4/1/2023 – 9/30/2023 |
Institutional Class | |||
Actual | $1,000.00 | $973.00 | $2.97 |
Hypothetical (5% return before expenses) | $1,000.00 | $1,022.06 | $3.04 |
* | Expenses are equal to the Fund's annualized expense ratio of 0.60%, multiplied by the average account value over the period, multiplied by the number of days in the most recent fiscal half–year (183), divided by 365 (to reflect the half–year period). |
Loomis Sayles Global Bond Fund | Beginning Account Value 4/1/2023 | Ending Account Value 9/30/2023 | Expenses Paid During Period* 4/1/2023 – 9/30/2023 |
Institutional Class | |||
Actual | $1,000.00 | $944.60 | $3.36 |
Hypothetical (5% return before expenses) | $1,000.00 | $1,021.61 | $3.50 |
Retail Class | |||
Actual | $1,000.00 | $943.40 | $4.58 |
Hypothetical (5% return before expenses) | $1,000.00 | $1,020.36 | $4.76 |
Class N | |||
Actual | $1,000.00 | $944.80 | $3.12 |
Hypothetical (5% return before expenses) | $1,000.00 | $1,021.86 | $3.24 |
* | Expenses are equal to the Fund's annualized expense ratio (after waiver/reimbursement): 0.69%, 0.94% and 0.64% for Institutional Class, Retail Class and Class N, respectively, multiplied by the average account value over the period, multiplied by the number of days in the most recent fiscal half–year (183), divided by 365 (to reflect the half–year period). |
Loomis Sayles Inflation Protected Securities Fund | Beginning Account Value 4/1/2023 | Ending Account Value 9/30/2023 | Expenses Paid During Period* 4/1/2023 – 9/30/2023 |
Institutional Class | |||
Actual | $1,000.00 | $957.70 | $1.96 |
Hypothetical (5% return before expenses) | $1,000.00 | $1,023.06 | $2.03 |
Retail Class | |||
Actual | $1,000.00 | $957.30 | $3.19 |
Hypothetical (5% return before expenses) | $1,000.00 | $1,021.81 | $3.29 |
Class N | |||
Actual | $1,000.00 | $958.90 | $1.72 |
Hypothetical (5% return before expenses) | $1,000.00 | $1,023.31 | $1.78 |
* | Expenses are equal to the Fund's annualized expense ratio (after waiver/reimbursement): 0.40%, 0.65% and 0.35% for Institutional Class, Retail Class and Class N, respectively, multiplied by the average account value over the period, multiplied by the number of days in the most recent fiscal half–year (183), divided by 365 (to reflect the half–year period). |
Loomis Sayles Institutional High Income Fund | Beginning Account Value 4/1/2023 | Ending Account Value 9/30/2023 | Expenses Paid During Period* 4/1/2023 – 9/30/2023 |
Institutional Class | |||
Actual | $1,000.00 | $1,013.00 | $3.63 |
Hypothetical (5% return before expenses) | $1,000.00 | $1,021.46 | $3.65 |
* | Expenses are equal to the Fund's annualized expense ratio of 0.72%, multiplied by the average account value over the period, multiplied by the number of days in the most recent fiscal half–year (183), divided by 365 (to reflect the half–year period). |
One-Year | Three-Year | Five-Year | |
Loomis Sayles Fixed Income Fund | 71% | 73% | 64% |
Loomis Sayles Global Bond Fund | 68% | 31% | 39% |
Loomis Sayles Inflation Protected Securities Fund | 80% | 43% | 35% |
Loomis Sayles Institutional High Income Fund | 80% | 53% | 92% |
Loomis Sayles Fixed Income Fund
Principal Amount (‡) | Description | Value (†) |
Bonds and Notes — 89.7% of Net Assets | ||
Non-Convertible Bonds — 85.2% | ||
ABS Car Loan — 4.1% | ||
$675,000 | American Credit Acceptance Receivables Trust, Series 2021-3, Class D, 1.340%, 11/15/2027(a) | $641,152 |
125,000 | American Credit Acceptance Receivables Trust, Series 2022-4, Class C, 7.860%, 2/15/2029(a) | 125,936 |
685,000 | Avis Budget Rental Car Funding AESOP LLC, Series 2020-2A, Class A, 2.020%, 2/20/2027(a) | 625,094 |
630,000 | Avis Budget Rental Car Funding AESOP LLC, Series 2020-2A, Class C, 4.250%, 2/20/2027(a) | 589,144 |
145,000 | Avis Budget Rental Car Funding AESOP LLC, Series 2021-1A, Class C, 2.130%, 8/20/2027(a) | 126,158 |
125,000 | Avis Budget Rental Car Funding AESOP LLC, Series 2023-8A, Class C, 7.340%, 2/20/2030(a) | 124,223 |
100,000 | CarMax Auto Owner Trust, Series 2022-1, Class D, 2.470%, 7/17/2028 | 90,625 |
119,474 | Carvana Auto Receivables Trust, Series 2021-N3, Class C, 1.020%, 6/12/2028 | 110,399 |
515,000 | Carvana Auto Receivables Trust, Series 2021-P3, Class C, 1.930%, 10/12/2027 | 440,623 |
200,000 | Carvana Auto Receivables Trust, Series 2023-N1, Class D, 6.690%, 7/10/2029(a) | 195,518 |
525,000 | Credit Acceptance Auto Loan Trust, Series 2020-2A, Class C, 2.730%, 11/15/2029(a) | 524,179 |
900,000 | Credit Acceptance Auto Loan Trust, Series 2021-2A, Class C, 1.640%, 6/17/2030(a) | 854,272 |
335,000 | Credit Acceptance Auto Loan Trust, Series 2021-3A, Class C, 1.630%, 9/16/2030(a) | 313,623 |
1,380,000 | DT Auto Owner Trust, Series 2021-3A, Class D, 1.310%, 5/17/2027(a) | 1,252,922 |
385,000 | DT Auto Owner Trust, Series 2023-3A, Class D, 7.120%, 5/15/2029(a) | 387,575 |
815,000 | Exeter Automobile Receivables Trust, Series 2021-1A, Class D, 1.080%, 11/16/2026 | 779,746 |
1,000,000 | Exeter Automobile Receivables Trust, Series 2021-3A, Class D, 1.550%, 6/15/2027 | 922,239 |
100,000 | Exeter Automobile Receivables Trust, Series 2022-2A, Class D, 4.560%, 7/17/2028 | 95,278 |
Principal Amount (‡) | Description | Value (†) |
ABS Car Loan — continued | ||
$160,000 | Exeter Automobile Receivables Trust, Series 2022-6A, Class C, 6.320%, 5/15/2028 | $158,935 |
335,000 | Exeter Automobile Receivables Trust, Series 2023-2A, Class D, 6.320%, 8/15/2029 | 327,300 |
160,000 | Exeter Automobile Receivables Trust, Series 2023-3A, Class D, 6.680%, 4/16/2029 | 159,175 |
215,000 | First Investors Auto Owner Trust, Series 2022-2A, Class D, 8.710%, 10/16/2028(a) | 219,347 |
435,000 | Flagship Credit Auto Trust, Series 2021-2, Class D, 1.590%, 6/15/2027(a) | 397,643 |
200,000 | Ford Credit Auto Lease Trust, Series 2023-B, Class D, 6.970%, 6/15/2028 | 199,092 |
335,000 | Foursight Capital Automobile Receivables Trust, Series 2021-2, Class D, 1.920%, 9/15/2027(a) | 309,674 |
1,975,000 | GLS Auto Receivables Issuer Trust, Series 2021-1A, Class D, 1.680%, 1/15/2027(a) | 1,884,383 |
725,000 | GLS Auto Receivables Issuer Trust, Series 2021-2A, Class D, 1.420%, 4/15/2027(a) | 673,844 |
675,000 | GLS Auto Receivables Issuer Trust, Series 2021-3A, Class D, 1.480%, 7/15/2027(a) | 621,068 |
255,000 | GLS Auto Receivables Issuer Trust, Series 2023-2A, Class D, 6.310%, 3/15/2029(a) | 251,046 |
935,000 | Hertz Vehicle Financing III LLC, Series 2022-1A, Class D, 4.850%, 6/25/2026(a) | 874,802 |
599,000 | Hertz Vehicle Financing III LLC, Series 2022-3A, Class D, 6.310%, 3/25/2025(a) | 594,186 |
255,000 | Hertz Vehicle Financing III LLC, Series 2023-1A, Class D2, 9.130%, 6/25/2027(a) | 251,711 |
360,000 | Hertz Vehicle Financing III LLC, Series 2023-2A, Class D, 9.400%, 9/25/2029(a) | 362,053 |
605,000 | Hertz Vehicle Financing LLC, Series 2022-2A, Class D, 5.160%, 6/26/2028(a) | 522,642 |
455,000 | Hertz Vehicle Financing LLC, Series 2022-4A, Class D, 6.560%, 9/25/2026(a) | 434,406 |
59,306 | JPMorgan Chase Bank N.A, Series 2021-1, Class D, 1.174%, 9/25/2028(a) | 57,828 |
Loomis Sayles Fixed Income Fund (continued)
Principal Amount (‡) | Description | Value (†) |
ABS Car Loan — continued | ||
$76,637 | JPMorgan Chase Bank N.A, Series 2021-3, Class D, 1.009%, 2/26/2029(a) | $72,738 |
635,000 | Prestige Auto Receivables Trust, Series 2022-1A, Class D, 8.080%, 8/15/2028(a) | 648,051 |
81,714 | Santander Bank Auto Credit-Linked Notes, Series 2021-1A, Class B, 1.833%, 12/15/2031(a) | 79,648 |
200,000 | Westlake Automobile Receivables Trust, Series 2023-1A, Class D, 6.790%, 11/15/2028(a) | 198,503 |
17,496,781 | ||
ABS Credit Card — 0.1% | ||
380,000 | Mission Lane Credit Card Master Trust, 7.690%, 11/15/2028(a) | 379,946 |
ABS Home Equity — 4.5% | ||
686,666 | 510 Asset-Backed Trust, Series 2021-NPL1, Class A1, 2.240%, 6/25/2061(a)(b) | 631,469 |
630,000 | CAFL Issuer LLC, Series 2021-RTL1, Class A1, 2.239%, 3/28/2029(a)(b) | 582,271 |
371,720 | CIM Trust, Series 2021-NR2, Class A1, 2.568%, 7/25/2059(a)(b) | 357,673 |
210,000 | CoreVest American Finance Ltd., Series 2021-1, Class C, 2.800%, 4/15/2053(a) | 160,377 |
300,000 | CoreVest American Finance Ltd., Series 2021-2, Class C, 2.478%, 7/15/2054(a) | 229,884 |
150,000 | CoreVest American Finance Ltd., Series 2021-3, Class D, 3.469%, 10/15/2054(a) | 118,423 |
499,651 | Credit Suisse Mortgage Trust, Series 2021-RPL1, Class A1, 1.668%, 9/27/2060(a)(b) | 459,914 |
1,207,263 | Credit Suisse Mortgage Trust, Series 2021-RPL4, Class A1, 1.796%, 12/27/2060(a)(b) | 1,123,972 |
236,810 | Federal Home Loan Mortgage Corp., Series 2022-DNA3, Class M1A, REMIC, 30 day USD SOFR Average + 2.000%, 7.315%, 4/25/2042(a)(c) | 238,499 |
675,000 | FirstKey Homes Trust, Series 2021-SFR1, Class E1, 2.389%, 8/17/2038(a) | 585,691 |
315,000 | FirstKey Homes Trust, Series 2021-SFR2, Class E1, 2.258%, 9/17/2038(a) | 270,177 |
205,000 | FirstKey Homes Trust, Series 2021-SFR2, Class E2, 2.358%, 9/17/2038(a) | 175,333 |
300,000 | FirstKey Homes Trust, Series 2022-SFR2, Class D, 4.500%, 7/17/2039(a) | 271,001 |
Principal Amount (‡) | Description | Value (†) |
ABS Home Equity — continued | ||
$272,819 | GCAT Trust, Series 2019-RPL1, Class A1, 2.650%, 10/25/2068(a)(b) | $253,939 |
367,239 | GITSIT Mortgage Loan Trust, Series 2023-NPL1, Class A1, 8.353%, 5/25/2053(a)(b) | 365,700 |
85,772 | Home Partners of America Trust, Series 2021-1, Class E, 2.577%, 9/17/2041(a) | 66,239 |
799,000 | Home Partners of America Trust, Series 2021-2, Class E1, 2.852%, 12/17/2026(a) | 687,132 |
413,940 | Home Partners of America Trust, Series 2021-2, Class E2, 2.952%, 12/17/2026(a) | 355,577 |
127,024 | Legacy Mortgage Asset Trust, Series 2020-GS5, Class A1, 6.250%, 6/25/2060(a)(b) | 125,625 |
1,215,000 | Legacy Mortgage Asset Trust, Series 2020-RPL1, Class A2, 3.250%, 9/25/2059(a)(b) | 1,001,537 |
551,558 | Legacy Mortgage Asset Trust, Series 2021-GS2, Class A1, 1.750%, 4/25/2061(a)(b) | 509,448 |
115,000 | Mill City Mortgage Loan Trust, Series 2019-GS1, Class M2, 3.250%, 7/25/2059(a)(b) | 90,912 |
705,000 | Progress Residential Trust, Series 2021-SFR2, Class E1, 2.547%, 4/19/2038(a) | 619,001 |
240,000 | Progress Residential Trust, Series 2021-SFR3, Class E1, 2.538%, 5/17/2026(a) | 209,411 |
200,000 | Progress Residential Trust, Series 2021-SFR3, Class E2, 2.688%, 5/17/2026(a) | 174,141 |
125,000 | Progress Residential Trust, Series 2021-SFR4, Class E1, 2.409%, 5/17/2038(a) | 108,560 |
100,000 | Progress Residential Trust, Series 2021-SFR4, Class E2, 2.559%, 5/17/2038(a) | 86,665 |
295,000 | Progress Residential Trust, Series 2021-SFR5, Class E1, 2.209%, 7/17/2038(a) | 253,172 |
100,000 | Progress Residential Trust, Series 2021-SFR5, Class E2, 2.359%, 7/17/2038(a) | 85,839 |
380,000 | Progress Residential Trust, Series 2021-SFR6, Class E1, 2.425%, 7/17/2038(a) | 328,568 |
200,000 | Progress Residential Trust, Series 2021-SFR6, Class E2, 2.525%, 7/17/2038(a) | 172,749 |
340,000 | Progress Residential Trust, Series 2021-SFR7, Class E1, 2.591%, 8/17/2040(a) | 269,711 |
Loomis Sayles Fixed Income Fund (continued)
Principal Amount (‡) | Description | Value (†) |
ABS Home Equity — continued | ||
$100,000 | Progress Residential Trust, Series 2021-SFR7, Class E2, 2.640%, 8/17/2040(a) | $78,659 |
100,000 | Progress Residential Trust, Series 2023-SFR2, Class B, 4.500%, 10/17/2028(a) | 91,755 |
789,020 | PRPM LLC, Series 2021-1, Class A1, 2.115%, 1/25/2026(a)(b) | 743,123 |
288,876 | PRPM LLC, Series 2021-2, Class A1, 2.115%, 3/25/2026(a)(b) | 277,072 |
540,610 | PRPM LLC, Series 2021-3, Class A1, 1.867%, 4/25/2026(a)(b) | 507,160 |
161,812 | PRPM LLC, Series 2021-4, Class A1, 1.867%, 4/25/2026(a)(b) | 148,720 |
786,389 | PRPM LLC, Series 2021-5, Class A1, 1.793%, 6/25/2026(a)(b) | 712,036 |
926,678 | PRPM LLC, Series 2022-5, Class A1, 6.900%, 9/27/2027(a)(b) | 919,890 |
785,821 | Toorak Mortgage Corp. Ltd., Series 2021-1, Class A1, 2.240%, 6/25/2024(a)(b) | 764,094 |
240,000 | Towd Point Mortgage Trust, Series 2016-3, Class M2, 4.000%, 4/25/2056(a)(b) | 229,135 |
495,000 | Towd Point Mortgage Trust, Series 2018-5, Class M1, 3.250%, 7/25/2058(a)(b) | 370,997 |
603,597 | Towd Point Mortgage Trust, Series 2019-4, Class A1, 2.900%, 10/25/2059(a)(b) | 553,059 |
100,000 | Towd Point Mortgage Trust, Series 2020-1, Class A2B, 3.250%, 1/25/2060(a)(b) | 82,652 |
143,446 | VCAT LLC, Series 2021-NPL1, Class A1, 2.289%, 12/26/2050(a)(b) | 138,799 |
218,616 | VOLT XCII LLC, Series 2021-NPL1, Class A1, 1.893%, 2/27/2051(a)(b) | 205,491 |
608,983 | VOLT XCIII LLC, Series 2021-NPL2, Class A1, 1.893%, 2/27/2051(a)(b) | 565,755 |
510,581 | VOLT XCIV LLC, Series 2021-NPL3, Class A1, 2.240%, 2/27/2051(a)(b) | 481,094 |
341,072 | VOLT XCVI LLC, Series 2021-NPL5, Class A1, 2.116%, 3/27/2051(a)(b) | 322,755 |
803,548 | VOLT XCVII LLC, Series 2021-NPL6, Class A1, 2.240%, 4/25/2051(a)(b) | 748,411 |
18,909,267 | ||
ABS Other — 2.7% | ||
380,000 | Affirm Asset Securitization Trust, Series 2023-B, Class A, 6.820%, 9/15/2028(a) | 379,507 |
158,971 | Aqua Finance Trust, Series 2019-A, Class C, 4.010%, 7/16/2040(a) | 143,771 |
160,000 | Aqua Finance Trust, Series 2021-A, Class B, 2.400%, 7/17/2046(a) | 128,086 |
Principal Amount (‡) | Description | Value (†) |
ABS Other — continued | ||
$87,127 | Business Jet Securities LLC, Series 2021-1A, Class B, 2.918%, 4/15/2036(a) | $77,066 |
696,575 | CAL Funding IV Ltd., Series 2020-1A, Class A, 2.220%, 9/25/2045(a) | 606,320 |
208,094 | Castlelake Aircraft Structured Trust, Series 2018-1, Class B, 5.300%, 6/15/2043(a) | 152,167 |
780,366 | CLI Funding VIII LLC, Series 2021-1A, Class A, 1.640%, 2/18/2046(a) | 666,418 |
115,000 | Foundation Finance Trust, Series 2023-2A, Class B, 6.970%, 6/15/2049(a) | 114,969 |
64,401 | FREED ABS Trust, Series 2021-2, Class C, 1.940%, 6/19/2028(a) | 63,466 |
370,000 | FREED ABS Trust, Series 2021-3FP, Class D, 2.370%, 11/20/2028(a) | 349,332 |
1,500,000 | Frontier Issuer LLC, Series 2023-1, Class A2, 6.600%, 8/20/2053(a) | 1,433,265 |
115,000 | HPEFS Equipment Trust, Series 2023-2A, Class D, 6.970%, 7/21/2031(a) | 115,299 |
651,637 | JOL Air Ltd., Series 2019-1, Class A, 3.967%, 4/15/2044(a) | 587,327 |
1,073,080 | MAPS Trust, Series 2021-1A, Class A, 2.521%, 6/15/2046(a) | 919,658 |
110,000 | Marlette Funding Trust, Series 2021-2A, Class C, 1.500%, 9/15/2031(a) | 106,050 |
105,708 | Merlin Aviation Holdings DAC, Series 2016-1, Class A, 4.500%, 12/15/2032(a)(b) | 92,118 |
201,256 | OneMain Financial Issuance Trust, Series 2018-2A, Class A, 3.570%, 3/14/2033(a) | 198,880 |
345,000 | OneMain Financial Issuance Trust, Series 2021-1A, Class D, 2.470%, 6/16/2036(a) | 275,525 |
380,000 | OneMain Financial Issuance Trust, Series 2022-S1, Class D, 5.200%, 5/14/2035(a) | 342,963 |
100,000 | SCF Equipment Leasing LLC, Series 2021-1A, Class D, 1.930%, 9/20/2030(a) | 90,199 |
315,000 | SCF Equipment Leasing LLC, Series 2022-2A, Class C, 6.500%, 8/20/2032(a) | 305,090 |
113,599 | Shenton Aircraft Investment I Ltd., Series 2015-1A, Class A, 4.750%, 10/15/2042(a) | 95,692 |
99,143 | Sierra Timeshare Receivables Funding LLC, Series 2019-2A, Class C, 3.120%, 5/20/2036(a) | 95,915 |
64,934 | Sierra Timeshare Receivables Funding LLC, Series 2019-3A, Class C, 3.000%, 8/20/2036(a) | 60,757 |
Loomis Sayles Fixed Income Fund (continued)
Principal Amount (‡) | Description | Value (†) |
ABS Other — continued | ||
$56,886 | Sierra Timeshare Receivables Funding LLC, Series 2021-1A, Class C, 1.790%, 11/20/2037(a) | $52,819 |
99,792 | Sierra Timeshare Receivables Funding LLC, Series 2023-2A, Class C, 7.300%, 4/20/2040(a) | 98,771 |
1,216,051 | Slam Ltd., Series 2021-1A, Class A, 2.434%, 6/15/2046(a) | 1,033,673 |
100,000 | SoFi Consumer Loan Program Trust, Series 2021-1, Class D, 2.040%, 9/25/2030(a) | 93,922 |
616,464 | Sunnova Helios X Issuer LLC, Series 2022-C, Class C, 6.000%, 11/22/2049(a) | 519,830 |
137,940 | Sunnova Helios XII Issuer LLC, Series 2023-B, Class B, 5.600%, 8/22/2050(a) | 128,481 |
600,399 | TIF Funding II LLC, Series 2021-1A, Class A, 1.650%, 2/20/2046(a) | 496,969 |
230,000 | Towd Point Mortgage Trust, Series 2017-1, Class M1, 3.750%, 10/25/2056(a)(b) | 213,860 |
523,093 | WAVE Trust, Series 2017-1A, Class A, 3.844%, 11/15/2042(a) | 420,499 |
1,122,574 | Willis Engine Structured Trust VI, Series 2021-A, Class A, 3.104%, 5/15/2046(a) | 900,202 |
11,358,866 | ||
ABS Student Loan — 0.5% | ||
218,717 | College Avenue Student Loans LLC, Series 2021-A, Class C, 2.920%, 7/25/2051(a) | 195,470 |
211,866 | EDvestinU Private Education Loan Issue No. 3 LLC, Series 2021-A, Class A, 1.800%, 11/25/2045(a) | 183,364 |
74,048 | Navient Private Education Refi Loan Trust, Series 2020-HA, Class A, 1.310%, 1/15/2069(a) | 67,026 |
209,690 | Navient Private Education Refi Loan Trust, Series 2021-A, Class A, 0.840%, 5/15/2069(a) | 181,384 |
100,000 | Navient Private Education Refi Loan Trust, Series 2021-A, Class B, 2.240%, 5/15/2069(a) | 70,013 |
170,000 | Navient Private Education Refi Loan Trust, Series 2021-EA, Class B, 2.030%, 12/16/2069(a) | 108,449 |
385,000 | Navient Private Education Refi Loan Trust, Series 2021-FA, Class B, 2.120%, 2/18/2070(a) | 235,879 |
131,548 | SMB Private Education Loan Trust, Series 2016-C, Class A2A, 2.340%, 9/15/2034(a) | 127,654 |
Principal Amount (‡) | Description | Value (†) |
ABS Student Loan — continued | ||
$57,224 | SMB Private Education Loan Trust, Series 2020-A, Class A2A, 2.230%, 9/15/2037(a) | $52,582 |
722,292 | SMB Private Education Loan Trust, Series 2021-A, Class A2A2, 1 mo. USD SOFR + 0.844%, 6.177%, 1/15/2053(a)(c) | 710,652 |
475,000 | SMB Private Education Loan Trust, Series 2021-B, Class B, 2.650%, 7/17/2051(a) | 368,889 |
2,301,362 | ||
ABS Whole Business — 0.5% | ||
785,000 | Applebee's Funding LLC/IHOP Funding LLC, Series 2023-1A, Class A2, 7.824%, 3/05/2053(a) | 773,876 |
56,700 | Domino's Pizza Master Issuer LLC, Series 2017-1A, Class A23, 4.118%, 7/25/2047(a) | 52,456 |
133,350 | Domino's Pizza Master Issuer LLC, Series 2018-1A, Class A2II, 4.328%, 7/25/2048(a) | 123,793 |
640,263 | Domino's Pizza Master Issuer LLC, Series 2021-1A, Class A2I, 2.662%, 4/25/2051(a) | 539,734 |
293,250 | Hardee's Funding LLC, Series 2021-1A, Class A2, 2.865%, 6/20/2051(a) | 230,432 |
91,438 | Planet Fitness Master Issuer LLC, Series 2019-1A, Class A2, 3.858%, 12/05/2049(a) | 76,815 |
49,250 | Planet Fitness Master Issuer LLC, Series 2022-1A, Class A2I, 3.251%, 12/05/2051(a) | 44,038 |
259,188 | Wendy's Funding LLC, Series 2018-1A, Class A2II, 3.884%, 3/15/2048(a) | 232,059 |
2,073,203 | ||
Aerospace & Defense — 0.3% | ||
855,000 | Embraer Netherlands Finance BV, 7.000%, 7/28/2030(a) | 848,122 |
435,000 | TransDigm, Inc., 6.750%, 8/15/2028(a) | 428,253 |
1,276,375 | ||
Airlines — 1.3% | ||
313,473 | American Airlines Pass-Through Trust, Series 2016-3, Class B, 3.750%, 4/15/2027 | 292,881 |
924,375 | American Airlines Pass-Through Trust, Series 2017-1, Class B, 4.950%, 8/15/2026 | 895,557 |
642,810 | American Airlines Pass-Through Trust, Series 2017-2, Class B, 3.700%, 4/15/2027 | 610,401 |
371,132 | U.S. Airways Pass-Through Trust, Series 2012-1, Class A, 5.900%, 4/01/2026 | 371,395 |
Loomis Sayles Fixed Income Fund (continued)
Principal Amount (‡) | Description | Value (†) |
Airlines — continued | ||
$1,011,446 | U.S. Airways Pass-Through Trust, Series 2012-2, Class A, 4.625%, 12/03/2026 | $973,404 |
430,185 | United Airlines Pass-Through Trust, Series 20-1, Class A, 5.875%, 4/15/2029 | 426,124 |
949,458 | United Airlines Pass-Through Trust, Series 2014-1, Class A, 4.000%, 10/11/2027 | 902,026 |
1,075,000 | United Airlines Pass-Through Trust, Series 2023-1, Class A, 5.800%, 7/15/2037 | 1,045,309 |
5,517,097 | ||
Automotive — 0.8% | ||
130,000 | General Motors Financial Co., Inc., 3.100%, 1/12/2032 | 100,579 |
2,270,000 | General Motors Financial Co., Inc., 3.600%, 6/21/2030 | 1,899,873 |
270,000 | General Motors Financial Co., Inc., 5.850%, 4/06/2030 | 258,626 |
135,000 | General Motors Financial Co., Inc., 6.000%, 1/09/2028 | 133,347 |
285,000 | General Motors Financial Co., Inc., 6.400%, 1/09/2033 | 278,332 |
60,000 | General Motors Financial Co., Inc., Series A, (fixed rate to 9/30/2027, variable rate thereafter), 5.750%(d) | 48,317 |
100,000 | General Motors Financial Co., Inc., Series C, (fixed rate to 9/30/2030, variable rate thereafter), 5.700%(d) | 85,461 |
285,000 | ZF North America Capital, Inc., 6.875%, 4/14/2028(a) | 279,029 |
300,000 | ZF North America Capital, Inc., 7.125%, 4/14/2030(a) | 294,180 |
3,377,744 | ||
Banking — 6.4% | ||
205,000 | AIB Group PLC, (fixed rate to 9/13/2028, variable rate thereafter), 6.608%, 9/13/2029(a) | 204,147 |
1,146,000 | Ally Financial, Inc., 8.000%, 11/01/2031 | 1,157,041 |
1,585,000 | Ally Financial, Inc., Series B, (fixed rate to 5/15/2026, variable rate thereafter), 4.700%(d) | 1,087,691 |
1,500,000 | Ally Financial, Inc., Series C, (fixed rate to 5/15/2028, variable rate thereafter), 4.700%(d) | 939,295 |
3,340,000 | Bank of America Corp., 6.110%, 1/29/2037 | 3,293,700 |
762,000 | Bank of America Corp., (fixed rate to 9/21/2031, variable rate thereafter), 2.482%, 9/21/2036 | 554,490 |
915,000 | Barclays PLC, (fixed rate to 11/24/2026, variable rate thereafter), 2.279%, 11/24/2027 | 806,176 |
Principal Amount (‡) | Description | Value (†) |
Banking — continued | ||
$1,125,000 | Barclays PLC, (fixed rate to 3/15/2028, variable rate thereafter), 4.375%(d) | $780,797 |
980,000 | Barclays PLC, (fixed rate to 5/09/2033, variable rate thereafter), 6.224%, 5/09/2034 | 928,344 |
1,175,000 | BNP Paribas SA, (fixed rate to 1/20/2027, variable rate thereafter), 2.591%, 1/20/2028(a) | 1,046,810 |
580,000 | CaixaBank SA, (fixed rate to 9/13/2033, variable rate thereafter), 6.840%, 9/13/2034(a) | 568,736 |
685,000 | Credit Agricole SA, 3.250%, 1/14/2030(a) | 571,338 |
495,000 | Credit Agricole SA, (fixed rate to 1/10/2028, variable rate thereafter), 4.000%, 1/10/2033 | 438,912 |
370,000 | Deutsche Bank AG, (fixed rate to 10/07/2031, variable rate thereafter), 3.742%, 1/07/2033 | 265,510 |
1,202,000 | Deutsche Bank AG, (fixed rate to 10/14/2030, variable rate thereafter), 3.729%, 1/14/2032 | 894,761 |
235,000 | Deutsche Bank AG, (fixed rate to 12/01/2027, variable rate thereafter), 4.875%, 12/01/2032 | 200,486 |
2,075,000 | Goldman Sachs Group, Inc., (fixed rate to 8/23/2027, variable rate thereafter), 4.482%, 8/23/2028 | 1,964,010 |
1,055,000 | HSBC Holdings PLC, (fixed rate to 3/09/2028, variable rate thereafter), 6.161%, 3/09/2029 | 1,044,389 |
300,000 | ING Groep NV, (fixed rate to 9/11/2033, variable rate thereafter), 6.114%, 9/11/2034 | 291,333 |
355,000 | Intesa Sanpaolo SpA, 6.625%, 6/20/2033(a) | 333,604 |
290,000 | Intesa Sanpaolo SpA, (fixed rate to 6/01/2031, variable rate thereafter), 4.198%, 6/01/2032(a) | 213,933 |
1,465,000 | Morgan Stanley, (fixed rate to 1/19/2033, variable rate thereafter), 5.948%, 1/19/2038 | 1,369,300 |
1,495,000 | Morgan Stanley, (fixed rate to 1/21/2027, variable rate thereafter), 2.475%, 1/21/2028 | 1,332,970 |
530,000 | NatWest Group PLC, (fixed rate to 9/30/2027, variable rate thereafter), 5.516%, 9/30/2028 | 512,836 |
1,040,000 | Sumitomo Mitsui Financial Group, Inc., 5.464%, 1/13/2026 | 1,029,650 |
320,000 | Synchrony Bank, 5.400%, 8/22/2025 | 307,834 |
650,000 | Synchrony Bank, 5.625%, 8/23/2027 | 603,662 |
360,000 | UBS Group AG, (fixed rate to 11/15/2032, variable rate thereafter), 9.016%, 11/15/2033(a) | 415,733 |
Loomis Sayles Fixed Income Fund (continued)
Principal Amount (‡) | Description | Value (†) |
Banking — continued | ||
$500,000 | UBS Group AG, (fixed rate to 6/05/2025, variable rate thereafter), 2.193%, 6/05/2026(a) | $465,030 |
1,390,000 | UBS Group AG, (fixed rate to 7/15/2025, variable rate thereafter), 6.373%, 7/15/2026(a) | 1,384,761 |
780,000 | UBS Group AG, (fixed rate to 8/11/2027, variable rate thereafter), 6.442%, 8/11/2028(a) | 778,510 |
1,000,000 | UBS Group AG, (fixed rate to 8/12/2032, variable rate thereafter), 6.537%, 8/12/2033(a) | 990,600 |
200,000 | UniCredit SpA, (fixed rate to 6/03/2026, variable rate thereafter), 1.982%, 6/03/2027(a) | 176,674 |
405,000 | UniCredit SpA, (fixed rate to 6/19/2027, variable rate thereafter), 5.861%, 6/19/2032(a) | 368,611 |
27,321,674 | ||
Brokerage — 0.4% | ||
210,000 | Jefferies Financial Group, Inc., 5.875%, 7/21/2028 | 205,513 |
1,670,000 | Jefferies Financial Group, Inc., 6.250%, 1/15/2036 | 1,641,442 |
1,846,955 | ||
Building Materials — 1.6% | ||
4,500,000 | Cemex SAB de CV, 3.875%, 7/11/2031(a) | 3,769,268 |
1,195,000 | Cemex SAB de CV, (fixed rate to 6/08/2026, variable rate thereafter), 5.125%(a)(d) | 1,118,750 |
140,000 | JELD-WEN, Inc., 4.875%, 12/15/2027(a) | 123,533 |
213,000 | Masco Corp., 6.500%, 8/15/2032 | 214,567 |
380,000 | Masco Corp., 7.750%, 8/01/2029 | 412,009 |
1,188,000 | Owens Corning, 7.000%, 12/01/2036 | 1,253,856 |
6,891,983 | ||
Cable Satellite — 3.8% | ||
375,000 | CCO Holdings LLC/CCO Holdings Capital Corp., 4.250%, 2/01/2031(a) | 298,616 |
3,385,000 | CCO Holdings LLC/CCO Holdings Capital Corp., 4.250%, 1/15/2034(a) | 2,492,301 |
50,000 | Charter Communications Operating LLC/Charter Communications Operating Capital, 2.300%, 2/01/2032 | 36,439 |
1,780,000 | Charter Communications Operating LLC/Charter Communications Operating Capital, 2.800%, 4/01/2031 | 1,388,145 |
180,000 | Charter Communications Operating LLC/Charter Communications Operating Capital, 3.700%, 4/01/2051 | 104,741 |
Principal Amount (‡) | Description | Value (†) |
Cable Satellite — continued | ||
$2,625,000 | Charter Communications Operating LLC/Charter Communications Operating Capital, 3.950%, 6/30/2062 | $1,489,016 |
230,000 | Charter Communications Operating LLC/Charter Communications Operating Capital, 4.400%, 4/01/2033 | 195,624 |
1,295,000 | CSC Holdings LLC, 3.375%, 2/15/2031(a) | 882,461 |
200,000 | CSC Holdings LLC, 4.500%, 11/15/2031(a) | 141,556 |
2,710,000 | CSC Holdings LLC, 4.625%, 12/01/2030(a) | 1,440,780 |
1,750,000 | CSC Holdings LLC, 5.375%, 2/01/2028(a) | 1,424,696 |
1,020,000 | DISH DBS Corp., 5.125%, 6/01/2029 | 565,468 |
2,215,000 | DISH DBS Corp., 5.250%, 12/01/2026(a) | 1,882,420 |
2,710,000 | DISH DBS Corp., 5.750%, 12/01/2028(a) | 2,083,312 |
270,000 | DISH DBS Corp., 7.750%, 7/01/2026 | 202,500 |
375,000 | Time Warner Cable LLC, 4.500%, 9/15/2042 | 259,807 |
1,500,000 | Time Warner Cable LLC, 6.550%, 5/01/2037 | 1,360,514 |
16,248,396 | ||
Chemicals — 0.7% | ||
775,000 | Ashland, Inc., 3.375%, 9/01/2031(a) | 602,668 |
200,000 | Braskem Netherlands Finance BV, 4.500%, 1/31/2030(a) | 163,006 |
705,000 | Braskem Netherlands Finance BV, 5.875%, 1/31/2050(a) | 507,801 |
545,000 | Braskem Netherlands Finance BV, 8.500%, 1/12/2031(a) | 540,068 |
310,000 | Celanese U.S. Holdings LLC, 6.330%, 7/15/2029 | 303,865 |
230,000 | Celanese U.S. Holdings LLC, 6.379%, 7/15/2032 | 221,610 |
330,000 | Celanese U.S. Holdings LLC, 6.700%, 11/15/2033 | 321,227 |
200,000 | INEOS Quattro Finance 2 PLC, 3.375%, 1/15/2026(a) | 182,189 |
2,842,434 | ||
Construction Machinery — 1.0% | ||
200,000 | Ashtead Capital, Inc., 5.500%, 8/11/2032(a) | 184,790 |
275,000 | Ashtead Capital, Inc., 5.550%, 5/30/2033(a) | 255,127 |
1,755,000 | Ashtead Capital, Inc., 5.950%, 10/15/2033(a) | 1,666,122 |
415,000 | John Deere Capital Corp., MTN, 0.900%, 1/10/2024 | 409,661 |
Loomis Sayles Fixed Income Fund (continued)
Principal Amount (‡) | Description | Value (†) |
Construction Machinery — continued | ||
$645,000 | John Deere Capital Corp., MTN, 1.250%, 1/10/2025 | $611,202 |
965,000 | Toro Co., 6.625%, 5/01/2037 | 948,306 |
4,075,208 | ||
Consumer Cyclical Services — 1.6% | ||
700,000 | Expedia Group, Inc., 2.950%, 3/15/2031 | 563,951 |
735,000 | Expedia Group, Inc., 3.250%, 2/15/2030 | 621,665 |
1,010,000 | Go Daddy Operating Co. LLC/GD Finance Co., Inc., 3.500%, 3/01/2029(a) | 849,767 |
2,965,000 | Uber Technologies, Inc., 4.500%, 8/15/2029(a) | 2,650,285 |
1,420,000 | Uber Technologies, Inc., 6.250%, 1/15/2028(a) | 1,388,568 |
390,000 | Uber Technologies, Inc., 7.500%, 9/15/2027(a) | 393,239 |
120,000 | Uber Technologies, Inc., 8.000%, 11/01/2026(a) | 121,411 |
6,588,886 | ||
Diversified Manufacturing — 0.4% | ||
204,000 | GE Capital Funding LLC, 4.550%, 5/15/2032 | 188,023 |
120,000 | Ingersoll Rand, Inc., 5.700%, 8/14/2033 | 115,814 |
135,000 | Nordson Corp., 5.600%, 9/15/2028 | 133,704 |
185,000 | Nordson Corp., 5.800%, 9/15/2033 | 180,707 |
1,135,000 | Veralto Corp., 5.450%, 9/18/2033(a) | 1,098,135 |
1,716,383 | ||
Electric — 0.4% | ||
1,092,007 | Alta Wind Holdings LLC, 7.000%, 6/30/2035(a) | 980,550 |
100,000 | Enel Finance International NV, 6.800%, 9/15/2037(a) | 100,843 |
265,000 | Pacific Gas & Electric Co., 5.450%, 6/15/2027 | 255,044 |
505,000 | Southern Co., 5.700%, 3/15/2034 | 494,568 |
1,831,005 | ||
Finance Companies — 5.2% | ||
1,406,000 | AerCap Ireland Capital DAC/AerCap Global Aviation Trust, 3.000%, 10/29/2028 | 1,205,614 |
1,245,000 | AerCap Ireland Capital DAC/AerCap Global Aviation Trust, 3.300%, 1/30/2032 | 989,665 |
345,000 | AerCap Ireland Capital DAC/AerCap Global Aviation Trust, 3.400%, 10/29/2033 | 266,865 |
190,000 | AerCap Ireland Capital DAC/AerCap Global Aviation Trust, 5.750%, 6/06/2028 | 185,624 |
575,000 | AerCap Ireland Capital DAC/AerCap Global Aviation Trust, 6.150%, 9/30/2030 | 566,352 |
Principal Amount (‡) | Description | Value (†) |
Finance Companies — continued | ||
$300,000 | AGFC Capital Trust I, 3 mo. USD SOFR + 2.012%, 7.320%, 1/15/2067(a)(c) | $158,238 |
612,000 | Air Lease Corp., 4.625%, 10/01/2028 | 567,030 |
985,000 | Air Lease Corp., Series B, (fixed rate to 6/15/2026, variable rate thereafter), 4.650%(d) | 867,429 |
740,000 | Aircastle Ltd., 6.500%, 7/18/2028(a) | 725,702 |
460,000 | Aircastle Ltd., Series A, (fixed rate to 6/15/2026, variable rate thereafter), 5.250%(a)(d) | 361,720 |
2,290,000 | Ares Capital Corp., 3.200%, 11/15/2031 | 1,752,181 |
240,000 | Aviation Capital Group LLC, 1.950%, 1/30/2026(a) | 215,771 |
590,000 | Aviation Capital Group LLC, 6.250%, 4/15/2028(a) | 576,294 |
955,000 | Aviation Capital Group LLC, 6.375%, 7/15/2030(a) | 924,807 |
655,000 | Barings BDC, Inc., 3.300%, 11/23/2026 | 574,688 |
625,000 | Blue Owl Capital Corp., 2.875%, 6/11/2028 | 513,922 |
1,490,000 | Blue Owl Capital Corp., 4.250%, 1/15/2026 | 1,393,950 |
1,100,000 | GATX Corp., 5.450%, 9/15/2033 | 1,032,297 |
65,000 | GATX Corp., 6.050%, 3/15/2034 | 63,478 |
155,000 | Nationstar Mortgage Holdings, Inc., 5.125%, 12/15/2030(a) | 125,849 |
685,000 | Nationstar Mortgage Holdings, Inc., 5.500%, 8/15/2028(a) | 604,215 |
1,315,000 | Navient Corp., Series A, MTN, 5.625%, 8/01/2033 | 954,230 |
70,000 | OneMain Finance Corp., 3.500%, 1/15/2027 | 59,938 |
80,000 | OneMain Finance Corp., 4.000%, 9/15/2030 | 60,028 |
175,000 | OneMain Finance Corp., 5.375%, 11/15/2029 | 146,563 |
2,135,000 | Rocket Mortgage LLC/Rocket Mortgage Co-Issuer, Inc., 2.875%, 10/15/2026(a) | 1,880,273 |
1,345,000 | Rocket Mortgage LLC/Rocket Mortgage Co-Issuer, Inc., 3.625%, 3/01/2029(a) | 1,111,959 |
3,345,000 | Rocket Mortgage LLC/Rocket Mortgage Co-Issuer, Inc., 3.875%, 3/01/2031(a) | 2,667,203 |
1,080,000 | Rocket Mortgage LLC/Rocket Mortgage Co-Issuer, Inc., 4.000%, 10/15/2033(a) | 815,598 |
655,000 | SMBC Aviation Capital Finance DAC, 5.450%, 5/03/2028(a) | 633,000 |
22,000,483 | ||
Financial Other — 0.7% | ||
630,000 | Agile Group Holdings Ltd., 6.050%, 10/13/2025 | 68,941 |
205,000 | Central China Real Estate Ltd., 7.250%, 7/16/2024(e) | 8,380 |
200,000 | Central China Real Estate Ltd., 7.250%, 8/13/2024(e) | 8,114 |
Loomis Sayles Fixed Income Fund (continued)
Principal Amount (‡) | Description | Value (†) |
Financial Other — continued | ||
$190,000 | Central China Real Estate Ltd., 7.250%, 4/28/2025(e) | $7,125 |
200,000 | Central China Real Estate Ltd., 7.500%, 7/14/2025(e) | 7,330 |
200,000 | CIFI Holdings Group Co. Ltd., 6.000%, 7/16/2025(e) | 13,382 |
200,000 | CIFI Holdings Group Co. Ltd., 6.450%, 11/07/2024(e) | 13,240 |
600,000 | Country Garden Holdings Co. Ltd., 3.300%, 1/12/2031 | 37,326 |
2,510,000 | Icahn Enterprises LP/Icahn Enterprises Finance Corp., 4.375%, 2/01/2029 | 2,007,145 |
10,000 | Icahn Enterprises LP/Icahn Enterprises Finance Corp., 4.750%, 9/15/2024 | 9,632 |
40,000 | Icahn Enterprises LP/Icahn Enterprises Finance Corp., 5.250%, 5/15/2027 | 35,159 |
15,000 | Icahn Enterprises LP/Icahn Enterprises Finance Corp., 6.375%, 12/15/2025 | 14,269 |
1,285,000 | Kaisa Group Holdings Ltd., 9.375%, 6/30/2024(e) | 75,031 |
200,000 | Kaisa Group Holdings Ltd., 9.950%, 7/23/2025(e) | 11,708 |
200,000 | Kaisa Group Holdings Ltd., 10.500%, 1/15/2025(e) | 11,686 |
1,810,000 | Kaisa Group Holdings Ltd., 11.250%, 4/16/2025(e) | 103,985 |
400,000 | Logan Group Co. Ltd., 4.250%, 7/12/2025(e) | 20,000 |
400,000 | Logan Group Co. Ltd., 4.850%, 12/14/2026(e) | 20,000 |
405,000 | Shimao Group Holdings Ltd., 3.450%, 1/11/2031(e) | 16,200 |
425,000 | Shimao Group Holdings Ltd., 5.600%, 7/15/2026(e) | 16,894 |
200,000 | Shimao Group Holdings Ltd., 6.125%, 2/21/2024(e) | 8,000 |
410,000 | Sunac China Holdings Ltd., 6.500%, 1/10/2025(e) | 63,550 |
230,000 | Sunac China Holdings Ltd., 6.500%, 1/26/2026(e) | 35,650 |
445,000 | Sunac China Holdings Ltd., 7.000%, 7/09/2025(e) | 68,975 |
200,000 | Times China Holdings Ltd., 5.750%, 1/14/2027(e) | 6,000 |
400,000 | Times China Holdings Ltd., 6.200%, 3/22/2026(e) | 12,000 |
400,000 | Yuzhou Group Holdings Co. Ltd., 6.350%, 1/13/2027(e) | 24,176 |
370,000 | Yuzhou Group Holdings Co. Ltd., 7.700%, 2/20/2025(e) | 24,235 |
225,000 | Yuzhou Group Holdings Co. Ltd., 8.300%, 5/27/2025(e) | 14,049 |
2,762,182 | ||
Principal Amount (‡) | Description | Value (†) |
Food & Beverage — 0.6% | ||
$995,000 | Bacardi Ltd./Bacardi-Martini BV, 5.400%, 6/15/2033(a) | $932,340 |
350,000 | JBS USA LUX SA/JBS USA Food Co./JBS USA Finance, Inc., 3.000%, 2/02/2029 | 293,716 |
1,230,000 | Pilgrim's Pride Corp., 3.500%, 3/01/2032 | 951,162 |
280,000 | Pilgrim's Pride Corp., 4.250%, 4/15/2031 | 233,577 |
2,410,795 | ||
Gaming — 1.2% | ||
925,000 | Genm Capital Labuan Ltd., 3.882%, 4/19/2031(a) | 723,769 |
385,000 | GLP Capital LP/GLP Financing II, Inc., 3.250%, 1/15/2032 | 298,794 |
1,850,000 | Light & Wonder International, Inc., 7.000%, 5/15/2028(a) | 1,818,383 |
30,000 | Light & Wonder International, Inc., 7.250%, 11/15/2029(a) | 29,400 |
215,000 | Light & Wonder International, Inc., 7.500%, 9/01/2031(a) | 212,496 |
710,000 | VICI Properties LP/VICI Note Co., Inc., 4.250%, 12/01/2026(a) | 661,543 |
575,000 | VICI Properties LP/VICI Note Co., Inc., 4.500%, 9/01/2026(a) | 540,187 |
505,000 | VICI Properties LP/VICI Note Co., Inc., 4.625%, 6/15/2025(a) | 487,673 |
415,000 | VICI Properties LP/VICI Note Co., Inc., 5.625%, 5/01/2024(a) | 412,374 |
5,184,619 | ||
Government Owned - No Guarantee — 0.5% | ||
730,000 | Antares Holdings LP, 3.750%, 7/15/2027(a) | 628,896 |
805,000 | Antares Holdings LP, 7.950%, 8/11/2028(a) | 800,227 |
870,000 | Pertamina Persero PT, 6.450%, 5/30/2044(a) | 831,015 |
200,000 | Sino-Ocean Land Treasure IV Ltd., 4.750%, 8/05/2029(f) | 7,020 |
400,000 | Sino-Ocean Land Treasure IV Ltd., 4.750%, 1/14/2030(f) | 13,136 |
2,280,294 | ||
Health Insurance — 0.7% | ||
25,000 | Centene Corp., 2.450%, 7/15/2028 | 21,121 |
2,490,000 | Centene Corp., 2.500%, 3/01/2031 | 1,912,864 |
625,000 | Centene Corp., 2.625%, 8/01/2031 | 478,689 |
180,000 | Centene Corp., 3.375%, 2/15/2030 | 150,133 |
150,000 | Centene Corp., 4.625%, 12/15/2029 | 135,095 |
430,000 | Molina Healthcare, Inc., 3.875%, 5/15/2032(a) | 344,854 |
3,042,756 | ||
Loomis Sayles Fixed Income Fund (continued)
Principal Amount (‡) | Description | Value (†) |
Healthcare — 0.8% | ||
$395,000 | Alcon Finance Corp., 5.375%, 12/06/2032(a) | $383,141 |
700,000 | HCA, Inc., 4.125%, 6/15/2029 | 633,697 |
2,605,000 | HCA, Inc., 5.500%, 6/01/2033 | 2,463,610 |
3,480,448 | ||
Home Construction — 0.2% | ||
1,010,000 | PulteGroup, Inc., 6.375%, 5/15/2033 | 1,014,764 |
Independent Energy — 3.6% | ||
1,385,000 | Aker BP ASA, 3.750%, 1/15/2030(a) | 1,190,126 |
675,000 | Aker BP ASA, 5.600%, 6/13/2028(a) | 659,514 |
1,060,000 | Continental Resources, Inc., 2.875%, 4/01/2032(a) | 793,780 |
4,040,000 | Continental Resources, Inc., 5.750%, 1/15/2031(a) | 3,795,399 |
740,000 | Energian Israel Finance Ltd., 5.375%, 3/30/2028(a) | 663,669 |
965,000 | Energian Israel Finance Ltd., 5.875%, 3/30/2031(a) | 836,896 |
50,000 | EQT Corp., 3.125%, 5/15/2026(a) | 46,260 |
840,000 | EQT Corp., 3.625%, 5/15/2031(a) | 710,590 |
1,125,000 | EQT Corp., 3.900%, 10/01/2027 | 1,040,595 |
160,000 | EQT Corp., 5.000%, 1/15/2029 | 150,402 |
160,000 | EQT Corp., 5.700%, 4/01/2028 | 156,814 |
975,000 | EQT Corp., 7.000%, 2/01/2030 | 1,003,022 |
175,000 | Matador Resources Co., 6.875%, 4/15/2028(a) | 171,822 |
45,000 | Occidental Petroleum Corp., 6.125%, 1/01/2031 | 44,354 |
65,000 | Occidental Petroleum Corp., 7.875%, 9/15/2031 | 70,337 |
975,000 | Occidental Petroleum Corp., 8.875%, 7/15/2030 | 1,096,202 |
1,040,000 | Ovintiv, Inc., 6.500%, 8/15/2034 | 1,024,265 |
65,000 | Ovintiv, Inc., 6.500%, 2/01/2038 | 62,079 |
310,000 | Ovintiv, Inc., 6.625%, 8/15/2037 | 297,397 |
40,000 | Ovintiv, Inc., 7.200%, 11/01/2031 | 41,175 |
125,000 | Ovintiv, Inc., 7.375%, 11/01/2031 | 130,977 |
130,000 | Southwestern Energy Co., 4.750%, 2/01/2032 | 111,577 |
355,000 | Var Energi ASA, 7.500%, 1/15/2028(a) | 364,279 |
705,000 | Var Energi ASA, 8.000%, 11/15/2032(a) | 739,757 |
15,201,288 | ||
Industrial Other — 0.3% | ||
1,095,000 | Jacobs Engineering Group, Inc., 6.350%, 8/18/2028 | 1,091,812 |
395,000 | TopBuild Corp., 4.125%, 2/15/2032(a) | 320,679 |
1,412,491 | ||
Leisure — 0.9% | ||
35,000 | Carnival Corp., 4.000%, 8/01/2028(a) | 30,348 |
620,000 | Carnival Corp., 5.750%, 3/01/2027(a) | 561,239 |
395,000 | Carnival Corp., 6.000%, 5/01/2029(a) | 336,928 |
150,000 | Carnival Corp., 7.000%, 8/15/2029(a) | 147,904 |
770,000 | NCL Corp. Ltd., 5.875%, 3/15/2026(a) | 710,897 |
Principal Amount (‡) | Description | Value (†) |
Leisure — continued | ||
$485,000 | NCL Corp. Ltd., 5.875%, 2/15/2027(a) | $460,638 |
280,000 | NCL Finance Ltd., 6.125%, 3/15/2028(a) | 247,100 |
140,000 | Royal Caribbean Cruises Ltd., 4.250%, 7/01/2026(a) | 128,365 |
1,195,000 | Royal Caribbean Cruises Ltd., 5.500%, 4/01/2028(a) | 1,095,805 |
3,719,224 | ||
Life Insurance — 2.1% | ||
1,860,000 | Athene Global Funding, 1.716%, 1/07/2025(a) | 1,745,999 |
434,000 | Brighthouse Financial, Inc., 4.700%, 6/22/2047 | 301,425 |
1,745,000 | Brighthouse Financial, Inc., 5.625%, 5/15/2030 | 1,633,055 |
2,270,000 | MetLife, Inc., 9.250%, 4/08/2068(a) | 2,549,741 |
1,115,000 | MetLife, Inc., 10.750%, 8/01/2069 | 1,425,254 |
1,165,000 | Penn Mutual Life Insurance Co., 6.650%, 6/15/2034(a) | 1,128,756 |
8,784,230 | ||
Lodging — 0.8% | ||
855,000 | Hilton Domestic Operating Co., Inc., 3.625%, 2/15/2032(a) | 689,298 |
200,000 | Hilton Grand Vacations Borrower Escrow LLC/Hilton Grand Vacations Borrower Escrow, Inc., 4.875%, 7/01/2031(a) | 163,044 |
685,000 | Hilton Grand Vacations Borrower Escrow LLC/Hilton Grand Vacations Borrower Escrow, Inc., 5.000%, 6/01/2029(a) | 594,200 |
530,000 | Marriott Ownership Resorts, Inc., 4.500%, 6/15/2029(a) | 444,087 |
620,000 | Travel & Leisure Co., 4.500%, 12/01/2029(a) | 520,025 |
815,000 | Travel & Leisure Co., 4.625%, 3/01/2030(a) | 685,839 |
110,000 | Travel & Leisure Co., 6.000%, 4/01/2027 | 104,654 |
55,000 | Travel & Leisure Co., 6.625%, 7/31/2026(a) | 53,515 |
3,254,662 | ||
Media Entertainment — 1.4% | ||
540,000 | iHeartCommunications, Inc., 4.750%, 1/15/2028(a) | 412,818 |
550,000 | iHeartCommunications, Inc., 5.250%, 8/15/2027(a) | 435,884 |
1,510,000 | Netflix, Inc., 4.875%, 6/15/2030(a) | 1,429,529 |
200,000 | Netflix, Inc., 5.375%, 11/15/2029(a) | 195,146 |
915,000 | Netflix, Inc., 5.875%, 11/15/2028 | 920,180 |
1,185,000 | Netflix, Inc., 6.375%, 5/15/2029 | 1,223,580 |
Loomis Sayles Fixed Income Fund (continued)
Principal Amount (‡) | Description | Value (†) |
Media Entertainment — continued | ||
$300,000 | Warnermedia Holdings, Inc., 4.054%, 3/15/2029 | $267,288 |
1,235,000 | Warnermedia Holdings, Inc., 4.279%, 3/15/2032 | 1,048,291 |
5,932,716 | ||
Metals & Mining — 3.9% | ||
1,910,000 | Anglo American Capital PLC, 2.875%, 3/17/2031(a) | 1,517,941 |
940,000 | Anglo American Capital PLC, 5.500%, 5/02/2033(a) | 879,336 |
1,430,000 | ArcelorMittal SA, 6.800%, 11/29/2032 | 1,420,196 |
2,680,000 | First Quantum Minerals Ltd., 6.875%, 10/15/2027(a) | 2,571,131 |
477,000 | First Quantum Minerals Ltd., 7.500%, 4/01/2025(a) | 476,063 |
430,000 | FMG Resources August 2006 Pty. Ltd., 4.375%, 4/01/2031(a) | 353,800 |
5,000 | Freeport-McMoRan, Inc., 4.250%, 3/01/2030 | 4,418 |
325,000 | Glencore Funding LLC, 2.500%, 9/01/2030(a) | 256,984 |
2,905,000 | Glencore Funding LLC, 2.850%, 4/27/2031(a) | 2,305,156 |
1,100,000 | Glencore Funding LLC, 5.700%, 5/08/2033(a) | 1,043,052 |
1,485,000 | Glencore Funding LLC, 6.125%, 10/06/2028(a) | 1,482,451 |
1,425,000 | Glencore Funding LLC, 6.375%, 10/06/2030(a) | 1,421,164 |
2,690,000 | Glencore Funding LLC, 6.500%, 10/06/2033(a) | 2,685,253 |
215,000 | Volcan Cia Minera SAA, 4.375%, 2/11/2026(a) | 122,719 |
16,539,664 | ||
Midstream — 2.2% | ||
295,000 | Cheniere Energy Partners LP, 3.250%, 1/31/2032 | 234,465 |
1,450,000 | Cheniere Energy Partners LP, 4.000%, 3/01/2031 | 1,239,657 |
165,000 | Cheniere Energy Partners LP, 4.500%, 10/01/2029 | 149,403 |
535,000 | Cheniere Energy Partners LP, 5.950%, 6/30/2033(a) | 515,991 |
530,000 | DCP Midstream Operating LP, 3.250%, 2/15/2032 | 427,610 |
10,000 | DCP Midstream Operating LP, 5.125%, 5/15/2029 | 9,527 |
575,000 | DCP Midstream Operating LP, 6.450%, 11/03/2036(a) | 565,369 |
1,320,000 | Enbridge, Inc., 5.700%, 3/08/2033 | 1,264,558 |
1,040,000 | Energy Transfer LP, 5.000%, 5/15/2044 | 811,335 |
715,000 | Energy Transfer LP, 5.750%, 2/15/2033 | 687,303 |
95,000 | EnLink Midstream LLC, 6.500%, 9/01/2030(a) | 92,166 |
Principal Amount (‡) | Description | Value (†) |
Midstream — continued | ||
$550,000 | Hess Midstream Operations LP, 4.250%, 2/15/2030(a) | $463,781 |
285,000 | Hess Midstream Operations LP, 5.625%, 2/15/2026(a) | 275,381 |
95,000 | NGPL PipeCo LLC, 7.768%, 12/15/2037(a) | 97,712 |
35,000 | Targa Resources Corp., 5.200%, 7/01/2027 | 34,297 |
460,000 | Targa Resources Corp., 6.125%, 3/15/2033 | 450,938 |
395,000 | Targa Resources Partners LP/Targa Resources Partners Finance Corp., 4.000%, 1/15/2032 | 331,678 |
100,000 | Targa Resources Partners LP/Targa Resources Partners Finance Corp., 4.875%, 2/01/2031 | 89,565 |
105,000 | Targa Resources Partners LP/Targa Resources Partners Finance Corp., 5.500%, 3/01/2030 | 98,271 |
170,000 | Western Midstream Operating LP, 4.050%, 2/01/2030 | 148,596 |
230,000 | Western Midstream Operating LP, 5.250%, 2/01/2050 | 179,178 |
405,000 | Western Midstream Operating LP, 5.300%, 3/01/2048 | 316,120 |
80,000 | Western Midstream Operating LP, 5.450%, 4/01/2044 | 64,489 |
55,000 | Western Midstream Operating LP, 5.500%, 8/15/2048 | 43,732 |
100,000 | Western Midstream Operating LP, 6.150%, 4/01/2033 | 96,441 |
485,000 | Western Midstream Operating LP, 6.350%, 1/15/2029 | 486,000 |
9,173,563 | ||
Natural Gas — 0.1% | ||
245,000 | Southern Co. Gas Capital Corp., 5.750%, 9/15/2033 | 240,180 |
Non-Agency Commercial Mortgage-Backed Securities — 1.8% | ||
710,000 | BANK, Series 2021-BN35, Class AS, 2.457%, 6/15/2064 | 530,220 |
147,079 | BB-UBS Trust, Series 2012-TFT, Class A, 2.892%, 6/05/2030(a) | 129,171 |
740,000 | BPR Trust, Series 2021-NRD, Class F, 1 mo. USD SOFR + 6.870%, 12.203%, 12/15/2038(a)(c) | 663,019 |
570,000 | BPR Trust, Series 2022-STAR, Class A, 1 mo. USD SOFR + 3.232%, 8.564%, 8/15/2024(a)(c) | 565,829 |
11,106 | Commercial Mortgage Pass-Through Certificates, Series 2012-CR3, Class AM, 3.416%, 10/15/2045(a) | 10,262 |
90,361 | Commercial Mortgage Pass-Through Certificates, Series 2012-LTRT, Class A2, 3.400%, 10/05/2030(a) | 74,584 |
Loomis Sayles Fixed Income Fund (continued)
Principal Amount (‡) | Description | Value (†) |
Non-Agency Commercial Mortgage-Backed Securities — continued | ||
$136,403 | Commercial Mortgage Trust, Series 2012-LC4, Class B, 4.934%, 12/10/2044(b) | $122,762 |
185,000 | Credit Suisse Mortgage Trust, Series 2014-USA, Class B, 4.185%, 9/15/2037(a) | 146,105 |
100,000 | Credit Suisse Mortgage Trust, Series 2014-USA, Class C, 4.336%, 9/15/2037(a) | 75,272 |
200,000 | Credit Suisse Mortgage Trust, Series 2014-USA, Class D, 4.373%, 9/15/2037(a) | 153,517 |
545,000 | DC Commercial Mortgage Trust, Series 2023-DC, Class C, 7.379%, 9/12/2040(a)(b) | 542,969 |
247,127 | Extended Stay America Trust, Series 2021-ESH, Class D, 1 mo. USD SOFR + 2.364%, 7.697%, 7/15/2038(a)(c) | 243,093 |
295,000 | GS Mortgage Securities Corportation Trust, Series 2013-PEMB, Class A, 3.668%, 3/05/2033(a)(b) | 253,881 |
315,000 | GS Mortgage Securities Corportation Trust, Series 2013-PEMB, Class B, 3.668%, 3/05/2033(a)(b) | 252,422 |
255,000 | GS Mortgage Securities Trust, Series 2014-GC18, Class B, 4.885%, 1/10/2047(b) | 212,090 |
989,925 | JP Morgan Chase Commercial Mortgage Securities Trust, Series 2012-LC9, Class C, 3.910%, 12/15/2047(a)(b) | 884,109 |
100,000 | JP Morgan Chase Commercial Mortgage Securities Trust, Series 2012-LC9, Class D, 3.910%, 12/15/2047(a)(b) | 80,498 |
149,284 | Med Trust, Series 2021-MDLN, Class B, 1 mo. USD SOFR + 1.564%, 6.897%, 11/15/2038(a)(c) | 145,536 |
398,089 | Med Trust, Series 2021-MDLN, Class C, 1 mo. USD SOFR + 1.914%, 7.247%, 11/15/2038(a)(c) | 386,526 |
194,069 | Med Trust, Series 2021-MDLN, Class D, 1 mo. USD SOFR + 2.114%, 7.447%, 11/15/2038(a)(c) | 186,030 |
118,231 | Morgan Stanley Bank of America Merrill Lynch Trust, Series 2013-C11, Class A4, 4.020%, 8/15/2046(b) | 117,344 |
97,959 | MSBAM Commercial Mortgage Securities Trust, Series 2012-CKSV, Class A2, 3.277%, 10/15/2030(a) | 80,816 |
800,000 | RBS Commercial Funding, Inc. Trust, Series 2013-GSP, Class A, 3.961%, 1/15/2032(a)(b) | 786,899 |
211,954 | Wells Fargo Commercial Mortgage Trust, Series 2013-LC12, Class B, 4.087%, 7/15/2046(b) | 172,213 |
Principal Amount (‡) | Description | Value (†) |
Non-Agency Commercial Mortgage-Backed Securities — continued | ||
$275,000 | Wells Fargo Commercial Mortgage Trust, Series 2016-C36, Class B, 3.671%, 11/15/2059(b) | $225,432 |
420,000 | WFRBS Commercial Mortgage Trust, Series 2013-C15, Class B, 4.352%, 8/15/2046(b) | 348,595 |
390,000 | WFRBS Commercial Mortgage Trust, Series 2014-C20, Class B, 4.378%, 5/15/2047 | 300,417 |
7,689,611 | ||
Other REITs — 0.0% | ||
270,000 | EPR Properties, 3.600%, 11/15/2031 | 200,143 |
Paper — 0.4% | ||
350,000 | WestRock MWV LLC, 7.950%, 2/15/2031 | 383,170 |
1,035,000 | WestRock MWV LLC, 8.200%, 1/15/2030 | 1,139,298 |
1,522,468 | ||
Pharmaceuticals — 1.8% | ||
985,000 | Bausch Health Cos., Inc., 4.875%, 6/01/2028(a) | 560,156 |
130,000 | Bausch Health Cos., Inc., 5.000%, 1/30/2028(a) | 52,937 |
35,000 | Bausch Health Cos., Inc., 5.000%, 2/15/2029(a) | 13,300 |
290,000 | Bausch Health Cos., Inc., 5.250%, 1/30/2030(a) | 108,867 |
390,000 | Bausch Health Cos., Inc., 5.250%, 2/15/2031(a) | 149,662 |
40,000 | Bausch Health Cos., Inc., 6.250%, 2/15/2029(a) | 15,800 |
915,000 | Pfizer Investment Enterprises Pte. Ltd., 4.750%, 5/19/2033 | 864,929 |
620,000 | Teva Pharmaceutical Finance Co. LLC, 6.150%, 2/01/2036 | 549,799 |
610,000 | Teva Pharmaceutical Finance Netherlands II BV, 7.375%, 9/15/2029, (EUR) | 654,674 |
520,000 | Teva Pharmaceutical Finance Netherlands II BV, 7.875%, 9/15/2031, (EUR) | 568,325 |
340,000 | Teva Pharmaceutical Finance Netherlands III BV, 3.150%, 10/01/2026 | 303,032 |
1,710,000 | Teva Pharmaceutical Finance Netherlands III BV, 4.100%, 10/01/2046 | 1,070,401 |
1,160,000 | Teva Pharmaceutical Finance Netherlands III BV, 4.750%, 5/09/2027 | 1,064,338 |
695,000 | Teva Pharmaceutical Finance Netherlands III BV, 5.125%, 5/09/2029 | 628,280 |
Loomis Sayles Fixed Income Fund (continued)
Principal Amount (‡) | Description | Value (†) |
Pharmaceuticals — continued | ||
$645,000 | Teva Pharmaceutical Finance Netherlands III BV, 7.875%, 9/15/2029 | $653,426 |
460,000 | Teva Pharmaceutical Finance Netherlands III BV, 8.125%, 9/15/2031 | 475,894 |
7,733,820 | ||
Property & Casualty Insurance — 0.2% | ||
1,630,000 | MBIA Insurance Corp., 3 mo. USD SOFR + 11.522%, 16.830%, 1/15/2033(a)(f) | 48,900 |
1,135,000 | Stewart Information Services Corp., 3.600%, 11/15/2031 | 834,057 |
882,957 | ||
Retailers — 0.5% | ||
1,025,000 | Dillard's, Inc., 7.750%, 7/15/2026 | 1,034,676 |
1,250,000 | Lithia Motors, Inc., 3.875%, 6/01/2029(a) | 1,052,888 |
2,087,564 | ||
Technology — 6.9% | ||
1,070,000 | Avnet, Inc., 5.500%, 6/01/2032 | 984,243 |
735,000 | Block, Inc., 3.500%, 6/01/2031 | 577,387 |
410,000 | Broadcom, Inc., 2.450%, 2/15/2031(a) | 320,458 |
920,000 | Broadcom, Inc., 2.600%, 2/15/2033(a) | 686,029 |
425,000 | Broadcom, Inc., 3.137%, 11/15/2035(a) | 309,860 |
680,000 | Broadcom, Inc., 3.419%, 4/15/2033(a) | 543,902 |
750,000 | Broadcom, Inc., 3.469%, 4/15/2034(a) | 589,058 |
715,000 | Broadcom, Inc., 4.150%, 11/15/2030 | 633,299 |
330,000 | Broadcom, Inc., 4.150%, 4/15/2032(a) | 286,379 |
180,000 | CDW LLC/CDW Finance Corp., 2.670%, 12/01/2026 | 162,343 |
545,000 | CDW LLC/CDW Finance Corp., 3.250%, 2/15/2029 | 464,716 |
70,000 | CDW LLC/CDW Finance Corp., 3.276%, 12/01/2028 | 60,394 |
2,020,000 | CDW LLC/CDW Finance Corp., 3.569%, 12/01/2031 | 1,663,753 |
310,000 | CDW LLC/CDW Finance Corp., 4.250%, 4/01/2028 | 282,571 |
1,870,000 | CommScope, Inc., 4.750%, 9/01/2029(a) | 1,375,468 |
1,295,000 | Entegris Escrow Corp., 4.750%, 4/15/2029(a) | 1,164,216 |
1,695,000 | Fiserv, Inc., 5.625%, 8/21/2033 | 1,642,360 |
435,000 | Global Payments, Inc., 2.900%, 5/15/2030 | 356,625 |
530,000 | Global Payments, Inc., 2.900%, 11/15/2031 | 415,770 |
255,000 | Global Payments, Inc., 5.300%, 8/15/2029 | 243,180 |
545,000 | Global Payments, Inc., 5.400%, 8/15/2032 | 510,857 |
400,000 | GTCR W-2 Merger Sub LLC, 7.500%, 1/15/2031(a) | 400,560 |
1,215,000 | Iron Mountain, Inc., 4.875%, 9/15/2029(a) | 1,064,880 |
Principal Amount (‡) | Description | Value (†) |
Technology — continued | ||
$275,000 | Leidos, Inc., 2.300%, 2/15/2031 | $211,483 |
1,040,000 | Leidos, Inc., 5.750%, 3/15/2033 | 996,695 |
235,000 | Marvell Technology, Inc., 5.950%, 9/15/2033 | 230,655 |
1,320,000 | Micron Technology, Inc., 5.875%, 2/09/2033 | 1,260,946 |
3,560,000 | Micron Technology, Inc., 5.875%, 9/15/2033 | 3,390,738 |
1,480,000 | Micron Technology, Inc., 6.750%, 11/01/2029 | 1,503,747 |
290,000 | MSCI, Inc., 3.250%, 8/15/2033(a) | 223,198 |
315,000 | Open Text Corp., 6.900%, 12/01/2027(a) | 315,717 |
1,270,000 | Oracle Corp., 3.950%, 3/25/2051 | 870,642 |
505,000 | Oracle Corp., 6.150%, 11/09/2029 | 512,652 |
400,000 | S&P Global, Inc., 5.250%, 9/15/2033(a) | 389,892 |
615,000 | Sensata Technologies BV, 4.000%, 4/15/2029(a) | 529,575 |
205,000 | SK Hynix, Inc., 6.375%, 1/17/2028(a) | 204,642 |
995,000 | Trimble, Inc., 6.100%, 3/15/2033 | 974,830 |
680,000 | Verisk Analytics, Inc., 5.750%, 4/01/2033 | 676,186 |
1,220,000 | VMware, Inc., 2.200%, 8/15/2031 | 920,650 |
490,000 | Western Digital Corp., 2.850%, 2/01/2029 | 393,392 |
810,000 | Western Digital Corp., 4.750%, 2/15/2026 | 771,807 |
29,115,755 | ||
Transportation Services — 0.2% | ||
945,000 | ERAC USA Finance LLC, 4.900%, 5/01/2033(a) | 889,775 |
90,000 | Rand Parent LLC, 8.500%, 2/15/2030(a) | 83,237 |
973,012 | ||
Treasuries — 13.9% | ||
10,581(g ) | Brazil Notas do Tesouro Nacional, Series NTNF, 10.000%, 1/01/2029, (BRL) | 2,001,383 |
16,104,000,000 | Indonesia Treasury Bonds, Series FR95, 6.375%, 8/15/2028, (IDR) | 1,034,553 |
207,240(h ) | Mexico Bonos, Series M, 7.500%, 5/26/2033, (MXN) | 1,009,866 |
22,800,000 | Republic of South Africa Government Bonds, Series 2035, 8.875%, 2/28/2035, (ZAR) | 948,909 |
16,275,000 | U.S. Treasury Bonds, 3.250%, 5/15/2042 | 12,969,140 |
41,100,000 | U.S. Treasury Notes, 4.625%, 6/30/2025 | 40,748,402 |
58,712,253 | ||
Wireless — 3.2% | ||
775,000 | American Tower Corp., 5.500%, 3/15/2028 | 760,343 |
1,165,000 | American Tower Corp., 5.900%, 11/15/2033 | 1,137,402 |
Loomis Sayles Fixed Income Fund (continued)
Principal Amount (‡) | Description | Value (†) |
Wireless — continued | ||
$675,000 | Crown Castle, Inc., 5.100%, 5/01/2033 | $624,069 |
585,000 | IHS Holding Ltd., 5.625%, 11/29/2026(a) | 481,350 |
935,000 | SBA Communications Corp., 3.125%, 2/01/2029 | 779,858 |
600,000 | SoftBank Group Corp., 4.625%, 7/06/2028 | 523,362 |
1,305,000 | Sprint Capital Corp., 8.750%, 3/15/2032 | 1,509,684 |
150,000 | T-Mobile USA, Inc., 2.400%, 3/15/2029 | 126,220 |
265,000 | T-Mobile USA, Inc., 2.700%, 3/15/2032 | 207,292 |
3,275,000 | T-Mobile USA, Inc., 3.375%, 4/15/2029 | 2,880,492 |
1,620,000 | T-Mobile USA, Inc., 3.500%, 4/15/2031 | 1,369,822 |
2,965,000 | T-Mobile USA, Inc., 3.875%, 4/15/2030 | 2,626,904 |
500,000 | T-Mobile USA, Inc., 5.750%, 1/15/2034 | 487,761 |
13,514,559 | ||
Total Non-Convertible Bonds (Identified Cost $406,245,508) | 360,920,066 | |
Convertible Bonds — 3.7% | ||
Airlines — 0.3% | ||
150,000 | JetBlue Airways Corp., 0.500%, 4/01/2026 | 115,965 |
1,160,000 | Southwest Airlines Co., 1.250%, 5/01/2025 | 1,151,300 |
1,267,265 | ||
Cable Satellite — 0.8% | ||
1,055,000 | DISH Network Corp., 2.375%, 3/15/2024 | 1,012,800 |
4,105,000 | DISH Network Corp., 3.375%, 8/15/2026 | 2,467,105 |
90,000 | DISH Network Corp., Zero Coupon, 6.944%–33.164%, 12/15/2025(i) | 60,632 |
3,540,537 | ||
Consumer Cyclical Services — 0.3% | ||
1,270,000 | Uber Technologies, Inc., Zero Coupon, 0.000%–5.582%, 12/15/2025(i) | 1,185,939 |
Electric — 0.2% | ||
1,075,000 | PPL Capital Funding, Inc., 2.875%, 3/15/2028(a) | 978,250 |
Gaming — 0.1% | ||
215,000 | Penn Entertainment, Inc., 2.750%, 5/15/2026 | 260,946 |
Healthcare — 0.5% | ||
2,405,000 | Teladoc Health, Inc., 1.250%, 6/01/2027 | 1,916,544 |
Leisure — 0.1% | ||
750,000 | NCL Corp. Ltd., 1.125%, 2/15/2027 | 622,065 |
Principal Amount (‡) | Description | Value (†) |
Media Entertainment — 0.2% | ||
$550,000 | Snap, Inc., Zero Coupon, 6.697%–7.641%, 5/01/2027(i) | $407,550 |
540,000 | Spotify USA, Inc., Zero Coupon, 5.189%–5.873%, 3/15/2026(i) | 459,270 |
866,820 | ||
Pharmaceuticals — 0.8% | ||
820,000 | BioMarin Pharmaceutical, Inc., 0.599%, 8/01/2024 | 795,400 |
2,205,000 | BioMarin Pharmaceutical, Inc., 1.250%, 5/15/2027 | 2,184,273 |
485,000 | Livongo Health, Inc., 0.875%, 6/01/2025 | 442,950 |
3,422,623 | ||
Retailers — 0.1% | ||
65,000 | Etsy, Inc., 0.125%, 9/01/2027 | 52,000 |
415,000 | Etsy, Inc., 0.250%, 6/15/2028 | 313,533 |
365,533 | ||
Technology — 0.3% | ||
465,000 | Splunk, Inc., 1.125%, 6/15/2027 | 438,727 |
910,000 | Unity Software, Inc., Zero Coupon, 7.084%–8.213%, 11/15/2026(i) | 720,265 |
1,158,992 | ||
Total Convertible Bonds (Identified Cost $19,527,863) | 15,585,514 | |
Municipals — 0.8% | ||
Virginia — 0.8% | ||
3,780,000 | Tobacco Settlement Financing Corp., 6.706%, 6/01/2046 (Identified Cost $3,763,743) | 3,128,312 |
Total Bonds and Notes (Identified Cost $429,537,114) | 379,633,892 | |
Collateralized Loan Obligations — 3.9% | ||
555,000 | 522 Funding CLO Ltd., Series 2021-7A, Class D, 3 mo. USD SOFR + 3.162%, 8.507%, 4/23/2034(a)(c) | 520,148 |
1,005,000 | AIMCO CLO, Series 2017-AA, Class DR, 3 mo. USD SOFR + 3.412%, 8.738%, 4/20/2034(a)(c) | 963,399 |
605,000 | AIMCO CLO 12 Ltd., Series 2020-12A, Class AR, 3 mo. USD SOFR + 1.170%, 6.478%, 1/17/2032(a)(c) | 601,600 |
1,940,000 | AIMCO CLO 14 Ltd., Series 2021-14A, Class D, 3 mo. USD SOFR + 3.162%, 8.488%, 4/20/2034(a)(c) | 1,863,845 |
2,100,000 | ARES XLII CLO Ltd., Series 2017-42A, Class BR, 3 mo. USD SOFR + 1.762%, 7.107%, 1/22/2028(a)(c) | 2,096,025 |
Loomis Sayles Fixed Income Fund (continued)
Principal Amount (‡) | Description | Value (†) |
$255,000 | Atrium XV, Series 15A, Class D, 3 mo. USD SOFR + 3.262%, 8.607%, 1/23/2031(a)(c) | $249,569 |
450,000 | Carlyle U.S. CLO Ltd., Series 2016-4A, Class A2R, 3 mo. USD SOFR + 1.712%, 7.038%, 10/20/2027(a)(c) | 448,214 |
370,000 | Carlyle U.S. CLO Ltd., Series 2018-4A, Class C, 3 mo. USD SOFR + 3.162%, 8.488%, 1/20/2031(a)(c) | 354,208 |
305,000 | CarVal CLO I Ltd., Series 2018-1A, Class D, 3 mo. USD SOFR + 3.152%, 8.460%, 7/16/2031(a)(c) | 297,447 |
503,000 | CIFC Funding Ltd., Series 2018-1A, Class D, 3 mo. USD SOFR + 2.912%, 8.222%, 4/18/2031(a)(c) | 482,230 |
1,090,000 | Clover CLO LLC, Series 2021-1A, Class D, 3 mo. USD SOFR + 3.212%, 8.557%, 4/22/2034(a)(c) | 1,058,099 |
340,000 | Elmwood CLO VIII Ltd., Series 2021-1A, Class D2, 3 mo. USD SOFR + 3.112%, 8.438%, 1/20/2034(a)(c) | 332,029 |
365,000 | Invesco CLO Ltd., Series 2021-1A, Class D, 3 mo. USD SOFR + 3.312%, 8.620%, 4/15/2034(a)(c) | 352,293 |
500,000 | Madison Park Funding XXXI Ltd., Series 2018-31A, Class D, 3 mo. USD SOFR + 3.262%, 8.607%, 1/23/2031(a)(c) | 486,713 |
1,930,000 | Oaktree CLO Ltd., Series 2019-2A, Class BR, 3 mo. USD SOFR + 2.962%, 8.270%, 4/15/2031(a)(c) | 1,873,277 |
255,000 | OCP CLO Ltd., Series 2018-15A, Class C, 3 mo. USD SOFR + 3.212%, 8.538%, 7/20/2031(a)(c) | 253,125 |
1,835,000 | OZLM XXIII Ltd., Series 2019-23A, Class DR, 3 mo. USD SOFR + 4.012%, 9.320%, 4/15/2034(a)(c) | 1,775,418 |
250,000 | Recette CLO Ltd., Series 2015-1A, Class DRR, 3 mo. USD SOFR + 3.512%, 8.838%, 4/20/2034(a)(c) | 237,088 |
866,052 | Rockford Tower CLO Ltd., Series 2018-1A, Class A, 3 mo. USD SOFR + 1.362%, 6.741%, 5/20/2031(a)(c) | 863,261 |
470,000 | Signal Peak CLO 1 Ltd., Series 2014-1A, Class AR3, 3 mo. USD SOFR + 1.422%, 6.730%, 4/17/2034(a)(c) | 466,082 |
Principal Amount (‡) | Description | Value (†) |
$575,000 | Sixth Street CLO XVIII Ltd., Series 2021-18A, Class D, 3 mo. USD SOFR + 3.162%, 8.488%, 4/20/2034(a)(c) | $556,674 |
410,000 | Verde CLO Ltd., Series 2019-1A, Class AR, 3 mo. USD SOFR + 1.362%, 6.670%, 4/15/2032(a)(c) | 407,738 |
Total Collateralized Loan Obligations (Identified Cost $16,915,010) | 16,538,482 | |
Shares | ||
Common Stocks— 1.6% | ||
Aerospace & Defense — 0.0% | ||
302 | Lockheed Martin Corp. | 123,506 |
Air Freight & Logistics — 0.1% | ||
959 | United Parcel Service, Inc., Class B | 149,479 |
Banks — 0.0% | ||
477 | JPMorgan Chase & Co. | 69,175 |
Beverages — 0.0% | ||
2,316 | Coca-Cola Co. | 129,650 |
Biotechnology — 0.2% | ||
5,608 | AbbVie, Inc. | 835,928 |
Capital Markets — 0.1% | ||
106 | BlackRock, Inc. | 68,528 |
1,195 | Morgan Stanley | 97,596 |
166,124 | ||
Chemicals — 0.0% | ||
178 | Linde PLC | 66,278 |
Communications Equipment — 0.0% | ||
948 | Cisco Systems, Inc. | 50,964 |
Consumer Staples Distribution & Retail — 0.1% | ||
126 | Costco Wholesale Corp. | 71,185 |
712 | Walmart, Inc. | 113,870 |
185,055 | ||
Containers & Packaging — 0.0% | ||
360 | Packaging Corp. of America | 55,278 |
Electric Utilities — 0.0% | ||
882 | Duke Energy Corp. | 77,846 |
308 | NextEra Energy, Inc. | 17,645 |
95,491 | ||
Electrical Equipment — 0.0% | ||
684 | Emerson Electric Co. | 66,054 |
Financial Services — 0.0% | ||
173 | Mastercard, Inc., Class A | 68,492 |
Ground Transportation — 0.0% | ||
464 | Union Pacific Corp. | 94,484 |
Loomis Sayles Fixed Income Fund (continued)
Shares | Description | Value (†) |
Health Care Equipment & Supplies — 0.0% | ||
1,043 | Abbott Laboratories | $101,015 |
Health Care Providers & Services — 0.1% | ||
286 | Elevance Health, Inc. | 124,530 |
266 | UnitedHealth Group, Inc. | 134,115 |
258,645 | ||
Hotels, Restaurants & Leisure — 0.0% | ||
1,438 | Starbucks Corp. | 131,246 |
Household Products — 0.0% | ||
976 | Procter & Gamble Co. | 142,359 |
IT Services — 0.0% | ||
332 | Accenture PLC, Class A | 101,960 |
Life Sciences Tools & Services — 0.0% | ||
174 | Thermo Fisher Scientific, Inc. | 88,074 |
Machinery — 0.1% | ||
270 | Cummins, Inc. | 61,684 |
306 | Deere & Co. | 115,478 |
177,162 | ||
Media — 0.2% | ||
138,910 | Altice USA, Inc., Class A(f) | 454,236 |
4,012 | Comcast Corp., Class A | 177,892 |
34,625 | iHeartMedia, Inc., Class A(f) | 109,415 |
741,543 | ||
Metals & Mining — 0.0% | ||
2,726 | Newmont Corp. | 100,726 |
Oil, Gas & Consumable Fuels — 0.4% | ||
939 | Battalion Oil Corp.(f) | 5,803 |
10,661 | Canadian Natural Resources Ltd. | 689,447 |
360 | Devon Energy Corp. | 17,172 |
4,098 | Diamondback Energy, Inc. | 634,698 |
562 | Pioneer Natural Resources Co. | 129,007 |
2,846 | Williams Cos., Inc. | 95,882 |
1,572,009 | ||
Pharmaceuticals — 0.1% | ||
1,848 | Bristol-Myers Squibb Co. | 107,258 |
795 | Johnson & Johnson | 123,821 |
169 | Merck & Co., Inc. | 17,399 |
248,478 | ||
Professional Services — 0.0% | ||
456 | Clarivate PLC(f) | 3,060 |
Semiconductors & Semiconductor Equipment — 0.1% | ||
235 | Broadcom, Inc. | 195,186 |
1,719 | Microchip Technology, Inc. | 134,168 |
1,256 | QUALCOMM, Inc. | 139,492 |
468,846 | ||
Software — 0.1% | ||
610 | Microsoft Corp. | 192,607 |
Shares | Description | Value (†) |
Specialized REITs — 0.0% | ||
609 | American Tower Corp. | $100,150 |
Specialty Retail — 0.0% | ||
391 | Home Depot, Inc. | 118,145 |
Technology Hardware, Storage & Peripherals — 0.0% | ||
800 | Apple, Inc. | 136,968 |
Trading Companies & Distributors — 0.0% | ||
1,207 | Fastenal Co. | 65,950 |
Total Common Stocks (Identified Cost $9,357,050) | 6,904,901 | |
Principal Amount (‡) | ||
Senior Loans — 0.8% | ||
Consumer Cyclical Services — 0.1% | ||
$526,025 | Uber Technologies, Inc., 2023 Term Loan B, 3 mo. USD SOFR + 2.750%, 8.159%, 3/03/2030(c)(j) | 525,546 |
Healthcare — 0.2% | ||
664,543 | Star Parent, Inc., 2023 Term Loan B, 9/19/2030(k) | 648,946 |
Leisure — 0.2% | ||
388,204 | Carnival Corp., 2021 Incremental Term Loan B, 1 mo. USD SOFR + 3.250%, 8.681%, 10/18/2028(c)(l) | 385,778 |
248,863 | Carnival Corp., 2021 Incremental Term Loan B, 10/18/2028(k) | 247,307 |
81,621 | Carnival Corp., 2023 Term Loan B, 8/08/2027(k) | 81,315 |
213,152 | Carnival Corp., 2023 Term Loan B, 1 mo. USD SOFR + 3.000%, 8.327%, 8/08/2027(c)(l) | 212,353 |
926,753 | ||
Property & Casualty Insurance — 0.1% | ||
320,000 | HUB International Ltd., 2023 Term Loan B, 3 mo. USD SOFR + 4.250%, 9.584%, 6/20/2030(c)(l) | 320,535 |
Restaurants — 0.1% | ||
595,000 | 1011778 BC Unlimited Liability Co., 2023 Term Loan B5, 1 mo. USD SOFR + 2.250%, 7.566%, 9/23/2030(j) | 592,400 |
Technology — 0.1% | ||
349,000 | GTCR W Merger Sub LLC, USD Term Loan B, 9/20/2030(k) | 348,745 |
Total Senior Loans (Identified Cost $3,364,861) | 3,362,925 | |
Loomis Sayles Fixed Income Fund (continued)
Shares | Description | Value (†) |
Preferred Stocks — 0.5% | ||
Convertible Preferred Stocks — 0.5% | ||
Banking — 0.4% | ||
868 | Bank of America Corp., Series L, 7.250% | $965,398 |
722 | Wells Fargo & Co., Series L, Class A, 7.500% | 805,030 |
1,770,428 | ||
Midstream — 0.1% | ||
5,333 | El Paso Energy Capital Trust I, 4.750% | 242,171 |
Technology — 0.0% | ||
8,046 | Clarivate PLC, Series A, 5.250% | 235,185 |
Total Convertible Preferred Stocks (Identified Cost $3,337,951) | 2,247,784 | |
Total Preferred Stocks (Identified Cost $3,337,951) | 2,247,784 | |
Principal Amount (‡) | ||
Short-Term Investments — 4.1% | ||
$7,748,754 | Tri-Party Repurchase Agreement with Fixed Income Clearing Corporation, dated 9/29/2023 at 2.500% to be repurchased at $7,750,368 on 10/02/2023 collateralized by $8,876,200 U.S. Treasury Note, 0.750% due 8/31/2026 valued at $7,903,735 including accrued interest (Note 2 of Notes to Financial Statements) | 7,748,754 |
850,000 | U.S. Treasury Bills, 5.205%–5.223%, 11/30/2023(m)(n) | 842,575 |
8,870,000 | U.S. Treasury Bills, 5.263%, 12/28/2023(n)(o) | 8,755,961 |
Total Short-Term Investments (Identified Cost $17,347,266) | 17,347,290 | |
Total Investments — 100.6% (Identified Cost $479,859,252) | 426,035,274 | |
Other assets less liabilities — (0.6)% | (2,513,230 ) | |
Net Assets — 100.0% | $423,522,044 | |
(†) | See Note 2 of Notes to Financial Statements. |
(‡) | Principal Amount stated in U.S. dollars unless otherwise noted. |
(a) | All or a portion of these securities are exempt from registration under Rule 144A of the Securities Act of 1933. These securities may be resold in transactions exempt from registration, normally to qualified institutional buyers. At September 30, 2023, the value of Rule 144A holdings amounted to $182,776,575 or 43.2% of net assets. |
(b) | Variable rate security. The interest rate adjusts periodically based on; (i) changes in current interest rates and/or prepayments on underlying pools of assets, if applicable, (ii) reference to a base lending rate plus or minus a margin, and/or (iii) reference to a base lending rate adjusted by a multiplier and/or subject to certain floors or caps. Rate as of September 30, 2023 is disclosed. |
(c) | Variable rate security. Rate as of September 30, 2023 is disclosed. |
(d) | Perpetual bond with no specified maturity date. |
(e) | The issuer is in default with respect to interest and/or principal payments. Income is not being accrued. |
(f) | Non-income producing security. |
(g) | Amount shown represents units. One unit represents a principal amount of 1,000. |
(h) | Amount shown represents units. One unit represents a principal amount of 100. |
(i) | Interest rate represents annualized yield at time of purchase; not a coupon rate. The Fund’s investment in this security is comprised of various lots with differing annualized yields. |
(j) | Stated interest rate has been determined in accordance with the provisions of the loan agreement and is subject to a minimum benchmark floor rate of 0.00%, to which the spread is added. |
(k) | Position is unsettled. Contract rate was not determined at September 30, 2023 and does not take effect until settlement date. Maturity date is not finalized until settlement date. |
(l) | Stated interest rate has been determined in accordance with the provisions of the loan agreement and is subject to a minimum benchmark floor rate of 0.75%, to which the spread is added. |
(m) | The Fund's investment in U.S. Government/Agency securities is comprised of various lots with differing discount rates. These separate investments, which have the same maturity date, have been aggregated for the purpose of presentation in the Portfolio of Investments. |
(n) | Interest rate represents discount rate at time of purchase; not a coupon rate. |
(o) | Security (or a portion thereof) has been pledged as collateral for open derivative contracts. |
ABS | Asset-Backed Securities |
MTN | Medium Term Note |
REITs | Real Estate Investment Trusts |
REMIC | Real Estate Mortgage Investment Conduit |
SOFR | Secured Overnight Financing Rate |
BRL | Brazilian Real |
EUR | Euro |
IDR | Indonesian Rupiah |
MXN | Mexican Peso |
ZAR | South African Rand |
Loomis Sayles Fixed Income Fund (continued)
Counterparty | Delivery Date | Currency Bought/ Sold (B/S) | Units of Currency | In Exchange for | Notional Value | Unrealized Appreciation (Depreciation) | |
Bank of America N.A. | 12/20/2023 | EUR | S | 1,063,000 | $1,146,041 | $1,127,977 | $18,064 |
Financial Futures | Expiration Date | Contracts | Notional Amount | Value | Unrealized Appreciation (Depreciation) |
CBOT 10 Year U.S. Treasury Notes Futures | 12/19/2023 | 70 | $7,712,931 | $7,564,375 | $(148,556 ) |
CBOT 2 Year U.S. Treasury Notes Futures | 12/29/2023 | 190 | 38,611,355 | 38,515,078 | (96,277 ) |
CBOT 5 Year U.S. Treasury Notes Futures | 12/29/2023 | 856 | 90,979,280 | 90,187,625 | (791,655 ) |
CBOT U.S. Long Bond Futures | 12/19/2023 | 472 | 56,566,541 | 53,704,750 | (2,861,791 ) |
Total | $(3,898,279 ) |
Financial Futures | Expiration Date | Contracts | Notional Amount | Value | Unrealized Appreciation (Depreciation) |
CME Ultra Long Term U.S. Treasury Bond Futures | 12/19/2023 | 48 | $6,037,915 | $5,697,000 | $340,915 |
Ultra 10 Year U.S. Treasury Notes Futures | 12/19/2023 | 450 | 51,536,238 | 50,203,125 | 1,333,113 |
Total | $1,674,028 |
Treasuries | 13.9 % |
Technology | 7.3 |
Banking | 6.8 |
Finance Companies | 5.2 |
Cable Satellite | 4.6 |
ABS Home Equity | 4.5 |
ABS Car Loan | 4.1 |
Metals & Mining | 3.9 |
Independent Energy | 3.6 |
Wireless | 3.2 |
ABS Other | 2.7 |
Pharmaceuticals | 2.7 |
Midstream | 2.3 |
Life Insurance | 2.1 |
Consumer Cyclical Services | 2.0 |
Other Investments, less than 2% each | 23.7 |
Collateralized Loan Obligations | 3.9 |
Short-Term Investments | 4.1 |
Total Investments | 100.6 |
Other assets less liabilities (including forward foreign currency and futures contracts) | (0.6 ) |
Net Assets | 100.0 % |
Loomis Sayles Global Bond Fund
Principal Amount(‡) | Description | Value (†) |
Bonds and Notes — 96.7% of Net Assets | ||
Australia — 2.5% | ||
1,820,000 | Australia Government Bonds, Series 164, 0.500%, 9/21/2026, (AUD) | $1,053,828 |
240,000 | Glencore Capital Finance DAC, EMTN, 1.125%, 3/10/2028, (EUR) | 218,914 |
1,080,000 | Glencore Funding LLC, 2.500%, 9/01/2030(a) | 853,978 |
280,000 | Glencore Funding LLC, 2.625%, 9/23/2031(a) | 216,109 |
4,845,000 | New South Wales Treasury Corp., Series 26, 4.000%, 5/20/2026, (AUD) | 3,089,191 |
8,485,000 | Queensland Treasury Corp., Series 27, 2.750%, 8/20/2027, (AUD) | 5,152,470 |
10,584,490 | ||
Belgium — 0.5% | ||
305,000 | Anheuser-Busch InBev Finance, Inc., 4.700%, 2/01/2036 | 279,543 |
2,485,000 | Kingdom of Belgium Government Bonds, Series 88, 1.700%, 6/22/2050, (EUR) | 1,670,972 |
1,950,515 | ||
Brazil — 1.5% | ||
1,020,000 | Banco do Brasil SA, 4.625%, 1/15/2025(a) | 995,342 |
22,836(b ) | Brazil Notas do Tesouro Nacional, Series NTNF, 10.000%, 1/01/2027, (BRL) | 4,433,033 |
4,600(b ) | Brazil Notas do Tesouro Nacional, Series NTNF, 10.000%, 1/01/2029, (BRL) | 870,085 |
6,298,460 | ||
Canada — 3.9% | ||
2,065,000 | Bank of Nova Scotia, EMTN, 3.250%, 1/18/2028, (EUR) | 2,134,942 |
9,240,000 | Canada Government Bonds, 0.500%, 12/01/2030, (CAD) | 5,295,695 |
1,825,000 | Canada Government Bonds, 1.500%, 9/01/2024, (CAD) | 1,300,913 |
286,608 | CNH Capital Canada Receivables Trust, Series 2021-1A, Class A2, 1.001%, 11/16/2026, (CAD)(a) | 203,741 |
5,245,000 | Province of Ontario, 1.900%, 12/02/2051, (CAD) | 2,159,515 |
5,175,000 | Province of Quebec, Zero Coupon, 3.540%–3.542%, 10/29/2030, (EUR)(c) | 4,258,912 |
1,260,000 | Toronto-Dominion Bank, EMTN, 3.715%, 3/13/2030, (EUR) | 1,322,986 |
16,676,704 | ||
China — 6.4% | ||
42,910,000 | China Development Bank, Series 2103, 3.300%, 3/03/2026, (CNY) | 5,989,740 |
Principal Amount(‡) | Description | Value (†) |
China — continued | ||
41,870,000 | China Development Bank, Series 2115, 3.120%, 9/13/2031, (CNY) | $5,823,699 |
38,870,000 | China Government Bonds, 1.990%, 4/09/2025, (CNY) | 5,294,717 |
30,390,000 | China Government Bonds, 3.270%, 11/19/2030, (CNY) | 4,340,496 |
17,610,000 | China Government Bonds, 3.320%, 4/15/2052, (CNY) | 2,525,442 |
20,670,000 | China Government Bonds, 3.720%, 4/12/2051, (CNY) | 3,162,979 |
27,137,073 | ||
Colombia — 0.3% | ||
1,300,000 | Colombia Government International Bonds, 7.500%, 2/02/2034 | 1,227,486 |
Denmark — 1.0% | ||
32,600,000 | Denmark Government Bonds, 2.250%, 11/15/2033, (DKK) | 4,285,236 |
France — 2.9% | ||
1,300,000 | Electricite de France SA, EMTN, 2.000%, 12/09/2049, (EUR) | 746,464 |
300,000 | Electricite de France SA, EMTN, 4.625%, 1/25/2043, (EUR) | 290,025 |
300,000 | Electricite de France SA, 5.000%, 9/21/2048(a) | 234,682 |
600,000 | Electricite de France SA, EMTN, 5.125%, 9/22/2050, (GBP) | 574,196 |
6,685,000 | French Republic Government Bonds OAT, Zero Coupon, 2.371%, 5/25/2032, (EUR)(d) | 5,340,445 |
3,275,000 | French Republic Government Bonds OAT, 0.500%, 6/25/2044, (EUR) | 1,853,646 |
2,245,000 | French Republic Government Bonds OAT, 0.750%, 5/25/2028, (EUR) | 2,131,379 |
1,600,000 | Mutuelle Assurance Des Commercants et Industriels de France et Des Cadres et Sal, (fixed rate to 3/21/2032, variable rate thereafter), 2.125%, 6/21/2052, (EUR) | 1,169,608 |
12,340,445 | ||
Germany — 9.0% | ||
7,675,000 | Bundesrepublik Deutschland Bundesanleihe, Zero Coupon, 0.000%–1.110%, 8/15/2026, (EUR)(c) | 7,470,874 |
2,660,000 | Bundesrepublik Deutschland Bundesanleihe, Zero Coupon, 0.308%, 8/15/2050, (EUR)(d) | 1,288,550 |
790,000 | Bundesrepublik Deutschland Bundesanleihe, Zero Coupon, 1.365%, 8/15/2052, (EUR)(d) | 359,963 |
8,420,000 | Bundesrepublik Deutschland Bundesanleihe, 0.250%, 8/15/2028, (EUR) | 7,908,310 |
Loomis Sayles Global Bond Fund (continued)
Principal Amount(‡) | Description | Value (†) |
Germany — continued | ||
2,485,000 | Bundesrepublik Deutschland Bundesanleihe, 0.500%, 8/15/2027, (EUR) | $2,409,734 |
12,325,000 | Bundesrepublik Deutschland Bundesanleihe, 1.000%, 8/15/2024, (EUR) | 12,749,876 |
790,000 | Bundesrepublik Deutschland Bundesanleihe, 1.000%, 8/15/2025, (EUR) | 802,251 |
2,345,000 | Bundesrepublik Deutschland Bundesanleihe, 1.250%, 8/15/2048, (EUR) | 1,736,339 |
815,000 | Deutsche Bank AG, (fixed rate to 10/14/2030, variable rate thereafter), 3.729%, 1/14/2032 | 606,681 |
1,805,000 | Deutsche Bank AG, (fixed rate to 10/07/2031, variable rate thereafter), 3.742%, 1/07/2033 | 1,295,258 |
400,000 | Deutsche Bank AG, EMTN, (fixed rate to 3/24/2027, variable rate thereafter), 4.000%, 6/24/2032, (EUR) | 376,935 |
1,525,000 | Kreditanstalt fuer Wiederaufbau, EMTN, 2.875%, 12/28/2029, (EUR) | 1,574,459 |
38,579,230 | ||
Indonesia — 1.6% | ||
18,722,000,000 | Indonesia Treasury Bonds, Series FR78, 8.250%, 5/15/2029, (IDR) | 1,302,060 |
38,485,000,000 | Indonesia Treasury Bonds, Series FR87, 6.500%, 2/15/2031, (IDR) | 2,441,451 |
50,865,000,000 | Indonesia Treasury Bonds, Series FR96, 7.000%, 2/15/2033, (IDR) | 3,310,816 |
7,054,327 | ||
Ireland — 1.6% | ||
650,000 | AIB Group PLC, EMTN, (fixed rate to 7/23/2028, variable rate thereafter), 4.625%, 7/23/2029, (EUR) | 676,629 |
1,055,000 | AIB Group PLC, (fixed rate to 2/16/2028, variable rate thereafter), 5.750%, 2/16/2029, (EUR) | 1,147,777 |
320,000 | AIB Group PLC, (fixed rate to 9/13/2028, variable rate thereafter), 6.608%, 9/13/2029(a) | 318,669 |
400,000 | Bank of Ireland Group PLC, (fixed rate to 9/30/2026, variable rate thereafter), 2.029%, 9/30/2027(a) | 350,430 |
1,310,000 | Ireland Government Bonds, Zero Coupon, 0.029%, 10/18/2031, (EUR)(d) | 1,074,283 |
3,205,000 | Ireland Government Bonds, 1.000%, 5/15/2026, (EUR) | 3,206,393 |
6,774,181 | ||
Israel — 0.2% | ||
3,425,000 | Israel Government Bonds - Fixed, Series 330, 1.000%, 3/31/2030, (ILS) | 735,398 |
Principal Amount(‡) | Description | Value (†) |
Italy — 1.3% | ||
1,600,000 | Enel Finance International NV, 6.000%, 10/07/2039(a) | $1,487,256 |
1,110,000 | Intesa Sanpaolo SpA, EMTN, (fixed rate to 3/14/2028, variable rate thereafter), 6.500%, 3/14/2029, (GBP) | 1,316,146 |
535,000 | Intesa Sanpaolo SpA, 6.625%, 6/20/2033(a) | 502,756 |
1,260,000 | Intesa Sanpaolo SpA, (fixed rate to 11/21/2032, variable rate thereafter), 8.248%, 11/21/2033(a) | 1,268,026 |
370,000 | UniCredit SpA, (fixed rate to 6/03/2031, variable rate thereafter), 3.127%, 6/03/2032(a) | 282,785 |
700,000 | UniCredit SpA, (fixed rate to 6/30/2030, variable rate thereafter), 5.459%, 6/30/2035 | 586,813 |
5,443,782 | ||
Japan — 4.9% | ||
435,950,000 | Japan Government Five Year Bonds, Series 139, 0.100%, 3/20/2024, (JPY) | 2,920,550 |
497,250,000 | Japan Government Thirty Year Bonds, Series 26, 2.400%, 3/20/2037, (JPY) | 3,885,398 |
468,600,000 | Japan Government Thirty Year Bonds, Series 41, 1.700%, 12/20/2043, (JPY) | 3,264,647 |
164,800,000 | Japan Government Thirty Year Bonds, Series 51, 0.300%, 6/20/2046, (JPY) | 845,173 |
646,500,000 | Japan Government Thirty Year Bonds, Series 62, 0.500%, 3/20/2049, (JPY) | 3,339,313 |
997,300,000 | Japan Government Two Year Bonds, Series 436, 0.005%, 5/01/2024, (JPY) | 6,677,986 |
20,933,067 | ||
Korea — 2.2% | ||
8,400,000,000 | Korea Treasury Bonds, Series 3006, 1.375%, 6/10/2030, (KRW) | 5,275,932 |
5,200,000,000 | Korea Treasury Bonds, Series 3212, 4.250%, 12/10/2032, (KRW) | 3,956,023 |
9,231,955 | ||
Luxembourg — 1.4% | ||
1,180,000 | Blackstone Property Partners Europe Holdings Sarl, EMTN, 1.000%, 5/04/2028, (EUR) | 982,824 |
1,435,000 | Blackstone Property Partners Europe Holdings Sarl, EMTN, 1.750%, 3/12/2029, (EUR) | 1,188,111 |
345,000 | Blackstone Property Partners Europe Holdings Sarl, 3.625%, 10/29/2029, (EUR) | 309,455 |
1,810,000 | Logicor Financing Sarl, EMTN, 0.875%, 1/14/2031, (EUR) | 1,309,331 |
Loomis Sayles Global Bond Fund (continued)
Principal Amount(‡) | Description | Value (†) |
Luxembourg — continued | ||
2,785,000 | Logicor Financing Sarl, EMTN, 1.625%, 1/17/2030, (EUR) | $2,220,827 |
100,000 | Logicor Financing Sarl, EMTN, 2.000%, 1/17/2034, (EUR) | 70,109 |
6,080,657 | ||
Malaysia — 0.4% | ||
7,770,000 | Malaysia Government Bonds, Series 119, 3.906%, 7/15/2026, (MYR) | 1,668,980 |
Mexico — 1.6% | ||
405,000 | America Movil SAB de CV, 2.875%, 5/07/2030 | 339,041 |
996,320(e ) | Mexico Bonos, Series M 20, 8.500%, 5/31/2029, (MXN) | 5,368,780 |
1,450,000 | Mexico Government International Bonds, 3.500%, 2/12/2034 | 1,133,765 |
6,841,586 | ||
New Zealand — 1.2% | ||
8,975,000 | New Zealand Government Bonds, Series 427, 4.500%, 4/15/2027, (NZD) | 5,227,044 |
Norway — 1.3% | ||
320,000 | Aker BP ASA, 3.750%, 1/15/2030(a) | 274,975 |
1,235,000 | Aker BP ASA, 4.000%, 1/15/2031(a) | 1,060,897 |
655,000 | Aker BP ASA, 6.000%, 6/13/2033(a) | 633,043 |
2,000,000 | City of Oslo, NO, 2.300%, 3/14/2024, (NOK) | 184,589 |
2,000,000 | City of Oslo, NO, 2.350%, 9/04/2024, (NOK) | 182,264 |
1,000,000 | City of Oslo, NO, 3.650%, 11/08/2023, (NOK) | 93,378 |
3,340,000 | SpareBank 1 Boligkreditt AS, EMTN, 0.050%, 11/03/2028, (EUR) | 2,943,388 |
5,372,534 | ||
Portugal — 0.1% | ||
230,000 | EDP Finance BV, EMTN, 0.375%, 9/16/2026, (EUR) | 218,577 |
435,000 | EDP Finance BV, 1.710%, 1/24/2028(a) | 367,849 |
586,426 | ||
Singapore — 0.5% | ||
2,780,000 | Singapore Government Bonds, 2.125%, 6/01/2026, (SGD) | 1,955,885 |
South Africa — 2.3% | ||
400,000 | Anglo American Capital PLC, 2.875%, 3/17/2031(a) | 317,894 |
440,000 | Anglo American Capital PLC, 5.625%, 4/01/2030(a) | 424,941 |
214,850,000 | Republic of South Africa Government Bonds, Series R213, 7.000%, 2/28/2031, (ZAR) | 8,903,218 |
9,646,053 | ||
Principal Amount(‡) | Description | Value (†) |
Spain — 2.3% | ||
400,000 | Banco Santander SA, 4.250%, 4/11/2027 | $373,202 |
2,600,000 | Banco Santander SA, 5.179%, 11/19/2025 | 2,530,398 |
1,725,000 | Spain Government Bonds, 1.300%, 10/31/2026, (EUR) | 1,710,100 |
2,460,000 | Spain Government Bonds, 1.950%, 7/30/2030, (EUR) | 2,341,948 |
2,835,000 | Spain Government Bonds, 4.200%, 1/31/2037, (EUR) | 3,026,078 |
9,981,726 | ||
Supranationals — 2.2% | ||
4,940,000 | European Union, 1.000%, 7/06/2032, (EUR) | 4,272,263 |
2,665,000 | Inter-American Development Bank, Series 112, 4.400%, 1/26/2026, (CAD) | 1,935,576 |
36,080,000 | Nordic Investment Bank, EMTN, 1.500%, 3/13/2025, (NOK) | 3,221,226 |
9,429,065 | ||
Sweden — 0.6% | ||
190,000 | Heimstaden Bostad Treasury BV, EMTN, 1.625%, 10/13/2031, (EUR) | 125,423 |
9,900,000 | Kommuninvest I Sverige AB, MTN, 1.000%, 5/12/2025, (SEK) | 862,878 |
18,000,000 | Sweden Government Bonds, Series 1058, 2.500%, 5/12/2025, (SEK) | 1,621,500 |
2,609,801 | ||
Switzerland — 0.7% | ||
195,000 | UBS Group AG, EMTN, (fixed rate to 1/14/2027, variable rate thereafter), 0.650%, 1/14/2028, (EUR) | 179,688 |
1,620,000 | UBS Group AG, EMTN, 0.650%, 9/10/2029, (EUR) | 1,345,725 |
715,000 | UBS Group AG, (fixed rate to 5/14/2031, variable rate thereafter), 3.091%, 5/14/2032(a) | 564,742 |
200,000 | UBS Group AG, EMTN, (fixed rate to 6/15/2029, variable rate thereafter), 3.125%, 6/15/2030, (EUR) | 192,619 |
655,000 | Zurich Finance Ireland Designated Activity Co., EMTN, (fixed rate to 8/23/2032, variable rate thereafter), 5.125%, 11/23/2052, (GBP) | 704,973 |
2,987,747 | ||
Thailand — 0.3% | ||
54,870,000 | Thailand Government Bonds, 1.600%, 12/17/2029, (THB) | 1,395,567 |
United Kingdom — 4.2% | ||
1,055,000 | Channel Link Enterprises Finance PLC, Series A8, (fixed rate to 6/20/2027, variable rate thereafter), 2.706%, 6/30/2050, (EUR) | 1,012,370 |
Loomis Sayles Global Bond Fund (continued)
Principal Amount(‡) | Description | Value (†) |
United Kingdom — continued | ||
3,350,000 | CK Hutchison International 19 Ltd., 3.625%, 4/11/2029(a) | $3,028,308 |
85,500 | Lanark Master Issuer PLC, Series 2020-1A, Class 2A, SONIA Index + 0.570%, 5.789%, 12/22/2069, (GBP)(a)(f) | 104,339 |
885,000 | National Grid Electricity Distribution South Wales PLC, EMTN, 1.625%, 10/07/2035, (GBP) | 681,174 |
135,000 | National Grid Electricity Distribution West Midlands PLC, EMTN, 5.750%, 4/16/2032, (GBP) | 161,901 |
630,000 | National Grid Electricity Transmission PLC, EMTN, 2.750%, 2/06/2035, (GBP) | 561,032 |
2,405,000 | U.K. Gilts, 0.625%, 6/07/2025, (GBP) | 2,746,340 |
625,000 | U.K. Gilts, 3.250%, 1/31/2033, (GBP) | 695,135 |
2,930,000 | U.K. Gilts, 4.250%, 12/07/2055, (GBP) | 3,236,007 |
4,155,000 | U.K. Gilts, 4.750%, 12/07/2030, (GBP) | 5,213,084 |
390,000 | Virgin Money U.K. PLC, GMTN, (fixed rate to 9/03/2026, variable rate thereafter), 4.000%, 9/03/2027, (GBP) | 435,252 |
205,000 | Virgin Money U.K. PLC, GMTN, (fixed rate to 10/29/2027, variable rate thereafter), 4.625%, 10/29/2028, (EUR) | 208,561 |
18,083,503 | ||
United States — 37.8% | ||
1,651,233 | AASET Trust, Series 2021-2A, Class A, 2.798%, 1/15/2047(a) | 1,411,452 |
750,000 | AES Corp., 3.950%, 7/15/2030(a) | 646,440 |
290,000,000 | Aflac, Inc., 0.932%, 1/25/2027, (JPY) | 1,938,385 |
390,000,000 | Aflac, Inc., (fixed rate to 10/23/2027, variable rate thereafter), 2.108%, 10/23/2047, (JPY) | 2,615,641 |
275,000 | Ally Financial, Inc., 3.875%, 5/21/2024 | 269,874 |
2,860,000 | Amgen, Inc., 5.250%, 3/02/2033 | 2,734,042 |
1,185,000 | Amgen, Inc., 5.650%, 3/02/2053 | 1,109,068 |
4,125,000 | AT&T, Inc., 2.250%, 2/01/2032 | 3,104,595 |
140,000 | AT&T, Inc., 3.650%, 6/01/2051 | 90,271 |
700,000 | AT&T, Inc., 5.400%, 2/15/2034 | 655,129 |
165,000 | Boeing Co., 2.196%, 2/04/2026 | 151,500 |
85,000 | Boeing Co., 2.250%, 6/15/2026 | 77,341 |
10,000 | Boeing Co., 3.250%, 2/01/2035 | 7,688 |
120,000 | Boeing Co., 3.550%, 3/01/2038 | 87,971 |
40,000 | Boeing Co., 3.625%, 3/01/2048 | 25,959 |
210,000 | Boeing Co., 3.750%, 2/01/2050 | 142,384 |
195,000 | Boeing Co., 3.825%, 3/01/2059 | 124,562 |
235,000 | Boeing Co., 3.850%, 11/01/2048 | 160,490 |
390,000 | Boeing Co., 3.900%, 5/01/2049 | 271,961 |
175,000 | Boeing Co., 3.950%, 8/01/2059 | 116,125 |
1,385,000 | BPR Trust, Series 2022-OANA, Class A, 1 mo. USD SOFR + 1.898%, 7.230%, 4/15/2037(a)(f) | 1,359,983 |
803,000 | Broadcom, Inc., 2.450%, 2/15/2031(a) | 627,629 |
479,000 | Broadcom, Inc., 3.187%, 11/15/2036(a) | 343,916 |
Principal Amount(‡) | Description | Value (†) |
United States — continued | ||
410,000 | Broadcom, Inc., 3.419%, 4/15/2033(a) | $327,941 |
215,000 | Centene Corp., 2.450%, 7/15/2028 | 181,641 |
2,266,000 | Centene Corp., 4.625%, 12/15/2029 | 2,040,828 |
155,000 | Charter Communications Operating LLC/Charter Communications Operating Capital, 2.300%, 2/01/2032 | 112,960 |
2,000,000 | Charter Communications Operating LLC/Charter Communications Operating Capital, 2.800%, 4/01/2031 | 1,559,714 |
210,000 | Charter Communications Operating LLC/Charter Communications Operating Capital, 4.800%, 3/01/2050 | 146,846 |
1,440,000 | Charter Communications Operating LLC/Charter Communications Operating Capital, 5.050%, 3/30/2029 | 1,346,044 |
2,930,000 | Citigroup, Inc., Series MPLE, 4.090%, 6/09/2025, (CAD) | 2,082,010 |
120,000 | Comcast Corp., 4.250%, 1/15/2033 | 107,933 |
505,000 | Comcast Corp., 4.650%, 2/15/2033 | 472,789 |
1,100,000 | Continental Resources, Inc., 2.875%, 4/01/2032(a) | 823,734 |
947,000 | Continental Resources, Inc., 4.375%, 1/15/2028 | 878,341 |
580,000 | Continental Resources, Inc., 5.750%, 1/15/2031(a) | 544,884 |
600,000,000 | Corning, Inc., 0.698%, 8/09/2024, (JPY) | 4,006,317 |
2,840,000 | CVS Health Corp., 5.300%, 6/01/2033 | 2,689,939 |
1,690,000 | Digital Dutch Finco BV, 1.000%, 1/15/2032, (EUR) | 1,287,159 |
865,000 | Energy Transfer LP, 5.300%, 4/15/2047 | 702,618 |
830,000 | EQT Corp., 3.625%, 5/15/2031(a) | 702,130 |
580,000 | EQT Corp., 5.000%, 1/15/2029 | 545,206 |
6,306,588 | Federal Home Loan Mortgage Corp., 2.500%, 12/01/2051 | 5,007,108 |
9,581,346 | Federal National Mortgage Association, 2.000%, 5/01/2051 | 7,305,000 |
5,846,256 | Federal National Mortgage Association, 2.000%, 11/01/2051 | 4,451,063 |
4,400,186 | Federal National Mortgage Association, 2.000%, 11/01/2051 | 3,354,022 |
2,984,100 | Federal National Mortgage Association, 2.000%, 2/01/2052 | 2,271,650 |
4,983,829 | Federal National Mortgage Association, 2.500%, 5/01/2052 | 3,959,525 |
220,166 | Federal National Mortgage Association, 3.000%, 11/01/2046 | 185,950 |
8,951,273 | Federal National Mortgage Association, 3.000%, 11/01/2051 | 7,405,558 |
663,235 | Federal National Mortgage Association, 3.500%, 6/01/2045 | 585,969 |
Loomis Sayles Global Bond Fund (continued)
Principal Amount(‡) | Description | Value (†) |
United States — continued | ||
247,896 | Federal National Mortgage Association, 3.500%, 9/01/2047 | $213,654 |
3,976,293 | Federal National Mortgage Association, 3.500%, 5/01/2052 | 3,424,123 |
202,641 | Federal National Mortgage Association, 4.000%, 8/01/2048 | 183,525 |
4,130,194 | Federal National Mortgage Association, 4.000%, 3/01/2049 | 3,731,558 |
1,403,667 | Federal National Mortgage Association, 4.000%, 5/01/2050 | 1,265,510 |
329,161 | Federal National Mortgage Association, 4.500%, 11/01/2043 | 309,401 |
53,553 | Federal National Mortgage Association, 4.500%, 7/01/2046 | 49,746 |
355,456 | Federal National Mortgage Association, 4.500%, 3/01/2047 | 332,878 |
61,892 | Federal National Mortgage Association, 4.500%, 9/01/2047 | 57,639 |
7,188,821 | Federal National Mortgage Association, 4.500%, 9/01/2052 | 6,603,235 |
2,859,911 | Federal National Mortgage Association, 5.000%, 8/01/2052 | 2,701,328 |
585,000 | Ferguson Finance PLC, 3.250%, 6/02/2030(a) | 495,844 |
270,000 | Freeport-McMoRan, Inc., 4.250%, 3/01/2030 | 238,573 |
820,000 | GS Mortgage Securities Corp. II, Series 2023- SHIP, Class A, 4.466%, 9/10/2038(a)(g) | 780,904 |
3,780,000 | HCA, Inc., 2.375%, 7/15/2031 | 2,893,171 |
65,000 | HCA, Inc., 3.625%, 3/15/2032 | 53,878 |
805,000 | HCA, Inc., 5.500%, 6/01/2033 | 761,307 |
1,663,930 | Legacy Mortgage Asset Trust, Series 2019-GS7, Class A1, 6.250%, 11/25/2059(a)(g) | 1,648,437 |
1,407,702 | Legacy Mortgage Asset Trust, Series 2020-GS1, Class A1, 5.882%, 10/25/2059(a)(g) | 1,399,276 |
55,000 | Lennar Corp., 4.750%, 5/30/2025 | 53,806 |
420,000 | Lennar Corp., 5.000%, 6/15/2027 | 408,513 |
2,166,979 | Navigator Aircraft ABS Ltd., Series 2021-1, Class A, 2.771%, 11/15/2046(a)(g) | 1,880,396 |
1,310,000 | Oracle Corp., 5.550%, 2/06/2053 | 1,147,774 |
472,000 | Ovintiv, Inc., 6.500%, 8/15/2034 | 464,859 |
265,000 | Ovintiv, Inc., 6.500%, 2/01/2038 | 253,090 |
195,000 | Ovintiv, Inc., 7.200%, 11/01/2031 | 200,726 |
932,000 | Ovintiv, Inc., 7.375%, 11/01/2031 | 976,564 |
1,475,000 | Pfizer Investment Enterprises Pte. Ltd., 4.750%, 5/19/2033 | 1,394,285 |
1,365,000 | Pfizer Investment Enterprises Pte. Ltd., 5.300%, 5/19/2053 | 1,268,293 |
530,000,000 | Prologis Yen Finance LLC, 0.972%, 9/25/2028, (JPY) | 3,458,264 |
1,453,618 | PRPM LLC, Series 2021-1, Class A1, 2.115%, 1/25/2026(a)(g) | 1,369,061 |
Principal Amount(‡) | Description | Value (†) |
United States — continued | ||
841,126 | PRPM LLC, Series 2021-10, Class A1, 2.487%, 10/25/2026(a)(g) | $780,092 |
593,000 | PulteGroup, Inc., 5.000%, 1/15/2027 | 579,741 |
305,000 | Santander Holdings USA, Inc., 3.244%, 10/05/2026 | 276,289 |
1,585,000 | Taubman Centers Commercial Mortgage Trust, Series 2022-DPM, Class A, 1 mo. USD SOFR + 2.186%, 7.518%, 5/15/2037(a)(f) | 1,554,185 |
1,935,000 | Thermo Fisher Scientific, Inc., 5.086%, 8/10/2033 | 1,871,041 |
625,000 | T-Mobile USA, Inc., 3.300%, 2/15/2051 | 391,063 |
350,000 | T-Mobile USA, Inc., 3.400%, 10/15/2052 | 218,626 |
2,020,000 | T-Mobile USA, Inc., 3.875%, 4/15/2030 | 1,789,661 |
840,000 | T-Mobile USA, Inc., 4.375%, 4/15/2040 | 674,963 |
2,570,000 | T-Mobile USA, Inc., 5.050%, 7/15/2033 | 2,384,474 |
8,075,000 | U.S. Treasury Bonds, 2.875%, 5/15/2043(h) | 5,982,440 |
11,872,384 | U.S. Treasury Inflation-Indexed Notes, 0.625%, 7/15/2032(i) | 10,343,699 |
3,775,000 | U.S. Treasury Notes, 3.375%, 5/15/2033 | 3,423,453 |
2,180,000 | U.S. Treasury Notes, 4.750%, 7/31/2025 | 2,165,523 |
2,135,000 | Uniform Mortgage-Backed Security, TBA, 6.500%, 11/01/2053 | 2,143,340 |
677,037 | United Airlines Pass-Through Trust, Series 2016-1, Class B, 3.650%, 7/07/2027 | 633,958 |
864,809 | United Airlines Pass-Through Trust, Series 2016-2, Class B, 3.650%, 4/07/2027 | 812,099 |
6,030,000 | UnitedHealth Group, Inc., 4.500%, 4/15/2033 | 5,579,624 |
2,416,773 | Vericrest Opportunity Loan Transferee, Series 2021-NP11, Class A1, 1.868%, 8/25/2051(a)(g) | 2,234,660 |
350,000 | Verizon Communications, Inc., 2.850%, 9/03/2041 | 226,270 |
1,885,000 | VMware, Inc., 2.200%, 8/15/2031 | 1,422,480 |
2,040,627 | VOLT XCIII LLC, Series 2021-NPL2, Class A1, 1.893%, 2/27/2051(a)(g) | 1,895,777 |
899,974 | VOLT XCVII LLC, Series 2021-NPL6, Class A1, 2.240%, 4/25/2051(a)(g) | 838,221 |
161,398,582 | ||
Total Bonds and Notes (Identified Cost $478,802,291) | 412,517,505 | |
Loomis Sayles Global Bond Fund (continued)
Principal Amount(‡) | Description | Value (†) |
Short-Term Investments — 1.6% | ||
$4,890,216 | Tri-Party Repurchase Agreement with Fixed Income Clearing Corporation, dated 9/29/2023 at 2.500% to be repurchased at $4,891,234 on 10/02/2023 collateralized by $5,601,800 U.S. Treasury Note, 0.750% due 8/31/2026 valued at $4,988,074 including accrued interest (Note 2 of Notes to Financial Statements) | $4,890,216 |
2,200,000 | U.S. Treasury Bills, 5.291%, 12/12/2023(j) | 2,176,960 |
Total Short-Term Investments (Identified Cost $7,066,937) | 7,067,176 | |
Total Investments — 98.3% (Identified Cost $485,869,228) | 419,584,681 | |
Other assets less liabilities — 1.7% | 7,149,402 | |
Net Assets — 100.0% | $426,734,083 | |
(†) | See Note 2 of Notes to Financial Statements. |
(‡) | Principal Amount stated in U.S. dollars unless otherwise noted. |
(a) | All or a portion of these securities are exempt from registration under Rule 144A of the Securities Act of 1933. These securities may be resold in transactions exempt from registration, normally to qualified institutional buyers. At September 30, 2023, the value of Rule 144A holdings amounted to $35,155,724 or 8.2% of net assets. |
(b) | Amount shown represents units. One unit represents a principal amount of 1,000. |
(c) | Interest rate represents annualized yield at time of purchase; not a coupon rate. The Fund’s investment in this security is comprised of various lots with differing annualized yields. |
(d) | Interest rate represents annualized yield at time of purchase; not a coupon rate. |
(e) | Amount shown represents units. One unit represents a principal amount of 100. |
(f) | Variable rate security. Rate as of September 30, 2023 is disclosed. |
(g) | Variable rate security. The interest rate adjusts periodically based on; (i) changes in current interest rates and/or prepayments on underlying pools of assets, if applicable, (ii) reference to a base lending rate plus or minus a margin, and/or (iii) reference to a base lending rate adjusted by a multiplier and/or subject to certain floors or caps. Rate as of September 30, 2023 is disclosed. |
(h) | Security (or a portion thereof) has been pledged as collateral for open derivative contracts. |
(i) | Treasury Inflation Protected Security (TIPS). |
(j) | Interest rate represents discount rate at time of purchase; not a coupon rate. |
ABS | Asset-Backed Securities |
EMTN | Euro Medium Term Note |
GMTN | Global Medium Term Note |
MTN | Medium Term Note |
SOFR | Secured Overnight Financing Rate |
SONIA | Sterling Overnight Index |
TBA | To Be Announced |
AUD | Australian Dollar |
BRL | Brazilian Real |
CAD | Canadian Dollar |
CHF | Swiss Franc |
CNH | Chinese Yuan Renminbi Offshore |
CNY | Chinese Yuan Renminbi |
DKK | Danish Krone |
EUR | Euro |
GBP | British Pound |
IDR | Indonesian Rupiah |
ILS | Israeli Shekel |
JPY | Japanese Yen |
KRW | South Korean Won |
MXN | Mexican Peso |
MYR | Malaysian Ringgit |
NOK | Norwegian Krone |
NZD | New Zealand Dollar |
SEK | Swedish Krona |
SGD | Singapore Dollar |
THB | Thai Baht |
ZAR | South African Rand |
Counterparty | Delivery Date | Currency Bought/ Sold (B/S) | Units of Currency | In Exchange for | Notional Value | Unrealized Appreciation (Depreciation) | |
Bank of America N.A. | 12/04/2023 | BRL | S | 25,224,000 | $5,124,746 | $4,978,388 | $146,358 |
Bank of America N.A. | 12/20/2023 | KRW | S | 6,623,166,000 | 5,007,308 | 4,930,430 | 76,878 |
Barclays Bank PLC | 12/20/2023 | SGD | S | 1,520,000 | 1,122,185 | 1,115,866 | 6,319 |
BNP Paribas SA | 12/20/2023 | CNH | B | 20,136,000 | 2,775,848 | 2,767,486 | (8,362 ) |
BNP Paribas SA | 12/20/2023 | GBP | S | 3,793,000 | 4,706,658 | 4,630,356 | 76,302 |
BNP Paribas SA | 12/20/2023 | NZD | S | 8,127,000 | 4,811,306 | 4,871,081 | (59,775 ) |
Citibank N.A. | 12/20/2023 | ZAR | S | 108,731,000 | 5,664,961 | 5,703,253 | (38,292 ) |
Goldman Sachs Bank USA | 12/20/2023 | MXN | S | 72,882,000 | 4,200,377 | 4,127,578 | 72,799 |
HSBC Bank USA N.A. | 12/20/2023 | CAD | S | 2,542,000 | 1,878,019 | 1,873,839 | 4,180 |
Morgan Stanley Capital Services LLC | 12/20/2023 | JPY | B | 2,835,193,000 | 19,570,736 | 19,216,906 | (353,830 ) |
Standard Chartered Bank | 12/20/2023 | EUR | S | 13,489,000 | 14,502,186 | 14,313,532 | 188,654 |
UBS AG | 12/20/2023 | AUD | S | 5,124,000 | 3,315,689 | 3,303,329 | 12,360 |
UBS AG | 12/20/2023 | CHF | B | 2,330,000 | 2,630,581 | 2,567,780 | (62,801 ) |
Loomis Sayles Global Bond Fund (continued)
Counterparty | Delivery Date | Currency Bought/ Sold (B/S) | Units of Currency | In Exchange for | Notional Value | Unrealized Appreciation (Depreciation) | |
UBS AG | 12/20/2023 | IDR | S | 82,626,616,000 | $5,361,038 | $5,345,303 | $15,735 |
UBS AG | 12/20/2023 | SEK | S | 7,374,000 | 662,692 | 677,564 | (14,872 ) |
Total | $61,653 | ||||||
Counterparty | Settlement Date | Deliver/Units of Currency | Receive/Units of Currency | Notional Value | Unrealized Appreciaation (Depreciation) | ||
Barclays Bank PLC | 12/20/2023 | EUR | 595,796 | PLN | 2,770,000 | $632,194 | $(22 ) |
BNP Paribas SA | 12/20/2023 | DKK | 24,858,000 | EUR | 3,336,600 | 3,540,553 | 907 |
Goldman Sachs Bank USA | 11/09/2023 | EUR | 1,201,567 | HUF | 470,391,000 | 1,268,442 | (3,865 ) |
HSBC Bank USA N.A. | 12/20/2023 | NOK | 36,818,000 | EUR | 3,218,075 | 3,414,784 | (34,701 ) |
UBS AG | 12/20/2023 | ZAR | 24,015,000 | EUR | 1,169,128 | 1,240,592 | (19,063 ) |
Total | $(56,744 ) | ||||||
Financial Futures | Expiration Date | Contracts | Notional Amount | Value | Unrealized Appreciation (Depreciation) |
CBOT 10 Year U.S. Treasury Notes Futures | 12/19/2023 | 23 | $2,534,249 | $2,485,438 | $(48,811 ) |
CBOT 2 Year U.S. Treasury Notes Futures | 12/29/2023 | 94 | 19,102,278 | 19,054,828 | (47,450 ) |
CBOT 5 Year U.S. Treasury Notes Futures | 12/29/2023 | 173 | 18,390,310 | 18,227,172 | (163,138 ) |
CME Ultra Long Term U.S. Treasury Bond Futures | 12/19/2023 | 71 | 9,037,844 | 8,426,812 | (611,032 ) |
Eurex 10 Year Euro BUND Futures | 12/07/2023 | 42 | 5,886,766 | 5,712,195 | (174,571 ) |
Eurex 30 Year Euro BUXL Futures | 12/07/2023 | 4 | 548,507 | 517,460 | (31,047 ) |
Long Gilt Futures | 12/27/2023 | 13 | 1,484,478 | 1,493,500 | 9,022 |
Ultra 10-Year U.S. Treasury Notes Futures | 12/19/2023 | 42 | 4,799,240 | 4,685,625 | (113,615 ) |
Total | $(1,180,642 ) |
Financial Futures | Expiration Date | Contracts | Notional Amount | Value | Unrealized Appreciation (Depreciation) |
CBOT U.S. Long Bond Futures | 12/19/2023 | 52 | $6,245,574 | $5,916,625 | $328,949 |
Eurex 5 Year Euro BOBL Futures | 12/07/2023 | 75 | 9,313,736 | 9,178,252 | 135,484 |
Total | $464,433 |
Loomis Sayles Global Bond Fund (continued)
Treasuries | 43.6 % |
Mortgage Related | 12.9 |
Banking | 5.7 |
Government Owned - No Guarantee | 4.3 |
Local Authorities | 3.6 |
ABS Home Equity | 2.4 |
Supranational | 2.2 |
Other Investments, less than 2% each | 22.0 |
Short-Term Investments | 1.6 |
Total Investments | 98.3 |
Other assets less liabilities (including forward foreign currency and futures contracts) | 1.7 |
Net Assets | 100.0 % |
United States Dollar | 41.2 % |
Euro | 20.7 |
Japanese Yen | 7.7 |
Yuan Renminbi | 6.4 |
British Pound | 3.8 |
Canadian Dollar | 3.0 |
South Korean Won | 2.2 |
Australian Dollar | 2.1 |
South African Rand | 2.1 |
Other, less than 2% each | 9.1 |
Total Investments | 98.3 |
Other assets less liabilities (including forward foreign currency and futures contracts) | 1.7 |
Net Assets | 100.0 % |
Loomis Sayles Inflation Protected Securities Fund
Principal Amount | Description | Value (†) |
Bonds and Notes — 94.8% of Net Assets | ||
Aerospace & Defense — 0.3% | ||
$465,000 | Boeing Co., 5.705%, 5/01/2040 | $429,010 |
Automotive — 0.3% | ||
410,000 | Magna International, Inc., 5.980%, 3/21/2026 | 410,275 |
Banking — 2.3% | ||
400,000 | Banco Santander SA, 6.921%, 8/08/2033 | 382,193 |
410,000 | Deutsche Bank AG, (fixed rate to 11/10/2032, variable rate thereafter), 7.079%, 2/10/2034 | 370,534 |
895,000 | HSBC USA, Inc., 5.625%, 3/17/2025 | 889,701 |
720,000 | ING Groep NV, SOFR + 1.560%, 6.905%, 9/11/2027(a) | 722,203 |
505,000 | Morgan Stanley, MTN, (fixed rate to 4/20/2028, variable rate thereafter), 5.164%, 4/20/2029 | 485,838 |
300,000 | Truist Financial Corp., MTN, (fixed rate to 6/08/2026, variable rate thereafter), 6.047%, 6/08/2027 | 296,737 |
3,147,206 | ||
Electric — 0.2% | ||
235,000 | NextEra Energy Capital Holdings, Inc., 6.051%, 3/01/2025 | 235,356 |
Environmental — 0.1% | ||
170,000 | Republic Services, Inc., 5.000%, 4/01/2034 | 160,925 |
Finance Companies — 1.1% | ||
1,520,000 | Blue Owl Credit Income Corp., 5.500%, 3/21/2025 | 1,470,301 |
Food & Beverage — 0.6% | ||
910,000 | Mars, Inc., 4.750%, 4/20/2033(b) | 859,386 |
Life Insurance — 0.3% | ||
400,000 | Allianz SE, (fixed rate to 3/06/2033, variable rate thereafter), 6.350%, 9/06/2053(b) | 386,167 |
Midstream — 0.5% | ||
780,000 | Magellan Midstream Partners LP, 5.000%, 3/01/2026 | 765,554 |
Natural Gas — 0.2% | ||
385,000 | Sempra, 3.700%, 4/01/2029 | 346,872 |
Railroads — 0.0% | ||
15,000 | Canadian Pacific Railway Co., 2.050%, 3/05/2030 | 12,115 |
Sovereigns — 0.1% | ||
200,000 | Abu Dhabi Government International Bonds, 3.875%, 4/16/2050(b) | 149,677 |
Transportation Services — 0.4% | ||
530,000 | AP Moller - Maersk AS, 5.875%, 9/14/2033(b) | 514,418 |
Principal Amount | Description | Value (†) |
Treasuries — 88.4% | ||
$21,394,975 | U.S. Treasury Inflation-Indexed Bonds, 0.250%, 2/15/2050(c) | $12,586,890 |
7,575,456 | U.S. Treasury Inflation-Indexed Bonds, 0.750%, 2/15/2042(c) | 5,735,079 |
559,989 | U.S. Treasury Inflation-Indexed Notes, 0.125%, 7/15/2024(c) | 546,980 |
15,147,392 | U.S. Treasury Inflation-Indexed Notes, 0.125%, 4/15/2025(c) | 14,449,586 |
18,404,370 | U.S. Treasury Inflation-Indexed Notes, 0.125%, 4/15/2027(c) | 16,893,918 |
23,836,032 | U.S. Treasury Inflation-Indexed Notes, 0.125%, 7/15/2031(c) | 20,236,186 |
25,592,917 | U.S. Treasury Inflation-Indexed Notes, 0.375%, 1/15/2027(c) | 23,804,662 |
7,364,350 | U.S. Treasury Inflation-Indexed Notes, 0.625%, 7/15/2032(c) | 6,416,118 |
21,790,260 | U.S. Treasury Inflation-Indexed Notes, 0.875%, 1/15/2029(c) | 20,215,786 |
120,885,205 | ||
Total Bonds and Notes (Identified Cost $156,205,025) | 129,772,467 | |
Short-Term Investments — 4.0% | ||
1,322,530 | Tri-Party Repurchase Agreement with Fixed Income Clearing Corporation, dated 9/29/2023 at 2.500% to be repurchased at $1,322,806 on 10/02/2023 collateralized by $1,359,300 U.S. Treasury Note, 4.375% due 8/15/2026 valued at $1,349,050 including accrued interest (Note 2 of Notes to Financial Statements) | 1,322,530 |
4,220,000 | U.S. Treasury Bills, 5.308%, 3/21/2024(d) | 4,113,341 |
Total Short-Term Investments (Identified Cost $5,435,509) | 5,435,871 | |
Total Investments — 98.8% (Identified Cost $161,640,534) | 135,208,338 | |
Other assets less liabilities — 1.2% | 1,601,887 | |
Net Assets — 100.0% | $136,810,225 | |
(†) | See Note 2 of Notes to Financial Statements. |
(a) | Variable rate security. Rate as of September 30, 2023 is disclosed. |
(b) | All or a portion of these securities are exempt from registration under Rule 144A of the Securities Act of 1933. These securities may be resold in transactions exempt from registration, normally to qualified institutional buyers. At September 30, 2023, the value of Rule 144A holdings amounted to $1,909,648 or 1.4% of net assets. |
(c) | Treasury Inflation Protected Security (TIPS). |
(d) | Interest rate represents discount rate at time of purchase; not a coupon rate. |
MTN | Medium Term Note |
SOFR | Secured Overnight Financing Rate |
Loomis Sayles Inflation Protected Securities Fund (continued)
Notional Value | Currency | Expiration Date | Fund Pays1 | Fund Receives1 | Market Value | Unrealized Appreciation (Depreciation) |
10,505,000 | USD | 1/18/2028 | 1 yr. SOFR | 3.36% | $(554,127 ) | $(554,127 ) |
2,450,000 | USD | 1/18/2053 | (2.942%) | 1 yr. SOFR | 484,677 | 484,677 |
Total | $(69,450 ) | $(69,450 ) |
1 | Payments are made annually. |
Counterparty | Delivery Date | Currency Bought/ Sold (B/S) | Units of Currency | In Exchange for | Notional Value | Unrealized Appreciation (Depreciation) | |
Bank of America N.A. | 12/14/2023 | EUR | S | 772,000 | $830,170 | $818,869 | $11,301 |
Treasuries | 88.4 % |
Banking | 2.3 |
Other Investments, less than 2% each | 4.1 |
Short-Term Investments | 4.0 |
Total Investments | 98.8 |
Other assets less liabilities (including swap agreements and forward foreign currency contracts) | 1.2 |
Net Assets | 100.0 % |
Loomis Sayles Institutional High Income Fund
Principal Amount (‡) | Description | Value (†) |
Bonds and Notes — 86.6% of Net Assets | ||
Non-Convertible Bonds — 82.2% | ||
ABS Car Loan — 0.7% | ||
$802,000 | Hertz Vehicle Financing III LLC, Series 2022-1A, Class D, 4.850%, 6/25/2026(a) | $750,365 |
488,000 | Hertz Vehicle Financing III LLC, Series 2022-3A, Class D, 6.310%, 3/25/2025(a) | 484,078 |
300,000 | Hertz Vehicle Financing III LLC, Series 2023-2A, Class D, 9.400%, 9/25/2029(a) | 301,711 |
440,000 | Hertz Vehicle Financing LLC, Series 2022-2A, Class D, 5.160%, 6/26/2028(a) | 380,103 |
410,000 | Hertz Vehicle Financing LLC, Series 2022-4A, Class D, 6.560%, 9/25/2026(a) | 391,443 |
2,307,700 | ||
ABS Other — 0.1% | ||
191,786 | Business Jet Securities LLC, Series 2021-1A, Class C, 5.067%, 4/15/2036(a) | 178,516 |
198,440 | Sierra Timeshare Receivables Funding LLC, Series 2021-1A, Class D, 3.170%, 11/20/2037(a) | 182,974 |
361,490 | ||
Aerospace & Defense — 1.5% | ||
400,000 | Bombardier, Inc., 6.000%, 2/15/2028(a) | 362,878 |
1,355,000 | Bombardier, Inc., 7.125%, 6/15/2026(a) | 1,312,805 |
620,000 | Embraer Netherlands Finance BV, 7.000%, 7/28/2030(a) | 615,012 |
160,000 | TransDigm, Inc., 6.250%, 3/15/2026(a) | 157,213 |
1,655,000 | TransDigm, Inc., 6.750%, 8/15/2028(a) | 1,629,329 |
695,000 | TransDigm, Inc., 6.875%, 12/15/2030(a) | 681,478 |
4,758,715 | ||
Airlines — 1.3% | ||
485,000 | Allegiant Travel Co., 7.250%, 8/15/2027(a) | 456,506 |
390,557 | American Airlines Pass-Through Trust, Series 2016-3, Class B, 3.750%, 4/15/2027 | 364,901 |
1,058,164 | American Airlines Pass-Through Trust, Series 2017-2, Class B, 3.700%, 4/15/2027 | 1,004,814 |
2,285,000 | American Airlines, Inc./AAdvantage Loyalty IP Ltd., 5.750%, 4/20/2029(a) | 2,125,165 |
3,951,386 | ||
Automotive — 3.2% | ||
480,000 | Allison Transmission, Inc., 4.750%, 10/01/2027(a) | 442,968 |
385,000 | American Axle & Manufacturing, Inc., 5.000%, 10/01/2029 | 311,385 |
180,000 | Ford Motor Co., 3.250%, 2/12/2032 | 138,719 |
1,115,000 | Ford Motor Credit Co. LLC, 2.300%, 2/10/2025 | 1,045,833 |
Principal Amount (‡) | Description | Value (†) |
Automotive — continued | ||
$3,080,000 | Ford Motor Credit Co. LLC, 3.375%, 11/13/2025 | $2,857,673 |
545,000 | Ford Motor Credit Co. LLC, 6.950%, 3/06/2026 | 544,101 |
1,200,000 | Ford Motor Credit Co. LLC, 6.950%, 6/10/2026 | 1,198,530 |
1,620,000 | General Motors Financial Co., Inc., Series A, (fixed rate to 9/30/2027, variable rate thereafter), 5.750%(b) | 1,304,570 |
895,000 | General Motors Financial Co., Inc., Series B, (fixed rate to 9/30/2028, variable rate thereafter), 6.500%(b) | 761,854 |
320,000 | General Motors Financial Co., Inc., Series C, (fixed rate to 9/30/2030, variable rate thereafter), 5.700%(b) | 273,475 |
750,000 | Jaguar Land Rover Automotive PLC, 5.500%, 7/15/2029(a) | 641,247 |
265,000 | Wheel Pros, Inc., 6.500%, 5/15/2029(a) | 88,762 |
280,000 | ZF North America Capital, Inc., 7.125%, 4/14/2030(a) | 274,568 |
9,883,685 | ||
Banking — 1.8% | ||
665,000 | Ally Financial, Inc., 5.750%, 11/20/2025 | 645,953 |
715,000 | Barclays PLC, (fixed rate to 6/27/2033, variable rate thereafter), 7.119%, 6/27/2034 | 688,640 |
405,000 | Barclays PLC, (fixed rate to 9/23/2030, variable rate thereafter), 3.564%, 9/23/2035 | 312,705 |
750,000 | Deutsche Bank AG, (fixed rate to 10/07/2031, variable rate thereafter), 3.742%, 1/07/2033 | 538,196 |
605,000 | Deutsche Bank AG, (fixed rate to 10/14/2030, variable rate thereafter), 3.729%, 1/14/2032 | 450,358 |
620,000 | Deutsche Bank AG, (fixed rate to 12/01/2027, variable rate thereafter), 4.875%, 12/01/2032 | 528,942 |
1,630,000 | Intesa Sanpaolo SpA, 6.625%, 6/20/2033(a) | 1,531,760 |
1,180,000 | UniCredit SpA, (fixed rate to 6/30/2030, variable rate thereafter), 5.459%, 6/30/2035(a) | 989,199 |
5,685,753 | ||
Brokerage — 0.5% | ||
340,000 | Coinbase Global, Inc., 3.375%, 10/01/2028(a) | 244,915 |
185,000 | Coinbase Global, Inc., 3.625%, 10/01/2031(a) | 122,749 |
405,000 | Jefferies Finance LLC/JFIN Co-Issuer Corp., 5.000%, 8/15/2028(a) | 341,013 |
95,000 | NFP Corp., 4.875%, 8/15/2028(a) | 83,634 |
540,000 | NFP Corp., 6.875%, 8/15/2028(a) | 462,606 |
445,000 | NFP Corp., 8.500%, 10/01/2031(a) | 445,675 |
1,700,592 | ||
Loomis Sayles Institutional High Income Fund (continued)
Principal Amount (‡) | Description | Value (†) |
Building Materials — 2.4% | ||
$470,000 | ACProducts Holdings, Inc., 6.375%, 5/15/2029(a) | $310,200 |
485,000 | Advanced Drainage Systems, Inc., 6.375%, 6/15/2030(a) | 465,818 |
790,000 | Beacon Roofing Supply, Inc., 6.500%, 8/01/2030(a) | 765,597 |
490,000 | Builders FirstSource, Inc., 4.250%, 2/01/2032(a) | 401,832 |
635,000 | Camelot Return Merger Sub, Inc., 8.750%, 8/01/2028(a) | 612,553 |
745,000 | Cemex SAB de CV, (fixed rate to 3/14/2028, variable rate thereafter), 9.125%(a)(b) | 775,549 |
840,000 | Cemex SAB de CV, (fixed rate to 6/08/2026, variable rate thereafter), 5.125%(a)(b) | 786,402 |
1,305,000 | Foundation Building Materials, Inc., 6.000%, 3/01/2029(a) | 1,086,081 |
540,000 | LBM Acquisition LLC, 6.250%, 1/15/2029(a) | 442,800 |
450,000 | MIWD Holdco II LLC/MIWD Finance Corp., 5.500%, 2/01/2030(a) | 371,810 |
470,000 | Patrick Industries, Inc., 4.750%, 5/01/2029(a) | 392,450 |
810,000 | Specialty Building Products Holdings LLC/SBP Finance Corp., 6.375%, 9/30/2026(a) | 757,467 |
320,000 | Standard Industries, Inc., 4.375%, 7/15/2030(a) | 265,024 |
7,433,583 | ||
Cable Satellite — 8.4% | ||
3,845,000 | CCO Holdings LLC/CCO Holdings Capital Corp., 4.250%, 2/01/2031(a) | 3,061,812 |
3,335,000 | CCO Holdings LLC/CCO Holdings Capital Corp., 4.250%, 1/15/2034(a) | 2,455,487 |
15,000 | CCO Holdings LLC/CCO Holdings Capital Corp., 4.500%, 5/01/2032 | 11,773 |
605,000 | CCO Holdings LLC/CCO Holdings Capital Corp., 4.500%, 6/01/2033(a) | 462,909 |
790,000 | CCO Holdings LLC/CCO Holdings Capital Corp., 5.000%, 2/01/2028(a) | 717,429 |
45,000 | CCO Holdings LLC/CCO Holdings Capital Corp., 5.125%, 5/01/2027(a) | 41,927 |
400,000 | CSC Holdings LLC, 3.375%, 2/15/2031(a) | 272,575 |
200,000 | CSC Holdings LLC, 4.500%, 11/15/2031(a) | 141,556 |
7,305,000 | CSC Holdings LLC, 4.625%, 12/01/2030(a) | 3,883,727 |
3,755,000 | CSC Holdings LLC, 5.000%, 11/15/2031(a) | 2,012,591 |
215,000 | CSC Holdings LLC, 5.500%, 4/15/2027(a) | 184,271 |
1,955,000 | CSC Holdings LLC, 5.750%, 1/15/2030(a) | 1,095,378 |
425,000 | CSC Holdings LLC, 6.500%, 2/01/2029(a) | 352,085 |
2,505,000 | Directv Financing LLC/Directv Financing Co-Obligor, Inc., 5.875%, 8/15/2027(a) | 2,214,871 |
Principal Amount (‡) | Description | Value (†) |
Cable Satellite — continued | ||
$1,145,000 | DISH DBS Corp., 5.125%, 6/01/2029 | $634,765 |
1,410,000 | DISH DBS Corp., 5.250%, 12/01/2026(a) | 1,198,290 |
1,105,000 | DISH DBS Corp., 5.750%, 12/01/2028(a) | 849,469 |
4,160,000 | DISH DBS Corp., 7.750%, 7/01/2026 | 3,120,000 |
1,810,000 | Sirius XM Radio, Inc., 3.875%, 9/01/2031(a) | 1,371,005 |
665,000 | Sirius XM Radio, Inc., 5.000%, 8/01/2027(a) | 607,411 |
385,000 | Telesat Canada/Telesat LLC, 5.625%, 12/06/2026(a) | 264,687 |
1,355,000 | Ziggo Bond Co. BV, 6.000%, 1/15/2027(a) | 1,240,490 |
26,194,508 | ||
Chemicals — 2.6% | ||
205,000 | Ashland, Inc., 3.375%, 9/01/2031(a) | 159,415 |
810,000 | ASP Unifrax Holdings, Inc., 5.250%, 9/30/2028(a) | 576,837 |
1,120,000 | Braskem Netherlands Finance BV, 8.500%, 1/12/2031(a) | 1,109,864 |
390,000 | Consolidated Energy Finance SA, 5.625%, 10/15/2028(a) | 322,238 |
4,738,000 | Hercules LLC, 6.500%, 6/30/2029 | 4,341,145 |
240,000 | INEOS Quattro Finance 2 PLC, 3.375%, 1/15/2026(a) | 218,627 |
1,225,000 | Olympus Water U.S. Holding Corp., 4.250%, 10/01/2028(a) | 998,638 |
325,000 | Olympus Water U.S. Holding Corp., 9.750%, 11/15/2028(a) | 324,298 |
165,000 | WR Grace Holdings LLC, 5.625%, 8/15/2029(a) | 133,444 |
8,184,506 | ||
Consumer Cyclical Services — 3.1% | ||
1,585,000 | ADT Security Corp., 4.125%, 8/01/2029(a) | 1,340,133 |
340,000 | Arches Buyer, Inc., 4.250%, 6/01/2028(a) | 289,881 |
285,000 | Match Group Holdings II LLC, 3.625%, 10/01/2031(a) | 224,899 |
210,000 | Match Group Holdings II LLC, 5.000%, 12/15/2027(a) | 193,687 |
150,000 | Prime Security Services Borrower LLC/Prime Finance, Inc., 3.375%, 8/31/2027(a) | 131,415 |
830,000 | Realogy Group LLC/Realogy Co-Issuer Corp., 5.750%, 1/15/2029(a) | 600,049 |
1,235,000 | Uber Technologies, Inc., 4.500%, 8/15/2029(a) | 1,103,913 |
4,595,000 | Uber Technologies, Inc., 6.250%, 1/15/2028(a) | 4,493,290 |
230,000 | Uber Technologies, Inc., 7.500%, 9/15/2027(a) | 231,910 |
535,000 | Uber Technologies, Inc., 8.000%, 11/01/2026(a) | 541,289 |
450,000 | VT Topco, Inc., 8.500%, 8/15/2030(a) | 445,747 |
9,596,213 | ||
Loomis Sayles Institutional High Income Fund (continued)
Principal Amount (‡) | Description | Value (†) |
Consumer Products — 1.2% | ||
$520,000 | Coty, Inc./HFC Prestige Products, Inc./HFC Prestige International U.S. LLC, 4.750%, 1/15/2029(a) | $468,920 |
685,000 | Coty, Inc./HFC Prestige Products, Inc./HFC Prestige International U.S. LLC, 6.625%, 7/15/2030(a) | 668,793 |
1,705,000 | Energizer Holdings, Inc., 4.375%, 3/31/2029(a) | 1,422,908 |
690,000 | Newell Brands, Inc., 5.200%, 4/01/2026 | 650,251 |
225,000 | Prestige Brands, Inc., 3.750%, 4/01/2031(a) | 181,125 |
505,000 | Tempur Sealy International, Inc., 3.875%, 10/15/2031(a) | 389,586 |
3,781,583 | ||
Diversified Manufacturing — 0.5% | ||
365,000 | Chart Industries, Inc., 7.500%, 1/01/2030(a) | 367,000 |
385,000 | Madison IAQ LLC, 5.875%, 6/30/2029(a) | 310,018 |
920,000 | Resideo Funding, Inc., 4.000%, 9/01/2029(a) | 755,854 |
1,432,872 | ||
Electric — 1.1% | ||
2,545,000 | Calpine Corp., 4.500%, 2/15/2028(a) | 2,293,621 |
985,000 | NRG Energy, Inc., 3.875%, 2/15/2032(a) | 739,430 |
290,000 | Talen Energy Supply LLC, 8.625%, 6/01/2030(a) | 297,279 |
3,330,330 | ||
Environmental — 0.5% | ||
35,000 | Clean Harbors, Inc., 5.125%, 7/15/2029(a) | 32,197 |
285,000 | Clean Harbors, Inc., 6.375%, 2/01/2031(a) | 277,125 |
1,390,000 | Covanta Holding Corp., 4.875%, 12/01/2029(a) | 1,140,356 |
1,449,678 | ||
Finance Companies — 4.9% | ||
1,000,000 | AGFC Capital Trust I, 3 mo. USD SOFR + 2.012%, 7.320%, 1/15/2067(a)(c) | 527,460 |
330,000 | Aircastle Ltd., 6.500%, 7/18/2028(a) | 323,624 |
345,000 | Aircastle Ltd., Series A, (fixed rate to 6/15/2026, variable rate thereafter), 5.250%(a)(b) | 271,290 |
160,000 | Blackstone Secured Lending Fund, 2.750%, 9/16/2026 | 140,648 |
775,000 | Blackstone Secured Lending Fund, 3.625%, 1/15/2026 | 715,972 |
880,000 | Blue Owl Capital Corp., 3.400%, 7/15/2026 | 788,975 |
130,000 | Cobra AcquisitionCo LLC, 6.375%, 11/01/2029(a) | 96,200 |
510,406 | Global Aircraft Leasing Co. Ltd., 7.250% PIK or 6.500% Cash, 9/15/2024(a)(d) | 486,162 |
535,000 | Nationstar Mortgage Holdings, Inc., 5.000%, 2/01/2026(a) | 499,741 |
660,000 | Nationstar Mortgage Holdings, Inc., 5.125%, 12/15/2030(a) | 535,871 |
Principal Amount (‡) | Description | Value (†) |
Finance Companies — continued | ||
$350,000 | Nationstar Mortgage Holdings, Inc., 5.500%, 8/15/2028(a) | $308,723 |
1,320,000 | Nationstar Mortgage Holdings, Inc., 5.750%, 11/15/2031(a) | 1,091,933 |
3,105,000 | Navient Corp., Series A, MTN, 5.625%, 8/01/2033 | 2,253,143 |
715,000 | OneMain Finance Corp., 3.500%, 1/15/2027 | 612,219 |
1,380,000 | OneMain Finance Corp., 4.000%, 9/15/2030 | 1,035,490 |
125,000 | OneMain Finance Corp., 5.375%, 11/15/2029 | 104,687 |
990,000 | OneMain Finance Corp., 7.125%, 3/15/2026 | 969,588 |
1,220,000 | Rocket Mortgage LLC/Rocket Mortgage Co-Issuer, Inc., 2.875%, 10/15/2026(a) | 1,074,442 |
3,135,000 | Rocket Mortgage LLC/Rocket Mortgage Co-Issuer, Inc., 3.875%, 3/01/2031(a) | 2,499,755 |
1,235,000 | Rocket Mortgage LLC/Rocket Mortgage Co-Issuer, Inc., 4.000%, 10/15/2033(a) | 932,651 |
15,268,574 | ||
Financial Other — 1.2% | ||
200,000 | Agile Group Holdings Ltd., 5.500%, 4/21/2025 | 25,744 |
400,000 | Agile Group Holdings Ltd., 6.050%, 10/13/2025 | 43,772 |
200,000 | Central China Real Estate Ltd., 7.250%, 7/16/2024(e) | 8,176 |
200,000 | Central China Real Estate Ltd., 7.250%, 8/13/2024(e) | 8,114 |
280,000 | Central China Real Estate Ltd., 7.650%, 8/27/2025(e) | 10,195 |
441,195 | CFLD Cayman Investment Ltd., 2.500%, 1/31/2031(a)(f) | 38,168 |
535,665 | CFLD Cayman Investment Ltd., 2.500%, 1/31/2031(a)(f) | 16,156 |
55,431 | CFLD Cayman Investment Ltd., Zero Coupon, 0.000%–36.271%, 1/31/2031(a)(g) | 554 |
810,000 | China Aoyuan Group Ltd., 6.200%, 3/24/2026(e) | 12,433 |
405,000 | China Evergrande Group, 8.750%, 6/28/2025(e) | 8,100 |
200,000 | China Evergrande Group, 9.500%, 4/11/2022(e) | 4,000 |
674,699 | Easy Tactic Ltd., 7.500% PIK or 6.500% Cash, 7/11/2027(h) | 36,953 |
200,000 | Fantasia Holdings Group Co. Ltd., 11.875%, 6/01/2023(e) | 6,000 |
3,015,000 | Icahn Enterprises LP/Icahn Enterprises Finance Corp., 4.375%, 2/01/2029 | 2,410,973 |
825,000 | Icahn Enterprises LP/Icahn Enterprises Finance Corp., 5.250%, 5/15/2027 | 725,158 |
400,000 | Kaisa Group Holdings Ltd., 9.375%, 6/30/2024(e) | 23,356 |
Loomis Sayles Institutional High Income Fund (continued)
Principal Amount (‡) | Description | Value (†) |
Financial Other — continued | ||
$200,000 | Kaisa Group Holdings Ltd., 9.950%, 7/23/2025(e) | $11,708 |
800,000 | Kaisa Group Holdings Ltd., 11.250%, 4/16/2025(e) | 45,960 |
610,000 | Kaisa Group Holdings Ltd., 11.650%, 6/01/2026(e) | 33,550 |
200,000 | Kaisa Group Holdings Ltd., 11.700%, 11/11/2025(e) | 11,416 |
210,000 | KWG Group Holdings Ltd., 6.300%, 2/13/2026(e) | 16,800 |
205,000 | Shimao Group Holdings Ltd., 3.450%, 1/11/2031(e) | 8,200 |
260,000 | Shimao Group Holdings Ltd., 4.750%, 7/03/2022(e) | 9,747 |
200,000 | Shimao Group Holdings Ltd., 5.200%, 1/16/2027(e) | 6,000 |
200,000 | Shimao Group Holdings Ltd., 6.125%, 2/21/2024(e) | 8,000 |
200,000 | Sunac China Holdings Ltd., 6.500%, 1/10/2025(e) | 31,000 |
405,000 | Sunac China Holdings Ltd., 6.500%, 1/26/2026(e) | 62,775 |
265,000 | Sunac China Holdings Ltd., 6.650%, 8/03/2024(e) | 33,141 |
200,000 | Times China Holdings Ltd., 5.750%, 1/14/2027(e) | 6,000 |
405,000 | Times China Holdings Ltd., 6.200%, 3/22/2026(e) | 12,150 |
920,000 | Yuzhou Group Holdings Co. Ltd., 6.350%, 1/13/2027(e) | 55,605 |
200,000 | Yuzhou Group Holdings Co. Ltd., 7.700%, 2/20/2025(e) | 13,100 |
205,000 | Yuzhou Group Holdings Co. Ltd., 7.850%, 8/12/2026(e) | 12,448 |
295,000 | Zhenro Properties Group Ltd., 6.630%, 1/07/2026(e) | 1,549 |
3,757,001 | ||
Food & Beverage — 0.8% | ||
425,000 | HLF Financing Sarl LLC/Herbalife International, Inc., 4.875%, 6/01/2029(a) | 301,750 |
1,205,000 | Lamb Weston Holdings, Inc., 4.375%, 1/31/2032(a) | 1,009,474 |
895,000 | Post Holdings, Inc., 4.500%, 9/15/2031(a) | 744,902 |
375,000 | Simmons Foods, Inc./Simmons Prepared Foods, Inc./Simmons Pet Food, Inc./Simmons Feed, 4.625%, 3/01/2029(a) | 307,622 |
2,363,748 | ||
Gaming — 2.2% | ||
340,000 | Boyd Gaming Corp., 4.750%, 6/15/2031(a) | 289,332 |
750,000 | Caesars Entertainment, Inc., 6.250%, 7/01/2025(a) | 739,734 |
755,000 | Light & Wonder International, Inc., 7.000%, 5/15/2028(a) | 742,097 |
1,310,000 | Light & Wonder International, Inc., 7.250%, 11/15/2029(a) | 1,283,800 |
Principal Amount (‡) | Description | Value (†) |
Gaming — continued | ||
$260,000 | Light & Wonder International, Inc., 7.500%, 9/01/2031(a) | $256,971 |
1,025,000 | Melco Resorts Finance Ltd., 5.375%, 12/04/2029(a) | 840,786 |
90,000 | Penn Entertainment, Inc., 4.125%, 7/01/2029(a) | 73,547 |
745,000 | Sands China Ltd., 5.650%, 8/08/2028 | 701,288 |
600,000 | Studio City Finance Ltd., 5.000%, 1/15/2029(a) | 451,710 |
705,000 | Wynn Macau Ltd., 5.500%, 1/15/2026(a) | 659,023 |
1,020,000 | Wynn Macau Ltd., 5.625%, 8/26/2028(a) | 884,291 |
6,922,579 | ||
Government Owned - No Guarantee — 0.2% | ||
490,000 | Antares Holdings LP, 7.950%, 8/11/2028(a) | 487,095 |
Health Care REITs — 0.2% | ||
795,000 | MPT Operating Partnership LP/MPT Finance Corp., 3.500%, 3/15/2031 | 496,453 |
Health Insurance — 0.2% | ||
90,000 | Molina Healthcare, Inc., 3.875%, 11/15/2030(a) | 74,485 |
870,000 | Molina Healthcare, Inc., 3.875%, 5/15/2032(a) | 697,727 |
772,212 | ||
Healthcare — 1.9% | ||
190,000 | AdaptHealth LLC, 4.625%, 8/01/2029(a) | 145,826 |
965,000 | AdaptHealth LLC, 5.125%, 3/01/2030(a) | 747,274 |
1,015,000 | Bausch & Lomb Escrow Corp., 8.375%, 10/01/2028(a) | 1,018,015 |
1,475,000 | CHS/Community Health Systems, Inc., 5.250%, 5/15/2030(a) | 1,121,260 |
150,000 | Fortrea Holdings, Inc., 7.500%, 7/01/2030(a) | 145,952 |
440,000 | Garden Spinco Corp., 8.625%, 7/20/2030(a) | 459,297 |
185,000 | Hologic, Inc., 3.250%, 2/15/2029(a) | 156,270 |
675,000 | Medline Borrower LP, 3.875%, 4/01/2029(a) | 570,660 |
1,120,000 | Star Parent, Inc., 9.000%, 10/01/2030(a) | 1,131,763 |
350,000 | U.S. Acute Care Solutions LLC, 6.375%, 3/01/2026(a) | 301,000 |
5,797,317 | ||
Home Construction — 0.0% | ||
115,000 | Forestar Group, Inc., 3.850%, 5/15/2026(a) | 104,385 |
40,000 | Meritage Homes Corp., 3.875%, 4/15/2029(a) | 34,409 |
138,794 | ||
Independent Energy — 5.9% | ||
585,000 | Antero Resources Corp., 5.375%, 3/01/2030(a) | 538,591 |
65,000 | Apache Corp., 4.375%, 10/15/2028 | 58,785 |
285,000 | Apache Corp., 4.750%, 4/15/2043 | 207,583 |
315,000 | Baytex Energy Corp., 8.500%, 4/30/2030(a) | 318,726 |
Loomis Sayles Institutional High Income Fund (continued)
Principal Amount (‡) | Description | Value (†) |
Independent Energy — continued | ||
$270,000 | Baytex Energy Corp., 8.750%, 4/01/2027(a) | $274,219 |
925,000 | Chesapeake Energy Corp., 5.500%, 2/01/2026(a) | 895,061 |
585,000 | Chesapeake Energy Corp., 6.750%, 4/15/2029(a) | 572,483 |
1,050,000 | Civitas Resources, Inc., 8.375%, 7/01/2028(a) | 1,068,375 |
2,180,000 | Continental Resources, Inc., 2.875%, 4/01/2032(a) | 1,632,491 |
330,000 | Continental Resources, Inc., 4.900%, 6/01/2044 | 242,429 |
455,000 | Continental Resources, Inc., 5.750%, 1/15/2031(a) | 427,452 |
490,000 | Crescent Energy Finance LLC, 7.250%, 5/01/2026(a) | 480,200 |
585,000 | Crescent Energy Finance LLC, 9.250%, 2/15/2028(a) | 597,256 |
655,000 | Energian Israel Finance Ltd., 4.875%, 3/30/2026(a) | 608,364 |
345,000 | Energian Israel Finance Ltd., 5.375%, 3/30/2028(a) | 309,413 |
315,000 | Gulfport Energy Corp., 8.000%, 5/17/2026(a) | 315,394 |
1,170,000 | Leviathan Bond Ltd., 6.750%, 6/30/2030(a) | 1,075,326 |
440,000 | Matador Resources Co., 5.875%, 9/15/2026 | 424,656 |
515,000 | Matador Resources Co., 6.875%, 4/15/2028(a) | 505,649 |
260,000 | MEG Energy Corp., 5.875%, 2/01/2029(a) | 242,808 |
795,000 | Northern Oil & Gas, Inc., 8.125%, 3/01/2028(a) | 794,046 |
750,000 | Northern Oil & Gas, Inc., 8.750%, 6/15/2031(a) | 755,625 |
300,000 | Occidental Petroleum Corp., 6.125%, 1/01/2031 | 295,693 |
215,000 | Occidental Petroleum Corp., 6.450%, 9/15/2036 | 211,116 |
645,000 | Occidental Petroleum Corp., 6.625%, 9/01/2030 | 653,546 |
650,000 | Occidental Petroleum Corp., 8.875%, 7/15/2030 | 730,801 |
590,000 | Permian Resources Operating LLC, 5.875%, 7/01/2029(a) | 555,004 |
185,000 | Permian Resources Operating LLC, 6.875%, 4/01/2027(a) | 182,359 |
380,000 | Permian Resources Operating LLC, 7.000%, 1/15/2032(a) | 374,761 |
315,000 | Range Resources Corp., 8.250%, 1/15/2029 | 322,946 |
1,540,000 | Sanchez Energy Corp., 6.125%, 1/15/2023(e) | 107,800 |
1,410,000 | Sitio Royalties Operating Partnership LP/Sitio Finance Corp., 7.875%, 11/01/2028(a) | 1,413,525 |
135,000 | SM Energy Co., 5.625%, 6/01/2025 | 132,125 |
210,000 | SM Energy Co., 6.625%, 1/15/2027 | 205,800 |
430,000 | SM Energy Co., 6.750%, 9/15/2026 | 422,097 |
Principal Amount (‡) | Description | Value (†) |
Independent Energy — continued | ||
$360,000 | Southwestern Energy Co., 5.375%, 2/01/2029 | $331,555 |
345,000 | Strathcona Resources Ltd., 6.875%, 8/01/2026(a) | 325,162 |
18,609,222 | ||
Industrial Other — 0.1% | ||
385,000 | Brundage-Bone Concrete Pumping Holdings, Inc., 6.000%, 2/01/2026(a) | 366,216 |
Leisure — 3.5% | ||
1,830,000 | Carnival Corp., 5.750%, 3/01/2027(a) | 1,656,560 |
40,000 | Carnival Corp., 6.000%, 5/01/2029(a) | 34,119 |
110,000 | Carnival Corp., 7.000%, 8/15/2029(a) | 108,463 |
115,000 | Carnival Corp., 9.875%, 8/01/2027(a) | 120,051 |
380,000 | Cinemark USA, Inc., 5.250%, 7/15/2028(a) | 337,311 |
2,765,000 | NCL Corp. Ltd., 5.875%, 3/15/2026(a) | 2,552,767 |
5,000 | NCL Corp. Ltd., 5.875%, 3/15/2026 | 4,616 |
295,000 | NCL Finance Ltd., 6.125%, 3/15/2028(a) | 260,338 |
465,000 | Royal Caribbean Cruises Ltd., 3.700%, 3/15/2028 | 393,454 |
1,315,000 | Royal Caribbean Cruises Ltd., 4.250%, 7/01/2026(a) | 1,205,712 |
1,730,000 | Royal Caribbean Cruises Ltd., 5.500%, 4/01/2028(a) | 1,586,396 |
530,000 | Royal Caribbean Cruises Ltd., 11.625%, 8/15/2027(a) | 574,996 |
305,000 | SeaWorld Parks & Entertainment, Inc., 5.250%, 8/15/2029(a) | 267,912 |
565,000 | Viking Cruises Ltd., 5.875%, 9/15/2027(a) | 515,676 |
260,000 | Viking Cruises Ltd., 7.000%, 2/15/2029(a) | 239,200 |
870,000 | Viking Ocean Cruises Ship VII Ltd., 5.625%, 2/15/2029(a) | 787,350 |
335,000 | VOC Escrow Ltd., 5.000%, 2/15/2028(a) | 304,685 |
10,949,606 | ||
Lodging — 1.4% | ||
255,000 | Hilton Domestic Operating Co., Inc., 3.625%, 2/15/2032(a) | 205,580 |
1,670,000 | Hilton Grand Vacations Borrower Escrow LLC/Hilton Grand Vacations Borrower Escrow, Inc., 4.875%, 7/01/2031(a) | 1,361,420 |
705,000 | Hilton Grand Vacations Borrower Escrow LLC/Hilton Grand Vacations Borrower Escrow, Inc., 5.000%, 6/01/2029(a) | 611,549 |
790,000 | Marriott Ownership Resorts, Inc., 4.500%, 6/15/2029(a) | 661,941 |
450,000 | Travel & Leisure Co., 4.500%, 12/01/2029(a) | 377,438 |
1,435,000 | Travel & Leisure Co., 4.625%, 3/01/2030(a) | 1,207,581 |
4,425,509 | ||
Loomis Sayles Institutional High Income Fund (continued)
Principal Amount (‡) | Description | Value (†) |
Media Entertainment — 1.2% | ||
$665,000 | Diamond Sports Group LLC/Diamond Sports Finance Co., 5.375%, 8/15/2026(a)(e) | $13,300 |
425,000 | Diamond Sports Group LLC/Diamond Sports Finance Co., 6.625%, 8/15/2027(a)(e) | 8,500 |
1,950,000 | iHeartCommunications, Inc., 4.750%, 1/15/2028(a) | 1,490,731 |
1,050,000 | iHeartCommunications, Inc., 6.375%, 5/01/2026 | 904,769 |
255,000 | Playtika Holding Corp., 4.250%, 3/15/2029(a) | 212,925 |
960,000 | Stagwell Global LLC, 5.625%, 8/15/2029(a) | 775,613 |
245,000 | Warnermedia Holdings, Inc., 4.279%, 3/15/2032 | 207,960 |
3,613,798 | ||
Metals & Mining — 2.8% | ||
900,000 | ATI, Inc., 4.875%, 10/01/2029 | 791,759 |
550,000 | ATI, Inc., 7.250%, 8/15/2030 | 545,875 |
510,000 | Commercial Metals Co., 4.125%, 1/15/2030 | 443,985 |
1,008,000 | First Quantum Minerals Ltd., 6.875%, 3/01/2026(a) | 978,451 |
3,030,000 | First Quantum Minerals Ltd., 6.875%, 10/15/2027(a) | 2,906,913 |
850,000 | GrafTech Finance, Inc., 4.625%, 12/15/2028(a) | 657,301 |
485,000 | GrafTech Global Enterprises, Inc., 9.875%, 12/15/2028(a) | 460,018 |
355,000 | Mineral Resources Ltd., 8.000%, 11/01/2027(a) | 348,344 |
735,000 | Mineral Resources Ltd., 8.125%, 5/01/2027(a) | 725,063 |
655,000 | Mineral Resources Ltd., 9.250%, 10/01/2028(a) | 661,550 |
163,000 | U.S. Steel Corp., 6.875%, 3/01/2029 | 160,238 |
170,000 | Volcan Cia Minera SAA, 4.375%, 2/11/2026(a) | 97,033 |
8,776,530 | ||
Midstream — 5.0% | ||
520,000 | Antero Midstream Partners LP/Antero Midstream Finance Corp., 5.375%, 6/15/2029(a) | 476,106 |
240,000 | Antero Midstream Partners LP/Antero Midstream Finance Corp., 7.875%, 5/15/2026(a) | 241,709 |
820,000 | Blue Racer Midstream LLC/Blue Racer Finance Corp., 7.625%, 12/15/2025(a) | 823,059 |
595,000 | CQP Holdco LP/BIP-V Chinook Holdco LLC, 5.500%, 6/15/2031(a) | 527,377 |
490,000 | Crestwood Midstream Partners LP/Crestwood Midstream Finance Corp., 6.000%, 2/01/2029(a) | 472,997 |
Principal Amount (‡) | Description | Value (†) |
Midstream — continued | ||
$1,695,000 | Energy Transfer LP, Series A, 3 mo. USD LIBOR + 4.028%, 9.654%(b)(c) | $1,584,451 |
485,000 | EnLink Midstream LLC, 6.500%, 9/01/2030(a) | 470,532 |
90,000 | EnLink Midstream Partners LP, 5.050%, 4/01/2045 | 67,585 |
370,000 | EnLink Midstream Partners LP, 5.450%, 6/01/2047 | 289,091 |
625,000 | EnLink Midstream Partners LP, 5.600%, 4/01/2044 | 518,750 |
85,000 | Enterprise Products Operating LLC, Series E, (fixed rate to 8/16/2027, variable rate thereafter), 5.250%, 8/16/2077 | 74,799 |
1,080,000 | EQM Midstream Partners LP, 4.125%, 12/01/2026 | 999,705 |
140,000 | EQM Midstream Partners LP, 6.500%, 7/15/2048 | 123,117 |
1,230,000 | EQM Midstream Partners LP, 7.500%, 6/01/2027(a) | 1,232,450 |
210,000 | EQM Midstream Partners LP, 7.500%, 6/01/2030(a) | 210,892 |
570,000 | Ferrellgas LP/Ferrellgas Finance Corp., 5.375%, 4/01/2026(a) | 534,258 |
1,430,000 | Hess Midstream Operations LP, 4.250%, 2/15/2030(a) | 1,205,831 |
895,000 | Hess Midstream Operations LP, 5.125%, 6/15/2028(a) | 823,235 |
310,000 | Holly Energy Partners LP/Holly Energy Finance Corp., 5.000%, 2/01/2028(a) | 285,213 |
190,000 | Holly Energy Partners LP/Holly Energy Finance Corp., 6.375%, 4/15/2027(a) | 186,538 |
1,025,000 | Kinetik Holdings LP, 5.875%, 6/15/2030(a) | 960,937 |
520,000 | Suburban Propane Partners LP/Suburban Energy Finance Corp., 5.000%, 6/01/2031(a) | 434,060 |
350,000 | Sunoco LP/Sunoco Finance Corp., 4.500%, 5/15/2029 | 307,187 |
1,555,000 | Venture Global Calcasieu Pass LLC, 3.875%, 11/01/2033(a) | 1,207,341 |
320,000 | Venture Global Calcasieu Pass LLC, 4.125%, 8/15/2031(a) | 262,599 |
130,000 | Western Midstream Operating LP, 4.500%, 3/01/2028 | 120,954 |
450,000 | Western Midstream Operating LP, 4.750%, 8/15/2028 | 420,866 |
300,000 | Western Midstream Operating LP, 5.250%, 2/01/2050 | 233,710 |
540,000 | Western Midstream Operating LP, 5.300%, 3/01/2048 | 421,493 |
10,000 | Western Midstream Operating LP, 6.150%, 4/01/2033 | 9,644 |
15,526,486 | ||
Loomis Sayles Institutional High Income Fund (continued)
Principal Amount (‡) | Description | Value (†) |
Non-Agency Commercial Mortgage-Backed Securities — 1.2% | ||
$800,000 | Citigroup Commercial Mortgage Trust, Series 2014-GC21, Class D, 5.105%, 5/10/2047(a)(i) | $492,882 |
165,000 | Credit Suisse Mortgage Trust, Series 2014-USA, Class E, 4.373%, 9/15/2037(a) | 87,981 |
205,000 | GS Mortgage Securities Trust, Series 2011-GC5, Class C, 5.299%, 8/10/2044(a)(i) | 143,504 |
1,830,000 | GS Mortgage Securities Trust, Series 2011-GC5, Class D, 5.299%, 8/10/2044(a)(i) | 540,650 |
425,000 | GS Mortgage Securities Trust, Series 2014-GC22, Class D, 4.842%, 6/10/2047(a)(i) | 192,394 |
720,000 | JPMBB Commercial Mortgage Securities Trust, Series 2013-C14, Class C, 4.385%, 8/15/2046(i) | 612,360 |
1,135,000 | Morgan Stanley Bank of America Merrill Lynch Trust, Series 2013-C11, Class B, 4.220%, 8/15/2046(i) | 479,146 |
475,000 | MSBAM Commercial Mortgage Securities Trust, Series 2012-CKSV, Class C, 4.305%, 10/15/2030(a)(i) | 292,602 |
190,252 | Starwood Retail Property Trust, Series 2014-STAR, Class A, PRIME + 0.000%, 8.500%, 11/15/2027(a)(c) | 136,030 |
310,000 | Wells Fargo Commercial Mortgage Trust, Series 2014-LC16, Class B, 4.322%, 8/15/2050 | 235,697 |
545,000 | Wells Fargo Commercial Mortgage Trust, Series 2014-LC16, Class C, 4.458%, 8/15/2050 | 201,821 |
215,000 | WFRBS Commercial Mortgage Trust, Series 2012-C10, Class C, 4.484%, 12/15/2045(i) | 147,274 |
185,000 | WFRBS Commercial Mortgage Trust, Series 2013-C15, Class C, 4.352%, 8/15/2046(i) | 136,899 |
3,699,240 | ||
Oil Field Services — 1.6% | ||
420,000 | Diamond Foreign Asset Co./Diamond Finance LLC, 8.500%, 10/01/2030(a) | 420,059 |
170,000 | Oceaneering International, Inc., 6.000%, 2/01/2028(a) | 159,965 |
265,000 | Precision Drilling Corp., 6.875%, 1/15/2029(a) | 251,008 |
40,000 | Precision Drilling Corp., 7.125%, 1/15/2026(a) | 39,609 |
325,000 | Seadrill Finance Ltd., 8.375%, 8/01/2030(a) | 330,889 |
380,000 | Solaris Midstream Holdings LLC, 7.625%, 4/01/2026(a) | 366,718 |
405,000 | Transocean Aquila Ltd., 8.000%, 9/30/2028(a) | 405,000 |
Principal Amount (‡) | Description | Value (†) |
Oil Field Services — continued | ||
$1,743,750 | Transocean Poseidon Ltd., 6.875%, 2/01/2027(a) | $1,716,827 |
410,000 | Transocean Titan Financing Ltd., 8.375%, 2/01/2028(a) | 417,175 |
625,000 | Transocean, Inc., 7.500%, 1/15/2026(a) | 610,825 |
440,000 | Weatherford International Ltd., 8.625%, 4/30/2030(a) | 443,368 |
5,161,443 | ||
Other REITs — 0.2% | ||
120,000 | Service Properties Trust, 3.950%, 1/15/2028 | 93,474 |
280,000 | Service Properties Trust, 4.350%, 10/01/2024 | 268,605 |
75,000 | Service Properties Trust, 4.650%, 3/15/2024 | 73,978 |
60,000 | Service Properties Trust, 4.750%, 10/01/2026 | 51,456 |
215,000 | Service Properties Trust, 4.950%, 2/15/2027 | 181,542 |
669,055 | ||
Packaging — 0.3% | ||
422,598 | ARD Finance SA, 7.250% PIK or 6.500% Cash, 6/30/2027(d) | 318,825 |
410,000 | LABL, Inc., 5.875%, 11/01/2028(a) | 368,065 |
360,000 | Sealed Air Corp./Sealed Air Corp. U.S., 6.125%, 2/01/2028(a) | 348,667 |
1,035,557 | ||
Pharmaceuticals — 3.9% | ||
3,190,000 | Bausch Health Cos., Inc., 4.875%, 6/01/2028(a) | 1,814,109 |
160,000 | Bausch Health Cos., Inc., 5.250%, 1/30/2030(a) | 60,064 |
965,000 | Bausch Health Cos., Inc., 6.125%, 2/01/2027(a) | 600,193 |
640,000 | Cheplapharm Arzneimittel GmbH, 5.500%, 1/15/2028(a) | 582,842 |
385,000 | Grifols SA, 4.750%, 10/15/2028(a) | 328,255 |
1,750,000 | Organon & Co./Organon Foreign Debt Co-Issuer BV, 5.125%, 4/30/2031(a) | 1,402,367 |
870,000 | Perrigo Finance Unlimited Co., 4.650%, 6/15/2030 | 741,662 |
770,000 | Teva Pharmaceutical Finance Co. LLC, 6.150%, 2/01/2036 | 682,814 |
245,000 | Teva Pharmaceutical Finance Netherlands II BV, 7.375%, 9/15/2029, (EUR) | 262,943 |
200,000 | Teva Pharmaceutical Finance Netherlands II BV, 7.875%, 9/15/2031, (EUR) | 218,586 |
265,000 | Teva Pharmaceutical Finance Netherlands III BV, 3.150%, 10/01/2026 | 236,187 |
5,915,000 | Teva Pharmaceutical Finance Netherlands III BV, 4.100%, 10/01/2046 | 3,702,587 |
510,000 | Teva Pharmaceutical Finance Netherlands III BV, 4.750%, 5/09/2027 | 467,942 |
Loomis Sayles Institutional High Income Fund (continued)
Principal Amount (‡) | Description | Value (†) |
Pharmaceuticals — continued | ||
$715,000 | Teva Pharmaceutical Finance Netherlands III BV, 7.875%, 9/15/2029 | $724,341 |
515,000 | Teva Pharmaceutical Finance Netherlands III BV, 8.125%, 9/15/2031 | 532,794 |
12,357,686 | ||
Property & Casualty Insurance — 1.3% | ||
355,000 | Acrisure LLC/Acrisure Finance, Inc., 4.250%, 2/15/2029(a) | 298,309 |
780,000 | Acrisure LLC/Acrisure Finance, Inc., 6.000%, 8/01/2029(a) | 655,468 |
65,000 | Alliant Holdings Intermediate LLC/Alliant Holdings Co-Issuer, 4.250%, 10/15/2027(a) | 58,197 |
670,000 | AmWINS Group, Inc., 4.875%, 6/30/2029(a) | 587,073 |
425,000 | BroadStreet Partners, Inc., 5.875%, 4/15/2029(a) | 374,985 |
975,000 | HUB International Ltd., 7.250%, 6/15/2030(a) | 973,216 |
935,000 | Liberty Mutual Group, Inc., 4.300%, 2/01/2061(a) | 553,146 |
1,920,000 | MBIA Insurance Corp., 3 mo. USD SOFR + 11.522%, 16.830%, 1/15/2033(a)(f) | 57,600 |
560,000 | USI, Inc., 6.875%, 5/01/2025(a) | 555,687 |
4,113,681 | ||
Refining — 0.5% | ||
545,000 | Parkland Corp., 4.500%, 10/01/2029(a) | 466,697 |
1,025,000 | Parkland Corp., 4.625%, 5/01/2030(a) | 873,792 |
325,000 | PBF Holding Co. LLC/PBF Finance Corp., 7.875%, 9/15/2030(a) | 323,885 |
1,664,374 | ||
Restaurants — 1.2% | ||
245,000 | 1011778 BC ULC/New Red Finance, Inc., 3.500%, 2/15/2029(a) | 209,733 |
265,000 | 1011778 BC ULC/New Red Finance, Inc., 3.875%, 1/15/2028(a) | 237,716 |
1,815,000 | 1011778 BC ULC/New Red Finance, Inc., 4.375%, 1/15/2028(a) | 1,635,947 |
340,000 | Bloomin' Brands, Inc./OSI Restaurant Partners LLC, 5.125%, 4/15/2029(a) | 297,939 |
190,000 | KFC Holding Co./Pizza Hut Holdings LLC/Taco Bell of America LLC, 4.750%, 6/01/2027(a) | 180,500 |
735,000 | Papa John's International, Inc., 3.875%, 9/15/2029(a) | 606,698 |
530,000 | Yum! Brands, Inc., 3.625%, 3/15/2031 | 436,283 |
3,604,816 | ||
Retailers — 1.4% | ||
480,000 | Asbury Automotive Group, Inc., 4.500%, 3/01/2028 | 429,703 |
1,150,000 | Asbury Automotive Group, Inc., 4.625%, 11/15/2029(a) | 987,712 |
525,000 | Bath & Body Works, Inc., 5.250%, 2/01/2028 | 485,863 |
Principal Amount (‡) | Description | Value (†) |
Retailers — continued | ||
$75,000 | Bath & Body Works, Inc., 6.625%, 10/01/2030(a) | $70,313 |
315,000 | Bath & Body Works, Inc., 6.875%, 11/01/2035 | 281,321 |
90,000 | Crocs, Inc., 4.125%, 8/15/2031(a) | 69,633 |
85,000 | Lithia Motors, Inc., 4.375%, 1/15/2031(a) | 70,322 |
390,000 | Michaels Cos., Inc., 7.875%, 5/01/2029(a) | 254,610 |
370,000 | NMG Holding Co., Inc./Neiman Marcus Group LLC, 7.125%, 4/01/2026(a) | 347,100 |
125,000 | Nordstrom, Inc., 4.250%, 8/01/2031 | 90,653 |
845,000 | Sonic Automotive, Inc., 4.625%, 11/15/2029(a) | 700,466 |
480,000 | Sonic Automotive, Inc., 4.875%, 11/15/2031(a) | 382,169 |
90,000 | Victoria's Secret & Co., 4.625%, 7/15/2029(a) | 65,228 |
4,235,093 | ||
Technology — 5.9% | ||
675,000 | Block, Inc., 2.750%, 6/01/2026 | 607,094 |
270,000 | Broadcom, Inc., 4.300%, 11/15/2032 | 235,559 |
780,000 | CDW LLC/CDW Finance Corp., 3.250%, 2/15/2029 | 665,098 |
125,000 | CDW LLC/CDW Finance Corp., 3.276%, 12/01/2028 | 107,846 |
25,000 | CDW LLC/CDW Finance Corp., 4.250%, 4/01/2028 | 22,788 |
805,000 | Cloud Software Group, Inc., 6.500%, 3/31/2029(a) | 711,886 |
2,855,000 | CommScope Technologies LLC, 5.000%, 3/15/2027 | 1,620,356 |
740,000 | CommScope Technologies LLC, 5.000%, 3/15/2027(a) | 419,987 |
70,000 | CommScope, Inc., 4.750%, 9/01/2029(a) | 51,488 |
225,000 | Dun & Bradstreet Corp., 5.000%, 12/15/2029(a) | 193,981 |
700,000 | Elastic NV, 4.125%, 7/15/2029(a) | 596,159 |
935,000 | Entegris Escrow Corp., 5.950%, 6/15/2030(a) | 867,079 |
270,000 | Everi Holdings, Inc., 5.000%, 7/15/2029(a) | 232,385 |
470,000 | Gartner, Inc., 3.750%, 10/01/2030(a) | 394,426 |
940,000 | GoTo Group, Inc., 5.500%, 9/01/2027(a) | 522,360 |
1,232,000 | GTCR W-2 Merger Sub LLC, 7.500%, 1/15/2031(a) | 1,233,725 |
360,000 | Iron Mountain, Inc., 4.500%, 2/15/2031(a) | 296,087 |
975,000 | Iron Mountain, Inc., 5.250%, 3/15/2028(a) | 901,366 |
405,000 | Iron Mountain, Inc., 5.250%, 7/15/2030(a) | 353,826 |
1,410,000 | Micron Technology, Inc., 6.750%, 11/01/2029 | 1,432,623 |
1,095,000 | NCR Atleos Escrow Corp., 9.500%, 4/01/2029(a) | 1,059,084 |
495,000 | NCR Corp., 5.000%, 10/01/2028(a) | 443,073 |
795,000 | NCR Corp., 5.125%, 4/15/2029(a) | 700,442 |
45,000 | NCR Corp., 5.250%, 10/01/2030(a) | 38,780 |
665,000 | Neptune Bidco U.S., Inc., 9.290%, 4/15/2029(a) | 602,033 |
Loomis Sayles Institutional High Income Fund (continued)
Principal Amount (‡) | Description | Value (†) |
Technology — continued | ||
$1,340,000 | Newfold Digital Holdings Group, Inc., 6.000%, 2/15/2029(a) | $1,011,727 |
725,000 | Open Text Corp., 6.900%, 12/01/2027(a) | 726,650 |
40,000 | Open Text Holdings, Inc., 4.125%, 2/15/2030(a) | 33,464 |
380,000 | Paysafe Finance PLC/Paysafe Holdings U.S. Corp., 4.000%, 6/15/2029(a) | 318,900 |
225,000 | Sabre Global, Inc., 11.250%, 12/15/2027(a) | 206,460 |
400,000 | Seagate HDD Cayman, 4.091%, 6/01/2029 | 344,928 |
540,000 | Seagate HDD Cayman, 8.250%, 12/15/2029(a) | 554,579 |
30,600 | Seagate HDD Cayman, 9.625%, 12/01/2032(a) | 32,973 |
1,125,000 | Sensata Technologies, Inc., 3.750%, 2/15/2031(a) | 910,491 |
125,000 | Sensata Technologies, Inc., 4.375%, 2/15/2030(a) | 107,938 |
18,557,641 | ||
Transportation Services — 0.6% | ||
2,035,000 | Rand Parent LLC, 8.500%, 2/15/2030(a) | 1,882,070 |
Treasuries — 0.2% | ||
3,818(j ) | Brazil Notas do Tesouro Nacional, Series NTNF, 10.000%, 1/01/2029, (BRL) | 722,170 |
Wireless — 1.5% | ||
665,000 | Altice France Holding SA, 10.500%, 5/15/2027(a) | 415,233 |
655,000 | Altice France SA, 5.125%, 1/15/2029(a) | 465,722 |
685,000 | Altice France SA, 5.500%, 10/15/2029(a) | 492,594 |
705,000 | Altice France SA, 8.125%, 2/01/2027(a) | 625,191 |
445,000 | IHS Holding Ltd., 5.625%, 11/29/2026(a) | 366,155 |
615,000 | IHS Holding Ltd., 6.250%, 11/29/2028(a) | 466,404 |
255,000 | IHS Netherlands Holdco BV, 8.000%, 9/18/2027(a) | 213,557 |
1,735,000 | SoftBank Group Corp., 4.625%, 7/06/2028 | 1,513,389 |
105,000 | Vodafone Group PLC, (fixed rate to 12/04/2050, variable rate thereafter), 5.125%, 6/04/2081 | 71,241 |
4,629,486 | ||
Wirelines — 2.0% | ||
935,000 | Cincinnati Bell Telephone Co. LLC, 6.300%, 12/01/2028 | 774,779 |
1,255,000 | Frontier Communications Holdings LLC, 5.000%, 5/01/2028(a) | 1,071,547 |
1,375,000 | Frontier Communications Holdings LLC, 5.875%, 10/15/2027(a) | 1,250,519 |
630,000 | Iliad Holding SASU, 6.500%, 10/15/2026(a) | 591,893 |
705,000 | Level 3 Financing, Inc., 3.625%, 1/15/2029(a) | 394,800 |
245,000 | Level 3 Financing, Inc., 4.250%, 7/01/2028(a) | 152,643 |
200,000 | Liquid Telecommunications Financing PLC, 5.500%, 9/04/2026(a) | 128,182 |
Principal Amount (‡) | Description | Value (†) |
Wirelines — continued | ||
$465,000 | Lumen Technologies, Inc., 4.000%, 2/15/2027(a) | $306,179 |
1,185,000 | Telecom Italia Capital SA, 6.375%, 11/15/2033 | 1,027,481 |
805,000 | Uniti Group LP/Uniti Group Finance, Inc./CSL Capital LLC, 4.750%, 4/15/2028(a) | 657,349 |
6,355,372 | ||
Total Non-Convertible Bonds (Identified Cost $289,800,503) | 257,011,418 | |
Convertible Bonds — 4.4% | ||
Airlines — 0.4% | ||
1,390,000 | Southwest Airlines Co., 1.250%, 5/01/2025 | 1,379,575 |
Cable Satellite — 1.5% | ||
7,350,000 | DISH Network Corp., 3.375%, 8/15/2026 | 4,417,350 |
200,000 | DISH Network Corp., Zero Coupon, 6.944%–33.748%, 12/15/2025(g) | 134,738 |
4,552,088 | ||
Consumer Cyclical Services — 0.0% | ||
85,000 | Zillow Group, Inc., 1.375%, 9/01/2026 | 101,278 |
Consumer Products — 0.1% | ||
590,000 | Beauty Health Co., 1.250%, 10/01/2026(a) | 458,725 |
Gaming — 0.1% | ||
190,000 | Penn Entertainment, Inc., 2.750%, 5/15/2026 | 230,603 |
Healthcare — 1.0% | ||
850,000 | Envista Holdings Corp., 1.750%, 8/15/2028(a) | 782,850 |
310,000 | Lantheus Holdings, Inc., 2.625%, 12/15/2027(a) | 359,414 |
2,470,000 | Teladoc Health, Inc., 1.250%, 6/01/2027 | 1,968,343 |
3,110,607 | ||
Leisure — 0.2% | ||
555,000 | NCL Corp. Ltd., 1.125%, 2/15/2027 | 460,328 |
Pharmaceuticals — 0.9% | ||
2,130,000 | BioMarin Pharmaceutical, Inc., 1.250%, 5/15/2027 | 2,109,978 |
715,000 | Livongo Health, Inc., 0.875%, 6/01/2025 | 653,009 |
2,762,987 | ||
Technology — 0.2% | ||
660,000 | Unity Software, Inc., Zero Coupon, 7.197%–7.662%, 11/15/2026(g) | 522,390 |
Loomis Sayles Institutional High Income Fund (continued)
Principal Amount (‡) | Description | Value (†) |
Technology — continued | ||
$110,000 | Wolfspeed, Inc., 0.250%, 2/15/2028 | $74,140 |
200,000 | Wolfspeed, Inc., 1.875%, 12/01/2029(a) | 130,100 |
726,630 | ||
Total Convertible Bonds (Identified Cost $17,401,811) | 13,782,821 | |
Total Bonds and Notes (Identified Cost $307,202,314) | 270,794,239 | |
Shares | ||
Common Stocks— 2.7% | ||
Aerospace & Defense — 0.1% | ||
410 | Lockheed Martin Corp. | 167,674 |
Air Freight & Logistics — 0.1% | ||
1,413 | United Parcel Service, Inc., Class B | 220,244 |
Banks — 0.0% | ||
671 | JPMorgan Chase & Co. | 97,308 |
Beverages — 0.1% | ||
3,050 | Coca-Cola Co. | 170,739 |
Biotechnology — 0.2% | ||
4,984 | AbbVie, Inc. | 742,915 |
Capital Markets — 0.1% | ||
137 | BlackRock, Inc. | 88,569 |
1,826 | Morgan Stanley | 149,130 |
237,699 | ||
Chemicals — 0.0% | ||
258 | Linde PLC | 96,066 |
Communications Equipment — 0.0% | ||
1,229 | Cisco Systems, Inc. | 66,071 |
Consumer Staples Distribution & Retail — 0.1% | ||
182 | Costco Wholesale Corp. | 102,823 |
1,041 | Walmart, Inc. | 166,487 |
269,310 | ||
Containers & Packaging — 0.0% | ||
482 | Packaging Corp. of America | 74,011 |
Electric Utilities — 0.1% | ||
1,364 | Duke Energy Corp. | 120,387 |
539 | NextEra Energy, Inc. | 30,879 |
151,266 | ||
Electrical Equipment — 0.0% | ||
1,200 | Emerson Electric Co. | 115,884 |
Financial Services — 0.0% | ||
246 | Mastercard, Inc., Class A | 97,394 |
Ground Transportation — 0.0% | ||
635 | Union Pacific Corp. | 129,305 |
Shares | Description | Value (†) |
Health Care Equipment & Supplies — 0.1% | ||
1,489 | Abbott Laboratories | $144,210 |
Health Care Providers & Services — 0.1% | ||
413 | Elevance Health, Inc. | 179,828 |
382 | UnitedHealth Group, Inc. | 192,601 |
372,429 | ||
Hotels, Restaurants & Leisure — 0.1% | ||
2,176 | Starbucks Corp. | 198,604 |
Household Products — 0.1% | ||
1,475 | Procter & Gamble Co. | 215,144 |
IT Services — 0.1% | ||
505 | Accenture PLC, Class A | 155,091 |
Life Sciences Tools & Services — 0.0% | ||
235 | Thermo Fisher Scientific, Inc. | 118,950 |
Machinery — 0.1% | ||
474 | Cummins, Inc. | 108,290 |
429 | Deere & Co. | 161,896 |
270,186 | ||
Media — 0.2% | ||
110,256 | Altice USA, Inc., Class A(f) | 360,537 |
5,431 | Comcast Corp., Class A | 240,810 |
27,529 | iHeartMedia, Inc., Class A(f) | 86,992 |
688,339 | ||
Metals & Mining — 0.0% | ||
3,765 | Newmont Corp. | 139,117 |
Oil, Gas & Consumable Fuels — 0.5% | ||
42,669 | Battalion Oil Corp.(f) | 263,695 |
7,700 | Canadian Natural Resources Ltd. | 497,959 |
632 | Devon Energy Corp. | 30,146 |
3,030 | Diamondback Energy, Inc. | 469,286 |
811 | Pioneer Natural Resources Co. | 186,165 |
4,262 | Williams Cos., Inc. | 143,587 |
1,590,838 | ||
Pharmaceuticals — 0.1% | ||
2,400 | Bristol-Myers Squibb Co. | 139,296 |
1,180 | Johnson & Johnson | 183,785 |
296 | Merck & Co., Inc. | 30,473 |
353,554 | ||
Professional Services — 0.0% | ||
357 | Clarivate PLC(f) | 2,395 |
Semiconductors & Semiconductor Equipment — 0.2% | ||
340 | Broadcom, Inc. | 282,397 |
2,332 | Microchip Technology, Inc. | 182,013 |
1,666 | QUALCOMM, Inc. | 185,026 |
649,436 | ||
Software — 0.1% | ||
826 | Microsoft Corp. | 260,809 |
Loomis Sayles Institutional High Income Fund (continued)
Shares | Description | Value (†) |
Specialized REITs — 0.0% | ||
841 | American Tower Corp. | $138,302 |
Specialty Retail — 0.1% | ||
523 | Home Depot, Inc. | 158,030 |
Technology Hardware, Storage & Peripherals — 0.1% | ||
1,048 | Apple, Inc. | 179,428 |
321 | IQOR US, Inc.(f) | 254 |
179,682 | ||
Trading Companies & Distributors — 0.0% | ||
1,666 | Fastenal Co. | 91,030 |
Total Common Stocks (Identified Cost $15,324,501) | 8,362,032 | |
Principal Amount (‡) | ||
Senior Loans — 2.1% | ||
Chemicals — 0.2% | ||
$550,000 | Chemours Co., 2023 USD Term Loan B, 1 mo. USD SOFR + 3.500%, 8.816%, 8/18/2028(c)(k) | 543,125 |
Electric — 0.1% | ||
199,500 | Talen Energy Supply LLC, 2023 Term Loan B, 3 mo. USD SOFR + 4.500%, 9.877%, 5/17/2030(c)(k) | 200,125 |
Healthcare — 0.2% | ||
495,000 | Star Parent, Inc., 2023 Term Loan B, 9/19/2030(l) | 483,382 |
Leisure — 0.4% | ||
487,144 | Carnival Corp., 2021 Incremental Term Loan B, 1 mo. USD SOFR + 3.250%, 8.681%, 10/18/2028(c)(m) | 484,100 |
575,279 | Carnival Corp., 2021 Incremental Term Loan B, 10/18/2028(l) | 571,683 |
60,244 | Carnival Corp., 2023 Term Loan B, 8/08/2027(l) | 60,018 |
273,591 | Carnival Corp., 2023 Term Loan B, 1 mo. USD SOFR + 3.000%, 8.327%, 8/08/2027(c)(m) | 272,565 |
1,388,366 | ||
Media Entertainment — 0.5% | ||
1,604,461 | MH Sub I LLC, 2023 Term Loan, 1 mo. USD SOFR + 4.250%, 9.566%, 5/03/2028(c)(k) | 1,550,054 |
Property & Casualty Insurance — 0.2% | ||
190,000 | AssuredPartners, Inc., 2023 Term Loan B4, 2/12/2027(l) | 189,882 |
386,050 | USI, Inc., 2022 Incremental Term Loan, 3 mo. USD SOFR + 3.750%, 9.140%, 11/22/2029(c)(k) | 385,460 |
Principal Amount (‡) | Description | Value (†) |
Property & Casualty Insurance — continued | ||
$56,292 | USI, Inc., 2023 Acquisition Term Loan, 9/27/2030(l) | $56,128 |
37,528 | USI, Inc., 2023 Refi Term Loan, 9/27/2030(l) | 37,403 |
668,873 | ||
Restaurants — 0.1% | ||
474,140 | 1011778 BC Unlimited Liability Co., 2023 Term Loan B5, 1 mo. USD SOFR + 2.250%, 7.566%, 9/23/2030(n) | 472,068 |
Technology — 0.4% | ||
633,209 | Gen Digital, Inc., 2022 Term Loan B, 1 mo. USD SOFR + 2.000%, 7.416%, 9/12/2029(c)(k) | 630,676 |
719,017 | Neptune Bidco U.S., Inc., 2022 USD Term Loan B, 3 mo. USD SOFR + 5.000%, 10.399%, 4/11/2029(c)(k) | 645,620 |
1,276,296 | ||
Total Senior Loans (Identified Cost $6,600,698) | 6,582,289 | |
Collateralized Loan Obligations — 1.9% | ||
325,000 | Battalion CLO XVI Ltd., Series 2019-16A, Class ER, 3 mo. USD SOFR + 6.862%, 12.188%, 12/19/2032(a)(c) | 275,771 |
920,000 | Clover CLO LLC, Series 2021-2A, Class E, 3 mo. USD SOFR + 6.762%, 12.088%, 7/20/2034(a)(c) | 902,418 |
730,000 | NYACK Park CLO Ltd., Series 2021-1A, Class E, 3 mo. USD SOFR + 6.362%, 11.688%, 10/20/2034(a)(c) | 655,287 |
730,000 | Octagon Investment Partners 44 Ltd., Series 2019-1A, Class ER, 3 mo. USD SOFR + 7.012%, 12.320%, 10/15/2034(a)(c) | 635,425 |
735,000 | OHA Credit Funding 2 Ltd., Series 2019-2A, Class ER, 3 mo. USD LIBOR + 6.360%, 11.955%, 4/21/2034(a)(c) | 728,913 |
985,000 | OHA Credit Funding 3 Ltd., Series 2019-3A, Class ER, 3 mo. USD SOFR + 6.512%, 11.838%, 7/02/2035(a)(c) | 970,063 |
470,000 | Palmer Square CLO Ltd., Series 2021-3A, Class E, 3 mo. USD SOFR + 6.412%, 11.720%, 1/15/2035(a)(c) | 451,864 |
730,000 | Palmer Square CLO Ltd., Series 2021-4A, Class E, 3 mo. USD SOFR + 6.312%, 11.620%, 10/15/2034(a)(c) | 692,913 |
Loomis Sayles Institutional High Income Fund (continued)
Principal Amount (‡) | Description | Value (†) |
$285,000 | PPM CLO 5 Ltd., Series 2021-5A, Class E, 3 mo. USD SOFR + 6.762%, 12.072%, 10/18/2034(a)(c) | $256,428 |
445,000 | Whetstone Park CLO Ltd., Series 2021-1A, Class E, 3 mo. USD SOFR + 6.412%, 11.738%, 1/20/2035(a)(c) | 413,801 |
Total Collateralized Loan Obligations (Identified Cost $6,347,577) | 5,982,883 | |
Shares | ||
Exchange-Traded Funds — 0.8% | ||
33,000 | iShares® iBoxx $ High Yield Corporate Bond ETF (Identified Cost$2,897,347) | 2,432,760 |
Preferred Stocks — 0.4% | ||
Convertible Preferred Stocks — 0.2% | ||
Midstream — 0.0% | ||
3,556 | El Paso Energy Capital Trust I, 4.750% | 161,478 |
Technology — 0.2% | ||
23,105 | Clarivate PLC, Series A, 5.250% | 675,359 |
Total Convertible Preferred Stocks (Identified Cost $1,312,685) | 836,837 | |
Non-Convertible Preferred Stocks — 0.2% | ||
Home Construction — 0.1% | ||
21,265 | Hovnanian Enterprises, Inc., 7.625% | 375,540 |
Other REITs — 0.1% | ||
3,363 | Prologis, Inc., Series Q, 8.540% | 189,740 |
Total Non-Convertible Preferred Stocks (Identified Cost $192,799) | 565,280 | |
Total Preferred Stocks (Identified Cost $1,505,484) | 1,402,117 | |
Principal Amount (‡) | Description | Value (†) |
Short-Term Investments — 5.4% | ||
$5,916,904 | Tri-Party Repurchase Agreement with Fixed Income Clearing Corporation, dated 9/29/2023 at 2.500% to be repurchased at $5,918,137 on 10/02/2023 collateralized by $6,777,900 U.S. Treasury Note, 0.750% due 8/31/2026 valued at $6,035,322 including accrued interest (Note 2 of Notes to Financial Statements) | $5,916,904 |
11,095,000 | U.S. Treasury Bills, 5.285%–5.290%, 1/04/2024(o)(p) | 10,941,313 |
Total Short-Term Investments (Identified Cost $16,857,378) | 16,858,217 | |
Total Investments — 99.9% (Identified Cost $356,735,299) | 312,414,537 | |
Other assets less liabilities — 0.1% | 328,611 | |
Net Assets — 100.0% | $312,743,148 | |
(†) | See Note 2 of Notes to Financial Statements. |
(‡) | Principal Amount stated in U.S. dollars unless otherwise noted. |
(a) | All or a portion of these securities are exempt from registration under Rule 144A of the Securities Act of 1933. These securities may be resold in transactions exempt from registration, normally to qualified institutional buyers. At September 30, 2023, the value of Rule 144A holdings amounted to $197,265,173 or 63.1% of net assets. |
(b) | Perpetual bond with no specified maturity date. |
(c) | Variable rate security. Rate as of September 30, 2023 is disclosed. |
(d) | Payment-in-kind security for which the issuer, at each interest payment date, may make interest payments in cash and/or additional principal. For the period ended September 30, 2023, interest payments were made in cash. |
(e) | The issuer is in default with respect to interest and/or principal payments. Income is not being accrued. |
(f) | Non-income producing security. |
(g) | Interest rate represents annualized yield at time of purchase; not a coupon rate. The Fund’s investment in this security is comprised of various lots with differing annualized yields. |
(h) | Payment–in–kind security for which the issuer, at each interest payment date, may make interest payments in cash and/or additional principal. For the period ended September 30, 2023, interest payments were made in principal. |
(i) | Variable rate security. The interest rate adjusts periodically based on; (i) changes in current interest rates and/or prepayments on underlying pools of assets, if applicable, (ii) reference to a base lending rate plus or minus a margin, and/or (iii) reference to a base lending rate adjusted by a multiplier and/or subject to certain floors or caps. Rate as of September 30, 2023 is disclosed. |
(j) | Amount shown represents units. One unit represents a principal amount of 1,000. |
(k) | Stated interest rate has been determined in accordance with the provisions of the loan agreement and is subject to a minimum benchmark floor rate of 0.50%, to which the spread is added. |
(l) | Position is unsettled. Contract rate was not determined at September 30, 2023 and does not take effect until settlement date. Maturity date is not finalized until settlement date. |
Loomis Sayles Institutional High Income Fund (continued)
(m) | Stated interest rate has been determined in accordance with the provisions of the loan agreement and is subject to a minimum benchmark floor rate of 0.75%, to which the spread is added. |
(n) | Stated interest rate has been determined in accordance with the provisions of the loan agreement and is subject to a minimum benchmark floor rate of 0.00%, to which the spread is added. |
(o) | The Fund's investment in U.S. Government/Agency securities is comprised of various lots with differing discount rates. These separate investments, which have the same maturity date, have been aggregated for the purpose of presentation in the Portfolio of Investments. |
(p) | Interest rate represents discount rate at time of purchase; not a coupon rate. |
ABS | Asset-Backed Securities |
ETF | Exchange-Traded Fund |
LIBOR | London Interbank Offered Rate |
MTN | Medium Term Note |
PIK | Payment-in-Kind |
REITs | Real Estate Investment Trusts |
SOFR | Secured Overnight Financing Rate |
BRL | Brazilian Real |
EUR | Euro |
Counterparty | Delivery Date | Currency Bought/ Sold (B/S) | Units of Currency | In Exchange for | Notional Value | Unrealized Appreciation (Depreciation) | |
Bank of America N.A. | 12/20/2023 | EUR | S | 445,000 | $479,763 | $472,201 | $7,562 |
Cable Satellite | 9.9 % |
Technology | 6.7 |
Independent Energy | 5.9 |
Midstream | 5.0 |
Finance Companies | 4.9 |
Pharmaceuticals | 4.9 |
Leisure | 4.1 |
Automotive | 3.2 |
Consumer Cyclical Services | 3.1 |
Healthcare | 3.1 |
Chemicals | 2.8 |
Metals & Mining | 2.8 |
Building Materials | 2.4 |
Gaming | 2.3 |
Wirelines | 2.0 |
Other Investments, less than 2% each | 28.7 |
Collateralized Loan Obligations | 1.9 |
Short-Term Investments | 5.4 |
Exchange-Traded Funds | 0.8 |
Total Investments | 99.9 |
Other assets less liabilities (including forward foreign currency contracts) | 0.1 |
Net Assets | 100.0 % |
Fixed Income Fund | Global Bond Fund | Inflation Protected Securities Fund | |
ASSETS | |||
Investments at cost | $479,859,252 | $485,869,228 | $161,640,534 |
Net unrealized depreciation | (53,823,978 ) | (66,284,547 ) | (26,432,196 ) |
Investments at value | 426,035,274 | 419,584,681 | 135,208,338 |
Cash | 4,340 | — | — |
Due from brokers (Note 2) | — | 433,073 | 1,334,000 |
Foreign currency at value (identified cost $0, $3,544,546 and $832,377, respectively) | — | 3,508,074 | 827,161 |
Receivable for Fund shares sold | — | 356,594 | 148,609 |
Receivable for securities sold | 1,391,948 | 3,323,447 | — |
Receivable for when-issued/delayed delivery securities sold (Note 2) | — | 4,280,315 | — |
Collateral received for open forward foreign currency contracts (Notes 2 and 4) | — | 270,000 | — |
Dividends and interest receivable | 4,669,936 | 3,417,569 | 201,572 |
Unrealized appreciation on forward foreign currency contracts (Note 2) | 18,064 | 600,492 | 11,301 |
Tax reclaims receivable | 135 | 39,692 | — |
Receivable for variation margin on centrally cleared swap agreements (Note 2) | — | — | 12,655 |
Receivable for variation margin on futures contracts (Note 2) | 176,539 | 41,562 | — |
Prepaid expenses (Note 8) | 270 | 289 | 199 |
TOTAL ASSETS | 432,296,506 | 435,855,788 | 137,743,835 |
LIABILITIES | |||
Payable for securities purchased | 8,215,239 | — | — |
Payable for when-issued/delayed delivery securities purchased (Note 2) | — | 6,438,372 | — |
Payable for Fund shares redeemed | — | 1,120,771 | 707,304 |
Unrealized depreciation on forward foreign currency contracts (Note 2) | — | 595,583 | — |
Foreign taxes payable (Note 2) | — | 1,603 | — |
Due to brokers (Note 2) | — | 270,000 | — |
Management fees payable (Note 6) | 175,756 | 159,087 | 3,589 |
Deferred Trustees’ fees (Note 6) | 298,576 | 422,140 | 146,594 |
Administrative fees payable (Note 6) | 16,281 | 16,538 | 5,397 |
Payable to distributor (Note 6d) | — | 3,703 | 1,841 |
Other accounts payable and accrued expenses | 68,610 | 93,908 | 68,885 |
TOTAL LIABILITIES | 8,774,462 | 9,121,705 | 933,610 |
NET ASSETS | $423,522,044 | $426,734,083 | $136,810,225 |
NET ASSETS CONSIST OF: | |||
Paid-in capital | $478,633,510 | $556,437,130 | $196,848,828 |
Accumulated loss | (55,111,466 ) | (129,703,047 ) | (60,038,603 ) |
NET ASSETS | $423,522,044 | $426,734,083 | $136,810,225 |
Fixed Income Fund | Global Bond Fund | Inflation Protected Securities Fund | |
COMPUTATION OF NET ASSET VALUE AND OFFERING PRICE: | |||
Institutional Class shares: | |||
Net assets | $423,522,044 | $229,009,743 | $93,239,847 |
Shares of beneficial interest | 37,868,221 | 17,002,735 | 10,092,425 |
Net asset value, offering and redemption price per share | $11.18 | $13.47 | $9.24 |
Retail Class shares: | |||
Net assets | $— | $103,002,961 | $29,500,394 |
Shares of beneficial interest | — | 7,820,884 | 3,199,512 |
Net asset value, offering and redemption price per share | $— | $13.17 | $9.22 |
Class N shares: | |||
Net assets | $— | $94,721,379 | $14,069,984 |
Shares of beneficial interest | — | 7,006,941 | 1,521,511 |
Net asset value, offering and redemption price per share | $— | $13.52 | $9.25 |
Institutional High Income Fund | |
ASSETS | |
Investments at cost | $356,735,299 |
Net unrealized depreciation | (44,320,762 ) |
Investments at value | 312,414,537 |
Cash | 29,012 |
Foreign currency at value (identified cost $101) | 99 |
Receivable for securities sold | 3,361,948 |
Dividends and interest receivable | 4,423,803 |
Unrealized appreciation on forward foreign currency contracts (Note 2) | 7,562 |
Prepaid expenses (Note 8) | 254 |
TOTAL ASSETS | 320,237,215 |
LIABILITIES | |
Payable for securities purchased | 7,045,220 |
Management fees payable (Note 6) | 151,342 |
Deferred Trustees’ fees (Note 6) | 222,242 |
Administrative fees payable (Note 6) | 12,040 |
Payable to distributor (Note 6d) | 516 |
Other accounts payable and accrued expenses | 62,707 |
TOTAL LIABILITIES | 7,494,067 |
NET ASSETS | $312,743,148 |
NET ASSETS CONSIST OF: | |
Paid-in capital | $372,934,345 |
Accumulated loss | (60,191,197 ) |
NET ASSETS | $312,743,148 |
COMPUTATION OF NET ASSET VALUE AND OFFERING PRICE: | |
Institutional Class shares: | |
Net assets | $312,743,148 |
Shares of beneficial interest | 57,247,014 |
Net asset value, offering and redemption price per share | $5.46 |
Fixed Income Fund | Global Bond Fund | Inflation Protected Securities Fund | |
INVESTMENT INCOME | |||
Interest | $19,283,784 | $14,940,029 | $5,625,947 |
Dividends | 413,914 | — | — |
Less net foreign taxes withheld | (5,809 ) | (50,493 ) | — |
19,691,889 | 14,889,536 | 5,625,947 | |
Expenses | |||
Management fees (Note 6) | 2,108,550 | 2,698,219 | 439,774 |
Service and distribution fees (Note 6) | — | 286,627 | 83,426 |
Administrative fees (Note 6) | 195,434 | 227,376 | 81,539 |
Trustees' fees and expenses (Note 6) | 64,456 | 80,324 | 38,023 |
Transfer agent fees and expenses (Notes 6 and 7) | 3,729 | 373,946 | 176,349 |
Audit and tax services fees | 62,662 | 60,304 | 50,846 |
Custodian fees and expenses | 23,968 | 42,222 | 12,271 |
Legal fees | 17,469 | 20,920 | 8,195 |
Registration fees | 12,076 | 54,153 | 53,881 |
Shareholder reporting expenses | 7,742 | 74,428 | 57,603 |
Miscellaneous expenses | 56,122 | 57,943 | 48,785 |
Total expenses | 2,552,208 | 3,976,462 | 1,050,692 |
Less waiver and/or expense reimbursement (Note 6) | — | (367,024 ) | (271,486 ) |
Net expenses | 2,552,208 | 3,609,438 | 779,206 |
Net investment income | 17,139,681 | 11,280,098 | 4,846,741 |
Net realized and unrealized gain (loss) on Investments, Futures contracts, Swap agreements, Forward foreign currency contracts and Foreign currency transactions | |||
Net realized gain (loss) on: | |||
Investments | (2,541,681 ) | (36,783,861 ) | (17,399,373 ) |
Futures contracts | (7,362,890 ) | (1,997,094 ) | (263,558 ) |
Swap agreements | — | — | (563 ) |
Forward foreign currency contracts (Note 2d) | 6,277 | (1,907,280 ) | (77,461 ) |
Foreign currency transactions (Note 2c) | (21,192 ) | 412,094 | 144,689 |
Net change in unrealized appreciation (depreciation) on: | |||
Investments | 6,780,727 | 43,989,208 | 16,990,309 |
Futures contracts | (1,084,991 ) | (426,501 ) | (293,627 ) |
Swap agreements | — | — | (69,450 ) |
Forward foreign currency contracts (Note 2d) | 18,064 | (1,325,047 ) | (51,082 ) |
Foreign currency translations (Note 2c) | 4,444 | 354,707 | 7,576 |
Net realized and unrealized gain (loss) on Investments, Futures contracts, Swap agreements, Forward foreign currency contracts and Foreign currency transactions | (4,201,242 ) | 2,316,226 | (1,012,540 ) |
NET INCREASE IN NET ASSETS RESULTING FROM OPERATIONS | $12,938,439 | $13,596,324 | $3,834,201 |
Institutional High Income Fund | |
INVESTMENT INCOME | |
Interest | $22,042,845 |
Dividends | 584,647 |
Less net foreign taxes withheld | (2,120 ) |
22,625,372 | |
Expenses | |
Management fees (Note 6) | 1,969,135 |
Administrative fees (Note 6) | 153,321 |
Trustees' fees and expenses (Note 6) | 52,092 |
Transfer agent fees and expenses (Notes 6 and 7) | 36,643 |
Audit and tax services fees | 58,019 |
Custodian fees and expenses | 23,634 |
Legal fees | 14,359 |
Registration fees | 13,320 |
Shareholder reporting expenses | 7,613 |
Miscellaneous expenses | 51,551 |
Total expenses | 2,379,687 |
Net investment income | 20,245,685 |
Net realized and unrealized gain (loss) on Investments, Swap agreements, Forward foreign currency contracts and Foreign currency transactions | |
Net realized gain (loss) on: | |
Investments | (20,217,449 ) |
Swap agreements | 217,876 |
Forward foreign currency contracts (Note 2d) | 2,628 |
Foreign currency transactions (Note 2c) | (5,716 ) |
Net change in unrealized appreciation (depreciation) on: | |
Investments | 24,465,433 |
Swap agreements | (4,207 ) |
Forward foreign currency contracts (Note 2d) | 7,562 |
Foreign currency translations (Note 2c) | 919 |
Net realized and unrealized gain on Investments, Swap agreements, Forward foreign currency contracts and Foreign currency transactions | 4,467,046 |
NET INCREASE IN NET ASSETS RESULTING FROM OPERATIONS | $24,712,731 |
Fixed Income Fund | Global Bond Fund | |||
Year Ended September 30, 2023 | Year Ended September 30, 2022 | Year Ended September 30, 2023 | Year Ended September 30, 2022 | |
FROM OPERATIONS: | ||||
Net investment income | $17,139,681 | $12,067,668 | $11,280,098 | $9,937,962 |
Net realized loss on investments, futures contracts, forward foreign currency contracts and foreign currency transactions | (9,919,486 ) | (4,722,736 ) | (40,276,141 ) | (43,791,789 ) |
Net change in unrealized appreciation (depreciation) on investments, futures contracts, forward foreign currency contracts and foreign currency translations | 5,718,244 | (71,187,395 ) | 42,592,367 | (115,973,259 ) |
Net increase (decrease) in net assets resulting from operations | 12,938,439 | (63,842,463 ) | 13,596,324 | (149,827,086 ) |
FROM DISTRIBUTIONS TO SHAREHOLDERS: | ||||
Institutional Class | (6,051,005 ) | (30,083,728 ) | — | (15,886,291 ) |
Retail Class | — | — | — | (6,461,573 ) |
Class N | — | — | — | (8,245,710 ) |
Total distributions | (6,051,005 ) | (30,083,728 ) | — | (30,593,574 ) |
NET INCREASE (DECREASE) IN NET ASSETS FROM CAPITAL SHARES TRANSACTIONS (NOTE 11) | 16,936,243 | (17,433,441 ) | (100,908,806 ) | (54,019,429 ) |
Net increase (decrease) in net assets | 23,823,677 | (111,359,632 ) | (87,312,482 ) | (234,440,089 ) |
NET ASSETS | ||||
Beginning of the year | 399,698,367 | 511,057,999 | 514,046,565 | 748,486,654 |
End of the year | $423,522,044 | $399,698,367 | $426,734,083 | $514,046,565 |
Inflation Protected Securities Fund | Institutional High Income Fund | |||
Year Ended September 30, 2023 | Year Ended September 30, 2022 | Year Ended September 30, 2023 | Year Ended September 30, 2022 | |
FROM OPERATIONS: | ||||
Net investment income | $4,846,741 | $16,681,384 | $20,245,685 | $16,303,353 |
Net realized loss on investments, futures contracts, swap agreements, forward foreign currency contracts and foreign currency transactions | (17,596,266 ) | (8,401,173 ) | (20,002,661 ) | (9,519,302 ) |
Net change in unrealized appreciation (depreciation) on investments, futures contracts, swap agreements, forward foreign currency contracts and foreign currency translations | 16,583,726 | (45,113,913 ) | 24,469,707 | (58,567,337 ) |
Net increase (decrease) in net assets resulting from operations | 3,834,201 | (36,833,702 ) | 24,712,731 | (51,783,286 ) |
FROM DISTRIBUTIONS TO SHAREHOLDERS: | ||||
Institutional Class | (4,548,824 ) | (19,933,500 ) | (15,201,101 ) | (20,772,904 ) |
Retail Class | (1,212,172 ) | (3,466,542 ) | — | — |
Class N | (667,949 ) | (954,553 ) | — | — |
Total distributions | (6,428,945 ) | (24,354,595 ) | (15,201,101 ) | (20,772,904 ) |
NET INCREASE (DECREASE) IN NET ASSETS FROM CAPITAL SHARES TRANSACTIONS (Note 11) | (81,488,073 ) | 21,869,371 | (8,833,771 ) | 20,176,895 |
Net increase (decrease) in net assets | (84,082,817 ) | (39,318,926 ) | 677,859 | (52,379,295 ) |
NET ASSETS | ||||
Beginning of the year | 220,893,042 | 260,211,968 | 312,065,289 | 364,444,584 |
End of the year | $136,810,225 | $220,893,042 | $312,743,148 | $312,065,289 |
Fixed Income Fund– Institutional Class | |||||
Year Ended September 30, 2023 | Year Ended September 30, 2022 | Year Ended September 30, 2021 | Year Ended September 30, 2020 | Year Ended September 30, 2019 | |
Net asset value, beginning of the period | $10.99 | $13.52 | $13.17 | $13.49 | $13.40 |
INCOME (LOSS) FROM INVESTMENT OPERATIONS: | |||||
Net investment income(a) | 0.46 | 0.33 | 0.44 | 0.55 | 0.59 |
Net realized and unrealized gain (loss) | (0.10 ) | (2.06 ) | 0.73 | (0.31 ) | 0.19 |
Total from Investment Operations | 0.36 | (1.73 ) | 1.17 | 0.24 | 0.78 |
LESS DISTRIBUTIONS FROM: | |||||
Net investment income | (0.11 ) | (0.29 ) | (0.64 ) | (0.56 ) | (0.59 ) |
Net realized capital gains | (0.06 ) | (0.51 ) | (0.18 ) | — | (0.10 ) |
Total Distributions | (0.17 ) | (0.80 ) | (0.82 ) | (0.56 ) | (0.69 ) |
Net asset value, end of the period | $11.18 | $10.99 | $13.52 | $13.17 | $13.49 |
Total return | 3.26 % | (13.63 )% | 9.08 % | 1.78 % | 6.29 % |
RATIOS TO AVERAGE NET ASSETS: | |||||
Net assets, end of the period (000's) | $423,522 | $399,698 | $511,058 | $633,060 | $776,812 |
Net expenses | 0.61 % | 0.58 % | 0.59 % | 0.58 % | 0.57 % |
Gross expenses | 0.61 % | 0.58 % | 0.59 % | 0.58 % | 0.57 % |
Net investment income | 4.06 % | 2.66 % | 3.27 % | 4.23 % | 4.51 % |
Portfolio turnover rate | 35 % | 36 % | 99 %(b) | 29 % | 14 % |
(a) | Per share net investment income has been calculated using the average shares outstanding during the period. |
(b) | The variation in the Fund's turnover rate from 2020 to 2021 was primarily due to a repositioning of the portfolio due to a change in the portfolio management team. |
Global Bond Fund – Institutional Class | |||||
Year Ended September 30, 2023 | Year Ended September 30, 2022 | Year Ended September 30, 2021 | Year Ended September 30, 2020 | Year Ended September 30, 2019 | |
Net asset value, beginning of the period | $13.22 | $17.62 | $18.33 | $17.07 | $16.16 |
INCOME (LOSS) FROM INVESTMENT OPERATIONS: | |||||
Net investment income(a) | 0.33 | 0.25 | 0.27 | 0.33 | 0.33 |
Net realized and unrealized gain (loss) | (0.08 )(b) | (3.93 ) | (0.07 ) | 1.12 | 0.69 |
Total from Investment Operations | 0.25 | (3.68 ) | 0.20 | 1.45 | 1.02 |
LESS DISTRIBUTIONS FROM: | |||||
Net investment income | — | (0.38 ) | (0.35 ) | (0.08 ) | (0.05 ) |
Net realized capital gains | — | (0.34 ) | (0.56 ) | (0.11 ) | (0.06 ) |
Total Distributions | — | (0.72 ) | (0.91 ) | (0.19 ) | (0.11 ) |
Net asset value, end of the period | $13.47 | $13.22 | $17.62 | $18.33 | $17.07 |
Total return(c) | 1.89 % | (21.73 )% | 0.91 % | 8.57 % | 6.27 % |
RATIOS TO AVERAGE NET ASSETS: | |||||
Net assets, end of the period (000's) | $229,010 | $258,963 | $381,340 | $375,501 | $353,872 |
Net expenses(d) | 0.69 % | 0.70 %(e) | 0.69 % | 0.69 % | 0.70 %(e) |
Gross expenses | 0.78 % | 0.75 %(e) | 0.75 % | 0.76 % | 0.76 %(e) |
Net investment income | 2.35 % | 1.58 % | 1.47 % | 1.90 % | 2.00 % |
Portfolio turnover rate | 49 % | 103 %(f) | 267 % | 273 % | 215 % |
(a) | Per share net investment income has been calculated using the average shares outstanding during the period. |
(b) | The amount shown for a share outstanding does not correspond with the aggregate realized and unrealized gain (loss) on investments for the period due to the timing of sales and redemptions of fund shares in relation to fluctuating market values of investments of the Fund. |
(c) | Had certain expenses not been waived/reimbursed during the period, total returns would have been lower. |
(d) | The investment adviser agreed to waive its fees and/or reimburse a portion of the Fund’s expenses during the period. Without this waiver/reimbursement, expenses would have been higher. |
(e) | Includes interest expense. Without this expense the ratio of net expenses would have been 0.69% and the ratio of gross expenses would have been 0.75%. |
(f) | The variation in the Fund's turnover rate from 2021 to 2022 was primarily due to a change in trading strategy from a previously utilized auction strategy used in prior fiscal years. |
Global Bond Fund– Retail Class | |||||
Year Ended September 30, 2023 | Year Ended September 30, 2022 | Year Ended September 30, 2021 | Year Ended September 30, 2020 | Year Ended September 30, 2019 | |
Net asset value, beginning of the period | $12.96 | $17.29 | $18.00 | $16.76 | $15.86 |
INCOME (LOSS) FROM INVESTMENT OPERATIONS: | |||||
Net investment income(a) | 0.29 | 0.21 | 0.22 | 0.28 | 0.28 |
Net realized and unrealized gain (loss) | (0.08 )(b) | (3.87 ) | (0.07 ) | 1.10 | 0.68 |
Total from Investment Operations | 0.21 | (3.66 ) | 0.15 | 1.38 | 0.96 |
LESS DISTRIBUTIONS FROM: | |||||
Net investment income | — | (0.33 ) | (0.30 ) | (0.03 ) | (0.00 )(c) |
Net realized capital gains | — | (0.34 ) | (0.56 ) | (0.11 ) | (0.06 ) |
Total Distributions | — | (0.67 ) | (0.86 ) | (0.14 ) | (0.06 ) |
Net asset value, end of the period | $13.17 | $12.96 | $17.29 | $18.00 | $16.76 |
Total return(d) | 1.62 % | (21.96 )% | 0.67 % | 8.32 % | 6.08 % |
RATIOS TO AVERAGE NET ASSETS: | |||||
Net assets, end of the period (000's) | $103,003 | $117,540 | $171,318 | $178,887 | $207,251 |
Net expenses(e) | 0.94 % | 0.95 %(f) | 0.94 % | 0.94 % | 0.95 %(f) |
Gross expenses | 1.03 % | 1.00 %(f) | 1.00 % | 1.01 % | 1.01 %(f) |
Net investment income | 2.10 % | 1.33 % | 1.22 % | 1.65 % | 1.75 % |
Portfolio turnover rate | 49 % | 103 %(g) | 267 % | 273 % | 215 % |
(a) | Per share net investment income has been calculated using the average shares outstanding during the period. |
(b) | The amount shown for a share outstanding does not correspond with the aggregate realized and unrealized gain (loss) on investments for the period due to the timing of sales and redemptions of fund shares in relation to fluctuating market values of investments of the Fund. |
(c) | Amount rounds to less than $0.01 per share. |
(d) | Had certain expenses not been waived/reimbursed during the period, total returns would have been lower. |
(e) | The investment adviser agreed to waive its fees and/or reimburse a portion of the Fund’s expenses during the period. Without this waiver/reimbursement, expenses would have been higher. |
(f) | Includes interest expense. Without this expense the ratio of net expenses would have been 0.94% and the ratio of gross expenses would have been 1.00%. |
(g) | The variation in the Fund's turnover rate from 2021 to 2022 was primarily due to a change in trading strategy from a previously utilized auction strategy used in prior fiscal years. |
Global Bond Fund– Class N | |||||
Year Ended September 30, 2023 | Year Ended September 30, 2022 | Year Ended September 30, 2021 | Year Ended September 30, 2020 | Year Ended September 30, 2019 | |
Net asset value, beginning of the period | $13.26 | $17.68 | $18.39 | $17.12 | $16.21 |
INCOME (LOSS) FROM INVESTMENT OPERATIONS: | |||||
Net investment income(a) | 0.33 | 0.26 | 0.27 | 0.33 | 0.34 |
Net realized and unrealized gain (loss) | (0.07 )(b) | (3.95 ) | (0.07 ) | 1.14 | 0.69 |
Total from Investment Operations | 0.26 | (3.69 ) | 0.20 | 1.47 | 1.03 |
LESS DISTRIBUTIONS FROM: | |||||
Net investment income | — | (0.39 ) | (0.35 ) | (0.09 ) | (0.06 ) |
Net realized capital gains | — | (0.34 ) | (0.56 ) | (0.11 ) | (0.06 ) |
Total Distributions | — | (0.73 ) | (0.91 ) | (0.20 ) | (0.12 ) |
Net asset value, end of the period | $13.52 | $13.26 | $17.68 | $18.39 | $17.12 |
Total return(c) | 1.96 % | (21.73 )% | 0.95 % | 8.66 % | 6.31 % |
RATIOS TO AVERAGE NET ASSETS: | |||||
Net assets, end of the period (000's) | $94,721 | $137,544 | $195,829 | $157,341 | $246,394 |
Net expenses(d) | 0.64 % | 0.65 %(e) | 0.64 % | 0.64 % | 0.65 %(e) |
Gross expenses | 0.68 % | 0.66 %(e) | 0.66 % | 0.66 % | 0.66 %(e) |
Net investment income | 2.39 % | 1.63 % | 1.51 % | 1.93 % | 2.06 % |
Portfolio turnover rate | 49 % | 103 %(f) | 267 % | 273 % | 215 % |
(a) | Per share net investment income has been calculated using the average shares outstanding during the period. |
(b) | The amount shown for a share outstanding does not correspond with the aggregate realized and unrealized gain (loss) on investments for the period due to the timing of sales and redemptions of fund shares in relation to fluctuating market values of investments of the Fund. |
(c) | Had certain expenses not been waived/reimbursed during the period, total returns would have been lower. |
(d) | The investment adviser agreed to waive its fees and/or reimburse a portion of the Fund’s expenses during the period. Without this waiver/reimbursement, expenses would have been higher. |
(e) | Includes interest expense. Without this expense the ratio of net expenses would have been 0.64% and the ratio of gross expenses would have been 0.65%. |
(f) | The variation in the Fund’s turnover rate from 2021 to 2022 was primarily due to a change in trading strategy from a previously utilized auction strategy used in prior fiscal years. |
Inflation Protected Securities Fund – Institutional Class | |||||
Year Ended September 30, 2023 | Year Ended September 30, 2022 | Year Ended September 30, 2021 | Year Ended September 30, 2020 | Year Ended September 30, 2019 | |
Net asset value, beginning of the period | $9.53 | $11.94 | $11.78 | $10.59 | $10.13 |
INCOME (LOSS) FROM INVESTMENT OPERATIONS: | |||||
Net investment income(a) | 0.27 | 0.66 | 0.44 | 0.11 | 0.20 |
Net realized and unrealized gain (loss) | (0.17 ) | (2.09 ) | 0.18 | 1.18 | 0.48 |
Total from Investment Operations | 0.10 | (1.43 ) | 0.62 | 1.29 | 0.68 |
LESS DISTRIBUTIONS FROM: | |||||
Net investment income | (0.39 ) | (0.84 ) | (0.46 ) | (0.10 ) | (0.22 ) |
Net realized capital gains | — | (0.14 ) | — | — | — |
Total Distributions | (0.39 ) | (0.98 ) | (0.46 ) | (0.10 ) | (0.22 ) |
Net asset value, end of the period | $9.24 | $9.53 | $11.94 | $11.78 | $10.59 |
Total return(b) | 0.99 % | (12.55 )% | 5.33 % | 12.20 % | 6.73 % |
RATIOS TO AVERAGE NET ASSETS: | |||||
Net assets, end of the period (000's) | $93,240 | $176,873 | $217,863 | $116,549 | $24,076 |
Net expenses(c) | 0.40 % | 0.40 % | 0.40 % | 0.40 % | 0.40 % |
Gross expenses | 0.56 % | 0.49 % | 0.52 % | 0.70 % | 0.96 % |
Net investment income | 2.73 % | 5.90 % | 3.65 % | 1.00 % | 1.92 % |
Portfolio turnover rate | 36 % | 107 % | 57 % | 82 % | 246 % |
(a) | Per share net investment income has been calculated using the average shares outstanding during the period. |
(b) | Had certain expenses not been waived/reimbursed during the period, total returns would have been lower. |
(c) | The investment adviser agreed to waive its fees and/or reimburse a portion of the Fund’s expenses during the period. Without this waiver/reimbursement, expenses would have been higher. |
Inflation Protected Securities Fund– Retail Class | |||||
Year Ended September 30, 2023 | Year Ended September 30, 2022 | Year Ended September 30, 2021 | Year Ended September 30, 2020 | Year Ended September 30, 2019 | |
Net asset value, beginning of the period | $9.51 | $11.92 | $11.77 | $10.57 | $10.11 |
INCOME (LOSS) FROM INVESTMENT OPERATIONS: | |||||
Net investment income(a) | 0.26 | 0.62 | 0.45 | 0.10 | 0.18 |
Net realized and unrealized gain (loss) | (0.18 ) | (2.07 ) | 0.14 | 1.17 | 0.47 |
Total from Investment Operations | 0.08 | (1.45 ) | 0.59 | 1.27 | 0.65 |
LESS DISTRIBUTIONS FROM: | |||||
Net investment income | (0.37 ) | (0.82 ) | (0.44 ) | (0.07 ) | (0.19 ) |
Net realized capital gains | — | (0.14 ) | — | — | — |
Total Distributions | (0.37 ) | (0.96 ) | (0.44 ) | (0.07 ) | (0.19 ) |
Net asset value, end of the period | $9.22 | $9.51 | $11.92 | $11.77 | $10.57 |
Total return(b) | 0.74 % | (12.79 )% | 5.04 % | 12.09 % | 6.47 % |
RATIOS TO AVERAGE NET ASSETS: | |||||
Net assets, end of the period (000's) | $29,500 | $31,496 | $33,949 | $7,805 | $1,076 |
Net expenses(c) | 0.65 % | 0.65 % | 0.65 % | 0.65 % | 0.65 % |
Gross expenses | 0.81 % | 0.74 % | 0.77 % | 0.95 % | 1.21 % |
Net investment income | 2.67 % | 5.50 % | 3.76 % | 0.91 % | 1.77 % |
Portfolio turnover rate | 36 % | 107 % | 57 % | 82 % | 246 % |
(a) | Per share net investment income has been calculated using the average shares outstanding during the period. |
(b) | Had certain expenses not been waived/reimbursed during the period, total returns would have been lower. |
(c) | The investment adviser agreed to waive its fees and/or reimburse a portion of the Fund’s expenses during the period. Without this waiver/reimbursement, expenses would have been higher. |
Inflation Protected Securities Fund– Class N | |||||
Year Ended September 30, 2023 | Year Ended September 30, 2022 | Year Ended September 30, 2021 | Year Ended September 30, 2020 | Year Ended September 30, 2019 | |
Net asset value, beginning of the period | $9.54 | $11.95 | $11.79 | $10.59 | $10.13 |
INCOME (LOSS) FROM INVESTMENT OPERATIONS: | |||||
Net investment income(a) | 0.31 | 0.70 | 0.49 | 0.10 | 0.21 |
Net realized and unrealized gain (loss) | (0.20 ) | (2.12 ) | 0.14 | 1.20 | 0.47 |
Total from Investment Operations | 0.11 | (1.42 ) | 0.63 | 1.30 | 0.68 |
LESS DISTRIBUTIONS FROM: | |||||
Net investment income | (0.40 ) | (0.85 ) | (0.47 ) | (0.10 ) | (0.22 ) |
Net realized capital gains | — | (0.14 ) | — | — | — |
Total Distributions | (0.40 ) | (0.99 ) | (0.47 ) | (0.10 ) | (0.22 ) |
Net asset value, end of the period | $9.25 | $9.54 | $11.95 | $11.79 | $10.59 |
Total return(b) | 1.05 % | (12.49 )% | 5.37 % | 12.33 % | 6.78 % |
RATIOS TO AVERAGE NET ASSETS: | |||||
Net assets, end of the period (000's) | $14,070 | $12,523 | $8,401 | $3,291 | $1,779 |
Net expenses(c) | 0.35 % | 0.35 % | 0.35 % | 0.35 % | 0.35 % |
Gross expenses | 0.47 % | 0.41 % | 0.46 % | 0.68 % | 0.91 % |
Net investment income | 3.14 % | 6.26 % | 4.06 % | 0.90 % | 2.09 % |
Portfolio turnover rate | 36 % | 107 % | 57 % | 82 % | 246 % |
(a) | Per share net investment income has been calculated using the average shares outstanding during the period. |
(b) | Had certain expenses not been waived/reimbursed during the period, total returns would have been lower. |
(c) | The investment adviser agreed to waive its fees and/or reimburse a portion of the Fund’s expenses during the period. Without this waiver/reimbursement, expenses would have been higher. |
Institutional High Income Fund– Institutional Class | |||||
Year Ended September 30, 2023 | Year Ended September 30, 2022 | Year Ended September 30, 2021 | Year Ended September 30, 2020 | Year Ended September 30, 2019 | |
Net asset value, beginning of the period | $5.31 | $6.56 | $5.99 | $6.44 | $6.90 |
INCOME (LOSS) FROM INVESTMENT OPERATIONS: | |||||
Net investment income(a) | 0.33 | 0.28 | 0.26 | 0.29 | 0.34 |
Net realized and unrealized gain (loss) | 0.08 | (1.15 ) | 0.63 | (0.32 ) | (0.35 ) |
Total from Investment Operations | 0.41 | (0.87 ) | 0.89 | (0.03 ) | (0.01 ) |
LESS DISTRIBUTIONS FROM: | |||||
Net investment income | (0.26 ) | (0.23 ) | (0.32 ) | (0.37 ) | (0.37 ) |
Net realized capital gains | — | (0.15 ) | — | (0.05 ) | (0.08 ) |
Total Distributions | (0.26 ) | (0.38 ) | (0.32 ) | (0.42 ) | (0.45 ) |
Net asset value, end of the period | $5.46 | $5.31 | $6.56 | $5.99 | $6.44 |
Total return | 7.88 % | (14.06 )% | 15.16 % | (0.67 )% | 0.20 % |
RATIOS TO AVERAGE NET ASSETS: | |||||
Net assets, end of the period (000's) | $312,743 | $312,065 | $364,445 | $516,815 | $572,393 |
Net expenses | 0.72 % | 0.69 % | 0.70 % | 0.69 % | 0.68 % |
Gross expenses | 0.72 % | 0.69 % | 0.70 % | 0.69 % | 0.68 % |
Net investment income | 6.12 % | 4.70 % | 4.07 % | 4.84 % | 5.33 % |
Portfolio turnover rate | 64 % | 65 % | 105 %(b) | 25 % | 23 % |
(a) | Per share net investment income has been calculated using the average shares outstanding during the period. |
(b) | The variation in the Fund's turnover rate from 2020 to 2021 was primarily due to a repositioning of the portfolio due to a change in the portfolio management team. |
Loomis Sayles Global Bond Fund (“Global Bond Fund”)
Loomis Sayles Inflation Protected Securities Fund (“Inflation Protected Securities Fund”)
Loomis Sayles Institutional High Income Fund (“Institutional High Income Fund”)
available market quotations are not available are priced at fair value pursuant to the Funds’ Valuation Procedures. The Board of Trustees has approved a valuation designee who is subject to the Board’s oversight.
2023 Distributions | 2022 Distributions | |||||
Fund | Ordinary Income | Long-Term Capital Gains | Total | Ordinary Income | Long-Term Capital Gains | Total |
Fixed Income Fund | $4,963,120 | $1,087,885 | $6,051,005 | $11,271,018 | $18,812,710 | $30,083,728 |
Global Bond Fund | — | — | — | 21,919,363 | 8,674,211 | 30,593,574 |
Inflation Protected Securities Fund | 6,428,945 | — | 6,428,945 | 22,470,195 | 1,884,400 | 24,354,595 |
Institutional High Income Fund | 15,201,101 | — | 15,201,101 | 20,772,904 | — | 20,772,904 |
Fixed Income Fund | Global Bond Fund | Inflation Protected Securities Fund | Institutional High Income Fund | |
Undistributed ordinary income | $14,706,824 | $— | $40,265 | $16,897,939 |
Capital loss carryforward: | ||||
Short-term: | ||||
No expiration date | (3,583,755 ) | (10,875,864 ) | (9,041,686 ) | (2,248,535 ) |
Long-term: | ||||
No expiration date | (7,553,414 ) | (37,838,130 ) | (21,314,310 ) | (24,644,597 ) |
Total capital loss carryforward | (11,137,169 ) | (48,713,994 ) | (30,355,996 ) | (26,893,132 ) |
Late-year ordinary and post-October capital loss deferrals* | — | (10,054,892 ) | — | — |
Unrealized depreciation | (54,875,377 ) | (70,510,418 ) | (29,576,278 ) | (45,946,478 ) |
Total accumulated losses | $(51,305,722 ) | $(129,279,304 ) | $(59,892,009 ) | $(55,941,671 ) |
* | Under current tax law, net operating losses, capital losses, foreign currency losses, losses on passive foreign investment companies and contingent payment debt instruments after October 31 or December 31, as applicable, may be deferred and treated as occurring on the first day of the following taxable year. Global Bond Fund is deferring foreign currency losses. |
Fixed Income Fund | Global Bond Fund | Inflation Protected Securities Fund | Institutional High Income Fund | |
Federal tax cost | $480,909,989 | $490,032,783 | $164,709,950 | $358,360,982 |
Gross tax appreciation | $2,448,023 | $661,467 | $2,840 | $1,961,486 |
Gross tax depreciation | (57,322,738 ) | (71,095,879 ) | (29,573,902 ) | (47,907,931 ) |
Net tax depreciation | $(54,874,715 ) | $(70,434,412 ) | $(29,571,062 ) | $(45,946,445 ) |
Fixed Income Fund | ||||
Asset Valuation Inputs | ||||
Description | Level 1 | Level 2 | Level 3 | Total |
Bonds and Notes(a) | $— | $379,633,892 | $— | $379,633,892 |
Collateralized Loan Obligations | — | 16,538,482 | — | 16,538,482 |
Common Stocks(a) | 6,904,901 | — | — | 6,904,901 |
Senior Loans(a) | — | 3,362,925 | — | 3,362,925 |
Preferred Stocks(a) | 2,247,784 | — | — | 2,247,784 |
Short-Term Investments | — | 17,347,290 | — | 17,347,290 |
Total Investments | 9,152,685 | 416,882,589 | — | 426,035,274 |
Forward Foreign Currency Contracts (unrealized appreciation) | — | 18,064 | — | 18,064 |
Futures Contracts (unrealized appreciation) | 1,674,028 | — | — | 1,674,028 |
Total | $10,826,713 | $416,900,653 | $— | $427,727,366 |
Liability Valuation Inputs | ||||
Description | Level 1 | Level 2 | Level 3 | Total |
Futures Contracts (unrealized depreciation) | $(3,898,279 ) | $— | $— | $(3,898,279 ) |
(a) | Details of the major categories of the Fund’s investments are reflected within the Portfolio of Investments. |
Global Bond Fund | ||||
Asset Valuation Inputs | ||||
Description | Level 1 | Level 2 | Level 3 | Total |
Bonds and Notes(a) | $— | $412,517,505 | $— | $412,517,505 |
Short-Term Investments | — | 7,067,176 | — | 7,067,176 |
Total Investments | — | 419,584,681 | — | 419,584,681 |
Forward Foreign Currency Contracts (unrealized appreciation) | — | 600,492 | — | 600,492 |
Futures Contracts (unrealized appreciation) | 473,455 | — | — | 473,455 |
Total | $473,455 | $420,185,173 | $— | $420,658,628 |
Liability Valuation Inputs | ||||
Description | Level 1 | Level 2 | Level 3 | Total |
Forward Foreign Currency Contracts (unrealized depreciation) | $— | $(595,583 ) | $— | $(595,583 ) |
Futures Contracts (unrealized depreciation) | (1,189,664 ) | — | — | (1,189,664 ) |
Total | $(1,189,664 ) | $(595,583 ) | $— | $(1,785,247 ) |
(a) | Details of the major categories of the Fund’s investments are reflected within the Portfolio of Investments. |
Inflation Protected Securities Fund | ||||
Asset Valuation Inputs | ||||
Description | Level 1 | Level 2 | Level 3 | Total |
Bonds and Notes(a) | $— | $129,772,467 | $— | $129,772,467 |
Short-Term Investments | — | 5,435,871 | — | 5,435,871 |
Total Investments | — | 135,208,338 | — | 135,208,338 |
Centrally Cleared Interest Rate Swap Agreements (unrealized appreciation) | — | 484,677 | — | 484,677 |
Forward Foreign Currency Contracts (unrealized appreciation) | — | 11,301 | — | 11,301 |
Total | $— | $135,704,316 | $— | $135,704,316 |
Liability Valuation Inputs | ||||
Description | Level 1 | Level 2 | Level 3 | Total |
Centrally Cleared Interest Rate Swap Agreements (unrealized depreciation) | $— | $(554,127 ) | $— | $(554,127 ) |
(a) | Details of the major categories of the Fund’s investments are reflected within the Portfolio of Investments. |
Institutional High Income Fund | ||||
Asset Valuation Inputs | ||||
Description | Level 1 | Level 2 | Level 3 | Total |
Bonds and Notes | ||||
Non-Convertible Bonds(a) | $— | $257,011,418 | $— | $257,011,418 |
Convertible Bonds(a) | — | 13,782,821 | — | 13,782,821 |
Total Bonds and Notes | — | 270,794,239 | — | 270,794,239 |
Common Stocks | ||||
Technology Hardware, Storage & Peripherals | 179,428 | 254 | — | 179,682 |
All Other Common Stocks(a) | 8,182,350 | — | — | 8,182,350 |
Total Common Stocks | 8,361,778 | 254 | — | 8,362,032 |
Senior Loans(a) | — | 6,582,289 | — | 6,582,289 |
Collateralized Loan Obligations | — | 5,982,883 | — | 5,982,883 |
Exchange-Traded Funds | 2,432,760 | — | — | 2,432,760 |
Preferred Stocks | ||||
Convertible Preferred Stocks(a) | 836,837 | — | — | 836,837 |
Non-Convertible Preferred Stocks | ||||
Other REITs | — | 189,740 | — | 189,740 |
All Other Non-Convertible Preferred Stocks(a) | 375,540 | — | — | 375,540 |
Total Non-Convertible Preferred Stocks | 375,540 | 189,740 | — | 565,280 |
Total Preferred Stocks | 1,212,377 | 189,740 | — | 1,402,117 |
Short-Term Investments | — | 16,858,217 | — | 16,858,217 |
Total Investments | 12,006,915 | 300,407,622 | — | 312,414,537 |
Forward Foreign Currency Contracts (unrealized appreciation) | — | 7,562 | — | 7,562 |
Total | $12,006,915 | $300,415,184 | $— | $312,422,099 |
(a) | Details of the major categories of the Fund’s investments are reflected within the Portfolio of Investments. |
Fixed Income Fund | ||||||||||
Asset Valuation Inputs | ||||||||||
Investments in Securities | Balance as of September 30, 2022 | Accrued Discounts (Premiums) | Realized Gain (Loss) | Change in Unrealized Appreciation (Depreciation) | Purchases | Sales | Transfers into Level 3 | Transfers out of Level 3 | Balance as of September 30, 2023 | Change in Unrealized Appreciation (Depreciation) from Investments Still Held at September 30, 2023 |
Bonds and Notes | ||||||||||
Non-Convertible Bonds | ||||||||||
Property & Casualty Insurance | $199,675 | $— | $— | $— | $— | $— | $— | $(199,675 ) | $— | $— |
Institutional High Income Fund | ||||||||||
Asset Valuation Inputs | ||||||||||
Investments in Securities | Balance as of September 30, 2022 | Accrued Discounts (Premiums) | Realized Gain (Loss) | Change in Unrealized Appreciation (Depreciation) | Purchases | Sales | Transfers into Level 3 | Transfers out of Level 3 | Balance as of September 30, 2023 | Change in Unrealized Appreciation (Depreciation) from Investments Still Held at September 30, 2023 |
Bonds and Notes | ||||||||||
Non-Convertible Bonds | ||||||||||
Independent Energy | $30,800 | $— | $— | $— | $— | $— | $— | $(30,800 ) | $— | $— |
Property & Casualty Insurance | 235,200 | — | — | — | — | — | — | (235,200 ) | — | — |
Total | $266,000 | $— | $— | $— | $— | $— | $— | $(266,000 ) | $— | $— |
Assets | Unrealized appreciation on forward foreign currency contracts | Unrealized appreciation on futures contracts1 | Total |
Over-the-counter asset derivatives | |||
Foreign exchange contracts | $18,064 | $— | $18,064 |
Exchange-traded asset derivatives | |||
Interest rate contracts | — | 1,674,028 | 1,674,028 |
Total asset derivatives | $18,064 | $1,674,028 | $1,692,092 |
Liabilities | Unrealized depreciation on futures contracts1 |
Exchange-traded liability derivatives | |
Interest rate contracts | $(3,898,279 ) |
1 | Represents cumulative unrealized appreciation (depreciation) on futures contracts. Only the current day’s variation margin on futures contracts is reported within the Statements of Assets and Liabilities as receivable or payable for variation margin, as applicable. |
Net Realized Gain (Loss) on: | Forward foreign currency contracts | Futures contracts |
Interest rate contracts | $— | $(7,362,890 ) |
Foreign exchange contracts | 6,277 | — |
Total | $6,277 | $(7,362,890 ) |
Net Change in Unrealized Appreciation (Depreciation) on: | Forward foreign currency contracts | Futures contracts |
Interest rate contracts | $— | $(1,084,991 ) |
Foreign exchange contracts | 18,064 | — |
Total | $18,064 | $(1,084,991 ) |
Assets | Unrealized appreciation on forward foreign currency contracts | Unrealized appreciation on futures contracts1 | Total |
Over-the-counter asset derivatives | |||
Foreign exchange contracts | $600,492 | $— | $600,492 |
Exchange-traded asset derivatives | |||
Interest rate contracts | — | 473,455 | 473,455 |
Total asset derivatives | $600,492 | $473,455 | $1,073,947 |
Liabilities | Unrealized depreciation on forward foreign currency contracts | Unrealized depreciation on futures contracts1 | Total |
Over-the-counter liability derivatives | |||
Foreign exchange contracts | $(595,583 ) | $— | $(595,583 ) |
Exchange-traded liability derivatives | |||
Interest rate contracts | — | (1,189,664 ) | (1,189,664 ) |
Total liability derivatives | $(595,583 ) | $(1,189,664 ) | $(1,785,247 ) |
1 | Represents cumulative unrealized appreciation (depreciation) on futures contracts. Only the current day’s variation margin on futures contracts is reported within the Statements of Assets and Liabilities as receivable or payable for variation margin, as applicable. |
Net Realized Gain (Loss) on: | Forward foreign currency contracts | Futures contracts |
Interest rate contracts | $— | $(1,997,094 ) |
Foreign exchange contracts | (1,907,280 ) | — |
Total | $(1,907,280 ) | $(1,997,094 ) |
Net Change in Unrealized Appreciation (Depreciation) on: | Forward foreign currency contracts | Futures contracts |
Interest rate contracts | $— | $(426,501 ) |
Foreign exchange contracts | (1,325,047 ) | — |
Total | $(1,325,047 ) | $(426,501 ) |
Assets | Unrealized appreciation on forward foreign currency contracts | Swap agreements at value | Total |
Over-the-counter asset derivatives | |||
Foreign exchange contracts | $11,301 | $— | $11,301 |
Exchange-traded/cleared asset derivatives | |||
Interest rate contracts | — | 484,677 | 484,677 |
Total asset derivatives | $11,301 | $484,677 | $495,978 |
Liabilities | Swap agreements at value |
Exchange-traded/cleared liability derivatives | |
Interest rate contracts | $(554,127 ) |
Net Realized Gain (Loss) on: | Forward foreign currency contracts | Futures contracts | Swap agreements |
Interest rate contracts | $— | $(263,558 ) | $(563 ) |
Foreign exchange contracts | (77,461 ) | — | — |
Total | $(77,461 ) | $(263,558 ) | $(563 ) |
Net Change in Unrealized Appreciation (Depreciation) on: | Forward foreign currency contracts | Futures contracts | Swap agreements |
Interest rate contracts | $— | $(293,627 ) | $(69,450 ) |
Foreign exchange contracts | (51,082 ) | — | — |
Total | $(51,082 ) | $(293,627 ) | $(69,450 ) |
Assets | Unrealized appreciation on forward foreign currency contracts |
Over-the-counter asset derivatives | |
Foreign exchange contracts | $7,562 |
Net Realized Gain (Loss) on: | Forward foreign currency contracts | Swap agreements |
Foreign exchange contracts | $2,628 | $— |
Credit contracts | — | 217,876 |
Total | $2,628 | $217,876 |
Net Change in Unrealized Appreciation (Depreciation) on: | Forward foreign currency contracts | Swap agreements |
Foreign exchange contracts | $7,562 | $— |
Credit contracts | — | (4,207 ) |
Total | $7,562 | $(4,207 ) |
Fixed Income Fund | Forwards | Futures |
Average Notional Amount Outstanding | 0.15 % | 23.51 % |
Highest Notional Amount Outstanding | 0.27 % | 58.05 % |
Lowest Notional Amount Outstanding | 0.00 % | 7.56 % |
Notional Amount Outstanding as of September 30, 2023 | 0.27 % | 58.05 % |
Global Bond Fund | Forwards | Futures |
Average Notional Amount Outstanding | 30.27 % | 18.67 % |
Highest Notional Amount Outstanding | 43.60 % | 20.51 % |
Lowest Notional Amount Outstanding | 23.59 % | 16.45 % |
Notional Amount Outstanding as of September 30, 2023 | 23.59 % | 17.74 % |
Inflation Protected Securities Fund | Forwards | Futures | Interest Rate Swaps |
Average Notional Amount Outstanding | 0.91 % | 2.05 % | 5.12 % |
Highest Notional Amount Outstanding | 1.72 % | 7.52 % | 9.47 % |
Lowest Notional Amount Outstanding | 0.46 % | 0.00 % | 0.00 % |
Notional Amount Outstanding as of September 30, 2023 | 0.60 % | 0.00 % | 9.47 % |
Institutional High Income Fund | Forwards | Credit Default Swaps |
Average Notional Amount Outstanding | 0.08 % | 0.29 % |
Highest Notional Amount Outstanding | 0.16 % | 0.98 % |
Lowest Notional Amount Outstanding | 0.00 % | 0.00 % |
Notional Amount Outstanding as of September 30, 2023 | 0.15 % | 0.00 % |
Fixed Income Fund | |||||
Counterparty | Gross Amounts of Assets | Offset Amount | Net Asset Balance | Collateral (Received)/ Pledged | Net Amount |
Bank of America N.A. | $18,064 | $— | $18,064 | $— | $18,064 |
Global Bond Fund | |||||
Counterparty | Gross Amounts of Assets | Offset Amount | Net Asset Balance | Collateral (Received)/ Pledged | Net Amount |
Bank of America N.A. | $223,236 | $— | $223,236 | $— | $223,236 |
Barclays Bank PLC | 6,319 | (22 ) | 6,297 | — | 6,297 |
BNP Paribas SA | 77,209 | (68,137 ) | 9,072 | — | 9,072 |
Goldman Sachs Bank USA | 72,799 | (3,865 ) | 68,934 | — | 68,934 |
HSBC Bank USA N.A. | 4,180 | (4,180 ) | — | — | — |
Standard Chartered Bank | 188,654 | — | 188,654 | (188,654 ) | — |
UBS AG | 28,095 | (28,095 ) | — | — | — |
$600,492 | $(104,299 ) | $496,193 | $(188,654 ) | $307,539 | |
Counterparty | Gross Amounts of Liabilities | Offset Amount | Net Liability Balance | Collateral (Received)/ Pledged | Net Amount | |||||
Barclays Bank PLC | $(22 ) | $22 | $— | $— | $— | |||||
BNP Paribas SA | (68,137 ) | 68,137 | — | — | — | |||||
Citibank N.A. | (38,292 ) | — | (38,292 ) | — | (38,292 ) | |||||
Goldman Sachs Bank USA | (3,865 ) | 3,865 | — | — | — | |||||
HSBC Bank USA N.A. | (34,701 ) | 4,180 | (30,521 ) | — | (30,521 ) | |||||
Morgan Stanley Capital Services LLC | (353,830 ) | — | (353,830 ) | 133,073 | (220,757 ) | |||||
UBS AG | (96,736 ) | 28,095 | (68,641 ) | — | (68,641 ) | |||||
$(595,583 ) | $104,299 | $(491,284 ) | $133,073 | $(358,211 ) | ||||||
Inflation Protected Securities Fund | |||||
Counterparty | Gross Amounts of Assets | Offset Amount | Net Asset Balance | Collateral (Received)/ Pledged | Net Amount |
Bank of America N.A. | $11,301 | $— | $11,301 | $— | $11,301 |
Institutional High Income Fund | |||||
Counterparty | Gross Amounts of Assets | Offset Amount | Net Asset Balance | Collateral (Received)/ Pledged | Net Amount |
Bank of America N.A. | $7,562 | $— | $7,562 | $— | $7,562 |
U.S. Government/ Agency Securities | Other Securities | |||
Fund | Purchases | Sales | Purchases | Sales |
Fixed Income Fund | $43,671,643 | $79,518,960 | $122,674,223 | $58,197,471 |
Global Bond Fund | 70,702,559 | 97,399,473 | 152,422,295 | 184,697,416 |
Inflation Protected Securities Fund | 22,890,076 | 105,289,128 | 39,339,404 | 49,263,662 |
Institutional High Income Fund | — | 15,638,341 | 202,305,217 | 198,298,236 |
Percentage of Average Daily Net Assets | |||||
Fund | First $1 Billion | Next $1 Billion | Next $3 Billion | Next $5 Billion | Over $10 Billion |
Fixed Income Fund | 0.50 % | 0.50 % | 0.50 % | 0.50 % | 0.50 % |
Global Bond Fund | 0.55 % | 0.50 % | 0.48 % | 0.45 % | 0.40 % |
Inflation Protected Securities Fund | 0.25 % | 0.25 % | 0.25 % | 0.25 % | 0.25 % |
Institutional High Income Fund | 0.58 % | 0.58 % | 0.58 % | 0.58 % | 0.58 % |
Expense Limit as a Percentage of Average Daily Net Assets | |||
Fund | Institutional Class | Retail Class | Class N |
Fixed Income Fund | 0.65 % | — % | — % |
Global Bond Fund | 0.69 % | 0.94 % | 0.64 % |
Inflation Protected Securities Fund | 0.40 % | 0.65 % | 0.35 % |
Institutional High Income Fund | 0.73 % | — % | — % |
Expense Limit as a Percentage of Average Daily Net Assets | |
Fund | Institutional Class |
Institutional High Income Fund | 0.75 % |
Gross Management Fees | Contractual Waivers of Management Fees1 | Net Management Fees | Percentage of Average Daily Net Assets | ||
Fund | Gross | Net | |||
Fixed Income Fund | $2,108,550 | $— | $2,108,550 | 0.50 % | 0.50 % |
Global Bond Fund | 2,698,219 | 367,024 | 2,331,195 | 0.55 % | 0.48 % |
Inflation Protected Securities Fund | 439,774 | 268,896 | 170,878 | 0.25 % | 0.10 % |
Institutional High Income Fund | 1,969,135 | — | 1,969,135 | 0.60 % | 0.60 % |
1 | Management fee waivers are subject to possible recovery until September 30, 2024 |
Fund | Retail Class |
Global Bond Fund | $286,627 |
Inflation Protected Securities Fund | 83,426 |
Fund | Administrative Fees |
Fixed Income Fund | $195,434 |
Global Bond Fund | 227,376 |
Inflation Protected Securities Fund | 81,539 |
Institutional High Income Fund | 153,321 |
Fund | Sub-Transfer Agent Fees |
Global Bond Fund | $321,112 |
Inflation Protected Securities Fund | 151,979 |
Institutional High Income Fund | 32,189 |
Fund | Reimbursements of Sub-Transfer Agent Fees |
Global Bond Fund | $3,703 |
Inflation Protected Securities Fund | 1,841 |
Institutional High Income Fund | 516 |
Percentage of Net Assets | |
Inflation Protected Securities Fund | |
Loomis Sayles Employees’ Profit Sharing Retirement Plan | 3.77% |
Loomis Sayles Non-Qualified Retirement Plans | 4.23% |
Natixis Sustainable Future 2015 Fund | 0.65% |
Natixis Sustainable Future 2020 Fund | 0.37% |
Natixis Sustainable Future 2025 Fund | 0.45% |
Natixis Sustainable Future 2030 Fund | 0.60% |
Natixis Sustainable Future 2035 Fund | 0.56% |
Natixis Sustainable Future 2040 Fund | 0.46% |
Natixis Sustainable Future 2045 Fund | 0.29% |
Natixis Sustainable Future 2050 Fund | 0.12% |
Natixis Sustainable Future 2055 Fund | 0.01% |
11.51% | |
Institutional High Income Fund | |
Loomis Sayles Employees’ Profit Sharing Retirement Plan | 5.74% |
Loomis Sayles Non-Qualified Retirement Plans | 7.32% |
Loomis Sayles Employees | 14.39% |
27.45% |
Transfer Agent Fees and Expenses | |||
Fund | Institutional Class | Retail Class | Class N |
Global Bond Fund | $253,525 | $115,612 | $4,809 |
Inflation Protected Securities Fund | 137,477 | 36,282 | 2,590 |
Fund | Number of 5% Non-Affiliated Account Holders | Percentage of Non-Affiliated Ownership | Percentage of Affiliated Ownership (Note 6f) | Total Percentage of Ownership |
Fixed Income Fund | 6 | 52.93 % | — | 52.93 % |
Global Bond Fund | 2 | 11.66 % | — | 11.66 % |
Inflation Protected Securities Fund | 3 | 26.69 % | 11.51 % | 38.20 % |
Institutional High Income Fund | 2 | 38.13 % | 27.45 % | 65.58 % |
Year Ended September 30, 2023 | Year Ended September 30, 2022 | |||
Fixed Income Fund | Shares | Amount | Shares | Amount |
Institutional Class | ||||
Issued from the sale of shares | 2,890,331 | $32,655,465 | 2,605,768 | $32,281,330 |
Issued in connection with the reinvestment of distributions | 531,632 | 5,975,549 | 2,333,029 | 29,722,796 |
Redeemed | (1,924,924 ) | (21,694,771 ) | (6,362,131 ) | (79,437,567 ) |
Increase (decrease) from capital share transactions | 1,497,039 | $16,936,243 | (1,423,334 ) | $(17,433,441 ) |
Year Ended September 30, 2023 | Year Ended September 30, 2022 | |||
Global Bond Fund | Shares | Amount | Shares | Amount |
Institutional Class | ||||
Issued from the sale of shares | 3,726,239 | $52,204,626 | 4,447,369 | $71,156,433 |
Issued in connection with the reinvestment of distributions | — | — | 902,143 | 15,110,903 |
Redeemed | (6,318,212 ) | (88,549,846 ) | (7,391,340 ) | (116,101,764 ) |
Net change | (2,591,973 ) | $(36,345,220 ) | (2,041,828 ) | $(29,834,428 ) |
Retail Class | ||||
Issued from the sale of shares | 1,470,580 | $19,944,442 | 1,228,258 | $19,044,087 |
Issued in connection with the reinvestment of distributions | — | — | 383,679 | 6,311,520 |
Redeemed | (2,722,425 ) | (37,073,401 ) | (2,449,024 ) | (38,312,560 ) |
Net change | (1,251,845 ) | $(17,128,959 ) | (837,087 ) | $(12,956,953 ) |
Class N | ||||
Issued from the sale of shares | 1,483,309 | $20,766,079 | 2,833,108 | $43,699,498 |
Issued in connection with the reinvestment of distributions | — | — | 472,290 | 7,934,482 |
Redeemed | (4,850,760 ) | (68,200,706 ) | (4,007,619 ) | (62,862,028 ) |
Net change | (3,367,451 ) | $(47,434,627 ) | (702,221 ) | $(11,228,048 ) |
Decrease from capital share transactions | (7,211,269 ) | $(100,908,806 ) | (3,581,136 ) | $(54,019,429 ) |
Year Ended September 30, 2023 | Year Ended September 30, 2022 | |||
Inflation Protected Securities Fund | Shares | Amount | Shares | Amount |
Institutional Class | ||||
Issued from the sale of shares | 3,045,279 | $29,563,914 | 15,214,922 | $175,070,093 |
Issued in connection with the reinvestment of distributions | 471,031 | 4,519,612 | 1,844,768 | 19,744,333 |
Redeemed | (11,989,124 ) | (116,475,940 ) | (16,738,225 ) | (185,873,673 ) |
Net change | (8,472,814 ) | $(82,392,414 ) | 321,465 | $8,940,753 |
Retail Class | ||||
Issued from the sale of shares | 978,076 | $9,440,601 | 2,407,076 | $28,500,810 |
Issued in connection with the reinvestment of distributions | 126,780 | 1,211,738 | 323,729 | 3,461,976 |
Redeemed | (1,217,822 ) | (11,885,361 ) | (2,266,276 ) | (25,607,484 ) |
Net change | (112,966 ) | $(1,233,022 ) | 464,529 | $6,355,302 |
Class N | ||||
Issued from the sale of shares | 857,383 | $8,380,603 | 836,792 | $9,115,939 |
Issued in connection with the reinvestment of distributions | 68,672 | 658,034 | 90,934 | 954,553 |
Redeemed | (717,922 ) | (6,901,274 ) | (317,230 ) | (3,497,176 ) |
Net change | 208,133 | $2,137,363 | 610,496 | $6,573,316 |
Increase (decrease) from capital share transactions | (8,377,647 ) | $(81,488,073 ) | 1,396,490 | $21,869,371 |
Year Ended September 30, 2023 | Year Ended September 30, 2022 | |||
Institutional High Income Fund | Shares | Amount | Shares | Amount |
Institutional Class | ||||
Issued from the sale of shares | 11,855,806 | $62,899,685 | 5,056,311 | $30,488,164 |
Issued in connection with the reinvestment of distributions | 2,289,111 | 12,155,178 | 2,642,067 | 16,327,976 |
Redeemed | (15,681,063 ) | (83,888,634 ) | (4,445,781 ) | (26,639,245 ) |
Increase (decrease) from capital share transactions | (1,536,146 ) | $(8,833,771 ) | 3,252,597 | $20,176,895 |
Boston, Massachusetts
November 21, 2023
Fund | Qualifying Percentage |
Fixed Income Fund | 2.89% |
Institutional High Income Fund | 4.18% |
allowable pursuant to the Internal Revenue Code as qualified dividend income eligible for reduced tax rates. These lower rates range from 0%
to 20% depending on an individual’s tax bracket. If the Funds pay a distribution during calendar year 2023, complete information will be
reported in conjunction with Form 1099-DIV.
Fixed Income Fund
Institutional High Income Fund
Fund | Amount |
Fixed Income Fund | $1,087,885 |
Fund | Foreign-Tax Credit Pass-Through | Foreign Source Income |
Global Bond Fund | $�� | $9,636,487 |
Name and Year of Birth | Position(s) Held with the Trust, Length of Time Served and Term of Office1 | Principal Occupation(s) During Past 5 Years | Number of Portfolios in Fund Complex Overseen2and Other Directorships Held During Past 5 Years | Experience, Qualifications, Attributes, Skills for Board Membership |
Independent Trustees | ||||
Edmond J. English (1953) | Trustee since 2013 Contract Review Committee Member and Governance Committee Member | Executive Chairman of Bob’s Discount Furniture (retail) | 52 Director, Burlington Stores, Inc. (retail); Director, Rue Gilt Groupe, Inc. (e-commerce retail) | Significant experience on the Board and on the boards of other business organizations (including retail companies and a bank); executive experience (including at a retail company) |
Richard A. Goglia (1951) | Trustee since 2015 Audit Committee Member and Governance Committee Member | Retired | 52 Formerly, Director of Triumph Group (aerospace industry) | Significant experience on the Board and executive experience (including his role as Vice President and treasurer of a defense company and experience at a financial services company) |
Martin T. Meehan (1956) | Trustee since 2012 Chairperson of the Governance Committee and Contract Review Committee Member | President, University of Massachusetts | 52 None | Significant experience on the Board and on the boards of other business organizations; experience as President of the University of Massachusetts; government experience (including as a member of the U.S. House of Representatives); academic experience |
Maureen B. Mitchell (1951) | Trustee since 2017 Chairperson of the Contract Review Committee | Retired | 52 Director, Sterling Bancorp (bank) | Significant experience on the Board; financial services industry and executive experience (including role as President of global sales and marketing at a financial services company) |
Name and Year of Birth | Position(s) Held with the Trust, Length of Time Served and Term of Office1 | Principal Occupation(s) During Past 5 Years | Number of Portfolios in Fund Complex Overseen2and Other Directorships Held During Past 5 Years | Experience, Qualifications, Attributes, Skills for Board Membership |
Independent Trustees − continued | ||||
James P. Palermo (1955) | Trustee since 2016 Audit Committee Member and Governance Committee Member | Founding Partner, Breton Capital Management, LLC (private equity); Partner, STEP Partners, LLC (private equity) | 52 Director, FutureFuel.io (chemicals and biofuels) | Significant experience on the Board; financial services industry and executive experience (including roles as Chief Executive Officer of client management and asset servicing for a banking and financial services company) |
Erik R. Sirri (1958) | Chairperson of the Board of Trustees since 2021 Trustee since 2009 Ex Officio Member of the Audit Committee, Contract Review Committee and Governance Committee | Professor of Finance at Babson College | 52 None | Significant experience on the Board; experience as Director of the Division of Trading and Markets at the Securities and Exchange Commission; academic experience; training as an economist |
Peter J. Smail (1952) | Trustee since 2009 Contract Review Committee Member | Retired | 52 None | Significant experience on the Board; mutual fund industry and executive experience (including roles as President and Chief Executive Officer for an investment adviser) |
Kirk A. Sykes (1958) | Trustee since 2019 Audit Committee Member and Governance Committee Member | Managing Director of Accordia Partners, LLC (real estate development); President of Primary Corporation (real estate development); Managing Principal of Merrick Capital Partners (infrastructure finance) | 52 Advisor/Risk Management Committee, Eastern Bank (bank); Director, Apartment Investment and Management Company (real estate investment trust); formerly, Director, Ares Commercial Real Estate Corporation (real estate investment trust) | Experience on the Board and significant experience on the boards of other business organizations (including real estate companies and banks) |
Cynthia L. Walker (1956) | Trustee since 2005 Chairperson of the Audit Committee | Retired; formerly, Deputy Dean for Finance and Administration, Yale University School of Medicine | 52 None | Significant experience on the Board; executive experience in a variety of academic organizations (including roles as dean for finance and administration) |
Name and Year of Birth | Position(s) Held with the Trust, Length of Time Served and Term of Office1 | Principal Occupation(s) During Past 5 Years | Number of Portfolios in Fund Complex Overseen2and Other Directorships Held During Past 5 Years | Experience, Qualifications, Attributes, Skills for Board Membership |
Interested Trustees | ||||
Kevin P. Charleston3 (1965) One Financial Center Boston, MA 02111 | Trustee since 2015 President and Chief Executive Officer of Loomis Sayles Funds I since 2015 | President, Chief Executive Officer and Chairman of the Board of Directors, Loomis, Sayles & Company, L.P. | 52 None | Significant experience on the Board; continuing service as President, Chief Executive Officer and Chairman of the Board of Directors of Loomis, Sayles & Company, L.P. |
David L. Giunta4 (1965) | Trustee since 2011 Executive Vice President of Loomis Sayles Funds I since 2008 | President and Chief Executive Officer, Natixis Advisors, LLC and Natixis Distribution, LLC | 52 None | Significant experience on the Board; experience as President and Chief Executive Officer of Natixis Advisors, LLC and Natixis Distribution, LLC |
1 | Each Trustee serves until retirement, resignation or removal from the Board. The current retirement age is 75. The position of Chairperson of the Board is appointed for a three-year term. |
2 | The Trustees of the Trust serve as Trustees of a fund complex that includes all series of the Natixis Funds Trust I, Natixis Funds Trust II, Natixis Funds Trust IV, Gateway Trust, Loomis Sayles Funds I, Loomis Sayles Funds II, Natixis ETF Trust and Natixis ETF Trust II (collectively, the “Fund Complex”). |
3 | Mr. Charleston is deemed an “interested person” of the Trust because he holds the following positions with an affiliated person of the Trust: President, Chief Executive Officer and Chairman of the Board of Directors of Loomis, Sayles & Company, L.P. |
4 | Mr. Giunta is deemed an “interested person” of the Trust because he holds the following positions with an affiliated person of the Trust: President and Chief Executive Officer, Natixis Advisors, LLC and Natixis Distribution, LLC. |
Name and Year of Birth | Position(s) Held with the Trust | Term of Office1 and Length of Time Served | Principal Occupation(s) During Past 5 Years2 |
Officers of the Trusts | |||
Matthew J. Block (1981) | Treasurer, Principal Financial and Accounting Officer | Since 2022 | Senior Vice President, Natixis Advisors, LLC and Natixis Distribution, LLC; formerly, Vice President, Natixis Advisors, LLC and Natixis Distribution, LLC; Assistant Treasurer of the Fund Complex; Managing Director, State Street Bank and Trust Company |
Susan McWhan Tobin (1963) | Secretary and Chief Legal Officer | Since 2022 | Executive Vice President, General Counsel and Secretary, Natixis Advisors, LLC and Natixis Distribution, LLC; formerly, Executive Vice President and Chief Compliance Officer of Natixis Investment Managers (March 2019 – May 2022) and Senior Vice President and Head of Compliance, U.S. for Natixis Investment Managers (July 2011 – March 2019) |
Natalie R. Wagner (1979) | Chief Compliance Officer, Assistant Secretary and Anti-Money Laundering Officer | Since 2021 | Senior Vice President, Natixis Advisors, LLC and Natixis Distribution, LLC; formerly, Vice President, Head of Corporate Compliance, Global Atlantic Financial Group |
1 | Each officer of the Trust serves for an indefinite term in accordance with the Trust's current by-laws until the date his or her successor is elected and qualified, or until he or she sooner dies, retires, is removed or becomes disqualified. |
2 | Each person listed above, except as noted, holds the same position(s) with the Fund Complex. Previous positions during the past five years with Natixis Distribution, LLC, Natixis Advisors, LLC or Loomis, Sayles & Company, L.P. are omitted, if not materially different from an officer’s current position with such entity. |
Natixis Advisors, LLC
888 Boylston Street, Suite 800
Boston, MA 02199-8197
secretaryofthefunds@natixis.com
Communications regarding recommendations for Trustee candidates may not be submitted by e-mail.
Please note: Unlike written correspondence, e-mail is not secure. Please do NOT include your account number, social security number, PIN, or any other non-public, personal information in an e-mail communication because this information may be viewed by others.

 Exp. 11/30/24
6031445.1.1
M-LSFIA-0923


Loomis Sayles Core Plus Bond Fund |
Loomis Sayles Credit Income Fund |
Loomis Sayles Global Allocation Fund |
Loomis Sayles Growth Fund |
Loomis Sayles Intermediate Duration Bond Fund |
Loomis Sayles Limited Term Government and Agency Fund |

Managers |
Ian Anderson |
Peter W. Palfrey, CFA® |
Richard G. Raczkowski |
Barath W. Sankaran, CFA® |
Loomis, Sayles & Company, L.P. |
Symbols | |
Class A | NEFRX |
Class C | NECRX |
Class N | NERNX |
Class Y | NERYX |
Investment Goal
Hypothetical Growth of $100,000 Investment in Class Y Shares1 |
September 30, 2013 through September 30, 2023 |

Average Annual Total Returns — September 30, 20231 | |||||
1 Year | 5 Years | 10 Years | Expense Ratios3 | ||
Gross | Net | ||||
Class Y | |||||
NAV | 1.28 % | 0.51 % | 1.80 % | 0.49 % | 0.49 % |
Class A | |||||
NAV | 1.04 | 0.27 | 1.55 | 0.74 | 0.74 |
With 4.25% Maximum Sales Charge | -3.28 | -0.61 | 1.12 | ||
Class C | |||||
NAV | 0.26 | -0.49 | 0.94 | 1.49 | 1.49 |
With CDSC4 | -0.72 | -0.49 | 0.94 | ||
Class N | |||||
NAV | 1.37 | 0.62 | 1.90 | 0.38 | 0.38 |
Comparative Performance | |||||
Bloomberg U.S. Aggregate Bond Index2 | 0.64 | 0.10 | 1.13 | ||
1 | Fund performance has been increased by fee waivers and/or expense reimbursements, if any, without which performance would have been lower. |
2 | Bloomberg U.S. Aggregate Bond Index is a broad-based index that covers the U.S. dollar-denominated, investment-grade, fixed-rate, taxable bond market of SEC- registered securities. The index includes bonds from the Treasury, government-related, corporate, mortgage-backed securities, asset-backed securities, and collateralized mortgage-backed securities sectors. |
3 | Expense ratios are as shown in the Fund’s prospectus in effect as of the date of this report. The expense ratios for the current reporting period can be found in the Financial Highlights section of this report under Ratios to Average Net Assets. Net expenses reflect contractual expense limitations set to expire on 1/31/24. When a Fund’s expenses are below the limitation, gross and net expense ratios will be the same. See Note 5 of the Notes to Financial Statements for more information about the Fund’s expense limitations. |
4 | Performance for Class C shares assumes a 1.00% contingent deferred sales charge (“CDSC”) applied when you sell shares within one year of purchase, and includes automatic conversion to Class A shares after eight years. |
Managers |
Matthew J. Eagan, CFA® |
Brian P. Kennedy |
Peter Sheehan* |
Elaine M. Stokes |
Loomis, Sayles & Company, L.P. |
Symbols | |
Class A | LOCAX |
Class C | LOCCX |
Class N | LOCNX |
Class Y | LOCYX |
* | Effective June 30, 2023, Peter Sheehan serves as portfolio manager of the Fund. |
Investment Goal
Hypothetical Growth of $100,000 Investment in Class Y Shares1 |
September 29, 2020 (inception) through September 30, 2023 |

Average Annual Total Returns — September 30, 20231 | ||||
1 Year | Life of Fund | Expense Ratios3 | ||
Gross | Net | |||
Class Y (Inception 9/29/20) | ||||
NAV | 3.27 % | -2.88 % | 3.12 % | 0.57 % |
Class A (Inception 9/29/20) | ||||
NAV | 3.13 | -3.08 | 3.37 | 0.82 |
With 4.25% Maximum Sales Charge | -1.26 | -4.46 | ||
Class C (Inception 9/29/20) | ||||
NAV | 2.37 | -3.85 | 4.18 | 1.57 |
With CDSC4 | 1.38 | -3.85 | ||
Class N (Inception 9/29/20) | ||||
NAV | 3.45 | -2.79 | 1.30 | 0.52 |
Comparative Performance | ||||
Bloomberg U.S. Credit Index2 | 3.47 | -4.89 | ||
1 | Fund performance has been increased by fee waivers and/or expense reimbursements, if any, without which performance would have been lower. |
2 | Bloomberg U.S. Credit Index measures the investment grade, U.S. dollar-denominated, fixed-rate, taxable corporate and government-related bond markets. It is composed of the U.S. Corporate Index and a non-corporate component that includes non-U.S. agencies, sovereigns, supranationals and local authorities. The Index was called the U.S. Corporate Index until July 2000, when it was renamed to reflect its inclusion of both corporate and non-corporate issuers. The Index is a subset of the U.S. Government/Credit Index and U.S. Aggregate Index. |
3 | Expense ratios are as shown in the Fund’s prospectus in effect as of the date of this report. The expense ratios for the current reporting period can be found in the Financial Highlights section of this report under Ratios to Average Net Assets. Net expenses reflect contractual expense limitations set to expire on 1/31/24. When a Fund’s expenses are below the limitation, gross and net expense ratios will be the same. See Note 5 of the Notes to Financial Statements for more information about the Fund’s expense limitations. |
4 | Performance for Class C shares assumes a 1.00% contingent deferred sales charge (“CDSC”) applied when you sell shares within one year of purchase. |
Managers |
Matthew J. Eagan, CFA® |
Eileen N. Riley, CFA® |
David W. Rolley, CFA® |
Lee M. Rosenbaum |
Loomis, Sayles & Company, L.P |
Symbols | |
Class A | LGMAX |
Class C | LGMCX |
Class N | LGMNX |
Class Y | LSWWX |
Investment Goal
Top Ten Holdings as of September 30, 2023 | |
Security Name | % of Net Assets |
1 Alphabet, Inc., Class A | 3.28% |
2 Amazon.com, Inc. | 3.24 |
3 Mastercard, Inc., Class A | 2.89 |
4 S&P Global, Inc. | 2.88 |
5 Linde PLC | 2.78 |
6 UnitedHealth Group, Inc. | 2.67 |
7 Accenture PLC, Class A | 2.65 |
8 Airbnb, Inc., Class A | 2.61 |
9 ASML Holding NV | 2.47 |
10 Atlas Copco AB, Class A | 2.39 |
The portfolio is actively managed and holdings are subject to change. There is no guarantee the Fund continues to invest in the securities referenced. The holdings listed exclude any temporary cash investments, are presented on an individual security basis and do not represent holdings of the issuer. |
Hypothetical Growth of $100,000 Investment in Class Y Shares1 |
September 30, 2013 through September 30, 2023 |
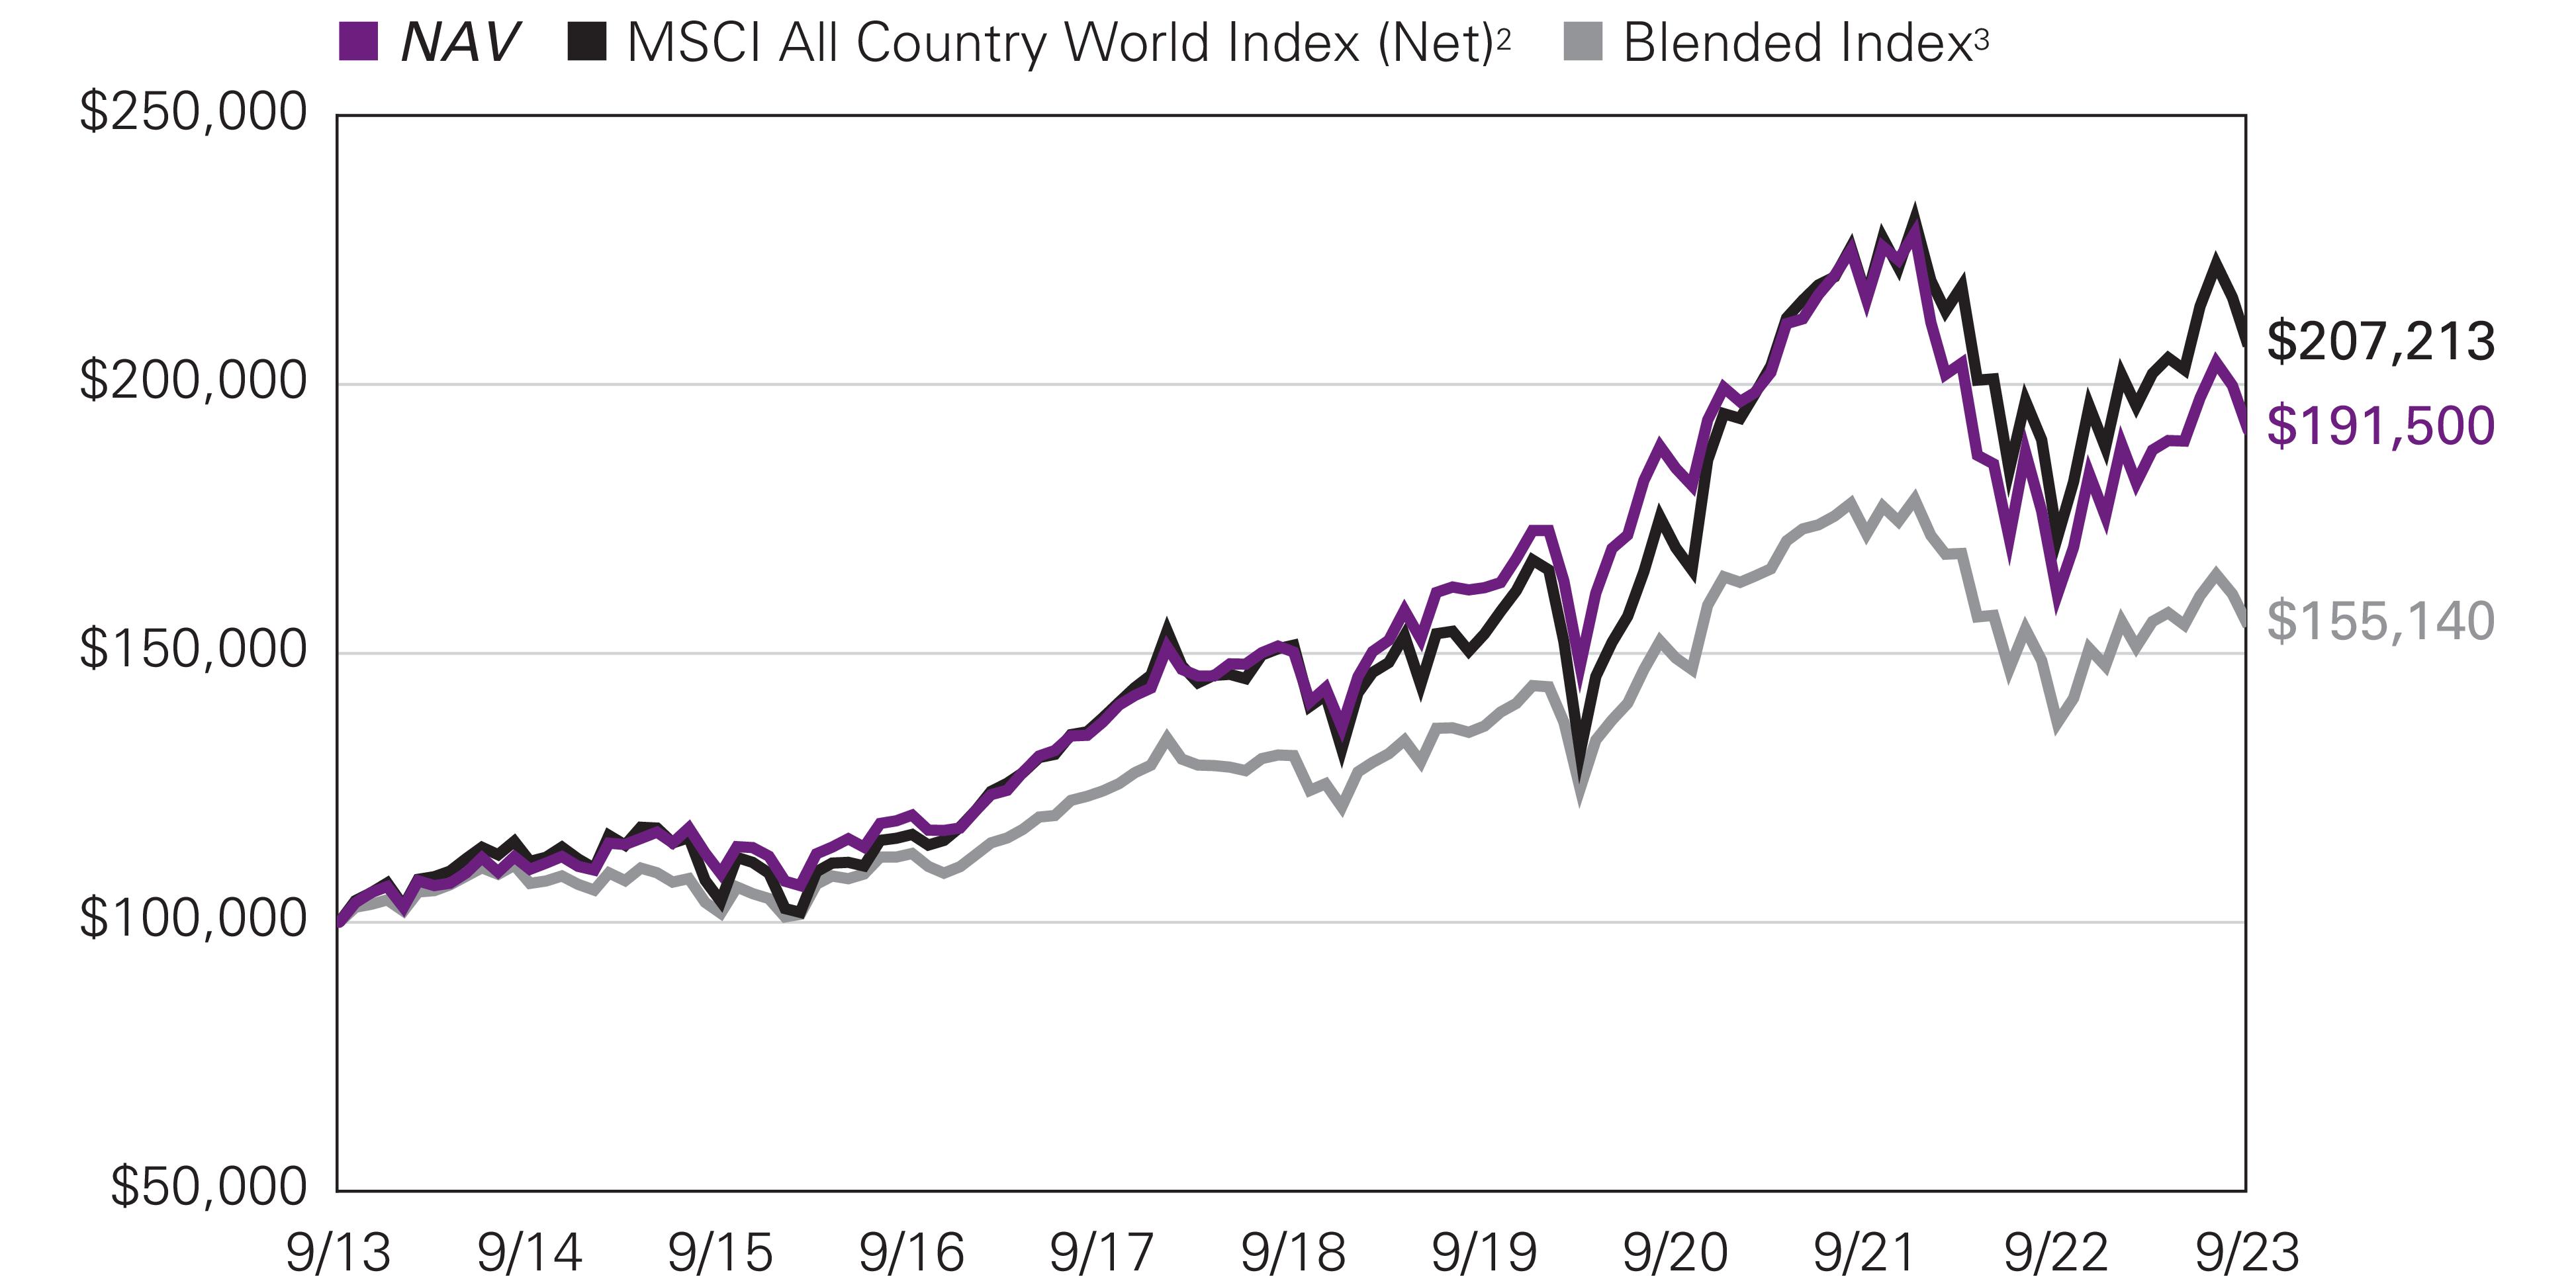
Average Annual Total Returns — September 30, 20231 | ||||||
1 Year | 5 Years | 10 Years | Life of Class N | Expense Ratios4 | ||
Gross | Net | |||||
Class Y | ||||||
NAV | 19.00 % | 4.98 % | 6.72 % | — % | 0.89 % | 0.89 % |
Class A | ||||||
NAV | 18.67 | 4.71 | 6.45 | — | 1.14 | 1.14 |
With 5.75% Maximum Sales Charge | 11.82 | 3.47 | 5.83 | — | ||
Class C | ||||||
NAV | 17.84 | 3.92 | 5.81 | — | 1.89 | 1.89 |
With CDSC5 | 16.84 | 3.92 | 5.81 | — | ||
Class N (Inception 2/2/17) | ||||||
NAV | 19.16 | 5.07 | — | 7.19 | 0.81 | 0.81 |
Comparative Performance | ||||||
MSCI All Country World Index (Net)2 | 20.80 | 6.46 | 7.56 | 8.38 | ||
Blended Index3 | 13.18 | 3.44 | 4.49 | 4.92 | ||
1 | Fund performance has been increased by fee waivers and/or expense reimbursements, if any, without which performance would have been lower. |
2 | MSCI All Country World Index (Net) is a free float-adjusted market capitalization weighted index that is designed to measure the equity market performance of developed and emerging markets. |
3 | Blended Index is an unmanaged, blended index composed of the following weights: 60% MSCI All Country World Index (Net) and 40% Bloomberg Global Aggregate Bond Index. The Bloomberg Global Aggregate Bond Index provides a broad-based measure of the global investment-grade fixed income markets. The four major components of this index are the U.S. Aggregate, the Pan-European Aggregate, the Asian-Pacific Aggregate, and the Canadian Aggregate Indices. The Index also includes Eurodollar and Euro-Yen corporate bonds, Canadian government, agency and corporate securities, and USD investment grade 144A securities. |
4 | Expense ratios are as shown in the Fund’s prospectus in effect as of the date of this report. The expense ratios for the current reporting period can be found in the Financial Highlights section of this report under Ratios to Average Net Assets. Net expenses reflect contractual expense limitations set to expire on 1/31/25. When a Fund’s expenses are below the limitation, gross and net expense ratios will be the same. See Note 5 of the Notes to Financial Statements for more information about the Fund’s expense limitations. |
5 | Performance for Class C shares assumes a 1.00% contingent deferred sales charge (“CDSC”) applied when you sell shares within one year of purchase, and includes automatic conversion to Class A shares after eight years. |
Managers |
Aziz V. Hamzaogullari, CFA® |
Loomis, Sayles & Company, L.P. |
Symbols | |
Class A | LGRRX |
Class C | LGRCX |
Class N | LGRNX |
Class Y | LSGRX |
Investment Goal
Top Ten Holdings as of September 30, 2023 | |
Security Name | % of Net Assets |
1 Meta Platforms, Inc., Class A | 7.79% |
2 NVIDIA Corp. | 7.38 |
3 Tesla, Inc. | 5.92 |
4 Visa, Inc., Class A | 5.50 |
5 Amazon.com, Inc. | 5.19 |
6 Microsoft Corp. | 4.90 |
7 Boeing Co. | 4.75 |
8 Oracle Corp. | 4.64 |
9 Alphabet, Inc., Class A | 4.48 |
10 Netflix, Inc. | 3.87 |
The portfolio is actively managed and holdings are subject to change. There is no guarantee the Fund continues to invest in the securities referenced. The holdings listed exclude any temporary cash investments, are presented on an individual security basis and do not represent holdings of the issuer. |
Hypothetical Growth of $100,000 Investment in Class Y Shares1 |
September 30, 2013 through September 30, 2023 |
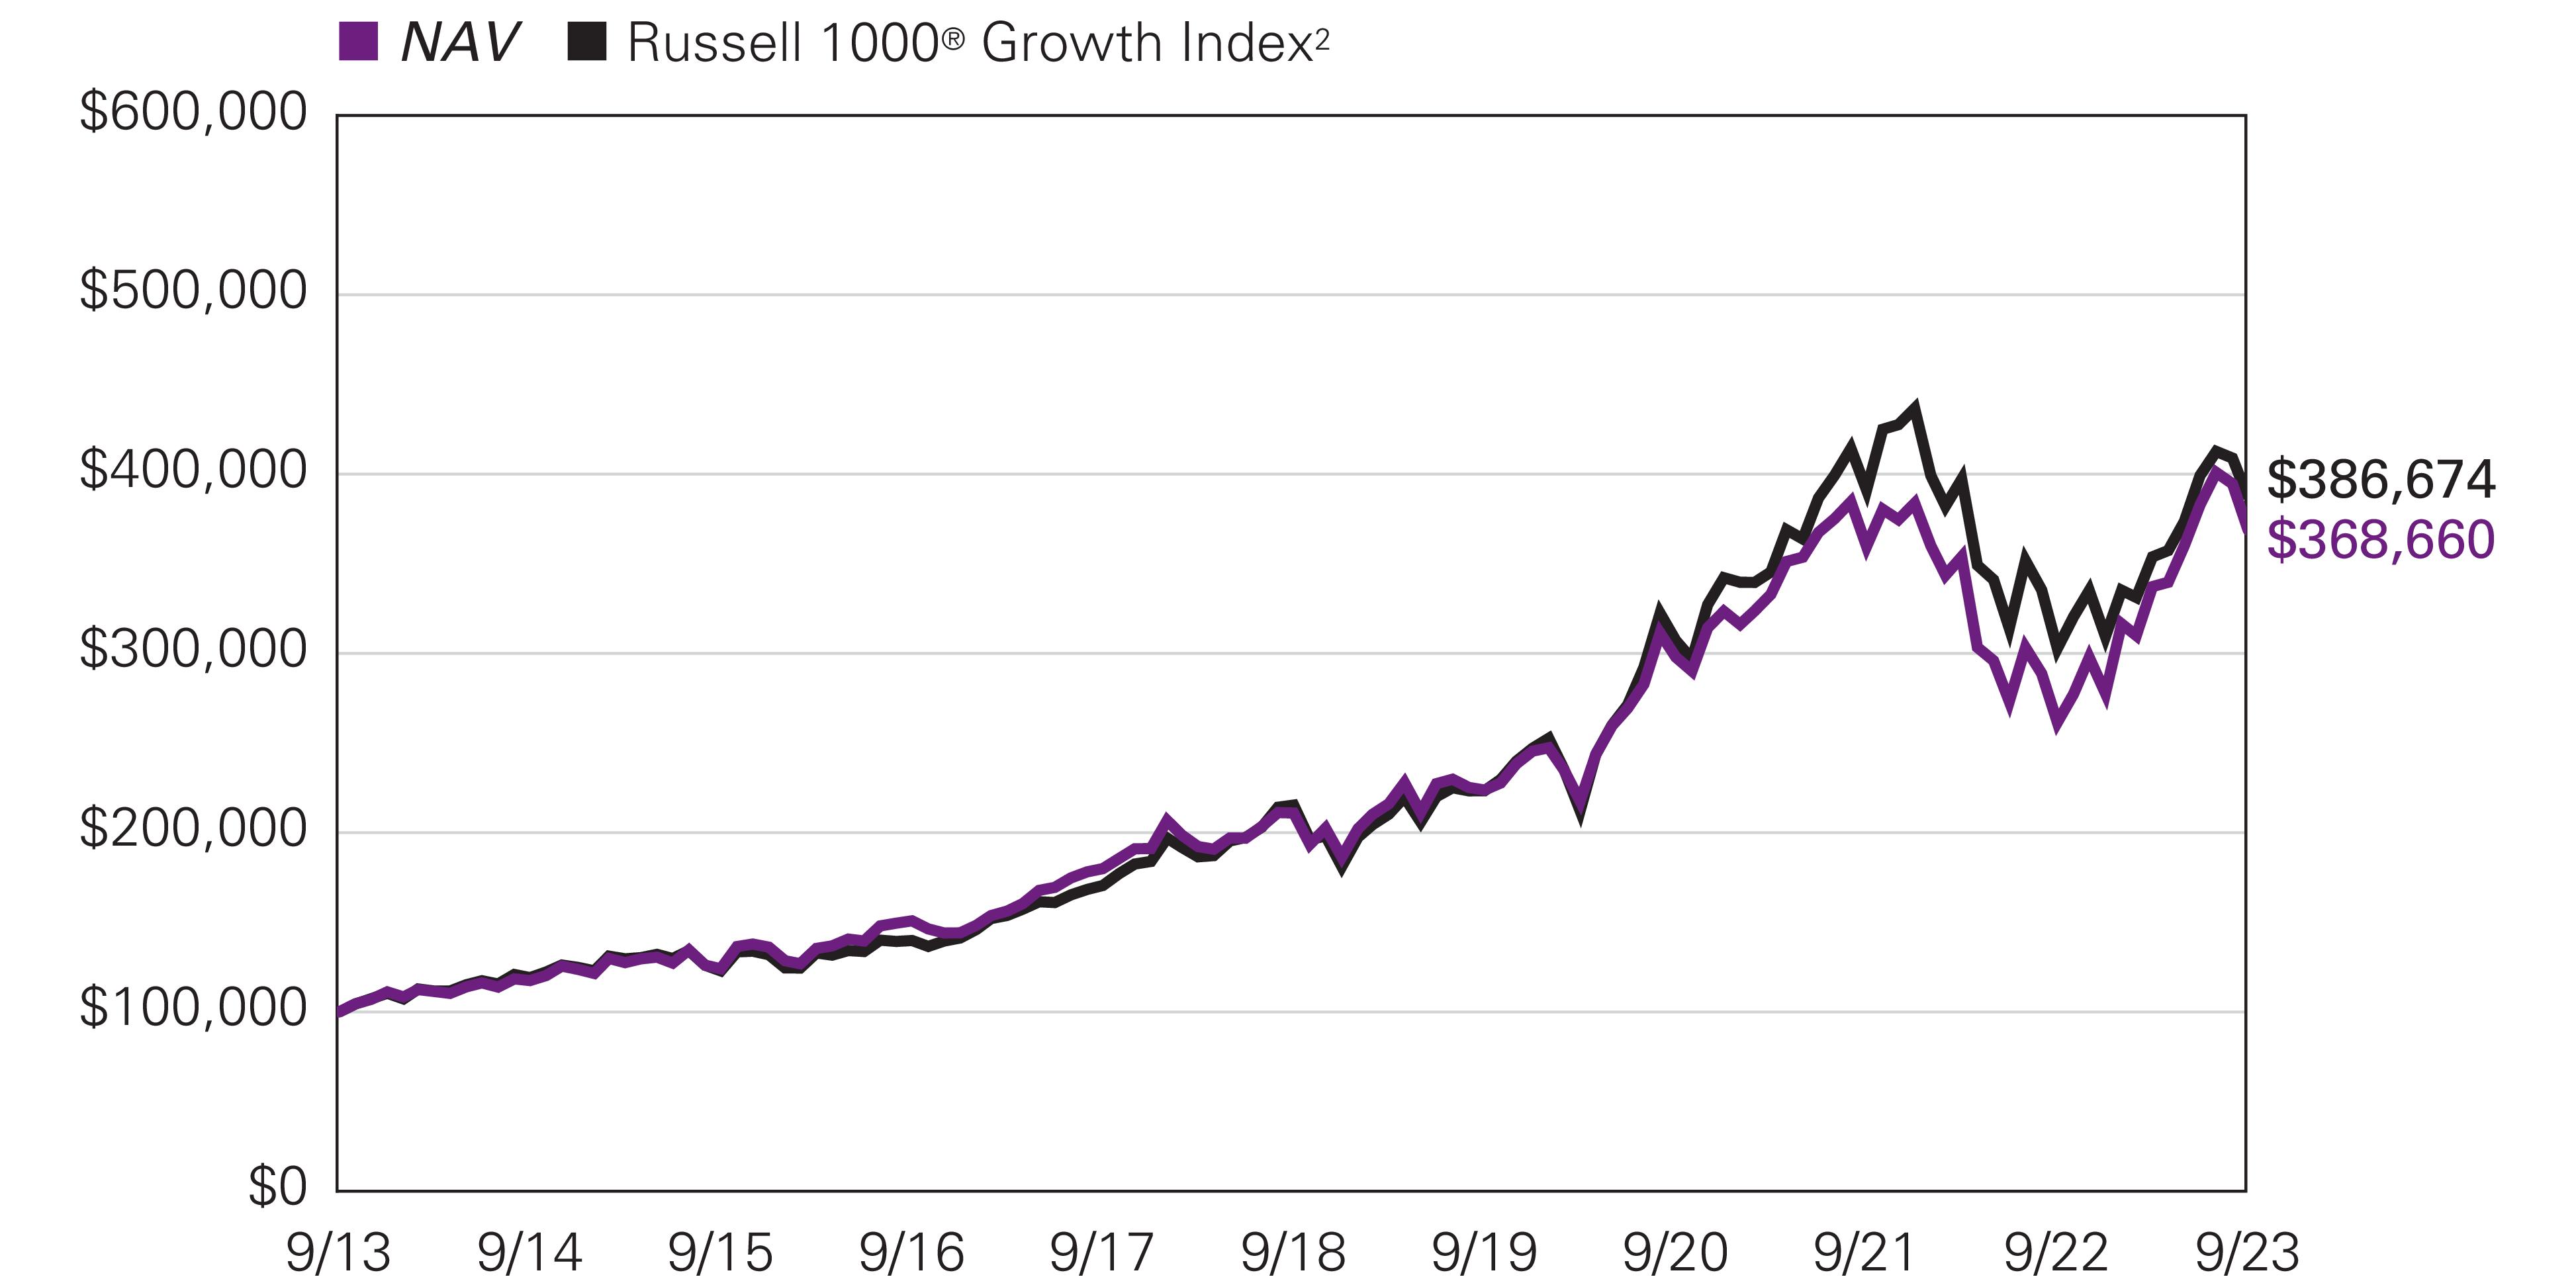
Average Annual Total Returns — September 30, 20231 | |||||
1 Year | 5 Years | 10 Years | Expense Ratios3 | ||
Gross | Net | ||||
Class Y | |||||
NAV | 40.97 % | 11.81 % | 13.94 % | 0.65 % | 0.65 % |
Class A | |||||
NAV | 40.67 | 11.54 | 13.66 | 0.90 | 0.90 |
With 5.75% Maximum Sales Charge | 32.61 | 10.23 | 12.99 | ||
Class C | |||||
NAV | 39.68 | 10.71 | 12.98 | 1.65 | 1.65 |
With CDSC4 | 38.68 | 10.71 | 12.98 | ||
Class N | |||||
NAV | 41.19 | 11.91 | 14.00 | 0.57 | 0.57 |
Comparative Performance | |||||
Russell 1000® Growth Index2 | 27.72 | 12.42 | 14.48 | ||
1 | Fund performance has been increased by fee waivers and/or expense reimbursements, if any, without which performance would have been lower. |
2 | Russell 1000® Growth Index is an unmanaged index that measures the performance of the large-cap growth segment of the U.S. equity universe. It includes those Russell 1000® Index companies with higher price-to-book ratios and higher forecasted growth values. |
3 | Expense ratios are as shown in the Fund’s prospectus in effect as of the date of this report. The expense ratios for the current reporting period can be found in the Financial Highlights section of this report under Ratios to Average Net Assets. Net expenses reflect contractual expense limitations set to expire on 1/31/25. When a Fund’s expenses are below the limitation, gross and net expense ratios will be the same. See Note 5 of the Notes to Financial Statements for more information about the Fund’s expense limitations. |
4 | Performance for Class C shares assumes a 1.00% contingent deferred sales charge (“CDSC”) applied when you sell shares within one year of purchase, and includes automatic conversion to Class A shares after eight years. |
Managers |
Daniel Conklin, CFA® |
Christopher T. Harms |
Clifton V. Rowe, CFA® |
Loomis, Sayles & Company, L.P. |
Symbols | |
Class A | LSDRX |
Class C | LSCDX |
Class N | LSDNX |
Class Y | LSDIX |
Investment Goal
Hypothetical Growth of $100,000 Investment in Class Y Shares1, 2 |
September 30, 2013 through September 30, 2023 |
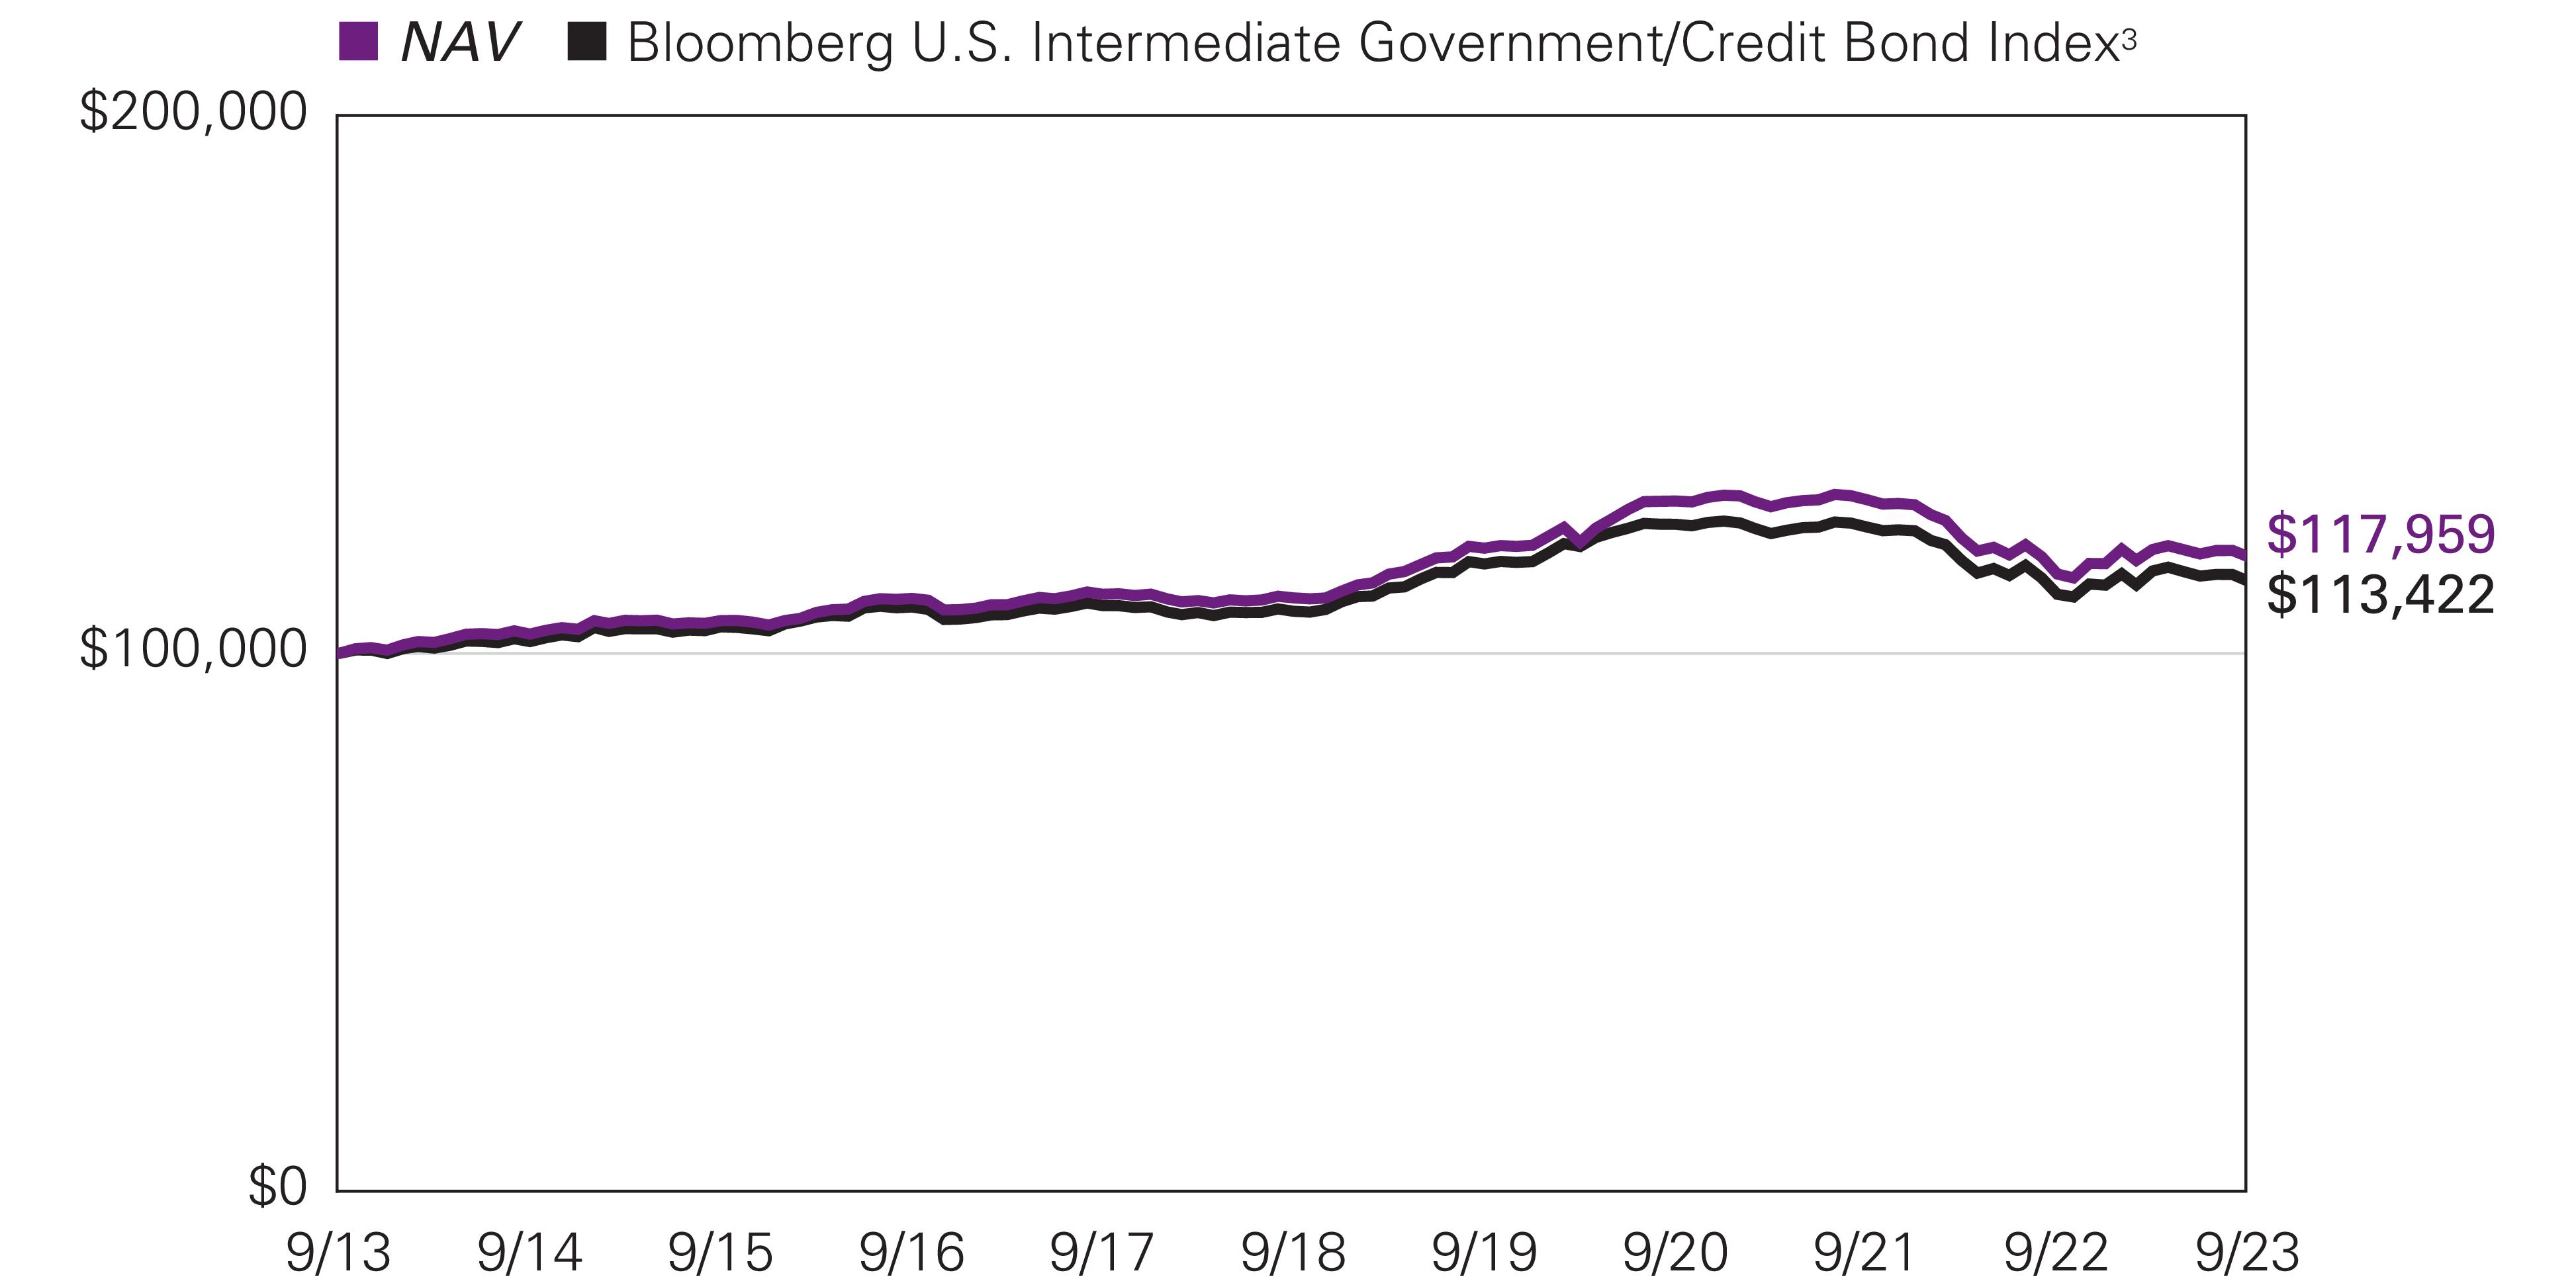
Average Annual Total Returns — September 30, 20231,2 | ||||||
1 Year | 5 Years | 10 Years | Life of Class N | Expense Ratios4 | ||
Gross | Net | |||||
Class Y | ||||||
NAV | 2.81 % | 1.35 % | 1.67 % | — % | 0.44 % | 0.40 % |
Class A | ||||||
NAV | 2.53 | 1.09 | 1.40 | — | 0.68 | 0.65 |
With 4.25% Maximum Sales Charge | -1.83 | 0.22 | 0.96 | — | ||
Class C (Inception 8/31/16) | ||||||
NAV | 1.69 | 0.33 | 0.78 | — | 1.43 | 1.40 |
With CDSC5 | 0.70 | 0.33 | 0.78 | — | ||
Class N (Inception 2/1/19) | ||||||
NAV | 2.97 | — | — | 1.07 | 0.37 | 0.35 |
Comparative Performance | ||||||
Bloomberg U.S. Intermediate Government/Credit Bond Index3 | 2.20 | 1.02 | 1.27 | 0.59 | ||
1 | Fund performance has been increased by fee waivers and/or expense reimbursements, if any, without which performance would have been lower. |
2 | As of August 31, 2016, the Fund's Retail Class shares and Institutional Class shares were redesignated as Class A shares and Class Y shares, respectively. Accordingly, the returns shown in the table for Class A shares prior to August 31, 2016 are those of Retail Class shares, restated to reflect the sales loads of Class A shares, and the returns in the table for Class Y shares prior to August 31, 2016 are those of Institutional Class shares. Prior to the inception of Class C shares (August 31, 2016), performance is that of Retail Class shares, restated to reflect the higher net expenses and sales loads of Class C shares. |
3 | Bloomberg U.S. Intermediate Government/Credit Bond Index includes securities in the intermediate maturity range within the Government and Credit Indices. The Government Index includes treasuries (i.e., public obligations of the U.S. Treasury that have remaining maturities of more than one year) and agencies (i.e., publicly issued debt of U.S. Government agencies, quasi-federal corporations, and corporate or foreign debt guaranteed by the U.S. Government). The Credit Index includes publicly issued U.S. corporate and foreign debentures and secured notes that meet specified maturity, liquidity, and quality requirements. |
4 | Expense ratios are as shown in the Fund’s prospectus in effect as of the date of this report. The expense ratios for the current reporting period can be found in the Financial Highlights section of this report under Ratios to Average Net Assets. Net expenses reflect contractual expense limitations set to expire on 1/31/24. When a Fund’s expenses are below the limitation, gross and net expense ratios will be the same. See Note 5 of the Notes to Financial Statements for more information about the Fund’s expense limitations. |
5 | Performance for Class C shares assumes a 1.00% contingent deferred sales charge (“CDSC”) applied when you sell shares within one year of purchase, and includes automatic conversion to Class A shares after eight years. |
Managers |
Daniel Conklin, CFA® |
Christopher T. Harms |
Clifton V. Rowe, CFA® |
Loomis, Sayles & Company, L.P. |
Symbols | |
Class A | NEFLX |
Class C | NECLX |
Class N | LGANX |
Class Y | NELYX |
Investment Goal
Hypothetical Growth of $100,000 Investment in Class Y Shares1 |
September 30, 2013 through September 30, 2023 |

Average Annual Total Returns — September 30, 20231 | ||||||
1 Year | 5 Years | 10 Years | Life of Class N | Expense Ratios3 | ||
Gross | Net | |||||
Class Y | ||||||
NAV | 2.79 % | 0.95 % | 0.94 % | — % | 0.48 % | 0.45 % |
Class A | ||||||
NAV | 2.64 | 0.71 | 0.70 | — | 0.72 | 0.70 |
With 2.25% Maximum Sales Charge | 0.28 | 0.25 | 0.47 | — | ||
Class C | ||||||
NAV | 1.86 | -0.05 | 0.09 | — | 1.48 | 1.45 |
With CDSC4 | 0.87 | -0.05 | 0.09 | — | ||
Class N (Inception 2/1/17) | ||||||
NAV | 2.94 | 1.04 | — | 0.96 | 0.40 | 0.39 |
Comparative Performance | ||||||
Bloomberg U.S. 1-5 Year Government Bond Index2 | 2.10 | 0.90 | 0.80 | 0.72 | ||
1 | Fund performance has been increased by fee waivers and/or expense reimbursements, if any, without which performance would have been lower. |
2 | Bloomberg U.S. 1-5 Year Government Bond Index is a subindex of the Bloomberg U.S. Government Index, which is comprised of the Bloomberg U.S. Treasury and U.S. Agency Indices. The Bloomberg U.S. Government Index includes Treasuries (public obligations of the U.S. Treasury that have remaining maturities of more than one year) and U.S. agency debentures (publicly issued debt of U.S. government agencies, quasi-federal corporations, and corporate or foreign debt guaranteed by the U.S. government). The Bloomberg U.S. Government Index is a component of the Bloomberg U.S. Government/Credit Index and the Bloomberg U.S. Aggregate Bond Index. |
3 | Expense ratios are as shown in the Fund’s prospectus in effect as of the date of this report. The expense ratios for the current reporting period can be found in the Financial Highlights section of this report under Ratios to Average Net Assets. Net expenses reflect contractual expense limitations set to expire on 1/31/24. When a Fund’s expenses are below the limitation, gross and net expense ratios will be the same. See Note 5 of the Notes to Financial Statements for more information about the Fund’s expense limitations. |
4 | Performance for Class C shares assumes a 1.00% contingent deferred sales charge (“CDSC”) applied when you sell shares within one year of purchase, and includes automatic conversion to Class A shares after eight years. |
Loomis Sayles Core Plus Bond Fund | Beginning Account Value 4/1/2023 | Ending Account Value 9/30/2023 | Expenses Paid During Period* 4/1/2023 – 9/30/2023 |
Class A | |||
Actual | $1,000.00 | $951.80 | $3.62 |
Hypothetical (5% return before expenses) | $1,000.00 | $1,021.36 | $3.75 |
Class C | |||
Actual | $1,000.00 | $948.10 | $7.28 |
Hypothetical (5% return before expenses) | $1,000.00 | $1,017.60 | $7.54 |
Class N | |||
Actual | $1,000.00 | $953.10 | $1.91 |
Hypothetical (5% return before expenses) | $1,000.00 | $1,023.11 | $1.98 |
Class Y | |||
Actual | $1,000.00 | $952.60 | $2.40 |
Hypothetical (5% return before expenses) | $1,000.00 | $1,022.61 | $2.48 |
* | Expenses are equal to the Fund’s annualized expense ratio (after waiver/reimbursement): 0.74%, 1.49%, 0.39% and 0.49% for Class A, C, N and Y, respectively, multiplied by the average account value over the period, multiplied by the number of days in the most recent fiscal half-year (183), divided by 365 (to reflect the half-year period). |
Loomis Sayles Credit Income Fund | Beginning Account Value 4/1/2023 | Ending Account Value 9/30/2023 | Expenses Paid During Period* 4/1/2023 – 9/30/2023 |
Class A | |||
Actual | $1,000.00 | $968.40 | $4.05 |
Hypothetical (5% return before expenses) | $1,000.00 | $1,020.96 | $4.15 |
Class C | |||
Actual | $1,000.00 | $963.70 | $7.68 |
Hypothetical (5% return before expenses) | $1,000.00 | $1,017.25 | $7.89 |
Class N | |||
Actual | $1,000.00 | $970.00 | $2.57 |
Hypothetical (5% return before expenses) | $1,000.00 | $1,022.46 | $2.64 |
Class Y | |||
Actual | $1,000.00 | $969.70 | $2.81 |
Hypothetical (5% return before expenses) | $1,000.00 | $1,022.21 | $2.89 |
* | Expenses are equal to the Fund’s annualized expense ratio (after waiver/reimbursement): 0.82%, 1.56%, 0.52% and 0.57% for Class A, C, N and Y, respectively, multiplied by the average account value over the period, multiplied by the number of days in the most recent fiscal half-year (183), divided by 365 (to reflect the half-year period). |
Loomis Sayles Global Allocation Fund | Beginning Account Value 4/1/2023 | Ending Account Value 9/30/2023 | Expenses Paid During Period* 4/1/2023 – 9/30/2023 |
Class A | |||
Actual | $1,000.00 | $1,018.50 | $5.92 |
Hypothetical (5% return before expenses) | $1,000.00 | $1,019.20 | $5.92 |
Class C | |||
Actual | $1,000.00 | $1,014.80 | $9.70 |
Hypothetical (5% return before expenses) | $1,000.00 | $1,015.44 | $9.70 |
Class N | |||
Actual | $1,000.00 | $1,020.60 | $4.15 |
Hypothetical (5% return before expenses) | $1,000.00 | $1,020.96 | $4.15 |
Class Y | |||
Actual | $1,000.00 | $1,019.70 | $4.66 |
Hypothetical (5% return before expenses) | $1,000.00 | $1,020.46 | $4.66 |
* | Expenses are equal to the Fund's annualized expense ratio: 1.17%, 1.92%, 0.82% and 0.92% for Class A, C, N and Y, respectively, multiplied by the average account value over the period, multiplied by the number of days in the most recent fiscal half–year (183), divided by 365 (to reflect the half–year period). |
Loomis Sayles Growth Fund | Beginning Account Value 4/1/2023 | Ending Account Value 9/30/2023 | Expenses Paid During Period* 4/1/2023 – 9/30/2023 |
Class A | |||
Actual | $1,000.00 | $1,092.00 | $4.82 |
Hypothetical (5% return before expenses) | $1,000.00 | $1,020.46 | $4.66 |
Class C | |||
Actual | $1,000.00 | $1,087.80 | $8.74 |
Hypothetical (5% return before expenses) | $1,000.00 | $1,016.70 | $8.44 |
Class N | |||
Actual | $1,000.00 | $1,093.90 | $2.99 |
Hypothetical (5% return before expenses) | $1,000.00 | $1,022.21 | $2.89 |
Class Y | |||
Actual | $1,000.00 | $1,093.10 | $3.52 |
Hypothetical (5% return before expenses) | $1,000.00 | $1,021.71 | $3.40 |
* | Expenses are equal to the Fund's annualized expense ratio: 0.92%, 1.67%, 0.57% and 0.67% for Class A, C, N and Y, respectively, multiplied by the average account value over the period, multiplied by the number of days in the most recent fiscal half–year (183), divided by 365 (to reflect the half–year period). |
Loomis Sayles Intermediate Duration Bond Fund | Beginning Account Value 4/1/2023 | Ending Account Value 9/30/2023 | Expenses Paid During Period* 4/1/2023 – 9/30/2023 |
Class A | |||
Actual | $1,000.00 | $987.30 | $3.24 |
Hypothetical (5% return before expenses) | $1,000.00 | $1,021.81 | $3.29 |
Class C | |||
Actual | $1,000.00 | $983.80 | $6.96 |
Hypothetical (5% return before expenses) | $1,000.00 | $1,018.05 | $7.08 |
Class N | |||
Actual | $1,000.00 | $990.00 | $1.75 |
Hypothetical (5% return before expenses) | $1,000.00 | $1,023.31 | $1.78 |
Class Y | |||
Actual | $1,000.00 | $988.70 | $1.99 |
Hypothetical (5% return before expenses) | $1,000.00 | $1,023.06 | $2.03 |
* | Expenses are equal to the Fund’s annualized expense ratio (after waiver/reimbursement): 0.65%, 1.40%, 0.35% and 0.40% for Class A, C, N and Y, respectively, multiplied by the average account value over the period, multiplied by the number of days in the most recent fiscal half-year (183), divided by 365 (to reflect the half-year period). |
Loomis Sayles Limited Term Government And Agency Fund | Beginning Account Value 4/1/2023 | Ending Account Value 9/30/2023 | Expenses Paid During Period* 4/1/2023 – 9/30/2023 |
Class A | |||
Actual | $1,000.00 | $1,001.40 | $3.51 |
Hypothetical (5% return before expenses) | $1,000.00 | $1,021.56 | $3.55 |
Class C | |||
Actual | $1,000.00 | $997.60 | $7.26 |
Hypothetical (5% return before expenses) | $1,000.00 | $1,017.80 | $7.33 |
Class N | |||
Actual | $1,000.00 | $1,002.90 | $2.01 |
Hypothetical (5% return before expenses) | $1,000.00 | $1,023.06 | $2.03 |
Class Y | |||
Actual | $1,000.00 | $1,001.80 | $2.26 |
Hypothetical (5% return before expenses) | $1,000.00 | $1,022.81 | $2.28 |
* | Expenses are equal to the Fund’s annualized expense ratio (after waiver/reimbursement): 0.70%, 1.45%, 0.40% and 0.45% for Class A, C, N and Y, respectively, multiplied by the average account value over the period, multiplied by the number of days in the most recent fiscal half-year (183), divided by 365 (to reflect the half-year period). |
One-Year | Three-Year | Five-Year | |
Loomis Sayles Core Plus Bond Fund | 29% | 19% | 30% |
Loomis Sayles Credit Income Fund | 18% | N/A | N/A |
Loomis Sayles Global Allocation Fund | 100% | 74% | 19% |
Loomis Sayles Growth Fund | 32% | 58% | 62% |
Loomis Sayles Intermediate Duration Bond Fund | 97% | 85% | 61% |
Loomis Sayles Limited Term Government and Agency Fund | 48% | 44% | 40% |
Loomis Sayles Core Plus Bond Fund
Principal Amount (‡) | Description | Value (†) |
Bonds and Notes — 91.8% of Net Assets | ||
Non-Convertible Bonds — 91.7% | ||
ABS Car Loan — 2.6% | ||
$4,420,000 | AmeriCredit Automobile Receivables Trust, Series 2023-1, Class C, 5.800%, 12/18/2028 | $4,391,411 |
6,444,000 | Avis Budget Rental Car Funding AESOP LLC, Series 2019-2A, Class A, 3.350%, 9/22/2025(a) | 6,301,347 |
7,064,000 | Avis Budget Rental Car Funding AESOP LLC, Series 2020-2A, Class A, 2.020%, 2/20/2027(a) | 6,446,222 |
8,160,000 | Avis Budget Rental Car Funding AESOP LLC, Series 2022-1A, Class A, 3.830%, 8/21/2028(a) | 7,514,919 |
1,840,000 | Avis Budget Rental Car Funding AESOP LLC, Series 2023-2A, Class A, 5.200%, 10/20/2027(a) | 1,794,227 |
3,245,000 | Avis Budget Rental Car Funding AESOP LLC, Series 2023-8A, Class A, 6.020%, 2/20/2030(a) | 3,231,446 |
6,504,109 | Carvana Auto Receivables Trust, Series 2023-N1, Class A, 6.360%, 4/12/2027(a) | 6,499,055 |
9,895,000 | Carvana Auto Receivables Trust, Series 2023-P1, Class A3, 5.980%, 12/10/2027(a) | 9,838,576 |
7,300,000 | Credit Acceptance Auto Loan Trust, Series 2023-1A, Class A, 6.480%, 3/15/2033(a) | 7,299,006 |
2,020,000 | DT Auto Owner Trust, Series 2023-1A, Class C, 5.550%, 10/16/2028(a) | 1,982,747 |
2,110,473 | Exeter Automobile Receivables Trust, Series 2021-2A, Class C, 0.980%, 6/15/2026 | 2,075,664 |
4,320,000 | Exeter Automobile Receivables Trust, Series 2023-1A, Class C, 5.820%, 2/15/2028 | 4,262,563 |
4,805,000 | Ford Credit Auto Lease Trust, Series 2023-B, Class C, 6.430%, 4/15/2027 | 4,787,731 |
3,455,000 | Ford Credit Auto Owner Trust, Series 2018-1, Class B, 3.340%, 7/15/2031(a) | 3,322,529 |
14,500,000 | Ford Credit Auto Owner Trust, Series 2023-1, Class A, 4.850%, 8/15/2035(a) | 14,031,708 |
4,950,000 | GM Financial Automobile Leasing Trust, Series 2023-1, Class B, 5.510%, 1/20/2027 | 4,884,417 |
12,845,000 | Hertz Vehicle Financing III LLC, Series 2023-2A, Class A, 5.570%, 9/25/2029(a) | 12,505,194 |
9,874,000 | Hertz Vehicle Financing LLC, Series 2021-1A, Class A, 1.210%, 12/26/2025(a) | 9,370,443 |
9,930,000 | NextGear Floorplan Master Owner Trust, Series 2023-1A, Class A2, 5.740%, 3/15/2028(a) | 9,899,555 |
10,730,000 | OneMain Direct Auto Receivables Trust, Series 2023-1A, Class A, 5.410%, 11/14/2029(a) | 10,579,276 |
1,315,148 | Santander Bank Auto Credit-Linked Notes, Series 2022-C, Class B, 6.451%, 12/15/2032(a) | 1,312,061 |
834,307 | Santander Bank Auto Credit-Linked Notes, Series 2022-C, Class C, 6.986%, 12/15/2032(a) | 834,352 |
6,158,594 | Santander Drive Auto Receivables Trust, Series 2021-3, Class C, 0.950%, 9/15/2027 | 6,064,880 |
19,695,000 | Santander Drive Auto Receivables Trust, Series 2022-2, Class B, 3.440%, 9/15/2027 | 19,143,166 |
6,865,000 | Westlake Automobile Receivables Trust, Series 2022-2A, Class C, 4.850%, 9/15/2027(a) | 6,739,144 |
1,295,000 | Westlake Automobile Receivables Trust, Series 2023-1A, Class B, 5.410%, 1/18/2028(a) | 1,278,628 |
4,910,000 | Westlake Automobile Receivables Trust, Series 2023-2A, Class C, 6.290%, 3/15/2028(a) | 4,902,090 |
171,292,357 | ||
ABS Home Equity — 0.3% | ||
2,506,668 | CoreVest American Finance Ltd., Series 2019-3, Class A, 2.705%, 10/15/2052(a) | 2,384,819 |
Principal Amount (‡) | Description | Value (†) |
ABS Home Equity — continued | ||
$10,197 | Countrywide Asset-Backed Certificates, Series 2004-S1, Class A3, 5.115%, 2/25/2035(b) | $10,030 |
954,131 | OBX Trust, Series 2018-EXP1, Class 1A3, 4.000%, 4/25/2048(a)(b) | 848,506 |
2,963,430 | Progress Residential Trust, Series 2023-SFR1, Class A, 4.300%, 3/17/2040(a) | 2,767,659 |
77,613 | Sequoia Mortgage Trust, Series 2017-CH1, Class A1, 4.000%, 8/25/2047(a)(b) | 71,271 |
367,003 | Sequoia Mortgage Trust, Series 2018-CH1, Class A1, 4.000%, 3/25/2048(a)(b) | 330,168 |
218,632 | Sequoia Mortgage Trust, Series 2018-CH3, Class A2, 4.000%, 8/25/2048(a)(b) | 211,105 |
1,298,545 | Towd Point Mortgage Trust, Series 2015-1, Class A5, 4.308%, 10/25/2053(a)(b) | 1,271,149 |
2,888,347 | Towd Point Mortgage Trust, Series 2015-4, Class M2, 3.750%, 4/25/2055(a)(b) | 2,822,832 |
5,101,352 | Towd Point Mortgage Trust, Series 2016-2, Class M2, 3.000%, 8/25/2055(a)(b) | 4,537,439 |
4,082,532 | Towd Point Mortgage Trust, Series 2018-3, Class A1, 3.750%, 5/25/2058(a)(b) | 3,863,603 |
19,118,581 | ||
ABS Other — 1.5% | ||
2,230,000 | Affirm Asset Securitization Trust, Series 2023-A, Class A, 6.610%, 1/18/2028(a) | 2,215,559 |
6,492,060 | CLI Funding VIII LLC, Series 2021-1A, Class A, 1.640%, 2/18/2046(a) | 5,544,099 |
11,824,388 | DB Master Finance LLC, Series 2021-1A, Class A2II, 2.493%, 11/20/2051(a) | 9,864,755 |
2,974,825 | Donlen Fleet Lease Funding 2 LLC, Series 2021-2, Class A2, 0.560%, 12/11/2034(a) | 2,912,170 |
7,992,800 | Jack in the Box Funding LLC, Series 2022-1A, Class A2I, 3.445%, 2/26/2052(a) | 7,154,299 |
13,449,050 | Jack in the Box Funding LLC, Series 2022-1A, Class A2II, 4.136%, 2/26/2052(a) | 10,733,095 |
6,417,091 | Lunar Structured Aircraft Portfolio Notes, Series 2021-1, Class A, 2.636%, 10/15/2046(a) | 5,547,428 |
8,837,961 | Navigator Aircraft ABS Ltd., Series 2021-1, Class A, 2.771%, 11/15/2046(a)(b) | 7,669,141 |
457,223 | OneMain Financial Issuance Trust, Series 2020-1A, Class A, 3.840%, 5/14/2032(a) | 456,504 |
13,500,000 | OneMain Financial Issuance Trust, Series 2021-1A, Class A2, 30 day USD SOFR Average + 0.760%, 6.073%, 6/16/2036(a)(c) | 13,209,062 |
18,175,000 | Textainer Marine Containers Ltd., Series 2021-3A, Class A, 1.940%, 8/20/2046(a) | 14,886,630 |
2,996,129 | Textainer Marine Containers VII Ltd., Series 2020-2A, Class A, 2.100%, 9/20/2045(a) | 2,624,738 |
15,890,000 | Wheels Fleet Lease Funding 1 LLC, Series 2023-1A, Class A, 5.800%, 4/18/2038(a) | 15,767,218 |
98,584,698 | ||
ABS Student Loan — 0.6% | ||
3,043,377 | Navient Private Education Refi Loan Trust, Series 2020-HA, Class A, 1.310%, 1/15/2069(a) | 2,754,757 |
8,340,714 | Navient Private Education Refi Loan Trust, Series 2021-CA, Class A, 1.060%, 10/15/2069(a) | 7,091,617 |
8,624,492 | Navient Private Education Refi Loan Trust, Series 2023-A, Class A, 5.510%, 10/15/2071(a) | 8,445,560 |
3,072,875 | SMB Private Education Loan Trust, Series 2021-A, Class APT2, 1.070%, 1/15/2053(a) | 2,627,069 |
Loomis Sayles Core Plus Bond Fund (continued)
Principal Amount (‡) | Description | Value (†) |
ABS Student Loan — continued | ||
$7,344,767 | SMB Private Education Loan Trust, Series 2021-C, Class A2, 1 mo. USD SOFR + 0.914%, 6.247%, 1/15/2053(a)(c) | $7,197,829 |
8,646,567 | SMB Private Education Loan Trust, Series 2023-A, Class A1A, 5.380%, 1/15/2053(a) | 8,394,528 |
2,120,564 | SoFi Professional Loan Program LLC, Series 2020-A, Class A2FX, 2.540%, 5/15/2046(a) | 1,941,011 |
38,452,371 | ||
ABS Whole Business — 0.3% | ||
7,162,800 | Domino's Pizza Master Issuer LLC, Series 2018-1A, Class A2I, 4.116%, 7/25/2048(a) | 6,795,721 |
4,713,225 | Planet Fitness Master Issuer LLC, Series 2022-1A, Class A2I, 3.251%, 12/05/2051(a) | 4,214,457 |
11,928,350 | Planet Fitness Master Issuer LLC, Series 2022-1A, Class A2II, 4.008%, 12/05/2051(a) | 9,614,751 |
20,624,929 | ||
Aerospace & Defense — 0.5% | ||
15,199,000 | Boeing Co., 5.705%, 5/01/2040 | 14,022,637 |
20,159,000 | Boeing Co., 5.805%, 5/01/2050 | 18,254,322 |
1,329,000 | Textron, Inc., 3.000%, 6/01/2030 | 1,118,308 |
33,395,267 | ||
Agency Commercial Mortgage-Backed Securities — 0.5% | ||
6,067,911 | Federal Home Loan Mortgage Corp., 3.350%, 8/01/2037 | 5,000,284 |
3,619,051 | Federal Home Loan Mortgage Corp., 3.450%, 5/01/2037 | 3,025,424 |
1,248,432 | Federal Home Loan Mortgage Corp., 3.700%, 5/01/2037 | 1,077,862 |
8,638,006 | Federal Home Loan Mortgage Corp., 3.750%, 5/01/2037 | 7,410,826 |
2,087,596 | Federal Home Loan Mortgage Corp., 3.900%, 7/01/2037 | 1,818,482 |
2,087,782 | Federal Home Loan Mortgage Corp., 3.900%, 7/01/2037 | 1,790,067 |
7,013,000 | Federal National Mortgage Association, 3.850%, 9/01/2037 | 5,915,777 |
160,000 | Federal National Mortgage Association, 3.940%, 9/01/2032 | 144,947 |
6,597,982 | Federal National Mortgage Association, 4.240%, 7/01/2038 | 5,804,921 |
31,988,590 | ||
Airlines — 0.8% | ||
5,384,603 | American Airlines, Inc./AAdvantage Loyalty IP Ltd., 5.500%, 4/20/2026(a) | 5,258,941 |
5,620,467 | American Airlines, Inc./AAdvantage Loyalty IP Ltd., 5.750%, 4/20/2029(a) | 5,227,317 |
1,416,818 | Continental Airlines Pass-Through Trust, Series 2012-2, Class A, 4.000%, 4/29/2026 | 1,377,728 |
14,751,433 | Delta Air Lines, Inc./SkyMiles IP Ltd., 4.750%, 10/20/2028(a) | 14,018,919 |
3,178,194 | United Airlines Pass-Through Trust, Series 2020-1, Class B, 4.875%, 7/15/2027 | 3,057,454 |
22,605,000 | United Airlines Pass-Through Trust, Series 2023-1, Class A, 5.800%, 7/15/2037 | 21,980,650 |
Principal Amount (‡) | Description | Value (†) |
Airlines — continued | ||
$2,266,000 | United Airlines, Inc., 4.375%, 4/15/2026(a) | $2,095,575 |
3,543,000 | United Airlines, Inc., 4.625%, 4/15/2029(a) | 3,045,317 |
56,061,901 | ||
Apartment REITs — 0.0% | ||
1,715,000 | American Homes 4 Rent LP, 3.375%, 7/15/2051 | 1,029,299 |
Automotive — 1.4% | ||
11,690,000 | Ford Motor Credit Co. LLC, 6.800%, 5/12/2028 | 11,676,478 |
5,315,000 | Ford Motor Credit Co. LLC, 6.950%, 3/06/2026 | 5,306,234 |
17,142,000 | General Motors Co., 5.000%, 4/01/2035 | 14,797,703 |
1,000,000 | General Motors Financial Co., Inc., 2.350%, 1/08/2031 | 756,390 |
5,067,000 | General Motors Financial Co., Inc., 2.900%, 2/26/2025 | 4,834,247 |
11,519,000 | Goodyear Tire & Rubber Co., 5.625%, 4/30/2033 | 9,427,283 |
6,206,000 | Hyundai Capital America, 2.375%, 10/15/2027(a) | 5,372,745 |
10,356,000 | Hyundai Capital America, 2.650%, 2/10/2025(a) | 9,890,285 |
7,453,000 | Hyundai Capital America, 3.000%, 2/10/2027(a) | 6,752,392 |
11,455,000 | Hyundai Capital America, 6.100%, 9/21/2028(a) | 11,373,275 |
1,725,000 | Lear Corp., 3.550%, 1/15/2052 | 1,051,570 |
12,381,000 | Lear Corp., 5.250%, 5/15/2049 | 10,008,838 |
4,550,000 | Nissan Motor Acceptance Co. LLC, 7.050%, 9/15/2028(a) | 4,549,213 |
95,796,653 | ||
Banking — 7.2% | ||
10,051,000 | Banco Santander Chile, 2.700%, 1/10/2025(a) | 9,637,420 |
11,000,000 | Banco Santander SA, 1.849%, 3/25/2026 | 9,892,586 |
3,800,000 | Banco Santander SA, 2.958%, 3/25/2031 | 3,021,877 |
15,850,000 | Bangkok Bank PCL, 4.050%, 3/19/2024(a) | 15,703,865 |
4,000,000 | Bank of America Corp., (fixed rate to 11/10/2027, variable rate thereafter), 6.204%, 11/10/2028 | 4,018,065 |
26,146,000 | Bank of America Corp., (fixed rate to 4/22/2024, variable rate thereafter), 0.976%, 4/22/2025 | 25,331,631 |
5,475,000 | Bank of America Corp., (fixed rate to 4/24/2027, variable rate thereafter), 3.705%, 4/24/2028 | 5,042,437 |
16,280,000 | Bank of America Corp., (fixed rate to 4/25/2033, variable rate thereafter), 5.288%, 4/25/2034 | 15,148,718 |
24,210,000 | Bank of America Corp., MTN, (fixed rate to 4/23/2026, variable rate thereafter), 3.559%, 4/23/2027 | 22,713,271 |
18,664,000 | Barclays PLC, (fixed rate to 3/10/2041, variable rate thereafter), 3.811%, 3/10/2042 | 12,184,819 |
7,864,000 | BBVA Bancomer SA, 1.875%, 9/18/2025(a) | 7,214,539 |
13,513,000 | BNP Paribas SA, (fixed rate to 1/13/2026, variable rate thereafter), 1.323%, 1/13/2027(a) | 12,101,107 |
26,613,000 | BNP Paribas SA, (fixed rate to 11/19/2024, variable rate thereafter), 2.819%, 11/19/2025(a) | 25,559,936 |
23,750,000 | Capital One Financial Corp., (fixed rate to 6/08/2033, variable rate thereafter), 6.377%, 6/08/2034 | 22,413,246 |
1,154,000 | Citigroup, Inc., (fixed rate to 5/01/2024, variable rate thereafter), 0.981%, 5/01/2025 | 1,116,856 |
9,038,000 | Deutsche Bank AG, 1.686%, 3/19/2026 | 8,185,518 |
8,585,000 | Deutsche Bank AG, (fixed rate to 10/07/2031, variable rate thereafter), 3.742%, 1/07/2033 | 6,160,547 |
6,737,000 | Deutsche Bank AG, (fixed rate to 10/14/2030, variable rate thereafter), 3.729%, 1/14/2032 | 5,014,981 |
1,750,000 | Deutsche Bank AG, (fixed rate to 11/10/2032, variable rate thereafter), 7.079%, 2/10/2034 | 1,581,548 |
Loomis Sayles Core Plus Bond Fund (continued)
Principal Amount (‡) | Description | Value (†) |
Banking — continued | ||
$10,680,000 | Deutsche Bank AG, (fixed rate to 11/24/2025, variable rate thereafter), 2.129%, 11/24/2026 | $9,658,464 |
12,486,000 | Goldman Sachs Group, Inc., 6.750%, 10/01/2037 | 12,643,913 |
6,320,000 | Goldman Sachs Group, Inc., (fixed rate to 6/05/2027, variable rate thereafter), 3.691%, 6/05/2028 | 5,824,462 |
1,326,000 | HSBC Holdings PLC, 4.950%, 3/31/2030 | 1,239,080 |
13,610,000 | HSBC Holdings PLC, (fixed rate to 5/24/2024, variable rate thereafter), 0.976%, 5/24/2025 | 13,112,184 |
4,740,000 | Intesa Sanpaolo SpA, (fixed rate to 6/01/2031, variable rate thereafter), 4.198%, 6/01/2032(a) | 3,496,698 |
24,590,000 | JPMorgan Chase & Co., (fixed rate to 10/15/2029, variable rate thereafter), 2.739%, 10/15/2030 | 20,563,807 |
14,076,000 | JPMorgan Chase & Co., (fixed rate to 5/13/2030, variable rate thereafter), 2.956%, 5/13/2031 | 11,565,189 |
14,145,000 | Macquarie Bank Ltd., 3.231%, 3/21/2025(a) | 13,641,760 |
7,950,000 | Mitsubishi UFJ Financial Group, Inc., (fixed rate to 4/19/2033, variable rate thereafter), 5.406%, 4/19/2034 | 7,541,748 |
1,500,000 | Morgan Stanley, (fixed rate to 2/01/2028, variable rate thereafter), 5.123%, 2/01/2029 | 1,444,524 |
13,321,000 | Morgan Stanley, (fixed rate to 7/22/2027, variable rate thereafter), 3.591%, 7/22/2028(b) | 12,153,811 |
10,135,000 | Morgan Stanley, MTN, (fixed rate to 4/20/2028, variable rate thereafter), 5.164%, 4/20/2029 | 9,750,425 |
5,600,000 | PNC Financial Services Group, Inc., (fixed rate to 1/24/2033, variable rate thereafter), 5.068%, 1/24/2034 | 5,078,355 |
11,465,000 | Santander Holdings USA, Inc., (fixed rate to 1/06/2027, variable rate thereafter), 2.490%, 1/06/2028 | 9,954,799 |
24,503,000 | Societe Generale SA, 2.625%, 1/22/2025(a) | 23,295,384 |
18,840,000 | Standard Chartered PLC, (fixed rate to 1/12/2032, variable rate thereafter), 3.603%, 1/12/2033(a) | 14,438,976 |
22,346,000 | Standard Chartered PLC, (fixed rate to 1/30/2025, variable rate thereafter), 2.819%, 1/30/2026(a) | 21,256,142 |
660,000 | Standard Chartered PLC, (fixed rate to 3/15/2028, variable rate thereafter), 4.866%, 3/15/2033(a) | 590,713 |
5,660,000 | Sumitomo Mitsui Financial Group, Inc., 1.474%, 7/08/2025 | 5,235,673 |
10,888,000 | Sumitomo Mitsui Financial Group, Inc., 3.040%, 7/16/2029 | 9,301,018 |
23,580,000 | Toronto-Dominion Bank, MTN, 5.523%, 7/17/2028 | 23,274,377 |
6,655,000 | Truist Financial Corp., MTN, (fixed rate to 6/08/2033, variable rate thereafter), 5.867%, 6/08/2034 | 6,263,838 |
5,040,000 | UBS Group AG, (fixed rate to 11/15/2032, variable rate thereafter), 9.016%, 11/15/2033(a) | 5,820,266 |
690,000 | UBS Group AG, (fixed rate to 7/15/2025, variable rate thereafter), 6.373%, 7/15/2026(a) | 687,399 |
7,695,000 | UBS Group AG, (fixed rate to 8/11/2027, variable rate thereafter), 6.442%, 8/11/2028(a) | 7,680,303 |
15,845,000 | UniCredit SpA, (fixed rate to 6/03/2026, variable rate thereafter), 1.982%, 6/03/2027(a) | 13,997,019 |
481,553,294 | ||
Principal Amount (‡) | Description | Value (†) |
Building Materials — 0.4% | ||
$15,155,000 | American Builders & Contractors Supply Co., Inc., 3.875%, 11/15/2029(a) | $12,599,109 |
8,962,000 | Cemex SAB de CV, 3.875%, 7/11/2031(a) | 7,506,708 |
9,128,000 | Mohawk Industries, Inc., 3.625%, 5/15/2030 | 7,972,943 |
17,000 | Summit Materials LLC/Summit Materials Finance Corp., 5.250%, 1/15/2029(a) | 15,436 |
28,094,196 | ||
Cable Satellite — 0.6% | ||
17,010,000 | CCO Holdings LLC/CCO Holdings Capital Corp., 4.250%, 1/15/2034(a) | 12,524,089 |
21,060,000 | Charter Communications Operating LLC/Charter Communications Operating Capital, 5.500%, 4/01/2063 | 15,579,075 |
5,285,000 | Time Warner Cable LLC, 4.500%, 9/15/2042 | 3,661,547 |
783,000 | Time Warner Cable LLC, 5.500%, 9/01/2041 | 612,489 |
2,245,000 | Time Warner Cable LLC, 5.875%, 11/15/2040 | 1,860,100 |
7,162,000 | Time Warner Cable LLC, 6.550%, 5/01/2037 | 6,496,001 |
1,707,000 | Time Warner Cable LLC, 6.750%, 6/15/2039 | 1,562,530 |
42,295,831 | ||
Chemicals — 0.9% | ||
1,610,000 | Alpek SAB de CV, 3.250%, 2/25/2031(a) | 1,263,772 |
21,698,000 | Braskem America Finance Co., 7.125%, 7/22/2041(a) | 18,937,466 |
1,873,000 | Celanese U.S. Holdings LLC, 6.050%, 3/15/2025 | 1,866,274 |
4,145,000 | Celanese U.S. Holdings LLC, 6.330%, 7/15/2029 | 4,062,975 |
6,640,000 | Celanese U.S. Holdings LLC, 6.379%, 7/15/2032 | 6,397,788 |
4,410,000 | Nutrien Ltd., 5.800%, 3/27/2053 | 4,050,864 |
8,271,000 | Orbia Advance Corp. SAB de CV, 5.875%, 9/17/2044(a) | 6,814,769 |
9,466,000 | Orbia Advance Corp. SAB de CV, 6.750%, 9/19/2042(a) | 8,792,690 |
3,830,000 | Sociedad Quimica y Minera de Chile SA, 3.500%, 9/10/2051(a) | 2,372,340 |
10,424,000 | Sociedad Quimica y Minera de Chile SA, 4.250%, 1/22/2050(a) | 7,686,553 |
62,245,491 | ||
Collateralized Mortgage Obligations — 0.6% | ||
33,880,000 | Federal Home Loan Mortgage Corp., 6.763%, 10/25/2053(c) | 33,880,000 |
150,826 | Government National Mortgage Association, Series 2010-H24, Class FA, 1 mo. USD SOFR + 0.464%, 5.782%, 10/20/2060(c) | 149,847 |
100,969 | Government National Mortgage Association, Series 2012-H18, Class NA, 1 mo. USD SOFR + 0.634%, 5.952%, 8/20/2062(c) | 100,461 |
498 | Government National Mortgage Association, Series 2013-H01, Class FA, 1.650%, 1/20/2063(d) | 425 |
8,692 | Government National Mortgage Association, Series 2013-H03, Class HA, 1.750%, 12/20/2062(d) | 7,479 |
7,207 | Government National Mortgage Association, Series 2013-H04, Class BA, 1.650%, 2/20/2063(d) | 6,224 |
85,742 | Government National Mortgage Association, Series 2013-H10, Class PA, 2.500%, 4/20/2063(d) | 75,887 |
Loomis Sayles Core Plus Bond Fund (continued)
Principal Amount (‡) | Description | Value (†) |
Collateralized Mortgage Obligations — continued | ||
$4,654,763 | Government National Mortgage Association, Series 2015-H10, Class JA, 2.250%, 4/20/2065 | $4,482,125 |
6,819 | Government National Mortgage Association, Series 2015-H13, Class FL, 1 mo. USD SOFR + 0.394%, 4.908%, 5/20/2063(c)(d) | 6,163 |
38,708,611 | ||
Consumer Cyclical Services — 0.0% | ||
1,791,000 | Expedia Group, Inc., 6.250%, 5/01/2025(a) | 1,793,946 |
Consumer Products — 0.1% | ||
2,157,000 | Kimberly-Clark de Mexico SAB de CV, 2.431%, 7/01/2031(a) | 1,759,342 |
1,425,000 | Natura &Co. Luxembourg Holdings Sarl, 6.000%, 4/19/2029(a) | 1,311,655 |
2,738,000 | Natura Cosmeticos SA, 4.125%, 5/03/2028(a) | 2,351,199 |
5,422,196 | ||
Electric — 1.3% | ||
3,587,000 | AES Corp., 3.300%, 7/15/2025(a) | 3,397,521 |
1,609,000 | AES Corp., 3.950%, 7/15/2030(a) | 1,386,829 |
10,104,000 | Calpine Corp., 5.000%, 2/01/2031(a) | 8,169,990 |
12,220,000 | CenterPoint Energy, Inc., SOFR Index + 0.650%, 5.991%, 5/13/2024(c) | 12,217,754 |
13,354,000 | Clearway Energy Operating LLC, 3.750%, 2/15/2031(a) | 10,533,617 |
20,355,874 | Cometa Energia SA de CV, 6.375%, 4/24/2035(a) | 18,956,906 |
2,415,000 | DPL, Inc., 4.350%, 4/15/2029 | 1,996,383 |
852,000 | Edison International, 4.950%, 4/15/2025 | 834,974 |
2,811,000 | Enel Americas SA, 4.000%, 10/25/2026 | 2,613,415 |
1,348,000 | Enel Generacion Chile SA, 4.250%, 4/15/2024 | 1,326,531 |
4,316,000 | Entergy Corp., 2.800%, 6/15/2030 | 3,580,521 |
750,000 | IPALCO Enterprises, Inc., 4.250%, 5/01/2030 | 657,769 |
10,966,000 | National Rural Utilities Cooperative Finance Corp., (fixed rate to 5/01/2023, variable rate thereafter), 8.541%, 4/30/2043(c) | 10,774,171 |
3,800,000 | NRG Energy, Inc., 3.875%, 2/15/2032(a) | 2,852,623 |
3,509,000 | Pattern Energy Operations LP/Pattern Energy Operations, Inc., 4.500%, 8/15/2028(a) | 3,047,566 |
7,133,000 | Transelec SA, 4.250%, 1/14/2025(a) | 6,924,526 |
89,271,096 | ||
Finance Companies — 2.0% | ||
6,365,000 | AerCap Ireland Capital DAC/AerCap Global Aviation Trust, 3.000%, 10/29/2028 | 5,457,849 |
18,150,000 | Air Lease Corp., GMTN, 3.750%, 6/01/2026 | 17,107,745 |
20,287,000 | Aircastle Ltd., 2.850%, 1/26/2028(a) | 17,213,170 |
22,772,000 | Ares Capital Corp., 2.150%, 7/15/2026 | 19,979,200 |
15,425,000 | Avolon Holdings Funding Ltd., 2.750%, 2/21/2028(a) | 13,069,641 |
4,262,000 | Blue Owl Capital Corp., 2.625%, 1/15/2027 | 3,660,425 |
13,397,000 | Blue Owl Capital Corp., 3.400%, 7/15/2026 | 12,011,245 |
10,958,000 | Blue Owl Technology Finance Corp., 3.750%, 6/17/2026(a) | 9,724,924 |
18,679,000 | FS KKR Capital Corp., 3.400%, 1/15/2026 | 17,117,197 |
6,000,000 | Navient Corp., 5.000%, 3/15/2027 | 5,393,160 |
6,547,000 | Navient Corp., MTN, 6.125%, 3/25/2024 | 6,512,014 |
1,580,000 | OneMain Finance Corp., 3.875%, 9/15/2028 | 1,268,175 |
5,769,000 | Rocket Mortgage LLC/Rocket Mortgage Co-Issuer, Inc., 3.875%, 3/01/2031(a) | 4,600,027 |
1,655,000 | Rocket Mortgage LLC/Rocket Mortgage Co-Issuer, Inc., 4.000%, 10/15/2033(a) | 1,249,828 |
134,364,600 | ||
Principal Amount (‡) | Description | Value (†) |
Financial Other — 0.1% | ||
$4,763,000 | Icahn Enterprises LP/Icahn Enterprises Finance Corp., 4.375%, 2/01/2029 | $3,808,778 |
Food & Beverage — 0.7% | ||
14,008,000 | BRF SA, 5.750%, 9/21/2050(a) | 9,358,465 |
2,032,000 | Gruma SAB de CV, 4.875%, 12/01/2024(a) | 2,003,250 |
24,100,000 | JBS USA LUX SA/JBS USA Food Co./JBS Luxembourg Sarl, 7.250%, 11/15/2053(a) | 23,298,675 |
11,530,000 | Minerva Luxembourg SA, 4.375%, 3/18/2031(a) | 8,922,492 |
6,134,000 | Post Holdings, Inc., 4.500%, 9/15/2031(a) | 5,105,288 |
1,599,000 | Smithfield Foods, Inc., 3.000%, 10/15/2030(a) | 1,222,290 |
49,910,460 | ||
Government Owned - No Guarantee — 1.5% | ||
6,872,000 | Antares Holdings LP, 3.950%, 7/15/2026(a) | 6,184,319 |
17,141,000 | BOC Aviation USA Corp., 1.625%, 4/29/2024(a) | 16,702,978 |
3,903,000 | Empresa de los Ferrocarriles del Estado, 3.068%, 8/18/2050(a) | 2,231,027 |
8,230,000 | Freeport Indonesia PT, 5.315%, 4/14/2032(a) | 7,409,963 |
6,355,000 | Korea National Oil Corp., 4.875%, 4/03/2028(a) | 6,192,355 |
16,956,000 | NBN Co. Ltd., 1.450%, 5/05/2026(a) | 15,235,547 |
7,985,000 | OCP SA, 3.750%, 6/23/2031(a) | 6,291,493 |
11,538,000 | Saudi Arabian Oil Co., 3.500%, 11/24/2070(a) | 6,850,688 |
11,825,000 | Tennessee Valley Authority, 4.250%, 9/15/2065 | 9,376,639 |
7,669,000 | Tennessee Valley Authority, 4.625%, 9/15/2060 | 6,645,734 |
5,427,000 | Tennessee Valley Authority, 4.875%, 1/15/2048 | 4,980,024 |
9,290,000 | Tennessee Valley Authority, 5.250%, 9/15/2039 | 9,088,323 |
97,189,090 | ||
Health Insurance — 0.1% | ||
7,364,000 | Centene Corp., 3.375%, 2/15/2030 | 6,142,106 |
Healthcare — 0.2% | ||
2,650,000 | CVS Health Corp., 5.250%, 1/30/2031 | 2,546,180 |
12,395,000 | HCA, Inc., 4.625%, 3/15/2052 | 9,306,108 |
11,852,288 | ||
Home Construction — 0.2% | ||
4,801,000 | Forestar Group, Inc., 3.850%, 5/15/2026(a) | 4,357,832 |
8,905,000 | NVR, Inc., 3.000%, 5/15/2030 | 7,419,049 |
11,776,881 | ||
Independent Energy — 0.4% | ||
8,952,000 | Devon Energy Corp., 4.500%, 1/15/2030 | 8,135,123 |
1,765,000 | EQT Corp., 3.125%, 5/15/2026(a) | 1,632,961 |
4,696,000 | EQT Corp., 3.900%, 10/01/2027 | 4,343,676 |
601,000 | EQT Corp., 5.000%, 1/15/2029 | 564,946 |
9,078,204 | Leviathan Bond Ltd., 6.125%, 6/30/2025(a) | 8,829,552 |
5,835,000 | Pan American Energy LLC, 9.125%, 4/30/2027(a) | 6,162,168 |
29,668,426 | ||
Industrial Other — 0.0% | ||
3,408,000 | Georgetown University, Series A, 5.215%, 10/01/2118 | 2,838,182 |
Life Insurance — 0.2% | ||
14,171,000 | Brighthouse Financial, Inc., 5.625%, 5/15/2030 | 13,261,902 |
2,327,000 | OneAmerica Financial Partners, Inc., 4.250%, 10/15/2050(a) | 1,488,512 |
14,750,414 | ||
Lodging — 0.1% | ||
6,397,000 | Hilton Domestic Operating Co., Inc., 3.625%, 2/15/2032(a) | 5,157,236 |
Loomis Sayles Core Plus Bond Fund (continued)
Principal Amount (‡) | Description | Value (†) |
Media Entertainment — 0.6% | ||
54,020,000 | Grupo Televisa SAB, EMTN, 7.250%, 5/14/2043, (MXN) | 1,894,412 |
5,553,000 | Outfront Media Capital LLC/Outfront Media Capital Corp., 4.250%, 1/15/2029(a) | 4,406,417 |
12,303,000 | Prosus NV, 3.680%, 1/21/2030(a) | 9,916,576 |
13,750,000 | Prosus NV, 3.832%, 2/08/2051(a) | 7,594,092 |
20,770,000 | Warnermedia Holdings, Inc., 5.391%, 3/15/2062 | 15,340,380 |
39,151,877 | ||
Metals & Mining — 0.9% | ||
1,835,000 | Anglo American Capital PLC, 2.250%, 3/17/2028(a) | 1,566,088 |
3,620,000 | Anglo American Capital PLC, 3.875%, 3/16/2029(a) | 3,243,875 |
3,322,000 | Anglo American Capital PLC, 3.950%, 9/10/2050(a) | 2,257,900 |
7,696,000 | Anglo American Capital PLC, 5.625%, 4/01/2030(a) | 7,432,601 |
9,977,000 | FMG Resources August 2006 Pty. Ltd., 4.375%, 4/01/2031(a) | 8,208,980 |
14,428,000 | Fresnillo PLC, 4.250%, 10/02/2050(a) | 10,086,903 |
25,662,000 | Glencore Funding LLC, 2.500%, 9/01/2030(a) | 20,291,456 |
5,290,000 | POSCO, 5.625%, 1/17/2026(a) | 5,267,767 |
3,555,000 | SunCoke Energy, Inc., 4.875%, 6/30/2029(a) | 3,020,772 |
61,376,342 | ||
Midstream — 0.6% | ||
568,000 | Energy Transfer LP, 5.150%, 2/01/2043 | 451,384 |
1,500,000 | Energy Transfer LP, 5.300%, 4/15/2047 | 1,218,412 |
125,000 | Energy Transfer LP, 5.400%, 10/01/2047 | 103,093 |
4,900,000 | Energy Transfer LP, 5.950%, 10/01/2043 | 4,307,714 |
8,548,000 | Energy Transfer LP, 6.500%, 2/01/2042 | 8,172,549 |
1,338,000 | Energy Transfer LP, 6.625%, 10/15/2036 | 1,320,740 |
2,445,000 | EQM Midstream Partners LP, 6.500%, 7/01/2027(a) | 2,387,486 |
2,014,000 | Gray Oak Pipeline LLC, 2.600%, 10/15/2025(a) | 1,856,167 |
982,000 | Gray Oak Pipeline LLC, 3.450%, 10/15/2027(a) | 869,984 |
12,960,000 | Sempra Global, 3.250%, 1/15/2032(a) | 10,149,530 |
930,000 | Targa Resources Partners LP/Targa Resources Partners Finance Corp., 6.500%, 7/15/2027 | 937,207 |
13,096,000 | Williams Cos., Inc., 3.500%, 11/15/2030 | 11,291,736 |
43,066,002 | ||
Mortgage Related — 24.3% | ||
9,705,593 | Federal Home Loan Mortgage Corp., 1.500%, with various maturities from 2050 to 2051(e) | 32,444,718 |
1,291,643 | Federal Home Loan Mortgage Corp., 2.000%, with various maturities from 2050 to 2052(e) | 85,397,021 |
4,266,296 | Federal Home Loan Mortgage Corp., 2.500%, with various maturities from 2050 to 2051(e) | 33,075,276 |
1,024,131 | Federal Home Loan Mortgage Corp., 3.000%, with various maturities from 2042 to 2052(e) | 44,948,902 |
572,862 | Federal Home Loan Mortgage Corp., 3.500%, with various maturities from 2043 to 2052(e) | 13,595,211 |
866,706 | Federal Home Loan Mortgage Corp., 4.000%, with various maturities from 2044 to 2052(e) | 52,901,667 |
564,502 | Federal Home Loan Mortgage Corp., 4.500%, with various maturities from 2041 to 2052(e) | 22,801,600 |
1,277,293 | Federal Home Loan Mortgage Corp., 5.000%, with various maturities in 2048(e) | 11,658,994 |
1,643,062 | Federal Home Loan Mortgage Corp., 5.500%, with various maturities in 2053(e) | 28,645,852 |
Principal Amount (‡) | Description | Value (†) |
Mortgage Related — continued | ||
$3,683 | Federal Home Loan Mortgage Corp., 6.000%, with various maturities from 2035 to 2053(e) | $55,063,916 |
1,403,236 | Federal Home Loan Mortgage Corp., 6.500%, with various maturities in 2053(e) | 35,202,027 |
1,078,300 | Federal Home Loan Mortgage Corp., 7.000%, 9/01/2053 | 1,109,394 |
56,831,939 | Federal National Mortgage Association, 2.000%, with various maturities from 2037 to 2052(e) | 201,522,301 |
384,669 | Federal National Mortgage Association, 2.500%, with various maturities from 2045 to 2062(e) | 532,125,278 |
3,065,405 | Federal National Mortgage Association, 3.000%, with various maturities from 2045 to 2052(e) | 51,505,125 |
132,478 | Federal National Mortgage Association, 3.500%, with various maturities from 2043 to 2052(e) | 98,943,994 |
2,966,990 | Federal National Mortgage Association, 4.000%, with various maturities from 2041 to 2052(e) | 33,556,063 |
68,029 | Federal National Mortgage Association, 4.500%, with various maturities from 2043 to 2053(e) | 16,379,055 |
1,650,296 | Federal National Mortgage Association, 5.000%, with various maturities from 2048 to 2053(e) | 11,740,699 |
2,802,766 | Federal National Mortgage Association, 5.500%, with various maturities from 2050 to 2053(e) | 8,282,661 |
16,951 | Federal National Mortgage Association, 6.000%, with various maturities from 2034 to 2053(e) | 56,458,504 |
1,699 | Federal National Mortgage Association, 6.500%, with various maturities from 2029 to 2053(e) | 22,540,231 |
9,228 | Federal National Mortgage Association, 7.000%, with various maturities in 2030(e) | 15,511 |
128 | Federal National Mortgage Association, 7.500%, with various maturities from 2024 to 2032(e) | 8,223 |
4,506 | Government National Mortgage Association, 3.659%, 7/20/2063(b) | 4,335 |
1,136 | Government National Mortgage Association, 3.890%, 12/20/2062(b) | 1,068 |
3,034,689 | Government National Mortgage Association, 4.344%, 11/20/2066(b) | 2,957,443 |
5,068,619 | Government National Mortgage Association, 4.387%, 12/20/2066(b) | 4,895,133 |
1,243,325 | Government National Mortgage Association, 4.388%, 12/20/2063(b) | 1,223,509 |
17,654 | Government National Mortgage Association, 4.390%, 11/20/2062(b) | 16,682 |
2,226,838 | Government National Mortgage Association, 4.393%, 2/20/2066(b) | 2,158,849 |
945,649 | Government National Mortgage Association, 4.408%, 6/20/2064(b) | 923,177 |
1,078,380 | Government National Mortgage Association, 4.412%, 2/20/2066(b) | 1,045,030 |
2,302 | Government National Mortgage Association, 4.422%, 5/20/2063(b) | 2,231 |
Loomis Sayles Core Plus Bond Fund (continued)
Principal Amount (‡) | Description | Value (†) |
Mortgage Related — continued | ||
$1,352,570 | Government National Mortgage Association, 4.426%, 10/20/2066(b) | $1,307,305 |
1,502,470 | Government National Mortgage Association, 4.450%, 6/20/2066(b) | 1,463,195 |
1,655,802 | Government National Mortgage Association, 4.496%, 9/20/2066(b) | 1,607,850 |
2,429,693 | Government National Mortgage Association, 4.507%, 6/20/2066(b) | 2,363,238 |
2,281,143 | Government National Mortgage Association, 4.510%, 12/20/2064(b) | 2,236,273 |
2,771,897 | Government National Mortgage Association, 4.544%, 10/20/2064(b) | 2,711,563 |
502,409 | Government National Mortgage Association, 4.557%, 1/20/2064(b) | 497,650 |
2,086,966 | Government National Mortgage Association, 4.574%, 2/20/2065(b) | 2,040,799 |
741,756 | Government National Mortgage Association, 4.600%, 1/20/2065(b) | 726,495 |
1,068,797 | Government National Mortgage Association, 4.605%, 3/20/2065(b) | 1,044,424 |
2,828,840 | Government National Mortgage Association, 4.609%, with various maturities from 2065 to 2066(b)(e) | 3,788,203 |
2,273,941 | Government National Mortgage Association, 4.615%, 3/20/2066(b) | 2,204,569 |
1,738,726 | Government National Mortgage Association, 4.634%, 12/20/2064(b) | 1,707,270 |
1,264,577 | Government National Mortgage Association, 4.654%, 6/20/2064(b) | 1,239,608 |
2,680 | Government National Mortgage Association, 4.657%, 5/20/2063(b) | 2,612 |
4,368,692 | Government National Mortgage Association, 4.659%, 12/20/2066(b) | 4,235,444 |
3,470 | Government National Mortgage Association, 4.677%, 8/20/2061(b) | 3,389 |
2,058,014 | Government National Mortgage Association, 4.692%, 1/20/2065(b) | 2,012,273 |
42,664 | Government National Mortgage Association, 4.700%, with various maturities from 2062 to 2066(b)(e) | 1,163,840 |
1,459,723 | Government National Mortgage Association, 4.730%, 1/20/2064(b) | 1,438,425 |
72,333 | Government National Mortgage Association, 5.500%, 4/15/2038 | 71,700 |
9,351 | Government National Mortgage Association, 6.000%, with various maturities from 2029 to 2038(e) | 13,535 |
2,505 | Government National Mortgage Association, 6.500%, with various maturities from 2029 to 2032(e) | 15,402 |
10,448 | Government National Mortgage Association, 7.000%, 9/15/2025 | 10,404 |
1,124 | Government National Mortgage Association, 7.500%, with various maturities from 2025 to 2030(e) | 1,530 |
155,178,000 | Uniform Mortgage-Backed Security, TBA, 3.500%, 11/01/2053(f) | 133,562,190 |
1,630,618,866 | ||
Natural Gas — 0.0% | ||
2,701,000 | Boston Gas Co., 3.001%, 8/01/2029(a) | 2,287,828 |
Principal Amount (‡) | Description | Value (†) |
Non-Agency Commercial Mortgage-Backed Securities — 2.0% | ||
$22,085,000 | AOA Mortgage Trust, Series 2021-1177, Class A, 1 mo. USD SOFR + 0.989%, 6.322%, 10/15/2038(a)(c) | $20,383,925 |
1,531,640 | BANK, Series 2019-BN16, Class A4, 4.005%, 2/15/2052 | 1,390,522 |
3,409,380 | BANK, Series 2019-BN20, Class A3, 3.011%, 9/15/2062 | 2,837,231 |
12,696,152 | BANK, Series 2019-BN22, Class A4, 2.978%, 11/15/2062 | 10,713,545 |
6,138,240 | BANK, Series 2019-BN24, Class A3, 2.960%, 11/15/2062 | 5,187,419 |
7,135,000 | BPR Trust, Series 2021-NRD, Class A, 1 mo. USD SOFR + 1.525%, 6.858%, 12/15/2038(a)(c) | 6,730,865 |
14,179,842 | Citigroup Commercial Mortgage Trust, Series 2019-C7, Class A4, 3.102%, 12/15/2072 | 11,999,706 |
7,070,071 | Citigroup Commercial Mortgage Trust, Series 2019-GC43, Class A4, 3.038%, 11/10/2052 | 5,918,720 |
8,877,514 | Citigroup Commercial Mortgage Trust, Series 2020-GC46, Class A5, 2.717%, 2/15/2053 | 7,283,610 |
735,606 | Commercial Mortgage Trust, Series 2010-C1, Class D, 5.985%, 7/10/2046(a)(b) | 684,116 |
2,112,208 | Credit Suisse Mortgage Trust, Series 2014-USA, Class A1, 3.304%, 9/15/2037(a) | 1,761,255 |
11,367,000 | Credit Suisse Mortgage Trust, Series 2014-USA, Class A2, 3.953%, 9/15/2037(a) | 9,699,756 |
8,025,000 | DC Commercial Mortgage Trust, Series 2023-DC, Class A, 6.314%, 9/12/2040(a) | 7,999,739 |
7,694,197 | Extended Stay America Trust, Series 2021-ESH, Class A, 1 mo. USD SOFR + 1.194%, 6.527%, 7/15/2038(a)(c) | 7,628,986 |
1,411,474 | Extended Stay America Trust, Series 2021-ESH, Class D, 1 mo. USD SOFR + 2.364%, 7.697%, 7/15/2038(a)(c) | 1,388,437 |
5,627,003 | GS Mortgage Securities Trust, Series 2011-GC5, Class C, 5.299%, 8/10/2044(a)(b) | 3,939,007 |
2,317,554 | GS Mortgage Securities Trust, Series 2014-GC18, Class B, 4.885%, 1/10/2047(b) | 1,927,569 |
6,596,065 | GS Mortgage Securities Trust, Series 2020-GC45, Class A5, 2.911%, 2/13/2053 | 5,515,603 |
8,330,022 | Med Trust, Series 2021-MDLN, Class A, 1 mo. USD SOFR + 1.064%, 6.397%, 11/15/2038(a)(c) | 8,120,961 |
845,294 | Morgan Stanley Bank of America Merrill Lynch Trust, Series 2013-C11, Class A4, 4.020%, 8/15/2046(b) | 838,954 |
4,982,141 | WFRBS Commercial Mortgage Trust, Series 2011-C4, Class D, 4.993%, 6/15/2044(a)(b) | 4,205,076 |
5,245,978 | WFRBS Commercial Mortgage Trust, Series 2014-C20, Class AS, 4.176%, 5/15/2047 | 4,912,691 |
131,067,693 | ||
Other REITs — 0.0% | ||
3,790,000 | EPR Properties, 3.600%, 11/15/2031 | 2,809,412 |
Paper — 0.2% | ||
11,175,000 | Klabin Austria GmbH, 7.000%, 4/03/2049(a) | 10,548,579 |
Pharmaceuticals — 0.4% | ||
12,370,000 | Amgen, Inc., 5.750%, 3/02/2063 | 11,411,085 |
Loomis Sayles Core Plus Bond Fund (continued)
Principal Amount (‡) | Description | Value (†) |
Pharmaceuticals — continued | ||
$10,284,000 | Teva Pharmaceutical Finance Netherlands III BV, 3.150%, 10/01/2026 | $9,165,825 |
7,588,000 | Teva Pharmaceutical Finance Netherlands III BV, 7.125%, 1/31/2025 | 7,614,232 |
1,903,000 | Viatris, Inc., 4.000%, 6/22/2050 | 1,150,427 |
29,341,569 | ||
Property & Casualty Insurance — 0.1% | ||
2,585,000 | Ascot Group Ltd., 4.250%, 12/15/2030(a) | 1,907,705 |
5,865,000 | Liberty Mutual Group, Inc., 3.950%, 5/15/2060(a) | 3,679,049 |
5,586,754 | ||
Refining — 0.2% | ||
1,000,000 | Thaioil Treasury Center Co. Ltd., 3.750%, 6/18/2050(a) | 602,387 |
19,664,000 | Thaioil Treasury Center Co. Ltd., 4.875%, 1/23/2043(a) | 15,020,936 |
15,623,323 | ||
Retailers — 0.4% | ||
3,081,000 | Alibaba Group Holding Ltd., 3.250%, 2/09/2061 | 1,645,608 |
12,355,000 | Dick's Sporting Goods, Inc., 4.100%, 1/15/2052 | 7,505,709 |
4,907,000 | El Puerto de Liverpool SAB de CV, 3.875%, 10/06/2026(a) | 4,596,525 |
8,985,000 | Falabella SA, 3.375%, 1/15/2032(a) | 6,608,118 |
6,632,000 | Lithia Motors, Inc., 4.375%, 1/15/2031(a) | 5,486,767 |
4,582,000 | MercadoLibre, Inc., 3.125%, 1/14/2031 | 3,605,537 |
29,448,264 | ||
Sovereigns — 0.2% | ||
4,185,000 | Panama Government International Bonds, 6.853%, 3/28/2054 | 3,886,057 |
14,320,000 | Republic of South Africa Government International Bonds, 7.300%, 4/20/2052 | 11,315,234 |
15,201,291 | ||
Technology — 1.6% | ||
3,175,000 | Baidu, Inc., 2.375%, 10/09/2030 | 2,509,742 |
4,515,000 | Baidu, Inc., 3.075%, 4/07/2025 | 4,372,236 |
5,890,000 | Broadcom, Inc., 3.137%, 11/15/2035(a) | 4,294,291 |
11,954,000 | Corning, Inc., 5.450%, 11/15/2079 | 10,039,054 |
2,133,000 | Equifax, Inc., 2.600%, 12/15/2025 | 1,984,396 |
4,324,000 | Equifax, Inc., 7.000%, 7/01/2037 | 4,331,663 |
15,011,000 | Hewlett Packard Enterprise Co., 6.200%, 10/15/2035 | 15,083,481 |
12,714,000 | Iron Mountain, Inc., 4.500%, 2/15/2031(a) | 10,456,800 |
5,460,000 | Jabil, Inc., 3.000%, 1/15/2031 | 4,423,910 |
2,250,000 | Jabil, Inc., 5.450%, 2/01/2029 | 2,188,010 |
6,151,000 | Molex Electronic Technologies LLC, 3.900%, 4/15/2025(a) | 5,886,683 |
14,161,000 | Oracle Corp., 4.100%, 3/25/2061 | 9,444,868 |
4,505,000 | Qorvo, Inc., 1.750%, 12/15/2024(a) | 4,232,755 |
3,513,000 | Sabre Global, Inc., 8.625%, 6/01/2027(a) | 2,978,344 |
39,000 | Science Applications International Corp., 4.875%, 4/01/2028(a) | 35,394 |
4,204,000 | Sensata Technologies, Inc., 3.750%, 2/15/2031(a) | 3,402,402 |
13,563,000 | Tencent Holdings Ltd., 3.290%, 6/03/2060(a) | 7,344,033 |
13,307,000 | Ziff Davis, Inc., 4.625%, 10/15/2030(a) | 11,266,364 |
104,274,426 | ||
Tobacco — 0.4% | ||
26,019,000 | BAT Capital Corp., 2.789%, 9/06/2024 | 25,246,929 |
Principal Amount (‡) | Description | Value (†) |
Treasuries — 33.3% | ||
6,545,647(g ) | Mexico Bonos, Series M, 5.750%, 3/05/2026, (MXN) | 33,674,917 |
12,930,849(g ) | Mexico Bonos, Series M 20, 8.500%, 5/31/2029, (MXN) | 69,679,302 |
154,795,000 | U.S. Treasury Bonds, 1.750%, 8/15/2041 | 96,396,168 |
241,735,000 | U.S. Treasury Bonds, 2.000%, 11/15/2041 | 156,872,795 |
71,990,000 | U.S. Treasury Bonds, 2.375%, 2/15/2042 | 49,760,276 |
46,925,000 | U.S. Treasury Bonds, 3.250%, 5/15/2042 | 37,393,359 |
91,165,000 | U.S. Treasury Bonds, 3.375%, 8/15/2042 | 73,865,017 |
61,645,000 | U.S. Treasury Bonds, 3.625%, 2/15/2053 | 50,982,341 |
25,855,000 | U.S. Treasury Bonds, 3.625%, 5/15/2053 | 21,407,132 |
15,860,000 | U.S. Treasury Bonds, 3.875%, 2/15/2043 | 13,803,156 |
84,395,000 | U.S. Treasury Bonds, 3.875%, 5/15/2043 | 73,370,903 |
30,715,000 | U.S. Treasury Bonds, 4.125%, 8/15/2053 | 27,883,461 |
33,540,000 | U.S. Treasury Notes, 2.750%, 7/31/2027 | 31,243,296 |
45,850,000 | U.S. Treasury Notes, 2.750%, 8/15/2032 | 39,703,234 |
1,135,000 | U.S. Treasury Notes, 2.875%, 5/15/2032 | 996,273 |
175,885,000 | U.S. Treasury Notes, 3.125%, 8/31/2029 | 162,089,020 |
160,115,000 | U.S. Treasury Notes, 3.375%, 5/15/2033 | 145,204,291 |
41,465,000 | U.S. Treasury Notes, 3.500%, 1/31/2028 | 39,571,540 |
25,800,000 | U.S. Treasury Notes, 3.500%, 4/30/2028 | 24,590,625 |
21,635,000 | U.S. Treasury Notes, 3.500%, 1/31/2030 | 20,278,587 |
127,735,000 | U.S. Treasury Notes, 3.500%, 2/15/2033 | 117,196,862 |
31,760,000 | U.S. Treasury Notes, 3.625%, 3/31/2028 | 30,447,419 |
31,255,000 | U.S. Treasury Notes, 3.625%, 5/31/2028 | 29,955,964 |
12,305,000 | U.S. Treasury Notes, 3.625%, 3/31/2030 | 11,606,595 |
3,655,000 | U.S. Treasury Notes, 3.750%, 6/30/2030 | 3,469,109 |
14,275,000 | U.S. Treasury Notes, 3.875%, 11/30/2027 | 13,837,828 |
33,275,000 | U.S. Treasury Notes, 3.875%, 12/31/2027 | 32,249,454 |
150,610,000 | U.S. Treasury Notes, 3.875%, 9/30/2029 | 144,473,819 |
30,770,000 | U.S. Treasury Notes, 3.875%, 11/30/2029 | 29,491,122 |
60,010,000 | U.S. Treasury Notes, 3.875%, 12/31/2029 | 57,485,361 |
128,115,000 | U.S. Treasury Notes, 3.875%, 8/15/2033 | 121,048,657 |
10,015,000 | U.S. Treasury Notes, 4.000%, 6/30/2028 | 9,747,803 |
10,050,000 | U.S. Treasury Notes, 4.125%, 9/30/2027 | 9,840,756 |
19,250,000 | U.S. Treasury Notes, 4.125%, 10/31/2027 | 18,840,186 |
17,846,000 | U.S. Treasury Notes, 4.125%, 7/31/2028 | 17,461,196 |
235,490,000 | U.S. Treasury Notes, 4.125%, 11/15/2032 | 227,119,065 |
88,215,000 | U.S. Treasury Notes, 4.625%, 9/30/2028 | 88,270,134 |
4,053,612,000 | Uruguay Government International Bonds, 8.250%, 5/21/2031, (UYU) | 98,389,009 |
213,447,000 | Uruguay Government International Bonds, 8.500%, 3/15/2028, (UYU)(a) | 5,349,077 |
93,095,000 | Uruguay Government International Bonds, 8.500%, 3/15/2028, (UYU) | 2,333,002 |
2,237,378,111 | ||
Wireless — 0.8% | ||
17,567,000 | Bharti Airtel Ltd., 4.375%, 6/10/2025(a) | 17,121,095 |
983,000 | Crown Castle, Inc., 4.150%, 7/01/2050 | 700,152 |
3,360,000 | Empresa Nacional de Telecomunicaciones SA, 3.050%, 9/14/2032(a) | 2,562,000 |
8,085,000 | Kenbourne Invest SA, 4.700%, 1/22/2028(a) | 5,030,245 |
5,452,000 | Millicom International Cellular SA, 4.500%, 4/27/2031(a) | 3,893,555 |
14,210,000 | SBA Communications Corp., 3.125%, 2/01/2029 | 11,852,167 |
16,530,000 | Sitios Latinoamerica SAB de CV, 5.375%, 4/04/2032(a) | 14,213,816 |
55,373,030 | ||
Wirelines — 0.6% | ||
18,528,000 | AT&T, Inc., 1.700%, 3/25/2026 | 16,811,229 |
7,956,000 | AT&T, Inc., 3.500%, 9/15/2053 | 4,915,607 |
Loomis Sayles Core Plus Bond Fund (continued)
Principal Amount (‡) | Description | Value (†) |
Wirelines — continued | ||
$2,905,000 | AT&T, Inc., 3.550%, 9/15/2055 | $1,778,319 |
1,863,000 | AT&T, Inc., 3.650%, 6/01/2051 | 1,201,251 |
11,891,000 | AT&T, Inc., 3.650%, 9/15/2059 | 7,235,055 |
7,539,000 | AT&T, Inc., 3.800%, 12/01/2057 | 4,776,151 |
36,717,612 | ||
Total Non-Convertible Bonds (Identified Cost $6,983,349,225) | 6,158,305,676 | |
Municipals — 0.1% | ||
Virginia — 0.1% | ||
12,785,000 | University of Virginia, 3.227%, 9/01/2119 (Identified Cost $12,785,000) | 7,354,441 |
Total Bonds and Notes (Identified Cost $6,996,134,225) | 6,165,660,117 | |
Collateralized Loan Obligations — 3.1% | ||
2,390,000 | 37 Capital CLO 1 Ltd., Series 2021-1A, Class D, 3 mo. USD SOFR + 3.782%, 9.090%, 10/15/2034(a)(c) | 2,355,177 |
1,000,000 | 37 Capital CLO II Ltd., Series 2022-1A, Class C1, 3 mo. USD SOFR + 3.350%, 8.658%, 7/15/2034(a)(c) | 1,001,316 |
1,000,000 | AIMCO CLO 14 Ltd., Series 2021-14A, Class B, 3 mo. USD SOFR + 1.612%, 6.938%, 4/20/2034(a)(c) | 979,032 |
1,575,000 | Allegro CLO XII Ltd., Series 2020-1A, Class B, 3 mo. USD SOFR + 1.962%, 7.295%, 1/21/2032(a)(c) | 1,551,154 |
1,896,362 | AMMC CLO 16 Ltd., Series 2015-16A, Class BR2, 3 mo. USD SOFR + 1.712%, 7.023%, 4/14/2029(a)(c) | 1,896,386 |
4,275,000 | AMMC CLO 26 Ltd., Series 2023-26A, Class D, 3 mo. USD SOFR + 5.750%, 10.893%, 4/15/2036(a)(c) | 4,337,864 |
400,000 | ARES XXXVII CLO Ltd., Series 2015-4A, Class A3R, 3 mo. USD SOFR + 1.762%, 7.070%, 10/15/2030(a)(c) | 394,260 |
745,000 | Atrium IX, Series 9A, Class BR2, 3 mo. USD SOFR + 1.762%, 7.150%, 5/28/2030(a)(c) | 737,612 |
982,443 | Atrium XIII, Series 13A, Class A1, 3 mo. USD SOFR + 1.442%, 6.787%, 11/21/2030(a)(c) | 980,158 |
1,650,000 | Atrium XV, Series 15A, Class B, 3 mo. USD SOFR + 2.012%, 7.357%, 1/23/2031(a)(c) | 1,647,612 |
3,000,000 | Atrium XV, Series 15A, Class D, 3 mo. USD SOFR + 3.262%, 8.607%, 1/23/2031(a)(c) | 2,936,103 |
1,165,000 | Bain Capital Credit CLO Ltd., Series 2019-1A, Class CR, 3 mo. USD SOFR + 2.412%, 7.732%, 4/19/2034(a)(c) | 1,144,423 |
845,000 | Bain Capital Credit CLO Ltd., Series 2020-1A, Class B, 3 mo. USD SOFR + 1.962%, 7.272%, 4/18/2033(a)(c) | 837,937 |
1,750,000 | Bain Capital Credit CLO Ltd., Series 2021-7A, Class D, 3 mo. USD SOFR + 3.512%, 8.857%, 1/22/2035(a)(c) | 1,694,149 |
565,000 | Bain Capital Credit CLO Ltd., Series 2023-1A, Class B, 3 mo. USD SOFR + 2.250%, 6.993%, 4/16/2036(a)(c) | 552,916 |
2,250,000 | Bain Capital Credit CLO Ltd., Series 2023-1A, Class D, 3 mo. USD SOFR + 4.900%, 9.643%, 4/16/2036(a)(c) | 2,261,785 |
Principal Amount (‡) | Description | Value (†) |
$4,165,000 | Balboa Bay Loan Funding Ltd., Series 2021-1A, Class A, 3 mo. USD SOFR + 1.462%, 6.788%, 7/20/2034(a)(c) | $4,142,092 |
3,420,000 | Balboa Bay Loan Funding Ltd., Series 2023-1A, Class B, 3 mo. USD SOFR + 2.550%, 7.429%, 4/20/2035(a)(c) | 3,426,416 |
1,400,000 | Ballyrock CLO Ltd., Series 2019-1A, Class A2R, 3 mo. USD SOFR + 1.812%, 7.120%, 7/15/2032(a)(c) | 1,386,192 |
1,065,000 | Battalion CLO VIII, Series 2015-8A, Class BR2, 3 mo. USD SOFR + 2.262%, 7.572%, 7/18/2030(a)(c) | 1,056,003 |
5,000,000 | Battalion CLO X Ltd., Series 2016-10A, Class A1R2, 3 mo. USD SOFR + 1.432%, 6.777%, 1/25/2035(a)(c) | 4,939,940 |
400,000 | Battalion CLO XIX Ltd., Series 2021-19A, Class D, 3 mo. USD SOFR + 3.512%, 8.820%, 4/15/2034(a)(c) | 372,448 |
1,675,000 | Betony CLO 2 Ltd., Series 2018-1A, Class A2, 3 mo. USD SOFR + 1.862%, 7.231%, 4/30/2031(a)(c) | 1,660,201 |
1,865,000 | BlueMountain CLO XXIX Ltd., Series 2020-29A, Class BR, 3 mo. USD SOFR + 2.012%, 7.363%, 7/25/2034(a)(c) | 1,837,786 |
2,400,000 | Buttermilk Park CLO Ltd., Series 2018-1A, Class C, 3 mo. USD SOFR + 2.362%, 7.670%, 10/15/2031(a)(c) | 2,343,024 |
1,875,320 | Carbone CLO Ltd., Series 2017-1A, Class A1, 3 mo. USD SOFR + 1.402%, 6.728%, 1/20/2031(a)(c) | 1,873,253 |
545,000 | Carlyle Global Market Strategies CLO Ltd., Series 2015-5A, Class A2RR, 3 mo. USD SOFR + 1.912%, 7.238%, 1/20/2032(a)(c) | 537,569 |
3,975,000 | CarVal CLO II Ltd., Series 2019-1A, Class DR, 3 mo. USD SOFR + 3.462%, 8.788%, 4/20/2032(a)(c) | 3,860,150 |
3,515,000 | CarVal CLO III Ltd., Series 2019-2A, Class DR, 3 mo. USD SOFR + 3.212%, 8.538%, 7/20/2032(a)(c) | 3,460,888 |
525,000 | Cayuga Park CLO Ltd., Series 2020-1A, Class B1R, 3 mo. USD SOFR + 1.912%, 7.220%, 7/17/2034(a)(c) | 515,469 |
1,255,000 | CIFC Funding Ltd., Series 2017-1A, Class B, 3 mo. USD SOFR + 1.962%, 7.295%, 4/23/2029(a)(c) | 1,251,116 |
540,000 | CIFC Funding Ltd., Series 2019-3A, Class CR, 3 mo. USD SOFR + 3.312%, 8.620%, 10/16/2034(a)(c) | 537,814 |
2,500,000 | CIFC Funding Ltd., Series 2019-5A, Class CR, 3 mo. USD SOFR + 3.412%, 8.720%, 1/15/2035(a)(c) | 2,473,292 |
2,935,000 | CIFC Funding Ltd., Series 2020-1A, Class BR, 3 mo. USD SOFR + 1.912%, 7.220%, 7/15/2036(a)(c) | 2,888,342 |
4,500,000 | CIFC Funding Ltd., Series 2020-3A, Class DR, 3 mo. USD SOFR + 3.362%, 8.688%, 10/20/2034(a)(c) | 4,403,871 |
7,190,000 | CIFC Funding Ltd., Series 2021-7A, Class D, 3 mo. USD SOFR + 3.262%, 8.607%, 1/23/2035(a)(c) | 6,904,960 |
4,210,000 | Clover CLO LLC, Series 2018-1A, Class A1R, 3 mo. USD SOFR + 1.382%, 6.708%, 4/20/2032(a)(c) | 4,199,795 |
Loomis Sayles Core Plus Bond Fund (continued)
Principal Amount (‡) | Description | Value (†) |
$725,000 | Clover CLO Ltd., Series 2019-1A, Class BR, 3 mo. USD SOFR + 1.850%, 7.160%, 4/18/2035(a)(c) | $710,065 |
7,655,000 | Crown City CLO III, Series 2021-1A, Class A1A, 3 mo. USD SOFR + 1.432%, 6.758%, 7/20/2034(a)(c) | 7,567,871 |
633,374 | Dryden 30 Senior Loan Fund, Series 2013-30A, Class AR, 3 mo. USD SOFR + 1.082%, 6.446%, 11/15/2028(a)(c) | 631,450 |
5,450,000 | Dryden 78 CLO Ltd., Series 2020-78A, Class A, 3 mo. USD SOFR + 1.442%, 6.750%, 4/17/2033(a)(c) | 5,379,297 |
4,520,000 | Elmwood CLO III Ltd., Series 2019-3A, Class AR, 3 mo. USD SOFR + 1.422%, 6.748%, 10/20/2034(a)(c) | 4,500,713 |
2,700,000 | Elmwood CLO IV Ltd., Series 2020-1A, Class A, 3 mo. USD SOFR + 1.502%, 6.810%, 4/15/2033(a)(c) | 2,691,949 |
1,750,000 | Fortress Credit BSL XII Ltd., Series 2021-4A, Class D, 3 mo. USD SOFR + 3.912%, 9.220%, 10/15/2034(a)(c) | 1,733,478 |
500,000 | Generate CLO 9 Ltd., Series 9A, Class A, 3 mo. USD SOFR + 1.462%, 6.788%, 10/20/2034(a)(c) | 496,347 |
1,875,000 | GoldenTree Loan Management U.S. CLO 2 Ltd., Series 2017-2A, Class BR, 3 mo. USD SOFR + 1.662%, 6.988%, 11/20/2030(a)(c) | 1,859,539 |
1,518,000 | Greywolf CLO VI Ltd., Series 2018-1A, Class A2, 3 mo. USD SOFR + 1.890%, 7.241%, 4/26/2031(a)(c) | 1,509,504 |
2,575,000 | Hayfin U.S. XII Ltd., Series 2018-9A, Class BR, 3 mo. USD SOFR + 2.062%, 7.427%, 4/28/2031(a)(c) | 2,560,322 |
5,000,000 | Invesco U.S. CLO Ltd., Series 2023-2A, Class D, 3 mo. USD SOFR + 4.950%, 9.806%, 4/21/2036(a)(c) | 5,033,375 |
2,000,000 | LCM XX LP, Series 20A, Class BR, 3 mo. USD SOFR + 1.812%, 7.138%, 10/20/2027(a)(c) | 1,999,662 |
1,190,000 | Long Point Park CLO Ltd., Series 2017-1A, Class A2, 3 mo. USD SOFR + 1.637%, 6.945%, 1/17/2030(a)(c) | 1,172,401 |
3,155,000 | Madison Park Funding LIX Ltd., Series 2021-59A, Class A, 3 mo. USD SOFR + 1.402%, 6.712%, 1/18/2034(a)(c) | 3,136,367 |
680,000 | Madison Park Funding XXII Ltd., Series 2016-22A, Class BR, 3 mo. USD SOFR + 1.862%, 7.170%, 1/15/2033(a)(c) | 670,528 |
475,000 | Madison Park Funding XXXV Ltd., Series 2019-35A, Class CR, 3 mo. USD SOFR + 2.162%, 7.488%, 4/20/2032(a)(c) | 467,574 |
835,000 | Madison Park Funding XXXVIII Ltd., Series 2021-38A, Class B, 3 mo. USD SOFR + 1.912%, 7.220%, 7/17/2034(a)(c) | 824,074 |
1,410,903 | Magnetite XVIII Ltd., Series 2016-18A, Class AR2, 3 mo. USD SOFR + 1.142%, 6.506%, 11/15/2028(a)(c) | 1,407,197 |
1,250,000 | Magnetite XXI Ltd., Series 2019-21A, Class BR, 3 mo. USD SOFR + 1.612%, 6.938%, 4/20/2034(a)(c) | 1,224,033 |
465,000 | MP CLO VIII Ltd., Series 2015-2A, Class ARR, 3 mo. USD LIBOR + 1.200%, 6.827%, 4/28/2034(a)(c) | 456,307 |
Principal Amount (‡) | Description | Value (†) |
$1,345,000 | Neuberger Berman CLO XIV, Series 2013-14A, Class BR2, 3 mo. USD SOFR + 1.762%, 7.127%, 1/28/2030(a)(c) | $1,332,961 |
650,000 | Neuberger Berman CLO XIV Ltd., Series 2013-14A, Class CR2, 3 mo. USD SOFR + 2.162%, 7.527%, 1/28/2030(a)(c) | 642,511 |
3,410,000 | Neuberger Berman Loan Advisers CLO 40 Ltd., Series 2021-40A, Class B, 3 mo. USD SOFR + 1.662%, 6.970%, 4/16/2033(a)(c) | 3,359,399 |
2,745,000 | NYACK Park CLO Ltd., Series 2021-1A, Class D, 3 mo. USD SOFR + 3.062%, 8.388%, 10/20/2034(a)(c) | 2,582,996 |
1,750,000 | Octagon Investment Partners 31 Ltd., Series 2017-1A, Class B1R, 3 mo. USD SOFR + 1.762%, 7.088%, 7/20/2030(a)(c) | 1,735,960 |
4,385,000 | Octagon Investment Partners 32 Ltd., Series 2017-1A, Class CR, 3 mo. USD SOFR + 2.312%, 7.620%, 7/15/2029(a)(c) | 4,294,915 |
4,000,000 | OHA Credit Funding 10 Ltd., Series 2021-10A, Class A, 3 mo. USD SOFR + 1.392%, 6.702%, 1/18/2036(a)(c) | 3,980,664 |
1,000,000 | OHA Credit Funding 16 Ltd., Series 2023-16A, Class B, 3 mo. USD SOFR + 2.250%, 6.745%, 10/20/2036(a)(c) | 1,000,000 |
8,880,000 | OHA Credit Funding 8 Ltd., Series 2021-8A, Class B1, 3 mo. USD SOFR + 1.762%, 7.072%, 1/18/2034(a)(c) | 8,795,010 |
1,280,000 | OHA Credit Partners XI Ltd., Series 2015-11A, Class BR, 3 mo. USD SOFR + 1.912%, 7.238%, 1/20/2032(a)(c) | 1,273,902 |
470,000 | OZLM Funding IV Ltd., Series 2013-4A, Class A2R, 3 mo. USD SOFR + 1.962%, 7.307%, 10/22/2030(a)(c) | 462,997 |
260,000 | Palmer Square CLO Ltd., Series 2015-2A, Class BR2, 3 mo. USD SOFR + 2.212%, 7.538%, 7/20/2030(a)(c) | 257,264 |
250,000 | Palmer Square CLO Ltd., Series 2019-1A, Class A2R, 3 mo. USD SOFR + 1.962%, 7.331%, 11/14/2034(a)(c) | 246,586 |
2,120,000 | Palmer Square Loan Funding Ltd., Series 2020-4A, Class C, 3 mo. USD SOFR + 3.862%, 9.253%, 11/25/2028(a)(c) | 2,118,453 |
1,250,000 | Palmer Square Loan Funding Ltd., Series 2021-1A, Class B, 3 mo. USD SOFR + 2.062%, 7.388%, 4/20/2029(a)(c) | 1,237,027 |
750,000 | Palmer Square Loan Funding Ltd., Series 2021-3A, Class A2, 3 mo. USD SOFR + 1.662%, 6.988%, 7/20/2029(a)(c) | 747,846 |
1,500,000 | Palmer Square Loan Funding Ltd., Series 2021-4A, Class A2, 3 mo. USD SOFR + 1.662%, 6.970%, 10/15/2029(a)(c) | 1,491,268 |
1,000,000 | Palmer Square Loan Funding Ltd., Series 2022-2A, Class A2, 3 mo. USD SOFR + 1.900%, 7.208%, 10/15/2030(a)(c) | 996,533 |
1,450,000 | Post CLO Ltd., Series 2021-1A, Class A, 3 mo. USD SOFR + 1.462%, 6.770%, 10/15/2034(a)(c) | 1,439,965 |
5,670,000 | Post CLO Ltd., Series 2021-1A, Class B, 3 mo. USD SOFR + 2.012%, 7.320%, 10/15/2034(a)(c) | 5,610,618 |
1,245,000 | Post CLO Ltd., Series 2022-1A, Class B, 3 mo. USD SOFR + 1.900%, 7.226%, 4/20/2035(a)(c) | 1,215,235 |
3,730,000 | PPM CLO 5 Ltd., Series 2021-5A, Class B, 3 mo. USD SOFR + 1.962%, 7.272%, 10/18/2034(a)(c) | 3,646,821 |
Loomis Sayles Core Plus Bond Fund (continued)
Principal Amount (‡) | Description | Value (†) |
$1,460,000 | Recette CLO Ltd., Series 2015-1A, Class BRR, 3 mo. USD SOFR + 1.662%, 6.988%, 4/20/2034(a)(c) | $1,433,136 |
750,000 | Regatta IX Funding Ltd., Series 2017-1A, Class B, 3 mo. USD SOFR + 2.062%, 7.370%, 4/17/2030(a)(c) | 749,575 |
3,250,000 | Riserva CLO Ltd., Series 2016-3A, Class DRR, 3 mo. USD SOFR + 3.512%, 8.822%, 1/18/2034(a)(c) | 3,125,736 |
1,495,000 | Rockford Tower CLO Ltd., Series 2017-1A, Class BR2A, 3 mo. USD SOFR + 1.912%, 7.238%, 4/20/2034(a)(c) | 1,458,223 |
2,750,000 | RR 26 Ltd., Series 2023-26A, Class A1, 3 mo. USD SOFR + 1.780%, 6.512%, 4/15/2038(a)(c) | 2,751,752 |
3,000,000 | Signal Peak CLO 1 Ltd., Series 2014-1A, Class AR3, 3 mo. USD SOFR + 1.422%, 6.730%, 4/17/2034(a)(c) | 2,974,992 |
1,000,000 | Signal Peak CLO Ltd., Series 2022-12A, Class B1, 3 mo. USD SOFR + 2.600%, 7.910%, 7/18/2034(a)(c) | 1,000,400 |
1,000,000 | Silver Creek CLO Ltd., Series 2014-1A, Class DR, 3 mo. USD SOFR + 3.612%, 8.938%, 7/20/2030(a)(c) | 1,002,516 |
2,085,000 | THL Credit Wind River CLO Ltd., Series 2017-4A, Class B, 3 mo. USD SOFR + 1.712%, 7.091%, 11/20/2030(a)(c) | 2,052,682 |
3,500,000 | TICP CLO V Ltd., Series 2016-5A, Class CR, 3 mo. USD SOFR + 2.462%, 7.770%, 7/17/2031(a)(c) | 3,480,071 |
1,880,000 | TICP CLO XII Ltd., Series 2018-12A, Class BR, 3 mo. USD SOFR + 1.912%, 7.220%, 7/15/2034(a)(c) | 1,845,258 |
5,000,000 | Trestles CLO IV Ltd., Series 2021-4A, Class A, 3 mo. USD SOFR + 1.432%, 6.765%, 7/21/2034(a)(c) | 4,952,880 |
1,000,000 | Trinitas CLO XVI Ltd., Series 2021-16A, Class A1, 3 mo. USD SOFR + 1.442%, 6.768%, 7/20/2034(a)(c) | 987,151 |
500,000 | Trinitas CLO XVIII Ltd., Series 2021-18A, Class A1, 3 mo. USD SOFR + 1.432%, 6.758%, 1/20/2035(a)(c) | 493,591 |
2,280,000 | Wellington Management CLO 1 Ltd., Series 2023-1A, Class C, 3 mo. USD SOFR + 3.100%, 9.400%, 10/20/2036(a)(c) | 2,280,401 |
250,000 | Wind River CLO Ltd., Series 2021-3A, Class A, 3 mo. USD SOFR + 1.412%, 6.738%, 7/20/2033(a)(c) | 247,703 |
Total Collateralized Loan Obligations (Identified Cost $203,861,428) | 204,715,556 | |
Short-Term Investments — 8.8% | ||
80,539,294 | Tri-Party Repurchase Agreement with Fixed Income Clearing Corporation, dated 9/29/2023 at 2.500% to be repurchased at $80,556,073 on 10/02/2023 collateralized by $58,545,500 U.S. Treasury Note, 0.750% due 8/31/2026 valued at $52,131,330; $33,072,800 U.S. Treasury Note, 1.375% due 8/31/2026 valued at $30,018,791; including accrued interest (Note 2 of Notes to Financial Statements) | 80,539,294 |
13,005,000 | Federal Home Loan Bank Discount Notes, 5.150%-5.220%, 10/05/2023(h)(i) | 12,999,446 |
Principal Amount (‡) | Description | Value (†) |
$28,525,000 | Federal Home Loan Bank Discount Notes, 5.220%-5.270%, 10/02/2023(h)(i)(j) | $28,525,000 |
73,300,000 | Federal Home Loan Bank Discount Notes, 5.250%, 10/10/2023(i) | 73,216,545 |
52,405,000 | Federal Home Loan Bank Discount Notes, 5.250%, 10/11/2023(i) | 52,336,178 |
71,255,000 | Federal Home Loan Bank Discount Notes, 5.250%, 10/16/2023(i) | 71,113,089 |
100,000,000 | Federal National Mortgage Association Discount Notes, 5.225%, 10/02/2023(i) | 100,000,000 |
40,890,000 | U.S. Treasury Bills, 5.251%–5.262%, 2/01/2024(h)(i)(k) | 40,155,224 |
126,320,000 | U.S. Treasury Bills, 5.266%–5.268%, 11/02/2023(h)(i) | 125,744,577 |
3,110,000 | U.S. Treasury Bills, 5.300%, 12/21/2023(i) | 3,073,278 |
Total Short-Term Investments (Identified Cost $587,663,098) | 587,702,631 | |
Total Investments — 103.7% (Identified Cost $7,787,658,751) | 6,958,078,304 | |
Other assets less liabilities — (3.7)% | (245,069,150 ) | |
Net Assets — 100.0% | $6,713,009,154 | |
(†) | See Note 2 of Notes to Financial Statements. |
(‡) | Principal Amount stated in U.S. dollars unless otherwise noted. |
(a) | All or a portion of these securities are exempt from registration under Rule 144A of the Securities Act of 1933. These securities may be resold in transactions exempt from registration, normally to qualified institutional buyers. At September 30, 2023, the value of Rule 144A holdings amounted to $1,401,270,934 or 20.9% of net assets. |
(b) | Variable rate security. The interest rate adjusts periodically based on; (i) changes in current interest rates and/or prepayments on underlying pools of assets, if applicable, (ii) reference to a base lending rate plus or minus a margin, and/or (iii) reference to a base lending rate adjusted by a multiplier and/or subject to certain floors or caps. Rate as of September 30, 2023 is disclosed. |
(c) | Variable rate security. Rate as of September 30, 2023 is disclosed. |
(d) | Level 3 security. Value has been determined using significant unobservable inputs. See Note 3 of Notes to Financial Statements. |
(e) | The Fund’s investment in mortgage related securities of Federal Home Loan Mortgage Corporation, Federal National Mortgage Association and Government National Mortgage Association are interests in separate pools of mortgages. All separate investments in securities of each issuer which have the same coupon rate have been aggregated for the purpose of presentation in the Portfolio of Investments. |
(f) | When-issued/delayed delivery. |
(g) | Amount shown represents units. One unit represents a principal amount of 100. |
(h) | The Fund's investment in U.S. Government/Agency securities is comprised of various lots with differing discount rates. These separate investments, which have the same maturity date, have been aggregated for the purpose of presentation in the Portfolio of Investments. |
(i) | Interest rate represents discount rate at time of purchase; not a coupon rate. |
Loomis Sayles Core Plus Bond Fund (continued)
(j) | Interest rate represents annualized yield at time of purchase; not a coupon rate. The Fund’s investment in this security is comprised of various lots with differing annualized yields. |
(k) | Security (or a portion thereof) has been pledged as collateral for open derivative contracts. |
ABS | Asset-Backed Securities |
EMTN | Euro Medium Term Note |
GMTN | Global Medium Term Note |
LIBOR | London Interbank Offered Rate |
MTN | Medium Term Note |
REITs | Real Estate Investment Trusts |
SOFR | Secured Overnight Financing Rate |
TBA | To Be Announced |
MXN | Mexican Peso |
UYU | Uruguayan Peso |
Financial Futures | Expiration Date | Contracts | Notional Amount | Value | Unrealized Appreciation (Depreciation) |
CBOT 10 Year U.S. Treasury Notes Futures | 12/19/2023 | 2,936 | $323,502,359 | $317,271,500 | $(6,230,859 ) |
CBOT 2 Year U.S. Treasury Notes Futures | 12/29/2023 | 654 | 132,903,087 | 132,572,953 | (330,134 ) |
CBOT 5 Year U.S. Treasury Notes Futures | 12/29/2023 | 4,776 | 507,700,124 | 503,196,375 | (4,503,749 ) |
CME Ultra Long Term U.S. Treasury Bond Futures | 12/19/2023 | 435 | 55,372,707 | 51,629,063 | (3,743,644 ) |
Ultra 10-Year U.S. Treasury Notes Futures | 12/19/2023 | 2,976 | 342,303,832 | 332,010,000 | (10,293,832 ) |
Total | $(25,102,218 ) |
Treasuries | 33.3 % |
Mortgage Related | 24.3 |
Banking | 7.2 |
ABS Car Loan | 2.6 |
Finance Companies | 2.0 |
Non-Agency Commercial Mortgage-Backed Securities | 2.0 |
Other Investments, less than 2% each | 20.4 |
Collateralized Loan Obligations | 3.1 |
Short-Term Investments | 8.8 |
Total Investments | 103.7 |
Other assets less liabilities (including futures contracts) | (3.7 ) |
Net Assets | 100.0 % |
Loomis Sayles Credit Income Fund
Principal Amount | Description | Value (†) |
Bonds and Notes — 88.6% of Net Assets | ||
Non-Convertible Bonds — 83.3% | ||
Aerospace & Defense — 0.8% | ||
$20,000 | Huntington Ingalls Industries, Inc., 4.200%, 5/01/2030 | $18,087 |
125,000 | Textron, Inc., 3.000%, 6/01/2030 | 105,183 |
20,000 | TransDigm, Inc., 6.250%, 3/15/2026(a) | 19,652 |
10,000 | TransDigm, Inc., 6.750%, 8/15/2028(a) | 9,845 |
152,767 | ||
Airlines — 0.6% | ||
66,193 | American Airlines Pass-Through Trust, Series 2016-3, Class A, 3.250%, 4/15/2030 | 56,628 |
9,698 | United Airlines Pass-Through Trust, Series 2020-1, Class B, 4.875%, 7/15/2027 | 9,329 |
55,000 | United Airlines Pass-Through Trust, Series 2023-1, Class A, 5.800%, 7/15/2037 | 53,481 |
119,438 | ||
Apartment REITs — 0.0% | ||
10,000 | American Homes 4 Rent LP, 2.375%, 7/15/2031 | 7,624 |
Automotive — 1.2% | ||
60,000 | Allison Transmission, Inc., 3.750%, 1/30/2031(a) | 48,504 |
70,000 | General Motors Co., 5.200%, 4/01/2045 | 54,426 |
40,000 | General Motors Co., 6.250%, 10/02/2043 | 35,838 |
5,000 | General Motors Financial Co., Inc., 3.100%, 1/12/2032 | 3,869 |
5,000 | General Motors Financial Co., Inc., 5.850%, 4/06/2030 | 4,789 |
90,000 | General Motors Financial Co., Inc., 6.000%, 1/09/2028 | 88,898 |
5,000 | General Motors Financial Co., Inc., Series C, (fixed rate to 9/30/2030, variable rate thereafter), 5.700%(b) | 4,273 |
240,597 | ||
Banking — 13.4% | ||
40,000 | Ally Financial, Inc., 2.200%, 11/02/2028 | 31,605 |
65,000 | Ally Financial, Inc., Series B, (fixed rate to 5/15/2026, variable rate thereafter), 4.700%(b) | 44,606 |
50,000 | Ally Financial, Inc., Series C, (fixed rate to 5/15/2028, variable rate thereafter), 4.700%(b) | 31,310 |
30,000 | Bank of America Corp., (fixed rate to 4/25/2033, variable rate thereafter), 5.288%, 4/25/2034 | 27,915 |
65,000 | Bank of America Corp., (fixed rate to 9/15/2033, variable rate thereafter), 5.872%, 9/15/2034 | 63,257 |
270,000 | Bank of America Corp., MTN, 4.250%, 10/22/2026 | 256,489 |
200,000 | Barclays PLC, (fixed rate to 5/09/2033, variable rate thereafter), 6.224%, 5/09/2034 | 189,458 |
200,000 | Barclays PLC, (fixed rate to 9/23/2030, variable rate thereafter), 3.564%, 9/23/2035 | 154,422 |
215,000 | Citigroup, Inc., 4.450%, 9/29/2027 | 201,852 |
250,000 | Credit Agricole SA, (fixed rate to 1/10/2028, variable rate thereafter), 4.000%, 1/10/2033(a) | 221,672 |
150,000 | Deutsche Bank AG, (fixed rate to 9/18/2030, variable rate thereafter), 3.547%, 9/18/2031 | 120,931 |
390,000 | Morgan Stanley, 3.625%, 1/20/2027 | 364,079 |
50,000 | Morgan Stanley, (fixed rate to 1/19/2033, variable rate thereafter), 5.948%, 1/19/2038 | 46,734 |
80,000 | Morgan Stanley, (fixed rate to 1/21/2027, variable rate thereafter), 2.475%, 1/21/2028 | 71,329 |
200,000 | NatWest Group PLC, (fixed rate to 6/14/2026, variable rate thereafter), 1.642%, 6/14/2027 | 176,626 |
115,000 | Santander Holdings USA, Inc., 3.244%, 10/05/2026 | 104,175 |
200,000 | Societe Generale SA, (fixed rate to 7/08/2030, variable rate thereafter), 3.653%, 7/08/2035(a) | 157,363 |
Principal Amount | Description | Value (†) |
Banking — continued | ||
$200,000 | Standard Chartered PLC, (fixed rate to 4/01/2030, variable rate thereafter), 4.644%, 4/01/2031(a) | $179,927 |
250,000 | UBS Group AG, (fixed rate to 8/12/2032, variable rate thereafter), 6.537%, 8/12/2033(a) | 247,650 |
2,691,400 | ||
Brokerage — 0.9% | ||
15,000 | Jefferies Financial Group, Inc., 6.250%, 1/15/2036 | 14,744 |
180,000 | Jefferies Financial Group, Inc., 6.500%, 1/20/2043 | 173,334 |
188,078 | ||
Building Materials — 1.1% | ||
260,000 | Cemex SAB de CV, 3.875%, 7/11/2031(a) | 217,780 |
Cable Satellite — 5.4% | ||
125,000 | CCO Holdings LLC/CCO Holdings Capital Corp., 4.250%, 2/01/2031(a) | 99,539 |
120,000 | CCO Holdings LLC/CCO Holdings Capital Corp., 4.500%, 8/15/2030(a) | 98,497 |
35,000 | CCO Holdings LLC/CCO Holdings Capital Corp., 4.750%, 2/01/2032(a) | 28,000 |
25,000 | CCO Holdings LLC/CCO Holdings Capital Corp., 5.125%, 5/01/2027(a) | 23,293 |
10,000 | CCO Holdings LLC/CCO Holdings Capital Corp., 5.500%, 5/01/2026(a) | 9,659 |
5,000 | Charter Communications Operating LLC/Charter Communications Operating Capital, 2.300%, 2/01/2032 | 3,644 |
20,000 | Charter Communications Operating LLC/Charter Communications Operating Capital, 2.800%, 4/01/2031 | 15,597 |
90,000 | Charter Communications Operating LLC/Charter Communications Operating Capital, 3.950%, 6/30/2062 | 51,052 |
5,000 | Charter Communications Operating LLC/Charter Communications Operating Capital, 4.400%, 4/01/2033 | 4,253 |
150,000 | Charter Communications Operating LLC/Charter Communications Operating Capital, 4.800%, 3/01/2050 | 104,890 |
200,000 | CSC Holdings LLC, 4.625%, 12/01/2030(a) | 106,330 |
200,000 | CSC Holdings LLC, 5.000%, 11/15/2031(a) | 107,195 |
15,000 | Directv Financing LLC/Directv Financing Co-Obligor, Inc., 5.875%, 8/15/2027(a) | 13,263 |
175,000 | DISH DBS Corp., 5.125%, 6/01/2029 | 97,016 |
175,000 | DISH DBS Corp., 5.250%, 12/01/2026(a) | 148,724 |
45,000 | DISH DBS Corp., 5.750%, 12/01/2028(a) | 34,594 |
200,000 | Time Warner Cable LLC, 4.500%, 9/15/2042 | 138,564 |
1,084,110 | ||
Chemicals — 0.9% | ||
15,000 | Celanese U.S. Holdings LLC, 6.330%, 7/15/2029 | 14,703 |
10,000 | Celanese U.S. Holdings LLC, 6.379%, 7/15/2032 | 9,635 |
15,000 | Celanese U.S. Holdings LLC, 6.700%, 11/15/2033 | 14,601 |
70,000 | CF Industries, Inc., 4.500%, 12/01/2026(a) | 66,978 |
15,000 | FMC Corp., 3.450%, 10/01/2029 | 12,631 |
60,000 | Hercules LLC, 6.500%, 6/30/2029 | 54,975 |
173,523 | ||
Construction Machinery — 1.6% | ||
200,000 | Ashtead Capital, Inc., 5.950%, 10/15/2033(a) | 189,871 |
90,000 | Caterpillar Financial Services Corp., MTN, 0.950%, 1/10/2024 | 88,851 |
20,000 | John Deere Capital Corp., MTN, 0.900%, 1/10/2024 | 19,743 |
35,000 | John Deere Capital Corp., MTN, 1.250%, 1/10/2025 | 33,166 |
331,631 | ||
Consumer Cyclical Services — 2.6% | ||
10,000 | Expedia Group, Inc., 2.950%, 3/15/2031 | 8,056 |
195,000 | Expedia Group, Inc., 3.250%, 2/15/2030 | 164,932 |
Loomis Sayles Credit Income Fund (continued)
Principal Amount | Description | Value (†) |
Consumer Cyclical Services — continued | ||
$50,000 | Go Daddy Operating Co. LLC/GD Finance Co., Inc., 3.500%, 3/01/2029(a) | $42,068 |
325,000 | Uber Technologies, Inc., 4.500%, 8/15/2029(a) | 290,503 |
25,000 | Uber Technologies, Inc., 7.500%, 9/15/2027(a) | 25,208 |
530,767 | ||
Diversified Manufacturing — 0.4% | ||
5,000 | Ingersoll Rand, Inc., 5.700%, 8/14/2033 | 4,825 |
5,000 | Nordson Corp., 5.600%, 9/15/2028 | 4,952 |
10,000 | Nordson Corp., 5.800%, 9/15/2033 | 9,768 |
55,000 | Veralto Corp., 5.450%, 9/18/2033(a) | 53,214 |
72,759 | ||
Electric — 0.8% | ||
15,000 | AES Corp., 2.450%, 1/15/2031 | 11,536 |
5,000 | AES Corp., 3.950%, 7/15/2030(a) | 4,310 |
60,000 | Calpine Corp., 3.750%, 3/01/2031(a) | 48,337 |
20,000 | IPALCO Enterprises, Inc., 4.250%, 5/01/2030 | 17,541 |
35,000 | NRG Energy, Inc., 4.450%, 6/15/2029(a) | 30,353 |
15,000 | Pacific Gas & Electric Co., 5.450%, 6/15/2027 | 14,436 |
25,000 | Southern Co., 5.700%, 3/15/2034 | 24,484 |
20,000 | Vistra Operations Co. LLC, 3.700%, 1/30/2027(a) | 18,243 |
169,240 | ||
Finance Companies — 7.2% | ||
150,000 | AerCap Ireland Capital DAC/AerCap Global Aviation Trust, 3.875%, 1/23/2028 | 136,034 |
20,000 | Air Lease Corp., 3.125%, 12/01/2030 | 16,285 |
60,000 | Air Lease Corp., MTN, 3.000%, 2/01/2030 | 49,350 |
40,000 | Air Lease Corp., Series B, (fixed rate to 6/15/2026, variable rate thereafter), 4.650%(b) | 35,225 |
125,000 | Aircastle Ltd., 4.125%, 5/01/2024 | 123,211 |
40,000 | Aircastle Ltd., 6.500%, 7/18/2028(a) | 39,227 |
15,000 | Aircastle Ltd., Series A, (fixed rate to 6/15/2026, variable rate thereafter), 5.250%(a)(b) | 11,795 |
40,000 | Ares Capital Corp., 2.875%, 6/15/2028 | 33,456 |
60,000 | Ares Capital Corp., 3.200%, 11/15/2031 | 45,909 |
35,000 | Aviation Capital Group LLC, 1.950%, 1/30/2026(a) | 31,466 |
35,000 | Aviation Capital Group LLC, 6.250%, 4/15/2028(a) | 34,187 |
30,000 | Aviation Capital Group LLC, 6.375%, 7/15/2030(a) | 29,051 |
30,000 | Barings BDC, Inc., 3.300%, 11/23/2026 | 26,322 |
115,000 | Blackstone Secured Lending Fund, 2.125%, 2/15/2027 | 97,501 |
50,000 | Blue Owl Capital Corp., 2.625%, 1/15/2027 | 42,943 |
70,000 | Blue Owl Capital Corp., 2.875%, 6/11/2028 | 57,559 |
60,000 | Blue Owl Technology Finance Corp., 2.500%, 1/15/2027 | 50,375 |
55,000 | GATX Corp., 5.450%, 9/15/2033 | 51,615 |
5,000 | GATX Corp., 6.050%, 3/15/2034 | 4,883 |
65,000 | Hercules Capital, Inc., 3.375%, 1/20/2027 | 56,832 |
35,000 | Nationstar Mortgage Holdings, Inc., 5.750%, 11/15/2031(a) | 28,953 |
60,000 | Navient Corp., 5.000%, 3/15/2027 | 53,932 |
10,000 | Oaktree Specialty Lending Corp., 2.700%, 1/15/2027 | 8,611 |
5,000 | OneMain Finance Corp., 3.500%, 1/15/2027 | 4,281 |
10,000 | OneMain Finance Corp., 5.375%, 11/15/2029 | 8,375 |
10,000 | OneMain Finance Corp., 7.125%, 3/15/2026 | 9,794 |
140,000 | Rocket Mortgage LLC/Rocket Mortgage Co-Issuer, Inc., 2.875%, 10/15/2026(a) | 123,297 |
75,000 | Rocket Mortgage LLC/Rocket Mortgage Co-Issuer, Inc., 3.625%, 3/01/2029(a) | 62,005 |
Principal Amount | Description | Value (†) |
Finance Companies — continued | ||
$160,000 | Rocket Mortgage LLC/Rocket Mortgage Co-Issuer, Inc., 3.875%, 3/01/2031(a) | $127,579 |
60,000 | Rocket Mortgage LLC/Rocket Mortgage Co-Issuer, Inc., 4.000%, 10/15/2033(a) | 45,311 |
1,445,364 | ||
Financial Other — 0.6% | ||
30,000 | Icahn Enterprises LP/Icahn Enterprises Finance Corp., 4.375%, 2/01/2029 | 23,990 |
120,000 | Icahn Enterprises LP/Icahn Enterprises Finance Corp., 5.250%, 5/15/2027 | 105,477 |
129,467 | ||
Food & Beverage — 1.5% | ||
30,000 | Central American Bottling Corp./CBC Bottling Holdco SL/Beliv Holdco SL, 5.250%, 4/27/2029(a) | 27,075 |
20,000 | JBS USA LUX SA/JBS USA Food Co./JBS USA Finance, Inc., 3.000%, 2/02/2029 | 16,784 |
10,000 | Pilgrim's Pride Corp., 3.500%, 3/01/2032 | 7,733 |
10,000 | Pilgrim's Pride Corp., 4.250%, 4/15/2031 | 8,342 |
50,000 | Pilgrim's Pride Corp., 5.875%, 9/30/2027(a) | 50,727 |
60,000 | Post Holdings, Inc., 4.625%, 4/15/2030(a) | 51,377 |
190,000 | Smithfield Foods, Inc., 3.000%, 10/15/2030(a) | 145,238 |
307,276 | ||
Gaming — 1.1% | ||
20,000 | GLP Capital LP/GLP Financing II, Inc., 3.250%, 1/15/2032 | 15,522 |
75,000 | Light & Wonder International, Inc., 7.000%, 5/15/2028(a) | 73,718 |
5,000 | Light & Wonder International, Inc., 7.250%, 11/15/2029(a) | 4,900 |
10,000 | Light & Wonder International, Inc., 7.500%, 9/01/2031(a) | 9,884 |
85,000 | VICI Properties LP/VICI Note Co., Inc., 3.875%, 2/15/2029(a) | 73,450 |
20,000 | VICI Properties LP/VICI Note Co., Inc., 4.250%, 12/01/2026(a) | 18,635 |
5,000 | VICI Properties LP/VICI Note Co., Inc., 4.500%, 9/01/2026(a) | 4,697 |
5,000 | VICI Properties LP/VICI Note Co., Inc., 4.625%, 6/15/2025(a) | 4,828 |
10,000 | VICI Properties LP/VICI Note Co., Inc., 5.625%, 5/01/2024(a) | 9,937 |
215,571 | ||
Health Insurance — 0.7% | ||
90,000 | Centene Corp., 2.500%, 3/01/2031 | 69,140 |
35,000 | Centene Corp., 2.625%, 8/01/2031 | 26,807 |
20,000 | Centene Corp., 3.000%, 10/15/2030 | 16,132 |
5,000 | Centene Corp., 3.375%, 2/15/2030 | 4,170 |
5,000 | Centene Corp., 4.625%, 12/15/2029 | 4,503 |
5,000 | Molina Healthcare, Inc., 3.875%, 11/15/2030(a) | 4,138 |
25,000 | Molina Healthcare, Inc., 3.875%, 5/15/2032(a) | 20,050 |
144,940 | ||
Healthcare — 1.6% | ||
20,000 | Bausch & Lomb Escrow Corp., 8.375%, 10/01/2028(a) | 20,059 |
75,000 | Cigna Group, 4.375%, 10/15/2028 | 70,966 |
10,000 | CVS Health Corp., 5.250%, 1/30/2031 | 9,608 |
83,188 | CVS Pass-Through Trust, Series 2014, 4.163%, 8/11/2036(a) | 71,148 |
Loomis Sayles Credit Income Fund (continued)
Principal Amount | Description | Value (†) |
Healthcare — continued | ||
$5,000 | Encompass Health Corp., 4.750%, 2/01/2030 | $4,424 |
165,000 | HCA, Inc., 4.125%, 6/15/2029 | 149,371 |
325,576 | ||
Home Construction — 0.5% | ||
75,000 | MDC Holdings, Inc., 3.966%, 8/06/2061 | 41,280 |
60,000 | PulteGroup, Inc., 6.000%, 2/15/2035 | 57,697 |
98,977 | ||
Independent Energy — 3.6% | ||
150,000 | Aker BP ASA, 4.000%, 1/15/2031(a) | 128,854 |
147,000 | Continental Resources, Inc., 2.875%, 4/01/2032(a) | 110,081 |
113,000 | Continental Resources, Inc., 5.750%, 1/15/2031(a) | 106,158 |
20,000 | Diamondback Energy, Inc., 3.125%, 3/24/2031 | 16,660 |
25,000 | Energian Israel Finance Ltd., 5.375%, 3/30/2028(a) | 22,421 |
40,000 | Energian Israel Finance Ltd., 5.875%, 3/30/2031(a) | 34,690 |
10,000 | EQT Corp., 3.125%, 5/15/2026(a) | 9,252 |
30,000 | EQT Corp., 3.625%, 5/15/2031(a) | 25,378 |
45,000 | EQT Corp., 3.900%, 10/01/2027 | 41,624 |
10,000 | EQT Corp., 5.000%, 1/15/2029 | 9,400 |
10,000 | EQT Corp., 5.700%, 4/01/2028 | 9,801 |
60,000 | EQT Corp., 7.000%, 2/01/2030 | 61,724 |
10,000 | Matador Resources Co., 6.875%, 4/15/2028(a) | 9,818 |
30,000 | Occidental Petroleum Corp., 5.550%, 3/15/2026 | 29,605 |
5,000 | Occidental Petroleum Corp., 8.875%, 7/15/2030 | 5,622 |
45,000 | Ovintiv, Inc., 5.375%, 1/01/2026 | 44,368 |
50,000 | Ovintiv, Inc., 6.500%, 8/15/2034 | 49,244 |
5,000 | Southwestern Energy Co., 4.750%, 2/01/2032 | 4,291 |
718,991 | ||
Industrial Other — 0.3% | ||
55,000 | Jacobs Engineering Group, Inc., 6.350%, 8/18/2028 | 54,840 |
20,000 | TopBuild Corp., 4.125%, 2/15/2032(a) | 16,237 |
71,077 | ||
Leisure — 1.3% | ||
40,000 | Carnival Corp., 5.750%, 3/01/2027(a) | 36,209 |
30,000 | Carnival Corp., 6.000%, 5/01/2029(a) | 25,590 |
10,000 | Carnival Corp., 7.000%, 8/15/2029(a) | 9,860 |
50,000 | Carnival Corp., 9.875%, 8/01/2027(a) | 52,196 |
30,000 | NCL Corp. Ltd., 5.875%, 3/15/2026(a) | 27,697 |
25,000 | NCL Corp. Ltd., 5.875%, 2/15/2027(a) | 23,744 |
10,000 | NCL Finance Ltd., 6.125%, 3/15/2028(a) | 8,825 |
60,000 | Royal Caribbean Cruises Ltd., 5.500%, 4/01/2028(a) | 55,020 |
35,000 | VOC Escrow Ltd., 5.000%, 2/15/2028(a) | 31,833 |
270,974 | ||
Life Insurance — 1.1% | ||
50,000 | Athene Global Funding, 1.608%, 6/29/2026(a) | 43,686 |
55,000 | Athene Global Funding, 1.716%, 1/07/2025(a) | 51,629 |
95,000 | Athene Global Funding, 2.550%, 11/19/2030(a) | 72,854 |
30,000 | Athene Holding Ltd., 3.500%, 1/15/2031 | 24,440 |
30,000 | CNO Financial Group, Inc., 5.250%, 5/30/2029 | 28,285 |
220,894 | ||
Lodging — 1.5% | ||
60,000 | Hilton Domestic Operating Co., Inc., 3.625%, 2/15/2032(a) | 48,372 |
40,000 | Hilton Domestic Operating Co., Inc., 4.000%, 5/01/2031(a) | 33,572 |
10,000 | Hilton Grand Vacations Borrower Escrow LLC/Hilton Grand Vacations Borrower Escrow, Inc., 4.875%, 7/01/2031(a) | 8,152 |
Principal Amount | Description | Value (†) |
Lodging — continued | ||
$25,000 | Hilton Grand Vacations Borrower Escrow LLC/Hilton Grand Vacations Borrower Escrow, Inc., 5.000%, 6/01/2029(a) | $21,686 |
40,000 | Marriott International, Inc., 5.550%, 10/15/2028 | 39,553 |
25,000 | Marriott International, Inc., Series FF, 4.625%, 6/15/2030 | 23,029 |
20,000 | Marriott International, Inc., Series HH, 2.850%, 4/15/2031 | 16,122 |
20,000 | Marriott Ownership Resorts, Inc., 4.500%, 6/15/2029(a) | 16,758 |
45,000 | Travel & Leisure Co., 4.500%, 12/01/2029(a) | 37,744 |
70,000 | Travel & Leisure Co., 4.625%, 3/01/2030(a) | 58,906 |
303,894 | ||
Media Entertainment — 1.8% | ||
85,000 | iHeartCommunications, Inc., 4.750%, 1/15/2028(a) | 64,981 |
90,000 | iHeartCommunications, Inc., 5.250%, 8/15/2027(a) | 71,326 |
135,000 | Netflix, Inc., 4.875%, 6/15/2030(a) | 127,806 |
5,000 | Netflix, Inc., 5.375%, 11/15/2029(a) | 4,879 |
5,000 | Netflix, Inc., 5.875%, 11/15/2028 | 5,028 |
15,000 | Netflix, Inc., 6.375%, 5/15/2029 | 15,488 |
15,000 | Warnermedia Holdings, Inc., 4.054%, 3/15/2029 | 13,364 |
60,000 | Warnermedia Holdings, Inc., 4.279%, 3/15/2032 | 50,929 |
353,801 | ||
Metals & Mining — 3.7% | ||
200,000 | Anglo American Capital PLC, 4.500%, 3/15/2028(a) | 188,465 |
50,000 | ArcelorMittal SA, 6.800%, 11/29/2032 | 49,657 |
20,000 | ArcelorMittal SA, 7.000%, 10/15/2039 | 20,035 |
25,000 | ATI, Inc., 5.875%, 12/01/2027 | 23,688 |
200,000 | First Quantum Minerals Ltd., 6.875%, 10/15/2027(a) | 191,875 |
45,000 | FMG Resources August 2006 Pty. Ltd., 4.375%, 4/01/2031(a) | 37,026 |
10,000 | Freeport-McMoRan, Inc., 4.250%, 3/01/2030 | 8,836 |
10,000 | Freeport-McMoRan, Inc., 4.625%, 8/01/2030 | 9,010 |
15,000 | Glencore Funding LLC, 2.500%, 9/01/2030(a) | 11,861 |
135,000 | Glencore Funding LLC, 3.875%, 10/27/2027(a) | 124,906 |
45,000 | Glencore Funding LLC, 5.700%, 5/08/2033(a) | 42,670 |
35,000 | Novelis Corp., 4.750%, 1/30/2030(a) | 30,291 |
10,000 | Volcan Cia Minera SAA, 4.375%, 2/11/2026(a) | 5,708 |
744,028 | ||
Midstream — 3.1% | ||
15,000 | Cheniere Energy Partners LP, 3.250%, 1/31/2032 | 11,922 |
75,000 | Cheniere Energy Partners LP, 4.000%, 3/01/2031 | 64,120 |
5,000 | Cheniere Energy Partners LP, 4.500%, 10/01/2029 | 4,527 |
25,000 | Cheniere Energy Partners LP, 5.950%, 6/30/2033(a) | 24,112 |
55,000 | DCP Midstream Operating LP, 3.250%, 2/15/2032 | 44,375 |
10,000 | DCP Midstream Operating LP, 5.125%, 5/15/2029 | 9,527 |
65,000 | Enbridge, Inc., 5.700%, 3/08/2033 | 62,270 |
55,000 | Energy Transfer LP, 4.000%, 10/01/2027 | 51,070 |
35,000 | Energy Transfer LP, 5.750%, 2/15/2033 | 33,644 |
5,000 | EnLink Midstream LLC, 6.500%, 9/01/2030(a) | 4,851 |
30,000 | EnLink Midstream Partners LP, 5.450%, 6/01/2047 | 23,440 |
35,000 | EQM Midstream Partners LP, Series 10Y, 5.500%, 7/15/2028 | 32,846 |
15,000 | Hess Midstream Operations LP, 4.250%, 2/15/2030(a) | 12,649 |
15,000 | Hess Midstream Operations LP, 5.625%, 2/15/2026(a) | 14,494 |
80,000 | NGPL PipeCo LLC, 4.875%, 8/15/2027(a) | 75,518 |
15,000 | Plains All American Pipeline LP/PAA Finance Corp., 3.800%, 9/15/2030 | 12,884 |
5,000 | Plains All American Pipeline LP/PAA Finance Corp., 4.300%, 1/31/2043 | 3,553 |
25,000 | Targa Resources Corp., 6.125%, 3/15/2033 | 24,508 |
Loomis Sayles Credit Income Fund (continued)
Principal Amount | Description | Value (†) |
Midstream — continued | ||
$15,000 | Targa Resources Partners LP/Targa Resources Partners Finance Corp., 4.000%, 1/15/2032 | $12,595 |
5,000 | Targa Resources Partners LP/Targa Resources Partners Finance Corp., 4.875%, 2/01/2031 | 4,478 |
45,000 | Venture Global Calcasieu Pass LLC, 3.875%, 11/01/2033(a) | 34,939 |
20,000 | Venture Global Calcasieu Pass LLC, 4.125%, 8/15/2031(a) | 16,412 |
10,000 | Western Midstream Operating LP, 4.050%, 2/01/2030 | 8,741 |
10,000 | Western Midstream Operating LP, 5.250%, 2/01/2050 | 7,790 |
20,000 | Western Midstream Operating LP, 5.300%, 3/01/2048 | 15,611 |
5,000 | Western Midstream Operating LP, 5.450%, 4/01/2044 | 4,031 |
5,000 | Western Midstream Operating LP, 6.150%, 4/01/2033 | 4,822 |
619,729 | ||
Natural Gas — 0.0% | ||
10,000 | Southern Co. Gas Capital Corp., 5.750%, 9/15/2033 | 9,803 |
Office REITs — 0.0% | ||
10,000 | Corporate Office Properties LP, 2.750%, 4/15/2031 | 7,505 |
Other REITs — 0.1% | ||
15,000 | EPR Properties, 3.600%, 11/15/2031 | 11,119 |
Paper — 0.2% | ||
45,000 | Suzano Austria GmbH, 3.750%, 1/15/2031 | 36,989 |
Pharmaceuticals — 1.7% | ||
85,000 | Bausch Health Cos., Inc., 4.875%, 6/01/2028(a) | 48,338 |
25,000 | Bausch Health Cos., Inc., 5.000%, 1/30/2028(a) | 10,180 |
50,000 | Teva Pharmaceutical Finance Co. LLC, 6.150%, 2/01/2036 | 44,339 |
85,000 | Teva Pharmaceutical Finance Netherlands III BV, 3.150%, 10/01/2026 | 75,758 |
250,000 | Teva Pharmaceutical Finance Netherlands III BV, 4.100%, 10/01/2046 | 156,492 |
335,107 | ||
Property & Casualty Insurance — 1.3% | ||
175,000 | Fidelity National Financial, Inc., 2.450%, 3/15/2031 | 134,934 |
40,000 | HUB International Ltd., 7.250%, 6/15/2030(a) | 39,927 |
65,000 | SiriusPoint Ltd., 4.600%, 11/01/2026(a) | 56,123 |
55,000 | Stewart Information Services Corp., 3.600%, 11/15/2031 | 40,417 |
271,401 | ||
Restaurants — 0.8% | ||
125,000 | 1011778 BC ULC/New Red Finance, Inc., 4.375%, 1/15/2028(a) | 112,669 |
45,000 | Yum! Brands, Inc., 4.625%, 1/31/2032 | 39,034 |
151,703 | ||
Retail REITs — 0.8% | ||
115,000 | Brixmor Operating Partnership LP, 4.050%, 7/01/2030 | 100,396 |
75,000 | SITE Centers Corp., 3.625%, 2/01/2025 | 71,396 |
171,792 | ||
Retailers — 0.3% | ||
65,000 | Lithia Motors, Inc., 3.875%, 6/01/2029(a) | 54,750 |
10,000 | Tapestry, Inc., 3.050%, 3/15/2032 | 7,326 |
62,076 | ||
Technology — 7.9% | ||
15,000 | Broadcom, Inc., 2.450%, 2/15/2031(a) | 11,724 |
15,000 | Broadcom, Inc., 2.600%, 2/15/2033(a) | 11,185 |
20,000 | Broadcom, Inc., 3.137%, 11/15/2035(a) | 14,582 |
30,000 | Broadcom, Inc., 3.419%, 4/15/2033(a) | 23,996 |
Principal Amount | Description | Value (†) |
Technology — continued | ||
$25,000 | Broadcom, Inc., 3.469%, 4/15/2034(a) | $19,635 |
30,000 | Broadcom, Inc., 4.150%, 11/15/2030 | 26,572 |
15,000 | Broadcom, Inc., 4.150%, 4/15/2032(a) | 13,017 |
55,000 | Broadcom, Inc., 4.300%, 11/15/2032 | 47,984 |
10,000 | CDW LLC/CDW Finance Corp., 2.670%, 12/01/2026 | 9,019 |
10,000 | CDW LLC/CDW Finance Corp., 3.250%, 2/15/2029 | 8,527 |
35,000 | CDW LLC/CDW Finance Corp., 3.276%, 12/01/2028 | 30,197 |
110,000 | CDW LLC/CDW Finance Corp., 3.569%, 12/01/2031 | 90,600 |
20,000 | CDW LLC/CDW Finance Corp., 4.250%, 4/01/2028 | 18,230 |
10,000 | CommScope Technologies LLC, 5.000%, 3/15/2027(a) | 5,675 |
105,000 | CommScope, Inc., 4.750%, 9/01/2029(a) | 77,232 |
65,000 | Entegris Escrow Corp., 4.750%, 4/15/2029(a) | 58,436 |
5,000 | Everi Holdings, Inc., 5.000%, 7/15/2029(a) | 4,303 |
85,000 | Fiserv, Inc., 5.625%, 8/21/2033 | 82,360 |
35,000 | Flex Ltd., 6.000%, 1/15/2028 | 34,822 |
5,000 | Gartner, Inc., 3.625%, 6/15/2029(a) | 4,277 |
25,000 | Global Payments, Inc., 2.900%, 5/15/2030 | 20,496 |
25,000 | Global Payments, Inc., 2.900%, 11/15/2031 | 19,612 |
15,000 | Global Payments, Inc., 5.300%, 8/15/2029 | 14,305 |
30,000 | Global Payments, Inc., 5.400%, 8/15/2032 | 28,121 |
60,000 | Iron Mountain, Inc., 5.250%, 7/15/2030(a) | 52,419 |
35,000 | Jabil, Inc., 1.700%, 4/15/2026 | 31,441 |
15,000 | Leidos, Inc., 2.300%, 2/15/2031 | 11,535 |
45,000 | Leidos, Inc., 5.750%, 3/15/2033 | 43,126 |
30,000 | Marvell Technology, Inc., 2.450%, 4/15/2028 | 25,914 |
25,000 | Marvell Technology, Inc., 2.950%, 4/15/2031 | 20,226 |
265,000 | Micron Technology, Inc., 4.663%, 2/15/2030 | 241,157 |
65,000 | Micron Technology, Inc., 5.875%, 9/15/2033 | 61,910 |
25,000 | MSCI, Inc., 3.250%, 8/15/2033(a) | 19,241 |
15,000 | Open Text Corp., 6.900%, 12/01/2027(a) | 15,034 |
60,000 | Oracle Corp., 3.950%, 3/25/2051 | 41,133 |
30,000 | Oracle Corp., 6.150%, 11/09/2029 | 30,455 |
55,000 | S&P Global, Inc., 4.250%, 5/01/2029 | 51,921 |
20,000 | S&P Global, Inc., 5.250%, 9/15/2033(a) | 19,495 |
60,000 | TD SYNNEX Corp., 1.750%, 8/09/2026 | 52,726 |
50,000 | Trimble, Inc., 6.100%, 3/15/2033 | 48,986 |
35,000 | Verisk Analytics, Inc., 4.125%, 3/15/2029 | 32,580 |
20,000 | Verisk Analytics, Inc., 5.750%, 4/01/2033 | 19,888 |
50,000 | VMware, Inc., 2.200%, 8/15/2031 | 37,732 |
30,000 | Western Digital Corp., 2.850%, 2/01/2029 | 24,085 |
30,000 | Western Digital Corp., 4.750%, 2/15/2026 | 28,585 |
1,584,496 | ||
Transportation Services — 0.5% | ||
45,000 | ERAC USA Finance LLC, 4.900%, 5/01/2033(a) | 42,370 |
60,000 | Rand Parent LLC, 8.500%, 2/15/2030(a) | 55,491 |
97,861 | ||
Treasuries — 7.1% | ||
135,000 | U.S. Treasury Bonds, 1.125%, 8/15/2040 | 76,739 |
255,000 | U.S. Treasury Bonds, 1.875%, 2/15/2051 | 142,919 |
155,000 | U.S. Treasury Bonds, 2.250%, 2/15/2052 | 95,119 |
415,000 | U.S. Treasury Bonds, 3.250%, 5/15/2042 | 330,703 |
785,000 | U.S. Treasury Notes, 4.625%, 6/30/2025 | 778,285 |
1,423,765 | ||
Wireless — 3.3% | ||
40,000 | American Tower Corp., 5.500%, 3/15/2028 | 39,243 |
60,000 | American Tower Corp., 5.900%, 11/15/2033 | 58,579 |
20,000 | Crown Castle, Inc., 5.100%, 5/01/2033 | 18,491 |
70,000 | SBA Communications Corp., 3.125%, 2/01/2029 | 58,385 |
55,000 | Sprint Capital Corp., 8.750%, 3/15/2032 | 63,627 |
130,000 | T-Mobile USA, Inc., 3.375%, 4/15/2029 | 114,340 |
Loomis Sayles Credit Income Fund (continued)
Principal Amount | Description | Value (†) |
Wireless — continued | ||
$65,000 | T-Mobile USA, Inc., 3.500%, 4/15/2031 | $54,962 |
265,000 | T-Mobile USA, Inc., 3.875%, 4/15/2030 | 234,782 |
25,000 | T-Mobile USA, Inc., 5.750%, 1/15/2034 | 24,388 |
666,797 | ||
Total Non-Convertible Bonds (Identified Cost $19,511,827) | 16,780,687 | |
Convertible Bonds — 5.3% | ||
Airlines — 0.4% | ||
10,000 | JetBlue Airways Corp., 0.500%, 4/01/2026 | 7,731 |
85,000 | Southwest Airlines Co., 1.250%, 5/01/2025 | 84,362 |
92,093 | ||
Cable Satellite — 1.2% | ||
350,000 | DISH Network Corp., 3.375%, 8/15/2026 | 210,350 |
45,000 | DISH Network Corp., Zero Coupon, 0.000%–29.314%, 12/15/2025(c) | 30,316 |
240,666 | ||
Consumer Cyclical Services — 0.3% | ||
65,000 | Uber Technologies, Inc., Zero Coupon, 0.000%–5.152%, 12/15/2025(c) | 60,698 |
Consumer Products — 0.1% | ||
20,000 | Beauty Health Co., 1.250%, 10/01/2026(a) | 15,550 |
Electric — 0.2% | ||
55,000 | PPL Capital Funding, Inc., 2.875%, 3/15/2028(a) | 50,050 |
Gaming — 0.1% | ||
10,000 | Penn Entertainment, Inc., 2.750%, 5/15/2026 | 12,137 |
Healthcare — 0.8% | ||
50,000 | Envista Holdings Corp., 1.750%, 8/15/2028(a) | 46,050 |
140,000 | Teladoc Health, Inc., 1.250%, 6/01/2027 | 111,566 |
157,616 | ||
Independent Energy — 0.1% | ||
20,000 | Northern Oil & Gas, Inc., 3.625%, 4/15/2029(a) | 24,706 |
Leisure — 0.2% | ||
40,000 | NCL Corp. Ltd., 1.125%, 2/15/2027 | 33,177 |
Media Entertainment — 0.2% | ||
25,000 | Snap, Inc., Zero Coupon, 6.709%–6.954%, 5/01/2027(c) | 18,525 |
25,000 | Spotify USA, Inc., Zero Coupon, 5.189%–5.777%, 3/15/2026(c) | 21,263 |
39,788 | ||
Pharmaceuticals — 1.2% | ||
195,000 | BioMarin Pharmaceutical, Inc., 1.250%, 5/15/2027 | 193,167 |
15,000 | Guardant Health, Inc., Zero Coupon, 0.000%, 11/15/2027(d) | 10,312 |
40,000 | Livongo Health, Inc., 0.875%, 6/01/2025 | 36,532 |
240,011 | ||
Retailers — 0.0% | ||
5,000 | Etsy, Inc., 0.250%, 6/15/2028 | 3,778 |
Technology — 0.5% | ||
60,000 | Splunk, Inc., 1.125%, 6/15/2027 | 56,610 |
40,000 | Unity Software, Inc., Zero Coupon, 7.084%–8.213%, 11/15/2026(c) | 31,660 |
Principal Amount | Description | Value (†) |
Technology — continued | ||
$5,000 | Wolfspeed, Inc., 0.250%, 2/15/2028 | $3,370 |
15,000 | Wolfspeed, Inc., 1.875%, 12/01/2029(a) | 9,757 |
101,397 | ||
Total Convertible Bonds (Identified Cost $1,352,444) | 1,071,667 | |
Total Bonds and Notes (Identified Cost $20,864,271) | 17,852,354 | |
Collateralized Loan Obligations — 3.6% | ||
250,000 | AIMCO CLO 14 Ltd., Series 2021-14A, Class D, 3 mo. USD SOFR + 3.162%, 8.488%, 4/20/2034(a)(e) | 240,186 |
250,000 | Fillmore Park CLO Ltd., Series 2018-1A, Class D, 3 mo. USD SOFR + 3.162%, 8.470%, 7/15/2030(a)(e) | 241,618 |
250,000 | Recette CLO Ltd., Series 2015-1A, Class DRR, 3 mo. USD SOFR + 3.512%, 8.838%, 4/20/2034(a)(e) | 237,088 |
Total Collateralized Loan Obligations (Identified Cost $750,000) | 718,892 | |
Shares | ||
Preferred Stocks — 0.9% | ||
Convertible Preferred Stocks — 0.9% | ||
Banking — 0.8% | ||
76 | Bank of America Corp., Series L, 7.250% | 84,528 |
71 | Wells Fargo & Co., Series L, Class A, 7.500% | 79,165 |
163,693 | ||
Technology — 0.1% | ||
638 | Clarivate PLC, Series A, 5.250% | 18,649 |
Total Convertible Preferred Stocks (Identified Cost $245,301) | 182,342 | |
Total Preferred Stocks (Identified Cost $245,301) | 182,342 | |
Principal Amount | ||
Short-Term Investments — 5.8% | ||
$226,141 | Tri-Party Repurchase Agreement with Fixed Income Clearing Corporation, dated 9/29/2023 at 2.500% to be repurchased at $226,188 on 10/02/2023 collateralized by $259,100 U.S. Treasury Note, 0.750% due 8/31/2026 valued at $230,713 including accrued interest (Note 2 of Notes to Financial Statements) | 226,141 |
325,000 | U.S. Treasury Bills, 5.115%, 12/14/2023(f) | 321,507 |
100,000 | U.S. Treasury Bills, 5.201%, 10/24/2023(f)(g) | 99,678 |
325,000 | U.S. Treasury Bills, 5.231%, 12/28/2023(f)(h) | 320,822 |
210,000 | U.S. Treasury Bills, 5.258%, 1/04/2024(f) | 207,091 |
Total Short-Term Investments (Identified Cost $1,175,322) | 1,175,239 | |
Total Investments — 98.9% (Identified Cost $23,034,894) | 19,928,827 | |
Other assets less liabilities — 1.1% | 217,729 | |
Net Assets — 100.0% | $20,146,556 | |
(†) | See Note 2 of Notes to Financial Statements. |
Loomis Sayles Credit Income Fund (continued)
(a) | All or a portion of these securities are exempt from registration under Rule 144A of the Securities Act of 1933. These securities may be resold in transactions exempt from registration, normally to qualified institutional buyers. At September 30, 2023, the value of Rule 144A holdings amounted to $7,510,399 or 37.3% of net assets. |
(b) | Perpetual bond with no specified maturity date. |
(c) | Interest rate represents annualized yield at time of purchase; not a coupon rate. The Fund’s investment in this security is comprised of various lots with differing annualized yields. |
(d) | Interest rate represents annualized yield at time of purchase; not a coupon rate. |
(e) | Variable rate security. Rate as of September 30, 2023 is disclosed. |
(f) | Interest rate represents discount rate at time of purchase; not a coupon rate. |
(g) | The Fund's investment in U.S. Government/Agency securities is comprised of various lots with differing discount rates. These separate investments, which have the same maturity date, have been aggregated for the purpose of presentation in the Portfolio of Investments. |
(h) | Security (or a portion thereof) has been pledged as collateral for open derivative contracts. |
MTN | Medium Term Note |
REITs | Real Estate Investment Trusts |
SOFR | Secured Overnight Financing Rate |
Financial Futures | Expiration Date | Contracts | Notional Amount | Value | Unrealized Appreciation (Depreciation) |
CBOT 10 Year U.S. Treasury Notes Futures | 12/19/2023 | 5 | $550,924 | $540,313 | $(10,611 ) |
CBOT 2 Year U.S. Treasury Notes Futures | 12/29/2023 | 12 | 2,438,612 | 2,432,531 | (6,081 ) |
CBOT 5 Year U.S. Treasury Notes Futures | 12/29/2023 | 13 | 1,381,543 | 1,369,672 | (11,871 ) |
CBOT U.S. Long Bond Futures | 12/19/2023 | 29 | 3,479,980 | 3,299,656 | (180,324 ) |
Total | $(208,887 ) |
Financial Futures | Expiration Date | Contracts | Notional Amount | Value | Unrealized Appreciation (Depreciation) |
CME Ultra Long Term U.S. Treasury Bond Futures | 12/19/2023 | 5 | $629,545 | $593,438 | $36,107 |
Ultra 10 Year U.S. Treasury Notes Futures | 12/19/2023 | 13 | 1,489,578 | 1,450,312 | 39,266 |
Total | $75,373 |
Banking | 14.2 % |
Technology | 8.5 |
Finance Companies | 7.2 |
Treasuries | 7.1 |
Cable Satellite | 6.6 |
Metals & Mining | 3.7 |
Independent Energy | 3.7 |
Wireless | 3.3 |
Midstream | 3.1 |
Consumer Cyclical Services | 2.9 |
Pharmaceuticals | 2.9 |
Healthcare | 2.4 |
Media Entertainment | 2.0 |
Other Investments, less than 2% each | 21.9 |
Collateralized Loan Obligations | 3.6 |
Short-Term Investments | 5.8 |
Total Investments | 98.9 |
Other assets less liabilities (including futures contracts) | 1.1 |
Net Assets | 100.0 % |
Loomis Sayles Global Allocation Fund
Shares | Description | Value (†) |
Common Stocks — 67.4% of Net Assets | ||
France — 2.9% | ||
69,259 | LVMH Moet Hennessy Louis Vuitton SE | $52,278,801 |
240,467 | Vinci SA | 26,603,110 |
78,881,911 | ||
Japan — 1.7% | ||
1,804,561 | Nomura Research Institute Ltd. | 46,903,634 |
Netherlands — 2.5% | ||
112,949 | ASML Holding NV | 66,498,724 |
Sweden — 2.4% | ||
4,791,849 | Atlas Copco AB, Class A | 64,357,728 |
Taiwan — 1.6% | ||
2,670,000 | Taiwan Semiconductor Manufacturing Co. Ltd. | 43,537,642 |
United Kingdom — 1.6% | ||
882,292 | Halma PLC | 20,787,435 |
210,147 | London Stock Exchange Group PLC | 21,062,158 |
41,849,593 | ||
United States — 54.7% | ||
232,454 | Accenture PLC, Class A | 71,388,948 |
76,707 | Adobe, Inc.(a) | 39,112,899 |
512,877 | Airbnb, Inc., Class A(a) | 70,371,853 |
675,169 | Alphabet, Inc., Class A(a) | 88,352,615 |
687,467 | Amazon.com, Inc.(a) | 87,390,805 |
69,934 | BlackRock, Inc. | 45,211,632 |
99,596 | Costco Wholesale Corp. | 56,267,756 |
211,968 | Cummins, Inc. | 48,426,209 |
239,200 | Danaher Corp. | 59,345,520 |
196,810 | Diamondback Energy, Inc. | 30,481,933 |
101,913 | Goldman Sachs Group, Inc. | 32,975,989 |
197,159 | Home Depot, Inc. | 59,573,563 |
227,810 | IQVIA Holdings, Inc.(a) | 44,821,618 |
305,368 | JPMorgan Chase & Co. | 44,284,467 |
201,645 | Linde PLC | 75,082,516 |
196,612 | Mastercard, Inc., Class A | 77,840,657 |
35,968 | Mettler-Toledo International, Inc.(a) | 39,855,062 |
427,035 | NIKE, Inc., Class B | 40,833,087 |
110,914 | NVIDIA Corp. | 48,246,481 |
37,295 | O'Reilly Automotive, Inc.(a) | 33,895,934 |
112,313 | Parker-Hannifin Corp. | 43,748,160 |
117,835 | Roper Technologies, Inc. | 57,065,134 |
212,756 | S&P Global, Inc. | 77,743,170 |
259,441 | Salesforce, Inc.(a) | 52,609,446 |
82,720 | Schneider Electric SE | 13,631,600 |
171,488 | Texas Instruments, Inc. | 27,268,307 |
82,108 | Trane Technologies PLC | 16,660,534 |
142,579 | UnitedHealth Group, Inc. | 71,886,906 |
611,233 | Zions Bancorp NA | 21,325,919 |
1,475,698,720 | ||
Total Common Stocks (Identified Cost $1,599,072,185) | 1,817,727,952 | |
Principal Amount (‡) | ||
Bonds and Notes — 30.7% | ||
Non-Convertible Bonds — 28.3% | ||
Australia — 1.3% | ||
$2,990,000 | AngloGold Ashanti Holdings PLC, 3.375%, 11/01/2028 | 2,514,722 |
Principal Amount (‡) | Description | Value (†) |
Australia — continued | ||
10,700,000 | Australia Government Bonds, Series 164, 0.500%, 9/21/2026, (AUD) | 6,195,584 |
670,000 | GAIF Bond Issuer Pty. Ltd., 3.400%, 9/30/2026(b) | 618,507 |
12,105,000 | Glencore Funding LLC, 6.500%, 10/06/2033(b) | 12,083,642 |
5,000,000 | Macquarie Group Ltd., (fixed rate to 1/14/2032, variable rate thereafter), 2.871%, 1/14/2033(b) | 3,778,989 |
4,000,000 | Macquarie Group Ltd., (fixed rate to 9/23/2026, variable rate thereafter), 1.629%, 9/23/2027(b) | 3,494,391 |
11,610,000 | New South Wales Treasury Corp., 2.000%, 3/08/2033, (AUD) | 5,772,881 |
95,000 | Sydney Airport Finance Co. Pty. Ltd., 3.375%, 4/30/2025(b) | 91,179 |
34,549,895 | ||
Belgium — 0.1% | ||
2,745,000 | Anheuser-Busch InBev SA, EMTN, 2.000%, 1/23/2035, (EUR) | 2,353,715 |
Brazil — 0.8% | ||
1,035,000 | Braskem Netherlands Finance BV, 4.500%, 1/10/2028 | 915,438 |
1,785,000 | Braskem Netherlands Finance BV, 4.500%, 1/31/2030 | 1,454,825 |
2,685,000 | Brazil Government International Bonds, 4.500%, 5/30/2029 | 2,503,619 |
53,329 (c) | Brazil Notas do Tesouro Nacional, Series NTNF, 10.000%, 1/01/2031, (BRL) | 9,855,868 |
650,000 | Centrais Eletricas Brasileiras SA, 4.625%, 2/04/2030(b) | 562,381 |
835,000 | Embraer Netherlands Finance BV, 7.000%, 7/28/2030(b) | 828,283 |
575,000 | Raizen Fuels Finance SA, 5.300%, 1/20/2027(b) | 557,682 |
2,515,000 | Suzano Austria GmbH, 2.500%, 9/15/2028 | 2,089,665 |
550,000 | Suzano Austria GmbH, 3.750%, 1/15/2031 | 452,087 |
1,185,000 | Suzano Austria GmbH, Series DM3N, 3.125%, 1/15/2032 | 910,088 |
20,129,936 | ||
Canada — 1.2% | ||
1,235,000 | 1011778 BC ULC/New Red Finance, Inc., 4.000%, 10/15/2030(b) | 1,026,252 |
327,912 | Air Canada Pass-Through Trust, Series 2015-2, Class A, 4.125%, 6/15/2029(b) | 292,898 |
665,880 | Air Canada Pass-Through Trust, Series 2017-1, Class AA, 3.300%, 7/15/2031(b) | 579,149 |
505,000 | Antares Holdings LP, 3.750%, 7/15/2027(b) | 435,058 |
1,210,000 | Antares Holdings LP, 3.950%, 7/15/2026(b) | 1,088,915 |
305,000 | Antares Holdings LP, 7.950%, 8/11/2028(b) | 303,192 |
2,835,000 | Bell Telephone Co. of Canada or Bell Canada, MTN, 3.600%, 9/29/2027, (CAD) | 1,935,251 |
1,735,000 | Brookfield Finance I U.K. PLC/Brookfield Finance, Inc., 2.340%, 1/30/2032 | 1,302,273 |
1,015,000 | Brookfield Finance, Inc., 3.900%, 1/25/2028 | 934,869 |
2,715,000 | Brookfield Renewable Partners ULC, MTN, 4.250%, 1/15/2029, (CAD) | 1,863,930 |
800,000 | CPPIB Capital, Inc., 0.375%, 6/20/2024, (EUR)(b) | 824,410 |
4,695,000 | Enbridge Gas, Inc., MTN, 2.900%, 4/01/2030, (CAD) | 3,010,815 |
Loomis Sayles Global Allocation Fund (continued)
Principal Amount (‡) | Description | Value (†) |
Canada — continued | ||
4,770,000 | Enbridge, Inc., MTN, 2.990%, 10/03/2029, (CAD) | 3,025,864 |
2,965,000 | Federation des Caisses Desjardins du Quebec, (fixed rate to 5/26/2025, variable rate thereafter), 2.856%, 5/26/2030, (CAD) | 2,065,185 |
143,485 | Institutional Mortgage Securities Canada, Inc., Series 2014-5A, Class A2, 2.616%, 7/12/2047, (CAD)(b) | 104,660 |
4,670,000 | Ontario Power Generation, Inc., MTN, 2.977%, 9/13/2029, (CAD) | 3,038,655 |
705,000 | Open Text Corp., 6.900%, 12/01/2027(b) | 706,605 |
2,350,000 | Province of Quebec, 4.500%, 9/08/2033 | 2,254,797 |
2,960,000 | Rogers Communications, Inc., 3.300%, 12/10/2029, (CAD) | 1,881,303 |
1,675,000 | Toronto-Dominion Bank, MTN, 1.150%, 6/12/2025 | 1,550,676 |
2,735,000 | Toronto-Dominion Bank, Series FXD, 1.950%, 1/12/2027 | 2,436,046 |
1,580,000 | Videotron Ltd., 5.125%, 4/15/2027(b) | 1,495,075 |
32,155,878 | ||
Chile — 0.6% | ||
575,000 | Antofagasta PLC, 2.375%, 10/14/2030 | 447,111 |
975,000 | Antofagasta PLC, 5.625%, 5/13/2032 | 928,970 |
2,525,000 | Banco Santander Chile, 3.177%, 10/26/2031(b) | 2,098,477 |
950,000 | Celulosa Arauco y Constitucion SA, 4.500%, 8/01/2024 | 930,193 |
1,005,000 | Chile Government International Bonds, 2.550%, 1/27/2032 | 811,520 |
2,580,000 | Colbun SA, 3.150%, 3/06/2030 | 2,155,147 |
1,960,000 | Corp. Nacional del Cobre de Chile, 3.000%, 9/30/2029(b) | 1,660,562 |
595,000 | Empresa Nacional de Telecomunicaciones SA, 3.050%, 9/14/2032(b) | 453,688 |
1,980,000 | Empresa Nacional del Petroleo, 3.450%, 9/16/2031(b) | 1,583,862 |
525,000 | Enel Chile SA, 4.875%, 6/12/2028 | 499,371 |
2,690,000 | Engie Energia Chile SA, 3.400%, 1/28/2030 | 2,237,375 |
1,120,000 | Transelec SA, 4.250%, 1/14/2025(b) | 1,087,266 |
14,893,542 | ||
China — 0.0% | ||
625,000 | Tencent Holdings Ltd., 2.880%, 4/22/2031(b) | 506,360 |
Colombia — 0.5% | ||
1,395,000 | Colombia Government International Bonds, 3.125%, 4/15/2031 | 1,030,704 |
575,000 | Colombia Government International Bonds, 3.875%, 4/25/2027 | 522,900 |
1,280,000 | Colombia Government International Bonds, 7.500%, 2/02/2034 | 1,208,602 |
7,073,300,000 | Colombia TES, Series B, 6.250%, 11/26/2025, (COP) | 1,595,929 |
29,559,900,000 | Colombia TES, Series B, 7.500%, 8/26/2026, (COP) | 6,663,830 |
2,536,000 | Ecopetrol SA, 5.875%, 5/28/2045 | 1,671,122 |
1,300,000 | Empresas Publicas de Medellin ESP, 4.250%, 7/18/2029(b) | 1,043,166 |
13,736,253 | ||
Czechia — 0.1% | ||
1,525,000 | CEZ AS, EMTN, 0.875%, 12/02/2026, (EUR) | 1,436,355 |
1,120,000 | CEZ AS, EMTN, 3.000%, 6/05/2028, (EUR) | 1,109,781 |
2,546,136 | ||
Principal Amount (‡) | Description | Value (†) |
Denmark — 0.1% | ||
2,055,000 | Orsted AS, EMTN, 2.125%, 5/17/2027, (GBP) | 2,232,389 |
Dominican Republic — 0.2% | ||
2,160,000 | Dominican Republic International Bonds, 4.500%, 1/30/2030(b) | 1,827,779 |
1,155,000 | Dominican Republic International Bonds, 4.875%, 9/23/2032(b) | 936,803 |
590,000 | Dominican Republic International Bonds, 5.950%, 1/25/2027(b) | 572,099 |
995,000 | Dominican Republic International Bonds, 6.000%, 7/19/2028(b) | 945,439 |
425,000 | Dominican Republic International Bonds, 8.625%, 4/20/2027(b) | 437,243 |
4,719,363 | ||
Eurozone — 0.1% | ||
4,275,000 | Ecuador Government International Bonds, 6.000%, 7/31/2030 | 2,172,304 |
France — 0.2% | ||
205,000 | BNP Paribas SA, 4.375%, 5/12/2026(b) | 196,225 |
890,000 | BNP Paribas SA, (fixed rate to 6/09/2025, variable rate thereafter), 2.219%, 6/09/2026(b) | 830,559 |
1,410,000 | Electricite de France SA, 4.875%, 9/21/2038(b) | 1,146,248 |
1,400,000 | Engie SA, 1.250%, 10/24/2041, (EUR) | 861,723 |
1,015,000 | Societe Generale SA, 4.750%, 11/24/2025(b) | 970,851 |
4,005,606 | ||
Germany — 0.3% | ||
1,635,000 | Deutsche Bank AG, (fixed rate to 1/07/2027, variable rate thereafter), 2.552%, 1/07/2028 | 1,426,798 |
870,000 | Deutsche Bank AG, (fixed rate to 10/07/2031, variable rate thereafter), 3.742%, 1/07/2033 | 624,307 |
2,255,000 | Deutsche Bank AG, (fixed rate to 10/14/2030, variable rate thereafter), 3.729%, 1/14/2032 | 1,678,608 |
3,220,000 | Fraport AG Frankfurt Airport Services Worldwide, 1.875%, 3/31/2028, (EUR) | 3,052,745 |
1,450,000 | Siemens Financieringsmaatschappij NV, 2.350%, 10/15/2026(b) | 1,329,476 |
250,000 | ZF North America Capital, Inc., 6.875%, 4/14/2028(b) | 244,762 |
265,000 | ZF North America Capital, Inc., 7.125%, 4/14/2030(b) | 259,859 |
8,616,555 | ||
Guatemala — 0.0% | ||
1,050,000 | CT Trust, 5.125%, 2/03/2032(b) | 825,027 |
India — 0.4% | ||
2,940,000 | Bharti Airtel Ltd., 3.250%, 6/03/2031 | 2,423,677 |
2,790,000 | Export-Import Bank of India, 2.250%, 1/13/2031(b) | 2,164,201 |
1,250,000 | Power Finance Corp. Ltd., 3.950%, 4/23/2030(b) | 1,082,263 |
2,400,000 | Shriram Finance Ltd., 4.150%, 7/18/2025(b) | 2,265,243 |
2,420,000 | Shriram Finance Ltd., 4.400%, 3/13/2024 | 2,384,910 |
10,320,294 | ||
Indonesia — 0.2% | ||
50,092,000,000 | Indonesia Treasury Bonds, Series FR75, 7.500%, 5/15/2038, (IDR) | 3,395,884 |
43,840,000,000 | Indonesia Treasury Bonds, Series FR82, 7.000%, 9/15/2030, (IDR) | 2,868,847 |
6,264,731 | ||
Loomis Sayles Global Allocation Fund (continued)
Principal Amount (‡) | Description | Value (†) |
Ireland — 0.3% | ||
$3,245,000 | AerCap Ireland Capital DAC/AerCap Global Aviation Trust, 3.300%, 1/30/2032 | $2,579,489 |
1,250,000 | Bank of Ireland Group PLC, 4.500%, 11/25/2023(b) | 1,245,325 |
3,710,000 | Ireland Government Bonds, Zero Coupon, 0.029%, 10/18/2031, (EUR)(d) | 3,042,434 |
6,867,248 | ||
Israel — 1.1% | ||
2,750,000 | Teva Pharmaceutical Finance Co. LLC, 6.150%, 2/01/2036 | 2,438,623 |
4,570,000 | Teva Pharmaceutical Finance Netherlands III BV, 3.150%, 10/01/2026 | 4,073,106 |
17,791,000 | Teva Pharmaceutical Finance Netherlands III BV, 4.100%, 10/01/2046 | 11,136,554 |
2,700,000 | Teva Pharmaceutical Finance Netherlands III BV, 4.750%, 5/09/2027 | 2,477,339 |
510,000 | Teva Pharmaceutical Finance Netherlands III BV, 5.125%, 5/09/2029 | 461,040 |
4,415,000 | Teva Pharmaceutical Finance Netherlands III BV, 7.875%, 9/15/2029 | 4,472,677 |
3,170,000 | Teva Pharmaceutical Finance Netherlands III BV, 8.125%, 9/15/2031 | 3,279,530 |
28,338,869 | ||
Italy — 0.6% | ||
200,000 | Intesa Sanpaolo SpA, 5.710%, 1/15/2026(b) | 190,960 |
485,000 | Intesa Sanpaolo SpA, 6.625%, 6/20/2033(b) | 455,769 |
575,000 | Intesa Sanpaolo SpA, EMTN, 0.625%, 2/24/2026, (EUR) | 553,954 |
3,305,000 | Italy Buoni Poliennali Del Tesoro, Series 10Y, 2.000%, 2/01/2028, (EUR) | 3,211,362 |
6,965,000 | Italy Buoni Poliennali Del Tesoro, Series 11Y, 1.350%, 4/01/2030, (EUR) | 6,132,263 |
2,370,000 | Italy Buoni Poliennali Del Tesoro, Series 7Y, 2.500%, 11/15/2025, (EUR) | 2,435,634 |
830,000 | UniCredit SpA, (fixed rate to 4/02/2029, variable rate thereafter), 7.296%, 4/02/2034(b) | 781,886 |
1,460,000 | UniCredit SpA, (fixed rate to 6/19/2027, variable rate thereafter), 5.861%, 6/19/2032(b) | 1,328,819 |
200,000 | UniCredit SpA, (fixed rate to 6/30/2030, variable rate thereafter), 5.459%, 6/30/2035(b) | 167,661 |
15,258,308 | ||
Japan — 0.8% | ||
1,047,100,600 (e) | Japan Government CPI-Linked Bonds, Series 23, 0.100%, 3/10/2028, (JPY) | 7,391,105 |
693,300,000 | Japan Government Ten Year Bonds, Series 371, 0.400%, 6/20/2033, (JPY) | 4,484,738 |
2,375,000 | Mitsubishi UFJ Financial Group, Inc., (fixed rate to 1/19/2027, variable rate thereafter), 2.341%, 1/19/2028 | 2,112,709 |
2,020,000 | Mizuho Financial Group, Inc., 2.564%, 9/13/2031 | 1,528,784 |
2,000,000 | Nomura Holdings, Inc., 1.851%, 7/16/2025 | 1,850,385 |
2,385,000 | Nomura Holdings, Inc., 2.710%, 1/22/2029 | 1,994,893 |
1,200,000 | Sumitomo Mitsui Financial Group, Inc., 5.766%, 1/13/2033 | 1,172,778 |
1,780,000 | Toyota Motor Corp., 5.123%, 7/13/2033 | 1,736,606 |
22,271,998 | ||
Korea — 0.8% | ||
1,060,000 | Kia Corp., 2.750%, 2/14/2027(b) | 960,742 |
Principal Amount (‡) | Description | Value (†) |
Korea — continued | ||
$1,515,000 | Korea East-West Power Co. Ltd., 1.750%, 5/06/2025(b) | $1,421,221 |
2,400,000 | Korea National Oil Corp., 2.125%, 4/18/2027(b) | 2,138,417 |
4,500,000,000 | Korea Treasury Bonds, Series 2312, 0.875%, 12/10/2023, (KRW) | 3,321,459 |
4,500,000,000 | Korea Treasury Bonds, Series 2509, 1.125%, 9/10/2025, (KRW) | 3,166,252 |
13,130,550,000 | Korea Treasury Bonds, Series 3012, 1.500%, 12/10/2030, (KRW) | 8,221,601 |
770,000 | Shinhan Bank Co. Ltd., 3.875%, 3/24/2026(b) | 726,219 |
2,765,000 | SK Hynix, Inc., 2.375%, 1/19/2031(b) | 2,076,534 |
200,000 | SK Hynix, Inc., 6.375%, 1/17/2028(b) | 199,650 |
140,000 | SK Telecom Co. Ltd., 6.625%, 7/20/2027(b) | 144,972 |
22,377,067 | ||
Luxembourg — 0.1% | ||
920,000 | ArcelorMittal SA, 6.750%, 3/01/2041 | 876,826 |
1,905,000 | Blackstone Property Partners Europe Holdings Sarl, EMTN, 1.625%, 4/20/2030, (EUR) | 1,491,960 |
280,000 | Logicor Financing Sarl, EMTN, 0.875%, 1/14/2031, (EUR) | 202,549 |
1,490,000 | Logicor Financing Sarl, EMTN, 1.625%, 1/17/2030, (EUR) | 1,188,163 |
100,000 | Logicor Financing Sarl, EMTN, 2.000%, 1/17/2034, (EUR) | 70,109 |
3,829,607 | ||
Mexico — 1.7% | ||
620,000 | Alfa SAB de CV, 6.875%, 3/25/2044 | 560,158 |
770,000 | America Movil SAB de CV, 2.125%, 3/10/2028, (EUR) | 753,230 |
860,000 | America Movil SAB de CV, 2.875%, 5/07/2030 | 719,939 |
730,000 | Banco Santander Mexico SA Institucion de Banca Multiple Grupo Financiero Santand, 5.375%, 4/17/2025(b) | 717,484 |
1,950,000 | Cemex SAB de CV, 3.875%, 7/11/2031(b) | 1,633,350 |
855,000 | Cemex SAB de CV, 5.450%, 11/19/2029 | 809,954 |
810,000 | Cemex SAB de CV, (fixed rate to 6/08/2026, variable rate thereafter), 5.125%(b)(f) | 758,316 |
1,775,000 | Coca-Cola Femsa SAB de CV, 2.750%, 1/22/2030 | 1,508,697 |
10,000,000 | Grupo Televisa SAB, EMTN, 7.250%, 5/14/2043, (MXN) | 350,687 |
1,515,000 | Kimberly-Clark de Mexico SAB de CV, 2.431%, 7/01/2031 | 1,235,699 |
840,000 | Kimberly-Clark de Mexico SAB de CV, 2.431%, 7/01/2031(b) | 685,140 |
1,707,184 (g) | Mexico Bonos, Series M, 5.750%, 3/05/2026, (MXN) | 8,782,826 |
724,558 (g) | Mexico Bonos, Series M 20, 7.500%, 6/03/2027, (MXN) | 3,794,601 |
1,294,043 (g) | Mexico Bonos, Series M 20, 8.500%, 5/31/2029, (MXN) | 6,973,093 |
637,836 (g) | Mexico Bonos, Series M 30, 8.500%, 11/18/2038, (MXN) | 3,224,663 |
2,665,000 | Mexico Government International Bonds, 3.250%, 4/16/2030 | 2,267,006 |
1,880,000 | Mexico Government International Bonds, 3.500%, 2/12/2034 | 1,469,985 |
196,000 | Mexico Government International Bonds, 4.000%, 3/15/2115, (EUR) | 139,978 |
Loomis Sayles Global Allocation Fund (continued)
Principal Amount (‡) | Description | Value (†) |
Mexico — continued | ||
$810,000 | Mexico Government International Bonds, 4.875%, 5/19/2033 | $725,808 |
350,000 | Mexico Government International Bonds, 6.338%, 5/04/2053 | 318,523 |
1,850,000 | Orbia Advance Corp. SAB de CV, 1.875%, 5/11/2026(b) | 1,651,402 |
1,240,000 | Orbia Advance Corp. SAB de CV, 4.000%, 10/04/2027 | 1,139,114 |
3,505,000 | Petroleos Mexicanos, 5.950%, 1/28/2031 | 2,508,704 |
100,000 | Sigma Alimentos SA de CV, 2.625%, 2/07/2024, (EUR)(b) | 104,928 |
835,000 | Sigma Alimentos SA de CV, 4.125%, 5/02/2026 | 793,067 |
2,090,000 | Sigma Finance Netherlands BV, 4.875%, 3/27/2028 | 1,983,687 |
1,010,000 | Unifin Financiera SAB de CV, 7.250%, 9/27/2023(h) | 12,120 |
2,195,000 | Unifin Financiera SAB de CV, 9.875%, 1/28/2029(h) | 43,351 |
45,665,510 | ||
Netherlands — 0.1% | ||
870,000 | Cooperatieve Rabobank UA, 4.375%, 8/04/2025 | 839,167 |
1,725,000 | ING Groep NV, (fixed rate to 7/01/2025, variable rate thereafter), 1.400%, 7/01/2026(b) | 1,585,564 |
2,424,731 | ||
New Zealand — 0.5% | ||
5,000,000 | Fonterra Co.-operative Group Ltd., MTN, 5.500%, 2/26/2024, (AUD) | 3,223,601 |
3,575,000 | New Zealand Government Bonds, Series 429, 3.000%, 4/20/2029, (NZD) | 1,910,603 |
10,700,000 | New Zealand Government Bonds, Series 524, 0.500%, 5/15/2024, (NZD) | 6,209,880 |
6,310,000 | New Zealand Government Bonds, Series 531, 1.500%, 5/15/2031, (NZD) | 2,890,203 |
14,234,287 | ||
Norway — 0.7% | ||
3,660,000 | DNB Bank ASA, (fixed rate to 5/25/2026, variable rate thereafter), 1.535%, 5/25/2027(b) | 3,231,368 |
2,790,000 | Equinor ASA, 3.625%, 4/06/2040 | 2,153,110 |
16,500,000 | Norway Government Bonds, Series 478, 1.500%, 2/19/2026, (NOK) | 1,450,727 |
41,750,000 | Norway Government Bonds, Series 479, 1.750%, 2/17/2027, (NOK) | 3,611,569 |
36,610,000 | Norway Government Bonds, Series 480, 2.000%, 4/26/2028, (NOK) | 3,128,998 |
46,500,000 | Norway Government Bonds, Series 482, 1.375%, 8/19/2030, (NOK) | 3,666,391 |
455,000 | Var Energi ASA, 8.000%, 11/15/2032(b) | 477,432 |
17,719,595 | ||
Paraguay — 0.1% | ||
1,420,000 | Paraguay Government International Bonds, 4.950%, 4/28/2031(b) | 1,312,213 |
615,000 | Paraguay Government International Bonds, 5.000%, 4/15/2026(b) | 599,133 |
1,911,346 | ||
Principal Amount (‡) | Description | Value (†) |
Peru — 0.1% | ||
$3,220,000 | Corp. Financiera de Desarrollo SA, 2.400%, 9/28/2027(b) | $2,767,815 |
1,050,000 | Transportadora de Gas del Peru SA, 4.250%, 4/30/2028(b) | 992,004 |
3,759,819 | ||
Poland — 0.3% | ||
26,400,000 | Republic of Poland Government Bonds, Series 1030, 1.250%, 10/25/2030, (PLN) | 4,559,897 |
12,970,000 | Republic of Poland Government Bonds, Series 725, 3.250%, 7/25/2025, (PLN) | 2,881,697 |
7,441,594 | ||
Portugal — 0.1% | ||
3,590,000 | EDP Finance BV, 1.710%, 1/24/2028(b) | 3,035,812 |
Qatar — 0.1% | ||
1,770,000 | Ooredoo International Finance Ltd., 2.625%, 4/08/2031(b) | 1,473,260 |
1,600,000 | QatarEnergy, 2.250%, 7/12/2031(b) | 1,281,043 |
2,754,303 | ||
Romania — 0.0% | ||
1,100,000 | Romania Government International Bonds, 2.000%, 4/14/2033, (EUR)(b) | 798,487 |
Singapore — 0.3% | ||
10,055,000 | Singapore Government Bonds, 2.125%, 6/01/2026, (SGD) | 7,074,252 |
South Africa — 0.6% | ||
1,400,000 | Anglo American Capital PLC, 2.625%, 9/10/2030(b) | 1,118,375 |
1,400,000 | Anglo American Capital PLC, 5.625%, 4/01/2030(b) | 1,352,085 |
1,420,000 | MTN Mauritius Investments Ltd., 4.755%, 11/11/2024 | 1,380,950 |
930,000 | MTN Mauritius Investments Ltd., 4.755%, 11/11/2024(b) | 904,425 |
116,835,000 | Republic of South Africa Government Bonds, Series 2035, 8.875%, 2/28/2035, (ZAR) | 4,862,533 |
39,185,000 | Republic of South Africa Government Bonds, Series R213, 7.000%, 2/28/2031, (ZAR) | 1,623,796 |
7,585,000 | Republic of South Africa Government International Bonds, 5.750%, 9/30/2049 | 5,006,479 |
16,248,643 | ||
Spain — 0.3% | ||
2,000,000 | Banco Santander SA, (fixed rate to 9/14/2026, variable rate thereafter), 1.722%, 9/14/2027 | 1,748,806 |
1,000,000 | CaixaBank SA, EMTN, (fixed rate to 11/23/2027, variable rate thereafter), 6.250%, 2/23/2033, (EUR) | 1,059,147 |
3,700,000 | Cellnex Telecom SA, EMTN, 1.750%, 10/23/2030, (EUR) | 3,173,390 |
700,000 | Naturgy Finance BV, EMTN, 1.500%, 1/29/2028, (EUR) | 670,505 |
2,525,000 | Spain Government Bonds, 1.950%, 7/30/2030, (EUR) | 2,403,829 |
9,055,677 | ||
Loomis Sayles Global Allocation Fund (continued)
Principal Amount (‡) | Description | Value (†) |
Supranationals — 0.3% | ||
10,030,000 | International Bank for Reconstruction & Development, 1.200%, 7/22/2026, (CAD) | 6,679,282 |
16,750,000 | Nordic Investment Bank, EMTN, 1.500%, 3/13/2025, (NOK) | 1,495,442 |
8,174,724 | ||
Sweden — 0.3% | ||
1,900,000 | Heimstaden Bostad Treasury BV, EMTN, 1.375%, 7/24/2028, (EUR) | 1,461,609 |
1,200,000 | Swedbank AB, 6.136%, 9/12/2026(b) | 1,195,102 |
29,665,000 | Sweden Government Bonds, Series 1057, 1.500%, 11/13/2023, (SEK) | 2,708,135 |
2,560,000 | Sweden Government Bonds, Series 1058, 2.500%, 5/12/2025, (SEK) | 230,613 |
38,000,000 | Sweden Government Bonds, Series 1062, 0.125%, 5/12/2031, (SEK) | 2,814,321 |
8,409,780 | ||
Switzerland — 0.3% | ||
930,000 | Credit Suisse AG, 2.950%, 4/09/2025 | 883,681 |
1,375,000 | Novartis Capital Corp., 2.000%, 2/14/2027 | 1,243,333 |
325,000 | UBS Group AG, (fixed rate to 11/15/2032, variable rate thereafter), 9.016%, 11/15/2033(b) | 375,315 |
2,185,000 | UBS Group AG, (fixed rate to 5/14/2031, variable rate thereafter), 3.091%, 5/14/2032(b) | 1,725,821 |
2,290,000 | UBS Group AG, (fixed rate to 6/05/2025, variable rate thereafter), 2.193%, 6/05/2026(b) | 2,129,836 |
250,000 | UBS Group AG, (fixed rate to 7/15/2025, variable rate thereafter), 6.373%, 7/15/2026(b) | 249,058 |
750,000 | UBS Group AG, (fixed rate to 8/12/2032, variable rate thereafter), 6.537%, 8/12/2033(b) | 742,950 |
340,000 | Willow No. 2 Ireland PLC for Zurich Insurance Co. Ltd., EMTN, (fixed rate to 10/01/2025, variable rate thereafter), 4.250%, 10/01/2045 | 313,337 |
7,663,331 | ||
Taiwan — 0.1% | ||
1,925,000 | TSMC Arizona Corp., 2.500%, 10/25/2031 | 1,550,148 |
Tanzania — 0.0% | ||
985,000 | HTA Group Ltd., 7.000%, 12/18/2025(b) | 946,940 |
Turkey — 0.3% | ||
1,010,000 | Aydem Yenilenebilir Enerji AS, 7.750%, 2/02/2027(b) | 889,558 |
1,120,000 | TC Ziraat Bankasi AS, 5.375%, 3/02/2026(b) | 1,037,886 |
1,685,000 | Turk Telekomunikasyon AS, 6.875%, 2/28/2025 | 1,640,664 |
1,415,000 | Turkcell Iletisim Hizmetleri AS, 5.800%, 4/11/2028 | 1,298,783 |
3,480,000 | Turkey Government International Bonds, 5.250%, 3/13/2030 | 2,891,428 |
680,000 | Turkey Government International Bonds, 7.625%, 4/26/2029 | 651,508 |
8,409,827 | ||
Turkmenistan — 0.0% | ||
415,000 | Trinidad Generation UnLtd, 5.250%, 11/04/2027(b) | 397,629 |
United Arab Emirates — 0.0% | ||
1,295,000 | Abu Dhabi Government International Bonds, 3.125%, 4/16/2030(b) | 1,160,613 |
Principal Amount (‡) | Description | Value (†) |
United Kingdom — 0.4% | ||
$200,000 | Ashtead Capital, Inc., 5.500%, 8/11/2032(b) | $184,790 |
1,350,000 | CK Hutchison International 19 Ltd., 3.625%, 4/11/2029(b) | 1,220,363 |
1,420,000 | Diageo Capital PLC, 2.125%, 4/29/2032 | 1,097,529 |
1,395,000 | Nationwide Building Society, (fixed rate to 7/18/2029, variable rate thereafter), 3.960%, 7/18/2030(b) | 1,227,354 |
1,190,000 | NatWest Markets PLC, 0.800%, 8/12/2024(b) | 1,137,531 |
235,000 | Network Rail Infrastructure Finance PLC, Series 6, EMTN, 4.750%, 1/22/2024, (GBP) | 285,900 |
955,000 | Santander U.K. Group Holdings PLC, (fixed rate to 1/11/2027, variable rate thereafter), 2.469%, 1/11/2028 | 831,143 |
1,455,000 | Standard Chartered PLC, (fixed rate to 11/18/2030, variable rate thereafter), 3.265%, 2/18/2036(b) | 1,104,682 |
2,200,000 | Standard Chartered PLC, (fixed rate to 3/30/2025, variable rate thereafter), 3.971%, 3/30/2026(b) | 2,117,811 |
250,000 | Standard Chartered PLC, EMTN, 3.125%, 11/19/2024, (EUR) | 260,068 |
2,065,000 | U.K. Gilts, 3.250%, 1/31/2033, (GBP) | 2,296,728 |
11,763,899 | ||
United States — 11.8% | ||
165,000 | AES Corp., 3.950%, 7/15/2030(b) | 142,217 |
315,000 | Aircastle Ltd., Series A, (fixed rate to 6/15/2026, variable rate thereafter), 5.250%(b)(f) | 247,700 |
1,915,000 | Albemarle Corp., 5.050%, 6/01/2032 | 1,737,337 |
1,145,000 | Ally Financial, Inc., Series B, (fixed rate to 5/15/2026, variable rate thereafter), 4.700%(f) | 785,745 |
1,285,000 | Ally Financial, Inc., Series C, (fixed rate to 5/15/2028, variable rate thereafter), 4.700%(f) | 804,662 |
1,155,609 | American Airlines Pass-Through Trust, Series 2016-1, Class B, 5.250%, 7/15/2025 | 1,144,157 |
899,309 | American Airlines Pass-Through Trust, Series 2016-3, Class B, 3.750%, 4/15/2027 | 840,233 |
235,875 | American Airlines Pass-Through Trust, Series 2017-1, Class B, 4.950%, 8/15/2026 | 228,521 |
311,515 | American Airlines Pass-Through Trust, Series 2017-2, Class B, 3.700%, 4/15/2027 | 295,810 |
3,975,000 | Apple, Inc., Series MPLE, 2.513%, 8/19/2024, (CAD) | 2,855,649 |
260,000 | Aptiv PLC, 1.600%, 9/15/2028, (EUR) | 242,396 |
2,330,000 | Ares Capital Corp., 3.200%, 11/15/2031 | 1,782,787 |
425,000 | Ashland, Inc., 3.375%, 9/01/2031(b) | 330,495 |
910,000 | Bank of America Corp., (fixed rate to 9/21/2031, variable rate thereafter), 2.482%, 9/21/2036 | 662,187 |
2,865,000 | Bank of America Corp., Series MPLE, (fixed rate to 9/15/2026, variable rate thereafter), 1.978%, 9/15/2027, (CAD) | 1,881,545 |
665,000 | Barings BDC, Inc., 3.300%, 11/23/2026 | 583,462 |
9,560,000 | Bausch Health Cos., Inc., 4.875%, 6/01/2028(b) | 5,436,640 |
1,735,000 | Bausch Health Cos., Inc., 5.000%, 1/30/2028(b) | 706,509 |
930,000 | Beazer Homes USA, Inc., 7.250%, 10/15/2029 | 872,639 |
500,000 | Block, Inc., 3.500%, 6/01/2031 | 392,781 |
4,840,000 | Blue Owl Capital Corp., 4.250%, 1/15/2026 | 4,527,999 |
Loomis Sayles Global Allocation Fund (continued)
Principal Amount (‡) | Description | Value (†) |
United States — continued | ||
$1,550,000 | Blue Owl Technology Finance Corp., 2.500%, 1/15/2027 | $1,301,349 |
2,585,000 | Blue Owl Technology Finance Corp., 4.750%, 12/15/2025(b) | 2,391,020 |
875,000 | BPR Trust, Series 2021-NRD, Class F, 1 mo. USD SOFR + 6.870%, 12.203%, 12/15/2038(b)(i) | 783,975 |
3,120,000 | Broadcom, Inc., 2.450%, 2/15/2031(b) | 2,438,608 |
2,845,000 | Broadcom, Inc., 2.600%, 2/15/2033(b) | 2,121,471 |
690,000 | Broadcom, Inc., 3.187%, 11/15/2036(b) | 495,412 |
5,095,000 | Broadcom, Inc., 3.419%, 4/15/2033(b) | 4,075,269 |
4,670,000 | Broadcom, Inc., 3.469%, 4/15/2034(b) | 3,667,870 |
2,485,000 | Broadcom, Inc., 4.150%, 4/15/2032(b) | 2,156,518 |
695,000 | Carnival Corp., 5.750%, 3/01/2027(b) | 629,131 |
150,000 | Carnival Corp., 7.000%, 8/15/2029(b) | 147,904 |
10,570,000 | CCO Holdings LLC/CCO Holdings Capital Corp., 4.250%, 2/01/2031(b) | 8,416,997 |
6,265,000 | CCO Holdings LLC/CCO Holdings Capital Corp., 4.250%, 1/15/2034(b) | 4,612,782 |
1,575,000 | CCO Holdings LLC/CCO Holdings Capital Corp., 4.750%, 2/01/2032(b) | 1,260,000 |
370,000 | Celanese U.S. Holdings LLC, 6.330%, 7/15/2029 | 362,678 |
270,000 | Celanese U.S. Holdings LLC, 6.379%, 7/15/2032 | 260,151 |
195,000 | Celanese U.S. Holdings LLC, 6.700%, 11/15/2033 | 189,816 |
2,510,000 | Centene Corp., 2.500%, 3/01/2031 | 1,928,229 |
1,480,000 | Centene Corp., 3.000%, 10/15/2030 | 1,193,783 |
165,000 | Charles River Laboratories International, Inc., 3.750%, 3/15/2029(b) | 141,483 |
175,000 | Charles River Laboratories International, Inc., 4.000%, 3/15/2031(b) | 148,094 |
1,075,000 | Charter Communications Operating LLC/Charter Communications Operating Capital, 3.950%, 6/30/2062 | 609,788 |
895,000 | Charter Communications Operating LLC/Charter Communications Operating Capital, 4.400%, 4/01/2033 | 761,232 |
4,945,000 | Charter Communications Operating LLC/Charter Communications Operating Capital, 4.400%, 12/01/2061 | 3,046,604 |
3,790,000 | CommScope Technologies LLC, 5.000%, 3/15/2027(b) | 2,151,016 |
8,375,000 | CommScope, Inc., 4.750%, 9/01/2029(b) | 6,160,185 |
2,663,000 | Continental Resources, Inc., 2.875%, 4/01/2032(b) | 1,994,185 |
4,662,000 | Continental Resources, Inc., 5.750%, 1/15/2031(b) | 4,379,741 |
13,550,000 | CSC Holdings LLC, 3.375%, 2/15/2031(b) | 9,233,477 |
2,400,000 | CSC Holdings LLC, 4.125%, 12/01/2030(b) | 1,698,514 |
2,395,000 | CSC Holdings LLC, 4.500%, 11/15/2031(b) | 1,695,131 |
20,310,000 | CSC Holdings LLC, 4.625%, 12/01/2030(b) | 10,797,876 |
1,850,000 | CSC Holdings LLC, 5.000%, 11/15/2031(b) | 991,556 |
595,000 | CSC Holdings LLC, 5.375%, 2/01/2028(b) | 484,396 |
495,000 | CSC Holdings LLC, 5.750%, 1/15/2030(b) | 277,346 |
1,115,000 | CSC Holdings LLC, 6.500%, 2/01/2029(b) | 923,706 |
940,000 | DH Europe Finance II Sarl, 0.750%, 9/18/2031, (EUR) | 776,885 |
50,000 | Dillard's, Inc., 7.000%, 12/01/2028 | 49,462 |
8,000 | Dillard's, Inc., 7.750%, 7/15/2026 | 8,075 |
355,000 | Directv Financing LLC/Directv Financing Co-Obligor, Inc., 5.875%, 8/15/2027(b) | 313,884 |
Principal Amount (‡) | Description | Value (†) |
United States — continued | ||
$3,550,000 | DISH DBS Corp., 5.125%, 6/01/2029 | $1,968,049 |
4,115,000 | DISH DBS Corp., 5.250%, 12/01/2026(b) | 3,497,136 |
795,000 | DISH DBS Corp., 5.750%, 12/01/2028(b) | 611,156 |
1,960,000 | DISH DBS Corp., 7.750%, 7/01/2026 | 1,470,000 |
80,000 | EnLink Midstream LLC, 6.500%, 9/01/2030(b) | 77,614 |
575,000 | EnLink Midstream Partners LP, 5.450%, 6/01/2047 | 449,264 |
280,000 | EPR Properties, 3.600%, 11/15/2031 | 207,555 |
1,555,000 | EQT Corp., 3.625%, 5/15/2031(b) | 1,315,437 |
805,000 | EQT Corp., 5.000%, 1/15/2029 | 756,708 |
115,000 | Everi Holdings, Inc., 5.000%, 7/15/2029(b) | 98,979 |
2,570,000 | Expedia Group, Inc., 2.950%, 3/15/2031 | 2,070,507 |
2,710,000 | Freeport-McMoRan, Inc., 4.375%, 8/01/2028 | 2,484,300 |
4,795,000 | Freeport-McMoRan, Inc., 5.400%, 11/14/2034 | 4,388,570 |
2,100,000 | General Motors Co., 5.200%, 4/01/2045 | 1,632,784 |
405,000 | General Motors Co., 6.250%, 10/02/2043 | 362,856 |
570,000 | General Motors Financial Co., Inc., 3.100%, 1/12/2032 | 440,999 |
760,000 | General Motors Financial Co., Inc., 6.400%, 1/09/2033 | 742,220 |
460,000 | GLP Capital LP/GLP Financing II, Inc., 3.250%, 1/15/2032 | 357,001 |
105,000 | Goodyear Tire & Rubber Co., 7.000%, 3/15/2028 | 103,620 |
1,400,000 | GTCR W-2 Merger Sub LLC, 7.500%, 1/15/2031(b) | 1,401,960 |
960,000 | Hess Midstream Operations LP, 4.250%, 2/15/2030(b) | 809,509 |
475,000 | Hilton Grand Vacations Borrower Escrow LLC/Hilton Grand Vacations Borrower Escrow, Inc., 4.875%, 7/01/2031(b) | 387,230 |
470,000 | Hilton Grand Vacations Borrower Escrow LLC/Hilton Grand Vacations Borrower Escrow, Inc., 5.000%, 6/01/2029(b) | 407,700 |
1,395,000 | Hyundai Capital America, 6.375%, 4/08/2030(b) | 1,393,493 |
7,770,000 | Icahn Enterprises LP/Icahn Enterprises Finance Corp., 4.375%, 2/01/2029 | 6,213,353 |
195,000 | Icahn Enterprises LP/Icahn Enterprises Finance Corp., 4.750%, 9/15/2024 | 187,818 |
3,555,000 | Icahn Enterprises LP/Icahn Enterprises Finance Corp., 5.250%, 5/15/2027 | 3,124,774 |
390,000 | Icahn Enterprises LP/Icahn Enterprises Finance Corp., 6.375%, 12/15/2025 | 370,994 |
1,210,000 | iHeartCommunications, Inc., 4.750%, 1/15/2028(b) | 925,017 |
2,730,000 | iHeartCommunications, Inc., 5.250%, 8/15/2027(b) | 2,163,571 |
1,310,000 | Iron Mountain, Inc., 4.875%, 9/15/2029(b) | 1,148,142 |
795,000 | JBS USA LUX SA/JBS USA Food Co./JBS USA Finance, Inc., 3.750%, 12/01/2031 | 636,827 |
730,000 | JELD-WEN, Inc., 4.875%, 12/15/2027(b) | 644,137 |
1,135,000 | John Deere Capital Corp., MTN, 0.450%, 6/07/2024 | 1,097,437 |
1,400,000 | Light & Wonder International, Inc., 7.000%, 5/15/2028(b) | 1,376,074 |
525,000 | Light & Wonder International, Inc., 7.250%, 11/15/2029(b) | 514,500 |
210,000 | Light & Wonder International, Inc., 7.500%, 9/01/2031(b) | 207,554 |
1,140,000 | Lithia Motors, Inc., 3.875%, 6/01/2029(b) | 960,233 |
Loomis Sayles Global Allocation Fund (continued)
Principal Amount (‡) | Description | Value (†) |
United States — continued | ||
$995,000 | Marriott Ownership Resorts, Inc., 4.500%, 6/15/2029(b) | $833,710 |
155,000 | Matador Resources Co., 6.875%, 4/15/2028(b) | 152,186 |
615,000 | Medtronic Global Holdings SCA, 1.125%, 3/07/2027, (EUR) | 591,820 |
6,240,000 | Micron Technology, Inc., 5.875%, 2/09/2033 | 5,960,835 |
798,750 | Mileage Plus Holdings LLC/Mileage Plus Intellectual Property Assets Ltd., 6.500%, 6/20/2027(b) | 791,403 |
435,000 | Molina Healthcare, Inc., 3.875%, 5/15/2032(b) | 348,864 |
345,000 | MSCI, Inc., 3.250%, 8/15/2033(b) | 265,529 |
520,000 | Nationstar Mortgage Holdings, Inc., 5.125%, 12/15/2030(b) | 422,202 |
1,095,000 | Nationstar Mortgage Holdings, Inc., 5.500%, 8/15/2028(b) | 965,862 |
4,600,000 | NCL Corp. Ltd., 5.875%, 3/15/2026(b) | 4,246,918 |
615,000 | NCL Corp. Ltd., 5.875%, 2/15/2027(b) | 584,109 |
1,960,000 | NCL Finance Ltd., 6.125%, 3/15/2028(b) | 1,729,700 |
2,020,000 | Netflix, Inc., 4.875%, 6/15/2030(b) | 1,912,350 |
20,000 | NGPL PipeCo LLC, 7.768%, 12/15/2037(b) | 20,571 |
30,000 | Occidental Petroleum Corp., 6.125%, 1/01/2031 | 29,569 |
2,355,000 | Occidental Petroleum Corp., 6.625%, 9/01/2030 | 2,386,204 |
795,000 | Occidental Petroleum Corp., 7.875%, 9/15/2031 | 860,270 |
1,845,000 | Occidental Petroleum Corp., 8.875%, 7/15/2030 | 2,074,352 |
70,000 | OneMain Finance Corp., 3.500%, 1/15/2027 | 59,937 |
80,000 | OneMain Finance Corp., 4.000%, 9/15/2030 | 60,028 |
170,000 | OneMain Finance Corp., 5.375%, 11/15/2029 | 142,375 |
860,000 | OneMain Finance Corp., 6.875%, 3/15/2025 | 853,183 |
1,705,000 | OneMain Finance Corp., 7.125%, 3/15/2026 | 1,669,845 |
130,000 | OneMain Finance Corp., 8.250%, 10/01/2023 | 130,000 |
400,000 | Ovintiv, Inc., 6.250%, 7/15/2033 | 386,766 |
1,000,000 | Ovintiv, Inc., 6.500%, 8/15/2034 | 984,870 |
45,000 | Ovintiv, Inc., 6.500%, 2/01/2038 | 42,977 |
230,000 | Ovintiv, Inc., 6.625%, 8/15/2037 | 220,649 |
30,000 | Ovintiv, Inc., 7.200%, 11/01/2031 | 30,881 |
115,000 | Ovintiv, Inc., 7.375%, 11/01/2031 | 120,499 |
130,000 | Ovintiv, Inc., 8.125%, 9/15/2030 | 141,293 |
1,265,000 | Pilgrim's Pride Corp., 3.500%, 3/01/2032 | 978,227 |
315,000 | Pilgrim's Pride Corp., 4.250%, 4/15/2031 | 262,775 |
745,000 | Post Holdings, Inc., 4.500%, 9/15/2031(b) | 620,059 |
2,165,000 | Prologis Euro Finance LLC, 0.250%, 9/10/2027, (EUR) | 1,970,668 |
1,450,000 | Prologis Euro Finance LLC, 1.875%, 1/05/2029, (EUR) | 1,336,704 |
365,000 | Prologis LP, 2.250%, 6/30/2029, (GBP) | 368,298 |
1,385,000 | Rand Parent LLC, 8.500%, 2/15/2030(b) | 1,280,917 |
430,000 | Realty Income Corp., 5.125%, 7/06/2034, (EUR) | 450,480 |
1,100,000 | Realty Income Corp., EMTN, 1.625%, 12/15/2030, (GBP) | 1,000,744 |
7,695,000 | Rocket Mortgage LLC/Rocket Mortgage Co-Issuer, Inc., 2.875%, 10/15/2026(b) | 6,776,910 |
6,794,000 | Rocket Mortgage LLC/Rocket Mortgage Co-Issuer, Inc., 3.625%, 3/01/2029 | 5,616,840 |
2,540,000 | Rocket Mortgage LLC/Rocket Mortgage Co-Issuer, Inc., 3.625%, 3/01/2029(b) | 2,099,908 |
7,011,000 | Rocket Mortgage LLC/Rocket Mortgage Co-Issuer, Inc., 3.875%, 3/01/2031(b) | 5,590,361 |
Principal Amount (‡) | Description | Value (†) |
United States — continued | ||
$4,510,000 | Rocket Mortgage LLC/Rocket Mortgage Co-Issuer, Inc., 4.000%, 10/15/2033(b) | $3,405,875 |
2,945,000 | Royal Caribbean Cruises Ltd., 4.250%, 7/01/2026(b) | 2,700,245 |
3,280,000 | Royal Caribbean Cruises Ltd., 5.500%, 4/01/2028(b) | 3,007,733 |
1,425,000 | SBA Communications Corp., 3.125%, 2/01/2029 | 1,188,553 |
435,000 | Sensata Technologies BV, 4.000%, 4/15/2029(b) | 374,578 |
140,000 | Silgan Holdings, Inc., 3.250%, 3/15/2025, (EUR) | 143,939 |
315,000 | Southwestern Energy Co., 4.750%, 2/01/2032 | 270,361 |
765,000 | Synchrony Bank, 5.625%, 8/23/2027 | 710,463 |
255,000 | Tapestry, Inc., 3.050%, 3/15/2032 | 186,806 |
515,000 | Targa Resources Corp., 6.125%, 3/15/2033 | 504,855 |
165,000 | Targa Resources Partners LP/Targa Resources Partners Finance Corp., 4.875%, 2/01/2031 | 147,782 |
245,000 | Thermo Fisher Scientific Finance I BV, 2.000%, 10/18/2051, (EUR) | 152,635 |
100,000 | Thermo Fisher Scientific, Inc., EMTN, 1.500%, 10/01/2039, (EUR) | 70,212 |
90,000 | Time Warner Cable LLC, 4.500%, 9/15/2042 | 62,354 |
85,000 | Time Warner Cable LLC, 5.500%, 9/01/2041 | 66,490 |
2,805,000 | T-Mobile USA, Inc., 3.875%, 4/15/2030 | 2,485,148 |
400,000 | TopBuild Corp., 4.125%, 2/15/2032(b) | 324,739 |
405,000 | TransDigm, Inc., 6.750%, 8/15/2028(b) | 398,718 |
4,075,000 | Travel & Leisure Co., 4.500%, 12/01/2029(b) | 3,417,906 |
530,000 | Travel & Leisure Co., 4.625%, 3/01/2030(b) | 446,006 |
240,000 | TriNet Group, Inc., 3.500%, 3/01/2029(b) | 202,124 |
216,156 | U.S. Airways Pass-Through Trust, Series 2012-2, Class A, 4.625%, 12/03/2026 | 208,026 |
12,440,000 | U.S. Treasury Bonds, 2.250%, 2/15/2052 | 7,634,078 |
5,210,000 | U.S. Treasury Bonds, 3.625%, 5/15/2053 | 4,313,717 |
4,980,000 | U.S. Treasury Bonds, 4.125%, 8/15/2053 | 4,520,906 |
4,992,091 | U.S. Treasury Inflation-Indexed Notes, 1.375%, 7/15/2033(j) | 4,615,442 |
2,910,000 | U.S. Treasury Notes, 0.875%, 1/31/2024 | 2,866,691 |
17,750,000 | U.S. Treasury Notes, 2.250%, 3/31/2024(k) | 17,471,963 |
4,915,000 | U.S. Treasury Notes, 3.375%, 5/15/2033 | 4,457,291 |
2,370,000 | U.S. Treasury Notes, 3.750%, 6/30/2030 | 2,249,463 |
13,115,000 | Uber Technologies, Inc., 4.500%, 8/15/2029(b) | 11,722,931 |
8,655,000 | Uber Technologies, Inc., 6.250%, 1/15/2028(b) | 8,463,422 |
1,555,000 | Uber Technologies, Inc., 7.500%, 9/15/2027(b) | 1,567,913 |
140,000 | Uber Technologies, Inc., 8.000%, 11/01/2026(b) | 141,646 |
1,720,740 | United Airlines Pass-Through Trust, Series 20-1, Class A, 5.875%, 4/15/2029 | 1,704,496 |
269,757 | United Airlines Pass-Through Trust, Series 2016-2, Class B, 3.650%, 4/07/2027 | 253,315 |
895,000 | Venture Global Calcasieu Pass LLC, 3.875%, 11/01/2033(b) | 694,900 |
390,000 | Venture Global Calcasieu Pass LLC, 4.125%, 8/15/2031(b) | 320,042 |
3,095,000 | Verizon Communications, Inc., Series MPLE, 2.500%, 5/16/2030, (CAD) | 1,870,193 |
895,000 | VICI Properties LP/VICI Note Co., Inc., 4.250%, 12/01/2026(b) | 833,917 |
1,185,000 | VICI Properties LP/VICI Note Co., Inc., 4.500%, 9/01/2026(b) | 1,113,254 |
Loomis Sayles Global Allocation Fund (continued)
Principal Amount (‡) | Description | Value (†) |
United States — continued | ||
$640,000 | VICI Properties LP/VICI Note Co., Inc., 4.625%, 6/15/2025(b) | $618,042 |
1,945,000 | VMware, Inc., 2.200%, 8/15/2031 | 1,467,758 |
1,270,000 | Warnermedia Holdings, Inc., 4.279%, 3/15/2032 | 1,077,999 |
130,000 | Western Digital Corp., 2.850%, 2/01/2029 | 104,369 |
90,000 | Western Digital Corp., 3.100%, 2/01/2032 | 66,277 |
360,000 | Western Midstream Operating LP, 4.050%, 2/01/2030 | 314,673 |
475,000 | Western Midstream Operating LP, 5.250%, 2/01/2050 | 370,041 |
470,000 | Western Midstream Operating LP, 5.300%, 3/01/2048 | 366,855 |
150,000 | Western Midstream Operating LP, 5.450%, 4/01/2044 | 120,916 |
115,000 | Western Midstream Operating LP, 5.500%, 8/15/2048 | 91,439 |
1,250,000 | Yum! Brands, Inc., 4.625%, 1/31/2032 | 1,084,279 |
318,928,572 | ||
Uruguay — 0.1% | ||
1,415,000 | Uruguay Government International Bonds, 4.375%, 1/23/2031 | 1,352,704 |
86,955,000 | Uruguay Government International Bonds, 8.250%, 5/21/2031, (UYU) | 2,110,566 |
3,463,270 | ||
Total Non-Convertible Bonds (Identified Cost $887,962,221) | 761,963,870 | |
Convertible Bonds — 2.4% | ||
United States — 2.4% | ||
12,590,000 | BioMarin Pharmaceutical, Inc., 1.250%, 5/15/2027 | 12,471,654 |
23,580,000 | DISH Network Corp., 3.375%, 8/15/2026 | 14,171,580 |
6,285,000 | DISH Network Corp., Zero Coupon, 0.000%-9.514%, 12/15/2025(l) | 4,234,142 |
70,000 | Etsy, Inc., 0.125%, 9/01/2027 | 56,000 |
405,000 | Etsy, Inc., 0.250%, 6/15/2028 | 305,978 |
185,000 | JetBlue Airways Corp., 0.500%, 4/01/2026 | 143,024 |
4,390,000 | Livongo Health, Inc., 0.875%, 6/01/2025 | 4,009,387 |
1,615,000 | NCL Corp. Ltd., 1.125%, 2/15/2027 | 1,339,513 |
345,000 | Northern Oil & Gas, Inc., 3.625%, 4/15/2029(b) | 426,175 |
230,000 | Penn Entertainment, Inc., 2.750%, 5/15/2026 | 279,151 |
565,000 | Snap, Inc., Zero Coupon, 6.697%-7.641%, 5/01/2027(l) | 418,665 |
7,550,000 | Southwest Airlines Co., 1.250%, 5/01/2025 | 7,493,375 |
1,025,000 | Splunk, Inc., 1.125%, 6/15/2027 | 967,087 |
655,000 | Spotify USA, Inc., Zero Coupon, 5.189%-5.873%, 3/15/2026(l) | 557,077 |
14,290,000 | Teladoc Health, Inc., 1.250%, 6/01/2027 | 11,387,701 |
6,678,000 | Uber Technologies, Inc., Zero Coupon, 0.000%-5.582%, 12/15/2025(l) | 6,235,983 |
410,000 | Unity Software, Inc., Zero Coupon, 7.197%-7.334%, 11/15/2026(l) | 324,515 |
120,000 | Zillow Group, Inc., 1.375%, 9/01/2026 | 142,980 |
Total Convertible Bonds (Identified Cost $83,506,676) | 64,963,987 | |
Principal Amount (‡) | Description | Value (†) |
Municipals — 0.0% | ||
United States — 0.0% | ||
$120,000 | Tobacco Settlement Financing Corp., Series A-1, 6.706%-, 6/01/2046 (Identified cost $119,990) | $99,311 |
Total Bonds and Notes (Identified Cost $971,588,887) | 827,027,168 | |
Senior Loans — 0.2% | ||
Canada — 0.0% | ||
585,000 | 1011778 BC Unlimited Liability Co., 2023 Term Loan B5, 1 mo. USD SOFR + 2.250%, 7.566%, 9/23/2030(m) | 582,443 |
United States — 0.2% | ||
1,833,249 | Carnival Corp., 2021 Incremental Term Loan B, 1 mo. USD SOFR + 3.250%, 8.681%, 10/18/2028(i)(n) | 1,821,792 |
245,900 | Carnival Corp., 2021 Incremental Term Loan B, 10/18/2028(o) | 244,363 |
80,649 | Carnival Corp., 2023 Term Loan B, 8/08/2027(o) | 80,347 |
1,531,720 | Carnival Corp., 2023 Term Loan B, 1 mo. USD SOFR + 3.000%, 8.327%, 8/08/2027(i)(n) | 1,525,977 |
341,000 | GTCR W Merger Sub LLC, USD Term Loan B, 9/20/2030(o) | 340,751 |
270,000 | HUB International Ltd., 2023 Term Loan B, 3 mo. USD SOFR + 4.250%, 9.584%, 6/20/2030(i)(n) | 270,451 |
1,081,191 | Star Parent, Inc., 2023 Term Loan B, 9/19/2030(o) | 1,055,815 |
486,325 | Uber Technologies, Inc., 2023 Term Loan B, 3 mo. USD SOFR + 2.750%, 8.159%, 3/03/2030(i)(m) | 485,882 |
5,825,378 | ||
Total Senior Loans (Identified Cost $6,402,711) | 6,407,821 | |
Shares | ||
Preferred Stocks — 0.1% | ||
United States — 0.1% | ||
24,376 | El Paso Energy Capital Trust I, 4.750%, 3/31/2028 (Identified Cost $1,125,845) | 1,106,914 |
Loomis Sayles Global Allocation Fund (continued)
Principal Amount (‡) | Description | Value (†) |
Short-Term Investments — 1.7% | ||
$42,210,104 | Tri-Party Repurchase Agreement with Fixed Income Clearing Corporation, dated 9/29/2023 at 2.500% to be repurchased at $42,218,898 on 10/02/2023 collateralized by $48,351,700 U.S. Treasury Note, 0.750% due 8/31/2026 valued at $43,054,350 including accrued interest (Note 2 of Notes to Financial Statements) | $42,210,104 |
4,150,000 | U.S. Treasury Bills, 5.170%, 12/21/2023(p) | 4,100,998 |
Total Short-Term Investments (Identified Cost $46,311,829) | 46,311,102 | |
Total Investments — 100.1% (Identified Cost $2,624,501,457) | 2,698,580,957 | |
Other assets less liabilities — (0.1)% | (2,268,373 ) | |
Net Assets — 100.0% | $2,696,312,584 | |
(†) | See Note 2 of Notes to Financial Statements. |
(‡) | Principal Amount stated in U.S. dollars unless otherwise noted. |
(a) | Non-income producing security. |
(b) | All or a portion of these securities are exempt from registration under Rule 144A of the Securities Act of 1933. These securities may be resold in transactions exempt from registration, normally to qualified institutional buyers. At September 30, 2023, the value of Rule 144A holdings amounted to $277,712,051 or 10.3% of net assets. |
(c) | Amount shown represents units. One unit represents a principal amount of 1,000. |
(d) | Interest rate represents annualized yield at time of purchase; not a coupon rate. |
(e) | Amount shown represents principal amount including inflation adjustments. |
(f) | Perpetual bond with no specified maturity date. |
(g) | Amount shown represents units. One unit represents a principal amount of 100. |
(h) | The issuer is in default with respect to interest and/or principal payments. Income is not being accrued. |
(i) | Variable rate security. Rate as of September 30, 2023 is disclosed. |
(j) | Treasury Inflation Protected Security (TIPS). |
(k) | Security (or a portion thereof) has been pledged as collateral for open derivative contracts. |
(l) | Interest rate represents annualized yield at time of purchase; not a coupon rate. The Fund’s investment in this security is comprised of various lots with differing annualized yields. |
(m) | Stated interest rate has been determined in accordance with the provisions of the loan agreement and is subject to a minimum benchmark floor rate of 0.00%, to which the spread is added. |
(n) | Stated interest rate has been determined in accordance with the provisions of the loan agreement and is subject to a minimum benchmark floor rate of 0.75%, to which the spread is added. |
(o) | Position is unsettled. Contract rate was not determined at September 30, 2023 and does not take effect until settlement date. Maturity date is not finalized until settlement date. |
(p) | Interest rate represents discount rate at time of purchase; not a coupon rate. |
CPI | Consumer Price Index |
EMTN | Euro Medium Term Note |
MTN | Medium Term Note |
SOFR | Secured Overnight Financing Rate |
AUD | Australian Dollar |
BRL | Brazilian Real |
CAD | Canadian Dollar |
COP | Colombian Peso |
EUR | Euro |
GBP | British Pound |
IDR | Indonesian Rupiah |
JPY | Japanese Yen |
KRW | South Korean Won |
MXN | Mexican Peso |
NOK | Norwegian Krone |
NZD | New Zealand Dollar |
PLN | Polish Zloty |
SEK | Swedish Krona |
SGD | Singapore Dollar |
UYU | Uruguayan Peso |
ZAR | South African Rand |
Counterparty | Delivery Date | Currency Bought/ Sold (B/S) | Units of Currency | In Exchange for | Notional Value | Unrealized Appreciation (Depreciation) | |
Bank of America N.A. | 12/20/2023 | GBP | B | 11,193,000 | $13,892,304 | $13,664,006 | $(228,298 ) |
Bank of America N.A. | 12/20/2023 | JPY | B | 7,022,630,000 | 48,478,403 | 47,599,308 | (879,095 ) |
Bank of America N.A. | 12/20/2023 | KRW | S | 19,047,379,000 | 14,400,377 | 14,179,287 | 221,090 |
Bank of America N.A. | 12/20/2023 | MXN | S | 256,059,000 | 14,738,243 | 14,501,569 | 236,674 |
HSBC Bank USA N.A. | 12/20/2023 | AUD | S | 13,800,000 | 8,913,420 | 8,896,554 | 16,866 |
HSBC Bank USA N.A. | 12/20/2023 | CAD | S | 26,705,000 | 19,729,542 | 19,685,632 | 43,910 |
Morgan Stanley Capital Services LLC | 12/20/2023 | EUR | B | 82,154,000 | 88,347,426 | 87,175,763 | (1,171,663 ) |
Morgan Stanley Capital Services LLC | 12/20/2023 | NZD | S | 6,003,000 | 3,559,329 | 3,598,019 | (38,690 ) |
UBS AG | 12/20/2023 | COP | S | 30,469,789,000 | 7,547,632 | 7,323,995 | 223,637 |
UBS AG | 12/20/2023 | IDR | S | 100,000,000,000 | 6,488,269 | 6,469,225 | 19,044 |
Total | $(1,556,525 ) | ||||||
Loomis Sayles Global Allocation Fund (continued)
Counterparty | Settlement Date | Deliver/Units of Currency | Receive/Units of Currency | Notional Value | Unrealized Appreciaation (Depreciation) | ||
Morgan Stanley Capital Services LLC | 12/20/2023 | NOK | 30,959,000 | EUR | 2,705,675 | $2,871,063 | $(29,492 ) |
Financial Futures | Expiration Date | Contracts | Notional Amount | Value | Unrealized Appreciation (Depreciation) |
CBOT 10 Year U.S. Treasury Notes Futures | 12/19/2023 | 74 | $8,153,670 | $7,996,625 | $(157,045 ) |
CBOT 2 Year U.S. Treasury Notes Futures | 12/29/2023 | 125 | 25,403,641 | 25,338,867 | (64,774 ) |
CBOT 5 Year U.S. Treasury Notes Futures | 12/29/2023 | 541 | 57,501,770 | 56,999,422 | (502,348 ) |
CBOT U.S. Long Bond Futures | 12/19/2023 | 798 | 95,771,849 | 90,797,438 | (4,974,411 ) |
Total | $(5,698,578 ) |
Financial Futures | Expiration Date | Contracts | Notional Amount | Value | Unrealized Appreciation (Depreciation) |
CME Ultra Long Term U.S. Treasury Bond Futures | 12/19/2023 | 189 | $23,812,972 | $22,431,938 | $1,381,034 |
Ultra 10 Year U.S. Treasury Notes Futures | 12/19/2023 | 387 | 44,388,677 | 43,174,687 | 1,213,990 |
Total | $2,595,024 |
Treasuries | 7.8 % |
Semiconductors & Semiconductor Equipment | 6.9 |
Capital Markets | 6.6 |
Machinery | 5.8 |
Software | 5.5 |
Life Sciences Tools & Services | 5.4 |
IT Services | 4.3 |
Specialty Retail | 3.5 |
Textiles, Apparel & Luxury Goods | 3.4 |
Interactive Media & Services | 3.3 |
Chemicals | 3.3 |
Broadline Retail | 3.2 |
Financial Services | 2.9 |
Cable Satellite | 2.8 |
Health Care Providers & Services | 2.7 |
Hotels, Restaurants & Leisure | 2.6 |
Banks | 2.4 |
Banking | 2.2 |
Consumer Staples Distribution & Retail | 2.1 |
Pharmaceuticals | 2.1 |
Other Investments, less than 2% each | 19.6 |
Short-Term Investments | 1.7 |
Total Investments | 100.1 |
Other assets less liabilities (including forward foreign currency and futures contracts) | (0.1 ) |
Net Assets | 100.0 % |
United States Dollar | 78.6 % |
Euro | 7.3 |
Swedish Krona | 2.6 |
Japanese Yen | 2.2 |
Other, less than 2% each | 9.4 |
Total Investments | 100.1 |
Other assets less liabilities (including forward foreign currency and futures contracts) | (0.1 ) |
Net Assets | 100.0 % |
Loomis Sayles Growth Fund
Shares | Description | Value (†) |
Common Stocks — 98.1% of Net Assets | ||
Aerospace & Defense — 4.7% | ||
2,675,683 | Boeing Co.(a) | $512,874,917 |
Air Freight & Logistics — 1.6% | ||
1,560,439 | Expeditors International of Washington, Inc. | 178,873,123 |
Automobiles — 5.9% | ||
2,557,210 | Tesla, Inc.(a) | 639,865,086 |
Beverages — 3.2% | ||
6,505,040 | Monster Beverage Corp.(a) | 344,441,868 |
Biotechnology — 5.0% | ||
307,870 | Regeneron Pharmaceuticals, Inc.(a) | 253,364,695 |
827,806 | Vertex Pharmaceuticals, Inc.(a) | 287,861,259 |
541,225,954 | ||
Broadline Retail — 6.2% | ||
1,292,540 | Alibaba Group Holding Ltd., ADR(a) | 112,114,919 |
4,408,381 | Amazon.com, Inc.(a) | 560,393,393 |
672,508,312 | ||
Capital Markets — 3.0% | ||
411,155 | FactSet Research Systems, Inc. | 179,781,636 |
2,351,323 | SEI Investments Co. | 141,620,184 |
321,401,820 | ||
Entertainment — 6.7% | ||
1,108,106 | Netflix, Inc.(a) | 418,420,825 |
3,731,093 | Walt Disney Co.(a) | 302,405,088 |
720,825,913 | ||
Financial Services — 7.3% | ||
1,983,727 | Block, Inc.(a) | 87,799,757 |
1,799,067 | PayPal Holdings, Inc.(a) | 105,173,457 |
2,581,311 | Visa, Inc., Class A | 593,727,343 |
786,700,557 | ||
Health Care Equipment & Supplies — 1.3% | ||
476,399 | Intuitive Surgical, Inc.(a) | 139,246,664 |
Hotels, Restaurants & Leisure — 3.8% | ||
2,202,677 | Starbucks Corp. | 201,038,330 |
1,288,244 | Yum China Holdings, Inc. | 71,780,956 |
1,079,908 | Yum! Brands, Inc. | 134,923,705 |
407,742,991 | ||
Interactive Media & Services — 14.3% | ||
3,698,473 | Alphabet, Inc., Class A(a) | 483,982,177 |
1,698,862 | Alphabet, Inc., Class C(a) | 223,994,955 |
2,801,003 | Meta Platforms, Inc., Class A(a) | 840,889,110 |
1,548,866,242 | ||
IT Services — 1.7% | ||
3,289,235 | Shopify, Inc., Class A(a) | 179,493,554 |
Life Sciences Tools & Services — 2.6% | ||
1,028,425 | Illumina, Inc.(a) | 141,182,184 |
271,444 | Thermo Fisher Scientific, Inc. | 137,396,810 |
278,578,994 | ||
Machinery — 0.7% | ||
196,176 | Deere & Co. | 74,032,899 |
Pharmaceuticals — 4.6% | ||
1,560,708 | Novartis AG, ADR | 158,973,717 |
2,345,881 | Novo Nordisk AS, ADR | 213,334,418 |
3,549,955 | Roche Holding AG, ADR | 120,449,973 |
492,758,108 | ||
Shares | Description | Value (†) |
Semiconductors & Semiconductor Equipment — 8.9% | ||
1,832,261 | NVIDIA Corp. | $797,015,213 |
1,510,554 | QUALCOMM, Inc. | 167,762,127 |
964,777,340 | ||
Software — 16.6% | ||
1,573,664 | Autodesk, Inc.(a) | 325,606,818 |
1,676,248 | Microsoft Corp. | 529,275,306 |
4,732,164 | Oracle Corp. | 501,230,811 |
1,579,946 | Salesforce, Inc.(a) | 320,381,450 |
548,318 | Workday, Inc., Class A(a) | 117,806,122 |
1,794,300,507 | ||
Total Common Stocks (Identified Cost $6,102,374,554) | 10,598,514,849 | |
Principal Amount | ||
Short-Term Investments — 1.9% | ||
$198,748,203 | Tri-Party Repurchase Agreement with Fixed Income Clearing Corporation, dated 9/29/2023 at 2.500% to be repurchased at $198,789,609 on 10/02/2023 collateralized by $204,263,500 U.S. Treasury Note, 4.375% due 8/15/2026 valued at $202,723,198 including accrued interest (Note 2 of Notes to Financial Statements) (Identified Cost $198,748,203) | 198,748,203 |
Total Investments — 100.0% (Identified Cost $6,301,122,757) | 10,797,263,052 | |
Other assets less liabilities — 0.0% | 2,877,124 | |
Net Assets — 100.0% | $10,800,140,176 | |
(†) | See Note 2 of Notes to Financial Statements. |
(a) | Non-income producing security. |
ADR | An American Depositary Receipt is a certificate issued by a custodian bank representing the right to receive securities of the foreign issuer described. The values of ADRs may be significantly influenced by trading on exchanges not located in the United States. |
Loomis Sayles Growth Fund (continued)
Software | 16.6 % |
Interactive Media & Services | 14.3 |
Semiconductors & Semiconductor Equipment | 8.9 |
Financial Services | 7.3 |
Entertainment | 6.7 |
Broadline Retail | 6.2 |
Automobiles | 5.9 |
Biotechnology | 5.0 |
Aerospace & Defense | 4.7 |
Pharmaceuticals | 4.6 |
Hotels, Restaurants & Leisure | 3.8 |
Beverages | 3.2 |
Capital Markets | 3.0 |
Life Sciences Tools & Services | 2.6 |
Other Investments, less than 2% each | 5.3 |
Short-Term Investments | 1.9 |
Total Investments | 100.0 |
Other assets less liabilities | 0.0 * |
Net Assets | 100.0 % |
* | Less than 0.1% |
Loomis Sayles Intermediate Duration Bond Fund
Principal Amount | Description | Value (†) |
Bonds and Notes — 97.7% of Net Assets | ||
ABS Car Loan — 8.7% | ||
$255,000 | Ally Auto Receivables Trust, Series 2022-3, Class A3, 5.070%, 4/15/2027 | $252,606 |
35,924 | American Credit Acceptance Receivables Trust, Series 2020-4, Class C, 1.310%, 12/14/2026(a) | 35,691 |
37,683 | American Credit Acceptance Receivables Trust, Series 2022-1, Class B, 1.680%, 9/14/2026(a) | 37,574 |
80,000 | American Credit Acceptance Receivables Trust, Series 2022-4, Class C, 7.860%, 2/15/2029(a) | 80,599 |
420,000 | American Credit Acceptance Receivables Trust, Series 2023-3, Class C, 6.440%, 10/12/2029(a) | 418,913 |
39,380 | AmeriCredit Automobile Receivables Trust, Series 2020-2, Class B, 0.970%, 2/18/2026 | 39,253 |
215,000 | AmeriCredit Automobile Receivables Trust, Series 2021-2, Class B, 0.690%, 1/19/2027 | 204,451 |
520,000 | AmeriCredit Automobile Receivables Trust, Series 2021-3, Class C, 1.410%, 8/18/2027 | 471,349 |
335,000 | AmeriCredit Automobile Receivables Trust, Series 2022-2, Class A3, 4.380%, 4/18/2028 | 329,069 |
870,000 | AmeriCredit Automobile Receivables Trust, Series 2023-1, Class B, 5.570%, 3/20/2028 | 859,482 |
140,000 | Avis Budget Rental Car Funding AESOP LLC, Series 2019-2A, Class A, 3.350%, 9/22/2025(a) | 136,901 |
255,000 | Avis Budget Rental Car Funding AESOP LLC, Series 2023-2A, Class A, 5.200%, 10/20/2027(a) | 248,656 |
1,210,000 | Avis Budget Rental Car Funding AESOP LLC, Series 2023-3A, Class A, 5.440%, 2/22/2028(a) | 1,188,031 |
170,000 | Carmax Auto Owner Trust, Series 2023-3, Class A3, 5.280%, 5/15/2028 | 168,844 |
21,347 | CarMax Auto Owner Trust, Series 2020-3, Class A3, 0.620%, 3/17/2025 | 21,280 |
1,055,000 | CarMax Auto Owner Trust, Series 2023-2, Class A3, 5.050%, 1/18/2028 | 1,043,198 |
55,918 | CarNow Auto Receivables Trust, Series 2023-1A, Class A, 6.620%, 12/16/2024(a) | 55,914 |
113,947 | Carvana Auto Receivables Trust, Series 2021-N4, Class C, 1.720%, 9/11/2028 | 107,830 |
431,064 | Carvana Auto Receivables Trust, Series 2021-P4, Class A3, 1.310%, 1/11/2027 | 413,367 |
725,393 | Carvana Auto Receivables Trust, Series 2023-N1, Class A, 6.360%, 4/12/2027(a) | 724,829 |
675,000 | Carvana Auto Receivables Trust, Series 2023-P1, Class A3, 5.980%, 12/10/2027(a) | 671,151 |
480,000 | Carvana Auto Receivables Trust, Series 2023-P4, Class A3, 6.160%, 10/10/2028(a) | 479,956 |
176,017 | Credit Acceptance Auto Loan Trust, Series 2021-3A, Class A, 1.000%, 5/15/2030(a) | 172,127 |
845,000 | Credit Acceptance Auto Loan Trust, Series 2022-3A, Class A, 6.570%, 10/15/2032(a) | 846,233 |
710,000 | Credit Acceptance Auto Loan Trust, Series 2023-1A, Class A, 6.480%, 3/15/2033(a) | 709,903 |
465,000 | Credit Acceptance Auto Loan Trust, Series 2023-2A, Class B, 6.610%, 7/15/2033(a) | 459,442 |
130,000 | Credit Acceptance Auto Loan Trust, Series 2023-3A, Class C, 7.620%, 12/15/2033(a) | 129,820 |
191,979 | Drive Auto Receivables Trust, Series 2021-3, Class B, 1.110%, 5/15/2026 | 190,790 |
68,902 | DT Auto Owner Trust, Series 2020-2A, Class C, 3.280%, 3/16/2026(a) | 68,614 |
16,587 | DT Auto Owner Trust, Series 2021-2A, Class B, 0.810%, 1/15/2027(a) | 16,550 |
Principal Amount | Description | Value (†) |
ABS Car Loan — continued | ||
$410,000 | DT Auto Owner Trust, Series 2021-4A, Class C, 1.500%, 9/15/2027(a) | $388,515 |
630,000 | DT Auto Owner Trust, Series 2022-3A, Class B, 6.740%, 7/17/2028(a) | 632,849 |
345,000 | DT Auto Owner Trust, Series 2023-2A, Class B, 5.410%, 2/15/2029(a) | 339,918 |
219,142 | Exeter Automobile Receivables Trust, Series 2021-4A, Class B, 1.050%, 5/15/2026 | 217,751 |
680,000 | Exeter Automobile Receivables Trust, Series 2022-5A, Class B, 5.970%, 3/15/2027 | 677,047 |
360,000 | Exeter Automobile Receivables Trust, Series 2023-1A, Class B, 5.720%, 4/15/2027 | 357,464 |
380,000 | Exeter Automobile Receivables Trust, Series 2023-2A, Class B, 5.610%, 9/15/2027 | 375,906 |
130,000 | Exeter Automobile Receivables Trust, Series 2023-3A, Class B, 6.110%, 9/15/2027 | 129,079 |
290,000 | Flagship Credit Auto Trust, Series 2021-2, Class B, 0.930%, 6/15/2027(a) | 283,366 |
490,000 | Flagship Credit Auto Trust, Series 2022-4, Class A3, 6.320%, 6/15/2027(a) | 492,379 |
430,000 | Flagship Credit Auto Trust, Series 2023-1, Class A3, 5.010%, 8/16/2027(a) | 423,791 |
450,000 | Flagship Credit Auto Trust, Series 2023-2, Class C, 5.810%, 5/15/2029(a) | 440,778 |
595,000 | Ford Credit Auto Owner Trust, Series 2018-1, Class A, 3.190%, 7/15/2031(a) | 574,146 |
570,000 | Ford Credit Auto Owner Trust, Series 2021-1, Class A, 1.370%, 10/17/2033(a) | 511,399 |
1,035,000 | Ford Credit Auto Owner Trust, Series 2023-2, Class A, 5.280%, 2/15/2036(a) | 1,016,508 |
355,000 | Ford Credit Floorplan Master Owner Trust A, Series 2023-1, Class A1, 4.920%, 5/15/2028(a) | 348,122 |
410,000 | Foursight Capital Automobile Receivables Trust, Series 2022-1, Class A3, 1.830%, 12/15/2026(a) | 400,038 |
340,000 | Foursight Capital Automobile Receivables Trust, Series 2022-2, Class A3, 4.590%, 6/15/2027(a) | 335,943 |
380,000 | GECU Auto Receivables Trust, Series 2023-1A, Class A3, 5.630%, 8/15/2028(a) | 378,274 |
57,926 | GLS Auto Receivables Issuer Trust, Series 2020-4A, Class C, 1.140%, 11/17/2025(a) | 57,498 |
955,511 | GLS Auto Receivables Issuer Trust, Series 2021-4A, Class B, 1.530%, 4/15/2026(a) | 941,574 |
280,000 | GM Financial Automobile Leasing Trust, Series 2023-2, Class A3, 5.050%, 7/20/2026 | 276,778 |
77 | GM Financial Consumer Automobile Receivables Trust, Series 2020-2, Class A3, 1.490%, 12/16/2024 | 77 |
265,000 | Harley-Davidson Motorcycle Trust, Series 2023-B, Class A3, 5.690%, 8/15/2028 | 265,345 |
215,000 | Harley-Davidson Motorcycle Trust, Series 2023-B, Class A4, 5.780%, 4/15/2031 | 214,329 |
715,000 | Hertz Vehicle Financing III LLC, Series 2023-3A, Class A, 5.940%, 2/25/2028(a) | 714,337 |
370,000 | Hyundai Auto Lease Securitization Trust, Series 2023-B, Class A3, 5.150%, 6/15/2026(a) | 366,414 |
4,109 | Hyundai Auto Receivables Trust, Series 2020-A, Class A3, 1.410%, 11/15/2024 | 4,101 |
14,765 | Mercedes-Benz Auto Receivables Trust, Series 2020-1, Class A3, 0.550%, 2/18/2025 | 14,702 |
250,000 | Navistar Financial Dealer Note Master Owner Trust II, Series 2023-1, Class A, 6.180%, 8/25/2028(a) | 249,254 |
80,374 | Prestige Auto Receivables Trust, Series 2020-1A, Class C, 1.310%, 11/16/2026(a) | 80,128 |
Loomis Sayles Intermediate Duration Bond Fund (continued)
Principal Amount | Description | Value (†) |
ABS Car Loan — continued | ||
$430,000 | Prestige Auto Receivables Trust, Series 2021-1A, Class C, 1.530%, 2/15/2028(a) | $409,502 |
340,000 | Prestige Auto Receivables Trust, Series 2023-1A, Class C, 5.650%, 2/15/2028(a) | 332,486 |
48,087 | Santander Consumer Auto Receivables Trust, Series 2020-AA, Class C, 3.710%, 2/17/2026(a) | 47,985 |
835,000 | Santander Drive Auto Receivables Trust, Series 2022-3, Class B, 4.130%, 8/16/2027 | 815,373 |
560,000 | Santander Drive Auto Receivables Trust, Series 2022-4, Class B, 4.420%, 11/15/2027 | 547,269 |
285,000 | Santander Drive Auto Receivables Trust, Series 2022-5, Class B, 4.430%, 3/15/2027 | 279,491 |
115,000 | Santander Drive Auto Receivables Trust, Series 2023-1, Class C, 5.090%, 5/15/2030 | 112,240 |
290,000 | Santander Drive Auto Receivables Trust, Series 2023-2, Class A3, 5.210%, 7/15/2027 | 286,973 |
170,000 | Santander Drive Auto Receivables Trust, Series 2023-3, Class C, 5.770%, 11/15/2030 | 168,688 |
540,000 | Santander Drive Auto Receivables Trust, Series 2023-4, Class B, 5.770%, 12/15/2028 | 541,122 |
420,000 | SFS Auto Receivables Securitization Trust, Series 2023-1A, Class A3, 5.470%, 10/20/2028(a) | 414,951 |
440,000 | Toyota Auto Loan Extended Note Trust, Series 2020-1A, Class A, 1.350%, 5/25/2033(a) | 408,262 |
370,000 | Toyota Auto Receivables Owner Trust, Series 2023-C, Class A3, 5.160%, 4/17/2028 | 366,718 |
320,000 | United Auto Credit Securitization Trust, Series 2022-2, Class C, 5.810%, 5/10/2027(a) | 317,399 |
138,743 | Westlake Automobile Receivables Trust, Series 2021-2A, Class B, 0.620%, 7/15/2026(a) | 137,819 |
1,050,000 | Westlake Automobile Receivables Trust, Series 2021-3A, Class C, 1.580%, 1/15/2027(a) | 1,003,576 |
170,000 | Westlake Automobile Receivables Trust, Series 2023-1A, Class C, 5.740%, 8/15/2028(a) | 168,006 |
695,000 | Westlake Automobile Receivables Trust, Series 2023-3A, Class C, 6.020%, 9/15/2028(a) | 692,421 |
73,124 | World Omni Auto Receivables Trust, Series 2020-B, Class A3, 0.630%, 5/15/2025 | 72,574 |
380,000 | World Omni Automobile Lease Securitization Trust, Series 2023-A, Class A3, 5.070%, 9/15/2026 | 375,931 |
360,000 | World Omni Select Auto Trust, Series 2021-A, Class B, 0.850%, 8/16/2027 | 338,504 |
29,927,523 | ||
ABS Credit Card — 0.3% | ||
960,000 | Mercury Financial Credit Card Master Trust, Series 2022-1A, Class A, 2.500%, 9/21/2026(a) | 918,263 |
230,000 | Mission Lane Credit Card Master Trust, Series 2023-A, Class A, 7.230%, 7/17/2028(a) | 228,203 |
1,146,466 | ||
ABS Home Equity — 0.0% | ||
1,536 | Countrywide Asset-Backed Certificates, Series 2004-S1, Class A3, 5.115%, 2/25/2035(b) | 1,511 |
ABS Other — 2.0% | ||
125,000 | Affirm Asset Securitization Trust, Series 2022-A, Class A, 4.300%, 5/17/2027(a) | 122,263 |
105,000 | Affirm Asset Securitization Trust, Series 2023-A, Class A, 6.610%, 1/18/2028(a) | 104,320 |
320,000 | Affirm Asset Securitization Trust, Series 2023-B, Class A, 6.820%, 9/15/2028(a) | 319,585 |
288,772 | Aqua Finance Trust, Series 2021-A, Class A, 1.540%, 7/17/2046(a) | 253,796 |
Principal Amount | Description | Value (†) |
ABS Other — continued | ||
$76,963 | BHG Securitization Trust, Series 2022-C, Class A, 5.320%, 10/17/2035(a) | $76,431 |
53,440 | Chesapeake Funding II LLC, Series 2020-1A, Class A1, 0.870%, 8/15/2032(a) | 52,840 |
402,294 | Chesapeake Funding II LLC, Series 2023-1A, Class A1, 5.650%, 5/15/2035(a) | 399,578 |
19,074 | CNH Equipment Trust, Series 2020-A, Class A3, 1.160%, 6/16/2025 | 18,961 |
500,000 | Daimler Trucks Retail Trust, Series 2023-1, Class A4, 5.930%, 12/16/2030 | 499,529 |
645,000 | DLLMT LLC, Series 2023-1A, Class A3, 5.340%, 3/22/2027(a) | 634,865 |
203,387 | Donlen Fleet Lease Funding 2 LLC, Series 2021-2, Class A2, 0.560%, 12/11/2034(a) | 199,103 |
156,490 | Enterprise Fleet Financing LLC, Series 2022-3, Class A2, 4.380%, 7/20/2029(a) | 153,200 |
440,000 | Enterprise Fleet Financing LLC, Series 2023-2, Class A2, 5.560%, 4/22/2030(a) | 436,616 |
630,000 | Frontier Issuer LLC, Series 2023-1, Class A2, 6.600%, 8/20/2053(a) | 601,971 |
84,271 | Hilton Grand Vacations Trust, Series 2022-2A, Class C, 5.570%, 1/25/2037(a) | 80,826 |
455,000 | M&T Equipment Notes, Series 2023-1A, Class A3, 5.740%, 7/15/2030(a) | 451,708 |
62,642 | Marlette Funding Trust, Series 2022-3A, Class A, 5.180%, 11/15/2032(a) | 62,392 |
51,522 | MVW LLC, Series 2020-1A, Class A, 1.740%, 10/20/2037(a) | 47,428 |
1,135,000 | OneMain Financial Issuance Trust, Series 2022-S1, Class A, 4.130%, 5/14/2035(a) | 1,089,021 |
370,000 | SCF Equipment Leasing LLC, Series 2022-1A, Class A3, 2.920%, 7/20/2029(a) | 356,680 |
62,652 | Sierra Timeshare Receivables Funding LLC, Series 2020-2A, Class A, 1.330%, 7/20/2037(a) | 58,633 |
785,000 | Wheels Fleet Lease Funding 1 LLC, Series 2023-1A, Class A, 5.800%, 4/18/2038(a) | 778,934 |
6,798,680 | ||
ABS Student Loan — 0.1% | ||
89,224 | Massachusetts Educational Financing Authority, Series 2018-A, Class A, 3.850%, 5/25/2033 | 81,894 |
49,543 | Navient Private Education Refi Loan Trust, Series 2020-GA, Class A, 1.170%, 9/16/2069(a) | 43,637 |
60,719 | Navient Private Education Refi Loan Trust, Series 2020-HA, Class A, 1.310%, 1/15/2069(a) | 54,961 |
180,492 | ||
ABS Whole Business — 0.1% | ||
508,250 | Planet Fitness Master Issuer LLC, Series 2018-1A, Class A2II, 4.666%, 9/05/2048(a) | 487,166 |
Agency Commercial Mortgage-Backed Securities — 0.5% | ||
701,647 | Federal Home Loan Mortgage Corp. Multifamily Structured Pass-Through Certificates, Series K042, Class A2, 2.670%, 12/25/2024 | 678,049 |
990,464 | Federal Home Loan Mortgage Corp. Multifamily Structured Pass-Through Certificates, Series KJ26, Class A2, 2.606%, 7/25/2027 | 928,254 |
1,606,303 | ||
Apartment REITs — 0.1% | ||
225,000 | Invitation Homes Operating Partnership LP, 2.000%, 8/15/2031 | 166,509 |
Loomis Sayles Intermediate Duration Bond Fund (continued)
Principal Amount | Description | Value (†) |
Automotive — 3.3% | ||
$515,000 | American Honda Finance Corp., GMTN, 5.125%, 7/07/2028 | $506,955 |
930,000 | BMW U.S. Capital LLC, 5.150%, 8/11/2033(a) | 885,228 |
735,000 | Daimler Truck Finance North America LLC, 5.200%, 1/17/2025(a) | 728,193 |
340,000 | Daimler Truck Finance North America LLC, 5.400%, 9/20/2028(a) | 333,679 |
665,000 | Denso Corp., 1.239%, 9/16/2026(a) | 581,696 |
875,000 | General Motors Financial Co., Inc., 6.050%, 10/10/2025 | 871,127 |
180,000 | Harley-Davidson Financial Services, Inc., 3.350%, 6/08/2025(a) | 170,826 |
995,000 | Harley-Davidson Financial Services, Inc., 6.500%, 3/10/2028(a) | 983,646 |
645,000 | Hyundai Capital America, 2.100%, 9/15/2028(a) | 535,172 |
410,000 | Hyundai Capital America, 5.700%, 6/26/2030(a) | 394,422 |
255,000 | Hyundai Capital America, 5.950%, 9/21/2026(a) | 254,276 |
240,000 | Kia Corp., 1.000%, 4/16/2024(a) | 233,652 |
495,000 | LKQ Corp., 5.750%, 6/15/2028(a) | 483,573 |
340,000 | Mercedes-Benz Finance North America LLC, 4.800%, 3/30/2028(a) | 329,370 |
515,000 | Mercedes-Benz Finance North America LLC, 5.100%, 8/03/2028(a) | 504,345 |
315,000 | Nissan Motor Acceptance Co. LLC, 7.050%, 9/15/2028(a) | 314,946 |
590,000 | PACCAR Financial Corp., MTN, 4.950%, 8/10/2028 | 583,273 |
685,000 | Toyota Motor Credit Corp., 4.550%, 5/17/2030 | 649,194 |
370,000 | Toyota Motor Credit Corp., MTN, 5.000%, 8/14/2026 | 366,359 |
980,000 | Toyota Motor Credit Corp., MTN, 5.250%, 9/11/2028 | 974,470 |
275,000 | Volkswagen Group of America Finance LLC, 3.350%, 5/13/2025(a) | 263,530 |
290,000 | Volkswagen Group of America Finance LLC, 4.250%, 11/13/2023(a) | 289,391 |
11,237,323 | ||
Banking — 15.1% | ||
800,000 | ABN AMRO Bank NV, (fixed rate to 9/18/2026, variable rate thereafter), 6.339%, 9/18/2027(a) | 797,994 |
200,000 | AIB Group PLC, (fixed rate to 9/13/2028, variable rate thereafter), 6.608%, 9/13/2029(a) | 199,168 |
700,000 | AIB Group PLC, (fixed rate to 10/14/2025, variable rate thereafter), 7.583%, 10/14/2026(a) | 712,826 |
735,000 | Ally Financial, Inc., 7.100%, 11/15/2027 | 734,907 |
585,000 | American Express Co., (fixed rate to 5/01/2033, variable rate thereafter), 5.043%, 5/01/2034 | 539,341 |
1,065,000 | American Express Co., (fixed rate to 7/27/2028, variable rate thereafter), 5.282%, 7/27/2029 | 1,038,303 |
1,030,000 | ANZ New Zealand International Ltd., 5.355%, 8/14/2028(a) | 1,011,205 |
565,000 | ASB Bank Ltd., (fixed rate to 6/17/2027, variable rate thereafter), 5.284%, 6/17/2032(a) | 539,411 |
840,000 | Bank of America Corp., MTN, (fixed rate to 4/02/2025, variable rate thereafter), 3.384%, 4/02/2026 | 803,960 |
265,000 | Bank of America Corp., (fixed rate to 4/25/2033, variable rate thereafter), 5.288%, 4/25/2034 | 246,585 |
1,155,000 | Bank of America NA, 5.526%, 8/18/2026 | 1,149,395 |
395,000 | Bank of Ireland Group PLC, 4.500%, 11/25/2023(a) | 393,523 |
315,000 | Bank of Ireland Group PLC, (fixed rate to 9/16/2025, variable rate thereafter), 6.253%, 9/16/2026(a) | 313,026 |
30,000 | Bank of Montreal, 5.300%, 6/05/2026 | 29,596 |
1,710,000 | Bank of Montreal, 5.717%, 9/25/2028 | 1,691,830 |
Principal Amount | Description | Value (†) |
Banking — continued | ||
$570,000 | Bank of New York Mellon Corp., (fixed rate to 4/26/2026, variable rate thereafter), 4.947%, 4/26/2027 | $556,369 |
635,000 | Bank of New Zealand, 2.000%, 2/21/2025(a) | 601,591 |
250,000 | Bank of New Zealand, 2.285%, 1/27/2027(a) | 224,337 |
340,000 | Banque Federative du Credit Mutuel SA, 5.790%, 7/13/2028(a) | 337,394 |
570,000 | BNP Paribas SA, (fixed rate to 6/12/2028, variable rate thereafter), 5.335%, 6/12/2029(a) | 553,504 |
475,000 | CaixaBank SA, (fixed rate to 9/13/2033, variable rate thereafter), 6.840%, 9/13/2034(a) | 465,775 |
595,000 | Canadian Imperial Bank of Commerce, 5.001%, 4/28/2028 | 571,241 |
1,205,000 | Canadian Imperial Bank of Commerce, 6.092%, 10/03/2033 | 1,197,003 |
705,000 | Capital One Financial Corp., (fixed rate to 12/06/2023, variable rate thereafter), 1.343%, 12/06/2024 | 696,485 |
770,000 | Capital One Financial Corp., (fixed rate to 6/08/2028, variable rate thereafter), 6.312%, 6/08/2029 | 752,519 |
1,725,000 | Citibank NA, 5.803%, 9/29/2028 | 1,725,246 |
510,000 | Citigroup, Inc., (fixed rate to 4/08/2025, variable rate thereafter), 3.106%, 4/08/2026 | 486,700 |
490,000 | Citigroup, Inc., (fixed rate to 5/25/2033, variable rate thereafter), 6.174%, 5/25/2034 | 468,255 |
705,000 | Citizens Financial Group, Inc., (fixed rate to 5/21/2032, variable rate thereafter), 5.641%, 5/21/2037 | 590,505 |
435,000 | Cooperatieve Rabobank UA, (fixed rate to 2/28/2028, variable rate thereafter), 5.564%, 2/28/2029(a) | 423,967 |
920,000 | Credit Agricole SA, (fixed rate to 10/03/2028, variable rate thereafter), 6.316%, 10/03/2029(a) | 920,106 |
335,000 | Credit Suisse AG, 5.000%, 7/09/2027 | 321,793 |
800,000 | Danske Bank AS, (fixed rate to 9/10/2024, variable rate thereafter), 0.976%, 9/10/2025(a) | 758,293 |
855,000 | Danske Bank AS, (fixed rate to 9/22/2025, variable rate thereafter), 6.259%, 9/22/2026(a) | 854,690 |
330,000 | Deutsche Bank AG, (fixed rate to 11/10/2032, variable rate thereafter), 7.079%, 2/10/2034 | 298,235 |
480,000 | Deutsche Bank AG, (fixed rate to 7/13/2026, variable rate thereafter), 7.146%, 7/13/2027 | 483,249 |
590,000 | DNB Bank ASA, (fixed rate to 9/16/2025, variable rate thereafter), 1.127%, 9/16/2026(a) | 532,359 |
720,000 | Federation des Caisses Desjardins du Quebec, 5.700%, 3/14/2028(a) | 709,697 |
460,000 | Fifth Third Bancorp, (fixed rate to 7/27/2028, variable rate thereafter), 6.339%, 7/27/2029 | 454,418 |
1,650,000 | Goldman Sachs Group, Inc., (fixed rate to 8/10/2025, variable rate thereafter), 5.798%, 8/10/2026 | 1,637,383 |
1,525,000 | HSBC Holdings PLC, (fixed rate to 8/14/2026, variable rate thereafter), 5.887%, 8/14/2027 | 1,506,396 |
520,000 | HSBC USA, Inc., 3.750%, 5/24/2024 | 511,405 |
525,000 | HSBC USA, Inc., 5.625%, 3/17/2025 | 521,892 |
585,000 | Huntington Bancshares, Inc., (fixed rate to 8/21/2028, variable rate thereafter), 6.208%, 8/21/2029 | 572,277 |
290,000 | Huntington National Bank, 5.650%, 1/10/2030 | 273,278 |
200,000 | ING Groep NV, (fixed rate to 9/11/2033, variable rate thereafter), 6.114%, 9/11/2034 | 194,222 |
495,000 | Intesa Sanpaolo SpA, 7.000%, 11/21/2025(a) | 500,386 |
Loomis Sayles Intermediate Duration Bond Fund (continued)
Principal Amount | Description | Value (†) |
Banking — continued | ||
$550,000 | JPMorgan Chase & Co., (fixed rate to 6/01/2028, variable rate thereafter), 2.069%, 6/01/2029 | $463,434 |
820,000 | JPMorgan Chase & Co., (fixed rate to 6/01/2033, variable rate thereafter), 5.350%, 6/01/2034 | 777,587 |
735,000 | JPMorgan Chase & Co., (fixed rate to 12/15/2024, variable rate thereafter), 5.546%, 12/15/2025 | 729,875 |
435,000 | KeyBank NA, 5.850%, 11/15/2027 | 413,686 |
790,000 | Lloyds Banking Group PLC, (fixed rate to 8/07/2026, variable rate thereafter), 5.985%, 8/07/2027 | 782,886 |
270,000 | Macquarie Group Ltd., (fixed rate to 6/15/2033, variable rate thereafter), 5.887%, 6/15/2034(a) | 254,111 |
1,110,000 | Morgan Stanley, (fixed rate to 7/20/2028, variable rate thereafter), 5.449%, 7/20/2029 | 1,081,660 |
925,000 | National Australia Bank Ltd., 4.900%, 6/13/2028 | 898,494 |
1,130,000 | National Bank of Canada, (fixed rate to 6/09/2024, variable rate thereafter), 3.750%, 6/09/2025 | 1,108,564 |
1,215,000 | NatWest Markets PLC, 1.600%, 9/29/2026(a) | 1,067,891 |
390,000 | Nordea Bank Abp, 1.500%, 9/30/2026(a) | 342,500 |
210,000 | Northern Trust Corp., (fixed rate to 5/08/2027, variable rate thereafter), 3.375%, 5/08/2032 | 185,277 |
1,100,000 | PNC Financial Services Group, Inc., (fixed rate to 6/12/2028, variable rate thereafter), 5.582%, 6/12/2029 | 1,067,125 |
710,000 | Royal Bank of Canada, GMTN, 5.200%, 8/01/2028 | 691,050 |
510,000 | Santander Holdings USA, Inc., (fixed rate to 6/12/2028, variable rate thereafter), 6.565%, 6/12/2029 | 497,499 |
1,280,000 | State Street Corp., 5.272%, 8/03/2026 | 1,267,975 |
675,000 | Sumitomo Mitsui Financial Group, Inc., 5.800%, 7/13/2028 | 670,312 |
200,000 | Sumitomo Mitsui Trust Bank Ltd., 2.550%, 3/10/2025(a) | 190,625 |
830,000 | Svenska Handelsbanken AB, 5.500%, 6/15/2028(a) | 805,922 |
360,000 | Swedbank AB, 5.472%, 6/15/2026(a) | 355,121 |
850,000 | Swedbank AB, 6.136%, 9/12/2026(a) | 846,530 |
560,000 | Synchrony Bank, 5.400%, 8/22/2025 | 538,709 |
285,000 | Synchrony Financial, 4.875%, 6/13/2025 | 273,261 |
575,000 | Toronto-Dominion Bank, MTN, 5.523%, 7/17/2028 | 567,547 |
630,000 | Truist Financial Corp., MTN, (fixed rate to 1/26/2033, variable rate thereafter), 5.122%, 1/26/2034 | 563,187 |
1,385,000 | UBS AG, 5.650%, 9/11/2028 | 1,361,936 |
840,000 | UBS Group AG, (fixed rate to 9/22/2033, variable rate thereafter), 6.301%, 9/22/2034(a) | 820,393 |
585,000 | UniCredit SpA, (fixed rate to 9/22/2025, variable rate thereafter), 2.569%, 9/22/2026(a) | 535,906 |
695,000 | Wells Fargo & Co., MTN, (fixed rate to 4/25/2025, variable rate thereafter), 3.908%, 4/25/2026 | 669,669 |
1,365,000 | Wells Fargo & Co., MTN, (fixed rate to 7/25/2028, variable rate thereafter), 5.574%, 7/25/2029 | 1,331,683 |
52,062,455 | ||
Brokerage — 0.3% | ||
340,000 | Ameriprise Financial, Inc., 5.150%, 5/15/2033 | 321,146 |
355,000 | Blue Owl Finance LLC, 4.375%, 2/15/2032(a) | 283,962 |
530,000 | Jefferies Financial Group, Inc., 5.875%, 7/21/2028 | 518,676 |
1,123,784 | ||
Building Materials — 0.1% | ||
220,000 | Ferguson Finance PLC, 4.650%, 4/20/2032(a) | 197,547 |
215,000 | Mohawk Industries, Inc., 5.850%, 9/18/2028 | 213,413 |
410,960 | ||
Principal Amount | Description | Value (†) |
Chemicals — 0.5% | ||
$240,000 | Cabot Corp., 4.000%, 7/01/2029 | $217,280 |
300,000 | Celanese U.S. Holdings LLC, 6.700%, 11/15/2033 | 292,024 |
535,000 | EIDP, Inc., 4.500%, 5/15/2026 | 521,103 |
845,000 | FMC Corp., 5.650%, 5/18/2033 | 764,328 |
1,794,735 | ||
Collateralized Mortgage Obligations — 0.6% | ||
88,994 | Government National Mortgage Association, Series 2014-H14, Class FA, 1 mo. USD SOFR + 0.614%, 5.718%, 7/20/2064(c) | 88,469 |
79,219 | Government National Mortgage Association, Series 2014-H15, Class FA, 1 mo. USD SOFR + 0.614%, 5.932%, 7/20/2064(c) | 78,724 |
187 | Government National Mortgage Association, Series 2015-H09, Class HA, 1.750%, 3/20/2065(d) | 166 |
137,631 | Government National Mortgage Association, Series 2015-H10, Class JA, 2.250%, 4/20/2065 | 132,526 |
266,418 | Government National Mortgage Association, Series 2016-H06, Class FC, 1 mo. USD SOFR + 1.034%, 4.853%, 2/20/2066(c) | 264,797 |
761,831 | Government National Mortgage Association, Series 2018-H17, Class JA, 3.750%, 9/20/2068(b) | 712,961 |
160,297 | Government National Mortgage Association, Series 2019-H01, Class FL, 1 mo. USD SOFR + 0.564%, 5.882%, 12/20/2068(c) | 159,766 |
324,553 | Government National Mortgage Association, Series 2019-H01, Class FT, 1 mo. USD SOFR + 0.514%, 5.832%, 10/20/2068(c) | 323,398 |
471,902 | Government National Mortgage Association, Series 2019-H10, Class FM, 1 mo. USD SOFR + 0.514%, 5.832%, 5/20/2069(c) | 466,647 |
2,227,454 | ||
Construction Machinery — 0.9% | ||
410,000 | Caterpillar Financial Services Corp., DMTN, 4.350%, 5/15/2026 | 400,802 |
1,150,000 | Caterpillar Financial Services Corp., 5.150%, 8/11/2025 | 1,143,841 |
1,075,000 | CNH Industrial Capital LLC, 5.500%, 1/12/2029 | 1,056,393 |
520,000 | John Deere Capital Corp., MTN, 4.950%, 7/14/2028 | 512,818 |
3,113,854 | ||
Consumer Cyclical Services — 0.0% | ||
165,000 | Expedia Group, Inc., 6.250%, 5/01/2025(a) | 165,272 |
Consumer Products — 0.4% | ||
25,000 | Brunswick Corp., 4.400%, 9/15/2032 | 20,339 |
1,190,000 | Unilever Capital Corp., 5.000%, 12/08/2033 | 1,152,409 |
135,000 | Whirlpool Corp., 5.500%, 3/01/2033 | 129,364 |
1,302,112 | ||
Electric — 2.4% | ||
435,000 | AES Corp., 3.300%, 7/15/2025(a) | 412,022 |
910,000 | American Electric Power Co., Inc., 5.699%, 8/15/2025 | 905,336 |
120,000 | Consolidated Edison Co. of New York, Inc., Series B, 2.900%, 12/01/2026 | 109,065 |
745,000 | DTE Energy Co., 4.220%, 11/01/2024 | 731,109 |
1,110,000 | Edison International, 4.700%, 8/15/2025 | 1,080,142 |
605,000 | Entergy Corp., 0.900%, 9/15/2025 | 549,296 |
280,000 | Interstate Power & Light Co., 5.700%, 10/15/2033 | 275,365 |
665,000 | National Rural Utilities Cooperative Finance Corp., MTN, 5.050%, 9/15/2028 | 653,293 |
Loomis Sayles Intermediate Duration Bond Fund (continued)
Principal Amount | Description | Value (†) |
Electric — continued | ||
$141,000 | National Rural Utilities Cooperative Finance Corp., (fixed rate to 5/01/2023, variable rate thereafter), 8.541%, 4/30/2043(c) | $138,533 |
675,000 | NextEra Energy Capital Holdings, Inc., 5.749%, 9/01/2025 | 673,105 |
380,000 | NextEra Energy Capital Holdings, Inc., 6.051%, 3/01/2025 | 380,575 |
380,000 | Southern California Edison Co., 5.650%, 10/01/2028 | 379,320 |
730,000 | Vistra Operations Co. LLC, 5.125%, 5/13/2025(a) | 711,714 |
830,000 | WEC Energy Group, Inc., 4.750%, 1/09/2026 | 813,057 |
540,000 | Xcel Energy, Inc., 5.450%, 8/15/2033 | 515,337 |
8,327,269 | ||
Finance Companies — 2.5% | ||
510,000 | AerCap Ireland Capital DAC/AerCap Global Aviation Trust, 3.150%, 2/15/2024 | 504,181 |
360,000 | Air Lease Corp., 1.875%, 8/15/2026 | 319,842 |
555,000 | Aircastle Ltd., 2.850%, 1/26/2028(a) | 470,908 |
285,000 | Aircastle Ltd., 6.500%, 7/18/2028(a) | 279,493 |
500,000 | Ares Capital Corp., 2.875%, 6/15/2028 | 418,196 |
50,000 | Ares Capital Corp., 4.250%, 3/01/2025 | 48,085 |
225,000 | Aviation Capital Group LLC, 4.375%, 1/30/2024(a) | 223,024 |
545,000 | Bain Capital Specialty Finance, Inc., 2.550%, 10/13/2026 | 470,006 |
200,000 | Barings BDC, Inc., 3.300%, 11/23/2026 | 175,477 |
795,000 | Blackstone Private Credit Fund, 2.625%, 12/15/2026 | 684,291 |
490,000 | Blackstone Secured Lending Fund, 2.850%, 9/30/2028 | 401,022 |
260,000 | Blue Owl Capital Corp., 3.750%, 7/22/2025 | 243,603 |
90,000 | Blue Owl Capital Corp., 4.250%, 1/15/2026 | 84,198 |
140,000 | Blue Owl Credit Income Corp., 7.750%, 9/16/2027 | 138,874 |
690,000 | Blue Owl Credit Income Corp., 7.950%, 6/13/2028(a) | 683,962 |
890,000 | Blue Owl Technology Finance Corp., 4.750%, 12/15/2025(a) | 823,214 |
435,000 | FS KKR Capital Corp., 3.125%, 10/12/2028 | 353,977 |
660,000 | Golub Capital BDC, Inc., 2.500%, 8/24/2026 | 578,427 |
505,000 | Hercules Capital, Inc., 3.375%, 1/20/2027 | 441,545 |
465,000 | Main Street Capital Corp., 3.000%, 7/14/2026 | 410,872 |
340,000 | Morgan Stanley Direct Lending Fund, 4.500%, 2/11/2027 | 315,839 |
160,000 | Sixth Street Specialty Lending, Inc., 6.950%, 8/14/2028 | 158,249 |
520,000 | USAA Capital Corp., 3.375%, 5/01/2025(a) | 501,075 |
8,728,360 | ||
Financial Other — 0.2% | ||
470,000 | LeasePlan Corp. NV, 2.875%, 10/24/2024(a) | 452,152 |
185,000 | ORIX Corp., 3.250%, 12/04/2024 | 178,734 |
630,886 | ||
Food & Beverage — 0.9% | ||
280,000 | Cargill, Inc., 4.500%, 6/24/2026(a) | 273,840 |
1,135,000 | Conagra Brands, Inc., 5.300%, 10/01/2026 | 1,123,473 |
875,000 | JBS USA LUX SA/JBS USA Food Co./JBS Luxembourg Sarl, 6.750%, 3/15/2034(a) | 851,366 |
915,000 | Pernod Ricard International Finance LLC, 1.250%, 4/01/2028(a) | 765,644 |
3,014,323 | ||
Government Owned - No Guarantee — 0.3% | ||
800,000 | Antares Holdings LP, 3.750%, 7/15/2027(a) | 689,201 |
350,000 | BOC Aviation USA Corp., 1.625%, 4/29/2024(a) | 341,056 |
1,030,257 | ||
Principal Amount | Description | Value (†) |
Health Care REITs — 0.2% | ||
$350,000 | Healthpeak OP LLC, 5.250%, 12/15/2032 | $325,524 |
235,000 | Omega Healthcare Investors, Inc., 4.500%, 1/15/2025 | 228,383 |
553,907 | ||
Healthcare — 0.6% | ||
755,000 | GE HealthCare Technologies, Inc., 5.550%, 11/15/2024 | 751,215 |
320,000 | IQVIA, Inc., 5.700%, 5/15/2028(a) | 310,893 |
855,000 | Thermo Fisher Scientific, Inc., 4.977%, 8/10/2030 | 832,213 |
1,894,321 | ||
Hybrid ARMs — 0.0% | ||
13,912 | Federal Home Loan Mortgage Corp., 1 yr. CMT + 2.225%, 5.216%, 1/01/2035(c) | 14,100 |
28,615 | Federal Home Loan Mortgage Corp., 1 yr. CMT + 2.500%, 5.280%, 5/01/2036(c) | 29,080 |
43,180 | ||
Independent Energy — 0.2% | ||
405,000 | ConocoPhillips Co., 5.050%, 9/15/2033 | 387,712 |
460,000 | Pioneer Natural Resources Co., 5.100%, 3/29/2026 | 454,087 |
841,799 | ||
Life Insurance — 5.2% | ||
400,000 | Allianz SE, (fixed rate to 3/06/2033, variable rate thereafter), 6.350%, 9/06/2053(a) | 386,167 |
330,000 | Athene Global Funding, 2.500%, 3/24/2028(a) | 279,737 |
410,000 | Brighthouse Financial Global Funding, 1.200%, 12/15/2023(a) | 406,016 |
780,000 | Brighthouse Financial Global Funding, 1.750%, 1/13/2025(a) | 735,563 |
835,000 | CNO Global Funding, 2.650%, 1/06/2029(a) | 697,132 |
530,000 | Corebridge Financial, Inc., 6.050%, 9/15/2033(a) | 514,763 |
205,000 | Corebridge Global Funding, 0.900%, 9/22/2025(a) | 185,757 |
670,000 | Corebridge Global Funding, 5.750%, 7/02/2026(a) | 661,910 |
870,000 | Equitable Financial Life Global Funding, 5.500%, 12/02/2025(a) | 857,221 |
155,000 | F&G Annuities & Life, Inc., 7.400%, 1/13/2028 | 154,623 |
1,170,000 | F&G Global Funding, 5.150%, 7/07/2025(a) | 1,135,710 |
330,000 | Five Corners Funding Trust III, 5.791%, 2/15/2033(a) | 323,754 |
230,000 | GA Global Funding Trust, 1.250%, 12/08/2023(a) | 227,729 |
995,000 | GA Global Funding Trust, 2.250%, 1/06/2027(a) | 871,886 |
665,000 | Great-West Lifeco U.S. Finance 2020 LP, 0.904%, 8/12/2025(a) | 601,710 |
1,370,000 | Guardian Life Global Funding, 1.100%, 6/23/2025(a) | 1,258,027 |
705,000 | Jackson National Life Global Funding, 1.750%, 1/12/2025(a) | 661,943 |
155,000 | Jackson National Life Global Funding, 3.875%, 6/11/2025(a) | 147,581 |
230,000 | Lincoln National Corp., 3.400%, 3/01/2032 | 180,787 |
860,000 | MassMutual Global Funding II, 5.050%, 6/14/2028(a) | 838,199 |
520,000 | MetLife, Inc., 5.375%, 7/15/2033 | 499,886 |
530,000 | Metropolitan Life Global Funding I, 0.950%, 7/02/2025(a) | 486,826 |
695,000 | New York Life Global Funding, 4.700%, 4/02/2026(a) | 680,800 |
845,000 | New York Life Global Funding, 5.450%, 9/18/2026(a) | 842,833 |
840,000 | Northwestern Mutual Global Funding, 4.900%, 6/12/2028(a) | 815,598 |
440,000 | Protective Life Global Funding, 1.646%, 1/13/2025(a) | 416,423 |
765,000 | Protective Life Global Funding, 4.714%, 7/06/2027(a) | 735,747 |
655,000 | Reliance Standard Life Global Funding II, 2.750%, 5/07/2025(a) | 615,838 |
Loomis Sayles Intermediate Duration Bond Fund (continued)
Principal Amount | Description | Value (†) |
Life Insurance — continued | ||
$415,000 | Reliance Standard Life Global Funding II, 5.243%, 2/02/2026(a) | $403,177 |
570,000 | RGA Global Funding, 2.700%, 1/18/2029(a) | 483,301 |
755,000 | Security Benefit Global Funding, 1.250%, 5/17/2024(a) | 728,640 |
17,835,284 | ||
Lodging — 0.4% | ||
400,000 | Hyatt Hotels Corp., 5.750%, 1/30/2027 | 397,435 |
720,000 | Marriott International, Inc., 5.550%, 10/15/2028 | 711,945 |
350,000 | Marriott International, Inc., Series Z, 4.150%, 12/01/2023 | 348,891 |
1,458,271 | ||
Media Entertainment — 0.4% | ||
550,000 | Prosus NV, 4.193%, 1/19/2032(a) | 438,581 |
815,000 | Take-Two Interactive Software, Inc., 4.950%, 3/28/2028 | 787,666 |
1,226,247 | ||
Metals & Mining — 0.7% | ||
1,045,000 | BHP Billiton Finance USA Ltd., 4.875%, 2/27/2026 | 1,030,428 |
1,160,000 | Glencore Funding LLC, 6.375%, 10/06/2030(a) | 1,156,877 |
290,000 | Northern Star Resources Ltd., 6.125%, 4/11/2033(a) | 270,769 |
2,458,074 | ||
Midstream — 0.4% | ||
460,000 | Enbridge, Inc., 5.700%, 3/08/2033 | 440,680 |
435,000 | ONEOK, Inc., 5.550%, 11/01/2026 | 432,164 |
600,000 | Williams Cos., Inc., 5.400%, 3/02/2026 | 595,343 |
1,468,187 | ||
Mortgage Related — 0.5% | ||
522 | Federal Home Loan Mortgage Corp., 3.000%, 10/01/2026 | 506 |
7 | Federal Home Loan Mortgage Corp., 6.500%, 1/01/2024 | 7 |
8 | Federal Home Loan Mortgage Corp., 8.000%, 7/01/2025 | 8 |
9,998 | Government National Mortgage Association, 3.890%, with various maturities in 2062(b)(e) | 9,443 |
13,654 | Government National Mortgage Association, 4.015%, 4/20/2063(b) | 13,091 |
14,703 | Government National Mortgage Association, 4.157%, 6/20/2066(b) | 13,960 |
45,663 | Government National Mortgage Association, 4.256%, 11/20/2066(b) | 44,110 |
41,612 | Government National Mortgage Association, 4.389%, 9/20/2066(b) | 40,063 |
51,726 | Government National Mortgage Association, 4.410%, 10/20/2066(b) | 49,814 |
124,969 | Government National Mortgage Association, 4.426%, 10/20/2066(b) | 120,786 |
51,252 | Government National Mortgage Association, 4.453%, 11/20/2066(b) | 49,329 |
2,349 | Government National Mortgage Association, 4.466%, 11/20/2064(b) | 2,294 |
37,323 | Government National Mortgage Association, 4.471%, 8/20/2066(b) | 36,156 |
117,180 | Government National Mortgage Association, 4.496%, 9/20/2066(b) | 113,787 |
248,187 | Government National Mortgage Association, 4.585%, 7/20/2067(b) | 239,300 |
Principal Amount | Description | Value (†) |
Mortgage Related — continued | ||
$52,705 | Government National Mortgage Association, 4.586%, 10/20/2066(b) | $51,273 |
616,969 | Government National Mortgage Association, 4.639%, 4/20/2067(b) | 597,628 |
418,822 | Government National Mortgage Association, 4.670%, 1/20/2067(b) | 407,647 |
61,299 | Government National Mortgage Association, 4.700%, with various maturities from 2061 to 2064(b)(e) | 60,656 |
4 | Government National Mortgage Association, 6.500%, 12/15/2023 | 4 |
1,849,862 | ||
Natural Gas — 0.1% | ||
155,000 | Sempra, 5.400%, 8/01/2026 | 153,356 |
365,000 | Southern Co. Gas Capital Corp., 5.750%, 9/15/2033 | 357,819 |
511,175 | ||
Non-Agency Commercial Mortgage-Backed Securities — 5.4% | ||
230,000 | BANK, Series 2019-BN24, Class A3, 2.960%, 11/15/2062 | 194,373 |
270,000 | BANK, Series 2020-BN25, Class A5, 2.649%, 1/15/2063 | 222,192 |
870,000 | BANK, Series 2021-BN37, Class A5, 2.618%, 11/15/2064(b) | 682,732 |
635,000 | BANK, Series 2023-5YR3, Class A3, 6.724%, 9/15/2056(b) | 650,333 |
660,000 | BBCMS Mortgage Trust, Series 2020-BID, Class A, 1 mo. USD SOFR + 2.254%, 7.588%, 10/15/2037(a)(c) | 628,460 |
865,000 | BBCMS Mortgage Trust, Series 2021-C12, Class A5, 2.689%, 11/15/2054 | 685,878 |
300,000 | BBCMS Mortgage Trust, Series 2023-C20, Class A5, 5.576%, 7/15/2056 | 292,901 |
178,976 | BB-UBS Trust, Series 2012-TFT, Class A, 2.892%, 6/05/2030(a) | 157,184 |
285,000 | Benchmark Mortgage Trust, Series 2020-B16, Class A5, 2.732%, 2/15/2053 | 234,913 |
755,000 | Benchmark Mortgage Trust, Series 2021-B31, Class A5, 2.669%, 12/15/2054 | 595,631 |
520,000 | Benchmark Mortgage Trust, Series 2023-V2, Class A3, 5.812%, 5/15/2055(b) | 512,792 |
520,000 | BPR Trust, Series 2021-NRD, Class A, 1 mo. USD SOFR + 1.525%, 6.858%, 12/15/2038(a)(c) | 490,547 |
360,000 | BPR Trust, Series 2022-OANA, Class A, 1 mo. USD SOFR + 1.898%, 7.230%, 4/15/2037(a)(c) | 353,497 |
491,600 | CFCRE Commercial Mortgage Trust, Series 2016-C3, Class A3, 3.865%, 1/10/2048 | 464,356 |
361,996 | CFCRE Commercial Mortgage Trust, Series 2016-C4, Class A4, 3.283%, 5/10/2058 | 336,929 |
992,138 | Citigroup Commercial Mortgage Trust, Series 2016-GC37, Class A4, 3.314%, 4/10/2049 | 923,109 |
540,000 | Citigroup Commercial Mortgage Trust, Series 2019-C7, Class A4, 3.102%, 12/15/2072 | 456,975 |
439,483 | Commercial Mortgage Pass-Through Certificates, Series 2012-LTRT, Class A2, 3.400%, 10/05/2030(a) | 362,749 |
7,382 | Commercial Mortgage Pass-Through Certificates, Series 2014-CR16, Class ASB, 3.653%, 4/10/2047 | 7,357 |
280,000 | Commercial Mortgage Pass-Through Certificates, Series 2014-UBS3, Class A4, 3.819%, 6/10/2047 | 274,552 |
280,000 | Commercial Mortgage Pass-Through Certificates, Series 2015-DC1, Class A5, 3.350%, 2/10/2048 | 267,880 |
520,299 | Commercial Mortgage Pass-Through Certificates, Series 2016-DC2, Class A5, 3.765%, 2/10/2049 | 491,359 |
Loomis Sayles Intermediate Duration Bond Fund (continued)
Principal Amount | Description | Value (†) |
Non-Agency Commercial Mortgage-Backed Securities — continued | ||
$795,000 | Credit Suisse Mortgage Trust, Series 2014-USA, Class A2, 3.953%, 9/15/2037(a) | $678,394 |
33,828 | CSAIL Commercial Mortgage Trust, Series 2015-C4, Class ASB, 3.617%, 11/15/2048 | 32,838 |
470,000 | CSAIL Commercial Mortgage Trust, Series 2019-C18, Class A4, 2.968%, 12/15/2052 | 394,741 |
335,000 | DC Commercial Mortgage Trust, Series 2023-DC, Class A, 6.314%, 9/12/2040(a) | 333,945 |
365,000 | GS Mortgage Securities Corp. II, Series 2023- SHIP, Class A, 4.466%, 9/10/2038(a)(b) | 347,597 |
605,000 | GS Mortgage Securities Corp. Trust, Series 2012-BWTR, Class A, 2.954%, 11/05/2034(a) | 443,021 |
440,000 | GS Mortgage Securities Corportation Trust, Series 2013-PEMB, Class A, 3.668%, 3/05/2033(a)(b) | 378,670 |
330,000 | GS Mortgage Securities Trust, Series 2014-GC18, Class A4, 4.074%, 1/10/2047 | 327,927 |
245,000 | GS Mortgage Securities Trust, Series 2020-GC45, Class A5, 2.911%, 2/13/2053 | 204,868 |
180,000 | Hudsons Bay Simon JV Trust, Series 2015-HB10, Class A10, 4.155%, 8/05/2034(a) | 153,593 |
355,000 | Hudsons Bay Simon JV Trust, Series 2015-HB7, Class A7, 3.914%, 8/05/2034(a) | 301,750 |
7,852 | JPMBB Commercial Mortgage Securities Trust, Series 2014-C19, Class ASB, 3.584%, 4/15/2047 | 7,808 |
575,000 | JPMCC Commercial Mortgage Securities Trust, Series 2019-COR5, Class A4, 3.386%, 6/13/2052 | 501,315 |
776,274 | Med Trust, Series 2021-MDLN, Class A, 1 mo. USD SOFR + 1.064%, 6.397%, 11/15/2038(a)(c) | 756,792 |
129,604 | Morgan Stanley Bank of America Merrill Lynch Trust, Series 2015-C22, Class A4, 3.306%, 4/15/2048 | 122,968 |
550,000 | Morgan Stanley Capital I Trust, Series 2020-L4, Class A3, 2.698%, 2/15/2053 | 448,360 |
845,000 | New Economy Assets Phase 1 Sponsor LLC, Series 2021-1, Class A1, 1.910%, 10/20/2061(a) | 728,641 |
465,000 | SCOTT Trust, Series 2023-SFS, Class A, 5.910%, 3/15/2040(a) | 450,931 |
980,000 | SPGN Mortgage Trust, Series 2022-TFLM, Class A, 1 mo. USD SOFR + 1.550%, 6.882%, 2/15/2039(a)(c) | 933,909 |
201,109 | Wells Fargo Commercial Mortgage Trust, Series 2016-C33, Class A4, 3.426%, 3/15/2059 | 188,018 |
490,000 | Wells Fargo Commercial Mortgage Trust, Series 2020-C58, Class A4, 2.092%, 7/15/2053 | 379,747 |
825,000 | Wells Fargo Commercial Mortgage Trust, Series 2022-C62, Class A4, 4.000%, 4/15/2055(b) | 714,622 |
325,000 | WFRBS Commercial Mortgage Trust, Series 2014-C19, Class A5, 4.101%, 3/15/2047 | 321,744 |
20,909 | WFRBS Commercial Mortgage Trust, Series 2014-C20, Class ASB, 3.638%, 5/15/2047 | 20,762 |
18,459,660 | ||
Office REITs — 0.1% | ||
485,000 | Hudson Pacific Properties LP, 5.950%, 2/15/2028 | 404,893 |
Other REITs — 0.1% | ||
410,000 | Prologis LP, 5.125%, 1/15/2034 | 387,190 |
Packaging — 0.1% | ||
335,000 | Amcor Flexibles North America, Inc., 4.000%, 5/17/2025 | 323,990 |
Principal Amount | Description | Value (†) |
Property & Casualty Insurance — 0.1% | ||
$255,000 | Assured Guaranty U.S. Holdings, Inc., 6.125%, 9/15/2028 | $255,004 |
240,000 | Trustage Financial Group, Inc., 4.625%, 4/15/2032(a) | 198,053 |
453,057 | ||
Railroads — 0.5% | ||
645,000 | CSX Corp., 5.200%, 11/15/2033 | 623,820 |
1,095,000 | Norfolk Southern Corp., 5.050%, 8/01/2030 | 1,055,034 |
215,000 | Union Pacific Corp., 3.646%, 2/15/2024 | 213,198 |
1,892,052 | ||
Refining — 0.2% | ||
540,000 | Phillips 66 Co., 4.950%, 12/01/2027 | 529,184 |
Retailers — 1.0% | ||
345,000 | AutoNation, Inc., 3.500%, 11/15/2024 | 333,193 |
290,000 | AutoNation, Inc., 4.500%, 10/01/2025 | 280,013 |
910,000 | AutoZone, Inc., 5.050%, 7/15/2026 | 896,723 |
825,000 | Dollar General Corp., 5.450%, 7/05/2033 | 761,934 |
1,245,000 | Walgreens Boots Alliance, Inc., 0.950%, 11/17/2023 | 1,236,980 |
3,508,843 | ||
Sovereigns — 0.2% | ||
630,000 | Panama Government International Bonds, 6.875%, 1/31/2036 | 630,129 |
Technology — 2.3% | ||
270,000 | Avnet, Inc., 5.500%, 6/01/2032 | 248,361 |
485,000 | Avnet, Inc., 6.250%, 3/15/2028 | 483,626 |
440,000 | Broadcom, Inc., 4.000%, 4/15/2029(a) | 397,052 |
870,000 | CDW LLC/CDW Finance Corp., 3.276%, 12/01/2028 | 750,610 |
660,000 | Equifax, Inc., 5.100%, 6/01/2028 | 637,760 |
605,000 | Fiserv, Inc., 5.625%, 8/21/2033 | 586,211 |
355,000 | Flex Ltd., 6.000%, 1/15/2028 | 353,192 |
525,000 | Global Payments, Inc., 1.500%, 11/15/2024 | 498,683 |
665,000 | Hewlett Packard Enterprise Co., 5.250%, 7/01/2028 | 649,203 |
1,045,000 | Intel Corp., 5.200%, 2/10/2033 | 1,011,808 |
1,180,000 | Intuit, Inc., 5.200%, 9/15/2033 | 1,149,032 |
285,000 | Microchip Technology, Inc., 0.972%, 2/15/2024 | 279,758 |
695,000 | Micron Technology, Inc., 6.750%, 11/01/2029 | 706,151 |
200,000 | Qorvo, Inc., 1.750%, 12/15/2024(a) | 187,914 |
155,000 | S&P Global, Inc., 5.250%, 9/15/2033(a) | 151,083 |
8,090,444 | ||
Tobacco — 0.8% | ||
585,000 | Altria Group, Inc., 2.450%, 2/04/2032 | 441,311 |
710,000 | BAT Capital Corp., 6.343%, 8/02/2030 | 699,332 |
400,000 | Philip Morris International, Inc., 5.125%, 2/15/2030 | 383,617 |
1,190,000 | Philip Morris International, Inc., 5.500%, 9/07/2030 | 1,157,142 |
2,681,402 | ||
Transportation Services — 0.5% | ||
450,000 | Element Fleet Management Corp., 3.850%, 6/15/2025(a) | 428,742 |
390,000 | Element Fleet Management Corp., 6.271%, 6/26/2026(a) | 388,668 |
175,000 | Penske Truck Leasing Co. LP/PTL Finance Corp., 4.000%, 7/15/2025(a) | 168,082 |
240,000 | Penske Truck Leasing Co. LP/PTL Finance Corp., 5.550%, 5/01/2028(a) | 232,476 |
435,000 | Penske Truck Leasing Co. LP/PTL Finance Corp., 6.050%, 8/01/2028(a) | 429,543 |
1,647,511 | ||
Treasuries — 37.9% | ||
3,635,000 | U.S. Treasury Notes, 2.750%, 7/31/2027 | 3,386,088 |
Loomis Sayles Intermediate Duration Bond Fund (continued)
Principal Amount | Description | Value (†) |
Treasuries — continued | ||
$9,900,000 | U.S. Treasury Notes, 3.250%, 6/30/2027 | $9,406,160 |
30,555,000 | U.S. Treasury Notes, 3.500%, 4/30/2028 | 29,122,734 |
11,235,000 | U.S. Treasury Notes, 3.625%, 3/31/2028 | 10,770,679 |
13,355,000 | U.S. Treasury Notes, 3.625%, 5/31/2028 | 12,799,933 |
8,810,000 | U.S. Treasury Notes, 3.875%, 4/30/2025 | 8,630,703 |
17,710,000 | U.S. Treasury Notes, 3.875%, 11/30/2027 | 17,167,631 |
8,895,000 | U.S. Treasury Notes, 3.875%, 12/31/2027 | 8,620,853 |
3,080,000 | U.S. Treasury Notes, 3.875%, 8/15/2033 | 2,910,119 |
805,000 | U.S. Treasury Notes, 4.000%, 2/29/2028 | 784,183 |
13,855,000 | U.S. Treasury Notes, 4.125%, 7/31/2028 | 13,556,252 |
3,290,000 | U.S. Treasury Notes, 4.625%, 6/30/2025 | 3,261,855 |
10,305,000 | U.S. Treasury Notes, 4.750%, 7/31/2025 | 10,236,568 |
130,653,758 | ||
Wireless — 0.2% | ||
810,000 | American Tower Corp., 5.250%, 7/15/2028 | 782,171 |
Wirelines — 0.3% | ||
565,000 | AT&T, Inc., 5.400%, 2/15/2034 | 528,783 |
495,000 | Bell Telephone Co. of Canada or Bell Canada, 5.100%, 5/11/2033 | 462,732 |
991,515 | ||
Total Bonds and Notes (Identified Cost $351,538,288) | 337,059,800 | |
Short-Term Investments — 2.4% | ||
8,427,014 | Tri-Party Repurchase Agreement with Fixed Income Clearing Corporation, dated 9/29/2023 at 2.500% to be repurchased at $8,428,769 on 10/02/2023 collateralized by $9,653,200 U.S. Treasury Note, 0.750% due 8/31/2026 valued at $8,595,608 including accrued interest (Note 2 of Notes to Financial Statements) (Identified Cost $8,427,014) | 8,427,014 |
Total Investments — 100.1% (Identified Cost $359,965,302) | 345,486,814 | |
Other assets less liabilities — (0.1)% | (372,002 ) | |
Net Assets — 100.0% | $345,114,812 | |
(†) | See Note 2 of Notes to Financial Statements. |
(a) | All or a portion of these securities are exempt from registration under Rule 144A of the Securities Act of 1933. These securities may be resold in transactions exempt from registration, normally to qualified institutional buyers. At September 30, 2023, the value of Rule 144A holdings amounted to $88,139,011 or 25.5% of net assets. |
(b) | Variable rate security. The interest rate adjusts periodically based on; (i) changes in current interest rates and/or prepayments on underlying pools of assets, if applicable, (ii) reference to a base lending rate plus or minus a margin, and/or (iii) reference to a base lending rate adjusted by a multiplier and/or subject to certain floors or caps. Rate as of September 30, 2023 is disclosed. |
(c) | Variable rate security. Rate as of September 30, 2023 is disclosed. |
(d) | Level 3 security. Value has been determined using significant unobservable inputs. See Note 3 of Notes to Financial Statements. |
(e) | The Fund’s investment in mortgage related securities of Government National Mortgage Association are interests in separate pools of mortgages. All separate investments in securities of each issuer which have the same coupon rate have been aggregated for the purpose of presentation in the Portfolio of Investments. |
ABS | Asset-Backed Securities |
ARMs | Adjustable Rate Mortgages |
CMT | Constant Maturity Treasury |
GMTN | Global Medium Term Note |
MTN | Medium Term Note |
REITs | Real Estate Investment Trusts |
SOFR | Secured Overnight Financing Rate |
Financial Futures | Expiration Date | Contracts | Notional Amount | Value | Unrealized Appreciation (Depreciation) |
CBOT 5 Year U.S. Treasury Notes Futures | 12/29/2023 | 71 | $7,547,469 | $7,480,516 | $(66,953 ) |
Ultra 10-Year U.S. Treasury Notes Futures | 12/19/2023 | 126 | 14,485,507 | 14,056,875 | (428,632 ) |
Total | $(495,585 ) |
Loomis Sayles Intermediate Duration Bond Fund (continued)
Treasuries | 37.9 % |
Banking | 15.1 |
ABS Car Loan | 8.7 |
Non-Agency Commercial Mortgage-Backed Securities | 5.4 |
Life Insurance | 5.2 |
Automotive | 3.3 |
Finance Companies | 2.5 |
Electric | 2.4 |
Technology | 2.3 |
ABS Other | 2.0 |
Other Investments, less than 2% each | 12.9 |
Short-Term Investments | 2.4 |
Total Investments | 100.1 |
Other assets less liabilities (including futures contracts) | (0.1 ) |
Net Assets | 100.0 % |
Loomis Sayles Limited Term Government and Agency Fund
Principal Amount | Description | Value (†) |
Bonds and Notes — 95.5% of Net Assets | ||
ABS Car Loan — 2.1% | ||
$3,220,000 | Avis Budget Rental Car Funding AESOP LLC, Series 2022-1A, Class A, 3.830%, 8/21/2028(a) | $2,965,446 |
1,823,209 | Carvana Auto Receivables Trust, Series 2021-N2, Class A2, 0.970%, 3/10/2028 | 1,714,905 |
560,049 | Credit Acceptance Auto Loan Trust, Series 2020-3A, Class A, 1.240%, 10/15/2029(a) | 559,036 |
2,735,000 | Exeter Automobile Receivables Trust, Series 2022-5A, Class A3, 5.430%, 4/15/2026 | 2,730,852 |
267 | GM Financial Consumer Automobile Receivables Trust, Series 2020-2, Class A3, 1.490%, 12/16/2024 | 267 |
655,000 | GM Financial Revolving Receivables Trust, Series 2021-1, Class A, 1.170%, 6/12/2034(a) | 575,666 |
1,555,000 | Hertz Vehicle Financing III LLC, Series 2023-3A, Class A, 5.940%, 2/25/2028(a) | 1,553,559 |
14,139 | Hyundai Auto Receivables Trust, Series 2020-A, Class A3, 1.410%, 11/15/2024 | 14,112 |
85,738 | Nissan Auto Receivables Owner Trust, Series 2020-A, Class A3, 1.380%, 12/16/2024 | 85,512 |
620,000 | PenFed Auto Receivables Owner Trust, Series 2022-A, Class A4, 4.180%, 12/15/2028(a) | 601,476 |
765,000 | Toyota Auto Loan Extended Note Trust, Series 2020-1A, Class A, 1.350%, 5/25/2033(a) | 709,818 |
4,365,000 | Toyota Auto Loan Extended Note Trust, Series 2022-1A, Class A, 3.820%, 4/25/2035(a) | 4,105,827 |
15,616,476 | ||
ABS Other — 0.3% | ||
183,555 | Chesapeake Funding II LLC, Series 2020-1A, Class A1, 0.870%, 8/15/2032(a) | 181,496 |
32,808 | CNH Equipment Trust, Series 2020-A, Class A3, 1.160%, 6/16/2025 | 32,613 |
575,624 | Donlen Fleet Lease Funding 2 LLC, Series 2021-2, Class A2, 0.560%, 12/11/2034(a) | 563,500 |
586,836 | Enterprise Fleet Financing LLC, Series 2022-3, Class A2, 4.380%, 7/20/2029(a) | 574,499 |
292,941 | MVW LLC, Series 2020-1A, Class A, 1.740%, 10/20/2037(a) | 269,663 |
433,071 | Sierra Timeshare Receivables Funding LLC, Series 2020-2A, Class A, 1.330%, 7/20/2037(a) | 405,284 |
576,947 | Welk Resorts LLC, Series 2019-AA, Class A, 2.800%, 6/15/2038(a) | 549,162 |
2,576,217 | ||
ABS Student Loan — 0.9% | ||
1,406,485 | Navient Private Education Refi Loan Trust, Series 2019-FA, Class A2, 2.600%, 8/15/2068(a) | 1,292,163 |
438,712 | Navient Private Education Refi Loan Trust, Series 2020-DA, Class A, 1.690%, 5/15/2069(a) | 395,140 |
1,484,053 | Navient Private Education Refi Loan Trust, Series 2021-CA, Class A, 1.060%, 10/15/2069(a) | 1,261,802 |
3,481,318 | Navient Private Education Refi Loan Trust, Series 2021-EA, Class A, 0.970%, 12/16/2069(a) | 2,906,695 |
776,268 | SMB Private Education Loan Trust, Series 2021-D, Class A1A, 1.340%, 3/17/2053(a) | 681,005 |
6,536,805 | ||
Agency Commercial Mortgage-Backed Securities — 27.6% | ||
7,344,343 | Federal Home Loan Mortgage Corp. Multifamily Structured Pass-Through Certificates, Series K038, Class A2, 3.389%, 3/25/2024 | 7,270,336 |
Principal Amount | Description | Value (†) |
Agency Commercial Mortgage-Backed Securities — continued | ||
$2,580,000 | Federal Home Loan Mortgage Corp. Multifamily Structured Pass-Through Certificates, Series K064, Class A2, 3.224%, 3/25/2027 | $2,420,182 |
19,074,155 | Federal Home Loan Mortgage Corp. Multifamily Structured Pass-Through Certificates, Series K139, Class A1, 2.209%, 10/25/2031 | 16,491,963 |
11,380,000 | Federal Home Loan Mortgage Corp. Multifamily Structured Pass-Through Certificates, Series K747, Class A2, 2.050%, 11/25/2028(b) | 9,811,597 |
7,929,868 | Federal Home Loan Mortgage Corp. Multifamily Structured Pass-Through Certificates, Series KC06, Class A2, 2.541%, 8/25/2026 | 7,345,532 |
2,129,552 | Federal Home Loan Mortgage Corp. Multifamily Structured Pass-Through Certificates, Series K-F100, Class AS, 30 day USD SOFR Average + 0.180%, 5.491%, 1/25/2028(c) | 2,092,708 |
5,564,048 | Federal Home Loan Mortgage Corp. Multifamily Structured Pass-Through Certificates, Series K-F121, Class AS, 30 day USD SOFR Average + 0.180%, 5.491%, 8/25/2028(c) | 5,453,040 |
12,662,262 | Federal Home Loan Mortgage Corp. Multifamily Structured Pass-Through Certificates, Series KF123, Class AS, 30 day USD SOFR Average + 0.200%, 5.511%, 9/25/2028(c) | 12,498,134 |
1,245,348 | Federal Home Loan Mortgage Corp. Multifamily Structured Pass-Through Certificates, Series KF53, Class A, 30 day USD SOFR Average + 0.504%, 5.816%, 10/25/2025(c) | 1,238,669 |
5,160,767 | Federal Home Loan Mortgage Corp. Multifamily Structured Pass-Through Certificates, Series KF72, Class A, 30 day USD SOFR Average + 0.614%, 5.926%, 10/25/2026(c) | 5,137,464 |
1,894,454 | Federal Home Loan Mortgage Corp. Multifamily Structured Pass-Through Certificates, Series KF74, Class AS, 1 mo. USD SOFR Historical Calendar Day Compounded + 0.530%, 5.842%, 1/25/2027(c) | 1,887,852 |
5,244,774 | Federal Home Loan Mortgage Corp. Multifamily Structured Pass-Through Certificates, Series KF77, Class AL, 30 day USD SOFR Average + 0.814%, 6.126%, 2/25/2027(c) | 5,247,625 |
6,898,222 | Federal Home Loan Mortgage Corp. Multifamily Structured Pass-Through Certificates, Series KF77, Class AS, 30 day USD SOFR Average + 0.900%, 6.211%, 2/25/2027(c) | 6,960,748 |
17,566,566 | Federal Home Loan Mortgage Corp. Multifamily Structured Pass-Through Certificates, Series KF78, Class AL, 30 day USD SOFR Average + 0.914%, 6.226%, 3/25/2030(c) | 17,515,852 |
17,566,566 | Federal Home Loan Mortgage Corp. Multifamily Structured Pass-Through Certificates, Series KF78, Class AS, 30 day USD SOFR Average + 1.000%, 6.311%, 3/25/2030(c) | 17,796,145 |
3,132,630 | Federal Home Loan Mortgage Corp. Multifamily Structured Pass-Through Certificates, Series KF79, Class AL, 30 day USD SOFR Average + 0.584%, 5.896%, 5/25/2030(c) | 3,114,991 |
2,890,666 | Federal Home Loan Mortgage Corp. Multifamily Structured Pass-Through Certificates, Series KF79, Class AS, 30 day USD SOFR Average + 0.580%, 5.891%, 5/25/2030(c) | 2,870,110 |
Loomis Sayles Limited Term Government and Agency Fund (continued)
Principal Amount | Description | Value (†) |
Agency Commercial Mortgage-Backed Securities — continued | ||
$3,997,045 | Federal Home Loan Mortgage Corp. Multifamily Structured Pass-Through Certificates, Series KF80, Class AL, 30 day USD SOFR Average + 0.554%, 5.866%, 6/25/2030(c) | $3,959,017 |
2,245,786 | Federal Home Loan Mortgage Corp. Multifamily Structured Pass-Through Certificates, Series KF80, Class AS, 30 day USD SOFR Average + 0.510%, 5.821%, 6/25/2030(c) | 2,231,130 |
835,665 | Federal Home Loan Mortgage Corp. Multifamily Structured Pass-Through Certificates, Series KF81, Class AL, 30 day USD SOFR Average + 0.474%, 5.786%, 6/25/2027(c) | 835,777 |
626,749 | Federal Home Loan Mortgage Corp. Multifamily Structured Pass-Through Certificates, Series KF81, Class AS, 30 day USD SOFR Average + 0.400%, 5.711%, 6/25/2027(c) | 623,694 |
588,161 | Federal Home Loan Mortgage Corp. Multifamily Structured Pass-Through Certificates, Series KF84, Class AL, 30 day USD SOFR Average + 0.414%, 5.726%, 7/25/2030(c) | 580,560 |
494,802 | Federal Home Loan Mortgage Corp. Multifamily Structured Pass-Through Certificates, Series KF84, Class AS, 30 day USD SOFR Average + 0.320%, 5.631%, 7/25/2030(c) | 485,844 |
161,572 | Federal Home Loan Mortgage Corp. Multifamily Structured Pass-Through Certificates, Series KF85, Class AL, 30 day USD SOFR Average + 0.414%, 5.726%, 8/25/2030(c) | 159,066 |
430,714 | Federal Home Loan Mortgage Corp. Multifamily Structured Pass-Through Certificates, Series KF85, Class AS, 30 day USD SOFR Average + 0.330%, 5.641%, 8/25/2030(c) | 423,943 |
530,390 | Federal Home Loan Mortgage Corp. Multifamily Structured Pass-Through Certificates, Series KF86, Class AL, 30 day USD SOFR Average + 0.404%, 5.716%, 8/25/2027(c) | 527,818 |
473,623 | Federal Home Loan Mortgage Corp. Multifamily Structured Pass-Through Certificates, Series KF86, Class AS, 30 day USD SOFR Average + 0.320%, 5.631%, 8/25/2027(c) | 469,210 |
440,611 | Federal Home Loan Mortgage Corp. Multifamily Structured Pass-Through Certificates, Series KF93, Class AL, 30 day USD SOFR Average + 0.394%, 5.706%, 10/25/2027(c) | 436,891 |
529,019 | Federal Home Loan Mortgage Corp. Multifamily Structured Pass-Through Certificates, Series KF93, Class AS, 30 day USD SOFR Average + 0.310%, 5.621%, 10/25/2027(c) | 523,704 |
2,965,584 | Federal Home Loan Mortgage Corp. Multifamily Structured Pass-Through Certificates, Series KF97, Class AS, 30 day USD SOFR Average + 0.250%, 5.561%, 12/25/2030(c) | 2,908,733 |
6,775,952 | Federal Home Loan Mortgage Corp. Multifamily Structured Pass-Through Certificates, Series KJ20, Class A2, 3.799%, 12/25/2025 | 6,565,039 |
8,246,363 | Federal Home Loan Mortgage Corp. Multifamily Structured Pass-Through Certificates, Series KJ21, Class A2, 3.700%, 9/25/2026 | 7,919,863 |
6,507,557 | Federal Home Loan Mortgage Corp. Multifamily Structured Pass-Through Certificates, Series KJ26, Class A2, 2.606%, 7/25/2027 | 6,098,828 |
Principal Amount | Description | Value (†) |
Agency Commercial Mortgage-Backed Securities — continued | ||
$7,165,000 | Federal Home Loan Mortgage Corp. Multifamily Structured Pass-Through Certificates, Series KJ37, Class A2, 2.333%, 11/25/2030 | $6,090,107 |
16,300,000 | Federal Home Loan Mortgage Corp. Multifamily Structured Pass-Through Certificates, Series KJ42, Class A2, 4.118%, 11/25/2032 | 15,170,133 |
8,515,000 | Federal Home Loan Mortgage Corp. Multifamily Structured Pass-Through Certificates, Series KS12, Class A, 30 day USD SOFR Average + 0.764%, 6.076%, 8/25/2029(c) | 8,491,760 |
2,855,000 | Federal Home Loan Mortgage Corp. Multifamily Structured Pass-Through Certificates, Series KS14, Class AL, 30 day USD SOFR Average + 0.454%, 5.766%, 4/25/2030(c) | 2,829,750 |
3,140,000 | Federal Home Loan Mortgage Corp. Multifamily Structured Pass-Through Certificates, Series KS14, Class AS, 30 day USD SOFR Average + 0.370%, 5.681%, 4/25/2030(c) | 3,107,294 |
733,071 | Federal Home Loan Mortgage Corp. Multifamily Structured Pass-Through Certificates, Series Q008, Class A, 30 day USD SOFR Average + 0.504%, 5.816%, 10/25/2045(c) | 727,691 |
171,970 | Federal Home Loan Mortgage Corp. Multifamily Structured Pass-Through Certificates, Series Q015, Class A, 30 day USD SOFR Average + 0.200%, 5.513%, 8/25/2024(c) | 171,939 |
3,913,379 | Federal Home Loan Mortgage Corp. Multifamily Structured Pass-Through Certificates, Series Q016, Class APT1, 1.242%, 5/25/2051(b) | 3,538,105 |
5,200,000 | Federal National Mortgage Association, 3.580%, 1/01/2026 | 4,995,379 |
1,548,312 | Federal National Mortgage Association, Series 2014-M2, Class A2, 3.513%, 12/25/2023(b) | 1,538,643 |
704,347 | Federal National Mortgage Association, Series 2020-M5, Class FA, 30 day USD SOFR Average + 0.574%, 5.886%, 1/25/2027(c) | 699,890 |
71,539 | Government National Mortgage Association, Series 2003-72, Class Z, 5.412%, 11/16/2045(b) | 68,923 |
207,331,679 | ||
Collateralized Mortgage Obligations — 10.7% | ||
41,471 | Federal Home Loan Mortgage Corp., Series 2131, Class ZB, REMIC, 6.000%, 3/15/2029(d) | 39,494 |
366,831 | Federal Home Loan Mortgage Corp., Series 2978, Class JG, REMIC, 5.500%, 5/15/2035(d) | 359,951 |
562,166 | Federal Home Loan Mortgage Corp., Series 3036, Class NE, REMIC, 5.000%, 9/15/2035(d) | 544,341 |
191,934 | Federal Home Loan Mortgage Corp., Series 3412, Class AY, REMIC, 5.500%, 2/15/2038(d) | 185,250 |
538,958 | Federal Home Loan Mortgage Corp., Series 3561, Class W, IO, REMIC, 2.600%, 6/15/2048(b)(e) | 477,709 |
427,263 | Federal Home Loan Mortgage Corp., Series 3620, Class AT, REMIC, 3.841%, 12/15/2036(b)(e) | 416,806 |
98,978 | Federal Home Loan Mortgage Corp., Series 4212, Class FW, REMIC, 0.000%, 6/15/2043(b)(d) | 76,990 |
4,683 | Federal Home Loan Mortgage Corp. Structured Pass-Through Certificates, Series T-60, Class 2A1, 3.926%, 3/25/2044(b)(d) | 3,832 |
236,227 | Federal Home Loan Mortgage Corp. Structured Pass-Through Certificates, Series T-62, Class 1A1, 1 yr. MTA + 1.200%, 5.826%, 10/25/2044(c)(d) | 210,673 |
Loomis Sayles Limited Term Government and Agency Fund (continued)
Principal Amount | Description | Value (†) |
Collateralized Mortgage Obligations — continued | ||
$971 | Federal National Mortgage Association, Series 1994-42, Class FD, REMIC, 10 yr. CMT - 0.500%, 3.770%, 4/25/2024(c)(d) | $938 |
5,332 | Federal National Mortgage Association, Series 2002-W10, Class A7, REMIC, 4.419%, 8/25/2042(b)(d) | 4,768 |
516,409 | Federal National Mortgage Association, Series 2003-48, Class GH, REMIC, 5.500%, 6/25/2033(d) | 505,620 |
7,304 | Federal National Mortgage Association, Series 2005-100, Class BQ, REMIC, 5.500%, 11/25/2025(d) | 7,038 |
280,108 | Federal National Mortgage Association, Series 2007-73, Class A1, REMIC, 30 day USD SOFR Average + 0.174%, 5.462%, 7/25/2037(c)(d) | 268,649 |
504,381 | Federal National Mortgage Association, Series 2008-86, Class LA, REMIC, 3.492%, 8/25/2038(b) | 471,484 |
1,028,893 | Federal National Mortgage Association, Series 2012-56, Class FK, REMIC, 30 day USD SOFR Average + 0.564%, 5.879%, 6/25/2042(c)(d) | 985,271 |
1,135,114 | Federal National Mortgage Association, Series 2012-58, Class KF, REMIC, 30 day USD SOFR Average + 0.664%, 5.979%, 6/25/2042(c) | 1,105,439 |
2,803,362 | Federal National Mortgage Association, Series 2012-83, Class LF, REMIC, 30 day USD SOFR Average + 0.624%, 5.939%, 8/25/2042(c) | 2,717,810 |
1,840,298 | Federal National Mortgage Association, Series 2013-67, Class NF, REMIC, 30 day USD SOFR Average + 1.114%, 5.000%, 7/25/2043(c) | 1,698,682 |
3,033,940 | Federal National Mortgage Association, Series 2015-4, Class BF, REMIC, 30 day USD SOFR Average + 0.514%, 5.829%, 2/25/2045(c) | 2,922,357 |
4,303,171 | Federal National Mortgage Association, Series 2020-35, Class FA, REMIC, 30 day USD SOFR Average + 0.614%, 5.242%, 6/25/2050(c) | 4,173,913 |
868,891 | Government National Mortgage Association, Series 2005-18, Class F, 1 mo. USD SOFR + 0.314%, 5.639%, 2/20/2035(c)(d) | 850,170 |
662,199 | Government National Mortgage Association, Series 2007-59, Class FM, 1 mo. USD SOFR + 0.634%, 5.959%, 10/20/2037(c)(d) | 652,937 |
139,718 | Government National Mortgage Association, Series 2009-H01, Class FA, 1 mo. USD SOFR + 1.264%, 6.589%, 11/20/2059(c)(d) | 138,320 |
460,805 | Government National Mortgage Association, Series 2010-H20, Class AF, 1 mo. USD SOFR + 0.444%, 5.762%, 10/20/2060(c) | 457,792 |
359,901 | Government National Mortgage Association, Series 2010-H24, Class FA, 1 mo. USD SOFR + 0.464%, 5.782%, 10/20/2060(c) | 357,567 |
266,084 | Government National Mortgage Association, Series 2010-H27, Class FA, 1 mo. USD SOFR + 0.494%, 5.812%, 12/20/2060(c) | 264,435 |
15,253 | Government National Mortgage Association, Series 2011-H08, Class FA, 1 mo. USD SOFR + 0.714%, 6.032%, 2/20/2061(c) | 15,205 |
28,393 | Government National Mortgage Association, Series 2011-H23, Class HA, 3.000%, 12/20/2061(d) | 25,593 |
3 | Government National Mortgage Association, Series 2012-124, Class HT, 0.000%, 7/20/2032(b)(d) | 3 |
Principal Amount | Description | Value (†) |
Collateralized Mortgage Obligations — continued | ||
$1,901,230 | Government National Mortgage Association, Series 2012-18, Class FM, 1 mo. USD SOFR + 0.364%, 5.689%, 9/20/2038(c) | $1,886,399 |
87 | Government National Mortgage Association, Series 2012-H15, Class FA, 1 mo. USD SOFR + 0.564%, 5.500%, 5/20/2062(c)(d) | 83 |
202,879 | Government National Mortgage Association, Series 2012-H18, Class NA, 1 mo. USD SOFR + 0.634%, 5.952%, 8/20/2062(c) | 201,858 |
9,608 | Government National Mortgage Association, Series 2012-H29, Class HF, 1 mo. USD SOFR + 0.614%, 4.785%, 10/20/2062(c)(d) | 8,796 |
11,552 | Government National Mortgage Association, Series 2013-H02, Class GF, 1 mo. USD SOFR + 0.614%, 5.001%, 12/20/2062(c)(d) | 10,810 |
425,190 | Government National Mortgage Association, Series 2013-H08, Class FA, 1 mo. USD SOFR + 0.464%, 5.782%, 3/20/2063(c)(d) | 417,568 |
703,755 | Government National Mortgage Association, Series 2013-H10, Class FA, 1 mo. USD SOFR + 0.514%, 5.832%, 3/20/2063(c) | 699,800 |
91,624 | Government National Mortgage Association, Series 2013-H14, Class FG, 1 mo. USD SOFR + 0.584%, 5.902%, 5/20/2063(c)(d) | 90,216 |
2,679,077 | Government National Mortgage Association, Series 2014-H14, Class FA, 1 mo. USD SOFR + 0.614%, 5.718%, 7/20/2064(c) | 2,663,274 |
2,354,238 | Government National Mortgage Association, Series 2014-H15, Class FA, 1 mo. USD SOFR + 0.614%, 5.932%, 7/20/2064(c) | 2,339,515 |
1,464,254 | Government National Mortgage Association, Series 2015-H04, Class FL, 1 mo. USD SOFR + 0.584%, 5.688%, 2/20/2065(c) | 1,455,532 |
3,576 | Government National Mortgage Association, Series 2015-H05, Class FA, 1 mo. USD SOFR + 0.414%, 4.741%, 4/20/2061(c)(d) | 3,461 |
5,008 | Government National Mortgage Association, Series 2015-H09, Class HA, 1.750%, 3/20/2065(d) | 4,441 |
211,471 | Government National Mortgage Association, Series 2015-H10, Class FC, 1 mo. USD SOFR + 0.594%, 5.698%, 4/20/2065(c) | 210,215 |
2,326,135 | Government National Mortgage Association, Series 2015-H10, Class JA, 2.250%, 4/20/2065 | 2,239,863 |
2,026 | Government National Mortgage Association, Series 2015-H11, Class FA, 1 mo. USD SOFR + 0.364%, 4.774%, 4/20/2065(c)(d) | 1,871 |
1,372,623 | Government National Mortgage Association, Series 2015-H12, Class FL, 1 mo. USD SOFR + 0.344%, 5.662%, 5/20/2065(c) | 1,362,747 |
27,410 | Government National Mortgage Association, Series 2015-H19, Class FH, 1 mo. USD SOFR + 0.414%, 4.497%, 7/20/2065(c)(d) | 25,379 |
1,883 | Government National Mortgage Association, Series 2015-H29, Class FA, 1 mo. USD SOFR + 0.814%, 4.629%, 10/20/2065(c)(d) | 1,806 |
2,536 | Government National Mortgage Association, Series 2015-H30, Class FA, 1 mo. USD SOFR + 0.794%, 4.810%, 8/20/2061(c)(d) | 2,410 |
2,918,843 | Government National Mortgage Association, Series 2016-H06, Class FC, 1 mo. USD SOFR + 1.034%, 4.853%, 2/20/2066(c) | 2,901,088 |
Loomis Sayles Limited Term Government and Agency Fund (continued)
Principal Amount | Description | Value (†) |
Collateralized Mortgage Obligations — continued | ||
$734,906 | Government National Mortgage Association, Series 2016-H20, Class FB, 1 mo. USD SOFR + 0.664%, 5.982%, 9/20/2066(c) | $731,245 |
1,987,499 | Government National Mortgage Association, Series 2017-H05, Class FC, 1 mo. USD SOFR + 0.864%, 5.144%, 2/20/2067(c) | 1,970,336 |
2,815 | Government National Mortgage Association, Series 2018-H02, Class FJ, 1 mo. USD SOFR + 0.314%, 4.408%, 10/20/2064(c)(d) | 2,722 |
4,168,134 | Government National Mortgage Association, Series 2018-H11, Class FJ, 1 yr. USD SOFR + 0.795%, 5.027%, 6/20/2068(c) | 4,106,393 |
72,245 | Government National Mortgage Association, Series 2018-H14, Class FG, 1 mo. USD SOFR + 0.464%, 5.782%, 9/20/2068(c) | 71,659 |
6,376,477 | Government National Mortgage Association, Series 2018-H16, Class FA, 1 mo. USD SOFR + 0.534%, 5.385%, 9/20/2068(c) | 6,245,759 |
5,844,827 | Government National Mortgage Association, Series 2019-H04, Class NA, 3.500%, 9/20/2068 | 5,399,991 |
874,091 | Government National Mortgage Association, Series 2019-H13, Class FT, 1 yr. CMT + 0.450%, 5.830%, 8/20/2069(c) | 873,044 |
1,604,648 | Government National Mortgage Association, Series 2020-30, Class F, 1 mo. USD SOFR + 0.514%, 5.844%, 4/20/2048(c) | 1,530,502 |
3,100,351 | Government National Mortgage Association, Series 2020-53, Class NF, 1 mo. USD SOFR + 0.564%, 5.894%, 5/20/2046(c) | 2,897,585 |
1,732,342 | Government National Mortgage Association, Series 2020-H01, Class FT, 1 yr. CMT + 0.500%, 5.880%, 1/20/2070(c) | 1,724,926 |
3,329,697 | Government National Mortgage Association, Series 2020-H02, Class FG, 1 mo. USD SOFR + 0.714%, 5.414%, 1/20/2070(c) | 3,306,845 |
3,804,113 | Government National Mortgage Association, Series 2020-H04, Class FP, 1 mo. USD SOFR + 0.614%, 5.294%, 6/20/2069(c) | 3,772,249 |
6,304,563 | Government National Mortgage Association, Series 2020-H07, Class FL, 1 mo. USD SOFR + 0.764%, 6.082%, 4/20/2070(c) | 6,287,269 |
4,558,783 | Government National Mortgage Association, Series 2020-H10, Class FD, 1 mo. USD SOFR + 0.514%, 5.832%, 5/20/2070(c) | 4,541,957 |
79,928,651 | ||
Hybrid ARMs — 2.2% | ||
130,771 | Federal Home Loan Mortgage Corp., 1 yr. RFUCC Treasury + 1.732%, 4.126%, 4/01/2037(c) | 129,249 |
39,328 | Federal Home Loan Mortgage Corp., 1 yr. RFUCC Treasury + 1.742%, 4.229%, 12/01/2037(c) | 38,773 |
410,082 | Federal Home Loan Mortgage Corp., 1 yr. CMT + 2.286%, 4.430%, 2/01/2036(c) | 407,918 |
142,470 | Federal Home Loan Mortgage Corp., 1 yr. RFUCC Treasury + 1.903%, 4.453%, 4/01/2037(c) | 140,083 |
71,809 | Federal Home Loan Mortgage Corp., 1 yr. CMT + 2.250%, 4.498%, 2/01/2035(c) | 72,505 |
253,796 | Federal Home Loan Mortgage Corp., 1 yr. CMT + 2.245%, 4.538%, 3/01/2036(c) | 256,256 |
671,140 | Federal Home Loan Mortgage Corp., 1 yr. CMT + 2.267%, 4.587%, 2/01/2036(c) | 674,128 |
Principal Amount | Description | Value (†) |
Hybrid ARMs — continued | ||
$73,835 | Federal Home Loan Mortgage Corp., 1 yr. CMT + 2.204%, 4.593%, 9/01/2038(c) | $72,474 |
211,636 | Federal Home Loan Mortgage Corp., 6 mo. RFUCC Treasury + 1.770%, 4.643%, 6/01/2037(c) | 205,848 |
1,062,927 | Federal Home Loan Mortgage Corp., 1 yr. RFUCC Treasury + 1.840%, 4.825%, 1/01/2046(c) | 1,063,509 |
58,168 | Federal Home Loan Mortgage Corp., 1 yr. RFUCC Treasury + 1.678%, 4.875%, 3/01/2038(c) | 56,628 |
193,747 | Federal Home Loan Mortgage Corp., 1 yr. CMT + 2.165%, 4.993%, 4/01/2036(c) | 190,619 |
67,702 | Federal Home Loan Mortgage Corp., 1 yr. RFUCC Treasury + 1.770%, 5.021%, 11/01/2038(c) | 66,227 |
1,068,997 | Federal Home Loan Mortgage Corp., 1 yr. CMT + 2.249%, 5.155%, 3/01/2037(c) | 1,081,795 |
602,777 | Federal Home Loan Mortgage Corp., 1 yr. RFUCC Treasury + 1.897%, 5.275%, 9/01/2041(c) | 589,423 |
137,200 | Federal Home Loan Mortgage Corp., 1 yr. RFUCC Treasury + 1.935%, 5.297%, 12/01/2034(c) | 135,180 |
413,826 | Federal Home Loan Mortgage Corp., 1 yr. RFUCC Treasury + 1.765%, 5.746%, 9/01/2035(c) | 412,029 |
75,033 | Federal Home Loan Mortgage Corp., 1 yr. RFUCC Treasury + 1.703%, 5.771%, 11/01/2038(c) | 74,042 |
250,505 | Federal Home Loan Mortgage Corp., 1 yr. CMT + 2.248%, 5.900%, 9/01/2038(c) | 254,480 |
188,789 | Federal Home Loan Mortgage Corp., 1 yr. CMT + 2.220%, 6.142%, 7/01/2033(c) | 186,039 |
714,231 | Federal National Mortgage Association, 1 yr. RFUCC Treasury + 1.800%, 4.050%, 10/01/2041(c) | 721,779 |
110,273 | Federal National Mortgage Association, 1 yr. RFUCC Treasury + 1.800%, 4.050%, 12/01/2041(c) | 108,487 |
34,920 | Federal National Mortgage Association, 1 yr. RFUCC Treasury + 1.729%, 4.074%, 1/01/2037(c) | 34,477 |
171,443 | Federal National Mortgage Association, 1 yr. RFUCC Treasury + 1.734%, 4.188%, 2/01/2037(c) | 169,055 |
93,837 | Federal National Mortgage Association, 1 yr. CMT + 2.185%, 4.310%, 12/01/2034(c) | 92,250 |
285,343 | Federal National Mortgage Association, 1 yr. CMT + 2.185%, 4.310%, 1/01/2036(c) | 283,465 |
28,549 | Federal National Mortgage Association, 1 yr. RFUCC Treasury + 1.565%, 4.315%, 4/01/2037(c) | 28,075 |
128,526 | Federal National Mortgage Association, 1 yr. RFUCC Treasury + 1.667%, 4.392%, 10/01/2033(c) | 127,330 |
458,999 | Federal National Mortgage Association, 1 yr. RFUCC Treasury + 1.820%, 4.445%, 2/01/2047(c) | 454,058 |
80,193 | Federal National Mortgage Association, 1 yr. RFUCC Treasury + 1.729%, 4.476%, 11/01/2035(c) | 81,436 |
429,266 | Federal National Mortgage Association, 1 yr. RFUCC Treasury + 1.804%, 4.520%, 3/01/2037(c) | 423,854 |
88,084 | Federal National Mortgage Association, 1 yr. RFUCC Treasury + 1.800%, 4.544%, 3/01/2034(c) | 88,891 |
131,018 | Federal National Mortgage Association, 1 yr. CMT + 2.486%, 4.611%, 5/01/2035(c) | 131,643 |
378,511 | Federal National Mortgage Association, 1 yr. RFUCC Treasury + 1.559%, 4.685%, 7/01/2035(c) | 378,119 |
698,857 | Federal National Mortgage Association, 1 yr. CMT + 2.228%, 4.701%, 4/01/2034(c) | 703,255 |
114,798 | Federal National Mortgage Association, 1 yr. CMT + 2.147%, 4.721%, 9/01/2034(c) | 115,563 |
82,419 | Federal National Mortgage Association, 1 yr. CMT + 2.196%, 4.740%, 4/01/2034(c) | 80,411 |
555,028 | Federal National Mortgage Association, 1 yr. RFUCC Treasury + 1.550%, 4.824%, 4/01/2037(c) | 559,724 |
Loomis Sayles Limited Term Government and Agency Fund (continued)
Principal Amount | Description | Value (†) |
Hybrid ARMs — continued | ||
$214,059 | Federal National Mortgage Association, 1 yr. CMT + 2.131%, 4.843%, 6/01/2036(c) | $211,367 |
113,785 | Federal National Mortgage Association, 1 yr. RFUCC Treasury + 1.680%, 5.014%, 11/01/2036(c) | 113,316 |
455,097 | Federal National Mortgage Association, 1 yr. RFUCC Treasury + 1.706%, 5.045%, 9/01/2037(c) | 462,496 |
246,355 | Federal National Mortgage Association, 6 mo. RFUCC Treasury + 2.065%, 5.056%, 7/01/2037(c) | 248,143 |
85,672 | Federal National Mortgage Association, 1 yr. CMT + 2.287%, 5.148%, 10/01/2033(c) | 84,570 |
43,201 | Federal National Mortgage Association, 1 yr. CMT + 2.211%, 5.211%, 4/01/2033(c) | 42,758 |
929,532 | Federal National Mortgage Association, 1 yr. CMT + 2.214%, 5.262%, 10/01/2034(c) | 941,840 |
18,151 | Federal National Mortgage Association, 1 yr. RFUCC Treasury + 1.806%, 5.275%, 7/01/2041(c) | 17,730 |
736,298 | Federal National Mortgage Association, 1 yr. CMT + 2.170%, 5.343%, 12/01/2040(c) | 745,544 |
98,757 | Federal National Mortgage Association, 1 yr. CMT + 2.500%, 5.477%, 8/01/2036(c) | 101,136 |
769,126 | Federal National Mortgage Association, 1 yr. CMT + 2.185%, 5.687%, 11/01/2033(c) | 782,324 |
373,729 | Federal National Mortgage Association, 1 yr. RFUCC Treasury + 1.564%, 5.742%, 9/01/2037(c) | 369,470 |
67,759 | Federal National Mortgage Association, 1 yr. RFUCC Treasury + 1.515%, 5.765%, 8/01/2035(c) | 66,263 |
209,487 | Federal National Mortgage Association, 1 yr. RFUCC Treasury + 1.639%, 5.889%, 8/01/2038(c) | 206,417 |
144,610 | Federal National Mortgage Association, 1 yr. CMT + 2.287%, 5.924%, 6/01/2033(c) | 143,349 |
214,832 | Federal National Mortgage Association, 1 yr. RFUCC Treasury + 1.681%, 5.931%, 7/01/2038(c) | 211,785 |
49,659 | Federal National Mortgage Association, 1 yr. CMT + 2.145%, 5.934%, 9/01/2036(c) | 49,253 |
88,650 | Federal National Mortgage Association, 1 yr. RFUCC Treasury + 1.713%, 5.963%, 8/01/2034(c) | 86,558 |
275,786 | Federal National Mortgage Association, 1 yr. CMT + 2.270%, 6.020%, 6/01/2037(c) | 277,399 |
58,555 | Federal National Mortgage Association, 1 yr. RFUCC Treasury + 2.473%, 6.223%, 6/01/2035(c) | 57,454 |
127,686 | Federal National Mortgage Association, 1 yr. CMT + 2.223%, 6.223%, 8/01/2035(c) | 125,970 |
49,545 | Federal National Mortgage Association, 1 yr. CMT + 2.440%, 6.266%, 8/01/2033(c) | 49,134 |
209,195 | Federal National Mortgage Association, 6 mo. RFUCC Treasury + 1.546%, 6.747%, 7/01/2035(c) | 211,681 |
19,712 | Federal National Mortgage Association, 6 mo. RFUCC Treasury + 1.460%, 7.161%, 2/01/2037(c) | 19,985 |
16,315,019 | ||
Mortgage Related — 1.1% | ||
10,667 | Federal Home Loan Mortgage Corp., 3.000%, 10/01/2026 | 10,324 |
100,630 | Federal Home Loan Mortgage Corp., 4.000%, with various maturities from 2024 to 2042(f) | 92,822 |
22,680 | Federal Home Loan Mortgage Corp., 4.500%, with various maturities from 2025 to 2034(f) | 21,592 |
12 | Federal Home Loan Mortgage Corp., 5.500%, 10/01/2023 | 12 |
101,491 | Federal Home Loan Mortgage Corp., 6.500%, 12/01/2034 | 103,369 |
Principal Amount | Description | Value (†) |
Mortgage Related — continued | ||
$21 | Federal Home Loan Mortgage Corp., 7.500%, 6/01/2026 | $21 |
75,790 | Federal National Mortgage Association, 3.000%, 3/01/2042 | 64,792 |
502,646 | Federal National Mortgage Association, 5.000%, with various maturities from 2037 to 2038(f) | 492,510 |
142,047 | Federal National Mortgage Association, 5.500%, with various maturities from 2024 to 2033(f) | 138,756 |
125,525 | Federal National Mortgage Association, 6.500%, with various maturities from 2032 to 2037(f) | 126,807 |
24,279 | Federal National Mortgage Association, 7.500%, with various maturities from 2030 to 2032(f) | 24,389 |
105,215 | Government National Mortgage Association, 4.140%, with various maturities from 2061 to 2063(b)(f) | 100,604 |
13,673 | Government National Mortgage Association, 4.390%, 12/20/2062(b) | 13,263 |
1,843,077 | Government National Mortgage Association, 4.439%, 10/20/2065(b) | 1,792,183 |
97,839 | Government National Mortgage Association, 4.547%, 1/20/2064(b) | 96,668 |
742,388 | Government National Mortgage Association, 4.576%, 2/20/2066(b) | 726,995 |
1,876 | Government National Mortgage Association, 4.619%, 8/20/2062(b) | 1,814 |
52,491 | Government National Mortgage Association, 4.630%, with various maturities from 2062 to 2063(b)(f) | 51,646 |
6,476 | Government National Mortgage Association, 4.642%, 2/20/2062(b) | 6,085 |
576,003 | Government National Mortgage Association, 4.663%, 11/20/2063(b) | 570,620 |
9,518 | Government National Mortgage Association, 4.677%, 8/20/2061(b) | 9,295 |
343,961 | Government National Mortgage Association, 4.700%, with various maturities from 2061 to 2064(b)(f) | 337,509 |
1,874 | Government National Mortgage Association, 4.889%, 4/20/2061(b) | 1,826 |
4,453 | Government National Mortgage Association, 6.000%, 12/15/2031 | 4,517 |
19,436 | Government National Mortgage Association, 6.500%, 5/15/2031 | 19,612 |
948,489 | Government National Mortgage Association, 1 mo. RFUCC Treasury + 1.758%, 6.875%, 2/20/2061(c) | 956,869 |
17,280 | Government National Mortgage Association, 7.000%, 10/15/2028 | 17,268 |
667,971 | Government National Mortgage Association, 1 mo. RFUCC Treasury + 1.890%, 7.038%, 2/20/2063(c) | 677,574 |
526,740 | Government National Mortgage Association, 1 mo. RFUCC Treasury + 2.170%, 7.318%, 3/20/2063(c) | 535,519 |
500,930 | Government National Mortgage Association, 1 mo. RFUCC Treasury + 2.186%, 7.335%, 5/20/2065(c) | 508,011 |
502,488 | Government National Mortgage Association, 1 mo. RFUCC Treasury + 2.229%, 7.378%, 6/20/2065(c) | 513,516 |
289,109 | Government National Mortgage Association, 1 mo. RFUCC Treasury + 2.329%, 7.477%, 2/20/2063(c) | 294,516 |
8,311,304 | ||
Non-Agency Commercial Mortgage-Backed Securities — 3.6% | ||
1,595,000 | BANK, Series 2020-BN25, Class A5, 2.649%, 1/15/2063 | 1,312,578 |
Loomis Sayles Limited Term Government and Agency Fund (continued)
Principal Amount | Description | Value (†) |
Non-Agency Commercial Mortgage-Backed Securities — continued | ||
$3,895,000 | BBCMS Mortgage Trust, Series 2020-BID, Class A, 1 mo. USD SOFR + 2.254%, 7.588%, 10/15/2037(a)(c) | $3,708,867 |
1,825,000 | BPR Trust, Series 2021-NRD, Class A, 1 mo. USD SOFR + 1.525%, 6.858%, 12/15/2038(a)(c) | 1,721,630 |
4,650,000 | BPR Trust, Series 2022-SSP, Class A, 1 mo. USD SOFR + 3.000%, 8.332%, 5/15/2039(a)(c) | 4,638,382 |
1,745,000 | CFCRE Commercial Mortgage Trust, Series 2016-C7, Class A3, 3.839%, 12/10/2054 | 1,636,261 |
1,076,116 | Commercial Mortgage Pass-Through Certificates, Series 2012-LTRT, Class A2, 3.400%, 10/05/2030(a) | 888,226 |
1,488,000 | Commercial Mortgage Pass-Through Certificates, Series 2014-UBS2, Class A5, 3.961%, 3/10/2047 | 1,476,706 |
1,927,127 | Commercial Mortgage Pass-Through Certificates, Series 2016-DC2, Class ASB, 3.550%, 2/10/2049 | 1,875,772 |
2,570,000 | DROP Mortgage Trust, Series 2021-FILE, Class A, 1 mo. USD SOFR + 1.264%, 6.597%, 10/15/2043(a)(c) | 2,395,700 |
2,600,000 | Hudsons Bay Simon JV Trust, Series 2015-HB7, Class A7, 3.914%, 8/05/2034(a) | 2,210,000 |
3,295,000 | SPGN Mortgage Trust, Series 2022-TFLM, Class A, 1 mo. USD SOFR + 1.550%, 6.882%, 2/15/2039(a)(c) | 3,140,032 |
2,995,449 | Starwood Retail Property Trust, Series 2014-STAR, Class A, PRIME + 0.000%, 8.500%, 11/15/2027(a)(c) | 2,141,746 |
27,145,900 | ||
Treasuries — 47.0% | ||
4,010,000 | U.S. Treasury Notes, 0.375%, 9/30/2027 | 3,384,847 |
3,620,000 | U.S. Treasury Notes, 2.750%, 4/30/2027 | 3,385,124 |
71,120,000 | U.S. Treasury Notes, 2.750%, 2/15/2028 | 65,774,888 |
4,460,000 | U.S. Treasury Notes, 3.875%, 3/31/2025 | 4,371,323 |
6,715,000 | U.S. Treasury Notes, 3.875%, 4/30/2025 | 6,578,339 |
26,990,000 | U.S. Treasury Notes, 3.875%, 11/30/2027 | 26,163,431 |
10,465,000 | U.S. Treasury Notes, 3.875%, 12/31/2027 | 10,142,465 |
12,315,000 | U.S. Treasury Notes, 4.000%, 2/29/2028 | 11,996,542 |
42,930,000 | U.S. Treasury Notes, 4.000%, 6/30/2028 | 41,784,641 |
5,270,000 | U.S. Treasury Notes, 4.125%, 10/31/2027 | 5,157,807 |
7,645,000 | U.S. Treasury Notes, 4.125%, 7/31/2028 | 7,480,155 |
28,125,000 | U.S. Treasury Notes, 4.250%, 5/31/2025 | 27,707,520 |
13,620,000 | U.S. Treasury Notes, 4.375%, 8/31/2028 | 13,484,864 |
30,065,000 | U.S. Treasury Notes, 4.625%, 6/30/2025 | 29,807,803 |
20,570,000 | U.S. Treasury Notes, 4.625%, 3/15/2026 | 20,426,974 |
4,285,000 | U.S. Treasury Notes, 4.625%, 9/30/2028 | 4,287,678 |
18,775,000 | U.S. Treasury Notes, 4.750%, 7/31/2025 | 18,650,322 |
3,710,000 | U.S. Treasury Notes, 5.000%, 8/31/2025 | 3,702,464 |
48,100,000 | U.S. Treasury Notes, 5.000%, 9/30/2025 | 48,054,906 |
352,342,093 | ||
Total Bonds and Notes (Identified Cost $744,443,600) | 716,104,144 | |
Short-Term Investments — 13.9% | ||
16,180,699 | Tri-Party Repurchase Agreement with Fixed Income Clearing Corporation, dated 9/29/2023 at 2.500% to be repurchased at $16,184,070 on 10/02/2023 collateralized by $18,183,500 U.S. Treasury Note, 1.375% due 8/31/2026 valued at $16,504,399 including accrued interest (Note 2 of Notes to Financial Statements) | 16,180,699 |
19,850,000 | Federal Home Loan Bank Discount Notes, 5.220%, 10/02/2023(g) | 19,850,000 |
Principal Amount | Description | Value (†) |
$20,125,000 | Federal Home Loan Bank Discount Notes, 5.250%, 10/11/2023(g) | $20,098,571 |
48,130,000 | Federal National Mortgage Association Discount Notes, 5.225%, 10/02/2023(g) | 48,130,000 |
Total Short-Term Investments (Identified Cost $104,249,423) | 104,259,270 | |
Total Investments — 109.4% (Identified Cost $848,693,023) | 820,363,414 | |
Other assets less liabilities — (9.4)% | (70,610,040 ) | |
Net Assets — 100.0% | $749,753,374 | |
(†) | See Note 2 of Notes to Financial Statements. |
(a) | All or a portion of these securities are exempt from registration under Rule 144A of the Securities Act of 1933. These securities may be resold in transactions exempt from registration, normally to qualified institutional buyers. At September 30, 2023, the value of Rule 144A holdings amounted to $40,995,820 or 5.5% of net assets. |
(b) | Variable rate security. The interest rate adjusts periodically based on; (i) changes in current interest rates and/or prepayments on underlying pools of assets, if applicable, (ii) reference to a base lending rate plus or minus a margin, and/or (iii) reference to a base lending rate adjusted by a multiplier and/or subject to certain floors or caps. Rate as of September 30, 2023 is disclosed. |
(c) | Variable rate security. Rate as of September 30, 2023 is disclosed. |
(d) | Level 3 security. Value has been determined using significant unobservable inputs. See Note 3 of Notes to Financial Statements. |
(e) | Interest only security. Security represents right to receive monthly interest payments on an underlying pool of mortgages. Principal shown is the outstanding par amount of the pool held as of the end of the period. |
(f) | The Fund’s investment in mortgage related securities of Federal Home Loan Mortgage Corporation, Federal National Mortgage Association and Government National Mortgage Association are interests in separate pools of mortgages. All separate investments in securities of each issuer which have the same coupon rate have been aggregated for the purpose of presentation in the Portfolio of Investments. |
(g) | Interest rate represents discount rate at time of purchase; not a coupon rate. |
ABS | Asset-Backed Securities |
ARMs | Adjustable Rate Mortgages |
CMT | Constant Maturity Treasury |
MTA | Monthly Treasury Average Interest |
REMIC | Real Estate Mortgage Investment Conduit |
SOFR | Secured Overnight Financing Rate |
Loomis Sayles Limited Term Government and Agency Fund (continued)
Treasuries | 47.0 % |
Agency Commercial Mortgage-Backed Securities | 27.6 |
Collateralized Mortgage Obligations | 10.7 |
Non-Agency Commercial Mortgage-Backed Securities | 3.6 |
Hybrid ARMs | 2.2 |
ABS Car Loan | 2.1 |
Other Investments, less than 2% each | 2.3 |
Short-Term Investments | 13.9 |
Total Investments | 109.4 |
Other assets less liabilities | (9.4 ) |
Net Assets | 100.0 % |
Core Plus Bond Fund | Credit Income Fund | Global Allocation Fund | |
ASSETS | |||
Investments at cost | $7,787,658,751 | $23,034,894 | $2,624,501,457 |
Net unrealized appreciation (depreciation) | (829,580,447 ) | (3,106,067 ) | 74,079,500 |
Investments at value | 6,958,078,304 | 19,928,827 | 2,698,580,957 |
Cash | 255,588 | — | — |
Due from brokers (Note 2) | 3,371,000 | — | 1,685,158 |
Foreign currency at value (identified cost $145, $0 and $4,750,191, respectively) | 141 | — | 4,622,763 |
Receivable for Fund shares sold | 14,488,147 | — | 1,314,294 |
Receivable from investment adviser (Note 6) | — | 8,531 | — |
Receivable for securities sold | 277,789,766 | 146,383 | 16,103,999 |
Receivable for when-issued/delayed delivery securities sold (Note 2) | 375,426,793 | — | — |
Collateral received for open forward foreign currency contracts (Notes 2 and 4) | — | — | 320,000 |
Dividends and interest receivable | 58,146,144 | 229,307 | 10,188,657 |
Unrealized appreciation on forward foreign currency contracts (Note 2) | — | — | 761,221 |
Tax reclaims receivable | — | — | 346,361 |
Receivable for variation margin on futures contracts (Note 2) | 2,269,678 | 7,516 | 175,107 |
Prepaid expenses (Note 8) | 2,076 | 147 | 1,007 |
TOTAL ASSETS | 7,689,827,637 | 20,320,711 | 2,734,099,524 |
LIABILITIES | |||
Payable for securities purchased | 441,705,849 | 88,049 | 28,459,332 |
Payable for when-issued/delayed delivery securities purchased (Note 2) | 513,413,328 | — | — |
Payable for Fund shares redeemed | 18,324,968 | — | 3,392,111 |
Unrealized depreciation on forward foreign currency contracts (Note 2) | — | — | 2,347,238 |
Foreign taxes payable (Note 2) | — | — | 63,761 |
Due to brokers (Note 2) | — | — | 320,000 |
Management fees payable (Note 6) | 1,783,288 | — | 1,699,033 |
Deferred Trustees’ fees (Note 6) | 937,833 | 9,445 | 425,050 |
Administrative fees payable (Note 6) | 261,070 | 784 | 105,709 |
Payable to distributor (Note 6d) | 56,297 | — | 45,934 |
Audit and tax services fees payable | 59,010 | 68,341 | 61,026 |
Other accounts payable and accrued expenses | 276,840 | 7,536 | 867,746 |
TOTAL LIABILITIES | 976,818,483 | 174,155 | 37,786,940 |
NET ASSETS | $6,713,009,154 | $20,146,556 | $2,696,312,584 |
NET ASSETS CONSIST OF: | |||
Paid-in capital | $8,164,337,609 | $24,572,928 | $2,546,286,496 |
Accumulated earnings (loss) | (1,451,328,455 ) | (4,426,372 ) | 150,026,088 |
NET ASSETS | $6,713,009,154 | $20,146,556 | $2,696,312,584 |
Core Plus Bond Fund | Credit Income Fund | Global Allocation Fund | |
COMPUTATION OF NET ASSET VALUE AND OFFERING PRICE: | |||
Class A shares: | |||
Net assets | $376,624,257 | $196,569 | $474,968,049 |
Shares of beneficial interest | 34,462,001 | 23,990 | 22,141,164 |
Net asset value and redemption price per share | $10.93 | $8.19 | $21.45 |
Offering price per share (100/[100-maximum sales charge] of net asset value) (Note 1) | $11.42 | $8.55 | $22.76 |
Class C shares: (redemption price per share is equal to net asset value less any applicable contingent deferred sales charge) (Note 1) | |||
Net assets | $30,401,904 | $889 | $256,486,857 |
Shares of beneficial interest | 2,778,971 | 109 | 12,456,681 |
Net asset value and offering price per share | $10.94 | $8.18 * | $20.59 |
Class N shares: | |||
Net assets | $2,015,456,654 | $19,929,934 | $266,297,696 |
Shares of beneficial interest | 182,599,764 | 2,434,178 | 12,228,843 |
Net asset value, offering and redemption price per share | $11.04 | $8.19 | $21.78 |
Class Y shares: | |||
Net assets | $4,290,526,339 | $19,164 | $1,698,559,982 |
Shares of beneficial interest | 388,974,499 | 2,342 | 78,093,675 |
Net asset value, offering and redemption price per share | $11.03 | $8.18 | $21.75 |
* | Net asset value calculations have been determined utilizing fractional share and penny amounts. |
Growth Fund | Intermediate Duration Bond Fund | Limited Term Government and Agency Fund | |
ASSETS | |||
Investments at cost | $6,301,122,757 | $359,965,302 | $848,693,023 |
Net unrealized appreciation (depreciation) | 4,496,140,295 | (14,478,488 ) | (28,329,609 ) |
Investments at value | 10,797,263,052 | 345,486,814 | 820,363,414 |
Cash | — | — | 109 |
Due from brokers (Note 2) | — | 590,000 | — |
Receivable for Fund shares sold | 27,990,314 | 159,241 | 2,581,321 |
Receivable for securities sold | 13,260,781 | 1,752,233 | 20,166,920 |
Dividends and interest receivable | 379,293 | 3,163,573 | 3,481,173 |
Tax reclaims receivable | 7,696,480 | 132 | — |
Receivable for variation margin on futures contracts (Note 2) | — | 40,647 | — |
Prepaid expenses (Note 8) | 3,139 | 231 | 355 |
TOTAL ASSETS | 10,846,593,059 | 351,192,871 | 846,593,292 |
LIABILITIES | |||
Payable for securities purchased | 30,806,207 | 5,632,077 | 94,308,773 |
Payable for Fund shares redeemed | 9,075,927 | 127,657 | 1,181,239 |
Distributions payable | — | — | 561,385 |
Management fees payable (Note 6) | 4,615,169 | 61,489 | 157,398 |
Deferred Trustees’ fees (Note 6) | 917,972 | 163,663 | 458,214 |
Administrative fees payable (Note 6) | 427,511 | 13,082 | 28,559 |
Payable to distributor (Note 6d) | 73,702 | 6,597 | 11,829 |
Audit and tax services fees payable | 42,542 | 57,481 | 62,068 |
Other accounts payable and accrued expenses | 493,853 | 16,013 | 70,453 |
TOTAL LIABILITIES | 46,452,883 | 6,078,059 | 96,839,918 |
NET ASSETS | $10,800,140,176 | $345,114,812 | $749,753,374 |
NET ASSETS CONSIST OF: | |||
Paid-in capital | $5,718,046,544 | $391,986,139 | $845,478,071 |
Accumulated earnings (loss) | 5,082,093,632 | (46,871,327 ) | (95,724,697 ) |
NET ASSETS | $10,800,140,176 | $345,114,812 | $749,753,374 |
COMPUTATION OF NET ASSET VALUE AND OFFERING PRICE: | |||
Class A shares: | |||
Net assets | $798,842,616 | $7,149,797 | $209,032,043 |
Shares of beneficial interest | 40,798,640 | 780,313 | 19,778,822 |
Net asset value and redemption price per share | $19.58 | $9.16 | $10.57 |
Offering price per share (100/[100-maximum sales charge] of net asset value) (Note 1) | $20.77 | $9.57 | $10.81 |
Class C shares: (redemption price per share is equal to net asset value less any applicable contingent deferred sales charge) (Note 1) | |||
Net assets | $78,115,741 | $698,321 | $8,509,724 |
Shares of beneficial interest | 4,706,942 | 75,970 | 807,230 |
Net asset value and offering price per share | $16.60 | $9.19 | $10.54 |
Class N shares: | |||
Net assets | $718,310,999 | $55,983,141 | $45,715,983 |
Shares of beneficial interest | 33,169,745 | 6,114,971 | 4,313,137 |
Net asset value, offering and redemption price per share | $21.66 | $9.16 | $10.60 |
Class Y shares: | |||
Net assets | $9,204,870,820 | $281,283,553 | $486,495,624 |
Shares of beneficial interest | 425,928,476 | 30,714,023 | 45,887,141 |
Net asset value, offering and redemption price per share | $21.61 | $9.16 | $10.60 |
Core Plus Bond Fund | Credit Income Fund | Global Allocation Fund | |
INVESTMENT INCOME | |||
Interest | $261,489,744 | $902,978 | $40,961,159 |
Dividends | — | 14,437 | 24,418,897 |
Less net foreign taxes withheld | — | — | (1,204,270 ) |
261,489,744 | 917,415 | 64,175,786 | |
Expenses | |||
Management fees (Note 6) | 20,719,842 | 88,151 | 21,232,335 |
Service and distribution fees (Note 6) | 1,407,950 | 639 | 4,120,941 |
Administrative fees (Note 6) | 2,965,046 | 9,729 | 1,322,590 |
Trustees' fees and expenses (Note 6) | 376,005 | 17,340 | 176,511 |
Transfer agent fees and expenses (Notes 6 and 7) | 4,628,336 | 4,373 | 2,388,014 |
Audit and tax services fees | 58,913 | 68,351 | 61,923 |
Custodian fees and expenses | 190,061 | 7,911 | 176,550 |
Legal fees | 255,949 | 893 | 115,434 |
Registration fees | 238,321 | 75,485 | 109,306 |
Shareholder reporting expenses | 271,650 | 4,859 | 152,153 |
Miscellaneous expenses | 231,680 | 42,683 | 144,320 |
Total expenses | 31,343,753 | 320,414 | 30,000,077 |
Less waiver and/or expense reimbursement (Note 6) | (456,348 ) | (210,497 ) | — |
Net expenses | 30,887,405 | 109,917 | 30,000,077 |
Net investment income | 230,602,339 | 807,498 | 34,175,709 |
Net realized and unrealized gain (loss) on Investments, Futures contracts, Forward foreign currency contracts and Foreign currency transactions | |||
Net realized gain (loss) on: | |||
Investments | (201,801,145 ) | (625,995 ) | 118,010,239 |
Futures contracts | (58,324,300 ) | (357,294 ) | (9,602,991 ) |
Forward foreign currency contracts (Note 2e) | — | — | (5,164,099 ) |
Foreign currency transactions (Note 2d) | 127,585 | — | 85,914 |
Net change in unrealized appreciation (depreciation) on: | |||
Investments | 81,002,401 | 998,295 | 368,454,167 |
Futures contracts | (10,538,977 ) | (111,864 ) | (870,412 ) |
Forward foreign currency contracts (Note 2e) | — | — | 1,802,223 |
Foreign currency translations (Note 2d) | 5,306 | — | 138,620 |
Net realized and unrealized gain (loss) on Investments, Futures contracts, Forward foreign currency contracts and Foreign currency transactions | (189,529,130 ) | (96,858 ) | 472,853,661 |
NET INCREASE IN NET ASSETS RESULTING FROM OPERATIONS | $41,073,209 | $710,640 | $507,029,370 |
Growth Fund | Intermediate Duration Bond Fund | Limited Term Government and Agency Fund | |
INVESTMENT INCOME | |||
Interest | $2,848,235 | $12,097,468 | $26,770,004 |
Dividends | 49,657,679 | — | — |
Less net foreign taxes withheld | (2,510,550 ) | — | — |
49,995,364 | 12,097,468 | 26,770,004 | |
Expenses | |||
Management fees (Note 6) | 50,343,793 | 782,053 | 2,268,277 |
Service and distribution fees (Note 6) | 2,475,159 | 42,934 | 655,605 |
Administrative fees (Note 6) | 4,665,811 | 144,972 | 331,097 |
Trustees' fees and expenses (Note 6) | 523,560 | 45,612 | 93,715 |
Transfer agent fees and expenses (Notes 6 and 7) | 9,008,908 | 222,394 | 685,057 |
Audit and tax services fees | 46,292 | 57,510 | 62,081 |
Custodian fees and expenses | 455,176 | 25,427 | 36,353 |
Legal fees | 396,504 | 12,870 | 29,772 |
Registration fees | 475,850 | 60,321 | 112,392 |
Shareholder reporting expenses | 565,988 | 21,365 | 52,146 |
Miscellaneous expenses | 403,162 | 51,336 | 57,649 |
Total expenses | 69,360,203 | 1,466,794 | 4,384,144 |
Less waiver and/or expense reimbursement (Note 6) | — | (184,858 ) | (533,000 ) |
Net expenses | 69,360,203 | 1,281,936 | 3,851,144 |
Net investment income (loss) | (19,364,839 ) | 10,815,532 | 22,918,860 |
Net realized and unrealized gain (loss) on Investments, Futures contracts and foreign currency transactions | |||
Net realized gain (loss) on: | |||
Investments | 623,787,240 | (9,533,725 ) | (11,880,518 ) |
Futures contracts | — | (2,159,161 ) | — |
Net change in unrealized appreciation (depreciation) on: | |||
Investments | 2,716,486,374 | 7,773,041 | 7,382,057 |
Futures contracts | — | 776,181 | — |
Foreign currency translations (Note 2d) | 137,400 | — | — |
Net realized and unrealized gain (loss) on Investments, Futures contracts and foreign currency transactions | 3,340,411,014 | (3,143,664 ) | (4,498,461 ) |
NET INCREASE IN NET ASSETS RESULTING FROM OPERATIONS | $3,321,046,175 | $7,671,868 | $18,420,399 |
Core Plus Bond Fund | Credit Income Fund | |||
Year Ended September 30, 2023 | Year Ended September 30, 2022 | Year Ended September 30, 2023 | Year Ended September 30, 2022 | |
FROM OPERATIONS: | ||||
Net investment income | $230,602,339 | $174,385,553 | $807,498 | $631,633 |
Net realized gain (loss) on investments, futures contracts, swap agreements and foreign currency transactions | (259,997,860 ) | (277,234,957 ) | (983,289 ) | 266,764 |
Net change in unrealized appreciation (depreciation) on investments, futures contracts and foreign currency translations | 70,468,730 | (1,058,570,772 ) | 886,431 | (4,721,802 ) |
Net increase (decrease) in net assets resulting from operations | 41,073,209 | (1,161,420,176 ) | 710,640 | (3,823,405 ) |
FROM DISTRIBUTIONS TO SHAREHOLDERS: | ||||
Class A | (14,223,494 ) | (16,005,020 ) | (11,032 ) | (3,571 ) |
Class C | (1,000,231 ) | (1,420,755 ) | (34 ) | (25 ) |
Class N | (75,521,129 ) | (68,723,627 ) | (1,004,585 ) | (818,127 ) |
Class Y | (146,856,134 ) | (135,179,006 ) | (1,127 ) | (1,898 ) |
Total distributions | (237,600,988 ) | (221,328,408 ) | (1,016,778 ) | (823,621 ) |
NET INCREASE (DECREASE) IN NET ASSETS FROM CAPITAL SHARES TRANSACTIONS (Note 11) | 998,143,455 | (1,555,408,285 ) | 1,293 | 142,887 |
Net increase (decrease) in net assets | 801,615,676 | (2,938,156,869 ) | (304,845 ) | (4,504,139 ) |
NET ASSETS | ||||
Beginning of the year | 5,911,393,478 | 8,849,550,347 | 20,451,401 | 24,955,540 |
End of the year | $6,713,009,154 | $5,911,393,478 | $20,146,556 | $20,451,401 |
Global Allocation Fund | Growth Fund | |||
Year Ended September 30, 2023 | Year Ended September 30, 2022 | Year Ended September 30, 2023 | Year Ended September 30, 2022 | |
FROM OPERATIONS: | ||||
Net investment income (loss) | $34,175,709 | $26,885,363 | $(19,364,839 ) | $(10,830,629 ) |
Net realized gain on investments, futures contracts, swap agreements, forward foreign currency contracts and foreign currency transactions | 103,329,063 | 205,757,956 | 623,787,240 | 1,235,669,337 |
Net change in unrealized appreciation (depreciation) on investments, futures contracts, forward foreign currency contracts and foreign currency translations | 369,524,598 | (1,371,139,443 ) | 2,716,623,774 | (4,804,984,300 ) |
Net increase (decrease) in net assets resulting from operations | 507,029,370 | (1,138,496,124 ) | 3,321,046,175 | (3,580,145,592 ) |
FROM DISTRIBUTIONS TO SHAREHOLDERS: | ||||
Class A | (46,037,953 ) | (54,983,218 ) | (87,496,281 ) | (87,877,160 ) |
Class C | (28,653,920 ) | (37,592,938 ) | (11,157,335 ) | (6,955,691 ) |
Class N | (23,349,603 ) | (26,402,455 ) | (94,252,383 ) | (39,935,698 ) |
Class Y | (167,186,118 ) | (248,208,914 ) | (1,021,376,434 ) | (530,904,861 ) |
Total distributions | (265,227,594 ) | (367,187,525 ) | (1,214,282,433 ) | (665,673,410 ) |
NET DECREASE IN NET ASSETS FROM CAPITAL SHARES TRANSACTIONS (Note 11) | (506,795,479 ) | (410,454,398 ) | (794,319,290 ) | (35,119,431 ) |
Net increase (decrease) in net assets | (264,993,703 ) | (1,916,138,047 ) | 1,312,444,452 | (4,280,938,433 ) |
NET ASSETS | ||||
Beginning of the year | 2,961,306,287 | 4,877,444,334 | 9,487,695,724 | 13,768,634,157 |
End of the year | $2,696,312,584 | $2,961,306,287 | $10,800,140,176 | $9,487,695,724 |
Intermediate Duration Bond Fund | Limited Term Government and Agency Fund | |||
Year Ended September 30, 2023 | Year Ended September 30, 2022 | Year Ended September 30, 2023 | Year Ended September 30, 2022 | |
FROM OPERATIONS: | ||||
Net investment income | $10,815,532 | $5,926,872 | $22,918,860 | $7,352,923 |
Net realized loss on investments and futures contracts | (11,692,886 ) | (19,695,363 ) | (11,880,518 ) | (21,343,422 ) |
Net change in unrealized appreciation (depreciation) on investments and futures contracts | 8,549,222 | (24,895,828 ) | 7,382,057 | (38,167,377 ) |
Net increase (decrease) in net assets resulting from operations | 7,671,868 | (38,664,319 ) | 18,420,399 | (52,157,876 ) |
FROM DISTRIBUTIONS TO SHAREHOLDERS: | ||||
Class A | (458,681 ) | (418,231 ) | (7,482,280 ) | (2,294,331 ) |
Class C | (16,463 ) | (3,268 ) | (275,385 ) | (45,623 ) |
Class N | (924,081 ) | (457,509 ) | (1,508,048 ) | (191,170 ) |
Class Y | (9,622,358 ) | (6,995,943 ) | (15,806,812 ) | (6,809,271 ) |
Total distributions | (11,021,583 ) | (7,874,951 ) | (25,072,525 ) | (9,340,395 ) |
NET INCREASE (DECREASE) IN NET ASSETS FROM CAPITAL SHARES TRANSACTIONS (Note 11) | 55,500,864 | (42,173,549 ) | (15,089,643 ) | (200,047,990 ) |
Net increase (decrease) in net assets | 52,151,149 | (88,712,819 ) | (21,741,769 ) | (261,546,261 ) |
NET ASSETS | ||||
Beginning of the year | 292,963,663 | 381,676,482 | 771,495,143 | 1,033,041,404 |
End of the year | $345,114,812 | $292,963,663 | $749,753,374 | $771,495,143 |
Core Plus Bond Fund—Class A | |||||
Year Ended September 30, 2023 | Year Ended September 30, 2022 | Year Ended September 30, 2021 | Year Ended September 30, 2020 | Year Ended September 30, 2019 | |
Net asset value, beginning of the period | $11.20 | $13.59 | $14.08 | $13.25 | $12.53 |
INCOME (LOSS) FROM INVESTMENT OPERATIONS: | |||||
Net investment income(a) | 0.38 | 0.26 | 0.21 | 0.26 | 0.34 |
Net realized and unrealized gain (loss) | (0.25 ) | (2.30 ) | (0.13 ) | 0.86 | 0.70 |
Total from Investment Operations | 0.13 | (2.04 ) | 0.08 | 1.12 | 1.04 |
LESS DISTRIBUTIONS FROM: | |||||
Net investment income | (0.40 ) | (0.32 ) | (0.29 ) | (0.29 ) | (0.32 ) |
Net realized capital gains | — | (0.03 ) | (0.28 ) | — | — |
Total Distributions | (0.40 ) | (0.35 ) | (0.57 ) | (0.29 ) | (0.32 ) |
Net asset value, end of the period | $10.93 | $11.20 | $13.59 | $14.08 | $13.25 |
Total return(b) | 1.04 %(c) | (15.24 )%(c) | 0.53 % | 8.60 % | 8.39 % |
RATIOS TO AVERAGE NET ASSETS: | |||||
Net assets, end of the period (000's) | $376,624 | $428,825 | $747,497 | $617,609 | $558,291 |
Net expenses | 0.74 %(d) | 0.73 %(d)(e) | 0.71 % | 0.72 %(f) | 0.73 % |
Gross expenses | 0.75 % | 0.74 % | 0.71 % | 0.72 % | 0.73 % |
Net investment income | 3.33 % | 2.08 % | 1.51 % | 1.88 % | 2.63 % |
Portfolio turnover rate | 168 % | 280 % | 266 % | 359 %(g) | 297 % |
(a) | Per share net investment income has been calculated using the average shares outstanding during the period. |
(b) | A sales charge for Class A shares is not reflected in total return calculations. |
(c) | Had certain expenses not been waived/reimbursed during the period, total returns would have been lower. |
(d) | The investment adviser agreed to waive its fees and/or reimburse a portion of the Fund’s expenses during the period. Without this waiver/reimbursement, expenses would have been higher. |
(e) | Effective July 1, 2022, the expense limit decreased from 0.75% to 0.74%. |
(f) | Effective July 1, 2020, the expense limit decreased from 0.80% to 0.75%. |
(g) | The variation in the Fund’s turnover rate from 2019 to 2020 was primarily due to a significant repositioning of the portfolio. |
Core Plus Bond Fund—Class C | |||||
Year Ended September 30, 2023 | Year Ended September 30, 2022 | Year Ended September 30, 2021 | Year Ended September 30, 2020 | Year Ended September 30, 2019 | |
Net asset value, beginning of the period | $11.21 | $13.60 | $14.09 | $13.25 | $12.53 |
INCOME (LOSS) FROM INVESTMENT OPERATIONS: | |||||
Net investment income(a) | 0.30 | 0.17 | 0.10 | 0.15 | 0.24 |
Net realized and unrealized gain (loss) | (0.26 ) | (2.30 ) | (0.13 ) | 0.88 | 0.70 |
Total from Investment Operations | 0.04 | (2.13 ) | (0.03 ) | 1.03 | 0.94 |
LESS DISTRIBUTIONS FROM: | |||||
Net investment income | (0.31 ) | (0.23 ) | (0.18 ) | (0.19 ) | (0.22 ) |
Net realized capital gains | — | (0.03 ) | (0.28 ) | — | — |
Total Distributions | (0.31 ) | (0.26 ) | (0.46 ) | (0.19 ) | (0.22 ) |
Net asset value, end of the period | $10.94 | $11.21 | $13.60 | $14.09 | $13.25 |
Total return(b) | 0.26 %(c) | (15.88 )%(c) | (0.24 )% | 7.83 % | 7.57 % |
RATIOS TO AVERAGE NET ASSETS: | |||||
Net assets, end of the period (000's) | $30,402 | $48,679 | $95,755 | $132,590 | $160,201 |
Net expenses | 1.49 %(d) | 1.48 %(d)(e) | 1.46 % | 1.47 %(f) | 1.48 % |
Gross expenses | 1.50 % | 1.49 % | 1.46 % | 1.47 % | 1.48 % |
Net investment income | 2.57 % | 1.33 % | 0.75 % | 1.13 % | 1.88 % |
Portfolio turnover rate | 168 % | 280 % | 266 % | 359 %(g) | 297 % |
(a) | Per share net investment income has been calculated using the average shares outstanding during the period. |
(b) | A contingent deferred sales charge for Class C shares is not reflected in total return calculations. |
(c) | Had certain expenses not been waived/reimbursed during the period, total returns would have been lower. |
(d) | The investment adviser agreed to waive its fees and/or reimburse a portion of the Fund’s expenses during the period. Without this waiver/reimbursement, expenses would have been higher. |
(e) | Effective July 1, 2022, the expense limit decreased from 1.50% to 1.49%. |
(f) | Effective July 1, 2020, the expense limit decreased from 1.55% to 1.50%. |
(g) | The variation in the Fund’s turnover rate from 2019 to 2020 was primarily due to a significant repositioning of the portfolio. |
Core Plus Bond Fund—Class N | |||||
Year Ended September 30, 2023 | Year Ended September 30, 2022 | Year Ended September 30, 2021 | Year Ended September 30, 2020 | Year Ended September 30, 2019 | |
Net asset value, beginning of the period | $11.31 | $13.72 | $14.21 | $13.37 | $12.63 |
INCOME (LOSS) FROM INVESTMENT OPERATIONS: | |||||
Net investment income(a) | 0.43 | 0.31 | 0.26 | 0.30 | 0.38 |
Net realized and unrealized gain (loss) | (0.26 ) | (2.32 ) | (0.14 ) | 0.88 | 0.72 |
Total from Investment Operations | 0.17 | (2.01 ) | 0.12 | 1.18 | 1.10 |
LESS DISTRIBUTIONS FROM: | |||||
Net investment income | (0.44 ) | (0.37 ) | (0.33 ) | (0.34 ) | (0.36 ) |
Net realized capital gains | — | (0.03 ) | (0.28 ) | — | — |
Total Distributions | (0.44 ) | (0.40 ) | (0.61 ) | (0.34 ) | (0.36 ) |
Net asset value, end of the period | $11.04 | $11.31 | $13.72 | $14.21 | $13.37 |
Total return | 1.37 % | (14.94 )% | 0.86 % | 8.95 % | 8.85 % |
RATIOS TO AVERAGE NET ASSETS: | |||||
Net assets, end of the period (000's) | $2,015,457 | $1,890,793 | $2,563,736 | $2,682,487 | $2,610,699 |
Net expenses | 0.40 % | 0.38 %(b) | 0.38 % | 0.38 %(c) | 0.39 % |
Gross expenses | 0.40 % | 0.38 % | 0.38 % | 0.38 % | 0.39 % |
Net investment income | 3.69 % | 2.47 % | 1.84 % | 2.21 % | 2.96 % |
Portfolio turnover rate | 168 % | 280 % | 266 % | 359 %(d) | 297 % |
(a) | Per share net investment income has been calculated using the average shares outstanding during the period. |
(b) | Effective July 1, 2022, the expense limit decreased from 0.45% to 0.44%. |
(c) | Effective July 1, 2020, the expense limit decreased from 0.50% to 0.45%. |
(d) | The variation in the Fund’s turnover rate from 2019 to 2020 was primarily due to a significant repositioning of the portfolio. |
Core Plus Bond Fund—Class Y | |||||
Year Ended September 30, 2023 | Year Ended September 30, 2022 | Year Ended September 30, 2021 | Year Ended September 30, 2020 | Year Ended September 30, 2019 | |
Net asset value, beginning of the period | $11.30 | $13.71 | $14.20 | $13.36 | $12.63 |
INCOME (LOSS) FROM INVESTMENT OPERATIONS: | |||||
Net investment income(a) | 0.42 | 0.30 | 0.24 | 0.29 | 0.37 |
Net realized and unrealized gain (loss) | (0.26 ) | (2.32 ) | (0.13 ) | 0.88 | 0.71 |
Total from Investment Operations | 0.16 | (2.02 ) | 0.11 | 1.17 | 1.08 |
LESS DISTRIBUTIONS FROM: | |||||
Net investment income | (0.43 ) | (0.36 ) | (0.32 ) | (0.33 ) | (0.35 ) |
Net realized capital gains | — | (0.03 ) | (0.28 ) | — | — |
Total Distributions | (0.43 ) | (0.39 ) | (0.60 ) | (0.33 ) | (0.35 ) |
Net asset value, end of the period | $11.03 | $11.30 | $13.71 | $14.20 | $13.36 |
Total return | 1.28 %(b) | (15.03 )%(b) | 0.78 % | 8.87 % | 8.67 % |
RATIOS TO AVERAGE NET ASSETS: | |||||
Net assets, end of the period (000's) | $4,290,526 | $3,543,096 | $5,442,563 | $5,846,057 | $4,163,785 |
Net expenses | 0.49 %(c) | 0.48 %(c)(d) | 0.46 % | 0.47 %(e) | 0.48 % |
Gross expenses | 0.50 % | 0.49 % | 0.46 % | 0.47 % | 0.48 % |
Net investment income | 3.60 % | 2.35 % | 1.76 % | 2.11 % | 2.87 % |
Portfolio turnover rate | 168 % | 280 % | 266 % | 359 %(f) | 297 % |
(a) | Per share net investment income has been calculated using the average shares outstanding during the period. |
(b) | Had certain expenses not been waived/reimbursed during the period, total returns would have been lower. |
(c) | The investment adviser agreed to waive its fees and/or reimburse a portion of the Fund’s expenses during the period. Without this waiver/reimbursement, expenses would have been higher. |
(d) | Effective July 1, 2022, the expense limit decreased from 0.50% to 0.49%. |
(e) | Effective July 1, 2020, the expense limit decreased from 0.55% to 0.50%. |
(f) | The variation in the Fund’s turnover rate from 2019 to 2020 was primarily due to a significant repositioning of the portfolio. |
Credit Income Fund—Class A | ||||
Year Ended September 30, 2023 | Year Ended September 30, 2022 | Year Ended September 30, 2021 | Period Ended September 30, 2020* | |
Net asset value, beginning of the period | $8.31 | $10.21 | $9.97 | $10.00 |
INCOME (LOSS) FROM INVESTMENT OPERATIONS: | ||||
Net investment income (loss)(a) | 0.31 | 0.23 | 0.21 | (0.00 )(b) |
Net realized and unrealized gain (loss) | (0.05 ) | (1.82 ) | 0.31 | (0.03 ) |
Total from Investment Operations | 0.26 | (1.59 ) | 0.52 | (0.03 ) |
LESS DISTRIBUTIONS FROM: | ||||
Net investment income | (0.33 ) | (0.27 ) | (0.28 ) | — |
Net realized capital gains | (0.05 ) | (0.04 ) | (0.00 )(b) | — |
Total Distributions | (0.38 ) | (0.31 ) | (0.28 ) | — |
Net asset value, end of the period | $8.19 | $8.31 | $10.21 | $9.97 |
Total return(c)(d) | 3.13 % | (15.88 )% | 5.24 % | (0.30 )%(e) |
RATIOS TO AVERAGE NET ASSETS: | ||||
Net assets, end of the period (000's) | $197 | $175 | $91 | $1 |
Net expenses(f) | 0.82 % | 0.82 % | 0.82 % | 0.82 %(g) |
Gross expenses | 2.95 % | 3.37 % | 4.79 % | 125.79 %(g) |
Net investment income (loss) | 3.61 % | 2.54 % | 2.07 % | (0.82 )%(g) |
Portfolio turnover rate | 27 % | 21 % | 55 % | 0 % |
* | From commencement of operations on September 29, 2020 through September 30, 2020. |
(a) | Per share net investment income (loss) has been calculated using the average shares outstanding during the period. |
(b) | Amount rounds to less than $0.01 per share. |
(c) | A sales charge for Class A shares is not reflected in total return calculations. |
(d) | Had certain expenses not been waived/reimbursed during the period, total returns would have been lower. |
(e) | Periods less than one year are not annualized. |
(f) | The investment adviser agreed to waive its fees and/or reimburse a portion of the Fund’s expenses during the period. Without this waiver/reimbursement, expenses would have been higher. |
(g) | Computed on an annualized basis for periods less than one year. |
Credit Income Fund—Class C | ||||
Year Ended September 30, 2023 | Year Ended September 30, 2022 | Year Ended September 30, 2021 | Period Ended September 30, 2020* | |
Net asset value, beginning of the period | $8.30 | $10.20 | $9.97 | $10.00 |
INCOME (LOSS) FROM INVESTMENT OPERATIONS: | ||||
Net investment income (loss)(a) | 0.24 | 0.16 | 0.13 | (0.00 )(b) |
Net realized and unrealized gain (loss) | (0.04 ) | (1.82 ) | 0.30 | (0.03 ) |
Total from Investment Operations | 0.20 | (1.66 ) | 0.43 | (0.03 ) |
LESS DISTRIBUTIONS FROM: | ||||
Net investment income | (0.27 ) | (0.20 ) | (0.20 ) | — |
Net realized capital gains | (0.05 ) | (0.04 ) | (0.00 )(b) | — |
Total Distributions | (0.32 ) | (0.24 ) | (0.20 ) | — |
Net asset value, end of the period | $8.18 | $8.30 | $10.20 | $9.97 |
Total return(c)(d) | 2.37 % | (16.53 )% | 4.34 % | (0.30 )%(e) |
RATIOS TO AVERAGE NET ASSETS: | ||||
Net assets, end of the period (000's) | $1 | $1 | $1 | $1 |
Net expenses(f) | 1.57 % | 1.57 % | 1.57 % | 1.57 %(g) |
Gross expenses | 3.66 % | 4.18 % | 5.60 % | 126.54 %(g) |
Net investment income (loss) | 2.79 % | 1.67 % | 1.29 % | (1.57 )%(g) |
Portfolio turnover rate | 27 % | 21 % | 55 % | 0 % |
* | From commencement of operations on September 29, 2020 through September 30, 2020. |
(a) | Per share net investment income (loss) has been calculated using the average shares outstanding during the period. |
(b) | Amount rounds to less than $0.01 per share. |
(c) | A contingent deferred sales charge for Class C shares is not reflected in total return calculations. |
(d) | Had certain expenses not been waived/reimbursed during the period, total returns would have been lower. |
(e) | Periods less than one year are not annualized. |
(f) | The investment adviser agreed to waive its fees and/or reimburse a portion of the Fund’s expenses during the period. Without this waiver/reimbursement, expenses would have been higher. |
(g) | Computed on an annualized basis for periods less than one year. |
Credit Income Fund—Class N | ||||
Year Ended September 30, 2023 | Year Ended September 30, 2022 | Year Ended September 30, 2021 | Period Ended September 30, 2020* | |
Net asset value, beginning of the period | $8.31 | $10.21 | $9.97 | $10.00 |
INCOME (LOSS) FROM INVESTMENT OPERATIONS: | ||||
Net investment income(a) | 0.33 | 0.26 | 0.24 | 0.00 (b) |
Net realized and unrealized gain (loss) | (0.04 ) | (1.82 ) | 0.31 | (0.03 ) |
Total from Investment Operations | 0.29 | (1.56 ) | 0.55 | (0.03 ) |
LESS DISTRIBUTIONS FROM: | ||||
Net investment income | (0.36 ) | (0.30 ) | (0.31 ) | — |
Net realized capital gains | (0.05 ) | (0.04 ) | (0.00 )(b) | — |
Total Distributions | (0.41 ) | (0.34 ) | (0.31 ) | — |
Net asset value, end of the period | $8.19 | $8.31 | $10.21 | $9.97 |
Total return(c) | 3.45 % | (15.63 )% | 5.54 % | (0.30 )%(d) |
RATIOS TO AVERAGE NET ASSETS: | ||||
Net assets, end of the period (000's) | $19,930 | $20,229 | $24,842 | $24,915 |
Net expenses(e) | 0.52 % | 0.52 % | 0.52 % | 0.52 %(f) |
Gross expenses | 1.51 % | 1.30 % | 1.16 % | 27.91 %(f) |
Net investment income | 3.85 % | 2.75 % | 2.38 % | 0.55 %(f) |
Portfolio turnover rate | 27 % | 21 % | 55 % | 0 % |
* | From commencement of operations on September 29, 2020 through September 30, 2020. |
(a) | Per share net investment income has been calculated using the average shares outstanding during the period. |
(b) | Amount rounds to less than $0.01 per share. |
(c) | Had certain expenses not been waived/reimbursed during the period, total returns would have been lower. |
(d) | Periods less than one year are not annualized. |
(e) | The investment adviser agreed to waive its fees and/or reimburse a portion of the Fund’s expenses during the period. Without this waiver/reimbursement, expenses would have been higher. |
(f) | Computed on an annualized basis for periods less than one year. |
Credit Income Fund—Class Y | ||||
Year Ended September 30, 2023 | Year Ended September 30, 2022 | Year Ended September 30, 2021 | Period Ended September 30, 2020* | |
Net asset value, beginning of the period | $8.31 | $10.20 | $9.97 | $10.00 |
INCOME (LOSS) FROM INVESTMENT OPERATIONS: | ||||
Net investment income (loss)(a) | 0.32 | 0.25 | 0.24 | (0.00 )(b) |
Net realized and unrealized gain (loss) | (0.04 ) | (1.81 ) | 0.29 | (0.03 ) |
Total from Investment Operations | 0.28 | (1.56 ) | 0.53 | (0.03 ) |
LESS DISTRIBUTIONS FROM: | ||||
Net investment income | (0.36 ) | (0.29 ) | (0.30 ) | — |
Net realized capital gains | (0.05 ) | (0.04 ) | (0.00 )(b) | — |
Total Distributions | (0.41 ) | (0.33 ) | (0.30 ) | — |
Net asset value, end of the period | $8.18 | $8.31 | $10.20 | $9.97 |
Total return(c) | 3.27 % | (15.59 )% | 5.38 % | (0.30 )%(d) |
RATIOS TO AVERAGE NET ASSETS: | ||||
Net assets, end of the period (000's) | $19 | $46 | $22 | $1 |
Net expenses(e) | 0.57 % | 0.57 % | 0.57 % | 0.57 %(f) |
Gross expenses | 2.70 % | 3.12 % | 4.54 % | 125.54 %(f) |
Net investment income (loss) | 3.72 % | 2.70 % | 2.33 % | (0.57 )%(f) |
Portfolio turnover rate | 27 % | 21 % | 55 % | 0 % |
* | From commencement of operations on September 29, 2020 through September 30, 2020. |
(a) | Per share net investment income (loss) has been calculated using the average shares outstanding during the period. |
(b) | Amount rounds to less than $0.01 per share. |
(c) | Had certain expenses not been waived/reimbursed during the period, total returns would have been lower. |
(d) | Periods less than one year are not annualized. |
(e) | The investment adviser agreed to waive its fees and/or reimburse a portion of the Fund’s expenses during the period. Without this waiver/reimbursement, expenses would have been higher. |
(f) | Computed on an annualized basis for periods less than one year. |
Global Allocation Fund—Class A | |||||
Year Ended September 30, 2023 | Year Ended September 30, 2022 | Year Ended September 30, 2021 | Year Ended September 30, 2020 | Year Ended September 30, 2019 | |
Net asset value, beginning of the period | $19.94 | $28.86 | $26.23 | $23.76 | $23.10 |
INCOME (LOSS) FROM INVESTMENT OPERATIONS: | |||||
Net investment income(a) | 0.23 | 0.13 | 0.06 | 0.10 | 0.19 |
Net realized and unrealized gain (loss) | 3.31 | (6.89 ) | 4.18 | 3.05 | 1.38 |
Total from Investment Operations | 3.54 | (6.76 ) | 4.24 | 3.15 | 1.57 |
LESS DISTRIBUTIONS FROM: | |||||
Net investment income | — | — | (0.13 ) | (0.12 ) | (0.16 ) |
Net realized capital gains | (2.03 ) | (2.16 ) | (1.48 ) | (0.56 ) | (0.75 ) |
Total Distributions | (2.03 ) | (2.16 ) | (1.61 ) | (0.68 ) | (0.91 ) |
Net asset value, end of the period | $21.45 | $19.94 | $28.86 | $26.23 | $23.76 |
Total return(b) | 18.67 % | (25.59 )% | 16.73 % | 13.41 % | 7.66 % |
RATIOS TO AVERAGE NET ASSETS: | |||||
Net assets, end of the period (000's) | $474,968 | $482,031 | $737,469 | $632,479 | $453,009 |
Net expenses | 1.17 % | 1.14 % | 1.13 % | 1.15 % | 1.16 % |
Gross expenses | 1.17 % | 1.14 % | 1.13 % | 1.15 % | 1.16 % |
Net investment income | 1.09 % | 0.52 % | 0.23 % | 0.42 % | 0.83 % |
Portfolio turnover rate | 19 % | 35 % | 45 % | 37 % | 27 % |
(a) | Per share net investment income has been calculated using the average shares outstanding during the period. |
(b) | A sales charge for Class A shares is not reflected in total return calculations. |
Global Allocation Fund—Class C | |||||
Year Ended September 30, 2023 | Year Ended September 30, 2022 | Year Ended September 30, 2021 | Year Ended September 30, 2020 | Year Ended September 30, 2019 | |
Net asset value, beginning of the period | $19.34 | $28.26 | $25.78 | $23.43 | $22.78 |
INCOME (LOSS) FROM INVESTMENT OPERATIONS: | |||||
Net investment income (loss)(a) | 0.07 | (0.06 ) | (0.14 ) | (0.08 ) | 0.02 |
Net realized and unrealized gain (loss) | 3.21 | (6.70 ) | 4.10 | 2.99 | 1.38 |
Total from Investment Operations | 3.28 | (6.76 ) | 3.96 | 2.91 | 1.40 |
LESS DISTRIBUTIONS FROM: | |||||
Net investment income | — | — | — | — | (0.00 )(b) |
Net realized capital gains | (2.03 ) | (2.16 ) | (1.48 ) | (0.56 ) | (0.75 ) |
Total Distributions | (2.03 ) | (2.16 ) | (1.48 ) | (0.56 ) | (0.75 ) |
Net asset value, end of the period | $20.59 | $19.34 | $28.26 | $25.78 | $23.43 |
Total return(c) | 17.84 % | (26.16 )% | 15.85 % | 12.55 % | 6.85 % |
RATIOS TO AVERAGE NET ASSETS: | |||||
Net assets, end of the period (000's) | $256,487 | $302,501 | $503,073 | $483,814 | $480,479 |
Net expenses | 1.92 % | 1.89 % | 1.88 % | 1.90 % | 1.91 % |
Gross expenses | 1.92 % | 1.89 % | 1.88 % | 1.90 % | 1.91 % |
Net investment income (loss) | 0.33 % | (0.23 )% | (0.52 )% | (0.33 )% | 0.08 % |
Portfolio turnover rate | 19 % | 35 % | 45 % | 37 % | 27 % |
(a) | Per share net investment income (loss) has been calculated using the average shares outstanding during the period. |
(b) | Amount rounds to less than $0.01 per share. |
(c) | A contingent deferred sales charge for Class C shares is not reflected in total return calculations. |
Global Allocation Fund—Class N | |||||
Year Ended September 30, 2023 | Year Ended September 30, 2022 | Year Ended September 30, 2021 | Year Ended September 30, 2020 | Year Ended September 30, 2019 | |
Net asset value, beginning of the period | $20.14 | $29.09 | $26.42 | $23.92 | $23.25 |
INCOME (LOSS) FROM INVESTMENT OPERATIONS: | |||||
Net investment income(a) | 0.31 | 0.22 | 0.15 | 0.18 | 0.27 |
Net realized and unrealized gain (loss) | 3.36 | (6.96 ) | 4.21 | 3.07 | 1.38 |
Total from Investment Operations | 3.67 | (6.74 ) | 4.36 | 3.25 | 1.65 |
LESS DISTRIBUTIONS FROM: | |||||
Net investment income | — | (0.05 ) | (0.21 ) | (0.19 ) | (0.23 ) |
Net realized capital gains | (2.03 ) | (2.16 ) | (1.48 ) | (0.56 ) | (0.75 ) |
Total Distributions | (2.03 ) | (2.21 ) | (1.69 ) | (0.75 ) | (0.98 ) |
Net asset value, end of the period | $21.78 | $20.14 | $29.09 | $26.42 | $23.92 |
Total return | 19.16 % | (25.36 )% | 17.10 % | 13.78 % | 8.04 % |
RATIOS TO AVERAGE NET ASSETS: | |||||
Net assets, end of the period (000's) | $266,298 | $243,862 | $350,222 | $264,338 | $202,692 |
Net expenses | 0.82 % | 0.81 % | 0.81 % | 0.82 % | 0.82 % |
Gross expenses | 0.82 % | 0.81 % | 0.81 % | 0.82 % | 0.82 % |
Net investment income | 1.43 % | 0.87 % | 0.55 % | 0.76 % | 1.20 % |
Portfolio turnover rate | 19 % | 35 % | 45 % | 37 % | 27 % |
(a) | Per share net investment income has been calculated using the average shares outstanding during the period. |
Global Allocation Fund—Class Y | |||||
Year Ended September 30, 2023 | Year Ended September 30, 2022 | Year Ended September 30, 2021 | Year Ended September 30, 2020 | Year Ended September 30, 2019 | |
Net asset value, beginning of the period | $20.14 | $29.09 | $26.42 | $23.92 | $23.25 |
INCOME (LOSS) FROM INVESTMENT OPERATIONS: | |||||
Net investment income(a) | 0.29 | 0.20 | 0.13 | 0.16 | 0.24 |
Net realized and unrealized gain (loss) | 3.35 | (6.96 ) | 4.21 | 3.07 | 1.40 |
Total from Investment Operations | 3.64 | (6.76 ) | 4.34 | 3.23 | 1.64 |
LESS DISTRIBUTIONS FROM: | |||||
Net investment income | — | (0.03 ) | (0.19 ) | (0.17 ) | (0.22 ) |
Net realized capital gains | (2.03 ) | (2.16 ) | (1.48 ) | (0.56 ) | (0.75 ) |
Total Distributions | (2.03 ) | (2.19 ) | (1.67 ) | (0.73 ) | (0.97 ) |
Net asset value, end of the period | $21.75 | $20.14 | $29.09 | $26.42 | $23.92 |
Total return | 19.00 % | (25.41 )% | 17.02 % | 13.70 % | 7.95 % |
RATIOS TO AVERAGE NET ASSETS: | |||||
Net assets, end of the period (000's) | $1,698,560 | $1,932,913 | $3,286,680 | $2,660,927 | $1,938,124 |
Net expenses | 0.92 % | 0.89 % | 0.88 % | 0.90 % | 0.91 % |
Gross expenses | 0.92 % | 0.89 % | 0.88 % | 0.90 % | 0.91 % |
Net investment income | 1.33 % | 0.77 % | 0.48 % | 0.67 % | 1.08 % |
Portfolio turnover rate | 19 % | 35 % | 45 % | 37 % | 27 % |
(a) | Per share net investment income has been calculated using the average shares outstanding during the period. |
Growth Fund—Class A | |||||
Year Ended September 30, 2023 | Year Ended September 30, 2022 | Year Ended September 30, 2021 | Year Ended September 30, 2020 | Year Ended September 30, 2019 | |
Net asset value, beginning of the period | $16.45 | $23.85 | $20.72 | $16.02 | $16.05 |
INCOME (LOSS) FROM INVESTMENT OPERATIONS: | |||||
Net investment income (loss)(a) | (0.08 ) | (0.06 ) | (0.05 ) | 0.01 | 0.05 |
Net realized and unrealized gain (loss) | 5.89 | (6.10 ) | 4.17 | 5.14 | 0.71 |
Total from Investment Operations | 5.81 | (6.16 ) | 4.12 | 5.15 | 0.76 |
LESS DISTRIBUTIONS FROM: | |||||
Net investment income | — | — | — | (0.05 ) | (0.05 ) |
Net realized capital gains | (2.68 ) | (1.24 ) | (0.99 ) | (0.40 ) | (0.74 ) |
Total Distributions | (2.68 ) | (1.24 ) | (0.99 ) | (0.45 ) | (0.79 ) |
Net asset value, end of the period | $19.58 | $16.45 | $23.85 | $20.72 | $16.02 |
Total return(b) | 40.67 % | (27.48 )% | 20.43 % | 32.80 % | 5.81 % |
RATIOS TO AVERAGE NET ASSETS: | |||||
Net assets, end of the period (000's) | $798,843 | $1,164,116 | $1,740,523 | $1,477,915 | $1,250,030 |
Net expenses | 0.92 % | 0.90 % | 0.89 % | 0.90 % | 0.91 % |
Gross expenses | 0.92 % | 0.90 % | 0.89 % | 0.90 % | 0.91 % |
Net investment income (loss) | (0.43 )% | (0.30 )% | (0.22 )% | 0.04 % | 0.35 % |
Portfolio turnover rate | 13 % | 20 % | 9 % | 19 % | 7 % |
(a) | Per share net investment income (loss) has been calculated using the average shares outstanding during the period. |
(b) | A sales charge for Class A shares is not reflected in total return calculations. |
Growth Fund—Class C | |||||
Year Ended September 30, 2023 | Year Ended September 30, 2022 | Year Ended September 30, 2021 | Year Ended September 30, 2020 | Year Ended September 30, 2019 | |
Net asset value, beginning of the period | $14.42 | $21.21 | $18.66 | $14.53 | $14.68 |
INCOME (LOSS) FROM INVESTMENT OPERATIONS: | |||||
Net investment loss(a) | (0.18 ) | (0.20 ) | (0.20 ) | (0.11 ) | (0.06 ) |
Net realized and unrealized gain (loss) | 5.04 | (5.35 ) | 3.74 | 4.64 | 0.65 |
Total from Investment Operations | 4.86 | (5.55 ) | 3.54 | 4.53 | 0.59 |
LESS DISTRIBUTIONS FROM: | |||||
Net realized capital gains | (2.68 ) | (1.24 ) | (0.99 ) | (0.40 ) | (0.74 ) |
Net asset value, end of the period | $16.60 | $14.42 | $21.21 | $18.66 | $14.53 |
Total return(b) | 39.68 % | (28.05 )% | 19.55 % | 31.76 % | 5.05 % |
RATIOS TO AVERAGE NET ASSETS: | |||||
Net assets, end of the period (000's) | $78,116 | $65,977 | $127,003 | $128,764 | $120,493 |
Net expenses | 1.67 % | 1.65 % | 1.63 % | 1.65 % | 1.66 % |
Gross expenses | 1.67 % | 1.65 % | 1.63 % | 1.65 % | 1.66 % |
Net investment loss | (1.18 )% | (1.05 )% | (0.97 )% | (0.71 )% | (0.39 )% |
Portfolio turnover rate | 13 % | 20 % | 9 % | 19 % | 7 % |
(a) | Per share net investment loss has been calculated using the average shares outstanding during the period. |
(b) | A contingent deferred sales charge for Class C shares is not reflected in total return calculations. |
Growth Fund—Class N | |||||
Year Ended September 30, 2023 | Year Ended September 30, 2022 | Year Ended September 30, 2021 | Year Ended September 30, 2020 | Year Ended September 30, 2019 | |
Net asset value, beginning of the period | $17.87 | $25.73 | $22.26 | $17.17 | $17.15 |
INCOME (LOSS) FROM INVESTMENT OPERATIONS: | |||||
Net investment income (loss)(a) | (0.02 ) | 0.01 | 0.02 | 0.07 | 0.11 |
Net realized and unrealized gain (loss) | 6.49 | (6.63 ) | 4.49 | 5.53 | 0.76 |
Total from Investment Operations | 6.47 | (6.62 ) | 4.51 | 5.60 | 0.87 |
LESS DISTRIBUTIONS FROM: | |||||
Net investment income | — | — | (0.05 ) | (0.11 ) | (0.11 ) |
Net realized capital gains | (2.68 ) | (1.24 ) | (0.99 ) | (0.40 ) | (0.74 ) |
Total Distributions | (2.68 ) | (1.24 ) | (1.04 ) | (0.51 ) | (0.85 ) |
Net asset value, end of the period | $21.66 | $17.87 | $25.73 | $22.26 | $17.17 |
Total return | 41.19 % | (27.25 )% | 20.80 % | 33.26 % | 6.14 % |
RATIOS TO AVERAGE NET ASSETS: | |||||
Net assets, end of the period (000's) | $718,311 | $663,001 | $806,186 | $579,571 | $442,787 |
Net expenses | 0.58 % | 0.57 % | 0.56 % | 0.57 % | 0.56 % |
Gross expenses | 0.58 % | 0.57 % | 0.56 % | 0.57 % | 0.56 % |
Net investment income (loss) | (0.08 )% | 0.04 % | 0.09 % | 0.38 % | 0.69 % |
Portfolio turnover rate | 13 % | 20 % | 9 % | 19 % | 7 % |
(a) | Per share net investment income (loss) has been calculated using the average shares outstanding during the period. |
Growth Fund—Class Y | |||||
Year Ended September 30, 2023 | Year Ended September 30, 2022 | Year Ended September 30, 2021 | Year Ended September 30, 2020 | Year Ended September 30, 2019 | |
Net asset value, beginning of the period | $17.86 | $25.73 | $22.26 | $17.17 | $17.14 |
INCOME (LOSS) FROM INVESTMENT OPERATIONS: | |||||
Net investment income (loss)(a) | (0.03 ) | (0.01 ) | 0.01 | 0.05 | 0.10 |
Net realized and unrealized gain (loss) | 6.46 | (6.62 ) | 4.48 | 5.53 | 0.77 |
Total from Investment Operations | 6.43 | (6.63 ) | 4.49 | 5.58 | 0.87 |
LESS DISTRIBUTIONS FROM: | |||||
Net investment income | — | — | (0.03 ) | (0.09 ) | (0.10 ) |
Net realized capital gains | (2.68 ) | (1.24 ) | (0.99 ) | (0.40 ) | (0.74 ) |
Total Distributions | (2.68 ) | (1.24 ) | (1.02 ) | (0.49 ) | (0.84 ) |
Net asset value, end of the period | $21.61 | $17.86 | $25.73 | $22.26 | $17.17 |
Total return | 40.97 % | (27.29 )% | 20.72 % | 33.15 % | 6.09 % |
RATIOS TO AVERAGE NET ASSETS: | |||||
Net assets, end of the period (000's) | $9,204,871 | $7,594,603 | $11,094,922 | $9,313,775 | $7,017,707 |
Net expenses | 0.67 % | 0.65 % | 0.64 % | 0.65 % | 0.66 % |
Gross expenses | 0.67 % | 0.65 % | 0.64 % | 0.65 % | 0.66 % |
Net investment income (loss) | (0.17 )% | (0.05 )% | 0.02 % | 0.27 % | 0.60 % |
Portfolio turnover rate | 13 % | 20 % | 9 % | 19 % | 7 % |
(a) | Per share net investment income (loss) has been calculated using the average shares outstanding during the period. |
Intermediate Duration Bond Fund—Class A | |||||
Year Ended September 30, 2023 | Year Ended September 30, 2022 | Year Ended September 30, 2021 | Year Ended September 30, 2020 | Year Ended September 30, 2019 | |
Net asset value, beginning of the period | $9.23 | $10.58 | $10.99 | $10.51 | $9.97 |
INCOME (LOSS) FROM INVESTMENT OPERATIONS: | |||||
Net investment income(a) | 0.29 | 0.15 | 0.11 | 0.19 | 0.25 |
Net realized and unrealized gain (loss) | (0.06 ) | (1.30 ) | (0.11 ) | 0.54 | 0.55 |
Total from Investment Operations | 0.23 | (1.15 ) | (0.00 )(b) | 0.73 | 0.80 |
LESS DISTRIBUTIONS FROM: | |||||
Net investment income | (0.30 ) | (0.15 ) | (0.12 ) | (0.20 ) | (0.26 ) |
Net realized capital gains | — | (0.05 ) | (0.29 ) | (0.05 ) | — |
Total Distributions | (0.30 ) | (0.20 ) | (0.41 ) | (0.25 ) | (0.26 ) |
Net asset value, end of the period | $9.16 | $9.23 | $10.58 | $10.99 | $10.51 |
Total return(c)(d) | 2.53 % | (10.98 )% | (0.06 )% | 7.06 % | 8.11 % |
RATIOS TO AVERAGE NET ASSETS: | |||||
Net assets, end of the period (000's) | $7,150 | $18,077 | $20,942 | $19,962 | $21,415 |
Net expenses(e) | 0.65 % | 0.65 % | 0.65 % | 0.65 % | 0.65 % |
Gross expenses | 0.71 % | 0.68 % | 0.70 % | 0.72 % | 0.72 % |
Net investment income | 3.12 % | 1.49 % | 1.03 % | 1.78 % | 2.42 % |
Portfolio turnover rate | 138 % | 144 % | 100 % | 123 % | 135 % |
(a) | Per share net investment income has been calculated using the average shares outstanding during the period. |
(b) | Amount rounds to less than $0.01 per share. |
(c) | A sales charge for Class A shares is not reflected in total return calculations. |
(d) | Had certain expenses not been waived/reimbursed during the period, total returns would have been lower. |
(e) | The investment adviser agreed to waive its fees and/or reimburse a portion of the Fund’s expenses during the period. Without this waiver/reimbursement, expenses would have been higher. |
Intermediate Duration Bond Fund—Class C | |||||
Year Ended September 30, 2023 | Year Ended September 30, 2022 | Year Ended September 30, 2021 | Year Ended September 30, 2020 | Year Ended September 30, 2019 | |
Net asset value, beginning of the period | $9.27 | $10.62 | $11.02 | $10.54 | $10.00 |
INCOME (LOSS) FROM INVESTMENT OPERATIONS: | |||||
Net investment income(a) | 0.24 | 0.06 | 0.03 | 0.11 | 0.17 |
Net realized and unrealized gain (loss) | (0.08 ) | (1.29 ) | (0.11 ) | 0.54 | 0.55 |
Total from Investment Operations | 0.16 | (1.23 ) | (0.08 ) | 0.65 | 0.72 |
LESS DISTRIBUTIONS FROM: | |||||
Net investment income | (0.24 ) | (0.07 ) | (0.03 ) | (0.12 ) | (0.18 ) |
Net realized capital gains | — | (0.05 ) | (0.29 ) | (0.05 ) | — |
Total Distributions | (0.24 ) | (0.12 ) | (0.32 ) | (0.17 ) | (0.18 ) |
Net asset value, end of the period | $9.19 | $9.27 | $10.62 | $11.02 | $10.54 |
Total return(b)(c) | 1.69 % | (11.65 )% | (0.76 )% | 6.27 % | 7.28 % |
RATIOS TO AVERAGE NET ASSETS: | |||||
Net assets, end of the period (000's) | $698 | $174 | $315 | $668 | $467 |
Net expenses(d) | 1.40 % | 1.40 % | 1.40 % | 1.40 % | 1.40 % |
Gross expenses | 1.46 % | 1.43 % | 1.45 % | 1.46 % | 1.48 % |
Net investment income | 2.53 % | 0.60 % | 0.30 % | 1.00 % | 1.64 % |
Portfolio turnover rate | 138 % | 144 % | 100 % | 123 % | 135 % |
(a) | Per share net investment income has been calculated using the average shares outstanding during the period. |
(b) | A contingent deferred sales charge for Class C shares is not reflected in total return calculations. |
(c) | Had certain expenses not been waived/reimbursed during the period, total returns would have been lower. |
(d) | The investment adviser agreed to waive its fees and/or reimburse a portion of the Fund’s expenses during the period. Without this waiver/reimbursement, expenses would have been higher. |
Intermediate Duration Bond Fund—Class N | |||||
Year Ended September 30, 2023 | Year Ended September 30, 2022 | Year Ended September 30, 2021 | Year Ended September 30, 2020 | Period Ended September 30, 2019* | |
Net asset value, beginning of the period | $9.22 | $10.57 | $10.98 | $10.50 | $10.07 |
INCOME (LOSS) FROM INVESTMENT OPERATIONS: | |||||
Net investment income(a) | 0.33 | 0.18 | 0.14 | 0.22 | 0.17 |
Net realized and unrealized gain (loss) | (0.06 ) | (1.30 ) | (0.11 ) | 0.54 | 0.45 |
Total from Investment Operations | 0.27 | (1.12 ) | 0.03 | 0.76 | 0.62 |
LESS DISTRIBUTIONS FROM: | |||||
Net investment income | (0.33 ) | (0.18 ) | (0.15 ) | (0.23 ) | (0.19 ) |
Net realized capital gains | — | (0.05 ) | (0.29 ) | (0.05 ) | — |
Total Distributions | (0.33 ) | (0.23 ) | (0.44 ) | (0.28 ) | (0.19 ) |
Net asset value, end of the period | $9.16 | $9.22 | $10.57 | $10.98 | $10.50 |
Total return(b) | 2.97 % | (10.73 )% | 0.25 % | 7.39 % | 6.19 %(c) |
RATIOS TO AVERAGE NET ASSETS: | |||||
Net assets, end of the period (000's) | $55,983 | $19,294 | $20,094 | $3,307 | $3,546 |
Net expenses(d) | 0.35 % | 0.35 % | 0.35 % | 0.35 % | 0.35 %(e) |
Gross expenses | 0.39 % | 0.37 % | 0.38 % | 0.43 % | 0.42 %(e) |
Net investment income | 3.60 % | 1.80 % | 1.32 % | 2.09 % | 2.54 %(e) |
Portfolio turnover rate | 138 % | 144 % | 100 % | 123 % | 135 %(f) |
* | From commencement of Class operations on February 1, 2019 through September 30, 2019. |
(a) | Per share net investment income has been calculated using the average shares outstanding during the period. |
(b) | Had certain expenses not been waived/reimbursed during the period, total returns would have been lower. |
(c) | Periods less than one year are not annualized. |
(d) | The investment adviser agreed to waive its fees and/or reimburse a portion of the Fund’s expenses during the period. Without this waiver/reimbursement, expenses would have been higher. |
(e) | Computed on an annualized basis for periods less than one year. |
(f) | Represents the Fund’s portfolio turnover rate for year ended September 30, 2019. |
Intermediate Duration Bond Fund—Class Y | |||||
Year Ended September 30, 2023 | Year Ended September 30, 2022 | Year Ended September 30, 2021 | Year Ended September 30, 2020 | Year Ended September 30, 2019 | |
Net asset value, beginning of the period | $9.23 | $10.58 | $10.99 | $10.51 | $9.97 |
INCOME (LOSS) FROM INVESTMENT OPERATIONS: | |||||
Net investment income(a) | 0.32 | 0.17 | 0.14 | 0.21 | 0.27 |
Net realized and unrealized gain (loss) | (0.06 ) | (1.29 ) | (0.11 ) | 0.54 | 0.55 |
Total from Investment Operations | 0.26 | (1.12 ) | 0.03 | 0.75 | 0.82 |
LESS DISTRIBUTIONS FROM: | |||||
Net investment income | (0.33 ) | (0.18 ) | (0.15 ) | (0.22 ) | (0.28 ) |
Net realized capital gains | — | (0.05 ) | (0.29 ) | (0.05 ) | — |
Total Distributions | (0.33 ) | (0.23 ) | (0.44 ) | (0.27 ) | (0.28 ) |
Net asset value, end of the period | $9.16 | $9.23 | $10.58 | $10.99 | $10.51 |
Total return(b) | 2.81 % | (10.76 )% | 0.20 % | 7.33 % | 8.38 % |
RATIOS TO AVERAGE NET ASSETS: | |||||
Net assets, end of the period (000's) | $281,284 | $255,418 | $340,326 | $293,577 | $215,752 |
Net expenses(c) | 0.40 % | 0.40 % | 0.40 % | 0.40 % | 0.40 % |
Gross expenses | 0.46 % | 0.44 % | 0.45 % | 0.47 % | 0.48 % |
Net investment income | 3.47 % | 1.70 % | 1.28 % | 2.01 % | 2.67 % |
Portfolio turnover rate | 138 % | 144 % | 100 % | 123 % | 135 % |
(a) | Per share net investment income has been calculated using the average shares outstanding during the period. |
(b) | Had certain expenses not been waived/reimbursed during the period, total returns would have been lower. |
(c) | The investment adviser agreed to waive its fees and/or reimburse a portion of the Fund’s expenses during the period. Without this waiver/reimbursement, expenses would have been higher. |
Limited Term Government and Agency Fund—Class A | |||||
Year Ended September 30, 2023 | Year Ended September 30, 2022 | Year Ended September 30, 2021 | Year Ended September 30, 2020 | Year Ended September 30, 2019 | |
Net asset value, beginning of the period | $10.65 | $11.40 | $11.54 | $11.34 | $11.09 |
INCOME (LOSS) FROM INVESTMENT OPERATIONS: | |||||
Net investment income(a) | 0.32 | 0.07 | 0.04 | 0.11 | 0.15 |
Net realized and unrealized gain (loss) | (0.04 ) | (0.72 ) | (0.11 ) | 0.25 | 0.34 |
Total from Investment Operations | 0.28 | (0.65 ) | (0.07 ) | 0.36 | 0.49 |
LESS DISTRIBUTIONS FROM: | |||||
Net investment income | (0.36 ) | (0.10 ) | (0.07 ) | (0.16 ) | (0.24 ) |
Net asset value, end of the period | $10.57 | $10.65 | $11.40 | $11.54 | $11.34 |
Total return(b) | 2.64 %(c) | (5.75 )%(c) | (0.58 )%(c) | 3.19 % | 4.42 % |
RATIOS TO AVERAGE NET ASSETS: | |||||
Net assets, end of the period (000's) | $209,032 | $246,532 | $287,244 | $296,217 | $308,186 |
Net expenses | 0.69 %(d)(e) | 0.69 %(d)(f) | 0.73 %(d)(f) (g) | 0.78 %(h) | 0.80 % |
Gross expenses | 0.77 %(e) | 0.72 %(f) | 0.73 %(f) | 0.78 % | 0.80 % |
Net investment income | 3.04 % | 0.65 % | 0.36 % | 0.93 % | 1.31 % |
Portfolio turnover rate | 267 % | 203 % | 247 % | 319 %(i) | 527 %(i) |
(a) | Per share net investment income has been calculated using the average shares outstanding during the period. |
(b) | A sales charge for Class A shares is not reflected in total return calculations. |
(c) | Had certain expenses not been waived/reimbursed during the period, total returns would have been lower. |
(d) | The investment adviser agreed to waive its fees and/or reimburse a portion of the Fund’s expenses during the period. Without this waiver/reimbursement, expenses would have been higher. |
(e) | Includes refund of prior year service fee of 0.01%. See Note 6b of Notes to Financial Statements. |
(f) | Includes refund of prior year service fee of 0.01%. |
(g) | Effective July 1, 2021, the expense limit decreased from 0.75% to 0.70%. |
(h) | Effective July 1, 2020, the expense limit decreased from 0.80% to 0.75%. |
(i) | The variation in the Fund’s turnover rate from 2019 to 2020 is due to changes in volume of U.S. Treasury securities related to certain trading strategies. |
Limited Term Government and Agency Fund—Class C | |||||
Year Ended September 30, 2023 | Year Ended September 30, 2022 | Year Ended September 30, 2021 | Year Ended September 30, 2020 | Year Ended September 30, 2019 | |
Net asset value, beginning of the period | $10.62 | $11.38 | $11.54 | $11.35 | $11.10 |
INCOME (LOSS) FROM INVESTMENT OPERATIONS: | |||||
Net investment income (loss)(a) | 0.24 | (0.02 ) | (0.05 ) | 0.02 | 0.06 |
Net realized and unrealized gain (loss) | (0.04 ) | (0.71 ) | (0.11 ) | 0.24 | 0.34 |
Total from Investment Operations | 0.20 | (0.73 ) | (0.16 ) | 0.26 | 0.40 |
LESS DISTRIBUTIONS FROM: | |||||
Net investment income | (0.28 ) | (0.03 ) | (0.00 )(b) | (0.07 ) | (0.15 ) |
Net asset value, end of the period | $10.54 | $10.62 | $11.38 | $11.54 | $11.35 |
Total return(c) | 1.86 %(d) | (6.43 )%(d) | (1.35 )%(d) | 2.34 % | 3.64 % |
RATIOS TO AVERAGE NET ASSETS: | |||||
Net assets, end of the period (000's) | $8,510 | $14,145 | $24,922 | $19,628 | $22,142 |
Net expenses | 1.45 %(e) | 1.45 %(e) | 1.48 %(e)(f) | 1.53 %(g) | 1.55 % |
Gross expenses | 1.53 % | 1.48 % | 1.49 % | 1.53 % | 1.55 % |
Net investment income (loss) | 2.24 % | (0.16 )% | (0.40 )% | 0.18 % | 0.57 % |
Portfolio turnover rate | 267 % | 203 % | 247 % | 319 %(h) | 527 %(h) |
(a) | Per share net investment income (loss) has been calculated using the average shares outstanding during the period. |
(b) | Amount rounds to less than $0.01 per share. |
(c) | A contingent deferred sales charge for Class C shares is not reflected in total return calculations. |
(d) | Had certain expenses not been waived/reimbursed during the period, total returns would have been lower. |
(e) | The investment adviser agreed to waive its fees and/or reimburse a portion of the Fund’s expenses during the period. Without this waiver/reimbursement, expenses would have been higher. |
(f) | Effective July 1, 2021, the expense limit decreased from 1.50% to 1.45%. |
(g) | Effective July 1, 2020, the expense limit decreased from 1.55% to 1.50%. |
(h) | The variation in the Fund’s turnover rate from 2019 to 2020 is due to changes in volume of U.S. Treasury securities related to certain trading strategies. |
Limited Term Government and Agency Fund—Class N | |||||
Year Ended September 30, 2023 | Year Ended September 30, 2022 | Year Ended September 30, 2021 | Year Ended September 30, 2020 | Year Ended September 30, 2019 | |
Net asset value, beginning of the period | $10.68 | $11.43 | $11.57 | $11.37 | $11.12 |
INCOME (LOSS) FROM INVESTMENT OPERATIONS: | |||||
Net investment income(a) | 0.37 | 0.11 | 0.08 | 0.14 | 0.19 |
Net realized and unrealized gain (loss) | (0.06 ) | (0.73 ) | (0.11 ) | 0.26 | 0.33 |
Total from Investment Operations | 0.31 | (0.62 ) | (0.03 ) | 0.40 | 0.52 |
LESS DISTRIBUTIONS FROM: | |||||
Net investment income | (0.39 ) | (0.13 ) | (0.11 ) | (0.20 ) | (0.27 ) |
Net asset value, end of the period | $10.60 | $10.68 | $11.43 | $11.57 | $11.37 |
Total return(b) | 2.94 % | (5.45 )% | (0.25 )% | 3.53 % | 4.77 % |
RATIOS TO AVERAGE NET ASSETS: | |||||
Net assets, end of the period (000's) | $45,716 | $19,656 | $12,972 | $11,035 | $5,272 |
Net expenses(c) | 0.40 % | 0.39 % | 0.40 %(d) | 0.45 %(e) | 0.46 % |
Gross expenses | 0.43 % | 0.40 % | 0.41 % | 0.46 % | 0.48 % |
Net investment income | 3.44 % | 1.03 % | 0.68 % | 1.20 % | 1.65 % |
Portfolio turnover rate | 267 % | 203 % | 247 % | 319 %(f) | 527 %(f) |
(a) | Per share net investment income has been calculated using the average shares outstanding during the period. |
(b) | Had certain expenses not been waived/reimbursed during the period, total returns would have been lower. |
(c) | The investment adviser agreed to waive its fees and/or reimburse a portion of the Fund’s expenses during the period. Without this waiver/reimbursement, expenses would have been higher. |
(d) | Effective July 1, 2021, the expense limit decreased from 0.45% to 0.40% |
(e) | Effective July 1, 2020, the expense limit decreased from 0.50% to 0.45%. |
(f) | The variation in the Fund’s turnover rate from 2019 to 2020 is due to changes in volume of U.S. Treasury securities related to certain trading strategies. |
Limited Term Government and Agency Fund—Class Y | |||||
Year Ended September 30, 2023 | Year Ended September 30, 2022 | Year Ended September 30, 2021 | Year Ended September 30, 2020 | Year Ended September 30, 2019 | |
Net asset value, beginning of the period | $10.69 | $11.43 | $11.57 | $11.38 | $11.13 |
INCOME (LOSS) FROM INVESTMENT OPERATIONS: | |||||
Net investment income(a) | 0.35 | 0.10 | 0.07 | 0.13 | 0.17 |
Net realized and unrealized gain (loss) | (0.05 ) | (0.72 ) | (0.11 ) | 0.25 | 0.34 |
Total from Investment Operations | 0.30 | (0.62 ) | (0.04 ) | 0.38 | 0.51 |
LESS DISTRIBUTIONS FROM: | |||||
Net investment income | (0.39 ) | (0.12 ) | (0.10 ) | (0.19 ) | (0.26 ) |
Net asset value, end of the period | $10.60 | $10.69 | $11.43 | $11.57 | $11.38 |
Total return | 2.79 %(b) | (5.42 )%(b) | (0.33 )%(b) | 3.35 % | 4.67 % |
RATIOS TO AVERAGE NET ASSETS: | |||||
Net assets, end of the period (000's) | $486,496 | $491,162 | $707,904 | $691,616 | $457,248 |
Net expenses | 0.45 %(c) | 0.45 %(c) | 0.48 %(c)(d) | 0.53 %(e) | 0.55 % |
Gross expenses | 0.53 % | 0.48 % | 0.49 % | 0.53 % | 0.55 % |
Net investment income | 3.30 % | 0.87 % | 0.61 % | 1.11 % | 1.55 % |
Portfolio turnover rate | 267 % | 203 % | 247 % | 319 %(f) | 527 %(f) |
(a) | Per share net investment income has been calculated using the average shares outstanding during the period. |
(b) | Had certain expenses not been waived/reimbursed during the period, total returns would have been lower. |
(c) | The investment adviser agreed to waive its fees and/or reimburse a portion of the Fund’s expenses during the period. Without this waiver/reimbursement, expenses would have been higher. |
(d) | Effective July 1, 2021, the expense limit decreased from 0.50% to 0.45%. |
(e) | Effective July 1, 2020, the expense limit decreased from 0.55% to 0.50%. |
(f) | The variation in the Fund’s turnover rate from 2019 to 2020 is due to changes in volume of U.S. Treasury securities related to certain trading strategies. |
Loomis Sayles Core Plus Bond Fund ("Core Plus Bond Fund")
Loomis Sayles Intermediate Duration Bond Fund (“Intermediate Duration Bond Fund”)
Loomis Sayles Credit Income Fund (“Credit Income Fund”)
Loomis Sayles Global Allocation Fund (“Global Allocation Fund”)
Loomis Sayles Growth Fund (“Growth Fund”)
Loomis Sayles Limited Term Government and Agency Fund (“Limited Term Government and Agency Fund”)
and Liabilities and are recorded as a realized gain when received.
2023 Distributions | 2022 Distributions | |||||
Fund | Ordinary Income | Long-Term Capital Gains | Total | Ordinary Income | Long-Term Capital Gains | Total |
Core Plus Bond Fund | $237,600,988 | $— | $237,600,988 | $203,923,706 | $17,404,702 | $221,328,408 |
Credit Income Fund | 978,537 | 38,241 | 1,016,778 | 778,535 | 45,086 | 823,621 |
Global Allocation Fund | — | 265,227,594 | 265,227,594 | 17,835,692 | 349,351,833 | 367,187,525 |
Growth Fund | 1,801,992 | 1,212,480,441 | 1,214,282,433 | 38,655,122 | 627,018,288 | 665,673,410 |
Intermediate Duration Bond Fund | 11,021,583 | — | 11,021,583 | 6,692,992 | 1,181,959 | 7,874,951 |
Limited Term Government and Agency Fund | 25,072,525 | — | 25,072,525 | 9,340,395 | — | 9,340,395 |
Core Plus Bond Fund | Credit Income Fund | Global Allocation Fund | Growth Fund | |
Undistributed ordinary income | $7,202,880 | $14,688 | $— | $— |
Undistributed long-term capital gains | — | — | 97,933,959 | 693,384,213 |
Total undistributed earnings | 7,202,880 | 14,688 | 97,933,959 | 693,384,213 |
Capital loss carryforward: | ||||
Short-term: | ||||
No expiration date | (263,274,882 ) | (20,684 ) | — | — |
Long-term: | ||||
No expiration date | (335,593,277 ) | (70,466 ) | — | — |
Total capital loss carryforward | (598,868,159 ) | (91,150 ) | — | — |
Late-year ordinary and post-October capital loss deferrals* | — | (1,025,802 ) | (2,253,183 ) | (15,598,809 ) |
Unrealized appreciation (depreciation) | (858,725,184 ) | (3,314,663 ) | 54,804,640 | 4,405,226,200 |
Total accumulated earnings (losses) | $(1,450,390,463 ) | $(4,416,927 ) | $150,485,416 | $5,083,011,604 |
* | Under current tax law, net operating losses, capital losses, foreign currency losses, and losses on passive foreign investment companies and contingent payment debt instruments after October 31 or December 31, as applicable, may be deferred and treated as occurring on the first day of the following taxable year. Credit Income Fund is deferring capital losses, Global Allocation Fund is deferring currency losses and Growth Fund is deferring net operating losses. |
Intermediate Duration Bond Fund | Limited Term Government and Agency Fund | |
Undistributed ordinary income | $122,127 | $754,515 |
Capital loss carryforward: | ||
Short-term: | ||
No expiration date | (19,689,910 ) | (10,097,977 ) |
Long-term: | ||
No expiration date | (12,535,488 ) | (56,235,014 ) |
Total capital loss carryforward | (32,225,398 ) | (66,332,991 ) |
Unrealized depreciation | (14,604,393 ) | (29,126,622 ) |
Total accumulated losses | $(46,707,664 ) | $(94,705,098 ) |
Core Plus Bond Fund | Credit Income Fund | Global Allocation Fund | Growth Fund | Intermediate Duration Bond Fund | Limited Term Government and Agency Fund | |
Federal tax cost | $7,816,736,683 | $23,243,490 | $2,643,753,710 | $6,391,855,959 | $360,091,207 | $849,490,036 |
Gross tax appreciation | $9,909,927 | $47,024 | $231,527,573 | $4,915,574,428 | $49,271 | $632,109 |
Gross tax depreciation | (868,568,306 ) | (3,361,687 ) | (176,457,646 ) | (510,167,335 ) | (14,653,664 ) | (29,758,731 ) |
Net tax appreciation (depreciation) | $(858,658,379 ) | $(3,314,663 ) | $55,069,927 | $4,405,407,093 | $(14,604,393 ) | $(29,126,622 ) |
Core Plus Bond Fund | ||||
Asset Valuation Inputs | ||||
Description | Level 1 | Level 2 | Level 3 | Total |
Bonds and Notes | ||||
Non-Convertible Bonds | ||||
Collateralized Mortgage Obligations | $— | $38,612,433 | $96,178 | $38,708,611 |
All Other Non-Convertible Bonds(a) | — | 6,119,597,065 | — | 6,119,597,065 |
Total Non-Convertible Bonds | — | 6,158,209,498 | 96,178 | 6,158,305,676 |
Municipals(a) | — | 7,354,441 | — | 7,354,441 |
Total Bonds and Notes | — | 6,165,563,939 | 96,178 | 6,165,660,117 |
Collateralized Loan Obligations | — | 204,715,556 | — | 204,715,556 |
Short-Term Investments | — | 587,702,631 | — | 587,702,631 |
Total Investments | $— | $6,957,982,126 | $96,178 | $6,958,078,304 |
Core Plus Bond Fund | ||||
Liability Valuation Inputs | ||||
Description | Level 1 | Level 2 | Level 3 | Total |
Futures Contracts (unrealized depreciation) | $(25,102,218 ) | $— | $— | $(25,102,218 ) |
(a) | Details of the major categories of the Fund’s investments are reflected within the Portfolio of Investments. |
Credit Income Fund | ||||
Asset Valuation Inputs | ||||
Description | Level 1 | Level 2 | Level 3 | Total |
Bonds and Notes(a) | $— | $17,852,354 | $— | $17,852,354 |
Collateralized Loan Obligations | — | 718,892 | — | 718,892 |
Preferred Stocks(a) | 182,342 | — | — | 182,342 |
Short-Term Investments | — | 1,175,239 | — | 1,175,239 |
Total Investments | 182,342 | 19,746,485 | — | 19,928,827 |
Futures Contracts (unrealized appreciation) | 75,373 | — | — | 75,373 |
Total | $257,715 | $19,746,485 | $— | $20,004,200 |
Liability Valuation Inputs | ||||
Description | Level 1 | Level 2 | Level 3 | Total |
Futures Contracts (unrealized depreciation) | $(208,887 ) | $— | $— | $(208,887 ) |
(a) | Details of the major categories of the Fund’s investments are reflected within the Portfolio of Investments. |
Global Allocation Fund | ||||
Asset Valuation Inputs | ||||
Description | Level 1 | Level 2 | Level 3 | Total |
Common Stocks | ||||
France | $— | $78,881,911 | $— | $78,881,911 |
Japan | — | 46,903,634 | — | 46,903,634 |
Netherlands | — | 66,498,724 | — | 66,498,724 |
Sweden | — | 64,357,728 | — | 64,357,728 |
Taiwan | — | 43,537,642 | — | 43,537,642 |
United Kingdom | — | 41,849,593 | — | 41,849,593 |
United States | 1,462,067,120 | 13,631,600 | — | 1,475,698,720 |
Total Common Stocks | 1,462,067,120 | 355,660,832 | — | 1,817,727,952 |
Bonds and Notes(a) | — | 827,027,168 | — | 827,027,168 |
Senior Loans(a) | — | 6,407,821 | — | 6,407,821 |
Preferred Stocks(a) | 1,106,914 | — | — | 1,106,914 |
Short-Term Investments | — | 46,311,102 | — | 46,311,102 |
Total Investments | 1,463,174,034 | 1,235,406,923 | — | 2,698,580,957 |
Forward Foreign Currency Contracts (unrealized appreciation) | — | 761,221 | — | 761,221 |
Futures Contracts (unrealized appreciation) | 2,595,024 | — | — | 2,595,024 |
Total | $1,465,769,058 | $1,236,168,144 | $— | $2,701,937,202 |
Liability Valuation Inputs | ||||
Description | Level 1 | Level 2 | Level 3 | Total |
Forward Foreign Currency Contracts (unrealized depreciation) | $— | $(2,347,238 ) | $— | $(2,347,238 ) |
Futures Contracts (unrealized depreciation) | (5,698,578 ) | — | — | (5,698,578 ) |
Total | $(5,698,578 ) | $(2,347,238 ) | $— | $(8,045,816 ) |
(a) | Details of the major categories of the Fund’s investments are reflected within the Portfolio of Investments. |
Growth Fund | ||||
Asset Valuation Inputs | ||||
Description | Level 1 | Level 2 | Level 3 | Total |
Common Stocks(a) | $10,598,514,849 | $— | $— | $10,598,514,849 |
Short-Term Investments | — | 198,748,203 | — | 198,748,203 |
Total Investments | $10,598,514,849 | $198,748,203 | $— | $10,797,263,052 |
(a) | Details of the major categories of the Fund’s investments are reflected within the Portfolio of Investments. |
Intermediate Duration Bond Fund | ||||
Asset Valuation Inputs | ||||
Description | Level 1 | Level 2 | Level 3 | Total |
Bonds and Notes | ||||
Collateralized Mortgage Obligations | $— | $2,227,288 | $166 | $2,227,454 |
All Other Bonds and Notes(a) | — | 334,832,346 | — | 334,832,346 |
Total Bonds and Notes | — | 337,059,634 | 166 | 337,059,800 |
Short-Term Investments | — | 8,427,014 | — | 8,427,014 |
Total Investments | $— | $345,486,648 | $166 | $345,486,814 |
Liability Valuation Inputs | ||||
Description | Level 1 | Level 2 | Level 3 | Total |
Futures Contracts (unrealized depreciation) | $(495,585 ) | $— | $— | $(495,585 ) |
(a) | Details of the major categories of the Fund’s investments are reflected within the Portfolio of Investments. |
Limited Term Government and Agency Fund | ||||
Asset Valuation Inputs | ||||
Description | Level 1 | Level 2 | Level 3 | Total |
Bonds and Notes | ||||
Collateralized Mortgage Obligations | $— | $74,499,250 | $5,429,401 | $79,928,651 |
All Other Bonds and Notes(a) | — | 636,175,493 | — | 636,175,493 |
Total Bonds and Notes | — | 710,674,743 | 5,429,401 | 716,104,144 |
Short-Term Investments | — | 104,259,270 | — | 104,259,270 |
Total Investments | $— | $814,934,013 | $5,429,401 | $820,363,414 |
(a) | Details of the major categories of the Fund’s investments are reflected within the Portfolio of Investments. |
Core Plus Bond Fund | ||||||||||
Asset Valuation Inputs | ||||||||||
Investments in Securities | Balance as of September 30, 2022 | Accrued Discounts (Premiums) | Realized Gain (Loss) | Change in Unrealized Appreciation (Depreciation) | Purchases | Sales | Transfers into Level 3 | Transfers out of Level 3 | Balance as of September 30, 2023 | Change in Unrealized Appreciation (Depreciation) from Investments Still Held at September 30, 2023 |
Bonds and Notes | ||||||||||
Non-Convertible Bonds | ||||||||||
Collateralized Mortgage Obligations | $122,859 | $— | $89 | $(709 ) | $2,396 | $(28,457 ) | $— | $— | $96,178 | $(2,430 ) |
Intermediate Duration Bond Fund | ||||||||||
Asset Valuation Inputs | ||||||||||
Investments in Securities | Balance as of September 30, 2022 | Accrued Discounts (Premiums) | Realized Gain (Loss) | Change in Unrealized Appreciation (Depreciation) | Purchases | Sales | Transfers into Level 3 | Transfers out of Level 3 | Balance as of September 30, 2023 | Change in Unrealized Appreciation (Depreciation) from Investments Still Held at September 30, 2023 |
Bonds and Notes | ||||||||||
Collateralized Mortgage Obligations | $201 | $— | $— | $2 | $— | $(37 ) | $— | $— | $166 | $(2 ) |
Limited Term Government and Agency Fund | ||||||||||
Asset Valuation Inputs | ||||||||||
Investments in Securities | Balance as of September 30, 2022 | Accrued Discounts (Premiums) | Realized Gain (Loss) | Change in Unrealized Appreciation (Depreciation) | Purchases | Sales | Transfers into Level 3 | Transfers out of Level 3 | Balance as of September 30, 2023 | Change in Unrealized Appreciation (Depreciation) from Investments Still Held at September 30, 2023 |
Bonds and Notes | ||||||||||
Collateralized Mortgage Obligations | $3,867,800 | $— | $(37,910 ) | $(102,861 ) | $3,799 | $(1,636,657 ) | $3,335,230 | $— | $5,429,401 | $(153,030 ) |
Liabilities | Unrealized depreciation on futures contracts1 |
Exchange-traded liability derivatives | |
Interest rate contracts | $(25,102,218 ) |
1 | Represents cumulative unrealized appreciation (depreciation) on futures contracts. Only the current day’s variation margin on futures contracts is reported within the Statements of Assets and Liabilities as receivable or payable for variation margin, as applicable. |
Net Realized Gain (Loss) on: | Futures contracts |
Interest rate contracts | $(58,324,300 ) |
Net Change in Unrealized Appreciation (Depreciation) on: | Futures contracts |
Interest rate contracts | $(10,538,977 ) |
Assets | Unrealized appreciation on futures contracts1 |
Exchange-traded asset derivatives | |
Interest rate contracts | $75,373 |
Liabilities | Unrealized depreciation on futures contracts1 |
Exchange-traded liability derivatives | |
Interest rate contracts | $(208,887 ) |
1 | Represents cumulative unrealized appreciation (depreciation) on futures contracts. Only the current day’s variation margin on futures contracts is reported within the Statements of Assets and Liabilities as receivable or payable for variation margin, as applicable. |
Net Realized Gain (Loss) on: | Futures contracts |
Interest rate contracts | $(357,294 ) |
Net Change in Unrealized Appreciation (Depreciation) on: | Futures contracts |
Interest rate contracts | $(111,864 ) |
Assets | Unrealized appreciation on forward foreign currency contracts | Unrealized appreciation on futures contracts1 | Total |
Over-the-counter asset derivatives | |||
Foreign exchange contracts | $761,221 | $— | $761,221 |
Exchange-traded asset derivatives | |||
Interest rate contracts | — | 2,595,024 | 2,595,024 |
Total asset derivatives | $761,221 | $2,595,024 | $3,356,245 |
Liabilities | Unrealized depreciation on forward foreign currency contracts | Unrealized depreciation on futures contracts1 | Total |
Over-the-counter liability derivatives | |||
Foreign exchange contracts | $(2,347,238 ) | $— | $(2,347,238 ) |
Exchange-traded liability derivatives | |||
Interest rate contracts | — | (5,698,578 ) | (5,698,578 ) |
Total liability derivatives | $(2,347,238 ) | $(5,698,578 ) | $(8,045,816 ) |
1 | Represents cumulative unrealized appreciation (depreciation) on futures contracts. Only the current day’s variation margin on futures contracts is reported within the Statements of Assets and Liabilities as receivable or payable for variation margin, as applicable. |
Net Realized Gain (Loss) on: | Forward foreign currency contracts | Futures contracts |
Interest rate contracts | $— | $(9,602,991 ) |
Foreign exchange contracts | (5,164,099 ) | — |
Total | $(5,164,099 ) | $(9,602,991 ) |
Net Change in Unrealized Appreciation (Depreciation) on: | Forward foreign currency contracts | Futures contracts |
Interest rate contracts | $— | $(870,412 ) |
Foreign exchange contracts | 1,802,223 | — |
Total | $1,802,223 | $(870,412 ) |
Liabilities | Unrealized depreciation on futures contracts1 |
Exchange-traded liability derivatives | |
Interest rate contracts | $(495,585 ) |
1 | Represents cumulative unrealized appreciation (depreciation) on futures contracts. Only the current day’s variation margin on futures contracts is reported within the Statements of Assets and Liabilities as receivable or payable for variation margin, as applicable. |
Net Realized Gain (Loss) on: | Futures contracts |
Interest rate contracts | $(2,159,161 ) |
Net Change in Unrealized Appreciation (Depreciation) on: | Futures contracts |
Interest rate contracts | $776,181 |
Core Plus Bond Fund | Futures |
Average Notional Amount Outstanding | 16.73 % |
Highest Notional Amount Outstanding | 19.91 % |
Lowest Notional Amount Outstanding | 10.48 % |
Notional Amount Outstanding as of September 30, 2023 | 19.91 % |
Credit Income Fund | Futures |
Average Notional Amount Outstanding | 26.55 % |
Highest Notional Amount Outstanding | 48.08 % |
Lowest Notional Amount Outstanding | 6.19 % |
Notional Amount Outstanding as of September 30, 2023 | 48.08 % |
Global Allocation Fund | Forwards | Futures |
Average Notional Amount Outstanding | 9.27 % | 3.91 % |
Highest Notional Amount Outstanding | 11.24 % | 9.15 % |
Lowest Notional Amount Outstanding | 8.49 % | 1.12 % |
Notional Amount Outstanding as of September 30, 2023 | 8.49 % | 9.15 % |
Intermediate Duration Bond Fund | Futures |
Average Notional Amount Outstanding | 11.25 % |
Highest Notional Amount Outstanding | 14.41 % |
Lowest Notional Amount Outstanding | 6.24 % |
Notional Amount Outstanding as of September 30, 2023 | 6.24 % |
Global Allocation Fund | |||||
Counterparty | Gross Amounts of Assets | Offset Amount | Net Asset Balance | Collateral (Received)/ Pledged | Net Amount |
Bank of America N.A. | $457,764 | $(457,764 ) | $— | $— | $— |
HSBC Bank USA N.A. | 60,776 | — | 60,776 | — | 60,776 |
UBS AG | 242,681 | — | 242,681 | (242,681 ) | — |
$761,221 | $(457,764 ) | $303,457 | $(242,681 ) | $60,776 | |
Counterparty | Gross Amounts of Liabilities | Offset Amount | Net Liability Balance | Collateral (Received)/ Pledged | Net Amount |
Bank of America N.A. | $(1,107,393 ) | $457,764 | $(649,629 ) | $330,000 | $(319,629 ) |
Morgan Stanley Capital Services LLC | (1,239,845 ) | — | (1,239,845 ) | 1,239,845 | — |
$(2,347,238 ) | $457,764 | $(1,889,474 ) | $1,569,845 | $(319,629 ) | |
U.S. Government/ Agency Securities | Other Securities | |||
Fund | Purchases | Sales | Purchases | Sales |
Core Plus Bond Fund | $10,284,781,812 | $9,070,388,670 | $725,556,672 | $1,057,753,295 |
Credit Income Fund | 1,017,928 | 3,435,513 | 4,256,560 | 3,302,163 |
Global Allocation Fund | 42,848,052 | 79,001,064 | 476,360,183 | 1,204,420,255 |
Growth Fund | — | — | 1,276,700,934 | 3,426,339,474 |
Intermediate Duration Bond Fund | 167,447,071 | 99,547,610 | 308,445,215 | 324,145,732 |
Limited Term Government and Agency Fund | 1,814,831,909 | 1,816,891,501 | 4,283,021 | 18,967,495 |
Percentage of Average Daily Net Assets | ||||||
Fund | First $100 million | Next $400 million | Next $500 million | Next $1 billion | Next $2 billion | Over $4 billion |
Core Plus Bond Fund | 0.2000 % | 0.1875 % | 0.1875 % | 0.1875 % | 0.1500 % | 0.1500 % |
Credit Income Fund | 0.4200 % | 0.4200 % | 0.4200 % | 0.4200 % | 0.4200 % | 0.4200 % |
Global Allocation Fund | 0.7500 % | 0.7500 % | 0.7500 % | 0.7500 % | 0.7300 % | 0.7000 % |
Growth Fund | 0.5000 % | 0.5000 % | 0.5000 % | 0.5000 % | 0.5000 % | 0.5000 % |
Intermediate Duration Bond Fund | 0.2500 % | 0.2500 % | 0.2500 % | 0.2500 % | 0.2500 % | 0.2500 % |
Limited Term Government and Agency Fund | 0.3250 % | 0.3250 % | 0.3000 % | 0.2500 % | 0.2500 % | 0.2500 % |
Percentage of Average Daily Net Assets | |||
Fund | First $100 million | Next $1.9 billion | Over $2 billion |
Core Plus Bond Fund | 0.2000 % | 0.1875 % | 0.1500 % |
Expense Limit as a Percentage of Average Daily Net Assets | ||||
Fund | Class A | Class C | Class N | Class Y |
Core Plus Bond Fund | 0.74 % | 1.49 % | 0.44 % | 0.49 % |
Credit Income Fund | 0.82 % | 1.57 % | 0.52 % | 0.57 % |
Global Allocation Fund | 1.20 % | 1.95 % | 0.90 % | 0.95 % |
Growth Fund | 1.00 % | 1.75 % | 0.70 % | 0.75 % |
Intermediate Duration Bond Fund | 0.65 % | 1.40 % | 0.35 % | 0.40 % |
Limited Term Government and Agency Fund | 0.70 % | 1.45 % | 0.40 % | 0.45 % |
Expense Limit as a Percentage of Average Daily Net Assets | ||||
Fund | Class A | Class C | Class N | Class Y |
Global Allocation Fund | 1.25 % | 2.00 % | 0.95 % | 1.00 % |
Growth Fund | 1.25 % | 2.00 % | 0.95 % | 1.00 % |
Gross Management Fees | Contractual Waivers of Management Fees1 | Net Management Fees | Percentage of Average Daily Net Assets | ||
Fund | Gross | Net | |||
Core Plus Bond Fund | $10,359,921 | $— | $10,359,921 | 0.16 % | 0.16 % |
Credit Income Fund | 88,151 | 88,151 | — | 0.42 % | — % |
Global Allocation Fund | 21,232,335 | — | 21,232,335 | 0.74 % | 0.74 % |
Growth Fund | 50,343,793 | — | 50,343,793 | 0.50 % | 0.50 % |
Intermediate Duration Bond Fund | 782,053 | 183,745 | 598,308 | 0.25 % | 0.19 % |
Limited Term Government and Agency Fund | 2,268,277 | 531,412 | 1,736,865 | 0.32 % | 0.24 % |
1 | Waiver/expense reimbursements are subject to possible recovery until September 30, 2024. |
Reimbursement | |||||
Class A | Class C | Class N | Class Y | Total | |
Core Plus Bond Fund | $42,682 | $3,993 | $— | $409,673 | $456,348 |
Service Fees | Distribution Fees | |||
Fund | Class A | Class C | Class C | |
Core Plus Bond Fund | $1,029,454 | $94,624 | $283,872 | |
Credit Income Fund | 630 | 2 | 7 | |
Global Allocation Fund | 1,235,685 | 721,314 | 2,163,942 | |
Growth Fund | 1,777,495 | 174,416 | 523,248 | |
Intermediate Duration Bond Fund | 36,874 | 1,515 | 4,545 | |
Limited Term Government and Agency Fund | 547,175 | 27,108 | 81,322 | |
Fund | Administrative Fees |
Core Plus Bond Fund | $2,965,046 |
Credit Income Fund | 9,729 |
Global Allocation Fund | 1,322,590 |
Growth Fund | 4,665,811 |
Intermediate Duration Bond Fund | 144,972 |
Limited Term Government and Agency Fund | 331,097 |
Fund | Sub-Transfer Agent Fees |
Core Plus Bond Fund | $4,356,906 |
Credit Income Fund | 110 |
Global Allocation Fund | 2,306,633 |
Growth Fund | 7,923,001 |
Intermediate Duration Bond Fund | 214,198 |
Limited Term Government and Agency Fund | 410,733 |
Fund | Reimbursements of Sub-Transfer Agent Fees |
Core Plus Bond Fund | $56,297 |
Global Allocation Fund | 45,934 |
Growth Fund | 73,702 |
Intermediate Duration Bond Fund | 6,597 |
Limited Term Government and Agency Fund | 11,829 |
Fund | Commissions |
Core Plus Bond Fund | $8,413 |
Global Allocation Fund | 25,694 |
Growth Fund | 76,830 |
Limited Term Government and Agency Fund | 43,786 |
Percentage of Net Assets | |
Core Plus Bond Fund | |
Loomis Sayles Employees’ Profit Sharing Retirement Plan | 0.17 % |
Credit Income Fund | |
Natixis and Affiliates | 99.00 % |
Loomis Sayles Employees | 0.05 % |
99.05 % | |
Global Allocation Fund | |
Loomis Sayles Employees’ Profit Sharing Retirement Plan | 0.75 % |
Growth Fund | |
Loomis Sayles Employees’ Profit Sharing Retirement Plan | 0.81 % |
Loomis Sayles Funded Pension Plan and Trust | 0.14 % |
0.95 % | |
Intermediate Duration Bond Fund | |
Loomis Sayles Employees’ Profit Sharing Retirement Plan | 0.84 % |
Limited Term Government and Agency Fund | |
Loomis Sayles Employees’ Profit Sharing Retirement Plan | 0.24 % |
Loomis Sayles Distribution and Trust | 0.62 % |
Natixis Sustainable Future 2015 Fund | 0.09 % |
Natixis Sustainable Future 2020 Fund | 0.06 % |
Natixis Sustainable Future 2025 Fund | 0.10 % |
Natixis Sustainable Future 2030 Fund | 0.13 % |
Natixis Sustainable Future 2035 Fund | 0.11 % |
Natixis Sustainable Future 2040 Fund | 0.07 % |
Natixis Sustainable Future 2045 Fund | 0.04 % |
1.46 % |
Reimbursement of Transfer Agency Expenses | |
Fund | Class N |
Credit Income Fund | $1,063 |
Intermediate Duration Bond Fund | 1,113 |
Limited Term Government and Agency Fund | 1,588 |
Transfer Agent Fees and Expenses | ||||
Fund | Class A | Class C | Class N | Class Y |
Core Plus Bond Fund | $431,826 | $39,761 | $11,858 | $4,144,891 |
Credit Income Fund | 3,008 | 11 | 1,063 | 291 |
Global Allocation Fund | 455,023 | 266,198 | 3,824 | 1,662,969 |
Growth Fund | 683,495 | 67,388 | 4,734 | 8,253,291 |
Intermediate Duration Bond Fund | 11,241 | 467 | 1,113 | 209,573 |
Limited Term Government and Agency Fund | 226,978 | 10,966 | 1,588 | 445,525 |
Fund | Number of 5% Account Holders | Percentage of Ownership |
Core Plus Bond Fund | 1 | 5.39 % |
Growth Fund | 1 | 12.73 % |
Intermediate Duration Bond Fund | 5 | 68.79 % |
Limited Term Government and Agency Fund | 1 | 7.03 % |
Year Ended September 30, 2023 | Year Ended September 30, 2022 | |||
Core Plus Bond Fund | Shares | Amount | Shares | Amount |
Class A | ||||
Issued from the sale of shares | 11,357,305 | $130,223,433 | 10,474,485 | $132,986,632 |
Issued in connection with the reinvestment of distributions | 869,581 | 9,938,436 | 938,411 | 11,828,548 |
Redeemed | (16,060,576 ) | (184,384,945 ) | (28,114,978 ) | (356,886,979 ) |
Net change | (3,833,690 ) | $(44,223,076 ) | (16,702,082 ) | $(212,071,799 ) |
Class C | ||||
Issued from the sale of shares | 357,507 | $4,114,433 | 423,129 | $5,278,465 |
Issued in connection with the reinvestment of distributions | 76,079 | 870,566 | 100,207 | 1,261,196 |
Redeemed | (1,998,166 ) | (22,822,620 ) | (3,221,131 ) | (40,470,551 ) |
Net change | (1,564,580 ) | $(17,837,621 ) | (2,697,795 ) | $(33,930,890 ) |
Class N | ||||
Issued from the sale of shares | 66,972,306 | $777,684,789 | 38,179,814 | $490,210,689 |
Issued in connection with the reinvestment of distributions | 6,158,589 | 71,024,752 | 5,162,553 | 65,205,642 |
Redeemed | (57,778,078 ) | (669,470,666 ) | (62,977,876 ) | (811,978,447 ) |
Net change | 15,352,817 | $179,238,875 | (19,635,509 ) | $(256,562,116 ) |
Class Y | ||||
Issued from the sale of shares | 175,407,125 | $2,034,481,891 | 102,729,590 | $1,306,190,967 |
Issued in connection with the reinvestment of distributions | 10,358,184 | 119,421,605 | 8,612,778 | 108,982,625 |
Redeemed | (110,384,583 ) | (1,272,938,219 ) | (194,725,398 ) | (2,468,017,072 ) |
Net change | 75,380,726 | $880,965,277 | (83,383,030 ) | $(1,052,843,480 ) |
Increase (decrease) from capital share transactions | 85,335,273 | $998,143,455 | (122,418,416 ) | $(1,555,408,285 ) |
Year Ended September 30, 2023 | Year Ended September 30, 2022 | |||
Credit Income Fund | Shares | Amount | Shares | Amount |
Class A | ||||
Issued from the sale of shares | 13,459 | $116,360 | 11,798 | $103,473 |
Issued in connection with the reinvestment of distributions | 1,299 | 11,032 | 389 | 3,571 |
Redeemed | (11,853 ) | (98,382 ) | — | — |
Net change | 2,905 | $29,010 | 12,187 | $107,044 |
Class C | ||||
Issued in connection with the reinvestment of distributions | 4 | $34 | 3 | $25 |
Net change | 4 | $34 | 3 | $25 |
Class Y | ||||
Issued from the sale of shares | 300 | $2,480 | 5,804 | $57,920 |
Issued in connection with the reinvestment of distributions | 133 | 1,127 | 202 | 1,898 |
Redeemed | (3,680 ) | (31,358 ) | (2,572 ) | (24,000 ) |
Net change | (3,247 ) | $(27,751 ) | 3,434 | $35,818 |
Increase (decrease) from capital share transactions | (338 ) | $1,293 | 15,624 | $142,887 |
Year Ended September 30, 2023 | Year Ended September 30, 2022 | |||
Global Allocation Fund | Shares | Amount | Shares | Amount |
Class A | ||||
Issued from the sale of shares | 3,389,851 | $71,361,898 | 4,486,306 | $116,023,013 |
Issued in connection with the reinvestment of distributions | 1,584,011 | 31,205,007 | 1,295,399 | 36,335,959 |
Redeemed | (7,011,580 ) | (149,010,976 ) | (7,156,453 ) | (177,508,478 ) |
Net change | (2,037,718 ) | $(46,444,071 ) | (1,374,748 ) | $(25,149,506 ) |
Class C | ||||
Issued from the sale of shares | 777,798 | $15,680,854 | 1,599,502 | $41,324,930 |
Issued in connection with the reinvestment of distributions | 1,249,698 | 23,769,266 | 1,119,198 | 30,632,442 |
Redeemed | (5,208,741 ) | (106,549,675 ) | (4,879,499 ) | (116,412,070 ) |
Net change | (3,181,245 ) | $(67,099,555 ) | (2,160,799 ) | $(44,454,698 ) |
Class N | ||||
Issued from the sale of shares | 1,581,514 | $33,910,780 | 1,767,033 | $46,769,376 |
Issued in connection with the reinvestment of distributions | 960,857 | 19,169,099 | 769,270 | 21,747,266 |
Redeemed | (2,419,236 ) | (52,220,251 ) | (2,468,746 ) | (61,003,997 ) |
Net change | 123,135 | $859,628 | 67,557 | $7,512,645 |
Class Y | ||||
Issued from the sale of shares | 11,651,567 | $249,069,549 | 17,815,028 | $464,667,649 |
Issued in connection with the reinvestment of distributions | 6,812,550 | 135,842,251 | 7,072,360 | 200,006,364 |
Redeemed | (36,342,744 ) | (779,023,281 ) | (41,896,295 ) | (1,013,036,852 ) |
Net change | (17,878,627 ) | $(394,111,481 ) | (17,008,907 ) | $(348,362,839 ) |
Decrease from capital share transactions | (22,974,455 ) | $(506,795,479 ) | (20,476,897 ) | $(410,454,398 ) |
Year Ended September 30, 2023 | Year Ended September 30, 2022 | |||
Growth Fund | Shares | Amount | Shares | Amount |
Class A | ||||
Issued from the sale of shares | 25,307,103 | $429,030,222 | 39,717,368 | $783,108,012 |
Issued in connection with the reinvestment of distributions | 3,080,126 | 45,431,858 | 2,690,613 | 64,816,875 |
Redeemed | (58,359,545 ) | (987,390,432 ) | (44,619,514 ) | (895,385,409 ) |
Net change | (29,972,316 ) | $(512,928,352 ) | (2,211,533 ) | $(47,460,522 ) |
Class C | ||||
Issued from the sale of shares | 1,427,876 | $22,531,190 | 482,265 | $9,254,099 |
Issued in connection with the reinvestment of distributions | 596,956 | 7,503,741 | 212,100 | 4,507,128 |
Redeemed | (1,891,889 ) | (28,339,214 ) | (2,108,692 ) | (39,692,654 ) |
Net change | 132,943 | $1,695,717 | (1,414,327 ) | $(25,931,427 ) |
Class N | ||||
Issued from the sale of shares | 9,723,730 | $196,959,490 | 16,076,988 | $384,004,405 |
Issued in connection with the reinvestment of distributions | 3,273,160 | 53,254,325 | 974,540 | 25,445,235 |
Redeemed | (16,922,957 ) | (345,813,738 ) | (11,291,066 ) | (249,812,188 ) |
Net change | (3,926,067 ) | $(95,599,923 ) | 5,760,462 | $159,637,452 |
Class Y | ||||
Issued from the sale of shares | 145,614,231 | $2,904,813,412 | 106,157,081 | $2,382,270,036 |
Issued in connection with the reinvestment of distributions | 50,233,839 | 816,299,889 | 15,751,106 | 411,103,854 |
Redeemed | (185,161,203 ) | (3,717,011,614 ) | (127,856,705 ) | (2,914,738,824 ) |
Redeemed in-kind (Note 12) | (10,072,998 ) | (191,588,419 ) | — | — |
Net change | 613,869 | $(187,486,732 ) | (5,948,518 ) | $(121,364,934 ) |
Decrease from capital share transactions | (33,151,571 ) | $(794,319,290 ) | (3,813,916 ) | $(35,119,431 ) |
Year Ended September 30, 2023 | Year Ended September 30, 2022 | |||
Intermediate Duration Bond Fund | Shares | Amount | Shares | Amount |
Class A | ||||
Issued from the sale of shares | 162,767 | $1,527,536 | 620,754 | $6,337,904 |
Issued in connection with the reinvestment of distributions | 42,793 | 399,890 | 38,180 | 379,158 |
Redeemed | (1,383,949 ) | (12,973,971 ) | (679,509 ) | (6,739,182 ) |
Net change | (1,178,389 ) | $(11,046,545 ) | (20,575 ) | $(22,120 ) |
Class C | ||||
Issued from the sale of shares | 86,200 | $813,282 | 25,419 | $268,078 |
Issued in connection with the reinvestment of distributions | 1,755 | 16,435 | 318 | 3,209 |
Redeemed | (30,766 ) | (292,234 ) | (36,638 ) | (374,076 ) |
Net change | 57,189 | $537,483 | (10,901 ) | $(102,789 ) |
Class N | ||||
Issued from the sale of shares | 4,504,771 | $41,858,306 | 223,571 | $2,186,390 |
Issued in connection with the reinvestment of distributions | 99,571 | 924,081 | 46,222 | 457,509 |
Redeemed | (581,767 ) | (5,430,564 ) | (78,242 ) | (767,571 ) |
Net change | 4,022,575 | $37,351,823 | 191,551 | $1,876,328 |
Class Y | ||||
Issued from the sale of shares | 10,622,669 | $99,573,320 | 10,432,771 | $104,382,931 |
Issued in connection with the reinvestment of distributions | 1,030,869 | 9,604,346 | 701,722 | 6,984,487 |
Redeemed | (8,626,109 ) | (80,519,563 ) | (15,625,439 ) | (155,292,386 ) |
Net change | 3,027,429 | $28,658,103 | (4,490,946 ) | $(43,924,968 ) |
Increase (decrease) from capital share transactions | 5,928,804 | $55,500,864 | (4,330,871 ) | $(42,173,549 ) |
Year Ended September 30, 2023 | Year Ended September 30, 2022 | |||
Limited Term Government and Agency Fund | Shares | Amount | Shares | Amount |
Class A | ||||
Issued from the sale of shares | 2,652,652 | $28,284,400 | 3,443,653 | $38,051,151 |
Issued in connection with the reinvestment of distributions | 607,403 | 6,478,043 | 180,701 | 1,981,779 |
Redeemed | (6,626,486 ) | (70,703,766 ) | (5,686,327 ) | (62,870,713 ) |
Net change | (3,366,431 ) | $(35,941,323 ) | (2,061,973 ) | $(22,837,783 ) |
Class C | ||||
Issued from the sale of shares | 216,846 | $2,300,977 | 355,616 | $3,946,921 |
Issued in connection with the reinvestment of distributions | 22,066 | 234,758 | 3,777 | 41,142 |
Redeemed | (762,968 ) | (8,118,114 ) | (1,217,350 ) | (13,438,953 ) |
Net change | (524,056 ) | $(5,582,379 ) | (857,957 ) | $(9,450,890 ) |
Class N | ||||
Issued from the sale of shares | 3,011,128 | $32,301,122 | 1,015,581 | $11,197,256 |
Issued in connection with the reinvestment of distributions | 140,941 | 1,507,954 | 17,409 | 191,162 |
Redeemed | (679,452 ) | (7,286,871 ) | (327,674 ) | (3,626,861 ) |
Net change | 2,472,617 | $26,522,205 | 705,316 | $7,761,557 |
Class Y | ||||
Issued from the sale of shares | 27,925,195 | $299,329,524 | 29,040,597 | $322,624,285 |
Issued in connection with the reinvestment of distributions | 1,144,373 | 12,243,193 | 473,606 | 5,223,069 |
Redeemed | (29,148,521 ) | (311,660,863 ) | (45,475,068 ) | (503,368,228 ) |
Net change | (78,953 ) | $(88,146 ) | (15,960,865 ) | $(175,520,874 ) |
Decrease from capital share transactions | (1,496,823 ) | $(15,089,643 ) | (18,175,479 ) | $(200,047,990 ) |
Boston, Massachusetts
November 21, 2023
Funds listed below qualify for the dividends received deduction for corporate shareholders. These percentages are as follows:
Fund | Qualifying Percentage |
Credit Income Fund | 1.66 % |
Growth Fund | 100.00 % |
Credit Income Fund
Growth Fund
Fund | Amount |
Credit Income Fund | $38,241 |
Global Allocation Fund | 265,227,594 |
Growth Fund | 1,212,480,441 |
Name and Year of Birth | Position(s) Held with the Trusts, Length of Time Served and Term of Office1 | Principal Occupation(s) During Past 5 Years | Number of Portfolios in Fund Complex Overseen2and Other Directorships Held During Past 5 Years | Experience, Qualifications, Attributes, Skills for Board Membership |
Independent Trustees | ||||
Edmond J. English (1953) | Trustee since 2013 Contract Review Committee Member and Governance Committee Member | Executive Chairman of Bob’s Discount Furniture (retail) | 52 Director, Burlington Stores, Inc. (retail); Director, Rue Gilt Groupe, Inc. (e-commerce retail) | Significant experience on the Board and on the boards of other business organizations (including retail companies and a bank); executive experience (including at a retail company) |
Richard A. Goglia (1951) | Trustee since 2015 Audit Committee Member and Governance Committee Member | Retired | 52 Formerly, Director of Triumph Group (aerospace industry) | Significant experience on the Board and executive experience (including his role as Vice President and treasurer of a defense company and experience at a financial services company) |
Martin T. Meehan (1956) | Trustee since 2012 Chairperson of the Governance Committee and Contract Review Committee Member | President, University of Massachusetts | 52 None | Significant experience on the Board and on the boards of other business organizations; experience as President of the University of Massachusetts; government experience (including as a member of the U.S. House of Representatives); academic experience |
Maureen B. Mitchell (1951) | Trustee since 2017 Chairperson of the Contract Review Committee | Retired | 52 Director, Sterling Bancorp (bank) | Significant experience on the Board; financial services industry and executive experience (including role as President of global sales and marketing at a financial services company) |
Name and Year of Birth | Position(s) Held with the Trusts, Length of Time Served and Term of Office1 | Principal Occupation(s) During Past 5 Years | Number of Portfolios in Fund Complex Overseen2and Other Directorships Held During Past 5 Years | Experience, Qualifications, Attributes, Skills for Board Membership |
Independent Trustees − continued | ||||
James P. Palermo (1955) | Trustee since 2016 Audit Committee Member and Governance Committee Member | Founding Partner, Breton Capital Management, LLC (private equity); Partner, STEP Partners, LLC (private equity) | 52 Director, FutureFuel.io (chemicals and biofuels) | Significant experience on the Board; financial services industry and executive experience (including roles as Chief Executive Officer of client management and asset servicing for a banking and financial services company) |
Erik R. Sirri (1958) | Chairperson of the Board of Trustees since January 2021 Trustee since 2009 Ex Officio Member of the Audit Committee, Contract Review Committee and Governance Committee | Professor of Finance at Babson College | 52 None | Significant experience on the Board; experience as Director of the Division of Trading and Markets at the Securities and Exchange Commission; academic experience; training as an economist |
Peter J. Smail (1952) | Trustee since 2009 Contract Review Committee Member | Retired | 52 None | Significant experience on the Board; mutual fund industry and executive experience (including roles as President and Chief Executive Officer for an investment adviser) |
Name and Year of Birth | Position(s) Held with the Trusts, Length of Time Served and Term of Office1 | Principal Occupation(s) During Past 5 Years | Number of Portfolios in Fund Complex Overseen2and Other Directorships Held During Past 5 Years | Experience, Qualifications, Attributes, Skills for Board Membership |
Independent Trustees − continued | ||||
Kirk A. Sykes (1958) | Trustee since 2019 Audit Committee Member and Governance Committee Member | Managing Director of Accordia Partners, LLC (real estate development); President of Primary Corporation (real estate development); Managing Principal of Merrick Capital Partners (infrastructure finance) | 52 Advisor/Risk Management Committee, Eastern Bank (bank); Director, Apartment Investment and Management Company (real estate investment trust); formerly, Director, Ares Commercial Real Estate Corporation (real estate investment trust) | Experience on the Board and significant experience on the boards of other business organizations (including real estate companies and banks) |
Cynthia L. Walker (1956) | Trustee since 2005 Chairperson of the Audit Committee | Retired; formerly, Deputy Dean for Finance and Administration, Yale University School of Medicine | 52 None | Significant experience on the Board; executive experience in a variety of academic organizations (including roles as dean for finance and administration) |
Interested Trustees | ||||
Kevin P. Charleston3 (1965) One Financial Center Boston, MA 02111 | Trustee since 2015 President and Chief Executive Officer of Loomis Sayles Funds I since 2015 | President, Chief Executive Officer and Chairman of the Board of Directors, Loomis, Sayles & Company, L.P. | 52 None | Significant experience on the Board; continuing service as President, Chief Executive Officer and Chairman of the Board of Directors of Loomis, Sayles & Company, L.P. |
Name and Year of Birth | Position(s) Held with the Trusts, Length of Time Served and Term of Office1 | Principal Occupation(s) During Past 5 Years | Number of Portfolios in Fund Complex Overseen2and Other Directorships Held During Past 5 Years | Experience, Qualifications, Attributes, Skills for Board Membership |
Interested Trustees − continued | ||||
David L. Giunta4 (1965) | Trustee since 2011 President and Chief Executive Officer of Natixis Funds Trust I; President of Loomis Sayles Funds II and Executive Vice President of Loomis Sayles Funds I since 2008; Chief Executive Officer of Loomis Sayles Funds II since 2015 | President and Chief Executive Officer, Natixis Advisors, LLC and Natixis Distribution, LLC | 52 None | Significant experience on the Board; experience as President and Chief Executive Officer of Natixis Advisors, LLC and Natixis Distribution, LLC |
1 | Each Trustee serves until retirement, resignation or removal from the Board. The current retirement age is 75. The position of Chairperson of the Board is appointed for a three-year term. |
2 | The Trustees of the Trusts serve as Trustees of a fund complex that includes all series of the Natixis Funds Trust I, Natixis Funds Trust II, Natixis Funds Trust IV, Gateway Trust, Loomis Sayles Funds I, Loomis Sayles Funds II, Natixis ETF Trust and Natixis ETF Trust II (collectively, the “Fund Complex”). |
3 | Mr. Charleston is deemed an “interested person” of the Trusts because he holds the following positions with an affiliated person of the Trusts: President, Chief Executive Officer and Chairman of the Board of Directors of Loomis, Sayles & Company, L.P. |
4 | Mr. Giunta is deemed an “interested person” of the Trusts because he holds the following positions with an affiliated person of the Trusts: President and Chief Executive Officer, Natixis Advisors, LLC and Natixis Distribution, LLC. |
Name and Year of Birth | Position(s) Held with the Trusts | Term of Office1 and Length of Time Served | Principal Occupation(s) During Past 5 Years2 |
Officers of the Trusts | |||
Matthew J. Block (1981) | Treasurer, Principal Financial and Accounting Officer | Since 2022 | Senior Vice President, Natixis Advisors, LLC and Natixis Distribution, LLC; formerly, Vice President, Natixis Advisors, LLC and Natixis Distribution, LLC; Assistant Treasurer of the Fund Complex; Managing Director, State Street Bank and Trust Company |
Susan McWhan Tobin (1963) | Secretary and Chief Legal Officer | Since 2022 | Executive Vice President, General Counsel and Secretary, Natixis Advisors, LLC and Natixis Distribution, LLC; formerly, Executive Vice President and Chief Compliance Officer of Natixis Investment Managers (March 2019 – May 2022) and Senior Vice President and Head of Compliance, U.S. for Natixis Investment Managers (July 2011 – March 2019) |
Natalie R. Wagner (1979) | Chief Compliance Officer, Assistant Secretary and Anti-Money Laundering Officer | Since 2021 | Senior Vice President, Natixis Advisors, LLC and Natixis Distribution, LLC; formerly, Vice President, Head of Corporate Compliance, Global Atlantic Financial Group |
1 | Each officer of the Trusts serves for an indefinite term in accordance with the Trusts' current by-laws until the date his or her successor is elected and qualified, or until he or she sooner dies, retires, is removed or becomes disqualified. |
2 | Each person listed above, except as noted, holds the same position(s) with the Fund Complex. Previous positions during the past five years with Natixis Distribution, LLC, Natixis Advisors, LLC or Loomis, Sayles & Company, L.P. are omitted, if not materially different from an officer’s current position with such entity. |
Natixis Advisors, LLC
888 Boylston Street, Suite 800
Boston, MA 02199-8197

Exp. 11/30/24
6031448.1.1
LSIF58A-0923
(b) Not Applicable.
Item 2. Code of Ethics.
The Registrant has adopted a code of ethics that applies to the Registrant’s principal executive officer, principal financial officer and persons performing similar functions. There have been no amendments or waivers of the Registrant’s code of ethics during the period.
Item 3. Audit Committee Financial Expert.
The Board of Trustees of the Registrant has established an audit committee. Mr. Richard A. Goglia, Mr. James P. Palermo, Mr. Kirk A. Sykes and Ms. Cynthia L. Walker are members of the audit committee and have been designated as “audit committee financial experts” by the Board of Trustees. Each of these individuals is also an Independent Trustee of the Registrant.
Item 4. Principal Accountant Fees and Services.
Fees billed by the Principal Accountant for services rendered to the Registrant.
The table below sets forth fees billed by the principal accountant, PricewaterhouseCoopers LLP, for the past two fiscal years for professional services rendered in connection with a) the audit of the Registrant’s annual financial statements and services provided in connection with regulatory filings; b) audit-related services (including services that are reasonably related to the performance of the audit of the Registrant’s financial statements but not reported under “Audit Fees”); c) tax compliance, tax advice and tax planning and d) all other fees billed for professional services rendered by the principal accountant to the Registrant, other than the services reported as a part of (a) through (c) of this Item.
| Audit fees | Audit-related fees1 | Tax fees2 | All other fees | |||||||||||||||||||||||||||||
| 10/1/21- 9/30/22 | 10/1/22- 9/30/23 | 10/1/21- 9/30/22 | 10/1/22- 9/30/23 | 10/1/21- 9/30/22 | 10/1/22- 9/30/23 | 10/1/21- 9/30/22 | 10/1/22- 9/30/23 | |||||||||||||||||||||||||
Loomis Sayles Funds I – Loomis Sayles Fixed Income Fund, Loomis Sayles Global Bond Fund, Loomis Sayles High Income Opportunities Fund, Loomis Sayles Inflation Protected Securities Fund, Loomis Sayles Institutional High Income Fund, Loomis Sayles Intermediate Duration Bond Fund, Loomis Sayles Securitized Asset Fund and Loomis Sayles Small Cap Value Fund | $ | 363,921 | $ | 374,838 | $ | 823 | $ | 848 | $ | 69,189 | $ | 76,266 | $ | — | $ | — | ||||||||||||||||
| 1. | Audit-related fees consist of: |
2022 & 2023 - performance of agreed-upon procedures related to the Registrant’s deferred compensation plan.
| 2. | Tax fees consist of: |
2022 & 2023 – review of Registrant’s tax returns.
2023 – review of Registrant’s tax accounting policies related to resecuritization transactions.
Aggregate fees billed to the Registrant for non-audit services during 2022 and 2023 were $70,012 and $77,114, respectively.
Fees billed by the Principal Accountant for services rendered to the Adviser and Control Affiliates.
The following table sets forth the fees billed by the Registrant’s principal accountant for non-audit services rendered to Loomis, Sayles & Company, L.P. and entities controlling, controlled by or under common control with Loomis, Sayles & Company, L.P. (“Control Affiliates”) that provide ongoing services to the Registrant, for engagements that related directly to the operations and financial reporting of the Registrant for the last two fiscal years.
| Audit-related fees | Tax fees | All other fees | ||||||||||||||||||||||
| 10/1/21- 9/30/22 | 10/1/22- 9/30/23 | 10/1/21- 9/30/22 | 10/1/22- 9/30/23 | 10/1/21- 9/30/22 | 10/1/22- 9/30/23 | |||||||||||||||||||
Control Affiliates | $ | — | $ | — | $ | — | $ | — | $ | 50,000 | $ | — | ||||||||||||
The following table sets forth the aggregate fees billed by the Registrant’s principal accountant for non-audit services rendered to Loomis, Sayles & Company, L.P. and Control Affiliates that provide ongoing services to the Registrant, for the last two fiscal years, including the fees disclosed in the table above.
| Aggregate Non-Audit Fees | ||||||||
| 10/1/21-9/30/22 | 10/1/22-9/30/23 | |||||||
Control Affiliates | $ | 50,000 | $ | — | ||||
None of the services described above were approved pursuant to paragraph (c)(7)(i)(C) of Regulation S-X.
Audit Committee Pre Approval Policies.
Annually, the Registrant’s Audit Committee reviews the audit, audit-related, tax and other non-audit services together with the projected fees, for services proposed to be rendered to the Registrant and/or other entities for which pre-approval is required during the upcoming year. Any subsequent revisions to already pre-approved services or fees (including fee increases) and requests for pre-approval of new services would be presented for consideration quarterly as needed. If, in the opinion of management, a proposed engagement by the Registrant’s independent accountants needs to commence before the next regularly scheduled Audit Committee meeting, any member of the Audit Committee who is an Independent Trustee of the Registrant is authorized to pre-approve the engagement, but only for engagements to provide audit, audit related and tax services. This approval is subject to review by the full Audit Committee at its next quarterly meeting. All other engagements require the approval of all the members of the Audit Committee.
Item 5. Audit Committee of Listed Registrants.
Not applicable.
Item 6. Schedule of Investments.
Included as part of the Report to Shareholders filed as Item 1 herewith.
Item 7. Disclosure of Proxy Voting Policies and Procedures for Closed-End Management Investment Companies.
Not applicable.
Item 8. Portfolio Managers of Closed-End Management Investment Companies
Not applicable.
Item 9. Purchases of Equity Securities by Closed-End Management Investment Companies and Affiliated Purchasers.
Not applicable.
Item 10. Submission of Matters to a Vote of Securities Holders.
There were no material changes to the procedures by which shareholders may recommend nominees to the Registrant’s Board of Trustees.
Item 11. Controls and Procedures.
The Registrant’s principal executive officer and principal financial officer have concluded that the Registrant’s disclosure controls and procedures are sufficient to ensure that information required to be disclosed by the Registrant in this Form N-CSR was recorded, processed, summarized and reported within the time periods specified in the Securities and Exchange Commission’s rules and forms, based upon such officers’ evaluation of these controls and procedures as of a date within 90 days of the filing date of the report.
There were no changes in the Registrant’s internal control over financial reporting that occurred during the period covered by the report that have materially affected, or is reasonably likely to materially affect, the Registrant’s internal control over financial reporting.
Item 12. Disclosure of Securities Lending Activities for Closed-End Management Investment Companies.
Not applicable.
Item 13. Exhibits.
SIGNATURES
Pursuant to the requirements of the Securities Exchange Act of 1934 and the Investment Company Act of 1940, the Registrant has duly caused this report to be signed on its behalf by the undersigned, thereunto duly authorized.
| Loomis Sayles Funds I | ||
| By: | /s/ Kevin Charleston | |
| Name: | Kevin Charleston | |
| Title: | President and Chief Executive Officer | |
| Date: | November 21, 2023 | |
Pursuant to the requirements of the Securities Exchange Act of 1934 and the Investment Company Act of 1940, this report has been signed by the following persons on behalf of the Registrant and in the capacities and on the dates indicated.
| By: | /s/ Kevin Charleston | |
| Name: | Kevin Charleston | |
| Title: | President and Chief Executive Officer | |
| Date: | November 21, 2023 | |
| By: | /s/ Matthew Block | |
| Name: | Matthew Block | |
| Title: | Treasurer and Principal Financial and Accounting Officer | |
| Date: | November 21, 2023 | |