UNITED STATES
SECURITIES AND EXCHANGE COMMISSION
Washington, DC 20549
FORM 10-K
| x | ANNUAL REPORT PURSUANT TO SECTION 13 OR 15(d) OF THE SECURITIES EXCHANGE ACT OF 1934 |
| | for the fiscal year ended December 30, 2007 |
OR
| ¨ | TRANSITION REPORT PURSUANT TO SECTION 13 OR 15(d) OF THE SECURITIES EXCHANGE ACT OF 1934 |
Commission file number 0-32233
PEET’S COFFEE & TEA, INC.
(Exact Name of Registrant as Specified in Its Charter)
| | |
| Washington | | 91-0863396 |
(State or Other Jurisdiction of Incorporation or Organization) | | (I.R.S. Employer Identification No.) |
1400 Park Avenue
Emeryville, California 94608-3520
(Address of Principal Executive Offices)(Zip Code)
(510) 594-2100
(Registrant’s telephone number, including area code)
Securities registered pursuant to Section 12(b) of the Act:
| | |
Title of each class | | Name of each exchange on which registered |
| Common Stock, no par value | | The Nasdaq National Market |
Securities registered pursuant to Section 12(g) of the Act:
None
Indicate by check mark whether the registrant is well-known, seasoned filer (as defined in Rule 405 under the Securities Act). Yes ¨ No x
Indicate by check mark whether the registrant is not required to file reports pursuant to Section 13 or Section 15(d) of the Securities Act. Yes ¨ No x
Indicate by check mark whether the registrant (1) has filed all reports required to be filed by Section 13 or 15(d) of the Securities Exchange Act of 1934 during the preceding 12 months (or for such shorter period that the registrant was required to file such reports), and (2) has been subject to such filing requirements for the past 90 days. Yes x No ¨
Indicate by check mark if disclosure of delinquent filers pursuant to Item 405 of Regulation S-K is not contained herein, and will not be contained, to the best of registrant’s knowledge, in definitive proxy or information statements incorporated by reference in Part III of this Form 10-K or any amendment to this Form 10-K. ¨
Indicate by check mark whether the registrant is a large accelerated filer, an accelerated filer, a non-accelerated filer, or a smaller reporting company. See the definitions of “large accelerated filer,” “accelerated filer” and “smaller reporting company” in Rule 12b-2 of the Exchange Act.
Large Accelerated Filer ¨ Accelerated Filer x Non-Accelerated Filer ¨ Smaller reporting company ¨
Indicate by check mark whether the registrant is a shell company (as defined in Exchange Act Rule 12b-2). Yes ¨ No x
The approximate aggregate market value of the voting stock held by non-affiliates of the registrant based on the closing price and shares of the Common Stock outstanding on July 1, 2007 (the registrant’s most recently completed second quarter), as reported by the Nasdaq National Market, was $338,833,900. Shares of Common Stock held by each officer, director and each person known to the Company to hold 5% or more of the outstanding Common Stock have been excluded as such persons may be deemed to be affiliates of the Company. Such determination of affiliate status is not necessarily a conclusive determination for other purposes.
As of March 2, 2008, 13,957,678 shares of registrant’s Common Stock were outstanding.
DOCUMENTS INCORPORATED BY REFERENCE
Portions of the proxy statement related to the registrant’s 2007 annual meeting of shareholders, which proxy statement will be filed under the Securities Exchange Act of 1934 within 120 days of the end of the registrant’s fiscal year ended December 30, 2007, are incorporated by reference into Part III of this annual report on Form 10-K.
TABLE OF CONTENTS
References to “we”, “us”, “our”, “Peet’s”, and the “Company” in this annual report on Form 10-K refer to Peet’s Coffee & Tea, Inc.
FORWARD-LOOKING STATEMENTS
Some of the matters discussed under the captions “Risk Factors,” “Management’s Discussion and Analysis of Financial Condition and Results of Operation,” “Business” and elsewhere in this annual report on Form 10-K (“report”) include forward-looking statements. We have based these forward-looking statements on our current expectations and assumptions about future events, including, among other things:
| | • | | Implementing our business strategy; |
| | • | | Attracting and retaining customers; |
| | • | | Establishing and expanding our market presence in new geographic regions; |
| | • | | The availability and pricing of high quality Arabica coffee beans; |
| | • | | Consumers’ tastes and preferences; and |
| | • | | Competition in our markets. |
In some cases, you can identify forward-looking statements by terminology such as “may,” “should,” “could,” “predict,” “potential,” “continue,” “expect,” “anticipate,” “future,” “intend,” “plan,” “believe,” “estimate” and similar expressions (or the negative of such expressions). These statements are based on our current beliefs, expectations and assumptions and are subject to a number of risks and uncertainties. Actual results, levels of activity, performance, achievements and events may vary significantly from those implied by the forward-looking statements. A description of risks that could cause our results to vary appears under the caption “Risk Factors” and elsewhere in this report. Forward-looking statements speak only as of the date of this report.
1
PART I
Item 1. Business
Peet’s Coffee & Tea is a specialty coffee roaster and marketer of fresh roasted whole bean coffee. We sell our coffee under strict freshness standards through multiple channels of distribution including grocery stores, home delivery, office, restaurant and foodservice accounts and Company-owned and operated stores in six states.
Since we believe that roasted coffee is a perishable product, we pursue distribution channels that are consistent with our strict freshness standards. For instance, our distribution to grocery stores emphasizes the use of a direct store delivery (“DSD”) system whereby our employees or agents deliver fresh goods to our grocery partners. We roast to order and ship coffee directly from our roasting facility to our home delivery customers. Our goal is to ensure that customers receive coffee within days of roasting.
We have expanded from a retailer that operates its own outlets to a premium coffee brand available through multiple channels of distribution. We signed our first office coffee distribution agreement in 1997 and have since added a number of restaurants, foodservice accounts and office coffee distributors in select markets. We added online ordering capability to our website in 1997 to complement our existing mail order home delivery business and have since invested in marketing programs designed to support our home delivery channel. In 1998, we initiated a strategic expansion into specialty grocery and gourmet food stores. This expansion was further developed to include distribution to mainstream grocers as we expanded our grocery accounts from 130 to 5,800 stores. We believe our expansion strategy emphasizes disciplined growth and enhancement of our brand’s image and quality reputation. We operate our business through two reportable segments: retail and specialty sales. See Note 10, “Segment Information” to the “Notes to Consolidated Financial Statements” included elsewhere in this report.
Our website is located at www.peets.com. Our annual report on Form 10-K, quarterly reports on Form 10-Q and current reports on Form 8-K, as well as any amendments or exhibits to those reports, are available free of charge through our website at www.peets.com as soon as reasonably practicable after we file them with, or furnish them to, the Securities and Exchange Commission (“SEC”). The content on any website referred to in this annual report on Form 10-K is not incorporated by reference into this annual report on Form 10-K unless expressly noted. The Company was organized as a Washington corporation in 1971.
Company Retail Stores
As of December 30, 2007 we operated 166 retail stores in six states through which we sell whole bean coffee, beverages and pastries, tea, and other related items. Our stores are designed to facilitate the sale of fresh whole bean coffee and to encourage customer trial of our coffee through coffee beverages. Each store has a dedicated staff person at the bean counter to take orders and assist customers with questions on coffee origins and on home brewing. Upon order, beans are scooped and ground to the customer’s specific requirements. At our beverage counter, we rotate and sell freshly-brewed coffees and coffee-based beverages to promote customer familiarity, sampling, and sales of whole-bean coffees. To ensure that our freshness standards are consistently met, it is our policy not to serve brewed coffee that is more than 30 minutes old and every espresso based drink is made to order using freshly pulled shots of espresso and freshly steamed milk. See “Item 2. Properties” for further discussion about our retail stores.
Specialty Sales
Grocery
In addition to sales through our retail stores, we have expanded the availability of our products through a network of grocery stores, including Safeway, Albertson’s, Ralph’s and Whole Foods Market. To support this expansion, we have developed a DSD sales and distribution system. Peet’s DSD route sales representatives
2
deliver directly to their stores anywhere between one to three times per week, properly shelve the product, resolve pricing discrepancies, rotate to ensure freshness, sell and erect free-standing displays and forge store-level selling relationships. We currently have 46 company-operated DSD route sales representatives, and approximately 135 independent distributors or multi-liners who will continue to support the expansion into new grocery accounts in the western United States and our existing grocery customers.
Home Delivery
In the home delivery channel, we provide points of contact to our customers for coffee ordering and coffee knowledge through a dedicated website and customer service representatives. Our website features an Express Buy function for registered customers for speed and ease, special coffee and tea programs and a coffee and tea selector to assist the customer in choosing a product based upon certain characteristics. Peets.com also features a proprietary tool that allows customers to manage the timing and delivery of their recurring orders. We reward our most loyal home delivery customers who maintain regular, ongoing deliveries of coffee or tea through our Peetnik Loyalty Program. This program has proven to be successful in growing our home delivery business online by encouraging our most loyal customers to establish regular deliveries of fresh roasted coffee or tea. In addition to our website, we have a team of customer service representatives who assist customers in placing customer orders, choosing a gift item, providing product information and resolving customer issues. Customer service representatives are regularly trained on Peet’s product offerings through weekly coffee and tea tastings.
Foodservice and Office
In the foodservice and office business, we have a staff of sales and account managers who make sales calls to potential accounts and conduct quality audits at our existing accounts. Additionally, we have established relationships with foodservice and office distributors to expand our account base in select markets and channels. These distributors have their own sales and account management resources. We have two models for servicing our foodservice accounts and distributing our products: “We Proudly Brew” (“WPB”) accounts and Licensing accounts. WPB accounts are foodservice accounts where Peet’s supplies the equipment and product to brew and resell our products. Licensing accounts involve the creation of a full Peet’s beverage store within another location such as an airport, grocery store or college campus. The license partner is responsible for the build-out and management of the unit and we provide training and operations oversight. The office coffee channel is a distributor based business where we sell to specialty distributors who in turn sell our products for brewing to individual offices.
Our Coffee
Coffee Beans
Coffee is an agricultural crop that undergoes quality changes and price fluctuation depending on weather, economic and political conditions in coffee producing countries. We purchase onlyarabica coffee beans, which are considered superior to beans traded in the commodity market. Thus, thearabicabeans purchased by us tend to trade on a negotiated basis at a substantial premium above commodity coffee prices, depending upon the supply and demand at the time of purchase. Our access to high qualityarabicabeans depends on our relationships with coffee brokers, exporters and growers, with whom we have built long-term relationships to ensure a steady supply of coffee beans. We believe that, as a result of our reputation that has been built over 40 years, we have access to some of the highest quality coffee beans from the finest estates and growing regions around the world and we are occasionally presented with opportunities to purchase unique and special coffees.
Unlike roasted coffee beans, green coffee beans are not highly perishable. We generally turn our inventory of green coffee beans two to three times per year. We typically carry approximately $11 million to $17 million worth of green coffee beans in our inventory. We currently use fixed-price purchase commitments, but in the past have used and may potentially in the future use coffee futures and coffee futures options to manage coffee supply and price risk.
3
Our Roasting Method
Our roasting method was first developed by Alfred Peet and further honed by our talented and skilled roasting personnel. We roast by hand in small batches, and we rely on the skills and training of each roaster to maximize the flavor and potential in our beans. Our roasters undergo an extensive apprenticeship program to learn our roasting method and to gain the skills necessary to roast coffee at Peet’s and make a long-term commitment to our artisan craft.
Coffee Types and Blends
Beyond sourcing and roasting, we have developed a reputation for expert coffee blending. Our blends, such as Major Dickason’s Blend®, are well regarded by our customers for their uniqueness, consistency and special flavor characteristics. We sell approximately 32 types of coffee as regular menu items, including approximately 21 blends and 11 single origin coffees such as Colombia, Guatemala, Sumatra and Kenya. We also offer a line of high-end reserve coffees including JR Reserve Blend® and Kona, and we have also featured seasonal reserve coffees such as Jamaica Blue Mountain and Panama Esmeralda. We are active in seeking, roasting and selling unique special lot and one-time coffees. On average, we offer four to six such coffees every year, including our Anniversary Blend and Holiday Blend.
Tea, Food and Merchandise
Peet’s offers a line of hand selected whole leaf and bagged tea. Our quality standards for tea are very high. We purchase tea directly from importers and brokers and store and pack the tea at our facility in Emeryville, California. We offer a limited line of specialty food items, such as jellies, jams and candies. These products are carefully selected for quality and uniqueness.
Our merchandise program consists of items such as brewing equipment for coffee and tea, paper filters and brewing accessories and branded and non-branded cups, saucers, travel mugs and serveware. We do not emphasize these items, but we carry them in retail stores and offer them through home delivery as a means to reinforce our commitment to premium home-brewed coffee and tea.
Competitive Positioning
The specialty coffee category is competitive, but it is dominated by one company that is larger than all the competitors combined. Our primary competitors in whole bean specialty coffee sales include Starbucks, Green Mountain Coffee, Illy Caffé, Millstone (Procter & Gamble), Seattle’s Best (Starbucks) and Dunkin’ Donuts. There are numerous smaller, regional brands that also compete in this category. Premium coffee brands may serve as substitutes for our whole bean coffee and we also compete indirectly against all other coffee brands on the market.
In addition to competing with other distributors of whole bean coffee, we compete with retailers of prepared beverages, including coffee house chains, particularly Starbucks, and to a lesser degree, Coffee Bean and Tea Leaf, Dunkin Donuts and Caribou Coffee, numerous convenience stores, restaurants, coffee shops and street vendors.
We believe that our customers choose among specialty coffee brands based upon quality, variety, convenience, and to a lesser extent, price. Although consumers may differentiate coffee brands based on freshness (as an element of coffee quality), to our knowledge, few significant competitors focus on product freshness and roast-dating in the same manner as Peet’s. We believe that our market share in the specialty category is based on a solidly differentiated position built on our freshness standards and artisan-roasting style. Because of the fragmented nature of the specialty coffee market, we cannot accurately estimate our market share. However, many of our existing competitors have significantly greater financial, marketing and operating resources.
4
Our roasted coffee is priced in tiers. Our regular menu coffees are currently priced in our retail locations within a range of $9.95 to $18.95 per pound. Our line of high-end reserve coffees is priced between $49.90 and $79.90 per pound. In the grocery channel, we sell our coffee in 12 ounce packages at prices established by the grocery store. Most grocery stores sell our product at a price between $8.99 and $11.99 for a 12 ounce bag.
Intellectual Property
We regard intellectual property and other proprietary rights as important to our success. We place high value on our Peet’s trade name, and we own several trademarks and service marks that have been registered with the United States Patent and Trademark Office, including Peet’s®, Peet’s Coffee & Tea®, peets.com®, Peet’s Deep-Roast®, Peet’s Deep-Roasted®, Peet’s Deep-Roasting®, Blend 101®, eCup®, Espresso Forte®, Fresh Fridays®, Gaia Organic Blend®, Garuda Blend®, JR Reserve Blend®, Major Dickason’s Blend®, Peetniks®, Pride of the Port®, Pumphrey’s Blend®, Summer House®, Snow Leopard®, and Vine Street Blend®. We also have registered trademarks on our stylized logo and our P-mug design. In addition, we have applications pending with the United States Patent and Trademark Office for a number of additional marks including Coffee Handmade Daily™, Freddo™, and Blended Freddo™. We own registered trademarks for our name and logo in Argentina, Australia, Canada, Chile, China, the European Union, Hong Kong, Japan, Paraguay, Singapore, South Korea, Taiwan and Thailand. We have filed additional applications for trademark protection in Brazil and the Philippines. In addition to peets.com and coffee.com, we own several other domain names relating to coffee, Peet’s and our roasting process.
In addition to registered and pending trademarks, we consider the packaging for our coffee beans (consisting of dark brown coloring with African-style motif and lettering with a white band running around the lower quarter of the bag) and the design of the interior of our stores (consisting of dark wood fixtures, classic lighting, granite countertops and understated color) to be strong identifiers of our brand. Although we consider our packaging and store design to be essential to our brand identity, we have not applied to register these trademarks and trade dress, and thus cannot rely on the legal protections afforded by trademark registration.
Our ability to differentiate our brand from those of our competitors depends, in part, on the strength and enforcement of our trademarks. We must constantly protect against any infringement by competitors. If a competitor infringes on our trademark rights, we may have to litigate to protect our rights, in which case, we may incur significant expenses and divert significant attention from our business operations.
Information Systems
The information systems installed at Peet’s are used to manage our operations and increase the productivity of our workforce. We have a retail point-of-sale system that we believe increases store productivity, provides a higher level of service to our customers and maintains timely information for performance evaluation. Our registers have touch screen components and full point-of-sale capability. In 2002, during the rollout of our DSD system in the grocery channel, we implemented a grocery order entry and invoice system with handheld capability that allows our route sales representatives to provide service and information on the spot. In 2003, we implemented business intelligence software to better support and analyze our business in all channels. In 2004, we deployed an integrated labor and scheduling system in our retail stores to improve productivity and customer service. In 2007, we tested a new inventory management system in our retail stores and in 2008 we plan to complete the implementation in all stores. In 2008, we will also design and develop a new enterprise system that we plan to implement in 2009.
Our website, peets.com, is hosted at our corporate headquarters in Emeryville, California. All website applications are built on Microsoft ASP with in-house development. We offer full-functioning e-commerce and our website is integrated with our call center for access to orders placed at both locations. Online delivery confirmation is provided by United Parcel Service and the United States Postal Service. Our website contains several customer-centered functions. Manage Deliveries is an application which enables consumers to schedule
5
recurring deliveries including choosing specific coffees and teas to be delivered at the frequency of their choice. Other important customer functions include a coffee and tea selector, Express Buy and multiple “ship-to” capability on a single bill. Additionally, customers with Peet’s cards can check their balance as well as reload their card online. We designed our website to provide fast, easy and effective operation when navigating and shopping on our website. We have dedicated information technology employees and marketing staffers for website maintenance, improvement, development and performance.
Employees
As of March 2, 2008, we employed a workforce of 3,678 people, approximately 687 of whom work approximately 40 hours per week and are considered full-time employees. We consider our relationship with our employees to be good. Since 1979, we have provided full benefits to all employees who work at least 21 hours per week and have worked at least 500 total hours for the Company. We believe we offer competitive benefits packages to attract and retain valuable employees.
Government Regulation
Our coffee roasting operations and our retail stores are subject to various governmental laws, regulations, and licenses relating to customs, health and safety, building and land use, and environmental protection. Our roasting facility is subject to state and local air-quality and emissions regulations. If we encounter difficulties in obtaining any necessary licenses or complying with these laws and regulations, then:
| | • | | The opening of new retail locations could be delayed; |
| | • | | The operation of existing retail locations or our coffee roasting operations could be interrupted; or |
| | • | | Our product offerings could be limited. |
We believe that we are in compliance in all material respects with all such laws and regulations and that we have obtained all material licenses that are required for the operation of our business. We are not aware of any environmental regulations that have or that we believe will have a material adverse effect on our operations.
Executive Officers of the Registrant
Set forth below is information with respect to the names, ages, positions and offices of our executive officers as of March 2, 2008.
| | | | |
Name | | Age | | Position |
Patrick J. O’Dea | | 46 | | Chief Executive Officer, President and Director |
Thomas P. Cawley | | 47 | | Chief Financial Officer, Vice President and Secretary |
James E. Grimes | | 52 | | Vice President, Operations and Information Systems |
Kay L. Bogeajis | | 53 | | Vice President, Retail Operations |
Patrick J. O’Deahas served as Chief Executive Officer, President and as a director since May 2002. From April 1997 to March 2001, he was CEO of Archway/Mother’s Cookies and Mother’s Cake & Cookie Company. From 1995 to 1997, Mr. O’Dea was the Vice President and General Manager of the Specialty Cheese Division of Stella Foods. From 1984 to 1995, he was with Procter & Gamble, where he marketed several of the company’s snack and beverage brands.
Thomas P. Cawley has served as Chief Financial Officer since July 2003. From August 2000 to June 2003, he was at Gap, Inc. serving as Chief Financial Officer, Gap Brand. From 1986 to August 2000, Mr. Cawley was at PepsiCo/Yum Brands (formerly Tricon Global Restaurants), holding various positions such as Director of Finance, Vice President—Controller, and Chief Financial Officer of Pizza Hut. Previous to 1986, Mr. Cawley was with The Quaker Oats Company and General Foods.
6
James E. Grimes has served as Vice President of Operations and Information Systems since July 2002. In August 2001, Mr. Grimes founded Supply Chain Consulting, where he provided supply chain management expertise. From 1998 to 2001, he was Senior Vice President of Operations at Archway/Mother’s Cookies. Previously, Mr. Grimes held various positions at Mother’s Cake and Cookie Company, Frito Lay and Procter & Gamble.
Kay L. Bogeajis joined the Company in October 2007. From January 2003 to October 2007, Ms. Bogeajis served as Vice President, Western Operations for Taco Bell Corporation, a Yum Brand company, where she was responsible for more than 1,400 stores and approximately $1.4 billion in system-wide sales. From October 2001 to January 2003, she was Vice President Systemwide Operations for Taco Bell. Previously, she held prominent retail operations and sales positions with Taco Bell, Frito-Lay, Inc., a PepsiCo company, and Burger King Corporation.
We may not be successful in the implementation of our business strategy or our business strategy may not be successful, either of which will impede our growth and operating results.
Our business strategy emphasizes expansion through multiple channels of distribution. Our ability to implement this business strategy is dependent on our ability to:
| | • | | Market our products on a national scale and over the internet; |
| | • | | Enter into distribution and other strategic arrangements with third party retailers and other potential distributors of our coffee; |
| | • | | Increase our brand recognition on a national scale; |
| | • | | Identify and lease strategic locations suitable for new stores; and |
| | • | | Manage growth in administrative overhead and distribution costs likely to result from the planned expansion of our retail and non-retail distribution channels. |
We do not know whether we will be able to successfully implement our business strategy or whether our business strategy will be successful. Our revenue may be adversely affected if we fail to implement our business strategy or if we divert resources to a business strategy that ultimately proves unsuccessful.
Because our business is highly dependent on a single product, specialty coffee, if the demand for specialty coffee decreases, our business could suffer.
Sales of specialty coffee constituted nearly 83% of our 2007 net revenue and 84% of our 2006 and 2005 net revenue. Demand for specialty coffee is affected by many factors, including:
| | • | | Consumer tastes and preferences; |
| | • | | National, regional and local economic conditions; |
| | • | | Demographic trends; and |
| | • | | Perceived or actual health benefits or risks. |
Because we are highly dependent on consumer demand for specialty coffee, a shift in consumer preferences away from specialty coffee would harm our business more than if we had more diversified product offerings. If customer demand for specialty coffee decreases, our sales would decrease accordingly.
7
If we fail to continue to develop and maintain our brand, our business could suffer.
We believe that maintaining and developing our brand is critical to our success and that the importance of brand recognition may increase as a result of competitors offering products similar to ours. Because the majority of our retail stores are located on the West Coast, primarily in California, our brand recognition remains largely regional. Our brand building initiative involves increasing the availability of our products and opening new stores to increase awareness of our brand and create and maintain brand loyalty. If our brand building initiative is unsuccessful, we may never recover the expenses incurred in connection with these efforts and we may be unable to increase our future revenue or implement our business strategy.
Our success in promoting and enhancing the Peet’s brand will also depend on our ability to provide customers with high quality products and customer service. Although we take measures to ensure that we sell only fresh roasted whole bean coffee and that our retail employees properly prepare our coffee beverages, we have no control over our whole bean coffee products once purchased by customers. Accordingly, customers may prepare coffee from our whole bean coffee inconsistent with our standards, store our whole bean coffee for long periods of time or resell our whole bean coffee without our consent, which in each case, potentially affects the quality of the coffee prepared from our products. If customers do not perceive our products and service to be of high quality, then the value of our brand may be diminished and, consequently, our ability to implement our business strategy may be adversely affected.
Increases in the cost and decreases in availability of high quality Arabica coffee beans could impact our profitability and growth of our business.
Green coffee is our largest single cost of sales. We do not purchase coffee on the commodity markets, but price movements in the trading of coffee do impact the price we pay. Coffee is a trade commodity and, in general, its price can fluctuate depending on:
| | • | | Weather patterns in coffee-producing countries; |
| | • | | Economic and political conditions affecting coffee-producing countries; |
| | • | | Foreign currency fluctuations; |
| | • | | The ability of coffee-producing countries to agree to export quotas; and |
| | • | | General economic conditions that make commodities more or less attractive investment options. |
Over the past two years, the commodity cost for coffee has risen above the range it was trading in for the prior three to four years. We expect our costs to continue to rise in 2008. If we are unable to pass along increased coffee costs, our margin will decrease and our profitability will suffer accordingly. If we are not able to purchase sufficient quantities of high quality Arabica beans due to any of the above factors, we many not be able to fulfill the demand for our coffee, our revenue may decrease and our ability to expand our business may also suffer.
Civil litigation relating to our stock option granting practices could have a material adverse effect on the Company.
We and certain of our directors and current and former officers are defendants in two shareholder derivative actions relating to our stock option granting practices. See Note 9, “Commitments and Contingencies, Legal Proceedings” in the “Notes to Consolidated Financial Statements” for a more detailed description of these proceedings. These actions are in their preliminary stages, and we intend to take all appropriate steps in the defense of these cases. These lawsuits could divert management time and attention from day-to-day operations, result in significant legal expenses, and result in an outcome that could have a material adverse effect on our business, financial condition, results of operations and cash flows.
8
Because our business is based primarily in California, a worsening of economic conditions, a decrease in consumer spending or a change in the competitive conditions in this market may substantially decrease our revenue and may adversely impact our ability to implement our business strategy.
Our California retail stores generated 60% of our 2007 and 2006 net revenue and a substantial portion of the revenue from our other distribution channels is generated in California. We expect that our California operations will continue to generate a substantial portion of our revenue. In addition, our California retail stores provide us with means for increasing brand awareness, building customer loyalty and creating a premium specialty coffee brand. As a result, an economic downturn or other decrease in consumer spending in California may not only lead to a substantial decrease in revenue, but may also adversely impact our ability to market our brand, build customer loyalty, or otherwise implement our business strategy.
Labor conditions in the grocery business could negatively impact our grocery business.
There have been grocery strikes in the past that have negatively impacted our grocery business and it is possible that future grocery strikes in places where we have large distribution may adversely impact our grocery business.
Government mandatory healthcare requirements could adversely affect our profits.
The Company offers healthcare benefits to all employees who work at least 21 hours a week and meet service eligibility requirements. In the past, some states, including California, have unsuccessfully proposed legislation mandating that employers pay healthcare premiums into a state run fund for all employees immediately upon hiring. If legislation similar to this were to be enacted in the states we do business, it could have an adverse affect on the Company’s profits.
If we are unable to continue leasing our retail locations or obtain leases for new stores, our existing operations and our ability to expand may be adversely affected.
All of our 166 retail locations as of year-end are on leased premises. If we are unable to renew these leases, our revenue and profits could suffer. In addition, we intend to lease other premises in connection with the planned expansion of our retail operations. Because we compete with other retailers and restaurants for store sites and some landlords may grant exclusive locations to our competitors, we may not be able to obtain new leases or renew existing leases on acceptable terms. This could adversely impact our revenue growth and brand building initiatives.
Because we rely heavily on common carriers to ship our coffee on a daily basis, any disruption in their services or increase in shipping costs could adversely affect our business.
We rely on a number of common carriers to deliver coffee to our customers and retail stores. We consider roasted coffee a perishable product and we rely on these common carriers to deliver fresh roasted coffee on a daily basis. We have no control over these common carriers and the services provided by them may be interrupted as a result of labor shortages, contract disputes or other factors. If we experience an interruption in these services, we may be unable to ship our coffee in a timely manner. A delay in shipping could:
| | • | | Have an adverse impact on the quality of the coffee shipped, and thereby adversely affect our brand and reputation; |
| | • | | Result in the disposal of an amount of coffee that could not be shipped in a timely manner; and |
| | • | | Require us to contract with alternative, and possibly more expensive, common carriers. |
Any significant increase in shipping costs could lower our profit margins or force us to raise prices, which could cause our revenue and profits to suffer.
9
We depend on the expertise of key personnel. If these individuals leave or change their role within our Company without effective replacements, our operations may suffer.
The success of our business is dependent to a large degree on our management and our coffee roasters and purchasers. If members of our management leave without effective replacements, our ability to implement our business strategy could be impaired. If we lost the services of our coffee roasters and purchasers, our ability to source and purchase a sufficient supply of high quality coffee beans and roast coffee beans consistent with our quality standards could suffer. In either case, our business and operations could be adversely affected.
We may not be able to hire or retain additional management and other personnel and our recruiting and training costs may increase as a result of turnover, both of which may increase our costs and reduce our profits and may adversely impact our ability to implement our business strategy.
The success of our business depends upon our ability to attract and retain highly motivated, well-qualified management and other personnel, including technical personnel and retail employees. We face significant competition in the recruitment of qualified employees. Our ability to execute our business strategy may suffer if:
| | • | | We are unable to recruit or retain a sufficient number of qualified employees; |
| | • | | The costs of employee compensation or benefits increase substantially; or |
| | • | | The costs of outsourcing certain tasks to third party providers increase substantially. |
Because we have only one roasting facility, a significant interruption in the operation of our roasting and distribution facilities could potentially disrupt our operations.
We have only one roasting and distribution facility. A significant interruption in the operation of this facility, whether as a result of a natural disaster or other causes, could significantly impair our ability to operate our business. Since we only roast our coffee to order, we do not carry inventory of roasted coffee in our roasting plant. Therefore, a disruption in service in our roasting facility would impact our sales in our retail and specialty channels almost immediately. Moreover, our roasting and distribution facilities and most of our stores are located near several major earthquake faults. The impact of a major earthquake on our facilities, infrastructure and overall operations is difficult to predict and an earthquake could seriously disrupt our entire business.
Our earthquake insurance covers net income, continuing normal operating expenses and extra expenses incurred during the period of restoration once the large deductible has been exceeded. However, in the event of a catastrophic earthquake, our coverage is limited and would not cover all of our expenses and losses caused by an earthquake.
We have a high deductible workers’ compensation insurance program and more claims and higher costs from these claims may adversely affect our profits.
Our 2007 workers’ compensation insurance program is a modified self-insured program with a high deductible with an overall program ceiling to limit exposure. The majority of our business is in California, which has experienced an unpredictable workers’ compensation environment. Therefore, we are highly exposed to this environment. Additionally, we have had to estimate our liability for existing claims whose outcome is uncertain. While we believe our reserve methodology on these claims is appropriate, should a greater amount of claims occur or the settlement costs increase beyond what was anticipated, our expenses could increase and our profitability may decrease. For the policy year effective March 1, 2008, we have purchased a guaranteed cost policy and therefore our self-insured claims exposure is limited to incidents prior to March 1, 2008.
Our roasting methods are not proprietary, so competitors may be able to duplicate them, which could harm our competitive position.
We consider our roasting methods essential to the flavor and richness of our roasted whole bean coffee and, therefore, essential to our brand. Because we do not hold any patents for our roasting methods, it may be difficult
10
for us to prevent competitors from copying our roasting methods. If our competitors copy our roasting methods, the value of our brand may be diminished, and we may lose customers to our competitors. In addition, competitors may be able to develop roasting methods that are more advanced than our roasting methods, which may also harm our competitive position.
Competition in the specialty coffee market is intense and could affect our profits.
The specialty coffee category is competitive, but it is dominated by one company that is larger than all the competitors combined. Our primary competitors in whole bean specialty coffee sales include Starbucks, Green Mountain Coffee, Illy Caffé, Millstone (Procter & Gamble), Seattle’s Best (Starbucks) and Dunkin’ Donuts. There are numerous smaller, regional brands that also compete in this category. Premium coffee brands may serve as substitutes for our whole bean coffee and we also compete indirectly against all other coffee brands on the market. In addition to competing with other distributors of whole bean coffee, we compete with retailers of prepared beverages, including coffee house chains, particularly Starbucks, and to a lesser degree, Coffee Bean and Tea Leaf, Dunkin Donuts and Caribou Coffee, numerous convenience stores, restaurants, coffee shops and street vendors.
Despite competing in a fragmented product category, whole bean specialty coffee brands are being established across multiple distribution channels. Several competitors have been aggressive in obtaining distribution in specialty grocery and gourmet food stores, through online, and in office, restaurant and foodservice locations. Other competitors may have an advantage over us based on their earlier entry into these distribution channels. In addition, many of our competitors may have substantially greater financial, marketing and operating resources than we do.
Adverse public or medical opinion about caffeine may harm our business.
Our specialty coffee contains significant amounts of caffeine and other active compounds, the health effects of some of which are not fully understood. A number of research studies conclude or suggest that excessive consumption of caffeine may lead to increased heart rate, nausea and vomiting, restlessness and anxiety, depression, headaches, tremors, sleeplessness and other adverse health effects. An unfavorable report on the health effects of caffeine or other compounds present in coffee could significantly reduce the demand for coffee, which could harm our business and reduce our sales and profits.
Adverse publicity regarding customer complaints may harm our business.
We may be the subject of complaints or litigation from customers alleging beverage and food-related illnesses, injuries suffered on the premises or other quality, health or operational concerns. Adverse publicity resulting from such allegations may materially adversely affect us, regardless of whether such allegations are true or whether we are ultimately held liable.
| Item 1B. | Unresolved Staff Comments |
Not Applicable.
Peet’s headquarters are located in Emeryville, California. As of December 30, 2007, the Company was in the process of converting our former roasting and distribution facility into office space. As a result, we continued to lease approximately 103,000 square feet in four locations. The lease for what will be our main office space devoted to general corporate and retail overhead and a call center for the home delivery business is approximately 60,000 square feet and extends to October 2015 with two five year extension options. In addition, we will be retaining a second office and warehouse space totaling approximately 8,000 square feet that we are currently leasing on a month-to-month basis. We plan to vacate approximately 33,000 square feet of office and former production space related to two leases that expire on March 15, 2008 and April 30, 2008.
11
In December 2006 we purchased approximately 460,000 square feet of land and a 138,000 square foot building with related site improvements in Alameda, California for the purpose of operating a new roasting and distribution facility. The final purchase price of the facility and the land was $18.6 million. We transitioned our operations to this facility during the first and second quarter of 2007 and were effectively at full production capability by May 2007.
In 2007, we opened 30 new stores. Our retail locations are all company-owned and operated in leased facilities. Our stores are typically located in urban neighborhoods, suburban shopping centers (usually consisting of grocery, specialty and service stores) and on high-traffic streets.
The following table lists the number of retail locations as of December 30, 2007:
| | |
Location | | Number |
Northern California | | 106 |
Southern California | | 34 |
Illinois | | 2 |
Oregon | | 8 |
Massachusetts | | 6 |
Washington | | 6 |
Colorado | | 4 |
| | |
Total | | 166 |
| | |
In November 2006, a complaint styled as a shareholder derivative action was filed, purportedly on behalf of Peet’s, against certain of our present and former directors and officers. The complaint alleges that the defendants caused or allowed improprieties in connection with certain stock option grants since at least 2001 and thereby breached their fiduciary duties to Peet’s and violated specified provisions of the California Corporations Code. The complaint also alleges that certain of our present and former directors and officers were unjustly enriched as a result. Purportedly on behalf of Peet’s, the complaint seeks, among other things, damages, restitution and corporate governance reforms. This complaint and a similar one have been filed in the Superior Court for Alameda County, California and a third was filed in February 2007 in the United States District Court for the Northern District of California.
On February 12, 2008, the United States District Court granted our motion for dismissal of the federal shareholder derivative action. The court also granted the plaintiff leave to file an amended complaint, and ordered that any amended complaint be filed by February 29, 2008. Counsel for the plaintiffs in this case subsequently informed our attorneys that they did not intend to file an amended complaint, and no amended complaint was filed on or before February 29, 2008. The actions filed in the Alameda County Superior Court remain pending.
These actions could result in substantial costs and divert management’s attention and resources. These actions are at a preliminary stage, and we are not in a position to determine whether a loss is probable or estimate a range of amount of loss.
We may from time to time become involved in certain legal proceedings in the ordinary course of business. The Company is not a party to any other legal proceedings that management believes would have a material adverse effect on the financial position or results of operations of the Company.
| Item 4. | Submission of Matters to a Vote of Security Holders |
No matters were submitted to a vote of our shareholders during the quarter ended December 30, 2007.
12
PART II
| Item 5. | Market for Registrant’s Common Equity, Related Stockholder Matters and Issuer Purchases of Equity Securities |
Market for the Registrant’s Stock
The Company’s common stock is traded on the Nasdaq National Market under the symbol “PEET”. The following table sets forth, for the periods indicated, the high and low closing prices for our common stock as reported on the Nasdaq National Market for each quarter during the last two fiscal years.
| | | | | | |
| | | High | | Low |
Fiscal Year Ended December 30, 2007 | | | | | | |
Fourth Quarter | | $ | 30.06 | | $ | 26.02 |
Third Quarter | | | 28.01 | | | 23.35 |
Second Quarter | | | 28.89 | | | 24.63 |
First Quarter | | | 28.20 | | | 24.94 |
Fiscal Year Ended December 31, 2006 | | | | | | |
Fourth Quarter | | $ | 27.87 | | $ | 24.29 |
Third Quarter | | | 30.90 | | | 24.43 |
Second Quarter | | | 32.76 | | | 28.21 |
First Quarter | | | 31.91 | | | 28.19 |
As of March 2, 2008, there were approximately 348 registered holders of record of the Company’s common stock. On March 2, 2008, the last sale price reported on the Nasdaq National Market for the common stock was $23.41 per share.
Dividend Policy
We have not declared or paid any dividends on our capital stock since 1990. We expect to retain any future earnings to fund the development and expansion of our business. Therefore, we do not anticipate paying cash dividends on our common stock in the foreseeable future.
Issuer Purchases of Equity Securities
On September 6, 2006, the Company’s Board of Directors authorized the Company to purchase up to 1.0 million shares of Peet’s common stock, with no expiration, and the Company announced its plan on September 12, 2006 on Form 8-K. As of December 30, 2007, no shares had been purchased under this program. The Company expects to make purchases from time to time on the open market at prevailing market prices or in negotiated transactions off the market.
13
Performance Graph*
The following graph depicts the Company’s total return to shareholders from December 29, 2002 through December 30, 2007, relative to the performance of the NASDAQ Composite Index, and the Standard & Poor’s Smallcap 600 Consumer Goods Sector, Processed and Packaged Foods Industry. All indices shown in the graph have been reset to a base of 100 as of December 29, 2002, assume an investment of $100 on that date and the reinvestment of dividends paid since that date, calculated on a monthly basis. The Company has never paid cash dividends on its common stock. The points represent index levels based on the last trading day of the Company’s fiscal year. The chart set forth below was prepared by Research Data Group, Inc., which holds a license to provide the indices used herein. The stock price performance shown in the graph is not necessarily indicative of future price performance.
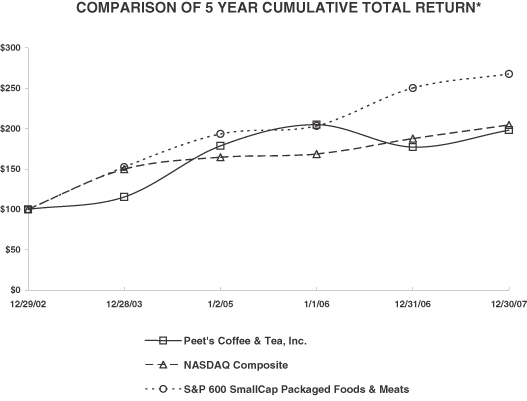
| * | This section is not “soliciting material”, is not deemed “filed” with the SEC and is not to be incorporated by reference in any of our filings under the Securities Act or the Securities Exchange Act made before or after the date hereof and irrespective of any general incorporation language in any such filing. |
| Item 6. | Selected Financial Data |
The table below shows selected consolidated financial data for our last five fiscal years. Our fiscal year is based on a 52 or 53 week year and ends on the Sunday closest to the last day in December.
The following selected consolidated financial data should be read in conjunction with our consolidated financial statements and related notes and “Management’s Discussion and Analysis of Financial Condition and Results of Operations” included elsewhere in this report.
14
Selected Consolidated Financial Data
(in thousands, except per share data)
| | | | | | | | | | | | | | | | | | | | |
| | | Year | |
| | 2007
(52 weeks) | | | 2006
(52 weeks) | | | 2005
(52 weeks) | | | 2004
(53 weeks) | | | 2003
(52 weeks) | |
Statement of Income Data: | | | | | | | | | | | | | | | | | | | | |
Net revenue | | $ | 249,389 | | | $ | 210,493 | | | $ | 175,198 | | | $ | 145,683 | | | $ | 119,816 | |
Cost of sales and related occupancy expenses | | | 118,389 | | | | 98,928 | | | | 80,837 | | | | 67,806 | | | | 55,694 | |
Operating expenses | | | 85,800 | | | | 72,272 | | | | 57,879 | | | | 47,645 | | | | 37,746 | |
General and administrative expenses | | | 22,682 | | | | 20,634 | | | | 13,341 | | | | 11,439 | | | | 14,087 | |
Depreciation and amortization expenses | | | 10,912 | | | | 8,609 | | | | 7,293 | | | | 5,787 | | | | 4,883 | |
Income from operations | | | 11,606 | | | | 10,050 | | | | 15,848 | | | | 13,006 | | | | 7,406 | |
Interest income | | | 1,446 | | | | 2,456 | | | | 1,769 | | | | 922 | | | | 1,163 | |
Income before income taxes | | | 13,052 | | | | 12,506 | | | | 17,617 | | | | 13,928 | | | | 8,569 | |
Income tax provision | | | (4,675 | ) | | | (4,690 | ) | | | (6,842 | ) | | | (5,218 | ) | | | (3,444 | ) |
Net income | | $ | 8,377 | | | $ | 7,816 | | | $ | 10,775 | | | $ | 8,710 | | | $ | 5,125 | |
| | | | | | | | | | | | | | | | | | | | |
Net income per share: | | | | | | | | | | | | | | | | | | | | |
Basic | | $ | 0.61 | | | $ | 0.57 | | | $ | 0.78 | | | $ | 0.65 | | | $ | 0.41 | |
Diluted | | $ | 0.59 | | | $ | 0.55 | | | $ | 0.74 | | | $ | 0.62 | | | $ | 0.39 | |
| | | | | |
Shares used in calculation of net income per share: | | | | | | | | | | | | | | | | | | | | |
Basic | | | 13,724 | | | | 13,733 | | | | 13,801 | | | | 13,308 | | | | 12,589 | |
Diluted | | | 14,120 | | | | 14,202 | | | | 14,469 | | | | 13,949 | | | | 13,228 | |
| | | | | |
Balance Sheet Data: | | | | | | | | | | | | | | | | | | | | |
Cash and cash equivalents | | $ | 15,312 | | | $ | 7,692 | | | $ | 20,623 | | | $ | 11,356 | | | $ | 30,263 | |
Working capital | | | 38,380 | | | | 37,254 | | | | 62,584 | | | | 16,726 | | | | 45,166 | |
Total assets | | | 177,547 | | | | 153,005 | | | | 148,752 | | | | 128,944 | | | | 111,319 | |
Total shareholders’ equity | | | 147,253 | | | | 127,439 | | | | 126,878 | | | | 109,905 | | | | 96,098 | |
15
| Item 7. | Management’s Discussion and Analysis of Financial Condition and Results of Operations |
You should read the following discussion and analysis in conjunction with our consolidated financial statements and related notes included elsewhere in this report. Except for historical information, the discussion below contains forward-looking statements within the meaning of Section 21E of the Securities Exchange Act of 1934. The fiscal years ended December 30, 2007 (fiscal 2007), December 31, 2006 (fiscal 2006) and January 1, 2006 (fiscal 2005) all included 52 weeks.
Company Overview and Industry Outlook
Peet’s is a specialty coffee roaster and marketer of fresh, deep-roasted whole bean coffee sold through multiple channels of distribution for home and away-from-home enjoyment. Founded in Berkeley, California in 1966, Peet’s has established a loyal customer base with strong brand awareness in California. Our growth strategy is based on the sale of whole bean coffee and high-quality beverages in multiple channels of distribution including our own retail stores, grocery, home delivery, and office and restaurant accounts throughout the United States. Our current expansion strategy is focused in the western United States, where we have strong customer awareness, loyalty and brand affinity.
In 2007, the Company pursued its strategy to build out its multiple channels in the United States. The results of the efforts in 2007 include:
| | • | | opening 30 new retail locations, 26 of which were in California, and four in the Pacific Northwest; |
| | • | | expanding our grocery network to now include virtually all major grocery stores west of the Rockies and select markets on the East Coast. This helped drive 22% revenue growth in our grocery business; |
| | • | | expanding the availability of office coffee through a national partnership with Vistar, the largest office coffee distributor in the United States; |
| | • | | growing our foodservice business by establishing license kiosks in numerous locations including grocery stores such as select Raley’s and Albertson’s; and |
| | • | | transitioning our roasting operations to our new roasting facility in Alameda, California, enabling our future growth needs for our business. |
We expect the specialty coffee industry to continue to grow. We believe that this growth will be fueled by continued consumer interest in high quality coffee and related products. We believe that by offering high-quality products to consumers throughout the country, we will attract the same loyal customer base that we have attracted in California. We believe the growth in specialty coffee is particularly acute in two areas; grocery and coffeehouses. Specialty coffee dollars spent in grocery stores last year grew 15% while coffeehouse growth continues to expand with active development by Peet’s and our competitors, particularly Starbucks.
The coffee industry also experienced increased commodity costs in the last two years above the prior three to four year range. We expect coffee costs to continue to rise in 2008.
As we grow, we expect our operations to continue to be vertically integrated, allowing us to control the quality of our product at all stages. We purchase high quality Arabica coffee beans from countries around the world, and we use our artisan-roasting technique to bring out the distinctive flavor of our coffees. Because roasted coffee is perishable, we are committed to delivering our coffee under the strictest freshness standards. As a result, we do not stock or inventory roasted coffee. We roast to order and ship fresh coffee daily to our stores and customers. Control of purchasing, roasting, packaging and distribution of our coffee allows us to maintain our commitment to freshness, is cost effective, and enhances our margins and profit potential.
Business Segments
Our coffee and related items are sold through multiple channels of distribution that provide broad market exposure to potential purchasers of fresh roasted whole bean coffee. We are indifferent as to where consumers
16
purchase our coffees and teas, and believe that our specialty and retail segments are synergistic. However, we also recognize that the economics of our retail stores and other distribution channels are different enough that we have chosen to report them as separate segments under SFAS No. 131, “Disclosures about Segments of an Enterprise and Related Information”. Therefore, we currently have two reportable segments, consisting of:
| | • | | Specialty sales, which consist of sales to home delivery customers, sales to grocery stores, restaurant and foodservice companies and office accounts. |
We believe growth opportunities exist in all of our distribution channels. We believe that our specialty sales can expand to geographies where we do not have a retail presence. Our first priority has been to develop primarily in the western U.S. markets where we already have a presence and have higher customer awareness. We expect to continue to open new stores in strategic west coast locations that meet our demographic profile and partner with distributors and companies who share our passion for quality and freshness and are willing and able to execute accordingly in the foodservice and office environment. In grocery, we have already penetrated most of the grocery market in the western U.S. and in 2007 we started to expand into the eastern United States. Over the next two to three years, we plan to be nationwide with our grocery distribution.
Business Categories
In addition to our reportable segments, we measure our business by monitoring the volume and revenue growth of two distinct business categories:
| | • | | Whole bean coffee and related products, consisting of products for home brewing, tea and packaged foods; and |
| | • | | Beverages and pastries. |
We believe these business categories are useful in understanding our results of operations for the periods presented because we operate our stores and record revenue through these two categories. Our stores are primarily designed to facilitate the sale of fresh whole bean coffee and hand-crafted coffee beverages. The format of our stores replicates that of a specialty grocer. Beans are freshly scooped from bins under the counter, weighed on counter top scales and hand packed into branded bags. In addition, our stores are also designed to encourage customer trial of our coffee through coffee beverages. Each store has a beverage bar that is dedicated to the sale of prepared beverages and artisan baked pastries.
Results of Operations
The following discussion on results of operations should be read in conjunction with “Item 6. Selected Consolidated Financial Data,” the consolidated financial statements and accompanying notes and the other financial data included elsewhere in this report.
17
Our fiscal year is based on a 52 or 53 week year. The fiscal year ends on the Sunday closest to the last day of December. 2007, 2006 and 2005 were all 52 week years. The Company began expensing stock options in 2006, therefore margins in 2005 are not comparable to 2006 and 2007.
| | | | | | | | | |
| | | 2007 | | | 2006 | | | 2005 | |
Statement of income as a percent of net revenue: | | | | | | | | | |
Net revenue | | 100.0 | % | | 100.0 | % | | 100.0 | % |
Cost of sales and related occupancy expenses | | 47.5 | | | 47.0 | | | 46.1 | |
Operating expenses | | 34.4 | | | 34.3 | | | 33.0 | |
General and administrative expenses | | 9.1 | | | 9.8 | | | 7.6 | |
Depreciation and amortization expenses | | 4.4 | | | 4.1 | | | 4.2 | |
Income from operations | | 4.6 | | | 4.8 | | | 9.1 | |
Interest income | | 0.6 | | | 1.2 | | | 1.0 | |
Income before income taxes | | 5.2 | | | 6.0 | | | 10.1 | |
Income tax provision | | 1.9 | | | 2.2 | | | 3.9 | |
Net income | | 3.3 | % | | 3.8 | % | | 6.2 | % |
| | | | | | | | | |
Percent of net revenue by business segment: | | | | | | | | | |
Retail Stores | | 67.5 | % | | 67.2 | % | | 67.4 | % |
Specialty Stores | | 32.5 | | | 32.8 | | | 32.6 | |
Percent of net revenue by business category: | | | | | | | | | |
Whole bean coffee and related products | | 53.8 | % | | 55.8 | % | | 57.7 | % |
Beverages and pastries | | 46.2 | | | 44.2 | | | 42.3 | |
Cost of sales and related occupancy expenses as a percent of segment revenue: | | | | | | | | | |
Retail Stores | | 46.6 | % | | 46.2 | % | | 45.0 | % |
Specialty Stores | | 49.4 | | | 48.6 | | | 48.5 | |
Operating expenses as a percent of segment revenue: | | | | | | | | | |
Retail Stores | | 42.6 | % | | 42.6 | % | | 40.7 | % |
Specialty Stores | | 17.4 | | | 17.5 | | | 17.3 | |
Percent increase from prior year: | | | | | | | | | |
Net Revenue | | 18.5 | % | | 20.1 | % | | 20.3 | % |
Retail Stores | | 19.1 | | | 19.8 | | | 17.5 | |
Specialty Stores | | 17.2 | | | 20.9 | | | 26.4 | |
Cost of sales and related occupancy expenses | | 19.7 | | | 22.4 | | | 19.2 | |
Operating expenses | | 18.7 | | | 24.9 | | | 21.5 | |
General and administrative expenses | | 9.9 | | | 54.7 | | | 16.6 | |
Depreciation and amortization expenses | | 26.8 | | | 18.0 | | | 26.0 | |
| | | |
Selected operating data: | | | | | | | | | |
Number of retail stores in operation | | | | | | | | | |
Beginning of the year | | 136 | | | 111 | | | 92 | |
Store openings | | 30 | | | 25 | | | 20 | |
Store closures | | — | | | — | | | (1 | ) |
| | | | | | | | | |
End of the year | | 166 | | | 136 | | | 111 | |
| | | | | | | | | |
2007 (52 weeks) Compared with 2006 (52 weeks)
Net revenue
Net revenue for 2007 increased 18.5% versus 2006 as a result of continued expansion of our retail and specialty sales segments. Sales of whole bean and related products increased 14.0% to $134.1 million. Sales from beverages and pastries increased 24.1% to $115.3 million.
18
In the retail segment, net revenue increased 19.1% compared to 2006 primarily as a result of increased sales from new stores we opened in the last two years and growth in the existing stores. We opened 30 new stores in 2007 and 25 stores in 2006. Sales of whole bean coffee and related products in the retail segment increased by 8.1% to $53.1 million, while sales of beverages and pastries increased by 24.9% to $115.3 million. The increase in beverage and pastry sales was primarily related to sales at the stores we opened in 2006 and 2007 and increased traffic in our existing stores. The slower growth in whole bean and related products was primarily due to continuing cannibalization of bean sales in retail stores as we increased the availability of Peet’s coffee in grocery stores and our own retail stores.
In the specialty sales segment, net revenue increased 17.2% compared to 2006. The $11.9 million increase consisted of a $7.4 million increase in grocery sales, a $1.2 million increase in home delivery sales, and a $3.2 million increase in sales to foodservice and office accounts. Grocery continued to have the highest growth rate in the segment with a 21.6% increase compared to last year, primarily due to continued strong growth in our existing accounts and secondarily due to new accounts we added during the year. In grocery, we added 1,400 new stores during the year, bringing the number of grocery stores selling Peet’s coffee to approximately 5,800. Net revenue to the home delivery channel grew 7.0% compared to 2006 due primarily to special offerings to our existing customers. In addition, foodservice and office coffee revenue increased 18.7% primarily due to our effort to expand distributorships and licensed partners.
Cost of sales and related occupancy expenses
Cost of sales and related occupancy expenses consist of product costs, including manufacturing costs, rent and other occupancy costs. As a percent of net revenue, cost of sales increased from 47.0% in 2006 to 47.5% in 2007. This increase was driven by an increase of occupancy as a percent of net revenue. Occupancy increased approximately 0.5% compared to last year due primarily to the impact of opening new stores, which have lower sales levels. Product cost was about flat to last year as the retail price increase we took in November 2006 combined with procurement and waste savings offset inflation in milk and coffee and the cost of the new roasting plant.
We expect cost of sales and related occupancy expenses as a percent of net revenue to decrease in 2008 due to leverage of our new roasting facility, but we expect the impact of retail occupancy to continue to a lesser extent and the negative impact from high coffee costs to continue.
Operating expenses
Operating expenses consist of both retail store and specialty operating costs, such as employee labor and benefits, repairs and maintenance, supplies, training, travel and banking and card processing fees. Operating expenses as a percent of net revenue for 2007 increased 0.1% to 34.4%. The increase is primarily due to a 1.2% increase from opening 55 new stores in the last two years, largely offset by the November 2006 retail price increase (0.5%) and leverage of retail overhead (0.6%).
General and administrative expenses
General and administrative expenses in 2007 were $22.7 million, or 9.1% of net revenue, compared to $20.6 million, or 9.8% for the last year. The decrease in expenses as a percent of net revenue is primarily due to higher net revenue (1.5%) and partially due to lower professional fees associated with our stock option review and related litigation (0.3%), partially offset by increases in headcount (0.9%). Professional fees associated with our stock option review and related litigation were $1.4 million in 2007 and $1.8 million in 2006.
Depreciation and amortization expenses
Depreciation and amortization expenses increased in 2007 primarily due to the 55 stores we opened during 2007 and 2006.
19
Interest income
We currently invest in U.S. government, agency, municipal and guaranteed student loan obligations. Interest income includes interest income and gains or losses from the sale of these instruments. We earned $1.4 million in interest income in 2007, compared to $2.5 million last year, due to our lower average cash and investment balances. The Company does not have exposure in its investment portfolio for subprime mortgages or auction rate securities.
Income tax provision
The effective income tax rate for 2007 was 35.8% versus 37.5% in the prior year. Our effective rate decreased 1.7% primarily due to increased benefits from the domestic production deduction and lower effective state income taxes from California enterprise zone tax credits and growth in states with lower rates.
2006 (52 weeks) Compared with 2005 (52 weeks)
Net revenue
Net revenue for 2006 increased 20.1% versus 2005 as a result of continued expansion of our retail and specialty sales segments. Sales of whole bean and related products increased 16.4% to $117.5 million. Sales from beverages and pastries increased 25.3% to $92.9 million.
In the retail segment, net revenue increased 19.8% compared to 2005 primarily as a result of increased sales from new stores we opened in 2005 and 2006 and growth in the existing stores. We opened 25 new stores in 2006 and 20 stores in 2005. Sales of whole bean coffee and related products in the retail segment increased by 9.2% to $49.1 million, while sales of beverages and pastries increased by 26.3% to $92.3 million. The increase in beverage and pastry sales was primarily related to sales at the stores we opened in 2005 and 2006 and increased traffic in our existing stores. The slower growth in whole bean and related products was primarily due to continuing cannibalization of bean sales in retail stores as we increased the availability of Peet’s coffee in grocery stores.
In the specialty sales segment, net revenue increased 20.9% compared to 2005. The $11.9 million increase consisted of an $8.3 million increase in grocery sales, a $2.0 million increase in home delivery sales, and a $1.6 million increase in sales to foodservice and office accounts. Grocery continued to have the highest growth rate in the segment with a 31.7% increase compared to 2005, primarily due to continued strong growth in our existing accounts and secondarily due to new accounts we added during the year. In grocery, we added 500 new stores during the year, bringing the number of grocery stores selling Peet’s coffee to approximately 4,400. Net revenue to the home delivery channel grew 13.1% compared to 2005 due primarily to three online only special offerings held during the year. In addition, foodservice and office coffee revenue increased 10.5% primarily due to our effort to expand distributorships, partially offset by the forced closure of six Company operated Peet’s kiosks in Larry’s Markets in the Seattle area due to the bankruptcy and closure of Larry’s Markets.
Cost of sales and related occupancy expenses
Cost of sales and related occupancy expenses consist of product costs, including manufacturing costs, rent and other occupancy costs. As a percent of net revenue, cost of sales increased from 46.1% in 2005 to 47.0% in 2006 due to higher green coffee costs (1.0%) and the impact of expensing stock-based compensation (0.2%), partially offset by the price increase taken in our grocery channel (0.5%).
Operating expenses
Operating expenses consist of both retail store and specialty operating costs, such as employee labor and benefits, repairs and maintenance, supplies, training, travel and banking and card processing fees. Operating expenses as a percent of net revenue for 2006 increased compared to 2005 primarily due to the opening of new stores, higher expenses in existing stores and the impact of expensing stock options.
20
In the retail segment, operating expenses as a percent of net revenue increased by 1.9% to 42.6%. Of the increase, 0.7% was due to opening 45 new stores in the last two years, a 48.0% increase in the number of stores since 2004. New stores generally have higher operating expenses due to lower sales volume and startup costs. Stores opened prior to 2005 had a 0.5% increase in operating expenses due to higher supplies and repairs and maintenance expense. The impact of expensing stock options accounted for the remaining 0.7% of the increase.
As a percent of net revenue, specialty operating expenses increased 0.2% to 17.5%. Stock-based compensation changes accounted for approximately 0.5% of the increase. This was offset by the price increase taken in October 2005 in our grocery channel.
General and administrative expenses
General and administrative expenses in 2006 were $20.6 million, or 9.8% of net revenue, compared to $13.3 million, or 7.6% of net revenue for the same period last year. Of the 2.2% increase in expenses as a percent of net revenues, 1.1%, or $2.2 million, was attributable to the impact of stock-based compensation, 0.8%, or $1.8 million, was related to the legal and other professional fees incurred for the stock option review and the remainder was due to increases in headcount, as well as recruiting, audit and accounting related and other professional services.
Depreciation and amortization expenses
Depreciation and amortization expenses increased in 2006 primarily due to the 45 stores we opened during 2006 and 2005.
Interest income
We currently invest in U.S. government, agency, municipal and guaranteed student loan obligations. Interest income includes interest income and gains or losses from the sale of these instruments. We earned $2.5 million in interest income in 2006, compared to $1.8 million in 2005, primarily due to higher interest rates on our investments.
Income tax provision
The effective income tax rate in 2006 was 37.5% versus 38.8% in 2005. Our effective rate decreased 1.3% primarily due to increased interest income from tax-exempt marketable securities during 2006.
Liquidity and Capital Resources
At December 30, 2007, we had $15.3 million in cash and cash equivalents and $15.8 million in short-term and long-term marketable securities for a total of $31.1 million. Working capital was $38.4 million as of December 30, 2007 compared to $37.3 million at December 31, 2006.
Net cash provided by operations was $20.1 million in 2007 compared to $17.8 million in 2006. Operating cash flows were positively impacted in 2007 by net income, net of depreciation expense, and other changes in working capital, offset by increases in inventories to support our growth.
Net cash used in investing activities was $21.2 million in 2007. Investing activities primarily relate to purchases of property and equipment, and maturities and purchases of marketable securities. During 2007, maturities net of purchases totaled $9.6 million as we used funds to invest in property and equipment. Cash paid for property and equipment totaling $30.8 million included:
| | • | | $20.2 million to build-out new stores and remodel existing ones; |
| | • | | $1.3 million used for foodservice kiosks, grocery displays and other equipment for specialty sales; |
21
| | • | | $5.9 million used for additional machinery for the new roasting facilities; and |
| | • | | $3.4 million used for information technology support systems and other software and hardware to support our growing infrastructure. |
Net cash provided by financing activities was $8.7 million in 2007, primarily from the exercise of stock options by employees.
Our 2008 capital expenditures are expected to be between $29.0 and $31.0 million. Approximately $15.3 million is expected to be used for the opening of 25 to 30 new retail stores scheduled for 2008 and for remodeling existing stores. $3.5 million is expected to be used for remodeling our former roasting and distribution facility into office space. Approximately $3.5 million is expected to be incurred for the design and development of a new enterprise system that we plan to implement in 2009. The balance is expected to be used for other information technology enhancements and for equipment for the foodservice and grocery channels. We expect to finance these capital expenditures with our cash and marketable securities and with operating cash flows.
The following table summarizes the Company’s contractual obligations and the timing and effect that such commitments are expected to have on the Company’s liquidity and capital requirements in future periods as of December 30, 2007 (in thousands):
| | | | | | | | | | | | | | | |
| | | Payments Due by Period
(in thousands) |
Contractual obligations | | Total | | Less than
1 year | | 1-3 years | | 4-5 years | | After 5
years |
Equipment operating leases | | $ | 1,647 | | $ | 359 | | $ | 1,038 | | $ | 250 | | $ | — |
Retail store operating leases (1) | | | 96,784 | | | 13,574 | | | 24,648 | | | 22,222 | | | 36,340 |
Fixed-price coffee purchase commitments | | | 27,342 | | | 20,294 | | | 6,795 | | | 253 | | | — |
Not-yet-priced coffee commitments | | | 9,713 | | | 8,829 | | | 884 | | | — | | | — |
Development commitments (2) | | | 2,938 | | | 2,938 | | | — | | | — | | | — |
| | | | | | | | | | | | | | | |
Total contractual cash obligations | | $ | 138,424 | | $ | 45,994 | | $ | 33,365 | | $ | 22,725 | | $ | 36,340 |
| | | | | | | | | | | | | | | |
| (1) | Payments for maintenance, insurance, taxes and contingent rent for which we are obligated are excluded. In fiscal 2007 these charges totaled approximately $2.3 million. |
| (2) | Contractual obligations for purchases of leasehold improvements for office space in our former roasting facility and equipment and leasehold improvements for retail locations. |
For the next twelve months, we expect our cash flows from operations and cash and marketable securities to be sufficient for our operating and capital requirements, our existing share purchase program and our contractual obligations as they come due. The Company has excluded from the table above uncertain tax liabilities as defined in FASB Interpretation No. 48, “Accounting for Uncertainty in Income Taxes,” (“FIN 48”), due to the uncertainty of the period of payment. As of December 30, 2007, the Company has a $0.1 million liability for uncertain tax positions (see Note 5 to the consolidated financial statements).
Inflation
We do not believe that inflation has had a material impact on our results of operation in recent years. However, we cannot predict what effect inflation may have on our results of operations in the future.
Critical Accounting Policies, Judgments and Estimates
The preparation of financial statements in conformity with generally accepted accounting principles requires the appropriate application of certain accounting policies and judgments, many of which require us to make estimates and assumptions about future events and their impact on amounts reported in our financial statements and related notes. Since future events and their impact cannot be determined with certainty, the actual results will inevitably differ from our estimates. Such differences could be material to the financial statements.
22
We believe our application of accounting policies, and the estimates inherently required therein, are reasonable. These accounting policies and estimates are periodically reevaluated, and adjustments are made when facts and circumstances dictate a change. Historically, we have found our application of accounting policies to be appropriate, and actual results have not differed materially from those determined using necessary estimates.
Our accounting policies are more fully described in Note 1 “Summary of Significant Accounting Policies” in the “Notes to the Consolidated Financial Statements,” included elsewhere in this report. We have identified the following critical accounting policies:
| | • | | Inventory.Raw materials consist primarily of green coffee beans. Finished goods include roasted coffee, tea, accessory products, spices and packaged foods. All products are valued at the lower of cost or market using the first-in, first-out method, except green bean and roasted coffee, which is valued at the average cost. We continually evaluate the composition of our coffee related merchandise and mark down such inventory as needed. Our historical inventory write-offs have been immaterial. |
| | • | | Impairment of long-lived assets.When facts and circumstances indicate that the carrying of long-lived assets may be impaired, an evaluation of recoverability is performed by comparing the carrying values of the assets to projected future cash flows in addition to other quantitative and qualitative analyses. Upon indication that the carrying values of such assets may not be recoverable, the Company recognizes an impairment loss by a charge against current operations for an amount equal to the difference between the carrying value and the assets’ fair value. Property, plant and equipment assets are grouped at the lowest level for which there are identifiable cash flows when assessing impairment. Cash flows for retail net assets are identified at the individual store level. The fair value of the retail net asset is estimated using the discounted cash flows of the assets. Long-lived assets to be disposed of are reported at the lower of their carrying amount or fair value, less estimated costs to sell. Judgments made by the Company related to the expected useful lives of long-lived assets and the ability of the Company to realize undiscounted cash flows in excess of the carrying amounts of such assets are affected by factors such as the ongoing maintenance and improvements of the assets, changes in economic conditions and changes in operating performance. As the Company assesses the ongoing expected cash flows and carrying amounts of its long-lived assets, these factors could cause the Company to realize material impairment charges. |
| | • | | Accrued workers’ compensation.We record an estimated liability for the self-insured portion of workers’ compensation claims. The liability of $3.1 million recorded as of December 30, 2007 is determined based on an independent actuarial assessment of information received from our insurance carrier including claims paid, filed and reserved for and historical experience. Should a greater amount of claims occur compared to what is estimated or the settlement costs increase beyond what was anticipated, the recorded liability may not be sufficient. |
| | • | | Income taxes. In establishing deferred income tax assets and liabilities, we make judgments and interpretations based on enacted tax laws and published tax guidance applicable to our operations. We record deferred tax assets and liabilities and evaluate the need for valuation allowances to reduce deferred tax assets to realizable amounts. Changes in our valuation of the deferred tax assets or changes in the income tax provision and reserves may affect our annual effective income tax rate. Changes in tax laws and rates could also affect recorded deferred tax assets and liabilities in the future. Management is not aware of any such changes that would have a material effect on the Company’s results of operations, cash flows or financial position. On January 1, 2007, we adopted the provisions of FIN 48, which requires that we recognize in our financial statements the impact of a tax position, if that position is more likely than not of being sustained on audit, based on the technical merits of the position. |
| | • | | Stock-based compensation. On January 2, 2006, we adopted the fair value recognition provisions of Statement of Financial Accounting Standards No. 123(R), “Share-Based Payment” (“SFAS 123(R)”).We use the Black-Scholes-Merton option-pricing model, which requires assumptions |
23
| | requiring a high degree of judgment. These assumptions include estimating the length of time employees will retain their vested stock options before exercising them, the estimated volatility of our common stock price over the expected term and the number of options that will ultimately not complete their vesting requirements. Changes in the subjective assumptions can materially affect the estimate of fair value of share-based payments and, consequently, the related amount recognized in the consolidated statements of income. |
Recent Accounting Pronouncements
In July 2006, the FASB issued FIN 48, which clarifies the accounting for uncertainty in tax positions. FIN 48 requires that we recognize in our financial statements the impact of a tax position, if that position is more likely than not of being sustained on audit, based on the technical merits of the position. The Company adopted the provisions of FIN 48 on January 1, 2007. See Note 5 for additional information.
In September 2006, the FASB issued SFAS No. 157, “Fair Value Measurements” (“SFAS 157”), which defines fair value, establishes a framework for measuring fair value in generally accepted accounting principles and expands disclosures about fair value measurements. SFAS 157 is effective for financial statements issued for fiscal years beginning after November 15, 2007, and interim periods within those fiscal years. Early adoption is permitted. The Company will adopt these new requirements beginning December 31, 2007. We do not believe the adoption of SFAS 157 will have a material effect on our financial position or results of operations.
In February 2007, the FASB issued SFAS No. 159, “The Fair Value Option for Financial Assets and Financial Liabilities—Including an amendment of FASB Statement No. 115” (“SFAS 159”). SFAS 159 permits entities to elect to measure financial instruments and certain other items at fair value. Upon adoption of SFAS 159, an entity may elect the fair value option for eligible items that exist at the adoption date. Subsequent to the initial adoption, the election of the fair value option can only be made at initial recognition of the asset or liability or upon a re-measurement event that gives rise to new-basis accounting. SFAS 159 is effective for fiscal years beginning after November 15, 2007. We do not believe the adoption of SFAS 159 will have a material effect on our financial position or results of operations.
| Item 7A. | Quantitative and Qualitative Disclosures about Market Risk |
We invest excess cash in interest-bearing, U.S. government, agency, municipal and guaranteed student loan obligations. These financial instruments are all subject to fluctuations of daily interest rates. Therefore our investment portfolio is exposed to market risk from these changes.
The supply and price of coffee are subject to significant volatility and can be affected by multiple factors in the producing countries, including weather, political and economic conditions. In addition, green coffee bean prices have been affected in the past, and may be affected in the future, by the actions of certain organizations and associations that have historically attempted to influence commodity prices of green coffee beans through agreements establishing export quotas or restricting coffee supplies worldwide.
We currently use fixed-price purchase commitments, but in the past have used and may potentially in the future use coffee futures and coffee futures options to manage coffee supply and price risk.
Fixed-Price and Not-Yet-Priced Purchase Commitments
We enter into fixed-price purchase commitments in order to secure an adequate supply of quality green coffee beans and fix our cost of green coffee beans. These commitments are made with established coffee brokers and are denominated in U.S. dollars. We also enter into “not-yet-priced” commitments based on a fixed premium over the New York “C” market with the option to fix the price at any time. As of December 30, 2007, we had approximately $27.3 million in open fixed-priced purchase commitments and approximately $9.7 million
24
in not-yet-priced commitments for a total of approximately $37.0 million with delivery dates ranging from January 2008 through July 2012. See Note 9 to the consolidated financial statements. We believe, based on relationships established with our suppliers, that the risk of non-delivery on such purchase commitments is low.
| Item 8. | Financial Statements and Supplementary Data |
All information required by this item is included in Item 15 of this annual report on Form 10-K and is incorporated in this item by reference.
| Item 9. | Changes in and Disagreements with Accountants on Accounting and Financial Disclosure |
None.
| Item 9A. | Controls and Procedures |
Disclosure Controls and Procedures
We conducted an evaluation, under the supervision and with the participation of our management, including our Chief Executive Officer and our Chief Financial Officer, of the effectiveness of the design and operation of our disclosure controls and procedures (as defined in Rules 13a-15(e) and 15d-15(e) under the Securities Exchange Act of 1934, as amended (the “Exchange Act”)). Based on the foregoing, our Chief Executive Officer and Chief Financial Officer have concluded that our disclosure controls and procedures were effective as of the end of the period covered by this annual report.
Management’s Report on Internal Control over Financial Reporting
Our management is responsible for establishing and maintaining adequate internal control over financial reporting, as such term is defined in Exchange Act Rule 13a-15(f). The Company’s internal control system was designed to provide reasonable assurance to the Company��s management and board of directors regarding the preparation and fair presentation of published financial statements. All internal control systems, no matter how well designed, have inherent limitations. Therefore, even those systems determined to be effective can provide only reasonable assurance with respect to financial statement preparation and presentation. Under the supervision and with the participation of our management, including our Chief Executive Officer and our Chief Financial Officer, as directed by our board of directors, we conducted an evaluation of the effectiveness of our internal control over financial reporting based on the framework inInternal Control – Integrated Frameworkissued by the Committee of Sponsoring Organizations of the Treadway Commission (“COSO”). Based on our evaluation under the COSO framework, our management concluded that our internal control over financial reporting was effective as of December 30, 2007.
The registered independent public accounting firm of Deloitte & Touche LLP has issued a report on the effectiveness of the Company’s internal control over financial reporting as of December 30, 2007. See page F-2 of the consolidated financial statements.
Changes in Internal Control over Financial Reporting
Effective March 26, 2007, the Compensation Committee of the Board of Directors adopted a stock option granting policy and specified Company procedures. The policy set forth policies and procedures relating to stock option granting practices, including (a) the review of stock option grant documentation prior to a grant to ensure proper support for the measurement date including the appropriate Board of Directors, Compensation Committee or Chief Executive Officer approval, (b) eliminating the use of unanimous written consents by all Board of Directors and its Compensation Committee, and (c) the use of predetermined effective dates for all grants. During the last fiscal quarter the Company has had sufficient occurrences to test these formal procedures and related controls to provide reasonable assurance that the measurement date for stock option grants is appropriately determined.
25
There were no other changes in the Company’s internal control over financial reporting identified in connection with the evaluation required by paragraph (d) of Exchange Act Rules 13a-15(e) or 15d-15(e) that was conducted during the last fiscal quarter that have materially affected, or are reasonably likely to materially affect, the Company’s internal control over financial reporting.
| Item 9B. | Other Information |
Not applicable.
26
PART III
| Item 10. | Directors, Executive Officers and Corporate Governance |
Information with respect to continuing directors and nominees of the Company, committees of the Board of Directors and the Company’s Code of Business Conduct and Ethics is set forth under the caption” Proposal 1—Election of Directors” in the Company’s proxy statement relating to its 2007 Annual Meeting of Shareholders (the “Proxy Statement”) and is incorporated by reference into this Form 10-K. The Proxy Statement will be filed with the SEC in accordance with Rule 14a-6(c) promulgated under the Securities Exchange Act of 1934, as amended (the “Exchange Act.”). With the exception of the foregoing information and other information specifically incorporated by reference into this Form 10-K, the Proxy Statement is not being filed as a part hereof. Information respecting executive officers of the Company is set forth at Part I of this Form 10-K under the caption “Business—Executive Officers of the Registrant.”
Information with respect to compliance with Section 16(a) of the Exchange Act is set forth under the caption “Section 16(a) Beneficial Ownership Reporting Compliance” in the Proxy Statement and is incorporated by reference into this Form 10-K.
The Company has adopted the Peet’s Coffee & Tea, Inc. Code of Business Conduct and Ethics that applies to all officers, directors and employees. The Code of Business Conduct and Ethics is available on our website at www.peets.com. If the Company makes any substantive amendments to the Code of Business Conduct and Ethics or grants any waiver from a provision of the code to any executive officer or director, the Company will promptly disclose the nature of the amendment or waiver on its website.
| Item 11. | Executive Compensation |
Information concerning executive and director compensation required by Item 11 is set forth under the caption “Executive Compensation” in the Proxy Statement and is incorporated by reference into this Form 10-K.
| Item 12. | Security Ownership of Certain Beneficial Owners and Management and Related Stockholder Matters |
Information concerning security ownership of certain beneficial owners and management and equity compensation plans required by Item 12 is set forth under the caption “Security Ownership of Certain Beneficial Owners and Management” and “Executive Compensation—Equity Compensation Plan Information” in the Proxy Statement and is incorporated by reference into this Form 10-K.
| Item 13. | Certain Relationships and Related Transactions, and Director Independence |
Information concerning certain relationships and related transactions required by Item 13 is set forth under the caption “Certain Transactions” in the Proxy Statement and is incorporated by reference into this Form 10-K. Information concerning director independence required by Item 13 is set forth under the caption “Proposal 1- Election of Directors—Independence of the Board of Directors” in the Proxy Statement and is incorporated by reference into this Form 10-K.
| Item 14. | Principal Accountant Fees and Services |
Information concerning principal accounting fees and services required by Item 14 is set forth under the caption “Proposal 2- Ratification of Selection of Independent Registered Public Accounting Firm” in the Proxy Statement and is incorporated by reference into this Form 10-K.
27
PART IV
| Item 15. | Exhibits and Financial Statement Schedules |
The following documents are filed as part of this Form 10-K.
(a)(1)Index to Consolidated Financial Statements.
The following Consolidated Financial Statements of Peet’s Coffee & Tea, Inc. and its subsidiaries are filed as part of this Form 10-K:
| | |
| | | Page |
Report of Independent Registered Public Accounting Firm | | F-2 |
| |
Consolidated Balance Sheets as of December 30, 2007 and December 31, 2006 | | F-3 |
| |
Consolidated Statements of Income for the Years Ended December 30, 2007, December 31, 2006, and January 1, 2006 | |
F-4 |
| |
Consolidated Statements of Shareholders’ Equity for the Years Ended December 30, 2007, December 31, 2006, and January 1, 2006 | |
F-5 |
| |
Consolidated Statements of Cash Flows for the Years December 30, 2007, December 31, 2006, and January 1, 2006 | |
F-6 |
| |
Notes to Consolidated Financial Statements | | F-7 |
(a)(2)Index to Financial Statement Schedule.
Schedules are omitted because they are not applicable, not required or because the required information is included in the Consolidated Financial Statements or Notes thereto.
(a)(3)Listing of Exhibits
| | |
Exhibit | | Description |
| 3.1 | | Amended and Restated Articles of Incorporation.* |
| |
| 3.2 | | Amended and Restated Bylaws.* |
| |
| 4.1 | | Form of common stock certificate.* |
| |
| 10.1 | | Amended and Restated 1993 Stock Option Plan. (1)* |
| |
| 10.2 | | 1994 California Stock Option Plan. (1)* |
| |
| 10.3 | | 1997 Equity Incentive Plan and form of Stock Option Agreement. (1)* |
| |
| 10.4 | | Peet’s Operating Company, Inc. Savings and Retirement Plan. (1)* |
| |
| 10.5 | | 2000 Equity Incentive Plan amended and restated December 31, 2007. (1) |
| |
| 10.6 | | 2000 Employee Stock Purchase Plan and form of Offering. (1)* |
| |
| 10.7 | | Key Employee Severance Benefit Plan amended and restated December 31, 2007. (2) |
| |
| 10.8 | | Change of Control Option Acceleration Plan amended and restated December 31, 2007. (1) |
| |
| 10.9 | | Form of Indemnity Agreement between the registrant and each of its directors and officers. Incorporated by reference to Exhibit 10.21 to the Company’s annual report on Form 10-K for the year ended December 31, 2000. (2) |
28
| | |
Exhibit | | Description |
| 10.10 | | Peet’s Operating Company, Inc. Key Employment Agreement for James E. Grimes, Vice President, Operations and Information Systems, dated as of June 24, 2002. Incorporated by reference to the Company’s annual report on Form 10-K for the year ended December 28, 2003. (2) |
| |
| 10.11 | | Peet’s Coffee & Tea, Inc. Key Employment Agreement for Patrick J. O’Dea, Chief Executive Officer, dated as of May 6, 2002. Incorporated by reference to Exhibit 10.17 to the Company’s quarterly report on Form 10-Q for the quarter ended June 30, 2002. (2) |
| |
| 10.12 | | Peet’s Coffee & Tea, Inc. Amended and Restated 2000 Non-Employee Director Stock Option Plan as amended and restated March 3, 2008 and Form of Stock Option Agreement. (1) |
| |
| 10.13 | | Peet’s Coffee & Tea, Inc. Key Employment Agreement for Thomas P. Cawley, Chief Financial Officer, dated as of June 25, 2003. Incorporated by reference to Exhibit 10.17 to the Company’s quarterly report on Form 10-Q for the quarter ended September 28, 2003. (2) |
| |
| 10.14 | | Nonqualified Deferred Compensation Plan dated December 1, 2003. Incorporated by reference to Exhibit 10.30 to the Company’s quarterly report on Form 10-Q for the quarter ended March 28, 2004. (2) |
| |
| 10.15 | | Agreement for Purchase and Sale of Property, dated as of November 29, 2005, by the Company and Harbor Bay Acquisition LLC.* |
| |
| 21.1 | | Subsidiaries of the registrant.* |
| |
| 23.1 | | Consent of Deloitte & Touche LLP. |
| |
| 31.1 | | Certification of the Company’s Chief Executive Officer, Patrick J. O’Dea, pursuant to Rule 13a-14(a) under the Securities Exchange Act of 1934, as amended. |
| |
| 31.2 | | Certification of the Company’s Chief Financial Officer, Thomas P. Cawley, pursuant to Rule 13a-14(a) under the Securities Exchange Act of 1934, as amended. |
| |
| 32.1 | | Certification of the Company’s Chief Executive Officer, Patrick J. O’Dea, pursuant to Section 906 of Sarbanes-Oxley Act of 2002. |
| |
| 32.2 | | Certification of the Company’s Chief Financial Officer, Thomas P. Cawley, pursuant to Section 906 of Sarbanes-Oxley Act of 2002. |
| * | Incorporated by reference to the Registrant’s Information Statement on Form S-1 (File No. 333-47957) filed on October 13, 2000, as subsequently amended. |
| (1) | Compensatory plan or arrangement. |
29
SIGNATURES
Pursuant to the requirements of Section 13 or 15(d) of the Securities Exchange Act of 1934, the registrant has duly caused this report to be signed on its behalf by the undersigned, thereunto duly authorized.
| | | | | | | | |
Date: March 12, 2008 | | | | PEET’S COFFEE & TEA, INC. |
| | | | |
| | | | | | By: | | /S/ PATRICK J. O’DEA |
| | | | | | | | Patrick J. O’Dea President and Chief Executive Officer |
POWER OF ATTORNEY
KNOW ALL PERSONS BY THESE PRESENTS, that each person whose signature appears below constitutes and appoints Patrick J. O’Dea and Thomas P. Cawley and each of them, as his true and lawful attorneys-in-fact and agents, with full power of substitution and resubstitution, for him and in his name, place, and stead, in any and all capacities, to sign any and all amendments to this report and to file the same, with all granting unto said attorneys-in-fact and agents, and each of them, full power and authority to do and perform each and every act and thing requisite and necessary to be done in connection therewith, as fully to all intents and purposes as he might or could do in person, hereby ratifying and confirming all that said attorneys-in-fact and agents, or any of them, or their or his substitute or substitutes, may lawfully do or cause to be done by virtue hereof.
Pursuant to the requirements of the Securities Exchange Act of 1934, this report has been signed below by the following persons on behalf of the registrant and in the capacities and on the dates indicated.
| | | | |
Signature | | Title | | Date |
| | |
/S/ PATRICK J. O’DEA Patrick J. O’Dea | | President, Chief Executive Officer and Director (Principal Executive Officer) | | March 12, 2008 |
| | |
/S/ THOMAS P. CAWLEY Thomas P. Cawley | | Vice President, Chief Financial Officer and Secretary (Principal Financial and Accounting Officer) | | March 12, 2008 |
| | |
/S/ JEAN-MICHEL VALETTE Jean-Michel Valette | | Chairman | | March 12, 2008 |
| | |
/S/ GERALD BALDWIN Gerald Baldwin | | Director | | March 12, 2008 |
| | |
/S/ HILARY BILLINGS Hilary Billings | | Director | | March 12, 2008 |
| | |
/S/ GORDON A. BOWKER Gordon A. Bowker | | Director | | March 12, 2008 |
| | |
/S/ DAVID DENO David Deno | | Director | | March 12, 2008 |
| | |
/S/ MICHAEL LINTON Michael Linton | | Director | | March 12, 2008 |
| | |
/S/ ELIZABETH SARTAIN Elizabeth Sartain | | Director | | March 12, 2008 |
30
INDEX TO CONSOLIDATED FINANCIAL STATEMENTS
| | |
| | | Page |
Report of Independent Registered Public Accounting Firm | | F-2 |
| |
Consolidated Balance Sheets as of December 30, 2007 and December 31, 2006 | | F-3 |
| |
Consolidated Statements of Income for the Years Ended December 30, 2007, December 31, 2006, and January 1, 2006 | | F-4 |
| |
Consolidated Statements of Shareholders’ Equity for the Years Ended December 30, 2007, December 31, 2006, and January 1, 2006 | | F-5 |
| |
Consolidated Statements of Cash Flows for the Years December 30, 2007, December 31, 2006, and January 1, 2006 | | F-6 |
| |
Notes to Consolidated Financial Statements | | F-7 |
F-1
REPORT OF INDEPENDENT REGISTERED PUBLIC ACCOUNTING FIRM
Board of Directors and Shareholders of Peet’s Coffee & Tea, Inc.:
We have audited the accompanying consolidated balance sheets of Peet’s Coffee & Tea, Inc. and subsidiaries (the “Company”) as of December 30, 2007 and December 31, 2006, and the related consolidated statements of income, shareholders’ equity, and cash flows for each of the three fiscal years in the period ended December 30, 2007. We also have audited the Company’s internal control over financial reporting as of December 30, 2007, based on criteria established inInternal Control—Integrated Framework issued by the Committee of Sponsoring Organizations of the Treadway Commission. The Company’s management is responsible for these financial statements, for maintaining effective internal control over financial reporting, and for its assessment of the effectiveness of internal control over financial reporting, included in the accompanying “Management’s Report on Internal Control over Financial Reporting”. Our responsibility is to express an opinion on these financial statements and an opinion on the Company’s internal control over financial reporting based on our audits.
We conducted our audits in accordance with the standards of the Public Company Accounting Oversight Board (United States). Those standards require that we plan and perform the audit to obtain reasonable assurance about whether the financial statements are free of material misstatement and whether effective internal control over financial reporting was maintained in all material respects. Our audits of the financial statements included examining, on a test basis, evidence supporting the amounts and disclosures in the financial statements, assessing the accounting principles used and significant estimates made by management, and evaluating the overall financial statement presentation. Our audit of internal control over financial reporting included obtaining an understanding of internal control over financial reporting, assessing the risk that a material weakness exists, testing and evaluating the design and operating effectiveness of internal control based on the assessed risk. Our audits also included performing such other procedures as we considered necessary in the circumstances. We believe that our audits provide a reasonable basis for our opinions.
A company’s internal control over financial reporting is a process designed by, or under the supervision of, the company’s principal executive and principal financial officers, or persons performing similar functions, and effected by the company’s board of directors, management, and other personnel to provide reasonable assurance regarding the reliability of financial reporting and the preparation of financial statements for external purposes in accordance with generally accepted accounting principles. A company’s internal control over financial reporting includes those policies and procedures that (1) pertain to the maintenance of records that, in reasonable detail, accurately and fairly reflect the transactions and dispositions of the assets of the company; (2) provide reasonable assurance that transactions are recorded as necessary to permit preparation of financial statements in accordance with generally accepted accounting principles and that receipts and expenditures of the company are being made only in accordance with authorizations of management and directors of the company; and (3) provide reasonable assurance regarding prevention or timely detection of unauthorized acquisition, use, or disposition of the company’s assets that could have a material effect on the financial statements.
Because of the inherent limitations of internal control over financial reporting, including the possibility of collusion or improper management override of controls, material misstatements due to error or fraud may not be prevented or detected on a timely basis. Also, projections of any evaluation of the effectiveness of the internal control over financial reporting to future periods are subject to the risk that the controls may become inadequate because of changes in conditions, or that the degree of compliance with the policies or procedures may deteriorate.
In our opinion, the consolidated financial statements referred to above present fairly, in all material respects, the financial position of Peet’s Coffee & Tea, Inc. and subsidiaries as of December 30, 2007 and December 31, 2006, and the results of their operations and their cash flows for each of the three fiscal years in the period ended December 30, 2007, in conformity with accounting principles generally accepted in the United States of America. Also, in our opinion, the Company maintained, in all material respects, effective internal control over financial reporting as of December 30, 2007, based on the criteria established inInternal Control—Integrated Framework issued by the Committee of Sponsoring Organizations of the Treadway Commission.
As discussed in Note 1 to the consolidated financial statements, the Company adopted Financial Accounting Standards No. 123(R), “Share-Based Payment,”on January 2, 2006. As discussed in Note 5 to the consolidated financial statements, the Company adopted FASB Interpretation No. 48, “Accounting for Uncertainty in Income Taxes,” on January 1, 2007.
/s/ DELOITTE & TOUCHE LLP
San Francisco, California
March 12, 2008
F-2
PART I—FINANCIAL INFORMATION
| ITEM 1. | FINANCIAL STATEMENTS |
PEET’S COFFEE & TEA, INC.
CONSOLIDATED BALANCE SHEETS
(In thousands, except share amounts)
| | | | | | | |
| | | December 30,
2007 | | December 31,
2006 | |
ASSETS | | | | | | | |
Current assets | | | | | | | |
Cash and cash equivalents | | $ | 15,312 | | $ | 7,692 | |
Short-term marketable securities | | | 7,932 | | | 19,511 | |
Accounts receivable, net | | | 8,287 | | | 6,838 | |
Inventories | | | 24,483 | | | 19,533 | |
Deferred income taxes—current | | | 2,950 | | | 1,888 | |
Prepaid expenses and other | | | 4,285 | | | 3,852 | |
| | | | | | | |
Total current assets | | | 63,249 | | | 59,314 | |
Long-term marketable securities | | | 7,831 | | | 5,989 | |
Property, plant and equipment, net | | | 99,231 | | | 82,447 | |
Deferred income taxes—non current | | | 3,353 | | | 1,315 | |
Other assets, net | | | 3,883 | | | 3,940 | |
| | | | | | | |
Total assets | | $ | 177,547 | | $ | 153,005 | |
| | | | | | | |
LIABILITIES AND SHAREHOLDERS’ EQUITY | | | | | | | |
Current liabilities | | | | | | | |
Accounts payable and other accrued liabilities | | $ | 10,104 | | $ | 11,046 | |
Accrued compensation and benefits | | | 8,909 | | | 6,389 | |
Deferred revenue | | | 5,856 | | | 4,625 | |
| | | | | | | |
Total current liabilities | | | 24,869 | | | 22,060 | |
Deferred lease credits and other long-term liabilities | | | 5,425 | | | 3,506 | |
| | | | | | | |
Total liabilities | | | 30,294 | | | 25,566 | |
Shareholders’ equity | | | | | | | |
Common stock, no par value; authorized 50,000,000 shares; issued and outstanding: 13,932,000 and 13,516,000 shares | | | 104,616 | | | 93,246 | |
Accumulated other comprehensive income (loss) | | | 52 | | | (15 | ) |
Retained earnings | | | 42,585 | | | 34,208 | |
| | | | | | | |
Total shareholders’ equity | | | 147,253 | | | 127,439 | |
| | | | | | | |
Total liabilities and shareholders’ equity | | $ | 177,547 | | $ | 153,005 | |
| | | | | | | |
See notes to consolidated financial statements.
F-3
PEET’S COFFEE & TEA, INC.
CONSOLIDATED STATEMENTS OF INCOME
(In thousands, except per share amounts)
| | | | | | | | | |
| | | 2007 | | 2006 | | 2005 |
Retail stores | | $ | 168,392 | | $ | 141,377 | | $ | 118,030 |
Specialty sales | | | 80,997 | | | 69,116 | | | 57,168 |
| | | | | | | | | |
Net revenue | | | 249,389 | | | 210,493 | | | 175,198 |
Cost of sales and related occupancy expenses | | | 118,389 | | | 98,928 | | | 80,837 |
Operating expenses | | | 85,800 | | | 72,272 | | | 57,879 |
General and administrative expenses | | | 22,682 | | | 20,634 | | | 13,341 |
Depreciation and amortization expenses | | | 10,912 | | | 8,609 | | | 7,293 |
| | | | | | | | | |
Total costs and expenses from operations | | | 237,783 | | | 200,443 | | | 159,350 |
| | | | | | | | | |
Income from operations | | | 11,606 | | | 10,050 | | | 15,848 |
Interest income | | | 1,446 | | | 2,456 | | | 1,769 |
| | | | | | | | | |
Income before income taxes | | | 13,052 | | | 12,506 | | | 17,617 |
Income tax provision | | | 4,675 | | | 4,690 | | | 6,842 |
| | | | | | | | | |
Net income | | $ | 8,377 | | $ | 7,816 | | $ | 10,775 |
| | | | | | | | | |
Net income per share: | | | | | | | | | |
Basic | | $ | 0.61 | | $ | 0.57 | | $ | 0.78 |
Diluted | | $ | 0.59 | | $ | 0.55 | | $ | 0.74 |
Shares used in calculation of net income per share: | | | | | | | | | |
Basic | | | 13,724 | | | 13,733 | | | 13,801 |
Diluted | | | 14,120 | | | 14,202 | | | 14,469 |
See notes to consolidated financial statements.
F-4
PEET’S COFFEE & TEA, INC.
CONSOLIDATED STATEMENTS OF SHAREHOLDERS’ EQUITY
(In thousands)
| | | | | | | | | | | | | | | | | | | | | |
| | | Common Stock | | | Retained
Earnings | | Accumulated Other
Comprehensive
Income/ (Loss) | | | Total
Shareholders’
Equity | | | Comprehensive
Income |
| | Shares
Outstanding | | | Amount | | | | | |
Balance at January 2, 2005 | | 13,500 | | | $ | 94,440 | | | $ | 15,617 | | $ | (152 | ) | | $ | 109,905 | | | | |
Stock options exercised, including tax benefit | | 536 | | | | 9,991 | | | | | | | | | | | 9,991 | | | | |
Stock sold in Employee Stock Purchase Program | | 40 | | | | 1,019 | | | | | | | | | | | 1,019 | | | | |
Stock-based compensation | | | | | | 44 | | | | | | | | | | | 44 | | | | |
Stock purchased in accordance with share purchase program | | (174 | ) | | | (4,932 | ) | | | | | | | | | | (4,932 | ) | | | |
Net unrealized gain on marketable securities, net of tax of $48 | | | | | | | | | | | | | 76 | | | | 76 | | | $ | 76 |
Net income | | | | | | | | | | 10,775 | | | | | | | 10,775 | | | | 10,775 |
| | | | | | | | | | | | | | | | | | | | | |
Balance at January 1, 2006 | | 13,902 | | | $ | 100,562 | | | $ | 26,392 | | $ | (76 | ) | | $ | 126,878 | | | $ | 10,851 |
| | | | | | | | | | | | | | | | | | | | | |
Stock options exercised, including tax benefit | | 160 | | | | 3,531 | | | | | | | | | | | 3,531 | | | | |
Stock sold in Employee Stock Purchase Program | | 44 | | | | 1,065 | | | | | | | | | | | 1,065 | | | | |
Stock-based compensation | | | | | | 4,022 | | | | | | | | | | | 4,022 | | | | |
Stock purchased in accordance with share purchase program | | (590 | ) | | | (15,934 | ) | | | | | | | | | | (15,934 | ) | | | |
Net unrealized gain on marketable securities, net of tax of $59 | | | | | | | | | | | | | 61 | | | | 61 | | | $ | 61 |
Net income | | | | | | | | | | 7,816 | | | | | | | 7,816 | | | | 7,816 |
| | | | | | | | | | | | | | | | | | | | | |
Balance at December 31, 2006 | | 13,516 | | | $ | 93,246 | | | $ | 34,208 | | $ | (15 | ) | | $ | 127,439 | | | $ | 7,877 |
| | | | | | | | | | | | | | | | | | | | | |
Stock options exercised, including tax benefit | | 391 | | | | 8,026 | | | | | | | | | | | 8,026 | | | | |
Stock sold in Employee Stock Purchase Program | | 25 | | | | 530 | | | | | | | | | | | 530 | | | | |
Stock-based compensation | | | | | | 2,814 | | | | | | | | | | | 2,814 | | | | |
Net unrealized gain on marketable securities, net of tax of $46 | | | | | | | | | | | | | 67 | | | | 67 | | | $ | 67 |
Net income | | | | | | | | | | 8,377 | | | | | | | 8,377 | | | | 8,377 |
| | | | | | | | | | | | | | | | | | | | | |
Balance at December 30, 2007 | | 13,932 | | | $ | 104,616 | | | $ | 42,585 | | $ | 52 | | | $ | 147,253 | | | $ | 16,321 |
| | | | | | | | | | | | | | | | | | | | | |
See notes to consolidated financial statements.
F-5
PEET’S COFFEE & TEA, INC.
CONSOLIDATED STATEMENTS OF CASH FLOWS
(In thousands)
| | | | | | | | | | | | |
| | | 2007 | | | 2006 | | | 2005 | |
Cash flows from operating activities: | | | | | | | | | | | | |
Net income | | $ | 8,377 | | | $ | 7,816 | | | $ | 10,775 | |
Adjustments to reconcile net income to net cash provided by
operating activities: | | | | | | | | | | | | |
Depreciation and amortization | | | 12,861 | | | | 10,244 | | | | 8,643 | |
Amortization of interest purchased | | | 242 | | | | 415 | | | | 139 | |
Stock-based compensation | | | 2,814 | | | | 4,022 | | | | 44 | |
Excess tax benefit from exercise of stock options | | | (1,350 | ) | | | (724 | ) | | | — | |
Tax benefit from exercise of stock options | | | 1,234 | | | | 708 | | | | 3,262 | |
Loss on disposition of assets and asset impairment | | | 494 | | | | 288 | | | | 437 | |
Deferred income taxes | | | (3,100 | ) | | | (3,495 | ) | | | 908 | |
Changes in other assets and liabilities: | | | | | | | | | | | | |
Accounts receivable, net | | | (1,449 | ) | | | (1,686 | ) | | | (1,016 | ) |
Inventories | | | (4,950 | ) | | | (2,532 | ) | | | (3,708 | ) |
Prepaid expenses and other current assets | | | (433 | ) | | | (480 | ) | | | (1,092 | ) |
Other assets, net | | | (45 | ) | | | (244 | ) | | | (373 | ) |
Accounts payable, accrued liabilities and deferred revenue | | | 3,519 | | | | 2,473 | | | | 1,129 | |
Deferred lease credits and other long-term liabilities | | | 1,919 | | | | 969 | | | | 355 | |
| | | | | | | | | | | | |
Net cash provided by operating activities | | | 20,133 | | | | 17,774 | | | | 19,503 | |
| | | | | | | | | | | | |
Cash flows from investing activities: | | | | | | | | | | | | |
Purchases of property and equipment | | | (30,824 | ) | | | (44,443 | ) | | | (14,020 | ) |
Proceeds from sales of property and equipment | | | 23 | | | | 28 | | | | 104 | |
Changes in restricted investments | | | — | | | | 1,500 | | | | (1,750 | ) |
Proceeds from sales and maturities of marketable securities | | | 31,304 | | | | 49,888 | | | | 89,154 | |
Purchases of marketable securities | | | (21,688 | ) | | | (26,356 | ) | | | (86,444 | ) |
| | | | | | | | | | | | |
Net cash used in investing activities | | | (21,185 | ) | | | (19,383 | ) | | | (12,956 | ) |
| | | | | | | | | | | | |
Cash flows from financing activities: | | | | | | | | | | | | |
Net proceeds from issuance of common stock | | | 7,322 | | | | 3,888 | | | | 7,748 | |
Purchase of common stock | | | — | | | | (15,934 | ) | | | (4,932 | ) |
Excess tax benefit from exercise of stock options | | | 1,350 | | | | 724 | | | | — | |
Bank overdrafts | | | — | | | | — | | | | (96 | ) |
| | | | | | | | | | | | |
Net cash provided by (used in) financing activities | | | 8,672 | | | | (11,322 | ) | | | 2,720 | |
| | | | | | | | | | | | |
Increase (decrease) in cash and cash equivalents | | | 7,620 | | | | (12,931 | ) | | | 9,267 | |
Cash and cash equivalents, beginning of period | | | 7,692 | | | | 20,623 | | | | 11,356 | |
| | | | | | | | | | | | |
Cash and cash equivalents, end of period | | $ | 15,312 | | | $ | 7,692 | | | $ | 20,623 | |
| | | | | | | | | | | | |
| | | |
Non-cash investing activities: | | | | | | | | | | | | |
Capital expenditures incurred, but not yet paid | | $ | 1,995 | | | $ | 2,751 | | | $ | 756 | |
Other cash flow information: | | | | | | | | | | | | |
Cash paid for income taxes | | | 6,761 | | | | 7,890 | | | | 3,146 | |
| | | | | | | | | | | | |
See notes to consolidated financial statements.
F-6
PEET’S COFFEE & TEA, INC.
NOTES TO CONSOLIDATED FINANCIAL STATEMENTS
1. Summary of Significant Accounting Policies
Organization
Peet’s Coffee & Tea, Inc., a Washington corporation (the “Company”), sells fresh roasted coffee, hand selected tea, and related merchandise in several distribution channels, including grocery, home delivery, foodservice and office accounts and company-operated retail stores. At December 30, 2007 and December 31, 2006, the Company operated 166 and 136 retail stores, respectively, in California, Colorado, Illinois, Oregon, Massachusetts and Washington.
Principles of Consolidation—The consolidated financial statements include the accounts of the Company and its subsidiaries. All intercompany transactions have been eliminated in consolidation.
Year End—The Company’s fiscal year end is the Sunday closest to December 31. The fiscal years ended December 30, 2007, December 31, 2006, and January 1, 2006 included 52 weeks.
Use of Estimates—The preparation of financial statements in conformity with accounting principles generally accepted in the United States of America (“GAAP”) requires management to make estimates and assumptions that affect the reported amounts of assets and liabilities and disclosures of contingent assets and liabilities at the date of the financial statements and the reported amounts of revenues and expenses during the reporting period. Actual results could differ from those estimates.
Cash and Cash Equivalents—The Company considers all liquid investments with original maturities of three months or less to be cash equivalents.
Inventories—Raw materials consist primarily of green coffee beans. Finished goods include roasted coffee, tea, accessory products, spices, and packaged foods. All products are valued at the lower of cost or market using the first-in, first-out method, except green bean and roasted coffee, which are valued at the average cost.
Property, plant and equipment—Property, plant and equipment are stated at cost. Depreciation and amortization are recorded on the straight-line method over the estimated useful lives of the property and equipment, which range from 3 to 40 years. Leasehold improvements are amortized using the straight-line method over the lesser of the estimated useful life or the term of the related lease, consistent with the period used for recognizing rent expense and deferred lease credits, which range from 5 to 10 years. Repairs and maintenance costs are expensed as incurred.
Intangible and other assets—Intangible and other assets include lease rights, contract acquisition costs, deposits, and restricted cash. Lease rights represent payments made to lessors and others to secure retail locations and are amortized on the straight-line method over the life of the related lease from 5 to 10 years. The cost of intangible assets, primarily lease rights, subject to amortization was $1,066,000 at December 30, 2007 and December 31, 2006. The related accumulated amortization was $802,000 and $708,000 at December 30, 2007 and December 31, 2006, respectively. Amortization expense for 2007, 2006, and 2005 was $94,000, $121,000, and $135,000, respectively. Future amortization expense for 2008 through 2012 is estimated at $87,000, $83,000, $33,000, $15,000 and $11,000, respectively.
Restricted cash of $3,239,000 and $3,085,000 as of December 30, 2007 and December 31, 2006, respectively, represents collateral for the Company’s high deductible workers’ compensation policy and is classified in intangible and other assets, net on the consolidated balance sheets.
F-7
PEET’S COFFEE & TEA, INC.
NOTES TO CONSOLIDATED FINANCIAL STATEMENTS—(Continued)
Investments—Marketable securities are classified as available-for-sale and are recorded at fair value. Any unrealized gains and losses are recorded in other comprehensive income. Gains and losses are due to fluctuations in interest rates and are considered temporary impairments as management has the intent and ability to hold the securities to recovery.
Impairment of Long-Lived Assets—When facts and circumstances indicate that the carrying of long-lived assets may be impaired, an evaluation of recoverability is performed by comparing the carrying values of the assets to projected future cash flows in addition to other quantitative and qualitative analyses. Upon indication that the carrying values of such assets may not be recoverable, the Company recognizes an impairment loss by a charge against current operations for an amount equal to the difference between the carrying value and the assets’ fair value. The fair value of the retail net asset is estimated using the discounted cash flows of the assets. Property, plant and equipment assets are grouped at the lowest level for which there are identifiable cash flows when assessing impairment. Cash flows for retail net assets are identified at the individual store level. Impairment losses for underperforming stores of $460,000, $0 and $311,000 were recorded during 2007, 2006, and 2005, respectively, which were classified as operating expenses on the consolidated statements of income.
Accrued Compensation and Benefits—The Company records an estimated liability for the self-insured portion of workers’ compensation claims. The liability is determined based on information received from the Company’s insurance adjuster including claims paid, filed and reserved for, as well as using historical experience and other actuarial assumptions. As of December 30, 2007 and December 31, 2006, the Company had $3,067,000 and $2,616,000, respectively, accrued for workers’ compensation.
Revenue Recognition—Net revenue is recognized at the point of sale at our Company-operated retail stores. Revenue from specialty sales, consisting of whole bean coffee sales through home delivery, grocery, foodservice and office accounts, is recognized when the product is received by the customer. Revenue from stored value cards, gift certificates and home delivery advanced payments is recognized upon redemption or receipt of product by the customer. Cash received in advance of product delivery is recorded in deferred revenue on the accompanying consolidated balance sheets. All revenues are recognized net of any discounts. Net revenue is presented net of any taxes collected from customers and remitted to government entities. Net revenue includes an allowance for grocery sales returns for coffee exceeding our freshness standards based on historical experience and current trends. The Company establishes an allowance for estimated doubtful accounts based on historical experience and current trends.
A summary of the allowance for doubtful accounts is as follows (in thousands):
| | | | | | | | | | | | | |
| | | Balance at
Beginning
of Year | | Additions
Charged to
Expense | | Write-offs
and Other | | | Balance
at end
of Year |
Allowance for doubtful accounts: | | | | | | | | | | | | | |
Year ended December 30, 2007 | | $ | 67 | | $ | 7 | | $ | (2 | ) | | $ | 72 |
Year ended December 31, 2006 | | | 145 | | | — | | | (78 | ) | | | 67 |
Year ended January 1, 2006 | | | 89 | | | 57 | | | (1 | ) | | | 145 |
The Company records shipping revenue in net revenue. The Company recorded shipping revenue of $2,718,000, $2,532,000, and $2,090,000 related to home delivery sales in 2007, 2006, and 2005, respectively.
Cost of sales and related occupancy expenses—Cost of sales and related occupancy expenses consist primarily of coffee and other product costs. It also includes plant manufacturing (including depreciation), freight and distribution costs. Occupancy expenses include rent and related expenses such as utilities.
F-8
PEET’S COFFEE & TEA, INC.
NOTES TO CONSOLIDATED FINANCIAL STATEMENTS—(Continued)
Operating expenses—Operating expenses consist of both retail store and specialty operating costs, such as employee labor and benefits, repairs and maintenance, supplies, training, travel and banking and card processing fees.
Preopening costs—Costs incurred in connection with the start-up and promotion of new store openings are expensed as incurred.
Fair Value of Financial Instruments—The carrying value of cash and equivalents, receivables and accounts payable approximates fair value. Marketable securities are recorded at fair value.
Advertising costs—Advertising costs are expensed as incurred. Advertising expense was $4,260,000, $4,543,000, and $3,748,000 in 2007, 2006, and 2005, respectively.
Operating leases—Certain of the Company’s lease agreements provide for tenant improvement allowances, rent holidays, scheduled rent increases and/or contingent rent provisions during the term of the lease. For purposes of recognizing incentives and minimum rental expenses, rent is expensed on a straight-line basis, and the Company records the difference between the recognized rental expense and accounts payable under the lease to deferred lease credits and other long-term liabilities, over the lease term, which may or may not coincide with the commencement of the lease. Tenant improvement allowances are amortized as a reduction in rent expense over the term of the lease. If the original lease term is less than the Company’s anticipated rental period, one or more stated option terms are included in the straight-line computation. Certain leases provide for contingent rents, which are determined as a percentage of gross sales in excess of specified levels. The Company records a contingent rent liability in accounts payable on the consolidated balance sheets and the corresponding rent expense when specified levels have been achieved or when management determines that achieving the specified levels during the fiscal year is probable.
Gift Cards—The Company sells gift cards in its retail stores and through its web site. Our gift cards do not have an expiration date. We recognize income from gift cards when the likelihood of the gift card being redeemed by the customer is remote (gift card breakage) and we determine that we do not have a legal obligation to remit the unredeemed gift cards to the relevant jurisdictions. We determine the gift card breakage rate based upon our historical redemption patterns. We apply an estimated gift card breakage rate after the card has been dormant for 24 months, when based on historical information, we determine the likelihood of redemption becomes remote. Gift card breakage income of $332,000, $206,000, and $217,000 in 2007, 2006, and 2005, respectively, is included in operating expenses in the consolidated statements of income.
Income Taxes—Income taxes are accounted for using the asset and liability method, under which deferred tax assets and liabilities are determined based on the difference between the financial statements and tax bases of assets and liabilities using enacted tax rates currently in effect.
Stock-Based Compensation—On January 2, 2006, the Company adopted the fair value recognition provisions of Statement of Financial Accounting Standards No. 123(R), “Share-Based Payment,” (“SFAS 123(R)”), using the modified-prospective-transition method. The fair value of each stock award is estimated on the grant date using the Black-Scholes option-pricing model based on assumptions for volatility, risk-free interest rates, expected life of the option, and dividends (if any). Such amounts have been reduced by the Company’s estimate of forfeitures of all unvested awards. The expected term of the options represents the estimated period of time from date of option grant until exercise and is based on historical experience of similar awards, giving consideration to the contractual terms, vesting schedules and expectations of future employee behavior. For grants prior to July 3, 2006 expected stock price volatility was estimated using only the historical volatility of the Company’s stock. Beginning with the period ended October 1, 2006, expected stock price volatility is based on a
F-9
PEET’S COFFEE & TEA, INC.
NOTES TO CONSOLIDATED FINANCIAL STATEMENTS—(Continued)
combination of historical volatility and the implied volatility of the Company’s traded options. The risk-free interest rate is based on the implied yield available on U.S. Treasury zero-coupon issues with an equivalent term. The Company has not paid dividends in the past and does not plan to pay dividends in the near future. Additional disclosure requirements of SFAS 123(R) are set forth in Note 8, “Stock Options, Employee Purchase and Deferred Compensation Plans”.
Stock-based compensation expense recognized in the consolidated statements of income related to stock options was $2,814,000, $4,022,000, and $44,000 for 2007, 2006 and 2005, respectively. The related total tax benefit was $1,147,000, $1,641,000, and $19,000 for 2007, 2006 and 2005, respectively. Stock-based compensation expense was recognized as follows in the consolidated statements of income (in thousands):
| | | | | | | | | |
| | | 2007 | | 2006 | | 2005 |
Cost of sales and related occupancy expenses | | $ | 234 | | $ | 466 | | $ | 2 |
Operating expenses | | | 986 | | | 1,292 | | | 19 |
General and administrative expenses | | | 1,594 | | | 2,264 | | | 23 |
| | | | | | | | | |
Total | | $ | 2,814 | | $ | 4,022 | | $ | 44 |
| | | | | | | | | |
Prior to January 1, 2006, the Company accounted for stock-based awards to employees and non-employee directors using the intrinsic value method in accordance with Accounting Principles Board, (APB) No. 25, “Accounting for Stock Issued to Employees”. The following table shows the effect on net income and net income per share for 2005 had compensation cost been recognized based upon the estimated fair value on the grant date of stock options and ESPP awards (in thousands, except net income per share):
| | | | |
| | | 2005 | |
Net income—as reported | | $ | 10,775 | |
Stock-based employee compensation included in reported net income, net of tax | | | 25 | |
Stock-based compensation expense determined under fair value based method, net of tax | | | (4,085 | ) |
| | | | |
Net income—pro forma | | $ | 6,715 | |
| | | | |
Basic net income per share—as reported | | $ | 0.78 | |
Basic net income per share—pro forma | | $ | 0.49 | |
Diluted net income per share—as reported | | $ | 0.74 | |
Diluted net income per share—pro forma | | $ | 0.46 | |
The fair value of each option grant and ESPP award is estimated on the date of grant using the Black-Scholes option-pricing model with the following assumptions:
| | | | | | | | | | | | | | | | | | | | | | | | |
| | | Stock Options | | | ESPP | |
| | | 2007 | | | 2006 | | | 2005 | | | 2007 | | | 2006 | | | 2005 | |
Expected term (in years) | | | 5.5 | | | | 5.4 | | | | 3.8 | | | | 0.5 | | | | 0.5 | | | | 0.5 | |
Expected stock price volatility | | | 30.1 | % | | | 34.1 | % | | | 37.8 | % | | | 25.1 | % | | | 27.8 | % | | | 26.6 | % |
Risk-free interest rate | | | 4.7 | % | | | 5.0 | % | | | 3.9 | % | | | 4.9 | % | | | 5.0 | % | | | 3.3 | % |
Expected dividend yield | | | 0 | % | | | 0 | % | | | 0 | % | | | 0 | % | | | 0 | % | | | 0 | % |
Estimated fair value per option granted | | $ | 9.92 | | | $ | 11.83 | | | $ | 9.03 | | | $ | 5.86 | | | $ | 7.16 | | | $ | 6.86 | |
Net Income per Share—Basic net income per share is computed as net income divided by the weighted average number of common shares outstanding for the period. Diluted net income per share reflects the potential dilution that could occur from common shares issued through stock options. Anti-dilutive shares of 841,277, 578,424, and 28,828 have been excluded from diluted weighted average shares outstanding in 2007, 2006, and 2005, respectively.
F-10
PEET’S COFFEE & TEA, INC.
NOTES TO CONSOLIDATED FINANCIAL STATEMENTS—(Continued)
The number of incremental shares from the assumed exercise of stock options was calculated by applying the treasury stock method. The following table summarizes the differences between basic weighted average shares outstanding and diluted weighted average shares outstanding used to compute diluted net income per share (in thousands):
| | | | | | |
| | | 2007 | | 2006 | | 2005 |
Basic weighted average shares outstanding | | 13,724 | | 13,733 | | 13,801 |
Incremental shares from assumed exercise of stock options | | 396 | | 469 | | 668 |
| | | | | | |
Diluted weighted average shares outstanding | | 14,120 | | 14,202 | | 14,469 |
| | | | | | |
Recently Issued Accounting Standards
In July 2006, the FASB issued Financial Interpretation No. 48, “Accounting for Uncertainty in Income Taxes”, an interpretation of FASB Statement No. 109, (“FIN 48”), which clarifies the accounting for uncertainty in tax positions. FIN 48 requires that the Company recognize in its financial statements the impact of a tax position, if that position is more likely than not of being sustained on audit, based on the technical merits of the position. The Company adopted the provisions of FIN 48 on January 1, 2007. See Note 5 for additional information.
In September 2006, the FASB issued SFAS No. 157, “Fair Value Measurements” (“SFAS 157”), which defines fair value, establishes a framework for measuring fair value in generally accepted accounting principles and expands disclosures about fair value measurements. SFAS 157 is effective for financial statements issued for fiscal years beginning after November 15, 2007, and interim periods within those fiscal years. Early adoption is permitted. The Company will adopt these new requirements beginning December 31, 2007. The Company does not believe the adoption of SFAS 157 will have a material effect on its financial position or results of operations.
In February 2007, the FASB issued SFAS No. 159, “The Fair Value Option for Financial Assets and Financial Liabilities—Including an amendment of FASB Statement No. 115” (“SFAS 159”). SFAS 159 permits entities to elect to measure financial instruments and certain other items at fair value. Upon adoption of SFAS 159, an entity may elect the fair value option for eligible items that exist at the adoption date. Subsequent to the initial adoption, the election of the fair value option can only be made at initial recognition of the asset or liability or upon a re-measurement event that gives rise to new-basis accounting. SFAS 159 is effective for fiscal years beginning after November 15, 2007. The Company does not believe the adoption of SFAS 159 will have a material effect on its financial position or results of operations.
2. Inventories
The Company’s inventories consist of the following at year end 2007 and 2006 (in thousands):
| | | | | | |
| | | 2007 | | 2006 |
Green coffee | | $ | 15,421 | | $ | 11,535 |
Other inventory | | | 9,062 | | | 7,998 |
| | | | | | |
Total | | $ | 24,483 | | $ | 19,533 |
| | | | | | |
F-11
PEET’S COFFEE & TEA, INC.
NOTES TO CONSOLIDATED FINANCIAL STATEMENTS—(Continued)
3. Property, Plant and Equipment
Property, plant and equipment consist of the following at year end 2007 and 2006 (in thousands):
| | | | | | | | |
| | | 2007 | | | 2006 | |
Leasehold improvements | | $ | 59,125 | | | $ | 46,791 | |
Furniture, fixtures and equipment | | | 61,472 | | | | 52,950 | |
Plant equipment | | | 17,729 | | | | 11,601 | |
Building | | | 13,949 | | | | 12,752 | |
Land | | | 8,902 | | | | 8,209 | |
Construction in progress | | | 6,334 | | | | 9,745 | |
| | | | | | | | |
Total | | | 167,511 | | | | 142,048 | |
Less: Accumulated depreciation | | | (68,280 | ) | | | (59,601 | ) |
| | | | | | | | |
Property, plant and equipment, net | | $ | 99,231 | | | $ | 82,447 | |
| | | | | | | | |
Depreciation expense was $12,767,000 in 2007, $10,128,000 in 2006 and $8,508,000 in 2005. Construction in progress includes retail stores under construction and related fixtures, manufacturing plant equipment, and other capital projects not yet placed in service.
4. Marketable Securities
At December 30, 2007 and December 31, 2006, the Company maintained marketable securities classified as available-for-sale as follows (in thousands):
| | | | | | | | | | |
| | | Amortized
Cost | | Gross Unrealized
Holding Gains (Losses) | | | Fair
Value |
December 30, 2007 | | | | | | | | | | |
U.S. government and agency obligations | | $ | 1,000 | | $ | — | | | $ | 1,000 |
State and local government obligations | | | 6,911 | | | 21 | | | | 6,932 |
| | | | | | | | | | |
Total marketable securities—short-term | | $ | 7,911 | | $ | 21 | | | $ | 7,932 |
| | | | | | | | | | |
State and local government obligations | | $ | 7,765 | | $ | 66 | | | $ | 7,831 |
| | | | | | | | | | |
Total marketable securities—long-term | | $ | 7,765 | | $ | 66 | | | $ | 7,831 |
| | | | | | | | | | |
| | | |
| | | Amortized
Cost | | Gross Unrealized
Holding Gains (Losses) | | | Fair
Value |
| | | |
December 31, 2006 | | | | | | | | | | |
U.S. government and agency obligations | | $ | 3,000 | | $ | (7 | ) | | $ | 2,993 |
State and local government obligations | | | 16,534 | | | (16 | ) | | | 16,518 |
| | | | | | | | | | |
Total marketable securities—short-term | | $ | 19,534 | | $ | (23 | ) | | $ | 19,511 |
| | | | | | | | | | |
U.S. government and agency obligations | | $ | 6,000 | | $ | (11 | ) | | $ | 5,989 |
| | | | | | | | | | |
Total marketable securities—long-term | | $ | 6,000 | | $ | (11 | ) | | $ | 5,989 |
| | | | | | | | | | |
Gross unrealized holding gains at December 30, 2007 are due to fluctuations in interest rates. At December 30, 2007, all long-term marketable securities have maturities ranging from one to two years.
F-12
PEET’S COFFEE & TEA, INC.
NOTES TO CONSOLIDATED FINANCIAL STATEMENTS—(Continued)
During 2007 and 2006, the Company sold available-for-sale securities for net proceeds from marketable securities of $31,304,000 and $49,888,000, respectively with no realized gains. Realized gains and losses are determined on the specific identification method. For the year ended December 30, 2007, the Company had unrealized gains $67,000 (net of $46,000 tax) and for the year ended December 31, 2006, the Company had unrealized gains of $61,000 (net of $59,000 tax), included in accumulated other comprehensive income.
5. Income Taxes
The income tax provision consists of the following (in thousands):
| | | | | | | | | | | | |
| | | 2007 | | | 2006 | | | 2005 | |
Current: | | | | | | | | | | | | |
Federal | | $ | 5,993 | | | $ | 6,639 | | | $ | 4,464 | |
State | | | 1,922 | | | | 1,662 | | | | 1,567 | |
| | | | | | | | | | | | |
Total | | | 7,915 | | | | 8,301 | | | | 6,031 | |
| | | | | | | | | | | | |
Deferred: | | | | | | | | | | | | |
Federal | | | (2,648 | ) | | | (3,266 | ) | | | 908 | |
State | | | (592 | ) | | | (345 | ) | | | (97 | ) |
| | | | | | | | | | | | |
Total | | | (3,240 | ) | | | (3,611 | ) | | | 811 | |
| | | | | | | | | | | | |
Total | | $ | 4,675 | | | $ | 4,690 | | | $ | 6,842 | |
| | | | | | | | | | | | |
The difference between the effective income tax rate and the United States federal income tax rate is summarized as follows:
| | | | | | | | | |
| | | 2007 | | | 2006 | | | 2005 | |
Statutory Federal rate | | 35.0 | % | | 35.0 | % | | 35.0 | % |
State income taxes less federal benefit | | 5.7 | | | 5.9 | | | 5.8 | |
Tax-exempt interest | | (1.6 | ) | | (2.4 | ) | | (0.5 | ) |
Domestic production deduction | | (2.8 | ) | | (1.6 | ) | | (1.2 | ) |
Other, net | | (0.5 | ) | | 0.6 | | | (0.3 | ) |
| | | | | | | | | |
Total | | 35.8 | % | | 37.5 | % | | 38.8 | % |
| | | | | | | | | |
Deferred tax assets (liabilities) consist of the following at year end 2007 and 2006 (in thousands):
| | | | | | | | |
| | | 2007 | | | 2006 | |
Charitable contributions | | $ | — | | | $ | 33 | |
Credit carryforwards | | | 150 | | | | 106 | |
Scheduled rent | | | 1,996 | | | | 1,308 | |
Accrued reserves | | | 1,442 | | | | 1,222 | |
Accrued compensation | | | 633 | | | | 498 | |
State taxes | | | 457 | | | | 450 | |
Stock options | | | 2,499 | | | | 1,748 | |
Other | | | 105 | | | | 11 | |
| | | | | | | | |
Gross deferred tax assets | | | 7,282 | | | | 5,376 | |
| | | | | | | | |
Property and equipment | | | (774 | ) | | | (1,677 | ) |
Other | | | (205 | ) | | | (496 | ) |
| | | | | | | | |
Gross deferred tax liabilities | | | (979 | ) | | | (2,173 | ) |
| | | | | | | | |
Net deferred tax assets | | $ | 6,303 | | | $ | 3,203 | |
| | | | | | | | |
F-13
PEET’S COFFEE & TEA, INC.
NOTES TO CONSOLIDATED FINANCIAL STATEMENTS—(Continued)
The Company adopted the provisions of FIN 48 on January 1, 2007.
The following table summarizes the activity related to unrecognized tax benefits (in thousands):
| | | |
Gross unrecognized tax benefit at January 1, 2007 | | $ | 55 |
Gross increases for the current period | | | 30 |
| | | |
Gross unrecognized tax benefit at December 30, 2007 | | $ | 85 |
| | | |
The amount of unrecognized tax benefits that would increase the Company’s tax rate if recognized is $85,000. This relates to state exposures from not filing a state tax return. It is the Company’s policy to recognize interest and penalties in the tax provision. Related to the unrecognized tax benefits noted above, the Company accrued penalties and interest of $15,000 during 2007 and in total, as of December 30, 2007, has recognized a liability for penalties and interest of $28,000. We do not expect our unrecognized tax benefits to change significantly over the next 12 months.
The Company files income tax returns in the U.S. federal jurisdiction and various state jurisdictions. The Company’s federal income tax returns for the years 2002 through 2004 were effectively settled with the Internal Revenue Service. The Company’s federal income tax returns for 2005 and 2006 are open tax years and the 2005 federal income tax return is currently under audit by the Internal Revenue Service. The Company’s returns for the state of California tax for 2004 through 2006 are open tax years. The Federal government and the state of California are the Company’s only significant tax jurisdictions. The Company also files in numerous state jurisdictions with varying statutes of limitations.
No valuation allowance for deferred tax assets was recorded as management believes it is more likely than not that all of the deferred tax assets will be realized. The Company has California Enterprise Zone credit carryforwards of $150,000 that do not expire.
6. Employee Benefit Plan
The Company’s 401(k) plan covers substantially all employees. Employees may contribute up to 60% of their annual salary up to a maximum of $15,500. The Company matches 50% of amounts contributed by its employees, subject to a maximum of 5% of the employees eligible compensation contributed to the plan. The Company’s contribution was $490,000, $409,000, and $323,000 in 2007, 2006, and 2005, respectively. The plan does not offer investments in Company stock.
7. Stock Purchase Program
In September 2006, the Board of Directors approved the purchase up to one million shares of the Company’s common stock, with no expiration. As of December 30, 2007, no shares have been purchased under this program. During the year ended December 31, 2006, the Company purchased and retired the remaining 589,504 shares of common stock available for purchase under the February 2004 share purchase program at an average price of $26.99.
8. Stock Option, Employee Purchase and Deferred Compensation Plans
Effective in 2001, the Company adopted a new stock option plan for which the Company has reserved 1,500,000 shares of common stock for issuance pursuant to the plan. As of each annual meeting of the Company’s shareholders, beginning in 2002, and continuing through and including the annual meeting of the
F-14
PEET’S COFFEE & TEA, INC.
NOTES TO CONSOLIDATED FINANCIAL STATEMENTS—(Continued)
Company’s shareholders in 2010, the number of shares of common stock reserved for issuance under the 2000 plan will be increased automatically by the lesser of (i) five percent (5%) of the total number of shares of common stock outstanding on such date, (ii) five hundred thousand (500,000) shares, or (iii) a number of shares determined by the Board prior to such date, which number shall be less than (i) and (ii) above. The purchase price of the common stock issuable under this plan is determined by the Board of Directors, however may not be less than 85% of the fair market value of common stock at the grant date. The term of a granted stock option is 10 years from the grant date. Stock options vest according to a pre-determined vest schedule set at grant date.
Also effective in 2001, the Company adopted the 2000 Non-Employee Director Plan that provides for the automatic grant of nonstatutory stock options to purchase shares of common stock to non-employee directors, which is administered by the Board of Directors. The aggregate number of shares of common stock that may be issued under the plan is 330,000. As of each annual meeting of the Company’s shareholders, beginning in 2002, and continuing through and including the annual meeting of the Company’s shareholders in 2020, the number of shares of common stock reserved for issuance under the 2000 plan will be increased automatically by the lesser of (i) three quarters of one percent (0.75%) of the total number of shares of common stock outstanding on such date, (ii) sixty thousand (60,000) shares, or (iii) a number of shares determined by the Board prior to such date, which number shall be less than (i) and (ii) above. The exercise price of options granted will be equal to the fair market value of the common stock on the date of grant and have a term no more than ten years from the date granted. Stock options vest according to a pre-determined vest schedule set at grant date. In 2007, 2006, and 2005, the Company granted non-employee director options to purchase an aggregate of 73,750, 68,125, and 56,089 shares of common stock, respectively.
The aggregate intrinsic value in the table below is before applicable income taxes, based on the Company’s closing stock price as of the last business day of the year, which would have been received by the optionees had all options been exercised on that date. As of December 30, 2007, total unrecognized stock-based compensation expense related to nonvested stock options was approximately $4.6 million, which is expected to be recognized over a weighted average period of approximately 40 months. During the year ended December 30, 2007, the total intrinsic value of stock options exercised was $3.8 million.
F-15
PEET’S COFFEE & TEA, INC.
NOTES TO CONSOLIDATED FINANCIAL STATEMENTS—(Continued)
As of December 30, 2007, there were 946,341 shares available for grant under the 2000 stock option plan and 153,100 shares available for grant under the 2000 Non-Employee Director stock option plan. Changes in stock options were as follows:
| | | | | | | | | | | |
| | | Options
Outstanding | | | Weighted Average
Exercise Price Per
Share | | Weighted Average
Remaining
Contractual Life
(Years) | | Aggregate
Intrinsic Value
(in thousands) |
Outstanding at January 2, 2005 | | 2,649,073 | | | $ | 15.69 | | 5.96 | | $ | 28,503 |
Granted | | 600,440 | | | | 26.77 | | | | | |
Canceled | | (161,812 | ) | | | 19.74 | | | | | |
Exercised | | (536,395 | ) | | | 12.65 | | | | | |
| | | | | | | | | | | |
Outstanding at January 1, 2006 | | 2,551,306 | | | | 18.68 | | 6.71 | | | 29,790 |
Granted | | 461,089 | | | | 29.54 | | | | | |
Canceled | | (119,464 | ) | | | 25.13 | | | | | |
Exercised | | (160,250 | ) | | | 17.79 | | | | | |
| | | | | | | | | | | |
Outstanding at December 31, 2006 | | 2,732,711 | | | | 20.33 | | 6.55 | | | 18,147 |
Granted | | 333,882 | | | | 26.79 | | | | | |
Canceled | | (96,583 | ) | | | 26.00 | | | | | |
Exercised | | (390,647 | ) | | | 17.40 | | | | | |
| | | | | | | | | | | |
Oustanding at December 30, 2007 | | 2,579,363 | | | $ | 21.36 | | 6.40 | | $ | 21,028 |
| | | | | | | | | | | |
Vested or expected to vest, December 30, 2007 | | 2,349,711 | | | | | | | | | |
| | | | | | | | | | | |
Exercisable at December 30, 2007 | | 1,799,189 | | | $ | 18.54 | | 5.47 | | $ | 19,615 |
| | | | | | | | | | | |
The following table summarizes stock option information at year end 2007:
| | | | | | | | | | | | |
Range of Exercise Prices | | Options Outstanding | | Options Exercisable |
| | Number of
Options | | Weighted-Average
Remaining
Contractual Life
(Years) | | Weighted-Average
Exercise Price | | Number of
Options | | Weighted-Average
Exercise Price |
$6.38 to $12.98 | | 263,036 | | 4.19 | | $ | 11.17 | | 263,063 | | $ | 11.17 |
$15.49 to $15.49 | | 627,452 | | 4.40 | | | 15.49 | | 627,452 | | | 15.49 |
$15.59 to $22.84 | | 569,877 | | 5.78 | | | 19.80 | | 556,300 | | | 19.74 |
$23.28 to $26.50 | | 565,627 | | 8.27 | | | 26.08 | | 224,738 | | | 26.01 |
$27.32 to $35.87 | | 553,371 | | 8.44 | | | 29.65 | | 127,663 | | | 30.29 |
| | | | | | | | | | | | |
$6.38 to $35.87 | | 2,579,363 | | 6.40 | | $ | 21.36 | | 1,799,216 | | $ | 18.54 |
| | | | | | | | | | | | |
During 2001, the Company adopted the 2000 Employee Stock Purchase Plan (“ESPP”), where eligible employees can choose to have up to 15% of their annual earnings withheld to purchase the Company’s common stock. The purchase price of stock is 85% of the lower of the beginning of the offering period or end of the offering period market price. The Company authorized 200,000 shares of common stock available for issuance under the plan, which will be increased as of each annual meeting of the Company’s shareholders, beginning 2002 until 2020, by the least of 200,000 shares or 1.5% of the number of shares of common stock outstanding on that date. However, the Board of Directors has the authority to designate a smaller number of shares by which the authorized number of shares of common stock will be increased on that date. During 2007, 2006, and 2005,
F-16
PEET’S COFFEE & TEA, INC.
NOTES TO CONSOLIDATED FINANCIAL STATEMENTS—(Continued)
employees purchased 25,106, 43,474, and 39,957 shares, respectively, of the Company’s common stock under the plan at a weighted-average per share price of $20.94, $26.99, and 24.07, respectively. At December 30, 2007, 972,162 shares remain available for future issuance.
Effective December 1, 2003, the Company adopted a Nonqualified Deferred Compensation Plan (the “Plan”) for certain executive employees. The purpose of the Plan is to offer those employees an opportunity to elect to defer the receipt of compensation in order to provide termination of employment and related benefits taxable pursuant to section 451 of the Internal Revenue Code of 1986, as amended (the “Code”). The Plan is intended to be a “top-hat” plan (i.e., an unfunded deferred compensation plan maintained for a select group of management or highly-compensated employees) under sections 201(2), 301(a)(3) and 401(a)(1) of the Employee Retirement Income Security Act of 1974 (“ERISA”). The long-term liability related to compensation deferrals under the Plan was $317,000 and $222,000 as of December 30, 2007 and December 31, 2006, respectively, which is included in deferred lease credits and other long-term liabilities. The related asset is classified in cash and cash equivalents on the consolidated balance sheets.
9. Commitments and Contingencies
Leases—The Company leases its Emeryville, California administrative offices and its retail stores and certain equipment under operating leases that expire from 2008 through 2018. Certain leases contain renewal options for an additional five to fifteen years, and also provide for contingent rents to be paid equal to a stipulated percentage of sales. The lease agreements also provide for periodic adjustments to the minimum lease payments based on changes in cost of living indices or other scheduled increases.
Future minimum lease payments required under non-cancelable operating leases subsequent to December 30, 2007 are as follows (amounts in thousands):
| | | |
| | | Leases |
Years: | | | |
2008 | | $ | 13,933 |
2009 | | | 13,153 |
2010 | | | 12,283 |
2011 | | | 11,622 |
2012 | | | 11,100 |
Thereafter | | | 36,340 |
| | | |
Total minimum lease payments | | $ | 98,431 |
| | | |
Rent expense was $12,449,000, $9,955,000 and $8,314,000 for 2007, 2006, and 2005, respectively, including contingent rents of $120,000, $130,000, and $194,000, respectively.
Purchase Commitments—As of December 30, 2007, the Company had approximately $37,100,000 of outstanding coffee purchase commitments from 2008 to 2012 with both fixed prices and prices with a fixed premium over the New York “C” market.
Legal Proceedings—In November 2006, a complaint styled as a shareholder derivative action was filed, purportedly on behalf of Peet’s, against certain of our present and former directors and officers. The complaint alleges that the defendants caused or allowed improprieties in connection with certain stock option grants since at least 2001 and thereby breached their fiduciary duties to Peet’s and violated specified provisions of the California Corporations Code. The complaint also alleges that certain of our present and former directors and officers were
F-17
PEET’S COFFEE & TEA, INC.
NOTES TO CONSOLIDATED FINANCIAL STATEMENTS—(Continued)
unjustly enriched as a result. Purportedly on behalf of Peet’s, the complaint seeks, among other things, damages, restitution and corporate governance reforms. This complaint and a similar one have been filed in the Superior Court for Alameda County, California and a third was filed in February 2007 in the United States District Court for the Northern District of California.
On February 12, 2008, the United States District Court granted our motion for dismissal of the federal shareholder derivative action. The court also granted the plaintiff leave to file an amended complaint, and ordered that any amended complaint be filed by February 29, 2008. Counsel for the plaintiffs in this case subsequently informed our attorneys that they did not intend to file an amended complaint, and no amended complaint was filed on or before February 29, 2008. The actions filed in the Alameda County Superior Court remain pending.
These actions could result in substantial costs and divert management’s attention and resources. These actions are at a preliminary stage, and we are not in a position to determine whether a loss is probable or estimate a range of amount of loss.
The Company may from time to time become involved in certain legal proceedings in the ordinary course of business. Currently, the Company is not a party to any other legal proceedings that management believes would have a material adverse effect on the financial position or results of operations of the Company.
10. Segment Information
The Company operates in two reportable segments: retail and specialty sales. Retail store operations consist of sales of whole bean coffee, beverages, tea and related products through Company-operated retail stores. Specialty sales consist of whole bean coffee sales through grocery, home delivery, foodservice and office coffee accounts. Management evaluates segment performance primarily based on revenue and segment operating income. The following table presents certain financial information for each segment. Segment income before taxes excludes unallocated marketing expenses and general and administrative expenses. Unallocated assets include cash, coffee inventory in the warehouse, corporate headquarter assets and intangible and other assets.
F-18
PEET’S COFFEE & TEA, INC.
NOTES TO CONSOLIDATED FINANCIAL STATEMENTS—(Continued)
Segment Information
(Dollars in thousands)
| | | | | | | | | | | | | | | | | | | | | | | |
| | | Retail | | | Specialty | | | Unallocated | | | Total | |
| | | Amount | | | Percent of
Net Revenue | | | Amount | | Percent of
Net Revenue | | | Amount | | | Amount | | Percent of
Net Revenue | |
2007 | | | | | | | | | | | | | | | | | | | | | | | |
Net revenue | | $ | 168,392 | | | 100.0 | % | | $ | 80,997 | | 100.0 | % | | | | | | $ | 249,389 | | 100.0 | % |
Cost of sales and occupancy | | | 78,412 | | | 46.6 | % | | | 39,977 | | 49.4 | % | | | | | | | 118,389 | | 47.5 | % |
Operating expenses | | | 71,714 | | | 42.6 | % | | | 14,086 | | 17.4 | % | | | | | | | 85,800 | | 34.4 | % |
Depreciation and amortization | | | 8,516 | | | 5.1 | % | | | 1,376 | | 1.7 | % | | $ | 1,020 | | | | 10,912 | | 4.4 | % |
Segment operating income (loss) | | | 9,750 | | | 5.8 | % | | | 25,558 | | 31.6 | % | | | (23,702 | ) | | | 11,606 | | 4.7 | % |
Interest income | | | | | | | | | | | | | | | | 1,446 | | | | 1,446 | | | |
Income before income taxes | | | | | | | | | | | | | | | | | | | | 13,052 | | | |
Total assets | | | 59,854 | (b) | | | | | | 13,306 | | | | | | 104,387 | (a) | | | 177,547 | | | |
Capital expenditures | | | 20,218 | | | | | | | 1,361 | | | | | | 9,245 | | | | 30,824 | | | |
| | | | | | | |
2006 | | | | | | | | | | | | | | | | | | | | | | | |
Net revenue | | $ | 141,377 | | | 100.0 | % | | $ | 69,116 | | 100.0 | % | | | | | | $ | 210,493 | | 100.0 | % |
Cost of sales and occupancy | | | 65,341 | | | 46.2 | % | | | 33,587 | | 48.6 | % | | | | | | | 98,928 | | 47.0 | % |
Operating expenses | | | 60,201 | | | 42.6 | % | | | 12,071 | | 17.5 | % | | | | | | | 72,272 | | 34.3 | % |
Depreciation and amortization | | | 6,269 | | | 4.4 | % | | | 1,406 | | 2.0 | % | | $ | 934 | | | | 8,609 | | 4.1 | % |
Segment operating income (loss) | | | 9,566 | | | 6.8 | % | | | 22,052 | | 31.9 | % | | | (21,568 | ) | | | 10,050 | | 4.8 | % |
Interest income | | | | | | | | | | | | | | | | 2,456 | | | | 2,456 | | | |
Income before income taxes | | | | | | | | | | | | | | | | | | | | 12,506 | | | |
Total assets | | | 47,640 | (b) | | | | | | 12,673 | | | | | | 92,692 | (a) | | | 153,005 | | | |
Capital expenditures | | | 17,901 | | | | | | | 1,045 | | | | | | 25,497 | | | | 44,443 | | | |
| | | | | | | |
2005 | | | | | | | | | | | | | | | | | | | | | | | |
Net revenue | | $ | 118,030 | | | 100.0 | % | | $ | 57,168 | | 100.0 | % | | | | | | $ | 175,198 | | 100.0 | % |
Cost of sales and occupancy | | | 53,089 | | | 45.0 | % | | | 27,747 | | 48.5 | % | | | | | | | 80,837 | | 46.1 | % |
Operating expenses | | | 47,986 | | | 40.7 | % | | | 9,893 | | 17.3 | % | | | | | | | 57,879 | | 33.0 | % |
Depreciation and amortization | | | 5,149 | | | 4.4 | % | | | 1,481 | | 2.6 | % | | $ | 663 | | | | 7,293 | | 4.1 | % |
Segment operating income (loss) | | | 11,806 | | | 10.0 | % | | | 18,047 | | 31.6 | % | | | (14,004 | ) | | | 15,848 | | 9.0 | % |
Interest income | | | | | | | | | | | | | | | | 1,769 | | | | 1,769 | | | |
Income before income taxes | | | | | | | | | | | | | | | | | | | | 17,617 | | | |
Total assets | | | 34,436 | (b) | | | | | | 11,517 | | | | | | 102,799 | (a) | | | 148,752 | | | |
Capital expenditures | | | 11,525 | | | | | | | 1,223 | | | | | | 1,272 | | | | 14,020 | | | |
| (a) | Unallocated total assets includes cash and marketable securities of $27,995,000, $31,401,000, and $68,704,000 at the end of the years 2007, 2006, and 2005, respectively. |
| (b) | Retail total assets includes cash of $3,079,590, $1,791,000, and $1,262,000 at the end of the years 2007, 2006, and 2005, respectively. |
Net revenue from external customers for the two major product lines is as follows (in thousands):
| | | | | | | | | |
| | | 2007 | | 2006 | | 2005 |
Whole bean coffee, tea, and related products | | $ | 134,065 | | $ | 117,549 | | $ | 101,029 |
Beverages and pastries | | | 115,324 | | | 92,944 | | | 74,169 |
| | | | | | | | | |
Total | | $ | 249,389 | | $ | 210,493 | | $ | 175,198 |
| | | | | | | | | |
F-19
PEET’S COFFEE & TEA, INC.
NOTES TO CONSOLIDATED FINANCIAL STATEMENTS—(Continued)
11. Quarterly Financial Information (Unaudited, in thousands)
| | | | | | | | | | | | |
| | | Quarter Ended |
| | April 1,
2007 | | July 1,
2007 | | September 30,
2007 | | December 30,
2007 |
Net revenue | | $ | 57,513 | | $ | 60,103 | | $ | 60,860 | | $ | 70,913 |
Cost of sales and related occupancy expenses | | | 27,190 | | | 28,374 | | | 29,142 | | | 33,683 |
Income from operations | | | 1,837 | | | 2,420 | | | 2,578 | | | 4,771 |
Net income | | | 1,416 | | | 1,802 | | | 1,836 | | | 3,323 |
Basic income per share | | | 0.10 | | | 0.13 | | | 0.13 | | | 0.24 |
Diluted income per share | | | 0.10 | | | 0.13 | | | 0.13 | | | 0.23 |
| | | | | | | | | | | | |
| | | Quarter Ended |
| | April 2,
2006 | | July 2,
2006 | | October 1,
2006 | | December 31,
2006 |
Net revenue | | $ | 49,707 | | $ | 49,689 | | $ | 50,873 | | $ | 60,224 |
Cost of sales and related occupancy expenses | | | 22,815 | | | 23,093 | | | 24,081 | | | 29,939 |
Income from operations | | | 2,967 | | | 2,345 | | | 1,841 | | | 2,897 |
Net income | | | 2,252 | | | 1,907 | | | 1,479 | | | 2,178 |
Basic income per share | | | 0.16 | | | 0.14 | | | 0.11 | | | 0.16 |
Diluted income per share | | | 0.15 | | | 0.13 | | | 0.10 | | | 0.16 |
The quarterly information presented includes legal and other professional fees incurred for the Company’s voluntary stock option review beginning in 2006 and restatement of financial statements and legal fees for the related lawsuits in the following amounts:
| | | | | | |
Pre-tax amount (in thousands) | | 2007 | | 2006 |
First Quarter | | $ | 976 | | $ | — |
Second Quarter | | | 64 | | | — |
Third Quarter | | | 188 | | | — |
Fourth Quarter | | | 135 | | | 1,762 |
F-20