Item 1: Report to Shareholders| International Stock Portfolio | June 30, 2006 |
The views and opinions in this report were current as of June 30, 2006. They are not guarantees of performance or investment results and should not be taken as investment advice. Investment decisions reflect a variety of factors, and the managers reserve the right to change their views about individual stocks, sectors, and the markets at any time. As a result, the views expressed should not be relied upon as a forecast of the fund’s future investment intent. The report is certified under the Sarbanes-Oxley Act of 2002, which requires mutual funds and other public companies to affirm that, to the best of their knowledge, the information in their financial reports is fairly and accurately stated in all material respects.
Dear Investor
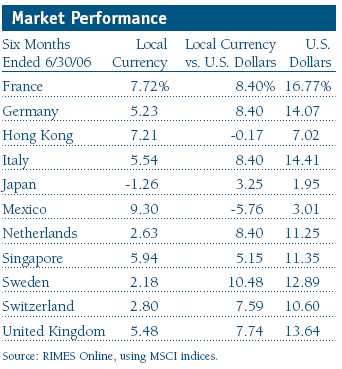
Non-U.S. stocks produced good returns during the past six months, but first-quarter strength gave way to weakness in the second quarter as a sell-off in U.S. equities spread across the globe. Rate hikes by several central banks, along with a slowdown in U.S. economic growth, raised concerns that global growth might also slacken. Emerging markets fared worst in recent months, especially those in Eastern Europe, the Middle East, and Africa. Among developed markets, European stocks delivered broad gains over the first half of 2006, while stocks in Japan declined but were moderately higher in U.S. dollar terms.
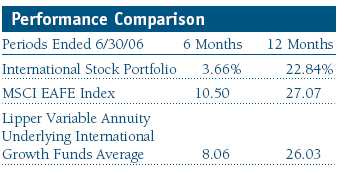
The portfolio significantly trailed the returns of the MSCI EAFE Index during the recent six-month period and was behind for the 12 months ended June 30, 2006. A major reason for the fund’s lagging results versus the index during the past six months was stock selection, which was relatively disappointing across the board. Value stocks outperformed growth due to a marked increase in merger and acquisition activity, which also affected our growth-oriented portfolio.
MARKET ENVIRONMENT
International markets had shrugged off higher energy prices and rising interest rates to generate solid gains for most of the past six months, until a sell-off took place late in the period. After moderating in the fourth quarter of 2005, energy prices have remained persistently high since the beginning of 2006. Although there were no obvious signs of global inflation, the central banks of the world’s three largest economies—the United States, the European Union, and Japan—have either raised or are expecting to raise interest rates to slow economic growth to a sustainable, noninflationary level.
Among developed markets, Europe benefited from improving economic indicators, a strengthening euro, and increased merger and acquisition activity. Economic growth in France was better than expected, while surveys of the business climate in Germany and Italy were promising. Japan’s economic recovery gathered strength, and the decision by the Bank of Japan to end its five-year policy of monetary easing suggests confidence in Japan’s economic recovery—although Japanese stocks declined late in the period.
Last year’s rally in emerging markets continued into January, stalled somewhat in February and March, then lifted off again in April before giving in to a steep decline in May and June. Eastern European stocks were hard hit during the recent sell-off. A major story unfolded in Brazil as the country’s finance minister resigned in March because of a corruption scandal. Investors focused on the likely direction of his replacement’s economic policy, but Latin American stocks posted excellent returns over the first half.
PORTFOLIO REVIEW
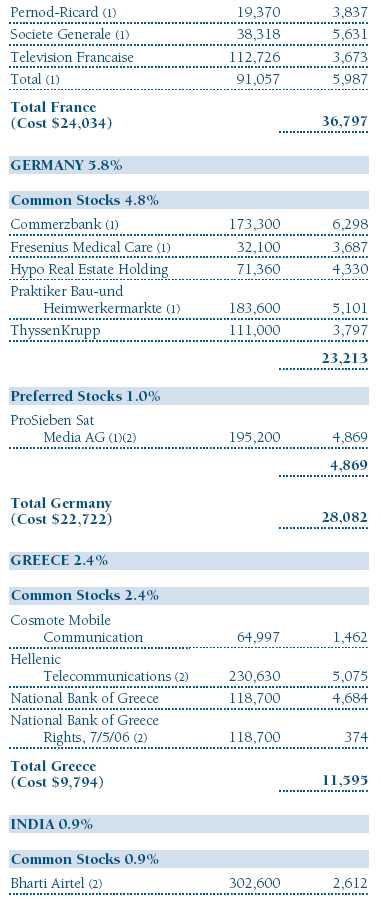
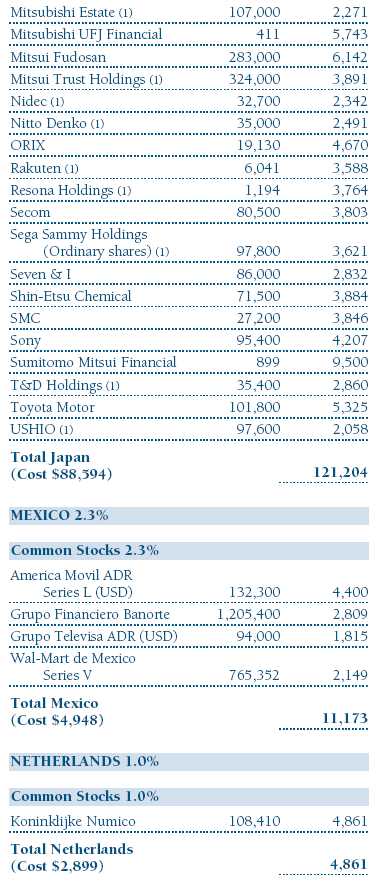
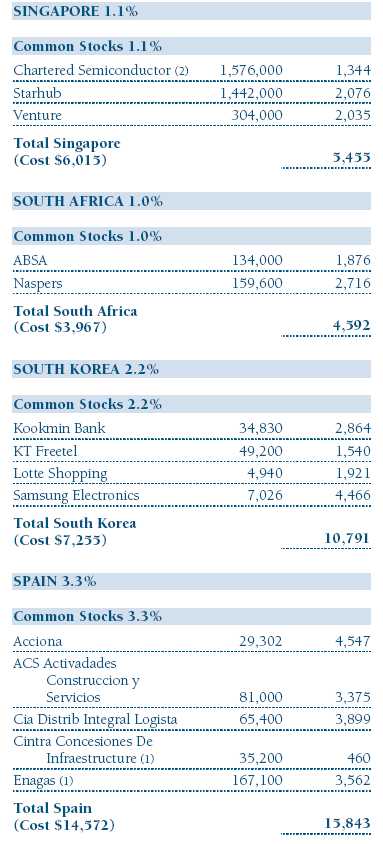
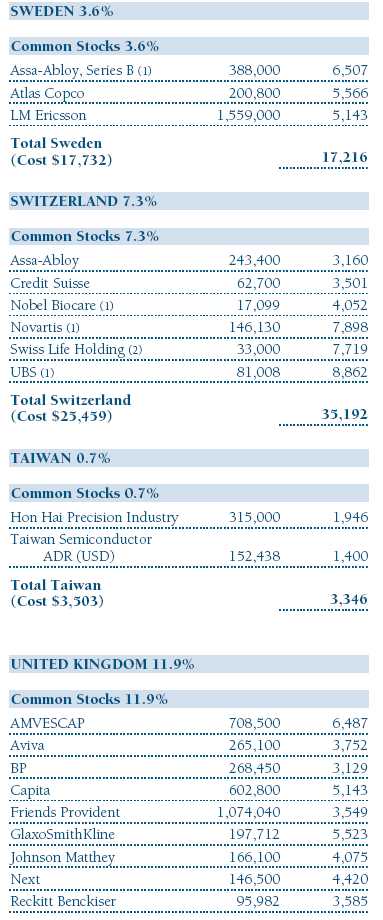
A focus first and foremost on individual stock selection characterizes our investment approach to the portfolio. We have been largely unconcerned about our sector and geographical weightings and more disciplined about selecting stocks of companies in which we have a high level of conviction. That said, your fund’s absolute performance was disappointing during the past six months but strong during the 12 months ended June 30, 2006. Several key holdings hampered results relative to our major benchmarks in recent months. Among them were Japan’s AIFUL, ORIX, and Mitsui Trust Holdings, as well as Belgium’s SES Global. Other Japanese stocks that hindered performance were retailers, which are sensitive to economic conditions, including Marui and Rakuten. (Please refer to the fund’s portfolio of investments for a detailed list of holdings and the amount each represents of the portfolio.)
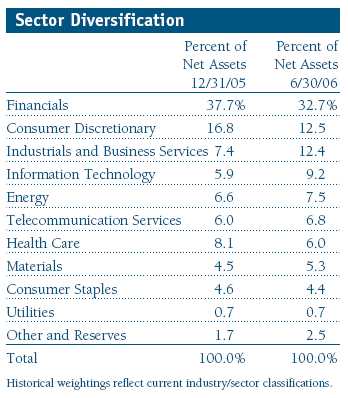
Notwithstanding our focus on individual stock selection, our bottom-up approach drove us into financials—an unusual area for a growth-oriented portfolio since they tend to be considered value investments—simply because of our high conviction level for many stocks in the sector. In fact, the portfolio is perhaps more growth-oriented now than in the past as we believe this is the correct approach at this time, and our focus has ensured investments only in areas where we see the strongest growth. Our relatively heavy weighting in financials hampered both absolute and relative performance. In particular, portfolio performance suffered from the disappointing returns of European, Japanese, and Turkish banks in a rising interest rate environment. Detractors worth mentioning include Japan’s Resona Holdings and Sumitomo Mitsui Financial, and Turkey’s Turkiye Is Bankasi and Turkiye Garanti Bankasi.
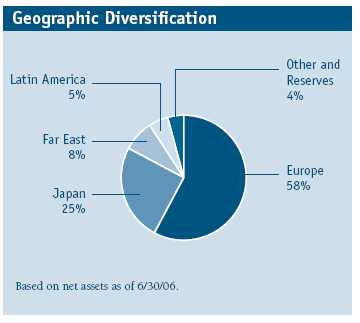
We were underweight in Europe, which did relatively well, as a result of our focus on stock selection. Investors became more risk averse during the period, and Europe is less risky than other regions. Merger and acquisition activity boosted stocks on the Continent, where signs of an economic upturn are becoming more apparent. Regarding sectors, we were also underweight in utilities, health care, and materials. Utilities tend to do well in a volatile market, since they are considered defensive stocks, similar to bonds. Materials did well, and we are adding to stocks in the sector despite higher valuations.
The portfolio had its winners as well, although they were overshadowed by negative factors during the period. In the second quarter, the major contributors to positive results included Italy’s UniCredito and Toro Assicurazioni. The latter company was bought by Assicurazioni Generali, resulting in a sharp runup in the share price.
A key theme that emerged during the period was the increase in domestic demand in Japan and the rest of Asia. Previously, strength in the export sector had driven economic growth. As a result, we have been concentrating more on stocks likely to benefit from regional demand and deemphasizing export-driven companies. We trimmed our holdings in South Korea’s Hyundai Motor and Samsung Electronics and bought Taiwan Semiconductor Manufacturing and stocks of other companies positioned to capture this trend. Our mix between domestic demand and export-oriented Asian stocks is now about 50-50, whereas previously it had been roughly 70-30 in favor of the latter.
OUTLOOK
Our outlook for international equities markets remains optimistic. The international economic growth pattern is fairly synchronized and somewhat behind the U.S. cycle, which allows for a greater margin of growth potential. Of greatest concern is the pattern of rising interest rates in most areas. The recent downturn in equity markets was driven by concerns about inflation, rising interest rates, and prospects for slowing global economic growth. We expect monetary tightening to come to an end during the next 12 months, however, with inflation peaking and economic growth moderating, providing a reasonable environment for equities. The key risk is that consumer demand in the U.S. could decline if interest rates fail to fall as we anticipate. We believe a weaker dollar will boost returns for U.S. investors in international markets during the foreseeable future.
In Europe, recent surveys showing increased business and consumer confidence indicate that demand appears to be gaining momentum, providing an alternative to export-driven growth. Corporate profits and cash flow are strong as companies benefit from restructuring and topline growth. Companies have been raising dividends and buying back their shares, which should provide additional support. Further consolidation among utilities and financials could attract investor interest. European stocks still seem reasonably priced compared with U.S. equities.
Prospects for Japan appear encouraging despite consolidation earlier in the year. Shortages in the labor market are stimulating wage growth, which is reflected in higher retail sales and stronger credit growth. The recent decision by the Bank of Japan to end its injections of liquidity into the financial system marks another step toward the normalization of monetary policy. Consumer prices have been rising, but as long as interest rates do not go up precipitously, the stock market seems poised to continue rallying as the economy expands.
Emerging markets have already attracted more money so far this year than in the whole of 2005. Macroeconomic policies remain supportive of equities, and the quality of company management and governance is rising, which could benefit shareholders as companies pay more attention to increasing returns.
We have positioned the portfolio with approximately 120 stocks that represent our highest level of conviction and pared it of stocks about which we feel less optimistic. Our bottom-up, stock-selection approach worked well through 2005—although the first half of 2006 caused us some problems. We believe that this discipline along with our growth-oriented bias will serve shareholders best over the long term. Overall, except for the concerns we have already addressed, we are optimistic about the prospects for continued gains in international markets and will maintain our focus on individual stocks in our effort to enhance shareholder value.
Respectfully submitted,

David J.L. Warren
President, T. Rowe Price International Funds, Inc.
July 21, 2006
| Risks of International Investing |
Funds that invest overseas generally carry more risk than funds that invest strictly in U.S. assets. Funds investing in a single country or in a limited geographic region tend to be riskier than more diversified funds. Risks can result from varying stages of economic and political development; differing regulatory environments, trading days, and accounting standards; and higher transaction costs of non-U.S. markets. Non-U.S. investments are also subject to currency risk, or a decline in the value of a foreign currency versus the U.S. dollar, which reduces the dollar value of securities denominated in that currency.
GDP: Gross domestic product is the total market value of all goods and services produced in a country in a given year.
Lipper averages: The averages of available mutual fund performance returns for specified periods in defined categories as tracked by Lipper Inc.
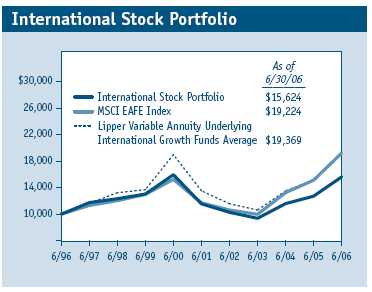
MSCI EAFE Index: Widely accepted as the benchmark for international stock performance (EAFE refers to Europe, Australasia, and the Far East). The index represents the major markets of the world.
Price/earnings ratio: Calculated by dividing a stock’s market value per share by the company’s earnings per share for the past 12 months or by expected earnings for the coming year.

This chart shows the value of a hypothetical $10,000 investment in the fund over the past 10 fiscal year periods or since inception (for funds lacking 10-year records). The result is compared with benchmarks, which may include a broad-based market index and a peer group average or index. Market indexes do not include expenses, which are deducted from fund returns as well as mutual fund averages and indexes.

Fund Expense Example
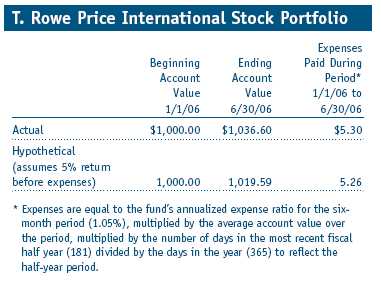
As a mutual fund shareholder, you may incur two types of costs: (1) transaction costs, such as redemption fees or sales loads, and (2) ongoing costs, including management fees, distribution and service (12b-1) fees, and other fund expenses. The following example is intended to help you understand your ongoing costs (in dollars) of investing in the fund and to compare these costs with the ongoing costs of investing in other mutual funds. The example is based on an investment of $1,000 invested at the beginning of the most recent six-month period and held for the entire period.
Actual Expenses
The first line of the following table (“Actual”) provides information about actual account values and actual expenses. You may use the information in this line, together with your account balance, to estimate the expenses that you paid over the period. Simply divide your account value by $1,000 (for example, an $8,600 account value divided by $1,000 = 8.6), then multiply the result by the number in the first line under the heading “Expenses Paid During Period” to estimate the expenses you paid on your account during this period.
Hypothetical Example for Comparison Purposes
The information on the second line of the table (“Hypothetical”) is based on hypothetical account values and expenses derived from the fund’s actual expense ratio and an assumed 5% per year rate of return before expenses (not the fund’s actual return). You may compare the ongoing costs of investing in the fund with other funds by contrasting this 5% hypothetical example and the 5% hypothetical examples that appear in the shareholder reports of the other funds. The hypothetical account values and expenses may not be used to estimate the actual ending account balance or expenses you paid for the period.
You should also be aware that the expenses shown in the table highlight only your ongoing costs and do not reflect any transaction costs, such as redemption fees or sales loads. Therefore, the second line of the table is useful in comparing ongoing costs only, and will not help you determine the relative total costs of owning different funds. To the extent a fund charges transaction costs, however, the total cost of owning that fund is higher.
The accompanying notes are an integral part of these financial statements.


The accompanying notes are an integral part of these financial statements.
The accompanying notes are an integral part of these financial statements.

The accompanying notes are an integral part of these financial statements.
The accompanying notes are an integral part of these financial statements.
Notes to Financial Statements
T. Rowe Price International Stock Portfolio
June 30, 2006 (Unaudited)
NOTE 1 - SIGNIFICANT ACCOUNTING POLICIES
T. Rowe Price International Series, Inc. (the corporation), is registered under the Investment Company Act of 1940 (the 1940 Act). The International Stock Portfolio (the fund), a diversified, open-end management investment company, is one portfolio established by the corporation. The fund commenced operations on March 31, 1994. The fund seeks long-term growth of capital through investments primarily in the common stocks of established, non-U.S. companies. Shares of the fund are currently offered only through certain insurance companies as an investment medium for both variable annuity contracts and variable life insurance policies.
The accompanying financial statements were prepared in accordance with accounting principles generally accepted in the United States of America, which require the use of estimates made by fund management. Fund management believes that estimates and security valuations are appropriate; however, actual results may differ from those estimates, and the security valuations reflected in the financial statements may differ from the value the fund ultimately realizes upon sale of the securities.
Valuation The fund values its investments and computes its net asset value per share at the close of the New York Stock Exchange (NYSE), normally 4 p.m. ET, each day that the NYSE is open for business. Equity securities listed or regularly traded on a securities exchange or in the over-the-counter (OTC) market are valued at the last quoted sale price or, for certain markets, the official closing price at the time the valuations are made, except for OTC Bulletin Board securities, which are valued at the mean of the latest bid and asked prices. A security that is listed or traded on more than one exchange is valued at the quotation on the exchange determined to be the primary market for such security. Listed securities not traded on a particular day are valued at the mean of the latest bid and asked prices for domestic securities and the last quoted sale price for international securities.
Investments in mutual funds are valued at the mutual fund’s closing net asset value per share on the day of valuation.
Other investments, including restricted securities, and those for which the above valuation procedures are inappropriate or are deemed not to reflect fair value are stated at fair value as determined in good faith by the T. Rowe Price Valuation Committee, established by the fund’s Board of Directors.
Most foreign markets close before the close of trading on the NYSE. If the fund determines that developments between the close of a foreign market and the close of the NYSE will, in its judgment, materially affect the value of some or all of its portfolio securities, which in turn will affect the fund’s share price, the fund will adjust the previous closing prices to reflect the fair value of the securities as of the close of the NYSE, as determined in good faith by the T. Rowe Price Valuation Committee, established by the fund’s Board of Directors. A fund may also fair value securities in other situations, such as when a particular foreign market is closed but the fund is open. In deciding whether to make fair value adjustments, the fund reviews a variety of factors, including developments in foreign markets, the performance of U.S. securities markets, and the performance of instruments trading in U.S. markets that represent foreign securities and baskets of foreign securities. The fund uses outside pricing services to provide it with closing market prices and information used for adjusting those prices. The fund cannot predict when and how often it will use closing prices and when it will adjust those prices to reflect fair value. As a means of evaluating its fair value process, the fund routinely compares closing market prices, the next day’s opening prices in the same markets, and adjusted prices.
Currency Translation Assets, including investments, and liabilities denominated in foreign currencies are translated into U.S. dollar values each day at the prevailing exchange rate, using the mean of the bid and asked prices of such currencies against U.S. dollars as quoted by a major bank. Purchases and sales of securities, income, and expenses are translated into U.S. dollars at the prevailing exchange rate on the date of the transaction. The effect of changes in foreign currency exchange rates on realized and unrealized security gains and losses is reflected as a component of security gains and losses.
Rebates Subject to best execution, the fund may direct certain security trades to brokers who have agreed to rebate a portion of the related brokerage commission to the fund in cash. Commission rebates are reflected as realized gain on securities in the accompanying financial statements and totaled $53,000 for the six months ended June 30, 2006.
Investment Transactions, Investment Income, and Distributions Income and expenses are recorded on the accrual basis. Dividends received from mutual fund investments are reflected as dividend income; capital gain distributions are reflected as realized gain/loss. Dividend income and capital gain distributions are recorded on the ex-dividend date. Investment transactions are accounted for on the trade date. Realized gains and losses are reported on the identified cost basis. Distributions to shareholders are recorded on the ex-dividend date. Income distributions are declared and paid on an annual basis. Capital gain distributions, if any, are declared and paid by the fund, typically on an annual basis.
NOTE 2 - INVESTMENT TRANSACTIONS
Consistent with its investment objective, the fund engages in the following practices to manage exposure to certain risks or to enhance performance. The investment objective, policies, program, and risk factors of the fund are described more fully in the fund’s prospectus and Statement of Additional Information.
Emerging Markets At June 30, 2006, approximately 14% of the fund’s net assets were invested in securities of companies located in emerging markets. Future economic or political developments could adversely affect the liquidity or value, or both, of such securities.
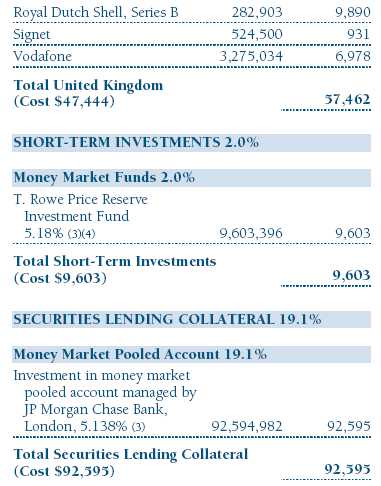
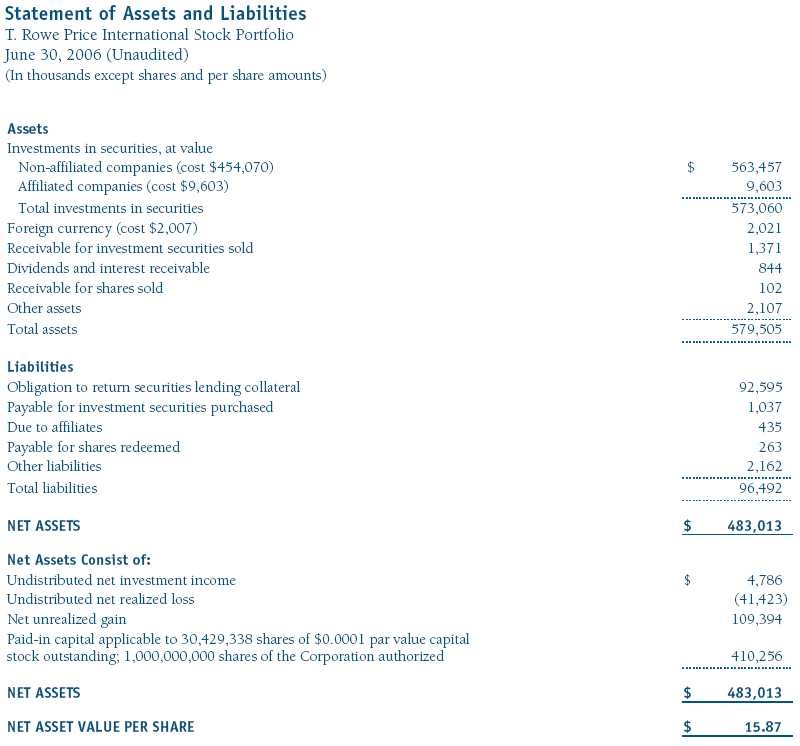
Securities Lending The fund lends its securities to approved brokers to earn additional income. It receives as collateral cash and U.S. government securities valued at 102% to 105% of the value of the securities on loan. Cash collateral is invested in a money market pooled account managed by the fund’s lending agent in accordance with investment guidelines approved by fund management. Collateral is maintained over the life of the loan in an amount not less than the value of loaned securities, as determined at the close of fund business each day; any additional collateral required due to changes in security values is delivered to the fund the next business day. Although risk is mitigated by the collateral, the fund could experience a delay in recovering its securities and a possible loss of income or value if the borrower fails to return the securities. Securities lending revenue recognized by the fund consists of earnings on invested collateral and borrowing fees, net of any rebates to the borrower and compensation to the lending agent. At June 30, 2006, the value of loaned securities was $90,587,000; aggregate collateral consisted of $92,595,000 in the money market pooled account.
Other Purchases and sales of portfolio securities, other than short-term securities, aggregated $160,619,000 and $162,184,000, respectively, for the six months ended June 30, 2006.
NOTE 3 - FEDERAL INCOME TAXES
No provision for federal income taxes is required since the fund intends to continue to qualify as a regulated investment company under Subchapter M of the Internal Revenue Code and distribute to shareholders all of its taxable income and gains. Federal income tax regulations differ from generally accepted accounting principles; therefore, distributions determined in accordance with tax regulations may differ in amount or character from net investment income and realized gains for financial reporting purposes. Financial reporting records are adjusted for permanent book/tax differences to reflect tax character. Financial records are not adjusted for temporary differences. The amount and character of tax-basis distributions and composition of net assets are finalized at fiscal year-end; accordingly, tax-basis balances have not been determined as of June 30, 2006.
The fund intends to retain realized gains to the extent of available capital loss carryforwards. As of December 31, 2005, the fund had $72,182,000 of unused capital loss carryforwards, of which $22,295,000 expire in 2010 and $49,887,000 expire 2011.
At June 30, 2006, the cost of investments for federal income tax purposes was $463,673,000. Net unrealized gain aggregated $109,394,000 at period-end, of which $118,295,000 related to appreciated investments and $8,901,000 related to depreciated investments.
NOTE 4 - FOREIGN TAXES
The fund is subject to foreign income taxes imposed by certain countries in which it invests. Additionally, capital gains realized by the fund upon disposition of securities issued in or by certain foreign countries are subject to capital gains tax imposed by those countries, which is payable prior to repatriation of sale proceeds. Similarly, a tax on net profits, including interest income and realized and unrealized capital gains, is imposed by certain other countries. All taxes are computed in accordance with the applicable foreign tax law, and, to the extent permitted, capital losses are used to offset capital gains. Tax expense attributable to income is accrued by the fund as a reduction of income. Current and deferred tax expense attributable to net capital gains is reflected as a component of realized and/or change in unrealized gain/loss on securities in the accompanying financial statements. At June 30, 2006, the fund had no taxes payable attributable to foreign securities, no deferred tax liability attributable to foreign securities, and $5,049,000 of foreign capital loss carryforwards, including $161,000 that expire in 2009, $2,996,000 that expire in 2010, and $1,892,000 that expire thereafter through 2013.
NOTE 5 - RELATED PARTY TRANSACTIONS
The fund is managed by T. Rowe Price International, Inc. (the manager), a wholly owned subsidiary of T. Rowe Price Associates, Inc. (Price Associates), which is wholly owned by T. Rowe Price Group, Inc. The investment management and administrative agreement between the fund and the manager provides for an all-inclusive annual fee equal to 1.05% of the fund’s average daily net assets. The fee is computed daily and paid monthly. The agreement provides that investment management, shareholder servicing, transfer agency, accounting, and custody services are provided to the fund, and interest, taxes, brokerage commissions, directors’ fees and expenses, and extraordinary expenses are paid directly by the fund.
The fund may invest in the T. Rowe Price Reserve Investment Fund and the T. Rowe Price Government Reserve Investment Fund (collectively, the T. Rowe Price Reserve Funds), open-end management investment companies managed by Price Associates and affiliates of the fund. The T. Rowe Price Reserve Funds are offered as cash management options to mutual funds, trusts, and other accounts managed by Price Associates and/or its affiliates, and are not available for direct purchase by members of the public. The T. Rowe Price Reserve Funds pay no investment management fees. During the six months ended June 30, 2006, dividend income from the T. Rowe Price Reserve Funds totaled $178,000, and the value of shares of the T. Rowe Price Reserve Funds held at June 30, 2006, and December 31, 2005, was $9,603,000 and $7,901,000, respectively.
| Information on Proxy Voting Policies, Procedures, and Records |
A description of the policies and procedures used by T. Rowe Price funds and portfolios to determine how to vote proxies relating to portfolio securities is available in each fund’s Statement of Additional Information, which you may request by calling 1-800-225-5132 or by accessing the SEC’s Web site, www.sec.gov. The description of our proxy voting policies and procedures is also available on our Web site, www.troweprice.com. To access it, click on the words “Company Info” at the top of our homepage for individual investors. Then, in the window that appears, click on the “Proxy Voting Policy” navigation button in the top left corner.
Each fund’s most recent annual proxy voting record is available on our Web site and through the SEC’s Web site. To access it through our Web site, follow the directions above, then click on the words “Proxy Voting Record” at the bottom of the Proxy Voting Policy page.
| How to Obtain Quarterly Portfolio Holdings |
The fund files a complete schedule of portfolio holdings with the Securities and Exchange Commission for the first and third quarters of each fiscal year on Form N-Q. The fund’s Form N-Q is available electronically on the SEC’s Web site (www.sec.gov); hard copies may be reviewed and copied at the SEC’s Public Reference Room, 450 Fifth St. N.W., Washington, DC 20549. For more information on the Public Reference Room, call 1-800-SEC-0330.
| Approval of Investment Management Agreement |
On March 8, 2006, the fund’s Board of Directors unanimously approved the investment advisory contract (Contract) between the fund and its investment manager, T. Rowe Price International, Inc. (Manager). The Board considered a variety of factors in connection with its review of the Contract, also taking into account information provided by the Manager during the course of the year, as discussed below:
Services Provided by the Manager
The Board considered the nature, quality, and extent of the services provided to the fund by the Manager. These services included, but were not limited to, management of the fund’s portfolio and a variety of activities related to portfolio management. The Board also reviewed the background and experience of the Manager’s senior management team and investment personnel involved in the management of the fund. The Board concluded that it was satisfied with the nature, quality, and extent of the services provided by the Manager.
Investment Performance of the Fund
The Board reviewed the fund’s average annual total return over the 1-, 3-, 5-, and 10-year periods as well as the fund’s year-by-year returns and compared these returns with previously agreed upon comparable performance measures and market data, including those supplied by Lipper and Morningstar, which are independent providers of mutual fund data. On the basis of this evaluation and the Board’s ongoing review of investment results, the Board concluded that the fund’s performance was satisfactory.
Costs, Benefits, Profits, and Economies of Scale
The Board reviewed detailed information regarding the revenues received by the Manager under the Contract and other benefits that the Manager (and its affiliates) may have realized from its relationship with the fund, including research received under “soft dollar” agreements. The Board noted that the use of soft dollars as a means of paying for third-party, non-broker research had been eliminated. The Board also received information on the estimated costs incurred and profits realized by the Manager and its affiliates from advising T. Rowe Price mutual funds, as well as estimates of the gross profits realized from managing the fund in particular. The Board concluded that the Manager’s profits were reasonable in light of the services provided to the fund. The Board also considered whether the fund or other funds benefit under the fee levels set forth in the Contract from any economies of scale realized by the Manager. The Board noted that, under the Contract, the fund pays the Manager a single fee based on the fund’s assets and the Manager, in turn, pays all expenses of the fund, with certain exceptions. The Board concluded that, based on the profitability data it reviewed and consistent with this single fee structure, the Contract provided for a reasonable sharing of benefits from any economies of scale with the fund.
Fees
The Board reviewed the fund’s single-fee structure and compared the rate with fees and expenses of other comparable funds based on information and data supplied by Lipper. The information provided to the Board indicated that the fund’s single fee rate was generally above the median management fee rate for comparable funds, but generally below the median expense ratio for comparable funds. The Board also reviewed the fee schedules for comparable privately managed accounts of the Manager and its affiliates. Management informed the Board that the Manager’s responsibilities for privately managed accounts are more limited than its responsibilities for the fund and other T. Rowe Price mutual funds that it or its affiliates advise. On the basis of the information provided, the Board concluded that the fees paid by the fund under the Contract were reasonable.
Approval of the Contract
As noted, the Board approved the continuation of the Contract. No single factor was considered in isolation or to be determinative to the decision. Rather, the Board concluded, in light of a weighting and balancing of all factors considered, that it was in the best interests of the fund to approve the continuation of the Contract, including the fees to be charged for services thereunder.

Item 2. Code of Ethics.
A code of ethics, as defined in Item 2 of Form N-CSR, applicable to its principal executive officer, principal financial officer, principal accounting officer or controller, or persons performing similar functions is filed as an exhibit to the registrant’s annual Form N-CSR. No substantive amendments were approved or waivers were granted to this code of ethics during the registrant’s most recent fiscal half-year.
Item 3. Audit Committee Financial Expert.
Disclosure required in registrant’s annual Form N-CSR.
Item 4. Principal Accountant Fees and Services.
Disclosure required in registrant’s annual Form N-CSR.
Item 5. Audit Committee of Listed Registrants.
Not applicable.
Item 6. Schedule of Investments.
Not applicable. The complete schedule of investments is included in Item 1 of this Form N-CSR.
Item 7. Disclosure of Proxy Voting Policies and Procedures for Closed-End Management Investment Companies.
Not applicable.
Item 8. Portfolio Managers of Closed-End Management Investment Companies.
Not applicable.
Item 9. Purchases of Equity Securities by Closed-End Management Investment Company and Affiliated Purchasers.
Not applicable.
Item 10. Submission of Matters to a Vote of Security Holders.
Not applicable.
Item 11. Controls and Procedures.
(a) The registrant’s principal executive officer and principal financial officer have evaluated the registrant’s disclosure controls and procedures within 90 days of this filing and have concluded that the registrant’s disclosure controls and procedures were effective, as of that date, in ensuring that information required to be disclosed by the registrant in this Form N-CSR was recorded, processed, summarized, and reported timely.
(b) The registrant’s principal executive officer and principal financial officer are aware of no change in the registrant’s internal control over financial reporting that occurred during the registrant’s second fiscal quarter covered by this report that has materially affected, or is reasonably likely to materially affect, the registrant’s internal control over financial reporting.
Item 12. Exhibits.(a)(1) The registrant’s code of ethics pursuant to Item 2 of Form N-CSR is filed with the registrant’s annual Form N-CSR.
(2) Separate certifications by the registrant's principal executive officer and principal financial officer, pursuant to Section 302 of the Sarbanes-Oxley Act of 2002 and required by Rule 30a-2(a) under the Investment Company Act of 1940, are attached.
(3) Written solicitation to repurchase securities issued by closed-end companies: not applicable.
(b) A certification by the registrant's principal executive officer and principal financial officer, pursuant to Section 906 of the Sarbanes-Oxley Act of 2002 and required by Rule 30a-2(b) under the Investment Company Act of 1940, is attached.
| | |
SIGNATURES |
| |
| | Pursuant to the requirements of the Securities Exchange Act of 1934 and the Investment |
| Company Act of 1940, the registrant has duly caused this report to be signed on its behalf by the |
| undersigned, thereunto duly authorized. |
| |
| T. Rowe Price International Series, Inc. |
| |
| |
| By | /s/ Edward C. Bernard |
| | Edward C. Bernard |
| | Principal Executive Officer |
| |
| Date | August 18, 2006 |
| |
| |
| | Pursuant to the requirements of the Securities Exchange Act of 1934 and the Investment |
| Company Act of 1940, this report has been signed below by the following persons on behalf of |
| the registrant and in the capacities and on the dates indicated. |
| |
| |
| By | /s/ Edward C. Bernard |
| | Edward C. Bernard |
| | Principal Executive Officer |
| |
| Date | August 18, 2006 |
| |
| |
| By | /s/ Joseph A. Carrier |
| | Joseph A. Carrier |
| | Principal Financial Officer |
| |
| Date | August 18, 2006 |