| UNITED STATES |
| SECURITIES AND EXCHANGE COMMISSION |
| Washington, D.C. 20549 |
| |
FORM N-CSR |
| |
CERTIFIED SHAREHOLDER REPORT OF REGISTERED |
MANAGEMENT INVESTMENT COMPANIES |
| |
| |
| |
| Investment Company Act File Number: 811-07145 |
|
| |
| T. Rowe Price International Series, Inc. |
|
| (Exact name of registrant as specified in charter) |
| |
| 100 East Pratt Street, Baltimore, MD 21202 |
|
| (Address of principal executive offices) |
| |
| David Oestreicher |
| 100 East Pratt Street, Baltimore, MD 21202 |
|
| (Name and address of agent for service) |
| |
| |
| Registrant’s telephone number, including area code: (410) 345-2000 |
| |
| |
| Date of fiscal year end: December 31 |
| |
| |
| Date of reporting period: June 30, 2008 |
Item 1: Report to Shareholders| International Stock Portfolio | June 30, 2008 |
The views and opinions in this report were current as of June 30, 2008. They are not guarantees of performance or investment results and should not be taken as investment advice. Investment decisions reflect a variety of factors, and the managers reserve the right to change their views about individual stocks, sectors, and the markets at any time. As a result, the views expressed should not be relied upon as a forecast of the fund’s future investment intent. The report is certified under the Sarbanes-Oxley Act, which requires mutual funds and other public companies to affirm that, to the best of their knowledge, the information in their financial reports is fairly and accurately stated in all material respects.
Manager’s Letter
T. Rowe Price International Stock Portfolio
Dear Investor
While we were encouraged by the market’s strong performance in April and May, international stocks, with few exceptions, produced large losses in June and for the six-month period. Stock markets worldwide were volatile and fell dramatically in the first half of 2008, amid heightened credit market turmoil and in response to the global economic slowdown. Materials and energy stocks generated solid results for the fund, while financials were the biggest drag on performance.
• International stocks declined for the six months ended June 30, 2008, amid the ongoing credit crisis and a U.S. economic slowdown.
• Your portfolio performed in line with its MSCI benchmark and the Lipper peer group average.
• Financials were the portfolio’s largest performance detractors for the reporting period, while materials and energy stocks generated gains.
• We believe consumer discretionary, financials, and other areas that can benefit from increasing domestic consumption hold good long-term investment prospects.
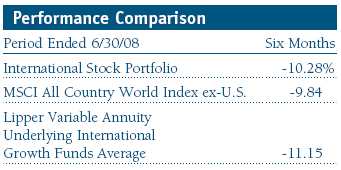
The International Stock Portfolio returned -10.28% for the six-month period ended June 30, 2008. As shown in the table above, the portfolio performed in line with its benchmarks, the MSCI All Country World Index ex-U.S. and the Lipper Variable Annuity Underlying International Growth Funds Average. Our performance versus the MSCI index benefited from stock selection, especially in materials and energy. However, stock selection in the information technology and financials sectors hurt our comparison with the benchmark.
Market Review

International equities trended lower for most of the past six months. Emerging markets fell farther than developed markets as risk aversion led to a flight to quality. The broad retreat from risky asset classes was triggered by the global credit crunch, which intensified as the period progressed. The spreading U.S. subprime mortgage problem and a weak U.S. economy dominated investor sentiment over the period.
There are three major issues that have troubled the equity markets over the last six months. One has been with us for a while, one started last fall, and the third was a “black swan”—an extraordinarily rare event that was nonetheless an embarrassment to those of us paid to facilitate transactions in the financial markets.
The first is inflation caused by rising commodity prices. As the chairman of the Standard Chartered Bank said in a recent statement to shareholders, “The key challenge for the world now is how we manage increasingly scarce resources.” We understood that tight commodity supplies and rising emerging market demand would keep prices high, but we have been surprised by the magnitude of the price increases: Oil eclipsed $140 per barrel, U.S. consumers are paying about $4 a gallon for gasoline, and grain prices have climbed sharply around the world. We think many commodity prices will stay high but that the sharp price movements are behind us.
The second issue is the global economic slowdown. It started in the U.S. last fall and is now spreading to Europe. Japan’s growth will likely remain modest, and although emerging markets are still growing rapidly, they have slowed from last year’s pace. We believe that the ways in which companies address and react to the changing global economic landscape will determine near-term stock performance.
The third issue was the lack of liquidity in credit markets, which, when coupled with declining asset prices, resulted in massive write-offs, markdowns, and the need for cash infusions at many financial companies. We think the worst of this crisis is over, and most fixed-income assets can be priced and are trading. After what seemed like an awfully long pause, fixed-income investors are breathing again.
The Japanese market tumbled during the past six months, but returns for U.S. investors were buffered by the appreciation of its currency as the yen rallied against the dollar. However, Japanese exporters were hurt by the strength of the yen and slackening U.S. demand. The Bank of Japan said fallout from the slowing U.S. economy and problems associated with the subprime mortgage meltdown are likely to reduce Japan’s 2008 growth rate to less than 2%.
European stock markets succumbed to the weakness in housing, especially in the U.K., Spain, and Ireland, and diminished consumer spending power. In addition, liquidity tightened and all but dried up in the interbank lending market. Across Europe, the strongest sectors were materials and energy, while consumer discretionary, information technology, and financials were the weakest performers.
Emerging markets were hurt by the inflationary forces of rising food and commodity prices and fear of economic weakness caused by a U.S. slowdown. Over the past six months, the MSCI Emerging Markets Index declined more than 11%. Although the materials and energy sectors were fairly resilient, industrials, financials, and consumer discretionary posted major losses. Latin America performed much better than other emerging markets regions, while Asian markets fell hardest.
Portfolio Strategy
We believe that over time stocks move with earnings and cash flow growth, meaning simply that if a company grows free cash flow by 15% a year, its stock should appreciate at roughly the same rate. We search for companies we think can generate double-digit growth over time by participating in expanding markets, taking market share, or improving profitability at a rate much faster than sales. We think that if we can find those companies and pay a fair price for their stock, we can compound absolute returns at double-digit levels and provide solid long-term relative returns.

With this objective in mind, our industry analysts dedicated to this strategy, as well as other T. Rowe Price portfolio managers, travel the world trying to find companies that fit these criteria. We look for the best non-U.S. stocks wherever we may find them rather than employing a regional focus.
Performance Review
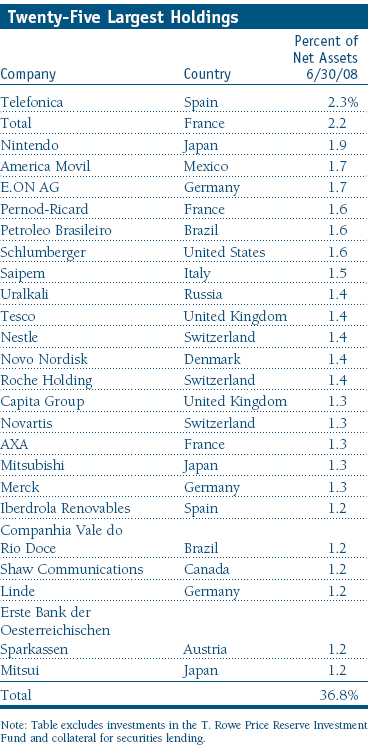
The portfolio’s materials sector holdings were the stand-out performers for the past six months. Russian fertilizer company Uralkali, the world’s largest potash fertilizer trading company, was the portfolio’s best contributor during the period. The company exports more than 90% of its output from its mining operations and is benefiting from higher demand and pricing resulting from soaring crop prices. The firm exports to more than 60 countries, but its largest customers are in China, Brazil, Southeast Asia, and India. The stock’s solid gains, coupled with substantial additions over the past six months, have vaulted the company onto our 25-largest-holdings list. (Please refer to the portfolio of investments for a detailed list of holdings and the amount each represents in the portfolio.)
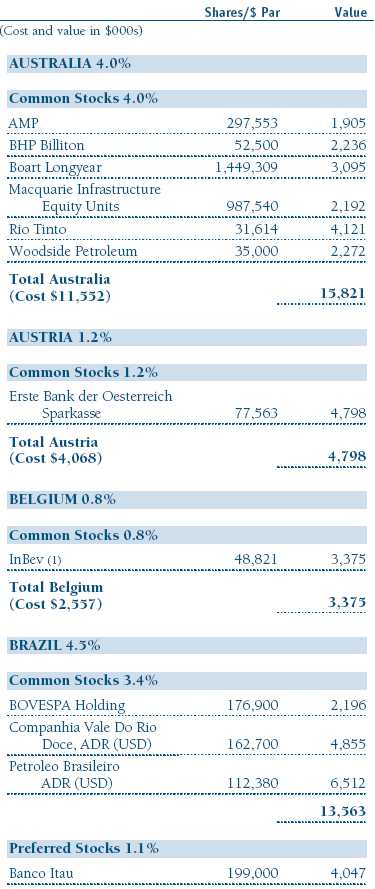
Mining companies in the materials sector also generated noteworthy gains. Rio Tinto (Australia), the world’s third-largest mining company, its largest coal miner, and a buyout target in BHP Billiton’s sights, was one of the portfolio’s best contributors for the past six months. Rio rejected a February buyout offer from its larger rival, stating its prospects were better as a stand-alone entity than as a combined company. Although the stock has been volatile, it has more than doubled from its low last summer. Xstrata, a Swiss mining company and a recent portfolio addition, surged with the price of coal and a bid from Companhia Vale do Rio Doce (Brazil).
We have lighter exposure to the materials sector than our MSCI benchmark and intend to maintain the underweight, believing that the group is likely to give back some of its multiyear outperformance. These companies also do not typically display the long-term growth characteristics we favor. We continue to be extremely selective in the sector. Although we owned coal, potash, and iron ore firms, we have avoided steel companies because we think that the scarcity among resources is in “natural” resources. Over time, additional steel capacity can and will be added, bringing margins down. Most of our holdings have provided strong results, which largely offset the underweight. We believe that we will see less single-sector dominance in coming quarters and that the markets will be increasingly powered by individual stock movements.
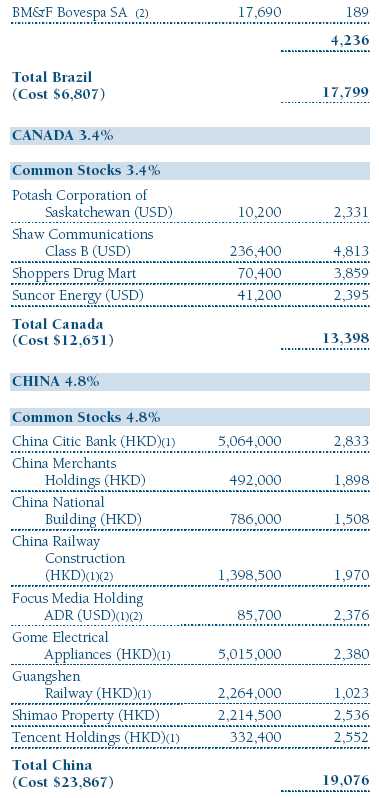
Energy stocks were the portfolio’s second-best contributors for the past six months. Shares of Petroleo Brasileiro (Petrobras), Brazil’s state-controlled oil company, generated solid gains in the past six months and have approximately doubled over the past year. The stock’s solid performance was due to a number of new oil finds. It is scheduled to begin pumping oil from its eight-billion-barrel Tupi field in early 2009. However, this production could be dwarfed by its latest oil discovery, the Carioca field, which, by some estimates, may hold 33 billion barrels of oil and could be the third-largest oil field ever discovered. However, extracting the oil from the field is no slam dunk as it is located beneath a layer of salt in the deepwater Santos Basin, hundreds of miles off Brazil’s southeastern coast.
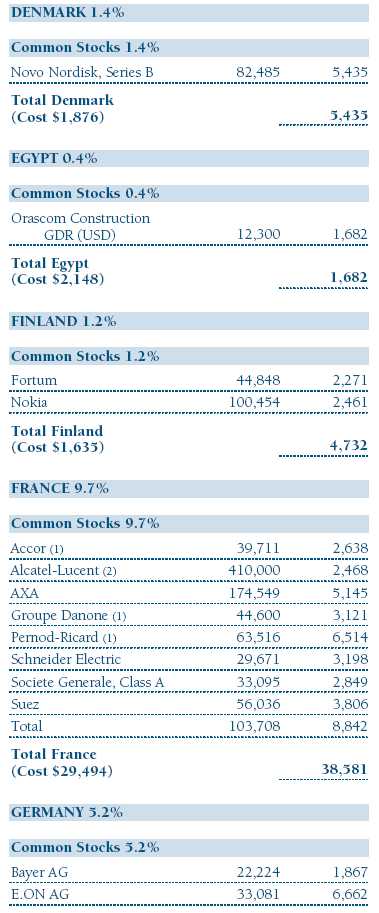
Our next-best contributor in the energy sector was PT Bumi Resources, an oil and coal mining company headquartered in Jakarta, Indonesia. The company is the largest thermal coal producer in Indonesia and the second-largest thermal coal exporter globally. We also enjoyed good results from Woodside Petroleum, a recent portfolio addition, one of Australia’s largest publicly traded oil and liquefied natural gas exploration and production companies. Among other holdings in the sector, we favor the prospects for Suncor Energy, a Canadian oil sands refiner. The company is primarily engaged in recovering bitumen from oil sand and upgrading it into diesel fuel and refinery-ready crude oil for processing into transportation fuels and lubricants. The company has ambitious expansion plans and reserves to sustain production for the next 50 years.
Although many of the portfolio’s best gainers in energy and materials are based in developing markets, we also had our share of disappointments, especially holdings in China. Banks across emerging Asia reduced lending after property prices climbed rapidly through 2007, and both property and banking stocks sold off sharply in the first quarter of this year. In India, our property stocks also succumbed to the selling pressure. The U.S. credit crunch hurt financials companies worldwide, and consumers’ tightened purse strings have weighed on discretionary spending globally. As investors reduced risk in the first quarter’s flight to quality, a lot of the “hot” money came out of emerging markets, although, on a relative basis, our emerging markets investments held up well.
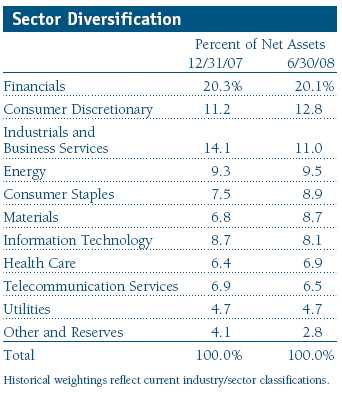
Despite significant reductions in our financials holdings over the past year, the sector remained our largest at the end of the reporting period. In the last six months, financials were far and away the portfolio’s largest detractors. Among the sector’s worst-performing stocks was Swiss-based UBS, a longtime portfolio holding that may end up writing off approximately $20 billion in subprime mortgage investments. Unlike Citigroup, UBS isn’t a mortgage underwriter—it was purely investing in securities tied to the declining asset class.
In China, Shimao Property, which is primarily engaged in property development, investments, and hotel operations, was the portfolio’s largest detractor. China Citic Bank also sold off due to the sharp reduction in lending. DLF Limited, an Indian soup-to-nuts real estate development company, tumbled during the reporting period. Overall, our holdings in commercial banks, including Société Générale, Sberbank, and the National Bank of Greece, were among our largest detractors. In the sharp decline in the financials sector, most stocks were treated with equal distaste. We have responded to this by eliminating names we felt were more permanently damaged and adding to those unfairly punished or in a position to gain share coming out the other end of the crisis.
We added to our holdings in the consumer discretionary sector but had mixed results as buying into a declining economy is best done slowly. For example, we bought Urbi Desarrollos Urbanos, a Mexican homebuilder; Melco PBL Entertainment (hotels, restaurants, and leisure) in Hong Kong; and Shaw Communications, a cable company in Canada, after its shares had fallen significantly.
Investment Outlook
How much will the U.S. slowdown hurt the global economy? China’s exports to the U.S. will be affected, but the U.S. is less important as a global consumer today than at any time in the past. The U.S. currently consumes about 20% of China’s exports as Europe, Japan, and the Middle East have become larger importers of its goods. Another example of the decoupling process is in Mexico, which should have been hurt by the diminishing U.S. growth prospects, but its economy is doing fine. In fact, Wal-Mart de Mexico (Walmex) posted double-digit first-quarter earnings gains.
Our focus throughout the period, and for the long term, targets companies with good global franchises and attempts to buy them at reasonable prices or when they are out of favor. As previously mentioned, we’ve been buying financials and consumer stocks because investors fear the world is going to slip into global recession. On the sell side, we want to trim our holdings when investors become ebullient or when a company no longer meets our growth expectations.
In our view, the credit crisis has had more effect on the world’s economy than the U.S. consumer slowdown. Over the next several quarters, we expect global economic growth to ease, which, in turn, leads us to believe that sales growth will slow. Earnings growth rates should also be slower but nevertheless still rise. Therefore, we feel it’s important to own companies that have the ability to maintain their earnings or companies whose stocks have already priced in lower earnings expectations.
We have maintained about a 25% allocation in emerging markets, although it hurt our performance over the past six months. From a regional view, the Chinese and Indian markets have corrected to the point that growth appears to be reasonably priced. If commodity prices plateau or ease a little, then inflation would subside and the markets should rally. While this may take some time, we are gradually increasing our exposure to these markets.
We are currently underweight in Europe and especially the U.K. Overall, Europe’s economies seem to be weakening and historically they tend to follow the U.S. market’s lead. In Ireland, growth is slowing because of the housing issues, while in Spain and the U.K. growth has slowed to the point where either could slip into recession. European authorities seem to be in no hurry to cut interest rates in order to deal with slowing demand. Nevertheless, we don’t buy markets; first and foremost, we are stock pickers. Several European companies, including E.ON AG, Total, and Pernod-Ricard, are among our largest holdings and should perform well in a slowing global economy.
In this challenging and volatile environment, we will continue to work diligently on your behalf to find companies that can provide solid, long-term returns.
Respectfully submitted,

Robert W. Smith
Chairman of the Investment Advisory Committee
July 11, 2008
The committee chairman has day-to-day responsibility for managing the portfolio and works with committee members in developing and executing its investment program.
| Risks of International Investing |
Funds that invest overseas generally carry more risk than funds that invest strictly in U.S. assets. Funds investing in a single country or in a limited geographic region tend to be riskier than more diversified funds. Risks can result from varying stages of economic and political development; differing regulatory environments, trading days, and accounting standards; and higher transaction costs of non-U.S. markets. Non-U.S. investments are also subject to currency risk, or a decline in the value of a foreign currency versus the U.S. dollar, which reduces the dollar value of securities denominated in that currency.
Lipper averages: The averages of available mutual fund performance returns for specified periods in defined categories as tracked by Lipper Inc.
MSCI All Country World Index ex-U.S.: An index that measures equity market performance of developed and emerging countries, excluding the U.S.
Portfolio Highlights
Performance and Expenses
T. Rowe Price International Stock Portfolio
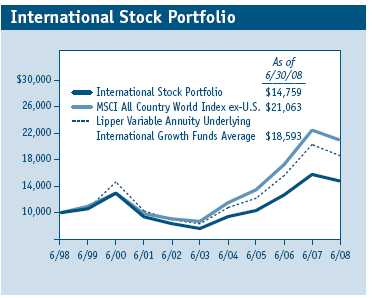
This chart shows the value of a hypothetical $10,000 investment in the portfolio over the past 10 fiscal year periods or since inception (for portfolios lacking 10-year records). The result is compared with benchmarks, which may include a broad-based market index and a peer group average or index. Market indexes do not include expenses, which are deducted from portfolio returns as well as mutual fund averages and indexes.

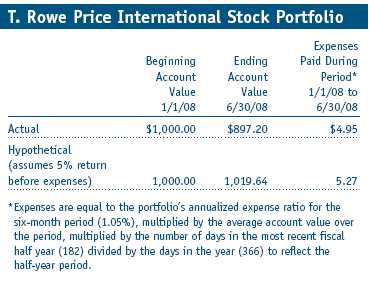
Fund Expense Example
As a mutual fund shareholder, you may incur two types of costs: (1) transaction costs, such as redemption fees or sales loads, and (2) ongoing costs, including management fees, distribution and service (12b-1) fees, and other fund expenses. The following example is intended to help you understand your ongoing costs (in dollars) of investing in the fund and to compare these costs with the ongoing costs of investing in other mutual funds. The example is based on an investment of $1,000 invested at the beginning of the most recent six-month period and held for the entire period.
Actual Expenses
The first line of the following table (“Actual”) provides information about actual account values and actual expenses. You may use the information in this line, together with your account balance, to estimate the expenses that you paid over the period. Simply divide your account value by $1,000 (for example, an $8,600 account value divided by $1,000 = 8.6), then multiply the result by the number in the first line under the heading “Expenses Paid During Period” to estimate the expenses you paid on your account during this period.
Hypothetical Example for Comparison Purposes
The information on the second line of the table (“Hypothetical”) is based on hypothetical account values and expenses derived from the fund’s actual expense ratio and an assumed 5% per year rate of return before expenses (not the fund’s actual return). You may compare the ongoing costs of investing in the fund with other funds by contrasting this 5% hypothetical example and the 5% hypothetical examples that appear in the shareholder reports of the other funds. The hypothetical account values and expenses may not be used to estimate the actual ending account balance or expenses you paid for the period.
You should also be aware that the expenses shown in the table highlight only your ongoing costs and do not reflect any transaction costs, such as redemption fees or sales loads. Therefore, the second line of the table is useful in comparing ongoing costs only and will not help you determine the relative total costs of owning different funds. To the extent a fund charges transaction costs, however, the total cost of owning that fund is higher.
Financial Highlights
T. Rowe Price International Stock Portfolio
(Unaudited)

The accompanying notes are an integral part of these financial statements.
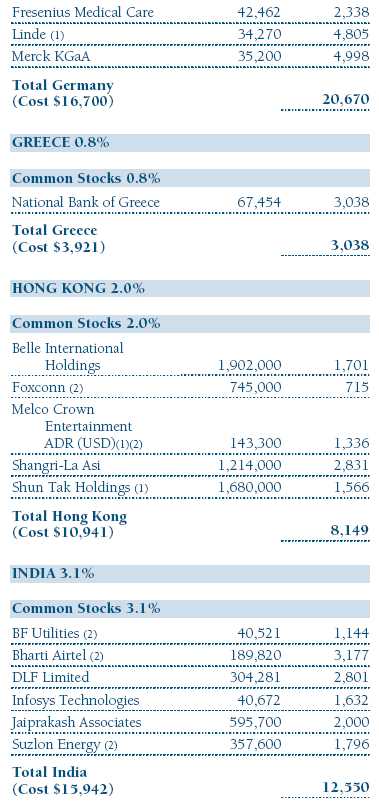
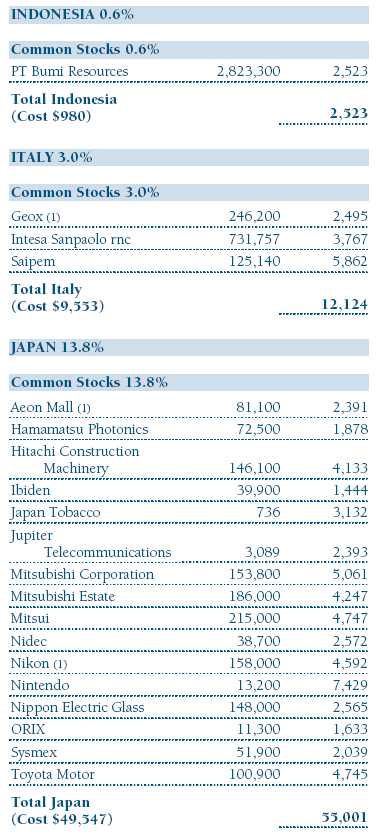
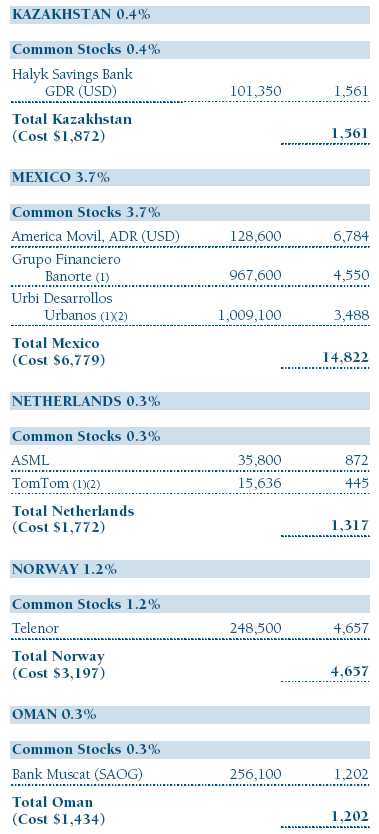
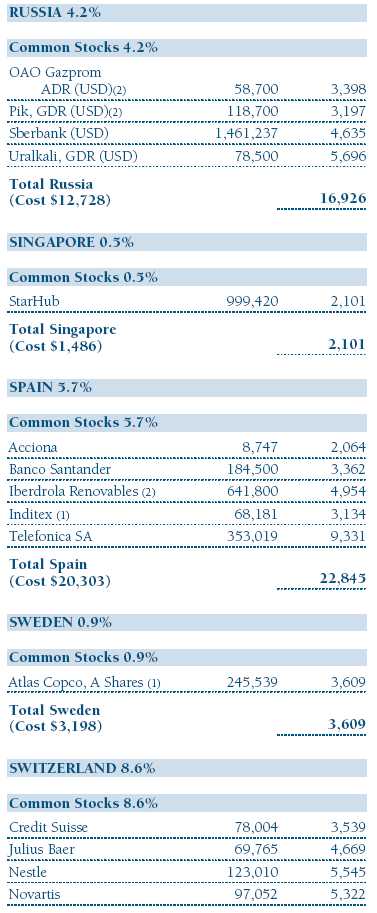
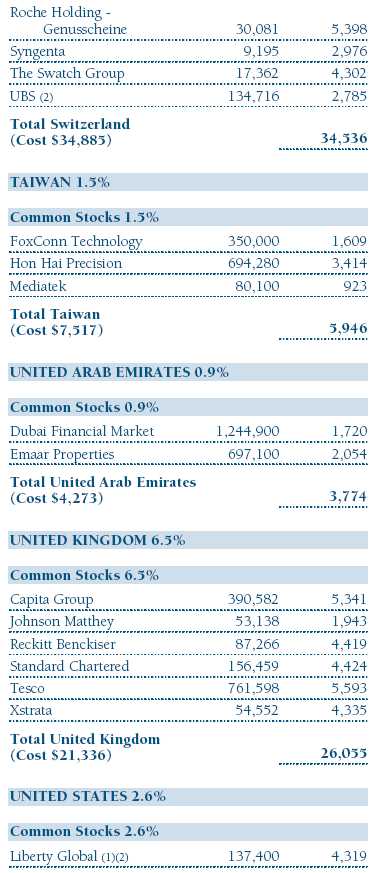
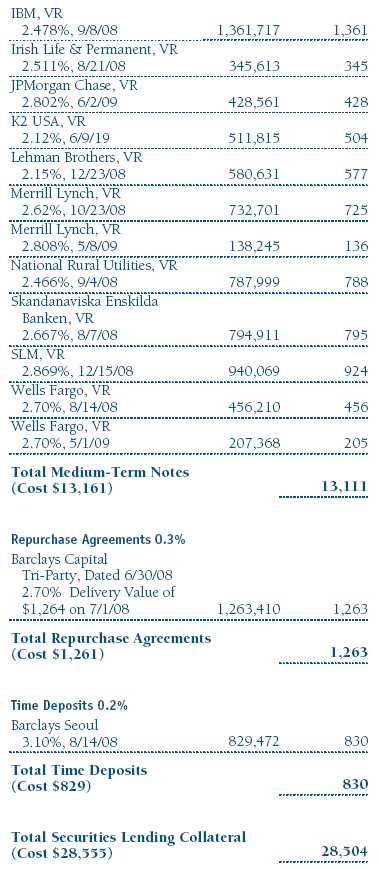
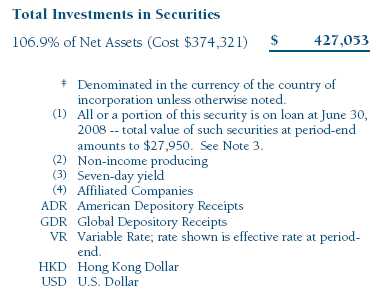
Portfolio of Investments ‡
T. Rowe Price International Stock Portfolio
June 30, 2008 (Unaudited)


The accompanying notes are an integral part of these financial statements.
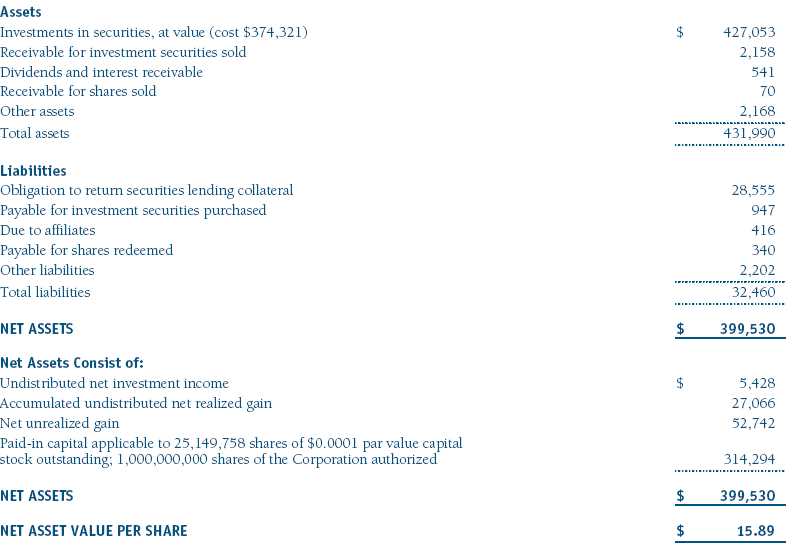
Statement of Assets and Liabilities
T. Rowe Price International Stock Portfolio
June 30, 2008 (Unaudited)
($000s, except shares and per share amounts)
The accompanying notes are an integral part of these financial statements.
Statement of Operations
T. Rowe Price International Stock Portfolio
(Unaudited)
($000s)

The accompanying notes are an integral part of these financial statements.
Statement of Changes in Net Assets
T. Rowe Price International Stock Portfolio
(Unaudited)
($000s)

The accompanying notes are an integral part of these financial statements.
Notes to Financial Statements
T. Rowe Price International Stock Portfolio
June 30, 2008 (Unaudited)
T. Rowe Price International Series, Inc. (the corporation), is registered under the Investment Company Act of 1940 (the 1940 Act). The International Stock Portfolio (the fund), a diversified, open-end management investment company, is one portfolio established by the corporation. The fund commenced operations on March 31, 1994. The fund seeks long-term growth of capital through investments primarily in the common stocks of established, non-U.S. companies. Shares of the fund are currently offered only through certain insurance companies as an investment medium for both variable annuity contracts and variable life insurance policies.
NOTE 1 - SIGNIFICANT ACCOUNTING POLICIES
Basis of Preparation The accompanying financial statements were prepared in accordance with accounting principles generally accepted in the United States of America, which require the use of estimates made by fund management. Fund management believes that estimates and security valuations are appropriate; however, actual results may differ from those estimates, and the security valuations reflected in the financial statements may differ from the value the fund ultimately realizes upon sale of the securities.
Investment Transactions, Investment Income, and Distributions Income and expenses are recorded on the accrual basis. Premiums and discounts on debt securities are amortized for financial reporting purposes. Dividends received from mutual fund investments are reflected as dividend income; capital gain distributions are reflected as realized gain/loss. Dividend income and capital gain distributions are recorded on the ex-dividend date. Income tax-related interest and penalties, if incurred, would be recorded as income tax expense. Investment transactions are accounted for on the trade date. Realized gains and losses are reported on the identified cost basis. Distributions to shareholders are recorded on the ex-dividend date. Income distributions are declared and paid on an annual basis. Capital gain distributions, if any, are declared and paid by the fund, typically on an annual basis.
Currency Translation Assets, including investments, and liabilities denominated in foreign currencies are translated into U.S. dollar values each day at the prevailing exchange rate, using the mean of the bid and asked prices of such currencies against U.S. dollars as quoted by a major bank. Purchases and sales of securities, income, and expenses are translated into U.S. dollars at the prevailing exchange rate on the date of the transaction. The effect of changes in foreign currency exchange rates on realized and unrealized security gains and losses is reflected as a component of security gains and losses.
New Accounting Pronouncements On January 1, 2008, the fund adopted Statement of Financial Accounting Standards No. 157 (FAS 157), Fair Value Measurements. FAS 157 defines fair value, establishes the framework for measuring fair value, and expands the disclosures of fair value measurements in the financial statements. Adoption of FAS 157 did not have a material impact on the fund’s net assets or results of operations.
In March 2008, the Financial Accounting Standards Board issued Statement of Financial Accounting Standards No. 161, Disclosures about Derivative Instruments and Hedging Activities (FAS 161), which is effective for fiscal years and interim periods beginning after November 15, 2008. FAS 161 requires enhanced disclosures about derivative and hedging activities, including how such activities are accounted for and their effect on financial position, performance and cash flows. Management is currently evaluating the impact the adoption of FAS 161 will have on the fund’s financial statements and related disclosures.
NOTE 2 - VALUATION
The fund’s investments are reported at fair value as defined under FAS 157. The fund values its investments and computes its net asset value per share at the close of the New York Stock Exchange (NYSE), normally 4 p.m. ET, each day that the NYSE is open for business.
Valuation Methods Equity securities listed or regularly traded on a securities exchange or in the over-the-counter (OTC) market are valued at the last quoted sale price or, for certain markets, the official closing price at the time the valuations are made, except for OTC Bulletin Board securities, which are valued at the mean of the latest bid and asked prices. A security that is listed or traded on more than one exchange is valued at the quotation on the exchange determined to be the primary market for such security. Listed securities not traded on a particular day are valued at the mean of the latest bid and asked prices for domestic securities and the last quoted sale price for international securities.
Debt securities with remaining maturities of less than one year at the time of acquisition generally use amortized cost in local currency to approximate fair value. However, if amortized cost is deemed not to reflect fair value or the fund holds a significant amount of such securities with remaining maturities of more than 60 days, the securities are valued at prices furnished by dealers who make markets in such securities or by an independent pricing service.
Investments in mutual funds are valued at the mutual fund’s closing net asset value per share on the day of valuation.
Other investments, including restricted securities, and those for which the above valuation procedures are inappropriate or are deemed not to reflect fair value are stated at fair value as determined in good faith by the T. Rowe Price Valuation Committee, established by the fund’s Board of Directors.
For valuation purposes, the last quoted prices of non-U.S. equity securities may be adjusted under the circumstances described below. If the fund determines that developments between the close of a foreign market and the close of the NYSE will, in its judgment, materially affect the value of some or all of its portfolio securities, the fund will adjust the previous closing prices to reflect what it believes to be the fair value of the securities as of the close of the NYSE. In deciding whether it is necessary to adjust closing prices to reflect fair value, the fund reviews a variety of factors, including developments in foreign markets, the performance of U.S. securities markets, and the performance of instruments trading in U.S. markets that represent foreign securities and baskets of foreign securities. A fund may also fair value securities in other situations, such as when a particular foreign market is closed but the fund is open. The fund uses outside pricing services to provide it with closing prices and information to evaluate and/or adjust those prices. The fund cannot predict how often it will use closing prices and how often it will determine it necessary to adjust those prices to reflect fair value. As a means of evaluating its security valuation process, the fund routinely compares closing prices, the next day’s opening prices in the same markets, and adjusted prices.
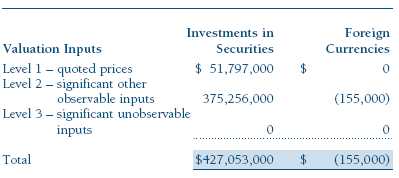
Valuation Inputs Various inputs are used to determine the value of the fund’s investments. These inputs are summarized in the three broad levels listed below:
Level 1 – quoted prices in active markets for identical securities
Level 2 – observable inputs other than Level 1 quoted prices (including, but not limited to, quoted prices for similar securities, interest rates, prepayment speeds, credit risk)
Level 3 – unobservable inputs
Observable inputs are those based on market data obtained from sources independent of the fund, and unobservable inputs reflect the fund’s own assumptions based on the best information available. The input levels are not necessarily an indication of the risk or liquidity associated with investments at that level. For example, non-U.S. equity securities actively traded in foreign markets generally are reflected in Level 2 despite the availability of closing prices, because the fund evaluates and determines whether those closing prices reflect fair value at the close of the NYSE or require adjustment, as described above. The following table summarizes the fund’s investments, based on the inputs used to determine their values on June 30, 2008:
NOTE 3 - INVESTMENT TRANSACTIONS
Consistent with its investment objective, the fund engages in the following practices to manage exposure to certain risks or to enhance performance. The investment objective, policies, program, and risk factors of the fund are described more fully in the fund’s prospectus and Statement of Additional Information.
Emerging Markets At June 30, 2008, approximately 24% of the fund’s net assets were invested, directly or through its investments in T. Rowe Price institutional funds, in securities of companies located in emerging markets denominated in or linked to the currencies of emerging market countries. Future economic or political developments could adversely affect the liquidity or value, or both, of such securities.
Repurchase Agreements All repurchase agreements are fully collateralized by U.S. government securities or AAA-rated asset-backed securities. Collateral is in the possession of the fund’s custodian or, for tri-party agreements, the custodian designated by the agreement. Collateral is evaluated daily to ensure that its market value exceeds the delivery value of the repurchase agreements at maturity. Although risk is mitigated by the collateral, the fund could experience a delay in recovering its value and a possible loss of income or value if the counter-party fails to perform in accordance with the terms of the agreement.
Securities Lending The fund lends its securities to approved brokers to earn additional income. It receives as collateral cash and U.S. government securities valued at 102% to 105% of the value of the securities on loan. Cash collateral is invested by the fund’s lending agent(s) in accordance with investment guidelines approved by fund management. Although risk is mitigated by the collateral, the fund could experience a delay in recovering its securities and a possible loss of income or value if the borrower fails to return the securities or if collateral investments decline in value. Securities lending revenue recognized by the fund consists of earnings on invested collateral and borrowing fees, net of any rebates to the borrower and compensation to the lending agent. On June 30, 2008, the value of loaned securities was $27,950,000; aggregate collateral received included U.S. government securities valued at $1,201,000.
Other Purchases and sales of portfolio securities, other than short-term securities, aggregated 134,688,000 and 155,589,000, respectively, for the six months ended June 30, 2008.
NOTE 4 - FEDERAL INCOME TAXES
No provision for federal income taxes is required since the fund intends to continue to qualify as a regulated investment company under Subchapter M of the Internal Revenue Code and distribute to shareholders all of its taxable income and gains. Distributions are determined in accordance with Federal income tax regulations, which differ from generally accepted accounting principles, and, therefore, may differ in amount or character from net investment income and realized gains for financial reporting purposes. Financial reporting records are adjusted for permanent book/tax differences to reflect tax character but are not adjusted for temporary differences. The amount and character of tax-basis distributions and composition of net assets are finalized at fiscal year-end; accordingly, tax-basis balances have not been determined as of June 30, 2008.
In accordance with federal tax regulations, the fund deferred recognition of certain capital loss amounts previously recognized in the prior fiscal year for financial reporting purposes until the current fiscal period for tax purposes. Such deferrals amounted to $532,000 and related to net capital losses realized between November 1 and the fund’s fiscal year-end date.
At June 30, 2008, the cost of investments for federal income tax purposes was $374,321,000. Net unrealized gain aggregated $52,742,000 at period-end, of which $82,292,000 related to appreciated investments and $29,550,000 related to depreciated investments.
NOTE 5 - FOREIGN TAXES
The fund is subject to foreign income taxes imposed by certain countries in which it invests. Additionally, capital gains realized by the fund upon disposition of securities issued in or by certain foreign countries are subject to capital gains tax imposed by those countries. All taxes are computed in accordance with the applicable foreign tax law, and, to the extent permitted, capital losses are used to offset capital gains. Tax expense attributable to income is accrued by the fund as a reduction of income. Current and deferred tax expense attributable to net capital gains is reflected as a component of realized and/or change in unrealized gain/loss on securities in the accompanying financial statements. At June 30, 2008, the fund had no deferred tax liability attributable to foreign securities and $3,604,000 of foreign capital loss carryforwards, including $1,380,000 that expire in 2010, $577,000 that expire in 2011, $1,384,000 that expire in 2012, $56,000 that expire in 2013, and $207,000 that expire in 2017.
NOTE 6 - RELATED PARTY TRANSACTIONS
The fund is managed by T. Rowe Price International, Inc. (the manager), a wholly owned subsidiary of T. Rowe Price Associates, Inc. (Price Associates), which is wholly owned by T. Rowe Price Group, Inc.
The investment management and administrative agreement between the fund and the manager provides for an all-inclusive annual fee equal to 1.05% of the fund’s average daily net assets. The fee is computed daily and paid monthly. The agreement provides that investment management, shareholder servicing, transfer agency, accounting, custody services, and directors’ fees and expenses are provided to the fund, and interest, taxes, brokerage commissions, and extraordinary expenses are paid directly by the fund.
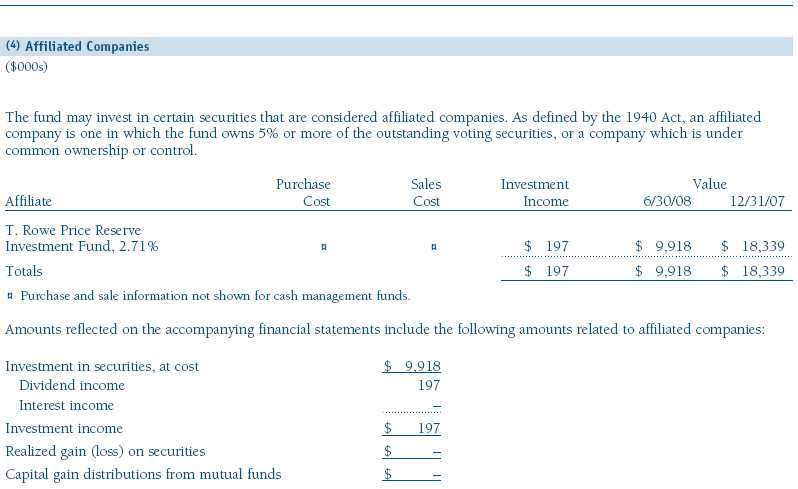
The fund may invest in the T. Rowe Price Reserve Investment Fund and the T. Rowe Price Government Reserve Investment Fund (collectively, the T. Rowe Price Reserve Investment Funds), open-end management investment companies managed by Price Associates and considered affiliates of the fund. The T. Rowe Price Reserve Investment Funds are offered as cash management options to mutual funds, trusts, and other accounts managed by Price Associates and/or its affiliates and are not available for direct purchase by members of the public. The T. Rowe Price Reserve Investment Funds pay no investment management fees.
| Information on Proxy Voting Policies, Procedures, and Records |
A description of the policies and procedures used by T. Rowe Price funds and portfolios to determine how to vote proxies relating to portfolio securities is available in each fund’s Statement of Additional Information, which you may request by calling 1-800-225-5132 or by accessing the SEC’s Web site, www.sec.gov. The description of our proxy voting policies and procedures is also available on our Web site, www.troweprice.com. To access it, click on the words “Company Info” at the top of our homepage for individual investors. Then, in the window that appears, click on the “Proxy Voting Policy” navigation button in the top left corner.
Each fund’s most recent annual proxy voting record is available on our Web site and through the SEC’s Web site. To access it through our Web site, follow the directions above, then click on the words “Proxy Voting Record” at the bottom of the Proxy Voting Policy page.
| How to Obtain Quarterly Portfolio Holdings |
The fund files a complete schedule of portfolio holdings with the Securities and Exchange Commission for the first and third quarters of each fiscal year on Form N-Q. The fund’s Form N-Q is available electronically on the SEC’s Web site (www.sec.gov); hard copies may be reviewed and copied at the SEC’s Public Reference Room, 450 Fifth St. N.W., Washington, DC 20549. For more information on the Public Reference Room, call 1-800-SEC-0330.
| Approval of Investment Management Agreement |
On March 4, 2008, the fund’s Board of Directors (Board) unanimously approved the investment advisory contract (Contract) between the fund and its investment manager, T. Rowe Price International, Inc. (Manager). The Board considered a variety of factors in connection with its review of the Contract, also taking into account information provided by the Manager during the course of the year, as discussed below:
Services Provided by the Manager
The Board considered the nature, quality, and extent of the services provided to the fund by the Manager. These services included, but were not limited to, management of the fund’s portfolio and a variety of related activities, as well as financial and administrative services, reporting, and communications. The Board also reviewed the background and experience of the Manager’s senior management team and investment personnel involved in the management of the fund. The Board concluded that it was satisfied with the nature, quality, and extent of the services provided by the Manager.
Investment Performance of the Fund
The Board reviewed the fund’s average annual total returns over the 1-, 3-, 5-, and 10-year periods as well as the fund’s year-by-year returns and compared these returns with previously agreed upon comparable performance measures and market data, including those supplied by Lipper and Morningstar, which are independent providers of mutual fund data. On the basis of this evaluation and the Board’s ongoing review of investment results, the Board concluded that the fund’s performance was satisfactory.
Costs, Benefits, Profits, and Economies of Scale
The Board reviewed detailed information regarding the revenues received by the Manager under the Contract and other benefits that the Manager (and its affiliates) may have realized from its relationship with the fund, including research received under “soft dollar” agreements. The Board noted that soft dollars were not used to pay for third-party, non-broker research. The Board also received information on the estimated costs incurred and profits realized by the Manager and its affiliates from advising T. Rowe Price mutual funds, as well as estimates of the gross profits realized from managing the fund in particular. The Board concluded that the Manager’s profits were reasonable in light of the services provided to the fund. The Board also considered whether the fund or other funds benefit under the fee levels set forth in the Contract from any economies of scale realized by the Manager. The Board noted that, under the Contract, the fund pays the Manager a single fee based on the fund’s assets and the Manager, in turn, pays all expenses of the fund, with certain exceptions. The Board concluded that, based on the profitability data it reviewed and consistent with this single-fee structure, the Contract provided for a reasonable sharing of benefits from any economies of scale with the fund.
Fees
The Board reviewed the fund’s single-fee structure and compared the rate with fees and expenses of other comparable funds based on information and data supplied by Lipper. (For these purposes, the Board assumed the management fee was equal to the single fee less the fund’s operating expenses.) The information provided to the Board indicated that the fund’s management fee rate was above the median for comparable funds and that the expense ratio was at or below the median for comparable funds. The Board also reviewed the fee schedules for comparable privately managed accounts of the Manager and its affiliates. Management informed the Board that the Manager’s responsibilities for privately managed accounts are more limited than its responsibilities for the fund and other T. Rowe Price mutual funds that it or its affiliates advise. On the basis of the information provided, the Board concluded that the fees paid by the fund under the Contract were reasonable.
Approval of the Contract
As noted, the Board approved the continuation of the Contract. No single factor was considered in isolation or to be determinative to the decision. Rather, the Board concluded, in light of a weighting and balancing of all factors considered, that it was in the best interests of the fund to approve the continuation of the Contract, including the fees to be charged for services thereunder.
Item 2. Code of Ethics.
A code of ethics, as defined in Item 2 of Form N-CSR, applicable to its principal executive officer, principal financial officer, principal accounting officer or controller, or persons performing similar functions is filed as an exhibit to the registrant’s annual Form N-CSR. No substantive amendments were approved or waivers were granted to this code of ethics during the registrant’s most recent fiscal half-year.
Item 3. Audit Committee Financial Expert.
Disclosure required in registrant’s annual Form N-CSR.
Item 4. Principal Accountant Fees and Services.
Disclosure required in registrant’s annual Form N-CSR.
Item 5. Audit Committee of Listed Registrants.
Not applicable.
Item 6. Investments.
(a) Not applicable. The complete schedule of investments is included in Item 1 of this Form N-CSR.
(b) Not applicable.
Item 7. Disclosure of Proxy Voting Policies and Procedures for Closed-End Management Investment Companies.
Not applicable.
Item 8. Portfolio Managers of Closed-End Management Investment Companies.
Not applicable.
Item 9. Purchases of Equity Securities by Closed-End Management Investment Company and Affiliated Purchasers.
Not applicable.
Item 10. Submission of Matters to a Vote of Security Holders.
Not applicable.
Item 11. Controls and Procedures.
(a) The registrant’s principal executive officer and principal financial officer have evaluated the registrant’s disclosure controls and procedures within 90 days of this filing and have concluded that the registrant’s disclosure controls and procedures were effective, as of that date, in ensuring that information required to be disclosed by the registrant in this Form N-CSR was recorded, processed, summarized, and reported timely.
(b) The registrant’s principal executive officer and principal financial officer are aware of no change in the registrant’s internal control over financial reporting that occurred during the registrant’s second fiscal quarter covered by this report that has materially affected, or is reasonably likely to materially affect, the registrant’s internal control over financial reporting.
Item 12. Exhibits.
(a)(1) The registrant’s code of ethics pursuant to Item 2 of Form N-CSR is filed with the registrant’s annual Form N-CSR.
(2) Separate certifications by the registrant's principal executive officer and principal financial officer, pursuant to Section 302 of the Sarbanes-Oxley Act of 2002 and required by Rule 30a-2(a) under the Investment Company Act of 1940, are attached.
(3) Written solicitation to repurchase securities issued by closed-end companies: not applicable.
(b) A certification by the registrant's principal executive officer and principal financial officer, pursuant to Section 906 of the Sarbanes-Oxley Act of 2002 and required by Rule 30a-2(b) under the Investment Company Act of 1940, is attached.
| | |
SIGNATURES |
| |
| | Pursuant to the requirements of the Securities Exchange Act of 1934 and the Investment |
| Company Act of 1940, the registrant has duly caused this report to be signed on its behalf by the |
| undersigned, thereunto duly authorized. |
| |
| T. Rowe Price International Series, Inc. |
| |
| |
| |
| By | /s/ Edward C. Bernard |
| | Edward C. Bernard |
| | Principal Executive Officer |
| |
| Date | August 20, 2008 |
| |
| |
| |
| | Pursuant to the requirements of the Securities Exchange Act of 1934 and the Investment |
| Company Act of 1940, this report has been signed below by the following persons on behalf of |
| the registrant and in the capacities and on the dates indicated. |
| |
| |
| By | /s/ Edward C. Bernard |
| | Edward C. Bernard |
| | Principal Executive Officer |
| |
| Date | August 20, 2008 |
| |
| |
| |
| By | /s/ Gregory K. Hinkle |
| | Gregory K. Hinkle |
| | Principal Financial Officer |
| |
| Date | August 20, 2008 |