| UNITED STATES |
| SECURITIES AND EXCHANGE COMMISSION |
| Washington, D.C. 20549 |
| |
FORM N-CSR |
| |
CERTIFIED SHAREHOLDER REPORT OF REGISTERED |
MANAGEMENT INVESTMENT COMPANIES |
| |
| |
| |
| Investment Company Act File Number: 811-07145 |
|
| |
| T. Rowe Price International Series, Inc. |
|
| (Exact name of registrant as specified in charter) |
| |
| 100 East Pratt Street, Baltimore, MD 21202 |
|
| (Address of principal executive offices) |
| |
| David Oestreicher |
| 100 East Pratt Street, Baltimore, MD 21202 |
|
| (Name and address of agent for service) |
| |
| |
| Registrant’s telephone number, including area code: (410) 345-2000 |
| |
| |
| Date of fiscal year end: December 31 |
| |
| |
| Date of reporting period: June 30, 2011 |
Item 1: Report to Shareholders| International Stock Portfolio | June 30, 2011 |
• International stock markets were volatile and generated mixed results in the six-month period ended June 30, 2011.
• Your portfolio posted a solid gain and outperformed its benchmark index due to stock selection in the information technology and materials sectors.
• We continue to focus on buying companies with durable global franchises that can grow their earnings and cash flow at a double-digit rate over the long term.
• Our research is uncovering attractive growth opportunities across a broad array of international stock markets. We remain especially encouraged by the long-term prospects for emerging markets.
The views and opinions in this report were current as of June 30, 2011. They are not guarantees of performance or investment results and should not be taken as investment advice. Investment decisions reflect a variety of factors, and the managers reserve the right to change their views about individual stocks, sectors, and the markets at any time. As a result, the views expressed should not be relied upon as a forecast of the fund’s future investment intent. The report is certified under the Sarbanes-Oxley Act, which requires mutual funds and other public companies to affirm that, to the best of their knowledge, the information in their financial reports is fairly and accurately stated in all material respects.
Manager’s Letter
T. Rowe Price International Stock Portfolio
Dear Investor
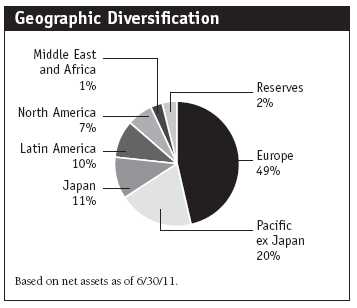
We are pleased to report good results for the six months ended June 30, 2011. The portfolio’s returns benefited from dollar weakness. In the reporting period, we did a good job selecting stocks in Europe and Japan, but stock selection detracted from our results in the Pacific ex Japan region. We believe emerging economies offer strong growth prospects over the intermediate and longer term, although our overweight hurt our results in the current reporting period. The portfolio remains broadly diversified across regions, countries, and sectors and focused on companies with the best long-term growth prospects.
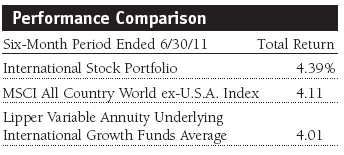
The International Stock Portfolio generated a solid 4.39% return for the six months ended June 30, 2011. As shown in the Performance Comparison table, the portfolio outperformed the benchmark MSCI All Country World ex-U.S.A. Index and the Lipper Variable Annuity Underlying International Growth Funds Average. Our performance versus the MSCI index benefited from stock selection in the information technology and materials sectors. However, stock picking in the industrials and business services and the consumer sectors hurt our comparison with the benchmark. The fund’s underweight allocation and stock selection in health care also detracted from relative performance.
Portfolio Positioning
As often mentioned, we invest for the long term, and we are willing to hold stocks through difficult periods as long as we feel comfortable that the company will emerge well positioned on the other side. During this period, we persevered along those lines. We will hold on to companies where we have strong conviction and selectively add where we see compelling value and believe that margins will normalize and strong sales growth will continue.
While the past six months were favorable overall, they tested our resolve at times. For example, well-positioned banks in Brazil endured wage inflation and the imposition of higher reserve requirements, which, in the short term, has hurt earnings and stock prices. Because of our analysts’ conviction and my contrarian bent (buy ’em when nobody wants ’em), I have held on to those positions and, in selected cases, added to them, reducing the portfolio’s average cost per share. A similar situation exists in China, where higher commodity prices could not be passed along to consumers because of the government’s intent to hold down inflation. The result: Several truly great businesses have endured steep profit margin declines.
As I wrote in the last shareholder letter, government policy decisions are increasingly affecting my investment decisions, and the portfolio’s performance has been hurt by policies that went counter to our forecast. Government intervention is like Baskin-Robbins’ ice cream—it comes in many varieties. In Australia, higher taxes are taking a larger portion of earnings at resource companies. In the U.K., outsourcing companies have had their margins squeezed by austerity programs and budget slashing. While these conditions are generally just temporary headwinds—short-term issues should not derail a good long-term secular investment theme—we have implemented additional screening measures, and, more than ever, we are focused on investing in companies that are less exposed to these arbitrary measures.
As I write this letter, my investment decisions are being shaped by the following views:
• Economies and earnings are improving in most regions, but the pace is slowing.
• Interest rates have remained low in mature markets but have been rising in developing markets, which could prove to be a near-term headwind for emerging countries.
• Consumer spending in emerging markets should continue to be a strong global growth driver.
• The European debt crisis caused several countries to have their debt downgraded. This issue may not be resolved quickly and will slow growth for companies that operate in the region.
• Government policy is imposing new costs on businesses.
I work with a talented group of industry analysts and other T. Rowe Price portfolio managers, and I want to thank them for their efforts. We are bottom-up stock pickers and analyze every company using several criteria. We attempt to discern if the management team is effective in deploying its free cash flow. We also look to see if the company is taking market share and whether it has pricing power. Next, we analyze whether the stock, at current prices, offers a good risk/reward proposition over the next few years. Finally, we are more focused than ever on how government policy could affect companies in various regions and sectors. Balancing the answers to these questions shapes our buying and selling decisions and, ultimately, the size of the positions in the portfolio.
Market Environment
International stocks were volatile over the six-month reporting period, and, overall, mature markets outperformed developing countries. Most countries and regions posted strong gains in the first quarter and far less robust returns in the second. The notable exception was Japan. A devastating earthquake and tsunami struck northeastern Japan in mid-March and caused a nuclear crisis. In general, European markets were stronger than those in the Pacific region, although the Nordic countries lagged. The euro zone generally posted good results in the period, thanks in large part to currency strength. The U.S. dollar fell versus the euro and the British pound sterling, while the yen was relatively unchanged. Although stocks rallied sharply in the beginning and in the final week of the reporting period, investors entered the third quarter concerned about the debt crisis in Europe and potentially slower growth in emerging markets where governments are raising interest rates to fight inflation.
The European region rallied, and risk aversion waned at the end of the period. The European Union confirmed its commitment to help Greece and the other financially strapped peripheral nations. Greece received a 110 billion euro rescue package a year ago, but the country has fallen short of its deficit reduction goals. At the end of June, the Greek parliament approved another, more-stringent round of austerity measures—including tax increases, cuts in state spending, and a privatization plan that should raise 50 billion euros—to meet the conditions needed to receive the next installment (12 billion euros) of the bailout package and avert defaulting on its outstanding loans. At the same time, the European Central Bank (ECB) is battling high unemployment and resurgent inflation, which is now above its 2% target. It is likely that the ECB will raise interest rates to preserve price stability in the region. However, that could lead to further strength in the euro and could hamper the recoveries in other European nations.
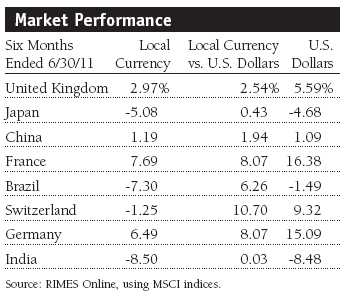
Developed markets in the Pacific Rim were lower due to the devastation and steep market decline in Japan. Hong Kong posted a loss, and Singapore and Australia trailed the broad market in the last six months. Although Japan’s economy contracted at a 3.5% annual rate in the first quarter, supply constraints had eased more rapidly than expected. The Bank of Japan stated that the Japanese economy would expand in the second half of the year as rebuilding efforts following the earthquake and tsunami progressed. While the natural disaster in Japan was a large humanitarian tragedy, we do not believe it will prove to be as much of a long-term economic setback for Japan as many feared.
Across the largest emerging Asian markets, Chinese stocks were only modestly higher, while the markets in India and Taiwan declined. China’s economy is starting to slow as a result of higher interest rates and Beijing’s efforts to rein in inflation. While investors remain concerned that tighter monetary policies will hurt economic growth, others think the government waited too long to start fighting inflation. Chinese consumer prices rose 5.5% year over year in May, which is the fastest rate in nearly three years. Inflation remains the biggest risk for Asia’s economies—rising prices can strangle consumer demand and choke off business investment.
Low interest rates and the paltry returns on bonds in developed markets favored a shift to stocks. While investors in mature markets appear unconcerned about higher interest rates, inflation and rising interest rates in emerging markets were a primary focus of concern. In Brazil, for example, revenue and earnings growth has been fine, but as interest rates went up, stock earnings multiples compressed, which especially hurt the financials sector. Growth in Brazil has been as strong as anywhere in the world, but investors have significantly trimmed stock valuations. Finally, geopolitical events contributed to volatility during the period. Antigovernment protests and violence across the Middle East and North Africa drove crude oil prices to more than $100 a barrel in March. Although the sharp rise was largely due to fears about possible supply disruptions, it added to volatility and risk aversion in general.
Portfolio Review
Domestic consumption in emerging markets was our best investment theme last year, but it hurt our results during this six-month reporting period. We were overweight in emerging markets that performed poorly, and it detracted from our comparison with the benchmark. However, we continue to believe that emerging markets can generate superior growth for the next three to five years and possibly longer. From a sector perspective, we added to our allocations in the industrials and business services, financials, and consumer discretionary sectors over the past six months. Concurrently, we trimmed our allocation to every other sector.
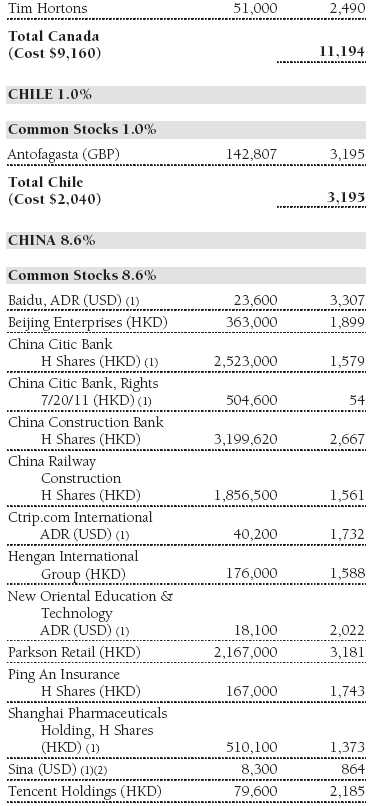
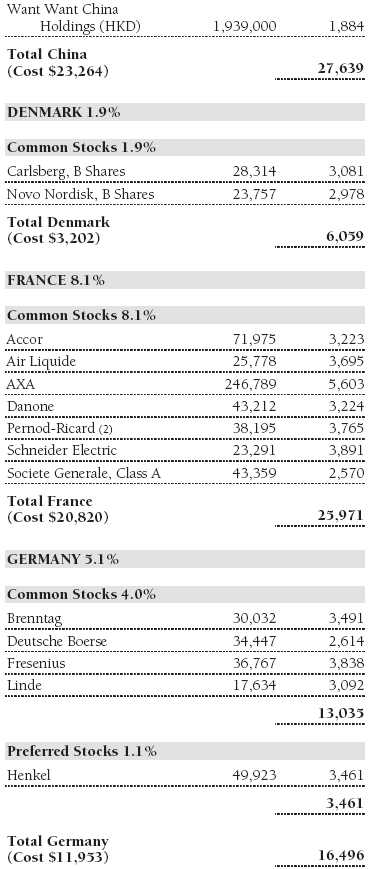
Consumer staples, which is generally viewed as a defensive-oriented sector, was the portfolio’s top contributor since the end of 2010. Portuguese food and staples retailer Jeronimo Martins was a standout for the last six months. The company operates convenience stores and supermarket chains in Portugal and Poland and is involved in food distribution and consumer products manufacturing. Food products companies Danone (U.K.), Want Want China Holdings, and Nestle (Switzerland) also generated solid contributions in the period. We trimmed our overweight allocation during the second quarter, taking some profits from Want Want. We also eliminated two stocks: Philip Morris International (U.S.), which had generated good gains, and United Spirits (India), one of the portfolio’s largest first-half detractors. (Please refer to the fund’s portfolio of investments for a complete list of holdings and the amount each represents in the portfolio.)
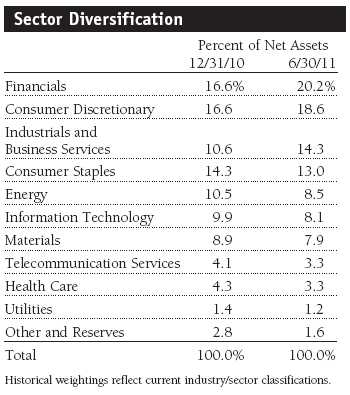
Information technology was our next-best sector contributor for the last six months due to stock selection. Four of the fund’s 10 best contributors came from the sector. Chinese Internet-related companies Sina, Baidu, and Tencent were strong performers, and we took some profits off the table. We sold much of our stake in Sina a bit prematurely as its price continued to climb. We still like Baidu and Tencent, but the stocks trade at high earnings multiples, and, while both are growing rapidly, we felt that after a strong advance there was a less favorable risk/reward trade-off. Accenture (U.S.) was another top contributor and looks to be well positioned in consulting and technology outsourcing, areas that should do well later in the economic cycle. The company is recovering nicely after the downturn and is benefiting from increased global merger and acquisition activity.
We eliminated our positions in Konica Minolta (Japan) and Hon Hai Precision (Taiwan). We invested in Konica because we thought that the copier market would flourish as a later-cycle business, when companies increased their capital spending, but performance has remained poor, and our expectations have been tempered. We eliminated Hon Hai, the world’s-largest electronic manufacturing services provider, because we became worried about the industry’s faltering demand. The company is doing a good job of containing costs, but we believe that its business will remain softer than our earlier estimates for a while longer.
Royal Dutch Shell (U.K.) and Rosneft (Russia) rallied in the oil, gas, and consumable fuels segment. Shell remained among the portfolio’s largest positions. We like the company’s prospects as it is now benefiting from investments made over the past several years. It has invested in the world’s largest gas-to-liquids plant in Qatar, which the company believes will eventually produce about three billion barrels of oil equivalent from a natural gas field. We think that Shell will benefit from a recovery in refining margins, and its new projects can continue to generate consistent long-term revenue and earnings growth. We took our gains and eliminated our position in Rosneft after the stock reached our target price.
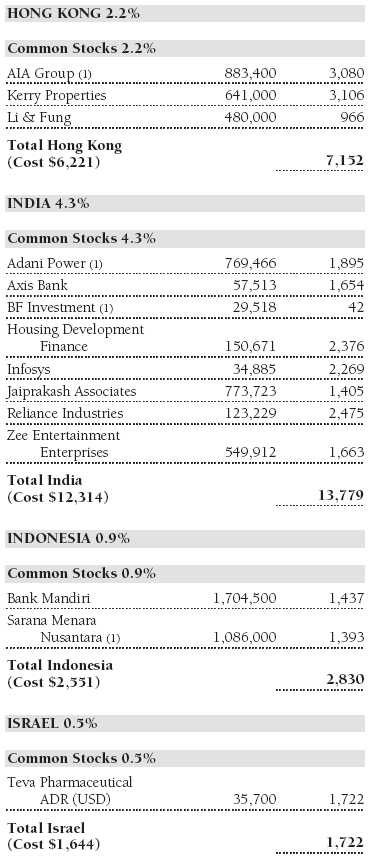
Among our emerging markets energy holdings, we were disappointed with the returns for Reliance Industries (India) and Petroleo Brasileiro (Brazil). We added to our position in Reliance, an exploration and production company that fell due to investor concerns about several investments in non-core operations. In general, its management team has been astute at allocating capital in its core business, and the money they deployed to other operations is small relative to the size of the company. In addition to investments in U.S. shale oil, the company has gas production capacity in India that it can utilize if and when it can get better pricing from the Indian government. Petrobras generated moderate gains, but its stock underperformed after issuing significantly more shares to bolster capital spending. The company continues to execute well and now has a stronger balance sheet, but the additional shares have significantly diluted the company’s earnings per share.
Our consumer discretionary holdings produced good results for the past six months, and the sector remained the portfolio’s second-largest allocation at the end of the reporting period. We favor companies in the sector that can generate stable recurring revenues. Compagniè Financière Richemont (U.K.), one of the world’s premier luxury goods companies, posted good revenues and income during the period. Sales of the company’s high-end jewelry, watches, writing instruments, and clothing benefited as stock markets rallied and sentiment about future economic growth improved. Lojas Renner, the second-largest department store chain in Brazil, also provided a strong contribution in the first half. The company operates more than 100 stores, selling men’s, women’s, and children’s apparel and footwear through 11 private label brands. The stock’s advance was powered by strong same-store sales growth, retail margin improvement, and store openings in new markets.
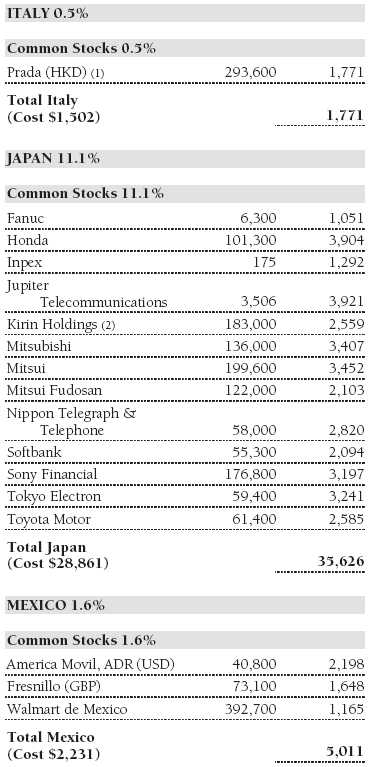
The sector also had several of the fund’s largest detractors. Rising oil prices and the turmoil in the Middle East and North Africa hurt Carnival (U.S.), but we remain positive on the company’s longer-term prospects and added to our position during the period. We think the cruise business will benefit from improving demand in 2012, and there are few competitors in this solid-margin business. We were likely a bit early in buying Parkson Retail (China). While its revenues are expanding nicely and we think the retailer will continue to post good growth for the next several years, earnings have been slower to make similar strides. However, the company is a good fit for our longer-term thesis that consumer spending will continue to accelerate in emerging markets.
Investment Outlook
We believe that China, India, and Brazil will continue to generate reasonable growth with less inflation 12 months from now. We think that earnings will grow and multiples will expand when investors start to feel better about the prospects for inflation. If we are right, those markets could recoup much of their recent underperformance. Over the next year, we think emerging markets will continue to experience heightened volatility but outperform the developed markets in Europe and Japan.
Developed non-U.S. markets are likely to generate mixed performance, and we would be surprised if the returns over the next year are as good as they were over the last 12 months. The mature markets look somewhat challenging, particularly in Europe as interest rates trend higher and growth moderates somewhat. Currency gains were a tailwind in this period, but going forward they will likely be mixed—a headwind for the euro and yen, and a slight tailwind in Asia. Overall, valuations have increased with market gains, but they still appear reasonable. However, we are bottom-up investors, focused on the long term and making only modest tactical allocation shifts around our best investment ideas. We will continue to identify and invest in what we believe are the most attractive companies for long-term investors, while maintaining a broadly diversified portfolio across sectors and countries.
Respectfully submitted,

Robert W. Smith
Chairman of the Investment Advisory Committee
July 6, 2011
The committee chairman has day-to-day responsibility for managing the portfolio and works with committee members in developing and executing the fund’s investment program.
| Risks of International Investing |
Funds that invest overseas generally carry more risk than funds that invest strictly in U.S. assets. Funds investing in a single country or in a limited geographic region tend to be riskier than more diversified funds. Risks can result from varying stages of economic and political development; differing regulatory environments, trading days, and accounting standards; and higher transaction costs of non-U.S. markets. Non-U.S. investments are also subject to currency risk, or a decline in the value of a foreign currency versus the U.S. dollar, which reduces the dollar value of securities denominated in that currency.
Lipper averages: The averages of available mutual fund performance returns for specified periods in defined categories as tracked by Lipper Inc.
MSCI All Country World ex-U.S.A. Index: An index that measures equity market performance of developed and emerging countries, excluding the U.S.
Portfolio Highlights

Performance and Expenses
T. Rowe Price International Stock Portfolio
This chart shows the value of a hypothetical $10,000 investment in the portfolio over the past 10 fiscal year periods or since inception (for portfolios lacking 10-year records). The result is compared with benchmarks, which may include a broad-based market index and a peer group average or index. Market indexes do not include expenses, which are deducted from portfolio returns as well as mutual fund averages and indexes.

Fund Expense Example
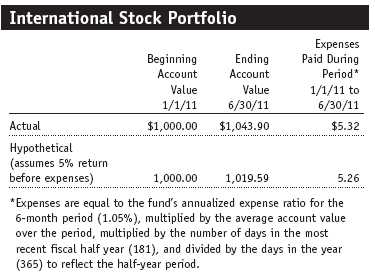
As a mutual fund shareholder, you may incur two types of costs: (1) transaction costs, such as redemption fees or sales loads, and (2) ongoing costs, including management fees, distribution and service (12b-1) fees, and other fund expenses. The following example is intended to help you understand your ongoing costs (in dollars) of investing in the fund and to compare these costs with the ongoing costs of investing in other mutual funds. The example is based on an investment of $1,000 invested at the beginning of the most recent six-month period and held for the entire period.
Actual Expenses
The first line of the following table (“Actual”) provides information about actual account values and actual expenses. You may use the information on this line, together with your account balance, to estimate the expenses that you paid over the period. Simply divide your account value by $1,000 (for example, an $8,600 account value divided by $1,000 = 8.6), then multiply the result by the number on the first line under the heading “Expenses Paid During Period” to estimate the expenses you paid on your account during this period.
Hypothetical Example for Comparison Purposes
The information on the second line of the table (“Hypothetical”) is based on hypothetical account values and expenses derived from the fund’s actual expense ratio and an assumed 5% per year rate of return before expenses (not the fund’s actual return). You may compare the ongoing costs of investing in the fund with other funds by contrasting this 5% hypothetical example and the 5% hypothetical examples that appear in the shareholder reports of the other funds. The hypothetical account values and expenses may not be used to estimate the actual ending account balance or expenses you paid for the period.
You should also be aware that the expenses shown in the table highlight only your ongoing costs and do not reflect any transaction costs, such as redemption fees or sales loads. Therefore, the second line of the table is useful in comparing ongoing costs only and will not help you determine the relative total costs of owning different funds. To the extent a fund charges transaction costs, however, the total cost of owning that fund is higher.
Financial Highlights
T. Rowe Price International Stock Portfolio
(Unaudited)
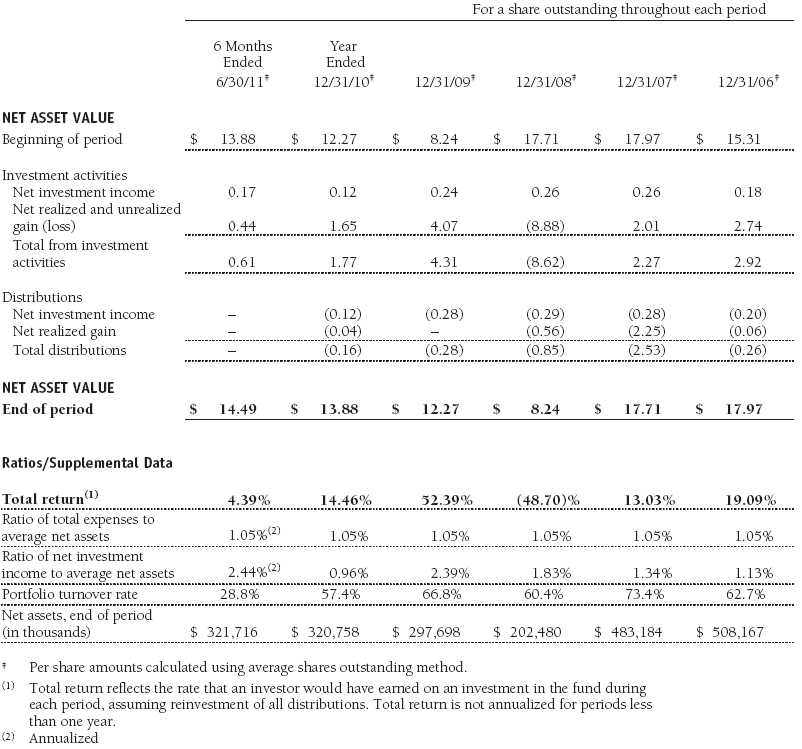
The accompanying notes are an integral part of these financial statements.
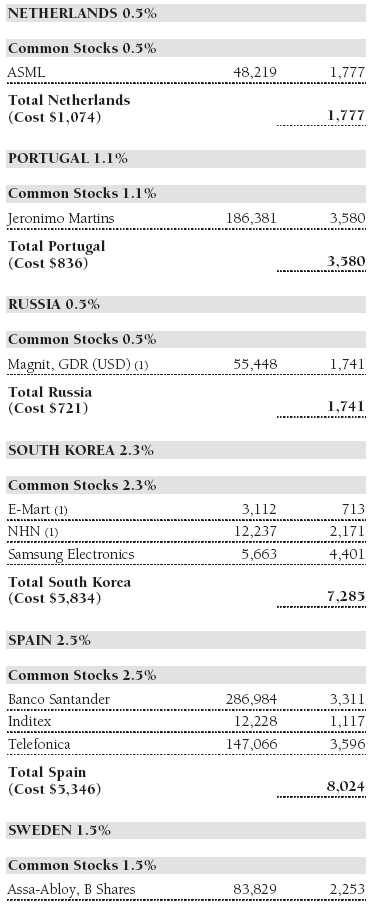
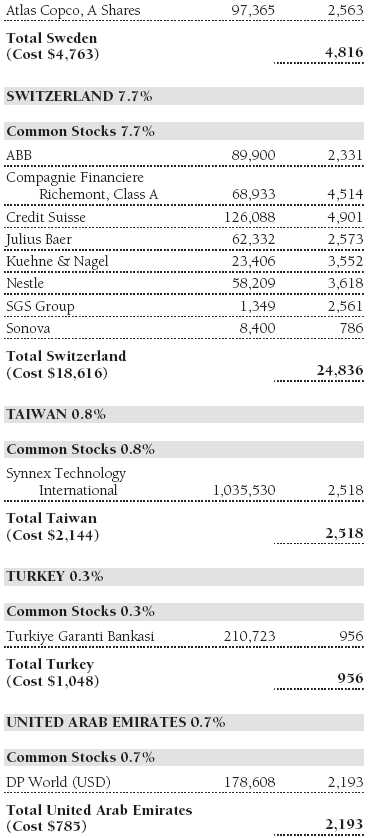
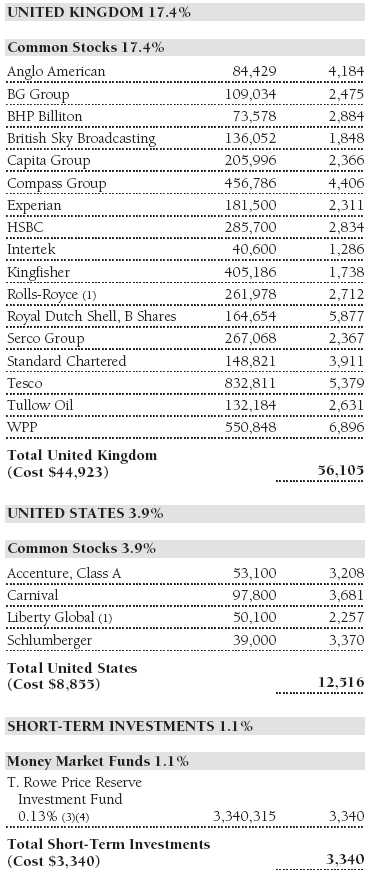
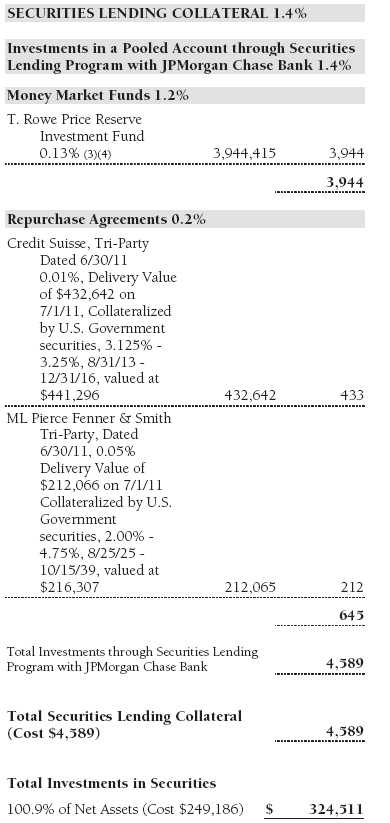
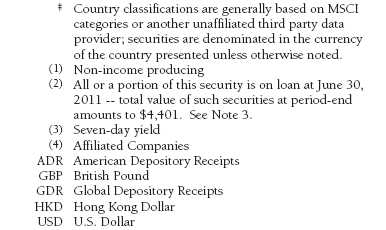
Portfolio of Investments‡
T. Rowe Price International Stock Portfolio
June 30, 2011 (Unaudited)
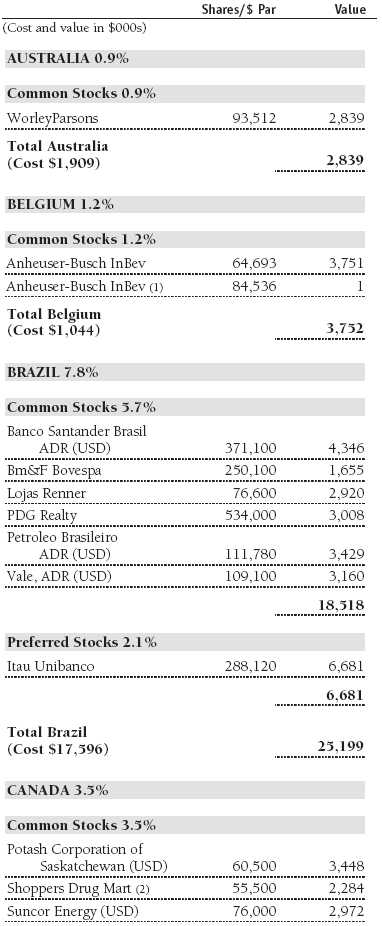
The accompanying notes are an integral part of these financial statements.
Statement of Assets and Liabilities
T. Rowe Price International Stock Portfolio
June 30, 2011 (Unaudited)
($000s, except shares and per share amounts)

The accompanying notes are an integral part of these financial statements.
Statement of Operations
T. Rowe Price International Stock Portfolio
(Unaudited)
($000s)
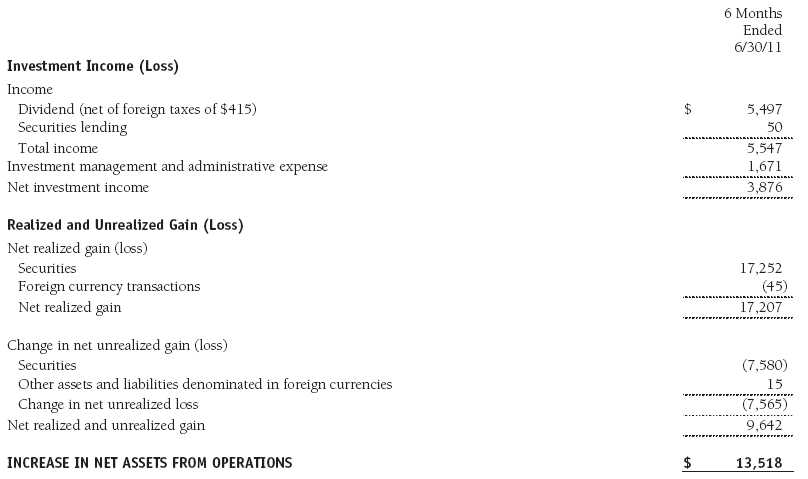
The accompanying notes are an integral part of these financial statements.
Statement of Changes in Net Assets
T. Rowe Price International Stock Portfolio
(Unaudited)
($000s)

The accompanying notes are an integral part of these financial statements.
Notes to Financial Statements
T. Rowe Price International Stock Portfolio
June 30, 2011 (Unaudited)
T. Rowe Price International Series, Inc. (the corporation), is registered under the Investment Company Act of 1940 (the 1940 Act). The International Stock Portfolio (the fund), a diversified, open-end management investment company, is one portfolio established by the corporation. The fund commenced operations on March 31, 1994. The fund seeks long-term growth of capital through investments primarily in the common stocks of established, non-U.S. companies. Shares of the fund are currently offered only through certain insurance companies as an investment medium for both variable annuity contracts and variable life insurance policies.
NOTE 1 - SIGNIFICANT ACCOUNTING POLICIES
Basis of Preparation The accompanying financial statements were prepared in accordance with accounting principles generally accepted in the United States of America (GAAP), which require the use of estimates made by management. Management believes that estimates and valuations are appropriate; however, actual results may differ from those estimates, and the valuations reflected in the accompanying financial statements may differ from the value ultimately realized upon sale or maturity.
Investment Transactions, Investment Income, and Distributions Income and expenses are recorded on the accrual basis. Premiums and discounts on debt securities are amortized for financial reporting purposes. Dividends received from mutual fund investments are reflected as dividend income; capital gain distributions are reflected as realized gain/loss. Dividend income and capital gain distributions are recorded on the ex-dividend date. Income tax-related interest and penalties, if incurred, would be recorded as income tax expense. Investment transactions are accounted for on the trade date. Realized gains and losses are reported on the identified cost basis. Distributions to shareholders are recorded on the ex-dividend date. Income distributions are declared and paid annually. Capital gain distributions, if any, are generally declared and paid by the fund annually.
Currency Translation Assets, including investments, and liabilities denominated in foreign currencies are translated into U.S. dollar values each day at the prevailing exchange rate, using the mean of the bid and asked prices of such currencies against U.S. dollars as quoted by a major bank. Purchases and sales of securities, income, and expenses are translated into U.S. dollars at the prevailing exchange rate on the date of the transaction. The effect of changes in foreign currency exchange rates on realized and unrealized security gains and losses is reflected as a component of security gains and losses.
Credits Credits are earned on the fund’s temporarily uninvested cash balances held at the custodian and such credits reduce the amount paid by the manager for custody of the fund’s assets. In order to pass the benefit of custody credits to the fund, the manager has voluntarily reduced its investment management and administrative expense in the accompanying financial statements.
NOTE 2 - VALUATION
The fund’s financial instruments are reported at fair value as defined by GAAP. The fund determines the values of its assets and liabilities and computes its net asset value per share at the close of the New York Stock Exchange (NYSE), normally 4 p.m. ET, each day that the NYSE is open for business.
Valuation Methods Equity securities listed or regularly traded on a securities exchange or in the over-the-counter (OTC) market are valued at the last quoted sale price or, for certain markets, the official closing price at the time the valuations are made, except for OTC Bulletin Board securities, which are valued at the mean of the latest bid and asked prices. A security that is listed or traded on more than one exchange is valued at the quotation on the exchange determined to be the primary market for such security. Listed securities not traded on a particular day are valued at the mean of the latest bid and asked prices for domestic securities and the last quoted sale price for international securities. Debt securities with remaining maturities of less than one year at the time of acquisition generally use amortized cost in local currency to approximate fair value. However, if amortized cost is deemed not to reflect fair value or the fund holds a significant amount of such securities with remaining maturities of more than 60 days, the securities are valued at prices furnished by dealers who make markets in such securities or by an independent pricing service.
Investments in mutual funds are valued at the mutual fund’s closing net asset value per share on the day of valuation.
Other investments, including restricted securities, and those financial instruments for which the above valuation procedures are inappropriate or are deemed not to reflect fair value are stated at fair value as determined in good faith by the T. Rowe Price Valuation Committee, established by the fund’s Board of Directors.
For valuation purposes, the last quoted prices of non-U.S. equity securities may be adjusted under the circumstances described below. If the fund determines that developments between the close of a foreign market and the close of the NYSE will, in its judgment, materially affect the value of some or all of its portfolio securities, the fund will adjust the previous closing prices to reflect what it believes to be the fair value of the securities as of the close of the NYSE. In deciding whether it is necessary to adjust closing prices to reflect fair value, the fund reviews a variety of factors, including developments in foreign markets, the performance of U.S. securities markets, and the performance of instruments trading in U.S. markets that represent foreign securities and baskets of foreign securities. A fund may also fair value securities in other situations, such as when a particular foreign market is closed but the fund is open. The fund uses outside pricing services to provide it with closing prices and information to evaluate and/or adjust those prices. The fund cannot predict how often it will use closing prices and how often it will determine it necessary to adjust those prices to reflect fair value. As a means of evaluating its security valuation process, the fund routinely compares closing prices, the next day’s opening prices in the same markets, and adjusted prices.
Valuation Inputs Various inputs are used to determine the value of the fund’s financial instruments. These inputs are summarized in the three broad levels listed below:
Level 1 – quoted prices in active markets for identical financial instruments
Level 2 – observable inputs other than Level 1 quoted prices (including, but not limited to, quoted prices for similar financial instruments, interest rates, prepayment speeds, and credit risk)
Level 3 – unobservable inputs
Observable inputs are those based on market data obtained from sources independent of the fund, and unobservable inputs reflect the fund’s own assumptions based on the best information available. The input levels are not necessarily an indication of the risk or liquidity associated with financial instruments at that level. For example, non-U.S. equity securities actively traded in foreign markets generally are reflected in Level 2 despite the availability of closing prices because the fund evaluates and determines whether those closing prices reflect fair value at the close of the NYSE or require adjustment, as described above. The following table summarizes the fund’s financial instruments, based on the inputs used to determine their values on June 30, 2011:

NOTE 3 - OTHER INVESTMENT TRANSACTIONS
Consistent with its investment objective, the fund engages in the following practices to manage exposure to certain risks and/or to enhance performance. The investment objective, policies, program, and risk factors of the fund are described more fully in the fund’s prospectus and Statement of Additional Information.
Emerging Markets At June 30, 2011, approximately 29% of the fund’s net assets were invested, either directly or through investments in T. Rowe Price institutional funds, in securities of companies located in emerging markets, securities issued by governments of emerging market countries, and/or securities denominated in or linked to the currencies of emerging market countries. Emerging market securities are often subject to greater price volatility, less liquidity, and higher rates of inflation than U.S. securities. In addition, emerging markets may be subject to greater political, economic and social uncertainty, and differing regulatory environments that may potentially impact the fund’s ability to buy or sell certain securities or repatriate proceeds to U.S. dollars.
Repurchase Agreements All repurchase agreements are fully collateralized by U.S. government securities. Collateral is in the possession of the fund’s custodian or, for tri-party agreements, the custodian designated by the agreement. Although risk is mitigated by the collateral, the fund could experience a delay in recovering its value and a possible loss of income or value if the counterparty fails to perform in accordance with the terms of the agreement.
Securities Lending The fund lends its securities to approved brokers to earn additional income. It receives as collateral cash and U.S. government securities valued at 102% to 105% of the value of the securities on loan. Cash collateral is invested by the fund’s lending agent(s) in accordance with investment guidelines approved by management. Although risk is mitigated by the collateral, the fund could experience a delay in recovering its securities and a possible loss of income or value if the borrower fails to return the securities or if collateral investments decline in value. Securities lending revenue recognized by the fund consists of earnings on invested collateral and borrowing fees, net of any rebates to the borrower and compensation to the lending agent. In accordance with GAAP, investments made with cash collateral are reflected in the accompanying financial statements, but collateral received in the form of securities are not. On June 30, 2011, the value of loaned securities was $4,401,000 and cash collateral investments totaled $4,589,000.
Other Purchases and sales of portfolio securities other than short-term securities aggregated $90,988,000 and $95,877,000, respectively, for the six months ended June 30, 2011.
NOTE 4 - FEDERAL INCOME TAXES
No provision for federal income taxes is required since the fund intends to continue to qualify as a regulated investment company under Subchapter M of the Internal Revenue Code and distribute to shareholders all of its taxable income and gains. Distributions determined in accordance with federal income tax regulations may differ in amount or character from net investment income and realized gains for financial reporting purposes. Financial reporting records are adjusted for permanent book/tax differences to reflect tax character but are not adjusted for temporary differences. The amount and character of tax-basis distributions and composition of net assets are finalized at fiscal year-end; accordingly, tax-basis balances have not been determined as of the date of this report.
In accordance with federal tax regulations, the fund recognized capital losses in the current period for tax purposes that had been recognized in the prior fiscal year for financial reporting purposes. Such deferrals relate to net capital losses realized between November 1, 2010 and December 31, 2010, and totaled $39,000. The fund intends to retain realized gains to the extent of available capital loss carryforwards. As of December 31, 2010, the fund had $49,653,000 of unused capital loss carryforwards, which expire in fiscal 2017.
At June 30, 2011, the cost of investments for federal income tax purposes was $249,186,000. Net unrealized gain aggregated $75,398,000 at period-end, of which $79,391,000 related to appreciated investments and $3,993,000 related to depreciated investments.
NOTE 5 - FOREIGN TAXES
The fund is subject to foreign income taxes imposed by certain countries in which it invests. Acquisition of certain foreign currencies related to security transactions are also subject to tax. Additionally, capital gains realized by the fund upon disposition of securities issued in or by certain foreign countries are subject to capital gains tax imposed by those countries. All taxes are computed in accordance with the applicable foreign tax law, and, to the extent permitted, capital losses are used to offset capital gains. Taxes attributable to income are accrued by the fund as a reduction of income. Taxes incurred on the purchase of foreign currencies are recorded as realized loss on foreign currency transactions. Current and deferred tax expense attributable to net capital gains is reflected as a component of realized and/or change in unrealized gain/loss on securities in the accompanying financial statements. At June 30, 2011, the fund had no deferred tax liability attributable to foreign securities and $3,293,000 of foreign capital loss carryforwards, including $1,332,000 that expire in 2012, $54,000 that expire in 2013, $740,000 that expire in 2017, $718,000 that expire in 2018 and $449,000 that expire in 2019.
NOTE 6 - RELATED PARTY TRANSACTIONS
The fund is managed by T. Rowe Price Associates, Inc. (Price Associates), a wholly owned subsidiary of T. Rowe Price Group, Inc. (Price Group). Price Associates has entered into a subadvisory agreement with T. Rowe Price International Ltd, a wholly owned subsidiary of Price Associates, to provide investment advisory services to the fund; the subadvisory agreement provides that Price Associates may pay the subadvisor up to 60% of the management fee that Price Associates receives from the fund. The fund was previously managed by T. Rowe Price International, Inc. (Price International), which was merged into its parent company, Price Associates, effective at the close of business on December 31, 2010. Thereafter, Price Associates assumed responsibility for all of Price International’s existing investment management contracts, and Price International ceased all further operations. The corporate reorganization was designed to simplify Price Group’s corporate structure related to its international business and was intended to result in no material changes in the nature, quality, level, or cost of services provided to the T. Rowe Price funds.
The investment management and administrative agreement between the fund and Price Associates provides for an all-inclusive annual fee equal to 1.05% of the fund’s average daily net assets. The fee is computed daily and paid monthly. The all-inclusive fee covers investment management, shareholder servicing, transfer agency, accounting, and custody services provided to the fund, as well as fund directors’ fees and expenses; interest, taxes, brokerage commissions, and extraordinary expenses are paid directly by the fund.
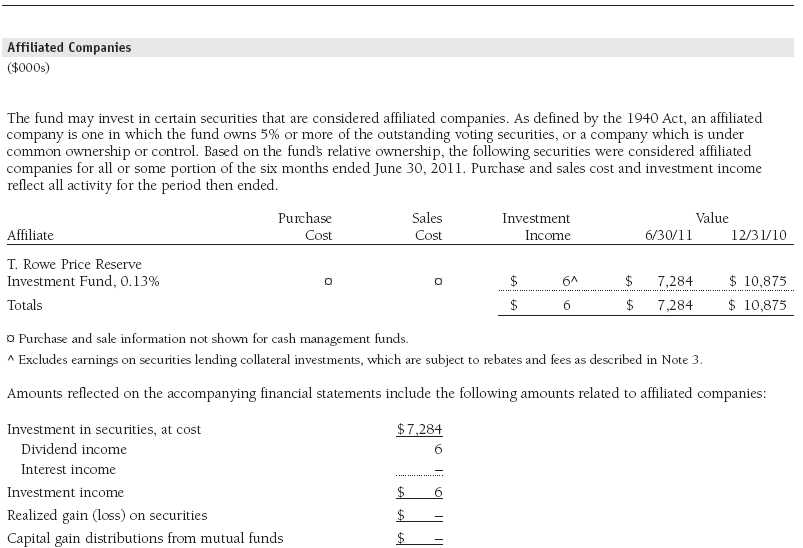
The fund may invest in the T. Rowe Price Reserve Investment Fund and the T. Rowe Price Government Reserve Investment Fund (collectively, the T. Rowe Price Reserve Investment Funds), open-end management investment companies managed by Price Associates and considered affiliates of the fund. The T. Rowe Price Reserve Investment Funds are offered as cash management options to mutual funds, trusts, and other accounts managed by Price Associates and/or its affiliates and are not available for direct purchase by members of the public. The T. Rowe Price Reserve Investment Funds pay no investment management fees.
| Information on Proxy Voting Policies, Procedures, and Records |
A description of the policies and procedures used by T. Rowe Price funds and portfolios to determine how to vote proxies relating to portfolio securities is available in each fund’s Statement of Additional Information, which you may request by calling 1-800-225-5132 or by accessing the SEC’s website, sec.gov. The description of our proxy voting policies and procedures is also available on our website, troweprice.com. To access it, click on the words “Our Company” at the top of our corporate homepage. Then, when the next page appears, click on the words “Proxy Voting Policies” on the left side of the page.
Each fund’s most recent annual proxy voting record is available on our website and through the SEC’s website. To access it through our website, follow the directions above, then click on the words “Proxy Voting Records” on the right side of the Proxy Voting Policies page.
| How to Obtain Quarterly Portfolio Holdings |
The fund files a complete schedule of portfolio holdings with the Securities and Exchange Commission for the first and third quarters of each fiscal year on Form N-Q. The fund’s Form N-Q is available electronically on the SEC’s website (sec.gov); hard copies may be reviewed and copied at the SEC’s Public Reference Room, 450 Fifth St. N.W., Washington, DC 20549. For more information on the Public Reference Room, call 1-800-SEC-0330.
| Approval of Investment Management Agreement |
On March 9, 2011, the fund’s Board of Directors (Board) unanimously approved the continuation of the investment advisory contract (Contract) between the fund and its investment advisor, T. Rowe Price Associates, Inc. (Advisor), as well as the investment subadvisory contracts (Subadvisory Contracts) that the Advisor has entered into with T. Rowe Price International Ltd and T. Rowe Price International Ltd – Tokyo Branch (Subadvisors). The Board considered a variety of factors in connection with its review of the Contract and Subadvisory Contracts, also taking into account information provided by the Advisor during the course of the year, as discussed below:
Services Provided by the Advisor
The Board considered the nature, quality, and extent of the services provided to the fund by the Advisor and Subadvisors. These services included, but were not limited to, management of the fund’s portfolio and a variety of related activities, as well as financial and administrative services, reporting, and communications. The Board also reviewed the background and experience of the Advisor’s and Subadvisors’ senior management teams and investment personnel involved in the management of the fund. The Board noted that a restructuring involving the Advisor and certain of its affiliated investment advisors led to a restatement of the fund’s investment advisory contract and new investment subadvisory contracts, effective at the close of business on December 31, 2010. This restructuring, which resulted in T. Rowe Price Associates, Inc., becoming the fund’s new investment advisor and T. Rowe Price International Ltd and T. Rowe Price International Ltd – Tokyo Branch becoming the fund’s new investment subadvisors, had been determined by the Board at a meeting in October 2010 not to diminish the nature, quality, or level of services provided to the fund or materially to change the manner in which advisory services were to be provided. The Board concluded that it was satisfied with the nature, quality, and extent of the services provided by the Advisor and Subadvisors.
Investment Performance of the Fund
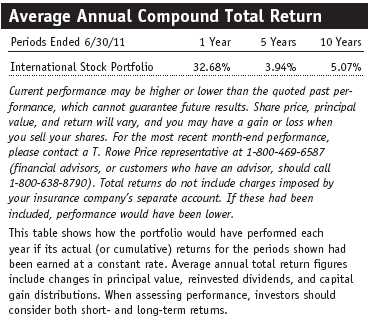
The Board reviewed the fund’s average annual total returns over the 1-, 3-, 5-, and 10-year periods, as well as the fund’s year-by-year returns, and compared these returns with a wide variety of previously agreed upon comparable performance measures and market data, including those supplied by Lipper and Morningstar, which are independent providers of mutual fund data. On the basis of this evaluation and the Board’s ongoing review of investment results, and factoring in the relative market conditions during certain of the performance periods, the Board concluded that the fund’s performance was satisfactory.
Costs, Benefits, Profits, and Economies of Scale
The Board reviewed detailed information regarding the revenues received by the Advisor under the Contract and other benefits that the Advisor (and its affiliates, including the Subadvisors) may have realized from its relationship with the fund, including research received under “soft dollar” agreements and commission-sharing arrangements with broker-dealers. The Board considered that the Advisor and Subadvisors may receive some benefit from soft-dollar arrangements pursuant to which research is received from broker-dealers that execute the applicable fund’s portfolio transactions. The Board also received information on the estimated costs incurred and profits realized by the Advisor and its affiliates (including the Subadvisors) from advising T. Rowe Price mutual funds, as well as estimates of the gross profits realized from managing the fund in particular. The Board concluded that the Advisor’s profits were reasonable in light of the services provided to the fund. The Board also considered whether the fund or other funds benefit under the fee levels set forth in the Contract from any economies of scale realized by the Advisor. The Board noted that, under the Contract, the fund pays the Advisor a single fee based on the fund’s average daily net assets and that the Advisor, in turn, pays all expenses of the fund, with certain exceptions. Under the Subadvisory Contracts, the Advisor may pay either Subadvisor up to 60% of the advisory fee that the Advisor receives from the fund. The Board concluded that, based on the profitability data it reviewed and consistent with this single fee structure, the Contract provided for a reasonable sharing of any benefits from economies of scale with the fund.
Fees
The Board reviewed the fund’s single-fee structure and compared it with fees and expenses of other comparable funds based on information and data supplied by Lipper. The information provided to the Board indicated that the fund’s management fee rate was above the median for comparable funds and the fund’s total expense ratio was at or below the median for comparable funds. (For these purposes, the Board assumed the fund’s management fee rate was equal to the single fee less the fund’s operating expenses.) The Board also reviewed the fee schedules for institutional accounts of the Advisor and its affiliates with similar mandates. Management provided the Board with information about the Advisor’s responsibilities and services provided to institutional account clients, which are more limited than its responsibilities for the fund and other T. Rowe Price mutual funds that it advises, and showing that the Advisor performs significant additional services and assumes greater risk for the fund and other T. Rowe Price mutual funds that it advises than it does for institutional account clients. On the basis of the information provided, the Board concluded that the fees paid by the fund under the Contract were reasonable.
Approval of the Contract
As noted, the Board approved the continuation of the Contract and Subadvisory Contracts. No single factor was considered in isolation or to be determinative to the decision. Rather, the Board was assisted by the advice of independent legal counsel and concluded, in light of a weighting and balancing of all factors considered, that it was in the best interests of the fund to approve the continuation of the Contract and the Subadvisory Contracts (including the fees to be charged for services thereunder).
Item 2. Code of Ethics.
A code of ethics, as defined in Item 2 of Form N-CSR, applicable to its principal executive officer, principal financial officer, principal accounting officer or controller, or persons performing similar functions is filed as an exhibit to the registrant’s annual Form N-CSR. No substantive amendments were approved or waivers were granted to this code of ethics during the registrant’s most recent fiscal half-year.
Item 3. Audit Committee Financial Expert.
Disclosure required in registrant’s annual Form N-CSR.
Item 4. Principal Accountant Fees and Services.
Disclosure required in registrant’s annual Form N-CSR.
Item 5. Audit Committee of Listed Registrants.
Not applicable.
Item 6. Investments.
(a) Not applicable. The complete schedule of investments is included in Item 1 of this Form N-CSR.
(b) Not applicable.
Item 7. Disclosure of Proxy Voting Policies and Procedures for Closed-End Management Investment Companies.
Not applicable.
Item 8. Portfolio Managers of Closed-End Management Investment Companies.
Not applicable.
Item 9. Purchases of Equity Securities by Closed-End Management Investment Company and Affiliated Purchasers.
Not applicable.
Item 10. Submission of Matters to a Vote of Security Holders.
Not applicable.
Item 11. Controls and Procedures.
(a) The registrant’s principal executive officer and principal financial officer have evaluated the registrant’s disclosure controls and procedures within 90 days of this filing and have concluded that the registrant’s disclosure controls and procedures were effective, as of that date, in ensuring that information required to be disclosed by the registrant in this Form N-CSR was recorded, processed, summarized, and reported timely.
(b) The registrant’s principal executive officer and principal financial officer are aware of no change in the registrant’s internal control over financial reporting that occurred during the registrant’s second fiscal quarter covered by this report that has materially affected, or is reasonably likely to materially affect, the registrant’s internal control over financial reporting.
Item 12. Exhibits.
(a)(1) The registrant’s code of ethics pursuant to Item 2 of Form N-CSR is filed with the registrant’s annual Form N-CSR.
(2) Separate certifications by the registrant's principal executive officer and principal financial officer, pursuant to Section 302 of the Sarbanes-Oxley Act of 2002 and required by Rule 30a-2(a) under the Investment Company Act of 1940, are attached.
(3) Written solicitation to repurchase securities issued by closed-end companies: not applicable.
(b) A certification by the registrant's principal executive officer and principal financial officer, pursuant to Section 906 of the Sarbanes-Oxley Act of 2002 and required by Rule 30a-2(b) under the Investment Company Act of 1940, is attached.
| | |
SIGNATURES |
| |
| | Pursuant to the requirements of the Securities Exchange Act of 1934 and the Investment |
| Company Act of 1940, the registrant has duly caused this report to be signed on its behalf by the |
| undersigned, thereunto duly authorized. |
| |
| T. Rowe Price International Series, Inc. |
| |
| |
| |
| By | /s/ Edward C. Bernard |
| | Edward C. Bernard |
| | Principal Executive Officer |
| |
| Date | August 17, 2011 |
| |
| |
| |
| | Pursuant to the requirements of the Securities Exchange Act of 1934 and the Investment |
| Company Act of 1940, this report has been signed below by the following persons on behalf of |
| the registrant and in the capacities and on the dates indicated. |
| |
| |
| By | /s/ Edward C. Bernard |
| | Edward C. Bernard |
| | Principal Executive Officer |
| |
| Date | August 17, 2011 |
| |
| |
| |
| By | /s/ Gregory K. Hinkle |
| | Gregory K. Hinkle |
| | Principal Financial Officer |
| |
| Date | August 17, 2011 |