UNITED STATES
SECURITIES AND EXCHANGE COMMISSION
Washington, D.C. 20549
FORM N-CSR
CERTIFIED SHAREHOLDER REPORT OF REGISTERED
MANAGEMENT INVESTMENT COMPANIES
Investment Company Act file number 811-08352
LKCM Funds
(Exact name of Registrant as specified in charter)
c/o Luther King Capital Management Corporation
301 Commerce Street, Suite 1600
Fort Worth, TX 76102
(Address of principal executive offices) (Zip code)
K&L Gates LLP
1601 K Street, NW
Washington, DC 20006
(Name and address of agent for service)
1-800-688-LKCM and 1-800-423-6369
Registrant’s telephone number, including area code
Date of fiscal year end: December 31
Date of reporting period: December 31, 2023
Item 1. Reports to Stockholders.
| | (a) | Include a copy of the report transmitted to stockholders pursuant to Rule 30e-1 under the Act (17 CFR 270.30e-1). |
LKCM
FUNDS
LKCM Small Cap Equity Fund
LKCM Small-Mid Cap Equity Fund
LKCM Equity Fund
LKCM Balanced Fund
LKCM Fixed Income Fund
LKCM International Equity Fund
Annual Report
December 31, 2023
Dear Fellow Shareholders:
We report the following performance information for the LKCM Funds for indicated periods ended December 31, 2023:
| | | | | | | | | | | | | | | | | | | | | | | | | | | | | | | | | | | | | | | | |
Funds | | Inception
Date | | NAV @
12/31/23 | | Net
Expense
Ratio*,** | | Gross
Expense
Ratio** | | One Year
Total
Return
Ended
12/31/23 | | Five Year
Average
Annualized
Return
Ended
12/31/23 | | Ten Year
Average
Annualized
Return
Ended
12/31/23 | | Avg.
Annual
Total
Return
Since
Incept. |
LKCM Small Cap Equity Fund | | | | 07/14/1994 | | | | $ | 19.53 | | | | | 1.01% | | | | | 1.08% | | | | | 22.57% | | | | | 12.57% | | | | | 7.15% | | | | | 10.23% | |
Russell 2000® Index(1) | | | | | | | | | | | | | | | | | | | | | | | | 16.93% | | | | | 9.97% | | | | | 7.16% | | | | | 8.89% | |
LKCM Small-Mid Cap Equity Fund | | | | 05/02/2011 | | | | $ | 9.91 | | | | | 1.01% | | | | | 1.81% | | | | | 25.76% | | | | | 14.11% | | | | | 7.63% | | | | | 8.17% | |
Russell 2500® Index(2) | | | | | | | | | | | | | | | | | | | | | | | | 17.42% | | | | | 11.67% | | | | | 8.36% | | | | | 9.44% | |
LKCM Equity Fund | | | | 01/03/1996 | | | | $ | 34.41 | | | | | 0.81% | | | | | 0.98% | | | | | 12.65% | | | | | 13.22% | | | | | 9.64% | | | | | 9.00% | |
S&P 500® Index®(3) | | | | | | | | | | | | | | | | | | | | | | | | 26.29% | | | | | 15.69% | | | | | 12.03% | | | | | 9.57% | |
LKCM Balanced Fund | | | | 12/30/1997 | | | | $ | 26.00 | | | | | 0.80% | | | | | 0.99% | | | | | 10.84% | | | | | 8.87% | | | | | 7.08% | | | | | 6.71% | |
S&P 500® Index(3) | | | | | | | | | | | | | | | | | | | | | | | | 26.29% | | | | | 15.69% | | | | | 12.03% | | | | | 8.30% | |
Bloomberg U.S. Intermediate | | | | | | | | | | | | | | | | | | | | | | | | | | | | | | | | | | | | | | | | |
Government/Credit Bond Index(4) | | | | | | | | | | | | | | | | | | | | | | | | 5.24% | | | | | 1.59% | | | | | 1.72% | | | | | 3.83% | |
LKCM Fixed Income Fund | | | | 12/30/1997 | | | | $ | 10.36 | | | | | 0.50% | | | | | 0.79% | | | | | 4.98% | | | | | 1.65% | | | | | 1.59% | | | | | 3.66% | |
Bloomberg U.S. Intermediate | | | | | | | | | | | | | | | | | | | | | | | | | | | | | | | | | | | | | | | | |
Government/Credit Bond Index(4) | | | | | | | | | | | | | | | | | | | | | | | | 5.24% | | | | | 1.59% | | | | | 1.72% | | | | | 3.83% | |
LKCM International Equity Fund | | | | 05/01/2019 | | | | $ | 12.68 | | | | | 1.01% | | | | | 1.46% | | | | | 16.09% | | | | | NA | | | | | NA | | | | | 6.77% | |
MSCI/EAFE® Index(5) | | | | | | | | | | | | | | | | | | | | | | | | 18.85% | | | | | NA | | | | | NA | | | | | 6.40% | |
Performance data quoted represents past performance and does not guarantee future results. The investment return and principal value of an investment will fluctuate so that an investor’s shares, when redeemed, may be worth more or less than their original cost. Current performance of the Funds may be lower or higher than the performance quoted. Performance data current to the most recent month end may be obtained by calling 1-800-688-LKCM. Returns would have been lower if Luther King Capital Management Corporation, the Funds’ investment adviser, had not waived a portion of its management fee and/or reimbursed certain expenses of the Funds. Please see Note B to the Notes to the Financial Statements for specific information regarding management fee waiver and/or expense reimbursement arrangements for the Funds. The Funds impose a 1.00% redemption fee on shares held less than 30 days. If reflected, the fee would reduce performance shown.
| * | Luther King Capital Management Corporation, the Funds’ investment adviser, has contractually agreed to waive all or a portion of its management fee and/or reimburse expenses of each Fund to maintain the expense ratios designated in the Funds’ prospectus through May 1, 2024. This expense limitation excludes interest, taxes, brokerage commissions, indirect fees and expenses related to investments in other investment companies, including money market funds, and extraordinary expenses. Investment performance, which is based on the net expense ratio, reflects fee waivers, if any, in effect during the relevant period. In the absence of such waivers, total return would be reduced. LKCM waived management fees and/or reimbursed expenses for each Fund during the fiscal year ended December 31, 2023. |
| ** | Expense ratios above are as reported in the Funds’ current prospectus dated May 1, 2023. Expense ratios reported for other periods in the financial highlights of this report may differ. |
| (1) | The Russell 2000® Index is an unmanaged index which measures the performance of the 2,000 smallest companies in the Russell 3000® Index. |
| (2) | The Russell 2500® Index is an unmanaged index which measures the performance of the 2,500 smallest companies in the Russell 3000® Index. |
| (3) | The S&P 500® Index is an unmanaged capitalization-weighted index of 500 selected stocks that is generally considered representative of the performance of large capitalization companies in the U.S. stock market. |
| (4) | The Bloomberg U.S. Intermediate Government/Credit Bond Index is an unmanaged market value weighted index measuring both the principal price changes of, and income provided by, the underlying universe of securities that comprise the index. Securities included in the index must meet the following criteria: fixed as opposed to variable rate; remaining maturity of one to ten years; minimum outstanding par value of $250 million; rated investment grade or higher by Moody’s Investors Service or equivalent; must be dollar denominated and non-convertible; and must be publicly issued. |
| (5) | The Morgan Stanley Capital International Europe, Australia, Far East Index (“MSCI/EAFE® Index”) is an unmanaged index composed of large-cap and mid-cap securities across 21 developed markets, including countries in Europe, Australasia and the Far East. The MSCI/EAFE® Index is a recognized international index and is weighted by market capitalization. |
Note: The indices defined above are not available for direct investment and the index performance therefore does not include fees, expenses or taxes.
2023 Review
Entering 2023, headline U.S. inflation was running at a rate of approximately 6.5% and the U.S. unemployment rate was at a half-century low of approximately 3.5%. At that time, approximately ninety-eight percent of CEOs were preparing for a recession in 2023, according to the Conference Board’s CEO Confidence Survey. This pessimism appeared well founded at the time by the historical economic assumption that there is supposed to be a short-term tradeoff between inflation and unemployment. The cost of lowering inflation has historically been resulting higher unemployment. When people lose their jobs—or worry about losing their jobs—they typically rein in spending, which historically leads to reduced demand and, ultimately, lower prices. This is how the U.S. economy operated the last time the Federal Reserve battled high inflation in the 1970s. Fifty years ago, the result was a deep recession, an extended period of muted economic growth, and higher prices aptly labeled stagflation.
2
We believe the critical factor that helped the U.S. economy avoid a recession in 2023 was the resilience of consumers. Despite ongoing challenges, such as the Russia-Ukraine War and conflict in the Middle East, significant bank failures in the spring of 2023, and the persistent pressure of higher interest rates and tighter financial conditions, U.S. economic growth continued to accelerate through the third quarter of 2023. According to the latest data, the U.S. economy grew at an annualized rate of approximately 4.9% in the third quarter of 2023 before inflation. The strength was driven primarily by consumer spending, which grew at a seasonally adjusted annual rate of approximately 3.6%, contributing approximately 2.5% to real growth in Gross Domestic Product (GDP). The recovery in consumption following the pandemic recession was notably strong, surpassing the performance after recent recessions. We believe a resilient labor market, increasing incomes, the surplus of savings from pandemic-related government transfers, and low debt service ratios all played a role in sustaining this resilient spending trend.
We believe the exceptionally robust labor market has been a key driver of robust consumer spending. The pandemic recession witnessed an unprecedented loss of approximately 22 million jobs in the U.S., surpassing any previous economic downturn. However, the recovery appeared to be remarkably swift. In contrast to the prolonged jobless recoveries of the 2001 and 2007 recessions, which took nearly four and six years to regain lost jobs, respectively, the pandemic recession saw a full recovery within just approximately 2.5 years. Notably, approximately five million additional jobs have been created beyond pre-recession levels. The U.S. unemployment rate has consistently stayed below 4% for a record 21 months, marking the lengthiest sub-4% unemployment streak since the 1960s.
The buoyant labor market appears to have generally contributed to an upswing in incomes post-pandemic. Real per capita incomes have ascended since 2022, reaching a year-over-year growth rate not witnessed since early 2015. Increased real income and stimulus payments during the pandemic bolstered consumer wallets. As of October 2023, total consumer bank deposits reached a peak of approximately $17.4 trillion, which we believe have corresponded to diminishing debt service ratios and elevated net worth. Debt service ratios, having stayed below 10% since 2012, were pushed to historical lows primarily as a result of U.S. government transfer payments during the pandemic.
2024 Outlook
We believe the U.S. economy has witnessed three critical peaks: inflation, economic growth, and the Federal Reserve’s policy interest rate. Historically, these dynamics have typically aligned with a broad peak in interest rates and a subsequent steepening of the yield curve. If inflation continues to subside and economic growth softens, we believe central banks will begin to signal interest rate cuts, which should cause U.S. Treasury yields to drift lower.
We believe inflation should continue its decline in 2024, pulled lower by falling shelter costs. The Zillow Rent Index, which measures the changes in new leases, currently reflects an approximate 3.3% increase in shelter costs over the prior year. This figure compares favorably to an approximate 6.5% rise in shelter costs embedded in the latest Consumer Price Index (CPI) reading, which is designed to reflect all existing leases rather than new leases. The shelter component of CPI is important in our view as it comprises roughly one-third of the index. Though inflation should trend lower during 2024 in our view, we believe the era in which inflation tended to undershoot the Federal Reserve’s 2% target and deflation risks occasionally emerged is likely over.
We believe economic growth proved higher than expected during 2023 as government spending and the drawdown of pandemic-era excess savings offset the impact of meaningfully tighter monetary policy. Despite inflation falling, the Federal Reserve continued to tighten monetary policy during 2023. We believe we are unlikely to see a repeat of the 2023 economic tailwind, consisting of a doubling of the U.S. fiscal deficit—unprecedented outside of wartime—and broadly depleted excess consumer savings—particularly by lower income groups. Therefore, we believe economic growth will likely slow in 2024 due to falling consumer savings, plateauing wage gains, lower savings rates, a softening labor market, less fiscal stimulus, and the lagged effects of high interest rates. We believe a critical risk to the year ahead is that the Federal Reserve must precisely calibrate monetary policy when the economy reaches full employment. If the Federal Reserve cuts interest rates too slowly, unemployment could rise; if it cuts interest rates too fast, inflation could rise. Monetary policy decisions will likely hold the key between tepid economic growth and a slight economic contraction over the next twelve to eighteen months. History also suggests that it is difficult to accelerate growth once the economy has reached full employment.
We believe that interest rates are poised to fall around the world. Central banks rapidly increased interest rates to combat surging inflation in many countries. Domestically, the CPI has fallen by nearly two-thirds since its approximate 9.1% peak in June 2022. With the Federal Reserve holding the upper end of its benchmark rate at 5.50% since July of 2023, any further decline in the inflation rate in our view, will likely result in further monetary tightening in real terms. Monetary policy’s real—or inflation-adjusted—stance has the most significant impact on the economy in our view. We believe that any tightening of real monetary policy into softening economic growth will likely hinder further economic expansion. Accordingly, we believe that central banks in most developed economies will likely loosen interest rates in the year ahead.
We believe that politics will most likely feature prominently in the headlines at home and abroad in the coming year. While the U.S. Presidential election will garner significant attention, there will also be critical elections in India, Indonesia, Mexico, and perhaps the U.K. While the outcome of these elections creates the opportunity for significant policy shifts, we believe markets tend to overestimate the influence of policy shifts on long-term economic trends. Often, the effect of most policy shifts is uncertain and frequently overwhelmed by factors outside the control of governments. In our view, the most significant concern is that the world is passing through a period of peak globalization. The 1990s were a remarkable era of pro-market globalization bookended by the fall of the Berlin Wall in
3
1989 and the acceptance of China into the World Trade Organization in 2001. While it is impossible to know what the future holds, we believe we are witnessing the fracturing of the old order into two primary trading blocs—one anchored by the U.S. and the other by China. We believe this global fracturing into a multipolar world will affect trade and global economic growth.
We anticipate corporate earnings for the S&P 500® Index for 2023 will be essentially unchanged from 2022 once fourth quarter 2023 earnings are reported. If so, this would suggest that the 26.29% return for the S&P 500® Index in 2023 was largely due to the expansion of the Price/Earnings ratio. In our view, the Price/Earnings ratio expanded during 2023 primarily in response to investors reducing both the odds of a recession and interest rates staying “higher for longer.” We believe corporate earnings are forecasted to grow around 11% in 2024, which may prove optimistic in our view. We believe an economy can grow above potential if it is force-fed rapid credit growth or, as it turns out, massive fiscal stimulus. As the tailwind from excessive fiscal stimulus fades, we believe it will be important for corporate profits to drive the equity markets higher in 2024. Most economic soft landings have historically been derailed by an external shock, such as Iraq’s invasion of Kuwait in 1990, which resulted in sharply higher energy prices. While the U.S. economy currently appears to be coming in for a soft landing, we believe it will not take much of a wobble or external shock, such as the escalating turmoil in the Middle East, to tilt the economy into recession as economic growth likely slows in 2024.
LKCM Small Cap Equity Fund
The LKCM Small Cap Equity Fund returned 22.57% for the year ended December 31, 2023, as compared to the 16.93% return for the Russell 2000® Index, the Fund’s benchmark. The Fund’s relative performance benefited from sector allocation decisions, particularly being underweight the Utilities sector and being overweight the Industrials sector relative to the benchmark, which were partially offset by the Fund’s overweight position in the Energy sector. Stock selection decisions in the Consumer Staples, Energy, Industrials, Healthcare and Financials sectors were the largest contributors to the Fund’s relative performance, which were partially offset by stock selection in the Consumer Discretionary, Information Technology and Communication Services sectors – the only three underperforming sectors during the year ended December 31, 2023. Overall, both sector allocation and stock selection decisions contributed positively to the Fund’s performance relative to the benchmark during 2023. The Fund’s bias towards high quality companies and growth-oriented companies benefited the Fund during the first three quarters of 2023, while giving back some of that performance during the frenetic rally during the fourth quarter of 2023 that focused on lower quality companies and value-oriented companies. We continue to focus the Fund’s investment program on companies that we believe have solid fundamentals and attractive entry points for long term capital appreciation.
LKCM Small-Mid Cap Equity Fund
The LKCM Small-Mid Cap Equity Fund returned 25.76% for the year ended December 31, 2023, as compared to the 17.42% return for the Russell 2500® Index, the Fund’s benchmark. During the year, both stock selection and sector allocation decisions were positive contributors to the Fund’s performance relative to the benchmark. Stock selection was the largest positive contributor to the Fund’s relative performance with particularly strong selection in the Industrials, Consumer Staples and Healthcare sectors, which was partially offset by stock selection in the Consumer Discretionary and Communication Services sectors. The Fund’s relative performance also benefited from an overweight position in the Industrials sector and underweight positions in the Utilities and Healthcare sectors, which was partially offset by an overweight position in the Energy sector, which underperformed the market after two strong prior years. In addition, the Fund’s focus on companies that we believe are higher quality benefited the Fund’s relative performance during the year, as higher quality companies generally outperformed lower quality companies during the year. The Fund continues to implement an investment strategy that focuses on companies that we believe are higher quality, and we believe the Fund is well-positioned for 2024.
LKCM Equity Fund
The LKCM Equity Fund returned 12.65% for the year ended December 31, 2023, as compared to the 26.29% return for the S&P 500® Index, the Fund’s benchmark. The Fund’s underweight position in the Utilities and Financials sectors contributed positively to the Fund’s relative performance, which was offset by the Fund’s underweight position in the Communications Services sector and overweight position in the Industrials sector. Stock selection decisions in the Healthcare sector benefited the Fund’s relative performance, which was offset by stock selection decisions in the Information Technology, Materials and Financials sectors. The strong returns for the S&P 500® Index during the past year were predominantly driven by a small number of technology-related companies. While the Fund was invested in some of those companies, our investment strategy focuses on diversification of the Fund’s investments in an effort to minimize portfolio concentration risk. We believe that the Fund’s focus on portfolio diversification as well as investments in higher quality companies have the Fund well-positioned for a potentially volatile election year.
LKCM Balanced Fund
The LKCM Balanced Fund returned 10.84% for the year ended December 31, 2023 versus the 26.29% return for the S&P 500® Index and the 5.24% return for the Bloomberg Intermediate Government/Credit Bond Index, the Fund’s benchmark indices. The Fund’s equity portfolio benefited from being underweight the Utilities, Financials and Healthcare sectors and from stock selection in the Healthcare sector relative to the S&P 500® Index, which was offset by an underweight position and stock selection in the Information Technology sector. The strong returns for the S&P 500® Index during the past year were predominantly driven by a small number of technology-related companies. While the Fund was invested in some of those companies, our investment strategy focuses on diversification of the
4
Fund’s investments in an effort to minimize portfolio concentration risk. The Fund’s fixed income portfolio benefited from its relative short duration during the first part of the year, but lagged the Bloomberg Intermediate Government/Credit Bond Index during the fourth quarter of 2023 as the Federal Reserve pivoted to a less aggressive monetary policy stance. The Fund’s fixed income portfolio slightly outperformed its benchmark for the year and was additive to the Fund’s returns. The Fund’s investment strategy focuses on investments in higher quality companies and portfolio diversification, which we believe have the Fund well-positioned for the future.
LKCM Fixed Income Fund
The LKCM Fixed Income Fund returned 4.98% for the year ended December 31, 2023 compared to its benchmark, the Bloomberg Intermediate Government/Credit Bond Index, which returned 5.24% for the year ended December 31, 2023. During the first three quarters of 2023, the Fund’s shorter duration of approximately 3.2 years was additive to the Fund’s performance, relative to the approximate 3.8 year duration of the benchmark, as the Federal Reserve continued to tighten monetary policy. However, during the fourth quarter of 2023, the Federal Reserve signaled the end of monetary policy tightening for this cycle, and the U.S. Treasury reversed their policy of increasing issuance of longer-term debt that had put upward pressure on longer duration issues earlier in the year. These actions by the Federal Reserve and the U.S. Treasury led the markets to rally sharply into the end of the year as longer duration fixed income securities outperformed their shorter duration counterparts. Despite the substantial volatility throughout the year as a result of the regional banking turmoil, the massive increase in U.S. Treasury issuance to fund the increasing U.S. federal deficit, and 100 basis points of additional monetary policy tightening by the Federal Reserve, the 10-year U.S. Treasury ended 2023 where it began, at approximately 3.88%. In this environment, the Fund’s overweight in corporate bonds relative to government bonds was additive to relative performance as credit spreads tightened during the year. The Fund remains largely focused in the short-to-intermediate duration sector that has continued to help limit price volatility as well as in investment-grade corporate bonds with strong underlying fundamentals to mitigate credit risk and achieve a sustainable cash flow stream.
LKCM International Equity Fund
The LKCM International Equity Fund returned 16.09% for the year ended December 31, 2023, as compared to the 18.85% return for the MSCI/EAFE Index, the Fund’s benchmark. During this period, the Fund’s relative performance benefited from being overweight in the Industrials and Information Technology sectors. The only two sectors weights that detracted from the Fund’s relative performance were the Fund’s underweight position in the Financials sector and overweight position in the Energy sectors. Stock selection decisions in the Materials, Communication Services, and Consumer Discretionary sectors were the largest contributors to positive security selection relative to the benchmark, which were offset by security selection decisions in the Healthcare, Financials, and Energy sectors. Overall, security selection detracted from the Fund’s performance relative to the benchmark, whereas sector allocation offset much of this negative attribution. The Fund’s tilt toward growth-oriented companies weighed on relative performance, particularly, during the latter part of the year when value-oriented companies tended to outperform, and the Financials sector, more specifically, rebounded.
During the past year, we saw deterioration of economic activity in many international markets versus our domestic market with year-over-year growth in real GDP declining as the year progressed for Germany, Japan, Australia, and the United Kingdom. Inflation continues to be persistent in many of these markets, though they have started to experience decelerating inflation. Japan remains an exception as inflation continued to accelerate into the end of the year. Japan also has maintained a much more accommodative rate policy, despite the acceleration in pricing, but the core CPI, excluding food and energy, still remains relatively benign at approximately 2.6%. Other markets have been more aggressive on restrictive monetary policy in order to curb inflationary pressures. Fiscal programs in these markets were much more conservative than in the United States in our view, where the fiscal impulse from legislative policy provided support and liquidity remained high despite restrictive monetary policy. We expect further economic strain during the first portion of 2024 with a possibility for improving economic prospects for these markets as the year progresses.
J. Luther King, Jr., CFA, CIC
January 16, 2024
5
The information provided herein represents the opinion of J. Luther King, Jr., CFA, CIC and is not intended to be a forecast of future events, a guarantee of future results, nor investment advice.
Please refer to the Schedule of Investments found on pages 15-29 of the report for more information on Fund holdings. Fund holdings and sector allocations are subject to change and are not recommendations to buy or sell any securities.
Mutual fund investing involves risk. Principal loss is possible. Past performance is not a guarantee of future results. Investments in equity securities are subject to market risks and significant fluctuations in value. Small and medium capitalization funds typically carry additional risks, since smaller companies generally have a higher risk of failure, and, historically, their equity securities have experienced a greater degree of market volatility than equity securities on average. Investments in debt securities typically decrease in value when interest rates rise. This risk is greater for longer-term debt securities. Investments in mortgage backed securities include additional risks that investors should be aware of such as credit risk, prepayment risk, possible illiquidity and default, as well as increased susceptibility to adverse economic developments. These and other risks are discussed in the Funds’ summary and statutory prospectuses.
Earnings growth is not a measure of future performance.
Price-earnings ratio is the ratio of a company’s share price to the company’s earnings per share.
Duration is a measure of the sensitivity of the price of a bond or other debt instrument to a change in interest rates. Securities with a longer duration generally have more volatile prices than securities of comparable quality with a shorter duration.
Bond ratings are grades given to bonds that indicate their credit quality as determined by a private independent rating service such as S&P Global. The firm evaluates a bond issuer’s financial strength, or its ability to pay a bond’s principal and interest in a timely fashion. Ratings are expressed as letters ranging from ‘AAA’, which is the highest grade, to ‘D’, which is the lowest grade. In limited situations when the rating agency has not issued a formal rating, the rating agency will classify the security as nonrated.
Cash flow is the net amount of cash and cash-equivalents being transferred into and out of a business.
The Consumer Price Index (CPI) is a measure of the average change over time in the prices paid by urban consumers for a market basket of consumer goods and services.
Yield curve is a line that plots yields (interest rates) of fixed income securities having equal credit quality but differing maturity dates. The slope of the yield curve gives an idea of future interest rate changes and economic activity. An inverted yield curve signals that interest rates associated with fixed income securities with shorter maturities are higher than interest rates associated with fixed income securities with longer maturities.
Gross domestic product (GDP) is the total monetary or market value of all the finished goods and services produced within a country’s borders in a specific time period.
Must be preceded or accompanied by a current prospectus.
Investors should consider the investment objective, risks and charges and expenses of a Fund carefully before reinvesting. A Fund’s summary prospectus and the prospectus contain this and other information about a Fund. Investors can obtain a summary prospectus and the prospectus by calling 1-800-688-LKCM. The summary prospectus and the prospectus should be read carefully before investing in a Fund.
Quasar Distributors, LLC, distributor.
6
PERFORMANCE:
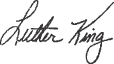
The following information illustrates the historical performance of the LKCM Small Cap Equity Fund as of December 31, 2023 compared to the Fund’s representative benchmark and peer group indices.
Performance data quoted represents past performance; past performance does not guarantee future results. The graph and table reflect the reinvestment of dividends and other distributions, if any, but do not reflect the deduction of taxes that a shareholder would pay on Fund distributions or the redemption of Fund shares. The investment return and principal value of an investment will fluctuate so that an investor’s shares, when redeemed, may be worth more or less than their original cost. Current performance of the Fund may be lower or higher than the performance quoted. Performance data current to the most recent month end may be obtained by calling 1-800-688-LKCM. Returns would have been lower if LKCM had not waived a portion of its management fee and/or reimbursed certain expenses of the Fund. Please see Note B to the Notes to the Financial Statements for specific information regarding management fee waiver and/or expense reimbursement arrangements for the Fund. The Fund imposes a 1.00% redemption fee on shares held less than 30 days. If reflected, the fee would reduce performance shown.
An index is an unmanaged portfolio and does not trade or incur any expenses. The Lipper Small-Cap Core Funds Index, however, does reflect the fees and expenses borne by the funds included in that index. One can not invest in an unmanaged index.
AVERAGE ANNUAL TOTAL RETURN (Periods Ended December 31, 2023)
| | | | | | | | | | | | | | | | | | | | |
| | | | | |
| | | Past
1 Year | | Past
5 Years(1) | | Past
10 Years(1) | | Since
Inception(1)(2) |
LKCM Small Cap Equity Fund | | | | 22.57% | | | | | 12.57% | | | | | 7.15% | | | | | 10.23% | |
Russell 2000® Index | | | | 16.93% | | | | | 9.97% | | | | | 7.16% | | | | | 8.89% | |
Lipper Small-Cap Core Funds Index | | | | 16.15% | | | | | 11.30% | | | | | 7.76% | | | | | 9.69% | |
A HYPOTHETICAL $10,000 INVESTMENT IN LKCM SMALL CAP EQUITY FUND
(for the ten years ended December 31, 2023)
The Russell 2000® Index is an unmanaged index consisting of the 2,000 smallest companies in the Russell 3000® Index.
The Lipper Small-Cap Core Funds Index is an unmanaged index generally considered representative of small cap core mutual funds tracked by Lipper, Inc.
7
PERFORMANCE:
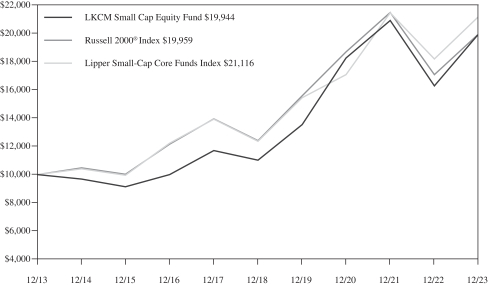
The following information illustrates the historical performance of the LKCM Small-Mid Cap Equity Fund as of December 31, 2023 compared to the Fund’s representative benchmark and peer group indices.
Performance data quoted represents past performance; past performance does not guarantee future results. The graph and table reflect the reinvestment of dividends and other distributions, if any, but do not reflect the deduction of taxes that a shareholder would pay on Fund distributions or the redemption of Fund shares. The investment return and principal value of an investment will fluctuate so that an investor’s shares, when redeemed, may be worth more or less than their original cost. Current performance of the Fund may be lower or higher than the performance quoted. Performance data current to the most recent month end may be obtained by calling 1-800-688-LKCM. Returns would have been lower if LKCM had not waived a portion of its management fee and/or reimbursed certain expenses of the Fund. Please see Note B to the Notes to the Financial Statements for specific information regarding management fee waiver and/or expense reimbursement arrangements for the Fund. The Fund imposes a 1.00% redemption fee on shares held less than 30 days. If reflected, the fee would reduce performance shown.
An index is an unmanaged portfolio and does not trade or incur any expenses. The Lipper Small-Cap Core Funds Index, however, does reflect the fees and expenses borne by the funds included in that index. One can not invest in an unmanaged index.
AVERAGE ANNUAL TOTAL RETURN (Periods Ended December 31, 2023)
| | | | | | | | | | | | | | | | | | | | |
| | | | | |
| | | Past
1 Year | | Past
5 Years(1) | | Past
10 Years(1) | | Since
Inception(1)(2) |
LKCM Small-Mid Cap Equity Fund | | | | 25.76% | | | | | 14.11% | | | | | 7.63% | | | | | 8.17% | |
Russell 2500® Index | | | | 17.42% | | | | | 11.67% | | | | | 8.36% | | | | | 9.44% | |
Lipper Small-Cap Core Funds Index | | | | 16.15% | | | | | 11.30% | | | | | 7.76% | | | | | 8.78% | |
A HYPOTHETICAL $10,000 INVESTMENT IN LKCM SMALL-MID CAP EQUITY FUND
(for the ten years ended December 31, 2023)
The Russell 2500® Index is an unmanaged index consisting of the 2,500 smallest companies in the Russell 3000® Index.
The Lipper Small-Cap Core Funds Index is an unmanaged index generally considered representative of small cap core mutual funds tracked by Lipper, Inc.
8
PERFORMANCE:
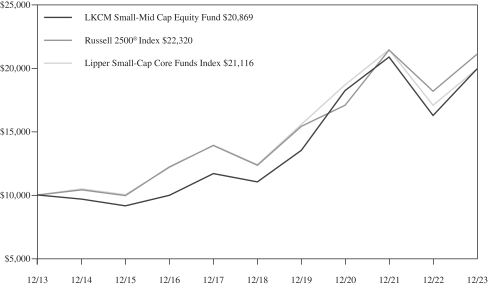
The following information illustrates the historical performance of the LKCM Equity Fund as of December 31, 2023 compared to the Fund’s representative benchmark and peer group indices.
Performance data quoted represents past performance; past performance does not guarantee future results. The graph and table reflect the reinvestment of dividends and other distributions, if any, but do not reflect the deduction of taxes that a shareholder would pay on Fund distributions or the redemption of Fund shares. The investment return and principal value of an investment will fluctuate so that an investor’s shares, when redeemed, may be worth more or less than their original cost. Current performance of the Fund may be lower or higher than the performance quoted. Performance data current to the most recent month end may be obtained by calling 1-800-688-LKCM. Returns would have been lower if LKCM had not waived a portion of its management fee and/or reimbursed certain expenses of the Fund. Please see Note B to the Notes to the Financial Statements for specific information regarding management fee waiver and/or expense reimbursement arrangements for the Fund. The Fund imposes a 1.00% redemption fee on shares held less than 30 days. If reflected, the fee would reduce performance shown.
An index is an unmanaged portfolio and does not trade or incur any expenses. The Lipper Large-Cap Core Funds Index, however, does reflect the fees and expenses borne by the funds included in that index. One can not invest in an unmanaged index.
AVERAGE ANNUAL TOTAL RETURN (Periods Ended December 31, 2023)
| | | | | | | | | | | | | | | | | | | | |
| | | | | |
| | | Past
1 Year | | Past
5 Years(1) | | Past
10 Years(1) | | Since
Inception(1)(2) |
LKCM Equity Fund | | | | 12.65% | | | | | 13.22% | | | | | 9.64% | | | | | 9.00% | |
S&P 500® Index | | | | 26.29% | | | | | 15.69% | | | | | 12.03% | | | | | 9.57% | |
Lipper Large-Cap Core Funds Index | | | | 24.65% | | | | | 14.32% | | | | | 10.77% | | | | | 8.52% | |
A HYPOTHETICAL $10,000 INVESTMENT IN LKCM EQUITY FUND
(for the ten years ended December 31, 2023)
The S&P 500® Index is an unmanaged capitalization-weighted index of 500 selected stocks that is generally considered representative of the performance of large capitalization companies in the U.S. stock market.
The Lipper Large-Cap Core Funds Index is an unmanaged index generally considered representative of large cap core mutual funds tracked by Lipper, Inc.
9
PERFORMANCE:
The following information illustrates the historical performance of the LKCM Balanced Fund as of December 31, 2023 compared to the Fund’s representative benchmark and peer group indices.
Performance data quoted represents past performance; past performance does not guarantee future results. The graph and table reflect the reinvestment of dividends and other distributions, if any, but do not reflect the deduction of taxes that a shareholder would pay on Fund distributions or the redemption of Fund shares. The investment return and principal value of an investment will fluctuate so that an investor’s shares, when redeemed, may be worth more or less than their original cost. Current performance of the Fund may be lower or higher than the performance quoted. Performance data current to the most recent month end may be obtained by calling 1-800-688-LKCM. Returns would have been lower if LKCM had not waived a portion of its management fee and/or reimbursed certain expenses of the Fund. Please see Note B to the Notes to the Financial Statements for specific information regarding management fee waiver and/or expense reimbursement arrangements for the Fund. The Fund imposes a 1.00% redemption fee on shares held less than 30 days. If reflected, the fee would reduce performance shown.
An index is an unmanaged portfolio and does not trade or incur any expenses. The Lipper Mixed-Asset Target Allocation Growth Funds Index, however, does reflect the fees and expenses borne by the funds included in that index. One can not invest in an unmanaged index.
AVERAGE ANNUAL TOTAL RETURN (Periods Ended December 31, 2023)
| | | | | | | | | | | | | | | | | | | | |
| | | | | |
| | | Past
1 Year | | Past
5 Years(1) | | Past
10 Years(1) | | Since
Inception(1)(2) |
LKCM Balanced Fund | | | | 10.84% | | | | | 8.87% | | | | | 7.08% | | | | | 6.71% | |
S&P 500® Index | | | | 26.29% | | | | | 15.69% | | | | | 12.03% | | | | | 8.30% | |
Bloomberg U.S. Intermediate Government/Credit Bond Index | | | | 5.24% | | | | | 1.59% | | | | | 1.72% | | | | | 3.83% | |
Lipper Mixed-Asset Target Allocation Growth Funds Index | | | | 16.54% | | | | | 9.75% | | | | | 7.16% | | | | | 6.56% | |
A HYPOTHETICAL $10,000 INVESTMENT IN LKCM BALANCED FUND
(for the ten years ended December 31, 2023)
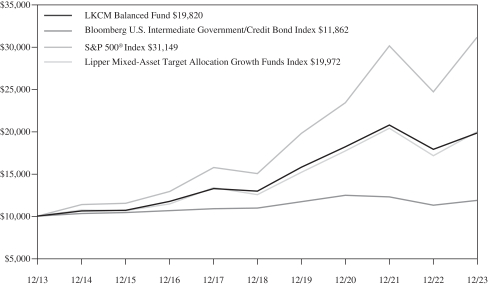
The S&P 500® Index is an unmanaged capitalization-weighted index of 500 selected stocks that is generally considered representative of the performance of large capitalization companies in the U.S. stock market.
The Bloomberg U.S. Intermediate Government/Credit Bond Index is an unmanaged market value weighted index measuring both the principal price changes of, and income provided by, the underlying universe of securities that comprise the index. Securities included in the index must meet the following criteria; fixed as opposed to variable rate; remaining maturity of one to ten years; minimum outstanding par value of $250 million; rated investment grade or higher by Moody’s Investors Service or equivalent; must be dollar denominated and non-convertible; and must be publicly issued.
The Lipper Mixed-Asset Target Allocation Growth Funds Index is an unmanaged index generally considered representative of mutual funds tracked by Lipper, Inc. that, by portfolio practice, maintain a mix of between 60%-80% equity securities, with the remainder invested in bonds, cash and cash equivalents.
10
PERFORMANCE:
The following information illustrates the historical performance of the LKCM Fixed Income Fund as of December 31, 2023 compared to the Fund’s representative benchmark and peer group indices.
Performance data quoted represents past performance; past performance does not guarantee future results. The graph and table reflect the reinvestment of dividends and other distributions, if any, but do not reflect the deduction of taxes that a shareholder would pay on Fund distributions or the redemption of Fund shares. The investment return and principal value of an investment will fluctuate so that an investor’s shares, when redeemed, may be worth more or less than their original cost. Current performance of the Fund may be lower or higher than the performance quoted. Performance data current to the most recent month end may be obtained by calling 1-800-688-LKCM. Returns would have been lower if LKCM had not waived a portion of its management fee and/or reimbursed certain expenses of the Fund. Please see Note B to the Notes to the Financial Statements for specific information regarding management fee waiver and/or expense reimbursement arrangements for the Fund. The Fund imposes a 1.00% redemption fee on shares held less than 30 days. If reflected, the fee would reduce performance shown.
An index is an unmanaged portfolio and does not trade or incur any expenses. The Lipper Short Intermediate Investment-Grade Debt Funds Index, however, does reflect the fees and expenses borne by the funds included in that index. One can not invest in an unmanaged index.
AVERAGE ANNUAL TOTAL RETURN (Periods Ended December 31, 2023)
| | | | | | | | | | | | | | | | | | | | |
| | | | | |
| | | Past
1 Year | | Past
5 Years(1) | | Past
10 Years(1) | | Since
Inception(1)(2) |
LKCM Fixed Income Fund | | | | 4.98% | | | | | 1.65% | | | | | 1.59% | | | | | 3.66% | |
Bloomberg U.S. Intermediate Government/Credit Bond Index | | | | 5.24% | | | | | 1.59% | | | | | 1.72% | | | | | 3.83% | |
Lipper Short Intermediate Investment-Grade Debt Funds Index | | | | 5.56% | | | | | 2.01% | | | | | 1.81% | | | | | 3.47% | |
A HYPOTHETICAL $10,000 INVESTMENT IN LKCM FIXED INCOME FUND
(for the ten years ended December 31, 2023)
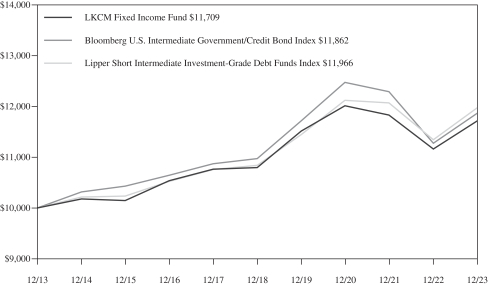
The Bloomberg U.S. Intermediate Government/Credit Bond Index is an unmanaged market value weighted index measuring both the principal price changes of, and income provided by, the underlying universe of securities that comprise the index. Securities included in the index must meet the following criteria: fixed as opposed to variable rate; remaining maturity of one to ten years; minimum outstanding par value of $250 million; rated investment grade or higher by Moody’s Investors Service or equivalent; must be dollar denominated and non-convertible; and must be publicly issued.
The Lipper Short Intermediate Investment-Grade Debt Funds Index is an unmanaged index generally considered representative of short intermediate investment grade mutual funds tracked by Lipper, Inc.
11
PERFORMANCE:
The following information illustrates the historical performance of the LKCM International Equity Fund as of December 31, 2023 compared to the Fund’s representative benchmark and peer group indices.
Performance data quoted represents past performance; past performance does not guarantee future results. The graph and table reflect the reinvestment of dividends and other distributions, if any, but do not reflect the deduction of taxes that a shareholder would pay on Fund distributions or the redemption of Fund shares. The investment return and principal value of an investment will fluctuate so that an investor’s shares, when redeemed, may be worth more or less than their original cost. Current performance of the Fund may be lower or higher than the performance quoted. Performance data current to the most recent month end may be obtained by calling 1-800-688-LKCM. Returns would have been lower if LKCM had not waived a portion of its management fee and/or reimbursed certain expenses of the Fund. Please see Note B to the Notes to the Financial Statements for specific information regarding management fee waiver and/or expense reimbursement arrangements for the Fund. The Fund imposes a 1.00% redemption fee on shares held less than 30 days. If reflected, the fee would reduce performance shown.
An index is an unmanaged portfolio and does not trade or incur any expenses. The Lipper International Large-Cap Core Funds Index, however, does reflect the fees and expenses borne by the funds included in that index. One can not invest in an unmanaged index.
AVERAGE ANNUAL TOTAL RETURN (Periods Ended December 31, 2023)
| | | | | | | | | | | | | | | | | | | | |
| | | | | |
| | | Past
1 Year | | Past
5 Years(1) | | Past
10 Years(1) | | Since
Inception(1)(2) |
LKCM International Equity Fund | | | | 16.09 | % | | | | NA | | | | | NA | | | | | 6.77 | % |
MSCI/EAFE® Index | | | | 18.85 | % | | | | NA | | | | | NA | | | | | 6.40 | % |
Lipper International Large-Cap Core Funds Index | | | | 16.82 | % | | | | NA | | | | | NA | | | | | 5.37 | % |
A HYPOTHETICAL $10,000 INVESTMENT IN LKCM INTERNATIONAL EQUITY FUND
(for the period from May 1, 2019 (inception date) to December 31, 2023)
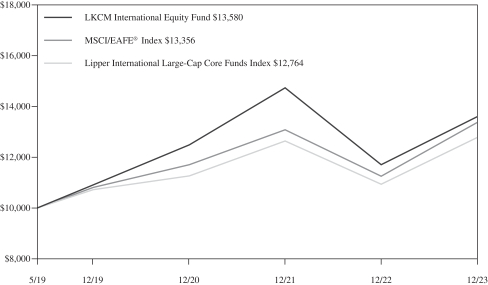
The Morgan Stanley Capital International Europe, Australia, Far East Index (“MSCI/EAFE® Index”) is an unmanaged index composed of large-cap and mid-cap securities across 21 developed markets, including countries in Europe, Australasia and the Far East. The MSCI/EAFE® Index is a recognized international index and is weighted by market capitalization.
The Lipper International Large-Cap Core Funds Index is an unmanaged index generally considered representative of large cap core mutual funds tracked by Lipper Inc.
12
LKCM Funds Expense Example — December 31, 2023 (Unaudited)
As a shareholder of the Funds, you incur two types of costs: (1) transaction costs, including redemption fees; and (2) ongoing costs, including management fees, distribution and/or service (12b-1) fees and other Fund expenses. This Example is intended to help you understand your ongoing costs (in dollars) of investing in the Funds and to compare these costs with the ongoing costs of investing in other mutual funds. The Example is based on an investment of $1,000 invested at the beginning of the period and held for the entire period (07/01/2023-12/31/2023).
ACTUAL EXPENSES
The third and fourth columns of the table below provide information about actual account values and actual expenses. You may use the information in these columns, together with the amount you invested, to estimate the expenses that you paid over the period. Simply divide your account value by $1,000 (for example, an $8,600 account value divided by $1,000 = 8.6), then multiply the result by the number in the fourth column under the heading entitled “Expenses Paid During Period” to estimate the expenses you paid on your account during this period. Although the Funds charge no sales load, you will be assessed fees for outgoing wire transfers, returned checks and stop payment orders at prevailing rates charged by U.S. Bancorp Fund Services, LLC (doing business as U.S. Bank Global Fund Services), the Funds’ transfer agent. If you request that a redemption be made by wire transfer, currently a $15.00 fee is charged by the Funds’ transfer agent. You will be charged a redemption fee equal to 1.00% of the net amount of the redemption if you redeem your shares of the LKCM Small Cap Equity, Small-Mid Cap Equity, Equity, Balanced, Fixed Income, and International Equity Funds within 30 days of purchase, unless otherwise determined by the Funds in their discretion. To the extent the Funds invest in shares of other investment companies as part of their investment strategies, you will indirectly bear your proportionate share of any fees and expenses charged by the underlying funds in which the Funds invest in addition to the expenses of the Funds. Actual expenses of the underlying funds are expected to vary among the various underlying funds. These expenses are not included in the example below. The example below includes management fees, registration fees and other expenses. However, the example below does not include portfolio trading commissions and related expenses and other extraordinary expenses as determined under generally accepted accounting principles.
HYPOTHETICAL EXAMPLES FOR COMPARISON PURPOSES
The fifth and sixth columns of the table below provide information about hypothetical account values and hypothetical expenses based on the Funds’ actual expense ratios and an assumed rate of return of 5% per year before expenses, which are not the Funds’ actual returns. The hypothetical account values and expenses may not be used to estimate the actual ending account balance or expenses you paid for the period. You may use this information to compare the ongoing costs of investing in the Funds and other funds. To do so, compare this 5% hypothetical example with the 5% hypothetical examples that appear in the shareholder reports of the other funds. Please note that the expenses shown in the table are meant to highlight your ongoing costs only and do not reflect any transactional costs, such as redemption fees. Therefore, the fifth and sixth columns of the table are useful in comparing ongoing costs only, and will not help you determine the relative total costs of owning different funds. In addition, if these transaction costs were included, your costs would have been higher.
| | | | | | | | | | | | | | | | | | | | | | | | | | | | | | |
| | | | | | | Actual | | Hypothetical (5% return
before expenses) |
| | | Fund’s
Annualized
Expense
Ratio(1) | | Beginning
Account Value
07/01/2023 | | Ending
Account Value
12/31/2023 | | Expenses
Paid
During
Period(1) | | Ending
Account Value
12/31/2023 | | Expenses
Paid
During
Period(1) |
LKCM Small Cap Equity Fund | | | | 1.00 | % | | | $ | 1,000.00 | | | | $ | 1,081.70 | | | | $ | 5.25 | | | | $ | 1,020.16 | | | | $ | 5.09 | |
LKCM Small-Mid Cap Equity Fund | | | | 1.00 | % | | | $ | 1,000.00 | | | | $ | 1,111.00 | | | | $ | 5.32 | | | | $ | 1,020.16 | | | | $ | 5.09 | |
LKCM Equity Fund | | | | 0.80 | % | | | $ | 1,000.00 | | | | $ | 1,040.50 | | | | $ | 4.11 | | | | $ | 1,021.17 | | | | $ | 4.08 | |
LKCM Balanced Fund | | | | 0.80 | % | | | $ | 1,000.00 | | | | $ | 1,046.80 | | | | $ | 4.13 | | | | $ | 1,021.17 | | | | $ | 4.08 | |
LKCM Fixed Income Fund | | | | 0.50 | % | | | $ | 1,000.00 | | | | $ | 1,036.00 | | | | $ | 2.57 | | | | $ | 1,022.68 | | | | $ | 2.55 | |
LKCM International Equity Fund | | | | 1.00 | % | | | $ | 1,000.00 | | | | $ | 1,016.00 | | | | $ | 5.08 | | | | $ | 1,020.16 | | | | $ | 5.09 | |
| (1) | Expenses are equal to the annualized net expense ratio for the Fund, multiplied by the average account value over the period, multiplied by 184/365 (to reflect the one-half year period). |
13
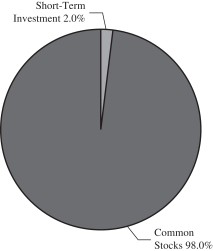
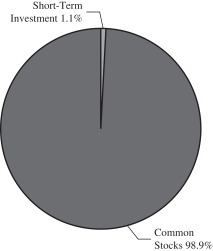
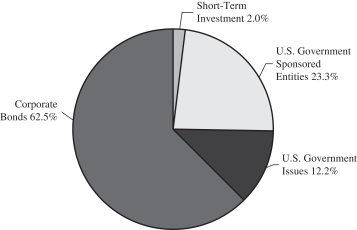
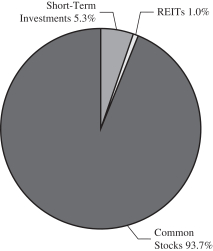
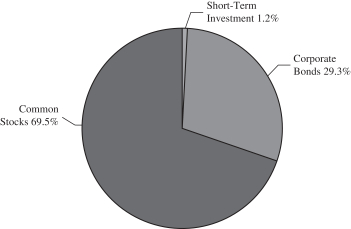
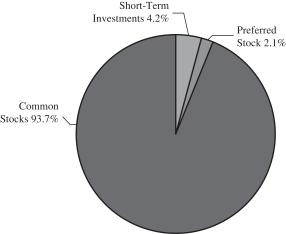
ALLOCATION OF PORTFOLIO HOLDINGS — LKCM Funds — December 31, 2023
Percentages represent market value as a percentage of total investments.
LKCM Small Cap Equity Fund
LKCM Equity Fund
LKCM Fixed Income Fund
LKCM Small-Mid Cap Equity Fund
LKCM Balanced Fund
LKCM International Equity Fund
14
|
| LKCM SMALL CAP EQUITY FUND |
| SCHEDULEOF INVESTMENTS |
| as of December 31, 2023 |
| | | | | | | | | | |
| COMMON STOCKS - 98.3% | | Shares | | Value |
| Aerospace & Defense - 2.0% | | |
Hexcel Corp. | | | | 39,900 | | | | $ | 2,942,625 | |
Mercury Systems, Inc. (a) | | | | 46,949 | | | | | 1,716,925 | |
| | | | | | | | | | |
| | | | | | | | | 4,659,550 | |
| | | | | | | | | | |
| Banks - 7.4% | | |
Cadence Bank | | | | 99,352 | | | | | 2,939,826 | |
Cullen/Frost Bankers, Inc. | | | | 21,375 | | | | | 2,318,974 | |
Hilltop Holdings, Inc. | | | | 32,874 | | | | | 1,157,494 | |
Home BancShares Inc./AR | | | | 141,973 | | | | | 3,596,176 | |
Pinnacle Financial Partners, Inc. | | | | 46,057 | | | | | 4,017,091 | |
Webster Financial Corp. | | | | 61,844 | | | | | 3,139,201 | |
| | | | | | | | | | |
| | | | | | | | | 17,168,762 | |
| | | | | | | | | | |
| Beverages - 1.3% | | |
Primo Water Corp. (b) | | | | 202,743 | | | | | 3,051,282 | |
| | | | | | | | | | |
| Broadline Retail - 0.9% | | |
Ollie’s Bargain Outlet Holdings, Inc. (a) | | | | 28,293 | | | | | 2,147,156 | |
| | | | | | | | | | |
| Building Products - 5.3% | | |
CSW Industrials, Inc. | | | | 20,048 | | | | | 4,158,156 | |
PGT Innovations, Inc. (a) | | | | 114,297 | | | | | 4,651,887 | |
Zurn Elkay Water Solutions Corp. | | | | 115,319 | | | | | 3,391,532 | |
| | | | | | | | | | |
| | | | | | | | | 12,201,575 | |
| | | | | | | | | | |
| Chemicals - 4.1% | | |
Ecovyst, Inc. (a) | | | | 367,120 | | | | | 3,586,763 | |
Ferroglobe Representation & Warranty Insurance Trust (a)(c) | | | | 302,970 | | | | | 0 | |
Hawkins, Inc. | | | | 39,493 | | | | | 2,781,097 | |
Quaker Chemical Corp. | | | | 14,941 | | | | | 3,188,708 | |
| | | | | | | | | | |
| | | | | | | | | 9,556,568 | |
| | | | | | | | | | |
| Commercial Services & Supplies - 0.8% | | |
Driven Brands Holdings Inc. (a) | | | | 124,781 | | | | | 1,779,377 | |
| | | | | | | | | | |
| Communications Equipment - 0.8% | | |
Lumentum Holdings, Inc. (a) | | | | 34,025 | | | | | 1,783,591 | |
| | | | | | | | | | |
| Construction Materials - 1.2% | | |
Eagle Materials, Inc. | | | | 13,412 | | | | | 2,720,490 | |
| | | | | | | | | | |
| Consumer Finance - 1.0% | | |
FirstCash Holdings, Inc. | | | | 20,481 | | | | | 2,219,936 | |
| | | | | | | | | | |
| Electrical Equipment - 0.8% | | |
Generac Holdings, Inc. (a) | | | | 15,144 | | | | | 1,957,211 | |
| | | | | | | | | | |
| Energy Equipment & Services - 2.3% | | |
Weatherford International PLC (a)(b) | | | | 55,184 | | | | | 5,398,652 | |
| | | | | | | | | | |
| Financial Services - 4.1% | | |
AvidXchange Holdings, Inc. (a) | | | | 339,404 | | | | | 4,205,215 | |
Euronet Worldwide, Inc. (a) | | | | 28,100 | | | | | 2,851,869 | |
Repay Holdings Corp. (a) | | | | 279,840 | | | | | 2,389,834 | |
| | | | | | | | | | |
| | | | | | | | | 9,446,918 | |
| | | | | | | | | | |
| Food Products - 1.0% | | |
Utz Brands, Inc. | | | | 139,223 | | | | | 2,260,982 | |
| | | | | | | | | | |
| | | | | | | | | | |
| COMMON STOCKS | | Shares | | Value |
| Health Care Equipment & Supplies - 3.7% | | |
Alphatec Holdings, Inc. (a) | | | | 195,847 | | | | $ | 2,959,248 | |
Enovis Corp. (a) | | | | 54,242 | | | | | 3,038,637 | |
Neogen Corp. (a) | | | | 125,934 | | | | | 2,532,533 | |
| | | | | | | | | | |
| | | | | | | | | 8,530,418 | |
| | | | | | | | | | |
| Health Care Providers & Services - 3.9% | | |
Ensign Group, Inc. | | | | 7,851 | | | | | 880,961 | |
HealthEquity, Inc. (a) | | | | 37,029 | | | | | 2,455,023 | |
Progyny, Inc. (a) | | | | 79,386 | | | | | 2,951,570 | |
R1 RCM Inc. (a) | | | | 257,880 | | | | | 2,725,792 | |
| | | | | | | | | | |
| | | | | | | | | 9,013,346 | |
| | | | | | | | | | |
| Hotels, Restaurants & Leisure - 6.1% | | |
Bowlero Corp. (a) | | | | 189,190 | | | | | 2,678,930 | |
Everi Holdings, Inc. (a) | | | | 181,945 | | | | | 2,050,520 | |
Playa Hotels & Resorts NV (a)(b) | | | | 350,322 | | | | | 3,030,285 | |
Red Rock Resorts, Inc. - Class A | | | | 51,909 | | | | | 2,768,307 | |
Wingstop, Inc. | | | | 14,088 | | | | | 3,614,700 | |
| | | | | | | | | | |
| | | | | | | | | 14,142,742 | |
| | | | | | | | | | |
| Insurance - 3.3% | | |
Goosehead Insurance, Inc. - Class A (a) | | | | 63,278 | | | | | 4,796,472 | |
Palomar Holdings, Inc. (a) | | | | 52,983 | | | | | 2,940,557 | |
| | | | | | | | | | |
| | | | | | | | | 7,737,029 | |
| | | | | | | | | | |
| IT Services - 0.7% | | |
Perficient Inc. (a) | | | | 25,450 | | | | | 1,675,119 | |
| | | | | | | | | | |
| Leisure Products - 0.6% | | |
YETI Holdings, Inc. (a) | | | | 28,454 | | | | | 1,473,348 | |
| | | | | | | | | | |
| Life Sciences Tools & Services - 2.9% | | |
Medpace Holdings, Inc. (a) | | | | 13,349 | | | | | 4,091,869 | |
Stevanato Group SpA (b) | | | | 96,142 | | | | | 2,623,715 | |
| | | | | | | | | | |
| | | | | | | | | 6,715,584 | |
| | | | | | | | | | |
| Machinery - 9.6% | | |
Alamo Group, Inc. | | | | 19,357 | | | | | 4,068,648 | |
Chart Industries, Inc. (a) | | | | 19,311 | | | | | 2,632,669 | |
ESAB Corp. | | | | 52,221 | | | | | 4,523,382 | |
Franklin Electric Co., Inc. | | | | 18,534 | | | | | 1,791,311 | |
Helios Technologies, Inc. | | | | 51,458 | | | | | 2,333,620 | |
ITT, Inc. | | | | 30,360 | | | | | 3,622,555 | |
Watts Water Technologies, Inc. - Class A | | | | 15,324 | | | | | 3,192,602 | |
| | | | | | | | | | |
| | | | | | | | | 22,164,787 | |
| | | | | | | | | | |
| Marine Transportation - 1.8% | | |
Kirby Corp. (a) | | | | 52,376 | | | | | 4,110,468 | |
| | | | | | | | | | |
| Media - 2.4% | | |
Magnite, Inc. (a) | | | | 279,296 | | | | | 2,608,625 | |
Nexstar Media Group, Inc. - Class A | | | | 18,077 | | | | | 2,833,569 | |
| | | | | | | | | | |
| | | | | | | | | 5,442,194 | |
| | | | | | | | | | |
| Oil, Gas & Consumable Fuels - 6.6% | | |
CNX Resources Corp. (a) | | | | 164,454 | | | | | 3,289,080 | |
HF Sinclair Corp. | | | | 48,714 | | | | | 2,707,037 | |
Magnolia Oil & Gas Corp. - Class A | | | | 159,066 | | | | | 3,386,515 | |
The accompanying notes are an integral part of these financial statements.
15
|
| LKCM SMALL CAP EQUITY FUND |
| SCHEDULEOF INVESTMENTS, CONTINUED |
| as of December 31, 2023 |
| | | | | | | | | | |
| COMMON STOCKS | | Shares | | Value |
| Oil, Gas & Consumable Fuels - 6.6%, Continued | | |
Northern Oil and Gas, Inc. | | | | 76,508 | | | | $ | 2,836,152 | |
Permian Resources Corp. | | | | 216,937 | | | | | 2,950,343 | |
| | | | | | | | | | |
| | | | | | | | | 15,169,127 | |
| | | | | | | | | | |
| Personal Care Products - 2.3% | | |
BellRing Brands, Inc. (a) | | | | 98,013 | | | | | 5,432,861 | |
| | | | | | | | | | |
| Professional Services - 3.2% | | |
CBIZ, Inc. (a) | | | | 43,369 | | | | | 2,714,466 | |
NV5 Global, Inc. (a) | | | | 24,215 | | | | | 2,690,771 | |
Upwork, Inc. (a) | | | | 142,058 | | | | | 2,112,402 | |
| | | | | | | | | | |
| | | | | | | | | 7,517,639 | |
| | | | | | | | | | |
| Real Estate Management & Development - 1.0% | | |
FirstService Corp. (b) | | | | 14,470 | | | | | 2,345,442 | |
| | | | | | | | | | |
| Semiconductors & Semiconductor Equipment - 0.8% | | |
Tower Semiconductor Ltd. (a)(b) | | | | 63,302 | | | | | 1,931,977 | |
| | | | | | | | | | |
| Software - 11.2% | | |
Altair Engineering, Inc. - Class A (a) | | | | 47,450 | | | | | 3,992,918 | |
Appian Corp. - Class A (a) | | | | 48,326 | | | | | 1,819,957 | |
LiveRamp Holdings, Inc. (a) | | | | 92,415 | | | | | 3,500,680 | |
Model N, Inc. (a) | | | | 71,897 | | | | | 1,936,186 | |
Nutanix, Inc. - Class A (a) | | | | 109,644 | | | | | 5,228,921 | |
Q2 Holdings, Inc. (a) | | | | 79,392 | | | | | 3,446,407 | |
Sprout Social, Inc. - Class A (a) | | | | 41,388 | | | | | 2,542,879 | |
Workiva Inc. (a) | | | | 33,777 | | | | | 3,429,379 | |
| | | | | | | | | | |
| | | | | | | | | 25,897,327 | |
| | | | | | | | | | |
| Specialty Retail - 1.7% | | |
Academy Sports & Outdoors, Inc. | | | | 59,874 | | | | | 3,951,684 | |
| | | | | | | | | | |
| Textiles, Apparel & Luxury Goods - 1.2% | | |
Crocs, Inc. (a) | | | | 29,199 | | | | | 2,727,479 | |
| | | | | | | | | | |
| Trading Companies & Distributors - 2.3% | | |
Global Industrial Co. | | | | 73,726 | | | | | 2,863,517 | |
SiteOne Landscape Supply, Inc. (a) | | | | 15,657 | | | | | 2,544,263 | |
| | | | | | | | | | |
| | | | | | | | | 5,407,780 | |
| | | | | | | | | | |
TOTAL COMMON STOCKS
(Cost $156,878,404) | | 227,738,401 |
| | | | | | | | | | |
| | | | | | | | | | |
| SHORT-TERM INVESTMENT - 2.0% | | Shares | | Value |
| Money Market Fund - 2.0% | | | | |
Invesco Short-Term Investments Trust - Government & Agency Portfolio - Institutional Shares, 5.27% (d) | | | | 4,545,035 | | | | $ | 4,545,035 | |
| | | | | | | | | | |
TOTAL SHORT-TERM INVESTMENT
(Cost $4,545,035) | | 4,545,035 |
| | | | | | | | | | |
TOTAL INVESTMENTS - 100.3%
(Cost $161,423,439) | | 232,283,436 |
Liabilities in Excess of Other Assets - (0.3)% | | | | | (733,339 | ) |
| | | | | | | | | | |
TOTAL NET ASSETS - 100.0% | | | | | | | | $ | 231,550,097 | |
| | | | | | | | | | |
| (a) | Non-income producing security. |
| (b) | Security issued by non-U.S. incorporated company. |
| (c) | Fair value determined using significant unobservable inputs in accordance with procedures established by and under the supervision of the Adviser, acting through its Valuation Committee. These securities represented $0 or 0.0% of net assets as of December 31, 2023. |
| (d) | The rate shown represents the 7-day effective yield as of December 31, 2023. |
Percentages are stated as a percent of net assets.
The Global Industry Classification Standard (GICS®) was developed by and/or is the exclusive property of MSCI, Inc. and Standard & Poor’s Financial Services LLC (“S&P”). GICS is a service mark of MSCI, Inc. and S&P and has been licensed for use by U.S. Bank Global Fund Services.
The accompanying notes are an integral part of these financial statements.
16
|
| LKCM SMALL-MID CAP EQUITY FUND |
| SCHEDULEOF INVESTMENTS |
| as of December 31, 2023 |
| | | | | | | | | | |
| COMMON STOCKS - 93.8% | | Shares | | Value |
| Aerospace & Defense - 2.6% | | |
Axon Enterprise, Inc. (a) | | | | 2,851 | | | | $ | 736,499 | |
| | | | | | | | | | |
| Banks - 3.2% | | |
Cullen/Frost Bankers, Inc. | | | | 2,742 | | | | | 297,480 | |
Pinnacle Financial Partners, Inc. | | | | 3,652 | | | | | 318,527 | |
Webster Financial Corp. | | | | 5,677 | | | | | 288,165 | |
| | | | | | | | | | |
| | | | | | | | | 904,172 | |
| | | | | | | | | | |
| Beverages - 1.2% | | |
Celsius Holdings, Inc. (a) | | | | 6,398 | | | | | 348,819 | |
| | | | | | | | | | |
| Biotechnology - 1.5% | | |
Natera, Inc. (a) | | | | 6,951 | | | | | 435,411 | |
| | | | | | | | | | |
| Building Products - 5.8% | | |
Builders FirstSource, Inc. (a) | | | | 4,213 | | | | | 703,319 | |
CSW Industrials, Inc. | | | | 2,963 | | | | | 614,556 | |
Zurn Elkay Water Solutions Corp. | | | | 11,306 | | | | | 332,509 | |
| | | | | | | | | | |
| | | | | | | | | 1,650,384 | |
| | | | | | | | | | |
| Capital Markets - 1.6% | | |
LPL Financial Holdings, Inc. | | | | 2,030 | | | | | 462,069 | |
| | | | | | | | | | |
| Chemicals - 1.8% | | |
Quaker Chemical Corp. | | | | 2,440 | | | | | 520,745 | |
| | | | | | | | | | |
| Construction & Engineering - 3.9% | | |
AECOM | | | | 6,066 | | | | | 560,680 | |
WillScot Mobile Mini Holdings Corp. (a) | | | | 12,143 | | | | | 540,364 | |
| | | | | | | | | | |
| | | | | | | | | 1,101,044 | |
| | | | | | | | | | |
| Construction Materials - 1.9% | | |
Eagle Materials, Inc. | | | | 2,647 | | | | | 536,917 | |
| | | | | | | | | | |
| Distributors - 2.0% | | |
Pool Corp. | | | | 1,462 | | | | | 582,914 | |
| | | | | | | | | | |
| Electronic Equipment, Instruments & Components - 1.2% |
Trimble, Inc. (a) | | | | 6,379 | | | | | 339,363 | |
| | | | | | | | | | |
| Energy Equipment & Services - 1.2% | | |
Weatherford International PLC (a)(b) | | | | 3,496 | | | | | 342,014 | |
| | | | | | | | | | |
| Financial Services - 5.6% | | |
AvidXchange Holdings, Inc. (a) | | | | 34,705 | | | | | 429,995 | |
Euronet Worldwide, Inc. (a) | | | | 5,362 | | | | | 544,189 | |
FleetCor Technologies, Inc. (a) | | | | 2,188 | | | | | 618,351 | |
| | | | | | | | | | |
| | | | | | | | | 1,592,535 | |
| | | | | | | | | | |
| Health Care Equipment & Supplies - 3.5% | | |
Enovis Corp. (a) | | | | 9,418 | | | | | 527,596 | |
Neogen Corp. (a) | | | | 23,383 | | | | | 470,232 | |
| | | | | | | | | | |
| | | | | | | | | 997,828 | |
| | | | | | | | | | |
| Health Care Providers & Services - 2.2% | | |
Ensign Group, Inc. | | | | 1,932 | | | | | 216,790 | |
Progyny, Inc. (a) | | | | 10,958 | | | | | 407,418 | |
| | | | | | | | | | |
| | | | | | | | | 624,208 | |
| | | | | | | | | | |
| | | | | | | | | | |
| COMMON STOCKS | | Shares | | Value |
| Hotels, Restaurants & Leisure - 3.4% | | |
Bowlero Corp. (a) | | | | 27,702 | | | | $ | 392,260 | |
Wingstop, Inc. | | | | 2,204 | | | | | 565,503 | |
| | | | | | | | | | |
| | | | | | | | | 957,763 | |
| | | | | | | | | | |
| Insurance - 4.7% | | |
Globe Life, Inc. | | | | 3,165 | | | | | 385,244 | |
Goosehead Insurance, Inc. - Class A (a) | | | | 6,677 | | | | | 506,116 | |
Palomar Holdings, Inc. (a) | | | | 7,982 | | | | | 443,001 | |
| | | | | | | | | | |
| | | | | | | | | 1,334,361 | |
| | | | | | | | | | |
| IT Services - 1.5% | | |
Twilio Inc. - Class A (a) | | | | 5,498 | | | | | 417,133 | |
| | | | | | | | | | |
| Life Sciences Tools & Services - 2.3% | | |
Charles River Laboratories International, Inc. (a) | | | | 1,742 | | | | | 411,809 | |
Stevanato Group SpA (b) | | | | 9,329 | | | | | 254,588 | |
| | | | | | | | | | |
| | | | | | | | | 666,397 | |
| | | | | | | | | | |
| Machinery - 5.3% | | |
ITT, Inc. | | | | 4,462 | | | | | 532,406 | |
Kadant, Inc. | | | | 2,383 | | | | | 667,978 | |
Toro Co. | | | | 3,250 | | | | | 311,968 | |
| | | | | | | | | | |
| | | | | | | | | 1,512,352 | |
| | | | | | | | | | |
| Media - 1.4% | | |
Nexstar Media Group, Inc. - Class A | | | | 2,635 | | | | | 413,036 | |
| | | | | | | | | | |
| Metals & Mining - 2.1% | | |
Reliance Steel & Aluminum Co. | | | | 2,154 | | | | | 602,431 | |
| | | | | | | | | | |
| Oil, Gas & Consumable Fuels - 4.5% | | |
Diamondback Energy Inc. | | | | 2,334 | | | | | 361,957 | |
HF Sinclair Corp. | | | | 3,381 | | | | | 187,882 | |
Northern Oil and Gas, Inc. | | | | 9,202 | | | | | 341,118 | |
Permian Resources Corp. | | | | 28,184 | | | | | 383,302 | |
| | | | | | | | | | |
| | | | | | | | | 1,274,259 | |
| | | | | | | | | | |
| Personal Care Products - 2.1% | | |
BellRing Brands, Inc. (a) | | | | 10,538 | | | | | 584,121 | |
| | | | | | | | | | |
| Professional Services - 6.5% | | |
Broadridge Financial Solutions, Inc. | | | | 3,601 | | | | | 740,906 | |
CBIZ, Inc. (a) | | | | 8,018 | | | | | 501,847 | |
Paylocity Holding Corp. (a) | | | | 3,618 | | | | | 596,427 | |
| | | | | | | | | | |
| | | | | | | | | 1,839,180 | |
| | | | | | | | | | |
| Real Estate Management & Development - 5.2% | | |
Colliers International Group, Inc. (b) | | | | 4,756 | | | | | 601,729 | |
DigitalBridge Group, Inc. | | | | 22,165 | | | | | 388,774 | |
FirstService Corp. (b) | | | | 3,043 | | | | | 493,240 | |
| | | | | | | | | | |
| | | | | | | | | 1,483,743 | |
| | | | | | | | | | |
| Software - 7.6% | | |
Altair Engineering, Inc. - Class A (a) | | | | 5,360 | | | | | 451,044 | |
Q2 Holdings, Inc. (a) | | | | 15,817 | | | | | 686,616 | |
Sprout Social, Inc. - Class A (a) | | | | 9,257 | | | | | 568,750 | |
Workiva Inc. (a) | | | | 4,648 | | | | | 471,911 | |
| | | | | | | | | | |
| | | | | | | | | 2,178,321 | |
| | | | | | | | | | |
The accompanying notes are an integral part of these financial statements.
17
|
| LKCM SMALL-MID CAP EQUITY FUND |
| SCHEDULEOF INVESTMENTS, CONTINUED |
| as of December 31, 2023 |
| | | | | | | | | | |
| COMMON STOCKS | | Shares | | Value |
| Specialty Retail - 4.3% | | |
Academy Sports & Outdoors, Inc. | | | | 7,532 | | | | $ | 497,112 | |
Five Below, Inc. (a) | | | | 1,497 | | | | | 319,101 | |
Floor & Decor Holdings, Inc. - Class A (a) | | | | 3,611 | | | | | 402,843 | |
| | | | | | | | | | |
| | | | | | | | | 1,219,056 | |
| | | | | | | | | | |
| Trading Companies & Distributors - 3.7% | | |
SiteOne Landscape Supply, Inc. (a) | | | | 2,722 | | | | | 442,325 | |
Watsco, Inc. | | | | 1,438 | | | | | 616,140 | |
| | | | | | | | | | |
| | | | | | | | | 1,058,465 | |
| | | | | | | | | | |
TOTAL COMMON STOCKS
(Cost $21,045,694) | | 26,715,540 |
| | | | | | | | | | |
| | | | | | | | | | |
| REAL ESTATE INVESTMENT TRUSTS - 1.0% |
| Residential REITs - 1.0% | | |
Camden Property Trust | | | | 2,902 | | | | | 288,140 | |
| | | | | | | | | | |
TOTAL REAL ESTATE INVESTMENT TRUSTS
(Cost $392,385) | | 288,140 |
| | | | | | | | | | |
| | | | | | | | | | |
| SHORT-TERM INVESTMENTS - 5.3% | | | | |
| Money Market Funds - 5.3% | | | | |
Invesco Short-Term Investments Trust - Government & Agency Portfolio - Institutional Shares, 5.27% (c) | | | | 854,360 | | | | | 854,360 | |
MSILF Government Portfolio, 5.27% (c) | | | | 666,157 | | | | | 666,157 | |
| | | | | | | | | | |
| | | | | | | | | 1,520,517 | |
| | | | | | | | | | |
TOTAL SHORT-TERM INVESTMENTS
(Cost $1,520,517) | | 1,520,517 |
| | | | | | | | | | |
TOTAL INVESTMENTS - 100.1%
(Cost $22,958,596) | | 28,524,197 |
Liabilities in Excess of Other Assets - (0.1)% | | | | | (30,426 | ) |
| | | | | | | | | | |
TOTAL NET ASSETS - 100.0% | | | | | | | | $ | 28,493,771 | |
| | | | | | | | | | |
| (a) | Non-income producing security. |
| (b) | Security issued by non-U.S. incorporated company. |
| (c) | The rate shown represents the 7-day effective yield as of December 31, 2023. |
Percentages are stated as a percent of net assets.
The Global Industry Classification Standard (GICS®) was developed by and/or is the exclusive property of MSCI, Inc. and Standard & Poor’s Financial Services LLC (“S&P”). GICS is a service mark of MSCI, Inc. and S&P and has been licensed for use by U.S. Bank Global Fund Services.
The accompanying notes are an integral part of these financial statements.
18
|
| LKCM EQUITY FUND |
| SCHEDULEOF INVESTMENTS |
| as of December 31, 2023 |
| | | | | | | | | | |
| COMMON STOCKS - 99.1% | | Shares | | Value |
| Banks - 5.3% | | |
Bank of America Corp. | | | | 160,000 | | | | $ | 5,387,200 | |
Cullen/Frost Bankers, Inc. | | | | 65,000 | | | | | 7,051,850 | |
Glacier Bancorp, Inc. | | | | 50,000 | | | | | 2,066,000 | |
JPMorgan Chase & Co. | | | | 68,000 | | | | | 11,566,800 | |
| | | | | | | | | | |
| | | | | | | | | 26,071,850 | |
| | | | | | | | | | |
| Beverages - 2.7% | | |
Coca-Cola Co. | | | | 95,000 | | | | | 5,598,350 | |
PepsiCo, Inc. | | | | 45,000 | | | | | 7,642,800 | |
| | | | | | | | | | |
| | | | | | | | | 13,241,150 | |
| | | | | | | | | | |
| Biotechnology - 1.6% | | |
Amgen, Inc. | | | | 28,000 | | | | | 8,064,560 | |
| | | | | | | | | | |
| Chemicals - 6.4% | | |
Air Products & Chemicals, Inc. | | | | 25,000 | | | | | 6,845,000 | |
Albemarle Corp. | | | | 26,000 | | | | | 3,756,480 | |
DuPont de Nemours, Inc. | | | | 85,000 | | | | | 6,539,050 | |
Ecolab, Inc. | | | | 47,000 | | | | | 9,322,450 | |
FMC Corp. | | | | 80,000 | | | | | 5,044,000 | |
| | | | | | | | | | |
| | | | | | | | | 31,506,980 | |
| | | | | | | | | | |
| Commercial Services & Supplies - 4.9% | | |
Cintas Corp. | | | | 16,000 | | | | | 9,642,560 | |
Veralto Corp. | | | | 11,916 | | | | | 980,210 | |
Waste Connections, Inc. (a) | | | | 90,000 | | | | | 13,434,300 | |
| | | | | | | | | | |
| | | | | | | | | 24,057,070 | |
| | | | | | | | | | |
| Construction & Engineering - 2.6% | | |
Fluor Corp. (b) | | | | 125,000 | | | | | 4,896,250 | |
Valmont Industries, Inc. | | | | 35,000 | | | | | 8,172,850 | |
| | | | | | | | | | |
| | | | | | | | | 13,069,100 | |
| | | | | | | | | | |
| Construction Materials - 1.8% | | |
Martin Marietta Materials, Inc. | | | | 18,000 | | | | | 8,980,380 | |
| | | | | | | | | | |
| Electrical Equipment - 3.5% | | |
Emerson Electric Co. | | | | 50,000 | | | | | 4,866,500 | |
Generac Holdings, Inc. (b) | | | | 35,000 | | | | | 4,523,400 | |
Rockwell Automation, Inc. | | | | 25,000 | | | | | 7,762,000 | |
| | | | | | | | | | |
| | | | | | | | | 17,151,900 | |
| | | | | | | | | | |
Electronic Equipment, Instruments & Components -
4.0% | | |
Teledyne Technologies, Inc. (b) | | | | 25,000 | | | | | 11,157,250 | |
Trimble, Inc. (b) | | | | 160,000 | | | | | 8,512,000 | |
| | | | | | | | | | |
| | | | | | | | | 19,669,250 | |
| | | | | | | | | | |
| Financial Services - 1.0% | | |
PayPal Holdings, Inc. (b) | | | | 85,000 | | | | | 5,219,850 | |
| | | | | | | | | | |
| Food Products - 0.9% | | |
Kraft Heinz Co. | | | | 120,000 | | | | | 4,437,600 | |
| | | | | | | | | | |
| Ground Transportation - 1.2% | | |
Union Pacific Corp. | | | | 24,000 | | | | | 5,894,880 | |
| | | | | | | | | | |
| Health Care Equipment & Supplies - 4.0% | | |
Alcon, Inc. (a) | | | | 60,000 | | | | | 4,687,200 | |
Neogen Corp. (b) | | | | 450,000 | | | | | 9,049,500 | |
| | | | | | | | | | |
| COMMON STOCKS | | Shares | | Value |
| Health Care Equipment & Supplies - 4.0%, Continued | | |
Stryker Corp. | | | | 20,000 | | | | $ | 5,989,200 | |
| | | | | | | | | | |
| | | | | | | | | 19,725,900 | |
| | | | | | | | | | |
| Household Durables - 0.9% | | |
Newell Brands, Inc. | | | | 500,000 | | | | | 4,340,000 | |
| | | | | | | | | | |
| Household Products - 2.1% | | |
Kimberly-Clark Corp. | | | | 50,000 | | | | | 6,075,500 | |
Procter & Gamble Co. | | | | 30,000 | | | | | 4,396,200 | |
| | | | | | | | | | |
| | | | | | | | | 10,471,700 | |
| | | | | | | | | | |
| Industrial Conglomerates - 2.1% | | |
Honeywell International Inc. | | | | 50,000 | | | | | 10,485,500 | |
| | | | | | | | | | |
| Interactive Media & Services - 3.1% | | |
Alphabet, Inc. - Class A (b) | | | | 110,000 | | | | | 15,365,900 | |
| | | | | | | | | | |
| IT Services - 2.2% | | |
Akamai Technologies, Inc. (b) | | | | 90,000 | | | | | 10,651,500 | |
| | | | | | | | | | |
| Life Sciences Tools & Services - 3.1% | | |
Danaher Corp. | | | | 35,750 | | | | | 8,270,405 | |
Thermo Fisher Scientific, Inc. | | | | 13,000 | | | | | 6,900,270 | |
| | | | | | | | | | |
| | | | | | | | | 15,170,675 | |
| | | | | | | | | | |
| Machinery - 6.3% | | |
Chart Industries, Inc. (b) | | | | 30,000 | | | | | 4,089,900 | |
Franklin Electric Co., Inc. | | | | 85,000 | | | | | 8,215,250 | |
IDEX Corp. | | | | 20,000 | | | | | 4,342,200 | |
Toro Co. | | | | 80,000 | | | | | 7,679,200 | |
Xylem, Inc. | | | | 60,000 | | | | | 6,861,600 | |
| | | | | | | | | | |
| | | | | | | | | 31,188,150 | |
| | | | | | | | | | |
| Marine Transportation - 1.7% | | |
Kirby Corp. (b) | | | | 110,000 | | | | | 8,632,800 | |
| | | | | | | | | | |
| Oil, Gas & Consumable Fuels - 6.1% | | |
Chevron Corp. | | | | 42,500 | | | | | 6,339,300 | |
ConocoPhillips | | | | 100,000 | | | | | 11,607,000 | |
Coterra Energy, Inc. | | | | 384,000 | | | | | 9,799,680 | |
Kimbell Royalty Partners LP | | | | 160,000 | | | | | 2,408,000 | |
| | | | | | | | | | |
| | | | | | | | | 30,153,980 | |
| | | | | | | | | | |
| Pharmaceuticals - 4.7% | | |
Merck & Co., Inc. | | | | 80,000 | | | | | 8,721,600 | |
Pfizer Inc. | | | | 135,000 | | | | | 3,886,650 | |
Zoetis, Inc. | | | | 53,500 | | | | | 10,559,295 | |
| | | | | | | | | | |
| | | | | | | | | 23,167,545 | |
| | | | | | | | | | |
| Semiconductors & Semiconductor Equipment - 1.5% | | |
NVIDIA Corp. | | | | 15,000 | | | | | 7,428,300 | |
| | | | | | | | | | |
| Software - 15.0% | | |
Adobe, Inc. (b) | | | | 20,000 | | | | | 11,932,000 | |
Microsoft Corp. | | | | 103,000 | | | | | 38,732,120 | |
Oracle Corp. | | | | 120,000 | | | | | 12,651,600 | |
Roper Technologies, Inc. | | | | 20,000 | | | | | 10,903,400 | |
| | | | | | | | | | |
| | | | | | | | | 74,219,120 | |
| | | | | | | | | | |
The accompanying notes are an integral part of these financial statements.
19
|
| LKCM EQUITY FUND |
| SCHEDULEOF INVESTMENTS, CONTINUED |
| as of December 31, 2023 |
| | | | | | | | | | |
| COMMON STOCKS | | Shares | | Value |
| Specialty Retail - 4.7% | | |
Academy Sports & Outdoors, Inc. | | | | 90,000 | | | | $ | 5,940,000 | |
O’Reilly Automotive, Inc. (b) | | | | 7,135 | | | | | 6,778,821 | |
The Home Depot, Inc. | | | | 30,000 | | | | | 10,396,500 | |
| | | | | | | | | | |
| | | | | | | | | 23,115,321 | |
| | | | | | | | | | |
| Technology Hardware, Storage & Peripherals - 3.7% | | |
Apple Inc. | | | | 96,000 | | | | | 18,482,880 | |
| | | | | | | | | | |
| Trading Companies & Distributors - 2.0% | | |
FTAI Aviation Ltd. (a) | | | | 220,000 | | | | | 10,208,000 | |
| | | | | | | | | | |
TOTAL COMMON STOCKS
(Cost $242,145,740) | | | | | 490,171,841 | |
| | | | | | | | | | |
| | | | | | | | | | |
| SHORT-TERM INVESTMENT - 1.1% | | | | |
| Money Market Fund - 1.1% | | | | |
Invesco Short-Term Investments Trust - Government & Agency Portfolio - Institutional Shares, 5.27% (c) | | | | 5,278,422 | | | | | 5,278,422 | |
| | | | | | | | | | |
TOTAL SHORT-TERM INVESTMENT
(Cost $5,278,422) | | 5,278,422 |
| | | | | | | | | | |
TOTAL INVESTMENTS - 100.2%
(Cost $247,424,162) | | 495,450,263 |
Liabilities in Excess of Other Assets - (0.2)% | | | | | (773,582 | ) |
| | | | | | | | | | |
TOTAL NET ASSETS - 100.0% | | | | | | | | $ | 494,676,681 | |
| | | | | | | | | | |
| (a) | Security issued by non-U.S. incorporated company. |
| (b) | Non-income producing security. |
| (c) | The rate shown represents the 7-day effective yield as of December 31, 2023. |
Percentages are stated as a percent of net assets.
The Global Industry Classification Standard (GICS®) was developed by and/or is the exclusive property of MSCI, Inc. and Standard & Poor’s Financial Services LLC (“S&P”). GICS is a service mark of MSCI, Inc. and S&P and has been licensed for use by U.S. Bank Global Fund Services.
The accompanying notes are an integral part of these financial statements.
20
|
| LKCM BALANCED FUND |
| SCHEDULEOF INVESTMENTS |
| as of December 31, 2023 |
| | | | | | | | | | |
| COMMON STOCKS - 69.9% | | Shares | | Value |
| Aerospace & Defense - 1.1% | | |
L3Harris Technologies, Inc. | | | | 5,850 | | | | $ | 1,232,127 | |
| | | | | | | | | | |
| Banks - 3.9% | | |
Bank of America Corp. | | | | 44,900 | | | | | 1,511,783 | |
Cullen/Frost Bankers, Inc. | | | | 9,700 | | | | | 1,052,353 | |
JPMorgan Chase & Co. | | | | 10,700 | | | | | 1,820,069 | |
| | | | | | | | | | |
| | | | | | | | | 4,384,205 | |
| | | | | | | | | | |
| Beverages - 2.2% | | |
Coca-Cola Co. | | | | 21,400 | | | | | 1,261,102 | |
PepsiCo, Inc. | | | | 7,550 | | | | | 1,282,292 | |
| | | | | | | | | | |
| | | | | | | | | 2,543,394 | |
| | | | | | | | | | |
| Broadline Retail - 1.5% | | |
Amazon.com, Inc. (a) | | | | 11,200 | | | | | 1,701,728 | |
| | | | | | | | | | |
| Capital Markets - 1.5% | | |
Moody’s Corp. | | | | 4,450 | | | | | 1,737,992 | |
| | | | | | | | | | |
| Chemicals - 4.0% | | |
Air Products and Chemicals, Inc. | | | | 4,800 | | | | | 1,314,240 | |
Corteva, Inc. | | | | 7,658 | | | | | 366,971 | |
DuPont de Nemours, Inc. | | | | 12,658 | | | | | 973,780 | |
Ecolab Inc. | | | | 2,400 | | | | | 476,040 | |
Linde PLC (b) | | | | 3,600 | | | | | 1,478,556 | |
| | | | | | | | | | |
| | | | | | | | | 4,609,587 | |
| | | | | | | | | | |
| Commercial Services & Supplies - 3.2% | | |
Cintas Corp. | | | | 2,200 | | | | | 1,325,852 | |
Veralto Corp. | | | | 1,700 | | | | | 139,842 | |
Waste Connections, Inc. (b) | | | | 8,100 | | | | | 1,209,087 | |
Waste Management, Inc. | | | | 5,250 | | | | | 940,275 | |
| | | | | | | | | | |
| | | | | | | | | 3,615,056 | |
| | | | | | | | | | |
| Construction Materials - 1.4% | | |
Martin Marietta Materials, Inc. | | | | 3,300 | | | | | 1,646,403 | |
| | | | | | | | | | |
| Consumer Staples Distribution & Retail - 1.1% | | |
Walmart, Inc. | | | | 8,100 | | | | | 1,276,965 | |
| | | | | | | | | | |
| Diversified Telecommunication Services - 0.6% | | |
Verizon Communications Inc. | | | | 17,341 | | | | | 653,756 | |
| | | | | | | | | | |
| Electrical Equipment - 1.7% | | |
Emerson Electric Co. | | | | 8,800 | | | | | 856,504 | |
Rockwell Automation, Inc. | | | | 3,325 | | | | | 1,032,346 | |
| | | | | | | | | | |
| | | | | | | | | 1,888,850 | |
| | | | | | | | | | |
| Electronic Equipment, Instruments & Components - 2.1% |
Teledyne Technologies, Inc. (a) | | | | 2,950 | | | | | 1,316,556 | |
Trimble Inc. (a) | | | | 19,750 | | | | | 1,050,700 | |
| | | | | | | | | | |
| | | | | | | | | 2,367,256 | |
| | | | | | | | | | |
| Entertainment - 1.1% | | |
Walt Disney Co. | | | | 13,700 | | | | | 1,236,973 | |
| | | | | | | | | | |
| Financial Services - 1.8% | | |
PayPal Holdings, Inc. (a) | | | | 9,100 | | | | | 558,831 | |
Visa Inc. - Class A | | | | 5,650 | | | | | 1,470,978 | |
| | | | | | | | | | |
| | | | | | | | | 2,029,809 | |
| | | | | | | | | | |
| | | | | | | | | | |
| COMMON STOCKS | | Shares | | Value |
| Ground Transportation - 1.1% | | |
Union Pacific Corp. | | | | 5,275 | | | | $ | 1,295,646 | |
| | | | | | | | | | |
| Health Care Equipment & Supplies - 2.6% | | |
Abbott Laboratories | | | | 10,000 | | | | | 1,100,700 | |
Alcon, Inc. (b) | | | | 17,900 | | | | | 1,398,348 | |
Neogen Corp. (a) | | | | 20,000 | | | | | 402,200 | |
| | | | | | | | | | |
| | | | | | | | | 2,901,248 | |
| | | | | | | | | | |
| Household Durables - 0.3% | | |
Newell Brands, Inc. | | | | 40,000 | | | | | 347,200 | |
| | | | | | | | | | |
| Household Products - 2.2% | | |
Colgate-Palmolive Co. | | | | 16,100 | | | | | 1,283,331 | |
Kimberly-Clark Corp. | | | | 6,100 | | | | | 741,211 | |
Procter & Gamble Co. | | | | 3,250 | | | | | 476,255 | |
| | | | | | | | | | |
| | | | | | | | | 2,500,797 | |
| | | | | | | | | | |
| Industrial Conglomerates - 1.0% | | |
Honeywell International Inc. | | | | 5,200 | | | | | 1,090,492 | |
| | | | | | | | | | |
| Insurance - 0.7% | | |
Arthur J Gallagher & Co. | | | | 3,400 | | | | | 764,592 | |
| | | | | | | | | | |
| Interactive Media & Services - 2.9% | | |
Alphabet Inc. - Class C (a) | | | | 13,800 | | | | | 1,944,834 | |
Meta Platforms, Inc. - Class A (a) | | | | 3,675 | | | | | 1,300,803 | |
| | | | | | | | | | |
| | | | | | | | | 3,245,637 | |
| | | | | | | | | | |
| IT Services - 2.1% | | |
Accenture PLC - Class A (b) | | | | 2,600 | | | | | 912,366 | |
Akamai Technologies, Inc. (a) | | | | 12,800 | | | | | 1,514,880 | |
| | | | | | | | | | |
| | | | | | | | | 2,427,246 | |
| | | | | | | | | | |
| Life Sciences Tools & Services - 3.3% | | |
Charles River Laboratories International, Inc. (a) | | | | 5,250 | | | | | 1,241,100 | |
Danaher Corp. | | | | 5,100 | | | | | 1,179,834 | |
Thermo Fisher Scientific, Inc. | | | | 2,600 | | | | | 1,380,054 | |
| | | | | | | | | | |
| | | | | | | | | 3,800,988 | |
| | | | | | | | | | |
| Machinery - 1.5% | | |
Chart Industries, Inc. (a) | | | | 4,800 | | | | | 654,384 | |
Fortive Corp. | | | | 9,350 | | | | | 688,441 | |
IDEX Corp. | | | | 1,600 | | | | | 347,376 | |
| | | | | | | | | | |
| | | | | | | | | 1,690,201 | |
| | | | | | | | | | |
| Metals & Mining - 0.7% | | |
Newmont Goldcorp Corp. | | | | 18,100 | | | | | 749,159 | |
| | | | | | | | | | |
| Oil, Gas & Consumable Fuels - 5.2% | | |
Chevron Corp. | | | | 7,795 | | | | | 1,162,702 | |
ConocoPhillips | | | | 10,900 | | | | | 1,265,163 | |
Coterra Energy, Inc. | | | | 24,000 | | | | | 612,480 | |
EOG Resources, Inc. | | | | 4,450 | | | | | 538,228 | |
Kinder Morgan, Inc. | | | | 62,000 | | | | | 1,093,680 | |
Pioneer Natural Resources Co. | | | | 5,650 | | | | | 1,270,571 | |
| | | | | | | | | | |
| | | | | | | | | 5,942,824 | |
| | | | | | | | | | |
| Personal Care Products - 0.6% | | |
Estee Lauder Cos., Inc. - Class A | | | | 4,600 | | | | | 672,750 | |
| | | | | | | | | | |
The accompanying notes are an integral part of these financial statements.
21
|
| LKCM BALANCED FUND |
| SCHEDULEOF INVESTMENTS, CONTINUED |
| as of December 31, 2023 |
| | | | | | | | | | |
| COMMON STOCKS | | Shares | | Value |
| Pharmaceuticals - 2.6% | | |
Merck & Co., Inc. | | | | 12,500 | | | | $ | 1,362,750 | |
Zoetis Inc. | | | | 8,026 | | | | | 1,584,092 | |
| | | | | | | | | | |
| | | | | | | | | 2,946,842 | |
| | | | | | | | | | |
| Professional Services - 0.9% | | |
Broadridge Financial Solutions, Inc. | | | | 5,250 | | | | | 1,080,188 | |
| | | | | | | | | | |
| Semiconductors & Semiconductor Equipment - 1.8% | | |
NVIDIA Corp. | | | | 2,000 | | | | | 990,440 | |
Qualcomm Inc. | | | | 7,600 | | | | | 1,099,188 | |
| | | | | | | | | | |
| | | | | | | | | 2,089,628 | |
| | | | | | | | | | |
| Software - 7.0% | | |
Adobe Inc. (a) | | | | 1,850 | | | | | 1,103,710 | |
Microsoft Corp. | | | | 6,750 | | | | | 2,538,269 | |
Oracle Corp. | | | | 12,800 | | | | | 1,349,504 | |
Roper Technologies, Inc. | | | | 2,600 | | | | | 1,417,442 | |
Salesforce, Inc. (a) | | | | 6,050 | | | | | 1,591,997 | |
| | | | | | | | | | |
| | | | | | | | | 8,000,922 | |
| | | | | | | | | | |
| Specialized REITs - 1.0% | | |
American Tower Corp. | | | | 5,500 | | | | | 1,187,340 | |
| | | | | | | | | | |
| Specialty Retail - 1.4% | | |
Home Depot, Inc. | | | | 4,500 | | | | | 1,559,475 | |
| | | | | | | | | | |
| Technology Hardware, Storage & Peripherals - 2.7% | | |
Apple Inc. | | | | 15,950 | | | | | 3,070,854 | |
| | | | | | | | | | |
| Textiles, Apparel & Luxury Goods - 1.1% | | |
NIKE, Inc. - Class B | | | | 12,000 | | | | | 1,302,840 | |
| | | | | | | | | | |
TOTAL COMMON STOCKS
(Cost $45,567,028) | | | | | 79,590,970 | |
| | | | | | | | | | |
| | | | | | | | | | |
| CORPORATE BONDS - 29.7% | | Par | | |
| Aerospace & Defense - 1.2% |
L3Harris Technologies, Inc., | | | | | | | | | | |
5.40%, 07/31/2033 | | | | | | | | | | |
(Call 04/30/2033) | | | $ | 500,000 | | | | | 521,122 | |
RTX Corp., | | | | | | | | | | |
5.15%, 02/27/2033 | | | | | | | | | | |
(Call 11/27/2032) | | | | 800,000 | | | | | 816,871 | |
| | | | | | | | | | |
| | | | | | | | | 1,337,993 | |
| | | | | | | | | | |
| Banks - 1.0% |
Cullen/Frost Bankers, Inc., | | | | | | | | | | |
4.50%, 03/17/2027 | | | | | | | | | | |
(Call 02/17/2027) | | | | 750,000 | | | | | 715,489 | |
JPMorgan Chase & Co. | | | | | | | | | | |
3.88%, 09/10/2024 | | | | 200,000 | | | | | 197,861 | |
3.20%, 06/15/2026 | | | | | | | | | | |
(Call 03/15/2026) | | | | 200,000 | | | | | 193,152 | |
| | | | | | | | | | |
| | | | | | | | | 1,106,502 | |
| | | | | | | | | | |
| Beverages - 1.0% |
Keurig Dr Pepper, Inc., | | | | | | | | | | |
2.55%, 09/15/2026 | | | | | | | | | | |
(Call 06/15/2026) | | | | 750,000 | | | | | 708,661 | |
| | | | | | | | | | |
| CORPORATE BONDS | | Par | | Value |
| Beverages - 1.0%, Continued |
PepsiCo, Inc., | | | | | | | | | | |
2.38%, 10/06/2026 | | | | | | | | | | |
(Call 07/06/2026) | | | $ | 435,000 | | | | $ | 413,743 | |
| | | | | | | | | | |
| | | | | | | | | 1,122,404 | |
| | | | | | | | | | |
| Biotechnology - 0.9% |
AbbVie, Inc., | | | | | | | | | | |
3.20%, 05/14/2026 | | | | | | | | | | |
(Call 02/14/2026) | | | | 600,000 | | | | | 581,615 | |
Amgen, Inc., | | | | | | | | | | |
2.60%, 08/19/2026 | | | | | | | | | | |
(Call 05/19/2026) | | | | 450,000 | | | | | 427,969 | |
| | | | | | | | | | |
| | | | | | | | | 1,009,584 | |
| | | | | | | | | | |
| Broadline Retail - 0.7% |
Amazon.com, Inc. | | | | | | | | | | |
1.20%, 06/03/2027 | | | | | | | | | | |
(Call 04/03/2027) | | | | 260,000 | | | | | 234,823 | |
4.55%, 12/01/2027 | | | | | | | | | | |
(Call 11/01/2027) | | | | 550,000 | | | | | 559,246 | |
| | | | | | | | | | |
| | | | | | | | | 794,069 | |
| | | | | | | | | | |
| Chemicals - 2.0% |
Air Products and Chemicals, Inc., | | | | | | | | | | |
1.85%, 05/15/2027 | | | | | | | | | | |
(Call 03/15/2027) | | | | 675,000 | | | | | 622,967 | |
DuPont de Nemours, Inc., | | | | | | | | | | |
4.73%, 11/15/2028 | | | | | | | | | | |
(Call 08/15/2028) | | | | 650,000 | | | | | 660,795 | |
Ecolab Inc. | | | | | | | | | | |
2.70%, 11/01/2026 | | | | | | | | | | |
(Call 08/01/2026) | | | | 500,000 | | | | | 479,103 | |
5.25%, 01/15/2028 | | | | | | | | | | |
(Call 12/15/2027) | | | | 475,000 | | | | | 491,015 | |
| | | | | | | | | | |
| | | | | | | | | 2,253,880 | |
| | | | | | | | | | |
| Commercial Services & Supplies - 0.4% |
Waste Management, Inc., | | | | | | | | | | |
4.15%, 04/15/2032 | | | | | | | | | | |
(Call 01/15/2032) | | | | 500,000 | | | | | 489,371 | |
| | | | | | | | | | |
| Consumer Staples Distribution & Retail - 1.9% |
Costco Wholesale Corp., | | | | | | | | | | |
1.38%, 06/20/2027 | | | | | | | | | | |
(Call 04/20/2027) | | | | 690,000 | | | | | 627,004 | |
Dollar Tree, Inc., | | | | | | | | | | |
4.00%, 05/15/2025 | | | | | | | | | | |
(Call 03/15/2025) | | | | 825,000 | | | | | 810,732 | |
Walmart, Inc., | | | | | | | | | | |
3.55%, 06/26/2025 | | | | | | | | | | |
(Call 04/26/2025) | | | | 700,000 | | | | | 690,728 | |
| | | | | | | | | | |
| | | | | | | | | 2,128,464 | |
| | | | | | | | | | |
| Diversified Telecommunication Services - 1.2% |
AT&T, Inc., | | | | | | | | | | |
1.70%, 03/25/2026 | | | | | | | | | | |
(Call 01/16/2024) | | | | 250,000 | | | | | 234,046 | |
The accompanying notes are an integral part of these financial statements.
22
|
| LKCM BALANCED FUND |
| SCHEDULEOF INVESTMENTS, CONTINUED |
| as of December 31, 2023 |
| | | | | | | | | | |
| CORPORATE BONDS | | Par | | Value |
Diversified Telecommunication Services - 1.2%,
Continued | | |
T-Mobile USA, Inc. | | | | | | | | | | |
3.75%, 04/15/2027 | | | | | | | | | | |
(Call 02/15/2027) | | | $ | 100,000 | | | | $ | 97,128 | |
4.75%, 02/01/2028 | | | | | | | | | | |
(Call 01/16/2024) | | | | 100,000 | | | | | 99,714 | |
Verizon Communications Inc. | | | | | | | | | | |
3.50%, 11/01/2024 | | | | | | | | | | |
(Call 08/01/2024) | | | | 750,000 | | | | | 738,976 | |
2.63%, 08/15/2026 | | | | 250,000 | | | | | 238,329 | |
| | | | | | | | | | |
| | | | | | | | | 1,408,193 | |
| | | | | | | | | | |
| Electric Utilities - 0.3% |
Duke Energy Corp., | | | | | | | | | | |
5.00%, 12/08/2027 | | | | | | | | | | |
(Call 11/08/2027) | | | | 345,000 | | | | | 349,205 | |
| | | | | | | | | | |
| Electrical Equipment - 0.2% |
Emerson Electric Co., | | | | | | | | | | |
3.15%, 06/01/2025 | | | | | | | | | | |
(Call 03/01/2025) | | | | 200,000 | | | | | 195,722 | |
| | | | | | | | | | |
| Energy Equipment & Services - 0.7% |
Enterprise Products Operating LLC | | | | | | | | | | |
3.75%, 02/15/2025 | | | | | | | | | | |
(Call 11/15/2024) | | | | 665,000 | | | | | 656,800 | |
5.05%, 01/10/2026 | | | | 100,000 | | | | | 100,992 | |
| | | | | | | | | | |
| | | | | | | | | 757,792 | |
| | | | | | | | | | |
| Entertainment - 0.7% |
Walt Disney Co., | | | | | | | | | | |
1.75%, 08/30/2024 | | | | | | | | | | |
(Call 07/30/2024) | | | | 810,000 | | | | | 791,368 | |
| | | | | | | | | | |
| Financial Services - 1.7% |
Mastercard, Inc., | | | | | | | | | | |
4.85%, 03/09/2033 | | | | | | | | | | |
(Call 12/09/2032) | | | | 500,000 | | | | | 517,616 | |
PayPal Holdings, Inc., | | | | | | | | | | |
1.65%, 06/01/2025 | | | | | | | | | | |
(Call 05/01/2025) | | | | 700,000 | | | | | 668,742 | |
Visa Inc. | | | | | | | | | | |
3.15%, 12/14/2025 | | | | | | | | | | |
(Call 09/14/2025) | | | | 300,000 | | | | | 292,937 | |
1.90%, 04/15/2027 | | | | | | | | | | |
(Call 02/15/2027) | | | | 500,000 | | | | | 465,249 | |
| | | | | | | | | | |
| | | | | | | | | 1,944,544 | |
| | | | | | | | | | |
| Ground Transportation - 0.2% |
Union Pacific Corp., | | | | | | | | | | |
3.75%, 07/15/2025 | | | | | | | | | | |
(Call 05/15/2025) | | | | 200,000 | | | | | 197,126 | |
| | | | | | | | | | |
| Health Care Equipment & Supplies - 0.5% |
Abbott Laboratories | | | | | | | | | | |
3.88%, 09/15/2025 | | | | | | | | | | |
(Call 06/15/2025) | | | | 255,000 | | | | | 252,600 | |
3.75%, 11/30/2026 | | | | | | | | | | |
(Call 08/30/2026) | | | | 355,000 | | | | | 350,391 | |
| | | | | | | | | | |
| | | | | | | | | 602,991 | |
| | | | | | | | | | |
| | | | | | | | | | |
| CORPORATE BONDS | | Par | | Value |
| Health Care Providers & Services - 0.0% (c) |
CVS Health Corp., | | | | | | | | | | |
3.38%, 08/12/2024 | | | | | | | | | | |
(Call 05/12/2024) | | | $ | 50,000 | | | | $ | 49,323 | |
| | | | | | | | | | |
| Hotels, Restaurants & Leisure - 0.5% |
McDonald’s Corp., | | | | | | | | | | |
1.45%, 09/01/2025 | | | | | | | | | | |
(Call 08/01/2025) | | | | 600,000 | | | | | 568,224 | |
| | | | | | | | | | |
| Household Products - 0.5% |
Colgate-Palmolive Co., | | | | | | | | | | |
3.10%, 08/15/2027 | | | | | | | | | | |
(Call 07/15/2027) | | | | 595,000 | | | | | 575,054 | |
| | | | | | | | | | |
| Industrial Conglomerates - 0.6% |
Honeywell International Inc., | | | | | | | | | | |
1.35%, 06/01/2025 | | | | | | | | | | |
(Call 05/01/2025) | | | | 750,000 | | | | | 716,793 | |
| | | | | | | | | | |
| Interactive Media & Services - 0.2% |
Alphabet, Inc., | | | | | | | | | | |
2.00%, 08/15/2026 | | | | | | | | | | |
(Call 05/15/2026) | | | | 200,000 | | | | | 189,067 | |
| | | | | | | | | | |
| Life Sciences Tools & Services - 0.2% |
Danaher Corp., | | | | | | | | | | |
3.35%, 09/15/2025 | | | | | | | | | | |
(Call 06/15/2025) | | | | 250,000 | | | | | 244,540 | |
| | | | | | | | | | |
| Oil, Gas & Consumable Fuels - 2.9% |
Chevron Corp., | | | | | | | | | | |
2.00%, 05/11/2027 | | | | | | | | | | |
(Call 03/11/2027) | | | | 400,000 | | | | | 371,751 | |
ConocoPhillips Co. | | | | | | | | | | |
6.95%, 04/15/2029 | | | | 500,000 | | | | | 558,183 | |
5.05%, 09/15/2033 | | | | | | | | | | |
(Call 06/15/2033) | | | | 250,000 | | | | | 257,512 | |
Devon Energy Corp., | | | | | | | | | | |
4.50%, 01/15/2030 | | | | | | | | | | |
(Call 01/15/2025) | | | | 500,000 | | | | | 481,108 | |
EOG Resources, Inc., | | | | | | | | | | |
4.38%, 04/15/2030 | | | | | | | | | | |
(Call 01/15/2030) | | | | 500,000 | | | | | 499,032 | |
Exxon Mobil Corp. | | | | | | | | | | |
2.71%, 03/06/2025 | | | | | | | | | | |
(Call 12/06/2024) | | | | 255,000 | | | | | 249,257 | |
3.04%, 03/01/2026 | | | | | | | | | | |
(Call 12/01/2025) | | | | 400,000 | | | | | 388,911 | |
Kinder Morgan Energy Partners, L.P., | | | | | | | | | | |
4.25%, 09/01/2024 | | | | | | | | | | |
(Call 06/01/2024) | | | | 125,000 | | | | | 123,888 | |
Kinder Morgan, Inc., | | | | | | | | | | |
5.20%, 06/01/2033 | | | | | | | | | | |
(Call 03/01/2033) | | | | 325,000 | | | | | 323,826 | |
| | | | | | | | | | |
| | | | | | | | | 3,253,468 | |
| | | | | | | | | | |
The accompanying notes are an integral part of these financial statements.
23
|
| LKCM BALANCED FUND |
| SCHEDULEOF INVESTMENTS, CONTINUED |
| as of December 31, 2023 |
| | | | | | | | | | |
| CORPORATE BONDS | | Par | | Value |
| Personal Care Products - 0.7% |
Estee Lauder Cos., Inc., | | | | | | | | | | |
2.00%, 12/01/2024 | | | | | | | | | | |
(Call 11/01/2024) | | | $ | 805,000 | | | | $ | 782,315 | |
| | | | | | | | | | |
| Pharmaceuticals - 2.3% |
Eli Lilly & Co., | | | | | | | | | | |
5.00%, 02/27/2026 | | | | | | | | | | |
(Call 02/27/2024) | | | | 545,000 | | | | | 545,275 | |
Johnson & Johnson, | | | | | | | | | | |
0.55%, 09/01/2025 | | | | | | | | | | |
(Call 08/01/2025) | | | | 735,000 | | | | | 688,995 | |
Pfizer, Inc., | | | | | | | | | | |
0.80%, 05/28/2025 | | | | | | | | | | |
(Call 04/28/2025) | | | | 800,000 | | | | | 757,589 | |
Zoetis Inc., | | | | | | | | | | |
4.50%, 11/13/2025 | | | | | | | | | | |
(Call 08/13/2025) | | | | 600,000 | | | | | 597,096 | |
| | | | | | | | | | |
| | | | | | | | | 2,588,955 | |
| | | | | | | | | | |
| Semiconductors & Semiconductor Equipment - 0.8% |
Intel Corp., | | | | | | | | | | |
3.70%, 07/29/2025 | | | | | | | | | | |
(Call 04/29/2025) | | | | 500,000 | | | | | 492,376 | |
NVIDIA Corp., | | | | | | | | | | |
3.20%, 09/16/2026 | | | | | | | | | | |
(Call 06/16/2026) | | | | 400,000 | | | | | 389,486 | |
| | | | | | | | | | |
| | | | | | | | | 881,862 | |
| | | | | | | | | | |
| Software - 2.9% |
Adobe Inc., | | | | | | | | | | |
1.90%, 02/01/2025 | | | | | | | | | | |
(Call 01/01/2025) | | | | 755,000 | | | | | 732,783 | |
Fortinet, Inc., | | | | | | | | | | |
1.00%, 03/15/2026 | | | | | | | | | | |
(Call 02/15/2026) | | | | 600,000 | | | | | 550,749 | |
Intuit, Inc., | | | | | | | | | | |
5.13%, 09/15/2028 | | | | | | | | | | |
(Call 08/15/2028) | | | | 550,000 | | | | | 569,310 | |
Microsoft Corp., | | | | | | | | | | |
3.13%, 11/03/2025 | | | | | | | | | | |
(Call 08/03/2025) | | | | 230,000 | | | | | 224,742 | |
Oracle Corp. | | | | | | | | | | |
2.50%, 04/01/2025 | | | | | | | | | | |
(Call 03/01/2025) | | | | 500,000 | | | | | 483,691 | |
2.95%, 05/15/2025 | | | | | | | | | | |
(Call 02/15/2025) | | | | 500,000 | | | | | 485,699 | |
Roper Technologies, Inc., | | | | | | | | | | |
1.00%, 09/15/2025 | | | | | | | | | | |
(Call 08/15/2025) | | | | 250,000 | | | | | 233,810 | |
| | | | | | | | | | |
| | | | | | | | | 3,280,784 | |
| | | | | | | | | | |
| Specialized REITs - 1.0% |
American Tower Corp. | | | | | | | | | | |
2.40%, 03/15/2025 | | | | | | | | | | |
(Call 02/15/2025) | | | | 600,000 | | | | | 580,087 | |
| | | | | | | | | | |
| CORPORATE BONDS | | Par | | Value |
| Specialized REITs - 1.0%, Continued |
3.38%, 10/15/2026 | | | | | | | | | | |
(Call 07/15/2026) | | | $ | 635,000 | | | | $ | 609,081 | |
| | | | | | | | | | |
| | | | | | | | | 1,189,168 | |
| | | | | | | | | | |
| Specialty Retail - 2.2% |
Home Depot, Inc., | | | | | | | | | | |
2.80%, 09/14/2027 | | | | | | | | | | |
(Call 06/14/2027) | | | | 500,000 | | | | | 476,022 | |
Lowe’s Cos., Inc., | | | | | | | | | | |
2.50%, 04/15/2026 | | | | | | | | | | |
(Call 01/15/2026) | | | | 800,000 | | | | | 762,398 | |
O’Reilly Automotive, Inc. | | | | | | | | | | |
4.20%, 04/01/2030 | | | | | | | | | | |
(Call 01/01/2030) | | | | 500,000 | | | | | 482,816 | |
4.70%, 06/15/2032 | | | | | | | | | | |
(Call 03/15/2032) | | | | 250,000 | | | | | 247,897 | |
Tractor Supply Co., | | | | | | | | | | |
5.25%, 05/15/2033 | | | | | | | | | | |
(Call 02/15/2033) | | | | 500,000 | | | | | 512,896 | |
| | | | | | | | | | |
| | | | | | | | | 2,482,029 | |
| | | | | | | | | | |
| Technology Hardware, Storage & Peripherals - 0.3% |
Apple Inc. | | | | | | | | | | |
2.50%, 02/09/2025 | | | | 250,000 | | | | | 244,026 | |
3.20%, 05/13/2025 | | | | 55,000 | | | | | 53,939 | |
| | | | | | | | | | |
| | | | | | | | | 297,965 | |
| | | | | | | | | | |
TOTAL CORPORATE BONDS
(Cost $34,670,749) | | | | | 33,588,755 | |
| | | | | | | | | | |
| | | | | | |
| SHORT-TERM INVESTMENT - 1.2% | | Shares | | |
| Money Market Fund - 1.2% | | | | |
Invesco Short-Term Investments Trust - Government & Agency Portfolio - Institutional Shares, 5.27% (d) | | | | 1,395,503 | | | | | 1,395,503 | |
| | | | | | | | | | |
TOTAL SHORT-TERM INVESTMENT
(Cost $1,395,503) | | | | | 1,395,503 | |
| | | | | | | | | | |
TOTAL INVESTMENTS - 100.8%
(Cost $81,633,280) | | | | | 114,575,228 | |
Liabilities in Excess of Other Assets - (0.8)% | | | | | (908,103 | ) |
| | | | | | | | | | |
TOTAL NET ASSETS - 100.0% | | | | | | | | $ | 113,667,125 | |
| | | | | | | | | | |
| (a) | Non-income producing security. |
| (b) | Security issued by non-U.S. incorporated company. |
| (c) | Represents less than 0.05% of net assets. |
| (d) | The rate shown represents the 7-day effective yield as of December 31, 2023. |
Percentages are stated as a percent of net assets.
The Global Industry Classification Standard (GICS®) was developed by and/or is the exclusive property of MSCI, Inc. and Standard & Poor’s Financial Services LLC (“S&P”). GICS is a service mark of MSCI, Inc. and S&P and has been licensed for use by U.S. Bank Global Fund Services.
The accompanying notes are an integral part of these financial statements.
24
|
| LKCM FIXED INCOME FUND |
| SCHEDULEOF INVESTMENTS |
| as of December 31, 2023 |
| | | | | | | | | | |
| CORPORATE BONDS - 62.3% | | Par | | Value |
| Aerospace & Defense - 2.1% | | | | |
L3Harris Technologies, Inc., | | | | | | | | | | |
5.40%, 07/31/2033 | | | | | | | | | | |
(Call 04/30/2033) | | | $ | 3,025,000 | | | | $ | 3,152,788 | |
RTX Corp., | | | | | | | | | | |
5.15%, 02/27/2033 | | | | | | | | | | |
(Call 11/27/2032) | | | | 2,750,000 | | | | | 2,807,995 | |
| | | | | | | | | | |
| | | | | | | | | 5,960,783 | |
| | | | | | | | | | |
| Banks - 4.0% | | | | |
Bank of America Corp., | | | | | | | | | | |
4.45%, 03/03/2026 | | | | 2,000,000 | | | | | 1,979,735 | |
Cullen/Frost Bankers, Inc., | | | | | | | | | | |
4.50%, 03/17/2027 | | | | | | | | | | |
(Call 02/17/2027) | | | | 3,942,000 | | | | | 3,760,612 | |
JPMorgan Chase & Co. | | | | | | | | | | |
3.88%, 02/01/2024 | | | | 1,750,000 | | | | | 1,747,010 | |
3.30%, 04/01/2026 | | | | | | | | | | |
(Call 01/01/2026) | | | | 3,500,000 | | | | | 3,390,874 | |
3.20%, 06/15/2026 | | | | | | | | | | |
(Call 03/15/2026) | | | | 636,000 | | | | | 614,222 | |
| | | | | | | | | | |
| | | | | | | | | 11,492,453 | |
| | | | | | | | | | |
| Beverages - 0.7% | | | | |
Keurig Dr Pepper, Inc., | | | | | | | | | | |
2.55%, 09/15/2026 | | | | | | | | | | |
(Call 06/15/2026) | | | | 2,225,000 | | | | | 2,102,360 | |
| | | | | | | | | | |
Biotechnology - 1.1% | | | | | | | | | | |
Amgen, Inc. | | | | | | | | | | |
2.60%, 08/19/2026 | | | | | | | | | | |
(Call 05/19/2026) | | | | 1,000,000 | | | | | 951,043 | |
2.20%, 02/21/2027 | | | | | | | | | | |
(Call 12/21/2026) | | | | 2,500,000 | | | | | 2,327,083 | |
| | | | | | | | | | |
| | | | | | | | | 3,278,126 | |
| | | | | | | | | | |
| Chemicals - 2.0% | | | | |
Air Products and Chemicals, Inc., | | | | | | | | | | |
1.50%, 10/15/2025 | | | | | | | | | | |
(Call 09/15/2025) | | | | 4,000,000 | | | | | 3,784,233 | |
Ecolab Inc., | | | | | | | | | | |
2.70%, 11/01/2026 | | | | | | | | | | |
(Call 08/01/2026) | | | | 2,000,000 | | | | | 1,916,413 | |
| | | | | | | | | | |
| | | | | | | | | 5,700,646 | |
| | | | | | | | | | |
| Consumer Finance - 0.7% |
American Express Co., | | | | | | | | | | |
4.20%, 11/06/2025 | | | | | | | | | | |
(Call 10/06/2025) | | | | 2,000,000 | | | | | 1,977,827 | |
| | | | | | | | | | |
| Consumer Staples Distribution & Retail - 1.0% |
Dollar Tree, Inc., | | | | | | | | | | |
4.00%, 05/15/2025 | | | | | | | | | | |
(Call 03/15/2025) | | | | 3,000,000 | | | | | 2,948,113 | |
| | | | | | | | | | |
| Containers & Packaging - 1.5% | | | | |
Ball Corp., | | | | | | | | | | |
5.25%, 07/01/2025 | | | | 4,252,000 | | | | | 4,250,631 | |
| | | | | | | | | | |
| | | | | | | | | | |
| CORPORATE BONDS | | Par | | Value |
| Diversified Telecommunication Services - 4.2% |
AT&T, Inc. | | | | | | | | | | |
1.70%, 03/25/2026 | | | | | | | | | | |
(Call 01/16/2024) | | | $ | 1,450,000 | | | | $ | 1,357,469 | |
4.25%, 03/01/2027 | | | | | | | | | | |
(Call 12/01/2026) | | | | 4,235,000 | | | | | 4,192,510 | |
Verizon Communications, Inc. | | | | | | | | | | |
3.50%, 11/01/2024 | | | | | | | | | | |
(Call 08/01/2024) | | | | 1,750,000 | | | | | 1,724,278 | |
4.13%, 03/16/2027 | | | | 2,000,000 | | | | | 1,972,879 | |
2.10%, 03/22/2028 | | | | | | | | | | |
(Call 01/22/2028) | | | | 3,000,000 | | | | | 2,717,554 | |
| | | | | | | | | | |
| | | | | | | | | 11,964,690 | |
| | | | | | | | | | |
| Electrical Equipment - 2.7% | | | | |
Emerson Electric Co., | | | | | | | | | | |
3.15%, 06/01/2025 | | | | | | | | | | |
(Call 03/01/2025) | | | | 6,500,000 | | | | | 6,360,964 | |
Rockwell Automation, Inc., | | | | | | | | | | |
2.88%, 03/01/2025 | | | | | | | | | | |
(Call 12/01/2024) | | | | 1,440,000 | | | | | 1,408,038 | |
| | | | | | | | | | |
| | | | | | | | | 7,769,002 | |
| | | | | | | | | | |
Electronic Equipment, Instruments &
Components - 1.9% | | |
Trimble, Inc., | | | | | | | | | | |
6.10%, 03/15/2033 | | | | | | | | | | |
(Call 12/15/2032) | | | | 5,000,000 | | | | | 5,350,591 | |
| | | | | | | | | | |
| Energy Equipment & Services - 1.0% | | | | |
Enterprise Products Operating LLC, | | | | | | | | | | |
3.75%, 02/15/2025 | | | | | | | | | | |
(Call 11/15/2024) | | | | 2,963,000 | | | | | 2,926,462 | |
| | | | | | | | | | |
| Food Products - 0.5% |
Kraft Heinz Food Co., | |
4.63%, 01/30/2029 | |
(Call 10/30/2028) | | | | 1,353,000 | | | | | 1,363,643 | |
| | | | | | | | | | |
| Ground Transportation - 2.9% |
Burlington Northern Santa Fe, LLC, | |
3.00%, 04/01/2025 | |
(Call 01/01/2025) | | | | 2,250,000 | | | | | 2,202,610 | |
Union Pacific Corp. | | | | | | | | | | |
3.25%, 01/15/2025 | | | | | | | | | | |
(Call 10/15/2024) | | | | 3,295,000 | | | | | 3,230,715 | |
3.75%, 07/15/2025 | | | | | | | | | | |
(Call 05/15/2025) | | | | 3,025,000 | | | | | 2,981,525 | |
| | | | | | | | | | |
| | | | | | | | | 8,414,850 | |
| | | | | | | | | | |
| Health Care Equipment & Supplies - 1.3% |
Abbott Laboratories, | |
2.95%, 03/15/2025 | |
(Call 12/15/2024) | | | | 3,925,000 | | | | | 3,847,569 | |
| | | | | | | | | | |
| Health Care Providers & Services - 2.1% |
CVS Health Corp., | |
3.75%, 04/01/2030 | |
(Call 01/01/2030) | | | | 2,000,000 | | | | | 1,883,038 | |
The accompanying notes are an integral part of these financial statements.
25
|
| LKCM FIXED INCOME FUND |
| SCHEDULEOF INVESTMENTS, CONTINUED |
| as of December 31, 2023 |
| | | | | | | | | | |
| CORPORATE BONDS | | Par | | Value |
| Health Care Providers & Services - 2.1%, Continued |
UnitedHealth Group, Inc., | | | | | | | | | | |
4.25%, 01/15/2029 | | | | | | | | | | |
(Call 12/15/2028) | | | $ | 4,000,000 | | | | $ | 3,999,276 | |
| | | | | | | | | | |
| | | | | | | | | 5,882,314 | |
| | | | | | | | | | |
| Hotels, Restaurants & Leisure - 0.8% |
McDonald’s Corp., | |
3.50%, 07/01/2027 | |
(Call 05/01/2027) | | | | 2,500,000 | | | | | 2,431,656 | |
| | | | | | | | | | |
| Household Products - 0.3% |
Procter & Gamble Co., | |
8.00%, 09/01/2024 | | | | 775,000 | | | | | 793,318 | |
| | | | | | | | | | |
| Industrial Conglomerates - 2.1% |
Honeywell International, Inc., | | | | | | | | | | |
2.30%, 08/15/2024 | | | | | | | | | | |
(Call 07/15/2024) | | | | 3,105,000 | | | | | 3,050,472 | |
1.35%, 06/01/2025 | |
(Call 05/01/2025) | | | | 3,000,000 | | | | | 2,867,173 | |
| | | | | | | | | | |
| | | | | | | | | 5,917,645 | |
| | | | | | | | | | |
| Interactive Media & Services - 1.4% |
Alphabet, Inc., | |
3.38%, 02/25/2024 | | | | 4,000,000 | | | | | 3,986,758 | |
| | | | | | | | | | |
| Life Sciences Tools & Services - 3.3% |
Danaher Corp., | |
3.35%, 09/15/2025 | |
(Call 06/15/2025) | | | | 5,500,000 | | | | | 5,379,874 | |
Thermo Fisher Scientific, Inc., | | | | | | | | | | |
5.09%, 08/10/2033 | | | | | | | | | | |
(Call 05/10/2033) | | | | 4,000,000 | | | | | 4,179,240 | |
| | | | | | | | | | |
| | | | | | | | | 9,559,114 | |
| | | | | | | | | | |
| Oil, Gas & Consumable Fuels - 7.0% |
Chevron Corp., | |
2.95%, 05/16/2026 | |
(Call 02/16/2026) | | | | 1,870,000 | | | | | 1,810,222 | |
ConocoPhillips Co., | | | | | | | | | | |
5.05%, 09/15/2033 | | | | | | | | | | |
(Call 06/15/2033) | | | | 2,000,000 | | | | | 2,060,094 | |
Devon Energy Corp., | | | | | | | | | | |
4.50%, 01/15/2030 | | | | | | | | | | |
(Call 01/15/2025) | | | | 4,000,000 | | | | | 3,848,868 | |
Kinder Morgan Energy Partners, L.P., | | | | | | | | | | |
4.25%, 09/01/2024 | | | | | | | | | | |
(Call 06/01/2024) | | | | 3,000,000 | | | | | 2,973,307 | |
Kinder Morgan, Inc., | | | | | | | | | | |
5.20%, 06/01/2033 | | | | | | | | | | |
(Call 03/01/2033) | | | | 7,300,000 | | | | | 7,273,628 | |
ONEOK, Inc., | | | | | | | | | | |
6.35%, 01/15/2031 | | | | | | | | | | |
(Call 10/15/2030) | | | | 2,000,000 | | | | | 2,139,066 | |
| | | | | | | | | | |
| | | | | | | | | 20,105,185 | |
| | | | | | | | | | |
| | | | | | | | | | |
| CORPORATE BONDS | | Par | | Value |
| Personal Care Products - 0.2% |
Estee Lauder Cos., Inc., | |
2.00%, 12/01/2024 | |
(Call 11/01/2024) | | | $ | 556,000 | | | | $ | 540,332 | |
| | | | | | | | | | |
| Pharmaceuticals - 1.7% |
Bristol-Myers Squibb Co., | |
3.63%, 05/15/2024 | |
(Call 02/15/2024) | | | | 4,750,000 | | | | | 4,718,739 | |
| | | | | | | | | | |
| Semiconductors & Semiconductor Equipment - 3.4% | | |
Intel Corp., | |
3.70%, 07/29/2025 | |
(Call 04/29/2025) | | | | 2,250,000 | | | | | 2,215,691 | |
NVIDIA Corp., | | | | | | | | | | |
1.55%, 06/15/2028 | | | | | | | | | | |
(Call 04/15/2028) | | | | 4,000,000 | | | | | 3,585,790 | |
QUALCOMM, Inc., | | | | | | | | | | |
2.90%, 05/20/2024 | | | | | | | | | | |
(Call 03/20/2024) | | | | 4,000,000 | | | | | 3,962,522 | |
| | | | | | | | | | |
| | | | | | | | | 9,764,003 | |
| | | | | | | | | | |
| Software - 4.2% |
Adobe Inc., | |
1.90%, 02/01/2025 | |
(Call 01/01/2025) | | | | 4,280,000 | | | | | 4,154,052 | |
Oracle Corp. | | | | | | | | | | |
2.65%, 07/15/2026 | | | | | | | | | | |
(Call 04/15/2026) | | | | 2,000,000 | | | | | 1,898,121 | |
2.30%, 03/25/2028 | | | | | | | | | | |
(Call 01/25/2028) | | | | 3,000,000 | | | | | 2,736,891 | |
6.15%, 11/09/2029 | | | | | | | | | | |
(Call 09/09/2029) | | | | 3,000,000 | | | | | 3,233,793 | |
| | | | | | | | | | |
| | | | | | | | | 12,022,857 | |
| | | | | | | | | | |
| Specialized REITs - 3.2% |
American Tower Corp. | |
5.00%, 02/15/2024 | | | | 2,500,000 | | | | | 2,497,025 | |
3.38%, 10/15/2026 | | | | | | | | | | |
(Call 07/15/2026) | | | | 4,030,000 | | | | | 3,865,505 | |
4.05%, 03/15/2032 | | | | | | | | | | |
(Call 12/15/2031) | | | | 3,000,000 | | | | | 2,816,212 | |
| | | | | | | | | | |
| | | | | | | | | 9,178,742 | |
| | | | | | | | | | |
| Specialty Retail - 4.1% |
Lowe’s Cos., Inc., | |
2.50%, 04/15/2026 | |
(Call 01/15/2026) | | | | 1,000,000 | | | | | 952,996 | |
O’Reilly Automotive, Inc. | | | | | | | | | | |
4.35%, 06/01/2028 | | | | | | | | | | |
(Call 03/01/2028) | | | | 675,000 | | | | | 670,622 | |
4.20%, 04/01/2030 | | | | | | | | | | |
(Call 01/01/2030) | | | | 2,325,000 | | | | | 2,245,095 | |
4.70%, 06/15/2032 | | | | | | | | | | |
(Call 03/15/2032) | | | | 2,750,000 | | | | | 2,726,865 | |
Tractor Supply Co., | | | | | | | | | | |
5.25%, 05/15/2033 | | | | | | | | | | |
(Call 02/15/2033) | | | | 5,000,000 | | | | | 5,128,964 | |
| | | | | | | | | | |
| | | | | | | | | 11,724,542 | |
| | | | | | | | | | |
The accompanying notes are an integral part of these financial statements.
26
|
| LKCM FIXED INCOME FUND |
| SCHEDULEOF INVESTMENTS, CONTINUED |
| as of December 31, 2023 |
| | | | | | | | | | |
| CORPORATE BONDS | |
Par | | Value |
| Technology Hardware, Storage & Peripherals - 0.9% |
Apple Inc., | |
2.50%, 02/09/2025 | | | $ | 2,515,000 | | | | $ | 2,454,904 | |
| | | | | | | | | | |
TOTAL CORPORATE BONDS
(Cost $181,828,580) | | | | | | | | | 178,427,855 | |
| | | | | | | | | | |
| | | | | | | | | | |
U.S. GOVERNMENT SPONSORED
ENTITIES - 23.2% | | | | |
Federal Home Loan Banks | | | | | | | | | | |
1.50%, 12/17/2024 | | | | | | | | | | |
(Call 03/17/2024) (a) | | | | 2,500,000 | | | | | 2,426,090 | |
3.05%, 12/30/2024 | | | | 2,500,000 | | | | | 2,462,774 | |
3.00%, 01/27/2025 | | | | | | | | | | |
(Call 01/27/2024) | | | | 2,200,000 | | | | | 2,169,456 | |
3.00%, 04/14/2025 | | | | | | | | | | |
(Call 04/14/2024) (a) | | | | 5,000,000 | | | | | 4,962,402 | |
3.25%, 06/09/2025 | | | | | | | | | | |
(Call 03/09/2024) | | | | 1,000,000 | | | | | 984,143 | |
1.13%, 10/28/2025 | | | | | | | | | | |
(Call 01/28/2024) (a) | | | | 3,000,000 | | | | | 2,851,332 | |
3.50%, 11/12/2025 | | | | | | | | | | |
(Call 02/12/2024) (a) | | | | 1,505,000 | | | | | 1,497,676 | |
0.75%, 01/27/2026 (a) | | | | 3,000,000 | | | | | 2,801,765 | |
1.50%, 02/17/2026 | | | | | | | | | | |
(Call 02/17/2024) (a) | | | | 2,500,000 | | | | | 2,409,175 | |
2.38%, 03/13/2026 | | | | 3,575,000 | | | | | 3,433,316 | |
0.88%, 03/30/2026 | | | | | | | | | | |
(Call 03/30/2024) (a) | | | | 3,000,000 | | | | | 2,819,938 | |
0.75%, 05/26/2026 | | | | | | | | | | |
(Call 02/26/2024) (a) | | | | 2,500,000 | | | | | 2,355,719 | |
1.13%, 10/28/2026 | | | | | | | | | | |
(Call 01/28/2024) (a) | | | | 3,000,000 | | | | | 2,810,015 | |
1.25%, 11/10/2026 | | | | | | | | | | |
(Call 11/10/2024) | | | | 3,000,000 | | | | | 2,753,045 | |
1.63%, 01/25/2027 | | | | | | | | | | |
(Call 01/25/2024) (a) | | | | 2,500,000 | | | | | 2,380,205 | |
3.00%, 03/10/2027 | | | | | | | | | | |
(Call 03/10/2024) (a) | | | | 3,150,000 | | | | | 3,076,946 | |
3.50%, 05/24/2027 | | | | | | | | | | |
(Call 02/24/2024) (a) | | | | 2,650,000 | | | | | 2,607,852 | |
4.50%, 09/29/2027 | | | | 1,750,000 | | | | | 1,781,562 | |
1.00%, 01/27/2028 (a) | | | | 4,000,000 | | | | | 3,565,789 | |
1.50%, 11/16/2028 | | | | | | | | | | |
(Call 02/16/2024) (a) | | | | 3,000,000 | | | | | 2,747,384 | |
2.82%, 06/27/2029 | | | | | | | | | | |
(Call 01/09/2024) | | | | 4,000,000 | | | | | 3,728,188 | |
1.25%, 09/30/2031 | | | | | | | | | | |
(Call 03/30/2024) (a) | | | | 3,000,000 | | | | | 2,593,322 | |
1.75%, 12/15/2033 | | | | | | | | | | |
(Call 03/15/2024) (a) | | | | 2,500,000 | | | | | 2,162,364 | |
| | | | | | | | | | |
U.S. GOVERNMENT SPONSORED
ENTITIES | |
Par | | Value |
Freddie Mac | | | | | | | | | | |
0.75%, 05/28/2025 | | | | | | | | | | |
(Call 05/28/2024) | | | $ | 3,500,000 | | | | $ | 3,329,328 | |
5.00%, 06/30/2027 | | | | | | | | | | |
(Call 03/30/2024) (a) | | | | 1,895,000 | | | | | 1,880,400 | |
| | | | | | | | | | |
TOTAL U.S. GOVERNMENT SPONSORED ENTITIES
(Cost $70,318,218) | | | | | | | | | 66,590,186 | |
| | | | | | | | | | |
| | | | | | | | | | |
| U.S. GOVERNMENT ISSUES - 12.1% | | | | |
U.S. Treasury Inflation Indexed Bonds, | | | | | | | | | | |
0.63%, 01/15/2024 | | | | 4,615,135 | | | | | 4,602,892 | |
U.S. Treasury Notes | | | | | | | | | | |
2.00%, 02/15/2025 | | | | 2,000,000 | | | | | 1,941,641 | |
2.88%, 06/15/2025 | | | | 1,000,000 | | | | | 977,598 | |
2.00%, 08/15/2025 | | | | 1,000,000 | | | | | 962,617 | |
5.00%, 08/31/2025 | | | | 4,000,000 | | | | | 4,037,891 | |
1.63%, 02/15/2026 | | | | 2,000,000 | | | | | 1,896,094 | |
4.63%, 11/15/2026 | | | | 500,000 | | | | | 508,184 | |
4.13%, 09/30/2027 | | | | 400,000 | | | | | 402,859 | |
4.00%, 10/31/2029 | | | | 2,000,000 | | | | | 2,012,070 | |
5.38%, 02/15/2031 | | | | 2,500,000 | | | | | 2,745,410 | |
2.88%, 05/15/2032 | | | | 6,500,000 | | | | | 6,035,352 | |
4.13%, 11/15/2032 | | | | 8,500,000 | | | | | 8,657,714 | |
| | | | | | | | | | |
TOTAL U.S. GOVERNMENT ISSUES
(Cost $34,919,135) | | | | | | | | | 34,780,322 | |
| | | | | | | | | | |
| | | | | | | | | | |
| SHORT-TERM INVESTMENT - 2.0% | | Shares | | |
| Money Market Fund - 2.0% | | | | |
Invesco Short-Term Investments Trust - Government & Agency Portfolio - Class Institutional, 5.27% (b) | | | | 5,654,480 | | | | | 5,654,480 | |
| | | | | | | | | | |
TOTAL SHORT-TERM INVESTMENT
(Cost $5,654,480) | | | | | 5,654,480 | |
| | | | | | | | | | |
TOTAL INVESTMENTS - 99.6%
(Cost $292,720,413) | | | | | | | | | 285,452,843 | |
Other Assets in Excess of Liabilities - 0.4% | | | | | 1,039,332 | |
| | | | | | | | | | |
TOTAL NET ASSETS - 100.0% | | | | | | | | $ | 286,492,175 | |
| | | | | | | | | | |
| (a) | Step coupon bond. The rate disclosed is as of December 31, 2023. |
| (b) | The rate shown represents the 7-day effective yield as of December 31, 2023. |
Percentages are stated as a percent of net assets.
The Global Industry Classification Standard (GICS®) was developed by and/or is the exclusive property of MSCI, Inc. and Standard & Poor’s Financial Services LLC (“S&P”). GICS is a service mark of MSCI, Inc. and S&P and has been licensed for use by U.S. Bank Global Fund Services.
The accompanying notes are an integral part of these financial statements.
27
|
| LKCM INTERNATIONAL EQUITY FUND |
| SCHEDULEOF INVESTMENTS |
| as of December 31, 2023 |
| | | | | | | | | | |
| COMMON STOCKS - 93.5% | | Shares | | Value |
| AUSTRALIA - 3.3% | | | | |
| Biotechnology - 2.3% | | | | |
CSL Ltd. | | | | 7,143 | | | | $ | 1,392,521 | |
| | | | | | | | | | |
| Metals & Mining - 1.0% | | | | |
BHP Billiton Ltd. | | | | 18,232 | | | | | 622,889 | |
| | | | | | | | | | |
Total Australia | | | | | | | | | 2,015,410 | |
| | | | | | | | | | |
| CANADA - 1.8% | | |
| Oil, Gas & Consumable Fuels - 1.8% | | | | |
Cenovus Energy Inc. | | | | 66,045 | | | | | 1,100,542 | |
| | | | | | | | | | |
| FINLAND - 2.2% | | |
| Banks - 2.2% | | | | |
Nordea Bank Abp | | | | 105,105 | | | | | 1,304,815 | |
| | | | | | | | | | |
| FRANCE - 15.2% | | |
| Aerospace & Defense - 2.6% | | | | |
Safran SA | | | | 8,708 | | | | | 1,535,308 | |
| | | | | | | | | | |
| Chemicals - 2.9% | | | | |
Air Liquide SA | | | | 8,977 | | | | | 1,747,777 | |
| | | | | | | | | | |
| Electrical Equipment - 2.7% | | | | |
Schneider Electric SA | | | | 7,980 | | | | | 1,606,420 | |
| | | | | | | | | | |
| IT Services - 2.3% | | | | |
Capgemini | | | | 6,766 | | | | | 1,414,034 | |
| | | | | | | | | | |
| Personal Care Products - 2.4% | | | | |
L’Oreal SA | | | | 2,913 | | | | | 1,452,129 | |
| | | | | | | | | | |
| Textiles, Apparel & Luxury Goods - 2.3% | | | | |
LVMH Moet Hennessy Louis Vuitton SE | | | | 1,737 | | | | | 1,411,374 | |
| | | | | | | | | | |
Total France | | | | | | | | | 9,167,042 | |
| | | | | | | | | | |
| GERMANY - 11.0% | | |
| Diversified Telecommunication Services - 2.3% |
Deutsche Telekom AG | | | | 57,220 | | | | | 1,375,755 | |
| | | | | | | | | | |
| Insurance - 2.2% | | | | |
Allianz SE | | | | 4,862 | | | | | 1,299,325 | |
| | | | | | | | | | |
| Semiconductors & Semiconductor Equipment - 2.5% |
Infineon Technologies AG | | | | 36,500 | | | | | 1,524,332 | |
| | | | | | | | | | |
| Software - 2.9% | | | | |
SAP SE | | | | 11,333 | | | | | 1,744,390 | |
| | | | | | | | | | |
| Textiles, Apparel & Luxury Goods - 1.1% | | | | |
Adidas AG | | | | 3,384 | | | | | 687,650 | |
| | | | | | | | | | |
Total Germany | | | | | | | | | 6,631,452 | |
| | | | | | | | | | |
| IRELAND - 3.2% | | |
| Construction Materials - 3.2% | | | | |
CRH PLC (a) | | | | 28,149 | | | | | 1,946,785 | |
| | | | | | | | | | |
| ITALY - 1.0% | | |
| Textiles, Apparel & Luxury Goods - 1.0% | | | | |
Moncler SpA | | | | 9,372 | | | | | 577,027 | |
| | | | | | | | | | |
| JAPAN - 3.6% | | |
| Building Products - 1.7% | | | | |
Daikin Industries Ltd. | | | | 6,126 | | | | | 993,760 | |
| | | | | | | | | | |
| | | | | | | | | | |
| COMMON STOCKS | | Shares | | Value |
| Electrical Equipment - 1.9% | | | | |
Nidec Corp. | | | | 27,922 | | | | $ | 1,125,456 | |
| | | | | | | | | | |
Total Japan | | | | | | | | | 2,119,216 | |
| | | | | | | | | | |
| NETHERLANDS - 9.9% | | |
| Banks - 2.2% | | | | |
ING Groep NV | | | | 88,756 | | | | | 1,330,854 | |
| | | | | | | | | | |
| Capital Markets - 2.5% | | | | |
Euronext NV (b) | | | | 17,168 | | | | | 1,492,009 | |
| | | | | | | | | | |
| Professional Services - 2.5% | | | | |
Wolters Kluwer NV | | | | 10,694 | | | | | 1,521,427 | |
| | | | | | | | | | |
| Semiconductors & Semiconductor Equipment - 2.7% |
ASML Holding NV | | | | 2,171 | | | | | 1,638,857 | |
| | | | | | | | | | |
Total Netherlands | | | | | | | | | 5,983,147 | |
| | | | | | | | | | |
| NORWAY - 4.1% | | |
| Diversified Telecommunication Services - 2.0% |
Telenor ASA | | | | 103,807 | | | | | 1,191,362 | |
| | | | | | | | | | |
| Oil, Gas & Consumable Fuels - 2.1% | | | | |
Aker BP ASA | | | | 43,551 | | | | | 1,265,052 | |
| | | | | | | | | | |
Total Norway | | | | | | | | | 2,456,414 | |
| | | | | | | | | | |
| SPAIN - 2.2% | | |
| Machinery - 2.2% | | | | |
Fluidra SA | | | | 63,820 | | | | | 1,330,511 | |
| | | | | | | | | | |
| SWEDEN - 2.3% | | |
| Hotels, Restaurants & Leisure - 2.3% | | | | |
Evolution AB (b) | | | | 11,846 | | | | | 1,410,982 | |
| | | | | | | | | | |
| SWITZERLAND - 13.0% | | |
| Capital Markets - 1.8% | | | | |
Julius Baer Group Ltd. | | | | 19,807 | | | | | 1,111,135 | |
| | | | | | | | | | |
| Electrical Equipment - 2.5% | | | | |
ABB Ltd. | | | | 33,939 | | | | | 1,506,829 | |
| | | | | | | | | | |
| Food Products - 2.2% | | | | |
Nestle SA | | | | 11,493 | | | | | 1,332,267 | |
| | | | | | | | | | |
| Health Care Equipment & Supplies - 2.5% | | | | |
Alcon, Inc. | | | | 18,908 | | | | | 1,479,287 | |
| | | | | | | | | | |
| Life Sciences Tools & Services - 1.9% | | | | |
Lonza Group AG | | | | 2,756 | | | | | 1,161,892 | |
| | | | | | | | | | |
| Pharmaceuticals - 2.1% | | | | |
Roche Holding AG | | | | 4,288 | | | | | 1,246,494 | |
| | | | | | | | | | |
Total Switzerland | | | | | | | | | 7,837,904 | |
| | | | | | | | | | |
| UNITED KINGDOM - 20.7% | | |
| Aerospace & Defense - 2.1% | | | | |
BAE Systems PLC | | | | 90,023 | | | | | 1,274,202 | |
| | | | | | | | | | |
| Banks - 2.0% | | | | |
Barclays PLC | | | | 600,196 | | | | | 1,175,223 | |
| | | | | | | | | | |
| Beverages - 1.9% | | | | |
Diageo PLC | | | | 31,382 | | | | | 1,139,014 | |
| | | | | | | | | | |
The accompanying notes are an integral part of these financial statements.
28
|
| LKCM INTERNATIONAL EQUITY FUND |
| SCHEDULEOF INVESTMENTS, CONTINUED |
| as of December 31, 2023 |
| | | | | | | | | | |
| COMMON STOCKS | | Shares | | Value |
| Commercial Services & Supplies - 1.6% | | | | |
Rentokil Initial PLC | | | | 166,291 | | | | $ | 937,259 | |
| | | | | | | | | | |
| Hotels, Restaurants & Leisure - 5.2% | | | | |
Compass Group PLC | | | | 52,819 | | | | | 1,445,302 | |
InterContinental Hotels Group PLC | | | | 18,745 | | | | | 1,690,345 | |
| | | | | | | | | | |
| | | | | | | | | 3,135,647 | |
| | | | | | | | | | |
| Oil, Gas & Consumable Fuels - 3.0% | | | | |
Shell PLC | | | | 55,081 | | | | | 1,803,025 | |
| | | | | | | | | | |
| Personal Care Products - 2.2% | | | | |
Unilever PLC | | | | 27,510 | | | | | 1,331,786 | |
| | | | | | | | | | |
| Textiles, Apparel & Luxury Goods - 0.6% |
Burberry Group PLC | | | | 20,000 | | | | | 360,738 | |
| | | | | | | | | | |
| Trading Companies & Distributors - 2.1% |
Ashtead Group PLC | | | | 18,538 | | | | | 1,288,523 | |
| | | | | | | | | | |
Total United Kingdom | | | | | | | | | 12,445,417 | |
| | | | | | | | | | |
TOTAL COMMON STOCKS
(Cost $48,838,233) | | | | | | | | | 56,326,664 | |
| | | | | | | | | | |
| | | | | | | | | | |
| PREFERRED STOCKS - 2.1% | | | | |
| GERMANY - 2.1% | | |
| Life Sciences Tools & Services - 2.1% | | | | |
Sartorius AG | | | | 3,448 | | | | | 1,266,175 | |
| | | | | | | | | | |
TOTAL PREFERRED STOCKS
(Cost $1,139,269) | | | | | | | | | 1,266,175 | |
| | | | | | | | | | |
| | | | | | | | | | |
| SHORT-TERM INVESTMENTS - 4.2% | | | | |
| Money Market Funds - 4.2% | | | | |
Invesco Short-Term Investments Trust - Government & Agency Portfolio - Institutional Shares - 5.27% (c) | | | | 1,809,086 | | | | | 1,809,086 | |
MSILF Government Portfolio - 5.27% (c) | | | | 698,556 | | | | | 698,556 | |
| | | | | | | | | | |
| | | | | | | | | 2,507,642 | |
| | | | | | | | | | |
TOTAL SHORT-TERM INVESTMENTS
(Cost $2,507,642) | | 2,507,642 |
| | | | | | | | | | |
TOTAL INVESTMENTS - 99.8%
(Cost $52,485,144) | | | | 60,100,481 |
Other Assets in Excess of Liabilities - 0.2% | | | | | 145,008 | |
| | | | | | | | | | |
TOTAL NET ASSETS - 100.0% | | | | | | | | $ | 60,245,489 | |
| | | | | | | | | | |
| (a) | Non-income producing security. |
| (b) | Security is exempt from registration pursuant to Rule 144A under the Securities Act of 1933, as amended. These securities may only be resold in transactions exempt from registration to qualified institutional investors. As of December 31, 2023, the value of these securities total $2,902,991 or 4.8% of the Fund’s net assets. |
| (c) | The rate shown represents the 7-day effective yield as of December 31, 2023. |
Percentages are stated as a percent of net assets.
The Global Industry Classification Standard (GICS®) was developed by and/or is the exclusive property of MSCI, Inc. and Standard & Poor’s Financial Services LLC (“S&P”). GICS is a service mark of MSCI, Inc. and S&P and has been licensed for use by U.S. Bank Global Fund Services.
The accompanying notes are an integral part of these financial statements.
29
|
| STATEMENTOF ASSETSAND LIABILITIES |
| December 31, 2023 |
| | | | | | | | | | | | | | | | | | | | | | | | | | | | | | | | | | | | | | | | | | | | | | | | | | | | | | | | | | | | |
| | | | | | | | | | | | |
| | | | | LKCM
Small Cap
Equity Fund | | | | LKCM
Small-Mid Cap
Equity Fund | | | | LKCM
Equity Fund | | | | LKCM
Balanced
Fund | | | | LKCM Fixed
Income Fund | | | | LKCM
International
Equity Fund |
| | | | | | | | | | | | | | | | | | | | | | | | | | | | | | | | | | | | | | | | | | | | | | | | | | | | | | | | | | | | |
Assets | | | | | | | | | | | | | | | | | | | | | | | | | | | | | | | | | | | | | | | | | | | | | | | | | | | | | | | | | | | | |
Investments, at value* | | | | | | | | $ | 232,283,436 | | | | | | | | | $ | 28,524,197 | | | | | | | | | $ | 495,450,263 | | | | | | | | | $ | 114,575,228 | | | | | | | | | $ | 285,452,843 | | | | | | | | | $ | 60,100,481 | |
Dividends and interest receivable | | | | | | | | | 127,998 | | | | | | | | | | 19,664 | | | | | | | | | | 443,041 | | | | | | | | | | 339,846 | | | | | | | | | | 2,552,668 | | | | | | | | | | 269,967 | |
Receivable for Fund shares sold | | | | | | | | | 24,970 | | | | | | | | | | 123,955 | | | | | | | | | | 679,290 | | | | | | | | | | 114 | | | | | | | | | | 1,927,760 | | | | | | | | | | — | |
Prepaid expenses and other assets | | | | | | | | | 26,071 | | | | | | | | | | 12,439 | | | | | | | | | | 27,018 | | | | | | | | | | 7,083 | | | | | | | | | | 18,380 | | | | | | | | | | 5,964 | |
| | | | | | | | | | | | | | | | | | | | | | | | | | | | | | | | | | | | | | | | | | | | | | | | | | | | | | | | | | | | |
Total assets | | | | | | | | | 232,462,475 | | | | | | | | | | 28,680,255 | | | | | | | | | | 496,599,612 | | | | | | | | | | 114,922,271 | | | | | | | | | | 289,951,651 | | | | | | | | | | 60,376,412 | |
| | | | | | | | | | | | | | | | | | | | | | | | | | | | | | | | | | | | | | | | | | | | | | | | | | | | | | | | | | | | |
Liabilities | | | | | | | | | | | | | | | | | | | | | | | | | | | | | | | | | | | | | | | | | | | | | | | | | | | | | | | | | | | | |
Due to custodian | | | | | | | | | — | | | | | | | | | | — | | | | | | | | | | — | | | | | | | | | | 312,859 | | | | | | | | | | 2,867,873 | | | | | | | | | | — | |
Payable for investment advisory fees | | | | | | | | | 360,953 | | | | | | | | | | 3,369 | | | | | | | | | | 614,560 | | | | | | | | | | 102,548 | | | | | | | | | | 126,177 | | | | | | | | | | 71,309 | |
Payable for administrative fees | | | | | | | | | 53,905 | | | | | | | | | | 15,826 | | | | | | | | | | 111,225 | | | | | | | | | | 29,947 | | | | | | | | | | 70,069 | | | | | | | | | | 17,755 | |
Payable for accounting and transfer agent fees and expenses | | | | | | | | | 34,371 | | | | | | | | | | 17,034 | | | | | | | | | | 60,334 | | | | | | | | | | 25,125 | | | | | | | | | | 43,008 | | | | | | | | | | 20,824 | |
Payable for trustees’ fees and officer compensation (Note B) | | | | | | | | | 1,962 | | | | | | | | | | 174 | | | | | | | | | | 5,093 | | | | | | | | | | 1,195 | | | | | | | | | | 2,970 | | | | | | | | | | 547 | |
Payable for professional fees | | | | | | | | | 32,863 | | | | | | | | | | 8,207 | | | | | | | | | | 72,513 | | | | | | | | | | 21,920 | | | | | | | | | | 44,406 | | | | | | | | | | 12,815 | |
Payable for custody fees and expenses | | | | | | | | | 6,503 | | | | | | | | | | 1,547 | | | | | | | | | | 14,684 | | | | | | | | | | 3,631 | | | | | | | | | | 8,246 | | | | | | | | | | 7,025 | |
Payable for reports to shareholders | | | | | | | | | 3,085 | | | | | | | | | | 334 | | | | | | | | | | 6,232 | | | | | | | | | | 2,001 | | | | | | | | | | 3,399 | | | | | | | | | | 625 | |
Payable for Fund shares redeemed | | | | | | | | | 418,623 | | | | | | | | | | 139,983 | | | | | | | | | | 1,038,034 | | | | | | | | | | 755,854 | | | | | | | | | | 293,167 | | | | | | | | | | — | |
Accrued expenses and other liabilities | | | | | | | | | 113 | | | | | | | | | | 10 | | | | | | | | | | 256 | | | | | | | | | | 66 | | | | | | | | | | 161 | | | | | | | | | | 23 | |
| | | | | | | | | | | | | | | | | | | | | | | | | | | | | | | | | | | | | | | | | | | | | | | | | | | | | | | | | | | | |
Total liabilities | | | | | | | | | 912,378 | | | | | | | | | | 186,484 | | | | | | | | | | 1,922,931 | | | | | | | | | | 1,255,146 | | | | | | | | | | 3,459,476 | | | | | | | | | | 130,923 | |
| | | | | | | | | | | | | | | | | | | | | | | | | | | | | | | | | | | | | | | | | | | | | | | | | | | | | | | | | | | | |
Net assets | | | | | | | | $ | 231,550,097 | | | | | | | | | $ | 28,493,771 | | | | | | | | | $ | 494,676,681 | | | | | | | | | $ | 113,667,125 | | | | | | | | | $ | 286,492,175 | | | | | | | | | $ | 60,245,489 | |
| | | | | | | | | | | | | | | | | | | | | | | | | | | | | | | | | | | | | | | | | | | | | | | | | | | | | | | | | | | | |
Net assets consist of: | | | | | | | | | | | | | | | | | | | | | | | | | | | | | | | | | | | | | | | | | | | | | | | | | | | | | | | | | | | | |
Paid-in capital | | | | | | | | $ | 160,780,487 | | | | | | | | | $ | 23,112,580 | | | | | | | | | $ | 247,525,929 | | | | | | | | | $ | 80,702,568 | | | | | | | | | $ | 295,803,417 | | | | | | | | | $ | 55,799,913 | |
Total distributable earnings | | | | | | | | | 70,769,610 | | | | | | | | | | 5,381,191 | | | | | | | | | | 247,150,752 | | | | | | | | | | 32,964,557 | | | | | | | | | | (9,311,242 | ) | | | | | | | | | 4,445,576 | |
| | | | | | | | | | | | | | | | | | | | | | | | | | | | | | | | | | | | | | | | | | | | | | | | | | | | | | | | | | | | |
Net assets | | | | | | | | $ | 231,550,097 | | | | | | | | | $ | 28,493,771 | | | | | | | | | $ | 494,676,681 | | | | | | | | | $ | 113,667,125 | | | | | | | | | $ | 286,492,175 | | | | | | | | | $ | 60,245,489 | |
| | | | | | | | | | | | | | | | | | | | | | | | | | | | | | | | | | | | | | | | | | | | | | | | | | | | | | | | | | | | |
Shares of beneficial interest outstanding (unlimited shares of no par value authorized) | | | | | | | | | 11,856,139 | | | | | | | | | | 2,876,562 | | | | | | | | | | 14,377,853 | | | | | | | | | | 4,372,486 | | | | | | | | | | 27,662,742 | | | | | | | | | | 4,752,938 | |
Net asset value per share (offering and redemption price) | | | | | | | | $ | 19.53 | | | | | | | | | $ | 9.91 | | | | | | | | | $ | 34.41 | | | | | | | | | $ | 26.00 | | | | | | | | | $ | 10.36 | | | | | | | | | $ | 12.68 | |
| | | | | | | | | | | | | | | | | | | | | | | | | | | | | | | | | | | | | | | | | | | | | | | | | | | | | | | | | | | | |
| | | | | | | | | | | | |
* Cost of Investments | | | | | | | | $ | 161,423,439 | | | | | | | | | $ | 22,958,596 | | | | | | | | | $ | 247,424,162 | | | | | | | | | $ | 81,633,280 | | | | | | | | | $ | 292,720,413 | | | | | | | | | $ | 52,485,144 | |
| | | | | | | | | | | | | | | | | | | | | | | | | | | | | | | | | | | | | | | | | | | | | | | | | | | | | | | | | | | | |
The accompanying notes are an integral part of these financial statements.
30
|
| STATEMENTOF OPERATIONS |
| Year Ended December 31, 2023 |
| | | | | | | | | | | | | | | | | | | | | | | | | | | | | | | | | | | | | | | | | | | | | | | | | | | | | | | | | | | | |
| | | | | | | | | | | | |
| | | | | LKCM
Small Cap
Equity Fund | | | | LKCM
Small-Mid Cap
Equity Fund | | | | LKCM
Equity
Fund | | | | LKCM
Balanced
Fund | | | | LKCM
Fixed
Income Fund | | | | LKCM
International
Equity Fund |
| | | | | | | | | | | | | | | | | | | | | | | | | | | | | | | | | | | | | | | | | | | | | | | | | | | | | | | | | | | | |
Investment Income: | | | | | | | | | | | | | | | | | | | | | | | | | | | | | | | | | | | | | | | | | | | | | | | | | | | | | | | | | | | | |
Dividends* | | | | | | | | $ | 1,220,681 | | | | | | | | | $ | 143,760 | | | | | | | | | $ | 7,021,012 | | | | | | | | | $ | 1,259,749 | | | | | | | | | $ | — | | | | | | | | | $ | 1,251,843 | |
Interest | | | | | | | | | 598,326 | | | | | | | | | | 43,079 | | | | | | | | | | 1,116,458 | | | | | | | | | | 843,996 | | | | | | | | | | 7,881,133 | | | | | | | | | | 202,098 | |
| | | | | | | | | | | | | | | | | | | | | | | | | | | | | | | | | | | | | | | | | | | | | | | | | | | | | | | | | | | | |
Total investment income | | | | | | | | | 1,819,007 | | | | | | | | | | 186,839 | | | | | | | | | | 8,137,470 | | | | | | | | | | 2,103,745 | | | | | | | | | | 7,881,133 | | | | | | | | | | 1,453,941 | |
| | | | | | | | | | | | | | | | | | | | | | | | | | | | | | | | | | | | | | | | | | | | | | | | | | | | | | | | | | | | |
| | | | | | | | | | | | |
Expenses: | | | | | | | | | | | | | | | | | | | | | | | | | | | | | | | | | | | | | | | | | | | | | | | | | | | | | | | | | | | | |
Investment advisory fees (Note B) | | | | | | | | | 1,488,393 | | | | | | | | | | 144,536 | | | | | | | | | | 3,301,184 | | | | | | | | | | 713,831 | | | | | | | | | | 1,392,057 | | | | | | | | | | 507,186 | |
Administrative fees | | | | | | | | | 202,777 | | | | | | | | | | 62,321 | | | | | | | | | | 443,684 | | | | | | | | | | 119,441 | | | | | | | | | | 278,270 | | | | | | | | | | 68,833 | |
Accounting and transfer agent fees and expenses | | | | | | | | | 144,747 | | | | | | | | | | 68,225 | | | | | | | | | | 295,821 | | | | | | | | | | 116,217 | | | | | | | | | | 195,476 | | | | | | | | | | 93,930 | |
Professional fees | | | | | | | | | 97,488 | | | | | | | | | | 14,117 | | | | | | | | | | 234,506 | | | | | | | | | | 59,524 | | | | | | | | | | 139,833 | | | | | | | | | | 31,409 | |
Trustees’ fees and officer compensation (Note B) | | | | | | | | | 99,358 | | | | | | | | | | 10,116 | | | | | | | | | | 260,433 | | | | | | | | | | 60,450 | | | | | | | | | | 150,663 | | | | | | | | | | 33,094 | |
Federal and state registration | | | | | | | | | 44,864 | | | | | | | | | | 25,718 | | | | | | | | | | 71,600 | | | | | | | | | | 32,437 | | | | | | | | | | 42,492 | | | | | | | | | | 20,435 | |
Custody fees and expenses | | | | | | | | | 25,073 | | | | | | | | | | 6,755 | | | | | | | | | | 57,379 | | | | | | | | | | 14,129 | | | | | | | | | | 32,524 | | | | | | | | | | 34,727 | |
Reports to shareholders | | | | | | | | | 15,651 | | | | | | | | | | 3,121 | | | | | | | | | | 32,076 | | | | | | | | | | 27,085 | | | | | | | | | | 19,083 | | | | | | | | | | 5,517 | |
Other | | | | | | | | | 6,948 | | | | | | | | | | 695 | | | | | | | | | | 17,330 | | | | | | | | | | 4,455 | | | | | | | | | | 10,598 | | | | | | | | | | 1,707 | |
| | | | | | | | | | | | | | | | | | | | | | | | | | | | | | | | | | | | | | | | | | | | | | | | | | | | | | | | | | | | |
Total expenses | | | | | | | | | 2,125,299 | | | | | | | | | | 335,604 | | | | | | | | | | 4,714,013 | | | | | | | | | | 1,147,569 | | | | | | | | | | 2,260,996 | | | | | | | | | | 796,838 | |
Less, expense waiver and/or reimbursement (Note B) | | | | | | | | | (140,774 | ) | | | | | | | | | (142,893 | ) | | | | | | | | | (941,230 | ) | | | | | | | | | (269,008 | ) | | | | | | | | | (868,939 | ) | | | | | | | | | (233,343 | ) |
| | | | | | | | | | | | | | | | | | | | | | | | | | | | | | | | | | | | | | | | | | | | | | | | | | | | | | | | | | | | |
Net expenses | | | | | | | | | 1,984,525 | | | | | | | | | | 192,711 | | | | | | | | | | 3,772,783 | | | | | | | | | | 878,561 | | | | | | | | | | 1,392,057 | | | | | | | | | | 563,495 | |
| | | | | | | | | | | | | | | | | | | | | | | | | | | | | | | | | | | | | | | | | | | | | | | | | | | | | | | | | | | | |
Net investment income (loss) | | | | | | | | | (165,518 | ) | | | | | | | | | (5,872 | ) | | | | | | | | | 4,364,687 | | | | | | | | | | 1,225,184 | | | | | | | | | | 6,489,076 | | | | | | | | | | 890,446 | |
| | | | | | | | | | | | | | | | | | | | | | | | | | | | | | | | | | | | | | | | | | | | | | | | | | | | | | | | | | | | |
| | | | | | | | | | | | |
Realized and Unrealized Gain (Loss): | | | | | | | | | | | | | | | | | | | | | | | | | | | | | | | | | | | | | | | | | | | | | | | | | | | | | | | | | | | | |
Net realized gain (loss) on: | | | | | | | | | | | | | | | | | | | | | | | | | | | | | | | | | | | | | | | | | | | | | | | | | | | | | | | | | | | | |
Investments | | | | | | | | $ | 5,580,864 | | | | | | | | | $ | (184,400 | ) | | | | | | | | $ | 1,256,854 | | | | | | | | | $ | 2,484,526 | | | | | | | | | $ | (1,597,482 | ) | | | | | | | | $ | (1,218,968 | ) |
Foreign currency translation | | | | | | | | | (82 | ) | | | | | | | | | (33 | ) | | | | | | | | | — | | | | | | | | | | 10 | | | | | | | | | | — | | | | | | | | | | (38,843 | ) |
Net change in unrealized appreciation (depreciation) on: | | | | | | | | | | | | | | | | | | | | | | | | | | | | | | | | | | | | | | | | | | | | | | | | | | | | | | | | | | | | |
Investments | | | | | | | | | 35,113,618 | | | | | | | | | | 5,055,133 | | | | | | | | | | 50,924,134 | | | | | | | | | | 7,619,381 | | | | | | | | | | 8,670,167 | | | | | | | | | | 8,073,571 | |
Foreign currency translation | | | | | | | | | — | | | | | | | | | | 21 | | | | | | | | | | 387 | | | | | | | | | | 96 | | | | | | | | | | — | | | | | | | | | | 11,696 | |
| | | | | | | | | | | | | | | | | | | | | | | | | | | | | | | | | | | | | | | | | | | | | | | | | | | | | | | | | | | | |
| | | | | | | | | | | | |
Net Realized and Unrealized Gain (Loss) | | | | | | | | | 40,694,400 | | | | | | | | | | 4,870,721 | | | | | | | | | | 52,181,375 | | | | | | | | | | 10,104,013 | | | | | | | | | | 7,072,685 | | | | | | | | | | 6,827,456 | |
| | | | | | | | | | | | | | | | | | | | | | | | | | | | | | | | | | | | | | | | | | | | | | | | | | | | | | | | | | | | |
| | | | | | | | | | | | |
Net Increase (Decrease) in Net Assets Resulting from Operations | | | | | | | | $ | 40,528,882 | | | | | | | | | $ | 4,864,849 | | | | | | | | | $ | 56,546,062 | | | | | | | | | $ | 11,329,197 | | | | | | | | | $ | 13,561,761 | | | | | | | | | $ | 7,717,902 | |
| | | | | | | | | | | | | | | | | | | | | | | | | | | | | | | | | | | | | | | | | | | | | | | | | | | | | | | | | | | | |
| | | | | | | | | | | | |
* Net of foreign taxes withheld and/or issuance fees | | | | | | | | $ | 11,352 | | | | | | | | | $ | 1,060 | | | | | | | | | $ | 17,190 | | | | | | | | | $ | 2,483 | | | | | | | | | $ | — | | | | | | | | | $ | 195,236 | |
| | | | | | | | | | | | | | | | | | | | | | | | | | | | | | | | | | | | | | | | | | | | | | | | | | | | | | | | | | | | |
The accompanying notes are an integral part of these financial statements.
31
|
| STATEMENTSOF CHANGESIN NET ASSETS |
| | | | | | | | | | | | | | | | | | | | | | | | | | | | | | | | | | | | | | | | |
| | | | |
| | | | | LKCM
Small Cap
Equity Fund | | | | LKCM
Small-Mid Cap
Equity Fund |
| | | | | | | | | | | | | | | | | | | | | | | | | | | | | | | | | | | | | | | | |
| | | | | | | | |
| | | | | Year Ended
December 31,
2023 | | | | Year Ended
December 31,
2022 | | | | Year Ended
December 31,
2023 | | | | Year Ended
December 31,
2022 |
Operations: | | | | | | | | | | | | | | | | | | | | | | | | | | | | | | | | | | | | | | | | |
Net investment loss | | | | | | | | $ | (165,518 | ) | | | | | | | | $ | (428,432 | ) | | | | | | | | $ | (5,872 | ) | | | | | | | | $ | (18,969 | ) |
Net realized gain (loss) | | | | | | | | | 5,580,782 | | | | | | | | | | 5,502,322 | | | | | | | | | | (184,433 | ) | | | | | | | | | 1,232,520 | |
Net change in unrealized appreciation (depreciation) | | | | | | | | | 35,113,618 | | | | | | | | | | (55,428,861 | ) | | | | | | | | | 5,055,154 | | | | | | | | | | (5,556,680 | ) |
| | | | | | | | | | | | | | | | | | | | | | | | | | | | | | | | | | | | | | | | |
Net increase (decrease) in net assets resulting from operations | | | | | | | | | 40,528,882 | | | | | | | | | | (50,354,971 | ) | | | | | | | | | 4,864,849 | | | | | | | | | | (4,343,129 | ) |
| | | | | | | | | | | | | | | | | | | | | | | | | | | | | | | | | | | | | | | | |
| | | | | | | | |
Net Dividends and Distributions to Shareholders | | | | | | | | | | | | | | | | | | | | | | | | | | | | | | | | | | | | | | | | |
Net realized gain on investments | | | | | | | | | (6,260,272 | ) | | | | | | | | | (4,046,906 | ) | | | | | | | | | — | | | | | | | | | | (1,188,908 | ) |
| | | | | | | | | | | | | | | | | | | | | | | | | | | | | | | | | | | | | | | | |
Net Dividends and Distributions to Shareholders | | | | | | | | | (6,260,272 | ) | | | | | | | | | (4,046,906 | ) | | | | | | | | | — | | | | | | | | | | (1,188,908 | ) |
| | | | | | | | | | | | | | | | | | | | | | | | | | | | | | | | | | | | | | | | |
| | | | | | | | |
Net increase (decrease) in net assets from
Fund share transactions (Note C) | | | | | | | | | 27,242,557 | | | | | | | | | | (4,758,424 | ) | | | | | | | | | 8,395,246 | | | | | | | | | | 6,411,090 | |
| | | | | | | | | | | | | | | | | | | | | | | | | | | | | | | | | | | | | | | | |
| | | | | | | | |
Total increase (decrease) in net assets | | | | | | | | | 61,511,167 | | | | | | | | | | (59,160,301 | ) | | | | | | | | | 13,260,095 | | | | | | | | | | 879,053 | |
| | | | | | | | |
Net Assets: | | | | | | | | | | | | | | | | | | | | | | | | | | | | | | | | | | | | | | | | |
Beginning of period | | | | | | | | | 170,038,930 | | | | | | | | | | 229,199,231 | | | | | | | | | | 15,233,676 | | | | | | | | | | 14,354,623 | |
| | | | | | | | | | | | | | | | | | | | | | | | | | | | | | | | | | | | | | | | |
End of period | | | | | | | | $ | 231,550,097 | | | | | | | | | $ | 170,038,930 | | | | | | | | | $ | 28,493,771 | | | | | | | | | $ | 15,233,676 | |
| | | | | | | | | | | | | | | | | | | | | | | | | | | | | | | | | | | | | | | | |
The accompanying notes are an integral part of these financial statements.
32
|
| STATEMENTSOF CHANGESIN NET ASSETS |
| | | | | | | | | | | | | | | | | | | | | | | | | | | | | | | | | | | | | | | | |
| | | | |
| | | | | LKCM
Equity Fund | | | | LKCM
Balanced Fund |
| | | | | | | | | | | | | | | | | | | | | | | | | | | | | | | | | | | | | | | | |
| | | | | | | | |
| | | | | Year Ended
December 31,
2023 | | | | Year Ended
December 31,
2022 | | | | Year Ended
December 31,
2023 | | | | Year Ended
December 31,
2022 |
Operations: | | | | | | | | | | | | | | | | | | | | | | | | | | | | | | | | | | | | | | | | |
Net investment income | | | | | | | | $ | 4,364,687 | | | | | | | | | $ | 4,330,522 | | | | | | | | | $ | 1,225,184 | | | | | | | | | $ | 1,209,936 | |
Net realized gain | | | | | | | | | 1,256,854 | | | | | | | | | | 21,505,600 | | | | | | | | | | 2,484,536 | | | | | | | | | | 3,251,132 | |
Net change in unrealized appreciation (depreciation) | | | | | | | | | 50,924,521 | | | | | | | | | | (109,800,071 | ) | | | | | | | | | 7,619,477 | | | | | | | | | | (24,111,720 | ) |
| | | | | | | | | | | | | | | | | | | | | | | | | | | | | | | | | | | | | | | | |
Net increase (decrease) in net assets resulting from operations | | | | | | | | | 56,546,062 | | | | | | | | | | (83,963,949 | ) | | | | | | | | | 11,329,197 | | | | | | | | | | (19,650,652 | ) |
| | | | | | | | | | | | | | | | | | | | | | | | | | | | | | | | | | | | | | | | |
| | | | | | | | |
Net Dividends and Distributions to Shareholders | | | | | | | | | | | | | | | | | | | | | | | | | | | | | | | | | | | | | | | | |
Net investment income | | | | | | | | | (4,375,883 | ) | | | | | | | | | (4,309,581 | ) | | | | | | | | | (1,238,189 | ) | | | | | | | | | (1,201,135 | ) |
Net realized gain on investments | | | | | | | | | (2,741,827 | ) | | | | | | | | | (19,797,528 | ) | | | | | | | | | (2,673,192 | ) | | | | | | | | | (2,642,183 | ) |
| | | | | | | | | | | | | | | | | | | | | | | | | | | | | | | | | | | | | | | | |
Net Dividends and Distributions to Shareholders | | | | | | | | | (7,117,710 | ) | | | | | | | | | (24,107,109 | ) | | | | | | | | | (3,911,381 | ) | | | | | | | | | (3,843,318 | ) |
| | | | | | | | | | | | | | | | | | | | | | | | | | | | | | | | | | | | | | | | |
| | | | | | | | |
Net increase (decrease) in net assets from
Fund share transactions (Note C) | | | | | | | | | (15,393,523 | ) | | | | | | | | | 26,016,554 | | | | | | | | | | (2,496,735 | ) | | | | | | | | | (12,660,599 | ) |
| | | | | | | | | | | | | | | | | | | | | | | | | | | | | | | | | | | | | | | | |
| | | | | | | | |
Total increase (decrease) in net assets | | | | | | | | | 34,034,829 | | | | | | | | | | (82,054,504 | ) | | | | | | | | | 4,921,081 | | | | | | | | | | (36,154,569 | ) |
| | | | | | | | |
Net Assets: | | | | | | | | | | | | | | | | | | | | | | | | | | | | | | | | | | | | | | | | |
Beginning of period | | | | | | | | | 460,641,852 | | | | | | | | | | 542,696,356 | | | | | | | | | | 108,746,044 | | | | | | | | | | 144,900,613 | |
| | | | | | | | | | | | | | | | | | | | | | | | | | | | | | | | | | | | | | | | |
End of period | | | | | | | | $ | 494,676,681 | | | | | | | | | $ | 460,641,852 | | | | | | | | | $ | 113,667,125 | | | | | | | | | $ | 108,746,044 | |
| | | | | | | | | | | | | | | | | | | | | | | | | | | | | | | | | | | | | | | | |
The accompanying notes are an integral part of these financial statements.
33
|
| STATEMENTSOF CHANGESIN NET ASSETS |
| | | | | | | | | | | | | | | | | | | | | | | | | | | | | | | | | | | | | | | | |
| | | | |
| | | | | LKCM
Fixed Income Fund | | | | LKCM
International Equity Fund |
| | | | | | | | | | | | | | | | | | | | | | | | | | | | | | | | | | | | | | | | |
| | | | | | | | |
| | | | | Year Ended
December 31,
2023 | | | | Year Ended
December 31,
2022 | | | | Year Ended
December 31,
2023 | | | | Year Ended
December 31,
2022 |
Operations: | | | | | | | | | | | | | | | | | | | | | | | | | | | | | | | | | | | | | | | | |
Net investment income | | | | | | | | $ | 6,489,076 | | | | | | | | | $ | 4,338,166 | | | | | | | | | $ | 890,446 | | | | | | | | | $ | 1,752,964 | |
Net realized gain (loss) | | | | | | | | | (1,597,482 | ) | | | | | | | | | (774,929 | ) | | | | | | | | | (1,257,811 | ) | | | | | | | | | (2,527,417 | ) |
Net change in unrealized appreciation (depreciation) | | | | | | | | | 8,670,167 | | | | | | | | | | (20,329,448 | ) | | | | | | | | | 8,085,267 | | | | | | | | | | (10,863,054 | ) |
| | | | | | | | | | | | | | | | | | | | | | | | | | | | | | | | | | | | | | | | |
Net increase (decrease) in net assets resulting from operations | | | | | | | | | 13,561,761 | | | | | | | | | | (16,766,211 | ) | | | | | | | | | 7,717,902 | | | | | | | | | | (11,637,507 | ) |
| | | | | | | | | | | | | | | | | | | | | | | | | | | | | | | | | | | | | | | | |
| | | | | | | | |
Net Dividends and Distributions to Shareholders: | | | | | | | | | | | | | | | | | | | | | | | | | | | | | | | | | | | | | | | | |
Net investment income | | | | | | | | | (6,485,802 | ) | | | | | | | | | (4,012,550 | ) | | | | | | | | | (862,131 | ) | | | | | | | | | (1,168,820 | ) |
Net realized gain on investments | | | | | | | | | — | | | | | | | | | | (321,988 | ) | | | | | | | | | — | | | | | | | | | | (578,126 | ) |
| | | | | | | | | | | | | | | | | | | | | | | | | | | | | | | | | | | | | | | | |
Net Dividends and Distributions to Shareholders | | | | | | | | | (6,485,802 | ) | | | | | | | | | (4,334,538 | ) | | | | | | | | | (862,131 | ) | | | | | | | | | (1,746,946 | ) |
| | | | | | | | | | | | | | | | | | | | | | | | | | | | | | | | | | | | | | | | |
| | | | | | | | |
Net increase (decrease) in net assets from
Fund share transactions (Note C) | | | | | | | | | 4,029,672 | | | | | | | | | | 742,557 | | | | | | | | | | 8,380,677 | | | | | | | | | | 2,889,320 | |
| | | | | | | | | | | | | | | | | | | | | | | | | | | | | | | | | | | | | | | | |
| | | | | | | | |
Total increase (decrease) in net assets | | | | | | | | | 11,105,631 | | | | | | | | | | (20,358,192 | ) | | | | | | | | | 15,236,448 | | | | | | | | | | (10,495,133 | ) |
| | | | | | | | |
Net Assets: | | | | | | | | | | | | | | | | | | | | | | | | | | | | | | | | | | | | | | | | |
Beginning of period | | | | | | | | | 275,386,544 | | | | | | | | | | 295,744,736 | | | | | | | | | | 45,009,041 | | | | | | | | | | 55,504,174 | |
| | | | | | | | | | | | | | | | | | | | | | | | | | | | | | | | | | | | | | | | |
End of period | | | | | | | | $ | 286,492,175 | | | | | | | | | $ | 275,386,544 | | | | | | | | | $ | 60,245,489 | | | | | | | | | $ | 45,009,041 | |
| | | | | | | | | | | | | | | | | | | | | | | | | | | | | | | | | | | | | | | | |
The accompanying notes are an integral part of these financial statements.
34
|
| FINANCIAL HIGHLIGHTS |
| SELECTED DATAFOR EACH SHAREOF CAPITAL STOCK OUTSTANDING |
| | | | | | | | | | | | | | | | | | | | | | | | | | | | | | | | | | | | | | | | | | | | | | | | | | |
| | |
| | | | | LKCM Small Cap Equity Fund |
| | | | | | | | | | | | | | | | | | | | | | | | | | | | | | | | | | | | | | | | | | | | | | | | | | |
| | | | | | | | | | |
| | | | | Year
Ended
December 31,
2023 | | | | Year
Ended
December 31,
2022 | | | | Year
Ended
December 31,
2021 | | | | Year
Ended
December 31,
2020 | | | | Year
Ended
December 31,
2019 |
Net Asset Value – Beginning of Period | | | | | | | | $ | 16.37 | | | | | | | | | $ | 21.54 | | | | | | | | | $ | 21.77 | | | | | | | | | $ | 16.78 | | | | | | | | | $ | 14.39 | |
| | | | | | | | | | | | | | | | | | | | | | | | | | | | | | | | | | | | | | | | | | | | | | | | | | |
Net investment loss | | | | | | | | | (0.01 | )(1) | | | | | | | | | (0.04 | )(1) | | | | | | | | | (0.08 | )(1) | | | | | | | | | (0.02 | )(1) | | | | | | | | | (0.02 | )(1) |
Net realized and unrealized gain (loss) on investments | | | | | | | | | 3.71 | | | | | | | | | | (4.73 | ) | | | | | | | | | 3.23 | | | | | | | | | | 5.85 | | | | | | | | | | 3.29 | |
| | | | | | | | | | | | | | | | | | | | | | | | | | | | | | | | | | | | | | | | | | | | | | | | | | |
Total from investment operations | | | | | | | | | 3.70 | | | | | | | | | | (4.77 | ) | | | | | | | | | 3.15 | | | | | | | | | | 5.83 | | | | | | | | | | 3.27 | |
| | | | | | | | | | | | | | | | | | | | | | | | | | | | | | | | | | | | | | | | | | | | | | | | | | |
| | | | | | | | | | |
Less distributions: | | | | | | | | | | | | | | | | | | | | | | | | | | | | | | | | | | | | | | | | | | | | | | | | | | |
Distributions from net realized gains | | | | | | | | | (0.54 | ) | | | | | | | | | (0.40 | ) | | | | | | | | | (3.38 | ) | | | | | | | | | (0.84 | ) | | | | | | | | | (0.88 | ) |
| | | | | | | | | | | | | | | | | | | | | | | | | | | | | | | | | | | | | | | | | | | | | | | | | | |
Total dividends and distributions | | | | | | | | | (0.54 | ) | | | | | | | | | (0.40 | ) | | | | | | | | | (3.38 | ) | | | | | | | | | (0.84 | ) | | | | | | | | | (0.88 | ) |
| | | | | | | | | | | | | | | | | | | | | | | | | | | | | | | | | | | | | | | | | | | | | | | | | | |
Net Asset Value – End of Period | | | | | | | | $ | 19.53 | | | | | | | | | $ | 16.37 | | | | | | | | | $ | 21.54 | | | | | | | | | $ | 21.77 | | | | | | | | | $ | 16.78 | |
| | | | | | | | | | | | | | | | | | | | | | | | | | | | | | | | | | | | | | | | | | | | | | | | | | |
Total Return | | | | | | | | | 22.57% | | | | | | | | | | -22.11% | | | | | | | | | | 14.49% | | | | | | | | | | 34.79% | | | | | | | | | | 22.70% | |
| | | | | | | | | | |
Ratios and Supplemental Data: | | | | | | | | | | | | | | | | | | | | | | | | | | | | | | | | | | | | | | | | | | | | | | | | | | |
Net assets, end of period (thousands) | | | | | | | | $ | 231,550 | | | | | | | | | $ | 170,039 | | | | | | | | | $ | 229,199 | | | | | | | | | $ | 202,678 | | | | | | | | | $ | 180,682 | |
Ratio of expenses to average net assets: | | | | | | | | | | | | | | | | | | | | | | | | | | | | | | | | | | | | | | | | | | | | | | | | | | |
Before expense waiver and/or reimbursement | | | | | | | | | 1.07% | | | | | | | | | | 1.07% | | | | | | | | | | 1.03% | | | | | | | | | | 1.07% | | | | | | | | | | 1.07% | |
After expense waiver and/or reimbursement | | | | | | | | | 1.00% | | | | | | | | | | 1.00% | | | | | | | | | | 1.00% | | | | | | | | | | 1.00% | | | | | | | | | | 1.00% | |
Ratio of net investment loss to average net assets: | | | | | | | | | | | | | | | | | | | | | | | | | | | | | | | | | | | | | | | | | | | | | | | | | | |
Before expense waiver and/or reimbursement | | | | | | | | | (0.15)% | | | | | | | | | | (0.30)% | | | | | | | | | | (0.35)% | | | | | | | | | | (0.20)% | | | | | | | | | | (0.20)% | |
After expense waiver and/or reimbursement | | | | | | | | | (0.08)% | | | | | | | | | | (0.23)% | | | | | | | | | | (0.32)% | | | | | | | | | | (0.13)% | | | | | | | | | | (0.13)% | |
Portfolio turnover rate | | | | | | | | | 28% | | | | | | | | | | 42% | | | | | | | | | | 42% | | | | | | | | | | 60% | | | | | | | | | | 63% | |
| (1) | Net investment loss per share represents net investment loss divided by the average shares outstanding throughout the period. |
| | | | | | | | | | | | | | | | | | | | | | | | | | | | | | | | | | | | | | | | | | | | | | | | | | |
| | |
| | | | | LKCM Small-Mid Cap Equity Fund |
| | | | | | | | | | | | | | | | | | | | | | | | | | | | | | | | | | | | | | | | | | | | | | | | | | |
| | | | | | | | | | |
| | | | | Year
Ended
December 31,
2023 | | | | Year
Ended
December 31,
2022 | | | | Year
Ended
December 31,
2021 | | | | Year
Ended
December 31,
2020 | | | | Year
Ended
December 31,
2019 |
Net Asset Value – Beginning of Period | | | | | | | | $ | 7.88 | | | | | | | | | $ | 10.97 | | | | | | | | | $ | 11.15 | | | | | | | | | $ | 9.09 | | | | | | | | | $ | 7.92 | |
| | | | | | | | | | | | | | | | | | | | | | | | | | | | | | | | | | | | | | | | | | | | | | | | | | |
Net investment loss | | | | | | | | | (0.00 | )(1) | | | | | | | | | (0.01 | )(1) | | | | | | | | | (0.06 | )(1) | | | | | | | | | (0.02 | )(1) | | | | | | | | | (0.02 | )(1) |
Net realized and unrealized gain (loss) on investments | | | | | | | | | 2.03 | | | | | | | | | | (2.43 | ) | | | | | | | | | 1.77 | | | | | | | | | | 2.80 | | | | | | | | | | 2.48 | |
| | | | | | | | | | | | | | | | | | | | | | | | | | | | | | | | | | | | | | | | | | | | | | | | | | |
Total from investment operations | | | | | | | | | 2.03 | | | | | | | | | | (2.44 | ) | | | | | | | | | 1.71 | | | | | | | | | | 2.78 | | | | | | | | | | 2.46 | |
| | | | | | | | | | | | | | | | | | | | | | | | | | | | | | | | | | | | | | | | | | | | | | | | | | |
| | | | | | | | | | |
Less distributions: | | | | | | | | | | | | | | | | | | | | | | | | | | | | | | | | | | | | | | | | | | | | | | | | | | |
Distributions from net realized gains | | | | | | | | | — | | | | | | | | | | (0.65 | ) | | | | | | | | | (1.89 | ) | | | | | | | | | (0.72 | ) | | | | | | | | | (1.29 | ) |
| | | | | | | | | | | | | | | | | | | | | | | | | | | | | | | | | | | | | | | | | | | | | | | | | | |
Total dividends and distributions | | | | | | | | | — | | | | | | | | | | (0.65 | ) | | | | | | | | | (1.89 | ) | | | | | | | | | (0.72 | ) | | | | | | | | | (1.29 | ) |
| | | | | | | | | | | | | | | | | | | | | | | | | | | | | | | | | | | | | | | | | | | | | | | | | | |
Redemption fees | | | | | | | | | 0.00 | (2) | | | | | | | | | — | | | | | | | | | | — | | | | | | | | | | — | | | | | | | | | | — | |
| | | | | | | | | | | | | | | | | | | | | | | | | | | | | | | | | | | | | | | | | | | | | | | | | | |
Net Asset Value – End of Period | | | | | | | | $ | 9.91 | | | | | | | | | $ | 7.88 | | | | | | | | | $ | 10.97 | | | | | | | | | $ | 11.15 | | | | | | | | | $ | 9.09 | |
| | | | | | | | | | | | | | | | | | | | | | | | | | | | | | | | | | | | | | | | | | | | | | | | | | |
Total Return | | | | | | | | | 25.76% | | | | | | | | | | -22.12% | | | | | | | | | | 15.37% | | | | | | | | | | 30.66% | | | | | | | | | | 31.05% | |
| | | | | | | | | | |
Ratios and Supplemental Data: | | | | | | | | | | | | | | | | | | | | | | | | | | | | | | | | | | | | | | | | | | | | | | | | | | |
Net assets, end of period (thousands) | | | | | | | | $ | 28,494 | | | | | | | | | $ | 15,234 | | | | | | | | | $ | 14,355 | | | | | | | | | $ | 15,108 | | | | | | | | | $ | 12,590 | |
Ratio of expenses to average net assets: | | | | | | | | | | | | | | | | | | | | | | | | | | | | | | | | | | | | | | | | | | | | | | | | | | |
Before expense waiver and/or reimbursement | | | | | | | | | 1.74% | | | | | | | | | | 1.80% | | | | | | | | | | 1.74% | | | | | | | | | | 1.98% | | | | | | | | | | 1.95% | |
After expense waiver and/or reimbursement | | | | | | | | | 1.00% | | | | | | | | | | 1.00% | | | | | | | | | | 1.00% | | | | | | | | | | 1.00% | | | | | | | | | | 1.00% | |
Ratio of net investment loss to average net assets: | | | | | | | | | | | | | | | | | | | | | | | | | | | | | | | | | | | | | | | | | | | | | | | | | | |
Before expense waiver and/or reimbursement | | | | | | | | | (0.77)% | | | | | | | | | | (0.92)% | | | | | | | | | | (1.23)% | | | | | | | | | | (1.25)% | | | | | | | | | | (1.20)% | |
After expense waiver and/or reimbursement | | | | | | | | | (0.03)% | | | | | | | | | | (0.11)% | | | | | | | | | | (0.49)% | | | | | | | | | | (0.27)% | | | | | | | | | | (0.25)% | |
Portfolio turnover rate | | | | | | | | | 32% | | | | | | | | | | 50% | | | | | | | | | | 50% | | | | | | | | | | 76% | | | | | | | | | | 68% | |
| (1) | Net investment loss per share represents net investment loss divided by the average shares outstanding throughout the period. |
| (2) | Less than $(0.005) per share. |
The accompanying notes are an integral part of these financial statements.
35
|
| FINANCIAL HIGHLIGHTS |
| SELECTED DATAFOR EACH SHAREOF CAPITAL STOCK OUTSTANDING |
| | | | | | | | | | | | | | | | | | | | | | | | | | | | | | | | | | | | | | | | | | | | | | | | | | |
| | |
| | | | | LKCM Equity Fund |
| | | | | | | | | | | | | | | | | | | | | | | | | | | | | | | | | | | | | | | | | | | | | | | | | | |
| | | | | | | | | | |
| | | | | Year
Ended
December 31,
2023 | | | | Year
Ended
December 31,
2022 | | | | Year
Ended
December 31,
2021 | | | | Year
Ended
December 31,
2020 | | | | Year
Ended
December 31,
2019 |
Net Asset Value – Beginning of Period | | | | | | | | $ | 30.99 | | | | | | | | | $ | 38.69 | | | | | | | | | $ | 33.74 | | | | | | | | | $ | 29.02 | | | | | | | | | $ | 23.34 | |
| | | | | | | | | | | | | | | | | | | | | | | | | | | | | | | | | | | | | | | | | | | | | | | | | | |
Net investment income | | | | | | | | | 0.30 | (1) | | | | | | | | | 0.31 | (1) | | | | | | | | | 0.16 | (1) | | | | | | | | | 0.17 | (1) | | | | | | | | | 0.22 | (1) |
Net realized and unrealized gain (loss) on investments | | | | | | | | | 3.62 | | | | | | | | | | (6.31 | ) | | | | | | | | | 7.43 | | | | | | | | | | 6.44 | | | | | | | | | | 6.75 | |
| | | | | | | | | | | | | | | | | | | | | | | | | | | | | | | | | | | | | | | | | | | | | | | | | | |
Total from investment operations | | | | | | | | | 3.92 | | | | | | | | | | (6.00 | ) | | | | | | | | | 7.59 | | | | | | | | | | 6.61 | | | | | | | | | | 6.97 | |
| | | | | | | | | | | | | | | | | | | | | | | | | | | | | | | | | | | | | | | | | | | | | | | | | | |
| | | | | | | | | | |
Less distributions: | | | | | | | | | | | | | | | | | | | | | | | | | | | | | | | | | | | | | | | | | | | | | | | | | | |
Dividends from net investment income | | | | | | | | | (0.31 | ) | | | | | | | | | (0.30 | ) | | | | | | | | | (0.17 | ) | | | | | | | | | (0.17 | ) | | | | | | | | | (0.23 | ) |
Distributions from net realized gains | | | | | | | | | (0.19 | ) | | | | | | | | | (1.40 | ) | | | | | | | | | (2.47 | ) | | | | | | | | | (1.72 | ) | | | | | | | | | (1.06 | ) |
| | | | | | | | | | | | | | | | | | | | | | | | | | | | | | | | | | | | | | | | | | | | | | | | | | |
Total dividends and distributions | | | | | | | | | (0.50 | ) | | | | | | | | | (1.70 | ) | | | | | | | | | (2.64 | ) | | | | | | | | | (1.89 | ) | | | | | | | | | (1.29 | ) |
| | | | | | | | | | | | | | | | | | | | | | | | | | | | | | | | | | | | | | | | | | | | | | | | | | |
Redemption fees | | | | | | | | | — | | | | | | | | | | 0.00 | (2) | | | | | | | | | — | | | | | | | | | | — | | | | | | | | | | — | |
| | | | | | | | | | | | | | | | | | | | | | | | | | | | | | | | | | | | | | | | | | | | | | | | | | |
Net Asset Value – End of Period | | | | | | | | $ | 34.41 | | | | | | | | | $ | 30.99 | | | | | | | | | $ | 38.69 | | | | | | | | | $ | 33.74 | | | | | | | | | $ | 29.02 | |
| | | | | | | | | | | | | | | | | | | | | | | | | | | | | | | | | | | | | | | | | | | | | | | | | | |
Total Return | | | | | | | | | 12.65% | | | | | | | | | | -15.44% | | | | | | | | | | 22.48% | | | | | | | | | | 22.83% | | | | | | | | | | 29.85% | |
| | | | | | | | | | |
Ratios and Supplemental Data: | | | | | | | | | | | | | | | | | | | | | | | | | | | | | | | | | | | | | | | | | | | | | | | | | | |
Net assets, end of period (thousands) | | | | | | | | $ | 494,677 | | | | | | | | | $ | 460,642 | | | | | | | | | $ | 542,696 | | | | | | | | | $ | 449,653 | | | | | | | | | $ | 381,307 | |
Ratio of expenses to average net assets: | | | | | | | | | | | | | | | | | | | | | | | | | | | | | | | | | | | | | | | | | | | | | | | | | | |
Before expense waiver and/or reimbursement | | | | | | | | | 1.00% | | | | | | | | | | 0.97% | | | | | | | | | | 0.96% | | | | | | | | | | 0.98% | | | | | | | | | | 0.99% | |
After expense waiver and/or reimbursement | | | | | | | | | 0.80% | | | | | | | | | | 0.80% | | | | | | | | | | 0.80% | | | | | | | | | | 0.80% | | | | | | | | | | 0.80% | |
Ratio of net investment income to average net assets: | | | | | | | | | | | | | | | | | | | | | | | | | | | | | | | | | | | | | | | | | | | | | | | | | | |
Before expense waiver and/or reimbursement | | | | | | | | | 0.73% | | | | | | | | | | 0.74% | | | | | | | | | | 0.27% | | | | | | | | | | 0.37% | | | | | | | | | | 0.61% | |
After expense waiver and/or reimbursement | | | | | | | | | 0.93% | | | | | | | | | | 0.91% | | | | | | | | | | 0.43% | | | | | | | | | | 0.55% | | | | | | | | | | 0.80% | |
Portfolio turnover rate | | | | | | | | | 10% | | | | | | | | | | 11% | | | | | | | | | | 11% | | | | | | | | | | 10% | | | | | | | | | | 9% | |
| (1) | Net investment income per share represents net investment income divided by the average shares outstanding throughout the period. |
| | | | | | | | | | | | | | | | | | | | | | | | | | | | | | | | | | | | | | | | | | | | | | | | | | |
| | |
| | | | | LKCM Balanced Fund |
| | | | | | | | | | | | | | | | | | | | | | | | | | | | | | | | | | | | | | | | | | | | | | | | | | |
| | | | | | | | | | |
| | | | | Year
Ended
December 31,
2023 | | | | Year
Ended
December 31,
2022 | | | | Year
Ended
December 31,
2021 | | | | Year
Ended
December 31,
2020 | | | | Year
Ended
December 31,
2019 |
Net Asset Value – Beginning of Period | | | | | | | | $ | 24.29 | | | | | | | | | $ | 29.21 | | | | | | | | | $ | 26.76 | | | | | | | | | $ | 24.22 | | | | | | | | | $ | 21.07 | |
| | | | | | | | | | | | | | | | | | | | | | | | | | | | | | | | | | | | | | | | | | | | | | | | | | |
Net investment income | | | | | | | | | 0.28 | (1) | | | | | | | | | 0.26 | (1) | | | | | | | | | 0.20 | (1) | | | | | | | | | 0.24 | (1) | | | | | | | | | 0.27 | (1) |
Net realized and unrealized gain (loss) on investments | | | | | | | | | 2.34 | | | | | | | | | | (4.30 | ) | | | | | | | | | 3.54 | | | | | | | | | | 3.42 | | | | | | | | | | 4.32 | |
| | | | | | | | | | | | | | | | | | | | | | | | | | | | | | | | | | | | | | | | | | | | | | | | | | |
Total from investment operations | | | | | | | | | 2.62 | | | | | | | | | | (4.04 | ) | | | | | | | | | 3.74 | | | | | | | | | | 3.66 | | | | | | | | | | 4.59 | |
| | | | | | | | | | | | | | | | | | | | | | | | | | | | | | | | | | | | | | | | | | | | | | | | | | |
| | | | | | | | | | |
Less distributions: | | | | | | | | | | | | | | | | | | | | | | | | | | | | | | | | | | | | | | | | | | | | | | | | | | |
Dividends from net investment income | | | | | | | | | (0.29 | ) | | | | | | | | | (0.27 | ) | | | | | | | | | (0.20 | ) | | | | | | | | | (0.24 | ) | | | | | | | | | (0.27 | ) |
Distributions from net realized gains | | | | | | | | | (0.62 | ) | | | | | | | | | (0.61 | ) | | | | | | | | | (1.09 | ) | | | | | | | | | (0.88 | ) | | | | | | | | | (1.17 | ) |
| | | | | | | | | | | | | | | | | | | | | | | | | | | | | | | | | | | | | | | | | | | | | | | | | | |
Total dividends and distributions | | | | | | | | | (0.91 | ) | | | | | | | | | (0.88 | ) | | | | | | | | | (1.29 | ) | | | | | | | | | (1.12 | ) | | | | | | | | | (1.44 | ) |
| | | | | | | | | | | | | | | | | | | | | | | | | | | | | | | | | | | | | | | | | | | | | | | | | | |
Redemption fees | | | | | | | | | 0.00 | (2) | | | | | | | | | 0.00 | (2) | | | | | | | | | — | | | | | | | | | | — | | | | | | | | | | — | |
| | | | | | | | | | | | | | | | | | | | | | | | | | | | | | | | | | | | | | | | | | | | | | | | | | |
Net Asset Value – End of Period | | | | | | | | $ | 26.00 | | | | | | | | | $ | 24.29 | | | | | | | | | $ | 29.21 | | | | | | | | | $ | 26.76 | | | | | | | | | $ | 24.22 | |
| | | | | | | | | | | | | | | | | | | | | | | | | | | | | | | | | | | | | | | | | | | | | | | | | | |
Total Return | | | | | | | | | 10.84% | | | | | | | | | | -13.84% | | | | | | | | | | 14.01% | | | | | | | | | | 15.28% | | | | | | | | | | 21.85% | |
| | | | | | | | | | |
Ratios and Supplemental Data: | | | | | | | | | | | | | | | | | | | | | | | | | | | | | | | | | | | | | | | | | | | | | | | | | | |
Net assets, end of period (thousands) | | | | | | | | $ | 113,667 | | | | | | | | | $ | 108,746 | | | | | | | | | $ | 144,901 | | | | | | | | | $ | 125,507 | | | | | | | | | $ | 103,825 | |
Ratio of expenses to average net assets: | | | | | | | | | | | | | | | | | | | | | | | | | | | | | | | | | | | | | | | | | | | | | | | | | | |
Before expense waiver and/or reimbursement | | | | | | | | | 1.04% | | | | | | | | | | 0.99% | | | | | | | | | | 0.96% | | | | | | | | | | 0.99% | | | | | | | | | | 1.00% | |
After expense waiver and/or reimbursement | | | | | | | | | 0.80% | | | | | | | | | | 0.80% | | | | | | | | | | 0.80% | | | | | | | | | | 0.80% | | | | | | | | | | 0.80% | |
Ratio of net investment income to average net assets: | | | | | | | | | | | | | | | | | | | | | | | | | | | | | | | | | | | | | | | | | | | | | | | | | | |
Before expense waiver and/or reimbursement | | | | | | | | | 0.87% | | | | | | | | | | 0.82% | | | | | | | | | | 0.53% | | | | | | | | | | 0.78% | | | | | | | | | | 0.95% | |
After expense waiver and/or reimbursement | | | | | | | | | 1.11% | | | | | | | | | | 1.01% | | | | | | | | | | 0.69% | | | | | | | | | | 0.97% | | | | | | | | | | 1.15% | |
Portfolio turnover rate | | | | | | | | | 11% | | | | | | | | | | 13% | | | | | | | | | | 11% | | | | | | | | | | 18% | | | | | | | | | | 17% | |
| (1) | Net investment income per share represents net investment income divided by the average shares outstanding throughout the period. |
The accompanying notes are an integral part of these financial statements.
36
|
| FINANCIAL HIGHLIGHTS |
| SELECTED DATAFOR EACH SHAREOF CAPITAL STOCK OUTSTANDING |
| | | | | | | | | | | | | | | | | | | | | | | | | | | | | | | | | | | | | | | | | | | | | | | | | | |
| | |
| | | | | LKCM Fixed Income Fund |
| | | | | | | | | | | | | | | | | | | | | | | | | | | | | | | | | | | | | | | | | | | | | | | | | | |
| | | | | | | | | | |
| | | | | Year
Ended
December 31,
2023 | | | | Year
Ended
December 31,
2022 | | | | Year
Ended
December 31,
2021 | | | | Year
Ended
December 31,
2020 | | | | Year
Ended
December 31,
2019 |
Net Asset Value – Beginning of Period | | | | | | | | $ | 10.10 | | | | | | | | | $ | 10.87 | | | | | | | | | $ | 11.19 | | | | | | | | | $ | 10.92 | | | | | | | | | $ | 10.47 | |
| | | | | | | | | | | | | | | | | | | | | | | | | | | | | | | | | | | | | | | | | | | | | | | | | | |
Net investment income | | | | | | | | | 0.24 | (1) | | | | | | | | | 0.16 | (1) | | | | | | | | | 0.15 | (1) | | | | | | | | | 0.19 | (1) | | | | | | | | | 0.25 | (1) |
Net realized and unrealized gain (loss) on investments | | | | | | | | | 0.26 | | | | | | | | | | (0.77 | ) | | | | | | | | | (0.32 | ) | | | | | | | | | 0.27 | | | | | | | | | | 0.45 | |
| | | | | | | | | | | | | | | | | | | | | | | | | | | | | | | | | | | | | | | | | | | | | | | | | | |
Total from investment operations | | | | | | | | | 0.50 | | | | | | | | | | (0.61 | ) | | | | | | | | | (0.17 | ) | | | | | | | | | 0.46 | | | | | | | | | | 0.70 | |
| | | | | | | | | | | | | | | | | | | | | | | | | | | | | | | | | | | | | | | | | | | | | | | | | | |
| | | | | | | | | | |
Less distributions: | | | | | | | | | | | | | | | | | | | | | | | | | | | | | | | | | | | | | | | | | | | | | | | | | | |
Dividends from net investment income | | | | | | | | | (0.24 | ) | | | | | | | | | (0.15 | ) | | | | | | | | | (0.15 | ) | | | | | | | | | (0.19 | ) | | | | | | | | | (0.25 | ) |
Distributions from net realized gains | | | | | | | | | — | | | | | | | | | | (0.01 | ) | | | | | | | | | (0.00 | )(2) | | | | | | | | | — | | | | | | | | | | — | |
| | | | | | | | | | | | | | | | | | | | | | | | | | | | | | | | | | | | | | | | | | | | | | | | | | |
Total dividends and distributions | | | | | | | | | (0.24 | ) | | | | | | | | | (0.16 | ) | | | | | | | | | (0.15 | ) | | | | | | | | | (0.19 | ) | | | | | | | | | (0.25 | ) |
| | | | | | | | | | | | | | | | | | | | | | | | | | | | | | | | | | | | | | | | | | | | | | | | | | |
Redemption fees | | | | | | | | | 0.00 | (2) | | | | | | | | | — | | | | | | | | | | — | | | | | | | | | | — | | | | | | | | | | — | |
| | | | | | | | | | | | | | | | | | | | | | | | | | | | | | | | | | | | | | | | | | | | | | | | | | |
Net Asset Value – End of Period | | | | | | | | $ | 10.36 | | | | | | | | | $ | 10.10 | | | | | | | | | $ | 10.87 | | | | | | | | | $ | 11.19 | | | | | | | | | $ | 10.92 | |
| | | | | | | | | | | | | | | | | | | | | | | | | | | | | | | | | | | | | | | | | | | | | | | | | | |
Total Return | | | | | | | | | 4.98% | | | | | | | | | | -5.63% | | | | | | | | | | -1.54% | | | | | | | | | | 4.29% | | | | | | | | | | 6.70% | |
| | | | | | | | | | |
Ratios and Supplemental Data: | | | | | | | | | | | | | | | | | | | | | | | | | | | | | | | | | | | | | | | | | | | | | | | | | | |
Net assets, end of period (thousands) | | | | | | | | $ | 286,492 | | | | | | | | | $ | 275,387 | | | | | | | | | $ | 295,745 | | | | | | | | | $ | 289,857 | | | | | | | | | $ | 275,917 | |
Ratio of expenses to average net assets: | | | | | | | | | | | | | | | | | | | | | | | | | | | | | | | | | | | | | | | | | | | | | | | | | | |
Before expense waiver and/or reimbursement | | | | | | | | | 0.81% | | | | | | | | | | 0.79% | | | | | | | | | | 0.78% | | | | | | | | | | 0.79% | | | | | | | | | | 0.79% | |
After expense waiver and/or reimbursement | | | | | | | | | 0.50% | | | | | | | | | | 0.50% | | | | | | | | | | 0.50% | | | | | | | | | | 0.50% | | | | | | | | | | 0.50% | |
Ratio of net investment income to average net assets: | | | | | | | | | | | | | | | | | | | | | | | | | | | | | | | | | | | | | | | | | | | | | | | | | | |
Before expense waiver and/or reimbursement | | | | | | | | | 2.02% | | | | | | | | | | 1.25% | | | | | | | | | | 1.05% | | | | | | | | | | 1.46% | | | | | | | | | | 2.02% | |
After expense waiver and/or reimbursement | | | | | | | | | 2.33% | | | | | | | | | | 1.54% | | | | | | | | | | 1.33% | | | | | | | | | | 1.75% | | | | | | | | | | 2.31% | |
Portfolio turnover rate | | | | | | | | | 23% | | | | | | | | | | 21% | | | | | | | | | | 31% | | | | | | | | | | 46% | | | | | | | | | | 37% | |
| (1) | Net investment income per share represents net investment income divided by the average shares outstanding during the period. |
| | | | | | | | | | | | | | | | | | | | | | | | | | | | | | | | | | | | | | | | | | | | | | | | | | |
| | |
| | | | | LKCM International Equity Fund |
| | | | | | | | | | | | | | | | | | | | | | | | | | | | | | | | | | | | | | | | | | | | | | | | | | |
| | | | | | | | | | |
| | | | | Year
Ended
December 31,
2023 | | | | Year
Ended
December 31,
2022 | | | | Year
Ended
December 31,
2021 | | | | Year
Ended
December 31,
2020 | | | | May 1, 2019(1)
through
December 31,
2019 |
Net Asset Value – Beginning of Period | | | | | | | | $ | 11.08 | | | | | | | | | $ | 14.50 | | | | | | | | | $ | 12.44 | | | | | | | | | $ | 10.89 | | | | | | | | | $ | 10.00 | |
| | | | | | | | | | | | | | | | | | | | | | | | | | | | | | | | | | | | | | | | | | | | | | | | | | |
Net investment income | | | | | | | | | 0.19 | (2) | | | | | | | | | 0.45 | (2) | | | | | | | | | 0.10 | (2) | | | | | | | | | 0.03 | (2) | | | | | | | | | 0.02 | (2) |
Net realized and unrealized gain on investments | | | | | | | | | 1.59 | | | | | | | | | | (3.42 | ) | | | | | | | | | 2.14 | | | | | | | | | | 1.54 | | | | | | | | | | 0.88 | |
| | | | | | | | | | | | | | | | | | | | | | | | | | | | | | | | | | | | | | | | | | | | | | | | | | |
Total from investment operations | | | | | | | | | 1.78 | | | | | | | | | | (2.97 | ) | | | | | | | | | 2.24 | | | | | | | | | | 1.57 | | | | | | | | | | 0.90 | |
| | | | | | | | | | | | | | | | | | | | | | | | | | | | | | | | | | | | | | | | | | | | | | | | | | |
| | | | | | | | | | |
Less distributions: | | | | | | | | | | | | | | | | | | | | | | | | | | | | | | | | | | | | | | | | | | | | | | | | | | |
Dividends from net investment income | | | | | | | | | (0.18 | ) | | | | | | | | | (0.30 | ) | | | | | | | | | (0.08 | ) | | | | | | | | | (0.02 | ) | | | | | | | | | (0.01 | ) |
Distributions from return of capital | | | | | | | | | — | | | | | | | | | | — | | | | | | | | | | — | | | | | | | | | | (0.00 | )(3) | | | | | | | | | — | |
Distributions from net realized gains | | | | | | | | | — | | | | | | | | | | (0.15 | ) | | | | | | | | | (0.10 | ) | | | | | | | | | — | | | | | | | | | | (0.00 | )(3) |
| | | | | | | | | | | | | | | | | | | | | | | | | | | | | | | | | | | | | | | | | | | | | | | | | | |
Total dividends and distributions | | | | | | | | | (0.18 | ) | | | | | | | | | (0.45 | ) | | | | | | | | | (0.18 | ) | | | | | | | | | (0.02 | ) | | | | | | | | | (0.01 | ) |
| | | | | | | | | | | | | | | | | | | | | | | | | | | | | | | | | | | | | | | | | | | | | | | | | | |
Net Asset Value – End of Period | | | | | | | | $ | 12.68 | | | | | | | | | $ | 11.08 | | | | | | | | | $ | 14.50 | | | | | | | | | $ | 12.44 | | | | | | | | | $ | 10.89 | |
| | | | | | | | | | | | | | | | | | | | | | | | | | | | | | | | | | | | | | | | | | | | | | | | | | |
Total Return | | | | | | | | | 16.09% | | | | | | | | | | -20.51% | | | | | | | | | | 18.00% | | | | | | | | | | 14.45% | | | | | | | | | | 8.97% | (4) |
| | | | | | | | | | | |
Ratios and Supplemental Data: | | | | | | | | | | | | | | | | | | | | | | | | | | | | | | | | | | | | | | | | | | | | | | | | | | |
Net assets, end of period (thousands) | | | | | | | | $ | 60,245 | | | | | | | | | $ | 45,009 | | | | | | | | | $ | 55,504 | | | | | | | | | $ | 32,295 | | | | | | | | | $ | 10,645 | |
Ratio of expenses to average net assets: | | | | | | | | | | | | | | | | | | | | | | | | | | | | | | | | | | | | | | | | | | | | | | | | | | |
Before expense waiver and/or reimbursement | | | | | | | | | 1.41% | | | | | | | | | | 1.45% | | | | | | | | | | 1.40% | | | | | | | | | | 1.88% | | | | | | | | | | 4.09% | (5) |
After expense waiver and/or reimbursement | | | | | | | | | 1.00% | | | | | | | | | | 1.00% | | | | | | | | | | 1.00% | | | | | | | | | | 1.00% | | | | | | | | | | 1.00% | (5) |
Ratio of net investment income (loss) to average net assets: | | | | | | | | | | | | | | | | | | | | | | | | | | | | | | | | | | | | | | | | | | | | | | | | | | |
Before expense waiver and/or reimbursement | | | | | | | | | 1.17% | | | | | | | | | | 3.35% | | | | | | | | | | 0.29% | | | | | | | | | | (0.55)% | | | | | | | | | | (2.76)% | (5) |
After expense waiver and/or reimbursement | | | | | | | | | 1.58% | | | | | | | | | | 3.80% | | | | | | | | | | 0.69% | | | | | | | | | | 0.33% | | | | | | | | | | 0.33% | (5) |
Portfolio turnover rate | | | | | | | | | 11% | | | | | | | | | | 26% | | | | | | | | | | 15% | | | | | | | | | | 6% | | | | | | | | | | 2% | (4) |
| (1) | Commencement of operations. |
| (2) | Net investment income per share represents net investment income divided by the average shares outstanding during the period. |
The accompanying notes are an integral part of these financial statements.
37
|
| LKCM FUNDS |
| NOTESTOTHE FINANCIAL STATEMENTS |
| December 31, 2023 |
A. Organization and Significant Accounting Policies: LKCM Funds (the “Trust”) is registered under the Investment Company Act of 1940 (“1940 Act”) as an open-end, management investment company. The Trust was organized as a Delaware statutory trust on February 10, 1994 and consists of seven diversified series as of December 31, 2023, six of which are presented herein and include the LKCM Small Cap Equity Fund, LKCM Small-Mid Cap Equity Fund, LKCM Equity Fund, LKCM Balanced Fund, LKCM Fixed Income Fund and LKCM International Equity Fund (collectively, the “Funds”). The assets of the Funds are invested in separate, independently managed portfolios. Investment operations of the Funds began on July 14, 1994 (LKCM Small Cap Equity Fund), January 3, 1996 (LKCM Equity Fund), December 30, 1997 (LKCM Balanced Fund and LKCM Fixed Income Fund), May 2, 2011 (LKCM Small-Mid Cap Equity Fund) and May 1, 2019 (LKCM International Equity Fund). The LKCM Small Cap Equity Fund, LKCM Small-Mid Cap Equity Fund and LKCM Equity Fund previously had two share classes—Institutional Class shares and Adviser Class shares. The Board of Trustees of the Trust approved the (i) liquidation and termination of Adviser Class shares of the LKCM Small Cap Equity Fund, which took place on October 31, 2018, and (ii) termination of Adviser Class shares of the LKCM Equity Fund and LKCM Small-Mid Cap Equity Fund, which had not commenced operations and had no assets or shareholders, on September 24, 2018. Each Fund charges a 1% redemption fee for redemptions of Fund shares held for less than 30 days, unless otherwise determined by a Fund in its discretion.
The LKCM Small Cap Equity Fund seeks to maximize long-term capital appreciation by investing under normal circumstances at least 80% of its net assets (plus any borrowings for investment purposes) in equity securities of smaller companies (those with market capitalizations at the time of investment between $0.8 billion and $7 billion) which Luther King Capital Management Corporation (the “Adviser”) believes are likely to have above-average growth in revenue and/or earnings and potential for above-average capital appreciation. The LKCM Small-Mid Cap Equity Fund seeks to maximize long-term capital appreciation by investing under normal circumstances at least 80% of its net assets (plus any borrowings for investment purposes) in equity securities of small-mid capitalization companies (those with market capitalizations at the time of investment between $2 billion and $20 billion) which the Adviser believes are likely to have above-average growth in revenue and/or earnings and potential for above-average capital appreciation. The LKCM Equity Fund seeks to maximize long-term capital appreciation by investing under normal circumstances at least 80% of its net assets (plus any borrowings for investment purposes) in equity securities of companies which the Adviser believes are likely to have above-average growth in revenue and/or earnings, above-average returns on shareholders’ equity, potential for above-average capital appreciation and/or companies that the Adviser believes have attractive relative valuations. The LKCM Balanced Fund seeks current income and long-term capital appreciation by investing primarily in a portfolio of equity and fixed income securities with at least 25% of the Fund’s total assets invested in fixed income securities under normal circumstances. The LKCM Fixed Income Fund seeks current income by investing under normal circumstances at least 80% of its net assets (plus any borrowings for investment purposes) in a portfolio of investment grade corporate and U.S. Government fixed income securities. The LKCM International Equity Fund seeks to maximize long-term capital appreciation by investing primarily in equity securities of non-U.S. companies and invests under normal circumstances at least 80% of its net assets (plus any borrowings for investment purposes) in equity securities.
The following is a summary of significant accounting policies followed by the Funds in preparation of the financial statements. The Funds are investment companies and, accordingly, follow the investment company accounting and reporting guidance of the Financial Accounting Standards Board Accounting Standards Codification Topic 946, Investment Companies.
1. Security Valuation: Equity securities listed or traded on a U.S. securities exchange for which market quotations are readily available are valued at the last quoted sale price on the exchange on which the security is primarily traded. Nasdaq Global Market securities are valued at the Nasdaq Official Closing Price (“NOCP”). Unlisted U.S. equity securities and listed U.S. equity securities not traded on a particular valuation date are valued at the mean of the most recent quoted bid and ask price on the relevant exchanges or markets. Equity securities listed on a foreign exchange for which market quotations are readily available are valued at the last quoted sales price on the exchange on which the security is primarily traded. Debt securities are normally valued at the mean of the closing bid and ask price and/or by using a combination of broker quotations or evaluated prices provided by an independent pricing service. Futures contracts and options on futures contracts are valued at the settlement prices established each day on the principal exchange on which they are traded. Forward contracts are valued based on the forward rate using information provided by an independent pricing service. Other assets and securities for which no market or broker quotations or evaluated prices are readily available are valued by the Adviser in good faith at fair value. Rule 2a-5 under the Investment Company Act of 1940 (the “Valuation Rule”) establishes requirements for determining fair value in good faith for purposes of the Investment Company Act of 1940, including related oversight and reporting requirements. The Valuation Rule also defines when market quotations are “readily available” for purposes of the Investment Company Act of 1940, the threshold for determining whether a Fund must fair value a security. The Valuation Rule permits a Fund’s board to designate the Funds’ primary investment adviser as “valuation designee” to perform the Fund’s fair value determinations subject to board oversight and certain reporting and other requirements intended to ensure that the registered investment company’s board receives the information it needs to oversee the investment adviser’s fair value determinations. The Board has designated the Adviser as valuation designee under the Valuation Rule to perform fair value functions in accordance with the requirements of the Valuation Rule. The Adviser may value securities at fair value in good faith pursuant to the Adviser’s and the
38
Fund’s procedures. The Adviser may use prices provided by independent pricing services to assist in the fair valuation of the Funds’ portfolio securities. For foreign securities held by the LKCM International Equity Fund, such fair value prices generally will be based on such independent pricing services’ proprietary multi-factor models that measure movements in relevant indices, market indicators and other factors between the time the relevant foreign markets have closed and the time the Fund calculates its net asset value, and therefore may differ from quoted or official closing prices for such foreign securities in such foreign markets.
The Trust has adopted accounting standards which establish an authoritative definition of fair value and set out a hierarchy for measuring fair value. These standards require additional disclosures about the various inputs and valuation techniques used to develop the measurements of fair value and a discussion of changes in valuation techniques and related inputs during the period. These standards define fair value as the price that would be received to sell an asset or paid to transfer a liability in an orderly transaction between market participants at the measurement date. The fair value hierarchy is organized into three levels based upon the assumptions (referred to as “inputs”) used in pricing the asset or liability. These standards state that “observable inputs” reflect the assumptions market participants would use in pricing the asset or liability based on market data obtained from independent sources and “unobservable inputs” reflect an entity’s own assumptions about the assumptions market participants would use in pricing the asset or liability. These inputs are summarized in the three broad levels listed below.
| | | | |
| Level 1 | | – | | Quoted unadjusted prices for identical instruments in active markets to which the Trust has access at the date of measurement. |
| | |
| Level 2 | | – | | Quoted prices for similar instruments in active markets; quoted prices for identical or similar instruments in markets that are not active; and model-derived valuations in which all significant inputs and significant value drivers are observable in active markets. Level 2 inputs are those in markets for which there are few transactions, the prices are not current, little public information exists or instances where prices vary substantially over time or among brokered market makers. |
| | |
| Level 3 | | – | | Model derived valuations in which one or more significant inputs or significant value drivers are unobservable. Unobservable inputs are those inputs that reflect the Trust’s own assumptions that market participants would use to price the asset or liability based on the best available information. |
The inputs or methodology used for valuing securities are not necessarily an indication of the risk associated with investing in those securities. As of December 31, 2023, the Funds’ assets carried at fair value were classified as follows:
| | | | | | | | | | | | | | | | | | | | |
| LKCM Small Cap Equity Fund | | | | | | | | |
| | | | |
Description | | Level 1 | | Level 2 | | Level 3 | | Total |
Common Stocks | | | $ | 227,738,401 | | | | $ | — | | | | $ | 0 | (1) | | | $ | 227,738,401 | |
Short-Term Investment | | | | 4,545,035 | | | | | — | | | | | — | | | | | 4,545,035 | |
| | | | | | | | | | | | | | | | | | | | |
Total Investments* | | | $ | 232,283,436 | | | | $ | — | | | | $ | 0 | | | | $ | 232,283,436 | |
| | | | | | | | | | | | | | | | | | | | |
| | | | |
| LKCM Small-Mid Cap Equity Fund | | | | | | | | |
| | | | |
Description | | Level 1 | | Level 2 | | Level 3 | | Total |
Common Stocks | | | $ | 26,715,540 | | | | $ | — | | | | $ | — | | | | $ | 26,715,540 | |
REITs | | | | 288,140 | | | | | — | | | | | — | | | | | 288,140 | |
Short-Term Investments | | | | 1,520,517 | | | | | — | | | | | — | | | | | 1,520,517 | |
| | | | | | | | | | | | | | | | | | | | |
Total Investments* | | | $ | 28,524,197 | | | | $ | — | | | | $ | — | | | | $ | 28,524,197 | |
| | | | | | | | | | | | | | | | | | | | |
| | | | |
| LKCM Equity Fund | | | | | | | | |
| | | | |
Description | | Level 1 | | Level 2 | | Level 3 | | Total |
Common Stocks | | | $ | 490,171,841 | | | | $ | — | | | | $ | — | | | | $ | 490,171,841 | |
Short-Term Investment | | | | 5,278,422 | | | | | — | | | | | — | | | | | 5,278,422 | |
| | | | | | | | | | | | | | | | | | | | |
Total Investments* | | | $ | 495,450,263 | | | | $ | — | | | | $ | — | | | | $ | 495,450,263 | |
| | | | | | | | | | | | | | | | | | | | |
| | | | |
| LKCM Balanced Fund | | | | | | | | |
| | | | |
Description | | Level 1 | | Level 2 | | Level 3 | | Total |
Common Stocks | | | $ | 79,590,970 | | | | $ | — | | | | $ | — | | | | $ | 79,590,970 | |
Corporate Bonds | | | | — | | | | | 33,588,755 | | | | | — | | | | | 33,588,755 | |
Short-Term Investment | | | | 1,395,503 | | | | | — | | | | | — | | | | | 1,395,503 | |
| | | | | | | | | | | | | | | | | | | | |
Total Investments* | | | $ | 80,986,473 | | | | $ | 33,588,755 | | | | $ | — | | | | $ | 114,575,228 | |
| | | | | | | | | | | | | | | | | | | | |
39
| | | | | | | | | | | | | | | | | | | | |
| LKCM Fixed Income Fund | | | | | | | | |
| | | | |
Description | | Level 1 | | Level 2 | | Level 3 | | Total |
Corporate Bonds | | | $ | — | | | | $ | 178,427,855 | | | | $ | — | | | | $ | 178,427,855 | |
U.S. Government Sponsored Entities | | | | — | | | | | 66,590,186 | | | | | — | | | | | 66,590,186 | |
U.S. Government Issues | | | | — | | | | | 34,780,322 | | | | | — | | | | | 34,780,322 | |
Short-Term Investment | | | | 5,654,480 | | | | | — | | | | | — | | | | | 5,654,480 | |
| | | | | | | | | | | | | | | | | | | | |
Total Investments* | | | $ | 5,654,480 | | | | $ | 279,798,363 | | | | $ | — | | | | $ | 285,452,843 | |
| | | | | | | | | | | | | | | | | | | | |
| | | | |
| LKCM International Equity Fund | | | | | | | | |
| | | | |
Description | | Level 1 | | Level 2 | | Level 3 | | Total |
Common Stocks | | | $ | 3,047,327 | | | | $ | 53,279,337 | | | | $ | — | | | | $ | 56,326,664 | |
Preferred Stock | | | | — | | | | | 1,266,175 | | | | | — | | | | | 1,266,175 | |
Short-Term Investments | | | | 2,507,642 | | | | | — | | | | | — | | | | | 2,507,642 | |
| | | | | | | | | | | | | | | | | | | | |
Total Investments* | | | $ | 5,554,969 | | | | $ | 54,545,512 | | | | $ | — | | | | $ | 60,100,481 | |
| | | | | | | | | | | | | | | | | | | | |
| | (1) | Level 3 security valued at $0. |
| | * | Additional information regarding the industry classifications of these investments is disclosed in the Schedule of Investments. |
There were no transfers into or out of Level 1, Level 2 or Level 3 fair value measurements during the reporting period. Transfers between levels are recognized at the end of the reporting period. Below is a reconciliation of Level 3 assets held by the LKCM Small Cap Equity Fund for which significant observable inputs were used to determine fair value.
| | | | | |
| | | Level 3 |
Description | | Common Stocks |
Balance as of December 31, 2022 | | | $ | 0 | (1) |
Purchases | | | | — | |
Sales proceeds | | | | — | |
Realized gain (loss) | | | | — | |
Change in unrealized appreciation/depreciation | | | | — | |
Transfers into/(out of) Level 3 | | | | — | |
| | | | | |
Balance as of December 31, 2023 | | | $ | 0 | (1) |
| | | | | |
| Change in unrealized appreciation/depreciation during the period for Level 3 investments held at December 31, 2023 | | | $ | — | |
| | | | | |
| | (1) | Level 3 security valued at $0. |
2. Recently Issued Accounting Pronouncements: In June 2022, the FASB issued Accounting Standards Update (“ASU”) No. 2022-03, Fair Value Measurement (Topic 820); Fair Value Measurement of Equity Securities Subject to Contractual Sale Restrictions, which provides clarifying guidance that a contractual restriction on the sale of an equity security is not considered part of the unit of account of the equity security and, therefore, is not considered in measuring fair value. The ASU is effective for fiscal years beginning after December 15, 2023, and interim periods within those fiscal years. The Trust has evaluated the ASU and has determined that there is no impact to the Funds’ financial statements.
3. Federal Income Taxes: The Funds have elected to be treated as “regulated investment companies” under Subchapter M of the Internal Revenue Code and each Fund intends to distribute all of its investment company net taxable income and net capital gains to shareholders. Therefore, no federal income tax provision is recorded.
4. Distributions to Shareholders: The LKCM Small Cap Equity Fund, LKCM Small-Mid Cap Equity Fund, LKCM Equity Fund and LKCM International Equity Fund generally intend to declare and pay income dividends and distribute net capital gains, if any, at least on an annual basis. The LKCM Balanced Fund and LKCM Fixed Income Fund generally intend to declare and pay income dividends on a quarterly basis and distribute net capital gains, if any, at least on an annual basis.
5. Foreign Securities: Investing in securities of foreign companies and foreign governments involves special risks and considerations not typically associated with investing in securities of U.S. issuers. These risks include devaluation of currencies and future adverse political and economic developments. Moreover, securities of many foreign companies and foreign governments and their markets may be less liquid and their prices more volatile than those of securities of comparable U.S. companies and securities of the U.S. government.
6. Expense Allocation: Expenses incurred by the Funds are allocated among the Funds based upon (i) relative average net assets, (ii) a specific identification basis as incurred, or (iii) evenly among the Funds, depending on the nature of the expense.
7. Use of Estimates: The preparation of financial statements in conformity with accounting principles generally accepted in the United States of America requires management to make estimates and assumptions that affect the reported amounts of assets and
40
liabilities and disclosure of contingent assets and liabilities at the date of the financial statements and the reported amounts of revenues and expenses during the reporting period. Actual results could differ from those estimates.
8. Guarantees and Indemnifications: In the normal course of business, the Funds enter into contracts with service providers that contain general indemnification clauses. The Funds’ maximum exposure under these arrangements is unknown as this would involve future claims against the Funds that have not yet occurred. Based on experience, the Funds expect the risk of loss to be remote.
9. Security Transactions and Investment Income: Security and shareholder transactions are recorded on the trade date. Realized gains and losses on sales of investments are calculated on the identified cost basis. Dividend income and dividends and distributions to shareholders are recorded on the ex-dividend date. Withholding taxes on foreign dividends have been provided for in accordance with the Funds’ understanding of the applicable jurisdiction’s tax rules and rates. Interest income is recognized on the accrual basis. All discounts and premiums are amortized based on the effective interest method for tax and financial reporting purposes. The Funds may hold the securities of real estate investment trusts (“REITs”). Distributions from such investments may include income, capital gains and return of capital.
10. Other: Distributions from net investment income and realized capital gains are determined in accordance with income tax regulations, which may differ from U.S. GAAP. Certain capital accounts in the consolidated financial statements are periodically adjusted for permanent differences in order to reflect their tax character. These permanent differences are primarily due to the varying treatment of income and gain/loss on portfolio securities held by the Fund and have no impact on net assets or NAV per share.
Accordingly, at December 31, 2023, reclassifications were recorded as follows:
| | | | | | | | | | | | | | | | | | | | | | | | | | | | | | |
| | | LKCM
Small Cap
Equity Fund | | LKCM
Small-Mid Cap
Equity Fund | | LKCM
Equity
Fund | | LKCM
Balanced
Fund | | LKCM
Fixed
Income Fund | | LKCM
International
Equity Fund |
Paid-in capital | | | | $9,526 | | | | | $(5,895) | | | | | $201,984 | | | | | $223,304 | | | | | $ — | | | | | $ — | |
Total distributable earnings | | | | (9,526 | ) | | | | 5,895 | | | | | (201,984 | ) | | | | (223,304 | ) | | | | — | | | | | — | |
11. Restricted and Illiquid Securities: The Funds are permitted to invest in securities that are subject to legal or contractual restrictions on resale including investments considered by the Funds to be illiquid. Restricted securities generally may be resold in transactions exempt from registration. Illiquid investments are investments that the Funds reasonably expect cannot be sold or disposed of in current market conditions within seven calendar days or less in the ordinary course of business without the sale or disposition significantly changing the market value of the investment. A security may be considered illiquid if it lacks a readily available market or if its valuation has not changed for a certain period of time. Disposal of these securities may involve time-consuming negotiations and expense, and prompt sale at the current valuation may be difficult.
B. Investment Advisory and Other Agreements: The Adviser serves as the investment adviser to the Funds under an Investment Advisory Agreement (the “Agreement”). The Adviser receives a fee, computed daily and payable quarterly, at the annual rates presented below as applied to each Fund’s average daily net assets. The Adviser has contractually agreed to waive all or a portion of its management fee and/or reimburse expenses of the Funds through May 1, 2024 in order to limit each Fund’s operating expenses to the annual cap rates presented below. This expense limitation excludes interest, taxes, brokerage commissions, indirect fees and expenses relating to investments in other investment companies, including money market funds, and extraordinary expenses.
For the fiscal year ended December 31, 2023, the Adviser waived the following management fees and/or reimbursed expenses to meet its expense cap obligations:
| | | | | | | | | | | | | | | | | | | | | | | | | | | | | | |
| | | LKCM
Small Cap
Equity Fund | | LKCM
Small-Mid Cap
Equity Fund | | LKCM
Equity
Fund | | LKCM
Balanced
Fund | | LKCM
Fixed
Income Fund | | LKCM
International
Equity Fund |
Annual Management Fee Rate | | | | 0.75% | | | | | 0.75% | | | | | 0.70% | | | | | 0.65% | | | | | 0.50% | | | | | 0.90% | |
Annual Cap on Expenses | | | | 1.00% | | | | | 1.00% | | | | | 0.80% | | | | | 0.80% | | | | | 0.50% | | | | | 1.00% | |
Fees Waived and/or Expenses Reimbursed in 2023 | | | | $140,774 | | | | | $142,893 | | | | | $941,230 | | | | | $269,008 | | | | | $868,939 | | | | | $233,343 | |
The Trust reimburses the Adviser for a portion of compensation paid to the Trust’s Chief Compliance Officer. This compensation is reported as part of the “Trustees’ fees and officer compensation” expense on the Statement of Operations.
U.S. Bancorp Fund Services, LLC (“U.S. Bancorp”), doing business as U.S. Bank Global Fund Services, serves as transfer agent and administrator for the Trust and serves as accounting services agent for the Trust. U.S. Bank, N.A. serves as custodian for the Funds.
Distribution services are performed pursuant to a distribution contract with Quasar Distributors, LLC (“Quasar”), the Trust’s principal underwriter.
The Funds have adopted a Distribution Plan pursuant to Rule 12b-1 under the 1940 Act, under which each Fund may pay an annualized fee of up to 0.75% of its average daily net assets for distribution and other services. Currently, the Board of Trustees has not authorized payments under this plan and, as a result, the Funds currently neither accrue nor pay any fees under the plan.
41
C. Fund Shares: At December 31, 2023, there was an unlimited number of shares of beneficial interest, no par value, authorized, for each Fund. The following table summarizes the activity in shares of each Fund:
| | | | | | | | | | | | | | | | | | | | |
| LKCM Small Cap Equity Fund | | | | | | | | |
| | | Year Ended
December 31, 2023 | | Year Ended
December 31, 2022 |
| | | Shares | | Amount | | Shares | | Amount |
Shares sold | | | | 1,894,299 | | | | $ | 34,598,154 | | | | | 268,696 | | | | $ | 4,860,344 | |
Shares issued to shareholders in reinvestment of distributions | | | | 298,750 | | | | | 5,909,267 | | | | | 239,058 | | | | | 3,824,933 | |
Shares redeemed | | | | (726,227 | ) | | | | (13,264,864 | ) | | | | (756,918 | ) | | | | (13,443,701 | ) |
| | | | | | | | | | | | | | | | | | | | |
Net increase (decrease) | | | | 1,466,822 | | | | $ | 27,242,557 | | | | | (249,164 | ) | | | $ | (4,758,424 | ) |
| | | | | | | | | | | | | | | | | | | | |
Shares Outstanding: | | | | | | | | | | | | | | | | | | | | |
Beginning of period | | | | 10,389,317 | | | | | | | | | | 10,638,481 | | | | | | |
| | | | | | | | | | | | | | | | | | | | |
End of period | | | | 11,856,139 | | | | | | | | | | 10,389,317 | | | | | | |
| | | | | | | | | | | | | | | | | | | | |
| | | | |
| LKCM Small-Mid Cap Equity Fund | | | | | | | | |
| | | Year Ended
December 31, 2023 | | Year Ended
December 31, 2022 |
| | | Shares | | Amount | | Shares | | Amount |
Shares sold | | | | 1,099,254 | | | | $ | 9,759,202 | | | | | 629,277 | | | | $ | 6,667,954 | |
Shares issued to shareholders in reinvestment of distributions | | | | — | | | | | — | | | | | 113,644 | | | | | 879,607 | |
Shares redeemed | | | | (156,022 | ) | | | | (1,363,990 | ) | | | | (118,488 | ) | | | | (1,137,248 | ) |
Redemption fee | | | | | | | | | 34 | | | | | | | | | | 777 | |
| | | | | | | | | | | | | | | | | | | | |
Net increase (decrease) | | | | 943,232 | | | | $ | 8,395,246 | | | | | 624,433 | | | | $ | 6,411,090 | |
| | | | | | | | | | | | | | | | | | | | |
Shares Outstanding: | | | | | | | | | | | | | | | | | | | | |
Beginning of period | | | | 1,933,330 | | | | | | | | | | 1,308,897 | | | | | | |
| | | | | | | | | | | | | | | | | | | | |
End of period | | | | 2,876,562 | | | | | | | | | | 1,933,330 | | | | | | |
| | | | | | | | | | | | | | | | | | | | |
| | | | |
| LKCM Equity Fund | | | | | | | | |
| | | Year Ended
December 31, 2023 | | Year Ended
December 31, 2022 |
| | | Shares | | Amount | | Shares | | Amount |
Shares sold | | | | 814,797 | | | | $ | 26,594,117 | | | | | 931,290 | | | | $ | 31,576,631 | |
Shares issued to shareholders in reinvestment of distributions | | | | 196,635 | | | | | 6,783,890 | | | | | 753,789 | | | | | 23,073,476 | |
Shares redeemed | | | | (1,497,101 | ) | | | | (48,771,530 | ) | | | | (847,249 | ) | | | | (28,634,881 | ) |
Redemption fee | | | | | | | | | — | | | | | | | | | | 1,328 | |
| | | | | | | | | | | | | | | | | | | | |
Net increase (decrease) | | | | (485,669 | ) | | | $ | (15,393,523 | ) | | | | 837,830 | | | | $ | 26,016,554 | |
| | | | | | | | | | | | | | | | | | | | |
Shares Outstanding: | | | | | | | | | | | | | | | | | | | | |
Beginning of period | | | | 14,863,522 | | | | | | | | | | 14,025,692 | | | | | | |
| | | | | | | | | | | | | | | | | | | | |
End of period | | | | 14,377,853 | | | | | | | | | | 14,863,522 | | | | | | |
| | | | | | | | | | | | | | | | | | | | |
| | | | |
| LKCM Balanced Fund | | | | | | | | |
| | | Year Ended
December 31, 2023 | | Year Ended
December 31, 2022 |
| | | Shares | | Amount | | Shares | | Amount |
Shares sold | | | | 147,353 | | | | $ | 3,704,312 | | | | | 327,143 | | | | $ | 8,655,073 | |
Shares issued to shareholders in reinvestment of distributions | | | | 147,221 | | | | | 3,793,144 | | | | | 153,835 | | | | | 3,734,574 | |
Shares redeemed | | | | (399,213 | ) | | | | (9,994,292 | ) | | | | (964,808 | ) | | | | (25,051,598 | ) |
Redemption fee | | | | | | | | | 101 | | | | | | | | | | 1,352 | |
| | | | | | | | | | | | | | | | | | | | |
Net increase (decrease) | | | | (104,639 | ) | | | $ | (2,496,735 | ) | | | | (483,828 | ) | | | $ | (12,660,599 | ) |
| | | | | | | | | | | | | | | | | | | | |
Shares Outstanding: | | | | | | | | | | | | | | | | | | | | |
Beginning of period | | | | 4,477,125 | | | | | | | | | | 4,960,953 | | | | | | |
| | | | | | | | | | | | | | | | | | | | |
End of period | | | | 4,372,486 | | | | | | | | | | 4,477,125 | | | | | | |
| | | | | | | | | | | | | | | | | | | | |
42
| | | | | | | | | | | | | | | | | | | | |
| LKCM Fixed Income Fund | | | | | | | | |
| | | Year Ended
December 31, 2023 | | Year Ended
December 31, 2022 |
| | | Shares | | Amount | | Shares | | Amount |
Shares sold | | | | 2,781,717 | | | | $ | 28,384,982 | | | | | 1,965,505 | | | | $ | 20,344,434 | |
Shares issued to shareholders in reinvestment of distributions | | | | 587,310 | | | | | 5,958,494 | | | | | 389,925 | | | | | 3,975,171 | |
Shares redeemed | | | | (2,977,320 | ) | | | | (30,313,904 | ) | | | | (2,293,487 | ) | | | | (23,577,048 | ) |
Redemption Fee | | | | — | | | | | 100 | | | | | — | | | | | — | |
| | | | | | | | | | | | | | | | | | | | |
Net increase | | | | 391,707 | | | | $ | 4,029,672 | | | | | 61,943 | | | | $ | 742,557 | |
| | | | | | | | | | | | | | | | | | | | |
Shares Outstanding: | | | | | | | | | | | | | | | | | | | | |
Beginning of period | | | | 27,271,035 | | | | | | | | | | 27,209,092 | | | | | | |
| | | | | | | | | | | | | | | | | | | | |
End of period | | | | 27,662,742 | | | | | | | | | | 27,271,035 | | | | | | |
| | | | | | | | | | | | | | | | | | | | |
| | | |
| LKCM International Equity Fund | | | | | | |
| | | Year Ended
December 31, 2023 | | Year Ended
December 31, 2022 |
| | | Shares | | Amount | | Shares | | Amount |
Shares sold | | | | 756,956 | | | | $ | 9,166,966 | | | | | 256,486 | | | | $ | 3,210,994 | |
Shares issued to shareholders in reinvestment of distributions | | | | 51,557 | | | | | 656,838 | | | | | 118,702 | | | | | 1,305,719 | |
Shares redeemed | | | | (118,345 | ) | | | | (1,443,127 | ) | | | | (139,743 | ) | | | | (1,627,393 | ) |
| | | | | | | | | | | | | | | | | | | | |
Net increase | | | | 690,168 | | | | $ | 8,380,677 | | | | | 235,445 | | | | $ | 2,889,320 | |
| | | | | | | | | | | | | | | | | | | | |
Shares Outstanding: | | | | | | | | | | | | | | | | | | | | |
Beginning of period | | | | 4,062,770 | | | | | | | | | | 3,827,325 | | | | | | |
| | | | | | | | | | | | | | | | | | | | |
End of period | | | | 4,752,938 | | | | | | | | | | 4,062,770 | | | | | | |
| | | | | | | | | | | | | | | | | | | | |
D. Security Transactions: Purchases and sales of investment securities, other than short-term investments, for the year ended December 31, 2023 were as follows:
| | | | | | | | | | | | | | | | | | | | |
| | | Purchases | | Sales |
| | | U.S.
Government | | Other | | U.S.
Government | | Other |
LKCM Small Cap Equity Fund | | | $ | — | | | | $ | 76,495,781 | | | | $ | — | | | | $ | 52,572,497 | |
LKCM Small-Mid Cap Equity Fund | | | | — | | | | | 13,460,944 | | | | | — | | | | | 5,949,895 | |
LKCM Equity Fund | | | | — | | | | | 48,567,967 | | | | | — | | | | | 44,084,145 | |
LKCM Balanced Fund | | | | — | | | | | 12,197,074 | | | | | — | | | | | 16,847,421 | |
LKCM Fixed Income Fund | | | | 20,489,977 | | | | | 44,435,618 | | | | | 16,930,434 | | | | | 44,670,939 | |
LKCM International Equity Fund | | | | — | | | | | 14,120,546 | | | | | — | | | | | 5,565,948 | |
E. Tax Information: At December 31, 2023, the components of accumulated earnings (losses) on a tax basis were as follows:
| | | | | | | | | | | | | | | | | | | | | | | | | | | | | | |
| | | LKCM
Small Cap
Equity Fund | | LKCM
Small-Mid Cap
Equity Fund | | LKCM
Equity
Fund | | LKCM
Balanced
Fund | | LKCM
Fixed
Income Fund | | LKCM
International
Equity Fund |
Tax cost | | | $ | 161,453,848 | | | | $ | 22,980,667 | | | | $ | 247,468,342 | | | | $ | 81,633,280 | | | | $ | 292,720,413 | | | | $ | 52,492,229 | |
| | | | | | | | | | | | | | | | | | | | | | | | | | | | | | |
Gross unrealized appreciation | | | $ | 74,070,145 | | | | $ | 6,067,124 | | | | $ | 253,417,670 | | | | $ | 36,121,666 | | | | $ | 1,743,097 | | | | $ | 11,316,264 | |
Gross unrealized depreciation | | | | (3,240,557 | ) | | | | (523,594 | ) | | | | (5,435,255 | ) | | | | (3,179,584 | ) | | | | (9,010,667 | ) | | | | (3,700,601 | ) |
| | | | | | | | | | | | | | | | | | | | | | | | | | | | | | |
Net unrealized appreciation | | | $ | 70,829,588 | | | | $ | 5,543,530 | | | | $ | 247,982,415 | | | | $ | 32,942,082 | | | | $ | (7,267,570 | ) | | | $ | 7,615,663 | |
| | | | | | | | | | | | | | | | | | | | | | | | | | | | | | |
Undistributed ordinary income | | | | — | | | | | — | | | | | 44,462 | | | | | — | | | | | 328,739 | | | | | 581,402 | |
Undistributed long-term capital gain | | | | — | | | | | — | | | | | — | | | | | 22,475 | | | | | — | | | | | — | |
| | | | | | | | | | | | | | | | | | | | | | | | | | | | | | |
Distributable earnings | | | $ | — | | | | $ | — | | | | $ | 44,462 | | | | $ | 22,475 | | | | $ | 328,739 | | | | $ | 581,402 | |
| | | | | | | | | | | | | | | | | | | | | | | | | | | | | | |
Other accumulated losses | | | | (59,978 | ) | | | | (162,339 | ) | | | | (876,125 | ) | | | | — | | | | | (2,372,411 | ) | | | | (3,751,489 | ) |
| | | | | | | | | | | | | | | | | | | | | | | | | | | | | | |
Total distributable earnings | | | $ | 70,769,610 | | | | $ | 5,381,191 | | | | $ | 247,150,752 | | | | $ | 32,964,557 | | | | $ | (9,311,242 | ) | | | $ | 4,445,576 | |
| | | | | | | | | | | | | | | | | | | | | | | | | | | | | | |
The difference between book cost of investments and tax cost of investments is attributable primarily to the tax deferral of losses on wash sales.
43
To the extent the Funds realize future net capital gains, taxable distributions will be reduced by any unused capital loss carryforwards as permitted by the Internal Revenue Code. At December 31, 2023, the capital loss carryforwards were as follows:
| | | | | | | | | | |
| | | Short-Term | | Long-Term |
LKCM Small-Mid Cap Equity Fund | | | $ | — | | | | $ | 162,339 | |
LKCM Fixed Income Fund | | | | 396,545 | | | | | 1,975,866 | |
LKCM International Equity Fund | | | | 801,583 | | | | | 2,949,909 | |
At December 31, 2023, the following Funds deferred, on a tax basis, post-October capital losses of:
| | | | | |
LKCM Equity Fund | | | $ | 876,125 | |
LKCM Small Cap Equity Fund | | | | 59,978 | |
The tax components of dividends paid during the periods shown below were as follows:
| | | | | | | | | | | | | | | | | | | | |
| | | Year Ended December 31, 2023 | | Year Ended December 31, 2022 |
| | | Ordinary
Income | | Long-Term
Capital Gains | | Ordinary
Income | | Long-Term
Capital Gains |
LKCM Small Cap Equity Fund | | | $ | — | | | | $ | 6,260,272 | | | | $ | — | | | | $ | 4,046,906 | |
LKCM Small-Mid Cap Equity Fund | | | | — | | | | | — | | | | | — | | | | | 1,188,908 | |
LKCM Equity Fund | | | | 4,375,883 | | | | | 2,741,827 | | | | | 4,309,581 | | | | | 19,797,528 | |
LKCM Balanced Fund | | | | 1,233,982 | | | | | 2,677,399 | | | | | 1,201,135 | | | | | 2,642,183 | |
LKCM Fixed Income Fund | | | | 6,485,802 | | | | | — | | | | | 4,012,701 | | | | | 321,837 | |
LKCM International Equity Fund | | | | 862,131 | | | | | — | | | | | 1,168,837 | | | | | 578,109 | |
The Funds designated earnings and profits distributed to shareholders upon the redemption of shares during 2023 and 2022 in determining undistributed net capital gains as of December 31, 2023 and 2022.
The Trust has adopted financial reporting rules regarding recognition and measurement of tax positions taken or expected to be taken on a tax return. The Trust has reviewed all open tax years and major jurisdictions and concluded that there is no impact on the Funds’ financial position or results of operations. Tax years that remain open to examination by major tax jurisdictions include tax years ended December 31, 2020 through December 31, 2023 (LKCM Small Cap Equity Fund, LKCM Small-Mid Cap Equity Fund, LKCM Equity Fund, LKCM Balanced Fund and LKCM Fixed Income Fund) and December 31, 2021 through December 31, 2023 (LKCM International Equity Fund). There is no tax liability resulting from unrecognized tax benefits relating to uncertain income tax positions taken or expected to be taken on tax returns as of December 31, 2023. The Funds are not aware of any tax positions for which it is reasonably possible that the total amounts of unrecognized tax benefits will significantly change in the next twelve months. If applicable, the Funds would recognize interest accrued related to unrecognized tax benefits in “interest expense” and penalties in “other expense” on the statement of operations.
F. Other Matters: Investing in the Funds involves risks and the potential loss of all or a portion of your investment. Each Fund is subject to the risk that the securities markets will move down, sometimes rapidly and unpredictably, based on overall economic conditions and other factors, which may negatively affect the Fund’s performance. Factors that affect markets in general, including geopolitical, regulatory, market and economic developments and other developments that impact specific economic sectors, industries, companies and segments of the market, could adversely impact the Fund’s investments and lead to a decline in the value of your investment in a Fund. Geopolitical and other events, including wars, tensions and other conflicts between nations, terrorism, economic uncertainty, trade disputes, pandemics, public health crises, natural disasters and related events have led, and in the future may continue to lead, to instability in world economies and markets generally and reduced liquidity in equity, credit and fixed income markets. In addition, policy changes by the U.S. Government, the U.S. Federal Reserve and/or foreign governments and political events within the U.S. and abroad may cause increased volatility in financial markets, affect investor and consumer confidence and adversely impact the broader financial markets and economy, perhaps suddenly and to a significant degree. Market disruptions have caused, and may continue to cause, broad changes in market value, negative public perceptions concerning these developments, and adverse investor sentiment or publicity. The foregoing may adversely affect, among other things, the value and liquidity of a Fund’s investments, a Fund’s ability to satisfy redemption requests, a Fund’s financial and operational performance, and/or the value of your investment in a Fund.
G. Subsequent Events: In preparing these financial statements, management has evaluated the Funds’ related events and transactions that occurred subsequent to December 31, 2023 through the date the financial statements were issued and has determined that there were no significant subsequent events requiring recognition or disclosure in the financial statements.
H. Other Regulatory Matters: In October 2022, the Securities and Exchange Commission (the “SEC”) adopted a final rule relating to, among other things, to tailored shareholder reports for mutual funds. The rule and form amendments will, among other things, require the Funds to transmit concise and visually engaging shareholder reports that highlight key information. The amendments will require that funds tag information in a structured data format and that certain more in-depth information be made available online and available for delivery free of charge to investors on request. The rule has a compliance date of July 24, 2024. Management is evaluating the impact of the rule on the content of the Funds’ shareholder reports.
44
|
| REPORTOF INDEPENDENT REGISTERED PUBLIC ACCOUNTING FIRM |
To the shareholders and the Board of Trustees of LKCM Funds
Opinion on the Financial Statements and Financial Highlights
We have audited the accompanying statements of assets and liabilities of LKCM Funds (the “Trust”) comprising the LKCM Small Cap Equity Fund, LKCM Small-Mid Cap Equity Fund, LKCM Equity Fund, LKCM Balanced Fund, LKCM Fixed Income Fund, and LKCM International Equity Fund, including the schedules of investments, as of December 31, 2023, the related statements of operations for the year then ended, the statements of changes in net assets for each of the two years in the period then ended, the financial highlights for the periods indicated in the table below, and the related notes. In our opinion, the financial statements and financial highlights present fairly, in all material respects, the financial position of each of the funds constituting the Trust as of December 31, 2023, and the results of their operations for the year then ended, the changes in their net assets for each of the two years in the period then ended, and the financial highlights for the periods listed in the table below, in conformity with accounting principles generally accepted in the United States of America.
| | |
| Individual Fund Comprising the LKCM Funds | | Financial Highlights |
| LKCM Small Cap Equity Fund, LKCM Small-Mid Cap Equity Fund, LKCM Equity Fund, LKCM Balanced Fund, and LKCM Fixed Income Fund | | For the years ended December 31, 2023, 2022, 2021, 2020, and 2019 |
| LKCM International Equity Fund | | For the years ended December 31, 2023, 2022, 2021, 2020, and the period from May 1, 2019 (commencement of operations) through December 31, 2019 |
Basis for Opinion
These financial statements and financial highlights are the responsibility of the Trust’s management. Our responsibility is to express an opinion on the Trust’s financial statements and financial highlights based on our audits. We are a public accounting firm registered with the Public Company Accounting Oversight Board (United States) (PCAOB) and are required to be independent with respect to the Trust in accordance with the U.S. federal securities laws and the applicable rules and regulations of the Securities and Exchange Commission and the PCAOB.
We conducted our audits in accordance with the standards of the PCAOB. Those standards require that we plan and perform the audit to obtain reasonable assurance about whether the financial statements and financial highlights are free of material misstatement, whether due to error or fraud. The Trust is not required to have, nor were we engaged to perform, an audit of its internal control over financial reporting. As part of our audits we are required to obtain an understanding of internal control over financial reporting but not for the purpose of expressing an opinion on the effectiveness of the Trust’s internal control over financial reporting. Accordingly, we express no such opinion.
Our audits included performing procedures to assess the risks of material misstatement of the financial statements and financial highlights, whether due to error or fraud, and performing procedures that respond to those risks. Such procedures included examining, on a test basis, evidence regarding the amounts and disclosures in the financial statements and financial highlights. Our audits also included evaluating the accounting principles used and significant estimates made by management, as well as evaluating the overall presentation of the financial statements and financial highlights. Our procedures included confirmation of securities owned as of December 31, 2023, by correspondence with the custodian. We believe that our audits provide a reasonable basis for our opinion.
Milwaukee, Wisconsin
February 27, 2024
We have served as the auditor of one or more LKCM Funds since 2007.
45
|
| LKCM FUNDS |
| ADDITIONAL INFORMATION |
| December 31, 2023 |
Tax Information: For the fiscal year ended December 31, 2023, certain dividends paid by the Funds may be subject to a maximum tax rate of 23.8%, as provided for by the Jobs & Growth Tax Relief Reconciliation Act of 2003. The percentage of dividends declared from ordinary income designated as qualified dividend income was as follows:
| | | | | |
LKCM Equity Fund | | | | 100.00 | % |
LKCM Balanced Fund | | | | 100.00 | % |
LKCM International Equity Fund | | | | 100.00 | % |
For corporate shareholders, the percentage of ordinary income distributions qualifying for the corporate dividends received deduction for the fiscal year ended December 31, 2023 was as follows:
| | | | | |
LKCM Equity Fund | | | | 100.00 | % |
LKCM Balanced Fund | | | | 96.61 | % |
The Funds hereby designate the following percentages of their ordinary income distributions for the fiscal year ended December 31, 2023 as interest-related dividends under Internal Revenue Code Section 871(k)(1)(C).
| | | | | |
LKCM Balanced Fund | | | | 40.06 | % |
LKCM Fixed Income Fund | | | | 98.24 | % |
The percentage of taxable ordinary income distributions that are designated as short-term capital gain distributions under Internal Revenue Code Section 871(k)(2)(C) for the fiscal year ended December 31, 2023 was as follows:
| | | | | |
LKCM Small Cap Equity Fund | | | | 0.00 | % |
LKCM Small-Mid Cap Equity Fund | | | | 0.00 | % |
LKCM Equity Fund | | | | 0.00 | % |
Availability of Proxy Voting Information: A description of the policies and procedures that the Funds use to determine how to vote proxies relating to their portfolio securities, as well as information regarding how the Funds voted proxies relating to portfolio securities during the most recent 12-month period ended June 30, is available without charge, upon request, by calling toll-free 1-800-688-LKCM or on the SEC website at http://www.sec.gov.
The actual voting records relating to portfolio securities during the twelve month period ended June 30 (as filed with the SEC on Form N-PX) are available without charge, upon request, by calling the Funds toll free at 1-800-688-LKCM or by accessing the SEC’s website at www.sec.gov.
Availability of Quarterly Portfolio Schedule: The Funds file a complete schedule of portfolio holdings with the U.S. Securities and Exchange Commission (the “SEC”) for the first and third quarters of each fiscal year on Part F of Form N-PORT. The Funds’ Part F of Form N-PORT are available on the SEC’s website at www.sec.gov and may be reviewed and copied at the SEC’s Public Reference Room in Washington, D.C. Information on the operation of the Public Reference Room may be obtained by calling 1-800-732-0330. The Funds’ Form Part F of Form N-PORT may also be obtained by calling toll-free 1-800-688-LKCM.
46
Information about the Fund’s Trustees and Officers:
The business and affairs of the Fund are managed under the direction of the Fund’s Board of Trustees. Information pertaining to the Trustees of the Fund is set forth below. The Statement of Additional Information includes additional information about the Fund’s Trustees and officers and is available, without charge, upon request by calling 1-800-688-LKCM.
| | | | | | | | | | |
Name, Address
and Age | | Position(s)
Held with
the Trust | | Term of
Office &
Length
of Time
Served(1) | | Principal Occupation
During Past Five Years | | Number of
Portfolios in
Fund Complex
Overseen by Trustee | | Other
Directorships
Held by Trustee |
| Independent Trustees | | | | | | | | | | |
Richard J. Howell 301 Commerce Street Suite 1600 Fort Worth, TX 76102 Year of Birth: 1942 | | Trustee Chairman of the Audit and Compliance Committee | | Since 2005 Since 2008 | | CPA; Adjunct Faculty at SMU Cox School of Business from 2004 to 2009; Consulting Services, since 2002; Audit Partner, Arthur Andersen LLP from 1974 to 2002. | | 7 | | None |
Larry J. Lockwood 301 Commerce Street Suite 1600 Fort Worth, TX 76102 Year of Birth: 1953 | | Chairman of the Board of Trustees Trustee | | Since 2021 Since 2013 | | C.R. Williams Professor of Finance, Stan Block Endowed Chair in Finance, Department of Finance, Neeley School of Business, Texas Christian University since 1994. | | 7 | | None |
Steven R. Purvis 301 Commerce Street Suite 1600 Fort Worth, TX 76102 Year of Birth: 1964 | | Trustee | | Since 2013 | | Principal, Luther King Capital Management Corporation from 2004 to 2021, Vice President and Portfolio Manager, Luther King Capital Management Corporation from 1996 to 2021. | | 7 | | AZZ Incorporated |
Mauricio Rodriguez 301 Commerce Street Suite 1600 Fort Worth, TX 76102 Year of Birth: 1966 | | Trustee | | Since 2021 | | Chair, Department of Finance, Neeley School of Business; Texas Christian University since 2002. | | 7 | | None |
| Interested Trustees | | | | | | | | | | |
J. Luther King, Jr.(2) 301 Commerce Street Suite 1600 Fort Worth, TX 76102 Year of Birth: 1940 | | Trustee, President and Chief Executive Officer | | Since 1994 | | Chairman, President and Director, Luther King Capital Management Corporation since 1979. | | 7 | | TXO Energy Partners, L.P. |
| (1) | Each Trustee holds office during the lifetime of the Trust until that individual resigns, retires or is otherwise removed or replaced. |
| (2) | Mr. King is considered an “interested person” of the Trust (as defined in the 1940 Act) because of his affiliation with the Adviser. |
47
Information about the Fund’s Trustees and Officers, Continued
| | | | | | |
Name, Address
and Age | | Position(s) Held with the Trust | | Term of Office & Length of Time Served(1) | | Principal Occupation During Past Five Years |
| Principal Officers of the Trust |
J. Luther King, Jr.(2) 301 Commerce Street Suite 1600 Fort Worth, TX 76102 Year of Birth: 1940 | | Trustee, President and Chief Executive Officer | | Since 1994 | | Chairman, President and Director, Luther King Capital Management Corporation since 1979. |
Paul W. Greenwell 301 Commerce Street Suite 1600 Fort Worth, TX 76102 Year of Birth: 1950 | | Vice President | | Since 1996 | | Principal, Luther King Capital Management Corporation since 1986, Vice President and Portfolio Manager, Luther King Capital Management Corporation since 1983. |
Richard Lenart 301 Commerce Street Suite 1600 Fort Worth, TX 76102 Year of Birth: 1966 | | Secretary and Treasurer | | Since 2006 | | Luther King Capital Management Corporation since 2005. |
Jacob D. Smith 301 Commerce Street Suite 1600 Fort Worth, TX 76102 Year of Birth: 1974 | | Chief Financial Officer | | Since 2010 | | General Counsel, Luther King Capital Management Corporation since 2006; Chief Compliance Officer, Luther King Capital Management Corporation from 2006-2022; Principal, Luther King Capital Management Corporation since 2013. |
| | Chief Compliance Officer | | Since 2006 |
| (1) | Each officer holds office during the lifetime of the Trust until that individual resigns, retires or is otherwise removed or replaced. |
| (2) | Mr. King is considered an “interested person” of the Trust (as defined in the 1940 Act) because of his affiliation with the Adviser. |
48
LKCM FUNDS
PRIVACY NOTICE
Our Commitment to Your Privacy
At LKCM Funds, we are committed to safeguarding the confidentiality and privacy of nonpublic personal information about our current and former shareholders. This privacy notice describes the types of nonpublic personal information we collect about you and the sources through which we obtain this information, the purposes for which we obtain and use your nonpublic information, and the policies and procedures we have implemented to protect the privacy of your nonpublic personal information.
How We Protect Your Nonpublic Personal Information
Protecting your nonpublic personal information is an important priority at LKCM Funds. Accordingly, we have implemented policies and procedures designed to safeguard your nonpublic personal information, such as your tax identification number, account and investment history, account numbers, account balances and nonpublic contact information, from unauthorized access or use. Pursuant to these policies and procedures, we maintain various physical, technological, and administrative safeguards to protect the security and confidentiality of your nonpublic personal information, and we adapt these safeguards to respond to evolving technological and other standards.
We do not disclose nonpublic personal information about you to non-affiliated firms, organizations or individuals except as authorized by you or your representatives or as required or permitted by law. We may disclose nonpublic personal information about you to nonaffiliated third parties, such as custodians, brokers, auditors, accountants, and systems and administrative service providers, in connection with the services we provide to you or on your behalf. When we provide nonpublic personal information about you to nonaffiliated third parties for these purposes, we expect them to safeguard your nonpublic personal information, use your nonpublic personal information only for the intended purposes and otherwise abide by applicable law.
How We Obtain Your Nonpublic Personal Information
We collect nonpublic personal information about you from various sources, including documents, new account applications and other information that you or your representatives, custodians, attorneys, accountants or similar parties provide to us, communications that we have with you or your representatives, custodians, attorneys, accountants or similar parties, and documents and other information related to your accounts or investment experience with us.
Please do not hesitate to contact Jacob D. Smith, our Chief Compliance Officer, if you have any questions regarding this privacy notice or the measures we have implemented to protect the privacy of your nonpublic personal information.
49
U.S. Bancorp Fund Services, LLC
P.O. Box 701
Milwaukee, WI 53201-0701
LKCM FUNDS
P.O. Box 701
Milwaukee, WI 53201-0701
| | | | |
Officers and Trustees |
J. Luther King, Jr., CFA, CIC Trustee, President and Chief Executive Officer | | Richard J. Howell Trustee | | Richard Lenart Secretary & Treasurer |
| | |
Paul W. Greenwell Vice President | | Larry J. Lockwood Chairman of the Board of Trustees | | Jacob D. Smith Chief Financial Officer Chief Compliance Officer |
| | |
Steven R. Purvis, CFA Trustee | | Mauricio Rodriguez Trustee | | |
|
Investment Adviser |
Luther King Capital Management Corporation 301 Commerce Street, Suite 1600 Fort Worth, TX 76102 |
Administrator, Transfer Agent, Dividend Paying Agent & Shareholder Servicing Agent |
U.S. Bancorp Fund Services, LLC P.O. Box 701 Milwaukee, WI 53201-0701 |
Custodian |
U.S. Bank, N.A. 1555 N. River Center Drive, Suite 302 Milwaukee, WI 53212 |
Independent Registered Public Accounting Firm |
Deloitte & Touche LLP 555 E. Wells St., Suite 1400 Milwaukee, WI 53202 |
Distributor |
Quasar Distributors, LLC 111 East Kilbourn Avenue, Suite 2200 Milwaukee, WI 53202 |

LKCM Aquinas Catholic Equity Fund
Annual Report
December 31, 2023
Dear Fellow Shareholders:
We report the following performance information for the LKCM Aquinas Catholic Equity Fund for indicated periods ended December 31, 2023:
| | | | | | | | | | | | | | | | | | | | | | | | | | | | | | | | | | | | | | | | |
Fund | | Inception
Date | | NAV @
12/31/23 | | Net
Expense
Ratio*, ** | | Gross
Expense
Ratio** | | One Year
Total
Return
Ended
12/31/23 | | Five Year
Average
Annualized
Return
Ended
12/31/23 | | Ten Year
Average
Annualized
Return
Ended
12/31/23 | | Avg.
Annual
Total
Return
Since
Incept.*** |
LKCM Aquinas Catholic Equity Fund (1) | | | | 07/11/2005 | | | | $ | 16.73 | | | | | 1.00 | % | | | | 1.45 | % | | | | 14.07 | % | | | | 13.78 | % | | | | 8.72 | % | | | | 8.31 | % |
S&P 500® Index (2) | | | | | | | | | | | | | | | | | | | | | | | | 26.29 | % | | | | 15.69 | % | | | | 12.03 | % | | | | 9.86 | % |
Performance data quoted represents past performance and does not guarantee future results. The investment return and principal value of an investment will fluctuate so that an investor’s shares, when redeemed, may be worth more or less than their original cost. Current performance of the Fund may be lower or higher than the performance quoted. Performance data current to the most recent month end may be obtained by calling 1-800-423-6369. Returns would have been lower if Luther King Capital Management Corporation, the Funds’ investment adviser, had not waived a portion of its management fee and/or reimbursed certain expenses of the Fund. Please see Note B to the Notes to the Financial Statements for specific information regarding management fee waiver and/or expense reimbursement arrangements for the Fund. The Fund imposes a 1.00% redemption fee on shares held less than 30 days. If reflected, the fee would reduce performance shown.
| * | Luther King Capital Management Corporation, the Fund’s investment adviser, has contractually agreed to waive all or a portion of its management fee and/or reimburse expenses of the Fund to maintain an expense ratio of 1.00% per annum through May 1, 2024. This expense limitation excludes interest, taxes, brokerage commissions, indirect fees and expenses related to investments in other investment companies, including money market funds, and extraordinary expenses. Investment performance, which is based on the net expense ratio, reflects fee waivers, if any, in effect during the relevant period. In the absence of such waivers, total return would be reduced. LKCM waived management fees and/or reimbursed expenses for the Fund during the fiscal year ended December 31, 2023. |
| ** | Expense ratios above are as reported in the Fund’s current prospectus dated May 1, 2023. Expense ratios reported for other periods in the financial highlights of this report may differ. |
| *** | The assets of the Aquinas Value Fund, Aquinas Growth Fund and Aquinas Small-Cap Fund were acquired by the LKCM Aquinas Value Fund, LKCM Aquinas Growth Fund and LKCM Aquinas Small Cap Fund, respectively, on July 11, 2005. Due to the change in adviser and investment technique, performance is being quoted for the period after the merger. The LKCM Aquinas Small Cap Fund and LKCM Aquinas Growth Fund were reorganized into the LKCM Aquinas Value Fund effective upon the close of business on July 29, 2016, after which the LKCM Aquinas Value Fund’s name, investment strategies and expenses changed to those of the LKCM Aquinas Catholic Equity Fund. The performance shown prior to August 1, 2016 is that of the LKCM Aquinas Value Fund. |
| (1) | Effective upon the close of business on July 29, 2016, the LKCM Aquinas Small Cap Fund and the LKCM Aquinas Growth Fund reorganized into the LKCM Aquinas Value Fund (the “Reorganizations”). Immediately after the Reorganizations were completed, the LKCM Aquinas Value Fund changed its name to the LKCM Aquinas Catholic Equity Fund and its investment strategies and expenses, including the expense limitation agreement, changed to the investment strategies and expenses, including the expense limitation agreement, of the LKCM Aquinas Catholic Equity Fund. The Fund’s performance prior to August 1, 2016 reflects the Fund’s prior investment strategies. |
| (2) | The S&P 500® Index is an unmanaged capitalization-weighted index of 500 selected stocks that is generally considered representative of the performance of large capitalization companies in the U.S. stock market. |
Note: The Index defined above is not available for direct investment and the index performance therefore does not include fees, expenses or taxes.
2023 Review
Entering 2023, headline U.S. inflation was running at a rate of approximately 6.5% and the U.S. unemployment rate was at a half-century low of approximately 3.5%. At that time, approximately ninety-eight percent of CEOs were preparing for a recession in 2023, according to the Conference Board’s CEO Confidence Survey. This pessimism appeared well founded at the time by the historical economic assumption that there is supposed to be a short-term tradeoff between inflation and unemployment. The cost of lowering inflation has historically been resulting higher unemployment. When people lose their jobs – or worry about losing their jobs – they typically rein in spending, which historically leads to reduced demand and, ultimately, lower prices. This is how the U.S. economy operated the last time the Federal Reserve battled high inflation in the 1970s. Fifty years ago, the result was a deep recession, an extended period of muted economic growth, and higher prices aptly labeled stagflation.
We believe the critical factor that helped the U.S. economy avoid a recession in 2023 was the resilience of consumers. Despite ongoing challenges, such as the Russia-Ukraine War and conflict in the Middle East significant bank failures in the spring of 2023, and the persistent pressure of higher interest rates and tighter financial conditions, U.S. economic growth continued to accelerate through the third quarter of 2023. According to the latest data, the U.S. economy grew at an annualized rate of approximately 4.9% in the third quarter of 2023 before inflation. The strength was driven primarily by consumer spending, which grew at a seasonally adjusted annual rate of approximately 3.6%, contributing approximately 2.5% to real growth in Gross Domestic Product (GDP). The recovery in consumption following the pandemic recession was notably strong, surpassing the performance after recent recessions. We believe a resilient labor market, increasing incomes, the surplus of savings from pandemic-related government transfers, and low debt service ratios all played a role in sustaining this resilient spending trend.
We believe the exceptionally robust labor market has been a key driver of robust consumer spending. The pandemic recession witnessed an unprecedented loss of approximately 22 million jobs in the U.S., surpassing any previous economic downturn. However, the recovery appeared to be remarkably swift. In contrast to the prolonged jobless recoveries of the 2001 and 2007 recessions, which took nearly four
2
and six years to regain lost jobs, respectively, the pandemic recession saw a full recovery within just approximately 2.5 years. Notably, approximately five million additional jobs have been created beyond pre-recession levels. The U.S. unemployment rate has consistently stayed below 4% for a record 21 months, marking the lengthiest sub-4% unemployment streak since the 1960s.
The buoyant labor market appears to have generally contributed to an upswing in incomes post-pandemic. Real per capita incomes have ascended since 2022, reaching a year-over-year growth rate not witnessed since early 2015. Increased real income and stimulus payments during the pandemic bolstered consumer wallets. As of October 2023, total consumer bank deposits reached a peak of approximately $17.4 trillion, which we believe have corresponded to diminishing debt service ratios and elevated net worth. Debt service ratios, having stayed below 10% since 2012, were pushed to historical lows primarily as a result of U.S. government transfer payments during the pandemic.
2024 Outlook
We believe the U.S. economy has witnessed three critical peaks: inflation, economic growth, and the Federal Reserve’s policy interest rate. Historically, these dynamics have typically aligned with a broad peak in interest rates and a subsequent steepening of the yield curve. If inflation continues to subside and economic growth softens, we believe central banks will begin to signal interest rate cuts, which should cause U.S. Treasury yields to drift lower.
We believe inflation should continue its decline in 2024, pulled lower by falling shelter costs. The Zillow Rent Index, which measures the changes in new leases, currently reflects an approximate 3.3% increase in shelter costs over the prior year. This figure compares favorably to an approximate 6.5% rise in shelter costs embedded in the latest Consumer Price Index (CPI) reading, which is designed to reflect all existing leases rather than new leases. The shelter component of CPI is important in our view as it comprises roughly one-third of the index. Though inflation should trend lower during 2024 in our view, we believe the era in which inflation tended to undershoot the Federal Reserve’s 2% target and deflation risks occasionally emerged is likely over.
We believe economic growth proved higher than expected during 2023 as government spending and the drawdown of pandemic-era excess savings offset the impact of meaningfully tighter monetary policy. Despite inflation falling, the Federal Reserve continued to tighten monetary policy during 2023. We believe we are unlikely to see a repeat of the 2023 economic tailwind, consisting of a doubling of the U.S. fiscal deficit—unprecedented outside of wartime—and broadly depleted excess consumer savings—particularly by lower income groups. Therefore, we believe economic growth will likely slow in 2024 due to falling consumer savings, plateauing wage gains, lower savings rates, a softening labor market, less fiscal stimulus, and the lagged effects of high interest rates. We believe a critical risk to the year ahead is that the Federal Reserve must precisely calibrate monetary policy when the economy reaches full employment. If the Federal Reserve cuts interest rates too slowly, unemployment could rise; if it cuts interest rates too fast, inflation could rise. Monetary policy decisions will likely hold the key between tepid economic growth and a slight economic contraction over the next twelve to eighteen months. History also suggests that it is difficult to accelerate growth once the economy has reached full employment.
We believe that interest rates are poised to fall around the world. Central banks rapidly increased interest rates to combat surging inflation in many countries. Domestically, the CPI has fallen by nearly two-thirds since its approximate 9.1% peak in June 2022. With the Federal Reserve holding the upper end of its benchmark rate at 5.50% since July of 2023, any further decline in the inflation rate, in our view, will likely result in further monetary tightening in real terms. Monetary policy’s real – or inflation-adjusted – stance has the most significant impact on the economy in our view. We believe that any tightening of real monetary policy into softening economic growth will likely hinder further economic expansion. Accordingly, we believe that central banks in most developed economies will likely loosen interest rates in the year ahead.
We believe that politics will most likely feature prominently in the headlines at home and abroad in the coming year. While the U.S. Presidential election will garner significant attention, there will also be critical elections in India, Indonesia, Mexico, and perhaps the U.K. While the outcome of these elections creates the opportunity for significant policy shifts, we believe markets tend to overestimate the influence of policy shifts on long-term economic trends. Often, the effect of most policy shifts is uncertain and frequently overwhelmed by factors outside the control of governments. In our view, the most significant concern is that the world is passing through a period of peak globalization. The 1990s were a remarkable era of pro-market globalization bookended by the fall of the Berlin Wall in 1989 and the acceptance of China into the World Trade Organization in 2001. While it is impossible to know what the future holds, we believe we are witnessing the fracturing of the old order into two primary trading blocs – one anchored by the U.S. and the other by China. We believe this global fracturing into a multipolar world will affect trade and global economic growth.
We anticipate corporate earnings for the S&P 500® Index for 2023 will be essentially unchanged from 2022 once fourth quarter 2023 earnings are reported. If so, this would suggest that the 26.29% return for the S&P 500® Index in 2023 was largely due to the expansion of the Price/Earnings ratio. In our view, the Price/Earnings ratio expanded during 2023 primarily in response to investors reducing both the odds of a recession and interest rates staying “higher for longer.” We believe corporate earnings are forecasted to grow around 11% in 2024, which may prove optimistic in our view. We believe an economy can grow above potential if it is force-fed rapid credit growth or, as it turns out, massive fiscal stimulus. As the tailwind from excessive fiscal stimulus fades, we believe it will be important for corporate profits to drive the equity markets higher in 2024. Most economic soft landings have historically been derailed by an external shock, such as Iraq’s invasion of Kuwait in 1990, which resulted in sharply higher energy prices. While the U.S. economy currently appears to be coming in for a soft landing, we believe it will not take much of a wobble or external shock, such as the escalating turmoil in the Middle East, to tilt the economy into recession as economic growth likely slows in 2024.
3
LKCM Aquinas Catholic Equity Fund
During the year ended December 31, 2023, the LKCM Aquinas Catholic Equity Fund returned 14.07% against the 26.29% return for the Fund’s benchmark, the S&P 500® Index. During the year, the Fund’s relative performance benefited from underweight positions in the Financials, Healthcare, Real Estate and Utilities sectors, which was offset by overweight positions in the Energy and Industrials sectors. The Fund’s relative performance benefited from stock selection in the Healthcare and Communication Services sectors, which was offset by stock selection decisions in the Consumer Discretionary, Financials and Information Technology sectors. The strong returns for the S&P 500® Index during the past year were predominantly driven by a small number of technology-related companies. While the Fund was invested in some of those companies, our investment strategy focuses on diversification of the Fund’s investments in an effort to minimize portfolio concentration risk.
We continue to believe the companies held by the Fund are well positioned financially, with the ability to raise dividends and/or engage in share buybacks through consistent cash flows generated from operations. Our investment strategy for the Fund continues to focus on investments in higher quality companies with sustainable competitive advantages and the potential for significant free cash generation that can be returned to investors as appropriate based on reinvestment opportunities within their industries. We believe the Fund remains well-positioned for the upcoming year.
J. Luther King, Jr., CFA, CIC
January 16, 2024
The information provided herein represents the opinion of J. Luther King, Jr., CFA, CIC and is not intended to be a forecast of future events, a guarantee of future results, nor investment advice.
Please refer to the Schedule of Investments found on page 8 of the report for more information on Fund holdings. Fund holdings and sector allocations are subject to change and are not recommendations to buy or sell any securities.
Mutual fund investing involves risk. Principal loss is possible. Past performance is not a guarantee of future results. Investments in equity securities are subject to market risks and significant fluctuations in value. Small and medium capitalization funds typically carry additional risks, since smaller companies generally have a higher risk of failure, and, historically, their equity securities have experienced a greater degree of market volatility than equity securities on average. These and other risks are discussed in the Fund’s summary and statutory prospectuses. Since the Fund practices socially responsible investing within the framework provided by the United States Conference of Catholic Bishops’ Socially Responsible Investing Guidelines, the Fund may forego a profitable investment opportunity or sell a security when it may be disadvantageous to do so.
Earnings growth is not a measure of future performance.
Price-earnings ratio is the ratio of a company’s share price to the company’s earnings per share.
Cash flow is the net amount of cash and cash-equivalents being transferred into and out of a business.
The Consumer Price Index (CPI) is a measure of the average change over time in the prices paid by urban consumers for a market basket of consumer goods and services.
Yield curve is a line that plots yields (interest rates) of fixed income securities having equal credit quality but differing maturity dates. The slope of the yield curve gives an idea of future interest rate changes and economic activity. An inverted yield curve signals that interest rates associated with fixed income securities with shorter maturities are higher than interest rates associated with fixed income securities with longer maturities.
Gross domestic product (GDP) is the total monetary or market value of all the finished goods and services produced within a country’s borders in a specific time period.
Must be preceded or accompanied by a current prospectus.
Investors should consider the investment objective, risks and charges and expenses of the Fund carefully before reinvesting. The Fund’s summary prospectus and the prospectus contain this and other information about the Fund. Investors can obtain a summary prospectus and the prospectus by calling 1-800-423-6369. The summary prospectus and the prospectus should be read carefully before investing the in the Fund.
Quasar Distributors, LLC, distributor.
4
PERFORMANCE:
The following information illustrates the historical performance of the LKCM Aquinas Catholic Equity Fund as of December 31, 2023 compared to the Fund’s representative benchmark and peer group indices.
Performance data quoted represents past performance; past performance does not guarantee future results. The graph and table reflect the reinvestment of dividends and other distributions, if any, but do not reflect the deduction of taxes that a shareholder would pay on Fund distributions or the redemption of Fund shares. The investment return and principal value of an investment will fluctuate so that an investor’s shares, when redeemed, may be worth more or less than their original cost. Current performance of the Fund may be lower or higher than the performance quoted. Performance data current to the most recent month end may be obtained by calling 1-800-423-6369. Returns would have been lower if LKCM had not waived a portion of its management fee and/or reimbursed certain expenses of the Fund. Please see Note B to the Notes to the Financial Statements for specific information regarding management fee waiver and/or expense reimbursement arrangements for the Fund. The Fund imposes a 1.00% redemption fee on shares held less than 30 days. If reflected, the fee would reduce performance shown.
An index is an unmanaged portfolio and does not trade or incur any expenses. The Lipper Large-Cap Core Funds Index, however, does reflect the fees and expenses borne by the funds included in that index. One can not invest in an unmanaged index.
AVERAGE ANNUAL TOTAL RETURN (Periods Ended December 31, 2023)(1)
| | | | | | | | | | | | | | | | | | | | |
| | | | | |
| | | Past
1 Year | | Past
5 Years(2) | | Past
10 Years(2) | | Since
Inception(2)(3) |
LKCM Aquinas Catholic Equity Fund | | | | 14.07% | | | | | 13.78% | | | | | 8.72% | | | | | 8.31% | |
S&P 500® Index | | | | 26.29% | | | | | 15.69% | | | | | 12.03% | | | | | 9.86% | |
Lipper Large-Cap Core Funds Index | | | | 24.65% | | | | | 14.32% | | | | | 10.77% | | | | | 8.96% | |
| (1) | Effective upon the close of business on July 29, 2016, the LKCM Aquinas Small Cap Fund and the LKCM Aquinas Growth Fund reorganized into the LKCM Aquinas Value Fund (the “Reorganizations”). At the time the Reorganizations were completed, the LKCM Aquinas Value Fund changed its name to the LKCM Aquinas Catholic Equity Fund (“Fund”) and its investment strategies and expenses, including the expense limitation agreement, changed to the investment strategies and expenses, including the expense limitation agreement, of the Fund. The Fund’s performance prior to August 1, 2016 reflects the Fund’s prior investment strategies. |
| (3) | The assets of the Aquinas Value Fund, Aquinas Growth Fund and Aquinas Small-Cap Fund were acquired by the LKCM Aquinas Value Fund, LKCM Aquinas Growth Fund and LKCM Aquinas Small Cap Fund, respectively, on July 11, 2005. At the time of the reorganization, the Adviser also changed from Aquinas Investment Advisers, Inc. to Luther King Capital Management Corporation. Due to the change in adviser and investment technique, performance is being quoted for the period after the merger. As stated above, the LKCM Aquinas Growth Fund and LKCM Aquinas Small-Cap Fund were reorganized into the LKCM Aquinas Value Fund effective upon the close of business on July 29, 2016, after which the LKCM Aquinas Value Fund’s name, investment strategies and expenses changed to those of the Fund. The performance shown prior to August 1, 2016, is that of the LKCM Aquinas Value Fund. |
A HYPOTHETICAL $10,000 INVESTMENT IN LKCM AQUINAS CATHOLIC EQUITY FUND
(for the ten years ended December 31, 2023)
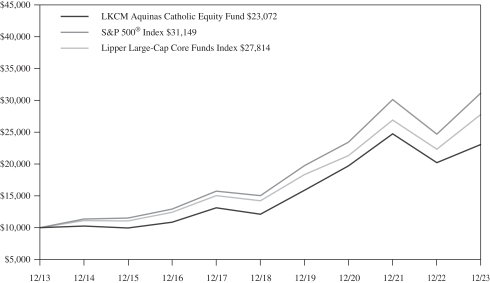
The S&P 500® Index is an unmanaged capitalization-weighted index of 500 selected stocks that is generally considered representative of the performance of large capitalization companies in the U.S. stock market.
The Lipper Large-Cap Core Funds Index is an unmanaged index generally considered representative of large cap core mutual funds tracked by Lipper, Inc.
5
LKCM Aquinas Catholic Equity Fund Expense Example — December 31, 2023 (Unaudited)
As a shareholder of the Fund, you incur two types of costs: (1) transaction costs, including redemption fees; and (2) ongoing costs, including management fees, distribution and/or service (12b-1) fees and other Fund expenses. This Example is intended to help you understand your ongoing costs (in dollars) of investing in the Fund and to compare these costs with the ongoing costs of investing in other mutual funds. The Example is based on an investment of $1,000 invested at the beginning of the period and held for the entire period (07/01/2023-12/31/2023).
ACTUAL EXPENSES
The third and fourth columns of the table below provide information about actual account values and actual expenses. You may use the information in these columns, together with the amount you invested, to estimate the expenses that you paid over the period. Simply divide your account value by $1,000 (for example, an $8,600 account value divided by $1,000 = 8.6), then multiply the result by the number in the fourth column under the heading entitled “Expenses Paid During Period” to estimate the expenses you paid on your account during this period. Although the Fund charges no sales load, you will be assessed fees for outgoing wire transfers, returned checks and stop payment orders at prevailing rates charged by U.S. Bancorp Fund Services, LLC (doing business as U.S. Bank Global Fund Services), the Fund’s transfer agent. If you request that a redemption be made by wire transfer, currently a $15.00 fee is charged by the Fund’s transfer agent. You will be charged a redemption fee equal to 1.00% of the net amount of the redemption if you redeem your shares of the Fund within 30 days of purchase, unless otherwise determined by the Fund in its discretion. To the extent the Fund invests in shares of other investment companies as part of its investment strategy, you will indirectly bear your proportionate share of any fees and expenses charged by the underlying funds in which the Fund invests in addition to the expenses of the Fund. Actual expenses of the underlying funds are expected to vary among the various underlying funds. These expenses are not included in the example below. The example below includes management fees, registration fees and other expenses. However, the example below does not include portfolio trading commissions and related expenses and other extraordinary expenses as determined under generally accepted accounting principles.
HYPOTHETICAL EXAMPLES FOR COMPARISON PURPOSES
The fifth and sixth columns of the table below provide information about hypothetical account values and hypothetical expenses based on the Fund’s actual expense ratio and an assumed rate of return of 5% per year before expenses, which is not the Fund’s actual return. The hypothetical account values and expenses may not be used to estimate the actual ending account balance or expenses you paid for the period. You may use this information to compare the ongoing costs of investing in the Fund and other funds. To do so, compare this 5% hypothetical example with the 5% hypothetical examples that appear in the shareholder reports of the other funds. Please note that the expenses shown in the table are meant to highlight your ongoing costs only and do not reflect any transactional costs, such as redemption fees. Therefore, the fifth and sixth columns of the table are useful in comparing ongoing costs only, and will not help you determine the relative total costs of owning different funds. In addition, if these transaction costs were included, your costs would have been higher.
| | | | | | | | | | | | | | | | | | | | | | | | | | | | | | |
| | | Fund’s
Annualized
Expense
Ratio(1) | | Beginning
Account Value
07/01/2023 | | Actual | | Hypothetical (5% return
before expenses) |
| | | Ending
Account Value
12/31/2023 | | Expenses
Paid
During
Period(1) | | Ending
Account Value
12/31/2023 | | Expenses
Paid
During
Period(1) |
LKCM Aquinas Catholic Equity Fund | | | | 1.00 | % | | | $ | 1,000.00 | | | | $ | 1,047.50 | | | | $ | 5.16 | | | | $ | 1,020.16 | | | | $ | 5.09 | |
| (1) | Expenses are equal to the annualized net expense ratio for the Fund, multiplied by the average account value over the period, multiplied by 184/365 (to reflect the one-half year period). |
6
ALLOCATION OF PORTFOLIO HOLDINGS — LKCM Aquinas Catholic Equity Fund — December 31, 2023
Percentages represent market value as a percentage of total investments.
LKCM Aquinas Catholic Equity Fund
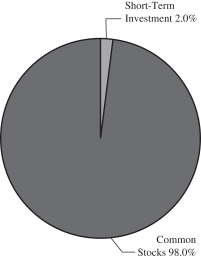
7
|
| LKCM AQUINAS CATHOLIC EQUITY FUND |
| SCHEDULEOF INVESTMENTS |
| as of December 31, 2023 |
| | | | | | | | | | |
| COMMON STOCKS - 98.1% | | Shares | | Value |
| Aerospace & Defense - 2.3% | | | | |
L3Harris Technologies, Inc. | | | | 6,300 | | | | $ | 1,326,906 | |
| | | | | | | | | | |
| Banks - 0.8% | | | | |
Cullen/Frost Bankers, Inc. | | | | 4,000 | | | | | 433,960 | |
| | | | | | | | | | |
| Beverages - 4.8% | | | | |
Keurig Dr Pepper, Inc. | | | | 27,500 | | | | | 916,300 | |
PepsiCo, Inc. | | | | 11,000 | | | | | 1,868,240 | |
| | | | | | | | | | |
| | | | | | | | | 2,784,540 | |
| | | | | | | | | | |
| Broadline Retail - 2.1% | | | | |
Amazon.com, Inc. (a) | | | | 8,000 | | | | | 1,215,520 | |
| | | | | | | | | | |
| Chemicals - 11.3% | | | | |
Air Products & Chemicals, Inc. | | | | 4,000 | | | | | 1,095,200 | |
Albemarle Corp. | | | | 6,500 | | | | | 939,120 | |
Corteva, Inc. | | | | 22,500 | | | | | 1,078,200 | |
DuPont de Nemours, Inc. | | | | 12,000 | | | | | 923,160 | |
Ecolab, Inc. | | | | 5,000 | | | | | 991,750 | |
Sherwin-Williams Co. | | | | 5,000 | | | | | 1,559,500 | |
| | | | | | | | | | |
| | | | | | | | | 6,586,930 | |
| | | | | | | | | | |
| Construction Materials - 1.7% | | | | |
Martin Marietta Materials, Inc. | | | | 2,000 | | | | | 997,820 | |
| | | | | | | | | | |
| Consumer Finance - 2.6% | | | | |
American Express Company | | | | 8,000 | | | | | 1,498,720 | |
| | | | | | | | | | |
Electronic Equipment, Instruments &
Components - 4.6% | | | | |
Teledyne Technologies, Inc. (a) | | | | 3,000 | | | | | 1,338,870 | |
Trimble, Inc. (a) | | | | 25,000 | | | | | 1,330,000 | |
| | | | | | | | | | |
| | | | | | | | | 2,668,870 | |
| | | | | | | | | | |
| Food Products - 2.1% | | | | |
Kraft Heinz Co. | | | | 32,500 | | | | | 1,201,850 | |
| | | | | | | | | | |
| Health Care Equipment & Supplies - 4.6% | | | | |
Alcon, Inc. (b) | | | | 13,500 | | | | | 1,054,620 | |
Stryker Corp. | | | | 5,500 | | | | | 1,647,030 | |
| | | | | | | | | | |
| | | | | | | | | 2,701,650 | |
| | | | | | | | | | |
| Industrial Conglomerates - 2.5% | | | | |
Honeywell International, Inc. | | | | 7,000 | | | | | 1,467,970 | |
| | | | | | | | | | |
| Interactive Media & Services - 4.7% | | | | |
Alphabet, Inc. - Class A (a) | | | | 19,500 | | | | | 2,723,955 | |
| | | | | | | | | | |
| IT Services - 2.5% | | | | |
Akamai Technologies, Inc. (a) | | | | 12,500 | | | | | 1,479,375 | |
| | | | | | | | | | |
| Machinery - 3.1% | | | | |
Chart Industries, Inc. (a) | | | | 8,500 | | | | | 1,158,805 | |
Illinois Tool Works Inc. | | | | 2,500 | | | | | 654,850 | |
| | | | | | | | | | |
| | | | | | | | | 1,813,655 | |
| | | | | | | | | | |
| Marine Transportation - 2.2% | | | | |
Kirby Corp. (a) | | | | 16,500 | | | | | 1,294,920 | |
| | | | | | | | | | |
| Oil, Gas & Consumable Fuels - 9.9% | | | | |
Chevron Corp. | | | | 6,500 | | | | | 969,540 | |
Devon Energy Corp. | | | | 28,000 | | | | | 1,268,400 | |
Diamondback Energy Inc. | | | | 5,000 | | | | | 775,400 | |
Kinder Morgan, Inc. | | | | 60,000 | | | | | 1,058,400 | |
| | | | | | | | | | |
| COMMON STOCKS | | Shares | | Value |
| Oil, Gas & Consumable Fuels - 9.9%, Continued | | |
Permian Resources Corp. | | | | 60,000 | | | | $ | 816,000 | |
Pioneer Natural Resources Co. | | | | 4,000 | | | | | 899,520 | |
| | | | | | | | | | |
| | | | | | | | | 5,787,260 | |
| | | | | | | | | | |
| Pharmaceuticals - 3.4% | | | | |
Zoetis, Inc. | | | | 10,000 | | | | | 1,973,700 | |
| | | | | | | | | | |
| Professional Services - 4.4% | | | | |
Broadridge Financial Solutions, Inc. | | | | 5,500 | | | | | 1,131,625 | |
Verisk Analytics, Inc. | | | | 6,000 | | | | | 1,433,160 | |
| | | | | | | | | | |
| | | | | | | | | 2,564,785 | |
| | | | | | | | | | |
Semiconductors & Semiconductor
Equipment - 2.0% | | | | |
NVIDIA Corp. | | | | 2,300 | | | | | 1,139,006 | |
| | | | | | | | | | |
| Software - 16.0% | | | | |
Adobe, Inc. (a) | | | | 3,700 | | | | | 2,207,420 | |
Microsoft Corp. | | | | 7,500 | | | | | 2,820,300 | |
Oracle Corp. | | | | 20,000 | | | | | 2,108,600 | |
Roper Technologies, Inc. | | | | 4,000 | | | | | 2,180,680 | |
| | | | | | | | | | |
| | | | | | | | | 9,317,000 | |
| | | | | | | | | | |
| Specialty Retail - 5.5% | | | | |
Academy Sports & Outdoors, Inc. | | | | 27,500 | | | | | 1,815,000 | |
Home Depot, Inc. | | | | 4,000 | | | | | 1,386,200 | |
| | | | | | | | | | |
| | | | | | | | | 3,201,200 | |
| | | | | | | | | | |
| Technology Hardware, Storage & Peripherals - 3.6% | | |
Apple Inc. | | | | 11,000 | | | | | 2,117,830 | |
| | | | | | | | | | |
| Textiles, Apparel & Luxury Goods - 1.4% | | | | |
Ralph Lauren Corp. | | | | 5,800 | | | | | 836,360 | |
| | | | | | | | | | |
TOTAL COMMON STOCKS
(Cost $29,065,687) | | | | | | | | | 57,133,782 | |
| | | | | | | | | | |
| | | | | | | | | | |
| SHORT-TERM INVESTMENT - 2.0% | | | | |
| Money Market Fund - 2.0% | | | | |
Invesco Short-Term Investments Trust - Government & Agency Portfolio - Institutional Shares, 5.27% (c) | | | | 1,158,727 | | | | | 1,158,727 | |
| | | | | | | | | | |
TOTAL SHORT-TERM INVESTMENT | | | | | | | | | | |
(Cost $1,158,727) | | | | | | | | | 1,158,727 | |
| | | | | | | | | | |
TOTAL INVESTMENTS - 100.1% | | | | | | | | | | |
(Cost $30,224,414) | | | | | | | | $ | 58,292,509 | |
Liabilities in Excess of Other Assets - (0.1)% | | | | | | | | | (69,359 | ) |
| | | | | | | | | | |
TOTAL NET ASSETS - 100.0% | | | | | | | | $ | 58,223,150 | |
| | | | | | | | | | |
| (a) | Non-income producing security. |
| (b) | Security issued by non-U.S. incorporated company. |
| (c) | The rate shown represents the 7-day effective yield as of December 31, 2023. |
Percentages are stated as a percent of net assets.
The Global Industry Classification Standard (GICS®) was developed by and/or is the exclusive property of MSCI, Inc. and Standard & Poor’s Financial Services LLC (“S&P”). GICS is a service mark of MSCI, Inc. and S&P and has been licensed for use by U.S. Bank Global Fund Services.
The accompanying notes are an integral part of these financial statements.
8
|
| STATEMENTOF ASSETSAND LIABILITIES |
| December 31, 2023 |
| | | | | | | | | | |
|
| LKCM Aquinas Catholic Equity Fund |
| | | | | | | | | | |
Assets | | | | | | | | | | |
Investments, at value* | | | | | | | | $ | 58,292,509 | |
Dividends and interest receivable | | | | | | | | | 50,438 | |
Receivable for Fund shares sold | | | | | | | | | 176 | |
Prepaid expenses and other assets | | | | | | | | | 12,536 | |
| | | | | | | | | | |
Total assets | | | | | | | | | 58,355,659 | |
| | | | | | | | | | |
Liabilities | | | | | | | | | | |
Payable for investment advisory fees | | | | | | | | | 42,044 | |
Payable for distribution expense | | | | | | | | | 27,864 | |
Payable for administrative fees | | | | | | | | | 17,014 | |
Payable for accounting and transfer agent fees and expenses | | | | | | | | | 21,900 | |
Payable for trustees’ fees and officer compensation (Note B) | | | | | | | | | 559 | |
Payable for professional fees | | | | | | | | | 13,290 | |
Payable for custody fees and expenses | | | | | | | | | 1,964 | |
Payable for reports to shareholders | | | | | | | | | 6,107 | |
Payable for Fund shares redeemed | | | | | | | | | 1,736 | |
Accrued expenses and other liabilities | | | | | | | | | 31 | |
| | | | | | | | | | |
Total liabilities | | | | | | | | | 132,509 | |
| | | | | | | | | | |
Net assets | | | | | | | | $ | 58,223,150 | |
| | | | | | | | | | |
Net assets consist of: | | | | | | | | | | |
Paid-in capital | | | | | | | | $ | 30,150,997 | |
Total distributable earnings | | | | | | | | | 28,072,153 | |
| | | | | | | | | | |
Net assets | | | | | | | | $ | 58,223,150 | |
| | | | | | | | | | |
Shares of beneficial interest outstanding
(unlimited shares of no par value authorized) | | | | | | | | | 3,480,085 | |
Net asset value per share
(offering and redemption price) | | | | | | | | $ | 16.73 | |
| | | | | | | | | | |
| | |
* Cost of Investments | | | | | | | | $ | 30,224,414 | |
| | | | | | | | | | |
The accompanying notes are an integral part of these financial statements.
9
|
| STATEMENTOF OPERATIONS |
| Year Ended December 31, 2023 |
| | | | | | | | | | |
|
| LKCM Aquinas Catholic Equity Fund |
| | | | | | | | | | |
Investment Income: | | | | | | | | | | |
Dividends* | | | | | | | | $ | 824,357 | |
Interest | | | | | | | | | 140,058 | |
| | | | | | | | | | |
Total investment income | | | | | | | | | 964,415 | |
| | | | | | | | | | |
| | |
Expenses: | | | | | | | | | | |
Investment advisory fees (Note B) | | | | | | | | | 489,290 | |
Administrative fees | | | | | | | | | 65,851 | |
Accounting and transfer agent fees and expenses | | | | | | | | | 89,457 | |
Distribution expense (Note B) | | | | | | | | | 54,366 | |
Professional fees | | | | | | | | | 31,444 | |
Trustees’ fees and officer compensation (Note B) | | | | | | | | | 32,305 | |
Federal and state registration | | | | | | | | | 31,834 | |
Custody fees and expenses | | | | | | | | | 7,492 | |
Reports to shareholders | | | | | | | | | 26,670 | |
Other | | | | | | | | | 2,106 | |
| | | | | | | | | | |
Total expenses | | | | | | | | | 830,815 | |
Less, expense waiver and/or reimbursement (Note B) | | | | | | | | | (287,159 | ) |
| | | | | | | | | | |
Net expenses | | | | | | | | | 543,656 | |
| | | | | | | | | | |
Net investment income (loss) | | | | | | | | | 420,759 | |
| | | | | | | | | | |
| | |
Realized and Unrealized Gain (Loss): | | | | | | | | | | |
Net realized gain (loss) on: | | | | | | | | | | |
Investments | | | | | | | | $ | 1,138,747 | |
Net change in unrealized appreciation (depreciation) on: | | | | | | | | | | |
Investments | | | | | | | | | 5,515,457 | |
| | | | | | | | | | |
| | |
Net Realized and Unrealized Gain (Loss) | | | | | | | | | 6,654,204 | |
| | | | | | | | | | |
| | |
Net Increase (Decrease) in Net Assets Resulting from Operations | | | | | | | | $ | 7,074,963 | |
| | | | | | | | | | |
| | |
* Net of foreign taxes withheld and/or issuance fees | | | | | | | | $ | 206 | |
| | | | | | | | | | |
The accompanying notes are an integral part of these financial statements.
10
|
| STATEMENTSOF CHANGESIN NET ASSETS |
| | | | | | | | | | | | | | | | | | | | |
|
| LKCM Aquinas Catholic Equity Fund |
|
| |
| | | | |
| | | | | Year Ended
December 31,
2023 | | | | Year Ended
December 31,
2022 |
Operations: | | | | | | | | | | | | | | | | | | | | |
Net investment income | | | | | | | | $ | 420,759 | | | | | | | | | $ | 551,597 | |
Net realized gain | | | | | | | | | 1,138,747 | | | | | | | | | | 2,618,670 | |
Net change in unrealized appreciation (depreciation) | | | | | | | | | 5,515,457 | | | | | | | | | | (14,534,879 | ) |
| | | | | | | | | | | | | | | | | | | | |
Net increase (decrease) in net assets resulting from operations | | | | | | | | | 7,074,963 | | | | | | | | | | (11,364,612 | ) |
| | | | | | | | | | | | | | | | | | | | |
Net Dividends and Distributions to Shareholders: | | | | | | | | | | | | | | | | | | | | |
Net investment income | | | | | | | | | (416,560 | ) | | | | | | | | | (551,601 | ) |
Net realized gain on investments | | | | | | | | | (1,078,666 | ) | | | | | | | | | (2,315,238 | ) |
| | | | | | | | | | | | | | | | | | | | |
Net Dividends and Distributions to Shareholders | | | | | | | | | (1,495,226 | ) | | | | | | | | | (2,866,839 | ) |
| | | | | | | | | | | | | | | | | | | | |
| | | | |
Net increase (decrease) in net assets from Fund share transactions (Note C) | | | | | | | | | 2,560,047 | | | | | | | | | | 398,809 | |
| | | | | | | | | | | | | | | | | | | | |
| | | | |
Total increase (decrease) in net assets | | | | | | | | | 8,139,784 | | | | | | | | | | (13,832,642 | ) |
| | | | |
Net Assets: | | | | | | | | | | | | | | | | | | | | |
Beginning of period | | | | | | | | | 50,083,366 | | | | | | | | | | 63,916,008 | |
| | | | | | | | | | | | | | | | | | | | |
End of period | | | | | | | | $ | 58,223,150 | | | | | | | | | $ | 50,083,366 | |
| | | | | | | | | | | | | | | | | | | | |
The accompanying notes are an integral part of these financial statements.
11
|
| FINANCIAL HIGHLIGHTS |
| SELECTED DATAFOR EACH SHAREOF CAPITAL STOCK OUTSTANDING |
| | | | | | | | | | | | | | | | | | | | | | | | | | | | | | | | | | | | | | | | | | | | | | | | | | |
| | | | | | | | | | |
| LKCM Aquinas Catholic Equity Fund | | | | | | | | | | | | | | | | | | | | |
| | | | | | | | | | |
| | | | | | | | | | | | | | | | | | | | | | | | | | | | | | | | | | | | | | | | | | | | | | | | | | |
| | | | | | | | | | |
| | | | | Year Ended
December 31,
2023 | | | | Year Ended
December 31,
2022 | | | | Year Ended
December 31,
2021 | | | | Year Ended
December 31,
2020 | | | | Year Ended
December 31,
2019 |
| | | | | | | | | | | | | | | | | | | | | | | | | | | | | | | | | | | | | | | | | | | | | | | | | | |
Net asset value, beginning of period | | | | | | | | $ | 15.05 | | | | | | | | | $ | 19.52 | | | | | | | | | $ | 17.53 | | | | | | | | | $ | 15.06 | | | | | | | | | $ | 12.80 | |
| | | | | | | | | | | | | | | | | | | | | | | | | | | | | | | | | | | | | | | | | | | | | | | | | | |
| | | | | | | | | | |
Income (loss) from investment operations: | | | | | | | | | | | | | | | | | | | | | | | | | | | | | | | | | | | | | | | | | | | | | | | | | | |
Net investment income (loss)(1) | | | | | | | | | 0.12 | | | | | | | | | | 0.17 | | | | | | | | | | 0.05 | | | | | | | | | | 0.06 | | | | | | | | | | 0.07 | |
Net realized and unrealized gains (losses) | | | | | | | | | 2.00 | | | | | | | | | | (3.72 | ) | | | | | | | | | 4.40 | | | | | | | | | | 3.59 | | | | | | | | | | 3.92 | |
| | | | | | | | | | | | | | | | | | | | | | | | | | | | | | | | | | | | | | | | | | | | | | | | | | |
Total from investment operations | | | | | | | | | 2.12 | | | | | | | | | | (3.55 | ) | | | | | | | | | 4.45 | | | | | | | | | | 3.65 | | | | | | | | | | 3.99 | |
| | | | | | | | | | | | | | | | | | | | | | | | | | | | | | | | | | | | | | | | | | | | | | | | | | |
| | | | | | | | | | |
Less distributions: | | | | | | | | | | | | | | | | | | | | | | | | | | | | | | | | | | | | | | | | | | | | | | | | | | |
From net investment income | | | | | | | | | (0.12 | ) | | | | | | | | | (0.18 | ) | | | | | | | | | (0.05 | ) | | | | | | | | | (0.06 | ) | | | | | | | | | (0.08 | ) |
From realized capital gains | | | | | | | | | (0.32 | ) | | | | | | | | | (0.74 | ) | | | | | | | | | (2.41 | ) | | | | | | | | | (1.12 | ) | | | | | | | | | (1.65 | ) |
| | | | | | | | | | | | | | | | | | | | | | | | | | | | | | | | | | | | | | | | | | | | | | | | | | |
Total distributions | | | | | | | | | (0.44 | ) | | | | | | | | | (0.92 | ) | | | | | | | | | (2.46 | ) | | | | | | | | | (1.18 | ) | | | | | | | | | (1.73 | ) |
| | | | | | | | | | | | | | | | | | | | | | | | | | | | | | | | | | | | | | | | | | | | | | | | | | |
Redemption fees | | | | | | | | | 0.00 | (2) | | | | | | | | | — | | | | | | | | | | — | | | | | | | | | | — | | | | | | | | | | — | |
| | | | | | | | | | | | | | | | | | | | | | | | | | | | | | | | | | | | | | | | | | | | | | | | | | |
Net asset value, end of period | | | | | | | | $ | 16.73 | | | | | | | | | $ | 15.05 | | | | | | | | | $ | 19.52 | | | | | | | | | $ | 17.53 | | | | | | | | | $ | 15.06 | |
| | | | | | | | | | | | | | | | | | | | | | | | | | | | | | | | | | | | | | | | | | | | | | | | | | |
Total return | | | | | | | | | 14.07 | % | | | | | | | | | -18.17 | % | | | | | | | | | 25.34 | % | | | | | | | | | 24.28 | % | | | | | | | | | 31.16 | % |
Ratios and Supplemental Data: | | | | | | | | | | | | | | | | | | | | | | | | | | | | | | | | | | | | | | | | | | | | | | | | | | |
Net assets, end of period ($000’s) | | | | | | | | $ | 58,223 | | | | | | | | | $ | 50,083 | | | | | | | | | $ | 63,916 | | | | | | | | | $ | 53,862 | | | | | | | | | $ | 47,408 | |
Ratio of expenses to average net assets: | | | | | | | | | | | | | | | | | | | | | | | | | | | | | | | | | | | | | | | | | | | | | | | | | | |
Before expense waiver and/or reimbursement | | | | | | | | | 1.53% | | | | | | | | | | 1.45 | % | | | | | | | | | 1.40 | % | | | | | | | | | 1.48 | % | | | | | | | | | 1.51 | % |
After expense waiver and/or reimbursement | | | | | | | | | 1.00% | | | | | | | | | | 1.00 | % | | | | | | | | | 1.00 | % | | | | | | | | | 1.00 | % | | | | | | | | | 1.00 | % |
Ratio of net investment income (loss) to average net assets: | | | | | | | | | | | | | | | | | | | | | | | | | | | | | | | | | | | | | | | | | | | | | | | | | | |
Before expense waiver and/or reimbursement | | | | | | | | | 0.24% | | | | | | | | | | 0.57 | % | | | | | | | | | (0.15 | )% | | | | | | | | | (0.12 | )% | | | | | | | | | (0.05 | )% |
After expense waiver and/or reimbursement | | | | | | | | | 0.77% | | | | | | | | | | 1.02 | % | | | | | | | | | 0.25 | % | | | | | | | | | 0.36 | % | | | | | | | | | 0.46 | % |
Portfolio turnover rate | | | | | | | | | 16% | | | | | | | | | | 23 | % | | | | | | | | | 18 | % | | | | | | | | | 17 | % | | | | | | | | | 12 | % |
| (1) | Net investment income per share represents net investment income divided by the average shares outstanding throughout the period. |
The accompanying notes are an integral part of these financial statements.
12
|
| LKCM FUNDS |
| NOTESTOTHE FINANCIAL STATEMENTS |
| December 31, 2023 |
A. Organization and Significant Accounting Policies: LKCM Funds (the “Trust”) is registered under the Investment Company Act of 1940 (“1940 Act”) as an open-end, management investment company. The Trust was organized as a Delaware statutory trust on February 10, 1994 and consists of seven diversified series as of December 31, 2023, one of which is presented herein: the LKCM Aquinas Catholic Equity Fund (the “Fund”). On July 11, 2005, the LKCM Aquinas Funds acquired the assets and assumed the liabilities of the Aquinas Funds. Effective upon the close of business on July 29, 2016, the LKCM Aquinas Small Cap Fund and the LKCM Aquinas Growth Fund reorganized into the LKCM Aquinas Value Fund, which changed its name immediately thereafter to the LKCM Aquinas Catholic Equity Fund and its investment strategies and expenses, including the expense limitation agreement, changed to the investment strategies and expenses, including the expense limitation agreement, of the LKCM Aquinas Catholic Equity Fund. The Fund is subject to expenses pursuant to the Rule 12b-1 plan described in Note B. The Fund charges a 1% redemption fee for redemptions of Fund shares held for less than 30 days, unless otherwise determined by the Fund in its discretion.
The LKCM Aquinas Catholic Equity Fund seeks to maximize long-term capital appreciation, while incorporating Catholic values investing principles in the investment process. The LKCM Aquinas Catholic Equity Fund seeks to achieve its investment objective by investing under normal circumstances at least 80% of its net assets (plus any borrowings for investment purposes) in equity securities of companies that Luther King Capital Management Corporation (the “Adviser”) believes are likely to have above-average growth in revenue and/or earnings, above-average returns on shareholders’ equity, potential for above-average capital appreciation, and/or companies the Adviser believes have attractive relative valuations.
The Fund practices socially responsible investing within the framework provided by the United States Conference of Catholic Bishops’ Socially Responsible Investment Guidelines (the “Guidelines”). The Fund’s investment approach incorporates the Guidelines through a combination of screening portfolio companies based on criteria set forth in the Guidelines, dialogue with companies whose policies and practices may conflict with the Guidelines, and/or potentially excluding from the Fund’s portfolio the securities of those companies that are unwilling to alter their policies and practices over a reasonable period of time. The Adviser monitors companies selected for the Fund for policies on various issues contemplated by the Guidelines. If the Fund invests in a company whose policies and practices are inconsistent with the Guidelines, the Adviser may attempt to influence the company, sell the company’s securities or otherwise exclude future investments in such company.
The following is a summary of significant accounting policies followed by the Fund in preparation of the financial statements. The Fund is an investment company and, accordingly, follows the investment company accounting and reporting guidance of the Financial Accounting Standards Board Accounting Standards Codification Topic 946, Investment Companies.
1. Security Valuation: Equity securities listed or traded on a U.S. securities exchange for which market quotations are readily available are valued at the last quoted sale price on the exchange on which the security is primarily traded. Nasdaq Global Market securities are valued at the Nasdaq Official Closing Price (“NOCP”). Unlisted U.S. equity securities and listed U.S. equity securities not traded on a particular valuation date are valued at the mean of the most recent quoted bid and ask price on the relevant exchanges or markets. Equity securities listed on a foreign exchange for which market quotations are readily available are valued at the last quoted sales price on the exchange on which the security is primarily traded. Debt securities are normally valued at the mean of the closing bid and ask price and/or by using a combination of broker quotations or evaluated prices provided by an independent pricing service. Futures contracts and options on futures contracts are valued at the settlement prices established each day on the principal exchange on which they are traded. Forward contracts are valued based on the forward rate using information provided by an independent pricing service. Other assets and securities for which no market or broker quotations or evaluated prices are readily available are valued by the Adviser in good faith at fair value. Rule 2a-5 under the Investment Company Act of 1940 (the “Valuation Rule”) establishes requirements for determining fair value in good faith for purposes of the Investment Company Act of 1940, including related oversight and reporting requirements. The Valuation Rule also defines when market quotations are “readily available” for purposes of the Investment Company Act of 1940, the threshold for determining whether the Fund must fair value a security. The Valuation Rule permits the Fund’s board to designate the Fund’s primary investment adviser as “valuation designee” to perform the Fund’s fair value determinations subject to board oversight and certain reporting and other requirements intended to ensure that the registered investment company’s board receives the information it needs to oversee the investment adviser’s fair value determinations. The Board has designated the Adviser as valuation designee under the Valuation Rule to perform fair value functions in accordance with the requirements of the Valuation Rule. The Adviser may value securities at fair value in good faith pursuant to the Adviser’s and the Fund’s procedures. The Adviser may use prices provided by independent pricing services to assist in the fair valuation of the Fund’s portfolio securities.
The Trust has adopted accounting standards which establish an authoritative definition of fair value and set out a hierarchy for measuring fair value. These standards require additional disclosures about the various inputs and valuation techniques used to develop the measurements of fair value and a discussion of changes in valuation techniques and related inputs during the period. These standards define fair value as the price that would be received to sell an asset or paid to transfer a liability in an orderly transaction between market participants at the measurement date. The fair value hierarchy is organized into three levels based upon
13
the assumptions (referred to as “inputs”) used in pricing the asset or liability. These standards state that “observable inputs” reflect the assumptions market participants would use in pricing the asset or liability based on market data obtained from independent sources and “unobservable inputs” reflect an entity’s own assumptions about the assumptions market participants would use in pricing the asset or liability. These inputs are summarized in the three broad levels listed below.
2. Recently Issued Accounting Pronouncements: In June 2022, the FASB issued Accounting Standards Update (“ASU”) No. 2022-03, Fair Value Measurement (Topic 820); Fair Value Measurement of Equity Securities Subject to Contractual Sale Restrictions, which provides clarifying guidance that a contractual restriction on the sale of an equity security is not considered part of the unit of account of the equity security and, therefore, is not considered in measuring fair value. The ASU is effective for fiscal years beginning after December 15, 2023, and interim periods within those fiscal years. The Trust has evaluated the ASU and has determined that there is no impact to the Funds’ financial statements
| | | | |
| Level 1 | | – | | Quoted unadjusted prices for identical instruments in active markets to which the Trust has access at the date of measurement. |
| | |
| Level 2 | | – | | Quoted prices for similar instruments in active markets; quoted prices for identical or similar instruments in markets that are not active; and model-derived valuations in which all significant inputs and significant value drivers are observable in active markets. Level 2 inputs are those in markets for which there are few transactions, the prices are not current, little public information exists or instances where prices vary substantially over time or among brokered market makers. |
| | |
| Level 3 | | – | | Model derived valuations in which one or more significant inputs or significant value drivers are unobservable. Unobservable inputs are those inputs that reflect the Trust’s own assumptions that market participants would use to price the asset or liability based on the best available information. |
The inputs or methodology used for valuing securities are not necessarily an indication of the risk associated with investing in those securities. As of December 31, 2023, the Fund’s assets carried at fair value were classified as follows:
| | | | | | | | | | | | | | | | | | | | |
| LKCM Aquinas Catholic Equity Fund | | | | | | | | |
| | | | |
Description | | Level 1 | | Level 2 | | Level 3 | | Total |
Common Stocks | | | $ | 57,133,782 | | | | $ | — | | | | $ | — | | | | $ | 57,133,782 | |
Short-Term Investment | | | | 1,158,727 | | | | | — | | | | | — | | | | | 1,158,727 | |
| | | | | | | | | | | | | | | | | | | | |
Total Investments* | | | $ | 58,292,509 | | | | $ | — | | | | $ | — | | | | $ | 58,292,509 | |
| | | | | | | | | | | | | | | | | | | | |
| | * | Additional information regarding the industry classifications of these investments is disclosed in the Schedule of Investments. |
2. Federal Income Taxes: The Fund has elected to be treated as a “regulated investment company” under Subchapter M of the Internal Revenue Code and the Fund intends to distribute all of its investment company net taxable income and net capital gains to shareholders. Therefore, no federal income tax provision is recorded.
3. Distributions to Shareholders: The Fund generally intends to declare and pay income dividends and distribute net capital gain, if any, at least on an annual basis.
4. Foreign Securities: Investing in securities of foreign companies and foreign governments involves special risks and considerations not typically associated with investing in securities of U.S. issuers. These risks include devaluation of currencies and future adverse political and economic developments. Moreover, securities of many foreign companies and foreign governments and their markets may be less liquid and their prices more volatile than those of securities of comparable U.S. companies and securities of the U.S. government.
5. Expense Allocation: Expenses incurred by the Funds in the Trust are allocated among the Funds based upon (i) relative average net assets, (ii) a specific identification basis as incurred, or (iii) evenly among the Funds, depending on the nature of the expense.
6. Use of Estimates: The preparation of financial statements in conformity with accounting principles generally accepted in the United States of America requires management to make estimates and assumptions that affect the reported amounts of assets and liabilities and disclosure of contingent assets and liabilities at the date of the financial statements and the reported amounts of revenues and expenses during the reporting period. Actual results could differ from those estimates.
7. Guarantees and Indemnifications: In the normal course of business, the Fund enters into contracts with service providers that contain general indemnification clauses. The Fund’s maximum exposure under these arrangements is unknown as this would involve future claims against the Fund that have not yet occurred. Based on experience, the Fund expects the risk of loss to be remote.
8. Security Transactions and Investment Income: Security and shareholder transactions are recorded on the trade date. Realized gains and losses on sales of investments are calculated on the identified cost basis. Dividend income and dividends and distributions to shareholders are recorded on the ex-dividend date. Withholding taxes on foreign dividends have been provided for in accordance with the Fund’s understanding of the applicable jurisdiction’s tax rules and rates. Interest income is recognized on the accrual basis. All discounts and premiums are amortized based on the effective interest method for tax and financial reporting purposes. The Fund may hold the securities of real estate investment trusts (“REITs”). Distributions from such investments may include income, capital gains and return of capital.
14
9. Other: Distributions from net investment income and realized capital gains are determined in accordance with income tax regulations, which may differ from U.S. GAAP. Certain capital accounts in the consolidated financial statements are periodically adjusted for permanent differences in order to reflect their tax character. These permanent differences are primarily due to the varying treatment of income and gain/loss on portfolio securities held by the Fund and have no impact on net assets or NAV per share.
Accordingly, at December 31, 2023, reclassifications were recorded as follows for the Fund:
| | | | | |
Paid-in capital | | | $ | 65,555 | |
Total distributable earnings | | | | (65,555 | ) |
10. Restricted and Illiquid Securities: The Fund is permitted to invest in securities that are subject to legal or contractual restrictions on resale including investments considered by the Fund to be illiquid. Restricted securities generally may be resold in transactions exempt from registration. Illiquid investments are investments that the Fund reasonably expects cannot be sold or disposed of in current market conditions within seven calendar days or less in the ordinary course of business without the sale or disposition significantly changing the market value of the investment. A security may be considered illiquid if it lacks a readily available market or if its valuation has not changed for a certain period of time. Disposal of these securities may involve time-consuming negotiations and expense, and prompt sale at the current valuation may be difficult.
B. Investment Advisory and Other Agreements: The Adviser serves as the investment adviser to the Fund under an Investment Advisory Agreement (the “Agreement”). The Adviser receives a fee, computed daily and payable quarterly, at the annual rate presented below as applied to the Fund’s average daily net assets. The Adviser has contractually agreed to waive all or a portion of its management fee and/or reimburse expenses of the Fund through May 1, 2024 in order to limit the Fund’s operating expenses to the annual cap rate presented below. This expense limitation excludes interest, taxes, brokerage commissions, indirect fees and expenses relating to investments in other investment companies, including money market funds, and extraordinary expenses.
For the fiscal year ended December 31, 2023, the Adviser waived the following management fees and/or reimbursed expenses to meet its expense cap obligations:
| | | | | |
| | | LKCM Aquinas
Catholic Equity
Fund |
Annual Management Fee Rate | | | | 0.90% | |
Annual Cap on Expenses | | | | 1.00% | |
Fees Waived and/or Expenses Reimbursed in 2023 | | | $ | 287,159 | |
The Trust reimburses the Adviser for a portion of compensation paid to the Trust’s Chief Compliance Officer. This compensation is reported as part of the “Trustees fees and officer compensation” expense on the Statement of Operations.
U.S. Bancorp Fund Services, LLC (“U.S. Bancorp”), doing business as U.S. Bank Global Fund Services, serves as transfer agent and administrator for the Fund and serves as accounting services agent for the Fund. U.S. Bank, N.A. serves as custodian for the Fund.
Distribution services are performed pursuant to a distribution contract with Quasar Distributors, LLC (“Quasar”), the Trust’s principal underwriter.
The Trust has adopted a Distribution Plan pursuant to Rule 12b-1 for the Fund, under which the Fund may pay an annualized fee of up to 1.00% of its average daily net assets for distribution and other services. However, the Board of Trustees has currently only authorized an annual fee of 0.10% of the average daily net assets for the Fund. Prior to August 1, 2016, the Fund assessed an annual Rule 12b-1 fee of 0.25% of the average daily net assets for the Fund. For the year ended December 31, 2023, fees incurred by the Fund pursuant to the 12b-1 Plan were $54,366.
C. Fund Shares: At December 31, 2023, there was an unlimited number of shares of beneficial interest, no par value, authorized for the Fund. The following table summarizes the activity in shares of the Fund:
| | | | | | | | | | | | | | | | | | | | |
| | | Year Ended
December 31, 2023 | | Year Ended
December 31, 2022 |
| | | Shares | | Amount | | Shares | | Amount |
Shares sold | | | | 435,470 | | | | $ | 6,902,249 | | | | | 178,465 | | | | $ | 2,978,029 | |
Shares issued to shareholders in reinvestment of distributions | | | | 81,975 | | | | | 1,375,552 | | | | | 183,638 | | | | | 2,725,191 | |
Shares redeemed | | | | (365,131 | ) | | | | (5,718,058 | ) | | | | (308,056 | ) | | | | (5,304,853 | ) |
Redemption fee | | | | | | | | | 304 | | | | | | | | | | 442 | |
| | | | | | | | | | | | | | | | | | | | |
Net increase | | | | 152,314 | | | | $ | 2,560,047 | | | | | 54,047 | | | | $ | 398,809 | |
| | | | | | | | | | | | | | | | | | | | |
Shares Outstanding: | | | | | | | | | | | | | | | | | | | | |
Beginning of period | | | | 3,327,771 | | | | | | | | | | 3,273,724 | | | | | | |
| | | | | | | | | | | | | | | | | | | | |
End of period | | | | 3,480,085 | | | | | | | | | | 3,327,771 | | | | | | |
| | | | | | | | | | | | | | | | | | | | |
15
D. Security Transactions: Purchases and sales of investment securities, other than short-term investments, for the Fund for the year ended December 31, 2023 were as follows:
| | | | | | | | | | | | | | | | |
| | | Purchases | | | Sales | |
| | | U.S.
Government | | | Other | | | U.S.
Government | | | Other | |
| | $ | — | | | $ | 9,879,963 | | | $ | — | | | $ | 8,143,206 | |
E. Tax Information: At December 31, 2023, the components of accumulated earnings (losses) on a tax basis for the Fund were as follows:
| | | | |
Tax cost | | $ | 30,224,414 | |
| | | | |
Gross unrealized appreciation | | $ | 28,474,701 | |
Gross unrealized depreciation | | | (406,606 | ) |
| | | | |
Net unrealized appreciation | | $ | 28,068,095 | |
| | | | |
Undistributed ordinary income | | | 9,632 | |
Undistributed long-term capital gain | | | — | |
| | | | |
Distributable earnings | | $ | 9,632 | |
| | | | |
Other accumulated losses | | | (5,574 | ) |
| | | | |
Total distributable earnings | | $ | 28,072,153 | |
| | | | |
At December 31, 2023, the Fund deferred, on a tax basis, post-October capital losses of $5,574.
To the extent the Fund realizes future net capital gains, taxable distributions will be reduced by any unused capital loss carryforwards as permitted by the Internal Revenue Code. At December 31, 2023, the Fund had no capital loss carryforwards.
The tax components of dividends paid during the periods shown below for the Fund were as follows:
| | | | | | | | | | | | | | | | |
| | | Year Ended December 31, 2023 | | | Year Ended December 31, 2022 | |
| | | Ordinary
Income | | | Long-Term
Capital Gains | | | Ordinary
Income | | | Long-Term
Capital Gains | |
LKCM Aquinas Catholic Equity Fund | | $ | 416,560 | | | $ | 1,078,666 | | | $ | 551,601 | | | $ | 2,315,238 | |
The Fund designated earnings and profits distributed to shareholders upon the redemption of shares during 2023 and 2022 in determining undistributed net capital gains as of December 31, 2023 and 2022, respectively.
The Trust has adopted financial reporting rules regarding recognition and measurement of tax positions taken or expected to be taken on a tax return. The Trust has reviewed all open tax years and major jurisdictions and concluded that there is no impact on the Fund’s financial position or results of operations. Tax years that remain open to examination by major tax jurisdictions include tax years ended December 31, 2020 through December 31, 2023. There is no tax liability resulting from unrecognized tax benefits relating to uncertain income tax positions taken or expected to be taken on tax returns as of December 31, 2023. The Fund is not aware of any tax positions for which it is reasonably possible that the total amounts of unrecognized tax benefits will significantly change in the next twelve months. If applicable, the Fund would recognize interest accrued related to unrecognized tax benefits in “interest expense” and penalties in “other expense” on the statement of operations.
F. Other Matters: Investing in the Funds involves risks and the potential loss of all or a portion of your investment. Each Fund is subject to the risk that the securities markets will move down, sometimes rapidly and unpredictably, based on overall economic conditions and other factors, which may negatively affect the Fund’s performance. Factors that affect markets in general, including geopolitical, regulatory, market and economic developments and other developments that impact specific economic sectors, industries, companies and segments of the market, could adversely impact the Fund’s investments and lead to a decline in the value of your investment in a Fund. Geopolitical and other events, including wars, tensions and other conflicts between nations, terrorism, economic uncertainty, trade disputes, pandemics, public health crises, natural disasters and related events have led, and in the future may continue to lead, to instability in world economies and markets generally and reduced liquidity in equity, credit and fixed income markets. In addition, policy changes by the U.S. Government, the U.S. Federal Reserve and/or foreign governments and political events within the U.S. and abroad may cause increased volatility in financial markets, affect investor and consumer confidence and adversely impact the broader financial markets and economy, perhaps suddenly and to a significant degree. Market disruptions have caused, and may continue to cause, broad changes in market value, negative public perceptions concerning these developments, and adverse investor sentiment or publicity. The foregoing may adversely affect, among other things, the value and liquidity of a Fund’s investments, a Fund’s ability to satisfy redemption requests, a Fund’s financial and operational performance, and/or the value of your investment in a Fund.
G. Subsequent Events: In preparing these financial statements, management has evaluated the Fund’s related events and transactions that occurred subsequent to December 31, 2023 through the date the financial statements were issued and has determined that there were no significant subsequent events requiring recognition or disclosure in the financial statements.
16
H. Other Regulatory Matters: In October 2022, the Securities and Exchange Commission (the “SEC”) adopted a final rule relating to, among other things, to tailored shareholder reports for mutual funds. The rule and form amendments will, among other things, require the Fund to transmit concise and visually engaging shareholder reports that highlight key information. The amendments will require that the fund tag information in a structured data format and that certain more in-depth information be made available online and available for delivery free of charge to investors on request. The rule has a compliance date of July 24, 2024. Management is evaluating the impact of the rule on the content of the Fund’s shareholder reports.
17
|
| REPORTOF INDEPENDENT REGISTERED PUBLIC ACCOUNTING FIRM |
To the shareholders and the Board of Trustees of LKCM Funds
Opinion on the Financial Statements and Financial Highlights
We have audited the accompanying statement of assets and liabilities, including the schedule of investments, of LKCM Aquinas Catholic Equity Fund, one of the funds constituting the LKCM Funds (the “Trust”), as of December 31, 2023, the related statement of operations for the year then ended, the statements of changes in net assets for each of the two years in the period then ended, the financial highlights for each of the five years in the period then ended, and the related notes. In our opinion, the financial statements and financial highlights present fairly, in all material respects, the financial position of LKCM Aquinas Catholic Equity Fund of the Trust as of December 31, 2023, and the results of its operations for the year then ended, the changes in its net assets for each of the two years in the period then ended, and the financial highlights for each of the five years in the period then ended, in conformity with accounting principles generally accepted in the United States of America.
Basis for Opinion
These financial statements and financial highlights are the responsibility of the Trust’s management. Our responsibility is to express an opinion on the Trust’s financial statements and financial highlights based on our audits. We are a public accounting firm registered with the Public Company Accounting Oversight Board (United States) (PCAOB) and are required to be independent with respect to the Trust in accordance with the U.S. federal securities laws and the applicable rules and regulations of the Securities and Exchange Commission and the PCAOB.
We conducted our audits in accordance with the standards of the PCAOB. Those standards require that we plan and perform the audit to obtain reasonable assurance about whether the financial statements and financial highlights are free of material misstatement, whether due to error or fraud. The Trust is not required to have, nor were we engaged to perform, an audit of its internal control over financial reporting. As part of our audits we are required to obtain an understanding of internal control over financial reporting but not for the purpose of expressing an opinion on the effectiveness of the Trust’s internal control over financial reporting. Accordingly, we express no such opinion.
Our audits included performing procedures to assess the risks of material misstatement of the financial statements and financial highlights, whether due to error or fraud, and performing procedures that respond to those risks. Such procedures included examining, on a test basis, evidence regarding the amounts and disclosures in the financial statements and financial highlights. Our audits also included evaluating the accounting principles used and significant estimates made by management, as well as evaluating the overall presentation of the financial statements and financial highlights. Our procedures included confirmation of securities owned as of December 31, 2023, by correspondence with the custodian. We believe that our audits provide a reasonable basis for our opinion.
Milwaukee, Wisconsin
February 27, 2024
We have served as the auditor of one or more LKCM Funds since 2007.
18
|
| LKCM AQUINAS CATHOLIC EQUITY FUND |
| ADDITIONAL INFORMATION |
| December 31, 2023 |
Tax Information: For the fiscal year ended December 31, 2023, certain dividends paid by the Fund may be subject to a maximum tax rate of 23.8%, as provided for by the Jobs & Growth Tax Relief Reconciliation Act of 2003. The percentage of dividends declared from ordinary income designated as qualified dividend income was 100.00%.
For corporate shareholders, the percentage of ordinary income distributions qualifying for the corporate dividends received deduction for the fiscal year ended December 31, 2023 was 100.00%.
Availability of Proxy Voting Information: A description of the policies and procedures that the Fund uses to determine how to vote proxies relating to its portfolio securities, as well as information regarding how the Fund voted proxies relating to portfolio securities during the most recent 12-month period ended June 30, is available without charge, upon request, by calling toll-free 1-800-423-6369 or on the SEC website at http://www.sec.gov.
The actual voting records relating to portfolio securities during the twelve month period ended June 30 (as filed with the SEC on Form N-PX) are available without charge, upon request, by calling the Fund toll free at 1-800-423-6369 or by accessing the SEC’s website at www.sec.gov.
Availability of Quarterly Portfolio Schedule: The Fund files a complete schedule of portfolio holdings with the U.S. Securities and Exchange Commission (the “SEC”) for the first and third quarters of each fiscal year on Part F of Form N-PORT. The Fund’s Part F of Form N-PORT is available on the SEC’s website at www.sec.gov and may be reviewed and copied at the SEC’s Public Reference Room in Washington, D.C. Information on the operation of the Public Reference Room may be obtained by calling 1-800-732-0330. The Fund’s Part F of Form N-PORT may also be obtained by calling toll-free 1-800-423-6369.
19
Information about the Fund’s Trustees and Officers:
The business and affairs of the Fund are managed under the direction of the Fund’s Board of Trustees. Information pertaining to the Trustees of the Fund is set forth below. The Statement of Additional Information includes additional information about the Fund’s Trustees and officers and is available, without charge, upon request by calling 1-800-423-6369.
| | | | | | | | | | |
Name, Address
and Age | | Position(s)
Held with
the Trust | | Term of
Office &
Length of Time Served(1) | | Principal Occupation
During Past Five Years | | Number of
Portfolios in
Fund Complex
Overseen
by Trustee | | Other Directorships Held by Trustee |
| Independent Trustees |
Richard J. Howell 301 Commerce Street Suite 1600 Fort Worth, TX 76102 Year of Birth: 1942 | | Trustee Chairman of the Audit and Compliance Committee | | Since 2005 Since 2008 | | CPA; Adjunct Faculty at SMU Cox School of Business from 2004 to 2009; Consulting Services, since 2002; Audit Partner, Arthur Andersen LLP from 1974 to 2002. | | 7 | | None |
Larry J. Lockwood 301 Commerce Street Suite 1600 Fort Worth, TX 76102 Year of Birth: 1953 | | Chairman of the Board of Trustees Trustee | | Since 2021 Since 2013 | | C.R. Williams Professor of Finance, Stan Block Endowed Chair in Finance, Department of Finance, Neeley School of Business, Texas Christian University since 1994. | | 7 | | None |
Steven R. Purvis 301 Commerce Street Suite 1600 Fort Worth, TX 76102 Year of Birth: 1964 | | Trustee | | Since 2013 | | Principal, Luther King Capital Management Corporation from 2004 to 2021, Vice President and Portfolio Manager, Luther King Capital Management Corporation from 1996 to 2021. | | 7 | | AZZ Incorporated |
Mauricio Rodriguez 301 Commerce Street Suite 1600 Fort Worth, TX 76102 Year of Birth: 1966 | | Trustee | | Since 2021 | | Chair, Department of Finance, Neeley School of Business; Texas Christian University since 2002. | | 7 | | None |
| Interested Trustees | | | | | | | | | | |
J. Luther King, Jr.(2) 301 Commerce Street Suite 1600 Fort Worth, TX 76102 Year of Birth: 1940 | | Trustee, President and Chief Executive Officer | | Since 1994 | | Chairman, President and Director, Luther King Capital Management Corporation since 1979. | | 7 | | TXO Partners, L.P. |
| (1) | Each Trustee holds office during the lifetime of the Trust until that individual resigns, retires or is otherwise removed or replaced. |
| (2) | Mr. King is considered an “interested person” of the Trust (as defined in the 1940 Act) because of his affiliation with the Adviser. |
20
| | | | | | |
Information about the Fund’s Trustees and Officers, Continued |
Name, Address and Age | | Position(s) Held with the Trust | | Term of
Office &
Length of Time Served(1) | | Principal Occupation
During Past Five Years |
| Principal Officers of the Trust |
J. Luther King, Jr.(2) 301 Commerce Street Suite 1600 Fort Worth, TX 76102 Year of Birth: 1940 | | Trustee, President and Chief Executive Officer | | Since 1994 | | Chairman, President and Director, Luther King Capital Management Corporation since 1979. |
Paul W. Greenwell 301 Commerce Street Suite 1600 Fort Worth, TX 76102 Year of Birth: 1950 | | Vice President | | Since 1996 | | Principal, Luther King Capital Management Corporation since 1986, Vice President and Portfolio Manager, Luther King Capital Management Corporation since 1983. |
Richard Lenart 301 Commerce Street Suite 1600 Fort Worth, TX 76102 Year of Birth: 1966 | | Secretary and Treasurer | | Since 2006 | | Luther King Capital Management Corporation since 2005. |
Jacob D. Smith 301 Commerce Street Suite 1600 Fort Worth, TX 76102 Year of Birth: 1974 | | Chief Financial Officer Chief Compliance Officer | | Since 2010 Since 2006 | | General Counsel, Luther King Capital Management Corporation since 2006; Chief Compliance Officer, Luther King Capital Management Corporation from 2006-2022; Principal, Luther King Capital Management Corporation since 2013. |
| (1) | Each officer holds office during the lifetime of the Trust until that individual resigns, retires or is otherwise removed or replaced. |
| (2) | Mr. King is considered an “interested person” of the Trust (as defined in the 1940 Act) because of his affiliation with the Adviser. |
21
LKCM FUNDS
PRIVACY NOTICE
Our Commitment to Your Privacy
At LKCM Funds, we are committed to safeguarding the confidentiality and privacy of nonpublic personal information about our current and former shareholders. This privacy notice describes the types of nonpublic personal information we collect about you and the sources through which we obtain this information, the purposes for which we obtain and use your nonpublic information, and the policies and procedures we have implemented to protect the privacy of your nonpublic personal information.
How We Protect Your Nonpublic Personal Information
Protecting your nonpublic personal information is an important priority at LKCM Funds. Accordingly, we have implemented policies and procedures designed to safeguard your nonpublic personal information, such as your tax identification number, account and investment history, account numbers, account balances and nonpublic contact information, from unauthorized access or use. Pursuant to these policies and procedures, we maintain various physical, technological, and administrative safeguards to protect the security and confidentiality of your nonpublic personal information, and we adapt these safeguards to respond to evolving technological and other standards.
We do not disclose nonpublic personal information about you to non-affiliated firms, organizations or individuals except as authorized by you or your representatives or as required or permitted by law. We may disclose nonpublic personal information about you to nonaffiliated third parties, such as custodians, brokers, auditors, accountants, and systems and administrative service providers, in connection with the services we provide to you or on your behalf. When we provide nonpublic personal information about you to nonaffiliated third parties for these purposes, we expect them to safeguard your nonpublic personal information, use your nonpublic personal information only for the intended purposes and otherwise abide by applicable law.
How We Obtain Your Nonpublic Personal Information
We collect nonpublic personal information about you from various sources, including documents, new account applications and other information that you or your representatives, custodians, attorneys, accountants or similar parties provide to us, communications that we have with you or your representatives, custodians, attorneys, accountants or similar parties, and documents and other information related to your accounts or investment experience with us.
Please do not hesitate to contact Jacob D. Smith, our Chief Compliance Officer, if you have any questions regarding this privacy notice or the measures we have implemented to protect the privacy of your nonpublic personal information.
U.S. Bancorp Fund Services, LLC
P.O. Box 701
Milwaukee, WI 53201-0701
LKCM FUNDS
P.O. Box 701
Milwaukee, WI 53201-0701
| | | | |
Officers and Trustees |
J. Luther King, Jr., CFA, CIC Trustee, President and Chief Executive Officer | | Richard J. Howell Trustee | | Richard Lenart Secretary & Treasurer |
| | |
Paul W. Greenwell Vice President | | Larry J. Lockwood Chairman of the Board of Trustees | | Jacob D. Smith Chief Financial Officer Chief Compliance Officer |
| | |
Steven R. Purvis, CFA Trustee | | Mauricio Rodriguez Trustee | | |
|
Investment Adviser |
Luther King Capital Management Corporation 301 Commerce Street, Suite 1600 Fort Worth, TX 76102 |
Administrator, Transfer Agent, Dividend Paying Agent & Shareholder Servicing Agent |
U.S. Bancorp Fund Services, LLC P.O. Box 701 Milwaukee, WI 53201-0701 |
Custodian |
U.S. Bank, N.A. 1555 N. River Center Drive, Suite 302 Milwaukee, WI 53212 |
Independent Registered Public Accounting Firm |
Deloitte & Touche LLP 555 E. Wells St., Suite 1400 Milwaukee, WI 53202 |
Distributor |
Quasar Distributors, LLC 111 East Kilbourn Avenue, Suite 2200 Milwaukee, WI 53202 |
Item 2. Code of Ethics.
The Registrant has adopted a code of ethics that applies to the Registrant’s principal executive officer and principal financial officer. The Registrant has not made any substantive amendments to its code of ethics during the period covered by this report. The Registrant has not granted any waivers from any provisions of the code of ethics during the period covered by this report.
A copy of the Registrant’s Code of Ethics is filed herewith.
Item 3. Audit Committee Financial Expert.
The Registrant’s board of trustees has determined that there is at least one audit committee financial expert serving on its audit committee. Richard J. Howell is the “audit committee financial expert” and is considered to be “independent” as each term is defined in Item 3 of Form N-CSR.
Item 4. Principal Accountant Fees and Services.
The Registrant has engaged its principal accountant to perform audit services, audit-related services, tax services and other services during the past two fiscal years. “Audit services” refer to performing an audit of the Registrant’s annual financial statements or services that are normally provided by the accountant in connection with statutory and regulatory filings or engagements for those fiscal years. “Audit-related services” refer to the assurance and related services by the principal accountant that are reasonably related to the performance of the audit. “Tax services” refer to professional services rendered by the principal accountant for tax compliance, tax advice, and tax planning. The following table details the aggregate fees billed or expected to be billed for each of the last two fiscal years for audit fees, audit-related fees, tax fees and other fees by the principal accountant.
| | | | | | | | |
| | | FYE 12/31/2023 | | | FYE 12/31/2022 | |
Audit Fees | | $ | 172,470 | | | $ | 167,450 | |
Audit-Related Fees | | | — | | | | — | |
Tax Fees | | | 37,820 | | | | 36,720 | |
All Other Fees | | | — | | | | — | |
The audit committee has adopted pre-approval policies and procedures that require the audit committee to pre-approve all audit and non-audit services of the Registrant, including services provided to any entity affiliated with the Registrant.
The percentage of fees billed by Deloitte & Touche LLP applicable to non-audit services pursuant to waiver of pre-approval requirement were as follows:
1
| | | | | | | | |
| | | FYE 12/31/23 | | | FYE 12/31/2022 | |
Audit-Related Fees | | | 0 | % | | | 0 | % |
Tax Fees | | | 0 | % | | | 0 | % |
All Other Fees | | | 0 | % | | | 0 | % |
All of the principal accountant’s hours spent on auditing the Registrant’s financial statements were attributed to work performed by full-time permanent employees of the principal accountant.
The following table indicates the non-audit fees billed or expected to be billed by the Registrant’s accountant for services to the Registrant and to the Registrant’s investment adviser (and any other controlling entity, etc.—not sub-adviser) for the last two years.
| | | | | | | | |
Non-Audit Related Fees | | FYE 12/31/2023 | | | FYE 12/31/2022 | |
Registrant | | $ | 37,820 | | | $ | 36,720 | |
Registrant’s Investment Adviser | | | — | | | | — | |
The audit committee of the board of trustees has considered whether the provision of non-audit services that were rendered to the Registrant’s investment adviser is compatible with maintaining the principal accountant’s independence and has concluded that the provision of such non-audit services by the accountant has not compromised the accountant’s independence.
The Registrant has not been identified by the U.S. Securities and Exchange Commission as having filed an annual report issued by a registered public accounting firm branch or office that is located in a foreign jurisdiction where the Public Company Accounting Oversight Board is unable to inspect or completely investigate because of a position taken by an authority in that jurisdiction.
The Registrant is not a foreign issuer.
Item 5. Audit Committee of Listed Registrants.
Not applicable to Registrants who are not listed issuers (as defined in Rule 10A-3 under the Securities Exchange Act of 1934).
Item 6. Investments.
| (a) | Schedule of Investments is included as part of the report to shareholders filed under Item 1 of this Form. |
Item 7. Disclosure of Proxy Voting Policies and Procedures for Closed-End Management Investment Companies.
Not applicable to open-end investment companies.
Item 8. Portfolio Managers of Closed-End Management Investment Companies.
Not applicable to open-end investment companies.
2
Item 9. Purchases of Equity Securities by Closed-End Management Investment Company and Affiliated Purchasers.
Not applicable to open-end investment companies.
Item 10. Submission of Matters to a Vote of Security Holders.
There have been no material changes to the procedures by which shareholders may recommend nominees to the Registrant’s board of trustees.
Item 11. Controls and Procedures.
| (a) | The Registrant’s Chief Executive Officer and Chief Financial Officer have reviewed the Registrant’s disclosure controls and procedures (as defined in Rule 30a-3(c) under the Investment Company Act of 1940 (the “Act”)) as of a date within 90 days of the filing of this report, as required by Rule 30a-3(b) under the Act and Rules 13a-15(b) or 15d-15(b) under the Securities Exchange Act of 1934. Based on their review, such officers have concluded that the disclosure controls and procedures are effective in ensuring that information required to be disclosed in this report is appropriately recorded, processed, summarized and reported and made known to them by others within the Registrant and by the Registrant’s service provider. |
| (b) | There were no changes in the Registrant’s internal control over financial reporting (as defined in Rule 30a-3(d) under the Act) that occurred during the period covered by this report that have materially affected, or are reasonably likely to materially affect, the Registrant’s internal control over financial reporting. |
Item 12. Disclosure of Securities Lending Activities for Closed-End Management Investment Companies
Not applicable to open-end investment companies.
Item 13. Exhibits.
(2) A separate certification for each principal executive officer and principal financial officer pursuant to Section 302 of the Sarbanes-Oxley Act of 2002. Filed herewith.
(3) Any written solicitation to purchase securities under Rule 23c-1 under the Act sent or given during the period covered by the report by or on behalf of the Registrant to 10 or more persons. Not applicable to open-end investment companies.
(4) Change in the Registrant’s independent public accountant. There was no change in the Registrant’s independent public accountant for the period covered by this report.
3
SIGNATURES
Pursuant to the requirements of the Securities Exchange Act of 1934 and the Investment Company Act of 1940, the Registrant has duly caused this report to be signed on its behalf by the undersigned, thereunto duly authorized.
| | |
LKCM Funds |
| |
By: | | /s/ J. Luther King, Jr., |
| | J. Luther King, Jr., |
| | President |
| |
Date: | | 3/1/2024 |
Pursuant to the requirements of the Securities Exchange Act of 1934 and the Investment Company Act of 1940, this report has been signed below by the following persons on behalf of the Registrant and in the capacities and on the dates indicated.
| | |
| By: | | /s/ J. Luther King, Jr., |
| | J. Luther King, Jr., |
| | President |
| |
| Date: | | 3/1/2024 |
| |
| By: | | /s/ Jacob D. Smith, |
| | Jacob D. Smith, |
| | Chief Financial Officer |
| |
| Date: | | 3/1/2024 |