UNITED STATES
SECURITIES AND EXCHANGE COMMISSION
Washington, D.C. 20549
FORM N-CSR
CERTIFIED SHAREHOLDER REPORT OF REGISTERED
MANAGEMENT INVESTMENT COMPANIES
Investment Company Act file number 811-08352
LKCM Funds
(Exact name of Registrant as specified in charter)
c/o Luther King Capital Management Corporation
301 Commerce Street, Suite 1600
Fort Worth, TX 76102
(Address of principal executive offices) (Zip code)
K&L Gates LLP
1601 K Street, NW
Washington, DC 20006
(Name and address of agent for service)
1-800-688-LKCM and 1-800-423-6369
Registrant’s telephone number, including area code
Date of fiscal year end: December 31
Date of reporting period: December 31, 2021
Item 1. Reports to Stockholders.
| | (a) | Include a copy of the report transmitted to stockholders pursuant to Rule 30e-1 under the Act (17 CFR 270.30e-1). |
LKCM
FUNDS
LKCM Small Cap Equity Fund
LKCM Small-Mid Cap Equity Fund
LKCM Equity Fund
LKCM Balanced Fund
LKCM Fixed Income Fund
LKCM International Equity Fund
Annual Report
December 31, 2021
Dear Fellow Shareholders:
We report the following performance information for the LKCM Funds for indicated periods ended December 31, 2021:
| | | | | | | | | | | | | | | | | | | | | | | | | | | | | | | | | | | | | | | | |
Funds | | Inception
Date | | NAV @
12/31/21 | | Net
Expense
Ratio*,** | | Gross
Expense
Ratio** | | One Year
Total
Return
Ended
12/31/21 | | Five Year
Average
Annualized
Return
Ended
12/31/21 | | Ten Year
Average
Annualized
Return
Ended
12/31/21 | | Avg.
Annual
Total
Return
Since
Incept. |
LKCM Small Cap Equity Fund | | | | 07/14/1994 | | | | $ | 21.54 | | | | | 1.00% | | | | | 1.07% | | | | | 14.49% | | | | | 15.88% | | | | | 11.97% | | | | | 11.20% | |
Russell 2000® Index(1) | | | | | | | | | | | | | | | | | | | | | | | | 14.82% | | | | | 12.02% | | | | | 13.23% | | | | | 9.85% | |
LKCM Small-Mid Cap Equity Fund | | | | 05/02/2011 | | | | $ | 10.97 | | | | | 1.00% | | | | | 1.98% | | | | | 15.37% | | | | | 17.44% | | | | | 12.05% | | | | | 9.99% | |
Russell 2500® Index(2) | | | | | | | | | | | | | | | | | | | | | | | | 18.18% | | | | | 13.75% | | | | | 14.15% | | | | | 11.75% | |
LKCM Equity Fund | | | | 01/03/1996 | | | | $ | 38.69 | | | | | 0.81% | | | | | 0.99% | | | | | 22.48% | | | | | 18.12% | | | | | 14.83% | | | | | 9.93% | |
S&P 500® Index(3) | | | | | | | | | | | | | | | | | | | | | | | | 28.71% | | | | | 18.47% | | | | | 16.55% | | | | | 10.20% | |
LKCM Balanced Fund | | | | 12/30/1997 | | | | $ | 29.21 | | | | | 0.80% | | | | | 0.99% | | | | | 14.01% | | | | | 12.08% | | | | | 11.11% | | | | | 7.50% | |
S&P 500® Index(3) | | | | | | | | | | | | | | | | | | | | | | | | 28.71% | | | | | 18.47% | | | | | 16.55% | | | | | 8.87% | |
Bloomberg U.S. Intermediate | | | | | | | | | | | | | | | | | | | | | | | | | | | | | | | | | | | | | | | | |
Government/Credit Bond Index(4) | | | | | | | | | | | | | | | | | | | | | | | | -1.44% | | | | | 2.91% | | | | | 2.38% | | | | | 4.30% | |
LKCM Fixed Income Fund | | | | 12/30/1997 | | | | $ | 10.87 | | | | | 0.50% | | | | | 0.79% | | | | | -1.54% | | | | | 2.33% | | | | | 2.23% | | | | | 4.01% | |
Bloomberg U.S. Intermediate | | | | | | | | | | | | | | | | | | | | | | | | | | | | | | | | | | | | | | | | |
Government/Credit Bond Index(4) | | | | | | | | | | | | | | | | | | | | | | | | -1.44% | | | | | 2.91% | | | | | 2.38% | | | | | 4.30% | |
LKCM International Equity Fund | | | | 05/01/2019 | | | | $ | 14.50 | | | | | 1.01% | | | | | 1.89% | | | | | 18.00% | | | | | N/A | | | | | N/A | | | | | 15.58% | |
MSCI/EAFE® Index(5) | | | | | | | | | | | | | | | | | | | | | | | | 11.78% | | | | | N/A | | | | | N/A | | | | | 10.55% | |
Performance data quoted represents past performance and does not guarantee future results. The investment return and principal value of an investment will fluctuate so that an investor’s shares, when redeemed, may be worth more or less than the original cost. Current performance of the Funds may be lower or higher than the performance quoted. Performance data current to the most recent month end may be obtained by calling 1-800-688-LKCM. The Funds impose a 1.00% redemption fee on shares held less than 30 days. If reflected, the fee would reduce performance shown.
| * | Luther King Capital Management Corporation, the Funds’ investment adviser, has contractually agreed to waive all or a portion of its management fee and/or reimburse expenses of each Fund to maintain the expense ratios designated in the Funds’ prospectus through May 1, 2022. This expense limitation excludes interest, taxes, brokerage commissions, indirect fees and expenses related to investments in other investment companies, including money market funds, and extraordinary expenses. Investment performance, which is based on the net expense ratio, reflects fee waivers, if any, in effect during the relevant period. In the absence of such waivers, total return would be reduced. LKCM waived management fees and/or reimbursed expenses for each Fund during the fiscal year ended December 31, 2021. |
| ** | Expense ratios above are as reported in the Funds’ current prospectus dated May 1, 2021. Expense ratios reported for other periods in the financial highlights of this report may differ. |
| (1) | The Russell 2000® Index is an unmanaged index which measures the performance of the 2,000 smallest companies in the Russell 3000® Index. |
| (2) | The Russell 2500® Index is an unmanaged index which measures the performance of the 2,500 smallest companies in the Russell 3000® Index. |
| (3) | The S&P 500® Index is an unmanaged capitalization-weighted index of 500 selected stocks that is generally considered representative of the performance of large capitalization companies in the U.S. stock market. |
| (4) | The Bloomberg U.S. Intermediate Government/Credit Bond Index is an unmanaged market value weighted index measuring both the principal price changes of, and income provided by, the underlying universe of securities that comprise the index. Securities included in the index must meet the following criteria: fixed as opposed to variable rate; remaining maturity of one to ten years; minimum outstanding par value of $250 million; rated investment grade or higher by Moody’s Investors Service or equivalent; must be dollar denominated and non-convertible; and must be publicly issued. |
| (5) | The Morgan Stanley Capital International Europe, Australia, Far East Index (“MSCI/EAFE® Index”) is an unmanaged index composed of large-cap and mid-cap securities across 21 European and Pacific Basin countries. The MSCI/EAFE® Index is a recognized international index and is weighted by market capitalization. |
Note: The indices defined above are not available for direct investment and the index performance therefore does not include fees, expenses or taxes.
2021 Review
Despite the many challenges posed by coronavirus variants, 2021 produced the best economic growth since 1984, a third year of double-digit gains in the S&P 500® Index, and relatively low market volatility. Several powerful engines drove the equity markets higher, including monetary and fiscal stimulus, and the distribution of effective vaccines. Much of the focus early in 2021 was fiscal policy, while emphasis shifted to monetary policy as we exited the year. On March 11th President Biden signed the American Rescue Plan which injected an additional $1.9 trillion into the economy. This new legislation allowed for, among other things, additional direct payments to consumers, supplemental unemployment benefits, and aid to local governments. The bond market reacted strongly to the potential for further fiscal stimulus with the yield on the 10-Year Treasury nearly doubling to 1.74% by the end of the first quarter of 2021, which would prove to be the highest yield for the 10-Year Treasury for the year.
The Federal Reserve meeting in June surprised investors by forecasting two 0.25% interest rate hikes in 2023, when previous guidance from the Federal Reserve had been for only one interest rate hike. Long duration government bond yields trended lower in early July, reflecting a worsening growth outlook in response to the Delta variant. The most significant pullback in the equity market, as measured
2
by the S&P 500® Index, during 2021 of approximately 5.2% began in September as long duration bond yields began to rise in apparent anticipation of the Federal Reserve announcing the taper of bond purchases, continued strong inflation readings, and challenges faced by a prominent Chinese real estate development company.
Core inflation returned in 2021 following a 30-year hiatus. Starting in March 2020, the U.S. government created approximately $3 trillion of new bank reserves, sent checks to individuals, and provided forgivable loans to businesses. The U.S. Treasury then borrowed roughly an additional $2 trillion and sent even more checks to individuals. While the ensuing inflation was not a great surprise in our view, the expected duration of the inflation is a matter of great debate. In sum, the fiscal stimulus injected into the economy was equivalent to more than 25% of Gross Domestic Product (GDP). While much of this money went to assist individuals and businesses heavily impacted by the pandemic, these actions stoked demand just as the economy struggled with both production and supply chain challenges. In terms of monetary policy, the Federal Reserve’s “Quantitative Easing” both lowered interest rates and significantly expanded the monetary base. The money supply, as measured by M2, increased 39% from February 2020, a faster rate than any other equivalent time period since 1960.
Despite there being five million fewer people employed, we believe that the U.S. has generally regained the lost economic output brought about by the pandemic. There are approximately 10.6 million job vacancies according to the latest government data, reflecting very strong markets and demand in our view. One component of the labor force disruption has been termed the “Great Resignation.” A record 4.3 million Americans, approximately 2.9% of the workforce, left their jobs in August, which was impacted by an acceleration in workers retiring from the workforce. As a result, the annual increase in the Employment Cost Index rose to approximately 3.7% during the third quarter, which is a level not seen since 2004.
The labor force has expanded to a new high in each economic expansion since World War II. The smallest gain was 2.5% during the aborted double-dip recovery of 1980. Today, the labor force is still 1.5% below the 2019 peak. If the labor force were to expand a meager 2.5% this cycle, the economy would need to add about 6.7 million workers. Following recessions, consumers are historically reticent to spend and businesses to hire, while laid-off workers are eager to gain employment. However, following the pandemic induced recession, consumer spending has been exceptionally robust thanks in part due to fiscal policy. Employers appear to be anxious to hire, but workers have been slower to reenter the labor force.
The equity market, as measured by the S&P 500® Index, rose 28.7% in 2021, including dividends. For most of the past year there was considerable debate among investors regarding the influence of monetary and fiscal policy on the equity market. We believe that monetary and fiscal policy undoubtedly has had a positive impact on short-term economic activity, which is indeed the goal of the policy actions taken in our view. However, the impressive market return in 2021 seemingly was not the result of increased risk appetite among investors as the Price/Earnings ratio of the S&P 500® Index declined slightly during the year. We believe the market return last year was primarily driven by improving business fundamentals reflected in higher than originally forecasted corporate profits. We anticipate continued strength in corporate profits in 2022.
2022 Outlook
The period from the mid-1980’s to 2007 is often referred to economically as the “Great Moderation” and reflected a welcome respite following the volatility of the “Great Inflation” period lasting from 1965 to 1982. If we were to title 2022, it would be the “Great Normalization.” The economic and health policy response to the pandemic materially altered the pattern of daily life, including where and how we work and where and how we consume. The pattern of daily life continues to be disrupted as the Omicron variant has caused pockets of travel restrictions, resumption of curfews in Europe, further delays in plans to return to the office, and resumption of virtual class in some schools. Yet, we believe the coming year will bring several important steps to a return to normal in terms of economic growth, fiscal stimulus, monetary policy, and inflation.
We believe one of the most important economic shifts in the “Great Normalization” will be brought about by the Federal Reserve. In our view, the central bank acted swiftly to help mitigate the economic fallout of the pandemic in two primary ways. First, it rapidly lowered its key interest rate, the Federal Funds Rate, to near zero in March of 2020. Second, the central bank began purchasing significant amounts of U.S. Treasuries and Mortgage-Backed Securities to help keep market interest rates low to stabilize and support the economy. The Federal Reserve has already communicated its goal of ending net new bond purchases by March of 2022. Furthermore, the latest forecast by the Federal Reserve’s interest rate setting body indicates that the central bank is likely to increase its benchmark interest rate by 0.75% in 2022 in three increments. We believe market reaction to central bank policy is often not a function of the action policymakers take. Rather, in our view it is a function of what they do relative to expectations. By sending a clear, hawkish signal now, we believe the central bank has left itself room to appear dovish, even as it tightens monetary policy.
Inflation readings are likely to moderate in 2022 in our view, but the pace of moderation is highly dependent on a combination of challenging variables to forecast. While headline Consumer Price Index (CPI) inflation of 6.8% is remarkable, the underlying composition of the inflation is noteworthy. Supply disruptions and the significant shift in consumer spending from services to goods has pressured the price of goods to outpace services. Over 60% of the core CPI increase, which excludes food and energy, in the past year was due to core goods, which represent 25% of the core CPI basket.
3
We believe policy changes may present the greatest challenges for equities in 2022, as Federal Reserve balance sheet shifts have proven tricky to equities over the past decade and fiscal support appears likely to wane in the coming year. Each period of balance sheet normalization or contraction since 2009 has coincided with an equity market correction, including in 2011, 2015, and 2018. However, we believe there are plenty of potential offsets. Bond yields are negative after accounting for inflation, which may further shift investments from the bond market to the equity market. In addition, we believe other potential offsets include a capital-spending boom, a strong U.S. dollar surge, and peak inflation.
We are constructive on the equity market, as measured by the S&P 500® Index, as we head into 2022. The market has not had a correction, however, which we define as at least a 10% pullback, since the March 2020 low. In our view, we would be surprised to not have at least one market correction in 2022 as shifting monetary policy is generally accompanied by increased market volatility. Moreover, we believe mid-term election years have historically promoted volatility related to various scenarios of election results. Bear markets, defined as a greater than 20% pullback, generally coincide with economic recessions in our view. We believe it would be difficult to see consecutive quarters of negative economic growth in 2022 given the amount of stimulus remaining in the economy. No recession since at least 1960 has emerged before the yield on the 10-Year Treasury fell below the Fed Funds rate. Currently, with this yield differential at positive 1.5%, and we believe the yield curve is far from inverting. Finally, both consumer and corporate balance sheets remain very healthy in our view. Recessions are often marked by extended leverage in the economy which we simply do not believe is present today.
LKCM Small Cap Equity Fund
The LKCM Small Cap Equity Fund returned 14.49% for the year ended December 31, 2021, as compared to the 14.82% return for the Russell 2000® Index, the Fund’s benchmark. The Fund’s relative performance slightly benefited from sector allocation decisions, particularly being overweight the Industrials and Communication Services sectors and being slightly underweight the Healthcare sector relative to the benchmark. Stock selection decisions in the Healthcare, Real Estate, Industrials and Consumer Discretionary sectors benefited the Fund’s relative performance, which was partially offset by stock selection decisions in the Information Technology, Communication Services and Financials sectors that detracted from performance. The Fund also benefited during the year from five portfolio companies being acquired and five portfolio companies graduating out of our small cap investment strategy due to market appreciation. The Fund benefited from our investment strategy that focuses on companies that we believe are high quality as well as our tilt towards growth-oriented companies. The Fund complemented this tilt with quality valued-oriented companies within the portfolio that benefited the Fund’s performance during this past year in which value-oriented companies generally outperformed growth-oriented companies. We anticipate that the Fund will continue to work towards a balanced approach of growth-oriented companies and value-oriented companies and believe that the Fund is well-positioned for 2022.
LKCM Small-Mid Cap Equity Fund
The LKCM Small-Mid Cap Equity Fund returned 15.37% for the year ended December 31, 2021, as compared to the 18.18% return for the Russell 2500® Index, the Fund’s benchmark. The Fund’s overweight position in the Healthcare sector detracted from the Fund’s relative performance, which was partially offset by being overweight in the Energy and Industrials sectors. Stock selection decisions in the Information Technology, Consumer Discretionary and Consumer Staples sectors detracted from the Fund’s relative performance, which was partially offset by stock selection decisions in the Healthcare, Industrials and Real Estate sectors. The Fund continues to implement an investment strategy that focuses on companies that we believe are high quality, and we believe the Fund is well-positioned for 2022.
LKCM Equity Fund
The LKCM Equity Fund returned 22.48% for the year ended December 31, 2021, as compared to the 28.71% return for the S&P 500® Index, the Fund’s benchmark. The Fund’s overweight position in the Industrials sector detracted from the Fund’s relative performance, which was partially offset by the Fund’s underweight position in the Communication Services and Utilities sectors. Stock section decisions in the Information Technology and Materials sectors detracted from the Fund’s relative performance, which was partially offset by stock selection decisions in the Industrials and Communication Services sectors. We remain confident in our investment strategy for the Fund that focuses on investments in companies that we believe are high quality, and we believe the Fund is well-positioned for 2022.
LKCM Balanced Fund
The LKCM Balanced Fund returned 14.01% for the year ended December 31, 2021 versus the 28.71% return for the S&P 500® Index and the -1.44% return for the Bloomberg Intermediate Government/Credit Bond Index. The equity portion of the Fund’s portfolio benefited from stock selection decisions in the Healthcare and Financials sectors relative to the benchmark, which was offset by stock selection decisions in the Information Technology and Communications Services sectors. The fixed income portion of the Fund’s portfolio benefited from its relatively short duration as compared to the benchmark and continued to remain focused on high quality intermediate corporate bonds. While we currently anticipate an increased level of volatility in the capital markets during the upcoming year, we believe the Fund is well-positioned for 2022.
4
LKCM Fixed Income Fund
The LKCM Fixed Income Fund returned -1.54% for the year ended December 31, 2021 compared to its benchmark, the Bloomberg Intermediate Government/Credit Bond Index, which returned -1.44% for the year ended December 31, 2021. During the year, high-quality U.S. government notes and bonds and corporate issues produced negative returns across the board as interest rates rose sharply while speculative grade or junk bond issues outperformed following the stock market higher. U.S. Treasury and high-quality corporate issue yields increased substantially with yields in the belly of the curve, i.e., the three-to-seven-year sector, rising the most, and the curve ended the year flatter than where it began the year after steepening dramatically in the first quarter in response to strong economic growth. We believe that this flattening of the curve was largely in response to the Federal Reserve ultimately tapering its buying of securities, or quantitative easing, at an accelerated pace after injecting unprecedented liquidity into the economy and the markets over the past several years. Interest rates also rose, in our view, in anticipation of increases in the federal funds rate and ultimately balance sheet run off, or quantitative tightening. We believe these actions by the Federal Reserve are designed to reverse the aggressive monetary policy easing put in place to backstop the economy during the height of the pandemic and counter the sharp increase in inflation. In our view, the aggressive easing of monetary policy, in conjunction with unprecedented fiscal policy, enacted to counter the negative effects of the pandemic, have ultimately led to more enduring supply-chain bottlenecks and labor shortages that have thus far resulted in more persistent increases in inflation. Within this backdrop, high-quality corporate bonds in the belly of the curve were the most negatively impacted by rising interest rates and widening credit spreads. While the Fund’s shorter overall defensive duration was additive to performance during the year, the focus on high-quality corporate bonds in the belly of the curve detracted from the Fund’s performance. The Fund remains defensive with a shorter overall duration of 2.5 years in an effort to mitigate interest rate risk and holdings of high-quality corporate bonds of companies with strong underlying fundamentals in an effort to limit credit risk and produce a sustainable cash flow stream.
LKCM International Equity Fund
The LKCM International Equity Fund returned 18.00% for the year ended December 31, 2021, as compared to the 11.78% return for the MSCI EAFE Index, the Fund’s benchmark. During this period, the Fund’s relative performance benefited from underweight positions in the Utilities and Communication Services sectors, which was partially offset by being underweight the Financials sector. The Fund’s relative performance also benefited from strong stock selection decisions in the Industrials, Healthcare, Information Technology and Financials sectors, which was partially offset by stock selection decisions in the Consumer Staples, Communication Services and Materials sectors. The Fund benefited from our bias towards companies that we believe are high quality with prospects for secular growth, as we believe these companies will perform better than the broader market through market cycles. The Fund’s holdings of quality valued-oriented companies also benefited the Fund’s performance during this past year in which value-oriented companies generally outperformed growth-oriented companies. We believe the global economic outlook continues to carry the pandemic weight of uncertainty, although the extraordinary stimulus measures enacted globally appear to have promoted strong demand. As we move through 2022, our focus will be on the outlook for longer-term inflation and its related impacts on interest rates.
J. Luther King, Jr., CFA, CIC
January 5, 2022
5
The information provided herein represents the opinion of J. Luther King, Jr., CFA, CIC and is not intended to be a forecast of future events, a guarantee of future results, nor investment advice.
Please refer to the Schedule of Investments found on pages 15-31 of the report for more information on Fund holdings. Fund holdings and sector allocations are subject to change and are not recommendations to buy or sell any securities.
Mutual fund investing involves risk. Principal loss is possible. Past performance is not a guarantee of future results. Investments in equity securities are subject to market risks and significant fluctuations in value. Small and medium capitalization funds typically carry additional risks, since smaller companies generally have a higher risk of failure, and, historically, their stocks have experienced a greater degree of market volatility than stocks on average. Investments in debt securities typically decrease in value when interest rates rise. This risk is greater for longer-term debt securities. Investments in mortgage backed securities include additional risks that investors should be aware of such as credit risk, prepayment risk, possible illiquidity and default, as well as increased susceptibility to adverse economic developments. These and other risks are discussed in the Funds’ summary and statutory prospectuses.
Earnings growth is not a measure of future performance.
Duration is a measure of the sensitivity of the price of a bond or other debt instrument to a change in interest rates. Securities with a longer duration generally have more volatile prices than securities of comparable quality with a shorter duration.
Spread is the percentage point difference between yields of various classes of bonds compared to treasury bonds.
Yield curve is a line that plots yields (interest rates) of bonds having equal credit quality but differing maturity dates. The slope of the yield curve gives an idea of future interest rate changes and economic activity.
Bond ratings are grades given to bonds that indicate their credit quality as determined by a private independent rating service such as S&P Global. The firm evaluates a bond issuer’s financial strength, or its ability to pay a bond’s principal and interest in a timely fashion. Ratings are expressed as letters ranging from ‘AAA’, which is the highest grade, to ‘D’, which is the lowest grade. In limited situations when the rating agency has not issued a formal rating, the rating agency will classify the security as nonrated.
Cash flow is the net amount of cash and cash-equivalents being transferred into and out of a business.
The Consumer Price Index (CPI) is a measure of the average change over time in the prices paid by urban consumers for a market basket of consumer goods and services.
Investors should consider the investment objective, risks and charges and expenses of a Fund carefully before investing. Each Fund’s summary prospectus and the prospectus contain this and other information about the Fund. Investors can obtain a summary prospectus and/or the prospectus by calling 1-800-688-LKCM. The summary prospectus and/or the prospectus should be read carefully before investing in a Fund.
Quasar Distributors, LLC, distributor.
6
PERFORMANCE:
The following information illustrates the historical performance of the LKCM Small Cap Equity Fund as of December 31, 2021 compared to the Fund’s benchmark and peer group indices.
Performance data quoted represents past performance; past performance does not guarantee future results. The graph and table reflect the reinvestment of dividends and other distributions, if any, but do not reflect the deduction of taxes that a shareholder would pay on Fund distributions or the redemption of Fund shares. The investment return and principal value of an investment will fluctuate so that an investor’s shares, when redeemed, may be worth more or less than their original cost. Current performance of the Fund may be lower or higher than the performance quoted. Performance data current to the most recent month end may be obtained by calling 1-800-688-LKCM. Returns would have been lower if LKCM had not waived a portion of its management fee and/or reimbursed certain expenses of the Fund. Please see Note B to the Notes to the Financial Statements for specific information regarding management fee waiver and/or expense reimbursement arrangements for the Fund.
An index is an unmanaged portfolio and does not trade or incur any expenses. The Lipper Small-Cap Core Funds Index, however, does reflect the fees and expenses borne by the funds included in that index. One can not invest in an unmanaged index.
AVERAGE ANNUAL TOTAL RETURN (Periods Ended December 31, 2021)
| | | | | | | | | | | | | | | | | | | | |
| | | | | |
| | | Past
1 Year | | Past
5 Years(1) | | Past
10 Years(1) | | Since
Inception(1)(2) |
LKCM Small Cap Equity Fund | | | | 14.49% | | | | | 15.88% | | | | | 11.97% | | | | | 11.20% | |
Russell 2000® Index | | | | 14.82% | | | | | 12.02% | | | | | 13.23% | | | | | 9.85% | |
Lipper Small-Cap Core Funds Index | | | | 25.55% | | | | | 11.91% | | | | | 12.97% | | | | | 10.49% | |
A HYPOTHETICAL $10,000 INVESTMENT IN LKCM SMALL CAP EQUITY FUND
(for the ten years ended December 31, 2021)
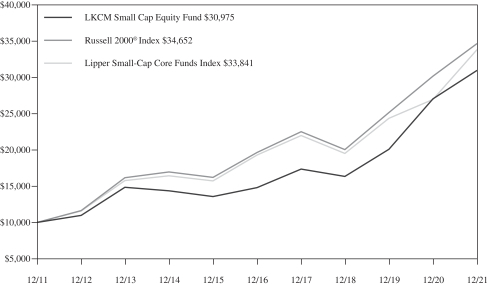
The Russell 2000® Index is an unmanaged index consisting of the 2,000 smallest companies in the Russell 3000® Index.
The Lipper Small-Cap Core Funds Index is an unmanaged index generally considered representative of small cap core mutual funds tracked by Lipper, Inc.
7
PERFORMANCE:
The following information illustrates the historical performance of the LKCM Small-Mid Cap Equity Fund as of December 31, 2021 compared to the Fund’s benchmark and peer group indices.
Performance data quoted represents past performance; past performance does not guarantee future results. The graph and table reflect the reinvestment of dividends and other distributions, if any, but do not reflect the deduction of taxes that a shareholder would pay on Fund distributions or the redemption of Fund shares. The investment return and principal value of an investment will fluctuate so that an investor’s shares, when redeemed, may be worth more or less than their original cost. Current performance of the Fund may be lower or higher than the performance quoted. Performance data current to the most recent month end may be obtained by calling 1-800-688-LKCM. Returns would have been lower if LKCM had not waived a portion of its management fee and/or reimbursed certain expenses of the Fund. Please see Note B to the Notes to the Financial Statements for specific information regarding management fee waiver and/or expense reimbursement arrangements for the Fund.
An index is an unmanaged portfolio and does not trade or incur any expenses. The Lipper Small-Cap Core Funds Index, however, does reflect the fees and expenses borne by the funds included in that index. One can not invest in an unmanaged index.
AVERAGE ANNUAL TOTAL RETURN (Periods Ended December 31, 2021)
| | | | | | | | | | | | | | | | | | | | |
| | | | | |
| | | Past
1 Year | | Past
5 Years(1) | | Past
10 Years(1) | | Since
Inception(1)(2) |
LKCM Small-Mid Cap Equity Fund | | | | 15.37% | | | | | 17.44% | | | | | 12.05% | | | | | 9.99% | |
Russell 2500® Index | | | | 18.18% | | | | | 13.75% | | | | | 14.15% | | | | | 11.75% | |
Lipper Small-Cap Core Funds Index | | | | 25.55% | | | | | 11.91% | | | | | 12.97% | | | | | 10.67% | |
A HYPOTHETICAL $10,000 INVESTMENT IN LKCM SMALL-MID CAP EQUITY FUND
(for the ten years ended December 31, 2021)
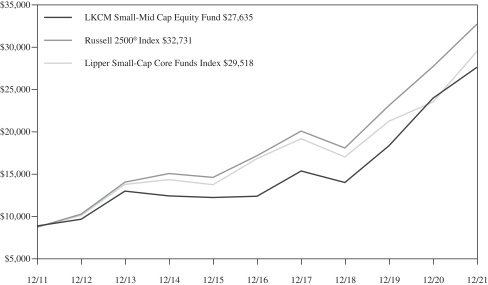
The Russell 2500® Index is an unmanaged index consisting of the 2,500 smallest companies in the Russell 3000® Index.
The Lipper Small-Cap Core Funds Index is an unmanaged index generally considered representative of small cap core mutual funds tracked by Lipper, Inc.
8
PERFORMANCE:
The following information illustrates the historical performance of the LKCM Equity Fund as of December 31, 2021 compared to the Fund’s benchmark and peer group indices.
Performance data quoted represents past performance; past performance does not guarantee future results. The graph and table reflect the reinvestment of dividends and other distributions, if any, but do not reflect the deduction of taxes that a shareholder would pay on Fund distributions or the redemption of Fund shares. The investment return and principal value of an investment will fluctuate so that an investor’s shares, when redeemed, may be worth more or less than their original cost. Current performance of the Fund may be lower or higher than the performance quoted. Performance data current to the most recent month end may be obtained by calling 1-800-688-LKCM. Returns would have been lower if LKCM had not waived a portion of its management fee and/or reimbursed certain expenses of the Fund. Please see Note B to the Notes to the Financial Statements for specific information regarding management fee waiver and/or expense reimbursement arrangements for the Fund.
An index is an unmanaged portfolio and does not trade or incur any expenses. The Lipper Large-Cap Core Funds Index, however, does reflect the fees and expenses borne by the funds included in that index. One can not invest in an unmanaged index.
AVERAGE ANNUAL TOTAL RETURN (Periods Ended December 31, 2021)
| | | | | | | | | | | | | | | | | | | | |
| | | | | |
| | | Past
1 Year | | Past
5 Years(1) | | Past
10 Years(1) | | Since
Inception(1)(2) |
LKCM Equity Fund | | | | 22.48% | | | | | 18.12% | | | | | 14.83% | | | | | 9.93% | |
S&P 500® Index | | | | 28.71% | | | | | 18.47% | | | | | 16.55% | | | | | 10.20% | |
Lipper Large-Cap Core Funds Index | | | | 26.04% | | | | | 16.71% | | | | | 15.12% | | | | | 9.06% | |
A HYPOTHETICAL $10,000 INVESTMENT IN LKCM EQUITY FUND
(for the ten years ended December 31, 2021)
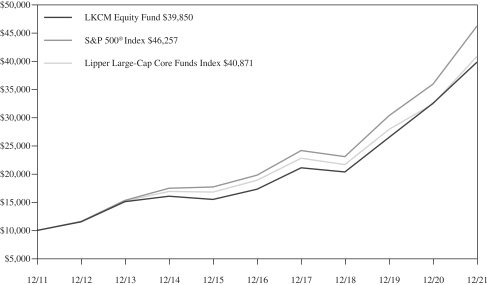
The S&P 500® Index is an unmanaged capitalization-weighted index of 500 selected stocks that is generally considered representative of the performance of large capitalization companies in the U.S. stock market.
The Lipper Large-Cap Core Funds Index is an unmanaged index generally considered representative of large cap core mutual funds tracked by Lipper, Inc.
9
PERFORMANCE:
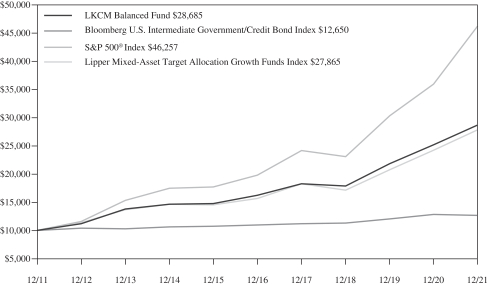
The following information illustrates the historical performance of the LKCM Balanced Fund as of December 31, 2021 compared to the Fund’s benchmark and peer group indices.
Performance data quoted represents past performance; past performance does not guarantee future results. The graph and table reflect the reinvestment of dividends and other distributions, if any, but do not reflect the deduction of taxes that a shareholder would pay on Fund distributions or the redemption of Fund shares. The investment return and principal value of an investment will fluctuate so that an investor’s shares, when redeemed, may be worth more or less than their original cost. Current performance of the Fund may be lower or higher than the performance quoted. Performance data current to the most recent month end may be obtained by calling 1-800-688-LKCM. Returns would have been lower if LKCM had not waived a portion of its management fee and/or reimbursed certain expenses of the Fund. Please see Note B to the Notes to the Financial Statements for specific information regarding management fee waiver and/or expense reimbursement arrangements for the Fund.
An index is an unmanaged portfolio and does not trade or incur any expenses. The Lipper Mixed-Asset Target Allocation Growth Funds Index, however, does reflect the fees and expenses borne by the funds included in that index. One can not invest in an unmanaged index.
AVERAGE ANNUAL TOTAL RETURN (Periods Ended December 31, 2021)
| | | | | | | | | | | | | | | | | | | | |
| | | | | |
| | | Past
1 Year | | Past
5 Years(1) | | Past
10 Years(1) | | Since
Inception(1)(2) |
LKCM Balanced Fund | | | | 14.01% | | | | | 12.08% | | | | | 11.11% | | | | | 7.50% | |
S&P 500® Index | | | | 28.71% | | | | | 18.47% | | | | | 16.55% | | | | | 8.87% | |
Bloomberg U.S. Intermediate Government/Credit Bond Index | | | | -1.44% | | | | | 2.91% | | | | | 2.38% | | | | | 4.30% | |
Lipper Mixed-Asset Target Allocation Growth Funds Index | | | | 15.07% | | | | | 12.22% | | | | | 10.79% | | | | | 7.21% | |
A HYPOTHETICAL $10,000 INVESTMENT IN LKCM BALANCED FUND
(for the ten years ended December 31, 2021)
The S&P 500® Index is an unmanaged capitalization-weighted index of 500 selected stocks that is generally considered representative of the performance of large capitalization companies in the U.S. stock market.
The Bloomberg U.S. Intermediate Government/Credit Bond Index is an unmanaged market value weighted index measuring both the principal price changes of, and income provided by, the underlying universe of securities that comprise the index. Securities included in the index must meet the following criteria; fixed as opposed to variable rate; remaining maturity of one to ten years; minimum outstanding par value of $250 million; rated investment grade or higher by Moody’s Investors Service or equivalent; must be dollar denominated and non-convertible; and must be publicly issued.
The Lipper Mixed-Asset Target Allocation Growth Funds Index is an unmanaged index generally considered representative of mutual funds tracked by Lipper, Inc. that, by portfolio practice, maintain a mix of between 60%-80% equity securities, with the remainder invested in bonds, cash and cash equivalents.
10
PERFORMANCE:
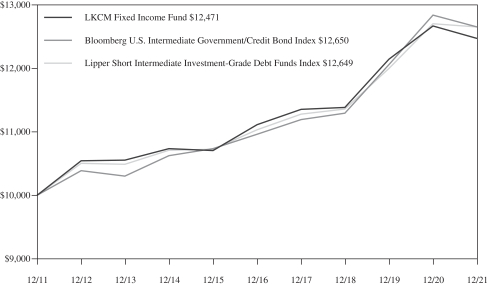
The following information illustrates the historical performance of the LKCM Fixed Income Fund as of December 31, 2021 compared to the Fund’s benchmark and peer group indices.
Performance data quoted represents past performance; past performance does not guarantee future results. The graph and table reflect the reinvestment of dividends and other distributions, if any, but do not reflect the deduction of taxes that a shareholder would pay on Fund distributions or the redemption of Fund shares. The investment return and principal value of an investment will fluctuate so that an investor’s shares, when redeemed, may be worth more or less than their original cost. Current performance of the Fund may be lower or higher than the performance quoted. Performance data current to the most recent month end may be obtained by calling 1-800-688-LKCM. Returns would have been lower if LKCM had not waived a portion of its management fee and/or reimbursed certain expenses of the Fund. Please see Note B to the Notes to the Financial Statements for specific information regarding management fee waiver and/or expense reimbursement arrangements for the Fund.
An index is an unmanaged portfolio and does not trade or incur any expenses. The Lipper Short Intermediate Investment-Grade Debt Funds Index, however, does reflect the fees and expenses borne by the funds included in that index. One can not invest in an unmanaged index.
AVERAGE ANNUAL TOTAL RETURN (Periods Ended December 31, 2021)
| | | | | | | | | | | | | | | | | | | | |
| | | | | |
| | | Past
1 Year | | Past
5 Years(1) | | Past
10 Years(1) | | Since
Inception(1)(2) |
LKCM Fixed Income Fund | | | | -1.54% | | | | | 2.33% | | | | | 2.23% | | | | | 4.01% | |
Bloomberg U.S. Intermediate Government/Credit Bond Index | | | | -1.44% | | | | | 2.91% | | | | | 2.38% | | | | | 4.30% | |
Lipper Short Intermediate Investment-Grade Debt Funds Index | | | | -0.40% | | | | | 2.78% | | | | | 2.38% | | | | | 3.80% | |
A HYPOTHETICAL $10,000 INVESTMENT IN LKCM FIXED INCOME FUND
(for the ten years ended December 31, 2021)
The Bloomberg U.S. Intermediate Government/Credit Bond Index is an unmanaged market value weighted index measuring both the principal price changes of, and income provided by, the underlying universe of securities that comprise the index. Securities included in the index must meet the following criteria: fixed as opposed to variable rate; remaining maturity of one to ten years; minimum outstanding par value of $250 million; rated investment grade or higher by Moody’s Investors Service or equivalent; must be dollar denominated and non-convertible; and must be publicly issued.
The Lipper Short Intermediate Investment-Grade Debt Funds Index is an unmanaged index generally considered representative of short intermediate investment grade mutual funds tracked by Lipper, Inc.
11
PERFORMANCE:
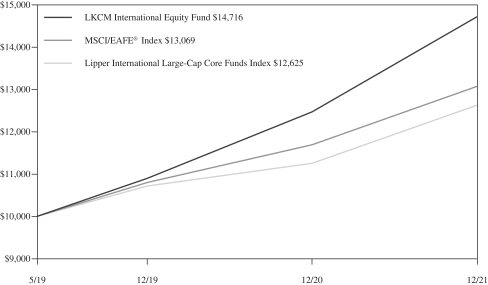
The following information illustrates the historical performance of the LKCM International Equity Fund as of December 31, 2021 compared to the Fund’s benchmark and peer group indices.
Performance data quoted represents past performance; past performance does not guarantee future results. The graph and table reflect the reinvestment of dividends and other distributions, if any, but do not reflect the deduction of taxes that a shareholder would pay on Fund distributions or the redemption of Fund shares. The investment return and principal value of an investment will fluctuate so that an investor’s shares, when redeemed, may be worth more or less than their original cost. Current performance of the Fund may be lower or higher than the performance quoted. Performance data current to the most recent month end may be obtained by calling 1-800-688-LKCM. Returns would have been lower if LKCM had not waived a portion of its management fee and/or reimbursed certain expenses of the Fund. Please see Note B to the Notes to the Financial Statements for specific information regarding management fee waiver and/or expense reimbursement arrangements for the Fund.
An index is an unmanaged portfolio and does not trade or incur any expenses. The Lipper International Large-Cap Core Funds Index, however, does reflect the fees and expenses borne by the funds included in that index. One can not invest in an unmanaged index.
AVERAGE ANNUAL TOTAL RETURN (Periods Ended December 31, 2021)
| | | | | | | | | | | | | | | | | | | | |
| | | | | |
| | | Past
1 Year | | Past
5 Years(1) | | Past
10 Years(1) | | Since
Inception(1)(2) |
LKCM International Equity Fund | | | | 18.00% | | | | | N/A | | | | | N/A | | | | | 15.58% | |
MSCI/EAFE® Index | | | | 11.78% | | | | | N/A | | | | | N/A | | | | | 10.55% | |
Lipper International Large-Cap Core Funds Index | | | | 12.16% | | | | | N/A | | | | | N/A | | | | | 9.13% | |
A HYPOTHETICAL $10,000 INVESTMENT IN LKCM INTERNATIONAL EQUITY FUND
(for the period from May 1, 2019 (inception date) to December 31, 2021)
The Morgan Stanley Capital International Europe, Australia, Far East Index (“MSCI/EAFE® Index”) is an unmanaged index composed of large-cap and mid-cap securities across 21 European and Pacific Basin countries. The MSCI/EAFE® Index is a recognized international index and is weighted by market capitalization.
The Lipper International Large-Cap Core Funds Index is an unmanaged index generally considered representative of large cap core mutual funds tracked by Lipper, Inc.
12
LKCM Funds Expense Example — December 31, 2021
As a shareholder of the Funds, you incur two types of costs: (1) transaction costs, including redemption fees; and (2) ongoing costs, including management fees, distribution and/or service (12b-1) fees and other Fund expenses. This Example is intended to help you understand your ongoing costs (in dollars) of investing in the Funds and to compare these costs with the ongoing costs of investing in other mutual funds. The Example is based on an investment of $1,000 invested at the beginning of the period and held for the entire period (07/01/2021-12/31/2021).
ACTUAL EXPENSES
The third and fourth columns of the table below provide information about actual account values and actual expenses. You may use the information in these columns, together with the amount you invested, to estimate the expenses that you paid over the period. Simply divide your account value by $1,000 (for example, an $8,600 account value divided by $1,000 = 8.6), then multiply the result by the number in the fourth column under the heading entitled “Expenses Paid During Period” to estimate the expenses you paid on your account during this period. Although the Funds charge no sales load, you will be assessed fees for outgoing wire transfers, returned checks and stop payment orders at prevailing rates charged by U.S. Bancorp Fund Services, LLC (doing business as U.S. Bank Global Fund Services), the Funds’ transfer agent. If you request that a redemption be made by wire transfer, currently a $15.00 fee is charged by the Funds’ transfer agent. You will be charged a redemption fee equal to 1.00% of the net amount of the redemption if you redeem your shares of the Funds within 30 days of purchase, unless otherwise determined by the Funds in their discretion. To the extent the Funds invest in shares of other investment companies as part of their investment strategies, you will indirectly bear your proportionate share of any fees and expenses charged by the underlying funds in which the Funds invest in addition to the expenses of the Funds. Actual expenses of the underlying funds are expected to vary among the various underlying funds. These expenses are not included in the example below. The example below includes management fees, registration fees and other expenses. However, the example below does not include portfolio trading commissions and related expenses and other extraordinary expenses as determined under generally accepted accounting principles.
HYPOTHETICAL EXAMPLES FOR COMPARISON PURPOSES
The fifth and sixth columns of the table below provide information about hypothetical account values and hypothetical expenses based on the Funds’ actual expense ratios and an assumed rate of return of 5% per year before expenses, which are not the Funds’ actual returns. The hypothetical account values and expenses may not be used to estimate the actual ending account balance or expenses you paid for the period. You may use this information to compare the ongoing costs of investing in the Funds and other funds. To do so, compare this 5% hypothetical example with the 5% hypothetical examples that appear in the shareholder reports of the other funds. Please note that the expenses shown in the table are meant to highlight your ongoing costs only and do not reflect any transactional costs, such as redemption fees. Therefore, the fifth and sixth columns of the table are useful in comparing ongoing costs only, and will not help you determine the relative total costs of owning different funds. In addition, if these transactions costs were included, your costs would have been higher.
| | | | | | | | | | | | | | | | | | | | | | | | | | | | | | |
| | | | | | | Actual | | Hypothetical (5% return
before expenses) |
| | | Fund’s
Annualized
Expense
Ratio(1) | | Beginning
Account Value
07/01/2021 | | Ending
Account Value
12/31/2021 | | Expenses
Paid
During
Period(1) | | Ending
Account Value
12/31/2021 | | Expenses
Paid
During
Period(1) |
LKCM Small Cap Equity Fund | | | | 1.00 | % | | | $ | 1,000.00 | | | | $ | 973.70 | | | | $ | 4.97 | | | | $ | 1,020.16 | | | | $ | 5.09 | |
LKCM Small-Mid Cap Equity Fund | | | | 1.00 | % | | | $ | 1,000.00 | | | | $ | 1,019.30 | | | | $ | 5.09 | | | | $ | 1,020.16 | | | | $ | 5.09 | |
LKCM Equity Fund | | | | 0.80 | % | | | $ | 1,000.00 | | | | $ | 1,074.40 | | | | $ | 4.18 | | | | $ | 1,021.17 | | | | $ | 4.08 | |
LKCM Balanced Fund | | | | 0.80 | % | | | $ | 1,000.00 | | | | $ | 1,052.40 | | | | $ | 4.14 | | | | $ | 1,021.17 | | | | $ | 4.08 | |
LKCM Fixed Income Fund | | | | 0.50 | % | | | $ | 1,000.00 | | | | $ | 992.10 | | | | $ | 2.51 | | | | $ | 1,022.68 | | | | $ | 2.55 | |
LKCM International Equity Fund | | | | 1.00 | % | | | $ | 1,000.00 | | | | $ | 1,035.90 | | | | $ | 5.13 | | | | $ | 1,020.16 | | | | $ | 5.09 | |
| (1) | Expenses are equal to the annualized net expense ratio for the Fund, multiplied by the average account value over the period, multiplied by 184/365 (to reflect the one-half year period). |
13
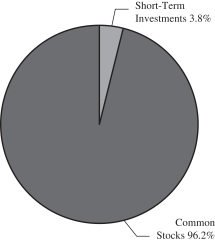
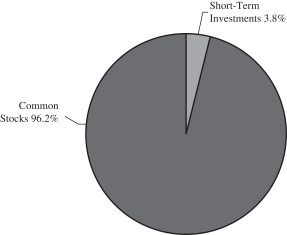
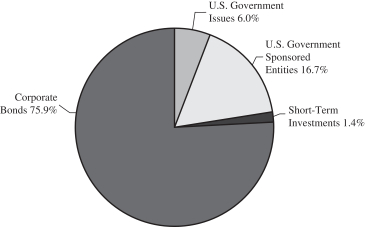
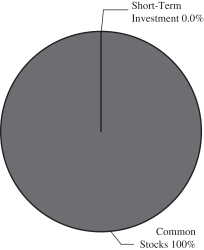
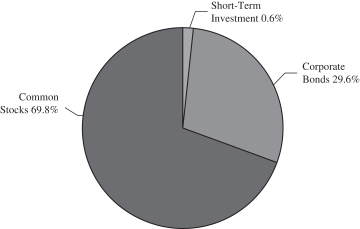
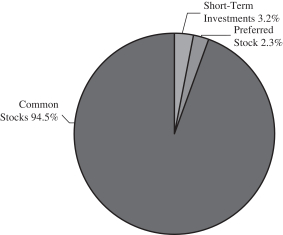
ALLOCATION OF PORTFOLIO HOLDINGS — LKCM Funds — December 31, 2021
Percentages represent market value as a percentage of total investments.
LKCM Small Cap Equity Fund
LKCM Equity Fund
LKCM Fixed Income Fund
LKCM Small-Mid Cap Equity Fund
LKCM Balanced Fund
LKCM International Equity Fund
14
|
| LKCM SMALL CAP EQUITY FUND |
| SCHEDULEOF INVESTMENTS |
| December 31, 2021 |
| | | | | | | | | | |
| COMMON STOCKS - 94.2% | | Shares | | Value |
| Aerospace & Defense - 2.7% | | | | |
Hexcel Corp. (a) | | | | 35,325 | | | | $ | 1,829,835 | |
Mercury Systems, Inc. (a) | | | | 42,800 | | | | | 2,356,568 | |
Triumph Group, Inc. (a) | | | | 111,098 | | | | | 2,058,646 | |
| | | | | | | | | | |
| | | | | | | | | 6,245,049 | |
| | | | | | | | | | |
| Auto Components - 1.2% | | | | |
Fox Factory Holding Corp. (a) | | | | 16,290 | | | | | 2,770,929 | |
| | | | | | | | | | |
| Banks - 7.8% | | | | |
Cadence Bank | | | | 114,529 | | | | | 3,411,819 | |
Comerica, Inc. | | | | 31,215 | | | | | 2,715,705 | |
Cullen/Frost Bankers, Inc. | | | | 21,375 | | | | | 2,694,746 | |
Glacier Bancorp, Inc. | | | | 43,655 | | | | | 2,475,238 | |
Pinnacle Financial Partners, Inc. | | | | 35,705 | | | | | 3,409,828 | |
Seacoast Banking Corp. of Florida | | | | 92,175 | | | | | 3,262,073 | |
| | | | | | | | | | |
| | | | | | | | | 17,969,409 | |
| | | | | | | | | | |
| Beverages - 1.9% | | | | |
Celsius Holdings, Inc. (a) | | | | 40,451 | | | | | 3,016,431 | |
Primo Water Corp. (b) | | | | 80,000 | | | | | 1,410,400 | |
| | | | | | | | | | |
| | | | | | | | | 4,426,831 | |
| | | | | | | | | | |
| Biotechnology - 1.5% | | | | |
Castle Biosciences, Inc. (a) | | | | 34,275 | | | | | 1,469,369 | |
Neogen Corp. (a) | | | | 40,790 | | | | | 1,852,274 | |
| | | | | | | | | | |
| | | | | | | | | 3,321,643 | |
| | | | | | | | | | |
| Building Products - 4.9% | | | | |
Builders FirstSource, Inc. (a) | | | | 51,015 | | | | | 4,372,496 | |
CSW Industrials, Inc. | | | | 24,550 | | | | | 2,967,113 | |
PGT Innovations, Inc. (a) | | | | 77,046 | | | | | 1,732,764 | |
Zurn Water Solutions Corp. | | | | 60,995 | | | | | 2,220,218 | |
| | | | | | | | | | |
| | | | | | | | | 11,292,591 | |
| | | | | | | | | | |
| Chemicals - 2.2% | | | | |
Ecovyst, Inc. | | | | 271,145 | | | | | 2,776,525 | |
Ferroglobe Representation & Warranty Insurance Trust (a)(c) | | | | 302,970 | | | | | — | |
Quaker Chemical Corp. | | | | 9,340 | | | | | 2,155,485 | |
| | | | | | | | | | |
| | | | | | | | | 4,932,010 | |
| | | | | | | | | | |
| Commercial Services & Supplies - 0.8% | | | | |
Driven Brands Holdings, Inc. (a) | | | | 55,000 | | | | | 1,849,100 | |
| | | | | | | | | | |
| Construction & Engineering - 1.4% | | | | |
NV5 Global, Inc. (a) | | | | 23,342 | | | | | 3,223,997 | |
| | | | | | | | | | |
| Construction Materials - 1.7% | | | | |
Eagle Materials, Inc. | | | | 24,020 | | | | | 3,998,369 | |
| | | | | | | | | | |
| Electrical Equipment - 1.0% | | | | |
Regal Rexnord Corp. | | | | 13,599 | | | | | 2,314,278 | |
| | | | | | | | | | |
| Electronic Equipment & Instruments - 1.3% |
Novanta, Inc. (a)(b) | | | | 16,290 | | | | | 2,872,416 | |
| | | | | | | | | | |
| Energy Equipment & Services - 0.7% | | | | |
Weatherford International Plc (a)(b) | | | | 59,000 | | | | | 1,635,480 | |
| | | | | | | | | | |
| | | | | | | | | | |
| COMMON STOCKS | | Shares | | Value |
| Health Care Equipment & Supplies - 4.1% |
Cerus Corp. (a) | | | | 325,000 | | | | $ | 2,213,250 | |
NeoGenomics, Inc. (a) | | | | 53,710 | | | | | 1,832,585 | |
STAAR Surgical Co. (a) | | | | 26,825 | | | | | 2,449,123 | |
TransMedics Group, Inc. (a) | | | | 57,090 | | | | | 1,093,844 | |
ViewRay, Inc. (a) | | | | 306,205 | | | | | 1,687,190 | |
| | | | | | | | | | |
| | | | | | | | | 9,275,992 | |
| | | | | | | | | | |
| Health Care Providers & Services - 7.2% | | | | |
HealthEquity, Inc. (a) | | | | 24,350 | | | | | 1,077,244 | |
Medpace Holdings, Inc. (a) | | | | 23,765 | | | | | 5,172,215 | |
Omnicell, Inc. (a) | | | | 18,320 | | | | | 3,305,661 | |
Progyny, Inc. (a) | | | | 53,370 | | | | | 2,687,179 | |
R1 RCM, Inc. (a) | | | | 106,100 | | | | | 2,704,489 | |
U.S. Physical Therapy, Inc. | | | | 16,015 | | | | | 1,530,233 | |
| | | | | | | | | | |
| | | | | | | | | 16,477,021 | |
| | | | | | | | | | |
| Hotels, Restaurants & Leisure - 6.4% | | | | |
Bally’s Corp. (a) | | | | 20,000 | | | | | 761,200 | |
Everi Holdings, Inc. (a) | | | | 197,622 | | | | | 4,219,230 | |
Playa Hotels & Resorts NV (a)(b) | | | | 269,190 | | | | | 2,148,136 | |
Red Rock Resorts, Inc. - Class A | | | | 95,550 | | | | | 5,256,205 | |
Wingstop, Inc. | | | | 12,855 | | | | | 2,221,344 | |
| | | | | | | | | | |
| | | | | | | | | 14,606,115 | |
| | | | | | | | | | |
| Household Durables - 0.8% | | | | |
Sonos, Inc. (a) | | | | 61,390 | | | | | 1,829,422 | |
| | | | | | | | | | |
| Insurance - 3.0% | | | | |
Argo Group International Holdings, Ltd. (b) | | | | 54,285 | | | | | 3,154,501 | |
Goosehead Insurance, Inc. - Class A | | | | 10,595 | | | | | 1,378,198 | |
Palomar Holdings, Inc. (a) | | | | 36,600 | | | | | 2,370,582 | |
| | | | | | | | | | |
| | | | | | | | | 6,903,281 | |
| | | | | | | | | | |
| Internet & Catalog Retail - 1.0% | | | | |
Magnite, Inc. (a) | | | | 129,000 | | | | | 2,257,500 | |
| | | | | | | | | | |
| IT Consulting & Services - 3.1% | | | | |
LiveRamp Holdings, Inc. (a) | | | | 38,026 | | | | | 1,823,347 | |
Perficient Inc. (a) | | | | 34,250 | | | | | 4,428,182 | |
Repay Holdings Corp. (a) | | | | 49,010 | | | | | 895,413 | |
| | | | | | | | | | |
| | | | | | | | | 7,146,942 | |
| | | | | | | | | | |
| IT Services - 0.9% | | | | |
Brightcove, Inc. (a) | | | | 208,500 | | | | | 2,130,870 | |
| | | | | | | | | | |
| Leisure Equipment & Products - 2.1% | | | | |
Callaway Golf Company (a) | | | | 99,600 | | | | | 2,733,024 | |
YETI Holdings, Inc. (a) | | | | 25,535 | | | | | 2,115,064 | |
| | | | | | | | | | |
| | | | | | | | | 4,848,088 | |
| | | | | | | | | | |
| Life Sciences Tools & Services - 0.3% | | | | |
Inotiv, Inc. (a) | | | | 18,420 | | | | | 774,929 | |
| | | | | | | | | | |
| Machinery - 6.4% | | | | |
Alamo Group, Inc. | | | | 10,360 | | | | | 1,524,785 | |
Colfax Corp. (a) | | | | 56,635 | | | | | 2,603,511 | |
Evoqua Water Technologies Corp. (a) | | | | 45,775 | | | | | 2,139,981 | |
Helios Technologies, Inc. | | | | 35,295 | | | | | 3,711,975 | |
The accompanying notes are an integral part of these financial statements.
15
|
| LKCM SMALL CAP EQUITY FUND |
| SCHEDULEOF INVESTMENTS, CONTINUED |
| December 31, 2021 |
| | | | | | | | | | |
| COMMON STOCKS | | Shares | | Value |
| Machinery - 6.4%, Continued | | | | |
ITT, Inc. | | | | 16,730 | | | | $ | 1,709,639 | |
Watts Water Technologies, Inc. - Class A | | | | 15,775 | | | | | 3,063,032 | |
| | | | | | | | | | |
| | | | | | | | | 14,752,923 | |
| | | | | | | | | | |
| Marine - 1.2% | | | | |
Kirby Corp. (a) | | | | 46,370 | | | | | 2,755,305 | |
| | | | | | | | | | |
| Media & Entertainment - 1.6% | | | | |
Nexstar Media Group, Inc. - Class A | | | | 24,920 | | | | | 3,762,422 | |
| | | | | | | | | | |
| Oil & Gas & Consumable Fuels - 1.6% | | | | |
Magnolia Oil & Gas Corp. - Class A | | | | 193,005 | | | | | 3,642,004 | |
| | | | | | | | | | |
| Oil, Gas & Consumable Fuels - 2.5% | | | | |
CNX Resources Corp. (a) | | | | 200,000 | | | | | 2,750,000 | |
HollyFrontier Corp. | | | | 91,625 | | | | | 3,003,468 | |
| | | | | | | | | | |
| | | | | | | | | 5,753,468 | |
| | | | | | | | | | |
| Personal Products - 1.3% | | | | |
BellRing Brands, Inc. - Class A (a) | | | | 101,375 | | | | | 2,892,229 | |
| | | | | | | | | | |
| Professional Services - 1.9% | | | | |
Upwork, Inc. (a) | | | | 125,760 | | | | | 4,295,962 | |
| | | | | | | | | | |
| Real Estate Development - 2.8% | | | | |
FirstService Corp. (b) | | | | 9,995 | | | | | 1,963,718 | |
Newmark Group, Inc. - Class A | | | | 240,000 | | | | | 4,488,000 | |
| | | | | | | | | | |
| | | | | | | | | 6,451,718 | |
| | | | | | | | | | |
| Real Estate Investment Trust - 1.0% | | | | |
SL Green Realty Corp. | | | | 32,145 | | | | | 2,304,797 | |
| | | | | | | | | | |
| Software - 7.8% | | | | |
ACI Worldwide, Inc. (a) | | | | 52,105 | | | | | 1,808,043 | |
Alkami Technology, Inc. (a) | | | | 52,495 | | | | | 1,053,050 | |
Altair Engineering, Inc. - Class A (a) | | | | 36,190 | | | | | 2,798,211 | |
Blackbaud, Inc. (a) | | | | 31,815 | | | | | 2,512,749 | |
Model N, Inc. (a) | | | | 63,650 | | | | | 1,911,409 | |
OneSpan Inc. (a) | | | | 92,375 | | | | | 1,563,909 | |
Q2 Holdings, Inc. (a) | | | | 11,905 | | | | | 945,733 | |
Sprout Social, Inc. - Class A (a) | | | | 23,500 | | | | | 2,131,215 | |
Workiva Inc. (a) | | | | 24,520 | | | | | 3,199,615 | |
| | | | | | | | | | |
| | | | | | | | | 17,923,934 | |
| | | | | | | | | | |
| Software & Services - 0.8% | | | | |
Alarm.com Holdings, Inc. (a) | | | | 22,430 | | | | | 1,902,288 | |
| | | | | | | | | | |
| Specialty Retail - 2.2% | | | | |
Academy Sports & Outdoors, Inc. (a) | | | | 38,000 | | | | | 1,668,200 | |
Leslie’s, Inc. (a) | | | | 58,665 | | | | | 1,388,014 | |
Petco Health & Wellness Co, Inc. (a) | | | | 96,000 | | | | | 1,899,840 | |
| | | | | | | | | | |
| | | | | | | | | 4,956,054 | |
| | | | | | | | | | |
| Technology Hardware, Storage & Peripherals - 1.2% |
Avid Technology, Inc. (a) | | | | 84,585 | | | | | 2,754,933 | |
| | | | | | | | | | |
| Thrifts & Mortgage Finance - 1.5% | | | | |
Home BancShares, Inc. | | | | 137,301 | | | | | 3,343,279 | |
| | | | | | | | | | |
| | | | | | | | | | |
| COMMON STOCKS | | Shares | | Value |
| Trading Companies & Distributors - 2.4% |
Global Industrial Co. | | | | 65,265 | | | | $ | 2,669,338 | |
Textainer Group Holdings Ltd. (b) | | | | 76,250 | | | | | 2,722,888 | |
| | | | | | | | | | |
| | | | | | | | | 5,392,226 | |
| | | | | | | | | | |
TOTAL COMMON STOCKS
(Cost $124,810,564) | | | | 215,985,804 |
| | | | | | | | | | |
| | | | | | | | | | |
| SHORT-TERM INVESTMENTS - 3.7% |
| Money Market Funds - 3.7% | | | | |
Invesco Short-Term Investments Trust - Government & Agency Portfolio - Institutional Shares, 0.03% (d) | | | | 6,713,308 | | | | | 6,713,308 | |
Morgan Stanley Institutional Liquidity Funds - Government Portfolio - Institutional Shares, 0.03% (d) | | | | 1,705,400 | | | | | 1,705,400 | |
| | | | | | | | | | |
| | | | | | | | | 8,418,708 | |
| | | | | | | | | | |
TOTAL SHORT-TERM INVESTMENTS
(Cost $8,418,708) | | | | 8,418,708 |
| | | | | | | | | | |
Total Investments - 97.9%
(Cost $133,229,272) | | | | 224,404,512 |
Other Assets in Excess of Liabilities - 2.1% | | | | | 4,794,719 | |
| | | | | | | | | | |
TOTAL NET ASSETS - 100.0% | | | | | | | | $ | 229,199,231 | |
| | | | | | | | | | |
| (a) | Non-income producing security. |
| (b) | Security issued by non-U.S. incorporated company. |
| (c) | Securities for which market quotations are not readily available. These securities have been valued at their fair value under procedures approved by the Fund’s Board of Trustees. Level 3 security. |
| (d) | The rate quoted is the annualized seven-day yield of the Fund at period end. |
Investments are classified by industry pursuant to the Global Industry Classification Standard (GICS®), which was developed by and/or is the exclusive property of Morgan Stanley Capital International, Inc. (“MSCI”) and Standard & Poor’s Financial Services LLC (“S&P”). GICS is a service mark of MSCI and S&P and has been licensed for use by U.S. Bancorp Fund Services, LLC.
The accompanying notes are an integral part of these financial statements.
16
|
| LKCM SMALL-MID CAP EQUITY FUND |
| SCHEDULEOF INVESTMENTS |
| December 31, 2021 |
| | | | | | | | | | |
| COMMON STOCKS - 100.1% | | Shares | | Value |
| Aerospace & Defense - 2.8% | | | | |
Axon Enterprise, Inc. (a) | | | | 2,525 | | | | $ | 396,425 | |
| | | | | | | | | | |
| Banks - 8.2% | | | | |
Cadence Bank | | | | 1,000 | | | | | 29,790 | |
Comerica, Inc. | | | | 3,635 | | | | | 316,245 | |
Cullen/Frost Bankers, Inc. | | | | 3,180 | | | | | 400,902 | |
Zions Bancorp N.A. | | | | 6,860 | | | | | 433,278 | |
| | | | | | | | | | |
| | | | | | | | | 1,180,215 | |
| | | | | | | | | | |
| Biotechnology - 6.9% | | | | |
Charles River Laboratories International, Inc. (a) | | | | 1,285 | | | | | 484,162 | |
Natera, Inc. (a) | | | | 2,480 | | | | | 231,607 | |
Neogen Corp. (a) | | | | 5,960 | | | | | 270,644 | |
| | | | | | | | | | |
| | | | | | | | | 986,413 | |
| | | | | | | | | | |
| Building Products - 8.0% | | | | |
Builders FirstSource, Inc. (a) | | | | 5,675 | | | | | 486,404 | |
CSW Industrials, Inc. | | | | 1,190 | | | | | 143,824 | |
Trex Co., Inc. (a) | | | | 2,035 | | | | | 274,786 | |
Zurn Water Solutions Corp. | | | | 6,560 | | | | | 238,784 | |
| | | | | | | | | | |
| | | | | | | | | 1,143,798 | |
| | | | | | | | | | |
| Capital Markets - 2.9% | | | | |
LPL Financial Holdings, Inc. | | | | 2,620 | | | | | 419,436 | |
| | | | | | | | | | |
| Construction & Engineering - 1.1% | | | | |
WillScot Mobile Mini Holdings Corp. (a) | | | | 4,010 | | | | | 163,768 | |
| | | | | | | | | | |
| Construction Materials - 2.4% | | | | |
Eagle Materials, Inc. | | | | 2,040 | | | | | 339,578 | |
| | | | | | | | | | |
| Electrical Equipment - 1.7% | | | | |
Regal Rexnord Corp. | | | | 1,462 | | | | | 248,803 | |
| | | | | | | | | | |
| Electronic Equipment & Instruments - 2.8% |
Trimble, Inc. (a) | | | | 4,605 | | | | | 401,510 | |
| | | | | | | | | | |
| Food Products - 1.6% | | | | |
Freshpet, Inc. (a) | | | | 2,445 | | | | | 232,935 | |
| | | | | | | | | | |
| Health Care Equipment & Supplies - 2.7% |
NeoGenomics, Inc. (a) | | | | 4,880 | | | | | 166,506 | |
STAAR Surgical Co. (a) | | | | 2,390 | | | | | 218,207 | |
| | | | | | | | | | |
| | | | | | | | | 384,713 | |
| | | | | | | | | | |
| Health Care Providers & Services - 7.0% |
Medpace Holdings, Inc. (a) | | | | 1,850 | | | | | 402,634 | |
Omnicell, Inc. (a) | | | | 2,370 | | | | | 427,643 | |
R1 RCM, Inc. (a) | | | | 6,570 | | | | | 167,469 | |
| | | | | | | | | | |
| | | | | | | | | 997,746 | |
| | | | | | | | | | |
| Hotels, Restaurants & Leisure - 1.5% | | | | |
Wingstop, Inc. | | | | 1,205 | | | | | 208,224 | |
| | | | | | | | | | |
| Insurance - 1.6% | | | | |
Palomar Holdings, Inc. (a) | | | | 3,585 | | | | | 232,200 | |
| | | | | | | | | | |
| Internet & Catalog Retail - 0.8% | | | | |
Magnite, Inc. (a) | | | | 6,640 | | | | | 116,200 | |
| | | | | | | | | | |
| | | | | | | | | | |
| COMMON STOCKS | | Shares | | Value |
| IT Consulting & Services - 4.7% | | | | |
Black Knight, Inc. (a) | | | | 4,355 | | | | $ | 360,986 | |
Perficient Inc. (a) | | | | 2,375 | | | | | 307,064 | |
| | | | | | | | | | |
| | | | | | | | | 668,050 | |
| | | | | | | | | | |
| Leisure Equipment & Products - 5.9% | | | | |
Brunswick Corp. | | | | 2,650 | | | | | 266,934 | |
Pool Corp. | | | | 725 | | | | | 410,350 | |
YETI Holdings, Inc. (a) | | | | 2,095 | | | | | 173,529 | |
| | | | | | | | | | |
| | | | | | | | | 850,813 | |
| | | | | | | | | | |
| Machinery - 4.8% | | | | |
Colfax Corp. (a) | | | | 6,385 | | | | | 293,518 | |
ITT, Inc. | | | | 3,840 | | | | | 392,410 | |
| | | | | | | | | | |
| | | | | | | | | 685,928 | |
| | | | | | | | | | |
| Marine - 2.0% | | | | |
Kirby Corp. (a) | | | | 4,820 | | | | | 286,404 | |
| | | | | | | | | | |
| Media & Entertainment - 1.9% | | | | |
Nexstar Media Group, Inc. - Class A | | | | 1,840 | | | | | 277,803 | |
| | | | | | | | | | |
| Metals & Mining - 3.3% | | | | |
Teck Resources Ltd. - Class B (b) | | | | 16,600 | | | | | 478,412 | |
| | | | | | | | | | |
| Multiline Retail - 2.2% | | | | |
Five Below, Inc. (a) | | | | 1,495 | | | | | 309,301 | |
| | | | | | | | | | |
| Oil, Gas & Consumable Fuels - 5.7% | | | | |
CNX Resources Corp. (a) | | | | 10,300 | | | | | 141,625 | |
Diamondback Energy Inc. | | | | 3,625 | | | | | 390,957 | |
HollyFrontier Corp. | | | | 8,840 | | | | | 289,775 | |
| | | | | | | | | | |
| | | | | | | | | 822,357 | |
| | | | | | | | | | |
| Pharmaceuticals - 2.3% | | | | |
Horizon Therapeutics PLC (a)(b) | | | | 2,995 | | | | | 322,741 | |
| | | | | | | | | | |
| Professional Services - 2.2% | | | | |
Upwork, Inc. (a) | | | | 9,365 | | | | | 319,908 | |
| | | | | | | | | | |
| Real Estate Development - 4.3% | | | | |
FirstService Corp. (b) | | | | 1,645 | | | | | 323,193 | |
Newmark Group, Inc. - Class A | | | | 15,985 | | | | | 298,920 | |
| | | | | | | | | | |
| | | | | | | | | 622,113 | |
| | | | | | | | | | |
| Software - 4.3% | | | | |
Altair Engineering, Inc. - Class A (a) | | | | 2,300 | | | | | 177,836 | |
Appian Corp. (a) | | | | 1,240 | | | | | 80,860 | |
Nutanix, Inc. - Class A (a) | | | | 6,710 | | | | | 213,781 | |
Paylocity Holding Corp. (a) | | | | 630 | | | | | 148,781 | |
| | | | | | | | | | |
| | | | | | | | | 621,258 | |
| | | | | | | | | | |
| Specialty Retail - 3.2% | | | | |
Academy Sports & Outdoors, Inc. (a) | | | | 3,920 | | | | | 172,088 | |
Leslie’s, Inc. (a) | | | | 12,310 | | | | | 291,255 | |
| | | | | | | | | | |
| | | | | | | | | 463,343 | |
| | | | | | | | | | |
The accompanying notes are an integral part of these financial statements.
17
|
| LKCM SMALL-MID CAP EQUITY FUND |
| SCHEDULEOF INVESTMENTS, CONTINUED |
| December 31, 2021 |
| | | | | | | | | | |
| COMMON STOCKS | | Shares | | Value |
| Trading Companies & Distributors - 1.3% |
Watsco, Inc. | | | | 600 | | | | $ | 187,728 | |
| | | | | | | | | | |
TOTAL COMMON STOCKS
(Cost $8,300,997) | | | | | | | | | 14,368,123 | |
| | | | | | | | | | |
Total Investments - 100.1%
(Cost $8,300,997) | | | | | 14,368,123 | |
Liabilities in Excess of Other Assets - (0.1)% | | | | | (13,500 | ) |
| | | | | | | | | | |
TOTAL NET ASSETS - 100.0% | | | | | | | | $ | 14,354,623 | |
| | | | | | | | | | |
| (a) | Non-income producing security. |
| (b) | Security issued by non-U.S. incorporated company. |
Investments are classified by industry pursuant to the Global Industry Classification Standard (GICS®), which was developed by and/or is the exclusive property of Morgan Stanley Capital International, Inc. (“MSCI”) and Standard & Poor’s Financial Services LLC (“S&P”). GICS is a service mark of MSCI and S&P and has been licensed for use by U.S. Bancorp Fund Services, LLC.
The accompanying notes are an integral part of these financial statements.
18
|
| LKCM EQUITY FUND |
| SCHEDULEOF INVESTMENTS |
| December 31, 2021 |
| | | | | | | | | | |
| COMMON STOCKS - 96.3% | | Shares | | Value |
| Aerospace & Defense - 1.9% | | | | |
Honeywell International, Inc. | | | | 50,000 | | | | $ | 10,425,500 | |
| | | | | | | | | | |
| Banks - 5.0% | | | | |
Bank of America Corp. | | | | 160,000 | | | | | 7,118,400 | |
Comerica, Inc. | | | | 100,000 | | | | | 8,700,000 | |
Cullen/Frost Bankers, Inc. | | | | 65,000 | | | | | 8,194,550 | |
Glacier Bancorp, Inc. | | | | 60,000 | | | | | 3,402,000 | |
| | | | | | | | | | |
| | | | | | | | | 27,414,950 | |
| | | | | | | | | | |
| Beverages - 3.2% | | | | |
The Coca-Cola Co. | | | | 95,000 | | | | | 5,624,950 | |
Keurig Dr Pepper, Inc. | | | | 100,000 | | | | | 3,686,000 | |
PepsiCo, Inc. | | | | 45,000 | | | | | 7,816,950 | |
| | | | | | | | | | |
| | | | | | | | | 17,127,900 | |
| | | | | | | | | | |
| Biotechnology - 1.2% | | | | |
Amgen, Inc. | | | | 28,000 | | | | | 6,299,160 | |
| | | | | | | | | | |
| Chemicals - 5.6% | | | | |
DuPont de Nemours, Inc. | | | | 95,000 | | | | | 7,674,100 | |
Ecolab, Inc. | | | | 45,000 | | | | | 10,556,550 | |
FMC Corp. | | | | 110,000 | | | | | 12,087,900 | |
| | | | | | | | | | |
| | | | | | | | | 30,318,550 | |
| | | | | | | | | | |
| Commercial Services & Supplies - 3.6% | | | | |
Cintas Corp. | | | | 16,000 | | | | | 7,090,720 | |
Waste Connections, Inc. (b) | | | | 90,000 | | | | | 12,264,300 | |
| | | | | | | | | | |
| | | | | | | | | 19,355,020 | |
| | | | | | | | | | |
| Computers & Peripherals - 3.3% | | | | |
Apple, Inc. | | | | 100,000 | | | | | 17,757,000 | |
| | | | | | | | | | |
| Construction Materials - 1.5% | | | | |
Martin Marietta Materials, Inc. | | | | 18,000 | | | | | 7,929,360 | |
| | | | | | | | | | |
| Diversified Financials - 2.0% | | | | |
JPMorgan Chase & Co. | | | | 68,000 | | | | | 10,767,800 | |
| | | | | | | | | | |
| Electrical Equipment & Instruments - 4.9% | | |
Franklin Electric Co., Inc. | | | | 85,000 | | | | | 8,037,600 | |
Rockwell Automation, Inc. | | | | 25,000 | | | | | 8,721,250 | |
Roper Technologies, Inc. | | | | 20,000 | | | | | 9,837,200 | |
| | | | | | | | | | |
| | | | | | | | | 26,596,050 | |
| | | | | | | | | | |
| Electronic Equipment & Instruments - 2.8% | | |
National Instruments Corp. | | | | 55,000 | | | | | 2,401,850 | |
Trimble, Inc. (a) | | | | 150,000 | | | | | 13,078,500 | |
| | | | | | | | | | |
| | | | | | | | | 15,480,350 | |
| | | | | | | | | | |
| Electronic Equipment, Instruments & Components - 1.6% |
Teledyne Technologies, Inc. (a) | | | | 20,000 | | | | | 8,737,800 | |
| | | | | | | | | | |
| Food Products - 0.7% | | | | |
Mondelez International, Inc. - Class A | | | | 54,000 | | | | | 3,580,740 | |
| | | | | | | | | | |
| Health Care Equipment & Supplies - 4.2% |
Alcon, Inc. (b) | | | | 60,000 | | | | | 5,227,200 | |
Stryker Corp. | | | | 20,000 | | | | | 5,348,400 | |
Thermo Fisher Scientific, Inc. | | | | 18,000 | | | | | 12,010,320 | |
| | | | | | | | | | |
| | | | | | | | | 22,585,920 | |
| | | | | | | | | | |
| | | | | | | | | | |
| COMMON STOCKS | | Shares | | Value |
| Household Durables - 1.0% | | | | |
Newell Brands, Inc. | | | | 240,000 | | | | $ | 5,241,600 | |
| | | | | | | | | | |
| Household Products - 2.2% | | | | |
Kimberly-Clark Corp. | | | | 50,000 | | | | | 7,146,000 | |
The Procter & Gamble Co. | | | | 30,000 | | | | | 4,907,400 | |
| | | | | | | | | | |
| | | | | | | | | 12,053,400 | |
| | | | | | | | | | |
| Internet & Catalog Retail - 3.1% | | | | |
Amazon.com, Inc. (a) | | | | 5,000 | | | | | 16,671,700 | |
| | | | | | | | | | |
| IT Consulting & Services - 2.1% | | | | |
PayPal Holdings, Inc. (a) | | | | 60,000 | | | | | 11,314,800 | |
| | | | | | | | | | |
| Life Sciences Tools & Services - 2.7% | | | | |
Danaher Corp. | | | | 45,000 | | | | | 14,805,450 | |
| | | | | | | | | | |
| Machinery - 7.7% | | | | |
Generac Holdings, Inc. (a) | | | | 35,000 | | | | | 12,317,200 | |
IDEX Corp. | | | | 20,000 | | | | | 4,726,400 | |
The Toro Co. | | | | 74,000 | | | | | 7,393,340 | |
Valmont Industries, Inc. | | | | 40,000 | | | | | 10,020,000 | |
Xylem, Inc. | | | | 60,000 | | | | | 7,195,200 | |
| | | | | | | | | | |
| | | | | | | | | 41,652,140 | |
| | | | | | | | | | |
| Marine - 1.1% | | | | |
Kirby Corp. (a) | | | | 100,000 | | | | | 5,942,000 | |
| | | | | | | | | | |
| Media & Entertainment - 4.2% | | | | |
Alphabet, Inc. - Class A (a) | | | | 5,500 | | | | | 15,933,720 | |
Meta Platforms, Inc. Class A (a) | | | | 20,000 | | | | | 6,727,000 | |
| | | | | | | | | | |
| | | | | | | | | 22,660,720 | |
| | | | | | | | | | |
| Metals & Mining - 1.5% | | | | |
Newmont Goldcorp Corp. | | | | 130,000 | | | | | 8,062,600 | |
| | | | | | | | | | |
| Oil & Gas & Consumable Fuels - 3.3% | | | | |
Chevron Corp. | | | | 31,500 | | | | | 3,696,525 | |
ConocoPhillips | | | | 100,000 | | | | | 7,218,000 | |
Coterra Energy, Inc. | | | | 374,000 | | | | | 7,106,000 | |
| | | | | | | | | | |
| | | | | | | | | 18,020,525 | |
| | | | | | | | | | |
| Personal Products - 1.7% | | | | |
The Estee Lauder Cos., Inc. - Class A | | | | 25,000 | | | | | 9,255,000 | |
| | | | | | | | | | |
| Pharmaceuticals - 4.9% | | | | |
Merck & Co., Inc. | | | | 80,000 | | | | | 6,131,200 | |
Pfizer, Inc. | | | | 130,000 | | | | | 7,676,500 | |
Zoetis, Inc. | | | | 53,500 | | | | | 13,055,605 | |
| | | | | | | | | | |
| | | | | | | | | 26,863,305 | |
| | | | | | | | | | |
| Road & Rail - 1.1% | | | | |
Union Pacific Corp. | | | | 24,000 | | | | | 6,046,320 | |
| | | | | | | | | | |
| Semiconductor & Semiconductor Equipment - 1.0% | | |
Intel Corp. | | | | 110,000 | | | | | 5,665,000 | |
| | | | | | | | | | |
| Software - 10.6% | | | | |
Adobe, Inc. (a) | | | | 28,000 | | | | | 15,877,680 | |
Microsoft Corp. | | | | 80,000 | | | | | 26,905,600 | |
OneSpan Inc. (a) | | | | 150,000 | | | | | 2,539,500 | |
Oracle Corp. | | | | 120,000 | | | | | 10,465,200 | |
The accompanying notes are an integral part of these financial statements.
19
|
| LKCM EQUITY FUND |
| SCHEDULEOF INVESTMENTS, CONTINUED |
| December 31, 2021 |
| | | | | | | | | | |
| COMMON STOCKS | | Shares | | Value |
| Software - 10.6%, Continued | | | | |
Sprout Social, Inc. - Class A (a) | | | | 20,000 | | | | $ | 1,813,800 | |
| | | | | | | | | | |
| | | | | | | | | 57,601,780 | |
| | | | | | | | | | |
| Software & Services - 1.9% | | | | |
Akamai Technologies, Inc. (a) | | | | 90,000 | | | | | 10,533,600 | |
| | | | | | | | | | |
| Specialty Retail - 2.3% | | | | |
The Home Depot, Inc. | | | | 30,000 | | | | | 12,450,300 | |
| | | | | | | | | | |
| Textiles, Apparel & Luxury Goods - 1.3% | | |
VF Corp. | | | | 100,000 | | | | | 7,322,000 | |
| | | | | | | | | | |
| Trading Companies & Distributors - 1.1% | | |
Fortress Transportation and Infrastructure Investors LLC | | | | 200,000 | | | | | 5,784,000 | |
| | | | | | | | | | |
TOTAL COMMON STOCKS
(Cost $215,420,195) | | | | 522,322,340 |
| | | | | | | | | | |
| | | | | | | | | | |
| SHORT-TERM INVESTMENTS - 3.8% |
| Money Market Funds - 3.8% | | | | |
Invesco Short-Term Investments Trust - Government & Agency Portfolio - Institutional Shares, 0.03% (c) | | | | 16,293,709 | | | | | 16,293,709 | |
Morgan Stanley Institutional Liquidity Funds - Government Portfolio - Institutional Shares, 0.03% (c) | | | | 4,363,453 | | | | | 4,363,453 | |
| | | | | | | | | | |
| | | | | | | | | 20,657,162 | |
| | | | | | | | | | |
TOTAL SHORT-TERM INVESTMENTS
(Cost $20,657,162) | | 20,657,162 |
| | | | | | | | | | |
Total Investments - 100.1%
(Cost $236,077,357) | | | | 542,979,502 |
Liabilities in Excess of Other Assets - (0.1)% | | | | | (283,146 | ) |
| | | | | | | | | | |
TOTAL NET ASSETS - 100.0% | | | | | | | | $ | 542,696,356 | |
| | | | | | | | | | |
| (a) | Non-income producing security. |
| (b) | Security issued by non-U.S. incorporated company. |
| (c) | The rate quoted is the annualized seven-day yield of the Fund at period end. |
Investments are classified by industry pursuant to the Global Industry Classification Standard (GICS®), which was developed by and/or is the exclusive property of Morgan Stanley Capital International, Inc. (“MSCI”) and Standard & Poor’s Financial Services LLC (“S&P”). GICS is a service mark of MSCI and S&P and has been licensed for use by U.S. Bancorp Fund Services, LLC.
The accompanying notes are an integral part of these financial statements.
20
|
| LKCM BALANCED FUND |
| SCHEDULEOF INVESTMENTS |
| December 31, 2021 |
| | | | | | | | | | |
| COMMON STOCKS - 69.7% | | Shares | |
Value |
| Aerospace & Defense - 2.3% | | | | |
Axon Enterprise, Inc. (a) | | | | 5,500 | | | | $ | 863,500 | |
Honeywell International, Inc. | | | | 5,100 | | | | | 1,063,401 | |
L3Harris Technologies, Inc. | | | | 6,300 | | | | | 1,343,412 | |
| | | | | | | | | | |
| | | | | | | | | 3,270,313 | |
| | | | | | | | | | |
| Banks - 3.7% | | | | |
Bank of America Corp. | | | | 55,000 | | | | | 2,446,950 | |
Cullen/Frost Bankers, Inc. | | | | 10,900 | | | | | 1,374,163 | |
Zions Bancorp N.A. | | | | 23,500 | | | | | 1,484,260 | |
| | | | | | | | | | |
| | | | | | | | | 5,305,373 | |
| | | | | | | | | | |
| Beverages - 1.9% | | | | |
The Coca-Cola Co. | | | | 28,100 | | | | | 1,663,801 | |
PepsiCo, Inc. | | | | 6,200 | | | | | 1,077,002 | |
| | | | | | | | | | |
| | | | | | | | | 2,740,803 | |
| | | | | | | | | | |
| Biotechnology - 1.1% | | | | |
Charles River Laboratories International, Inc. (a) | | | | 4,200 | | | | | 1,582,476 | |
| | | | | | | | | | |
| Chemicals - 5.6% | | | | |
Air Products and Chemicals, Inc. | | | | 5,000 | | | | | 1,521,300 | |
Corteva, Inc. | | | | 20,358 | | | | | 962,527 | |
DuPont de Nemours, Inc. | | | | 13,658 | | | | | 1,103,293 | |
Ecolab, Inc. | | | | 5,900 | | | | | 1,384,081 | |
FMC Corp. | | | | 12,600 | | | | | 1,384,614 | |
Linde PLC (b) | | | | 5,200 | | | | | 1,801,436 | |
| | | | | | | | | | |
| | | | | | | | | 8,157,251 | |
| | | | | | | | | | |
| Commercial Services & Supplies - 2.8% | | | | |
Cintas Corp. | | | | 4,000 | | | | | 1,772,680 | |
Waste Connections, Inc. (b) | | | | 9,500 | | | | | 1,294,565 | |
Waste Management, Inc. | | | | 6,000 | | | | | 1,001,400 | |
| | | | | | | | | | |
| | | | | | | | | 4,068,645 | |
| | | | | | | | | | |
| Communications Equipment - 1.9% | | | | |
QUALCOMM, Inc. | | | | 15,300 | | | | | 2,797,911 | |
| | | | | | | | | | |
| Computers & Peripherals - 2.1% | | | | |
Apple, Inc. | | | | 17,200 | | | | | 3,054,204 | |
| | | | | | | | | | |
| Construction Materials - 1.2% | | | | |
Martin Marietta Materials, Inc. | | | | 4,100 | | | | | 1,806,132 | |
| | | | | | | | | | |
| Diversified Financials - 2.1% | | | | |
JPMorgan Chase & Co. | | | | 10,000 | | | | | 1,583,500 | |
Moody’s Corp. | | | | 3,800 | | | | | 1,484,204 | |
| | | | | | | | | | |
| | | | | | | | | 3,067,704 | |
| | | | | | | | | | |
| Diversified Telecommunication Services - 1.0% | | |
AT&T, Inc. | | | | 25,189 | | | | | 619,650 | |
Verizon Communications, Inc. | | | | 15,841 | | | | | 823,098 | |
| | | | | | | | | | |
| | | | | | | | | 1,442,748 | |
| | | | | | | | | | |
| Electrical Equipment & Instruments - 1.9% |
Emerson Electric Co. | | | | 13,400 | | | | | 1,245,798 | |
Rockwell Automation, Inc. | | | | 4,500 | | | | | 1,569,825 | |
| | | | | | | | | | |
| | | | | | | | | 2,815,623 | |
| | | | | | | | | | |
| | | | | | | | | | |
| COMMON STOCKS | | Shares | |
Value |
| Electronic Equipment & Instruments - 1.5% | | |
National Instruments Corp. | | | | 12,800 | | | | $ | 558,976 | |
Trimble, Inc. (a) | | | | 18,100 | | | | | 1,578,139 | |
| | | | | | | | | | |
| | | | | | | | | 2,137,115 | |
| | | | | | | | | | |
| Electronic Equipment, Instruments & Components - 1.0% |
Teledyne Technologies, Inc. (a) | | | | 3,200 | | | | | 1,398,048 | |
| | | | | | | | | | |
| Food & Drug Retailing - 0.8% | | | | |
Walmart, Inc. | | | | 7,900 | | | | | 1,143,051 | |
| | | | | | | | | | |
| Health Care Equipment & Supplies - 3.6% |
Alcon, Inc. (b) | | | | 20,800 | | | | | 1,812,096 | |
PerkinElmer, Inc. | | | | 10,100 | | | | | 2,030,706 | |
Thermo Fisher Scientific, Inc. | | | | 2,000 | | | | | 1,334,480 | |
| | | | | | | | | | |
| | | | | | | | | 5,177,282 | |
| | | | | | | | | | |
| Household Products - 1.7% | | | | |
Colgate-Palmolive Co. | | | | 11,900 | | | | | 1,015,546 | |
Kimberly-Clark Corp. | | | | 6,000 | | | | | 857,520 | |
The Procter & Gamble Co. | | | | 3,500 | | | | | 572,530 | |
| | | | | | | | | | |
| | | | | | | | | 2,445,596 | |
| | | | | | | | | | |
| Internet & Catalog Retail - 1.3% | | | | |
Amazon.com, Inc. (a) | | | | 550 | | | | | 1,833,887 | |
| | | | | | | | | | |
| IT Consulting & Services - 4.2% | | | | |
Black Knight, Inc. (a) | | | | 19,400 | | | | | 1,608,066 | |
Broadridge Financial Solutions, Inc. | | | | 10,200 | | | | | 1,864,764 | |
PayPal Holdings, Inc. (a) | | | | 6,600 | | | | | 1,244,628 | |
Visa, Inc. - Class A | | | | 6,100 | | | | | 1,321,931 | |
| | | | | | | | | | |
| | | | | | | | | 6,039,389 | |
| | | | | | | | | | |
| Life Sciences Tools & Services - 1.3% | | | | |
Danaher Corp. | | | | 5,500 | | | | | 1,809,555 | |
| | | | | | | | | | |
| Machinery - 1.4% | | | | |
Fortive Corp. | | | | 10,100 | | | | | 770,529 | |
Xylem, Inc. | | | | 11,000 | | | | | 1,319,120 | |
| | | | | | | | | | |
| | | | | | | | | 2,089,649 | |
| | | | | | | | | | |
| Media & Entertainment - 4.7% | | | | |
Alphabet, Inc. - Class C (a) | | | | 725 | | | | | 2,097,853 | |
The Walt Disney Co. (a) | | | | 11,400 | | | | | 1,765,746 | |
Meta Platforms, Inc. Class A (a) | | | | 5,400 | | | | | 1,816,290 | |
Pinterest, Inc. - Class A (a) | | | | 31,050 | | | | | 1,128,667 | |
| | | | | | | | | | |
| | | | | | | | | 6,808,556 | |
| | | | | | | | | | |
| Metals & Mining - 0.6% | | | | |
Newmont Goldcorp Corp. | | | | 15,000 | | | | | 930,300 | |
| | | | | | | | | | |
| Oil & Gas & Consumable Fuels - 3.9% | | | | |
Chevron Corp. | | | | 11,295 | | | | | 1,325,468 | |
ConocoPhillips | | | | 17,900 | | | | | 1,292,022 | |
Coterra Energy, Inc. | | | | 25,900 | | | | | 492,100 | |
EOG Resources, Inc. | | | | 4,800 | | | | | 426,384 | |
Kinder Morgan, Inc. | | | | 65,000 | | | | | 1,030,900 | |
Pioneer Natural Resources Co. | | | | 6,100 | | | | | 1,109,468 | |
| | | | | | | | | | |
| | | | | | | | | 5,676,342 | |
| | | | | | | | | | |
The accompanying notes are an integral part of these financial statements.
21
|
| LKCM BALANCED FUND |
| SCHEDULEOF INVESTMENTS, CONTINUED |
| December 31, 2021 |
| | | | | | | | | | |
| COMMON STOCKS | | Shares | |
Value |
| Personal Products - 1.0% | | | | |
The Estee Lauder Cos., Inc. - Class A | | | | 4,000 | | | | $ | 1,480,800 | |
| | | | | | | | | | |
| Pharmaceuticals - 3.4% | | | | |
Abbott Laboratories | | | | 10,800 | | | | | 1,519,992 | |
Merck & Co., Inc. | | | | 16,400 | | | | | 1,256,896 | |
Zoetis, Inc. | | | | 8,626 | | | | | 2,105,003 | |
| | | | | | | | | | |
| | | | | | | | | 4,881,891 | |
| | | | | | | | | | |
| Real Estate Investment Trusts - 1.2% | | | | |
American Tower Corp. | | | | 5,900 | | | | | 1,725,750 | |
| | | | | | | | | | |
| Road & Rail - 1.0% | | | | |
Union Pacific Corp. | | | | 5,700 | | | | | 1,436,001 | |
| | | | | | | | | | |
| Software - 4.8% | | | | |
Adobe, Inc. (a) | | | | 2,000 | | | | | 1,134,120 | |
Microsoft Corp. | | | | 7,300 | | | | | 2,455,136 | |
Oracle Corp. | | | | 17,800 | | | | | 1,552,338 | |
salesforce.com, Inc. (a) | | | | 7,400 | | | | | 1,880,562 | |
| | | | | | | | | | |
| | | | | | | | | 7,022,156 | |
| | | | | | | | | | |
| Software & Services - 1.1% | | | | |
Akamai Technologies, Inc. (a) | | | | 13,800 | | | | | 1,615,152 | |
| | | | | | | | | | |
| Specialty Retail - 1.5% | | | | |
The Home Depot, Inc. | | | | 5,300 | | | | | 2,199,553 | |
| | | | | | | | | | |
| Textiles, Apparel & Luxury Goods - 2.1% | | |
NIKE, Inc. - Class B | | | | 10,800 | | | | | 1,800,036 | |
VF Corp. | | | | 16,700 | | | | | 1,222,774 | |
| | | | | | | | | | |
| | | | | | | | | 3,022,810 | |
| | | | | | | | | | |
TOTAL COMMON STOCKS
(Cost $51,921,320) | | | | | | | | | 100,982,066 | |
| | | | | | | | | | |
| | | | | | | | | | |
| CORPORATE BONDS - 29.5% | | Principal
Amount | | |
| Aerospace & Defense - 1.5% | | | | |
Honeywell International, Inc.: | | | | | | | | | | |
2.300%, 08/15/2024 | | | | | | | | | | |
Callable 07/15/2024 | | | $ | 250,000 | | | | | 258,536 | |
1.350%, 06/01/2025 | | | | | | | | | | |
Callable 05/01/2025 | | | | 750,000 | | | | | 753,833 | |
L3Harris Technologies, Inc. | | | | | | | | | | |
3.850%, 06/15/2023 | | | | | | | | | | |
Callable 05/15/2023 | | | | 900,000 | | | | | 935,189 | |
Raytheon Technologies Corp. | | | | | | | | | | |
3.700%, 12/15/2023 | | | | | | | | | | |
Callable 09/15/2023 | | | | 250,000 | | | | | 262,133 | |
| | | | | | | | | | |
| | | | | | | | | 2,209,691 | |
| | | | | | | | | | |
| Air Freight & Logistics - 0.4% | | | | |
United Parcel Service, Inc. | | | | | | | | | | |
2.450%, 10/01/2022 | | | | 600,000 | | | | | 608,766 | |
| | | | | | | | | | |
| Banks - 1.8% | | | | |
Bank of America Corp. | | | | | | | | | | |
3.300%, 01/11/2023 | | | | 500,000 | | | | | 513,848 | |
| | | | | | | | | | |
| CORPORATE BONDS | | Principal
Amount | | Value |
| Banks - 1.8%, Continued | | | | |
Comerica Bank | | | | | | | | | | |
2.500%, 07/23/2024 | | | $ | 300,000 | | | | $ | 310,108 | |
Comerica, Inc. | | | | | | | | | | |
3.700%, 07/31/2023 | | | | | | | | | | |
Callable 06/30/2023 | | | | 475,000 | | | | | 494,516 | |
The Bank of New York Mellon Corp. | | | | | | | | | | |
2.200%, 08/16/2023 | | | | | | | | | | |
Callable 06/16/2023 | | | | 200,000 | | | | | 204,425 | |
Truist Bank: | | | | | | | | | | |
3.200%, 04/01/2024 | | | | | | | | | | |
Callable 03/01/2024 | | | | 250,000 | | | | | 261,866 | |
4.050%, 11/03/2025 | | | | | | | | | | |
Callable 09/03/2025 | | | | 385,000 | | | | | 420,798 | |
3.300%, 05/15/2026 | | | | | | | | | | |
Callable 04/15/2026 | | | | 400,000 | | | | | 426,003 | |
| | | | | | | | | | |
| | | | | | | | | 2,631,564 | |
| | | | | | | | | | |
| Beverages - 1.0% | | | | |
Keurig Dr Pepper, Inc. | | | | | | | | | | |
2.550%, 09/15/2026 | | | | | | | | | | |
Callable 06/15/2026 | | | | 1,000,000 | | | | | 1,033,537 | |
PepsiCo, Inc. | | | | | | | | | | |
2.375%, 10/06/2026 | | | | | | | | | | |
Callable 07/06/2026 | | | | 435,000 | | | | | 454,833 | |
| | | | | | | | | | |
| | | | | | | | | 1,488,370 | |
| | | | | | | | | | |
| Biotechnology - 1.3% | | | | |
AbbVie, Inc.: | | | | | | | | | | |
2.850%, 05/14/2023 | | | | | | | | | | |
Callable 03/14/2023 | | | | 525,000 | | | | | 536,847 | |
3.200%, 05/14/2026 | | | | | | | | | | |
Callable 02/14/2026 | | | | 600,000 | | | | | 636,963 | |
Amgen, Inc.: | | | | | | | | | | |
3.625%, 05/22/2024 | | | | | | | | | | |
Callable 02/22/2024 | | | | 250,000 | | | | | 263,485 | |
2.600%, 08/19/2026 | | | | | | | | | | |
Callable 05/19/2026 | | | | 450,000 | | | | | 469,863 | |
| | | | | | | | | | |
| | | | | | | | | 1,907,158 | |
| | | | | | | | | | |
| Chemicals - 0.8% | | | | |
Air Products and Chemicals, Inc. | | | | | | | | | | |
1.850%, 05/15/2027 | | | | | | | | | | |
Callable 03/15/2027 | | | | 675,000 | | | | | 685,542 | |
Ecolab, Inc. | | | | | | | | | | |
2.700%, 11/01/2026 | | | | | | | | | | |
Callable 08/01/2026 | | | | 500,000 | | | | | 525,652 | |
| | | | | | | | | | |
| | | | | | | | | 1,211,194 | |
| | | | | | | | | | |
| Communications Equipment - 1.0% | | | | |
Cisco Systems, Inc. | | | | | | | | | | |
2.200%, 09/20/2023 | | | | | | | | | | |
Callable 07/20/2023 | | | | 750,000 | | | | | 768,950 | |
QUALCOMM, Inc. | | | | | | | | | | |
2.900%, 05/20/2024 | | | | | | | | | | |
Callable 03/20/2024 | | | | 600,000 | | | | | 625,723 | |
| | | | | | | | | | |
| | | | | | | | | 1,394,673 | |
| | | | | | | | | | |
The accompanying notes are an integral part of these financial statements.
22
|
| LKCM BALANCED FUND |
| SCHEDULEOF INVESTMENTS, CONTINUED |
| December 31, 2021 |
| | | | | | | | | | |
| CORPORATE BONDS | | Principal
Amount | | Value |
| Computers & Peripherals - 0.2% | | | | |
Apple, Inc.: | | | | | | | | | | |
2.500%, 02/09/2025 | | | $ | 250,000 | | | | $ | 260,427 | |
3.200%, 05/13/2025 | | | | 55,000 | | | | | 58,594 | |
| | | | | | | | | | |
| | | | | | | | | 319,021 | |
| | | | | | | | | | |
| Consumer Finance - 0.8% | | | | |
American Express Co.: | | | | | | | | | | |
3.400%, 02/27/2023 | | | | | | | | | | |
Callable 01/27/2023 | | | | 125,000 | | | | | 128,649 | |
3.700%, 08/03/2023 | | | | | | | | | | |
Callable 07/03/2023 | | | | 300,000 | | | | | 312,930 | |
3.000%, 10/30/2024 | | | | | | | | | | |
Callable 09/29/2024 | | | | 650,000 | | | | | 681,791 | |
| | | | | | | | | | |
| | | | | | | | | 1,123,370 | |
| | | | | | | | | | |
| Diversified Financials - 0.6% | | | | |
JPMorgan Chase & Co.: | | | | | | | | | | |
3.250%, 09/23/2022 | | | | 100,000 | | | | | 102,024 | |
3.375%, 05/01/2023 | | | | 225,000 | | | | | 232,057 | |
3.875%, 02/01/2024 | | | | 275,000 | | | | | 291,318 | |
3.200%, 06/15/2026 | | | | | | | | | | |
Callable 03/15/2026 | | | | 200,000 | | | | | 212,407 | |
| | | | | | | | | | |
| | | | | | | | | 837,806 | |
| | | | | | | | | | |
| Diversified Telecommunication Services - 1.5% | | |
AT&T, Inc.: | | | | | | | | | | |
3.400%, 05/15/2025 | | | | | | | | | | |
Callable 02/15/2025 | | | | 850,000 | | | | | 899,013 | |
1.700%, 03/25/2026 | | | | | | | | | | |
Callable 03/25/2023 | | | | 250,000 | | | | | 249,082 | |
Verizon Communications, Inc.: | | | | | | | | | | |
3.500%, 11/01/2024 | | | | | | | | | | |
Callable 08/01/2024 | | | | 750,000 | | | | | 798,721 | |
2.625%, 08/15/2026 | | | | 250,000 | | | | | 260,697 | |
| | | | | | | | | | |
| | | | | | | | | 2,207,513 | |
| | | | | | | | | | |
| Electrical Equipment & Instruments - 0.6% |
Emerson Electric Co.: | | | | | | | | | | |
2.625%, 02/15/2023 | | | | | | | | | | |
Callable 11/15/2022 | | | | 400,000 | | | | | 406,602 | |
3.150%, 06/01/2025 | | | | | | | | | | |
Callable 03/01/2025 | | | | 200,000 | | | | | 211,157 | |
Roper Technologies, Inc. | | | | | | | | | | |
1.000%, 09/15/2025 | | | | | | | | | | |
Callable 08/15/2025 | | | | 250,000 | | | | | 244,592 | |
| | | | | | | | | | |
| | | | | | | | | 862,351 | |
| | | | | | | | | | |
| Electronic Equipment & Instruments - 0.4% | | |
Trimble, Inc. | | | | | | | | | | |
4.150%, 06/15/2023 | | | | | | | | | | |
Callable 05/15/2023 | | | | 500,000 | | | | | 520,229 | |
| | | | | | | | | | |
| Food & Drug Retailing - 0.7% | | | | |
Walmart, Inc.: | | | | | | | | | | |
2.350%, 12/15/2022 | | | | | | | | | | |
Callable 11/15/2022 | | | | 300,000 | | | | | 305,043 | |
| | | | | | | | | | |
| CORPORATE BONDS | | Principal
Amount | | Value |
| Food & Drug Retailing - 0.7%, Continued | | |
3.550%, 06/26/2025 | | | | | | | | | | |
Callable 04/26/2025 | | | $ | 700,000 | | | | $ | 756,384 | |
| | | | | | | | | | |
| | | | | | | | | 1,061,427 | |
| | | | | | | | | | |
| Food & Staples Retailing - 0.5% | | | | |
Costco Wholesale Corp. | | | | | | | | | | |
1.375%, 06/20/2027 | | | | | | | | | | |
Callable 04/20/2027 | | | | 690,000 | | | | | 685,628 | |
| | | | | | | | | | |
| Hotels, Restaurants & Leisure - 0.4% | | | | |
McDonald’s Corp. | | | | | | | | | | |
1.450%, 09/01/2025 | | | | | | | | | | |
Callable 08/01/2025 | | | | 600,000 | | | | | 606,151 | |
| | | | | | | | | | |
| Internet & Catalog Retail - 0.6% | | | | |
Amazon.com, Inc.: | | | | | | | | | | |
2.400%, 02/22/2023 | | | | | | | | | | |
Callable 01/22/2023 | | | | 550,000 | | | | | 560,380 | |
1.200%, 06/03/2027 | | | | | | | | | | |
Callable 04/03/2027 | | | | 260,000 | | | | | 256,698 | |
| | | | | | | | | | |
| | | | | | | | | 817,078 | |
| | | | | | | | | | |
| IT Services - 1.2% | | | | |
PayPal Holdings, Inc. | | | | | | | | | | |
1.650%, 06/01/2025 | | | | | | | | | | |
Callable 05/01/2025 | | | | 1,250,000 | | | | | 1,266,781 | |
Visa, Inc. | | | | | | | | | | |
1.900%, 04/15/2027 | | | | | | | | | | |
Callable 02/15/2027 | | | | 500,000 | | | | | 507,250 | |
| | | | | | | | | | |
| | | | | | | | | 1,774,031 | |
| | | | | | | | | | |
| Life Sciences Tools & Services - 0.9% | | | | |
Danaher Corp. | | | | | | | | | | |
3.350%, 09/15/2025 | | | | | | | | | | |
Callable 06/15/2025 | | | | 250,000 | | | | | 266,524 | |
Thermo Fisher Scientific, Inc. | | | | | | | | | | |
1.215%, 10/18/2024 | | | | | | | | | | |
Callable 10/18/2022 | | | | 1,000,000 | | | | | 999,604 | |
| | | | | | | | | | |
| | | | | | | | | 1,266,128 | |
| | | | | | | | | | |
| Machinery - 0.5% | | | | |
Illinois Tool Works, Inc. | | | | | | | | | | |
3.500%, 03/01/2024 | | | | | | | | | | |
Callable 12/01/2023 | | | | 715,000 | | | | | 749,215 | |
| | | | | | | | | | |
| Media & Entertainment - 1.2% | | | | |
Alphabet, Inc.: | | | | | | | | | | |
3.375%, 02/25/2024 | | | | 600,000 | | | | | 632,610 | |
1.998%, 08/15/2026 | | | | | | | | | | |
Callable 05/15/2026 | | | | 200,000 | | | | | 206,429 | |
The Walt Disney Co. | | | | | | | | | | |
1.750%, 08/30/2024 | | | | | | | | | | |
Callable 07/30/2024 | | | | 810,000 | | | | | 823,468 | |
| | | | | | | | | | |
| | | | | | | | | 1,662,507 | |
| | | | | | | | | | |
The accompanying notes are an integral part of these financial statements.
23
|
| LKCM BALANCED FUND |
| SCHEDULEOF INVESTMENTS, CONTINUED |
| December 31, 2021 |
| | | | | | | | | | |
| CORPORATE BONDS | | Principal
Amount | | Value |
| Oil & Gas & Consumable Fuels - 3.0% | | | | |
Chevron Corp. | | | | | | | | | | |
1.995%, 05/11/2027 | | | | | | | | | | |
Callable 03/11/2027 | | | $ | 400,000 | | | | $ | 406,523 | |
ConocoPhillips | | | | | | | | | | |
2.400%, 12/15/2022 | | | | | | | | | | |
Callable 09/15/2022 | | | | 490,000 | | | | | 495,998 | |
Enterprise Products Operating, LLC | | | | | | | | | | |
3.750%, 02/15/2025 | | | | | | | | | | |
Callable 11/15/2024 | | | | 300,000 | | | | | 319,116 | |
EOG Resources, Inc. | | | | | | | | | | |
2.625%, 03/15/2023 | | | | | | | | | | |
Callable 12/15/2022 | | | | 600,000 | | | | | 610,364 | |
Exxon Mobil Corp.: | | | | | | | | | | |
2.709%, 03/06/2025 | | | | | | | | | | |
Callable 12/06/2024 | | | | 255,000 | | | | | 265,421 | |
3.043%, 03/01/2026 | | | | | | | | | | |
Callable 12/01/2025 | | | | 400,000 | | | | | 423,764 | |
Kinder Morgan Energy Partners, L.P. | | | | | | | | | | |
3.950%, 09/01/2022 | | | | | | | | | | |
Callable 06/01/2022 | | | | 400,000 | | | | | 405,406 | |
3.450%, 02/15/2023 | | | | | | | | | | |
Callable 11/15/2022 | | | | 425,000 | | | | | 434,132 | |
Kinder Morgan, Inc. | | | | | | | | | | |
3.150%, 01/15/2023 | | | | | | | | | | |
Callable 12/15/2022 | | | | 500,000 | | | | | 510,712 | |
Schlumberger Investment SA | | | | | | | | | | |
3.650%, 12/01/2023 | | | | | | | | | | |
Callable 09/01/2023 (b) | | | | 500,000 | | | | | 522,493 | |
| | | | | | | | | | |
| | | | | | | | | 4,393,929 | |
| | | | | | | | | | |
| Personal Products - 0.6% | | |
The Estee Lauder Cos., Inc. | | | | | | | | | | |
2.000%, 12/01/2024 | | | | | | | | | | |
Callable 11/01/2024 | | | | 805,000 | | | | | 827,611 | |
| | | | | | | | | | |
| Pharmaceuticals - 2.2% | | |
Abbott Laboratories: | | | | | | | | | | |
3.400%, 11/30/2023 | | | | | | | | | | |
Callable 09/30/2023 | | | | 480,000 | | | | | 502,788 | |
3.875%, 09/15/2025 | | | | | | | | | | |
Callable 06/15/2025 | | | | 255,000 | | | | | 277,277 | |
Bristol-Myers Squibb Co.: | | | | | | | | | | |
2.750%, 02/15/2023 | | | | | | | | | | |
Callable 01/15/2023 | | | | 650,000 | | | | | 664,889 | |
3.625%, 05/15/2024 | | | | | | | | | | |
Callable 02/15/2024 | | | | 250,000 | | | | | 263,587 | |
Johnson & Johnson | | | | | | | | | | |
0.550%, 09/01/2025 | | | | | | | | | | |
Callable 08/01/2025 | | | | 735,000 | | | | | 719,132 | |
Pfizer, Inc. | | | | | | | | | | |
0.800%, 05/28/2025 | | | | | | | | | | |
Callable 04/28/2025 | | | | 800,000 | | | | | 791,038 | |
| | | | | | | | | | |
| | | | | | | | | 3,218,711 | |
| | | | | | | | | | |
| | | | | | | | | | |
| CORPORATE BONDS | | Principal
Amount | | Value |
| Real Estate Investment Trusts - 0.9% | | |
American Tower Corp.: | | | | | | | | | | |
2.400%, 03/15/2025 | | | | | | | | | | |
Callable 02/15/2025 | | | $ | 600,000 | | | | $ | 616,778 | |
3.375%, 10/15/2026 | | | | | | | | | | |
Callable 07/15/2026 | | | | 635,000 | | | | | 675,514 | |
| | | | | | | | | | |
| | | | | | | | | 1,292,292 | |
| | | | | | | | | | |
| Road & Rail - 0.6% | | |
Burlington Northern Santa Fe, LLC | | | | | | | | | | |
3.000%, 03/15/2023 | | | | | | | | | | |
Callable 12/15/2022 | | | | 600,000 | | | | | 612,188 | |
Union Pacific Corp. | | | | | | | | | | |
3.750%, 07/15/2025 | | | | | | | | | | |
Callable 05/15/2025 | | | | 200,000 | | | | | 216,307 | |
| | | | | | | | | | |
| | | | | | | | | 828,495 | |
| | | | | | | | | | |
| Semiconductor Equipment & Products - 0.4% | | |
Intel Corp. | | | | | | | | | | |
3.700%, 07/29/2025 | | | | | | | | | | |
Callable 04/29/2025 | | | | 500,000 | | | | | 540,171 | |
| | | | | | | | | | |
| Software - 2.8% | | | | |
Adobe, Inc. | | | | | | | | | | |
1.900%, 02/01/2025 | | | | | | | | | | |
Callable 01/01/2025 | | | | 1,005,000 | | | | | 1,030,122 | |
Fortinet, Inc. | | | | | | | | | | |
1.000%, 03/15/2026 | | | | | | | | | | |
Callable 02/15/2026 | | | | 1,360,000 | | | | | 1,319,358 | |
Microsoft Corp.: | | | | | | | | | | |
2.375%, 02/12/2022 | | | | | | | | | | |
Callable 01/12/2022 | | | | 400,000 | | | | | 400,168 | |
3.125%, 11/03/2025 | | | | | | | | | | |
Callable 08/03/2025 | | | | 230,000 | | | | | 245,671 | |
Oracle Corp.: | | | | | | | | | | |
2.500%, 04/01/2025 | | | | | | | | | | |
Callable 03/01/2025 | | | | 500,000 | | | | | 512,254 | |
2.950%, 05/15/2025 | | | | | | | | | | |
Callable 02/15/2025 | | | | 500,000 | | | | | 519,751 | |
| | | | | | | | | | |
| | | | | | | | | 4,027,324 | |
| | | | | | | | | | |
| Specialty Retail - 1.1% | | |
Lowe’s Cos, Inc. | | | | | | | | | | |
2.500%, 04/15/2026 | | | | | | | | | | |
Callable 01/15/2026 | | | | 800,000 | | | | | 834,006 | |
The Home Depot, Inc.: | | | | | | | | | | |
2.625%, 06/01/2022 | | | | | | | | | | |
Callable 05/01/2022 | | | | 290,000 | | | | | 292,247 | |
2.800%, 09/14/2027 | | | | | | | | | | |
Callable 06/14/2027 | | | | 500,000 | | | | | 530,957 | |
| | | | | | | | | | |
| | | | | | | | | 1,657,210 | |
| | | | | | | | | | |
TOTAL CORPORATE BONDS
(Cost $42,356,035) | | | | | | | | | 42,729,614 | |
| | | | | | | | | | |
The accompanying notes are an integral part of these financial statements.
24
|
| LKCM BALANCED FUND |
| SCHEDULEOF INVESTMENTS, CONTINUED |
| December 31, 2021 |
| | | | | | | | | | |
| SHORT-TERM INVESTMENTS - 0.6% | | Shares | |
Value |
| Money Market Funds - 0.6% | | | | |
Invesco Short-Term Investments Trust - Government & Agency Portfolio - Institutional Shares, 0.03%(c) | | | | 865,401 | | | | $ | 865,401 | |
| | | | | | | | | | |
TOTAL SHORT-TERM INVESTMENTS
(Cost $865,401) | | | | | 865,401 | |
| | | | | | | | | | |
Total Investments - 99.8%
(Cost $95,142,756) | | | | | | | | | 144,577,081 | |
Other Assets in Excess of Liabilities - 0.2% | | | | | 323,532 | |
| | | | | | | | | | |
TOTAL NET ASSETS - 100.0% | | | | | | | | $ | 144,900,613 | |
| | | | | | | | | | |
| (a) | Non-income producing security. |
| (b) | Security issued by non-U.S. incorporated company. |
| (c) | The rate quoted is the annualized seven-day yield of the Fund at period end. |
Investments are classified by industry pursuant to the Global Industry Classification Standard (GICS®), which was developed by and/or is the exclusive property of Morgan Stanley Capital International, Inc. (“MSCI”) and Standard & Poor’s Financial Services LLC (“S&P”). GICS is a service mark of MSCI and S&P and has been licensed for use by U.S. Bancorp Fund Services, LLC.
The accompanying notes are an integral part of these financial statements.
25
|
| LKCM FIXED INCOME FUND |
| SCHEDULEOF INVESTMENTS |
| December 31, 2021 |
| | | | | | | | | | |
| CORPORATE BONDS - 75.5% | | Principal
Amount | | Value |
| Aerospace & Defense - 4.9% | | | | |
Honeywell International, Inc.: | | | | | | | | | | |
2.300%, 08/15/2024 | | | | | | | | | | |
Callable 07/15/2024 | | | $ | 3,105,000 | | | | $ | 3,211,009 | |
1.350%, 06/01/2025 | | | | | | | | | | |
Callable 05/01/2025 | | | | 3,000,000 | | | | | 3,015,334 | |
L3Harris Technologies, Inc. | | | | | | | | | | |
3.850%, 06/15/2023 | | | | | | | | | | |
Callable 05/15/2023 | | | | 6,245,000 | | | | | 6,489,176 | |
Raytheon Technologies Corp. | | | | | | | | | | |
3.700%, 12/15/2023 | | | | | | | | | | |
Callable 09/15/2023 | | | | 1,750,000 | | | | | 1,834,931 | |
| | | | | | | | | | |
| | | | | | | | | 14,550,450 | |
| | | | | | | | | | |
| Air Freight & Logistics - 1.0% | | | | |
United Parcel Service, Inc. | | | | | | | | | | |
2.450%, 10/01/2022 | | | | 3,000,000 | | | | | 3,043,828 | |
| | | | | | | | | | |
| Banks - 5.4% | | | | |
Bank of America Corp.: | | | | | | | | | | |
3.300%, 01/11/2023 | | | | 2,000,000 | | | | | 2,055,394 | |
4.450%, 03/03/2026 | | | | 2,000,000 | | | | | 2,205,151 | |
Comerica, Inc. | | | | | | | | | | |
3.700%, 07/31/2023 | | | | | | | | | | |
Callable 06/30/2023 | | | | 2,000,000 | | | | | 2,082,175 | |
The Bank of New York Mellon Corp. | | | | | | | | | | |
2.800%, 05/04/2026 | | | | | | | | | | |
Callable 02/04/2026 | | | | 300,000 | | | | | 314,794 | |
Truist Bank: | | | | | | | | | | |
3.200%, 04/01/2024 | | | | | | | | | | |
Callable 03/01/2024 | | | | 2,500,000 | | | | | 2,618,657 | |
3.300%, 05/15/2026 | | | | | | | | | | |
Callable 04/15/2026 | | | | 4,333,000 | | | | | 4,614,677 | |
Wells Fargo & Co. | | | | | | | | | | |
4.125%, 08/15/2023 | | | | 2,000,000 | | | | | 2,098,851 | |
| | | | | | | | | | |
| | | | | | | | | 15,989,699 | |
| | | | | | | | | | |
| Beverages - 0.8% | | | | |
Keurig Dr Pepper, Inc. | | | | | | | | | | |
2.550%, 09/15/2026 | | | | | | | | | | |
Callable 06/15/2026 | | | | 2,225,000 | | | | | 2,299,620 | |
| | | | | | | | | | |
| Biotechnology - 2.8% | | | | |
AbbVie, Inc. | | | | | | | | | | |
2.900%, 11/06/2022 | | | | 2,115,000 | | | | | 2,154,401 | |
Amgen, Inc.: | | | | | | | | | | |
2.250%, 08/19/2023 | | | | | | | | | | |
Callable 06/19/2023 | | | | 2,350,000 | | | | | 2,401,787 | |
2.600%, 08/19/2026 | | | | | | | | | | |
Callable 05/19/2026 | | | | 1,000,000 | | | | | 1,044,139 | |
2.200%, 02/21/2027 | | | | | | | | | | |
Callable 12/21/2026 | | | | 2,500,000 | | | | | 2,562,241 | |
| | | | | | | | | | |
| | | | | | | | | 8,162,568 | |
| | | | | | | | | | |
| | | | | | | | | | |
| CORPORATE BONDS | | Principal
Amount | | Value |
| Chemicals - 2.1% | | | | |
Air Products and Chemicals, Inc. | | | | | | | | | | |
1.500%, 10/15/2025 | | | | | | | | | | |
Callable 09/15/2025 | | | $ | 4,000,000 | | | | $ | 4,018,065 | |
Ecolab, Inc. | | | | | | | | | | |
2.700%, 11/01/2026 | | | | | | | | | | |
Callable 08/01/2026 | | | | 2,000,000 | | | | | 2,102,608 | |
| | | | | | | | | | |
| | | | | | | | | 6,120,673 | |
| | | | | | | | | | |
| Communications Equipment - 1.4% | | | | |
QUALCOMM, Inc. | | | | | | | | | | |
2.900%, 05/20/2024 | | | | | | | | | | |
Callable 03/20/2024 | | | | 4,000,000 | | | | | 4,171,490 | |
| | | | | | | | | | |
| Computers & Peripherals - 2.0% | | | | |
Apple, Inc.: | | | | | | | | | | |
2.400%, 05/03/2023 | | | | 3,250,000 | | | | | 3,328,736 | |
2.500%, 02/09/2025 | | | | 2,515,000 | | | | | 2,619,901 | |
| | | | | | | | | | |
| | | | | | | | | 5,948,637 | |
| | | | | | | | | | |
| Consumer Finance - 3.7% | | | | |
American Express Co.: | | | | | | | | | | |
2.500%, 08/01/2022 | | | | | | | | | | |
Callable 07/01/2022 | | | | 3,000,000 | | | | | 3,031,199 | |
3.400%, 02/27/2023 | | | | | | | | | | |
Callable 01/27/2023 | | | | 2,500,000 | | | | | 2,572,976 | |
2.500%, 07/30/2024 | | | | | | | | | | |
Callable 06/30/2024 | | | | 1,063,000 | | | | | 1,099,055 | |
3.000%, 10/30/2024 | | | | | | | | | | |
Callable 09/29/2024 | | | | 2,000,000 | | | | | 2,097,820 | |
4.200%, 11/06/2025 | | | | | | | | | | |
Callable 10/06/2025 | | | | 2,000,000 | | | | | 2,202,419 | |
| | | | | | | | | | |
| | | | | | | | | 11,003,469 | |
| | | | | | | | | | |
| Containers & Packaging - 1.6% | | | | |
Ball Corp. | | | | | | | | | | |
5.250%, 07/01/2025 | | | | 4,252,000 | | | | | 4,692,571 | |
| | | | | | | | | | |
| Diversified Financials - 4.1% | | | | |
JPMorgan Chase & Co.: | | | | | | | | | | |
3.375%, 05/01/2023 | | | | 3,788,000 | | | | | 3,906,818 | |
2.700%, 05/18/2023 | | | | | | | | | | |
Callable 03/18/2023 | | | | 1,855,000 | | | | | 1,897,803 | |
3.875%, 02/01/2024 | | | | 1,750,000 | | | | | 1,853,840 | |
3.300%, 04/01/2026 | | | | | | | | | | |
Callable 01/01/2026 | | | | 3,500,000 | | | | | 3,736,014 | |
3.200%, 06/15/2026 | | | | | | | | | | |
Callable 03/15/2026 | | | | 636,000 | | | | | 675,454 | |
| | | | | | | | | | |
| | | | | | | | | 12,069,929 | |
| | | | | | | | | | |
| Diversified Telecommunication Services - 6.9% | | |
AT&T, Inc.: | | | | | | | | | | |
3.000%, 06/30/2022 | | | | | | | | | | |
Callable 04/30/2022 | | | | 2,230,000 | | | | | 2,247,161 | |
1.700%, 03/25/2026 | | | | | | | | | | |
Callable 03/25/2023 | | | | 1,450,000 | | | | | 1,444,674 | |
The accompanying notes are an integral part of these financial statements.
26
|
| LKCM FIXED INCOME FUND |
| SCHEDULEOF INVESTMENTS, CONTINUED |
| December 31, 2021 |
| | | | | | | | | | |
| CORPORATE BONDS | | Principal
Amount | | Value |
| Diversified Telecommunication Services - 6.9%, Continued |
3.800%, 02/15/2027 | | | | | | | | | | |
Callable 11/15/2026 | | | $ | 2,000,000 | | | | $ | 2,174,720 | |
4.250%, 03/01/2027 | | | | | | | | | | |
Callable 12/01/2026 | | | | 4,000,000 | | | | | 4,442,727 | |
Verizon Communications, Inc.: | | | | | | | | | | |
3.500%, 11/01/2024 | | | | | | | | | | |
Callable 08/01/2024 | | | | 1,750,000 | | | | | 1,863,682 | |
4.125%, 03/16/2027 | | | | 2,000,000 | | | | | 2,224,758 | |
2.100%, 03/22/2028 | | | | | | | | | | |
Callable 01/22/2028 | | | | 6,000,000 | | | | | 6,020,656 | |
| | | | | | | | | | |
| | | | | | | | | 20,418,378 | |
| | | | | | | | | | |
| Electrical Equipment & Instruments - 2.8% | | |
Emerson Electric Co. | | | | | | | | | | |
3.150%, 06/01/2025 | | | | | | | | | | |
Callable 03/01/2025 | | | | 6,500,000 | | | | | 6,862,589 | |
Rockwell Automation, Inc. | | | | | | | | | | |
2.875%, 03/01/2025 | | | | | | | | | | |
Callable 12/01/2024 | | | | 1,440,000 | | | | | 1,505,973 | |
| | | | | | | | | | |
| | | | | | | | | 8,368,562 | |
| | | | | | | | | | |
| Electronic Equipment & Instruments - 1.6% | | |
Trimble, Inc. | | | | | | | | | | |
4.150%, 06/15/2023 | | | | | | | | | | |
Callable 05/15/2023 | | | | 4,500,000 | | | | | 4,682,061 | |
| | | | | | | | | | |
| Household Products - 0.3% | | |
The Procter & Gamble Co. | | | | | | | | | | |
8.000%, 09/01/2024 | | | | 775,000 | | | | | 911,502 | |
| | | | | | | | | | |
| Internet & Catalog Retail - 0.9% | | | | |
Amazon.com, Inc. | | | | | | | | | | |
2.500%, 11/29/2022 | | | | | | | | | | |
Callable 08/29/2022 | | | | 2,500,000 | | | | | 2,537,790 | |
| | | | | | | | | | |
| IT Services - 0.7% | | |
PayPal Holdings, Inc. | | | | | | | | | | |
1.650%, 06/01/2025 | | | | | | | | | | |
Callable 05/01/2025 | | | | 1,860,000 | | | | | 1,884,970 | |
| | | | | | | | | | |
| Life Sciences Tools & Services - 3.3% | | |
Danaher Corp. | | | | | | | | | | |
3.350%, 09/15/2025 | | | | | | | | | | |
Callable 06/15/2025 | | | | 5,500,000 | | | | | 5,863,535 | |
Thermo Fisher Scientific, Inc. | | | | | | | | | | |
1.215%, 10/18/2024 | | | | | | | | | | |
Callable 10/18/2022 | | | | 4,000,000 | | | | | 3,998,414 | |
| | | | | | | | | | |
| | | | | | | | | 9,861,949 | |
| | | | | | | | | | |
| Media & Entertainment - 2.0% | | |
Alphabet, Inc.: | | | | | | | | | | |
3.375%, 02/25/2024 | | | | 4,000,000 | | | | | 4,217,401 | |
1.998%, 08/15/2026 | | | | | | | | | | |
Callable 05/15/2026 | | | | 1,725,000 | | | | | 1,780,453 | |
| | | | | | | | | | |
| | | | | | | | | 5,997,854 | |
| | | | | | | | | | |
| | | | | | | | | | |
| CORPORATE BONDS | | Principal
Amount | | Value |
| Oil & Gas & Consumable Fuels - 5.2% | | |
Chevron Corp.: | | | | | | | | | | |
2.411%, 03/03/2022 | | | | | | | | | | |
Callable 01/03/2022 | | | $ | 1,450,000 | | | | $ | 1,452,187 | |
2.355%, 12/05/2022 | | | | | | | | | | |
Callable 09/05/2022 | | | | 1,000,000 | | | | | 1,012,817 | |
2.954%, 05/16/2026 | | | | | | | | | | |
Callable 02/16/2026 | | | | 1,870,000 | | | | | 1,982,749 | |
Enterprise Products Operating, LLC | | | | | | | | | | |
3.750%, 02/15/2025 | | | | | | | | | | |
Callable 11/15/2024 | | | | 2,963,000 | | | | | 3,151,801 | |
Kinder Morgan Energy Partners, L.P. | | | | | | | | | | |
4.250%, 09/01/2024 | | | | | | | | | | |
Callable 06/01/2024 | | | | 3,000,000 | | | | | 3,201,272 | |
Kinder Morgan, Inc. | | | | | | | | | | |
3.150%, 01/15/2023 | | | | | | | | | | |
Callable 12/15/2022 | | | | 4,350,000 | | | | | 4,443,190 | |
| | | | | | | | | | |
| | | | | | | | | 15,244,016 | |
| | | | | | | | | | |
| Personal Products - 0.2% | | |
The Estee Lauder Cos., Inc. | | | | | | | | | | |
2.000%, 12/01/2024 | | | | | | | | | | |
Callable 11/01/2024 | | | | 556,000 | | | | | 571,617 | |
| | | | | | | | | | |
| Pharmaceuticals - 4.3% | | |
Abbott Laboratories: | | | | | | | | | | |
3.400%, 11/30/2023 | | | | | | | | | | |
Callable 09/30/2023 | | | | 1,750,000 | | | | | 1,833,080 | |
2.950%, 03/15/2025 | | | | | | | | | | |
Callable 12/15/2024 | | | | 3,925,000 | | | | | 4,125,537 | |
Bristol-Myers Squibb Co. | | | | | | | | | | |
3.625%, 05/15/2024 | | | | | | | | | | |
Callable 02/15/2024 | | | | 4,750,000 | | | | | 5,008,158 | |
Zoetis, Inc. | | | | | | | | | | |
3.250%, 02/01/2023 | | | | | | | | | | |
Callable 11/01/2022 | | | | 1,664,000 | | | | | 1,696,089 | |
| | | | | | | | | | |
| | | | | | | | | 12,662,864 | |
| | | | | | | | | | |
| Real Estate Investment Trusts - 3.9% | | |
American Tower Corp.: | | | | | | | | | | |
2.250%, 01/15/2022 | | | | 1,000,000 | | | | | 1,000,545 | |
3.500%, 01/31/2023 | | | | 3,500,000 | | | | | 3,595,103 | |
5.000%, 02/15/2024 | | | | 2,500,000 | | | | | 2,692,053 | |
3.375%, 10/15/2026 | | | | | | | | | | |
Callable 07/15/2026 | | | | 4,030,000 | | | | | 4,287,119 | |
| | | | | | | | | | |
| | | | | | | | | 11,574,820 | |
| | | | | | | | | | |
| Road & Rail - 4.5% | | |
Burlington Northern Santa Fe, LLC: | | | | | | | | | | |
3.000%, 03/15/2023 | | | | | | | | | | |
Callable 12/15/2022 | | | | 4,695,000 | | | | | 4,790,375 | |
3.000%, 04/01/2025 | | | | | | | | | | |
Callable 01/01/2025 | | | | 2,250,000 | | | | | 2,365,562 | |
The accompanying notes are an integral part of these financial statements.
27
|
| LKCM FIXED INCOME FUND |
| SCHEDULEOF INVESTMENTS, CONTINUED |
| December 31, 2021 |
| | | | | | | | | | |
| CORPORATE BONDS | | Principal
Amount | | Value |
| Road & Rail - 4.5%, Continued | | |
Union Pacific Corp.: | | | | | | | | | | |
2.950%, 03/01/2022 | | | $ | 1,390,000 | | | | $ | 1,395,051 | |
3.250%, 01/15/2025 | | | | | | | | | | |
Callable 10/15/2024 | | | | 1,500,000 | | | | | 1,579,221 | |
3.750%, 07/15/2025 | | | | | | | | | | |
Callable 05/15/2025 | | | | 3,025,000 | | | | | 3,271,636 | |
| | | | | | | | | | |
| | | | | | | | | 13,401,845 | |
| | | | | | | | | | |
| Semiconductor Equipment & Products - 0.8% | | |
Intel Corp. | | | | | | | | | | |
3.700%, 07/29/2025 | | | | | | | | | | |
Callable 04/29/2025 | | | | 2,250,000 | | | | | 2,430,770 | |
| | | | | | | | | | |
| Semiconductors & Semiconductor Equipment - 1.4% | | |
NVIDIA Corp. | | | | | | | | | | |
1.550%, 06/15/2028 | | | | | | | | | | |
Callable 04/15/2028 | | | | 4,000,000 | | | | | 3,974,422 | |
| | | | | | | | | | |
| Software - 4.9% | | |
Adobe, Inc. | | | | | | | | | | |
1.900%, 02/01/2025 | | | | | | | | | | |
Callable 01/01/2025 | | | | 4,280,000 | | | | | 4,386,988 | |
Oracle Corp.: | | | | | | | | | | |
2.500%, 10/15/2022 | | | | 3,000,000 | | | | | 3,043,331 | |
2.650%, 07/15/2026 | | | | | | | | | | |
Callable 04/15/2026 | | | | 2,000,000 | | | | | 2,058,615 | |
3.250%, 11/15/2027 | | | | | | | | | | |
Callable 08/15/2027 | | | | 2,000,000 | | | | | 2,108,606 | |
2.300%, 03/25/2028 | | | | | | | | | | |
Callable 01/25/2028 | | | | 3,000,000 | | | | | 2,994,279 | |
| | | | | | | | | | |
| | | | | | | | | 14,591,819 | |
| | | | | | | | | | |
| Specialty Retail - 2.0% | | |
Lowe’s Cos, Inc. | | | | | | | | | | |
2.500%, 04/15/2026 | | | | | | | | | | |
Callable 01/15/2026 | | | | 1,000,000 | | | | | 1,042,507 | |
The Home Depot, Inc.: | | | | | | | | | | |
2.625%, 06/01/2022 | | | | | | | | | | |
Callable 05/01/2022 | | | | 2,125,000 | | | | | 2,141,470 | |
2.700%, 04/01/2023 | | | | | | | | | | |
Callable 01/01/2023 | | | | 2,750,000 | | | | | 2,805,810 | |
| | | | | | | | | | |
| | | | | | | | | 5,989,787 | |
| | | | | | | | | | |
TOTAL CORPORATE BONDS
(Cost $218,729,378) | | | | | | | | | 223,157,960 | |
| | | | | | | | | | |
| | | | | | | | | | |
| U.S. GOVERNMENT ISSUES - 6.0% | | | | |
| U.S. Treasury Inflation Indexed Bonds - 1.5% | | |
0.625%, 01/15/2024 | | | | 4,148,900 | | | | | 4,416,404 | |
| | | | | | | | | | |
| U.S. Treasury Notes - 4.5% | | | | |
1.125%, 02/28/2022 | | | | 2,000,000 | | | | | 2,003,325 | |
1.750%, 07/15/2022 | | | | 2,000,000 | | | | | 2,016,069 | |
1.375%, 02/15/2023 | | | | 2,000,000 | | | | | 2,021,211 | |
2.000%, 02/15/2023 | | | | 2,000,000 | | | | | 2,034,727 | |
| | | | | | | | | | |
| U.S. GOVERNMENT ISSUES | | Principal
Amount | | Value |
| U.S. Treasury Notes - 4.5%, Continued | | | | |
2.000%, 02/15/2025 | | | $ | 2,000,000 | | | | $ | 2,060,937 | |
2.000%, 08/15/2025 | | | | 1,000,000 | | | | | 1,031,875 | |
1.625%, 02/15/2026 | | | | 2,000,000 | | | | | 2,035,625 | |
| | | | | | | | | | |
| | | | | | | | | 13,203,769 | |
| | | | | | | | | | |
TOTAL U.S. GOVERNMENT ISSUES
(Cost $17,175,050) | | | | | 17,620,173 | |
| | | | | | | | | | |
| | | | | | | | | | |
U.S. GOVERNMENT SPONSORED
ENTITIES - 16.6% | | | | |
| Fannie Mae - 0.6% | | |
0.500%, 06/17/2025 | | | | 1,852,000 | | | | | 1,816,075 | |
| | | | | | | | | | |
| Federal Home Loan Banks - 14.8% | | | | |
0.500%, 12/17/2024 (a) | | | | | | | | | | |
Callable 03/17/2022 | | | | 2,500,000 | | | | | 2,500,087 | |
0.500%, 10/28/2025 (a) | | | | | | | | | | |
Callable 10/28/2022 | | | | 3,000,000 | | | | | 2,989,487 | |
0.300%, 01/27/2026 (a) | | | | | | | | | | |
Callable 01/27/2022 | | | | 3,000,000 | | | | | 2,953,928 | |
2.375%, 03/13/2026 | | | | 3,575,000 | | | | | 3,747,897 | |
0.500%, 03/30/2026 (a) | | | | | | | | | | |
Callable 03/30/2022 | | | | 3,000,000 | | | | | 2,974,487 | |
0.500%, 05/26/2026 (a) | | | | | | | | | | |
Callable 02/26/2022 | | | | 2,500,000 | | | | | 2,478,384 | |
0.625%, 10/28/2026 (a) | | | | | | | | | | |
Callable 01/28/2022 | | | | 3,000,000 | | | | | 2,992,461 | |
1.250%, 11/10/2026 | | | | | | | | | | |
Callable 11/10/2022 | | | | 3,000,000 | | | | | 2,993,122 | |
0.650%, 01/27/2028 (a) | | | | | | | | | | |
Callable 01/27/2022 | | | | 4,000,000 | | | | | 3,905,739 | |
1.000%, 11/16/2028 (a) | | | | | | | | | | |
Callable 05/16/2022 | | | | 3,000,000 | | | | | 2,992,367 | |
2.820%, 06/27/2029 | | | | | | | | | | |
Callable 06/27/2022 | | | | 4,000,000 | | | | | 4,041,213 | |
1.000%, 01/27/2031 (a) | | | | | | | | | | |
Callable 01/27/2022 | | | | 4,000,000 | | | | | 3,907,318 | |
1.000%, 09/30/2031 (a) | | | | | | | | | | |
Callable 03/30/2022 | | | | 3,000,000 | | | | | 2,949,038 | |
1.250%, 12/15/2033 (a) | | | | | | | | | | |
Callable 03/15/2022 | | | | 2,500,000 | | | | | 2,496,982 | |
| | | | | | | | | | |
| | | | | | | | | 43,922,510 | |
| | | | | | | | | | |
| Freddie Mac - 1.2% | | | | |
0.750%, 05/28/2025 | | | | | | | | | | |
Callable 05/28/2022 | | | | 3,500,000 | | | | | 3,464,515 | |
| | | | | | | | | | |
TOTAL U.S. GOVERNMENT SPONSORED ENTITIES
(Cost $49,685,094) | | | | | | | | | 49,203,100 | |
| | | | | | | | | | |
The accompanying notes are an integral part of these financial statements.
28
|
| LKCM FIXED INCOME FUND |
| SCHEDULEOF INVESTMENTS, CONTINUED |
| December 31, 2021 |
| | | | | | | | | | |
| SHORT-TERM INVESTMENTS - 1.4% | | Shares | |
Value |
| Money Market Funds - 1.4% | | | | |
Invesco Short-Term Investments Trust - Government & Agency Portfolio - Institutional Shares, 0.03% (b) | | | | 4,182,867 | | | | $ | 4,182,867 | |
| | | | | | | | | | |
TOTAL SHORT-TERM INVESTMENTS
(Cost $4,182,867) | | | | | 4,182,867 | |
| | | | | | | | | | |
Total Investments - 99.5%
(Cost $289,772,389) | | | | | | | | | 294,164,100 | |
Other Assets in Excess of Liabilities - 0.5% | | | | | 1,580,636 | |
| | | | | | | | | | |
TOTAL NET ASSETS - 100.0% | | | | | | | | $ | 295,744,736 | |
| | | | | | | | | | |
| (a) | Step-up bond that pays an initial coupon rate for the first period and then a higher coupon rate for the following periods. Rate as of period end. |
| (b) | The rate quoted is the annualized seven-day yield of the Fund at period end. |
Investments are classified by industry pursuant to the Global Industry Classification Standard (GICS®), which was developed by and/or is the exclusive property of Morgan Stanley Capital International, Inc. (“MSCI”) and Standard & Poor’s Financial Services LLC (“S&P”). GICS is a service mark of MSCI and S&P and has been licensed for use by U.S. Bancorp Fund Services, LLC.
The accompanying notes are an integral part of these financial statements.
29
|
| LKCM INTERNATIONAL EQUITY FUND |
| SCHEDULEOF INVESTMENTS |
| December 31, 2021 |
| | | | | | | | | | |
| COMMON STOCKS - 94.5% | | Shares | | Value |
| AUSTRALIA - 4.1% | | | | |
| Diversified Operations - 1.8% | | | | |
BHP Billiton Ltd. | | | | 34,000 | | | | $ | 1,026,516 | |
| | | | | | | | | | |
| Pharmaceuticals - 2.3% | | |
CSL Ltd. | | | | 5,950 | | | | | 1,258,424 | |
| | | | | | | | | | |
Total Australia | | | | | | | | | 2,284,940 | |
| | | | | | | | | | |
| FINLAND - 2.3% | | | | |
| Banks - 2.3% | | | | |
Nordea Bank Abp | | | | 106,500 | | | | | 1,299,146 | |
| | | | | | | | | | |
Total Finland | | | | | | | | | 1,299,146 | |
| | | | | | | | | | |
| FRANCE - 12.7% | | | | |
| Chemicals - 2.2% | | | | |
Air Liquide SA | | | | 7,150 | | | | | 1,246,989 | |
| | | | | | | | | | |
| Electrical Equipment & Instruments - 3.1% | | |
Schneider Electric SA | | | | 8,600 | | | | | 1,690,719 | |
| | | | | | | | | | |
| IT Consulting & Services - 2.8% | | |
Cap Gemini | | | | 6,300 | | | | | 1,544,006 | |
| | | | | | | | | | |
| Oil & Gas & Consumable Fuels - 1.6% | | |
TOTAL SA | | | | 17,000 | | | | | 865,303 | |
| | | | | | | | | | |
| Specialty Retail - 3.0% | | |
LVMH Moet Hennessy Louis Vuitton SE | | | | 2,040 | | | | | 1,685,923 | |
| | | | | | | | | | |
Total France | | | | | | | | | 7,032,940 | |
| | | | | | | | | | |
| GERMANY - 11.3% | | | | |
| Insurance - 2.0% | | | | |
Allianz SE | | | | 4,600 | | | | | 1,084,949 | |
| | | | | | | | | | |
| Machinery - 2.4% | | |
KION Group AG | | | | 12,250 | | | | | 1,338,014 | |
| | | | | | | | | | |
| Semiconductor Equipment & Products - 2.5% | | |
Infineon Technologies AG | | | | 31,020 | | | | | 1,428,112 | |
| | | | | | | | | | |
| Software - 2.3% | | |
SAP SE | | | | 9,000 | | | | | 1,266,654 | |
| | | | | | | | | | |
| Textiles, Apparel & Luxury Goods - 2.1% | | | | |
Adidas AG | | | | 4,100 | | | | | 1,180,574 | |
| | | | | | | | | | |
Total Germany | | | | | | | | | 6,298,303 | |
| | | | | | | | | | |
| IRELAND - 2.5% | | | | |
| Construction Materials - 2.5% | | | | |
CRH PLC | | | | 26,250 | | | | | 1,389,674 | |
| | | | | | | | | | |
Total Ireland | | | | | | | | | 1,389,674 | |
| | | | | | | | | | |
| ITALY - 1.9% | | | | |
| Textiles, Apparel & Luxury Goods - 1.9% | | | | |
Moncler SpA | | | | 14,500 | | | | | 1,047,889 | |
| | | | | | | | | | |
Total Italy | | | | | | | | | 1,047,889 | |
| | | | | | | | | | |
| JAPAN - 8.5% | | | | |
| Building Products - 2.3% | | | | |
Daikin Industries Ltd. | | | | 5,450 | | | | | 1,234,530 | |
| | | | | | | | | | |
| | | | | | | | | | |
| COMMON STOCKS | | Shares | | Value |
| Computers & Peripherals - 2.0% | | | | |
Nidec Corp. | | | | 9,500 | | | | $ | 1,123,797 | |
| | | | | | | | | | |
| Food & Drug Retailing - 1.1% | | | | |
Tsuruha Holdings, Inc. | | | | 6,600 | | | | | 633,724 | |
| | | | | | | | | | |
| Media & Entertainment - 2.0% | | | | |
Nintendo Co., Ltd. | | | | 2,350 | | | | | 1,099,465 | |
| | | | | | | | | | |
| Personal Products - 1.1% | | | | |
Shiseido Co., Ltd. | | | | 11,000 | | | | | 613,652 | |
| | | | | | | | | | |
Total Japan | | | | | | | | | 4,705,168 | |
| | | | | | | | | | |
| NETHERLANDS - 9.6% | | | | |
| Banks - 2.2% | | | | |
ING Groep NV | | | | 89,000 | | | | | 1,237,366 | |
| | | | | | | | | | |
| Capital Markets - 2.3% | | | | |
Euronext NV | | | | 12,250 | | | | | 1,273,557 | |
| | | | | | | | | | |
| Professional Services - 2.4% | | | | |
Wolters Kluwer NV | | | | 11,250 | | | | | 1,324,134 | |
| | | | | | | | | | |
| Semiconductor Equipment & Products - 2.7% |
ASML Holding NV | | | | 1,875 | | | | | 1,501,912 | |
| | | | | | | | | | |
Total Netherlands | | | | | | | | | 5,336,969 | |
| | | | | | | | | | |
| NORWAY - 1.4% | | | | |
| Chemicals - 1.4% | | | | |
Elkem ASA | | | | 225,000 | | | | | 758,364 | |
| | | | | | | | | | |
Total Norway | | | | | | | | | 758,364 | |
| | | | | | | | | | |
| SPAIN - 2.7% | | | | |
| Machinery - 2.7% | | | | |
Fluidra SA | | | | 37,500 | | | | | 1,495,582 | |
| | | | | | | | | | |
Total Spain | | | | | | | | | 1,495,582 | |
| | | | | | | | | | |
| SWEDEN - 5.1% | | | | |
| Hotels, Restaurants & Leisure - 2.4% | | | | |
Evolution AB | | | | 9,250 | | | | | 1,307,404 | |
| | | | | | | | | | |
| Oil & Gas & Consumable Fuels - 1.5% | | | | |
Lundin Petroleum AB | | | | 23,000 | | | | | 823,004 | |
| | | | | | | | | | |
| Tobacco - 1.2% | | | | |
SWEDISH MATCH | | | | 85,000 | | | | | 674,788 | |
| | | | | | | | | | |
Total Sweden | | | | | | | | | 2,805,196 | |
| | | | | | | | | | |
| SWITZERLAND - 14.5% | | | | |
| Banks - 2.4% | | | | |
Julius Baer Group Ltd. | | | | 19,500 | | | | | 1,304,010 | |
| | | | | | | | | | |
| Electrical Equipment & Instruments - 2.6% | | | | |
ABB Ltd. | | | | 37,892 | | | | | 1,444,170 | |
| | | | | | | | | | |
| Health Care Equipment & Supplies - 2.6% | | | | |
Alcon, Inc. | | | | 16,175 | | | | | 1,426,722 | |
| | | | | | | | | | |
| Pharmaceuticals - 5.1% | | | | |
Lonza Group AG | | | | 1,675 | | | | | 1,394,586 | |
Roche Holding AG | | | | 3,500 | | | | | 1,452,015 | |
| | | | | | | | | | |
| | | | | | | | | 2,846,601 | |
| | | | | | | | | | |
The accompanying notes are an integral part of these financial statements.
30
|
| LKCM INTERNATIONAL EQUITY FUND |
| SCHEDULEOF INVESTMENTS, CONTINUED |
| December 31, 2021 |
| | | | | | | | | | |
| COMMON STOCKS | | Shares | | Value |
| Software - 1.8% | | | | |
Temenos AG | | | | 7,275 | | | | $ | 1,002,796 | |
| | | | | | | | | | |
Total Switzerland | | | | | | | | | 8,024,299 | |
| | | | | | | | | | |
| UNITED KINGDOM - 17.9% | | | | |
| Banks - 2.3% | | | | |
Barclays PLC | | | | 500,000 | | | | | 1,273,628 | |
| | | | | | | | | | |
| Beverages - 2.5% | | | | |
Diageo PLC | | | | 25,000 | | | | | 1,366,898 | |
| | | | | | | | | | |
| Commercial Services & Supplies - 2.2% | | | | |
Rentokil Initial Plc | | | | 156,000 | | | | | 1,234,853 | |
| | | | | | | | | | |
| Hotels, Restaurants & Leisure - 2.0% | | | | |
InterContinental Hotels Group PLC (a) | | | | 17,000 | | | | | 1,099,031 | |
| | | | | | | | | | |
| Insurance - 1.4% | | | | |
Prudential PLC | | | | 45,471 | | | | | 786,321 | |
| | | | | | | | | | |
| Oil & Gas & Consumable Fuels - 1.4% | | | | |
Royal Dutch Shell PLC - A Shares | | | | 36,000 | | | | | 788,917 | |
| | | | | | | | | | |
| Personal Products - 2.2% | | | | |
Unilever PLC | | | | 23,150 | | | | | 1,241,913 | |
| | | | | | | | | | |
| Specialty Retail - 1.3% | | | | |
Burberry Group PLC | | | | 30,150 | | | | | 744,168 | |
| | | | | | | | | | |
| Trading Companies & Distributors - 2.6% |
Ashtead Group PLC | | | | 17,850 | | | | | 1,438,966 | |
| | | | | | | | | | |
Total United Kingdom | | | | | | | | | 9,974,695 | |
| | | | | | | | | | |
TOTAL COMMON STOCKS
(Cost $42,779,527) | | | | 52,453,165 |
| | | | | | | | | | |
| | | | | | | | | | |
| PREFERRED STOCKS - 2.3% | | | | |
| GERMANY - 2.3% | | | | |
| Health Care Equipment & Supplies - 2.3% |
Sartorius AG | | | | 1,900 | | | | | 1,285,045 | |
| | | | | | | | | | |
TOTAL PREFERRED STOCKS
(Cost $557,271) | | | | 1,285,045 |
| | | | | | | | | | |
| | | | | | | | | | |
| SHORT-TERM INVESTMENTS - 3.2% |
| Money Market Funds - 3.2% | | | | |
Morgan Stanley Institutional Liquidity Funds - Government Portfolio - Institutional Shares, 0.03% (b) | | | | 104,225 | | | | | 104,225 | |
Invesco Short-Term Investments Trust - Government & Agency Portfolio - Institutional Shares, 0.03% (b) | | | | 1,663,226 | | | | | 1,663,226 | |
| | | | | | | | | | |
| | | | | | | | | 1,767,451 | |
| | | | | | | | | | |
TOTAL SHORT-TERM INVESTMENTS
(Cost $1,767,451) | | 1,767,451 |
| | | | | | | | | | |
Total Investments - 100.0%
(Cost $45,104,249) | | | | 55,505,661 |
Liabilities in Excess of Other Assets - 0.0% | | | | | (1,487 | ) |
| | | | | | | | | | |
TOTAL NET ASSETS - 100.0% | | | | | | | | $ | 55,504,174 | |
| | | | | | | | | | |
| (a) | Non-income producing security. |
| (b) | The rate quoted is the annualized seven-day yield of the Fund at period end. |
Investments are classified by industry pursuant to the Global Industry Classification Standard (GICS®), which was developed by and/or is the exclusive property of Morgan Stanley Capital International, Inc. (“MSCI”) and Standard & Poor’s Financial Services LLC (“S&P”). GICS is a service mark of MSCI and S&P and has been licensed for use by U.S. Bancorp Fund Services, LLC.
The accompanying notes are an integral part of these financial statements.
31
|
| STATEMENTOF ASSETSAND LIABILITIES |
| December 31, 2021 |
| | | | | | | | | | | | | | | | | | | | | | | | | | | | | | | | | | | | | | | | | | | | | | | | | | | | | | | | | | | | |
| | | | | | | | | | | | |
| | | | | LKCM
Small Cap
Equity Fund | | | | LKCM
Small-Mid Cap
Equity Fund | | | | LKCM
Equity
Fund | | | | LKCM
Balanced
Fund | | | | LKCM
Fixed
Income Fund | | | | LKCM
International
Equity Fund |
| | | | | | | | | | | | | | | | | | | | | | | | | | | | | | | | | | | | | | | | | | | | | | | | | | | | | | | | | | | | |
Assets | | | | | | | | | | | | | | | | | | | | | | | | | | | | | | | | | | | | | | | | | | | | | | | | | | | | | | | | | | | | |
Investments, at value* | | | | | | | | $ | 224,404,512 | | | | | | | | | $ | 14,368,123 | | | | | | | | | $ | 542,979,502 | | | | | | | | | $ | 144,577,081 | | | | | | | | | $ | 294,164,100 | | | | | | | | | $ | 55,505,661 | |
Foreign currency, at value** | | | | | | | | | — | | | | | | | | | | 558 | | | | | | | | | | — | | | | | | | | | | — | | | | | | | | | | — | | | | | | | | | | — | |
Dividends and interest receivable | | | | | | | | | 146,092 | | | | | | | | | | 11,289 | | | | | | | | | | 432,270 | | | | | | | | | | 320,528 | | | | | | | | | | 1,907,632 | | | | | | | | | | 88,502 | |
Receivable for securities sold | | | | | | | | | — | | | | | | | | | | 39,497 | | | | | | | | | | — | | | | | | | | | | — | | | | | | | | | | — | | | | | | | | | | — | |
Receivable for investment advisory fees (Note B) | | | | | | | | | — | | | | | | | | | | 4,717 | | | | | | | | | | — | | | | | | | | | | — | | | | | | | | | | — | | | | | | | | | | — | |
Receivable for Fund shares sold | | | | | | | | | 5,161,790 | | | | | | | | | | — | | | | | | | | | | 254,925 | | | | | | | | | | 258,570 | | | | | | | | | | — | | | | | | | | | | 18,728 | |
Prepaid expenses and other assets | | | | | | | | | 24,343 | | | | | | | | | | 5,548 | | | | | | | | | | 33,535 | | | | | | | | | | 13,476 | | | | | | | | | | 22,874 | | | | | | | | | | 11,989 | |
| | | | | | | | | | | | | | | | | | | | | | | | | | | | | | | | | | | | | | | | | | | | | | | | | | | | | | | | | | | | |
Total assets | | | | | | | | | 229,736,737 | | | | | | | | | | 14,429,732 | | | | | | | | | | 543,700,232 | | | | | | | | | | 145,169,655 | | | | | | | | | | 296,094,606 | | | | | | | | | | 55,624,880 | |
| | | | | | | | | | | | | | | | | | | | | | | | | | | | | | | | | | | | | | | | | | | | | | | | | | | | | | | | | | | | |
Liabilities | | | | | | | | | | | | | | | | | | | | | | | | | | | | | | | | | | | | | | | | | | | | | | | | | | | | | | | | | | | | |
Due to custodian | | | | | | | | | — | | | | | | | | | | 28,254 | | | | | | | | | | — | | | | | | | | | | — | | | | | | | | | | 2 | | | | | | | | | | — | |
Payable for investment advisory fees (Note B) | | | | | | | | | 393,585 | | | | | | | | | | — | | | | | | | | | | 708,217 | | | | | | | | | | 170,551 | | | | | | | | | | 180,138 | | | | | | | | | | 65,814 | |
Payable for administrative fees | | | | | | | | | 53,452 | | | | | | | | | | 11,069 | | | | | | | | | | 113,768 | | | | | | | | | | 32,270 | | | | | | | | | | 67,016 | | | | | | | | | | 12,489 | |
Payable for accounting and
transfer agent fees and expenses | | | | | | | | | 34,552 | | | | | | | | | | 15,697 | | | | | | | | | | 55,164 | | | | | | | | | | 25,665 | | | | | | | | | | 41,096 | | | | | | | | | | 22,402 | |
Payable for professional fees | | | | | | | | | 30,435 | | | | | | | | | | 6,995 | | | | | | | | | | 64,035 | | | | | | | | | | 21,727 | | | | | | | | | | 38,508 | | | | | | | | | | 9,750 | |
Payable for custody fees and expenses | | | | | | | | | 6,125 | | | | | | | | | | 1,418 | | | | | | | | | | 13,732 | | | | | | | | | | 3,772 | | | | | | | | | | 7,637 | | | | | | | | | | 8,764 | |
Payable for reports to shareholders | | | | | | | | | 6,466 | | | | | | | | | | 600 | | | | | | | | | | 12,633 | | | | | | | | | | 4,059 | | | | | | | | | | 8,924 | | | | | | | | | | 463 | |
Payable for trustees’ fees and officer compensation (Note B) | | | | | | | | | 4,795 | | | | | | | | | | 330 | | | | | | | | | | 11,074 | | | | | | | | | | 2,935 | | | | | | | | | | 6,416 | | | | | | | | | | 1,000 | |
Payable for Fund shares redeemed | | | | | | | | | 7,990 | | | | | | | | | | 10,739 | | | | | | | | | | 25,015 | | | | | | | | | | 8,000 | | | | | | | | | | — | | | | | | | | | | — | |
Accrued expenses and other liabilities | | | | | | | | | 106 | | | | | | | | | | 7 | | | | | | | | | | 238 | | | | | | | | | | 63 | | | | | | | | | | 133 | | | | | | | | | | 24 | |
| | | | | | | | | | | | | | | | | | | | | | | | | | | | | | | | | | | | | | | | | | | | | | | | | | | | | | | | | | | | |
Total liabilities | | | | | | | | | 537,506 | | | | | | | | | | 75,109 | | | | | | | | | | 1,003,876 | | | | | | | | | | 269,042 | | | | | | | | | | 349,870 | | | | | | | | | | 120,706 | |
| | | | | | | | | | | | | | | | | | | | | | | | | | | | | | | | | | | | | | | | | | | | | | | | | | | | | | | | | | | | |
Net assets | | | | | | | | $ | 229,199,231 | | | | | | | | | $ | 14,354,623 | | | | | | | | | $ | 542,696,356 | | | | | | | | | $ | 144,900,613 | | | | | | | | | $ | 295,744,736 | | | | | | | | | $ | 55,504,174 | |
| | | | | | | | | | | | | | | | | | | | | | | | | | | | | | | | | | | | | | | | | | | | | | | | | | | | | | | | | | | | |
Net assets consist of: | | | | | | | | | | | | | | | | | | | | | | | | | | | | | | | | | | | | | | | | | | | | | | | | | | | | | | | | | | | | |
Paid-in capital | | | | | | | | $ | 138,234,357 | | | | | | | | | $ | 8,287,495 | | | | | | | | | $ | 235,794,212 | | | | | | | | | $ | 95,466,288 | | | | | | | | | $ | 291,031,188 | | | | | | | | | $ | 44,529,917 | |
Total distributable earnings | | | | | | | | | 90,964,874 | | | | | | | | | | 6,067,128 | | | | | | | | | | 306,902,144 | | | | | | | | | | 49,434,325 | | | | | | | | | | 4,713,548 | | | | | | | | | | 10,974,257 | |
| | | | | | | | | | | | | | | | | | | | | | | | | | | | | | | | | | | | | | | | | | | | | | | | | | | | | | | | | | | | |
Net assets | | | | | | | | $ | 229,199,231 | | | | | | | | | $ | 14,354,623 | | | | | | | | | $ | 542,696,356 | | | | | | | | | $ | 144,900,613 | | | | | | | | | $ | 295,744,736 | | | | | | | | | $ | 55,504,174 | |
| | | | | | | | | | | | | | | | | | | | | | | | | | | | | | | | | | | | | | | | | | | | | | | | | | | | | | | | | | | | |
Shares of beneficial interest outstanding
(unlimited shares of no par value authorized) | | | | | | | | | 10,638,481 | | | | | | | | | | 1,308,897 | | | | | | | | | | 14,025,692 | | | | | | | | | | 4,960,953 | | | | | | | | | | 27,209,092 | | | | | | | | | | 3,827,325 | |
Net asset value per share
(offering and redemption price) | | | | | | | | $ | 21.54 | | | | | | | | | $ | 10.97 | | | | | | | | | $ | 38.69 | | | | | | | | | $ | 29.21 | | | | | | | | | $ | 10.87 | | | | | | | | | $ | 14.50 | |
| | | | | | | | | | | | | | | | | | | | | | | | | | | | | | | | | | | | | | | | | | | | | | | | | | | | | | | | | | | | |
| | | | | | | | | | | | |
* Cost of Investments | | | | | | | | $ | 133,229,272 | | | | | | | | | $ | 8,300,997 | | | | | | | | | $ | 236,077,357 | | | | | | | | | $ | 95,142,756 | | | | | | | | | $ | 289,772,389 | | | | | | | | | $ | 45,104,249 | |
| | | | | | | | | | | | | | | | | | | | | | | | | | | | | | | | | | | | | | | | | | | | | | | | | | | | | | | | | | | | |
| | | | | | | | | | | | |
** Cost of Foreign Currency | | | | | | | | $ | — | | | | | | | | | $ | 553 | | | | | | | | | $ | — | | | | | | | | | $ | — | | | | | | | | | $ | — | | | | | | | | | $ | — | |
| | | | | | | | | | | | | | | | | | | | | | | | | | | | | | | | | | | | | | | | | | | | | | | | | | | | | | | | | | | | |
The accompanying notes are an integral part of these financial statements.
32
|
| STATEMENTOF OPERATIONS |
| Year Ended December 31, 2021 |
| | | | | | | | | | | | | | | | | | | | | | | | | | | | | | | | | | | | | | | | | | | | | | | | | | | | | | | | | | | | |
| | | | | | | | | | | | |
| | | | | LKCM
Small Cap
Equity Fund | | | | LKCM
Small-Mid Cap
Equity Fund | | | | LKCM
Equity
Fund | | | | LKCM
Balanced
Fund | | | | LKCM
Fixed
Income Fund | | | | LKCM
International
Equity Fund |
| | | | | | | | | | | | | | | | | | | | | | | | | | | | | | | | | | | | | | | | | | | | | | | | | | | | | | | | | | | | |
Investment Income: | | | | | | | | | | | | | | | | | | | | | | | | | | | | | | | | | | | | | | | | | | | | | | | | | | | | | | | | | | | | |
Dividends* | | | | | | | | $ | 1,557,106 | | | | | | | | | $ | 80,849 | | | | | | | | | $ | 6,229,036 | | | | | | | | | $ | 1,318,986 | | | | | | | | | $ | — | | | | | | | | | $ | 808,242 | |
Interest | | | | | | | | | 1,870 | | | | | | | | | | 95 | | | | | | | | | | 12,745 | | | | | | | | | | 709,545 | | | | | | | | | | 5,342,605 | | | | | | | | | | 588 | |
| | | | | | | | | | | | | | | | | | | | | | | | | | | | | | | | | | | | | | | | | | | | | | | | | | | | | | | | | | | | |
Total investment income | | | | | | | | | 1,558,976 | | | | | | | | | | 80,944 | | | | | | | | | | 6,241,781 | | | | | | | | | | 2,028,531 | | | | | | | | | | 5,342,605 | | | | | | | | | | 808,830 | |
| | | | | | | | | | | | | | | | | | | | | | | | | | | | | | | | | | | | | | | | | | | | | | | | | | | | | | | | | | | | |
| | | | | | | | | | | | |
Expenses: | | | | | | | | | | | | | | | | | | | | | | | | | | | | | | | | | | | | | | | | | | | | | | | | | | | | | | | | | | | | |
Investment advisory fees (Note B) | | | | | | | | | 1,718,396 | | | | | | | | | | 119,726 | | | | | | | | | | 3,547,029 | | | | | | | | | | 883,371 | | | | | | | | | | 1,461,765 | | | | | | | | | | 431,451 | |
Administrative fees | | | | | | | | | 212,708 | | | | | | | | | | 43,551 | | | | | | | | | | 438,476 | | | | | | | | | | 125,271 | | | | | | | | | | 264,709 | | | | | | | | | | 47,981 | |
Accounting and transfer agent fees and expenses | | | | | | | | | 156,916 | | | | | | | | | | 65,532 | | | | | | | | | | 284,896 | | | | | | | | | | 121,086 | | | | | | | | | | 187,539 | | | | | | | | | | 84,461 | |
Professional fees | | | | | | | | | 78,952 | | | | | | | | | | 10,680 | | | | | | | | | | 171,716 | | | | | | | | | | 51,009 | | | | | | | | | | 102,706 | | | | | | | | | | 10,303 | |
Trustees’ fees and officer compensation (Note B) | | | | | | | | | 112,308 | | | | | | | | | | 8,307 | | | | | | | | | | 256,037 | | | | | | | | | | 70,232 | | | | | | | | | | 162,968 | | | | | | | | | | 19,223 | |
Federal and state registration | | | | | | | | | 35,719 | | | | | | | | | | 21,732 | | | | | | | | | | 54,347 | | | | | | | | | | 22,823 | | | | | | | | | | 36,413 | | | | | | | | | | 22,872 | |
Custody fees and expenses | | | | | | | | | 24,769 | | | | | | | | | | 6,037 | | | | | | | | | | 52,753 | | | | | | | | | | 14,444 | | | | | | | | | | 30,251 | | | | | | | | | | 48,912 | |
Reports to shareholders | | | | | | | | | 17,521 | | | | | | | | | | 1,663 | | | | | | | | | | 34,821 | | | | | | | | | | 11,002 | | | | | | | | | | 21,958 | | | | | | | | | | 2,214 | |
Other | | | | | | | | | 8,061 | | | | | | | | | | 601 | | | | | | | | | | 18,479 | | | | | | | | | | 5,117 | | | | | | | | | | 12,368 | | | | | | | | | | 1,374 | |
| | | | | | | | | | | | | | | | | | | | | | | | | | | | | | | | | | | | | | | | | | | | | | | | | | | | | | | | | | | | |
Total expenses | | | | | | | | | 2,365,350 | | | | | | | | | | 277,829 | | | | | | | | | | 4,858,554 | | | | | | | | | | 1,304,355 | | | | | | | | | | 2,280,677 | | | | | | | | | | 668,791 | |
Less, expense waiver and/or
reimbursement (Note B) | | | | | | | | | (74,254 | ) | | | | | | | | | (118,194 | ) | | | | | | | | | (804,807 | ) | | | | | | | | | (217,130 | ) | | | | | | | | | (818,913 | ) | | | | | | | | | (189,401 | ) |
| | | | | | | | | | | | | | | | | | | | | | | | | | | | | | | | | | | | | | | | | | | | | | | | | | | | | | | | | | | | |
Net expenses | | | | | | | | | 2,291,096 | | | | | | | | | | 159,635 | | | | | | | | | | 4,053,747 | | | | | | | | | | 1,087,225 | | | | | | | | | | 1,461,764 | | | | | | | | | | 479,390 | |
| | | | | | | | | | | | | | | | | | | | | | | | | | | | | | | | | | | | | | | | | | | | | | | | | | | | | | | | | | | | |
Net investment income (loss) | | | | | | | | | (732,120 | ) | | | | | | | | | (78,691 | ) | | | | | | | | | 2,188,034 | | | | | | | | | | 941,306 | | | | | | | | | | 3,880,841 | | | | | | | | | | 329,440 | |
| | | | | | | | | | | | | | | | | | | | | | | | | | | | | | | | | | | | | | | | | | | | | | | | | | | | | | | | | | | | |
| | | | | | | | | | | | |
Realized and Unrealized Gain (Loss): | | | | | | | | | | | | | | | | | | | | | | | | | | | | | | | | | | | | | | | | | | | | | | | | | | | | | | | | | | | | |
Net realized gain (loss) on: | | | | | | | | | | | | | | | | | | | | | | | | | | | | | | | | | | | | | | | | | | | | | | | | | | | | | | | | | | | | |
Investments | | | | | | | | $ | 29,340,979 | | | | | | | | | $ | 2,253,062 | | | | | | | | | $ | 33,687,399 | | | | | | | | | $ | 5,267,253 | | | | | | | | | $ | 1,731,290 | | | | | | | | | $ | 1,559,219 | |
Foreign currency translation | | | | | | | | | — | | | | | | | | | | (2 | ) | | | | | | | | | (3 | ) | | | | | | | | | (1 | ) | | | | | | | | | — | | | | | | | | | | (46,281 | ) |
Net change in unrealized appreciation (depreciation) on: | | | | | | | | | | | | | | | | | | | | | | | | | | | | | | | | | | | | | | | | | | | | | | | | | | | | | | | | | | | | |
Investments | | | | | | | | | 829,538 | | | | | | | | | | 96,333 | | | | | | | | | | 65,351,081 | | | | | | | | | | 11,493,740 | | | | | | | | | | (10,167,137 | ) | | | | | | | | | 5,383,464 | |
Foreign currency translation | | | | | | | | | — | | | | | | | | | | — | | | | | | | | | | — | | | | | | | | | | — | | | | | | | | | | — | | | | | | | | | | (1,156 | ) |
| | | | | | | | | | | | | | | | | | | | | | | | | | | | | | | | | | | | | | | | | | | | | | | | | | | | | | | | | | | | |
| | | | | | | | | | | | |
Net Realized and Unrealized Gain (Loss) | | | | | | | | | 30,170,517 | | | | | | | | | | 2,349,393 | | | | | | | | | | 99,038,477 | | | | | | | | | | 16,760,992 | | | | | | | | | | (8,435,847 | ) | | | | | | | | | 6,895,246 | |
| | | | | | | | | | | | | | | | | | | | | | | | | | | | | | | | | | | | | | | | | | | | | | | | | | | | | | | | | | | | |
| | | | | | | | | | | | |
Net Increase (Decrease) in Net Assets Resulting from Operations | | | | | | | | $ | 29,438,397 | | | | | | | | | $ | 2,270,702 | | | | | | | | | $ | 101,226,511 | | | | | | | | | $ | 17,702,298 | | | | | | | | | $ | (4,555,006 | ) | | | | | | | | $ | 7,224,686 | |
| | | | | | | | | | | | | | | | | | | | | | | | | | | | | | | | | | | | | | | | | | | | | | | | | | | | | | | | | | | | |
| | | | | | | | | | | | |
* Net of foreign taxes withheld and/or issuance fees | | | | | | | | $ | 1,917 | | | | | | | | | $ | 589 | | | | | | | | | $ | 15,255 | | | | | | | | | $ | 1,741 | | | | | | | | | $ | — | | | | | | | | | $ | 91,342 | |
| | | | | | | | | | | | | | | | | | | | | | | | | | | | | | | | | | | | | | | | | | | | | | | | | | | | | | | | | | | | |
The accompanying notes are an integral part of these financial statements.
33
|
| STATEMENTSOF CHANGESIN NET ASSETS |
| | | | | | | | | | | | | | | | | | | | | | | | | | | | | | | | | | | | | | | | |
| | | | |
| | | | | LKCM
Small Cap
Equity Fund | | | | LKCM
Small-Mid Cap
Equity Fund |
| | | | | | | | | | | | | | | | | | | | | | | | | | | | | | | | | | | | | | | | |
| | | | | | | | |
| | | | | Year Ended
December 31,
2021 | | | | Year Ended
December 31,
2020 | | | | Year Ended
December 31,
2021 | | | | Year Ended
December 31,
2020 |
Operations: | | | | | | | | | | | | | | | | | | | | | | | | | | | | | | | | | | | | | | | | |
Net investment loss | | | | | | | | $ | (732,120 | ) | | | | | | | | $ | (188,879 | ) | | | | | | | | $ | (78,691 | ) | | | | | | | | $ | (32,152 | ) |
Net realized gain | | | | | | | | | 29,340,979 | | | | | | | | | | 11,511,516 | | | | | | | | | | 2,253,060 | | | | | | | | | | 1,174,753 | |
Net change in unrealized appreciation | | | | | | | | | 829,538 | | | | | | | | | | 37,360,816 | | | | | | | | | | 96,333 | | | | | | | | | | 2,453,932 | |
| | | | | | | | | | | | | | | | | | | | | | | | | | | | | | | | | | | | | | | | |
Net increase in net assets resulting from operations | | | | | | | | | 29,438,397 | | | | | | | | | | 48,683,453 | | | | | | | | | | 2,270,702 | | | | | | | | | | 3,596,533 | |
| | | | | | | | | | | | | | | | | | | | | | | | | | | | | | | | | | | | | | | | |
| | | | | | | | |
Distributions to Shareholders | | | | | | | | | (30,592,443 | ) | | | | | | | | | (7,270,969 | ) | | | | | | | | | (2,133,969 | ) | | | | | | | | | (936,700 | ) |
| | | | | | | | | | | | | | | | | | | | | | | | | | | | | | | | | | | | | | | | |
| | | | | | | | |
Net increase (decrease) in net assets from
Fund share transactions | | | | | | | | | 27,674,863 | | | | | | | | | | (19,416,505 | ) | | | | | | | | | (890,465 | ) | | | | | | | | | (141,824 | ) |
| | | | | | | | | | | | | | | | | | | | | | | | | | | | | | | | | | | | | | | | |
| | | | | | | | |
Total increase (decrease) in net assets | | | | | | | | | 26,520,817 | | | | | | | | | | 21,995,979 | | | | | | | | | | (753,732 | ) | | | | | | | | | 2,518,009 | |
| | | | | | | | |
Net Assets: | | | | | | | | | | | | | | | | | | | | | | | | | | | | | | | | | | | | | | | | |
Beginning of period | | | | | | | | | 202,678,414 | | | | | | | | | | 180,682,435 | | | | | | | | | | 15,108,355 | | | | | | | | | | 12,590,346 | |
| | | | | | | | | | | | | | | | | | | | | | | | | | | | | | | | | | | | | | | | |
End of period | | | | | | | | $ | 229,199,231 | | | | | | | | | $ | 202,678,414 | | | | | | | | | $ | 14,354,623 | | | | | | | | | $ | 15,108,355 | |
| | | | | | | | | | | | | | | | | | | | | | | | | | | | | | | | | | | | | | | | |
The accompanying notes are an integral part of these financial statements.
34
|
| STATEMENTSOF CHANGESIN NET ASSETS |
| | | | | | | | | | | | | | | | | | | | | | | | | | | | | | | | | | | | | | | | |
| | | | |
| | | | | LKCM
Equity Fund | | | | LKCM
Balanced Fund |
| | | | | | | | | | | | | | | | | | | | | | | | | | | | | | | | | | | | | | | | |
| | | | | | | | |
| | | | | Year Ended
December 31,
2021 | | | | Year Ended
December 31,
2020 | | | | Year Ended
December 31,
2021 | | | | Year Ended
December 31,
2020 |
Operations: | | | | | | | | | | | | | | | | | | | | | | | | | | | | | | | | | | | | | | | | |
Net investment income | | | | | | | | $ | 2,188,034 | | | | | | | | | $ | 2,114,794 | | | | | | | | | $ | 941,306 | | | | | | | | | $ | 1,068,531 | |
Net realized gain | | | | | | | | | 33,687,396 | | | | | | | | | | 22,432,961 | | | | | | | | | | 5,267,252 | | | | | | | | | | 4,042,398 | |
Net change in unrealized appreciation | | | | | | | | | 65,351,081 | | | | | | | | | | 58,658,948 | | | | | | | | | | 11,493,740 | | | | | | | | | | 11,490,886 | |
| | | | | | | | | | | | | | | | | | | | | | | | | | | | | | | | | | | | | | | | |
Net increase in net assets resulting from operations | | | | | | | | | 101,226,511 | | | | | | | | | | 83,206,703 | | | | | | | | | | 17,702,298 | | | | | | | | | | 16,601,815 | |
| | | | | | | | | | | | | | | | | | | | | | | | | | | | | | | | | | | | | | | | |
| | | | | | | | |
Distributions to Shareholders | | | | | | | | | (34,873,796 | ) | | | | | | | | | (23,899,115 | ) | | | | | | | | | (6,153,028 | ) | | | | | | | | | (5,072,763 | ) |
| | | | | | | | | | | | | | | | | | | | | | | | | | | | | | | | | | | | | | | | |
| | | | | | | | |
Net increase in net assets resulting from
Fund share transactions | | | | | | | | | 26,690,707 | | | | | | | | | | 9,038,373 | | | | | | | | | | 7,844,345 | | | | | | | | | | 10,153,339 | |
| | | | | | | | | | | | | | | | | | | | | | | | | | | | | | | | | | | | | | | | |
| | | | | | | | |
Total increase in net assets | | | | | | | | | 93,043,422 | | | | | | | | | | 68,345,961 | | | | | | | | | | 19,393,615 | | | | | | | | | | 21,682,391 | |
| | | | | | | | |
Net Assets: | | | | | | | | | | | | | | | | | | | | | | | | | | | | | | | | | | | | | | | | |
Beginning of period | | | | | | | | | 449,652,934 | | | | | | | | | | 381,306,973 | | | | | | | | | | 125,506,998 | | | | | | | | | | 103,824,607 | |
| | | | | | | | | | | | | | | | | | | | | | | | | | | | | | | | | | | | | | | | |
End of period | | | | | | | | $ | 542,696,356 | | | | | | | | | $ | 449,652,934 | | | | | | | | | $ | 144,900,613 | | | | | | | | | $ | 125,506,998 | |
| | | | | | | | | | | | | | | | | | | | | | | | | | | | | | | | | | | | | | | | |
The accompanying notes are an integral part of these financial statements.
35
|
| STATEMENTSOF CHANGESIN NET ASSETS |
| | | | | | | | | | | | | | | | | | | | | | | | | | | | | | | | | | | | | | | | |
| | | | |
| | | | | LKCM
Fixed Income Fund | | | | LKCM
International Equity Fund |
| | | | | | | | | | | | | | | | | | | | | | | | | | | | | | | | | | | | | | | | |
| | | | | | | | |
| | | | | Year Ended
December 31,
2021 | | | | Year Ended
December 31,
2020 | | | | Year Ended
December 31,
2021 | | | | Year Ended
December 31,
2020 |
Operations: | | | | | | | | | | | | | | | | | | | | | | | | | | | | | | | | | | | | | | | | |
Net investment income | | | | | | | | $ | 3,880,841 | | | | | | | | | $ | 5,020,682 | | | | | | | | | $ | 329,440 | | | | | | | | | $ | 57,733 | |
Net realized gain (loss) | | | | | | | | | 1,731,290 | | | | | | | | | | (872,810 | ) | | | | | | | | | 1,512,938 | | | | | | | | | | (579,799 | ) |
Net change in unrealized appreciation (depreciation) | | | | | | | | | (10,167,137 | ) | | | | | | | | | 7,939,510 | | | | | | | | | | 5,382,308 | | | | | | | | | | 4,041,643 | |
| | | | | | | | | | | | | | | | | | | | | | | | | | | | | | | | | | | | | | | | |
Net increase (decrease) in net assets resulting from operations | | | | | | | | | (4,555,006 | ) | | | | | | | | | 12,087,382 | | | | | | | | | | 7,224,686 | | | | | | | | | | 3,519,577 | |
| | | | | | | | | | | | | | | | | | | | | | | | | | | | | | | | | | | | | | | | |
| | | | | | | | |
Distributions to Shareholders | | | | | | | | | (3,924,713 | ) | | | | | | | | | (5,026,453 | ) | | | | | | | | | (680,356 | ) | | | | | | | | | (61,631 | ) |
| | | | | | | | | | | | | | | | | | | | | | | | | | | | | | | | | | | | | | | | |
| | | | | | | | |
Net increase in net assets from
Fund share transactions | | | | | | | | | 14,367,868 | | | | | | | | | | 6,878,886 | | | | | | | | | | 16,665,163 | | | | | | | | | | 18,191,405 | |
| | | | | | | | | | | | | | | | | | | | | | | | | | | | | | | | | | | | | | | | |
| | | | | | | | |
Total increase in net assets | | | | | | | | | 5,888,149 | | | | | | | | | | 13,939,815 | | | | | | | | | | 23,209,493 | | | | | | | | | | 21,649,351 | |
| | | | | | | | |
Net Assets: | | | | | | | | | | | | | | | | | | | | | | | | | | | | | | | | | | | | | | | | |
Beginning of period | | | | | | | | | 289,856,587 | | | | | | | | | | 275,916,772 | | | | | | | | | | 32,294,681 | | | | | | | | | | 10,645,330 | |
| | | | | | | | | | | | | | | | | | | | | | | | | | | | | | | | | | | | | | | | |
End of period | | | | | | | | $ | 295,744,736 | | | | | | | | | $ | 289,856,587 | | | | | | | | | $ | 55,504,174 | | | | | | | | | $ | 32,294,681 | |
| | | | | | | | | | | | | | | | | | | | | | | | | | | | | | | | | | | | | | | | |
The accompanying notes are an integral part of these financial statements.
36
|
| FINANCIAL HIGHLIGHTS |
| SELECTED DATAFOR EACH SHAREOF CAPITAL STOCK OUTSTANDING |
| | | | | | | | | | | | | | | | | | | | | | | | | | | | | | | | | | | | | | | | | | | | | | | | | | |
| | |
| | | | | LKCM Small Cap Equity Fund |
| | | | | | | | | | | | | | | | | | | | | | | | | | | | | | | | | | | | | | | | | | | | | | | | | | |
| | | | | | | | | | |
| | | | | Year
Ended
December 31,
2021 | | | | Year
Ended
December 31,
2020 | | | | Year
Ended
December 31,
2019 | | | | Year
Ended
December 31,
2018 | | | | Year
Ended
December 31,
2017 |
Net Asset Value – Beginning of Period | | | | | | | | $ | 21.77 | | | | | | | | | $ | 16.78 | | | | | | | | | $ | 14.39 | | | | | | | | | $ | 18.44 | | | | | | | | | $ | 18.82 | |
| | | | | | | | | | | | | | | | | | | | | | | | | | | | | | | | | | | | | | | | | | | | | | | | | | |
Net investment loss | | | | | | | | | (0.08 | )(1) | | | | | | | | | (0.02 | )(1) | | | | | | | | | (0.02 | )(1) | | | | | | | | | (0.03 | )(2) | | | | | | | | | (0.04 | )(1) |
Net realized and unrealized gain (loss) on investments | | | | | | | | | 3.23 | | | | | | | | | | 5.85 | | | | | | | | | | 3.29 | | | | | | | | | | (1.05 | ) | | | | | | | | | 3.27 | |
| | | | | | | | | | | | | | | | | | | | | | | | | | | | | | | | | | | | | | | | | | | | | | | | | | |
Total from investment operations | | | | | | | | | 3.15 | | | | | | | | | | 5.83 | | | | | | | | | | 3.27 | | | | | | | | | | (1.08 | ) | | | | | | | | | 3.23 | |
| | | | | | | | | | | | | | | | | | | | | | | | | | | | | | | | | | | | | | | | | | | | | | | | | | |
Distributions from net realized gains | | | | | | | | | (3.38 | ) | | | | | | | | | (0.84 | ) | | | | | | | | | (0.88 | ) | | | | | | | | | (2.97 | ) | | | | | | | | | (3.61 | ) |
| | | | | | | | | | | | | | | | | | | | | | | | | | | | | | | | | | | | | | | | | | | | | | | | | | |
Total dividends and distributions | | | | | | | | | (3.38 | ) | | | | | | | | | (0.84 | ) | | | | | | | | | (0.88 | ) | | | | | | | | | (2.97 | ) | | | | | | | | | (3.61 | ) |
| | | | | | | | | | | | | | | | | | | | | | | | | | | | | | | | | | | | | | | | | | | | | | | | | | |
Net Asset Value – End of Period | | | | | | | | $ | 21.54 | | | | | | | | | $ | 21.77 | | | | | | | | | $ | 16.78 | | | | | | | | | $ | 14.39 | | | | | | | | | $ | 18.44 | |
| | | | | | | | | | | | | | | | | | | | | | | | | | | | | | | | | | | | | | | | | | | | | | | | | | |
Total Return | | | | | | | | | 14.49% | | | | | | | | | | 34.79% | | | | | | | | | | 22.70% | | | | | | | | | | -5.70% | | | | | | | | | | 17.04% | |
| | | | | | | | | | |
Ratios and Supplemental Data: | | | | | | | | | | | | | | | | | | | | | | | | | | | | | | | | | | | | | | | | | | | | | | | | | | |
Net assets, end of period (thousands) | | | | | | | | $ | 229,199 | | | | | | | | | $ | 202,678 | | | | | | | | | $ | 180,682 | | | | | | | | | $ | 160,322 | | | | | | | | | $ | 201,139 | |
Ratio of expenses to average net assets: | | | | | | | | | | | | | | | | | | | | | | | | | | | | | | | | | | | | | | | | | | | | | | | | | | |
Before expense waiver and/or reimbursement | | | | | | | | | 1.03% | | | | | | | | | | 1.07% | | | | | | | | | | 1.07% | | | | | | | | | | 1.08% | | | | | | | | | | 1.10% | |
After expense waiver and/or reimbursement | | | | | | | | | 1.00% | | | | | | | | | | 1.00% | | | | | | | | | | 1.00% | | | | | | | | | | 1.00% | | | | | | | | | | 1.00% | |
Ratio of net investment loss to average net assets: | | | | | | | | | | | | | | | | | | | | | | | | | | | | | | | | | | | | | | | | | | | | | | | | | | |
Before expense waiver and/or reimbursement | | | | | | | | | (0.35)% | | | | | | | | | | (0.20)% | | | | | | | | | | (0.20)% | | | | | | | | | | (0.25)% | | | | | | | | | | (0.28)% | |
After expense waiver and/or reimbursement | | | | | | | | | (0.32)% | | | | | | | | | | (0.13)% | | | | | | | | | | (0.13)% | | | | | | | | | | (0.17)% | | | | | | | | | | (0.18)% | |
Portfolio turnover rate | | | | | | | | | 42% | | | | | | | | | | 60% | | | | | | | | | | 63% | | | | | | | | | | 45% | | | | | | | | | | 42% | |
| (1) | Net investment loss per share represents net investment loss divided by the average shares outstanding throughout the period. |
| (2) | Net investment loss per share is calculated using the ending balance of undistributed net investment loss prior to considerations of adjustments for permanent book and tax differences. |
| | | | | | | | | | | | | | | | | | | | | | | | | | | | | | | | | | | | | | | | | | | | | | | | | | |
| | |
| | | | | LKCM Small-Mid Cap Equity Fund |
| | | | | | | | | | | | | | | | | | | | | | | | | | | | | | | | | | | | | | | | | | | | | | | | | | |
| | | | | | | | | | |
| | | | | Year
Ended
December 31,
2021 | | | | Year
Ended
December 31,
2020 | | | | Year
Ended
December 31,
2019 | | | | Year
Ended
December 31,
2018 | | | | Year
Ended
December 31,
2017 |
Net Asset Value – Beginning of Period | | | | | | | | $ | 11.15 | | | | | | | | | $ | 9.09 | | | | | | | | | $ | 7.92 | | | | | | | | | $ | 10.60 | | | | | | | | | $ | 9.56 | |
| | | | | | | | | | | | | | | | | | | | | | | | | | | | | | | | | | | | | | | | | | | | | | | | | | |
Net investment loss | | | | | | | | | (0.06 | )(1) | | | | | | | | | (0.02 | )(1) | | | | | | | | | (0.02 | )(1) | | | | | | | | | (0.03 | )(2) | | | | | | | | | (0.01 | )(1) |
Net realized and unrealized gain (loss) on investments | | | | | | | | | 1.77 | | | | | | | | | | 2.80 | | | | | | | | | | 2.48 | | | | | | | | | | (0.93 | ) | | | | | | | | | 2.32 | |
| | | | | | | | | | | | | | | | | | | | | | | | | | | | | | | | | | | | | | | | | | | | | | | | | | |
Total from investment operations | | | | | | | | | 1.71 | | | | | | | | | | 2.78 | | | | | | | | | | 2.46 | | | | | | | | | | (0.96 | ) | | | | | | | | | 2.31 | |
| | | | | | | | | | | | | | | | | | | | | | | | | | | | | | | | | | | | | | | | | | | | | | | | | | |
Distributions from net realized gains | | | | | | | | | (1.89 | ) | | | | | | | | | (0.72 | ) | | | | | | | | | (1.29 | ) | | | | | | | | | (1.72 | ) | | | | | | | | | (1.27 | ) |
| | | | | | | | | | | | | | | | | | | | | | | | | | | | | | | | | | | | | | | | | | | | | | | | | | |
Net Asset Value – End of Period | | | | | | | | $ | 10.97 | | | | | | | | | $ | 11.15 | | | | | | | | | $ | 9.09 | | | | | | | | | $ | 7.92 | | | | | | | | | $ | 10.60 | |
| | | | | | | | | | | | | | | | | | | | | | | | | | | | | | | | | | | | | | | | | | | | | | | | | | |
Total Return | | | | | | | | | 15.37% | | | | | | | | | | 30.66% | | | | | | | | | | 31.05% | | | | | | | | | | -8.89% | | | | | | | | | | 24.13% | |
| | | | | | | | | | |
Ratios and Supplemental Data: | | | | | | | | | | | | | | | | | | | | | | | | | | | | | | | | | | | | | | | | | | | | | | | | | | |
Net assets, end of period (thousands) | | | | | | | | $ | 14,355 | | | | | | | | | $ | 15,108 | | | | | | | | | $ | 12,590 | | | | | | | | | $ | 12,162 | | | | | | | | | $ | 19,378 | |
Ratio of expenses to average net assets: | | | | | | | | | | | | | | | | | | | | | | | | | | | | | | | | | | | | | | | | | | | | | | | | | | |
Before expense waiver and/or reimbursement | | | | | | | | | 1.74% | | | | | | | | | | 1.98% | | | | | | | | | | 1.95% | | | | | | | | | | 1.75% | | | | | | | | | | 1.76% | |
After expense waiver and/or reimbursement | | | | | | | | | 1.00% | | | | | | | | | | 1.00% | | | | | | | | | | 1.00% | | | | | | | | | | 1.00% | | | | | | | | | | 1.00% | |
Ratio of net investment loss to average net assets: | | | | | | | | | | | | | | | | | | | | | | | | | | | | | | | | | | | | | | | | | | | | | | | | | | |
Before expense waiver and/or reimbursement | | | | | | | | | (1.23)% | | | | | | | | | | (1.25)% | | | | | | | | | | (1.20)% | | | | | | | | | | (1.05)% | | | | | | | | | | (0.94)% | |
After expense waiver and/or reimbursement | | | | | | | | | (0.49)% | | | | | | | | | | (0.27)% | | | | | | | | | | (0.25)% | | | | | | | | | | (0.30)% | | | | | | | | | | (0.18)% | |
Portfolio turnover rate | | | | | | | | | 50% | | | | | | | | | | 76% | | | | | | | | | | 68% | | | | | | | | | | 56% | | | | | | | | | | 63% | |
| (1) | Net investment loss per share represents net investment loss divided by the average shares outstanding throughout the period. |
| (2) | Net investment loss per share is calculated using the ending balance of undistributed net investment loss prior to considerations of adjustments for permanent book and tax differences. |
The accompanying notes are an integral part of these financial statements.
37
|
| FINANCIAL HIGHLIGHTS |
| SELECTED DATAFOR EACH SHAREOF CAPITAL STOCK OUTSTANDING |
| | | | | | | | | | | | | | | | | | | | | | | | | | | | | | | | | | | | | | | | | | | | | | | | | | |
| | |
| | | | | LKCM Equity Fund |
| | | | | | | | | | | | | | | | | | | | | | | | | | | | | | | | | | | | | | | | | | | | | | | | | | |
| | | | | | | | | | |
| | | | | Year
Ended
December 31,
2021 | | | | Year
Ended
December 31,
2020 | | | | Year
Ended
December 31,
2019 | | | | Year
Ended
December 31,
2018 | | | | Year
Ended
December 31,
2017 |
Net Asset Value – Beginning of Period | | | | | | | | $ | 33.74 | | | | | | | | | $ | 29.02 | | | | | | | | | $ | 23.34 | | | | | | | | | $ | 26.02 | | | | | | | | | $ | 22.42 | |
| | | | | | | | | | | | | | | | | | | | | | | | | | | | | | | | | | | | | | | | | | | | | | | | | | |
Net investment income | | | | | | | | | 0.16 | (1) | | | | | | | | | 0.17 | (1) | | | | | | | | | 0.22 | (1) | | | | | | | | | 0.21 | | | | | | | | | | 0.17 | |
Net realized and unrealized gain (loss) on investments | | | | | | | | | 7.43 | | | | | | | | | | 6.44 | | | | | | | | | | 6.75 | | | | | | | | | | (1.08 | ) | | | | | | | | | 4.69 | |
| | | | | | | | | | | | | | | | | | | | | | | | | | | | | | | | | | | | | | | | | | | | | | | | | | |
Total from investment operations | | | | | | | | | 7.59 | | | | | | | | | | 6.61 | | | | | | | | | | 6.97 | | | | | | | | | | (0.87 | ) | | | | | | | | | 4.86 | |
| | | | | | | | | | | | | | | | | | | | | | | | | | | | | | | | | | | | | | | | | | | | | | | | | | |
Distributions from net investment income | | | | | | | | | (0.17 | ) | | | | | | | | | (0.17 | ) | | | | | | | | | (0.23 | ) | | | | | | | | | (0.21 | ) | | | | | | | | | (0.17 | ) |
Distributions from net realized gains | | | | | | | | | (2.47 | ) | | | | | | | | | (1.72 | ) | | | | | | | | | (1.06 | ) | | | | | | | | | (1.60 | ) | | | | | | | | | (1.09 | ) |
| | | | | | | | | | | | | | | | | | | | | | | | | | | | | | | | | | | | | | | | | | | | | | | | | | |
Total dividends and distributions | | | | | | | | | (2.64 | ) | | | | | | | | | (1.89 | ) | | | | | | | | | (1.29 | ) | | | | | | | | | (1.81 | ) | | | | | | | | | (1.26 | ) |
| | | | | | | | | | | | | | | | | | | | | | | | | | | | | | | | | | | | | | | | | | | | | | | | | | |
Net Asset Value – End of Period | | | | | | | | $ | 38.69 | | | | | | | | | $ | 33.74 | | | | | | | | | $ | 29.02 | | | | | | | | | $ | 23.34 | | | | | | | | | $ | 26.02 | |
| | | | | | | | | | | | | | | | | | | | | | | | | | | | | | | | | | | | | | | | | | | | | | | | | | |
Total Return | | | | | | | | | 22.48% | | | | | | | | | | 22.83% | | | | | | | | | | 29.85% | | | | | | | | | | -3.28% | | | | | | | | | | 21.69% | |
| | | | | | | | | | |
Ratios and Supplemental Data: | | | | | | | | | | | | | | | | | | | | | | | | | | | | | | | | | | | | | | | | | | | | | | | | | | |
Net assets, end of period (thousands) | | | | | | | | $ | 542,696 | | | | | | | | | $ | 449,653 | | | | | | | | | $ | 381,307 | | | | | | | | | $ | 308,667 | | | | | | | | | $ | 340,601 | |
Ratio of expenses to average net assets: | | | | | | | | | | | | | | | | | | | | | | | | | | | | | | | | | | | | | | | | | | | | | | | | | | |
Before expense waiver and/or reimbursement | | | | | | | | | 0.96% | | | | | | | | | | 0.98% | | | | | | | | | | 0.99% | | | | | | | | | | 0.98% | | | | | | | | | | 0.99% | |
After expense waiver and/or reimbursement | | | | | | | | | 0.80% | | | | | | | | | | 0.80% | | | | | | | | | | 0.80% | | | | | | | | | | 0.80% | | | | | | | | | | 0.80% | |
Ratio of net investment income to average net assets: | | | | | | | | | | | | | | | | | | | | | | | | | | | | | | | | | | | | | | | | | | | | | | | | | | |
Before expense waiver and/or reimbursement | | | | | | | | | 0.27% | | | | | | | | | | 0.37% | | | | | | | | | | 0.61% | | | | | | | | | | 0.56% | | | | | | | | | | 0.50% | |
After expense waiver and/or reimbursement | | | | | | | | | 0.43% | | | | | | | | | | 0.55% | | | | | | | | | | 0.80% | | | | | | | | | | 0.74% | | | | | | | | | | 0.69% | |
Portfolio turnover rate | | | | | | | | | 11% | | | | | | | | | | 10% | | | | | | | | | | 9% | | | | | | | | | | 16% | | | | | | | | | | 11% | |
| (1) | Net investment income per share represents net investment income divided by the average shares outstanding throughout the period. |
| | | | | | | | | | | | | | | | | | | | | | | | | | | | | | | | | | | | | | | | | | | | | | | | | | |
| | |
| | | | | LKCM Balanced Fund |
| | | | | | | | | | | | | | | | | | | | | | | | | | | | | | | | | | | | | | | | | | | | | | | | | | |
| | | | | | | | | | |
| | | | | Year
Ended
December 31,
2021 | | | | Year
Ended
December 31,
2020 | | | | Year
Ended
December 31,
2019 | | | | Year
Ended
December 31,
2018 | | | | Year
Ended
December 31,
2017 |
Net Asset Value – Beginning of Period | | | | | | | | $ | 26.76 | | | | | | | | | $ | 24.22 | | | | | | | | | $ | 21.07 | | | | | | | | | $ | 22.18 | | | | | | | | | $ | 20.46 | |
| | | | | | | | | | | | | | | | | | | | | | | | | | | | | | | | | | | | | | | | | | | | | | | | | | |
Net investment income | | | | | | | | | 0.20 | (1) | | | | | | | | | 0.24 | (1) | | | | | | | | | 0.27 | (1) | | | | | | | | | 0.23 | | | | | | | | | | 0.20 | |
Net realized and unrealized gain (loss) on investments | | | | | | | | | 3.54 | | | | | | | | | | 3.42 | | | | | | | | | | 4.32 | | | | | | | | | | (0.70 | ) | | | | | | | | | 2.43 | |
| | | | | | | | | | | | | | | | | | | | | | | | | | | | | | | | | | | | | | | | | | | | | | | | | | |
Total from investment operations | | | | | | | | | 3.74 | | | | | | | | | | 3.66 | | | | | | | | | | 4.59 | | | | | | | | | | (0.47 | ) | | | | | | | | | 2.63 | |
| | | | | | | | | | | | | | | | | | | | | | | | | | | | | | | | | | | | | | | | | | | | | | | | | | |
Distributions from net investment income | | | | | | | | | (0.20 | ) | | | | | | | | | (0.24 | ) | | | | | | | | | (0.27 | ) | | | | | | | | | (0.23 | ) | | | | | | | | | (0.20 | ) |
Distributions from net realized gains | | | | | | | | | (1.09 | ) | | | | | | | | | (0.88 | ) | | | | | | | | | (1.17 | ) | | | | | | | | | (0.41 | ) | | | | | | | | | (0.71 | ) |
| | | | | | | | | | | | | | | | | | | | | | | | | | | | | | | | | | | | | | | | | | | | | | | | | | |
Total dividends and distributions | | | | | | | | | (1.29 | ) | | | | | | | | | (1.12 | ) | | | | | | | | | (1.44 | ) | | | | | | | | | (0.64 | ) | | | | | | | | | (0.91 | ) |
| | | | | | | | | | | | | | | | | | | | | | | | | | | | | | | | | | | | | | | | | | | | | | | | | | |
Net Asset Value – End of Period | | | | | | | | $ | 29.21 | | | | | | | | | $ | 26.76 | | | | | | | | | $ | 24.22 | | | | | | | | | $ | 21.07 | | | | | | | | | $ | 22.18 | |
| | | | | | | | | | | | | | | | | | | | | | | | | | | | | | | | | | | | | | | | | | | | | | | | | | |
Total Return | | | | | | | | | 14.01% | | | | | | | | | | 15.28% | | | | | | | | | | 21.85% | | | | | | | | | | -2.15% | | | | | | | | | | 12.88% | |
| | | | | | | | | | |
Ratios and Supplemental Data: | | | | | | | | | | | | | | | | | | | | | | | | | | | | | | | | | | | | | | | | | | | | | | | | | | |
Net assets, end of period (thousands) | | | | | | | | $ | 144,901 | | | | | | | | | $ | 125,507 | | | | | | | | | $ | 103,825 | | | | | | | | | $ | 85,907 | | | | | | | | | $ | 83,430 | |
Ratio of expenses to average net assets: | | | | | | | | | | | | | | | | | | | | | | | | | | | | | | | | | | | | | | | | | | | | | | | | | | |
Before expense waiver and/or reimbursement | | | | | | | | | 0.96% | | | | | | | | | | 0.99% | | | | | | | | | | 1.00% | | | | | | | | | | 1.00% | | | | | | | | | | 1.02% | |
After expense waiver and/or reimbursement | | | | | | | | | 0.80% | | | | | | | | | | 0.80% | | | | | | | | | | 0.80% | | | | | | | | | | 0.80% | | | | | | | | | | 0.80% | |
Ratio of net investment income to average net assets: | | | | | | | | | | | | | | | | | | | | | | | | | | | | | | | | | | | | | | | | | | | | | | | | | | |
Before expense waiver and/or reimbursement | | | | | | | | | 0.53% | | | | | | | | | | 0.78% | | | | | | | | | | 0.95% | | | | | | | | | | 0.83% | | | | | | | | | | 0.73% | |
After expense waiver and/or reimbursement | | | | | | | | | 0.69% | | | | | | | | | | 0.97% | | | | | | | | | | 1.15% | | | | | | | | | | 1.03% | | | | | | | | | | 0.95% | |
Portfolio turnover rate | | | | | | | | | 11% | | | | | | | | | | 18% | | | | | | | | | | 17% | | | | | | | | | | 17% | | | | | | | | | | 15% | |
| (1) | Net investment income per share represents net investment income divided by the average shares outstanding throughout the period. |
The accompanying notes are an integral part of these financial statements.
38
|
| FINANCIAL HIGHLIGHTS |
| SELECTED DATAFOR EACH SHAREOF CAPITAL STOCK OUTSTANDING |
| | | | | | | | | | | | | | | | | | | | | | | | | | | | | | | | | | | | | | | | | | | | | | | | | | |
| | |
| | | | | LKCM Fixed Income Fund |
| | | | | | | | | | | | | | | | | | | | | | | | | | | | | | | | | | | | | | | | | | | | | | | | | | |
| | | | | | | | | | |
| | | | | Year
Ended
December 31,
2021 | | | | Year
Ended
December 31,
2020 | | | | Year
Ended
December 31,
2019 | | | | Year
Ended
December 31,
2018 | | | | Year
Ended
December 31,
2017 |
Net Asset Value – Beginning of Period | | | | | | | | $ | 11.19 | | | | | | | | | $ | 10.92 | | | | | | | | | $ | 10.47 | | | | | | | | | $ | 10.68 | | | | | | | | | $ | 10.67 | |
| | | | | | | | | | | | | | | | | | | | | | | | | | | | | | | | | | | | | | | | | | | | | | | | | | |
Net investment income | | | | | | | | | 0.15 | (1) | | | | | | | | | 0.19 | (1) | | | | | | | | | 0.25 | (1) | | | | | | | | | 0.24 | | | | | | | | | | 0.21 | |
Net realized and unrealized gain (loss) on investments | | | | | | | | | (0.32 | ) | | | | | | | | | 0.27 | | | | | | | | | | 0.45 | | | | | | | | | | (0.21 | ) | | | | | | | | | 0.02 | |
| | | | | | | | | | | | | | | | | | | | | | | | | | | | | | | | | | | | | | | | | | | | | | | | | | |
Total from investment operations | | | | | | | | | (0.17 | ) | | | | | | | | | 0.46 | | | | | | | | | | 0.70 | | | | | | | | | | 0.03 | | | | | | | | | | 0.23 | |
| | | | | | | | | | | | | | | | | | | | | | | | | | | | | | | | | | | | | | | | | | | | | | | | | | |
Distributions from net investment income | | | | | | | | | (0.15 | ) | | | | | | | | | (0.19 | ) | | | | | | | | | (0.25 | ) | | | | | | | | | (0.24 | ) | | | | | | | | | (0.21 | ) |
Distributions from net realized gains | | | | | | | | | (0.00 | )(2) | | | | | | | | | — | | | | | | | | | | — | | | | | | | | | | — | | | | | | | | | | (0.01 | ) |
| | | | | | | | | | | | | | | | | | | | | | | | | | | | | | | | | | | | | | | | | | | | | | | | | | |
Total dividends and distributions | | | | | | | | | (0.15 | ) | | | | | | | | | (0.19 | ) | | | | | | | | | (0.25 | ) | | | | | | | | | (0.24 | ) | | | | | | | | | (0.22 | ) |
| | | | | | | | | | | | | | | | | | | | | | | | | | | | | | | | | | | | | | | | | | | | | | | | | | |
Net Asset Value – End of Period | | | | | | | | $ | 10.87 | | | | | | | | | $ | 11.19 | | | | | | | | | $ | 10.92 | | | | | | | | | $ | 10.47 | | | | | | | | | $ | 10.68 | |
| | | | | | | | | | | | | | | | | | | | | | | | | | | | | | | | | | | | | | | | | | | | | | | | | | |
Total Return | | | | | | | | | (1.54)% | | | | | | | | | | 4.29% | | | | | | | | | | 6.70% | | | | | | | | | | 0.26% | | | | | | | | | | 2.15% | |
| | | | | | | | | | |
Ratios and Supplemental Data: | | | | | | | | | | | | | | | | | | | | | | | | | | | | | | | | | | | | | | | | | | | | | | | | | | |
Net assets, end of period (thousands) | | | | | | | | $ | 295,745 | | | | | | | | | $ | 289,857 | | | | | | | | | $ | 275,917 | | | | | | | | | $ | 249,286 | | | | | | | | | $ | 248,976 | |
Ratio of expenses to average net assets: | | | | | | | | | | | | | | | | | | | | | | | | | | | | | | | | | | | | | | | | | | | | | | | | | | |
Before expense waiver and/or reimbursement | | | | | | | | | 0.78% | | | | | | | | | | 0.79% | | | | | | | | | | 0.79% | | | | | | | | | | 0.78% | | | | | | | | | | 0.80% | |
After expense waiver and/or reimbursement | | | | | | | | | 0.50% | | | | | | | | | | 0.50% | | | | | | | | | | 0.50% | | | | | | | | | | 0.50% | | | | | | | | | | 0.50% | |
Ratio of net investment income to average net assets: | | | | | | | | | | | | | | | | | | | | | | | | | | | | | | | | | | | | | | | | | | | | | | | | | | |
Before expense waiver and/or reimbursement | | | | | | | | | 1.05% | | | | | | | | | | 1.46% | | | | | | | | | | 2.02% | | | | | | | | | | 1.96% | | | | | | | | | | 1.66% | |
After expense waiver and/or reimbursement | | | | | | | | | 1.33% | | | | | | | | | | 1.75% | | | | | | | | | | 2.31% | | | | | | | | | | 2.24% | | | | | | | | | | 1.96% | |
Portfolio turnover rate | | | | | | | | | 31% | | | | | | | | | | 46% | | | | | | | | | | 37% | | | | | | | | | | 23% | | | | | | | | | | 28% | |
| (1) | Net investment income per share represents net investment income divided by the average shares outstanding during the period. |
| | | | | | | | | | | | | | | | | | | | | | | | | | | | | | |
| | |
| | | | | LKCM
International Equity Fund |
| | | | | | | | | | | | | | | | | | | | | | | | | | | | | | |
| | | | | | |
| | | | | Year
Ended
December 31,
2021 | | | | Year
Ended
December 31,
2020 | | | | May 1, 2019(1)
through
December 31,
2019 |
Net Asset Value – Beginning of Period | | | | | | | | $ | 12.44 | | | | | | | | | $ | 10.89 | | | | | | | | | $ | 10.00 | |
| | | | | | | | | | | | | | | | | | | | | | | | | | | | | | |
Net investment income | | | | | | | | | 0.10 | (2) | | | | | | | | | 0.03 | (2) | | | | | | | | | 0.02 | (2) |
Net realized and unrealized gain on investments | | | | | | | | | 2.14 | | | | | | | | | | 1.54 | | | | | | | | | | 0.88 | |
| | | | | | | | | | | | | | | | | | | | | | | | | | | | | | |
Total from investment operations | | | | | | | | | 2.24 | | | | | | | | | | 1.57 | | | | | | | | | | 0.90 | |
| | | | | | | | | | | | | | | | | | | | | | | | | | | | | | |
Distributions from net investment income | | | | | | | | | (0.08 | ) | | | | | | | | | (0.02 | ) | | | | | | | | | (0.01 | ) |
Distributions from return of capital | | | | | | | | | — | | | | | | | | | | (0.00 | )(3) | | | | | | | | | — | |
Distributions from net realized gains | | | | | | | | | (0.10 | ) | | | | | | | | | — | | | | | | | | | | (0.00 | )(3) |
| | | | | | | | | | | | | | | | | | | | | | | | | | | | | | |
Total dividends and distributions | | | | | | | | | (0.18 | ) | | | | | | | | | (0.02 | ) | | | | | | | | | (0.01 | ) |
| | | | | | | | | | | | | | | | | | | | | | | | | | | | | | |
Net Asset Value – End of Period | | | | | | | | $ | 14.50 | | | | | | | | | $ | 12.44 | | | | | | | | | $ | 10.89 | |
| | | | | | | | | | | | | | | | | | | | | | | | | | | | | | |
Total Return | | | | | | | | | 18.00% | | | | | | | | | | 14.45% | | | | | | | | | | 8.97% | (4) |
| | | | | | | |
Ratios and Supplemental Data: | | | | | | | | | | | | | | | | | | | | | | | | | | | | | | |
Net assets, end of period (thousands) | | | | | | | | $ | 55,504 | | | | | | | | | $ | 32,295 | | | | | | | | | $ | 10,645 | |
Ratio of expenses to average net assets: | | | | | | | | | | | | | | | | | | | | | | | | | | | | | | |
Before expense waiver and/or reimbursement | | | | | | | | | 1.40% | | | | | | | | | | 1.88% | | | | | | | | | | 4.09% | (5) |
After expense waiver and/or reimbursement | | | | | | | | | 1.00% | | | | | | | | | | 1.00% | | | | | | | | | | 1.00% | (5) |
Ratio of net investment income (loss) to average net assets: | | | | | | | | | | | | | | | | | | | | | | | | | | | | | | |
Before expense waiver and/or reimbursement | | | | | | | | | 0.29% | | | | | | | | | | (0.55)% | | | | | | | | | | (2.76)% | (5) |
After expense waiver and/or reimbursement | | | | | | | | | 0.69% | | | | | | | | | | 0.33% | | | | | | | | | | 0.33% | (5) |
Portfolio turnover rate | | | | | | | | | 15% | | | | | | | | | | 6% | | | | | | | | | | 2% | (4) |
| (1) | Commencement of operations. |
| (2) | Net investment income per share represents net investment income divided by the average shares outstanding during the period. |
The accompanying notes are an integral part of these financial statements.
39
|
| LKCM FUNDS |
| NOTESTOTHE FINANCIAL STATEMENTS |
A. Organization and Significant Accounting Policies: LKCM Funds (the “Trust”) is registered under the Investment Company Act of 1940 (“1940 Act”) as an open-end, management investment company. The Trust was organized as a Delaware statutory trust on February 10, 1994 and consists of seven diversified series as of December 31, 2021, six of which are presented herein and include the LKCM Small Cap Equity Fund, LKCM Small-Mid Cap Equity Fund, LKCM Equity Fund, LKCM Balanced Fund, LKCM Fixed Income Fund and LKCM International Equity Fund (collectively, the “Funds”). The assets of the Funds are invested in separate, independently managed portfolios. Investment operations of the Funds began on July 14, 1994 (LKCM Small Cap Equity Fund), January 3, 1996 (LKCM Equity Fund), December 30, 1997 (LKCM Balanced Fund and LKCM Fixed Income Fund), May 2, 2011 (LKCM Small-Mid Cap Equity Fund) and May 1, 2019 (LKCM International Equity Fund). The LKCM Small Cap Equity Fund, LKCM Small-Mid Cap Equity Fund and LKCM Equity Fund previously had two share classes—Institutional Class shares and Adviser Class shares. The Board of Trustees of the Trust approved the (i) liquidation and termination of Adviser Class shares of the LKCM Small Cap Equity Fund, which took place on October 31, 2018, and (ii) termination of Adviser Class shares of the LKCM Equity Fund and LKCM Small-Mid Cap Equity Fund, which had not commenced operations and had no assets or shareholders, on September 24, 2018. Each Fund charges a 1% redemption fee for redemptions of Fund shares held for less than 30 days, unless otherwise determined by a Fund in its discretion.
The LKCM Small Cap Equity Fund seeks to maximize long-term capital appreciation by investing under normal circumstances at least 80% of its net assets (plus any borrowings for investment purposes) in equity securities of smaller companies (those with market capitalizations at the time of investment between $1.2 billion and $7 billion) which Luther King Capital Management Corporation (the “Adviser”) believes are likely to have above-average growth in revenue and/or earnings and potential for above-average capital appreciation. The LKCM Small-Mid Cap Equity Fund seeks to maximize long-term capital appreciation by investing under normal circumstances at least 80% of its net assets (plus any borrowings for investment purposes) in equity securities of small-mid capitalization companies (those with market capitalizations at the time of investment between $2 billion and $20 billion) which the Adviser believes are likely to have above-average growth in revenue and/or earnings and potential for above-average capital appreciation. The LKCM Equity Fund seeks to maximize long-term capital appreciation by investing under normal circumstances at least 80% of its net assets (plus any borrowings for investment purposes) in equity securities of companies which the Adviser believes are likely to have above-average growth in revenue and/or earnings, above-average returns on shareholders’ equity, potential for above-average capital appreciation and/or companies that the Adviser believes have attractive relative valuations. The LKCM Balanced Fund seeks current income and long-term capital appreciation by investing primarily in a portfolio of equity and fixed income securities with at least 25% of the Fund’s total assets invested in fixed income securities under normal circumstances. The LKCM Fixed Income Fund seeks current income by investing under normal circumstances at least 80% of its net assets (plus any borrowings for investment purposes) in a portfolio of investment grade corporate and U.S. Government fixed income securities. The LKCM International Equity Fund seeks to maximize long-term capital appreciation by investing primarily in equity securities of non-U.S. companies and invests under normal circumstances at least 80% of its net assets (plus any borrowings for investment purposes) in equity securities.
The following is a summary of significant accounting policies followed by the Funds in preparation of the financial statements. The Funds are investment companies and, accordingly, follow the investment company accounting and reporting guidance of the Financial Accounting Standards Board Accounting Standards Codification Topic 946, Investment Companies.
1. Security Valuation: Equity securities listed or traded on a U.S. securities exchange for which market quotations are readily available are valued at the last quoted sale price on the exchange on which the security is primarily traded. Nasdaq Global Market securities are valued at the Nasdaq Official Closing Price (“NOCP”). Unlisted U.S. equity securities and listed U.S. equity securities not traded on a particular valuation date are valued at the mean of the most recent quoted bid and ask price on the relevant exchanges or markets. Equity securities listed on a foreign exchange for which market quotations are readily available are valued at the last quoted sales price on the exchange on which the security is primarily traded. Debt securities are normally valued at the mean of the closing bid and ask price and/or by using a combination of broker quotations or evaluated prices provided by an independent pricing service. Futures and options on futures are valued at the settlement prices established each day on the principal exchange on which they are traded. Forward contracts are valued based on the forward rate using information provided by an independent pricing service. Other assets and securities for which no market or broker quotations or evaluated prices are readily available are valued in good faith at fair value using guidelines approved by the Board of Trustees. The Board of Trustees has established policies and procedures that authorize the Adviser to fair value a security in good faith under certain circumstances. The Funds may use prices provided by independent pricing services to assist in the fair valuation of the Funds’ portfolio securities. For foreign securities held by the LKCM International Equity Fund, such fair value prices generally will be based on such independent pricing services’ proprietary multi-factor models that measure movements in relevant indices, market indicators or other factors between the time the relevant foreign markets have closed and the time the Fund calculates its net asset value, and therefore may differ from quoted or official closing prices for such foreign securities in such foreign markets.
The Trust has adopted accounting standards which establish an authoritative definition of fair value and set out a hierarchy for measuring fair value. These standards require additional disclosures about the various inputs and valuation techniques used to develop the measurements of fair value and a discussion of changes in valuation techniques and related inputs during the period. These standards define fair value as the price that would be received to sell an asset or paid to transfer a liability in an orderly
40
transaction between market participants at the measurement date. The fair value hierarchy is organized into three levels based upon the assumptions (referred to as “inputs”) used in pricing the asset or liability. These standards state that “observable inputs” reflect the assumptions market participants would use in pricing the asset or liability based on market data obtained from independent sources and “unobservable inputs” reflect an entity’s own assumptions about the assumptions market participants would use in pricing the asset or liability. These inputs are summarized in the three broad levels listed below.
| | | | |
| Level 1 | | – | | Quoted unadjusted prices for identical instruments in active markets to which the Trust has access at the date of measurement. |
| | |
| Level 2 | | – | | Quoted prices for similar instruments in active markets; quoted prices for identical or similar instruments in markets that are not active; and model-derived valuations in which all significant inputs and significant value drivers are observable in active markets. Level 2 inputs are those in markets for which there are few transactions, the prices are not current, little public information exists or instances where prices vary substantially over time or among brokered market makers. |
| | |
| Level 3 | | – | | Model derived valuations in which one or more significant inputs or significant value drivers are unobservable. Unobservable inputs are those inputs that reflect the Trust’s own assumptions that market participants would use to price the asset or liability based on the best available information. |
The inputs or methodology used for valuing securities are not necessarily an indication of the risk associated with investing in those securities. As of December 31, 2021, the Funds’ assets carried at fair value were classified as follows:
| | | | | | | | | | | | | | | | | | | | |
| LKCM Small Cap Equity Fund | | | | | | | | |
| | | | |
Description | | Level 1 | | Level 2 | | Level 3 | | Total |
Common Stocks | | | $ | 215,985,804 | | | | $ | — | | | | $ | 0 | (1) | | | $ | 215,985,804 | |
Short-Term Investments | | | | 8,418,708 | | | | | — | | | | | — | | | | | 8,418,708 | |
| | | | | | | | | | | | | | | | | | | | |
Total Investments* | | | $ | 224,404,512 | | | | $ | — | | | | $ | 0 | | | | $ | 224,404,512 | |
| | | | | | | | | | | | | | | | | | | | |
| | | | |
| LKCM Small-Mid Cap Equity Fund | | | | | | | | |
| | | | |
Description | | Level 1 | | Level 2 | | Level 3 | | Total |
Common Stocks | | | $ | 14,368,123 | | | | $ | — | | | | $ | — | | | | $ | 14,368,123 | |
| | | | | | | | | | | | | | | | | | | | |
Total Investments* | | | $ | 14,368,123 | | | | $ | — | | | | $ | — | | | | $ | 14,368,123 | |
| | | | | | | | | | | | | | | | | | | | |
| | | | |
| LKCM Equity Fund | | | | | | | | |
| | | | |
Description | | Level 1 | | Level 2 | | Level 3 | | Total |
Common Stocks | | | $ | 522,322,340 | | | | $ | — | | | | $ | — | | | | $ | 522,322,340 | |
Short-Term Investments | | | | 20,657,162 | | | | | — | | | | | — | | | | | 20,657,162 | |
| | | | | | | | | | | | | | | | | | | | |
Total Investments* | | | $ | 542,979,502 | | | | $ | — | | | | $ | — | | | | $ | 542,979,502 | |
| | | | | | | | | | | | | | | | | | | | |
| | | | |
| LKCM Balanced Fund | | | | | | | | |
| | | | |
Description | | Level 1 | | Level 2 | | Level 3 | | Total |
Common Stocks | | | $ | 100,982,066 | | | | $ | — | | | | $ | — | | | | $ | 100,982,066 | |
Corporate Bonds | | | | — | | | | | 42,729,614 | | | | | — | | | | | 42,729,614 | |
Short-Term Investments | | | | 865,401 | | | | | — | | | | | — | | | | | 865,401 | |
| | | | | | | | | | | | | | | | | | | | |
Total Investments* | | | $ | 101,847,467 | | | | $ | 42,729,614 | | | | $ | — | | | | $ | 144,577,081 | |
| | | | | | | | | | | | | | | | | | | | |
| | | | |
| LKCM Fixed Income Fund | | | | | | | | |
| | | | |
Description | | Level 1 | | Level 2 | | Level 3 | | Total |
Corporate Bonds | | | $ | — | | | | $ | 223,157,960 | | | | $ | — | | | | $ | 223,157,960 | |
U.S. Government Issues | | | | — | | | | | 17,620,173 | | | | | — | | | | | 17,620,173 | |
U.S. Government Sponsored Entities | | | | — | | | | | 49,203,100 | | | | | — | | | | | 49,203,100 | |
Short-Term Investments | | | | 4,182,867 | | | | | — | | | | | — | | | | | 4,182,867 | |
| | | | | | | | | | | | | | | | | | | | |
Total Investments* | | | $ | 4,182,867 | | | | $ | 289,981,233 | | | | $ | — | | | | $ | 294,164,100 | |
| | | | | | | | | | | | | | | | | | | | |
| | | | |
| LKCM International Equity Fund | | | | | | | | |
| | | | |
Description | | Level 1 | | Level 2 | | Level 3 | | Total |
Common Stocks | | | $ | — | | | | $ | 52,453,165 | | | | $ | — | | | | $ | 52,453,165 | |
Preferred Stocks | | | | — | | | | | 1,285,045 | | | | | — | | | | | 1,285,045 | |
Short-Term Investments | | | | 1,767,451 | | | | | — | | | | | — | | | | | 1,767,451 | |
| | | | | | | | | | | | | | | | | | | | |
Total Investments* | | | $ | 1,767,451 | | | | $ | 53,738,210 | | | | $ | — | | | | $ | 55,505,661 | |
| | | | | | | | | | | | | | | | | | | | |
| | (1) | Level 3 security valued at $0. |
| | * | Additional information regarding the industry classifications of these investments is disclosed in the Schedule of Investments. |
41
There were no transfers into or out of Level 1, Level 2 or Level 3 fair value measurements during the reporting period. Transfers between levels are recognized at the end of the reporting period.
Below is a reconciliation of Level 3 assets held by the LKCM Small Cap Equity Fund for which significant observable inputs were used to determine fair value.
| | | | | |
| | | Level 3 |
Description | | Common Stocks |
Balance as of December 31, 2020 | | | $ | 0 | |
Purchases | | | | — | |
Sales proceeds | | | | — | |
Accreted discounts, net | | | | | |
Realized gain (loss) | | | | — | |
Change in unrealized appreciation/depreciation | | | | — | |
Transfers into/(out of) Level 3 | | | | — | |
| | | | | |
Balance as of December 31, 2021 | | | $ | 0 | |
| | | | | |
| Change in unrealized appreciation/depreciation during the period for Level 3 investments held at December 31, 2021 | | | $ | — | |
| | | | | |
2. Federal Income Taxes: The Funds have elected to be treated as “regulated investment companies” under Subchapter M of the Internal Revenue Code and each Fund intends to distribute all of its investment company net taxable income and net capital gains to shareholders. Therefore, no federal income tax provision is recorded.
3. Distributions to Shareholders: The LKCM Small Cap Equity Fund, LKCM Small-Mid Cap Equity Fund, LKCM Equity Fund and LKCM International Equity Fund generally intend to declare and pay income dividends and distribute net capital gains, if any, at least on an annual basis. The LKCM Balanced Fund and LKCM Fixed Income Fund generally intend to declare and pay income dividends on a quarterly basis and distribute net capital gains, if any, at least on an annual basis.
4. Foreign Securities: Investing in securities of foreign companies and foreign governments involves special risks and considerations not typically associated with investing in securities of U.S. issuers. These risks include devaluation of currencies and future adverse political and economic developments. Moreover, securities of many foreign companies and foreign governments and their markets may be less liquid and their prices more volatile than those of securities of comparable U.S. companies and securities of the U.S. government.
5. Expense Allocation: Expenses incurred by the Funds in the Trust are allocated among the Funds based upon (i) relative average net assets, (ii) a specific identification basis as incurred, or (iii) evenly among the Funds, depending on the nature of the expense.
6. Use of Estimates: The preparation of financial statements in conformity with accounting principles generally accepted in the United States of America requires management to make estimates and assumptions that affect the reported amounts of assets and liabilities and disclosure of contingent assets and liabilities at the date of the financial statements and the reported amounts of revenues and expenses during the reporting period. Actual results could differ from those estimates.
7. Guarantees and Indemnifications: In the normal course of business, the Funds enter into contracts with service providers that contain general indemnification clauses. The Funds’ maximum exposure under these arrangements is unknown as this would involve future claims against the Funds that have not yet occurred. Based on experience, the Funds expect the risk of loss to be remote.
8. Security Transactions and Investment Income: Security and shareholder transactions are recorded on the trade date. Realized gains and losses on sales of investments are calculated on the identified cost basis. Dividend income is recorded on the ex-dividend date. Withholding taxes on foreign dividends have been provided for in accordance with the Funds’ understanding of the applicable jurisdiction’s tax rules and rates. Interest income is recognized on the accrual basis. All discounts and premiums are amortized based on the effective interest method for tax and financial reporting purposes. The Funds may hold the securities of real estate investment trusts (“REITs”).
9. Other: Distributions from net investment income and realized capital gains are determined in accordance with income tax regulations, which may differ from U.S. GAAP. Certain capital accounts in the consolidated financial statements are periodically adjusted for permanent differences in order to reflect their tax character. These permanent differences are primarily due to the varying treatment of income and gain/loss on portfolio securities held by the Fund and have no impact on net assets or NAV per share.
Accordingly, at December 31, 2021, reclassifications were recorded as follows:
| | | | | | | | | | | | | | | | | | | | | | | | | | | | | | |
| | | LKCM
Small Cap
Equity Fund | | LKCM
Small-Mid Cap
Equity Fund | | LKCM
Equity Fund | | LKCM
Balanced
Fund | | LKCM
Fixed
Income Fund | | LKCM
International
Equity Fund |
Paid-in capital | | | | $1,835,181 | | | | | $434,162 | | | | | $1,002,511 | | | | | $55,530 | | | | | $24,622 | | | | | $7,648 | |
Total distributable earnings | | | | (1,835,181 | ) | | | | (434,162 | ) | | | | (1,002,511 | ) | | | | (55,530 | ) | | | | (24,622 | ) | | | | (7,648 | ) |
42
10. Restricted and Illiquid Securities: The Funds are permitted to invest in securities that are subject to legal or contractual restrictions on resale including investments considered by the Funds to be illiquid. Restricted securities generally may be resold in transactions exempt from registration. Illiquid investments are investments that the Funds reasonably expect cannot be sold or disposed of in current market conditions within seven calendar days or less in the ordinary course of business without the sale or disposition significantly changing the market value of the investment. A security may be considered illiquid if it lacks a readily available market or if its valuation has not changed for a certain period of time. Disposal of these securities may involve time-consuming negotiations and expense, and prompt sale at the current valuation may be difficult.
B. Investment Advisory and Other Agreements: The Adviser serves as the investment adviser to the Funds under an Investment Advisory Agreement (the “Agreement”). The Adviser receives a fee, computed daily and payable quarterly, at the annual rates presented below as applied to each Fund’s average daily net assets. The Adviser has contractually agreed to waive all or a portion of its management fee and/or reimburse expenses of the Funds through May 1, 2022 in order to limit each Fund’s operating expenses to the annual cap rates presented below. This expense limitation excludes interest, taxes, brokerage commissions, indirect fees and expenses relating to investments in other investment companies, including money market funds, and extraordinary expenses.
For the fiscal year ended December 31, 2021, the Adviser waived the following management fees and/or reimbursed expenses to meet its expense cap obligations:
| | | | | | | | | | | | | | | | | | | | | | | | | | | | | | |
| | | LKCM
Small Cap
Equity Fund | | LKCM
Small-Mid Cap
Equity Fund | | LKCM
Equity
Fund | | LKCM
Balanced
Fund | | LKCM
Fixed
Income Fund | | LKCM
International
Equity Fund |
Annual Management Fee Rate | | | | 0.75% | | | | | 0.75% | | | | | 0.70% | | | | | 0.65% | | | | | 0.50% | | | | | 0.90% | |
Annual Cap on Expenses | | | | 1.00% | | | | | 1.00% | | | | | 0.80% | | | | | 0.80% | | | | | 0.50% | | | | | 1.00% | |
Fees Waived and/or Expenses Reimbursed in 2021 | | | | $74,254 | | | | | $118,194 | | | | | $804,807 | | | | | $217,130 | | | | | $818,913 | | | | | $189,401 | |
The Trust reimburses the Adviser for a portion of compensation paid to the Trust’s Chief Compliance Officer. This compensation is reported as part of the “Trustees’ fees and officer compensation” expense on the Statement of Operations.
U.S. Bancorp Fund Services, LLC (“U.S. Bancorp”), doing business as U.S. Bank Global Fund Services, serves as transfer agent and administrator for the Trust and serves as accounting services agent for the Trust. U.S. Bank, N.A. serves as custodian for the Funds.
Distribution services are performed pursuant to a distribution contract with Quasar Distributors, LLC (“Quasar”), the Trust’s principal underwriter.
Effective September 30, 2021, GC Mountain Acquisition Corp., an affiliate of Genstar Capital, became the majority owner of Foreside Financial Group, LLC, Quasar’s parent company (the “Transaction”). This transaction resulted in a change in control of Quasar under the 1940 Act. Accordingly, the Transaction resulted in the assignment and termination of the distribution contract with Quasar. The Board of Trustees of the Funds approved a new Distribution Agreement that took effect upon the close of the Transaction.
The Funds have adopted a Distribution Plan pursuant to Rule 12b-1 under the 1940 Act, under which each Fund may pay an annualized fee of up to 0.75% of its average daily net assets for distribution and other services. Currently, the Board of Trustees has not authorized payments under this plan and, as a result, the Funds currently neither accrue nor pay any fees under the plan.
C. Fund Shares: At December 31, 2021, there was an unlimited number of shares of beneficial interest, no par value, authorized, for each Fund. The following table summarizes the activity in shares of each Fund:
| | | | | | | | | | | | | | | | | | | | |
| | | | |
| LKCM Small Cap Equity Fund | | | | | | | | |
| | | Year Ended
December 31, 2021 | | Year Ended
December 31, 2020 |
| | | Shares | | Amount | | Shares | | Amount |
Shares sold | | | | 742,164 | | | | $ | 17,323,790 | | | | | 762,251 | | | | $ | 14,229,157 | |
Shares issued to shareholders in
reinvestment of distributions | | | | 1,370,179 | | | | | 29,486,241 | | | | | 318,189 | | | | | 6,876,068 | |
Shares redeemed | | | | (785,462 | ) | | | | (19,135,168 | ) | | | | (2,536,430 | ) | | | | (40,521,730 | ) |
| | | | | | | | | | | | | | | | | | | | |
Net increase (decrease) | | | | 1,326,881 | | | | $ | 27,674,863 | | | | | (1,455,990 | ) | | | $ | (19,416,505 | ) |
| | | | | | | | | | | | | | | | | | | | |
Shares Outstanding: | | | | | | | | | | | | | | | | | | | | |
Beginning of period | | | | 9,311,600 | | | | | | | | | | 10,767,590 | | | | | | |
| | | | | | | | | | | | | | | | | | | | |
End of period | | | | 10,638,481 | | | | | | | | | | 9,311,600 | | | | | | |
| | | | | | | | | | | | | | | | | | | | |
43
| | | | | | | | | | | | | | | | | | | | |
| | | | |
| LKCM Small-Mid Cap Equity Fund | | | | | | | | |
| | | Year Ended
December 31, 2021 | | Year Ended
December 31, 2020 |
| | | Shares | | Amount | | Shares | | Amount |
Shares sold | | | | 107,747 | | | | $ | 1,343,832 | | | | | 3,152 | | | | $ | 29,921 | |
Shares issued to shareholders in
reinvestment of distributions | | | | 191,747 | | | | | 2,099,630 | | | | | 71,406 | | | | | 791,182 | |
Shares redeemed | | | | (345,703 | ) | | | | (4,333,927 | ) | | | | (104,924 | ) | | | | (965,072 | ) |
Other | | | | | | | | | — | | | | | | | | | | 2,145 | (1) |
| | | | | | | | | | | | | | | | | | | | |
Net decrease | | | | (46,209 | ) | | | $ | (890,465 | ) | | | | (30,366 | ) | | | $ | (141,824 | ) |
| | | | | | | | | | | | | | | | | | | | |
Shares Outstanding: | | | | | | | | | | | | | | | | | | | | |
Beginning of period | | | | 1,355,106 | | | | | | | | | | 1,385,472 | | | | | | |
| | | | | | | | | | | | | | | | | | | | |
End of period | | | | 1,308,897 | | | | | | | | | | 1,355,106 | | | | | | |
| | | | | | | | | | | | | | | | | | | | |
| (1) | Reimbursement from U.S. Bancorp Fund Services, LLC to correct shareholder transaction. |
| | | | | | | | | | | | | | | | | | | | |
| | | | |
| LKCM Equity Fund | | | | | | | | |
| | | Year Ended
December 31, 2021 | | Year Ended
December 31, 2020 |
| | | Shares | | Amount | | Shares | | Amount |
Shares sold | | | | 786,326 | | | | $ | 29,544,937 | | | | | 842,802 | | | | $ | 24,542,333 | |
Shares issued to shareholders in
reinvestment of distributions | | | | 858,852 | | | | | 33,323,438 | | | | | 681,511 | | | | | 22,830,617 | |
Shares redeemed | | | | (946,112 | ) | | | | (36,177,759 | ) | | | | (1,336,997 | ) | | | | (38,335,179 | ) |
Redemption fee | | | | | | | | | 91 | | | | | | | | | | 602 | |
| | | | | | | | | | | | | | | | | | | | |
Net increase | | | | 699,066 | | | | $ | 26,690,707 | | | | | 187,316 | | | | $ | 9,038,373 | |
| | | | | | | | | | | | | | | | | | | | |
Shares Outstanding: | | | | | | | | | | | | | | | | | | | | |
Beginning of period | | | | 13,326,626 | | | | | | | | | | 13,139,310 | | | | | | |
| | | | | | | | | | | | | | | | | | | | |
End of period | | | | 14,025,692 | | | | | | | | | | 13,326,626 | | | | | | |
| | | | | | | | | | | | | | | | | | | | |
| | | | | | | | | | | | | | | | | | | | |
| | | | |
| LKCM Balanced Fund | | | | | | | | |
| | | Year Ended
December 31, 2021 | | Year Ended
December 31, 2020 |
| | | Shares | | Amount | | Shares | | Amount |
Shares sold | | | | 300,183 | | | | $ | 8,545,296 | | | | | 940,460 | | | | $ | 22,052,533 | |
Shares issued to shareholders in
reinvestment of distributions | | | | 205,971 | | | | | 6,005,184 | | | | | 190,194 | | | | | 4,942,296 | |
Shares redeemed | | | | (235,087 | ) | | | | (6,706,546 | ) | | | | (727,140 | ) | | | | (16,842,672 | ) |
Redemption fee | | | | | | | | | 411 | | | | | | | | | | 1,182 | |
| | | | | | | | | | | | | | | | | | | | |
Net increase | | | | 271,067 | | | | $ | 7,844,345 | | | | | 403,514 | | | | $ | 10,153,339 | |
| | | | | | | | | | | | | | | | | | | | |
Shares Outstanding: | | | | | | | | | | | | | | | | | | | | |
Beginning of period | | | | 4,689,886 | | | | | | | | | | 4,286,372 | | | | | | |
| | | | | | | | | | | | | | | | | | | | |
End of period | | | | 4,960,953 | | | | | | | | | | 4,689,886 | | | | | | |
| | | | | | | | | | | | | | | | | | | | |
| | | | | | | | | | | | | | | | | | | | |
| | | | |
| LKCM Fixed Income Fund | | | | | | | | |
| | | Year Ended
December 31, 2021 | | Year Ended
December 31, 2020 |
| | | Shares | | Amount | | Shares | | Amount |
Shares sold | | | | 2,477,664 | | | | $ | 27,346,315 | | | | | 3,423,810 | | | | $ | 38,000,779 | |
Shares issued to shareholders in
reinvestment of distributions | | | | 325,856 | | | | | 3,573,515 | | | | | 402,793 | | | | | 4,445,623 | |
Shares redeemed | | | | (1,499,784 | ) | | | | (16,551,962 | ) | | | | (3,198,954 | ) | | | | (35,567,807 | ) |
Redemption fee | | | | | | | | | — | | | | | | | | | | 291 | |
| | | | | | | | | | | | | | | | | | | | |
Net increase | | | | 1,303,736 | | | | $ | 14,367,868 | | | | | 627,649 | | | | $ | 6,878,886 | |
| | | | | | | | | | | | | | | | | | | | |
Shares Outstanding: | | | | | | | | | | | | | | | | | | | | |
Beginning of period | | | | 25,905,356 | | | | | | | | | | 25,277,707 | | | | | | |
| | | | | | | | | | | | | | | | | | | | |
End of period | | | | 27,209,092 | | | | | | | | | | 25,905,356 | | | | | | |
| | | | | | | | | | | | | | | | | | | | |
44
| | | | | | | | | | | | | | | | | | | | |
| | | | |
| LKCM International Equity Fund | | | | | | | | |
| | | Year Ended
December 31, 2021 | | Year Ended
December 31, 2020 |
| | | Shares | | Amount | | Shares | | Amount |
Shares sold | | | | 1,230,967 | | | | $ | 16,639,624 | | | | | 1,640,644 | | | | $ | 18,432,932 | |
Shares issued to shareholders in
reinvestment of distributions | | | | 34,722 | | | | | 504,168 | | | | | 3,036 | | | | | 37,889 | |
Shares redeemed | | | | (33,414 | ) | | | | (478,629 | ) | | | | (26,307 | ) | | | | (279,416 | ) |
| | | | | | | | | | | | | | | | | | | | |
Net increase | | | | 1,232,275 | | | | $ | 16,665,163 | | | | | 1,617,373 | | | | $ | 18,191,405 | |
| | | | | | | | | | | | | | | | | | | | |
Shares Outstanding: | | | | | | | | | | | | | | | | | | | | |
Beginning of period | | | | 2,595,050 | | | | | | | | | | 977,677 | | | | | | |
| | | | | | | | | | | | | | | | | | | | |
End of period | | | | 3,827,325 | | | | | | | | | | 2,595,050 | | | | | | |
| | | | | | | | | | | | | | | | | | | | |
D. Security Transactions: Purchases and sales of investment securities, other than short-term investments, for the year ended December 31, 2021 were as follows:
| | | | | | | | | | | | | | | | | | | | |
| | | Purchases | | Sales |
| | | U.S.
Government | | Other | | U.S.
Government | | Other |
LKCM Small Cap Equity Fund | | | $ | — | | | | $ | 92,017,174 | | | | $ | — | | | | $ | 100,039,049 | |
LKCM Small-Mid Cap Equity Fund | | | | — | | | | | 7,719,617 | | | | | — | | | | | 10,750,464 | |
LKCM Equity Fund | | | | — | | | | | 50,782,614 | | | | | 4,300,000 | | | | | 53,724,512 | |
LKCM Balanced Fund | | | | — | | | | | 18,408,147 | | | | | — | | | | | 14,497,382 | |
LKCM Fixed Income Fund | | | | — | | | | | 105,990,716 | | | | | 8,104,000 | | | | | 79,361,914 | |
LKCM International Equity Fund | | | | — | | | | | 22,579,186 | | | | | — | | | | | 6,546,589 | |
E. Tax Information: At December 31, 2021, the components of accumulated earnings (losses) on a tax basis were as follows:
| | | | | | | | | | | | | | | | | | | | | | | | | | | | | | |
| | | LKCM
Small Cap
Equity Fund | | LKCM
Small-Mid Cap
Equity Fund | | LKCM
Equity
Fund | | LKCM
Balanced
Fund | | LKCM
Fixed
Income Fund | | LKCM
International
Equity Fund |
Tax cost | | | $ | 133,319,138 | | | | $ | 8,300,997 | | | | $ | 236,077,358 | | | | $ | 95,142,756 | | | | $ | 289,772,389 | | | | $ | 45,104,249 | |
| | | | | | | | | | | | | | | | | | | | | | | | | | | | | | |
Gross unrealized appreciation | | | $ | 94,870,888 | | | | $ | 6,173,503 | | | | $ | 310,956,837 | | | | $ | 50,434,674 | | | | $ | 5,759,386 | | | | $ | 12,232,249 | |
Gross unrealized depreciation | | | | (3,785,514 | ) | | | | (106,375 | ) | | | | (4,054,693 | ) | | | | (1,000,349 | ) | | | | (1,367,675 | ) | | | | (1,831,714 | ) |
| | | | | | | | | | | | | | | | | | | | | | | | | | | | | | |
Net unrealized appreciation | | | $ | 91,085,374 | | | | $ | 6,067,128 | | | | $ | 306,902,144 | | | | $ | 49,434,325 | | | | $ | 4,391,711 | | | | $ | 10,400,535 | |
| | | | | | | | | | | | | | | | | | | | | | | | | | | | | | |
Undistributed ordinary income | | | | — | | | | | — | | | | | — | | | | | — | | | | | — | | | | | 909 | |
Undistributed long-term capital gain | | | | 1,095,408 | | | | | — | | | | | — | | | | | — | | | | | 321,837 | | | | | 578,109 | |
| | | | | | | | | | | | | | | | | | | | | | | | | | | | | | |
Distributable earnings | | | $ | 1,095,408 | | | | $ | — | | | | $ | — | | | | $ | — | | | | $ | 321,837 | | | | $ | 579,018 | |
| | | | | | | | | | | | | | | | | | | | | | | | | | | | | | |
Other accumulated losses | | | | (1,215,908 | ) | | | | — | | | | | — | | | | | — | | | | | — | | | | | (5,296 | ) |
| | | | | | | | | | | | | | | | | | | | | | | | | | | | | | |
Total distributable earnings | | | $ | 90,964,874 | | | | $ | 6,067,128 | | | | $ | 306,902,144 | | | | $ | 49,434,325 | | | | $ | 4,713,548 | | | | $ | 10,974,257 | |
| | | | | | | | | | | | | | | | | | | | | | | | | | | | | | |
The difference between book cost of investments and tax cost of investments is attributable primarily to the tax deferral of losses on wash sales.
Net investment income and realized gains and losses for federal income tax purposes may differ from that reported on the financial statements because of permanent book-to-tax differences. GAAP requires that permanent differences between financial reporting and tax reporting be reclassified between various components of net assets. These differences are primarily due to net operating losses, swap contract adjustments, dividend reclasses, and dividends on redemption adjustments with differing book and tax methods.
To the extent the Funds realize future net capital gains, taxable distributions will be reduced by any unused capital loss carryforwards as permitted by the Internal Revenue Code. During the fiscal year ended December 31, 2021, the LKCM Fixed Income Fund used $1,340,959 and the LKCM International Equity Fund used $559,952 in capital loss carryforwards. At December 31, 2021, none of the Funds had capital loss carryforwards.
45
At December 31, 2021, the following Fund deferred, on a tax basis, late-year ordinary losses of:
| | | | | | | | | | |
LKCM International Equity Fund | | | $ | 5,295 | | | | | | |
At December 31, 2021, the following Fund deferred, on a tax basis, post-October capital losses of:
| | | | | | | | | | |
LKCM Small Cap Equity Fund | | | $ | 1,215,908 | | | | | | |
The tax components of dividends paid during the periods shown below were as follows:
| | | | | | | | | | | | | | | | | | | | | | | | | |
| | | Year Ended
December 31, 2021 | | Year Ended
December 31, 2020 |
| | | Ordinary
Income | | Long-Term
Capital Gains | | Ordinary
Income | | Return
of Capital | | Long-Term
Capital Gains |
LKCM Small Cap Equity Fund | | | $ | 1,146,597 | | | | $ | 29,445,846 | | | | $ | — | | | | $ | — | | | | $ | 7,270,969 | |
LKCM Small-Mid Cap Equity Fund | | | | — | | | | | 2,133,969 | | | | | — | | | | | — | | | | | 936,700 | |
LKCM Equity Fund | | | | 2,188,898 | | | | | 32,684,898 | | | | | 2,114,875 | | | | | — | | | | | 21,784,240 | |
LKCM Balanced Fund | | | | 970,003 | | | | | 5,183,025 | | | | | 1,068,531 | | | | | — | | | | | 4,004,232 | |
LKCM Fixed Income Fund | | | | 3,880,841 | | | | | 43,872 | | | | | 5,026,453 | | | | | — | | | | | — | |
LKCM International Equity Fund | | | | 284,654 | | | | | 395,702 | | | | | 55,491 | | | | | 6,140 | | | | | — | |
The Funds designated earnings and profits distributed to shareholders upon the redemption of shares during 2021 and 2020 in determining undistributed net capital gains as of December 31, 2021 and 2020, respectively.
The Trust has adopted financial reporting rules regarding recognition and measurement of tax positions taken or expected to be taken on a tax return. The Trust has reviewed all open tax years and major jurisdictions and concluded that there is no impact on the Funds’ financial position or results of operations. Tax years that remain open to examination by major tax jurisdictions include tax years ended December 31, 2018 through December 31, 2021 (LKCM Small Cap Equity Fund, LKCM Small-Mid Cap Equity Fund, LKCM Equity Fund, LKCM Balanced Fund and LKCM Fixed Income Fund) and December 31, 2019 through December 31, 2021 (LKCM International Equity Fund). There is no tax liability resulting from unrecognized tax benefits relating to uncertain income tax positions taken or expected to be taken on tax returns as of December 31, 2021. The Funds are not aware of any tax positions for which it is reasonably possible that the total amounts of unrecognized tax benefits will significantly change in the next twelve months. If applicable, the Funds would recognize interest accrued related to unrecognized tax benefits in “interest expense” and penalties in “other expense” on the statement of operations.
F. Other Matters: The global outbreak of COVID-19 and other variants and the ensuing pandemic has adversely impacted global economic and commercial activity and has contributed to significant volatility and uncertainty in global financial markets. The global impact of the COVID-19 pandemic continues to rapidly evolve and its long-term implications for economies, markets, sectors, industries and issuers remains uncertain. The financial and operational performance of the issuers of securities in which the Funds invest depends upon future developments with respect to the COVID-19 pandemic, including, without limitation, the scope, duration and spread of COVID-19 as well as the development, efficacy and administration of COVID-19 vaccines, and such future developments and uncertainties with respect thereto may adversely affect, among other things, the value and liquidity of the Funds’ investment, the Funds’ ability to satisfy redemption requests, and Funds’ financial and operational performance.
G. Accounting Pronouncement: In December 2020, the SEC adopted a new rule providing a framework for fund valuation practices (“Rule 2a-5”). Rule 2a-5 establishes requirements for determining fair value in good faith for purposes of the 1940 Act. Rule 2a-5 will permit fund boards to designate certain parties to perform fair value determinations, subject to board oversight and certain other conditions. Rule 2a-5 also defines when market quotations are “readily available” for purposes of the 1940 Act and the threshold for determining whether a fund must fair value a security. In connection with Rule 2a-5, the SEC also adopted related recordkeeping requirements and is rescinding previously issued guidance, including with respect to the role of a board in determining fair value and the accounting and auditing of fund investments. The Funds will be required to comply with the rules by September 8, 2022. Management is currently assessing the potential impact of Rule 2a-5 on the Funds’ financial statements.
H. Subsequent Events: In preparing these financial statements, management has evaluated the Funds’ related events and transactions that occurred subsequent to December 31, 2021 through the date the financial statements were issued and has determined that there were no significant subsequent events requiring recognition or disclosure in the financial statements.
46
|
| REPORTOF INDEPENDENT REGISTERED PUBLIC ACCOUNTING FIRM |
To the shareholders and the Board of Trustees of LKCM Funds
Opinion on the Financial Statements and Financial Highlights
We have audited the accompanying statements of assets and liabilities of LKCM Funds (the “Trust”) comprising the LKCM Small Cap Equity Fund, LKCM Equity Fund, LKCM Balanced Fund, LKCM Fixed Income Fund, LKCM Small-Mid Cap Equity Fund, and LKCM International Equity Fund, including the schedules of investments, as of December 31, 2021; the related statements of operations for the year then ended, the statements of changes in net assets for each of the two years in the period then ended, the financial highlights for the periods indicated in the table below; and the related notes. In our opinion, the financial statements and financial highlights present fairly, in all material respects, the financial position of each of the funds constituting the Trust as of December 31, 2021, and the results of their operations for the year then ended, the changes in their net assets for each of the two years in the period then ended, and the financial highlights for the periods listed in the table below, in conformity with accounting principles generally accepted in the United States of America.
| | |
| Individual Fund Comprising the LKCM Funds | | Financial Highlights |
| LKCM Small Cap Equity Fund, LKCM Equity Fund, LKCM Balanced Fund, LKCM Fixed Income Fund, and LKCM Small-Mid Cap Equity Fund | | For the years ended December 31, 2021, 2020, 2019, 2018 and 2017 |
| LKCM International Equity Fund | | For the year ended December 31, 2021, 2020 and the period from May 1, 2019 (commencement of operations) through December 31, 2019 |
Basis for Opinion
These financial statements and financial highlights are the responsibility of the Trust’s management. Our responsibility is to express an opinion on the Trust’s financial statements and financial highlights based on our audits. We are a public accounting firm registered with the Public Company Accounting Oversight Board (United States) (PCAOB) and are required to be independent with respect to the Trust in accordance with the U.S. federal securities laws and the applicable rules and regulations of the Securities and Exchange Commission and the PCAOB.
We conducted our audits in accordance with the standards of the PCAOB. Those standards require that we plan and perform the audit to obtain reasonable assurance about whether the financial statements and financial highlights are free of material misstatement, whether due to error or fraud. The Trust is not required to have, nor were we engaged to perform, an audit of its internal control over financial reporting. As part of our audits we are required to obtain an understanding of internal control over financial reporting but not for the purpose of expressing an opinion on the effectiveness of the Trust’s internal control over financial reporting. Accordingly, we express no such opinion.
Our audits included performing procedures to assess the risks of material misstatement of the financial statements and financial highlights, whether due to error or fraud, and performing procedures that respond to those risks. Such procedures included examining, on a test basis, evidence regarding the amounts and disclosures in the financial statements and financial highlights. Our audits also included evaluating the accounting principles used and significant estimates made by management, as well as evaluating the overall presentation of the financial statements and financial highlights. Our procedures included confirmation of securities owned as of December 31, 2021, by correspondence with the custodian. We believe that our audits provide a reasonable basis for our opinion.
Milwaukee, Wisconsin
February 25, 2022
We have served as the auditor of one or more LKCM Funds since 2007.
47
|
| LKCM FUNDS |
| ADDITIONAL INFORMATION |
| December 31, 2021 (Unaudited) |
Tax Information: For the fiscal year ended December 31, 2021, certain dividends paid by the Funds may be subject to a maximum tax rate of 23.8%, as provided for by the Jobs & Growth Tax Relief Reconciliation Act of 2003. The percentage of dividends declared from ordinary income designated as qualified dividend income was as follows:
| | | | | |
LKCM Small Cap Equity Fund | | | | 100.00 | % |
LKCM Equity Fund | | | | 100.00 | % |
LKCM Balanced Fund | | | | 100.00 | % |
LKCM International Equity Fund | | | | 100.00 | % |
For corporate shareholders, the percentage of ordinary income distributions qualifying for the corporate dividends received deduction for the fiscal year ended December 31, 2021 was as follows:
| | | | | |
LKCM Small Cap Equity Fund | | | | 100.00 | % |
LKCM Equity Fund | | | | 100.00 | % |
LKCM Balanced Fund | | | | 100.00 | % |
The Funds hereby designate the following percentages of their ordinary income distributions for the fiscal year ended December 31, 2021 as interest-related dividends under Internal Revenue Code Section 871(k)(1)(C).
| | | | | |
LKCM Balanced Fund | | | | 32.86 | % |
LKCM Fixed Income Fund | | | | 100.00 | % |
The percentage of taxable ordinary income distributions that are designated as short-term capital gain distributions under Internal Revenue Code Section 871(k)(2)(C) for the fiscal year ended December 31, 2021 was as follows:
| | | | | |
LKCM Small Cap Equity Fund | | | | 100.00 | % |
LKCM Equity Fund | | | | 0.04 | % |
LKCM Balanced Fund | | | | 3.10 | % |
Availability of Proxy Voting Information: A description of the policies and procedures that the Funds use to determine how to vote proxies relating to their portfolio securities, as well as information regarding how the Funds voted proxies relating to portfolio securities during the most recent 12-month period ended June 30, is available without charge, upon request, by calling toll-free 1-800-688-LKCM or on the SEC website at http://www.sec.gov.
The actual voting records relating to portfolio securities during the twelve month period ended June 30 (as filed with the SEC on Form N-PX) are available without charge, upon request, by calling the Funds toll free at 1-800-688-LKCM or by accessing the SEC’s website at www.sec.gov.
Availability of Quarterly Portfolio Schedule: The Funds file a complete schedule of portfolio holdings with the U.S. Securities and Exchange Commission (the “SEC”) for the first and third quarters of each fiscal year on Part F of Form N-PORT. The Funds’ Part F of Form N-PORT are available on the SEC’s website at www.sec.gov and may be reviewed and copied at the SEC’s Public Reference Room in Washington, D.C. Information on the operation of the Public Reference Room may be obtained by calling 1-800-732-0330. The Funds’ Form Part F of Form N-PORT may also be obtained by calling toll-free 1-800-688-LKCM.
48
Information about the Fund’s Trustees and Officers:
The business and affairs of the Fund are managed under the direction of the Fund’s Board of Trustees. Information pertaining to the Trustees of the Fund is set forth below. The Statement of Additional Information includes additional information about the Fund’s Trustees and officers and is available, without charge, upon request by calling 1-800-688-LKCM.
| | | | | | | | | | |
Name, Address
and Age | | Position(s)
Held with
the Trust | | Term of
Office &
Length
of Time
Served(1) | | Principal Occupation
During Past Five Years | | Number of
Portfolios in
Fund Complex
Overseen by Trustee | | Other
Directorships
Held by Trustee |
| Independent Trustees | | | | | | | | | | |
Richard J. Howell 301 Commerce Street Suite 1600 Fort Worth, TX 76102 Year of Birth: 1942 | | Trustee Chairman of the Audit and Compliance Committee | | Since 2005 Since 2008 | | CPA; Adjunct Faculty at SMU Cox School of Business from 2004 to 2009; Consulting Services, since 2002; Audit Partner, Arthur Andersen LLP from 1974 to 2002. | | 7 | | None |
Larry J. Lockwood 301 Commerce Street Suite 1600 Fort Worth, TX 76102 Year of Birth: 1953 | | Chairman of the Board of Trustees Trustee | | Since 2021 Since 2013 | | C.R. Williams Professor of Finance, Stan Block Endowed Chair in Finance, Department of Finance, Neeley School of Business, Texas Christian University since 1994. | | 7 | | None |
Mauricio Rodriguez 301 Commerce Street Suite 1600 Fort Worth, TX 76102 Year of Birth: 1966 | | Trustee | | Since 2021 | | Chair, Department of Finance, Neeley School of Business; Texas Christian University since 2002. | | 7 | | None |
| | | | | |
| Interested Trustees | | | | | | | | | | |
J. Luther King, Jr.(2) 301 Commerce Street Suite 1600 Fort Worth, TX 76102 Year of Birth: 1940 | | Trustee, President and Chief Executive Officer | | Since 1994 | | Chairman, President and Director, Luther King Capital Management Corporation since 1979. | | 7 | | None |
Steven R. Purvis(2) 301 Commerce Street Suite 1600 Fort Worth, TX 76102 Year of Birth: 1964 | | Trustee | | Since 2013 | | Principal, Luther King Capital Management Corporation from 2004 to 2021, Vice President and Portfolio Manager, Luther King Capital Management Corporation from 1996 to 2021. | | 7 | | AZZ Incorporated |
| (1) | Each Trustee holds office during the lifetime of the Trust until that individual resigns, retires or is otherwise removed or replaced. |
| (2) | Messrs. King and Purvis are each considered an “interested person” of the Trust (as defined in the 1940 Act) because of their affiliation with the Adviser. |
49
Information about the Fund’s Trustees and Officers, Continued
| | | | | | |
Name, Address
and Age | | Position(s) Held with the Trust | | Term of Office & Length of Time Served(1) | | Principal Occupation During Past Five Years |
| Principal Officers of the Trust |
J. Luther King, Jr.(2) 301 Commerce Street Suite 1600 Fort Worth, TX 76102 Year of Birth: 1940 | | Trustee, President and Chief Executive Officer | | Since 1994 | | Chairman, President and Director, Luther King Capital Management Corporation since 1979. |
Paul W. Greenwell 301 Commerce Street Suite 1600 Fort Worth, TX 76102 Year of Birth: 1950 | | Vice President | | Since 1996 | | Principal, Luther King Capital Management Corporation since 1986, Vice President and Portfolio Manager, Luther King Capital Management Corporation since 1983. |
Richard Lenart 301 Commerce Street Suite 1600 Fort Worth, TX 76102 Year of Birth: 1966 | | Secretary and Treasurer | | Since 2006 | | Luther King Capital Management Corporation since 2005. |
Jacob D. Smith 301 Commerce Street Suite 1600 Fort Worth, TX 76102 Year of Birth: 1974 | | Chief Financial Officer | | Since 2010 | | General Counsel and Chief Compliance Officer, Luther King Capital Management Corporation since 2006; Principal, Luther King Capital Management Corporation since 2013. |
| | Chief Compliance Officer | | Since 2006 |
| (1) | Each officer holds office during the lifetime of the Trust until that individual resigns, retires or is otherwise removed or replaced. |
| (2) | Messrs. King and Purvis are each considered an “interested person” of the Trust (as defined in the 1940 Act) because of their affiliation with the Adviser. |
50
LKCM FUNDS
PRIVACY NOTICE
Our Commitment to Your Privacy
At LKCM Funds, we are committed to safeguarding the confidentiality and privacy of nonpublic personal information about our current and former shareholders. This privacy notice describes the types of nonpublic personal information we collect about you and the sources through which we obtain this information, the purposes for which we obtain and use your nonpublic information, and the policies and procedures we have implemented to protect the privacy of your nonpublic personal information.
How We Protect Your Nonpublic Personal Information
Protecting your nonpublic personal information is an important priority at LKCM Funds. Accordingly, we have implemented policies and procedures designed to safeguard your nonpublic personal information, such as your tax identification number, account and investment history, account numbers, account balances and nonpublic contact information, from unauthorized access or use. Pursuant to these policies and procedures, we maintain various physical, technological, and administrative safeguards to protect the security and confidentiality of your nonpublic personal information, and we adapt these safeguards to respond to evolving technological and other standards.
We do not disclose nonpublic personal information about you to non-affiliated firms, organizations or individuals except as authorized by you or your representatives or as required or permitted by law. We may disclose nonpublic personal information about you to nonaffiliated third parties, such as custodians, brokers, auditors, accountants, and systems and administrative service providers, in connection with the services we provide to you or on your behalf. When we provide nonpublic personal information about you to nonaffiliated third parties for these purposes, we expect them to safeguard your nonpublic personal information, use your nonpublic personal information only for the intended purposes and otherwise abide by applicable law.
How We Obtain Your Nonpublic Personal Information
We collect nonpublic personal information about you from various sources, including documents, new account applications and other information that you or your representatives, custodians, attorneys, accountants or similar parties provide to us, communications that we have with you or your representatives, custodians, attorneys, accountants or similar parties, and documents and other information related to your accounts or investment experience with us.
Please do not hesitate to contact Jacob D. Smith, our Chief Compliance Officer, if you have any questions regarding this privacy notice or the measures we have implemented to protect the privacy of your nonpublic personal information.
51
U.S. Bancorp Fund Services, LLC
P.O. Box 701
Milwaukee, WI 53201-0701
LKCM FUNDS
P.O. Box 701
Milwaukee, WI 53201-0701
| | | | |
Officers and Trustees |
J. Luther King, Jr., CFA, CIC Trustee, President and Chief Executive Officer | | Richard J. Howell Trustee | | Richard Lenart Secretary & Treasurer |
| | |
Paul W. Greenwell Vice President | | Larry J. Lockwood Chairman of the Board of Trustees | | Jacob D. Smith Chief Financial Officer Chief Compliance Officer |
| | |
Steven R. Purvis, CFA Trustee | | Mauricio Rodriguez Trustee | | |
|
Investment Adviser |
Luther King Capital Management Corporation 301 Commerce Street, Suite 1600 Fort Worth, TX 76102 |
Administrator, Transfer Agent, Dividend Paying Agent & Shareholder Servicing Agent |
U.S. Bancorp Fund Services, LLC P.O. Box 701 Milwaukee, WI 53201-0701 |
Custodian |
U.S. Bank, N.A. 1555 N. River Center Drive, Suite 302 Milwaukee, WI 53212 |
Independent Registered Public Accounting Firm |
Deloitte & Touche LLP 555 E. Wells St., Suite 1400 Milwaukee, WI 53202 |
Distributor |
Quasar Distributors, LLC 111 East Kilbourn Avenue, Suite 2200 Milwaukee, WI 53202 |

LKCM Aquinas Catholic Equity Fund
Annual Report
December 31, 2021
Dear Fellow Shareholders:
We report the following performance information for the LKCM Aquinas Catholic Equity Fund for indicated periods ended December 31, 2021:
| | | | | | | | | | | | | | | | | | | | | | | | | | | | | | | | | | | | | | | | |
Fund | | Inception
Date | | NAV @
12/31/21 | | Net
Expense
Ratio*, ** | | Gross
Expense
Ratio** | | One Year
Total
Return
Ended
12/31/21 | | Five Year
Average
Annualized
Return
Ended
12/31/21 | | Ten Year
Average
Annualized
Return
Ended
12/31/21 | | Avg.
Annual
Total
Return
Since
Incept.*** |
LKCM Aquinas Catholic Equity Fund(1) | | | | 07/11/2005 | | | | $ | 19.52 | | | | | 1.00% | | | | | 1.48% | | | | | 25.34% | | | | | 17.83% | | | | | 13.97% | | | | | 9.83% | |
S&P 500 ® Index(2) | | | | | | | | | | | | | | | | | | | | | | | | 28.71% | | | | | 18.47% | | | | | 16.55% | | | | | 10.89% | |
Performance data quoted represents past performance and does not guarantee future results. The investment return and principal value of an investment will fluctuate so that an investor’s shares, when redeemed, may be worth more or less than the original cost. Current performance of the Fund may be lower or higher than the performance quoted. Performance data current to the most recent month end may be obtained by calling 1-800-423-6369. The Fund imposes a 1.00% redemption fee on shares held less than 30 days. If reflected, the fee would reduce performance shown.
| * | Luther King Capital Management Corporation, the Fund’s investment adviser, has contractually agreed to waive all or a portion of its management fee and/or reimburse expenses of the Fund to maintain an expense ratio of 1.00% per annum through May 1, 2022. This expense limitation excludes interest, taxes, brokerage commissions, indirect fees and expenses related to investments in other investment companies, including money market funds, and extraordinary expenses. Investment performance, which is based on the net expense ratio, reflects fee waivers, if any, in effect during the relevant period. In the absence of such waivers, total return would be reduced. LKCM waived management fees and/or reimbursed expenses for the Fund during the fiscal year ended December 31, 2021. |
| ** | Expense ratios above are as reported in the Fund’s current prospectus dated May 1, 2021, as supplemented. Expense ratios reported for other periods in the financial highlights of this report may differ. |
| *** | The assets of the Aquinas Value Fund, Aquinas Growth Fund and Aquinas Small-Cap Fund were acquired by the LKCM Aquinas Value Fund, LKCM Aquinas Growth Fund and LKCM Aquinas Small Cap Fund, respectively, on July 11, 2005. Due to the change in adviser and investment technique, performance is being quoted for the period after the merger. The LKCM Aquinas Small Cap Fund and LKCM Aquinas Growth Fund were reorganized into the LKCM Aquinas Value Fund effective upon the close of business on July 29, 2016, after which the LKCM Aquinas Value Fund’s name, investment strategies and expenses changed to those of the LKCM Aquinas Catholic Equity Fund. The performance shown prior to August 1, 2016 is that of the LKCM Aquinas Value Fund. |
| (1) | Effective upon the close of business on July 29, 2016, the LKCM Aquinas Small Cap Fund and the LKCM Aquinas Growth Fund reorganized into the LKCM Aquinas Value Fund (the “Reorganizations”). Immediately after the Reorganizations were completed, the LKCM Aquinas Value Fund changed its name to the LKCM Aquinas Catholic Equity Fund and its investment strategies and expenses, including the expense limitation agreement, changed to the investment strategies and expenses, including the expense limitation agreement, of the LKCM Aquinas Catholic Equity Fund. The Fund’s performance prior to August 1, 2016 reflects the Fund’s prior investment strategies. |
| (2) | The S&P 500® Index is an unmanaged capitalization-weighted index of 500 selected stocks that is generally considered representative of the performance of large capitalization companies in the U.S. stock market. |
Note: The index defined above is not available for direct investment and the index performance therefore does not include fees, expenses or taxes.
2021 Review
Despite the many challenges posed by coronavirus variants, 2021 produced the best economic growth since 1984, a third year of double-digit gains in the S&P 500® Index, and relatively low market volatility. Several powerful engines drove the equity markets higher, including monetary and fiscal stimulus, and the distribution of effective vaccines. Much of the focus early in 2021 was fiscal policy, while emphasis shifted to monetary policy as we exited the year. On March 11th President Biden signed the American Rescue Plan which injected an additional $1.9 trillion into the economy. This new legislation allowed for, among other things, additional direct payments to consumers, supplemental unemployment benefits, and aid to local governments. The bond market reacted strongly to the potential for further fiscal stimulus with the yield on the 10-Year Treasury nearly doubling to 1.74% by the end of the first quarter of 2021, which would prove to be the highest yield for the 10-Year Treasury for the year.
The Federal Reserve meeting in June surprised investors by forecasting two 0.25% interest rate hikes in 2023, when previous guidance from the Federal Reserve had been for only one interest rate hike. Long duration government bond yields trended lower in early July, reflecting a worsening growth outlook in response to the Delta variant. The most significant pullback in the equity market, as measured by the S&P 500® Index, during 2021 of approximately 5.2% began in September as long duration bond yields began to rise in apparent anticipation of the Federal Reserve announcing the taper of bond purchases, continued strong inflation readings, and challenges faced by a prominent Chinese real estate development company.
Core inflation returned in 2021 following a 30-year hiatus. Starting in March 2020, the U.S. government created approximately $3 trillion of new bank reserves, sent checks to individuals, and provided forgivable loans to businesses. The U.S. Treasury then borrowed roughly an additional $2 trillion and sent even more checks to individuals. While the ensuing inflation was not a great surprise in our view, the expected duration of the inflation is a matter of great debate. In sum, the fiscal stimulus injected into the economy was equivalent to more than 25% of Gross Domestic Product (GDP). While much of this money went to assist individuals and businesses heavily impacted by the pandemic, these actions stoked demand just as the economy struggled with both production and supply chain challenges. In terms of monetary policy, the Federal Reserve’s “Quantitative Easing” both lowered interest rates and significantly expanded the monetary base. The money supply, as measured by M2, increased 39% from February 2020, a faster rate than any other equivalent time period since 1960.
2
Despite there being five million fewer people employed, we believe that the U.S. has generally regained the lost economic output brought about by the pandemic. There are approximately 10.6 million job vacancies according to the latest government data, reflecting very strong markets and demand in our view. One component of the labor force disruption has been termed the “Great Resignation.” A record 4.3 million Americans, approximately 2.9% of the workforce, left their jobs in August, which was impacted by an acceleration in workers retiring from the workforce. As a result, the annual increase in the Employment Cost Index rose to approximately 3.7% during the third quarter, which is a level not seen since 2004.
The labor force has expanded to a new high in each economic expansion since World War II. The smallest gain was 2.5% during the aborted double-dip recovery of 1980. Today, the labor force is still 1.5% below the 2019 peak. If the labor force were to expand a meager 2.5% this cycle, the economy would need to add about 6.7 million workers. Following recessions, consumers are historically reticent to spend and businesses to hire, while laid-off workers are eager to gain employment. However, following the pandemic induced recession, consumer spending has been exceptionally robust thanks in part due to fiscal policy. Employers appear to be anxious to hire, but workers have been slower to reenter the labor force.
The equity market, as measured by the S&P 500® Index, rose 28.7% in 2021, including dividends. For most of the past year there was considerable debate among investors regarding the influence of monetary and fiscal policy on the equity market. We believe that monetary and fiscal policy undoubtedly has had a positive impact on short-term economic activity, which is indeed the goal of the policy actions taken in our view. However, the impressive market return in 2021 seemingly was not the result of increased risk appetite among investors as the Price/Earnings ratio of the S&P 500® Index declined slightly during the year. We believe the market return last year was primarily driven by improving business fundamentals reflected in higher than originally forecasted corporate profits. We anticipate continued strength in corporate profits in 2022.
2022 Outlook
The period from the mid-1980’s to 2007 is often referred to economically as the “Great Moderation” and reflected a welcome respite following the volatility of the “Great Inflation” period lasting from 1965 to 1982. If we were to title 2022, it would be the “Great Normalization.” The economic and health policy response to the pandemic materially altered the pattern of daily life, including where and how we work and where and how we consume. The pattern of daily life continues to be disrupted as the Omicron variant has caused pockets of travel restrictions, resumption of curfews in Europe, further delays in plans to return to the office, and resumption of virtual class in some schools. Yet, we believe the coming year will bring several important steps to a return to normal in terms of economic growth, fiscal stimulus, monetary policy, and inflation.
We believe one of the most important economic shifts in the “Great Normalization” will be brought about by the Federal Reserve. In our view the central bank acted swiftly to help mitigate the economic fallout of the pandemic in two primary ways. First, it rapidly lowered its key interest rate, the Federal Funds Rate, to near zero in March of 2020. Second, the central bank began purchasing significant amounts of U.S. Treasuries and Mortgage-Backed Securities to help keep market interest rates low to stabilize and support the economy. The Federal Reserve has already communicated its goal of ending net new bond purchases by March of 2022. Furthermore, the latest forecast by the Federal Reserve’s interest rate setting body indicates that the central bank is likely to increase its benchmark interest rate by 0.75% in 2022 in three increments. We believe market reaction to central bank policy is often not a function of the action policymakers take. Rather, in our view it is a function of what they do relative to expectations. By sending a clear, hawkish signal now, we believe the central bank has left itself room to appear dovish, even as it tightens monetary policy.
Inflation readings are likely to moderate in 2022 in our view, but the pace of moderation is highly dependent on a combination of challenging variables to forecast. While headline Consumer Price Index (CPI) inflation is remarkable, the underlying composition of the inflation is noteworthy. Supply disruptions and the significant shift in consumer spending from services to goods has pressured the price of goods to outpace services. Over 60% of the core CPI increase, which excludes food and energy, in the past year was due to core goods, which represent 25% of the core CPI basket.
We believe policy changes may present the greatest challenges for equities in 2022, as Federal Reserve balance sheet shifts have proven tricky to equities over the past decade and fiscal support appears likely to wane in the coming year. Each period of balance sheet normalization or contraction since 2009 has coincided with an equity market correction, including in 2011, 2015, and 2018. However, we believe there are plenty of potential offsets. Bond yields are negative after accounting for inflation, which may further shift investments from the bond market to the equity market. In addition, we believe other potential offsets include a capital-spending boom, a strong U.S. dollar surge, and peak inflation.
We are constructive on the equity market, as measured by the S&P 500® Index, as we head into 2022. The market has not had a correction, however, which we define as at least a 10% pullback, since the March 2020 low. In our view, we would be surprised to not have at least one market correction in 2022 as shifting monetary policy is generally accompanied by increased market volatility. Moreover, we believe mid-term election years have historically promoted volatility related to various scenarios of election results. Bear markets, defined as a greater than 20% pullback, generally coincide with economic recessions in our view. We believe it would be difficult to see consecutive quarters of negative economic growth in 2022 given the amount of stimulus remaining in the economy. No recession since at least 1960 has emerged before the yield on the 10-Year Treasury fell below the Fed Funds rate. Currently, with this yield differential at positive 1.5%, and we believe the yield curve is far from inverting. Finally, both consumer and corporate balance
3
sheets remain very healthy in our view. Recessions are often marked by extended leverage in the economy which we simply do not believe is present today.
LKCM Aquinas Catholic Equity Fund
During the year ended December 31, 2021, the LKCM Aquinas Catholic Equity Fund returned 25.34% against the 28.71% return for the Fund’s benchmark, the S&P 500® Index. During the year, the Fund’s relative performance benefited from being underweight the Communication Services and Utilities sectors, which was offset by the Fund’s overweight position in the Industrials sector and underweight position in the Real Estate sector that detracted from performance. The Fund also benefited from stock selection in the Energy, Communication Services and Healthcare sectors, which was offset by stock selection decisions in the Information Technology and Consumer Discretionary sectors.
Over the past three years, the Fund has provided strong returns relative to historic stock market advances and inflation, heavily driven by strong corporate profit growth with valuation expansion heavily supported by continued low levels of interest rates. The economic reopening related to broader use and availability of COVID vaccines has in our view resulted in strong demand across most economic areas. This, coupled with good pricing and productivity gains, has, in our view, further led to record operating margins for a considerable number of companies.
We continue to believe the companies held by the Fund are well positioned financially, with the ability to raise dividends and/or buy back meaningful shares of stock. Our investment strategy for the Fund focuses on investments in high quality companies with sustainable competitive advantages and the potential for significant free cash generation that can be returned to investors as appropriate based on reinvestment opportunities within their industries. We believe the Fund remains well-positioned for the upcoming year.
J. Luther King, Jr., CFA, CIC
January 5, 2022
4
The information provided herein represents the opinion of J. Luther King, Jr., CFA, CIC and is not intended to be a forecast of future events, a guarantee of future results, nor investment advice.
Please refer to the Schedule of Investments found on page 9 of the report for more information on Fund holdings. Fund holdings and sector allocations are subject to change and are not recommendations to buy or sell any securities.
Mutual fund investing involves risk. Principal loss is possible. Past performance is not a guarantee of future results. Investments in equity securities are subject to market risks and significant fluctuations in value. Small and medium capitalization funds typically carry additional risks, since smaller companies generally have a higher risk of failure, and, historically, their stocks have experienced a greater degree of market volatility than stocks on average. These and other risks are discussed in the Fund’s summary and statutory prospectuses. Since the Fund practices socially responsible investing within the framework provided by the United States Conference of Catholic Bishop’s Socially Responsible Investing Guidelines, the Fund may forego a profitable investment opportunity or sell a security when it may be disadvantageous to do so.
Earnings growth is not a measure of future performance.
Performance data quoted represents past performance; past performance does not guarantee future results. The investment return and principal value of an investment will fluctuate so that an investor’s shares, when redeemed, may be worth more or less than their original cost. Current performance of the Fund may be lower or higher than the performance quoted. Performance data current to the most recent month end may be obtained by calling 1-800-423-6369. Returns would have been lower if LKCM had not waived a portion of its management fee and/or reimbursed certain expenses of the Fund. Please see Note B to the Notes to the Financial Statements for specific information regarding management fee waiver and/or expense reimbursement arrangements for the Fund.
Yield curve is a line that plots yields (interest rates) of bonds having equal credit quality but differing maturity dates. The slope of the yield curve gives an idea of future interest rate changes and economic activity.
The Bloomberg U.S. Intermediate Government/Credit Bond Index is an unmanaged market value weighted index measuring both the principal price changes of, and income provided by, the underlying universe of securities that comprise the index. Securities included in the index must meet the following criteria: fixed as opposed to variable rate; remaining maturity of one to ten years; minimum outstanding par value of $250 million; rated investment grade or higher by Moody’s Investors Service or equivalent; must be dollar denominated and non-convertible; and must be publicly issued.
Price-earnings ratio is the ratio of a company’s share price to the company’s earnings per share.
Duration is a measure of the sensitivity of the price of a bond or other debt instrument to a change in interest rates.
Cash flow is the net amount of cash and cash-equivalents being transferred into and out of a business.
The Consumer Price Index (CPI) is a measure of the average change over time in the prices paid by urban consumers for a market basket of consumer goods and services.
Investors should consider the investment objective, risks and charges and expenses of the Fund carefully before investing. The Fund’s summary prospectus and prospectus contain this and other information about the Fund. Investors can obtain the summary prospectus and/or the prospectus by calling 1-800-423-6369. The summary prospectus and/or prospectus should be read carefully before investing in the Fund.
Quasar Distributors, LLC, distributor.
5
PERFORMANCE:
The following information illustrates the historical performance of the LKCM Aquinas Catholic Equity Fund as of December 31, 2021 compared to the Fund’s benchmark and peer group indices.
Performance data quoted represents past performance; past performance does not guarantee future results. The graph and table reflect the reinvestment of dividends and other distributions, if any, but do not reflect the deduction of taxes that a shareholder would pay on Fund distributions or the redemption of Fund shares. The investment return and principal value of an investment will fluctuate so that an investor’s shares, when redeemed, may be worth more or less than their original cost. Current performance of the Fund may be lower or higher than the performance quoted. Performance data current to the most recent month end may be obtained by calling 1-800-423-6369. Returns would have been lower if LKCM had not waived a portion of its management fee and/or reimbursed certain expenses of the Fund. Please see Note B to the Notes to the Financial Statements for specific information regarding management fee waiver and/or expense reimbursement arrangements for the Fund.
An index is an unmanaged portfolio and does not trade or incur any expenses. The Lipper Large-Cap Core Funds Index, however, does reflect the fees and expenses borne by the funds included in that index. One can not invest in an unmanaged index.
AVERAGE ANNUAL TOTAL RETURN (Periods Ended December 31, 2021)(1)
| | | | | | | | | | | | | | | | | | | | |
| | | | | |
| | | Past
1 Year | | Past
5 Years(2) | | Past
10 Years(2) | | Since
Inception(2)(3) |
LKCM Aquinas Catholic Equity Fund | | | | 25.34% | | | | | 17.83% | | | | | 13.97% | | | | | 9.83% | |
S&P 500® Index | | | | 28.71% | | | | | 18.47% | | | | | 16.55% | | | | | 10.89% | |
Lipper Large-Cap Core Funds Index | | | | 26.04% | | | | | 16.71% | | | | | 15.12% | | | | | 9.88% | |
| (1) | Effective upon the close of business on July 29, 2016, the LKCM Aquinas Small Cap Fund and the LKCM Aquinas Growth Fund reorganized into the LKCM Aquinas Value Fund (the “Reorganizations”). At the time the Reorganizations were completed, the LKCM Aquinas Value Fund changed its name to the LKCM Aquinas Catholic Equity Fund (“Fund”) and its investment strategies and expenses, including the expense limitation agreement, changed to the investment strategies and expenses, including the expense limitation agreement, of the Fund. The Fund’s performance prior to August 1, 2016 reflects the Fund’s prior investment strategies. |
| (3) | The assets of the Aquinas Value Fund, Aquinas Growth Fund and Aquinas Small-Cap Fund were acquired by the LKCM Aquinas Value Fund, LKCM Aquinas Growth Fund and LKCM Aquinas Small Cap Fund, respectively, on July 11, 2005. At the time of the reorganization, the Adviser also changed from Aquinas Investment Advisers, Inc. to Luther King Capital Management Corporation. Due to the change in adviser and investment technique, performance is being quoted for the period after the merger. As stated above, the LKCM Aquinas Growth Fund and LKCM Aquinas Small-Cap Fund were reorganized into the LKCM Aquinas Value Fund effective upon the close of business on July 29, 2016, after which the LKCM Aquinas Value Fund’s name, investment strategies and expenses changed to those of the Fund. The performance shown prior to August 1, 2016, is that of the LKCM Aquinas Value Fund. |
A HYPOTHETICAL $10,000 INVESTMENT IN LKCM AQUINAS CATHOLIC EQUITY FUND
(for the ten years ended December 31, 2021)
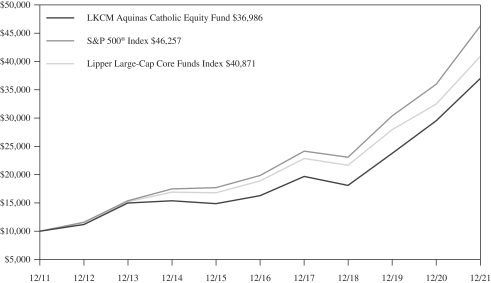
The S&P 500® Index is an unmanaged capitalization-weighted index of 500 selected stocks that is generally considered representative of the performance of large capitalization companies in the U.S. stock market.
The Lipper Large-Cap Core Funds Index is an unmanaged index generally considered representative of large cap core mutual funds tracked by Lipper, Inc.
6
LKCM Aquinas Catholic Equity Fund Expense Example — December 31, 2021 (Unaudited)
As a shareholder of the Fund, you incur two types of costs: (1) transaction costs, including redemption fees; and (2) ongoing costs, including management fees, distribution and/or service (12b-1) fees and other Fund expenses. This Example is intended to help you understand your ongoing costs (in dollars) of investing in the Fund and to compare these costs with the ongoing costs of investing in other mutual funds. The Example is based on an investment of $1,000 invested at the beginning of the period and held for the entire period (07/01/2021-12/31/2021).
ACTUAL EXPENSES
The third and fourth columns of the table below provide information about actual account values and actual expenses. You may use the information in these columns, together with the amount you invested, to estimate the expenses that you paid over the period. Simply divide your account value by $1,000 (for example, an $8,600 account value divided by $1,000 = 8.6), then multiply the result by the number in the fourth column under the heading entitled “Expenses Paid During Period” to estimate the expenses you paid on your account during this period. Although the Fund charges no sales load, you will be assessed fees for outgoing wire transfers, returned checks and stop payment orders at prevailing rates charged by U.S. Bancorp Fund Services, LLC (doing business as U.S. Bank Global Fund Services), the Fund’s transfer agent. If you request that a redemption be made by wire transfer, currently a $15.00 fee is charged by the Fund’s transfer agent. You will be charged a redemption fee equal to 1.00% of the net amount of the redemption if you redeem your shares of the Fund within 30 days of purchase, unless otherwise determined by the Fund in its discretion. To the extent the Fund invests in shares of other investment companies as part of its investment strategy, you will indirectly bear your proportionate share of any fees and expenses charged by the underlying funds in which the Fund invests in addition to the expenses of the Fund. Actual expenses of the underlying funds are expected to vary among the various underlying funds. These expenses are not included in the example below. The example below includes management fees, registration fees and other expenses. However, the example below does not include portfolio trading commissions and related expenses and other extraordinary expenses as determined under generally accepted accounting principles.
HYPOTHETICAL EXAMPLES FOR COMPARISON PURPOSES
The fifth and sixth columns of the table below provide information about hypothetical account values and hypothetical expenses based on the Fund’s actual expense ratio and an assumed rate of return of 5% per year before expenses, which is not the Fund’s actual return. The hypothetical account values and expenses may not be used to estimate the actual ending account balance or expenses you paid for the period. You may use this information to compare the ongoing costs of investing in the Fund and other funds. To do so, compare this 5% hypothetical example with the 5% hypothetical examples that appear in the shareholder reports of the other funds. Please note that the expenses shown in the table are meant to highlight your ongoing costs only and do not reflect any transactional costs, such as redemption fees. Therefore, the fifth and sixth columns of the table are useful in comparing ongoing costs only, and will not help you determine the relative total costs of owning different funds. In addition, if these transactions costs were included, your costs would have been higher.
| | | | | | | | | | | | | | | | | | | | | | | | | | | | | | |
| | | Fund’s
Annualized
Expense
Ratio(1) | | Beginning
Account Value
07/01/2021 | | Actual | | Hypothetical (5% return
before expenses) |
| | | Ending
Account Value
12/31/2021 | | Expenses
Paid
During
Period(1) | | Ending
Account Value
12/31/2021 | | Expenses
Paid
During
Period(1) |
LKCM Aquinas Catholic Equity Fund | | | | 1.00 | % | | | $ | 1,000.00 | | | | $ | 1,099.10 | | | | $ | 5.29 | | | | $ | 1,020.16 | | | | $ | 5.09 | |
| (1) | Expenses are equal to the annualized net expense ratio for the Fund, multiplied by the average account value over the period, multiplied by 184/365 (to reflect the one-half year period). |
7
ALLOCATION OF PORTFOLIO HOLDINGS — LKCM Aquinas Catholic Equity Fund — December 31, 2021
Percentages represent market value as a percentage of total investments.
LKCM Aquinas Catholic Equity Fund
8
|
| LKCM AQUINAS CATHOLIC EQUITY FUND |
| SCHEDULEOF INVESTMENTS |
| December 31, 2021 |
| | | | | | | | | | |
| COMMON STOCKS - 100.2% | | Shares | | Value |
| Aerospace & Defense - 2.3% |
Honeywell International, Inc. | | | | 7,000 | | | | $ | 1,459,570 | |
| | | | | | | | | | |
| Banks - 9.2% |
Comerica, Inc. | | | | 15,000 | | | | | 1,305,000 | |
Cullen/Frost Bankers, Inc. | | | | 5,000 | | | | | 630,350 | |
Truist Financial Corp. | | | | 32,375 | | | | | 1,895,556 | |
Zions Bancorp N.A. | | | | 32,500 | | | | | 2,052,700 | |
| | | | | | | | | | |
| | | | | | | | | 5,883,606 | |
| | | | | | | | | | |
| Beverages - 4.3% |
Keurig Dr Pepper, Inc. | | | | 22,500 | | | | | 829,350 | |
PepsiCo, Inc. | | | | 11,000 | | | | | 1,910,810 | |
| | | | | | | | | | |
| | | | | | | | | 2,740,160 | |
| | | | | | | | | | |
| Chemicals - 8.4% |
Air Products & Chemicals, Inc. | | | | 4,000 | | | | | 1,217,040 | |
Corteva, Inc. | | | | 22,500 | | | | | 1,063,800 | |
DuPont de Nemours, Inc. | | | | 14,500 | | | | | 1,171,310 | |
Ecolab, Inc. | | | | 5,000 | | | | | 1,172,950 | |
The Sherwin-Williams Co. | | | | 2,100 | | | | | 739,536 | |
| | | | | | | | | | |
| | | | | | | | | 5,364,636 | |
| | | | | | | | | | |
| Communications Equipment - 1.2% |
QUALCOMM, Inc. | | | | 4,200 | | | | | 768,054 | |
| | | | | | | | | | |
| Computers & Peripherals - 4.2% |
Apple, Inc. | | | | 15,000 | | | | | 2,663,550 | |
| | | | | | | | | | |
| Construction Materials - 1.4% |
Martin Marietta Materials, Inc. | | | | 2,000 | | | | | 881,040 | |
| | | | | | | | | | |
| Consumer Finance - 1.9% |
American Express Company | | | | 7,500 | | | | | 1,227,000 | |
| | | | | | | | | | |
| Electrical Equipment & Instruments - 3.1% |
Roper Technologies, Inc. | | | | 4,000 | | | | | 1,967,440 | |
| | | | | | | | | | |
| Electronic Equipment & Instruments - 3.1% |
Trimble, Inc. (a) | | | | 22,500 | | | | | 1,961,775 | |
| | | | | | | | | | |
| Electronic Equipment, Instruments & Components - 1.2% |
Teledyne Technologies, Inc. (a) | | | | 1,700 | | | | | 742,713 | |
| | | | | | | | | | |
| Health Care Equipment & Supplies - 1.5% |
Stryker Corp. | | | | 3,700 | | | | | 989,454 | |
| | | | | | | | | | |
| Internet & Catalog Retail - 2.6% |
Amazon.com, Inc. (a) | | | | 500 | | | | | 1,667,170 | |
| | | | | | | | | | |
| IT Consulting & Services - 3.1% |
Black Knight, Inc. (a) | | | | 2,000 | | | | | 165,780 | |
Broadridge Financial Solutions, Inc. | | | | 5,500 | | | | | 1,005,510 | |
PayPal Holdings, Inc. (a) | | | | 4,200 | | | | | 792,036 | |
| | | | | | | | | | |
| | | | | | | | | 1,963,326 | |
| | | | | | | | | | |
| Machinery - 1.9% |
Xylem, Inc. | | | | 10,000 | | | | | 1,199,200 | |
| | | | | | | | | | |
| Marine - 1.4% |
Kirby Corp. (a) | | | | 15,000 | | | | | 891,300 | |
| | | | | | | | | | |
| | | | | | | | | | |
| COMMON STOCKS | | Shares | | Value |
| Media & Entertainment - 6.3% |
Alphabet, Inc. - Class A (a) | | | | 1,200 | | | | $ | 3,476,448 | |
The Walt Disney Co. (a) | | | | 3,600 | | | | | 557,604 | |
| | | | | | | | | | |
| | | | | | | | | 4,034,052 | |
| | | | | | | | | | |
| Oil & Gas & Consumable Fuels - 7.6% |
Chevron Corp. | | | | 6,500 | | | | | 762,775 | |
Devon Energy Corp. | | | | 43,902 | | | | | 1,933,883 | |
Kinder Morgan, Inc. | | | | 52,500 | | | | | 832,650 | |
Pioneer Natural Resources Co. | | | | 7,500 | | | | | 1,364,100 | |
| | | | | | | | | | |
| | | | | | | | | 4,893,408 | |
| | | | | | | | | | |
| Pharmaceuticals - 8.2% |
Abbott Laboratories | | | | 17,500 | | | | | 2,462,950 | |
Zoetis, Inc. | | | | 11,500 | | | | | 2,806,345 | |
| | | | | | | | | | |
| | | | | | | | | 5,269,295 | |
| | | | | | | | | | |
| Professional Services - 4.3% |
Dun & Bradstreet Holdings, Inc. (a) | | | | 45,000 | | | | | 922,050 | |
Verisk Analytics, Inc. | | | | 8,000 | | | | | 1,829,840 | |
| | | | | | | | | | |
| | | | | | | | | 2,751,890 | |
| | | | | | | | | | |
| Semiconductor & Semiconductor Equipment - 1.6% |
Intel Corporation | | | | 20,000 | | | | | 1,030,000 | |
| | | | | | | | | | |
| Software - 12.6% | | | | |
Adobe, Inc. (a) | | | | 3,700 | | | | | 2,098,122 | |
Microsoft Corp. | | | | 8,000 | | | | | 2,690,560 | |
Oracle Corp. | | | | 25,000 | | | | | 2,180,250 | |
Sprout Social, Inc. - Class A (a) | | | | 12,000 | | | | | 1,088,280 | |
| | | | | | | | | | |
| | | | | | | | | 8,057,212 | |
| | | | | | | | | | |
| Software & Services - 2.6% | | | | |
Akamai Technologies, Inc. (a) | | | | 14,500 | | | | | 1,697,080 | |
| | | | | | | | | | |
| Specialty Retail - 6.2% | | | | |
The Home Depot, Inc. | | | | 4,500 | | | | | 1,867,545 | |
Leslie’s, Inc. (a) | | | | 44,500 | | | | | 1,052,870 | |
Petco Health & Wellness Co, Inc. (a) | | | | 52,000 | | | | | 1,029,080 | |
| | | | | | | | | | |
| | | | | | | | | 3,949,495 | |
| | | | | | | | | | |
TOTAL COMMON STOCKS
(Cost $26,964,909) | | | | | | | | | 64,052,426 | |
| | | | | | | | | | |
Total Investments - 100.2%
(Cost $26,964,909) | | | | | | | | | 64,052,426 | |
Liabilities in Excess of Other Assets - (0.2)% | | | | | | | | | (136,418 | ) |
| | | | | | | | | | |
TOTAL NET ASSETS - 100.0% | | | | | | | | $ | 63,916,008 | |
| | | | | | | | | | |
| (a) | Non-income producing security. |
Investments are classified by industry pursuant to the Global Industry Classification Standard (GICS®), which was developed by and/or is the exclusive property of Morgan Stanley Capital International, Inc. (“MSCI”) and Standard & Poor’s Financial Services LLC (“S&P”). GICS is a service mark of MSCI and S&P and has been licensed for use by U.S. Bancorp Fund Services, LLC.
The accompanying notes are an integral part of these financial statements.
9
|
| STATEMENTOF ASSETSAND LIABILITIES |
| December 31, 2021 |
| | | | | | | | | | |
|
| LKCM Aquinas Catholic Equity Fund |
| | | | | | | | | | |
Assets | | | | | | | | | | |
Investments, at value* | | | | | | | | $ | 64,052,426 | |
Dividends and interest receivable | | | | | | | | | 41,328 | |
Receivable for securities sold | | | | | | | | | 25,737 | |
Receivable for Fund shares sold | | | | | | | | | 2,803 | |
Prepaid expenses and other assets | | | | | | | | | 6,725 | |
| | | | | | | | | | |
Total assets | | | | | | | | | 64,129,019 | |
| | | | | | | | | | |
Liabilities | | | | | | | | | | |
Due to custodian | | | | | | | | | 21,009 | |
Payable for investment advisory fees (Note B) | | | | | | | | | 79,859 | |
Payable for distribution expense (Note B) | | | | | | | | | 41,186 | |
Payable for administrative fees | | | | | | | | | 14,166 | |
Payable for accounting and transfer agent fees and expenses | | | | | | | | | 19,177 | |
Payable for professional fees | | | | | | | | | 12,700 | |
Payable for custody fees and expenses | | | | | | | | | 1,827 | |
Payable for reports to shareholders | | | | | | | | | 10,281 | |
Payable for trustees’ fees and officer compensation (Note B) | | | | | | | | | 276 | |
Payable for Fund shares redeemed | | | | | | | | | 11,731 | |
Accrued expenses and other liabilities | | | | | | | | | 799 | |
| | | | | | | | | | |
Total liabilities | | | | | | | | | 213,011 | |
| | | | | | | | | | |
Net assets | | | | | | | | $ | 63,916,008 | |
| | | | | | | | | | |
Net assets consist of: | | | | | | | | | | |
Paid-in capital | | | | | | | | $ | 26,934,883 | |
Total distributable earnings | | | | | | | | | 36,981,125 | |
| | | | | | | | | | |
Net assets | | | | | | | | $ | 63,916,008 | |
| | | | | | | | | | |
Shares of beneficial interest outstanding
(unlimited shares of no par value authorized) | | | | | | | | | 3,273,724 | |
Net asset value per share
(offering and redemption price) | | | | | | | | $ | 19.52 | |
| | | | | | | | | | |
| | |
* Cost of Investments | | | | | | | | $ | 26,964,909 | |
| | | | | | | | | | |
The accompanying notes are an integral part of these financial statements.
10
|
| STATEMENTOF OPERATIONS |
| For the Year Ended December 31, 2021 |
| | | | | | | | | | |
|
| LKCM Aquinas Catholic Equity Fund |
| | | | | | | | | | |
Investment Income: | | | | | | | | | | |
Dividends | | | | | | | | $ | 745,413 | |
Interest | | | | | | | | | 237 | |
| | | | | | | | | | |
Total investment income | | | | | | | | | 745,650 | |
| | | | | | | | | | |
| | |
Expenses: | | | | | | | | | | |
Investment advisory fees (Note B) | | | | | | | | | 537,956 | |
Administrative fees | | | | | | | | | 54,546 | |
Accounting and transfer agent fees and expenses | | | | | | | | | 78,176 | |
Distribution expense (Note B) | | | | | | | | | 59,773 | |
Professional fees | | | | | | | | | 25,487 | |
Trustees’ fees and officer compensation (Note B) | | | | | | | | | 30,079 | |
Federal and state registration | | | | | | | | | 27,268 | |
Custody fees and expenses | | | | | | | | | 7,014 | |
Reports to shareholders | | | | | | | | | 12,192 | |
Other | | | | | | | | | 2,213 | |
| | | | | | | | | | |
Total expenses | | | | | | | | | 834,704 | |
Less, expense waiver and/or reimbursement (Note B) | | | | | | | | | (236,976 | ) |
| | | | | | | | | | |
Net expenses | | | | | | | | | 597,728 | |
| | | | | | | | | | |
Net investment income | | | | | | | | | 147,922 | |
| | | | | | | | | | |
| | |
Realized and Unrealized Gain | | | | | | | | | | |
Net realized gain on Investments | | | | | | | | $ | 6,253,404 | |
Net change in unrealized appreciation on Investments | | | | | | | | | 6,910,981 | |
| | | | | | | | | | |
| | |
Net Realized and Unrealized Gain | | | | | | | | | 13,164,385 | |
| | | | | | | | | | |
| | |
Net Increase in Net Assets Resulting from Operations | | | | | | | | $ | 13,312,307 | |
| | | | | | | | | | |
The accompanying notes are an integral part of these financial statements.
11
|
| STATEMENTSOF CHANGESIN NET ASSETS |
| | | | | | | | | | | | | | | | | | | | |
|
| LKCM Aquinas Catholic Equity Fund |
|
| |
| | | | |
| | | | | Year Ended
December 31,
2021 | | | | Year Ended
December 31,
2020 |
Operations: | | | | | | | | | | | | | | | | | | | | |
Net investment income | | | | | | | | $ | 147,922 | | | | | | | | | $ | 168,991 | |
Net realized gain on investments | | | | | | | | | 6,253,404 | | | | | | | | | | 4,536,968 | |
Net change in unrealized appreciation on investments | | | | | | | | | 6,910,981 | | | | | | | | | | 5,819,393 | |
| | | | | | | | | | | | | | | | | | | | |
Net increase in net assets resulting from operations | | | | | | | | | 13,312,307 | | | | | | | | | | 10,525,352 | |
| | | | | | | | | | | | | | | | | | | | |
| | | | |
Distributions to Shareholders | | | | | | | | | (7,216,137 | ) | | | | | | | | | (3,408,224 | ) |
| | | | | | | | | | | | | | | | | | | | |
| | | | |
Net increase (decrease) in net assets from Fund share transactions (Note C) | | | | | | | | | 3,957,949 | | | | | | | | | | (663,370 | ) |
| | | | | | | | | | | | | | | | | | | | |
| | | | |
Total increase in net assets | | | | | | | | | 10,054,119 | | | | | | | | | | 6,453,758 | |
| | | | |
Net Assets: | | | | | | | | | | | | | | | | | | | | |
Beginning of period | | | | | | | | | 53,861,889 | | | | | | | | | | 47,408,131 | |
| | | | | | | | | | | | | | | | | | | | |
End of period | | | | | | | | $ | 63,916,008 | | | | | | | | | $ | 53,861,889 | |
| | | | | | | | | | | | | | | | | | | | |
The accompanying notes are an integral part of these financial statements.
12
|
| FINANCIAL HIGHLIGHTS |
| SELECTED DATAFOR EACH SHAREOF CAPITAL STOCK OUTSTANDING |
| | | | | | | | | | | | | | | | | | | | | | | | | | | | | | | | | | | | | | | | | | | | | | | | | | |
| | |
| | | | | LKCM Aquinas Catholic Equity Fund |
| | | | | | | | | | | | | | | | | | | | | | | | | | | | | | | | | | | | | | | | | | | | | | | | | | |
| | | | | | | | | | |
| | | | | Year
Ended
December 31,
2021 | | | | Year
Ended
December 31,
2020 | | | | Year
Ended
December 31,
2019 | | | | Year
Ended
December 31,
2018 | | | | Year
Ended
December 31,
2017 |
Net Asset Value – Beginning of Period | | | | | | | | $ | 17.53 | | | | | | | | | $ | 15.06 | | | | | | | | | $ | 12.80 | | | | | | | | | $ | 17.19 | | | | | | | | | $ | 15.40 | |
| | | | | | | | | | | | | | | | | | | | | | | | | | | | | | | | | | | | | | | | | | | | | | | | | | |
Net investment income | | | | | | | | | 0.05 | (1) | | | | | | | | | 0.06 | (1) | | | | | | | | | 0.07 | (1) | | | | | | | | | 0.06 | | | | | | | | | | 0.05 | |
Net realized and unrealized gain (loss) on investments | | | | | | | | | 4.40 | | | | | | | | | | 3.59 | | | | | | | | | | 3.92 | | | | | | | | | | (1.46 | ) | | | | | | | | | 3.16 | |
| | | | | | | | | | | | | | | | | | | | | | | | | | | | | | | | | | | | | | | | | | | | | | | | | | |
Total from investment operations | | | | | | | | | 4.45 | | | | | | | | | | 3.65 | | | | | | | | | | 3.99 | | | | | | | | | | (1.40 | ) | | | | | | | | | 3.21 | |
| | | | | | | | | | | | | | | | | | | | | | | | | | | | | | | | | | | | | | | | | | | | | | | | | | |
Distributions from net investment income | | | | | | | | | (0.05 | ) | | | | | | | | | (0.06 | ) | | | | | | | | | (0.08 | ) | | | | | | | | | (0.07 | ) | | | | | | | | | (0.05 | ) |
Distributions from net realized gains | | | | | | | | | (2.41 | ) | | | | | | | | | (1.12 | ) | | | | | | | | | (1.65 | ) | | | | | | | | | (2.92 | ) | | | | | | | | | (1.37 | ) |
| | | | | | | | | | | | | | | | | | | | | | | | | | | | | | | | | | | | | | | | | | | | | | | | | | |
Total dividends and distributions | | | | | | | | | (2.46 | ) | | | | | | | | | (1.18 | ) | | | | | | | | | (1.73 | ) | | | | | | | | | (2.99 | ) | | | | | | | | | (1.42 | ) |
| | | | | | | | | | | | | | | | | | | | | | | | | | | | | | | | | | | | | | | | | | | | | | | | | | |
Net Asset Value – End of Period | | | | | | | | $ | 19.52 | | | | | | | | | $ | 17.53 | | | | | | | | | $ | 15.06 | | | | | | | | | $ | 12.80 | | | | | | | | | $ | 17.19 | |
| | | | | | | | | | | | | | | | | | | | | | | | | | | | | | | | | | | | | | | | | | | | | | | | | | |
Total Return | | | | | | | | | 25.34% | | | | | | | | | | 24.28% | | | | | | | | | | 31.16% | | | | | | | | | | -7.96% | | | | | | | | | | 20.79% | |
| | | | | | | | | | |
Ratios and Supplemental Data: | | | | | | | | | | | | | | | | | | | | | | | | | | | | | | | | | | | | | | | | | | | | | | | | | | |
Net assets, end of period (thousands) | | | | | | | | $ | 63,916 | | | | | | | | | $ | 53,862 | | | | | | | | | $ | 47,408 | | | | | | | | | $ | 45,332 | | | | | | | | | $ | 71,058 | |
Ratio of expenses to average net assets: | | | | | | | | | | | | | | | | | | | | | | | | | | | | | | | | | | | | | | | | | | | | | | | | | | |
Before expense waiver and/or reimbursement | | | | | | | | | 1.40% | | | | | | | | | | 1.48% | | | | | | | | | | 1.51% | | | | | | | | | | 1.44% | | | | | | | | | | 1.43% | |
After expense waiver and/or reimbursement | | | | | | | | | 1.00% | | | | | | | | | | 1.00% | | | | | | | | | | 1.00% | | | | | | | | | | 1.00% | | | | | | | | | | 1.00% | |
Ratio of net investment income to average net assets: | | | | | | | | | | | | | | | | | | | | | | | | | | | | | | | | | | | | | | | | | | | | | | | | | | |
Before expense waiver and/or reimbursement | | | | | | | | | (0.15)% | | | | | | | | | | (0.12)% | | | | | | | | | | (0.05)% | | | | | | | | | | (0.12)% | | | | | | | | | | (0.14)% | |
After expense waiver and/or reimbursement | | | | | | | | | 0.25% | | | | | | | | | | 0.36% | | | | | | | | | | 0.46% | | | | | | | | | | 0.32% | | | | | | | | | | 0.29% | |
Portfolio turnover rate | | | | | | | | | 18% | | | | | | | | | | 17% | | | | | | | | | | 12% | | | | | | | | | | 14% | | | | | | | | | | 18% | |
| (1) | Net investment income per share represents net investment income divided by the average shares outstanding throughout the period. |
The accompanying notes are an integral part of these financial statements.
13
|
| LKCM FUNDS |
| NOTESTOTHE FINANCIAL STATEMENTS |
| December 31, 2021 |
A. Organization and Significant Accounting Policies: LKCM Funds (the “Trust”) is registered under the Investment Company Act of 1940 (“1940 Act”) as an open-end, management investment company. The Trust was organized as a Delaware statutory trust on February 10, 1994 and consists of seven diversified series as of December 31, 2021, one of which is presented herein: the LKCM Aquinas Catholic Equity Fund (the “Fund”). On July 11, 2005, the LKCM Aquinas Funds acquired the assets and assumed the liabilities of the Aquinas Funds. Effective upon the close of business on July 29, 2016, the LKCM Aquinas Small Cap Fund and the LKCM Aquinas Growth Fund reorganized into the LKCM Aquinas Value Fund, which changed its name immediately thereafter to the LKCM Aquinas Catholic Equity Fund and its investment strategies and expenses, including the expense limitation agreement, changed to the investment strategies and expenses, including the expense limitation agreement, of the LKCM Aquinas Catholic Equity Fund. The Fund is subject to expenses pursuant to the Rule 12b-1 plan described in Note B. The Fund charges a 1% redemption fee for redemptions of Fund shares held for less than 30 days, unless otherwise determined by the Fund in its discretion.
The LKCM Aquinas Catholic Equity Fund seeks to maximize long-term capital appreciation, while incorporating Catholic values investing principles in the investment process. The LKCM Aquinas Catholic Equity Fund seeks to achieve its investment objective by investing under normal circumstances at least 80% of its net assets (plus any borrowings for investment purposes) in equity securities of companies that Luther King Capital Management Corporation (the “Adviser”) believes are likely to have above-average growth in revenue and/or earnings, above-average returns on shareholders’ equity, potential for above-average capital appreciation, and/or companies the Adviser believes have attractive relative valuations.
The Fund practices socially responsible investing within the framework provided by the United States Conference of Catholic Bishops’ Socially Responsible Investment Guidelines (the “Guidelines”). The Fund’s investment approach incorporates the Guidelines through a combination of screening portfolio companies based on criteria set forth in the Guidelines, dialogue with companies whose policies and practices conflict with the Guidelines, and/or potentially excluding from the Fund’s portfolio the securities of those companies that are unwilling to alter their policies and practices over a reasonable period of time. The Adviser monitors companies selected for the Fund for policies on various issues contemplated by the Guidelines. If the Fund invests in a company whose policies and practices are inconsistent with the Guidelines, the Adviser may attempt to influence the company, sell the company’s securities or otherwise exclude future investments in such company.
The following is a summary of significant accounting policies followed by the Fund in preparation of the financial statements. The Fund is an investment company and, accordingly, follows the investment company accounting and reporting guidance of the Financial Accounting Standards Board Accounting Standards Codification Topic 946, Investment Companies.
1. Security Valuation: Equity securities listed or traded on a U.S. securities exchange for which market quotations are readily available are valued at the last quoted sale price on the exchange on which the security is primarily traded. Nasdaq Global Market securities are valued at the Nasdaq Official Closing Price (“NOCP”). Unlisted U.S. equity securities and listed U.S. equity securities not traded on a particular valuation date are valued at the mean of the most recent quoted bid and ask price on the relevant exchanges or markets. Equity securities listed on a foreign exchange for which market quotations are readily available are valued at the last quoted sales price on the exchange on which the security is primarily traded. Debt securities are normally valued at the mean of the closing bid and ask price and/or by using a combination of broker quotations or evaluated prices provided by an independent pricing service. Futures and options on futures are valued at the settlement prices established each day on the principal exchange on which they are traded. Forward contracts are valued based on the forward rate using information provided by an independent pricing service. Other assets and securities for which no market or broker quotations or evaluated prices are readily available are valued in good faith at fair value using guidelines approved by the Board of Trustees. The Board of Trustees has established policies and procedures that authorize the Adviser to fair value a security in good faith under certain circumstances. The Fund may use prices provided by independent pricing services to assist in the fair valuation of the Fund’s portfolio securities.
The Trust has adopted accounting standards which establish an authoritative definition of fair value and set out a hierarchy for measuring fair value. These standards require additional disclosures about the various inputs and valuation techniques used to develop the measurements of fair value and a discussion of changes in valuation techniques and related inputs during the period. These standards define fair value as the price that would be received to sell an asset or paid to transfer a liability in an orderly transaction between market participants at the measurement date. The fair value hierarchy is organized into three levels based upon the assumptions (referred to as “inputs”) used in pricing the asset or liability. These standards state that “observable inputs” reflect the assumptions market participants would use in pricing the asset or liability based on market data obtained from independent sources and “unobservable inputs” reflect an entity’s own assumptions about the assumptions market participants would use in pricing the asset or liability. These inputs are summarized in the three broad levels listed below.
| | | | |
| Level 1 | | – | | Quoted unadjusted prices for identical instruments in active markets to which the Trust has access at the date of measurement. |
14
| | | | |
| | |
| Level 2 | | – | | Quoted prices for similar instruments in active markets; quoted prices for identical or similar instruments in markets that are not active; and model-derived valuations in which all significant inputs and significant value drivers are observable in active markets. Level 2 inputs are those in markets for which there are few transactions, the prices are not current, little public information exists or instances where prices vary substantially over time or among brokered market makers. |
| | |
| Level 3 | | – | | Model derived valuations in which one or more significant inputs or significant value drivers are unobservable. Unobservable inputs are those inputs that reflect the Trust’s own assumptions that market participants would use to price the asset or liability based on the best available information. |
The inputs or methodology used for valuing securities are not necessarily an indication of the risk associated with investing in those securities. As of December 31, 2021, the Fund’s assets carried at fair value were classified as follows:
| | | | | | | | | | | | | | | | | | | | |
| LKCM Aquinas Catholic Equity Fund | | | | | | | | |
| | | | |
Description | | Level 1 | | Level 2 | | Level 3 | | Total |
Common Stocks | | | $ | 64,052,426 | | | | $ | — | | | | $ | — | | | | $ | 64,052,426 | |
| | | | | | | | | | | | | | | | | | | | |
Total Investments* | | | $ | 64,052,426 | | | | $ | — | | | | $ | — | | | | $ | 64,052,426 | |
| | | | | | | | | | | | | | | | | | | | |
| | * | Additional information regarding the industry classifications of these investments is disclosed in the Schedule of Investments. |
2. Federal Income Taxes: The Fund has elected to be treated as a “regulated investment company” under Subchapter M of the Internal Revenue Code and the Fund intends to distribute all of its investment company net taxable income and net capital gains to shareholders. Therefore, no federal income tax provision is recorded.
3. Distributions to Shareholders: The Fund generally intends to declare and pay income dividends and distribute net capital gain, if any, at least on an annual basis.
4. Foreign Securities: Investing in securities of foreign companies and foreign governments involves special risks and considerations not typically associated with investing in securities of U.S. issuers. These risks include devaluation of currencies and future adverse political and economic developments. Moreover, securities of many foreign companies and foreign governments and their markets may be less liquid and their prices more volatile than those of securities of comparable U.S. companies and securities of the U.S. government.
5. Expense Allocation: Expenses incurred by the Funds in the Trust are allocated among the Funds based upon (i) relative average net assets, (ii) a specific identification basis as incurred, or (iii) evenly among the Funds, depending on the nature of the expense.
6. Use of Estimates: The preparation of financial statements in conformity with accounting principles generally accepted in the United States of America requires management to make estimates and assumptions that affect the reported amounts of assets and liabilities and disclosure of contingent assets and liabilities at the date of the financial statements and the reported amounts of revenues and expenses during the reporting period. Actual results could differ from those estimates.
7. Guarantees and Indemnifications: In the normal course of business, the Fund enters into contracts with service providers that contain general indemnification clauses. The Fund’s maximum exposure under these arrangements is unknown as this would involve future claims against the Fund that have not yet occurred. Based on experience, the Fund expects the risk of loss to be remote.
8. Security Transactions and Investment Income: Security and shareholder transactions are recorded on the trade date. Realized gains and losses on sales of investments are calculated on the identified cost basis. Dividend income and dividends and distributions to shareholders are recorded on the ex-dividend date. Withholding taxes on foreign dividends have been provided for in accordance with the Fund’s understanding of the applicable jurisdiction’s tax rules and rates. Interest income is recognized on the accrual basis. All discounts and premiums are amortized based on the effective interest method for tax and financial reporting purposes. The Fund may hold the securities of real estate investment trusts (“REITs”). Distributions from such investments may include income, capital gains and return of capital.
9. Other: Distributions from net investment income and realized capital gains are determined in accordance with income tax regulations, which may differ from U.S. GAAP. Certain capital accounts in the consolidated financial statements are periodically adjusted for permanent differences in order to reflect their tax character. These permanent differences are primarily due to the varying treatment of income and gain/loss on portfolio securities held by the Fund and have no impact on net assets or NAV per share.
Accordingly, at December 31, 2021, reclassifications were recorded as follows for the Fund:
| | | | | |
Paid-in capital | | | $ | 379,573 | |
Total distributable earnings | | | | (379,573 | ) |
10. Restricted and Illiquid Securities: The Fund is permitted to invest in securities that are subject to legal or contractual restrictions on resale including investments considered by the Fund to be illiquid. Restricted securities generally may be resold in transactions exempt from registration. Illiquid investments are investments that the Fund reasonably expects cannot be sold or disposed of in current market conditions within seven calendar days or less in the ordinary course of business without the sale or disposition significantly changing the market value of the investment. A security may be considered illiquid if it lacks a readily
15
available market or if its valuation has not changed for a certain period of time. Disposal of these securities may involve time-consuming negotiations and expense, and prompt sale at the current valuation may be difficult.
B. Investment Advisory and Other Agreements: The Adviser serves as the investment adviser to the Fund under an Investment Advisory Agreement (the “Agreement”). The Adviser receives a fee, computed daily and payable quarterly, at the annual rate presented below as applied to the Fund’s average daily net assets. The Adviser has contractually agreed to waive all or a portion of its management fee and/or reimburse expenses of the Fund through May 1, 2022 in order to limit the Fund’s operating expenses to the annual cap rate presented below. This expense limitation excludes interest, taxes, brokerage commissions, indirect fees and expenses relating to investments in other investment companies, including money market funds, and extraordinary expenses.
For the fiscal year ended December 31, 2021, the Adviser waived the following management fees and/or reimbursed expenses to meet its expense cap obligations:
| | | | | |
| | | LKCM Aquinas
Catholic Equity
Fund |
Annual Management Fee Rate | | | | 0.90% | |
Annual Cap on Expenses | | | | 1.00% | |
Fees Waived and/or Expenses Reimbursed in 2021 | | | $ | 236,976 | |
The Trust reimburses the Adviser for a portion of compensation paid to the Trust’s Chief Compliance Officer. This compensation is reported as part of the “Trustees’ fees and officer compensation” expense on the Statement of Operations.
U.S. Bancorp Fund Services, LLC (“U.S. Bancorp”), doing business as U.S. Bank Global Fund Services, serves as transfer agent and administrator for the Fund and serves as accounting services agent for the Fund. U.S. Bank, N.A. serves as custodian for the Fund.
Distribution services are performed pursuant to a distribution contract with Quasar Distributors, LLC (“Quasar”), the Trust’s principal underwriter.
Effective September 30, 2021, GC Mountain Acquisition Corp., an affiliate of Genstar Capital, became the majority owner of Foreside Financial Group, LLC, Quasar’s parent company (the “Transaction”). This transaction resulted in a change in control of Quasar under the 1940 Act. Accordingly, the Transaction resulted in the assignment and termination of the distribution contract with Quasar. The Board of Trustees of the Funds approved a new Distribution Agreement that took effect upon the close of the Transaction.
The Trust has adopted a Distribution Plan pursuant to Rule 12b-1 of the 1940 Act the Fund, under which the Fund may pay an annualized fee of up to 1.00% of its average daily net assets for distribution and other services. However, the Board of Trustees has currently only authorized an annual fee of 0.10% of the average daily net assets for the Fund. Prior to August 1, 2016, the Fund assessed an annual Rule 12b-1 fee of 0.25% of the average daily net assets for the Fund. For the year ended December 31, 2021, fees incurred by the Fund pursuant to the 12b-1 Plan were $59,773.
C. Fund Shares: At December 31, 2021, there was an unlimited number of shares of beneficial interest, no par value, authorized for the Fund. The following table summarizes the activity in shares of the Fund:
| | | | | | | | | | | | | | | | | | | | |
| | | Year Ended
December 31, 2021 | | Year Ended
December 31, 2020 |
| | | Shares | | Amount | | Shares | | Amount |
Shares sold | | | | 147,648 | | | | $ | 2,968,608 | | | | | 131,291 | | | | $ | 2,112,948 | |
Shares issued to shareholders in reinvestment of distributions | | | | 347,962 | | | | | 6,820,061 | | | | | 188,041 | | | | | 3,279,433 | |
Shares redeemed | | | | (293,618 | ) | | | | (5,830,731 | ) | | | | (396,131 | ) | | | | (6,055,975 | ) |
Redemption fee | | | | | | | | | 11 | | | | | | | | | | 224 | |
| | | | | | | | | | | | | | | | | | | | |
Net increase (decrease) | | | | 201,993 | | | | $ | 3,957,949 | | | | | (76,799 | ) | | | $ | (663,370 | ) |
| | | | | | | | | | | | | | | | | | | | |
Shares Outstanding: | | | | | | | | | | | | | | | | | | | | |
Beginning of period | | | | 3,071,731 | | | | | | | | | | 3,148,530 | | | | | | |
| | | | | | | | | | | | | | | | | | | | |
End of period | | | | 3,273,724 | | | | | | | | | | 3,071,731 | | | | | | |
| | | | | | | | | | | | | | | | | | | | |
D. Security Transactions: Purchases and sales of investment securities, other than short-term investments, for the Fund for the year ended December 31, 2021 were as follows:
| | | | | | | | | | | | | | | | |
| | | Purchases | | | Sales | |
| | | U.S.
Government | | | Other | | | U.S.
Government | | | Other | |
| | $ | — | | | $ | 10,669,730 | | | $ | — | | | $ | 12,536,330 | |
16
E. Tax Information: At December 31, 2021, the components of accumulated earnings (losses) on a tax basis for the Fund were as follows:
| | | | |
Tax cost | | $ | 26,964,909 | |
| | | | |
Gross unrealized appreciation | | | 37,254,567 | |
Gross unrealized depreciation | | | (167,050 | ) |
| | | | |
Net unrealized appreciation | | | 37,087,517 | |
| | | | |
Undistributed ordinary income | | | 5,437 | |
Undistributed long-term capital gain | | | — | |
| | | | |
Distributable earnings | | | 5,437 | |
| | | | |
Other accumulated losses | | | (111,829 | ) |
| | | | |
Total distributable earnings | | | 36,981,125 | |
| | | | |
At December 31, 2021, the Fund deferred, on a tax basis, post-October capital losses of $111,829.
The tax components of dividends paid during the periods shown below for the Fund were as follows:
| | | | | | | | | | | | | | | | | | | | |
| | | Year Ended December 31, 2021 | | Year Ended December 31, 2020 |
| | | Ordinary
Income | | Long-Term
Capital Gains | | Ordinary
Income | | Long-Term
Capital Gains |
LKCM Aquinas Catholic Equity Fund | | | $ | 147,922 | | | | $ | 7,068,215 | | | | $ | 169,007 | | | | $ | 3,239,217 | |
The Fund designated earnings and profits distributed to shareholders upon the redemption of shares during 2021 and 2020 in determining undistributed net capital gains as of December 31, 2021 and 2020, respectively.
The Trust has adopted financial reporting rules regarding recognition and measurement of tax positions taken or expected to be taken on a tax return. The Trust has reviewed all open tax years and major jurisdictions and concluded that there is no impact on the Fund’s financial position or results of operations. Tax years that remain open to examination by major tax jurisdictions include tax years ended December 31, 2018 through December 31, 2021. There is no tax liability resulting from unrecognized tax benefits relating to uncertain income tax positions taken or expected to be taken on tax returns as of December 31, 2021. The Fund is not aware of any tax positions for which it is reasonably possible that the total amounts of unrecognized tax benefits will significantly change in the next twelve months. If applicable, the Fund would recognize interest accrued related to unrecognized tax benefits in “interest expense” and penalties in “other expense” on the statement of operations.
F. Other Matters: The global outbreak of COVID-19 and other variants and the ensuing pandemic has adversely impacted global economic and commercial activity and has contributed to significant volatility and uncertainty in global financial markets. The global impact of the COVID-19 pandemic continues to rapidly evolve and its long-term implications for economies, markets, sectors, industries and issuers remains uncertain. The financial and operational performance of the issuers of securities in which the Fund invests depends upon future developments with respect to the COVID-19 pandemic, including, without limitation, the scope, duration and spread of COVID-19 as well as the development, efficacy and administration of COVID-19 vaccines, and such future developments and uncertainties with respect thereto may adversely affect, among other things, the value and liquidity of the Fund’s investment, the Fund’s ability to satisfy redemption requests, and Fund’s financial and operational performance.
G. Accounting Pronouncement: In December 2020, the SEC adopted a new rule providing a framework for fund valuation practices (“Rule 2a-5”). Rule 2a-5 establishes requirements for determining fair value in good faith for purposes of the 1940 Act. Rule 2a-5 will permit fund boards to designate certain parties to perform fair value determinations, subject to board oversight and certain other conditions. Rule 2a-5 also defines when market quotations are “readily available” for purposes of the 1940 Act and the threshold for determining whether a fund must fair value a security. In connection with Rule 2a-5, the SEC also adopted related recordkeeping requirements and is rescinding previously issued guidance, including with respect to the role of a board in determining fair value and the accounting and auditing of fund investments. The Fund will be required to comply with the rules by September 8, 2022. Management is currently assessing the potential impact of Rule 2a-5 on the Fund’s financial statements.
H. Subsequent Events: In preparing these financial statements, management has evaluated the Fund’s related events and transactions that occurred subsequent to December 31, 2021 through the date the financial statements were issued and has determined that there were no significant subsequent events requiring recognition or disclosure in the financial statements.
17
|
| REPORTOF INDEPENDENT REGISTERED PUBLIC ACCOUNTING FIRM |
To the shareholders and the Board of Trustees of LKCM Funds
Opinion on the Financial Statements and Financial Highlights
We have audited the accompanying statement of assets and liabilities, including the schedule of investments, of LKCM Aquinas Catholic Equity Fund, one of the funds constituting the LKCM Funds (the “Trust”), as of December 31, 2021, the related statement of operations for the year then ended, the statements of changes in net assets for each of the two years in the period then ended, the financial highlights for each of the five years in the period then ended, and the related notes. In our opinion, the financial statements and financial highlights present fairly, in all material respects, the financial position of LKCM Aquinas Catholic Equity Fund of the Trust as of December 31, 2021, and the results of its operations for the year then ended, the changes in its net assets for each of the two years in the period then ended, and the financial highlights for each of the five years in the period then ended, in conformity with accounting principles generally accepted in the United States of America.
Basis for Opinion
These financial statements and financial highlights are the responsibility of the Trust’s management. Our responsibility is to express an opinion on the Trust’s financial statements and financial highlights based on our audits. We are a public accounting firm registered with the Public Company Accounting Oversight Board (United States) (PCAOB) and are required to be independent with respect to the Trust in accordance with the U.S. federal securities laws and the applicable rules and regulations of the Securities and Exchange Commission and the PCAOB.
We conducted our audits in accordance with the standards of the PCAOB. Those standards require that we plan and perform the audit to obtain reasonable assurance about whether the financial statements and financial highlights are free of material misstatement, whether due to error or fraud. The Trust is not required to have, nor were we engaged to perform, an audit of its internal control over financial reporting. As part of our audits we are required to obtain an understanding of internal control over financial reporting but not for the purpose of expressing an opinion on the effectiveness of the Trust’s internal control over financial reporting. Accordingly, we express no such opinion.
Our audits included performing procedures to assess the risks of material misstatement of the financial statements and financial highlights, whether due to error or fraud, and performing procedures that respond to those risks. Such procedures included examining, on a test basis, evidence regarding the amounts and disclosures in the financial statements and financial highlights. Our audits also included evaluating the accounting principles used and significant estimates made by management, as well as evaluating the overall presentation of the financial statements and financial highlights. Our procedures included confirmation of securities owned as of December 31, 2021, by correspondence with the custodian. We believe that our audits provide a reasonable basis for our opinion.

Milwaukee, Wisconsin
February 25, 2022
We have served as the auditor of one or more LKCM Funds since 2007.
18
|
| LKCM AQUINAS CATHOLIC EQUITY FUND |
| ADDITIONAL INFORMATION |
| December 31, 2021 |
Tax Information: For the fiscal year ended December 31, 2021, certain dividends paid by the Fund may be subject to a maximum tax rate of 23.8%, as provided for by the Jobs & Growth Tax Relief Reconciliation Act of 2003. The percentage of dividends declared from ordinary income designated as qualified dividend income was 100.00%.
For corporate shareholders, the percentage of ordinary income distributions qualifying for the corporate dividends received deduction for the fiscal year ended December 31, 2021 was 100.00%.
Availability of Proxy Voting Information: A description of the policies and procedures that the Fund uses to determine how to vote proxies relating to its portfolio securities, as well as information regarding how the Fund voted proxies relating to portfolio securities during the most recent 12-month period ended June 30, is available without charge, upon request, by calling toll-free 1-800-423-6369 or on the SEC website at http://www.sec.gov.
The actual voting records relating to portfolio securities during the twelve month period ended June 30 (as filed with the SEC on Form N-PX) are available without charge, upon request, by calling the Fund toll free at 1-800-423-6369 or by accessing the SEC’s website at www.sec.gov.
Availability of Quarterly Portfolio Schedule: The Fund files a complete schedule of portfolio holdings with the U.S. Securities and Exchange Commission (the “SEC”) for the first and third quarters of each fiscal year on Part F of Form N-PORT. The Fund’s Part F of Form N-PORT is available on the SEC’s website at www.sec.gov and may be reviewed and copied at the SEC’s Public Reference Room in Washington, D.C. Information on the operation of the Public Reference Room may be obtained by calling 1-800-732-0330. The Fund’s Part F of Form N-PORT may also be obtained by calling toll-free 1-800-423-6369.
19
Information about the Fund’s Trustees and Officers:
The business and affairs of the Fund are managed under the direction of the Fund’s Board of Trustees. Information pertaining to the Trustees of the Fund is set forth below. The Statement of Additional Information includes additional information about the Fund’s Trustees and officers and is available, without charge, upon request by calling 1-800-688-LKCM.
| | | | | | | | | | |
Name, Address
and Age | | Position(s)
Held with
the Trust | | Term of
Office &
Length
of Time
Served(1) | | Principal Occupation
During Past Five Years | | Number of
Portfolios in
Fund Complex
Overseen by Trustee | | Other
Directorships
Held by Trustee |
| Independent Trustees | | | | | | | | | | |
Richard J. Howell 301 Commerce Street Suite 1600 Fort Worth, TX 76102 Year of Birth: 1942 | | Trustee Chairman of the Audit and Compliance Committee | | Since 2005 Since 2008 | | CPA; Adjunct Faculty at SMU Cox School of Business from 2004 to 2009; Consulting Services, since 2002; Audit Partner, Arthur Andersen LLP from 1974 to 2002. | | 7 | | None |
Larry J. Lockwood 301 Commerce Street Suite 1600 Fort Worth, TX 76102 Year of Birth: 1953 | | Chairman of the Board of Trustees Trustee | | Since 2021 Since 2013 | | C.R. Williams Professor of Finance, Stan Block Endowed Chair in Finance, Department of Finance, Neeley School of Business, Texas Christian University since 1994. | | 7 | | None |
Mauricio Rodriguez 301 Commerce Street Suite 1600 Fort Worth, TX 76102 Year of Birth: 1966 | | Trustee | | Since 2021 | | Chair, Department of Finance, Neeley School of Business; Texas Christian University since 2002. | | 7 | | None |
| | | | | |
| Interested Trustees | | | | | | | | | | |
J. Luther King, Jr.(2) 301 Commerce Street Suite 1600 Fort Worth, TX 76102 Year of Birth: 1940 | | Trustee, President and Chief Executive Officer | | Since 1994 | | Chairman, President and Director, Luther King Capital Management Corporation since 1979. | | 7 | | None |
Steven R. Purvis(2) 301 Commerce Street Suite 1600 Fort Worth, TX 76102 Year of Birth: 1964 | | Trustee | | Since 2013 | | Principal, Luther King Capital Management Corporation from 2004 to 2021, Vice President and Portfolio Manager, Luther King Capital Management Corporation from 1996 to 2021. | | 7 | | AZZ Incorporated |
| (1) | Each Trustee holds office during the lifetime of the Trust until that individual resigns, retires or is otherwise removed or replaced. |
| (2) | Messrs. King and Purvis are each considered an “interested person” of the Trust (as defined in the 1940 Act) because of their affiliation with the Adviser. |
20
Information about the Fund’s Trustees and Officers, Continued
| | | | | | |
Name, Address
and Age | | Position(s) Held with the Trust | | Term of Office & Length of Time Served(1) | | Principal Occupation During Past Five Years |
| Principal Officers of the Trust |
J. Luther King, Jr.(2) 301 Commerce Street Suite 1600 Fort Worth, TX 76102 Year of Birth: 1940 | | Trustee, President and Chief Executive Officer | | Since 1994 | | Chairman, President and Director, Luther King Capital Management Corporation since 1979. |
Paul W. Greenwell 301 Commerce Street Suite 1600 Fort Worth, TX 76102 Year of Birth: 1950 | | Vice President | | Since 1996 | | Principal, Luther King Capital Management Corporation since 1986, Vice President and Portfolio Manager, Luther King Capital Management Corporation since 1983. |
Richard Lenart 301 Commerce Street Suite 1600 Fort Worth, TX 76102 Year of Birth: 1966 | | Secretary and Treasurer | | Since 2006 | | Luther King Capital Management Corporation since 2005. |
Jacob D. Smith 301 Commerce Street Suite 1600 Fort Worth, TX 76102 Year of Birth: 1974 | | Chief Financial Officer | | Since 2010 | | General Counsel and Chief Compliance Officer, Luther King Capital Management Corporation since 2006; Principal, Luther King Capital Management Corporation since 2013. |
| | Chief Compliance Officer | | Since 2006 |
| (1) | Each officer holds office during the lifetime of the Trust until that individual resigns, retires or is otherwise removed or replaced. |
| (2) | Messrs. King and Purvis are each considered an “interested person” of the Trust (as defined in the 1940 Act) because of their affiliation with the Adviser. |
21
LKCM FUNDS
PRIVACY NOTICE
Our Commitment to Your Privacy
At LKCM Funds, we are committed to safeguarding the confidentiality and privacy of nonpublic personal information about our current and former shareholders. This privacy notice describes the types of nonpublic personal information we collect about you and the sources through which we obtain this information, the purposes for which we obtain and use your nonpublic information, and the policies and procedures we have implemented to protect the privacy of your nonpublic personal information.
How We Protect Your Nonpublic Personal Information
Protecting your nonpublic personal information is an important priority at LKCM Funds. Accordingly, we have implemented policies and procedures designed to safeguard your nonpublic personal information, such as your tax identification number, account and investment history, account numbers, account balances and nonpublic contact information, from unauthorized access or use. Pursuant to these policies and procedures, we maintain various physical, technological, and administrative safeguards to protect the security and confidentiality of your nonpublic personal information, and we adapt these safeguards to respond to evolving technological and other standards.
We do not disclose nonpublic personal information about you to non-affiliated firms, organizations or individuals except as authorized by you or your representatives or as required or permitted by law. We may disclose nonpublic personal information about you to nonaffiliated third parties, such as custodians, brokers, auditors, accountants, and systems and administrative service providers, in connection with the services we provide to you or on your behalf. When we provide nonpublic personal information about you to nonaffiliated third parties for these purposes, we expect them to safeguard your nonpublic personal information, use your nonpublic personal information only for the intended purposes and otherwise abide by applicable law.
How We Obtain Your Nonpublic Personal Information
We collect nonpublic personal information about you from various sources, including documents, new account applications and other information that you or your representatives, custodians, attorneys, accountants or similar parties provide to us, communications that we have with you or your representatives, custodians, attorneys, accountants or similar parties, and documents and other information related to your accounts or investment experience with us.
Please do not hesitate to contact Jacob D. Smith, our Chief Compliance Officer, if you have any questions regarding this privacy notice or the measures we have implemented to protect the privacy of your nonpublic personal information.
U.S. Bancorp Fund Services, LLC
P.O. Box 701
Milwaukee, WI 53201-0701
LKCM FUNDS
P.O. Box 701
Milwaukee, WI 53201-0701
| | | | |
Officers and Trustees |
J. Luther King, Jr., CFA, CIC Trustee, President and Chief Executive Officer | | Richard J. Howell Trustee | | Richard Lenart Secretary & Treasurer |
| | |
Paul W. Greenwell Vice President | | Larry J. Lockwood Chairman of the Board of Trustees | | Jacob D. Smith Chief Financial Officer Chief Compliance Officer |
| | |
Steven R. Purvis, CFA Trustee | | Mauricio Rodriguez Trustee | | |
|
Investment Adviser |
Luther King Capital Management Corporation 301 Commerce Street, Suite 1600 Fort Worth, TX 76102 |
Administrator, Transfer Agent, Dividend Paying Agent & Shareholder Servicing Agent |
U.S. Bancorp Fund Services, LLC P.O. Box 701 Milwaukee, WI 53201-0701 |
Custodian |
U.S. Bank, N.A. 1555 N. River Center Drive, Suite 302 Milwaukee, WI 53212 |
Independent Registered Public Accounting Firm |
Deloitte & Touche LLP 555 E. Wells St., Suite 1400 Milwaukee, WI 53202 |
Distributor |
Quasar Distributors, LLC 111 East Kilbourn Avenue, Suite 2200 Milwaukee, WI 53202 |
Item 2. Code of Ethics.
The Registrant has adopted a code of ethics that applies to the Registrant’s principal executive officer and principal financial officer. The Registrant has not made any substantive amendments to its code of ethics during the period covered by this report. The Registrant has not granted any waivers from any provisions of the code of ethics during the period covered by this report.
A copy of the Registrant’s Code of Ethics is filed herewith.
Item 3. Audit Committee Financial Expert.
The Registrant’s board of trustees has determined that there is at least one audit committee financial expert serving on its audit committee. Richard J. Howell is the “audit committee financial expert” and is considered to be “independent” as each term is defined in Item 3 of Form N-CSR.
Item 4. Principal Accountant Fees and Services.
The Registrant has engaged its principal accountant to perform audit services, audit-related services, tax services and other services during the past two fiscal years. “Audit services” refer to performing an audit of the Registrant’s annual financial statements or services that are normally provided by the accountant in connection with statutory and regulatory filings or engagements for those fiscal years. “Audit-related services” refer to the assurance and related services by the principal accountant that are reasonably related to the performance of the audit. “Tax services” refer to professional services rendered by the principal accountant for tax compliance, tax advice, and tax planning. The following table details the aggregate fees billed or expected to be billed for each of the last two fiscal years for audit fees, audit-related fees, tax fees and other fees by the principal accountant.
| | | | | | | | |
| | | FYE 12/31/2021 | | | FYE 12/31/2020 | |
Audit Fees | | $ | 156,500 | | | $ | 152,000 | |
Audit-Related Fees | | | — | | | | — | |
Tax Fees | | | 34,320 | | | | 33,320 | |
All Other Fees | | | — | | | | — | |
The audit committee has adopted pre-approval policies and procedures that require the audit committee to pre-approve all audit and non-audit services of the Registrant, including services provided to any entity affiliated with the Registrant.
1
The percentage of fees billed by Deloitte & Touche LLP applicable to non-audit services pursuant to waiver of pre-approval requirement were as follows:
| | | | | | | | |
| | | FYE 12/31/2021 | | | FYE 12/31/2020 | |
Audit-Related Fees | | | 0 | % | | | 0 | % |
Tax Fees | | | 0 | % | | | 0 | % |
All Other Fees | | | 0 | % | | | 0 | % |
All of the principal accountant’s hours spent on auditing the Registrant’s financial statements were attributed to work performed by full-time permanent employees of the principal accountant.
The following table indicates the non-audit fees billed or expected to be billed by the Registrant’s accountant for services to the Registrant and to the Registrant’s investment adviser (and any other controlling entity, etc.—not sub-adviser) for the last two years.
| | | | | | | | |
Non-Audit Related Fees | | FYE 12/31/2021 | | | FYE 12/31/2020 | |
Registrant | | $ | 34,320 | | | $ | 33,320 | |
Registrant’s Investment Adviser | | | — | | | | — | |
The audit committee of the board of trustees has considered whether the provision of non-audit services that were rendered to the Registrant’s investment adviser is compatible with maintaining the principal accountant’s independence and has concluded that the provision of such non-audit services by the accountant has not compromised the accountant’s independence.
The Registrant has not been identified by the U.S. Securities and Exchange Commission as having filed an annual report issued by a registered public accounting firm branch or office that is located in a foreign jurisdiction where the Public Company Accounting Oversight Board is unable to inspect or completely investigate because of a position taken by an authority in that jurisdiction.
The Registrant is not a foreign issuer.
Item 5. Audit Committee of Listed Registrants.
Not applicable to Registrants who are not listed issuers (as defined in Rule 10A-3 under the Securities Exchange Act of 1934).
Item 6. Investments.
| (a) | Schedule of Investments is included as part of the report to shareholders filed under Item 1 of this Form. |
Item 7. Disclosure of Proxy Voting Policies and Procedures for Closed-End Management Investment Companies.
Not applicable to open-end investment companies.
Item 8. Portfolio Managers of Closed-End Management Investment Companies.
Not applicable to open-end investment companies.
2
Item 9. Purchases of Equity Securities by Closed-End Management Investment Company and Affiliated Purchasers.
Not applicable to open-end investment companies.
Item 10. Submission of Matters to a Vote of Security Holders.
There have been no material changes to the procedures by which shareholders may recommend nominees to the Registrant’s board of trustees.
Item 11. Controls and Procedures.
| (a) | The Registrant’s Chief Executive Officer and Chief Financial Officer have reviewed the Registrant’s disclosure controls and procedures (as defined in Rule 30a-3(c) under the Investment Company Act of 1940 (the “Act”)) as of a date within 90 days of the filing of this report, as required by Rule 30a-3(b) under the Act and Rules 13a-15(b) or 15d-15(b) under the Securities Exchange Act of 1934. Based on their review, such officers have concluded that the disclosure controls and procedures are effective in ensuring that information required to be disclosed in this report is appropriately recorded, processed, summarized and reported and made known to them by others within the Registrant and by the Registrant’s service provider. |
| (b) | There were no changes in the Registrant’s internal control over financial reporting (as defined in Rule 30a-3(d) under the Act) that occurred during the period covered by this report that have materially affected, or are reasonably likely to materially affect, the Registrant’s internal control over financial reporting. |
Item 12. Disclosure of Securities Lending Activities for Closed-End Management Investment Companies
Not applicable to open-end investment companies.
Item 13. Exhibits.
(2) A separate certification for each principal executive officer and principal financial officer pursuant to Section 302 of the Sarbanes-Oxley Act of 2002. Filed herewith.
(3) Any written solicitation to purchase securities under Rule 23c-1 under the Act sent or given during the period covered by the report by or on behalf of the Registrant to 10 or more persons. Not applicable to open-end investment companies.
(4) Change in the Registrant’s independent public accountant. There was no change in the Registrant’s independent public accountant for the period covered by this report.
3
SIGNATURES
Pursuant to the requirements of the Securities Exchange Act of 1934 and the Investment Company Act of 1940, the Registrant has duly caused this report to be signed on its behalf by the undersigned, thereunto duly authorized.
| | | | | | |
| LKCM Funds | | | | |
| | | |
| By: | | /s/ J. Luther King, Jr. | | | | |
| | J. Luther King, Jr., | | | | |
| | President | | | | |
| | | |
| Date: | | 03/03/2022 | | | | |
Pursuant to the requirements of the Securities Exchange Act of 1934 and the Investment Company Act of 1940, this report has been signed below by the following persons on behalf of the Registrant and in the capacities and on the dates indicated.
| | | | | | |
| By: | | /s/ J. Luther King, Jr. | | | | |
| | J. Luther King, Jr., | | | | |
| | President | | | | |
| | | |
| Date: | | 03/03/2022 | | | | |
| | | |
| By: | | /s/ Jacob D. Smith | | | | |
| | Jacob D. Smith, | | | | |
| | Chief Financial Officer | | | | |
| | | |
| Date: | | 03/03/2022 | | | | |
4