As filed with the U.S. Securities and Exchange Commission on March 6, 2020
UNITED STATES
SECURITIES AND EXCHANGE COMMISSION
Washington, D.C. 20549
FORMN-CSR
CERTIFIED SHAREHOLDER REPORT OF REGISTERED
MANAGEMENT INVESTMENT COMPANIES
Investment Company Act file number811-8352
LKCM Funds
(Exact name of registrant as specified in charter)
c/o Luther King Capital Management Corporation
301 Commerce Street, Suite 1600
Fort Worth, TX 76102
(Address of principal executive offices) (Zip code)
K&L Gates LLP
1601 K Street, NW
Washington, DC 20006
(Name and address of agent for service)
1-800-688-LKCM and1-800-423-6369
Registrant’s telephone number, including area code
Date of fiscal year end: December 31
Date of reporting period: December 31, 2019
Item 1. Reports to Stockholders.
LKCM
FUNDS
LKCM Small Cap Equity Fund
LKCM Small-Mid Cap Equity Fund
LKCM Equity Fund
LKCM Balanced Fund
LKCM Fixed Income Fund
LKCM International Equity Fund
Annual Report
December 31, 2019
Beginning on January 1, 2021, as permitted by regulations adopted by the Securities and Exchange Commission, paper copies of the LKCM Funds’ shareholder reports will no longer be sent by mail, unless you specifically request paper copies of the reports from the LKCM Funds (if you hold your Fund shares directly with the LKCM Funds) or from your financial intermediary, such as a broker-dealer or bank (if you hold your Fund shares through a financial intermediary). Instead, the reports will be made available on a website, and you will be notified by mail each time a report is posted and provided with a website link to access the report.
If you already elected to receive shareholder reports electronically, you will not be affected by this change and you need not take any action. If you hold your Fund shares directly with the LKCM Funds, you may elect to receive shareholder reports and other communications electronically from the LKCM Funds by calling1-800-688-LKCM or, if you hold your Fund shares through a financial intermediary, by contacting your financial intermediary.
You may elect to receive all future reports on paper free of charge. If you hold your Fund shares directly with the LKCM Funds, you can inform the LKCM Funds that you wish to continue receiving paper copies of your shareholder reports by calling1-800-688-LKCM or, if you hold your Fund shares through a financial intermediary, contacting your financial intermediary. Your election to receive reports in paper will apply to all of the LKCM Funds you hold directly with LKCM Funds or all of the funds you hold through your financial intermediary, as applicable.
Dear Fellow Shareholders:
We report the following performance information for the LKCM Funds for indicated periods ended December 31, 2019:
| | | | | | | | | | | | | | | | | | | | | | | | | | | | | | | | | | | | | | | | |
Fund | | Inception
Date | | NAV @
12/31/19 | | Net
Expense
Ratio*, ** | | Gross
Expense
Ratio** | | One Year
Total
Return
Ended
12/31/19 | | Five Year
Average
Annualized
Return
Ended
12/31/19 | | Ten Year
Average
Annualized
Return
Ended
12/31/19 | | Avg.
Annual
Total
Return
Since
Incept. |
LKCM Equity Fund - | | | | 1/3/96 | | | | $ | 29.02 | | | | | 0.81% | | | | | 0.99% | | | | | 29.85% | | | | | 10.48% | | | | | 12.41% | | | | | 8.93% | |
S&P 500® Index(1) | | | | | | | | | | | | | | | | | | | | | | | | 31.49% | | | | | 11.70% | | | | | 13.56% | | | | | 9.17% | |
LKCM Small Cap Equity Fund - | | | | 7/14/94 | | | | $ | 16.78 | | | | | 1.00% | | | | | 1.08% | | | | | 22.70% | | | | | 6.92% | | | | | 10.80% | | | | | 10.24% | |
Russell 2000® Index(2) | | | | | | | | | | | | | | | | | | | | | | | | 25.52% | | | | | 8.23% | | | | | 11.83% | | | | | 9.28% | |
LKCMSmall-Mid Cap Equity Fund - | | | | 5/2/11 | | | | $ | 9.09 | | | | | 1.00% | | | | | 1.75% | | | | | 31.05% | | | | | 8.13% | | | | | N/A | | | | | 7.24% | |
Russell 2500® Index(3) | | | | | | | | | | | | | | | | | | | | | | | | 27.77% | | | | | 8.93% | | | | | N/A | | | | | 10.12% | |
LKCM International Equity Fund - | | | | 5/1/19 | | | | $ | 10.89 | | | | | 1.00% | | | | | 1.40% | | | | | N/A | | | | | N/A | | | | | N/A | | | | | 8.97% | # |
MSCI/EAFE® Index(4) | | | | | | | | | | | | | | | | | | | | | | | | N/A | | | | | N/A | | | | | N/A | | | | | 7.98% | # |
LKCM Balanced Fund | | | | 12/30/97 | | | | $ | 24.22 | | | | | 0.80% | | | | | 1.00% | | | | | 21.85% | | | | | 8.30% | | | | | 9.52% | | | | | 6.87% | |
S&P 500® Index(1) | | | | | | | | | | | | | | | | | | | | | | | | 31.49% | | | | | 11.70% | | | | | 13.56% | | | | | 7.63% | |
Bloomberg Barclays U.S. Intermediate | | | | | | | | | | | | | | | | | | | | | | | | | | | | | | | | | | | | | | | | |
Government/Credit Bond Index(5) | | | | | | | | | | | | | | | | | | | | | | | | 6.80% | | | | | 2.57% | | | | | 3.05% | | | | | 4.47% | |
LKCM Fixed Income Fund | | | | 12/30/97 | | | | $ | 10.92 | | | | | 0.50% | | | | | 0.78% | | | | | 6.70% | | | | | 2.50% | | | | | 2.97% | | | | | 4.25% | |
Bloomberg Barclays U.S. Intermediate | | | | | | | | | | | | | | | | | | | | | | | | | | | | | | | | | | | | | | | | |
Government/Credit Bond Index(5) | | | | | | | | | | | | | | | | | | | | | | | | 6.80% | | | | | 2.57% | | | | | 3.05% | | | | | 4.47% | |
Performance data quoted represents past performance and does not guarantee future results. The investment return and principal value of an investment will fluctuate so that an investor’s shares, when redeemed, may be worth more or less than the original cost. Current performance of the Funds may be lower or higher than the performance quoted. Performance data current to the most recent month end may be obtained by calling 1-800-688-LKCM. The Funds impose a 1.00% redemption fee on shares held less than 30 days. If reflected, the fee would reduce performance shown.
| * | Luther King Capital Management Corporation, the Funds’ investment adviser, has contractually agreed to waive all or a portion of its management fee and/or reimburse expenses of each Fund to maintain the expense ratios designated in the Funds’ prospectus through May 1, 2020. This expense limitation excludes interest, taxes, brokerage commissions, indirect fees and expenses related to investments in other investment companies, including money market funds, and extraordinary expenses. Investment performance, which is based on the net expense ratio, reflects fee waivers, if any, in effect during the relevant period. In the absence of such waivers, total return would be reduced. Investment performance is based upon the net expense ratio. LKCM waived management fees and/or reimbursed expenses for each Fund during the fiscal year ended December 31, 2019. |
| ** | Expense ratios above are as reported in the Funds’ current prospectus dated May 1, 2019. Expense ratios reported for other periods in the financial highlights of this report may differ. |
| # | Cumulative return for the period from May 1, 2019, the LKCM International Equity Fund’s inception date, through December 31, 2019. Short term performance, in particular, is not a good indication of the Fund’s future performance, and an investment should not be made based solely on returns. |
| (1) | The S&P 500® Index is an unmanaged capitalization-weighted index of 500 selected stocks that is generally considered representative of the performance of large capitalization companies in the U.S. stock market. |
| (2) | The Russell 2000® Index is an unmanaged index which measures the performance of the 2,000 smallest companies in the Russell 3000® Index. |
| (3) | The Russell 2500® Index is an unmanaged index which measures the performance of the 2,500 smallest companies in the Russell 3000® Index. |
| (4) | The Morgan Stanley Capital International Europe, Australia, Far East Index (“MSCI/EAFE Index”) is an unmanaged index composed of large-cap and mid-cap securities across 21 European and Pacific Basin countries. The MSCI/EAFE Index is a recognized international index and is weighted by market capitalization. |
| (5) | The Bloomberg Barclays U.S. Intermediate Government/Credit Bond Index is an unmanaged market value weighted index measuring both the principal price changes of, and income provided by, the underlying universe of securities that comprise the index. Securities included in the index must meet the following criteria: fixed as opposed to variable rate; remaining maturity of one to ten years; minimum outstanding par value of $250 million; rated investment grade or higher by Moody’s Investors Service or equivalent; must be dollar denominated and non-convertible; and must be publicly issued. |
Note: The indices defined above are not available for direct investment and the index performance therefore does not include fees, expenses or taxes.
2019 Review
The longest U.S. economic expansion on record, now in its eleventh year, also remains sluggish compared to otherpost-war expansions. We believe this lack of robust growth has contributed to the longevity of the current U.S. economic expansion. We believe that in order for the economy to grow above trend, aside from the immediate aftermath of a recession, consumers, businesses, and government must employ credit to pull forward consumption. Such action often results in a cycle of rising debt burdens which typically crest just as the business cycle turns down, often driven by the Federal Reserve acting to dampen inflation by raising interest rates. In our view, the consumer, in particular, has been quite disciplined regarding leverage and savings during this expansion, which has contributed to both its moderate pace and sustainability.
However, moderate economic growth of around 2.0% per year after inflation can lead to the perception that growth is relatively fragile. Investors spent a good portion of 2019 on recession watch as traditional warning signs, such as an inverted yield curve, slowing job gains, and contracting manufacturing activity, suggested an elevated risk of a recession. Weakness in many other global economies also reinforced these perceived recessionary concerns. Fortunately, weaker economic growth amid rising trade tensions spurred policymakers
2
around the world into action as central banks lowered interest rates, reinstated quantitative easing, quickened the pace of money supply growth, and expanded fiscal spending.
The Federal Reserve then surprised markets in the first quarter of 2019 with a large and unexpected reversal in monetary policy. At the Federal Reserve’s first interest rate policy meeting of the year and only six weeks into 2019, the Federal Reserve signaled that it would refrain from further interest rate increases for the foreseeable future and suspend its balance sheet reduction at some point during the year. In our view, several factors appeared to contribute to the abrupt change in the course for monetary policy, including the decline in global equity markets following the December 2018 interest rate hike, declining inflation expectations, and the impact of trade tensions on global growth. We believe the sharp dovish tilt in monetary policy, combined with significant equity valuation compression during December 2018, set the stage for valuation expansion as monetary conditions eased and trade tensions moderated as 2019 progressed. We believe this confluence of events and other factors contributed to the strong performance of the markets during 2019, as measured by the 31.49% and 6.80% advances for the S&P 500® Index and the Bloomberg Barclays Intermediate Government/Credit Bond Index, respectively, for the year ended December 31, 2019.
Finally, the U.S. economy achieved a unique milestone as we closed the decade. We believe the history of recessions in the U.S. illustrates that they are a natural, though painful, part of the business cycle. The National Bureau of Economic Research marks the beginning of the first business cycle of record during the fourth quarter of 1854. In every decade since the 1850s, the U.S. economy has experienced a recession, which is generally defined as two consecutive quarters of contracting U.S. Gross Domestic Product (GDP). However, 2019 brought to a close the only decade over the past 165 years in which the U.S. economy did not experience a recession.
2020 Outlook
We believe the domestic economic outlook has become incrementally positive, as the slump in manufacturing appears to be bottoming, labor markets remain robust, monetary policy remains accommodative, and some political uncertainties appear to have diminished. Personal consumption represents roughly 70% of the U.S. economy, and the consumer remains healthy in our view. The U.S. economy created a surprisingly strong 266,000 new jobs in November 2019, aided in part by the return to work of 49,000 striking General Motors employees. Labor market strength also appears evident in the most recent November 2019 unemployment rate of 3.5%, the lowest since December 1969. We believe that tight labor markets are supportive of higher wages, which grew by 3.1% in November 2019 compared with a year earlier. The lowest paid U.S. workers appeared to be the recipients of the biggest raises as earnings for nonsupervisory workers grew by 3.7% from a year earlier, and this trend could continue in our view.Twenty-two states have ushered in higher minimum wage levels around the beginning of 2020. Only seven of these increases appear to relate to inflation adjustments, the balance of which are the result of state legislative actions or ballot initiatives passed by voters. We believe this will impact an estimated 6.8 million workers with increases ranging from a $0.10 per hour inflation-related adjustment in Florida to a $1.50 per hour increase in New Mexico and Washington. We believe that these strong labor conditions have helped lift consumer confidence back to recent highs.
The U.S. dollar finished 2019 little changed from the beginning of the year; however, we believe that it could face three potential headwinds over the coming year. First, rising global bond yields have generally narrowed the excess yield spread offered by owning U.S. bonds, potentially resulting in a decrease in demand for U.S. dollars by foreign investors. Second, we believe the U.S. dollar has historically been a counter-cyclical currency, meaning that it weakens as the economic growth between the U.S. and the rest of the world narrows. In our view, the heart of the European economy, Germany’s large manufacturing base, has been particularly hard hit over the past year as auto manufacturing firms, still reeling from emissions scandals, have been heavily impacted by declining auto exports to China and significant retooling costs to develop more electric vehicles. However, we believe that European economic growth, aided by recent easing of monetary policy by the European Central Bank, should stabilize and show signs of recovery in the coming years. Finally, the U.S. dollar generally is sensitive to changes in inflation expectations, which fell frommid-2018 through the early part of the fourth quarter of 2019. We believe that if inflation expectations were to lift slightly from depressed levels in light of easing monetary policy, the U.S. dollar could weaken, and any weakening in the U.S. dollar would likely help boost corporate earnings of domestic companies with foreign sales.
For 2020, the U.S. presidential election features prominently in the year ahead. As the election approaches, investors will parse unexpected developments, which likely will be rapidly reflected in market prices. One simple result could be higher volatility as November 2020 approaches, particularly if risk to the status quo is perceived to rise. Historically, the electorate has viewed the U.S. presidential election through the prism of the economy. Since Woodrow Wilson’s second term in 1916, in all twelve cases when the incumbent presidents avoided a recession two years before seeking another term, they went on to win reelection. Conversely, in the six instances when a recession occurred in the two yearrun-up to are-election year, the incumbent lost with one exception, Calvin Coolidge, who won the election in 1924 as the incumbent after the passing of President Harding.
In summary, our projected outlook for 2020 is for the economy to continue to expand around 2% in real terms, aided by easing monetary policy as well as healthy consumption which we expect to be supported by continued strength in the labor market and real wage growth. The trade tension fever may have finally broken, which we believe should be positive for business confidence, a component of capital spending plans by businesses. As always, a market correction, generally defined as a decline of approximately 10% in the value of the equity markets, could occur at any time in our view. However, we believe a bear market, generally defined as a decline of greater than 20% in the value of the equity markets, appears less likely without an accompanying recession. We believe there is a low probability of
3
this risk, absent a severe exogenous shock to the U.S. economy. The November 2020 elections will rightly capture the attention of investors, and there is considerable time for developments to occur in the interim.
LKCM Equity Fund
The LKCM Equity Fund returned 29.85% for the year ended December 31, 2019, as compared to the 31.49% return for the S&P 500® Index, the Fund’s benchmark. The Fund’s relative performance benefited from stock selection decisions, particularly in the Industrials, Consumer Discretionary and Healthcare sectors, which was partially offset by stock selection decisions in the Information Technology and Energy sectors. The Fund’s underweight position in the Information Technology sector detracted from the Fund’s relative performance, which was partially offset by the Fund not investing in the Utilities sector. We believe the Fund is well positioned with a portfolio of companies that we believe are high quality, have solid balance sheets, are reasonably valued, and otherwise meet our stringent investment criteria.
LKCM Small Cap Equity Fund
The LKCM Small Cap Equity Fund returned 22.70% for the year ending December 31, 2019, as compared to the 25.52% return for the Russell 2000® Index, the Fund’s benchmark. The Fund’s relative performance benefited from sector allocation decisions, particularly being overweight the Information Technology and Industrials sectors. Stock selection decisions in the Information Technology and Healthcare sectors detracted from the Fund’s relative performance, which were partially offset by stock selection decisions in the Financials and Consumer Staples sectors. The Fund also benefited during the year from six portfolio companies being acquired and seven portfolio companies graduating out of our small cap investment strategy due to market appreciation. We were pleased with the Fund’s performance in light of the tilt in the Fund’s investment strategy towards high quality growth-oriented companies. We continue to remain confident in our strategy of investing in companies that we believe are high quality and competitively advantaged and otherwise meet our stringent investment criteria.
LKCMSmall-Mid Cap Equity Fund
The LKCMSmall-Mid Cap Equity Fund outperformed the Russell 2500® Index, the Fund’s benchmark, for the year ended December 31, 2019, returning 31.05% as compared to the 27.77% return for the benchmark. The Fund’s relative performance benefited from sector allocation decisions, particularly being overweight the Information Technology sector and underweight the Utilities sector. The Fund’s relative performance also benefited from stock selection decisions in the Industrials, Communication Services, and Materials sectors, which was partially offset by stock selection decisions in the Healthcare and Consumer Discretionary sectors. The Fund also benefited during the year from three portfolio companies being acquired and three portfolio companies graduating out of oursmall-mid cap investment strategy due to market appreciation. We were pleased with the Fund’s performance in light of the tilt in the Fund’s investment strategy towards high quality growth-oriented companies. We continue to remain confident in our strategy of investing in companies that we believe are high quality and competitively advantaged and otherwise meet our stringent investment criteria.
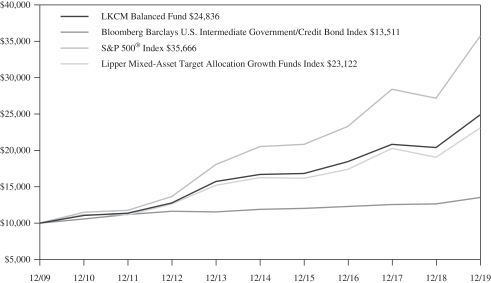
LKCM Balanced Fund
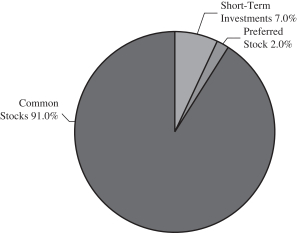
The LKCM Balanced Fund returned 21.85% for the year ended December 31, 2019 versus the 31.49% return for the S&P 500® Index and the 6.80% return for the Bloomberg Barclays U.S. Intermediate Government/Credit Bond Index. The Fund benefited from strong stock selection in the Healthcare, Industrials and Materials sectors relative to the S&P 500® Index, which was partially offset by stock selection in the Information Technology sector. The Fund’s overweight position in the Energy sector detracted from the Fund’s relative performance, which was partially offset by the Fund not investing in the Utilities sector in the equity portfolio. The Fund’s fixed income portfolio remained focused on high quality intermediate corporate bonds, which seeks to serve the dual purpose of generating income and moderating overall risk in the Fund’s portfolio. At December 31, 2019, the Fund’s holdings consisted of approximately 69.4% equity securities, 28.3% fixed income securities, and 2.3% cash and cash equivalents, which we believe has the Fund well-positioned for the upcoming year.
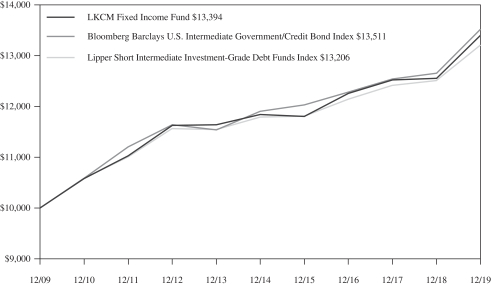
LKCM Fixed Income Fund
The LKCM Fixed Income Fund returned 6.70% for the year ended December 31, 2019 compared to its benchmark, the Bloomberg Barclays U.S. Intermediate Government/Credit Bond Index, which returned 6.80% for the year ended December 31, 2019. During the year, yields declined substantially across the curve and the yield curve steepened as the Federal Reserve cut the Federal Funds rate during the second half of the year in response to slowing economic conditions. The lagged effect of cumulative monetary policy tightening that ultimately inverted the yield curve during the summer and continuing uncertainties created by escalating trade policy tensions exacerbated slowing growth around the globe and contributed to the Federal Reserve’s decision to reverse course in its monetary policy. In this environment, where longer-duration securities outperformed their shorter-duration counterparts, the Fund’s duration of approximately 3.3 years detracted from performance relative to the duration of 3.9 years for the benchmark. However, in a year characterized by sharply tighter credit spreads, corporate bonds outperformed their higher quality counterparts in the U.S. government and agency issues sector as theflight-to-quality trade reversed and lower-rated fixed income securities outperformed. As a result, the Fund’s overweight position in corporate bonds relative to the benchmark, specifically corporate bonds in theBBB-rated sector, was beneficial to the Fund’s relative performance as credit spreads tightened substantially during the year. The Fund remains largely focused onshort-to-intermediate investment grade corporate bonds with strong underlying credit fundamentals in an effort to mitigate interest rate risk and credit risk in this modest growth environment.
4
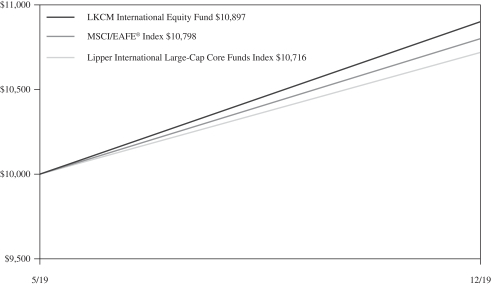
LKCM International Equity Fund
The LKCM International Equity Fund returned 8.97% for the period from May 1, 2019, the inception date of the Fund, through December 31, 2019, as compared to the 7.98% for the MSCI EAFE Index, the Fund’s benchmark. During this period, the Fund’s relative performance benefited from an underweight position in the Financials sector and overweight positions in the Industrials, Consumer Discretionary, Information Technology and Healthcare sectors, which was partially offset by an overweight position in the Consumer Staples sector and an underweight position in the Utilities sector. The Fund’s relative performance also benefited from stock selection decisions in the Industrials, Energy, Materials and Information Technology sectors, which was partially offset by stock selection decisions in the Financials, Healthcare and Consumer Discretionary sectors. We believe the Fund is well positioned to generate attractive returns for Fund shareholders through competitively advantaged companies that we believe can generate returns in excess of their cost of capital and have good opportunities for earnings growth. In addition, we believe that the Fund’s overweight positions in the Industrials and Information Technology sectors should have the Fund well positioned for an anticipated resumption of expansionary policy in response to the decline in global economic activity throughout 2019, while we believe the Fund’s underweight position in the Financials sector will likely remain in place as lower interest rates continue to pressure bank margins.
J. Luther King, Jr., CFA, CIC
January 28, 2020
The information provided herein represents the opinion of J. Luther King, Jr., CFA, CIC and is not intended to be a forecast of future events, a guarantee of future results, nor investment advice.
Please refer to the Schedule of Investments found on pages 16-31 of the report for more information on Fund holdings. Fund holdings and sector allocations are subject to change and are not recommendations to buy or sell any securities.
Mutual fund investing involves risk. Principal loss is possible. Past performance is not a guarantee of future results. Investments in equity securities are subject to market risks and significant fluctuations in value. Small and medium capitalization funds typically carry additional risks, since smaller companies generally have a higher risk of failure, and, historically, their stocks have experienced a greater degree of market volatility than stocks on average. Investments in debt securities typically decrease in value when interest rates rise. This risk is greater for longer-term debt securities. Investments in mortgage backed securities include additional risks that investors should be aware of such as credit risk, prepayment risk, possible illiquidity and default, as well as increased susceptibility to adverse economic developments. These risks are discussed in the Funds’ summary and statutory prospectuses.
Earnings growth is not a measure of future performance.
Duration is a commonly used measure of the potential volatility of the price of a debt security, or the aggregate market value of a portfolio of debt securities, prior to maturity. Securities with a longer duration generally have more volatile prices than securities of comparable quality with a shorter duration.
Spread is the percentage point difference between yields of various classes of bonds compared to treasury bonds.
Yield curve is a line that plots yields (interest rates) of bonds having equal credit quality but differing maturity dates. The slope of the yield curve gives an idea of future interest rate changes and economic activity.
Bond ratings are grades given to bonds that indicate their credit quality as determined by a private independent rating service such as S&P Global. The firm evaluates a bond issuer’s financial strength, or its ability to pay a bond’s principal and interest in a timely fashion. Ratings are expressed as letters ranging from ‘AAA’, which is the highest grade, to ‘D’, which is the lowest grade. In limited situations when the rating agency has not issued a formal rating, the rating agency will classify the security as nonrated.
Investors should consider the investment objective, risks and charges and expenses of a Fund carefully before investing. Each Fund’s summary prospectus and the prospectus contain this and other information about the Fund. Investors can obtain a summary prospectus or the prospectus by calling 1-800-688-LKCM. The summary prospectus and the prospectus should be read carefully before investing in a Fund.
Quasar Distributors, LLC, distributor.
5
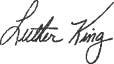
PERFORMANCE:
The following information illustrates the historical performance of the LKCM Small Cap Equity Fund as of December 31, 2019 compared to the Fund’s representative benchmark and peer group indices.
Performance data quoted represents past performance; past performance does not guarantee future results. The graph and table reflect the reinvestment of dividends and other distributions, if any, but do not reflect the deduction of taxes that a shareholder would pay on Fund distributions or the redemption of Fund shares. The investment return and principal value of an investment will fluctuate so that an investor’s shares, when redeemed, may be worth more or less than their original cost. Current performance of the Fund may be lower or higher than the performance quoted. Performance data current to the most recent month end may be obtained by calling 1-800-688-LKCM. Returns would have been lower if LKCM had not waived a portion of its management fee and/or reimbursed certain expenses of the Fund. Please see Note B to the Notes to the Financial Statements for specific information regarding management fee waiver and/or expense reimbursement arrangements for the Fund.
An index is an unmanaged portfolio and does not trade or incur any expenses. The Lipper Small-Cap Core Funds Index, however, does reflect the fees and expenses borne by the funds included in that index. One can not invest in an unmanaged index.
AVERAGE ANNUAL TOTAL RETURN (Periods Ended December 31, 2019)
| | | | | | | | | | | | | | | | | | | | |
| | | | | |
| | | Past
1 Year | | Past
5 Years(1) | | Past
10 Years(1) | | Since
Inception(1)(2) |
LKCM Small Cap Equity Fund | | | | 22.70% | | | | | 6.92% | | | | | 10.80% | | | | | 10.24% | |
Russell 2000® Index | | | | 25.52% | | | | | 8.23% | | | | | 11.83% | | | | | 9.28% | |
Lipper Small-Cap Core Funds Index | | | | 24.80% | | | | | 8.19% | | | | | 11.40% | | | | | 9.93% | |
A HYPOTHETICAL $10,000 INVESTMENT IN LKCM SMALL CAP EQUITY FUND
(for the ten years ended December 31, 2019)
The Russell 2000® Index is an unmanaged index consisting of the 2,000 smallest companies in the Russell 3000® Index.
The Lipper Small-Cap Core Funds Index is an unmanaged index generally considered representative of small cap core mutual funds tracked by Lipper, Inc.
6
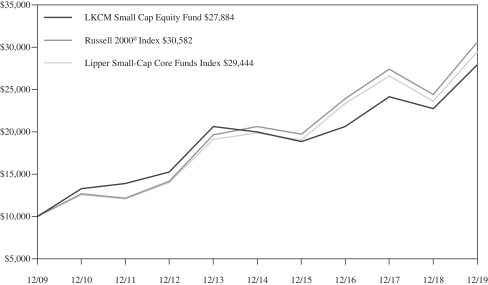
PERFORMANCE:
The following information illustrates the historical performance of the LKCM Small-Mid Cap Equity Fund as of December 31, 2019 compared to the Fund’s benchmark and peer group indices.
Performance data quoted represents past performance; past performance does not guarantee future results. The graph and table reflect the reinvestment of dividends and other distributions, if any, but do not reflect the deduction of taxes that a shareholder would pay on Fund distributions or the redemption of Fund shares. The investment return and principal value of an investment will fluctuate so that an investor’s shares, when redeemed, may be worth more or less than their original cost. Current performance of the Fund may be lower or higher than the performance quoted. Performance data current to the most recent month end may be obtained by calling 1-800-688-LKCM. Returns would have been lower if LKCM had not waived a portion of its management fee and/or reimbursed certain expenses of the Fund. Please see Note B to the Notes to the Financial Statements for specific information regarding management fee waiver and/or expense reimbursement arrangements for the Fund.
An index is an unmanaged portfolio and does not trade or incur any expenses. The Lipper Small-Cap Core Funds Index, however, does reflect the fees and expenses borne by the funds included in that index. One can not invest in an unmanaged index.
AVERAGE ANNUAL TOTAL RETURN (Periods Ended December 31, 2019)
| | | | | | | | | | | | | | | |
| | | | |
| | | Past
1 Year | | Past
5 Years(1) | | Since
Inception(1)(2) |
LKCM Small-Mid Cap Equity Fund | | | | 31.05% | | | | | 8.13% | | | | | 7.24% | |
Russell 2500® Index | | | | 27.77% | | | | | 8.93% | | | | | 10.12% | |
Lipper Small-Cap Core Funds Index | | | | 24.80% | | | | | 8.19% | | | | | 9.07% | |
A HYPOTHETICAL $10,000 INVESTMENT IN LKCM SMALL-MID CAP EQUITY FUND
(for the period from May 2, 2011 (inception date) to December 31, 2019)
The Russell 2500® Index is an unmanaged index consisting of the 2,500 smallest companies in the Russell 3000® Index.
The Lipper Small-Cap Core Funds Index is an unmanaged index generally considered representative of small cap core mutual funds tracked by Lipper, Inc.
7
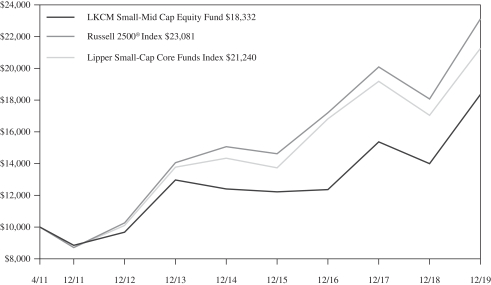
PERFORMANCE:
The following information illustrates the historical performance of the LKCM Equity Fund as of December 31, 2019 compared to the Fund’s benchmark and peer group indices.
Performance data quoted represents past performance; past performance does not guarantee future results. The graph and table reflect the reinvestment of dividends and other distributions, if any, but do not reflect the deduction of taxes that a shareholder would pay on Fund distributions or the redemption of Fund shares. The investment return and principal value of an investment will fluctuate so that an investor’s shares, when redeemed, may be worth more or less than their original cost. Current performance of the Fund may be lower or higher than the performance quoted. Performance data current to the most recent month end may be obtained by calling 1-800-688-LKCM. Returns would have been lower if LKCM had not waived a portion of its management fee and/or reimbursed certain expenses of the Fund. Please see Note B to the Notes to the Financial Statements for specific information regarding management fee waiver and/or expense reimbursement arrangements for the Fund.
An index is an unmanaged portfolio and does not trade or incur any expenses. The Lipper Large-Cap Core Funds Index, however, does reflect the fees and expenses borne by the funds included in that index. One can not invest in an unmanaged index.
AVERAGE ANNUAL TOTAL RETURN (Periods Ended December 31, 2019)
| | | | | | | | | | | | | | | | | | | | |
| | | | | |
| | | Past
1 Year | | Past
5 Years(1) | | Past
10 Years(1) | | Since
Inception(1)(2) |
LKCM Equity Fund | | | | 29.85% | | | | | 10.48% | | | | | 12.41% | | | | | 8.93% | |
S&P 500® Index | | | | 31.49% | | | | | 11.70% | | | | | 13.56% | | | | | 9.17% | |
Lipper Large-Cap Core Funds Index | | | | 29.00% | | | | | 10.54% | | | | | 12.17% | | | | | 8.12% | |
A HYPOTHETICAL $10,000 INVESTMENT IN LKCM EQUITY FUND
(for the ten years ended December 31, 2019)
The S&P 500® Index is an unmanaged capitalization-weighted index of 500 selected stocks that is generally considered representative of the performance of large capitalization companies in the U.S. stock market.
The Lipper Large-Cap Core Funds Index is an unmanaged index generally considered representative of large cap core mutual funds tracked by Lipper, Inc.
8
PERFORMANCE:
The following information illustrates the historical performance of the LKCM Balanced Fund as of December 31, 2019 compared to the Fund’s benchmark and peer group indices.
Performance data quoted represents past performance; past performance does not guarantee future results. The graph and table reflect the reinvestment of dividends and other distributions, if any, but do not reflect the deduction of taxes that a shareholder would pay on Fund distributions or the redemption of Fund shares. The investment return and principal value of an investment will fluctuate so that an investor’s shares, when redeemed, may be worth more or less than their original cost. Current performance of the Fund may be lower or higher than the performance quoted. Performance data current to the most recent month end may be obtained by calling 1-800-688-LKCM. Returns would have been lower if LKCM had not waived a portion of its management fee and/or reimbursed certain expenses of the Fund. Please see Note B to the Notes to the Financial Statements for specific information regarding management fee waiver and/or expense reimbursement arrangements for the Fund.
An index is an unmanaged portfolio and does not trade or incur any expenses. The Lipper Mixed-Asset Target Allocation Growth Funds Index, however, does reflect the fees and expenses borne by the funds included in that index. One can not invest in an unmanaged index.
AVERAGE ANNUAL TOTAL RETURN (Periods Ended December 31, 2019)
| | | | | | | | | | | | | | | | | | | | |
| | | | | |
| | | Past
1 Year | | Past
5 Years(1) | | Past
10 Years(1) | | Since
Inception(1)(2) |
LKCM Balanced Fund | | | | 21.85% | | | | | 8.30% | | | | | 9.52% | | | | | 6.87% | |
S&P 500® Index | | | | 31.49% | | | | | 11.70% | | | | | 13.56% | | | | | 7.63% | |
Bloomberg Barclays U.S. Intermediate Government/Credit Bond Index | | | | 6.80% | | | | | 2.57% | | | | | 3.05% | | | | | 4.47% | |
Lipper Mixed-Asset Target Allocation Growth Funds Index | | | | 21.10% | | | | | 7.25% | | | | | 8.80% | | | | | 6.46% | |
A HYPOTHETICAL $10,000 INVESTMENT IN LKCM BALANCED FUND
(for the ten years ended December 31, 2019)
The S&P 500® Index is an unmanaged capitalization-weighted index of 500 selected stocks that is generally considered representative of the performance of large capitalization companies in the U.S. stock market.
The Bloomberg Barclays U.S. Intermediate Government/Credit Bond Index is an unmanaged market value weighted index measuring both the principal price changes of, and income provided by, the underlying universe of securities that comprise the index. Securities included in the index must meet the following criteria; fixed as opposed to variable rate; remaining maturity of one to ten years;
9
minimum outstanding par value of $250 million; rated investment grade or higher by Moody’s Investors Service or equivalent; must be dollar denominated and non-convertible; and must be publicly issued.
The Lipper Mixed-Asset Target Allocation Growth Funds Index is an unmanaged index generally considered representative of mutual funds tracked by Lipper, Inc. that, by portfolio practice, maintain a mix of between 60%-80% equity securities, with the remainder invested in bonds, cash and cash equivalents.
10
PERFORMANCE:
The following information illustrates the historical performance of the LKCM Fixed Income Fund as of December 31, 2019 compared to the Fund’s benchmark and peer group indices.
Performance data quoted represents past performance; past performance does not guarantee future results. The graph and table reflect the reinvestment of dividends and other distributions, if any, but do not reflect the deduction of taxes that a shareholder would pay on Fund distributions or the redemption of Fund shares. The investment return and principal value of an investment will fluctuate so that an investor’s shares, when redeemed, may be worth more or less than their original cost. Current performance of the Fund may be lower or higher than the performance quoted. Performance data current to the most recent month end may be obtained by calling 1-800-688-LKCM. Returns would have been lower if LKCM had not waived a portion of its management fee and/or reimbursed certain expenses of the Fund. Please see Note B to the Notes to the Financial Statements for specific information regarding management fee waiver and/or expense reimbursement arrangements for the Fund.
An index is an unmanaged portfolio and does not trade or incur any expenses. The Lipper Short Intermediate Investment-Grade Debt Funds Index, however, does reflect the fees and expenses borne by the funds included in that index. One can not invest in an unmanaged index.
AVERAGE ANNUAL TOTAL RETURN (Periods Ended December 31, 2019)
| | | | | | | | | | | | | | | | | | | | |
| | | | | |
| | | Past
1 Year | | Past
5 Years(1) | | Past
10 Years(1) | | Since
Inception(1)(2) |
LKCM Fixed Income Fund | | | | 6.70% | | | | | 2.50% | | | | | 2.97% | | | | | 4.25% | |
Bloomberg Barclays U.S. Intermediate Government/Credit Bond Index | | | | 6.80% | | | | | 2.57% | | | | | 3.05% | | | | | 4.47% | |
Lipper Short Intermediate Investment-Grade Debt Funds Index | | | | 5.60% | | | | | 2.29% | | | | | 2.82% | | | | | 3.91% | |
A HYPOTHETICAL $10,000 INVESTMENT IN LKCM FIXED INCOME FUND
(for the ten years ended December 31, 2019)
The Bloomberg Barclays U.S. Intermediate Government/Credit Bond Index is an unmanaged market value weighted index measuring both the principal price changes of, and income provided by, the underlying universe of securities that comprise the index. Securities included in the index must meet the following criteria: fixed as opposed to variable rate; remaining maturity of one to ten years; minimum outstanding par value of $250 million; rated investment grade or higher by Moody’s Investors Service or equivalent; must be dollar denominated and non-convertible; and must be publicly issued.
The Lipper Short Intermediate Investment-Grade Debt Funds Index is an unmanaged index generally considered representative of short intermediate investment grade mutual funds tracked by Lipper, Inc.
11
PERFORMANCE:
The following information illustrates the historical performance of the LKCM International Equity Fund as of December 31, 2019 compared to the Fund’s benchmark and peer group indices.
Performance data quoted represents past performance; past performance does not guarantee future results. The graph and table reflect the reinvestment of dividends and other distributions, if any, but do not reflect the deduction of taxes that a shareholder would pay on Fund distributions or the redemption of Fund shares. The investment return and principal value of an investment will fluctuate so that an investor’s shares, when redeemed, may be worth more or less than their original cost. Current performance of the Fund may be lower or higher than the performance quoted. Performance data current to the most recent month end may be obtained by calling 1-800-688-LKCM. Returns would have been lower if LKCM had not waived a portion of its management fee and/or reimbursed certain expenses of the Fund. Please see Note B to the Notes to the Financial Statements for specific information regarding management fee waiver and/or expense reimbursement arrangements for the Fund.
An index is an unmanaged portfolio and does not trade or incur any expenses. The Lipper International Large-Cap Core Funds Index, however, does reflect the fees and expenses borne by the funds included in that index. One can not invest in an unmanaged index.
CUMULATIVE TOTAL RETURN (Period Ended December 31, 2019)
| | | | | |
| | |
| | | Since
Inception(1) |
LKCM International Equity Fund | | | | 8.97% | |
MSCI/EAFE® Index | | | | 7.98% | |
Lipper InternationalLarge-Cap Core Funds Index | | | | 7.16% | |
A HYPOTHETICAL $10,000 INVESTMENT IN LKCM INTERNATIONAL EQUITY FUND
(for the period from May 1, 2019 (inception date) to December 31, 2019)
The Morgan Stanley Capital International Europe, Australia, Far East Index (“MSCI/EAFE Index”) is an unmanaged index composed of large-cap and mid-cap securities across 21 European and Pacific Basin countries. The MSCI/EAFE Index is a recognized international index and is weighted by market capitalization.
The Lipper International Large-Cap Core Funds Index is an unmanaged index generally considered representative of largecap core mutual funds tracked by Lipper Inc.
12
LKCM Funds Expense Example — December 31, 2019
As a shareholder of the Funds, you incur two types of costs: (1) transaction costs, including redemption fees; and (2) ongoing costs, including management fees, distribution and/or service (12b-1) fees and other Fund expenses. This Example is intended to help you understand your ongoing costs (in dollars) of investing in the Funds and to compare these costs with the ongoing costs of investing in other mutual funds. The Example is based on an investment of $1,000 invested at the beginning of the period and held for the entire period (7/1/19-12/31/19).
ACTUAL EXPENSES
The first line of the tables below provides information about actual account values and actual expenses. You may use the information in this line, together with the amount you invested, to estimate the expenses that you paid over the period. Simply divide your account value by $1,000 (for example, an $8,600 account value divided by $1,000 = 8.6), then multiply the result by the number in the first line under the heading entitled “Expenses Paid During Period” to estimate the expenses you paid on your account during this period. Although the Funds charge no sales load, you will be assessed fees for outgoing wire transfers, returned checks and stop payment orders at prevailing rates charged by U.S. Bancorp Fund Services, LLC (doing business as U.S. Bank Global Fund Services), the Funds’ transfer agent. If you request that a redemption be made by wire transfer, currently a $15.00 fee is charged by the Funds’ transfer agent. You will be charged a redemption fee equal to 1.00% of the net amount of the redemption if you redeem your shares of the LKCM Small Cap Equity, Small-Mid Cap Equity, Equity, Balanced, Fixed Income, and International Equity Funds within 30 days of purchase, unless otherwise determined by the Funds in their discretion. To the extent the Funds invest in shares of other investment companies as part of their investment strategies, you will indirectly bear your proportionate share of any fees and expenses charged by the underlying funds in which the Funds invest in addition to the expenses of the Funds. Actual expenses of the underlying funds are expected to vary among the various underlying funds. These expenses are not included in the example below. The example below includes management fees, registration fees and other expenses. However, the example below does not include portfolio trading commissions and related expenses and other extraordinary expenses as determined under generally accepted accounting principles.
HYPOTHETICAL EXAMPLES FOR COMPARISON PURPOSES
The second line of the tables below provides information about hypothetical account values and hypothetical expenses based on the Funds’ actual expense ratios and an assumed rate of return of 5% per year before expenses, which are not the Funds’ actual returns. The hypothetical account values and expenses may not be used to estimate the actual ending account balance or expenses you paid for the period. You may use this information to compare the ongoing costs of investing in the Funds and other funds. To do so, compare this 5% hypothetical example with the 5% hypothetical examples that appear in the shareholder reports of the other funds. Please note that the expenses shown in the table are meant to highlight your ongoing costs only and do not reflect any transactional costs, such as redemption fees. Therefore, the second line of the table is useful in comparing ongoing costs only, and will not help you determine the relative total costs of owning different funds. In addition, if these transactions costs were included, your costs would have been higher.
| | | | | | | | | | | | | | | |
| | | LKCM Small Cap Equity Fund |
| | | Beginning
Account Value
7/1/19 | | Ending
Account Value
12/31/19 | | Expenses Paid
During Period*
7/1/19–12/31/19 |
Actual | | | $ | 1,000.00 | | | | $ | 1,027.70 | | | | $ | 5.11 | |
Hypothetical (5% return before expense) | | | $ | 1,000.00 | | | | $ | 1,020.16 | | | | $ | 5.09 | |
| * | Expenses are equal to the Fund’s annualized net expense ratio of 1.00%, multiplied by the average account value over the period, multiplied by 184/365 to reflect theone-half year period. |
| | | | | | | | | | | | | | | |
| | | LKCMSmall-Mid Cap Equity Fund |
| | | Beginning
Account Value
7/1/19 | | Ending
Account Value
12/31/19 | | Expenses Paid
During Period*
7/1/19–12/31/19 |
Actual | | | $ | 1,000.00 | | | | $ | 1,055.90 | | | | $ | 5.18 | |
Hypothetical (5% return before expense) | | | $ | 1,000.00 | | | | $ | 1,020.16 | | | | $ | 5.09 | |
| * | Expenses are equal to the Fund’s annualized net expense ratio of 1.00%, multiplied by the average account value over the period, multiplied by 184/365 to reflect theone-half year period. |
| | | | | | | | | | | | | | | |
| | | LKCM Equity Fund |
| | | Beginning
Account Value
7/1/19 | | Ending
Account Value
12/31/19 | | Expenses Paid
During Period*
7/1/19–12/31/19 |
Actual | | | $ | 1,000.00 | | | | $ | 1,086.60 | | | | $ | 4.21 | |
Hypothetical (5% return before expense) | | | $ | 1,000.00 | | | | $ | 1,021.17 | | | | $ | 4.08 | |
| * | Expenses are equal to the Fund’s annualized net expense ratio of 0.80%, multiplied by the average account value over the period, multiplied by 184/365 to reflect theone-half year period. |
13
| | | | | | | | | | | | | | | |
| | | LKCM Balanced Fund |
| | | Beginning
Account Value
7/1/19 | | Ending
Account Value
12/31/19 | | Expenses Paid
During Period*
7/1/19–12/31/19 |
Actual | | | $ | 1,000.00 | | | | $ | 1,060.40 | | | | $ | 4.15 | |
Hypothetical (5% return before expense) | | | $ | 1,000.00 | | | | $ | 1,021.17 | | | | $ | 4.08 | |
| * | Expenses are equal to the Fund’s annualized net expense ratio of 0.80%, multiplied by the average account value over the period, multiplied by 184/365 to reflect theone-half year period. |
| | | | | | | | | | | | | | | |
| | | LKCM Fixed Income Fund |
| | | Beginning
Account Value
7/1/19 | | Ending
Account Value
12/31/19 | | Expenses Paid
During Period*
7/1/19–12/31/19 |
Actual | | | $ | 1,000.00 | | | | $ | 1,017.10 | | | | $ | 2.54 | |
Hypothetical (5% return before expense) | | | $ | 1,000.00 | | | | $ | 1,022.68 | | | | $ | 2.55 | |
| * | Expenses are equal to the Fund’s annualized net expense ratio of 0.50%, multiplied by the average account value over the period, multiplied by 184/365 to reflect theone-half year period. |
| | | | | | | | | | | | | | | |
| | | LKCM International Equity Fund |
| | | Beginning
Account Value
7/1/19 | | Ending
Account Value
12/31/19 | | Expenses Paid
During Period
7/1/19–12/31/19 |
Actual | | | $ | 1,000.00 | | | | $ | 1,087.50 | | | | $ | 5.26 | |
Hypothetical (5% return before expense) | | | $ | 1,000.00 | | | | $ | 1,020.16 | | | | $ | 5.09 | |
| * | Expenses are equal to the Fund’s annualized net expense ratio of 1.00%, multiplied by the average account value over the period, multiplied by 184/365 to reflect theone-half year period. |
14
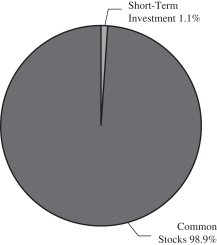
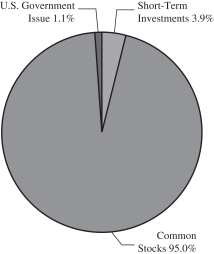
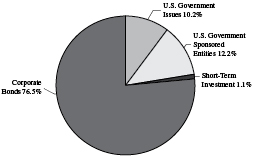
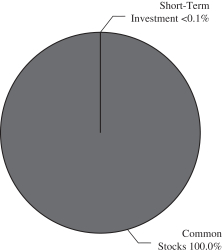
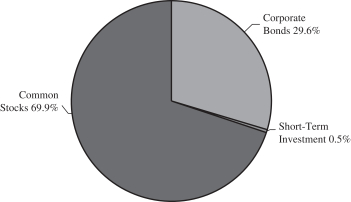
ALLOCATION OF PORTFOLIO HOLDINGS — LKCM Funds — December 31, 2019
Percentages represent market value as a percentage of total investments.
LKCM Small Cap Equity Fund
LKCM Equity Fund
LKCM Fixed Income Fund
LKCM Small-Mid Cap Equity Fund
LKCM Balanced Fund
LKCM International Equity Fund
15
|
| LKCM SMALL CAP EQUITY FUND |
| SCHEDULEOF INVESTMENTS |
| December 31, 2019 |
| | | | | | | | | | |
| COMMON STOCKS - 98.8% | | Shares | | Value |
| Aerospace & Defense - 1.5% |
Mercury Systems, Inc. (a) | | | | 39,045 | | | | $ | 2,698,400 | |
| | | | | | | | | | |
| Automobiles - 0.5% |
Thor Industries, Inc. | | | | 13,340 | | | | | 991,029 | |
| | | | | | | | | | |
| Banks - 7.7% |
BancorpSouth Bank | | | | 64,634 | | | | | 2,030,154 | |
Cadence BanCorp | | | | 98,682 | | | | | 1,789,105 | |
CBTX, Inc. | | | | 40,830 | | | | | 1,270,629 | |
Glacier Bancorp, Inc. | | | | 51,170 | | | | | 2,353,308 | |
Pinnacle Financial Partners, Inc. | | | | 36,970 | | | | | 2,366,080 | |
Seacoast Banking Corp. of Florida (a) | | | | 73,490 | | | | | 2,246,589 | |
Veritex Holdings, Inc. | | | | 64,067 | | | | | 1,866,272 | |
| | | | | | | | | | |
| | | | | | | | | 13,922,137 | |
| | | | | | | | | | |
| Biotechnology - 5.1% |
Charles River Laboratories International, Inc. (a) | | | | 12,645 | | | | | 1,931,650 | |
Emergent BioSolutions, Inc. (a) | | | | 36,770 | | | | | 1,983,742 | |
Ligand Pharmaceuticals, Inc. (a) | | | | 22,235 | | | | | 2,318,888 | |
Natera, Inc. (a) | | | | 13,590 | | | | | 457,847 | |
Neogen Corp. (a) | | | | 38,510 | | | | | 2,513,163 | |
| | | | | | | | | | |
| | | | | | | | | 9,205,290 | |
| | | | | | | | | | |
| Building Products - 6.8% |
American Woodmark Corp. (a) | | | | 23,055 | | | | | 2,409,478 | |
Builders FirstSource, Inc. (a) | | | | 132,725 | | | | | 3,372,542 | |
CSW Industrials, Inc. | | | | 39,040 | | | | | 3,006,080 | |
PGT Innovations, Inc. (a) | | | | 122,101 | | | | | 1,820,526 | |
Trex Co., Inc. (a) | | | | 19,540 | | | | | 1,756,255 | |
| | | | | | | | | | |
| | | | | | | | | 12,364,881 | |
| | | | | | | | | | |
| Chemicals - 2.5% |
Compass Minerals International, Inc. | | | | 43,230 | | | | | 2,635,301 | |
Ferro Corp. (a) | | | | 125,000 | | | | | 1,853,750 | |
Ferroglobe Representation & Warranty Insurance Trust (a)(c) | | | | 302,970 | | | | | — | |
| | | | | | | | | | |
| | | | | | | | | 4,489,051 | |
| | | | | | | | | | |
| Construction & Engineering - 1.5% |
EMCOR Group, Inc. | | | | 29,435 | | | | | 2,540,240 | |
NV5 Global, Inc. (a) | | | | 1,668 | | | | | 84,151 | |
| | | | | | | | | | |
| | | | | | | | | 2,624,391 | |
| | | | | | | | | | |
| Construction Materials - 0.5% |
Eagle Materials, Inc. | | | | 9,490 | | | | | 860,363 | |
| | | | | | | | | | |
| Consumer Finance - 0.9% |
FirstCash, Inc. | | | | 21,090 | | | | | 1,700,487 | |
| | | | | | | | | | |
| Electronic Equipment & Instruments - 0.5% |
Novanta, Inc. (a)(b) | | | | 10,400 | | | | | 919,776 | |
| | | | | | | | | | |
| Food Products - 3.4% |
Freshpet, Inc. (a) | | | | 36,590 | | | | | 2,162,103 | |
Hostess Brands, Inc. (a) | | | | 160,520 | | | | | 2,333,961 | |
J&J Snack Foods Corp. | | | | 9,150 | | | | | 1,686,070 | |
| | | | | | | | | | |
| | | | | | | | | 6,182,134 | |
| | | | | | | | | | |
| | | | | | | | | | |
| COMMON STOCKS | | Shares | | Value |
| Health Care Equipment & Supplies - 5.1% |
Cantel Medical Corp. | | | | 13,670 | | | | $ | 969,203 | |
Cerus Corp. (a) | | | | 5,000 | | | | | 21,100 | |
Mesa Laboratories, Inc. | | | | 6,025 | | | | | 1,502,635 | |
NeoGenomics, Inc. (a) | | | | 92,520 | | | | | 2,706,210 | |
STAAR Surgical Co. (a) | | | | 81,705 | | | | | 2,873,565 | |
ViewRay, Inc. (a) | | | | 250,000 | | | | | 1,055,000 | |
| | | | | | | | | | |
| | | | | | | | | 9,127,713 | |
| | | | | | | | | | |
| Health Care Providers & Services - 7.4% |
HealthEquity, Inc. (a) | | | | 32,820 | | | | | 2,430,977 | |
Medpace Holdings, Inc. (a) | | | | 29,760 | | | | | 2,501,626 | |
Omnicell, Inc. (a) | | | | 39,775 | | | | | 3,250,413 | |
R1 RCM, Inc. (a) | | | | 225,000 | | | | | 2,920,500 | |
U.S. Physical Therapy, Inc. | | | | 19,240 | | | | | 2,200,094 | |
| | | | | | | | | | |
| | | | | | | | | 13,303,610 | |
| | | | | | | | | | |
| Health Care Technology - 1.5% |
Teladoc Health, Inc. (a) | | | | 32,990 | | | | | 2,761,923 | |
| | | | | | | | | | |
| Hotels, Restaurants & Leisure - 3.5% |
Everi Holdings, Inc. (a) | | | | 187,397 | | | | | 2,516,742 | |
Planet Fitness, Inc. - Class A (a) | | | | 23,305 | | | | | 1,740,417 | |
Wingstop, Inc. | | | | 23,465 | | | | | 2,023,387 | |
| | | | | | | | | | |
| | | | | | | | | 6,280,546 | |
| | | | | | | | | | |
| Household Durables - 1.2% |
Century Communities, Inc. (a) | | | | 82,590 | | | | | 2,258,836 | |
| | | | | | | | | | |
| Insurance - 4.8% |
Goosehead Insurance, Inc. - Class A | | | | 25,395 | | | | | 1,076,748 | |
The Hanover Insurance Group, Inc. | | | | 15,330 | | | | | 2,095,151 | |
Kinsale Capital Group, Inc. | | | | 22,590 | | | | | 2,296,499 | |
Palomar Holdings, Inc. (a) | | | | 35,875 | | | | | 1,811,329 | |
ProAssurance Corp. | | | | 39,050 | | | | | 1,411,267 | |
| | | | | | | | | | |
| | | | | | | | | 8,690,994 | |
| | | | | | | | | | |
| Internet & Catalog Retail - 0.4% |
Revolve Group, Inc. (a) | | | | 35,000 | | | | | 642,600 | |
| | | | | | | | | | |
| IT Consulting & Services - 2.8% |
Cass Information Systems, Inc. | | | | 25,680 | | | | | 1,482,763 | |
FireEye, Inc. (a) | | | | 71,865 | | | | | 1,187,929 | |
LiveRamp Holdings, Inc. (a) | | | | 48,256 | | | | | 2,319,666 | |
| | | | | | | | | | |
| | �� | | | | | | | 4,990,358 | |
| | | | | | | | | | |
| Machinery - 8.5% |
Alamo Group, Inc. | | | | 16,025 | | | | | 2,011,939 | |
Barnes Group, Inc. | | | | 23,900 | | | | | 1,480,844 | |
Colfax Corp. (a) | | | | 42,830 | | | | | 1,558,156 | |
Evoqua Water Technologies Corp. (a) | | | | 110,615 | | | | | 2,096,154 | |
John Bean Technologies Corp. | | | | 14,290 | | | | | 1,609,911 | |
Kennametal, Inc. | | | | 50,565 | | | | | 1,865,343 | |
Rexnord Corp. (a) | | | | 77,975 | | | | | 2,543,545 | |
Watts Water Technologies, Inc. - Class A | | | | 21,340 | | | | | 2,128,878 | |
| | | | | | | | | | |
| | | | | | | | | 15,294,770 | |
| | | | | | | | | | |
The accompanying notes are an integral part of these financial statements.
16
|
| LKCM SMALL CAP EQUITY FUND |
| SCHEDULEOF INVESTMENTS, CONTINUED |
| December 31, 2019 |
| | | | | | | | | | |
| COMMON STOCKS | | Shares | | Value |
| Marine - 1.6% |
Kirby Corp. (a) | | | | 32,725 | | | | $ | 2,929,869 | |
| | | | | | | | | | |
| Media & Entertainment - 1.8% | | | | |
Nexstar Media Group, Inc. - Class A | | | | 27,625 | | | | | 3,239,031 | |
Sinclair Broadcast Group, Inc. - Class A | | | | 2,500 | | | | | 83,350 | |
| | | | | | | | | | |
| | | | | | | | | 3,322,381 | |
| | | | | | | | | | |
| Metals & Mining - 1.1% |
Carpenter Technology Corp. | | | | 40,615 | | | | | 2,021,815 | |
| | | | | | | | | | |
| Multiline Retail - 1.2% |
Ollie’s Bargain Outlet Holdings, Inc. (a) | | | | 33,460 | | | | | 2,185,273 | |
| | | | | | | | | | |
| Oil & Gas & Consumable Fuels - 2.8% |
Brigham Minerals, Inc. - Class A | | | | 96,865 | | | | | 2,076,785 | |
Magnolia Oil & Gas Corp. - Class A (a) | | | | 171,670 | | | | | 2,159,609 | |
WPX Energy, Inc. (a) | | | | 65,790 | | | | | 903,955 | |
| | | | | | | | | | |
| | | | | | | | | 5,140,349 | |
| | | | | | | | | | |
| Pharmaceuticals - 1.9% |
Horizon Therapeutics PLC (a)(b) | | | | 92,520 | | | | | 3,349,224 | |
| | | | | | | | | | |
| Real Estate Development - 1.6% |
FirstService Corp. (b) | | | | 10,030 | | | | | 933,191 | |
Newmark Group, Inc. - Class A | | | | 144,528 | | | | | 1,944,624 | |
| | | | | | | | | | |
| | | | | | | | | 2,877,815 | |
| | | | | | | | | | |
| Real Estate Investment Trusts - 2.6% |
First Industrial Realty Trust, Inc. | | | | 56,255 | | | | | 2,335,145 | |
PotlatchDeltic Corp. | | | | 54,340 | | | | | 2,351,292 | |
| | | | | | | | | | |
| | | | | | | | | 4,686,437 | |
| | | | | | | | | | |
| Software - 9.9% |
ACI Worldwide, Inc. (a) | | | | 76,645 | | | | | 2,903,696 | |
Appian Corp. (a) | | | | 55,740 | | | | | 2,129,825 | |
Fastly, Inc. - Class A (a) | | | | 42,185 | | | | | 846,653 | |
Five9, Inc. (a) | | | | 25,790 | | | | | 1,691,308 | |
Instructure, Inc. (a) | | | | 43,900 | | | | | 2,116,419 | |
LivePerson, Inc. (a) | | | | 51,805 | | | | | 1,916,785 | |
Mimecast Ltd. (a)(b) | | | | 20,425 | | | | | 886,037 | |
OneSpan Inc. (a) | | | | 84,765 | | | | | 1,451,177 | |
RealPage, Inc. (a) | | | | 27,055 | | | | | 1,454,206 | |
Talend SA - ADR (a)(b) | | | | 33,430 | | | | | 1,307,447 | |
Zuora, Inc. - Class A (a) | | | | 87,070 | | | | | 1,247,713 | |
| | | | | | | | | | |
| | | | | | | | | 17,951,266 | |
| | | | | | | | | | |
| Software & Services - 3.2% |
Alarm.com Holdings, Inc. (a) | | | | 20,510 | | | | | 881,315 | |
Cornerstone OnDemand, Inc. (a) | | | | 38,470 | | | | | 2,252,418 | |
Envestnet, Inc. (a) | | | | 32,131 | | | | | 2,237,282 | |
Yext, Inc. (a) | | | | 29,015 | | | | | 418,396 | |
| | | | | | | | | | |
| | | | | | | | | 5,789,411 | |
| | | | | | | | | | |
| Textiles, Apparel & Luxury Goods - 1.0% |
Steven Madden Ltd. | | | | 41,385 | | | | | 1,779,969 | |
| | | | | | | | | | |
| Thrifts & Mortgage Finance - 1.4% |
Home BancShares, Inc. | | | | 128,351 | | | | | 2,523,381 | |
| | | | | | | | | | |
| | | | | | | | | | |
| COMMON STOCKS | | Shares | | Value |
| Trading Companies & Distributors - 2.6% |
Systemax, Inc. | | | | 78,723 | | | | $ | 1,980,671 | |
Textainer Group Holdings Ltd. (a)(b) | | | | 99,520 | | | | | 1,065,859 | |
Triton International Limited of Bermuda (b) | | | | 40,065 | | | | | 1,610,613 | |
| | | | | | | | | | |
| | | | | | | | | 4,657,143 | |
| | | | | | | | | | |
TOTAL COMMON STOCKS
(Cost $125,538,736) | | | | | | | | | 178,523,622 | |
| | | | | | | | | | |
| | | | | | | | | | |
| SHORT-TERM INVESTMENT - 1.1% | | | | |
| Money Market Fund - 1.1% |
Invesco Short-Term Investments Trust - Government & Agency Portfolio - Institutional Shares, 1.51% (d) | | | | 1,994,841 | | | | | 1,994,841 | |
| | | | | | | | | | |
TOTAL SHORT-TERM INVESTMENT
(Cost $1,994,841) | | | | | 1,994,841 | |
| | | | | | | | | | |
Total Investments - 99.9%
(Cost $127,533,577) | | | | | | | | | 180,518,463 | |
Other Assets in Excess of Liabilities - 0.1% | | | | | 163,972 | |
| | | | | | | | | | |
TOTAL NET ASSETS - 100.0% | | | | | | | | $ | 180,682,435 | |
| | | | | | | | | | |
ADR American Depositary Receipt
| (a) | Non-income producing security. |
| (b) | Security issued bynon-U.S. incorporated company. |
| (c) | Securities for which market quotations are not readily available. These securities have been valued at their fair value under procedures approved by the Fund’s Board of Trustees. Level 3 security (see Note A.1.). |
| (d) | The rate quoted is the annualizedseven-day yield of the fund at period end. |
Investments are classified by industry pursuant to the Global Industry Classification Standard (GICS®), which was developed by and/or is the exclusive property of Morgan Stanley Capital International, Inc. (“MSCI”) and Standard & Poor’s Financial Services LLC (“S&P”). GICS is a service mark of MSCI and S&P and has been licensed for use by U.S. Bancorp Fund Services, LLC.
The accompanying notes are an integral part of these financial statements.
17
|
| LKCM SMALL-MID CAP EQUITY FUND |
| SCHEDULEOF INVESTMENTS |
| December 31, 2019 |
| | | | | | | | | | |
| COMMON STOCKS - 100.1% | | Shares | | Value |
| Aerospace & Defense - 3.3% |
Hexcel Corp. | | | | 2,555 | | | | $ | 187,307 | |
Mercury Systems, Inc. (a) | | | | 3,335 | | | | | 230,482 | |
| | | | | | | | | | |
| | | | | | | | | 417,789 | |
| | | | | | | | | | |
| Banks - 2.8% |
Cadence BanCorp | | | | 5,615 | | | | | 101,800 | |
Pinnacle Financial Partners, Inc. | | | | 3,865 | | | | | 247,360 | |
| | | | | | | | | | |
| | | | | | | | | 349,160 | |
| | | | | | | | | | |
| Biotechnology - 7.6% |
Charles River Laboratories International, Inc. (a) | | | | 1,745 | | | | | 266,566 | |
Exact Sciences Corp. (a) | | | | 2,510 | | | | | 232,125 | |
Ligand Pharmaceuticals, Inc. (a) | | | | 2,215 | | | | | 231,002 | |
Neogen Corp. (a) | | | | 3,425 | | | | | 223,516 | |
| | | | | | | | | | |
| | | | | | | | | 953,209 | |
| | | | | | | | | | |
| Building Products - 4.1% |
Builders FirstSource, Inc. (a) | | | | 13,490 | | | | | 342,781 | |
Trex Co., Inc. (a) | | | | 1,975 | | | | | 177,513 | |
| | | | | | | | | | |
| | | | | | | | | 520,294 | |
| | | | | | | | | | |
| Capital Markets - 2.0% |
LPL Financial Holdings, Inc. | | | | 2,730 | | | | | 251,843 | |
| | | | | | | | | | |
| Chemicals - 3.7% |
Compass Minerals International, Inc. | | | | 3,505 | | | | | 213,665 | |
FMC Corp. | | | | 2,525 | | | | | 252,045 | |
| | | | | | | | | | |
| | | | | | | | | 465,710 | |
| | | | | | | | | | |
| Construction & Engineering - 1.7% |
EMCOR Group, Inc. | | | | 2,445 | | | | | 211,003 | |
| | | | | | | | | | |
| Consumer Finance - 0.9% |
FirstCash, Inc. | | | | 1,455 | | | | | 117,317 | |
| | | | | | | | | | |
| Electronic Equipment & Instruments - 2.9% |
FLIR Systems, Inc. | | | | 4,195 | | | | | 218,434 | |
Trimble, Inc. (a) | | | | 3,380 | | | | | 140,912 | |
| | | | | | | | | | |
| | | | | | | | | 359,346 | |
| | | | | | | | | | |
| Food Products - 1.9% |
Freshpet, Inc. (a) | | | | 4,090 | | | | | 241,678 | |
| | | | | | | | | | |
| Health Care Equipment & Supplies - 6.7% |
Cantel Medical Corp. | | | | 2,505 | | | | | 177,604 | |
PerkinElmer, Inc. | | | | 1,555 | | | | | 150,991 | |
PRA Health Sciences, Inc. (a) | | | | 2,355 | | | | | 261,758 | |
STAAR Surgical Co. (a) | | | | 7,050 | | | | | 247,949 | |
| | | | | | | | | | |
| | | | | | | | | 838,302 | |
| | | | | | | | | | |
| Health Care Providers & Services - 3.8% |
HealthEquity, Inc. (a) | | | | 2,815 | | | | | 208,507 | |
Omnicell, Inc. (a) | | | | 3,365 | | | | | 274,988 | |
| | | | | | | | | | |
| | | | | | | | | 483,495 | |
| | | | | | | | | | |
| Health Care Technology - 2.3% |
Teladoc Health, Inc. (a) | | | | 3,405 | | | | | 285,067 | |
| | | | | | | | | | |
| | | | | | | | | | |
| COMMON STOCKS | | Shares | | Value |
| Hotels, Restaurants & Leisure - 3.0% |
Planet Fitness, Inc. - Class A (a) | | | | 2,605 | | | | $ | 194,541 | |
Wingstop, Inc. | | | | 2,165 | | | | | 186,688 | |
| | | | | | | | | | |
| | | | | | | | | 381,229 | |
| | | | | | | | | | |
| Insurance - 2.2% |
The Hanover Insurance Group, Inc. | | | | 2,000 | | | | | 273,340 | |
| | | | | | | | | | |
| Internet Software & Services - 2.0% |
Euronet Worldwide, Inc. (a) | | | | 1,635 | | | | | 257,611 | |
| | | | | | | | | | |
| IT Consulting & Services - 1.3% |
LiveRamp Holdings, Inc. (a) | | | | 3,390 | | | | | 162,957 | |
| | | | | | | | | | |
| Leisure Equipment & Products - 2.7% |
Pool Corp. | | | | 1,595 | | | | | 338,746 | |
| | | | | | | | | | |
| Machinery - 4.7% |
Colfax Corp. (a) | | | | 3,820 | | | | | 138,972 | |
Kennametal, Inc. | | | | 5,460 | | | | | 201,419 | |
Rexnord Corp. (a) | | | | 7,585 | | | | | 247,423 | |
| | | | | | | | | | |
| | | | | | | | | 587,814 | |
| | | | | | | | | | |
| Marine - 1.9% |
Kirby Corp. (a) | | | | 2,645 | | | | | 236,807 | |
| | | | | | | | | | |
| Media & Entertainment - 4.5% |
Live Nation Entertainment, Inc. (a) | | | | 3,310 | | | | | 236,566 | |
Nexstar Media Group, Inc. - Class A | | | | 2,850 | | | | | 334,162 | |
| | | | | | | | | | |
| | | | | | | | | 570,728 | |
| | | | | | | | | | |
| Metals & Mining - 2.0% |
Reliance Steel & Aluminum Co. | | | | 2,140 | | | | | 256,286 | |
| | | | | | | | | | |
| Multiline Retail - 2.7% |
Five Below, Inc. (a) | | | | 1,170 | | | | | 149,596 | |
Ollie’s Bargain Outlet Holdings, Inc. (a) | | | | 2,855 | | | | | 186,460 | |
| | | | | | | | | | |
| | | | | | | | | 336,056 | |
| | | | | | | | | | |
| Oil & Gas & Consumable Fuels - 3.2% |
Parsley Energy, Inc. - Class A | | | | 8,000 | | | | | 151,280 | |
WPX Energy, Inc. (a) | | | | 17,970 | | | | | 246,908 | |
| | | | | | | | | | |
| | | | | | | | | 398,188 | |
| | | | | | | | | | |
| Pharmaceuticals - 2.8% |
Horizon Therapeutics PLC (a)(b) | | | | 9,700 | | | | | 351,140 | |
| | | | | | | | | | |
| Real Estate Development - 0.1% |
FirstService Corp. (b) | | | | 160 | | | | | 14,886 | |
| | | | | | | | | | |
| Real Estate Investment Trusts - 5.1% |
American Campus Communities, Inc. | | | | 3,885 | | | | | 182,711 | |
First Industrial Realty Trust, Inc. | | | | 5,760 | | | | | 239,098 | |
PotlatchDeltic Corp. | | | | 4,995 | | | | | 216,134 | |
| | | | | | | | | | |
| | | | | | | | | 637,943 | |
| | | | | | | | | | |
| Software - 7.0% |
Fair Isaac Corp. (a) | | | | 675 | | | | | 252,909 | |
Fortinet, Inc. (a) | | | | 1,210 | | | | | 129,180 | |
Guidewire Software, Inc. (a) | | | | 1,920 | | | | | 210,758 | |
Proofpoint, Inc. (a) | | | | 1,680 | | | | | 192,830 | |
The accompanying notes are an integral part of these financial statements.
18
|
| LKCM SMALL-MID CAP EQUITY FUND |
| SCHEDULEOF INVESTMENTS, CONTINUED |
| December 31, 2019 |
| | | | | | | | | | |
| COMMON STOCKS | | Shares | | Value |
| Software - 7.0%, Continued |
RealPage, Inc. (a) | | | | 1,885 | | | | $ | 101,319 | |
| | | | | | | | | | |
| | | | | | | | | 886,996 | |
| | | | | | | | | | |
| Software & Services - 6.6% |
Akamai Technologies, Inc. (a) | | | | 1,775 | | | | | 153,325 | |
Cornerstone OnDemand, Inc. (a) | | | | 3,555 | | | | | 208,145 | |
Coupa Software, Inc. (a) | | | | 1,790 | | | | | 261,788 | |
Envestnet, Inc. (a) | | | | 3,000 | | | | | 208,890 | |
| | | | | | | | | | |
| | | | | | | | | 832,148 | |
| | | | | | | | | | |
| Textiles, Apparel & Luxury Goods - 1.1% |
Columbia Sportswear Co. | | | | 1,360 | | | | | 136,258 | |
| | | | | | | | | | |
| Thrifts & Mortgage Finance - 1.5% |
Home BancShares, Inc. | | | | 9,455 | | | | | 185,885 | |
| | | | | | | | | | |
| Trading Companies & Distributors - 2.0% |
Watsco, Inc. | | | | 1,420 | | | | | 255,813 | |
| | | | | | | | | | |
TOTAL COMMON STOCKS
(Cost $9,078,181) | | | | | | | | | 12,595,044 | |
| | | | | | | | | | |
| | | | | | | | | | |
| SHORT-TERM INVESTMENT - 0.0% | | | | |
| Money Market Fund - 0.0% |
Invesco Short-Term Investments Trust - Government & Agency Portfolio - Institutional Shares, 1.51% (c) | | | | 4,730 | | | | | 4,730 | |
| | | | | | | | | | |
TOTAL SHORT-TERM INVESTMENT
(Cost $4,730) | | | | | | | | | 4,730 | |
| | | | | | | | | | |
Total Investments - 100.1%
(Cost $9,082,911) | | | | | | | | | 12,599,774 | |
Liabilities in Excess of Other Assets - (0.1)% | | | | | (9,428 | ) |
| | | | | | | | | | |
TOTAL NET ASSETS - 100.0% | | | | | | | | $ | 12,590,346 | |
| | | | | | | | | | |
| (a) | Non-income producing security. |
| (b) | Security issued bynon-U.S. incorporated company. |
| (c) | The rate quoted is the annualizedseven-day yield of the fund at period end. |
Investments are classified by industry pursuant to the Global Industry Classification Standard (GICS®), which was developed by and/or is the exclusive property of Morgan Stanley Capital International, Inc. (“MSCI”) and Standard & Poor’s Financial Services LLC (“S&P”). GICS is a service mark of MSCI and S&P and has been licensed for use by U.S. Bancorp Fund Services, LLC.
The accompanying notes are an integral part of these financial statements.
19
|
| LKCM EQUITY FUND |
| SCHEDULEOF INVESTMENTS |
| December 31, 2019 |
| | | | | | | | | | |
| COMMON STOCKS - 94.8% | | Shares | | Value |
| Aerospace & Defense - 2.5% |
Honeywell International, Inc. | | | | 52,800 | | | | $ | 9,345,600 | |
| | | | | | | | | | |
| Banks - 7.4% |
Bank of America Corp. | | | | 242,000 | | | | | 8,523,240 | |
Comerica, Inc. | | | | 149,000 | | | | | 10,690,750 | |
Cullen/Frost Bankers, Inc. | | | | 65,000 | | | | | 6,355,700 | |
Glacier Bancorp, Inc. | | | | 60,000 | | | | | 2,759,400 | |
| | | | | | | | | | |
| | | | | | | | | 28,329,090 | |
| | | | | | | | | | |
| Beverages - 3.7% |
The Coca-Cola Co. | | | | 80,000 | | | | | 4,428,000 | |
Keurig Dr Pepper, Inc. | | | | 100,000 | | | | | 2,895,000 | |
PepsiCo, Inc. | | | | 49,000 | | | | | 6,696,830 | |
| | | | | | | | | | |
| | | | | | | | | 14,019,830 | |
| | | | | | | | | | |
| Biotechnology - 1.8% |
Amgen, Inc. | | | | 28,000 | | | | | 6,749,960 | |
| | | | | | | | | | |
| Chemicals - 5.9% |
Air Products & Chemicals, Inc. | | | | 21,000 | | | | | 4,934,790 | |
Ecolab, Inc. | | | | 45,000 | | | | | 8,684,550 | |
FMC Corp. | | | | 90,000 | | | | | 8,983,800 | |
| | | | | | | | | | |
| | | | | | | | | 22,603,140 | |
| | | | | | | | | | |
| Commercial Services & Supplies - 3.5% |
Cintas Corp. | | | | 16,000 | | | | | 4,305,280 | |
Waste Connections, Inc. (b) | | | | 97,500 | | | | | 8,852,025 | |
| | | | | | | | | | |
| | | | | | | | | 13,157,305 | |
| | | | | | | | | | |
| Computers & Peripherals - 2.3% |
Apple, Inc. | | | | 30,000 | | | | | 8,809,500 | |
| | | | | | | | | | |
| Diversified Financials - 3.7% |
JPMorgan Chase & Co. | | | | 102,000 | | | | | 14,218,800 | |
| | | | | | | | | | |
| Electrical Equipment & Instruments - 4.7% |
Franklin Electric Co., Inc. | | | | 85,000 | | | | | 4,872,200 | |
Rockwell Automation, Inc. | | | | 25,000 | | | | | 5,066,750 | |
Roper Technologies, Inc. | | | | 23,000 | | | | | 8,147,290 | |
| | | | | | | | | | |
| | | | | | | | | 18,086,240 | |
| | | | | | | | | | |
| Electronic Equipment & Instruments - 2.3% |
National Instruments Corp. | | | | 55,000 | | | | | 2,328,700 | |
Trimble, Inc. (a) | | | | 150,000 | | | | | 6,253,500 | |
| | | | | | | | | | |
| | | | | | | | | 8,582,200 | |
| | | | | | | | | | |
| Food Products - 0.8% |
Mondelez International, Inc. - Class A | | | | 54,000 | | | | | 2,974,320 | |
| | | | | | | | | | |
| Health Care Equipment & Supplies - 7.8% |
Danaher Corp. | | | | 72,000 | | | | | 11,050,560 | |
PerkinElmer, Inc. | | | | 100,000 | | | | | 9,710,000 | |
Thermo Fisher Scientific, Inc. | | | | 27,200 | | | | | 8,836,464 | |
| | | | | | | | | | |
| | | | | | | | | 29,597,024 | |
| | | | | | | | | | |
| Household Products - 2.8% |
Kimberly-Clark Corp. | | | | 50,000 | | | | | 6,877,500 | |
The Procter & Gamble Co. | | | | 30,000 | | | | | 3,747,000 | |
| | | | | | | | | | |
| | | | | | | | | 10,624,500 | |
| | | | | | | | | | |
| | | | | | | | | | |
| COMMON STOCKS | | Shares | | Value |
| Internet & Catalog Retail - 2.4% |
Amazon.com, Inc. (a) | | | | 5,000 | | | | $ | 9,239,200 | |
| | | | | | | | | | |
| IT Consulting & Services - 2.1% |
PayPal Holdings, Inc. (a) | | | | 75,000 | | | | | 8,112,750 | |
| | | | | | | | | | |
| Machinery - 6.1% |
Generac Holdings, Inc. (a) | | | | 107,000 | | | | | 10,763,130 | |
The Toro Co. | | | | 74,000 | | | | | 5,895,580 | |
Valmont Industries, Inc. | | | | 45,000 | | | | | 6,740,100 | |
| | | | | | | | | | |
| | | | | | | | | 23,398,810 | |
| | | | | | | | | | |
| Marine - 0.9% |
Kirby Corp. (a) | | | | 40,000 | | | | | 3,581,200 | |
| | | | | | | | | | |
| Media & Entertainment - 4.6% |
Alphabet, Inc. - Class A (a) | | | | 7,000 | | | | | 9,375,730 | |
Facebook, Inc. - Class A (a) | | | | 27,000 | | | | | 5,541,750 | |
Live Nation Entertainment, Inc. (a) | | | | 35,000 | | | | | 2,501,450 | |
| | | | | | | | | | |
| | | | | | | | | 17,418,930 | |
| | | | | | | | | | |
| Metals & Mining - 1.0% |
Newmont Goldcorp Corp. | | | | 90,000 | | | | | 3,910,500 | |
| | | | | | | | | | |
| Oil & Gas & Consumable Fuels - 4.9% |
Cabot Oil & Gas Corp. | | | | 190,000 | | | | | 3,307,900 | |
ConocoPhillips | | | | 91,500 | | | | | 5,950,245 | |
EOG Resources, Inc. | | | | 65,000 | | | | | 5,444,400 | |
Occidental Petroleum Corp. | | | | 100,000 | | | | | 4,121,000 | |
| | | | | | | | | | |
| | | | | | | | | 18,823,545 | |
| | | | | | | | | | |
| Personal Products - 1.6% |
The Estee Lauder Cos., Inc. - Class A | | | | 30,000 | | | | | 6,196,200 | |
| | | | | | | | | | |
| Pharmaceuticals - 5.0% |
Merck & Co., Inc. | | | | 80,000 | | | | | 7,276,000 | |
Pfizer, Inc. | | | | 115,000 | | | | | 4,505,700 | |
Zoetis, Inc. | | | | 53,500 | | | | | 7,080,725 | |
| | | | | | | | | | |
| | | | | | | | | 18,862,425 | |
| | | | | | | | | | |
| Road & Rail - 2.8% |
Kansas City Southern | | | | 40,000 | | | | | 6,126,400 | |
Union Pacific Corp. | | | | 24,000 | | | | | 4,338,960 | |
| | | | | | | | | | |
| | | | | | | | | 10,465,360 | |
| | | | | | | | | | |
| Software - 7.1% |
Adobe, Inc. (a) | | | | 30,000 | | | | | 9,894,300 | |
Microsoft Corp. | | | | 97,000 | | | | | 15,296,900 | |
RealPage, Inc. (a) | | | | 35,000 | | | | | 1,881,250 | |
| | | | | | | | | | |
| | | | | | | | | 27,072,450 | |
| | | | | | | | | | |
| Software & Services - 2.8% |
Akamai Technologies, Inc. (a) | | | | 90,000 | | | | | 7,774,200 | |
LogMeIn, Inc. | | | | 35,000 | | | | | 3,000,900 | |
| | | | | | | | | | |
| | | | | | | | | 10,775,100 | |
| | | | | | | | | | |
| Specialty Retail - 1.7% |
The Home Depot, Inc. | | | | 30,000 | | | | | 6,551,400 | |
| | | | | | | | | | |
The accompanying notes are an integral part of these financial statements.
20
|
| LKCM EQUITY FUND |
| SCHEDULEOF INVESTMENTS, CONTINUED |
| December 31, 2019 |
| | | | | | | | | | |
| COMMON STOCKS | | Shares | | Value |
| Textiles, Apparel & Luxury Goods - 2.6% |
VF Corp. | | | | 100,000 | | | | $ | 9,966,000 | |
| | | | | | | | | | |
TOTAL COMMON STOCKS
(Cost $178,584,679) | | | | | | | | | 361,471,379 | |
| | | | | | | | | | |
| | | | | | | | | | |
| | | Principal | | |
| SHORT-TERM INVESTMENTS- 5.0% |
| U.S. Treasury Note - 1.1% |
1.625%, 03/15/2020 | | | $ | 4,300,000 | | | | | 4,299,748 | |
| | | | | | | | | | |
| | | | | | | | | | |
| | | Shares | | |
| Money Market Funds - 3.9% | | | | |
Invesco Short-Term Investments Trust - Government & Agency Portfolio - Institutional Shares, 1.51% (c) | | | | 10,784,093 | | | | | 10,784,093 | |
Morgan Stanley Institutional Liquidity Funds - Government Portfolio - Institutional Shares, 1.48% (c) | | | | 4,096,867 | | | | | 4,096,867 | |
| | | | | | | | | | |
| | | | | | | | | 14,880,960 | |
| | | | | | | | | | |
TOTAL SHORT-TERM INVESTMENTS
(Cost $19,175,292) | | 19,180,708 |
| | | | | | | | | | |
Total Investments - 99.8%
(Cost $197,759,971) | | | | 380,652,087 |
Other Assets in Excess of Liabilities - 0.2% | | | | | 654,886 | |
| | | | | | | | | | |
TOTAL NET ASSETS - 100.0% | | | | | | | | $ | 381,306,973 | |
| | | | | | | | | | |
| (a) | Non-income producing security. |
| (b) | Security issued bynon-U.S. incorporated company. |
| (c) | The rate quoted is the annualizedseven-day yield of the fund at period end. |
Investments are classified by industry pursuant to the Global Industry Classification Standard (GICS®), which was developed by and/or is the exclusive property of Morgan Stanley Capital International, Inc. (“MSCI”) and Standard & Poor’s Financial Services LLC (“S&P”). GICS is a service mark of MSCI and S&P and has been licensed for use by U.S. Bancorp Fund Services, LLC.
The accompanying notes are an integral part of these financial statements.
21
|
| LKCM BALANCED FUND |
| SCHEDULEOF INVESTMENTS |
| December 31, 2019 |
| | | | | | | | | | |
| COMMON STOCKS - 69.2% | | Shares | | Value |
| Aerospace & Defense - 2.2% |
Honeywell International, Inc. | | | | 6,100 | | | | $ | 1,079,700 | |
L3Harris Technologies, Inc. | | | | 6,300 | | | | | 1,246,581 | |
| | | | | | | | | | |
| | | | | | | | | 2,326,281 | |
| | | | | | | | | | |
| Banks - 4.4% |
Bank of America Corp. | | | | 38,500 | | | | | 1,355,970 | |
Comerica, Inc. | | | | 13,500 | | | | | 968,625 | |
Cullen/Frost Bankers, Inc. | | | | 9,900 | | | | | 968,022 | |
Truist Financial Corp. | | | | 4,014 | | | | | 226,068 | |
Zions Bancorp N.A. | | | | 20,000 | | | | | 1,038,400 | |
| | | | | | | | | | |
| | | | | | | | | 4,557,085 | |
| | | | | | | | | | |
| Beverages - 1.8% |
The Coca-Cola Co. | | | | 17,600 | | | | | 974,160 | |
PepsiCo, Inc. | | | | 6,700 | | | | | 915,689 | |
| | | | | | | | | | |
| | | | | | | | | 1,889,849 | |
| | | | | | | | | | |
| Biotechnology - 1.2% |
Charles River Laboratories International, Inc. (a) | | | | 8,100 | | | | | 1,237,356 | |
| | | | | | | | | | |
| Chemicals - 5.7% |
Air Products and Chemicals, Inc. | | | | 5,500 | | | | | 1,292,445 | |
Corteva, Inc. | | | | 21,358 | | | | | 631,342 | |
DuPont de Nemours, Inc. | | | | 8,158 | | | | | 523,744 | |
Ecolab, Inc. | | | | 4,800 | | | | | 926,352 | |
FMC Corp. | | | | 13,700 | | | | | 1,367,534 | |
Linde PLC (b) | | | | 5,500 | | | | | 1,170,950 | |
| | | | | | | | | | |
| | | | | | | | | 5,912,367 | |
| | | | | | | | | | |
| Commercial Services & Supplies - 2.1% |
Cintas Corp. | | | | 4,000 | | | | | 1,076,320 | |
Waste Management, Inc. | | | | 10,000 | | | | | 1,139,600 | |
| | | | | | | | | | |
| | | | | | | | | 2,215,920 | |
| | | | | | | | | | |
| Communications Equipment - 0.7% |
QUALCOMM, Inc. | | | | 8,000 | | | | | 705,840 | |
| | | | | | | | | | |
| Computers & Peripherals - 1.6% |
Apple, Inc. | | | | 5,550 | | | | | 1,629,757 | |
| | | | | | | | | | |
| Construction Materials - 1.1% |
Martin Marietta Materials, Inc. | | | | 4,100 | | | | | 1,146,524 | |
| | | | | | | | | | |
| Diversified Financials - 2.4% |
JPMorgan Chase & Co. | | | | 9,500 | | | | | 1,324,300 | |
Moody’s Corp. | | | | 4,700 | | | | | 1,115,827 | |
| | | | | | | | | | |
| | | | | | | | | 2,440,127 | |
| | | | | | | | | | |
| Diversified Telecommunication Services - 2.0% |
AT&T, Inc. | | | | 26,689 | | | | | 1,043,006 | |
Verizon Communications, Inc. | | | | 16,341 | | | | | 1,003,338 | |
| | | | | | | | | | |
| | | | | | | | | 2,046,344 | |
| | | | | | | | | | |
| Electrical Equipment & Instruments - 2.0% |
Emerson Electric Co. | | | | 15,600 | | | | | 1,189,656 | |
Rockwell Automation, Inc. | | | | 4,500 | | | | | 912,015 | |
| | | | | | | | | | |
| | | | | | | | | 2,101,671 | |
| | | | | | | | | | |
| | | | | | | | | | |
| COMMON STOCKS | | Shares | | Value |
| Electronic Equipment & Instruments - 2.1% |
FLIR Systems, Inc. | | | | 13,700 | | | | $ | 713,359 | |
National Instruments Corp. | | | | 12,800 | | | | | 541,952 | |
Trimble, Inc. (a) | | | | 22,200 | | | | | 925,518 | |
| | | | | | | | | | |
| | | | | | | | | 2,180,829 | |
| | | | | | | | | | |
| Food & Drug Retailing - 0.9% |
Walmart, Inc. | | | | 8,300 | | | | | 986,372 | |
| | | | | | | | | | |
| Food Products - 0.7% |
Mondelez International, Inc. - Class A | | | | 13,400 | | | | | 738,072 | |
| | | | | | | | | | |
| Health Care Equipment & Supplies - 4.6% |
Becton, Dickinson & Co. | | | | 4,400 | | | | | 1,196,668 | |
Danaher Corp. | | | | 7,400 | | | | | 1,135,752 | |
Medtronic PLC (b) | | | | 4,100 | | | | | 465,145 | |
PerkinElmer, Inc. | | | | 10,100 | | | | | 980,710 | |
Thermo Fisher Scientific, Inc. | | | | 3,100 | | | | | 1,007,097 | |
| | | | | | | | | | |
| | | | | | | | | 4,785,372 | |
| | | | | | | | | | |
| Household Products - 2.1% |
Colgate-Palmolive Co. | | | | 13,600 | | | | | 936,224 | |
Kimberly-Clark Corp. | | | | 6,000 | | | | | 825,300 | |
The Procter & Gamble Co. | | | | 3,500 | | | | | 437,150 | |
| | | | | | | | | | |
| | | | | | | | | 2,198,674 | |
| | | | | | | | | | |
| Internet & Catalog Retail - 1.2% |
Amazon.com, Inc. (a) | | | | 650 | | | | | 1,201,096 | |
| | | | | | | | | | |
| IT Consulting & Services - 3.5% |
Black Knight, Inc. (a) | | | | 18,400 | | | | | 1,186,432 | |
PayPal Holdings, Inc. (a) | | | | 11,800 | | | | | 1,276,406 | |
Visa, Inc. - Class A | | | | 6,100 | | | | | 1,146,190 | |
| | | | | | | | | | |
| | | | | | | | | 3,609,028 | |
| | | | | | | | | | |
| Machinery - 1.7% |
Fortive Corp. | | | | 11,300 | | | | | 863,207 | |
Stanley Black & Decker, Inc. | | | | 5,400 | | | | | 894,996 | |
| | | | | | | | | | |
| | | | | | | | | 1,758,203 | |
| | | | | | | | | | |
| Marine - 0.9% |
Kirby Corp. (a) | | | | 10,200 | | | | | 913,206 | |
| | | | | | | | | | |
| Media & Entertainment - 2.5% |
Alphabet, Inc. - Class C (a) | | | | 925 | | | | | 1,236,744 | |
The Walt Disney Co. | | | | 9,500 | | | | | 1,373,985 | |
| | | | | | | | | | |
| | | | | | | | | 2,610,729 | |
| | | | | | | | | | |
| Oil & Gas & Consumable Fuels - 4.1% |
Cabot Oil & Gas Corp. | | | | 25,900 | | | | | 450,919 | |
Chevron Corp. | | | | 7,295 | | | | | 879,120 | |
ConocoPhillips | | | | 11,400 | | | | | 741,342 | |
EOG Resources, Inc. | | | | 8,600 | | | | | 720,336 | |
Exxon Mobil Corp. | | | | 4,633 | | | | | 323,291 | |
Pioneer Natural Resources Co. | | | | 4,100 | | | | | 620,617 | |
WPX Energy, Inc. (a) | | | | 41,000 | | | | | 563,340 | |
| | | | | | | | | | |
| | | | | | | | | 4,298,965 | |
| | | | | | | | | | |
| Pharmaceuticals - 4.3% |
Abbott Laboratories | | | | 13,500 | | | | | 1,172,610 | |
The accompanying notes are an integral part of these financial statements.
22
|
| LKCM BALANCED FUND |
| SCHEDULEOF INVESTMENTS, CONTINUED |
| December 31, 2019 |
| | | | | | | | | | |
| COMMON STOCKS | |
Shares | | Value |
| Pharmaceuticals - 4.3%, Continued |
Merck & Co., Inc. | | | | 13,200 | | | | $ | 1,200,540 | |
Pfizer, Inc. | | | | 18,100 | | | | | 709,158 | |
Zoetis, Inc. | | | | 10,326 | | | | | 1,366,646 | |
| | | | | | | | | | |
| | | | | | | | | 4,448,954 | |
| | | | | | | | | | |
| Real Estate Investment Trusts - 1.4% |
American Tower Corp. | | | | 6,300 | | | | | 1,447,866 | |
| | | | | | | | | | |
| Road & Rail - 0.9% |
Union Pacific Corp. | | | | 5,100 | | | | | 922,029 | |
| | | | | | | | | | |
| Software - 5.7% |
Adobe, Inc. (a) | | | | 3,300 | | | | | 1,088,373 | |
Microsoft Corp. | | | | 9,800 | | | | | 1,545,460 | |
Oracle Corp. | | | | 17,800 | | | | | 943,044 | |
RealPage, Inc. (a) | | | | 20,900 | | | | | 1,123,375 | |
salesforce.com, Inc. (a) | | | | 7,400 | | | | | 1,203,536 | |
| | | | | | | | | | |
| | | | | | | | | 5,903,788 | |
| | | | | | | | | | |
| Software & Services - 1.2% |
Akamai Technologies, Inc. (a) | | | | 14,800 | | | | | 1,278,424 | |
| | | | | | | | | | |
| Specialty Retail - 1.7% |
The Home Depot, Inc. | | | | 6,500 | | | | | 1,419,470 | |
O’Reilly Automotive, Inc. (a) | | | | 700 | | | | | 306,782 | |
| | | | | | | | | | |
| | | | | | | | | 1,726,252 | |
| | | | | | | | | | |
| Textiles, Apparel & Luxury Goods - 2.5% |
NIKE, Inc. - Class B | | | | 11,600 | | | | | 1,175,196 | |
VF Corp. | | | | 14,700 | | | | | 1,465,002 | |
| | | | | | | | | | |
| | | | | | | | | 2,640,198 | |
| | | | | | | | | | |
TOTAL COMMON STOCKS
(Cost $46,053,691) | �� | | | | | | | | 71,857,178 | |
| | | | | | | | | | |
| | | | | | | | | | |
| CORPORATE BONDS - 29.4% | | Principal
Amount | | |
| Aerospace & Defense - 0.3% |
Rockwell Collins, Inc. | | | | | | | | | | |
3.700%, 12/15/2023
Callable 09/15/2023 | | | $ | 250,000 | | | | | 263,724 | |
| | | | | | | | | | |
| Air Freight & Logistics - 1.0% |
FedEx Corp. | | | | | | | | | | |
2.700%, 04/15/2023 | | | | 425,000 | | | | | 431,412 | |
United Parcel Service, Inc. | | | | | | | | | | |
2.450%, 10/01/2022 | | | | 600,000 | | | | | 609,821 | |
| | | | | | | | | | |
| | | | | | | | | 1,041,233 | |
| | | | | | | | | | |
| Banks - 3.2% |
Bank of America Corp.: | | | | | | | | | | |
2.625%, 10/19/2020 | | | | 400,000 | | | | | 402,342 | |
2.625%, 04/19/2021 | | | | 250,000 | | | | | 252,351 | |
The Bank of New York Mellon Corp.: | | | | | | | | | | |
2.450%, 11/27/2020
Callable 10/27/2020 | | | | 350,000 | | | | | 351,773 | |
| | | | | | | | | | |
| CORPORATE BONDS | | Principal
Amount | | Value |
| Banks - 3.2%, Continued |
2.500%, 04/15/2021
Callable 03/15/2021 | | | $ | 200,000 | | | | $ | 201,428 | |
Comerica Bank | | | | | | | | | | |
2.500%, 07/23/2024 | | | | 300,000 | | | | | 303,834 | |
Comerica, Inc. | | | | | | | | | | |
3.700%, 07/31/2023
Callable 06/30/2023 | | | | 475,000 | | | | | 499,643 | |
Truist Bank: | | | | | | | | | | |
2.625%, 01/15/2022
Callable 12/15/2021 | | | | 500,000 | | | | | 506,857 | |
4.050%, 11/03/2025
Callable 09/03/2025 | | | | 385,000 | | | | | 423,286 | |
3.300%, 05/15/2026
Callable 04/15/2026 | | | | 400,000 | | | | | 416,658 | |
| | | | | | | | | | |
| | | | | | | | | 3,358,172 | |
| | | | | | | | | | |
| Beverages - 0.4% |
PepsiCo, Inc. | | | | | | | | | | |
3.000%, 08/25/2021 | | | | 415,000 | | | | | 423,379 | |
| | | | | | | | | | |
| Biotechnology - 1.4% |
AbbVie, Inc. | | | | | | | | | | |
2.850%, 05/14/2023
Callable 04/14/2023 | | | | 250,000 | | | | | 255,142 | |
3.200%, 05/14/2026
Callable 02/14/2026 | | | | 600,000 | | | | | 622,258 | |
Amgen, Inc.: | | | | | | | | | | |
2.700%, 05/01/2022
Callable 03/01/2022 | | | | 325,000 | | | | | 329,488 | |
3.625%, 05/22/2024
Callable 02/22/2024 | | | | 250,000 | | | | | 264,330 | |
| | | | | | | | | | |
| | | | | | | | | 1,471,218 | |
| | | | | | | | | | |
| Chemicals - 0.5% |
Ecolab, Inc. | | | | | | | | | | |
3.250%, 01/14/2023
Callable 11/14/2022 | | | | 500,000 | | | | | 516,273 | |
| | | | | | | | | | |
| Communications Equipment - 0.9% |
Cisco Systems, Inc. | | | | | | | | | | |
2.200%, 02/28/2021 | | | | 275,000 | | | | | 276,674 | |
QUALCOMM, Inc. | | | | | | | | | | |
2.900%, 05/20/2024
Callable 03/20/2024 | | | | 600,000 | | | | | 620,867 | |
| | | | | | | | | | |
| | | | | | | | | 897,541 | |
| | | | | | | | | | |
| Computers & Peripherals - 1.1% |
Apple, Inc.: | | | | | | | | | | |
2.850%, 05/06/2021 | | | | 500,000 | | | | | 507,837 | |
2.500%, 02/09/2025 | | | | 250,000 | | | | | 254,822 | |
3.200%, 05/13/2025 | | | | 55,000 | | | | | 58,162 | |
International Business Machines Corp. | | | | | | | | | | |
2.250%, 02/19/2021 | | | | 350,000 | | | | | 351,357 | |
| | | | | | | | | | |
| | | | | | | | | 1,172,178 | |
| | | | | | | | | | |
The accompanying notes are an integral part of these financial statements.
23
|
| LKCM BALANCED FUND |
| SCHEDULEOF INVESTMENTS, CONTINUED |
| December 31, 2019 |
| | | | | | | | | | |
| CORPORATE BONDS | | Principal
Amount | | Value |
| Consumer Finance - 0.8% |
American Express Co.: | | | | | | | | | | |
3.400%, 02/27/2023
Callable 01/27/2023 | | | $ | 125,000 | | | | $ | 129,871 | |
3.700%, 08/03/2023
Callable 07/03/2023 | | | | 300,000 | | | | | 315,605 | |
3.000%, 10/30/2024
Callable 09/29/2024 | | | | 350,000 | | | | | 362,108 | |
| | | | | | | | | | |
| | | | | | | | | 807,584 | |
| | | | | | | | | | |
| Diversified Financials - 0.9% |
JPMorgan Chase & Co.: | | | | | | | | | | |
2.400%, 06/07/2021
Callable 05/07/2021 | | | | 400,000 | | | | | 402,734 | |
3.250%, 09/23/2022 | | | | 100,000 | | | | | 103,498 | |
3.375%, 05/01/2023 | | | | 225,000 | | | | | 233,957 | |
3.200%, 06/15/2026
Callable 03/15/2026 | | | | 200,000 | | | | | 209,123 | |
| | | | | | | | | | |
| | | | | | | | | 949,312 | |
| | | | | | | | | | |
| Diversified Telecommunication Services - 0.5% |
Verizon Communications, Inc.: | | | | | | | | | | |
2.450%, 11/01/2022
Callable 08/01/2022 | | | | 200,000 | | | | | 202,743 | |
3.500%, 11/01/2024
Callable 08/01/2024 | | | | 250,000 | | | | | 265,275 | |
| | | | | | | | | | |
| | | | | | | | | 468,018 | |
| | | | | | | | | | |
| Electrical Equipment & Instruments - 1.2% |
Emerson Electric Co.: | | | | | | | | | | |
2.625%, 02/15/2023
Callable 11/15/2022 | | | | 400,000 | | | | | 410,777 | |
3.150%, 06/01/2025
Callable 03/01/2025 | | | | 200,000 | | | | | 209,661 | |
Roper Technologies, Inc. | | | | | | | | | | |
2.800%, 12/15/2021
Callable 11/15/2021 | | | | 600,000 | | | | | 609,118 | |
| | | | | | | | | | |
| | | | | | | | | 1,229,556 | |
| | | | | | | | | | |
| Electronic Equipment & Instruments - 0.5% | | |
Trimble, Inc. | | | | | | | | | | |
4.150%, 06/15/2023
Callable 05/15/2023 | | | | 500,000 | | | | | 527,316 | |
| | | | | | | | | | |
| Food & Drug Retailing - 1.1% | | |
Costco Wholesale Corp. | | | | | | | | | | |
2.250%, 02/15/2022 | | | | 400,000 | | | | | 404,413 | |
Walmart, Inc. | | | | | | | | | | |
3.550%, 06/26/2025
Callable 04/26/2025 | | | | 700,000 | | | | | 752,522 | |
| | | | | | | | | | |
| | | | | | | | | 1,156,935 | |
| | | | | | | | | | |
| Health Care Equipment & Supplies - 0.3% | | |
Danaher Corp. | | | | | | | | | | |
3.350%, 09/15/2025
Callable 06/15/2025 | | | | 250,000 | | | | | 266,134 | |
| | | | | | | | | | |
| | | | | | | | | | |
| CORPORATE BONDS | | Principal
Amount | | Value |
| Health Care Providers & Services - 0.4% | | | | |
CVS Health Corp. | | | | | | | | | | |
2.125%, 06/01/2021
Callable 05/01/2021 | | | $ | 400,000 | | | | $ | 400,785 | |
| | | | | | | | | | |
| Hotels, Restaurants & Leisure - 0.3% | | | | |
McDonald’s Corp.: | | | | | | | | | | |
2.750%, 12/09/2020
Callable 11/09/2020 | | | | 200,000 | | | | | 201,408 | |
3.625%, 05/20/2021 | | | | 100,000 | | | | | 102,556 | |
| | | | | | | | | | |
| | | | | | | | | 303,964 | |
| | | | | | | | | | |
| Insurance - 0.7% | | | | |
Berkshire Hathaway, Inc. | | | | | | | | | | |
2.200%, 03/15/2021
Callable 02/15/2021 | | | | 710,000 | | | | | 712,904 | |
| | | | | | | | | | |
| Internet & Catalog Retail - 0.7% | | | | |
Amazon.com, Inc. | | | | | | | | | | |
3.300%, 12/05/2021
Callable 10/05/2021 | | | | 695,000 | | | | | 715,341 | |
| | | | | | | | | | |
| Machinery - 0.7% | | | | |
Illinois Tool Works, Inc. | | | | | | | | | | |
3.500%, 03/01/2024
Callable 12/01/2023 | | | | 715,000 | | | | | 758,786 | |
| | | | | | | | | | |
| Media & Entertainment - 1.2% | | | | |
Alphabet, Inc.: | | | | | | | | | | |
3.375%, 02/25/2024 | | | | 600,000 | | | | | 638,645 | |
1.998%, 08/15/2026
Callable 05/15/2026 | | | | 200,000 | | | | | 199,172 | |
TWDC Enterprises 18 Corp. | | | | | | | | | | |
2.300%, 02/12/2021 | | | | 420,000 | | | | | 422,873 | |
| | | | | | | | | | |
| | | | | | | | | 1,260,690 | |
| | | | | | | | | | |
| Oil & Gas & Consumable Fuels - 5.0% | | | | |
Chevron Corp. | | | | | | | | | | |
2.411%, 03/03/2022
Callable 01/03/2022 | | | | 500,000 | | | | | 506,751 | |
ConocoPhillips | | | | | | | | | | |
2.400%, 12/15/2022
Callable 09/15/2022 | | | | 490,000 | | | | | 495,760 | |
Enterprise Products Operating, LLC: | | | | | | | | | | |
2.850%, 04/15/2021
Callable 03/15/2021 | | | | 500,000 | | | | | 505,275 | |
3.750%, 02/15/2025
Callable 11/15/2024 | | | | 300,000 | | | | | 319,923 | |
EOG Resources, Inc. | | | | | | | | | | |
2.625%, 03/15/2023
Callable 12/15/2022 | | | | 600,000 | | | | | 611,520 | |
Exxon Mobil Corp.: | | | | | | | | | | |
2.222%, 03/01/2021
Callable 02/01/2021 | | | | 325,000 | | | | | 326,990 | |
2.709%, 03/06/2025
Callable 12/06/2024 | | | | 255,000 | | | | | 263,805 | |
3.043%, 03/01/2026
Callable 12/01/2025 | | | | 400,000 | | | | | 419,980 | |
The accompanying notes are an integral part of these financial statements.
24
|
| LKCM BALANCED FUND |
| SCHEDULEOF INVESTMENTS, CONTINUED |
| December 31, 2019 |
| | | | | | | | | | |
| CORPORATE BONDS | | Principal
Amount | | Value |
| Oil & Gas & Consumable Fuels - 5.0%, Continued |
Kinder Morgan Energy Partners, L.P. | | | | | | | | | | |
3.950%, 09/01/2022
Callable 06/01/2022 | | | $ | 400,000 | | | | $ | 417,034 | |
Occidental Petroleum Corp.: | | | | | | | | | | |
2.600%, 04/15/2022
Callable 03/15/2022 | | | | 500,000 | | | | | 503,933 | |
3.500%, 06/15/2025
Callable 03/15/2025 | | | | 250,000 | | | | | 258,370 | |
Schlumberger Investment SA (b) | | | | | | | | | | |
3.650%, 12/01/2023
Callable 09/01/2023 | | | | 500,000 | | | | | 529,406 | |
| | | | | | | | | | |
| | | | | | | | | 5,158,747 | |
| | | | | | | | | | |
| Pharmaceuticals - 1.6% | | | | |
Abbott Laboratories: | | | | | | | | | | |
3.400%, 11/30/2023
Callable 09/30/2023 | | | | 480,000 | | | | | 504,958 | |
3.875%, 09/15/2025
Callable 06/15/2025 | | | | 255,000 | | | | | 277,967 | |
Bristol-Myers Squibb Co. (c) | | | | | | | | | | |
3.625%, 05/15/2024
Callable 02/15/2024 | | | | 250,000 | | | | | 264,376 | |
Merck & Co., Inc. | | | | | | | | | | |
2.350%, 02/10/2022 | | | | 650,000 | | | | | 656,696 | |
| | | | | | | | | | |
| | | | | | | | | 1,703,997 | |
| | | | | | | | | | |
| Real Estate Investment Trusts - 0.6% | | | | |
American Tower Corp. | | | | | | | | | | |
3.375%, 10/15/2026
Callable 07/15/2026 | | | | 635,000 | | | | | 660,789 | |
| | | | | | | | | | |
| Road & Rail - 0.8% | | | | |
Burlington Northern Santa Fe, LLC | | | | | | | | | | |
3.000%, 03/15/2023
Callable 12/15/2022 | | | | 600,000 | | | | | 616,781 | |
Union Pacific Corp. | | | | | | | | | | |
3.750%, 07/15/2025
Callable 05/15/2025 | | | | 200,000 | | | | | 214,607 | |
| | | | | | | | | | |
| | | | | | | | | 831,388 | |
| | | | | | | | | | |
| Semiconductor Equipment & Products - 1.0% | | |
Intel Corp. | | | | | | | | | | |
3.700%, 07/29/2025
Callable 04/29/2025 | | | | 500,000 | | | | | 541,252 | |
Texas Instruments Inc. | | | | | | | | | | |
2.750%, 03/12/2021
Callable 02/12/2021 | | | | 470,000 | | | | | 474,946 | |
| | | | | | | | | | |
| | | | | | | | | 1,016,198 | |
| | | | | | | | | | |
| Software - 1.2% | | | | |
Microsoft Corp.: | | | | | | | | | | |
2.375%, 02/12/2022
Callable 01/12/2022 | | | | 400,000 | | | | | 405,563 | |
3.125%, 11/03/2025
Callable 08/03/2025 | | | | 230,000 | | | | | 243,316 | |
| | | | | | | | | | |
| CORPORATE BONDS | | Principal
Amount | | Value |
| Software - 1.2%, Continued | | | | |
Oracle Corp. | | | | | | | | | | |
2.800%, 07/08/2021 | | | $ | 625,000 | | | | $ | 634,715 | |
| | | | | | | | | | |
| | | | | | | | | 1,283,594 | |
| | | | | | | | | | |
| Specialty Retail - 1.1% | | | | |
The Home Depot, Inc.: | | | | | | | | | | |
2.625%, 06/01/2022
Callable 05/01/2022 | | | | 290,000 | | | | | 295,981 | |
2.800%, 09/14/2027
Callable 06/14/2027 | | | | 500,000 | | | | | 520,558 | |
O’Reilly Automotive, Inc. | | | | | | | | | | |
4.875%, 01/14/2021
Callable 10/14/2020 | | | | 300,000 | | | | | 306,892 | |
| | | | | | | | | | |
| | | | | | | | | 1,123,431 | |
| | | | | | | | | | |
TOTAL CORPORATE BONDS
(Cost $29,832,975) | | | | | | | | | 30,479,187 | |
| | | | | | | | | | |
| | | | | | | | | | |
| SHORT-TERM INVESTMENT - 0.4% | | Shares | | |
| Money Market Fund - 0.4% | | | | |
Invesco Short-Term Investments Trust - Government & Agency Portfolio - Institutional Shares, 1.51% (d) | | | | 464,623 | | | | | 464,623 | |
| | | | | | | | | | |
TOTAL SHORT-TERM INVESTMENT
(Cost $464,623) | | | | | 464,623 | |
| | | | | | | | | | |
Total Investments - 99.0%
(Cost $76,351,289) | | | | | 102,800,988 | |
Other Assets in Excess of Liabilities - 1.0% | | | | | 1,023,619 | |
| | | | | | | | | | |
TOTAL NET ASSETS - 100.0% | | | | | | | | $ | 103,824,607 | |
| | | | | | | | | | |
| (a) | Non-income producing security. |
| (b) | Security issued bynon-U.S. incorporated company. |
| (c) | Rule 144A security. Resale to the public may require registration or may extend only to qualified institutional buyers. The fair market value of the Rule 144A securities was $264,376 representing 0.3% of the Fund’s total net assets. |
| (d) | The rate quoted is the annualizedseven-day yield of the fund at period end. |
Investments are classified by industry pursuant to the Global Industry Classification Standard (GICS®), which was developed by and/or is the exclusive property of Morgan Stanley Capital International, Inc. (“MSCI”) and Standard & Poor’s Financial Services LLC (“S&P”). GICS is a service mark of MSCI and S&P and has been licensed for use by U.S. Bancorp Fund Services, LLC.
The accompanying notes are an integral part of these financial statements.
25
|
| LKCM FIXED INCOME FUND |
| SCHEDULEOF INVESTMENTS |
| December 31, 2019 |
| | | | | | | | | | |
| CORPORATE BONDS - 76.0% | | Principal
Amount | | Value |
| Aerospace & Defense - 0.7% |
Rockwell Collins, Inc. | | | | | | | | | | |
3.700%, 12/15/2023
Callable 09/15/2023 | | | $ | 1,750,000 | | | | $ | 1,846,065 | |
| | | | | | | | | | |
| Air Freight & Logistics - 1.3% |
FedEx Corp. | | | | | | | | | | |
3.250%, 04/01/2026
Callable 01/01/2026 | | | | 3,500,000 | | | | | 3,645,712 | |
| | | | | | | | | | |
| Banks - 9.8% |
Bank of America Corp.: | | | | | | | | | | |
2.625%, 10/19/2020 | | | | 2,600,000 | | | | | 2,615,223 | |
2.625%, 04/19/2021 | | | | 1,704,000 | | | | | 1,720,027 | |
3.146% (3 Month LIBOR USD +
1.180%), 10/21/2022 (a)
Callable 10/21/2021 | | | | 2,975,000 | | | | | 3,019,264 | |
4.450%, 03/03/2026 | | | | 2,000,000 | | | | | 2,198,288 | |
The Bank of New York Mellon Corp. | | | | | | | | | | |
2.800%, 05/04/2026
Callable 02/04/2026 | | | | 300,000 | | | | | 308,778 | |
Comerica, Inc. | | | | | | | | | | |
3.700%, 07/31/2023
Callable 06/30/2023 | | | | 2,000,000 | | | | | 2,103,762 | |
Truist Bank: | | | | | | | | | | |
2.625%, 01/15/2022
Callable 12/15/2021 | | | | 3,700,000 | | | | | 3,750,743 | |
3.200%, 04/01/2024
Callable 03/01/2024 | | | | 2,500,000 | | | | | 2,602,871 | |
3.300%, 05/15/2026
Callable 04/15/2026 | | | | 4,333,000 | | | | | 4,513,453 | |
Truist Financial Corp. | | | | | | | | | | |
2.464% (3 Month LIBOR USD +
0.570%), 06/15/2020 (a) | | | | 2,000,000 | | | | | 2,003,856 | |
Wells Fargo & Co.
4.125%, 08/15/2023 | | | | 2,000,000 | | | | | 2,124,967 | |
| | | | | | | | | | |
| | | | | | | | | 26,961,232 | |
| | | | | | | | | | |
| Chemicals - 0.7% |
Ecolab, Inc. | | | | | | | | | | |
2.375%, 08/10/2022
Callable 07/10/2022 | | | | 1,925,000 | | | | | 1,945,340 | |
| | | | | | | | | | |
| Communications Equipment - 0.4% |
QUALCOMM, Inc. | | | | | | | | | | |
2.900%, 05/20/2024
Callable 03/20/2024 | | | | 1,000,000 | | | | | 1,034,777 | |
| | | | | | | | | | |
| Computers & Peripherals - 2.3% |
Apple, Inc.: | | | | | | | | | | |
2.400%, 05/03/2023 | | | | 3,250,000 | | | | | 3,307,517 | |
2.500%, 02/09/2025 | | | | 2,975,000 | | | | | 3,032,388 | |
| | | | | | | | | | |
| | | | | | | | | 6,339,905 | |
| | | | | | | | | | |
| | | | | | | | | | |
| CORPORATE BONDS | | Principal
Amount | | Value |
| Consumer Finance - 3.4% |
American Express Co.: | | | | | | | | | | |
2.266% (3 Month LIBOR USD +
0.330%), 10/30/2020 (a)
Callable 09/29/2020 | | | $ | 2,000,000 | | | | $ | 2,002,896 | |
3.000%, 10/30/2024
Callable 09/29/2024 | | | | 2,000,000 | | | | | 2,069,188 | |
4.200%, 11/06/2025
Callable 10/06/2025 | | | | 2,000,000 | | | | | 2,206,645 | |
American Express Credit Corp. | | | | | | | | | | |
2.375%, 05/26/2020
Callable 04/25/2020 | | | | 3,000,000 | | | | | 3,003,801 | |
| | | | | | | | | | |
| | | | | | | | | 9,282,530 | |
| | | | | | | | | | |
| Containers & Packaging - 2.0% |
Ball Corp.: | | | | | | | | | | |
5.000%, 03/15/2022 | | | | 2,000,000 | | | | | 2,118,560 | |
5.250%, 07/01/2025 | | | | 3,000,000 | | | | | 3,347,505 | |
| | | | | | | | | | |
| | | | | | | | | 5,466,065 | |
| | | | | | | | | | |
| Diversified Financials - 4.3% |
JPMorgan Chase & Co.: | | | | | | | | | | |
2.889% (3 Month LIBOR USD +
0.955%), 01/23/2020 (a) | | | | 3,082,000 | | | | | 3,083,815 | |
2.840% (3 Month LIBOR USD +
0.900%), 04/25/2023 (a)
Callable 04/25/2022 | | | | 2,409,000 | | | | | 2,430,909 | |
3.375%, 05/01/2023 | | | | 2,000,000 | | | | | 2,079,615 | |
3.300%, 04/01/2026
Callable 01/01/2026 | | | | 3,500,000 | | | | | 3,687,083 | |
3.200%, 06/15/2026
Callable 03/15/2026 | | | | 636,000 | | | | | 665,013 | |
| | | | | | | | | | |
| | | | | | | | | 11,946,435 | |
| | | | | | | | | | |
| Diversified Telecommunication Services - 7.3% |
AT&T, Inc.: | | | | | | | | | | |
2.951% (3 Month LIBOR USD +
0.950%), 07/15/2021 (a) | | | | 2,975,000 | | | | | 3,004,081 | |
3.800%, 02/15/2027
Callable 11/15/2026 | | | | 2,000,000 | | | | | 2,135,296 | |
4.250%, 03/01/2027
Callable 12/01/2026 | | | | 4,000,000 | | | | | 4,396,973 | |
CenturyLink, Inc. | | | | | | | | | | |
5.800%, 03/15/2022 | | | | 2,500,000 | | | | | 2,632,625 | |
Verizon Communications, Inc.: | | | | | | | | | | |
2.894% (3 Month LIBOR USD +
1.000%), 03/16/2022 (a) | | | | 2,200,000 | | | | | 2,237,467 | |
2.450%, 11/01/2022
Callable 08/01/2022 | | | | 1,750,000 | | | | | 1,773,997 | |
3.500%, 11/01/2024
Callable 08/01/2024 | | | | 1,750,000 | | | | | 1,856,926 | |
4.125%, 03/16/2027 | | | | 2,000,000 | | | | | 2,222,292 | |
| | | | | | | | | | |
| | | | | | | | | 20,259,657 | |
| | | | | | | | | | |
The accompanying notes are an integral part of these financial statements.
26
|
| LKCM FIXED INCOME FUND |
| SCHEDULEOF INVESTMENTS, CONTINUED |
| December 31, 2019 |
| | | | | | | | | | |
| CORPORATE BONDS | | Principal
Amount | | Value |
| Electrical Equipment & Instruments - 2.8% |
Emerson Electric Co.: | | | | | | | | | | |
2.625%, 12/01/2021
Callable 11/01/2021 | | | $ | 950,000 | | | | $ | 966,435 | |
3.150%, 06/01/2025
Callable 03/01/2025 | | | | 5,000,000 | | | | | 5,241,528 | |
Rockwell Automation, Inc. | | | | | | | | | | |
2.875%, 03/01/2025
Callable 12/01/2024 | | | | 1,440,000 | | | | | 1,481,846 | |
| | | | | | | | | | |
| | | | | | | | | 7,689,809 | |
| | | | | | | | | | |
| Electronic Equipment & Instruments - 1.7% |
Trimble, Inc. | | | | | | | | | | |
4.150%, 06/15/2023
Callable 05/15/2023 | | | | 4,500,000 | | | | | 4,745,843 | |
| | | | | | | | | | |
| Health Care Equipment & Supplies - 5.4% |
Danaher Corp. | | | | | | | | | | |
3.350%, 09/15/2025
Callable 06/15/2025 | | | | 5,500,000 | | | | | 5,854,959 | |
Thermo Fisher Scientific, Inc.: | | | | | | | | | | |
4.150%, 02/01/2024
Callable 11/01/2023 | | | | 4,500,000 | | | | | 4,825,132 | |
2.950%, 09/19/2026
Callable 06/19/2026 | | | | 4,000,000 | | | | | 4,116,846 | |
| | | | | | | | | | |
| | | | | | | | | 14,796,937 | |
| | | | | | | | | | |
| Health Care Providers & Services - 2.4% |
CVS Health Corp.: | | | | | | | | | | |
2.605% (3 Month LIBOR USD +
0.720%), 03/09/2021 (a) | | | | 4,500,000 | | | | | 4,528,646 | |
4.125%, 05/15/2021
Callable 02/15/2021 | | | | 2,000,000 | | | | | 2,051,616 | |
| | | | | | | | | | |
| | | | | | | | | 6,580,262 | |
| | | | | | | | | | |
| Household Products - 0.3% |
The Procter & Gamble Co. | | | | | | | | | | |
8.000%, 09/01/2024 | | | | 775,000 | | | | | 982,900 | |
| | | | | | | | | | |
| Internet & Catalog Retail - 1.8% |
Amazon.com, Inc. | | | | | | | | | | |
2.500%, 11/29/2022
Callable 08/29/2022 | | | | 5,000,000 | | | | | 5,102,312 | |
| | | | | | | | | | |
| Media & Entertainment - 2.2% |
Alphabet, Inc.: | | | | | | | | | | |
3.375%, 02/25/2024 | | | | 4,000,000 | | | | | 4,257,637 | |
1.998%, 08/15/2026
Callable 05/15/2026 | | | | 1,725,000 | | | | | 1,717,858 | |
| | | | | | | | | | |
| | | | | | | | | 5,975,495 | |
| | | | | | | | | | |
| Multiline Retail - 1.7% |
Family Dollar Stores, Inc.
5.000%, 02/01/2021 | | | | 4,500,000 | | | | | 4,658,535 | |
| �� | | | | | | | | | |
| | | | | | | | | | |
| CORPORATE BONDS | | Principal
Amount | | Value |
| Oil & Gas & Consumable Fuels - 8.9% |
Chevron Corp.: | | | | | | | | | | |
2.411%, 03/03/2022
Callable 01/03/2022 | | | $ | 1,450,000 | | | | $ | 1,469,577 | |
2.355%, 12/05/2022
Callable 09/05/2022 | | | | 1,000,000 | | | | | 1,014,568 | |
2.954%, 05/16/2026
Callable 02/16/2026 | | | | 1,870,000 | | | | | 1,956,125 | |
ConocoPhillips Co. | | | | | | | | | | |
2.810% (3 Month LIBOR USD +
0.900%), 05/15/2022 (a) | | | | 700,000 | | | | | 710,346 | |
Enterprise Products Operating, LLC: | | | | | | | | | | |
2.800%, 02/15/2021 | | | | 2,000,000 | | | | | 2,019,552 | |
3.750%, 02/15/2025
Callable 11/15/2024 | | | | 5,463,000 | | | | | 5,825,799 | |
Kinder Morgan Energy Partners, L.P. | | | | | | | | | | |
4.250%, 09/01/2024
Callable 06/01/2024 | | | | 3,000,000 | | | | | 3,215,081 | |
Kinder Morgan Inc. | | | | | | | | | | |
3.281% (3 Month LIBOR USD + 1.280%), 01/15/2023 (a) | | | | 2,000,000 | | | | | 2,029,312 | |
Occidental Petroleum Corp.: | | | | | | | | | | |
2.600%, 04/15/2022
Callable 03/15/2022 | | | | 3,125,000 | | | | | 3,149,581 | |
3.500%, 06/15/2025
Callable 03/15/2025 | | | | 3,000,000 | | | | | 3,100,443 | |
| | | | | | | | | | |
| | | | | | | | | 24,490,384 | |
| | | | | | | | | | |
| Pharmaceuticals - 2.5% | | | | |
Abbott Laboratories | | | | | | | | | | |
3.400%, 11/30/2023
Callable 09/30/2023 | | | | 1,750,000 | | | | | 1,840,991 | |
Bristol-Myers Squibb Co. (b) | | | | | | | | | | |
3.625%, 05/15/2024
Callable 02/15/2024 | | | | 4,750,000 | | | | | 5,023,145 | |
| | | | | | | | | | |
| | | | | | | | | 6,864,136 | |
| | | | | | | | | | |
| Real Estate Investment Trusts - 3.8% | | | | |
American Tower Corp.: | | | | | | | | | | |
3.500%, 01/31/2023 | | | | 3,500,000 | | | | | 3,629,322 | |
5.000%, 02/15/2024 | | | | 2,500,000 | | | | | 2,751,268 | |
3.375%, 10/15/2026
Callable 07/15/2026 | | | | 4,030,000 | | | | | 4,193,667 | |
| | | | | | | | | | |
| | | | | | | | | 10,574,257 | |
| | | | | | | | | | |
| Road & Rail - 5.0% | | | | |
Burlington Northern Santa Fe, LLC | | | | | | | | | | |
3.000%, 03/15/2023
Callable 12/15/2022 | | | | 4,695,000 | | | | | 4,826,313 | |
Union Pacific Corp.: | | | | | | | | | | |
2.250%, 06/19/2020
Callable 05/19/2020 | | | | 4,125,000 | | | | | 4,129,781 | |
3.250%, 01/15/2025
Callable 10/15/2024 | | | | 1,500,000 | | | | | 1,572,833 | |
The accompanying notes are an integral part of these financial statements.
27
|
| LKCM FIXED INCOME FUND |
| SCHEDULEOF INVESTMENTS, CONTINUED |
| December 31, 2019 |
| | | | | | | | | | |
| CORPORATE BONDS | | Principal
Amount | | Value |
| Road & Rail - 5.0%, Continued | | | | |
3.750%, 07/15/2025
Callable 05/15/2025 | | | $ | 3,025,000 | | | | $ | 3,245,932 | |
| | | | | | | | | | |
| | | | | | | | | 13,774,859 | |
| | | | | | | | | | |
| Semiconductor Equipment & Products - 0.9% |
Intel Corp. | | | | | | | | | | |
3.700%, 07/29/2025
Callable 04/29/2025 | | | | 2,250,000 | | | | | 2,435,634 | |
| | | | | | | | | | |
| Software - 1.7% | | | | |
Oracle Corp. | | | | | | | | | | |
3.250%, 11/15/2027
Callable 08/15/2027 | | | | 4,500,000 | | | | | 4,773,304 | |
| | | | | | | | | | |
| Software & Services - 0.9% |
Sabre GLBL, Inc. (b) | | | | | | | | | | |
5.375%, 04/15/2023
Callable 1/31/2020 | | | | 2,500,000 | | | | | 2,566,462 | |
| | | | | | | | | | |
| Specialty Retail - 1.8% | | | | |
The Home Depot Inc. | | | | | | | | | | |
2.950%, 06/15/2029
Callable 03/15/2029 | | | | 2,500,000 | | | | | 2,604,403 | |
O’Reilly Automotive, Inc. | | | | | | | | | | |
4.875%, 01/14/2021
Callable 10/14/2020 | | | | 2,203,000 | | | | | 2,253,613 | |
| | | | | | | | | | |
| | | | | | | | | 4,858,016 | |
| | | | | | | | | | |
TOTAL CORPORATE BONDS
(Cost $203,995,560) | | | | | | | | | 209,596,863 | |
| | | | | | | | | | |
| | | | | | | | | | |
| U.S. GOVERNMENT ISSUES - 10.1% | | |
| U.S. Treasury Inflation Indexed Bonds - 1.4% |
0.625%, 01/15/2024 | | | | 3,860,220 | | | | | 3,942,526 | |
| | | | | | | | | | |
| U.S. Treasury Notes - 8.7% | | | | |
2.000%, 07/31/2020 | | | | 2,000,000 | | | | | 2,004,258 | |
1.750%, 07/15/2022 | | | | 2,000,000 | | | | | 2,008,125 | |
2.000%, 02/15/2023 | | | | 2,000,000 | | | | | 2,023,984 | |
2.000%, 02/15/2025 | | | | 2,000,000 | | | | | 2,029,531 | |
2.000%, 08/15/2025 | | | | 1,000,000 | | | | | 1,013,984 | |
1.625%, 02/15/2026 | | | | 2,000,000 | | | | | 1,982,930 | |
2.375%, 05/15/2027 | | | | 4,000,000 | | | | | 4,150,078 | |
2.750%, 02/15/2028 | | | | 2,000,000 | | | | | 2,132,734 | |
2.875%, 08/15/2028 | | | | 3,000,000 | | | | | 3,236,250 | |
3.125%, 11/15/2028 | | | | 3,000,000 | | | | | 3,301,524 | |
| | | | | | | | | | |
| | | | | | | | | 23,883,398 | |
| | | | | | | | | | |
TOTAL U.S. GOVERNMENT ISSUES
(Cost $26,779,838) | | | | | | | | | 27,825,924 | |
| | | | | | | | | | |
| | | | | | | | | | |
U.S. GOVERNMENT SPONSORED
ENTITIES - 12.1% | | Principal
Amount | | Value |
| Fannie Mae - 0.4% | | | | |
2.000%, 10/26/2021 (c)
Callable 01/26/2020 | | | $ | 1,040,000 | | | | $ | 1,040,160 | |
| | | | | | | | | | |
| Federal Home Loan Bank - 0.5% | | | | |
2.500%, 05/15/2026 (c)
Callable 05/15/2020 | | | | 1,400,000 | | | | | 1,401,628 | |
| | | | | | | | | | |
| Freddie Mac - 11.2% | | | | |
1.500%, 08/25/2021 (c)
Callable 02/25/2020 | | | | 1,600,000 | | | | | 1,598,282 | |
2.375%, 01/13/2022 | | | | 2,000,000 | | | | | 2,031,231 | |
2.000%, 10/27/2023 (c)
Callable 01/27/2020 | | | | 4,500,000 | | | | | 4,500,011 | |
1.750%, 12/04/2023 (c)
Callable 03/04/2020 | | | | 3,000,000 | | | | | 2,998,349 | |
2.000%, 09/30/2024 (c)
Callable 03/20/2020 | | | | 2,326,000 | | | | | 2,309,769 | |
2.000%, 10/10/2024 (c)
Callable 01/10/2020 | | | | 862,000 | | | | | 861,134 | |
2.000%, 10/10/2024 (c)
Callable 01/10/2020 | | | | 3,200,000 | | | | | 3,193,635 | |
2.000%, 10/21/2024 (c)
Callable 04/21/2020 | | | | 2,500,000 | | | | | 2,497,614 | |
2.000%, 11/08/2024 (c)
Callable 05/08/2020 | | | | 3,000,000 | | | | | 2,989,010 | |
1.875%, 11/27/2024 (c)
Callable 02/27/2020 | | | | 2,000,000 | | | | | 1,998,707 | |
1.900%, 12/23/2024 (c)
Callable 06/23/2020 | | | | 4,000,000 | | | | | 3,996,643 | |
1.950%, 12/30/2024 (c)
Callable 03/30/2020 | | | | 2,000,000 | | | | | 1,999,205 | |
| | | | | | | | | | |
| | | | | | | | | 30,973,590 | |
| | | | | | | | | | |
TOTAL U.S. GOVERNMENT SPONSORED ENTITIES
(Cost $33,443,429) | | | | | | | | | 33,415,378 | |
| | | | | | | | | | |
| | | | | | | | | | |
| SHORT-TERM INVESTMENT - 1.1% | | Shares | | |
| Money Market Fund - 1.1% | | | | |
Invesco Short-Term Investments Trust - Government & Agency Portfolio - Institutional Shares, 1.51% (d) | | | | 3,063,042 | | | | | 3,063,042 | |
| | | | | | | | | | |
TOTAL SHORT-TERM INVESTMENT
(Cost $3,063,042) | | | | | | | | | 3,063,042 | |
| | | | | | | | | | |
Total Investments - 99.3%
(Cost $267,281,869) | | | | | 273,901,207 | |
Other Assets in Excess of Liabilities - 0.7% | | | | | 2,015,565 | |
| | | | | | | | | | |
TOTAL NET ASSETS - 100.0% | | | | | | | | $ | 275,916,772 | |
| | | | | | | | | | |
| (b) | Rule 144A security. Resale to the public may require registration or may extend only to qualified institutional buyers. The value of the Rule 144A securities was $7,589,607 representing 2.8% of the Fund’s total net assets. |
The accompanying notes are an integral part of these financial statements.
28
|
| LKCM FIXED INCOME FUND |
| SCHEDULEOF INVESTMENTS, CONTINUED |
| December 31, 2019 |
| (c) | Step-up bond that pays an initial coupon rate for the first period and then a higher coupon rate for the following periods. Rate as of period end. |
| (d) | The rate quoted is the annualizedseven-day yield of the fund at period end. |
Investments are classified by industry pursuant to the Global Industry Classification Standard (GICS®), which was developed by and/or is the exclusive property of Morgan Stanley Capital International, Inc. (“MSCI”) and Standard & Poor’s Financial Services LLC (“S&P”). GICS is a service mark of MSCI and S&P and has been licensed for use by U.S. Bancorp Fund Services, LLC.
The accompanying notes are an integral part of these financial statements.
29
|
| LKCM INTERNATIONAL EQUITY FUND |
| SCHEDULEOF INVESTMENTS |
| December 31, 2019 |
| | | | | | | | | | |
| COMMON STOCKS - 91.1% | | Shares | | Value |
| AUSTRALIA - 2.7% | | | | |
| Pharmaceuticals - 2.7% | | | | |
CSL Ltd. | | | | 1,500 | | | | $ | 290,823 | |
| | | | | | | | | | |
Total Australia | | | | | | | | | 290,823 | |
| | | | | | | | | | |
| BELGIUM - 1.4% | | | | |
| Beverages - 1.4% | | | | |
Anheuser-Busch InBev SA/NV | | | | 1,840 | | | | | 150,697 | |
| | | | | | | | | | |
Total Belgium | | | | | | | | | 150,697 | |
| | | | | | | | | | |
| FINLAND - 2.1% | | | | |
| Banks - 2.1% | | | | |
Nordea Bank Abp | | | | 27,700 | | | | | 224,098 | |
| | | | | | | | | | |
Total Finland | | | | | | | | | 224,098 | |
| | | | | | | | | | |
| FRANCE - 14.4% | | | | |
| Aerospace & Defense - 2.5% | | | | |
Safran SA | | | | 1,735 | | | | | 267,988 | |
| | | | | | | | | | |
| Chemicals - 2.5% | | | | |
Air Liquide SA | | | | 1,880 | | | | | 266,530 | |
| | | | | | | | | | |
| Electrical Equipment & Instruments - 2.6% | | | | |
Schneider Electric SA | | | | 2,700 | | | | | 277,398 | |
| | | | | | | | | | |
| IT Consulting & Services - 2.2% | | | | |
Cap Gemini | | | | 1,925 | | | | | 235,438 | |
| | | | | | | | | | |
| Oil & Gas & Consumable Fuels - 2.1% | | | | |
TOTAL SA | | | | 4,050 | | | | | 224,738 | |
| | | | | | | | | | |
| Specialty Retail - 2.5% | | | | |
LVMH Moet Hennessy Louis Vuitton SE | | | | 555 | | | | | 258,606 | |
| | | | | | | | | | |
Total France | | | | | | | | | 1,530,698 | |
| | | | | | | | | | |
| GERMANY - 6.4% | | | | |
| Machinery - 2.0% | | | | |
KION Group AG | | | | 3,060 | | | | | 210,429 | |
| | | | | | | | | | |
| Semiconductor Equipment & Products - 1.7% | | |
Infineon Technologies AG | | | | 8,000 | | | | | 180,756 | |
| | | | | | | | | | |
| Software - 2.7% | | | | |
SAP SE | | | | 2,165 | | | | | 291,406 | |
| | | | | | | | | | |
Total Germany | | | | | | | | | 682,591 | |
| | | | | | | | | | |
| IRELAND - 2.7% | | | | |
| Construction Materials - 2.7% | | | | |
CRH PLC | | | | 7,120 | | | | | 285,577 | |
| | | | | | | | | | |
Total Ireland | | | | | | | | | 285,577 | |
| | | | | | | | | | |
| ITALY - 3.6% | | | | |
| Banks - 1.8% | | | | |
UniCredit SpA | | | | 12,650 | | | | | 184,906 | |
| | | | | | | | | | |
| Textiles, Apparel & Luxury Goods - 1.8% | | | | |
Moncler SpA | | | | 4,300 | | | | | 193,532 | |
| | | | | | | | | | |
Total Italy | | | | | | | | | 378,438 | |
| | | | | | | | | | |
| | | | | | | | | | |
| COMMON STOCKS | | Shares | | Value |
| JAPAN - 8.2% | | | | |
| Computers & Peripherals - 1.8% | | | | |
Nidec Corp. | | | | 1,375 | | | | $ | 187,803 | |
| | | | | | | | | | |
| Food & Drug Retailing - 2.2% | | | | |
Tsuruha Holdings, Inc. | | | | 1,830 | | | | | 234,968 | |
| | | | | | | | | | |
| Media & Entertainment - 2.5% | | | | |
Nintendo Co., Ltd. | | | | 665 | | | | | 265,974 | |
| | | | | | | | | | |
| Personal Products - 1.7% | | | | |
Shiseido Co., Ltd. | | | | 2,535 | | | | | 180,010 | |
| | | | | | | | | | |
Total Japan | | | | | | | | | 868,755 | |
| | | | | | | | | | |
| JERSEY - 2.9% | | | | |
| Trading Companies & Distributors - 2.9% | | | | |
Ferguson PLC | | | | 3,450 | | | | | 313,976 | |
| | | | | | | | | | |
Total Jersey | | | | | | | | | 313,976 | |
| | | | | | | | | | |
| NETHERLANDS - 5.3% | | | | |
| Banks - 2.1% | | | | |
ING Groep NV | | | | 18,850 | | | | | 226,623 | |
| | | | | | | | | | |
| Semiconductor Equipment & Products - 3.2% | | |
ASML Holding NV | | | | 1,130 | | | | | 334,546 | |
| | | | | | | | | | |
Total Netherlands | | | | | | | | | 561,169 | |
| | | | | | | | | | |
| PORTUGAL - 1.5% | | | | |
| Oil & Gas & Consumable Fuels - 1.5% | | | | |
Galp Energia SGPS SA | | | | 9,635 | | | | | 161,754 | |
| | | | | | | | | | |
Total Portugal | | | | | | | | | 161,754 | |
| | | | | | | | | | |
| SPAIN - 2.9% | | | | |
| Banks - 1.4% | | | | |
CaixaBank SA | | | | 47,500 | | | | | 149,581 | |
| | | | | | | | | | |
| Machinery - 1.5% | | | | |
Fluidra SA (a) | | | | 11,650 | | | | | 159,428 | |
| | | | | | | | | | |
Total Spain | | | | | | | | | 309,009 | |
| | | | | | | | | | |
| SWEDEN - 1.9% | | | | |
| Oil & Gas & Consumable Fuels - 1.9% | | | | |
Lundin Petroleum AB | | | | 6,090 | | | | | 206,783 | |
| | | | | | | | | | |
Total Sweden | | | | | | | | | 206,783 | |
| | | | | | | | | | |
| SWITZERLAND - 11.5% | | | | |
| Banks - 2.3% | | | | |
Julius Baer Group Ltd. | | | | 4,750 | | | | | 244,876 | |
| | | | | | | | | | |
| Electrical Equipment & Instruments - 2.3% | | | | |
ABB Ltd. | | | | 10,000 | | | | | 241,231 | |
| | | | | | | | | | |
| Health Care Equipment & Supplies - 1.8% | | | | |
Alcon, Inc. (a) | | | | 3,435 | | | | | 194,564 | |
| | | | | | | | | | |
| Pharmaceuticals - 5.1% | | | | |
Lonza Group AG | | | | 715 | | | | | 260,838 | |
Roche Holding AG | | | | 860 | | | | | 279,503 | |
| | | | | | | | | | |
| | | | | | | | | 540,341 | |
| | | | | | | | | | |
Total Switzerland | | | | | | | | | 1,221,012 | |
| | | | | | | | | | |
The accompanying notes are an integral part of these financial statements.
30
|
| LKCM INTERNATIONAL EQUITY FUND |
| SCHEDULEOF INVESTMENTS, CONTINUED |
| December 31, 2019 |
| | | | | | | | | | |
| COMMON STOCKS | | Shares | | Value |
| UNITED KINGDOM - 23.6% | | | | |
| Banks - 2.1% | | | | |
Lloyds Banking Group PLC | | | | 270,000 | | | | $ | 223,675 | |
| | | | | | | | | | |
| Beverages - 1.8% | | | | |
Diageo PLC | | | | 4,600 | | | | | 193,830 | |
| | | | | | | | | | |
| Commercial Services & Supplies - 2.8% | | | | |
Rentokil Initial Plc | | | | 48,500 | | | | | 290,690 | |
| | | | | | | | | | |
| Hotels, Restaurants & Leisure - 4.6% | | | | |
Compass Group PLC | | | | 9,400 | | | | | 235,582 | |
InterContinental Hotels Group PLC | | | | 3,615 | | | | | 248,406 | |
| | | | | | | | | | |
| | | | | | | | | 483,988 | |
| | | | | | | | | | |
| Household Products - 1.9% | | | | |
Reckitt Benckiser Group PLC | | | | 2,550 | | | | | 207,134 | |
| | | | | | | | | | |
| Insurance - 1.9% | | | | |
Prudential PLC | | | | 10,815 | | | | | 207,224 | |
| | | | | | | | | | |
| Oil & Gas & Consumable Fuels - 2.2% | | | | |
Royal Dutch Shell PLC - A Shares | | | | 7,890 | | | | | 233,658 | |
| | | | | | | | | | |
| Personal Products - 2.2% | | | | |
Unilever PLC | | | | 4,075 | | | | | 233,265 | |
| | | | | | | | | | |
| Specialty Retail - 1.8% | | | | |
Burberry Group PLC | | | | 6,600 | | | | | 192,692 | |
| | | | | | | | | | |
| Trading Companies & Distributors - 2.3% | | | | |
Ashtead Group PLC | | | | 7,750 | | | | | 247,806 | |
| | | | | | | | | | |
Total United Kingdom | | | | | | | | | 2,513,962 | |
| | | | | | | | | | |
TOTAL COMMON STOCKS
(Cost $8,738,164) | | | | | | | | | 9,699,342 | |
| | | | | | | | | | |
| | | | | | | | | | |
| PREFERRED STOCK - 2.0% | | | | |
| GERMANY - 2.0% | | | | |
| Health Care Equipment & Supplies - 2.0% |
Sartorius AG | | | | 980 | | | | | 209,488 | |
| | | | | | | | | | |
Total Germany | | | | | | | | | 209,488 | |
| | | | | | | | | | |
TOTAL PREFERRED STOCK
(Cost $194,182) | | | | | | | | | 209,488 | |
| | | | | | | | | | |
| | | | | | | | | | |
| SHORT-TERM INVESTMENTS - 7.0% | | | | |
| Money Market Funds - 7.0% | | | | |
Fidelity Investments Money Market Government Portfolio - Class I, 1.49% (b) | | | | 148,388 | | | | | 148,388 | |
Morgan Stanley Institutional Liquidity Funds - Government Portfolio - Institutional Shares, 1.48% (b) | | | | 300,000 | | | | | 300,000 | |
| | | | | | | | | | |
| SHORT-TERM INVESTMENTS | | Shares | | Value |
| Money Market Funds - 7.0%, Continued | | | | |
Invesco Short-Term Investments Trust - Government & Agency Portfolio - Institutional Shares, 1.51% (b) | | | | 300,000 | | | | $ | 300,000 | |
| | | | | | | | | | |
TOTAL SHORT-TERM INVESTMENTS
(Cost $748,388) | | | | | | | | | 748,388 | |
| | | | | | | | | | |
Total Investments - 100.1%
(Cost $9,680,734) | | | | | | | | | 10,657,218 | |
Liabilities in Excess of Other Assets - (0.1)% | | | | | (11,888 | ) |
| | | | | | | | | | |
TOTAL NET ASSETS - 100.0% | | | | | | | | $ | 10,645,330 | |
| | | | | | | | | | |
| (a) | Non-income producing security. |
| (b) | The rate quoted is the annualizedseven-day yield of the fund at period end. |
Investments are classified by industry pursuant to the Global Industry Classification Standard (GICS®), which was developed by and/or is the exclusive property of Morgan Stanley Capital International, Inc. (“MSCI”) and Standard & Poor’s Financial Services LLC (“S&P”). GICS is a service mark of MSCI and S&P and has been licensed for use by U.S. Bancorp Fund Services, LLC.
The accompanying notes are an integral part of these financial statements.
31
|
| STATEMENTOF ASSETSAND LIABILITIES |
| December 31, 2019 |
| | | | | | | | | | | | | | | | | | | | | | | | | | | | | | | | | | | | | | | | | | | | | | | | | | | | | | | | | | | | |
| | | | | | | | | | | | |
| | | | | LKCM
Small Cap
Equity Fund | | | | LKCM
Small-Mid Cap
Equity Fund | | | | LKCM
Equity
Fund | | | | LKCM
Balanced
Fund | | | | LKCM
Fixed
Income Fund | | | | LKCM
International
Equity Fund |
| | | | | | | | | | | | | | | | | | | | | | | | | | | | | | | | | | | | | | | | | | | | | | | | | | | | | | | | | | | | |
Assets: | | | | | | | | | | | | | | | | | | | | | | | | | | | | | | | | | | | | | | | | | | | | | | | | | | | | | | | | | | | | |
Investments, at value* | | | | | | | | $ | 180,518,463 | | | | | | | | | $ | 12,599,774 | | | | | | | | | $ | 380,652,087 | | | | | | | | | $ | 102,800,988 | | | | | | | | | $ | 273,901,207 | | | | | | | | | $ | 10,657,218 | |
Receivable for Fund shares sold | | | | | | | | | 663,094 | | | | | | | | | | 6,000 | | | | | | | | | | 835,190 | | | | | | | | | | 880,995 | | | | | | | | | | 210,940 | | | | | | | | | | 6,000 | |
Dividends and interest receivable | | | | | | | | | 56,581 | | | | | | | | | | 2,820 | | | | | | | | | | 540,357 | | | | | | | | | | 293,316 | | | | | | | | | | 2,031,237 | | | | | | | | | | 9,171 | |
Receivable for investment advisory fees (Note B) | | | | | | | | | — | | | | | | | | | | 182 | | | | | | | | | | — | | | | | | | | | | — | | | | | | | | | | — | | | | | | | | | | 14,259 | |
Deferred offering costs | | | | | | | | | — | | | | | | | | | | — | | | | | | | | | | — | | | | | | | | | | — | | | | | | | | | | — | | | | | | | | | | 1,936 | |
Other assets | | | | | | | | | 19,052 | | | | | | | | | | 6,889 | | | | | | | | | | 29,035 | | | | | | | | | | 11,632 | | | | | | | | | | 21,933 | | | | | | | | | | 1,415 | |
| | | | | | | | | | | | | | | | | | | | | | | | | | | | | | | | | | | | | | | | | | | | | | | | | | | | | | | | | | | | |
Total assets | | | | | | | | | 181,257,190 | | | | | | | | | | 12,615,665 | | | | | | | | | | 382,056,669 | | | | | | | | | | 103,986,931 | | | | | | | | | | 276,165,317 | | | | | | | | | | 10,689,999 | |
| | | | | | | | | | | | | | | | | | | | | | | | | | | | | | | | | | | | | | | | | | | | | | | | | | | | | | | | | | | | |
Liabilities: | | | | | | | | | | | | | | | | | | | | | | | | | | | | | | | | | | | | | | | | | | | | | | | | | | | | | | | | | | | | |
Payable for Fund shares redeemed | | | | | | | | | 174,155 | | | | | | | | | | — | | | | | | | | | | 148,176 | | | | | | | | | | 11,258 | | | | | | | | | | — | | | | | | | | | | — | |
Payable for investment advisory fees (Note B) | | | | | | | | | 311,657 | | | | | | | | | | — | | | | | | | | | | 457,954 | | | | | | | | | | 99,436 | | | | | | | | | | 136,029 | | | | | | | | | | — | |
Payable for administrative fees | | | | | | | | | 25,522 | | | | | | | | | | 6,861 | | | | | | | | | | 47,837 | | | | | | | | | | 13,884 | | | | | | | | | | 37,258 | | | | | | | | | | 6,798 | |
Payable for accounting and transfer agent fees and expenses | | | | | | | | | 24,310 | | | | | | | | | | 10,045 | | | | | | | | | | 31,695 | | | | | | | | | | 15,710 | | | | | | | | | | 24,352 | | | | | | | | | | 9,872 | |
Payable for professional fees | | | | | | | | | 23,578 | | | | | | | | | | 6,242 | | | | | | | | | | 37,160 | | | | | | | | | | 14,479 | | | | | | | | | | 31,658 | | | | | | | | | | 22,486 | |
Payable for trustees’ fees and officer compensation (Note B) | | | | | | | | | 7,029 | | | | | | | | | | 469 | | | | | | | | | | 13,586 | | | | | | | | | | 3,656 | | | | | | | | | | 10,289 | | | | | | | | | | 366 | |
Payable for reports to shareholders | | | | | | | | | 4,273 | | | | | | | | | | 696 | | | | | | | | | | 7,025 | | | | | | | | | | 1,975 | | | | | | | | | | 4,226 | | | | | | | | | | 335 | |
Payable for custody fees and expenses | | | | | | | | | 4,231 | | | | | | | | | | 1,006 | | | | | | | | | | 6,263 | | | | | | | | | | 1,926 | | | | | | | | | | 4,733 | | | | | | | | | | 4,812 | |
| | | | | | | | | | | | | | | | | | | | | | | | | | | | | | | | | | | | | | | | | | | | | | | | | | | | | | | | | | | | |
Total liabilities | | | | | | | | | 574,755 | | | | | | | | | | 25,319 | | | | | | | | | | 749,696 | | | | | | | | | | 162,324 | | | | | | | | | | 248,545 | | | | | | | | | | 44,669 | |
| | | | | | | | | | | | | | | | | | | | | | | | | | | | | | | | | | | | | | | | | | | | | | | | | | | | | | | | | | | | |
Net assets | | | | | | | | $ | 180,682,435 | | | | | | | | | $ | 12,590,346 | | | | | | | | | $ | 381,306,973 | | | | | | | | | $ | 103,824,607 | | | | | | | | | $ | 275,916,772 | | | | | | | | | $ | 10,645,330 | |
| | | | | | | | | | | | | | | | | | | | | | | | | | | | | | | | | | | | | | | | | | | | | | | | | | | | | | | | | | | | |
Net assets consist of: | | | | | | | | | | | | | | | | | | | | | | | | | | | | | | | | | | | | | | | | | | | | | | | | | | | | | | | | | | | | |
Paid in capital | | | | | | | | $ | 127,182,083 | | | | | | | | | $ | 8,884,114 | | | | | | | | | $ | 198,485,156 | | | | | | | | | $ | 77,348,878 | | | | | | | | | $ | 269,765,583 | | | | | | | | | $ | 9,671,237 | |
Total distributable earnings | | | | | | | | | 53,500,352 | | | | | | | | | | 3,706,232 | | | | | | | | | | 182,821,817 | | | | | | | | | | 26,475,729 | | | | | | | | | | 6,151,189 | | | | | | | | | | 974,093 | |
| | | | | | | | | | | | | | | | | | | | | | | | | | | | | | | | | | | | | | | | | | | | | | | | | | | | | | | | | | | | |
Net assets | | | | | | | | $ | 180,682,435 | | | | | | | | | $ | 12,590,346 | | | | | | | | | $ | 381,306,973 | | | | | | | | | $ | 103,824,607 | | | | | | | | | $ | 275,916,772 | | | | | | | | | $ | 10,645,330 | |
| | | | | | | | | | | | | | | | | | | | | | | | | | | | | | | | | | | | | | | | | | | | | | | | | | | | | | | | | | | | |
Shares of beneficial interest outstanding
(unlimited shares of no par value authorized) | | | | | | | | | 10,767,590 | | | | | | | | | | 1,385,472 | | | | | | | | | | 13,139,310 | | | | | | | | | | 4,286,372 | | | | | | | | | | 25,277,707 | | | | | | | | | | 977,677 | |
Net asset value per share
(offering and redemption price) | | | | | | | | $ | 16.78 | | | | | | | | | $ | 9.09 | | | | | | | | | $ | 29.02 | | | | | | | | | $ | 24.22 | | | | | | | | | $ | 10.92 | | | | | | | | | $ | 10.89 | |
| | | | | | | | | | | | | | | | | | | | | | | | | | | | | | | | | | | | | | | | | | | | | | | | | | | | | | | | | | | | |
| | | | | | | | | | | | |
* Cost of investments | | | | | | | | $ | 127,533,577 | | | | | | | | | $ | 9,082,911 | | | | | | | | | $ | 197,759,971 | | | | | | | | | $ | 76,351,289 | | | | | | | | | $ | 267,281,869 | | | | | | | | | $ | 9,680,734 | |
| | | | | | | | | | | | | | | | | | | | | | | | | | | | | | | | | | | | | | | | | | | | | | | | | | | | | | | | | | | | |
The accompanying notes are an integral part of these financial statements.
32
| | | | | | | | | | | | | | | | | | | | | | | | | | | | | | | | | | | | | | | | | | | | | | | | | | | | | | | | | | | | |
| | | | |
| | | | | For the Year Ended December 31, 2019 | | | | May 1, 2019(1)
through
December 31,
2019 |
| | | | | | | | | | | | | | | | | | | | | | | | | | | | | | | | | | | | | | | | | | | | | | | | | | | | | | | | | | | | |
| | | | | | | | | | | | |
| | | | | LKCM
Small Cap
Equity Fund | | | | LKCM
Small-Mid Cap
Equity Fund | | | | LKCM
Equity
Fund | | | | LKCM
Balanced
Fund | | | | LKCM
Fixed
Income Fund | | | | LKCM
International
Equity Fund |
| | | | | | | | | | | | | | | | | | | | | | | | | | | | | | | | | | | | | | | | | | | | | | | | | | | | | | | | | | | | |
Investment Income: | | | | | | | | | | | | | | | | | | | | | | | | | | | | | | | | | | | | | | | | | | | | | | | | | | | | | | | | | | | | |
Dividends* | | | | | | | | $ | 1,466,742 | | | | | | | | | $ | 85,877 | | | | | | | | | $ | 5,411,544 | | | | | | | | | $ | 1,084,139 | | | | | | | | | $ | — | | | | | | | | | $ | 57,624 | |
Interest | | | | | | | | | 122,486 | | | | | | | | | | 10,595 | | | | | | | | | | 271,233 | | | | | | | | | | 810,992 | | | | | | | | | | 7,475,440 | | | | | | | | | | 10,506 | |
Other income | | | | | | | | | — | | | | | | | | | | — | | | | | | | | | | — | | | | | | | | | | — | | | | | | | | | | — | | | | | | | | | | 339 | |
| | | | | | | | | | | | | | | | | | | | | | | | | | | | | | | | | | | | | | | | | | | | | | | | | | | | | | | | | | | | |
Total income | | | | | | | | | 1,589,228 | | | | | | | | | | 96,472 | | | | | | | | | | 5,682,777 | | | | | | | | | | 1,895,131 | | | | | | | | | | 7,475,440 | | | | | | | | | | 68,469 | |
| | | | | | | | | | | | | | | | | | | | | | | | | | | | | | | | | | | | | | | | | | | | | | | | | | | | | | | | | | | | |
| | | | | | | | | | | | |
Expenses: | | | | | | | | | | | | | | | | | | | | | | | | | | | | | | | | | | | | | | | | | | | | | | | | | | | | | | | | | | | | |
Investment advisory fees (Note B) | | | | | | | | | 1,364,728 | | | | | | | | | | 96,354 | | | | | | | | | | 2,488,674 | | | | | | | | | | 630,911 | | | | | | | | | | 1,331,207 | | | | | | | | | | 46,403 | |
Accounting and transfer agent fees and expenses | | | | | | | | | 148,668 | | | | | | | | | | 61,928 | | | | | | | | | | 226,605 | | | | | | | | | | 105,556 | | | | | | | | | | 159,991 | | | | | | | | | | 39,560 | |
Administrative fees | | | | | | | | | 148,294 | | | | | | | | | | 40,940 | | | | | | | | | | 283,348 | | | | | | | | | | 80,440 | | | | | | | | | | 218,781 | | | | | | | | | | 27,100 | |
Trustees’ fees and officer
compensation (Note B) | | | | | | | | | 121,459 | | | | | | | | | | 9,289 | | | | | | | | | | 226,232 | | | | | | | | | | 60,025 | | | | | | | | | | 167,655 | | | | | | | | | | 1,826 | |
Professional fees | | | | | | | | | 82,014 | | | | | | | | | | 10,435 | | | | | | | | | | 149,988 | | | | | | | | | | 45,377 | | | | | | | | | | 116,001 | | | | | | | | | | 23,253 | |
Federal and state registration | | | | | | | | | 42,071 | | | | | | | | | | 22,930 | | | | | | | | | | 53,753 | | | | | | | | | | 22,941 | | | | | | | | | | 38,016 | | | | | | | | | | 5,282 | |
Custody fees and expenses | | | | | | | | | 21,965 | | | | | | | | | | 6,232 | | | | | | | | | | 37,176 | | | | | | | | | | 10,696 | | | | | | | | | | 27,342 | | | | | | | | | | 30,400 | |
Reports to shareholders | | | | | | | | | 14,831 | | | | | | | | | | 1,666 | | | | | | | | | | 27,894 | | | | | | | | | | 8,338 | | | | | | | | | | 18,887 | | | | | | | | | | 474 | |
Offering costs | | | | | | | | | — | | | | | | | | | | — | | | | | | | | | | — | | | | | | | | | | — | | | | | | | | | | — | | | | | | | | | | 3,929 | |
Organizational costs | | | | | | | | | — | | | | | | | | | | — | | | | | | | | | | — | | | | | | | | | | — | | | | | | | | | | — | | | | | | | | | | 32,469 | |
Other | | | | | | | | | 7,015 | | | | | | | | | | 558 | | | | | | | | | | 13,719 | | | | | | | | | | 3,452 | | | | | | | | | | 9,565 | | | | | | | | | | 52 | |
| | | | | | | | | | | | | | | | | | | | | | | | | | | | | | | | | | | | | | | | | | | | | | | | | | | | | | | | | | | | |
Total expenses | | | | | | | | | 1,951,045 | | | | | | | | | | 250,332 | | | | | | | | | | 3,507,389 | | | | | | | | | | 967,736 | | | | | | | | | | 2,087,445 | | | | | | | | | | 210,748 | |
Less, expense waiver and/or
reimbursement (Note B) | | | | | | | | | (131,407 | ) | | | | | | | | | (121,861 | ) | | | | | | | | | (663,190 | ) | | | | | | | | | (191,230 | ) | | | | | | | | | (756,238 | ) | | | | | | | | | (159,189 | ) |
| | | | | | | | | | | | | | | | | | | | | | | | | | | | | | | | | | | | | | | | | | | | | | | | | | | | | | | | | | | | |
Net expenses | | | | | | | | | 1,819,638 | | | | | | | | | | 128,471 | | | | | | | | | | 2,844,199 | | | | | | | | | | 776,506 | | | | | | | | | | 1,331,207 | | | | | | | | | | 51,559 | |
| | | | | | | | | | | | | | | | | | | | | | | | | | | | | | | | | | | | | | | | | | | | | | | | | | | | | | | | | | | | |
Net investment income (loss) | | | | | | | | | (230,410 | ) | | | | | | | | | (31,999 | ) | | | | | | | | | 2,838,578 | | | | | | | | | | 1,118,625 | | | | | | | | | | 6,144,233 | | | | | | | | | | 16,910 | |
| | | | | | | | | | | | | | | | | | | | | | | | | | | | | | | | | | | | | | | | | | | | | | | | | | | | | | | | | | | | |
| | | | | | | | | | | | |
Realized and Unrealized Gain (Loss): | | | | | | | | | | | | | | | | | | | | | | | | | | | | | | | | | | | | | | | | | | | | | | | | | | | | | | | | | | | | |
Net realized gain (loss) on: | | | | | | | | | | | | | | | | | | | | | | | | | | | | | | | | | | | | | | | | | | | | | | | | | | | | | | | | | | | | |
Investments | | | | | | | | | 11,529,290 | | | | | | | | | | 1,956,095 | | | | | | | | | | 14,638,054 | | | | | | | | | | 4,822,626 | | | | | | | | | | (133,875 | ) | | | | | | | | | (882 | ) |
Foreign currency translation | | | | | | | | | — | | | | | | | | | | — | | | | | | | | | | — | | | | | | | | | | — | | | | | | | | | | — | | | | | | | | | | (12,649 | ) |
Net change in unrealized appreciation on: | | | | | | | | | | | | | | | | | | | | | | | | | | | | | | | | | | | | | | | | | | | | | | | | | | | | | | | | | | | | |
Investments | | | | | | | | | 24,618,234 | | | | | | | | | | 1,606,994 | | | | | | | | | | 73,450,559 | | | | | | | | | | 12,832,158 | | | | | | | | | | 10,887,483 | | | | | | | | | | 976,484 | |
Foreign currency translation | | | | | | | | | — | | | | | | | | | | — | | | | | | | | | | — | | | | | | | | | | — | | | | | | | | | | — | | | | | | | | | | 99 | |
| | | | | | | | | | | | | | | | | | | | | | | | | | | | | | | | | | | | | | | | | | | | | | | | | | | | | | | | | | | | |
| | | | | | | | | | | | |
Net Realized and Unrealized
Gain | | | | | | | | | 36,147,524 | | | | | | | | | | 3,563,089 | | | | | | | | | | 88,088,613 | | | | | | | | | | 17,654,784 | | | | | | | | | | 10,753,608 | | | | | | | | | | 963,052 | |
| | | | | | | | | | | | | | | | | | | | | | | | | | | | | | | | | | | | | | | | | | | | | | | | | | | | | | | | | | | | |
| | | | | | | | | | | | |
Net Increase in Net Assets Resulting from Operations | | | | | | | | $ | 35,917,114 | | | | | | | | | $ | 3,531,090 | | | | | | | | | $ | 90,927,191 | | | | | | | | | $ | 18,773,409 | | | | | | | | | $ | 16,897,841 | | | | | | | | | $ | 979,962 | |
| | | | | | | | | | | | | | | | | | | | | | | | | | | | | | | | | | | | | | | | | | | | | | | | | | | | | | | | | | | | |
| | | | | | | | | | | | |
* Net of foreign taxes withheld | | | | | | | | $ | 1,078 | | | | | | | | | $ | 68 | | | | | | | | | $ | 9,726 | | | | | | | | | $ | — | | | | | | | | | $ | — | | | | | | | | | $ | 5,814 | |
| | | | | | | | | | | | | | | | | | | | | | | | | | | | | | | | | | | | | | | | | | | | | | | | | | | | | | | | | | | | |
| (1) | Commencement of operations. |
The accompanying notes are an integral part of these financial statements.
33
|
| STATEMENTSOF CHANGESIN NET ASSETS |
| | | | | | | | | | | | | | | | | | | | | | | | | | | | | | | | | | | | | | | | |
| | | | |
| | | | | LKCM
Small Cap
Equity Fund | | | | LKCM
Small-Mid Cap
Equity Fund |
| | | | | | | | | | | | | | | | | | | | | | | | | | | | | | | | | | | | | | | | |
| | | | | | | | |
| | | | | Year Ended
December 31,
2019 | | | | Year Ended
December 31,
2018 | | | | Year Ended
December 31,
2019 | | | | Year Ended
December 31,
2018 |
Operations: | | | | | | | | | | | | | | | | | | | | | | | | | | | | | | | | | | | | | | | | |
Net investment loss | | | | | | | | $ | (230,410 | ) | | | | | | | | $ | (356,826 | ) | | | | | | | | $ | (31,999 | ) | | | | | | | | $ | (52,514 | ) |
Net realized gain on investments | | | | | | | | | 11,529,290 | | | | | | | | | | 29,636,948 | | | | | | | | | | 1,956,095 | | | | | | | | | | 2,320,133 | |
Net change in unrealized
appreciation/depreciation | | | | | | | | | 24,618,234 | | | | | | | | | | (38,563,909 | ) | | | | | | | | | 1,606,994 | | | | | | | | | | (3,609,716 | ) |
| | | | | | | | | | | | | | | | | | | | | | | | | | | | | | | | | | | | | | | | |
| | | | | | | | | 35,917,114 | | | | | | | | | | (9,283,787 | ) | | | | | | | | | 3,531,090 | | | | | | | | | | (1,342,097 | ) |
| | | | | | | | | | | | | | | | | | | | | | | | | | | | | | | | | | | | | | | | |
| | | | | | | | |
Net Dividends and Distributions to Shareholders | | | | | | | | | (9,039,350 | ) | | | | | | | | | (28,133,206 | ) | | | | | | | | | (1,611,139 | ) | | | | | | | | | (2,221,982 | ) |
| | | | | | | | | | | | | | | | | | | | | | | | | | | | | | | | | | | | | | | | |
| | | | | | | | |
Net decrease in net assets resulting from
Fund share transactions (Note C) | | | | | | | | | (6,517,452 | ) | | | | | | | | | (3,923,364 | ) | | | | | | | | | (1,491,820 | ) | | | | | | | | | (3,651,822 | ) |
| | | | | | | | | | | | | | | | | | | | | | | | | | | | | | | | | | | | | | | | |
| | | | | | | | |
Total increase (decrease) in net assets | | | | | | | | | 20,360,312 | | | | | | | | | | (41,340,357 | ) | | | | | | | | | 428,131 | | | | | | | | | | (7,215,901 | ) |
| | | | | | | | |
Net Assets: | | | | | | | | | | | | | | | | | | | | | | | | | | | | | | | | | | | | | | | | |
Beginning of period | | | | | | | | | 160,322,123 | | | | | | | | | | 201,662,480 | | | | | | | | | | 12,162,215 | | | | | | | | | | 19,378,116 | |
| | | | | | | | | | | | | | | | | | | | | | | | | | | | | | | | | | | | | | | | |
End of period | | | | | | | | $ | 180,682,435 | | | | | | | | | $ | 160,322,123 | | | | | | | | | $ | 12,590,346 | | | | | | | | | $ | 12,162,215 | |
| | | | | | | | | | | | | | | | | | | | | | | | | | | | | | | | | | | | | | | | |
The accompanying notes are an integral part of these financial statements.
34
|
| STATEMENTSOF CHANGESIN NET ASSETS |
| | | | | | | | | | | | | | | | | | | | | | | | | | | | | | | | | | | | | | | | |
| | | | |
| | | | | LKCM
Equity Fund | | | | LKCM
Balanced Fund |
| | | | | | | | | | | | | | | | | | | | | | | | | | | | | | | | | | | | | | | | |
| | | | | | | | |
| | | | | Year Ended
December 31,
2019 | | | | Year Ended
December 31,
2018 | | | | Year Ended
December 31,
2019 | | | | Year Ended
December 31,
2018 |
Operations: | | | | | | | | | | | | | | | | | | | | | | | | | | | | | | | | | | | | | | | | |
Net investment income | | | | | | | | $ | 2,838,578 | | | | | | | | | $ | 2,590,876 | | | | | | | | | $ | 1,118,625 | | | | | | | | | $ | 884,913 | |
Net realized gain on investments | | | | | | | | | 14,638,054 | | | | | | | | | | 19,925,830 | | | | | | | | | | 4,822,626 | | | | | | | | | | 1,650,227 | |
Net change in unrealized
appreciation/depreciation | | | | | | | | | 73,450,559 | | | | | | | | | | (32,018,598 | ) | | | | | | | | | 12,832,158 | | | | | | | | | | (4,220,426 | ) |
| | | | | | | | | | | | | | | | | | | | | | | | | | | | | | | | | | | | | | | | |
| | | | | | | | | 90,927,191 | | | | | | | | | | (9,501,892 | ) | | | | | | | | | 18,773,409 | | | | | | | | | | (1,685,286 | ) |
| | | | | | | | | | | | | | | | | | | | | | | | | | | | | | | | | | | | | | | | |
| | | | | | | | |
Net Dividends and Distributions to Shareholders | | | | | | | | | (16,259,802 | ) | | | | | | | | | (22,493,233 | ) | | | | | | | | | (5,861,135 | ) | | | | | | | | | (2,464,389 | ) |
| | | | | | | | | | | | | | | | | | | | | | | | | | | | | | | | | | | | | | | | |
| | | | | | | | |
Net increase (decrease) in net assets resulting from
Fund share transactions (Note C) | | | | | | | | | (2,026,981 | ) | | | | | | | | | 60,336 | | | | | | | | | | 5,005,673 | | | | | | | | | | 6,626,622 | |
| | | | | | | | | | | | | | | | | | | | | | | | | | | | | | | | | | | | | | | | |
| | | | | | | | |
Total increase (decrease) in net assets | | | | | | | | | 72,640,408 | | | | | | | | | | (31,934,789 | ) | | | | | | | | | 17,917,947 | | | | | | | | | | 2,476,947 | |
| | | | | | | | |
Net Assets: | | | | | | | | | | | | | | | | | | | | | | | | | | | | | | | | | | | | | | | | |
Beginning of period | | | | | | | | | 308,666,565 | | | | | | | | | | 340,601,354 | | | | | | | | | | 85,906,660 | | | | | | | | | | 83,429,713 | |
| | | | | | | | | | | | | | | | | | | | | | | | | | | | | | | | | | | | | | | | |
End of period | | | | | | | | $ | 381,306,973 | | | | | | | | | $ | 308,666,565 | | | | | | | | | $ | 103,824,607 | | | | | | | | | $ | 85,906,660 | |
| | | | | | | | | | | | | | | | | | | | | | | | | | | | | | | | | | | | | | | | |
The accompanying notes are an integral part of these financial statements.
35
|
| STATEMENTSOF CHANGESIN NET ASSETS |
| | | | | | | | | | | | | | | | | | | | | | | | | | | | | | |
| | | | |
| | | | | LKCM Fixed Income Fund | | | | LKCM International Equity Fund |
| | | | | | | | | | | | | | | | | | | | | | | | | | | | | | |
| | | | | | |
| | | | | Year Ended
December 31,
2019 | | | | Year Ended
December 31,
2018 | | | | May 1, 2019(1)
through
December 31,
2019 |
Operations: | | | | | | | | | | | | | | | | | | | | | | | | | | | | | | |
Net investment income | | | | | | | | $ | 6,144,233 | | | | | | | | | $ | 5,574,912 | | | | | | | | | $ | 16,910 | |
Net realized loss on investments | | | | | | | | | (133,875 | ) | | | | | | | | | (334,274 | ) | | | | | | | | | (882 | ) |
Net realized loss on foreign currency translation | | | | | | | | | — | | | | | | | | | | — | | | | | | | | | | (12,649 | ) |
Net change in unrealized
appreciation/depreciation | | | | | | | | | 10,887,483 | | | | | | | | | | (4,540,199 | ) | | | | | | | | | 976,583 | |
| | | | | | | | | | | | | | | | | | | | | | | | | | | | | | |
| | | | | | | | | 16,897,841 | | | | | | | | | | 700,439 | | | | | | | | | | 979,962 | |
| | | | | | | | | | | | | | | | | | | | | | | | | | | | | | |
| | | | | | |
Net Dividends and Distributions to Shareholders | | | | | | | | | (6,149,434 | ) | | | | | | | | | (5,577,246 | ) | | | | | | | | | (6,697 | ) |
| | | | | | | | | | | | | | | | | | | | | | | | | | | | | | |
| | | | | | |
Net increase in net assets resulting from
Fund share transactions (Note C) | | | | | | | | | 15,882,035 | | | | | | | | | | 5,187,333 | | | | | | | | | | 9,672,065 | |
| | | | | | | | | | | | | | | | | | | | | | | | | | | | | | |
| | | | | | |
Total increase in net assets | | | | | | | | | 26,630,442 | | | | | | | | | | 310,526 | | | | | | | | | | 10,645,330 | |
| | | | | | |
Net Assets: | | | | | | | | | | | | | | | | | | | | | | | | | | | | | | |
Beginning of period | | | | | | | | | 249,286,330 | | | | | | | | | | 248,975,804 | | | | | | | | | | — | |
| | | | | | | | | | | | | | | | | | | | | | | | | | | | | | |
End of period | | | | | | | | $ | 275,916,772 | | | | | | | | | $ | 249,286,330 | | | | | | | | | $ | 10,645,330 | |
| | | | | | | | | | | | | | | | | | | | | | | | | | | | | | |
| (1) | Commencement of operations. |
The accompanying notes are an integral part of these financial statements.
36
|
| FINANCIAL HIGHLIGHTS |
| SELECTED DATAFOR EACH SHAREOF CAPITAL STOCK OUTSTANDING |
| | | | | | | | | | | | | | | | | | | | | | | | | | | | | | | | | | | | | | | | | | | | | | | | | | |
| | |
| | | | | LKCM Small Cap Equity Fund |
| | | | | | | | | | | | | | | | | | | | | | | | | | | | | | | | | | | | | | | | | | | | | | | | | | |
| | | | | | | | | | |
| | | | | Year
Ended
December 31,
2019 | | | | Year
Ended
December 31,
2018 | | | | Year
Ended
December 31,
2017 | | | | Year
Ended
December 31,
2016 | | | | Year
Ended
December 31,
2015 |
Net Asset Value – Beginning of Period | | | | | | | | $ | 14.39 | | | | | | | | | $ | 18.44 | | | | | | | | | $ | 18.82 | | | | | | | | | $ | 19.86 | | | | | | | | | $ | 24.05 | |
| | | | | | | | | | | | | | | | | | | | | | | | | | | | | | | | | | | | | | | | | | | | | | | | | | |
Net investment income (loss) | | | | | | | | | (0.02 | )(1) | | | | | | | | | (0.03 | )(2) | | | | | | | | | (0.04 | )(1) | | | | | | | | | (0.03 | )(1) | | | | | | | | | 0.01 | |
Net realized and unrealized gain (loss) on investments | | | | | | | | | 3.29 | | | | | | | | | | (1.05 | ) | | | | | | | | | 3.27 | | | | | | | | | | 1.88 | | | | | | | | | | (1.29 | ) |
| | | | | | | | | | | | | | | | | | | | | | | | | | | | | | | | | | | | | | | | | | | | | | | | | | |
Total from investment operations | | | | | | | | | 3.27 | | | | | | | | | | (1.08 | ) | | | | | | | | | 3.23 | | | | | | | | | | 1.85 | | | | | | | | | | (1.28 | ) |
| | | | | | | | | | | | | | | | | | | | | | | | | | | | | | | | | | | | | | | | | | | | | | | | | | |
Dividends from net investment income | | | | | | | | | — | | | | | | | | | | — | | | | | | | | | | — | | | | | | | | | | — | | | | | | | | | | (0.01 | ) |
Distributions from net realized gains | | | | | | | | | (0.88 | ) | | | | | | | | | (2.97 | ) | | | | | | | | | (3.61 | ) | | | | | | | | | (2.89 | ) | | | | | | | | | (2.90 | ) |
| | | | | | | | | | | | | | | | | | | | | | | | | | | | | | | | | | | | | | | | | | | | | | | | | | |
Total dividends and distributions | | | | | | | | | (0.88 | ) | | | | | | | | | (2.97 | ) | | | | | | | | | (3.61 | ) | | | | | | | | | (2.89 | ) | | | | | | | | | (2.91 | ) |
| | | | | | | | | | | | | | | | | | | | | | | | | | | | | | | | | | | | | | | | | | | | | | | | | | |
Net Asset Value – End of Period | | | | | | | | $ | 16.78 | | | | | | | | | $ | 14.39 | | | | | | | | | $ | 18.44 | | | | | | | | | $ | 18.82 | | | | | | | | | $ | 19.86 | |
| | | | | | | | | | | | | | | | | | | | | | | | | | | | | | | | | | | | | | | | | | | | | | | | | | |
Total Return | | | | | | | | | 22.70% | | | | | | | | | | -5.70% | | | | | | | | | | 17.04% | | | | | | | | | | 9.27% | | | | | | | | | | -5.58% | |
| | | | | | | | | | |
Ratios and Supplemental Data: | | | | | | | | | | | | | | | | | | | | | | | | | | | | | | | | | | | | | | | | | | | | | | | | | | |
Net assets, end of period (thousands) | | | | | | | | $ | 180,682 | | | | | | | | | $ | 160,322 | | | | | | | | | $ | 201,139 | | | | | | | | | $ | 281,790 | | | | | | | | | $ | 568,421 | |
Ratio of expenses to average net assets: | | | | | | | | | | | | | | | | | | | | | | | | | | | | | | | | | | | | | | | | | | | | | | | | | | |
Before expense waiver and/or reimbursement | | | | | | | | | 1.07% | | | | | | | | | | 1.08% | | | | | | | | | | 1.10% | | | | | | | | | | 1.05% | | | | | | | | | | 0.97% | |
After expense waiver and/or reimbursement | | | | | | | | | 1.00% | | | | | | | | | | 1.00% | | | | | | | | | | 1.00% | | | | | | | | | | 1.00% | | | | | | | | | | 0.97% | |
Ratio of net investment income (loss) to average net assets: | | | | | | | | | | | | | | | | | | | | | | | | | | | | | | | | | | | | | | | | | | | | | | | | | | |
Before expense waiver and/or reimbursement | | | | | | | | | (0.20 | )% | | | | | | | | | (0.25 | )% | | | | | | | | | (0.28 | )% | | | | | | | | | (0.18 | )% | | | | | | | | | 0.05% | |
After expense waiver and/or reimbursement | | | | | | | | | (0.13 | )% | | | | | | | | | (0.17 | )% | | | | | | | | | (0.18 | )% | | | | | | | | | (0.13 | )% | | | | | | | | | 0.05% | |
Portfolio turnover rate | | | | | | | | | 63% | | | | | | | | | | 45% | | | | | | | | | | 42% | | | | | | | | | | 50% | | | | | | | | | | 62% | |
| (1) | Net investment loss per share represents net investment loss divided by the average shares outstanding throughout the period. |
| (2) | Net investment loss per share is calculated using the ending balance of undistributed net investment loss prior to considerations of adjustments for permanent book and tax differences. |
| | | | | | | | | | | | | | | | | | | | | | | | | | | | | | | | | | | | | | | | | | | | | | | | | | |
| | |
| | | | | LKCMSmall-Mid Cap Equity Fund |
| | | | | | | | | | | | | | | | | | | | | | | | | | | | | | | | | | | | | | | | | | | | | | | | | | |
| | | | | | | | | | |
| | | | | Year
Ended
December 31,
2019 | | | | Year
Ended
December 31,
2018 | | | | Year
Ended
December 31,
2017 | | | | Year
Ended
December 31,
2016 | | | | Year
Ended
December 31,
2015 |
Net Asset Value – Beginning of Period | | | | | | | | $ | 7.92 | | | | | | | | | $ | 10.60 | | | | | | | | | $ | 9.56 | | | | | | | | | $ | 11.15 | | | | | | | | | $ | 12.10 | |
| | | | | | | | | | | | | | | | | | | | | | | | | | | | | | | | | | | | | | | | | | | | | | | | | | |
Net investment loss | | | | | | | | | (0.02 | )(1) | | | | | | | | | (0.03 | )(2) | | | | | | | | | (0.01 | )(1) | | | | | | | | | (0.05 | )(1) | | | | | | | | | (0.06 | )(2) |
Net realized and unrealized gain (loss) on investments | | | | | | | | | 2.48 | | | | | | | | | | (0.93 | ) | | | | | | | | | 2.32 | | | | | | | | | | 0.19 | | | | | | | | | | (0.10 | ) |
| | | | | | | | | | | | | | | | | | | | | | | | | | | | | | | | | | | | | | | | | | | | | | | | | | |
Total from investment operations | | | | | | | | | 2.46 | | | | | | | | | | (0.96 | ) | | | | | | | | | 2.31 | | | | | | | | | | 0.14 | | | | | | | | | | (0.16 | ) |
| | | | | | | | | | | | | | | | | | | | | | | | | | | | | | | | | | | | | | | | | | | | | | | | | | |
Distributions from net realized gains | | | | | | | | | (1.29 | ) | | | | | | | | | (1.72 | ) | | | | | | | | | (1.27 | ) | | | | | | | | | (1.73 | ) | | | | | | | | | (0.79 | ) |
| | | | | | | | | | | | | | | | | | | | | | | | | | | | | | | | | | | | | | | | | | | | | | | | | | |
Net Asset Value – End of Period | | | | | | | | $ | 9.09 | | | | | | | | | $ | 7.92 | | | | | | | | | $ | 10.60 | | | | | | | | | $ | 9.56 | | | | | | | | | $ | 11.15 | |
| | | | | | | | | | | | | | | | | | | | | | | | | | | | | | | | | | | | | | | | | | | | | | | | | | |
Total Return | | | | | | | | | 31.05% | | | | | | | | | | -8.89% | | | | | | | | | | 24.13% | | | | | | | | | | 1.17% | | | | | | | | | | -1.41% | |
| | | | | | | | | | |
Ratios and Supplemental Data: | | | | | | | | | | | | | | | | | | | | | | | | | | | | | | | | | | | | | | | | | | | | | | | | | | |
Net assets, end of period (thousands) | | | | | | | | $ | 12,590 | | | | | | | | | $ | 12,162 | | | | | | | | | $ | 19,378 | | | | | | | | | $ | 20,419 | | | | | | | | | $ | 331,954 | |
Ratio of expenses to average net assets: | | | | | | | | | | | | | | | | | | | | | | | | | | | | | | | | | | | | | | | | | | | | | | | | | | |
Before expense waiver and/or reimbursement | | | | | | | | | 1.95% | | | | | | | | | | 1.75% | | | | | | | | | | 1.76% | | | | | | | | | | 1.23% | | | | | | | | | | 1.14% | |
After expense waiver and/or reimbursement | | | | | | | | | 1.00% | | | | | | | | | | 1.00% | | | | | | | | | | 1.00% | | | | | | | | | | 1.00% | | | | | | | | | | 1.00% | |
Ratio of net investment loss to average net assets: | | | | | | | | | | | | | | | | | | | | | | | | | | | | | | | | | | | | | | | | | | | | | | | | | | |
Before expense waiver and/or reimbursement | | | | | | | | | (1.20 | )% | | | | | | | | | (1.05 | )% | | | | | | | | | (0.94 | )% | | | | | | | | | (0.68 | )% | | | | | | | | | (0.63 | )% |
After expense waiver and/or reimbursement | | | | | | | | | (0.25 | )% | | | | | | | | | (0.30 | )% | | | | | | | | | (0.18 | )% | | | | | | | | | (0.45 | )% | | | | | | | | | (0.49 | )% |
Portfolio turnover rate | | | | | | | | | 68% | | | | | | | | | | 56% | | | | | | | | | | 63% | | | | | | | | | | 80% | | | | | | | | | | 70% | |
| (1) | Net investment loss per share represents net investment loss divided by the average shares outstanding throughout the period. |
| (2) | Net investment loss per share is calculated using the ending balance of undistributed net investment loss prior to considerations of adjustments for permanent book and tax differences. |
The accompanying notes are an integral part of these financial statements.
37
|
| FINANCIAL HIGHLIGHTS |
| SELECTED DATAFOR EACH SHAREOF CAPITAL STOCK OUTSTANDING |
| | | | | | | | | | | | | | | | | | | | | | | | | | | | | | | | | | | | | | | | | | | | | | | | | | |
| | |
| | | | | LKCM Equity Fund |
| | | | | | | | | | | | | | | | | | | | | | | | | | | | | | | | | | | | | | | | | | | | | | | | | | |
| | | | | | | | | | |
| | | | | Year
Ended
December 31,
2019 | | | | Year
Ended
December 31,
2018 | | | | Year
Ended
December 31,
2017 | | | | Year
Ended
December 31,
2016 | | | | Year
Ended
December 31,
2015 |
Net Asset Value – Beginning of Period | | | | | | | | $ | 23.34 | | | | | | | | | $ | 26.02 | | | | | | | | | $ | 22.42 | | | | | | | | | $ | 21.40 | | | | | | | | | $ | 22.81 | |
| | | | | | | | | | | | | | | | | | | | | | | | | | | | | | | | | | | | | | | | | | | | | | | | | | |
Net investment income | | | | | | | | | 0.22 | (1) | | | | | | | | | 0.21 | | | | | | | | | | 0.17 | | | | | | | | | | 0.19 | (1) | | | | | | | | | 0.18 | (1) |
Net realized and unrealized gain (loss) on investments | | | | | | | | | 6.75 | | | | | | | | | | (1.08 | ) | | | | | | | | | 4.69 | | | | | | | | | | 2.32 | | | | | | | | | | (0.98 | ) |
| | | | | | | | | | | | | | | | | | | | | | | | | | | | | | | | | | | | | | | | | | | | | | | | | | |
Total from investment operations | | | | | | | | | 6.97 | | | | | | | | | | (0.87 | ) | | | | | | | | | 4.86 | | | | | | | | | | 2.51 | | | | | | | | | | (0.80 | ) |
| | | | | | | | | | | | | | | | | | | | | | | | | | | | | | | | | | | | | | | | | | | | | | | | | | |
Dividends from net investment income | | | | | | | | | (0.23 | ) | | | | | | | | | (0.21 | ) | | | | | | | | | (0.17 | ) | | | | | | | | | (0.20 | ) | | | | | | | | | (0.20 | ) |
Distributions from net realized gains | | | | | | | | | (1.06 | ) | | | | | | | | | (1.60 | ) | | | | | | | | | (1.09 | ) | | | | | | | | | (1.29 | ) | | | | | | | | | (0.41 | ) |
| | | | | | | | | | | | | | | | | | | | | | | | | | | | | | | | | | | | | | | | | | | | | | | | | | |
Total dividends and distributions | | | | | | | | | (1.29 | ) | | | | | | | | | (1.81 | ) | | | | | | | | | (1.26 | ) | | | | | | | | | (1.49 | ) | | | | | | | | | (0.61 | ) |
| | | | | | | | | | | | | | | | | | | | | | | | | | | | | | | | | | | | | | | | | | | | | | | | | | |
Net Asset Value – End of Period | | | | | | | | $ | 29.02 | | | | | | | | | $ | 23.34 | | | | | | | | | $ | 26.02 | | | | | | | | | $ | 22.42 | | | | | | | | | $ | 21.40 | |
| | | | | | | | | | | | | | | | | | | | | | | | | | | | | | | | | | | | | | | | | | | | | | | | | | |
Total Return | | | | | | | | | 29.85% | | | | | | | | | | -3.28% | | | | | | | | | | 21.69% | | | | | | | | | | 11.66% | | | | | | | | | | -3.54% | |
| | | | | | | | | | |
Ratios and Supplemental Data: | | | | | | | | | | | | | | | | | | | | | | | | | | | | | | | | | | | | | | | | | | | | | | | | | | |
Net assets, end of period (thousands) | | | | | | | | $ | 381,307 | | | | | | | | | $ | 308,667 | | | | | | | | | $ | 340,601 | | | | | | | | | $ | 286,508 | | | | | | | | | $ | 281,200 | |
Ratio of expenses to average net assets: | | | | | | | | | | | | | | | | | | | | | | | | | | | | | | | | | | | | | | | | | | | | | | | | | | |
Before expense waiver and/or reimbursement | | | | | | | | | 0.99% | | | | | | | | | | 0.98% | | | | | | | | | | 0.99% | | | | | | | | | | 0.98% | | | | | | | | | | 0.93% | |
After expense waiver and/or reimbursement | | | | | | | | | 0.80% | | | | | | | | | | 0.80% | | | | | | | | | | 0.80% | | | | | | | | | | 0.80% | | | | | | | | | | 0.80% | |
Ratio of net investment income to average net assets: | | | | | | | | | | | | | | | | | | | | | | | | | | | | | | | | | | | | | | | | | | | | | | | | | | |
Before expense waiver and/or reimbursement | | | | | | | | | 0.61% | | | | | | | | | | 0.56% | | | | | | | | | | 0.50% | | | | | | | | | | 0.69% | | | | | | | | | | 0.68% | |
After expense waiver and/or reimbursement | | | | | | | | | 0.80% | | | | | | | | | | 0.74% | | | | | | | | | | 0.69% | | | | | | | | | | 0.87% | | | | | | | | | | 0.81% | |
Portfolio turnover rate | | | | | | | | | 9% | | | | | | | | | | 16% | | | | | | | | | | 11% | | | | | | | | | | 16% | | | | | | | | | | 13% | |
| (1) | Net investment income per share represents net investment income divided by the average shares outstanding throughout the period. |
| | | | | | | | | | | | | | | | | | | | | | | | | | | | | | | | | | | | | | | | | | | | | | | | | | |
| | |
| | | | | LKCM Balanced Fund |
| | | | | | | | | | | | | | | | | | | | | | | | | | | | | | | | | | | | | | | | | | | | | | | | | | |
| | | | | | | | | | |
| | | | | Year
Ended
December 31,
2019 | | | | Year
Ended
December 31,
2018 | | | | Year
Ended
December 31,
2017 | | | | Year
Ended
December 31,
2016 | | | | Year
Ended
December 31,
2015 |
Net Asset Value – Beginning of Period | | | | | | | | $ | 21.07 | | | | | | | | | $ | 22.18 | | | | | | | | | $ | 20.46 | | | | | | | | | $ | 19.60 | | | | | | | | | $ | 20.10 | |
| | | | | | | | | | | | | | | | | | | | | | | | | | | | | | | | | | | | | | | | | | | | | | | | | | |
Net investment income | | | | | | | | | 0.27 | (1) | | | | | | | | | 0.23 | | | | | | | | | | 0.20 | | | | | | | | | | 0.20 | (1) | | | | | | | | | 0.19 | |
Net realized and unrealized gain (loss) on investments | | | | | | | | | 4.32 | | | | | | | | | | (0.70 | ) | | | | | | | | | 2.43 | | | | | | | | | | 1.69 | | | | | | | | | | (0.00 | )(2) |
| | | | | | | | | | | | | | | | | | | | | | | | | | | | | | | | | | | | | | | | | | | | | | | | | | |
Total from investment operations | | | | | | | | | 4.59 | | | | | | | | | | (0.47 | ) | | | | | | | | | 2.63 | | | | | | | | | | 1.89 | | | | | | | | | | 0.19 | |
| | | | | | | | | | | | | | | | | | | | | | | | | | | | | | | | | | | | | | | | | | | | | | | | | | |
Dividends from net investment income | | | | | | | | | (0.27 | ) | | | | | | | | | (0.23 | ) | | | | | | | | | (0.20 | ) | | | | | | | | | (0.18 | ) | | | | | | | | | (0.19 | ) |
Distributions from net realized gains | | | | | | | | | (1.17 | ) | | | | | | | | | (0.41 | ) | | | | | | | | | (0.71 | ) | | | | | | | | | (0.85 | ) | | | | | | | | | (0.50 | ) |
| | | | | | | | | | | | | | | | | | | | | | | | | | | | | | | | | | | | | | | | | | | | | | | | | | |
Total dividends and distributions | | | | | | | | | (1.44 | ) | | | | | | | | | (0.64 | ) | | | | | | | | | (0.91 | ) | | | | | | | | | (1.03 | ) | | | | | | | | | (0.69 | ) |
| | | | | | | | | | | | | | | | | | | | | | | | | | | | | | | | | | | | | | | | | | | | | | | | | | |
Net Asset Value – End of Period | | | | | | | | $ | 24.22 | | | | | | | | | $ | 21.07 | | | | | | | | | $ | 22.18 | | | | | | | | | $ | 20.46 | | | | | | | | | $ | 19.60 | |
| | | | | | | | | | | | | | | | | | | | | | | | | | | | | | | | | | | | | | | | | | | | | | | | | | |
Total Return | | | | | | | | | 21.85% | | | | | | | | | | -2.15% | | | | | | | | | | 12.88% | | | | | | | | | | 9.70% | | | | | | | | | | 0.91% | |
| | | | | | | | | | |
Ratios and Supplemental Data: | | | | | | | | | | | | | | | | | | | | | | | | | | | | | | | | | | | | | | | | | | | | | | | | | | |
Net assets, end of period (thousands) | | | | | | | | $ | 103,825 | | | | | | | | | $ | 85,907 | | | | | | | | | $ | 83,430 | | | | | | | | | $ | 63,192 | | | | | | | | | $ | 39,153 | |
Ratio of expenses to average net assets: | | | | | | | | | | | | | | | | | | | | | | | | | | | | | | | | | | | | | | | | | | | | | | | | | | |
Before expense waiver and/or reimbursement | | | | | | | | | 1.00% | | | | | | | | | | 1.00% | | | | | | | | | | 1.02% | | | | | | | | | | 1.03% | | | | | | | | | | 1.02% | |
After expense waiver and/or reimbursement | | | | | | | | | 0.80% | | | | | | | | | | 0.80% | | | | | | | | | | 0.80% | | | | | | | | | | 0.80% | | | | | | | | | | 0.80% | |
Ratio of net investment income to average net assets: | | | | | | | | | | | | | | | | | | | | | | | | | | | | | | | | | | | | | | | | | | | | | | | | | | |
Before expense waiver and/or reimbursement | | | | | | | | | 0.95% | | | | | | | | | | 0.83% | | | | | | | | | | 0.73% | | | | | | | | | | 0.73% | | | | | | | | | | 0.73% | |
After expense waiver and/or reimbursement | | | | | | | | | 1.15% | | | | | | | | | | 1.03% | | | | | | | | | | 0.95% | | | | | | | | | | 0.96% | | | | | | | | | | 0.95% | |
Portfolio turnover rate | | | | | | | | | 17% | | | | | | | | | | 17% | | | | | | | | | | 15% | | | | | | | | | | 16% | | | | | | | | | | 16% | |
| (1) | Net investment income per share represents net investment income divided by the average shares outstanding throughout the period. |
The accompanying notes are an integral part of these financial statements.
38
|
| FINANCIAL HIGHLIGHTS |
| SELECTED DATAFOR EACH SHAREOF CAPITAL STOCK OUTSTANDING |
| | | | | | | | | | | | | | | | | | | | | | | | | | | | | | | | | | | | | | | | | | | | | | | | | | |
| | |
| | | | | LKCM Fixed Income Fund |
| | | | | | | | | | | | | | | | | | | | | | | | | | | | | | | | | | | | | | | | | | | | | | | | | | |
| | | | | | | | | | |
| | | | | Year
Ended
December 31,
2019 | | | | Year
Ended
December 31,
2018 | | | | Year
Ended
December 31,
2017 | | | | Year
Ended
December 31,
2016 | | | | Year
Ended
December 31,
2015 |
Net Asset Value – Beginning of Period | | | | | | | | $ | 10.47 | | | | | | | | | $ | 10.68 | | | | | | | | | $ | 10.67 | | | | | | | | | $ | 10.50 | | | | | | | | | $ | 10.82 | |
| | | | | | | | | | | | | | | | | | | | | | | | | | | | | | | | | | | | | | | | | | | | | | | | | | |
Net investment income | | | | | | | | | 0.25 | (1) | | | | | | | | | 0.24 | | | | | | | | | | 0.21 | | | | | | | | | | 0.23 | | | | | | | | | | 0.25 | (1) |
Net realized and unrealized gain (loss) on investments | | | | | | | | | 0.45 | | | | | | | | | | (0.21 | ) | | | | | | | | | 0.02 | | | | | | | | | | 0.17 | | | | | | | | | | (0.28 | ) |
| | | | | | | | | | | | | | | | | | | | | | | | | | | | | | | | | | | | | | | | | | | | | | | | | | |
Total from investment operations | | | | | | | | | 0.70 | | | | | | | | | | 0.03 | | | | | | | | | | 0.23 | | | | | | | | | | 0.40 | | | | | | | | | | (0.03 | ) |
| | | | | | | | | | | | | | | | | | | | | | | | | | | | | | | | | | | | | | | | | | | | | | | | | | |
Dividends from net investment income | | | | | | | | | (0.25 | ) | | | | | | | | | (0.24 | ) | | | | | | | | | (0.21 | ) | | | | | | | | | (0.23 | ) | | | | | | | | | (0.26 | ) |
Distributions from net realized gains | | | | | | | | | — | | | | | | | | | | — | | | | | | | | | | (0.01 | ) | | | | | | | | | (0.00 | )(2) | | | | | | | | | (0.03 | ) |
| | | | | | | | | | | | | | | | | | | | | | | | | | | | | | | | | | | | | | | | | | | | | | | | | | |
Total dividends and distributions | | | | | | | | | (0.25 | ) | | | | | | | | | (0.24 | ) | | | | | | | | | (0.22 | ) | | | | | | | | | (0.23 | ) | | | | | | | | | (0.29 | ) |
| | | | | | | | | | | | | | | | | | | | | | | | | | | | | | | | | | | | | | | | | | | | | | | | | | |
Net Asset Value – End of Period | | | | | | | | $ | 10.92 | | | | | | | | | $ | 10.47 | | | | | | | | | $ | 10.68 | | | | | | | | | $ | 10.67 | | | | | | | | | $ | 10.50 | |
| | | | | | | | | | | | | | | | | | | | | | | | | | | | | | | | | | | | | | | | | | | | | | | | | | |
Total Return | | | | | | | | | 6.70% | | | | | | | | | | 0.26% | | | | | | | | | | 2.15% | | | | | | | | | | 3.83% | | | | | | | | | | -0.27% | |
| | | | | | | | | | |
Ratios and Supplemental Data: | | | | | | | | | | | | | | | | | | | | | | | | | | | | | | | | | | | | | | | | | | | | | | | | | | |
Net assets, end of period (thousands) | | | | | | | | $ | 275,917 | | | | | | | | | $ | 249,286 | | | | | | | | | $ | 248,976 | | | | | | | | | $ | 226,862 | | | | | | | | | $ | 198,841 | |
Ratio of expenses to average net assets: | | | | | | | | | | | | | | | | | | | | | | | | | | | | | | | | | | | | | | | | | | | | | | | | | | |
Before expense waiver and/or reimbursement | | | | | | | | | 0.79% | | | | | | | | | | 0.78% | | | | | | | | | | 0.80% | | | | | | | | | | 0.78% | | | | | | | | | | 0.73% | (3) |
After expense waiver and/or reimbursement | | | | | | | | | 0.50% | | | | | | | | | | 0.50% | | | | | | | | | | 0.50% | | | | | | | | | | 0.50% | | | | | | | | | | 0.56% | (3) |
Ratio of net investment income to average net assets: | | | | | | | | | | | | | | | | | | | | | | | | | | | | | | | | | | | | | | | | | | | | | | | | | | |
Before expense waiver and/or reimbursement | | | | | | | | | 2.02% | | | | | | | | | | 1.96% | | | | | | | | | | 1.66% | | | | | | | | | | 1.86% | | | | | | | | | | 2.18% | (3) |
After expense waiver and/or reimbursement | | | | | | | | | 2.31% | | | | | | | | | | 2.24% | | | | | | | | | | 1.96% | | | | | | | | | | 2.14% | | | | | | | | | | 2.35% | (3) |
Portfolio turnover rate | | | | | | | | | 37% | | | | | | | | | | 23% | | | | | | | | | | 28% | | | | | | | | | | 59% | | | | | | | | | | 29% | |
| (1) | Net investment income per share represents net investment income divided by the average shares outstanding during the period. |
| (3) | Effective May 22, 2015, the Adviser contractually agreed to lower the expense cap for the Fund from 0.65% to 0.50% of the Fund’s average daily net assets. |
| | | | | | | | | | |
| | |
| | | | | LKCM
International
Equity Fund |
| | | | | | | | | | |
| | |
| | | | | May 1, 2019(1)
through
December 31,
2019 |
Net Asset Value – Beginning of Period | | | | | | | | $ | 10.00 | |
| | | | | | | | | | |
Net investment income | | | | | | | | | 0.02 | (2) |
Net realized and unrealized gain on investments | | | | | | | | | 0.88 | |
| | | | | | | | | | |
Total from investment operations | | | | | | | | | 0.90 | |
| | | | | | | | | | |
Dividends from net investment income | | | | | | | | | (0.01 | ) |
Distributions from net realized gains | | | | | | | | | (0.00 | )(3) |
| | | | | | | | | | |
Total dividends and distributions | | | | | | | | | (0.01 | ) |
| | | | | | | | | | |
Net Asset Value – End of Period | | | | | | | | $ | 10.89 | |
| | | | | | | | | | |
Total Return | | | | | | | | | 8.97% | (4) |
| | | |
Ratios and Supplemental Data: | | | | | | | | | | |
Net assets, end of period (thousands) | | | | | | | | $ | 10,645 | |
Ratio of expenses to average net assets: | | | | | | | | | | |
Before expense waiver and/or reimbursement | | | | | | | | | 4.09% | (5) |
After expense waiver and/or reimbursement | | | | | | | | | 1.00% | (5) |
Ratio of net investment income to average net assets: | | | | | | | | | | |
Before expense waiver and/or reimbursement | | | | | | | | | (2.76 | )%(5) |
After expense waiver and/or reimbursement | | | | | | | | | 0.33% | (5) |
Portfolio turnover rate | | | | | | | | | 2% | (4) |
| (1) | Commencement of operations. |
| (2) | Net investment income per share represents net investment income divided by the average shares outstanding during the period. |
The accompanying notes are an integral part of these financial statements.
39
|
| LKCM FUNDS |
| NOTESTOTHE FINANCIAL STATEMENTS |
A. Organization and Significant Accounting Policies: LKCM Funds (the “Trust”) is registered under the Investment Company Act of 1940 (“1940 Act”) as an open-end, management investment company. The Trust was organized as a Delaware statutory trust on February 10, 1994 and consists of seven diversified series as of December 31, 2019, six of which are presented herein and include the LKCM Small Cap Equity Fund, LKCM Small-Mid Cap Equity Fund, LKCM Equity Fund, LKCM Balanced Fund, LKCM Fixed Income Fund and LKCM International Equity Fund (collectively, the “Funds”). The assets of the Funds are invested in separate, independently managed portfolios. Investment operations of the Funds began on July 14, 1994 (LKCM Small Cap Equity Fund), January 3, 1996 (LKCM Equity Fund), December 30, 1997 (LKCM Balanced Fund and LKCM Fixed Income Fund), May 2, 2011 (LKCM Small-Mid Cap Equity Fund) and May 1, 2019 (LKCM International Equity Fund). The LKCM Small Cap Equity Fund, LKCM Small-Mid Cap Equity Fund and LKCM Equity Fund previously had two share classes—Institutional Class shares and Adviser Class shares. The Board of Trustees of the Trust approved the (i) liquidation and termination of Adviser Class shares of the LKCM Small Cap Equity Fund, which took place on October 31, 2018, and (ii) termination of Adviser Class shares of the LKCM Equity Fund and LKCM Small-Mid Cap Equity Fund, which had not commenced operations and had no assets or shareholders, on September 24, 2018. Each Fund charges a 1% redemption fee for redemptions of Fund shares held for less than 30 days, unless otherwise determined by a Fund in its discretion.
The LKCM Small Cap Equity Fund seeks to maximize long-term capital appreciation by investing under normal circumstances at least 80% of its net assets (plus any borrowings for investment purposes) in equity securities of smaller companies (those with market capitalizations at the time of investment between $600 million and $5 billion) which Luther King Capital Management Corporation (the “Adviser”) believes are likely to have above-average growth in revenue and/or earnings and potential for above-average capital appreciation. The LKCM Small-Mid Cap Equity Fund seeks to maximize long-term capital appreciation by investing under normal circumstances at least 80% of its net assets (plus any borrowings for investment purposes) in equity securities of small-mid capitalization companies (those with market capitalizations at the time of investment between $1.25 billion and $12 billion) which the Adviser believes are likely to have above-average growth in revenue and/or earnings and potential for above-average capital appreciation. The LKCM Equity Fund seeks to maximize long-term capital appreciation by investing under normal circumstances at least 80% of its net assets (plus any borrowings for investment purposes) in equity securities of companies which the Adviser believes are likely to have above-average growth in revenue and/or earnings, above-average returns on shareholders’ equity, potential for above-average capital appreciation and/or companies that the Adviser believes have attractive relative valuations. The LKCM Balanced Fund seeks current income and long-term capital appreciation by investing primarily in a portfolio of equity and fixed income securities with at least 25% of the Fund’s total assets invested in fixed income securities under normal circumstances. The LKCM Fixed Income Fund seeks current income by investing under normal circumstances at least 80% of its net assets (plus any borrowings for investment purposes) in a portfolio of investment grade corporate and U.S. Government fixed income securities. The LKCM International Equity Fund seeks to maximize long-term capital appreciation by investing under normal circumstances at least 80% of its net assets (plus any borrowings for investment purposes) in equity securities of non-U.S. companies.
The following is a summary of significant accounting policies followed by the Funds in preparation of the financial statements. The Funds are investment companies and, accordingly, follow the investment company accounting and reporting guidance of the Financial Accounting Standards Board Accounting Standards Codification Topic 946,Investment Companies.
1. Security Valuation: Equity securities listed or traded on a U.S. securities exchange for which market quotations are readily available are valued at the last quoted sale price on the exchange on which the security is primarily traded. Nasdaq Global Market securities are valued at the Nasdaq Official Closing Price (“NOCP”). Unlisted U.S. equity securities and listed U.S. equity securities not traded on a particular valuation date are valued at the mean of the most recent quoted bid and ask price on the relevant exchanges or markets. Equity securities listed on a foreign exchange for which market quotations are readily available are valued at the last quoted sales price on the exchange on which the security is primarily traded. Debt securities are normally valued at the mean of the closing bid and ask price and/or by using a combination of broker quotations or evaluated prices provided by an independent pricing service. Futures and options on futures are valued at the settlement prices established each day on the principal exchange on which they are traded. Forward contracts are valued based on the forward rate using information provided by an independent pricing service. Other assets and securities for which no market or broker quotations or evaluated prices are readily available are valued in good faith at fair value using guidelines approved by the Board of Trustees. The Board of Trustees has established policies and procedures that authorize the Adviser to fair value a security in good faith under certain circumstances. The Funds may use prices provided by independent pricing services to assist in the fair valuation of the Funds’ portfolio securities. For foreign securities held by the LKCM International Equity Fund, such fair value prices generally will be based on such independent pricing services’ proprietary multi-factor models that measure movements in relevant indices, market indicators or other factors between the time the relevant foreign markets have closed and the time the Fund calculates its net asset value.
The Trust has adopted accounting standards which establish an authoritative definition of fair value and set out a hierarchy for measuring fair value. These standards require additional disclosures about the various inputs and valuation techniques used to develop the measurements of fair value and a discussion of changes in valuation techniques and related inputs during the period. These standards define fair value as the price that would be received to sell an asset or paid to transfer a liability in an orderly
40
transaction between market participants at the measurement date. The fair value hierarchy is organized into three levels based upon the assumptions (referred to as “inputs”) used in pricing the asset or liability. These standards state that “observable inputs” reflect the assumptions market participants would use in pricing the asset or liability based on market data obtained from independent sources and “unobservable inputs” reflect an entity’s own assumptions about the assumptions market participants would use in pricing the asset or liability. These inputs are summarized in the three broad levels listed below.
| | | | |
| Level 1 | | – | | Quoted unadjusted prices for identical instruments in active markets to which the Trust has access at the date of measurement. |
| | |
| Level 2 | | – | | Quoted prices for similar instruments in active markets; quoted prices for identical or similar instruments in markets that are not active; and model-derived valuations in which all significant inputs and significant value drivers are observable in active markets. Level 2 inputs are those in markets for which there are few transactions, the prices are not current, little public information exists or instances where prices vary substantially over time or among brokered market makers. |
| | |
| Level 3 | | – | | Model derived valuations in which one or more significant inputs or significant value drivers are unobservable. Unobservable inputs are those inputs that reflect the Trust’s own assumptions that market participants would use to price the asset or liability based on the best available information. |
The inputs or methodology used for valuing securities are not necessarily an indication of the risk associated with investing in those securities. As of December 31, 2019, the Funds’ assets carried at fair value were classified as follows:
| | | | | | | | | | | | | | | | | | | | |
| LKCM Small Cap Equity Fund | | | | | | | | |
| | | | |
Description | | Level 1 | | Level 2 | | Level 3 | | Total |
Common Stocks | | | $ | 178,523,622 | | | | $ | — | | | | $ | 0 | | | | $ | 178,523,622 | |
Money Market Fund | | | | 1,994,841 | | | | | — | | | | | — | | | | | 1,994,841 | |
| | | | | | | | | | | | | | | | | | | | |
Total Investments* | | | $ | 180,518,463 | | | | $ | — | | | | $ | 0 | | | | $ | 180,518,463 | |
| | | | | | | | | | | | | | | | | | | | |
| | | | |
| LKCMSmall-Mid Cap Equity Fund | | | | | | | | |
| | | | |
Description | | Level 1 | | Level 2 | | Level 3 | | Total |
Common Stocks | | | $ | 12,595,044 | | | | $ | — | | | | $ | — | | | | $ | 12,595,044 | |
Money Market Fund | | | | 4,730 | | | | | — | | | | | — | | | | | 4,730 | |
| | | | | | | | | | | | | | | | | | | | |
Total Investments* | | | $ | 12,599,774 | | | | $ | — | | | | $ | — | | | | $ | 12,599,774 | |
| | | | | | | | | | | | | | | | | | | | |
| | | | |
| LKCM Equity Fund | | | | | | | | |
| | | | |
Description | | Level 1 | | Level 2 | | Level 3 | | Total |
Common Stocks | | | $ | 361,471,379 | | | | $ | — | | | | $ | — | | | | $ | 361,471,379 | |
U.S. Government Issue | | | | — | | | | | 4,299,748 | | | | | — | | | | | 4,299,748 | |
Money Market Funds | | | | 14,880,960 | | | | | — | | | | | — | | | | | 14,880,960 | |
| | | | | | | | | | | | | | | | | | | | |
Total Investments* | | | $ | 376,352,339 | | | | $ | 4,299,748 | | | | $ | — | | | | $ | 380,652,087 | |
| | | | | | | | | | | | | | | | | | | | |
| | | | |
| LKCM Balanced Fund | | | | | | | | |
| | | | |
Description | | Level 1 | | Level 2 | | Level 3 | | Total |
Common Stocks | | | $ | 71,857,178 | | | | $ | — | | | | $ | — | | | | $ | 71,857,178 | |
Corporate Bonds | | | | — | | | | | 30,479,187 | | | | | — | | | | | 30,479,187 | |
Money Market Fund | | | | 464,623 | | | | | — | | | | | — | | | | | 464,623 | |
| | | | | | | | | | | | | | | | | | | | |
Total Investments* | | | $ | 72,321,801 | | | | $ | 30,479,187 | | | | $ | — | | | | $ | 102,800,988 | |
| | | | | | | | | | | | | | | | | | | | |
| | | | |
| LKCM Fixed Income Fund | | | | | | | | |
| | | | |
Description | | Level 1 | | Level 2 | | Level 3 | | Total |
Corporate Bonds | | | $ | — | | | | $ | 209,596,863 | | | | $ | — | | | | $ | 209,596,863 | |
U.S. Government Issues | | | | — | | | | | 27,825,924 | | | | | — | | | | | 27,825,924 | |
U.S. Government Sponsored Entities | | | | — | | | | | 33,415,378 | | | | | — | | | | | 33,415,378 | |
Money Market Fund | | | | 3,063,042 | | | | | — | | | | | — | | | | | 3,063,042 | |
| | | | | | | | | | | | | | | | | | | | |
Total Investments* | | | $ | 3,063,042 | | | | $ | 270,838,165 | | | | $ | — | | | | $ | 273,901,207 | |
| | | | | | | | | | | | | | | | | | | | |
| | | | |
| LKCM International Equity Fund | | | | | | | | |
| | | | |
Description | | Level 1 | | Level 2 | | Level 3 | | Total |
Common Stocks | | | $ | 159,428 | | | | $ | 9,539,914 | | | | $ | — | | | | $ | 9,699,342 | |
Preferred Stock | | | | — | | | | | 209,488 | | | | | — | | | | | 209,488 | |
Money Market Funds | | | | 748,388 | | | | | — | | | | | — | | | | | 748,388 | |
| | | | | | | | | | | | | | | | | | | | |
Total Investments* | | | $ | 907,816 | | | | $ | 9,749,402 | | | | $ | — | | | | $ | 10,657,218 | |
| | | | | | | | | | | | | | | | | | | | |
| | * | Additional information regarding the industry classifications of these investments is disclosed in the Schedule of Investments. |
41
Below is a reconciliation of Level 3 assets held by the LKCM Small Cap Equity Fund for which significant observable inputs were used to determine fair value.
| | | | | | | |
Description | | | | Common Stocks |
Balance as of January 1, 2019 | | | | | $ | 0 | |
| | Purchases | | | | — | |
| | Sales proceeds | | | | — | |
| | Realized gain (loss) | | | | — | |
| | Change in unrealized appreciation/depreciation | | | | — | |
| | Transfers into/(out of) Level 3 | | | | — | |
| | | | | | | |
Balance as of December 31, 2019 | | | | | $ | 0 | |
| | | | | | | |
| Change in unrealized appreciation/depreciation during the period for Level 3 investments held at December 31, 2019 | | | | | $ | — | |
| | | | | |
2. Federal Income Taxes: The Funds have elected to be treated as “regulated investment companies” under Subchapter M of the Internal Revenue Code and each Fund intends to distribute all of its investment company net taxable income and net capital gains to shareholders. Therefore, no federal income tax provision is recorded.
3. Distributions to Shareholders: The LKCM Small Cap Equity Fund, LKCM Small-Mid Cap Equity Fund, LKCM Equity Fund and LKCM International Equity Fund generally intend to declare and pay income dividends and distribute net capital gains, if any, at least on an annual basis. The LKCM Balanced Fund and LKCM Fixed Income Fund generally intend to declare and pay income dividends on a quarterly basis and distribute net capital, if any, at least on an annual basis.
4. Foreign Securities: Investing in securities of foreign companies and foreign governments involves special risks and considerations not typically associated with investing in securities of U.S. issuers. These risks include devaluation of currencies and future adverse political and economic developments. Moreover, securities of many foreign companies and foreign governments and their markets may be less liquid and their prices more volatile than those of securities of comparable U.S. companies and securities of the U.S. government.
5. Expense Allocation: Expenses incurred by the Funds are allocated among the Funds based upon (i) relative average net assets, (ii) a specific identification basis as incurred, or (iii) evenly among the Funds, depending on the nature of the expense.
6. Use of Estimates: The preparation of financial statements in conformity with accounting principles generally accepted in the United States of America requires management to make estimates and assumptions that affect the reported amounts of assets and liabilities and disclosure of contingent assets and liabilities at the date of the financial statements and the reported amounts of revenues and expenses during the reporting period. Actual results could differ from those estimates.
7. Guarantees and Indemnifications: In the normal course of business, the Funds enter into contracts with service providers that contain general indemnification clauses. The Funds’ maximum exposure under these arrangements is unknown as this would involve future claims against the Funds that have not yet occurred. Based on experience, the Funds expect the risk of loss to be remote.
8. Security Transactions and Investment Income: Security and shareholder transactions are recorded on the trade date. Realized gains and losses on sales of investments are calculated on the identified cost basis. Dividend income and dividends and distributions to shareholders are recorded on the ex-dividend date. Withholding taxes on foreign dividends have been provided for in accordance with the Funds’ understanding of the applicable jurisdiction’s tax rules and rates. Interest income is recognized on the accrual basis. All discounts and premiums are amortized based on the effective interest method for tax and financial reporting purposes. The Funds may hold the securities of real estate investment trusts (“REITs”). Distributions from such investments may include income, capital gains and return of capital.
9. Other: Distributions from net investment income and realized capital gains are determined in accordance with income tax regulations, which may differ from U.S. GAAP. Certain capital accounts in the consolidated financial statements are periodically adjusted for permanent differences in order to reflect their tax character. These permanent differences are primarily due to the varying treatment of income and gain/loss on portfolio securities held by the Fund and have no impact on net assets or NAV per share.
Accordingly, at December 31, 2019, reclassifications were recorded as follows:
| | | | | | | | | | | | | | | | | | | | | | | | | | | | | | |
| | | LKCM
Small Cap
Equity Fund | | LKCM
Small-Mid Cap
Equity Fund | | LKCM
Equity
Fund | | LKCM
Balanced
Fund | | LKCM
Fixed
Income Fund | | LKCM
International
Equity Fund |
Accumulated net investment income (loss) | | | $ | 230,410 | | | | $ | 31,999 | | | | $ | — | | | | $ | 2,370 | | | | $ | 5,201 | | | | $ | (13,485 | ) |
Accumulated net realized gain (loss) | | | | (1,065,914 | ) | | | | (151,174 | ) | | | | (297,809 | ) | | | | (79,251 | ) | | | | — | | | | | 14,313 | |
Capital stock | | | | 835,504 | | | | | 119,175 | | | | | 297,809 | | | | | 76,881 | | | | | (5,201 | ) | | | | (828 | ) |
42
10. Restricted and Illiquid Securities: The Funds are permitted to invest in securities that are subject to legal or contractual restrictions on resale including investments considered by the Funds to be illiquid. Restricted securities generally may be resold in transactions exempt from registration. Illiquid investments are investments that the Funds reasonably expect cannot be sold or disposed of in current market conditions within seven calendar days or less in the ordinary course of business without the sale or disposition significantly changing the market value of the investment. A security may be considered illiquid if it lacks a readily available market or if its valuation has not changed for a certain period of time. Disposal of these securities may involve time-consuming negotiations and expense, and prompt sale at the current valuation may be difficult.
11. Recent Accounting Pronouncements: In March 2017, the Financial Accounting Standards Board (“FASB”) issued ASU 2017-08,Receivables—Nonrefundable Fees and Other Costs (Subtopic 310-20): Premium Amortization on Purchased Callable Debt Securities (“ASU 2017-08”). The amendments in the ASU 2017-08 shorten the amortization period for certain callable debt securities, held at a premium, to be amortized to the earliest call date. The ASU 2017-08 does not require an accounting change for securities held at a discount; which continues to be amortized to maturity. The ASU 2017-08 is effective for fiscal years and interim periods within those fiscal years beginning after December 15, 2018. Effective, January 1, 2019, the Funds adopted ASU 2017-08, and the adoption did not have a material impact on the financial statements.
In August 2018, FASB issuedASU 2018-13,Fair Value Measurement (Topic 820):Disclosure Framework—Changes to the Disclosure Requirements for Fair Value Measurement(“ASU 2018-13”). The primary focus ofASU 2018-13 is to improve the effectiveness of the disclosure requirements for fair value measurements. The changes affect all companies that are required to include fair value measurement disclosures. In general, the amendments inASU 2018-13 are effective for all entities for fiscal years and interim periods within those fiscal years, beginning after December 15, 2019. An entity is permitted to early adopt the removed or modified disclosures upon the issuance of ASU2018-13 and may delay adoption of the additional disclosures, which are required for public companies only, until their effective date. Management has evaluated ASU 2018-13 and has adopted the relevant provisions of the disclosure framework.
B. Investment Advisory and Other Agreements: The Adviser serves as the investment adviser to the Funds under an Investment Advisory Agreement (the “Agreement”). The Adviser receives a fee, computed daily and payable quarterly, at the annual rates presented below as applied to each Fund’s average daily net assets. The Adviser has contractually agreed to waive all or a portion of its management fee and/or reimburse expenses of the Funds through May 1, 2020 in order to limit each Fund’s operating expenses to the annual cap rates presented below. This expense limitation excludes interest, taxes, brokerage commissions, indirect fees and expenses relating to investments in other investment companies, including money market funds, and extraordinary expenses. For the fiscal year ended December 31, 2019, the Adviser waived the following management fees and/or reimbursed expenses to meet its expense cap obligations:
| | | | | | | | | | | | | | | | | | | | | | | | |
| | | LKCM
Small Cap
Equity Fund | | | LKCM
Small-Mid Cap
Equity Fund | | | LKCM
Equity
Fund | | | LKCM
Balanced
Fund | | | LKCM
Fixed
Income Fund | | | LKCM
International
Equity Fund(1) | |
Annual Management Fee Rate | | | 0.75% | | | | 0.75% | | | | 0.70% | | | | 0.65% | | | | 0.50% | | | | 0.90% | |
Annual Cap on Expenses | | | 1.00% | | | | 1.00% | | | | 0.80% | | | | 0.80% | | | | 0.50% | | | | 1.00% | |
Fees Waived and/or Expenses Reimbursed in 2019 | | | $131,407 | | | | $121,861 | | | | $663,190 | | | | $191,230 | | | | $756,238 | | | | $159,189 | |
| (1) | For the period from May 1, 2019 (commencement of operations) through December 31, 2019. |
The Trust reimburses the Adviser for a portion of compensation paid to the Trust’s Chief Compliance Officer. This compensation is reported as part of the “Trustees’ fees and officer compensation” expense on the Statement of Operations.
U.S. Bancorp Fund Services, LLC, doing business as U.S. Bank Global Fund Services, serves as transfer agent and administrator for the Trust and serves as accounting services agent for the Trust. U.S. Bank, N.A. serves as custodian for the Funds.
Distribution services are performed pursuant to a distribution contract with Quasar Distributors, LLC, the Trust’s principal underwriter.
The Funds have adopted a Distribution Plan, under which each Fund may pay an annualized fee of up to 0.75% of its average daily net assets for distribution and other services. Currently, the Board of Trustees has not authorized payments under this plan and, as a result, the Funds currently neither accrue nor pay any fees under the plan.
43
C. Fund Shares: At December 31, 2019, there was an unlimited number of shares of beneficial interest, no par value, authorized, for each Fund. The following table summarizes the activity in shares of each Fund:
| | | | | | | | | | | | | | | | | | | | |
| LKCM Small Cap Equity Fund | | | | | | | | |
| | | Year Ended
December 31, 2019 | | Year Ended
December 31, 2018 |
| | | | | Institutional Class |
| | | Shares | | Amount | | Shares | | Amount |
Shares sold | | | | 553,209 | | | | $ | 9,022,479 | | | | | 629,067 | | | | $ | 12,579,033 | |
Shares issued to shareholders in reinvestment of distributions | | | | 473,251 | | | | | 7,960,077 | | | | | 1,755,599 | | | | | 24,982,114 | |
Shares redeemed | | | | (1,397,843 | ) | | | | (23,500,008 | ) | | | | (2,154,803 | ) | | | | (40,922,342 | ) |
Redemption fee | | | | | | | | | — | | | | | | | | | | 727 | |
| | | | | | | | | | | | | | | | | | | | |
Net increase (decrease) | | | | (371,383 | ) | | | $ | (6,517,452 | ) | | | | 229,863 | | | | $ | (3,360,468 | ) |
| | | | | | | | | | | | | | | | | | | | |
Shares Outstanding: | | | | | | | | | | | | | | | | | | | | |
Beginning of period | | | | 11,138,973 | | | | | | | | | | 10,909,110 | | | | | | |
| | | | | | | | | | | | | | | | | | | | |
End of period | | | | 10,767,590 | | | | | | | | | | 11,138,973 | | | | | | |
| | | | | | | | | | | | | | | | | | | | |
| | | |
| | | | | | | Year Ended
December 31, 2018 |
| | | | | | | Adviser Class* |
| | | | | | | Shares | | Amount |
Shares sold | | | | | | | | | | | | | | 8,126 | | | | $ | 141,867 | |
Shares redeemed | | | | | | | | | | | | | | (38,699 | ) | | | | (704,763 | ) |
| | | | | | | | | | | | | | | | | | | | |
Net decrease | | | | | | | | | | | | | | (30,573 | ) | | | $ | (562,896 | ) |
| | | | | | | | | | | | | | | | | | | | |
Shares Outstanding: | | | | | | | | | | | | | | | | | | | | |
Beginning of period | | | | | | | | | | | | | | 30,573 | | | | | | |
| | | | | | | | | | | | | | | | | | | | |
End of period | | | | | | | | | | | | | | — | | | | | | |
| | | | | | | | | | | | | | | | | | | | |
Total Net Decrease | | | | | | | | | | | | | | | | | | $ | (3,923,364 | ) |
| | | | | | | | | | | | | | | | |
| * | The Adviser Class Shares of the Fund were terminated on October 31, 2018. |
| | | | | | | | | | | | | | | | | | | | |
| | | | |
| LKCMSmall-Mid Cap Equity Fund | | | | | | | | |
| | | Year Ended
December 31, 2019 | | Year Ended
December 31, 2018 |
| | | Shares | | Amount | | Shares | | Amount |
Shares sold | | | | 8,594 | | | | $ | 79,975 | | | | | 33,214 | | | | $ | 362,456 | |
Shares issued to shareholders in reinvestment of distributions | | | | 145,840 | | | | | 1,330,062 | | | | | 255,531 | | | | | 1,998,256 | |
Shares redeemed | | | | (304,984 | ) | | | | (2,901,857 | ) | | | | (581,374 | ) | | | | (6,012,534 | ) |
Redemption fee | | | | | | | | | — | | | | | | | | | | — | |
| | | | | | | | | | | | | | | | | | | | |
Net decrease | | | | (150,550 | ) | | | $ | (1,491,820 | ) | | | | (292,629 | ) | | | $ | (3,651,822 | ) |
| | | | | | | | | | | | | | | | | | | | |
Shares Outstanding: | | | | | | | | | | | | | | | | | | | | |
Beginning of period | | | | 1,536,022 | | | | | | | | | | 1,828,651 | | | | | | |
| | | | | | | | | | | | | | | | | | | | |
End of period | | | | 1,385,472 | | | | | | | | | | 1,536,022 | | | | | | |
| | | | | | | | | | | | | | | | | | | | |
| | | | |
| LKCM Equity Fund | | | | | | | | |
| | | Year Ended
December 31, 2019 | | Year Ended
December 31, 2018 |
| | | Shares | | Amount | | Shares | | Amount |
Shares sold | | | | 751,273 | | | | $ | 20,128,808 | | | | | 844,102 | | | | $ | 23,187,647 | |
Shares issued to shareholders in reinvestment of distributions | | | | 531,455 | | | | | 15,454,725 | | | | | 929,685 | | | | | 21,494,324 | |
Shares redeemed | | | | (1,367,658 | ) | | | | (37,611,783 | ) | | | | (1,641,146 | ) | | | | (44,621,947 | ) |
Redemption fee | | | | | | | | | 1,269 | | | | | | | | | | 312 | |
| | | | | | | | | | | | | | | | | | | | |
Net increase (decrease) | | | | (84,930 | ) | | | $ | (2,026,981 | ) | | | | 132,641 | | | | $ | 60,336 | |
| | | | | | | | | | | | | | | | | | | | |
Shares Outstanding: | | | | | | | | | | | | | | | | | | | | |
Beginning of period | | | | 13,224,240 | | | | | | | | | | 13,091,599 | | | | | | |
| | | | | | | | | | | | | | | | | | | | |
End of period | | | | 13,139,310 | | | | | | | | | | 13,224,240 | | | | | | |
| | | | | | | | | | | | | | | | | | | | |
44
| | | | | | | | | | | | | | | | | | | | |
| LKCM Balanced Fund | | | | | | | | |
| | | Year Ended
December 31, 2019 | | Year Ended
December 31, 2018 |
| | | Shares | | Amount | | Shares | | Amount |
Shares sold | | | | 472,852 | | | | $ | 11,074,342 | | | | | 711,217 | | | | $ | 15,637,963 | |
Shares issued to shareholders in reinvestment of distributions | | | | 235,149 | | | | | 5,686,783 | | | | | 111,842 | | | | | 2,384,425 | |
Shares redeemed | | | | (499,010 | ) | | | | (11,756,977 | ) | | | | (507,312 | ) | | | | (11,396,388 | ) |
Redemption fee | | | | | | | | | 1,525 | | | | | | | | | | 622 | |
| | | | | | | | | | | | | | | | | | | | |
Net increase | | | | 208,991 | | | | $ | 5,005,673 | | | | | 315,747 | | | | $ | 6,626,622 | |
| | | | | | | | | | | | | | | | | | | | |
Shares Outstanding: | | | | | | | | | | | | | | | | | | | | |
Beginning of period | | | | 4,077,381 | | | | | | | | | | 3,761,634 | | | | | | |
| | | | | | | | | | | | | | | | | | | | |
End of period | | | | 4,286,372 | | | | | | | | | | 4,077,381 | | | | | | |
| | | | | | | | | | | | | | | | | | | | |
| | | | |
LKCM Fixed Income Fund | | | | | | | | | | | | | | | | | | | | |
| | | Year Ended
December 31, 2019 | | Year Ended
December 31, 2018 |
| | | Shares | | Amount | | Shares | | Amount |
Shares sold | | | | 2,945,477 | | | | $ | 31,817,012 | | | | | 1,518,406 | | | | $ | 16,007,187 | |
Shares issued to shareholders in reinvestment of distributions | | | | 498,493 | | | | | 5,410,572 | | | | | 475,511 | | | | | 4,982,833 | |
Shares redeemed | | | | (1,969,721 | ) | | | | (21,345,747 | ) | | | | (1,503,570 | ) | | | | (15,802,687 | ) |
Redemption fee | | | | | | | | | 198 | | | | | | | | | | — | |
| | | | | | | | | | | | | | | | | | | | |
Net increase | | | | 1,474,249 | | | | $ | 15,882,035 | | | | | 490,347 | | | | $ | 5,187,333 | |
| | | | | | | | | | | | | | | | | | | | |
Shares Outstanding: | | | | | | | | | | | | | | | | | | | | |
Beginning of period | | | | 23,803,458 | | | | | | | | | | 23,313,111 | | | | | | |
| | | | | | | | | | | | | | | | | | | | |
End of period | | | | 25,277,707 | | | | | | | | | | 23,803,458 | | | | | | |
| | | | | | | | | | | | | | | | | | | | |
| | | |
| LKCM International Equity Fund | | | | | | |
| | | May 1, 2019(1) through
December 31, 2019 | | | | |
| | | Shares | | Amount | | | | |
Shares sold | | | | 977,320 | | | | $ | 9,668,170 | | | | | | | | | | | |
Shares issued to shareholders in reinvestment of distributions | | | | 360 | | | | | 3,927 | | | | | | | | | | | |
Shares redeemed | | | | (3 | ) | | | | (32 | ) | | | | | | | | | | |
| | | | | | | | | | | | | | | | | | | | |
Net increase | | | | 977,677 | | | | $ | 9,672,065 | | | | | | | | | | | |
| | | | | | | | | | | | | | | | | | | | |
Shares Outstanding: | | | | | | | | | | | | | | | | | | | | |
Beginning of period | | | | — | | | | | | | | | | | | | | | | |
| | | | | | | | | | | | | | | | | | | | |
End of period | | | | 977,677 | | | | | | | | | | | | | | | | |
| | | | | | | | | | | | | | | | | | | | |
| (1) | Commencement of operations. |
D. Security Transactions: Purchases and sales of investment securities, other than short-term investments, for the fiscal year ended December 31, 2019 were as follows:
| | | | | | | | | | | | | | | | | | | | |
| | | Purchases | | Sales |
| | | U.S.
Government | | Other | | U.S.
Government | | Other |
LKCM Small Cap Equity Fund | | | $ | — | | | | $ | 111,824,553 | | | | $ | — | | | | $ | 129,270,374 | |
LKCMSmall-Mid Cap Equity Fund | | | | — | | | | | 8,425,315 | | | | | — | | | | | 10,964,614 | |
LKCM Equity Fund | | | | — | | | | | 29,839,791 | | | | | 9,979,777 | | | | | 56,565,100 | |
LKCM Balanced Fund | | | | — | | | | | 20,249,419 | | | | | — | | | | | 15,723,872 | |
LKCM Fixed Income Fund | | | | 47,706,271 | | | | | 65,446,375 | | | | | 61,345,328 | | | | | 36,408,108 | |
LKCM International Equity Fund(1) | | | | — | | | | | 9,088,936 | | | | | — | | | | | 157,370 | |
| (1) | Period from May 1, 2019 (commencement of operations) through December 31, 2019. |
45
E. Tax Information: At December 31, 2019, the components of accumulated earnings (losses) on a tax basis were as follows:
| | | | | | | | | | | | | | | | | | | | | | | | | | | | | | |
| | | LKCM
Small Cap
Equity Fund | | LKCM
Small-Mid Cap
Equity Fund | | LKCM
Equity
Fund | | LKCM
Balanced
Fund | | LKCM
Fixed
Income Fund | | LKCM
International
Equity Fund |
|
|
Tax Cost | | | $ | 127,593,033 | | | | $ | 9,083,153 | | | | $ | 197,759,971 | | | | $ | 76,351,289 | | | | $ | 267,281,869 | | | | $ | 9,680,635 | |
| | | | | | | | | | | | | | | | | | | | | | | | | | | | | | |
Gross Unrealized Appreciation | | | $ | 53,632,497 | | | | $ | 3,554,519 | | | | $ | 186,600,890 | | | | $ | 27,022,111 | | | | $ | 6,778,905 | | | | $ | 1,065,262 | |
Gross Unrealized Depreciation | | | | (707,067 | ) | | | | (37,898 | ) | | | | (3,708,774 | ) | | | | (572,412 | ) | | | | (159,567 | ) | | | | (88,778 | ) |
| | | | | | | | | | | | | | | | | | | | | | | | | | | | | | |
Net Unrealized Appreciation | | | $ | 52,925,430 | | | | $ | 3,516,621 | | | | $ | 182,892,116 | | | | $ | 26,449,699 | | | | $ | 6,619,338 | | | | $ | 976,484 | |
| | | | | | | | | | | | | | | | | | | | | | | | | | | | | | |
Undistributed Ordinary Income | | | | — | | | | | — | | | | | 72 | | | | | — | | | | | — | | | | | — | |
Undistributed Long-Term Capital Gain | | | | 574,922 | | | | | 189,611 | | | | | — | | | | | 26,030 | | | | | — | | | | | — | |
| | | | | | | | | | | | | | | | | | | | | | | | | | | | | | |
Total Distributable Earnings | | | $ | 574,922 | | | | $ | 189,611 | | | | $ | 72 | | | | $ | 26,030 | | | | $ | — | | | | $ | — | |
| | | | | | | | | | | | | | | | | | | | | | | | | | | | | | |
Other Accumulated Losses | | | $ | — | | | | $ | — | | | | $ | (70,371 | ) | | | $ | — | | | | $ | (468,149 | ) | | | $ | (2,391 | ) |
| | | | | | | | | | | | | | | | | | | | | | | | | | | | | | |
Total Accumulated Gains | | | $ | 53,500,352 | | | | $ | 3,706,232 | | | | $ | 182,821,817 | | | | $ | 26,475,729 | | | | $ | 6,151,189 | | | | $ | 974,093 | |
| | | | | | | | | | | | | | | | | | | | | | | | | | | | | | |
The difference between book cost of investments and tax cost of investments is attributable primarily to the tax deferral of losses on wash sales.
Net investment income and realized gains and losses for federal income tax purposes may differ from that reported on the financial statements because of permanentbook-to-tax differences. GAAP requires that permanent differences between financial reporting and tax reporting be reclassified between various components of net assets. These differences are primarily due to net operating losses, swap contract adjustments, dividend reclasses, and dividends on redemption adjustments with differing book and tax methods.
To the extent the Funds realize future net capital gains, taxable distributions will be reduced by any unused capital loss carryforwards as permitted by the Internal Revenue Code. At December 31, 2019, the capital loss carryforwards were as follows:
| | | | | |
| | | Long-Term |
LKCM Fixed Income Fund | | | $ | 468,149 | |
At December 31, 2019, the Funds deferred, on a tax basis, post-October capital losses of:
| | | | | |
LKCM Equity Fund | | | $ | 70,371 | |
LKCM International Equity Fund | | | $ | 2,490 | |
The tax components of dividends paid during the periods shown below were as follows:
| | | | | | | | | | | | | | | | | | | | |
| | | Year Ended December 31, 2019 | | Year Ended December 31, 2018 |
| | | Ordinary
Income | | Long-Term
Capital Gains | | Ordinary
Income | | Long-Term
Capital Gains |
LKCM Small Cap Equity Fund | | | $ | — | | | | $ | 9,039,350 | | | | $ | — | | | | $ | 28,133,206 | |
LKCMSmall-Mid Cap Equity Fund | | | | — | | | | | 1,611,139 | | | | | — | | | | | 2,221,982 | |
LKCM Equity Fund | | | | 2,849,089 | | | | | 13,410,713 | | | | | 2,586,418 | | | | | 19,906,815 | |
LKCM Balanced Fund | | | | 1,122,363 | | | | | 4,738,772 | | | | | 888,174 | | | | | 1,576,215 | |
LKCM Fixed Income Fund | | | | 6,149,434 | | | | | — | | | | | 5,577,246 | | | | | — | |
LKCM International Equity Fund(1) | | | | 6,697 | | | | | — | | | | | N/A | | | | | N/A | |
| (1) | Period from May 1, 2019 (commencement of operations) through December 31, 2019. |
The Funds designated earnings and profits distributed to shareholders upon the redemption of shares during 2019 and 2018 in determining undistributed net capital gains as of December 31, 2019 and 2018.
The Trust has adopted financial reporting rules regarding recognition and measurement of tax positions taken or expected to be taken on a tax return. The Trust has reviewed all open tax years and major jurisdictions and concluded that there is no impact on the Funds’ financial position or results of operations. Tax years that remain open to examination by major tax jurisdictions include tax years ended December 31, 2016 through December 31, 2019 (LKCM Small Cap Equity Fund, LKCM Small-Mid Cap Equity Fund, LKCM Equity Fund, LKCM Balanced Fund and LKCM Fixed Income Fund) and December 31, 2019 (LKCM International Equity Fund). There is no tax liability resulting from unrecognized tax benefits relating to uncertain income tax positions taken or expected to be taken on tax returns as of December 31, 2019. The Funds are not aware of any tax positions for which it is reasonably possible that the total amounts of unrecognized tax benefits will significantly change in the next twelve months. If applicable, the Funds would recognize interest accrued related to unrecognized tax benefits in “interest expense” and penalties in “other expense” on the statement of operations.
F. Subsequent Events: In preparing these financial statements, management has evaluated the Funds’ related events and transactions that occurred subsequent to December 31, 2019 through the date the financial statements were issued. Other than as disclosed below, management has determined that there were no significant subsequent events requiring recognition or disclosure in the financial statements.
On November 25, 2019, U.S. Bancorp, the parent company of Quasar Distributors, LLC (“Quasar”), the Funds’ distributor, announced that it had signed a purchase agreement to sell Quasar to Foreside Financial Group, LLC (“Foreside”) such that Quasar will become a wholly-owned broker-dealer subsidiary of Foreside. The transaction is expected to close by the end of March 2020. Quasar will remain the Funds’ distributor at the close of the transaction, subject to approval of the Board of Trustees of the Funds.
46
|
| REPORTOF INDEPENDENT REGISTERED PUBLIC ACCOUNTING FIRM |
To the shareholders and Board of Trustees of LKCM Funds
Opinion on the Financial Statements and Financial Highlights
We have audited the accompanying statements of assets and liabilities of LKCM Funds (the “Funds”) comprising the LKCM Small Cap Equity Fund, LKCM Equity Fund, LKCM Balanced Fund, LKCM Fixed Income Fund, LKCMSmall-Mid Cap Equity Fund, and LKCM International Equity Fund including the schedules of investments, as of December 31, 2019; the related statements of operations, changes in net assets, and the financial highlights for the periods indicated in the table below; and the related notes. In our opinion, the financial statements and financial highlights present fairly, in all material respects, the financial position of each of the portfolios constituting the Funds as of December 31, 2019, and the results of their operations, the changes in their net assets, and the financial highlights for the periods listed in the table below, in conformity with accounting principles generally accepted in the United States of America.
| | | | | | |
Individual Fund Comprising the LKCM
Funds | | Statement of
Operations | | Statements of
Changes in Net
Assets | | Financial Highlights |
LKCM Small Cap Equity Fund,
LKCM Equity Fund, LKCM Balanced Fund,
LKCM Fixed Income Fund, and
LKCM Small-Mid Cap Equity Fund | | For the year ended December 31, 2019 | | For the years ended December 31, 2019 and 2018 | | For the years ended December 31, 2019, 2018, 2017, 2016 and 2015 |
| LKCM International Equity Fund | | For the period from May 1, 2019 (commencement of operations)
through December 31, 2019 |
Basis for Opinion
These financial statements and financial highlights are the responsibility of the Funds’ management. Our responsibility is to express an opinion on the Funds’ financial statements and financial highlights based on our audits. We are a public accounting firm registered with the Public Company Accounting Oversight Board (United States) (PCAOB) and are required to be independent with respect to the Funds in accordance with the U.S. federal securities laws and the applicable rules and regulations of the Securities and Exchange Commission and the PCAOB.
We conducted our audits in accordance with the standards of the PCAOB. Those standards require that we plan and perform the audit to obtain reasonable assurance about whether the financial statements and financial highlights are free of material misstatement, whether due to error or fraud. The Funds are not required to have, nor were we engaged to perform, an audit of their internal control over financial reporting. As part of our audits we are required to obtain an understanding of internal control over financial reporting but not for the purpose of expressing an opinion on the effectiveness of the Funds’ internal control over financial reporting. Accordingly, we express no such opinion.
Our audits included performing procedures to assess the risks of material misstatement of the financial statements and financial highlights, whether due to error or fraud, and performing procedures that respond to those risks. Such procedures included examining, on a test basis, evidence regarding the amounts and disclosures in the financial statements and financial highlights. Our audits also included evaluating the accounting principles used and significant estimates made by management, as well as evaluating the overall presentation of the financial statements and financial highlights. Our procedures included confirmation of securities owned as of December 31, 2019, by correspondence with the custodian. We believe that our audits provide a reasonable basis for our opinion.
Milwaukee, Wisconsin
February 25, 2020
We have served as the auditor of one or more LKCM Funds since 2007.
47
|
| LKCM FUNDS |
| ADDITIONAL INFORMATION |
| December 31, 2019 |
Tax Information: For the fiscal year ended December 31, 2019, certain dividends paid by the Funds may be subject to a maximum tax rate of 23.8%, as provided for by the Jobs & Growth Tax Relief Reconciliation Act of 2003. The percentage of dividends declared from ordinary income designated as qualified dividend income was as follows:
| | | | | |
Equity | | | | 100.00 | % |
Balanced | | | | 95.38 | % |
International Equity | | | | 100.00 | % |
For corporate shareholders, the percentage of ordinary income distributions qualifying for the corporate dividends received deduction for the fiscal year ended December 31, 2019 was as follows:
| | | | | |
Equity | | | | 100.00 | % |
Balanced | | | | 92.38 | % |
The Funds hereby designate the following percentages of their ordinary income distributions for the fiscal year ended December 31, 2019 as interest-related dividends under Internal Revenue Code Section 871(k)(1)(C).
| | | | | |
Balanced | | | | 71.28 | % |
Fixed Income | | | | 74.46 | % |
The percentage of taxable ordinary income distributions that are designated as short-term capital gain distributions under Internal Revenue Code Section 871(k)(2)(C) Fund for the fiscal year ended December 31, 2019 was as follows:
| | | | | |
International Equity | | | | 48.86 | % |
Availability of Proxy Voting Information: A description of the policies and procedures that the Funds use to determine how to vote proxies relating to their portfolio securities, as well as information regarding how the Funds voted proxies relating to portfolio securities during the most recent 12-month period ended June 30, is available without charge, upon request, by callingtoll-free 1-800-688-LKCM or on the SEC website at http://www.sec.gov.
The actual voting records relating to portfolio securities during the twelve month period ended June 30 (as filed with the SEC on Form N-PX) are available without charge, upon request, by calling the Funds toll free at 1-800-688-LKCM or by accessing the SEC’s website at www.sec.gov.
Availability of Quarterly Portfolio Schedule: The Funds are required to file complete schedules of portfolio holdings with the SEC for the first and third fiscal quarters on Form N-Q. Once filed, the Funds’ Form N-Q is available without charge upon request on the SEC’s website (http://www.sec.gov) and is also available by calling 1-800-688-LKCM. You can also review and copy the Funds’ Form N-Q by visiting the SEC’s Public Reference Room in Washington, DC (information on the operation of the Public Reference Room may be obtained by calling 1-800-SEC-0330). Beginning June 1, 2020, monthly portfolio disclosures will be filed quarterly with the SEC on Form N-PORT, with quarter-end disclosures being made public 60 days after the end of each fiscal quarter.
48
Information about the Funds’ Trustees and Officers:
The business and affairs of the Funds are managed under the direction of the Funds’ Board of Trustees. Information pertaining to the Trustees of the Funds is set forth below. The Statement of Additional Information includes additional information about the Funds’ Trustees and officers and is available, without charge, upon request by calling 1-800-688-LKCM.
| | | | | | | | | | |
Name, Address
and Age | | Position(s)
Held with
the Trust | | Term of
Office &
Length of Time Served(1) | | Principal Occupation
During Past Five Years | | Number of
Portfolios in
Fund Complex
Overseen
by Trustee | | Other Directorships Held by Trustee |
| Independent Trustees: | | | | | | | | | | |
H. Kirk Downey 301 Commerce Street Suite 1600 Fort Worth, TX 76102 Year of Birth: 1942 | | Chairman of the Board of Trustees Trustee | | Since 2005 Since 1994 | | President and CEO, Texas Systems, LLC and CEO, Texas learning systems LLC since 1999 (education companies); Dean, M.J. Neeley School of Business, Texas Christian University Business School from 1987 to 1999. | | 7 | | None |
Richard J. Howell 301 Commerce Street Suite 1600 Fort Worth, TX 76102 Year of Birth: 1942 | | Trustee Chairman of the Audit and Compliance Committee | | Since 2005 Since 2008 | | CPA; Adjunct Faculty at SMU Cox School of Business from 2004 to 2009; Consulting Services, since 2002; Audit Partner, Arthur Andersen LLP from 1974 to 2002. | | 7 | | None |
Larry J. Lockwood 301 Commerce Street Suite 1600 Fort Worth, TX 76102 Year of Birth: 1953 | | Trustee | | Since 2013 | | C.R. Williams Professor of Finance, Stan Block Endowed Chair in Finance, Department of Finance, Neeley School of Business, Texas Christian University since 1994. | | 7 | | None |
| Interested Trustees: | | | | | | | | | | |
J. Luther King, Jr.(2) 301 Commerce Street Suite 1600 Fort Worth, TX 76102 Year of Birth: 1940 | | Trustee, President and Chief Executive Officer | | Since 1994 | | Chairman, President and Director, Luther King Capital Management Corporation since 1979. | | 7 | | Tyler Technologies, Inc. |
Steve R. Purvis(2) 301 Commerce Street Suite 1600 Fort Worth, TX 76102 Year of Birth: 1964 | | Trustee Vice President | | Since 2013 Since 2000 | | Principal, Luther King Capital Management Corporation since 2004, Vice President and Portfolio Manager Luther King Capital Management Corporation since 1996. | | 7 | | AZZ Incorporated |
| (1) | Each Trustee holds office during the lifetime of the Trust until that individual resigns, retires or is otherwise removed or replaced. |
| (2) | Messrs. King and Purvis are each considered an “interested person” of the Trust (as defined in the 1940 Act) because of their affiliation with the Adviser. |
49
Information about the Funds’ Trustees and Officers, Continued
| | | | | | |
Name, Address
and Age | | Position(s) Held with the Trust | | Term of
Office &
Length of Time Served | | Principal Occupation
During Past Five Years |
| Principal Officers: | | | | | | |
J. Luther King, Jr.(1) 301 Commerce Street Suite 1600 Fort Worth, TX 76102 Year of Birth: 1940 | | Trustee, President and Chief Executive Officer | | Since 1994 | | Chairman, President and Director, Luther King Capital Management Corporation since 1979. |
Steven R. Purvis(1) 301 Commerce Street Suite 1600 Fort Worth, TX 76102 Year of Birth: 1964 | | Trustee Vice President | | Since 2013 Since 2000 | | Principal, Luther King Capital Management Corporation since 2004, Vice President and Portfolio Manager, Luther King Capital Management Corporation since 1996. |
Paul W. Greenwell 301 Commerce Street Suite 1600 Fort Worth, TX 76102 Year of Birth: 1950 | | Vice President | | Since 1996 | | Principal, Luther King Capital Management Corporation since 1986, Vice President and Portfolio Manager, Luther King Capital Management Corporation since 1983. |
Richard Lenart 301 Commerce Street Suite 1600 Fort Worth, TX 76102 Year of Birth: 1966 | | Secretary and Treasurer | | Since 2006 | | Luther King Capital Management Corporation since 2005. |
Jacob D. Smith 301 Commerce Street Suite 1600 Fort Worth, TX 76102 Year of Birth: 1974 | | Chief Financial Officer Chief Compliance Officer | | Since 2010 Since 2006 | | General Counsel and Chief Compliance Officer, Luther King Capital Management Corporation since 2006; Principal, Luther King CapitalManagement Corporation since 2013. |
| (1) | Messrs. King and Purvis are each considered an “interested person” of the Trust (as defined in the 1940 Act) because of their affiliation with the Adviser. |
50
LKCM FUNDS
PRIVACY NOTICE
Our Commitment to Your Privacy
At LKCM Funds, we are committed to safeguarding the confidentiality and privacy of nonpublic personal information about our current and former shareholders. This privacy notice describes the types of nonpublic personal information we collect about you and the sources through which we obtain this information, the purposes for which we obtain and use your nonpublic information, and the policies and procedures we have implemented to protect the privacy of your nonpublic personal information.
How We Protect Your Nonpublic Personal Information
Protecting your nonpublic personal information is an important priority at LKCM Funds. Accordingly, we have implemented policies and procedures designed to safeguard your nonpublic personal information, such as your tax identification number, account and investment history, account numbers, account balances and nonpublic contact information, from unauthorized access or use. Pursuant to these policies and procedures, we maintain various physical, technological, and administrative safeguards to protect the security and confidentiality of your nonpublic personal information, and we adapt these safeguards to respond to evolving technological and other standards.
We do not disclose nonpublic personal information about you to non-affiliated firms, organizations or individuals except as authorized by you or your representatives or as required or permitted by law. We may disclose nonpublic personal information about you to nonaffiliated third parties, such as custodians, brokers, auditors, accountants, and systems and administrative service providers, in connection with the services we provide to you or on your behalf. When we provide nonpublic personal information about you to nonaffiliated third parties for these purposes, we expect them to safeguard your nonpublic personal information, use your nonpublic personal information only for the intended purposes and otherwise abide by applicable law.
How We Obtain Your Nonpublic Personal Information
We collect nonpublic personal information about you from various sources, including documents, new account applications and other information that you or your representatives, custodians, attorneys, accountants or similar parties provide to us, communications that we have with you or your representatives, custodians, attorneys, accountants or similar parties, and documents and other information related to your accounts or investment experience with us.
Please do not hesitate to contact Jacob D. Smith, our Chief Compliance Officer, if you have any questions regarding the measures we have implemented to protect the privacy of your nonpublic personal information.
U.S. Bancorp Fund Services, LLC
P.O. Box 701
Milwaukee, WI 53201-0701
LKCM FUNDS
P.O. Box 701
Milwaukee, WI 53201-0701
| | | | |
Officers and Trustees |
J. Luther King, Jr., CFA, CIC Trustee, President and Chief Executive Officer | | H. Kirk Downey Chairman of the Board | | Richard Lenart Secretary & Treasurer |
| | |
Paul W. Greenwell Vice President | | Richard J. Howell Trustee | | Jacob D. Smith Chief Financial Officer Chief Compliance Officer |
| | |
Steven R. Purvis, CFA Trustee, Vice President | | Larry J. Lockwood Trustee | | |
|
Investment Adviser |
Luther King Capital Management Corporation 301 Commerce Street, Suite 1600 Fort Worth, TX 76102 |
Administrator, Transfer Agent, Dividend Paying Agent & Shareholder Servicing Agent |
U.S. Bancorp Fund Services, LLC P.O. Box 701 Milwaukee, WI 53201-0701 |
Custodian |
U.S. Bank, N.A. 1555 N. River Center Drive, Suite 302 Milwaukee, WI 53212 |
Independent Registered Public Accounting Firm |
Deloitte & Touche LLP 555 E. Wells St., Suite 1400 Milwaukee, WI 53202 |
Distributor |
Quasar Distributors, LLC 777 East Wisconsin Avenue, Floor 6 Milwaukee, WI 53202 |

LKCM Aquinas Catholic Equity Fund
Annual Report
December 31, 2019
Beginning on January 1, 2021, as permitted by regulations adopted by the Securities and Exchange Commission, paper copies of the LKCM Funds’ shareholder reports will no longer be sent by mail, unless you specifically request paper copies of the reports from the LKCM Funds (if you hold your Fund shares directly with the LKCM Funds) or from your financial intermediary, such as a broker-dealer or bank (if you hold your Fund shares through a financial intermediary). Instead, the reports will be made available on a website, and you will be notified by mail each time a report is posted and provided with a website link to access the report.
If you already elected to receive shareholder reports electronically, you will not be affected by this change and you need not take any action. If you hold your Fund shares directly with the LKCM Funds, you may elect to receive shareholder reports and other communications electronically from the LKCM Funds by calling 1-800-688-LKCM or, if you hold your Fund shares through a financial intermediary, by contacting your financial intermediary.
You may elect to receive all future reports on paper free of charge. If you hold your Fund shares directly with the LKCM Funds, you can inform the LKCM Funds that you wish to continue receiving paper copies of your shareholder reports by calling 1-800-688-LKCM or, if you hold your Fund shares through a financial intermediary, contacting your financial intermediary. Your election to receive reports in paper will apply to all of the LKCM Funds you hold directly with LKCM Funds or all of the funds you hold through your financial intermediary, as applicable.
Dear Fellow Shareholders:
We report the following performance information for the LKCM Aquinas Catholic Equity Fund for indicated periods ended December 31, 2019:
| | | | | | | | | | | | | | | | | | | | | | | | | | | | | | | | | | | | | | | | |
Fund | | Inception
Date | | NAV @
12/31/19 | | Net
Expense
Ratio*, ** | | Gross
Expense
Ratio** | | One Year
Total
Return
Ended
12/31/19 | | Five Year
Average
Annualized
Return
Ended
12/31/19 | | Ten Year
Average
Annualized
Return
Ended
12/31/19 | | Avg.
Annual
Total
Return
Since
Incept.*** |
LKCM Aquinas Catholic Equity Fund(1) | | | | 7/11/05 | | | | $ | 15.06 | | | | | 1.00 | % | | | | 1.44 | % | | | | 31.16 | % | | | | 9.08 | % | | | | 10.83 | % | | | | 7.90 | % |
S&P 500® Index(2) | | | | | | | | | | | | | | | | | | | | | | | | 31.49 | % | | | | 11.70 | % | | | | 13.56 | % | | | | 9.26 | % |
Performance data quoted represents past performance and does not guarantee future results. The investment return and principal value of an investment will fluctuate so that an investor’s shares, when redeemed, may be worth more or less than the original cost. Current performance of the Fund may be lower or higher than the performance quoted. Performance data current to the most recent month end may be obtained by calling 1-800-423-6369. The Fund imposes a 1.00% redemption fee on shares held less than 30 days. If reflected, the fee would reduce performance shown.
| * | Luther King Capital Management Corporation, the Fund’s investment adviser, has contractually agreed to waive all or a portion of its management fee and/or reimburse expenses of the Fund to maintain an expense ratio of 1.00% per annum through May 1, 2020. This expense limitation excludes interest, taxes, brokerage commissions, indirect fees and expenses related to investments in other investment companies, including money market funds, and extraordinary expenses. Investment performance, which is based on the net expense ratio, reflects fee waivers, if any, in effect during the relevant period. In the absence of such waivers, total return would be reduced. Investment performance is based upon the net expense ratio. LKCM waived management fees and/or reimbursed expenses for the Fund during the fiscal year ended December 31, 2019. |
| ** | Expense ratios above are as reported in the Fund’s current prospectus dated May 1, 2019. Expense ratios reported for other periods in the financial highlights of this report may differ. |
| *** | The assets of the Aquinas Value Fund, Aquinas Growth Fund and Aquinas Small-Cap Fund were acquired by the LKCM Aquinas Value Fund, LKCM Aquinas Growth Fund and LKCM Aquinas Small Cap Fund, respectively, on July 11, 2005. Due to the change in adviser and investment technique, performance is being quoted for the period after the merger. The LKCM Aquinas Small Cap Fund and LKCM Aquinas Growth Fund were reorganized into the LKCM Aquinas Value Fund effective upon the close of business on July 29, 2016, after which the LKCM Aquinas Value Fund’s name, investment strategies and expenses changed to those of the LKCM Aquinas Catholic Equity Fund. The performance shown prior to August 1, 2016 is that of the LKCM Aquinas Value Fund. |
| (1) | Effective upon the close of business on July 29, 2016, the LKCM Aquinas Small Cap Fund and the LKCM Aquinas Growth Fund reorganized into the LKCM Aquinas Value Fund (the “Reorganizations”). Immediately after the Reorganizations were completed, the LKCM Aquinas Value Fund changed its name to the LKCM Aquinas Catholic Equity Fund and its investment strategies and expenses, including the expense limitation agreement, changed to the investment strategies and expenses, including the expense limitation agreement, of the LKCM Aquinas Catholic Equity Fund. The Fund’s performance prior to August 1, 2016 reflects the Fund’s prior investment strategies. |
| (2) | The S&P 500® Index is an unmanaged capitalization-weighted index of 500 selected stocks that is generally considered representative of the performance of large capitalization companies in the U.S. stock market. |
Note: The indices defined above are not available for direct investment and the index performance therefore does not include fees, expenses or taxes.
2019 Review
The longest U.S. economic expansion on record, now in its eleventh year, also remains sluggish compared to other post-war expansions. We believe this lack of robust growth has contributed to the longevity of the current U.S. economic expansion. We believe that in order for the economy to grow above trend, aside from the immediate aftermath of a recession, consumers, businesses, and government must employ credit to pull forward consumption. Such action often results in a cycle of rising debt burdens which typically crest just as the business cycle turns down, often driven by the Federal Reserve acting to dampen inflation by raising interest rates. In our view, the consumer, in particular, has been quite disciplined regarding leverage and savings during this expansion, which has contributed to both its moderate pace and sustainability.
However, moderate economic growth of around 2.0% per year after inflation can lead to the perception that growth is relatively fragile. Investors spent a good portion of 2019 on recession watch as traditional warning signs, such as an inverted yield curve, slowing job gains, and contracting manufacturing activity, suggested an elevated risk of a recession. Weakness in many other global economies also reinforced these perceived recessionary concerns. Fortunately, weaker economic growth amid rising trade tensions spurred policymakers around the world into action as central banks lowered interest rates, reinstated quantitative easing, quickened the pace of money supply growth, and expanded fiscal spending.
The Federal Reserve then surprised markets in the first quarter of 2019 with a large and unexpected reversal in monetary policy. At the Federal Reserve’s first interest rate policy meeting of the year and only six weeks into 2019, the Federal Reserve signaled that it would refrain from further interest rate increases for the foreseeable future and suspend its balance sheet reduction at some point during the year. In our view, several factors appeared to contribute to the abrupt change in the course for monetary policy, including the decline in global equity markets following the December 2018 interest rate hike, declining inflation expectations, and the impact of trade tensions on global growth. We believe the sharp dovish tilt in monetary policy, combined with significant equity valuation compression during December 2018, set the stage for valuation expansion as monetary conditions eased and trade tensions moderated as 2019 progressed. We believe this confluence of events and other factors contributed to the strong performance of the markets during 2019, as measured by the 31.49% and 6.80% advances for the S&P 500® Index and the Bloomberg Barclays Intermediate Government/Credit Bond Index, respectively, for the year ended December 31, 2019.
2
Finally, the U.S. economy achieved a unique milestone as we closed the decade. We believe the history of recessions in the U.S. illustrates that they are a natural, though painful, part of the business cycle. The National Bureau of Economic Research marks the beginning of the first business cycle of record during the fourth quarter of 1854. In every decade since the 1850s, the U.S. economy has experienced a recession, which is generally defined as two consecutive quarters of contracting U.S. Gross Domestic Product (GDP). However, 2019 brought to a close the only decade over the past 165 years in which the U.S. economy did not experience a recession.
2020 Outlook
We believe the domestic economic outlook has become incrementally positive, as the slump in manufacturing appears to be bottoming, labor markets remain robust, monetary policy remains accommodative, and some political uncertainties appear to have diminished. Personal consumption represents roughly 70% of the U.S. economy, and the consumer remains healthy in our view. The U.S. economy created a surprisingly strong 266,000 new jobs in November 2019, aided in part by the return to work of 49,000 striking General Motors employees. Labor market strength also appears evident in the most recent November 2019 unemployment rate of 3.5%, the lowest since December 1969. We believe that tight labor markets are supportive of higher wages, which grew by 3.1% in November 2019 compared with a year earlier. The lowest paid U.S. workers appeared to be the recipients of the biggest raises as earnings for nonsupervisory workers grew by 3.7% from a year earlier, and this trend could continue in our view. Twenty-two states have ushered in higher minimum wage levels around the beginning of 2020. Only seven of these increases appear to relate to inflation adjustments, the balance of which are the result of state legislative actions or ballot initiatives passed by voters. We believe this will impact an estimated 6.8 million workers with increases ranging from a $0.10 per hour inflation-related adjustment in Florida to a $1.50 per hour increase in New Mexico and Washington. We believe that these strong labor conditions have helped lift consumer confidence back to recent highs.
The U.S. dollar finished 2019 little changed from the beginning of the year; however, we believe that it could face three potential headwinds over the coming year. First, rising global bond yields have generally narrowed the excess yield spread offered by owning U.S. bonds, potentially resulting in a decrease in demand for U.S. dollars by foreign investors. Second, we believe the U.S. dollar has historically been a counter-cyclical currency, meaning that it weakens as the economic growth between the U.S. and the rest of the world narrows. In our view, the heart of the European economy, Germany’s large manufacturing base, has been particularly hard hit over the past year as auto manufacturing firms, still reeling from emissions scandals, have been heavily impacted by declining auto exports to China and significant retooling costs to develop more electric vehicles. However, we believe that European economic growth, aided by recent easing of monetary policy by the European Central Bank, should stabilize and show signs of recovery in the coming years. Finally, the U.S. dollar generally is sensitive to changes in inflation expectations, which fell from mid-2018 through the early part of the fourth quarter of 2019. We believe that if inflation expectations were to lift slightly from depressed levels in light of easing monetary policy, the U.S. dollar could weaken, and any weakening in the U.S. dollar would likely help boost corporate earnings of domestic companies with foreign sales.
For 2020, the U.S. presidential election features prominently in the year ahead. As the election approaches, investors will parse unexpected developments, which likely will be rapidly reflected in market prices. One simple result could be higher volatility as November 2020 approaches, particularly if risk to the status quo is perceived to rise. Historically, the electorate has viewed the U.S. presidential election through the prism of the economy. Since Woodrow Wilson’s second term in 1916, in all twelve cases when the incumbent presidents avoided a recession two years before seeking another term, they went on to win reelection. Conversely, in the six instances when a recession occurred in the two year run-up to a re-election year, the incumbent lost with one exception, Calvin Coolidge, who won the election in 1924 as the incumbent after the passing of President Harding.
In summary, our projected outlook for 2020 is for the economy to continue to expand around 2% in real terms, aided by easing monetary policy as well as healthy consumption which we expect to be supported by continued strength in the labor market and real wage growth. The trade tension fever may have finally broken, which we believe should be positive for business confidence, a component of capital spending plans by businesses. As always, a market correction, generally defined as a decline of approximately 10% in the value of the equity markets, could occur at any time in our view. However, we believe a bear market, generally defined as a decline of greater than 20% in the value of the equity markets, appears less likely without an accompanying recession. We believe there is a low probability of this risk, absent a severe exogenous shock to the U.S. economy. The November 2020 elections will rightly capture the attention of investors, and there is considerable time for developments to occur in the interim.
LKCM Aquinas Catholic Equity Fund
During the year ended December 31, 2019, the LKCM Aquinas Catholic Equity Fund returned 31.16% against the 31.49% return for the Fund’s benchmark, the S&P 500® Index. During the year the Fund’s relative performance benefited from sector allocation decisions, which was slightly offset by stock selection decisions. The Fund’s relative performance benefited from being overweight in the Information Technology sector and underweight in the Healthcare sector. The Fund also benefited from stock selection in the Healthcare and Materials sectors relative to the benchmark, although the Fund’s stock selection in the Information Technology and Energy sectors detracted from relative performance.
As the Fund enters 2020, we continue to emphasize portfolio companies for the Fund that we believe will benefit from lower tax rates and where continued dividend increases and share repurchases appear likely. Additionally, we expect that many of the portfolio companies held by the Fund should continue to benefit from repatriation of cash formerly held by those portfolio companies overseas.
3
We believe a significant portion of the profits of portfolio companies held by the Fund are generated from overseas operations, and we expect those portfolio companies will continue to benefit from strengthening overseas economies, particularly if the U.S. dollar weakens.
J. Luther King, Jr., CFA, CIC
January 28, 2020
The information provided herein represents the opinion of J. Luther King, Jr., CFA, CIC and is not intended to be a forecast of future events, a guarantee of future results, nor investment advice.
Please refer to the Schedule of Investments found on page 9 of the report for more information on Fund holdings. Fund holdings and sector allocations are subject to change and are not recommendations to buy or sell any securities.
Mutual fund investing involves risk. Principal loss is possible. Past performance is not a guarantee of future results. Investments in equity securities are subject to market risks and significant fluctuations in value. Small and medium capitalization funds typically carry additional risks, since smaller companies generally have a higher risk of failure, and, historically, their stocks have experienced a greater degree of market volatility than stocks on average. These risks are discussed in the Fund’s summary and statutory prospectuses. Since the Fund practices socially responsible investing within the framework provided by the United States Conference of Catholic Bishop’s Socially Responsible Investing Guidelines, the Fund may forego a profitable investment opportunity or sell a security when it may be disadvantageous to do so.
Earnings growth is not a measure of future performance.
Yield curve is a line that plots yields (interest rates) of bonds having equal credit quality but differing maturity dates. The slope of the yield curve gives an idea of future interest rate changes and economic activity.
The Bloomberg Barclays U.S. Intermediate Government/Credit Bond Index is an unmanaged market value weighted index measuring both the principal price changes of, and income provided by, the underlying universe of securities that comprise the index. Securities included in the index must meet the following criteria: fixed as opposed to variable rate; remaining maturity of one to ten years; minimum outstanding par value of $250 million; rated investment grade or higher by Moody’s Investors Service or equivalent; must be dollar denominated and non-convertible; and must be publicly issued.
Investors should consider the investment objective, risks and charges and expenses of the Fund carefully before investing. The Fund’s summary prospectus and prospectus contain this and other information about the Fund. Investors can obtain the summary prospectus and the prospectus by calling 1-800-423-6369. The summary prospectus and prospectus should be read carefully before investing in the Fund.
Quasar Distributors, LLC, distributor.
4
PERFORMANCE:
The following information illustrates the historical performance of the LKCM Aquinas Catholic Equity Fund as of December 31, 2019 compared to the Fund’s benchmark and peer group indices.
Performance data quoted represents past performance; past performance does not guarantee future results. The graph and table reflect the reinvestment of dividends and other distributions, if any, but do not reflect the deduction of taxes that a shareholder would pay on Fund distributions or the redemption of Fund shares. The investment return and principal value of an investment will fluctuate so that an investor’s shares, when redeemed, may be worth more or less than their original cost. Current performance of the Fund may be lower or higher than the performance quoted. Performance data current to the most recent month end may be obtained by calling 1-800-423-6369. Returns would have been lower if LKCM had not waived a portion of its management fee and/or reimbursed certain expenses of the Fund. Please see Note B to the Notes to the Financial Statements for specific information regarding management fee waiver and/or expense reimbursement arrangements for the Fund.
An index is an unmanaged portfolio and does not trade or incur any expenses. The Lipper Large-Cap Core Funds Index, however, does reflect the fees and expenses borne by the funds included in that index. One can not invest in an unmanaged index.
AVERAGE ANNUAL TOTAL RETURN (Periods Ended December 31, 2019)(1)
| | | | | | | | | | | | | | | | |
| | | | | |
| | | Past
1 Year | | | Past
5 Years(2) | | | Past
10 Years(2) | | | Since
Inception(2)(3) | |
LKCM Aquinas Catholic Equity Fund | | | 31.16% | | | | 9.08% | | | | 10.83% | | | | 7.90% | |
S&P 500® Index | | | 31.49% | | | | 11.70% | | | | 13.56% | | | | 9.26% | |
LipperLarge-Cap Core Funds Index | | | 29.00% | | | | 10.54% | | | | 12.17% | | | | 8.43% | |
| (1) | Effective upon the close of business on July 29, 2016, the LKCM Aquinas Small Cap Fund and the LKCM Aquinas Growth Fund reorganized into the LKCM Aquinas Value Fund (the “Reorganizations”). At the time the Reorganizations were completed, the LKCM Aquinas Value Fund changed its name to the LKCM Aquinas Catholic Equity Fund (“Fund”) and its investment strategies and expenses, including the expense limitation agreement, changed to the investment strategies and expenses, including the expense limitation agreement, of the Fund. The Fund’s performance prior to August 1, 2016 reflects the Fund’s prior investment strategies. |
| (3) | The assets of the Aquinas Value Fund, Aquinas Growth Fund and Aquinas Small-Cap Fund were acquired by the LKCM Aquinas Value Fund, LKCM Aquinas Growth Fund and LKCM Aquinas Small Cap Fund, respectively, on July 11, 2005. At the time of the reorganization, the Adviser also changed from Aquinas Investment Advisers, Inc. to Luther King Capital Management Corporation. Due to the change in adviser and investment technique, performance is being quoted for the period after the merger. As stated above, the LKCM Aquinas Growth Fund and LKCM Aquinas Small-Cap Fund were reorganized into the LKCM Aquinas Value Fund effective upon the close of business on July 29, 2016, after which the LKCM Aquinas Value Fund’s name, investment strategies and expenses changed to those of the Fund. The performance shown prior to August 1, 2016, is that of the LKCM Aquinas Value Fund. |
5
A HYPOTHETICAL $10,000 INVESTMENT IN LKCM AQUINAS CATHOLIC EQUITY FUND
(for the ten years ended December 31, 2019)
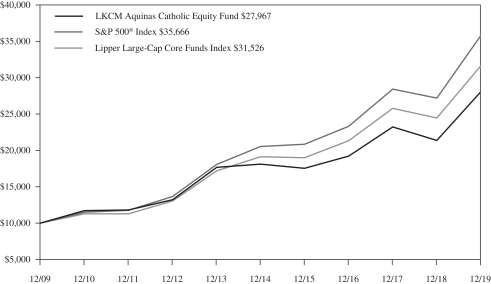
The S&P 500® Index is an unmanaged capitalization-weighted index of 500 selected stocks that is generally considered representative of the performance of large capitalization companies in the U.S. stock market.
The Lipper Large-Cap Core Funds Index is an unmanaged index generally considered representative of large cap core mutual funds tracked by Lipper, Inc.
6
LKCM Aquinas Catholic Equity Fund Expense Example — December 31, 2019
As a shareholder of the Fund, you incur two types of costs: (1) transaction costs, including redemption fees; and (2) ongoing costs, including management fees, distribution and/or service (12b-1) fees and other Fund expenses. This Example is intended to help you understand your ongoing costs (in dollars) of investing in the Fund and to compare these costs with the ongoing costs of investing in other mutual funds. The Example is based on an investment of $1,000 invested at the beginning of the period and held for the entire period (7/1/19-12/31/19).
ACTUAL EXPENSES
The first line of the table below provides information about actual account values and actual expenses. You may use the information in this line, together with the amount you invested, to estimate the expenses that you paid over the period. Simply divide your account value by $1,000 (for example, an $8,600 account value divided by $1,000 = 8.6), then multiply the result by the number in the first line under the heading entitled “Expenses Paid During Period” to estimate the expenses you paid on your account during this period. Although the Fund charges no sales load, you will be assessed fees for outgoing wire transfers, returned checks and stop payment orders at prevailing rates charged by U.S. Bancorp Fund Services, LLC (doing business as U.S. Bank Global Fund Services) the Fund’s transfer agent. If you request that a redemption be made by wire transfer, currently a $15 fee is charged by the Fund’s transfer agent. You will be charged a redemption fee equal to 1.00% of the net amount of the redemption if you redeem your shares of the Fund within 30 days of purchase, unless otherwise determined by the Fund in its discretion. To the extent the Fund invests in shares of other investment companies as part of its investment strategy, you will indirectly bear your proportionate share of any fees and expenses charged by the underlying funds in which the Fund invests in addition to the expenses of the Fund. Actual expenses of the underlying funds are expected to vary among the various underlying funds. These expenses are not included in the example below. The example below includes management fees, registration fees and other expenses. However, the example below does not include portfolio trading commissions and related expenses and other extraordinary expenses as determined under generally accepted accounting principles.
HYPOTHETICAL EXAMPLES FOR COMPARISON PURPOSES
The second line of the table below provides information about hypothetical account values and hypothetical expenses based on the Fund’s actual expense ratio and an assumed rate of return of 5% per year before expenses, which is not the Fund’s actual return. The hypothetical account values and expenses may not be used to estimate the actual ending account balance or expenses you paid for the period. You may use this information to compare the ongoing costs of investing in the Fund and other funds. To do so, compare this 5% hypothetical example with the 5% hypothetical examples that appear in the shareholder reports of the other funds. Please note that the expenses shown in the table are meant to highlight your ongoing costs only and do not reflect any transactional costs, such as redemption fees. Therefore, the second line of the table is useful in comparing ongoing costs only, and will not help you determine the relative total costs of owning different funds. In addition, if these transactions costs were included, your costs would have been higher.
| | | | | | | | | | | | | | | |
| | | LKCM Aquinas Catholic Equity Fund |
| | | Beginning
Account Value
7/1/19 | | Ending
Account Value
12/31/19 | | Expenses Paid
During Period*
7/1/19 – 12/31/19 |
Actual | | | $ | 1,000.00 | | | | $ | 1,066.60 | | | | $ | 5.21 | |
Hypothetical (5% return before expense) | | | $ | 1,000.00 | | | | $ | 1,020.16 | | | | $ | 5.09 | |
| * | Expenses are equal to the Fund’s annualized net expense ratio of 1.00%, multiplied by the average account value over the period, multiplied by 184/365 to reflect theone-half year period. |
7
ALLOCATION OF PORTFOLIO HOLDINGS — LKCM Aquinas Catholic Equity Fund — December 31, 2019
Percentages represent market value as a percentage of total investments.
LKCM Aquinas Catholic Equity Fund
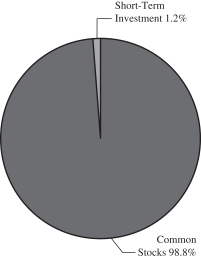
8
|
| LKCM AQUINAS CATHOLIC EQUITY FUND |
| SCHEDULEOF INVESTMENTS |
| December 31, 2019 |
| | | | | | | | | | |
| COMMON STOCKS - 98.9% | | Shares | | Value |
| Aerospace & Defense - 3.7% | | |
Honeywell International, Inc. | | | | 10,000 | | | | $ | 1,770,000 | |
| | | | | | | | | | |
| Banks - 11.2% | | |
Comerica, Inc. | | | | 18,000 | | | | | 1,291,500 | |
Cullen/Frost Bankers, Inc. | | | | 5,000 | | | | | 488,900 | |
Truist Financial Corp. | | | | 32,375 | | | | | 1,823,360 | |
Zions Bancorp N.A. | | | | 32,500 | | | | | 1,687,400 | |
| | | | | | | | | | |
| | | | | | | | | 5,291,160 | |
| | | | | | | | | | |
| Beverages - 3.2% | | |
PepsiCo, Inc. | | | | 11,000 | | | | | 1,503,370 | |
| | | | | | | | | | |
| Chemicals - 6.4% | | |
Corteva, Inc. | | | | 22,500 | | | | | 665,100 | |
Ecolab, Inc. | | | | 6,500 | | | | | 1,254,435 | |
The Sherwin-Williams Co. | | | | 1,900 | | | | | 1,108,726 | |
| | | | | | | | | | |
| | | | | | | | | 3,028,261 | |
| | | | | | | | | | |
| Computers & Peripherals - 4.9% | | |
Apple, Inc. | | | | 8,000 | | | | | 2,349,200 | |
| | | | | | | | | | |
| Construction Materials - 1.8% | | |
Martin Marietta Materials, Inc. | | | | 3,000 | | | | | 838,920 | |
| | | | | | | | | | |
| Diversified Telecommunication Services - 2.3% | | |
AT&T, Inc. | | | | 27,500 | | | | | 1,074,700 | |
| | | | | | | | | | |
| Electrical Equipment & Instruments - 3.4% | | |
Roper Technologies, Inc. | | | | 4,500 | | | | | 1,594,035 | |
| | | | | | | | | | |
| Electronic Equipment & Instruments - 5.1% | | |
FLIR Systems, Inc. | | | | 24,500 | | | | | 1,275,715 | |
Trimble, Inc. (a) | | | | 27,000 | | | | | 1,125,630 | |
| | | | | | | | | | |
| | | | | | | | | 2,401,345 | |
| | | | | | | | | | |
| Food Products - 1.7% | | |
Mondelez International, Inc. - Class A | | | | 15,000 | | | | | 826,200 | |
| | | | | | | | | | |
| Internet & Catalog Retail - 3.1% | | |
Amazon.com, Inc. (a) | | | | 800 | | | | | 1,478,272 | |
| | | | | | | | | | |
| IT Consulting & Services - 3.0% | | |
PayPal Holdings, Inc. (a) | | | | 13,000 | | | | | 1,406,210 | |
| | | | | | | | | | |
| Machinery - 3.0% | | |
Stanley Black & Decker, Inc. | | | | 8,500 | | | | | 1,408,790 | |
| | | | | | | | | | |
| Media & Entertainment - 4.5% | | |
Alphabet, Inc. - Class A (a) | | | | 1,600 | | | | | 2,143,024 | |
| | | | | | | | | | |
| Multiline Retail - 2.0% | | |
Dollar Tree, Inc. (a) | | | | 10,000 | | | | | 940,500 | |
| | | | | | | | | | |
| Oil & Gas & Consumable Fuels - 3.0% | | |
Occidental Petroleum Corp. | | | | 18,000 | | | | | 741,780 | |
WPX Energy, Inc. (a) | | | | 50,000 | | | | | 687,000 | |
| | | | | | | | | | |
| | | | | | | | | 1,428,780 | |
| | | | | | | | | | |
| Pharmaceuticals - 8.1% | | |
Abbott Laboratories | | | | 20,000 | | | | | 1,737,200 | |
Zoetis, Inc. | | | | 16,000 | | | | | 2,117,600 | |
| | | | | | | | | | |
| | | | | | | | | 3,854,800 | |
| | | | | | | | | | |
| | | | | | | | | | |
| COMMON STOCKS | | Shares | | Value |
| Professional Services - 3.5% | | |
Verisk Analytics, Inc. | | | | 11,000 | | | | $ | 1,642,740 | |
| | | | | | | | | | |
| Software - 13.5% | | |
Adobe, Inc. (a) | | | | 5,800 | | | | | 1,912,898 | |
Microsoft Corp. | | | | 10,000 | | | | | 1,577,000 | |
Oracle Corp. | | | | 27,500 | | | | | 1,456,950 | |
RealPage, Inc. (a) | | | | 27,500 | | | | | 1,478,125 | |
| | | | | | | | | | |
| | | | | | | | | 6,424,973 | |
| | | | | | | | | | |
| Software & Services - 3.8% | | |
Akamai Technologies, Inc. (a) | | | | 21,000 | | | | | 1,813,980 | |
| | | | | | | | | | |
| Specialty Retail - 4.9% | | |
The Home Depot, Inc. | | | | 5,500 | | | | | 1,201,090 | |
Tiffany & Co. | | | | 8,500 | | | | | 1,136,025 | |
| | | | | | | | | | |
| | | | | | | | | 2,337,115 | |
| | | | | | | | | | |
| Textiles, Apparel & Luxury Goods - 2.8% | | |
VF Corp. | | | | 13,500 | | | | | 1,345,410 | |
| | | | | | | | | | |
TOTAL COMMON STOCKS
(Cost $22,544,641) | | | | | 46,901,785 | |
| | | | | | | | | | |
| | | | | | | | | | |
| SHORT-TERM INVESTMENT - 1.3% | | |
| Money Market Fund - 1.3% | | |
Invesco Short-Term Investments Trust - Government & Agency Portfolio - Institutional Shares, 1.51% (b) | | | | 586,922 | | | | | 586,922 | |
| | | | | | | | | | |
TOTAL SHORT-TERM INVESTMENT
(Cost $586,922) | | | | | 586,922 | |
| | | | | | | | | | |
Total Investments - 100.2%
(Cost $23,131,563) | | | | | 47,488,707 | |
Liabilities in Excess of Other Assets - (0.2)% | | | | | (80,576 | ) |
| | | | | | | | | | |
TOTAL NET ASSETS - 100.0% | | | | | | | | $ | 47,408,131 | |
| | | | | | | | | | |
| (a) | Non-income producing security. |
| (b) | The rate quoted is the annualizedseven-day yield of the fund at period end. |
Investments are classified by industry pursuant to the Global Industry Classification Standard (GICS®), which was developed by and/or is the exclusive property of Morgan Stanley Capital International, Inc. (“MSCI”) and Standard & Poor’s Financial Services LLC (“S&P”). GICS is a service mark of MSCI and S&P and has been licensed for use by U.S. Bancorp Fund Services, LLC.
The accompanying notes are an integral part of these financial statements.
9
|
| STATEMENTOF ASSETSAND LIABILITIES |
| December 31, 2019 |
| | | | | | | | | | |
|
| LKCM Aquinas Catholic Equity Fund |
| | | | | | | | | | |
Assets: | | | | | | | | | | |
Investments, at value* | | | | | | | | $ | 47,488,707 | |
Receivable for Fund shares sold | | | | | | | | | 998 | |
Dividends and interest receivable | | | | | | | | | 51,816 | |
Other assets | | | | | | | | | 6,338 | |
| | | | | | | | | | |
Total assets | | | | | | | | | 47,547,859 | |
| | | | | | | | | | |
Liabilities: | | | | | | | | | | |
Payable for Fund shares redeemed | | | | | | | | | 2,395 | |
Payable for investment advisory fees (Note B) | | | | | | | | | 51,177 | |
Payable for distribution expense (Note B) | | | | | | | | | 44,285 | |
Payable for accounting and transfer agent fees and expenses | | | | | | | | | 12,710 | |
Payable for professional fees | | | | | | | | | 10,660 | |
Payable for reports to shareholders | | | | | | | | | 8,692 | |
Payable for administrative fees | | | | | | | | | 6,899 | |
Payable for trustees’ fees and officer compensation (Note B) | | | | | | | | | 1,881 | |
Payable for custody fees and expenses | | | | | | | | | 1,029 | |
| | | | | | | | | | |
Total liabilities | | | | | | | | | 139,728 | |
| | | | | | | | | | |
Net Assets | | | | | | | | $ | 47,408,131 | |
| | | | | | | | | | |
Net Assets Consist of: | | | | | | | | | | |
Paid in capital | | | | | | | | $ | 22,921,509 | |
Total distributable earnings | | | | | | | | | 24,486,622 | |
| | | | | | | | | | |
Net Assets | | | | | | | | $ | 47,408,131 | |
| | | | | | | | | | |
Shares of beneficial interest outstanding
(unlimited shares of no par value authorized) | | | | | | | | | 3,148,530 | |
Net asset value per share
(offering and redemption price) | | | | | | | | $ | 15.06 | |
| | | | | | | | | | |
| | |
* Cost of investments | | | | | | | | $ | 23,131,563 | |
| | | | | | | | | | |
The accompanying notes are an integral part of these financial statements.
10
|
| STATEMENTOF OPERATIONS |
| For the Year Ended December 31, 2019 |
| | | | | | | | | | |
|
| LKCM Aquinas Catholic Equity Fund |
| | | | | | | | | | |
Investment Income: | | | | | | | | | | |
Dividends | | | | | | | | $ | 681,594 | |
Interest | | | | | | | | | 11,183 | |
| | | | | | | | | | |
Total income | | | | | | | | | 692,777 | |
| | | | | | | | | | |
Expenses: | | | | | | | | | | |
Investment advisory fees (Note B) | | | | | | | | | 428,466 | |
Accounting and transfer agent fees and expenses | | | | | | | | | 74,955 | |
Distribution expense (Note B) | | | | | | | | | 47,607 | |
Administrative fees | | | | | | | | | 41,278 | |
Trustees’ fees and officer compensation (Note B) | | | | | | | | | 33,771 | |
Federal and state registration | | | | | | | | | 36,712 | |
Reports to shareholders | | | | | | | | | 19,081 | |
Professional fees | | | | | | | | | 26,318 | |
Custody fees and expenses | | | | | | | | | 8,594 | |
Other | | | | | | | | | 2,146 | |
| | | | | | | | | | |
Total expenses | | | | | | | | | 718,928 | |
Less, expense waiver and/or reimbursement (Note B) | | | | | | | | | (242,854 | ) |
| | | | | | | | | | |
Net expenses | | | | | | | | | 476,074 | |
| | | | | | | | | | |
Net investment income | | | | | | | | | 216,703 | |
| | | | | | | | | | |
| | |
Realized and Unrealized Gain on Investments: | | | | | | | | | | |
Net realized gain on investments | | | | | | | | | 5,320,117 | |
Net change in unrealized appreciation/depreciation on investments | | | | | | | | | 7,504,825 | |
| | | | | | | | | | |
| | |
Net Realized and Unrealized Gain on Investments | | | | | | | | | 12,824,942 | |
| | | | | | | | | | |
| | |
Net Increase in Net Assets Resulting from Operations | | | | | | | | $ | 13,041,645 | |
| | | | | | | | | | |
The accompanying notes are an integral part of these financial statements.
11
|
| STATEMENTSOF CHANGESIN NET ASSETS |
| | | | | | | | | | | | | | | | | | | | |
|
| LKCM Aquinas Catholic Equity Fund |
| | | | | | | | | | | | | | | | | | | | |
| | | | |
| | | | | Year Ended
December 31,
2019 | | | | Year Ended
December 31,
2018 |
Operations: | | | | | | | | | | | | | | | | | | | | |
Net investment income | | | | | | | | $ | 216,703 | | | | | | | | | $ | 198,745 | |
Net realized gain on investments | | | | | | | | | 5,320,117 | | | | | | | | | | 10,664,201 | |
Net change in unrealized
appreciation/depreciation on investments | | | | | | | | | 7,504,825 | | | | | | | | | | (13,838,210 | ) |
| | | | | | | | | | | | | | | | | | | | |
Net increase (decrease) in net assets resulting from operations | | | | | | | | | 13,041,645 | | | | | | | | | | (2,975,264 | ) |
| | | | | | | | | | | | | | | | | | | | |
| | | | |
Net Dividends and Distributions to Shareholders: | | | | | | | | | (4,929,412 | ) | | | | | | | | | (8,749,323 | ) |
| | | | | | | | | | | | | | | | | | | | |
| | | | |
Net decrease in net assets resulting from Fund share transactions (Note C) | | | | | | | | | (6,036,287 | ) | | | | | | | | | (14,000,732 | ) |
| | | | | | | | | | | | | | | | | | | | |
| | | | |
Total increase (decrease) in net assets | | | | | | | | | 2,075,946 | | | | | | | | | | (25,725,319 | ) |
| | | | |
Net Assets: | | | | | | | | | | | | | | | | | | | | |
Beginning of period | | | | | | | | | 45,332,185 | | | | | | | | | | 71,057,504 | |
| | | | | | | | | | | | | | | | | | | | |
End of period | | | | | | | | $ | 47,408,131 | | | | | | | | | $ | 45,332,185 | |
| | | | | | | | | | | | | | | | | | | | |
The accompanying notes are an integral part of these financial statements.
12
|
| FINANCIAL HIGHLIGHTS |
| SELECTED DATAFOR EACH SHAREOF CAPITAL STOCK OUTSTANDING |
| | | | | | | | | | | | | | | | | | | | | | | | | | | | | | | | | | | | | | | | | | | | | | | | | | |
| | |
| | | | | LKCM Aquinas Catholic Equity Fund |
| | | | | | | | | | | | | | | | | | | | | | | | | | | | | | | | | | | | | | | | | | | | | | | | | | |
| | | | | | | | | | |
| | | | | Year
Ended
December 31,
2019 | | | | Year
Ended
December 31,
2018 | | | | Year
Ended
December 31,
2017 | | | | Year
Ended
December 31,
2016 (1) | | | | Year
Ended
December 31,
2015 |
Net Asset Value – Beginning of Period | | | | | | | | $ | 12.80 | | | | | | | | | $ | 17.19 | | | | | | | | | $ | 15.40 | | | | | | | | | $ | 15.17 | | | | | | | | | $ | 16.87 | |
| | | | | | | | | | | | | | | | | | | | | | | | | | | | | | | | | | | | | | | | | | | | | | | | | | |
Net investment income | | | | | | | | | 0.07 | (2) | | | | | | | | | 0.06 | (2) | | | | | | | | | 0.05 | | | | | | | | | | 0.04 | | | | | | | | | | 0.03 | |
Net realized and unrealized gain (loss) on investments | | | | | | | | | 3.92 | | | | | | | | | | (1.46 | ) | | | | | | | | | 3.16 | | | | | | | | | | 1.41 | | | | | | | | | | (0.56 | ) |
| | | | | | | | | | | | | | | | | | | | | | | | | | | | | | | | | | | | | | | | | | | | | | | | | | |
Total from investment operations | | | | | | | | | 3.99 | | | | | | | | | | (1.40 | ) | | | | | | | | | 3.21 | | | | | | | | | | 1.45 | | | | | | | | | | (0.53 | ) |
| | | | | | | | | | | | | | | | | | | | | | | | | | | | | | | | | | | | | | | | | | | | | | | | | | |
Dividends from net investment income | | | | | | | | | (0.08 | ) | | | | | | | | | (0.07 | ) | | | | | | | | | (0.05 | ) | | | | | | | | | (0.04 | ) | | | | | | | | | (0.04 | ) |
Distributions from net realized gains | | | | | | | | | (1.65 | ) | | | | | | | | | (2.92 | ) | | | | | | | | | (1.37 | ) | | | | | | | | | (1.18 | ) | | | | | | | | | (1.13 | ) |
| | | | | | | | | | | | | | | | | | | | | | | | | | | | | | | | | | | | | | | | | | | | | | | | | | |
Total dividends and distributions | | | | | | | | | (1.73 | ) | | | | | | | | | (2.99 | ) | | | | | | | | | (1.42 | ) | | | | | | | | | (1.22 | ) | | | | | | | | | (1.17 | ) |
| | | | | | | | | | | | | | | | | | | | | | | | | | | | | | | | | | | | | | | | | | | | | | | | | | |
Net Asset Value – End of Period | | | | | | | | $ | 15.06 | | | | | | | | | $ | 12.80 | | | | | | | | | $ | 17.19 | | | | | | | | | $ | 15.40 | | | | | | | | | $ | 15.17 | |
| | | | | | | | | | | | | | | | | | | | | | | | | | | | | | | | | | | | | | | | | | | | | | | | | | |
Total Return | | | | | | | | | 31.16% | | | | | | | | | | -7.96% | | | | | | | | | | 20.79% | | | | | | | | | | 9.52% | | | | | | | | | | -3.28% | |
| | | | | | | | | | |
Ratios and Supplemental Data: | | | | | | | | | | | | | | | | | | | | | | | | | | | | | | | | | | | | | | | | | | | | | | | | | | |
Net assets, end of period (thousands) | | | | | | | | $ | 47,408 | | | | | | | | | $ | 45,332 | | | | | | | | | $ | 71,058 | | | | | | | | | $ | 62,997 | | | | | | | | | $ | 44,868 | |
Ratio of expenses to average net assets: | | | | | | | | | | | | | | | | | | | | | | | | | | | | | | | | | | | | | | | | | | | | | | | | | | |
Before expense waiver and/or reimbursement | | | | | | | | | 1.51% | | | | | | | | | | 1.44% | | | | | | | | | | 1.43% | | | | | | | | | | 1.66% | | | | | | | | | | 1.55% | |
After expense waiver and/or reimbursement(3) | | | | | | | | | 1.00% | | | | | | | | | | 1.00% | | | | | | | | | | 1.00% | | | | | | | | | | 1.23% | | | | | | | | | | 1.50% | |
Ratio of net investment income to average net assets: | | | | | | | | | | | | | | | | | | | | | | | | | | | | | | | | | | | | | | | | | | | | | | | | | | |
Before expense waiver and/or reimbursement | | | | | | | | | (0.05)% | | | | | | | | | | (0.12)% | | | | | | | | | | (0.14)% | | | | | | | | | | (0.15)% | | | | | | | | | | 0.14% | |
After expense waiver and/or reimbursement(3) | | | | | | | | | 0.46% | | | | | | | | | | 0.32% | | | | | | | | | | 0.29% | | | | | | | | | | 0.28% | | | | | | | | | | 0.19% | |
Portfolio turnover rate | | | | | | | | | 12% | | | | | | | | | | 14% | | | | | | | | | | 18% | | | | | | | | | | 18% | | | | | | | | | | 11% | |
| (1) | Effective upon the close of business on July 29, 2016, the LKCM Aquinas Growth Fund and the LKCM Aquinas Small Cap Fund were reorganized into the LKCM Aquinas Value Fund and the Fund was renamed the LKCM Aquinas Catholic Equity Fund. Activity after July 29, 2016 reflects the Funds’ combined operations. |
| (2) | Net investment income per share represents net investment income divided by the average shares outstanding throughout the period. |
| (3) | Effective August 1, 2016, the Fund’s investment adviser contractually agreed to lower the expense cap for the Fund from 1.50% to 1.00% of the Fund’s average daily net assets and the fees charged under the Fund’s Rule12b-1 plan changed from 0.25% per annum to 0.10% per annum as of August 1, 2016. |
The accompanying notes are an integral part of these financial statements.
13
|
| LKCM FUNDS |
| NOTESTOTHE FINANCIAL STATEMENTS |
A. Organization and Significant Accounting Policies: LKCM Funds (the “Trust”) is registered under the Investment Company Act of 1940 (“1940 Act”) as an open-end, management investment company. The Trust was organized as a Delaware statutory trust on February 10, 1994 and consists of seven diversified series as of December 31, 2019, one of which is presented herein: the LKCM Aquinas Catholic Equity Fund (the “Fund”). On July 11, 2005, the LKCM Aquinas Funds acquired the assets and assumed the liabilities of the Aquinas Funds. Effective upon the close of business on July 29, 2016, the LKCM Aquinas Small Cap Fund and the LKCM Aquinas Growth Fund reorganized into the LKCM Aquinas Value Fund, which changed its name immediately thereafter to the LKCM Aquinas Catholic Equity Fund and its investment strategies and expenses, including the expense limitation agreement, changed to the investment strategies and expenses, including the expense limitation agreement, of the LKCM Aquinas Catholic Equity Fund. The Fund is subject to expenses pursuant to the Rule 12b-1 plan described in Note B. The Fund charges a 1% redemption fee for redemptions of Fund shares held for less than 30 days, unless otherwise determined by the Fund in its discretion.
The LKCM Aquinas Catholic Equity Fund seeks to maximize long-term capital appreciation, while incorporating Catholic values investing principles in the investment process. The LKCM Aquinas Catholic Equity Fund seeks to achieve its investment objective by investing under normal circumstances at least 80% of its net assets (plus any borrowings for investment purposes) in equity securities of companies that Luther King Capital Management Corporation (the “Adviser”) believes are likely to have above-average growth in revenue and/or earnings, above-average returns on shareholders’ equity, potential for above-average capital appreciation, and/or companies the Adviser believes have attractive relative valuations.
The Fund practices socially responsible investing within the framework provided by the United States Conference of Catholic Bishops’ Socially Responsible Investment Guidelines (the “Guidelines”). The Fund’s investment approach incorporates the Guidelines through a combination of screening portfolio companies based on criteria set forth in the Guidelines, dialogue with companies whose policies and practices may conflict with the Guidelines, and/or potentially excluding from the Fund’s portfolio the securities of those companies that are unwilling to alter their policies and practices over a reasonable period of time. The Adviser monitors companies selected for the Fund for policies on various issues contemplated by the Guidelines. If the Fund invests in a company whose policies and practices are inconsistent with the Guidelines, the Adviser may attempt to influence the company, sell the company’s securities or otherwise exclude future investments in such company.
The following is a summary of significant accounting policies followed by the Fund in preparation of the financial statements. The Fund is an investment company and, accordingly, follows the investment company accounting and reporting guidance of the Financial Accounting Standards Board Accounting Standards Codification Topic 946,Investment Companies.
1. Security Valuation: Equity securities listed or traded on a U.S. securities exchange for which market quotations are readily available are valued at the last quoted sale price on the exchange on which the security is primarily traded. Nasdaq Global Market securities are valued at the Nasdaq Official Closing Price (“NOCP”). Unlisted U.S. equity securities and listed U.S. equity securities not traded on a particular valuation date are valued at the mean of the most recent quoted bid and ask price on the relevant exchanges or markets. Equity securities listed on a foreign exchange for which market quotations are readily available are valued at the last quoted sales price on the exchange on which the security is primarily traded. Debt securities are normally valued at the mean of the closing bid and ask price and/or by using a combination of broker quotations or evaluated prices provided by an independent pricing service. Futures and options on futures are valued at the settlement prices established each day on the principal exchange on which they are traded. Forward contracts are valued based on the forward rate using information provided by an independent pricing service. Other assets and securities for which no market or broker quotations or evaluated prices are readily available are valued in good faith at fair value using guidelines approved by the Board of Trustees. The Board of Trustees has established policies and procedures that authorize the Adviser to fair value a security in good faith under certain circumstances. The Fund may use prices provided by independent pricing services to assist in the fair valuation of the Fund’s portfolio securities.
The Trust has adopted accounting standards which establish an authoritative definition of fair value and set out a hierarchy for measuring fair value. These standards require additional disclosures about the various inputs and valuation techniques used to develop the measurements of fair value and a discussion of changes in valuation techniques and related inputs during the period. These standards define fair value as the price that would be received to sell an asset or paid to transfer a liability in an orderly transaction between market participants at the measurement date. The fair value hierarchy is organized into three levels based upon the assumptions (referred to as “inputs”) used in pricing the asset or liability. These standards state that “observable inputs” reflect the assumptions market participants would use in pricing the asset or liability based on market data obtained from independent sources and “unobservable inputs” reflect an entity’s own assumptions about the assumptions market participants would use in pricing the asset or liability. These inputs are summarized in the three broad levels listed below.
| | | | |
| Level 1 | | – | | Quoted unadjusted prices for identical instruments in active markets to which the Trust has access at the date of measurement. |
14
| | | | |
| | |
| Level 2 | | – | | Quoted prices for similar instruments in active markets; quoted prices for identical or similar instruments in markets that are not active; and model-derived valuations in which all significant inputs and significant value drivers are observable in active markets. Level 2 inputs are those in markets for which there are few transactions, the prices are not current, little public information exists or instances where prices vary substantially over time or among brokered market makers. |
| | |
| Level 3 | | – | | Model derived valuations in which one or more significant inputs or significant value drivers are unobservable. Unobservable inputs are those inputs that reflect the Trust’s own assumptions that market participants would use to price the asset or liability based on the best available information. |
The inputs or methodology used for valuing securities are not necessarily an indication of the risk associated with investing in those securities. As of December 31, 2019, the Fund’s assets carried at fair value were classified as follows:
| | | | | | | | | | | | | | | | | | | | |
| LKCM Aquinas Catholic Equity Fund | | | | | | | | |
| | | | |
Description | | Level 1 | | Level 2 | | Level 3 | | Total |
Common Stocks | | | $ | 46,901,785 | | | | $ | — | | | | $ | — | | | | $ | 46,901,785 | |
Money Market Fund | | | | 586,922 | | | | | — | | | | | — | | | | | 586,922 | |
| | | | | | | | | | | | | | | | | | | | |
Total Investments* | | | $ | 47,488,707 | | | | $ | — | | | | $ | — | | | | $ | 47,488,707 | |
| | | | | | | | | | | | | | | | | | | | |
| | * | Additional information regarding the industry classifications of these investments is disclosed in the Schedule of Investments. |
2. Federal Income Taxes: The Fund has elected to be treated as a “regulated investment company” under Subchapter M of the Internal Revenue Code and the Fund intends to distribute all of its investment company net taxable income and net capital gains to shareholders. Therefore, no federal income tax provision is recorded.
3. Distributions to Shareholders: The Fund generally intends to declare and pay income dividends and distribute net capital gain, if any, at least on an annual basis.
4. Foreign Securities: Investing in securities of foreign companies and foreign governments involves special risks and considerations not typically associated with investing in securities of U.S. issuers. These risks include devaluation of currencies and future adverse political and economic developments. Moreover, securities of many foreign companies and foreign governments and their markets may be less liquid and their prices more volatile than those of securities of comparable U.S. companies and securities of the U.S. government.
5. Expense Allocation: Expenses incurred by the Funds in the Trust are allocated among the Funds based upon (i) relative average net assets, (ii) a specific identification basis as incurred, or (iii) evenly among the Funds, depending on the nature of the expense.
6. Use of Estimates: The preparation of financial statements in conformity with accounting principles generally accepted in the United States of America requires management to make estimates and assumptions that affect the reported amounts of assets and liabilities and disclosure of contingent assets and liabilities at the date of the financial statements and the reported amounts of revenues and expenses during the reporting period. Actual results could differ from those estimates.
7. Guarantees and Indemnifications: In the normal course of business, the Fund enters into contracts with service providers that contain general indemnification clauses. The Fund’s maximum exposure under these arrangements is unknown as this would involve future claims against the Fund that have not yet occurred. Based on experience, the Fund expects the risk of loss to be remote.
8. Security Transactions and Investment Income: Security and shareholder transactions are recorded on the trade date. Realized gains and losses on sales of investments are calculated on the identified cost basis. Dividend income and dividends and distributions to shareholders are recorded on the ex-dividend date. Withholding taxes on foreign dividends have been provided for in accordance with the Fund’s understanding of the applicable jurisdiction’s tax rules and rates. Interest income is recognized on the accrual basis. All discounts and premiums are amortized based on the effective interest method for tax and financial reporting purposes. The Fund may hold the securities of real estate investment trusts (“REITs”). Distributions from such investments may include income, capital gains and return of capital.
9. Other: Distributions from net investment income and realized capital gains are determined in accordance with income tax regulations, which may differ from U.S. GAAP. Certain capital accounts in the consolidated financial statements are periodically adjusted for permanent differences in order to reflect their tax character. These permanent differences are primarily due to the varying treatment of income and gain/loss on portfolio securities held by the Fund and have no impact on net assets or NAV per share.
Accordingly, at December 31, 2019, reclassifications were recorded as follows for the Fund:
| | | | | |
Accumulated net realized gain | | | ($ | 455,690 | ) |
Paid in capital | | | | 455,690 | |
10. Restricted and Illiquid Securities: The Fund is permitted to invest in securities that are subject to legal or contractual restrictions on resale including investments considered by the Fund to be illiquid. Restricted securities generally may be resold in transactions exempt from registration. Illiquid investments are investments that the Fund reasonably expects cannot be sold or
15
disposed of in current market conditions within seven calendar days or less in the ordinary course of business without the sale or disposition significantly changing the market value of the investment. A security may be considered illiquid if it lacks a readily available market or if its valuation has not changed for a certain period of time. Disposal of these securities may involve time-consuming negotiations and expense, and prompt sale at the current valuation may be difficult.
11. Recent Accounting Pronouncements: In March 2017, the Financial Accounting Standards Board (“FASB”) issuedASU 2017-08,Receivables—Nonrefundable Fees and Other Costs (Subtopic310-20): Premium Amortization on Purchased Callable Debt Securities (“ASU2017-08”). The amendments in the ASU2017-08 shorten the amortization period for certain callable debt securities, held at a premium, to be amortized to the earliest call date. The ASU2017-08 does not require an accounting change for securities held at a discount; which continues to be amortized to maturity. The ASU2017-08 is effective for fiscal years and interim periods within those fiscal years beginning after December 15, 2018. Effective, January 1, 2019, the Fund adopted ASU 2017-08, and the adoption had no impact on the financial statements.
In August 2018, FASB issued ASU2018-13,Fair Value Measurement (Topic 820):Disclosure Framework—Changes to the Disclosure Requirements for Fair Value Measurement(“ASU 2018-13”). The primary focus ofASU 2018-13 is to improve the effectiveness of the disclosure requirements for fair value measurements. The changes affect all companies that are required to include fair value measurement disclosures. In general, the amendments inASU 2018-13 are effective for all entities for fiscal years and interim periods within those fiscal years, beginning after December 15, 2019. An entity is permitted to early adopt the removed or modified disclosures upon the issuance ofASU 2018-13 and may delay adoption of the additional disclosures, which are required for public companies only, until their effective date. Management has evaluated ASU 2018-13 and has adopted the relevant provisions of the disclosure framework.
B. Investment Advisory and Other Agreements: The Adviser serves as the investment adviser to the Fund under an Investment Advisory Agreement (the “Agreement”). The Adviser receives a fee, computed daily and payable quarterly, at the annual rate presented below as applied to the Fund’s average daily net assets. The Adviser has contractually agreed to waive all or a portion of its management fee and/or reimburse expenses of the Fund through May 1, 2020 in order to limit the Fund’s operating expenses to the annual cap rate identified below. This expense limitation excludes interest, taxes, brokerage commissions, indirect fees and expenses relating to investments in other investment companies, including money market funds, and extraordinary expenses. For the year ended December 31, 2019, the Adviser waived the following management fees and/or reimbursed expenses to meet its expense cap obligations for the Fund:
| | | | | |
Annual Management Fee Rate | | | | 0.90% | |
Annual Cap on Expenses | | | | 1.00% | |
Fees Waived and/or Expenses Reimbursed in 2019 | | | $ | 242,854 | |
The Trust reimburses the Adviser for a portion of compensation paid to the Trust’s Chief Compliance Officer. This compensation is reported as part of the “Trustees fees and officer compensation” expense on the Statement of Operations.
U.S. Bancorp Fund Services, LLC, doing business as U.S. Bank Global Fund Services, serves as transfer agent and administrator for the Fund and serves as accounting services agent for the Fund. U.S. Bank, N.A. serves as custodian for the Fund.
Distribution services are performed pursuant to a distribution contract with Quasar Distributors, LLC, the Trust’s principal underwriter.
The Trust has adopted a Rule 12b-1 plan for the Fund, under which the Fund may pay an annualized fee of up to 1.00% of its average daily net assets for distribution and other services. However, the Board of Trustees has currently only authorized an annual fee of 0.10% of the average daily net assets for the Fund. Prior to August 1, 2016, the Fund assessed an annualRule 12b-1 fee of 0.25% of the average daily net assets for the Fund. For the year ended December 31, 2019, fees incurred by the Fund pursuant to the12b-1 Plan were $47,607.
C. Fund Shares: At December 31, 2019, there was an unlimited number of shares of beneficial interest, no par value, authorized. The following table summarizes the activity in shares of the Fund:
| | | | | | | | | | | | | | | | | | | | |
| | | Year Ended
December 31, 2019 | | Year Ended
December 31, 2018 |
| | | Shares | | Amount | | Shares | | Amount |
Shares sold | | | | 148,983 | | | | $ | 2,264,439 | | | | | 278,894 | | | | $ | 4,917,666 | |
Shares issued to shareholders in
reinvestment of distributions | | | | 316,326 | | | | | 4,767,041 | | | | | 650,427 | | | | | 8,240,906 | |
Shares redeemed | | | | (858,817 | ) | | | | (13,067,846 | ) | | | | (1,521,952 | ) | | | | (27,160,652 | ) |
Redemption fee | | | | | | | | | 79 | | | | | | | | | | 1,348 | |
| | | | | | | | | | | | | | | | | | | | |
Net decrease | | | | (393,508 | ) | | | $ | (6,036,287 | ) | | | | (592,631 | ) | | | $ | (14,000,732 | ) |
| | | | | | | | | | | | | | | | | | | | |
Shares Outstanding: | | | | | | | | | | | | | | | | | | | | |
Beginning of period | | | | 3,542,038 | | | | | | | | | | 4,134,669 | | | | | | |
| | | | | | | | | | | | | | | | | | | | |
End of period | | | | 3,148,530 | | | | | | | | | | 3,542,038 | | | | | | |
| | | | | | | | | | | | | | | | | | | | |
16
D. Security Transactions: Purchases and sales of investment securities, other than short-term investments, for the Fund for the year ended December 31, 2019 were as follows:
| | | | | | | | | | | | | | | | |
| | | Purchases | | | Sales | |
| | | U.S.
Government | | | Other | | | U.S.
Government | | | Other | |
| | $ | — | | | $ | 5,685,765 | | | $ | — | | | $ | 17,134,974 | |
E. Tax Information: At December 31, 2019, the components of accumulated earnings (losses) on a tax basis for the Fund were as follows:
| | | | |
Tax Cost of Investments | | $ | 23,131,563 | |
| | | | |
Gross Unrealized Appreciation | | $ | 24,486,473 | |
Gross Unrealized Depreciation | | | (129,329 | ) |
| | | | |
Net Unrealized Appreciation | | $ | 24,357,144 | |
| | | | |
Undistributed Ordinary Income | | $ | 5,453 | |
Undistributed Long-Term Capital Gain | | | 124,025 | |
| | | | |
Total Distributable Earnings | | $ | 129,478 | |
| | | | |
Other Accumulated Losses | | $ | — | |
| | | | |
Total Accumulated Gains | | $ | 24,486,622 | |
| | | | |
To the extent the Fund realizes future net capital gains, taxable distributions will be reduced by any unused capital loss carryforwards as permitted by the Internal Revenue Code. At December 31, 2019, the Fund had no capital loss carryforwards.
The tax components of dividends paid during the periods shown below for the Fund were as follows:
| | | | | | | | | | | | | | | | |
| | | Year Ended December 31, 2019 | | | Year Ended December 31, 2018 | |
| | | Ordinary
Income | | | Long-Term
Capital Gains | | | Ordinary
Income | | | Long-Term
Capital Gains | |
| | $ | 216,623 | | | $ | 4,712,789 | | | $ | 204,969 | | | $ | 8,544,354 | |
The Fund designated earnings and profits distributed to shareholders upon the redemption of shares during 2019 and 2018 in determining undistributed net capital gains as of December 31, 2019 and 2018.
The Trust has adopted financial reporting rules regarding recognition and measurement of tax positions taken or expected to be taken on a tax return. The Trust has reviewed all open tax years and major jurisdictions and concluded that there is no impact on the Fund’s financial position or results of operations. Tax years that remain open to examination by major tax jurisdictions include tax years ended December 31, 2016 through December 31, 2019. There is no tax liability resulting from unrecognized tax benefits relating to uncertain income tax positions taken or expected to be taken on tax returns as of December 31, 2019. The Fund is not aware of any tax positions for which it is reasonably possible that the total amounts of unrecognized tax benefits will significantly change in the next twelve months. If applicable, the Fund would recognize interest accrued related to unrecognized tax benefits in “interest expense” and penalties in “other expense” on the statement of operations.
F. Subsequent Events: In preparing these financial statements, management has evaluated the Fund’s related events and transactions that occurred subsequent to December 31, 2019 through the date the financial statements were issued. Other than as disclosed below, management has determined that there were no significant subsequent events requiring recognition or disclosure in the financial statements.
On November 25, 2019, U.S. Bancorp, the parent company of Quasar Distributors, LLC (“Quasar”), the Fund’s distributor, announced that it had signed a purchase agreement to sell Quasar to Foreside Financial Group, LLC (“Foreside”) such that Quasar will become a wholly-owned broker-dealer subsidiary of Foreside. The transaction is expected to close by the end of March 2020. Quasar will remain the Fund’s distributor at the close of the transaction, subject to approval of the Board of Trustees of the Funds.
17
|
| REPORTOF INDEPENDENT REGISTERED PUBLIC ACCOUNTING FIRM |
To the shareholders and Board of Trustees of LKCM Funds
Opinion on the Financial Statements and Financial Highlights
We have audited the accompanying statement of assets and liabilities, including the schedule of investments of LKCM Aquinas Catholic Equity Fund, one of the series constituting the LKCM Funds (the “Fund”), as of December 31, 2019, the related statement of operations for the year then ended, the statements of changes in net assets for each of the two years in the period then ended, the financial highlights for each of the five years in the period then ended, and the related notes. In our opinion, the financial statements and financial highlights present fairly, in all material respects, the financial position of the Fund as of December 31, 2019, and the results of its operations for the year then ended, the changes in its net assets for each of the two years in the period then ended, and the financial highlights for each of the five years in the period then ended, in conformity with accounting principles generally accepted in the United States of America.
Basis for Opinion
These financial statements and financial highlights are the responsibility of the Fund’s management. Our responsibility is to express an opinion on the Fund’s financial statements and financial highlights based on our audits. We are a public accounting firm registered with the Public Company Accounting Oversight Board (United States) (PCAOB) and are required to be independent with respect to the Fund in accordance with the U.S. federal securities laws and the applicable rules and regulations of the Securities and Exchange Commission and the PCAOB.
We conducted our audits in accordance with the standards of the PCAOB. Those standards require that we plan and perform the audit to obtain reasonable assurance about whether the financial statements and financial highlights are free of material misstatement, whether due to error or fraud. The Fund is not required to have, nor were we engaged to perform, an audit of its internal control over financial reporting. As part of our audits we are required to obtain an understanding of internal control over financial reporting but not for the purpose of expressing an opinion on the effectiveness of the Fund’s internal control over financial reporting. Accordingly, we express no such opinion.
Our audits included performing procedures to assess the risks of material misstatement of the financial statements and financial highlights, whether due to error or fraud, and performing procedures that respond to those risks. Such procedures included examining, on a test basis, evidence regarding the amounts and disclosures in the financial statements and financial highlights. Our audits also included evaluating the accounting principles used and significant estimates made by management, as well as evaluating the overall presentation of the financial statements and financial highlights. Our procedures included confirmation of securities owned as of December 31, 2019, by correspondence with the custodian. We believe that our audits provide a reasonable basis for our opinion.

Milwaukee, Wisconsin
February 25, 2020
We have served as the auditor of one or more LKCM Funds since 2007.
18
|
| LKCM AQUINAS CATHOLIC EQUITY FUND |
| ADDITIONAL INFORMATION |
| December 31, 2019 |
Tax Information: For the fiscal year ended December 31, 2019, certain dividends paid by the Fund may be subject to a maximum tax rate of 23.8%, as provided for by the Jobs & Growth Tax Relief Reconciliation Act of 2003. The percentage of dividends declared from ordinary income designated as qualified dividend income was 100.00%
For corporate shareholders, the percentage of ordinary income distributions qualifying for the corporate dividends received deduction for the fiscal year ended December 31, 2019 was 100.00%.
Availability of Proxy Voting Information: A description of the policies and procedures that the Fund uses to determine how to vote proxies relating to its portfolio securities, as well as information regarding how the Fund voted proxies relating to portfolio securities during the most recent 12-month period ended June 30, is available without charge, upon request, by callingtoll-free1-800-423-6369 or on the SEC website at http://www.sec.gov.
The actual voting records relating to portfolio securities during the twelve month period ended June 30 (as filed with the SEC onForm N-PX) are available without charge, upon request, by calling the Fund toll free at 1-800-423-6369 or by accessing the SEC’s website at www.sec.gov.
Availability of Quarterly Portfolio Schedule: The Fund is required to file complete schedules of portfolio holdings with the SEC for the first and third fiscal quarters on Form N-Q. Once filed, the Fund’s Form N-Q is available without charge upon request on the SEC’s website (http://www.sec.gov) and is also available by calling 1-800-423-6369. You can also review and copy the Fund’s Form N-Q by visiting the SEC’s Public Reference Room in Washington, DC (information on the operation of the Public Reference Room may be obtained by calling 1-800-SEC-0330). Beginning June 1, 2020, monthly portfolio disclosures will be filed quarterly with the SEC on Form N-PORT, with quarter-end disclosures being made public 60 days after the end of each fiscal quarter.
19
Information about the Fund’s Trustees and Officers:
The business and affairs of the Fund are managed under the direction of the Fund’s Board of Trustees. Information pertaining to the Trustees of the Fund is set forth below. The Statement of Additional Information includes additional information about the Fund’s Trustees and officers and is available, without charge, upon request by calling 1-800-423-6369.
| | | | | | | | | | |
Name, Address and Age | | Position(s) Held with the Trust | | Term of Office & Length of Time Served(1) | | Principal Occupation During Past Five Years | | Number of
Portfolios in
Fund Complex
Overseen by Trustee | | Other Directorships Held by Trustee |
| Independent Trustees: | | | | | | | | | | |
H. Kirk Downey 301 Commerce Street Suite 1600 Fort Worth, TX 76102 Year of Birth: 1942 | | Chairman of the Board of Trustees Trustee | | Since 2005 Since 1994 | | President and CEO, Texas Systems, LLC and CEO, Texas learning systems LLC since 1999 (education companies); Dean, M.J. Neeley School of Business, Texas Christian University Business School from 1987 to 1999. | | 7 | | None |
Richard J. Howell 301 Commerce Street Suite 1600 Fort Worth, TX 76102 Year of Birth: 1942 | | Trustee Chairman of the Audit and Compliance Committee | | Since 2005 Since 2008 | | CPA; Adjunct Faculty at SMU Cox School of Business from 2004 to 2009; Consulting Services, since 2002; Audit Partner, Arthur Andersen LLP from 1974 to 2002. | | 7 | | None |
Larry J. Lockwood 301 Commerce Street Suite 1600 Fort Worth, TX 76102 Year of Birth: 1953 | | Trustee | | Since 2013 | | C.R. Williams Professor of Finance, Stan Block Endowed Chair in Finance, Department of Finance, Neeley School of Business, Texas Christian University since 1994. | | 7 | | None |
| Interested Trustees: | | | | | | | | | | |
J. Luther King, Jr.(2) 301 Commerce Street Suite 1600 Fort Worth, TX 76102 Year of Birth: 1940 | | Trustee, President and Chief Executive Officer | | Since 1994 | | Chairman, President and Director, Luther King Capital Management Corporation since 1979. | | 7 | | Tyler Technologies, Inc. |
Steven R. Purvis(2) 301 Commerce Street Suite 1600 Fort Worth, TX 76102 Year of Birth: 1964 | | Trustee Vice President | | Since 2013
Since 2000 | | Principal, Luther King Capital Management Corporation since 2004, Vice President and Portfolio Manager, Luther King Capital Management Corporation since 1996. | | 7 | | AZZ Incorporated |
| (1) | Each Trustee holds office during the lifetime of the Trust until that individual resigns, retires or is otherwise removed or replaced. |
| (2) | Messrs. King and Purvis are each considered an “interested person” of the Trust (as defined in the 1940 Act) because of their affiliation with the Adviser. |
20
Information about the Fund’s Trustees and Officers, Continued
| | | | | | |
Name, Address and Age | | Position(s) Held with the Trust | | Term of Office & Length of Time Served | | Principal Occupation During Past Five Years |
| Principal Officers: | | | | | | |
J. Luther King, Jr.(1) 301 Commerce Street Suite 1600 Fort Worth, TX 76102 Year of Birth: 1940 | | Trustee, President and Chief Executive Officer | | Since 1994 | | Chairman, President and Director, Luther King Capital Management Corporation since 1979. |
Steven R. Purvis(1) 301 Commerce Street Suite 1600 Fort Worth, TX 76102 Year of Birth: 1964 | | Trustee Vice President | | Since 2013 Since 2000 | | Principal, Luther King Capital Management Corporation since 2004, Vice President and Portfolio Manager, Luther King Capital Management Corporation since 1996. |
Paul W. Greenwell 301 Commerce Street Suite 1600 Fort Worth, TX 76102 Year of Birth: 1950 | | Vice President | | Since 1996 | | Principal, Luther King Capital Management Corporation since 1986, Vice President and Portfolio Manager, Luther King Capital Management Corporation since 1983. |
Richard Lenart 301 Commerce Street Suite 1600 Fort Worth, TX 76102 Year of Birth: 1966 | | Secretary and Treasurer | | Since 2006 | | Luther King Capital Management Corporation since 2005. |
Jacob D. Smith 301 Commerce Street Suite 1600 Fort Worth, TX 76102 Year of Birth: 1974 | | Chief Financial Officer Chief Compliance Officer | | Since 2010 Since 2006 | | General Counsel and Chief Compliance Officer, Luther King Capital Management Corporation since 2006; Principal, Luther King Capital Management Corporation since 2013. |
| (1) | Messrs. King and Purvis are each considered an “interested person” of the Trust (as defined in the 1940 Act) because of their affiliation with the Adviser. |
21
LKCM FUNDS
PRIVACY NOTICE
Our Commitment to Your Privacy
At LKCM Funds, we are committed to safeguarding the confidentiality and privacy of nonpublic personal information about our current and former shareholders. This privacy notice describes the types of nonpublic personal information we collect about you and the sources through which we obtain this information, the purposes for which we obtain and use your nonpublic information, and the policies and procedures we have implemented to protect the privacy of your nonpublic personal information.
How We Protect Your Nonpublic Personal Information
Protecting your nonpublic personal information is an important priority at LKCM Funds. Accordingly, we have implemented policies and procedures designed to safeguard your nonpublic personal information, such as your tax identification number, account and investment history, account numbers, account balances and nonpublic contact information, from unauthorized access or use. Pursuant to these policies and procedures, we maintain various physical, technological, and administrative safeguards to protect the security and confidentiality of your nonpublic personal information, and we adapt these safeguards to respond to evolving technological and other standards.
We do not disclose nonpublic personal information about you to non-affiliated firms, organizations or individuals except as authorized by you or your representatives or as required or permitted by law. We may disclose nonpublic personal information about you to nonaffiliated third parties, such as custodians, brokers, auditors, accountants, and systems and administrative service providers, in connection with the services we provide to you or on your behalf. When we provide nonpublic personal information about you to nonaffiliated third parties for these purposes, we expect them to safeguard your nonpublic personal information, use your nonpublic personal information only for the intended purposes and otherwise abide by applicable law.
How We Obtain Your Nonpublic Personal Information
We collect nonpublic personal information about you from various sources, including documents, new account applications and other information that you or your representatives, custodians, attorneys, accountants or similar parties provide to us, communications that we have with you or your representatives, custodians, attorneys, accountants or similar parties, and documents and other information related to your accounts or investment experience with us.
Please do not hesitate to contact Jacob D. Smith, our Chief Compliance Officer, if you have any questions regarding this privacy notice or the measures we have implemented to protect the privacy of your nonpublic personal information.
U.S. Bancorp Fund Services, LLC
P.O. Box 701
Milwaukee, WI 53201-0701
LKCM FUNDS
P.O. Box 701
Milwaukee, WI 53201-0701
| | | | |
Officers and Trustees |
J. Luther King, Jr., CFA, CIC Trustee, President and Chief Executive Officer | | H. Kirk Downey Chairman of the Board | | Richard Lenart Secretary & Treasurer |
| | |
Paul W. Greenwell Vice President | | Richard J. Howell Trustee | | Jacob D. Smith Chief Financial Officer Chief Compliance Officer |
| | |
Steven R. Purvis, CFA Trustee, Vice President | | Larry J. Lockwood Trustee | | |
|
Investment Adviser |
Luther King Capital Management Corporation 301 Commerce Street, Suite 1600 Fort Worth, TX 76102 |
Administrator, Transfer Agent, Dividend Paying Agent & Shareholder Servicing Agent |
U.S. Bancorp Fund Services, LLC P.O. Box 701 Milwaukee, WI 53201-0701 |
Custodian |
U.S. Bank, N.A. 1555 N. River Center Drive, Suite 302 Milwaukee, WI 53212 |
Independent Registered Public Accounting Firm |
Deloitte & Touche LLP 555 E. Wells St., Suite 1400 Milwaukee, WI 53202 |
Distributor |
Quasar Distributors, LLC 777 East Wisconsin Avenue, Floor 6 Milwaukee, WI 53202 |
Item 2. Code of Ethics.
The registrant has adopted a code of ethics that applies to the registrant’s principal executive officer and principal financial officer. The registrant has not made any substantive amendments to its code of ethics during the period covered by this report. The registrant has not granted any waivers from any provisions of the code of ethics during the period covered by this report.
A copy of the registrant’s Code of Ethics is filed herewith.
Item 3. Audit Committee Financial Expert.
The registrant’s board of trustees has determined that there is at least one audit committee financial expert serving on its audit committee. Richard J. Howell is the “audit committee financial expert” and is considered to be “independent” as each term is defined in Item 3 ofForm N-CSR.
Item 4. Principal Accountant Fees and Services.
The registrant has engaged its principal accountant to perform audit services, audit-related services, tax services and other services during the past two fiscal years. “Audit services” refer to performing an audit of the registrant’s annual financial statements or services that are normally provided by the accountant in connection with statutory and regulatory filings or engagements for those fiscal years. “Audit-related services” refer to the assurance and related services by the principal accountant that are reasonably related to the performance of the audit. “Tax services” refer to professional services rendered by the principal accountant for tax compliance, tax advice, and tax planning. “Other services” provided by the principal accountant were provided by the principal accountant. The following table details the aggregate fees billed or expected to be billed for each of the last two fiscal years for audit fees, audit-related fees, tax fees and other fees by the principal accountant.
| | | | | | | | |
| | | FYE 12/31/2019 | | | FYE 12/31/2018 | |
Audit Fees | | $ | 152,000 | | | $ | 130,100 | |
Audit-Related Fees | | | — | | | | — | |
Tax Fees | | $ | 33,320 | | | $ | 27,065 | |
All Other Fees | | | — | | | | — | |
The audit committee has adoptedpre-approval policies and procedures that require the audit committee topre-approve all audit andnon-audit services of the registrant, including services provided to any entity affiliated with the registrant.
1
The percentage of fees billed by Deloitte & Touche LLP applicable tonon-audit services pursuant to waiver ofpre-approval requirement were as follows:
| | | | | | | | |
| | | FYE 12/31/2019 | | | FYE 12/31/2018 | |
Audit-Related Fees | | | 0 | % | | | 0 | % |
Tax Fees | | | 0 | % | | | 0 | % |
All Other Fees | | | 0 | % | | | 0 | % |
All of the principal accountant’s hours spent on auditing the registrant’s financial statements were attributed to work performed byfull-time permanent employees of the principal accountant. The following table indicates thenon-audit fees billedor expected to be billed by the registrant’s accountant for services to the registrant and to the registrant’s investment adviser (and any other controlling entity, etc.—notsub-adviser) for the last two years. The audit committee of the board of trustees has considered whether the provision ofnon-audit services that were rendered to the registrant’s investment adviser is compatible with maintaining the principal accountant’s independence and has concluded that the provision of suchnon-audit services by the accountant has not compromised the accountant’s independence.
| | | | | | | | |
Non-Audit Related Fees | | FYE 12/31/2019 | | | FYE 12/31/2018 | |
Registrant | | $ | 33,320 | | | $ | 27,065 | |
Registrant’s Investment Adviser | | | — | | | | — | |
Item 5. Audit Committee of Listed Registrants.
Not applicable to registrants who are not listed issuers (as defined in Rule10A-3 under the Securities Exchange Act of 1934).
Item 6. Investments.
| (a) | Schedule of Investments is included as part of the report to shareholders filed under Item 1 of this Form. |
Item 7. Disclosure of Proxy Voting Policies and Procedures forClosed-End Management Investment Companies.
Not applicable toopen-end investment companies.
Item 8. Portfolio Managers ofClosed-End Management Investment Companies.
Not applicable toopen-end investment companies.
Item 9. Purchases of Equity Securities byClosed-End Management Investment Company and Affiliated Purchasers.
Not applicable toopen-end investment companies.
Item 10. Submission of Matters to a Vote of Security Holders.
There have been no material changes to the procedures by which shareholders may recommend nominees to the registrant’s board of trustees.
2
Item 11. Controls and Procedures.
| (a) | The registrant’s Chief Executive Officer and Chief Financial Officer have reviewed the registrant’s disclosure controls and procedures (as defined in Rule30a-3(c) under the Investment Company Act of 1940 (the “Act”)) as of a date within 90 days of the filing of this report, as required by Rule30a-3(b) under the Act and Rules13a-15(b) or 15d 15(b) under the Securities Exchange Act of 1934. Based on their review, such officers have concluded that the disclosure controls and procedures are reasonably designed to ensure that information required to be disclosed in this report is recorded, processed, summarized and reported within the required time periods and that information required to be disclosed by the registrant in reports that it files or submits on FormN-CSR is accumulated and communicated to the registrant’s management, including its principal executive and financial officers, as appropriate to allow timely decisions regarding required disclosure. |
| (b) | There were no changes in the registrant’s internal control over financial reporting (as defined in Rule30a-3(d) under the Act) that occurred during the second fiscal quarter of the period covered by this report that have materially affected, or are reasonably likely to materially affect, the registrant’s internal control over financial reporting. |
Item 12. Disclosure of Securities Lending Activities forClosed-End Management Investment Companies
Not applicable toopen-end investment companies.
Item 13. Exhibits.
| (a) | (1)Any code of ethics or amendment thereto, that is the subject of the disclosure required by Item 2, to the extent that the registrant intends to satisfy Item 2 requirements through filing an exhibit.Filed herewith. |
(2)A separate certification for each principal executive officer and principal financial officer pursuant to Section 302 of the Sarbanes-Oxley Act of 2002.Filed herewith.
(3)Any written solicitation to purchase securities under Rule 23c-1 under the Act sent or given during the period covered by the report by or on behalf of the registrant to 10 or more persons.Not applicable toopen-end investment companies.
| | (1) | Change in the registrant’s independent public accountant.There was no change in the registrant’s independent public accountant for the period covered by this report. |
| (b) | Certifications pursuant to Section 906 of the Sarbanes-Oxley Act of 2002. Furnished herewith. |
3
SIGNATURES
Pursuant to the requirements of the Securities Exchange Act of 1934 and the Investment Company Act of 1940, the registrant has duly caused this report to be signed on its behalf by the undersigned, thereunto duly authorized.
(Registrant)LKCM Funds
By (Signature and Title)/s/ J. Luther King, Jr.
J. Luther King, Jr., President
Date 3/3/2020
Pursuant to the requirements of the Securities Exchange Act of 1934 and the Investment Company Act of 1940, this report has been signed below by the following persons on behalf of the registrant and in the capacities and on the dates indicated.
By (Signature and Title)/s/ J. Luther King, Jr.
J. Luther King, Jr., President
Date 3/3/2020
By (Signature and Title)/s/ Jacob D. Smith
Jacob D. Smith, Chief Financial Officer
Date 3/3/2020
4