UNITED STATES
SECURITIES AND EXCHANGE COMMISSION
Washington, D.C. 20549
FORM N-CSR
CERTIFIED SHAREHOLDER REPORT OF REGISTERED
MANAGEMENT INVESTMENT COMPANIES
Investment Company Act file number 811-08352
LKCM Funds
(Exact name of Registrant as specified in charter)
c/o Luther King Capital Management Corporation
301 Commerce Street, Suite 1600
Fort Worth, TX 76102
(Address of principal executive offices) (Zip code)
K&L Gates LLP
1601 K Street, NW
Washington, DC 20006
(Name and address of agent for service)
1-800-688-LKCM and 1-800-423-6369
Registrant’s telephone number, including area code
Date of fiscal year end: December 31
Date of reporting period: December 31, 2022
Item 1. Reports to Stockholders.
| | (a) | Include a copy of the report transmitted to stockholders pursuant to Rule 30e-1 under the Act (17 CFR 270.30e-1). |
LKCM
FUNDS
LKCM Small Cap Equity Fund
LKCM Small-Mid Cap Equity Fund
LKCM Equity Fund
LKCM Balanced Fund
LKCM Fixed Income Fund
LKCM International Equity Fund
Annual Report
December 31, 2022
Dear Fellow Shareholders:
We report the following performance information for the LKCM Funds for indicated periods ended December 31, 2022:
| | | | | | | | | | | | | | | | | | | | | | | | | | | | | | | | | | | | | | | | |
Funds | | Inception
Date | | NAV @
12/31/22 | | Net
Expense
Ratio*, ** | | Gross
Expense
Ratio** | | One Year
Total
Return
Ended
12/31/22 | | Five Year
Average
Annualized
Return
Ended
12/31/22 | | Ten Year
Average
Annualized
Return
Ended
12/31/22 | | Avg.
Annual
Total
Return
Since
Incept. |
LKCM Small Cap Equity Fund | | | | 07/14/1994 | | | | $ | 16.37 | | | | | 1.00% | | | | | 1.03% | | | | | -22.11% | | | | | 6.82% | | | | | 8.20% | | | | | 9.82% | |
Russell 2000® Index(1) | | | | | | | | | | | | | | | | | | | | | | | | -20.44% | | | | | 4.13% | | | | | 9.01% | | | | | 8.62% | |
LKCM Small-Mid Cap Equity Fund | | | | 05/02/2011 | | | | $ | 7.88 | | | | | 1.00% | | | | | 1.74% | | | | | -22.12% | | | | | 6.99% | | | | | 8.32% | | | | | 6.79% | |
Russell 2500® Index(2) | | | | | | | | | | | | | | | | | | | | | | | | -18.37% | | | | | 5.89% | | | | | 10.03% | | | | | 8.78% | |
LKCM Equity Fund | | | | 01/03/1996 | | | | $ | 30.99 | | | | | 0.80% | | | | | 0.96% | | | | | -15.44% | | | | | 9.82% | | | | | 11.28% | | | | | 8.86% | |
S&P 500® Index®(3) | | | | | | | | | | | | | | | | | | | | | | | | -18.11% | | | | | 9.42% | | | | | 12.56% | | | | | 8.99% | |
LKCM Balanced Fund | | | | 12/30/1997 | | | | $ | 24.29 | | | | | 0.80% | | | | | 0.96% | | | | | -13.84% | | | | | 6.19% | | | | | 8.22% | | | | | 6.55% | |
S&P 500® Index(3) | | | | | | | | | | | | | | | | | | | | | | | | -18.11% | | | | | 9.42% | | | | | 12.56% | | | | | 7.64% | |
Bloomberg U.S. Intermediate | | | | | | | | | | | | | | | | | | | | | | | | | | | | | | | | | | | | | | | | |
Government/Credit Bond Index(4) | | | | | | | | | | | | | | | | | | | | | | | | -8.23% | | | | | 0.73% | | | | | 1.12% | | | | | 3.77% | |
LKCM Fixed Income Fund | | | | 12/30/1997 | | | | $ | 10.10 | | | | | 0.50% | | | | | 0.78% | | | | | -5.63% | | | | | 0.72% | | | | | 1.11% | | | | | 3.60% | |
Bloomberg U.S. Intermediate | | | | | | | | | | | | | | | | | | | | | | | | | | | | | | | | | | | | | | | | |
Government/Credit Bond Index(4) | | | | | | | | | | | | | | | | | | | | | | | | -8.23% | | | | | 0.73% | | | | | 1.12% | | | | | 3.77% | |
LKCM International Equity Fund | | | | 05/01/2019 | | | | $ | 11.08 | | | | | 1.00% | | | | | 1.40% | | | | | -20.51% | | | | | NA | | | | | NA | | | | | 4.37% | |
MSCI/EAFE® Index(5) | | | | | | | | | | | | | | | | | | | | | | | | -14.01% | | | | | NA | | | | | NA | | | | | 3.23% | |
Performance data quoted represents past performance and does not guarantee future results. The investment return and principal value of an investment will fluctuate so that an investor’s shares, when redeemed, may be worth more or less than their original cost. Current performance of the Funds may be lower or higher than the performance quoted. Performance data current to the most recent month end may be obtained by calling 1-800-688-LKCM. Returns would have been lower if Luther King Capital Management Corporation, the Funds’ investment adviser, had not waived a portion of its management fee and/or reimbursed certain expenses of the Funds. Please see Note B to the Notes to the Financial Statements for specific information regarding management fee waiver and/or expense reimbursement arrangements for the Funds. The Funds impose a 1.00% redemption fee on shares held less than 30 days. If reflected, the fee would reduce performance shown.
| * | Luther King Capital Management Corporation, the Funds’ investment adviser, has contractually agreed to waive all or a portion of its management fee and/or reimburse expenses of each Fund to maintain the expense ratios designated in the Funds’ prospectus through May 1, 2023. This expense limitation excludes interest, taxes, brokerage commissions, indirect fees and expenses related to investments in other investment companies, including money market funds, and extraordinary expenses. Investment performance, which is based on the net expense ratio, reflects fee waivers, if any, in effect during the relevant period. In the absence of such waivers, total return would be reduced. LKCM waived management fees and/or reimbursed expenses for each Fund during the fiscal year ended December 31, 2022. |
| ** | Expense ratios above are as reported in the Funds’ current prospectus dated May 1, 2022. Expense ratios reported for other periods in the financial highlights of this report may differ. |
| (1) | The Russell 2000® Index is an unmanaged index which measures the performance of the 2,000 smallest companies in the Russell 3000® Index. |
| (2) | The Russell 2500® Index is an unmanaged index which measures the performance of the 2,500 smallest companies in the Russell 3000® Index. |
| (3) | The S&P 500® Index is an unmanaged capitalization-weighted index of 500 selected stocks that is generally considered representative of the performance of large capitalization companies in the U.S. stock market. |
| (4) | The Bloomberg U.S. Intermediate Government/Credit Bond Index is an unmanaged market value weighted index measuring both the principal price changes of, and income provided by, the underlying universe of securities that comprise the index. Securities included in the index must meet the following criteria: fixed as opposed to variable rate; remaining maturity of one to ten years; minimum outstanding par value of $250 million; rated investment grade or higher by Moody’s Investors Service or equivalent; must be dollar denominated and non-convertible; and must be publicly issued. |
| (5) | The Morgan Stanley Capital International Europe, Australia, Far East Index (“MSCI/EAFE® Index”) is an unmanaged index composed of large-cap and mid-cap securities across 21 developed markets, including countries in Europe, Australasia and the Far East. The MSCI/EAFE® Index is a recognized international index and is weighted by market capitalization. |
Note: The indices defined above are not available for direct investment and the index performance therefore does not include fees, expenses or taxes.
2022 Review
Following two tumultuous years, the global economy entered 2022 with what appeared to be new strength. Inflation was accelerating, but markets generally expected the Federal Reserve to raise its benchmark interest rate by a modest amount over the course of the year to help bring inflation down. The decision by Russia to invade Ukraine on February 24th sent shockwaves through global markets as the price of gold, wheat, crude oil, and natural gas soared. By the end of the first quarter of 2022 economic momentum was waning under the weight of the Ukrainian invasion, persistent inflation, and the emergence of the Omicron variant of the COVID-19 virus which closed the world’s largest container port in Shanghai, among other disruptive effects.
Gross Domestic Product (GDP) readings for the first half of 2022 suggested to us that the U.S. economy was either in a recession, or on the cusp of one. Real GDP declined at an annual rate of 1.6% and 0.6% in the first and second quarters of 2022, respectively. In contrast, the U.S. economy grew in the third quarter of 2022 as measured by real GDP, expanding at an annual rate of 3.2%, which appears driven
2
by a narrowing trade deficit, an increase in consumer spending, and U.S. government outlays. There has only been one other episode in the post-World War II period in which two consecutive quarters of negative real GDP were not associated with a recession – the second and third quarters of 1947, as the U.S. economy was adjusting to the post war era. Employment expanded, and the unemployment rate averaged 3.6% in 1947, similar to the current tight labor market. The official recession dating organization, the National Bureau of Economic Research, has not yet labeled the first half of 2022 a recession and is unlikely to do so in our opinion because the period did not fully exhibit the breadth of economic softness typically associated with a recession. For example, in our view gross domestic income and robust job growth in the first half of 2022 were inconsistent with historical recessionary conditions.
In June 2022, inflation as measured by the Consumer Price Index reached a high of 9.1%, reminiscent of the late 1970s and early 1980s. Following a 0.25% interest rate hike in March 2022 and a 0.50% increase in May 2022, the Federal Reserve raised its benchmark interest rate by 0.75% in June 2022. We think that Federal Reserve Chair Jerome Powell put it best in late June 2022 when he said, “I think we now understand better how little we understand about inflation.” In the final nine months of 2022, the Federal Reserve raised its benchmark rate by 4.25%, the largest calendar year increase since 1973. We have twice witnessed more rapid tightening, and it did not end well for the economy in either instance. During the 1979-1980 period, the Volcker-led Federal Reserve increased its benchmark rate from 11.5% in October 1979 to 20.0% by March 1980, or 8.5% in just six months. Following a short period of easing, the Federal Reserve once again had to tighten monetary policy, moving its benchmark rate from 9.5% in August 1980 to 20.0% by that December. A recession ensued in both episodes, although this action appeared necessary to subdue double-digit inflation expectations at the time. This tightening process, though painful, ultimately set-up an extraordinary period of positive returns in both the equity and bond markets.
The Federal Reserve’s hawkish stance during 2022 had a profound impact on the bond market and the U.S. dollar. The 2-Year Treasury note, which is very sensitive to shifts in monetary policy, rose nearly 4.00% to a peak of 4.72% in early November 2022 before settling back to 4.43% at year-end. While inflation inherently erodes the purchasing power of a dollar, in nominal terms the U.S. dollar strengthened dramatically in 2022 versus its major trading partners. This strengthening resulted in an earnings headwind for U.S. multinational companies that generate significant international earnings. We believe this headwind should ease in the coming year, as central banks and governments around the world have increased interest rates and conducted foreign exchange interventions that we believe will increase the value of their own currencies relative to the U.S. dollar.
2022 was a bruising year for the capital markets. Stock and bond prices fell in unison as the Federal Reserve battled inflation. Long-dated bonds fared the worst with the price of the 30-Year Treasury bond falling 33.4%. The Standard & Poor’s 500 Index had its worst performance since 2008, declining 18.1%, with only two of the eleven sectors of the market, Energy and Utilities, finishing with positive returns. The equity market results were also very dramatic, with value stocks outperforming growth stocks by the second widest margin since 1979. The technology-laden NASDAQ Composite Index, which had dominated the stock market leadership since the market recovery began in May 2020, fell 32.5% in 2022.
2023 Outlook
We believe that the new year is likely to be worse for the U.S. economy, but better for the financial markets. In our view the economy continues to pass successive signposts that suggest that the ultimate destination is a recession. A deeply inverted yield curve, cascading leading economic indicators, and a sharp decline in housing activity have all historically portended a recession. We believe there are still some signposts potentially just over the horizon that would cement our recession outlook, including a meaningful increase in the low unemployment rate of 3.5%, which remains at half century lows.
We believe that much of what the U.S. economy will be digesting in the year ahead is the substantial monetary tightening that occurred in the last nine months of 2022. The time lag between changes in monetary policy and its impact on the real economy has historically been roughly one year. As a result, we believe the brunt of last year’s monetary tightening still lies ahead for the economy. Higher interest rates generally work through two primary channels. First, higher interest rates generally stifle areas of the economy that are most sensitive to changes in the cost of borrowing, such as housing, auto sales, and business capital spending. Second, declines in demand for goods in the interest rate sensitive parts of the economy generally result in lower wages for workers in those industries, and in some cases other workers lose their jobs entirely.
We believe the potential recession has been labeled the most anticipated recession in memory, but several factors appear to be delaying its onset. First, job openings remain elevated with 1.7 job openings per unemployed worker, nearly 50% higher than December 2019. The ability of workers to quickly find new employment opportunities generally pushes wages higher and keeps the unemployment rate lower. Second, after contracting for five sequential quarters, aggregate real disposable personal income rebounded in the second half of 2022. We believe it is highly unusual for real wages to decline when unemployment is this historically low. In our view, as inflation continues to fall, real wage growth should remain positive, even if nominal wage growth decelerates. Finally, it appears that U.S. households generally remain flush with savings, despite declines in the savings rates and increases in consumer credit balances.
If a recession does arrive in 2023, we believe that it will most likely be relatively mild. In our view, the characterization of a recession in 2023 would likely be an “earnings” recession rather than a “balance sheet” recession, which is an important distinction. The Great Financial Crisis that began in 2007 was a recession during which severe damage occurred to both household and business balance sheets. That adverse environment ultimately forced individuals and businesses to save more while consuming and investing less in order to deleverage. In our view, that period demonstrates the economy historically contracts more in balance sheet recessions and takes longer
3
for growth to reemerge, in part because credit creation is slower to rebound. In contrast, we believe that earnings recessions are typically more shallow in nature as the economic damage is generally less pervasive.
We believe there also is a case for avoiding a recession in the coming year, but it will likely require the labor market, consumer spending, and the Federal Reserve to each strike the right balance in order to achieve an economic “soft landing.” In our view, the labor market is now the most important factor in shaping the Federal Reserve’s deliberations over interest rate policy in the coming year. The annual pace of consumer inflation, as measured by the Consumer Price Index, has fallen each month since its June 2022 peak of 9.1%. We believe the downward trajectory is partially attributable to deflation in the price of goods, helped by easing supply constraints and a shift in spending towards services. In addition, we believe the housing component of services is currently putting upward pressure on inflation. We believe that falling goods prices and a roll-over in shelter prices could push inflation lower still in the coming year. However, there is considerable risk that inflation readings settle uncomfortably short of the Federal Reserve’s stated 2.0% target. In our view, narrowing this gap in inflation from the 4.0%-5.0% range to the Federal Reserve’s 2.0% target would require the upward pressure on services prices, other than housing, to significantly ease. Unfortunately, we believe that achieving this critical step will likely require bringing the supply and demand for labor back in balance.
We are more optimistic in our outlook for the financial markets than the economy. We believe the entire decline in the Standard & Poor’s 500 Index in 2022 was attributable to the compression of the Price/Earnings ratio, as corporate earnings likely expanded between 4.0%-5.0% for the year. It appears that the Price/Earnings ratio fell last year in response to higher interest rates, wider credit spreads, and recession fears. We believe the year ahead has the potential to be the inverse of 2022. We currently expect corporate earnings to decline in 2023, while the Price/Earnings ratio may ultimately expand as credit spreads begin to normalize. In our view, it is not unusual for the stock market to begin to move higher roughly a year before corporate earnings bottom. Finally, we believe it is historically rare for the Standard & Poor’s 500 Index to post consecutive years of negative returns. In the intervening seventy-seven years since the end of World War II, the market recorded negative returns in twenty-one of those years. In only three instances (1973-1974, 2000-2001, 2001-2002) has the market declined in successive years. Taken as a whole, we anticipate a more favorable market environment in 2023 as prices begin to discount future earnings on better outlooks for interest rates and credit spreads.
LKCM Small Cap Equity Fund
The LKCM Small Cap Equity Fund returned -22.11% for the year ended December 31, 2022, as compared to the -20.44% return for the Russell 2000® Index, the Fund’s benchmark. The Fund’s relative performance benefited from sector allocation decisions, particularly being overweight the Energy sector and being underweight the Real Estate and Healthcare sectors relative to the benchmark. Stock selection decisions in the Industrials, Information Technology and Healthcare sectors detracted from the Fund’s relative performance, which was partially offset by stock selection decisions in the Communication Services, Consumer Staples and Energy sectors. Although the Fund maintains holdings in both growth-oriented and value-oriented companies, the Fund’s tilt towards growth-oriented companies detracted from the Fund’s relative performance during the year. In addition, the Fund’s focus on companies that we believe are higher quality detracted from the Fund’s relative performance during the year, as lower quality companies generally outperformed higher quality companies during the year. We anticipate that the Fund will continue to work towards a balanced approach of higher quality growth-oriented companies and value-oriented companies and believe that the Fund is well-positioned for 2023.
LKCM Small-Mid Cap Equity Fund
The LKCM Small-Mid Cap Equity Fund returned -22.12% for the year ended December 31, 2022, as compared to the -18.37% return for the Russell 2500® Index, the Fund’s benchmark. The Fund’s relative performance benefited from its overweight position in the Energy sector, which was partially offset by the Fund’s overweight position in the Communication Services sector and underweight position in the Utilities sector. Stock selection decisions in the Healthcare, Real Estate and Materials sectors detracted from the Fund’s relative performance, which was partially offset by stock selection decisions in the Financials and Consumer Staples sectors. Although the Fund maintains holdings in both growth-oriented and value-oriented companies, the Fund’s tilt towards growth-oriented companies detracted from the Fund’s relative performance during the year. In addition, the Fund’s focus on companies that we believe are higher quality detracted from the Fund’s relative performance during the year, as lower quality companies generally outperformed higher quality companies during the year. The Fund continues to implement an investment strategy that focuses on companies that we believe are higher quality, and we believe the Fund is well-positioned for 2023.
LKCM Equity Fund
The LKCM Equity Fund returned -15.44% for the year ended December 31, 2022, as compared to the -18.11% return for the S&P 500® Index, the Fund’s benchmark. The Fund’s overweight positions in the Industrials and Energy sectors and underweight positions in the Communication Services and Consumer Discretionary sectors benefited the Fund’s relative performance, which was partially offset by the Fund’s underweight position in the Utilities sector. Stock selection decisions in the Healthcare and Information Technology sectors detracted from the Fund’s relative performance, which was partially offset by stock selection decisions in the Materials sector. We remain confident in our investment strategy for the Fund that focuses on investments in companies that we believe are higher quality, which we believe will not be as negatively impacted as lower quality companies on a relative basis from the current interest rate environment, and we believe the Fund is well-positioned for 2023.
4
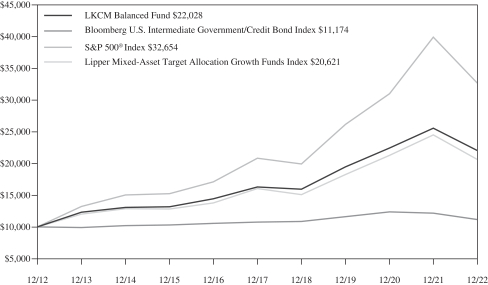
LKCM Balanced Fund
The LKCM Balanced Fund returned -13.84% for the year ended December 31, 2022 as compared to the -18.11% return for the S&P 500® Index and the -8.23% return for the Bloomberg U.S. Intermediate Government/Credit Bond Index. The equity portion of the Fund’s portfolio outperformed the S&P 500 Index and the fixed income portion of the portfolio outperformed the Bloomberg Intermediate Government/Credit Bond Index during the year. The Fund’s equity portfolio benefited from being overweight the Energy sector and underweight the Consumer Discretionary sector relative to the benchmark, which was partially offset by the Fund’s underweight position in the Utilities sector. Stock selection decisions in the Healthcare and Energy sectors detracted from the relative performance of the Fund’s equity portfolio, which was partially offset by stock selection decisions in the Materials sector. The Fund’s fixed income portfolio benefited from its relatively short duration as compared to the benchmark and remains focused on higher quality intermediate corporate bonds. We believe the Fund is well-positioned for 2023.
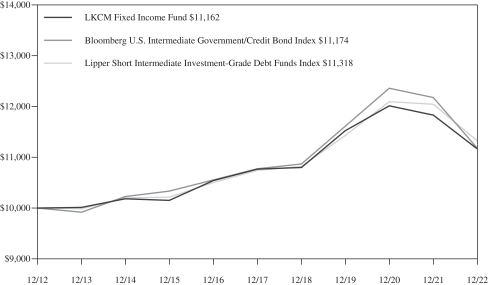
LKCM Fixed Income Fund
The LKCM Fixed Income Fund returned -5.63% for the year ended December 31, 2022 compared to its benchmark, the Bloomberg Intermediate Government/Credit Bond Index, which returned -8.23% for the year ended December 31, 2022. During 2022, negative returns permeated the bond market regardless of quality or tenor, although longer duration issues fared the worst as the Federal Reserve aggressively tightened monetary policy to reign in four-decade highs in inflation. Within this backdrop fixed income securities were negatively impacted by rising rates with shorter- duration fixed income securities outperforming their longer-duration counterparts, and higher quality fixed income securities outperforming lower quality counterparts. While the Fund’s defensive duration posture of approximately 2.8 years relative to the 3.8-year duration of the benchmark benefited the Fund’s relative performance, the Fund’s overweight position in corporate bonds detracted from relative performance as credit spreads widened. With inflation appearing to moderate, we think that the Federal Reserve may complete its tightening cycle during the first half of 2023. In this context, the Fund remains largely focused on investment-grade corporate bonds with strong underlying credit fundamentals in an effort to reduce credit risk and generate sustainable cash flow and a shorter-to-intermediate duration in an effort to mitigate interest rate risk.
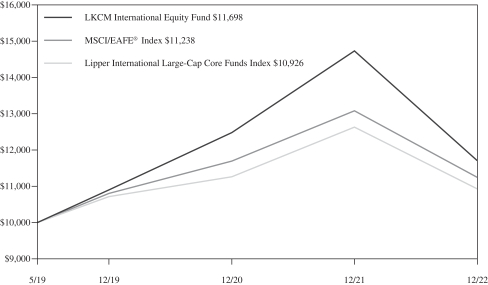
LKCM International Equity Fund
The LKCM International Equity Fund returned -20.51% for the year ended December 31, 2022, as compared to the -14.01% return for the MSCI EAFE Index, the Fund’s benchmark. During this period, the Fund’s relative performance benefited from an overweight position in the Energy sector and an underweight position in the Real Estate sector, which was offset by the Fund’s overweight position in the Industrials and Information Technology sectors. The Fund’s relative performance benefited from positive stock selection in the Materials and Consumer Staples sectors, while stock selection in the Industrials and Healthcare sectors detracted from relative performance. The Fund continues to focus on higher quality companies with prospects for secular growth, as we believe these tend to outperform through market cycles. Inflation and interest rates were two major headwinds for international equities during the past year. Economic concerns also escalated with the Russian invasion of Ukraine, and the increased risks of deglobalization. As we move into 2023, we believe that deglobalization remains a concern, but that the impact of higher interest rates should start to subside as inflation decelerates. We think that these policy headwinds to capital markets during 2022 may lead to weaker fundamentals and economic data for international equities in the upcoming year. We also believe that, as this year progresses, China’s emergence from its “Zero Tolerance” COVID policy should provide an offset to the lagged impact of restrictive monetary policy. In our view, a global recession may develop, but we remain optimistic in a possible reacceleration during second half of the year.
J. Luther King, Jr., CFA, CIC
January 9, 2023
5
The information provided herein represents the opinion of J. Luther King, Jr., CFA, CIC and is not intended to be a forecast of future events, a guarantee of future results, nor investment advice.
Please refer to the Schedule of Investments found on pages 15-30 of the report for more information on Fund holdings. Fund holdings and sector allocations are subject to change and are not recommendations to buy or sell any securities.
Mutual fund investing involves risk. Principal loss is possible. Past performance is not a guarantee of future results. Investments in equity securities are subject to market risks and significant fluctuations in value. Small and medium capitalization funds typically carry additional risks, since smaller companies generally have a higher risk of failure, and, historically, their stocks have experienced a greater degree of market volatility than stocks on average. Investments in debt securities typically decrease in value when interest rates rise. This risk is greater for longer-term debt securities. Investments in mortgage backed securities include additional risks that investors should be aware of such as credit risk, prepayment risk, possible illiquidity and default, as well as increased susceptibility to adverse economic developments. These and other risks are discussed in the Funds’ summary and statutory prospectuses.
Earnings growth is not a measure of future performance.
Price-earnings ratio is the ratio of a company’s share price to the company’s earnings per share.
Duration is a measure of the sensitivity of the price of a bond or other debt instrument to a change in interest rates. Securities with a longer duration generally have more volatile prices than securities of comparable quality with a shorter duration.
Bond ratings are grades given to bonds that indicate their credit quality as determined by a private independent rating service such as S&P Global. The firm evaluates a bond issuer’s financial strength, or its ability to pay a bond’s principal and interest in a timely fashion. Ratings are expressed as letters ranging from ‘AAA’, which is the highest grade, to ‘D’, which is the lowest grade. In limited situations when the rating agency has not issued a formal rating, the rating agency will classify the security as nonrated.
Cash flow is the net amount of cash and cash-equivalents being transferred into and out of a business.
The Consumer Price Index (CPI) is a measure of the average change over time in the prices paid by urban consumers for a market basket of consumer goods and services.
NASDAQ Composite Index is a market capitalization weighted index of more than 3,000 stocks listed on the Nasdaq stock exchange.
Yield curve is a line that plots yields (interest rates) of fixed income securities having equal credit quality but differing maturity dates. The slope of the yield curve gives an idea of future interest rate changes and economic activity. An inverted yield curve signals that interest rates associated with fixed income securities with shorter maturities are higher than interest rates associated with fixed income securities with longer maturities.
Credit Spreads are the percentage point difference between yields of various classes of fixed income securities, including corporate bonds, compared to U.S. treasury bonds.
Must be preceded or accompanied by a current prospectus.
Quasar Distributors, LLC, distributor.
6
PERFORMANCE:
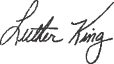
The following information illustrates the historical performance of the LKCM Small Cap Equity Fund as of December 31, 2022 compared to the Fund’s representative benchmark and peer group indices.
Performance data quoted represents past performance; past performance does not guarantee future results. The graph and table reflect the reinvestment of dividends and other distributions, if any, but do not reflect the deduction of taxes that a shareholder would pay on Fund distributions or the redemption of Fund shares. The investment return and principal value of an investment will fluctuate so that an investor’s shares, when redeemed, may be worth more or less than their original cost. Current performance of the Fund may be lower or higher than the performance quoted. Performance data current to the most recent month end may be obtained by calling 1-800-688-LKCM. Returns would have been lower if LKCM had not waived a portion of its management fee and/or reimbursed certain expenses of the Fund. Please see Note B to the Notes to the Financial Statements for specific information regarding management fee waiver and/or expense reimbursement arrangements for the Fund.
An index is an unmanaged portfolio and does not trade or incur any expenses. The Lipper Small-Cap Core Funds Index, however, does reflect the fees and expenses borne by the funds included in that index. One can not invest in an unmanaged index.
AVERAGE ANNUAL TOTAL RETURN (Periods Ended December 31, 2022)
| | | | | | | | | | | | | | | | | | | | |
| | | | | |
| | | Past
1 Year | | Past
5 Years(1) | | Past
10 Years(1) | | Since
Inception(1)(2) |
LKCM Small Cap Equity Fund | | | | -22.11% | | | | | 6.82% | | | | | 8.20% | | | | | 9.82% | |
Russell 2000® Index | | | | -20.44% | | | | | 4.13% | | | | | 9.01% | | | | | 8.62% | |
Lipper Small-Cap Core Funds Index | | | | -15.22% | | | | | 5.48% | | | | | 9.48% | | | | | 9.47% | |
A HYPOTHETICAL $10,000 INVESTMENT IN LKCM SMALL CAP EQUITY FUND
(for the ten years ended December 31, 2022)
The Russell 2000® Index is an unmanaged index consisting of the 2,000 smallest companies in the Russell 3000® Index.
The Lipper Small-Cap Core Funds Index is an unmanaged index generally considered representative of small cap core mutual funds tracked by Lipper, Inc.
7
PERFORMANCE:
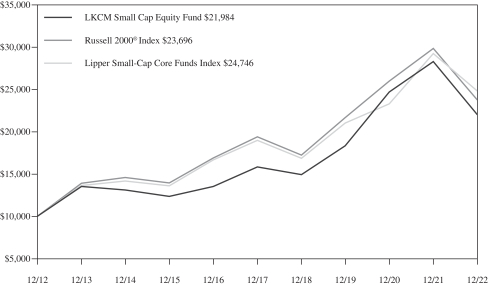
The following information illustrates the historical performance of the LKCM Small-Mid Cap Equity Fund as of December 31, 2022 compared to the Fund’s representative benchmark and peer group indices.
Performance data quoted represents past performance; past performance does not guarantee future results. The graph and table reflect the reinvestment of dividends and other distributions, if any, but do not reflect the deduction of taxes that a shareholder would pay on Fund distributions or the redemption of Fund shares. The investment return and principal value of an investment will fluctuate so that an investor’s shares, when redeemed, may be worth more or less than their original cost. Current performance of the Fund may be lower or higher than the performance quoted. Performance data current to the most recent month end may be obtained by calling 1-800-688-LKCM. Returns would have been lower if LKCM had not waived a portion of its management fee and/or reimbursed certain expenses of the Fund. Please see Note B to the Notes to the Financial Statements for specific information regarding management fee waiver and/or expense reimbursement arrangements for the Fund.
An index is an unmanaged portfolio and does not trade or incur any expenses. The Lipper Small-Cap Core Funds Index, however, does reflect the fees and expenses borne by the funds included in that index. One can not invest in an unmanaged index.
AVERAGE ANNUAL TOTAL RETURN (Periods Ended December 31, 2022)
| | | | | | | | | | | | | | | | | | | | |
| | | | | |
| | | Past
1 Year | | Past
5 Years(1) | | Past
10 Years(1) | | Since
Inception(1)(2) |
LKCM Small-Mid Cap Equity Fund | | | | -22.12% | | | | | 6.99% | | | | | 8.32% | | | | | 6.79% | |
Russell 2500® Index | | | | -18.37% | | | | | 5.89% | | | | | 10.03% | | | | | 8.78% | |
Lipper Small-Cap Core Funds Index | | | | -15.22% | | | | | 5.48% | | | | | 9.48% | | | | | 8.17% | |
A HYPOTHETICAL $10,000 INVESTMENT IN LKCM SMALL-MID CAP EQUITY FUND
(for the ten years ended December 31, 2022)
The Russell 2500® Index is an unmanaged index consisting of the 2,500 smallest companies in the Russell 3000® Index.
The Lipper Small-Cap Core Funds Index is an unmanaged index generally considered representative of small cap core mutual funds tracked by Lipper, Inc.
8
PERFORMANCE:
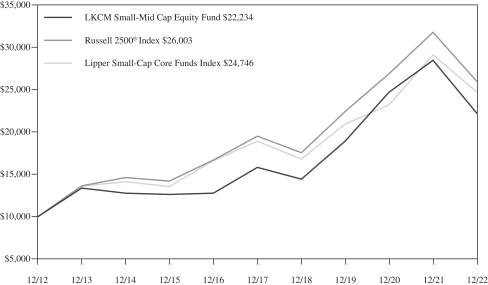
The following information illustrates the historical performance of the LKCM Equity Fund as of December 31, 2022 compared to the Fund’s representative benchmark and peer group indices.
Performance data quoted represents past performance; past performance does not guarantee future results. The graph and table reflect the reinvestment of dividends and other distributions, if any, but do not reflect the deduction of taxes that a shareholder would pay on Fund distributions or the redemption of Fund shares. The investment return and principal value of an investment will fluctuate so that an investor’s shares, when redeemed, may be worth more or less than their original cost. Current performance of the Fund may be lower or higher than the performance quoted. Performance data current to the most recent month end may be obtained by calling 1-800-688-LKCM. Returns would have been lower if LKCM had not waived a portion of its management fee and/or reimbursed certain expenses of the Fund. Please see Note B to the Notes to the Financial Statements for specific information regarding management fee waiver and/or expense reimbursement arrangements for the Fund.
An index is an unmanaged portfolio and does not trade or incur any expenses. The Lipper Large-Cap Core Funds Index, however, does reflect the fees and expenses borne by the funds included in that index. One can not invest in an unmanaged index.
AVERAGE ANNUAL TOTAL RETURN (Periods Ended December 31, 2022)
| | | | | | | | | | | | | | | | | | | | |
| | | | | |
| | | Past
1 Year | | Past
5 Years(1) | | Past
10 Years(1) | | Since
Inception(1)(2) |
LKCM Equity Fund | | | | -15.44% | | | | | 9.82% | | | | | 11.28% | | | | | 8.86% | |
S&P 500® Index | | | | -18.11% | | | | | 9.42% | | | | | 12.56% | | | | | 8.99% | |
Lipper Large-Cap Core Funds Index | | | | -17.00% | | | | | 8.25% | | | | | 11.39% | | | | | 7.96% | |
A HYPOTHETICAL $10,000 INVESTMENT IN LKCM EQUITY FUND
(for the ten years ended December 31, 2022)
The S&P 500® Index is an unmanaged capitalization-weighted index of 500 selected stocks that is generally considered representative of the performance of large capitalization companies in the U.S. stock market.
The Lipper Large-Cap Core Funds Index is an unmanaged index generally considered representative of large cap core mutual funds tracked by Lipper, Inc.
9
PERFORMANCE:
The following information illustrates the historical performance of the LKCM Balanced Fund as of December 31, 2022 compared to the Fund’s representative benchmark and peer group indices.
Performance data quoted represents past performance; past performance does not guarantee future results. The graph and table reflect the reinvestment of dividends and other distributions, if any, but do not reflect the deduction of taxes that a shareholder would pay on Fund distributions or the redemption of Fund shares. The investment return and principal value of an investment will fluctuate so that an investor’s shares, when redeemed, may be worth more or less than their original cost. Current performance of the Fund may be lower or higher than the performance quoted. Performance data current to the most recent month end may be obtained by calling 1-800-688-LKCM. Returns would have been lower if LKCM had not waived a portion of its management fee and/or reimbursed certain expenses of the Fund. Please see Note B to the Notes to the Financial Statements for specific information regarding management fee waiver and/or expense reimbursement arrangements for the Fund.
An index is an unmanaged portfolio and does not trade or incur any expenses. The Lipper Mixed-Asset Target Allocation Growth Funds Index, however, does reflect the fees and expenses borne by the funds included in that index. One can not invest in an unmanaged index.
AVERAGE ANNUAL TOTAL RETURN (Periods Ended December 31, 2022)
| | | | | | | | | | | | | | | | | | | | |
| | | | | |
| | | Past
1 Year | | Past
5 Years(1) | | Past
10 Years(1) | | Since
Inception(1)(2) |
LKCM Balanced Fund | | | | -13.84% | | | | | 6.19% | | | | | 8.22% | | | | | 6.55% | |
S&P 500® Index | | | | -18.11% | | | | | 9.42% | | | | | 12.56% | | | | | 7.64% | |
Bloomberg U.S. Intermediate Government/Credit Bond Index | | | | -8.23% | | | | | 0.73% | | | | | 1.12% | | | | | 3.77% | |
Lipper Mixed-Asset Target Allocation Growth Funds Index | | | | -15.88% | | | | | 5.11% | | | | | 7.51% | | | | | 6.17% | |
A HYPOTHETICAL $10,000 INVESTMENT IN LKCM BALANCED FUND
(for the ten years ended December 31, 2022)
The S&P 500® Index is an unmanaged capitalization-weighted index of 500 selected stocks that is generally considered representative of the performance of large capitalization companies in the U.S. stock market.
The Bloomberg U.S. Intermediate Government/Credit Bond Index is an unmanaged market value weighted index measuring both the principal price changes of, and income provided by, the underlying universe of securities that comprise the index. Securities included in the index must meet the following criteria; fixed as opposed to variable rate; remaining maturity of one to ten years; minimum outstanding par value of $250 million; rated investment grade or higher by Moody’s Investors Service or equivalent; must be dollar denominated and non-convertible; and must be publicly issued.
The Lipper Mixed-Asset Target Allocation Growth Funds Index is an unmanaged index generally considered representative of mutual funds tracked by Lipper, Inc. that, by portfolio practice, maintain a mix of between 60%-80% equity securities, with the remainder invested in bonds, cash and cash equivalents.
10
PERFORMANCE:
The following information illustrates the historical performance of the LKCM Fixed Income Fund as of December 31, 2022 compared to the Fund’s representative benchmark and peer group indices.
Performance data quoted represents past performance; past performance does not guarantee future results. The graph and table reflect the reinvestment of dividends and other distributions, if any, but do not reflect the deduction of taxes that a shareholder would pay on Fund distributions or the redemption of Fund shares. The investment return and principal value of an investment will fluctuate so that an investor’s shares, when redeemed, may be worth more or less than their original cost. Current performance of the Fund may be lower or higher than the performance quoted. Performance data current to the most recent month end may be obtained by calling 1-800-688-LKCM. Returns would have been lower if LKCM had not waived a portion of its management fee and/or reimbursed certain expenses of the Fund. Please see Note B to the Notes to the Financial Statements for specific information regarding management fee waiver and/or expense reimbursement arrangements for the Fund.
An index is an unmanaged portfolio and does not trade or incur any expenses. The Lipper Short Intermediate Investment-Grade Debt Funds Index, however, does reflect the fees and expenses borne by the funds included in that index. One can not invest in an unmanaged index.
AVERAGE ANNUAL TOTAL RETURN (Periods Ended December 31, 2022)
| | | | | | | | | | | | | | | | | | | | |
| | | | | |
| | | Past 1 Year | | Past 5 Years(1) | | Past 10 Years(1) | | Since Inception(1)(2) |
LKCM Fixed Income Fund | | | | -5.63% | | | | | 0.72% | | | | | 1.11% | | | | | 3.60% | |
Bloomberg U.S. Intermediate Government/Credit Bond Index | | | | -8.23% | | | | | 0.73% | | | | | 1.12% | | | | | 3.77% | |
Lipper Short Intermediate Investment-Grade Debt Funds Index | | | | -6.03% | | | | | 1.06% | | | | | 1.25% | | | | | 3.39% | |
A HYPOTHETICAL $10,000 INVESTMENT IN LKCM FIXED INCOME FUND
(for the ten years ended December 31, 2022)
The Bloomberg U.S. Intermediate Government/Credit Bond Index is an unmanaged market value weighted index measuring both the principal price changes of, and income provided by, the underlying universe of securities that comprise the index. Securities included in the index must meet the following criteria: fixed as opposed to variable rate; remaining maturity of one to ten years; minimum outstanding par value of $250 million; rated investment grade or higher by Moody’s Investors Service or equivalent; must be dollar denominated and non-convertible; and must be publicly issued.
The Lipper Short Intermediate Investment-Grade Debt Funds Index is an unmanaged index generally considered representative of short intermediate investment grade mutual funds tracked by Lipper, Inc.
11
PERFORMANCE:
The following information illustrates the historical performance of the LKCM International Equity Fund as of December 31, 2022 compared to the Fund’s representative benchmark and peer group indices.
Performance data quoted represents past performance; past performance does not guarantee future results. The graph and table reflect the reinvestment of dividends and other distributions, if any, but do not reflect the deduction of taxes that a shareholder would pay on Fund distributions or the redemption of Fund shares. The investment return and principal value of an investment will fluctuate so that an investor’s shares, when redeemed, may be worth more or less than their original cost. Current performance of the Fund may be lower or higher than the performance quoted. Performance data current to the most recent month end may be obtained by calling 1-800-688-LKCM. Returns would have been lower if LKCM had not waived a portion of its management fee and/or reimbursed certain expenses of the Fund. Please see Note B to the Notes to the Financial Statements for specific information regarding management fee waiver and/or expense reimbursement arrangements for the Fund.
An index is an unmanaged portfolio and does not trade or incur any expenses. The Lipper International Large-Cap Core Funds Index, however, does reflect the fees and expenses borne by the funds included in that index. One can not invest in an unmanaged index.
AVERAGE ANNUAL TOTAL RETURN (Periods Ended December 31, 2022)
| | | | | | | | | | | | | | | | | | | | |
| | | | | |
| | | Past 1 Year | | Past 5 Years(1) | | Past 10 Years(1) | | Since Inception(1)(2) |
LKCM International Equity Fund | | | | -20.51 | % | | | | NA | | | | | NA | | | | | 4.37 | % |
MSCI/EAFE® Index | | | | -14.01 | % | | | | NA | | | | | NA | | | | | 3.23 | % |
Lipper International Large-Cap Core Funds Index | | | | -13.45 | % | | | | NA | | | | | NA | | | | | 2.44 | % |
A HYPOTHETICAL $10,000 INVESTMENT IN LKCM INTERNATIONAL EQUITY FUND
(for the period from May 1, 2019 (inception date) to December 31, 2022)
The Morgan Stanley Capital International Europe, Australia, Far East Index (“MSCI/EAFE® Index”) is an unmanaged index composed of large-cap and mid-cap securities across 21 developed markets, including countries in Europe, Australasia and the Far East. The MSCI/EAFE® Index is a recognized international index and is weighted by market capitalization.
The Lipper International Large-Cap Core Funds Index is an unmanaged index generally considered representative of large cap core mutual funds tracked by Lipper Inc.
12
LKCM Funds Expense Example — December 31, 2022
As a shareholder of the Funds, you incur two types of costs: (1) transaction costs, including redemption fees; and (2) ongoing costs, including management fees, distribution and/or service (12b-1) fees and other Fund expenses. This Example is intended to help you understand your ongoing costs (in dollars) of investing in the Funds and to compare these costs with the ongoing costs of investing in other mutual funds. The Example is based on an investment of $1,000 invested at the beginning of the period and held for the entire period (07/01/2022-12/31/2022).
ACTUAL EXPENSES
The third and fourth columns of the table below provide information about actual account values and actual expenses. You may use the information in these columns, together with the amount you invested, to estimate the expenses that you paid over the period. Simply divide your account value by $1,000 (for example, an $8,600 account value divided by $1,000 = 8.6), then multiply the result by the number in the fourth column under the heading entitled “Expenses Paid During Period” to estimate the expenses you paid on your account during this period. Although the Funds charge no sales load, you will be assessed fees for outgoing wire transfers, returned checks and stop payment orders at prevailing rates charged by U.S. Bancorp Fund Services, LLC (doing business as U.S. Bank Global Fund Services), the Funds’ transfer agent. If you request that a redemption be made by wire transfer, currently a $15.00 fee is charged by the Funds’ transfer agent. You will be charged a redemption fee equal to 1.00% of the net amount of the redemption if you redeem your shares of the LKCM Small Cap Equity, Small-Mid Cap Equity, Equity, Balanced, Fixed Income, and International Equity Funds within 30 days of purchase, unless otherwise determined by the Funds in their discretion. To the extent the Funds invest in shares of other investment companies as part of their investment strategies, you will indirectly bear your proportionate share of any fees and expenses charged by the underlying funds in which the Funds invest in addition to the expenses of the Funds. Actual expenses of the underlying funds are expected to vary among the various underlying funds. These expenses are not included in the example below. The example below includes management fees, registration fees and other expenses. However, the example below does not include portfolio trading commissions and related expenses and other extraordinary expenses as determined under generally accepted accounting principles.
HYPOTHETICAL EXAMPLES FOR COMPARISON PURPOSES
The fifth and sixth columns of the table below provide information about hypothetical account values and hypothetical expenses based on the Funds’ actual expense ratios and an assumed rate of return of 5% per year before expenses, which are not the Funds’ actual returns. The hypothetical account values and expenses may not be used to estimate the actual ending account balance or expenses you paid for the period. You may use this information to compare the ongoing costs of investing in the Funds and other funds. To do so, compare this 5% hypothetical example with the 5% hypothetical examples that appear in the shareholder reports of the other funds. Please note that the expenses shown in the table are meant to highlight your ongoing costs only and do not reflect any transactional costs, such as redemption fees. Therefore, the fifth and sixth columns of the table are useful in comparing ongoing costs only, and will not help you determine the relative total costs of owning different funds. In addition, if these transaction costs were included, your costs would have been higher.
| | | | | | | | | | | | | | | | | | | | | | | | | | | | | | |
| | | | | | | Actual | | Hypothetical (5% return
before expenses) |
| | | Fund’s
Annualized
Expense
Ratio(1) | | Beginning
Account Value
07/01/2022 | | Ending
Account Value
12/31/2022 | | Expenses
Paid
During
Period(1) | | Ending
Account Value
12/31/2022 | | Expenses
Paid
During
Period(1) |
LKCM Small Cap Equity Fund | | | | 1.00 | % | | | $ | 1,000.00 | | | | $ | 1,035.60 | | | | $ | 5.13 | | | | $ | 1,020.16 | | | | $ | 5.09 | |
LKCM Small-Mid Cap Equity Fund | | | | 1.00 | % | | | $ | 1,000.00 | | | | $ | 996.90 | | | | $ | 5.03 | | | | $ | 1,020.16 | | | | $ | 5.09 | |
LKCM Equity Fund | | | | 0.80 | % | | | $ | 1,000.00 | | | | $ | 1,044.60 | | | | $ | 4.12 | | | | $ | 1,021.17 | | | | $ | 4.08 | |
LKCM Balanced Fund | | | | 0.80 | % | | | $ | 1,000.00 | | | | $ | 1,024.60 | | | | $ | 4.08 | | | | $ | 1,021.17 | | | | $ | 4.08 | |
LKCM Fixed Income Fund | | | | 0.50 | % | | | $ | 1,000.00 | | | | $ | 990.00 | | | | $ | 2.51 | | | | $ | 1,022.68 | | | | $ | 2.55 | |
LKCM International Equity Fund | | | | 1.00 | % | | | $ | 1,000.00 | | | | $ | 1,061.30 | | | | $ | 5.20 | | | | $ | 1,020.16 | | | | $ | 5.09 | |
| (1) | Expenses are equal to the annualized net expense ratio for the Fund, multiplied by the average account value over the period, multiplied by 184/365 (to reflect the one-half year period). |
13
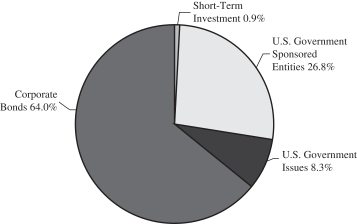
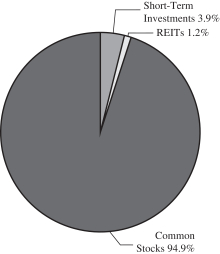
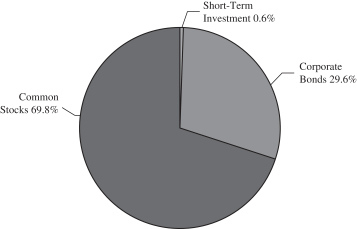
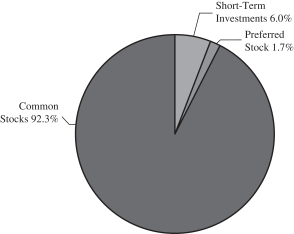
ALLOCATION OF PORTFOLIO HOLDINGS — LKCM Funds — December 31, 2022
Percentages represent market value as a percentage of total investments.
LKCM Small Cap Equity Fund

LKCM Equity Fund

LKCM Fixed Income Fund
LKCM Small-Mid Cap Equity Fund
LKCM Balanced Fund
LKCM International Equity Fund
14
|
| LKCM SMALL CAP EQUITY FUND |
| SCHEDULEOF INVESTMENTS |
| December 31, 2022 |
| | | | | | | | | | |
| COMMON STOCKS - 95.3% | | Shares | | Value |
| Aerospace & Defense - 2.4% | | | | |
Hexcel Corp. | | | | 35,640 | | | | $ | 2,097,414 | |
Mercury Systems, Inc. (a) | | | | 43,181 | | | | | 1,931,918 | |
| | | | | | | | | | |
| | | | | | | | | 4,029,332 | |
| | | | | | | | | | |
| Banks - 8.2% | | | | |
Cadence Bank | | | | 115,551 | | | | | 2,849,488 | |
Cullen/Frost Bankers, Inc. | | | | 21,566 | | | | | 2,883,374 | |
Glacier Bancorp, Inc. | | | | 44,045 | | | | | 2,176,704 | |
Pinnacle Financial Partners, Inc. | | | | 36,024 | | | | | 2,644,161 | |
Seacoast Banking Corp. of Florida | | | | 41,346 | | | | | 1,289,582 | |
Synovus Financial Corp. | | | | 57,000 | | | | | 2,140,350 | |
| | | | | | | | | | |
| | | | | | | | | 13,983,659 | |
| | | | | | | | | | |
| Beverages - 3.2% | | | | |
Celsius Holdings, Inc. (a) | | | | 28,699 | | | | | 2,985,844 | |
Primo Water Corp. (b) | | | | 161,428 | | | | | 2,508,591 | |
| | | | | | | | | | |
| | | | | | | | | 5,494,435 | |
| | | | | | | | | | |
| Biotechnology - 1.0% | | | | |
Neogen Corp. (a) | | | | 115,822 | | | | | 1,763,969 | |
| | | | | | | | | | |
| Building Products - 3.1% | | | | |
CSW Industrials, Inc. | | | | 17,908 | | | | | 2,076,074 | |
PGT Innovations, Inc. (a) | | | | 102,087 | | | | | 1,833,483 | |
Zurn Elkay Water Solutions Corp. | | | | 61,539 | | | | | 1,301,550 | |
| | | | | | | | | | |
| | | | | | | | | 5,211,107 | |
| | | | | | | | | | |
| Chemicals - 3.4% | | | | |
Avient Corp. | | | | 40,000 | | | | | 1,350,400 | |
Ecovyst, Inc. (a) | | | | 327,898 | | | | | 2,905,176 | |
Ferroglobe Representation & Warranty Insurance Trust (a)(c) | | | | 302,970 | | | | | — | |
Quaker Chemical Corp. | | | | 9,423 | | | | | 1,572,699 | |
| | | | | | | | | | |
| | | | | | | | | 5,828,275 | |
| | | | | | | | | | |
| Commercial Services & Supplies - 1.1% | | | | |
Driven Brands Holdings Inc. (a) | | | | 68,607 | | | | | 1,873,657 | |
| | | | | | | | | | |
| Communications Equipment - 1.0% | | | | |
Lumentum Holdings, Inc. (a) | | | | 31,294 | | | | | 1,632,608 | |
| | | | | | | | | | |
| Construction & Engineering - 1.8% | | | | |
NV5 Global, Inc. (a) | | | | 23,342 | | | | | 3,088,614 | |
| | | | | | | | | | |
| Construction Materials - 0.9% | | | | |
Eagle Materials, Inc. | | | | 11,980 | | | | | 1,591,543 | |
| | | | | | | | | | |
| Energy Equipment & Services - 2.6% | | | | |
Weatherford International Plc (a)(b) | | | | 87,564 | | | | | 4,458,759 | |
| | | | | | | | | | |
| Food Products - 1.5% | | | | |
Utz Brands, Inc. | | | | 160,077 | | | | | 2,538,821 | |
| | | | | | | | | | |
| Health Care Equipment & Supplies - 5.4% |
Alphatec Holdings, Inc. (a) | | | | 268,373 | | | | | 3,314,407 | |
Cerus Corp. (a) | | | | 490,057 | | | | | 1,788,708 | |
Enovis Corp. (a) | | | | 42,751 | | | | | 2,288,033 | |
STAAR Surgical Co. (a) | | | | 35,313 | | | | | 1,714,093 | |
| | | | | | | | | | |
| | | | | | | | | 9,105,241 | |
| | | | | | | | | | |
| | | | | | | | | | |
| COMMON STOCKS | | Shares | | Value |
| Health Care Providers & Services - 4.6% | | | | |
HealthEquity, Inc. (a) | | | | 33,070 | | | | $ | 2,038,435 | |
Medpace Holdings, Inc. (a) | | | | 11,921 | | | | | 2,532,140 | |
Progyny, Inc. (a) | | | | 53,847 | | | | | 1,677,334 | |
R1 RCM Inc. (a) | | | | 145,000 | | | | | 1,587,750 | |
| | | | | | | | | | |
| | | | | | | | | 7,835,659 | |
| | | | | | | | | | |
| Hotels, Restaurants & Leisure - 5.0% | | | | |
Everi Holdings, Inc. (a) | | | | 149,321 | | | | | 2,142,756 | |
Playa Hotels & Resorts NV (a)(b) | | | | 271,591 | | | | | 1,773,489 | |
Red Rock Resorts, Inc. - Class A | | | | 68,103 | | | | | 2,724,801 | |
Wingstop, Inc. | | | | 12,970 | | | | | 1,784,932 | |
| | | | | | | | | | |
| | | | | | | | | 8,425,978 | |
| | | | | | | | | | |
| Insurance - 2.0% | | | | |
Goosehead Insurance, Inc. - Class A (a) | | | | 44,992 | | | | | 1,545,025 | |
Palomar Holdings, Inc. (a) | | | | 42,611 | | | | | 1,924,313 | |
| | | | | | | | | | |
| | | | | | | | | 3,469,338 | |
| | | | | | | | | | |
| Internet & Catalog Retail - 1.6% | | | | |
Magnite, Inc. (a) | | | | 252,896 | | | | | 2,678,169 | |
| | | | | | | | | | |
| IT Consulting & Services - 2.1% | | | | |
LiveRamp Holdings, Inc. (a) | | | | 70,760 | | | | | 1,658,614 | |
Perficient Inc. (a) | | | | 25,676 | | | | | 1,792,955 | |
Repay Holdings Corp. (a) | | | | 17,000 | | | | | 136,850 | |
| | | | | | | | | | |
| | | | | | | | | 3,588,419 | |
| | | | | | | | | | |
| IT Services - 1.2% | | | | |
AvidXchange Holdings, Inc. (a) | | | | 198,300 | | | | | 1,971,102 | |
| | | | | | | | | | |
| Leisure Equipment & Products - 2.0% | | | | |
Topgolf Callaway Brands Corp. (a) | | | | 116,026 | | | | | 2,291,513 | |
YETI Holdings, Inc. (a) | | | | 25,763 | | | | | 1,064,270 | |
| | | | | | | | | | |
| | | | | | | | | 3,355,783 | |
| | | | | | | | | | |
| Machinery - 10.1% | | | | |
Alamo Group, Inc. | | | | 17,287 | | | | | 2,447,839 | |
Altra Industrial Motion Corp. | | | | 30,873 | | | | | 1,844,662 | |
ESAB Corp. | | | | 65,544 | | | | | 3,075,324 | |
Evoqua Water Technologies Corp. (a) | | | | 55,742 | | | | | 2,207,383 | |
Generac Holdings, Inc. (a) | | | | 9,475 | | | | | 953,754 | |
Helios Technologies, Inc. | | | | 35,609 | | | | | 1,938,554 | |
ITT, Inc. | | | | 27,119 | | | | | 2,199,351 | |
Watts Water Technologies, Inc. - Class A | | | | 17,681 | | | | | 2,585,493 | |
| | | | | | | | | | |
| | | | | | | | | 17,252,360 | |
| | | | | | | | | | |
| Marine - 1.8% | | | | |
Kirby Corp. (a) | | | | 46,783 | | | | | 3,010,486 | |
| | | | | | | | | | |
| Media & Entertainment - 1.7% | | | | |
Nexstar Media Group, Inc. - Class A | | | | 16,143 | | | | | 2,825,509 | |
| | | | | | | | | | |
| Oil, Gas & Consumable Fuels - 6.8% | | | | |
CNX Resources Corp. (a) | | | | 181,606 | | | | | 3,058,245 | |
HF Sinclair Corp. | | | | 56,574 | | | | | 2,935,625 | |
Magnolia Oil & Gas Corp. - Class A | | | | 146,294 | | | | | 3,430,594 | |
Northern Oil and Gas, Inc. | | | | 68,331 | | | | | 2,105,961 | |
| | | | | | | | | | |
| | | | | | | | | 11,530,425 | |
| | | | | | | | | | |
The accompanying notes are an integral part of these financial statements.
15
|
| LKCM SMALL CAP EQUITY FUND |
| SCHEDULEOF INVESTMENTS, CONTINUED |
| December 31, 2022 |
| | | | | | | | | | |
| COMMON STOCKS | | Shares | | Value |
| Personal Products - 1.5% | | | | |
BellRing Brands, Inc. (a) | | | | 102,280 | | | | $ | 2,622,459 | |
| | | | | | | | | | |
| Professional Services - 0.8% | | | | |
Upwork, Inc. (a) | | | | 126,881 | | | | | 1,324,638 | |
| | | | | | | | | | |
| Real Estate Development - 0.7% | | | | |
FirstService Corp.(b) | | | | 10,084 | | | | | 1,235,794 | |
| | | | | | | | | | |
| Software - 7.4% | | | | |
Altair Engineering, Inc. - Class A (a) | | | | 40,296 | | | | | 1,832,259 | |
Model N, Inc. (a) | | | | 64,217 | | | | | 2,604,642 | |
Nutanix, Inc. (a) | | | | 97,933 | | | | | 2,551,155 | |
Q2 Holdings, Inc. (a) | | | | 35,312 | | | | | 948,833 | |
Sprout Social, Inc. - Class A (a) | | | | 38,591 | | | | | 2,178,848 | |
Workiva Inc. (a) | | | | 30,171 | | | | | 2,533,459 | |
| | | | | | | | | | |
| | | | | | | | | 12,649,196 | |
| | | | | | | | | | |
| Software & Services - 0.6% | | | | |
Alarm.com Holdings, Inc. (a) | | | | 22,430 | | | | | 1,109,836 | |
| | | | | | | | | | |
| Specialty Retail - 3.3% | | | | |
Academy Sports & Outdoors, Inc. | | | | 53,473 | | | | | 2,809,471 | |
Leslie’s, Inc. (a) | | | | 97,866 | | | | | 1,194,944 | |
Petco Health & Wellness Co, Inc. (a) | | | | 164,000 | | | | | 1,554,720 | |
| | | | | | | | | | |
| | | | | | | | | 5,559,135 | |
| | | | | | | | | | |
| Technology Hardware, Storage & Peripherals - 1.3% |
Avid Technology, Inc. (a) | | | | 85,339 | | | | | 2,269,164 | |
| | | | | | | | | | |
| Textiles, Apparel & Luxury Goods - 1.7% | | | | |
Crocs, Inc. (a) | | | | 26,768 | | | | | 2,902,454 | |
| | | | | | | | | | |
| Thrifts & Mortgage Finance - 1.9% | | | | |
Home BancShares, Inc. | | | | 138,526 | | | | | 3,157,008 | |
| | | | | | | | | | |
| Trading Companies & Distributors - 1.6% | | | | |
Global Industrial Co. | | | | 65,847 | | | | | 1,549,380 | |
Textainer Group Holdings Ltd. (b) | | | | 35,312 | | | | | 1,095,025 | |
| | | | | | | | | | |
| | | | | | | | | 2,644,405 | |
| | | | | | | | | | |
TOTAL COMMON STOCKS
(Cost $125,654,957) | | | | 162,017,337 |
| | | | | | | | | | |
| | | | | | | | | | |
| REIT - 0.7% | | | | |
| Equity Real Estate Investment Trust (REIT) - 0.7% |
Pebblebrook Hotel Trust | | | | 92,820 | | | | | 1,242,860 | |
| | | | | | | | | | |
TOTAL REIT
(Cost $1,858,861) | | | | 1,242,860 |
| | | | | | | | | | |
| | | | | | | | | | |
| SHORT-TERM INVESTMENTS - 4.2% | | Shares | | Value |
| Money Market Funds - 4.2% | | | | |
Invesco Short-Term Investments Trust - Government & Agency Portfolio - Institutional Shares, 4.21% (d) | | | | 5,120,413 | | | | $ | 5,120,413 | |
MSILF Government Portfolio, 4.11% (d) | | | | 1,955,328 | | | | | 1,955,328 | |
| | | | | | | | | | |
| | | | | | | | | 7,075,741 | |
| | | | | | | | | | |
TOTAL SHORT-TERM INVESTMENTS
(Cost $7,075,741) | | | | 7,075,741 |
| | | | | | | | | | |
Total Investments - 100.2%
(Cost $134,589,559) | | | | 170,335,938 |
Liabilities in Excess of Other Assets - (0.2)% | | | | | (297,008 | ) |
| | | | | | | | | | |
TOTAL NET ASSETS - 100.0% | | | | | | | | $ | 170,038,930 | |
| | | | | | | | | | |
| (a) | Non-income producing security. |
| (b) | Security issued by non-U.S. incorporated company. |
| (c) | Securities for which market quotations are not readily available. These securities have been valued at their fair value under procedures approved by the Fund’s Board of Trustees. Level 3 security. |
| (d) | The rate quoted is the annualized seven-day yield of the Fund at period end. |
Investments are classified by industry pursuant to the Global Industry Classification Standard (GICS®), which was developed by and/or is the exclusive property of Morgan Stanley Capital International, Inc. (“MSCI”) and Standard & Poor’s Financial Services LLC (“S&P”). GICS is a service mark of MSCI and S&P and has been licensed for use by U.S. Bancorp Fund Services, LLC.
The accompanying notes are an integral part of these financial statements.
16
|
| LKCM SMALL-MID CAP EQUITY FUND |
| SCHEDULEOF INVESTMENTS |
| December 31, 2022 |
| | | | | | | | | | |
| COMMON STOCKS - 94.9% | | Shares | | Value |
| Aerospace & Defense - 3.0% | | | | |
Axon Enterprise, Inc. (a) | | | | 2,737 | | | | $ | 454,150 | |
| | | | | | | | | | |
| Banks - 4.1% | | | | |
Cadence Bank | | | | 10,438 | | | | | 257,401 | |
Cullen/Frost Bankers, Inc. | | | | 2,735 | | | | | 365,670 | |
| | | | | | | | | | |
| | | | | | | | | 623,071 | |
| | | | | | | | | | |
| Biotechnology - 4.5% | | | | |
Charles River Laboratories International, Inc. (a) | | | | 836 | | | | | 182,165 | |
Natera, Inc. (a) | | | | 2,776 | | | | | 111,512 | |
Neogen Corp. (a) | | | | 25,397 | | | | | 386,796 | |
| | | | | | | | | | |
| | | | | | | | | 680,473 | |
| | | | | | | | | | |
| Building Products - 4.1% | | | | |
Builders FirstSource, Inc. (a) | | | | 3,350 | | | | | 217,348 | |
CSW Industrials, Inc. | | | | 2,050 | | | | | 237,656 | |
Zurn Elkay Water Solutions Corp. | | | | 8,330 | | | | | 176,180 | |
| | | | | | | | | | |
| | | | | | | | | 631,184 | |
| | | | | | | | | | |
| Capital Markets - 2.9% | | | | |
LPL Financial Holdings, Inc. | | | | 2,015 | | | | | 435,583 | |
| | | | | | | | | | |
| Chemicals - 3.2% | | | | |
FMC Corp. | | | | 2,510 | | | | | 313,248 | |
Quaker Chemical Corp. | | | | 1,028 | | | | | 171,573 | |
| | | | | | | | | | |
| | | | | | | | | 484,821 | |
| | | | | | | | | | |
| Commercial Services & Supplies - 2.4% | | | | |
Driven Brands Holdings Inc. (a) | | | | 13,185 | | | | | 360,082 | |
| | | | | | | | | | |
| Construction & Engineering - 5.6% | | | | |
AECOM | | | | 5,135 | | | | | 436,115 | |
WillScot Mobile Mini Holdings Corp. (a) | | | | 9,210 | | | | | 416,016 | |
| | | | | | | | | | |
| | | | | | | | | 852,131 | |
| | | | | | | | | | |
| Construction Materials - 1.2% | | | | |
Eagle Materials, Inc. | | | | 1,390 | | | | | 184,661 | |
| | | | | | | | | | |
| Electronic Equipment & Instruments - 1.6% | | |
Trimble, Inc. (a) | | | | 4,704 | | | | | 237,834 | |
| | | | | | | | | | |
| Food Products - 1.9% | | | | |
Utz Brands, Inc. | | | | 18,742 | | | | | 297,248 | |
| | | | | | | | | | |
| Health Care Equipment & Supplies - 2.6% | | | | |
Enovis Corp. (a) | | | | 5,603 | | | | | 299,873 | |
STAAR Surgical Co. (a) | | | | 2,076 | | | | | 100,769 | |
| | | | | | | | | | |
| | | | | | | | | 400,642 | |
| | | | | | | | | | |
| Health Care Providers & Services - 1.1% | | | | |
Progyny, Inc. (a) | | | | 5,160 | | | | | 160,734 | |
| | | | | | | | | | |
| Hotels, Restaurants & Leisure - 1.5% | | | | |
Wingstop, Inc. | | | | 1,674 | | | | | 230,376 | |
| | | | | | | | | | |
| Insurance - 3.0% | | | | |
Goosehead Insurance, Inc. - Class A (a) | | | | 6,643 | | | | | 228,121 | |
Palomar Holdings, Inc. (a) | | | | 5,087 | | | | | 229,729 | |
| | | | | | | | | | |
| | | | | | | | | 457,850 | |
| | | | | | | | | | |
| | | | | | | | | | |
| COMMON STOCKS | | Shares | | Value |
| IT Consulting & Services - 6.2% | | | | |
Black Knight, Inc. (a) | | | | 4,900 | | | | $ | 302,575 | |
Broadridge Financial Solutions, Inc. | | | | 3,125 | | | | | 419,156 | |
Perficient Inc. (a) | | | | 3,092 | | | | | 215,915 | |
| | | | | | | | | | |
| | | | | | | | | 937,646 | |
| | | | | | | | | | |
| IT Services - 4.0% | | | | |
AvidXchange Holdings, Inc. (a) | | | | 23,050 | | | | | 229,117 | |
FleetCor Technologies, Inc. (a) | | | | 2,035 | | | | | 373,789 | |
| | | | | | | | | | |
| | | | | | | | | 602,906 | |
| | | | | | | | | | |
| Leisure Equipment & Products - 3.2% | | | | |
Pool Corp. | | | | 922 | | | | | 278,748 | |
YETI Holdings, Inc. (a) | | | | 5,138 | | | | | 212,251 | |
| | | | | | | | | | |
| | | | | | | | | 490,999 | |
| | | | | | | | | | |
| Life Sciences Tools & Services - 0.4% | | | | |
Stevanato Group SpA (b) | | | | 3,292 | | | | | 59,157 | |
| | | | | | | | | | |
| Machinery - 2.6% | | | | |
ITT, Inc. | | | | 2,553 | | | | | 207,048 | |
The Toro Co. | | | | 1,709 | | | | | 193,459 | |
| | | | | | | | | | |
| | | | | | | | | 400,507 | |
| | | | | | | | | | |
| Marine - 2.0% | | | | |
Kirby Corp. (a) | | | | 4,790 | | | | | 308,236 | |
| | | | | | | | | | |
| Media - 1.2% | | | | |
Cable One, Inc. | | | | 262 | | | | | 186,507 | |
| | | | | | | | | | |
| Media & Entertainment - 2.2% | | | | |
Nexstar Media Group, Inc. - Class A | | | | 1,939 | | | | | 339,383 | |
| | | | | | | | | | |
| Metals & Mining - 1.9% | | | | |
Reliance Steel & Aluminum Co. | | | | 1,427 | | | | | 288,882 | |
| | | | | | | | | | |
| Multiline Retail - 0.8% | | | | |
Five Below, Inc. (a) | | | | 684 | | | | | 120,979 | |
| | | | | | | | | | |
| Oil, Gas & Consumable Fuels - 8.0% | | | | |
Antero Resources Corp. (a) | | | | 4,451 | | | | | 137,937 | |
CNX Resources Corp. (a) | | | | 22,086 | | | | | 371,928 | |
Diamondback Energy Inc. | | | | 2,022 | | | | | 276,569 | |
HF Sinclair Corp. | | | | 4,141 | | | | | 214,876 | |
Marathon Oil Corp. | | | | 7,950 | | | | | 215,207 | |
| | | | | | | | | | |
| | | | | | | | | 1,216,517 | |
| | | | | | | | | | |
| Personal Products - 1.7% | | | | |
BellRing Brands, Inc. (a) | | | | 9,955 | | | | | 255,246 | |
| | | | | | | | | | |
| Real Estate Development - 1.8% | | | | |
FirstService Corp. (b) | | | | 2,245 | | | | | 275,125 | |
| | | | | | | | | | |
| Real Estate Management & Development - 3.1% |
Colliers International Group, Inc. (b) | | | | 3,506 | | | | | 322,692 | |
DigitalBridge Group, Inc. | | | | 13,352 | | | | | 146,071 | |
| | | | | | | | | | |
| | | | | | | | | 468,763 | |
| | | | | | | | | | |
| Software - 6.0% | | | | |
Altair Engineering, Inc. - Class A (a) | | | | 3,950 | | | | | 179,607 | |
Paylocity Holding Corp. (a) | | | | 1,744 | | | | | 338,789 | |
The accompanying notes are an integral part of these financial statements.
17
|
| LKCM SMALL-MID CAP EQUITY FUND |
| SCHEDULEOF INVESTMENTS, CONTINUED |
| December 31, 2022 |
| | | | | | | | | | |
| COMMON STOCKS | | Shares | | Value |
| Software - 6.0%, Continued | | | | |
Sprout Social, Inc. - Class A (a) | | | | 3,689 | | | | $ | 208,281 | |
Workiva Inc. (a) | | | | 2,269 | | | | | 190,528 | |
| | | | | | | | | | |
| | | | | | | | | 917,205 | |
| | | | | | | | | | |
| Specialty Retail - 3.6% | | | | |
Academy Sports & Outdoors, Inc. | | | | 7,812 | | | | | 410,443 | |
Leslie’s, Inc. (a) | | | | 11,730 | | | | | 143,223 | |
| | | | | | | | | | |
| | | | | | | | | 553,666 | |
| | | | | | | | | | |
| Textiles, Apparel & Luxury Goods - 1.3% | | | | |
Tapestry, Inc. | | | | 5,386 | | | | | 205,099 | |
| | | | | | | | | | |
| Trading Companies & Distributors - 2.2% | | | | |
Watsco, Inc. | | | | 1,370 | | | | | 341,678 | |
| | | | | | | | | | |
TOTAL COMMON STOCKS
(Cost $13,857,392) | | | | 14,459,341 |
| | | | | | | | | | |
| | | | | | | | | | |
| REITS - 1.2% | | | | |
| Equity Real Estate Investment Trusts (REITs) - 1.2% |
Camden Property Trust | | | | 1,580 | | | | | 176,771 | |
| | | | | | | | | | |
TOTAL REITS
(Cost $268,252) | | | | 176,771 |
| | | | | | | | | | |
| | | | | | | | | | |
| SHORT-TERM INVESTMENTS - 3.9% | | | | |
| Money Market Funds - 3.9% | | | | |
Invesco Short-Term Investments Trust - Government & Agency Portfolio - Institutional Shares, 4.21% (c) | | | | 458,716 | | | | | 458,716 | |
MSILF Government Portfolio, 4.11% (c) | | | | 138,959 | | | | | 138,959 | |
| | | | | | | | | | |
| | | | | | | | | 597,675 | |
| | | | | | | | | | |
TOTAL SHORT-TERM INVESTMENTS
(Cost $597,675) | | | | 597,675 |
| | | | | | | | | | |
Total Investments - 100.0%
(Cost $14,723,319) | | | | 15,233,787 |
Liabilities in Excess of Other Assets - 0.0% | | | | | (111 | ) |
| | | | | | | | | | |
TOTAL NET ASSETS - 100.0% | | | | | | | | $ | 15,233,676 | |
| | | | | | | | | | |
| (a) | Non-income producing security. |
| (b) | Security issued by non-U.S. incorporated company. |
| (c) | The rate quoted is the annualized seven-day yield of the Fund at period end. |
Investments are classified by industry pursuant to the Global Industry Classification Standard (GICS®), which was developed by and/or is the exclusive property of Morgan Stanley Capital International, Inc. (“MSCI”) and Standard & Poor’s Financial Services LLC (“S&P”). GICS is a service mark of MSCI and S&P and has been licensed for use by U.S. Bancorp Fund Services, LLC.
The accompanying notes are an integral part of these financial statements.
18
|
| LKCM EQUITY FUND |
| SCHEDULEOF INVESTMENTS |
| December 31, 2022 |
| | | | | | | | | | |
| COMMON STOCKS - 94.2% | | Shares | | Value |
Aerospace & Defense - 2.3% | | | | | | | | | | |
Honeywell International Inc. | | | | 50,000 | | | | $ | 10,715,000 | |
| | | | | | | | | | |
| Banks - 5.1% | | | | |
Bank of America Corp. | | | | 160,000 | | | | | 5,299,200 | |
Comerica, Inc. | | | | 100,000 | | | | | 6,685,000 | |
Cullen/Frost Bankers, Inc. | | | | 65,000 | | | | | 8,690,500 | |
Glacier Bancorp, Inc. | | | | 60,000 | | | | | 2,965,200 | |
| | | | | | | | | | |
| | | | | | | | | 23,639,900 | |
| | | | | | | | | | |
| Beverages - 3.9% | | | | |
The Coca-Cola Co. | | | | 95,000 | | | | | 6,042,950 | |
Keurig Dr Pepper, Inc. | | | | 110,000 | | | | | 3,922,600 | |
PepsiCo, Inc. | | | | 45,000 | | | | | 8,129,700 | |
| | | | | | | | | | |
| | | | | | | | | 18,095,250 | |
| | | | | | | | | | |
| Biotechnology - 3.1% | | | | |
Amgen, Inc. | | | | 28,000 | | | | | 7,353,920 | |
Neogen Corp. (a) | | | | 450,000 | | | | | 6,853,500 | |
| | | | | | | | | | |
| | | | | | | | | 14,207,420 | |
| | | | | | | | | | |
| Chemicals - 7.3% | | | | |
Air Products & Chemicals, Inc. | | | | 25,000 | | | | | 7,706,500 | |
DuPont de Nemours, Inc. | | | | 85,000 | | | | | 5,833,550 | |
Ecolab, Inc. | | | | 45,000 | | | | | 6,550,200 | |
FMC Corp. | | | | 110,000 | | | | | 13,728,000 | |
| | | | | | | | | | |
| | | | | | | | | 33,818,250 | |
| | | | | | | | | | |
| Commercial Services & Supplies - 4.2% | | | | |
Cintas Corp. | | | | 16,000 | | | | | 7,225,920 | |
Waste Connections, Inc. (b) | | | | 90,000 | | | | | 11,930,400 | |
| | | | | | | | | | |
| | | | | | | | | 19,156,320 | |
| | | | | | | | | | |
| Computers & Peripherals - 2.7% | | | | |
Apple Inc. | | | | 96,000 | | | | | 12,473,280 | |
| | | | | | | | | | |
| Construction Materials - 1.3% | | | | |
Martin Marietta Materials, Inc. | | | | 18,000 | | | | | 6,083,460 | |
| | | | | | | | | | |
| Diversified Financials - 2.0% | | | | |
JPMorgan Chase & Co. | | | | 68,000 | | | | | 9,118,800 | |
| | | | | | | | | | |
| Electrical Equipment & Instruments - 3.9% |
Emerson Electric Co. | | | | 50,000 | | | | | 4,803,000 | |
Franklin Electric Co., Inc. | | | | 85,000 | | | | | 6,778,750 | |
Rockwell Automation, Inc. | | | | 25,000 | | | | | 6,439,250 | |
| | | | | | | | | | |
| | | | | | | | | 18,021,000 | |
| | | | | | | | | | |
| Electronic Equipment & Instruments - 2.3% |
National Instruments Corp. | | | | 75,000 | | | | | 2,767,500 | |
Trimble, Inc. (a) | | | | 150,000 | | | | | 7,584,000 | |
| | | | | | | | | | |
| | | | | | | | | 10,351,500 | |
| | | | | | | | | | |
| Electronic Equipment, Instruments & Components - 1.7% |
Teledyne Technologies, Inc. (a) | | | | 20,000 | | | | | 7,998,200 | |
| | | | | | | | | | |
| Food Products - 0.9% | | | | |
The Kraft Heinz Company | | | | 100,000 | | | | | 4,071,000 | |
| | | | | | | | | | |
| | | | | | | | | | |
| COMMON STOCKS | | Shares | | Value |
| Health Care Equipment & Supplies - 2.0% |
Alcon, Inc. (b) | | | | 60,000 | | | | $ | 4,113,000 | |
Stryker Corp. | | | | 20,000 | | | | | 4,889,800 | |
| | | | | | | | | | |
| | | | | | | | | 9,002,800 | |
| | | | | | | | | | |
| Household Durables - 0.8% | | | | |
Newell Brands, Inc. | | | | 290,000 | | | | | 3,793,200 | |
| | | | | | | | | | |
| Household Products - 2.5% | | | | |
Kimberly-Clark Corp. | | | | 50,000 | | | | | 6,787,500 | |
The Procter & Gamble Co. | | | | 30,000 | | | | | 4,546,800 | |
| | | | | | | | | | |
| | | | | | | | | 11,334,300 | |
| | | | | | | | | | |
| Internet & Catalog Retail - 0.9% | | | | |
Amazon.com, Inc. (a) | | | | 50,000 | | | | | 4,200,000 | |
| | | | | | | | | | |
| IT Consulting & Services - 1.1% | | | | |
PayPal Holdings, Inc. (a) | | | | 70,000 | | | | | 4,985,400 | |
| | | | | | | | | | |
| Life Sciences Tools & Services - 3.6% | | | | |
Danaher Corp. | | | | 35,750 | | | | | 9,488,765 | |
Thermo Fisher Scientific, Inc. | | | | 13,000 | | | | | 7,158,970 | |
| | | | | | | | | | |
| | | | | | | | | 16,647,735 | |
| | | | | | | | | | |
| Machinery - 7.7% | | | | |
Generac Holdings, Inc. (a) | | | | 35,000 | | | | | 3,523,100 | |
IDEX Corp. | | | | 20,000 | | | | | 4,566,600 | |
The Toro Co. | | | | 80,000 | | | | | 9,056,000 | |
Valmont Industries, Inc. | | | | 35,000 | | | | | 11,573,450 | |
Xylem, Inc. | | | | 60,000 | | | | | 6,634,200 | |
| | | | | | | | | | |
| | | | | | | | | 35,353,350 | |
| | | | | | | | | | |
| Marine - 1.5% | | | | |
Kirby Corp. (a) | | | | 110,000 | | | | | 7,078,500 | |
| | | | | | | | | | |
| Media & Entertainment - 1.7% | | | | |
Alphabet, Inc. - Class A (a) | | | | 90,000 | | | | | 7,940,700 | |
| | | | | | | | | | |
| Metals & Mining - 1.5% | | | | |
Newmont Goldcorp Corp. | | | | 150,000 | | | | | 7,080,000 | |
| | | | | | | | | | |
| Oil & Gas & Consumable Fuels - 6.3% | | | | |
Chevron Corp. | | | | 42,500 | | | | | 7,628,325 | |
ConocoPhillips | | | | 100,000 | | | | | 11,800,000 | |
Coterra Energy, Inc. | | | | 384,000 | | | | | 9,434,880 | |
| | | | | | | | | | |
| | | | | | | | | 28,863,205 | |
| | | | | | | | | | |
| Oil, Gas & Consumable Fuels - 0.5% | | | | |
Kimbell Royalty Partners LP | | | | 130,000 | | | | | 2,171,000 | |
| | | | | | | | | | |
Personal Products - 1.1% | | | | | | | | | | |
The Estee Lauder Cos., Inc. - Class A | | | | 20,000 | | | | | 4,962,200 | |
| | | | | | | | | | |
Pharmaceuticals - 5.1% | | | | | | | | | | |
Merck & Co., Inc. | | | | 80,000 | | | | | 8,876,000 | |
Pfizer Inc. | | | | 130,000 | | | | | 6,661,200 | |
Zoetis, Inc. | | | | 53,500 | | | | | 7,840,425 | |
| | | | | | | | | | |
| | | | | | | | | 23,377,625 | |
| | | | | | | | | | |
The accompanying notes are an integral part of these financial statements.
19
|
| LKCM EQUITY FUND |
| SCHEDULEOF INVESTMENTS, CONTINUED |
| December 31, 2022 |
| | | | | | | | | | |
| COMMON STOCKS | | Shares | | Value |
| Road & Rail - 1.2% | | | | |
FTAI Infrastructure Inc. | | | | 200,000 | | | | $ | 590,000 | |
Union Pacific Corp. | | | | 24,000 | | | | | 4,969,680 | |
| | | | | | | | | | |
| | | | | | | | | 5,559,680 | |
| | | | | | | | | | |
| Semiconductor & Semiconductor Equipment - 0.7% |
Intel Corp. | | | | 125,000 | | | | | 3,303,750 | |
| | | | | | | | | | |
| Software - 10.8% | | | | |
Adobe, Inc. (a) | | | | 20,000 | | | | | 6,730,600 | |
Microsoft Corp. | | | | 103,000 | | | | | 24,701,460 | |
Oracle Corp. | | | | 120,000 | | | | | 9,808,800 | |
Roper Technologies, Inc. | | | | 20,000 | | | | | 8,641,800 | |
| | | | | | | | | | |
| | | | | 49,882,660 |
| | | | | | | | | | |
| Software & Services - 1.7% | | | | |
Akamai Technologies, Inc. (a) | | | | 90,000 | | | | | 7,587,000 | |
| | | | | | | | | | |
| Specialty Retail - 2.1% | | | | |
The Home Depot, Inc. | | | | 30,000 | | | | | 9,475,800 | |
| | | | | | | | | | |
| Trading Companies & Distributors - 0.7% |
FTAI Aviation Ltd. (b) | | | | 200,000 | | | | | 3,424,000 | |
| | | | | | | | | | |
TOTAL COMMON STOCKS
(Cost $236,670,318) | | | | | | | | | 433,772,285 | |
| | | | | | | | | | |
| | | | | | | | | | |
| SHORT-TERM INVESTMENTS - 5.8% | | | | |
| Money Market Funds - 5.8% | | | | |
Invesco Short-Term Investments Trust - Government & Agency Portfolio - Institutional Shares, 4.21% (c) | | | | 13,858,917 | | | | | 13,858,917 | |
MSILF Government Portfolio, 4.11% (c) | | | | 12,990,280 | | | | | 12,990,280 | |
| | | | | | | | | | |
| | | | | | | | | 26,849,197 | |
| | | | | | | | | | |
TOTAL SHORT-TERM INVESTMENTS
(Cost $26,849,197) | | 26,849,197 |
| | | | | | | | | | |
Total Investments - 100.0%
(Cost $263,519,515) | | | | 460,621,482 |
Other Assets in Excess of Liabilities - 0.0% | | | | | 20,370 | |
| | | | | | | | | | |
TOTAL NET ASSETS - 100.0% | | | | | | | | $ | 460,641,852 | |
| | | | | | | | | | |
| (a) | Non-income producing security. |
| (b) | Security issued by non-U.S. incorporated company. |
| (c) | The rate quoted is the annualized seven-day yield of the Fund at period end. |
Investments are classified by industry pursuant to the Global Industry Classification Standard (GICS®), which was developed by and/or is the exclusive property of Morgan Stanley Capital International, Inc. (“MSCI”) and Standard & Poor’s Financial Services LLC (“S&P”). GICS is a service mark of MSCI and S&P and has been licensed for use by U.S. Bancorp Fund Services, LLC.
The accompanying notes are an integral part of these financial statements.
20
|
| LKCM BALANCED FUND |
| SCHEDULEOF INVESTMENTS |
| December 31, 2022 |
| | | | | | | | | | |
| COMMON STOCKS - 69.7% | | Shares | | Value |
| Aerospace & Defense - 2.2% | | | | |
Honeywell International Inc. | | | | 5,700 | | | | $ | 1,221,510 | |
L3Harris Technologies, Inc. | | | | 5,850 | | | | | 1,218,029 | |
| | | | | | | | | | |
| | | | | | | | | 2,439,539 | |
| | | | | | | | | | |
| Banks - 3.8% | | | | |
Bank of America Corp. | | | | 47,900 | | | | | 1,586,448 | |
Cullen/Frost Bankers, Inc. | | | | 9,700 | | | | | 1,296,890 | |
First Republic Bank/CA | | | | 6,000 | | | | | 731,340 | |
Zions Bancorp N.A. | | | | 11,100 | | | | | 545,676 | |
| | | | | | | | | | |
| | | | | | | | | 4,160,354 | |
| | | | | | | | | | |
| Beverages - 2.5% | | | | |
The Coca-Cola Co. | | | | 21,400 | | | | | 1,361,254 | |
PepsiCo, Inc. | | | | 7,550 | | | | | 1,363,983 | |
| | | | | | | | | | |
| | | | | | | | | 2,725,237 | |
| | | | | | | | | | |
| Biotechnology - 1.3% | | | | |
Charles River Laboratories International, Inc. (a) | | | | 5,250 | | | | | 1,143,975 | |
Neogen Corp. (a) | | | | 20,000 | | | | | 304,600 | |
| | | | | | | | | | |
| | | | | | | | | 1,448,575 | |
| | | | | | | | | | |
| Chemicals - 6.9% | | | | |
Air Products and Chemicals, Inc. | | | | 6,000 | | | | | 1,849,560 | |
Corteva, Inc. | | | | 18,858 | | | | | 1,108,473 | |
DuPont de Nemours, Inc. | | | | 12,658 | | | | | 868,719 | |
Ecolab Inc. | | | | 5,700 | | | | | 829,692 | |
FMC Corp. | | | | 12,400 | | | | | 1,547,520 | |
Linde PLC (b) | | | | 3,900 | | | | | 1,272,102 | |
| | | | | | | | | | |
| | | | | | | | | 7,476,066 | |
| | | | | | | | | | |
| Commercial Services & Supplies - 3.0% | | | | |
Cintas Corp. | | | | 2,700 | | | | | 1,219,374 | |
Waste Connections, Inc. (b) | | | | 8,900 | | | | | 1,179,784 | |
Waste Management, Inc. | | | | 5,250 | | | | | 823,620 | |
| | | | | | | | | | |
| | | | | | | | | 3,222,778 | |
| | | | | | | | | | |
| Communications Equipment - 0.9% | | | | |
QUALCOMM, Inc. | | | | 9,000 | | | | | 989,460 | |
| | | | | | | | | | |
| Computers & Peripherals - 1.9% | | | | |
Apple Inc. | | | | 15,950 | | | | | 2,072,383 | |
| | | | | | | | | | |
| Construction Materials - 1.0% | | | | |
Martin Marietta Materials, Inc. | | | | 3,400 | | | | | 1,149,098 | |
| | | | | | | | | | |
| Diversified Financials - 2.8% | | | | |
JPMorgan Chase & Co. | | | | 13,000 | | | | | 1,743,300 | |
Moody’s Corp. | | | | 4,650 | | | | | 1,295,583 | |
| | | | | | | | | | |
| | | | | | | | | 3,038,883 | |
| | | | | | | | | | |
| Diversified Telecommunication Services - 0.9% | | |
Verizon Communications Inc. | | | | 26,341 | | | | | 1,037,835 | |
| | | | | | | | | | |
| Electrical Equipment & Instruments - 1.8% | | |
Emerson Electric Co. | | | | 8,800 | | | | | 845,328 | |
Rockwell Automation, Inc. | | | | 4,175 | | | | | 1,075,355 | |
| | | | | | | | | | |
| | | | | | | | | 1,920,683 | |
| | | | | | | | | | |
| | | | | | | | | | |
| COMMON STOCKS | | Shares | | Value |
| Electronic Equipment & Instruments - 0.9% | | |
Trimble Inc. (a) | | | | 19,750 | | | | $ | 998,560 | |
| | | | | | | | | | |
| Electronic Equipment, Instruments & Components - 1.1% |
Teledyne Technologies, Inc. (a) | | | | 2,950 | | | | | 1,179,735 | |
| | | | | | | | | | |
| Food & Drug Retailing - 1.1% | | | | |
Walmart, Inc. | | | | 8,100 | | | | | 1,148,499 | |
| | | | | | | | | | |
| Health Care Equipment & Supplies - 2.2% | | |
Alcon, Inc. (b) | | | | 17,900 | | | | | 1,227,045 | |
PerkinElmer, Inc. | | | | 8,150 | | | | | 1,142,793 | |
| | | | | | | | | | |
| | | | | | | | | 2,369,838 | |
| | | | | | | | | | |
| Household Durables - 0.5% | | | | |
Newell Brands, Inc. | | | | 40,000 | | | | | 523,200 | |
| | | | | | | | | | |
| Household Products - 2.2% | | | | |
Colgate-Palmolive Co. | | | | 16,100 | | | | | 1,268,519 | |
Kimberly-Clark Corp. | | | | 4,900 | | | | | 665,175 | |
The Procter & Gamble Co. | | | | 3,250 | | | | | 492,570 | |
| | | | | | | | | | |
| | | | | | | | | 2,426,264 | |
| | | | | | | | | | |
| Internet & Catalog Retail - 0.9% | | | | |
Amazon.com, Inc. (a) | | | | 11,200 | | | | | 940,800 | |
| | | | | | | | | | |
| IT Consulting & Services - 2.3% | | | | |
Broadridge Financial Solutions, Inc. | | | | 6,450 | | | | | 865,138 | |
PayPal Holdings, Inc. (a) | | | | 6,100 | | | | | 434,442 | |
Visa, Inc. - Class A | | | | 5,650 | | | | | 1,173,844 | |
| | | | | | | | | | |
| | | | | | | | | 2,473,424 | |
| | | | | | | | | | |
| Life Sciences Tools & Services - 2.6% | | | | |
Danaher Corp. | | | | 5,100 | | | | | 1,353,642 | |
Thermo Fisher Scientific, Inc. | | | | 2,600 | | | | | 1,431,794 | |
| | | | | | | | | | |
| | | | | | | | | 2,785,436 | |
| | | | | | | | | | |
| Machinery - 1.7% | | | | |
Fortive Corp. | | | | 9,350 | | | | | 600,738 | |
Xylem, Inc. | | | | 11,800 | | | | | 1,304,726 | |
| | | | | | | | | | |
| | | | | | | | | 1,905,464 | |
| | | | | | | | | | |
| Media & Entertainment - 2.9% | | | | |
Alphabet Inc. - Class C (a) | | | | 15,000 | | | | | 1,330,950 | |
The Walt Disney Co. (a) | | | | 13,700 | | | | | 1,190,256 | |
Meta Platforms, Inc. (a) | | | | 5,175 | | | | | 622,759 | |
| | | | | | | | | | |
| | | | | | | | | 3,143,965 | |
| | | | | | | | | | |
| Metals & Mining - 0.8% | | | | |
Newmont Goldcorp Corp. | | | | 18,100 | | | | | 854,320 | |
| | | | | | | | | | |
| Oil & Gas & Consumable Fuels - 6.1% | | | | |
Chevron Corp. | | | | 7,795 | | | | | 1,399,125 | |
ConocoPhillips | | | | 12,300 | | | | | 1,451,400 | |
Coterra Energy, Inc. | | | | 24,000 | | | | | 589,680 | |
EOG Resources, Inc. | | | | 4,450 | | | | | 576,364 | |
Kinder Morgan, Inc. | | | | 74,000 | | | | | 1,337,920 | |
Pioneer Natural Resources Co. | | | | 5,650 | | | | | 1,290,403 | |
| | | | | | | | | | |
| | | | | | | | | 6,644,892 | |
| | | | | | | | | | |
The accompanying notes are an integral part of these financial statements.
21
|
| LKCM BALANCED FUND |
| SCHEDULEOF INVESTMENTS, CONTINUED |
| December 31, 2022 |
| | | | | | | | | | |
| COMMON STOCKS | |
Shares | | Value |
| Personal Products - 1.0% | | | | |
The Estee Lauder Cos., Inc. - Class A | | | | 4,600 | | | | $ | 1,141,306 | |
| | | | | | | | | | |
| Pharmaceuticals - 3.4% | | | | |
Abbott Laboratories | | | | 10,000 | | | | | 1,097,900 | |
Merck & Co., Inc. | | | | 12,500 | | | | | 1,386,875 | |
Zoetis Inc. | | | | 8,026 | | | | | 1,176,210 | |
| | | | | | | | | | |
| | | | | | | | | 3,660,985 | |
| | | | | | | | | | |
| Real Estate Investment Trusts - 1.1% | | | | |
American Tower Corp. | | | | 5,500 | | | | | 1,165,230 | |
| | | | | | | | | | |
| Road & Rail - 1.0% | | | | |
Union Pacific Corp. | | | | 5,275 | | | | | 1,092,294 | |
| | | | | | | | | | |
| Software - 5.2% | | | | |
Adobe Inc. (a) | | | | 1,850 | | | | | 622,580 | |
Microsoft Corp. | | | | 6,750 | | | | | 1,618,785 | |
Oracle Corp. | | | | 16,500 | | | | | 1,348,710 | |
Roper Technologies, Inc. | | | | 2,600 | | | | | 1,123,434 | |
Salesforce, Inc. (a) | | | | 6,850 | | | | | 908,242 | |
| | | | | | | | | | |
| | | | | | | | | 5,621,751 | |
| | | | | | | | | | |
| Software & Services - 1.0% | | | | |
Akamai Technologies, Inc. (a) | | | | 12,800 | | | | | 1,079,040 | |
| | | | | | | | | | |
| Specialty Retail - 1.4% | | | | |
The Home Depot, Inc. | | | | 5,000 | | | | | 1,579,300 | |
| | | | | | | | | | |
| Textiles, Apparel & Luxury Goods - 1.3% | | | | |
NIKE, Inc. - Class B | | | | 12,000 | | | | | 1,404,120 | |
| | | | | | | | | | |
TOTAL COMMON STOCKS
(Cost $48,330,327) | | | | | | | | | 75,819,314 | |
| | | | | | | | | | |
| | | | | | | | | | |
| CORPORATE BONDS - 29.6% | | Principal
Amount | | |
| Aerospace & Defense - 1.1% | | | | |
Honeywell International, Inc.: | | | | | | | | | | |
2.300%, 08/15/2024 | | | | | | | | | | |
Callable 07/15/2024 | | | $ | 250,000 | | | | | 240,626 | |
1.350%, 06/01/2025 | | | | | | | | | | |
Callable 05/01/2025 | | | | 750,000 | | | | | 694,624 | |
Raytheon Technologies Corp. | | | | | | | | | | |
3.700%, 12/15/2023 | | | | | | | | | | |
Callable 09/15/2023 | | | | 250,000 | | | | | 247,151 | |
| | | | | | | | | | |
| | | | | | | | | 1,182,401 | |
| | | | | | | | | | |
| Banks - 1.4% | | | | |
Comerica Bank | | | | | | | | | | |
2.500%, 07/23/2024 | | | | 300,000 | | | | | 288,175 | |
Truist Bank: | | | | | | | | | | |
3.200%, 04/01/2024 | | | | | | | | | | |
Callable 03/01/2024 | | | | 250,000 | | | | | 244,270 | |
4.050%, 11/03/2025 | | | | | | | | | | |
Callable 09/03/2025 | | | | 385,000 | | | | | 377,899 | |
3.300%, 05/15/2026 | | | | | | | | | | |
Callable 04/15/2026 | | | | 400,000 | | | | | 375,110 | |
| | | | | | | | | | |
| CORPORATE BONDS | | Principal
Amount | | Value |
| Banks - 1.4%, Continued | | | | |
Truist Financial Corp. | | | | | | | | | | |
4.000%, 05/01/2025 | | | | | | | | | | |
Callable 03/01/2025 | | | $ | 300,000 | | | | $ | 293,677 | |
| | | | | | | | | | |
| | | | | | | | | 1,579,131 | |
| | | | | | | | | | |
| Beverages - 1.0% | | | | |
Keurig Dr Pepper, Inc. | | | | | | | | | | |
2.550%, 09/15/2026 | | | | | | | | | | |
Callable 06/15/2026 | | | | 750,000 | | | | | 688,118 | |
PepsiCo, Inc. | | | | | | | | | | |
2.375%, 10/06/2026 | | | | | | | | | | |
Callable 07/06/2026 | | | | 435,000 | | | | | 405,679 | |
| | | | | | | | | | |
| | | | | | | | | 1,093,797 | |
| | | | | | | | | | |
| Biotechnology - 1.1% | | | | |
AbbVie, Inc. | | | | | | | | | | |
3.200%, 05/14/2026 | | | | | | | | | | |
Callable 02/14/2026 | | | | 600,000 | | | | | 567,715 | |
Amgen, Inc.: | | | | | | | | | | |
3.625%, 05/22/2024 | | | | | | | | | | |
Callable 02/22/2024 | | | | 250,000 | | | | | 245,288 | |
2.600%, 08/19/2026 | | | | | | | | | | |
Callable 05/19/2026 | | | | 450,000 | | | | | 416,868 | |
| | | | | | | | | | |
| | | | | | | | | 1,229,871 | |
| | | | | | | | | | |
| Chemicals - 1.0% | | | | |
Air Products and Chemicals, Inc. | | | | | | | | | | |
1.850%, 05/15/2027 | | | | | | | | | | |
Callable 03/15/2027 | | | | 675,000 | | | | | 601,772 | |
Ecolab, Inc. | | | | | | | | | | |
2.700%, 11/01/2026 | | | | | | | | | | |
Callable 08/01/2026 | | | | 500,000 | | | | | 465,358 | |
| | | | | | | | | | |
| | | | | | | | | 1,067,130 | |
| | | | | | | | | | |
| Communications Equipment - 0.5% | | | | |
QUALCOMM, Inc. | | | | | | | | | | |
2.900%, 05/20/2024 | | | | | | | | | | |
Callable 03/20/2024 | | | | 600,000 | | | | | 585,832 | |
| | | | | | | | | | |
| Computers & Peripherals - 0.3% | | | | |
Apple Inc.: | | | | | | | | | | |
2.500%, 02/09/2025 | | | | 250,000 | | | | | 239,391 | |
3.200%, 05/13/2025 | | | | 55,000 | | | | | 53,237 | |
| | | | | | | | | | |
| | | | | | | | | 292,628 | |
| | | | | | | | | | |
| Consumer Finance - 0.6% | | | | |
American Express Co. | | | | | | | | | | |
3.000%, 10/30/2024 | | | | | | | | | | |
Callable 09/29/2024 | | | | 650,000 | | | | | 629,407 | |
| | | | | | | | | | |
| Diversified Financials - 0.6% | | | | |
JPMorgan Chase & Co.: | | | | | | | | | | |
3.875%, 02/01/2024 | | | | 275,000 | | | | | 271,623 | |
3.875%, 09/10/2024 | | | | 200,000 | | | | | 195,983 | |
3.200%, 06/15/2026 | | | | | | | | | | |
Callable 03/15/2026 | | | | 200,000 | | | | | 189,314 | |
| | | | | | | | | | |
| | | | | | | | | 656,920 | |
| | | | | | | | | | |
The accompanying notes are an integral part of these financial statements.
22
|
| LKCM BALANCED FUND |
| SCHEDULEOF INVESTMENTS, CONTINUED |
| December 31, 2022 |
| | | | | | | | | | |
| CORPORATE BONDS | | Principal
Amount | | Value |
| Diversified Telecommunication Services - 1.3% | | |
AT&T, Inc. | | | | | | | | | | |
1.700%, 03/25/2026 | | | | | | | | | | |
Callable 03/25/2023 | | | $ | 250,000 | | | | $ | 225,945 | |
T-Mobile USA, Inc.: | | | | | | | | | | |
3.750%, 04/15/2027 | | | | | | | | | | |
Callable 02/15/2027 | | | | 100,000 | | | | | 94,470 | |
4.750%, 02/01/2028 | | | | | | | | | | |
Callable 02/01/2023 | | | | 100,000 | | | | | 97,437 | |
Verizon Communications Inc.: | | | | | | | | | | |
3.500%, 11/01/2024 | | | | | | | | | | |
Callable 08/01/2024 | | | | 750,000 | | | | | 729,409 | |
2.625%, 08/15/2026 | | | | 250,000 | | | | | 231,332 | |
| | | | | | | | | | |
| | | | | | | | | 1,378,593 | |
| | | | | | | | | | |
| Electrical Equipment & Instruments - 0.2% | | |
Emerson Electric Co. | | | | | | | | | | |
3.150%, 06/01/2025 | | | | | | | | | | |
Callable 03/01/2025 | | | | 200,000 | | | | | 193,437 | |
| | | | | | | | | | |
| Electronic Equipment & Instruments - 0.5% | | |
Trimble Inc. | | | | | | | | | | |
4.150%, 06/15/2023 | | | | | | | | | | |
Callable 05/15/2023 | | | | 500,000 | | | | | 496,613 | |
| | | | | | | | | | |
| Food & Drug Retailing - 0.6% | | | | |
Walmart, Inc. | | | | | | | | | | |
3.550%, 06/26/2025 | | | | | | | | | | |
Callable 04/26/2025 | | | | 700,000 | | | | | 686,010 | |
| | | | | | | | | | |
| Food & Staples Retailing - 0.6% | | | | |
Costco Wholesale Corp. | | | | | | | | | | |
1.375%, 06/20/2027 | | | | | | | | | | |
Callable 04/20/2027 | | | | 690,000 | | | | | 606,374 | |
| | | | | | | | | | |
| Health Care Equipment & Supplies - 0.5% | | |
Abbott Laboratories: | | | | | | | | | | |
3.875%, 09/15/2025 | | | | | | | | | | |
Callable 06/15/2025 | | | | 255,000 | | | | | 250,406 | |
3.750%, 11/30/2026 | | | | | | | | | | |
Callable 08/30/2026 | | | | 355,000 | | | | | 346,535 | |
| | | | | | | | | | |
| | | | | | | | | 596,941 | |
| | | | | | | | | | |
| Health Care Providers & Services - 0.0% | | | | |
CVS Health Corp. | | | | | | | | | | |
3.375%, 08/12/2024 | | | | | | | | | | |
Callable 05/12/2024 | | | | 50,000 | | | | | 48,798 | |
| | | | | | | | | | |
| Hotels, Restaurants & Leisure - 0.5% | | | | |
McDonald’s Corp. | | | | | | | | | | |
1.450%, 09/01/2025 | | | | | | | | | | |
Callable 08/01/2025 | | | | 600,000 | | | | | 551,262 | |
| | | | | | | | | | |
| Household Products - 0.5% | | | | |
Colgate-Palmolive Co. | | | | | | | | | | |
3.100%, 08/15/2027 | | | | | | | | | | |
Callable 07/15/2027 | | | | 595,000 | | | | | 564,970 | |
| | | | | | | | | | |
| | | | | | | | | | |
| CORPORATE BONDS | | Principal
Amount | | Value |
| Internet & Catalog Retail - 0.7% | | | | |
Amazon.com, Inc.: | | | | | | | | | | |
1.200%, 06/03/2027 | | | | | | | | | | |
Callable 04/03/2027 | | | $ | 260,000 | | | | $ | 225,906 | |
4.550%, 12/01/2027 | | | | | | | | | | |
Callable 11/01/2027 | | | | 550,000 | | | | | 550,224 | |
| | | | | | | | | | |
| | | | | | | | | 776,130 | |
| | | | | | | | | | |
| IT Services - 1.3% | | | | |
PayPal Holdings, Inc. | | | | | | | | | | |
1.650%, 06/01/2025 | | | | | | | | | | |
Callable 05/01/2025 | | | | 700,000 | | | | | 649,921 | |
Visa Inc.: | | | | | | | | | | |
3.150%, 12/14/2025 | | | | | | | | | | |
Callable 09/14/2025 | | | | 300,000 | | | | | 289,592 | |
1.900%, 04/15/2027 | | | | | | | | | | |
Callable 02/15/2027 | | | | 500,000 | | | | | 451,787 | |
| | | | | | | | | | |
| | | | | | | | | 1,391,300 | |
| | | | | | | | | | |
| Life Sciences Tools & Services - 0.9% | | | | |
Danaher Corp. | | | | | | | | | | |
3.350%, 09/15/2025 | | | | | | | | | | |
Callable 06/15/2025 | | | | 250,000 | | | | | 241,102 | |
Thermo Fisher Scientific, Inc. | | | | | | | | | | |
1.215%, 10/18/2024 | | | | | | | | | | |
Callable 01/30/2023 | | | | 750,000 | | | | | 704,736 | |
| | | | | | | | | | |
| | | | | | | | | 945,838 | |
| | | | | | | | | | |
| Machinery - 0.6% | | | | |
Illinois Tool Works, Inc. | | | | | | | | | | |
3.500%, 03/01/2024 | | | | | | | | | | |
Callable 12/01/2023 | | | | 715,000 | | | | | 704,392 | |
| | | | | | | | | | |
| Media & Entertainment - 1.4% | | | | |
Alphabet, Inc.: | | | | | | | | | | |
3.375%, 02/25/2024 | | | | 600,000 | | | | | 601,070 | |
1.998%, 08/15/2026 | | | | | | | | | | |
Callable 05/15/2026 | | | | 200,000 | | | | | 184,411 | |
The Walt Disney Co. | | | | | | | | | | |
1.750%, 08/30/2024 | | | | | | | | | | |
Callable 07/30/2024 | | | | 810,000 | | | | | 773,104 | |
| | | | | | | | | | |
| | | | | | | | | 1,558,585 | |
| | | | | | | | | | |
| Multiline Retail - 0.7% | | | | |
Dollar Tree, Inc. | | | | | | | | | | |
4.000%, 05/15/2025 | | | | | | | | | | |
Callable 03/15/2025 | | | | 825,000 | | | | | 806,634 | |
| | | | | | | | | | |
| Oil & Gas & Consumable Fuels - 2.5% | | |
Chevron Corp. | | | | | | | | | | |
1.995%, 05/11/2027 | | | | | | | | | | |
Callable 03/11/2027 | | | | 400,000 | | | | | 360,400 | |
Devon Energy Corp. | | | | | | | | | | |
4.500%, 01/15/2030 | | | | | | | | | | |
Callable 01/15/2023 | | | | 500,000 | | | | | 467,897 | |
Enterprise Products Operating, LLC | | | | | | | | | | |
3.750%, 02/15/2025 | | | | | | | | | | |
Callable 11/15/2024 | | | | 665,000 | | | | | 647,564 | |
The accompanying notes are an integral part of these financial statements.
23
|
| LKCM BALANCED FUND |
| SCHEDULEOF INVESTMENTS, CONTINUED |
| December 31, 2022 |
| | | | | | | | | | |
| CORPORATE BONDS | | Principal
Amount | | Value |
| Oil & Gas & Consumable Fuels - 2.5%, Continued | | |
Exxon Mobil Corp.: | | | | | | | | | | |
2.709%, 03/06/2025 | | | | | | | | | | |
Callable 12/06/2024 | | | $ | 255,000 | | | | $ | 244,208 | |
3.043%, 03/01/2026 | | | | | | | | | | |
Callable 12/01/2025 | | | | 400,000 | | | | | 382,427 | |
Kinder Morgan Energy Partners, L.P. | | | | | | | | | | |
4.250%, 09/01/2024 | | | | | | | | | | |
Callable 06/01/2024 | | | | 125,000 | | | | | 123,029 | |
Schlumberger Investment SA | | | | | | | | | | |
3.650%, 12/01/2023 (b) | | | | | | | | | | |
Callable 09/01/2023 | | | | 500,000 | | | | | 493,996 | |
| | | | | | | | | | |
| | | | | | | | | 2,719,521 | |
| | | | | | | | | | |
| Personal Products - 0.7% | | | | |
The Estee Lauder Cos., Inc. | | | | | | | | | | |
2.000%, 12/01/2024 | | | | | | | | | | |
Callable 11/01/2024 | | | | 805,000 | | | | | 764,830 | |
| | | | | | | | | | |
| Pharmaceuticals - 2.1% | | | | |
Bristol-Myers Squibb Co. | | | | | | | | | | |
3.625%, 05/15/2024 | | | | | | | | | | |
Callable 02/15/2024 | | | | 250,000 | | | | | 246,734 | |
Johnson & Johnson | | | | | | | | | | |
0.550%, 09/01/2025 | | | | | | | | | | |
Callable 08/01/2025 | | | | 735,000 | | | | | 664,123 | |
Pfizer, Inc. | | | | | | | | | | |
0.800%, 05/28/2025 | | | | | | | | | | |
Callable 04/28/2025 | | | | 800,000 | | | | | 732,091 | |
Zoetis Inc. | | | | | | | | | | |
4.500%, 11/13/2025 | | | | | | | | | | |
Callable 08/13/2025 | | | | 600,000 | | | | �� | 597,149 | |
| | | | | | | | | | |
| | | | | | | | | 2,240,097 | |
| | | | | | | | | | |
| Real Estate Investment Trusts - 1.1% | | | | |
American Tower Corp.: | | | | | | | | | | |
2.400%, 03/15/2025 | | | | | | | | | | |
Callable 02/15/2025 | | | | 600,000 | | | | | 565,082 | |
3.375%, 10/15/2026 | | | | | | | | | | |
Callable 07/15/2026 | | | | 635,000 | | | | | 595,307 | |
| | | | | | | | | | |
| | | | | | | | | 1,160,389 | |
| | | | | | | | | | |
| Road & Rail - 0.2% | | | | |
Union Pacific Corp. | | | | | | | | | | |
3.750%, 07/15/2025 | | | | | | | | | | |
Callable 05/15/2025 | | | | 200,000 | | | | | 194,687 | |
| | | | | | | | | | |
| Semiconductor Equipment & Products - 0.7% | | |
Intel Corp.: | | | | | | | | | | |
2.875%, 05/11/2024 | | | | | | | | | | |
Callable 03/11/2024 | | | | 255,000 | | | | | 248,626 | |
3.700%, 07/29/2025 | | | | | | | | | | |
Callable 04/29/2025 | | | | 500,000 | | | | | 488,641 | |
| | | | | | | | | | |
| | | | | | | | | 737,267 | |
| | | | | | | | | | |
| Semiconductors & Semiconductor Equipment - 0.4% | | |
NVIDIA Corp. | | | | | | | | | | |
3.200%, 09/16/2026 | | | | | | | | | | |
Callable 06/16/2026 | | | | 400,000 | | | | | 380,996 | |
| | | | | | | | | | |
| | | | | | | | | | |
| CORPORATE BONDS | | Principal
Amount | | Value |
| Software - 2.4% | | | | |
Adobe Inc. | | | | | | | | | | |
1.900%, 02/01/2025 | | | | | | | | | | |
Callable 01/01/2025 | | | $ | 755,000 | | | | $ | 714,329 | |
Fortinet, Inc. | | | | | | | | | | |
1.000%, 03/15/2026 | | | | | | | | | | |
Callable 02/15/2026 | | | | 600,000 | | | | | 526,502 | |
Microsoft Corp. | | | | | | | | | | |
3.125%, 11/03/2025 | | | | | | | | | | |
Callable 08/03/2025 | | | | 230,000 | | | | | 222,637 | |
Oracle Corp.: | | | | | | | | | | |
2.500%, 04/01/2025 | | | | | | | | | | |
Callable 03/01/2025 | | | | 500,000 | | | | | 471,636 | |
2.950%, 05/15/2025 | | | | | | | | | | |
Callable 02/15/2025 | | | | 500,000 | | | | | 475,188 | |
Roper Technologies, Inc. | | | | | | | | | | |
1.000%, 09/15/2025 | | | | | | | | | | |
Callable 08/15/2025 | | | | 250,000 | | | | | 224,434 | |
| | | | | | | | | | |
| | | | | | | | | 2,634,726 | |
| | | | | | | | | | |
| Specialty Retail - 1.6% | | | | |
Lowe’s Cos, Inc. | | | | | | | | | | |
2.500%, 04/15/2026 | | | | | | | | | | |
Callable 01/15/2026 | | | | 800,000 | | | | | 747,461 | |
O’Reilly Automotive, Inc. | | | | | | | | | | |
4.200%, 04/01/2030 | | | | | | | | | | |
Callable 01/01/2030 | | | | 500,000 | | | | | 474,440 | |
The Home Depot, Inc. | | | | | | | | | | |
2.800%, 09/14/2027 | | | | | | | | | | |
Callable 06/14/2027 | | | | 500,000 | | | | | 464,657 | |
| | | | | | | | | | |
| | | | | | | | | 1,686,558 | |
| | | | | | | | | | |
TOTAL CORPORATE BONDS
(Cost $34,308,485) | | | | | | | | | 32,142,065 | |
| | | | | | | | | | |
| | | | | | | | | | |
| SHORT-TERM INVESTMENT - 0.6% | | Shares | | |
| Money Market Fund - 0.6% | | | | |
Invesco Short-Term Investments Trust - Government & Agency Portfolio -Institutional Shares, 4.21% (c) | | | | 665,476 | | | | | 665,476 | |
| | | | | | | | | | |
TOTAL SHORT-TERM INVESTMENT
(Cost $665,476) | | | | | 665,476 | |
| | | | | | | | | | |
Total Investments - 99.9%
(Cost $83,304,288) | | | | | | | | | 108,626,855 | |
Other Assets in Excess of Liabilities - 0.1% | | | | | 119,189 | |
| | | | | | | | | | |
TOTAL NET ASSETS - 100.0% | | | | | | | | $ | 108,746,044 | |
| | | | | | | | | | |
| (a) | Non-income producing security. |
| (b) | Security issued by non-U.S. incorporated company. |
| (c) | The rate quoted is the annualized seven-day yield of the Fund at period end. |
Investments are classified by industry pursuant to the Global Industry Classification Standard (GICS®), which was developed by and/or is the exclusive property of Morgan Stanley Capital International, Inc. (“MSCI”) and Standard & Poor’s Financial Services LLC (“S&P”). GICS is a service mark of MSCI and S&P and has been licensed for use by U.S. Bancorp Fund Services, LLC.
The accompanying notes are an integral part of these financial statements.
24
|
| LKCM FIXED INCOME FUND |
| SCHEDULEOF INVESTMENTS |
| December 31, 2022 |
| | | | | | | | | | |
| CORPORATE BONDS - 63.6% | | Principal
Amount | | Value |
| Aerospace & Defense - 5.1% | | | | |
Honeywell International, Inc.: | | | | | | | | | | |
2.300%, 08/15/2024 | | | | | | | | | | |
Callable 07/15/2024 | | | $ | 3,105,000 | | | | $ | 2,988,576 | |
1.350%, 06/01/2025 | | | | | | | | | | |
Callable 05/01/2025 | | | | 3,000,000 | | | | | 2,778,493 | |
L3Harris Technologies, Inc. | | | | | | | | | | |
3.850%, 06/15/2023 | | | | | | | | | | |
Callable 05/15/2023 | | | | 6,650,000 | | | | | 6,612,075 | |
Raytheon Technologies Corp. | | | | | | | | | | |
3.700%, 12/15/2023 | | | | | | | | | | |
Callable 09/15/2023 | | | | 1,750,000 | | | | | 1,730,060 | |
| | | | | | | | | | |
| | | | | | | | | 14,109,204 | |
| | | | | | | | | | |
| Banks - 3.7% | | | | |
Bank of America Corp. | | | | | | | | | | |
4.450%, 03/03/2026 | | | | 2,000,000 | | | | | 1,963,730 | |
Comerica, Inc. | | | | | | | | | | |
3.700%, 07/31/2023 | | | | | | | | | | |
Callable 06/30/2023 | | | | 2,000,000 | | | | | 1,985,712 | |
Truist Bank: | | | | | | | | | | |
3.200%, 04/01/2024 | | | | | | | | | | |
Callable 03/01/2024 | | | | 2,500,000 | | | | | 2,442,704 | |
3.300%, 05/15/2026 | | | | | | | | | | |
Callable 04/15/2026 | | | | 2,000,000 | | | | | 1,875,550 | |
Wells Fargo & Co. | | | | | | | | | | |
4.125%, 08/15/2023 | | | | 2,000,000 | | | | | 1,988,458 | |
| | | | | | | | | | |
| | | | | | | | | 10,256,154 | |
| | | | | | | | | | |
| Beverages - 0.7% | | | | |
Keurig Dr Pepper, Inc. | | | | | | | | | | |
2.550%, 09/15/2026 | | | | | | | | | | |
Callable 06/15/2026 | | | | 2,225,000 | | | | | 2,041,416 | |
| | | | | | | | | | |
| Biotechnology - 2.0% | | | | |
Amgen, Inc.: | | | | | | | | | | |
2.250%, 08/19/2023 | | | | | | | | | | |
Callable 06/19/2023 | | | | 2,350,000 | | | | | 2,310,305 | |
2.600%, 08/19/2026 | | | | | | | | | | |
Callable 05/19/2026 | | | | 1,000,000 | | | | | 926,373 | |
2.200%, 02/21/2027 | | | | | | | | | | |
Callable 12/21/2026 | | | | 2,500,000 | | | | | 2,249,803 | |
| | | | | | | | | | |
| | | | | | | | | 5,486,481 | |
| | | | | | | | | | |
| Chemicals - 2.0% | | | | |
Air Products and Chemicals, Inc. | | | | | | | | | | |
1.500%, 10/15/2025 | | | | | | | | | | |
Callable 09/15/2025 | | | | 4,000,000 | | | | | 3,681,769 | |
Ecolab, Inc. | | | | | | | | | | |
2.700%, 11/01/2026 | | | | | | | | | | |
Callable 08/01/2026 | | | | 2,000,000 | | | | | 1,861,434 | |
| | | | | | | | | | |
| | | | | | | | | 5,543,203 | |
| | | | | | | | | | |
| Communications Equipment - 1.4% | | | | |
QUALCOMM, Inc. | | | | | | | | | | |
2.900%, 05/20/2024 | | | | | | | | | | |
Callable 03/20/2024 | | | | 4,000,000 | | | | | 3,905,546 | |
| | | | | | | | | | |
| | | | | | | | | | |
| CORPORATE BONDS | | Principal
Amount | | Value |
| Computers & Peripherals - 0.9% | | | | |
Apple Inc. | | | | | | | | | | |
2.500%, 02/09/2025 | | | $ | 2,515,000 | | | | $ | 2,408,275 | |
| | | | | | | | | | |
| Consumer Finance - 1.8% | | | | |
American Express Co.: | | | | | | | | | | |
2.500%, 07/30/2024 | | | | | | | | | | |
Callable 06/30/2024 | | | | 1,063,000 | | | | | 1,023,369 | |
3.000%, 10/30/2024 | | | | | | | | | | |
Callable 09/29/2024 | | | | 2,000,000 | | | | | 1,936,636 | |
4.200%, 11/06/2025 | | | | | | | | | | |
Callable 10/06/2025 | | | | 2,000,000 | | | | | 1,977,710 | |
| | | | | | | | | | |
| | | | | | | | | 4,937,715 | |
| | | | | | | | | | |
| Containers & Packaging - 1.5% | | | | |
Ball Corp. | | | | | | | | | | |
5.250%, 07/01/2025 | | | | 4,252,000 | | | | | 4,202,555 | |
| | | | | | | | | | |
| Diversified Financials - 4.1% | | | | |
JPMorgan Chase & Co.: | | | | | | | | | | |
3.375%, 05/01/2023 | | | | 3,788,000 | | | | | 3,770,664 | |
2.700%, 05/18/2023 | | | | | | | | | | |
Callable 03/18/2023 | | | | 1,855,000 | | | | | 1,839,598 | |
3.875%, 02/01/2024 | | | | 1,750,000 | | | | | 1,728,508 | |
3.300%, 04/01/2026 | | | | | | | | | | |
Callable 01/01/2026 | | | | 3,500,000 | | | | | 3,325,404 | |
3.200%, 06/15/2026 | | | | | | | | | | |
Callable 03/15/2026 | | | | 636,000 | | | | | 602,020 | |
| | | | | | | | | | |
| | | | | | | | | 11,266,194 | |
| | | | | | | | | | |
| Diversified Telecommunication Services - 4.2% | | |
AT&T, Inc.: | | | | | | | | | | |
1.700%, 03/25/2026 | | | | | | | | | | |
Callable 03/25/2023 | | | | 1,450,000 | | | | | 1,310,482 | |
4.250%, 03/01/2027 | | | | | | | | | | |
Callable 12/01/2026 | | | | 4,235,000 | | | | | 4,131,386 | |
Verizon Communications, Inc.: | | | | | | | | | | |
3.500%, 11/01/2024 | | | | | | | | | | |
Callable 08/01/2024 | | | | 1,750,000 | | | | | 1,701,954 | |
4.125%, 03/16/2027 | | | | 2,000,000 | | | | | 1,953,775 | |
2.100%, 03/22/2028 | | | | | | | | | | |
Callable 01/22/2028 | | | | 3,000,000 | | | | | 2,613,660 | |
| | | | | | | | | | |
| | | | | | | | | 11,711,257 | |
| | | | | | | | | | |
| Electrical Equipment & Instruments - 3.1% | | |
Emerson Electric Co. | | | | | | | | | | |
3.150%, 06/01/2025 | | | | | | | | | | |
Callable 03/01/2025 | | | | 6,500,000 | | | | | 6,286,695 | |
Rockwell Automation, Inc.: | | | | | | | | | | |
0.350%, 08/15/2023 | | | | | | | | | | |
Callable 01/10/2023 | | | | 825,000 | | | | | 803,133 | |
2.875%, 03/01/2025 | | | | | | | | | | |
Callable 12/01/2024 | | | | 1,440,000 | | | | | 1,383,950 | |
| | | | | | | | | | |
| | | | | | | | | 8,473,778 | |
| | | | | | | | | | |
The accompanying notes are an integral part of these financial statements.
25
|
| LKCM FIXED INCOME FUND |
| SCHEDULEOF INVESTMENTS, CONTINUED |
| December 31, 2022 |
| | | | | | | | | | |
| CORPORATE BONDS | | Principal
Amount | | Value |
| Electronic Equipment & Instruments - 1.6% | | |
Trimble Inc. | | | | | | | | | | |
4.150%, 06/15/2023 | | | | | | | | | | |
Callable 05/15/2023 | | | $ | 4,500,000 | | | | $ | 4,469,518 | |
| | | | | | | | | | |
| Food Products - 0.5% | | | | |
Kraft Heinz Food Co. | | | | | | | | | | |
4.625%, 01/30/2029 | | | | | | | | | | |
Callable 10/30/2028 | | | | 1,353,000 | | | | | 1,343,174 | |
| | | | | | | | | | |
| Health Care Providers & Services - 0.7% | | | | |
CVS Health Corp. | | | | | | | | | | |
3.750%, 04/01/2030 | | | | | | | | | | |
Callable 01/01/2030 | | | | 2,000,000 | | | | | 1,827,778 | |
| | | | | | | | | | |
| Hotels, Restaurants & Leisure - 0.9% | | | | |
McDonald’s Corp. | | | | | | | | | | |
3.500%, 07/01/2027 | | | | | | | | | | |
Callable 05/01/2027 | | | | 2,500,000 | | | | | 2,379,101 | |
| | | | | | | | | | |
| Household Products - 0.3% | | | | |
The Procter & Gamble Co. | | | | | | | | | | |
8.000%, 09/01/2024 | | | | 775,000 | | | | | 815,096 | |
| | | | | | | | | | |
| Life Sciences Tools & Services - 3.3% | | | | |
Danaher Corp. | | | | | | | | | | |
3.350%, 09/15/2025 | | | | | | | | | | |
Callable 06/15/2025 | | | | 5,500,000 | | | | | 5,304,235 | |
Thermo Fisher Scientific, Inc. | | | | | | | | | | |
1.215%, 10/18/2024 | | | | | | | | | | |
Callable 01/30/2023 | | | | 4,000,000 | | | | | 3,758,592 | |
| | | | | | | | | | |
| | | | | | | | | 9,062,827 | |
| | | | | | | | | | |
| Media & Entertainment - 1.5% | | | | |
Alphabet, Inc. | | | | | | | | | | |
3.375%, 02/25/2024 | | | | 4,000,000 | | | | | 4,007,133 | |
| | | | | | | | | | |
| Multiline Retail - 1.1% | | | | |
Dollar Tree, Inc. | | | | | | | | | | |
4.000%, 05/15/2025 | | | | | | | | | | |
Callable 03/15/2025 | | | | 3,000,000 | | | | | 2,933,216 | |
| | | | | | | | | | |
| Oil & Gas & Consumable Fuels - 4.1% | | | | |
Chevron Corp. | | | | | | | | | | |
2.954%, 05/16/2026 | | | | | | | | | | |
Callable 02/16/2026 | | | | 1,870,000 | | | | | 1,778,783 | |
Devon Energy Corp. | | | | | | | | | | |
4.500%, 01/15/2030 | | | | | | | | | | |
Callable 01/15/2025 | | | | 4,000,000 | | | | | 3,743,176 | |
Enterprise Products Operating, LLC | | | | | | | | | | |
3.750%, 02/15/2025 | | | | | | | | | | |
Callable 11/15/2024 | | | | 2,963,000 | | | | | 2,885,313 | |
Kinder Morgan Energy Partners, L.P. | | | | | | | | | | |
4.250%, 09/01/2024 | | | | | | | | | | |
Callable 06/01/2024 | | | | 3,000,000 | | | | | 2,952,679 | |
| | | | | | | | | | |
| | | | | | | | | 11,359,951 | |
| | | | | | | | | | |
| | | | | | | | | | |
| CORPORATE BONDS | | Principal
Amount | | Value |
| Personal Products - 0.2% | | | | |
The Estee Lauder Cos., Inc. | | | | | | | | | | |
2.000%, 12/01/2024 | | | | | | | | | | |
Callable 11/01/2024 | | | $ | 556,000 | | | | $ | 528,255 | |
| | | | | | | | | | |
| Pharmaceuticals - 3.7% | | | | |
Abbott Laboratories: | | | | | | | | | | |
3.400%, 11/30/2023 | | | | | | | | | | |
Callable 09/30/2023 | | | | 1,750,000 | | | | | 1,732,001 | |
2.950%, 03/15/2025 | | | | | | | | | | |
Callable 12/15/2024 | | | | 3,925,000 | | | | | 3,796,230 | |
Bristol-Myers Squibb Co. | | | | | | | | | | |
3.625%, 05/15/2024 | | | | | | | | | | |
Callable 02/15/2024 | | | | 4,750,000 | | | | | 4,687,945 | |
| | | | | | | | | | |
| | | | | | | | | 10,216,176 | |
| | | | | | | | | | |
| Real Estate Investment Trusts - 3.6% | | | | |
American Tower Corp.: | | | | | | | | | | |
3.500%, 01/31/2023 | | | | 3,500,000 | | | | | 3,495,901 | |
5.000%, 02/15/2024 | | | | 2,500,000 | | | | | 2,492,648 | |
3.375%, 10/15/2026 | | | | | | | | | | |
Callable 07/15/2026 | | | | 4,030,000 | | | | | 3,778,092 | |
| | | | | | | | | | |
| | | | | | | | | 9,766,641 | |
| | | | | | | | | | |
| Road & Rail - 3.0% | | | | |
Burlington Northern Santa Fe, LLC | | | | | | | | | | |
3.000%, 04/01/2025 | | | | | | | | | | |
Callable 01/01/2025 | | | | 2,250,000 | | | | | 2,166,854 | |
Union Pacific Corp.: | | | | | | | | | | |
3.250%, 01/15/2025 | | | | | | | | | | |
Callable 10/15/2024 | | | | 3,295,000 | | | | | 3,205,127 | |
3.750%, 07/15/2025 | | | | | | | | | | |
Callable 05/15/2025 | | | | 3,025,000 | | | | | 2,944,649 | |
| | | | | | | | | | |
| | | | | | | | | 8,316,630 | |
| | | | | | | | | | |
| Semiconductor Equipment & Products - 0.8% | | |
Intel Corp. | | | | | | | | | | |
3.700%, 07/29/2025 | | | | | | | | | | |
Callable 04/29/2025 | | | | 2,250,000 | | | | | 2,198,883 | |
| | | | | | | | | | |
| Semiconductors & Semiconductor Equipment - 1.2% | | |
NVIDIA Corp. | | | | | | | | | | |
1.550%, 06/15/2028 | | | | | | | | | | |
Callable 04/15/2028 | | | | 4,000,000 | | | | | 3,429,473 | |
| | | | | | | | | | |
| Software - 4.2% | | | | |
Adobe Inc. | | | | | | | | | | |
1.900%, 02/01/2025 | | | | | | | | | | |
Callable 01/01/2025 | | | | 4,280,000 | | | | | 4,049,445 | |
Oracle Corp.: | | | | | | | | | | |
2.650%, 07/15/2026 | | | | | | | | | | |
Callable 04/15/2026 | | | | 2,000,000 | | | | | 1,843,040 | |
2.300%, 03/25/2028 | | | | | | | | | | |
Callable 01/25/2028 | | | | 3,000,000 | | | | | 2,608,307 | |
6.150%, 11/09/2029 | | | | | | | | | | |
Callable 09/09/2029 | | | | 3,000,000 | | | | | 3,128,268 | |
| | | | | | | | | | |
| | | | | | | | | 11,629,060 | |
| | | | | | | | | | |
The accompanying notes are an integral part of these financial statements.
26
|
| LKCM FIXED INCOME FUND |
| SCHEDULEOF INVESTMENTS, CONTINUED |
| December 31, 2022 |
| | | | | | | | | | |
| CORPORATE BONDS | | Principal
Amount | | Value |
| Specialty Retail - 2.4% | | | | |
Lowe’s Cos, Inc. | | | | | | | | | | |
2.500%, 04/15/2026 | | | | | | | | | | |
Callable 01/15/2026 | | | $ | 1,000,000 | | | | $ | 934,326 | |
O’Reilly Automotive, Inc.: | | | | | | | | | | |
4.350%, 06/01/2028 | | | | | | | | | | |
Callable 03/01/2028 | | | | 675,000 | | | | | 657,718 | |
4.200%, 04/01/2030 | | | | | | | | | | |
Callable 01/01/2030 | | | | 2,325,000 | | | | | 2,206,146 | |
The Home Depot, Inc. | | | | | | | | | | |
2.700%, 04/01/2023 | | | | | | | | | | |
Callable 01/01/2023 | | | | 2,750,000 | | | | | 2,737,373 | |
| | | | | | | | | | |
| | | | | | | | | 6,535,563 | |
| | | | | | | | | | |
TOTAL CORPORATE BONDS
(Cost $183,771,642) | | | | | | | | | 175,160,253 | |
| | | | | | | | | | |
| | | | | | | | | | |
| U.S. GOVERNMENT ISSUES - 8.2% | | | | |
| U.S. Treasury Inflation Indexed Bonds - 1.6% | | |
0.625%, 01/15/2024 | | | | 4,470,235 | | | | | 4,377,346 | |
| | | | | | | | | | |
| U.S. Treasury Notes - 6.6% | | | | |
2.000%, 02/15/2023 | | | | 2,000,000 | | | | | 1,994,596 | |
2.750%, 05/31/2023 | | | | 750,000 | | | | | 744,449 | |
2.000%, 02/15/2025 | | | | 2,000,000 | | | | | 1,904,610 | |
2.875%, 06/15/2025 | | | | 1,000,000 | | | | | 967,344 | |
2.000%, 08/15/2025 | | | | 1,000,000 | | | | | 945,234 | |
1.625%, 02/15/2026 | | | | 2,000,000 | | | | | 1,852,031 | |
4.000%, 10/31/2029 | | | | 2,000,000 | | | | | 2,005,781 | |
2.875%, 05/15/2032 | | | | 4,000,000 | | | | | 3,700,000 | |
4.125%, 11/15/2032 | | | | 4,000,000 | | | | | 4,097,500 | |
| | | | | | | | | | |
| | | | | | | | | 18,211,545 | |
| | | | | | | | | | |
TOTAL U.S. GOVERNMENT ISSUES
(Cost $23,024,139) | | | | | | | | | 22,588,891 | |
| | | | | | | | | | |
| | | | | | | | | | |
U.S. GOVERNMENT SPONSORED
ENTITIES - 26.6% | | | | |
| Fannie Mae - 0.6% | | | | |
0.500%, 06/17/2025 | | | | 1,852,000 | | | | | 1,686,930 | |
| | | | | | | | | | |
| Federal Home Loan Banks - 23.4% | | | | |
1.000%, 12/17/2024 (b) | | | | | | | | | | |
Callable 03/17/2023 | | | | 2,500,000 | | | | | 2,345,129 | |
3.050%, 12/30/2024 | | | | | | | | | | |
Callable 06/30/2023 | | | | 2,500,000 | | | | | 2,423,058 | |
3.000%, 01/27/2025 | | | | | | | | | | |
Callable 01/27/2023 | | | | 2,200,000 | | | | | 2,121,717 | |
2.000%, 04/14/2025 (b) | | | | | | | | | | |
Callable 04/14/2023 | | | | 5,000,000 | | | | | 4,822,011 | |
3.250%, 06/09/2025 | | | | | | | | | | |
Callable 06/09/2023 | | | | 1,000,000 | | | | | 964,868 | |
0.62500%, 10/28/2025 (b) | | | | | | | | | | |
Callable 01/28/2023 | | | | 3,000,000 | | | | | 2,747,588 | |
| | | | | | | | | | |
U.S. GOVERNMENT SPONSORED
ENTITIES | | Principal
Amount | | Value |
| Federal Home Loan Banks - 23.4%, Continued |
2.500%, 11/12/2025 (b) | | | | | | | | | | |
Callable 05/12/2023 | | | $ | 1,505,000 | | | | $ | 1,458,908 | |
0.500%, 01/27/2026 (b) | | | | | | | | | | |
Callable 01/27/2023 | | | | 3,000,000 | | | | | 2,681,686 | |
1.000%, 02/17/2026 (b) | | | | | | | | | | |
Callable 02/17/2023 | | | | 2,500,000 | | | | | 2,325,062 | |
2.375%, 03/13/2026 | | | | 3,575,000 | | | | | 3,373,914 | |
0.625%, 03/30/2026 (b) | | | | | | | | | | |
Callable 03/30/2023 | | | | 3,000,000 | | | | | 2,714,192 | |
0.625%, 05/26/2026 (b) | | | | | | | | | | |
Callable 02/26/2023 | | | | 2,500,000 | | | | | 2,264,573 | |
0.875%, 10/28/2026 (b) | | | | | | | | | | |
Callable 01/28/2023 | | | | 3,000,000 | | | | | 2,702,028 | |
1.250%, 11/10/2026 | | | | | | | | | | |
Callable 11/10/2023 | | | | 3,000,000 | | | | | 2,666,938 | |
1.125%, 01/25/2027 (b) | | | | | | | | | | |
Callable 01/25/2023 | | | | 2,500,000 | | | | | 2,284,212 | |
2.000%, 03/10/2027 (b) | | | | | | | | | | |
Callable 03/10/2023 | | | | 3,150,000 | | | | | 2,988,202 | |
3.500%, 05/24/2027 (b) | | | | | | | | | | |
Callable 02/24/2023 | | | | 2,650,000 | | | | | 2,555,068 | |
4.500%, 09/29/2027 | | | | | | | | | | |
Callable 09/29/2023 | | | | 1,750,000 | | | | | 1,751,205 | |
5.000%, 10/27/2027 (b) | | | | | | | | | | |
Callable 01/27/2023 | | | | 2,000,000 | | | | | 1,995,880 | |
0.650%, 01/27/2028 (b) | | | | | | | | | | |
Callable 01/27/2023 | | | | 4,000,000 | | | | | 3,394,002 | |
1.250%, 11/16/2028 (b) | | | | | | | | | | |
Callable 02/16/2023 | | | | 3,000,000 | | | | | 2,618,321 | |
2.820%, 06/27/2029 | | | | | | | | | | |
Callable 01/09/2023 | | | | 4,000,000 | | | | | 3,614,070 | |
1.000%, 01/27/2031 (b) | | | | | | | | | | |
Callable 01/27/2023 | | | | 4,000,000 | | | | | 3,245,618 | |
1.000%, 09/30/2031 (b) | | | | | | | | | | |
Callable 03/30/2023 | | | | 3,000,000 | | | | | 2,468,132 | |
1.500%, 12/15/2033 (b) | | | | | | | | | | |
Callable 03/15/2023 | | | | 2,500,000 | | | | | 2,070,594 | |
| | | | | | | | | | |
| | | | | | | | | 64,596,976 | |
| | | | | | | | | | |
| Freddie Mac - 2.6% | | | | |
0.750%, 05/28/2025 | | | | | | | | | | |
Callable 05/28/2023 | | | | 3,500,000 | | | | | 3,191,247 | |
5.000%, 10/27/2026 (b) | | | | | | | | | | |
Callable 01/27/2023 | | | | 2,000,000 | | | | | 1,994,625 | |
3.375%, 06/30/2027 (b) | | | | | | | | | | |
Callable 03/30/2023 | | | | 1,895,000 | | | | | 1,868,682 | |
| | | | | | | | | | |
| | | | | | | | | 7,054,554 | |
| | | | | | | | | | |
TOTAL U.S. GOVERNMENT SPONSORED ENTITIES
(Cost $80,229,560) | | | | | | | | | 73,338,460 | |
| | | | | | | | | | |
The accompanying notes are an integral part of these financial statements.
27
|
| LKCM FIXED INCOME FUND |
| SCHEDULEOF INVESTMENTS, CONTINUED |
| December 31, 2022 |
| | | | | | | | | | |
| SHORT-TERM INVESTMENT - 0.9% | | Shares | | Value |
| Money Market Fund - 0.9% | | | | |
Invesco Short-Term Investments Trust - Government & Agency Portfolio - Institutional Shares, 4.21% (a) | | | | 2,474,814 | | | | $ | 2,474,814 | |
| | | | | | | | | | |
TOTAL SHORT-TERM INVESTMENT
(Cost $2,474,814) | | | | | 2,474,814 | |
| | | | | | | | | | |
Total Investments - 99.3%
(Cost $289,500,155) | | | | | | | | | 273,562,418 | |
Other Assets in Excess of Liabilities - 0.7% | | | | | 1,824,126 | |
| | | | | | | | | | |
TOTAL NET ASSETS - 100.0% | | | | | | | | $ | 275,386,544 | |
| | | | | | | | | | |
| (a) | The rate quoted is the annualized seven-day yield of the Fund at period end. |
| (b) | Step-up bond that pays an initial coupon rate for the first period and then a higher coupon rate for the following periods. Rate as of period end. |
Investments are classified by industry pursuant to the Global Industry Classification Standard (GICS®), which was developed by and/or is the exclusive property of Morgan Stanley Capital International, Inc. (“MSCI”) and Standard & Poor’s Financial Services LLC (“S&P”). GICS is a service mark of MSCI and S&P and has been licensed for use by U.S. Bancorp Fund Services, LLC.
The accompanying notes are an integral part of these financial statements.
28
|
| LKCM INTERNATIONAL EQUITY FUND |
| SCHEDULEOF INVESTMENTS |
| December 31, 2022 |
| | | | | | | | | | |
| COMMON STOCKS - 92.1% | | Shares | | Value |
| AUSTRALIA - 4.9% | | | | |
| Diversified Operations - 2.3% | | | | |
BHP Billiton Ltd. | | | | 34,000 | | | | $ | 1,053,218 | |
| | | | | | | | | | |
| Pharmaceuticals - 2.6% | | | | |
CSL Ltd. | | | | 5,950 | | | | | 1,160,216 | |
| | | | | | | | | | |
Total Australia | | | | | | | | | 2,213,434 | |
| | | | | | | | | | |
| CANADA - 1.7% | | | | |
| Oil, Gas & Consumable Fuels - 1.7% | | | | |
Cenovus Energy Inc. | | | | 40,370 | | | | | 783,250 | |
| | | | | | | | | | |
Total Canada | | | | | | | | | 783,250 | |
| | | | | | | | | | |
| FINLAND - 2.5% | | | | |
| Banks - 2.5% | | | | |
Nordea Bank Abp | | | | 106,500 | | | | | 1,140,823 | |
| | | | | | | | | | |
Total Finland | | | | | | | | | 1,140,823 | |
| | | | | | | | | | |
| FRANCE - 14.2% | | | | |
| Aerospace & Defense - 2.8% | | | | |
Safran SA | | | | 10,000 | | | | | 1,252,535 | |
| | | | | | | | | | |
| Chemicals - 2.3% | | | | |
Air Liquide SA | | | | 7,150 | | | | | 1,014,835 | |
| | | | | | | | | | |
| Electrical Equipment & Instruments - 2.2% | | |
Schneider Electric SA | | | | 7,100 | | | | | 997,082 | |
| | | | | | | | | | |
| IT Consulting & Services - 2.1% | | | | |
Cap Gemini | | | | 5,600 | | | | | 936,183 | |
| | | | | | | | | | |
| Oil & Gas & Consumable Fuels - 1.2% | | | | |
TOTAL South Africa Pty Ltd | | | | 8,860 | | | | | 556,169 | |
| | | | | | | | | | |
| Personal Products - 1.1% | | | | |
L’Oreal SA | | | | 1,420 | | | | | 508,497 | |
| | | | | | | | | | |
| Specialty Retail - 2.5% | | | | |
LVMH Moet Hennessy Louis Vuitton SE | | | | 1,575 | | | | | 1,146,113 | |
| | | | | | | | | | |
Total France | | | | | | | | | 6,411,414 | |
| | | | | | | | | | |
| GERMANY - 9.4% | | | | |
| Diversified Telecommunication Services - 1.2% | | |
Deutsche Telekom AG | | | | 26,524 | | | | | 527,735 | |
| | | | | | | | | | |
| Insurance - 2.2% | | |
Allianz SE | | | | 4,600 | | | | | 982,362 | |
| | | | | | | | | | |
| Pharmaceuticals - 1.1% | | |
Bayer AG | | | | 9,746 | | | | | 501,626 | |
| | | | | | | | | | |
| Semiconductor Equipment & Products - 2.2% | | |
Infineon Technologies AG | | | | 33,000 | | | | | 1,002,931 | |
| | | | | | | | | | |
| Software - 2.2% | | |
SAP SE | | | | 9,500 | | | | | 980,783 | |
| | | | | | | | | | |
| Textiles, Apparel & Luxury Goods - 0.5% | | |
Adidas AG | | | | 1,670 | | | | | 226,328 | |
| | | | | | | | | | |
Total Germany | | | | | | | | | 4,221,765 | |
| | | | | | | | | | |
| | | | | | | | | | |
| COMMON STOCKS | | Shares | | Value |
| IRELAND - 2.5% | | | | |
| Construction Materials - 2.5% | | |
CRH PLC | | | | 28,000 | | | | $ | 1,113,561 | |
| | | | | | | | | | |
Total Ireland | | | | | | | | | 1,113,561 | |
| | | | | | | | | | |
| ITALY - 1.0% | | | | |
| Textiles, Apparel & Luxury Goods - 1.0% | | | | |
Moncler SpA | | | | 8,830 | | | | | 469,197 | |
| | | | | | | | | | |
Total Italy | | | | | | | | | 469,197 | |
| | | | | | | | | | |
| JAPAN - 3.5% | | | | |
| Building Products - 1.9% | | | | |
Daikin Industries Ltd. | | | | 5,450 | | | | | 826,839 | |
| | | | | | | | | | |
| Computers & Peripherals - 1.6% | | | | |
Nidec Corp. | | | | 14,250 | | | | | 733,293 | |
| | | | | | | | | | |
Total Japan | | | | | | | | | 1,560,132 | |
| | | | | | | | | | |
| NETHERLANDS - 9.2% | | | | |
| Banks - 2.4% | | | | |
ING Groep NV | | | | 89,000 | | | | | 1,084,120 | |
| | | | | | | | | | |
| Capital Markets - 2.0% | | | | |
Euronext NV | | | | 12,250 | | | | | 906,880 | |
| | | | | | | | | | |
| Professional Services - 2.6% | | | | |
Wolters Kluwer NV | | | | 11,250 | | | | | 1,177,143 | |
| | | | | | | | | | |
| Semiconductor Equipment & Products - 2.2% | | |
ASML Holding NV | | | | 1,800 | | | | | 981,450 | |
| | | | | | | | | | |
Total Netherlands | | | | | | | | | 4,149,593 | |
| | | | | | | | | | |
| NORWAY - 5.5% | | | | |
| Chemicals - 2.0% | | | | |
Elkem ASA | | | | 252,000 | | | | | 907,026 | |
| | | | | | | | | | |
| Diversified Telecommunication Services - 1.5% | | |
Telenor ASA | | | | 72,500 | | | | | 677,366 | |
| | | | | | | | | | |
| Oil, Gas & Consumable Fuels - 2.0% | | | | |
Aker BP ASA | | | | 28,744 | | | | | 893,446 | |
| | | | | | | | | | |
Total Norway | | | | | | | | | 2,477,838 | |
| | | | | | | | | | |
| SPAIN - 1.7% | | | | |
| Machinery - 1.7% | | | | |
Fluidra SA | | | | 47,555 | | | | | 739,432 | |
| | | | | | | | | | |
Total Spain | | | | | | | | | 739,432 | |
| | | | | | | | | | |
| SWEDEN - 2.1% | | | | |
| Hotels, Restaurants & Leisure - 2.1% | | | | |
Evolution AB | | | | 9,750 | | | | | 949,693 | |
| | | | | | | | | | |
Total Sweden | | | | | | | | | 949,693 | |
| | | | | | | | | | |
| SWITZERLAND - 13.4% | | | | |
| Banks - 2.5% | | | | |
Julius Baer Group Ltd. | | | | 19,500 | | | | | 1,134,922 | |
| | | | | | | | | | |
| Electrical Equipment & Instruments - 2.6% | | |
ABB Ltd. | | | | 37,892 | | | | | 1,154,854 | |
| | | | | | | | | | |
The accompanying notes are an integral part of these financial statements.
29
|
| LKCM INTERNATIONAL EQUITY FUND |
| SCHEDULEOF INVESTMENTS, CONTINUED |
| December 31, 2022 |
| | | | | | | | | | |
| COMMON STOCKS | | Shares | | Value |
| Food Products - 1.6% | | | | |
Nestle SA | | | | 6,100 | | | | $ | 704,608 | |
| | | | | | | | | | |
| Health Care Equipment & Supplies - 2.4% | | | | |
Alcon, Inc. | | | | 16,175 | | | | | 1,109,912 | |
| | | | | | | | | | |
| Pharmaceuticals - 4.3% | | | | |
Lonza Group AG | | | | 1,675 | | | | | 822,216 | |
Roche Holding AG | | | | 3,500 | | | | | 1,099,831 | |
| | | | | | | | | | |
| | | | | | | | | 1,922,047 | |
| | | | | | | | | | |
Total Switzerland | | | | | | | | | 6,026,343 | |
| | | | | | | | | | |
| UNITED KINGDOM - 20.5% | | | | |
| Banks - 2.1% | | | | |
Barclays PLC | | | | 500,000 | | | | | 951,411 | |
| | | | | | | | | | |
| Beverages - 2.4% | | | | |
Diageo PLC | | | | 25,000 | | | | | 1,094,302 | |
| | | | | | | | | | |
| Commercial Services & Supplies - 2.1% | | | | |
Rentokil Initial Plc | | | | 156,000 | | | | | 958,432 | |
| | | | | | | | | | |
| Hotels, Restaurants & Leisure - 3.1% | | | | |
Compass Group PLC | | | | 17,500 | | | | | 404,113 | |
InterContinental Hotels Group PLC | | | | 17,000 | | | | | 975,445 | |
| | | | | | | | | | |
| | | | | | | | | 1,379,558 | |
| | | | | | | | | | |
| Insurance - 2.2% | | | | |
Prudential PLC | | | | 73,000 | | | | | 995,381 | |
| | | | | | | | | | |
| Oil, Gas & Consumable Fuels - 2.5% | | | | |
Shell Plc | | | | 39,045 | | | | | 1,100,716 | |
| | | | | | | | | | |
| Personal Products - 2.6% | | | | |
Unilever PLC | | | | 23,150 | | | | | 1,168,799 | |
| | | | | | | | | | |
| Specialty Retail - 1.0% | | | | |
Burberry Group PLC | | | | 17,780 | | | | | 432,272 | |
| | | | | | | | | | |
| Trading Companies & Distributors - 2.5% | | | | |
Ashtead Group PLC | | | | 19,500 | | | | | 1,107,699 | |
| | | | | | | | | | |
Total United Kingdom | | | | | | | | | 9,188,570 | |
| | | | | | | | | | |
TOTAL COMMON STOCKS
(Cost $42,096,270) | | | | | | | | | 41,445,045 | |
| | | | | | | | | | |
| | | | | | | | | | |
| PREFERRED STOCKS - 1.7% | | | | |
| Life Sciences Tools & Services - 1.7% | | | | |
Sartorius AG | | | | 1,900 | | | | | 750,262 | |
| | | | | | | | | | |
TOTAL PREFERRED STOCKS
(Cost $557,271) | | | | | | | | | 750,262 | |
| | | | | | | | | | |
| | | | | | | | | | |
| SHORT-TERM INVESTMENTS - 6.0% | | Shares | | Value |
| Money Market Funds - 6.0% | | | | |
MSILF Government Portfolio, 4.11% (a) | | | | 1,337,808 | | | | $ | 1,337,808 | |
Invesco Short-Term Investments Trust - Government & Agency Portfolio - Institutional Shares, 4.21% (a) | | | | 1,356,600 | | | | | 1,356,601 | |
| | | | | | | | | | |
| | | | | | | | | 2,694,409 | |
| | | | | | | | | | |
TOTAL SHORT-TERM INVESTMENTS
(Cost $2,694,409) | | 2,694,409 |
| | | | | | | | | | |
Total Investments - 99.8%
(Cost $45,347,950) | | | | 44,889,716 |
Other Assets in Excess of Liabilities - 0.2% | | | | | 119,325 | |
| | | | | | | | | | |
TOTAL NET ASSETS - 100.0% | | | | | | | | $ | 45,009,041 | |
| | | | | | | | | | |
| (a) | The rate quoted is the annualized seven-day yield of the Fund at period end. |
Investments are classified by industry pursuant to the Global Industry Classification Standard (GICS®), which was developed by and/or is the exclusive property of Morgan Stanley Capital International, Inc. (“MSCI”) and Standard & Poor’s Financial Services LLC (“S&P”). GICS is a service mark of MSCI and S&P and has been licensed for use by U.S. Bancorp Fund Services, LLC.
The accompanying notes are an integral part of these financial statements.
30
|
| STATEMENTOF ASSETSAND LIABILITIES |
| December 31, 2022 |
| | | | | | | | | | | | | | | | | | | | | | | | | | | | | | | | | | | | | | | | | | | | | | | | | | | | | | | | | | | | |
| | | | | | | | | | | | |
| | | | | LKCM
Small Cap
Equity Fund | | | | LKCM
Small-Mid Cap
Equity Fund | | | | LKCM
Equity Fund | | | | LKCM
Balanced
Fund | | | | LKCM Fixed Income Fund | | | | LKCM
International
Equity Fund |
| | | | | | | | | | | | | | | | | | | | | | | | | | | | | | | | | | | | | | | | | | | | | | | | | | | | | | | | | | | | |
Assets | | | | | | | | | | | | | | | | | | | | | | | | | | | | | | | | | | | | | | | | | | | | | | | | | | | | | | | | | | | | |
Investments, at value* | | | | | | | | $ | 170,335,938 | | | | | | | | | $ | 15,233,787 | | | | | | | | | $ | 460,621,482 | | | | | | | | | $ | 108,626,855 | | | | | | | | | $ | 273,562,418 | | | | | | | | | $ | 44,889,716 | |
Cash | | | | | | | | | — | | | | | | | | | | — | | | | | | | | | | 57 | | | | | | | | | | — | | | | | | | | | | — | | | | | | | | | | — | |
Dividends and interest receivable | | | | | | | | | 130,060 | | | | | | | | | | 14,506 | | | | | | | | | | 628,105 | | | | | | | | | | 283,478 | | | | | | | | | | 1,965,736 | | | | | | | | | | 188,299 | |
Receivable for investment advisory fees (Note B) | | | | | | | | | — | | | | | | | | | | 9,705 | | | | | | | | | | — | | | | | | | | | | — | | | | | | | | | | — | | | | | | | | | | — | |
Receivable for Fund shares sold | | | | | | | | | 558 | | | | | | | | | | 310 | | | | | | | | | | 226,927 | | | | | | | | | | — | | | | | | | | | | 100,323 | | | | | | | | | | 147 | |
Prepaid expenses and other assets | | | | | | | | | 27,458 | | | | | | | | | | 8,830 | | | | | | | | | | 55,484 | | | | | | | | | | 24,284 | | | | | | | | | | 35,317 | | | | | | | | | | 8,763 | |
| | | | | | | | | | | | | | | | | | | | | | | | | | | | | | | | | | | | | | | | | | | | | | | | | | | | | | | | | | | | |
Total assets | | | | | | | | | 170,494,014 | | | | | | | | | | 15,267,138 | | | | | | | | | | 461,532,055 | | | | | | | | | | 108,934,617 | | | | | | | | | | 275,663,794 | | | | | | | | | | 45,086,925 | |
| | | | | | | | | | | | | | | | | | | | | | | | | | | | | | | | | | | | | | | | | | | | | | | | | | | | | | | | | | | | |
Liabilities | | | | | | | | | | | | | | | | | | | | | | | | | | | | | | | | | | | | | | | | | | | | | | | | | | | | | | | | | | | | |
Payable for investment advisory fees (Note B) | | | | | | | | | 299,436 | | | | | | | | | | — | | | | | | | | | | 662,483 | | | | | | | | | | 126,331 | | | | | | | | | | 155,146 | | | | | | | | | | 38,608 | |
Payable for administrative fees | | | | | | | | | 27,511 | | | | | | | | | | 9,643 | | | | | | | | | | 67,006 | | | | | | | | | | 18,553 | | | | | | | | | | 43,493 | | | | | | | | | | 9,569 | |
Payable for accounting and transfer agent fees and expenses | | | | | | | | | 23,878 | | | | | | | | | | 13,511 | | | | | | | | | | 30,929 | | | | | | | | | | 16,125 | | | | | | | | | | 26,275 | | | | | | | | | | 14,173 | |
Payable for professional fees | | | | | | | | | 24,045 | | | | | | | | | | 7,067 | | | | | | | | | | 52,425 | | | | | | | | | | 17,384 | | | | | | | | | | 33,304 | | | | | | | | | | 10,122 | |
Payable for custody fees and expenses | | | | | | | | | 3,428 | | | | | | | | | | 982 | | | | | | | | | | 8,196 | | | | | | | | | | 2,014 | | | | | | | | | | 4,973 | | | | | | | | | | 3,954 | |
Payable for reports to shareholders | | | | | | | | | 2,728 | | | | | | | | | | 389 | | | | | | | | | | 5,444 | | | | | | | | | | 1,951 | | | | | | | | | | 2,951 | | | | | | | | | | 586 | |
Payable for trustees’ fees and officer compensation (Note B) | | | | | | | | | 1,659 | | | | | | | | | | 157 | | | | | | | | | | 4,391 | | | | | | | | | | 938 | | | | | | | | | | 2,741 | | | | | | | | | | 470 | |
Payable for Fund shares redeemed | | | | | | | | | 70,893 | | | | | | | | | | 1,614 | | | | | | | | | | 55,000 | | | | | | | | | | 4,358 | | | | | | | | | | 6,000 | | | | | | | | | | — | |
Accrued expenses and other liabilities | | | | | | | | | 1,506 | | | | | | | | | | 99 | | | | | | | | | | 4,329 | | | | | | | | | | 919 | | | | | | | | | | 2,367 | | | | | | | | | | 402 | |
| | | | | | | | | | | | | | | | | | | | | | | | | | | | | | | | | | | | | | | | | | | | | | | | | | | | | | | | | | | | |
Total liabilities | | | | | | | | | 455,084 | | | | | | | | | | 33,462 | | | | | | | | | | 890,203 | | | | | | | | | | 188,573 | | | | | | | | | | 277,250 | | | | | | | | | | 77,884 | |
| | | | | | | | | | | | | | | | | | | | | | | | | | | | | | | | | | | | | | | | | | | | | | | | | | | | | | | | | | | | |
Net assets | | | | | | | | $ | 170,038,930 | | | | | | | | | $ | 15,233,676 | | | | | | | | | $ | 460,641,852 | | | | | | | | | $ | 108,746,044 | | | | | | | | | $ | 275,386,544 | | | | | | | | | $ | 45,009,041 | |
| | | | | | | | | | | | | | | | | | | | | | | | | | | | | | | | | | | | | | | | | | | | | | | | | | | | | | | | | | | | |
Net assets consist of: | | | | | | | | | | | | | | | | | | | | | | | | | | | | | | | | | | | | | | | | | | | | | | | | | | | | | | | | | | | | |
Paid-in capital | | | | | | | | $ | 133,528,404 | | | | | | | | | $ | 14,723,229 | | | | | | | | | $ | 262,717,468 | | | | | | | | | $ | 82,975,999 | | | | | | | | | $ | 291,773,745 | | | | | | | | | $ | 47,419,236 | |
Total distributable earnings | | | | | | | | | 36,510,526 | | | | | | | | | | 510,447 | | | | | | | | | | 197,924,384 | | | | | | | | | | 25,770,045 | | | | | | | | | | (16,387,201 | ) | | | | | | | | | (2,410,195 | ) |
| | | | | | | | | | | | | | | | | | | | | | | | | | | | | | | | | | | | | | | | | | | | | | | | | | | | | | | | | | | | |
Net assets | | | | | | | | $ | 170,038,930 | | | | | | | | | $ | 15,233,676 | | | | | | | | | $ | 460,641,852 | | | | | | | | | $ | 108,746,044 | | | | | | | | | $ | 275,386,544 | | | | | | | | | $ | 45,009,041 | |
| | | | | | | | | | | | | | | | | | | | | | | | | | | | | | | | | | | | | | | | | | | | | | | | | | | | | | | | | | | | |
Shares of beneficial interest outstanding
(unlimited shares of no par value authorized) | | | | | | | | | 10,389,317 | | | | | | | | | | 1,933,330 | | | | | | | | | | 14,863,522 | | | | | | | | | | 4,477,125 | | | | | | | | | | 27,271,035 | | | | | | | | | | 4,062,770 | |
Net asset value per share
(offering and redemption price) | | | | | | | | $ | 16.37 | | | | | | | | | $ | 7.88 | | | | | | | | | $ | 30.99 | | | | | | | | | $ | 24.29 | | | | | | | | | $ | 10.10 | | | | | | | | | $ | 11.08 | |
| | | | | | | | | | | | | | | | | | | | | | | | | | | | | | | | | | | | | | | | | | | | | | | | | | | | | | | | | | | | |
| | | | | | | | | | | | |
* Cost of Investments | | | | | | | | $ | 134,589,559 | | | | | | | | | $ | 14,723,319 | | | | | | | | | $ | 263,519,515 | | | | | | | | | $ | 83,304,288 | | | | | | | | | $ | 289,500,155 | | | | | | | | | $ | 45,347,950 | |
| | | | | | | | | | | | | | | | | | | | | | | | | | | | | | | | | | | | | | | | | | | | | | | | | | | | | | | | | | | | |
The accompanying notes are an integral part of these financial statements.
31
|
| STATEMENTOF OPERATIONS |
| Year Ended December 31, 2022 |
| | | | | | | | | | | | | | | | | | | | | | | | | | | | | | | | | | | | | | | | | | | | | | | | | | | | | | | | | | | | |
| | | | | | | | | | | | |
| | | | | LKCM
Small Cap
Equity Fund | | | | LKCM
Small-Mid Cap
Equity Fund | | | | LKCM
Equity
Fund | | | | LKCM
Balanced
Fund | | | | LKCM
Fixed
Income Fund | | | | LKCM
International
Equity Fund |
| | | | | | | | | | | | | | | | | | | | | | | | | | | | | | | | | | | | | | | | | | | | | | | | | | | �� | | | | | | | | | |
Investment Income: | | | | | | | | | | | | | | | | | | | | | | | | | | | | | | | | | | | | | | | | | | | | | | | | | | | | | | | | | | | | |
Dividends* | | | | | | | | $ | 1,277,601 | | | | | | | | | $ | 127,105 | | | | | | | | | $ | 7,597,500 | | | | | | | | | $ | 1,483,636 | | | | | | | | | $ | — | | | | | | | | | $ | 2,161,600 | |
Interest | | | | | | | | | 154,123 | | | | | | | | | | 19,451 | | | | | | | | | | 554,378 | | | | | | | | | | 684,822 | | | | | | | | | | 5,748,497 | | | | | | | | | | 52,815 | |
| | | | | | | | | | | | | | | | | | | | | | | | | | | | | | | | | | | | | | | | | | | | | | | | | | | | | | | | | | | | |
Total investment income | | | | | | | | | 1,431,724 | | | | | | | | | | 146,556 | | | | | | | | | | 8,151,878 | | | | | | | | | | 2,168,458 | | | | | | | | | | 5,748,497 | | | | | | | | | | 2,214,415 | |
| | | | | | | | | | | | | | | | | | | | | | | | | | | | | | | | | | | | | | | | | | | | | | | | | | | | | | | | | | | | |
| | | | | | | | | | | | |
Expenses: | | | | | | | | | | | | | | | | | | | | | | | | | | | | | | | | | | | | | | | | | | | | | | | | | | | | | | | | | | | | |
Investment advisory fees (Note B) | | | | | | | | | 1,395,312 | | | | | | | | | | 124,143 | | | | | | | | | | 3,343,687 | | | | | | | | | | 778,799 | | | | | | | | | | 1,410,331 | | | | | | | | | | 415,306 | |
Administrative fees | | | | | | | | | 174,684 | | | | | | | | | | 52,050 | | | | | | | | | | 422,510 | | | | | | | | | | 117,072 | | | | | | | | | | 264,080 | | | | | | | | | | 52,857 | |
Accounting and transfer agent fees and expenses | | | | | | | | | 146,887 | | | | | | | | | | 72,111 | | | | | | | | | | 278,704 | | | | | | | | | | 119,567 | | | | | | | | | | 186,944 | | | | | | | | | | 91,625 | |
Professional fees | | | | | | | | | 86,153 | | | | | | | | | | 12,396 | | | | | | | | | | 207,780 | | | | | | | | | | 56,189 | | | | | | | | | | 123,985 | | | | | | | | | | 26,342 | |
Trustees’ fees and officer compensation (Note B) | | | | | | | | | 111,009 | | | | | | | | | | 8,974 | | | | | | | | | | 266,119 | | | | | | | | | | 70,310 | | | | | | | | | | 153,479 | | | | | | | | | | 26,214 | |
Federal and state registration | | | | | | | | | 35,093 | | | | | | | | | | 18,167 | | | | | | | | | | 49,345 | | | | | | | | | | 25,028 | | | | | | | | | | 29,463 | | | | | | | | | | 21,484 | |
Custody fees and expenses | | | | | | | | | 21,371 | | | | | | | | | | 6,230 | | | | | | | | | | 51,089 | | | | | | | | | | 13,794 | | | | | | | | | | 30,271 | | | | | | | | | | 28,393 | |
Reports to shareholders | | | | | | | | | 12,683 | | | | | | | | | | 3,032 | | | | | | | | | | 26,831 | | | | | | | | | | 9,757 | | | | | | | | | | 13,945 | | | | | | | | | | 5,089 | |
Other | | | | | | | | | 2,629 | | | | | | | | | | 118 | | | | | | | | | | 5,937 | | | | | | | | | | 1,453 | | | | | | | | | | 3,594 | | | | | | | | | | 523 | |
| | | | | | | | | | | | | | | | | | | | | | | | | | | | | | | | | | | | | | | | | | | | | | | | | | | | | | | | | | | | |
Total expenses | | | | | | | | | 1,985,821 | | | | | | | | | | 297,221 | | | | | | | | | | 4,652,002 | | | | | | | | | | 1,191,969 | | | | | | | | | | 2,216,092 | | | | | | | | | | 667,833 | |
Less, expense waiver and/or reimbursement (Note B) | | | | | | | | | (125,665 | ) | | | | | | | | | (131,696 | ) | | | | | | | | | (830,646 | ) | | | | | | | | | (233,447 | ) | | | | | | | | | (805,761 | ) | | | | | | | | | (206,382 | ) |
| | | | | | | | | | | | | | | | | | | | | | | | | | | | | | | | | | | | | | | | | | | | | | | | | | | | | | | | | | | | |
Net expenses | | | | | | | | | 1,860,156 | | | | | | | | | | 165,525 | | | | | | | | | | 3,821,356 | | | | | | | | | | 958,522 | | | | | | | | | | 1,410,331 | | | | | | | | | | 461,451 | |
| | | | | | | | | | | | | | | | | | | | | | | | | | | | | | | | | | | | | | | | | | | | | | | | | | | | | | | | | | | | |
Net investment income (loss) | | | | | | | | | (428,432 | ) | | | | | | | | | (18,969 | ) | | | | | | | | | 4,330,522 | | | | | | | | | | 1,209,936 | | | | | | | | | | 4,338,166 | | | | | | | | | | 1,752,964 | |
| | | | | | | | | | | | | | | | | | | | | | | | | | | | | | | | | | | | | | | | | | | | | | | | | | | | | | | | | | | | |
| | | | | | | | | | | | |
Realized and Unrealized Gain (Loss): | | | | | | | | | | | | | | | | | | | | | | | | | | | | | | | | | | | | | | | | | | | | | | | | | | | | | | | | | | | | |
Net realized gain (loss) on: | | | | | | | | | | | | | | | | | | | | | | | | | | | | | | | | | | | | | | | | | | | | | | | | | | | | | | | | | | | | |
Investments | | | | | | | | $ | 5,502,322 | | | | | | | | | $ | 1,232,516 | | | | | | | | | $ | 21,505,545 | | | | | | | | | $ | 3,251,113 | | | | | | | | | $ | (774,929 | ) | | | | | | | | $ | (2,509,363 | ) |
Foreign currency translation | | | | | | | | | — | | | | | | | | | | 4 | | | | | | | | | | 55 | | | | | | | | | | 19 | | | | | | | | | | — | | | | | | | | | | (18,054 | ) |
Net change in unrealized appreciation (depreciation) on: | | | | | | | | | | | | | | | | | | | | | | | | | | | | | | | | | | | | | | | | | | | | | | | | | | | | | | | | | | | | |
Investments | | | | | | | | | (55,428,861 | ) | | | | | | | | | (5,556,658 | ) | | | | | | | | | (109,800,178 | ) | | | | | | | | | (24,111,758 | ) | | | | | | | | | (20,329,448 | ) | | | | | | | | | (10,859,646 | ) |
Foreign currency translation | | | | | | | | | — | | | | | | | | | | (22 | ) | | | | | | | | | 107 | | | | | | | | | | 38 | | | | | | | | | | — | | | | | | | | | | (3,408 | ) |
| | | | | | | | | | | | | | | | | | | | | | | | | | | | | | | | | | | | | | | | | | | | | | | | | | | | | | | | | | | | |
| | | | | | | | | | | | |
Net Realized and Unrealized Gain (Loss) | | | | | | | | | (49,926,539 | ) | | | | | | | | �� | (4,324,160 | ) | | | | | | | | | (88,294,471 | ) | | | | | | | | | 20,860,588 | | | | | | | | | | (21,104,377 | ) | | | | | | | | | (13,390,471 | ) |
| | | | | | | | | | | | | | | | | | | | | | | | | | | | | | | | | | | | | | | | | | | | | | | | | | | | | | | | | | | | |
| | | | | | | | | | | | |
Net Decrease in Net Assets Resulting from Operations | | | | | | | | $ | (50,354,971 | ) | | | | | | | | $ | (4,343,129 | ) | | | | | | | | $ | (83,963,949 | ) | | | | | | | | $ | (19,650,652 | ) | | | | | | | | $ | (16,766,211 | ) | | | | | | | | $ | (11,637,507 | ) |
| | | | | | | | | | | | | | | | | | | | | | | | | | | | | | | | | | | | | | | | | | | | | | | | | | | | | | | | | | | | |
| | | | | | | | | | | | |
* Net of foreign taxes withheld and/or issuance fees | | | | | | | | $ | 7,937 | | | | | | | | | $ | 396 | | | | | | | | | $ | 12,609 | | | | | | | | | $ | 1,920 | | | | | | | | | $ | — | | | | | | | | | $ | 149,938 | |
| | | | | | | | | | | | | | | | | | | | | | | | | | | | | | | | | | | | | | | | | | | | | | | | | | | | | | | | | | | | |
The accompanying notes are an integral part of these financial statements.
32
|
| STATEMENTSOF CHANGESIN NET ASSETS |
| | | | | | | | | | | | | | | | | | | | | | | | | | | | | | | | | | | | | | | | |
| | | | |
| | | | | LKCM
Small Cap
Equity Fund | | | | LKCM
Small-Mid Cap
Equity Fund |
| | | | | | | | | | | | | | | | | | | | | | | | | | | | | | | | | | | | | | | | |
| | | | | | | | |
| | | | | Year Ended
December 31,
2022 | | | | Year Ended
December 31,
2021 | | | | Year Ended
December 31,
2022 | | | | Year Ended
December 31,
2021 |
Operations: | | | | | | | | | | | | | | | | | | | | | | | | | | | | | | | | | | | | | | | | |
Net investment loss | | | | | | | | $ | (428,432 | ) | | | | | | | | $ | (732,120 | ) | | | | | | | | $ | (18,969 | ) | | | | | | | | $ | (78,691 | ) |
Net realized gain | | | | | | | | | 5,502,322 | | | | | | | | | | 29,340,979 | | | | | | | | | | 1,232,520 | | | | | | | | | | 2,253,060 | |
Net change in unrealized appreciation (depreciation) | | | | | | | | | (55,428,861 | ) | | | | | | | | | 829,538 | | | | | | | | | | (5,556,680 | ) | | | | | | | | | 96,333 | |
| | | | | | | | | | | | | | | | | | | | | | | | | | | | | | | | | | | | | | | | |
Net increase (decrease) in net assets resulting from operations | | | | | | | | | (50,354,971 | ) | | | | | | | | | 29,438,397 | | | | | | | | | | (4,343,129 | ) | | | | | | | | | 2,270,702 | |
| | | | | | | | | | | | | | | | | | | | | | | | | | | | | | | | | | | | | | | | |
| | | | | | | | |
Distributions to Shareholders | | | | | | | | | (4,046,906 | ) | | | | | | | | | (30,592,443 | ) | | | | | | | | | (1,188,908 | ) | | | | | | | | | (2,133,969 | ) |
| | | | | | | | | | | | | | | | | | | | | | | | | | | | | | | | | | | | | | | | |
| | | | | | | | |
Net increase (decrease) in net assets from
Fund share transactions (Note C) | | | | | | | | | (4,758,424 | ) | | | | | | | | | 27,674,863 | | | | | | | | | | 6,411,090 | | | | | | | | | | (890,465 | ) |
| | | | | | | | | | | | | | | | | | | | | | | | | | | | | | | | | | | | | | | | |
| | | | | | | | |
Total increase (decrease) in net assets | | | | | | | | | (59,160,301 | ) | | | | | | | | | 26,520,817 | | | | | | | | | | 879,053 | | | | | | | | | | (753,732 | ) |
| | | | | | | | |
Net Assets: | | | | | | | | | | | | | | | | | | | | | | | | | | | | | | | | | | | | | | | | |
Beginning of period | | | | | | | | | 229,199,231 | | | | | | | | | | 202,678,414 | | | | | | | | | | 14,354,623 | | | | | | | | | | 15,108,355 | |
| | | | | | | | | | | | | | | | | | | | | | | | | | | | | | | | | | | | | | | | |
End of period | | | | | | | | $ | 170,038,930 | | | | | | | | | $ | 229,199,231 | | | | | | | | | $ | 15,233,676 | | | | | | | | | $ | 14,354,623 | |
| | | | | | | | | | | | | | | | | | | | | | | | | | | | | | | | | | | | | | | | |
The accompanying notes are an integral part of these financial statements.
33
|
| STATEMENTSOF CHANGESIN NET ASSETS |
| | | | | | | | | | | | | | | | | | | | | | | | | | | | | | | | | | | | | | | | |
| | | | |
| | | | | LKCM
Equity Fund | | | | LKCM
Balanced Fund |
| | | | | | | | | | | | | | | | | | | | | | | | | | | | | | | | | | | | | | | | |
| | | | | | | | |
| | | | | Year Ended
December 31,
2022 | | | | Year Ended
December 31,
2021 | | | | Year Ended
December 31,
2022 | | | | Year Ended
December 31,
2021 |
Operations: | | | | | | | | | | | | | | | | | | | | | | | | | | | | | | | | | | | | | | | | |
Net investment income | | | | | | | | $ | 4,330,522 | | | | | | | | | $ | 2,188,034 | | | | | | | | | $ | 1,209,936 | | | | | | | | | $ | 941,306 | |
Net realized gain | | | | | | | | | 21,505,600 | | | | | | | | | | 33,687,396 | | | | | | | | | | 3,251,132 | | | | | | | | | | 5,267,252 | |
Net change in unrealized appreciation (depreciation) | | | | | | | | | (109,800,071 | ) | | | | | | | | | 65,351,081 | | | | | | | | | | (24,111,720 | ) | | | | | | | | | 11,493,740 | |
| | | | | | | | | | | | | | | | | | | | | | | | | | | | | | | | | | | | | | | | |
Net increase (decrease) in net assets resulting from operations | | | | | | | | | (83,963,949 | ) | | | | | | | | | 101,226,511 | | | | | | | | | | (19,650,652 | ) | | | | | | | | | 17,702,298 | |
| | | | | | | | | | | | | | | | | | | | | | | | | | | | | | | | | | | | | | | | |
| | | | | | | | |
Distributions to Shareholders | | | | | | | | | (24,107,109 | ) | | | | | | | | | (34,873,796 | ) | | | | | | | | | (3,843,318 | ) | | | | | | | | | (6,153,028 | ) |
| | | | | | | | | | | | | | | | | | | | | | | | | | | | | | | | | | | | | | | | |
| | | | | | | | |
Net increase (decrease) in net assets resulting from
Fund share transactions (Note C) | | | | | | | | | 26,016,554 | | | | | | | | | | 26,690,707 | | | | | | | | | | (12,660,599 | ) | | | | | | | | | 7,844,345 | |
| | | | | | | | | | | | | | | | | | | | | | | | | | | | | | | | | | | | | | | | |
| | | | | | | | |
Total increase (decrease) in net assets | | | | | | | | | (82,054,504 | ) | | | | | | | | | 93,043,422 | | | | | | | | | | (36,154,569 | ) | | | | | | | | | 19,393,615 | |
| | | | | | | | |
Net Assets: | | | | | | | | | | | | | | | | | | | | | | | | | | | | | | | | | | | | | | | | |
Beginning of period | | | | | | | | | 542,696,356 | | | | | | | | | | 449,652,934 | | | | | | | | | | 144,900,613 | | | | | | | | | | 125,506,998 | |
| | | | | | | | | | | | | | | | | | | | | | | | | | | | | | | | | | | | | | | | |
End of period | | | | | | | | $ | 460,641,852 | | | | | | | | | $ | 542,696,356 | | | | | | | | | $ | 108,746,044 | | | | | | | | | $ | 144,900,613 | |
| | | | | | | | | | | | | | | | | | | | | | | | | | | | | | | | | | | | | | | | |
The accompanying notes are an integral part of these financial statements.
34
|
| STATEMENTSOF CHANGESIN NET ASSETS |
| | | | | | | | | | | | | | | | | | | | | | | | | | | | | | | | | | | | | | | | |
| | | | |
| | | | | LKCM
Fixed Income Fund | | | | LKCM
International Equity Fund |
| | | | | | | | | | | | | | | | | | | | | | | | | | | | | | | | | | | | | | | | |
| | | | | | | | |
| | | | | Year Ended
December 31,
2022 | | | | Year Ended
December 31,
2021 | | | | Year Ended
December 31,
2022 | | | | Year Ended
December 31,
2021 |
Operations: | | | | | | | | | | | | | | | | | | | | | | | | | | | | | | | | | | | | | | | | |
Net investment income | | | | | | | | $ | 4,338,166 | | | | | | | | | $ | 3,880,841 | | | | | | | | | $ | 1,752,964 | | | | | | | | | $ | 329,440 | |
Net realized gain (loss) | | | | | | | | | (774,929 | ) | | | | | | | | | 1,731,290 | | | | | | | | | | (2,527,417 | ) | | | | | | | | | 1,512,938 | |
Net change in unrealized appreciation (depreciation) | | | | | | | | | (20,329,448 | ) | | | | | | | | | (10,167,137 | ) | | | | | | | | | (10,863,054 | ) | | | | | | | | | 5,382,308 | |
| | | | | | | | | | | | | | | | | | | | | | | | | | | | | | | | | | | | | | | | |
Net increase (decrease) in net assets resulting from operations | | | | | | | | | (16,766,211 | ) | | | | | | | | | (4,555,006 | ) | | | | | | | | | (11,637,507 | ) | | | | | | | | | 7,224,686 | |
| | | | | | | | | | | | | | | | | | | | | | | | | | | | | | | | | | | | | | | | |
| | | | | | | | |
Distributions to Shareholders | | | | | | | | | (4,334,538 | ) | | | | | | | | | (3,924,713 | ) | | | | | | | | | (1,746,946 | ) | | | | | | | | | (680,356 | ) |
| | | | | | | | | | | | | | | | | | | | | | | | | | | | | | | | | | | | | | | | |
| | | | | | | | |
Net increase in net assets from
Fund share transactions (Note C) | | | | | | | | | 742,557 | | | | | | | | | | 14,367,868 | | | | | | | | | | 2,889,320 | | | | | | | | | | 16,665,163 | |
| | | | | | | | | | | | | | | | | | | | | | | | | | | | | | | | | | | | | | | | |
| | | | | | | | |
Total increase (decrease) in net assets | | | | | | | | | (20,358,192 | ) | | | | | | | | | 5,888,149 | | | | | | | | | | (10,495,133 | ) | | | | | | | | | 23,209,493 | |
| | | | | | | | |
Net Assets: | | | | | | | | | | | | | | | | | | | | | | | | | | | | | | | | | | | | | | | | |
Beginning of period | | | | | | | | | 295,744,736 | | | | | | | | | | 289,856,587 | | | | | | | | | | 55,504,174 | | | | | | | | | | 32,294,681 | |
| | | | | | | | | | | | | | | | | | | | | | | | | | | | | | | | | | | | | | | | |
End of period | | | | | | | | $ | 275,386,544 | | | | | | | | | $ | 295,744,736 | | | | | | | | | $ | 45,009,041 | | | | | | | | | $ | 55,504,174 | |
| | | | | | | | | | | | | | | | | | | | | | | | | | | | | | | | | | | | | | | | |
The accompanying notes are an integral part of these financial statements.
35
|
| FINANCIAL HIGHLIGHTS |
| SELECTED DATAFOR EACH SHAREOF CAPITAL STOCK OUTSTANDING |
| | | | | | | | | | | | | | | | | | | | | | | | | | | | | | | | | | | | | | | | | | | | | | | | | | |
| | |
| | | | | LKCM Small Cap Equity Fund |
| | | | | | | | | | | | | | | | | | | | | | | | | | | | | | | | | | | | | | | | | | | | | | | | | | |
| | | | | | | | | | |
| | | | | Year
Ended
December 31,
2022 | | | | Year
Ended
December 31,
2021 | | | | Year
Ended
December 31,
2020 | | | | Year
Ended
December 31,
2019 | | | | Year
Ended
December 31,
2018 |
Net Asset Value – Beginning of Period | | | | | | | | $ | 21.54 | | | | | | | | | $ | 21.77 | | | | | | | | | $ | 16.78 | | | | | | | | | $ | 14.39 | | | | | | | | | $ | 18.44 | |
| | | | | | | | | | | | | | | | | | | | | | | | | | | | | | | | | | | | | | | | | | | | | | | | | | |
Net investment loss | | | | | | | | | (0.04 | )(1) | | | | | | | | | (0.08 | )(1) | | | | | | | | | (0.02 | )(1) | | | | | | | | | (0.02 | )(1) | | | | | | | | | (0.03 | )(2) |
Net realized and unrealized gain (loss) on investments | | | | | | | | | (4.73 | ) | | | | | | | | | 3.23 | | | | | | | | | | 5.85 | | | | | | | | | | 3.29 | | | | | | | | | | (1.05 | ) |
| | | | | | | | | | | | | | | | | | | | | | | | | | | | | | | | | | | | | | | | | | | | | | | | | | |
Total from investment operations | | | | | | | | | (4.77 | ) | | | | | | | | | 3.15 | | | | | | | | | | 5.83 | | | | | | | | | | 3.27 | | | | | | | | | | (1.08 | ) |
| | | | | | | | | | | | | | | | | | | | | | | | | | | | | | | | | | | | | | | | | | | | | | | | | | |
Distributions from net realized gains | | | | | | | | | (0.40 | ) | | | | | | | | | (3.38 | ) | | | | | | | | | (0.84 | ) | | | | | | | | | (0.88 | ) | | | | | | | | | (2.97 | ) |
| | | | | | | | | | | | | | | | | | | | | | | | | | | | | | | | | | | | | | | | | | | | | | | | | | |
Total dividends and distributions | | | | | | | | | (0.40 | ) | | | | | | | | | (3.38 | ) | | | | | | | | | (0.84 | ) | | | | | | | | | (0.88 | ) | | | | | | | | | (2.97 | ) |
| | | | | | | | | | | | | | | | | | | | | | | | | | | | | | | | | | | | | | | | | | | | | | | | | | |
Net Asset Value – End of Period | | | | | | | | $ | 16.37 | | | | | | | | | $ | 21.54 | | | | | | | | | $ | 21.77 | | | | | | | | | $ | 16.78 | | | | | | | | | $ | 14.39 | |
| | | | | | | | | | | | | | | | | | | | | | | | | | | | | | | | | | | | | | | | | | | | | | | | | | |
Total Return | | | | | | | | | -22.11% | | | | | | | | | | 14.49% | | | | | | | | | | 34.79% | | | | | | | | | | 22.70% | | | | | | | | | | -5.70% | |
| | | | | | | | | | |
Ratios and Supplemental Data: | | | | | | | | | | | | | | | | | | | | | | | | | | | | | | | | | | | | | | | | | | | | | | | | | | |
Net assets, end of period (thousands) | | | | | | | | $
|
170,039 |
| | | | | | | | $ | 229,199 | | | | | | | | | $ | 202,678 | | | | | | | | | $ | 180,682 | | | | | | | | | $ | 160,322 | |
Ratio of expenses to average net assets: | | | | | | | | | | | | | | | | | | | | | | | | | | | | | | | | | | | | | | | | | | | | | | | | | | |
Before expense waiver and/or reimbursement | | | | | | | | | 1.07% | | | | | | | | | | 1.03% | | | | | | | | | | 1.07% | | | | | | | | | | 1.07% | | | | | | | | | | 1.08% | |
After expense waiver and/or reimbursement | | | | | | | | | 1.00% | | | | | | | | | | 1.00% | | | | | | | | | | 1.00% | | | | | | | | | | 1.00% | | | | | | | | | | 1.00% | |
Ratio of net investment loss to average net assets: | | | | | | | | | | | | | | | | | | | | | | | | | | | | | | | | | | | | | | | | | | | | | | | | | | |
Before expense waiver and/or reimbursement | | | | | | | | | (0.30)% | | | | | | | | | | (0.35)% | | | | | | | | | | (0.20)% | | | | | | | | | | (0.20)% | | | | | | | | | | (0.25)% | |
After expense waiver and/or reimbursement | | | | | | | | | (0.23)% | | | | | | | | | | (0.32)% | | | | | | | | | | (0.13)% | | | | | | | | | | (0.13)% | | | | | | | | | | (0.17)% | |
Portfolio turnover rate | | | | | | | | | 42% | | | | | | | | | | 42% | | | | | | | | | | 60% | | | | | | | | | | 63% | | | | | | | | | | 45% | |
| (1) | Net investment loss per share represents net investment loss divided by the average shares outstanding throughout the period. |
| (2) | Net investment loss per share is calculated using the ending balance of undistributed net investment loss prior to considerations of adjustments for permanent book and tax differences. |
| | | | | | | | | | | | | | | | | | | | | | | | | | | | | | | | | | | | | | | | | | | | | | | | | | |
| | |
| | | | | LKCM Small-Mid Cap Equity Fund |
| | | | | | | | | | | | | | | | | | | | | | | | | | | | | | | | | | | | | | | | | | | | | | | | | | |
| | | | | | | | | | |
| | | | | Year
Ended
December 31,
2022 | | | | Year
Ended
December 31,
2021 | | | | Year
Ended
December 31,
2020 | | | | Year
Ended
December 31,
2019 | | | | Year
Ended
December 31,
2018 |
Net Asset Value – Beginning of Period | | | | | | | | $ | 10.97 | | | | | | | | | $ | 11.15 | | | | | | | | | $ | 9.09 | | | | | | | | | $ | 7.92 | | | | | | | | | $ | 10.60 | |
| | | | | | | | | | | | | | | | | | | | | | | | | | | | | | | | | | | | | | | | | | | | | | | | | | |
Net investment loss | | | | | | | | | (0.01 | )(1) | | | | | | | | | (0.06 | )(1) | | | | | | | | | (0.02 | )(1) | | | | | | | | | (0.02 | )(1) | | | | | | | | | (0.03 | )(2) |
Net realized and unrealized gain (loss) on investments | | | | | | | | | (2.43 | ) | | | | | | | | | 1.77 | | | | | | | | | | 2.80 | | | | | | | | | | 2.48 | | | | | | | | | | (0.93 | ) |
| | | | | | | | | | | | | | | | | | | | | | | | | | | | | | | | | | | | | | | | | | | | | | | | | | |
Total from investment operations | | | | | | | | | (2.44 | ) | | | | | | | | | 1.71 | | | | | | | | | | 2.78 | | | | | | | | | | 2.46 | | | | | | | | | | (0.96 | ) |
| | | | | | | | | | | | | | | | | | | | | | | | | | | | | | | | | | | | | | | | | | | | | | | | | | |
Distributions from net realized gains | | | | | | | | | (0.65 | ) | | | | | | | | | (1.89 | ) | | | | | | | | | (0.72 | ) | | | | | | | | | (1.29 | ) | | | | | | | | | (1.72 | ) |
| | | | | | | | | | | | | | | | | | | | | | | | | | | | | | | | | | | | | | | | | | | | | | | | | | |
Total dividends and distributions | | | | | | | | | (0.65 | ) | | | | | | | | | (1.89 | ) | | | | | | | | | (0.72 | ) | | | | | | | | | (1.29 | ) | | | | | | | | | (1.72 | ) |
| | | | | | | | | | | | | | | | | | | | | | | | | | | | | | | | | | | | | | | | | | | | | | | | | | |
Net Asset Value – End of Period | | | | | | | | $ | 7.88 | | | | | | | | | $ | 10.97 | | | | | | | | | $ | 11.15 | | | | | | | | | $ | 9.09 | | | | | | | | | $ | 7.92 | |
| | | | | | | | | | | | �� | | | | | | | | | | | | | | | | | | | | | | | | | | | | | | | | | | | | | | |
Total Return | | | | | | | | | -22.12% | | | | | | | | | | 15.37% | | | | | | | | | | 30.66% | | | | | | | | | | 31.05% | | | | | | | | | | -8.89% | |
| | | | | | | | | | |
Ratios and Supplemental Data: | | | | | | | | | | | | | | | | | | | | | | | | | | | | | | | | | | | | | | | | | | | | | | | | | | |
Net assets, end of period (thousands) | | | | | | | | $ | 15,234 | | | | | | | | | $ | 14,355 | | | | | | | | | $ | 15,108 | | | | | | | | | $ | 12,590 | | | | | | | | | $ | 12,162 | |
Ratio of expenses to average net assets: | | | | | | | | | | | | | | | | | | | | | | | | | | | | | | | | | | | | | | | | | | | | | | | | | | |
Before expense waiver and/or reimbursement | | | | | | | | | 1.80% | | | | | | | | | | 1.74% | | | | | | | | | | 1.98% | | | | | | | | | | 1.95% | | | | | | | | | | 1.75% | |
After expense waiver and/or reimbursement | | | | | | | | | 1.00% | | | | | | | | | | 1.00% | | | | | | | | | | 1.00% | | | | | | | | | | 1.00% | | | | | | | | | | 1.00% | |
Ratio of net investment loss to average net assets: | | | | | | | | | | | | | | | | | | | | | | | | | | | | | | | | | | | | | | | | | | | | | | | | | | |
Before expense waiver and/or reimbursement | | | | | | | | | (0.92)% | | | | | | | | | | (1.23)% | | | | | | | | | | (1.25)% | | | | | | | | | | (1.20)% | | | | | | | | | | (1.05)% | |
After expense waiver and/or reimbursement | | | | | | | | | (0.11)% | | | | | | | | | | (0.49)% | | | | | | | | | | (0.27)% | | | | | | | | | | (0.25)% | | | | | | | | | | (0.30)% | |
Portfolio turnover rate | | | | | | | | | 50% | | | | | | | | | | 50% | | | | | | | | | | 76% | | | | | | | | | | 68% | | | | | | | | | | 56% | |
| (1) | Net investment loss per share represents net investment loss divided by the average shares outstanding throughout the period. |
| (2) | Net investment loss per share is calculated using the ending balance of undistributed net investment loss prior to considerations of adjustments for permanent book and tax differences. |
The accompanying notes are an integral part of these financial statements.
36
|
| FINANCIAL HIGHLIGHTS |
| SELECTED DATAFOR EACH SHAREOF CAPITAL STOCK OUTSTANDING |
| | | | | | | | | | | | | | | | | | | | | | | | | | | | | | | | | | | | | | | | | | | | | | | | | | |
| | |
| | | | | LKCM Equity Fund |
| | | | | | | | | | | | | | | | | | | | | | | | | | | | | | | | | | | | | | | | | | | | | | | | | | |
| | | | | | | | | | |
| | | | | Year
Ended
December 31,
2022 | | | | Year
Ended
December 31,
2021 | | | | Year
Ended
December 31,
2020 | | | | Year
Ended
December 31,
2019 | | | | Year
Ended
December 31,
2018 |
Net Asset Value – Beginning of Period | | | | | | | | $ | 38.69 | | | | | | | | | $ | 33.74 | | | | | | | | | $ | 29.02 | | | | | | | | | $ | 23.34 | | | | | | | | | $ | 26.02 | |
| | | | | | | | | | | | | | | | | | | | | | | | | | | | | | | | | | | | | | | | | | | | | | | | | | |
Net investment income | | | | | | | | | 0.31 | (1) | | | | | | | | | 0.16 | (1) | | | | | | | | | 0.17 | (1) | | | | | | | | | 0.22 | (1) | | | | | | | | | 0.21 | |
Net realized and unrealized gain (loss) on investments | | | | | | | | | (6.31 | ) | | | | | | | | | 7.43 | | | | | | | | | | 6.44 | | | | | | | | | | 6.75 | | | | | | | | | | (1.08 | ) |
| | | | | | | | | | | | | | | | | | | | | | | | | | | | | | | | | | | | | | | | | | | | | | | | | | |
Total from investment operations | | | | | | | | | (6.00 | ) | | | | | | | | | 7.59 | | | | | | | | | | 6.61 | | | | | | | | | | 6.97 | | | | | | | | | | (0.87 | ) |
| | | | | | | | | | | | | | | | | | | | | | | | | | | | | | | | | | | | | | | | | | | | | | | | | | |
Dividends from net investment income | | | | | | | | | (0.30 | ) | | | | | | | | | (0.17 | ) | | | | | | | | | (0.17 | ) | | | | | | | | | (0.23 | ) | | | | | | | | | (0.21 | ) |
Distributions from net realized gains | | | | | | | | | (1.40 | ) | | | | | | | | | (2.47 | ) | | | | | | | | | (1.72 | ) | | | | | | | | | (1.06 | ) | | | | | | | | | (1.60 | ) |
| | | | | | | | | | | | | | | | | | | | | | | | | | | | | | | | | | | | | | | | | | | | | | | | | | |
Total dividends and distributions | | | | | | | | | (1.70 | ) | | | | | | | | | (2.64 | ) | | | | | | | | | (1.89 | ) | | | | | | | | | (1.29 | ) | | | | | | | | | (1.81 | ) |
| | | | | | | | | | | | | | | | | | | | | | | | | | | | | | | | | | | | | | | | | | | | | | | | | | |
Redemption fees | | | | | | | | | 0.00 | (2) | | | | | | | | | — | | | | | | | | | | — | | | | | | | | | | — | | | | | | | | | | — | |
| | | | | | | | | | | | | | | | | | | | | | | | | | | | | | | | | | | | | | | | | | | | | | | | | | |
Net Asset Value – End of Period | | | | | | | | $ | 30.99 | | | | | | | | | $ | 38.69 | | | | | | | | | $ | 33.74 | | | | | | | | | $ | 29.02 | | | | | | | | | $ | 23.34 | |
| | | | | | | | | | | | | | | | | | | | | | | | | | | | | | | | | | | | | | | | | | | | | | | | | | |
Total Return | | | | | | | | | -15.44% | | | | | | | | | | 22.48% | | | | | | | | | | 22.83% | | | | | | | | | | 29.85% | | | | | | | | | | -3.28% | |
| | | | | | | | | | |
Ratios and Supplemental Data: | | | | | | | | | | | | | | | | | | | | | | | | | | | | | | | | | | | | | | | | | | | | | | | | | | |
Net assets, end of period (thousands) | | | | | | | | $ | 460,642 | | | | | | | | | $ | 542,696 | | | | | | | | | $ | 449,653 | | | | | | | | | $ | 381,307 | | | | | | | | | $ | 308,667 | |
Ratio of expenses to average net assets: | | | | | | | | | | | | | | | | | | | | | | | | | | | | | | | | | | | | | | | | | | | | | | | | | | |
Before expense waiver and/or reimbursement | | | | | | | | | 0.97% | | | | | | | | | | 0.96% | | | | | | | | | | 0.98% | | | | | | | | | | 0.99% | | | | | | | | | | 0.98% | |
After expense waiver and/or reimbursement | | | | | | | | | 0.80% | | | | | | | | | | 0.80% | | | | | | | | | | 0.80% | | | | | | | | | | 0.80% | | | | | | | | | | 0.80% | |
Ratio of net investment income to average net assets: | | | | | | | | | | | | | | | | | | | | | | | | | | | | | | | | | | | | | | | | | | | | | | | | | | |
Before expense waiver and/or reimbursement | | | | | | | | | 0.74% | | | | | | | | | | 0.27% | | | | | | | | | | 0.37% | | | | | | | | | | 0.61% | | | | | | | | | | 0.56% | |
After expense waiver and/or reimbursement | | | | | | | | | 0.91% | | | | | | | | | | 0.43% | | | | | | | | | | 0.55% | | | | | | | | | | 0.80% | | | | | | | | | | 0.74% | |
Portfolio turnover rate | | | | | | | | | 11% | | | | | | | | | | 11% | | | | | | | | | | 10% | | | | | | | | | | 9% | | | | | | | | | | 16% | |
| (1) | Net investment income per share represents net investment income divided by the average shares outstanding throughout the period. |
| | | | | | | | | | | | | | | | | | | | | | | | | | | | | | | | | | | | | | | | | | | | | | | | | | |
| | |
| | | | | LKCM Balanced Fund |
| | | | | | | | | | | | | | | | | | | | | | | | | | | | | | | | | | | | | | | | | | | | | | | | | | |
| | | | | | | | | | |
| | | | | Year
Ended
December 31,
2022 | | | | Year
Ended
December 31,
2021 | | | | Year
Ended
December 31,
2020 | | | | Year
Ended
December 31,
2019 | | | | Year
Ended
December 31,
2018 |
Net Asset Value – Beginning of Period | | | | | | | | $ | 29.21 | | | | | | | | | $ | 26.76 | | | | | | | | | $ | 24.22 | | | | | | | | | $ | 21.07 | | | | | | | | | $ | 22.18 | |
| | | | | | | | | | | | | | | | | | | | | | | | | | | | | | | | | | | | | | | | | | | | | | | | | | |
Net investment income | | | | | | | | | 0.26 | (1) | | | | | | | | | 0.20 | (1) | | | | | | | | | 0.24 | (1) | | | | | | | | | 0.27 | (1) | | | | | | | | | 0.23 | |
Net realized and unrealized gain (loss) on investments | | | | | | | | | (4.30 | ) | | | | | | | | | 3.54 | | | | | | | | | | 3.42 | | | | | | | | | | 4.32 | | | | | | | | | | (0.70 | ) |
| | | | | | | | | | | | | | | | | | | | | | | | | | | | | | | | | | | | | | | | | | | | | | | | | | |
Total from investment operations | | | | | | | | | (4.04 | ) | | | | | | | | | 3.74 | | | | | | | | | | 3.66 | | | | | | | | | | 4.59 | | | | | | | | | | (0.47 | ) |
| | | | | | | | | | | | | | | | | | | | | | | | | | | | | | | | | | | | | | | | | | | | | | | | | | |
Dividends from net investment income | | | | | | | | | (0.27 | ) | | | | | | | | | (0.20 | ) | | | | | | | | | (0.24 | ) | | | | | | | | | (0.27 | ) | | | | | | | | | (0.23 | ) |
Distributions from net realized gains | | | | | | | | | (0.61 | ) | | | | | | | | | (1.09 | ) | | | | | | | | | (0.88 | ) | | | | | | | | | (1.17 | ) | | | | | | | | | (0.41 | ) |
| | | | | | | | | | | | | | | | | | | | | | | | | | | | | | | | | | | | | | | | | | | | | | | | | | |
Total dividends and distributions | | | | | | | | | (0.88 | ) | | | | | | | | | (1.29 | ) | | | | | | | | | (1.12 | ) | | | | | | | | | (1.44 | ) | | | | | | | | | (0.64 | ) |
| | | | | | | | | | | | | | | | | | | | | | | | | | | | | | | | | | | | | | | | | | | | | | | | | | |
Redemption fees | | | | | | | | | 0.00 | (2) | | | | | | | | | — | | | | | | | | | | — | | | | | | | | | | — | | | | | | | | | | — | |
| | | | | | | | | | | | | | | | | | | | | | | | | | | | | | | | | | | | | | | | | | | | | | | | | | |
Net Asset Value – End of Period | | | | | | | | $ | 24.29 | | | | | | | | | $ | 29.21 | | | | | | | | | $ | 26.76 | | | | | | | | | $ | 24.22 | | | | | | | | | $ | 21.07 | |
| | | | | | | | | | | | | | | | | | | | | | | | | | | | | | | | | | | | | | | | | | | | | | | | | | |
Total Return | | | | | | | | | -13.84% | | | | | | | | | | 14.01% | | | | | | | | | | 15.28% | | | | | | | | | | 21.85% | | | | | | | | | | -2.15% | |
| | | | | | | | | | |
Ratios and Supplemental Data: | | | | | | | | | | | | | | | | | | | | | | | | | | | | | | | | | | | | | | | | | | | | | | | | | | |
Net assets, end of period (thousands) | | | | | | | | $ | 108,746 | | | | | | | | | $ | 144,901 | | | | | | | | | $ | 125,507 | | | | | | | | | $ | 103,825 | | | | | | | | | $ | 85,907 | |
Ratio of expenses to average net assets: | | | | | | | | | | | | | | | | | | | | | | | | | | | | | | | | | | | | | | | | | | | | | | | | | | |
Before expense waiver and/or reimbursement | | | | | | | | | 0.99% | | | | | | | | | | 0.96% | | | | | | | | | | 0.99% | | | | | | | | | | 1.00% | | | | | | | | | | 1.00% | |
After expense waiver and/or reimbursement | | | | | | | | | 0.80% | | | | | | | | | | 0.80% | | | | | | | | | | 0.80% | | | | | | | | | | 0.80% | | | | | | | | | | 0.80% | |
Ratio of net investment income to average net assets: | | | | | | | | | | | | | | | | | | | | | | | | | | | | | | | | | | | | | | | | | | | | | | | | | | |
Before expense waiver and/or reimbursement | | | | | | | | | 0.82% | | | | | | | | | | 0.53% | | | | | | | | | | 0.78% | | | | | | | | | | 0.95% | | | | | | | | | | 0.83% | |
After expense waiver and/or reimbursement | | | | | | | | | 1.01% | | | | | | | | | | 0.69% | | | | | | | | | | 0.97% | | | | | | | | | | 1.15% | | | | | | | | | | 1.03% | |
Portfolio turnover rate | | | | | | | | | 13% | | | | | | | | | | 11% | | | | | | | | | | 18% | | | | | | | | | | 17% | | | | | | | | | | 17% | |
| (1) | Net investment income per share represents net investment income divided by the average shares outstanding throughout the period. |
The accompanying notes are an integral part of these financial statements.
37
|
| FINANCIAL HIGHLIGHTS |
| SELECTED DATAFOR EACH SHAREOF CAPITAL STOCK OUTSTANDING |
| | | | | | | | | | | | | | | | | | | | | | | | | | | | | | | | | | | | | | | | | | | | | | | | | | |
| | |
| | | | | LKCM Fixed Income Fund |
| | | | | | | | | | | | | | | | | | | | | | | | | | | | | | | | | | | | | | | | | | | | | | | | | | |
| | | | | | | | | | |
| | | | | Year
Ended
December 31,
2022 | | | | Year
Ended
December 31,
2021 | | | | Year
Ended
December 31,
2020 | | | | Year
Ended
December 31,
2019 | | | | Year
Ended
December 31,
2018 |
Net Asset Value – Beginning of Period | | | | | | | | $ | 10.87 | | | | | | | | | $ | 11.19 | | | | | | | | | $ | 10.92 | | | | | | | | | $ | 10.47 | | | | | | | | | $ | 10.68 | |
| | | | | | | | | | | | | | | | | | | | | | | | | | | | | | | | | | | | | | | | | | | | | | | | | | |
Net investment income | | | | | | | | | 0.16 | (1) | | | | | | | | | 0.15 | (1) | | | | | | | | | 0.19 | (1) | | | | | | | | | 0.25 | (1) | | | | | | | | | 0.24 | |
Net realized and unrealized gain (loss) on investments | | | | | | | | | (0.77 | ) | | | | | | | | | (0.32 | ) | | | | | | | | | 0.27 | | | | | | | | | | 0.45 | | | | | | | | | | (0.21 | ) |
| | | | | | | | | | | | | | | | | | | | | | | | | | | | | | | | | | | | | | | | | | | | | | | | | | |
Total from investment operations | | | | | | | | | (0.61 | ) | | | | | | | | | (0.17 | ) | | | | | | | | | 0.46 | | | | | | | | | | 0.70 | | | | | | | | | | 0.03 | |
| | | | | | | | | | | | | | | | | | | | | | | | | | | | | | | | | | | | | | | | | | | | | | | | | | |
Dividends from net investment income | | | | | | | | | (0.15 | ) | | | | | | | | | (0.15 | ) | | | | | | | | | (0.19 | ) | | | | | | | | | (0.25 | ) | | | | | | | | | (0.24 | ) |
Distributions from net realized gains | | | | | | | | | (0.01 | ) | | | | | | | | | (0.00 | )(2) | | | | | | | | | — | | | | | | | | | | — | | | | | | | | | | — | |
| | | | | | | | | | | | | | | | | | | | | | | | | | | | | | | | | | | | | | | | | | | | | | | | | | |
Total dividends and distributions | | | | | | | | | (0.16 | ) | | | | | | | | | (0.15 | ) | | | | | | | | | (0.19 | ) | | | | | | | | | (0.25 | ) | | | | | | | | | (0.24 | ) |
| | | | | | | | | | | | | | | | | | | | | | | | | | | | | | | | | | | | | | | | | | | | | | | | | | |
Net Asset Value – End of Period | | | | | | | | $ | 10.10 | | | | | | | | | $ | 10.87 | | | | | | | | | $ | 11.19 | | | | | | | | | $ | 10.92 | | | | | | | | | $ | 10.47 | |
| | | | | | | | | | | | | | | | | | | | | | | | | | | | | | | | | | | | | | | | | | | | | | | | | | |
Total Return | | | | | | | | | -5.63% | | | | | | | | | | -1.54% | | | | | | | | | | 4.29% | | | | | | | | | | 6.70% | | | | | | | | | | 0.26% | |
| | | | | | | | | | |
Ratios and Supplemental Data: | | | | | | | | | | | | | | | | | | | | | | | | | | | | | | | | | | | | | | | | | | | | | | | | | | |
Net assets, end of period (thousands) | | | | | | | | $ | 275,387 | | | | | | | | | $ | 295,745 | | | | | | | | | $ | 289,857 | | | | | | | | | $ | 275,917 | | | | | | | | | $ | 249,286 | |
Ratio of expenses to average net assets: | | | | | | | | | | | | | | | | | | | | | | | | | | | | | | | | | | | | | | | | | | | | | | | | | | |
Before expense waiver and/or reimbursement | | | | | | | | | 0.79% | | | | | | | | | | 0.78% | | | | | | | | | | 0.79% | | | | | | | | | | 0.79% | | | | | | | | | | 0.78% | |
After expense waiver and/or reimbursement | | | | | | | | | 0.50% | | | | | | | | | | 0.50% | | | | | | | | | | 0.50% | | | | | | | | | | 0.50% | | | | | | | | | | 0.50% | |
Ratio of net investment income to average net assets: | | | | | | | | | | | | | | | | | | | | | | | | | | | | | | | | | | | | | | | | | | | | | | | | | | |
Before expense waiver and/or reimbursement | | | | | | | | | 1.25% | | | | | | | | | | 1.05% | | | | | | | | | | 1.46% | | | | | | | | | | 2.02% | | | | | | | | | | 1.96% | |
After expense waiver and/or reimbursement | | | | | | | | | 1.54% | | | | | | | | | | 1.33% | | | | | | | | | | 1.75% | | | | | | | | | | 2.31% | | | | | | | | | | 2.24% | |
Portfolio turnover rate | | | | | | | | | 21% | | | | | | | | | | 31% | | | | | | | | | | 46% | | | | | | | | | | 37% | | | | | | | | | | 23% | |
| (1) | Net investment income per share represents net investment income divided by the average shares outstanding during the period. |
| | | | | | | | | | | | | | | | | | | | | | | | | | | | | | | | | | | | | | | | |
| | |
| | | | | LKCM
International Equity Fund |
| | | | | | | | | | | | | | | | | | | | | | | | | | | | | | | | | | | | | | | | |
| | | | | | | | |
| | | | | Year
Ended
December 31,
2022 | | | | Year
Ended
December 31,
2021 | | | | Year
Ended
December 31,
2020 | | | | May 1, 2019(1)
through
December 31,
2019 |
Net Asset Value – Beginning of Period | | | | | | | | $ | 14.50 | | | | | | | | | $ | 12.44 | | | | | | | | | $ | 10.89 | | | | | | | | | $ | 10.00 | |
| | | | | | | | | | | | | | | | | | | | | | | | | | | | | | | | | | | | | | | | |
Net investment income | | | | | | | | | 0.45 | (2) | | | | | | | | | 0.10 | (2) | | | | | | | | | 0.03 | (2) | | | | | | | | | 0.02 | (2) |
Net realized and unrealized gain on investments | | | | | | | | | (3.42 | ) | | | | | | | | | 2.14 | | | | | | | | | | 1.54 | | | | | | | | | | 0.88 | |
| | | | | | | | | | | | | | | | | | | | | | | | | | | | | | | | | | | | | | | | |
Total from investment operations | | | | | | | | | (2.97 | ) | | | | | | | | | 2.24 | | | | | | | | | | 1.57 | | | | | | | | | | 0.90 | |
| | | | | | | | | | | | | | | | | | | | | | | | | | | | | | | | | | | | | | | | |
Dividends from net investment income | | | | | | | | | (0.30 | ) | | | | | | | | | (0.08 | ) | | | | | | | | | (0.02 | ) | | | | | | | | | (0.01 | ) |
Distributions from return of capital | | | | | | | | | — | | | | | | | | | | — | | | | | | | | | | (0.00 | )(3) | | | | | | | | | — | |
Distributions from net realized gains | | | | | | | | | (0.15 | ) | | | | | | | | | (0.10 | ) | | | | | | | | | — | | | | | | | | | | (0.00 | )(3) |
| | | | | | | | | | | | | | | | | | | | | | | | | | | | | | | | | | | | | | | | |
Total dividends and distributions | | | | | | | | | (0.45 | ) | | | | | | | | | (0.18 | ) | | | | | | | | | (0.02 | ) | | | | | | | | | (0.01 | ) |
| | | | | | | | | | | | | | | | | | | | | | | | | | | | | | | | | | | | | | | | |
Net Asset Value – End of Period | | | | | | | | $ | 11.08 | | | | | | | | | $ | 14.50 | | | | | | | | | $ | 12.44 | | | | | | | | | $ | 10.89 | |
| | | | | | | | | | | | | | | | | | | | | | | | | | | | | | | | | | | | | | | | |
Total Return | | | | | | | | | -20.51% | | | | | | | | | | 18.00% | | | | | | | | | | 14.45% | | | | | | | | | | 8.97% | (4) |
| | | | | | | | | |
Ratios and Supplemental Data: | | | | | | | | | | | | | | | | | | | | | | | | | | | | | | | | | | | | | | | | |
Net assets, end of period (thousands) | | | | | | | | $ | 45,009 | | | | | | | | | $ | 55,504 | | | | | | | | | $ | 32,295 | | | | | | | | | $ | 10,645 | |
Ratio of expenses to average net assets: | | | | | | | | | | | | | | | | | | | | | | | | | | | | | | | | | | | | | | | | |
Before expense waiver and/or reimbursement | | | | | | | | | 1.45% | | | | | | | | | | 1.40% | | | | | | | | | | 1.88% | | | | | | | | | | 4.09% | (5) |
After expense waiver and/or reimbursement | | | | | | | | | 1.00% | | | | | | | | | | 1.00% | | | | | | | | | | 1.00% | | | | | | | | | | 1.00% | (5) |
Ratio of net investment income (loss) to average net assets: | | | | | | | | | | | | | | | | | | | | | | | | | | | | | | | | | | | | | | | | |
Before expense waiver and/or reimbursement | | | | | | | | | 3.35% | | | | | | | | | | 0.29% | | | | | | | | | | (0.55)% | | | | | | | | | | (2.76)% | (5) |
After expense waiver and/or reimbursement | | | | | | | | | 3.80% | | | | | | | | | | 0.69% | | | | | | | | | | 0.33% | | | | | | | | | | 0.33% | (5) |
Portfolio turnover rate | | | | | | | | | 26% | | | | | | | | | | 15% | | | | | | | | | | 6% | | | | | | | | | | 2% | (4) |
| (1) | Commencement of operations. |
| (2) | Net investment income per share represents net investment income divided by the average shares outstanding during the period. |
The accompanying notes are an integral part of these financial statements.
38
|
| LKCM FUNDS |
| NOTESTOTHE FINANCIAL STATEMENTS |
A. Organization and Significant Accounting Policies: LKCM Funds (the “Trust”) is registered under the Investment Company Act of 1940 (“1940 Act”) as an open-end, management investment company. The Trust was organized as a Delaware statutory trust on February 10, 1994 and consists of seven diversified series as of December 31, 2022, six of which are presented herein and include the LKCM Small Cap Equity Fund, LKCM Small-Mid Cap Equity Fund, LKCM Equity Fund, LKCM Balanced Fund, LKCM Fixed Income Fund and LKCM International Equity Fund (collectively, the “Funds”). The assets of the Funds are invested in separate, independently managed portfolios. Investment operations of the Funds began on July 14, 1994 (LKCM Small Cap Equity Fund), January 3, 1996 (LKCM Equity Fund), December 30, 1997 (LKCM Balanced Fund and LKCM Fixed Income Fund), May 2, 2011 (LKCM Small-Mid Cap Equity Fund) and May 1, 2019 (LKCM International Equity Fund). The LKCM Small Cap Equity Fund, LKCM Small-Mid Cap Equity Fund and LKCM Equity Fund previously had two share classes—Institutional Class shares and Adviser Class shares. The Board of Trustees of the Trust approved the (i) liquidation and termination of Adviser Class shares of the LKCM Small Cap Equity Fund, which took place on October 31, 2018, and (ii) termination of Adviser Class shares of the LKCM Equity Fund and LKCM Small-Mid Cap Equity Fund, which had not commenced operations and had no assets or shareholders, on September 24, 2018. Each Fund charges a 1% redemption fee for redemptions of Fund shares held for less than 30 days, unless otherwise determined by a Fund in its discretion.
The LKCM Small Cap Equity Fund seeks to maximize long-term capital appreciation by investing under normal circumstances at least 80% of its net assets (plus any borrowings for investment purposes) in equity securities of smaller companies (those with market capitalizations at the time of investment between $1.2 billion and $7 billion) which Luther King Capital Management Corporation (the “Adviser”) believes are likely to have above-average growth in revenue and/or earnings and potential for above-average capital appreciation. The LKCM Small-Mid Cap Equity Fund seeks to maximize long-term capital appreciation by investing under normal circumstances at least 80% of its net assets (plus any borrowings for investment purposes) in equity securities of small-mid capitalization companies (those with market capitalizations at the time of investment between $2 billion and $20 billion) which the Adviser believes are likely to have above-average growth in revenue and/or earnings and potential for above-average capital appreciation. The LKCM Equity Fund seeks to maximize long-term capital appreciation by investing under normal circumstances at least 80% of its net assets (plus any borrowings for investment purposes) in equity securities of companies which the Adviser believes are likely to have above-average growth in revenue and/or earnings, above-average returns on shareholders’ equity, potential for above-average capital appreciation and/or companies that the Adviser believes have attractive relative valuations. The LKCM Balanced Fund seeks current income and long-term capital appreciation by investing primarily in a portfolio of equity and fixed income securities with at least 25% of the Fund’s total assets invested in fixed income securities under normal circumstances. The LKCM Fixed Income Fund seeks current income by investing under normal circumstances at least 80% of its net assets (plus any borrowings for investment purposes) in a portfolio of investment grade corporate and U.S. Government fixed income securities. The LKCM International Equity Fund seeks to maximize long-term capital appreciation by investing primarily in equity securities of non-U.S. companies and invests under normal circumstances at least 80% of its net assets (plus any borrowings for investment purposes) in equity securities.
The following is a summary of significant accounting policies followed by the Funds in preparation of the financial statements. The Funds are investment companies and, accordingly, follow the investment company accounting and reporting guidance of the Financial Accounting Standards Board Accounting Standards Codification Topic 946, Investment Companies.
1. Security Valuation: Equity securities listed or traded on a U.S. securities exchange for which market quotations are readily available are valued at the last quoted sale price on the exchange on which the security is primarily traded. Nasdaq Global Market securities are valued at the Nasdaq Official Closing Price (“NOCP”). Unlisted U.S. equity securities and listed U.S. equity securities not traded on a particular valuation date are valued at the mean of the most recent quoted bid and ask price on the relevant exchanges or markets. Equity securities listed on a foreign exchange for which market quotations are readily available are valued at the last quoted sales price on the exchange on which the security is primarily traded. Debt securities are normally valued at the mean of the closing bid and ask price and/or by using a combination of broker quotations or evaluated prices provided by an independent pricing service. Futures and options on futures are valued at the settlement prices established each day on the principal exchange on which they are traded. Forward contracts are valued based on the forward rate using information provided by an independent pricing service. Other assets and securities for which no market or broker quotations or evaluated prices are readily available are valued in good faith at fair value Rule 2a-5 under the Investment Company Act of 1940 (the “Valuation Rule”) establishes requirements for determining fair value in good faith for purposes of the Investment Company Act of 1940, including related oversight and reporting requirements. The Valuation Rule also defines when market quotations are “readily available” for purposes of the Investment Company Act of 1940, the threshold for determining whether a Fund must fair value a security. The Valuation Rule permits a Fund’s board to designate the Funds’ primary investment adviser as “valuation designee” to perform the Fund’s fair value determinations subject to board oversight and certain reporting and other requirements intended to ensure that the registered investment company’s board receives the information it needs to oversee the investment adviser’s fair value determinations. The Board has designated the Adviser as valuation designee under the Valuation Rule to perform fair value functions in accordance with the requirements of the Valuation Rule. The Adviser may value securities at fair value in good faith pursuant to the Adviser’s and the Fund’s procedures. The Adviser may use prices provided by independent pricing services to assist in the fair valuation of the Funds’ portfolio securities.
39
For foreign securities held by the LKCM International Equity Fund, such fair value prices generally will be based on such independent pricing services’ proprietary multi-factor models that measure movements in relevant indices, market indicators or other factors between the time the relevant foreign markets have closed and the time the Fund calculates its net asset value, and therefore may differ from quoted or official closing prices for such foreign securities in such foreign markets.
The Trust has adopted accounting standards which establish an authoritative definition of fair value and set out a hierarchy for measuring fair value. These standards require additional disclosures about the various inputs and valuation techniques used to develop the measurements of fair value and a discussion of changes in valuation techniques and related inputs during the period. These standards define fair value as the price that would be received to sell an asset or paid to transfer a liability in an orderly transaction between market participants at the measurement date. The fair value hierarchy is organized into three levels based upon the assumptions (referred to as “inputs”) used in pricing the asset or liability. These standards state that “observable inputs” reflect the assumptions market participants would use in pricing the asset or liability based on market data obtained from independent sources and “unobservable inputs” reflect an entity’s own assumptions about the assumptions market participants would use in pricing the asset or liability. These inputs are summarized in the three broad levels listed below.
| | | | |
| Level 1 | | – | | Quoted unadjusted prices for identical instruments in active markets to which the Trust has access at the date of measurement. |
| | |
| Level 2 | | – | | Quoted prices for similar instruments in active markets; quoted prices for identical or similar instruments in markets that are not active; and model-derived valuations in which all significant inputs and significant value drivers are observable in active markets. Level 2 inputs are those in markets for which there are few transactions, the prices are not current, little public information exists or instances where prices vary substantially over time or among brokered market makers. |
| | |
| Level 3 | | – | | Model derived valuations in which one or more significant inputs or significant value drivers are unobservable. Unobservable inputs are those inputs that reflect the Trust’s own assumptions that market participants would use to price the asset or liability based on the best available information. |
The inputs or methodology used for valuing securities are not necessarily an indication of the risk associated with investing in those securities. As of December 31, 2022, the Funds’ assets carried at fair value were classified as follows:
| | | | | | | | | | | | | | | | | | | | |
| LKCM Small Cap Equity Fund | | | | | | | | |
| | | | |
Description | | Level 1 | | Level 2 | | Level 3 | | Total |
Common Stocks | | | $ | 162,017,337 | | | | $ | — | | | | $ | 0 | (1) | | | $ | 162,017,337 | |
REITs | | | | 1,242,860 | | | | | — | | | | | — | | | | | 1,242,860 | |
Short-Term Investments | | | | 7,075,741 | | | | | — | | | | | — | | | | | 7,075,741 | |
| | | | | | | | | | | | | | | | | | | | |
Total Investments* | | | $ | 170,335,938 | | | | $ | — | | | | $ | 0 | | | | $
|
170,335,938 |
|
| | | | | | | | | | | | | | | | | | | | |
| | | | |
| LKCM Small-Mid Cap Equity Fund | | | | | | | | |
| | | | |
Description | | Level 1 | | Level 2 | | Level 3 | | Total |
Common Stocks | | | $ | 14,459,341 | | | | $ | — | | | | $ | — | | | | $ | 14,459,341 | |
REITs | | | | 176,771 | | | | | — | | | | | — | | | | | 176,771 | |
Short-Term Investments | | | | 597,675 | | | | | — | | | | | — | | | | | 597,675 | |
| | | | | | | | | | | | | | | | | | | | |
Total Investments* | | | $ | 15,233,787 | | | | $ | — | | | | $ | — | | | | $ | 15,233,787 | |
| | | | | | | | | | | | | | | | | | | | |
| | | | |
| LKCM Equity Fund | | | | | | | | |
| | | | |
Description | | Level 1 | | Level 2 | | Level 3 | | Total |
Common Stocks | | | $ | 433,772,285 | | | | $ | — | | | | $ | — | | | | $ | 433,772,285 | |
Short-Term Investments | | | | 26,849,197 | | | | | — | | | | | — | | | | | 26,849,197 | |
| | | | | | | | | | | | | | | | | | | | |
Total Investments* | | | $ | 460,621,482 | | | | $ | — | | | | $ | — | | | | $ | 460,621,482 | |
| | | | | | | | | | | | | | | | | | | | |
| | | | |
| LKCM Balanced Fund | | | | | | | | |
| | | | |
Description | | Level 1 | | Level 2 | | Level 3 | | Total |
Common Stocks | | | $ | 75,819,314 | | | | $ | — | | | | $ | — | | | | $ | 75,819,314 | |
Corporate Bonds | | | | — | | | | | 32,142,065 | | | | | — | | | | | 32,142,065 | |
Short-Term Investment | | | | 665,476 | | | | | — | | | | | — | | | | | 665,476 | |
| | | | | | | | | | | | | | | | | | | | |
Total Investments* | | | $ | 76,484,790 | | | | $ | 32,142,065 | | | | $ | — | | | | $ | 108,626,855 | |
| | | | | | | | | | | | | | | | | | | | |
40
| | | | | | | | | | | | | | | | | | | | |
| LKCM Fixed Income Fund | | | | | | | | |
| | | | |
Description | | Level 1 | | Level 2 | | Level 3 | | Total |
Corporate Bonds | | | $ | — | | | | $ | 175,160,253 | | | | $ | — | | | | $ | 175,160,253 | |
U.S. Government Issues | | | | — | | | | | 22,588,891 | | | | | — | | | | | 22,588,891 | |
U.S. Government Sponsored Entities | | | | — | | | | | 73,338,460 | | | | | — | | | | | 73,338,460 | |
Short-Term Investment | | | | 2,474,814 | | | | | — | | | | | — | | | | | 2,474,814 | |
| | | | | | | | | | | | | | | | | | | | |
Total Investments* | | | $ | 2,474,814 | | | | $ | 271,087,604 | | | | $ | — | | | | $ | 273,562,418 | |
| | | | | | | | | | | | | | | | | | | | |
| | | | |
| LKCM International Equity Fund | | | | | | | | |
| | | | |
Description | | Level 1 | | Level 2 | | Level 3 | | Total |
Common Stocks | | | $ | 783,250 | | | | $ | 40,661,795 | | | | $ | — | | | | $ | 41,445,045 | |
Preferred Stock | | | | — | | | | | 750,262 | | | | | — | | | | | 750,262 | |
Short-Term Investments | | | | 2,694,409 | | | | | — | | | | | — | | | | | 2,694,409 | |
| | | | | | | | | | | | | | | | | | | | |
Total Investments* | | | $ | 3,477,659 | | | | $ | 41,412,057 | | | | $ | — | | | | $ | 44,889,716 | |
| | | | | | | | | | | | | | | | | | | | |
| | (1) | Level 3 security valued at $0. |
| | * | Additional information regarding the industry classifications of these investments is disclosed in the Schedule of Investments. |
There were no transfers into or out of Level 1, Level 2 or Level 3 fair value measurements during the reporting period. Transfers between levels are recognized at the end of the reporting period. Below is a reconciliation of Level 3 assets held by the LKCM Small Cap Equity Fund for which significant observable inputs were used to determine fair value.
| | | | | |
| | | Level 3 |
Description | | Common Stocks |
Balance as of December 31, 2021 | | | $ | 0 | (1) |
Purchases | | | | — | |
Sales proceeds | | | | — | |
Accreted discounts, net | | | | | |
Realized gain (loss) | | | | — | |
Change in unrealized appreciation/depreciation | | | | — | |
Transfers into/(out of) Level 3 | | | | — | |
| | | | | |
Balance as of December 31, 2022 | | | $ | 0 | (1) |
| | | | | |
| Change in unrealized appreciation/depreciation during the period for Level 3 investments held at December 31, 2022 | | | $ | — | |
| | | | | |
| (1) | Level 3 security valued at $0. |
2. Federal Income Taxes: The Funds have elected to be treated as “regulated investment companies” under Subchapter M of the Internal Revenue Code and each Fund intends to distribute all of its investment company net taxable income and net capital gains to shareholders. Therefore, no federal income tax provision is recorded.
3. Distributions to Shareholders: The LKCM Small Cap Equity Fund, LKCM Small-Mid Cap Equity Fund, LKCM Equity Fund and LKCM International Equity Fund generally intend to declare and pay income dividends and distribute net capital gains, if any, at least on an annual basis. The LKCM Balanced Fund and LKCM Fixed Income Fund generally intend to declare and pay income dividends on a quarterly basis and distribute net capital gains, if any, at least on an annual basis.
4. Foreign Securities: Investing in securities of foreign companies and foreign governments involves special risks and considerations not typically associated with investing in securities of U.S. issuers. These risks include devaluation of currencies and future adverse political and economic developments. Moreover, securities of many foreign companies and foreign governments and their markets may be less liquid and their prices more volatile than those of securities of comparable U.S. companies and securities of the U.S. government.
5. Expense Allocation: Expenses incurred by the Funds are allocated among the Funds based upon (i) relative average net assets, (ii) a specific identification basis as incurred, or (iii) evenly among the Funds, depending on the nature of the expense.
6. Use of Estimates: The preparation of financial statements in conformity with accounting principles generally accepted in the United States of America requires management to make estimates and assumptions that affect the reported amounts of assets and liabilities and disclosure of contingent assets and liabilities at the date of the financial statements and the reported amounts of revenues and expenses during the reporting period. Actual results could differ from those estimates.
7. Guarantees and Indemnifications: In the normal course of business, the Funds enter into contracts with service providers that contain general indemnification clauses. The Funds’ maximum exposure under these arrangements is unknown as this would involve future claims against the Funds that have not yet occurred. Based on experience, the Funds expect the risk of loss to be remote.
41
8. Security Transactions and Investment Income: Security and shareholder transactions are recorded on the trade date. Realized gains and losses on sales of investments are calculated on the identified cost basis. Dividend income and dividends and distributions to shareholders are recorded on the ex-dividend date. Withholding taxes on foreign dividends have been provided for in accordance with the Funds’ understanding of the applicable jurisdiction’s tax rules and rates. Interest income is recognized on the accrual basis. All discounts and premiums are amortized based on the effective interest method for tax and financial reporting purposes. The Funds may hold the securities of real estate investment trusts (“REITs”). Distributions from such investments may include income, capital gains and return of capital.
9. Other: Distributions from net investment income and realized capital gains are determined in accordance with income tax regulations, which may differ from U.S. GAAP. Certain capital accounts in the consolidated financial statements are periodically adjusted for permanent differences in order to reflect their tax character. These permanent differences are primarily due to the varying treatment of income and gain/loss on portfolio securities held by the Fund and have no impact on net assets or NAV per share.
Accordingly, at December 31, 2022, reclassifications were recorded as follows:
| | | | | | | | | | | | | | | | | | | | | | | | | | | | | | |
| | | LKCM
Small Cap
Equity Fund | | LKCM
Small-Mid Cap
Equity Fund | | LKCM
Equity
Fund | | LKCM
Balanced
Fund | | LKCM
Fixed
Income Fund | | LKCM
International
Equity Fund |
Paid-in capital | | | | $52,471 | | | | | $24,642 | | | | | $906,701 | | | | | $170,310 | | | | | $— | | | | | $— | |
Total distributable earnings | | | | (52,471 | ) | | | | (24,642 | ) | | | | (906,701 | ) | | | | (170,310 | ) | | | | — | | | | | — | |
10. Restricted and Illiquid Securities: The Funds are permitted to invest in securities that are subject to legal or contractual restrictions on resale including investments considered by the Funds to be illiquid. Restricted securities generally may be resold in transactions exempt from registration. Illiquid investments are investments that the Funds reasonably expect cannot be sold or disposed of in current market conditions within seven calendar days or less in the ordinary course of business without the sale or disposition significantly changing the market value of the investment. A security may be considered illiquid if it lacks a readily available market or if its valuation has not changed for a certain period of time. Disposal of these securities may involve time-consuming negotiations and expense, and prompt sale at the current valuation may be difficult.
B. Investment Advisory and Other Agreements: The Adviser serves as the investment adviser to the Funds under an Investment Advisory Agreement (the “Agreement”). The Adviser receives a fee, computed daily and payable quarterly, at the annual rates presented below as applied to each Fund’s average daily net assets. The Adviser has contractually agreed to waive all or a portion of its management fee and/or reimburse expenses of the Funds through May 1, 2023 in order to limit each Fund’s operating expenses to the annual cap rates presented below. This expense limitation excludes interest, taxes, brokerage commissions, indirect fees and expenses relating to investments in other investment companies, including money market funds, and extraordinary expenses.
For the fiscal year ended December 31, 2022, the Adviser waived the following management fees and/or reimbursed expenses to meet its expense cap obligations:
| | | | | | | | | | | | | | | | | | | | | | | | | | | | | | |
| | | LKCM
Small Cap
Equity Fund | | LKCM
Small-Mid Cap
Equity Fund | | LKCM
Equity
Fund | | LKCM
Balanced
Fund | | LKCM
Fixed
Income Fund | | LKCM
International
Equity Fund |
Annual Management Fee Rate | | | | 0.75% | | | | | 0.75% | | | | | 0.70% | | | | | 0.65% | | | | | 0.50% | | | | | 0.90% | |
Annual Cap on Expenses | | | | 1.00% | | | | | 1.00% | | | | | 0.80% | | | | | 0.80% | | | | | 0.50% | | | | | 1.00% | |
Fees Waived and/or Expenses Reimbursed in 2022 | | | | $125,665 | | | | | $131,696 | | | | | $830,646 | | | | | $233,447 | | | | | $805,761 | | | | | $206,382 | |
The Trust reimburses the Adviser for a portion of compensation paid to the Trust’s Chief Compliance Officer. This compensation is reported as part of the “Trustees’ fees and officer compensation” expense on the Statement of Operations.
U.S. Bancorp Fund Services, LLC (“U.S. Bancorp”), doing business as U.S. Bank Global Fund Services, serves as transfer agent and administrator for the Trust and serves as accounting services agent for the Trust. U.S. Bank, N.A. serves as custodian for the Funds.
Distribution services are performed pursuant to a distribution contract with Quasar Distributors, LLC (“Quasar”), the Trust’s principal underwriter.
The Funds have adopted a Distribution Plan pursuant to Rule 12b-1 under the 1940 Act, under which each Fund may pay an annualized fee of up to 0.75% of its average daily net assets for distribution and other services. Currently, the Board of Trustees has not authorized payments under this plan and, as a result, the Funds currently neither accrue nor pay any fees under the plan.
42
C. Fund Shares: At December 31, 2022, there was an unlimited number of shares of beneficial interest, no par value, authorized, for each Fund. The following table summarizes the activity in shares of each Fund:
| | | | | | | | | | | | | | | | | | | | |
| LKCM Small Cap Equity Fund | | | | | | | | |
| | | Year Ended
December 31, 2022 | | Year Ended
December 31, 2021 |
| | | Shares | | Amount | | Shares | | Amount |
Shares sold | | | | 268,696 | | | | $ | 4,860,344 | | | | | 742,164 | | | | $ | 17,323,790 | |
Shares issued to shareholders in reinvestment of distributions | | | | 239,058 | | | | | 3,824,933 | | | | | 1,370,179 | | | | | 29,486,241 | |
Shares redeemed | | | | (756,918 | ) | | | | (13,443,701 | ) | | | | (785,462 | ) | | | | (19,135,168 | ) |
| | | | | | | | | | | | | | | | | | | | |
Net increase (decrease) | | | | (249,164 | ) | | | $ | (4,758,424 | ) | | | | 1,326,881 | | | | $ | 27,674,863 | |
| | | | | | | | | | | | | | | | | | | | |
Shares Outstanding: | | | | | | | | | | | | | | | | | | | | |
Beginning of period | | | | 10,638,481 | | | | | | | | | | 9,311,600 | | | | | | |
| | | | | | | | | | | | | | | | | | | | |
End of period | | | | 10,389,317 | | | | | | | | | | 10,638,481 | | | | | | |
| | | | | | | | | | | | | | | | | | | | |
| | | | |
| LKCM Small-Mid Cap Equity Fund | | | | | | | | |
| | | Year Ended
December 31, 2022 | | Year Ended
December 31, 2021 |
| | | Shares | | Amount | | Shares | | Amount |
Shares sold | | | | 629,277 | | | | $ | 6,667,954 | | | | | 107,747 | | | | $ | 1,343,832 | |
Shares issued to shareholders in reinvestment of distributions | | | | 113,644 | | | | | 879,607 | | | | | 191,747 | | | | | 2,099,630 | |
Shares redeemed | | | | (118,488 | ) | | | | (1,137,248 | ) | | | | (345,703 | ) | | | | (4,333,927 | ) |
Redemption fee | | | | | | | | | 777 | | | | | | | | | | — | |
| | | | | | | | | | | | | | | | | | | | |
Net increase (decrease) | | | | 624,433 | | | | $ | 6,411,090 | | | | | (46,209 | ) | | | $ | (890,465 | ) |
| | | | | | | | | | | | | | | | | | | | |
Shares Outstanding: | | | | | | | | | | | | | | | | | | | | |
Beginning of period | | | | 1,308,897 | | | | | | | | | | 1,355,106 | | | | | | |
| | | | | | | | | | | | | | | | | | | | |
End of period | | | | 1,933,330 | | | | | | | | | | 1,308,897 | | | | | | |
| | | | | | | | | | | | | | | | | | | | |
| | | | |
| LKCM Equity Fund | | | | | | | | |
| | | Year Ended
December 31, 2022 | | Year Ended
December 31, 2021 |
| | | Shares | | Amount | | Shares | | Amount |
Shares sold | | | | 931,290 | | | | $ | 31,576,631 | | | | | 786,326 | | | | $ | 29,544,937 | |
Shares issued to shareholders in reinvestment of distributions | | | | 753,789 | | | | | 23,073,476 | | | | | 858,852 | | | | | 33,323,438 | |
Shares redeemed | | | | (847,249 | ) | | | | (28,634,881 | ) | | | | (946,112 | ) | | | | (36,177,759 | ) |
Redemption fee | | | | | | | | | 1,328 | | | | | | | | | | 91 | |
| | | | | | | | | | | | | | | | | | | | |
Net increase | | | | 837,830 | | | | $ | 26,016,554 | | | | | 699,066 | | | | $ | 26,690,707 | |
| | | | | | | | | | | | | | | | | | | | |
Shares Outstanding: | | | | | | | | | | | | | | | | | | | | |
Beginning of period | | | | 14,025,692 | | | | | | | | | | 13,326,626 | | | | | | |
| | | | | | | | | | | | | | | | | | | | |
End of period | | | | 14,863,522 | | | | | | | | | | 14,025,692 | | | | | | |
| | | | | | | | | | | | | | | | | | | | |
| | | | |
| LKCM Balanced Fund | | | | | | | | |
| | | Year Ended
December 31, 2022 | | Year Ended
December 31, 2021 |
| | | Shares | | Amount | | Shares | | Amount |
Shares sold | | | | 327,143 | | | | $ | 8,655,073 | | | | | 300,183 | | | | $ | 8,545,296 | |
Shares issued to shareholders in reinvestment of distributions | | | | 153,835 | | | | | 3,734,574 | | | | | 205,971 | | | | | 6,005,184 | |
Shares redeemed | | | | (964,808 | ) | | | | (25,051,598 | ) | | | | (235,087 | ) | | | | (6,706,546 | ) |
Redemption fee | | | | | | | | | 1,352 | | | | | | | | | | 411 | |
| | | | | | | | | | | | | | | | | | | | |
Net increase (decrease) | | | | (483,828 | ) | | | $ | (12,660,599 | ) | | | | 271,067 | | | | $ | 7,844,345 | |
| | | | | | | | | | | | | | | | | | | | |
Shares Outstanding: | | | | | | | | | | | | | | | | | | | | |
Beginning of period | | | | 4,960,953 | | | | | | | | | | 4,689,886 | | | | | | |
| | | | | | | | | | | | | | | | | | | | |
End of period | | | | 4,477,125 | | | | | | | | | | 4,960,953 | | | | | | |
| | | | | | | | | | | | | | | | | | | | |
43
| | | | | | | | | | | | | | | | | | | | |
LKCM Fixed Income Fund | | | | | | | | | | | | | | | | | | | | |
| | | Year Ended
December 31, 2022 | | Year Ended
December 31, 2021 |
| | | Shares | | Amount | | Shares | | Amount |
Shares sold | | | | 1,965,505 | | | | $ | 20,344,434 | | | | | 2,477,664 | | | | $ | 27,346,315 | |
Shares issued to shareholders in reinvestment of distributions | | | | 389,925 | | | | | 3,975,171 | | | | | 325,856 | | | | | 3,573,515 | |
Shares redeemed | | | | (2,293,487 | ) | | | | (23,577,048 | ) | | | | (1,499,784 | ) | | | | (16,551,962 | ) |
| | | | | | | | | | | | | | | | | | | | |
Net increase | | | | 61,943 | | | | $ | 742,557 | | | | | 1,303,736 | | | | $ | 14,367,868 | |
| | | | | | | | | | | | | | | | | | | | |
Shares Outstanding: | | | | | | | | | | | | | | | | | | | | |
Beginning of period | | | | 27,209,092 | | | | | | | | | | 25,905,356 | | | | | | |
| | | | | | | | | | | | | | | | | | | | |
End of period | | | | 27,271,035 | | | | | | | | | | 27,209,092 | | | | | | |
| | | | | | | | | | | | | | | | | | | | |
| | | |
| LKCM International Equity Fund | | | | | | |
| | | Year Ended
December 31, 2022 | | Year Ended
December 31, 2021 |
| | | Shares | | Amount | | Shares | | Amount |
Shares sold | | | | 256,486 | | | | $ | 3,210,994 | | | | | 1,230,967 | | | | $ | 16,639,624 | |
Shares issued to shareholders in reinvestment of distributions | | | | 118,702 | | | | | 1,305,719 | | | | | 34,722 | | | | | 504,168 | |
Shares redeemed | | | | (139,743 | ) | | | | (1,627,393 | ) | | | | (33,414 | ) | | | | (478,629 | ) |
| | | | | | | | | | | | | | | | | | | | |
Net increase | | | | 235,445 | | | | $ | 2,889,320 | | | | | 1,232,275 | | | | $ | 16,665,163 | |
| | | | | | | | | | | | | | | | | | | | |
Shares Outstanding: | | | | | | | | | | | | | | | | | | | | |
Beginning of period | | | | 3,827,325 | | | | | | | | | | 2,595,050 | | | | | | |
| | | | | | | | | | | | | | | | | | | | |
End of period | | | | 4,062,770 | | | | | | | | | | 3,827,325 | | | | | | |
| | | | | | | | | | | | | | | | | | | | |
D. Security Transactions: Purchases and sales of investment securities, other than short-term investments, for the year ended December 31, 2022 were as follows:
| | | | | | | | | | | | | | | | | | | | |
| | | Purchases | | Sales |
| | | U.S.
Government | | Other | | U.S.
Government | | Other |
LKCM Small Cap Equity Fund | | | $ | — | | | | $ | 74,660,434 | | | | $ | — | | | | $ | 77,038,615 | |
LKCM Small-Mid Cap Equity Fund | | | | — | | | | | 12,087,273 | | | | | — | | | | | 7,453,340 | |
LKCM Equity Fund | | | | — | | | | | 46,917,938 | | | | | — | | | | | 46,759,590 | |
LKCM Balanced Fund | | | | — | | | | | 16,055,441 | | | | | — | | | | | 30,596,216 | |
LKCM Fixed Income Fund | | | | 41,449,364 | | | | | 21,732,514 | | | | | 5,987,812 | | | | | 51,649,538 | |
LKCM International Equity Fund | | | | — | | | | | 13,357,379 | | | | | — | | | | | 11,512,666 | |
E. Tax Information: At December 31, 2022, the components of accumulated earnings (losses) on a tax basis were as follows:
| | | | | | | | | | | | | | | | | | | | | | | | | | | | | | |
| | | LKCM
Small Cap
Equity Fund | | LKCM
Small-Mid Cap
Equity Fund | | LKCM
Equity
Fund | | LKCM
Balanced
Fund | | LKCM
Fixed
Income Fund | | LKCM
International
Equity Fund |
Tax cost | | | $ | 134,619,968 | | | | $ | 14,723,319 | | | | $ | 263,519,515 | | | | $ | 83,304,288 | | | | $ | 289,500,155 | | | | $ | 45,347,950 | |
| | | | | | | | | | | | | | | | | | | | | | | | | | | | | | |
Gross unrealized appreciation | | | $ | 43,615,034 | | | | $ | 2,291,138 | | | | $ | 211,429,146 | | | | $ | 29,915,795 | | | | $ | 195,082 | | | | $ | 4,411,280 | |
Gross unrealized depreciation | | | | (7,899,064 | ) | | | | (1,780,691 | ) | | | | (14,327,072 | ) | | | | (4,593,190 | ) | | | | (16,132,819 | ) | | | | (4,873,799 | ) |
| | | | | | | | | | | | | | | | | | | | | | | | | | | | | | |
Net unrealized appreciation | | | $ | 35,715,970 | | | | $ | 510,447 | | | | $ | 197,102,074 | | | | $ | 25,322,605 | | | | $ | (15,937,737 | ) | | | $ | (462,519 | ) |
| | | | | | | | | | | | | | | | | | | | | | | | | | | | | | |
Undistributed ordinary income | | | | — | | | | | — | | | | | 20,898 | | | | | 8,786 | | | | | 325,465 | | | | | 580,288 | |
Undistributed long-term capital gain | | | | 794,556 | | | | | — | | | | | 801,412 | | | | | 438,654 | | | | | — | | | | | — | |
| | | | | | | | | | | | | | | | | | | | | | | | | | | | | | |
Distributable earnings | | | $ | 794,556 | | | | $ | — | | | | $ | 822,310 | | | | $ | 447,440 | | | | $ | 325,465 | | | | $ | 580,288 | |
| | | | | | | | | | | | | | | | | | | | | | | | | | | | | | |
Other accumulated losses | | | | — | | | | | — | | | | | — | | | | | — | | | | | (774,929 | ) | | | | (2,527,964 | ) |
| | | | | | | | | | | | | | | | | | | | | | | | | | | | | | |
Total distributable earnings | | | $ | 36,510,526 | | | | $ | 510,447 | | | | $ | 197,924,384 | | | | $ | 25,770,045 | | | | $ | (16,387,201 | ) | | | $ | (2,410,195 | ) |
| | | | | | | | | | | | | | | | | | | | | | | | | | | | | | |
The difference between book cost of investments and tax cost of investments is attributable primarily to the tax deferral of losses on wash sales.
44
To the extent the Funds realize future net capital gains, taxable distributions will be reduced by any unused capital loss carryforwards as permitted by the Internal Revenue Code. At December 31, 2022, the capital loss carryforwards were as follows:
| | | | | | | | | | |
| | | Short-Term | | Long-Term |
LKCM Fixed Income Fund | | | $ | 386,149 | | | | $ | 388,780 | |
LKCM International Equity Fund | | | | 197,862 | | | | | 2,330,102 | |
The tax components of dividends paid during the periods shown below were as follows:
| | | | | | | | | | | | | | | | | | | | |
| | | Year Ended December 31, 2022 | | Year Ended December 31, 2021 |
| | | Ordinary
Income | | Long-Term
Capital Gains | | Ordinary
Income | | Long-Term
Capital Gains |
LKCM Small Cap Equity Fund | | | $ | — | | | | $ | 4,046,906 | | | | $ | 1,146,597 | | | | $ | 29,445,846 | |
LKCM Small-Mid Cap Equity Fund | | | | — | | | | | 1,188,908 | | | | | — | | | | | 2,133,969 | |
LKCM Equity Fund | | | | 4,309,581 | | | | | 19,797,528 | | | | | 2,188,898 | | | | | 32,684,898 | |
LKCM Balanced Fund | | | | 1,201,135 | | | | | 2,642,183 | | | | | 970,003 | | | | | 5,183,025 | |
LKCM Fixed Income Fund | | | | 4,012,701 | | | | | 321,837 | | | | | 3,880,841 | | | | | 43,872 | |
LKCM International Equity Fund | | | | 1,168,837 | | | | | 578,109 | | | | | 284,654 | | | | | 395,702 | |
Certain Funds designated earnings and profits distributed to shareholders upon the redemption of shares during 2022 and 2021 in determining undistributed net capital gains as of December 31, 2022 and 2021.
The Trust has adopted financial reporting rules regarding recognition and measurement of tax positions taken or expected to be taken on a tax return. The Trust has reviewed all open tax years and major jurisdictions and concluded that there is no impact on the Funds’ financial position or results of operations. Tax years that remain open to examination by major tax jurisdictions include tax years ended December 31, 2019 through December 31, 2022 (LKCM Small Cap Equity Fund, LKCM Small-Mid Cap Equity Fund, LKCM Equity Fund, LKCM Balanced Fund and LKCM Fixed Income Fund) and December 31, 2021 through December 31, 2022 (LKCM International Equity Fund). There is no tax liability resulting from unrecognized tax benefits relating to uncertain income tax positions taken or expected to be taken on tax returns as of December 31, 2022. The Funds are not aware of any tax positions for which it is reasonably possible that the total amounts of unrecognized tax benefits will significantly change in the next twelve months. If applicable, the Funds would recognize interest accrued related to unrecognized tax benefits in “interest expense” and penalties in “other expense” on the statement of operations.
F. Other Matters: Investing in the Funds involves risks and the potential loss of all or a portion of your investment. Each Fund is subject to the risk that the securities markets will move down, sometimes rapidly and unpredictably, based on overall economic conditions and other factors, which may negatively affect the Fund’s performance. Factors that affect markets in general, including geopolitical, regulatory, market and economic developments and other developments that impact specific economic sectors, industries, companies and segments of the market, could adversely impact the Fund’s investments and lead to a decline in the value of your investment in a Fund. Geopolitical and other events, including war, such as the current war between Russia and Ukraine, tensions and other conflicts between nations, terrorism, economic uncertainty, trade disputes, pandemics, public health crises, natural disasters and related events have led, and in the future may continue to lead, to instability in world economies and markets generally and reduced liquidity in equity, credit and fixed income markets. Russia’s military invasion of Ukraine, the responses and sanctions by the United States and other countries, and the potential for wider conflict, have had and continue to have severe adverse effects on regional and global economies and could further increase volatility and uncertainty in the financial markets. Other events that have led to recent market disruptions and turbulence include the pandemic spread of the novel coronavirus known as COVID-19 and its variants, the duration and full effects of which are still uncertain. In addition, policy changes by the U.S. Government, the U.S. Federal Reserve and/or foreign governments and political events within the U.S. and abroad may cause increased volatility in financial markets, affect investor and consumer confidence and adversely impact the broader financial markets and economy, perhaps suddenly and to a significant degree. Interest rates have been historically low in recent years in the U.S. and abroad, and central banks reduced interest rates further in an effort to combat the economic effects of the COVID-19 pandemic. However, the U.S. Federal Reserve has reduced its interventions and increased interest rates as the economy improved and inflation accelerated. Market disruptions have caused, and may continue to cause, broad changes in market value, negative public perceptions concerning these developments, and adverse investor sentiment or publicity. The foregoing may adversely affect, among other things, the value and liquidity of a Fund’s investments, a Fund’s ability to satisfy redemption requests, a Fund’s financial and operational performance, and/or the value of your investment in a Fund.
G. Subsequent Events: In preparing these financial statements, management has evaluated the Funds’ related events and transactions that occurred subsequent to December 31, 2022 through the date the financial statements were issued and has determined that there were no significant subsequent events requiring recognition or disclosure in the financial statements.
45
|
| REPORTOF INDEPENDENT REGISTERED PUBLIC ACCOUNTING FIRM |
To the shareholders and the Board of Trustees of LKCM Funds
Opinion on the Financial Statements and Financial Highlights
We have audited the accompanying statements of assets and liabilities of LKCM Funds (the “Trust”) comprising the LKCM Small Cap Equity Fund, LKCM Equity Fund, LKCM Balanced Fund, LKCM Fixed Income Fund, LKCM Small-Mid Cap Equity Fund, and LKCM International Equity Fund, including the schedules of investments, as of December 31, 2022; the related statements of operations for the year then ended, the statements of changes in net assets for each of the two years in the period then ended, the financial highlights for the periods indicated in the table below; and the related notes. In our opinion, the financial statements and financial highlights present fairly, in all material respects, the financial position of each of the funds constituting the Trust as of December 31, 2022, and the results of their operations for the year then ended, the changes in their net assets for each of the two years in the period then ended, and the financial highlights for the periods listed in the table below, in conformity with accounting principles generally accepted in the United States of America.
| | |
| Individual Fund Comprising the LKCM Funds | | Financial Highlights |
| LKCM Small Cap Equity Fund, LKCM Equity Fund, LKCM Balanced Fund, LKCM Fixed Income Fund, and LKCM Small-Mid Cap Equity Fund | | For the years ended December 31, 2022, 2021, 2020, 2019 and 2018 |
| LKCM International Equity Fund | | For the year ended December 31, 2022, 2021, 2020 and the period from May 1, 2019 (commencement of operations) through December 31, 2019 |
Basis for Opinion
These financial statements and financial highlights are the responsibility of the Trust’s management. Our responsibility is to express an opinion on the Trust’s financial statements and financial highlights based on our audits. We are a public accounting firm registered with the Public Company Accounting Oversight Board (United States) (PCAOB) and are required to be independent with respect to the Trust in accordance with the U.S. federal securities laws and the applicable rules and regulations of the Securities and Exchange Commission and the PCAOB.
We conducted our audits in accordance with the standards of the PCAOB. Those standards require that we plan and perform the audit to obtain reasonable assurance about whether the financial statements and financial highlights are free of material misstatement, whether due to error or fraud. The Trust is not required to have, nor were we engaged to perform, an audit of its internal control over financial reporting. As part of our audits we are required to obtain an understanding of internal control over financial reporting but not for the purpose of expressing an opinion on the effectiveness of the Trust’s internal control over financial reporting. Accordingly, we express no such opinion.
Our audits included performing procedures to assess the risks of material misstatement of the financial statements and financial highlights, whether due to error or fraud, and performing procedures that respond to those risks. Such procedures included examining, on a test basis, evidence regarding the amounts and disclosures in the financial statements and financial highlights. Our audits also included evaluating the accounting principles used and significant estimates made by management, as well as evaluating the overall presentation of the financial statements and financial highlights. Our procedures included confirmation of securities owned as of December 31, 2022, by correspondence with the custodian. We believe that our audits provide a reasonable basis for our opinion.
Milwaukee, Wisconsin
February 28, 2023
We have served as the auditor of one or more LKCM Funds since 2007.
46
|
| LKCM FUNDS |
| ADDITIONAL INFORMATION |
| December 31, 2022 (Unaudited) |
Tax Information: For the fiscal year ended December 31, 2022, certain dividends paid by the Funds may be subject to a maximum tax rate of 23.8%, as provided for by the Jobs & Growth Tax Relief Reconciliation Act of 2003. The percentage of dividends declared from ordinary income designated as qualified dividend income was as follows:
| | | | | |
LKCM Equity Fund | | | | 100.00 | % |
LKCM Balanced Fund | | | | 100.00 | % |
LKCM International Equity Fund | | | | 100.00 | % |
For corporate shareholders, the percentage of ordinary income distributions qualifying for the corporate dividends received deduction for the fiscal year ended December 31, 2022 was as follows:
| | | | | |
LKCM Equity Fund | | | | 100.00 | % |
LKCM Balanced Fund | | | | 100.00 | % |
The Funds hereby designate the following percentages of their ordinary income distributions for the fiscal year ended December 31, 2022 as interest-related dividends under Internal Revenue Code Section 871(k)(1)(C).
| | | | | |
LKCM Balanced Fund | | | | 31.60 | % |
LKCM Fixed Income Fund | | | | 99.79 | % |
The percentage of taxable ordinary income distributions that are designated as short-term capital gain distributions under Internal Revenue Code Section 871(k)(2)(C) for the fiscal year ended December 31, 2022 was as follows:
| | | | | |
LKCM Small Cap Equity Fund | | | | 0.00 | % |
LKCM Small-Mid Cap Equity Fund | | | | 0.00 | % |
LKCM Equity Fund | | | | 0.00 | % |
Availability of Proxy Voting Information: A description of the policies and procedures that the Funds use to determine how to vote proxies relating to their portfolio securities, as well as information regarding how the Funds voted proxies relating to portfolio securities during the most recent 12-month period ended June 30, is available without charge, upon request, by calling toll-free 1-800-688-LKCM or on the SEC website at http://www.sec.gov.
The actual voting records relating to portfolio securities during the twelve month period ended June 30 (as filed with the SEC on Form N-PX) are available without charge, upon request, by calling the Funds toll free at 1-800-688-LKCM or by accessing the SEC’s website at www.sec.gov.
Availability of Quarterly Portfolio Schedule: The Funds file a complete schedule of portfolio holdings with the U.S. Securities and Exchange Commission (the “SEC”) for the first and third quarters of each fiscal year on Part F of Form N-PORT. The Funds’ Part F of Form N-PORT are available on the SEC’s website at www.sec.gov and may be reviewed and copied at the SEC’s Public Reference Room in Washington, D.C. Information on the operation of the Public Reference Room may be obtained by calling 1-800-732-0330. The Funds’ Form Part F of Form N-PORT may also be obtained by calling toll-free 1-800-688-LKCM.
47
Information about the Fund’s Trustees and Officers:
The business and affairs of the Fund are managed under the direction of the Fund’s Board of Trustees. Information pertaining to the Trustees of the Fund is set forth below. The Statement of Additional Information includes additional information about the Fund’s Trustees and officers and is available, without charge, upon request by calling 1-800-688-LKCM.
| | | | | | | | | | |
Name, Address
and Age | | Position(s)
Held with
the Trust | | Term of
Office &
Length
of Time
Served(1) | | Principal Occupation
During Past Five Years | | Number of
Portfolios in
Fund Complex
Overseen by Trustee | | Other
Directorships
Held by Trustee |
| Independent Trustees | | | | | | | | | | |
Richard J. Howell 301 Commerce Street Suite 1600 Fort Worth, TX 76102 Year of Birth: 1942 | | Trustee Chairman of the Audit and Compliance Committee | | Since 2005 Since 2008 | | CPA; Adjunct Faculty at SMU Cox School of Business from 2004 to 2009; Consulting Services, since 2002; Audit Partner, Arthur Andersen LLP from 1974 to 2002. | | 7 | | None |
Larry J. Lockwood 301 Commerce Street Suite 1600 Fort Worth, TX 76102 Year of Birth: 1953 | | Chairman of the Board of Trustees Trustee | | Since 2021 Since 2013 | | C.R. Williams Professor of Finance, Stan Block Endowed Chair in Finance, Department of Finance, Neeley School of Business, Texas Christian University since 1994. | | 7 | | None |
Mauricio Rodriguez 301 Commerce Street Suite 1600 Fort Worth, TX 76102 Year of Birth: 1966 | | Trustee | | Since 2021 | | Chair, Department of Finance, Neeley School of Business; Texas Christian University since 2002. | | 7 | | None |
| | | | | |
| Interested Trustees | | | | | | | | | | |
J. Luther King, Jr.(2) 301 Commerce Street Suite 1600 Fort Worth, TX 76102 Year of Birth: 1940 | | Trustee, President and Chief Executive Officer | | Since 1994 | | Chairman, President and Director, Luther King Capital Management Corporation since 1979. | | 7 | | TXO Energy Partners, L.P. |
Steven R. Purvis(2) 301 Commerce Street Suite 1600 Fort Worth, TX 76102 Year of Birth: 1964 | | Trustee | | Since 2013 | | Principal, Luther King Capital Management Corporation from 2004 to 2021, Vice President and Portfolio Manager, Luther King Capital Management Corporation from 1996 to 2021. | | 7 | | AZZ Incorporated |
| (1) | Each Trustee holds office during the lifetime of the Trust until that individual resigns, retires or is otherwise removed or replaced. |
| (2) | Messrs. King and Purvis are each considered an “interested person” of the Trust (as defined in the 1940 Act) because of his affiliation with the Adviser. |
48
Information about the Fund’s Trustees and Officers, Continued
| | | | | | |
Name, Address
and Age | | Position(s) Held with the Trust | | Term of Office & Length of Time Served(1) | | Principal Occupation During Past Five Years |
| Principal Officers of the Trust |
J. Luther King, Jr.(2) 301 Commerce Street Suite 1600 Fort Worth, TX 76102 Year of Birth: 1940 | | Trustee, President and Chief Executive Officer | | Since 1994 | | Chairman, President and Director, Luther King Capital Management Corporation since 1979. |
Paul W. Greenwell 301 Commerce Street Suite 1600 Fort Worth, TX 76102 Year of Birth: 1950 | | Vice President | | Since 1996 | | Principal, Luther King Capital Management Corporation since 1986, Vice President and Portfolio Manager, Luther King Capital Management Corporation since 1983. |
Richard Lenart 301 Commerce Street Suite 1600 Fort Worth, TX 76102 Year of Birth: 1966 | | Secretary and Treasurer | | Since 2006 | | Luther King Capital Management Corporation since 2005. |
Jacob D. Smith 301 Commerce Street Suite 1600 Fort Worth, TX 76102 Year of Birth: 1974 | | Chief Financial Officer | | Since 2010 | | General Counsel, Luther King Capital Management Corporation since 2006; Chief Compliance Officer, Luther King Capital Management Corporation from 2006-2022; Principal, Luther King Capital Management Corporation since 2013. |
| | Chief Compliance Officer | | Since 2006 |
| (1) | Each officer holds office during the lifetime of the Trust until that individual resigns, retires or is otherwise removed or replaced. |
| (2) | Messrs. King and Purvis is considered an “interested person” of the Trust (as defined in the 1940 Act) because of his affiliation with the Adviser. |
49
LKCM FUNDS
PRIVACY NOTICE
Our Commitment to Your Privacy
At LKCM Funds, we are committed to safeguarding the confidentiality and privacy of nonpublic personal information about our current and former shareholders. This privacy notice describes the types of nonpublic personal information we collect about you and the sources through which we obtain this information, the purposes for which we obtain and use your nonpublic information, and the policies and procedures we have implemented to protect the privacy of your nonpublic personal information.
How We Protect Your Nonpublic Personal Information
Protecting your nonpublic personal information is an important priority at LKCM Funds. Accordingly, we have implemented policies and procedures designed to safeguard your nonpublic personal information, such as your tax identification number, account and investment history, account numbers, account balances and nonpublic contact information, from unauthorized access or use. Pursuant to these policies and procedures, we maintain various physical, technological, and administrative safeguards to protect the security and confidentiality of your nonpublic personal information, and we adapt these safeguards to respond to evolving technological and other standards.
We do not disclose nonpublic personal information about you to non-affiliated firms, organizations or individuals except as authorized by you or your representatives or as required or permitted by law. We may disclose nonpublic personal information about you to nonaffiliated third parties, such as custodians, brokers, auditors, accountants, and systems and administrative service providers, in connection with the services we provide to you or on your behalf. When we provide nonpublic personal information about you to nonaffiliated third parties for these purposes, we expect them to safeguard your nonpublic personal information, use your nonpublic personal information only for the intended purposes and otherwise abide by applicable law.
How We Obtain Your Nonpublic Personal Information
We collect nonpublic personal information about you from various sources, including documents, new account applications and other information that you or your representatives, custodians, attorneys, accountants or similar parties provide to us, communications that we have with you or your representatives, custodians, attorneys, accountants or similar parties, and documents and other information related to your accounts or investment experience with us.
Please do not hesitate to contact Jacob D. Smith, our Chief Compliance Officer, if you have any questions regarding this privacy notice or the measures we have implemented to protect the privacy of your nonpublic personal information.
50
U.S. Bancorp Fund Services, LLC
P.O. Box 701
Milwaukee, WI 53201-0701
LKCM FUNDS
P.O. Box 701
Milwaukee, WI 53201-0701
| | | | |
Officers and Trustees |
J. Luther King, Jr., CFA, CIC Trustee, President and Chief Executive Officer | | Richard J. Howell Trustee | | Richard Lenart Secretary & Treasurer |
| | |
Paul W. Greenwell Vice President | | Larry J. Lockwood Chairman of the Board of Trustees | | Jacob D. Smith Chief Financial Officer Chief Compliance Officer |
| | |
Steven R. Purvis, CFA Trustee | | Mauricio Rodriguez Trustee | | |
|
Investment Adviser |
Luther King Capital Management Corporation 301 Commerce Street, Suite 1600 Fort Worth, TX 76102 |
Administrator, Transfer Agent, Dividend Paying Agent & Shareholder Servicing Agent |
U.S. Bancorp Fund Services, LLC P.O. Box 701 Milwaukee, WI 53201-0701 |
Custodian |
U.S. Bank, N.A. 1555 N. River Center Drive, Suite 302 Milwaukee, WI 53212 |
Independent Registered Public Accounting Firm |
Deloitte & Touche LLP 555 E. Wells St., Suite 1400 Milwaukee, WI 53202 |
Distributor |
Quasar Distributors, LLC 111 East Kilbourn Avenue, Suite 2200 Milwaukee, WI 53202 |

LKCM Aquinas Catholic Equity Fund
Annual Report
December 31, 2022
Dear Fellow Shareholders:
We report the following performance information for the LKCM Aquinas Catholic Equity Fund for indicated periods ended December 31, 2022:
| | | | | | | | | | | | | | | | | | | | | | | | | | | | | | | | | | | | | | | | |
Fund | | Inception
Date | | NAV @
12/31/22 | | Net
Expense
Ratio*,** | | Gross
Expense
Ratio** | | One Year
Total
Return
Ended
12/31/22 | | Five Year
Average
Annualized
Return
Ended
12/31/22 | | Ten Year
Average
Annualized
Return
Ended
12/31/22 | | Avg.
Annual
Total
Return
Since
Incept.*** |
LKCM Aquinas Catholic Equity Fund(1) | | | | 07/11/2005 | | | | $ | 15.05 | | | | | 1.00 | % | | | | 1.40 | % | | | | -18.17 | % | | | | 9.00 | % | | | | 10.45 | % | | | | 7.99 | % |
S&P 500® Index(2) | | | | | | | | | | | | | | | | | | | | | | | | -18.11 | % | | | | 9.42 | % | | | | 12.56 | % | | | | 8.99 | % |
Performance data quoted represents past performance and does not guarantee future results. The investment return and principal value of an investment will fluctuate so that an investor’s shares, when redeemed, may be worth more or less than their original cost. Current performance of the Fund may be lower or higher than the performance quoted. Performance data current to the most recent month end may be obtained by calling 1-800-423-6369. Returns would have been lower if Luther King Capital Management Corporation, the Funds’ investment adviser, had not waived a portion of its management fee and/or reimbursed certain expenses of the Fund. Please see Note B to the Notes to the Financial Statements for specific information regarding management fee waiver and/or expense reimbursement arrangements for the Fund. The Fund imposes a 1.00% redemption fee on shares held less than 30 days. If reflected, the fee would reduce performance shown.
| * | Luther King Capital Management Corporation, the Fund’s investment adviser, has contractually agreed to waive all or a portion of its management fee and/or reimburse expenses of the Fund to maintain an expense ratio of 1.00% per annum through May 1, 2023. This expense limitation excludes interest, taxes, brokerage commissions, indirect fees and expenses related to investments in other investment companies, including money market funds, and extraordinary expenses. Investment performance, which is based on the net expense ratio, reflects fee waivers, if any, in effect during the relevant period. In the absence of such waivers, total return would be reduced. LKCM waived management fees and/or reimbursed expenses for the Fund during the fiscal year ended December 31, 2022. |
| ** | Expense ratios above are as reported in the Fund’s current prospectus dated May 1, 2022. Expense ratios reported for other periods in the financial highlights of this report may differ. |
| *** | The assets of the Aquinas Value Fund, Aquinas Growth Fund and Aquinas Small-Cap Fund were acquired by the LKCM Aquinas Value Fund, LKCM Aquinas Growth Fund and LKCM Aquinas Small Cap Fund, respectively, on July 11, 2005. Due to the change in adviser and investment technique, performance is being quoted for the period after the merger. The LKCM Aquinas Small Cap Fund and LKCM Aquinas Growth Fund were reorganized into the LKCM Aquinas Value Fund effective upon the close of business on July 29, 2016, after which the LKCM Aquinas Value Fund’s name, investment strategies and expenses changed to those of the LKCM Aquinas Catholic Equity Fund. The performance shown prior to August 1, 2016 is that of the LKCM Aquinas Value Fund. |
| (1) | Effective upon the close of business on July 29, 2016, the LKCM Aquinas Small Cap Fund and the LKCM Aquinas Growth Fund reorganized into the LKCM Aquinas Value Fund (the “Reorganizations”). Immediately after the Reorganizations were completed, the LKCM Aquinas Value Fund changed its name to the LKCM Aquinas Catholic Equity Fund and its investment strategies and expenses, including the expense limitation agreement, changed to the investment strategies and expenses, including the expense limitation agreement, of the LKCM Aquinas Catholic Equity Fund. The Fund’s performance prior to August 1, 2016 reflects the Fund’s prior investment strategies. |
| (2) | The S&P 500® Index is an unmanaged capitalization-weighted index of 500 selected stocks that is generally considered representative of the performance of large capitalization companies in the U.S. stock market. |
Note: The Index defined above is not available for direct investment and the index performance therefore does not include fees, expenses or taxes.
2022 Review
Following two tumultuous years, the global economy entered 2022 with what appeared to be new strength. Inflation was accelerating, but markets generally expected the Federal Reserve to raise its benchmark interest rate by a modest amount over the course of the year to help bring inflation down. The decision by Russia to invade Ukraine on February 24th sent shockwaves through global markets as the price of gold, wheat, crude oil, and natural gas soared. By the end of the first quarter of 2022 economic momentum was waning under the weight of the Ukrainian invasion, persistent inflation, and the emergence of the Omicron variant of the COVID-19 virus which closed the world’s largest container port in Shanghai, among other disruptive effects.
Gross Domestic Product (GDP) readings for the first half of 2022 to us suggested that the U.S. economy was either in a recession, or on the cusp of one. Real GDP declined at an annual rate of 1.6% and 0.6% in the first and second quarters of 2022, respectively. In contrast, the U.S. economy grew in the third quarter of 2022 as measured by real GDP, expanding at an annual rate of 3.2%, which appears driven by a narrowing trade deficit, an increase in consumer spending, and U.S. government outlays. There has only been one other episode in the post-World War II period in which two consecutive quarters of negative real GDP were not associated with a recession – the second and third quarters of 1947, as the U.S. economy was adjusting to the post war era. Employment expanded, and the unemployment rate averaged 3.6% in 1947, similar to the current tight labor market. The official recession dating organization, the National Bureau of Economic Research, has not yet labeled the first half of 2022 a recession and is unlikely to do so in our opinion because the period did not fully exhibit the breadth of economic softness typically associated with a recession. For example, in our view gross domestic income and robust job growth in the first half of 2022 were inconsistent with historical recessionary conditions.
In June 2022, inflation as measured by the Consumer Price Index reached a high of 9.1%, reminiscent of the late 1970s and early 1980s. Following a 0.25% interest rate hike in March 2022 and a 0.50% increase in May 2022, the Federal Reserve raised its benchmark interest rate by 0.75% in June 2022. Federal Reserve Chair Jerome Powell put it best in late June 2022 when he said, “I think we now understand
2
better how little we understand about inflation.” In the final nine months of 2022, the Federal Reserve raised its benchmark rate by 4.25%, the largest calendar year increase since 1973. We have twice witnessed more rapid tightening, and it did not end well for the economy in either instance. During the 1979-1980 period, the Volcker-led Federal Reserve increased its benchmark rate from 11.5% in October 1979 to 20.0% by March 1980, or 8.5% in just six months. Following a short period of easing, the Federal Reserve once again had to tighten monetary policy, moving its benchmark rate from 9.5% in August 1980 to 20.0% by that December. A recession ensued in both episodes, although this action appeared necessary to subdue double-digit inflation expectations at the time. This tightening process, though painful, ultimately set-up an extraordinary period of positive returns in both the equity and bond markets.
The Federal Reserve’s hawkish stance during 2022 had a profound impact on the bond market and the U.S. dollar. The 2-Year Treasury note, which is very sensitive to shifts in monetary policy, rose nearly 4.00% to a peak of 4.72% in early November 2022 before settling back to 4.43% at year-end. While inflation inherently erodes the purchasing power of a dollar, in nominal terms the U.S. dollar strengthened dramatically in 2022 versus its major trading partners. This strengthening resulted in an earnings headwind for U.S. multinational companies that generate significant international earnings. We believe this headwind should ease in the coming year, as central banks and governments around the world have increased interest rates and conducted foreign exchange interventions that we believe will increase the value of their own currencies relative to the U.S. dollar.
2022 was a bruising year for the capital markets. Stock and bond prices fell in unison as the Federal Reserve battled inflation. Long-dated bonds fared the worst with the price of the 30-Year Treasury bond falling 33.4%. The Standard & Poor’s 500 Index had its worst performance since 2008, declining 18.1%, with only two of the eleven sectors of the market, Energy and Utilities, finishing with positive returns. The equity market results were also very dramatic, with value stocks outperforming growth stocks by the second widest margin since 1979. The technology-laden NASDAQ Composite Index, which had dominated the stock market leadership since the market recovery began in May 2020, fell 32.5% in 2022.
2023 Outlook
We believe that the new year is likely to be worse for the U.S. economy, but better for the financial markets. In our view the economy continues to pass successive signposts that suggest that the ultimate destination is a recession. A deeply inverted yield curve, cascading leading economic indicators, and a sharp decline in housing activity have all historically portended a recession. We believe there are still some signposts potentially just over the horizon that would cement our recession outlook, including a meaningful increase in the low unemployment rate of 3.5%, which remains at half century lows.
We believe that much of what the U.S. economy will be digesting in the year ahead is the substantial monetary tightening that occurred in the last nine months of 2022. The time lag between changes in monetary policy and its impact on the real economy has historically been roughly one year. As a result, we believe the brunt of last year’s monetary tightening still lies ahead for the economy. Higher interest rates generally work through two primary channels. First, higher interest rates generally stifle areas of the economy that are most sensitive to changes in the cost of borrowing, such as housing, auto sales, and business capital spending. Second, declines in demand for goods in the interest rate sensitive parts of the economy generally result in lower wages for workers in those industries, and in some cases other workers lose their jobs entirely.
We believe the potential recession has been labeled the most anticipated recession in memory, but several factors appear to be delaying its onset. First, job openings remain elevated with 1.7 job openings per unemployed worker, nearly 50% higher than December 2019. The ability of workers to quickly find new employment opportunities generally pushes wages higher and keeps the unemployment rate lower. Second, after contracting for five sequential quarters, aggregate real disposable personal income rebounded in the second half of 2022. We believe it is highly unusual for real wages to decline when unemployment is this historically low. In our view, as inflation continues to fall, real wage growth should remain positive, even if nominal wage growth decelerates. Finally, it appears that U.S. households generally remain flush with savings, despite declines in the savings rates and increases in consumer credit balances.
If a recession does arrive in 2023, we believe that it will most likely be relatively mild. In our view, the characterization of a recession in 2023 would likely be an “earnings” recession rather than a “balance sheet” recession, which is an important distinction. The Great Financial Crisis that began in 2007 was a recession during which severe damage occurred to both household and business balance sheets. That adverse environment ultimately forced individuals and businesses to save more while consuming and investing less in order to deleverage. In our view, that period demonstrates the economy historically contracts more in balance sheet recessions and takes longer for growth to reemerge, in part because credit creation is slower to rebound. In contrast, we believe that earnings recessions are typically more shallow in nature as the economic damage is generally less pervasive.
We believe there is also a case for avoiding a recession in the coming year, but it will likely require the labor market, consumer spending, and the Federal Reserve to each strike the right balance in order to achieve an economic “soft landing.” In our view, the labor market is now the most important factor in shaping the Federal Reserve’s deliberations over interest rate policy in the coming year. The annual pace of consumer inflation, as measured by the Consumer Price Index, has fallen each month since its June 2022 peak of 9.1%. We believe the downward trajectory is partially attributable to deflation in the price of goods, helped by easing supply constraints and a shift in spending towards services. In addition, we believe the housing component of services is currently putting upward pressure on inflation. We believe that falling goods prices and a roll-over in shelter prices could push inflation lower still in the coming year. However, there is considerable risk that inflation readings settle uncomfortably short of the Federal Reserve’s stated 2.0% target. In our
3
view, narrowing this gap in inflation from the 4.0%-5.0% range to the Federal Reserve’s 2.0% target would require the upward pressure on services prices, other than housing, to significantly ease. Unfortunately, we believe that achieving this critical step will likely require bringing the supply and demand for labor back in balance.
We are more optimistic in our outlook for the financial markets than the economy. We believe the entire decline in the Standard & Poor’s 500 Index in 2022 was attributable to the compression of the Price/Earnings ratio, as corporate earnings likely expanded between 4.0%-5.0% for the year. It appears that the Price/Earnings ratio fell last year in response to higher interest rates, wider credit spreads, and recession fears. We believe the year ahead has the potential to be the inverse of 2022. We currently expect corporate earnings to decline in 2023, while the Price/Earnings ratio may ultimately expand as credit spreads begin to normalize. In our view, it is not unusual for the stock market to begin to move higher roughly a year before corporate earnings bottom. Finally, we believe it is historically rare for the Standard & Poor’s 500 Index to post consecutive years of negative returns. In the intervening seventy-seven years since the end of World War II, the market recorded negative returns in twenty-one of those years. In only three instances (1973-1974, 2000-2001, 2001-2002) has the market declined in successive years. Taken as a whole, we anticipate a more favorable market environment in 2023 as prices begin to discount future earnings on better outlooks for interest rates and credit spreads.
LKCM Aquinas Catholic Equity Fund
During the year ended December 31, 2022, the LKCM Aquinas Catholic Equity Fund returned -18.17% as compared to the -18.11% return for the Fund’s benchmark, the S&P 500® Index. During the year, the Fund’s relative performance benefited from its overweight position in the Energy sector and underweight position in the Communication Services sector, which was partially offset by the Fund’s underweight position in the Healthcare sector. The Fund’s relative performance also benefited from stock selection in the Consumer Discretionary sector, which was offset by stock selection decisions in the Healthcare, Energy and Information Technology sectors.
We continue to believe the companies held by the Fund are well positioned financially, with the ability to raise dividends and/or buy back meaningful shares of stock. Our investment strategy for the Fund focuses on investments in higher quality companies with sustainable competitive advantages and the potential for significant cash flow generation that can be returned to investors as appropriate based on reinvestment opportunities within their industries. We believe the Fund remains well-positioned for the upcoming year.
J. Luther King, Jr., CFA, CIC
January 9, 2023
4
The information provided herein represents the opinion of J. Luther King, Jr., CFA, CIC and is not intended to be a forecast of future events, a guarantee of future results, nor investment advice.
Please refer to the Schedule of Investments found on page 9 of the report for more information on Fund holdings. Fund holdings and sector allocations are subject to change and are not recommendations to buy or sell any securities.
Mutual fund investing involves risk. Principal loss is possible. Past performance is not a guarantee of future results. Investments in equity securities are subject to market risks and significant fluctuations in value. Small and medium capitalization funds typically carry additional risks, since smaller companies generally have a higher risk of failure, and, historically, their stocks have experienced a greater degree of market volatility than stocks on average. These and other risks are discussed in the Fund’s summary and statutory prospectuses. Since the Fund practices socially responsible investing within the framework provided by the United States Conference of Catholic Bishops’ Socially Responsible Investing Guidelines, the Fund may forego a profitable investment opportunity or sell a security when it may be disadvantageous to do so.
Earnings growth is not a measure of future performance.
Price-earnings ratio is the ratio of a company’s share price to the company’s earnings per share.
Cash flow is the net amount of cash and cash-equivalents being transferred into and out of a business.
The Consumer Price Index (CPI) is a measure of the average change over time in the prices paid by urban consumers for a market basket of consumer goods and services.
NASDAQ Composite Index is a market capitalization weighted index of more than 3,000 stocks listed on the Nasdaq stock exchange.
Yield curve is a line that plots yields (interest rates) of fixed income securities have equal credit quality but differing maturity dates. The slope of the yield curve gives an idea of future interest rate changes and economic activity. An inverted yield curve signals that interest rates associated with fixed income securities with shorter maturities are higher than interest rates associated with fixed income securities with longer maturities.
Credit spreads are the percentage point difference between yields of various classes of fixed income securities, including corporate bonds, compared to U.S. Treasury bonds.
Must be preceded or accompanied by a current prospectus.
Quasar Distributors, LLC, distributor.
5
PERFORMANCE:
The following information illustrates the historical performance of the LKCM Aquinas Catholic Equity Fund as of December 31, 2022 compared to the Fund’s representative benchmark and peer group indices.
Performance data quoted represents past performance; past performance does not guarantee future results. The graph and table reflect the reinvestment of dividends and other distributions, if any, but do not reflect the deduction of taxes that a shareholder would pay on Fund distributions or the redemption of Fund shares. The investment return and principal value of an investment will fluctuate so that an investor’s shares, when redeemed, may be worth more or less than their original cost. Current performance of the Fund may be lower or higher than the performance quoted. Performance data current to the most recent month end may be obtained by calling 1-800-423-6369. Returns would have been lower if LKCM had not waived a portion of its management fee and/or reimbursed certain expenses of the Fund. Please see Note B to the Notes to the Financial Statements for specific information regarding management fee waiver and/or expense reimbursement arrangements for the Fund.
An index is an unmanaged portfolio and does not trade or incur any expenses. The Lipper Large-Cap Core Funds Index, however, does reflect the fees and expenses borne by the funds included in that index. One can not invest in an unmanaged index.
AVERAGE ANNUAL TOTAL RETURN (Periods Ended December 31, 2022)(1)
| | | | | | | | | | | | | | | | | | | | |
| | | | | |
| | | Past
1 Year | | Past
5 Years(2) | | Past
10 Years(2) | | Since
Inception(2)(3) |
LKCM Aquinas Catholic Equity Fund | | | | -18.17% | | | | | 9.00% | | | | | 10.45% | | | | | 7.99% | |
S&P 500® Index | | | | -18.11% | | | | | 9.42% | | | | | 12.56% | | | | | 8.99% | |
Lipper Large-Cap Core Funds Index | | | | -17.00% | | | | | 8.25% | | | | | 11.39% | | | | | 8.13% | |
| (1) | Effective upon the close of business on July 29, 2016, the LKCM Aquinas Small Cap Fund and the LKCM Aquinas Growth Fund reorganized into the LKCM Aquinas Value Fund (the “Reorganizations”). At the time the Reorganizations were completed, the LKCM Aquinas Value Fund changed its name to the LKCM Aquinas Catholic Equity Fund (“Fund”) and its investment strategies and expenses, including the expense limitation agreement, changed to the investment strategies and expenses, including the expense limitation agreement, of the Fund. The Fund’s performance prior to August 1, 2016 reflects the Fund’s prior investment strategies. |
| (3) | The assets of the Aquinas Value Fund, Aquinas Growth Fund and Aquinas Small-Cap Fund were acquired by the LKCM Aquinas Value Fund, LKCM Aquinas Growth Fund and LKCM Aquinas Small Cap Fund, respectively, on July 11, 2005. At the time of the reorganization, the Adviser also changed from Aquinas Investment Advisers, Inc. to Luther King Capital Management Corporation. Due to the change in adviser and investment technique, performance is being quoted for the period after the merger. As stated above, the LKCM Aquinas Growth Fund and LKCM Aquinas Small-Cap Fund were reorganized into the LKCM Aquinas Value Fund effective upon the close of business on July 29, 2016, after which the LKCM Aquinas Value Fund’s name, investment strategies and expenses changed to those of the Fund. The performance shown prior to August 1, 2016, is that of the LKCM Aquinas Value Fund. |
A HYPOTHETICAL $10,000 INVESTMENT IN LKCM AQUINAS CATHOLIC EQUITY FUND
(for the ten years ended December 31, 2022)
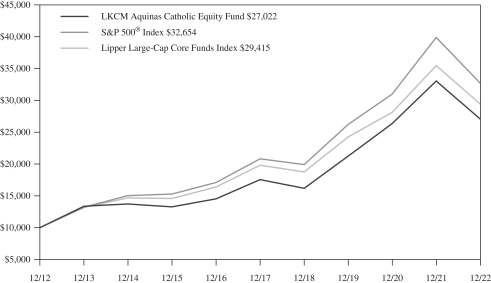
The S&P 500® Index is an unmanaged capitalization-weighted index of 500 selected stocks that is generally considered representative of the performance of large capitalization companies in the U.S. stock market.
The Lipper Large-Cap Core Funds Index is an unmanaged index generally considered representative of large cap core mutual funds tracked by Lipper, Inc.
6
LKCM Aquinas Catholic Equity Fund Expense Example — December 31, 2022 (Unaudited)
As a shareholder of the Fund, you incur two types of costs: (1) transaction costs, including redemption fees; and (2) ongoing costs, including management fees, distribution and/or service (12b-1) fees and other Fund expenses. This Example is intended to help you understand your ongoing costs (in dollars) of investing in the Fund and to compare these costs with the ongoing costs of investing in other mutual funds. The Example is based on an investment of $1,000 invested at the beginning of the period and held for the entire period (07/01/2022-12/31/2022).
ACTUAL EXPENSES
The third and fourth columns of the table below provide information about actual account values and actual expenses. You may use the information in these columns, together with the amount you invested, to estimate the expenses that you paid over the period. Simply divide your account value by $1,000 (for example, an $8,600 account value divided by $1,000 = 8.6), then multiply the result by the number in the fourth column under the heading entitled “Expenses Paid During Period” to estimate the expenses you paid on your account during this period. Although the Fund charges no sales load, you will be assessed fees for outgoing wire transfers, returned checks and stop payment orders at prevailing rates charged by U.S. Bancorp Fund Services, LLC (doing business as U.S. Bank Global Fund Services), the Fund’s transfer agent. If you request that a redemption be made by wire transfer, currently a $15.00 fee is charged by the Fund’s transfer agent. You will be charged a redemption fee equal to 1.00% of the net amount of the redemption if you redeem your shares of the Fund within 30 days of purchase, unless otherwise determined by the Fund in its discretion. To the extent the Fund invests in shares of other investment companies as part of its investment strategy, you will indirectly bear your proportionate share of any fees and expenses charged by the underlying funds in which the Fund invests in addition to the expenses of the Fund. Actual expenses of the underlying funds are expected to vary among the various underlying funds. These expenses are not included in the example below. The example below includes management fees, registration fees and other expenses. However, the example below does not include portfolio trading commissions and related expenses and other extraordinary expenses as determined under generally accepted accounting principles.
HYPOTHETICAL EXAMPLES FOR COMPARISON PURPOSES
The fifth and sixth columns of the table below provide information about hypothetical account values and hypothetical expenses based on the Fund’s actual expense ratio and an assumed rate of return of 5% per year before expenses, which is not the Fund’s actual return. The hypothetical account values and expenses may not be used to estimate the actual ending account balance or expenses you paid for the period. You may use this information to compare the ongoing costs of investing in the Fund and other funds. To do so, compare this 5% hypothetical example with the 5% hypothetical examples that appear in the shareholder reports of the other funds. Please note that the expenses shown in the table are meant to highlight your ongoing costs only and do not reflect any transactional costs, such as redemption fees. Therefore, the fifth and sixth columns of the table are useful in comparing ongoing costs only, and will not help you determine the relative total costs of owning different funds. In addition, if these transaction costs were included, your costs would have been higher.
| | | | | | | | | | | | | | | | | | | | | | | | | | | | | | |
| | | Fund’s
Annualized
Expense
Ratio(1) | | Beginning
Account Value
07/01/2022 | | Actual | | Hypothetical (5% return
before expenses) |
| | | Ending
Account Value
12/31/2022 | | Expenses
Paid
During
Period(1) | | Ending
Account Value
12/31/2022 | | Expenses
Paid
During
Period(1) |
LKCM Aquinas Catholic Equity Fund | | | | 1.00 | % | | | $ | 1,000.00 | | | | $ | 1,024.00 | | | | $ | 5.10 | | | | $ | 1,020.16 | | | | $ | 5.09 | |
| (1) | Expenses are equal to the annualized net expense ratio for the Fund, multiplied by the average account value over the period, multiplied by 184/365 (to reflect the one-half year period). |
7
ALLOCATION OF PORTFOLIO HOLDINGS — LKCM Aquinas Catholic Equity Fund — December 31, 2022
Percentages represent market value as a percentage of total investments.
LKCM Aquinas Catholic Equity Fund
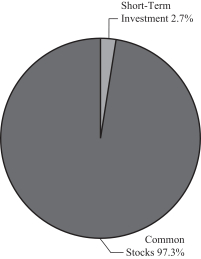
8
|
| LKCM AQUINAS CATHOLIC EQUITY FUND |
| SCHEDULEOF INVESTMENTS |
| December 31, 2022 |
| | | | | | | | | | |
| COMMON STOCKS - 97.4% | | Shares | | Value |
| Aerospace & Defense - 3.0% | | | | |
Honeywell International, Inc. | | | | 7,000 | | | | $ | 1,500,100 | |
| | | | | | | | | | |
| Banks - 7.7% | | | | |
Comerica, Inc. | | | | 15,000 | | | | | 1,002,750 | |
Cullen/Frost Bankers, Inc. | | | | 4,000 | | | | | 534,800 | |
Truist Financial Corp. | | | | 32,375 | | | | | 1,393,096 | |
Zions Bancorp N.A. | | | | 19,000 | | | | | 934,040 | |
| | | | | | | | | | |
| | | | | | | | | 3,864,686 | |
| | | | | | | | | | |
| Beverages - 5.9% | | | | |
Keurig Dr Pepper, Inc. | | | | 27,500 | | | | | 980,650 | |
PepsiCo, Inc. | | | | 11,000 | | | | | 1,987,260 | |
| | | | | | | | | | |
| | | | | | | | | 2,967,910 | |
| | | | | | | | | | |
| Biotechnology - 1.0% | | | | |
Neogen Corp. (a) | | | | 32,500 | | | | | 494,975 | |
| | | | | | | | | | |
| Chemicals - 10.0% | | | | |
Air Products & Chemicals, Inc. | | | | 4,000 | | | | | 1,233,040 | |
Corteva, Inc. | | | | 20,000 | | | | | 1,175,600 | |
DuPont de Nemours, Inc. | | | | 10,000 | | | | | 686,300 | |
Ecolab, Inc. | | | | 5,000 | | | | | 727,800 | |
The Sherwin-Williams Co. | | | | 5,000 | | | | | 1,186,650 | |
| | | | | | | | | | |
| | | | | | | | | 5,009,390 | |
| | | | | | | | | | |
| Computers & Peripherals - 3.1% | | | | |
Apple, Inc. | | | | 12,000 | | | | | 1,559,160 | |
| | | | | | | | | | |
| Construction Materials - 1.4% | | | | |
Martin Marietta Materials, Inc. | | | | 2,000 | | | | | 675,940 | |
| | | | | | | | | | |
| Consumer Finance - 2.2% | | | | |
American Express Company | | | | 7,500 | | | | | 1,108,125 | |
| | | | | | | | | | |
| Electronic Equipment & Instruments - 2.3% | | | | |
Trimble, Inc. (a) | | | | 22,500 | | | | | 1,137,600 | |
| | | | | | | | | | |
Electronic Equipment, Instruments &
Components - 1.6% | | |
Teledyne Technologies, Inc. (a) | | | | 2,000 | | | | | 799,820 | |
| | | | | | | | | | |
| Food Products - 2.4% | | | | |
The Kraft Heinz Company | | | | 30,000 | | | | | 1,221,300 | |
| | | | | | | | | | |
| Health Care Equipment & Supplies - 3.0% | | | | |
Alcon, Inc. (b) | | | | 2,500 | | | | | 171,375 | |
Stryker Corp. | | | | 5,500 | | | | | 1,344,695 | |
| | | | | | | | | | |
| | | | | | | | | 1,516,070 | |
| | | | | | | | | | |
| Internet & Catalog Retail - 1.4% | | | | |
Amazon.com, Inc. (a) | | | | 8,000 | | | | | 672,000 | |
| | | | | | | | | | |
| IT Consulting & Services - 2.3% | | | | |
Broadridge Financial Solutions, Inc. | | | | 5,500 | | | | | 737,715 | |
PayPal Holdings, Inc. (a) | | | | 5,700 | | | | | 405,954 | |
| | | | | | | | | | |
| | | | | | | | | 1,143,669 | |
| | | | | | | | | | |
| Machinery - 3.3% | | | | |
Illinois Tool Works Inc. | | | | 2,500 | | | | | 550,750 | |
Xylem, Inc. | | | | 10,000 | | | | | 1,105,700 | |
| | | | | | | | | | |
| | | | | | | | | 1,656,450 | |
| | | | | | | | | | |
| Marine - 2.1% | | | | |
Kirby Corp. (a) | | | | 16,500 | | | | | 1,061,775 | |
| | | | | | | | | | |
| | | | | | | | | | |
| COMMON STOCKS | | Shares | | Value |
| Media & Entertainment - 3.5% | | | | |
Alphabet, Inc. - Class A (a) | | | | 20,000 | | | | $ | 1,764,600 | |
| | | | | | | | | | |
| Oil & Gas & Consumable Fuels - 13.2% | | | | |
Chevron Corp. | | | | 6,500 | | | | | 1,166,685 | |
Devon Energy Corp. | | | | 32,000 | | | | | 1,968,320 | |
Diamondback Energy Inc. | | | | 5,000 | | | | | 683,900 | |
Kinder Morgan, Inc. | | | | 60,000 | | | | | 1,084,800 | |
Pioneer Natural Resources Co. | | | | 7,500 | | | | | 1,712,925 | |
| | | | | | | | | | |
| | | | | | | | | 6,616,630 | |
| | | | | | | | | | |
| Pharmaceuticals - 2.9% | | | | |
Zoetis, Inc. | | | | 10,000 | | | | | 1,465,500 | |
| | | | | | | | | | |
| Professional Services - 2.3% | | | | |
Verisk Analytics, Inc. | | | | 6,500 | | | | | 1,146,730 | |
| | | | | | | | | | |
| Software - 12.8% | | | | |
Adobe, Inc. (a) | | | | 3,700 | | | | | 1,245,161 | |
Microsoft Corp. | | | | 7,500 | | | | | 1,798,650 | |
Oracle Corp. | | | | 20,000 | | | | | 1,634,800 | |
Roper Technologies, Inc. | | | | 4,000 | | | | | 1,728,360 | |
| | | | | | | | | | |
| | | | | | | | | 6,406,971 | |
| | | | | | | | | | |
| Software & Services - 2.1% | | | | |
Akamai Technologies, Inc. (a) | | | | 12,500 | | | | | 1,053,750 | |
| | | | | | | | | | |
| Specialty Retail - 7.3% | | | | |
Academy Sports & Outdoors, Inc. | | | | 22,500 | | | | | 1,182,150 | |
The Home Depot, Inc. | | | | 4,000 | | | | | 1,263,440 | |
Leslie’s, Inc. (a) | | | | 60,000 | | | | | 732,600 | |
Petco Health & Wellness Co, Inc. (a) | | | | 50,000 | | | | | 474,000 | |
| | | | | | | | | | |
| | | | | | | | | 3,652,190 | |
| | | | | | | | | | |
| Textiles, Apparel & Luxury Goods - 0.6% | | | | |
Tapestry, Inc. | | | | 7,500 | | | | | 285,600 | |
| | | | | | | | | | |
TOTAL COMMON STOCKS | | | | | | | | | | |
(Cost $26,228,303) | | | | | | | | | 48,780,941 | |
| | | | | | | | | | |
| | | | | | | | | | |
| SHORT-TERM INVESTMENT - 2.7% | | | | |
| Money Market Fund - 2.7% | | | | |
Invesco Short-Term Investments Trust - Government & Agency Portfolio - Institutional Shares, 4.21% (c) | | | | 1,360,448 | | | | | 1,360,448 | |
| | | | | | | | | | |
TOTAL SHORT-TERM INVESTMENT | | | | | | | | | | |
(Cost $1,360,448) | | | | | | | | | 1,360,448 | |
| | | | | | | | | | |
Total Investments - 100.1% | | | | | | | | | 50,141,389 | |
(Cost $27,588,751) | | | | | | | | | | |
Liabilities in Excess of Other Assets - (0.1)% | | | | | | | | | (58,023 | ) |
| | | | | | | | | | |
TOTAL NET ASSETS - 100.0% | | | | | | | | $ | 50,083,366 | |
| | | | | | | | | | |
| (a) | Non-income producing security. |
| (b) | Security issued by non-U.S. incorporated company. |
| (c) | The rate quoted is the annualized seven-day yield of the Fund at period end. |
Investments are classified by industry pursuant to the Global Industry Classification Standard (GICS®), which was developed by and/or is the exclusive property of Morgan Stanley Capital International, Inc. (“MSCI”) and Standard & Poor’s Financial Services LLC (“S&P”). GICS is a service mark of MSCI and S&P and has been licensed for use by U.S. Bancorp Fund Services, LLC.
The accompanying notes are an integral part of these financial statements.
9
|
| STATEMENTOF ASSETSAND LIABILITIES |
| December 31, 2022 |
| | | | | | | | | | |
|
| LKCM Aquinas Catholic Equity Fund |
| | | | | | | | | | |
Assets | | | | | | | | | | |
Investments, at value* | | | | | | | | $ | 50,141,389 | |
Dividends and interest receivable | | | | | | | | | 50,275 | |
Receivable for Fund shares sold | | | | | | | | | 944 | |
Prepaid expenses and other assets | | | | | | | | | 20,225 | |
| | | | | | | | | | |
Total assets | | | | | | | | | 50,212,833 | |
| | | | | | | | | | |
Liabilities | | | | | | | | | | |
Due to custodian | | | | | | | | | 89 | |
Payable for investment advisory fees (Note B) | | | | | | | | | 57,508 | |
Payable for distribution expense (Note B) | | | | | | | | | 26,355 | |
Payable for administrative fees | | | | | | | | | 9,542 | |
Payable for accounting and transfer agent fees and expenses | | | | | | | | | 12,665 | |
Payable for professional fees | | | | | | | | | 10,816 | |
Payable for custody fees and expenses | | | | | | | | | 987 | |
Payable for reports to shareholders | | | | | | | | | 6,692 | |
Payable for trustees’ fees and officer compensation (Note B) | | | | | | | | | 434 | |
Payable for Fund Shares redeemed | | | | | | | | | 3,975 | |
Accrued expenses and other liabilities | | | | | | | | | 404 | |
| | | | | | | | | | |
Total liabilities | | | | | | | | | 129,467 | |
| | | | | | | | | | |
Net assets | | | | | | | | $ | 50,083,366 | |
| | | | | | | | | | |
Net assets consist of: | | | | | | | | | | |
Paid-in capital | | | | | | | | $ | 27,525,295 | |
Total distributable earnings | | | | | | | | | 22,558,071 | |
| | | | | | | | | | |
Net assets | | | | | | | | $ | 50,083,366 | |
| | | | | | | | | | |
Shares of beneficial interest outstanding
(unlimited shares of no par value authorized) | | | | | | | | | 3,327,771 | |
Net asset value per share
(offering and redemption price) | | | | | | | | $ | 15.05 | |
| | | | | | | | | | |
| | |
* Cost of Investments | | | | | | | | $ | 27,588,751 | |
| | | | | | | | | | |
The accompanying notes are an integral part of these financial statements.
10
|
| STATEMENTOF OPERATIONS |
| For the Year Ended December 31, 2022 |
| | | | | | | | | | |
|
LKCM Aquinas Catholic Equity Fund |
| | | | | | | | | | |
Investment Income: | | | | | | | | | | |
Dividends | | | | | | | | $ | 1,055,450 | |
Interest | | | | | | | | | 37,401 | |
| | | | | | | | | | |
Total investment income | | | | | | | | | 1,092,851 | |
| | | | | | | | | | |
| | |
Expenses: | | | | | | | | | | |
Investment advisory fees (Note B) | | | | | | | | | 487,129 | |
Administrative fees | | | | | | | | | 55,973 | |
Accounting and transfer agent fees and expenses | | | | | | | | | 80,706 | |
Distribution expense (Note B) | | | | | | | | | 54,125 | |
Professional fees | | | | | | | | | 27,992 | |
Trustees’ fees and officer compensation (Note B) | | | | | | | | | 31,202 | |
Federal and state registration | | | | | | | | | 22,412 | |
Custody fees and expenses | | | | | | | | | 6,621 | |
Reports to shareholders | | | | | | | | | 16,311 | |
Other | | | | | | | | | 609 | |
| | | | | | | | | | |
Total expenses | | | | | | | | | 783,080 | |
Less, expense waiver and/or reimbursement (Note B) | | | | | | | | | (241,826 | ) |
| | | | | | | | | | |
Net expenses | | | | | | | | | 541,254 | |
| | | | | | | | | | |
Net investment income (loss) | | | | | | | | | 551,597 | |
| | | | | | | | | | |
| | |
Realized and Unrealized Gain (Loss): | | | | | | | | | | |
Net realized gain on: | | | | | | | | | | |
Investments | | | | | | | | $ | 2,618,670 | |
Net change in unrealized depreciation on: | | | | | | | | | | |
Investments | | | | | | | | | (14,534,879 | ) |
| | | | | | | | | | |
| | |
Net Realized and Unrealized Loss | | | | | | | | | (11,916,209 | ) |
| | | | | | | | | | |
| | |
Net Decrease in Net Assets Resulting from Operations | | | | | | | | $ | (11,364,612 | ) |
| | | | | | | | | | |
The accompanying notes are an integral part of these financial statements.
11
|
| STATEMENTSOF CHANGESIN NET ASSETS |
| | | | | | | | | | | | | | | | | | | | |
|
| LKCM Aquinas Catholic Equity Fund |
|
| |
| | | | |
| | | | | Year Ended
December 31,
2022 | | | | Year Ended
December 31,
2021 |
Operations: | | | | | | | | | | | | | | | | | | | | |
Net investment income | | | | | | | | $ | 551,597 | | | | | | | | | $ | 147,922 | |
Net realized gain on investments | | | | | | | | | 2,618,670 | | | | | | | | | | 6,253,404 | |
Net change in unrealized
appreciation (depreciation) on investments | | | | | | | | | (14,534,879 | ) | | | | | | | | | 6,910,981 | |
| | | | | | | | | | | | | | | | | | | | |
Net increase (decrease) in net assets resulting from operations | | | | | | | | | (11,364,612 | ) | | | | | | | | | 13,312,307 | |
| | | | | | | | | | | | | | | | | | | | |
| | | | |
Distributions to Shareholders | | | | | | | | | (2,866,839 | ) | | | | | | | | | (7,216,137 | ) |
| | | | | | | | | | | | | | | | | | | | |
| | | | |
Net increase (decrease) in net assets from
Fund share transactions (Note C) | | | | | | | | | 398,809 | | | | | | | | | | 3,957,949 | |
| | | | | | | | | | | | | | | | | | | | |
| | | | |
Total increase (decrease) in net assets | | | | | | | | | (13,832,642 | ) | | | | | | | | | 10,054,119 | |
| | | | |
Net Assets: | | | | | | | | | | | | | | | | | | | | |
Beginning of period | | | | | | | | | 63,916,008 | | | | | | | | | | 53,861,889 | |
| | | | | | | | | | | | | | | | | | | | |
End of period | | | | | | | | $ | 50,083,366 | | | | | | | | | $ | 63,916,008 | |
| | | | | | | | | | | | | | | | | | | | |
The accompanying notes are an integral part of these financial statements.
12
|
| FINANCIAL HIGHLIGHTS |
| SELECTED DATAFOR EACH SHAREOF CAPITAL STOCK OUTSTANDING |
| | | | | | | | | | | | | | | | | | | | | | | | | | | | | | | | | | | | | | | | | | | | | | | | | | |
| | |
| | | | | LKCM Aquinas Catholic Equity Fund |
| | | | | | | | | | | | | | | | | | | | |
| | |
| | | | | Year Ended December 31, |
| | | | | | | | | | |
| | | | | 2022 | | | | 2021 | | | | 2020 | | | | 2019 | | | | 2018 |
Net Asset Value – Beginning of Period | | | | | | | | $ | 19.52 | | | | | | | | | $ | 17.53 | | | | | | | | | $ | 15.06 | | | | | | | | | $ | 12.80 | | | | | | | | | $ | 17.19 | |
| | | | | | | | | | | | | | | | | | | | | | | | | | | | | | | | | | | | | | | | | | | | | | | | | | |
Net investment income(1) | | | | | | | | | 0.17 | | | | | | | | | | 0.05 | | | | | | | | | | 0.06 | | | | | | | | | | 0.07 | | | | | | | | | | 0.06 | |
Net realized and unrealized gain (loss) on investments | | | | | | | | | (3.72 | ) | | | | | | | | | 4.40 | | | | | | | | | | 3.59 | | | | | | | | | | 3.92 | | | | | | | | | | (1.46 | ) |
| | | | | | | | | | | | | | | | | | | | | | | | | | | | | | | | | | | | | | | | | | | | | | | | | | |
Total from investment operations | | | | | | | | | (3.55 | ) | | | | | | | | | 4.45 | | | | | | | | | | 3.65 | | | | | | | | | | 3.99 | | | | | | | | | | (1.40 | ) |
| | | | | | | | | | | | | | | | | | | | | | | | | | | | | | | | | | | | | | | | | | | | | | | | | | |
Distributions from net investment income | | | | | | | | | (0.18 | ) | | | | | | | | | (0.05 | ) | | | | | | | | | (0.06 | ) | | | | | | | | | (0.08 | ) | | | | | | | | | (0.07 | ) |
Distributions from net realized gains | | | | | | | | | (0.74 | ) | | | | | | | | | (2.41 | ) | | | | | | | | | (1.12 | ) | | | | | | | | | (1.65 | ) | | | | | | | | | (2.92 | ) |
| | | | | | | | | | | | | | | | | | | | | | | | | | | | | | | | | | | | | | | | | | | | | | | | | | |
Total dividends and distributions | | | | | | | | | (0.92 | ) | | | | | | | | | (2.46 | ) | | | | | | | | | (1.18 | ) | | | | | | | | | (1.73 | ) | | | | | | | | | (2.99 | ) |
| | | | | | | | | | | | | | | | | | | | | | | | | | | | | | | | | | | | | | | | | | | | | | | | | | |
Net Asset Value – End of Period | | | | | | | | $ | 15.05 | | | | | | | | | $ | 19.52 | | | | | | | | | $ | 17.53 | | | | | | | | | $ | 15.06 | | | | | | | | | $ | 12.80 | |
| | | | | | | | | | | | | | | | | | | | | | | | | | | | | | | | | | | | | | | | | | | | | | | | | | |
Total Return | | | | | | | | | -18.17% | | | | | | | | | | 25.34% | | | | | | | | | | 24.28% | | | | | | | | | | 31.16% | | | | | | | | | | -7.96% | |
| | | | | | | | | | |
Ratios and Supplemental Data: | | | | | | | | | | | | | | | | | | | | | | | | | | | | | | | | | | | | | | | | | | | | | | | | | | |
Net assets, end of period (thousands) | | | | | | | | $ | 50,083 | | | | | | | | | $ | 63,916 | | | | | | | | | $ | 53,862 | | | | | | | | | $ | 47,408 | | | | | | | | | $ | 45,332 | |
Ratio of expenses to average net assets: | | | | | | | | | | | | | | | | | | | | | | | | | | | | | | | | | | | | | | | | | | | | | | | | | | |
Before expense waiver and/or reimbursement | | | | | | | | | 1.45% | | | | | | | | | | 1.40% | | | | | | | | | | 1.48% | | | | | | | | | | 1.51% | | | | | | | | | | 1.44% | |
After expense waiver and/or reimbursement | | | | | | | | | 1.00% | | | | | | | | | | 1.00% | | | | | | | | | | 1.00% | | | | | | | | | | 1.00% | | | | | | | | | | 1.00% | |
Ratio of net investment income (loss) to average net assets: | | | | | | | | | | | | | | | | | | | | | | | | | | | | | | | | | | | | | | | | | | | | | | | | | | |
Before expense waiver and/or reimbursement | | | | | | | | | 0.57% | | | | | | | | | | (0.15)% | | | | | | | | | | (0.12)% | | | | | | | | | | (0.05)% | | | | | | | | | | (0.12)% | |
After expense waiver and/or reimbursement | | | | | | | | | 1.02% | | | | | | | | | | 0.25% | | | | | | | | | | 0.36% | | | | | | | | | | 0.46% | | | | | | | | | | 0.32% | |
Portfolio turnover rate | | | | | | | | | 23% | | | | | | | | | | 18% | | | | | | | | | | 17% | | | | | | | | | | 12% | | | | | | | | | | 14% | |
| (1) | Net investment income per share represents net investment income divided by the average shares outstanding throughout the period. |
The accompanying notes are an integral part of these financial statements.
13
|
| LKCM FUNDS |
| NOTESTOTHE FINANCIAL STATEMENTS |
| December 31, 2022 |
A. Organization and Significant Accounting Policies: LKCM Funds (the “Trust”) is registered under the Investment Company Act of 1940 (“1940 Act”) as an open-end, management investment company. The Trust was organized as a Delaware statutory trust on February 10, 1994 and consists of seven diversified series as of December 31, 2022, one of which is presented herein: the LKCM Aquinas Catholic Equity Fund (the “Fund”). On July 11, 2005, the LKCM Aquinas Funds acquired the assets and assumed the liabilities of the Aquinas Funds. Effective upon the close of business on July 29, 2016, the LKCM Aquinas Small Cap Fund and the LKCM Aquinas Growth Fund reorganized into the LKCM Aquinas Value Fund, which changed its name immediately thereafter to the LKCM Aquinas Catholic Equity Fund and its investment strategies and expenses, including the expense limitation agreement, changed to the investment strategies and expenses, including the expense limitation agreement, of the LKCM Aquinas Catholic Equity Fund. The Fund is subject to expenses pursuant to the Rule 12b-1 plan described in Note B. The Fund charges a 1% redemption fee for redemptions of Fund shares held for less than 30 days, unless otherwise determined by the Fund in its discretion.
The LKCM Aquinas Catholic Equity Fund seeks to maximize long-term capital appreciation, while incorporating Catholic values investing principles in the investment process. The LKCM Aquinas Catholic Equity Fund seeks to achieve its investment objective by investing under normal circumstances at least 80% of its net assets (plus any borrowings for investment purposes) in equity securities of companies that Luther King Capital Management Corporation (the “Adviser”) believes are likely to have above-average growth in revenue and/or earnings, above-average returns on shareholders’ equity, potential for above-average capital appreciation, and/or companies the Adviser believes have attractive relative valuations.
The Fund practices socially responsible investing within the framework provided by the United States Conference of Catholic Bishops’ Socially Responsible Investment Guidelines (the “Guidelines”). The Fund’s investment approach incorporates the Guidelines through a combination of screening portfolio companies based on criteria set forth in the Guidelines, dialogue with companies whose policies and practices may conflict with the Guidelines, and/or potentially excluding from the Fund’s portfolio the securities of those companies that are unwilling to alter their policies and practices over a reasonable period of time. The Adviser monitors companies selected for the Fund for policies on various issues contemplated by the Guidelines. If the Fund invests in a company whose policies and practices are inconsistent with the Guidelines, the Adviser may attempt to influence the company, sell the company’s securities or otherwise exclude future investments in such company.
The following is a summary of significant accounting policies followed by the Fund in preparation of the financial statements. The Fund is an investment company and, accordingly, follows the investment company accounting and reporting guidance of the Financial Accounting Standards Board Accounting Standards Codification Topic 946, Investment Companies.
1. Security Valuation: Equity securities listed or traded on a U.S. securities exchange for which market quotations are readily available are valued at the last quoted sale price on the exchange on which the security is primarily traded. Nasdaq Global Market securities are valued at the Nasdaq Official Closing Price (“NOCP”). Unlisted U.S. equity securities and listed U.S. equity securities not traded on a particular valuation date are valued at the mean of the most recent quoted bid and ask price on the relevant exchanges or markets. Equity securities listed on a foreign exchange for which market quotations are readily available are valued at the last quoted sales price on the exchange on which the security is primarily traded. Debt securities are normally valued at the mean of the closing bid and ask price and/or by using a combination of broker quotations or evaluated prices provided by an independent pricing service. Futures and options on futures are valued at the settlement prices established each day on the principal exchange on which they are traded. Forward contracts are valued based on the forward rate using information provided by an independent pricing service. Other assets and securities for which no market or broker quotations or evaluated prices are readily available are valued in good faith at fair value. Rule 2a-5 under the Investment Company Act of 1940 (the “Valuation Rule”) establishes requirements for determining fair value in good faith for purposes of the Investment Company Act of 1940, including related oversight and reporting requirements. The Valuation Rule also defines when market quotations are “readily available” for purposes of the Investment Company Act of 1940, the threshold for determining whether the Fund must fair value a security. The Valuation Rule permits the Fund’s board to designate the Fund’s primary investment adviser as “valuation designee” to perform the Fund’s fair value determinations subject to board oversight and certain reporting and other requirements intended to ensure that the registered investment company’s board receives the information it needs to oversee the investment adviser’s fair value determinations. The Board has designated the Adviser as valuation designee under the Valuation Rule to perform fair value functions in accordance with the requirements of the Valuation Rule. The Adviser may value securities at fair value in good faith pursuant to the Adviser’s and the Fund’s procedures. The Adviser may use prices provided by independent pricing services to assist in the fair valuation of the Fund’s portfolio securities.
The Trust has adopted accounting standards which establish an authoritative definition of fair value and set out a hierarchy for measuring fair value. These standards require additional disclosures about the various inputs and valuation techniques used to develop the measurements of fair value and a discussion of changes in valuation techniques and related inputs during the period. These standards define fair value as the price that would be received to sell an asset or paid to transfer a liability in an orderly transaction between market participants at the measurement date. The fair value hierarchy is organized into three levels based upon the assumptions (referred to as “inputs”) used in pricing the asset or liability. These standards state that “observable inputs” reflect
14
the assumptions market participants would use in pricing the asset or liability based on market data obtained from independent sources and “unobservable inputs” reflect an entity’s own assumptions about the assumptions market participants would use in pricing the asset or liability. These inputs are summarized in the three broad levels listed below.
| | | | |
| Level 1 | | – | | Quoted unadjusted prices for identical instruments in active markets to which the Trust has access at the date of measurement. |
| | |
| Level 2 | | – | | Quoted prices for similar instruments in active markets; quoted prices for identical or similar instruments in markets that are not active; and model-derived valuations in which all significant inputs and significant value drivers are observable in active markets. Level 2 inputs are those in markets for which there are few transactions, the prices are not current, little public information exists or instances where prices vary substantially over time or among brokered market makers. |
| | |
| Level 3 | | – | | Model derived valuations in which one or more significant inputs or significant value drivers are unobservable. Unobservable inputs are those inputs that reflect the Trust’s own assumptions that market participants would use to price the asset or liability based on the best available information. |
The inputs or methodology used for valuing securities are not necessarily an indication of the risk associated with investing in those securities. As of December 31, 2022, the Fund’s assets carried at fair value were classified as follows:
| | | | | | | | | | | | | | | | | | | | |
| LKCM Aquinas Catholic Equity Fund | | | | | | | | |
| | | | |
Description | | Level 1 | | Level 2 | | Level 3 | | Total |
Common Stocks | | | $ | 48,780,941 | | | | $ | — | | | | $ | — | | | | $ | 48,780,941 | |
Short-Term Investment | | | | 1,360,448 | | | | | — | | | | | — | | | | | 1,360,448 | |
| | | | | | | | | | | | | | | | | | | | |
Total Investments* | | | $ | 50,141,389 | | | | $ | — | | | | $ | — | | | | $ | 50,141,389 | |
| | | | | | | | | | | | | | | | | | | | |
| | * | Additional information regarding the industry classifications of these investments is disclosed in the Schedule of Investments. |
2. Federal Income Taxes: The Fund has elected to be treated as a “regulated investment company” under Subchapter M of the Internal Revenue Code and the Fund intends to distribute all of its investment company net taxable income and net capital gains to shareholders. Therefore, no federal income tax provision is recorded.
3. Distributions to Shareholders: The Fund generally intends to declare and pay income dividends and distribute net capital gain, if any, at least on an annual basis.
4. Foreign Securities: Investing in securities of foreign companies and foreign governments involves special risks and considerations not typically associated with investing in securities of U.S. issuers. These risks include devaluation of currencies and future adverse political and economic developments. Moreover, securities of many foreign companies and foreign governments and their markets may be less liquid and their prices more volatile than those of securities of comparable U.S. companies and securities of the U.S. government.
5. Expense Allocation: Expenses incurred by the Funds in the Trust are allocated among the Funds based upon (i) relative average net assets, (ii) a specific identification basis as incurred, or (iii) evenly among the Funds, depending on the nature of the expense.
6. Use of Estimates: The preparation of financial statements in conformity with accounting principles generally accepted in the United States of America requires management to make estimates and assumptions that affect the reported amounts of assets and liabilities and disclosure of contingent assets and liabilities at the date of the financial statements and the reported amounts of revenues and expenses during the reporting period. Actual results could differ from those estimates.
7. Guarantees and Indemnifications: In the normal course of business, the Fund enters into contracts with service providers that contain general indemnification clauses. The Fund’s maximum exposure under these arrangements is unknown as this would involve future claims against the Fund that have not yet occurred. Based on experience, the Fund expects the risk of loss to be remote.
8. Security Transactions and Investment Income: Security and shareholder transactions are recorded on the trade date. Realized gains and losses on sales of investments are calculated on the identified cost basis. Dividend income and dividends and distributions to shareholders are recorded on the ex-dividend date. Withholding taxes on foreign dividends have been provided for in accordance with the Fund’s understanding of the applicable jurisdiction’s tax rules and rates. Interest income is recognized on the accrual basis. All discounts and premiums are amortized based on the effective interest method for tax and financial reporting purposes. The Fund may hold the securities of real estate investment trusts (“REITs”). Distributions from such investments may include income, capital gains and return of capital.
9. Other: Distributions from net investment income and realized capital gains are determined in accordance with income tax regulations, which may differ from U.S. GAAP. Certain capital accounts in the consolidated financial statements are periodically adjusted for permanent differences in order to reflect their tax character. These permanent differences are primarily due to the varying treatment of income and gain/loss on portfolio securities held by the Fund and have no impact on net assets or NAV per share.
Accordingly, at December 31, 2022, reclassifications were recorded as follows for the Fund:
| | | | | |
Paid-in capital | | | $ | 191,603 | |
Total distributable earnings | | | | (191,603 | ) |
15
10. Restricted and Illiquid Securities: The Fund is permitted to invest in securities that are subject to legal or contractual restrictions on resale including investments considered by the Fund to be illiquid. Restricted securities generally may be resold in transactions exempt from registration. Illiquid investments are investments that the Fund reasonably expects cannot be sold or disposed of in current market conditions within seven calendar days or less in the ordinary course of business without the sale or disposition significantly changing the market value of the investment. A security may be considered illiquid if it lacks a readily available market or if its valuation has not changed for a certain period of time. Disposal of these securities may involve time-consuming negotiations and expense, and prompt sale at the current valuation may be difficult.
B. Investment Advisory and Other Agreements: The Adviser serves as the investment adviser to the Fund under an Investment Advisory Agreement (the “Agreement”). The Adviser receives a fee, computed daily and payable quarterly, at the annual rate presented below as applied to the Fund’s average daily net assets. The Adviser has contractually agreed to waive all or a portion of its management fee and/or reimburse expenses of the Fund through May 1, 2023 in order to limit the Fund’s operating expenses to the annual cap rate presented below. This expense limitation excludes interest, taxes, brokerage commissions, indirect fees and expenses relating to investments in other investment companies, including money market funds, and extraordinary expenses.
For the fiscal year ended December 31, 2022, the Adviser waived the following management fees and/or reimbursed expenses to meet its expense cap obligations:
| | | | | |
| | | LKCM Aquinas
Catholic Equity
Fund |
Annual Management Fee Rate | | | | 0.90% | |
Annual Cap on Expenses | | | | 1.00% | |
Fees Waived and/or Expenses Reimbursed in 2022 | | | $ | 241,826 | |
The Trust reimburses the Adviser for a portion of compensation paid to the Trust’s Chief Compliance Officer. This compensation is reported as part of the “Trustees fees and officer compensation” expense on the Statement of Operations.
U.S. Bancorp Fund Services, LLC (“U.S. Bancorp”), doing business as U.S. Bank Global Fund Services, serves as transfer agent and administrator for the Fund and serves as accounting services agent for the Fund. U.S. Bank, N.A. serves as custodian for the Fund.
Distribution services are performed pursuant to a distribution contract with Quasar Distributors, LLC (“Quasar”), the Trust’s principal underwriter.
The Trust has adopted a Distribution Plan pursuant to Rule 12b-1 for the Fund, under which the Fund may pay an annualized fee of up to 1.00% of its average daily net assets for distribution and other services. However, the Board of Trustees has currently only authorized an annual fee of 0.10% of the average daily net assets for the Fund. Prior to August 1, 2016, the Fund assessed an annual Rule 12b-1 fee of 0.25% of the average daily net assets for the Fund. For the year ended December 31, 2022, fees incurred by the Fund pursuant to the 12b-1 Plan were $54,125.
C. Fund Shares: At December 31, 2022, there was an unlimited number of shares of beneficial interest, no par value, authorized for the Fund. The following table summarizes the activity in shares of the Fund:
| | | | | | | | | | | | | | | | | | | | |
| | | Year Ended
December 31, 2022 | | Year Ended
December 31, 2021 |
| | | Shares | | Amount | | Shares | | Amount |
Shares sold | | | | 178,465 | | | | $ | 2,978,029 | | | | | 147,648 | | | | $ | 2,968,608 | |
Shares issued to shareholders in reinvestment of distributions | | | | 183,638 | | | | | 2,725,191 | | | | | 347,962 | | | | | 6,820,061 | |
Shares redeemed | | | | (308,056 | ) | | | | (5,304,853 | ) | | | | (293,618 | ) | | | | (5,830,731 | ) |
Redemption fee | | | | | | | | | 442 | | | | | | | | | | 11 | |
| | | | | | | | | | | | | | | | | | | | |
Net increase | | | | 54,047 | | | | $ | 398,809 | | | | | 201,993 | | | | $ | 3,957,949 | |
| | | | | | | | | | | | | | | | | | | | |
Shares Outstanding: | | | | | | | | | | | | | | | | | | | | |
Beginning of period | | | | 3,273,724 | | | | | | | | | | 3,071,731 | | | | | | |
| | | | | | | | | | | | | | | | | | | | |
End of period | | | | 3,327,771 | | | | | | | | | | 3,273,724 | | | | | | |
| | | | | | | | | | | | | | | | | | | | |
D. Security Transactions: Purchases and sales of investment securities, other than short-term investments, for the Fund for the year ended December 31, 2022 were as follows:
| | | | | | | | | | | | | | | | |
| | | Purchases | | | Sales | |
| | | U.S.
Government | | | Other | | | U.S.
Government | | | Other | |
| | $ | — | | | $ | 12,027,954 | | | $ | — | | | $ | 15,337,091 | |
16
E. Tax Information: At December 31, 2022, the components of accumulated earnings (losses) on a tax basis for the Fund were as follows:
| | | | |
Tax cost | | $ | 27,588,751 | |
| | | | |
Gross unrealized appreciation | | $ | 22,817,594 | |
Gross unrealized depreciation | | | (264,956 | ) |
| | | | |
Net unrealized appreciation | | $ | 22,552,638 | |
| | | | |
Undistributed ordinary income | | | 5,433 | |
Undistributed long-term capital gain | | | — | |
| | | | |
Distributable earnings | | $ | 5,433 | |
| | | | |
Other accumulated losses | | | — | |
| | | | |
Total distributable earnings | | $ | 22,558,071 | |
| | | | |
To the extent the Fund realizes future net capital gains, taxable distributions will be reduced by any unused capital loss carryforwards as permitted by the Internal Revenue Code. At December 31, 2022, the Fund had no capital loss carryforwards.
The tax components of dividends paid during the periods shown below for the Fund were as follows:
| | | | | | | | | | | | | | | | |
| | | Year Ended December 31, 2022 | | | Year Ended December 31, 2021 | |
| | | Ordinary
Income | | | Long-Term
Capital Gains | | | Ordinary
Income | | | Long-Term
Capital Gains | |
LKCM Aquinas Catholic Equity Fund | | $ | 551,601 | | | $ | 2,315,238 | | | $ | 147,922 | | | $ | 7,068,215 | |
The Fund designated earnings and profits distributed to shareholders upon the redemption of shares during 2022 and 2021 in determining undistributed net capital gains as of December 31, 2022 and 2021, respectively.
The Trust has adopted financial reporting rules regarding recognition and measurement of tax positions taken or expected to be taken on a tax return. The Trust has reviewed all open tax years and major jurisdictions and concluded that there is no impact on the Fund’s financial position or results of operations. Tax years that remain open to examination by major tax jurisdictions include tax years ended December 31, 2019 through December 31, 2022. There is no tax liability resulting from unrecognized tax benefits relating to uncertain income tax positions taken or expected to be taken on tax returns as of December 31, 2022. The Fund is not aware of any tax positions for which it is reasonably possible that the total amounts of unrecognized tax benefits will significantly change in the next twelve months. If applicable, the Fund would recognize interest accrued related to unrecognized tax benefits in “interest expense” and penalties in “other expense” on the statement of operations.
F. Other Matters: Investing in the Funds involves risks and the potential loss of all or a portion of your investment. Each Fund is subject to the risk that the securities markets will move down, sometimes rapidly and unpredictably, based on overall economic conditions and other factors, which may negatively affect the Fund’s performance. Factors that affect markets in general, including geopolitical, regulatory, market and economic developments and other developments that impact specific economic sectors, industries, companies and segments of the market, could adversely impact the Fund’s investments and lead to a decline in the value of your investment in a Fund. Geopolitical and other events, including war, such as the current war between Russia and Ukraine, tensions and other conflicts between nations, terrorism, economic uncertainty, trade disputes, pandemics, public health crises, natural disasters and related events have led, and in the future may continue to lead, to instability in world economies and markets generally and reduced liquidity in equity, credit and fixed income markets. Russia’s military invasion of Ukraine, the responses and sanctions by the United States and other countries, and the potential for wider conflict, have had and continue to have severe adverse effects on regional and global economies and could further increase volatility and uncertainty in the financial markets. Other events that have led to recent market disruptions and turbulence include the pandemic spread of the novel coronavirus known as COVID-19 and its variants, the duration and full effects of which are still uncertain. In addition, policy changes by the U.S. Government, the U.S. Federal Reserve and/or foreign governments and political events within the U.S. and abroad may cause increased volatility in financial markets, affect investor and consumer confidence and adversely impact the broader financial markets and economy, perhaps suddenly and to a significant degree. Interest rates have been historically low in recent years in the U.S. and abroad, and central banks reduced interest rates further in an effort to combat the economic effects of the COVID-19 pandemic. However, the U.S. Federal Reserve has reduced its interventions and increased interest rates as the economy improved and inflation accelerated. Market disruptions have caused, and may continue to cause, broad changes in market value, negative public perceptions concerning these developments, and adverse investor sentiment or publicity. The foregoing may adversely affect, among other things, the value and liquidity of a Fund’s investments, a Fund’s ability to satisfy redemption requests, a Fund’s financial and operational performance, and/or the value of your investment in a Fund.
G. Subsequent Events: In preparing these financial statements, management has evaluated the Fund’s related events and transactions that occurred subsequent to December 31, 2022 through the date the financial statements were issued and has determined that there were no significant subsequent events requiring recognition or disclosure in the financial statements.
17
|
| REPORTOF INDEPENDENT REGISTERED PUBLIC ACCOUNTING FIRM |
To the shareholders and the Board of Trustees of LKCM Funds
Opinion on the Financial Statements and Financial Highlights
We have audited the accompanying statement of assets and liabilities, including the schedule of investments, of LKCM Aquinas Catholic Equity Fund, one of the funds constituting the LKCM Funds (the “Trust”), as of December 31, 2022, the related statement of operations for the year then ended, the statements of changes in net assets for each of the two years in the period then ended, the financial highlights for each of the five years in the period then ended, and the related notes. In our opinion, the financial statements and financial highlights present fairly, in all material respects, the financial position of LKCM Aquinas Catholic Equity Fund of the Trust as of December 31, 2022, and the results of its operations for the year then ended, the changes in its net assets for each of the two years in the period then ended, and the financial highlights for each of the five years in the period then ended, in conformity with accounting principles generally accepted in the United States of America.
Basis for Opinion
These financial statements and financial highlights are the responsibility of the Trust’s management. Our responsibility is to express an opinion on the Trust’s financial statements and financial highlights based on our audits. We are a public accounting firm registered with the Public Company Accounting Oversight Board (United States) (PCAOB) and are required to be independent with respect to the Trust in accordance with the U.S. federal securities laws and the applicable rules and regulations of the Securities and Exchange Commission and the PCAOB.
We conducted our audits in accordance with the standards of the PCAOB. Those standards require that we plan and perform the audit to obtain reasonable assurance about whether the financial statements and financial highlights are free of material misstatement, whether due to error or fraud. The Trust is not required to have, nor were we engaged to perform, an audit of its internal control over financial reporting. As part of our audits we are required to obtain an understanding of internal control over financial reporting but not for the purpose of expressing an opinion on the effectiveness of the Trust’s internal control over financial reporting. Accordingly, we express no such opinion.
Our audits included performing procedures to assess the risks of material misstatement of the financial statements and financial highlights, whether due to error or fraud, and performing procedures that respond to those risks. Such procedures included examining, on a test basis, evidence regarding the amounts and disclosures in the financial statements and financial highlights. Our audits also included evaluating the accounting principles used and significant estimates made by management, as well as evaluating the overall presentation of the financial statements and financial highlights. Our procedures included confirmation of securities owned as of December 31, 2022, by correspondence with the custodian. We believe that our audits provide a reasonable basis for our opinion.
Milwaukee, Wisconsin
February 28, 2023
We have served as the auditor of one or more LKCM Funds since 2007.
18
|
| LKCM AQUINAS CATHOLIC EQUITY FUND |
| ADDITIONAL INFORMATION |
| December 31, 2022 |
Tax Information: For the fiscal year ended December 31, 2022, certain dividends paid by the Fund may be subject to a maximum tax rate of 23.8%, as provided for by the Jobs & Growth Tax Relief Reconciliation Act of 2003. The percentage of dividends declared from ordinary income designated as qualified dividend income was 100.00%.
For corporate shareholders, the percentage of ordinary income distributions qualifying for the corporate dividends received deduction for the fiscal year ended December 31, 2022 was 100.00%.
Availability of Proxy Voting Information: A description of the policies and procedures that the Fund uses to determine how to vote proxies relating to its portfolio securities, as well as information regarding how the Fund voted proxies relating to portfolio securities during the most recent 12-month period ended June 30, is available without charge, upon request, by calling toll-free 1-800-423-6369 or on the SEC website at http://www.sec.gov.
The actual voting records relating to portfolio securities during the twelve month period ended June 30 (as filed with the SEC on Form N-PX) are available without charge, upon request, by calling the Fund toll free at 1-800-423-6369 or by accessing the SEC’s website at www.sec.gov.
Availability of Quarterly Portfolio Schedule: The Fund files a complete schedule of portfolio holdings with the U.S. Securities and Exchange Commission (the “SEC”) for the first and third quarters of each fiscal year on Part F of Form N-PORT. The Fund’s Part F of Form N-PORT is available on the SEC’s website at www.sec.gov and may be reviewed and copied at the SEC’s Public Reference Room in Washington, D.C. Information on the operation of the Public Reference Room may be obtained by calling 1-800-732-0330. The Fund’s Part F of Form N-PORT may also be obtained by calling toll-free 1-800-423-6369.
19
Information about the Fund’s Trustees and Officers:
The business and affairs of the Fund are managed under the direction of the Fund’s Board of Trustees. Information pertaining to the Trustees of the Fund is set forth below. The Statement of Additional Information includes additional information about the Fund’s Trustees and officers and is available, without charge, upon request by calling 1-800-423-6369.
| | | | | | | | | | |
Name, Address
and Age | | Position(s)
Held with
the Trust | | Term of
Office &
Length of Time Served(1) | | Principal Occupation
During Past Five Years | | Number of
Portfolios in
Fund Complex
Overseen
by Trustee | | Other Directorships Held by Trustee |
| Independent Trustees |
Richard J. Howell 301 Commerce Street Suite 1600 Fort Worth, TX 76102 Year of Birth: 1942 | | Trustee Chairman of the Audit and Compliance Committee | | Since 2005 Since 2008 | | CPA; Adjunct Faculty at SMU Cox School of Business from 2004 to 2009; Consulting Services, since 2002; Audit Partner, Arthur Andersen LLP from 1974 to 2002. | | 7 | | None |
Larry J. Lockwood 301 Commerce Street Suite 1600 Fort Worth, TX 76102 Year of Birth: 1953 | | Chairman of the Board of Trustees Trustee | | Since 2021 Since 2013 | | C.R. Williams Professor of Finance, Stan Block Endowed Chair in Finance, Department of Finance, Neeley School of Business, Texas Christian University since 1994. | | 7 | | None |
Mauricio Rodriguez 301 Commerce Street Suite 1600 Fort Worth, TX 76102 Year of Birth: 1966 | | Trustee | | Since 2021 | | Chair, Department of Finance, Neeley School of Business; Texas Christian University since 2002. | | 7 | | None |
| Interested Trustees | | | | | | | | | | |
J. Luther King, Jr.(2) 301 Commerce Street Suite 1600 Fort Worth, TX 76102 Year of Birth: 1940 | | Trustee, President and Chief Executive Officer | | Since 1994 | | Chairman, President and Director, Luther King Capital Management Corporation since 1979. | | 7 | | TXO Energy Partners, L.P. |
Steven R. Purvis(2) 301 Commerce Street Suite 1600 Fort Worth, TX 76102 Year of Birth: 1964 | | Trustee | | Since 2013 | | Principal, Luther King Capital Management Corporation from 2004 to 2021, Vice President and Portfolio Manager, Luther King Capital Management Corporation from 1996 to 2021. | | 7 | | AZZ Incorporated |
| (1) | Each Trustee holds office during the lifetime of the Trust until that individual resigns, retires or is otherwise removed or replaced. |
| (2) | Messrs. King and Purvis are considered an “interested person” of the Trust (as defined in the 1940 Act) because of his affiliation with the Adviser. |
20
| | | | | | |
Information about the Fund’s Trustees and Officers, Continued |
Name, Address and Age | | Position(s) Held with the Trust | | Term of
Office &
Length of Time Served(1) | | Principal Occupation
During Past Five Years |
| Principal Officers of the Trust |
J. Luther King, Jr.(2) 301 Commerce Street Suite 1600 Fort Worth, TX 76102 Year of Birth: 1940 | | Trustee, President and Chief Executive Officer | | Since 1994 | | Chairman, President and Director, Luther King Capital Management Corporation since 1979. |
Paul W. Greenwell 301 Commerce Street Suite 1600 Fort Worth, TX 76102 Year of Birth: 1950 | | Vice President | | Since 1996 | | Principal, Luther King Capital Management Corporation since 1986, Vice President and Portfolio Manager, Luther King Capital Management Corporation since 1983. |
Richard Lenart 301 Commerce Street Suite 1600 Fort Worth, TX 76102 Year of Birth: 1966 | | Secretary and Treasurer | | Since 2006 | | Luther King Capital Management Corporation since 2005. |
Jacob D. Smith 301 Commerce Street Suite 1600 Fort Worth, TX 76102 Year of Birth: 1974 | | Chief Financial Officer Chief Compliance Officer | | Since 2010 Since 2006 | | General Counsel, Luther King Capital Management Corporation since 2006; Chief Compliance Officer, Luther King Capital Management Corporation from 2006-2022; Principal, Luther King Capital Management Corporation since 2013. |
| (1) | Each officer holds office during the lifetime of the Trust until that individual resigns, retires or is otherwise removed or replaced. |
| (2) | Messrs. King and Purvis are considered an “interested person” of the Trust (as defined in the 1940 Act) because of his affiliation with the Adviser. |
21
LKCM FUNDS
PRIVACY NOTICE
Our Commitment to Your Privacy
At LKCM Funds, we are committed to safeguarding the confidentiality and privacy of nonpublic personal information about our current and former shareholders. This privacy notice describes the types of nonpublic personal information we collect about you and the sources through which we obtain this information, the purposes for which we obtain and use your nonpublic information, and the policies and procedures we have implemented to protect the privacy of your nonpublic personal information.
How We Protect Your Nonpublic Personal Information
Protecting your nonpublic personal information is an important priority at LKCM Funds. Accordingly, we have implemented policies and procedures designed to safeguard your nonpublic personal information, such as your tax identification number, account and investment history, account numbers, account balances and nonpublic contact information, from unauthorized access or use. Pursuant to these policies and procedures, we maintain various physical, technological, and administrative safeguards to protect the security and confidentiality of your nonpublic personal information, and we adapt these safeguards to respond to evolving technological and other standards.
We do not disclose nonpublic personal information about you to non-affiliated firms, organizations or individuals except as authorized by you or your representatives or as required or permitted by law. We may disclose nonpublic personal information about you to nonaffiliated third parties, such as custodians, brokers, auditors, accountants, and systems and administrative service providers, in connection with the services we provide to you or on your behalf. When we provide nonpublic personal information about you to nonaffiliated third parties for these purposes, we expect them to safeguard your nonpublic personal information, use your nonpublic personal information only for the intended purposes and otherwise abide by applicable law.
How We Obtain Your Nonpublic Personal Information
We collect nonpublic personal information about you from various sources, including documents, new account applications and other information that you or your representatives, custodians, attorneys, accountants or similar parties provide to us, communications that we have with you or your representatives, custodians, attorneys, accountants or similar parties, and documents and other information related to your accounts or investment experience with us.
Please do not hesitate to contact Jacob D. Smith, our Chief Compliance Officer, if you have any questions regarding this privacy notice or the measures we have implemented to protect the privacy of your nonpublic personal information.
U.S. Bancorp Fund Services, LLC
P.O. Box 701
Milwaukee, WI 53201-0701
LKCM FUNDS
P.O. Box 701
Milwaukee, WI 53201-0701
| | | | |
Officers and Trustees |
J. Luther King, Jr., CFA, CIC Trustee, President and Chief Executive Officer | | Richard J. Howell Trustee | | Richard Lenart Secretary & Treasurer |
| | |
Paul W. Greenwell Vice President | | Larry J. Lockwood Chairman of the Board of Trustees | | Jacob D. Smith Chief Financial Officer Chief Compliance Officer |
| | |
Steven R. Purvis, CFA Trustee | | Mauricio Rodriguez Trustee | | |
|
Investment Adviser |
Luther King Capital Management Corporation 301 Commerce Street, Suite 1600 Fort Worth, TX 76102 |
Administrator, Transfer Agent, Dividend Paying Agent & Shareholder Servicing Agent |
U.S. Bancorp Fund Services, LLC P.O. Box 701 Milwaukee, WI 53201-0701 |
Custodian |
U.S. Bank, N.A. 1555 N. River Center Drive, Suite 302 Milwaukee, WI 53212 |
Independent Registered Public Accounting Firm |
Deloitte & Touche LLP 555 E. Wells St., Suite 1400 Milwaukee, WI 53202 |
Distributor |
Quasar Distributors, LLC 111 East Kilbourn Avenue, Suite 2200 Milwaukee, WI 53202 |
Item 2. Code of Ethics.
The Registrant has adopted a code of ethics that applies to the Registrant’s principal executive officer and principal financial officer. The Registrant has not made any substantive amendments to its code of ethics during the period covered by this report. The Registrant has not granted any waivers from any provisions of the code of ethics during the period covered by this report.
A copy of the Registrant’s Code of Ethics is filed herewith.
Item 3. Audit Committee Financial Expert.
The Registrant’s board of trustees has determined that there is at least one audit committee financial expert serving on its audit committee. Richard J. Howell is the “audit committee financial expert” and is considered to be “independent” as each term is defined in Item 3 of Form N-CSR.
Item 4. Principal Accountant Fees and Services.
The Registrant has engaged its principal accountant to perform audit services, audit-related services, tax services and other services during the past two fiscal years. “Audit services” refer to performing an audit of the Registrant’s annual financial statements or services that are normally provided by the accountant in connection with statutory and regulatory filings or engagements for those fiscal years. “Audit-related services” refer to the assurance and related services by the principal accountant that are reasonably related to the performance of the audit. “Tax services” refer to professional services rendered by the principal accountant for tax compliance, tax advice, and tax planning. The following table details the aggregate fees billed or expected to be billed for each of the last two fiscal years for audit fees, audit-related fees, tax fees and other fees by the principal accountant.
| | | | | | | | |
| | | FYE 12/31/2022 | | | FYE 12/31/2021 | |
Audit Fees | | $ | 167,450 | | | $ | 156,500 | |
Audit-Related Fees | | | — | | | | — | |
Tax Fees | | | 36,720 | | | | 34,320 | |
All Other Fees | | | — | | | | — | |
The audit committee has adopted pre-approval policies and procedures that require the audit committee to pre-approve all audit and non-audit services of the Registrant, including services provided to any entity affiliated with the Registrant.
1
The percentage of fees billed by Deloitte & Touche LLP applicable to non-audit services pursuant to waiver of pre-approval requirement were as follows:
| | | | | | | | |
| | | FYE 12/31/22 | | | FYE 12/31/2021 | |
Audit-Related Fees | | | 0 | % | | | 0 | % |
Tax Fees | | | 0 | % | | | 0 | % |
All Other Fees | | | 0 | % | | | 0 | % |
All of the principal accountant’s hours spent on auditing the Registrant’s financial statements were attributed to work performed by full-time permanent employees of the principal accountant.
The following table indicates the non-audit fees billed or expected to be billed by the Registrant’s accountant for services to the Registrant and to the Registrant’s investment adviser (and any other controlling entity, etc.—not sub-adviser) for the last two years.
| | | | | | | | |
Non-Audit Related Fees | | FYE 12/31/2022 | | | FYE 12/31/2021 | |
Registrant | | $ | 36,720 | | | $ | 34,320 | |
Registrant’s Investment Adviser | | | — | | | | — | |
The audit committee of the board of trustees has considered whether the provision of non-audit services that were rendered to the Registrant’s investment adviser is compatible with maintaining the principal accountant’s independence and has concluded that the provision of such non-audit services by the accountant has not compromised the accountant’s independence.
The Registrant has not been identified by the U.S. Securities and Exchange Commission as having filed an annual report issued by a registered public accounting firm branch or office that is located in a foreign jurisdiction where the Public Company Accounting Oversight Board is unable to inspect or completely investigate because of a position taken by an authority in that jurisdiction.
The Registrant is not a foreign issuer.
Item 5. Audit Committee of Listed Registrants.
Not applicable to Registrants who are not listed issuers (as defined in Rule 10A-3 under the Securities Exchange Act of 1934).
Item 6. Investments.
| (a) | Schedule of Investments is included as part of the report to shareholders filed under Item 1 of this Form. |
Item 7. Disclosure of Proxy Voting Policies and Procedures for Closed-End Management Investment Companies.
Not applicable to open-end investment companies.
Item 8. Portfolio Managers of Closed-End Management Investment Companies.
Not applicable to open-end investment companies.
2
Item 9. Purchases of Equity Securities by Closed-End Management Investment Company and Affiliated Purchasers.
Not applicable to open-end investment companies.
Item 10. Submission of Matters to a Vote of Security Holders.
There have been no material changes to the procedures by which shareholders may recommend nominees to the Registrant’s board of trustees.
Item 11. Controls and Procedures.
| (a) | The Registrant’s Chief Executive Officer and Chief Financial Officer have reviewed the Registrant’s disclosure controls and procedures (as defined in Rule 30a-3(c) under the Investment Company Act of 1940 (the “Act”)) as of a date within 90 days of the filing of this report, as required by Rule 30a-3(b) under the Act and Rules 13a-15(b) or 15d-15(b) under the Securities Exchange Act of 1934. Based on their review, such officers have concluded that the disclosure controls and procedures are effective in ensuring that information required to be disclosed in this report is appropriately recorded, processed, summarized and reported and made known to them by others within the Registrant and by the Registrant’s service provider. |
| (b) | There were no changes in the Registrant’s internal control over financial reporting (as defined in Rule 30a-3(d) under the Act) that occurred during the period covered by this report that have materially affected, or are reasonably likely to materially affect, the Registrant’s internal control over financial reporting. |
Item 12. Disclosure of Securities Lending Activities for Closed-End Management Investment Companies
Not applicable to open-end investment companies.
Item 13. Exhibits.
(2) A separate certification for each principal executive officer and principal financial officer pursuant to Section 302 of the Sarbanes-Oxley Act of 2002. Filed herewith.
(3) Any written solicitation to purchase securities under Rule 23c-1 under the Act sent or given during the period covered by the report by or on behalf of the Registrant to 10 or more persons. Not applicable to open-end investment companies.
(4) Change in the Registrant’s independent public accountant. There was no change in the Registrant’s independent public accountant for the period covered by this report.
3
SIGNATURES
Pursuant to the requirements of the Securities Exchange Act of 1934 and the Investment Company Act of 1940, the Registrant has duly caused this report to be signed on its behalf by the undersigned, thereunto duly authorized.
| | | | |
| | LKCM Funds |
| | |
| | | By: | | /s/ J. Luther King, Jr. |
| | | | J. Luther King, Jr., |
| | | | President |
| | |
| | Date: | | 3/7/2023 |
Pursuant to the requirements of the Securities Exchange Act of 1934 and the Investment Company Act of 1940, this report has been signed below by the following persons on behalf of the Registrant and in the capacities and on the dates indicated.
| | | | |
| | By: | | /s/ J. Luther King, Jr. |
| | | | J. Luther King, Jr., |
| | | | | President |
| | |
| | Date: | | 3/7/2023 |
| | |
| | By: | | /s/ Jacob D. Smith |
| | | | Jacob D. Smith, |
| | | | Chief Financial Officer |
| | |
| | Date: | | 3/7/2023 |
4