As filed with the U.S. Securities and Exchange Commission on January 10, 2018
UNITED STATES
SECURITIES AND EXCHANGE COMMISSION
Washington, D.C. 20549
FORM N-CSR
CERTIFIED SHAREHOLDER REPORT OF REGISTERED
MANAGEMENT INVESTMENT COMPANIES
Investment Company Act file number 811-08348
LORD ASSET MANAGEMENT TRUST
(Exact name of registrant as specified in charter)
440 South LaSalle Street
Chicago, Illinois 60605-1028
(Address of principal executive offices) (Zip code)
Thomas S. White, Jr.
Thomas White International, Ltd.
440 South LaSalle Street
Chicago, Illinois 60605-1028
(Name and address of agent for service)
(312) 663-8300
Registrant’s telephone number, including area code
Date of fiscal year end: 10/31
Date of reporting period: 11/1/2016 – 10/31/2017
Item 1. Reports to Stockholders.


ANNUAL REPORT
OCTOBER 31, 2017
THE INTERNATIONAL FUND
THE EMERGING MARKETS FUND
THE AMERICAN OPPORTUNITIES FUND

The world economy is continuously evolving in ways we could have hardly imagined even a few years earlier. At Thomas White, we always ask ourselves “What is the big picture?” In other words, we always try to analyze local or regional trends from a broader global context.
We invite you to visit our websites as well as our YouTube channel for added insights into the transformative changes that make global investing more complex, but at the same time open up fascinating prospects for those who have the ability to spot them, and the discipline to focus on long-term trends.

President, Thomas White Funds
| | |
| |

| | thomaswhite.com The Thomas White website offers a panorama of the trends, economic indicators and policy changes occurring in the world economy that are of interest to global investors. |
| |

| | thomaswhitefunds.com The Thomas White Funds website provides important information on our three fund offerings, including performance, rankings, and commentaries. |
| |

| | thenewglobal.com Our New Global website is a highly informative resource for investors and their advisors, offering an in-depth understanding of the dramatic changes and trends in the world economy from a broader global context. |
| |

| | youtube.com/user/ThomasWhiteIntl Our YouTube channel features videos with Thomas White spokeswoman Stathy White, reporting on our investment team’s take on evolving global market trends. |
Thomas White: Empowering the InvestorSM
(This page is not part of the Annual Report.)

CONTENTS
Message to Shareholders
Dear Shareholders and Friends,
It has been a positive year for equity investors, especially for those who have international exposure. After a period of highly unexpected political events and heightened geopolitical risks, the global economic environment has become more favorable for businesses. Most global corporations are now benefiting from this positive setting, and I believe are well placed to reward their investors.
Global Economy Radiant in Synchronized Growth
Over the last five years, the global economy has struggled to achieve a steady and sustainable growth pace. Short spurts of acceleration proved to be false-starts and did not endure, hemmed in by wide regional disparities. Even the deep correction in energy and commodity prices after 2014 did not deliver the widely expected growth push, as capital investments slumped. Startling political developments such as the Brexit vote and the 2016 U.S. presidential elections only made the environment more uncertain.
This year marked the much-needed positive change as most major economies across the globe are expanding at a healthy pace. Global trade volumes have seen an appreciable recovery this year, filling a major gap in the growth puzzle. Energy and commodity prices now reflect the buoyant demand outlook, and appear more
sustainable. Consumers remain optimistic across the world, confident that more jobs are available, and wages are rising, even if at a modest rate. Global industrial activity is at its highest level in several years, and the services sector is also expanding at a robust pace. Low inflation risks make this environment even better, allowing interest rates to remain relatively low for longer.
The synchronized global growth is not an accident, but partly the result of persistent policy measures implemented over the last several years, especially by the central banks in the developed world. While there has been much skepticism over the scale of quantitative easing, and the lasting effects it could have on consumer and investor behavior, there is no doubt that the global economy is now better off because of these programs. This policy support provided enough time for the global economy to heal the deep wounds sustained during the 2008 financial crisis.
Policymakers Should Do More to Sustain This Recovery
The only major missing piece in the ongoing global growth story is capital investments. Despite record high cash holdings, low interest rates and remunerative commodity prices, businesses remain reluctant to invest in new capacity. This could be due to lack of confidence in the sustainability of consumer demand in major markets. Supportive fiscal policies could encourage more business
| | | | |
| www.thomaswhitefunds.com | | | 1 | |
investments. Governments that have enough fiscal flexibility might also consider more public spending, to kick start the investment cycle.
Higher debt levels at consumer and corporate levels are the most significant risk to the global economy. The risk is relatively benign in the near term, and masked by higher revenue and income growth. However, if unattended, this debt burden has the potential to deepen and prolong the next downturn.
Central banks in the developed countries should use extra caution as they contemplate and communicate the plans to scale down their balance sheets. Any misstep may cause unwanted volatility in the financial markets and potentially exacerbate the risks from higher consumer and corporate leverage.
We Expect Emerging Markets to Continue to Do Well
Barring a short period of turbulence soon after the U.S. presidential elections, emerging markets have largely been in favor over the last eighteen months. The combination of faster economic growth, lower political risks, higher commodity prices and relatively lower equity valuations should continue to attract investors to emerging markets. The emerging economies tend to do well when the rest of the world economy is robust. They also benefit disproportionately when global trade is expanding and commodity prices are elevated. All these factors now favor further growth in the emerging economies.
The structural changes in emerging economies have the potential to sustain their growth rates for longer periods.
Governments in several countries have tried to improve productivity and efficiency by investing in infrastructure and reducing regulatory bottlenecks. The sharp decline in average inflation levels in emerging countries is one of the major gains from the past reform initiatives. We expect the emerging economies to maintain their wide growth differential over the developed countries for the next several years.
Political risks in emerging markets are a persistent worry for investors. Compared to recent years, the domestic political environment appears to have calmed down in Russia and Turkey. In Brazil, though challenged by corruption allegations, the government is trying to implement necessary reforms. Elections are scheduled over the next two years in several countries across Latin America and Asia. It is possible that leadership changes in some of these countries could bring more responsive governments and transparency.
Our Portfolio Strategy
To benefit from the strengthening global economy, we have increased the Funds’ exposure to more cyclical sectors over the last year. Our research team believes cash flow expansion and potential reduction in leverage justifies current valuations in the energy and materials sectors. We remain hopeful of a recovery in demand for industrial goods and services, while the healthcare sector could potentially benefit from less stringent regulatory regimes. Despite elevated valuations, we expect segments of the technology sector to expand into newer markets and sustain rapid revenue growth rates. Our research places much
| | |
| 2 | | www.thomaswhitefunds.com |
emphasis on identifying management teams that are transparent and have the foresight and ability to identify and navigate long-term structural changes.
Please visit our websites www.thomaswhitefunds.com, www.thomaswhite.com, and www.thenewglobal.com, for our updated market commentaries and sector reviews.
I thank all Fund shareholders for the trust you continue to have in us. I would also like to welcome our new shareholders and thank you for selecting the Thomas White Funds. I assure you that all professionals at Thomas White are steadfastly committed to helping you achieve your investment goals.

Thomas S. White, Jr.
Chairman
Thomas White Funds
Chief Investment Officer
Thomas White International
| | | | |
| www.thomaswhitefunds.com | | | 3 | |
Past performance is not a guarantee of future results.
Opinions expressed are subject to change, are not guaranteed and should not be considered recommendations to buy or sell any security.
Must be preceded or accompanied by a prospectus.
Mutual fund investing involves risk. Principal loss is possible. Investing in international markets may involve additional risks such as social and political instability, market illiquidity, exchange-rate fluctuations, a high level of volatility and limited regulation. These risks are greater for emerging markets. Investing in small and mid-cap companies can involve more risk than investing in larger companies.
Diversification does not assure a profit nor protect against loss in a declining market.
Earnings growth for a Fund holding does not guarantee a corresponding increase in the market value of the holding of the Fund.
The Thomas White Funds are distributed by Quasar Distributors, LLC.
It is not possible to invest directly in an index.
Cash Flow: Measures the cash generating capability of a company by adding non-cash charges (i.e. depreciation) and interest expense to pretax income.
| | |
| 4 | | www.thomaswhitefunds.com |
THE WORLD HAS CHANGED
The number of stocks in the world has surged 134% since the end of the Cold War in 1989. As of October 2017, America’s 5,223 exchange-traded stocks now only represent 10.04% of the 50,343 stocks on the world’s 78 exchanges.1
| | | | | | | | | | | | |
| The Growth of World Stock Markets: Regional Weights |
| 1960 to October 31, 20172 | | 1960 | | 1970 | | 1980 | | 1990 | | 2000 | | 2017 |
| Developed Markets | | 99.9% | | 99.8% | | 99.2% | | 97% | | 96% | | 88% |
| | | | | | | |
United States | | 72% | | 66% | | 57% | | 43% | | 51% | | 52% |
| | | | | | | |
Canada | | 3% | | 3% | | 3% | | 2% | | 2% | | 3% |
| | | | | | | |
Europe | | 22% | | 23% | | 23% | | 25% | | 28% | | 21% |
| | | | | | | |
Asia Pacific | | 3% | | 8% | | 16% | | 27% | | 15% | | 12% |
| | | | | | | |
| Emerging Markets | | 0.1% | | 0.2% | | 0.8% | | 3% | | 4% | | 12% |
| The World Market | | 100% | | 100% | | 100% | | 100% | | 100% | | 100% |
Market Value
($ trillions) | | $0.5 | | $2.0 | | $4.1 | | $8.2 | | $26.9 | | $54.6 |
1World Federation of Exchanges, Focus-October 2017
2Source: Thomas White International (Data for 1960-2000); MSCI (Data for 2017)
Globalization has spurred growth in every region of the world. International stocks now represent over half of the total world stock market value, including, for example, Sony, Nokia, Toyota, BMW, L’Oreal, Unilever, Heineken, Volvo, Nestle, UBS, Volkswagen, Honda and Royal Dutch Shell. Emerging market companies include Samsung, LG and Hyundai.
Given their quality, diversity and long- term growth potential, it only makes common sense that investors search for opportunities worldwide. The Thomas
White American Opportunities, International and Emerging Markets Funds are managed by the same portfolio managers and analysts who adhere to an identical valuation-oriented investment style. The three portfolios complement one another in that, when combined, they seek to have similar geographical and industry allocations to that of the MSCI All Country World Index.
Shareholders who want to adopt a global investment strategy for their savings and investment program should consider owning all three Thomas White Funds.
Fund holdings are subject to change and should not be considered a recommendation to buy or sell any securities. For a complete list of Fund holdings, please refer to the Investment Portfolio section of this report.
| | | | |
| www.thomaswhitefunds.com | | | 5 | |
THOMAS WHITE INTERNATIONAL FUND
| | | | | | | | | | | | | | |
| | | | | | | | |
| | | Unaudited
Sales
Charge | | Deferred
Sales
Charge | | Administrative
Services
Fee | | 12b-1 Fees | | Operating
Expenses1,3 | | Prospectus
Gross
Annual
Operating
Expense2 | | Prospectus
Net
Annual
Operating
Expense2,3 |
| Investor Class | | None | | None | | Up to 0.25% | | None | | 1.24% | | 1.33% | | 1.24% |
| Class I | | None | | None | | None | | None | | 0.99% | | 1.10% | | 0.99% |
1 In the absence of the fee deferral/expense reimbursement arrangement for the International Fund, the ratio of expenses to average net assets would have been 1.36% for Investor Class shares and 1.14% for Class I shares.
2 Gross Annual Operating Expense and Net Annual Operating Expense are based on the most recent prospectus and may differ from other expense ratios appearing in this report.
3 Thomas White International, Ltd. (“Advisor”) has agreed to defer its fees and/or reimburse the Fund to the extent that the operating expenses for Investor Class and Class I shares exceed (as a percentage of average daily net assets) 1.24% and 0.99%, respectively. The fee deferral/expense reimbursement agreement expires February 28, 2018. The Fund has agreed to repay the Advisor for amounts deferred or reimbursed by the Advisor pursuant to the agreement provided that such repayment does not cause the Fund to exceed the above limits and the repayment is made within three years after the year in which the Advisor incurred the expense. The fee deferral/expense reimbursement agreement may only be amended or terminated by the Fund’s Board of Trustees.
| | | | | | | | |
| | | | | |
| | | NAV | | Net Assets | | Redemption Fee | | Portfolio Turnover |
| Investor Class | | $17.88 | | $43.8 million | | 2.00% on shares held less than 60 days | | 48% |
| Class I | | $17.79 | | $277.3 million | | |
| | |
| 6 | | www.thomaswhitefunds.com |
OCTOBER 31, 2017
| | | | | | | | | | | | | | | | | | | | | | | | | | | | | | |
| |
| Average Annual Returns as of October 31, 2017 (Unaudited) | |
| Class | | Sales Charge | | 6 month | | | Calendar
YTD | | | 1 Yr | | | 3 Yrs | | | 5 Yrs | | | 10 Yrs | | | Since
Inception
(6/28/1994)* | |
| Investor Class shares (TWWDX) | | None | | | 12.25% | | | | 25.24% | | | | 23.06% | | | | 3.59% | | | | 4.79% | | | | 0.09% | | | | 7.09% | |
| Class I shares1 (TWWIX) | | None | | | 12.35% | | | | 25.32% | | | | 23.23% | | | | 3.83% | | | | 5.03% | | | | 0.21% | | | | 7.15% | |
| MSCI All Country World ex US Index2 | | N/A | | | 12.02% | | | | 23.41% | | | | 23.64% | | | | 5.71% | | | | 7.29% | | | | 0.92% | | | | 5.53% | |
* The inception date of the Investor Class shares.
1 Performance figures for Class I shares, first offered on August 31, 2012, include the historical performance of Investor Class shares through August 30, 2012.
2 The MSCI All Country World ex US Index is a free float-adjusted market capitalization-weighted index of both developed and emerging markets. The index is unmanaged and returns assume the reinvestment of dividends. It is not possible to invest directly in an index.
Returns of each share class reflect differences in expenses applicable to each class which are primarily differences in service fees.
The returns do not reflect the deduction of taxes that a shareholder would pay on Fund distributions or the redemption of Fund shares. The returns reflect the actual performance for each period and do not include the impacts of trades executed on the last business day of the period that were recorded on the first business day of the next period.
Performance data is based upon past performance, which is no guarantee of future results. The investment return and principal value of an investment will fluctuate so that an investor’s shares, when redeemed, may be worth more or less than their original cost. Current performance may be higher or lower than the performance data quoted. Please call 1-800-811-0535 to obtain performance data as of the most recent month-end. The Fund imposes a 2% redemption fee on shares held less than 60 days. Performance data does not reflect the redemption fee. If reflected, total returns would be lower. Investment performance reflects any fee waivers that were in effect. In the absence of such waivers, total return would have been reduced. The Gross Expense Ratios, based on the most recent prospectus, are 1.33% (Investor Class) and 1.10% (Class I).
| | | | |
| www.thomaswhitefunds.com | | | 7 | |
THOMAS WHITE INTERNATIONAL FUND
GROWTH OF A $10,000 INVESTMENT WITH DIVIDENDS REINVESTED (Unaudited)
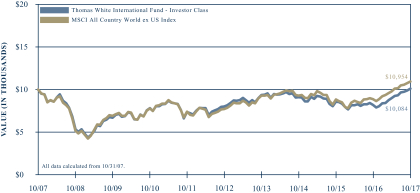
This chart illustrates the performance of a hypothetical $10,000 investment made in the Fund’s Investor Class shares and its benchmark, the MSCI All Country World ex US Index, for the past 10 years through October 31, 2017. It assumes reinvestment of dividends and capital gains, but does not reflect the effect of any applicable redemption fees. This chart does not imply future performance. Past performance does not guarantee future results. The cumulative ten year return was +0.84% for the Fund’s Investor Class shares and +9.54% for the benchmark. The Fund’s Investor Class shares average annual total return since inception on June 28, 1994 was +7.09%. The MSCI All Country World ex US Index is a free float-adjusted market capitalization-weighted index of both developed and emerging markets. The index is unmanaged and returns assume the reinvestment of dividends. It is not possible to invest directly in an index. During the periods shown, the Fund’s manager reimbursed certain Fund expenses. Absent this reimbursement, performance would have been lower. Performance will vary from class to class based on differences in class-specific expenses.
| | |
| 8 | | www.thomaswhitefunds.com |
OCTOBER 31, 2017
The Thomas White International Fund primarily invests in equity securities of companies located in the world’s developed countries outside of the U.S. There may also be a portion of the Fund’s assets invested in companies located in emerging market countries.
Portfolio Managers
Thomas S. White, Jr.
Jinwen Zhang, Ph.D., CFA
Douglas M. Jackman, CFA
Wei Li, Ph.D., CFA
John Wu, Ph.D., CFA
Rex Mathew, CFA, CM
Ramkumar Venkatramani, CFA
Performance Review
The Thomas White International Fund’s Class I shares returned +23.23% for the one-year period ended October 31, 2017, compared to +23.64% for the benchmark MSCI All Country World ex US Index. Since the Fund’s inception on June 28, 1994, the Fund’s Class I shares have returned +7.15%* annualized while the benchmark index returned +5.53% for the same period.
Faster Growth and Supportive Monetary Policy Help Equities
International equity prices declined at the beginning of the review period as investors shifted their attention to U.S. domestic assets that were expected to benefit from the policy changes promised by the incoming Trump administration. The economic recovery in the Eurozone appeared fragile while the Japanese economy seemed to have slowed
after the consumption tax increases. Several of the emerging economies, most notably China and Mexico, were expected to face tighter trade policies from the Trump administration. Finally, the strength of the U.S. Dollar against other currencies was unfavorable for international assets.
The investor sentiment started turning during the first half of 2017 as the U.S. administration struggled to implement several of the promised changes. At the same time, economic trends in the Eurozone and Japan started improving, while several of the emerging economies appeared to be accelerating. Global demand recovered and lifted export volumes for most Asian countries. During the third quarter, higher energy and commodity prices brightened the outlook for resource exporting countries as well.
Despite the more robust economic signals, the European Central Bank (ECB) and the Bank of Japan are continuing their bond purchases. The ECB will scale back its program early in 2018 but has promised to expand it again if growth falters. Inflation remains well below targets in the Eurozone and Japan, which makes rate increases unlikely before 2019.
Emerging markets outperformed the developed world during the review period, helped by healthy economic growth and favorable fiscal as well as monetary policies. Most emerging markets have seen a healthy recovery in corporate earnings, while relatively inexpensive valuations compared to the developed markets continue to attract investors.
* Performance for Class I shares include the historical performance of Investor Class shares through August 30, 2012.
| | | | |
| www.thomaswhitefunds.com | | | 9 | |
THOMAS WHITE INTERNATIONAL FUND
Portfolio Review
The Fund’s industrial holdings benefited from early signs of a revival in the investment cycle, especially in the developed economies. The financials sector gained as central banks in Europe and Japan are expected to keep interest rates low for longer than previously expected. The technology sector outperformed by a wide margin during the review period as companies gained market share and reported revenues and earnings that exceeded expectations. The sales platforms built by the leading e-commerce companies have proven to be very scalable, and continue to attract more users. Defensive sectors such as consumer staples and healthcare did not attract much investor attention during the period. These sectors are also facing business risks from disruptive online competitors as well as potential regulatory restrictions on pricing, in the case of drug makers. The telecom sector was subdued as erosion of pricing power has offset the gains from data demand growth.
Samsung Electronics, a leading electronic component and semiconductor manufacturer, was the biggest contributor to Fund returns during the review period, helped by the better than expected earnings in recent quarters and the company’s recent efforts to improve corporate governance. Ping An Insurance, one of the leading insurers in China, gained on robust earnings and business growth reported for the most recent quarter. Alibaba Group, the largest e-commerce player in Asia, advanced as it continued to expand into new market segments and repeatedly raised its revenue and earnings guidance. Dutch banking and financial services group ING Groep
benefited from the improved demand outlook for credit and services. Higher oil prices and signs of a recovery in energy demand helped integrated energy group Royal Dutch Shell outperform during the review period.
British lender Provident Financial detracted the most from Fund returns for the one-year review period after it sharply lowered earnings estimates on unexpected weakness in credit demand and higher credit costs. Belgium-based IWG, a leading provider of flexible workspaces across the globe, declined after it said earnings will be much lower than earlier estimates. Japanese telecom group Nippon Telegraph and Telephone as well as cigarette manufacturer Japan Tobacco were hurt as investor interest shifted to export-oriented Japanese corporations. Nevertheless, we believe Japanese domestic demand could recover as the government expands fiscal spending. Royal Ahold underperformed as revenue growth in its grocery stores continues to be threatened by growing competition from online retailers.
Economic Growth Outlook Remains Bright
The economic growth outlook for the Eurozone continues to brighten, and the International Monetary Fund (IMF) has lifted its GDP growth estimates for the region to 2.1% for this year. The ECB is more confident and expects the pace of expansion to reach 2.2%. While the region is now benefiting from the recovery in global trade volumes, the main driver of the Eurozone economy in recent years has been domestic demand. Though some countries such as Spain in the common currency area still have high unemployment,
| | |
| 10 | | www.thomaswhitefunds.com |
OCTOBER 31, 2017
the average jobless rates have steadily come down. Wages have started increasing at a faster pace, most notably in Germany where unions are demanding pay hikes of 5% or more. The healthier economic conditions have encouraged the ECB to scale down its bond purchases beginning in January 2018. However, lingering political risks such as the separatist movements in Spain are likely to prevent the ECB from increasing its benchmark rate anytime soon.
The Japanese economy is also gaining speed, and the IMF expects growth of 1.3% this year, helped by exports and investments. Domestic consumption could strengthen in Japan and boost growth in the coming quarters. The government has been re-elected and is now expected to expand the fiscal policies initiated in 2014. As in the Eurozone, inflation remains stubbornly low in Japan, and the central bank is expected to continue its bond purchases. Australia and Canada, as well as select European countries such as Norway, are benefiting from higher energy and commodity prices. If higher commodity prices prevail for longer, these
countries could also see a more robust recovery in capital spending.
The synchronized global economic recovery has brightened the growth prospects of emerging economies as well, most notably in Asia. The Chinese economy expanded at an annualized pace of 6.8% during the third quarter of 2017, very close to the pace set during the first half of the year. If the rate of expansion is sustained during the last three months of this year, aggregate growth for the year will exceed the Chinese government’s target of 6.5%. Korea and Taiwan, which rely more on exports, continue to see strong expansion in shipment volumes. Growth in India has fallen short of expectations in recent quarters, largely due to disruptions caused by major structural policy changes implemented by the government. The Latin American economies should benefit from higher energy and industrial commodity prices, though the outlook for Mexico remains clouded by the trade policy frictions with the U.S.
Thank you for your confidence in the Thomas White International Fund.
| | | | |
| www.thomaswhitefunds.com | | | 11 | |
THOMAS WHITE INTERNATIONAL FUND
Portfolio Country and Industry Allocation as of October 31, 2017 (Unaudited)
| | | | |
| | |
| Country Allocation | | % of TNA | |
| Australia | | | 6.6% | |
| Belgium | | | 1.5% | |
| Brazil | | | 2.0% | |
| Canada | | | 4.3% | |
| China | | | 6.6% | |
| Finland | | | 1.2% | |
| France | | | 2.8% | |
| Germany | | | 4.3% | |
| Hong Kong | | | 2.0% | |
| India | | | 3.3% | |
| Indonesia | | | 2.2% | |
| Ireland | | | 1.0% | |
| Israel | | | 1.0% | |
| Japan | | | 15.2% | |
| Mexico | | | 1.0% | |
| Netherlands | | | 6.1% | |
| Peru | | | 1.5% | |
| Russia | | | 2.3% | |
| South Africa | | | 2.6% | |
| South Korea | | | 6.5% | |
| Spain | | | 2.9% | |
| Sweden | | | 5.5% | |
| Switzerland | | | 1.7% | |
| Taiwan | | | 2.4% | |
| Thailand | | | 2.3% | |
| Turkey | | | 0.7% | |
| United Kingdom | | | 9.0% | |
| Cash & Other | | | 1.5% | |
| | | | |
| | |
| Industry Allocation | | % of TNA | |
| Automobiles & Components | | | 4.4% | |
| Banks | | | 18.4% | |
| Capital Goods | | | 9.9% | |
| Commercial & Professional Services | | | 1.3% | |
| Consumer Durables & Apparel | | | 2.0% | |
| Diversified Financials | | | 1.3% | |
| Energy | | | 6.3% | |
| Food & Staples Retailing | | | 1.1% | |
| Food, Beverage & Tobacco | | | 1.8% | |
| Health Care Equipment & Services | | | 1.0% | |
| Household & Personal Products | | | 2.9% | |
| Insurance | | | 5.6% | |
| Materials | | | 13.8% | |
| Media | | | 3.4% | |
| Pharmaceuticals, Biotechnology & Life Sciences | | | 2.1% | |
| Real Estate | | | 1.0% | |
| Retailing | | | 2.8% | |
| Semiconductors & Semiconductor Equipment | | | 3.7% | |
| Software & Services | | | 6.2% | |
| Technology Hardware & Equipment | | | 3.7% | |
| Telecommunication Services | | | 2.6% | |
| Transportation | | | 3.2% | |
| Cash & Other | | | 1.5% | |
| | | | | |
| | | | | |
| | | | | |
| | | | | |
| | | | | |
TNA - Total Net Assets
Fund holdings and industry allocations are subject to change and should not be considered a recommendation to buy or sell any securities. For a complete list of Fund holdings, please refer to the Investment Portfolio section of this report.
| | |
| 12 | | www.thomaswhitefunds.com |
| | |
| Investment Portfolio | | October 31, 2017 |
| | | | | | | | | | | | |
| Country | | Issue | | Industry | | Shares | | | Value (US$) | |
| | | | | | | | | | | |
COMMON
STOCKS (95.5%) | | | | | | | | | | |
|
| |
| AUSTRALIA (6.6%) | | | | | | | | |
| | BHP Billiton Ltd + | | Materials | | | 238,600 | | | | $4,878,442 | |
| | CSL Limited + | | Pharmaceuticals, Biotechnology & Life Sciences | | | 42,800 | | | | 4,564,759 | |
| | Iluka Resources Ltd + | | Materials | | | 565,800 | | | | 4,097,104 | |
| | Newcrest Mining Limited + | | Materials | | | 188,800 | | | | 3,220,898 | |
| | Orica Limited + | | Materials | | | 280,600 | | | | 4,494,440 | |
| | | | | | | | | | | | |
| | | | | | | | | | | 21,255,643 | |
|
| |
| BELGIUM (1.5%) | | | | | | | | |
| | KBC Group NV + | | Banks | | | 60,400 | | | | 5,017,984 | |
|
| |
| CANADA (4.3%) | | | | | | | | | | |
| | Canadian National Railway Company * | | Transportation | | | 44,600 | | | | 3,588,812 | |
| | Open Text Corporation * | | Software & Services | | | 98,600 | | | | 3,447,675 | |
| | Potash Corporation of Saskatchewan Inc. * | | Materials | | | 180,000 | | | | 3,503,449 | |
| | Suncor Energy, Inc. * | | Energy | | | 92,800 | | | | 3,150,640 | |
| | | | | | | | | | | | |
| | | | | | | | | | | 13,690,576 | |
|
| |
| CHINA (6.6%) | | | | | | | | |
| | Alibaba Group Holding Ltd. ADR * # | | Software & Services | | | 37,800 | | | | 6,988,842 | |
| | Anhui Conch Cement Company Limited - H Shares + | | Materials | | | 723,500 | | | | 3,093,283 | |
| | Baidu, Inc. ADR * | | Software & Services | | | 20,800 | | | | 5,073,952 | |
| | Ping An Insurance (Group) Company of China Limited - H Shares + | | Insurance | | | 685,500 | | | | 6,020,418 | |
| | | | | | | | | | | | |
| | | | | | | | | | | 21,176,495 | |
|
| |
| FINLAND (1.2%) | | | | | | | | |
| | Sampo Oyj - A Shares + | | Insurance | | | 75,300 | | | | 3,944,821 | |
|
| |
| FRANCE (2.8%) | | | | | | | | |
| | Eiffage + | | Capital Goods | | | 21,900 | | | | 2,289,040 | |
| | Safran SA + | | Capital Goods | | | 30,900 | | | | 3,255,871 | |
| | Total SA + | | Energy | | | 60,000 | | | | 3,346,668 | |
| | | | | | | | | | | | |
| | | | | | | | | | | 8,891,579 | |
|
| |
| GERMANY (3.3%) | | | | | | | | |
| | Bayerische Motoren Werke Aktiengesellschaft + | | Automobiles & Components | | | 31,400 | | | | 3,200,459 | |
| | Continental Aktiengesellschaft + | | Automobiles & Components | | | 10,400 | | | | 2,639,751 | |
| | Muenchener Rueckversicherungs-Gesellschaft AG + | | Insurance | | | 20,900 | | | | 4,675,530 | |
| | | | | | | | | | | | |
| | | | | | | | | | | 10,515,740 | |
|
| |
| HONG KONG (2.0%) | | | | | | | | |
| | Hang Lung Properties Ltd. + | | Real Estate | | | 1,405,000 | | | | 3,232,947 | |
| | Techtronic Industries Company Limited + | | Consumer Durables & Apparel | | | 559,000 | | | | 3,278,509 | |
| | | | | | | | | | | | |
| | | | | | | | | | | 6,511,456 | |
|
| |
The accompanying notes are an integral part of these financial statements
| | | | |
| www.thomaswhitefunds.com | | | 13 | |
| | |
| Thomas White International Fund | | |
| | | | | | | | | | | | |
| Country | | Issue | | Industry | | Shares | | | Value (US$) | |
| | | | | | | | | | | |
| INDIA (3.3%) | | | | | | | | |
| | Axis Bank Limited + | | Banks | | | 456,800 | | | | $3,692,543 | |
| | Exide Industries Ltd. | | Automobiles & Components | | | 781,000 | | | | 2,517,070 | |
| | Infosys Limited ADR # | | Software & Services | | | 292,700 | | | | 4,346,595 | |
| | | | | | | | | | | | |
| | | | | | | | | | | 10,556,208 | |
|
| |
| INDONESIA (2.2%) | | | | | | | | |
| | PT Bank Central Asia Tbk + | | Banks | | | 3,106,000 | | | | 4,797,900 | |
| | PT Telekomunikasi Indonesia Persero Tbk + | | Telecommunication Services | | | 7,493,600 | | | | 2,238,022 | |
| | | | | | | | | | | | |
| | | | | | | | | | | 7,035,922 | |
|
| |
| IRELAND (1.0%) | | | | | | | | |
| | CRH PLC + | | Materials | | | 88,400 | | | | 3,336,546 | |
|
| |
| ISRAEL (1.0%) | | | | | | | | |
| | Elbit Systems Ltd. + | | Capital Goods | | | 21,200 | | | | 3,141,575 | |
|
| |
| JAPAN (15.2%) | | | | | | | | |
| | DAIKIN INDUSTRIES, LTD. + | | Capital Goods | | | 31,300 | | | | 3,466,812 | |
| | FANUC Corporation + | | Capital Goods | | | 15,200 | | | | 3,563,535 | |
| | HONDA MOTOR CO., LTD. + | | Automobiles & Components | | | 114,800 | | | | 3,590,401 | |
| | Hoya Corp + | | Technology Hardware & Equipment | | | 76,600 | | | | 4,140,146 | |
| | Japan Tobacco Inc. + | | Food, Beverage & Tobacco | | | 79,400 | | | | 2,625,909 | |
| | Kansai Paint Co., Ltd. + | | Materials | | | 160,600 | | | | 4,141,692 | |
| | Nitori Holdings Co., Ltd. + | | Retailing | | | 20,100 | | | | 2,910,674 | |
| | ORIX Corporation + | | Diversified Financials | | | 195,700 | | | | 3,371,744 | |
| | Rakuten Inc + | | Retailing | | | 244,200 | | | | 2,599,344 | |
| | SMC Corp/Japan + | | Capital Goods | | | 14,000 | | | | 5,371,932 | |
| | SoftBank Corp. + | | Telecommunication Services | | | 67,600 | | | | 5,982,529 | |
| | Sundrug Co., Ltd. + | | Food & Staples Retailing | | | 84,500 | | | | 3,676,726 | |
| | Tokio Marine Holdings, Inc. + | | Insurance | | | 78,400 | | | | 3,379,214 | |
| | | | | | | | | | | | |
| | | | | | | | | | | 48,820,658 | |
|
| |
| MEXICO (1.0%) | | | | | | | | |
| | Cemex SAB de CV * | | Materials | | | 3,874,324 | | | | 3,150,506 | |
|
| |
| NETHERLANDS (6.1%) | | | | | | | | |
| | ING Groep N.V. + | | Banks | | | 359,800 | | | | 6,644,976 | |
| | Koninklijke DSM N.V. + | | Materials | | | 31,900 | | | | 2,720,496 | |
| | Koninklijke Philips NV + | | Capital Goods | | | 111,800 | | | | 4,549,951 | |
| | Royal Dutch Shell PLC - B Shares + | | Energy | | | 173,700 | | | | 5,590,549 | |
| | | | | | | | | | | | |
| | | | | | | | | | | 19,505,972 | |
|
| |
| PERU (1.5%) | | | | | | | | |
| | Credicorp Ltd. | | Banks | | | 22,500 | | | | 4,712,400 | |
|
| |
The accompanying notes are an integral part of these financial statements
| | |
| 14 | | www.thomaswhitefunds.com |
| | |
| Investment Portfolio | | October 31, 2017 |
| | | | | | | | | | | | |
| Country | | Issue | | Industry | | Shares | | | Value (US$) | |
| | | | | | | | | | | |
| RUSSIA (2.3%) | | | | | | | | |
| | LUKOIL PJSC ADR + | | Energy | | | 58,000 | | | | $3,081,017 | |
| | Sberbank of Russia PJSC ADR + | | Banks | | | 302,700 | | | | 4,342,889 | |
| | | | | | | | | | | | |
| | | | | | | | | | | 7,423,906 | |
|
| |
| SOUTH AFRICA (2.6%) | | | | | | | | |
| | Mondi Ltd + | | Materials | | | 98,700 | | | | 2,375,517 | |
| | Naspers Limited - N Shares + | | Media | | | 13,800 | | | | 3,409,569 | |
| | Sibanye Gold Limited # + | | Materials | | | 1,935,070 | | | | 2,499,349 | |
| | | | | | | | | | | | |
| | | | | | | | | | | 8,284,435 | |
|
| |
| SOUTH KOREA (6.5%) | | | | | | | | |
| | KB Financial Group Inc. + | | Banks | | | 90,000 | | | | 4,699,202 | |
| | KT&G Corporation + | | Food, Beverage & Tobacco | | | 33,500 | | | | 3,168,721 | |
| | LG Household & Health Care Ltd. + | | Household & Personal Products | | | 2,500 | | | | 2,625,605 | |
| | POSCO + | | Materials | | | 9,200 | | | | 2,679,041 | |
| | Samsung Electronics Co., Ltd. + | | Semiconductors & Semiconductor Equipment | | | 3,095 | | | | 7,618,879 | |
| | | | | | | | | | | | |
| | | | | | | | | | | 20,791,448 | |
|
| |
| SPAIN (2.9%) | | | | | | | | |
| | Aena SME, S.A. + | | Transportation | | | 18,000 | | | | 3,303,302 | |
| | Banco Bilbao Vizcaya Argentaria, S.A. + | | Banks | | | 684,500 | | | | 5,987,944 | |
| | | | | | | | | | | | |
| | | | | | | | | | | 9,291,246 | |
|
| |
| SWEDEN (5.5%) | | | | | | | | |
| | Hennes & Mauritz AB - B Shares # + | | Retailing | | | 143,900 | | | | 3,608,828 | |
| | Hexagon AB - B Shares + | | Technology Hardware & Equipment | | | 82,000 | | | | 4,206,916 | |
| | Nordea Bank AB + | | Banks | | | 322,300 | | | | 3,896,903 | |
| | SKF AB - B Shares + | | Capital Goods | | | 262,100 | | | | 6,082,193 | |
| | | | | | | | | | | | |
| | | | | | | | | | | 17,794,840 | |
|
| |
| SWITZERLAND (1.7%) | | | | | | | | |
| | IWG PLC + | | Commercial & Professional Services | | | 800,000 | | | | 2,289,153 | |
| | The Swatch Group AG + | | Consumer Durables & Apparel | | | 8,300 | | | | 3,255,680 | |
| | | | | | | | | | | | |
| | | | | | | | | | | 5,544,833 | |
|
| |
| TAIWAN (2.4%) | | | | | | | | |
| | Pegatron Corporation + | | Technology Hardware & Equipment | | | 1,299,000 | | | | 3,376,138 | |
| | Taiwan Semiconductor Manufacturing Company Ltd. ADR | | Semiconductors & Semiconductor Equipment | | | 104,000 | | | | 4,402,320 | |
| | | | | | | | | | | | |
| | | | | | | | | | | 7,778,458 | |
|
| |
The accompanying notes are an integral part of these financial statements
| | | | |
| www.thomaswhitefunds.com | | | 15 | |
| | |
| Thomas White International Fund | | |
| | | | | | | | | | | | |
| Country | | Issue | | Industry | | Shares | | | Value (US$) | |
| | | | | | | | | | | |
| THAILAND (2.3%) | | | | | | | | |
| | Airports of Thailand Public Company Ltd. | | Transportation | | | 1,853,000 | | | | $3,322,062 | |
| | Kasikornbank Public Company Limited + | | Banks | | | 611,000 | | | | 4,201,822 | |
| | | | | | | | | | | | |
| | | | | | | | | | | 7,523,884 | |
|
| |
| TURKEY (0.7%) | | | | | | | | |
| | Tofas Turk Otomobil Fabrikasi A.S. + | | Automobiles & Components | | | 277,700 | | | | 2,260,517 | |
|
| |
| UNITED KINGDOM (9.0%) | | | | | | | | |
| | BP p.l.c. + | | Energy | | | 756,300 | | | | 5,126,389 | |
| | Experian PLC + | | Commercial & Professional Services | | | 90,100 | | | | 1,896,494 | |
| | Lloyds Banking Group PLC + | | Banks | | | 4,941,000 | | | | 4,480,525 | |
| | Provident Financial plc + | | Diversified Financials | | | 69,000 | | | | 854,235 | |
| | RELX NV + | | Media | | | 181,604 | | | | 4,099,904 | |
| | Shire + | | Pharmaceuticals, Biotechnology & Life Sciences | | | 44,600 | | | | 2,195,140 | |
| | Smith & Nephew PLC + | | Health Care Equipment & Services | | | 171,100 | | | | 3,230,322 | |
| | Unilever NV + | | Household & Personal Products | | | 64,000 | | | | 3,718,732 | |
| | WPP PLC + | | Media | | | 186,200 | | | | 3,290,801 | |
| | | | | | | | | | | | |
| | | | | | | | | | | 28,892,542 | |
|
| |
| Total Common Stocks | | | | (Cost $246,418,886) | | | | | | | 306,850,190 | |
| | | | | | | | | | | | |
|
| |
| PREFERRED STOCKS (3.0%) | | | | | | | | | | | | |
|
| |
| BRAZIL (2.0%) | | | | | | | | |
| | Itau Unibanco Holding S.A. (2/7/18, 0.44%)^ | | Banks | | | 499,060 | | | | 6,439,435 | |
|
| |
| GERMANY (1.0%) | | | | | | | | |
| | Henkel AG & Co. KGaA + (2/22/18, 1.47%)^ | | Household & Personal Products | | | 21,900 | | | | 3,073,927 | |
|
| |
| Total Preferred Stocks | | | | (Cost $6,525,743) | | | | | | | 9,513,362 | |
| | | | | | | | | | | | |
|
| |
| Total Investments | | 98.5% | | (Cost $252,944,629) | | | | | | | $316,363,552 | |
Other Assets,
Less Liabilities | | 1.5% | | | | | | | | | 4,735,325 | |
| Total Net Assets: | | 100.0% | | | | | | | | | $321,098,877 | |
|
| |
| * | Non-Income Producing Securities |
| # | All or a portion of securities on loan at October 31, 2017. The market value of the securities loaned was $11,822,118. The loaned securities were secured with non-cash collateral with a value of $12,529,046. The non-cash collateral received consists of short term investments and long term bonds, and is held for the benefit of the Fund at the Fund’s custodian. The Fund cannot repledge or resell this collateral. Collateral is calculated based on prior day’s prices. - See Note 1(I) to Financial Statements |
| ^ | Maturity Date and Preferred Dividend Rate of Preferred Stock. |
| ADR | - American Depositary Receipt |
Industry classifications shown in the Investment Portfolio are based off of the Global Industry Classification Standard (GICS®). GICS was developed by and/or is the exclusive property of MSCI, Inc. and Standard & Poor’s Financial Services LLC (“S&P”). GICS is a service mark of MSCI and S&P and has been licensed for use by U.S. Bancorp Fund Services, LLC.
The accompanying notes are an integral part of these financial statements
| | |
| 16 | | www.thomaswhitefunds.com |
| | |
| Investment Portfolio | | October 31, 2017 |
The following table summarizes the inputs used, as of October 31, 2017, in valuating the Fund’s assets:
| | | | | | | | | | | | | | | | |
| | | Level 1 | | | Level 2 | | | Level 3 | | | Total | |
| Common Stocks | | | | | | | | | | | | | | | | |
| Australia | | | $------- | | | | $21,255,643 | | | | $------- | | | | $21,255,643 | |
| Belgium | | | ------- | | | | 5,017,984 | | | | ------- | | | | 5,017,984 | |
| Canada | | | 13,690,576 | | | | ------- | | | | ------- | | | | 13,690,576 | |
| China | | | 12,062,794 | | | | 9,113,701 | | | | ------- | | | | 21,176,495 | |
| Finland | | | ------- | | | | 3,944,821 | | | | ------- | | | | 3,944,821 | |
| France | | | ------- | | | | 8,891,579 | | | | ------- | | | | 8,891,579 | |
| Germany | | | ------- | | | | 10,515,740 | | | | ------- | | | | 10,515,740 | |
| Hong Kong | | | ------- | | | | 6,511,456 | | | | ------- | | | | 6,511,456 | |
| India | | | 6,863,665 | | | | 3,692,543 | | | | ------- | | | | 10,556,208 | |
| Indonesia | | | ------- | | | | 7,035,922 | | | | ------- | | | | 7,035,922 | |
| Ireland | | | ------- | | | | 3,336,546 | | | | ------- | | | | 3,336,546 | |
| Israel | | | ------- | | | | 3,141,575 | | | | ------- | | | | 3,141,575 | |
| Japan | | | ------- | | | | 48,820,658 | | | | ------- | | | | 48,820,658 | |
| Mexico | | | 3,150,506 | | | | ------- | | | | ------- | | | | 3,150,506 | |
| Netherlands | | | ------- | | | | 19,505,972 | | | | ------- | | | | 19,505,972 | |
| Peru | | | 4,712,400 | | | | ------- | | | | ------- | | | | 4,712,400 | |
| Russia | | | ------- | | | | 7,423,906 | | | | ------- | | | | 7,423,906 | |
| South Africa | | | ------- | | | | 8,284,435 | | | | ------- | | | | 8,284,435 | |
| South Korea | | | ------- | | | | 20,791,448 | | | | ------- | | | | 20,791,448 | |
| Spain | | | ------- | | | | 9,291,246 | | | | ------- | | | | 9,291,246 | |
| Sweden | | | ------- | | | | 17,794,840 | | | | ------- | | | | 17,794,840 | |
| Switzerland | | | ------- | | | | 5,544,833 | | | | ------- | | | | 5,544,833 | |
| Taiwan | | | 4,402,320 | | | | 3,376,138 | | | | ------- | | | | 7,778,458 | |
| Thailand | | | ------- | | | | 7,523,884 | | | | ------- | | | | 7,523,884 | |
| Turkey | | | ------- | | | | 2,260,517 | | | | ------- | | | | 2,260,517 | |
| United Kingdom | | | ------- | | | | 28,892,542 | | | | ------- | | | | 28,892,542 | |
| Total Common Stocks | | | $44,882,261 | | | | $261,967,929 | | | | $------- | | | | $306,850,190 | |
| Preferred Stocks | | | | | | | | | | | | | | | | |
| Brazil | | | $6,439,435 | | | | $------- | | | | $------- | | | | $6,439,435 | |
| Germany | | | ------- | | | | 3,073,927 | | | | ------- | | | | 3,073,927 | |
| Total Preferred Stocks | | | $6,439,435 | | | | $3,073,927 | | | | $------- | | | | $9,513,362 | |
| Total Investments | | | $51,321,696 | | | | $265,041,856 | | | | $------- | | | | $316,363,552 | |
For more information on valuation inputs, please refer to Note 1(A) of the accompanying Notes to Financial Statements.
The accompanying notes are an integral part of these financial statements
| | | | |
| www.thomaswhitefunds.com | | | 17 | |
| | |
| Thomas White International Fund | | |
The Fund’s assets assigned to Level 2 include certain foreign securities for which a third party statistical pricing service may be employed for purposes of fair market valuation. In addition, no transfers in and/or out between Levels 1, 2 or 3 were observed during the reporting period, as compared to their classification from the prior annual report.
The accompanying notes are an integral part of these financial statements
| | |
| 18 | | www.thomaswhitefunds.com |
THOMAS WHITE EMERGING MARKETS FUND
| | | | | | | | | | | | | | |
| | | | | | | | |
| | | Unaudited
Sales
Charge | | Deferred
Sales
Charge | | Administrative
Services
Fee | | 12b-1 Fees | | Operating
Expenses1,3 | | Prospectus
Gross
Annual
Operating
Expense2 | | Prospectus
Net Annual
Operating
Expense2,3 |
| Investor Class | | None | | None | | Up to 0.25% | | None | | 1.32% | | 1.32% | | 1.35% |
| Class I | | None | | None | | None | | None | | 1.09% | | 1.30% | | 1.10% |
1 In the absence of the fee deferral/expense reimbursement arrangement for the Emerging Markets Fund, the ratio of expenses to average net assets would have been 1.48% for Investor Class shares and 1.42% for Class I shares.
2 Gross Annual Operating Expense and Net Annual Operating Expense are based on the most recent prospectus and may differ from other expense ratios appearing in this report.
3 Thomas White International, Ltd. (“Advisor”) has agreed to defer its fees and/or reimburse the Fund to the extent that the operating expenses for Investor Class and Class I shares exceed (as a percentage of average daily net assets) 1.34% and 1.09%, respectively. The fee deferral/expense reimbursement agreement expires February 28, 2018. The Fund has agreed to repay the Advisor for amounts deferred or reimbursed by the Advisor pursuant to the agreement provided that such repayment does not cause the Fund to exceed the above limits and the repayment is made within three years after the year in which the Advisor incurred the expense. The fee deferral/expense reimbursement agreement may only be amended or terminated by the Fund’s Board of Trustees.
| | | | | | | | |
| | | | | |
| | | NAV | | Net Assets | | Redemption Fee | | Portfolio Turnover |
| Investor Class | | $11.30 | | $2.0 million | | 2.00% on shares held less than 60 days | | 67% |
| Class I | | $11.38 | | $45.4 million | | |
| | | | |
| www.thomaswhitefunds.com | | | 19 | |
THOMAS WHITE EMERGING MARKETS FUND
| | | | | | | | | | | | | | | | | | | | | | | | | | |
| |
| Average Annual Returns as of October 31, 2017 (Unaudited) | |
| Class | | Sales Charge | | 6 month | | | Calendar
YTD | | | 1 Yr | | | 3 Yrs | | | 5 Yrs | | | Since
Inception
(6/28/2010)* | |
| Investor Class shares (TWEMX) | | None | | | 11.39% | | | | 23.85% | | | | 17.02% | | | | 0.36% | | | | 1.19% | | | | 2.88% | |
| Class I shares1 (TWIIX) | | None | | | 11.55% | | | | 23.94% | | | | 17.29% | | | | 0.61% | | | | 1.42% | | | | 3.05% | |
| MSCI Emerging Markets Index2 | | N/A | | | 16.14% | | | | 32.26% | | | | 26.45% | | | | 5.70% | | | | 4.83% | | | | 4.74% | |
* The inception date of the Investor Class shares.
1 Performance figures for Class I shares, first offered on August 31, 2012, include the historical performance of Investor Class shares through August 30, 2012.
2 The MSCI Emerging Markets Index is a free float-adjusted market capitalization index that is designed to measure equity market performance of emerging markets. The index is unmanaged and returns assume the reinvestment of dividends. It is not possible to invest directly in an index.
Returns of each share class reflect differences in expenses applicable to each class which are primarily differences in service fees.
The returns do not reflect the deduction of taxes that a shareholder would pay on Fund distributions or the redemption of Fund shares. The returns reflect the actual performance for each period and do not include the impacts of trades executed on the last business day of the period that were recorded on the first business day of the next period.
Performance data is based upon past performance, which is no guarantee of future results. The investment return and principal value of an investment will fluctuate so that an investor’s shares, when redeemed, may be worth more or less than their original cost. Current performance may be higher or lower than the performance data quoted. Please call 1-800-811-0535 to obtain performance data as of the most recent month-end. The Fund imposes a 2% redemption fee on shares held less than 60 days. Performance data does not reflect the redemption fee. If reflected, total returns would be lower. Investment performance reflects any fee waivers that were in effect. In the absence of such waivers, total return would have been reduced. The Gross Expense Ratios, based on the most recent prospectus, are 1.32% (Investor Class) and 1.30% (Class I).
| | |
| 20 | | www.thomaswhitefunds.com |
OCTOBER 31, 2017
GROWTH OF A $10,000 INVESTMENT WITH DIVIDENDS REINVESTED (Unaudited)
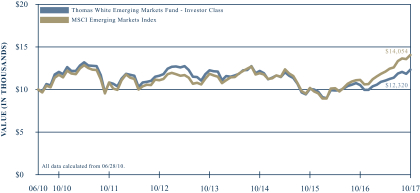
This chart illustrates the performance of a hypothetical $10,000 investment made in the Fund’s Investor Class shares and its benchmark, the MSCI Emerging Markets Index, since inception on June 28, 2010 through October 31, 2017. It assumes reinvestment of dividends and capital gains, but does not reflect the effect of any applicable redemption fees. This chart does not imply future performance. Past performance does not guarantee future results. The cumulative return since inception was +23.20% for the Fund’s Investor Class shares and +40.54% for the benchmark. The Fund’s Investor Class shares average annual total return since inception on June 28, 2010 was +2.88%. The MSCI Emerging Markets Index is a free float-adjusted market capitalization index that is designed to measure equity market performance of emerging markets. The index is unmanaged and returns assume the reinvestment of dividends. It is not possible to invest directly in an index. During the periods shown, the Fund’s manager reimbursed certain Fund expenses. Absent this reimbursement, performance would have been lower. Performance will vary from class to class based on differences in class-specific expenses.
| | | | |
| www.thomaswhitefunds.com | | | 21 | |
THOMAS WHITE EMERGING MARKETS FUND
The Thomas White Emerging Markets Fund invests primarily in securities of companies located in or whose businesses are closely associated with the world’s emerging markets countries.
Portfolio Managers
Thomas S. White, Jr.
Jinwen Zhang, Ph.D., CFA
Douglas M. Jackman, CFA
Wei Li, Ph.D., CFA
John Wu, Ph.D., CFA
Rex Mathew, CFA, CM
Ramkumar Venkatramani, CFA
Performance Review
During the one-year period ended October 31, 2017, the Thomas White Emerging Markets Fund’s Class I shares returned +17.29%, compared to +26.45% for its benchmark MSCI Emerging Markets Index. Since the Fund’s inception on June 28, 2010, the Fund’s Class I shares have returned +3.05%* annualized, against +4.74% for the benchmark index.
Emerging Markets Seeing Renewed Investor Interest
Emerging market equity prices declined at the beginning of the review period as investor attention shifted to the potential boost to U.S. assets from the proposed tax and fiscal policy changes by the incoming Trump administration. It was feared that restrictive trade policies proposed by the new administration could hurt overseas markets, especially emerging markets that are relatively more dependent on trade.
Additionally, the U.S. Dollar’s gains against international currencies also made overseas assets less attractive for investors.
The sentiment started to turn early in 2017 as the global economy gathered pace. Data from Europe and Japan indicated that economic trends are healthier than forecast. This helped brighten the outlook for global demand, as expanding export volumes in subsequent months confirmed. Domestic demand in major emerging markets continued to expand as expected. Other than in India where economic activity was hurt by key policy changes that are considered essential in the long run, most major emerging economies have met or exceeded growth expectations during the first three quarters of 2017.
Stronger economic data encouraged the International Monetary Fund (IMF) to lift its estimates for emerging markets economic growth for the current year as well as for 2018. After the subdued trends during the first half of 2017, energy and commodity prices trended higher during the third quarter. This led to renewed optimism about the recovery in resource exporting countries such as Russia, Brazil and South Africa. At the same time, the commodity price gains have not appreciably dampened consumer spending or widened current account deficits in importing countries. Inflation remains well under control in most emerging markets, except Mexico where the central bank has hiked interest rates. Brazil saw meaningful cuts to its benchmark interest rates this year while central banks in other large emerging countries have left rates unchanged in recent months.
| | |
| 22 | | www.thomaswhitefunds.com |
* Performance for Class I shares include the historical performance of Investor Class shares through August 30, 2012.
OCTOBER 31, 2017
Portfolio Review
The Fund’s technology holdings outperformed by a wide margin during the review period as companies gained market share and reported revenues and earnings that exceeded expectations. The sales platforms built by the leading e-commerce companies have proven to be very scalable and continue to attract more users. The materials sector benefited from the uptrend in industrial commodity prices, supported by signs of healthier demand. The telecom sector also outperformed as the rapid growth in popularity of handheld devices boosted demand for data services. Defensive sectors such as consumer staples and healthcare did not attract much investor attention during the period. The industrials sector also lagged as capital investments for new projects and capacity expansions remain subdued.
Four of the top five contributors to Fund returns for the one-year review period were from the technology sector. Alibaba Group, the largest e-commerce player in Asia, contributed the most to returns as it continued to expand into new market segments, and repeatedly raised its revenue and earnings guidance. Samsung Electronics, one of the largest electronic component and semiconductor manufacturers, gained on strong earnings growth as well as initiatives to improve corporate governance. Tencent Holdings, a market leader in mobile-based instant communication services in Asia with fast growing e-commerce businesses, advanced on better than expected revenue growth. Taiwan Semiconductor Manufacturing, the leading manufacturer of chipsets used in smartphones and other devices, gained on
expectations of further demand growth coming from new devices and technologies. Ping An Insurance, one of the leading insurers in China, benefited from robust earnings and business growth reported in recent quarters.
Indonesian department store operator Matahari Department Store detracted the most from Fund returns, and was sold, as it struggled to revive revenue growth on growing completion and weaker than expected consumer spending. Gentera, a Mexican lender that focuses on small loans, was hurt by the weak economic trends in the country and higher lending rates. Oil field services provider Gulf International, based in the Middle East, declined as the anticipated recovery in capital investment did not yet happen. China Biologic, a manufacturer of blood plasma products, was negatively affected by lower than expected revenue growth and the risk of government controls. Automaker Tata Motors underperformed as currency volatility reduced profit margins and offset the gains from volume growth in China and other major markets.
Emerging Economies Could Continue to Outpace the Developed World
After the growth slowdown that lasted nearly five years, emerging economies started recovering during the first half of 2016. This was triggered by a sharp rebound in prices of energy and industrial commodities from multi-year lows at the beginning of last year. Higher commodity prices were expected to help Brazil, Russia and other resource exporters to move out of severe recessions. The optimism faded as oil and commodity
| | | | |
| www.thomaswhitefunds.com | | | 23 | |
THOMAS WHITE EMERGING MARKETS FUND
prices moderated and a new U.S. administration that called for restrictive trade policies came to power during the first quarter of 2017.
However, the synchronous global economic growth this year has exceeded most forecasts and has brightened the outlook for emerging markets. Export volume growth for manufactured goods, the missing piece for emerging economies for most of last year, has seen a robust revival in recent quarters. Several of the Asian economies such as Korea and Taiwan have reported double digit growth in export volumes this year. Shipments from China have expanded while India is now seeing an export recovery after lagging other Asian countries earlier this year. Higher export earnings should continue to support aggregate growth in emerging markets, as the global economy is expected to sustain the current pace in 2018 as well.
Domestic demand in most emerging economies was stable, even during the multi-year slowdown after 2011. Measured fiscal stimulus and lower interest rates helped support domestic consumption during that period. As these economies expand at a faster pace, consumer spending could also see moderate acceleration in the coming quarters, especially in Asia and Latin America. Though no major country is expected to significantly expand public spending, most of them are likely to sustain the current spending levels. Relatively benign inflation levels should help central banks to avoid sharp rate increases, even if the growth outlook brightens further.
We thank you for investing in the Thomas White Emerging Markets Fund.
| | |
| 24 | | www.thomaswhitefunds.com |
OCTOBER 31, 2017
Portfolio Country and Industry Allocation as of October 31, 2017 (Unaudited)
| | | | |
| | |
| Country Allocation | | % of TNA | |
| Brazil | | | 7.8% | |
| Canada | | | 0.8% | |
| Chile | | | 1.7% | |
| China | | | 34.6% | |
| Hong Kong | | | 2.0% | |
| India | | | 7.1% | |
| Indonesia | | | 2.7% | |
| Malaysia | | | 1.1% | |
| Mexico | | | 3.7% | |
| Philippines | | | 1.2% | |
| Russia | | | 6.3% | |
| South Africa | | | 6.0% | |
| South Korea | | | 12.3% | |
| Taiwan | | | 7.1% | |
| Thailand | | | 1.2% | |
| Turkey | | | 2.5% | |
| United Arab Emirates | | | 1.0% | |
| Cash & Other | | | 0.9% | |
| | | | | |
| | | | |
| | | | |
| | |
| Industry Allocation | | % of TNA | |
| Automobiles & Components | | | 2.1% | |
| Banks | | | 19.9% | |
| Capital Goods | | | 4.8% | |
| Commercial & Professional Services | | | 0.0% | |
| Consumer Durables & Apparel | | | 3.8% | |
| Energy | | | 7.0% | |
| Food & Staples Retailing | | | 0.8% | |
| Health Care Equipment & Services | | | 1.4% | |
| Household & Personal Products | | | 1.9% | |
| Insurance | | | 4.5% | |
| Materials | | | 8.4% | |
| Media | | | 2.8% | |
| Real Estate | | | 2.1% | |
| Retailing | | | 1.1% | |
| Semiconductors & Semiconductor Equipment | | | 11.0% | |
| Software & Services | | | 17.6% | |
| Technology Hardware & Equipment | | | 3.1% | |
| Telecommunication Services | | | 3.3% | |
| Transportation | | | 2.6% | |
| Utilities | | | 0.9% | |
| Cash & Other | | | 0.9% | |
TNA - Total Net Assets
Fund holdings and industry allocations are subject to change and should not be considered a recommendation to buy or sell any securities. For a complete list of Fund holdings, please refer to the Investment Portfolio section of this report.
| | | | |
| www.thomaswhitefunds.com | | | 25 | |
| | |
| Thomas White Emerging Markets Fund | | |
| | | | | | | | | | | | |
| Country | | Issue | | Industry | | Shares | | | Value (US$) | |
| | | | | | | | | | | |
COMMON
STOCKS (93.0%) | | | | | | | | | | |
|
| |
| BRAZIL (2.8%) | | | | | | | | |
| | BB Seguridade Participacoes S.A. | | Insurance | | | 42,500 | | | | $358,703 | |
| | Hypermarcas S.A. | | Household & Personal Products | | | 36,900 | | | | 387,014 | |
| | Petroleo Brasileiro SA Petrobras * | | Energy | | | 110,200 | | | | 565,940 | |
| | | | | | | | | | | | |
| | | | | | | | | | | 1,311,657 | |
|
| |
| CANADA (0.8%) | | | | | | | | |
| | Gran Tierra Energy, Inc. * # | | Energy | | | 175,700 | | | | 381,269 | |
|
| |
| CHILE (1.7%) | | | | | | | | |
| | Itau CorpBanca | | Banks | | | 84,233,650 | | | | 785,228 | |
|
| |
| CHINA (34.6%) | | | | | | | | |
| | Alibaba Group Holding Ltd. ADR * # | | Software & Services | | | 13,400 | | | | 2,477,526 | |
| | Anhui Conch Cement Company Limited - H Shares + | | Materials | | | 188,000 | | | | 803,783 | |
| | Baidu, Inc. ADR * | | Software & Services | | | 3,000 | | | | 731,820 | |
| | Beijing Enterprises Holdings Limited + | | Capital Goods | | | 131,400 | | | | 780,887 | |
| | China Construction Bank Corp. - H Shares + | | Banks | | | 1,242,000 | | | | 1,108,298 | |
| | China Overseas Land & Investment Limited + | | Real Estate | | | 154,000 | | | | 499,559 | |
| | China Petroleum and Chemical Corporation (Sinopec) - H Shares + | | Energy | | | 576,000 | | | | 422,787 | |
| | China Railway Signal & Communication Corporation Ltd. - H Shares + | | Technology Hardware & Equipment | | | 580,000 | | | | 456,501 | |
| | China State Construction International Holdings Limited # + | | Capital Goods | | | 537,300 | | | | 756,721 | |
| | Chongqing Rural Commercial Bank Co., Ltd. - H Shares + | | Banks | | | 973,600 | | | | 662,144 | |
| | Ctrip.com International, Ltd. ADR * | | Retailing | | | 11,400 | | | | 545,946 | |
| | Haier Electronics Group Co., Ltd. + | | Consumer Durables & Apparel | | | 115,000 | | | | 305,867 | |
| | Momo Inc. ADR * | | Software & Services | | | 15,900 | | | | 484,473 | |
| | NetEase, Inc. ADR | | Software & Services | | | 3,600 | | | | 1,014,912 | |
| | Ping An Insurance (Group) Company of China Limited - H Shares + | | Insurance | | | 135,700 | | | | 1,191,788 | |
| | Sinopharm Group Co. Ltd. - H Shares + | | Health Care Equipment & Services | | | 150,000 | | | | 671,584 | |
| | Tencent Holdings Limited + | | Software & Services | | | 59,300 | | | | 2,670,995 | |
| | ZTO Express Cayman, Inc ADR * # | | Transportation | | | 50,100 | | | | 801,099 | |
| | | | | | | | | | | | |
| | | | | | | | | | | 16,386,690 | |
|
| |
| HONG KONG (2.0%) | | | | | | | | |
| | Techtronic Industries Company Limited + | | Consumer Durables & Apparel | | | 165,900 | | | | 972,996 | |
|
| |
| INDIA (7.1%) | | | | | | | | |
| | Infosys Limited | | Software & Services | | | 39,300 | | | | 559,333 | |
| | Mahindra & Mahindra Ltd. GDR + | | Automobiles & Components | | | 24,949 | | | | 520,436 | |
| | NTPC Limited + | | Utilities | | | 151,500 | | | | 424,628 | |
| | Reliance Industries Ltd. | | Energy | | | 33,900 | | | | 492,422 | |
The accompanying notes are an integral part of these financial statements
| | |
| 26 | | www.thomaswhitefunds.com |
| | |
| Investment Portfolio | | October 31, 2017 |
| | | | | | | | | | | | |
| Country | | Issue | | Industry | | Shares | | | Value (US$) | |
| | | | | | | | | | | |
| INDIA (CONT.) | | | | | | | | |
| | Tata Motors Limited * | | Automobiles & Components | | | 74,968 | | | | $495,842 | |
| | WNS (Holdings) Ltd. ADR * | | Software & Services | | | 10,500 | | | | 398,160 | |
| | YES BANK Limited + | | Banks | | | 95,200 | | | | 461,653 | |
| | | | | | | | | | | | |
| | | | | | | | | | | 3,352,474 | |
|
| |
| INDONESIA (2.7%) | | | | | | | | |
| | Pembangunan Perumahan Persero + | | Capital Goods | | | 2,096,700 | | | | 440,624 | |
| | PT Bank Negara Indonesia (Persero) Tbk + | | Banks | | | 1,013,600 | | | | 568,292 | |
| | Wijaya Karya Persero Tbk PT + | | Capital Goods | | | 1,934,100 | | | | 280,948 | |
| | | | | | | | | | | | |
| | | | | | | | | | | 1,289,864 | |
|
| |
| MALAYSIA (1.1%) | | | | | | | | |
| | CIMB Group Holdings Berhad + | | Banks | | | 354,300 | | | | 513,860 | |
|
| |
| MEXICO (3.7%) | | | | | | | | |
| | Cemex SAB de CV * | | Materials | | | 534,720 | | | | 434,821 | |
| | Grupo Financiero Banorte, S.A.B. de C.V. | | Banks | | | 151,800 | | | | 899,474 | |
| | Mexichem, S.A.B. de C.V. | | Materials | | | 168,650 | | | | 434,386 | |
| | | | | | | | | | | | |
| | | | | | | | | | | 1,768,681 | |
|
| |
| PHILIPPINES (1.2%) | | | | | | | | |
| | Metropolitan Bank & Trust Company + | | Banks | | | 334,800 | | | | 561,539 | |
|
| |
| RUSSIA (6.3%) | | | | | | | | |
| | LUKOIL PJSC ADR + | | Energy | | | 16,600 | | | | 881,808 | |
| | Mobile TeleSystems PJSC ADR | | Telecommunication Services | | | 64,000 | | | | 679,040 | |
| | Sberbank of Russia PJSC ADR + | | Banks | | | 100,450 | | | | 1,441,174 | |
| | | | | | | | | | | | |
| | | | | | | | | | | 3,002,022 | |
|
| |
| SOUTH AFRICA (6.0%) | | | | | | | | |
| | Capitec Bank Holdings Limited + | | Banks | | | 7,200 | | | | 478,615 | |
| | Naspers Limited - N Shares + | | Media | | | 5,425 | | | | 1,340,356 | |
| | Novus Holdings Limited + | | Commercial & Professional Services | | | 1 | | | | 0 | |
| | Sibanye Gold Limited + | | Materials | | | 375,111 | | | | 484,495 | |
| | Steinhoff International Holdings N.V. + | | Consumer Durables & Apparel | | | 121,077 | | | | 526,768 | |
| | | | | | | | | | | | |
| | | | | | | | | | | 2,830,234 | |
|
| |
| SOUTH KOREA (11.2%) | | | | | | | | |
| | KB Financial Group Inc. + | | Banks | | | 13,400 | | | | 699,659 | |
| | Korea Zinc Co Ltd + | | Materials | | | 1,350 | | | | 617,714 | |
| | LG Household & Health Care Ltd. + | | Household & Personal Products | | | 480 | | | | 504,116 | |
| | POSCO + | | Materials | | | 1,850 | | | | 538,720 | |
| | Samsung Electronics Co., Ltd. + | | Semiconductors & Semiconductor Equipment | | | 970 | | | | 2,387,823 | |
| | Samsung Life Insurance Co., Ltd. + | | Insurance | | | 4,800 | | | | 578,841 | |
| | | | | | | | | | | | |
| | | | | | | | | | | 5,326,873 | |
|
| |
The accompanying notes are an integral part of these financial statements
| | | | |
| www.thomaswhitefunds.com | | | 27 | |
| | |
| Thomas White Emerging Markets Fund | | |
| | | | | | | | | | | | |
| Country | | Issue | | Industry | | Shares | | | Value (US$) | |
| | | | | | | | | | | |
| TAIWAN (7.1%) | | | | | | | | |
| | Catcher Technology Co., Ltd + | | Technology Hardware & Equipment | | | 46,000 | | | | $491,150 | |
| | Pegatron Corporation + | | Technology Hardware & Equipment | | | 205,000 | | | | 532,801 | |
| | Taiwan Semiconductor Manufacturing Company Ltd. + | | Semiconductors & Semiconductor Equipment | | | 289,400 | | | | 2,337,535 | |
| | | | | | | | | | | | |
| | | | | | | | | | | 3,361,486 | |
|
| |
| THAILAND (1.2%) | | | | | | | | |
| | PTT Exploration and Production Public Company Limited + | | Energy | | | 212,900 | | | | 553,955 | |
|
| |
| TURKEY (2.5%) | | | | | | | | |
| | TAV Havalimanlari Holding AS + | | Transportation | | | 84,400 | | | | 420,259 | |
| | Turkcell Iletisim Hizmetleri AS + | | Telecommunication Services | | | 109,500 | | | | 409,441 | |
| | Turkiye Garanti Bankasi A.S. + | | Banks | | | 127,200 | | | | 349,682 | |
| | | | | | | | | | | | |
| | | | | | | | | | | 1,179,382 | |
|
| |
| UNITED ARAB EMIRATES (1.0%) | | | | | | | | |
| | Emaar Properties PJSC + | | Real Estate | | | 219,400 | | | | 496,584 | |
|
| |
| Total Common Stocks | | | | (Cost $33,560,379) | | | | | | | 44,074,794 | |
| | | | | | | | | | | | |
|
| |
PREFERRED
STOCKS (6.1%) | | | | | | | | | | |
|
| |
| BRAZIL (5.0%) | | | | | | | | |
| | Cia Brasileira de Distribuicao * (2/23/18, N/A)^ | | Food & Staples Retailing | | | 15,600 | | | | 363,760 | |
| | Itau Unibanco Holding S.A. (2/7/18, 0.44%)^ | | Banks | | | 69,049 | | | | 890,948 | |
| | Telefonica Brasil S.A. (2/21/18, 2.33%)^ | | Telecommunication Services | | | 29,600 | | | | 456,763 | |
| | Vale S.A. (2/28/18, N/A)^ | | Materials | | | 72,600 | | | | 665,124 | |
| | | | | | | | | | | | |
| | | | | | | | | | | 2,376,595 | |
|
| |
| SOUTH KOREA (1.1%) | | | | | | | | |
| | Samsung Electronics Co., Ltd. + (1/8/18, 1.43%)^ | | Semiconductors & Semiconductor Equipment | | | 250 | | | | 500,394 | |
|
| |
| Total Preferred Stocks | | | | (Cost $2,629,691) | | | | | | | 2,876,989 | |
| | | | | | | | | | | | |
|
| |
| RIGHTS (-%) | | | | | | | | | | |
|
| |
| CHINA (-%) | | | | | | | | |
| | Tencent Holdings Limited + | | Software & Services | | | 48 | | | | 0 | |
|
| |
| Total Rights | | | | (Cost $0) | | | | | | | 0 | |
| | | | | | | | | | | | |
|
| |
The accompanying notes are an integral part of these financial statements
| | |
| 28 | | www.thomaswhitefunds.com |
| | |
| Investment Portfolio | | October 31, 2017 |
| | | | | | | | | | | | |
| Country | | Issue | | Industry | | Shares | | | Value (US$) | |
| | | | | | | | | | | |
SHORT TERM
INVESTMENTS (1.6%) | | | | | | | | |
|
| |
| MONEY MARKET FUND (1.6%) | | | | | | | | |
| | Northern Institutional Treasury Portfolio - Shares Class, 0.93% (a) | | | | | 777,559 | | | | $777,559 | |
|
| |
| Total Short Term Investments | | | | (Cost $777,559) | | | | | | | 777,559 | |
| | | | | | | | | | | | |
|
| |
| | | | |
HELD AS COLLATERAL
FOR SECURITIES
LENDING (1.7%) | | | | | | | | | | | | |
|
| |
SHORT TERM
INVESTMENTS (1.7%) | | | | | | | | | | |
|
| |
| MONEY MARKET FUND (1.7%) | | | | | | | | |
| | Northern Institutional Liquid Assets Portfolio, 1.10% (a) | | | | | 814,125 | | | | 814,125 | |
|
| |
| Total held as collateral for securities lending | | | | (Cost $814,125) | | | | | | | 814,125 | |
| | | | | | | | | | | | |
|
| |
| Total Investments | | 102.4% | | (Cost $37,781,754) | | | | | | | $48,543,467 | |
| Liabilities in excess of other assets | | (2.4)% | | | | | | | | | (1,149,007 | ) |
| Total Net Assets: | | 100.0% | | | | | | | | | $47,394,460 | |
|
| |
| * | Non-Income Producing Securities |
| # | All or a portion of securities on loan at October 31, 2017. The market value of the securities loaned was $3,450,207. The loaned securities were secured with cash collateral of $814,125 and non-cash collateral with a value of $2,657,326. The non-cash collateral received consists of short term investments and long term bonds, and is held for the benefit of the Fund at the Fund’s custodian. The Fund cannot repledge or resell this collateral. Collateral is calculated based on prior day’s prices. - See Note 1(I) to Financial Statements |
| ^ | Maturity Date and Preferred Dividend rate of Preferred Stock |
| ADR | - American Depositary Receipt |
| GDR | - Global Depositary Receipt |
Industry classifications shown in the Investment Portfolio are based off of the Global Industry Classification Standard (GICS®). GICS was developed by and/or is the exclusive property of MSCI, Inc. and Standard & Poor’s Financial Services LLC (“S&P”). GICS is a service mark of MSCI and S&P and has been licensed for use by U.S. Bancorp Fund Services, LLC.
The accompanying notes are an integral part of these financial statements
| | | | |
| www.thomaswhitefunds.com | | | 29 | |
| | |
| Thomas White Emerging Markets Fund | | |
The following table summarizes the inputs used, as of October 31, 2017, in valuating the Fund’s assets:
| | | | | | | | | | | | | | | | |
| | | Level 1 | | | Level 2 | | | Level 3 | | | Total | |
| Common Stocks | | | | | | | | | | | | | | | | |
| Brazil | | | $1,311,657 | | | | $------- | | | | $------- | | | | $1,311,657 | |
| Canada | | | 381,269 | | | | ------- | | | | ------- | | | | 381,269 | |
| Chile | | | 785,228 | | | | ------- | | | | ------- | | | | 785,228 | |
| China | | | 6,055,776 | | | | 10,330,914 | | | | ------- | | | | 16,386,690 | |
| Hong Kong | | | ------- | | | | 972,996 | | | | ------- | | | | 972,996 | |
| India | | | 1,945,757 | | | | 1,406,717 | | | | ------- | | | | 3,352,474 | |
| Indonesia | | | ------- | | | | 1,289,864 | | | | ------- | | | | 1,289,864 | |
| Malaysia | | | ------- | | | | 513,860 | | | | ------- | | | | 513,860 | |
| Mexico | | | 1,768,681 | | | | ------- | | | | ------- | | | | 1,768,681 | |
| Philippines | | | ------- | | | | 561,539 | | | | ------- | | | | 561,539 | |
| Russia | | | 679,040 | | | | 2,322,982 | | | | ------- | | | | 3,002,022 | |
| South Africa | | | ------- | | | | 2,830,234 | | | | ------- | | | | 2,830,234 | |
| South Korea | | | ------- | | | | 5,326,873 | | | | ------- | | | | 5,326,873 | |
| Taiwan | | | ------- | | | | 3,361,486 | | | | ------- | | | | 3,361,486 | |
| Thailand | | | ------- | | | | 553,955 | | | | ------- | | | | 553,955 | |
| Turkey | | | ------- | | | | 1,179,382 | | | | ------- | | | | 1,179,382 | |
| United Arab Emirates | | | ------- | | | | 496,584 | | | | ------- | | | | 496,584 | |
| Total Common Stocks | | | $12,927,408 | | | | $31,147,386 | | | | $------- | | | | $44,074,794 | |
| Preferred Stocks | | | | | | | | | | | | | | | | |
| Brazil | | | $2,376,595 | | | | $------- | | | | $------- | | | | $2,376,595 | |
| South Korea | | | ------- | | | | 500,394 | | | | ------- | | | | 500,394 | |
| Total Preferred Stocks | | | $2,376,595 | | | | $500,394 | | | | $------- | | | | $2,876,989 | |
| Rights | | | | | | | | | | | | | | | | |
| China | | | $------- | | | | $------- | | | | $------- | | | | $------- | |
| Total Rights | | | $------- | | | | $------- | | | | $------- | | | | $------- | |
| Short Term Investments | | | $1,591,684 | | | | $------- | | | | $------- | | | | $1,591,684 | |
| Total Investments | | | $16,895,687 | | | | $31,647,780 | | | | $------- | | | | $48,543,467 | |
For more information on valuation inputs, please refer to Note 1(A) of the accompanying Notes to Financial Statements.
The Fund’s assets assigned to Level 2 include certain foreign securities for which a third party statistical pricing service may be employed for purposes of fair market valuation. In addition, no transfers in and/or out between Levels 1, 2 or 3 were observed during the reporting period, as compared to their classification from the prior annual report.
The accompanying notes are an integral part of these financial statements
| | |
| 30 | | www.thomaswhitefunds.com |
THOMAS WHITE AMERICAN OPPORTUNITIES FUND
| | | | | | | | | | | | | | |
| | | | | | | | |
| | | Unaudited
Sales
Charge | | Deferred
Sales
Charge | | Administrative
Services
Fee | | 12b-1 Fees | | Operating
Expenses1,3 | | Prospectus
Gross
Annual
Operating
Expense2 | | Prospectus
Net Annual
Operating
Expense2,3 |
| Investor Class | | None | | None | | Up to 0.25% | | None | | 1.19% | | 1.20% | | 1.20% |
1 In the absence of the fee deferral/expense reimbursement arrangement for the American Opportunities Fund, the ratio of expenses to average net assets would have been 1.19% for Investor Class shares.
2 Gross Annual Operating Expense and Net Annual Operating Expense are based on the most recent prospectus and may differ from other expense ratios appearing in this report.
3 Thomas White International, Ltd. (“Advisor”) has agreed to defer its fees and/or reimburse the Fund to the extent that the operating expenses for Investor Class shares exceed 1.34% of its average daily net assets. The fee deferral/expense reimbursement agreement expires February 28, 2018. The Fund has agreed to repay the Advisor for amounts deferred or reimbursed by the Advisor pursuant to the agreement provided that such repayment does not cause the Fund to exceed the above limits and the repayment is made within three years after the year in which the Advisor incurred the expense. The fee deferral/expense reimbursement agreement may only be amended or terminated by the Fund’s Board of Trustees.
| | | | | | | | |
| | | | | |
| | | NAV | | Net Assets | | Redemption Fee | | Portfolio Turnover |
Investor Class | | $16.49 | | $41.4 million | | 2.00% on shares held less than 60 days | | 29% |
| | | | |
| www.thomaswhitefunds.com | | | 31 | |
THOMAS WHITE AMERICAN OPPORTUNITIES FUND
| | | | | | | | | | | | | | | | | | | | | | | | | | |
| |
| Average Annual Returns as of October 31, 2017 (Unaudited) | |
| Class | | 6 month | | Calendar
YTD | | | 1 Yr | | | 3 Yrs | | | 5 Yrs | | | 10 Yrs | | | Since
Inception
(3/4/1999) | |
| Investor Class shares (TWAOX) | | 6.51% | | | 12.10% | | | | 20.45% | | | | 7.94% | | | | 13.28% | | | | 6.07% | | | | 8.15% | |
| Russell Midcap Index1 | | 7.22% | | | 13.60% | | | | 21.09% | | | | 9.04% | | | | 14.87% | | | | 8.09% | | | | 9.57% | |
| S&P 500 Index1 | | 9.10% | | | 16.91% | | | | 23.63% | | | | 10.77% | | | | 15.18% | | | | 7.51% | | | | 5.96% | |
1 The Russell Midcap Index measures the performance of the 800 smallest companies in the Russell 1000 Index. These represent approximately 31% of the total market capitalization of the Russell 1000 Index. The S&P 500 Index measures the performance of 500 leading companies in leading industries of the U.S. economy, capturing 80% coverage of U.S. equities. Both indices are unmanaged and returns assume the reinvestment of dividends. It is not possible to invest directly in an index.
The returns do not reflect the deduction of taxes that a shareholder would pay on Fund distributions or the redemption of Fund shares. The returns reflect the actual performance for each period and do not include the impacts of trades executed on the last business day of the period that were recorded on the first business day of the next period.
Performance data is based upon past performance, which is no guarantee of future results. The investment return and principal value of an investment will fluctuate so that an investor’s shares, when redeemed, may be worth more or less than their original cost. Current performance may be higher or lower than the performance data quoted. Please call 1-800-811-0535 to obtain performance data as of the most recent month-end. The Fund imposes a 2% redemption fee on shares held less than 60 days. Performance data does not reflect the redemption fee. If reflected, total returns would be lower. Investment performance reflects any fee waivers that were in effect. In the absence of such waivers, total return would have been reduced. The Investor Class Gross Expense Ratio, based on the most recent prospectus, is 1.20%.
| | |
| 32 | | www.thomaswhitefunds.com |
OCTOBER 31, 2017
GROWTH OF A $10,000 INVESTMENT WITH DIVIDENDS REINVESTED (Unaudited)
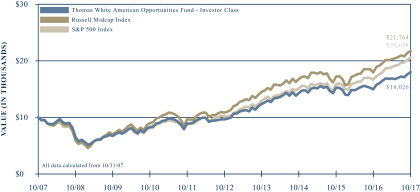
This chart illustrates the performance of a hypothetical $10,000 investment made in the Fund’s Investor Class shares, its primary benchmark, the Russell Midcap Index, and its secondary benchmark, the S&P 500 Index, for the past 10 years through October 31, 2017. It assumes reinvestment of dividends and capital gains, but does not reflect the effect of any applicable redemption fees. This chart does not imply future performance. Past performance does not guarantee future results. The cumulative ten year return was +80.26% for the Fund’s Investor Class shares, +117.64% for the primary benchmark, and +106.38% for the secondary benchmark. The Fund’s Investor Class shares average annual total return since inception on March 4, 1999 was +8.15%. The Russell Midcap Index measures the performance of the 800 smallest companies in the Russell 1000 Index. These represent approximately 31% of the total market capitalization of the Russell 1000 Index. The S&P 500 Index measures the performance of 500 leading companies in leading industries of the U.S. economy, capturing 80% coverage of U.S. equities. Both indices are unmanaged and returns assume the reinvestment of dividends. It is not possible to invest directly in an index. During the periods shown, the Fund’s manager reimbursed certain Fund expenses. Absent this reimbursement, performance would have been lower.
| | | | |
| www.thomaswhitefunds.com | | | 33 | |
THOMAS WHITE AMERICAN OPPORTUNITIES FUND
The Thomas White American Opportunities Fund primarily invests in equity securities of mid-size U.S. companies. The Fund may also invest in equity securities of smaller and larger size U.S. companies.
Portfolio Managers
Thomas S. White, Jr.
Jinwen Zhang, Ph.D., CFA
Douglas M. Jackman, CFA
Wei Li, Ph.D., CFA
John Wu, Ph.D., CFA
Rex Mathew, CFA, CM
Ramkumar Venkatramani, CFA
Performance Review
The Thomas White American Opportunities Fund Investor Class shares returned +20.45% during the one-year period ended October 31, 2017 while the Fund’s primary benchmark, the Russell Midcap Index, returned +21.09% and the secondary benchmark S&P 500 Index returned +23.63% during the same period. Since its inception on March 4, 1999, the Fund’s Investor Class shares annualized returns are +8.15%, compared to +9.57% for the Russell Midcap Index and +5.96% for the S&P 500 Index.
U.S. Economy Has Rebounded from Softer First Half
U.S. equities advanced at the beginning of the review period as investors were enthused by the promised fiscal policy changes by the new Trump administration. The expectation of significant corporate and personal income tax cuts led companies to improve their earnings outlook, with additional optimism
over the possibility of increased consumer demand. The economy was expected to receive a short-term boost from the widely talked about $1 trillion infrastructure investment package.
However, implementation of these proposals remained elusive during the early months of the administration. Weaker than expected economic growth trends during the first half of 2017 also soured investor sentiment, though the U.S. Federal Reserve delayed the expected increases in benchmark rates. Nevertheless, the labor markets continued to tighten, and wages expanded at a modest pace. The housing market also remained healthy as low inventories continued to push average home prices higher.
The U.S. economy rebounded during the third quarter of this year, expanding at an annualized pace of over 3%, despite the disruptions caused by extreme weather in several states. Consumer sentiment remained healthy while external trade has also rebounded. Corporate earnings and cash flows have improved during the review period. Several large companies have expanded their share buybacks and are paying out higher dividends. Merger and acquisition activity has also increased, compared to last year, as the cost of capital remains relatively low.
Portfolio Review
The healthcare sector rebounded on expectations of reduced regulatory restrictions in the U.S., as the government repeals the reforms implemented by the previous administration. The financials sector benefited from strong earnings growth as credit demand continued to strengthen.
| | |
| 34 | | www.thomaswhitefunds.com |
OCTOBER 31, 2017
Expectations of higher investments helped the industrials sector, which could also benefit from increased global demand. The technology sector continued to outperform during the review period as companies gained market share and reported revenues and earnings that exceeded expectations. The consumer discretionary sector lagged as several corporations with traditional business models are ceding market share to e-commerce. Defensive sectors such as consumer staples underperformed during the review period.
Homebuilder NVR contributed the most to Fund returns during the review period as the limited supply of residential housing is expected to help sustain demand and boost margins. Spirit Aerosystems, one of the largest airframe manufacturers for commercial planes, gained as the company concluded a supply agreement with aircraft manufacturer Boeing. An $8 billion acquisition bid by Northrop Grumman lifted defense manufacturer Orbital ATK. Online payment solutions provider PayPal outperformed on expectations that expansion into other market segments and geographies should help sustain earnings growth. Old Dominion Freight Line, a logistics services provider, was helped by expectations of higher demand as the economy accelerates.
Oil and gas producer Range Resources detracted the most from Fund returns for the review period on poorer than expected exploration success rates as well as investor concerns about a softer natural gas price outlook. Footwear retailer Foot Locker underperformed as it continued to report weaker than expected sales volumes. Chicago Bridge & Iron was hurt by lower
than anticipated construction activity as well as a legal challenge against the company on its accounting practices. Jewelry retailer Pandora was negatively affected by slower than forecast same store sales growth guidance from the company. Brixmor Property Group, a commercial property Real Estate Investment Trust (REIT), declined on concerns that lower revenue and earnings in the retail sector could reduce rentals and occupancies in the future.
Focus Shifts to Tax and Other Fiscal Policy Changes
The U.S. economy has picked up pace in recent months and aggregate growth is likely to exceed 3% annualized during the second half of this year. The International Monetary Fund (IMF) now expects the economy to expand 2.2% this year and 2.3% in 2018. Consumer spending remains the major driver of growth, buoyed by sustained wage growth and low borrowing costs. Affordable mortgage rates and higher incomes should help the housing market as well, and boost new construction activity. If the global economy continues to expand at the current pace, the outlook for industrial exports should also brighten.
As concerns over economic growth recede, investor attention is likely to shift to the promised fiscal policy changes and higher government spending on infrastructure. After a longer than expected delay, the Trump administration’s efforts to reduce tax rates and simplify the tax structure are now close to gaining Congressional approval. The proposed changes include lower taxes for businesses and an immediate tax deduction for capital spending, instead of depreciation
| | | | |
| www.thomaswhitefunds.com | | | 35 | |
THOMAS WHITE AMERICAN OPPORTUNITIES FUND
over several years. These measures could boost net earnings of most corporations and increase cash available for shareholder distributions and buybacks. The proposal for a low repatriation tax for earnings retained overseas by large U.S. corporations could also lead to higher shareholder payouts. If appropriate incentives are given, these corporations could be encouraged to spend part of the repatriated funds on capital projects. This may give a much-needed lift to demand for equipment as well as industrial materials and services.
The U.S. Federal Reserve has indicated it will start shrinking its bond portfolio,
accumulated over the last several years from quantitative easing programs, later this year. The scaling down of the Fed balance sheet will be done gradually by not reinvesting the proceeds from maturing securities. This could push up long-term interest rates, though the increase is not expected to be significant in the near term. The Fed unwinding is not expected to cause heightened credit market volatility either, provided the economic trends remain stable, as the process is likely to take several years to complete.
We thank you for investing in the Thomas White American Opportunities Fund.
| | |
| 36 | | www.thomaswhitefunds.com |
OCTOBER 31, 2017
Portfolio Industry Allocation and Market Capitalization as of October 31, 2017 (Unaudited)
| | | | |
| | |
| Industry Allocation | | % of TNA | |
| Automobiles & Components | | | 2.1% | |
| Banks | | | 6.2% | |
| Capital Goods | | | 8.2% | |
| Commercial & Professional Services | | | 0.9% | |
| Consumer Durables & Apparel | | | 6.5% | |
| Consumer Services | | | 4.8% | |
| Diversified Financials | | | 3.8% | |
| Energy | | | 5.6% | |
| Food, Beverage & Tobacco | | | 2.3% | |
| Health Care Equipment & Services | | | 6.6% | |
| Insurance | | | 3.3% | |
| Materials | | | 10.4% | |
| Media | | | 1.4% | |
| Pharmaceuticals, Biotechnology & Life Sciences | | | 1.5% | |
| REITS | | | 4.8% | |
| Retailing | | | 2.4% | |
| Software & Services | | | 14.2% | |
| Technology Hardware & Equipment | | | 2.5% | |
| Transportation | | | 4.0% | |
| Utilities | | | 7.1% | |
| Cash & Other | | | 1.4% | |
| | | | |
| | |
| Portfolio Market Cap Mix | | % of TNA | |
| Large Cap (over $15.2 billion) | | | 39.8% | |
| Mid Cap ($2.3-$15.2 billion) | | | 58.5% | |
| Small Cap (under $2.3 billion) | | | 0.3% | |
| Cash & Other | | | 1.4% | |
| | | | | |
| | | | | |
| | | | | |
| | | | | |
| | | | | |
| | | | | |
| | | | | |
| | | | | |
| | | | | |
| | | | | |
| | | | | |
| | | | | |
| | | | | |
| | | | | |
| | | | | |
| | | | | |
| | | | | |
| | | | | |
TNA - Total Net Assets
Fund holdings and industry allocations are subject to change and should not be considered a recommendation to buy or sell any securities. For a complete list of Fund holdings, please refer to the Investment Portfolio section of this report.
| | | | |
| www.thomaswhitefunds.com | | | 37 | |
| | |
| Thomas White American Opportunities Fund | | |
| | | | | | | | | | |
| Industry | | Issue | | Shares | | | Value | |
| | | | | | | | | |
| COMMON STOCKS (93.8%) | | | | | | | | |
|
| |
| AUTOMOBILES & COMPONENTS (2.1%) | | | | | | |
| | BorgWarner, Inc. | | | 12,000 | | | | $632,640 | |
| | Thor Industries, Inc. | | | 1,800 | | | | 245,196 | |
| | | | | | | | | | |
| | | | | | | | | 877,836 | |
|
| |
| BANKS (6.2%) | | | | | | |
| | Citizens Financial Group, Inc. | | | 15,100 | | | | 573,951 | |
| | Comerica Incorporated | | | 9,250 | | | | 726,772 | |
| | Regions Financial Corporation | | | 37,100 | | | | 574,308 | |
| | Zions Bancorporation | | | 14,900 | | | | 692,254 | |
| | | | | | | | | | |
| | | | | | | | | 2,567,285 | |
|
| |
| CAPITAL GOODS (8.2%) | | | | | | |
| | Carlisle Companies Incorporated | | | 3,530 | | | | 387,700 | |
| | Chicago Bridge & Iron Company N.V. | | | 9,855 | | | | 137,379 | |
| | Huntington Ingalls Industries, Inc. | | | 4,140 | | | | 963,916 | |
| | Sensata Technologies Holding N.V. * | | | 15,704 | | | | 768,082 | |
| | Snap-on Incorporated | | | 3,000 | | | | 473,340 | |
| | Spirit AeroSystems Holdings, Inc. - Class A | | | 8,250 | | | | 660,825 | |
| | | | | | | | | | |
| | | | | | | | | 3,391,242 | |
|
| |
| COMMERCIAL & PROFESSIONAL SERVICES (0.9%) | | | | | | |
| | Stericycle, Inc. * | | | 5,061 | | | | 358,572 | |
|
| |
| CONSUMER DURABLES & APPAREL (6.5%) | | | | | | |
| | Lennar Corporation - Class A | | | 11,650 | | | | 648,556 | |
| | NVR, Inc. * | | | 325 | | | | 1,066,445 | |
| | Pandora A/S ADR | | | 17,800 | | | | 420,810 | |
| | Polaris Industries Inc. | | | 4,900 | | | | 580,307 | |
| | | | | | | | | | |
| | | | | | | | | 2,716,118 | |
|
| |
| CONSUMER SERVICES (4.8%) | | | | | | |
| | Aramark | | | 11,987 | | | | 523,712 | |
| | Royal Caribbean Cruises Ltd. | | | 7,400 | | | | 915,898 | |
| | Wyndham Worldwide Corporation | | | 5,000 | | | | 534,250 | |
| | | | | | | | | | |
| | | | | | | | | 1,973,860 | |
|
| |
| DIVERSIFIED FINANCIALS (3.8%) | | | | | | |
| | Ameriprise Financial, Inc. | | | 3,500 | | | | 547,890 | |
| | Intercontinental Exchange, Inc. | | | 6,500 | | | | 429,650 | |
| | Voya Financial, Inc. | | | 15,500 | | | | 622,480 | |
| | | | | | | | | | |
| | | | | | | | | 1,600,020 | |
|
| |
| ENERGY (5.6%) | | | | | | |
| | CONSOL Energy Inc. * | | | 21,600 | | | | 348,408 | |
| | EQT Corporation | | | 9,400 | | | | 587,876 | |
| | Noble Energy, Inc. | | | 15,800 | | | | 440,346 | |
| | Range Resources Corporation | | | 34,286 | | | | 620,920 | |
| | TechnipFMC plc * | | | 11,247 | | | | 308,055 | |
| | | | | | | | | | |
| | | | | | | | | 2,305,605 | |
|
| |
The accompanying notes are an integral part of these financial statements
| | |
| 38 | | www.thomaswhitefunds.com |
| | |
| Investment Portfolio | | October 31, 2017 |
| | | | | | | | | | |
| Industry | | Issue | | Shares | | | Value | |
| | | | | | | | | |
| FOOD, BEVERAGE & TOBACCO (2.3%) | | | | | | |
| | Dr Pepper Snapple Group, Inc. | | | 4,900 | | | | $ 419,734 | |
| | Molson Coors Brewing Company - Class B | | | 6,600 | | | | 533,742 | |
| | | | | | | | | | |
| | | | | | | | | 953,476 | |
|
| |
| HEALTH CARE EQUIPMENT & SERVICES (6.6%) | | | | | | |
| | Centene Corporation * | | | 4,600 | | | | 430,882 | |
| | Cigna Corporation | | | 2,600 | | | | 512,772 | |
| | Humana, Inc. | | | 1,725 | | | | 440,479 | |
| | Laboratory Corporation of America Holdings * | | | 5,120 | | | | 786,995 | |
| | Zimmer Biomet Holdings, Inc. | | | 4,600 | | | | 559,452 | |
| | | | | | | | | | |
| | | | | | | | | 2,730,580 | |
|
| |
| INSURANCE (3.3%) | | | | | | |
| | Assurant, Inc. | | | 4,600 | | | | 462,990 | |
| | Everest Re Group, Ltd. | | | 1,700 | | | | 403,665 | |
| | The Hartford Financial Services Group, Inc. | | | 9,300 | | | | 511,965 | |
| | | | | | | | | | |
| | | | | | | | | 1,378,620 | |
|
| |
| MATERIALS (10.4%) | | | | | | |
| | AptarGroup, Inc. | | | 4,400 | | | | 383,108 | |
| | Ball Corporation | | | 14,100 | | | | 605,313 | |
| | Martin Marietta Materials, Inc. | | | 2,900 | | | | 628,865 | |
| | The Mosaic Company | | | 11,300 | | | | 252,442 | |
| | Owens-Illinois, Inc. * | | | 20,948 | | | | 500,448 | |
| | PPG Industries, Inc. | | | 6,460 | | | | 750,910 | |
| | The Scotts Miracle-Gro Company - Class A | | | 4,585 | | | | 456,758 | |
| | The Sherwin-Williams Company | | | 1,840 | | | | 727,076 | |
| | | | | | | | | | |
| | | | | | | | | 4,304,920 | |
|
| |
| MEDIA (1.4%) | | | | | | |
| | CBS Corporation - Class B | | | 10,450 | | | | 586,454 | |
|
| |
| PHARMACEUTICALS, BIOTECHNOLOGY & LIFE SCIENCES (1.5%) | | | | | | |
| | Jazz Pharmaceuticals Public Limited Company * | | | 4,300 | | | | 608,579 | |
|
| |
| RETAILING (2.4%) | | | | | | |
| | AutoZone, Inc. * | | | 694 | | | | 409,113 | |
| | Ross Stores, Inc. | | | 9,100 | | | | 577,759 | |
| | | | | | | | | | |
| | | | | | | | | 986,872 | |
|
| |
| SOFTWARE & SERVICES (14.2%) | | | | | | |
| | Alliance Data Systems Corporation | | | 3,500 | | | | 783,055 | |
| | CA, Inc. | | | 11,600 | | | | 375,608 | |
| | Cadence Design Systems, Inc. * | | | 17,900 | | | | 772,564 | |
| | Check Point Software Technologies Ltd. * | | | 5,050 | | | | 594,436 | |
| | DST Systems, Inc. | | | 6,500 | | | | 381,030 | |
The accompanying notes are an integral part of these financial statements
| | | | |
| www.thomaswhitefunds.com | | | 39 | |
| | |
| Thomas White American Opportunities Fund | | |
| | | | | | | | | | |
| Industry | | Issue | | Shares | | | Value | |
| | | | | | | | | |
| SOFTWARE & SERVICES (CONT.) | | | | | | |
| | Fidelity National Information Services, Inc. | | | 7,800 | | | | $ 723,528 | |
| | FleetCor Technologies Inc. * | | | 2,950 | | | | 487,546 | |
| | Intuit Inc. | | | 5,100 | | | | 770,202 | |
| | PayPal Holdings, Inc. * | | | 13,700 | | | | 994,072 | |
| | | | | | | | | | |
| | | | | | | | | 5,882,041 | |
|
| |
| TECHNOLOGY HARDWARE & EQUIPMENT (2.5%) | | | | | | |
| | Arrow Electronics, Inc. * | | | 6,500 | | | | 543,335 | |
| | NetApp, Inc. | | | 11,250 | | | | 499,725 | |
| | | | | | | | | | |
| | | | | | | | | 1,043,060 | |
|
| |
| TRANSPORTATION (4.0%) | | | | | | |
| | Old Dominion Freight Line, Inc. | | | 8,300 | | | | 1,005,379 | |
| | Southwest Airlines Co. | | | 12,100 | | | | 651,706 | |
| | | | | | | | | | |
| | | | | | | | | 1,657,085 | |
|
| |
| UTILITIES (7.1%) | | | | | | |
| | Alliant Energy Corporation | | | 14,000 | | | | 605,640 | |
| | Ameren Corporation | | | 11,300 | | | | 700,487 | |
| | CMS Energy Corporation | | | 13,050 | | | | 631,228 | |
| | DTE Energy Company | | | 5,200 | | | | 574,392 | |
| | Xcel Energy, Inc. | | | 9,050 | | | | 448,156 | |
| | | | | | | | | | |
| | | | | | | | | 2,959,903 | |
|
| |
| Total Common Stocks | | | | | (Cost $29,510,428 | ) | | | 38,882,128 | |
| | | | | | | | | | |
| | | |
| | | | | | | | | | |
| REAL ESTATE INVESTMENT TRUSTS (REITS) (4.8%) | | | | | | | | |
|
| |
| REITS (4.8%) | | | | | | | | |
| | Crown Castle International Corp. | | | 8,000 | | | | 856,640 | |
| | Omega Healthcare Investors, Inc. | | | 18,300 | | | | 528,138 | |
| | Welltower Inc. | | | 8,800 | | | | 589,248 | |
| | | | | | | | | | |
| | | | | | | | | 1,974,026 | |
|
| |
| Total REITs | | | | | (Cost $1,812,567 | ) | | | 1,974,026 | |
| | | | | | | | | | |
| | | |
| | | | | | | | | | |
| Total Investments | | 98.6% | | | (Cost $31,322,995 | ) | | | $40,856,154 | |
| Other Assets, Less Liabilities | | 1.4% | | | | | | | 577,077 | |
| Total Net Assets: | | 100.0% | | | | | | | $41,433,231 | |
| | | |
| | | | | | | | | | |
| * | Non-Income Producing Securities |
| ADR | - American Depositary Receipt |
Industry classifications shown in the Investment Portfolio are based off of the Global Industry Classification Standard (GICS®). GICS was developed by and/or is the exclusive property of MSCI, Inc. and Standard & Poor’s Financial Services LLC (“S&P”). GICS is a service mark of MSCI and S&P and has been licensed for use by U.S. Bancorp Fund Services, LLC.
The accompanying notes are an integral part of these financial statements
| | |
| 40 | | www.thomaswhitefunds.com |
| | |
| Investment Portfolio | | October 31, 2017 |
The following table summarizes the inputs used, as of October 31, 2017, in valuating the Fund’s assets:
| | | | | | | | | | | | | | | | |
| | | Level 1 | | | Level 2 | | | Level 3 | | | Total | |
| Common Stocks | | | | | | | | | | | | | | | | |
| Automobiles & Components | | | $877,836 | | | | $------- | | | | $------- | | | | $877,836 | |
| Banks | | | 2,567,285 | | | | ------- | | | | ------- | | | | 2,567,285 | |
| Capital Goods | | | 3,391,242 | | | | ------- | | | | ------- | | | | 3,391,242 | |
| Commercial & Professional Services | | | 358,572 | | | | ------- | | | | ------- | | | | 358,572 | |
| Consumer Durables & Apparel | | | 2,716,118 | | | | ------- | | | | ------- | | | | 2,716,118 | |
| Consumer Services | | | 1,973,860 | | | | ------- | | | | ------- | | | | 1,973,860 | |
| Diversified Financials | | | 1,600,020 | | | | ------- | | | | ------- | | | | 1,600,020 | |
| Energy | | | 2,305,605 | | | | ------- | | | | ------- | | | | 2,305,605 | |
| Food, Beverage & Tobacco | | | 953,476 | | | | ------- | | | | ------- | | | | 953,476 | |
| Health Care Equipment & Services | | | 2,730,580 | | | | ------- | | | | ------- | | | | 2,730,580 | |
| Insurance | | | 1,378,620 | | | | ------- | | | | ------- | | | | 1,378,620 | |
| Materials | | | 4,304,920 | | | | ------- | | | | ------- | | | | 4,304,920 | |
| Media | | | 586,454 | | | | ------- | | | | ------- | | | | 586,454 | |
| Pharmaceuticals, Biotechnology & Life Sciences | | | 608,579 | | | | ------- | | | | ------- | | | | 608,579 | |
| Retailing | | | 986,872 | | | | ------- | | | | ------- | | | | 986,872 | |
| Software & Services | | | 5,882,041 | | | | ------- | | | | ------- | | | | 5,882,041 | |
| Technology Hardware & Equipment | | | 1,043,060 | | | | ------- | | | | ------- | | | | 1,043,060 | |
| Transportation | | | 1,657,085 | | | | ------- | | | | ------- | | | | 1,657,085 | |
| Utilities | | | 2,959,903 | | | | ------- | | | | ------- | | | | 2,959,903 | |
| Total Common Stocks | | | $38,882,128 | | | | $------- | | | | $------- | | | | $38,882,128 | |
| REITS | | | $1,974,026 | | | | $------- | | | | $------- | | | | $1,974,026 | |
| Total Investments | | | $40,856,154 | | | | $------- | | | | $------- | | | | $40,856,154 | |
For more information on valuation inputs, please refer to Note 1(A) of the accompanying Notes to Financial Statements.
No transfers in and/or out between Levels 1, 2 or 3 were observed during the reporting period, as compared to their classification from the prior annual report.
The accompanying notes are an integral part of these financial statements
| | | | |
| www.thomaswhitefunds.com | | | 41 | |
THOMAS WHITE FUNDS
Statements of Assets and Liabilities
October 31, 2017
| | | | | | | | | | | | | | | | | | | | | | | | |
| | | International
Fund | | | Emerging Markets Fund | | | American
Opportunities
Fund | |
| ASSETS: | | | | | | | | | | | | | | | | | | | | | | | | |
| Investments in securities at market value1,3 | | $ | | | | | 316,363,552 | | | $ | | | | | 48,543,467 | | | $ | | | | | 40,856,154 | |
| Foreign currency2 | | | | | | | 7 | | | | | | | | 165,530 | | | | | | | | ------- | |
| Cash | | | | | | | 740,558 | | | | | | | | ------- | | | | | | | | 574,446 | |
| Receivables: | | | | | | | | | | | | | | | | | | | | | | | | |
Currency | | | | | | | 1,516 | | | | | | | | ------- | | | | | | | | ------- | |
Securities Lending | | | | | | | 6,511 | | | | | | | | 504 | | | | | | | | ------- | |
Investments sold | | | | | | | 2,306,433 | | | | | | | | 457,304 | | | | | | | | ------- | |
Dividends and interest | | | | | | | 460,778 | | | | | | | | 46,055 | | | | | | | | 21,563 | |
Reclaims | | | | | | | 1,515,075 | | | | | | | | 10,345 | | | | | | | | 3,215 | |
Fund shares sold | | | | | | | 263,330 | | | | | | | | 6,221 | | | | | | | | ------- | |
| Prepaid expenses | | | | | | | 34,176 | | | | | | | | 18,962 | | | | | | | | 11,906 | |
| Total assets | | | | | | | 321,691,936 | | | | | | | | 49,248,388 | | | | | | | | 41,467,284 | |
| | | | | | | | | | | | | | | | | | | | | | | | | |
| LIABILITIES: | | | | | | | | | | | | | | | | | | | | | | | | |
| Management and administrative fees payable | | | | | | | 175,718 | | | | | | | | 22,250 | | | | | | | | 3,058 | |
| Business management fees payable | | | | | | | 28,858 | | | | | | | | 3,185 | | | | | | | | 1,950 | |
| Trustees payable | | | | | | | ------- | | | | | | | | 343 | | | | | | | | ------- | |
| Accrued expenses | | | | | | | 191,376 | | | | | | | | 64,025 | | | | | | | | 29,045 | |
| Payable for fund shares redeemed | | | | | | | 197,107 | | | | | | | | 950,000 | | | | | | | | ------- | |
| Distribution fees (See Note 5) | | | | | | | ------- | | | | | | | | ------- | | | | | | | | ------- | |
| Collateral on loaned securities (See Note 1)3,4 | | | | | | | ------- | | | | | | | | 814,125 | | | | | | | | ------- | |
| Total liabilities | | | | | | | 593,059 | | | | | | | | 1,853,928 | | | | | | | | 34,053 | |
| Net Assets | | $ | | | | | 321,098,877 | | | $ | | | | | 47,394,460 | | | $ | | | | | 41,433,231 | |
| | | | | | | | | | | | | | | | | | | | | | | | | |
| NET ASSETS | | | | | | | | | | | | | | | | | | | | | | | | |
| Source of Net Assets: | | | | | | | | | | | | | | | | | | | | | | | | |
| Net capital paid in on shares of beneficial interest | | $ | | | | | 258,740,531 | | | $ | | | | | 48,499,078 | | | $ | | | | | 31,457,506 | |
| Accumulated net investment income/(loss) | | | | | | | (503,923 | ) | | | | | | | (2,592 | ) | | | | | | | 15,478 | |
| Accumulated net realized gain/(loss) | | | | | | | (504,040 | ) | | | | | | | (11,863,319 | ) | | | | | | | 427,088 | |
| Net unrealized appreciation/depreciation on: | | | | | | | | | | | | | | | | | | | | | | | | |
| Investments and foreign currency translations | | | | | | | 63,418,923 | | | | | | | | 10,761,713 | | | | | | | | 9,533,159 | |
Other assets and liabilities denominated in foregin currency | | | | | | | (52,614 | ) | | | | | | | (420 | ) | | | | | | | ------- | |
| Net assets | | $ | | | | | 321,098,877 | | | $ | | | | | 47,394,460 | | | $ | | | | | 41,433,231 | |
| The accompanying notes are an integral part of these financial statements. | |
| | |
| 42 | | www.thomaswhitefunds.com |
THOMAS WHITE FUNDS
Statements of Assets and Liabilities
October 31, 2017
| | | | | | | | | | | | | | | | | | | | | | | | |
| | | International
Fund | | | Emerging
Markets
Fund | | | American
Opportunities
Fund | |
| INVESTOR CLASS SHARES | | | | | | | | | | | | | | | | | | | | | | | | |
| Net assets | | $ | | | | | 43,811,606 | | | $ | | | | | 2,002,392 | | | $ | | | | | 41,433,231 | |
| Shares outstanding5 | | | | | | | 2,449,686 | | | | | | | | 177,271 | | | | | | | | 2,512,548 | |
| Net asset value and offering price per share | | $ | | | | | 17.88 | | | $ | | | | | 11.30 | | | $ | | | | | 16.49 | |
| | | | | | | | | | | | | | | | | | | | | | | | | |
| CLASS I SHARES | | | | | | | | | | | | | | | | | | | | | | | | |
| Net assets | | $ | | | | | 277,287,271 | | | $ | | | | | 45,392,068 | | | | | | | | | |
| Shares outstanding5 | | | | | | | 15,585,266 | | | | | | | | 3,988,413 | | | | | | | | | |
| Net asset value and offering price per share | | $ | | | | | 17.79 | | | $ | | | | | 11.38 | | | | | | | | | |
1 Cost Basis of Investments: International Fund: $252,944,629 Emerging Markets Fund: $37,781,754 including Security Lending collateral of $814,125 American Opportunities Fund: $31,322,995 | | | | | | | | | | | | | | | | | | | | | | | | |
2 Cost Basis of Cash denominated in foreign currencies: International Fund: $7 Emerging Markets Fund: $165,530 | | | | | | | | | | | | | | | | | | | | | | | | |
3 Value of securities out on loan at 10/31/2017: International Fund: $11,822,118 Emerging Markets Fund: $3,450,207 | | | | | | | | | | | | | | | | | | | | | | | | |
4 Non-cash collateral from securities on loan: International Fund: $12,529,046 Emerging Markets Fund: $2,657,326 | | | | | | | | | | | | | | | | | | | | | | | | |
| 5 There are an unlimited number of $.01 par value shares of beneficial interest authorized. | | | | | | | | | | | | | | | | | | | | | | | | |
| The accompanying notes are an integral part of these financial statements. | |
| | | | |
| www.thomaswhitefunds.com | | | 43 | |
THOMAS WHITE FUNDS
Statements of Operations
Year Ended October 31, 2017
| | | | | | | | | | | | | | | | | | | | | | | | |
| | | International
Fund | | | Emerging Markets
Fund | | | American
Opportunities
Fund | |
| INVESTMENT INCOME | |
| Income: | | | | | | | | | | | | | | | | | | | | | | | | |
Dividends1 | | $ | | | | | 11,098,824 | | | $ | | | | | 1,343,324 | | | $ | | | | | 600,832 | |
Interest | | | | | | | 3,864 | | | | | | | | 4,404 | | | | | | | | ------- | |
Securities lending income (Note 1) | | | | | | | 8,460 | | | | | | | | 7,490 | | | | | | | | ------- | |
| Total investment income | | | | | | | 11,111,148 | | | | | | | | 1,355,218 | | | | | | | | 600,832 | |
| Expenses: | | | | | | | | | | | | | | | | | | | | | | | | |
Investment management fees (Note 4) | | | | | | | 3,878,284 | | | | | | | | 531,084 | | | | | | | | 346,622 | |
Business management fees (Note 4) | | | | | | | 159,694 | | | | | | | | 21,868 | | | | | | | | 14,273 | |
Accounting and administration fees | | | | | | | 270,135 | | | | | | | | 46,355 | | | | | | | | 27,897 | |
Custodian fees | | | | | | | 191,059 | | | | | | | | 75,637 | | | | | | | | 9,312 | |
Transfer agent fees | | | | | | | | | | | | | | | | | | | | | | | | |
Class I Shares | | | | | | | 103,211 | | | | | | | | 44,599 | | | | | | | | ------- | |
Investor Class Shares | | | | | | | 31,177 | | | | | | | | 1,326 | | | | | | | | 16,726 | |
Class A Shares | | | | | | | 86 | | | | | | | | 20 | | | | | | | | ------- | |
Class C Shares | | | | | | | 17 | | | | | | | | 59 | | | | | | | | ------- | |
Trustees’ fees and expenses | | | | | | | 105,838 | | | | | | | | 14,887 | | | | | | | | 8,062 | |
Audit fees and expenses | | | | | | | 24,571 | | | | | | | | 21,592 | | | | | | | | 15,417 | |
Registration fees | | | | | | | | | | | | | | | | | | | | | | | | |
Class I Shares | | | | | | | 48,501 | | | | | | | | 55,056 | | | | | | | | ------- | |
Investor Class Shares | | | | | | | 12,795 | | | | | | | | 1,818 | | | | | | | | 12,175 | |
Class A Shares | | | | | | | 31 | | | | | | | | 19 | | | | | | | | ------- | |
Class C Shares | | | | | | | 6 | | | | | | | | 57 | | | | | | | | ------- | |
Printing expenses | | | | | | | 132,929 | | | | | | | | 16,224 | | | | | | | | 8,518 | |
Legal fees and expenses | | | | | | | 145,740 | | | | | | | | 30,184 | | | | | | | | 14,377 | |
Distribution expense (Note 5)2 | | | | | | | 1,264 | | | | | | | | 832 | | | | | | | | ------- | |
Administrative Service Fee (Note 4): | | | | | | | | | | | | | | | | | | | | | | | | |
Investor Class Shares | | | | | | | 232,277 | | | | | | | | 347 | | | | | | | | 3,858 | |
Class A Shares | | | | | | | 217 | | | | | | | | 34 | | | | | | | | ------- | |
Other expenses | | | | | | | 101,149 | | | | | | | | 25,553 | | | | | | | | 7,838 | |
| Total expenses | | | | | | | 5,438,981 | | | | | | | | 887,551 | | | | | | | | 485,075 | |
| Reimbursement of Class I Expenses (Note 4) | | | | | | | (128,430 | ) | | | | | | | (108,934 | ) | | | | | | | ------- | |
| Reimbursement of Management Fees (Note 4) | | | | | | | | | | | | | | | | | | | | | | | | |
Class I Shares | | | | | | | (406,987 | ) | | | | | | | (86,974 | ) | | | | | | | ------- | |
Investor Class Shares | | | | | | | (115,940 | ) | | | | | | | (2,618 | ) | | | | | | | ------- | |
| Net expenses | | | | | | | 4,787,624 | | | | | | | | 689,025 | | | | | | | | 485,075 | |
| Net investment income | | | | | | | 6,323,524 | | | | | | | | 666,193 | | | | | | | | 115,757 | |
| | | | | | | | | | | | | | | | | | | | | | | | | |
| REALIZED AND UNREALIZED GAIN ON INVESTMENTS | |
| Net realized gain on investments & foreign currency transactions | | | | | | | 64,693,543 | | | | | | | | 2,104,763 | | | | | | | | 2,563,472 | |
| Net change in unrealized appreciation on investments and foreign currency transactions | | | | | | | 20,182,751 | | | | | | | | 6,615,755 | | | | | | | | 4,796,761 | |
| Net gain on investments | | | | | | | 84,876,294 | | | | | | | | 8,720,518 | | | | | | | | 7,360,233 | |
| Net increase in net assets from operations | | $ | | | | | 91,199,818 | | | $ | | | | | 9,386,711 | | | $ | | | | | 7,475,990 | |
1 Net of foreign taxes withheld of: International Fund: $1,152,516 Emerging Markets Fund: $157,168 American Opportunities Fund: $2,917 | |
| 2 Distribution expenses were incurred by Class A and Class C shares prior to their closure on February 28, 2017. The Investor Class and Class I shares do not have a 12b-1 distribution plan. | |
| The accompanying notes are an integral part of these financial statements. | |
| | |
| 44 | | www.thomaswhitefunds.com |
THOMAS WHITE FUNDS
Statements of Changes in Net Assets
| | | | | | | | | | | | | | | | |
| | | International Fund | |
| | | | | | Year Ended
October 31,
2017 | | | | | | Year Ended
October 31,
2016 | |
| Change in net assets from operations: | | | | | | | | | | | | | | | | |
Net investment income | | $ | | | | | 6,323,524 | | | $ | | | | | 7,919,567 | |
Net realized gain (loss) on investments | | | | | | | 64,693,543 | | | | | | | | (30,069,504 | ) |
Net unrealized appreciation / depreciation on investments and foreign currency transactions | | | | | | | 20,182,751 | | | | | | | | (679,985 | ) |
Net increase (decrease) in net assets from operations | | | | | | | 91,199,818 | | | | | | | | (22,829,922 | ) |
| Distribution to Investor Class Shareholders: | | | | | | | | | | | | | | | | |
From net investment income | | | | | | | (694,712 | ) | | | | | | | (1,955,550 | ) |
From realized gain | | | | | | | (596,040 | ) | | | | | | | ------- | |
| Distribution to Class I Shareholders: | | | | | | | | | | | | | | | | |
From net investment income | | | | | | | (6,586,716 | ) | | | | | | | (5,068,121 | ) |
From realized gain | | | | | | | (3,774,564 | ) | | | | | | | ------- | |
| Distribution to Class A Shareholders: | | | | | | | | | | | | | | | | |
From net investment income | | | | | | | (252 | ) | | | | | | | (8,345 | ) |
| Total distributions | | | | | | | (11,652,284 | ) | | | | | | | (7,032,016 | ) |
| Fund share transactions (Note 3)1 | | | | | | | (330,906,023 | ) | | | | | | | 32,136,345 | |
| Total increase (decrease) | | | | | | | (251,358,489 | ) | | | | | | | 2,274,407 | |
| Net assets: | | | | | | | | | | | | | | | | |
| Beginning of period | | | | | | | 572,457,366 | | | | | | | | 570,182,959 | |
| End of period | | $ | | | | | 321,098,877 | | | $ | | | | | 572,457,366 | |
| Undistributed net investment income (loss) | | $ | | | | | (503,923 | ) | | $ | | | | | 729,894 | |
| 1 Class A and Class C shares closed on February 28, 2017. | | | | | | | | | | | | | | | | |
| The accompanying notes are an integral part of these financial statements. | | | | | | | | | | | | | | | | |
| | | | |
| www.thomaswhitefunds.com | | | 45 | |
THOMAS WHITE FUNDS
Statements of Changes in Net Assets
| | | | | | | | | | | | | | | | |
| | | Emerging Markets Fund | |
| | | | | | Year Ended
October 31,
2017 | | | | | | Year Ended
October 31,
2016 | |
| Change in net assets from operations: | | | | | | | | | | | | | | | | |
Net investment income | | $ | | | | | 666,193 | | | $ | | | | | 724,091 | |
Net realized gain (loss) on investments | | | | | | | 2,104,763 | | | | | | | | (7,986,636 | ) |
Net unrealized appreciation on investments and foreign currency transactions | | | | | | | 6,615,755 | | | | | | | | 10,897,492 | |
Net increase in net assets from operations | | | | | | | 9,386,711 | | | | | | | | 3,634,947 | |
| Distribution to Investor Class Shareholders: | | | | | | | | | | | | | | | | |
From net investment income | | | | | | | (29,005 | ) | | | | | | | (15,466 | ) |
| Distribution to Class I Shareholders: | | | | | | | | | | | | | | | | |
From net investment income | | | | | | | (871,551 | ) | | | | | | | (663,996 | ) |
| Distribution to Class A Shareholders: | | | | | | | | | | | | | | | | |
From net investment income | | | | | | | ------- | | | | | | | | (447 | ) |
| Total distributions | | | | | | | (900,556 | ) | | | | | | | (679,909 | ) |
| Fund share transactions (Note 3)1 | | | | | | | (39,470,584 | ) | | | | | | | (8,658,459 | ) |
| Total decrease | | | | | | | (30,984,429 | ) | | | | | | | (5,703,421 | ) |
| Net assets: | | | | | | | | | | | | | | | | |
| Beginning of period | | | | | | | 78,378,889 | | | | | | | | 84,082,310 | |
| End of period | | $ | | | | | 47,394,460 | | | $ | | | | | 78,378,889 | |
| Undistributed net investment income (loss) | | $ | | | | | (2,592 | ) | | $ | | | | | 60,308 | |
| 1 Class A and Class C shares closed on February 28, 2017. | | | | | | | | | | | | | | | | |
| The accompanying notes are an integral part of these financial statements. | | | | | | | | | | | | | | | | |
| | |
| 46 | | www.thomaswhitefunds.com |
THOMAS WHITE FUNDS
Statements of Changes in Net Assets
| | | | | | | | | | | | | | | | |
| | | American Opportunities Fund | |
| | | | | | Year Ended
October 31,
2017 | | | | | | Year Ended
October 31,
2016 | |
| Change in net assets from operations: | | | | | | | | | | | | | | | | |
Net investment income | | $ | | | | | 115,757 | | | $ | | | | | 277,387 | |
Net realized gain on investments | | | | | | | 2,563,472 | | | | | | | | 1,912,387 | |
Net unrealized appreciation / depreciation on investments and foreign currency transactions | | | | | | | 4,796,761 | | | | | | | | (2,965,495 | ) |
Net increase (decrease) in net assets from operations | | | | | | | 7,475,990 | | | | | | | | (775,721 | ) |
| Distribution to Investor Class Shareholders: | | | | | | | | | | | | | | | | |
From net investment income | | | | | | | (354,402 | ) | | | | | | | (7,621 | ) |
From realized gain | | | | | | | (3,219,478 | ) | | | | | | | (858,464 | ) |
| Total distributions | | | | | | | (3,573,880 | ) | | | | | | | (866,085 | ) |
| Fund share transactions (Note 3) | | | | | | | 714,978 | | | | | | | | 2,582,977 | |
| Total increase | | | | | | | 4,617,088 | | | | | | | | 941,171 | |
| Net assets: | | | | | | | | | | | | | | | | |
| Beginning of period | | | | | | | 36,816,143 | | | | | | | | 35,874,972 | |
| End of period | | $ | | | | | 41,433,231 | | | $ | | | | | 36,816,143 | |
| Undistributed net investment income | | $ | | | | | 15,478 | | | $ | | | | | 244,560 | |
| The accompanying notes are an integral part of these financial statements. | | | | | | | | | | | | | | | | |
| | | | |
| www.thomaswhitefunds.com | | | 47 | |
Notes to Financial Statements Year Ended October 31, 2017
NOTE 1. SUMMARY OF ACCOUNTING POLICIES
Lord Asset Management Trust (the “Trust”) was organized as a Delaware business trust on February 9, 1994, as an open-end diversified management investment company. The Trust currently has three series of shares (collectively referred to as the “Funds”) - the Thomas White International Fund (the “International Fund”), which commenced operations with the sale of Investor Class shares on June 28, 1994 and the sale of Class I shares, Class A shares and Class C shares on August 31, 2012; the Thomas White Emerging Markets Fund (the “Emerging Markets Fund”), which commenced operations with the sale of Investor Class shares on June 28, 2010 and the sale of Class I shares, Class A shares and Class C shares on August 31, 2012; and the Thomas White American Opportunities Fund (the “American Opportunities Fund”), which commenced operations with the sale of Investor Class shares on March 4, 1999. Class A and Class C shares of the International Fund and Emerging Markets Fund closed on February 28, 2017 and shareholders of those classes could transfer into Class I shares of their respective Fund. The investment objective of each Fund is to seek long-term capital growth. The International Fund invests in equity securities of companies located in the world’s developed countries outside of the U.S. The Emerging Markets Fund invests in securities of companies located in or whose businesses are closely associated with the world’s emerging markets countries. The American Opportunities Fund primarily invests in U.S. equity securities, with a focus on mid-size and small companies. The following is a summary of significant accounting policies followed in the preparation of the Trust’s financial statements.
(A) VALUATION OF SECURITIES
Securities listed or traded on a recognized national or foreign stock exchange or NASDAQ are valued at the last reported sales prices on the principal exchange on which the securities are traded. NASDAQ National Market securities are valued at the NASDAQ official closing price. Over-the-counter securities and listed securities for which no closing sale price is reported are valued at the mean between the last current bid and ask price. Securities for which market quotations are not readily available are valued at fair value under the Trust’s Valuation Procedures as determined by management and approved in good faith by the Board of Trustees. As of October 31, 2017, all securities within each Fund’s portfolio were valued at the last reported sales price on the principal exchange on which the securities are traded and, for the International and Emerging Markets Funds, adjusted by a fair value factor when necessary and as further described below. The Trust has retained an independent statistical fair value pricing service to assist in the fair valuation process for securities principally traded in a foreign market in order to adjust for changes in value that may occur between the close of the foreign exchange and the time at which Fund shares are priced. Short term investments are valued at original cost, which combined with accrued interest, approximates market value.
Fair value is defined as the price that would be received to sell an asset or paid to transfer a liability (i.e., the “exit price”) in an orderly transaction between market participants at the measurement date. In determining fair value, the Fund uses various valuation approaches. A
| | |
| 48 | | www.thomaswhitefunds.com |
Notes to Financial Statements Year Ended October 31, 2017
three-tiered fair value hierarchy for inputs is used in measuring fair value that maximizes the use of observable inputs and minimizes the use of unobservable inputs by generally requiring that the most observable inputs be used when available. Observable inputs are those that market participants would use in pricing the asset or liability based on market data obtained from sources independent of a Fund. Unobservable inputs reflect the Fund’s assumptions about the inputs market participants would use in pricing the asset or liability developed based on the best information available in the circumstances. The inputs or methodologies used for valuing securities are not necessarily an indication of the risks associated with investing in those securities.
The fair value hierarchy is categorized into three levels based on the inputs as follows:
Level 1 - Valuations based on unadjusted quoted prices in active markets for identical assets.
Level 2 - Valuations based on quoted prices for similar securities or in markets that are not active or for which all significant inputs are observable, either directly or indirectly.
Level 3 - Valuations based on inputs that are unobservable and significant to the overall fair value measurement.
(B) MULTI-CLASS OPERATIONS AND ALLOCATIONS
Expenses of the Funds that are not directly attributable to a specific class of shares are prorated among the classes based on the relative net assets of each class. Expenses directly attributable to a class of shares, which presently include administrative services fees, transfer agent fees and registration fees, are recorded to the specific class.
Income, realized and unrealized capital gains and losses of the Funds are prorated among the classes based on the relative net assets of each class within each specific Fund.
(C) MARKET RISK
Investing in securities of foreign companies and foreign governments involves special risks and considerations not typically associated with investing in U.S. companies and securities of the U.S. Government. These risks include revaluation of currencies and future adverse political and economic developments. Moreover, securities of many foreign companies and foreign governments and their markets may be less liquid and their prices more volatile than securities of comparable U.S. companies and securities of the U.S. Government.
(D) FOREIGN CURRENCY TRANSLATION
Portfolio securities and other assets and liabilities denominated in foreign currencies are translated into U.S. dollar amounts at date of valuation. Purchases and sales of portfolio securities and income items denominated in foreign currencies are translated into U.S. dollar amounts on the respective dates of such transactions. When a Fund purchases or sells a foreign
| | | | |
| www.thomaswhitefunds.com | | | 49 | |
Notes to Financial Statements Year Ended October 31, 2017
security, it will customarily enter into a foreign exchange contract to minimize foreign exchange risk from the trade date to the settlement date of such transaction.
The Funds do not isolate the portion of the results of operations resulting from changes in foreign exchange rates on investments from the fluctuations arising from changes in market prices of securities held. Such fluctuations are included with the net realized and unrealized gain or loss from investments.
Net realized gain (loss) on investments and foreign currency transactions include those gains and losses arising from the sale of foreign currencies, currency gains or losses realized between the trade and settlement dates on securities transactions, the differences between the amounts of dividends, and foreign withholding taxes recorded on a Fund’s books, and the U.S. dollar equivalent of the amounts actually received or paid. Net unrealized appreciation (depreciation) on investments and foreign currency translation includes changes in the value of assets and liabilities resulting from exchange rates.
(E) INCOME TAXES
Each Fund is a separate taxpayer for federal income tax purposes. Each Fund intends to distribute substantially all of its net investment income and net capital gains to its shareholders and to otherwise comply with the requirements of Subchapter M of the Internal Revenue Code applicable to regulated investment companies. Therefore, no federal income tax provision is required.
All open tax years and major jurisdictions have been reviewed for the Funds and, based on this review, there are no significant uncertain tax positions that would require recognition in the financial statements. Open tax years are those that are open for exam by taxing authorities and, as of October 31, 2017, open Federal tax years include the tax years ended October 31, 2014 through 2017. The Funds have no examinations in progress and are also not aware of any tax positions for which it is reasonably possible that the total amounts of unrecognized tax benefits will significantly change in the next twelve months.
The Funds accrue for such material foreign taxes on net realized and unrealized gains at the appropriate rate for each country. Based on rates ranging from approximately 10% to 15% there were no material accruals at year end.
(F) USE OF ESTIMATES
The preparation of financial statements in conformity with generally accepted accounting principles requires management to make estimates and assumptions that affect the reported amounts of assets and liabilities and disclosure of contingent liabilities at the date of the financial statements and the reported amounts of increases and decreases in net assets from operations during the period. Actual results could differ from these estimates.
| | |
| 50 | | www.thomaswhitefunds.com |
Notes to Financial Statements Year Ended October 31, 2017
The Funds are investment companies and follow accounting and reporting guidance under the Financial Accounting Standards Board (“FASB”) Accounting Standards Codification (“ASC”) Topic 946, “Financial Services-Investment Companies”.
(G) SECURITY TRANSACTIONS AND INVESTMENT INCOME
Security transactions are accounted for on a trade date basis. Interest is accrued on a daily basis and dividend income is recorded on the ex-dividend date, except that certain dividends from foreign securities are recorded when the information is available to the Fund. Realized gains and losses are determined using specific identification.
(H) DISTRIBUTIONS TO SHAREHOLDERS
The Funds usually declare and pay dividends from net investment income annually, but may do so more frequently to avoid excise tax. Distributions of net realized capital gains, if any, will be distributed at least annually.
(I) SECURITIES LENDING
The Funds may lend investment securities to investors who borrow securities in order to complete certain transactions. By lending investment securities, a Fund attempts to increase its net investment income through the receipt of interest earned on loan collateral. Any increase or decline in the market price of the securities loaned that might occur and any interest earned or dividends declared during the term of the loan would be for the account of the Fund. Risks of delay in recovery of the securities or even loss of rights in the collateral may occur should the borrower of the securities fail financially. Risk may also arise to the extent that the value of the securities loaned increases above the value of the collateral received. It is each Fund’s policy to obtain additional collateral from or return excess collateral to the borrower by the end of the next business day. Therefore, the value of the collateral may be temporarily less than the value of the securities on loan.
Funds that lend securities receive cash, cash equivalents, or other securities as collateral. Initial collateral levels shall not be less than 102% of the market value of the borrowed securities (105% if the collateral and the borrowed securities are denominated in different currencies). Marking to market is performed every business day (subject to de minimis rules of change in market value) for each Fund and each borrower is required to deliver additional collateral when necessary so that the total collateral held in the account for all loans of the Fund to the borrower will not be less than 100% of the market value of all the borrowed securities loaned to the borrower by the Fund. Any cash, cash equivalents, or other securities received as collateral is invested by the securities lending agent, Northern Trust, in accordance with pre-established guidelines as set forth in the securities lending agreement. The cash collateral is invested in the Northern Institutional Liquid Asset Portfolio (an open-end regulated investment company) and is shown on the investment portfolio for the Emerging Markets Fund. The cash collateral is reflected in the Funds’ Statements of Assets and Liabilities in the line item labeled “Investments in securities at market value.” Non-cash collateral is not shown in the Funds’ investment
| | | | |
| www.thomaswhitefunds.com | | | 51 | |
Notes to Financial Statements Year Ended October 31, 2017
portfolios nor disclosed in the Statements of Assets and Liabilities as it is held by the lending agent on behalf of the Funds, and the Funds do not have the ability to re-hypthecate those securities. A portion of the interest received on the loan collateral is retained by the Fund and the remainder is rebated to the borrower of the securities. From the interest retained by the Funds, 50% is paid to the securities lending agent for the International Fund and Emerging Markets Fund for its services. The net amount of interest earned, after the interest rebate and the allocation to the securities lending agent, is included in the statement of operations as securities lending income. The value of loaned securities and related collateral outstanding at October 31, 2017 are as follows:
| | | | | | | | | | | | | | | | |
| Fund | | Value of
Loaned
Securities | | | Value of
Cash
Collateral | | | Value of
Non-Cash
Collateral* | | | Total
Collateral | |
| Thomas White International Fund | | | $11,822,118 | | | | $0 | | | | $12,529,046 | | | | $12,529,046 | |
| | | | | |
| Thomas White Emerging Markets Fund | | | $3,450,207 | | | | $814,125 | | | | $2,657,326 | | | | $3,471,451 | |
| | * | Funds cannot repledge or dispose of this collateral, nor do the Funds earn any income or receive dividends with respect to this collateral. |
| | | | | | | | | | | | |
| Gross Amounts Not Offset in the Statement of Assets and Liabilities | |
Gross Asset Amounts Presented in
Statement of Assets and Liabilities | | Financial
Instrument | | | Collateral
Received | | | Net Amount
(not less than 0) | |
| $814,125 | | | ------- | | | | ($814,125) | | | | ------- | |
The International Fund and the Emerging Markets Fund have earned income on securities lending (after rebates to borrowers and allocation to the securities lending agent) as follows:
| | | | |
| Fund | | Net Income Earned | |
| Thomas White International Fund | | | $8,460 | |
| | |
| Thomas White Emerging Markets Fund | | | $7,490 | |
The Funds recently adopted guidance requiring entities to present gross obligations for secured borrowings by the type of collateral pledged and remaining time to maturity. The table below outlines the nature of these obligations at October 31, 2017.
| | | | | | | | | | | | | | | | | | | | |
| | | Overnight and
Continuous | | | Up to
30 Days | | | 30-90 Days | | | Greater than
90 Days | | | Total | |
| Securities lending transactions | | | | | | | | | | | | | | | | | | | | |
Money Market Fund^ | | | | | | | | | | | | | | | | | | | | |
Thomas White Emerging Markets Fund | | | $814,125 | | | | $------- | | | | $------- | | | | $------- | | | | $814,125 | |
| Total Borrowings | | | $814,125 | | | | $------- | | | | $------- | | | | $------- | | | | $814,125 | |
| | ^ | Represents an interest in Northern Institutional Liquid Assets Portfolio, an investment purchased with cash proceeds from securities lending collateral received. |
| | |
| 52 | | www.thomaswhitefunds.com |
Notes to Financial Statements Year Ended October 31, 2017
(J) REDEMPTION FEE
The Funds assess a 2% fee on redemptions (including exchanges) of Fund shares held for less than sixty days. Redemption fees are paid to each Fund to help offset transaction costs and to protect the Fund’s long-term shareholders. Each Fund will use the “first-in, first-out” (FIFO) method to determine the sixty-day holding period. Under this method, the date of the redemption or exchange will be compared to the earliest purchase date of shares held in the account. If this holding period is less than sixty days, the fee will be charged. The International Fund Investor Class, Class I and Class C shares charged $22, $534 and $65, respectively in redemption fees for the year ended October 31, 2017, which were included in net capital paid.
(K) REAL ESTATE INVESTMENT TRUSTS
The American Opportunities Fund has made certain investments in real estate investment trusts (“REITs”), which pay dividends to their shareholders based upon funds available from operations. It is quite common for these dividends to exceed the REITs’ taxable earnings and profits resulting in the excess portion of such dividends being designated as a return of capital. The American Opportunities Fund intends to include the gross dividends from such REITs in its annual distributions to its shareholders and, accordingly, a portion of the distributions received by the Fund’s shareholders may also be designated as a return of capital.
(L) RECENT ACCOUNTING PRONOUNCEMENT
In October 2016, the U.S. Securities and Exchange Commission adopted new rules and amended existing rules (together, “final rules”) intended to modernize the reporting and disclosure of information by registered investment companies. In part, the final rules amend Regulation S-X and require standardized, enhanced disclosure about derivatives in investment company financial statements, as well as other amendments. The updates to Regulation S-X are effective August 1, 2017 and may result in additional disclosure relating to the presentation of derivatives and certain other financial instruments. These updates have no impact on the Fund’s net assets or results of operations.
NOTE 2. SIGNIFICANT SHAREHOLDER
The following table indicates the number of shareholders who held a significant portion of the shares of each Class’s outstanding shares as of October 31, 2017. Investment activities of these shareholders could have a material effect on each Fund.
| | | | | | | | | | |
| Unaudited | | | | | | | | |
| Fund | | Share Class | | Number of
Shareholders | | | % Held | |
| Emerging Markets Fund | | Investor Class | | | 2 | | | | 73.1% | |
| | | | |
| Emerging Markets Fund | | Class I | | | 1 | | | | 16.8% | |
| | | | |
| American Opportunities Fund | | Investor Class | | | 1 | | | | 16.4% | |
| | | | |
| www.thomaswhitefunds.com | | | 53 | |
Notes to Financial Statements Year Ended October 31, 2017
NOTE 3. TRANSACTIONS IN SHARES OF BENEFICIAL INTEREST
As of October 31, 2017, there were an unlimited number of $0.01 par value shares of beneficial interest authorized. Transactions are summarized as follows:
| | | | | | | | | | | | | | | | | | | | | | | | |
| International Fund | |
| | | Year Ended October 31, 2017 | | | Year Ended October 31, 2016 | |
| | | Investor Class | | | Investor Class | |
| | | Shares | | | | | | Amount | | | Shares | | | | | | Amount | |
| Shares sold | | | 272,988 | | | $ | | | | | 4,206,966 | | | | 1,506,296 | | | $ | | | | | 22,509,186 | |
| Shares issued on reinvestment of dividends & distributions | | | 68,249 | | | | | | | | 1,205,839 | | | | 128,636 | | | | | | | | 1,925,681 | |
| Shares redeemed | | | (10,409,121 | ) | | | | | | | (165,146,599 | )^ | | | (6,147,093 | ) | | | | | | | (92,882,894 | ) |
| Net decrease | | | (10,067,884 | ) | | $ | | | | | (159,733,794 | ) | | | (4,512,161 | ) | | $ | | | | | (68,448,027 | ) |
| Shares outstanding: | | | | | | | | | | | | | | | | | | | | | | | | |
| Beginning of period | | | 12,517,570 | | | | | | | | | | | | 17,029,731 | | | | | | | | | |
| End of period | | | 2,449,686 | | | | | | | | | | | | 12,517,570 | | | | | | | | | |
| ^ Includes redemption fees of $22 | |
| | | | | | | | | | | | | | | | | | | | | | | | |
| | | Year Ended October 31, 2017 | | | Year Ended October 31, 2016 | |
| | | Class I | | | Class I | |
| | | Shares | | | | | | Amount | | | Shares | | | | | | Amount | |
| Shares sold | | | 2,183,721 | | | $ | | | | | 34,990,899 | | | | 13,793,315 | | | $ | | | | | 210,036,342 | |
| Sales in connection with reorganization | | | 68,548 | | | | | | | | 1,053,314 | | | | ------- | | | | | | | | ------- | |
| Shares issued on reinvestment of dividends & distributions | | | 482,969 | | | | | | | | 8,346,920 | | | | 285,107 | | | | | | | | 4,270,896 | |
| Shares redeemed | | | (12,780,743 | ) | | | | | | | (214,500,761 | )^ | | | (7,477,136 | ) | | | | | | | (113,489,125 | ) |
| Net increase (decrease) | | | (10,045,505 | ) | | $ | | | | | (170,109,628 | ) | | | 6,601,286 | | | $ | | | | | 100,818,113 | |
| Shares outstanding: | | | | | | | | | | | | | | | | | | | | | | | | |
| Beginning of period | | | 25,630,771 | | | | | | | | | | | | 19,029,485 | | | | | | | | | |
| End of period | | | 15,585,266 | | | | | | | | | | | | 25,630,771 | | | | | | | | | |
| ^ Includes redemption fees of $534 | |
| | |
| 54 | | www.thomaswhitefunds.com |
Notes to Financial Statements Year Ended October 31, 2017
| | | | | | | | | | | | | | | | | | | | | | | | |
| | | Year Ended October 31, 2017 | | | Year Ended October 31, 2016 | |
| | | Class A | | | Class A | |
| | | Shares | | | | | | Amount | | | Shares | | | | | | Amount | |
| Shares sold | | | 12,622 | | | $ | | | | | 184,030 | | | | 4,464 | | | $ | | | | | 67,421 | |
| Shares issued on reinvestment of dividends & distributions | | | 11 | | | | | | | | 158 | | | | 313 | | | | | | | | 4,654 | |
| Shares redeemed | | | (9,221 | ) | | | | | | | (135,830 | ) | | | (6,102 | ) | | | | | | | (91,223 | ) |
| Shares exchanged in connection with reorganization | | | (59,809 | ) | | | | | | | (915,341 | ) | | | ------- | | | | | | | | ------- | |
| Net decrease | | | (56,397 | ) | | $ | | | | | (866,983 | ) | | | (1,325 | ) | | $ | | | | | (19,148 | ) |
| Shares outstanding: | | | | | | | | | | | | | | | | | | | | | | | | |
| Beginning of period | | | 56,397 | | | | | | | | | | | | 57,722 | | | | | | | | | |
| End of period | | | 0 | | | | | | | | | | | | 56,397 | | | | | | | | | |
| * Class reorganized into Class I shares on February 28, 2017. | |
| | | | | | | | | | | | | | | | | | | | | | | | |
| | | Year Ended October 31, 2017 | | | Year Ended October 31, 2016 | |
| | | Class C | | | Class C | |
| | | Shares | | | | | | Amount | | | Shares | | | | | | Amount | |
| Shares sold | | | ------- | | | $ | | | | | ------- | | | | 483 | | | $ | | | | | 7,128 | |
| Shares issued on reinvestment of dividends & distributions | | | ------- | | | | | | | | ------- | | | | ------- | | | | | | | | ------- | |
| Shares redeemed | | | (3,843 | ) | | | | | | | (57,645 | )^ | | | (14,821 | ) | | | | | | | (221,721 | ) |
| Shares exchanged in connection with reorganization | | | (8,983 | ) | | | | | | | (137,973 | ) | | | ------- | | | | | | | | ------- | |
| Net decrease | | | (12,826 | ) | | $ | | | | | (195,618 | ) | | | (14,338 | ) | | $ | | | | | (214,593 | ) |
| Shares outstanding: | | | | | | | | | | | | | | | | | | | | | | | | |
| Beginning of period | | | 12,826 | | | | | | | | | | | | 27,164 | | | | | | | | | |
| End of period | | | 0 | | | | | | | | | | | | 12,826 | | | | | | | | | |
| ^ Includes redemption fees of $65 | |
| * Class reorganized into Class I shares on February 28, 2017. | |
| | | | | | | | | | | | | | | | | | | | | | | | |
| Emerging Markets Fund | |
| | | Year Ended October 31, 2017 | | | Year Ended October 31, 2016 | |
| | | Investor Class | | | Investor Class | |
| | | Shares | | | | | | Amount | | | Shares | | | | | | Amount | |
| Shares sold | | | 919 | | | $ | | | | | 9,450 | | | | 2,482 | | | $ | | | | | 23,210 | |
| Shares issued on reinvestment of dividends & distributions | | | 1,525 | | | | | | | | 16,822 | | | | 926 | | | | | | | | 9,129 | |
| Shares redeemed | | | (10,560 | ) | | | | | | | (108,272 | ) | | | (258,859 | ) | | | | | | | (2,286,115 | ) |
| Net decrease | | | (8,116 | ) | | $ | | | | | (82,000 | ) | | | (255,451 | ) | | $ | | | | | (2,253,776 | ) |
| Shares outstanding: | | | | | | | | | | | | | | | | | | | | | | | | |
| Beginning of period | | | 185,387 | | | | | | | | | | | | 440,838 | | | | | | | | | |
| End of period | | | 177,271 | | | | | | | | | | | | 185,387 | | | | | | | | | |
| | | | |
| www.thomaswhitefunds.com | | | 55 | |
Notes to Financial Statements Year Ended October 31, 2017
| | | | | | | | | | | | | | | | | | | | | | | | |
| | | Year Ended October 31, 2017 | | | Year Ended October 31, 2016 | |
| | | Class I | | | Class I | |
| | | Shares | | | | | | Amount | | | Shares | | | | | | Amount | |
| Shares sold | | | 230,984 | | | $ | | | | | 2,485,119 | | | | 403,747 | | | $ | | | | | 3,704,145 | |
| Sales in connection with reorganization | | | 32,678 | | | | | | | | 323,653 | | | | ------- | | | | | | | | ------- | |
| Shares issued on reinvestment of dividends & distributions | | | 69,841 | | | | | | | | 772,245 | | | | 44,953 | | | | | | | | 446,833 | |
| Shares redeemed | | | (4,062,521 | ) | | | | | | | (42,645,912 | ) | | | (1,096,703 | ) | | | | | | | (10,609,909 | ) |
| Net decrease | | | (3,729,018 | ) | | $ | | | | | (39,064,895 | ) | | | (648,003 | ) | | $ | | | | | (6,458,931 | ) |
| Shares outstanding: | | | | | | | | | | | | | | | | | | | | | | | | |
| Beginning of period | | | 7,717,431 | | | | | | | | | | | | 8,365,434 | | | | | | | | | |
| End of period | | | 3,988,413 | | | | | | | | | | | | 7,717,431 | | | | | | | | | |
| | | | | | | | | | | | | | | | | | | | | | | | |
| | | Year Ended October 31, 2017 | | | Year Ended October 31, 2016 | |
| | | Class A | | | Class A | |
| | | Shares | | | | | | Amount | | | Shares | | | | | | Amount | |
| Shares sold | | | ------- | | | $ | | | | | ------- | | | | 2,687 | | | $ | | | | | 23,806 | |
| Shares issued on reinvestment of dividends & distributions | | | ------- | | | | | | | | ------- | | | | 45 | | | | | | | | 447 | |
| Shares redeemed | | | (2 | ) | | | | | | | (18 | ) | | | 0 | | | | | | | | (3 | ) |
| Shares exchanged in connection with reorganization | | | (8,360 | ) | | | | | | | (82,158 | ) | | | ------- | | | | | | | | ------- | |
| Net increase (decrease) | | | (8,362 | ) | | $ | | | | | (82,176 | ) | | | 2,732 | | | $ | | | | | 24,250 | |
| Shares outstanding: | | | | | | | | | | | | | | | | | | | | | | | | |
| Beginning of period | | | 8,362 | | | | | | | | | | | | 5,630 | | | | | | | | | |
| End of period | | | 0 | | | | | | | | | | | | 8,362 | | | | | | | | | |
| * Class reorganized into Class I shares on February 28, 2017. | |
| | | | | | | | | | | | | | | | | | | | | | | | |
| | | Year Ended October 31, 2017 | | | Year Ended October 31, 2016 | |
| | | Class C | | | Class C | |
| | | Shares | | | | | | Amount | | | Shares | | | | | | Amount | |
| Shares sold | | | ------- | | | $ | | | | | ------- | | | | 3,376 | | | $ | | | | | 30,001 | |
| Shares issued on reinvestment of dividends & distributions | | | ------- | | | | | | | | ------- | | | | ------- | | | | | | | | ------- | |
| Shares redeemed | | | (2 | ) | | | | | | | (18 | ) | | | 0 | | | | | | | | (3 | ) |
| Shares exchanged in connection with reorganization | | | (24,712 | ) | | | | | | | (241,495 | ) | | | ------- | | | | | | | | ------- | |
| Net increase (decrease) | | | (24,714 | ) | | $ | | | | | (241,513 | ) | | | 3,376 | | | $ | | | | | 29,998 | |
| Shares outstanding: | | | | | | | | | | | | | | | | | | | | | | | | |
| Beginning of period | | | 24,714 | | | | | | | | | | | | 21,338 | | | | | | | | | |
| End of period | | | 0 | | | | | | | | | | | | 24,714 | | | | | | | | | |
| * Class reorganized into Class I shares on February 28, 2017. | |
| | |
| 56 | | www.thomaswhitefunds.com |
Notes to Financial Statements Year Ended October 31, 2017
| | | | | | | | | | | | | | | | | | | | | | | | |
| American Opportunities Fund | |
| | | Year Ended October 31, 2017 | | | Year Ended October 31, 2016 | |
| | | Investor Class | | | Investor Class | |
| | | Shares | | | | | | Amount | | | Shares | | | | | | Amount | |
| Shares sold | | | 43,875 | | | $ | | | | | 739,907 | | | | 163,993 | | | $ | | | | | 2,516,556 | |
| Shares issued on reinvestment of dividends & distributions | | | 205,012 | | | | | | | | 3,387,229 | | | | 54,955 | | | | | | | | 819,929 | |
| Shares redeemed | | | (205,152 | ) | | | | | | | (3,412,158 | ) | | | (49,200 | ) | | | | | | | (753,508 | ) |
| Net increase | | | 43,735 | | | $ | | | | | 714,978 | | | | 169,748 | | | $ | | | | | 2,582,977 | |
| Shares outstanding: | | | | | | | | | | | | | | | | | | | | | | | | |
| Beginning of period | | | 2,468,813 | | | | | | | | | | | | 2,299,065 | | | | | | | | | |
| End of period | | | 2,512,548 | | | | | | | | | | | | 2,468,813 | | | | | | | | | |
NOTE 4. INVESTMENT MANAGEMENT FEES AND OTHER TRANSACTIONS WITH AFFILIATES
Each Fund pays a monthly investment management fee to Thomas White International, Ltd. (the “Advisor”) at the rate of 0.85% of the Fund’s average daily net assets annually. For the year ended October 31, 2017, the International Fund, Emerging Markets Fund and American Opportunities Fund paid the Advisor $3,878,284, $531,084 and $346,622, respectively, in investment management fees.
During the year ended October 31, 2017, the Advisor has contractually agreed to reimburse its management fee and/or reimburse the Funds’ operating expenses to the extent necessary to ensure that each Fund’s annual operating expenses do not exceed the following percentages of average daily net assets:
| | | | | | | | |
| | | Investor Class | | | Class I | |
| International Fund | | | 1.24% | | | | 0.99% | |
| | | |
| Emerging Markets Fund | | | 1.35% | | | | 1.10% | |
| | | |
| American Opportunities Fund | | | 1.34% | | | | n/a | |
These agreements to reimburse fees renew automatically unless the Advisor gives written notice to end them.
The Advisor may recoup any previously waived amount from a Fund pursuant to the expense limitation agreements if such reimbursement does not cause the Fund to exceed either (i) the current expense limitation or (ii) the expense limitation in effect at the time the expense is waived, provided the reimbursement is made within three years after the year in which the Advisor incurred the expense. For the year ended October 31, 2017, the Advisor did not recoup any previously waived expenses.
| | | | |
| www.thomaswhitefunds.com | | | 57 | |
Notes to Financial Statements Year Ended October 31, 2017
As of October 31, 2017, the International and Emerging Markets Funds had the following amounts (and year of expiration) subject to repayment to the Advisor:
| | | | | | | | | | | | | | |
| Fund | | Share Class | | Year Fees Waived | | | Repayment Expires | | | Balance | |
| International Fund | | Investor Class | | | 2015 | | | | 2018 | | | | $235,702 | |
| | | | | |
| International Fund | | Investor Class | | | 2016 | | | | 2019 | | | | $185,995 | |
| | | | | |
| International Fund | | Investor Class | | | 2017 | | | | 2020 | | | | $115,940 | |
| | | | | |
| International Fund | | Class I | | | 2015 | | | | 2018 | | | | $309,206 | |
| | | | | |
| International Fund | | Class I | | | 2016 | | | | 2019 | | | | $376,987 | |
| | | | | |
| International Fund | | Class I | | | 2017 | | | | 2020 | | | | $535,417 | |
| | | | | |
| Emerging Markets Fund | | Investor Class | | | 2017 | | | | 2020 | | | | $2,618 | |
| | | | | |
| Emerging Markets Fund | | Class I | | | 2015 | | | | 2018 | | | | $126,544 | |
| | | | | |
| Emerging Markets Fund | | Class I | | | 2016 | | | | 2019 | | | | $150,335 | |
| | | | | |
| Emerging Markets Fund | | Class I | | | 2017 | | | | 2020 | | | | $195,908 | |
The Funds and U.S. Bancorp Fund Services, LLC (the “Administrator”) are parties to a Fund Administration Servicing Agreement. The Administrator provides administrative and fund accounting services pursuant to this agreement.
The Advisor and the Funds have adopted a Business Management Agreement under which the Advisor provides certain business management services to the Funds, including, without limitation, monitoring of the Funds’ relationships with third-party service providers and assisting with necessary and appropriate services to the Board of Trustees of the Trust, as well as either providing the Trust with or procuring for the Trust the services of a Chief Compliance Officer in accordance with Rule 38a-1 of the 1940 Act, in the event so requested. For these services, the Advisor is entitled to receive a fee from each Fund at a rate of 0.035% of the Fund’s average daily net assets. For the year ended October 31, 2017, for the services provided under the Business Management Agreement, the International Fund, Emerging Markets Fund, and American Opportunities Fund paid the Advisor $159,694, $21,868 and $14,273, respectively.
The Funds have adopted an Administrative Services Plan pursuant to which the Investor Class shares are and, prior to its closure on February 28, 2017, the Class A shares were authorized to make payments to certain entities, which may include banks, broker-dealers and other types of service providers, for providing administrative services with respect to shares of the Funds attributable to or held in the name of the service provider for its clients or customers with whom they have a servicing relationship. Under the terms of the Administrative Services Plan, Investor Class shares are authorized to make payments up to a maximum rate of 0.25% of the average daily net assets of the shares attributable to or held in the name of the service provider for providing the types of applicable administrative services covered under the terms of the Plan. For the year ended October 31, 2017, fees incurred by the International Fund pursuant to the Administrative Services Plan were $232,277 for Investor Class and $217 for Class A shares. For
| | |
| 58 | | www.thomaswhitefunds.com |
Notes to Financial Statements Year Ended October 31, 2017
the year ended October 31, 2017, fees incurred by the Emerging Markets Fund pursuant to the Administrative Services Plan were $347 for Investor Class and $34 for Class A shares. For the year ended October 31, 2017, fees incurred by the American Opportunities Fund pursuant to the Administrative Services Plan were $3,858 for Investor Class shares.
NOTE 5. SHAREHOLDER SERVICING AND DISTRIBUTION PLANS
The International Fund and Emerging Markets Fund had adopted a distribution and shareholder service plan (the “Plan”) pursuant to Rule 12b-1 under the Investment Company Act of 1940. The Plan allowed the International Fund and Emerging Markets Fund to compensate Quasar Distributors, LLC for the costs incurred in distributing the Funds’ Class A shares and Class C shares before the share classes were closed effective February 28, 2017, including amounts paid to brokers or dealers, at an annual rate of 0.25% and 1.00%, respectively, of the average daily net assets of each share Class. For the period November 1, 2016 through February 28, 2017, fees incurred by the International Fund pursuant to the Plan were $705 for Class A and $559 for Class C shares. For the period November 1, 2016 through February 28, 2017, fees incurred by the Emerging Markets Fund were $65 for Class A and $767 for Class C shares.
NOTE 6. CUSTODIAN AND TRANSFER AGENT FEES
Custodian Fees - Northern Trust is the custodian for the International Fund and Emerging Markets Fund. U.S. Bank is the custodian for the American Opportunities Fund. Northern Trust bills the International Fund and the Emerging Markets Fund quarterly based on the value of their holdings as of the previous quarter end plus transaction fees. U.S. Bank bills the American Opportunities Fund monthly based on the ending value of its holdings plus transaction fees.
Transfer Agent - U.S. Bancorp serves as the Funds’ transfer agent. Under the terms of the transfer agent agreement, U.S. Bancorp is entitled to account-based fees along with reimbursement of out-of-pocket expenses incurred in providing transfer agent services.
NOTE 7. INVESTMENT TRANSACTIONS
During the year ended October 31, 2017, the cost of purchases and the proceeds from sales of investment securities, other than short-term investments, were as follows:
| | | | | | | | |
| Fund | | Purchases | | | Sales | |
| International Fund | | | $215,164,470 | | | | $547,628,064 | |
| | | |
| Emerging Markets Fund | | | 41,992,126 | | | | 81,409,955 | |
| | | |
| American Opportunities Fund | | | 11,470,393 | | | | 14,303,977 | |
The American Opportunities Fund did not purchase or sell long-term U.S. Government securities during the year ended October 31, 2017. The International Fund and Emerging
| | | | |
| www.thomaswhitefunds.com | | | 59 | |
Notes to Financial Statements Year Ended October 31, 2017
Markets Fund did not directly purchase or sell long term U.S. Government securities, except for purposes of securities lending during the year ended October 31, 2017.
At October 31, 2017, the aggregate gross unrealized appreciation and depreciation of portfolio securities, based upon cost for federal income tax purposes, were as follows:
| | | | | | | | | | | | | | | | |
| Fund | | Tax Cost | | | Unrealized
Appreciation | | | Unrealized
Depreciation | | | Net Unrealized
Appreciation/
(Depreciation) | |
| International Fund | | | $254,811,024 | | | | $68,384,262 | | | | $(6,831,733) | | | | $61,552,529 | |
| | | | | |
| Emerging Markets Fund | | | 37,811,858 | | | | 11,688,838 | | | | (957,229) | | | | 10,731,609 | |
| | | | | |
| American Opportunities Fund | | | 31,309,987 | | | | 11,349,302 | | | | (1,803,135) | | | | 9,546,167 | |
Distributions to Shareholders
The Funds will distribute net investment income and net realized gains, if any, at least once a year. The amount of distributions from net investment income and net realized gains are determined in accordance with federal income tax regulations, which may differ from generally accepted accounting principles. These “book/tax” differences are either temporary or permanent in nature and are primarily due to differing treatments for passive foreign investment companies and losses deferred due to wash sales. Permanent differences, primarily due to reclassification of REIT income, resulted in reclassifications among the Funds’ components of net assets at October 31, 2017, the Funds’ tax year-end. For the International Fund, permanent differences resulted in reclassification of ($275,660) in undistributed net investment income and $275,660 in accumulated net realized loss. For the Emerging Markets Fund, permanent differences resulted in reclassification of $171,463 in undistributed net investment income/(loss), ($160,828) in accumulated net realized gain/(loss) and ($10,635) in paid in capital. For the American Opportunities Fund, permanent differences resulted in reclassification of $9,563 in undistributed net investment income and ($9,563) in accumulated net realized gain.
| | | | | | | | | | | | | | | | | | | | |
| Fund | | Undistributed
Ordinary
Income | | | Undistributed
Long-term
Gains | | | Net
Unrealized
Appreciation | | | Other
Accumulated
Losses | | | Total
Distributable
Earnings | |
| International Fund | | | $------- | | | | $858,431 | | | | $61,552,529 | | | | $(52,614) | | | | $62,358,346 | |
| | | | | | |
| Emerging Markets Fund | | | ------- | | | | ------- | | | | 10,731,609 | | | | (11,836,227) | | | | (1,104,618) | |
| | | | | | |
| American Opportunities Fund | | | ------- | | | | 429,558 | | | | 9,546,167 | | | | ------- | | | | 9,975,725 | |
Under the Regulated Investment Company Modernization Act of 2010, the Funds are permitted to carry forward capital losses incurred in taxable years beginning after December 22, 2010 for an unlimited period, and such capital losses will retain their character as either short-term or long-term capital losses.
| | |
| 60 | | www.thomaswhitefunds.com |
Notes to Financial Statements Year Ended October 31, 2017
As of October 31, 2017, the Emerging Markets Fund had $7,526,343 in short-term capital loss carry forwards with no expiration, and had $4,306,872 in long-term capital loss carryforwards with no expiration.
The tax character of distributions paid during the periods shown below were as follows:
| | | | | | | | | | | | | | | | |
| | | Year Ended October 31, 2017 | |
| | | Ordinary
Income | | | Return of
Capital | | | Long-Term
Capital Gains | | | Total
Distributions | |
| International Fund | | | $7,248,662 | | | | $------- | | | | $4,403,622 | | | | $11,652,284 | |
| | | | | |
| Emerging Markets Fund | | | 900,556 | | | | ------- | | | | ------- | | | | 900,556 | |
| | | | | |
| American Opportunities Fund | | | 352,734 | | | | ------- | | | | 3,221,146 | | | | 3,573,880 | |
| | | | | | | | | | | | | | | | | |
| | | Year Ended October 31, 2016 | |
| | | Ordinary
Income | | | Return of
Capital | | | Long-Term
Capital Gains | | | Total
Distributions | |
| International Fund | | | $7,032,016 | | | | $------- | | | | $------- | | | | $7,032,016 | |
| | | | | |
| Emerging Markets Fund | | | 679,909 | | | | ------- | | | | ------- | | | | 679,909 | |
| | | | | |
| American Opportunities Fund | | | 7,621 | | | | ------- | | | | 858,464 | | | | 866,085 | |
NOTE 8. REORGANIZATION OF SHARE CLASSES
Effective upon the close of business on February 28, 2017, the outstanding Class A and Class C shares of the Thomas White International Fund and the Thomas White Emerging Markets Fund were converted into Class I shares of their respective Funds, as applicable (the “Class Conversion”) pursuant to the Supplement to the Prospectus dated January 31, 2017. The Class Conversion was completed based on the share classes’ relative net asset values on the Conversion Date, without the imposition of any sales charge or any other charge as detailed below:
| | | | | | | | | | | | | | | | |
| International Fund | | Shares
Outstanding | | | Net
Assets | | | NAV
per Share | | | Share
Conversion Ratio | |
| Class A | | | 59,809 | | | | $915,341 | | | | $15.30 | | | | 0.9954 | |
| | | | | |
| Class C | | | 8,983 | | | | $137,973 | | | | $15.36 | | | | 0.9993 | |
| | | | | |
| Class I (Before Conversion) | | | 24,117,542 | | | | $370,573,288 | | | | $15.37 | | | | ------- | |
| | | | | |
| Class I (After Conversion) | | | 24,186,090 | | | | $371,626,602 | | | | $15.37 | | | | ------- | |
| | | | |
| www.thomaswhitefunds.com | | | 61 | |
Notes to Financial Statements Year Ended October 31, 2017
| | | | | | | | | | | | | | | | |
| Emerging Markets Fund | | Shares
Outstanding | | | Net
Assets | | | NAV
per Share | | | Share
Conversion Ratio | |
| Class A | | | 8,360 | | | | $82,158 | | | | $9.83 | | | | 0.9929 | |
| | | | | |
| Class C | | | 24,712 | | | | $241,495 | | | | $9.77 | | | | 0.9869 | |
| | | | | |
| Class I (Before Conversion) | | | 7,301,169 | | | | $72,300,755 | | | | $9.90 | | | | ------- | |
| | | | | |
| Class I (After Conversion) | | | 7,333,847 | | | | $72,624,408 | | | | $9.90 | | | | ------- | |
NOTE 9. SUBSEQUENT EVENTS
In preparing these financial statements, the Trust has evaluated events after October 31, 2017 and determined that there were no significant subsequent events that would require adjustment to or additional disclosure in these financial statements.
| | |
| 62 | | www.thomaswhitefunds.com |
Year Ended October 31, 2017
FINANCIAL HIGHLIGHTS
| | | | | | | | | | | | | | | | | | | | | | | | | | | | | | | | | | | | | | | | |
| Thomas White International Fund - Investor Class | |
| | | | | | Year
Ended
October 31,
2017 | | | | | | Year
Ended
October 31,
2016 | | | | | | Year
Ended
October 31,
2015 | | | | | | Year
Ended
October 31,
2014 | | | | | | Year
Ended
October 31,
2013 | |
| |
| Per share operating performance (For a share outstanding throughout each period) | |
| Net asset value, beginning of period | | | $ | | | | 14.97 | | | | $ | | | | 15.77 | | | | $ | | | | 16.95 | | | | $ | | | | 19.16 | | | | $ | | | | 16.55 | |
| | | | | | | | | | | |
| Income from investment operations: | | | | | | | | | | | | | | | | | | | | | | | | | | | | | | | | | | | | | | | | |
Net investment income 1 | | | | | | | 0.14 | | | | | | | | 0.17 | | | | | | | | 0.19 | | | | | | | | 0.26 | | | | | | | | 0.26 | |
Net realized and unrealized gains/(losses) | | | | | | | 3.30 | | | | | | | | (0.81 | ) | | | | | | | (1.17 | ) | | | | | | | (0.89 | ) | | | | | | | 2.57 | |
| Total from investment operations | | | | | | | 3.44 | | | | | | | | (0.64 | ) | | | | | | | (0.98 | ) | | | | | | | (0.63 | ) | | | | | | | 2.83 | |
| | | | | | | | | | | |
| Distributions: | | | | | | | | | | | | | | | | | | | | | | | | | | | | | | | | | | | | | | | | |
From net investment income | | | | | | | (0.28 | ) | | | | | | | (0.16 | ) | | | | | | | (0.20 | ) | | | | | | | (0.26 | ) | | | | | | | (0.22 | ) |
From net realized gains | | | | | | | (0.25 | ) | | | | | | | ------- | | | | | | | | ------- | | | | | | | | (1.32 | ) | | | | | | | ------- | |
Tax return of capital | | | | | | | ------- | | | | | | | | ------- | | | | | | | | ------- | | | | | | | | ------- | | | | | | | | (0.00 | ) 2 |
| Total Distributions | | | | | | | (0.53 | ) | | | | | | | (0.16 | ) | | | | | | | (0.20 | ) | | | | | | | (1.58 | ) | | | | | | | (0.22 | ) |
| Change in net asset value for the period | | | | | | | 2.91 | | | | | | | | (0.80 | ) | | | | | | | (1.18 | ) | | | | | | | (2.21 | ) | | | | | | | 2.61 | |
| Net asset value, end of period | | | $ | | | | 17.88 | | | | $ | | | | 14.97 | | | | $ | | | | 15.77 | | | | $ | | | | 16.95 | | | | $ | | | | 19.16 | |
| Total Return | | | | | | | 23.06% | | | | | | | | (4.08)% | | | | | | | | (5.77)% | | | | | | | | (3.00)% | | | | | | | | 17.13% | |
| | | | | | | | | | | |
| Ratios/supplemental data | | | | | | | | | | | | | | | | | | | | | | | | | | | | | | | | | | | | | | | | |
| Net assets, end of period (000) | | | $ | | | | 43,811 | | | | $ | | | | 187,408 | | | | $ | | | | 268,518 | | | | $ | | | | 369,098 | | | | $ | | | | 433,483 | |
| | | | | | | | | | | |
| Ratio to average net assets: | | | | | | | | | | | | | | | | | | | | | | | | | | | | | | | | | | | | | | | | |
| Expenses (net of reimbursement) | | | | | | | 1.24% | | | | | | | | 1.24% | | | | | | | | 1.24% | | | | | | | | 1.24% | | | | | | | | 1.24% | |
| Expenses (prior to reimbursement) | | | | | | | 1.36% | | | | | | | | 1.33% | | | | | | | | 1.32% | | | | | | | | 1.27% | | | | | | | | 1.31% | |
Net investment income
(net of reimbursement) | | | | | | | 0.90% | | | | | | | | 1.16% | | | | | | | | 1.16% | | | | | | | | 1.36% | | | | | | | | 1.43% | |
Net investment income
(prior to reimbursement) | | | | | | | 0.78% | | | | | | | | 1.07% | | | | | | | | 1.08% | | | | | | | | 1.33% | | | | | | | | 1.36% | |
| Portfolio turnover rate 3 | | | | | | | 48% | | | | | | | | 60% | | | | | | | | 57% | | | | | | | | 62% | | | | | | | | 42% | |
| (1) | Net investment income per share represents net investment income divided by the average shares outstanding throughout the period. |
| (2) | Amount is less than $0.005. |
| (3) | Portfolio turnover is calculated on the basis of the Fund as a whole without distinguishing between the classes of shares issued. |
The accompanying notes are an integral part of these financial statements
| | | | |
| www.thomaswhitefunds.com | | | 63 | |
Year Ended October 31, 2017
FINANCIAL HIGHLIGHTS
| | | | | | | | | | | | | | | | | | | | | | | | | | | | | | | | | | | | | | | | |
| Thomas White International Fund - Class I | |
| | | | | | Year
Ended
October 31,
2017 | | | | | | Year
Ended
October 31,
2016 | | | | | | Year
Ended
October 31,
2015 | | | | | | Year
Ended
October 31,
2014 | | | | | | Year
Ended
October 31,
2013 | |
| |
| Per share operating performance (For a share outstanding throughout each period) | |
| Net asset value, beginning of period | | | $ | | | | 14.98 | | | | $ | | | | 15.78 | | | | $ | | | | 16.97 | | | | $ | | | | 19.18 | | | | $ | | | | 16.56 | |
| | | | | | | | | | | |
| Income from investment operations: | | | | | | | | | | | | | | | | | | | | | | | | | | | | | | | | | | | | | | | | |
Net investment income 1 | | | | | | | 0.25 | | | | | | | | 0.23 | | | | | | | | 0.23 | | | | | | | | 0.30 | | | | | | | | 0.29 | |
Net realized and unrealized gains/(losses) | | | | | | | 3.22 | | | | | | | | (0.83 | ) | | | | | | | (1.17 | ) | | | | | | | (0.89 | ) | | | | | | | 2.59 | |
| Total from investment operations | | | | | | | 3.47 | | | | | | | | (0.60 | ) | | | | | | | (0.94 | ) | | | | | | | (0.59 | ) | | | | | | | 2.88 | |
| | | | | | | | | | | |
| Distributions: | | | | | | | | | | | | | | | | | | | | | | | | | | | | | | | | | | | | | | | | |
From net investment income | | | | | | | (0.41 | ) | | | | | | | (0.20 | ) | | | | | | | (0.25 | ) | | | | | | | (0.30 | ) | | | | | | | (0.26 | ) |
From net realized gains | | | | | | | (0.25 | ) | | | | | | | ------- | | | | | | | | ------- | | | | | | | | (1.32 | ) | | | | | | | ------- | |
Tax return of capital | | | | | | | ------- | | | | | | | | ------- | | | | | | | | ------- | | | | | | | | ------- | | | | | | | | (0.00 | ) 2 |
| Total Distributions | | | | | | | (0.66 | ) | | | | | | | (0.20 | ) | | | | | | | (0.25 | ) | | | | | | | (1.62 | ) | | | | | | | (0.26 | ) |
| Change in net asset value for the period | | | | | | | 2.81 | | | | | | | | (0.80 | ) | | | | | | | (1.19 | ) | | | | | | | (2.21 | ) | | | | | | | 2.62 | |
| Net asset value, end of period | | | $ | | | | 17.79 | | | | $ | | | | 14.98 | | | | $ | | | | 15.78 | | | | $ | | | | 16.97 | | | | $ | | | | 19.18 | |
| Total Return | | | | | | | 23.23% | | | | | | | | (3.81)% | | | | | | | | (5.56)% | | | | | | | | (2.76)% | | | | | | | | 17.40% | |
| | | | | | | | | | | |
| Ratios/supplemental data | | | | | | | | | | | | | | | | | | | | | | | | | | | | | | | | | | | | | | | | |
| Net assets, end of period (000) | | | $ | | | | 277,287 | | | | $ | | | | 384,017 | | | | $ | | | | 300,331 | | | | $ | | | | 443,397 | | | | $ | | | | 453,564 | |
| | | | | | | | | | | |
| Ratio to average net assets: | | | | | | | | | | | | | | | | | | | | | | | | | | | | | | | | | | | | | | | | |
| Expenses (net of reimbursement) | | | | | | | 0.99% | | | | | | | | 0.99% | | | | | | | | 0.99% | | | | | | | | 0.99% | | | | | | | | 0.99% | |
| Expenses (prior to reimbursement) | | | | | | | 1.14% | | | | | | | | 1.10% | | | | | | | | 1.08% | | | | | | | | 1.05% | | | | | | | | 1.11% | |
Net investment income
(net of reimbursement) | | | | | | | 1.53% | | | | | | | | 1.53% | | | | | | | | 1.40% | | | | | | | | 1.59% | | | | | | | | 1.62% | |
Net investment income
(prior to reimbursement) | | | | | | | 1.38% | | | | | | | | 1.42% | | | | | | | | 1.31% | | | | | | | | 1.53% | | | | | | | | 1.50% | |
| Portfolio turnover rate 3 | | | | | | | 48% | | | | | | | | 60% | | | | | | | | 57% | | | | | | | | 62% | | | | | | | | 42% | |
| (1) | Net investment income per share represents net investment income divided by the average shares outstanding throughout the period. |
| (2) | Amount is less than $0.005. |
| (3) | Portfolio turnover is calculated on the basis of the Fund as a whole without distinguishing between the classes of shares issued. |
The accompanying notes are an integral part of these financial statements
| | |
| 64 | | www.thomaswhitefunds.com |
Year Ended October 31, 2017
FINANCIAL HIGHLIGHTS
| | | | | | | | | | | | | | | | | | | | | | | | | | | | | | | | | | | | | | | | |
| Thomas White Emerging Markets Fund - Investor Class | |
| | | | | | Year
Ended
October 31,
2017 | | | | | | Year
Ended
October 31,
2016 | | | | | | Year
Ended
October 31,
2015 | | | | | | Year
Ended
October 31,
2014 | | | | | | Year
Ended
October 31,
2013 | |
| |
| Per share operating performance (For a share outstanding throughout each period) | |
| Net asset value, beginning of period | | | $ | | | | 9.80 | | | | $ | | | | 9.46 | | | | $ | | | | 11.55 | | | | $ | | | | 11.72 | | | | $ | | | | 11.21 | |
| | | | | | | | | | | |
| Income from investment operations: | | | | | | | | | | | | | | | | | | | | | | | | | | | | | | | | | | | | | | | | |
Net investment income 1 | | | | | | | 0.09 | | | | | | | | 0.05 | | | | | | | | 0.08 | | | | | | | | 0.13 | | | | | | | | 0.13 | |
Net realized and unrealized gains/(losses) | | | | | | | 1.57 | | | | | | | | 0.37 | | | | | | | | (2.08 | ) | | | | | | | (0.18 | ) | | | | | | | 0.47 | |
| Total from investment operations | | | | | | | 1.66 | | | | | | | | 0.42 | | | | | | | | (2.00 | ) | | | | | | | (0.05 | ) | | | | | | | 0.60 | |
Distributions from net investment income | | | | | | | (0.16 | ) | | | | | | | (0.08 | ) | | | | | | | (0.09 | ) | | | | | | | (0.12 | ) | | | | | | | (0.09 | ) |
| Change in net asset value for the period | | | | | | | 1.50 | | | | | | | | 0.34 | | | | | | | | (2.09 | ) | | | | | | | (0.17 | ) | | | | | | | 0.51 | |
| Net asset value, end of period | | | $ | | | | 11.30 | | | | $ | | | | 9.80 | | | | $ | | | | 9.46 | | | | $ | | | | 11.55 | | | | $ | | | | 11.72 | |
| Total Return | | | | | | | 17.02% | | | | | | | | 4.48% | | | | | | | | (17.31)% | | | | | | | | (0.40)% | | | | | | | | 5.36% | |
| | | | | | | | | | | |
| Ratios/supplemental data | | | | | | | | | | | | | | | | | | | | | | | | | | | | | | | | | | | | | | | | |
| | | | | | | | | | | |
| Net assets, end of period (000) | | | $ | | | | 2,002 | | | | $ | | | | 1,816 | | | | $ | | | | 4,172 | | | | $ | | | | 5,182 | | | | $ | | | | 5,703 | |
| | | | | | | | | | | |
| Ratio to average net assets: | | | | | | | | | | | | | | | | | | | | | | | | | | | | | | | | | | | | | | | | |
Expenses
(net of reimbursement/recoupment) | | | | | | | 1.34% | | | | | | | | 1.34% | | | | | | | | 1.34% | | | | | | | | 1.34% | | | | | | | | 1.34% | |
Expenses
(prior to reimbursement/recoupment) | | | | | | | 1.48% | | | | | | | | 1.31% | | | | | | | | 1.27% | | | | | | | | 1.29% | | | | | | | | 1.63% | |
Net investment income
(net of reimbursement/recoupment) | | | | | | | 0.90% | | | | | | | | 0.59% | | | | | | | | 0.75% | | | | | | | | 1.16% | | | | | | | | 1.14% | |
Net investment income
(prior to reimbursement/recoupment) | | | | | | | 0.76% | | | | | | | | 0.62% | | | | | | | | 0.82% | | | | | | | | 1.21% | | | | | | | | 0.85% | |
| Portfolio turnover rate 2 | | | | | | | 67% | | | | | | | | 57% | | | | | | | | 27% | | | | | | | | 64% | | | | | | | | 54% | |
| (1) | Net investment income per share represents net investment income divided by the average shares outstanding throughout the period. |
| (2) | Portfolio turnover is calculated on the basis of the Fund as a whole without distinguishing between the classes of shares issued. |
The accompanying notes are an integral part of these financial statements
| | | | |
| www.thomaswhitefunds.com | | | 65 | |
Year Ended October 31, 2017
FINANCIAL HIGHLIGHTS
| | | | | | | | | | | | | | | | | | | | | | | | | | | | | | | | | | | | | | | | |
| Thomas White Emerging Markets Fund - Class I | |
| | | | | | Year
Ended
October 31,
2017 | | | | | | Year Ended
October 31,
2016 | | | | | | Year Ended
October 31,
2015 | | | | | | Year Ended
October 31,
2014 | | | | | | Year Ended
October 31,
2013 | |
| |
| Per share operating performance (For a share outstanding throughout each period) | |
| Net asset value, beginning of period | | | $ | | | | 9.88 | | | | $ | | | | 9.52 | | | | $ | | | | 11.59 | | | | $ | | | | 11.73 | | | | $ | | | | 11.21 | |
| | | | | | | | | | | |
| Income from investment operations: | | | | | | | | | | | | | | | | | | | | | | | | | | | | | | | | | | | | | | | | |
Net investment income 1 | | | | | | | 0.11 | | | | | | | | 0.09 | | | | | | | | 0.11 | | | | | | | | 0.14 | | | | | | | | 0.13 | |
Net realized and unrealized gains/(losses) | | | | | | | 1.59 | | | | | | | | 0.36 | | | | | | | | (2.09 | ) | | | | | | | (0.16 | ) | | | | | | | 0.48 | |
| Total from investment operations | | | | | | | 1.70 | | | | | | | | 0.45 | | | | | | | | (1.98 | ) | | | | | | | (0.02 | ) | | | | | | | 0.61 | |
| Distributions from net investment income | | | | | | | (0.20 | ) | | | | | | | (0.09 | ) | | | | | | | (0.09 | ) | | | | | | | (0.12 | ) | | | | | | | (0.09 | ) |
| Change in net asset value for the period | | | | | | | 1.50 | | | | | | | | 0.36 | | | | | | | | (2.07 | ) | | | | | | | (0.14 | ) | | | | | | | 0.52 | |
| Net asset value, end of period | | | $ | | | | 11.38 | | | | $ | | | | 9.88 | | | | $ | | | | 9.52 | | | | $ | | | | 11.59 | | | | $ | | | | 11.73 | |
| Total Return | | | | | | | 17.29% | | | | | | | | 4.69% | | | | | | | | (17.06)% | | | | | | | | (0.12)% | | | | | | | | 5.48% | |
| | | | | | | | | | | |
| Ratios/supplemental data | | | | | | | | | | | | | | | | | | | | | | | | | | | | | | | | | | | | | | | | |
| Net assets, end of period (000) | | | $ | | | | 45,392 | | | | $ | | | | 76,240 | | | | $ | | | | 79,656 | | | | $ | | | | 76,705 | | | | $ | | | | 34,733 | |
| | | | | | | | | | | |
| Ratio to average net assets: | | | | | | | | | | | | | | | | | | | | | | | | | | | | | | | | | | | | | | | | |
| Expenses (net of reimbursement) | | | | | | | 1.09% | | | | | | | | 1.09% | | | | | | | | 1.09% | | | | | | | | 1.09% | | | | | | | | 1.09% | |
| Expenses (prior to reimbursement) | | | | | | | 1.41% | | | | | | | | 1.29% | | | | | | | | 1.25% | | | | | | | | 1.25% | | | | | | | | 1.66% | |
| Net investment income (net of reimbursement) | | | | | | | 1.07% | | | | | | | | 0.92% | | | | | | | | 1.04% | | | | | | | | 1.18% | | | | | | | | 1.15% | |
| Net investment income (prior to reimbursement) | | | | | | | 0.75% | | | | | | | | 0.72% | | | | | | | | 0.88% | | | | | | | | 1.02% | | | | | | | | 0.58% | |
| Portfolio turnover rate 2 | | | | | | | 67% | | | | | | | | 57% | | | | | | | | 27% | | | | | | | | 64% | | | | | | | | 54% | |
| (1) | Net investment income per share represents net investment income divided by the average shares outstanding throughout the period. |
| (2) | Portfolio turnover is calculated on the basis of the Fund as a whole without distinguishing between the classes of shares issued. |
The accompanying notes are an integral part of these financial statements
| | |
| 66 | | www.thomaswhitefunds.com |
Year Ended October 31, 2017
FINANCIAL HIGHLIGHTS
| | | | | | | | | | | | | | | | | | | | | | | | | | | | | | | | | | | | | | | | |
| Thomas White American Opportunities Fund - Investor Class | |
| | | | | | Year
Ended
October 31,
2017 | | | | | | Year
Ended
October 31,
2016 | | | | | | Year
Ended
October 31,
2015 | | | | | | Year
Ended
October 31,
2014 | | | | | | Year
Ended
October 31,
2013 | |
| |
| Per share operating performance (For a share outstanding throughout each period) | |
| Net asset value, beginning of period | | | $ | | | | 14.91 | | | | $ | | | | 15.60 | | | | $ | | | | 15.84 | | | | $ | | | | 15.12 | | | | $ | | | | 13.28 | |
| | | | | | | | | | | |
| Income from investment operations: | | | | | | | | | | | | | | | | | | | | | | | | | | | | | | | | | | | | | | | | |
Net investment income | | | | | | | 0.04 | | | | | | | | 0.11 | 1 | | | | | | | 0.08 | 1 | | | | | | | 0.07 | 1 | | | | | | | 0.11 | |
Net realized and unrealized gains/(losses) | | | | | | | 3.00 | | | | | | | | (0.44 | ) | | | | | | | 0.96 | | | | | | | | 2.21 | | | | | | | | 3.68 | |
| Total from investment operations | | | | | | | 3.04 | | | | | | | | (0.33 | ) | | | | | | | 1.04 | | | | | | | | 2.28 | | | | | | | | 3.79 | |
| | | | | | | | | | | |
| Distributions: | | | | | | | | | | | | | | | | | | | | | | | | | | | | | | | | | | | | | | | | |
From net investment income | | | | | | | (0.14 | ) | | | | | | | (0.00 | )2 | | | | | | | (0.07 | ) | | | | | | | (0.07 | ) | | | | | | | (0.09 | ) |
From net realized gains | | | | | | | (1.32 | ) | | | | | | | (0.36 | ) | | | | | | | (1.21 | ) | | | | | | | (1.49 | ) | | | | | | | (1.85 | ) |
Tax return of capital | | | | | | | ------- | | | | | | | | ------- | | | | | | | | ------- | | | | | | | | ------- | | | | | | | | (0.01 | ) |
| Total Distributions | | | | | | | (1.46 | ) | | | | | | | (0.36 | ) | | | | | | | (1.28 | ) | | | | | | | (1.56 | ) | | | | | | | (1.95 | ) |
| Change in net asset value for the period | | | | | | | 1.58 | | | | | | | | (0.69 | ) | | | | | | | (0.24 | ) | | | | | | | 0.72 | | | | | | | | 1.84 | |
| Net asset value, end of period | | | $ | | | | 16.49 | | | | $ | | | | 14.91 | | | | $ | | | | 15.60 | | | | $ | | | | 15.84 | | | | $ | | | | 15.12 | |
| Total Return | | | | | | | 20.45% | | | | | | | | (2.12)% | | | | | | | | 6.69% | | | | | | | | 15.38% | | | | | | | | 28.52% | |
| | | | | | | | | | | |
| Ratios/supplemental data | | | | | | | | | | | | | | | | | | | | | | | | | | | | | | | | | | | | | | | | |
| Net assets, end of period (000) | | | $ | | | | 41,433 | | | | $ | | | | 36,816 | | | | $ | | | | 35,875 | | | | $ | | | | 33,830 | | | | $ | | | | 29,138 | |
| | | | | | | | | | | |
| Ratio to average net assets: | | | | | | | | | | | | | | | | | | | | | | | | | | | | | | | | | | | | | | | | |
Expenses
(net of reimbursement/ recoupment) | | | | | | | 1.19% | | | | | | | | 1.20% | | | | | | | | 1.18% | | | | | | | | 1.24% | | | | | | | | 1.34% | |
Expenses
(prior to reimbursement/recoupment) | | | | | | | 1.19% | | | | | | | | 1.20% | | | | | | | | 1.18% | | | | | | | | 1.15% | | | | | | | | 1.31% | |
| Net investment income (net of reimbursement/recoupment) | | | | | | | 0.28% | | | | | | | | 0.78% | | | | | | | | 0.52% | | | | | | | | 0.45% | | | | | | | | 0.75% | |
| Net investment income (prior to reimbursement/recoupment) | | | | | | | 0.28% | | | | | | | | 0.78% | | | | | | | | 0.52% | | | | | | | | 0.54% | | | | | | | | 0.78% | |
| Portfolio turnover rate | | | | | | | 29% | | | | | | | | 60% | | | | | | | | 38% | | | | | | | | 32% | | | | | | | | 60% | |
| (1) | Per share net investment income was calculated prior to tax adjustments. |
| (2) | Amount is less than $0.005. |
The accompanying notes are an integral part of these financial statements
| | | | |
| www.thomaswhitefunds.com | | | 67 | |
Report of Independent Registered Public Accounting Firm
To the Board of Trustees and Shareholders
Lord Asset Management Trust
We have audited the accompanying statements of assets and liabilities of Thomas White International Fund, Thomas White Emerging Markets Fund, and Thomas White American Opportunities Fund (the “Funds”), each a series of Lord Asset Management Trust, including the schedules of investments, as of October 31, 2017, and the related statements of operations for the year then ended, and the statements of changes in net assets for each of the two years in the period then ended, and the financial highlights for each of the four years in the period then ended. These financial statements and financial highlights are the responsibility of the Fund’s management. Our responsibility is to express an opinion on these financial statements and financial highlights based on our audits. Other auditors have previously audited, in accordance with the standards of the Public Company Accounting Oversight Board, the financial highlights for the year ended October 31, 2013, and in their report, dated December 27, 2013, they expressed an unqualified opinion on those financial highlights.
We conducted our audits in accordance with the standards of the Public Company Accounting Oversight Board (United States). Those standards require that we plan and perform the audit to obtain reasonable assurance about whether the financial statements and financial highlights are free of material misstatement. The Funds are not required to have, nor were we engaged to perform, an audit of their internal control over financial reporting. Our audits included consideration of internal control over financial reporting as a basis for designing audit procedures that are appropriate in the circumstances, but not for the purpose of expressing an opinion on the effectiveness of the Trust’s internal control over financial reporting. Accordingly, we express no such opinion. An audit also includes examining, on a test basis, evidence supporting the amounts and disclosures in the financial statements, assessing the accounting principles used and significant estimates made by management, as well as evaluating the overall financial statement presentation. Our procedures included confirmation of securities owned as of October 31, 2017, by correspondence with the custodians. We believe that our audits provide a reasonable basis for our opinion.
In our opinion, the financial statements and financial highlights referred to above present fairly, in all material respects, the financial position of the Funds, as of October 31, 2017, and the results of their operations for the year then ended, and the changes in their net assets for each of the two years in the period then ended and the financial highlights for each of the four years in the period then ended, in conformity with accounting principles generally accepted in the United States of America.
TAIT, WELLER & BAKER LLP
Philadelphia, Pennsylvania
January 2, 2018
| | |
| 68 | | www.thomaswhitefunds.com |
Tax Information (Unaudited)
The Funds have elected to pass through to their shareholders the foreign taxes paid for the year ended October 31, 2017 as follows:
| | | | | | | | | | | | |
| | | Foreign Dividend
Income | | | Foreign Taxes
Paid | | | Foreign Taxes Paid
per share | |
| International Fund | | | $12,361,380 | | | | $1,134,564 | | | | $0.0629 | |
| | | | |
| Emerging Markets Fund | | | 1,498,156 | | | | 154,049 | | | | 0.0370 | |
QUALIFYING DIVIDEND INCOME
For the International Fund, Emerging Markets Fund and American Opportunities Fund, 100% of the income dividend is qualified.
ORDINARY INCOME DIVIDEND AND FOREIGN TAX CREDIT
The International Fund and the Emerging Markets Fund have made an election under Section 853 of the Internal Revenue Code to provide to their shareholders the benefit of foreign tax credits in the per share amount designated below. Therefore, shareholders who must file a U.S. Federal Income tax return will be entitled to a foreign tax credit or an itemized deduction in an amount equal to $0.0612 per share of the International Fund and $0.0356 per share of Emerging Markets Fund for each share owned on October 26, 2017, in computing their tax liability. It is generally more advantageous to claim a credit than a deduction.
| | | | |
| www.thomaswhitefunds.com | | | 69 | |
THOMAS WHITE FUNDS
DISCLOSURE OF FUND EXPENSES (Unaudited)
As a shareholder of the Funds you incur two types of costs : (1) transaction costs, including sales charges (loads) on purchase payments or contingent deferred sales charges on redemptions, if any, or redemption fees; and (2) ongoing costs, including management fees; distribution fees (12b-1); and other Fund expenses. This example is intended to help you understand your ongoing costs (in dollars) of investing in the Funds and to compare these costs with the ongoing costs of investing in other mutual funds.
The example is based on an investment of $1,000 invested at the beginning of the period and held for the entire period, May 1, 2017 through October 31, 2017 for the Funds’ Investor Class and Class I, as applicable.
ACTUAL EXPENSES
The third and fourth columns of the table below provide information about actual account values and actual expenses. You may use the information in this line together with the amount you invested to estimate the expenses you paid over the period. Simply divide your account value by $1,000 (for example, an $8,600 account value divided by $1,000=8.6), then multiply the result by the number in the fourth column under the heading entitled “Expenses Paid During Period” to estimate the expenses you paid on your own account during this period. IRA accounts are charged a $15.00 fee annually in September that is not reflected in the actual expense example. If you hold your Fund shares through an IRA account, you should add this cost to the expenses paid shown below.
HYPOTHETICAL EXAMPLE FOR COMPARISON PURPOSES
The fifth and sixth columns of the table below provide information about hypothetical account values and hypothetical expenses based on each Fund’s actual expense ratio and an assumed rate of return of 5% per year before expenses, which is not the Fund’s actual return. The hypothetical account values and expenses may not be used to estimate the actual ending account balance or expenses you paid for the period. You may use this information to compare the ongoing costs of investing in the Funds and other funds. To do so, compare this 5% hypothetical example with the 5% hypothetical examples that appear in the shareholder reports of the other funds. IRA accounts are charged a $15.00 fee annually in September that is not reflected in the hypothetical expense example. If you hold your Fund shares through an IRA account, you should separately compare the Funds’ IRA fees to the IRA fees of other funds.
Please note that the expenses shown in the table are meant to highlight your ongoing costs only and do not reflect any transactional costs such as sales charges (loads) or purchase payments or contingent deferred sales charges on redemptions, if any, or redemption fees. Therefore the sixth column of the table is useful in comparing ongoing costs only, and will not help you determine the relative costs of owning different funds. In addition, if these transactional costs were included, your costs may have been higher.
| | |
| 70 | | www.thomaswhitefunds.com |
THOMAS WHITE FUNDS
| | | | | | | | | | | | | | | | | | | | | | | | |
| | | | | | | | | Actual | | | Hypothetical (5% return
before expenses) | |
| | | Fund’s
Annualized
Expense
Ratio* | | | Beginning
Account
Value
May 1,
2017 | | | Ending
Account
Value
October 31,
2017 | | | Expenses
Paid
During
Period | | | Ending
Account
Value
October 31,
2017 | | | Expenses
Paid
During
Period | |
| International Fund | | | | | | | | | | | | | | | | | | | | | |
| Investor Class Shares | | | 1.24% | | | | $1,000.00 | | | | $1,122.50 | | | | $6.63 | | | | $1,018.95 | | | | $6.31 | |
| Class I Shares | | | 0.99% | | | | $1,000.00 | | | | $1,123.50 | | | | $5.30 | | | | $1,020.21 | | | | $5.04 | |
| Emerging Markets Fund | | | | | | | | | | | | | | | | | |
| Investor Class Shares | | | 1.34% | | | | $1,000.00 | | | | $1,113.90 | | | | $7.14 | | | | $1,018.45 | | | | $6.82 | |
| Class I Shares | | | 1.09% | | | | $1,000.00 | | | | $1,115.50 | | | | $5.81 | | | | $1,019.71 | | | | $5.55 | |
| American Opportunities Fund | | | | | | | | | | | | | | | | | |
| Investor Class | | | 1.19% | | | | $1,000.00 | | | | $1,065.10 | | | | $6.19 | | | | $1,019.21 | | | | $6.06 | |
| | * | Expenses for the International, Emerging Markets and American Opportunities Funds’ annualized expense ratio (after waiver and reimbursement), multiplied by the average account value over the period, multiplied by 184/365 (to reflect the one-half year period). |
QUARTERLY FORM N-Q PORTFOLIO SCHEDULE
The Funds file their complete schedule of portfolio holdings with the Securities and Exchange Commission (“SEC”) for the first and third quarters of each fiscal year on Form N-Q. Each Fund’s Form N-Q is available on the SEC’s website at http://www.sec.gov. The Funds’ Forms N-Q may be reviewed and copied at the SEC’s Public Reference Room in Washington, D.C. Information on the operation of the SEC’s Public reference Room may be obtained by calling 1-800-SEC-0330. Additionally, you may obtain copies of Forms N-Q from the Funds upon request by calling 1-800-811-0535.
PROXY VOTING POLICIES, PROCEDURES AND RECORD
You may obtain a description of the Funds’ (1) proxy voting policies, (2) proxy voting procedures and (3) information regarding how the Funds voted any proxies related to portfolio securities during the most recent 12 month period ended June 30 for which an SEC filing has been made, without charge, upon request by calling the Funds at 1-800-811-0535 or on the EDGAR database on the SEC’s website (http://www.sec.gov).
ADDITIONAL INFORMATION
The Statement of Additional Information contains additional information regarding the Funds and Trustees, and is available upon request without charge by calling 1-800-811-0535.
| | | | |
| www.thomaswhitefunds.com | | | 71 | |
THOMAS WHITE FUNDS
TRUSTEE AND OFFICER DISCLOSURE OCTOBER 31, 2017
| | | | | | | | | | |
| | | | | | |
Name, Address and Age | | Positions held with
Funds | | Length
of Time
Served | | Principal Occupation During Past Five Years | | Number of
Portfolios
overseen
by Trustee | | Other
Directorships
Held by Trustee |
Thomas S. White, Jr. 440 S. LaSalle St. Suite 3900 Chicago, IL 60605, 74 | | Trustee, Chairman | | 23 years | | President of Thomas White International, Ltd. | | 3 | | None |
| | | | | | |
Stathy M. White 440 S. LaSalle St. Suite 3900 Chicago, IL 60605, 60 | | President | | 6 years | | Chairman and Exec. Vice President of
Thomas White International, Ltd. | | N/A | | N/A |
| | | | | | |
David M. Sullivan II 440 S. LaSalle St. Suite 3900 Chicago, IL 60605, 45 | | Vice President and Treasurer | | 17 years | | Treasurer of the Thomas White Funds; Senior Vice President of Thomas White International, Ltd. | | N/A | | N/A |
| | | | | | |
J. Ryan Conner 440 S. LaSalle St. Suite 3900 Chicago, IL 60605, 37 | | Secretary and Chief Compliance Officer | | 6 years | | Senior Vice President of Thomas White International, Ltd.; Business Analyst, Computershare Inc. | | N/A | | N/A |
| | | | | | |
| Independent Trustees: | | | | | | | | | | |
| | | | | | |
Arthur J. Fiocco, Jr. 440 S. LaSalle St. Chicago, IL 60605 60 | | Trustee | | 2 Years | | Vice President of Operations of Baxter International, Inc. (medical products) (since 2016, prior to which he was a Director (since 2015)); Former Corporate Vice President of Hospira, Inc. (pharmaceutical company) (2004-2014). | | 3 | | None |
| | | | | | |
Elizabeth G. Montgomery 440 S. LaSalle St. Suite 3900 Chicago, IL 60605, 73 | | Trustee | | 16 years | | Retired; former President, Graham Group (management consulting). | | 3 | | None |
| | | | | | |
Robert W. Thomas 440 S. LaSalle St. Suite 3900 Chicago, IL 60605, 73 | | Trustee | | 11 years | | President of Thomas Laboratories, Inc. (pharmaceutical company) (since 1992). | | 3 | | None |
| | | | | | |
John N. Venson 440 S. LaSalle St. Suite 3900 Chicago, IL 60605, 70 | | Trustee | | 23 years | | Dean of the California School of Podiatric Medicine (since 2008); Doctor of Podiatric Medicine. | | 3 | | None |
| | | | | | |
William H. Woolverton 440 S. LaSalle St. Chicago, IL 60605 66 | | Trustee | | 2 Years | | Managing Director of DMS Governance Ltd. (fund governance) (since 2016); Former Senior Managing Director and General Counsel of Gottex Fund Management (investment advisory firm) (2005-2016). | | 3 | | None |
ADDITIONAL INFORMATION
The Statement of Additional Information contains additional information regarding the Funds and Trustees, and is available upon request without charge by calling 1-800-811-0535.
| | |
| 72 | | www.thomaswhitefunds.com |
Privacy Policy
LORD ASSET MANAGEMENT TRUST
THOMAS WHITE INTERNATIONAL, LTD.
I. Commitment to Consumer* Privacy
The Thomas White Funds Family and Thomas White International, Ltd. (collectively, “we” or “us”) are committed to handling consumer information responsibly. We recognize and respect the privacy expectations of our consumers, and we believe that the confidentiality and security of consumers’ personal financial information is one of our fundamental responsibilities.
II. Collection of Consumer Information
We collect, retain and use consumer information only where we reasonably believe it would be useful to the consumer and allowed by law. Consumer information collected by us generally comes from the following sources:
| | • | | Information we receive on applications or other forms; |
| | • | | Information about consumers’ transactions with us, our affiliates, or others. |
III. Disclosure of Consumer Information
We may disclose all of the consumer information we collect to affiliated financial institutions and to third parties who are not our affiliates:
| | • | | to perform marketing services on our behalf or pursuant to a joint marketing agreement between us and another party; and |
| | • | | as otherwise permitted by law. |
We do not disclose any consumer information about our former customers* to anyone except as permitted by law.
IV. Security of Customer Information
We are committed to, and also require our service providers to:
| | • | | maintain policies and procedures designed to assure only appropriate access to, and use of information about our customers; and |
| | • | | maintain physical, electronic and procedural safeguards that comply with federal standards to guard non-public personal information of our customers. |
* As defined in Regulation S-P
| | | | |
| www.thomaswhitefunds.com | | | 73 | |
This page is intentionally left blank.
OFFICERS AND TRUSTEES
Thomas S. White, Jr.
Chairman of the Board
Arthur J. Fiocco, Jr.
Trustee
Elizabeth G. Montgomery
Trustee
Robert W. Thomas
Trustee
John N. Venson, D.P.M.
Trustee
William H. Woolverton
Trustee
Stathy M. White
President
David M. Sullivan II
Vice President, Treasurer and
Assistant Secretary
J. Ryan Conner
Secretary and Chief Compliance Officer
INVESTMENT ADVISOR AND OTHER SERVICE PROVIDERS
Thomas White International, Ltd.
440 S. LaSalle Street, Suite 3900
Chicago, Illinois 60605-1028
CUSTODIANS
The Northern Trust Company
Chicago, Illinois
U.S. Bank, N.A.
Milwaukee, Wisconsin
LEGAL COUNSEL
Dechert LLP
Washington, DC
INDEPENDENT REGISTERED PUBLIC ACCOUNTING FIRM
Tait, Weller & Baker, LLP
Philadelphia, Pennsylvania
ADMINISTRATOR and TRANSFER AGENT
U.S. Bancorp Fund Services, LLC
Milwaukee, Wisconsin
DISTRIBUTOR
Quasar Distributors, LLC
Milwaukee, Wisconsin
FOR CURRENT PERFORMANCE, NET ASSET VALUE OR FOR ASSISTANCE WITH YOUR ACCOUNT, PLEASE CONTACT THE THOMAS WHITE FUNDS AT 800-811-0535 OR VISIT OUR WEB SITE AT WWW.THOMASWHITEFUNDS.COM

www.thomaswhitefunds.com
COVER PICTURE: Asian consumers are loosening their purse strings for luxury goods. In mainland
China recently, the growth rate for local luxury sales exceeded that of overseas purchases by
Chinese tourists for the first time since 2001, signaling a recovery from the slump caused by
Beijing’s anticorruption campaign and subdued consumer sentiment.
Item 2. Code of Ethics.
The registrant has adopted a code of ethics that applies to the registrant’s principal executive officer and principal financial officer. The registrant has not made any substantive amendments to its code of ethics during the period covered by this report. The registrant has not granted any waivers from any provisions of the code of ethics during the period covered by this report.
A copy of the Registrant’s Code of Ethics is filed herewith. The Registrant undertakes to provide to any person without charge, upon request, a copy of its code of ethics by mail when they call the Registrant at 1-800-811-0535.
Item 3. Audit Committee Financial Expert.
The Registrant’s Board of Trustees has determined that it does not have an Audit Committee financial expert serving on its Audit Committee. At this time, the Registrant believes that the experience provided by each member of the Audit Committee together offers the Registrant adequate oversight for the Registrant’s level of financial complexity.
Item 4. Principal Accountant Fees and Services.
The Registrant has engaged its principal accountant to perform audit services, audit-related services, tax services and other services during the past two fiscal years. “Audit services” refer to performing an audit of the Registrant’s annual financial statements or services that are normally provided by the accountant in connection with statutory and regulatory filings or engagements for those fiscal years. “Audit-related services” refer to the assurance and related services by the principal accountant that are reasonably related to the performance of the audit. “Tax services” refer to professional services rendered by the principal accountant for tax compliance, tax advice, and tax planning. “Other services” provided by the principal accountant were provided by the principal accountant. The following table details the aggregate fees billed or expected to be billed for each of the last two fiscal years for audit fees, audit-related fees, tax fees and other fees by the principal accountant.
| | | | |
| | | FYE 10/31/2017 | | FYE 10/31/2016 |
Audit Fees | | $52,500 | | $51,000 |
Audit-Related Fees | | - | | - |
Tax Fees | | $9,300 | | $9,000 |
All Other Fees | | - | | - |
The Audit Committee has adopted pre-approval policies and procedures that require the Audit Committee to pre-approve all audit and non-audit services of the Registrant, including services provided to any entity affiliated with the Registrant.
The percentage of fees billed by Tait, Weller & Baker, LLP applicable to non-audit services pursuant to waiver of pre-approval requirement were as follows:
| | | | |
| | | FYE 10/31/2017 | | FYE 10/31/2016 |
Audit-Related Fees | | 0% | | 0% |
Tax Fees | | 0% | | 0% |
All Other Fees | | 0% | | 0% |
1
All of the principal accountant’s hours spent on auditing the registrant’s financial statements were attributed to work performed by full-time permanent employees of the principal accountant. There were no non-audit fees billed or expected to be billed by the Registrant’s accountant for services to the Registrant and to the Registrant’s investment adviser (and any other controlling entity, etc. –not sub-adviser) for the last two years.
Item 5. Audit Committee of Listed Registrants.
Not applicable to registrants who are not listed issuers (as defined in Rule 10A-3 under the Securities Exchange Act of 1934).
Item 6. Investments.
| (a) | The Schedules of Investments are included as part of the report to shareholders filed under Item 1 of this Form N-CSR. |
Item 7. Disclosure of Proxy Voting Policies and Procedures for Closed-End Management Investment Companies.
Not applicable to open-end investment companies.
Item 8. Portfolio Managers of Closed-End Management Investment Companies.
Not applicable to open-end investment companies.
Item 9. Purchases of Equity Securities by Closed-End Management Investment Company and Affiliated Purchasers.
Not applicable to open-end investment companies.
Item 10. Submission of Matters to a Vote of Security Holders.
There have been no material changes to the procedures by which shareholders may recommend nominees to the Registrant’s Board of Trustees.
Item 11. Controls and Procedures.
| (a) | Based on an evaluation of Registrant’s Disclosure Controls and Procedures (as defined in Rule 30a-3(c) under the Investment Company Act of 1940) (the “Disclosure Controls”), as of a date within 90 days prior to the filing date (the “Filing Date”) of this Form N-CSR (the “Report”), the Registrant’s principal executive officer and principal financial officer have concluded that the Disclosure Controls are effectively designed to ensure that information required to be disclosed by the Registrant in the Report is recorded, processed, summarized and reported by the Filing Date, including ensuring that information required to be disclosed in the Report is accumulated and communicated to the Registrant’s management, including the Registrant’s principal executive officer and principal financial officer, as appropriate, to allow timely decisions regarding required disclosure. |
2
| (b) | There were no changes in the Registrant’s internal control over financial reporting (as defined in Rule 30a-3(d) under the Act) that occurred during the most recent fiscal quarter of the period covered by this report that has materially affected, or is reasonably likely to materially affect, the Registrant’s internal control over financial reporting. |
Item 12. Disclosure of Securities Lending Activities for Closed-End Management Investment Companies
Not applicable to open-end investment companies.
Item 13. Exhibits.
(a) (1) Code of ethics. Filed herewith.
(2) Certifications pursuant to Section 302 of the Sarbanes-Oxley Act of 2002. Filed herewith.
(3) Any written solicitation to purchase securities under Rule 23c-1 under the Act sent or given during the period covered by the report by or on behalf of the Registrant to 10 or more persons. Not applicable to open-end investment companies.
| (b) | Certifications pursuant to Section 906 of the Sarbanes-Oxley Act of 2002. Filed herewith. |
3
SIGNATURES
Pursuant to the requirements of the Securities Exchange Act of 1934 and the Investment Company Act of 1940, the registrant has duly caused this report to be signed on its behalf by the undersigned, thereunto duly authorized.
| | |
| (Registrant) LORD ASSET MANAGEMENT TRUST |
| | |
| |
| By (Signature and Title) | | /s/ Stathy M. White |
| | Stathy M. White |
| | President (Principal Executive Officer) |
Pursuant to the requirements of the Securities Exchange Act of 1934 and the Investment Company Act of 1940, this report has been signed below by the following persons on behalf of the registrant and in the capacities and on the dates indicated.
| | |
| By (Signature and Title) | | /s/ Stathy M. White |
| | Stathy M. White |
| | President (Principal Executive Officer) |
| | |
| By (Signature and Title) | | /s/ David M. Sullivan II |
| | David M. Sullivan II |
| | Treasurer (Principal Financial Officer) |
4