As filed with the U.S. Securities and Exchange Commission on January 6, 2020
UNITED STATES
SECURITIES AND EXCHANGE COMMISSION
Washington, D.C. 20549
FORMN-CSR
CERTIFIED SHAREHOLDER REPORT OF REGISTERED
MANAGEMENT INVESTMENT COMPANIES
Investment Company Act file number811-08348
LORD ASSET MANAGEMENT TRUST
(Exact name of registrant as specified in charter)
425 South Financial Place
Chicago, Illinois 60605-1028
(Address of principal executive offices) (Zip code)
Douglas M. Jackman
Thomas White International, Ltd.
425 South Financial Place
Chicago, Illinois 60605-1028
(Name and address of agent for service)
(312)663-8300
Registrant’s telephone number, including area code
Date of fiscal year end:10/31
Date of reporting period:11/1/2018 – 10/31/2019
Item 1. Reports to Stockholders.


ANNUAL REPORT
OCTOBER 31, 2019
THE INTERNATIONAL FUND
THE EMERGING MARKETS FUND
THE AMERICAN OPPORTUNITIES FUND
Beginning on January 1, 2021, as permitted by regulations adopted by the U.S. Securities and Exchange Commission, paper copies of the Funds’ annual and semi-annual shareholder reports will no longer be sent by mail, unless you specifically request paper copies of the reports from the Funds or from your financial intermediary, such as a broker-dealer or bank if you hold your shares through such an institution. Instead, the reports will be made available on the Funds’ website (www.thomaswhitefunds.com/fundreports-and-literature), and you will be notified by mail each time a report is posted and provided with a website link to access the report.
If you already elected to receive shareholder reports electronically, you will not be affected by this change and you need not take any action. You may elect to receive shareholder reports and other communications from the Funds electronically anytime by contacting your financial intermediary or, if you hold your shares directly with the Funds, by calling 1-800-811-0535.
You may elect to receive all future reports in paper free of charge. If you invest through a financial intermediary, you can contact your financial intermediary to request that you continue to receive paper copies of your shareholder reports. If you invest directly with the Funds, you can call 1-800-811-0535 to let the Funds know you wish to continue receiving paper copies of your shareholder reports. Your election to receive shareholder reports in paper may apply to all funds that you hold through the financial intermediary and will apply to all Funds held directly.

CONTENTS
Message to Shareholders
Dear Shareholders and Friends:
The past twelve months have flown by quickly! After the change in control and the retirement of our founder that we discussed in our 2018 Annual Message to Shareholders, we have seen a rededication to our disciplined investment process, an effort that is now showing results. We appreciate and thank you for your long-time confidence and look forward to expanding our shareholder base as we grow in the future.
The past year has seen many ups and downs across the political spectrum which continues to affect both local and global economic growth rates. Fromon-going protests in Hong Kong to the one year anniversary of yellow vest protesters in Paris, these disruptions continue to reflect the nationalist movements across the world. New political leadership in the past twelve months across the globe in countries like Argentina, Brazil, Italy and the UK, as well as upcoming elections in the U.S., will continue to focus the markets on global trade agreements, central bank policies and government spending. Despite these ongoing changes, markets have continued to be extremely resilient. To the surprise of many, U.S. domestic equity indices reached new highs in 2019 even with the general uncertainty we
highlighted in last year’s letter such as Brexit,China-U.S. trade negotiations and the finalization of the United States–Mexico–Canada Agreement (USMCA) trade deal. As many of these issues appear to be heading toward resolution early next year, their conclusion should help clear some uncertainty and help propel markets higher in 2020.
Global Economy Solid Despite Widespread Political Uncertainty
Theon-going political uncertainty created by the U.S.-China tariff battles are reflected in the performance of the markets as shown in the graph below. When a resolution seemed in sight, the markets rallied, but then declined when talks fell apart. While these discussions are ongoing, and are now expected to be implemented in multiple phases, the conclusion of Phase I should occur in early 2020. The importance of these talks are reflected not only in the strength of the global equity markets, but also in the impact to overall economic growth across the globe due to the rippling effects of U.S.-China trade. The impasse has had a greater negative impact on the Chinese economy as it has slowed to 6% Gross Domestic Product (GDP) growth in 2019, the lowest in a decade.
| | | | |
| www.thomaswhitefunds.com | | | 1 | |
Daily Asset Performance in 2019
Source: FactSet. Data through 12/6/2019. Global stock represented by the MSCI All Country World ex US Index, Commodities by the S&P GSCI Index and the S&P 500 by the S&P 500 Total Return Index.
The major global economies posted stable growth in 2019, albeit slightly lower than projected, as estimated by the International Monetary Fund (IMF) last year. At least a partial resolution to both Brexit and U.S.-China tariff battles during early 2020 should provide the markets some clarity and augment the global economic growth momentum. The developed markets continue to be bolstered by low or negative interest rates. During late summer of 2019, the amount of sovereign bonds yielding a negative rate peaked at over $17 trillion. This
current era of cheap credit helps equity yields but puts a renewed focus on dividend yields and interest rate spreads, particularly in the financial sector. It also creates significant challenges for the Bank of Japan, the European Central Bank and the U.S. Federal Reserve to utilize monetary stimulus to ignite their respective economies. New quantitative easing stimulus occurred in the U.S. in the second half of the year and also helped underpin domestic equity market performance so far in Q4.
| | |
| 2 | | www.thomaswhitefunds.com |
IMF GDP Growth Forecasts
Source: International Monetary Fund (IMF) World Economic Outlook Oct 2019; Annualized GDP Growth Forecasts in %.
Despite all of the political maneuvering, global equity markets posted one of its strongest years over the past two decades. We observe companies positioning themselves for the lingering uncertainty by strengthening balance sheets, refinancing debt to take advantage of the low rates and continued share buyback programs, particularly in the U.S. These factors have all contributed to modest earnings growth during the past twelve months, but solid
earnings are forecast for 2020. Despite the recent strong returns, we do not see the equity markets as having extreme valuations. As the table shows below, Trailing Price/Earnings multiples are not significantly above their trailing5- or10-year averages. In fact, both the emerging markets and developed international regions are currently at a discount to each of their trailing5-,10- and20- year averages.
| | | | |
| www.thomaswhitefunds.com | | | 3 | |
20-year Historical Price/Earnings Ratio Comparison
Source: Factset, MSCI; data as of 9/30/19. U.S. represented by MSCI US Index, Developed International represented by MSCI EAFE Index, Emerging Markets represented by MSCI Emerging Markets Index
Portfolio Strategy
Each of the three Thomas White Funds posted double-digits returns over the past twelve months ended October 31, 2019. The key driver for the performance across each portfolio was our focus on stock selection within sectors for each fund, as well as within country and region for the International and Emerging Market Funds. We believe that our investment approach, which has had and will continue to have active allocation decisions across sector and regions, is an effective way to manage the risk of different market forces such as style,
factor, currency and political risks over full-market cycles.
This investment process was designed by our founder and has continuously been refined over the past 25+ years. By leveraging the 20 years of average investment experience of our current portfolio management team, we believe we can continue to adapt to these ever changing market forces. As we head into 2020, global equity markets still face significant uncertainty in many areas affecting the markets such as global tariffs, Brexit and the upcoming U.S. election, yet the global economy is on a relatively strong
| | |
| 4 | | www.thomaswhitefunds.com |
foundation. Global growth is positive albeit slightly slower than prior years, inflation remains low across most countries and corporate earnings are expected to be stronger in 2020 than 2019. We continue to believe our investment approach is well suited to achieve long-term success when market performance is broad-based, as has been shown over the past twelve months. We believe that this dynamic, active investment approach should be able to continue to drive long-term investing success.
We want to thank all of our shareholders for your continued trust in our firm as we remain committed to helping you achieve your long-term investment goals. Please feel free to visit our websitewww.thomaswhitefunds.com for our quarterly market reviews and commentaries, or call us at1-800-811-0535 with any questions.

Douglas M. Jackman, CFA
President and Portfolio Manager
Thomas White International and Thomas White Funds
| | | | |
| www.thomaswhitefunds.com | | | 5 | |
Past performance is not a guarantee of future results.
Opinions expressed are subject to change, are not guaranteed and should not be considered recommendations to buy or sell any security.
Must be preceded or accompanied by a prospectus.
Mutual fund investing involves risk. Principal loss is possible. Investing in international markets may involve additional risks such as social and political instability, market illiquidity, exchange-rate fluctuations, a high level of volatility and limited regulation. These risks are greater for emerging markets. Investing in small and mid-cap companies can involve more risk than investing in larger companies.
Diversification does not assure a profit nor protect against loss in a declining market.
Earnings growth for a Fund holding does not guarantee a corresponding increase in the market value of the holding of the Fund.
The Thomas White Funds are distributed by Quasar Distributors, LLC.
It is not possible to invest directly in an index.
Cash Flow: Measures the cash generating capability of a company by adding non-cash charges (i.e. depreciation) and interest expense to pretax income.
Dividend Yield: Dividend yield is the ratio of a company’s annual dividend compared to its share price.
S&P GSCI Index: Serves as a benchmark for investment in the commodity markets and as a measure of commodity performance over time.
Trailing Price/Earnings: A relative valuation multiple that is based on the last 12 months of actual earnings. It is calculated by taking the current stock price and dividing it by the trailing earnings per share (EPS) for the past 12 months.
Average P/E Multiples: Average of the month-end Trailing Price/Earnings ratios for the period indicated.
MSCI US Index: A stock market index that is designed to measure the performance of the large and mid cap segments of the U.S. equity market.
MSCI EAFE Index: A stock market index that is designed to measure the equity market performance of developed markets outside of the U.S. & Canada.
Active investing has higher management fees because of the manager’s increased level of involvement while passive investing has lower management and operating fees. Investing in both actively and passively managed mutual funds involves risk and principal loss is possible. Both actively and passively managed mutual funds generally have daily liquidity. There are no guarantees regarding the performance of actively and passively managed mutual funds. Actively managed mutual funds may have higher portfolio turnover than passively managed funds. Excessive turnover can limit returns and can incur capital gains.
While there are no sales charges, management fees and other expenses still apply. Please refer to the prospectus for further details.
| | |
| 6 | | www.thomaswhitefunds.com |
THOMAS WHITE INTERNATIONAL FUND
| | | | | | | | | | | | | | |
| | | | | | | | |
| | | Unaudited
Sales
Charge | | Deferred
Sales
Charge | | Administrative
Services
Fee | | 12b-1 Fees | | Operating
Expenses1,3 | | Prospectus
Gross
Annual
Operating
Expense2 | | Prospectus
Net Annual
Operating
Expense2,3 |
| Investor Class | | None | | None | | Up to 0.25% | | None | | 1.24% | | 1.34% | | 1.24% |
| Class I | | None | | None | | None | | None | | 0.99% | | 1.18% | | 0.99% |
1 In the absence of the fee deferral/expense reimbursement arrangement for the International Fund, the ratio of expenses to average net assets would have been 1.63% for Investor Class shares and 1.40% for Class I shares.
2 Gross Annual Operating Expense and Net Annual Operating Expense are based on the most recent prospectus and may differ from other expense ratios appearing in this report.
3 Thomas White International, Ltd. (“Advisor”) has agreed to defer its fees and/or reimburse the Fund to the extent that the operating expenses for Investor Class and Class I shares exceed (as a percentage of average daily net assets) 1.24% and 0.99%, respectively. The fee deferral/expense reimbursement agreement expires February 29, 2020. The Fund has agreed to repay the Advisor for amounts deferred or reimbursed by the Advisor pursuant to the agreement provided that such repayment does not cause the Fund to exceed the above limits and the repayment is made within three years after the year in which the Advisor incurred the expense. The fee deferral/expense reimbursement agreement may only be amended or terminated by the Fund’s Board of Trustees.The net expense ratio is applicable to investors.
| | | | | | | | |
| | | | | |
| | | NAV | | Net Assets | | Redemption Fee | | Portfolio Turnover |
| Investor Class | | $14.80 | | $26.3 million | | 2.00% on shares held less than 60 days | | 43% |
| Class I | | $14.75 | | $92.8 million |
| | | | |
| www.thomaswhitefunds.com | | | 7 | |
THOMAS WHITE INTERNATIONAL FUND
| | | | | | | | | | | | | | | | | | | | | | | | | | | | | | |
| |
| Total Returns as of October 31, 2019 (Unaudited) | |
| | | | | | | | | | | | Annualized | |
| Class | | Sales Charge | | 6 month | | | Calendar
YTD | | | 1 Yr | | | 3 Yrs | | | 5 Yrs | | | 10 Yrs | | | Since
Inception
(6/28/1994)* | |
| | | | | | | | | |
| Investor Class shares (TWWDX) | | None | | | -0.08% | | | | 14.65% | | | | 10.59% | | | | 6.19% | | | | 1.58% | | | | 3.94% | | | | 6.40% | |
| | | | | | | | | |
| Class I shares1 (TWWIX) | | None | | | 0.03% | | | | 14.81% | | | | 10.90% | | | | 6.42% | | | | 1.83% | | | | 4.12% | | | | 6.47% | |
| | | | | | | | | |
| MSCI All Country World ex US Index2 | | N/A | | | 1.97% | | | | 15.45% | | | | 11.27% | | | | 8.07% | | | | 3.82% | | | | 4.94% | | | | 5.17% | |
* The inception date of the Investor Class shares.
1 Performance figures for Class I shares, first offered on August 31, 2012, include the historical performance of Investor Class shares through August 30, 2012.
2 The MSCI All Country World ex US Index is a free float-adjusted market capitalization-weighted index of both developed and emerging markets. The index is unmanaged and returns assume the reinvestment of dividends. It is not possible to invest directly in an index.
Returns of each share class reflect differences in expenses applicable to each class which are primarily differences in service fees.
The returns do not reflect the deduction of taxes that a shareholder would pay on Fund distributions or the redemption of Fund shares. The returns reflect the actual performance for each period and do not include the impacts of trades executed on the last business day of the period that were recorded on the first business day of the next period.
Performance data is based upon past performance, which is no guarantee of future results. The investment return and principal value of an investment will fluctuate so that an investor’s shares, when redeemed, may be worth more or less than their original cost. Current performance may be higher or lower than the performance data quoted. Please call 1-800-811-0535 to obtain performance data as of the most recent month-end. The Fund imposes a 2% redemption fee on shares held less than 60 days. Performance data does not reflect the redemption fee. If reflected, total returns would be lower. Investment performance reflects any fee waivers that were in effect. In the absence of such waivers, total return would have been reduced. The Gross Expense Ratios, based on the most recent prospectus, are 1.34% (Investor Class) and 1.18% (Class I).
| | |
| 8 | | www.thomaswhitefunds.com |
OCTOBER 31, 2019
GROWTH OF A $10,000 INVESTMENT WITH DIVIDENDS REINVESTED (Unaudited)
This chart illustrates the performance of a hypothetical $10,000 investment made in the Fund’s Investor Class shares and its benchmark, the MSCI All Country World ex US Index, for the past 10 years through October 31, 2019. It assumes reinvestment of dividends and capital gains, but does not reflect the effect of any applicable redemption fees. This chart does not imply future performance. Past performance does not guarantee future results. The cumulative ten year return was 47.16% for the Fund’s Investor Class shares and 62.03% for the benchmark. The Fund’s Investor Class shares average annual total return since inception on June 28, 1994 was 6.40%. The MSCI All Country World ex US Index is a free float-adjusted market capitalization-weighted index of both developed and emerging markets. The index is unmanaged and returns assume the reinvestment of dividends. It is not possible to invest directly in an index. During the periods shown, the Fund’s manager reimbursed certain Fund expenses. Absent this reimbursement, performance would have been lower. Performance will vary from class to class based on differences in class-specific expenses.
| | | | |
| www.thomaswhitefunds.com | | | 9 | |
THOMAS WHITE INTERNATIONAL FUND
The Thomas White International Fund primarily invests in equity securities of companies located in the world’s developed countries outside of the U.S. There may also be a portion of the Fund’s assets invested in companies located in emerging market countries.
Portfolio Managers
Jinwen Zhang, Ph.D., CFA
Douglas M. Jackman, CFA
Wei Li, Ph.D., CFA
John Wu, Ph.D., CFA
Rex Mathew, CFA, CMA
Ramkumar Venkatramani, CFA
Performance Review
The Thomas White International Fund Class I shares returned +10.90% for theone-year period ended October 31, 2019, compared to +11.27% for the benchmark MSCI All Country World ex US Index. Since the Fund’s inception on June 28, 1994, the Fund’s Class I shares have returned +6.47%* annualized while the benchmark index returned +5.17% for the same period.
International Equities Gain on U.S. - China Trade Deal Hopes
International equity prices ended theone-year review period with double-digit gains, helped by increased optimism about an initial U.S.-China trade deal as well as monetary easing by the major central banks. After the unexpected escalation in trade frictions that triggered an equity market selloff at the beginning of the period, both the U.S. and China have gradually
progressed towards a possible agreement. This deal is likely to address some of the concerns raised by both sides while delaying or avoiding the additional tariffs threatened by the U.S. Improved trade relations could lead to a recovery in global trade volumes and manufacturing sector growth that have remained weak for the past several quarters.
The U.S. Federal Reserve’s decision earlier this year to reverse course and start easing benchmark rates also boosted investor sentiment across the globe. The European Central Bank (ECB), prompted by persistently low growth rates in Europe, decided to relaunch its quantitative easing program. In Japan, the central bank maintained its asset purchases to prevent further downside risks to growth. Emerging market central banks have also been aggressively lowering interest rates, led by the Reserve Bank of India, which cut rates five times so far in 2019.
Portfolio Review
The energy sector outperformed as crude oil prices remained elevated for most of the period, before the recent correction. The healthcare and consumer staples sectors also benefited as investors sought relatively stable assets during increased market volatility. Technology holdings underperformed during the period as investors became skeptical about future revenue growth at several of the leading ecommerce, online service providers and semiconductor manufacturers in Asia. The consumer discretionary sector was hurt by concerns about slowing demand growth for durables and services in major markets. The financials sector also lagged on doubts
| * | Performance for Class I shares include the historical performance of Investor Class shares through August 30, 2012. |
| | |
| 10 | | www.thomaswhitefunds.com |
OCTOBER 31, 2019
about the sustainability of interest rate margins and fee income growth.
Chinese alcoholic spirits manufacturerKweichow Moutaicontributed the most to Fund returns during the review period as it exceeded earnings expectations on strong product pricing.Taiwan Semiconductor, the leading manufacturer of chipsets used in cell phones and other devices, benefited as demand remained robust.Techtronic Industries, the largest manufacturer of power tools, gained as the U.S. housing market rebounded strongly.CSL Limited, a biopharmaceutical manufacturer based in Australia, continued to outperform on better than expected earnings growth and on potential market growth for its products.Midea Group, a Chinese manufacturer of household electrical appliances and compressors, outperformed as Chinese domestic demand remained healthier than expected.
Baidu, the leading provider of online search services in China, detracted the most from returns for the period and was sold. Internet companies in Asia that are dependent on advertisement revenues are struggling with increased competition and tighter marketing budgets.Exide Industries, a manufacturer of automotive and industrial batteries in India, suffered from weak demand.Cemex, a Mexican cement producer, was sold as its earnings remained below expectations and prevented the planned reduction in financial leverage.Ryohin Keikaku, a Japanese specialty retailer, was hurt by subdued Chinese demand for its products.Carnival, one of the leading cruise line operators, underperformed on weak pricing in select markets such as Europe.
International Equity Valuations Remain Attractive Compared to the U.S.
Though economic growth rates in Europe and Japan have been softer than expected, the pace of expansion could accelerate if global trade tensions ease. An initial trade deal between the U.S. and China remains likely, despite the repeated hiccups and delays, and should help revive global trade volumes. Japan and European exporters such as Germany, are likely to benefit meaningfully from any improvement in external demand. Policy measures such as the relaunch of quantitative easing by the ECB and fiscal stimulus by the Japanese government should also support improved economic growth in the developed countries outside the U.S. Similarly, the emerging economies are also likely to see a brighter economic outlook, helped by conducive policy measures.
Equity valuations outside the U.S. remain relatively lower as U.S. domestic equities have outperformed for the last several years. As the earnings outlook for foreign companies improve, investors can be expected to increase their allocations to international equities that also offer superior dividend yields when compared to U.S. stocks. Slower U.S. Dollar gains against other currencies, provided the Fed remains accommodative, should remove another headwind against international equities in the coming year.
Thank you for your confidence in the Thomas White International Fund.
| | | | |
| www.thomaswhitefunds.com | | | 11 | |
THOMAS WHITE INTERNATIONAL FUND
Portfolio Country and Industry Allocation as of October 31, 2019
| | | | |
| | |
| Country Allocation | | % of TNA | |
| Australia | | | 5.7% | |
| | |
| Brazil | | | 3.8% | |
| | |
| Canada | | | 5.2% | |
| | |
| China | | | 8.3% | |
| | |
| Finland | | | 1.0% | |
| | |
| France | | | 8.8% | |
| | |
| Germany | | | 2.6% | |
| | |
| Hong Kong | | | 3.2% | |
| | |
| India | | | 3.0% | |
| | |
| Indonesia | | | 1.4% | |
| | |
| Ireland | | | 1.3% | |
| | |
| Italy | | | 2.3% | |
| | |
| Japan | | | 11.8% | |
| | |
| Mexico | | | 0.8% | |
| | |
| Netherlands | | | 5.5% | |
| | |
| Poland | | | 0.6% | |
| | |
| Russia | | | 3.3% | |
| | |
| Singapore | | | 1.2% | |
| | |
| South Africa | | | 1.7% | |
| | |
| South Korea | | | 3.9% | |
| | |
| Spain | | | 0.7% | |
| | |
| Sweden | | | 2.4% | |
| | |
| Switzerland | | | 3.3% | |
| | |
| Taiwan | | | 3.4% | |
| | |
| Thailand | | | 0.5% | |
| | |
| Turkey | | | 0.4% | |
| | |
| United Kingdom | | | 10.9% | |
| | |
| United States | | | 0.8% | |
| | |
| Cash & Other | | | 2.2% | |
| | | | |
| | |
| Industry Allocation | | % of TNA | |
| Automobiles & Components | | | 0.5% | |
| | |
| Banks | | | 14.9% | |
| | |
| Capital Goods | | | 10.2% | |
| | |
| Commercial & Professional Services | | | 2.2% | |
| | |
| Consumer Durables & Apparel | | | 5.1% | |
| | |
| Consumer Services | | | 1.9% | |
| | |
| Diversified Financials | | | 2.4% | |
| | |
| Energy | | | 6.9% | |
| | |
| Food, Beverage & Tobacco | | | 7.3% | |
| | |
| Health Care Equipment & Services | | | 3.3% | |
| | |
| Household & Personal Products | | | 2.6% | |
| | |
| Insurance | | | 6.2% | |
| | |
| Materials | | | 8.7% | |
| | |
| Media & Entertainment | | | 3.0% | |
| | |
| Pharmaceuticals, Biotechnology & Life Sciences | | | 5.2% | |
| | |
| Retailing | | | 1.8% | |
| | |
| Semiconductors & Semiconductor Equipment | | | 3.6% | |
| | |
| Software & Services | | | 4.3% | |
| | |
| Technology Hardware & Equipment | | | 3.5% | |
| | |
| Telecommunication Services | | | 1.4% | |
| | |
| Transportation | | | 1.9% | |
| | |
| Utilities | | | 0.9% | |
| | |
| Cash & Other | | | 2.2% | |
| | |
| | | | | |
| | |
| | | | | |
| | |
| | | | | |
| | |
| | | | | |
| | |
| | | | | |
| | |
| | | | | |
TNA - Total Net Assets
Fund holdings and industry allocations are subject to change and should not be considered a recommendation to buy or sell any securities. For a complete list of Fund holdings, please refer to the Investment Portfolio section of this report.
| | |
| 12 | | www.thomaswhitefunds.com |
| | |
| Investment Portfolio | | October 31, 2019 |
| | | | | | | | | | | | |
| Country | | Issue | | Industry | | Shares | | | Value (US$) | |
| | | | | | | | | | | |
COMMON STOCKS (95.6%) | | | | | | | | | | |
|
| |
| AUSTRALIA (5.7%) | | | | | | | | |
| | Aristocrat Leisure Limited + | | Consumer Services | | | 68,600 | | | | $1,491,627 | |
| | BHP Billiton Ltd + | | Materials | | | 84,500 | | | | 2,066,348 | |
| | CSL Limited + | | Pharmaceuticals, Biotechnology & Life Sciences | | | 11,650 | | | | 2,050,531 | |
| | Treasury Wine Estates Limited + | | Food, Beverage & Tobacco | | | 97,800 | | | | 1,181,755 | |
| | | | | | | | | | | | |
| | | | | | | | | | | 6,790,261 | |
|
| |
| BRAZIL (1.6%) | | | | | | | | |
| | Ambev SA | | Food, Beverage & Tobacco | | | 89,500 | | | | 387,413 | |
| | StoneCo Ltd. - A Shares * # | | Software & Services | | | 16,000 | | | | 588,640 | |
| | Suzano SA | | Materials | | | 116,200 | | | | 950,056 | |
| | | | | | | | | | | | |
| | | | | | | | | | | 1,926,109 | |
|
| |
| CANADA (5.2%) | | | | | | | | |
| | Canadian National Railway Company * | | Transportation | | | 16,400 | | | | 1,466,798 | |
| | Nutrien Ltd. * | | Materials | | | 23,800 | | | | 1,138,591 | |
| | Open Text Corporation * | | Software & Services | | | 37,300 | | | | 1,507,179 | |
| | Suncor Energy, Inc. * | | Energy | | | 34,200 | | | | 1,016,834 | |
| | The Toronto-Dominion Bank * | | Banks | | | 18,300 | | | | 1,044,980 | |
| | | | | | | | | | | | |
| | | | | | | | | | | 6,174,382 | |
|
| |
| CHINA (8.3%) | | | | | | | | |
| | Alibaba Group Holding Ltd. - ADR * | | Retailing | | | 9,900 | | | | 1,749,033 | |
| | Anhui Conch Cement Company Limited - H Shares + | | Materials | | | 222,500 | | | | 1,324,261 | |
| | Guangdong Investment Limited + | | Utilities | | | 218,000 | | | | 470,932 | |
| | Kweichow Moutai Co., Ltd. - A Shares + | | Food, Beverage & Tobacco | | | 15,300 | | | | 2,562,715 | |
| | Midea Group Co., Ltd. - A Shares + | | Consumer Durables & Apparel | | | 203,800 | | | | 1,593,132 | |
| | Ping An Insurance (Group) Company of China Limited - H Shares + | | Insurance | | | 192,000 | | | | 2,200,399 | |
| | | | | | | | | | | | |
| | | | | | | | | | | 9,900,472 | |
|
| |
| FINLAND (1.0%) | | | | | | | | |
| | Sampo Oyj - A Shares + | | Insurance | | | 27,700 | | | | 1,135,313 | |
|
| |
| FRANCE (8.8%) | | | | | | | | |
| | AXA SA + | | Insurance | | | 31,500 | | | | 832,497 | |
| | BNP Paribas SA + | | Banks | | | 18,000 | | | | 940,391 | |
| | Danone + | | Food, Beverage & Tobacco | | | 18,500 | | | | 1,536,378 | |
| | Dassault Systemes + | | Software & Services | | | 6,900 | | | | 1,049,609 | |
| | Eiffage + | | Capital Goods | | | 10,600 | | | | 1,139,056 | |
| | Kering + | | Consumer Durables & Apparel | | | 3,125 | | | | 1,779,772 | |
The accompanying notes are an integral part of these financial statements
| | | | |
| www.thomaswhitefunds.com | | | 13 | |
| | |
| Thomas White International Fund | | |
| | | | | | | | | | | | |
| Country | | Issue | | Industry | | Shares | | | Value (US$) | |
| | | | | | | | | | | |
| FRANCE (CONT.) | | | | | | | | |
| | L'Oreal + | | Household & Personal Products | | | 3,550 | | | | $1,036,938 | |
| | LVMH Moet Hennessy Louis Vuitton SE + | | Consumer Durables & Apparel | | | 1,950 | | | | 832,496 | |
| | Safran SA + | | Capital Goods | | | 8,425 | | | | 1,333,788 | |
| | | | | | | | | | | | |
| | | | | | | | | | | 10,480,925 | |
|
| |
| GERMANY (2.6%) | | | | | | | | |
| | Muenchener Rueckversicherungs-Gesellschaft AG + | | Insurance | | | 2,600 | | | | 722,157 | |
| | SAP SE + | | Software & Services | | | 7,500 | | | | 993,453 | |
| | Scout24 AG + | | Media & Entertainment | | | 23,300 | | | | 1,442,038 | |
| | | | | | | | | | | | |
| | | | | | | | | | | 3,157,648 | |
|
| |
| HONG KONG (3.2%) | | | | | | | | |
| | AIA Group Limited + | | Insurance | | | 82,400 | | | | 817,610 | |
| | Hong Kong Exchanges & Clearing Limited + | | Diversified Financials | | | 34,100 | | | | 1,055,894 | |
| | Techtronic Industries Company Limited + | | Consumer Durables & Apparel | | | 245,600 | | | | 1,900,279 | |
| | | | | | | | | | | | |
| | | | | | | | | | | 3,773,783 | |
|
| |
| INDIA (3.0%) | | | | | | | | |
| | HDFC Bank Ltd. - ADR | | Banks | | | 22,400 | | | | 1,368,416 | |
| | ITC Limited + | | Food, Beverage & Tobacco | | | 237,600 | | | | 863,378 | |
| | Larsen & Toubro Ltd + | | Capital Goods | | | 64,900 | | | | 1,347,093 | |
| | | | | | | | | | | | |
| | | | | | | | | | | 3,578,887 | |
|
| |
| INDONESIA (1.4%) | | | | | | | | |
| | PT Telekomunikasi Indonesia Persero Tbk + | | Telecommunication Services | | | 5,625,000 | | | | 1,635,652 | |
|
| |
| IRELAND (1.3%) | | | | | | | | |
| | CRH PLC + | | Materials | | | 42,190 | | | | 1,538,622 | |
|
| |
| ITALY (2.3%) | | | | | | | | |
| | Enel SpA + | | Utilities | | | 82,200 | | | | 636,528 | |
| | Ferrari NV + | | Automobiles & Components | | | 3,650 | | | | 586,072 | |
| | Intesa Sanpaolo S.p.A. + | | Banks | | | 621,500 | | | | 1,562,941 | |
| | | | | | | | | | | | |
| | | | | | | | | | | 2,785,541 | |
|
| |
| JAPAN (11.8%) | | | | | | | | |
| | East Japan Railway Company + | | Transportation | | | 9,100 | | | | 825,889 | |
| | KAJIMA CORPORATION + | | Capital Goods | | | 43,500 | | | | 596,427 | |
| | KOSE Corporation + | | Household & Personal Products | | | 5,460 | | | | 973,066 | |
| | M3, Inc. + | | Health Care Equipment & Services | | | 67,100 | | | | 1,605,031 | |
| | MEIJI Holdings Co., Ltd. + | | Food, Beverage & Tobacco | | | 8,400 | | | | 605,581 | |
| | Mizuho Financial Group, Inc. + | | Banks | | | 564,400 | | | | 876,494 | |
| | Nidec Corporation + | | Capital Goods | | | 7,400 | | | | 1,088,190 | |
The accompanying notes are an integral part of these financial statements
| | |
| 14 | | www.thomaswhitefunds.com |
| | |
| Investment Portfolio | | October 31, 2019 |
| | | | | | | | | | | | |
| Country | | Issue | | Industry | | Shares | | | Value (US$) | |
| | | | | | | | | | | |
| JAPAN (CONT.) | | | | | | | | |
| | Nintendo Co., Ltd. + | | Media & Entertainment | | | 3,400 | | | | $1,212,709 | |
| | Park24 Co., Ltd. + | | Commercial & Professional Services | | | 44,100 | | | | 1,045,958 | |
| | Recruit Holdings Co. Ltd. + | | Commercial & Professional Services | | | 17,900 | | | | 593,480 | |
| | Shin-Etsu Chemical Co., Ltd. + | | Materials | | | 6,600 | | | | 734,626 | |
| | SMC CORPORATION + | | Capital Goods | | | 3,200 | | | | 1,381,440 | |
| | Sompo Holdings, Inc. + | | Insurance | | | 23,600 | | | | 924,474 | |
| | Sumitomo Corporation + | | Capital Goods | | | 56,700 | | | | 918,182 | |
| | Takeda Pharmaceutical Company Limited + | | Pharmaceuticals, Biotechnology & Life Sciences | | | 19,632 | | | | 710,191 | |
| | | | | | | | | | | | |
| | | | | | | | | | | 14,091,738 | |
|
| |
| MEXICO (0.8%) | | | | | | | | |
| | Grupo Financiero Banorte S.A.B. de C.V. - Class O | | Banks | | | 168,800 | | | | 922,953 | |
|
| |
| NETHERLANDS (5.5%) | | | | | | | | |
| | Airbus SE + | | Capital Goods | | | 8,650 | | | | 1,239,614 | |
| | ASML Holding N.V. + | | Semiconductors & Semiconductor Equipment | | | 3,700 | | | | 970,692 | |
| | Euronext NV + | | Diversified Financials | | | 8,700 | | | | 701,827 | |
| | ING Groep N.V. + | | Banks | | | 125,400 | | | | 1,416,859 | |
| | Koninklijke Philips NV + | | Health Care Equipment & Services | | | 22,600 | | | | 990,233 | |
| | NN Group N.V. + | | Insurance | | | 19,100 | | | | 728,261 | |
| | Prosus NV * | | Retailing | | | 6,600 | | | | 455,129 | |
| | | | | | | | | | | | |
| | | | | | | | | | | 6,502,615 | |
| |
| | | |
| POLAND (0.6%) | | | | | | | | |
| | Bank Polska Kasa Opieki SA + | | Banks | | | 26,800 | | | | 756,150 | |
| | | | |
| | | | | | | | | | | | |
| RUSSIA (3.3%) | | | | | | | | |
| | LUKOIL PJSC - ADR + | | Energy | | | 21,200 | | | | 1,952,509 | |
| | Sberbank of Russia PJSC - ADR + | | Banks | | | 91,800 | | | | 1,350,178 | |
| | United Company RUSAL Plc * + | | Materials | | | 1,450,000 | | | | 660,005 | |
| | | | | | | | | | | | |
| | | | | | | | | | | 3,962,692 | |
|
| |
| SINGAPORE (1.2%) | | | | | | | | |
| | DBS Group Holdings Limited + | | Banks | | | 74,600 | | | | 1,422,575 | |
|
| |
| SOUTH AFRICA (1.7%) | | | | | | | | |
| | FirstRand Limited + | | Diversified Financials | | | 242,100 | | | | 1,045,918 | |
| | Naspers Limited - N Shares + | | Media & Entertainment | | | 6,600 | | | | 937,880 | |
| | | | | | | | | | | | |
| | | | | | | | | | | 1,983,798 | |
|
| |
| SOUTH KOREA (3.9%) | | | | | | | | |
| | KB Financial Group Inc. + | | Banks | | | 44,250 | | | | 1,588,076 | |
| | LG Household & Health Care Ltd. + | | Household & Personal Products | | | 1,045 | | | | 1,128,094 | |
The accompanying notes are an integral part of these financial statements
| | | | |
| www.thomaswhitefunds.com | | | 15 | |
| | |
| Thomas White International Fund | | |
| | | | | | | | | | | | |
| Country | | Issue | | Industry | | Shares | | | Value (US$) | |
| | | | | | | | | | | |
| SOUTH KOREA (CONT.) | | | | | | | | |
| | Samsung Electronics Co., Ltd. + | | Technology Hardware & Equipment | | | 43,800 | | | | $1,893,084 | |
| | | | | | | | | | | | |
| | | | | | | | | | | 4,609,254 | |
|
| |
| SPAIN (0.7%) | | | | | | | | |
| | Banco Santander S.A. + | | Banks | | | 213,400 | | | | 855,972 | |
|
| |
| SWEDEN (2.4%) | | | | | | | | |
| | Alfa Laval AB + | | Capital Goods | | | 27,400 | | | | 633,410 | |
| | ASSA ABLOY AB + | | Capital Goods | | | 26,500 | | | | 628,705 | |
| | Hexagon AB - B Shares + | | Technology Hardware & Equipment | | | 30,300 | | | | 1,547,501 | |
| | | | | | | | | | | | |
| | | | | | | | | | | 2,809,616 | |
|
| |
| SWITZERLAND (3.3%) | | | | | | | | |
| | Adecco Group AG + | | Commercial & Professional Services | | | 16,200 | | | | 960,522 | |
| | Ems-Chemie Holding AG + | | Materials | | | 1,600 | | | | 1,001,816 | |
| | Lonza Group AG + | | Pharmaceuticals, Biotechnology & Life Sciences | | | 2,000 | | | | 720,045 | |
| | Roche Holding AG + | | Pharmaceuticals, Biotechnology & Life Sciences | | | 4,200 | | | | 1,266,763 | |
| | | | | | | | | | | | |
| | | | | | | | | | | 3,949,146 | |
|
| |
| TAIWAN (3.4%) | | | | | | | | |
| | Largan Precision Company Limited + | | Technology Hardware & Equipment | | | 5,000 | | | | 731,217 | |
| | Taiwan Semiconductor Manufacturing Company, Ltd. + | | Semiconductors & Semiconductor Equipment | | | 62,000 | | | | 602,347 | |
| | Taiwan Semiconductor Manufacturing Company, Ltd. - ADR | | Semiconductors & Semiconductor Equipment | | | 53,000 | | | | 2,736,390 | |
| | | | | | | | | | | | |
| | | | | | | | | | | 4,069,954 | |
|
| |
| THAILAND (0.5%) | | | | | | | | | | |
| | Thai Beverage Public Company Limited + | | Food, Beverage & Tobacco | | | 906,700 | | | | 608,330 | |
|
| |
| TURKEY (0.4%) | | | | | | | | |
| | KOC Holding A.S. + | | Capital Goods | | | 141,500 | | | | 463,476 | |
|
| |
| UNITED KINGDOM (10.9%) | | | | | | | | |
| | Anglo American PLC + | | Materials | | | 37,800 | | | | 971,718 | |
| | Ashtead Group Plc + | | Capital Goods | | | 45,900 | | | | 1,396,491 | |
| | AstraZeneca Plc + | | Pharmaceuticals, Biotechnology & Life Sciences | | | 14,800 | | | | 1,443,392 | |
| | Barclays PLC + | | Banks | | | 496,000 | | | | 1,077,332 | |
| | BP p.l.c. + | | Energy | | | 306,900 | | | | 1,950,108 | |
| | British American Tobacco P.L.C. + | | Food, Beverage & Tobacco | | | 25,500 | | | | 891,269 | |
The accompanying notes are an integral part of these financial statements
| | |
| 16 | | www.thomaswhitefunds.com |
| | |
| Investment Portfolio | | October 31, 2019 |
| | | | | | | | | | | | |
| Country | | Issue | | Industry | | Shares | | | Value (US$) | |
| | | | | | | | | | | |
| UNITED KINGDOM (CONT.) | | | | | | | | |
| | GVC Holdings PLC + | | Consumer Services | | | 64,750 | | | | $746,888 | |
| | The Royal Bank of Scotland Group Public Limited Company + | | Banks | | | 361,100 | | | | 995,533 | |
| | Royal Dutch Shell PLC - B Shares + | | Energy | | | 75,500 | | | | 2,174,412 | |
| | Smith & Nephew plc + | | Health Care Equipment & Services | | | 61,300 | | | | 1,313,695 | |
| | | | | | | | | | | | |
| | | | | | | | | | | 12,960,838 | |
|
| |
| UNITED STATES (0.8%) | | | | | | | | |
| | Cognizant Technology Solutions Corporation - Class A | | Software & Services | | | 16,500 | | | | 1,005,510 | |
|
| |
Total Common Stocks | | (Cost $97,072,157) | | | | | | | 113,852,212 | |
| | | | | | | | | | | | |
|
| |
PREFERRED STOCKS (2.2%) | | | | | | | | | | |
|
| |
| BRAZIL (2.2%) | | | | | | | | | | |
| | Itau Unibanco Holding S.A. (2/5/20, 0.51%) ^ | | Banks | | | 170,640 | | | | 1,542,802 | |
| | Petroleo Brasileiro SA - Petrobras (2/27/20, 0.07%) ^ | | Energy | | | 141,200 | | | | 1,069,606 | |
| | | | | | | | | | | | |
| | | | | | | | | | | 2,612,408 | |
|
| |
Total Preferred Stocks | | (Cost $2,171,043) | | | | | | | 2,612,408 | |
| | | | | | | | | | | | |
|
| |
| Total Investments | | 97.8% | | (Cost $99,243,200) | | | | | | | $116,464,620 | |
Other Assets, Less Liabilities | | 2.2% | | | | | | | | | 2,651,911 | |
| Total Net Assets: | | 100.0% | | | | | | | | | $119,116,531 | |
|
| |
| * | Non-Income Producing Securities |
| # | All or a portion of securities on loan at October 31, 2019. The market value of the securities loaned was $588,640. The loaned securities were secured with non-cash collateral with a value of $600,467. The non-cash collateral received consists of short term investments and long term bonds, and is held for the benefit of the Fund at the Fund's custodian. The Fund cannot repledge or resell this collateral. Collateral is calculated based on prior day's prices.—See Note 1(I) to Financial Statements |
| ^ | Maturity Date and Preferred Dividend Rate of Preferred Stock |
| PLC | - Public Limited Company |
| ADR | - American Depositary Receipt |
Industry classifications shown in the Investment Portfolio are based off of the Global Industry Classification Standard (GICS®). GICS was developed by and/or is the exclusive property of MSCI, Inc. and Standard & Poor's Financial Services LLC ("S&P"). GICS is a service mark of MSCI and S&P and has been licensed for use by U.S. Bancorp Fund Services, LLC.
The accompanying notes are an integral part of these financial statements
| | | | |
| www.thomaswhitefunds.com | | | 17 | |
| | |
| Thomas White International Fund | | |
The following table summarizes the inputs used, as of October 31, 2019, in valuating the Fund’s assets:
| | | | | | | | | | | | | | | | |
| | | | | |
| | | Level 1 | | | Level 2 | | | Level 3 | | | Total | |
| Common Stocks | | | | | | | | | | | | | | | | |
| | | | | |
| Australia | | | $ ------- | | | | $6,790,261 | | | | $ ------- | | | | $6,790,261 | |
| | | | | |
| Brazil | | | 1,926,109 | | | | ------- | | | | ------- | | | | 1,926,109 | |
| | | | | |
| Canada | | | 6,174,382 | | | | ------- | | | | ------- | | | | 6,174,382 | |
| | | | | |
| China | | | 1,749,033 | | | | 8,151,439 | | |
| -------
|
| | | 9,900,472 | |
| | | | | |
| Finland | | | ------- | | | | 1,135,313 | | | | ------- | | | | 1,135,313 | |
| | | | | |
| France | | | ------- | | | | 10,480,925 | | | | ------- | | | | 10,480,925 | |
| | | | | |
| Germany | | | ------- | | | | 3,157,648 | | | | ------- | | | | 3,157,648 | |
| | | | | |
| Hong Kong | | | ------- | | | | 3,773,783 | | | | ------- | | | | 3,773,783 | |
| | | | | |
| India | | | 1,368,416 | | | | 2,210,471 | | | | ------- | | | | 3,578,887 | |
| | | | | |
| Indonesia | | | ------- | | | | 1,635,652 | | | | ------- | | | | 1,635,652 | |
| | | | | |
| Ireland | | | ------- | | | | 1,538,622 | | | | ------- | | | | 1,538,622 | |
| | | | | |
| Italy | | | ------- | | | | 2,785,541 | | | | ------- | | | | 2,785,541 | |
| | | | | |
| Japan | | | ------- | | | | 14,091,738 | | | | ------- | | | | 14,091,738 | |
| | | | | |
| Mexico | | | 922,953 | | | | ------- | | | | ------- | | | | 922,953 | |
| | | | | |
| Netherlands | | | 455,129 | | | | 6,047,486 | | | | ------- | | | | 6,502,615 | |
| | | | | |
| Poland | | | ------- | | | | 756,150 | | | | ------- | | | | 756,150 | |
| | | | | |
| Russia | | | ------- | | | | 3,962,692 | | | | ------- | | | | 3,962,692 | |
| | | | | |
| Singapore | | | ------- | | | | 1,422,575 | | | | ------- | | | | 1,422,575 | |
| | | | | |
| South Africa | | | ------- | | | | 1,983,798 | | | | ------- | | | | 1,983,798 | |
| | | | | |
| South Korea | | | ------- | | | | 4,609,254 | | | | ------- | | | | 4,609,254 | |
| | | | | |
| Spain | | | ------- | | | | 855,972 | | | | ------- | | | | 855,972 | |
| | | | | |
| Sweden | | | ------- | | | | 2,809,616 | | | | ------- | | | | 2,809,616 | |
| | | | | |
| Switzerland | | | ------- | | | | 3,949,146 | | | | ------- | | | | 3,949,146 | |
| | | | | |
| Taiwan | | | 2,736,390 | | | | 1,333,564 | | | | ------- | | | | 4,069,954 | |
| | | | | |
| Thailand | | | ------- | | | | 608,330 | | | | ------- | | | | 608,330 | |
| | | | | |
| Turkey | | | ------- | | | | 463,476 | | | | ------- | | | | 463,476 | |
| | | | | |
| United Kingdom | | | ------- | | | | 12,960,838 | | | | ------- | | | | 12,960,838 | |
| | | | | |
| United States | | | 1,005,510 | | |
| -------
|
| | | ------- | | | | 1,005,510 | |
| Total Common Stocks | | | $16,337,922 | | | | $97,514,290 | | | | $ ------- | | | | $113,852,212 | |
| Preferred Stocks | | | | | | | | | | | | | | | | |
| | | | | |
| Brazil | | | 2,612,408 | | | | ------- | | | | ------- | | | | 2,612,408 | |
| Total Preferred Stocks | | | 2,612,408 | | | | ------- | | | | ------- | | | | 2,612,408 | |
| Total Investments | | | $18,950,330 | | | | $97,514,290 | | | | $ ------- | | | | $116,464,620 | |
For more information on valuation inputs, please refer to Note 1(A) of the accompanying Notes to Financial Statements.
The accompanying notes are an integral part of these financial statements
| | |
| 18 | | www.thomaswhitefunds.com |
| | |
| Investment Portfolio | | October 31, 2019 |
The Fund’s assets assigned to Level 2 include certain foreign securities for which a third party statistical pricing service may be employed for purposes of fair market valuation. There were no transfers into or out of Level 3 during the reporting period, as compared to their classification from the prior annual report.
The accompanying notes are an integral part of these financial statements
| | | | |
| www.thomaswhitefunds.com | | | 19 | |
THOMAS WHITE EMERGING MARKETS FUND
| | | | | | | | | | | | | | |
| | | | | | | | |
| | | Unaudited
Sales
Charge | | Deferred
Sales
Charge | | Administrative
Services
Fee | | 12b-1 Fees | | Operating
Expenses1,3 | | Prospectus
Gross
Annual
Operating
Expense2 | | Prospectus
Net Annual
Operating
Expense2,3 |
| Investor Class | | None | | None | | Up to 0.25% | | None | | 1.34% | | 1.55% | | 1.35% |
| Class I | | None | | None | | None | | None | | 1.09% | | 1.52% | | 1.10% |
1 In the absence of the fee deferral/expense reimbursement arrangement for the Emerging Markets Fund, the ratio of expenses to average net assets would have been 1.65% for Investor Class shares and 1.63% for Class I shares.
2 Gross Annual Operating Expense and Net Annual Operating Expense are based on the most recent prospectus and may differ from other expense ratios appearing in this report.
3 Thomas White International, Ltd. (“Advisor”) has agreed to defer its fees and/or reimburse the Fund to the extent that the operating expenses for Investor Class and Class I shares exceed (as a percentage of average daily net assets) 1.34% and 1.09%, respectively. The fee deferral/expense reimbursement agreement expires February 29, 2020. The Fund has agreed to repay the Advisor for amounts deferred or reimbursed by the Advisor pursuant to the agreement provided that such repayment does not cause the Fund to exceed the above limits and the repayment is made within three years after the year in which the Advisor incurred the expense. The fee deferral/expense reimbursement agreement may only be amended or terminated by the Fund’s Board of Trustees. The net expense ratio is applicable to investors.
| | | | | | | | |
| | | | | |
| | | NAV | | Net Assets | | Redemption Fee | | Portfolio Turnover |
| Investor Class | | $10.91 | | $1.7 million | | 2.00% on shares held less than 60 days | | 29% |
| Class I | | $11.02 | | $34.7 million |
| | |
| 20 | | www.thomaswhitefunds.com |
OCTOBER 31, 2019
| | | | | | | | | | | | | | | | | | | | | | | | | | |
| |
| Total Returns as of October 31, 2019 (Unaudited) | |
| | | | | | | | | | | | Annualized | |
| Class | | Sales Charge | | 6 month | | | Calendar
YTD | | | 1 Yr | | | 3 Yrs | | | 5 Yrs | | | Since
Inception
(6/28/2010)* | |
| | | | | | | | |
| Investor Class shares (TWEMX) | | None | | | -1.88% | | | | 12.98% | | | | 11.84% | | | | 4.98% | | | | -0.01% | | | | 2.13% | |
| | | | | | | | |
| Class I shares1 (TWIIX) | | None | | | -1.78% | | | | 13.13% | | | | 12.11% | | | | 5.25% | | | | 0.25% | | | | 2.32% | |
| | | | | | | | |
| MSCI Emerging Markets Index2 | | N/A | | | -1.67% | | | | 10.35% | | | | 11.86% | | | | 7.36% | | | | 2.93% | | | | 3.47% | |
* The inception date of the Investor Class shares.
1 Performance figures for Class I shares, first offered on August 31, 2012, include the historical performance of Investor Class shares through August 30, 2012.
2 The MSCI Emerging Markets Index is a free float-adjusted market capitalization index that is designed to measure equity market performance of emerging markets. The index is unmanaged and returns assume the reinvestment of dividends. It is not possible to invest directly in an index.
Returns of each share class reflect differences in expenses applicable to each class which are primarily differences in service fees.
The returns do not reflect the deduction of taxes that a shareholder would pay on Fund distributions or the redemption of Fund shares. The returns reflect the actual performance for each period and do not include the impacts of trades executed on the last business day of the period that were recorded on the first business day of the next period.
Performance data is based upon past performance, which is no guarantee of future results. The investment return and principal value of an investment will fluctuate so that an investor’s shares, when redeemed, may be worth more or less than their original cost. Current performance may be higher or lower than the performance data quoted. Please call 1-800-811-0535 to obtain performance data as of the most recent month-end. The Fund imposes a 2% redemption fee on shares held less than 60 days. Performance data does not reflect the redemption fee. If reflected, total returns would be lower. Investment performance reflects any fee waivers that were in effect. In the absence of such waivers, total return would have been reduced. The Gross Expense Ratios, based on the most recent prospectus, are 1.55% (Investor Class) and 1.52% (Class I).
| | | | |
| www.thomaswhitefunds.com | | | 21 | |
THOMAS WHITE EMERGING MARKETS FUND
GROWTH OF A $10,000 INVESTMENT WITH DIVIDENDS REINVESTED (Unaudited)
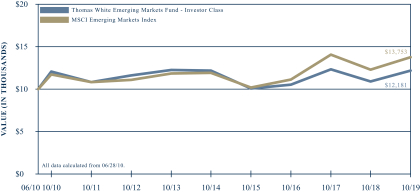
This chart illustrates the performance of a hypothetical $10,000 investment made in the Fund’s Investor Class shares and its benchmark, the MSCI Emerging Markets Index, since inception on June 28, 2010 through October 31, 2019. It assumes reinvestment of dividends and capital gains, but does not reflect the effect of any applicable redemption fees. This chart does not imply future performance. Past performance does not guarantee future results. The cumulative return since inception was 21.81% for the Fund’s Investor Class shares and 37.53% for the benchmark. The Fund’s Investor Class shares average annual total return since inception on June 28, 2010 was 2.13%. The MSCI Emerging Markets Index is a free float-adjusted market capitalization index that is designed to measure equity market performance of emerging markets. The index is unmanaged and returns assume the reinvestment of dividends. It is not possible to invest directly in an index. During the periods shown, the Fund’s manager reimbursed certain Fund expenses. Absent this reimbursement, performance would have been lower. Performance will vary from class to class based on differences in class-specific expenses.
| | |
| 22 | | www.thomaswhitefunds.com |
OCTOBER 31, 2019
The Thomas White Emerging Markets Fund invests primarily in securities of companies located in or whose businesses are closely associated with the world’s emerging markets countries.
Portfolio Managers
Jinwen Zhang, Ph.D., CFA
Douglas M. Jackman, CFA
Wei Li, Ph.D., CFA
John Wu, Ph.D., CFA
Rex Mathew, CFA, CMA
Ramkumar Venkatramani, CFA
Performance Review
During theone-year period ended October 31, 2019, the Thomas White Emerging Markets Fund Class I shares returned +12.11%, compared to +11.86% for its benchmark, the MSCI Emerging Markets Index. Since its inception on June 28, 2010, the Fund’s Class I shares have returned +2.32%* annualized, against +3.47% for the benchmark index.
Emerging Markets Recover As Trade Tensions Ease
The prospect of easing trade tensions between the U.S. and China as well as larger than expected monetary easing helped emerging market equities end the review period with healthy gains. Though global trade volumes and the manufacturing sector in several countries remained weak, investors have become more optimistic about the growth outlook for 2020. The U.S. Federal Reserve’s decision in early 2019 to reverse monetary tightening and start rate cuts
helped global investor sentiment meaningfully. Central banks in several emerging countries also lowered their benchmark rates while some governments introduced targeted fiscal stimulus measures to support growth.
Portfolio Review
Technology was the best performing sector over the review period as most large companies continued to report healthy revenue and earnings growth. Growing digitization of businesses as well as the introduction of newer technologies are likely to sustain both hardware and software demand in the future. The consumer discretionary and consumer staples sectors saw healthy earnings as consumer spending remained resilient in most large economies during the period. The materials and energy sectors underperformed during the period as prices of several industrial commodities weakened, with the notable exception of iron ore, and crude oil prices stagnated. The industrials sector also lagged as the much-awaited recovery in capital spending failed to materialize.
Taiwan Semiconductor, the leading manufacturer of chipsets used in cell phones and other devices, contributed the most to returns for the period as demand remained robust. Asian ecommerce groupAlibabaas well as online gaming and instant communications providerTencent benefited from healthy earnings growth. Both of these companies continue to expand into newer product segments and geographies to sustain their revenue growth.Samsung Electronics, the largest manufacturer of memory chips as
| * | Performance for Class I shares includes the historical performance of Investor Class shares through August 30, 2012. |
| | | | |
| www.thomaswhitefunds.com | | | 23 | |
THOMAS WHITE EMERGING MARKETS FUND
well as cell phones, also gained on expectations of improved earnings as semiconductor prices rise further. Russian oil producerLukoil outperformed, despite subdued crude oil prices, helped by continued gains in production volumes.
Baidu, the leading provider of online search services in China, detracted the most from returns for the period and was sold. Internet companies in Asia that are dependent on advertisement revenues are struggling with increased competition and tighter marketing budgets.Catcher Technology, a manufacturer of cellphone components based in Taiwan, declined on weaker than expected earnings and margins. Brazilian iron ore producerVale was hurt by a dam burst at one of its mines that could lead to significant financial penalties.United Tractors, an Indonesian coal miner and distributor of mining equipment, declined as Chinese demand for coking coal remained weak.China Petroleum & Chemicals, the largest Chinese energy company, underperformed on subdued oil prices and tighter refining spreads.
Emerging Markets Could See Improved Earnings Growth
Barring any unexpected escalation in the U.S.-China trade war, most emerging
economies are likely to see a modest improvement in economic growth next year. The anticipated recovery in trade volumes should revive global manufacturing activity and help the export-dependent economies, especially in Asia. The healthier growth outlook should also stoke demand for base metals and other commodities, lifting domestic activity in resource exporting countries such as Brazil, Indonesia, Russia and South Africa.
Monetary and fiscal policies should also remain supportive in most emerging countries, helped by benign inflation risks. Though the pace of rate cuts could slow, when compared to the aggressive easing in countries such as Brazil and India in 2019, interest rates in most emerging countries are likely to trend lower over the next year. This favorable environment should lift corporate earnings, and along with relatively inexpensive valuations compared to the developed markets, is likely to drive equity returns in emerging markets.
We thank you for investing in the Thomas White Emerging Markets Fund.
| | |
| 24 | | www.thomaswhitefunds.com |
OCTOBER 31, 2019
Portfolio Country and Industry Allocation as of October 31, 2019
| | | | |
| | |
| Country Allocation | | % of TNA | |
| Brazil | | | 10.9% | |
| | |
| Chile | | | 2.4% | |
| | |
| China | | | 29.8% | |
| | |
| India | | | 9.5% | |
| | |
| Indonesia | | | 4.5% | |
| | |
| Mexico | | | 4.6% | |
| | |
| Netherlands | | | 0.8% | |
| | |
| Panama | | | 1.0% | |
| | |
| Philippines | | | 1.9% | |
| | |
| Poland | | | 1.1% | |
| | |
| Russia | | | 4.9% | |
| | |
| South Africa | | | 3.2% | |
| | |
| South Korea | | | 12.2% | |
| | |
| Taiwan | | | 7.3% | |
| | |
| Thailand | | | 2.7% | |
| | |
| Turkey | | | 0.6% | |
| | |
| United Arab Emirates | | | 0.9% | |
| | |
| Cash & Other | | | 1.7% | |
| | |
| | | | | |
| | |
| | | | | |
| | |
| | | | | |
| | |
| | | | | |
| | |
| | | | | |
| | | | |
| | |
| Industry Allocation | | % of TNA | |
| Automobiles & Components | | | 1.7% | |
| | |
| Banks | | | 19.3% | |
| | |
| Capital Goods | | | 1.0% | |
| | |
| Consumer Durables & Apparel | | | 3.3% | |
| | |
| Diversified Financials | | | 3.3% | |
| | |
| Energy | | | 9.5% | |
| | |
| Food & Staples Retailing | | | 0.8% | |
| | |
| Food, Beverage & Tobacco | | | 4.8% | |
| | |
| Health Care Equipment & Services | | | 1.0% | |
| | |
| Household & Personal Products | | | 1.5% | |
| | |
| Insurance | | | 3.1% | |
| | |
| Materials | | | 7.6% | |
| | |
| Media & Entertainment | | | 3.4% | |
| | |
| Pharmaceuticals, Biotechnology & Life Sciences | | | 0.9% | |
| | |
| Real Estate | | | 2.2% | |
| | |
| Retailing | | | 6.7% | |
| | |
| Semiconductors & Semiconductor Equipment | | | 7.3% | |
| | |
| Software & Services | | | 7.3% | |
| | |
| Technology Hardware & Equipment | | | 5.9% | |
| | |
| Telecommunication Services | | | 1.4% | |
| | |
| Transportation | | | 3.9% | |
| | |
| Utilities | | | 2.4% | |
| | |
| Cash & Other | | | 1.7% | |
TNA - Total Net Assets
Fund holdings and industry allocations are subject to change and should not be considered a recommendation to buy or sell any securities. For a complete list of Fund holdings, please refer to the Investment Portfolio section of this report.
| | | | |
| www.thomaswhitefunds.com | | | 25 | |
| | |
| Thomas White Emerging Markets Fund | | |
| | | | | | | | | | | | |
| Country | | Issue | | Industry | | Shares | | | Value (US$) | |
| | | | | | | | | | | |
COMMON STOCKS (90.1%) | | | | | |
|
| |
| BRAZIL (4.8%) | | | | | | | | |
| | Ambev SA | | Food, Beverage & Tobacco | | | 60,200 | | | | $260,584 | |
| | B3 SA - Brasil Bolsa Balcao | | Diversified Financials | | | 45,400 | | | | 548,015 | |
| | Fleury SA | | Health Care Equipment & Services | | | 60,100 | | | | 379,437 | |
| | StoneCo Ltd. - A Shares * # | | Software & Services | | | 5,000 | | | | 183,950 | |
| | Suzano SA | | Materials | | | 45,100 | | | | 368,739 | |
| | | | | | | | | | | | |
| | | | | | | | | 1,740,725 | |
|
| |
| CHILE (2.4%) | | | | | | | | |
| | Enel Americas SA | | Utilities | | | 3,112,131 | | | | 581,217 | |
| | Enel Chile SA | | Utilities | | | 3,725,000 | | | | 306,348 | |
| | | | | | | | | | | | |
| | | | | | | | | 887,565 | |
|
| |
| CHINA (29.8%) | | | | | | | | |
| | Alibaba Group Holding Ltd. - ADR * | | Retailing | | | 11,125 | | | | 1,965,454 | |
| | Anhui Conch Cement Company Limited - H Shares + | | Materials | | | 138,900 | | | | 826,696 | |
| | Brilliance China Automotive Holdings Ltd. + | | Automobiles & Components | | | 188,000 | | | | 205,901 | |
| | China Construction Bank Corp. - H Shares + | | Banks | | | 1,053,000 | | | | 846,750 | |
| | China Overseas Land & Investment Limited + | | Real Estate | | | 146,000 | | | | 458,018 | |
| | China Petroleum and Chemical Corporation (Sinopec) - H Shares + | | Energy | | | 656,000 | | | | 374,113 | |
| | CSPC Pharmaceutical Group Limited + | | Pharmaceuticals, Biotechnology & Life Sciences | | | 128,000 | | | | 325,620 | |
| | Haier Electronics Group Co., Ltd. + | | Consumer Durables & Apparel | | | 119,000 | | | | 337,568 | |
| | Kweichow Moutai Co., Ltd. - A Shares + | | Food, Beverage & Tobacco | | | 2,800 | | | | 468,994 | |
| | Midea Group Co., Ltd. - A Shares + | | Consumer Durables & Apparel | | | 33,000 | | | | 257,965 | |
| | Momo Inc. - ADR # | | Media & Entertainment | | | 12,600 | | | | 422,352 | |
| | Ping An Insurance (Group) Company of China Limited - H Shares + | | Insurance | | | 80,200 | | | | 919,125 | |
| | Shanghai International Airport Co., Ltd. - A Shares + | | Transportation | | | 37,000 | | | | 398,921 | |
| | Shenzhou International Group Holdings Ltd. + | | Consumer Durables & Apparel | | | 44,000 | | | | 602,587 | |
| | Tencent Holdings Limited + | | Software & Services | | | 42,900 | | | | 1,749,359 | |
| | ZTO Express (Cayman) Inc. - ADR | | Transportation | | | 30,600 | | | | 673,200 | |
| | | | | | | | | | | | |
| | | | | | | | | 10,832,623 | |
|
| |
| INDIA (9.5%) | | | | | | | | |
| | Axis Bank Limited + | | Banks | | | 23,100 | | | | 239,712 | |
| | Coal India Limited + | | Energy | | | 115,700 | | | | 338,406 | |
| | HDFC Bank Ltd. - ADR | | Banks | | | 6,600 | | | | 403,194 | |
The accompanying notes are an integral part of these financial statements
| | |
| 26 | | www.thomaswhitefunds.com |
| | |
| Investment Portfolio | | October 31, 2019 |
| | | | | | | | | | | | |
| Country | | Issue | | Industry | | Shares | | | Value (US$) | |
| | | | | | | | | | | |
| INDIA (CONT.) | | | | | | | | |
| | ICICI Bank Limited + | | Banks | | | 59,600 | | | | $390,156 | |
| | ITC Limited + | | Food, Beverage & Tobacco | | | 123,100 | | | | 447,314 | |
| | Larsen & Toubro Ltd + | | Capital Goods | | | 18,200 | | | | 377,767 | |
| | Mahindra & Mahindra Ltd. - GDR + | | Automobiles & Components | | | 47,198 | | | | 404,325 | |
| | Vedanta Limited + | | Materials | | | 134,500 | | | | 280,363 | |
| | WNS (Holdings) Ltd. - ADR * | | Software & Services | | | 6,600 | | | | 408,144 | |
| | Zee Entertainment Enterprises Limited + | | Media & Entertainment | | | 48,300 | | | | 177,469 | |
| | | | | | | | | | | | |
| | | | | | | | | | | 3,466,850 | |
|
| |
| INDONESIA (4.5%) | | | | | | | | |
| | PT Bank Mandiri (Persero) Tbk + | | Banks | | | 736,300 | | | | 367,489 | |
| | PT Bank Rakyat Indonesia (Persero) Tbk + | | Banks | | | 1,627,000 | | | | 486,600 | |
| | PT Matahari Department Store Tbk + | | Retailing | | | 713,600 | | | | 184,616 | |
| | PT Telekomunikasi Indonesia Persero Tbk + | | Telecommunication Services | | | 1,006,000 | | | | 292,527 | |
| | PT United Tractos Tbk + | | Energy | | | 189,400 | | | | 291,170 | |
| | | | | | | | | | | | |
| | | | | | | | | 1,622,402 | |
|
| |
| MEXICO (3.7%) | | | | | | | | |
| | Grupo Aeroportuario del Sureste SAB de CV - Class B | | Transportation | | | 21,300 | | | | 348,790 | |
| | Grupo Financiero Banorte, S.A.B. de C.V. - Class O | | Banks | | | 129,100 | | | | 705,884 | |
| | Wal-Mart de Mexico S.A.B. de C.V. | | Food & Staples Retailing | | | 95,100 | | | | 285,006 | |
| | | | | | | | | | | | |
| | | | | | | | | 1,339,680 | |
|
| |
| NETHERLANDS (0.8%) | | | | | | | | |
| | Prosus NV * | | Retailing | | | 4,350 | | | | 299,972 | |
|
| |
| PANAMA (1.0%) | | | | | | | | |
| | Banco Latinoamericano de Comercio Exterior, S.A. - E Shares | | Diversified Financials | | | 17,100 | | | | 352,773 | |
|
| |
| PHILIPPINES (1.9%) | | | | | | | | |
| | Metropolitan Bank & Trust Company + | | Banks | | | 286,989 | | | | 381,545 | |
| | Semirara Mining and Power Corporation + | | Energy | | | 695,700 | | | | 319,950 | |
| | | | | | | | | | | | |
| | | | | | | | | | | 701,495 | |
|
| |
| POLAND (1.1%) | | | | | | | | |
| | Bank Polska Kasa Opieki SA + | | Banks | | | 5,700 | | | | 160,823 | |
| | KGHM Polska Miedz S.A. * + | | Materials | | | 10,600 | | | | 232,029 | |
| | | | | | | | | | | | |
| | | | | | | | | | | 392,852 | |
|
| |
| RUSSIA (4.9%) | | | | | | | | |
| | LUKOIL PJSC - ADR + | | Energy | | | 10,300 | | | | 948,625 | |
The accompanying notes are an integral part of these financial statements
| | | | |
| www.thomaswhitefunds.com | | | 27 | |
| | |
| Thomas White Emerging Markets Fund | | |
| | | | | | | | | | | | |
| Country | | Issue | | Industry | | Shares | | | Value (US$) | |
| | | | | | | | | | | |
| RUSSIA (CONT.) | | | | | | | | |
| | Sberbank of Russia PJSC - ADR + | | Banks | | | 56,075 | | | | $824,741 | |
| | | | | | | | | | | | |
| | | | | | | | | | | 1,773,366 | |
|
| |
| SOUTH AFRICA (3.2%) | | | | | | | | |
| | Absa Group Limited + | | Banks | | | 24,500 | | | | 251,045 | |
| | FirstRand Limited + | | Diversified Financials | | | 71,000 | | | | 306,733 | |
| | Naspers Limited - N Shares + | | Media & Entertainment | | | 4,350 | | | | 618,148 | |
| | | | | | | | | | | | |
| | | | | | | | | | | 1,175,926 | |
|
| |
| SOUTH KOREA (11.0%) | | | | | | |
| | KB Financial Group Inc. + | | Banks | | | 10,550 | | | | 378,626 | |
| | Korea Zinc Co Ltd. + | | Materials | | | 1,075 | | | | 400,500 | |
| | LG Household & Health Care Ltd. + | | Household & Personal Products | | | 490 | | | | 528,962 | |
| | POSCO + | | Materials | | | 1,425 | | | | 256,980 | |
| | Samsung Electronics Co., Ltd. + | | Technology Hardware & Equipment | | | 39,950 | | | | 1,726,683 | |
| | Samsung Fire & Marine Insurance Co., Ltd. + | | Insurance | | | 1,165 | | | | 215,896 | |
| | Shinhan Financial Group Co., Ltd. + | | Banks | | | 14,025 | | | | 510,254 | |
| | | | | | | | | | | | |
| | | | | | | | | | | 4,017,901 | |
|
| |
| TAIWAN (7.3%) | | | | | | | | |
| | Largan Precision Company Limited + | | Technology Hardware & Equipment | | | 3,000 | | | | 438,730 | |
| | Taiwan Semiconductor Manufacturing Company, Ltd. + | | Semiconductors & Semiconductor Equipment | | | 229,700 | | | | 2,231,600 | |
| | | | | | | | | | | | |
| | | | | | | | | | | 2,670,330 | |
|
| |
| THAILAND (2.7%) | | | | | | | | |
| | PTT Exploration and Production Public Company Limited + | | Energy | | | 108,100 | | | | 432,168 | |
| | Thai Beverage Public Company Limited + | | Food, Beverage & Tobacco | | | 822,700 | | | | 551,973 | |
| | | | | | | | | | | | |
| | | | | | | | | | | 984,141 | |
|
| |
| TURKEY (0.6%) | | | | | | | | |
| | Turkcell Iletisim Hizmetleri AS + | | Telecommunication Services | | | 91,600 | | | | 201,345 | |
|
| |
| UNITED STATES (0.9%) | | | | | | | | |
| | Cognizant Technology Solutions Corporation - A Shares | | Software & Services | | | 5,400 | | | | 329,076 | |
|
| |
| Total Common Stocks | | | | (Cost $26,238,373) | | | | | | | 32,789,022 | |
| | | | | | | | | | | | |
|
| |
PREFERRED STOCKS (7.3%) | | | | | | | | | | |
|
| |
| BRAZIL (6.1%) | | | | | | | | |
| | Banco Bradesco S.A. (1/31/20, N/A) ^ | | Banks | | | 39,600 | | | | 348,259 | |
The accompanying notes are an integral part of these financial statements
| | |
| 28 | | www.thomaswhitefunds.com |
| | |
| Investment Portfolio | | October 31, 2019 |
| | | | | | | | | | | | |
| Country | | Issue | | Industry | | Shares | | | Value (US$) | |
| | | | | | | | | | | |
| BRAZIL (CONT.) | | | | | | | | |
| | Gerdau S.A. (2/21/20, 0.93%) ^ | | Materials | | | 119,300 | | | | $399,501 | |
| | Itau Unibanco Holding S.A. (2/5/20, 0.51%) ^ | | Banks | | | 79,423 | | | | 718,084 | |
| | Petroleo Brasileiro SA Petrobras (2/27/20, 0.07%) ^ | | Energy | | | 100,200 | | | | 759,027 | |
| | | | | | | | | | | | |
| | | | | | | 2,224,871 | |
|
| |
| SOUTH KOREA (1.2%) | | | | | | | | |
| | Samsung Electronics Co., Ltd. (1/8/20, 3.37%) ^ + | | Semiconductors & Semiconductor Equipment | | | 12,500 | | | | 437,863 | |
|
| |
Total Preferred Stocks | | (Cost $2,294,937) | | | | | | | 2,662,734 | |
|
| |
REAL ESTATE INVESTMENT TRUST (REIT) (0.9%) | | | | | | | | |
|
| |
| MEXICO (0.9%) | | | | | | | | |
| | Fibra Uno Administracion SA de CV | | Real Estate | | | 212,600 | | | | 323,158 | |
| | | | |
| | | | | | | | | | | | |
| Total REIT | | (Cost $263,752) | | | | | | | 323,158 | |
| | | | | | | | | | | | |
|
| |
SHORT TERM INVESTMENT (1.6%) | | | | | |
|
| |
| MONEY MARKET FUND (1.6%) | | | | |
| | Northern Institutional Treasury Portfolio, 1.78%(a) | | | | | 584,308 | | | | 584,308 | |
|
| |
Total Short Term Investment | | (Cost $584,308) | | | | | | | 584,308 | |
| | | | | | | | | | | | |
|
| |
| Total Investments | | 99.9% | | (Cost $29,381,370) | | | | | | | $36,359,222 | |
Other Assets,
Less Liabilities | | 0.1% | | | | | | | | | 36,660 | |
| Total Net Assets: | | 100.0% | | | | | | | | | $36,395,882 | |
|
| |
| * | Non-Income Producing Securities |
| # | All or a portion of securities on loan at October 31, 2019. The market value of the securities loaned was $458,814. The loaned securities were secured with non-cash collateral with a value of $470,657. The non-cash collateral received consists of short term investments and long term bonds, and is held for the benefit of the Fund at the Fund’s custodian. The Fund cannot repledge or resell this collateral. Collateral is calculated based on prior day’s prices. - See Note 1(I) to Financial Statements |
| ^ | Maturity Date and Preferred Dividend Rate of Preferred Stock |
| ADR | - American Depositary Receipt |
| GDR | - Global Depositary Receipt |
The accompanying notes are an integral part of these financial statements
| | | | |
| www.thomaswhitefunds.com | | | 29 | |
| | |
| Thomas White Emerging Markets Fund | | |
Industry classifications shown in the Investment Portfolio are based off of the Global Industry Classification Standard (GICS®). GICS was developed by and/or is the exclusive property of MSCI, Inc. and Standard & Poor’s Financial Services LLC (“S&P”). GICS is a service mark of MSCI and S&P and has been licensed for use by U.S. Bancorp Fund Services, LLC.
The accompanying notes are an integral part of these financial statements
| | |
| 30 | | www.thomaswhitefunds.com |
| | |
| Investment Portfolio | | October 31, 2019 |
The following table summarizes the inputs used, as of October 31, 2019, in valuating the Fund’s assets:
| | | | | | | | | | | | | | | | |
| | | | | |
| | | Level 1 | | | Level 2 | | | Level 3 | | | Total | |
| Common Stocks | | | | | | | | | | | | | | | | |
| | | | | |
| Brazil | | | $1,740,725 | | | | $------- | | | | $------- | | | | $1,740,725 | |
| | | | | |
| Chile | | | 887,565 | | | | ------- | | | | ------- | | | | 887,565 | |
| | | | | |
| China | | | 3,061,006 | | | | 7,771,617 | | | | ------- | | | | 10,832,623 | |
| | | | | |
| India | | | 811,338 | | | | 2,655,512 | | | | ------- | | | | 3,466,850 | |
| | | | | |
| Indonesia | | | ------- | | | | 1,622,402 | | | | ------- | | | | 1,622,402 | |
| | | | | |
| Mexico | | | 1,339,680 | | | | ------- | | | | ------- | | | | 1,339,680 | |
| | | | | |
| Netherlands | | | 299,972 | | | | ------- | �� | | | ------- | | | | 299,972 | |
| | | | | |
| Panama | | | 352,773 | | | | ------- | | | | ------- | | | | 352,773 | |
| | | | | |
| Philippines | | | ------- | | | | 701,495 | | | | ------- | | | | 701,495 | |
| | | | | |
| Poland | | | ------- | | | | 392,852 | | | | ------- | | | | 392,852 | |
| | | | | |
| Russia | | | ------- | | | | 1,773,366 | | | | ------- | | | | 1,773,366 | |
| | | | | |
| South Africa | | | ------- | | | | 1,175,926 | | | | ------- | | | | 1,175,926 | |
| | | | | |
| South Korea | | | ------- | | | | 4,017,901 | | | | ------- | | | | 4,017,901 | |
| | | | | |
| Taiwan | | | ------- | | | | 2,670,330 | | | | ------- | | | | 2,670,330 | |
| | | | | |
| Thailand | | | ------- | | | | 984,141 | | | | ------- | | | | 984,141 | |
| | | | | |
| Turkey | | | ------- | | | | 201,345 | | | | ------- | | | | 201,345 | |
| | | | | |
| United States | | | 329,076 | | | | ------- | | | | ------- | | | | 329,076 | |
| Total Common Stocks | | | $8,822,135 | | | | $23,966,887 | | | | $------- | | | | $32,789,022 | |
| Preferred Stocks | | | | | | | | | | | | | | | | |
| | | | | |
| Brazil | | | $2,224,871 | | | | $------- | | | | $------- | | | | $2,224,871 | |
| | | | | |
| South Korea | | | ------- | | | | 437,863 | | | | ------- | | | | 437,863 | |
| Total Preferred Stocks | | | 2,224,871 | | | | 437,863 | | | | ------- | | | | 2,662,734 | |
| Real Estate Investment Trust (REIT) | | | | | | | | | | | | | | | | |
| | | | | |
| Mexico | | | $323,158 | | | | $------- | | | | $------- | | | | $323,158 | |
| Total REIT | | | 323,158 | | | | ------- | | | | ------- | | | | 323,158 | |
| | | | | |
| Short Term Investment | | | $584,308 | | | | $------- | | | | $------- | | | | $584,308 | |
| Total Investments | | | $11,954,472 | | | | $24,404,750 | | | | $------- | | | | $36,359,222 | |
For more information on valuation inputs, please refer to Note 1(A) of the accompanying Notes to Financial Statements.
The accompanying notes are an integral part of these financial statements
| | | | |
| www.thomaswhitefunds.com | | | 31 | |
| | |
| Thomas White Emerging Markets Fund | | |
The Fund’s assets assigned to Level 2 include certain foreign securities for which a third party statistical pricing service may be employed for purposes of fair market valuation. There were no transfers into or out of Level 3 during the reporting period, as compared to their classification from the prior annual report.
The accompanying notes are an integral part of these financial statements
| | |
| 32 | | www.thomaswhitefunds.com |
THOMAS WHITE AMERICAN OPPORTUNITIES FUND
| | | | | | | | | | | | | | |
| | | | | | | | |
| | | Unaudited
Sales
Charge | | Deferred
Sales
Charge | | Administrative
Services
Fee | | 12b-1 Fees | | Operating
Expenses1,3 | | Prospectus
Gross
Annual
Operating
Expense2 | | Prospectus
Net Annual
Operating
Expense2,3 |
| Investor Class | | None | | None | | Up to 0.25% | | None | | 1.34% | | 1.43% | | 1.34% |
1 In the absence of the fee deferral/expense reimbursement arrangement for the American Opportunities Fund, the ratio of expenses to average net assets would have been 1.55% for Investor Class shares.
2 Gross Annual Operating Expense and Net Annual Operating Expense are based on the most recent prospectus and may differ from other expense ratios appearing in this report.
3 Thomas White International, Ltd. (“Advisor”) has agreed to defer its fees and/or reimburse the Fund to the extent that the operating expenses for Investor Class shares exceed 1.34% of its average daily net assets. The fee deferral/expense reimbursement agreement expires February 29, 2020. The Fund has agreed to repay the Advisor for amounts deferred or reimbursed by the Advisor pursuant to the agreement provided that such repayment does not cause the Fund to exceed the above limits and the repayment is made within three years after the year in which the Advisor incurred the expense. The fee deferral/expense reimbursement agreement may only be amended or terminated by the Fund’s Board of Trustees. The net expense ratio is applicable to investors.
| | | | | | | | |
| | | | | |
| | | NAV | | Net Assets | | Redemption Fee | | Portfolio Turnover |
Investor Class | | $17.46 | | $45.8 million | | 2.00% on shares held less than 60 days | | 20% |
| | | | |
| www.thomaswhitefunds.com | | | 33 | |
THOMAS WHITE AMERICAN OPPORTUNITIES FUND
| | | | | | | | | | | | | | | | | | | | | | | | | | |
| |
| Total Returns as of October 31, 2019 (Unaudited) | |
| | | | | | | | | | | Annualized | |
| Class | | 6 month | | Calendar
YTD | | | 1 Yr | | | 3 Yrs | | | 5 Yrs | | | 10 Yrs | | | Since
Inception
(3/4/1999) | |
| | | | | | | | |
| Investor Class shares (TWAOX) | | 2.02% | | | 22.60% | | | | 13.37% | | | | 11.13% | | | | 7.46% | | | | 11.76% | | | | 8.01% | |
| | | | | | | | |
| Russell Midcap Index1 | | 1.85% | | | 23.21% | | | | 13.72% | | | | 12.28% | | | | 8.67% | | | | 13.70% | | | | 9.43% | |
| | | | | | | | |
| S&P 500 Index1 | | 4.16% | | | 23.16% | | | | 14.33% | | | | 14.91% | | | | 10.78% | | | | 13.70% | | | | 6.42% | |
1 The Russell Midcap Index measures the performance of the 800 smallest companies in the Russell 1000 Index. These represent approximately 31% of the total market capitalization of the Russell 1000 Index. The S&P 500 Index measures the performance of 500 leading companies in leading industries of the U.S. economy, capturing 80% coverage of U.S. equities. Both indices are unmanaged and returns assume the reinvestment of dividends. It is not possible to invest directly in an index.
The returns do not reflect the deduction of taxes that a shareholder would pay on Fund distributions or the redemption of Fund shares. The returns reflect the actual performance for each period and do not include the impacts of trades executed on the last business day of the period that were recorded on the first business day of the next period.
Performance data is based upon past performance, which is no guarantee of future results. The investment return and principal value of an investment will fluctuate so that an investor’s shares, when redeemed, may be worth more or less than their original cost. Current performance may be higher or lower than the performance data quoted. Please call 1-800-811-0535 to obtain performance data as of the most recent month-end. The Fund imposes a 2% redemption fee on shares held less than 60 days. Performance data does not reflect the redemption fee. If reflected, total returns would be lower. Investment performance reflects any fee waivers that were in effect. In the absence of such waivers, total return would have been reduced. The Investor Class Gross Expense Ratio, based on the most recent prospectus, is 1.43%.
| | |
| 34 | | www.thomaswhitefunds.com |
OCTOBER 31, 2019
GROWTH OF A $10,000 INVESTMENT WITH DIVIDENDS REINVESTED (Unaudited)
This chart illustrates the performance of a hypothetical $10,000 investment made in the Fund’s Investor Class shares, its primary benchmark, the Russell Midcap Index, and its secondary benchmark, the S&P 500 Index, for the past 10 years through October 31, 2019. It assumes reinvestment of dividends and capital gains, but does not reflect the effect of any applicable redemption fees. This chart does not imply future performance. Past performance does not guarantee future results. The cumulative ten year return was 203.98% for the Fund’s Investor Class shares, 261.11% for the primary benchmark, and 260.96% for the secondary benchmark. The Fund’s Investor Class shares average annual total return since inception on March 4, 1999 was 8.01%. The Russell Midcap Index measures the performance of the 800 smallest companies in the Russell 1000 Index. These represent approximately 31% of the total market capitalization of the Russell 1000 Index. The S&P 500 Index measures the performance of 500 leading companies in leading industries of the U.S. economy, capturing 80% coverage of U.S. equities. Both indices are unmanaged and returns assume the reinvestment of dividends. It is not possible to invest directly in an index. During the periods shown, the Fund’s manager reimbursed certain Fund expenses. Absent this reimbursement, performance would have been lower.
| | | | |
| www.thomaswhitefunds.com | | | 35 | |
THOMAS WHITE AMERICAN OPPORTUNITIES FUND
The Thomas White American Opportunities Fund primarily invests in equity securities of mid-size U.S. companies. The Fund may also invest in equity securities of smaller and larger size U.S. companies.
Portfolio Managers
Jinwen Zhang, Ph.D., CFA
Douglas M. Jackman, CFA
Wei Li, Ph.D., CFA
John Wu, Ph.D., CFA
Rex Mathew, CFA, CMA
Ramkumar Venkatramani, CFA
Performance Review
The Thomas White American Opportunities Fund Investor Class shares returned +13.37% during theone-year period ended October 31, 2019 while the Fund’s primary benchmark, the Russell Midcap Index, returned +13.72% and the secondary benchmark, the S&P 500 Index, returned +14.33% during the same period. Since its inception on March 4, 1999, the Fund’s Investor Class shares annualized returns are +8.01%, compared to +9.43% for the Russell Midcap Index and +6.42% for the S&P 500 Index.
Robust Economy and Earnings Lift U.S. Equities
U.S. equities saw strong gains during theone-year review period as domestic economic growth, supported by consumer spending, continued to beat expectations. Better than anticipated job additions and wage gains have helped sustain household income growth for the past several quarters.
The Federal Reserve’s decision to reverse its monetary policy stance at the beginning of this year and lower interest rates also boosted investor sentiment. Though the delay in concluding the U.S.-China initial trade deal has hurt manufacturing in recent months, the U.S. services sector continued to expand. Finally, corporate earnings have been largely ahead of expectations and most large companies continue to use their growing cash flows to expand share buybacks. Low borrowing costs and growth optimism also supported increased mergers and acquisitions activity during the review period.
Portfolio Review
Despite the recent unease about higher valuations, technology was the best performing sector during the review period. Investors remain attracted to the technology sector’s better revenue and earnings growth visibility, supported by favorable long-term trends. The industrials sector benefited from healthy revenue and earnings growth, especially in segments such as freight handling and automation. Strong housing demand recovery, fueled by low mortgage rates and higher household incomes, helped the real estate sector. The utilities sector was rewarded for steady earnings growth and relatively higher dividend yields. The energy sector underperformed significantly as margins remained under pressure, especially for higher cost producers of shale energy. The communications and consumer staples sectors were hurt by weak earnings outlook as consumer preferences continue to shift.
The Fund’s technology holdings contributed the most to returns during the review period on renewed optimism about vigorous
| | |
| 36 | | www.thomaswhitefunds.com |
OCTOBER 31, 2019
demand growth. Most semiconductor and other hardware manufacturers have seen higher product prices in recent quarters. These included semiconductor processing equipment manufacturerLAM Research as well asCadence Design Systems, a leading provider of software used in hardware design.AutoZone, the largest retailer of automotive replacement parts, benefited from strong demand growth as the average age of the U.S. vehicle fleet remains high. Stronger than expected freight volume growth, largely driven by expanding internet sales of consumer goods, helped logistics providerOld Dominion Freight Line. Payment solutions providerFleetCor Technologiesalso outperformed on sustained and healthy gains in transaction volumes.
NetApp, a provider of storage and data management solutions, detracted the most from Fund returns during the period on concerns that demand growth for cloud storage solutions could moderate in the coming years. BroadcasterCBS Corpwas hurt by continued pressure on margins as online streaming services gain market share.DXC Technology, a technology services provider, was hurt by weak earnings and was sold during the period. Shale energy producerConcho Resources as well as natural gas producerCNX Resources underperformed on relatively subdued product prices that have restricted earnings and cash flows. The Fund exited both these energy sector holdings during the review period.
Economic Growth Likely to Remain Buoyant
Barring an unexpected and substantial escalation of the U.S.-China trade standoff, the U.S. economy is likely to sustain the current pace of expansion in 2020 as well. As recent data show, the labor market is indicating no signs of a decline and the low unemployment rate should support continued wage gains. Household disposable incomes are also likely to be raised by relatively low fuel prices while the wealth effect from high asset prices should further boost consumer sentiment. The Federal Reserve appears determined to keep interest rates low and support economic growth until inflation risks are meaningfully higher.
This favorable economic environment should help strengthen earnings growth next year, especially in sectors that directly benefit from consumer spending. If the U.S.-China trade frictions ease and global trade volumes recover, the industrials and services exporters should benefit as well. Given this reasonably bright outlook for earnings growth, current U.S. valuations do not appear excessive even after the recent gains. However, uncertainties related to next year’s presidential elections could lead to increased volatility in the financial markets.
We thank you for investing in the Thomas White American Opportunities Fund.
| | | | |
| www.thomaswhitefunds.com | | | 37 | |
THOMAS WHITE AMERICAN OPPORTUNITIES FUND
Portfolio Industry Allocation and Market Capitalization as of October 31, 2019
| | | | |
| | |
| Industry Allocation | | % of TNA | |
| Automobiles & Components | | | 1.1% | |
| | |
| Banks | | | 4.7% | |
| | |
| Capital Goods | | | 11.9% | |
| | |
| Consumer Durables & Apparel | | | 2.1% | |
| | |
| Consumer Services | | | 2.9% | |
| | |
| Diversified Financials | | | 4.3% | |
| | |
| Energy | | | 3.0% | |
| | |
| Food, Beverage & Tobacco | | | 1.6% | |
| | |
| Health Care Equipment & Services | | | 7.4% | |
| | |
| Insurance | | | 4.4% | |
| | |
| Materials | | | 7.1% | |
| | |
| Media & Entertainment | | | 0.6% | |
| | |
| Pharmaceuticals, Biotechnology & Life Sciences | | | 4.3% | |
| | |
| REITs | | | 9.5% | |
| | |
| Retailing | | | 3.9% | |
| | |
| Semiconductors & Semiconductor Equipment | | | 4.9% | |
| | |
| Software & Services | | | 9.7% | |
| | |
| Technology Hardware & Equipment | | | 3.4% | |
| | |
| Transportation | | | 3.7% | |
| | |
| Utilities | | | 8.5% | |
| | |
| Cash & Other | | | 1.0% | |
| | | | |
| | |
| Portfolio Market Cap Mix | | % of TNA | |
| Large Cap (over $34.7 billion) | | | 18.2% | |
| | |
| Mid Cap ($2.5 - $34.7 billion) | | | 80.8% | |
| | |
| Cash & Other | | | 1.0% | |
| | |
| | | | | |
| | |
| | | | | |
| | |
| | | | | |
| | |
| | | | | |
| | |
| | | | | |
| | |
| | | | | |
| | |
| | | | | |
| | |
| | | | | |
| | |
| | | | | |
| | |
| | | | | |
| | |
| | | | | |
| | |
| | | | | |
| | |
| | | | | |
| | |
| | | | | |
| | |
| | | | | |
| | |
| | | | | |
| | |
| | | | | |
| | |
| | | | | |
TNA - Total Net Assets
Fund holdings and industry allocations are subject to change and should not be considered a recommendation to buy or sell any securities. For a complete list of Fund holdings, please refer to the Investment Portfolio section of this report.
| | |
| 38 | | www.thomaswhitefunds.com |
| | |
| Investment Portfolio | | October 31, 2019 |
| | | | | | | | | | |
| Industry | | Issue | | Shares | | | Value | |
| | | | | | | | | |
| COMMON STOCKS (89.5%) | | | | | | | | |
|
| |
| AUTOMOBILES & COMPONENTS (1.1%) | | | | | | | | |
| | BorgWarner, Inc. | | | 12,000 | | | | $500,160 | |
|
| |
| BANKS (4.7%) | | | | | | |
| | Citizens Financial Group, Inc. | | | 15,100 | | | | 530,916 | |
| | Comerica Incorporated | | | 9,250 | | | | 605,135 | |
| | Fifth Third Bancorp | | | 13,600 | | | | 395,488 | |
| | Regions Financial Corporation | | | 37,100 | | | | 597,310 | |
| | | | | | | | | | |
| | | | | | | | | 2,128,849 | |
|
| |
| CAPITAL GOODS (11.9%) | | | | | | |
| | Carlisle Companies Incorporated | | | 3,530 | | | | 537,513 | |
| | Cummins Inc. | | | 2,600 | | | | 448,448 | |
| | Huntington Ingalls Industries, Inc. | | | 2,215 | | | | 499,837 | |
| | Ingersoll-Rand PLC ^ | | | 5,000 | | | | 634,450 | |
| | The Middleby Corporation * | | | 3,400 | | | | 411,230 | |
| | Parker-Hannifin Corporation | | | 2,550 | | | | 467,899 | |
| | Sensata Technologies Holding plc * ^ | | | 7,854 | | | | 402,046 | |
| | Snap-on Incorporated | | | 4,350 | | | | 707,615 | |
| | Spirit AeroSystems Holdings, Inc. - Class A | | | 8,250 | | | | 675,015 | |
| | Textron Inc. | | | 6,575 | | | | 303,042 | |
| | W.W. Grainger, Inc. | | | 1,200 | | | | 370,608 | |
| | | | | | | | | | |
| | | | | | | | | 5,457,703 | |
|
| |
| CONSUMER DURABLES & APPAREL (2.1%) | | | | | | |
| | Lennar Corporation - Class A | | | 8,250 | | | | 491,700 | |
| | Polaris Industries Inc. | | | 4,900 | | | | 483,385 | |
| | | | | | | | | | |
| | | | | | | | | 975,085 | |
|
| |
| CONSUMER SERVICES (2.9%) | | | | | | |
| | Aramark | | | 11,987 | | | | 524,551 | |
| | Royal Caribbean Cruises Ltd. ^ | | | 7,400 | | | | 805,342 | |
| | | | | | | | | | |
| | | | | | | | | 1,329,893 | |
|
| |
| DIVERSIFIED FINANCIALS (4.3%) | | | | | | |
| | Ameriprise Financial, Inc. | | | 3,500 | | | | 528,115 | |
| | Intercontinental Exchange, Inc. | | | 6,500 | | | | 613,080 | |
| | Voya Financial, Inc. | | | 15,500 | | | | 836,380 | |
| | | | | | | | | | |
| | | | | | | | | 1,977,575 | |
|
| |
| ENERGY (3.0%) | | | | | | |
| | Diamondback Energy Inc | | | 3,350 | | | | 287,296 | |
| | Marathon Petroleum Corporation | | | 12,054 | | | | 770,853 | |
| | Noble Energy, Inc. | | | 15,800 | | | | 304,308 | |
| | | | | | | | | | |
| | | | | | | | | 1,362,457 | |
|
| |
| FOOD, BEVERAGE & TOBACCO (1.6%) | | | | | | |
| | The Hershey Company | | | 5,000 | | | | 734,350 | |
|
| |
| HEALTH CARE EQUIPMENT & SERVICES (7.4%) | | | | | | |
| | Boston Scientific Corporation * | | | 19,230 | | | | 801,891 | |
| | Centene Corporation * | | | 9,200 | | | | 488,336 | |
The accompanying notes are an integral part of these financial statements
| | | | |
| www.thomaswhitefunds.com | | | 39 | |
| | |
| Thomas White American Opportunities Fund | | |
| | | | | | | | | | |
| Industry | | Issue | | Shares | | | Value | |
| | | | | | | | | |
| HEALTH CARE EQUIPMENT & SERVICES (CONT.) | | | | | | |
| | Hill-Rom Holdings, Inc. | | | 5,290 | | | | $ 553,810 | |
| | Laboratory Corporation of America Holdings * | | | 3,095 | | | | 509,963 | |
| | WellCare Health Plans, Inc. * | | | 1,350 | | | | 400,410 | |
| | Zimmer Biomet Holdings, Inc. | | | 4,600 | | | | 635,858 | |
| | | | | | | | | | |
| | | | | | | | | 3,390,268 | |
|
| |
| INSURANCE (4.4%) | | | | | | |
| | Arch Capital Group Ltd. * ^ | | | 11,600 | | | | 484,416 | |
| | Assurant, Inc. | | | 4,600 | | | | 579,922 | |
| | Everest Re Group, Ltd. ^ | | | 1,700 | | | | 437,053 | |
| | The Hartford Financial Services Group, Inc. | | | 9,300 | | | | 530,844 | |
| | | | | | | | | | |
| | | | | | | | | 2,032,235 | |
|
| |
| MATERIALS (7.1%) | | | | | | |
| | AptarGroup, Inc. | | | 4,400 | | | | 519,860 | |
| | Ball Corporation | | | 7,800 | | | | 545,766 | |
| | Martin Marietta Materials, Inc. | | | 2,900 | | | | 759,539 | |
| | PPG Industries, Inc. | | | 6,460 | | | | 808,275 | |
| | The Sherwin-Williams Company | | | 1,040 | | | | 595,213 | |
| | | | | | | | | | |
| | | | | | | | | 3,228,653 | |
|
| |
| MEDIA & ENTERTAINMENT (0.6%) | | | | | | |
| | Twitter, Inc. * | | | 8,750 | | | | 262,238 | |
|
| |
| PHARMACEUTICALS, BIOTECHNOLOGY & LIFE SCIENCES (4.3%) | |
| | Agilent Technologies, Inc. | | | 10,200 | | | | 772,650 | |
| | Charles River Laboratories International, Inc. * | | | 5,890 | | | | 765,582 | |
| | Jazz Pharmaceuticals Public Limited Company * ^ | | | 3,300 | | | | 414,579 | |
| | | | | | | | | | |
| | | | | | | | | 1,952,811 | |
|
| |
| RETAILING (3.9%) | | | | | | |
| | AutoZone, Inc. * | | | 694 | | | | 794,200 | |
| | Ross Stores, Inc. | | | 9,100 | | | | 997,997 | |
| | | | | | | | | | |
| | | | | | | | | 1,792,197 | |
|
| |
| SEMICONDUCTORS & SEMICONDUCTOR EQUIPMENT (4.9%) | | | | | | |
| | Analog Devices, Inc. | | | 4,030 | | | | 429,719 | |
| | KLA Corporation | | | 3,300 | | | | 557,832 | |
| | Lam Research Corporation | | | 3,295 | | | | 893,077 | |
| | Xilinx, Inc. | | | 4,200 | | | | 381,108 | |
| | | | | | | | | | |
| | | | | | | | | 2,261,736 | |
|
| |
| SOFTWARE & SERVICES (9.7%) | | | | | | |
| | Cadence Design Systems, Inc. * | | | 9,525 | | | | 622,459 | |
| | Check Point Software Technologies Ltd. * ^ | | | 4,170 | | | | 468,749 | |
| | Fidelity National Information Services, Inc. | | | 7,800 | | | | 1,027,728 | |
| | FleetCor Technologies Inc. * | | | 2,950 | | | | 867,949 | |
| | Fortinet, Inc. * | | | 5,350 | | | | 436,346 | |
The accompanying notes are an integral part of these financial statements
| | |
| 40 | | www.thomaswhitefunds.com |
| | |
| Investment Portfolio | | October 31, 2019 |
| | | | | | | | | | |
| Industry | | Issue | | Shares | | | Value | |
| | | | | | | | | |
| SOFTWARE & SERVICES (CONT.) | | | | | | |
| | Intuit Inc. | | | 2,650 | | | | $ 682,375 | |
| | Synopsys, Inc. * | | | 2,400 | | | | 325,800 | |
| | | | | | | | | | |
| | | | | | | | | 4,431,406 | |
|
| |
| TECHNOLOGY HARDWARE & EQUIPMENT (3.4%) | | | | | | |
| | Arista Networks Inc. * | | | 1,700 | | | | 415,769 | |
| | F5 Networks, Inc. * | | | 3,475 | | | | 500,678 | |
| | NetApp, Inc. | | | 11,250 | | | | 628,650 | |
| | | | | | | | | | |
| | | | | | | | | 1,545,097 | |
|
| |
| TRANSPORTATION (3.7%) | | | | | | |
| | Kansas City Southern | | | 2,800 | | | | 394,184 | |
| | Old Dominion Freight Line, Inc. | | | 4,700 | | | | 855,776 | |
| | XPO Logistics, Inc. * | | | 5,750 | | | | 439,300 | |
| | | | | | | | | | |
| | | | | | | | | 1,689,260 | |
|
| |
| UTILITIES (8.5%) | | | | | | |
| | Alliant Energy Corporation | | | 14,000 | | | | 746,760 | |
| | Ameren Corporation | | | 11,300 | | | | 878,010 | |
| | CMS Energy Corporation | | | 13,050 | | | | 834,156 | |
| | DTE Energy Company | | | 5,200 | | | | 662,064 | |
| | Xcel Energy, Inc. | | | 12,050 | | | | 765,296 | |
| | | | | | | | | | |
| | | | | | | | | 3,886,286 | |
|
| |
| Total Common Stocks | | | | | (Cost $28,781,122 | ) | | | 40,938,259 | |
| | | | | | | | | | |
|
| |
| REAL ESTATE INVESTMENT TRUSTS (REITS) (9.5%) | | | | | | | | |
|
| |
| REAL ESTATE (9.5%) | | | | | | |
| | AvalonBay Communities, Inc. | | | 2,300 | | | | 500,618 | |
| | Boston Properties, Inc. | | | 4,025 | | | | 552,230 | |
| | Crown Castle International Corp. | | | 5,650 | | | | 784,164 | |
| | Digital Realty Trust, Inc. | | | 4,700 | | | | 597,088 | |
| | Essex Property Trust, Inc. | | | 1,425 | | | | 466,160 | |
| | Medical Properties Trust Inc. | | | 19,600 | | | | 406,308 | |
| | Prologis, Inc. | | | 8,400 | | | | 737,184 | |
| | Regency Centers Corp. | | | 4,550 | | | | 305,942 | |
| | | | | | | | | | |
| | | | | | | | | 4,349,694 | |
|
| |
| Total REITs | | | | | (Cost $3,610,947 | ) | | | 4,349,694 | |
| | | | | | | | | | |
|
| |
| Total Investments | | 99.0% | | | (Cost $32,392,069 | ) | | | $45,287,953 | |
| Other Assets, Less Liabilities | | 1.0% | | | | | | | 477,947 | |
| Total Net Assets: | | 100.0% | | | | | | | $45,765,900 | |
|
| |
| PLC | Public Limited Company |
| * | Non-Income Producing Securities |
| ^ | Foreign Issued Securities |
Industry classifications shown in the Investment Portfolio are based off of the Global Industry Classification Standard (GICS®). GICS was developed by and/or is the exclusive property of MSCI, Inc. and Standard & Poor’s Financial Services LLC (“S&P”). GICS is a service mark of MSCI and S&P and has been licensed for use by U.S. Bancorp Fund Services, LLC.
The accompanying notes are an integral part of these financial statements
| | | | |
| www.thomaswhitefunds.com | | | 41 | |
| | |
| Thomas White American Opportunities Fund | | |
The following table summarizes the inputs used, as of October 31, 2019, in valuating the Fund’s assets:
| | | | | | | | | | | | | | | | |
| | | | | |
| | | Level 1 | | | Level 2 | | | Level 3 | | | Total | |
| Common Stocks | | | | | | | | | | | | | | | | |
| | | | | |
| Automobiles & Components | | | $500,160 | | | | $------- | | | | $------- | | | | $500,160 | |
| | | | | |
| Banks | | | 2,128,849 | | | | ------- | | | | ------- | | | | 2,128,849 | |
| | | | | |
| Capital Goods | | | 5,457,703 | | | | ------- | | | | ------- | | | | 5,457,703 | |
| | | | | |
| Consumer Durables & Apparel | | | 975,085 | | | | ------- | | | | ------- | | | | 975,085 | |
| | | | | |
| Consumer Services | | | 1,329,893 | | | | ------- | | | | ------- | | | | 1,329,893 | |
| | | | | |
| Diversified Financials | | | 1,977,575 | | | | ------- | | | | ------- | | | | 1,977,575 | |
| | | | | |
| Energy | | | 1,362,457 | | | | ------- | | | | ------- | | | | 1,362,457 | |
| | | | | |
| Food, Beverage & Tobacco | | | 734,350 | | | | ------- | | | | ------- | | | | 734,350 | |
| | | | | |
| Health Care Equipment & Services | | | 3,390,268 | | | | ------- | | | | ------- | | | | 3,390,268 | |
| | | | | |
| Insurance | | | 2,032,235 | | | | ------- | | | | ------- | | | | 2,032,235 | |
| | | | | |
| Materials | | | 3,228,653 | | | | ------- | | | | ------- | | | | 3,228,653 | |
| | | | | |
| Media & Entertainment | | | 262,238 | | | | ------- | | | | ------- | | | | 262,238 | |
| | | | | |
| Pharmaceuticals, Biotechnology & Life Sciences | | | 1,952,811 | | | | ------- | | | | ------- | | | | 1,952,811 | |
| | | | | |
| Retailing | | | 1,792,197 | | | | ------- | | | | ------- | | | | 1,792,197 | |
| | | | | |
| Semiconductors & Semiconductor Equipment | | | 2,261,736 | | | | ------- | | | | ------- | | | | 2,261,736 | |
| | | | | |
| Software & Services | | | 4,431,406 | | | | ------- | | | | ------- | | | | 4,431,406 | |
| | | | | |
| Technology Hardware & Equipment | | | 1,545,097 | | | | ------- | | | | ------- | | | | 1,545,097 | |
| | | | | |
| Transportation | | | 1,689,260 | | | | ------- | | | | ------- | | | | 1,689,260 | |
| | | | | |
| Utilities | | | 3,886,286 | | | | ------- | | | | ------- | | | | 3,886,286 | |
| Total Common Stocks | | | $40,938,259 | | | | $------- | | | | $------- | | | | $40,938,259 | |
| REITS | | | | | | | | | | | | | | | | |
| | | | | |
| Real Estate | | | $4,349,694 | | | | $------- | | | | $------- | | | | $4,349,694 | |
| Total REITS | | | $4,349,694 | | | | $------- | | | | $------- | | | | $4,349,694 | |
| Total Investments | | | $45,287,953 | | | | $------- | | | | $------- | | | | $45,287,953 | |
| | | | | | | | | | | | | | | | | |
For more information on valuation inputs, please refer to Note 1(A) of the accompanying Notes to Financial Statements.
No transfers in and/or out between Levels 1, 2 or 3 were observed during the reporting period, as compared to their classification from the prior annual report.
The accompanying notes are an integral part of these financial statements
| | |
| 42 | | www.thomaswhitefunds.com |
THOMAS WHITE FUNDS
Statements of Assets and Liabilities
October 31, 2019
| | | | | | | | | | | | | | | | | | | | | | | | |
| | | | |
| | | International
Fund | | | Emerging
Markets
Fund | | | American
Opportunities
Fund | |
| | | | | | | |
| ASSETS: | | | | | | | | | | | | | | | | | | | | | | | | |
| | | | | | | |
| Investments in securities at market value1,3 | | $ | | | | | 116,464,620 | | | $ | | | | | 36,359,222 | | | $ | | | | | 45,287,953 | |
| | | | | | | |
| Foreign currency2 | | | | | | | 6 | | | | | | | | ------- | | | | | | | | ------- | |
| | | | | | | |
| Cash | | | | | | | 1,195,886 | | | | | | | | ------- | | | | | | | | 487,909 | |
| | | | | | | |
| Receivable from Advisor (Note 4) | | | | | | | ------- | | | | | | | | 15,100 | | | | | | | | ------- | |
| | | | | | | |
| Receivables: | | | | | | | | | | | | | | | | | | | | | | | | |
| | | | | | | |
Securities Lending | | | | | | | 694 | | | | | | | | 146 | | | | | | | | ------- | |
| | | | | | | |
Dividends and interest | | | | | | | 219,168 | | | | | | | | 30,307 | | | | | | | | 17,311 | |
| | | | | | | |
Reclaims | | | | | | | 1,467,174 | | | | | | | | 25,542 | | | | | | | | 3,975 | |
| | | | | | | |
Fund shares sold | | | | | | | 5,544 | | | | | | | | ------- | | | | | | | | ------- | |
| | | | | | | |
| Prepaid expenses and other assets | | | | | | | 36,151 | | | | | | | | 23,738 | | | | | | | | 17,936 | |
| | | | | | | |
| Total assets | | | | | | | 119,389,243 | | | | | | | | 36,454,055 | | | | | | | | 45,815,084 | |
| | | | | | | | | | | | | | | | | | | | | | | | | |
| | | | | | | |
| LIABILITIES: | | | | | | | | | | | | | | | | | | | | | | | | |
| | | | | | |
| Management and administrative fees payable (Note 4) | | | | 51,188 | | | | | | | | ------- | | | | | | | | 3,253 | |
| | | | | | | |
| Business management fees payable (Note 4) | | | | | | | 22,824 | | | | | | | | 2,858 | | | | | | | | 2,036 | |
| | | | | | | |
| Trustee fees payable | | | | | | | 14,479 | | | | | | | | 4,774 | | | | | | | | 5,111 | |
| | | | | | | |
| Payable for fund shares redeemed | | | | | | | 70,586 | | | | | | | | ------- | | | | | | | | ------- | |
| | | | | | |
| Accrued fund accounting and fund administration fees | | | | 18,105 | | | | | | | | 6,687 | | | | | | | | 6,901 | |
| | | | | | | |
| Accrued custody fees | | | | | | | 7,314 | | | | | | | | 5,877 | | | | | | | | 1,733 | |
| | | | | | | |
| Accrued printing and mailing expenses | | | | | | | 11,918 | | | | | | | | 3,296 | | | | | | | | 4,209 | |
| | | | | | | |
| Accrued professional fees | | | | | | | 61,718 | | | | | | | | 26,316 | | | | | | | | 22,450 | |
| | | | | | | |
| Accrued shareholder servicing fees | | | | | | | 12,895 | | | | | | | | 6,433 | | | | | | | | 3,452 | |
| | | | | | | |
| Accrued expenses and other liabilities | | | | | | | 1,685 | | | | | | | | 1,932 | | | | | | | | 39 | |
| | | | | | | |
| Total liabilities | | | | | | | 272,712 | | | | | | | | 58,173 | | | | | | | | 49,184 | |
| | | | | | | | | | | | | | | | | | | | | | | | | |
| | | | | | | |
| Net Assets | | $ | | | | | 119,116,531 | | | $ | | | | | 36,395,882 | | | $ | | | | | 45,765,900 | |
| | | | | | | | | | | | | | | | | | | | | | | | | |
| | | | | | | |
| NET ASSETS | | | | | | | | | | | | | | | | | | | | | | | | |
| | | | | | | |
| Source of Net Assets: | | | | | | | | | | | | | | | | | | | | | | | | |
| | | | | | | |
| Net capital paid in on shares of beneficial interest | | $ | | | | | 102,484,859 | | | $ | | | | | 37,756,412 | | | $ | | | | | 32,842,432 | |
| | | | | | | |
| Total distributable earnings (loss) | | | | | | | 16,631,672 | | | | | | | | (1,360,530 | ) | | | | | | | 12,923,468 | |
| | | | | | | |
| Net assets | | $ | | | | | 119,116,531 | | | $ | | | | | 36,395,882 | | | $ | | | | | 45,765,900 | |
| |
| The accompanying notes are an integral part of these financial statements. | |
| | | | |
| www.thomaswhitefunds.com | | | 43 | |
THOMAS WHITE FUNDS
Statements of Assets and Liabilities
October 31, 2019
| | | | | | | | | | | | | | | | | | | | | | | | |
| | | | |
| | | International
Fund | | | Emerging
Markets
Fund | | | American
Opportunities
Fund | |
| | | | | | | |
| INVESTOR CLASS SHARES | | | | | | | | | | | | | | | | | | | | | | | | |
| | | | | | | |
| Net assets | | $ | | | | | 26,331,317 | | | $ | | | | | 1,694,233 | | | $ | | | | | 45,765,900 | |
| | | | | | | |
| Shares outstanding4 | | | | | | | 1,779,431 | | | | | | | | 155,235 | | | | | | | | 2,620,915 | |
| | | | | | | |
| Net asset value and offering price per share | | $ | | | | | 14.80 | | | $ | | | | | 10.91 | | | $ | | | | | 17.46 | |
| | | | | | | | | | | | | | | | | | | | | | | | | |
| | | | | | | |
| CLASS I SHARES | | | | | | | | | | | | | | | | | | | | | | | | |
| | | | | | | |
| Net assets | | $ | | | | | 92,785,214 | | | $ | | | | | 34,701,649 | | | | | | | | | |
| | | | | | | |
| Shares outstanding4 | | | | | | | 6,290,091 | | | | | | | | 3,147,692 | | | | | | | | | |
| | | | | | | |
| Net asset value and offering price per share | | $ | | | | | 14.75 | | | $ | | | | | 11.02 | | | | | | | | | |
| | | | | | | |
1 Cost Basis of Investments: International Fund: $99,243,200 Emerging Markets Fund: $29,381,370 American Opportunities Fund: $32,392,069 | | | | | | | | | | | | | | | | | | | | | | | | |
| | | | | | | |
2 Cost Basis of Cash denominated in foreign currencies: International Fund: $6 | | | | | | | | | | | | | | | | | | | | | | | | |
| | | | | | | |
3 Value of securities out on loan at 10/31/2019: International Fund: $588,640 Emerging Markets Fund: $458,814 | | | | | | | | | | | | | | | | | | | | | | | | |
| | | | | | |
| 4 There are an unlimited number of $0.01 par value shares of beneficial interest authorized. | | | | | | | | | | | | | | | | | | | | | |
| |
| The accompanying notes are an integral part of these financial statements. | |
| | |
| 44 | | www.thomaswhitefunds.com |
THOMAS WHITE FUNDS
Statements of Operations
Year Ended October 31, 2019
| | | | | | | | | | | | | | | | | | | | | | | | |
| | | | |
| | | International
Fund | | | Emerging
Markets
Fund | | | American
Opportunities
Fund | |
| | | | | | | |
| INVESTMENT INCOME | | | | | | | | | | | | | | | | | | | | | | | | |
| | | | | | | |
| Income: | | | | | | | | | | | | | | | | | | | | | | | | |
| | | | | | | |
Dividends1 | | $ | | | | | 4,186,428 | | | $ | | | | | 1,289,815 | | | $ | | | | | 682,570 | |
| | | | | | | |
Interest | | | | | | | 8,763 | | | | | | | | 13,890 | | | | | | | | ------- | |
| | | | | | | |
Securities lending income (Note 1) | | | | | | | 2,799 | | | | | | | | 359 | | | | | | | | ------- | |
| | | | | | | |
Other income | | | | | | | 25 | | | | | | | | 2 | | | | | | | | 26 | |
| | | | | | | |
| Total investment income | | | | | | | 4,198,015 | | | | | | | | 1,304,066 | | | | | | | | 682,596 | |
| | | | | | | |
| Expenses (Note 1(B)): | | | | | | | | | | | | | | | | | | | | | | | | |
| | | | | | | |
Investment management fees (Note 4) | | | | | | | 1,043,657 | | | | | | | | 313,887 | | | | | | | | 370,017 | |
| | | | | | | |
Business management fees (Note 4) | | | | | | | 42,974 | | | | | | | | 12,925 | | | | | | | | 15,236 | |
| | | | | | | |
Trustees’ fees and expenses | | | | | | | 113,420 | | | | | | | | 31,115 | | | | | | | | 35,829 | |
| | | | | | | |
Fund accounting and fund administration fees | | | | | | | 105,751 | | | | | | | | 42,338 | | | | | | | | 39,720 | |
| | | | | | | |
Custodian fees | | | | | | | 63,632 | | | | | | | | 48,877 | | | | | | | | 9,786 | |
| | | | | | | |
Printing and mailing expenses | | | | | | | 18,163 | | | | | | | | 8,078 | | | | | | | | 11,395 | |
| | | | | | | |
Professional fees | | | | | | | 164,679 | | | | | | | | 55,403 | | | | | | | | 55,623 | |
| | | | | | | |
Shareholder servicing fees | | | | | | | 86,651 | | | | | | | | 37,119 | | | | | | | | 20,487 | |
| | | | | | | |
Registration fees | | | | | | | 24,478 | | | | | | | | 28,640 | | | | | | | | 30,285 | |
| | | | | | | |
Administrative service fee | | | | | | | 62,353 | | | | | | | | 296 | | | | | | | | 69,615 | |
| | | | | | | |
Other expenses | | | | | | | 62,285 | | | | | | | | 23,708 | | | | | | | | 15,461 | |
| | | | | | | |
| Total expenses | | | | | | | 1,788,043 | | | | | | | | 602,386 | | | | | | | | 673,454 | |
| | | | | | | |
| Reimbursement from Advisor (Note 4) | | | | | | | (498,308 | ) | | | | | | | (194,121 | ) | | | | | | | (88,392 | ) |
| | | | | | | |
| Net expenses | | | | | | | 1,289,735 | | | | | | | | 408,265 | | | | | | | | 585,062 | |
| | | | | | | |
| Net investment income | | | | | | | 2,908,280 | | | | | | | | 895,801 | | | | | | | | 97,534 | |
| | | | | | | | | | | | | | | | | | | | | | | | | |
| |
| REALIZED AND UNREALIZED GAIN (LOSS) ON INVESTMENTS AND FOREIGN CURRENCY TRANSLATION | |
| | | | | | | |
| Net realized gain (loss) on investments and foreign currency translation | | | | | | | 2,375,583 | | | | | | | | (97,639 | ) | | | | | | | 790,401 | |
| | | | | | | |
| Net change in unrealized appreciation on investments and foreign currency translation | | | | | | | 8,636,772 | | | | | | | | 3,384,455 | | | | | | | | 4,586,611 | |
| | | | | | | |
| Net realized and unrealized gain | | | | | | | 11,012,355 | | | | | | | | 3,286,816 | | | | | | | | 5,377,012 | |
| | | | | | | |
| Net increase in net assets resulting from operations | | $ | | | | | 13,920,635 | | | $ | | | | | 4,182,617 | | | $ | | | | | 5,474,546 | |
| | | | | | | |
1 Net of issuance fees and/or foreign tax withheld of: International Fund: $372,217 Emerging Markets Fund: $125,548 | | | | | | | | | | | | | | | | | | | | | | | | |
| | | | |
| The accompanying notes are an integral part of these financial statements. | | | | | | | | | | | | | |
| | | | |
| www.thomaswhitefunds.com | | | 45 | |
THOMAS WHITE FUNDS
Statements of Changes in Net Assets
| | | | | | | | | | | | | | | | |
| |
| International Fund | |
| | |
| | | Year Ended October 31, | |
| | | | | |
| | | | | | 2019 | | | | | | 2018 | |
| | | | | |
| Change in net assets resulting from operations: | | | | | | | | | | | | | | | | |
| | | | | |
Net investment income | | $ | | | | | 2,908,280 | | | $ | | | | | 4,334,767 | |
| | | | | |
Net realized gain on investments and foreign currency translation | | | | | | | 2,375,583 | | | | | | | | 21,287,918 | |
| | | | | |
Net change in unrealized appreciation (depreciation) on investments and foreign currency translation | | | | | | | 8,636,772 | | | | | | | | (54,785,026 | ) |
| | | | | |
Net increase (decrease) in net assets resulting from operations | | | | | | | 13,920,635 | | | | | | | | (29,162,341 | ) |
| | | | | |
| Distributions: | | | | | | | | | | | | | | | | |
| | | | | |
Distributable earnings - Investor Class | | | | | | | (913,958 | ) | | | | | | | (3,523,265 | ) |
| | | | | |
Distributable earnings - Class I | | | | | | | (3,480,694 | ) | | | | | | | (21,768,071 | ) |
| | | | | |
| Total distributions | | | | | | | (4,394,652 | ) | | | | | | | (25,291,336 | ) |
| | | | | |
| Fund share transactions (Note 3) | | | | | | | (101,060,937 | ) | | | | | | | (55,993,715 | ) |
| | | | | |
| Total decrease in net assets | | | | | | | (91,534,954 | ) | | | | | | | (110,447,392 | ) |
| | | | | |
| Net assets: | | | | | | | | | | | | | | | | |
| | | | | |
| Beginning of year | | | | | | | 210,651,485 | | | | | | | | 321,098,877 | |
| | | | | |
| End of year | | $ | | | | | 119,116,531 | | | $ | | | | | 210,651,485 | |
| |
| The accompanying notes are an integral part of these financial statements. | |
| | |
| 46 | | www.thomaswhitefunds.com |
THOMAS WHITE FUNDS
Statements of Changes in Net Assets
| | | | | | | | | | | | | | | | |
| |
| Emerging Markets Fund | |
| | |
| | | Year Ended October 31, | |
| | | | | |
| | | | | | 2019 | | | | | | 2018 | |
| | | | | |
| Change in net assets resulting from operations: | | | | | | | | | | | | | | | | |
| | | | | |
Net investment income | | $ | | | | | 895,801 | | | $ | | | | | 413,303 | |
| | | | | |
Net realized gain (loss) on investments and foreign currency translation | | | | | | | (97,639 | ) | | | | | | | 3,213,563 | |
| | | | | |
Net change in unrealized appreciation (depreciation) on investments and foreign currency translation | | | | | | | 3,384,455 | | | | | | | | (7,169,007 | ) |
| | | | | |
Net increase (decrease) in net assets resulting from operations | | | | | | | 4,182,617 | | | | | | | | (3,542,141 | ) |
| | | | | |
| Distributions: | | | | | | | | | | | | | | | | |
| | | | | |
Distributable earnings - Investor Class | | | | | | | (19,920 | ) | | | | | | | (19,106 | ) |
| | | | | |
Distributable earnings - Class I | | | | | | | (495,298 | ) | | | | | | | (372,630 | ) |
| | | | | |
| Total distributions | | | | | | | (515,218 | ) | | | | | | | (391,736 | ) |
| | | | | |
| Fund share transactions (Note 3) | | | | | | | (783,243 | ) | | | | | | | (9,948,857 | ) |
| | | | | |
| Total increase (decrease) in net assets | | | | | | | 2,884,156 | | | | | | | | (13,882,734 | ) |
| | | | | |
| Net assets: | | | | | | | | | | | | | | | | |
| | | | | |
| Beginning of year | | | | | | | 33,511,726 | | | | | | | | 47,394,460 | |
| | | | | |
| End of year | | $ | | | | | 36,395,882 | | | $ | | | | | 33,511,726 | |
| |
| The accompanying notes are an integral part of these financial statements. | |
| | | | |
| www.thomaswhitefunds.com | | | 47 | |
THOMAS WHITE FUNDS
Statements of Changes in Net Assets
| | | | | | | | | | | | | | | | |
| |
| American Opportunities Fund | |
| | |
| | | Year Ended October 31, | |
| | | | | |
| | | | | | 2019 | | | | | | 2018 | |
| | | | | |
| Change in net assets resulting from operations: | | | | | | | | | | | | | | | | |
| | | | | |
Net investment income | | $ | | | | | 97,534 | | | $ | | | | | 136,585 | |
| | | | | |
Net realized gain on investments | | | | | | | 790,401 | | | | | | | | 1,298,075 | |
| | | | | |
Net change in unrealized appreciation (depreciation) on investments | | | | | | | 4,586,611 | | | | | | | | (1,223,886 | ) |
| | | | | |
Net increase in net assets resulting from operations | | | | | | | 5,474,546 | | | | | | | | 210,774 | |
| | | | | |
| Total distributions | | | | | | | (1,210,521 | ) | | | | | | | (1,874,691 | ) |
| | | | | |
| Fund share transactions (Note 3) | | | | | | | 532,437 | | | | | | | | 1,200,124 | |
| | | | | |
| Total increase (decrease) in net assets | | | | | | | 4,796,462 | | | | | | | | (463,793 | ) |
| | | | | |
| Net assets: | | | | | | | | | | | | | | | | |
| | | | | |
| Beginning of year | | | | | | | 40,969,438 | | | | | | | | 41,433,231 | |
| | | | | |
| End of year | | $ | | | | | 45,765,900 | | | $ | | | | | 40,969,438 | |
| |
| The accompanying notes are an integral part of these financial statements. | |
| | |
| 48 | | www.thomaswhitefunds.com |
Year Ended October 31, 2019
FINANCIAL HIGHLIGHTS
| | | | | | | | | | | | | | | | | | | | | | | | | | | | | | | | | | | | | | | | |
| |
| Thomas White International Fund - Investor Class | |
| | | Year Ended October 31, | |
| | | | | | 2019 | | | | | | 2018 | | | | | | 2017 | | | | | | 2016 | | | | | | 2015 | |
| | | | | |
| Per share operating performance (For a share outstanding throughout the year) | | | | | | | | | | | | | | | | | |
| | | | | | | | | | | |
| Net asset value, beginning of year | | | $ | | | | 13.86 | | | | $ | | | | 17.88 | | | | $ | | | | 14.97 | | | | $ | | | | 15.77 | | | | $ | | | | 16.95 | |
| | | | | | | | | | | |
| Income from investment operations: | | | | | | | | | | | | | | | | | | | | | | | | | | | | | | | | | | | | | | | | |
| | | | | | | | | | | |
Net investment income 1 | | | | | | | 0.32 | | | | | | | | 0.25 | | | | | | | | 0.14 | | | | | | | | 0.17 | | | | | | | | 0.19 | |
| | | | | | | | | | | |
Net realized and unrealized gains/(losses) | | | | | | | 1.15 | | | | | | | | (2.44 | ) | | | | | | | 3.30 | | | | | | | | (0.81 | ) | | | | | | | (1.17 | ) |
| | | | | | | | | | | |
| Total from investment operations | | | | | | | 1.47 | | | | | | | | (2.19 | ) | | | | | | | 3.44 | | | | | | | | (0.64 | ) | | | | | | | (0.98 | ) |
| | | | | | | | | | | |
| Distributions: | | | | | | | | | | | | | | | | | | | | | | | | | | | | | | | | | | | | | | | | |
| | | | | | | | | | | |
From net investment income | | | | | | | (0.23 | ) | | | | | | | (0.29 | ) | | | | | | | (0.28 | ) | | | | | | | (0.16 | ) | | | | | | | (0.20 | ) |
| | | | | | | | | | | |
From net realized gains | | | | | | | (0.30 | ) | | | | | | | (1.54 | ) | | | | | | | (0.25 | ) | | | | | | | ------- | | | | | | | | ------- | |
| | | | | | | | | | | |
| Total Distributions | | | | | | | (0.53 | ) | | | | | | | (1.83 | ) | | | | | | | (0.53 | ) | | | | | | | (0.16 | ) | | | | | | | (0.20 | ) |
| | | | | | | | | | | |
| Change in net asset value for the year | | | | | | | 0.94 | | | | | | | | (4.02 | ) | | | | | | | 2.91 | | | | | | | | (0.80 | ) | | | | | | | (1.18 | ) |
| | | | | | | | | | | |
| Net asset value, end of year | | | $ | | | | 14.80 | | | | $ | | | | 13.86 | | | | $ | | | | 17.88 | | | | $ | | | | 14.97 | | | | $ | | | | 15.77 | |
| | | | | | | | | | | |
| Total Return | | | | | | | 10.59% | | | | | | | | (12.01)% | | | | | | | | 23.06% | | | | | | | | (4.08)% | | | | | | | | (5.77)% | |
| | | | | | | | | | | |
| Ratios/supplemental data | | | | | | | | | | | | | | | | | | | | | | | | | | | | | | | | | | | | | | | | |
| | | | | | | | | | | |
| Net assets, end of year ($000) | | | $ | | | | 26,331 | | | | $ | | | | 29,473 | | | | $ | | | | 43,811 | | | | $ | | | | 187,408 | | | | $ | | | | 268,518 | |
| | | | | | | | | | | |
| Ratio to average net assets: | | | | | | | | | | | | | | | | | | | | | | | | | | | | | | | | | | | | | | | | |
| | | | | | | | | | | |
Expenses
(net of reimbursement) | | | | | | | 1.24% | | | | | | | | 1.24% | | | | | | | | 1.24% | | | | | | | | 1.24% | | | | | | | | 1.24% | |
| | | | | | | | | | | |
Expenses
(prior to reimbursement) | | | | | | | 1.63% | | | | | | | | 1.34% | | | | | | | | 1.36% | | | | | | | | 1.33% | | | | | | | | 1.32% | |
| | | | | | | | | | | |
Net investment income
(net of reimbursement) | | | | | | | 2.17% | | | | | | | | 1.32% | | | | | | | | 0.90% | | | | | | | | 1.16% | | | | | | | | 1.16% | |
| | | | | | | | | | | |
Net investment income
(prior to reimbursement) | | | | | | | 1.78% | | | | | | | | 1.22% | | | | | | | | 0.78% | | | | | | | | 1.07% | | | | | | | | 1.08% | |
| | | | | | | | | | | |
| Portfolio turnover rate 2 | | | | | | | 43% | | | | | | | | 38% | | | | | | | | 48% | | | | | | | | 60% | | | | | | | | 57% | |
| 1 | Net investment income per share represents net investment income divided by the average shares outstanding throughout the period. |
| 2 | Portfolio turnover is calculated on the basis of the Fund as a whole without distinguishing between the classes of shares issued. |
The accompanying notes are an integral part of these financial statements.
| | | | |
| www.thomaswhitefunds.com | | | 49 | |
Year Ended October 31, 2019
FINANCIAL HIGHLIGHTS
| | | | | | | | | | | | | | | | | | | | | | | | | | | | | | | | | | | | | | | | |
| |
| Thomas White International Fund - Class I | |
| | | Year Ended October 31, | |
| | | | | | 2019 | | | | | | 2018 | | | | | | 2017 | | | | | | 2016 | | | | | | 2015 | |
| | | | | |
| Per share operating performance (For a share outstanding throughout the year) | | | | | | | | | | | | | | | | | |
| | | | | | | | | | | |
| Net asset value, beginning of year | | | $ | | | | 13.81 | | | | $ | | | | 17.79 | | | | $ | | | | 14.98 | | | | $ | | | | 15.78 | | | | $ | | | | 16.97 | |
| | | | | | | | | | | |
| Income from investment operations: | | | | | | | | | | | | | | | | | | | | | | | | | | | | | | | | | | | | | | | | |
| | | | | | | | | | | |
Net investment income 1 | | | | | | | 0.35 | | | | | | | | 0.27 | | | | | | | | 0.25 | | | | | | | | 0.23 | | | | | | | | 0.23 | |
| | | | | | | | | | | |
Net realized and unrealized gains/(losses) | | | | | | | 1.16 | | | | | | | | (2.42 | ) | | | | | | | 3.22 | | | | | | | | (0.83 | ) | | | | | | | (1.17 | ) |
| | | | | | | | | | | |
| Total from investment operations | | | | | | | 1.51 | | | | | | | | (2.15 | ) | | | | | | | 3.47 | | | | | | | | (0.60 | ) | | | | | | | (0.94 | ) |
| | | | | | | | | | | |
| Distributions: | | | | | | | | | | | | | | | | | | | | | | | | | | | | | | | | | | | | | | | | |
| | | | | | | | | | | |
From net investment income | | | | | | | (0.27 | ) | | | | | | | (0.29 | ) | | | | | | | (0.41 | ) | | | | | | | (0.20 | ) | | | | | | | (0.25 | ) |
| | | | | | | | | | | |
From net realized gains | | | | | | | (0.30 | ) | | | | | | | (1.54 | ) | | | | | | | (0.25 | ) | | | | | | | ------- | | | | | | | | ------- | |
| | | | | | | | | | | |
| Total Distributions | | | | | | | (0.57 | ) | | | | | | | (1.83 | ) | | | | | | | (0.66 | ) | | | | | | | (0.20 | ) | | | | | | | (0.25 | ) |
| | | | | | | | | | | |
| Change in net asset value for the year | | | | | | | 0.94 | | | | | | | | (3.98 | ) | | | | | | | 2.81 | | | | | | | | (0.80 | ) | | | | | | | (1.19 | ) |
| | | | | | | | | | | |
| Net asset value, end of year | | | $ | | | | 14.75 | | | | $ | | | | 13.81 | | | | $ | | | | 17.79 | | | | $ | | | | 14.98 | | | | $ | | | | 15.78 | |
| | | | | | | | | | | |
| Total Return | | | | | | | 10.90% | | | | | | | | (11.80)% | | | | | | | | 23.23% | | | | | | | | (3.81)% | | | | | | | | (5.56)% | |
| | | | | | | | | | | |
| Ratios/supplemental data | | | | | | | | | | | | | | | | | | | | | | | | | | | | | | | | | | | | | | | | |
| | | | | | | | | | | |
| Net assets, end of year ($000) | | | $ | | | | 92,785 | | | | $ | | | | 181,179 | | | | $ | | | | 277,287 | | | | $ | | | | 384,017 | | | | $ | | | | 300,331 | |
| | | | | | | | | | | |
| Ratio to average net assets: | | | | | | | | | | | | | | | | | | | | | | | | | | | | | | | | | | | | | | | | |
| | | | | | | | | | | |
Expenses
(net of reimbursement) | | | | | | | 0.99% | | | | | | | | 0.99% | | | | | | | | 0.99% | | | | | | | | 0.99% | | | | | | | | 0.99% | |
| | | | | | | | | | | |
Expenses
(prior to reimbursement) | | | | | | | 1.40% | | | | | | | | 1.18% | | | | | | | | 1.14% | | | | | | | | 1.10% | | | | | | | | 1.08% | |
| | | | | | | | | | | |
Net investment income
(net of reimbursement) | | | | | | | 2.42% | | | | | | | | 1.53% | | | | | | | | 1.53% | | | | | | | | 1.53% | | | | | | | | 1.40% | |
| | | | | | | | | | | |
Net investment income
(prior to reimbursement) | | | | | | | 2.01% | | | | | | | | 1.34% | | | | | | | | 1.38% | | | | | | | | 1.42% | | | | | | | | 1.31% | |
| | | | | | | | | | | |
| Portfolio turnover rate 2 | | | | | | | 43% | | | | | | | | 38% | | | | | | | | 48% | | | | | | | | 60% | | | | | | | | 57% | |
| 1 | Net investment income per share represents net investment income divided by the average shares outstanding throughout the period. |
| 2 | Portfolio turnover is calculated on the basis of the Fund as a whole without distinguishing between the classes of shares issued. |
The accompanying notes are an integral part of these financial statements.
| | |
| 50 | | www.thomaswhitefunds.com |
Year Ended October 31, 2019
FINANCIAL HIGHLIGHTS
| | | | | | | | | | | | | | | | | | | | | | | | | | | | | | | | | | | | | | | | |
| |
| Thomas White Emerging Markets Fund - Investor Class | |
| | | Year Ended October 31, | |
| | | | | | 2019 | | | | | | 2018 | | | | | | 2017 | | | | | | 2016 | | | | | | 2015 | |
| |
| Per share operating performance (For a share outstanding throughout the year) | |
| | | | | | | | | | | |
| Net asset value, beginning of year | | | $ | | | | 9.87 | | | | $ | | | | 11.30 | | | | $ | | | | 9.80 | | | | $ | | | | 9.46 | | | | $ | | | | 11.55 | |
| | | | | | | | | | | |
| Income from investment operations: | | | | | | | | | | | | | | | | | | | | | | | | | | | | | | | | | | | | | | | | |
| | | | | | | | | | | |
Net investment income 1 | | | | | | | 0.23 | | | | | | | | 0.10 | | | | | | | | 0.09 | | | | | | | | 0.05 | | | | | | | | 0.08 | |
| | | | | | | | | | | |
Net realized and unrealized gains/(losses) | | | | | | | 0.94 | | | | | | | | (1.41 | ) | | | | | | | 1.57 | | | | | | | | 0.37 | | | | | | | | (2.08 | ) |
| | | | | | | | | | | |
| Total from investment operations | | | | | | | 1.17 | | | | | | | | (1.31 | ) | | | | | | | 1.66 | | | | | | | | 0.42 | | | | | | | | (2.00 | ) |
| | | | | | | | | | | |
| Distributions from net investment income | | | | | | | (0.13 | ) | | | | | | | (0.12 | ) | | | | | | | (0.16 | ) | | | | | | | (0.08 | ) | | | | | | | (0.09 | ) |
| | | | | | | | | | | |
| Change in net asset value for the year | | | | | | | 1.04 | | | | | | | | (1.43 | ) | | | | | | | 1.50 | | | | | | | | 0.34 | | | | | | | | (2.09 | ) |
| | | | | | | | | | | |
| Net asset value, end of year | | | $ | | | | 10.91 | | | | $ | | | | 9.87 | | | | $ | | | | 11.30 | | | | $ | | | | 9.80 | | | | $ | | | | 9.46 | |
| | | | | | | | | | | |
| Total Return | | | | | | | 11.84% | | | | | | | | (11.59)% | | | | | | | | 17.02% | | | | | | | | 4.48% | | | | | | | | (17.31)% | |
| | | | | | | | | | | |
| Ratios/supplemental data | | | | | | | | | | | | | | | | | | | | | | | | | | | | | | | | | | | | | | | | |
| | | | | | | | | | | |
| Net assets, end of year ($000) | | | $ | | | | 1,694 | | | | $ | | | | 1,651 | | | | $ | | | | 2,002 | | | | $ | | | | 1,816 | | | | $ | | | | 4,172 | |
| | | | | | | | | | | |
| Ratio to average net assets: | | | | | | | | | | | | | | | | | | | | | | | | | | | | | | | | | | | | | | | | |
| | | | | | | | | | | |
Expenses
(net of reimbursement/recoupment) | | | | | | | 1.34% | | | | | | | | 1.34% | | | | | | | | 1.34% | | | | | | | | 1.34% | | | | | | | | 1.34% | |
| | | | | | | | | | | |
Expenses
(prior to reimbursement/recoupment) | | | | | | | 1.65% | | | | | | | | 1.54% | | | | | | | | 1.48% | | | | | | | | 1.31% | | | | | | | | 1.27% | |
| | | | | | | | | | | |
Net investment income
(net of reimbursement/recoupment) | | | | | | | 2.19% | | | | | | | | 0.85% | | | | | | | | 0.90% | | | | | | | | 0.59% | | | | | | | | 0.75% | |
| | | | | | | | | | | |
Net investment income
(prior to reimbursement/recoupment) | | | | | | | 1.88% | | | | | | | | 0.65% | | | | | | | | 0.76% | | | | | | | | 0.62% | | | | | | | | 0.82% | |
| | | | | | | | | | | |
| Portfolio turnover rate 2 | | | | | | | 29% | | | | | | | | 34% | | | | | | | | 67% | | | | | | | | 57% | | | | | | | | 27% | |
| 1 | Net investment income per share represents net investment income divided by the average shares outstanding throughout the period. |
| 2 | Portfolio turnover is calculated on the basis of the Fund as a whole without distinguishing between the classes of shares issued. |
The accompanying notes are an integral part of these financial statements.
| | | | |
| www.thomaswhitefunds.com | | | 51 | |
Year Ended October 31, 2019
FINANCIAL HIGHLIGHTS
| | | | | | | | | | | | | | | | | | | | | | | | | | | | | | | | | | | | | | | | |
| |
| Thomas White Emerging Markets Fund - Class I | |
| | | Year Ended October 31, | |
| | | | | | 2019 | | | | | | 2018 | | | | | | 2017 | | | | | | 2016 | | | | | | 2015 | |
| |
| Per share operating performance (For a share outstanding throughout the year) | |
| | | | | | | | | | | |
| Net asset value, beginning of year | | | $ | | | | 9.97 | | | | $ | | | | 11.38 | | | | $ | | | | 9.88 | | | | $ | | | | 9.52 | | | | $ | | | | 11.59 | |
| | | | | | | | | | | |
| Income from investment operations: | | | | | | | | | | | | | | | | | | | | | | | | | | | | | | | | | | | | | | | | |
| | | | | | | | | | | |
Net investment income 1 | | | | | | | 0.26 | | | | | | | | 0.12 | | | | | | | | 0.11 | | | | | | | | 0.09 | | | | | | | | 0.11 | |
| | | | | | | | | | | |
Net realized and unrealized gains/(losses) | | | | | | | 0.95 | | | | | | | | (1.41 | ) | | | | | | | 1.59 | | | | | | | | 0.36 | | | | | | | | (2.09 | ) |
| | | | | | | | | | | |
| Total from investment operations | | | | | | | 1.21 | | | | | | | | (1.29 | ) | | | | | | | 1.70 | | | | | | | | 0.45 | | | | | | | | (1.98 | ) |
| | | | | | | | | | | |
| Distributions from net investment income | | | | | | | (0.16 | ) | | | | | | | (0.12 | ) | | | | | | | (0.20 | ) | | | | | | | (0.09 | ) | | | | | | | (0.09 | ) |
| | | | | | | | | | | |
| Change in net asset value for the year | | | | | | | 1.05 | | | | | | | | (1.41 | ) | | | | | | | 1.50 | | | | | | | | 0.36 | | | | | | | | (2.07 | ) |
| | | | | | | | | | | |
| Net asset value, end of year | | | $ | | | | 11.02 | | | | $ | | | | 9.97 | | | | $ | | | | 11.38 | | | | $ | | | | 9.88 | | | | $ | | | | 9.52 | |
| | | | | | | | | | | |
| Total Return | | | | | | | 12.11% | | | | | | | | (11.33)% | | | | | | | | 17.29% | | | | | | | | 4.69% | | | | | | | | (17.06)% | |
| | | | | | | | | | | |
| Ratios/supplemental data | | | | | | | | | | | | | | | | | | | | | | | | | | | | | | | | | | | | | | | | |
| | | | | | | | | | | |
| Net assets, end of year ($000) | | | $ | | | | 34,702 | | | | $ | | | | 31,861 | | | | $ | | | | 45,392 | | | | $ | | | | 76,240 | | | | $ | | | | 79,656 | |
| | | | | | | | | | | |
| Ratio to average net assets: | | | | | | | | | | | | | | | | | | | | | | | | | | | | | | | | | | | | | | | | |
| | | | | | | | | | | |
Expenses
(net of reimbursement) | | | | | | | 1.09% | | | | | | | | 1.09% | | | | | | | | 1.09% | | | | | | | | 1.09% | | | | | | | | 1.09% | |
| | | | | | | | | | | |
Expenses
(prior to reimbursement) | | | | | | | 1.63% | | | | | | | | 1.51% | | | | | | | | 1.41% | | | | | | | | 1.29% | | | | | | | | 1.25% | |
| | | | | | | | | | | |
Net investment income
(net of reimbursement) | | | | | | | 2.44% | | | | | | | | 1.04% | | | | | | | | 1.07% | | | | | | | | 0.92% | | | | | | | | 1.04% | |
| | | | | | | | | | | |
Net investment income
(prior to reimbursement) | | | | | | | 1.90% | | | | | | | | 0.62% | | | | | | | | 0.75% | | | | | | | | 0.72% | | | | | | | | 0.88% | |
| | | | | | | | | | | |
| Portfolio turnover rate 2 | | | | | | | 29% | | | | | | | | 34% | | | | | | | | 67% | | | | | | | | 57% | | | | | | | | 27% | |
| 1 | Net investment income per share represents net investment income divided by the average shares outstanding throughout the period. |
| 2 | Portfolio turnover is calculated on the basis of the Fund as a whole without distinguishing between the classes of shares issued. |
The accompanying notes are an integral part of these financial statements.
| | |
| 52 | | www.thomaswhitefunds.com |
Year Ended October 31, 2019
FINANCIAL HIGHLIGHTS
| | | | | | | | | | | | | | | | | | | | | | | | | | | | | | | | | | | | | | | | |
| |
| Thomas White American Opportunities Fund - Investor Class | |
| | | Year Ended October 31, | |
| | | | | | 2019 | | | | | | 2018 | | | | | | 2017 | | | | | | 2016 | | | | | | 2015 | |
| |
| Per share operating performance (For a share outstanding throughout the year) | |
| | | | | | | | | | | |
| Net asset value, beginning of year | | | $ | | | | 15.81 | | | | $ | | | | 16.49 | | | | $ | | | | 14.91 | | | | $ | | | | 15.60 | | | | $ | | | | 15.84 | |
| | | | | | | | | | | |
| Income from investment operations: | | | | | | | | | | | | | | | | | | | | | | | | | | | | | | | | | | | | | | | | |
| | | | | | | | | | | |
Net investment income | | | | | | | 0.04 | 1 | | | | | | | 0.06 | 1 | | | | | | | 0.04 | 1 | | | | | | | 0.11 | 2 | | | | | | | 0.08 | 2 |
| | | | | | | | | | | |
Net realized and unrealized gains/(losses) | | | | | | | 2.08 | | | | | | | | ------- | | | | | | | | 3.00 | | | | | | | | (0.44 | ) | | | | | | | 0.96 | |
| | | | | | | | | | | |
| Total from investment operations | | | | | | | 2.12 | | | | | | | | 0.06 | | | | | | | | 3.04 | | | | | | | | (0.33 | ) | | | | | | | 1.04 | |
| | | | | | | | | | | |
| Distributions: | | | | | | | | | | | | | | | | | | | | | | | | | | | | | | | | | | | | | | | | |
| | | | | | | | | | | |
From net investment income | | | | | | | (0.03 | ) | | | | | | | (0.05 | ) | | | | | | | (0.14 | ) | | | | | | | (0.00 | ) 3 | | | | | | | (0.07 | ) |
| | | | | | | | | | | |
From net realized gains | | | | | | | (0.44 | ) | | | | | | | (0.69 | ) | | | | | | | (1.32 | ) | | | | | | | (0.36 | ) | | | | | | | (1.21 | ) |
| | | | | | | | | | | |
| Total Distributions | | | | | | | (0.47 | ) | | | | | | | (0.74 | ) | | | | | | | (1.46 | ) | | | | | | | (0.36 | ) | | | | | | | (1.28 | ) |
| | | | | | | | | | | |
| Change in net asset value for the year | | | | | | | 1.65 | | | | | | | | (0.68 | ) | | | | | | | 1.58 | | | | | | | | (0.69 | ) | | | | | | | (0.24 | ) |
| | | | | | | | | | | |
| Net asset value, end of year | | | $ | | | | 17.46 | | | | $ | | | | 15.81 | | | | $ | | | | 16.49 | | | | $ | | | | 14.91 | | | | $ | | | | 15.60 | |
| | | | | | | | | | | |
| Total Return | | | | | | | 13.37% | | | | | | | | 0.50% | | | | | | | | 20.45% | | | | | | | | (2.12)% | | | | | | | | 6.69% | |
| | | | | | | | | | | |
| Ratios/supplemental data | | | | | | | | | | | | | | | | | | | | | | | | | | | | | | | | | | | | | | | | |
| | | | | | | | | | | |
| Net assets, end of year ($000) | | | $ | | | | 45,766 | | | | $ | | | | 40,969 | | | | $ | | | | 41,433 | | | | $ | | | | 36,816 | | | | $ | | | | 37,875 | |
| | | | | | | | | | | |
| Ratio to average net assets: | | | | | | | | | | | | | | | | | | | | | | | | | | | | | | | | | | | | | | | | |
| | | | | | | | | | | |
Expenses
(net of reimbursement/recoupment) | | | | | | | 1.34% | | | | | | | | 1.34% | | | | | | | | 1.19% | | | | | | | | 1.20% | | | | | | | | 1.18% | |
| | | | | | | | | | | |
Expenses
(prior to reimbursement/recoupment) | | | | | | | 1.55% | | | | | | | | 1.43% | | | | | | | | 1.19% | | | | | | | | 1.20% | | | | | | | | 1.18% | |
| | | | | | | | | | | |
Net investment income
(net of reimbursement/recoupment) | | | | | | | 0.23% | | | | | | | | 0.31% | | | | | | | | 0.28% | | | | | | | | 0.78% | | | | | | | | 0.52% | |
| | | | | | | | | | | |
Net investment income
(prior to reimbursement/recoupment) | | | | | | | 0.02% | | | | | | | | 0.22% | | | | | | | | 0.28% | | | | | | | | 0.78% | | | | | | | | 0.52% | |
| | | | | | | | | | | |
| Portfolio turnover rate | | | | | | | 20% | | | | | | | | 21% | | | | | | | | 29% | | | | | | | | 60% | | | | | | | | 38% | |
| 1 | Net investment income per share represents net investment income divided by shares outstanding throughout the period. |
| 2 | Per share net investment income was calculated prior to tax adjustments. |
| 3 | Amount is less than $0.005. |
The accompanying notes are an integral part of these financial statements.
| | | | |
| www.thomaswhitefunds.com | | | 53 | |
Notes to Financial Statements Year Ended October 31, 2019
NOTE 1. ORGANIZATION AND SIGNIFICANT ACCOUNTING POLICIES
Lord Asset Management Trust (the “Trust”) was organized as a Delaware business trust on February 9, 1994, as an open-end diversified management investment company. The Trust currently has three series of shares (collectively referred to as the “Funds”) - the Thomas White International Fund (the “International Fund”), which commenced operations with the sale of Investor Class shares on June 28, 1994 and the sale of Class I shares, Class A shares and Class C shares on August 31, 2012; the Thomas White Emerging Markets Fund (the “Emerging Markets Fund”), which commenced operations with the sale of Investor Class shares on June 28, 2010 and the sale of Class I shares, Class A shares and Class C shares on August 31, 2012; and the Thomas White American Opportunities Fund (the “American Opportunities Fund”), which commenced operations with the sale of Investor Class shares on March 4, 1999. Class A and Class C shares of the International Fund and Emerging Markets Fund closed on February 28, 2017 and effective at the close of business on that date, the outstanding Class A and Class C shares of those Funds were converted to Class I shares, as applicable. The investment objective of each Fund is to seek long-term capital growth. The International Fund invests in equity securities of companies located in the world’s developed countries outside of the U.S. The Emerging Markets Fund invests in securities of companies located in or whose businesses are closely associated with the world’s emerging markets countries. The American Opportunities Fund primarily invests in U.S. equity securities, with a focus on mid-size and small companies.
The following is a summary of significant accounting policies followed in the preparation of the Trust’s financial statements.
(A) VALUATION OF SECURITIES
Securities listed or traded on a recognized national or foreign stock exchange or NASDAQ are valued at the last reported sales prices on the principal exchange on which the securities are traded. NASDAQ National Market securities are valued at the NASDAQ official closing price. Over-the-counter securities and listed securities for which no closing sale price is reported are valued at the mean between the last current bid and ask price. Securities for which market quotations are not readily available are valued at fair value under the Trust’s Valuation Procedures as determined by management and approved in good faith by the Board of Trustees. As of October 31, 2019, all securities within each Fund’s portfolio were valued at the last reported sales price on the principal exchange on which the securities are traded and, for the International and Emerging Markets Funds, adjusted by a fair value factor when necessary and as further described below. The Trust has retained an independent statistical fair value pricing service to assist in the fair valuation process for securities principally traded in a foreign market in order to adjust for changes in value that may occur between the close of the foreign exchange and the time at which Fund shares are priced. Short term investments are valued at original cost, which combined with accrued interest, approximates market value.
| | |
| 54 | | www.thomaswhitefunds.com |
Notes to Financial Statements Year Ended October 31, 2019
Fair value is defined as the price that would be received to sell an asset or paid to transfer a liability (i.e., the “exit price”) in an orderly transaction between market participants at the measurement date. In determining fair value, the Fund uses various valuation approaches. A three-tiered fair value hierarchy for inputs is used in measuring fair value that maximizes the use of observable inputs and minimizes the use of unobservable inputs by generally requiring that the most observable inputs be used when available. Observable inputs are those that market participants would use in pricing the asset or liability based on market data obtained from sources independent of a Fund. Unobservable inputs reflect the Fund’s assumptions about the inputs market participants would use in pricing the asset or liability developed based on the best information available in the circumstances. The inputs or methodologies used for valuing securities are not necessarily an indication of the risks associated with investing in those securities.
The fair value hierarchy is categorized into three levels based on the inputs as follows:
Level 1 - Valuations based on unadjusted quoted prices in active markets for identical assets.
Level 2 - Valuations based on quoted prices for similar securities or in markets that are not active or for which all significant inputs are observable, either directly or indirectly.
Level 3 - Valuations based on inputs that are unobservable and significant to the overall fair value measurement.
(B) MULTI-CLASS OPERATIONS AND ALLOCATIONS
Expenses of the Funds that are not directly attributable to a specific class of shares are prorated among the classes based on the relative net assets of each class. Expenses directly attributable to a class of shares, which presently include administration fees, administrative services fees, printing expenses, registration fees and transfer agent fees, are recorded to the specific class.
| | | | |
| www.thomaswhitefunds.com | | | 55 | |
Notes to Financial Statements Year Ended October 31, 2019
For the year ended October 31, 2019, the multi-class fund expenses per class are as follows:
| | | | | | | | | | | | |
| | | | |
| International Fund | | Investor
Class | | | Class I | | | Total | |
| | | | |
| Expenses: | | | | | | | | | | | | |
| | | | |
Investment management fees | | | $235,516 | | | | $808,141 | | | | $1,043,657 | |
| | | | |
Business management fees | | | 9,697 | | | | 33,277 | | | | 42,974 | |
| | | | |
Trustees’ fees and expenses | | | 25,596 | | | | 87,824 | | | | 113,420 | |
| | | | |
Fund accounting and fund administration fees | | | 23,913 | | | | 81,838 | | | | 105,751 | |
| | | | |
Custodian fees | | | 14,476 | | | | 49,156 | | | | 63,632 | |
| | | | |
Printing and mailing expenses | | | 4,301 | | | | 13,862 | | | | 18,163 | |
| | | | |
Professional fees | | | 36,955 | | | | 127,724 | | | | 164,679 | |
| | | | |
Shareholder servicing fees | | | 19,493 | | | | 67,158 | | | | 86,651 | |
| | | | |
Registration fees | | | 5,612 | | | | 18,866 | | | | 24,478 | |
| | | | |
Administrative service fee | | | 62,353 | | | | ------- | | | | 62,353 | |
| | | | |
Other expenses | | | 14,243 | | | | 48,042 | | | | 62,285 | |
| | | | |
| Total expenses | | | 452,155 | | | | 1,335,888 | | | | 1,788,043 | |
| | | | |
Reimbursement of management fees | | | (107,470 | ) | | | (368,764 | ) | | | (476,234 | ) |
| | | | |
Reimbursement of class specific expenses | | | ------- | | | | (22,074 | ) | | | (22,074 | ) |
| | | | |
| Reimbursement from Advisor | | | (107,470 | ) | | | (390,838 | ) | | | (498,308 | ) |
| | | | |
| Net expenses | | | $344,685 | | | | $945,050 | | | | $1,289,735 | |
| | | | | | | | | | | | |
| | | | |
| Emerging Markets Fund | | Investor
Class | | | Class I | | | Total | |
| | | | |
| Expenses: | | | | | | | | | | | | |
| | | | |
Investment management fees | | | $14,502 | | | | $299,385 | | | | $313,887 | |
| | | | |
Business management fees | | | 598 | | | | 12,327 | | | | 12,925 | |
| | | | |
Trustees’ fees and expenses | | | 1,435 | | | | 29,680 | | | | 31,115 | |
| | | | |
Fund accounting and fund administration fees | | | 1,956 | | | | 40,382 | | | | 42,338 | |
| | | | |
Custodian fees | | | 2,268 | | | | 46,609 | | | | 48,877 | |
| | | | |
Printing and mailing expenses | | | 374 | | | | 7,704 | | | | 8,078 | |
| | | | |
Professional fees | | | 2,557 | | | | 52,846 | | | | 55,403 | |
| | | | |
Shareholder servicing fees | | | 1,718 | | | | 35,401 | | | | 37,119 | |
| | | | |
Registration fees | | | 1,326 | | | | 27,314 | | | | 28,640 | |
| | | | |
Administrative service fee | | | 296 | | | | ------- | | | | 296 | |
| | | | |
Other expenses | | | 1,099 | | | | 22,609 | | | | 23,708 | |
| | | | |
| Total expenses | | | 28,129 | | | | 574,257 | | | | 602,386 | |
| | | | |
Reimbursement of management fees | | | (5,160 | ) | | | (106,349 | ) | | | (111,509 | ) |
| | | | |
Reimbursement of class specific expenses | | | ------- | | | | (82,612 | ) | | | (82,612 | ) |
| | | | |
| Reimbursement from Advisor | | | (5,160 | ) | | | (188,961 | ) | | | (194,121 | ) |
| | | | |
| Net expenses | | | $22,969 | | | | $385,296 | | | | $408,265 | |
Income, realized and unrealized capital gains and losses of the Funds are prorated among the classes based on the relative net assets of each class within each specific Fund.
| | |
| 56 | | www.thomaswhitefunds.com |
Notes to Financial Statements Year Ended October 31, 2019
(C) MARKET RISK
Investing in securities of foreign companies and foreign governments involves special risks and considerations not typically associated with investing in U.S. companies and securities of the U.S. Government. These risks include revaluation of currencies and future adverse political and economic developments. Moreover, securities of many foreign companies and foreign governments and their markets may be less liquid and their prices more volatile than securities of comparable U.S. companies and securities of the U.S. Government.
(D) FOREIGN CURRENCY TRANSLATION
Portfolio securities and other assets and liabilities denominated in foreign currencies are translated into U.S. dollar amounts at date of valuation. Purchases and sales of portfolio securities and income items denominated in foreign currencies are translated into U.S. dollar amounts on the respective dates of such transactions. When a Fund purchases or sells a foreign security, it will customarily enter into a foreign exchange contract to minimize foreign exchange risk from the trade date to the settlement date of such transaction.
The Funds do not isolate the portion of the results of operations resulting from changes in foreign exchange rates on investments from the fluctuations arising from changes in market prices of securities held. Such fluctuations are included with the net realized and unrealized gain or loss from investments.
Net realized gain (loss) on investments and foreign currency translation include those gains and losses arising from the sale of foreign currencies, currency gains or losses realized between the trade and settlement dates on securities transactions, the differences between the amounts of dividends, and foreign withholding taxes recorded on a Fund’s books, and the U.S. dollar equivalent of the amounts actually received or paid. Net unrealized appreciation (depreciation) on investments and foreign currency translation includes changes in the value of assets and liabilities resulting from exchange rates.
(E) INCOME TAXES
Each Fund is a separate taxpayer for federal income tax purposes. Each Fund intends to distribute substantially all of its net investment income and net capital gains to its shareholders and to otherwise comply with the requirements of Subchapter M of the Internal Revenue Code applicable to regulated investment companies. Therefore, no federal income tax provision is required.
All open tax years and major jurisdictions have been reviewed for the Funds and, based on this review, there are no significant uncertain tax positions that would require recognition in the financial statements. Open tax years are those that are open for exam by taxing authorities and, as of October 31, 2019, open Federal tax years include the tax years ended October 31, 2016
| | | | |
| www.thomaswhitefunds.com | | | 57 | |
Notes to Financial Statements Year Ended October 31, 2019
through 2019. The Funds have no examinations in progress and are also not aware of any tax positions for which it is reasonably possible that the total amounts of unrecognized tax benefits will significantly change in the next twelve months.
The Funds accrue for such material foreign taxes on net realized and unrealized gains at the appropriate rate for each country. Based on rates ranging from approximately 10% to 15%, there were no material accruals at period end.
(F) USE OF ESTIMATES
The preparation of financial statements in conformity with generally accepted accounting principles requires management to make estimates and assumptions that affect the reported amounts of assets and liabilities and disclosure of contingent liabilities at the date of the financial statements and the reported amounts of increases and decreases in net assets from operations during the period. Actual results could differ from these estimates.
The Funds are investment companies and follow accounting and reporting guidance under the Financial Accounting Standards Board (“FASB”) Accounting Standards Codification (“ASC”) Topic 946,“Financial Services-Investment Companies”.
(G) SECURITY TRANSACTIONS AND INVESTMENT INCOME
Security transactions are accounted for on a trade date basis. Interest is accrued on a daily basis and dividend income is recorded on the ex-dividend date, except that certain dividends from foreign securities are recorded when the information is available to the Fund. Realized gains and losses are determined using specific identification.
(H) DISTRIBUTIONS TO SHAREHOLDERS
The Funds usually declare and pay dividends from net investment income annually, but may do so more frequently to avoid excise tax. Distributions of net realized capital gains, if any, will be distributed at least annually.
(I) SECURITIES LENDING
The Funds may lend investment securities to investors who borrow securities in order to complete certain transactions. By lending investment securities, a Fund attempts to increase its net investment income through the receipt of interest earned on loan collateral. Any increase or decline in the market price of the securities loaned that might occur and any interest earned or dividends declared during the term of the loan would be for the account of the Fund. Risks of delay in recovery of the securities or even loss of rights in the collateral may occur should the borrower of the securities fail financially. Risk may also arise to the extent that the value of the securities loaned increases above the value of the collateral received. It is each Fund’s policy to obtain additional collateral from or return excess collateral to the borrower by the end of the next business day. Therefore, the value of the collateral may be temporarily less than the value of the securities on loan.
| | |
| 58 | | www.thomaswhitefunds.com |
Notes to Financial Statements Year Ended October 31, 2019
Funds that lend securities receive cash, cash equivalents, or other securities as collateral. Initial collateral levels shall not be less than 102% of the market value of the borrowed securities (105% if the collateral and the borrowed securities are denominated in different currencies). Marking to market is performed every business day (subject to de minimis rules of change in market value) for each Fund and each borrower is required to deliver additional collateral when necessary so that the total collateral held in the account for all loans of the Fund to the borrower will not be less than 100% of the market value of all the borrowed securities loaned to the borrower by the Fund. Any cash, cash equivalents, or other securities received as collateral is invested by the securities lending agent, Northern Trust, in accordance with pre-established guidelines as set forth in the securities lending agreement. The cash collateral would be invested in the Northern Institutional Liquid Asset Portfolio (an open-end regulated investment company) and would be shown on the investment portfolio for the International Fund and the Emerging Markets Fund. The cash collateral, if any, is reflected in the Funds’ Statements of Assets and Liabilities in the line item labeled “Investments in securities at market value.” Non-cash collateral is not shown in the Funds’ investment portfolios nor disclosed in the Statements of Assets and Liabilities as it is held by the lending agent on behalf of the Funds, and the Funds do not have the ability to re-hypthecate those securities. A portion of the interest received on the loan collateral is retained by the Fund and the remainder is rebated to the borrower of the securities. From the interest retained by the Funds, 50% is paid to the securities lending agent for the International Fund and Emerging Markets Fund for its services. The net amount of interest earned, after the interest rebate and the allocation to the securities lending agent, is included in the statement of operations as securities lending income. The value of loaned securities and related collateral outstanding at October 31, 2019 are as follows:
| | | | | | | | | | | | | | | | |
| | | | | |
| Fund | | Value of
Loaned
Securities | | | Value of
Cash
Collateral | | | Value of
Non-Cash
Collateral* | | | Total
Collateral | |
| Thomas White International Fund | | | $588,640 | | | | $825 | | | | $600,467 | | | | $601,292 | |
| | | | | |
| Thomas White Emerging Markets Fund | | | $458,814 | | | | $0 | | | | $470,657 | | | | $470,657 | |
| | * | Funds cannot repledge or dispose of this collateral, nor do the Funds earn any income or receive dividends with respect to this collateral. |
The International Fund and the Emerging Markets Fund have earned income on securities lending (after rebates to borrowers and allocation to the securities lending agent) as follows:
| | | | |
| | |
| Fund | | Net Income Earned | |
| Thomas White International Fund | | | $2,799 | |
| | |
| Thomas White Emerging Markets Fund | | | $359 | |
The Funds recently adopted guidance requiring entities to present gross obligations for secured borrowings by the type of collateral pledged and remaining time to maturity. There were no such obligations at October 31, 2019.
| | | | |
| www.thomaswhitefunds.com | | | 59 | |
Notes to Financial Statements Year Ended October 31, 2019
(J) REDEMPTION FEE
The Funds assess a 2% fee on redemptions (including exchanges) of Fund shares held for less than sixty days. Redemption fees are paid to each Fund to help offset transaction costs and to protect the Fund’s long-term shareholders. Each Fund will use the “first-in, first-out” (FIFO) method to determine the sixty-day holding period. Under this method, the date of the redemption or exchange will be compared to the earliest purchase date of shares held in the account. If this holding period is less than sixty days, the fee will be charged. The redemption fees were included in net capital paid (Note 3).
(K) REAL ESTATE INVESTMENT TRUSTS
The Emerging Markets Fund and American Opportunities Fund have made certain investments in real estate investment trusts (“REITs”), which pay dividends to their shareholders based upon funds available from operations. It is quite common for these dividends to exceed the REITs’ taxable earnings and profits resulting in the excess portion of such dividends being designated as a return of capital. The Emerging Markets Fund and American Opportunities Fund intend to include the gross dividends from such REITs in their annual distributions to their shareholders and, accordingly, a portion of the distributions received by the shareholders of the Emerging Markets Fund or American Opportunities Fund may also be designated as a return of capital.
(L) RECENT ACCOUNTING PRONOUNCEMENT
In August 2018, FASB issued ASU 2018-13,Fair Value Measurement (Topic 820):Disclosure Framework - Changes to the Disclosure Requirements for Fair Value Measurement (“ASU 2018-13”). The primary focus of ASU 2018-13 is to improve the effectiveness of the disclosure requirements for fair value measurements. The changes affect all companies that are required to include fair value measurement disclosures. In general, the amendments in ASU 2018-13 are effective for all entities for fiscal years and interim periods within those fiscal years, beginning after December 15, 2019. An entity is permitted to early adopt the removed or modified disclosures upon the issuance of ASU 2018-13 and may delay adoption of the additional disclosures, which are required for public companies only, until their effective date. Management is currently evaluating the impact these changes will have on the Funds’ financial statements and disclosures.
| | |
| 60 | | www.thomaswhitefunds.com |
Notes to Financial Statements Year Ended October 31, 2019
NOTE 2. SIGNIFICANT SHAREHOLDERS (Unaudited)
The following table indicates the number of shareholders who held a significant portion of the shares of each Class’s outstanding shares as of October 31, 2019. Investment activities of these shareholders could have a material effect on each Fund.
| | | | | | | | | | |
| | | | |
| Fund | | Share Class | | Number of
Shareholders | | | % Held | |
| International Fund | | Investor Class | | | 1 | | | | 13.9% | |
| | | | |
| International Fund | | Class I | | | 1 | | | | 13.7% | |
| | | | |
| Emerging Markets Fund | | Investor Class | | | 2 | | | | 81.4% | |
| | | | |
| Emerging Markets Fund | | Class I | | | 1 | | | | 18.4% | |
| | | | |
| American Opportunities Fund | | Investor Class | | | 1 | | | | 20.4% | |
NOTE 3. TRANSACTIONS IN SHARES OF BENEFICIAL INTEREST
As of October 31, 2019, there were an unlimited number of $0.01 par value shares of beneficial interest authorized. Transactions are summarized as follows:
| | | | | | | | | | | | | | | | | | | | | | | | | | | | |
|
| International Fund | |
| | | |
| | | Year Ended October 31, 2019 | | | | | | Year Ended October 31, 2018 | |
| | | |
| | | Investor Class | | | | | | Investor Class | |
| | | | | | | |
| | | Shares | | | | | | Amount | | | | | | Shares | | | | | | Amount | |
| | | | | | | |
| Shares sold | | | 42,656 | | | $ | | | | | 632,972 | | | | | | | | 36,613 | | | $ | | | | | 655,799 | |
| | | | | | | |
| Shares issued on reinvestment of dividends & distributions | | | 55,834 | | | | | | | | 825,230 | | | | | | | | 239,520 | | | | | | | | 3,228,728 | |
| | | | | | | |
| Shares redeemed | | | (446,081 | ) | | | | | | | (6,467,395 | )^ | | | | | | | (598,797 | ) | | | | | | | (10,572,135 | )^^ |
| | | | | | | |
| Net decrease | | | (347,591 | ) | | $ | | | | | (5,009,193 | ) | | | | | | | (322,664 | ) | | $ | | | | | (6,687,608 | ) |
| | | | | | | |
| Shares outstanding: | | | | | | | | | | | | | | | | | | | | | | | | | | | | |
| | | | | | | |
| Beginning of year | | | 2,127,022 | | | | | | | | | | | | | | | | 2,449,686 | | | | | | | | | |
| | | | | | | |
| End of year | | | 1,779,431 | | | | | | | | | | | | | | | | 2,127,022 | | | | | | | | | |
|
| ^ Net of redemption fees of $10 | |
|
| ^^ Net of redemption fees of $497 | |
| | | | |
| www.thomaswhitefunds.com | | | 61 | |
Notes to Financial Statements Year Ended October 31, 2019
| | | | | | | | | | | | | | | | | | | | | | | | | | | | |
| | | |
| | | Year Ended October 31, 2019 | | | | | | Year Ended October 31, 2018 | |
| | | |
| | | Class I | | | | | | Class I | |
| | | | | | | |
| | | Shares | | | | | | Amount | | | | | | Shares | | | | | | Amount | |
| | | | | | | |
| Shares sold | | | 1,507,762 | | | $ | | | | | 21,036,522 | | | | | | | | 852,416 | | | $ | | | | | 15,132,987 | |
| | | | | | | |
| Shares issued on reinvestment of dividends & distributions | | | 140,570 | | | | | | | | 2,022,012 | | | | | | | | 1,261,639 | | | | | | | | 16,956,419 | |
| | | | | | | |
| Shares redeemed | | | (8,474,715 | ) | | | | | | | (119,110,278 | )^ | | | | | | | (4,582,847 | ) | | | | | | | (81,395,513 | )^^ |
| | | | | | | |
| Net decrease | | | (6,826,383 | ) | | $ | | | | | (96,051,744 | ) | | | | | | | (2,468,792 | ) | | $ | | | | | (49,306,107 | ) |
| | | | | | | |
| Shares outstanding: | | | | | | | | | | | | | | | | | | | | | | | | | | | | |
| | | | | | | |
| Beginning of year | | | 13,116,474 | | | | | | | | | | | | | | | | 15,585,266 | | | | | | | | | |
| | | | | | | |
| End of year | | | 6,290,091 | | | | | | | | | | | | | | | | 13,116,474 | | | | | | | | | |
| | | | | | | |
| Total net decrease | | | | | | $ | | | | | (101,060,937 | ) | | | | | | | | | | $ | | | | | (55,993,715 | ) |
|
| ^ Net of redemption fees of $9 | |
|
| ^^ Net of redemption fees of $8 | |
| | | | | | | | | | | | | | | | | | | | | | | | | | | | |
|
| Emerging Markets Fund | |
| | | |
| | | Year Ended October 31, 2019 | | | | | | Year Ended October 31, 2018 | |
| | | |
| | | Investor Class | | | | | | Investor Class | |
| | | | | | | |
| | | Shares | | | | | | Amount | | | | | | Shares | | | | | | Amount | |
| | | | | | | |
| Shares sold | | | ------- | | | $ | | | | | ------- | | | | | | | | 5,032 | | | $ | | | | | 56,877 | |
| | | | | | | |
| Shares issued on reinvestment of dividends & distributions | | | 970 | | | | | | | | 10,633 | | | | | | | | 1,122 | | | | | | | | 10,728 | |
| | | | | | | |
| Shares redeemed | | | (12,948 | ) | | | | | | | (140,190 | ) | | | | | | | (16,212 | ) | | | | | | | (184,376 | )^ |
| | | | | | | |
| Net decrease | | | (11,978 | ) | | $ | | | | | (129,557 | ) | | | | | | | (10,058 | ) | | $ | | | | | (116,771 | ) |
| | | | | | | |
| Shares outstanding: | | | | | | | | | | | | | | | | | | | | | | | | | | | | |
| | | | | | | |
| Beginning of year | | | 167,213 | | | | | | | | | | | | | | | | 177,271 | | | | | | | | | |
| | | | | | | |
| End of year | | | 155,235 | | | | | | | | | | | | | | | | 167,213 | | | | | | | | | |
|
| ^ Net of redemption fees of $34 | |
| | | | | | | | | | | | | | | | | | | | | | | | | | | | |
| | | |
| | | Year Ended October 31, 2019 | | | | | | Year Ended October 31, 2018 | |
| | | |
| | | Class I | | | | | | Class I | |
| | | | | | | |
| | | Shares | | | | | | Amount | | | | | | Shares | | | | | | Amount | |
| | | | | | | |
| Shares sold | | | 156,423 | | | $ | | | | | 1,618,742 | | | | | | | | 312,421 | | | $ | | | | | 3,543,325 | |
| | | | | | | |
| Shares issued on reinvestment of dividends & distributions | | | 44,424 | | | | | | | | 491,779 | | | | | | | | 38,575 | | | | | | | | 372,630 | |
| | | | | | | |
| Shares redeemed | | | (248,009 | ) | | | | | | | (2,764,207 | ) | | | | | | | (1,144,555 | ) | | | | | | | (13,748,041 | ) |
| | | | | | | |
| Net decrease | | | (47,162 | ) | | $ | | | | | (653,686 | ) | | | | | | | (793,559 | ) | | $ | | | | | (9,832,086 | ) |
| | | | | | | |
| Shares outstanding: | | | | | | | | | | | | | | | | | | | | | | | | | | | | |
| | | | | | | |
| Beginning of year | | | 3,194,854 | | | | | | | | | | | | | | | | 3,988,413 | | | | | | | | | |
| | | | | | | |
| End of year | | | 3,147,692 | | | | | | | | | | | | | | | | 3,194,854 | | | | | | | | | |
| | | | | | | |
| Total net decrease | | | | | | $ | | | | | (783,243 | ) | | | | | | | | | | $ | | | | | (9,948,857 | ) |
| | |
| 62 | | www.thomaswhitefunds.com |
Notes to Financial Statements Year Ended October 31, 2019
| | | | | | | | | | | | | | | | | | | | | | | | | | | | |
|
| American Opportunities Fund | |
| | | |
| | | Year Ended October 31, 2019 | | | | | | Year Ended October 31, 2018 | |
| | | |
| | | Investor Class | | | | | | Investor Class | |
| | | | | | | |
| | | Shares | | | | | | Amount | | | | | | Shares | | | | | | Amount | |
| | | | | | | |
| Shares sold | | | 13,294 | | | $ | | | | | 215,109 | | | | | | | | 95,707 | | | $ | | | | | 1,603,940 | |
| | | | | | | |
| Shares issued on reinvestment of dividends & distributions | | | 65,657 | | | | | | | | 1,151,620 | | | | | | | | 116,726 | | | | | | | | 1,782,396 | |
| | | | | | | |
| Other transactions | | | | | | | | | | | 437 | ^ | | | | | | | | | | | | | | | | |
| | | | | | | |
| Shares redeemed | | | (48,636 | ) | | | | | | | (834,729 | ) | | | | | | | (134,381 | ) | | | | | | | (2,186,212 | )^^ |
| | | | | | | |
| Total net increase | | | 30,315 | | | $ | | | | | 532,437 | | | | | | | | 78,052 | | | $ | | | | | 1,200,124 | |
| | | | | | | |
| Shares outstanding: | | | | | | | | | | | | | | | | | | | | | | | | | | | | |
| | | | | | | |
| Beginning of year | | | 2,590,600 | | | | | | | | | | | | | | | | 2,512,548 | | | | | | | | | |
| | | | | | | |
| End of year | | | 2,620,915 | | | | | | | | | | | | | | | | 2,590,600 | | | | | | | | | |
|
| ^ Reimbursement from U.S. Bancorp Fund Services, LLC due to NAV error. | |
| | | | | | | |
| ^^ Net of redemption fees of $180 | | | | | | | | | | | | | | | | | | | | | | | | | | | | |
NOTE 4. INVESTMENT MANAGEMENT FEES AND OTHER TRANSACTIONS WITH AFFILIATES
Each Fund pays a monthly investment management fee to Thomas White International, Ltd. (the “Advisor”) at the rate of 0.85% of the Fund’s average daily net assets annually. For the year ended October 31, 2019, the International Fund, Emerging Markets Fund and American Opportunities Fund paid the Advisor $1,043,657, $313,887 and $370,017, respectively, in investment management fees.
During the year ended October 31, 2019, the Advisor has contractually agreed to reimburse its management fee and/or reimburse the Funds’ operating expenses to the extent necessary to ensure that each Fund’s annual operating expenses do not exceed the following percentages of average daily net assets:
| | | | | | | | |
| | | |
| | | Investor Class | | | Class I | |
| International Fund | | | 1.24% | | | | 0.99% | |
| | | |
| Emerging Markets Fund | | | 1.34% | | | | 1.09% | |
| | | |
| American Opportunities Fund | | | 1.34% | | | | n/a | |
These agreements to reimburse fees renew automatically unless the Advisor gives written notice to end them.
The Advisor may recoup any previously waived amount from a Fund pursuant to the expense limitation agreements if such reimbursement does not cause the Fund to exceed either (i) the current expense limitation or (ii) the expense limitation in effect at the time the expense is
| | | | |
| www.thomaswhitefunds.com | | | 63 | |
Notes to Financial Statements Year Ended October 31, 2019
waived, provided the reimbursement is made within three years after the year in which the Advisor incurred the expense. For the year ended October 31, 2019, the Advisor did not recoup any previously waived expenses.
As of October 31, 2019, the Funds had the following amounts (and year of expiration) subject to repayment to the Advisor:
| | | | | | | | | | | | | | | | |
| | | | | |
| Year Incurred | | 10/31/2017 | | | 10/31/2018 | | | 10/31/2019 | | | Remaining
Recoverable | |
| Expiration | | 10/31/2020 | | | 10/31/2021 | | | 10/31/2022 | | | Amount | |
| International Fund - Investor Class | | | $115,940 | | | | $47,574 | | | | $107,470 | | | | $270,984 | |
| | | | | |
| International Fund - Class I | | | 535,417 | | | | 465,425 | | | | 390,838 | | | | 1,391,680 | |
| | | | | |
| Total Fund | | | $651,357 | | | | $512,999 | | | | $498,308 | | | | $1,662,664 | |
| | | | | |
| | | | | | | | | | | | | | | | | |
| | | | | |
| Emerging Markets Fund - Investor Class | | | $2,618 | | | | $3,875 | | | | $5,160 | | | | $11,653 | |
| | | | | |
| Emerging Markets Fund - Class I | | | 195,908 | | | | 159,329 | | | | 188,961 | | | | 544,198 | |
| | | | | |
| Total Fund | | | $198,526 | | | | $163,204 | | | | $194,121 | | | | $555,851 | |
| | | | | |
| | | | | | | | | | | | | | | | | |
| | | | | |
| American Opportunities Fund - Investor Class | | | $------- | | | | $37,957 | | | | $88,392 | | | | $126,349 | |
| | | | | |
| Total Fund | | | $------- | | | | $37,957 | | | | $88,392 | | | | $126,349 | |
The Funds and U.S. Bancorp Fund Services, LLC, doing business as U.S. Bank Global Fund Services (“Fund Services”), are parties to a Fund Administration Servicing Agreement. Fund Services provides administrative and fund accounting services pursuant to this agreement.
The Advisor and the Funds have adopted a Business Management Agreement under which the Advisor provides certain business management services to the Funds, including, without limitation, monitoring of the Funds’ relationships with third-party service providers and assisting with necessary and appropriate services to the Board of Trustees of the Trust, as well as either providing the Trust with or procuring for the Trust the services of a Chief Compliance Officer in accordance with Rule 38a-1 of the 1940 Act, in the event so requested. For these services, the Advisor is entitled to receive a fee from each Fund at a rate of 0.035% of the Fund’s average daily net assets, accrued on a daily basis and paid to the Advisor on a monthly basis. For the year ended October 31, 2019, for the services provided under the Business Management Agreement, the International Fund, Emerging Markets Fund and American Opportunities Fund paid the Advisor $42,974, $12,925 and $15,236, respectively.
The Funds have adopted an Administrative Services Plan pursuant to which the Investor Class shares are authorized to make payments to certain entities, which may include banks, broker-dealers and other types of service providers, for providing administrative services with respect to shares of the Funds attributable to or held in the name of the service provider for its clients or customers with whom they have a servicing relationship. Under the terms of the Administrative
| | |
| 64 | | www.thomaswhitefunds.com |
Notes to Financial Statements Year Ended October 31, 2019
Services Plan, Investor Class shares are authorized to make payments up to a maximum rate of 0.25% of the average daily net assets of the shares attributable to or held in the name of the service provider for providing the types of applicable administrative services covered under the terms of the Plan. For the year ended October 31, 2019, fees incurred by the International Fund, Emerging Markets Fund and American Opportunities Fund pursuant to the Administrative Services Plan were $62,353, $296 and $69,615, respectively, for Investor Class.
NOTE 5. CUSTODIAN AND TRANSFER AGENT FEES
Custodian Fees - Northern Trust is the custodian for the International Fund and Emerging Markets Fund. U.S. Bank, N.A. (“U.S. Bank”) is the custodian for the American Opportunities Fund. Northern Trust bills the International Fund and the Emerging Markets Fund quarterly based on the value of their holdings as of the previous quarter end plus transaction fees. U.S. Bank bills the American Opportunities Fund monthly based on the ending value of its holdings plus transaction fees.
Transfer Agent - Fund Services serves as the Funds’ transfer agent. Under the terms of the transfer agent agreement, Fund Services is entitled to account-based fees along with reimbursement of out-of-pocket expenses incurred in providing transfer agent services.
NOTE 6. INVESTMENT TRANSACTIONS
During the year ended October 31, 2019, the cost of purchases and the proceeds from sales of investment securities, other than short-term investments, were as follows:
| | | | | | | | |
| | | |
| Fund | | Purchases | | | Sales | |
| International Fund | | | $53,488,240 | | | | $153,928,989 | |
| | | |
| Emerging Markets Fund | | | $10,392,954 | | | | $11,329,298 | |
| | | |
| American Opportunities Fund | | | $8,682,746 | | | | $9,253,966 | |
The American Opportunities Fund did not purchase or sell long-term U.S. Government securities during the year ended October 31, 2019. The International Fund and Emerging Markets Fund did not directly purchase or sell long term U.S. Government securities, except for purposes of securities lending during the year ended October 31, 2019.
At October 31, 2019, the aggregate gross unrealized appreciation and depreciation of portfolio securities, based upon cost for federal income tax purposes, were as follows:
| | | | | | | | | | | | | | | | |
| | | | | |
| Fund | | Tax Cost | | | Unrealized
Appreciation | | | Unrealized
Depreciation | | | Net Unrealized
Appreciation/
(Depreciation) | |
| International Fund | | | $100,359,922 | | | | $19,493,400 | | | | $(3,388,702) | | | | $16,104,698 | |
| | | | | |
| Emerging Markets Fund | | | $29,420,228 | | | | $8,930,792 | | | | $(1,991,798) | | | | $6,938,994 | |
| | | | | |
| American Opportunities Fund | | | $32,364,485 | | | | $13,535,880 | | | | $(612,412) | | | | $12,923,468 | |
| | | | |
| www.thomaswhitefunds.com | | | 65 | |
Notes to Financial Statements Year Ended October 31, 2019
Distributions to Shareholders
The Funds will distribute net investment income and net realized gains, if any, at least once a year. The amount of distributions from net investment income and net realized gains are determined in accordance with federal income tax regulations, which may differ from generally accepted accounting principles. These “book/tax” differences are either temporary or permanent in nature and are primarily due to differing treatments for passive foreign investment companies and losses deferred due to wash sales. Permanent differences, primarily due to reclassification of REIT income, resulted in reclassifications among the Funds’ components of net assets at October 31, 2019, the Funds’ tax year-end.
As of October 31, 2019, the following table shows the reclassifications made:
| | | | | | | | | | | | |
| | | |
| | | Distributable Earnings | | | | |
| | | | |
| Fund | | Accumulated
Undistributed Net
Investment Income
Gain (Loss) | | | Accumulated
Net Realized
Gain (Loss) | | | Paid-In Capital | |
| International Fund | | | $(38,327) | | | | $38,327 | | | | $------- | |
| | | | |
| Emerging Markets Fund | | | $(24,813) | | | | $24,813 | | | | $------- | |
| | | | |
| American Opportunities Fund | | | $(18,849) | | | | $377,915 | | | | $(359,066) | |
At October 31, 2019, the components of accumulated earnings (losses) on a tax basis were as follows:
| | | | | | | | | | | | | | | | | | | | |
| | | | | | |
| Fund | | Undistributed
Ordinary
Income | | | Undistributed
Long-term
Gains | | | Net
Unrealized
Appreciation | | | Other
Accumulated
Losses | | | Total
Distributable
Earnings | |
| International Fund | | | $530,339 | | | | $------- | | | | $16,104,698 | | | | $(3,365) | | | | $16,631,672 | |
| | | | | | |
| Emerging Markets Fund | | | $355,433 | | | | $------- | | | | $6,938,994 | | | | $(8,654,957) | | | | $(1,360,530) | |
| | | | | | |
| American Opportunities Fund | | | $------- | | | | $------- | | | | $12,923,468 | | | | $------- | | | | $12,923,468 | |
As of October 31, 2019, the Emerging Markets Fund had $6,646,097 in short-term capital loss carry forwards with no expiration and had $2,005,832 in long-term capital loss carryforwards with no expiration.
| | |
| 66 | | www.thomaswhitefunds.com |
Notes to Financial Statements Year Ended October 31, 2019
The tax character of distributions paid during the periods shown below were as follows:
| | | | | | | | | | | | | | | | |
| | |
| Year Ended October 31, 2019 | | | |
| | | | | |
| Fund | | Ordinary
Income | | | Return of
Capital | | | Long-Term
Capital Gains | | | Total
Distributions | |
| International Fund | | | $2,065,657 | | | | $------- | | | | $2,328,995 | | | | $4,394,652 | |
| | | | | |
| Emerging Markets Fund | | | $515,218 | | | | $------- | | | | $------- | | | | $515,218 | |
| | | | | |
| American Opportunities Fund | | | $72,290 | | | | $335,290 | | | | $802,941 | | | | $1,210,521 | |
| | | | | | | | | | | | | | | | | |
| | |
| Year Ended October 31, 2018 | | | |
| | | | | |
| Fund | | Ordinary
Income | | | Return of
Capital | | | Long-Term
Capital Gains | | | Total
Distributions | |
| International Fund | | | $4,008,212 | | | | $------- | | | | $21,283,124 | | | | $25,291,336 | |
| | | | | |
| Emerging Markets Fund | | | 391,736 | | | | ------- | | | | ------- | | | | 391,736 | |
| | | | | |
| American Opportunities Fund | | | 122,005 | | | | ------- | | | | 1,752,686 | | | | 1,874,691 | |
NOTE 7. SUBSEQUENT EVENTS
In preparing these financial statements, the Funds have evaluated events and transactions for potential recognition or disclosure through the date the financial statements were issued.
On December 13, 2019, the Board of Trustees approved the closure of Investor Class shares of the Emerging Markets Fund, effective March 1, 2020.
To meet their excise requirements, the Funds declared an additional dividend with a record date of December 19, 2019 and a payable date of December 20, 2019. The International Fund and Emerging Markets Fund will distribute to shareholders of record $530,339 and $355,433, respectively.
On November 25, 2019, U.S. Bancorp, the parent company of Quasar Distributors, LLC (“Quasar”), the Funds’ distributor, announced that it had signed a purchase agreement to sell Quasar to Foreside Financial Group, LLC (“Foreside”) such that Quasar will become a wholly-owned broker-dealer subsidiary of Foreside. The transaction is expected to close by the end of March 2020. Quasar will remain the Funds’ distributor at the close of the transaction, subject to Board approval.
| | | | |
| www.thomaswhitefunds.com | | | 67 | |
Report of Independent Registered Public Accounting Firm
To the Shareholders of and
The Board of Trustees of
Lord Asset Management Trust
Opinion on the Financial Statements
We have audited the accompanying statement of assets and liabilities of Thomas White International Fund, Thomas White Emerging Markets Fund, and Thomas White American Opportunities Fund (the “Funds”), each a series of Lord Asset Management Trust, including the schedule of investments, as of October 31, 2019, the related statement of operations for the year then ended, the statements of changes in net assets for each of the two years in the period then ended, financial highlights for each of the five years in the period then ended, and the related notes (collectively referred to as the “financial statements”). In our opinion, the financial statements present fairly, in all material respects, the financial position of the Funds as of October 31, 2019, the results of their operations for the year then ended, the changes in its net assets for each of the two years in the period then ended, and the financial highlights for each of the five years in the period then ended, in conformity with accounting principles generally accepted in the United States of America.
Basis for Opinion
These financial statements are the responsibility of the Funds’ management. Our responsibility is to express an opinion on the Funds’ financial statements based on our audits. We are a public accounting firm registered with the Public Company Accounting Oversight Board (United States) (“PCAOB”) and are required to be independent with respect to the Funds in accordance with the U.S. federal securities laws and the applicable rules and regulations of the Securities and Exchange Commission and the PCAOB. We have served as the auditor of one or more of the funds in the Trust since 2014.
We conducted our audits in accordance with the standards of the PCAOB. Those standards require that we plan and perform the audit to obtain reasonable assurance about whether the financial statements are free of material misstatement, whether due to error or fraud. The Funds are not required to have, nor were we engaged to perform, an audit of its internal control over financial reporting. As part of our audits we are required to obtain an understanding of internal control over financial reporting, but not for the purpose of expressing an opinion on the effectiveness of the Funds’ internal control over financial reporting. Accordingly, we express no such opinion.
Our audits included performing procedures to assess the risks of material misstatement of the financial statements, whether due to error or fraud, and performing procedures that respond to those risks. Such procedures included examining, on a test basis, evidence regarding the amounts and disclosures in the financial statements. Our audits also included evaluating the accounting principles used and significant estimates made by management, as well as evaluating
| | |
| 68 | | www.thomaswhitefunds.com |
Report of Independent Registered Public Accounting Firm
the overall presentation of the financial statements. Our procedures included confirmation of securities owned as of October 31, 2019. We believe that our audits provide a reasonable basis for our opinion.
TAIT, WELLER & BAKER LLP
Philadelphia, Pennsylvania
December 23, 2019
| | | | |
| www.thomaswhitefunds.com | | | 69 | |
Tax Information (Unaudited)
The Funds have elected to pass through to their shareholders the foreign taxes paid for the year ended October 31, 2019 as follows:
| | | | | | | | | | | | | | |
| | | | | |
| Fund | | Share Class | | Foreign Dividend
Income | | | Foreign Taxes
Paid | | | Foreign Taxes Paid
per share | |
| International Fund | | Investor Class | | | $883,197 | | | | $82,965 | | | | $0.0466 | |
| | | | | |
| International Fund | | Class I | | | $3,030,528 | | | | $284,678 | | | | $0.0453 | |
| | | | | |
| Emerging Markets Fund | | Investor Class | | | $45,988 | | | | $5,647 | | | | $0.0364 | |
| | | | | |
| Emerging Markets Fund | | Class I | | | $947,821 | | | | $116,389 | | | | $0.0370 | |
QUALIFYING DIVIDEND INCOME
For the International Fund, Emerging Markets Fund and American Opportunities Fund, 100% of the income dividend is qualified.
ORDINARY INCOME DIVIDEND AND FOREIGN TAX CREDIT
The International Fund and the Emerging Markets Fund have made an election under Section 853 of the Internal Revenue Code to provide to their shareholders the benefit of foreign tax credits in the per share amount designated below. Therefore, shareholders who must file a U.S. Federal Income tax return will be entitled to a foreign tax credit or an itemized deduction for each share owned on record date October 28, 2019, in computing their tax liability. It is generally more advantageous to claim a credit than a deduction.
| | | | | | | | | | |
| | | | |
| Fund | | Share Class | | Foreign Tax
Credit/Deduction | | | Foreign Tax
Credit/Deduction
per share | |
| International Fund | | Investor Class | | | $75,534 | | | | $0.0424 | |
| | | | |
| International Fund | | Class I | | | $259,183 | | | | $0.0412 | |
| | | | |
| Emerging Markets Fund | | Investor Class | | | $5,591 | | | | $0.0360 | |
| | | | |
| Emerging Markets Fund | | Class I | | | $115,237 | | | | $0.0366 | |
| | |
| 70 | | www.thomaswhitefunds.com |
THOMAS WHITE FUNDS
DISCLOSURE OF FUND EXPENSES (Unaudited)
As a shareholder of the Funds you incur two types of costs : (1) transaction costs, including sales charges (loads) on purchase payments or contingent deferred sales charges on redemptions, if any, or redemption fees; and (2) ongoing costs, including management fees; and other Fund expenses. This example is intended to help you understand your ongoing costs (in dollars) of investing in the Funds and to compare these costs with the ongoing costs of investing in other mutual funds.
The example is based on an investment of $1,000 invested at the beginning of the period and held for the entire period, May 1, 2019 through October 31, 2019 for the Funds’ Investor Class and Class I, as applicable.
ACTUAL EXPENSES
The third and fourth columns of the table below provide information about actual account values and actual expenses. You may use the information in this line together with the amount you invested to estimate the expenses you paid over the period. Simply divide your account value by $1,000 (for example, an $8,600 account value divided by $1,000=8.6), then multiply the result by the number in the fourth column under the heading entitled “Expenses Paid During Period” to estimate the expenses you paid on your own account during this period. IRA accounts are charged a $15.00 fee annually in September that is not reflected in the actual expense example. If you hold your Fund shares through an IRA account, you should add this cost to the expenses paid shown below.
HYPOTHETICAL EXAMPLE FOR COMPARISON PURPOSES
The fifth and sixth columns of the table below provide information about hypothetical account values and hypothetical expenses based on each Fund’s actual expense ratio and an assumed rate of return of 5% per year before expenses, which is not the Fund’s actual return. The hypothetical account values and expenses may not be used to estimate the actual ending account balance or expenses you paid for the period. You may use this information to compare the ongoing costs of investing in the Funds and other funds. To do so, compare this 5% hypothetical example with the 5% hypothetical examples that appear in the shareholder reports of the other funds. IRA accounts are charged a $15.00 fee annually in September that is not reflected in the hypothetical expense example. If you hold your Fund shares through an IRA account, you should separately compare the Funds’ IRA fees to the IRA fees of other funds.
Please note that the expenses shown in the table are meant to highlight your ongoing costs only and do not reflect any transactional costs such as sales charges (loads) or purchase payments or contingent deferred sales charges on redemptions, if any, or redemption fees. Therefore the sixth column of the table is useful in comparing ongoing costs only, and will not help you determine the relative costs of owning different funds. In addition, if these transactional costs were included, your costs may have been higher.
| | | | |
| www.thomaswhitefunds.com | | | 71 | |
THOMAS WHITE FUNDS
| | | | | | | | | | | | | | | | | | | | | | | | |
| | | | | |
| | | | | | | | | Actual | | | Hypothetical (5% return
before expenses) | |
| | | | | | | |
| | | Fund’s
Annualized
Expense
Ratio* | | | Beginning
Account
Value
May 1,
2019 | | | Ending
Account
Value
October 31,
2019 | | | Expenses
Paid
During
Period | | | Ending
Account
Value
October 31,
2019 | | | Expenses
Paid
During
Period | |
| | | | | | |
| International Fund | | | | | | | | | | | | | | | | | | | | | |
| Investor Class Shares | | | 1.24% | | | | $1,000.00 | | | | $999.20 | | | | $6.25 | | | | $1,018.95 | | | | $6.31 | |
| | | | | | | |
| Class I Shares | | | 0.99% | | | | $1,000.00 | | | | $1,000.30 | | | | $4.99 | | | | $1,020.21 | | | | $5.04 | |
| | | | | | |
| Emerging Markets Fund | | | | | | | | | | | | | | | | | | | | | |
| Investor Class Shares | | | 1.34% | | | | $1,000.00 | | | | $981.20 | | | | $6.69 | | | | $1,018.45 | | | | $6.82 | |
| | | | | | | |
| Class I Shares | | | 1.09% | | | | $1,000.00 | | | | $982.20 | | | | $5.45 | | | | $1,019.71 | | | | $5.55 | |
| | | | | |
| American Opportunities Fund | | | | | | | | | | | | | | | | | |
| Investor Class | | | 1.34% | | | | $1,000.00 | | | | $1,020.20 | | | | $6.82 | | | | $1,018.45 | | | | $6.82 | |
| | * | Expenses for the International, Emerging Markets and American Opportunities Funds’ annualized expense ratio (after waiver and reimbursement), multiplied by the average account value over the period, multiplied by 184/365 (to reflect theone-half year period). |
QUARTERLY PORTFOLIO HOLDINGS SCHEDULES
The Funds file their complete schedule of portfolio holdings with the U.S. Securities and Exchange Commission (“SEC”) for the first and third quarters of each fiscal year on Form N-Q, or Part F of Form N-PORT. These reports are available, free of charge, on the EDGAR database on the SEC’s website at www.sec.gov. Additionally, you may obtain copies of Forms from the Funds upon request by calling 1-800-811-0535.
PROXY VOTING POLICIES, PROCEDURES AND RECORD
You may obtain a description of the Funds’ (1) proxy voting policies, (2) proxy voting procedures and (3) information regarding how the Funds voted any proxies related to portfolio securities during the most recent 12 month period ended June 30 for which an SEC filing has been made, without charge, upon request by calling the Funds at 1-800-811-0535 or on the EDGAR database on the SEC’s website (http://www.sec.gov).
| | |
| 72 | | www.thomaswhitefunds.com |
THOMAS WHITE FUNDS
TRUSTEE AND OFFICER DISCLOSURE OCTOBER 31, 2019
| | | | | | | | | | |
| | | | | | |
Name, Address and Age | | Positions held with
Funds | | Length
of Time
Served | | Principal Occupation During Past Five Years | | Number of
Portfolios
overseen
by Trustee | | Other
Directorships
Held by Trustee |
| | | | | | |
Douglas M. Jackman 425 S. Financial Pl. Suite 3900 Chicago, IL 60605 52 | | Trustee, President | | 1 Year* | | President of Thomas White International, Ltd. (since 1995) | | 3 | | None |
| | | | | | |
David M. Sullivan II 425 S. Financial Pl. Suite 3900 Chicago, IL 60605, 47 | | Vice President and Treasurer | | 19 years | | Treasurer of the Thomas White Funds; Executive Vice President of Thomas White International, Ltd. | | N/A | | N/A |
| | | | | | |
J. Ryan Conner 425 S. Financial Pl. Suite 3900 Chicago, IL 60605, 39 | | Secretary and Chief Compliance Officer | | 8 years | | Senior Vice President of Thomas White International, Ltd. | | N/A | | N/A |
| | | | | | |
| Independent Trustees: | | | | | | | | | | |
| | | | | | |
Arthur J. Fiocco, Jr. 425 S. Financial Pl. Suite 3900 Chicago, IL 60605 62 | | Trustee | | 4 Years | | Vice President of Operations of Baxter International, Inc. (medical products) (since 2016, prior to which he was a Director (since 2015)); Corporate Vice President of Hospira, Inc. (pharmaceutical company) (2004-2014). | | 3 | | None |
| | | | | | |
Geri Sands Hansen 425 S. Financial Pl. Suite 3900 Chicago, IL 60605 58 | | Trustee | | 1 Year* | | Retired;Co-Founder and Chief Investment Officer of Attucks Asset Management, LLC (2001-2015). | | 3 | | None |
| | | | | | |
Elizabeth G. Montgomery 425 S. Financial Pl. Suite 3900 Chicago, IL 60605, 75 | | Trustee | | 18 years | | Retired; former President, Graham Group (management consulting). | | 3 | | None |
| | | | | | |
Robert W. Thomas 425 S. Financial Pl. Suite 3900 Chicago, IL 60605, 75 | | Trustee | | 13 years | | Retired; former President of Thomas Laboratories, Inc. (pharmaceutical company). | | 3 | | None |
| | | | | | |
John N. Venson 425 S. Financial Pl. Suite 3900 Chicago, IL 60605, 72 | | Trustee | | 25 years | | Retired; former Dean of the California School of Podiatric Medicine(2008-2017); Doctor of Podiatric Medicine. | | 3 | | None |
| | | | | | |
William H. Woolverton 425 S. Financial Pl. Suite 3900 Chicago, IL 60605 68 | | Trustee, Chairman | | 4 Years | | Private investor and Investment Management consultant (since 2019); Managing Director of DMS Governance Ltd. (fund governance) (2016-2019); Senior Managing Director and General Counsel of Gottex Fund Management (investment advisory firm) (2005-2016). | | 3 | | None |
| | * | Trustees elected through a shareholder vote held November 30, 2018 |
ADDITIONAL INFORMATION
The Statement of Additional Information contains additional information regarding the Funds and Trustees, and is available upon request without charge by calling 1-800-811-0535.
| | | | |
| www.thomaswhitefunds.com | | | 73 | |
Privacy Policy
LORD ASSET MANAGEMENT TRUST
THOMAS WHITE INTERNATIONAL, LTD.
I. Commitment to Consumer* Privacy
The Thomas White Funds Family and Thomas White International, Ltd. (collectively, “we” or “us”) are committed to handling consumer information responsibly. We recognize and respect the privacy expectations of our consumers, and we believe that the confidentiality and security of consumers’ personal financial information is one of our fundamental responsibilities.
II. Collection of Consumer Information
We collect, retain and use consumer information only where we reasonably believe it would be useful to the consumer and allowed by law. Consumer information collected by us generally comes from the following sources:
| | • | | Information we receive on applications or other forms; |
| | • | | Information about consumers’ transactions with us, our affiliates, or others. |
III. Disclosure of Consumer Information
We may disclose all of the consumer information we collect to affiliated financial institutions and to third parties who are not our affiliates:
| | • | | to perform marketing services on our behalf or pursuant to a joint marketing agreement between us and another party; and |
| | • | | as otherwise permitted by law. |
We do not disclose any consumer information about our former customers* to anyone except as permitted by law.
IV. Security of Customer Information
We are committed to, and also require our service providers to:
| | • | | maintain policies and procedures designed to assure only appropriate access to, and use of information about our customers; and |
| | • | | maintain physical, electronic and procedural safeguards that comply with federal standards to guard non-public personal information of our customers. |
* As defined in Regulation S-P
| | |
| 74 | | www.thomaswhitefunds.com |
OFFICERS AND TRUSTEES
William H. Woolverton
Chairman of the Board
Arthur J. Fiocco, Jr.
Trustee
Geri Sands Hansen
Trustee
Elizabeth G. Montgomery
Trustee
Robert W. Thomas
Trustee
John N. Venson, D.P.M.
Trustee
Douglas M. Jackman
President and Trustee
David M. Sullivan II
Vice President, Treasurer and
Assistant Secretary
J. Ryan Conner
Secretary and Chief Compliance Officer
INVESTMENT ADVISOR AND OTHER SERVICE PROVIDERS
INVESTMENT ADVISOR
Thomas White International, Ltd.
425 S Financial Place, Suite 3900
Chicago, Illinois 60605-1028
CUSTODIANS
The Northern Trust Company
Chicago, Illinois
U.S. Bank, N.A.
Milwaukee, Wisconsin
LEGAL COUNSEL
Dechert LLP
Washington, DC
INDEPENDENT REGISTERED PUBLIC ACCOUNTING FIRM
Tait, Weller & Baker, LLP
Philadelphia, Pennsylvania
ADMINISTRATOR and TRANSFER AGENT
U.S. Bancorp Fund Services, LLC
Milwaukee, Wisconsin
DISTRIBUTOR
Quasar Distributors, LLC
Milwaukee, Wisconsin
FOR CURRENT PERFORMANCE, NET ASSET VALUE OR FOR ASSISTANCE WITH YOUR ACCOUNT, PLEASE CONTACT THE THOMAS WHITE FUNDS AT 800-811-0535 OR VISIT OUR WEB SITE AT WWW.THOMASWHITEFUNDS.COM

www.thomaswhitefunds.com
Item 2. Code of Ethics.
The registrant has adopted a code of ethics that applies to the registrant’s principal executive officer and principal financial officer. The registrant has not made any substantive amendments to its code of ethics during the period covered by this report. The registrant has not granted any waivers from any provisions of the code of ethics during the period covered by this report.
A copy of the Registrant’s Code of Ethics is filed herewith. The Registrant undertakes to provide to any person without charge, upon request, a copy of its code of ethics by mail when they call the Registrant at1-800-811-0535.
Item 3. Audit Committee Financial Expert.
The Registrant’s Board of Trustees has determined that it does not have an Audit Committee financial expert serving on its Audit Committee. At this time, the Registrant believes that the experience provided by each member of the Audit Committee together offers the Registrant adequate oversight for the Registrant’s level of financial complexity.
Item 4. Principal Accountant Fees and Services.
The Registrant has engaged its principal accountant to perform audit services, audit-related services, tax services and other services during the past two fiscal years. “Audit services” refer to performing an audit of the Registrant’s annual financial statements or services that are normally provided by the accountant in connection with statutory and regulatory filings or engagements for those fiscal years. “Audit-related services” refer to the assurance and related services by the principal accountant that are reasonably related to the performance of the audit. “Tax services” refer to professional services rendered by the principal accountant for tax compliance, tax advice, and tax planning. “Other services” provided by the principal accountant were provided by the principal accountant. The following table details the aggregate fees billed or expected to be billed for each of the last two fiscal years for audit fees, audit-related fees, tax fees and other fees by the principal accountant.
| | | | |
| | | FYE 10/31/2019 | | FYE 10/31/2018 |
Audit Fees | | $51,000 | | $51,000 |
Audit-Related Fees | | - | | - |
Tax Fees | | $9,000 | | $9,000 |
All Other Fees | | - | | - |
The Audit Committee has adoptedpre-approval policies and procedures that require the Audit Committee topre-approve all audit andnon-audit services of the Registrant, including services provided to any entity affiliated with the Registrant.
The percentage of fees billed by Tait, Weller & Baker LLP applicable tonon-audit services pursuant to waiver ofpre-approval requirement were as follows:
1
| | | | |
| | | FYE 10/31/2019 | | FYE 10/31/2018 |
Audit-Related Fees | | 0% | | 0% |
Tax Fees | | 0% | | 0% |
All Other Fees | | 0% | | 0% |
All of the principal accountant’s hours spent on auditing the registrant’s financial statements were attributed to work performed byfull-time permanent employees of the principal accountant. There were nonon-audit fees billed or expected to be billed by the Registrant’s accountant for services to the Registrant and to the Registrant’s investment adviser (and any other controlling entity, etc. –notsub-adviser) for the last two years.
Item 5. Audit Committee of Listed Registrants.
Not applicable to registrants who are not listed issuers (as defined in Rule10A-3 under the Securities Exchange Act of 1934).
Item 6. Investments.
| (a) | The Schedules of Investments are included as part of the report to shareholders filed under Item 1 of this FormN-CSR. |
Item 7. Disclosure of Proxy Voting Policies and Procedures forClosed-End Management Investment Companies.
Not applicable toopen-end investment companies.
Item 8. Portfolio Managers ofClosed-End Management Investment Companies.
Not applicable toopen-end investment companies.
Item 9. Purchases of Equity Securities byClosed-End Management Investment Company and Affiliated Purchasers.
Not applicable toopen-end investment companies.
Item 10. Submission of Matters to a Vote of Security Holders.
There have been no material changes to the procedures by which shareholders may recommend nominees to the Registrant’s Board of Trustees.
Item 11. Controls and Procedures.
| (a) | Based on an evaluation of Registrant’s Disclosure Controls and Procedures (as defined in Rule30a-3(c) under the Investment Company Act of 1940) (the “Disclosure Controls”), as of a date within 90 days prior to the filing date (the “Filing Date”) of this FormN-CSR (the “Report”), the Registrant’s principal executive officer and principal financial officer have |
2
| | concluded that the Disclosure Controls are effectively designed to ensure that information required to be disclosed by the Registrant in the Report is recorded, processed, summarized and reported by the Filing Date, including ensuring that information required to be disclosed in the Report is accumulated and communicated to the Registrant’s management, including the Registrant’s principal executive officer and principal financial officer, as appropriate, to allow timely decisions regarding required disclosure. |
| (b) | There were no changes in the Registrant’s internal control over financial reporting (as defined in Rule30a-3(d) under the Act) that occurred during the most recent fiscal quarter of the period covered by this report that has materially affected, or is reasonably likely to materially affect, the Registrant’s internal control over financial reporting. |
Item 12. Disclosure of Securities Lending Activities forClosed-End Management Investment Companies
Not applicable toopen-end investment companies.
Item 13. Exhibits.
| (a) | (1)Code of ethics.Filed herewith. |
(2)Certifications pursuant to Section 302 of the Sarbanes-Oxley Act of 2002. Filed herewith.
(3)Any written solicitation to purchase securities under Rule 23c-1 under the Act sent or given during the period covered by the report by or on behalf of the Registrant to 10 or more persons. Not applicable toopen-end investment companies.
(4)Change in the registrant’s independent public accountant. There was no change in the registrant’s independent public accountant for the period covered by this report.
| (b) | Certifications pursuant to Section 906 of the Sarbanes-Oxley Act of 2002. Filed herewith. |
3
SIGNATURES
Pursuant to the requirements of the Securities Exchange Act of 1934 and the Investment Company Act of 1940, the registrant has duly caused this report to be signed on its behalf by the undersigned, thereunto duly authorized.
|
(Registrant)LORD ASSET MANAGEMENT TRUST |
|
By (Signature and Title)/s/ Douglas M. Jackman |
Douglas M. Jackman |
President (Principal Executive Officer) |
|
DateJanuary 6, 2020 |
Pursuant to the requirements of the Securities Exchange Act of 1934 and the Investment Company Act of 1940, this report has been signed below by the following persons on behalf of the registrant and in the capacities and on the dates indicated.
|
By (Signature and Title)/s/ Douglas M. Jackman |
Douglas M. Jackman |
President (Principal Executive Officer) |
|
DateJanuary 6, 2020 |
|
By (Signature and Title)/s/ David M. Sullivan II |
David M. Sullivan II |
Treasurer (Principal Financial Officer) |
|
DateJanuary 6, 2020 |
4