As filed with the U.S. Securities and Exchange Commission on January 9, 2019
UNITED STATES
SECURITIES AND EXCHANGE COMMISSION
Washington, D.C. 20549
FORM N-CSR
CERTIFIED SHAREHOLDER REPORT OF REGISTERED
MANAGEMENT INVESTMENT COMPANIES
Investment Company Act file number 811-08348
LORD ASSET MANAGEMENT TRUST
(Exact name of registrant as specified in charter)
425 South Financial Place
Chicago, Illinois 60605-1028
(Address of principal executive offices) (Zip code)
Thomas S. White, Jr.
Thomas White International, Ltd.
425 South Financial Place
Chicago, Illinois 60605-1028
(Name and address of agent for service)
(312) 663-8300
Registrant’s telephone number, including area code
Date of fiscal year end: 10/31
Date of reporting period: 11/1/2017 – 10/31/2018
Item 1. Reports to Stockholders.
1


ANNUAL REPORT
OCTOBER 31, 2018
THE INTERNATIONAL FUND
THE EMERGING MARKETS FUND
THE AMERICAN OPPORTUNITIES FUND

CONTENTS
Message to Shareholders
Dear Shareholders and Friends:
In September 2018, we announced that Thomas S. White, Jr., Founder and Chief Investment Officer, and Stathy White, Chairman of Thomas White International, the Advisor to the Funds, would retire effective the end of that month. Tom and Stathy left Morgan Stanley Asset Management to start the firm in 1992. Over the ensuing years, an expanding number of home-grown research analysts have developed the valuation-oriented stock selection techniques that established the firm as a manager of domestic and international portfolios, including the Thomas White Funds. As of September 30, 2018, our employees acquired Tom White’s full ownership interest in the firm. The result is that Thomas White International is now broadly owned by twelve long-term employees, who average 17 years at the firm. The firm is also now 54% minority-owned and 19% woman-owned.
On November 30, 2018, we are pleased to report that you, the Funds’ shareholders, overwhelmingly approved the change of control at Thomas White International. Aside from Tom White’s retirement, there will be no change in the members of the Investment Committee who manage our firm’s portfolios, including the Thomas White Funds. We believe the depth of experienced employee shareholders reflects our long-held goal to assure firm continuity and sustainability on behalf of all our clients.
Tom and Stathy White, as well as all the professionals at Thomas White International, thank you for your long-held trust in our organization. Our team looks forward to continue serving your investment needs for many years to come.
Global Uncertainty / Rising Political Uncertainty
As was noted in the most recent Semi-Annual Report, corporate earnings and cash flows remained robust in early 2018 despite increased market volatility and rising uncertainty. Over the next twelve months, the United States economy is forecast to slow from the above-normal growth achieved through the 2017 tax cuts. The modest slowdown is also driven in part by the tightening of interest rate policy via the U.S. Federal Reserve throughout 2018 and potentially into 2019.
Uncertainty surrounding global trade policy, particularly between the U.S. and China, is also contributing to a domestic and global slowdown. As continuing trade tensions weakened the global growth outlook, consensus views of U.S. growth expectations for next year have softened as well. While U.S. inflation remains just below the Fed’s 2% target and domestic unemployment rates remain near record lows, the economy could return to strong growth with less disruptive fiscal and trade policies.
| | | | |
| www.thomaswhitefunds.com | | | 1 | |
There is no doubt the U.S. has an upper hand in trade negotiations now, as the domestic economy is stronger than that of China which is more dependent on trade. This is evident in the relatively controlled responses from China to heightened U.S. rhetoric. Yet, the U.S. cannot remain shielded from the global slowdown that will most likely follow if the trade wars drag on. Some large U.S. corporations have already started reporting weaker overseas demand and others are expected to follow sooner rather than later.
Some of the major areas of dispute between the U.S. and China, such as better protection of intellectual property rights, could take several years to resolve. However, there are other areas that could be addressed within shorter time frames. This includes increased sourcing of farm produce and industrial equipment from the U.S. as well as improved market access for foreign companies in China. The Chinese government has already taken some initial steps such as allowing majority ownership in local ventures to foreign auto companies and lower tariffs on imports. The flexibility shown by the U.S. administration in renegotiating the North
American Free Trade Agreement (NAFTA) suggests that it is possible to arrive at a deal that will avoid further tariffs and controls.
Political changes over the past 24 months in countries ranging from the U.S., France, Brazil, Mexico and Korea, to name just a few, have also created new opportunities and new risks. Changing domestic policies have directly influenced potential capital investment across major sectors. Simultaneously, these changes have impacted evolving international trading relationships ranging from U.K.’s ongoing negotiations with the European Union over Brexit to the increased trade tension between China and the U.S., as well as the continuing approval process of the new United States-Mexico-Canada Agreement (USMCA), or revised NAFTA, between the US, Mexico and Canada. Despite a cloudy outlook, we expect the U.S. to lead growth in the developed markets and for emerging market growth to also remain solid. We believe a trade agreement between the U.S. and China in early 2019 could be a significant catalyst for rising earnings growth in both developed and emerging economies.
| | |
| 2 | | www.thomaswhitefunds.com |
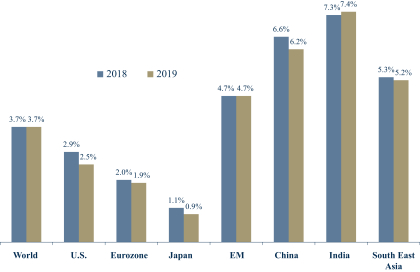
Annualized GDP Growth Forecasts in %; Source: International Monetary Fund (IMF) World Economic Outlook Oct 2018
Portfolio Strategy
We believe global equity market valuations remain compelling. This year’s early fourth quarter underperformance has pushed international and emerging market equity valuations to multi-year lows. As the CAPE (Cyclically Adjusted Price-to-Earnings) ratio data, through August 2018, in the chart on the following page shows, the U.S. equity valuations remain slightly above their long-term average while the Emerging Markets and Japan are nearing their lows seen during the 2008 financial crisis. However, most emerging market corporations appear to be in much better financial health than they were during the global recession. We also believe that the risks faced by these businesses, both domestic and external, are also generally lower. Though earnings and cash flows in select markets and industries have fallen short of forecasts this year, they continue to expand at a moderate pace. That is in stark contrast to 2008 when
earnings declined sharply and the recovery required large scale fiscal stimulus measures.
While it is true that leverage has gone up appreciably in emerging economies over the last decade, in most major economies, including China, much of the debt is in local currency. This reduces the vulnerability to external shocks and the impact of higher rates in the developed countries. Most governments in emerging countries are friendly to business, and their policies are largely supportive of faster economic growth. The new government in Brazil is expected to push much-needed reform measures. In Mexico, the government is likely to be more realistic than suggested by the recent rhetoric that has spooked investors. Even if India and Indonesia see leadership changes after next year’s national elections, the broader economic policy approaches are unlikely to change.
| | | | |
| www.thomaswhitefunds.com | | | 3 | |
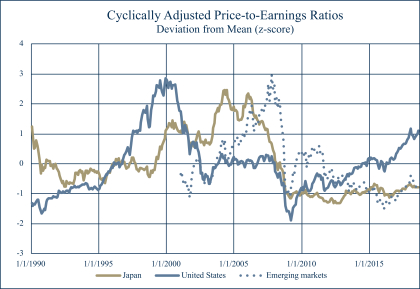
Source: International Monetary Fund (IMF) Global Financial Stability Report Oct 2018, data through August 2018.
Continuation of the trade disputes, tighter monetary policy, and any unexpected U.S. growth slowdown are the significant risks for the coming year. The larger U.S. corporations that draw a significant share of revenues from overseas markets have become more cautious about their revenue and earnings outlooks. Investors are worried about the impact of higher interest rates on the domestic economy, if the Federal Reserve decides to trim its balance sheet sooner than currently expected. There are also renewed doubts about the expected federal spending on infrastructure, as the mid-term elections reduced the likelihood of gaining Congressional approval for such measures or renegotiated multi-lateral trade deals.
We want to thank all of our shareholders for working with us during the proxy voting process and the Special Shareholder Meeting and keeping your trust in the Thomas White Funds. Our employees remain committed to helping you achieve your long-term investment goals. Please feel free to visit our website www.thomaswhitefunds.com or call us at 1-800-811-0535 with any questions.

Douglas M. Jackman, CFA
President and Portfolio Manager
Thomas White International and
Thomas White Funds
| | |
| 4 | | www.thomaswhitefunds.com |
Past performance is not a guarantee of future results.
Opinions expressed are subject to change, are not guaranteed and should not be considered recommendations to buy or sell any security.
Must be preceded or accompanied by a prospectus.
Mutual fund investing involves risk. Principal loss is possible. Investing in international markets may involve additional risks such as social and political instability, market illiquidity, exchange-rate fluctuations, a high level of volatility and limited regulation. These risks are greater for emerging markets. Investing in small and mid-cap companies can involve more risk than investing in larger companies.
Diversification does not assure a profit nor protect against loss in a declining market.
Earnings growth for a Fund holding does not guarantee a corresponding increase in the market value of the holding of the Fund.
The Thomas White Funds are distributed by Quasar Distributors, LLC.
It is not possible to invest directly in an index.
Cash Flow: Measures the cash generating capability of a company by adding non-cash charges (i.e. depreciation) and interest expense to pretax income.
CAPE Ratio: The cyclically adjusted price-to-earnings ratio, commonly known as CAPE, is a valuation measure usually applied to equity markets. It is defined as price divided by the average of ten years of earnings, adjusted for inflation.
Z-Score: A measure of how many standard deviations below or above the population mean a raw score is. A standard deviation is a measure that is used to quantify the amount of variation or dispersion of a set of data values.
| | | | |
| www.thomaswhitefunds.com | | | 5 | |
THOMAS WHITE INTERNATIONAL FUND
| | | | | | | | | | | | | | |
| | | | | | | | |
| | | Unaudited
Sales
Charge | | Deferred
Sales
Charge | | Administrative
Services
Fee | | 12b-1 Fees | | Operating
Expenses1,3 | | Prospectus
Gross
Annual
Operating
Expense2 | | Prospectus
Net
Annual
Operating
Expense2,3 |
| Investor Class | | None | | None | | Up to 0.25% | | None | | 1.24% | | 1.36% | | 1.24% |
| Class I | | None | | None | | None | | None | | 0.99% | | 1.14% | | 0.99% |
1 In the absence of the fee deferral/expense reimbursement arrangement for the International Fund, the ratio of expenses to average net assets would have been 1.34% for Investor Class shares and 1.18% for Class I shares.
2 Gross Annual Operating Expense and Net Annual Operating Expense are based on the most recent prospectus and may differ from other expense ratios appearing in this report.
3 Thomas White International, Ltd. (“Advisor”) has agreed to defer its fees and/or reimburse the Fund to the extent that the operating expenses for Investor Class and Class I shares exceed (as a percentage of average daily net assets) 1.24% and 0.99%, respectively. The fee deferral/expense reimbursement agreement expires February 28, 2019. The Fund has agreed to repay the Advisor for amounts deferred or reimbursed by the Advisor pursuant to the agreement provided that such repayment does not cause the Fund to exceed the above limits and the repayment is made within three years after the year in which the Advisor incurred the expense. The fee deferral/expense reimbursement agreement may only be amended or terminated by the Fund’s Board of Trustees.
| | | | | | | | |
| | | | | |
| | | NAV | | Net Assets | | Redemption Fee | | Portfolio Turnover |
| Investor Class | | $13.86 | | $29.5 million | | 2.00% on shares held less than 60 days | | 38% |
| Class I | | $13.81 | | $181.2 million |
| | |
| 6 | | www.thomaswhitefunds.com |
OCTOBER 31, 2018
| | | | | | | | | | | | | | | | | | | | | | | | | | | | | | |
| |
| Average Annual Returns as of October 31, 2018 (Unaudited) | |
| Class | | Sales Charge | | 6 month | | | Calendar
YTD | | | 1 Yr | | | 3 Yrs | | | 5 Yrs | | | 10 Yrs | | | Since
Inception
(6/28/1994)* | |
| Investor Class shares (TWWDX) | | None | | | -14.13% | | | | -14.08% | | | | -12.01% | | | | 1.27% | | | | -1.04% | | | | 5.23% | | | | 6.23% | |
| Class I shares1 (TWWIX) | | None | | | -14.07% | | | | -13.98% | | | | -11.80% | | | | 1.49% | | | | -0.81% | | | | 5.39% | | | | 6.29% | |
| MSCI All Country World ex US Index2 | | N/A | | | -11.32% | | | | -10.97% | | | | -8.24% | | | | 4.37% | | | | 1.63% | | | | 6.92% | | | | 4.93% | |
* The inception date of the Investor Class shares.
1 Performance figures for Class I shares, first offered on August 31, 2012, include the historical performance of Investor Class shares through August 30, 2012.
2 The MSCI All Country World ex US Index is a free float-adjusted market capitalization-weighted index of both developed and emerging markets. The index is unmanaged and returns assume the reinvestment of dividends. It is not possible to invest directly in an index.
Returns of each share class reflect differences in expenses applicable to each class which are primarily differences in service fees.
The returns do not reflect the deduction of taxes that a shareholder would pay on Fund distributions or the redemption of Fund shares. The returns reflect the actual performance for each period and do not include the impacts of trades executed on the last business day of the period that were recorded on the first business day of the next period.
Performance data is based upon past performance, which is no guarantee of future results. The investment return and principal value of an investment will fluctuate so that an investor’s shares, when redeemed, may be worth more or less than their original cost. Current performance may be higher or lower than the performance data quoted. Please call 1-800-811-0535 to obtain performance data as of the most recent month-end. The Fund imposes a 2% redemption fee on shares held less than 60 days. Performance data does not reflect the redemption fee. If reflected, total returns would be lower. Investment performance reflects any fee waivers that were in effect. In the absence of such waivers, total return would have been reduced. The Gross Expense Ratios, based on the most recent prospectus, are 1.36% (Investor Class) and 1.14% (Class I).
| | | | |
| www.thomaswhitefunds.com | | | 7 | |
THOMAS WHITE INTERNATIONAL FUND
GROWTH OF A $10,000 INVESTMENT WITH DIVIDENDS REINVESTED (Unaudited)
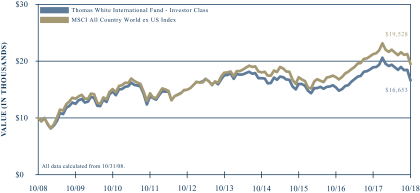
This chart illustrates the performance of a hypothetical $10,000 investment made in the Fund’s Investor Class shares and its benchmark, the MSCI All Country World ex US Index, for the past 10 years through October 31, 2018. It assumes reinvestment of dividends and capital gains, but does not reflect the effect of any applicable redemption fees. This chart does not imply future performance. Past performance does not guarantee future results. The cumulative ten year return was 66.53% for the Fund’s Investor Class shares and 95.28% for the benchmark. The Fund’s Investor Class shares average annual total return since inception on June 28, 1994 was 6.23%. The MSCI All Country World ex US Index is a free float-adjusted market capitalization-weighted index of both developed and emerging markets. The index is unmanaged and returns assume the reinvestment of dividends. It is not possible to invest directly in an index. During the periods shown, the Fund’s manager reimbursed certain Fund expenses. Absent this reimbursement, performance would have been lower. Performance will vary from class to class based on differences in class-specific expenses.
| | |
| 8 | | www.thomaswhitefunds.com |
OCTOBER 31, 2018
The Thomas White International Fund primarily invests in equity securities of companies located in the world’s developed countries outside of the U.S. There may also be a portion of the Fund’s assets invested in companies located in emerging market countries.
Portfolio Managers
Jinwen Zhang, Ph.D., CFA
Douglas M. Jackman, CFA
Wei Li, Ph.D., CFA
John Wu, Ph.D., CFA
Rex Mathew, CFA, CMA
Ramkumar Venkatramani, CFA
Performance Review
The Thomas White International Fund Class I shares returned -11.80% for the one-year period ended October 31, 2018, compared to -8.24% for the benchmark MSCI All Country World ex US Index. Since its inception on June 28, 1994, the Fund’s Class I shares have returned +6.29%* annualized while the benchmark index returned +4.93% for the same period.
Trade Conflicts and Slower European Growth Hurt International Equities
Despite a strong start, international equity prices declined during the one-year review period as investors were alarmed by the escalating trade tensions between the U.S. and the rest of the world. As higher trade tariffs came into effect, global trade volumes weakened and clouded the economic growth outlook. Earnings expectations for corporations with significant overseas
revenue exposures, including several large U.S. corporations, were revised lower. Weakened trade growth had a disproportionately larger impact on European economies such as Germany that slowed more than forecast. In addition, the continuing budget stalemate between Italy and the European Union dented investor sentiment in Europe.
Robust U.S. domestic growth in the second and third quarters of this year pushed up expectations of further interest rate hikes from the U.S. Federal Reserve. Though these expectations have eased more recently, the U.S. Dollar was relatively strong for most of the review period and restricted investor appetite for international equities. Japan, Canada and Australia outperformed other international developed markets during the review period as broader economic trends in these countries were relatively healthier.
Emerging markets lagged the developed markets during the period as their economies are likely to be hurt more by the trade spats. Much of the tariffs imposed by the U.S. are on imports from China, where the government has been trying to limit the downside risks to growth while the economy is in transition. Political risks in Turkey and Mexico have also made investors cautious. Brazil has been the brightest spot among emerging markets during the second half of the review period, helped by the election of a president who is seen as more pro-business.
Reviewing the Portfolio
The energy sector outperformed as crude oil prices remained elevated for most of the
| * | Performance for Class I shares includes the historical performance of Investor Class shares through August 30, 2012. |
| | | | |
| www.thomaswhitefunds.com | | | 9 | |
THOMAS WHITE INTERNATIONAL FUND
review period, before the recent correction. Healthcare and consumer staples sectors also benefited as investors sought relatively stable assets during increased market volatility. Technology holdings underperformed during the period as investors became skeptical about future revenue growth at several of the leading ecommerce, online service providers and semiconductor manufacturers in Asia. The consumer discretionary sector was hurt by concerns about slowing demand growth for durables and services in major markets. The financials sector also lagged on doubts about the sustainability of interest rate margins and fee income growth.
Russian oil producer Lukoil contributed the most to Fund returns as higher crude oil prices boosted margins and cash flows. Safran, a European manufacturer of aircraft engines and aerospace equipment, advanced on robust demand growth for its products. CSL Limited, a biopharmaceutical manufacturer based in Australia, benefited from better than expected earnings growth. Ping An, a leading Chinese insurer, produced strong returns on sustained earnings expansion. European pharmaceuticals manufacturer Shire outperformed after Japanese competitor Takeda made an acquisition offer that was accepted.
Spanish lender Banco Bilbao detracted the most from Fund returns for the period on concerns about its exposure to select emerging markets such as Turkey and Mexico with higher policy and regulatory risks. Dutch financial services group ING as well as Italian bank UniCredit also declined as credit demand has been lower than expected. Advertising group WPP was hurt
by lower revenue guidance on a continuing decline in client spending. Bearings and industrial components manufacturer SKF underperformed as demand outlook softened, especially in the automobile industry.
International Valuations Appear Attractive, Though a Slower Europe Will Challenge Policymakers
Growth in the Eurozone has fallen short of expectations this year as the region continues to face multiple headwinds. The decline in global trade and domestic political discontent have weakened the growth outlook for Germany and France, the largest economies in the region. The fragmented political structure in Italy, without a clear leadership, has delayed the resolution of its disagreements with the European Union over its budget. With only months remaining until the Brexit deadline, the U.K. still has no trade agreement with the European Union. If the U.K. leaves without any deal, it could be very disruptive for businesses on both sides.
Nevertheless, we believe the relatively inexpensive equity valuations across Europe have largely priced in these concerns. Though past negotiations have been futile, most of these challenges can still be resolved if the leaders show enough flexibility and focus on the long-term economic stability of the region. If some of these downside risks fade, it is likely that investors will turn more optimistic about European equities. On its part, the European Central Bank could possibly delay the winding down of its quantitative easing if economic growth continues to underwhelm.
Trade uncertainties and natural disasters hurt the Japanese economy during the third quarter of 2018, but is expected to recover in
| | |
| 10 | | www.thomaswhitefunds.com |
OCTOBER 31, 2018
the coming quarters. The renewed political mandate should allow the government to initiate much needed policy initiatives such as the recently announced migrant worker visa program. The Bank of Japan is likely to continue its asset purchase program as growth and inflation remain below targets. Japanese equity valuations are attractive, particularly in the light of relatively healthy corporate earnings and cash flows.
Emerging market equity valuations are at multi-year lows, even though their economies are likely to see average growth of close to 5% over the next two years. As trade tensions ease, we believe the Chinese government has enough policy flexibility to
maintain aggregate growth at current levels. India and Indonesia are also likely to maintain their current pace next year, when national elections are scheduled in both countries. The Brazilian economy is likely to see faster expansion in 2019, helped by favorable policies of the new government and higher capital investments. We believe fears about adverse policy steps from the new Mexican government are overstated and the country should benefit once the renegotiated North American trade deal is approved by the U.S. Congress.
Thank you for your confidence in the Thomas White International Fund.
| | | | |
| www.thomaswhitefunds.com | | | 11 | |
THOMAS WHITE INTERNATIONAL FUND
Portfolio Country and Industry Allocation as of October 31, 2018 (Unaudited)
| | | | |
| | |
| Country Allocation | | % of TNA | |
| Australia | | | 6.2% | |
| Belgium | | | 1.2% | |
| Brazil | | | 2.2% | |
| Canada | | | 5.0% | |
| China | | | 7.3% | |
| Finland | | | 2.3% | |
| France | | | 5.7% | |
| Germany | | | 3.8% | |
| Hong Kong | | | 1.8% | |
| India | | | 4.4% | |
| Indonesia | | | 2.3% | |
| Ireland | | | 1.1% | |
| Italy | | | 1.1% | |
| Japan | | | 13.2% | |
| Mexico | | | 1.9% | |
| Netherlands | | | 3.8% | |
| Peru | | | 1.4% | |
| Russia | | | 2.4% | |
| Singapore | | | 1.1% | |
| South Africa | | | 1.9% | |
| South Korea | | | 4.0% | |
| Spain | | | 2.9% | |
| Sweden | | | 2.6% | |
| Switzerland | | | 2.2% | |
| Taiwan | | | 2.0% | |
| Thailand | | | 3.1% | |
| Turkey | | | 0.5% | |
| United Kingdom | | | 10.4% | |
| Cash & Other | | | 2.2% | |
| | | | |
| | |
| Industry Allocation | | % of TNA | |
| Automobiles & Components | | | 3.2% | |
| Banks | | | 18.1% | |
| Capital Goods | | | 10.1% | |
| Commercial & Professional Services | | | 2.2% | |
| Consumer Durables & Apparel | | | 2.8% | |
| Consumer Services | | | 2.3% | |
| Diversified Financials | | | 4.2% | |
| Energy | | | 7.1% | |
| Food, Beverage & Tobacco | | | 2.8% | |
| Health Care Equipment & Services | | | 2.7% | |
| Household & Personal Products | | | 2.8% | |
| Insurance | | | 2.4% | |
| Materials | | | 11.0% | |
| Media & Entertainment | | | 5.2% | |
| Pharmaceuticals, Biotechnology & Life Sciences | | | 3.4% | |
| Retailing | | | 2.3% | |
| Semiconductors & Semiconductor Equipment | | | 3.4% | |
| Software & Services | | | 1.2% | |
| Technology Hardware & Equipment | | | 2.2% | |
| Telecommunication Services | | | 3.0% | |
| Transportation | | | 5.4% | |
| Cash & Other | | | 2.2% | |
| | | | | |
| | | | | |
| | | | | |
| | | | | |
| | | | | |
| | | | | |
| | | | | |
TNA - Total Net Assets
Fund holdings and industry allocations are subject to change and should not be considered a recommendation to buy or sell any securities. For a complete list of Fund holdings, please refer to the Investment Portfolio section of this report.
| | |
| 12 | | www.thomaswhitefunds.com |
| | |
| Investment Portfolio | | October 31, 2018 |
| | | | | | | | | | | | |
| Country | | Issue | | Industry | | Shares | | | Value (US$) | |
| | | | | | | | | | | |
COMMON
STOCKS (95.6%) | | | | | | | | | | |
|
| |
| AUSTRALIA (6.2%) | | | | | | | | |
| | Aristocrat Leisure Limited + | | Consumer Services | | | 154,400 | | | | $2,913,189 | |
| | BHP Billiton Ltd + | | Materials | | | 178,900 | | | | 4,139,824 | |
| | CSL Limited + | | Pharmaceuticals, Biotechnology & Life Sciences | | | 31,800 | | | | 4,264,836 | |
| | Treasury Wine Estates Limited + | | Food, Beverage & Tobacco | | | 163,000 | | | | 1,750,472 | |
| | | | | | | | | | | | |
| | | | | | | | | | | 13,068,321 | |
|
| |
| BELGIUM (1.2%) | | | | | | | | |
| | KBC Group NV+ | | Banks | | | 36,800 | | | | 2,533,939 | |
|
| |
| CANADA (5.0%) | | | | | | | | |
| | Canadian National Railway Company | | Transportation | | | 34,700 | | | | 2,966,416 | |
| | Nutrien Ltd. | | Materials | | | 51,200 | | | | 2,710,417 | |
| | Open Text Corporation | | Software & Services | | | 77,700 | | | | 2,622,954 | |
| | Suncor Energy, Inc. | | Energy | | | 69,600 | | | | 2,334,715 | |
| | | | | | | | | | | | |
| | | | | | | | | | | 10,634,502 | |
|
| |
| CHINA (7.3%) | | | | | | | | |
| | Alibaba Group Holding Ltd. - ADR * | | Retailing | | | 18,000 | | | | 2,561,040 | |
| | Anhui Conch Cement Company Limited - H Shares + | | Materials | | | 422,000 | | | | 2,169,825 | |
| | Baidu, Inc. - ADR * | | Media & Entertainment | | | 14,600 | | | | 2,774,876 | |
| | China Molybdenum Co., Ltd. - H Shares + # | | Materials | | | 4,440,000 | | | | 1,643,597 | |
| | Kweichow Moutai Co., Ltd. - A Shares + | | Food, Beverage & Tobacco | | | 25,400 | | | | 2,008,837 | |
| | Midea Group Co., Ltd. - A Shares + | | Consumer Durables & Apparel | | | 337,500 | | | | 1,793,961 | |
| | Ping An Insurance (Group) Company of China Limited - H Shares + | | Insurance | | | 253,500 | | | | 2,399,115 | |
| | | | | | | | | | | | |
| | | | | | | | | | | 15,351,251 | |
|
| |
| FINLAND (2.3%) | | | | | | | | |
| | Konecranes OYJ + # | | Capital Goods | | | 62,700 | | | | 2,248,263 | |
| | Sampo Oyj - A Shares + | | Insurance | | | 56,900 | | | | 2,619,670 | |
| | | | | | | | | | | | |
| | | | | | | | | | | 4,867,933 | |
|
| |
| FRANCE (5.7%) | | | | | | | | |
| | Danone + | | Food, Beverage & Tobacco | | | 30,600 | | | | 2,168,026 | |
| | Eiffage + | | Capital Goods | | | 23,000 | | | | 2,249,278 | |
| | Kering + | | Consumer Durables & Apparel | | | 4,300 | | | | 1,906,647 | |
| | Safran SA + | | Capital Goods | | | 28,800 | | | | 3,709,754 | |
| | Societe Generale SA + | | Banks | | | 53,400 | | | | 1,961,522 | |
| | | | | | | | | | | | |
| | | | | | | | | | | 11,995,227 | |
|
| |
The accompanying notes are an integral part of these financial statements
| | | | |
| www.thomaswhitefunds.com | | | 13 | |
| | |
| Thomas White International Fund | | |
| | | | | | | | | | | | |
| Country | | Issue | | Industry | | Shares | | | Value (US$) | |
| | | | | | | | | | | |
| GERMANY (3.8%) | | | | | | | | |
| | Bayer AG + | | Materials | | | 17,500 | | | | $1,343,576 | |
| | Bayerische Motoren Werke Aktiengesellschaft + | | Automobiles & Components | | | 35,200 | | | | 3,036,320 | |
| | Fresenius SE & Co KGaA + | | Health Care Equipment & Services | | | 25,200 | | | | 1,605,990 | |
| | Scout24 AG + | | Media & Entertainment | | | 47,200 | | | | 1,959,637 | |
| | | | | | | | | | | | |
| | | | | | | | | | | 7,945,523 | |
|
| |
| HONG KONG (1.8%) | | | | | | | | |
| | Hong Kong Exchanges & Clearing Limited + | | Diversified Financials | | | 56,400 | | | | 1,503,949 | |
| | Techtronic Industries Company Limited + | | Consumer Durables & Apparel | | | 482,000 | | | | 2,262,834 | |
| | | | | | | | | | | | |
| | | | | | | | | | | 3,766,783 | |
|
| |
| INDIA (4.4%) | | | | | | | | |
| | Exide Industries Ltd. + | | Automobiles & Components | | | 716,000 | | | | 2,585,369 | |
| | HDFC Bank Ltd. - ADR | | Banks | | | 29,000 | | | | 2,578,390 | |
| | Larsen & Toubro Ltd + | | Capital Goods | | | 124,300 | | | | 2,185,131 | |
| | Vedanta Limited + | | Materials | | | 652,700 | | | | 1,864,177 | |
| | | | | | | | | | | | |
| | | | | | | | | | | 9,213,067 | |
|
| |
| INDONESIA (2.3%) | | | | | | | | |
| | PT Bank Central Asia Tbk + | | Banks | | | 1,534,900 | | | | 2,390,054 | |
| | PT Telekomunikasi Indonesia Persero Tbk + | | Telecommunication Services | | | 10,091,400 | | | | 2,551,033 | |
| | | | | | | | | | | | |
| | | | | | | | | | | 4,941,087 | |
|
| |
| IRELAND (1.1%) | | | | | | | | |
| | CRH PLC + | | Materials | | | 81,100 | | | | 2,423,283 | |
|
| |
| ITALY (1.1%) | | | | | | | | |
| | Intesa Sanpaolo S.p.A. + | | Banks | | | 1,029,000 | | | | 2,274,911 | |
|
| |
| JAPAN (13.2%) | | | | | | | | |
| | DAIKIN INDUSTRIES, LTD. + | | Capital Goods | | | 21,300 | | | | 2,465,410 | |
| | H.I.S. Co., Ltd. + | | Consumer Services | | | 62,500 | | | | 1,907,584 | |
| | Hoya Corp + | | Technology Hardware & Equipment | | | 39,800 | | | | 2,254,064 | |
| | Kansai Paint Co., Ltd. + # | | Materials | | | 124,400 | | | | 1,832,578 | |
| | KOSE Corporation + | | Household & Personal Products | | | 11,000 | | | | 1,634,078 | |
| | M3, Inc. + | | Health Care Equipment & Services | | | 126,400 | | | | 2,051,445 | |
| | Nintendo Co., Ltd. + | | Media & Entertainment | | | 5,600 | | | | 1,736,014 | |
| | Nitori Holdings Co., Ltd. + | | Retailing | | | 16,900 | | | | 2,216,454 | |
| | ORIX Corporation + | | Diversified Financials | | | 174,100 | | | | 2,830,337 | |
| | Park24 Co., Ltd. + | | Commercial & Professional Services | | | 89,700 | | | | 2,355,304 | |
| | SMC Corp/Japan + | | Capital Goods | | | 9,000 | | | | 2,862,806 | |
| | SoftBank Corp. + | | Telecommunication Services | | | 45,500 | | | | 3,689,069 | |
| | | | | | | | | | | | |
| | | | | | | | | | | 27,835,143 | |
|
| |
The accompanying notes are an integral part of these financial statements
| | |
| 14 | | www.thomaswhitefunds.com |
| | |
| Investment Portfolio | | October 31, 2018 |
| | | | | | | | | | | | |
| Country | | Issue | | Industry | | Shares | | | Value (US$) | |
| | | | | | | | | | | |
| MEXICO (1.9%) | | | | | | | | | | |
| | Cemex SAB de CV * | | Materials | | | 2,915,524 | | | | $1,461,117 | |
| | Grupo Aeroportuario del Sureste SAB de CV - Class B | | Transportation | | | 155,900 | | | | 2,571,900 | |
| | | | | | | | | | | | |
| | | | | | | | | | | 4,033,017 | |
|
| |
| NETHERLANDS (3.8%) | | | | | | | | |
| | ING Groep N.V. + | | Banks | | | 249,100 | | | | 2,947,072 | |
| | Royal Dutch Shell PLC - B Shares + | | Energy | | | 154,700 | | | | 5,036,982 | |
| | | | | | | | | | | | |
| | | | | | | | | | | 7,984,054 | |
|
| |
| PERU (1.4%) | | | | | | | | | | |
| | Credicorp Ltd. | | Banks | | | 13,200 | | | | 2,979,372 | |
|
| |
| RUSSIA (2.4%) | | | | | | | | | | |
| | LUKOIL PJSC - ADR + | | Energy | | | 40,300 | | | | 3,009,185 | |
| | Sberbank of Russia PJSC - ADR + | | Banks | | | 168,000 | | | | 1,974,728 | |
| | | | | | | | | | | | |
| | | | | | | | | | | 4,983,913 | |
|
| |
| SINGAPORE (1.1%) | | | | | | | | |
| | DBS Group Holdings Limited + | | Banks | | | 134,600 | | | | 2,283,878 | |
|
| |
| SOUTH AFRICA (1.9%) | | | | | | | | |
| | FirstRand Limited + | | Diversified Financials | | | 509,200 | | | | 2,213,534 | |
| | Naspers Limited - N Shares + | | Media & Entertainment | | | 10,000 | | | | 1,751,553 | |
| | | | | | | | | | | | |
| | | | | | | | | | | 3,965,087 | |
|
| |
| SOUTH KOREA (4.0%) | | | | | | | | |
| | KB Financial Group Inc. + | | Banks | | | 45,250 | | | | 1,882,804 | |
| | LG Household & Health Care Ltd. + | | Household & Personal Products | | | 2,225 | | | | 2,048,266 | |
| | POSCO + | | Materials | | | 6,750 | | | | 1,522,788 | |
| | Samsung Electronics Co., Ltd. + | | Semiconductors & Semiconductor Equipment | | | 77,650 | | | | 2,904,081 | |
| | | | | | | | | | | | |
| | | | | | | | | | | 8,357,939 | |
|
| |
| SPAIN (2.9%) | | | | | | | | | | |
| | Aena SME, S.A. + | | Transportation | | | 15,800 | | | | 2,522,924 | |
| | Banco Bilbao Vizcaya Argentaria, S.A. + | | Banks | | | 636,600 | | | | 3,514,206 | |
| | | | | | | | | | | | |
| | | | | | | | | | | 6,037,130 | |
|
| |
| SWEDEN (2.6%) | | | | | | | | | | |
| | Hexagon AB - B Shares + | | Technology Hardware & Equipment | | | 50,100 | | | | 2,452,603 | |
| | SKF AB - B Shares + | | Capital Goods | | | 192,800 | | | | 3,093,324 | |
| | | | | | | | | | | | |
| | | | | | | | | | | 5,545,927 | |
|
| |
| SWITZERLAND (2.2%) | | | | | | | | |
| | Credit Suisse Group AG + | | Diversified Financials | | | 180,000 | | | | 2,345,910 | |
| | IWG PLC + | | Commercial & Professional Services | | | 800,000 | | | | 2,351,115 | |
| | | | | | | | | | | | |
| | | | | | | | | | | 4,697,025 | |
|
| |
The accompanying notes are an integral part of these financial statements
| | | | |
| www.thomaswhitefunds.com | | | 15 | |
| | |
| Thomas White International Fund | | |
| | | | | | | | | | | | |
| Country | | Issue | | Industry | | Shares | | | Value (US$) | |
| | | | | | | | | | | |
| TAIWAN (2.0%) | | | | | | | | |
| | Taiwan Semiconductor Manufacturing Company, Ltd. + | | Semiconductors & Semiconductor Equipment | | | 104,000 | | | | $772,682 | |
| | Taiwan Semiconductor Manufacturing Company, Ltd. - ADR | | Semiconductors & Semiconductor Equipment | | | 93,000 | | | | 3,543,300 | |
| | | | | | | | | | | | |
| | | | | | | | | | | 4,315,982 | |
|
| |
| THAILAND (3.1%) | | | | | | | | |
| | Airports of Thailand Public Company Ltd. + | | Transportation | | | 1,658,800 | | | | 3,210,279 | |
| | Kasikornbank Public Company Limited + | | Banks | | | 547,200 | | | | 3,298,814 | |
| | | | | | | | | | | | |
| | | | | | | | | | | 6,509,093 | |
|
| |
| TURKEY (0.5%) | | | | | | | | |
| | Tofas Turk Otomobil Fabrikasi A.S. + | | Automobiles & Components | | | 277,700 | | | | 1,047,466 | |
|
| |
| UNITED KINGDOM (10.4%) | | | | | | | | |
| | Antofagasta plc + | | Materials | | | 199,100 | | | | 1,994,998 | |
| | Ashtead Group Plc + | | Capital Goods | | | 95,300 | | | | 2,355,670 | |
| | BP p.l.c. + | | Energy | | | 625,200 | | | | 4,528,650 | |
| | Lloyds Banking Group plc + | | Banks | | | 4,166,800 | | | | 3,046,299 | |
| | Reckitt Benckiser Group PLC + | | Household & Personal Products | | | 26,500 | | | | 2,142,754 | |
| | SHIRE PLC + | | Pharmaceuticals, Biotechnology & Life Sciences | | | 49,600 | | | | 2,966,749 | |
| | Smith & Nephew plc + | | Health Care Equipment & Services | | | 129,000 | | | | 2,097,911 | |
| | WPP plc + | | Media & Entertainment | | | 238,500 | | | | 2,706,376 | |
| | | | | | | | | | | | |
| | | | | | | | | | | 21,839,407 | |
|
| |
Total Common
Stocks | | (Cost $194,082,519) | | | | | | | 201,430,260 | |
| | | | | | | | | | | | |
|
| |
PREFERRED
STOCK (2.2%) | | | | | | | | | | |
|
| |
| BRAZIL (2.2%) | | | | | | | | |
| | Itau Unibanco Holding S.A. (2/5/19, 0.35%) ^ | | Banks | | | 345,360 | | | | 4,560,256 | |
|
| |
| | | | | | | | | | | | |
Total Preferred
Stock | | (Cost $3,251,982) | | | | | | | 4,560,256 | |
| | | | | | | | | | | | |
|
| |
| Total Investments | | 97.8% | | (Cost $197,334,501) | | | | | | | $205,990,516 | |
| Other Assets, Less Liabilities | | 2.2% | | | | | | | | | 4,660,969 | |
| Total Net Assets: | | 100.0% | | | | | | | | | $210,651,485 | |
|
| |
The accompanying notes are an integral part of these financial statements
| | |
| 16 | | www.thomaswhitefunds.com |
| | |
| Investment Portfolio | | October 31, 2018 |
| * | Non-Income Producing Securities |
| # | All or a portion of securities on loan at October 31, 2018. The market value of the securities loaned was $3,964,624. The loaned securities were secured with non-cash collateral with a value of $4,247,803. The non-cash collateral received consists of short term investments and long term bonds, and is held for the benefit of the Fund at the Fund’s custodian. The Fund cannot repledge or resell this collateral. Collateral is calculated based on prior day’s prices. - See Note 1(I) to Financial Statements |
| ^ | Maturity Date and Preferred Dividend Rate of Preferred Stock |
| ADR | - American Depositary Receipt |
Industry classifications shown in the Investment Portfolio are based off of the Global Industry Classification Standard (GICS®). GICS was developed by and/or is the exclusive property of MSCI, Inc. and Standard & Poor’s Financial Services LLC (“S&P”). GICS is a service mark of MSCI and S&P and has been licensed for use by U.S. Bancorp Fund Services, LLC.
The accompanying notes are an integral part of these financial statements
| | | | |
| www.thomaswhitefunds.com | | | 17 | |
| | |
| Thomas White International Fund | | |
The following table summarizes the inputs used, as of October 31, 2018, in valuating the Fund’s assets:
| | | | | | | | | | | | | | | | |
| | | Level 1 | | | Level 2 | | | Level 3 | | | Total | |
| Common Stocks | | | | | | | | | | | | | | | | |
| Australia | | | $------- | | | | $13,068,321 | | | | $------- | | | | $13,068,321 | |
| Belgium | | | ------- | | | | 2,533,939 | | | | ------- | | | | 2,533,939 | |
| Canada | | | 10,634,502 | | | | ------- | | | | ------- | | | | 10,634,502 | |
| China | | | 5,335,916 | | | | 10,015,335 | | | | ------- | | | | 15,351,251 | |
| Finland | | | ------- | | | | 4,867,933 | | | | ------- | | | | 4,867,933 | |
| France | | | ------- | | | | 11,995,227 | | | | ------- | | | | 11,995,227 | |
| Germany | | | ------- | | | | 7,945,523 | | | | ------- | | | | 7,945,523 | |
| Hong Kong | | | ------- | | | | 3,766,783 | | | | ------- | | | | 3,766,783 | |
| India | | | 2,578,390 | | | | 6,634,677 | | | | ------- | | | | 9,213,067 | |
| Indonesia | | | ------- | | | | 4,941,087 | | | | ------- | | | | 4,941,087 | |
| Ireland | | | ------- | | | | 2,423,283 | | | | ------- | | | | 2,423,283 | |
| Italy | | | ------- | | | | 2,274,911 | | | | ------- | | | | 2,274,911 | |
| Japan | | | ------- | | | | 27,835,143 | | | | ------- | | | | 27,835,143 | |
| Mexico | | | 4,033,017 | | | | ------- | | | | ------- | | | | 4,033,017 | |
| Netherlands | | | ------- | | | | 7,984,054 | | | | ------- | | | | 7,984,054 | |
| Peru | | | 2,979,372 | | | | ------- | | | | ------- | | | | 2,979,372 | |
| Russia | | | ------- | | | | 4,983,913 | | | | ------- | | | | 4,983,913 | |
| Singapore | | | ------- | | | | 2,283,878 | | | | ------- | | | | 2,283,878 | |
| South Africa | | | ------- | | | | 3,965,087 | | | | ------- | | | | 3,965,087 | |
| South Korea | | | ------- | | | | 8,357,939 | | | | ------- | | | | 8,357,939 | |
| Spain | | | ------- | | | | 6,037,130 | | | | ------- | | | | 6,037,130 | |
| Sweden | | | ------- | | | | 5,545,927 | | | | ------- | | | | 5,545,927 | |
| Switzerland | | | ------- | | | | 4,697,025 | | | | ------- | | | | 4,697,025 | |
| Taiwan | | | 3,543,300 | | | | 772,682 | | | | ------- | | | | 4,315,982 | |
| Thailand | | | ------- | | | | 6,509,093 | | | | ------- | | | | 6,509,093 | |
| Turkey | | | ------- | | | | 1,047,466 | | | | ------- | | | | 1,047,466 | |
| United Kingdom | | | ------- | | | | 21,839,407 | | | | ------- | | | | 21,839,407 | |
| Total Common Stocks | | | $29,104,497 | | | | $172,325,763 | | | | $------- | | | | $201,430,260 | |
| Preferred Stock | | | | | | | | | | | | | | | | |
| Brazil | | | $4,560,256 | | | | $------- | | | | $------- | | | | $4,560,256 | |
| Total Preferred Stock | | | $4,560,256 | | | | $------- | | | | $------- | | | | $4,560,256 | |
| Total Investments | | | $33,664,753 | | | | $172,325,763 | | | | $------- | | | | $205,990,516 | |
For more information on valuation inputs, please refer to Note 1 (A) of the accompanying Notes to Financial Statements.
The accompanying notes are an integral part of these financial statements
| | |
| 18 | | www.thomaswhitefunds.com |
| | |
| Investment Portfolio | | October 31, 2018 |
The Fund’s assets assigned to Level 2 include certain foreign securities for which a third party statistical pricing service may be employed for purposes of fair market valuation. There were no transfers into or out of Level 3 during the reporting period, as compared to their classification from the prior annual report.
The accompanying notes are an integral part of these financial statements
| | | | |
| www.thomaswhitefunds.com | | | 19 | |
THOMAS WHITE EMERGING MARKETS FUND
| | | | | | | | | | | | | | |
| | | | | | | | |
| | | Unaudited
Sales
Charge | | Deferred
Sales
Charge | | Administrative
Services
Fee | | 12b-1 Fees | | Operating
Expenses1,3 | | Prospectus
Gross
Annual
Operating
Expense2 | | Prospectus
Net Annual
Operating
Expense2,3 |
| Investor Class | | None | | None | | Up to 0.25% | | None | | 1.34% | | 1.49% | | 1.35% |
| Class I | | None | | None | | None | | None | | 1.09% | | 1.42% | | 1.10% |
1 In the absence of the fee deferral/expense reimbursement arrangement for the Emerging Markets Fund, the ratio of expenses to average net assets would have been 1.54% for Investor Class shares and 1.51% for Class I shares.
2 Gross Annual Operating Expense and Net Annual Operating Expense are based on the most recent prospectus and may differ from other expense ratios appearing in this report.
3 Thomas White International, Ltd. (“Advisor”) has agreed to defer its fees and/or reimburse the Fund to the extent that the operating expenses for Investor Class and Class I shares exceed (as a percentage of average daily net assets) 1.34% and 1.09%, respectively. The fee deferral/expense reimbursement agreement expires February 28, 2019. The Fund has agreed to repay the Advisor for amounts deferred or reimbursed by the Advisor pursuant to the agreement provided that such repayment does not cause the Fund to exceed the above limits and the repayment is made within three years after the year in which the Advisor incurred the expense. The fee deferral/expense reimbursement agreement may only be amended or terminated by the Fund’s Board of Trustees.
| | | | | | | | |
| | | | | |
| | | NAV | | Net Assets | | Redemption Fee | | Portfolio Turnover |
| Investor Class | | $9.87 | | $1.7 million | | 2.00% on shares held less than 60 days | | 34% |
| Class I | | $9.97 | | $31.9 million |
| | |
| 20 | | www.thomaswhitefunds.com |
OCTOBER 31, 2018
| | | | | | | | | | | | | | | | | | | | | | | | | | |
| |
| Average Annual Returns as of October 31, 2018 (Unaudited) | |
| Class | | Sales Charge | | 6 month | | | Calendar
YTD | | | 1 Yr | | | 3 Yrs | | | 5 Yrs | | | Since
Inception
(6/28/2010)* | |
| Investor Class shares (TWEMX) | | None | | | -15.69% | | | | -14.98% | | | | -11.59% | | | | 2.63% | | | | -2.30% | | | | 1.03% | |
| Class I shares1 (TWIIX) | | None | | | -15.56% | | | | -14.77% | | | | -11.33% | | | | 2.88% | | | | -2.04% | | | | 1.21% | |
| MSCI Emerging Markets Index2 | | N/A | | | -16.53% | | | | -15.72% | | | | -12.52% | | | | 6.52% | | | | 0.78% | | | | 2.51% | |
* The inception date of the Investor Class shares.
1 Performance figures for Class I shares, first offered on August 31, 2012, include the historical performance of Investor Class shares through August 30, 2012.
2 The MSCI Emerging Markets Index is a free float-adjusted market capitalization index that is designed to measure equity market performance of emerging markets. The index is unmanaged and returns assume the reinvestment of dividends. It is not possible to invest directly in an index.
Returns of each share class reflect differences in expenses applicable to each class which are primarily differences in service fees.
The returns do not reflect the deduction of taxes that a shareholder would pay on Fund distributions or the redemption of Fund shares. The returns reflect the actual performance for each period and do not include the impacts of trades executed on the last business day of the period that were recorded on the first business day of the next period.
Performance data is based upon past performance, which is no guarantee of future results. The investment return and principal value of an investment will fluctuate so that an investor’s shares, when redeemed, may be worth more or less than their original cost. Current performance may be higher or lower than the performance data quoted. Please call 1-800-811-0535 to obtain performance data as of the most recent month-end. The Fund imposes a 2% redemption fee on shares held less than 60 days. Performance data does not reflect the redemption fee. If reflected, total returns would be lower. Investment performance reflects any fee waivers that were in effect. In the absence of such waivers, total return would have been reduced. The Gross Expense Ratios, based on the most recent prospectus, are 1.49% (Investor Class) and 1.42% (Class I).
| | | | |
| www.thomaswhitefunds.com | | | 21 | |
THOMAS WHITE EMERGING MARKETS FUND
GROWTH OF A $10,000 INVESTMENT WITH DIVIDENDS REINVESTED (Unaudited)
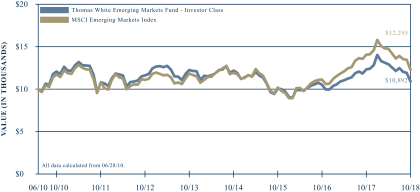
This chart illustrates the performance of a hypothetical $10,000 investment made in the Fund’s Investor Class shares and its benchmark, the MSCI Emerging Markets Index, since inception on June 28, 2010 through October 31, 2018. It assumes reinvestment of dividends and capital gains, but does not reflect the effect of any applicable redemption fees. This chart does not imply future performance. Past performance does not guarantee future results. The cumulative return since inception was 8.92% for the Fund’s Investor Class shares and 22.95% for the benchmark. The Fund’s Investor Class shares average annual total return since inception on June 28, 2010 was 1.03%. The MSCI Emerging Markets Index is a free float-adjusted market capitalization index that is designed to measure equity market performance of emerging markets. The index is unmanaged and returns assume the reinvestment of dividends. It is not possible to invest directly in an index. During the periods shown, the Fund’s manager reimbursed certain Fund expenses. Absent this reimbursement, performance would have been lower. Performance will vary from class to class based on differences in class-specific expenses.
| | |
| 22 | | www.thomaswhitefunds.com |
OCTOBER 31, 2018
The Thomas White Emerging Markets Fund invests primarily in securities of companies located in or whose businesses are closely associated with the world’s emerging markets countries.
Portfolio Managers
Jinwen Zhang, Ph.D., CFA
Douglas M. Jackman, CFA
Wei Li, Ph.D., CFA
John Wu, Ph.D., CFA
Rex Mathew, CFA, CMA
Ramkumar Venkatramani, CFA
Performance Review
During the one-year period ended October 31, 2018, the Thomas White Emerging Markets Fund Class I shares returned -11.33%, compared to -12.52% for the benchmark MSCI Emerging Markets Index. Since its inception on June 28, 2010, the Fund’s Class I shares have returned +1.21%* annualized, against +2.51% for the benchmark index.
Trade Related Headwinds Restrict Emerging Markets
After the strong gains in 2017, emerging market equities corrected as investors became concerned about the impact of continuing trade disputes between the U.S. and the rest of the world. Though aggregate growth rates in most emerging economies remain relatively stable, some of them could see a slowdown if U.S. import tariffs are increased further. Valuations of several emerging market companies that derive substantial revenues from exports have
declined this year, after their managements became more cautious about new order inflows.
Expectations of further rate increases by the U.S. Federal Reserve also made investors less keen on emerging market assets this year. Faster U.S. economic growth during the second and third quarters of 2018 increased the possibility of higher rates and kept the U.S. Dollar stronger relative to other currencies. Though U.S. rate hike expectations have declined more recently, investors remain cautious about the prospects of relatively higher external debt.
Higher political risks in Turkey and Russia also weakened emerging market investor sentiment during the review period. On the positive side, the leadership change in Brazil has encouraged investors. The risk of expensive fuel prices hurting growth in importing countries such as China, India and Indonesia also unnerved investors earlier this year, but has eased in recent months as crude oil prices moderated.
Portfolio Review
Energy was the best performing sector for the Fund as crude oil prices remained high for most of the review period. Despite the decline in prices of select commodities such as copper, costlier iron ore and higher cement demand in several large countries helped the materials sector. Wider net interest margins and fading concerns about loan losses boosted the financials sector during the review period. The technology sector was hurt by concerns about slowing demand growth for ecommerce, online
| * | Performance for Class I shares includes the historical performance of Investor Class shares through August 30, 2012. |
| | | | |
| www.thomaswhitefunds.com | | | 23 | |
THOMAS WHITE EMERGING MARKETS FUND
services and semiconductors, after the accelerated expansion in recent years. The consumer discretionary sector was negatively affected by doubts about the demand outlook for durables and services. The industrials sector also underperformed as global demand for capital goods and components remained below expectations.
The Fund’s energy holdings contributed the most to returns for the period on higher crude oil prices when compared to recent years. These companies have seen much higher margins and appear better placed to reduce leverage and increase dividend payouts. Stocks that gained include Brazilian integrated energy group Petrobras, Russian oil producer Lukoil and Thai energy group PTT Exploration and Production. Vale, the world’s largest iron ore miner, based in Brazil, benefited from strong Chinese demand for higher quality iron ore. B3, which operates equity and derivatives exchanges in Brazil, outperformed as transaction volumes have increased substantially in recent months.
Select Fund holdings in the Asian ecommerce and online services industries detracted from returns for the period. Though these companies continue to report strong earnings expansion, investors have become less hopeful of the strong growth pace continuing in the future. Some of these companies have become very large and they will have to aggressively expand into new geographies and market segments to sustain growth. The stocks that underperformed included Asian ecommerce leader Alibaba and Tencent, which provides online gaming and instant communication services. South African holding company Naspers, which is
the largest shareholder of Tencent, also declined. Doubts about future demand for memory chips as well as chipsets used in smartphones negatively affected Samsung Electronics. Brilliance China Automotive underperformed after its partner BMW decided to acquire majority control of the joint venture for nearly $4 billion.
Inexpensive Emerging Markets May Offer Attractive Risk-Reward Opportunities
This year’s underperformance has pushed down emerging market equity valuations to multi-year lows. For some countries and sectors within the emerging market universe, valuations are nearing their lows seen during the 2008 financial crisis. However, most emerging market corporations appear to be in much better financial health than they were during the global recession. The risks faced by these businesses, both domestic and external, are also generally lower. Though earnings and cash flows in select markets and industries have fallen short of forecasts this year, they continue to expand at a moderate pace. That is in stark contrast to 2008 when earnings declined sharply and the recovery required large scale fiscal stimulus measures.
The ongoing trade related frictions between the U.S. and the rest of the world have created a lot of volatility in global equity markets, especially in emerging markets. Some of the major areas of dispute between the U.S. and China, such as better protection of intellectual property rights, could take several years to resolve. However, there are other areas that could be addressed within shorter time frames. This includes increased sourcing of farm produce and industrial
| | |
| 24 | | www.thomaswhitefunds.com |
OCTOBER 31, 2018
equipment from the U.S. as well as improved market access for foreign companies in China. The relatively controlled response from China to heightened U.S. rhetoric and the flexibility shown by the U.S. administration in renegotiating the North American Free Trade Agreement (NAFTA) suggests that it is possible to arrive at a deal that will avoid further tariffs and controls.
While it is true that leverage has gone up appreciably in emerging economies over the last decade, in most major economies, including China, much of the debt is in local currency. This reduces the vulnerability to external shocks and the impact of higher rates in the developed countries. The governments in emerging economies have also been more proactive in limiting their current and fiscal deficits. When faced with market volatility, they have not shied away
from taking the required steps to stabilize their currencies. Rate hikes and control of public spending by Indonesia is a good recent example.
Most governments in emerging countries are friendly to business, and their policies are largely supportive of faster economic growth. The new government in Brazil is expected to push much-needed reform measures. In Mexico, the government is likely to be more realistic than suggested by the recent rhetoric that has spooked investors. Even if India and Indonesia see leadership changes after next year’s national elections, the broader economic policy approaches are unlikely to change.
We thank you for investing in the Thomas White Emerging Markets Fund.
| | | | |
| www.thomaswhitefunds.com | | | 25 | |
THOMAS WHITE EMERGING MARKETS FUND
Portfolio Country and Industry Allocation as of October 31, 2018 (Unaudited)
| | | | |
| | |
| Country Allocation | | % of TNA | |
| Brazil | | | 13.0% | |
| China | | | 29.2% | |
| Hong Kong | | | 1.9% | |
| India | | | 9.7% | |
| Indonesia | | | 2.4% | |
| Malaysia | | | 1.3% | |
| Mexico | | | 4.0% | |
| Peru | | | 1.1% | |
| Philippines | | | 0.9% | |
| Poland | | | 0.7% | |
| Russia | | | 5.2% | |
| South Africa | | | 3.9% | |
| South Korea | | | 12.7% | |
| Taiwan | | | 8.8% | |
| Thailand | | | 3.2% | |
| Turkey | | | 0.6% | |
| Cash & Other | | | 1.4% | |
| | | | | |
| | | | | |
| | | | |
| | |
| Industry Allocation | | % of TNA | |
| Automobiles & Components | | | 2.5% | |
| Banks | | | 20.4% | |
| Capital Goods | | | 2.2% | |
| Consumer Durables & Apparel | | | 2.7% | |
| Diversified Financials | | | 3.6% | |
| Energy | | | 12.4% | |
| Food, Beverage & Tobacco | | | 0.7% | |
| Household & Personal Products | | | 2.2% | |
| Insurance | | | 2.3% | |
| Materials | | | 10.6% | |
| Media & Entertainment | | | 11.8% | |
| Real Estate | | | 1.4% | |
| Retailing | | | 5.7% | |
| Semiconductors & Semiconductor Equipment | | | 11.0% | |
| Software & Services | | | 1.5% | |
| Technology Hardware & Equipment | | | 2.9% | |
| Telecommunication Services | | | 0.5% | |
| Transportation | | | 4.2% | |
| Cash & Other | | | 1.4% | |
TNA - Total Net Assets
Fund holdings and industry allocations are subject to change and should not be considered a recommendation to buy or sell any securities. For a complete list of Fund holdings, please refer to the Investment Portfolio section of this report.
| | |
| 26 | | www.thomaswhitefunds.com |
| | |
| Investment Portfolio | | October 31, 2018 |
| | | | | | | | | | | | |
| Country | | Issue | | Industry | | Shares | | | Value (US$) | |
| | | | | | | | | | | |
COMMON
STOCKS (90.1%) | | | | | | | | | | |
|
| |
| BRAZIL (5.7%) | | | | | | | | |
| | B3 SA - Brasil Bolsa Balcao | | Diversified Financials | | | 78,500 | | | | $ 562,989 | |
| | Hypera SA | | Household & Personal Products | | | 36,900 | | | | 293,197 | |
| | Vale SA | | Materials | | | 69,122 | | | | 1,045,699 | |
| | | | | | | | | | | | |
| | | | | | | | | | | 1,901,885 | |
|
| |
| CHINA (29.2%) | | | | | | | | |
| | Alibaba Group Holding Ltd. - ADR * | | Retailing | | | 11,125 | | | | 1,582,865 | |
| | Anhui Conch Cement Company Limited - H Shares + | | Materials | | | 138,900 | | | | 714,191 | |
| | Baidu, Inc. - ADR * | | Media & Entertainment | | | 2,475 | | | | 470,398 | |
| | China Construction Bank Corp. - H Shares + | | Banks | | | 1,053,000 | | | | 832,738 | |
| | China Overseas Land & Investment Limited + | | Real Estate | | | 146,000 | | | | 456,194 | |
| | China Petroleum and Chemical Corporation (Sinopec) - H Shares + | | Energy | | | 656,000 | | | | 530,481 | |
| | Ctrip.com International, Ltd. - ADR * | | Retailing | | | 9,800 | | | | 326,144 | |
| | Haier Electronics Group Co., Ltd. + | | Consumer Durables & Apparel | | | 119,000 | | | | 247,986 | |
| | Kweichow Moutai Co., Ltd. - A Shares + | | Food, Beverage & Tobacco | | | 2,800 | | | | 221,447 | |
| | Midea Group Co., Ltd. - A Shares + | | Consumer Durables & Apparel | | | 33,000 | | | | 175,410 | |
| | Momo Inc. - ADR * | | Media & Entertainment | | | 12,600 | | | | 422,982 | |
| | NetEase, Inc. - ADR | | Media & Entertainment | | | 2,315 | | | | 481,173 | |
| | Ping An Insurance (Group) Company of China Limited - H Shares + | | Insurance | | | 80,200 | | | | 759,010 | |
| | Shanghai International Airport Co., Ltd. - A Shares + | | Transportation | | | 37,000 | | | | 263,675 | |
| | SINA Corporation * | | Media & Entertainment | | | 4,300 | | | | 272,233 | |
| | Tencent Holdings Limited + | | Media & Entertainment | | | 45,400 | | | | 1,538,835 | |
| | ZTO Express (Cayman) Inc. - ADR # | | Transportation | | | 30,600 | | | | 496,332 | |
| | | | | | | | | | | | |
| | | | | | | | | | | 9,792,094 | |
|
| |
| HONG KONG (1.9%) | | | | | | | | |
| | Brilliance China Automotive Holdings Ltd. + | | Automobiles & Components | | | 188,000 | | | | 165,234 | |
| | Shenzhou International Group Holdings Ltd. + | | Consumer Durables & Apparel | | | 44,000 | | | | 484,723 | |
| | | | | | | | | | | | |
| | | | | | | | | | | 649,957 | |
|
| |
| INDIA (9.7%) | | | | | | | | |
| | Cholamandalam Investment and Finance Company Limited + | | Diversified Financials | | | 20,100 | | | | 346,618 | |
| | Eicher Motors Ltd. + | | Capital Goods | | | 800 | | | | 237,514 | |
| | Exide Industries Ltd. + | | Automobiles & Components | | | 94,300 | | | | 340,503 | |
| | HDFC Bank Ltd. - ADR | | Banks | | | 4,800 | | | | 426,768 | |
| | Larsen & Toubro Ltd + | | Capital Goods | | | 18,200 | | | | 319,947 | |
| | Mahindra & Mahindra Ltd. - GDR + | | Automobiles & Components | | | 33,698 | | | | 348,613 | |
The accompanying notes are an integral part of these financial statements
| | | | |
| www.thomaswhitefunds.com | | | 27 | |
| | |
| Thomas White Emerging Markets Fund | | |
| | | | | | | | | | | | |
| Country | | Issue | | Industry | | Shares | | | Value (US$) | |
| | | | | | | | | | | |
| INDIA (CONT.) | | | | | | | | |
| | Reliance Industries Ltd. + | | Energy | | | 36,900 | | | | $524,303 | |
| | WNS (Holdings) Ltd. - ADR * | | Software & Services | | | 9,900 | | | | 496,881 | |
| | YES BANK Limited + | | Banks | | | 78,400 | | | | 199,488 | |
| | | | | | | | | | | | |
| | | | | | | | | | | 3,240,635 | |
|
| |
| INDONESIA (2.4%) | | | | | | | | |
| | PT Bank Negara Indonesia (Persero) Tbk + | | Banks | | | 772,800 | | | | 374,535 | |
| | PT United Tractors Tbk + | | Energy | | | 189,400 | | | | 417,893 | |
| | | | | | | | | | | | |
| | | | | | | | | | | 792,428 | |
|
| |
| MALAYSIA (1.3%) | | | | | | | | |
| | CIMB Group Holdings Berhad + | | Banks | | | 312,800 | | | | 427,973 | |
|
| |
| MEXICO (4.0%) | | | | | | | | |
| | Cemex SAB de CV * | | Materials | | | 534,720 | | | | 267,975 | |
| | Grupo Aeroportuario del Sureste SAB de CV - Class B | | Transportation | | | 21,300 | | | | 351,389 | |
| | Grupo Financiero Banorte, S.A.B. de C.V. - Class O | | Banks | | | 129,100 | | | | 711,748 | |
| | | | | | | | | | | | |
| | | | | | | | | | | 1,331,112 | |
|
| |
| PERU (1.1%) | | | | | | | | |
| | Credicorp Ltd. | | Banks | | | 1,700 | | | | 383,707 | |
|
| |
| PHILIPPINES (0.9%) | | | | | | | | |
| | Metropolitan Bank & Trust Company + | | Banks | | | 253,972 | | | | 311,535 | |
|
| |
| POLAND (0.7%) | | | | | | | | |
| | KGHM Polska Miedz S.A. * + | | Materials | | | 10,600 | | | | 239,965 | |
|
| |
| RUSSIA (5.2%) | | | | | | | | | | |
| | LUKOIL PJSC - ADR + | | Energy | | | 14,700 | | | | 1,097,643 | |
| | Sberbank of Russia PJSC - ADR + | | Banks | | | 56,075 | | | | 659,124 | |
| | | | | | | | | | | | |
| | | | | | | | | | | 1,756,767 | |
|
| |
| SOUTH AFRICA (3.9%) | | | | | | | | |
| | Absa Group Limited + | | Banks | | | 24,500 | | | | 247,027 | |
| | FirstRand Limited + | | Diversified Financials | | | 71,000 | | | | 308,643 | |
| | Naspers Limited - N Shares + | | Media & Entertainment | | | 4,350 | | | | 761,926 | |
| | | | | | | | | | | | |
| | | | | | | | | | | 1,317,596 | |
|
| |
| SOUTH KOREA (11.5%) | | | | | | | | |
| | KB Financial Group Inc. + | | Banks | | | 10,550 | | | | 438,974 | |
| | Korea Zinc Co Ltd + | | Materials | | | 1,075 | | | | 358,849 | |
| | LG Chem Ltd. + | | Materials | | | 875 | | | | 267,628 | |
| | LG Household & Health Care Ltd. + | | Household & Personal Products | | | 490 | | | | 451,079 | |
| | POSCO + | | Materials | | | 1,425 | | | | 321,477 | |
| | Samsung Electronics Co., Ltd. + | | Semiconductors & Semiconductor Equipment | | | 39,950 | | | | 1,494,115 | |
| | Shinhan Financial Group Co., Ltd. + | | Banks | | | 14,025 | | | | 521,265 | |
| | | | | | | | | | | | |
| | | | | | | | | | | 3,853,387 | |
|
| |
The accompanying notes are an integral part of these financial statements
| | |
| 28 | | www.thomaswhitefunds.com |
| | |
| Investment Portfolio | | October 31, 2018 |
| | | | | | | | | | | | |
| Country | | Issue | | Industry | | Shares | | | Value (US$) | |
| | | | | | | | | | | |
| TAIWAN (8.8%) | | | | | | | | |
| | Airtac International Group + | | Capital Goods | | | 21,000 | | | | $183,332 | |
| | Catcher Technology Co., Ltd + | | Technology Hardware & Equipment | | | 33,000 | | | | 335,641 | |
| | Largan Precision Company Limited + | | Technology Hardware & Equipment | | | 3,000 | | | | 325,739 | |
| | Pegatron Corporation + | | Technology Hardware & Equipment | | | 170,000 | | | | 307,338 | |
| | Taiwan Semiconductor Manufacturing Company, Ltd. + | | Semiconductors & Semiconductor Equipment | | | 240,700 | | | | 1,788,313 | |
| | | | | | | | | | | | |
| | | | | | | | | | | 2,940,363 | |
|
| |
| THAILAND (3.2%) | | | | | | | | |
| | Airports of Thailand Public Company Ltd. + | | Transportation | | | 162,400 | | | | 314,293 | |
| | Kasikornbank Public Company Limited + | | Banks | | | 48,400 | | | | 291,781 | |
| | PTT Exploration and Production Public Company Limited + | | Energy | | | 108,100 | | | | 456,546 | |
| | | | | | | | | | | | |
| | | | | | | | | | | 1,062,620 | |
|
| |
| TURKEY (0.6%) | | | | | | | | |
| | Turkcell Iletisim Hizmetleri AS + | | Telecommunication Services | | | 91,600 | | | | 186,660 | |
|
| |
Total Common
Stocks | | | | (Cost $27,042,572) | | | | | | | 30,188,684 | |
| | | | | | | | | | | | |
|
| |
PREFERRED
STOCKS (8.5%) | | | | | | | | | | |
|
| |
| BRAZIL (7.3%) | | | | | | | | |
| | Banco Bradesco S.A. (2/1/19, N/A) ^ | | Banks | | | 33,000 | | | | 302,378 | |
| | Gerdau S.A. (2/28/19, 1.72%) ^ | | Materials | | | 75,900 | | | | 329,787 | |
| | Itau Unibanco Holding S.A. (2/5/19, 0.35%) ^ | | Banks | | | 53,949 | | | | 712,362 | |
| | Petroleo Brasileiro SA Petrobras (3/15/19, N/A) ^ | | Energy | | | 151,600 | | | | 1,124,728 | |
| | | | | | | | | | | | |
| | | | | | | | | | | 2,469,255 | |
|
| |
| SOUTH KOREA (1.2%) | | | | | | | | |
| | Samsung Electronics Co., Ltd. (1/9/19, 4.06%) ^ + | | Semiconductors & Semiconductor Equipment | | | 12,500 | | | | 393,900 | |
|
| |
Total Preferred
Stocks | | (Cost $2,415,364) | | | | | | | 2,863,155 | |
| | | | | | | | | | |
|
| |
SHORT TERM
INVESTMENT (1.4%) | | | | | | | | | | |
|
| |
| MONEY MARKET FUND (1.4%) | | | | | | | | |
| | Northern Institutional Treasury Portfolio, 2.04% (a) | | | | | 462,129 | | | | 462,129 | |
|
| |
Total Short Term
Investment | | (Cost $462,129) | | | | | | | 462,129 | |
| | | | | | | | | | | | |
|
| |
| Total Investments | | 100.0% | | (Cost $29,920,065) | | | | | | | $33,513,968 | |
| Liabilities in excess of other assets | | (0.0)% | | | | | | | | | (2,242 | ) |
| Total Net Assets: | | 100.0% | | | | | | | | | $33,511,726 | |
|
| |
The accompanying notes are an integral part of these financial statements
| | | | |
| www.thomaswhitefunds.com | | | 29 | |
| | |
| Thomas White Emerging Markets Fund | | |
| * | Non-Income Producing Securities |
| # | All or a portion of securities on loan at October 31, 2018. The market value of the securities loaned was $157,334. The loaned securities were secured with non-cash collateral with a value of $152,102. The non-cash collateral received consists of short term investments and long term bonds, and is held for the benefit of the Fund at the Fund’s custodian. The Fund cannot repledge or resell this collateral. Collateral is calculated based on prior day’s prices. - See Note 1(I) to Financial Statements |
| ^ | Maturity Date and Preferred Dividend Rate of Preferred Stock |
| ADR | - American Depositary Receipt |
| GDR | - Global Depositary Receipt |
Industry classifications shown in the Investment Portfolio are based off of the Global Industry Classification Standard (GICS®). GICS was developed by and/or is the exclusive property of MSCI, Inc. and Standard & Poor’s Financial Services LLC (“S&P”). GICS is a service mark of MSCI and S&P and has been licensed for use by U.S. Bancorp Fund Services, LLC.
The accompanying notes are an integral part of these financial statements
| | |
| 30 | | www.thomaswhitefunds.com |
| | |
| Investment Portfolio | | October 31, 2018 |
The following table summarizes the inputs used, as of October 31, 2018, in valuating the Fund’s assets:
| | | | | | | | | | | | | | | | |
| | | Level 1 | | | Level 2 | | | Level 3 | | | Total | |
| Common Stocks | | | | | | | | | | | | | | | | |
| Brazil | | | $1,901,885 | | | | $------- | | | | $------- | | | | $1,901,885 | |
| China | | | 4,052,127 | | | | 5,739,967 | | | | ------- | | | | 9,792,094 | |
| Hong Kong | | | ------- | | | | 649,957 | | | | ------- | | | | 649,957 | |
| India | | | 923,649 | | | | 2,316,986 | | | | ------- | | | | 3,240,635 | |
| Indonesia | | | ------- | | | | 792,428 | | | | ------- | | | | 792,428 | |
| Malaysia | | | ------- | | | | 427,973 | | | | ------- | | | | 427,973 | |
| Mexico | | | 1,331,112 | | | | ------- | | | | ------- | | | | 1,331,112 | |
| Peru | | | 383,707 | | | | ------- | | | | ------- | | | | 383,707 | |
| Philippines | | | ------- | | | | 311,535 | | | | ------- | | | | 311,535 | |
| Poland | | | ------- | | | | 239,965 | | | | ------- | | | | 239,965 | |
| Russia | | | ------- | | | | 1,756,767 | | | | ------- | | | | 1,756,767 | |
| South Africa | | | ------- | | | | 1,317,596 | | | | ------- | | | | 1,317,596 | |
| South Korea | | | ------- | | | | 3,853,387 | | | | ------- | | | | 3,853,387 | |
| Taiwan | | | ------- | | | | 2,940,363 | | | | ------- | | | | 2,940,363 | |
| Thailand | | | ------- | | | | 1,062,620 | | | | ------- | | | | 1,062,620 | |
| Turkey | | | ------- | | | | 186,660 | | | | ------- | | | | 186,660 | |
| Total Common Stocks | | | $8,592,480 | | | | $21,596,204 | | | | $------- | | | | $30,188,684 | |
| Preferred Stocks | | | | | | | | | | | | | | | | |
| Brazil | | | $2,469,255 | | | | $------- | | | | $------- | | | | $2,469,255 | |
| South Korea | | | ------- | | | | 393,900 | | | | ------- | | | | 393,900 | |
| Total Preferred Stocks | | | $2,469,255 | | | | $393,900 | | | | $------- | | | | $2,863,155 | |
| Short Term Investment | | | $462,129 | | | | $------- | | | | $------- | | | | $462,129 | |
| Total Investments | | | $11,523,864 | | | | $21,990,104 | | | | $------- | | | | $33,513,968 | |
For more information on valuation inputs, please refer to Note 1 (A) of the accompanying Notes to Financial Statements.
The Fund’s assets assigned to Level 2 include certain foreign securities for which a third party statistical pricing service may be employed for purposes of fair market valuation. There were no transfers into or out of Level 3 during the reporting period, as compared to their classification from the prior annual report.
The accompanying notes are an integral part of these financial statements
| | | | |
| www.thomaswhitefunds.com | | | 31 | |
THOMAS WHITE AMERICAN OPPORTUNITIES FUND
| | | | | | | | | | | | | | |
| | | | | | | | |
| | | Unaudited
Sales
Charge | | Deferred
Sales
Charge | | Administrative
Services
Fee | | 12b-1 Fees | | Operating
Expenses1,3 | | Prospectus
Gross
Annual
Operating
Expense2 | | Prospectus
Net Annual
Operating
Expense2,3 |
| Investor Class | | None | | None | | Up to 0.25% | | None | | 1.34% | | 1.19% | | 1.19% |
1 In the absence of the fee deferral/expense reimbursement arrangement for the American Opportunities Fund, the ratio of expenses to average net assets would have been 1.43% for Investor Class shares.
2 Gross Annual Operating Expense and Net Annual Operating Expense are based on the most recent prospectus and may differ from other expense ratios appearing in this report.
3 Thomas White International, Ltd. (“Advisor”) has agreed to defer its fees and/or reimburse the Fund to the extent that the operating expenses for Investor Class shares exceed 1.34% of its average daily net assets. The fee deferral/expense reimbursement agreement expires February 28, 2019. The Fund has agreed to repay the Advisor for amounts deferred or reimbursed by the Advisor pursuant to the agreement provided that such repayment does not cause the Fund to exceed the above limits and the repayment is made within three years after the year in which the Advisor incurred the expense. The fee deferral/expense reimbursement agreement may only be amended or terminated by the Fund’s Board of Trustees.
| | | | | | | | |
| | | | | |
| | | NAV | | Net Assets | | Redemption Fee | | Portfolio Turnover |
| Investor Class | | $15.81 | | $41.0 million | | 2.00% on shares held less than 60 days | | 21% |
| | |
| 32 | | www.thomaswhitefunds.com |
OCTOBER 31, 2018
| | | | | | | | | | | | | | | | | | | | | | | | | | |
| |
| Average Annual Returns as of October 31, 2018 (Unaudited) | |
| Class | | 6 month | | Calendar
YTD | | | 1 Yr | | | 3 Yrs | | | 5 Yrs | | | 10 Yrs | | | Since
Inception
(3/4/1999) | |
| Investor Class shares (TWAOX) | | -1.29% | | | -3.70% | | | | 0.50% | | | | 5.82% | | | | 7.84% | | | | 10.76% | | | | 7.74% | |
| Russell Midcap Index1 | | -0.86% | | | -1.47% | | | | 2.79% | | | | 9.04% | | | | 8.97% | | | | 14.19% | | | | 9.21% | |
| S&P 500 Index1 | | 3.40% | | | 3.01% | | | | 7.35% | | | | 11.52% | | | | 11.34% | | | | 13.24% | | | | 6.03% | |
1 The Russell Midcap Index measures the performance of the 800 smallest companies in the Russell 1000 Index. These represent approximately 31% of the total market capitalization of the Russell 1000 Index. The S&P 500 Index measures the performance of 500 leading companies in leading industries of the U.S. economy, capturing 80% coverage of U.S. equities. Both indices are unmanaged and returns assume the reinvestment of dividends. It is not possible to invest directly in an index.
The returns do not reflect the deduction of taxes that a shareholder would pay on Fund distributions or the redemption of Fund shares. The returns reflect the actual performance for each period and do not include the impacts of trades executed on the last business day of the period that were recorded on the first business day of the next period.
Performance data is based upon past performance, which is no guarantee of future results. The investment return and principal value of an investment will fluctuate so that an investor’s shares, when redeemed, may be worth more or less than their original cost. Current performance may be higher or lower than the performance data quoted. Please call 1-800-811-0535 to obtain performance data as of the most recent month-end. The Fund imposes a 2% redemption fee on shares held less than 60 days. Performance data does not reflect the redemption fee. If reflected, total returns would be lower. Investment performance reflects any fee waivers that were in effect. In the absence of such waivers, total return would have been reduced. The Investor Class Gross Expense Ratio, based on the most recent prospectus, is 1.19%.
| | | | |
| www.thomaswhitefunds.com | | | 33 | |
THOMAS WHITE AMERICAN OPPORTUNITIES FUND
GROWTH OF A $10,000 INVESTMENT WITH DIVIDENDS REINVESTED (Unaudited)
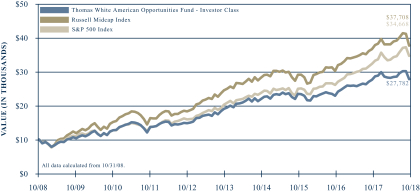
This chart illustrates the performance of a hypothetical $10,000 investment made in the Fund’s Investor Class shares, its primary benchmark, the Russell Midcap Index, and its secondary benchmark, the S&P 500 Index, for the past 10 years through October 31, 2018. It assumes reinvestment of dividends and capital gains, but does not reflect the effect of any applicable redemption fees. This chart does not imply future performance. Past performance does not guarantee future results. The cumulative ten year return was 177.82% for the Fund’s Investor Class shares, 277.08% for the primary benchmark, and 246.68% for the secondary benchmark. The Fund’s Investor Class shares average annual total return since inception on March 4, 1999 was 7.74%. The Russell Midcap Index measures the performance of the 800 smallest companies in the Russell 1000 Index. These represent approximately 31% of the total market capitalization of the Russell 1000 Index. The S&P 500 Index measures the performance of 500 leading companies in leading industries of the U.S. economy, capturing 80% coverage of U.S. equities. Both indices are unmanaged and returns assume the reinvestment of dividends. It is not possible to invest directly in an index. During the periods shown, the Fund’s manager reimbursed certain Fund expenses. Absent this reimbursement, performance would have been lower.
| | |
| 34 | | www.thomaswhitefunds.com |
OCTOBER 31, 2018
The Thomas White American Opportunities Fund primarily invests in equity securities of mid-size U.S. companies. The Fund may also invest in equity securities of smaller and larger size U.S. companies.
Portfolio Managers
Jinwen Zhang, Ph.D., CFA
Douglas M. Jackman, CFA
Wei Li, Ph.D., CFA
John Wu, Ph.D., CFA
Rex Mathew, CFA, CMA
Ramkumar Venkatramani, CFA
Performance Review
The Thomas White American Opportunities Fund Investor Class shares returned +0.50% during the one-year period ended October 31, 2018 while the Fund’s primary benchmark, the Russell Midcap Index, returned +2.79% and the secondary benchmark S&P 500 Index returned +7.35% during the same period. Since its inception on March 4, 1999, the Fund’s Investor Class shares annualized returns are +7.74%, compared to +9.21% for the Russell Midcap Index and +6.03% for the S&P 500 Index for the period.
Doubts About Earnings Growth Outlook and Interest Rates Trigger Correction
U.S. equities saw moderate gains during the first half of the one-year review period and outperformed most other developed markets as well as emerging markets for most of the period. The domestic economy accelerated and the annualized growth rate exceeded 4% during the second quarter. Corporate earnings in the U.S. saw a meaningful jump when compared to the previous period, partly
helped by the tax cuts implemented at the beginning of this year. Consumers remained very optimistic through most of the period as the economy continued to create new jobs and household incomes expanded. The only major weak spot was the moderation in the housing market, a result of more expensive homes and higher mortgage interest rates.
However, as trade tensions escalated, the fall in trade volumes led to downward revisions to global growth for this year as well 2019. Consequently, some of the larger U.S. corporations that draw a large share of revenues from overseas markets have become more cautious about their revenue and earnings outlook. Investors are worried about the impact of higher interest rates on the domestic economy if the Federal Reserve decides to trim its balance sheet sooner than currently expected. There are also renewed doubts about the expected federal spending on infrastructure, as the mid-term elections reduced the likelihood of gaining Congressional approval for such measures or renegotiated multi-lateral trade deals. These apprehensions made investors more cautious during the last three months of the review period and equity prices saw a meaningful correction.
Portfolio Review
Despite the correction during the last quarter of the review period, technology holdings outperformed significantly as most companies in the sector continued to see robust earnings growth. The healthcare sector received renewed investor interest, after underperforming in previous periods, as some of the concerns about pricing and regulatory risks eased. Consumer staples
| | | | |
| www.thomaswhitefunds.com | | | 35 | |
THOMAS WHITE AMERICAN OPPORTUNITIES FUND
holdings also outperformed as the larger companies within the sector are seeing better margins and cash flows. The materials and industrials sectors underperformed as prices of industrial commodities corrected this year, and demand for capital goods and components has remained tepid. Despite strong reported earnings growth, the financials sector also lagged as the Fed’s interest rate policy path remains uncertain.
NetApp, a provider of storage and data management solutions, contributed the most to Fund returns as demand for its services saw strong growth. Discount apparel retailer Ross Stores was helped by healthy revenue and earnings growth through the year. Better than expected earnings also helped business and financial management software services provider Intuit. Keurig Dr. Pepper, a manufacturer of coffee and non-alcoholic beverages, advanced on expectations of sustained earnings growth. Oil refiner Andeavor, acquired by Marathon Petroleum, also outperformed during the review period.
Natural gas producer EQT detracted the most from Fund returns during the period after it reduced volume guidance and increased capital outlays. However, EQT is expected to extract meaningful efficiency gains from its recently completed acquisitions. Thor Industries, a manufacturer of recreational vehicles, declined as earnings fell short of expectations on softer demand. Cruise line operator Royal Caribbean was hurt by concerns about slower demand growth in Asia, though it continues to see stable pricing in the North American market. Owens-Illinois, a manufacturer of glass packaging products, was negatively affected by lower
earnings guidance for the current year. Auto-parts supplier BorgWarner underperformed as tariffs on cars could restrict volume growth.
Wage Growth May Determine Fed Policy Path
We believe the biggest uncertainty facing financial markets in 2019 is the U.S. Federal Reserve’s monetary policy stance. As the U.S. economy accelerated this year, the Fed’s interest rate guidance built in more rate hikes in 2019 and beyond. Though inflation risks remained under control, the Fed continued to assess the economic growth outlook as robust. This implied that the Fed’s target rate is not yet near neutral, the level which neither bolsters nor restrains economic activity. After continuing trade tensions weakened the global growth outlook, consensus views of U.S. growth expectations for next year have also softened. Recent statements from Fed officials also appeared to acknowledge this assessment, and markets now expect fewer rate hikes in 2019 and an extended pause after that.
Leaving aside the housing slowdown, which is not unexpected, there are not many data points that suggest an imminent decline in U.S. economic activity. Surveys indicate robust manufacturing and services sector growth continuing in the U.S. through November, while the rest of the world showed trade-induced weakness. Labor markets have strengthened further, with surprisingly high monthly job addition numbers this late in the economic cycle. Consumer sentiment remains healthy and the recent fall in fuel prices should provide a boost in the coming months. Nevertheless,
| | |
| 36 | | www.thomaswhitefunds.com |
OCTOBER 31, 2018
from the high base set in 2018, U.S. economic growth rate could moderate in 2019 and it is reasonable for the Fed to shift to a more gradual rate hike path.
What could change this emerging consensus about Fed policy and make it more hawkish? In our view, the most likely and underappreciated trigger is an unexpected spurt in wage inflation. With the unemployment rate at record lows, there is little slack left in the labor markets. The persistently lower labor force participation in
recent years is generally due to structural reasons that are less likely to reverse quickly. Hence, continued hiring by businesses, new government jobs, tighter immigration policy and border controls, and a moderate increase in fiscal spending could lead to an acceleration in wage growth. Such a scenario may quickly force the Fed to conclude that it is safer to err on the side of caution and revert to a more hawkish policy posture.
We thank you for investing in the Thomas White American Opportunities Fund.
| | | | |
| www.thomaswhitefunds.com | | | 37 | |
THOMAS WHITE AMERICAN OPPORTUNITIES FUND
Portfolio Industry Allocation and Market Capitalization as of October 31, 2018 (Unaudited)
| | | | |
| | |
| Industry Allocation | | % of TNA | |
| Automobiles & Components | | | 1.8% | |
| Banks | | | 7.4% | |
| Capital Goods | | | 12.1% | |
| Consumer Durables & Apparel | | | 2.8% | |
| Consumer Services | | | 2.9% | |
| Diversified Financials | | | 4.0% | |
| Energy | | | 5.4% | |
| Food, Beverage & Tobacco | | | 2.3% | |
| Health Care Equipment & Services | | | 7.5% | |
| Insurance | | | 3.0% | |
| Materials | | | 7.3% | |
| Media & Entertainment | | | 1.3% | |
| Pharmaceuticals, Biotechnology & Life Sciences | | | 4.2% | |
| REITs | | | 4.0% | |
| Retailing | | | 3.4% | |
| Semiconductors & Semiconductor Equipment | | | 4.1% | |
| Software & Services | | | 11.9% | |
| Technology Hardware & Equipment | | | 2.2% | |
| Transportation | | | 3.6% | |
| Utilities | | | 7.7% | |
| Cash & Other | | | 1.1% | |
| | | | |
| | |
| Portfolio Market Cap Mix | | % of TNA | |
| Large Cap (over $15.2 billion) | | | 57.8% | |
| Mid Cap ($2.3 - $15.2 billion) | | | 41.1% | |
| Cash & Other | | | 1.1% | |
| | | | | |
| | | | | |
| | | | | |
| | | | | |
| | | | | |
| | | | | |
| | | | | |
| | | | | |
| | | | | |
| | | | | |
| | | | | |
| | | | | |
| | | | | |
| | | | | |
| | | | | |
| | | | | |
| | | | | |
| | |
| | | | | |
| | | | | |
TNA - Total Net Assets
Fund holdings and industry allocations are subject to change and should not be considered a recommendation to buy or sell any securities. For a complete list of Fund holdings, please refer to the Investment Portfolio section of this report.
| | |
| 38 | | www.thomaswhitefunds.com |
| | |
| Thomas White American Opportunities Fund | | |
| | | | | | | | | | |
| Industry | | Issue | | Shares | | | Value | |
| | | | | | | | | |
| COMMON STOCKS (94.9%) | | | | | | |
|
| |
| AUTOMOBILES & COMPONENTS (1.8%) | | | | | | |
| | BorgWarner, Inc. | | | 12,000 | | | | $ 472,920 | |
| | Thor Industries, Inc. | | | 3,775 | | | | 262,891 | |
| | | | | | | | | | |
| | | | | | | | | 735,811 | |
|
| |
| BANKS (7.4%) | | | | | | |
| | Citizens Financial Group, Inc. | | | 15,100 | | | | 563,985 | |
| | Comerica Incorporated | | | 9,250 | | | | 754,430 | |
| | Fifth Third Bancorp | | | 13,600 | | | | 367,064 | |
| | Regions Financial Corporation | | | 37,100 | | | | 629,587 | |
| | Zions Bancorporation, N.A. | | | 14,900 | | | | 701,045 | |
| | | | | | | | | | |
| | | | | | | | | 3,016,111 | |
|
| |
| CAPITAL GOODS (12.1%) | | | | | | |
| | Carlisle Companies Incorporated | | | 3,530 | | | | 340,963 | |
| | Cummins Inc. | | | 2,600 | | | | 355,394 | |
| | Huntington Ingalls Industries, Inc. | | | 4,140 | | | | 904,507 | |
| | Ingersoll-Rand PLC ^ | | | 5,000 | | | | 479,700 | |
| | The Middleby Corporation * | | | 3,400 | | | | 381,820 | |
| | Parker-Hannifin Corporation | | | 2,550 | | | | 386,656 | |
| | Sensata Technologies Holding plc * ^ | | | 15,704 | | | | 736,518 | |
| | Snap-on Incorporated | | | 4,350 | | | | 669,639 | |
| | Spirit AeroSystems Holdings, Inc. - Class A | | | 8,250 | | | | 693,083 | |
| | | | | | | | | | |
| | | | | | | | | 4,948,280 | |
|
| |
| CONSUMER DURABLES & APPAREL (2.8%) | | | | | | |
| | Lennar Corporation - Class A | | | 8,250 | | | | 354,585 | |
| | NVR, Inc. * | | | 165 | | | | 369,440 | |
| | Polaris Industries Inc. | | | 4,900 | | | | 436,002 | |
| | | | | | | | | | |
| | | | | | | | | 1,160,027 | |
|
| |
| CONSUMER SERVICES (2.9%) | | | | | | |
| | Aramark | | | 11,987 | | | | 430,573 | |
| | Royal Caribbean Cruises Ltd. ^ | | | 7,400 | | | | 775,002 | |
| | | | | | | | | | |
| | | | | | | | | 1,205,575 | |
|
| |
| DIVERSIFIED FINANCIALS (4.0%) | | | | | | |
| | Ameriprise Financial, Inc. | | | 3,500 | | | | 445,340 | |
| | Intercontinental Exchange, Inc. | | | 6,500 | | | | 500,760 | |
| | Voya Financial, Inc. | | | 15,500 | | | | 678,280 | |
| | | | | | | | | | |
| | | | | | | | | 1,624,380 | |
|
| |
| ENERGY (5.4%) | | | | | | |
| | CNX Resources Corporation * | | | 21,600 | | | | 338,040 | |
| | EQT Corporation | | | 9,400 | | | | 319,318 | |
| | Marathon Petroleum Corporation | | | 12,054 | | | | 849,204 | |
| | Noble Energy, Inc. | | | 15,800 | | | | 392,630 | |
| | TechnipFMC plc ^ | | | 11,247 | | | | 295,796 | |
| | | | | | | | | | |
| | | | | | | | | 2,194,988 | |
|
| |
The accompanying notes are an integral part of these financial statements
| | | | |
| www.thomaswhitefunds.com | | | 39 | |
| | |
| Investment Portfolio | | October 31, 2018 |
| | | | | | | | | | |
| Industry | | Issue | | Shares | | | Value | |
| | | | | | | | | |
| FOOD, BEVERAGE & TOBACCO (2.3%) | | | | | | |
| | The Hershey Company | | | 5,000 | | | | $ 535,750 | |
| | Molson Coors Brewing Company - Class B | | | 6,600 | | | | 422,400 | |
| | | | | | | | | | |
| | | | | | | | | 958,150 | |
|
| |
| HEALTH CARE EQUIPMENT & SERVICES (7.5%) | | | | | | |
| | Boston Scientific Corporation * | | | 19,230 | | | | 694,972 | |
| | Centene Corporation * | | | 4,600 | | | | 599,472 | |
| | Hill-Rom Holdings, Inc. | | | 5,290 | | | | 444,783 | |
| | Laboratory Corporation of America Holdings * | | | 5,120 | | | | 822,016 | |
| | Zimmer Biomet Holdings, Inc. | | | 4,600 | | | | 522,514 | |
| | | | | | | | | | |
| | | | | | | | | 3,083,757 | |
|
| |
| INSURANCE (3.0%) | | | | | | |
| | Assurant, Inc. | | | 4,600 | | | | 447,166 | |
| | Everest Re Group, Ltd. ^ | | | 1,700 | | | | 370,362 | |
| | The Hartford Financial Services Group, Inc. | | | 9,300 | | | | 422,406 | |
| | | | | | | | | | |
| | | | | | | | | 1,239,934 | |
|
| |
| MATERIALS (7.3%) | | | | | | |
| | AptarGroup, Inc. | | | 4,400 | | | | 448,624 | |
| | Ball Corporation | | | 14,100 | | | | 631,680 | |
| | Martin Marietta Materials, Inc. | | | 2,900 | | | | 496,712 | |
| | PPG Industries, Inc. | | | 6,460 | | | | 678,881 | |
| | The Sherwin-Williams Company | | | 1,840 | | | | 723,985 | |
| | | | | | | | | | |
| | | | | | | | | 2,979,882 | |
|
| |
| MEDIA & ENTERTAINMENT (1.3%) | | | | | | |
| | CBS Corporation - Class B Non-Voting | | | 9,366 | | | | 537,140 | |
|
| |
| PHARMACEUTICALS, BIOTECHNOLOGY & LIFE SCIENCES (4.2%) | | | | | | |
| | Agilent Technologies, Inc. | | | 7,200 | | | | 466,488 | |
| | Charles River Laboratories International, Inc. * | | | 5,890 | | | | 717,520 | |
| | Jazz Pharmaceuticals Public Limited Company * ^ | | | 3,300 | | | | 524,106 | |
| | | | | | | | | | |
| | | | | | | | | 1,708,114 | |
|
| |
| RETAILING (3.4%) | | | | | | | | |
| | AutoZone, Inc. * | | | 694 | | | | 509,028 | |
| | Ross Stores, Inc. | | | 9,100 | | | | 900,900 | |
| | | | | | | | | | |
| | | | | | | | | 1,409,928 | |
|
| |
| SEMICONDUCTORS & SEMICONDUCTOR EQUIPMENT (4.1%) | | | | | | |
| | Analog Devices, Inc. | | | 4,030 | | | | 337,351 | |
| | Lam Research Corporation | | | 1,870 | | | | 265,035 | |
| | Skyworks Solutions, Inc. | | | 6,300 | | | | 546,588 | |
| | Xilinx, Inc. | | | 6,200 | | | | 529,294 | |
| | | | | | | | | | |
| | | | | | | | | 1,678,268 | |
|
| |
The accompanying notes are an integral part of these financial statements
| | |
| 40 | | www.thomaswhitefunds.com |
| | |
| Thomas White American Opportunities Fund | | |
| | | | | | | | | | |
| Industry | | Issue | | Shares | | | Value | |
| | | | | | | | | |
| SOFTWARE & SERVICES (11.9%) | | | | | | |
| | Alliance Data Systems Corporation | | | 1,400 | | | | $ 288,652 | |
| | CA, Inc. | | | 11,600 | | | | 514,576 | |
| | Cadence Design Systems, Inc. * | | | 17,900 | | | | 797,803 | |
| | Check Point Software Technologies Ltd. * ^ | | | 7,170 | | | | 795,870 | |
| | Fidelity National Information Services, Inc. | | | 7,800 | | | | 811,980 | |
| | FleetCor Technologies Inc. * | | | 2,950 | | | | 590,088 | |
| | Intuit Inc. | | | 5,100 | | | | 1,076,100 | |
| | | | | | | | | | |
| | | | | | | | | 4,875,069 | |
|
| |
| TECHNOLOGY HARDWARE & EQUIPMENT (2.2%) | | | | | | |
| | NetApp, Inc. | | | 11,250 | | | | 883,013 | |
|
| |
| TRANSPORTATION (3.6%) | | | | | | |
| | Old Dominion Freight Line, Inc. | | | 8,300 | | | | 1,082,486 | |
| | Southwest Airlines Co. | | | 8,100 | | | | 397,710 | |
| | | | | | | | | | |
| | | | | | | | | 1,480,196 | |
|
| |
| UTILITIES (7.7%) | | | | | | |
| | Alliant Energy Corporation | | | 14,000 | | | | 601,720 | |
| | Ameren Corporation | | | 11,300 | | | | 729,754 | |
| | CMS Energy Corporation | | | 13,050 | | | | 646,236 | |
| | DTE Energy Company | | | 5,200 | | | | 584,480 | |
| | Xcel Energy, Inc. | | | 12,050 | | | | 590,571 | |
| | | | | | | | | | |
| | | | | | | | | 3,152,761 | |
|
| |
| Total Common Stocks | | | | | (Cost $30,663,778) | | | | 38,871,384 | |
| | | | | | | | | | |
|
| |
| REAL ESTATE INVESTMENT TRUSTS (REITS) (4.0%) | | | | | | | | |
|
| |
| REITS (4.0%) | | | | | | | | |
| | Crown Castle International Corp. | | | 5,650 | | | | 614,381 | |
| | Digital Realty Trust, Inc. | | | 4,700 | | | | 485,322 | |
| | Prologis, Inc. | | | 8,400 | | | | 541,548 | |
| | | | | | | | | | |
| | | | | | | | | 1,641,251 | |
|
| |
| Total REITs | | | (Cost $1,539,584) | | | | 1,641,251 | |
| | | | | | | | | | |
|
| |
| Total Investments | | 98.9% | | | (Cost $32,203,362 | ) | | | $40,512,635 | |
| Other Assets, Less Liabilities | | 1.1% | | | | | | | 456,803 | |
| Total Net Assets: | | 100.0% | | | | | | | $40,969,438 | |
|
| |
| * | Non-Income Producing Securities |
| ^ | Foreign Issued Securities |
Industry classifications shown in the Investment Portfolio are based off of the Global Industry Classification Standard (GICS®). GICS was developed by and/or is the exclusive property of MSCI, Inc. and Standard & Poor’s Financial Services LLC (“S&P”). GICS is a service mark of MSCI and S&P and has been licensed for use by U.S. Bancorp Fund Services, LLC.
The accompanying notes are an integral part of these financial statements
| | | | |
| www.thomaswhitefunds.com | | | 41 | |
| | |
| Investment Portfolio | | October 31, 2018 |
The following table summarizes the inputs used, as of October 31, 2018, in valuating the Fund’s assets:
| | | | | | | | | | | | | | | | |
| | | Level 1 | | | Level 2 | | | Level 3 | | | Total | |
| Common Stocks | | | | | | | | | | | | | | | | |
| Automobiles & Components | | | $735,811 | | | | $------- | | | | $------- | | | | $735,811 | |
| Banks | | | 3,016,111 | | | | ------- | | | | ------- | | | | 3,016,111 | |
| Capital Goods | | | 4,948,280 | | | | ------- | | | | ------- | | | | 4,948,280 | |
| Consumer Durables & Apparel | | | 1,160,027 | | | | ------- | | | | ------- | | | | 1,160,027 | |
| Consumer Services | | | 1,205,575 | | | | ------- | | | | ------- | | | | 1,205,575 | |
| Diversified Financials | | | 1,624,380 | | | | ------- | | | | ------- | | | | 1,624,380 | |
| Energy | | | 2,194,988 | | | | ------- | | | | ------- | | | | 2,194,988 | |
| Food, Beverage & Tobacco | | | 958,150 | | | | ------- | | | | ------- | | | | 958,150 | |
| Health Care Equipment & Services | | | 3,083,757 | | | | ------- | | | | ------- | | | | 3,083,757 | |
| Insurance | | | 1,239,934 | | | | ------- | | | | ------- | | | | 1,239,934 | |
| Materials | | | 2,979,882 | | | | ------- | | | | ------- | | | | 2,979,882 | |
| Media & Entertainment | | | 537,140 | | | | ------- | | | | ------- | | | | 537,140 | |
| Pharmaceuticals, Biotechnology & Life Sciences | | | 1,708,114 | | | | ------- | | | | ------- | | | | 1,708,114 | |
| Retailing | | | 1,409,928 | | | | ------- | | | | ------- | | | | 1,409,928 | |
| Semiconductors & Semiconductor Equipment | | | 1,678,268 | | | | ------- | | | | ------- | | | | 1,678,268 | |
| Software & Services | | | 4,875,069 | | | | ------- | | | | ------- | | | | 4,875,069 | |
| Technology Hardware & Equipment | | | 883,013 | | | | ------- | | | | ------- | | | | 883,013 | |
| Transportation | | | 1,480,196 | | | | ------- | | | | ------- | | | | 1,480,196 | |
| Utilities | | | 3,152,761 | | | | ------- | | | | ------- | | | | 3,152,761 | |
| Total Common Stocks | | | $38,871,384 | | | | $------- | | | | $------- | | | | $38,871,384 | |
| Real Estate Investment Trusts (REITs) | | | | | | | | | | | | | | | | |
| REITs | | | $1,641,251 | | | | $------- | | | | $------- | | | | $1,641,251 | |
| Total REITs | | | $1,641,251 | | | | $------- | | | | $------- | | | | $1,641,251 | |
| Total Investments | | | $40,512,635 | | | | $------- | | | | $------- | | | | $40,512,635 | |
For more information on valuation inputs, please refer to Note 1(A) of the accompanying Notes to Financial Statements.
No transfers in and/or out between Levels 1, 2 or 3 were observed during the reporting period, as compared to their classification from the prior annual report.
The accompanying notes are an integral part of these financial statements
| | |
| 42 | | www.thomaswhitefunds.com |
THOMAS WHITE FUNDS
Statements of Assets and Liabilities
October 31, 2018
| | | | | | | | | | | | | | | | | | | | | | | | |
| | | International
Fund | | | Emerging
Markets
Fund | | | American
Opportunities
Fund | |
| ASSETS: | | | | | | | | | | | | | | | | | | | | | | | | |
| Investments in securities at market value1,3 | | $ | | | | | 205,990,516 | | | $ | | | | | 33,513,968 | | | $ | | | | | 40,512,635 | |
| Foreign currency2 | | | | | | | 6 | | | | | | | | ------- | | | | | | | | ------- | |
| Cash | | | | | | | 3,230,194 | | | | | | | | ------- | | | | | | | | 454,755 | |
| Receivables: | | | | | | | | | | | | | | | | | | | | | | | | |
Securities Lending | | | | | | | ------- | | | | | | | | 276 | | | | | | | | ------- | |
Dividends and interest | | | | | | | 299,320 | | | | | | | | 20,971 | | | | | | | | 12,065 | |
Reclaims | | | | | | | 1,593,975 | | | | | | | | 12,022 | | | | | | | | 3,975 | |
Fund shares sold | | | | | | | 108,280 | | | | | | | | 20,000 | | | | | | | | ------- | |
| Prepaid expenses | | | | | | | 29,028 | | | | | | | | 16,275 | | | | | | | | 24,087 | |
| Total assets | | | | | | | 211,251,319 | | | | | | | | 33,583,512 | | | | | | | | 41,007,517 | |
| | | | | | | | | | | | | | | | | | | | | | | | | |
| LIABILITIES: | | | | | | | | | | | | | | | | | | | | | | | | |
| Management and administrative fees payable | | | | | | | 154,282 | | | | | | | | 13,302 | | | | | | | | 4,715 | |
| Business management fees payable | | | | | | | 26,237 | | | | | | | | 2,783 | | | | | | | | 1,962 | |
| Accrued expenses | | | | | | | 160,590 | | | | | | | | 55,701 | | | | | | | | 31,402 | |
| Payable for fund shares redeemed | | | | | | | 258,725 | | | | | | | | ------- | | | | | | | | ------- | |
| Total liabilities | | | | | | | 599,834 | | | | | | | | 71,786 | | | | | | | | 38,079 | |
| Net Assets | | $ | | | | | 210,651,485 | | | $ | | | | | 33,511,726 | | | $ | | | | | 40,969,438 | |
| | | | | | | | | | | | | | | | | | | | | | | | | |
| NET ASSETS | | | | | | | | | | | | | | | | | | | | | | | | |
| Source of Net Assets: | | | | | | | | | | | | | | | | | | | | | | | | |
| Net capital paid in on shares of beneficial interest | | $ | | | | | 203,545,796 | | | $ | | | | | 38,539,655 | | | $ | | | | | 32,669,061 | |
| Total distributable earnings | | | | | | | 7,105,689 | | | | | | | | (5,027,929 | ) | | | | | | | 8,300,377 | |
| Net assets | | $ | | | | | 210,651,485 | | | $ | | | | | 33,511,726 | | | $ | | | | | 40,969,438 | |
| The accompanying notes are an integral part of these financial statements. | |
| | | | |
| www.thomaswhitefunds.com | | | 43 | |
THOMAS WHITE FUNDS
Statements of Assets and Liabilities
October 31, 2018
| | | | | | | | | | | | | | | | | | | | | | | | |
| | | International
Fund | | | Emerging
Markets Fund | | | American
Opportunities
Fund | |
| INVESTOR CLASS SHARES | | | | | | | | | | | | | | | | | | | | | | | | |
| Net assets | | | $ | | | | 29,472,943 | | | $ | | | | | 1,650,887 | | | $ | | | | | 40,969,438 | |
| Shares outstanding4 | | | | | | | 2,127,022 | | | | | | | | 167,213 | | | | | | | | 2,590,600 | |
| Net asset value and offering price per share | | $ | | | | | 13.86 | | | $ | | | | | 9.87 | | | $ | | | | | 15.81 | |
| | | | | | | | | | | | | | | | | | | | | | | | | |
| CLASS I SHARES | | | | | | | | | | | | | | | | | | | | | | | | |
| Net assets | | | $ | | | | 181,178,542 | | | $ | | | | | 31,860,839 | | | | | | | | | |
| Shares outstanding4 | | | | | | | 13,116,474 | | | | | | | | 3,194,854 | | | | | | | | | |
| Net asset value and offering price per share | | $ | | | | | 13.81 | | | $ | | | | | 9.97 | | | | | | | | | |
1 Cost Basis of Investments: International Fund: $197,334,501 Emerging Markets Fund: $29,920,065 American Opportunities Fund: $32,203,362 | | | | | | | | | | | | | | | | | | | | | | | | |
2 Cost Basis of Cash denominated in foreign currencies: International Fund: $6 Emerging Markets Fund: $0 | | | | | | | | | | | | | | | | | | | | | | | | |
3 Value of securities out on loan at 10/31/2018: International Fund: $3,964,624 Emerging Markets Fund: $157,334 | | | | | | | | | | | | | | | | | | | | | | | | |
| 4 There are an unlimited number of $.01 par value shares of beneficial interest authorized. | | | | | | | | | | | | | | | | | | | | | | | | |
| The accompanying notes are an integral part of these financial statements. | |
| | |
| 44 | | www.thomaswhitefunds.com |
THOMAS WHITE FUNDS
Statements of Operations
Year Ended October 31, 2018
| | | | | | | | | | | | | | | | | | | | | | | | |
| | | International
Fund | | | Emerging
Markets Fund | | | American
Opportunities
Fund | |
| INVESTMENT INCOME | | | | | | | | | | | | | | | | | | | | | | | | |
| Income: | | | | | | | | | | | | | | | | | | | | | | | | |
Dividends1 | | $ | | | | | 7,272,615 | | | $ | | | | | 846,026 | | | $ | | | | | 726,989 | |
Interest | | | | | | | 6,116 | | | | | | | | 9,696 | | | | | | | | — | |
Securities lending income (Note 1) | | | | | | | 10,806 | | | | | | | | 2,827 | | | | | | | | — | |
| Total investment income | | | | | | | 7,289,537 | | | | | | | | 858,549 | | | | | | | | 726,989 | |
| Expenses: | | | | | | | | | | | | | | | | | | | | | | | | |
Investment management fees (Note 4) | | | | | | | 2,443,157 | | | | | | | | 342,088 | | | | | | | | 373,395 | |
Business management fees (Note 4) | | | | | | | 100,601 | | | | | | | | 14,086 | | | | | | | | 15,375 | |
Accounting fees | | | | | | | 94,388 | | | | | | | | 21,429 | | | | | | | | 16,981 | |
Administration fees | | | | | | | | | | | | | | | | | | | | | | | | |
Class I Shares | | | | | | | 85,176 | | | | | | | | 15,611 | | | | | | | | — | |
Investor Class Shares | | | | | | | 13,400 | | | | | | | | 818 | | | | | | | | 15,675 | |
Custodian fees | | | | | | | 121,124 | | | | | | | | 65,682 | | | | | | | | 10,610 | |
Transfer agent fees | | | | | | | | | | | | | | | | | | | | | | | | |
Class I Shares | | | | | | | 76,731 | | | | | | | | 26,868 | | | | | | | | — | |
Investor Class Shares | | | | | | | 12,060 | | | | | | | | 1,399 | | | | | | | | 17,812 | |
Trustees’ fees and expenses | | | | | | | 101,643 | | | | | | | | 13,931 | | | | | | | | 14,083 | |
Audit fees and expenses | | | | | | | 23,273 | | | | | | | | 20,379 | | | | | | | | 14,550 | |
Registration fees | | | | | | | | | | | | | | | | | | | | | | | | |
Class I Shares | | | | | | | 34,628 | | | | | | | | 35,917 | | | | | | | | — | |
Investor Class Shares | | | | | | | 5,447 | | | | | | | | 1,862 | | | | | | | | 8,246 | |
Printing expenses | | | | | | | | | | | | | | | | | | | | | | | | |
Class I Shares | | | | | | | 50,816 | | | | | | | | 5,981 | | | | | | | | — | |
Investor Class Shares | | | | | | | 7,868 | | | | | | | | 300 | | | | | | | | 6,489 | |
Legal fees and expenses | | | | | | | 130,162 | | | | | | | | 17,676 | | | | | | | | 18,373 | |
Administrative Service Fee: | | | | | | | | | | | | | | | | | | | | | | | | |
Investor Class Shares | | | | | | | 64,842 | | | | | | | | 543 | | | | | | | | 105,061 | |
Other expenses | | | | | | | 93,260 | | | | | | | | 23,880 | | | | | | | | 11,711 | |
| Total expenses | | | | | | | 3,458,576 | | | | | | | | 608,450 | | | | | | | | 628,361 | |
| Reimbursement of Class I Expenses (Note 4) | | | | | | | (221,555 | ) | | | | | | | (84,367 | ) | | | | | | | — | |
| Reimbursement of Management Fees (Note 4) | | | | | | | | | | | | | | | | | | | | | | | | |
Class I Shares | | | | | | | (243,870 | ) | | | | | | | (74,962 | ) | | | | | | | — | |
Investor Class Shares | | | | | | | (38,381 | ) | | | | | | | (3,875 | ) | | | | | | | 37,957 | |
| Net expenses | | | | | | | 2,954,770 | | | | | | | | 445,246 | | | | | | | | 590,404 | |
| Net investment income | | | | | | | 4,334,767 | | | | | | | | 413,303 | | | | | | | | 136,585 | |
| | | | | | | | | | | | | | | | | | | | | | | | | |
| REALIZED AND UNREALIZED GAIN/(LOSS) ON INVESTMENTS | |
Net realized gain on investments & foreign
currency transactions | | | | | | | 21,287,918 | | | | | | | | 3,213,563 | | | | | | | | 1,298,075 | |
Net change in unrealized depreciation on
investments and foreign currency transactions | | | | | | | (54,785,026 | ) | | | | | | | (7,169,007 | ) | | | | | | | (1,223,886 | ) |
| Net gain (loss) on investments | | | | | | | (33,497,108 | ) | | | | | | | (3,955,444 | ) | | | | | | | 74,189 | |
| Net increase (decrease) in net assets from operations | | $ | | | | | (29,162,341 | ) | | $ | | | | | (3,542,141 | ) | | $ | | | | | 210,774 | |
| 1 Net of foreign taxes withheld of: | | | | | | | | | | | | | | | | | | | | | | | | |
| International Fund: $805,542 | | | | | | | | | | | | | | | | | | | | | | | | |
| Emerging Markets Fund: $120,467 | | | | | | | | | | | | | | | | | | | | | | | | |
| American Opportunities Fund: $949 | | | | | | | | | | | | | | | | | | | | | | | | |
| The accompanying notes are an integral part of these financial statements. | |
| | | | |
| www.thomaswhitefunds.com | | | 45 | |
THOMAS WHITE FUNDS
Statements of Changes in Net Assets
| | | | | | | | | | | | | | | | |
| | | International Fund | |
| | | | | | Year Ended
October 31,
2018 | | | | | | Year Ended
October 31,
2017 | |
| Change in net assets from operations: | | | | | | | | | | | | | | | | |
Net investment income | | $ | | | | | 4,334,767 | | | $ | | | | | 6,323,524 | |
Net realized gain on investments | | | | | | | 21,287,918 | | | | | | | | 64,693,543 | |
Net unrealized appreciation / depreciation on investments and foreign currency transactions | | | | | | | (54,785,026 | ) | | | | | | | 20,182,751 | |
Net increase (decrease) in net assets from operations | | | | | | | (29,162,341 | ) | | | | | | | 91,199,818 | |
| Distributions: | | | | | | | | | | | | | | | | |
Distributable earnings - Investor Class | | | | | | | (3,523,265 | ) | | | | | | | (1,290,752 | ) |
Distributable earnings - Class I | | | | | | | (21,768,071 | ) | | | | | | | (10,361,280 | ) |
Distributable earnings - Class A | | | | | | | ------- | | | | | | | | (252 | ) |
| Total distributions | | | | | | | (25,291,336 | ) | | | | | | | (11,652,284 | )2 |
| Fund share transactions (Note 3)1 | | | | | | | (55,993,715 | ) | | | | | | | (330,906,023 | ) |
| Total decrease | | | | | | | (110,447,392 | ) | | | | | | | (251,358,489 | ) |
| Net assets: | | | | | | | | | | | | | | | | |
| Beginning of period | | | | | | | 321,098,877 | | | | | | | | 572,457,366 | |
| End of period | | $ | | | | | 210,651,485 | | | $ | | | | | 321,098,877 | 3 |
| 1 Class A and Class C shares closed on February 28, 2017. | |
| 2 Includes net investment income distributions of $694,712, $6,586,716 and $252, and net realized gain distributions of $596,040, $3,774,564 and $0 for the Investor Class, Class I and Class A shares respectively. | |
| 3 Includes accumulated undistributed net investment loss of $503,923. | |
| The accompanying notes are an integral part of these financial statements. | |
| | |
| 46 | | www.thomaswhitefunds.com |
THOMAS WHITE FUNDS
Statements of Changes in Net Assets
| | | | | | | | | | | | | | | | |
| | | Emerging Markets Fund | |
| | | | | | Year Ended
October 31,
2018 | | | | | | Year Ended
October 31,
2017 | |
| Change in net assets from operations: | | | | | | | | | | | | | | | | |
Net investment income | | $ | | | | | 413,303 | | | $ | | | | | 666,193 | |
Net realized gain on investments | | | | | | | 3,213,563 | | | | | | | | 2,104,763 | |
Net unrealized appreciation / depreciation on investments and foreign currency transactions | | | | | | | (7,169,007 | ) | | | | | | | 6,615,755 | |
Net increase (decrease) in net assets from operations | | | | | | | (3,542,141 | ) | | | | | | | 9,386,711 | |
| Distributions: | | | | | | | | | | | | | | | | |
Distributable earnings - Investor Class | | | | | | | (19,106 | ) | | | | | | | (29,005 | ) |
Distributable earnings - Class I | | | | | | | (372,630 | ) | | | | | | | (871,551 | ) |
| Total distributions | | | | | | | (391,736 | ) | | | | | | | (900,556 | )2 |
| Fund share transactions (Note 3)1 | | | | | | | (9,948,857 | ) | | | | | | | (39,470,584 | ) |
| Total decrease | | | | | | | (13,882,734 | ) | | | | | | | (30,984,429 | ) |
| Net assets: | | | | | | | | | | | | | | | | |
| Beginning of period | | | | | | | 47,394,460 | | | | | | | | 78,378,889 | |
| End of period | | $ | | | | | 33,511,726 | | | $ | | | | | 47,394,460 | 3 |
| 1 Class A and Class C shares closed on February 28, 2017. | |
| 2 Includes net investment income distributions of $29,005 and $871,551 for the Investor Class and Class I shares respectively. There were no net realized gain distributions for either class during this period. | |
| 3 Includes accumulated undistributed net investment loss of $2,592. | |
| The accompanying notes are an integral part of these financial statements. | |
| | | | |
| www.thomaswhitefunds.com | | | 47 | |
THOMAS WHITE FUNDS
Statements of Changes in Net Assets
| | | | | | | | | | | | | | | | |
| | | American Opportunities Fund | |
| | | | | | Year Ended
October 31,
2018 | | | | | | Year Ended
October 31,
2017 | |
| Change in net assets from operations: | | | | | | | | | | | | | | | | |
Net investment income | | $ | | | | | 136,585 | | | $ | | | | | 115,757 | |
Net realized gain on investments | | | | | | | 1,298,075 | | | | | | | | 2,563,472 | |
Net unrealized appreciation / depreciation on investments and foreign currency transactions | | | | | | | (1,223,886 | ) | | | | | | | 4,796,761 | |
Net increase in net assets from operations | | | | | | | 210,774 | | | | | | | | 7,475,990 | |
| Total distributions | | | | | | | (1,874,691 | ) | | | | | | | (3,573,880 | )1 |
| Fund share transactions (Note 3) | | | | | | | 1,200,124 | | | | | | | | 714,978 | |
| Total increase (decrease) | | | | | | | (463,793 | ) | | | | | | | 4,617,088 | |
| Net assets: | | | | | | | | | | | | | | | | |
| Beginning of period | | | | | | | 41,433,231 | | | | | | | | 36,816,143 | |
| End of period | | $ | | | | | 40,969,438 | | | $ | | | | | 41,433,231 | 2 |
| 1 Includes net investment income distributions of $354,402 and net realized gain distributions of $3,219,478. | |
| 2 Includes accumulated undistributed net investment income of $15,478. | | | | | | | | | | | | | | | | |
| The accompanying notes are an integral part of these financial statements. | | | | | | | | | | | | | | | | |
| | |
| 48 | | www.thomaswhitefunds.com |
Notes to Financial Statements Period Ended October 31, 2018
NOTE 1. SUMMARY OF ACCOUNTING POLICIES
Lord Asset Management Trust (the “Trust”) was organized as a Delaware business trust on February 9, 1994, as an open-end diversified management investment company. The Trust currently has three series of shares (collectively referred to as the “Funds”) - the Thomas White International Fund (the “International Fund”), which commenced operations with the sale of Investor Class shares on June 28, 1994 and the sale of Class I shares, Class A shares and Class C shares on August 31, 2012; the Thomas White Emerging Markets Fund (the “Emerging Markets Fund”), which commenced operations with the sale of Investor Class shares on June 28, 2010 and the sale of Class I shares, Class A shares and Class C shares on August 31, 2012; and the Thomas White American Opportunities Fund (the “American Opportunities Fund”), which commenced operations with the sale of Investor Class shares on March 4, 1999. Class A and Class C shares of the International Fund and Emerging Markets Fund closed on February 28, 2017 and effective at the close of business on that date, the outstanding Class A and Class C shares of those Funds were converted to Class I shares, as applicable. The investment objective of each Fund is to seek long-term capital growth. The International Fund invests in equity securities of companies located in the world’s developed countries outside of the U.S. The Emerging Markets Fund invests in securities of companies located in or whose businesses are closely associated with the world’s emerging markets countries. The American Opportunities Fund primarily invests in U.S. equity securities, with a focus on mid-size and small companies. The following is a summary of significant accounting policies followed in the preparation of the Trust’s financial statements.
(A) VALUATION OF SECURITIES
Securities listed or traded on a recognized national or foreign stock exchange or NASDAQ are valued at the last reported sales prices on the principal exchange on which the securities are traded. NASDAQ National Market securities are valued at the NASDAQ official closing price. Over-the-counter securities and listed securities for which no closing sale price is reported are valued at the mean between the last current bid and ask price. Securities for which market quotations are not readily available are valued at fair value under the Trust’s Valuation Procedures as determined by management and approved in good faith by the Board of Trustees. As of October 31, 2018, all securities within each Fund’s portfolio were valued at the last reported sales price on the principal exchange on which the securities are traded and, for the International and Emerging Markets Funds, adjusted by a fair value factor when necessary and as further described below. The Trust has retained an independent statistical fair value pricing service to assist in the fair valuation process for securities principally traded in a foreign market in order to adjust for changes in value that may occur between the close of the foreign exchange and the time at which Fund shares are priced. Short term investments are valued at original cost, which combined with accrued interest, approximates market value.
| | | | |
| www.thomaswhitefunds.com | | | 49 | |
Notes to Financial Statements Period Ended October 31, 2018
Fair value is defined as the price that would be received to sell an asset or paid to transfer a liability (i.e., the “exit price”) in an orderly transaction between market participants at the measurement date. In determining fair value, the Fund uses various valuation approaches. A three-tiered fair value hierarchy for inputs is used in measuring fair value that maximizes the use of observable inputs and minimizes the use of unobservable inputs by generally requiring that the most observable inputs be used when available. Observable inputs are those that market participants would use in pricing the asset or liability based on market data obtained from sources independent of a Fund. Unobservable inputs reflect the Fund’s assumptions about the inputs market participants would use in pricing the asset or liability developed based on the best information available in the circumstances. The inputs or methodologies used for valuing securities are not necessarily an indication of the risks associated with investing in those securities.
The fair value hierarchy is categorized into three levels based on the inputs as follows:
Level 1 - Valuations based on unadjusted quoted prices in active markets for identical assets.
Level 2 - Valuations based on quoted prices for similar securities or in markets that are not active or for which all significant inputs are observable, either directly or indirectly.
Level 3 - Valuations based on inputs that are unobservable and significant to the overall fair value measurement.
(B) MULTI-CLASS OPERATIONS AND ALLOCATIONS
Expenses of the Funds that are not directly attributable to a specific class of shares are prorated among the classes based on the relative net assets of each class. Expenses directly attributable to a class of shares, which presently include administrative services fees, transfer agent fees and registration fees, are recorded to the specific class.
Income, realized and unrealized capital gains and losses of the Funds are prorated among the classes based on the relative net assets of each class within each specific Fund.
(C) MARKET RISK
Investing in securities of foreign companies and foreign governments involves special risks and considerations not typically associated with investing in U.S. companies and securities of the U.S. Government. These risks include revaluation of currencies and future adverse political and economic developments. Moreover, securities of many foreign companies and foreign governments and their markets may be less liquid and their prices more volatile than securities of comparable U.S. companies and securities of the U.S. Government.
| | |
| 50 | | www.thomaswhitefunds.com |
Notes to Financial Statements Period Ended October 31, 2018
(D) FOREIGN CURRENCY TRANSLATION
Portfolio securities and other assets and liabilities denominated in foreign currencies are translated into U.S. dollar amounts at date of valuation. Purchases and sales of portfolio securities and income items denominated in foreign currencies are translated into U.S. dollar amounts on the respective dates of such transactions. When a Fund purchases or sells a foreign security, it will customarily enter into a foreign exchange contract to minimize foreign exchange risk from the trade date to the settlement date of such transaction.
The Funds do not isolate the portion of the results of operations resulting from changes in foreign exchange rates on investments from the fluctuations arising from changes in market prices of securities held. Such fluctuations are included with the net realized and unrealized gain or loss from investments.
Net realized gain (loss) on investments and foreign currency transactions include those gains and losses arising from the sale of foreign currencies, currency gains or losses realized between the trade and settlement dates on securities transactions, the differences between the amounts of dividends, and foreign withholding taxes recorded on a Fund’s books, and the U.S. dollar equivalent of the amounts actually received or paid. Net unrealized appreciation (depreciation) on investments and foreign currency translation includes changes in the value of assets and liabilities resulting from exchange rates.
(E) INCOME TAXES
Each Fund is a separate taxpayer for federal income tax purposes. Each Fund intends to distribute substantially all of its net investment income and net capital gains to its shareholders and to otherwise comply with the requirements of Subchapter M of the Internal Revenue Code applicable to regulated investment companies. Therefore, no federal income tax provision is required.
All open tax years and major jurisdictions have been reviewed for the Funds and, based on this review, there are no significant uncertain tax positions that would require recognition in the financial statements. Open tax years are those that are open for exam by taxing authorities and, as of October 31, 2018, open Federal tax years include the tax years ended October 31, 2015 through 2018. The Funds have no examinations in progress and are also not aware of any tax positions for which it is reasonably possible that the total amounts of unrecognized tax benefits will significantly change in the next twelve months.
The Funds accrue for such material foreign taxes on net realized and unrealized gains at the appropriate rate for each country. Based on rates ranging from approximately 10% to 15%, there were no material accruals at period end.
| | | | |
| www.thomaswhitefunds.com | | | 51 | |
Notes to Financial Statements Period Ended October 31, 2018
(F) USE OF ESTIMATES
The preparation of financial statements in conformity with generally accepted accounting principles requires management to make estimates and assumptions that affect the reported amounts of assets and liabilities and disclosure of contingent liabilities at the date of the financial statements and the reported amounts of increases and decreases in net assets from operations during the period. Actual results could differ from these estimates.
The Funds are investment companies and follow accounting and reporting guidance under the Financial Accounting Standards Board (“FASB”) Accounting Standards Codification (“ASC”) Topic 946, “Financial Services-Investment Companies”.
(G) SECURITY TRANSACTIONS AND INVESTMENT INCOME
Security transactions are accounted for on a trade date basis. Interest is accrued on a daily basis and dividend income is recorded on the ex-dividend date, except that certain dividends from foreign securities are recorded when the information is available to the Fund. Realized gains and losses are determined using specific identification.
(H) DISTRIBUTIONS TO SHAREHOLDERS
The Funds usually declare and pay dividends from net investment income annually, but may do so more frequently to avoid excise tax. Distributions of net realized capital gains, if any, will be distributed at least annually.
(I) SECURITIES LENDING
The Funds may lend investment securities to investors who borrow securities in order to complete certain transactions. By lending investment securities, a Fund attempts to increase its net investment income through the receipt of interest earned on loan collateral. Any increase or decline in the market price of the securities loaned that might occur and any interest earned or dividends declared during the term of the loan would be for the account of the Fund. Risks of delay in recovery of the securities or even loss of rights in the collateral may occur should the borrower of the securities fail financially. Risk may also arise to the extent that the value of the securities loaned increases above the value of the collateral received. It is each Fund’s policy to obtain additional collateral from or return excess collateral to the borrower by the end of the next business day. Therefore, the value of the collateral may be temporarily less than the value of the securities on loan.
Funds that lend securities receive cash, cash equivalents, or other securities as collateral. Initial collateral levels shall not be less than 102% of the market value of the borrowed securities (105% if the collateral and the borrowed securities are denominated in different currencies). Marking to market is performed every business day (subject to de minimis rules of change in market value) for each Fund and each borrower is required to deliver additional collateral when necessary so that the total collateral held in the account for all loans of the Fund to the borrower will not be less than
| | |
| 52 | | www.thomaswhitefunds.com |
Notes to Financial Statements Period Ended October 31, 2018
100% of the market value of all the borrowed securities loaned to the borrower by the Fund. Any cash, cash equivalents, or other securities received as collateral is invested by the securities lending agent, Northern Trust, in accordance with pre-established guidelines as set forth in the securities lending agreement. The cash collateral would be invested in the Northern Institutional Liquid Asset Portfolio (an open-end regulated investment company) and would be shown on the investment portfolio for the Emerging Markets Fund. The cash collateral, if any, is reflected in the Funds’ Statements of Assets and Liabilities in the line item labeled “Investments in securities at market value.” Non-cash collateral is not shown in the Funds’ investment portfolios nor disclosed in the Statements of Assets and Liabilities as it is held by the lending agent on behalf of the Funds, and the Funds do not have the ability to re-hypthecate those securities. A portion of the interest received on the loan collateral is retained by the Fund and the remainder is rebated to the borrower of the securities. From the interest retained by the Funds, 50% is paid to the securities lending agent for the International Fund and Emerging Markets Fund for its services. The net amount of interest earned, after the interest rebate and the allocation to the securities lending agent, is included in the statement of operations as securities lending income. The value of loaned securities and related collateral outstanding at October 31, 2018 are as follows:
| | | | | | | | | | | | | | | | |
| Fund | | Value of
Loaned
Securities | | | Value of
Cash
Collateral | | | Value of
Non-Cash
Collateral* | | | Total
Collateral | |
| Thomas White International Fund | | | $3,964,624 | | | | $0 | | | | $4,247,803 | | | | $4,247,803 | |
| | | | | |
| Thomas White Emerging Markets Fund | | | $157,334 | | | | $0 | | | | $152,102 | | | | $152,102 | |
| | * | Funds cannot repledge or dispose of this collateral, nor do the Funds earn any income or receive dividends with respect to this collateral. |
The International Fund and the Emerging Markets Fund have earned income on securities lending (after rebates to borrowers and allocation to the securities lending agent) as follows:
| | | | |
| Fund | | Net Income Earned | |
| Thomas White International Fund | | | $10,806 | |
| | |
| Thomas White Emerging Markets Fund | | | $2,827 | |
The Funds recently adopted guidance requiring entities to present gross obligations for secured borrowings by the type of collateral pledged and remaining time to maturity. There were no such obligations at October 31, 2018.
(J) REDEMPTION FEE
The Funds assess a 2% fee on redemptions (including exchanges) of Fund shares held for less than sixty days. Redemption fees are paid to each Fund to help offset transaction costs and to protect the Fund’s long-term shareholders. Each Fund will use the “first-in, first-out” (FIFO) method to determine the sixty-day holding period. Under this method, the date of the
| | | | |
| www.thomaswhitefunds.com | | | 53 | |
Notes to Financial Statements Period Ended October 31, 2018
redemption or exchange will be compared to the earliest purchase date of shares held in the account. If this holding period is less than sixty days, the fee will be charged. The International Fund Investor Class and Class I shares charged $497 and $8, respectively, the Emerging Markets Fund Investor Class charged $34 and the American Opportunities Fund charged $180 in redemption fees for the year ended October 31, 2018, which were included in net capital paid.
(K) REAL ESTATE INVESTMENT TRUSTS
The American Opportunities Fund has made certain investments in real estate investment trusts (“REITs”), which pay dividends to their shareholders based upon funds available from operations. It is quite common for these dividends to exceed the REITs’ taxable earnings and profits resulting in the excess portion of such dividends being designated as a return of capital. The American Opportunities Fund intends to include the gross dividends from such REITs in its annual distributions to its shareholders and, accordingly, a portion of the distributions received by the Fund’s shareholders may also be designated as a return of capital.
(L) RECENT ACCOUNTING PRONOUNCEMENT
In August 2018, FASB issued ASU 2018-13, Fair Value Measurement (Topic 820): Disclosure Framework - Changes to the Disclosure Requirements for Fair Value Measurement (“ASU 2018-13”). The primary focus of ASU 2018-13 is to improve the effectiveness of the disclosure requirements for fair value measurements. The changes affect all companies that are required to include fair value measurement disclosures. In general, the amendments in ASU 2018-13 are effective for all entities for fiscal years and interim periods within those fiscal years, beginning after December 15, 2019. An entity is permitted to early adopt the removed or modified disclosures upon the issuance of ASU 2018-13 and may delay adoption of the additional disclosures, which are required for public companies only, until their effective date. Management is currently evaluating the impact these changes will have on the Funds’ financial statements and disclosures.
NOTE 2. SIGNIFICANT SHAREHOLDER
The following table indicates the number of shareholders who held a significant portion of the shares of each Class’s outstanding shares as of October 31, 2018. Investment activities of these shareholders could have a material effect on each Fund.
| | | | | | | | | | |
| Unaudited | | | | | | | | |
| Fund | | Share Class | | Number of
Shareholders | | | % Held | |
| International Fund | | Investor Class | | | 1 | | | | 11.2% | |
| | | | |
| Emerging Markets Fund | | Investor Class | | | 2 | | | | 76.8% | |
| | | | |
| Emerging Markets Fund | | Class I | | | 1 | | | | 18.3% | |
| | | | |
| American Opportunities Fund | | Investor Class | | | 1 | | | | 20.1% | |
| | |
| 54 | | www.thomaswhitefunds.com |
Notes to Financial Statements Period Ended October 31, 2018
NOTE 3. TRANSACTIONS IN SHARES OF BENEFICIAL INTEREST
As of October 31, 2018, there were an unlimited number of $0.01 par value shares of beneficial interest authorized. Transactions are summarized as follows:
| | | | | | | | | | | | | | | | | | | | | | | | |
| International Fund | |
| | | Year Ended October 31, 2018 | | | Year Ended October 31, 2017 | |
| | | Investor Class | | | Investor Class | |
| | | Shares | | | | | | Amount | | | Shares | | | | | | Amount | |
| Shares sold | | | 36,613 | | | $ | | | | | 655,799 | | | | 272,988 | | | $ | | | | | 4,206,966 | |
| Shares issued on reinvestment of dividends & distributions | | | 239,520 | | | | | | | | 3,228,728 | | | | 68,249 | | | | | | | | 1,205,839 | |
| Shares redeemed | | | (598,797 | ) | | | | | | | (10,572,135 | )^ | | | (10,409,121 | ) | | | | | | | (165,146,599 | ) |
| Net decrease | | | (322,664 | ) | | $ | | | | | (6,687,608 | ) | | | (10,067,884 | ) | | $ | | | | | (159,733,794 | ) |
| Shares outstanding: | | | | | | | | | | | | | | | | | | | | | | | | |
| Beginning of period | | | 2,449,686 | | | | | | | | | | | | 12,517,570 | | | | | | | | | |
| End of period | | | 2,127,022 | | | | | | | | | | | | 2,449,686 | | | | | | | | | |
| ^ Includes redemption fees of $497 | |
| | | | | | | | | | | | | | | | | | | | | | | | |
| | | Year Ended October 31, 2018 | | | Year Ended October 31, 2017 | |
| | | Class I | | | Class I | |
| | | Shares | | | | | | Amount | | | Shares | | | | | | Amount | |
| Shares sold | | | 852,416 | | | $ | | | | | 15,132,987 | | | | 2,183,721 | | | $ | | | | | 34,990,899 | |
| Sales in connection with reorganization | | | ------- | | | | | | | | ------- | | | | 68,548 | | | | | | | | 1,053,314 | |
| Shares issued on reinvestment of dividends & distributions | | | 1,261,639 | | | | | | | | 16,956,419 | | | | 482,969 | | | | | | | | 8,346,920 | |
| Shares redeemed | | | (4,582,847 | ) | | | | | | | (81,395,513 | )^ | | | (12,780,743 | ) | | | | | | | (214,500,761 | ) |
| Net decrease | | | (2,468,792 | ) | | $ | | | | | (49,306,107 | ) | | | (10,045,505 | ) | | $ | | | | | (170,109,628 | ) |
| Shares outstanding: | | | | | | | | | | | | | | | | | | | | | | | | |
| Beginning of period | | | 15,585,266 | | | | | | | | | | | | 25,630,771 | | | | | | | | | |
| End of period | | | 13,116,474 | | | | | | | | | | | | 15,585,266 | | | | | | | | | |
| ^ Includes redemption fees of $8 | | | | | | | | | | | | | | | | | | | | | | | | |
| | | | | | | | | | | | | | | | | | | | | | | | |
| | | | |
| www.thomaswhitefunds.com | | | 55 | |
Notes to Financial Statements Period Ended October 31, 2018
| | | | | | | | | | | | | | | | | | | | | | | | |
| | | Year Ended October 31, 2018 | | | Year Ended October 31, 2017 | |
| | | Class A* | | | Class A | |
| | | Shares | | | | | | Amount | | | Shares | | | | | | Amount | |
| Shares sold | | | ------- | | | $ | | | | | ------- | | | | 12,622 | | | $ | | | | | 184,030 | |
| Shares issued on reinvestment of dividends & distributions | | | ------- | | | | | | | | ------- | | | | 11 | | | | | | | | 158 | |
| Shares redeemed | | | ------- | | | | | | | | ------- | | | | (9,221 | ) | | | | | | | (135,830 | ) |
| Shares exchanged in connection with reorganization | | | ------- | | | | | | | | ------- | | | | (59,809 | ) | | | | | | | (915,341 | ) |
| Net decrease | | | ------- | | | $ | | | | | ------- | | | | (56,397 | ) | | $ | | | | | (866,983 | ) |
| Shares outstanding: | | | | | | | | | | | | | | | | | | | | | | | | |
| Beginning of period | | | 0 | | | | | | | | | | | | 56,397 | | | | | | | | | |
| End of period | | | 0 | | | | | | | | | | | | 0 | | | | | | | | | |
| * Class Reorganized into Class I shares on February 28, 2017. | |
| | | | | | | | | | | | | | | | | | | | | | | | |
| | | Year Ended October 31, 2018 | | | Year Ended October 31, 2017 | |
| | | Class C* | | | Class C | |
| | | Shares | | | | | | Amount | | | Shares | | | | | | Amount | |
| Shares sold | | | ------- | | | $ | | | | | ------- | | | | ------- | | | $ | | | | | ------- | |
| Shares issued on reinvestment of dividends & distributions | | | ------- | | | | | | | | ------- | | | | ------- | | | | | | | | ------- | |
| Shares redeemed | | | ------- | | | | | | | | ------- | | | | (3,843 | ) | | | | | | | (57,645 | ) |
| Shares exchanged in connection with reorganization | | | ------- | | | | | | | | ------- | | | | (8,983 | ) | | | | | | | (137,973 | ) |
| Net decrease | | | ------- | | | $ | | | | | ------- | | | | (12,826 | ) | | $ | | | | | (195,618 | ) |
| Shares outstanding: | | | | | | | | | | | | | | | | | | | | | | | | |
| Beginning of period | | | 0 | | | | | | | | | | | | 12,826 | | | | | | | | | |
| End of period | | | 0 | | | | | | | | | | | | 0 | | | | | | | | | |
| * Class Reorganized into Class I shares on February 28, 2017. | | | | | |
| | | | | | | | | | | | | | | | | | | | | | | | |
| Emerging Markets Fund | |
| | | Year Ended October 31, 2018 | | | Year Ended October 31, 2017 | |
| | | Investor Class | | | Investor Class | |
| | | Shares | | | | | | Amount | | | Shares | | | | | | Amount | |
| Shares sold | | | 5,032 | | | $ | | | | | 56,877 | | | | 919 | | | $ | | | | | 9,450 | |
| Shares issued on reinvestment of dividends & distributions | | | 1,122 | | | | | | | | 10,728 | | | | 1,525 | | | | | | | | 16,822 | |
| Shares redeemed | | | (16,212 | ) | | | | | | | (184,376 | )^ | | | (10,560 | ) | | | | | | | (108,272 | ) |
| Net decrease | | | (10,058 | ) | | $ | | | | | (116,771 | ) | | | (8,116 | ) | | $ | | | | | (82,000 | ) |
| Shares outstanding: | | | | | | | | | | | | | | | | | | | | | | | | |
| Beginning of period | | | 177,271 | | | | | | | | | | | | 185,387 | | | | | | | | | |
| End of period | | | 167,213 | | | | | | | | | | | | 177,271 | | | | | | | | | |
| ^ Includes redemption fees of $34 | | | | | |
| | | | | | | | | | | | | | | | | |
| | |
| 56 | | www.thomaswhitefunds.com |
Notes to Financial Statements Period Ended October 31, 2018
| | | | | | | | | | | | | | | | | | | | | | | | |
| | | Year Ended October 31, 2018 | | | Year Ended October 31, 2017 | |
| | | Class I | | | Class I | |
| | | Shares | | | | | | Amount | | | Shares | | | | | | Amount | |
| Shares sold | | | 312,421 | | | $ | | | | | 3,543,325 | | | | 230,984 | | | $ | | | | | 2,485,119 | |
| Sales in connection with reorganization | | | ------- | | | | | | | | ------- | | | | 32,678 | | | | | | | | 323,653 | |
| Shares issued on reinvestment of dividends & distributions | | | 38,575 | | | | | | | | 372,630 | | | | 69,841 | | | | | | | | 772,245 | |
| Shares redeemed | | | (1,144,555 | ) | | | | | | | (13,748,041 | ) | | | (4,062,521 | ) | | | | | | | (42,645,912 | ) |
| Net decrease | | | (793,559 | ) | | $ | | | | | (9,832,086 | ) | | | (3,729,018 | ) | | $ | | | | | (39,064,895 | ) |
| Shares outstanding: | | | | | | | | | | | | | | | | | | | | | | | | |
| Beginning of period | | | 3,988,413 | | | | | | | | | | | | 7,717,431 | | | | | | | | | |
| End of period | | | 3,194,854 | | | | | | | | | | | | 3,988,413 | | | | | | | | | |
| | | | | | | | | | | | | | | | | | | | | | | | |
| | | Year Ended October 31, 2018 | | | Year Ended October 31, 2017 | |
| | | Class A* | | | Class A | |
| | | Shares | | | | | | Amount | | | Shares | | | | | | Amount | |
| Shares sold | | | ------- | | | $ | | | | | ------- | | | | ------- | | | $ | | | | | ------- | |
| Shares issued on reinvestment of dividends & distributions | | | ------- | | | | | | | | ------- | | | | ------- | | | | | | | | ------- | |
| Shares redeemed | | | ------- | | | | | | | | ------- | | | | (2 | ) | | | | | | | (18 | ) |
| Shares exchanged in connection with reorganization | | | ------- | | | | | | | | ------- | | | | (8,360 | ) | | | | | | | (82,158 | ) |
| Net decrease | | | ------- | | | $ | | | | | ------- | | | | (8,362 | ) | | $ | | | | | (82,176 | ) |
| Shares outstanding: | | | | | | | | | | | | | | | | | | | | | | | | |
| Beginning of period | | | 0 | | | | | | | | | | | | 8,362 | | | | | | | | | |
| End of period | | | 0 | | | | | | | | | | | | 0 | | | | | | | | | |
| * Class Reorganized into Class I shares on February 28, 2017. | |
| | | | | | | | | | | | | | | | | | | | | | | | |
| | | Year Ended October 31, 2018 | | | Year Ended October 31, 2017 | |
| | | Class C* | | | Class C | |
| | | Shares | | | | | | Amount | | | Shares | | | | | | Amount | |
| Shares sold | | | ------- | | | $ | | | | | ------- | | | | ------- | | | $ | | | | | ------- | |
| Shares issued on reinvestment of dividends & distributions | | | ------- | | | | | | | | ------- | | | | ------- | | | | | | | | ------- | |
| Shares redeemed | | | ------- | | | | | | | | ------- | | | | (2 | ) | | | | | | | (18 | ) |
| Shares exchanged in connection with reorganization | | | ------- | | | | | | | | ------- | | | | (24,712 | ) | | | | | | | (241,495 | ) |
| Net decrease | | | ------- | | | $ | | | | | ------- | | | | (24,714 | ) | | $ | | | | | (241,513 | ) |
| Shares outstanding: | | | | | | | | | | | | | | | | | | | | | | | | |
| Beginning of period | | | 0 | | | | | | | | | | | | 24,714 | | | | | | | | | |
| End of period | | | 0 | | | | | | | | | | | | 0 | | | | | | | | | |
| * Class Reorganized into Class I shares on February 28, 2017. | | | | | | | | | |
| | | | | | | | | | | | | | | | | | | | | | | | |
| | | | |
| www.thomaswhitefunds.com | | | 57 | |
Notes to Financial Statements Period Ended October 31, 2018
| | | | | | | | | | | | | | | | | | | | | | | | |
| American Opportunities Fund | |
| | | Year Ended October 31, 2018 | | | Year Ended October 31, 2017 | |
| | | Investor Class | | | Investor Class | |
| | | Shares | | | | | | Amount | | | Shares | | | | | | Amount | |
| Shares sold | | | 95,707 | | | $ | | | | | 1,603,940 | | | | 43,875 | | | $ | | | | | 739,907 | |
| Shares issued on reinvestment of dividends & distributions | | | 116,726 | | | | | | | | 1,782,396 | | | | 205,012 | | | | | | | | 3,387,229 | |
| Shares redeemed | | | (134,381 | ) | | | | | | | (2,186,212 | )^ | | | (205,152 | ) | | | | | | | (3,412,158 | ) |
| Net increase | | | 78,052 | | | $ | | | | | 1,200,124 | | | | 43,735 | | | $ | | | | | 714,978 | |
| Shares outstanding: | | | | | | | | | | | | | | | | | | | | | | | | |
| Beginning of period | | | 2,512,548 | | | | | | | | | | | | 2,468,813 | | | | | | | | | |
| End of period | | | 2,590,600 | | | | | | | | | | | | 2,512,548 | | | | | | | | | |
| ^ Includes redemption fees of $180 | | | | | | | | | | | | | | | | | |
NOTE 4. INVESTMENT MANAGEMENT FEES AND OTHER TRANSACTIONS WITH AFFILIATES
Each Fund pays a monthly investment management fee to Thomas White International, Ltd. (the “Advisor”) at the rate of 0.85% of the Fund’s average daily net assets annually. For the year ended October 31, 2018, the International Fund, Emerging Markets Fund and American Opportunities Fund paid the Advisor $2,443,157, $342,088 and $373,395, respectively, in investment management fees.
During the year ended October 31, 2018, the Advisor has contractually agreed to reimburse its management fee and/or reimburse the Funds’ operating expenses to the extent necessary to ensure that each Fund’s annual operating expenses do not exceed the following percentages of average daily net assets:
| | | | | | | | |
| | | Investor Class | | | Class I | |
| International Fund | | | 1.24% | | | | 0.99% | |
| | | |
| Emerging Markets Fund | | | 1.34% | | | | 1.09% | |
| | | |
| American Opportunities Fund | | | 1.34% | | | | n/a | |
These agreements to reimburse fees renew automatically unless the Advisor gives written notice to end them.
The Advisor may recoup any previously waived amount from a Fund pursuant to the expense limitation agreements if such reimbursement does not cause the Fund to exceed either (i) the current expense limitation or (ii) the expense limitation in effect at the time the expense is waived,
| | |
| 58 | | www.thomaswhitefunds.com |
Notes to Financial Statements Period Ended October 31, 2018
provided the reimbursement is made within three years after the year in which the Advisor incurred the expense. For the year ended October 31, 2018, the Advisor recouped the following amounts:
| | | | | | |
| Fund | | Share Class | | Recoupment
Amount | |
| | | |
| International Fund | | Investor Class | | | $9,193 | |
As of October 31, 2018, the International and Emerging Markets Funds had the following amounts (and year of expiration) subject to repayment to the Advisor:
| | | | | | | | | | | | | | |
| Fund | | Share Class | | Year Fees Waived | | | Repayment Expires | | | Balance | |
| | | | | |
| International Fund | | Investor Class | | | 2016 | | | | 2019 | | | | $185,995 | |
| | | | | |
| International Fund | | Investor Class | | | 2017 | | | | 2020 | | | | $115,940 | |
| | | | | |
| International Fund | | Investor Class | | | 2018 | | | | 2021 | | | | $47,574 | |
| | | | | |
| International Fund | | Class I | | | 2016 | | | | 2019 | | | | $376,987 | |
| | | | | |
| International Fund | | Class I | | | 2017 | | | | 2020 | | | | $535,417 | |
| | | | | |
| International Fund | | Class I | | | 2018 | | | | 2021 | | | | $465,425 | |
| | | | | |
| Emerging Markets Fund | | Investor Class | | | 2017 | | | | 2020 | | | | $2,618 | |
| | | | | |
| Emerging Markets Fund | | Investor Class | | | 2018 | | | | 2021 | | | | $3,875 | |
| | | | | |
| Emerging Markets Fund | | Class I | | | 2016 | | | | 2019 | | | | $150,335 | |
| | | | | |
| Emerging Markets Fund | | Class I | | | 2017 | | | | 2020 | | | | $195,908 | |
| | | | | |
| Emerging Markets Fund | | Class I | | | 2018 | | | | 2021 | | | | $159,329 | |
| | | | | |
| American Opportunities Fund | | Investor Class | | | 2018 | | | | 2021 | | | | $37,957 | |
The Funds and U.S. Bancorp Fund Services, LLC (the “Administrator”) are parties to a Fund Administration Servicing Agreement. The Administrator provides administrative and fund accounting services pursuant to this agreement.
The Advisor and the Funds have adopted a Business Management Agreement under which the Advisor provides certain business management services to the Funds, including, without limitation, monitoring of the Funds’ relationships with third-party service providers and assisting with necessary and appropriate services to the Board of Trustees of the Trust, as well as either providing the Trust with or procuring for the Trust the services of a Chief Compliance Officer in accordance with Rule 38a-1 of the 1940 Act, in the event so requested. For these services, the Advisor is entitled to receive a fee from each Fund at a rate of 0.035% of the Fund’s average daily net assets. For the year ended October 31, 2018, for the services provided under the Business Management Agreement, the International Fund, Emerging Markets Fund, and American Opportunities Fund paid the Advisor $100,601, $14,086 and $15,375, respectively.
| | | | |
| www.thomaswhitefunds.com | | | 59 | |
Notes to Financial Statements Period Ended October 31, 2018
The Funds have adopted an Administrative Services Plan pursuant to which the Investor Class shares are authorized to make payments to certain entities, which may include banks, broker-dealers and other types of service providers, for providing administrative services with respect to shares of the Funds attributable to or held in the name of the service provider for its clients or customers with whom they have a servicing relationship. Under the terms of the Administrative Services Plan, Investor Class shares are authorized to make payments up to a maximum rate of 0.25% of the average daily net assets of the shares attributable to or held in the name of the service provider for providing the types of applicable administrative services covered under the terms of the Plan. For the year ended October 31, 2018, fees incurred by the International Fund pursuant to the Administrative Services Plan were $64,842 for Investor Class. For the year ended October 31, 2018, fees incurred by the Emerging Markets Fund pursuant to the Administrative Services Plan were $543 for Investor Class. For the year ended October 31, 2018, fees incurred by the American Opportunities Fund pursuant to the Administrative Services Plan were $105,061 for Investor Class shares.
NOTE 5. CUSTODIAN AND TRANSFER AGENT FEES
Custodian Fees - Northern Trust is the custodian for the International Fund and Emerging Markets Fund. U.S. Bank is the custodian for the American Opportunities Fund. Northern Trust bills the International Fund and the Emerging Markets Fund quarterly based on the value of their holdings as of the previous quarter end plus transaction fees. U.S. Bank bills the American Opportunities Fund monthly based on the ending value of its holdings plus transaction fees.
Transfer Agent - U.S. Bancorp serves as the Funds’ transfer agent. Under the terms of the transfer agent agreement, U.S. Bancorp is entitled to account-based fees along with reimbursement of out-of-pocket expenses incurred in providing transfer agent services.
NOTE 6. INVESTMENT TRANSACTIONS
During the year ended October 31, 2018, the cost of purchases and the proceeds from sales of investment securities, other than short-term investments, were as follows:
| | | | | | | | |
| Fund | | Purchases | | | Sales | |
| International Fund | | | $106,832,496 | | | | $183,868,058 | |
| | | |
| Emerging Markets Fund | | | 13,337,741 | | | | 23,309,417 | |
| | | |
| American Opportunities Fund | | | 9,078,568 | | | | 8,985,740 | |
The American Opportunities Fund did not purchase or sell long-term U.S. Government securities during the year ended October 31, 2018. The International Fund and Emerging Markets Fund did not directly purchase or sell long term U.S. Government securities, except for purposes of securities lending during the year ended October 31, 2018.
| | |
| 60 | | www.thomaswhitefunds.com |
Notes to Financial Statements Period Ended October 31, 2018
At October 31, 2018, the aggregate gross unrealized appreciation and depreciation of portfolio securities, based upon cost for federal income tax purposes, were as follows:
| | | | | | | | | | | | | | | | |
| Fund | | Tax Cost | | | Unrealized
Appreciation | | | Unrealized
Depreciation | | | Net Unrealized
Appreciation/
(Depreciation) | |
| International Fund | | | $198,810,095 | | | | $27,568,220 | | | | $(20,387,799) | | | | $7,180,421 | |
| | | | | |
| Emerging Markets Fund | | | 29,967,815 | | | | 6,814,494 | | | | (3,268,341) | | | | 3,546,153 | |
| | | | | |
| American Opportunities Fund | | | 32,212,258 | | | | 9,599,088 | | | | (1,298,711) | | | | 8,300,377 | |
Distributions to Shareholders
The Funds will distribute net investment income and net realized gains, if any, at least once a year. The amount of distributions from net investment income and net realized gains are determined in accordance with federal income tax regulations, which may differ from generally accepted accounting principles. These “book/tax” differences are either temporary or permanent in nature and are primarily due to differing treatments for passive foreign investment companies and losses deferred due to wash sales. Permanent differences, primarily due to reclassification of REIT income, resulted in reclassifications among the Funds’ components of net assets at October 31, 2018, the Funds’ tax year-end. For the International Fund, permanent differences resulted in reclassification of ($798,980) in distributable earnings and $798,980 in paid in capital. For the Emerging Markets Fund, permanent differences resulted in reclassification of $10,567 in distributable earnings and ($10,567) in paid in capital. For the American Opportunities Fund, permanent differences resulted in reclassification of ($11,431) in distributable earnings and $11,431 in paid in capital.
| | | | | | | | | | | | | | | | | | | | |
| Fund | | Undistributed
Ordinary
Income | | | Undistributed
Long-term
Gains | | | Net
Unrealized
Appreciation | | | Other
Accumulated
Losses | | | Total
Distributable
Earnings | |
| International Fund | | | $------- | | | | $------- | | | | $7,180,421 | | | | $(74,732) | | | | $7,105,689 | |
| | | | | | |
| Emerging Markets Fund | | | ------- | | | | ------- | | | | 3,546,153 | | | | (8,574,082) | | | | (5,027,929) | |
| | | | | | |
| American Opportunities Fund | | | ------- | | | | ------- | | | | 8,300,377 | | | | ------- | | | | 8,300,377 | |
Under the Regulated Investment Company Modernization Act of 2010, the Funds are permitted to carry forward capital losses incurred in taxable years beginning after December 22, 2010 for an unlimited period, and such capital losses will retain their character as either short-term or long-term capital losses.
As of October 31, 2018, the Emerging Markets Fund had $6,851,969 in short-term capital loss carry forwards with no expiration, and had $1,718,242 in long-term capital loss carryforwards with no expiration.
| | | | |
| www.thomaswhitefunds.com | | | 61 | |
Notes to Financial Statements Period Ended October 31, 2018
The tax character of distributions paid during the periods shown below were as follows:
| | | | | | | | | | | | | | | | |
| | | Year Ended October 31, 2018 | |
| | | Ordinary
Income | | | Return of
Capital | | | Long-Term
Capital Gains | | | Total
Distributions | |
| International Fund | | | $4,008,212 | | | | $------- | | | | $21,283,124 | | | | $25,291,336 | |
| | | | | |
| Emerging Markets Fund | | | 391,736 | | | | ------- | | | | ------- | | | | 391,736 | |
| | | | | |
| American Opportunities Fund | | | 122,005 | | | | ------- | | | | 1,752,686 | | | | 1,874,691 | |
| | | | | | | | | | | | | | | | | |
| | | Year Ended October 31, 2017 | |
| | | Ordinary
Income | | | Return of
Capital | | | Long-Term
Capital Gains | | | Total
Distributions | |
| International Fund | | | $7,248,662 | | | | $------- | | | | $4,403,622 | | | | $11,652,284 | |
| | | | | |
| Emerging Markets Fund | | | 900,556 | | | | ------- | | | | ------- | | | | 900,556 | |
| | | | | |
| American Opportunities Fund | | | 352,734 | | | | ------- | | | | 3,221,146 | | | | 3,573,880 | |
| | | | | | | | | | | | | | | | | |
NOTE 7. REORGANIZATION OF SHARE CLASSES
Effective upon the close of business on February 28, 2017, the outstanding Class A and Class C shares of the Thomas White International Fund and the Thomas White Emerging Markets Fund were converted into Class I shares of their respective Funds, as applicable (the “Class Conversion”) pursuant to the Supplement to the Prospectus dated January 31, 2017. The Class Conversion was completed based on the share classes’ relative net asset values on the Conversion Date, without the imposition of any sales charge or any other charge as detailed below:
| | | | | | | | | | | | | | | | |
| International Fund | | Shares
Outstanding | | | Net
Assets | | | NAV
per Share | | | Share
Conversion Ratio | |
| Class A | | | 59,809 | | | | $915,341 | | | | $15.30 | | | | 0.9954 | |
| | | | | |
| Class C | | | 8,983 | | | | $137,973 | | | | $15.36 | | | | 0.9993 | |
| | | | | |
| Class I (Before Conversion) | | | 24,117,542 | | | | $370,573,288 | | | | $15.37 | | | | ------- | |
| | | | | |
| Class I (After Conversion) | | | 24,186,090 | | | | $371,626,602 | | | | $15.37 | | | | ------- | |
| | | | | | | | | | | | | | | | |
| Emerging Markets Fund | | Shares
Outstanding | | | Net
Assets | | | NAV
per Share | | | Share
Conversion Ratio | |
| Class A | | | 8,360 | | | | $82,158 | | | | $9.83 | | | | 0.9929 | |
| | | | | |
| Class C | | | 24,712 | | | | $241,495 | | | | $9.77 | | | | 0.9869 | |
| | | | | |
| Class I (Before Conversion) | | | 7,301,169 | | | | $72,300,755 | | | | $9.90 | | | | ------- | |
| | | | | |
| Class I (After Conversion) | | | 7,333,847 | | | | $72,624,408 | | | | $9.90 | | | | ------- | |
| | |
| 62 | | www.thomaswhitefunds.com |
Notes to Financial Statements Period Ended October 31, 2018
NOTE 8. SUBSEQUENT EVENTS
In preparing these financial statements, the Trust has evaluated events after October 31, 2018 and determined that there were no significant subsequent events that would require adjustment to or additional disclosure in these financial statements.
RESULTS OF SPECIAL MEETING OF SHAREHOLDERS (UNAUDITED)
A special meeting of shareholders (the “Special Meeting”) of the Thomas White Funds was held on November 30, 2018. At the Special Meeting, shareholders were asked to vote on the following proposals: to approve new Investment Advisory Agreements between the Trust and Thomas White International, Ltd.; to elect Trustees to the Board of Trustees of the Trust; to approve the removal of the fundamental investment restriction on investing in other open-end investment companies applicable to the International Fund and the American Opportunities Fund.
The details of how the proposals were voted on are included below:
| | | | | | | | | | | | |
| Proposal 1 | | Number of
Votes For | | | Number of
Votes
Against | | �� | % of Outstanding
Shares Voted
Affirmatively | |
| Approval of the new Investment Advisory Agreement | | | 17,428,403 | | | | 4,454 | | | | 84.61% | |
| | | | | | | | | | | | | |
Proposal 2
Nominee | | Number of
Votes For | | | Number of
Votes
Withheld | | | % of Outstanding
Shares Voted
Affirmatively | |
| Arthur Fiocco, Jr. | | | 19,606,290 | | | | 20,337 | | | | 95.18% | |
| | | | |
| Geri Sands Hansen | | | 19,604,873 | | | | 21,754 | | | | 95.17% | |
| | | | |
| William H. Woolverton | | | 19,606,290 | | | | 20,337 | | | | 95.18% | |
| | | | |
| Douglas M. Jackman | | | 19,606,290 | | | | 20,337 | | | | 95.18% | |
| | | | | | | | | | | | | |
| Proposal 3* | | Number of
Votes For | | | Number of
Votes
Against | | | % of Outstanding
Shares Voted
Affirmatively | |
| | | | |
| Approval to remove the fundamental investment restriction | | | 14,720,664 | | | | 19,781 | | | | 85.08% | |
| | * | Proposal 3 was voted on by shareholders of the International Fund and American Opportunities Fund. The Emerging Markets Fund does not have this investment restriction. |
| | | | |
| www.thomaswhitefunds.com | | | 63 | |
Year Ended October 31, 2018
FINANCIAL HIGHLIGHTS
| | | | | | | | | | | | | | | | | | | | | | | | | | | | | | | | | | | | | | | | |
| Thomas White International Fund - Investor Class | |
| | | | | | Year
Ended
October 31,
2018 | | | | | | Year
Ended
October 31,
2017 | | | | | | Year
Ended
October 31,
2016 | | | | | | Year
Ended
October 31,
2015 | | | | | | Year
Ended
October 31,
2014 | |
| |
| Per share operating performance (For a share outstanding throughout each period) | |
| Net asset value, beginning of period | | | $ | | | | 17.88 | | | | $ | | | | 14.97 | | | | $ | | | | 15.77 | | | | $ | | | | 16.95 | | | | $ | | | | 19.16 | |
| | | | | | | | | | | |
| Income from investment operations: | | | | | | | | | | | | | | | | | | | | | | | | | | | | | | | | | | | | | | | | |
Net investment income 1 | | | | | | | 0.25 | | | | | | | | 0.14 | | | | | | | | 0.17 | | | | | | | | 0.19 | | | | | | | | 0.26 | |
Net realized and unrealized gains/(losses) | | | | | | | (2.44 | ) | | | | | | | 3.30 | | | | | | | | (0.81 | ) | | | | | | | (1.17 | ) | | | | | | | (0.89 | ) |
| Total from investment operations | | | | | | | (2.19 | ) | | | | | | | 3.44 | | | | | | | | (0.64 | ) | | | | | | | (0.98 | ) | | | | | | | (0.63 | ) |
| | | | | | | | | | | |
| Distributions: | | | | | | | | | | | | | | | | | | | | | | | | | | | | | | | | | | | | | | | | |
From net investment income | | | | | | | (0.29 | ) | | | | | | | (0.28 | ) | | | | | | | (0.16 | ) | | | | | | | (0.20 | ) | | | | | | | (0.26 | ) |
From net realized gains | | | | | | | (1.54 | ) | | | | | | | (0.25 | ) | | | | | | | ------- | | | | | | | | ------- | | | | | | | | (1.32 | ) |
| Total Distributions | | | | | | | (1.83 | ) | | | | | | | (0.53 | ) | | | | | | | (0.16 | ) | | | | | | | (0.20 | ) | | | | | | | (1.58 | ) |
| Change in net asset value for the period | | | | | | | (4.02 | ) | | | | | | | 2.91 | | | | | | | | (0.80 | ) | | | | | | | (1.18 | ) | | | | | | | (2.21 | ) |
| Net asset value, end of period | | | $ | | | | 13.86 | | | | $ | | | | 17.88 | | | | $ | | | | 14.97 | | | | $ | | | | 15.77 | | | | $ | | | | 16.95 | |
| Total Return | | | | | | | (12.01)% | | | | | | | | 23.06% | | | | | | | | (4.08)% | | | | | | | | (5.77)% | | | | | | | | (3.00)% | |
| | | | | | | | | | | |
| Ratios/supplemental data | | | | | | | | | | | | | | | | | | | | | | | | | | | | | | | | | | | | | | | | |
| Net assets, end of period (000) | | | $ | | | | 29,473 | | | | $ | | | | 43,811 | | | | $ | | | | 187,408 | | | | $ | | | | 268,518 | | �� | | $ | | | | 369,098 | |
| | | | | | | | | | | |
| Ratio to average net assets: | | | | | | | | | | | | | | | | | | | | | | | | | | | | | | | | | | | | | | | | |
| Expenses (net of reimbursement) | | | | | | | 1.24% | | | | | | | | 1.24% | | | | | | | | 1.24% | | | | | | | | 1.24% | | | | | | | | 1.24% | |
| Expenses (prior to reimbursement) | | | | | | | 1.34% | | | | | | | | 1.36% | | | | | | | | 1.33% | | | | | | | | 1.32% | | | | | | | | 1.27% | |
Net investment income
(net of reimbursement) | | | | | | | 1.32% | | | | | | | | 0.90% | | | | | | | | 1.16% | | | | | | | | 1.16% | | | | | | | | 1.36% | |
Net investment income
(prior to reimbursement) | | | | | | | 1.22% | | | | | | | | 0.78% | | | | | | | | 1.07% | | | | | | | | 1.08% | | | | | | | | 1.33% | |
| Portfolio turnover rate 2 | | | | | | | 38% | | | | | | | | 48% | | | | | | | | 60% | | | | | | | | 57% | | | | | | | | 62% | |
| (1) | Net investment income per share represents net investment income divided by the average shares outstanding throughout the period. |
| (2) | Portfolio turnover is calculated on the basis of the Fund as a whole without distinguishing between the classes of shares issued. |
The accompanying notes are an integral part of these financial statements
| | |
| 64 | | www.thomaswhitefunds.com |
Year Ended October 31, 2018
FINANCIAL HIGHLIGHTS
| | | | | | | | | | | | | | | | | | | | | | | | | | | | | | | | | | | | | | | | |
| Thomas White International Fund - Class I | |
| | | | | | Year
Ended
October 31,
2018 | | | | | | Year
Ended
October 31,
2017 | | | | | | Year
Ended
October 31,
2016 | | | | | | Year
Ended
October 31,
2015 | | | | | | Year
Ended
October 31,
2014 | |
| |
| Per share operating performance (For a share outstanding throughout each period) | |
| Net asset value, beginning of period | | | $ | | | | 17.79 | | | | $ | | | | 14.98 | | | | $ | | | | 15.78 | | | | $ | | | | 16.97 | | | | $ | | | | 19.18 | |
| | | | | | | | | | | |
| Income from investment operations: | | | | | | | | | | | | | | | | | | | | | | | | | | | | | | | | | | | | | | | | |
Net investment income 1 | | | | | | | 0.27 | | | | | | | | 0.25 | | | | | | | | 0.23 | | | | | | | | 0.23 | | | | | | | | 0.30 | |
Net realized and unrealized gains/(losses) | | | | | | | (2.42 | ) | | | | | | | 3.22 | | | | | | | | (0.83 | ) | | | | | | | (1.17 | ) | | | | | | | (0.89 | ) |
| Total from investment operations | | | | | | | (2.15 | ) | | | | | | | 3.47 | | | | | | | | (0.60 | ) | | | | | | | (0.94 | ) | | | | | | | (0.59 | ) |
| | | | | | | | | | | |
| Distributions: | | | | | | | | | | | | | | | | | | | | | | | | | | | | | | | | | | | | | | | | |
From net investment income | | | | | | | (0.29 | ) | | | | | | | (0.41 | ) | | | | | | | (0.20 | ) | | | | | | | (0.25 | ) | | | | | | | (0.30 | ) |
From net realized gains | | | | | | | (1.54 | ) | | | | | | | (0.25 | ) | | | | | | | ------- | | | | | | | | ------- | | | | | | | | (1.32 | ) |
| Total Distributions | | | | | | | (1.83 | ) | | | | | | | (0.66 | ) | | | | | | | (0.20 | ) | | | | | | | (0.25 | ) | | | | | | | (1.62 | ) |
| Change in net asset value for the period | | | | | | | (3.98 | ) | | | | | | | 2.81 | | | | | | | | (0.80 | ) | | | | | | | (1.19 | ) | | | | | | | (2.21 | ) |
| Net asset value, end of period | | | $ | | | | 13.81 | | | | $ | | | | 17.79 | | | | $ | | | | 14.98 | | | | $ | | | | 15.78 | | | | $ | | | | 16.97 | |
| Total Return | | | | | | | (11.80)% | | | | | | | | 23.23% | | | | | | | | (3.81)% | | | | | | | | (5.56)% | | | | | | | | (2.76)% | |
| | | | | | | | | | | |
| Ratios/supplemental data | | | | | | | | | | | | | | | | | | | | | | | | | | | | | | | | | | | | | | | | |
| Net assets, end of period (000) | | | $ | | | | 181,179 | | | | $ | | | | 277,287 | | | | $ | | | | 384,017 | | | | $ | | | | 300,331 | | | | $ | | | | 443,397 | |
| | | | | | | | | | | |
| Ratio to average net assets: | | | | | | | | | | | | | | | | | | | | | | | | | | | | | | | | | | | | | | | | |
| Expenses (net of reimbursement) | | | | | | | 0.99% | | | | | | | | 0.99% | | | | | | | | 0.99% | | | | | | | | 0.99% | | | | | | | | 0.99% | |
| Expenses (prior to reimbursement) | | | | | | | 1.18% | | | | | | | | 1.14% | | | | | | | | 1.10% | | | | | | | | 1.08% | | | | | | | | 1.05% | |
Net investment income
(net of reimbursement) | | | | | | | 1.53% | | | | | | | | 1.53% | | | | | | | | 1.53% | | | | | | | | 1.40% | | | | | | | | 1.59% | |
Net investment income
(prior to reimbursement) | | | | | | | 1.34% | | | | | | | | 1.38% | | | | | | | | 1.42% | | | | | | | | 1.31% | | | | | | | | 1.53% | |
| Portfolio turnover rate 2 | | | | | | | 38% | | | | | | | | 48% | | | | | | | | 60% | | | | | | | | 57% | | | | | | | | 62% | |
| (1) | Net investment income per share represents net investment income divided by the average shares outstanding throughout the period. |
| (2) | Portfolio turnover is calculated on the basis of the Fund as a whole without distinguishing between the classes of shares issued. |
The accompanying notes are an integral part of these financial statements
| | | | |
| www.thomaswhitefunds.com | | | 65 | |
Year Ended October 31, 2018
FINANCIAL HIGHLIGHTS
| | | | | | | | | | | | | | | | | | | | | | | | | | | | | | | | | | | | | | | | |
| Thomas White Emerging Markets Fund - Investor Class | |
| | | | | | Year
Ended
October 31,
2018 | | | | | | Year
Ended
October 31,
2017 | | | | | | Year
Ended
October 31,
2016 | | | | | | Year
Ended
October 31,
2015 | | | | | | Year
Ended
October 31,
2014 | |
| |
| Per share operating performance (For a share outstanding throughout each period) | |
| Net asset value, beginning of period | | | $ | | | | 11.30 | | | | $ | | | | 9.80 | | | | $ | | | | 9.46 | | | | $ | | | | 11.55 | | | | $ | | | | 11.72 | |
| | | | | | | | | | | |
| Income from investment operations: | | | | | | | | | | | | | | | | | | | | | | | | | | | | | | | | | | | | | | | | |
Net investment income 1 | | | | | | | 0.10 | | | | | | | | 0.09 | | | | | | | | 0.05 | | | | | | | | 0.08 | | | | | | | | 0.13 | |
Net realized and unrealized gains/(losses) | | | | | | | (1.41 | ) | | | | | | | 1.57 | | | | | | | | 0.37 | | | | | | | | (2.08 | ) | | | | | | | (0.18 | ) |
| Total from investment operations | | | | | | | (1.31 | ) | | | | | | | 1.66 | | | | | | | | 0.42 | | | | | | | | (2.00 | ) | | | | | | | (0.05 | ) |
| Distributions from net investment income | | | | | | | (0.12 | ) | | | | | | | (0.16 | ) | | | | | | | (0.08 | ) | | | | | | | (0.09 | ) | | | | | | | (0.12 | ) |
| Change in net asset value for the period | | | | | | | (1.43 | ) | | | | | | | 1.50 | | | | | | | | 0.34 | | | | | | | | (2.09 | ) | | | | | | | (0.17 | ) |
| Net asset value, end of period | | | $ | | | | 9.87 | | | | $ | | | | 11.30 | | | | $ | | | | 9.80 | | | | $ | | | | 9.46 | | | | $ | | | | 11.55 | |
| Total Return | | | | | | | (11.59)% | | | | | | | | 17.02% | | | | | | | | 4.48% | | | | | | | | (17.31)% | | | | | | | | (0.40)% | |
| | | | | | | | | | | |
| Ratios/supplemental data | | | | | | | | | | | | | | | | | | | | | | | | | | | | | | | | | | | | | | | | |
| | | | | | | | | | | |
| Net assets, end of period (000) | | | $ | | | | 1,651 | | | | $ | | | | 2,002 | | | | $ | | | | 1,816 | | | | $ | | | | 4,172 | | | | $ | | | | 5,182 | |
| | | | | | | | | | | |
| Ratio to average net assets: | | | | | | | | | | | | | | | | | | | | | | | | | | | | | | | | | | | | | | | | |
Expenses
(net of reimbursement/recoupment) | | | | | | | 1.34% | | | | | | | | 1.34% | | | | | | | | 1.34% | | | | | | | | 1.34% | | | | | | | | 1.34% | |
Expenses
(prior to reimbursement/recoupment) | | | | | | | 1.54% | | | | | | | | 1.48% | | | | | | | | 1.31% | | | | | | | | 1.27% | | | | | | | | 1.29% | |
Net investment income
(net of reimbursement/recoupment) | | | | | | | 0.85% | | | | | | | | 0.90% | | | | | | | | 0.59% | | | | | | | | 0.75% | | | | | | | | 1.16% | |
Net investment income
(prior to reimbursement/recoupment) | | | | | | | 0.65% | | | | | | | | 0.76% | | | | | | | | 0.62% | | | | | | | | 0.82% | | | | | | | | 1.21% | |
| Portfolio turnover rate 2 | | | | | | | 34% | | | | | | | | 67% | | | | | | | | 57% | | | | | | | | 27% | | | | | | | | 64% | |
| (1) | Net investment income per share represents net investment income divided by the average shares outstanding throughout the period. |
| (2) | Portfolio turnover is calculated on the basis of the Fund as a whole without distinguishing between the classes of shares issued. |
The accompanying notes are an integral part of these financial statements
| | |
| 66 | | www.thomaswhitefunds.com |
Year Ended October 31, 2018
FINANCIAL HIGHLIGHTS
| | | | | | | | | | | | | | | | | | | | | | | | | | | | | | | | | | | | | | | | |
| Thomas White Emerging Markets Fund - Class I | |
| | | | | | Year
Ended
October 31,
2018 | | | | | | Year
Ended
October 31,
2017 | | | | | | Year Ended
October 31,
2016 | | | | | | Year Ended
October 31,
2015 | | | | | | Year Ended
October 31,
2014 | |
| |
| Per share operating performance (For a share outstanding throughout each period) | |
| Net asset value, beginning of period | | | $ | | | | 11.38 | | | | $ | | | | 9.88 | | | | $ | | | | 9.52 | | | | $ | | | | 11.59 | | | | $ | | | | 11.73 | |
| | | | | | | | | | | |
| Income from investment operations: | | | | | | | | | | | | | | | | | | | | | | | | | | | | | | | | | | | | | | | | |
Net investment income 1 | | | | | | | 0.12 | | | | | | | | 0.11 | | | | | | | | 0.09 | | | | | | | | 0.11 | | | | | | | | 0.14 | |
Net realized and unrealized gains/(losses) | | | | | | | (1.41 | ) | | | | | | | 1.59 | | | | | | | | 0.36 | | | | | | | | (2.09 | ) | | | | | | | (0.16 | ) |
| Total from investment operations | | | | | | | (1.29 | ) | | | | | | | 1.70 | | | | | | | | 0.45 | | | | | | | | (1.98 | ) | | | | | | | (0.02 | ) |
| Distributions from net investment income | | | | | | | (0.12 | ) | | | | | | | (0.20 | ) | | | | | | | (0.09 | ) | | | | | | | (0.09 | ) | | | | | | | (0.12 | ) |
| Change in net asset value for the period | | | | | | | (1.41 | ) | | | | | | | 1.50 | | | | | | | | 0.36 | | | | | | | | (2.07 | ) | | | | | | | (0.14 | ) |
| Net asset value, end of period | | | $ | | | | 9.97 | | | | $ | | | | 11.38 | | | | $ | | | | 9.88 | | | | $ | | | | 9.52 | | | | $ | | | | 11.59 | |
| Total Return | | | | | | | (11.33)% | | | | | | | | 17.29% | | | | | | | | 4.69% | | | | | | | | (17.06)% | | | | | | | | (0.12)% | |
| | | | | | | | | | | |
| Ratios/supplemental data | | | | | | | | | | | | | | | | | | | | | | | | | | | | | | | | | | | | | | | | |
| Net assets, end of period (000) | | | $ | | | | 31,861 | | | | $ | | | | 45,392 | | | | $ | | | | 76,240 | | | | $ | | | | 79,656 | | | | $ | | | | 76,705 | |
| | | | | | | | | | | |
| Ratio to average net assets: | | | | | | | | | | | | | | | | | | | | | | | | | | | | | | | | | | | | | | | | |
| Expenses (net of reimbursement) | | | | | | | 1.09% | | | | | | | | 1.09% | | | | | | | | 1.09% | | | | | | | | 1.09% | | | | | | | | 1.09% | |
| Expenses (prior to reimbursement) | | | | | | | 1.51% | | | | | | | | 1.41% | | | | | | | | 1.29% | | | | | | | | 1.25% | | | | | | | | 1.25% | |
| Net investment income (net of reimbursement) | | | | | | | 1.04% | | | | | | | | 1.07% | | | | | | | | 0.92% | | | | | | | | 1.04% | | | | | | | | 1.18% | |
| Net investment income (prior to reimbursement) | | | | | | | 0.62% | | | | | | | | 0.75% | | | | | | | | 0.72% | | | | | | | | 0.88% | | | | | | | | 1.02% | |
| Portfolio turnover rate 2 | | | | | | | 34% | | | | | | | | 67% | | | | | | | | 57% | | | | | | | | 27% | | | | | | | | 64% | |
| (1) | Net investment income per share represents net investment income divided by the average shares outstanding throughout the period. |
| (2) | Portfolio turnover is calculated on the basis of the Fund as a whole without distinguishing between the classes of shares issued. |
The accompanying notes are an integral part of these financial statements
| | | | |
| www.thomaswhitefunds.com | | | 67 | |
Year Ended October 31, 2018
FINANCIAL HIGHLIGHTS
| | | | | | | | | | | | | | | | | | | | | | | | | | | | | | | | | | | | | | | | |
| Thomas White American Opportunities Fund - Investor Class | |
| | | | | | Year
Ended
October 31,
2018 | | | | | | Year
Ended
October 31,
2017 | | | | | | Year
Ended
October 31,
2016 | | | | | | Year
Ended
October 31,
2015 | | | | | | Year
Ended
October 31,
2014 | |
| |
| Per share operating performance (For a share outstanding throughout each period) | |
| Net asset value, beginning of period | | | $ | | | | 16.49 | | | | $ | | | | 14.91 | | | | $ | | | | 15.60 | | | | $ | | | | 15.84 | | | | $ | | | | 15.12 | |
| | | | | | | | | | | |
| Income from investment operations: | | | | | | | | | | | | | | | | | | | | | | | | | | | | | | | | | | | | | | | | |
Net investment income | | | | | | | 0.06 | | | | | | | | 0.04 | | | | | | | | 0.11 | 1 | | | | | | | 0.08 | 1 | | | | | | | 0.07 | 1 |
Net realized and unrealized gains/(losses) | | | | | | | ------- | | | | | | | | 3.00 | | | | | | | | (0.44 | ) | | | | | | | 0.96 | | | | | | | | 2.21 | |
| Total from investment operations | | | | | | | 0.06 | | | | | | | | 3.04 | | | | | | | | (0.33 | ) | | | | | | | 1.04 | | | | | | | | 2.28 | |
| | | | | | | | | | | |
| Distributions: | | | | | | | | | | | | | | | | | | | | | | | | | | | | | | | | | | | | | | | | |
From net investment income | | | | | | | (0.05 | ) | | | | | | | (0.14 | ) | | | | | | | (0.00 | )2 | | | | | | | (0.07 | ) | | | | | | | (0.07 | ) |
From net realized gains | | | | | | | (0.69 | ) | | | | | | | (1.32 | ) | | | | | | | (0.36 | ) | | | | | | | (1.21 | ) | | | | | | | (1.49 | ) |
| Total Distributions | | | | | | | (0.74 | ) | | | | | | | (1.46 | ) | | | | | | | (0.36 | ) | | | | | | | (1.28 | ) | | | | | | | (1.56 | ) |
| Change in net asset value for the period | | | | | | | (0.68 | ) | | | | | | | 1.58 | | | | | | | | (0.69 | ) | | | | | | | (0.24 | ) | | | | | | | 0.72 | |
| Net asset value, end of period | | | $ | | | | 15.81 | | | | $ | | | | 16.49 | | | | $ | | | | 14.91 | | | | $ | | | | 15.60 | | | | $ | | | | 15.84 | |
| Total Return | | | | | | | 0.50% | | | | | | | | 20.45% | | | | | | | | (2.12)% | | | | | | | | 6.69% | | | | | | | | 15.38% | |
| | | | | | | | | | | |
| Ratios/supplemental data | | | | | | | | | | | | | | | | | | | | | | | | | | | | | | | | | | | | | | | | |
| Net assets, end of period (000) | | | $ | | | | 40,969 | | | | $ | | | | 41,433 | | | | $ | | | | 36,816 | | | | $ | | | | 35,875 | | | | $ | | | | 33,830 | |
| | | | | | | | | | | |
| Ratio to average net assets: | | | | | | | | | | | | | | | | | | | | | | | | | | | | | | | | | | | | | | | | |
Expenses
(net of reimbursement/ recoupment) | | | | | | | 1.34% | | | | | | | | 1.19% | | | | | | | | 1.20% | | | | | | | | 1.18% | | | | | | | | 1.24% | |
Expenses
(prior to reimbursement/recoupment) | | | | | | | 1.43% | | | | | | | | 1.19% | | | | | | | | 1.20% | | | | | | | | 1.18% | | | | | | | | 1.15% | |
| Net investment income (net of reimbursement/recoupment) | | | | | | | 0.31% | | | | | | | | 0.28% | | | | | | | | 0.78% | | | | | | | | 0.52% | | | | | | | | 0.45% | |
| Net investment income (prior to reimbursement/recoupment) | | | | | | | 0.22% | | | | | | | | 0.28% | | | | | | | | 0.78% | | | | | | | | 0.52% | | | | | | | | 0.54% | |
| Portfolio turnover rate | | | | | | | 21% | | | | | | | | 29% | | | | | | | | 60% | | | | | | | | 38% | | | | | | | | 32% | |
| (1) | Per share net investment income was calculated prior to tax adjustments. |
| (2) | Amount is less than $0.005. |
The accompanying notes are an integral part of these financial statements
| | |
| 68 | | www.thomaswhitefunds.com |
Report of Independent Registered Public Accounting Firm
To the Shareholders of and
The Board of Trustees of
Lord Asset Management Trust
Opinion on the Financial Statements
We have audited the accompanying statement of assets and liabilities of Thomas White International Fund, Thomas White Emerging Markets Fund, and Thomas White American Opportunities Fund (the “Funds”), each a series of Lord Asset Management Trust, including the schedule of investments, as of October 31, 2018, the related statement of operations for the year then ended, the statements of changes in net assets for each of the two years in the period then ended, financial highlights for each of the five years in the period then ended, and the related notes (collectively referred to as the “financial statements”). In our opinion, the financial statements present fairly, in all material respects, the financial position of the Funds as of October 31, 2018, the results of their operations for the year then ended, the changes in its net assets for each of the two years in the period then ended, and the financial highlights for each of the five years in the period then ended, in conformity with accounting principles generally accepted in the United States of America.
Basis for Opinion
These financial statements are the responsibility of the Funds’ management. Our responsibility is to express an opinion on the Funds’ financial statements based on our audits. We are a public accounting firm registered with the Public Company Accounting Oversight Board (United States) (“PCAOB”) and are required to be independent with respect to the Funds in accordance with the U.S. federal securities laws and the applicable rules and regulations of the Securities and Exchange Commission and the PCAOB. We have served as the auditor of one or more of the funds in the Trust since 2014.
We conducted our audits in accordance with the standards of the PCAOB. Those standards require that we plan and perform the audit to obtain reasonable assurance about whether the financial statements are free of material misstatement, whether due to error or fraud. The Funds are not required to have, nor were we engaged to perform, an audit of its internal control over financial reporting. As part of our audits we are required to obtain an understanding of internal control over financial reporting, but not for the purpose of expressing an opinion on the effectiveness of the Funds’ internal control over financial reporting. Accordingly, we express no such opinion.
Our audits included performing procedures to assess the risks of material misstatement of the financial statements, whether due to error or fraud, and performing procedures that respond to those risks. Such procedures included examining, on a test basis, evidence regarding the amounts and disclosures in the financial statements. Our audits also included evaluating the accounting principles used and significant estimates made by management, as well as evaluating
| | | | |
| www.thomaswhitefunds.com | | | 69 | |
Report of Independent Registered Public Accounting Firm
the overall presentation of the financial statements. Our procedures included confirmation of securities owned as of October 31, 2018 by correspondence with the custodians. We believe that our audits provide a reasonable basis for our opinion.
TAIT, WELLER & BAKER LLP
Philadelphia, Pennsylvania
December 31, 2018
| | |
| 70 | | www.thomaswhitefunds.com |
Tax Information (Unaudited)
The Funds have elected to pass through to their shareholders the foreign taxes paid for the year ended October 31, 2018 as follows:
| | | | | | | | | | | | |
| | | Foreign Dividend
Income | | | Foreign Taxes
Paid | | | Foreign Taxes Paid
per share | |
| International Fund | | | $6,229,723 | | | | $770,681 | | | | $0.0506 | |
| | | | |
| Emerging Markets Fund | | | 902,584 | | | | 119,746 | | | | 0.0356 | |
QUALIFYING DIVIDEND INCOME
For the International Fund, Emerging Markets Fund and American Opportunities Fund, 100% of the income dividend is qualified.
ORDINARY INCOME DIVIDEND AND FOREIGN TAX CREDIT
The International Fund and the Emerging Markets Fund have made an election under Section 853 of the Internal Revenue Code to provide to their shareholders the benefit of foreign tax credits in the per share amount designated below. Therefore, shareholders who must file a U.S. Federal Income tax return will be entitled to a foreign tax credit or an itemized deduction in an amount equal to $0.0490 per share of the International Fund and $0.0322 per share of Emerging Markets Fund for each share owned on October 26, 2018, in computing their tax liability. It is generally more advantageous to claim a credit than a deduction.
| | | | |
| www.thomaswhitefunds.com | | | 71 | |
THOMAS WHITE FUNDS
DISCLOSURE OF FUND EXPENSES (Unaudited)
As a shareholder of the Funds you incur two types of costs : (1) transaction costs, including sales charges (loads) on purchase payments or contingent deferred sales charges on redemptions, if any, or redemption fees; and (2) ongoing costs, including management fees; distribution fees (12b-1); and other Fund expenses. This example is intended to help you understand your ongoing costs (in dollars) of investing in the Funds and to compare these costs with the ongoing costs of investing in other mutual funds.
The example is based on an investment of $1,000 invested at the beginning of the period and held for the entire period, May 1, 2018 through October 31, 2018 for the Funds’ Investor Class and Class I, as applicable.
ACTUAL EXPENSES
The third and fourth columns of the table below provide information about actual account values and actual expenses. You may use the information in this line together with the amount you invested to estimate the expenses you paid over the period. Simply divide your account value by $1,000 (for example, an $8,600 account value divided by $1,000=8.6), then multiply the result by the number in the fourth column under the heading entitled “Expenses Paid During Period” to estimate the expenses you paid on your own account during this period. IRA accounts are charged a $15.00 fee annually in September that is not reflected in the actual expense example. If you hold your Fund shares through an IRA account, you should add this cost to the expenses paid shown below.
HYPOTHETICAL EXAMPLE FOR COMPARISON PURPOSES
The fifth and sixth columns of the table below provide information about hypothetical account values and hypothetical expenses based on each Fund’s actual expense ratio and an assumed rate of return of 5% per year before expenses, which is not the Fund’s actual return. The hypothetical account values and expenses may not be used to estimate the actual ending account balance or expenses you paid for the period. You may use this information to compare the ongoing costs of investing in the Funds and other funds. To do so, compare this 5% hypothetical example with the 5% hypothetical examples that appear in the shareholder reports of the other funds. IRA accounts are charged a $15.00 fee annually in September that is not reflected in the hypothetical expense example. If you hold your Fund shares through an IRA account, you should separately compare the Funds’ IRA fees to the IRA fees of other funds.
Please note that the expenses shown in the table are meant to highlight your ongoing costs only and do not reflect any transactional costs such as sales charges (loads) or purchase payments or contingent deferred sales charges on redemptions, if any, or redemption fees. Therefore the sixth column of the table is useful in comparing ongoing costs only, and will not help you determine the relative costs of owning different funds. In addition, if these transactional costs were included, your costs may have been higher.
| | |
| 72 | | www.thomaswhitefunds.com |
THOMAS WHITE FUNDS
| | | | | | | | | | | | | | | | | | | | | | | | |
| | | | | | | | | | | | Actual | | | Hypothetical (5% return
before expenses) | |
| | | Fund’s
Annualized
Expense
Ratio* | | | Beginning
Account
Value
May 1,
2018 | | | Ending
Account
Value
October 31,
2018 | | | Expenses
Paid
During
Period | | | Ending
Account
Value
October 31,
2018 | | | Expenses
Paid
During
Period | |
| International Fund | | | | | | | | | | | | | | | | | | | | | |
| Investor Class Shares | | | 1.24% | | | | $1,000.00 | | | | $858.70 | | | | $5.81 | | | | $1,018.95 | | | | $6.31 | |
| Class I Shares | | | 0.99% | | | | $1,000.00 | | | | $859.30 | | | | $4.64 | | | | $1,020.21 | | | | $5.04 | |
| Emerging Markets Fund | | | | | | | | | | | | | | | | | | | | | |
| Investor Class Shares | | | 1.34% | | | | $1,000.00 | | | | $843.10 | | | | $6.23 | | | | $1,018.45 | | | | $6.82 | |
| Class I Shares | | | 1.09% | | | | $1,000.00 | | | | $844.40 | | | | $5.07 | | | | $1,019.71 | | | | $5.55 | |
| American Opportunities Fund | | | | | | | | | | | | | | | | | |
| Investor Class | | | 1.34% | | | | $1,000.00 | | | | $987.10 | | | | $6.71 | | | | $1,018.45 | | | | $6.82 | |
| | * | Expenses for the International, Emerging Markets and American Opportunities Funds’ annualized expense ratio (after waiver and reimbursement), multiplied by the average account value over the period, multiplied by 184/365 (to reflect the one-half year period). |
QUARTERLY FORM N-Q PORTFOLIO SCHEDULE
The Funds file their complete schedule of portfolio holdings with the Securities and Exchange Commission (“SEC”) for the first and third quarters of each fiscal year on Form N-Q. Each Fund’s Form N-Q is available on the SEC’s website at http://www.sec.gov. The Funds’ Forms N-Q may be reviewed and copied at the SEC’s Public Reference Room in Washington, D.C. Information on the operation of the SEC’s Public reference Room may be obtained by calling 1-800-SEC-0330. Additionally, you may obtain copies of Forms N-Q from the Funds upon request by calling 1-800-811-0535.
PROXY VOTING POLICIES, PROCEDURES AND RECORD
You may obtain a description of the Funds’ (1) proxy voting policies, (2) proxy voting procedures and (3) information regarding how the Funds voted any proxies related to portfolio securities during the most recent 12 month period ended June 30 for which an SEC filing has been made, without charge, upon request by calling the Funds at 1-800-811-0535 or on the EDGAR database on the SEC’s website (http://www.sec.gov).
| | | | |
| www.thomaswhitefunds.com | | | 73 | |
Approval of New Investment Advisory Agreements
Effective as of September 30, 2018, Thomas White International, Ltd., the investment adviser to the Funds (the “Adviser”) and Thomas S. White, Jr., the founder of the firm, completed a transaction pursuant to which Mr. White sold his entire majority-ownership interest in the firm to the Adviser in exchange for cash (the “Transaction”). The Transaction was part of a transition plan pursuant to which various officers and employees of the Adviser increased their ownership interests in the firm in connection with Mr. White’s retirement from the Adviser. Due to the substantial change in the ownership arrangements of the Adviser, the closing of the Transaction resulted in a change of control of the Adviser (the “Change of Control”). As required by the Investment Company Act of 1940, as amended (the “1940 Act”), the then-effective Investment Advisory Agreements between the Adviser and the Funds (the “Prior Advisory Agreements”) each contained a provision that the Prior Advisory Agreements would automatically terminate in the event of their “assignment” (as defined in the 1940 Act). The Change of Control caused the assignment of each of the Prior Advisory Agreements and thus resulted in the automatic termination of each of the Prior Advisory Agreements.
The Board of Trustees of the Funds therefore met at an in-person meeting of the Board that was held on September 21, 2018 at which the members of the Board approved proposed new Investment Advisory Agreements (the “New Advisory Agreements”) with respect to the Funds between the Adviser, under its new ownership arrangements (referred to herein solely for these purposes as “New TWI”) and the Trust, on behalf of the Funds, and the New Advisory Agreements were approved by shareholders of each respective Fund at a Special Meeting of Shareholders that was held on November 30, 2018.
In accordance with relevant provisions of the 1940 Act, the Board of Trustees of the Funds was required to consider the initial approval of each of the New Advisory Agreements with New TWI, and this action was required to take place at an in-person meeting of the Board. The relevant provisions of the 1940 Act specifically provide that it is the duty of the Board to request and evaluate such information as the Board determines is necessary to allow them to properly consider the approval of the New Advisory Agreements, and it is the duty of the investment adviser to furnish the Trustees with such information that is responsive to their request. Accordingly, in determining whether to approve the adoption of the New Advisory Agreements, the Board of Trustees requested, and TWI provided, information and data relevant to the Board’s consideration. This included materials prepared by the Adviser for the Board that provided them with information regarding the investment performance of the Funds and information regarding the proposed fees and expenses of the Funds, compared to other similar mutual funds.
Following their consideration and review of the New Advisory Agreements, the Trustees determined that each Agreement would enable shareholders of the Fund to which it applies to continue to obtain high quality services at a cost that is appropriate, reasonable, and in the best interests of its shareholders. Accordingly, the Board, including all of the Independent Trustees, unanimously approved the adoption of the New Advisory Agreements. In reaching their
| | |
| 74 | | www.thomaswhitefunds.com |
Approval of New Investment Advisory Agreements
decisions, the Trustees requested and obtained from TWI such information as they deemed reasonably necessary to evaluate the New Advisory Agreements. The Trustees also carefully considered the information regarding the anticipated level of profitability of New TWI and comparative fee, expense and performance information prepared by Trust management. The Board also considered the similarity of each of the New Advisory Agreements to the respective Prior Advisory Agreements, noting that the material terms and conditions were not changing. In considering the adoption of the New Advisory Agreements, the Trustees evaluated a number of considerations that they believed, in light of the legal advice furnished to them by Trust counsel and their own reasonable business judgment, to be relevant. They based their decisions on the following considerations, among others, although they did not identify any one specific consideration or particular information that was controlling of their decisions:
| | • | | The nature, extent and quality of the advisory services expected to be provided. The Trustees concluded that New TWI will be capable of providing high quality services to each Fund, as indicated by the nature and quality of services previously provided in the past by TWI, New TWI’s expected management capabilities as demonstrated with respect to the Funds, the professional qualifications and experience of the Funds’ portfolio managers who would be working for New TWI, New TWI’s investment and management oversight processes as explained to the Board, and the overall long-term investment performance of the Funds while under the management of TWI. The Trustees also determined that New TWI proposed to provide investment advisory services that were of the same quality as services that TWI has previously provided to the Funds in the past, and that these services are appropriate in scope and extent in light of the Funds’ operations, the competitive landscape of the investment company business and investor needs. |
| | • | | The expected investment performance of the Funds. With respect to each Fund, the Trustees concluded on the basis of information derived from the performance data that TWI had achieved investment performance that was competitive relative to comparable funds over various trailing time periods, including over longer-term trailing time periods, and the Trustees took into consideration the fact that had TWI focused on long-term performance results with respect to their management of the Funds. The Trustees took into consideration that all of the current co-portfolio managers of the Funds, with the exception of Mr. White, would be working at New TWI. On the basis of the Trustees’ assessment of the nature, extent and quality of advisory services expected to be provided by New TWI, the Trustees concluded that New TWI would be capable of generating a level of long-term investment performance that is appropriate in light of the Funds’ investment objectives, policies and strategies and competitive with many other investment companies. |
| | • | | The cost of advisory services to be provided and the expected level of profitability. On the basis of comparative information derived from the expense data, the Trustees |
| | | | |
| www.thomaswhitefunds.com | | | 75 | |
Approval of New Investment Advisory Agreements
| | determined that the overall expense ratio of each Fund, on a net basis, was expected to be competitive with industry averages, particularly with respect to mutual funds of comparable asset size. The Trustees also noted that New TWI had proposed to enter into a contractual commitment for the benefit of Fund shareholders to limit the operating expenses of each of the classes of shares of the Funds. The Board took into consideration information regarding the fees that New TWI would be charging to other accounts, non-U.S. funds and private funds for similar investment advisory services, and the Trustees noted that the fees were comparable based on the relevant circumstances of the types of accounts involved. The Board also considered New TWI’s expected level of profitability with respect to its proposed management of the Funds, and noted that New TWI’s anticipated level of profitability was acceptable and not excessive and consistent with applicable industry averages and that New TWI expressed its commitment to using its own resources to help grow the Funds. The Trustees also took into consideration the nature and extent of other expenses that were undertaken to be borne directly by New TWI from its own financial resources in order to help to market and promote the Funds. Accordingly, on the basis of the Board’s review of the fees proposed to be charged by New TWI for investment advisory services, the investment advisory and other services proposed to be provided to the Funds by New TWI, and the estimated profitability of New TWI’s relationship with each Fund, the Board concluded that the level of investment advisory fees and New TWI’s anticipated level of profitability were appropriate in light of the investment advisory fees, overall expense ratios and investment performance of comparable investment companies and the historical profitability of the relationship between each Fund and TWI. The Trustees considered the anticipated level of profitability of New TWI both before and after the impact of the marketing related expenses that New TWI anticipates incurring out of its own resources in connection with its planned management of the Funds. |
| | • | | The extent to which economies of scale will be realized as the Funds grow and whether the advisory fees reflect economies of scale. While the Funds’ investment advisory fees do not decrease as Fund assets grow because the Funds are not subject to investment advisory fee breakpoints, the Trustees concluded that the Funds’ investment advisory fees are appropriate in light of the current size of the Funds, and appropriately reflect the current economic environment for New TWI and the competitive nature of the mutual fund market. The Trustees noted that New TWI had undertaken to limit the Funds’ total annual operating expenses by waiving fees and/or reimbursing certain Fund expenses. The Trustees then noted that they will have the opportunity to periodically re-examine whether a Fund has achieved economies of scale, and the appropriateness of investment advisory fees payable to New TWI, in the future. |
| | • | | Benefits to New TWI from its relationship with the Funds (and any corresponding benefits to the Funds). The Trustees concluded that other benefits that may be derived |
| | |
| 76 | | www.thomaswhitefunds.com |
Approval of New Investment Advisory Agreements
| | by New TWI from its relationship with the Funds, including “soft dollar” benefits in connection with Fund brokerage transactions and use of the Funds’ performance track records in advertising materials, are reasonable and fair, and consistent with industry practice and the best interests of the Funds and their shareholders. In addition, the Trustees determined that the Funds could be expected to benefit from their relationship to New TWI by virtue of New TWI’s proposed provision of business management services, in addition to investment advisory services, at a cost to the Funds that is generally comparable to the cost of an outside service provider, which the Trustees determined to be reasonable, fair and in the best interests of Fund shareholders in light of the nature and quality of the services provided and the necessity of the services for the Funds’ operations. In considering information regarding the business management fees payable by the Funds to New TWI under the terms of the Business Management Agreement, the Board members indicated that they had considered various factors with respect to the proposed business management fees, including the level and amount of these fees and the services to be provided by New TWI in connection with the Business Management Agreement, in determining the reasonableness of the total fees that are to be paid by the Funds to New TWI for the overall level of services that New TWI proposes to provide to the Funds and their shareholders. In considering the nature and extent of these non-advisory business management services that are proposed to be provided to the Funds by New TWI, the Board took into consideration: (i) whether the Business Management Agreement is in the best interest of the Funds and their shareholders; (ii) whether the services to be performed under the Business Management Agreement are required for the operation of the Funds; (iii) whether the services provided are of a nature and quality at least equal to the same or similar services provided by independent third parties; and (iv) whether the fees for the services are fair and reasonable in light of the usual and customary charges made by others for services of the same nature and quality. |
| | • | | Other Considerations. In approving the New Advisory Agreements, the Trustees determined that New TWI will be making a substantial commitment to the recruitment and retention of high quality personnel, and has undertaken to maintain the same level of financial, compliance and operational resources reasonably necessary to manage the Funds in a professional manner that is consistent with the best interests of the Funds and their shareholders that TWI has been providing. The Trustees also considered that New TWI has undertaken to make a significant entrepreneurial commitment to the management and success of the Funds, which is expected to entail a substantial financial and professional commitment, including the implementation of the Expense Limitation Agreements with respect to each Fund under which New TWI has undertaken to waive a portion of its fees to the benefit of Fund shareholders to the extent necessary in accordance with the terms of the Expense Limitation Agreements, subject to applicable recoupment provisions. The Board also considered matters with respect to the proposed |
| | | | |
| www.thomaswhitefunds.com | | | 77 | |
Approval of New Investment Advisory Agreements
| | brokerage practices of New TWI, including its soft dollar arrangements and its best-execution procedures, and noted that these were reasonable and consistent with standard industry practice. |
In reaching their conclusion with respect to the proposed adoption of each of the New Advisory Agreements and the level of fees to be paid under the New Advisory Agreements, the Trustees did not identify any one single factor as being controlling. Rather, the Board took note of a combination of factors that had influenced their decision making process. They noted the expected level and quality of investment advisory services proposed to be provided by New TWI to each of the Funds, and they found that these proposed services should be expected to benefit the shareholders of the Funds and also reflected the new management team’s overall commitment to the continued growth and development of the Funds. Based upon their consideration and review of these factors and other matters deemed relevant by the Board in reaching an informed business judgment, the Trustees, including a majority of the Independent Trustees, concluded that the terms of the New Advisory Agreements were fair and reasonable in light of the services proposed to be provided by New TWI and the Board therefore voted to approve the adoption of the New Advisory Agreements, as presented.
| | |
| 78 | | www.thomaswhitefunds.com |
THOMAS WHITE FUNDS
TRUSTEE AND OFFICER DISCLOSURE OCTOBER 31, 2018
| | | | | | | | | | |
| | | | | | |
Name, Address and Age | | Positions held with
Funds | | Length
of Time
Served | | Principal Occupation During Past Five Years | | Number of
Portfolios
overseen
by Trustee | | Other
Directorships
Held by Trustee |
Douglas M. Jackman 425 S. Financial Pl. Suite 3900 Chicago, IL 60605 51 | | Trustee, President | | 0 Years* | | President of Thomas White International, Ltd. (since 1996) | | 3 | | None |
| | | | | | |
David M. Sullivan II 425 S. Financial Pl. Suite 3900 Chicago, IL 60605, 46 | | Vice President and Treasurer | | 18 years | | Treasurer of the Thomas White Funds; Executive Vice President of Thomas White International, Ltd. | | N/A | | N/A |
| | | | | | |
J. Ryan Conner 425 S. Financial Pl. Suite 3900 Chicago, IL 60605, 38 | | Secretary and Chief Compliance Officer | | 7 years | | Senior Vice President of Thomas White International, Ltd. | | N/A | | N/A |
| | | | | | |
| Independent Trustees: | | | | | | | | | | |
| | | | | | |
Arthur J. Fiocco, Jr. 425 S. Financial Pl. Suite 3900 Chicago, IL 60605 61 | | Trustee | | 3 Years | | Vice President of Operations of Baxter International, Inc. (medical products) (since 2016, prior to which he was a Director (since 2015)); Former Corporate Vice President of Hospira, Inc. (pharmaceutical company) (2004-2014). | | 3 | | None |
| | | | | | |
Geri Sands Hansen 425 S. Financial Pl. Suite 3900 Chicago, IL 60605 57 | | Trustee | | 0 Years* | | Retired; Co-Founder and Chief Investment Officer of Attucks Asset Management, LLC (2001-2015). | | 3 | | None |
| | | | | | |
Elizabeth G. Montgomery 425 S. Financial Pl. Suite 3900 Chicago, IL 60605, 74 | | Trustee | | 17 years | | Retired; former President, Graham Group (management consulting). | | 3 | | None |
| | | | | | |
Robert W. Thomas 425 S. Financial Pl. Suite 3900 Chicago, IL 60605, 74 | | Trustee | | 12 years | | Retired; former President of Thomas Laboratories, Inc. (pharmaceutical company). | | 3 | | None |
| | | | | | |
John N. Venson 425 S. Financial Pl. Suite 3900 Chicago, IL 60605, 71 | | Trustee | | 24 years | | Retired; former Dean of the California School of Podiatric Medicine (2008-2017); Doctor of Podiatric Medicine. | | 3 | | None |
| | | | | | |
William H. Woolverton 425 S. Financial Pl. Suite 3900 Chicago, IL 60605 67 | | Trustee, Chairman | | 3 Years | | Managing Director of DMS Governance Ltd. (fund governance) (since 2016); Former Senior Managing Director and General Counsel of Gottex Fund Management (investment advisory firm) (2005-2016). | | 3 | | None |
| | * | Trustees elected through a shareholder vote held November 30, 2018 |
ADDITIONAL INFORMATION
The Statement of Additional Information contains additional information regarding the Funds and Trustees, and is available upon request without charge by calling 1-800-811-0535.
| | | | |
| www.thomaswhitefunds.com | | | 79 | |
Privacy Policy
LORD ASSET MANAGEMENT TRUST
THOMAS WHITE INTERNATIONAL, LTD.
I. Commitment to Consumer* Privacy
The Thomas White Funds Family and Thomas White International, Ltd. (collectively, “we” or “us”) are committed to handling consumer information responsibly. We recognize and respect the privacy expectations of our consumers, and we believe that the confidentiality and security of consumers’ personal financial information is one of our fundamental responsibilities.
II. Collection of Consumer Information
We collect, retain and use consumer information only where we reasonably believe it would be useful to the consumer and allowed by law. Consumer information collected by us generally comes from the following sources:
| | • | | Information we receive on applications or other forms; |
| | • | | Information about consumers’ transactions with us, our affiliates, or others. |
III. Disclosure of Consumer Information
We may disclose all of the consumer information we collect to affiliated financial institutions and to third parties who are not our affiliates:
| | • | | to perform marketing services on our behalf or pursuant to a joint marketing agreement between us and another party; and |
| | • | | as otherwise permitted by law. |
We do not disclose any consumer information about our former customers* to anyone except as permitted by law.
IV. Security of Customer Information
We are committed to, and also require our service providers to:
| | • | | maintain policies and procedures designed to assure only appropriate access to, and use of information about our customers; and |
| | • | | maintain physical, electronic and procedural safeguards that comply with federal standards to guard non-public personal information of our customers. |
* As defined in Regulation S-P
| | |
| 80 | | www.thomaswhitefunds.com |
This page is intentionally left blank.
This page is intentionally left blank.
OFFICERS AND TRUSTEES
William H. Woolverton
Chairman of the Board
Arthur J. Fiocco, Jr.
Trustee
Geri Sands Hansen
Trustee
Elizabeth G. Montgomery
Trustee
Robert W. Thomas
Trustee
John N. Venson, D.P.M.
Trustee
Douglas M. Jackman
President and Trustee
David M. Sullivan II
Vice President, Treasurer and
Assistant Secretary
J. Ryan Conner
Secretary and Chief Compliance Officer
INVESTMENT ADVISOR AND OTHER SERVICE PROVIDERS
Thomas White International, Ltd.
425 S Financial Place, Suite 3900
Chicago, Illinois 60605-1028
CUSTODIANS
The Northern Trust Company
Chicago, Illinois
U.S. Bank, N.A.
Milwaukee, Wisconsin
LEGAL COUNSEL
Dechert LLP
Washington, DC
INDEPENDENT REGISTERED PUBLIC ACCOUNTING FIRM
Tait, Weller & Baker, LLP
Philadelphia, Pennsylvania
ADMINISTRATOR and TRANSFER AGENT
U.S. Bancorp Fund Services, LLC
Milwaukee, Wisconsin
DISTRIBUTOR
Quasar Distributors, LLC
Milwaukee, Wisconsin
FOR CURRENT PERFORMANCE, NET ASSET VALUE OR FOR ASSISTANCE WITH YOUR ACCOUNT, PLEASE CONTACT THE THOMAS WHITE FUNDS AT 800-811-0535 OR VISIT OUR WEB SITE AT WWW.THOMASWHITEFUNDS.COM

www.thomaswhitefunds.com
Item 2. Code of Ethics.
The registrant has adopted a code of ethics that applies to the registrant’s principal executive officer and principal financial officer. The registrant has not made any substantive amendments to its code of ethics during the period covered by this report. The registrant has not granted any waivers from any provisions of the code of ethics during the period covered by this report.
A copy of the Registrant’s Code of Ethics is filed herewith. The Registrant undertakes to provide to any person without charge, upon request, a copy of its code of ethics by mail when they call the Registrant at 1-800-811-0535.
Item 3. Audit Committee Financial Expert.
The Registrant’s Board of Trustees has determined that it does not have an Audit Committee financial expert serving on its Audit Committee. At this time, the Registrant believes that the experience provided by each member of the Audit Committee together offers the Registrant adequate oversight for the Registrant’s level of financial complexity.
Item 4. Principal Accountant Fees and Services.
The Registrant has engaged its principal accountant to perform audit services, audit-related services, tax services and other services during the past two fiscal years. “Audit services” refer to performing an audit of the Registrant’s annual financial statements or services that are normally provided by the accountant in connection with statutory and regulatory filings or engagements for those fiscal years. “Audit-related services” refer to the assurance and related services by the principal accountant that are reasonably related to the performance of the audit. “Tax services” refer to professional services rendered by the principal accountant for tax compliance, tax advice, and tax planning. “Other services” provided by the principal accountant were provided by the principal accountant. The following table details the aggregate fees billed or expected to be billed for each of the last two fiscal years for audit fees, audit-related fees, tax fees and other fees by the principal accountant.
| | | | |
| | | FYE 10/31/2018 | | FYE 10/31/2017 |
Audit Fees | | $51,000 | | $51,000 |
Audit-Related Fees | | - | | - |
Tax Fees | | $9,000 | | $9,000 |
All Other Fees | | - | | - |
The Audit Committee has adopted pre-approval policies and procedures that require the Audit Committee to pre-approve all audit and non-audit services of the Registrant, including services provided to any entity affiliated with the Registrant.
The percentage of fees billed by Tait, Weller & Baker, LLP applicable to non-audit services pursuant to waiver of pre-approval requirement were as follows:
| | | | |
| | | FYE 10/31/2018 | | FYE 10/31/2017 |
Audit-Related Fees | | 0% | | 0% |
Tax Fees | | 0% | | 0% |
All Other Fees | | 0% | | 0% |
2
All of the principal accountant’s hours spent on auditing the registrant’s financial statements were attributed to work performed by full-time permanent employees of the principal accountant. There were no non-audit fees billed or expected to be billed by the Registrant’s accountant for services to the Registrant and to the Registrant’s investment adviser (and any other controlling entity, etc. –not sub-adviser) for the last two years.
Item 5. Audit Committee of Listed Registrants.
Not applicable to registrants who are not listed issuers (as defined in Rule 10A-3 under the Securities Exchange Act of 1934).
Item 6. Investments.
| (a) | The Schedules of Investments are included as part of the report to shareholders filed under Item 1 of this Form N-CSR. |
Item 7. Disclosure of Proxy Voting Policies and Procedures for Closed-End Management Investment Companies.
Not applicable to open-end investment companies.
Item 8. Portfolio Managers of Closed-End Management Investment Companies.
Not applicable to open-end investment companies.
Item 9. Purchases of Equity Securities by Closed-End Management Investment Company and Affiliated Purchasers.
Not applicable to open-end investment companies.
Item 10. Submission of Matters to a Vote of Security Holders.
There have been no material changes to the procedures by which shareholders may recommend nominees to the Registrant’s Board of Trustees.
Item 11. Controls and Procedures.
| (a) | Based on an evaluation of Registrant’s Disclosure Controls and Procedures (as defined in Rule 30a-3(c) under the Investment Company Act of 1940) (the “Disclosure Controls”), as of a date within 90 days prior to the filing date (the “Filing Date”) of this Form N-CSR (the “Report”), the Registrant’s principal executive officer and principal financial officer have concluded that the Disclosure Controls are effectively designed to ensure that information required to be disclosed by the Registrant in the Report is recorded, processed, summarized and reported by the Filing Date, including ensuring that information required to be disclosed in the Report is accumulated and communicated to the Registrant’s management, including the Registrant’s principal executive officer and principal financial officer, as appropriate, to allow timely decisions regarding required disclosure. |
3
| (b) | There were no changes in the Registrant’s internal control over financial reporting (as defined in Rule 30a-3(d) under the Act) that occurred during the most recent fiscal quarter of the period covered by this report that has materially affected, or is reasonably likely to materially affect, the Registrant’s internal control over financial reporting. |
Item 12. Disclosure of Securities Lending Activities for Closed-End Management Investment Companies
Not applicable to open-end investment companies.
Item 13. Exhibits.
(a) (1) Code of ethics. Filed herewith.
(2) Certifications pursuant to Section 302 of the Sarbanes-Oxley Act of 2002. Filed herewith.
(3) Any written solicitation to purchase securities under Rule 23c-1 under the Act sent or given during the period covered by the report by or on behalf of the Registrant to 10 or more persons. Not applicable to open-end investment companies.
(4) Change in the registrant’s independent public accountant. There was no change in the registrant’s independent public accountant for the period covered by this report.
| (b) | Certifications pursuant to Section 906 of the Sarbanes-Oxley Act of 2002. Filed herewith. |
4
SIGNATURES
Pursuant to the requirements of the Securities Exchange Act of 1934 and the Investment Company Act of 1940, the registrant has duly caused this report to be signed on its behalf by the undersigned, thereunto duly authorized.
| | |
| (Registrant) LORD ASSET MANAGEMENT TRUST |
| | |
| |
| By (Signature and Title) | | /s/ Douglas M. Jackman |
| | Douglas M. Jackman |
| | President (Principal Executive Officer) |
Pursuant to the requirements of the Securities Exchange Act of 1934 and the Investment Company Act of 1940, this report has been signed below by the following persons on behalf of the registrant and in the capacities and on the dates indicated.
| | |
| By (Signature and Title) | | /s/ Douglas M. Jackman |
| | Douglas M. Jackman |
| | President (Principal Executive Officer) |
| | |
| By (Signature and Title) | | /s/ David M. Sullivan II |
| | David M. Sullivan II |
| | Treasurer (Principal Financial Officer) |
5