Table of Contents
UNITED STATES
SECURITIES AND EXCHANGE COMMISSION
Washington, D.C. 20549
FORM N-CSR
CERTIFIED SHAREHOLDER REPORT OF REGISTERED
MANAGEMENT INVESTMENT COMPANIES
Investment Company Act file number 811-08348
LORD ASSET MANAGEMENT TRUST
(Exact name of registrant as specified in charter)
425 South Financial Place
Chicago, Illinois 60605-1028
(Address of principal executive offices) (Zip code)
Douglas M. Jackman
Thomas White International, Ltd.
425 South Financial Place
Chicago, Illinois 60605-1028
(Name and address of agent for service)
(312) 663-8300
Registrant’s telephone number, including area code
Date of fiscal year end: 10/31
Date of reporting period: 11/1/2020 – 10/31/2021
Table of Contents
Item 1. Reports to Stockholders.
| (a) | Include a copy of the report transmitted to stockholders pursuant to Rule 30e-1 under the Act (17 CFR 270.30e-1). |
Table of Contents


ANNUAL REPORT
OCTOBER 31, 2021
INTERNATIONAL FUND
AMERICAN OPPORTUNITIES FUND
Table of Contents
Table of Contents

| 1 | ||||
MANAGER COMMENTS, PERFORMANCE AND INVESTMENT PORTFOLIO | ||||
| 5 | ||||
| 18 | ||||
| 29 | ||||
| 31 | ||||
| 32 | ||||
| 34 | ||||
| 37 | ||||
| 49 | ||||
| 52 | ||||
QUARTERLY PORTFOLIO HOLDINGS SCHEDULES AND PROXY VOTING POLICIES | 53 | |||
| 54 | ||||
| 55 | ||||
| 56 | ||||
Table of Contents
Dear Thomas White Funds Shareholders:
We want to begin by hoping you, your family, and friends have remained safe and healthy over these past 12-months. From the onset of the discovery of the COVID-19 virus, normality as we knew it could be forever changed. Our daily personal and professional lives were interrupted but adapting to these changes has, in some aspects, positively impacted our daily routines. At Thomas White International, we are honored to have been able to work with our clients to help navigate this environment. We appreciate your long-time confidence and look forward to continuing to work with you.
The 2020-21 fiscal year continued to build upon the momentum global markets exhibited from the recovery that began in the second quarter of 2020. For the 12-month period ended October 31, 2021, the Russell Midcap Index rose +45.4% while the MSCI All Country World ex US Index returned +29.6%. During this same period, bond markets were generally flat to negative. Easy monetary policy across the globe created a favorable economic environment for equity markets and other assets such as housing but we expect these monetary policies to abate as inflation for wages, commodities and services are expanding beyond central bank targets in the U.S. and many other major economies. We would note that without this stimulus, the economic recovery could have
been much slower and the negative effects of unemployment and bankruptcies more severe.
Outside of the U.S., many developed countries have lagged the domestic economic recovery due to slower vaccination rates and smaller-scale fiscal spending. We believe that could change leading into 2022 as many countries have been opening up in the second half of 2021 and governments have increased fiscal spending on a targeted basis. Economies opening up could be derailed by the impact of variant strains such as Delta or Omicron, but governments have largely followed best practices in trying to get their populations vaccinated to allow their borders and economies to reopen. The varying fiscal approaches led to differing economic recoveries as the U.S. opted to provide stimulus funds to businesses as well as mailing checks directly to individuals. Europe has primarily utilized stimulus through infrastructure spending with their recently implemented $900B regional recovery fund leading to Gross Domestic Product (GDP) growth above 4%.
One challenge this pandemic has illuminated is the fragility of the global supply chain. The modern global economy is highly integrated and as countries shut down their economies, it created major supply disruptions. Manufacturing shutdowns were later compounded by labor shortages and logistical bottlenecks. Surging demand for goods but a shortage of inputs ranging from
| www.thomaswhitefunds.com | 1 |
Table of Contents
commodities to semiconductor chips has created month-long manufacturing delays, leading to higher inflation across the globe. Re-examining these supply chains and the ability to control logistics channels could create investment opportunities as more stable supply systems would likely require new infrastructure investments, while potentially underpinning higher input costs.
Geopolitics continue to play an outsized role in financial markets. For example, tensions between the U.S. and China remain despite the change in the political party holding the presidency in the U.S. Fears of the delisting of large Chinese companies like Alibaba, PDD and Tencent persist based on the potential actions of governments in both countries. The Chinese government has also imposed its own internal policies surrounding their Common Prosperity approach which has constrained growth at many of the largest Chinese companies. Conversely, the U.S. has approached its allies regarding the removal of tariffs and other policies imposed by the previous administration which has created positive investment and growth opportunities within countries like Germany, Canada and Mexico.
Navigating the Markets in 2022 and Beyond
Looking forward over the next one to three years, we remain optimistic that central banks are continuing to employ lessons learned from mistakes made over the past twenty years, such as not choking off economic growth too quickly as they begin the process of tightening monetary policy. Due to the ever changing COVID-19 environment, monetary policy is expected to
be dynamic but should lead to a favorable investing environment in 2022.
As we have learned in past investment cycles, maintaining a sharp focus on valuation and growth metrics are key to capturing value in these markets. Due to $4 trillion in fiscal stimulus in the U.S. over the past two years, there have been almost literal piles of cash available, and combined with low cost capital by leveraging through debt, this stimulus has propelled valuations in some areas to levels not seen since the turn of the last century. Trends such as the utilization of special purpose acquisition companies (SPACs)* in the past two years, seeing new initial public offerings (IPOs) double or triple in value only to fall 50% below those levels within months, reflects a level of speculation we have not seen since the Technology Bubble of the late 1990s. On the other hand, we see valuations in non-U.S. markets at the widest discount to the U.S. in over a decade. Companies within areas like financials, real estate investment trusts (REITs) and industrials remain at compelling valuations, in our opinion.
The U.S. economy is entering an environment where inflation has risen to levels not seen in nearly 40 years. While commented to be transitory by the Federal Reserve, the Fed governors face an unfamiliar paradigm. There could be bumps in the road but we believe it creates opportunities to focus on well run businesses that embrace technological change to improve their margins and operational efficiencies. Our deeply experienced investment team has managed client portfolios through many different investment cycles over the past twenty-five years. In the
| 2 | www.thomaswhitefunds.com |
Table of Contents
end, we believe it is important to maintain your investment discipline and to focus on a company’s ability to generate future growth and cash flow.
We believe 2022 and beyond holds promise as the global economy rapidly adapts to the changing economic and political landscape. We want to thank all of our shareholders for your continued trust in our firm as we remain committed as ever to helping you achieve your long-term investment goals. Please feel free to visit our website www.thomaswhitefunds.com for our quarterly market reviews and commentaries, or call us at 1-800-811-0535 with any questions.

Douglas M. Jackman, CFA
President and Portfolio Manager
Thomas White International and Thomas White Funds
| www.thomaswhitefunds.com | 3 |
Table of Contents
Past performance is not a guarantee of future results.
Opinions expressed are subject to change, are not guaranteed and should not be considered recommendations to buy or sell any security.
This report is for the information of shareholders of the Thomas White Funds, but may also be used as sales literature when preceded or accompanied by a current prospectus, which gives details about charges, expenses, investment objectives and operating policies of the funds.
Mutual fund investing involves risk. Principal loss is possible. Investing in international markets may involve additional risks such as social and political instability, market illiquidity, exchange-rate fluctuations, a high level of volatility and limited regulation. These risks are greater for emerging markets. Investing in small and mid-cap companies can involve more risk than investing in larger companies.
Earnings growth for a Fund holding does not guarantee a corresponding increase in the market value of the holding of the Fund.
The Thomas White Funds are distributed by Quasar Distributors, LLC.
It is not possible to invest directly in an index.
An outbreak of an infectious respiratory illness caused by a novel coronavirus known as COVID-19 has negatively affected the worldwide economy, as well as the economies of individual countries, the financial health of individual companies and the market in general in significant and unforeseen ways. The future impact of COVID-19 is currently unknown, and it may exacerbate other risks that apply to a Fund. Any such impact could adversely affect a Fund’s performance, the performance of the securities in which a Fund invests and may lead to losses on your investment in a Fund.
*Whether you are investing in a SPAC by participating in its IPO or by purchasing its securities on the open market following an IPO, you should carefully read the SPAC’s IPO prospectus as well as its periodic and current reports filed with the SEC pursuant to its ongoing reporting obligations.
While there are no sales charges, management fees and other expenses still apply. Please refer to the prospectus for further details.
| 4 | www.thomaswhitefunds.com |
Table of Contents
THOMAS WHITE INTERNATIONAL FUND
| (Unaudited) Sales Charge | Deferred Sales Charge | Administrative Services Fee | 12b-1 Fees | Gross Operating Expenses1 | Net Operating Expenses1 | |||||||
| Investor Class |
None |
None |
Up to 0.25% |
None |
1.63% |
1.24% | ||||||
| Class I | None | None | None | None | 1.44% | 0.99% | ||||||
1 Thomas White International, Ltd. (“Advisor”) has agreed to defer its fees and/or reimburse the Fund to the extent that the operating expenses for Investor Class and Class I shares exceed (as a percentage of average daily net assets) 1.24% and 0.99%, respectively. The fee deferral/expense reimbursement agreement expires February 28, 2022. The Fund has agreed to repay the Advisor for amounts deferred or reimbursed by the Advisor pursuant to the agreement provided that such repayment does not cause the Fund to exceed the above limits and the repayment is made within three years after the year in which the Advisor incurred the expense. The fee deferral/expense reimbursement agreement may only be amended or terminated by the Fund’s Board of Trustees. The net expense ratio is applicable to investors.
| Net Asset Value per Share (NAV) | Net Assets | Redemption Fee* | Portfolio Turnover | |||||
| Investor Class | $18.51 | $20.3 million | 2.00% |
49% | ||||
| Class I | $18.50 | $71.7 million | 2.00% | |||||
* On shares purchased and held for less than 60 days (as a percentage of amount redeemed, if applicable).
| www.thomaswhitefunds.com | 5 |
Table of Contents
THOMAS WHITE INTERNATIONAL FUND
| Total Returns as of October 31, 2021 (Unaudited) | ||||||||||||||
| Annualized | ||||||||||||||
| Class | Sales Charge | 1 Yr | 5 Yrs | 10 Yrs | ||||||||||
| Investor Class shares (TWWDX) | None | 27.92% | 8.71% | 5.38% | ||||||||||
| Class I shares1 (TWWIX) | None | 28.21% | 8.97% | 5.62% | ||||||||||
| MSCI All Country World ex US Index2 | N/A | 29.66% | 9.77% | 6.66% | ||||||||||
1 Performance figures for Class I shares, first offered on August 31, 2012, include the historical performance of Investor Class shares through August 30, 2012.
2 The MSCI All Country World ex US Index is a free float-adjusted market capitalization-weighted index of both developed and emerging markets. The index is unmanaged and returns assume the reinvestment of dividends. It is not possible to invest directly in an index.
Returns of each share class reflect differences in expenses applicable to each class which are primarily differences in service fees.
The returns do not reflect the deduction of taxes that a shareholder would pay on Fund distributions or the redemption of Fund shares. The returns reflect the actual performance for each period and do not include the impacts of trades executed on the last business day of the period that were recorded on the first business day of the next period.
Performance data is based upon past performance, which is no guarantee of future results. The investment return and principal value of an investment will fluctuate so that an investor’s shares, when redeemed, may be worth more or less than their original cost. Current performance may be higher or lower than the performance data quoted. Please call 1-800-811-0535 to obtain performance data as of the most recent month-end. The Fund imposes a 2% redemption fee on shares held less than 60 days. Performance data does not reflect the redemption fee. If reflected, total returns would be lower. Investment performance reflects any fee waivers that were in effect. In the absence of such waivers, total return would have been reduced.
| 6 | www.thomaswhitefunds.com |
Table of Contents
OCTOBER 31, 2021
GROWTH OF A $10,000 INVESTMENT WITH DIVIDENDS REINVESTED (Unaudited)
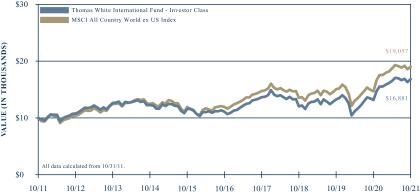
This chart illustrates the performance of a hypothetical $10,000 investment made in the Fund’s Investor Class shares and its benchmark, the MSCI All Country World ex US Index, for the past 10 years through October 31, 2021. It assumes reinvestment of dividends and capital gains but does not reflect the effect of any applicable redemption fees. This chart does not imply future performance. Past performance does not guarantee future results. The cumulative ten-year return was 68.81% for the Fund’s Investor Class shares and 90.57% for the benchmark. The Fund’s Investor Class shares average annual total return since inception on June 28, 1994 was 6.84%. The MSCI All Country World ex US Index is a free float-adjusted market capitalization-weighted index of both developed and emerging markets. The index is unmanaged and returns assume the reinvestment of dividends. It is not possible to invest directly in an index. During the periods shown, the Fund’s manager reimbursed certain Fund expenses. Absent this reimbursement, performance would have been lower. Performance will vary from class to class based on differences in class-specific expenses.
| www.thomaswhitefunds.com | 7 |
Table of Contents
THOMAS WHITE INTERNATIONAL FUND
The Thomas White International Fund primarily invests in equity securities of companies located in the world’s developed countries outside of the U.S. There may also be a portion of the Fund’s assets invested in companies located in emerging market countries.
Portfolio Managers
Wei Li, Ph.D., CFA
Douglas M. Jackman, CFA
Jinwen Zhang, Ph.D., CFA
John Wu, Ph.D., CFA
Rex Mathew, CFA, CMA
Performance Review
The Thomas White International Fund Class I shares returned +28.21% for the one-year period ended October 31, 2021, compared to +29.66% for the benchmark MSCI All Country World ex US Index.
The swift post-pandemic global economic recovery, aided by substantial monetary and fiscal policy support, helped international equities to strong gains during the one-year review period. News of successful vaccine development and hopes of a quick rollout of vaccination programs in the developed countries drove equity gains during the initial months of the review period. Despite the positive economic trends, governments and central banks persisted with supportive policy measures. Faster than expected corporate earnings recovery across most sectors also kept investor sentiment buoyant for most of the period. Rising inflation risks made investors more cautious in recent months, though most central banks believe inflation will moderate by the second half of 2022.
Portfolio Review
Stock selection was positive in the industrials, consumer staples, financials and technology sectors. At the region/country level, selection was positive in both developed and emerging Europe, Brazil, Korea and Japan. Selection was less effective in China, Canada and India. Ineffective stock selection in the consumer discretionary, communication services and utilities sectors hurt the Fund’s relative performance against the benchmark. Being underweight the energy and financials sectors also detracted from relative returns for the one-year period.
ASML Holding, the world’s leading manufacturer of semiconductor lithographic equipment, contributed the most to Fund returns for the year as it exceeded earnings expectations on strong order flows. Taiwan Semiconductor, the leading manufacturer of chipsets used in cell phones and other devices, benefited as demand remained robust. Samsung Electronics, the leading manufacturer of memory chips and cellphones, gained as strong memory chip prices boosted profits. Higher oil prices helped Russian oil producer Lukoil while favorable economic growth trends benefited Russian bank Sberbank.
Several of the Fund’s Chinese holdings came under selling pressure during the second half of the review period as the government initiated several measures that could push up costs and restrict growth opportunities. These included leading ecommerce company Alibaba, gaming and communication services provider Tencent, online search service Baidu, and food delivery and local deals platform Meituan. Japanese
| 8 | www.thomaswhitefunds.com |
Table of Contents
OCTOBER 31, 2021
investment firm Softbank, one of the largest shareholders in Alibaba, also underperformed.
Outlook
Most developed countries have lagged the U.S. in recent economic recovery trends, largely due to the relatively slower vaccination rates and smaller fiscal spending. That could change in the coming quarters as most countries fully open up and selectively increase fiscal spending. This is likely to be more pronounced in Europe where the $900+ billion regional recovery fund is in the early stages of implementation. Resurgent global demand for capital equipment and other industrial goods could provide another tailwind to the Eurozone and lift growth rates above 4% for 2021, as well as in 2022. Japan is also benefiting from similar trends, though the pace of growth is likely to moderate over the next twelve months.
Commodity exporters such as Canada, Australia, Brazil, Russia and South Africa are now enjoying one of the most favorable environments in years. While prices of select commodities, most notably lumber, have come off the multi-year highs seen earlier in 2021, they remain at very lucrative levels. Robust consumer demand in the developed world, particularly the U.S., should help
sustain export volumes for Asian manufacturers. The surge in demand for semiconductors and other technology hardware has added a new dimension to export growth for countries such as Korea and Taiwan. It is notable that growth forecasts for these export-oriented economies have been revised higher in recent months.
We expect the favorable demand trends and inexpensive borrowing costs to lift corporate earnings further in the coming quarters. If fiscal spending picks up pace in some of the larger economies outside the U.S., as we anticipate it to, earnings expansion is likely to endure for some time. The Fund’s portfolio remains fully invested and diversified across regions and economic sectors as we continue to identify companies which we believe can excel in this environment. Global coordination to confront the onset and disruption of the COVID-19 pandemic was swift and the unwinding of the stimulus should be more gradual. Companies across the globe have learned to navigate and adapt quickly to the ever shifting economic and health environment.
Thank you for your confidence in the Thomas White International Fund.
| www.thomaswhitefunds.com | 9 |
Table of Contents
THOMAS WHITE INTERNATIONAL FUND
Portfolio Country and Industry Allocation as of October 31, 2021
| Country Allocation | % of TNA | |||
| Australia | 5.1% | |||
| Austria | 0.6% | |||
| Brazil | 3.6% | |||
| Canada | 5.4% | |||
| China | 7.7% | |||
| France | 6.0% | |||
| Germany | 7.3% | |||
| Greece | 0.6% | |||
| Hong Kong | 2.7% | |||
| India | 0.9% | |||
| Ireland | 1.1% | |||
| Italy | 2.9% | |||
| Japan | 15.1% | |||
| Mexico | 0.7% | |||
| Netherlands | 5.9% | |||
| Russia | 4.1% | |||
| Singapore | 0.6% | |||
| South Korea | 8.1% | |||
| Spain | 0.7% | |||
| Sweden | 0.7% | |||
| Switzerland | 5.2% | |||
| Taiwan | 3.4% | |||
| United Kingdom | 9.2% | |||
| Cash & Other | 2.4% | |||
|
| |||
| Total | 100.0% | |||
|
| |||
| Industry Allocation | % of TNA | |||
| Automobiles & Components | 6.4% | |||
| Banks | 13.8% | |||
| Capital Goods | 12.4% | |||
| Commercial & Professional Services | 2.6% | |||
| Consumer Durables & Apparel | 2.7% | |||
| Consumer Services | 1.1% | |||
| Diversified Financials | 3.1% | |||
| Energy | 3.6% | |||
| Food, Beverage & Tobacco | 5.5% | |||
| Health Care Equipment & Services | 2.4% | |||
| Insurance | 1.6% | |||
| Materials | 11.4% | |||
| Media & Entertainment | 1.8% | |||
| Pharmaceuticals, Biotechnology & Life Sciences | 5.5% | |||
| Retailing | 1.9% | |||
| Semiconductors & Semiconductor Equipment | 7.0% | |||
| Software & Services | 2.9% | |||
| Technology Hardware & Equipment | 5.1% | |||
| Telecommunication Services | 3.7% | |||
| Transportation | 2.2% | |||
| Utilities | 0.9% | |||
| Cash & Other | 2.4% | |||
|
| |||
| Total | 100.0% | |||
|
| |||
TNA - Total Net Assets
Fund holdings and industry allocations are subject to change and should not be considered a recommendation to buy or sell any securities. For a complete list of Fund holdings, please refer to the Investment Portfolio section of this report.
| 10 | www.thomaswhitefunds.com |
Table of Contents
| Investment Portfolio | October 31, 2021 |
| Country | Issue | Industry | Shares | Value (US$) | ||||||||
| COMMON STOCKS (95.8%) | ||||||||||||
| ||||||||||||
| AUSTRALIA (5.1%) | ||||||||||||
| Aristocrat Leisure Limited + | Consumer Services | 28,800 | $1,016,909 | |||||||||
| BHP Group Ltd. # + | Materials | 27,200 | 746,084 | |||||||||
| Brambles Ltd. + | Commercial & Professional Services | 108,300 | 820,041 | |||||||||
| Commonwealth Bank of Australia + | Banks | 11,700 | 917,877 | |||||||||
| CSL Limited + | Pharmaceuticals, Biotechnology & Life Sciences | 5,250 | 1,190,392 | |||||||||
|
| |||||||||||
| 4,691,303 | ||||||||||||
| ||||||||||||
| AUSTRIA (0.6%) | ||||||||||||
| ANDRITZ AG + | Capital Goods | 9,150 | 517,520 | |||||||||
| ||||||||||||
| BRAZIL (2.9%) | ||||||||||||
| JBS SA | Food, Beverage & Tobacco | 170,000 | 1,179,861 | |||||||||
| Petroleo Brasileiro SA - ADR | Energy | 85,500 | 839,610 | |||||||||
| Suzano SA * | Materials | 70,300 | 611,971 | |||||||||
|
| |||||||||||
| 2,631,442 | ||||||||||||
| ||||||||||||
| CANADA (5.4%) | ||||||||||||
| Brookfield Asset Management, Inc. - Class A | Diversified Financials | 22,900 | 1,382,586 | |||||||||
| Magna International, Inc. | Automobiles & Components | 8,100 | 658,878 | |||||||||
| Royal Bank of Canada | Banks | 10,800 | 1,124,156 | |||||||||
| Shopify, Inc. - Class A * | Software & Services | 700 | 1,022,070 | |||||||||
| West Fraser Timber Co. Ltd. | Materials | 9,800 | 784,649 | |||||||||
|
| |||||||||||
| 4,972,339 | ||||||||||||
| ||||||||||||
| CHINA (7.7%) | ||||||||||||
| Alibaba Group Holding Ltd. - ADR * | Retailing | 10,700 | 1,764,858 | |||||||||
| Baidu, Inc. - Class A * + | Media & Entertainment | 34,000 | 695,452 | |||||||||
| China Merchants Port Holdings Co. Ltd. + | Transportation | 432,000 | 723,014 | |||||||||
| COSCO SHIPPING Holdings Co. Ltd. - H Shares * + | Transportation | 471,400 | 735,177 | |||||||||
| Lenovo Group Limited + | Technology Hardware & Equipment | 630,000 | 688,036 | |||||||||
| Tencent Holdings Limited + | Media & Entertainment | 16,300 | 1,012,006 | |||||||||
| Weichai Power Co. Ltd. - H Shares + | Capital Goods | 197,000 | 354,352 | |||||||||
| Wuxi Biologics Cayman, Inc. * + | Pharmaceuticals, Biotechnology & Life Sciences | 42,500 | 649,107 | |||||||||
| Xiaomi Corp. - Class B * + | Technology Hardware & Equipment | 157,000 | 432,460 | |||||||||
|
| |||||||||||
| 7,054,462 | ||||||||||||
| ||||||||||||
| FRANCE (6.0%) | ||||||||||||
| Air Liquide SA + | Materials | 4,700 | 785,628 | |||||||||
| BNP Paribas SA + | Banks | 18,400 | 1,234,348 | |||||||||
| Credit Agricole SA + | Banks | 63,500 | 959,425 | |||||||||
The accompanying notes are an integral part of these financial statements.
| www.thomaswhitefunds.com | 11 |
Table of Contents
| Thomas White International Fund |
| Country | Issue | Industry | Shares | Value (US$) | ||||||||
| FRANCE (CONT.) | ||||||||||||
| Danone SA + | Food, Beverage & Tobacco | 8,200 | $534,850 | |||||||||
| Eiffage SA + | Capital Goods | 8,800 | 906,668 | |||||||||
| LVMH Moet Hennessy Louis Vuitton SE + | Consumer Durables & Apparel | 1,425 | 1,117,165 | |||||||||
|
| |||||||||||
| 5,538,084 | ||||||||||||
| ||||||||||||
| GERMANY (6.2%) | ||||||||||||
| Daimler AG + | Automobiles & Components | 17,000 | 1,685,017 | |||||||||
| Deutsche Telekom AG + | Telecommunication Services | 63,300 | 1,176,953 | |||||||||
| SAP SE + | Software & Services | 5,600 | 811,044 | |||||||||
| Siemens AG + | Capital Goods | 10,000 | 1,621,029 | |||||||||
| Volkswagen AG + | Automobiles & Components | 1,300 | 422,404 | |||||||||
|
| |||||||||||
| 5,716,447 | ||||||||||||
| ||||||||||||
| GREECE (0.6%) | ||||||||||||
| Star Bulk Carriers Corp. # | Transportation | 28,400 | 587,596 | |||||||||
| ||||||||||||
| HONG KONG (2.7%) | ||||||||||||
| Hong Kong Exchanges & Clearing Limited + | Diversified Financials | 12,500 | 758,618 | |||||||||
| Techtronic Industries Company Limited + | Capital Goods | 81,500 | 1,674,636 | |||||||||
|
| |||||||||||
| 2,433,254 | ||||||||||||
| ||||||||||||
| INDIA (0.9%) | ||||||||||||
| HDFC Bank Ltd. - ADR | Banks | 11,900 | 855,729 | |||||||||
| ||||||||||||
| IRELAND (1.1%) | ||||||||||||
| CRH PLC + | Materials | 21,390 | 1,024,342 | |||||||||
| ||||||||||||
| ITALY (2.9%) | ||||||||||||
| Enel SpA + | Utilities | 96,000 | 804,142 | |||||||||
| Intesa Sanpaolo SpA + | Banks | 408,300 | 1,163,162 | |||||||||
| Poste Italiane SpA + | Insurance | 51,900 | 741,300 | |||||||||
|
| |||||||||||
| 2,708,604 | ||||||||||||
| ||||||||||||
| JAPAN (15.1%) | ||||||||||||
| Hitachi Ltd. + | Capital Goods | 16,600 | 957,259 | |||||||||
| Keyence Corp. + | Technology Hardware & Equipment | 1,600 | 964,816 | |||||||||
| MS&AD Insurance Group Holdings, Inc. + | Insurance | 22,900 | 735,369 | |||||||||
| Murata Manufacturing Co. Ltd. + | Technology Hardware & Equipment | 8,200 | 624,163 | |||||||||
| Nidec Corporation + | Capital Goods | 11,100 | 1,227,653 | |||||||||
| Nomura Research Institute Ltd. + | Software & Services | 22,000 | 883,760 | |||||||||
| Recruit Holdings Co. Ltd. + | Commercial & Professional Services | 23,000 | 1,532,932 | |||||||||
| Renesas Electronics Corp. * + | Semiconductors & Semiconductor Equipment | 83,800 | 1,034,877 | |||||||||
| Shin-Etsu Chemical Co. Ltd. + | Materials | 5,500 | 980,600 | |||||||||
The accompanying notes are an integral part of these financial statements.
| 12 | www.thomaswhitefunds.com |
Table of Contents
| Investment Portfolio | October 31, 2021 |
| Country | Issue | Industry | Shares | Value (US$) | ||||||||
| JAPAN (CONT.) | ||||||||||||
| SMC Corp. + | Capital Goods | 1,800 | $1,076,548 | |||||||||
| SoftBank Group Corp. + | Telecommunication Services | 10,200 | 553,553 | |||||||||
| Sony Group Corp. + | Consumer Durables & Apparel | 11,600 | 1,340,759 | |||||||||
| Sysmex Corp. + | Health Care Equipment & Services | 7,500 | 932,217 | |||||||||
| Toyota Industries Corporation + | Automobiles & Components | 11,800 | 1,003,090 | |||||||||
|
| |||||||||||
| 13,847,596 | ||||||||||||
| ||||||||||||
| MEXICO (0.7%) | ||||||||||||
| America Movil SAB de CV - Series L | Telecommunication Services | 735,000 | 654,388 | |||||||||
| ||||||||||||
| NETHERLANDS (5.9%) | ||||||||||||
| Airbus SE * + | Capital Goods | 7,150 | 916,678 | |||||||||
| ArcelorMittal SA + | Materials | 26,400 | 890,899 | |||||||||
| ASML Holding NV + | Semiconductors & Semiconductor Equipment | 2,010 | 1,637,532 | |||||||||
| ING Groep NV + | Banks | 80,000 | 1,214,388 | |||||||||
| Koninklijke Philips NV + | Health Care Equipment & Services | 16,120 | 759,558 | |||||||||
|
| |||||||||||
| 5,419,055 | ||||||||||||
| ||||||||||||
| RUSSIA (4.1%) | ||||||||||||
| LUKOIL PJSC - ADR + | Energy | 23,900 | 2,433,551 | |||||||||
| Sberbank of Russia PJSC - ADR + | Banks | 67,000 | 1,343,690 | |||||||||
|
| |||||||||||
| 3,777,241 | ||||||||||||
| ||||||||||||
| SINGAPORE (0.6%) | ||||||||||||
| Kulicke & Soffa Industries, Inc. | Semiconductors & Semiconductor Equipment | 10,300 | 587,100 | |||||||||
| ||||||||||||
| SOUTH KOREA (8.1%) | ||||||||||||
| Hyundai Motor Company + | Automobiles & Components | 5,800 | 1,038,140 | |||||||||
| KB Financial Group, Inc. + | Banks | 23,130 | 1,114,519 | |||||||||
| Korea Zinc Co. Ltd. + | Materials | 1,650 | 759,548 | |||||||||
| LG Chem Ltd. + | Materials | 1,425 | 1,021,096 | |||||||||
| POSCO + | Materials | 1,750 | 442,405 | |||||||||
| Samsung Electronics Co. Ltd. + | Technology Hardware & Equipment | 35,150 | 2,105,907 | |||||||||
| SK Telecom Co. Ltd. * + | Telecommunication Services | 3,775 | 1,002,837 | |||||||||
|
| |||||||||||
| 7,484,452 | ||||||||||||
| ||||||||||||
| SPAIN (0.7%) | ||||||||||||
| Banco Santander SA + | Banks | 161,000 | 611,319 | |||||||||
| ||||||||||||
The accompanying notes are an integral part of these financial statements.
| www.thomaswhitefunds.com | 13 |
Table of Contents
| Thomas White International Fund |
| Country | Issue | Industry | Shares | Value (US$) | ||||||||
| SWEDEN (0.7%) | ||||||||||||
| Volvo AB - B Shares + | Capital Goods | 28,100 | $655,279 | |||||||||
| ||||||||||||
| SWITZERLAND (5.2%) | ||||||||||||
| Lonza Group AG + | Pharmaceuticals, Biotechnology & Life Sciences | 1,050 | 862,374 | |||||||||
| Nestle SA + | Food, Beverage & Tobacco | 13,800 | 1,822,847 | |||||||||
| Roche Holding AG + | Pharmaceuticals, Biotechnology & Life Sciences | 3,500 | 1,355,945 | |||||||||
| UBS Group AG + | Diversified Financials | 39,000 | 711,409 | |||||||||
|
| |||||||||||
| 4,752,575 | ||||||||||||
| ||||||||||||
| TAIWAN (3.4%) | ||||||||||||
| Taiwan Semiconductor Manufacturing Company Ltd. - ADR | Semiconductors & Semiconductor Equipment | 27,600 | 3,138,120 | |||||||||
| ||||||||||||
| UNITED KINGDOM (9.2%) | ||||||||||||
| Anglo American PLC + | Materials | 31,400 | 1,189,424 | |||||||||
| Ashtead Group PLC + | Capital Goods | 18,000 | 1,511,992 | |||||||||
| AstraZeneca PLC + | Pharmaceuticals, Biotechnology & Life Sciences | 8,150 | 1,016,908 | |||||||||
| Barclays PLC + | Banks | 544,200 | 1,501,481 | |||||||||
| Diageo PLC + | Food, Beverage & Tobacco | 29,900 | 1,488,513 | |||||||||
| Glencore PLC + | Materials | 242,800 | 1,217,192 | |||||||||
| Smith & Nephew PLC + | Health Care Equipment & Services | 30,300 | 521,280 | |||||||||
|
| |||||||||||
| 8,446,790 | ||||||||||||
| ||||||||||||
| Total Common Stocks | (Cost $63,252,959) | 88,105,037 | ||||||||||
|
| |||||||||||
| ||||||||||||
| PREFERRED STOCKS (1.8%) | ||||||||||||
|
|
|
|
| ||||||||
| BRAZIL (0.7%) | ||||||||||||
| Banco Bradesco SA - ADR (Perpetual, 6.17%) ^ | Banks | 182,600 | 639,100 | |||||||||
|
|
|
|
|
|
| ||||||
| GERMANY (1.1%) | ||||||||||||
| Volkswagen AG (Perpetual, 2.59%) ^ + | Automobiles & Components | 4,700 | 1,053,234 | |||||||||
|
|
|
|
|
|
| ||||||
| Total Preferred Stocks | (Cost $1,504,423) | 1,692,334 | ||||||||||
|
| |||||||||||
|
|
|
|
| ||||||||
The accompanying notes are an integral part of these financial statements.
| 14 | www.thomaswhitefunds.com |
Table of Contents
| Investment Portfolio | October 31, 2021 |
| Country | Issue | Industry | Shares | Value (US$) | ||||||||
| HELD AS COLLATERAL FOR SECURITIES LENDING (0.2%) | ||||||||||||
|
| |||||||||||
| SHORT TERM INVESTMENT (0.2%) | ||||||||||||
|
| |||||||||||
| MONEY MARKET FUND (0.2%) | ||||||||||||
| Northern Institutional Liquid Assets Portfolio, 0.03% (a) | 161,550 | $161,550 | ||||||||||
|
|
|
|
|
|
| ||||||
| Total Held as Collateral for Securities Lending | (Cost $161,550) | 161,550 | ||||||||||
|
| |||||||||||
|
|
|
|
|
|
| ||||||
| Total Investments | 97.8% | (Cost $64,918,932) | $89,958,921 | |||||||||
| Other Assets, Less Liabilities | 2.2% | 2,051,386 | ||||||||||
| Total Net Assets: | 100.0% | $92,010,307 | ||||||||||
| ||||||||||||
| Percentages | are stated as a percent of net assets. |
| * | Non-Income Producing Securities |
| # | All or a portion of securities on loan at October 31, 2021. The market value of the securities loaned was $901,232. The loaned securities were secured with cash collateral of $161,550 and non-cash collateral with a value of $845,871. The non-cash collateral received consists of short term investments and long term bonds, and is held for the benefit of the Fund at the Fund’s custodian. The Fund cannot repledge or resell this collateral. Collateral is calculated based on prior day’s prices. - See Note 1(I) to Financial Statements |
| ^ | Maturity Date and Preferred Dividend Rate of Preferred Stock |
| + | Fair Valued Security |
| (a) | 7-Day Effective Yield as of October 31, 2021. |
| PLC | - Public Limited Company |
| ADR | - American Depositary Receipt |
The industry classifications represented in the Schedule of Investments are in accordance with Global Industry Classification Standards (GICS®), which was developed by and/or is the exclusive property of MSCI, Inc. and Standard & Poor Financial Services LLC.
The accompanying notes are an integral part of these financial statements.
| www.thomaswhitefunds.com | 15 |
Table of Contents
| Thomas White International Fund |
The following table summarizes the inputs used, as of October 31, 2021, in valuing the International Fund’s assets:
| Level 1 | Level 2 | Level 3 | Total | |||||||||||||
| Common Stocks | ||||||||||||||||
| Australia | $------- | $4,691,303 | $------- | $4,691,303 | ||||||||||||
| Austria | ------- | 517,520 | ------- | 517,520 | ||||||||||||
| Brazil | 2,631,442 | ------- | ------- | 2,631,442 | ||||||||||||
| Canada | 4,972,339 | ------- | ------- | 4,972,339 | ||||||||||||
| China | 1,764,858 | 5,289,604 | ------- | 7,054,462 | ||||||||||||
| France | ------- | 5,538,084 | ------- | 5,538,084 | ||||||||||||
| Germany | ------- | 5,716,447 | ------- | 5,716,447 | ||||||||||||
| Greece | 587,596 | ------- | ------- | 587,596 | ||||||||||||
| Hong Kong | ------- | 2,433,254 | ------- | 2,433,254 | ||||||||||||
| India | 855,729 | ------- | ------- | 855,729 | ||||||||||||
| Ireland | ------- | 1,024,342 | ------- | 1,024,342 | ||||||||||||
| Italy | ------- | 2,708,604 | ------- | 2,708,604 | ||||||||||||
| Japan | ------- | 13,847,596 | ------- | 13,847,596 | ||||||||||||
| Mexico | 654,388 | ------- | ------- | 654,388 | ||||||||||||
| Netherlands | ------- | 5,419,055 | ------- | 5,419,055 | ||||||||||||
| Russia | ------- | 3,777,241 | ------- | 3,777,241 | ||||||||||||
| Singapore | 587,100 | ------- | ------- | 587,100 | ||||||||||||
| South Korea | ------- | 7,484,452 | ------- | 7,484,452 | ||||||||||||
| Spain | ------- | 611,319 | ------- | 611,319 | ||||||||||||
| Sweden | ------- | 655,279 | ------- | 655,279 | ||||||||||||
| Switzerland | ------- | 4,752,575 | ------- | 4,752,575 | ||||||||||||
| Taiwan | 3,138,120 | ------- | ------- | 3,138,120 | ||||||||||||
| United Kingdom | ------- | 8,446,790 | ------- | 8,446,790 | ||||||||||||
| Total Common Stocks | $15,191,572 | $72,913,465 | $------- | $88,105,037 | ||||||||||||
| Preferred Stocks | ||||||||||||||||
| Brazil | $639,100 | $------- | $------- | $639,100 | ||||||||||||
| Germany | ------- | 1,053,234 | ------- | 1,053,234 | ||||||||||||
| Total Preferred Stocks | 639,100 | 1,053,234 | ------- | 1,692,334 | ||||||||||||
| Short Term Investments | $161,550 | $------- | $------- | $161,550 | ||||||||||||
| Total Investments | $15,992,222 | $73,966,699 | $------- | $89,958,921 | ||||||||||||
For more information on valuation inputs, please refer to Note 1(A) of the accompanying Notes to Financial Statements.
The accompanying notes are an integral part of these financial statements.
| 16 | www.thomaswhitefunds.com |
Table of Contents
| Investment Portfolio | October 31, 2021 |
The Fund’s assets assigned to Level 2 include certain foreign securities for which a third party statistical pricing service may be employed for purposes of fair market valuation. There were no transfers into or out of Level 3 during the reporting period, as compared to their classification from the prior annual report.
The accompanying notes are an integral part of these financial statements.
| www.thomaswhitefunds.com | 17 |
Table of Contents
THOMAS WHITE AMERICAN OPPORTUNITIES FUND
| (Unaudited) Sales Charge | Deferred Sales Charge | Administrative Services Fee | 12b-1 Fees | Gross Operating Expenses1 | Net Operating Expenses1 | |||||||
| Investor Class |
None |
None |
Up to 0.25% |
None |
1.62% |
1.34% | ||||||
1 Thomas White International, Ltd. (“Advisor”) has agreed to defer its fees and/or reimburse the Fund to the extent that the operating expenses for Investor Class shares exceed 1.34% of its average daily net assets. The fee deferral/expense reimbursement agreement expires February 28, 2022. The Fund has agreed to repay the Advisor for amounts deferred or reimbursed by the Advisor pursuant to the agreement provided that such repayment does not cause the Fund to exceed the above limits and the repayment is made within three years after the year in which the Advisor incurred the expense. The fee deferral/expense reimbursement agreement may only be amended or terminated by the Fund’s Board of Trustees. The net expense ratio is applicable to investors.
| Net Asset Value per Share (NAV) | Net Assets | Redemption Fee* | Portfolio Turnover | |||||
Investor Class |
$18.93 |
$25.2 million |
2.00% |
14% | ||||
* On shares purchased and held for less than 60 days (as a percentage of amount redeemed, if applicable).
| 18 | www.thomaswhitefunds.com |
Table of Contents
OCTOBER 31, 2021
| Total Returns as of October 31, 2021 (Unaudited) | ||||||||||
| Annualized | ||||||||||
| Class | 1 Yr | 5 Yrs | 10 Yrs | |||||||
| Investor Class shares (TWAOX) | 46.18% | 14.27% | 12.56% | |||||||
| Russell Midcap Total Return Index1 | 45.40% | 16.47% | 14.78% | |||||||
| Russell Midcap Value Total Return Index1 | 48.60% | 12.30% | 13.18% | |||||||
1 The Russell Midcap Total Return Index measures the performance of the 800 smallest companies in the Russell 1000 Index. These represent approximately 31% of the total market capitalization of the Russell 1000 Index. The Russell Midcap Value Total Return Index measures the performance of the mid-cap value segment of the U.S. equity universe. It includes those Russell Midcap Index companies with lower price-to-book ratios and lower forecasted growth values. Both indices are unmanaged and returns assume the reinvestment of dividends. It is not possible to invest directly in an index.
The returns do not reflect the deduction of taxes that a shareholder would pay on Fund distributions or the redemption of Fund shares. The returns reflect the actual performance for each period and do not include the impacts of trades executed on the last business day of the period that were recorded on the first business day of the next period.
Performance data is based upon past performance, which is no guarantee of future results. The investment return and principal value of an investment will fluctuate so that an investor’s shares, when redeemed, may be worth more or less than their original cost. Current performance may be higher or lower than the performance data quoted. Please call 1-800-811-0535 to obtain performance data as of the most recent month-end. The Fund imposes a 2% redemption fee on shares held less than 60 days. Performance data does not reflect the redemption fee. If reflected, total returns would be lower. Investment performance reflects any fee waivers that were in effect. In the absence of such waivers, total return would have been reduced.
| www.thomaswhitefunds.com | 19 |
Table of Contents
THOMAS WHITE AMERICAN OPPORTUNITIES FUND
GROWTH OF A $10,000 INVESTMENT WITH DIVIDENDS REINVESTED (Unaudited)
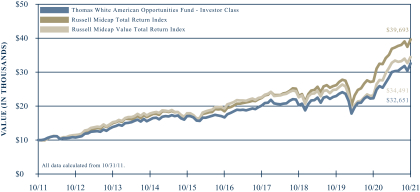
This chart illustrates the performance of a hypothetical $10,000 investment made in the Fund’s Investor Class shares, its primary benchmark, the Russell Midcap Total Return Index, and its secondary benchmark, the Russell Midcap Value Total Return Index, for the past 10 years through October 31, 2021. It assumes reinvestment of dividends and capital gains but does not reflect the effect of any applicable redemption fees. This chart does not imply future performance. Past performance does not guarantee future results. The cumulative ten-year return was 226.51% for the Fund’s Investor Class shares, 296.93% for the primary benchmark, and 244.91% for the secondary benchmark. The Fund’s Investor Class shares average annual total return since inception on March 4, 1999 was 8.95%. The Fund’s primary benchmark, the Russell Midcap Total Return Index, measures the performance of the 800 smallest companies in the Russell 1000 Index, which measures the performance of the 1,000 largest U.S. companies based on total market capitalization. The Fund’s secondary benchmark, the Russell Midcap Value Index, measures the performance of the mid-cap value segment of the U.S. equity universe. It includes those Russell Midcap Index companies with lower price-to-book ratios and lower forecasted growth values. Both indices are unmanaged and returns assume the reinvestment of dividends. It is not possible to invest directly in an index. During the periods shown, the Fund’s manager reimbursed certain Fund expenses. Absent this reimbursement, performance would have been lower.
| 20 | www.thomaswhitefunds.com |
Table of Contents
OCTOBER 31, 2021
The Thomas White American Opportunities Fund primarily invests in equity securities of mid-size U.S. companies. The Fund may also invest in equity securities of smaller and larger size U.S. companies.
Portfolio Managers
Wei Li, Ph.D., CFA
Douglas M. Jackman, CFA
Jinwen Zhang, Ph.D., CFA
John Wu, Ph.D., CFA
Rex Mathew, CFA, CMA
Performance Review
The Thomas White American Opportunities Fund Investor Class shares returned +46.18% during the one-year period ended October 31, 2021, while the Fund’s primary benchmark, the Russell Midcap Index, returned +45.40% and the secondary benchmark, the Russell Midcap Value Index, returned +48.60% during the same period.
U.S. equities saw strong gains during the one-year review period as domestic economic growth rebounded sharply after the forced shutdowns during the COVID-19 pandemic. Corporate earnings growth has been well ahead of expectations across most sectors, with even the sectors worst affected by shutdowns showing signs of a demand revival. While inflation risks have increased in recent months, the Federal Reserve remains confident that headline inflation numbers will moderate by the second half of 2022.
Portfolio Review
The Fund’s relative performance against the primary benchmark over the one-year review
period was propelled by positive stock selection in the technology, healthcare, industrials and energy sectors. Selection was less effective in the real estate, utilities, materials and financials sectors. Being underweight the consumer staples and communication services sectors was beneficial, while being underweight the energy sector detracted from performance.
The Fund’s technology holdings continued to outperform on sustained optimism about vigorous demand growth that could drive earnings expansion. Helped by the ongoing supply shortages, most semiconductor and other hardware manufacturers have seen higher product prices in recent quarters. These included semiconductor processing equipment manufacturer LAM Research as well as KLA Corp, a semiconductor manufacturer. Fortinet, a network security solutions provider, was the best performer for the period on better than expected earnings growth. Oil producer Diamondback benefited from higher oil prices. Regions Financial, a bank holding company, outperformed as higher interest rates and lower credit risks should boost margins.
Sensata Technologies, a manufacturer of sensors and other components used in automotive and other industries, detracted the most from performance as volume growth remains soft. Electricity and natural gas utilities Xcel Energy and CMS Energy lagged as higher energy prices have restricted margins. Fast service restaurant Domino’s Pizza, one of the best performers last year, declined as it failed to meet lofty earnings expectations. Corteva, a manufacturer of agricultural inputs,
| www.thomaswhitefunds.com | 21 |
Table of Contents
THOMAS WHITE AMERICAN OPPORTUNITIES FUND
underperformed as higher input costs could limit earnings growth despite healthy demand.
Outlook
As we look ahead to 2022, economic growth could be tempered by fears of higher, persistent inflation and continued disruption in the global supply chain. The economic recovery over the past twelve months from the onset of the pandemic in February 2020 has been swift as the fiscal and monetary stimulus was highly effective. Going forward, the Federal Reserve has begun tapering its quantitative easing which is expected to end in the first half of 2022, with the prospect of higher interest rates becoming more likely in the second half of the year.
If current trends from wages and material costs hold, it is likely that corporate margins
will come under pressure in the near term and earnings growth could moderate for businesses that are less capable of passing on higher costs to customers. We believe potential slowdowns due to new variants of COVID-19, continuing supply chain disruptions, and increased labor costs are the biggest threats to corporate earnings in the upcoming quarters.
The last twelve months have seen strong returns on the on-going recovery from the shock of the pandemic. Companies across the globe have learned to navigate and adapt quickly to the ever shifting environment. The Fund’s portfolio remains fully invested and diversified across economic sectors as we continue to identify companies which we believe can excel in this uncertainty.
We thank you for investing in the Thomas White American Opportunities Fund.
| 22 | www.thomaswhitefunds.com |
Table of Contents
OCTOBER 31, 2021
Portfolio Industry Allocation and Market Capitalization as of October 31, 2021
| Industry Allocation | % of TNA | |||
| Automobiles & Components | 1.1% | |||
| Banks | 3.7% | |||
| Capital Goods | 9.4% | |||
| Commercial & Professional Services | 4.5% | |||
| Consumer Durables & Apparel | 2.4% | |||
| Consumer Services | 4.1% | |||
| Diversified Financials | 4.1% | |||
| Energy | 3.1% | |||
| Food, Beverage & Tobacco | 1.3% | |||
| Health Care Equipment & Services | 8.5% | |||
| Household & Personal Products | 1.5% | |||
| Insurance | 4.4% | |||
| Materials | 6.6% | |||
| Media & Entertainment | 1.8% | |||
| Pharmaceuticals, Biotechnology & Life Sciences | 4.0% | |||
| Retailing | 3.4% | |||
| Semiconductors & Semiconductor Equipment | 4.7% | |||
| Software & Services | 10.2% | |||
| Technology Hardware & Equipment | 4.0% | |||
| Transportation | 4.4% | |||
| Utilities | 4.4% | |||
| REITs | 7.3% | |||
| Cash & Other | 1.1% | |||
|
| |||
| Total | 100% | |||
|
| |||
Portfolio Market Cap Mix | % of TNA | |||
Large Cap (over $46.4 billion) | 16.0% | |||
Mid Cap ($3.6-$46.4 billion) | 82.9% | |||
Cash & Other | 1.1% | |||
|
| |||
Total | 100% | |||
|
| |||
| | ||||
TNA - Total Net Assets
Fund holdings and industry allocations are subject to change and should not be considered a recommendation to buy or sell any securities. For a complete list of Fund holdings, please refer to the Investment Portfolio section of this report.
| www.thomaswhitefunds.com | 23 |
Table of Contents
| Thomas White American Opportunities Fund |
| Industry | Issue | Shares | Value | |||||||
| COMMON STOCKS (91.6%) | ||||||||||
| ||||||||||
| AUTOMOBILES & COMPONENTS (1.1%) | ||||||||||
| Ford Motor Co. * | 15,700 | $268,156 | ||||||||
| ||||||||||
| BANKS (3.7%) | ||||||||||
| Citizens Financial Group, Inc. | 9,200 | 435,896 | ||||||||
| Regions Financial Corporation | 20,990 | 497,043 | ||||||||
|
| |||||||||
| 932,939 | ||||||||||
| ||||||||||
| CAPITAL GOODS (9.4%) | ||||||||||
| Carlisle Companies Incorporated | 1,320 | 294,254 | ||||||||
| Cummins, Inc. | 1,040 | 249,434 | ||||||||
| Huntington Ingalls Industries, Inc. | 875 | 177,389 | ||||||||
| The Middleby Corporation * | 1,300 | 237,172 | ||||||||
| Otis Worldwide Corp. | 2,170 | 174,273 | ||||||||
| Parker-Hannifin Corporation | 990 | 293,624 | ||||||||
| Sensata Technologies Holding PLC * ^ | 2,770 | 152,627 | ||||||||
| Snap-on Incorporated | 1,040 | 211,359 | ||||||||
| Trane Technologies PLC ^ | 1,900 | 343,767 | ||||||||
| W.W. Grainger, Inc. | 520 | 240,817 | ||||||||
|
| |||||||||
| 2,374,716 | ||||||||||
| ||||||||||
| COMMERCIAL & PROFESSIONAL SERVICES (4.5%) | ||||||||||
| Booz Allen Hamilton Holding Corp. | 2,645 | 229,745 | ||||||||
| IHS Markit Ltd. ^ | 2,480 | 324,185 | ||||||||
| Republic Services, Inc. | 2,290 | 308,234 | ||||||||
| TransUnion | 2,290 | 264,014 | ||||||||
|
| |||||||||
| 1,126,178 | ||||||||||
| ||||||||||
| CONSUMER DURABLES & APPAREL (2.4%) | ||||||||||
| Brunswick Corporation | 2,985 | 277,874 | ||||||||
| Lennar Corporation - Class A | 3,150 | 314,779 | ||||||||
|
| |||||||||
| 592,653 | ||||||||||
| ||||||||||
| CONSUMER SERVICES (4.1%) | ||||||||||
| Aramark | 4,567 | 166,604 | ||||||||
| Darden Restaurants, Inc. | 1,300 | 187,382 | ||||||||
| Marriott International Inc. - Class A * | 1,210 | 193,624 | ||||||||
| Service Corporation International | 3,440 | 235,606 | ||||||||
| Vail Resorts, Inc. | 740 | 255,085 | ||||||||
|
| |||||||||
| 1,038,301 | ||||||||||
| ||||||||||
| DIVERSIFIED FINANCIALS (4.1%) | ||||||||||
| Ameriprise Financial, Inc. | 1,380 | 416,939 | ||||||||
| State Street Corp. | 3,430 | 338,027 | ||||||||
| Voya Financial, Inc. | 4,110 | 286,755 | ||||||||
|
| |||||||||
| 1,041,721 | ||||||||||
| ||||||||||
| ENERGY (3.1%) | ||||||||||
| Diamondback Energy Inc. | 4,460 | 478,067 | ||||||||
| Pioneer Natural Resources Co. | 1,570 | 293,559 | ||||||||
|
| |||||||||
| 771,626 | ||||||||||
|
|
|
|
|
| |||||
The accompanying notes are an integral part of these financial statements.
| 24 | www.thomaswhitefunds.com |
Table of Contents
| Investment Portfolio | October 31, 2021 |
| Industry | Issue | Shares | Value | |||||||
| FOOD, BEVERAGE & TOBACCO (1.3%) | ||||||||||
| The Hershey Company | 1,900 | $ 333,165 | ||||||||
|
|
|
|
|
| |||||
| HEALTH CARE EQUIPMENT & SERVICES (8.5%) | ||||||||||
| Boston Scientific Corporation * | 5,180 | 223,413 | ||||||||
| Centene Corporation * | 3,899 | 277,765 | ||||||||
| The Cooper Companies, Inc. | 440 | 183,445 | ||||||||
| Hill-Rom Holdings, Inc. | 1,980 | 306,702 | ||||||||
| Laboratory Corporation of America Holdings * | 1,205 | 345,859 | ||||||||
| Molina Healthcare, Inc. * | 740 | 218,833 | ||||||||
| STERIS PLC ^ | 835 | 195,173 | ||||||||
| Teleflex, Inc. | 390 | 139,207 | ||||||||
| Zimmer Biomet Holdings, Inc. | 1,810 | 259,047 | ||||||||
|
| |||||||||
| 2,149,444 | ||||||||||
| ||||||||||
| HOUSEHOLD & PERSONAL PRODUCTS (1.5%) | ||||||||||
| Church & Dwight Co., Inc. | 4,290 | 374,774 | ||||||||
| ||||||||||
| INSURANCE (4.4%) | ||||||||||
| Arch Capital Group Ltd. * ^ | 6,870 | 287,304 | ||||||||
| Assurant, Inc. | 1,810 | 291,971 | ||||||||
| Everest Re Group Ltd. ^ | 1,040 | 271,960 | ||||||||
| The Hartford Financial Services Group, Inc. | 3,540 | 258,172 | ||||||||
|
| |||||||||
| 1,109,407 | ||||||||||
| ||||||||||
| MATERIALS (6.6%) | ||||||||||
| Ball Corporation | 2,940 | 268,951 | ||||||||
| Corteva, Inc. | 5,430 | 234,305 | ||||||||
| Martin Marietta Materials, Inc. | 1,130 | 443,909 | ||||||||
| PPG Industries, Inc. | 1,710 | 274,575 | ||||||||
| Steel Dynamics, Inc. | 6,880 | 454,630 | ||||||||
|
| |||||||||
| 1,676,370 | ||||||||||
| ||||||||||
| MEDIA & ENTERTAINMENT (1.8%) | ||||||||||
| Match Group, Inc. * | 1,810 | 272,912 | ||||||||
| Twitter, Inc. * | 3,410 | 182,571 | ||||||||
|
| |||||||||
| 455,483 | ||||||||||
| ||||||||||
| PHARMACEUTICALS, BIOTECHNOLOGY & LIFE SCIENCES (4.0%) | ||||||||||
| Agilent Technologies, Inc. | 2,970 | 467,746 | ||||||||
| AstraZeneca PLC - ADR ^ | 1,805 | 112,596 | ||||||||
| Charles River Laboratories International, Inc. * | 965 | 432,976 | ||||||||
|
| |||||||||
| 1,013,318 | ||||||||||
| ||||||||||
| RETAILING (3.4%) | ||||||||||
| AutoZone, Inc. * | 254 | 453,349 | ||||||||
| Ross Stores, Inc. | 3,540 | 400,728 | ||||||||
|
| |||||||||
| 854,077 | ||||||||||
| ||||||||||
The accompanying notes are an integral part of these financial statements.
| www.thomaswhitefunds.com | 25 |
Table of Contents
| Thomas White American Opportunities Fund |
| Industry | Issue | Shares | Value | |||||||
| SEMICONDUCTORS & SEMICONDUCTOR EQUIPMENT (4.7%) | ||||||||||
| Analog Devices, Inc. | 1,590 | $ 275,849 | ||||||||
| KLA Corporation | 1,210 | 451,040 | ||||||||
| Lam Research Corporation | 540 | 304,328 | ||||||||
| Qorvo, Inc. * | 950 | 159,818 | ||||||||
|
| |||||||||
| 1,191,035 | ||||||||||
| ||||||||||
| SOFTWARE & SERVICES (10.2%) | ||||||||||
| Akamai Technologies, Inc. * | 2,330 | 245,722 | ||||||||
| ANSYS, Inc. * | 450 | 170,811 | ||||||||
| Cadence Design Systems, Inc. * | 2,285 | 395,556 | ||||||||
| EPAM Systems, Inc. * | 350 | 235,634 | ||||||||
| FleetCor Technologies, Inc. * | 830 | 205,350 | ||||||||
| Fortinet, Inc. * | 1,540 | 517,964 | ||||||||
| Global Payments, Inc. | 2,005 | 286,695 | ||||||||
| Synopsys, Inc. * | 1,520 | 506,434 | ||||||||
|
| |||||||||
| 2,564,166 | ||||||||||
| ||||||||||
| TECHNOLOGY HARDWARE & EQUIPMENT (4.0%) | ||||||||||
| Arista Networks, Inc. * | 1,080 | 442,465 | ||||||||
| Keysight Technologies, Inc. * | 1,880 | 338,437 | ||||||||
| Motorola Solutions, Inc. | 940 | 233,675 | ||||||||
|
| |||||||||
| 1,014,577 | ||||||||||
| ||||||||||
| TRANSPORTATION (4.4%) | ||||||||||
| GXO Logistics, Inc. * | 2,210 | 196,248 | ||||||||
| Kansas City Southern | 1,040 | 322,660 | ||||||||
| Old Dominion Freight Line, Inc. | 1,195 | 407,913 | ||||||||
| XPO Logistics, Inc. * | 2,210 | 189,618 | ||||||||
|
| |||||||||
| 1,116,439 | ||||||||||
| ||||||||||
| UTILITIES (4.4%) | ||||||||||
| Alliant Energy Corporation | 3,770 | 213,269 | ||||||||
| Ameren Corporation | 3,220 | 271,414 | ||||||||
| CMS Energy Corporation | 3,590 | 216,656 | ||||||||
| DTE Energy Company | 1,750 | 198,363 | ||||||||
| Xcel Energy, Inc. | 3,420 | 220,898 | ||||||||
|
| |||||||||
| 1,120,600 | ||||||||||
| ||||||||||
| Total Common Stocks | (Cost $12,741,373 | ) | 23,119,145 | |||||||
|
| |||||||||
| ||||||||||
| REAL ESTATE INVESTMENT TRUSTS (REITs) (7.3%) | ||||||||||
| ||||||||||
| REAL ESTATE (7.3%) | ||||||||||
| AvalonBay Communities, Inc. | 1,105 | 261,532 | ||||||||
| Boston Properties, Inc. | 1,585 | 180,119 | ||||||||
| Digital Realty Trust, Inc. | 1,330 | 209,887 | ||||||||
| Duke Realty Corp. | 7,950 | 447,108 | ||||||||
| EastGroup Properties, Inc. | 1,225 | 242,281 | ||||||||
| Medical Properties Trust Inc. | 10,500 | 223,965 | ||||||||
The accompanying notes are an integral part of these financial statements.
| 26 | www.thomaswhitefunds.com |
Table of Contents
| Investment Portfolio | October 31, 2021 |
| Industry | Issue | Shares | Value | |||||||
| REAL ESTATE (CONT.) | ||||||||||
| SBA Communications Corp. | 825 | $ 284,897 | ||||||||
|
| |||||||||
| 1,849,789 | ||||||||||
| ||||||||||
| Total REITs | (Cost $1,538,462 | ) | 1,849,789 | |||||||
|
| |||||||||
| ||||||||||
| Total Investments | 98.9% | (Cost $14,279,835 | ) | $24,968,934 | ||||||
| Other Assets, Less Liabilities | 1.1% | 272,679 | ||||||||
| Total Net Assets: | 100.0% | $25,241,613 | ||||||||
| ||||||||||
Percentages are stated as a percent of net assets.
| ADR | - American Depository Receipt |
| PLC | - Public Limited Company |
| * | Non-Income Producing Securities |
| ^ | Foreign Issued Securities |
The industry classifications represented in the Schedule of Investments are in accordance with Global Industry Classification Standards (GICS®), which was developed by and/or is the exclusive property of MSCI, Inc. and Standard & Poor Financial Services LLC.
The accompanying notes are an integral part of these financial statements.
| www.thomaswhitefunds.com | 27 |
Table of Contents
| Thomas White American Opportunities Fund |
The following table summarizes the inputs used, as of October 31, 2021, in valuing the American Opportunities Fund’s assets:
| Level 1 | Level 2 | Level 3 | Total | |||||||||||||
| Common Stocks | ||||||||||||||||
| Automobiles & Components | $268,156 | $------- | $------- | $268,156 | ||||||||||||
| Banks | 932,939 | ------- | ------- | 932,939 | ||||||||||||
| Capital Goods | 2,374,716 | ------- | ------- | 2,374,716 | ||||||||||||
| Commercial & Professional Services | 1,126,178 | ------- | ------- | 1,126,178 | ||||||||||||
| Consumer Durables & Apparel | 592,653 | ------- | ------- | 592,653 | ||||||||||||
| Consumer Services | 1,038,301 | ------- | ------- | 1,038,301 | ||||||||||||
| Diversified Financials | 1,041,721 | ------- | ------- | 1,041,721 | ||||||||||||
| Energy | 771,626 | ------- | ------- | 771,626 | ||||||||||||
| Food, Beverage & Tobacco | 333,165 | ------- | ------- | 333,165 | ||||||||||||
| Health Care Equipment & Services | 2,149,444 | ------- | ------- | 2,149,444 | ||||||||||||
| Household & Personal Products | 374,774 | ------- | ------- | 374,774 | ||||||||||||
| Insurance | 1,109,407 | ------- | ------- | 1,109,407 | ||||||||||||
| Materials | 1,676,370 | ------- | ------- | 1,676,370 | ||||||||||||
| Media & Entertainment | 455,483 | ------- | ------- | 455,483 | ||||||||||||
| Pharmaceuticals, Biotechnology & Life Sciences | 1,013,318 | ------- | ------- | 1,013,318 | ||||||||||||
| Retailing | 854,077 | ------- | ------- | 854,077 | ||||||||||||
| Semiconductors & Semiconductor Equipment | 1,191,035 | ------- | ------- | 1,191,035 | ||||||||||||
| Software & Services | 2,564,166 | ------- | ------- | 2,564,166 | ||||||||||||
| Technology Hardware & Equipment | 1,014,577 | ------- | ------- | 1,014,577 | ||||||||||||
| Transportation | 1,116,439 | ------- | ------- | 1,116,439 | ||||||||||||
| Utilities | 1,120,600 | ------- | ------- | 1,120,600 | ||||||||||||
| Total Common Stocks | $23,119,145 | $------- | $------- | $23,119,145 | ||||||||||||
| REITs | ||||||||||||||||
| Real Estate | $1,849,789 | $------- | $------- | $ 1,849,789 | ||||||||||||
| Total REITs | $1,849,789 | $------- | $------- | $ 1,849,789 | ||||||||||||
| Total Investments | $24,968,934 | $------- | $------- | $24,968,934 | ||||||||||||
For more information on valuation inputs, please refer to Note 1(A) of the accompanying Notes to Financial Statements.
There were no transfers into or out of Level 3 during the reporting period, as compared to their classification from the prior annual report.
The accompanying notes are an integral part of these financial statements.
| 28 | www.thomaswhitefunds.com |
Table of Contents
THOMAS WHITE FUNDS
Statements of Assets and Liabilities
October 31, 2021
| International Fund | American Opportunities Fund | |||||||||||||||
| ASSETS: | ||||||||||||||||
| Investments in securities at market value1,2 | $ | 89,958,921 | $ | 24,968,934 | ||||||||||||
| Cash | 1,132,723 | 325,600 | ||||||||||||||
| Foreign currency3 | 6 | ------- | ||||||||||||||
| Receivables: | ||||||||||||||||
Securities lending | 3 | ------- | ||||||||||||||
Dividends | 94,070 | 7,031 | ||||||||||||||
Reclaims | 1,100,288 | 2,170 | ||||||||||||||
Investments sold | 5,364 | ------- | ||||||||||||||
Fund shares sold | 6,027 | ------- | ||||||||||||||
| Prepaid expenses and other assets | 32,028 | 11,282 | ||||||||||||||
| Total assets | 92,329,430 | 25,315,017 | ||||||||||||||
| LIABILITIES: | ||||||||||||||||
| Management and administrative fees payable (Note 4) | 37,815 | 16,261 | ||||||||||||||
| Business management fees payable (Note 4) | 2,697 | 729 | ||||||||||||||
| Trustee fees payable | 9,499 | 2,501 | ||||||||||||||
| Payable for Fund shares redeemed | 23,697 | 25,782 | ||||||||||||||
| Collateral on loaned securities (See Note 1)2,4 | 161,550 | ------- | ||||||||||||||
| Accrued fund accounting and fund administration fees | 17,089 | 5,853 | ||||||||||||||
| Accrued custody fees | 28,337 | 927 | ||||||||||||||
| Accrued printing and mailing expenses | 6,959 | 1,190 | ||||||||||||||
| Accrued professional fees | 17,665 | 17,168 | ||||||||||||||
| Accrued shareholder servicing fees | 11,153 | 2,943 | ||||||||||||||
| Accrued expenses and other liabilities | 2,662 | 50 | ||||||||||||||
| Total liabilities | 319,123 | 73,404 | ||||||||||||||
| Net Assets | $ | 92,010,307 | $ | 25,241,613 | ||||||||||||
| NET ASSETS | ||||||||||||||||
| Source of Net Assets: | ||||||||||||||||
| Net capital paid in on shares of beneficial interest | $ | 57,641,511 | $ | 13,103,258 | ||||||||||||
| Total distributable earnings | 34,368,796 | 12,138,355 | ||||||||||||||
| Net assets | $ | 92,010,307 | $ | 25,241,613 | ||||||||||||
| The accompanying notes are an integral part of these financial statements. | ||||||||||||||||
| www.thomaswhitefunds.com | 29 |
Table of Contents
THOMAS WHITE FUNDS
Statements of Assets and Liabilities
October 31, 2021
| International Fund | American Opportunities Fund | |||||||||||||||
| INVESTOR CLASS SHARES | ||||||||||||||||
| Net assets | $ | 20,300,229 | $ | 25,241,613 | ||||||||||||
| Shares outstanding5 | 1,096,429 | 1,333,679 | ||||||||||||||
| Net asset value and offering price per share | $ | 18.51 | $ | 18.93 | ||||||||||||
| CLASS I SHARES | ||||||||||||||||
| Net assets | $ | 71,710,078 | ||||||||||||||
| Shares outstanding5 | 3,875,707 | |||||||||||||||
| Net asset value and offering price per share | $ | 18.50 | ||||||||||||||
1 Cost Basis of Investments: International Fund: $64,918,932 including Securities lending collateral of $161,550 American Opportunities Fund: $14,279,835 | ||||||||||||||||
2 Value of securities out on loan at 10/31/2021: International Fund: $901,232 | ||||||||||||||||
3 Cost Basis of Cash denominated in foreign currencies: International Fund: $6 | ||||||||||||||||
4 Non-cash collateral from securities on loan: International Fund: $845,871 | ||||||||||||||||
| 5 There are an unlimited number of $.01 par value shares of beneficial interest authorized. | ||||||||||||||||
| The accompanying notes are an integral part of these financial statements. |
| |||||||||||||||
| 30 | www.thomaswhitefunds.com |
Table of Contents
THOMAS WHITE FUNDS
Year Ended October 31, 2021
International | American | |||||||||||||||
| INVESTMENT INCOME | ||||||||||||||||
| Income: | ||||||||||||||||
Dividends1 | $ | 1,965,725 | $ | 260,724 | ||||||||||||
Securities lending income (Note 1) | 1,287 | ------- | ||||||||||||||
| Total investment income | 1,967,012 | 260,724 | ||||||||||||||
| Expenses (Note 1(B)): | ||||||||||||||||
Investment management fees (Note 4) | 768,179 | 187,358 | ||||||||||||||
Business management fees (Note 4) | 31,631 | 7,715 | ||||||||||||||
Fund accounting and fund administration fees | 103,743 | 34,952 | ||||||||||||||
Custodian fees | 40,502 | 6,328 | ||||||||||||||
Shareholder servicing fees | 66,152 | 18,129 | ||||||||||||||
Trustees’ fees and expenses | 38,618 | 9,144 | ||||||||||||||
Professional fees | 127,230 | 42,840 | ||||||||||||||
Registration fees | 39,947 | 23,548 | ||||||||||||||
Printing and mailing expenses | 24,776 | 4,035 | ||||||||||||||
Administrative service fee (Note 4) | 38,307 | 8,398 | ||||||||||||||
Other expenses | 64,527 | 15,092 | ||||||||||||||
| Total expenses | 1,343,612 | 357,539 | ||||||||||||||
| Reimbursement from Advisor (Note 4) | (393,515 | ) | (61,292 | ) | ||||||||||||
| Net expenses | 950,097 | 296,247 | ||||||||||||||
| Net investment income (loss) | 1,016,915 | (35,523 | ) | |||||||||||||
| REALIZED AND UNREALIZED GAIN ON INVESTMENTS |
| |||||||||||||||
| Net realized gain on investments and foreign currency translation | 11,625,622 | 1,473,795 | ||||||||||||||
| Net change in unrealized appreciation on investments and foreign currency transactions | 8,276,792 | 6,387,355 | ||||||||||||||
| Net realized and unrealized gain | 19,902,414 | 7,861,150 | ||||||||||||||
| Net increase in net assets resulting from operations | $ | 20,919,329 | $ | 7,825,627 | ||||||||||||
1 Net of issuance fees and/or foreign tax withheld of: International Fund: $241,511 | ||||||||||||||||
| American Opportunities: $775 |
| |||||||||||||||
| The accompanying notes are an integral part of these financial statements. |
| |||||||||||||||
| www.thomaswhitefunds.com | 31 |
Table of Contents
THOMAS WHITE FUNDS
Statements of Changes in Net Assets
| International Fund | ||||||||||||||||
| Year Ended October 31, | ||||||||||||||||
| 2021 | 2020 | |||||||||||||||
| Change in net assets from operations: | ||||||||||||||||
Net investment income | $ | 1,016,915 | $ | 764,746 | ||||||||||||
Net realized gain (loss) on investments and foreign currency translation | 11,625,622 | (1,468,830 | ) | |||||||||||||
Net changed in unrealized appreciation (depreciation) on investments and foreign currency translation | 8,276,792 | (462,365 | ) | |||||||||||||
Net increase (decrease) in net assets resulting from operations | 20,919,329 | (1,166,449 | ) | |||||||||||||
| Distributions: | ||||||||||||||||
Distributable earnings - Investor Class | ------- | (291,968 | ) | |||||||||||||
Distributable earnings - Class I | ------- | (1,135,834 | ) | |||||||||||||
| Total distributions | ------- | (1,427,802 | ) | |||||||||||||
| Fund share transactions (Note 3) | (4,441,015 | ) | (40,990,287 | ) | ||||||||||||
| Total increase (decrease) in net assets | 16,478,314 | (43,584,538 | ) | |||||||||||||
| Net assets: | ||||||||||||||||
| Beginning of year | 75,531,993 | 119,116,531 | ||||||||||||||
| End of year | $ | 92,010,307 | $ | 75,531,993 | ||||||||||||
| The accompanying notes are an integral part of these financial statements. |
| |||||||||||||||
| 32 | www.thomaswhitefunds.com |
Table of Contents
THOMAS WHITE FUNDS
Statements of Changes in Net Assets
| American Opportunities Fund | ||||||||||||||||
| Year Ended October 31, | ||||||||||||||||
| 2021 | 2020 | |||||||||||||||
| Change in net assets from operations: | ||||||||||||||||
Net investment income (loss) | $ | (35,523 | ) | $ | 47,057 | |||||||||||
Net realized gain on investments | 1,473,795 | 8,765,420 | ||||||||||||||
Net change in unrealized appreciation (depreciation) on investments | 6,387,355 | (8,594,140 | ) | |||||||||||||
Net increase in net assets resulting from operations | 7,825,627 | 218,337 | ||||||||||||||
| Total distributions from distributable earnings | ------- | (4,247,427 | ) | |||||||||||||
| Fund share transactions (Note 3) | 562,942 | (24,883,766 | ) | |||||||||||||
| Total increase (decrease) in net assets | 8,388,569 | (28,912,856 | ) | |||||||||||||
| Net assets: | ||||||||||||||||
| Beginning of year | 16,853,044 | 45,765,900 | ||||||||||||||
| End of year | $ | 25,241,613 | $ | 16,853,044 | ||||||||||||
| The accompanying notes are an integral part of these financial statements. |
| |||||||||||||||
| www.thomaswhitefunds.com | 33 |
Table of Contents
THOMAS WHITE FUNDS
| Thomas White International Fund - Investor Class | ||||||||||||||||||||||||||||||||||||||||
| Year Ended October 31, | ||||||||||||||||||||||||||||||||||||||||
| 2021 | 2020 | 2019 | 2018 | 2017 | ||||||||||||||||||||||||||||||||||||
| Per share operating performance (For a share outstanding throughout the year) |
| |||||||||||||||||||||||||||||||||||||||
| Net asset value, beginning of year | $ | 14.47 | $ | 14.80 | $ | 13.86 | $ | 17.88 | $ | 14.97 | ||||||||||||||||||||||||||||||
| Income from investment operations: | ||||||||||||||||||||||||||||||||||||||||
Net investment income 1 | 0.16 | 0.10 | 0.32 | 0.25 | 0.14 | |||||||||||||||||||||||||||||||||||
Net realized and unrealized gains/(losses) | 3.88 | (0.22 | ) | 1.15 | (2.44 | ) | 3.30 | |||||||||||||||||||||||||||||||||
| Total from investment operations | 4.04 | (0.12 | ) | 1.47 | (2.19 | ) | 3.44 | |||||||||||||||||||||||||||||||||
| Distributions: | ||||||||||||||||||||||||||||||||||||||||
From net investment income | ------- | (0.21 | ) | (0.23 | ) | (0.29 | ) | (0.28 | ) | |||||||||||||||||||||||||||||||
From net realized gains | ------- | ------- | (0.30 | ) | (1.54 | ) | (0.25 | ) | ||||||||||||||||||||||||||||||||
| Total Distributions | ------- | (0.21 | ) | (0.53 | ) | (1.83 | ) | (0.53 | ) | |||||||||||||||||||||||||||||||
| Change in net asset value for the year | 4.04 | (0.33 | ) | 0.94 | (4.02 | ) | 2.91 | |||||||||||||||||||||||||||||||||
| Net asset value, end of year | $ | 18.51 | $ | 14.47 | $ | 14.80 | $ | 13.86 | $ | 17.88 | ||||||||||||||||||||||||||||||
| Total Return | 27.92% | (0.86)% | 10.59% | (12.01)% | 23.06% | |||||||||||||||||||||||||||||||||||
| Ratios/supplemental data | ||||||||||||||||||||||||||||||||||||||||
| Net assets, end of year ($000) | $ | 20,300 | $ | 17,983 | $ | 26,331 | $ | 29,473 | $ | 43,811 | ||||||||||||||||||||||||||||||
| Ratio to average net assets: | ||||||||||||||||||||||||||||||||||||||||
| Expenses (net of reimbursement) | 1.24% | 1.24% | 1.24% | 1.24% | 1.24% | |||||||||||||||||||||||||||||||||||
| Expenses (prior to reimbursement) | 1.63% | 1.63% | 1.63% | 1.34% | 1.36% | |||||||||||||||||||||||||||||||||||
| Net investment income (net of reimbursement) | 0.92% | 0.71% | 2.17% | 1.32% | 0.90% | |||||||||||||||||||||||||||||||||||
| Net investment income (prior to reimbursement) | 0.53% | 0.32% | 1.78% | 1.22% | 0.78% | |||||||||||||||||||||||||||||||||||
| Portfolio turnover rate 2 | 49% | 24% | 43% | 38% | 48% | |||||||||||||||||||||||||||||||||||
| (1) | Net investment income per share represents net investment income divided by the average shares outstanding throughout the year. |
| (2) | Portfolio turnover is calculated on the basis of the Fund as a whole without distinguishing between the classes of shares issued. |
The accompanying notes are an integral part of these financial statements.
| 34 | www.thomaswhitefunds.com |
Table of Contents
THOMAS WHITE FUNDS
FINANCIAL HIGHLIGHTS
| Thomas White International Fund - Class I | ||||||||||||||||||||||||||||||||||||||||
| Year Ended October 31, | ||||||||||||||||||||||||||||||||||||||||
| 2021 | 2020 | 2019 | 2018 | 2017 | ||||||||||||||||||||||||||||||||||||
| Per share operating performance (For a share outstanding throughout the year) |
| |||||||||||||||||||||||||||||||||||||||
| Net asset value, beginning of year | $ | 14.43 | $ | 14.75 | $ | 13.81 | $ | 17.79 | $ | 14.98 | ||||||||||||||||||||||||||||||
| Income from investment operations: | ||||||||||||||||||||||||||||||||||||||||
Net investment income 1 | 0.21 | 0.13 | 0.35 | 0.27 | 0.25 | |||||||||||||||||||||||||||||||||||
Net realized and unrealized gains/(losses) | 3.86 | (0.20 | ) | 1.16 | (2.42 | ) | 3.22 | |||||||||||||||||||||||||||||||||
| Total from investment operations | 4.07 | (0.07 | ) | 1.51 | (2.15 | ) | 3.47 | |||||||||||||||||||||||||||||||||
| Distributions: | ||||||||||||||||||||||||||||||||||||||||
From net investment income | ------- | (0.25 | ) | (0.27 | ) | (0.29 | ) | (0.41 | ) | |||||||||||||||||||||||||||||||
From net realized gains | ------- | ------- | (0.30 | ) | (1.54 | ) | (0.25 | ) | ||||||||||||||||||||||||||||||||
| Total Distributions | ------- | (0.25 | ) | (0.57 | ) | (1.83 | ) | (0.66 | ) | |||||||||||||||||||||||||||||||
| Change in net asset value for the year | 4.07 | (0.32 | ) | 0.94 | (3.98 | ) | 2.81 | |||||||||||||||||||||||||||||||||
| Net asset value, end of year | $ | 18.50 | $ | 14.43 | $ | 14.75 | $ | 13.81 | $ | 17.79 | ||||||||||||||||||||||||||||||
| Total Return | 28.21% | (0.54)% | 10.90% | (11.80)% | 23.23% | |||||||||||||||||||||||||||||||||||
| Ratios/supplemental data | ||||||||||||||||||||||||||||||||||||||||
| Net assets, end of year ($000) | $ | 71,710 | $ | 57,549 | $ | 92,785 | $ | 181,179 | $ | 277,287 | ||||||||||||||||||||||||||||||
| Ratio to average net assets: | ||||||||||||||||||||||||||||||||||||||||
| Expenses (net of reimbursement) | 0.99% | 0.99% | 0.99% | 0.99% | 0.99% | |||||||||||||||||||||||||||||||||||
| Expenses (prior to reimbursement) | 1.44% | 1.49% | 1.40% | 1.18% | 1.14% | |||||||||||||||||||||||||||||||||||
| Net investment income (net of reimbursement) | 1.19% | 0.88% | 2.42% | 1.53% | 1.53% | |||||||||||||||||||||||||||||||||||
| Net investment income (prior to reimbursement) | 0.74% | 0.38% | 2.01% | 1.34% | 1.38% | |||||||||||||||||||||||||||||||||||
| Portfolio turnover rate 2 | 49% | 24% | 43% | 38% | 48% | |||||||||||||||||||||||||||||||||||
| (1) | Net investment income per share represents net investment income divided by the average shares outstanding throughout the year. |
| (2) | Portfolio turnover is calculated on the basis of the Fund as a whole without distinguishing between the classes of shares issued. |
The accompanying notes are an integral part of these financial statements.
| www.thomaswhitefunds.com | 35 |
Table of Contents
THOMAS WHITE FUNDS
FINANCIAL HIGHLIGHTS
| Thomas White American Opportunities Fund - Investor Class | ||||||||||||||||||||||||||||||||||||||||
| Year Ended October 31, | ||||||||||||||||||||||||||||||||||||||||
| 2021 | 2020 | 2019 | 2018 | 2017 | ||||||||||||||||||||||||||||||||||||
| Per share operating performance (For a share outstanding throughout the year) |
| |||||||||||||||||||||||||||||||||||||||
| Net asset value, beginning of year | $ | 12.95 | $ | 17.46 | $ | 15.81 | $ | 16.49 | $ | 14.91 | ||||||||||||||||||||||||||||||
| Income from investment operations: | ||||||||||||||||||||||||||||||||||||||||
Net investment income (loss) 1 | (0.03 | ) | 0.03 | 0.04 | 0.06 | 0.04 | ||||||||||||||||||||||||||||||||||
Net realized and unrealized gains/(losses) | 6.01 | (0.44 | ) | 2.08 | ------- | 3.00 | ||||||||||||||||||||||||||||||||||
| Total from investment operations | 5.98 | (0.41 | ) | 2.12 | 0.06 | 3.04 | ||||||||||||||||||||||||||||||||||
| Distributions: | ||||||||||||||||||||||||||||||||||||||||
From net investment income | ------- | (0.03 | ) | (0.03 | ) | (0.05 | ) | (0.14 | ) | |||||||||||||||||||||||||||||||
From net realized gains | ------- | (4.07 | ) | (0.44 | ) | (0.69 | ) | (1.32 | ) | |||||||||||||||||||||||||||||||
| Total Distributions | ------- | (4.10 | ) | (0.47 | ) | (0.74 | ) | (1.46 | ) | |||||||||||||||||||||||||||||||
| Change in net asset value for the year | 5.98 | (4.51 | ) | 1.65 | (0.68 | ) | 1.58 | |||||||||||||||||||||||||||||||||
| Net asset value, end of year | $ | 18.93 | $ | 12.95 | $ | 17.46 | $ | 15.81 | $ | 16.49 | ||||||||||||||||||||||||||||||
| Total Return | 46.18% | (2.87)% | 13.37% | 0.50% | 20.45% | |||||||||||||||||||||||||||||||||||
| Ratios/supplemental data | ||||||||||||||||||||||||||||||||||||||||
| Net assets, end of year ($000) | $ | 25,242 | $ | 16,853 | $ | 45,766 | $ | 40,969 | $ | 41,433 | ||||||||||||||||||||||||||||||
| Ratio to average net assets: | ||||||||||||||||||||||||||||||||||||||||
| Expenses (net of reimbursement/recoupment) | 1.34% | 1.34% | 1.34% | 1.34% | 1.19% | |||||||||||||||||||||||||||||||||||
| Expenses (prior to reimbursement/recoupment) | 1.62% | 1.71% | 1.55% | 1.43% | 1.19% | |||||||||||||||||||||||||||||||||||
| Net investment income (net of reimbursement/recoupment) | (0.16)% | 0.19% | 0.23% | 0.31% | 0.28% | |||||||||||||||||||||||||||||||||||
| Net investment income/(loss) (prior to reimbursement/recoupment) | (0.44)% | (0.18)% | 0.02% | 0.22% | 0.28% | |||||||||||||||||||||||||||||||||||
| Portfolio turnover rate | 14% | 31% | 20% | 21% | 29% | |||||||||||||||||||||||||||||||||||
| (1) | Net investment income per share represents net investment income divided by shares outstanding throughout the year. |
The accompanying notes are an integral part of these financial statements.
| 36 | www.thomaswhitefunds.com |
Table of Contents
Notes to Financial Statements Year Ended October 31, 2021
NOTE 1. ORGANIZATION AND SIGNIFICANT ACCOUNTING POLICIES
Lord Asset Management Trust (the “Trust”) was organized as a Delaware business trust on February 9, 1994, as an open-end diversified management investment company. The Trust currently has two series of shares (collectively referred to as the “Funds,” and each a “Fund”) - the Thomas White International Fund (the “International Fund”), which commenced operations with the sale of Investor Class shares on June 28, 1994 and the sale of Class I shares, Class A shares and Class C shares on August 31, 2012; and the Thomas White American Opportunities Fund (the “American Opportunities Fund”), which commenced operations with the sale of Investor Class shares on March 4, 1999. Class A and Class C shares of the International Fund closed on February 28, 2017 and, effective at the close of business on that date, the outstanding Class A and Class C shares of those Funds were converted to Class I shares, as applicable. The investment objective of each Fund is to seek long-term capital growth. The International Fund primarily invests in equity securities of companies located in the world’s developed countries outside of the U.S. The American Opportunities Fund primarily invests in U.S. equity securities, with a focus on mid-size and small companies.
The following is a summary of significant accounting policies followed in the preparation of the Trust’s financial statements.
(A) VALUATION OF SECURITIES
Securities listed or traded on a recognized national or foreign stock exchange or NASDAQ are valued at the last reported sales prices on the principal exchange on which the securities are traded. NASDAQ National Market securities are valued at the NASDAQ official closing price. Over-the-counter securities and listed securities for which no closing sale price is reported are valued at the mean between the last current bid and ask price. Securities for which market quotations are not readily available are valued at fair value under the Trust’s Valuation Procedures as determined by management and approved in good faith by the Board of Trustees. As of October 31, 2021, all securities within each Fund’s portfolio were valued at the last reported sales price on the principal exchange on which the securities are traded and, for the International Fund, adjusted by a fair value factor when necessary and as further described below. The Trust has retained an independent statistical fair value pricing service to assist in the fair valuation process for securities principally traded in a foreign market in order to adjust for changes in value that may occur between the close of the foreign exchange and the time at which Fund shares are priced. Short term investments are valued at original cost, which combined with accrued interest, approximates market value.
Fair value is defined as the price that would be received to sell an asset or paid to transfer a liability (i.e., the “exit price”) in an orderly transaction between market participants at the measurement date. In determining fair value, the Fund uses various valuation approaches. A three-tiered fair value hierarchy for inputs is used in measuring fair value that maximizes the use of observable inputs and minimizes the use of unobservable inputs by generally requiring that the most observable inputs be used when available. Observable inputs are those that market
| www.thomaswhitefunds.com | 37 |
Table of Contents
Notes to Financial Statements Year Ended October 31, 2021
participants would use in pricing the asset or liability based on market data obtained from sources independent of a Fund. Unobservable inputs reflect the Fund’s assumptions about the inputs market participants would use in pricing the asset or liability developed based on the best information available in the circumstances. The inputs or methodologies used for valuing securities are not necessarily an indication of the risks associated with investing in those securities.
The fair value hierarchy is categorized into three levels based on the inputs as follows:
Level 1 - Valuations based on unadjusted quoted prices in active markets for identical assets.
Level 2 - Valuations based on quoted prices for similar securities or in markets that are not active or for which all significant inputs are observable, either directly or indirectly.
Level 3 - Valuations based on inputs that are unobservable and significant to the overall fair value measurement.
(B) MULTI-CLASS OPERATIONS AND ALLOCATIONS
Expenses of the International Fund that are not directly attributable to a specific class of shares are prorated among the classes based on the relative net assets of each class. Expenses directly attributable to a class of shares, which presently include administration fees, administrative services fees, printing expenses, registration fees and transfer agent fees, are recorded to the specific class.
For the year ended October 31, 2021, the multi-class fund expenses per class are as follows:
International Fund | Investor Class | Class I | Total | |||||||||
| Expenses: | ||||||||||||
Investment management fees (Note 4) | $175,994 | $592,185 | $768,179 | |||||||||
Business management fees (Note 4) | 7,247 | 24,384 | 31,631 | |||||||||
Fund accounting and fund administration fees | 23,785 | 79,958 | 103,743 | |||||||||
Custodian fees | 9,362 | 31,140 | 40,502 | |||||||||
Shareholder servicing fees | 15,224 | 50,928 | 66,152 | |||||||||
Trustees’ fees and expenses | 8,861 | 29,757 | 38,618 | |||||||||
Professional fees | 29,288 | 97,942 | 127,230 | |||||||||
Registration fees | 9,148 | 30,799 | 39,947 | |||||||||
Printing and mailing expenses | 5,712 | 19,064 | 24,776 | |||||||||
Administrative service fee (Note 4) | 38,307 | ------- | 38,307 | |||||||||
Other expenses | 14,730 | 49,797 | 64,527 | |||||||||
| Total expenses | 337,658 | 1,005,954 | 1,343,612 | |||||||||
Reimbursement of management fees | (80,006 | ) | (269,094 | ) | (349,100 | ) | ||||||
Reimbursement of class specific expenses | ------- | (44,415 | ) | (44,415 | ) | |||||||
| Reimbursement from Advisor | (80,006 | ) | (313,509 | ) | (393,515 | ) | ||||||
| Net expenses | $257,652 | $692,445 | $950,097 | |||||||||
| 38 | www.thomaswhitefunds.com |
Table of Contents
Notes to Financial Statements Year Ended October 31, 2021
Income, realized and unrealized capital gains and losses of the Fund are prorated among the classes based on the relative net assets of each class within the Fund.
(C) MARKET RISK
Investing in securities of foreign companies and foreign governments involves special risks and considerations not typically associated with investing in U.S. companies and securities of the U.S. Government. These risks include revaluation of currencies and future adverse political and economic developments. Moreover, securities of many foreign companies and foreign governments and their markets may be less liquid and their prices more volatile than securities of comparable U.S. companies and securities of the U.S. Government.
(D) FOREIGN CURRENCY TRANSLATION
Portfolio securities and other assets and liabilities denominated in foreign currencies are translated into U.S. dollar amounts at the date of valuation. Purchases and sales of portfolio securities and income items denominated in foreign currencies are translated into U.S. dollar amounts on the respective dates of such transactions. When a Fund purchases or sells a foreign security, it will customarily enter into a foreign exchange contract to minimize foreign exchange risk from the trade date to the settlement date of such transaction.
The Funds do not isolate the portion of the results of operations resulting from changes in foreign exchange rates on investments from the fluctuations arising from changes in market prices of securities held. Such fluctuations are included with the net realized and unrealized gain or loss from investments.
Net realized gain (loss) on investments and foreign currency translation include those gains and losses arising from the sale of foreign currencies, currency gains or losses realized between the trade and settlement dates on securities transactions, the differences between the amounts of dividends, and foreign withholding taxes recorded on a Fund’s books, and the U.S. dollar equivalent of the amounts actually received or paid. Net unrealized appreciation (depreciation) on investments and foreign currency translation includes changes in the value of assets and liabilities resulting from exchange rates.
(E) INCOME TAXES
Each Fund is a separate taxpayer for federal income tax purposes. Each Fund intends to distribute substantially all of its net investment income and net capital gains to its shareholders and to otherwise comply with the requirements of Subchapter M of the Internal Revenue Code applicable to regulated investment companies. Therefore, no federal income tax provision is required.
All open tax years and major jurisdictions have been reviewed for the Funds and, based on this review, there are no significant uncertain tax positions that would require recognition in the
| www.thomaswhitefunds.com | 39 |
Table of Contents
Notes to Financial Statements Year Ended October 31, 2021
financial statements. Open tax years are those that are open for exam by taxing authorities and, as of October 31, 2021, open Federal tax years include the tax years ended October 31, 2018 through 2021. The Funds have no examinations in progress and are also not aware of any tax positions for which it is reasonably possible that the total amounts of unrecognized tax benefits will significantly change in the next twelve months.
The Funds accrue for such material foreign taxes on net realized and unrealized gains at the appropriate rate for each country. Based on rates ranging from approximately 10% to 15%, there were no material accruals at period end.
The Funds may utilize equalization accounting for tax purposes and designate earnings and profits, including net realized gains distributed to shareholders on the redemption of shares, as part of the dividends paid deduction for income tax purposes.
(F) USE OF ESTIMATES
The preparation of financial statements in conformity with generally accepted accounting principles requires management to make estimates and assumptions that affect the reported amounts of assets and liabilities and disclosure of contingent liabilities at the date of the financial statements and the reported amounts of increases and decreases in net assets from operations during the period. Actual results could differ from these estimates.
The Funds are investment companies and follow accounting and reporting guidance under the Financial Accounting Standards Board (“FASB”) Accounting Standards Codification (“ASC”) Topic 946, “Financial Services-Investment Companies”.
(G) SECURITY TRANSACTIONS AND INVESTMENT INCOME
Security transactions are accounted for on a trade date basis. Interest is accrued on a daily basis and dividend income is recorded on the ex-dividend date, except that certain dividends from foreign securities are recorded when the information is available to the Fund. Realized gains and losses are determined using specific identification.
(H) DISTRIBUTIONS TO SHAREHOLDERS
The Funds usually declare and pay dividends from net investment income annually but may do so more frequently to avoid excise tax. Distributions of net realized capital gains, if any, will be distributed at least annually.
(I) SECURITIES LENDING
The International Fund may lend investment securities to investors who borrow securities in order to complete certain transactions. By lending investment securities, the Fund attempts to increase its net investment income through the receipt of interest earned on loan collateral. Any increase or decline in
| 40 | www.thomaswhitefunds.com |
Table of Contents
Notes to Financial Statements Year Ended October 31, 2021
the market price of the securities loaned that might occur and any interest earned or dividends declared during the term of the loan would be for the account of the Fund. Risks of delay in recovery of the securities or even loss of rights in the collateral may occur should the borrower of the securities fail financially. Risk may also arise to the extent that the value of the securities loaned increases above the value of the collateral received. It is the Fund’s policy to obtain additional collateral from or return excess collateral to the borrower by the end of the next business day. Therefore, the value of the collateral may be temporarily less than the value of the securities on loan.
When the Fund lends securities it receives cash, cash equivalents, or other securities as collateral. Initial collateral levels shall not be less than 102% of the market value of the borrowed securities (105% if the collateral and the borrowed securities are denominated in different currencies). Marking to market is performed every business day (subject to de minimis rules of change in market value) for the Fund and each borrower is required to deliver additional collateral when necessary so that the total collateral held in the account for all loans of the Fund to the borrower will not be less than 100% of the market value of all the borrowed securities loaned to the borrower by the Fund. Any cash, cash equivalents, or other securities received as collateral is invested by the securities lending agent, Northern Trust, in accordance with pre-established guidelines as set forth in the securities lending agreement. The cash collateral would be invested in the Northern Institutional Liquid Asset Portfolio (an open-end regulated investment company) and would be shown on the investment portfolio for the International Fund. The cash collateral, if any, is reflected in the Fund’s Statement of Assets and Liabilities in the line item labeled “Investments in securities at market value”. Non-cash collateral is not shown in the Fund’s investment portfolio nor disclosed in the Statement of Assets and Liabilities as it is held by the lending agent on behalf of the Fund, and the Fund does not have the ability to re-hypothecate those securities. A portion of the interest received on the loan collateral is retained by the Fund and the remainder is rebated to the borrower of the securities. From the interest retained by the Fund, 50% is paid to the securities lending agent for the International Fund for its services. The net amount of interest earned, after the interest rebate and the allocation to the securities lending agent, is included in the statement of operations as securities lending income. The value of loaned securities and related collateral outstanding at October 31, 2021 are as follows:
| Fund | Value of Loaned Securities | Value of Cash Collateral | Value of Non-Cash Collateral* | Total Collateral | ||||||||||||
| International Fund | $901,232 | $161,550 | $845,871 | $1,007,421 | ||||||||||||
| * | The Fund cannot repledge or dispose of this collateral, nor does the Fund earn any income or receive dividends with respect to this collateral. |
| www.thomaswhitefunds.com | 41 |
Table of Contents
Notes to Financial Statements Year Ended October 31, 2021
The International Fund has earned income on securities lending (after rebates to borrowers and allocation to the securities lending agent) as follows:
| Fund | Net Income Earned | |||
| International Fund | $1,287 | |||
The Fund adopted guidance requiring entities to present gross obligations for secured borrowings by the type of collateral pledged and remaining time to maturity. There were no such obligations at October 31, 2021.
(J) REDEMPTION FEE
The Funds assess a 2% fee on redemptions (including exchanges) of Fund shares held for less than sixty days. Redemption fees are paid to each Fund to help offset transaction costs and to protect the Fund’s long-term shareholders. Each Fund will use the “first-in, first-out” (FIFO) method to determine the sixty-day holding period. Under this method, the date of the redemption or exchange will be compared to the earliest purchase date of shares held in the account. If this holding period is less than sixty days, the fee will be charged. The redemption fees were included in net capital paid (Note 3).
(K) REAL ESTATE INVESTMENT TRUSTS
The Funds have made certain investments in real estate investment trusts (“REITs”), which pay dividends to their shareholders based upon funds available from operations. It is quite common for these dividends to exceed the REITs’ taxable earnings and profits resulting in the excess portion of such dividends being designated as a return of capital. The Funds intend to include the gross dividends from such REITs in its annual distributions to its shareholders and, accordingly, a portion of the distributions received by the shareholders of the Funds may also be designated as a return of capital.
NOTE 2. SIGNIFICANT SHAREHOLDERS (Unaudited)
The following table indicates the number of shareholders who held a significant portion (greater than 5%) of the shares of each Class’s outstanding shares as of October 31, 2021. Investment activities of these shareholders could have a material effect on each Fund.
| Fund | Share Class | Number of Shareholders | Aggregate % Held of Class | |||||||
| International Fund | Investor Class | 5 | 84.1% | |||||||
| International Fund | Class I | 3 | 75.2% | |||||||
| American Opportunities Fund | Investor Class | 4 | 88.6% | |||||||
| 42 | www.thomaswhitefunds.com |
Table of Contents
Notes to Financial Statements Year Ended October 31, 2021
NOTE 3. TRANSACTIONS IN SHARES OF BENEFICIAL INTEREST
As of October 31, 2021, there were an unlimited number of $0.01 par value shares of beneficial interest authorized. Transactions are summarized as follows:
| International Fund | ||||||||||||||||||||||||||||
| Year Ended October 31, 2021 | Year Ended October 31, 2020 | |||||||||||||||||||||||||||
| Investor Class | Investor Class | |||||||||||||||||||||||||||
| Shares | Amount | Shares | Amount | |||||||||||||||||||||||||
| Shares sold | 40,685 | $ | 729,980 | 42,668 | $ | 604,815 | ||||||||||||||||||||||
| Shares issued on reinvestment of dividends & distributions | ------- | ------- | 16,963 | 256,494 | ||||||||||||||||||||||||
| Other transactions | ------- | 28 | ^ | |||||||||||||||||||||||||
| Shares redeemed | (186,903 | ) | (3,336,187 | )^^ | (596,415 | ) | (8,654,840 | )^^^ | ||||||||||||||||||||
| Net decrease | (146,218 | ) | $ | (2,606,207 | ) | (536,784 | ) | $ | (7,793,503 | ) | ||||||||||||||||||
| Shares outstanding: | ||||||||||||||||||||||||||||
| Beginning of year | 1,242,647 | 1,779,431 | ||||||||||||||||||||||||||
| End of year | 1,096,429 | 1,242,647 | ||||||||||||||||||||||||||
| ^ Reimbursement from U.S. Bancorp Fund Services, LLC due to NAV error. |
| |||||||||||||||||||||||||||
| ^^ Net redemption fees of $13. |
| |||||||||||||||||||||||||||
| ^^^ Net redemption fees of $407. |
| |||||||||||||||||||||||||||
| Year Ended October 31, 2021 | Year Ended October 31, 2020 | |||||||||||||||||||||||||||
| Class I | Class I | |||||||||||||||||||||||||||
| Shares | Amount | Shares | Amount | |||||||||||||||||||||||||
| Shares sold | 405,820 | $ | 7,299,963 | 799,606 | $ | 10,421,339 | ||||||||||||||||||||||
| Shares issued on reinvestment of dividends & distributions | ------- | ------- | 42,283 | 637,238 | ||||||||||||||||||||||||
| Other transactions | ------- | 1,042 | ^ | |||||||||||||||||||||||||
| Shares redeemed | (519,498 | ) | (9,134,771 | )^^ | (3,142,595 | ) | (44,256,403 | )^^^ | ||||||||||||||||||||
| Net decrease | (113,678 | ) | $ | (1,834,808 | ) | (2,300,706 | ) | $ | (33,196,784 | ) | ||||||||||||||||||
| Shares outstanding: | ||||||||||||||||||||||||||||
| Beginning of year | 3,989,385 | 6,290,091 | ||||||||||||||||||||||||||
| End of year | 3,875,707 | 3,989,385 | ||||||||||||||||||||||||||
| Total net decrease | $ | (4,441,015 | ) | $ | (40,990,287 | ) | ||||||||||||||||||||||
| ^ Reimbursement from U.S. Bancorp Fund Services, LLC due to NAV error. |
| |||||||||||||||||||||||||||
| ^^ Net redemption fees of $46. |
| |||||||||||||||||||||||||||
| ^^^ Net redemption fees of $9. |
| |||||||||||||||||||||||||||
| www.thomaswhitefunds.com | 43 |
Table of Contents
Notes to Financial Statements Year Ended October 31, 2021
| American Opportunities Fund | ||||||||||||||||||||||||||||
| Year Ended October 31, 2021 | Year Ended October 31, 2020 | |||||||||||||||||||||||||||
| Investor Class | Investor Class | |||||||||||||||||||||||||||
| Shares | Amount | Shares | Amount | |||||||||||||||||||||||||
| Shares sold | 45,121 | $ | 767,454 | 93,260 | $ | 1,359,812 | ||||||||||||||||||||||
| Shares issued on reinvestment of dividends & distributions | ------- | �� | ------- | 267,442 | 3,548,952 | |||||||||||||||||||||||
| Shares redeemed | (12,758 | ) | (204,512 | ) | (1,680,301 | ) | (29,792,530 | ) | ||||||||||||||||||||
| Total net increase (decrease) | 32,363 | $ | 562,942 | (1,319,599 | ) | $ | (24,883,766 | ) | ||||||||||||||||||||
| Shares outstanding: | ||||||||||||||||||||||||||||
| Beginning of year | 1,301,316 | 2,620,915 | ||||||||||||||||||||||||||
| End of year | 1,333,679 | 1,301,316 | ||||||||||||||||||||||||||
NOTE 4. INVESTMENT MANAGEMENT FEES AND OTHER TRANSACTIONS WITH AFFILIATES
Each Fund pays a monthly investment management fee to Thomas White International, Ltd. (the “Advisor”) at the rate of 0.85% of the Fund’s average daily net assets annually. For the year ended October 31, 2021, the International Fund and American Opportunities Fund paid the Advisor $768,179 and $187,358, respectively, in investment management fees.
During the year ended October 31, 2021, the Advisor has contractually agreed to reimburse its management fee and/or reimburse the Funds’ operating expenses to the extent necessary to ensure that each Fund’s annual operating expenses do not exceed the following percentages of average daily net assets:
| Investor Class | Class I | |||||||
| International Fund | 1.24% | 0.99% | ||||||
| American Opportunities Fund | 1.34% | n/a | ||||||
The fee deferral/expense reimbursement agreement expires February 28, 2022.
The Advisor may recoup any previously waived amount from a Fund pursuant to the expense limitation agreements if such reimbursement does not cause the Fund to exceed either (i) the current expense limitation or (ii) the expense limitation in effect at the time the expense is waived, provided the reimbursement is made within three years after the year in which the Advisor incurred the expense. For the year ended October 31, 2021, the Advisor did not recoup any previously waived expenses.
| 44 | www.thomaswhitefunds.com |
Table of Contents
Notes to Financial Statements Year Ended October 31, 2021
As of October 31, 2021, the Funds had the following amounts (and year of expiration) subject to repayment to the Advisor:
| Year Incurred Expiration | 10/31/2019 10/31/2022 | 10/31/2020 10/31/2023 | 10/31/2021 10/31/2024 | Remaining Recoverable Amount | ||||||||||||
| International Fund - Investor Class | $107,470 | $89,672 | $80,006 | $277,148 | ||||||||||||
| International Fund - Class I | 390,838 | 339,928 | 313,509 | 1,044,275 | ||||||||||||
| Total Fund | $498,308 | $429,600 | $393,515 | $1,321,423 | ||||||||||||
| American Opportunities Fund - Investor Class | $88,392 | $90,817 | $61,292 | $240,501 | ||||||||||||
| Total Fund | $88,392 | $90,817 | $61,292 | $240,501 | ||||||||||||
The Funds and U.S. Bancorp Fund Services, LLC, doing business as U.S. Bank Global Fund Services (“Fund Services”), are parties to a Fund Administration Servicing Agreement. Fund Services provides administrative and fund accounting services pursuant to this agreement.
The Advisor and the Funds have adopted a Business Management Agreement under which the Advisor provides certain business management services to the Funds, including, without limitation, monitoring of the Funds’ relationships with third-party service providers and assisting with necessary and appropriate services to the Board of Trustees of the Trust, as well as either providing the Trust with or procuring for the Trust the services of a Chief Compliance Officer in accordance with Rule 38a-1 of the 1940 Act. For these services, the Advisor is entitled to receive a fee from each Fund at a rate of 0.035% of the Fund’s average daily net assets, accrued on a daily basis and paid to the Advisor on a monthly basis. For the year ended October 31, 2021, for the services provided under the Business Management Agreement, the International Fund and American Opportunities Fund paid the Advisor $31,631 and $7,715, respectively.
The Funds have adopted an Administrative Services Plan (the “Plan”) pursuant to which the Investor Class shares are authorized to make payments to the Advisor, for providing or for arranging for the provision of non-distribution, shareholder-related administrative services provided by the Advisor or by securities broker-dealers and other securities professionals, with respect to shares of the Funds attributable to or held in the name of the service provider for its clients or customers with whom they have a servicing relationship. Under the terms of the Plan, Investor Class shares are authorized to make payments up to a maximum rate of 0.25% of the average daily net assets of the shares attributable to or held in the name of the service provider for providing the types of applicable administrative services covered under the terms of the Plan. For the year ended October 31, 2021, fees incurred by the International Fund, and American Opportunities Fund pursuant to the Administrative Services Plan were $38,307 and $8,398, respectively, for the Investor Class.
| www.thomaswhitefunds.com | 45 |
Table of Contents
Notes to Financial Statements Year Ended October 31, 2021
NOTE 5. CUSTODIAN AND TRANSFER AGENT FEES
Custodian Fees - Northern Trust is the custodian for the International Fund. U.S. Bank, N.A. (“U.S. Bank”) is the custodian for the American Opportunities Fund. Northern Trust bills the International Fund quarterly based on the value of their holdings as of the previous quarter end plus transaction fees. U.S. Bank bills the American Opportunities Fund monthly based on the ending value of its holdings plus transaction fees.
Transfer Agent - Fund Services serves as the Funds’ transfer agent. Under the terms of the transfer agent agreement, Fund Services is entitled to account-based fees along with reimbursement of out-of-pocket expenses incurred in providing transfer agent services.
NOTE 6. INVESTMENT TRANSACTIONS AND INCOME TAX INFORMATION
During the year ended October 31, 2021, the cost of purchases and the proceeds from sales of investment securities, other than short-term investments, were as follows:
| Fund | Purchases | Sales | ||||||
| International Fund | $42,533,771 | $46,253,736 | ||||||
| American Opportunities Fund | $3,554,422 | $2,941,205 | ||||||
The American Opportunities Fund did not purchase or sell long-term U.S. Government securities during the year ended October 31, 2021. The International Fund did not directly purchase or sell long term U.S. Government securities, except for purposes of securities lending during the year ended October 31, 2021.
At October 31, 2021, the aggregate gross unrealized appreciation and depreciation of portfolio securities, based upon cost for federal income tax purposes, were as follows:
| Fund | Tax Cost | Unrealized Appreciation | Unrealized Depreciation | Net Unrealized Appreciation/ (Depreciation) | ||||||||||||
| International Fund | $65,282,974 | $26,786,101 | $(2,110,154) | $24,675,947 | ||||||||||||
| American Opportunities Fund | $14,270,170 | $10,836,029 | $(137,265) | $10,698,764 | ||||||||||||
Distributions to Shareholders
The Funds will distribute net investment income and net realized gains, if any, at least once a year. The amount of distributions from net investment income and net realized gains are determined in accordance with federal income tax regulations, which may differ from generally accepted accounting principles. These “book/tax” differences are either temporary or permanent in nature and are primarily due to differing treatments for passive foreign investment companies
| 46 | www.thomaswhitefunds.com |
Table of Contents
Notes to Financial Statements Year Ended October 31, 2021
and losses deferred due to wash sales. Permanent differences, primarily due to reclassification of REIT income, resulted in reclassifications among the Funds’ components of net assets at October 31, 2021, the Funds’ tax year-end.
As of October 31, 2021, the following table shows the reclassifications made:
| Fund | Distributable Earnings | Paid-In Capital | ||||||
| International Fund | $(590,425) | $590,425 | ||||||
| American Opportunities Fund | $2,316 | $(2,316) | ||||||
At October 31, 2021, the components of accumulated earnings (losses) on a tax basis were as follows:
| Fund | Undistributed Ordinary Income | Undistributed Long-term Gains | Net Unrealized Appreciation | Other Accumulated Gains (Losses) | Total Distributable Earnings | |||||||||||||||
| International Fund | $1,273,415 | $8,426,941 | $24,675,947 | $(7,507) | $34,368,796 | |||||||||||||||
| American Opportunities Fund | $------- | $1,439,591 | $10,698,764 | $------- | $12,138,355 | |||||||||||||||
As of October 31, 2021, the Funds had no tax basis capital loss losses to offset future capital gains. During fiscal year 2021, the capital losses utilized by the International Fund were $2,074,971.
During the year ended October 31, 2021, the Funds did not pay any distributions.
The tax character of distributions paid during the period shown below was as follows:
| Year Ended October 31, 2020 | ||||||||||||||||
| Ordinary Income | Return of Capital | Long-Term Capital Gains | Total Distributions | |||||||||||||
| International Fund | $1,425,332 | $2,470 | $------- | $1,427,802 | ||||||||||||
| American Opportunities Fund | $35,071 | $------- | $4,212,356 | $4,247,427 | ||||||||||||
NOTE 7. COVID-19
The global outbreak of COVID-19 (commonly referred to as “coronavirus”) has disrupted economic markets and the prolonged economic impact is uncertain. The ultimate economic fallout from the pandemic, and the long-term impact on economies, markets, industries and individual issuers, are not known. The operational and financial performance of the issuers of securities in which the Funds invest depends on future developments, including the duration and
| www.thomaswhitefunds.com | 47 |
Table of Contents
Notes to Financial Statements Year Ended October 31, 2021
spread of the outbreak, and such uncertainty may in turn adversely affect the value and liquidity of the Funds’ investments, impair the Funds’ ability to satisfy redemption requests, and negatively impact the Funds’ performance.
NOTE 8. SUBSEQUENT EVENTS
In preparing these financial statements, the Trust has evaluated events after October 31, 2021 and determined that there were no significant subsequent events that would require adjustment to or additional disclosure in these financial statements.
| 48 | www.thomaswhitefunds.com |
Table of Contents
Report of Independent Registered Public Accounting Firm
To the Shareholders of and
The Board of Trustees of
Lord Asset Management Trust
Opinion on the Financial Statements
We have audited the accompanying statement of assets and liabilities of Thomas White International Fund and Thomas White American Opportunities Fund (the “Funds”), each a series of Lord Asset Management Trust, including the schedule of investments, as of October 31, 2021, the related statement of operations for the year then ended, the statements of changes in net assets for each of the two years in the period then ended, financial highlights for each of the five years in the period then ended, and the related notes (collectively referred to as the “financial statements”). In our opinion, the financial statements present fairly, in all material respects, the financial position of the Funds as of October 31, 2021, the results of their operations for the year then ended, the changes in its net assets for each of the two years in the period then ended, and the financial highlights for each of the five years in the period then ended, in conformity with accounting principles generally accepted in the United States of America.
Basis for Opinion
These financial statements are the responsibility of the Funds’ management. Our responsibility is to express an opinion on the Funds’ financial statements based on our audits. We are a public accounting firm registered with the Public Company Accounting Oversight Board (United States) (“PCAOB”) and are required to be independent with respect to the Funds in accordance with the U.S. federal securities laws and the applicable rules and regulations of the Securities and Exchange Commission and the PCAOB. We have served as the auditor of one or more of the funds in the Trust since 2014.
We conducted our audits in accordance with the standards of the PCAOB. Those standards require that we plan and perform the audit to obtain reasonable assurance about whether the financial statements are free of material misstatement, whether due to error or fraud. The Funds are not required to have, nor were we engaged to perform, an audit of its internal control over financial reporting. As part of our audits we are required to obtain an understanding of internal control over financial reporting, but not for the purpose of expressing an opinion on the effectiveness of the Funds’ internal control over financial reporting. Accordingly, we express no such opinion.
Our audits included performing procedures to assess the risks of material misstatement of the financial statements, whether due to error or fraud, and performing procedures that respond to those risks. Such procedures included examining, on a test basis, evidence regarding the amounts and disclosures in the financial statements. Our audits also included evaluating the accounting principles used and significant estimates made by management, as well as evaluating
| www.thomaswhitefunds.com | 49 |
Table of Contents
Report of Independent Registered Public Accounting Firm
the overall presentation of the financial statements. Our procedures included confirmation of securities owned as of October 31, 2021 with the custodian. We believe that our audits provide a reasonable basis for our opinion.
TAIT, WELLER & BAKER LLP
Philadelphia, Pennsylvania
December 28, 2021
| 50 | www.thomaswhitefunds.com |
Table of Contents
Tax Information (Unaudited)
The Funds have elected to pass through to their shareholders the foreign taxes paid for the year ended October 31, 2021 as follows:
| Fund | Share Class | Foreign Dividend Income | Foreign Taxes Paid | Foreign Taxes Paid per share | ||||||||||
| International Fund | Investor Class | $505,539 | $54,532 | $0.0497 | ||||||||||
| International Fund | Class I | $1,700,339 | $183,412 | $0.0473 | ||||||||||
QUALIFIED DIVIDEND INCOME
For the fiscal year ended October 31, 2021, certain dividends paid by the Funds may be subject to a maximum tax rate of 23.8%, as provided for by the Jobs and Growth Tax Relief Reconciliation Act of 2003. The percentage of dividends received from ordinary income designated as qualified dividend income was as follows:
| International Fund | 0.00% | |||
| American Opportunities Fund | 0.00% | |||
DIVIDENDS RECEIVED DEDUCTION
For corporate shareholders, the percent of ordinary income distributions qualifying for the corporate dividends received deduction for the fiscal year ended October 31, 2021 was as follows:
| International Fund | 0.00% | |||
| American Opportunities Fund | 0.00% | |||
ORDINARY INCOME DIVIDEND AND FOREIGN TAX CREDIT
The International Fund has made an election under Section 853 of the Internal Revenue Code to provide to its shareholders the benefit of foreign tax credits in the per share amount designated below. Therefore, shareholders who must file a U.S. Federal Income tax return will be entitled to a foreign tax credit or an itemized deduction for each share owned on the record date in computing their tax liability. It is generally more advantageous to claim a credit than a deduction.
| Fund | Share Class | Foreign Tax Credit/Deduction | Foreign Tax Credit/Deduction per share | |||||||
| International Fund | Investor Class | $52,681 | $0.0480 | |||||||
| International Fund | Class I | $177,189 | $0.0457 | |||||||
| www.thomaswhitefunds.com | 51 |
Table of Contents
THOMAS WHITE FUNDS
DISCLOSURE OF FUND EXPENSES (Unaudited)
As a shareholder of the Funds, you incur two types of costs : (1) transaction costs, including sales charges (loads) on purchase payments or contingent deferred sales charges on redemptions, if any, or redemption fees; and (2) ongoing costs, including management fees; and other Fund expenses. This example is intended to help you understand your ongoing costs (in dollars) of investing in the Funds and to compare these costs with the ongoing costs of investing in other mutual funds.
The example is based on an investment of $1,000 invested at the beginning of the period and held for the entire period, May 1, 2021 through October 31, 2021 for the Funds’ Investor Class and Class I, as applicable.
ACTUAL EXPENSES
The third and fourth columns of the table below provide information about actual account values and actual expenses. You may use the information in this line together with the amount you invested to estimate the expenses you paid over the period. Simply divide your account value by $1,000 (for example, an $8,600 account value divided by $1,000=8.6), then multiply the result by the number in the fourth column under the heading entitled “Expenses Paid During Period” to estimate the expenses you paid on your own account during this period. IRA accounts are charged a $15.00 fee annually in September that is not reflected in the actual expense example. If you hold your Fund shares through an IRA account, you should add this cost to the expenses paid shown below.
HYPOTHETICAL EXAMPLE FOR COMPARISON PURPOSES
The fifth and sixth columns of the table below provide information about hypothetical account values and hypothetical expenses based on each Fund’s actual expense ratio and an assumed rate of return of 5% per year before expenses, which is not the Fund’s actual return. The hypothetical account values and expenses may not be used to estimate the actual ending account balance or expenses you paid for the period. You may use this information to compare the ongoing costs of investing in the Funds and other funds. To do so, compare this 5% hypothetical example with the 5% hypothetical examples that appear in the shareholder reports of the other funds. IRA accounts are charged a $15.00 fee annually in September that is not reflected in the hypothetical expense example. If you hold your Fund shares through an IRA account, you should separately compare the Funds’ IRA fees to the IRA fees of other funds.
Please note that the expenses shown in the table are meant to highlight your ongoing costs only and do not reflect any transactional costs such as sales charges (loads) or purchase payments or contingent deferred sales charges on redemptions, if any, or redemption fees. Therefore, the sixth column of the table is useful in comparing ongoing costs only, and will not help you determine the relative costs of owning different funds. In addition, if these transactional costs were included, your costs may have been higher.
| 52 | www.thomaswhitefunds.com |
Table of Contents
THOMAS WHITE FUNDS
| Actual | Hypothetical (5% return before expenses) | |||||||||||||||||||||||
| Fund’s Annualized Expense Ratio* | Beginning Account Value May 1, 2021 | Ending Account Value October 31, 2021 | Expenses Paid During Period | Ending Account Value October 31, 2021 | Expenses Paid During Period | |||||||||||||||||||
| International Fund |
| |||||||||||||||||||||||
| Investor Class Shares | 1.24% | $1,000.00 | $1,022.70 | $6.32 | $1,018.95 | $6.31 | ||||||||||||||||||
| Class I Shares | 0.99% | $1,000.00 | $1,023.80 | $5.05 | $1,020.21 | $5.04 | ||||||||||||||||||
| American Opportunities Fund |
| |||||||||||||||||||||||
| Investor Class | 1.34% | $1,000.00 | $1,086.10 | $7.05 | $1,018.45 | $6.82 | ||||||||||||||||||
| * | Expenses for the International and American Opportunities Funds’ annualized expense ratio (after waiver and reimbursement), multiplied by the average account value over the period, multiplied by 184/365 (to reflect the one-half year period). |
QUARTERLY PORTFOLIO HOLDINGS SCHEDULES
The Funds file their complete schedule of portfolio holdings with the U.S. Securities and Exchange Commission (“SEC”) for the first and third quarters of each fiscal year on Form N-PORT. These reports are available, free of charge, on the EDGAR database on the SEC’s website at www.sec.gov. Additionally, you may obtain copies of Forms from the Funds upon request by calling 1-800-811-0535 or by visiting the Funds’ website at www.thomaswhitefunds.com/fund-reports-and-literature.
PROXY VOTING POLICIES, PROCEDURES AND RECORD
You may obtain a description of the Funds’ (1) proxy voting policies, (2) proxy voting procedures and (3) information regarding how the Funds voted any proxies related to portfolio securities during the most recent 12 month period ended June 30 for which an SEC filing has been made, without charge, upon request by calling the Funds at 1-800-811-0535 or on the EDGAR database on the SEC’s website (http://www.sec.gov).
| www.thomaswhitefunds.com | 53 |
Table of Contents
Statement Regarding Liquidity Risk Management Program
Consistent with Rule 22e-4 under the Investment Company Act of 1940, the Funds have established a liquidity risk management program to govern their approach to managing liquidity risk, i.e., the risk that a Fund could not meet redemption requests without significant dilution of remaining investors’ interests in the Fund (the “Program”). The Program is overseen by Thomas White International, Ltd. (the “Program Administrator”), the Funds’ investment adviser, through the Program Administrator’s Liquidity Risk Committee. The Funds’ Board of Trustees (“Board”) has approved the designation of the Program Administrator to oversee the Program. The Program’s principal objectives include supporting each Fund’s compliance with limits on investments in illiquid assets and mitigating the risk that a Fund will be unable to timely meet its redemption obligations. The Program also includes a number of elements that support the management and assessment of liquidity risk, including an annual assessment of factors that influence a Fund’s liquidity and the periodic classification and re-classification of a Fund’s investments into groupings that reflect the Program Administrator’s assessment of their relative liquidity under current market conditions. At a meeting of the Board held on June 25, 2021, the Program Administrator provided a written report to the Board addressing the operation, adequacy and effectiveness of implementation of the Program for the period from April 1, 2020 through March 31, 2021. During the period covered by the report, there were no liquidity events that impacted the Funds or their respective ability to timely meet redemptions without dilution to existing shareholders. The Program Administrator determined, and reported to the Board, that the Program had been adequately and effectively implemented to monitor and respond to the Funds’ liquidity developments. There can be no assurance that the Program will achieve its objectives in the future. Please refer to the Funds’ Prospectus or Statement of Additional Information for more information regarding a Fund’s exposure to liquidity risk and other principal risks to which an investment in a Fund may be subject.
| 54 | www.thomaswhitefunds.com |
Table of Contents
TRUSTEE AND OFFICER DISCLOSURE OCTOBER 31, 2021
Name, Address and Age | Positions held with | Length of Time Served | Principal Occupation During Past Five Years | Number of Portfolios overseen by Trustee | Other Directorships Held by Trustee | |||||
| Interested Trustee & Officers who are not Trustees: | ||||||||||
Douglas M. Jackman 425 S. Financial Pl. Suite 3900 Chicago, IL 60605 54 | Trustee, President | 3 Years | President of Thomas White International, Ltd. (since 1995) | 2 | None | |||||
David M. Sullivan II 425 S. Financial Pl. Suite 3900 Chicago, IL 60605, 49 | Vice President and Treasurer | 21 years | Treasurer of the Thomas White Funds; Executive Vice President of Thomas White International, Ltd. | N/A | N/A | |||||
J. Ryan Conner 425 S. Financial Pl. Suite 3900 Chicago, IL 60605, 41 | Secretary and Chief Compliance Officer | 10 years | Senior Vice President of Thomas White International, Ltd. | N/A | N/A | |||||
| Independent Trustees: | ||||||||||
Arthur J. Fiocco, Jr. 425 S. Financial Pl. Suite 3900 Chicago, IL 60605 64 | Trustee | 6 Years | Vice President of Operations of Baxter International, Inc. (medical products) (since 2016, prior to which he was a Director (since 2015)). | 2 | None | |||||
Geri Sands Hansen 425 S. Financial Pl. Suite 3900 Chicago, IL 60605 60 | Trustee | 3 Years | Retired; Co-Founder and Chief Investment Officer of Attucks Asset Management, LLC (2001-2015). | 2 | None | |||||
Elizabeth G. Montgomery 425 S. Financial Pl. Suite 3900 Chicago, IL 60605, 77 | Trustee | 20 years | Retired; former President, Graham Group (management consulting). | 2 | None | |||||
Robert W. Thomas 425 S. Financial Pl. Suite 3900 Chicago, IL 60605, 77 | Trustee | 15 years | Retired; former President of Thomas Laboratories, Inc. (pharmaceutical company). | 2 | None | |||||
John N. Venson 425 S. Financial Pl. Suite 3900 Chicago, IL 60605, 74 | Trustee | 27 years | Retired; former Dean of the California School of Podiatric Medicine (2008-2017); Doctor of Podiatric Medicine. | 2 | None | |||||
William H. Woolverton 425 S. Financial Pl. Suite 3900 Chicago, IL 60605 70 | Trustee, Chairman | 6 years | Private investor and Investment Management consultant (since 2019); Managing Director of DMS Governance Ltd. (fund governance) (2016-2019). | 2 | None | |||||
ADDITIONAL INFORMATION
The Statement of Additional Information contains additional information regarding the Funds and Trustees and is available upon request without charge by calling 1-800-811-0535.
| www.thomaswhitefunds.com | 55 |
Table of Contents
LORD ASSET MANAGEMENT TRUST
THOMAS WHITE INTERNATIONAL, LTD.
I. Commitment to Consumer* Privacy
The Thomas White Funds Family and Thomas White International, Ltd. (collectively, “we” or “us”) are committed to handling consumer information responsibly. We recognize and respect the privacy expectations of our consumers, and we believe that the confidentiality and security of consumers’ personal financial information is one of our fundamental responsibilities.
II. Collection of Consumer Information
We collect, retain and use consumer information only where we reasonably believe it would be useful to the consumer and allowed by law. Consumer information collected by us generally comes from the following sources:
| • | Information we receive on applications or other forms; |
| • | Information about consumers’ transactions with us, our affiliates, or others. |
III. Disclosure of Consumer Information
We may disclose all of the consumer information we collect to affiliated financial institutions and to third parties who are not our affiliates:
| • | to perform marketing services on our behalf or pursuant to a joint marketing agreement between us and another party; and |
| • | as otherwise permitted by law. |
We do not disclose any consumer information about our former customers* to anyone except as permitted by law.
IV. Security of Customer Information
We are committed to, and also require our service providers to:
| • | Maintain policies and procedures designed to assure only appropriate access to, and use of information about our customers; and |
| • | Maintain physical, electronic and procedural safeguards that comply with federal standards to guard non-public personal information of our customers. |
V. Limiting the Information We Can Share
Please call us at (312) 663-8300 or email us at info@thomaswhite.com if you would like us to limit:
| • | The sharing of information about your creditworthiness to our affiliates for their everyday business purposes; |
| • | Our affiliates using your information to market to you; or |
| • | The sharing of your information to non-affiliates to market to you. |
* As defined in Regulation S-P
| 56 | www.thomaswhitefunds.com |
Table of Contents
OFFICERS AND TRUSTEES
William H. Woolverton
Chairman of the Board
Arthur J. Fiocco, Jr.
Trustee
Geri Sands Hansen
Trustee
Elizabeth G. Montgomery
Trustee
Robert W. Thomas
Trustee
John N. Venson, D.P.M.
Trustee
Douglas M. Jackman
President and Trustee
David M. Sullivan II
Vice President, Treasurer and
Assistant Secretary
J. Ryan Conner
Secretary and Chief Compliance Officer
INVESTMENT ADVISOR AND OTHER SERVICE PROVIDERS
INVESTMENT ADVISOR
Thomas White International, Ltd.
425 S Financial Place, Suite 3900
Chicago, Illinois 60605-1028
CUSTODIANS
The Northern Trust Company
Chicago, Illinois
U.S. Bank, N.A.
Milwaukee, Wisconsin
LEGAL COUNSEL
Vedder Price P.C.
Chicago, Illinois
INDEPENDENT REGISTERED PUBLIC ACCOUNTING FIRM
Tait, Weller & Baker, LLP
Philadelphia, Pennsylvania
ADMINISTRATOR and TRANSFER AGENT
U.S. Bancorp Fund Services, LLC
Milwaukee, Wisconsin
DISTRIBUTOR
Quasar Distributors, LLC
Milwaukee, Wisconsin
FOR CURRENT PERFORMANCE, NET ASSET VALUE OR FOR ASSISTANCE WITH YOUR ACCOUNT, PLEASE CONTACT THE THOMAS WHITE FUNDS AT 800-811-0535 OR VISIT OUR WEB SITE AT WWW.THOMASWHITEFUNDS.COM
Table of Contents

www.thomaswhitefunds.com
Table of Contents
| (b) | Not applicable. |
Item 2. Code of Ethics.
The Registrant has adopted a code of ethics that applies to the Registrant’s President and Treasurer. The Registrant has not made any substantive amendments to its code of ethics during the period covered by this report. The Registrant has not granted any waivers from any provisions of the code of ethics during the period covered by this report.
A copy of the Registrant’s Code of Ethics is filed herewith. The Registrant undertakes to provide to any person without charge, upon request, a copy of its code of ethics by mail when they call the Registrant at 1-800-811-0535.
Item 3. Audit Committee Financial Expert.
The Registrant’s Board of Trustees has determined that it does not have an Audit Committee financial expert serving on its Audit Committee. At this time, the Registrant believes that the experience provided by each member of the Audit Committee together offers the Registrant adequate oversight for the Registrant’s level of financial complexity.
Item 4. Principal Accountant Fees and Services.
The Registrant has engaged its principal accountant to perform audit services, audit-related services, tax services and other services during the past two fiscal years. “Audit services” refer to performing an audit of the Registrant’s annual financial statements or services that are normally provided by the accountant in connection with statutory and regulatory filings or engagements for those fiscal years. “Audit-related services” refer to the assurance and related services by the principal accountant that are reasonably related to the performance of the audit. “Tax services” refer to professional services rendered by the principal accountant for tax compliance, tax advice, and tax planning. “Other services” were not provided by the principal accountant. The following table details the aggregate fees billed or expected to be billed for each of the last two fiscal years for audit fees, audit-related fees, tax fees and other fees by the principal accountant.
| FYE 10/31/2021 | FYE 10/31/2020 | |||
Audit Fees | $29,000 | $34,000 | ||
Audit-Related Fees | - | - | ||
Tax Fees | $5,000 | $6,000 | ||
All Other Fees | - | - |
The audit committee has adopted pre-approval policies and procedures that require the audit committee to pre-approve all audit and non-audit services of the Registrant, including services provided to any entity affiliated with the Registrant.
1
Table of Contents
The percentage of fees billed by Tait, Weller & Baker LLP applicable to non-audit services pursuant to waiver of pre-approval requirement were as follows:
| FYE 10/31/2021 | FYE 10/31/2020 | |||
Audit-Related Fees | 0% | 0% | ||
Tax Fees | 0% | 0% | ||
All Other Fees | 0% | 0% |
All of the principal accountant’s hours spent on auditing the Registrant’s financial statements were attributed to work performed by full-time permanent employees of the principal accountant.
There were no non-audit fees billed or expected to be billed by the Registrant’s accountant for services to the Registrant and to the Registrant’s investment adviser (and any other controlling entity, etc.—not sub-adviser) for the last two years.
Item 5. Audit Committee of Listed Registrants.
Not applicable to Registrants who are not listed issuers (as defined in Rule 10A-3 under the Securities Exchange Act of 1934).
Item 6. Investments.
| (a) | Schedule of Investments is included as part of the report to shareholders filed under Item 1 of this Form N-CSR. |
| (b) | Not Applicable. |
Item 7. Disclosure of Proxy Voting Policies and Procedures for Closed-End Management Investment Companies.
Not applicable to open-end investment companies.
Item 8. Portfolio Managers of Closed-End Management Investment Companies.
Not applicable to open-end investment companies.
Item 9. Purchases of Equity Securities by Closed-End Management Investment Company and Affiliated Purchasers.
Not applicable to open-end investment companies.
Item 10. Submission of Matters to a Vote of Security Holders.
There have been no material changes to the procedures by which shareholders may recommend nominees to the Registrant’s Board of Trustees.
2
Table of Contents
Item 11. Controls and Procedures.
| (a) | Based on an evaluation of the Registrant’s Disclosure Controls and Procedures (as defined in Rule 30a-3(d) under the Investment Company Act of 1940) (the “Disclosure Controls”), as of a of a date within 90 days prior to the filing date (the “Filing Date”) of this form N-CSR (the “Report”), the Registrant’s President and Treasurer have concluded that the Disclosure Controls are effectively designed to ensure that information required to be disclosed by the Registrant in the Report is recorded, processed, summarized and reported by the Filing Date, including ensuring that information required to be disclosed in the report is accumulated and communicated to the Registrant’s management, including the Registrant’s President and Treasurer, as appropriate, to allow timely decisions regarding required disclosures. |
| (b) | There were no changes in the Registrant’s internal control over financial reporting (as defined in Rule 30a-3(d) under the Investment Company Act of 1940) that occurred during the period covered by this report that have materially affected the Registrant’s internal control over financial reporting. |
Item 12. Disclosure of Securities Lending Activities for Closed-End Management Investment Companies
Not applicable to open-end investment companies.
Item 13. Exhibits.
| (a) |
(2) Certifications pursuant to Section 302 of the Sarbanes-Oxley Act of 2002. Filed herewith.
(3) Any written solicitation to purchase securities under Rule 23c-1 under the Investment Company of 1940 sent or given during the period covered by the report by or on behalf of the Registrant to 10 or more persons. Not applicable to open-end investment companies.
(4) Change in the Registrant’s independent public accountant. There was no change in the Registrant’s independent public accountant for the period covered by this report.
| (b) | Certifications pursuant to Section 906 of the Sarbanes-Oxley Act of 2002. Filed herewith. |
3
Table of Contents
SIGNATURES
Pursuant to the requirements of the Securities Exchange Act of 1934 and the Investment Company Act of 1940, the Registrant has duly caused this report to be signed on its behalf by the undersigned, thereunto duly authorized.
(Registrant) LORD ASSET MANAGEMENT TRUST |
By (Signature and Title)* /s/ Douglas M. Jackman |
Douglas M. Jackman |
President (Principal Executive Officer) |
Date January 6, 2022 |
Pursuant to the requirements of the Securities Exchange Act of 1934 and the Investment Company Act of 1940, this report has been signed below by the following persons on behalf of the Registrant and in the capacities and on the dates indicated.
By (Signature and Title)* /s/ Douglas M. Jackman |
Douglas M. Jackman |
President (Principal Executive Officer) |
Date- January 6, 2022 |
By (Signature and Title)* - /s/ David M. Sullivan II |
David M. Sullivan II |
Treasurer (Principal Financial Officer) |
Date- January 6, 2022 |
4