UNITED STATES
SECURITIES AND EXCHANGE COMMISSION
Washington, D.C. 20549
FORM N-CSR
CERTIFIED SHAREHOLDER REPORT OF REGISTERED MANAGEMENT
INVESTMENT COMPANIES
Investment Company Act file number 811-08360
Guinness Atkinson Funds
(Exact name of registrant as specified in charter)
225 South Lake Avenue, Suite 216
Pasadena, CA 91101
(Address of principal executive offices) (Zip code)
(Name and address of agent for service)
James J. Atkinson, Jr.
225 South Lake Avenue, Suite 216
Pasadena, CA 91101
Registrant’s telephone number, including area code: (866-307-5990)
Date of fiscal year end:December 31
Date of reporting period:December 31, 2019
Item 1. Reports to Stockholders.
The registrant’s annual report transmitted to shareholders pursuant to Rule 30e-1 under the Investment Company Act of 1940, as amended (the “Investment Company Act”), is as follows:
SmartETFs Smart Transportation & Technology ETF
Annual Report
December 31, 2019
TABLE OF CONTENTS
| Letter to Shareholders | 3 |
| Management’s Discussion of Fund Performance | 4 |
| Schedule of Investments | 11 |
| Statement of Assets and Liabilities | 14 |
| Statement of Operations | 15 |
| Statement of Changes in Net Assets | 16 |
| Financial Highlights | 17 |
| Notes to Financial Statements | 18 |
| Report of Independent Registered Public Accounting Firm | 23 |
| Trustee and Officer Information | 24 |
| Supplemental Information | 26 |
| Expense Example | 28 |
| Privacy Notice | 29 |
February 21, 2020
Dear SmartETF Shareholders,
We are delighted to provide this inaugural annual report for the SmartETFs family of ETFs and to welcome our early shareholders to SmartETFs. Thank you for joining us.
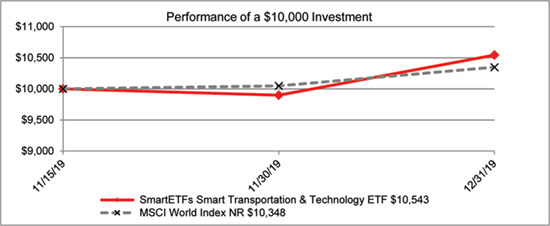
This annual report covers the SmartETFs Smart Transportation & Technology ETF (MOTO) from its inception, November 14, 2019 to December 31, 2019. We’re pleased to report that over this brief period the Fund produced a positive total return of 5.43% based on the growth in the net asset value and 4.91% based on the market price. The Fund managers provide more detailed commentary in their letter which accompanies the financial results.
We have big plans for the SmartETFs family of ETFs; the launch of MOTO is only the beginning. The SmartETFs team is working furiously behind the scenes and we are planning on having a number of additional ETFs in the SmartETFs family before the end of 2020. We will have a lot to share with you throughout the year. If you haven’t already done so we encourage you to sign up to follow us on Twitter and/or sign up for our email service. You can do both of these from the SmartETFs website atwww.SmartETFs.com.
We appreciate the confidence you’ve placed in us and look forward to serving you.
Regards,
Jim Atkinson
President
SmartETFs
Because the SmartETFs Smart Transportation & Technology ETF has less than a full year track record, the return figures cited are actual, not annualized. The total expense ratio for the ETF is 0.68%. All returns are for the periods ending December 31, 2019.
Performance data quoted represents past performance and does not guarantee future results. The investment return and principal value of an investment will fluctuate so that an investor’s shares, when redeemed, may be worth more or less than the original cost. Current performance of the Fund may be lower or higher than the performance quoted. Performance data current to the most recent month end may be obtained by visitingwww.SmartETFs.com. The returns do not reflect the deduction of taxes that a shareholder would pay on Fund distributions or on the sale of Fund shares. Market prices return is based on the midpoint of the bid and ask price for Fund shares as of the close of trading on the exchange where the shares are listed.
SmartETFs Smart Transportation & Technology ETF
ANNUAL REPORT FOR THE PERIOD ENDED
DECEMBER 31, 2019
Average annualized Total returns | 1 Year* |
| Smart Transportation & Technology ETF (Net Asset Value) | 5.43% |
| Smart Transportation & Technology ETF (Market Price) | 4.91% |
| | |
| Benchmark Index: | |
| MSCI World Index Net Return | 3.48% |
| * | Performance is presented for the period since November 14, 2019 |
The gross and net expense ratios for the Fund were 0.68% and 0.68%, respectively, which were the amounts stated in the current prospectus dated November 6, 2019.
Performance data quoted represents past performance and does not guarantee future results. The investment return and principal value of an investment in the Fund will fluctuate so that an investor’s shares, when redeemed, may be worth more or less than their original cost. Current performance of the Fund may be lower or higher than the performance quoted. Performance data current to the most recent month-end may be obtained by visitingwww.smartetfs.com, or calling (866) 307-5990. The returns do not reflect the deduction of taxes that a shareholder would pay on Fund distributions or on the sale of Fund shares. The returns shown are cumulative for the period, not annualized. Market prices return is based on the closing price for Fund shares as of the close of trading on the exchange where the shares are listed.
The SmartETFs Smart Transportation & Technology ETF (MOTO) was launched on November 14, 2019. This report reviews the performance of the ETF since its launch to the end of December 31, 2019.
The second half of the fourth quarter of 2019 was positive for global equities, with the MSCI World delivering a return of 3.5% from November 14, 2019 to year-end. Your ETF rose by 4.9%, outperforming the MSCI World Net Total Return Index by 1.4%.
Over the short period since inception, all Smart Transportation sub sectors delivered positive total shareholder returns.
OurSemiconductor names delivered the strongest average total returns (+8.7%) with those companies associated with Connectivity and Power delivering the strongest returns. Skyworks Solutions was the strongest performer in the ETF over the period, delivering a return of 22%. Other strong Semiconductor names included NVIDIA, ON Semiconductor and Taiwan Semiconductor Manufacturing ltd.
Our other MOTO subsectors,Components,EV manufacturersandServices all delivered similar positive returns of between 4 and 5% over the period. Within these groups, Tesla was noticeably the strongest performer (+18.8%) as concerns over manufacturing seemed to recede with vehicles sales numbers beating expectations for 4Q2019 and the new Shanghai EV plant coming close to start up. Other strong names included lead acid battery manufacturer Tianneng Power Ltd, up 17%, which benefitted from a strengthening demand outlook.
Weaker performers included Continental AG, Johnson Matthey, Volkswagen and Toyota who all suffered from the continued pressure on the absolute number of global new vehicle sales as well as near term company-specific hurdles that each face in the transition to EVs.
Individual Stock Performance over the period
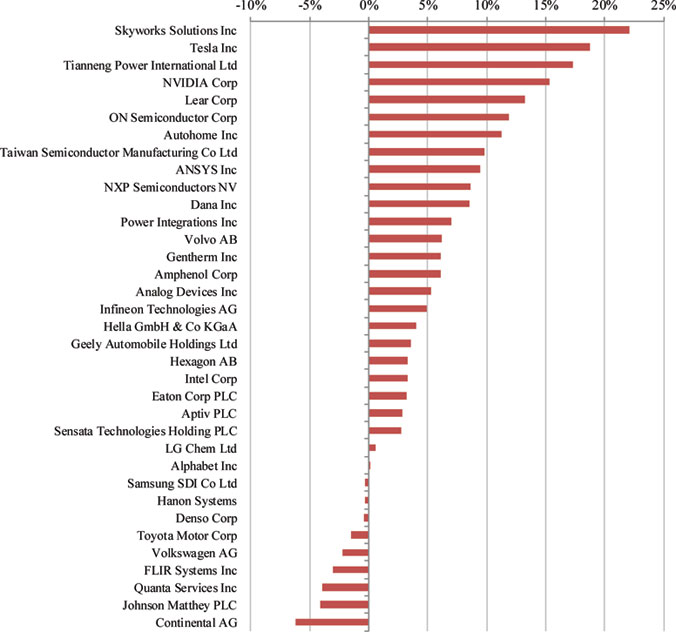
Source: Bloomberg, Guinness Atkinson.
There were no changes to the list of portfolio securities held by the Fund during the period covered by this report.
The sector and geographic weightings of the ETF at December 31, 2019 were as follows:
| Sector breakdown | Dec. 31, 2019 |
| EV Manufacturers | |
| EV Transition | 10.5% |
| EV Dominated | 3.3% |
| Components | |
| Autonomous | 17.1% |
| Car Components | 22.5% |
| Batteries | 11.1% |
| Semiconductors | |
| Power | 5.9% |
| General | 8.7% |
| Connectivity | 8.9% |
| Services | |
| TAAS | 2.8% |
| Other | 8.7% |
| Cash | 0.6% |
| Geographic breakdown | Dec. 31, 2019 |
| US | 49.6% |
| Germany | 11.0% |
| South Korea | 8.3% |
| China | 8.6% |
| SW | 5.7% |
| Japan | 4.9% |
| Ireland | 2.8% |
| Taiwan | 3.0% |
| Netherlands | 2.9% |
| UK | 2.6% |
| Cash | 0.6% |
We provide here a 2020 outlook for the lithium ion battery manufacturing industry and for the uptake of Electric Vehicles.
The longer-term view: growth in battery storage and electrified transportation
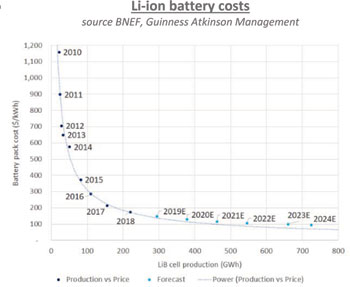
The battery industry plays a two-part role in the transition to sustainable energy. Batteries are likely to form part of the energy storage solution, allowing variable renewable energy (i.e. solar & wind) to play an expanding role in the global power grid. They are also, of course, a key component in electric vehicle manufacturing. A catalyst for greater battery use has been sharp falls in the cost of lithium ion batteries. According to BNEF, battery costs are down 85% over 2010-2018 (an implied ‘learning rate’ of around 18%) with costs likely to fall a further 15% in 2019 on our estimates. Significant economies of scale from mass battery manufacturing have lowered costs and, as these continue, the cost of producing a lithium ion battery is likely to fall towards $100/kWh in the mid-2020s. This would allow electric vehicles (EVs) to compete on price with internal combustion engine vehicles without subsidies.
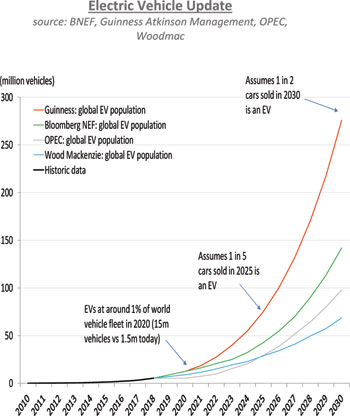
By our estimates, the total global EV passenger vehicle fleet reached around 8m vehicles at the end of 2019 with new sales in 2019 being about 2.5m vehicles (or 2.8% of global passenger vehicle sales). We expect an acceleration in the uptake of new EVs, with around 20% new passenger vehicles sales being electric in 2025, rising to around 50% in 2030. On this basis, there will be nearly 300 million electric vehicles on the world’s roads by 2030. This level of electric transportation would displace around 3m barrels of day of world oil demand in that year.
The growth rates for ‘pure battery’ EVs sales are eye-catchingly high, with sales now running at double the number of ‘plug-in hybrid’ EVs. A key factor behind the growth in continued demand is the stricter targets from governments and cities for the phasing out of internal combustion engine vehicles:
| ● | 2025 The European Union targets 20% of total sales to be EVs while Norway plans to ban the sales of all gasoline and diesel cars |
| ● | 2030 The Fossil Fuel Free Declaration covering 12 large global cities with a total population of 32 million people commits to no ICE vehicles on their streets by 2030 |
| ● | 2040 France, Italy and the UK plan 100% zero emission vehicle sales |
The shorter-term view: rapidly growing lithium ion battery capacity and new EV models
We expect to see another marked increase in the global manufacturing capacity of lithium ion batteries in 2020 and beyond. Large scale plant capacity is likely to expand from nearly 300GWh in 2018 to nearly 1,200GWh in 2023 and then onto over 2,000GWh by the end of the 2020s. These facilities are being built globally, but China will still maintain its dominance, with its share of global capacity staying in the 65-70% range.
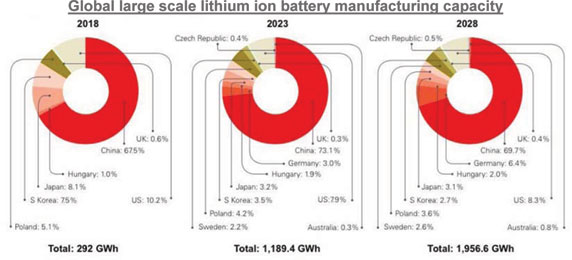
Source: Benchmark Mineral Intelligence
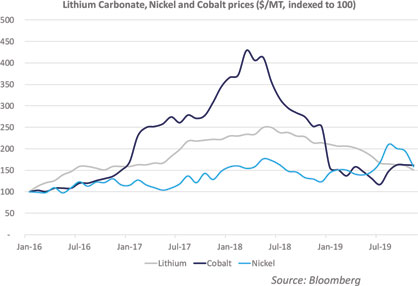
In contrast to the cost benefits coming from manufacturing scale, we note that roughly 50% of the cost of a typical lithium ion battery is due to the cost of the raw materials (anode, cathode, separator, electrolyte and wiring). Nickel, lithium and cobalt are critical here and we estimate that a typical NMC532 lithium ion battery would increase in cost by around 20% if the cost of these raw materials were to double.
We monitor these raw materials markets closely and note that lithium and cobalt are down around 20% and 50% respectively in 2019 while nickel has increased by around 10%. The declines in lithium and cobalt has put both metals much closer to cost curve ‘support’ levels and, while both are naturally volatile, we believe they could well cause input cost inflation for battery manufacturers in 2020 and that will likely mute the overall cost reduction of lithium ion batteries in 2020. As costs increase and social pressures grow around the sustainable sourcing of battery metals, we expect to see an increase in companies targeting the recycling of lithium ion batteries either via electrochemical processes or for re-use in electric grid storage.
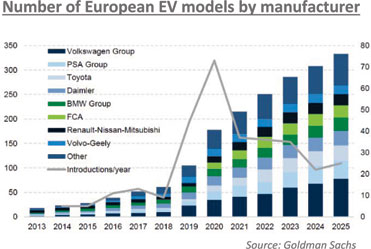
The auto industry added a record number of new EV models into the market in 2018 and has done so again in 2019, although sales in China and the US have been under some pressure as a result of incentive reductions. Nonetheless, there will be a further step up in 2020 with new EVs weighted towards the first half of the year as Audi presents its first all-electric saloon and a number of compact car models from Ford, Mini, Volkswagen, Vauxhall and Peugeot are fully electrified. Despite the cost improvements mentioned above, on our estimates, the upfront cost of an average EV is still greater than an average ICE vehicle and this, together with consumer concerns around access to charging infrastructure, will keep unsubsidised EV purchases close to current relatively low levels. We expect the ‘tipping point’ to come in the mid-2020s when EVs present a real economic alternative to ICE vehicles for the average global consumer.
Will Riley & Jonathan Waghorn
January 2020
The Fund invests in foreign securities, which involves political, economic and currency risks, greater volatility, and differences in accounting methods. These risks are greater for emerging markets. The Fund is non-diversified, meaning that its assets may be concentrated in fewer individual holdings than diversified funds. Therefore, the Fund is more exposed to individual stock volatility than diversified funds.Investments focused in a single geographic region may be exposed to greater risk and more volatility than investments diversified among various geographies. The Fund invests in smaller companies, which involves additional risks such as limited liquidity and greater volatility.
Please refer to the Schedule of Investments for details on Fund holdings.Current and future portfolio holdings are subject to risk.
The information provided herein represents the opinion of Guinness Atkinson Asset Management, Inc. for the period stated and is not intended to be a forecast of future events, a guarantee of future results, or investment advice. Opinions, Fund holdings and sector allocations are subject to change at any time, and are not recommendations to buy or sell any security.
SmartETFs Smart Transportation & Technology ETF
FUND PERFORMANCE AND SUMMARY
As of December 31, 2019
| | Cumulative
Total Return as of
12/31/19 |
| SmartETFs Smart Transportation & Technology ETF* (at NAV) | 5.43% |
| SmartETFs Smart Transportation & Technology ETF* (at Market Price) | 4.91% |
| MSCI World Index NR | 3.48% |
| * | Inception date is 11/14/2019. |
The performance data quoted represents past performance and past performance is not a guarantee of future results. The investment return and principal value of an investment will fluctuate so that an investor’s shares, when redeemed, may be worth more or less than their original cost. Current performance of theFund may be lower or higher than the performance quoted. Performance data current to the most recent month end may be obtained by visiting www.smartetfs.com.
Total returns reflect the reinvestment of distributions made by the Fund, if any. The deduction of taxes that a shareholder would pay on Fund distribution or the redemption of Fund shares is not reflected in the total returns.
The Fund’s shares are listed on an exchange. The price of the Fund’s shares is based on market price, and because the exchange-traded fund shares trade at market prices rather and net asset value, shares may trade at a price greater than net asset value (premium) or less than net asset value (discount).
The MSCI World Index (Net Return) is a free float-adjusted market capitalization weighted index that is designed to measure the equity market performance of developed markets. Net Return reflects deduction for withholding tax but reflects no duduction for fees and expenses. Net Return is net of local withholding taxes that any investor would pay.
SmartETFs Smart Transportation & Technology ETF
Schedule of Investments
at December 31, 2019
| Shares | | | Common Stocks: 96.7% | | Value ($) | |
| | | | | Auto/Trucks Parts & Equipment: 5.7% | | | | |
| | 1,684 | | | Gentherm Inc. * | | | 74,753 | |
| | 1,352 | | | Hella GmbH & Co KGaA | | | 74,829 | |
| | | | | | | | 149,582 | |
| | | | | Commerical Services: 2.6% | | | | |
| | 1,692 | | | Quanta Services Inc. | | | 68,881 | |
| | | | | | | | | |
| | | | | Rubber-Tires: 2.5% | | | | |
| | 524 | | | Continental AG | | | 67,749 | |
| | | | | | | | | |
| | | | | Smart Transportation: 25.1% | | | | |
| | 780 | | | Aptiv PLC | | | 74,077 | |
| | 1,600 | | | Denso Corp. | | | 73,120 | |
| | 36,000 | | | Geely Automobile Holdings Ltd. | | | 70,406 | |
| | 1,744 | | | Johnson Matthey PLC | | | 69,211 | |
| | 1,372 | | | Sensata Technologies Holding * | | | 73,910 | |
| | 208 | | | Tesla Inc. * | | | 87,013 | |
| | 104,000 | | | Tianneng Power International | | | 79,143 | |
| | 800 | | | Toyota Motor Corp. | | | 56,791 | |
| | 4,592 | | | Volvo AB Class B | | | 76,916 | |
| | | | | | | | 660,587 | |
| | | | | Technology: 3.0% | | | | |
| | 1,352 | | | Taiwan Semiconductor Manufacturing Co Ltd. - ADR | | | 78,551 | |
| | | | | | | | | |
| | | | | Technology & Transportation: 57.8% | | | | |
| | 56 | | | Alphabet Inc. Class C * | | | 74,873 | |
| | 704 | | | Amphenol Corp. Class A | | | 76,194 | |
| | 624 | | | Analog Devices Inc. | | | 74,156 | |
| | 316 | | | ANSYS Inc. * | | | 81,342 | |
| | 968 | | | Autohome Inc. - ADR * | | | 77,450 | |
| | 4,200 | | | Dana Inc. | | | 76,440 | |
| | 788 | | | Eaton Corp. PLC | | | 74,639 | |
| | 1,356 | | | FLIR Systems Inc. | | | 70,607 | |
| | 7,376 | | | Hanon Systems | | | 71,166 | |
| | 1,308 | | | Hexagon AB Class B | | | 73,309 | |
| | 3,312 | | | Infineon Technologies AG - ADR | | | 75,456 | |
| | 1,232 | | | Intel Corp. | | | 73,735 | |
| | 580 | | | Lear Corp. | | | 79,576 | |
| | 268 | | | LG Chem Ltd. | | | 73,630 | |
| | 344 | | | NVIDIA Corp. | | | 80,943 | |
| | 600 | | | NXP Semiconductors NV | | | 76,356 | |
| | 3,316 | | | ON Semiconductor Corp. * | | | 80,844 | |
| | 760 | | | Power Integrations Inc. | | | 75,172 | |
| | 356 | | | Samsung SDI Co Ltd. | | | 72,701 | |
| | 708 | | | Skyworks Solutions Inc. | | | 85,583 | |
| | | | | | | | 1,524,172 | |
| | | | | | | | | |
| | | | | Total Common Stocks (Cost $2,406,656) | | | 2,549,522 | |
The accompanying notes are an integral part of these financial statements.
SmartETFs Smart Transportation & Technology ETF
Schedule of Investments
at December 31, 2019
| Shares | | | | | Value ($) | |
| | | | Preferred Stocks: 2.7% | | | |
| | | | Smart Transportation: 2.7% | | | |
| | 360 | | | Volkswagen AG | | | 71,171 | |
| | | | | Total Preferred Stocks (Cost $71,381) | | | 71,171 | |
| | | | | | | | | |
| | | | | Total Investments (Cost $2,478,037)- 99.4% | | | 2,620,693 | |
| | | | | Other Assets in Excess of Liabilities - 0.6% | | | 15,098 | |
| | | | | TOTAL Net Assets - 100.0% | | $ | 2,635,791 | |
| * | Non-income producing security. |
ADR - American Depository Receipt
PLC - Public Limited Company
The accompanying notes are an integral part of these financial statements.
SmartETFs Smart Transportation & Technology ETF
Schedule of Investments
at December 31, 2019
| Security Type/Country | | Percent of Total
Net Assets | |
| Common Stocks | | | | |
| United States | | | 49.6 | % |
| Germany | | | 8.3 | % |
| South Korea | | | 8.2 | % |
| China | | | 5.9 | % |
| Sweden | | | 5.7 | % |
| Japan | | | 4.9 | % |
| Taiwan | | | 3.0 | % |
| Netherlands | | | 3.0 | % |
| Ireland | | | 2.8 | % |
| Hong Kong | | | 2.7 | % |
| United Kingdom | | | 2.6 | % |
| Total Common Stocks | | | 96.7 | % |
| Preferred Stocks | | | | |
| Germany | | | 2.7 | % |
| Total Preferred Stocks | | | 2.7 | % |
| Total Investments | | | 99.4 | % |
| Other Assets in Excess of Liabilities | | | 0.6 | % |
| TOTAL Net Assets | | | 100.0 | % |
The accompanying notes are an integral part of these financial statements.
STATEMENT OF ASSETS AND LIABILITIES
at December 31, 2019
| | | SmartETFs
Smart Transportation
& Technology ETF | |
| Assets: | | | | |
| Investments in securities, at value (Cost $2,478,037) | | $ | 2,620,693 | |
| Cash | | | 12,345 | |
| Receivables: | | | | |
| Due from Advisor | | | 8,220 | |
| Dividends and interest receivable | | | 3,180 | |
| Other receivable | | | 543 | |
| Total Assets | | | 2,644,981 | |
| | | | | |
| Liabilities: | | | | |
| Trustee’s fees payable | | | 760 | |
| CCO fees payable | | | 659 | |
| Audit fees payable | | | 7,500 | |
| Legal fees payable | | | 271 | |
| Total liabilities | | | 9,190 | |
| | | | | |
| Net Assets | | $ | 2,635,791 | |
| | | | | |
| Composition of Net Assets: | | | | |
| Paid-in capital | | $ | 2,491,283 | |
| Total distributable earnings (loss) | | | 144,508 | |
| Net Assets | | $ | 2,635,791 | |
| | | | |
| Number of shares issued and outstanding (unlimited number of shares authorized, no par value) | | | 100,002 | |
| Net Asset Value, Offering and Redemption Price Per Share | | $ | 26.36 | |
The accompanying notes are an integral part of these financial statements.
STATEMENT OF OPERATIONS
For the period November 14, 2019* through December 31, 2019
| | | SmartETFs
Smart Transportation
& Technology ETF | |
| Investment Income: | | | |
| Dividends (net of foreign withholding tax of $634) | | $ | 4,671 | |
| Total income | | | 4,671 | |
| | | | | |
| Expenses: | | | | |
| Advisory fees | | | 2,223 | |
| Audit fees | | | 7,500 | |
| Legal fees | | | 271 | |
| Trustees’ fees and expenses | | | 2,014 | |
| CCO fees and expenses | | | 659 | |
| Total expenses | | | 12,667 | |
| Less: fees waived and expenses absorbed | | | (10,444 | ) |
| Net expenses | | | 2,223 | |
| Net Investment Income | | | 2,448 | |
| | | | | |
| Realized and Unrealized Gain (Loss) on Investments and Foreign Currency: | | | | |
| Net realized gain (loss) on foreign currency | | | (618 | ) |
| Change in unrealized appreciation/(depreciation) on investments | | | 142,656 | |
| Change in unrealized appreciation/(depreciation) on foreign currency | | | 22 | |
| Net Realized and Unrealized Gain (Loss) on Investments and | | | | |
| Foreign Currency | | | 142,060 | |
| | | | | |
| Net Increase in Net Assets Resulting From Operations | | $ | 144,508 | |
| * | Commencement of operations. |
The accompanying notes are an integral part of these financial statements.
SmartETFS Smart Transportation & Technology ETF
STATEMENT OF CHANGES IN NET ASSETS
| | | For the period
November 14, 2019*
to December 31, 2019 | |
| INCREASE/(DECREASE) IN NET ASSETS FROM: | | | | |
| Operations: | | | | |
| Net investment income (loss) | | $ | 2,448 | |
| Net realized gain (loss) on investments and foreign currency transactions | | | (618 | ) |
| Net change in unrealized appreciation/(depreciation) on investments and foreign currency translation | | | 142,678 | |
| Net Increase (Decrease) in Net Assets Resulting from Operations | | | 144,508 | |
| | | | | |
| Distributions to Shareholders: | | | - | |
| | | | | |
| Capital Transactions: | | | | |
| Proceeds from shares sold | | | 2,491,283 | |
| Cost of shares redeemed | | | - | |
| Net Increase (Decrease) in Net Assets from Capital Share Transactions | | | 2,491,283 | |
| | | | | |
| Total Increase (Decrease) in Net Assets | | | 2,635,791 | |
| | | | | |
| Net Assets: | | | | |
| Beginning of period | | | - | |
| End of period | | $ | 2,635,791 | |
| | | | | |
| Capital Share Activity: | | | | |
| Shares sold | | | 100,002 | |
| Net Increase (Decrease) in Share Transactions | | | 100,002 | |
| * | Commencement of operations. |
The accompanying notes are an integral part of these financial statements.
SmartETFs Smart Transportation & Technology ETF
FINANCIAL HIGHLIGHTS
For a capital share outstanding throughout the period.
| | | | For the Period
November 14, 2019*
to December 31, 2019 | |
| | | | | |
| Net asset value, beginning of period | | $ | 25.00 | |
| | | | | |
| Investment operations: | | | | |
| Net investment income (loss) | | | 0.02 | |
| Net realized and unrealized gain (loss) | | | 1.34 | |
| Total from investment operations | | | 1.36 | |
| | | | | |
| Net asset value, end of period | | $ | 26.36 | |
| | | | | |
| Total return | | | 5.43 | %(1) |
| | | | | |
| Ratios/Supplemental Data: | | | | |
| Net assets, end of period (millions) | | $ | 2.64 | |
| | | | | |
| Ratio of expenses to average net assets: | | | | |
| Before fee waived | | | 3.87 | %(2) |
| After fees waived | | | 0.68 | %(2) |
| | | | | |
| Ratio of net investment income (loss) to average net assets: | | | | |
| Before fees waived | | | (2.44 | %)(2) |
| After fees waived | | | 0.75 | %(2) |
| | | | | |
| Portfolio turnover rate(3) | | | 0.00 | %(1) |
| * | Commencment of Operations. |
| (3) | Exclude securities received as a result of processing in-kind capital share transactions. |
The accompanying notes are an integral part of these financial statements.
NOTES TO FINANCIAL STATEMENTS
Note 1 - Organization
The SmartETFs Smart Transportation & Technology ETF (“Smart Transportation & Technology ETF” or the “Fund”) is a diversified series of Guinness Atkinson™ Funds (the “Trust”), was organized on April 28, 1997 as a Delaware business trust and registered under the Investment Company Act of 1940, as amended (the “1940 Act”), as an open-end management investment company.
The investment objective of the Smart Transportation & Technology ETF is long-term capital appreciation. The Fund commenced operations on November 14, 2019.
Note 2 - Significant Accounting Policies
The Fund is an investment company and accordingly follows the investment company accounting and reporting guidance of the Financial Accounting Standards Board (FASB) Accounting Standard Codification Topic 946 “Financial Services—Investment Companies”.
Securities Valuations.Securities of the Funds that are traded on a principal exchange (U.S. or foreign) or NASDAQ are valued at the official closing price on each day that the exchanges are open for trading. Securities traded on an exchange for which there have been no sales, and other over-the-counter securities are valued at the mean between the bid and asked prices. Securities for which quotations are not readily available are valued at their respective fair values as determined in good faith by the Fund’s Valuation Committee in accordance with procedures established by the Board of Trustees. Short term investments are stated at cost, combined with accrued interest, which approximates market value. Realized gains and losses from securities transactions are calculated using the identified cost method.
Foreign Currency Transactions.The accounting records of the Fund is maintained in U.S. dollars. Financial instruments and other assets and liabilities of the Fund denominated in a foreign currency, if any, are translated into U.S. dollars at current exchange rates. Purchases and sales of financial instruments, income receipts and expense payments are translated into U.S. dollars at the exchange rate on the date of the transaction. The Fund do not isolate that portion of the results of operations resulting from changes in foreign exchange rates from those resulting from changes in values to financial instruments. Such fluctuations are included with the net realized and unrealized gains or losses from investments. Realized foreign exchange gains or losses arise from transactions in financial instruments and foreign currencies, currency exchange fluctuations between the trade and settlement date of such transactions, and the difference between the amount of assets and liabilities recorded and the U.S. dollar equivalent of the amounts actually received or paid. Net unrealized foreign exchange gains and losses arise from changes in the value of assets and liabilities, including financial instruments, resulting from changes in currency exchange rates. The Fund may be subject to foreign taxes related to foreign income received, capital gains on the sale of securities and certain foreign currency transactions (a portion of which may be reclaimable). All foreign taxes are recorded in accordance with the applicable regulations and rates that exist in the foreign jurisdictions in which the Fund invests.
Illiquid Securities.Pursuant to Rule 22e-4 under the 1940 Act, the Fund has adopted a Liquidity Risk Management Program (“LRMP”) that requires, among other things, that the Fund limits its illiquid investments that are assets to no more than 15% of net assets. An illiquid investment is any security which may not reasonably be expected to be sold or disposed of in current market conditions in seven calendar days or less without the sale or disposition significantly changing the market value of the investment. If the Adviser, at any time determines that the value of illiquid securities held by the Fund exceeds 15% of its net asset value, the Adviser will take such steps as it considers appropriate to reduce them as soon as reasonably practicable in accordance with the Fund’s written LRMP.
Security Transactions, Dividend Income and Distributions.Security transactions are accounted for on the trade date. Dividend income and distributions to shareholders are recorded on the ex-dividend date. Realized gains and losses from securities transactions are calculated using the identified cost method.
NOTES TO FINANCIAL STATEMENTS (Continued)
Allocation of Expenses.The Fund is charged for those expenses directly attributable to it. Expenses that are not directly attributable to the Fund are allocated among the Funds in the Trust in proportion to their respective assets or another appropriate method.
Use of Estimates. The preparation of financial statements in conformity with U.S. accepted accounting principles (“GAAP”) requires management to make estimates and assumptions that affect the reported amounts of assets and liabilities and the disclosure of contingent assets and liabilities at the date of the financial statements. Actual results could differ from those estimates.
Federal Income Taxes.The Fund intends to comply with the requirements of Subchapter M of the Internal Revenue Code applicable to regulated investment companies and to distribute substantially all of their net investment income and any net realized gains to their shareholders. Therefore, no federal income tax or excise provision is required. Due to the timing of dividend distributions and the differences in accounting for income and realized gains and losses for financial statement and federal income tax purposes, the fiscal year in which amounts are distributed may differ from the year in which the income and realized gains and losses are recorded by the Fund.
Management of the Fund has evaluated tax positions taken or expected to be taken in the course of preparing the Fund’s tax returns to determine whether these positions meet a “more-likely-than-not” standard that, based on the technical merits, have a more than fifty percent likelihood of being sustained by a taxing authority upon examination. A tax position that meets the “more-likely-than-not” recognition threshold is measured to determine the amount of benefit to recognize in the financial statements. The Fund recognizes interest and penalties, if any, related to unrecognized tax benefits as income tax expense in the Statements of Operations. The Income Tax Statement requires management of the Fund to analyze tax positions taken in the prior three open tax years, if any, and tax positions expected to be taken in the Fund’s current tax year, as defined by the IRS statute of limitations for all major jurisdictions, including federal tax authorities and certain state tax authorities. As of and during the year ended December 31, 2019, the Fund did not have a liability for any unrecognized tax benefits. The Fund has no examination in progress and are not aware of any tax positions for which it is reasonably possible that the total amounts of unrecognized tax benefits will significantly change in the next twelve months.
Indemnifications.Under the Trust's organizational documents, its current and former officers and trustees are indemnified against certain liabilities arising out of the performance of their duties to the Fund. In addition, in the normal course of business, the Fund enters into contracts that contain a variety of representations and warranties that provide general indemnifications. The Fund’s maximum exposure under these arrangements is unknown as this would involve future claims that may be made against the Fund that have not yet occurred or that would be covered by other parties.
Note 3 – Valuation of Investments
The Fund utilizes various methods to measure the fair value of most of its investments on a recurring basis. GAAP establishes a hierarchy that prioritizes inputs to valuation techniques used to measure fair value. The three levels of inputs are as follows:
| ● | Level 1 – Unadjusted quoted prices in active markets for identical assets or liabilities that a Fund has the ability to access. |
| ● | Level 2 – Observable inputs other than quoted prices included in level 1 that are observable for the asset or liability, either directly or indirectly. These inputs may include quoted prices for the identical instrument on an inactive market, prices for similar instruments, interest rates, prepayment speeds, credit risk, yield curves, default rates and similar data. |
NOTES TO FINANCIAL STATEMENTS (Continued)
| ● | Level 3 – Unobservable inputs for the asset or liability, to the extent relevant observable inputs are not available, representing the Fund’s own assumptions about the assumptions a market participant would use in valuing the asset or liability, and would be based on the best information available. |
The availability of observable inputs can vary from security to security and is affected by a wide variety of factors, including for example, the type of security, whether the security is new and not yet established in the marketplace, the liquidity of markets, and other characteristics particular to the security. To the extent that valuation is based on models or inputs that are less observable or unobservable in the market, the determination of fair value requires more judgment. Accordingly, the degree of judgment exercised in determining fair value is greatest for instruments categorized in Level 3.
The inputs used to measure fair value may fall into different levels of the fair value hierarchy. In such cases, for disclosure purposes, the level in the fair value hierarchy within which the fair value measurement falls in its entirety, is determined based on the lowest level input that is significant to the fair value measurement in its entirety.
The following table summarizes the market value of the Fund’s investments as of December 31, 2019, based on the inputs used to value them:
| Investments | | Level 1 | | | Level 2 | | | Level 3 | |
| Common Stocks | | $ | 2,549,522 | | | $ | - | | | $ | - | |
| Preferred Stocks | | | 71,171 | | | | - | | | | - | |
| Total | | $ | 2,620,693 | | | $ | - | | | $ | - | |
Note 4 – Capital Share Transactions
Shares are created and redeemed by the Fund only in Creation Unit size aggregations of 25,000 Shares. Only broker-dealers or large institutional investors with creation and redemption agreements called Authorized Participants (“AP”) are permitted to purchase or redeem Creation Units from the Fund. Such transactions are generally permitted on an in-kind basis, with a balancing cash component to equate the transactions to the NAV per unit of the Fund on the transaction date. Both purchases and redemptions of Creation Units are subject to a Transaction Fee.
Note 5 - Investment Transactions
Purchases and sales of investments, excluding in-kind transactions and short-term investments, for the period November 14, 2019 through December 31, 2019 were as follows:
| | Purchases | Sales |
| Smart Transportation & Technology ETF | $237,880 | $ - |
Purchases, sales, and realized gain/(loss) of in-kind transactions for the period November 14, 2019 through December 31, 2019 were as follows:
| | Purchases | Sales | Gain/(Loss) |
| Smart Transportation & Technology ETF | $2,240,157 | $ - | $ - |
Note 6 – Principle Risks
The Fund is subject to the risks common to all funds that invest in equity securities and foreign securities. Investing in the Fund may be more risky than investing in a fund that invests only in U.S. securities due to the increased volatility of foreign markets.
NOTES TO FINANCIAL STATEMENTS (Continued)
Autonomous/Electric Vehicle Risk.Autonomous and/or electric vehicles are a relatively new development in transportation markets. They could fail to “catch on” with consumers in a meaningful way and could suffer technical problems, supply or demand shortfalls, or be supplanted by other technologies.
Technology Risk.The technologies used by autonomous and electric vehicles and their support systems, such as software, grids, networks, fuel and batteries, may be unproven, susceptible to obsolescence or subject to future regulation in countries or locations of deployment.
Cybersecurity Risk.Technologies created or deployed for Smart Transportation, including for vehicles or drive systems as well as for networks and intelligent roadways, may be subject to greater cybersecurity risk than other companies.
Product Risk.Companies creating products and technologies for autonomous or electric transportation, for passenger, commercial or freight usage, face considerable competition.
Product Regulation Risk. Autonomous vehicles and their networks may be subject to multiple levels of regulation including local regulations and operating restrictions.
Foreign Securities Risk. Foreign securities experience more volatility than their domestic counterparts, in part because of higher political and economic risks, lack of reliable information, fluctuations in currency exchange rates and the risks that a foreign government may take over assets, restrict the ability to exchange currency or restrict the delivery of securities.
Note 7 - Investment Advisory and Other Agreements
The Trust, on behalf of the Fund, entered into an Investment Advisory Agreement with Guinness Atkinson Asset Management, Inc. (the “Adviser”), under which the Adviser provides the Fund with investment management services. The Adviser furnishes all necessary office facilities, equipment and personnel for servicing the investments of the Fund. The Adviser also arranges for sub-advisory, transfer agency, custody, fund administration, securities lending, and all other non-distribution related services necessary for the Fund to operate. The Fund pays the Adviser an advisory fee equal to 0.68% of the Fund’s average daily net assets.
The Adviser has contractually agreed to limit the Fund’s total operating expenses by reducing all or a portion of its fees and reimburse the Fund for expenses (excluding brokerage expenses, interest, taxes and extraordinary expenses) so that its ratio of expenses to average daily net assets will not exceed 0.68%.
Penserra Capital Management, LLC (“Penserra”) serves as the Fund’s sub-adviser.
Foreside Fund Services, LLC, a Delaware limited liability company, (the “Distributor”) serves as the Fund’s principal underwriter and distributor of Creation Units pursuant to a distribution agreement. The Distributor does not maintain any secondary market in Fund Shares.
Mutual Fund Administration, LLC (the “Administrator”) serves as the Fund’s administrator under an administration agreement.
Brown Brothers Harriman & Co. (the “Custodian”, “Transfer Agent” and “Fund Accounting agent”) serves as the Fund’s custodian, transfer agent and fund accounting agent.
Foreside Fund Officer Services, LLC provides Chief Compliance Officer (“CCO”) services to the Fund. The fees paid for CCO services for the period November 14, 2019 through December 31, 2019 are reported on the Statements of Operations.
The fees paid to non-interested Trustees for the period November 14, 2019 through December 31, 2019 are reported on the Statements of Operations.
NOTES TO FINANCIAL STATEMENTS (Continued)
Certain officers of the Trust are also officers and/or Directors of the Adviser and the Administrator. None of these officers are compensated directly by the Fund.
Note 8 - Tax Matters
GAAP requires certain components of net assets to be reclassified between financial and tax reporting. These reclassifications have no effect on net assets or NAV per share. For the year ended December 31, 2019, the following amounts resulting primarily from the differing book and tax treatment of the use of equalization for tax purposes and the reversal of gains and losses from redemption in-kind transactions have been reclassified:
| | | | Paid-in Capital | | | | Total Distributable Earnings (Loss) | |
| Smart Transportation & Technology ETF | | $ | - | | | $ | - | |
As of December 31, 2019, the components of accumulated earnings (loss) on a tax basis were as follows:
| | | Undistributed
Ordinary
Income | | | Undistributed
Long-Term
Capital Gains | | | Accumulated
Capital and
Other
Losses | | | Unrealized
Appreciation
(Depreciation)
on
Investments | | | Unrealized
Appreciation
(Depreciation)
on Foreign
Currency | | | Accumulated
Earnings
(Loss) | |
| Smart Transportation & Technology ETF | | $ | 2,448 | | | $ | - | | | $ | (618 | ) | | $ | 142,656 | | | $ | 22 | | | $ | 144,508 | |
At December 31, 2019, gross unrealized appreciation and depreciation of investments, based on cost for federal income tax purposes were as follows:
| | | Tax Cost | | | Unrealized
Appreciation | | | Unrealized
Depreciation | | | Net Unrealized
Appreciation
(Depreciation) | |
| Smart Transportation & Technology ETF | | $ | 2,478,037 | | | $ | 153,429 | | | $ | (10,773 | ) | | $ | 142,656 | |
The difference between cost amounts for financial statement and federal income tax purposes is due primarily to timing differences in recognizing certain gains and losses in security transactions.
Note 9 - Recently Issued Accounting Pronouncements
In August 2018, FASB issued Accounting Standards Update No. 2018-13 (“ASU 2018-13”), “Disclosure Framework – Changes to the Disclosure Requirements for Fair Value Measurement,” which amends the fair value measurement disclosure requirements of ASC Topic 820 (“ASC 820”), “Fair Value Measurement.” ASU 2018-13 includes new, eliminated, and modified disclosure requirements for ASC 820. In addition, ASU 2018-13 clarifies that materiality is an appropriate consideration of entities when evaluating disclosure requirements. ASU 2018-13 is effective for all entities for fiscal years beginning after December 15, 2019, including interim periods therein. Early adoption is permitted and the Fund has adopted ASU 2018-13 with these financial statements.
Note 10 - Events Subsequent to the Fiscal Period End
The Fund has adopted financial reporting rules regarding a subsequent event which requires an entity to recognize in the financial statements the effects of all subsequent events that provide additional evidence about conditions that existed at the date of the balance sheet. Management has evaluated the Fund’s related events and transactions and has determined that there were no events or transactions that occurred that would materially impact the amounts or disclosures in the Fund’s financial statements.
REPORT OF INDEPENDENT REGISTERED PUBLIC ACCOUNTING FIRM
To the Shareholders and Board of Trustees of Guinness Atkinson Funds
Opinion on the Financial Statements
We have audited the accompanying statement of assets and liabilities of SmartETFs Smart Transportation & Technology Fund (the “Fund”), a series of Guinness Atkinson Funds (the “Trust”), including the schedule of investments, as of December 31, 2019, the related statement of operations for the period then ended, and the statement of changes in net assets and the financial highlights for the period November 14, 2019 (commencement of operations) through December 31, 2019, and the related notes (collectively referred to as the “financial statements”). In our opinion, the financial statements present fairly, in all material respects, the financial position of the Fund as of December 31, 2019, the results of its operations for the period then ended, the changes in its net assets and financial highlights for the period November 14, 2019 through December 31, 2019, in conformity with accounting principles generally accepted in the United States of America.
Basis for Opinion
These financial statements are the responsibility of the Fund’s management. Our responsibility is to express an opinion on the Fund’s financial statements based on our audits. We are a public accounting firm registered with the Public Company Accounting Oversight Board (United States) (“PCAOB”) and are required to be independent with respect to the Fund in accordance with the U.S. federal securities laws and the applicable rules and regulations of the Securities and Exchange Commission and the PCAOB. We have served as the auditor of one or more of the funds in the Trust since 2003.
We conducted our audit in accordance with the standards of the PCAOB. Those standards require that we plan and perform the audit to obtain reasonable assurance about whether the financial statements are free of material misstatement, whether due to error or fraud. The Fund is not required to have, nor were we engaged to perform, an audit of the Fund’s internal control over financial reporting. As part of our audit we are required to obtain an understanding of internal control over financial reporting, but not for the purpose of expressing an opinion on the effectiveness of the Fund’s internal control over financial reporting. Accordingly, we express no such opinion.
Our audit included performing procedures to assess the risks of material misstatement of the financial statements, whether due to error or fraud, and performing procedures that respond to those risks. Such procedures included examining, on a test basis, evidence regarding the amounts and disclosures in the financial statements. Our audit also included evaluating the accounting principles used and significant estimates made by management, as well as evaluating the overall presentation of the financial statements. Our procedures included confirmation of securities owned as of December 31, 2019 by correspondence with the custodian and brokers; when replies were not received from brokers, we performed other auditing procedures. We believe that our audit provides a reasonable basis for our opinion.
| | TAIT, WELLER & BAKER LLP |
Philadelphia, Pennsylvania March 2, 2020 | |
TRUSTEE AND OFFICER INFORMATION (Unaudited)
Unless otherwise noted, each Trustee and officer’s address is 225 South Lake Avenue, Suite 216, Pasadena, California 91101. Trustees and officers of the Trust serve until their resignation, removal or retirement. Additional information about the Trustees is included in the Funds’ Statement of Additional Information which is available, without charge, upon request by calling 866-307-5990 (toll free in the United States) or by visiting the Fund’s website at www.smartetfs.com.
| Disinterested Trustees |
| Name and Age | Position Held
with the Trust | Length of
Time Served | Principal Occupation(s)
During the Past 5 Years | Number of
Portfolios In
Fund
Complex
Overseen by
Trustee | Other Directorships Held by Trustee |
J. Brooks Reece, Jr. (72) | Trustee and Chairman | Indefinite; Since April 1994 | Operating Partner, Stonebridge Partners Small Cap Team, since 2018. Previously, CEO, Adcole Corp, from 1989 to 2017. | 10 | None |
James I. Fordwood (72) | Trustee, Audit Committee Chairman | Indefinite; Since April 1994 | CFO and Managing Member of Prima Marketing LLC (network of convenience stores) since 1998; President, Balmacara Production Inc. since 1986 (holding company); Treasurer, Inverness21 LLC (owns and operates office buildings) since 2007; Treasurer, JL Energy Inc. (holding company) since 1985; Treasurer, Thistle, Inc. (seismic data management) since 1984. | 10 | None |
Dr. Bret A. Herscher (61) | Trustee | Indefinite; Since April 1994 | Self-employed Consultant, since 2018, to companies in the medical device sector. Chief Technology Officer, EARGO, Inc., a hearing aid company, from 2012 to 2018. | 10 | None |
Susan Penry- Williams (73) | Trustee | Indefinite; Since February 2016 | Retired; Partner, Kramer Levin Naftalis & Frankel LLP, from 1994 to 2014. | 10 | None |
| Interested Trustees |
Name,
Address, and
Age | Position
Held with
the Trust | Length of Time Served | Principal Occupations
During the Past 5 Years | Number of
Portfolios In
Fund
Complex
Overseen by
Trustee | Other
Directorships Held by Trustee |
Timothy W.N. Guinness* 14 Queen Anne’s Gate London, England SW1H 9AA U.K. (71) | Trustee | Indefinite; | Chairman/CIO of Guinness Atkinson™ Asset Management since November 2002. Chairman of Guinness Asset Management Ltd., investment advisor in London, since 2003. Director of Guinness Capital Management Ltd. since 2010. Partner, Ekins Guinness LLP (investment research) since 2017; Non-Executive Director of Brompton Bicycle Ltd., Since 2000. | 10 | None |
| * | “Interested person” (as defined in the 1940 Act) of the Funds because of his affiliation with Guinness Atkinson™. |
| Officers |
Name and
Age | Position(s)
Held
with the Trust | Length of
Time Served | Principal Occupation(s) During the Past 5 Years |
James J. Atkinson (62) | President | Since April 2003 | Chief Executive Officer and Director of Guinness Atkinson™ Asset Management since 2002. Director of Guinness Asset Management Ltd. since 2003. Principal of Orbis Marketing, a mutual fund marketing and advertising firm, since 2001. |
Patrick Keniston (54) | Chief Compliance Officer | Since May 2013 | Managing Director, Foreside Fund Officer Services, LLC, since 2008. |
Rita Dam (52) | Treasurer | Since September 2009 | Co-Chief Executive Officer (2016 - present), and Vice President, Mutual Fund Administration, LLC (2006 - 2015). Co-President (2018 – present), Foothill Capital Management, LLC, a registered investment adviser. |
Joy Ausili (52) | Secretary & Assistant Treasurer | Since September 2009 | Co-Chief Executive Officer, Mutual Fund Administration, LLC (2016 - present), and Vice President, Mutual Fund Administration, LLC (2006 -2015). Co-President (2018 – present), Foothill Capital Management, LLC, a registered investment advisor. |
Sardjono Kadiman (44) | Assistant Treasurer | Since September 2009 | Managing Director (2018 – present), and Vice President, Mutual Fund Administration, LLC. (2008-2017). |
Lyna Phan (44) | Assistant Treasurer | Since September 2011 | Managing Director (2018 – present), and Vice President, Mutual Fund Administration, LLC (2010-2017). |
SUPPLEMENTAL INFORMATION (Unaudited)
Board Consideration of Investment Advisory and Sub-Advisory Agreements for the SmartETFs Smart Transportation & Technology ETF
At a quarterly in-person meeting held on February 11, 2019, the Board of Trustees (the “Trustees” or the “Board”) of Guinness Atkinson Funds (the “Trust”), including the trustees who are not “interested persons” of the Trust (the “Independent Trustees”) as defined in the Investment Company Act of 1940, as amended (the “1940 Act”), reviewed and unanimously approved the investment advisory agreement (the “Advisory Agreement”) between the Trust and the Adviser and the sub-advisory agreement (the “Sub-Advisory Agreement”) between the Adviser and Penserra Capital Management LLC (the “Sub-Adviser”) with respect to the SmartETFs Smart Transportation & Technology ETF series of the Trust (the “Fund”), each for an initial two-year term. The Advisory Agreement and the Sub-Advisory Agreement are collectively referred to below as the “Fund Advisory Agreements.” In approving each Fund Advisory Agreement, the Board, including the Independent Trustees, determined that such approval was in the best interests of the Fund in light of the extent and quality of the services to be provided and such other matters as the Board considered to be relevant in the exercise of its reasonable business judgment.
At the meeting, the Trustees discussed with counsel to the Trust and independent legal counsel to the Independent Trustees, their fiduciary duties under the 1940 Act in reviewing the Fund Advisory Agreements and their obligation to obtain and review information relevant and necessary to their consideration of the Fund Advisory Agreements. The Trustees received a memorandum summarizing the duties of the Trustees under, and the fiduciary standards established by, the 1940 Act and state law, legislative and regulatory guidance, and judicial precedent with respect to evaluating the reasonableness of fees and interpretation of the applicable fiduciary standards.
To assist the Board in its evaluation of the Fund Advisory Agreements, the Independent Trustees received a separate report from each of the Adviser and the Sub-Adviser in advance of the Meeting responding to a request for information provided on behalf of the Independent Trustees that, among other things, outlined the services provided by the Adviser and the Sub-Adviser to the Fund (including the relevant personnel responsible for these services and their experience); the fee rate or management fee rate payable by the Fund as compared to fees charged to a peer group of the Fund and as compared to fees charged to other clients of the Adviser and the compensation to be received by the Sub-Adviser from the Adviser; the expenses of the Fund as compared to expense ratios of the funds in the Fund’s peer group; the nature of the expenses incurred in providing services to the Fund and the potential for economies of scale, if any; financial data on the Adviser and the Sub-Adviser; any fall-out benefits accruing to the Adviser or the Sub-Adviser; and information on the Adviser’s and the Sub-Adviser’s compliance programs. The Independent Trustees also met separately with their Independent Counsel to discuss the information provided by the Adviser and the Sub-Adviser. In their deliberations, the Trustees considered the factors summarized below, and in approving the Fund Advisory Agreements with respect to the Fund, the Trustees did not identify any single factor, or information provided with respect to any single factor, as controlling.
Nature, Extent and of Quality of Services
The Trustees considered information about the nature, extent and quality of the services provided by the Adviser to the Guinness Atkinson traditional open-end mutual funds, including the background and experience of the Adviser’s senior management and portfolio managers, and their special knowledge about the areas in which the Fund is expected to invest. The Trustees also considered information gained from their experience as Trustees of the Guinness Atkinson traditional open-end mutual funds, in addition to the overall reputation and capabilities of the Adviser and its investment professionals, the Adviser’s commitment to providing high quality services to those funds, the Trustees’ overall confidence in the Adviser’s integrity and responsiveness to Trustee concerns, the Adviser's integrity as reflected in its adherence to compliance practices, and the Adviser’s willingness and initiative in implementing changes designed to improve services to the Fund. With respect to the Sub-Adviser, the Trustees considered the Sub-Adviser’s specialized role in sub-advising third party exchange-traded funds and acting as a passive manager in that capacity.
SUPPLEMENTAL INFORMATION (Unaudited)
Fund Performances, Advisory Fees and Expenses
The Trustees reviewed the fee and expense information of the Fund compiled from peer group data, and considered that the Fund’s proposed 0.68% fee covering essentially all operating expenses of the Fund was above the average and median total expenses charged to other comparable exchange traded funds; however, only one other fund in the peer group was actively managed similar to the Fund. The Board noted that because the Fund was new, the Adviser and Sub-Adviser had not provided any historical performance information.
The Board reviewed information regarding the sub-advisory fee charged by the Sub-Adviser with respect to the Fund, and noted that the Sub-Adviser serves as sub-adviser to a large number of other exchange-traded funds in a similar capacity to which it will serve the Fund. The Trustees considered the types of services provided by the Sub-Adviser with respect to the Fund, particularly that the Sub-Adviser specializes in sub-advising third-party exchange-traded funds and acts as a passive manager in that capacity. The Trustees also observed that the Adviser pays the Sub-Adviser’s sub-advisory fee out of the Adviser’s advisory fee and that the size of the fee paid to the Sub-Adviser appears reasonable.
Costs of Services and Profitability
The Trustees considered the financial information provided by the Adviser and Sub-Adviser, including the expected costs of the Fund and the profitability of the Fund to the Adviser and Sub-Adviser. The Trustees noted that in light of the expected small asset size during the startup period and the proposed fee arrangement, the Adviser and Sub-Adviser would not be realizing any profits during the early periods of the Fund’s operations.
Economies of Scale
The Trustees considered whether the Fund would realize any economies of scale. They noted that in the Fund’s start-up period, its asset levels would likely be too low to achieve significant economies of scale and that the matter of such economies would be reviewed in the future as the Fund’s assets grew.
Conclusion
Based on all of the information considered and the conclusions reached, the Board, including the Independent Trustees, unanimously determined that the nature, overall quality, and extent of the services to be provided by the Adviser and Sub-Adviser to the Fund was satisfactory; the compensation payable to the Adviser and Sub-Adviser pursuant to the Fund’s Advisory Agreement and Sub-Advisory Agreement, respectively, was fair and reasonable in light of the nature and quality of the services to be provided to the Fund; and the approval of the Fund Advisory Agreements would be in the best interests of the Fund and its shareholders.
Expense Example (Unaudited)
All ETFs have operating expenses. As a shareholder of the Fund you incur an advisory fee. In addition to the advisory fee, a shareholder may pay brokerage expenses, taxes, interest, litigation expenses and other extraordinary expenses (including acquired fund fees and expenses), if any. It is important for you to understand the impact of these ongoing costs on your investment returns. Shareholder may incur brokerage commissions on their purchases and sales of Fund shares, which are not reflected in these examples.
The examples use the annualized expense ratio and are intended to help you understand your ongoing costs (in dollars) of investing in the Fund and to compare these costs with the ongoing costs of investing in other funds. The examples are based on an investment of $1,000 invested at the beginning of the period shown and held for the entire period (unless otherwise noted below). The table below illustrates the Fund’s cost in two ways:
Actual Expenses
This section helps you estimate the actual expenses after fee waivers that the Fund may have incurred over the period. The “Expenses Paid During Period” column shows the actual dollar expense cost incurred by a $1,000 investment in the Fund, and the “Ending Account Value” number is derived from deducting that expense cost from the Fund’s gross investment return for the period.
You may use the information, together with the amount you invested in the Fund, to estimate the expenses you paid over the period. Simply divide your account value by $1,000 (for example, an $8,600 account value divided by $1,000 = 8.6), then multiply that ratio by the number shown for the Fund under “Expenses Paid During Period”.
Hypothetical Example for Comparison Purposes
This section helps you compare the Fund’s costs with those of other funds. It assumes that the Fund had an annualized return of 5% before expenses, which is not the Fund’s actual return and the expense ratio for the period is unchanged. The hypothetical account value and expense may not be used to estimate the actual ending account balance or the expenses you paid for the period. This example is useful in making comparisons because the SEC requires all funds to make this 5% calculation. You can assess the Fund’s comparative cost by comparing the hypothetical results for the Fund in the “Expenses Paid During Period” column with those that appear in the same charts in the shareholder reports of other funds.
| | Beginning
Account Value | Ending Account Value | Expenses Paid During
Period | Annualized
Expense Ratio |
| Actual Performance2 | 11/14/191 | 12/31/19 | 11/14/191– 12/31/19 | |
| SmartETFs Smart Transportation & Technology ETF | $1,000.00 | $1,053.41 | $0.92 | 0.68% |
Hypothetical (5% annual return before expenses)3 | 07/01/19 | 12/31/19 | 07/01/19 – 12/31/19 | |
| SmartETFs Smart Transportation & Technology ETF | $1,000.00 | $1,021.78 | $3.47 | 0.68% |
| 1 | Commencement of operations. |
| 2 | Expenses paid during the period are equal to the Fund’s annualized expense ratio, multiplied by the average account value over the period, multiplied by 48/365 (to reflect the since inception period). |
| 3 | Expenses paid during the period are equal to the Fund’s annualized expense ratio, multiplied by the average account value over the period, multiplied by 184/365 (to reflect the six-month period). |
Privacy Notice
The SmartETFs Smart Transportation & Technology ETF and Guinness Atkinson Asset Management, Inc. may collect non-public information about you from the following sources:
| ● | Information we receive about you on applications or other forms; |
| ● | Information you give us orally; and |
| ● | Information about your transactions with us. |
We do not disclose any non-public personal information about our shareholders or former shareholders without the shareholder’s authorization, except as required by law or in response to inquiries from governmental authorities. We restrict access to your personal and account information to those employees who need to know that information to provide products and services to you. We also may disclose that information to unaffiliated third parties (such as to brokers or custodians) only as permitted by law and only as needed for us to provide agreed services to you. We maintain physical, electronic and procedural safeguards to guard your non-public personal information.

This report is intended for the Fund’s shareholders. It may not be distributed to prospective investors unless it is preceded or accompanied by a SmartETFs Smart Transportation & Technology ETF (the “Fund”) prospectus and summary prospectus, which includes more complete information. Investing involves substantial risk and high volatility, including possible loss of principal. An investor should consider the investment objective, risks, charges and expenses of the Fund carefully before investing. To obtain a prospectus and summary prospectus, which contains this and other information, e-mail request to mail@Smart-ETFs.com, by calling 866-307-5990 (toll free in the United States), visiting the Fund’s website, www.SmartETFs.com, or by calling or writing a broker-dealer or other financial intermediary. Please read the prospectus and summary prospectus carefully before investing.
Additional information about the Trust’s Board of Trustees/Officers and a description of the policies and procedures the Trust uses to determine how to vote proxies relating to portfolio securities are provided in the Statement of Additional Information. The Statement of Additional Information and information re-garding how the Trust voted proxies relating to portfolio securities during the most recent twelve month period ending June 30 is available, without charge, by calling 866-307-5990, or by visiting www.SmartETFs.com, or on the Securities and Exchange Commission’s website at http://www.sec.gov.
The Fund files its complete schedule of portfolio holdings with the Securities and Exchange Commission for the first and third quarters of each fiscal year on Form N-PORT. The Fund’s Form N-PORT are available on the Commission’s website at www.sec.gov. In addition, the Fund’s full portfolio holdings are updated daily and available on the Fund’s website at www.SmartETFs.com.
Foreside Fund Services, LLC, distributor.
Item 2. Code of Ethics.
The registrant has adopted a code of ethics that applies to the registrant's principal executive officer and principal financial officer. The registrant has not made any amendments to its code of ethics during the period covered by this report. The registrant has not granted any waivers from any provisions of the code of ethics during the period covered by this report.
The registrant undertakes to provide to any person without charge, upon request, a copy of its code of ethics by mail when they call the registrant at 1-866-307-5990.
Item 3. Audit Committee Financial Expert.
The registrant’s board of trustees has determined that there is at least one audit committee financial expert serving on its audit committee.James I. Fordwood is the “audit committee financial expert” and is considered to be “independent” as each term is defined in Item 3 of Form N-CSR.
Item 4. Principal Accountant Fees and Services.
The registrant has engaged its principal accountant to perform audit services, audit-related services, tax services and other services during the past two fiscal years. "Audit services" refer to performing an audit of the registrant's annual financial statements or services that are normally provided by the accountant in connection with statutory and regulatory filings or engagements for those fiscal years. "Audit-related services" refer to the assurance and related services by the principal accountant that are reasonably related to the performance of the audit. "Tax services" refer to professional services rendered by the principal accountant for tax compliance, tax advice, and tax planning. There were no "other services" provided by the principal accountant. The following table details the aggregate fees billed or expected to be billed for each of the last two fiscal years for audit fees, audit-related fees, tax fees and other fees by the principal accountant.
| | FYE 12/31/2019 | FYE 12/31/2018 |
| Audit Fees | $5,000 | N/A |
| Audit-Related Fees | N/A | N/A |
| Tax Fees | $2,500 | N/A |
| All Other Fees | N/A | N/A |
The audit committee has adopted pre-approval policies and procedures that require the audit committee to pre-approve all audit and non-audit services of the registrant, including services provided to any entity affiliated with the registrant.
The percentage of fees billed by Tait, Weller, & Baker LLP applicable to non-audit services pursuant to waiver of pre-approval requirement were as follows:
| | FYE 12/31/2019 | FYE 12/31/2018 |
| Audit-Related Fees | 0% | 0% |
| Tax Fees | 0% | 0% |
| All Other Fees | 0% | 0% |
All of the principal accountant's hours spent on auditing the registrant's financial statements were attributed to work performed by full-time permanent employees of the principal accountant.
The following table indicates the non-audit fees billed or expected to be billed by the registrant's accountant for services to the registrant and to the registrant's investment adviser (and any other controlling entity, etc.—not sub-adviser) for the last two years. The audit committee of the Board of Trustees has considered whether the provision of non-audit services that were rendered to the registrant's investment adviser is compatible with maintaining the principal accountant's independence and has concluded that the provision of such non-audit services by the accountant has not compromised the accountant's independence.
| Non-Audit Related Fees | FYE 12/31/2019 | FYE 12/31/2018 |
| Registrant | N/A | N/A |
| Registrant’s Investment Advisor | N/A | N/A |
Item 5. Audit Committee of Listed Registrants.
Not applicable to registrants who are not listed issuers (as defined in Rule 10A-3 under the Securities Exchange Act of 1934).
Item 6. Schedule of Investments.
| (a) | Schedule of Investments is included as part of the report to shareholders filed under Item 1 of this Form. |
Item 7. Disclosure of Proxy Voting Policies and Procedures for Closed-End Management Investment Companies.
Not Applicable.
Item 8. Portfolio Managers of Closed-End Management Investment Companies.
Not Applicable.
Item 9. Purchases of Equity Securities by Closed-End Management Investment Company and Affiliated Purchasers.
Not Applicable.
Item 10. Submission of Matters to a Vote of Security Holders.
The registrant has not made any material changes to the procedures by which shareholders may recommend nominees to the registrant’s Board of Trustees.
Item 11. Controls and Procedures.
| (a) | The registrant’s principal executive officer and principal financial officer have evaluated the registrant’s disclosure controls and procedures within 90 days of this filing and have concluded based on such evaluation that the registrant’s disclosure controls and procedures were effective, as of that date, in ensuring that information required to be disclosed by the registrant in this Form N-CSR was recorded, processed, summarized, and reported within the time periods specified in the Securities and Exchange Commission’s rules and forms. |
| (b) | There were no changes in the registrant’s internal control over financial reporting (as defined in Rule 30a-3(d) under the Investment Company Act of 1940) that occurred during the registrant’s last fiscal quarter that have materially affected, or are reasonably likely to materially affect, the registrant’s internal control over financial reporting. |
Item 12. Disclosure of Securities Lending Activities for Closed-End Management Investment Companies.
Not applicable to open-end investment companies.
Item 13. Exhibits.
(a)
(1)Any code of ethics or amendment thereto, that is subject of the disclosure required by Item 2, to the extent that the registrant intends to satisfy Item 2 requirements through filing an exhibit. Incorporated by reference to the Registrant’s Form N-CSR filed March 10, 2011.
(b)
(2)Certifications pursuant to Section 302 of the Sarbanes-Oxley Act of 2002.Filed herewith.
(3)Any written solicitation to purchase securities under Rule 23c-1 under the Act sent or given during the period covered by the report by or on behalf of the registrant to 10 or more persons.Not applicable to open-end investment companies.
| (c) | Certification pursuant to Section 906 of the Sarbanes-Oxley Act of 2002. Filed herewith. |
SIGNATURES
Pursuant to the requirements of the Securities Exchange Act of 1934 and the Investment Company Act of 1940, the registrant has duly caused this report to be signed on its behalf by the undersigned, thereunto duly authorized.
| (Registrant) | Guinness Atkinson Funds | |
| By | /s/ James J. Atkinson | |
| Name: | James J. Atkinson | |
| Title: | President | |
| Date: | 3/10/2020 | |
Pursuant to the requirements of the Securities Exchange Act of 1934 and the Investment Company Act of 1940, this report has been signed by the following persons on behalf of the registrant and in the capacities and on the dates indicated.
| By | /s/ James J. Atkinson | |
| Name: | James J. Atkinson | |
| Title: | President | |
| Date: | 3/10/2020 | |
| By | /s/ Rita Dam | |
| Name: | Rita Dam | |
| Title: | Treasurer | |
| Date: | 3/10/2020 | |