UNITED STATES
SECURITIES AND EXCHANGE COMMISSION
Washington, D.C. 20549
FORM N-CSR
CERTIFIED SHAREHOLDER REPORT OF REGISTERED
MANAGEMENT INVESTMENT COMPANIES
Investment Company Act file number | 811-08360 |
|
GUINNESS ATKINSON FUNDS |
(Exact name of registrant as specified in charter) |
|
21550 Oxnard Street, Suite 850 Woodland Hills, CA | | 91367 |
(Address of principal executive offices) | | (Zip code) |
|
James J. Atkinson, Jr. 21550 Oxnard Street, Suite 850 Woodland Hills, CA 91367 |
(Name and address of agent for service) |
|
Registrant’s telephone number, including area code: | (800-915-6566) | |
|
Date of fiscal year end: | December 31 | |
|
Date of reporting period: | December 31, 2017 | |
| | | | | | | | |
Item 1. Reports to Stockholders.
The registrant’s annual report transmitted to shareholders pursuant to Rule 30e-1 under the Investment Company Act of 1940, as amended (the “Investment Company Act”), is as follows:

2
Guinness AtkinsonTM Funds
Annual Report
December 31, 2017
TABLE OF CONTENTS
| | 5 | | | Letter to Shareholders | |
| | 8 | | | Expense Examples | |
| | 9 | | | Alternative Energy Fund | |
| | 17 | | | Asia Focus Fund | |
| | 24 | | | Asia Pacific Dividend Builder Fund | |
| | 31 | | | China & Hong Kong Fund | |
| | 37 | | | Dividend Builder Fund | |
| | 47 | | | Global Energy Fund | |
| | 57 | | | Global Innovators Fund | |
| | 68 | | | Renminbi Yuan & Bond Fund | |
| | 74 | | | Statements of Assets and Liabilities | |
| | 76 | | | Statements of Operations | |
| | 78 | | | Statements of Changes in Net Assets | |
| | 83 | | | Financial Highlights | |
| | 92 | | | Notes to Financial Statements | |
| | 104 | | | Report of Independent Registered Public Accounting Firm | |
| | 107 | | | Trustee and Officer Information | |
| | 110 | | | Privacy Notice | |
| | 111 | | | Guinness Atkinson Funds Information | |
3
The table below provides total return data for each of the Funds over the one, three, five, ten-years and since inception periods through December 31, 2017. Also included in the table is the expense ratio data from the most recent prospectus dated May 1, 2017.
Fund (inception date) | | 1-year | | 3-year | | 5-year | | 10-year | | Since Inception | | Expense Ratio | |
Alternative Energy Fund (March 31, 2006) | | | 20.68 | % | | | -3.97 | % | | | 4.16 | % | | | -14.39 | % | | | -10.35 | % | | | 2.60 | % gross; 1.99% net† | |
Asia Focus Fund (April 29, 1996) | | | 47.10 | % | | | 12.42 | % | | | 5.35 | % | | | 1.09 | % | | | 3.86 | % | | | 2.24 | % gross; 1.98% net† | |
Asia Pacific Dividend Builder Fund
(March 31, 2006) | | | 36.70 | % | | | 12.37 | % | | | 8.66 | % | | | 4.69 | % | | | 6.98 | % | | | 3.14 | % gross; 1.11% net† | |
China & Hong Kong Fund (June 30, 1994) | | | 48.85 | % | | | 12.30 | % | | | 8.13 | % | | | 2.18 | % | | | 7.83 | % | | | 1.67 | %† | |
Dividend Builder Fund (March 30, 2012) | | | 21.34 | % | | | 7.70 | % | | | 11.23 | % | | | — | | | | 10.60 | % | | | 2.11 | % Gross; 0.70% net† | |
Global Energy Fund (June 30, 2004) | | | -1.06 | % | | | -2.81 | % | | | -1.69 | % | | | -2.10 | % | | | 6.82 | % | | | 1.53 | % gross; 1.45% net† | |
Global Innovators Fund Investor Class
(December 15, 1998) | | | 34.75 | % | | | 12.68 | % | | | 18.53 | % | | | 9.29 | % | | | 8.24 | % | | | 1.35 | % gross; 1.24% net† | |
Global Innovators Fund Institutional Class
(December 31, 2015) | | | 35.07 | % | | | 12.87 | % | | | 18.65 | % | | | 9.35 | % | | | 8.27 | % | | | 1.38 | % gross; 0.99% net† | |
Renminbi Yuan & Bond Fund (June 30, 2011) | | | 9.79 | % | | | 0.54 | % | | | 1.17 | % | | | — | | | | 1.52 | % | | | 4.35 | % gross; 1.00% net† | |
Periods of greater than one year are average annualized returns; one year and shorter period returns are actual returns. All returns are for the periods ended December 31, 2017.
Performance data shown for the Global Innovators Fund's Institutional Class shares (GINNX) prior to its launch date on December 31, 2015 uses performance data from the Global Innovators Fund's Investor Class shares (IWIRX).
Performance data quoted represents past performance and does not guarantee future results. The investment return and principal value of an investment will fluctuate so that an investor's shares, when redeemed, may be worth more or less than the original cost. Current performance of the Funds may be lower or higher than the performance quoted. Performance data current to the most recent month end may be obtained by visiting www.gafunds.com or calling 1-800-915-6565. The recent growth rate in the stock market has helped to produce short-term returns that are not typical. Because of ongoing market volatility, fund performance may be subject to substantial short-term changes.
Each of the Asia Focus Fund, the Asia Pacific Dividend Builder Fund, the China & Hong Kong Fund, and the Renminbi Yuan & Bond Fund imposes 2% redemption fee on shares held less than 30 days. Performance data quoted does not reflect this fee. If it had, total return would be lower.
Expense ratios are from the most recent prospectus (dated May 1, 2017) and are from the most recent audited financials (period ending December 31, 2016) at the time that prospectus was completed.
†All of the Guinness Atkinson Funds, except the China & Hong Kong Fund, have an expense cap in place and the advisor is contractually obligated to cap the Funds' total expenses through June 30, 2018.
4
Dear Guinness Atkinson Funds Shareholders,
Why can't they all be like that? We're referring, of course, to the market year. There is no question 2017 was an atypical year in the markets. The MSCI World Index was up 23.10% for the year; which is in and of itself a remarkable return albeit not unprecedented. What was unprecedented was the fact that the index posted a positive total return in every single month of the year. Hence our query: why can't they all be like that? We're pleased to report that the Guinness Atkinson Funds generally had an excellent year, with seven of the eight Funds posting positive returns. The one exception was the Global Energy Fund, which as it turns out, was the top performing Guinness Atkinson Fund for 2016. The performance table on the opposite page has all the details.
The top performing Guinness Atkinson Fund for the year was the China & Hong Kong Fund, which produced a total return of 48.85% for the year. We take a particular satisfaction in this result given the large number of vocal nay-sayers which have doubted the China story since, well, since we launched the Fund in 1994. The anti-China sentiment doesn't seem to bother China in the least; the country just keeps motoring along and is now the second largest economy in the world and the fastest growing major economy in the world. While we're on the subject of China, we should mention our Renminbi Yuan & Bond Fund, which produced a total return of 9.79% in 2017. If you follow the renminbi you'll know that all of the experts were predicting a slump (or collapse even) in the renminbi the last couple of years.
Our two pan-Asia Funds, Asia Focus and Asia Pacific Dividend Builder had strong years as well, up 47.10% and 36.70% respectively.
The Global Innovators Fund continued its long run of excellent performance. For the year, the Fund had a total return of 34.75% for the Investor Class and 35.07% for the Institutional Class. This Fund will reach its 20th anniversary in December of 2018 and we know we have many shareholders that have been in this Fund since inception or shortly thereafter. We're delighted that so many have been along for the ride. Shareholders in this Fund will be pleased to know that it continues to be among the very best in its category. We don't wish to burden our readers with a lot of impressive statistics regarding the relative performance of this Fund, but we think it is important to let readers know that the Fund has been in the top decile in its Morningstar category (currently Large Blend) for trailing 10 year performance for the last 23 consecutive quarters. For the year, it finished in the top 1% in its category (1,396 funds); top 3% for three years (1,217 funds); top 1% for five years (1,079 funds); and top 7% for 10 years (800 funds). The investment thesis for this Fund is simple: We believe innovative companies outperform and the results of the Fund support this thesis.
As noted, our Global Energy Fund did not produce a positive return in 2017. This isn't too much of a surprise given the energy – particularly oil – markets in 2017. The Alternative Energy Fund produced a total return of 20.68% for the year. We've mentioned in the past that we're optimistic about the long-term prospects for alternative energy. It is our view that we're just at the point where – because of a continuation of the long-term decline in solar and wind costs – renewable energy is cost competitive with conventional energy without subsidies. We believe that reaching this tipping point will prove to be a catalyst for accelerating growth for the industry.
The Guinness Atkinson Dividend Builder Fund provided a total return of 21.34%. While this Fund may not be a leader in total return, we very much like its lower level of risk and its dividend orientation. Quality companies are the key ingredient in this Fund: all of the companies in the portfolio need to meet rather strict criteria to be eligible for inclusion. We believe this focus on quality, dividend-paying companies will serve this Fund well in less-buoyant markets.
Our investment team has provided a detailed commentary for each of the Guinness Atkinson Funds adjacent to each Fund's financial results.
As usual, we appreciate the confidence you have placed in us and our management team and look forward to what will hopefully be a great 2018.
We encourage you to visit gafunds.com for the latest news and announcements on the Guinness Atkinson Funds.
Sincerely, | | | |

| | 
| |
Timothy Guinness | | James Atkinson | |
5
Morningstar Ratings Through December 31, 2017
Fund | | Category | | Overall | | 3-year | | 5-year | | 10-year | |
Alternative Energy | | Foreign Small/ | | 1* | | 1* | | 1* | | 1* | |
| | Mid Value | | (59 funds) | | (59 funds) | | (44 funds) | | (25 funds) | |
Asia Focus | | Pacific/Asia | | 2** | | 4**** | | 2** | | 1* | |
| | ex-Japan | | (68 funds) | | (68 funds) | | (50 funds) | | (23 funds) | |
Asia Pacific Dividend | | Pacific/Asia | | 4**** | | 4**** | | 4**** | | 3*** | |
Builder | | ex-Japan | | (68 funds) | | (68 funds) | | (50 funds) | | (23 funds) | |
China & Hong Kong | | China Region | | 2** | | 3*** | | 2** | | 2** | |
| | | | (81 funds) | | (81 funds) | | (69 funds) | | (37 funds) | |
Global Energy | | Energy Equity | | 3*** | | 3*** | | 3*** | | 3*** | |
| | | | (90 funds) | | (90 funds) | | (75 funds) | | (61 funds) | |
Global Innovators | | Large Blend | | 4**** | | 5***** | | 5***** | | 3*** | |
| | | | (1,217 funds) | | (1,217 funds) | | (1,079 funds) | | (800 funds) | |
Renminbi Yuan & Bond | | Emerging Markets | | 4**** | | 2** | | 5***** | | | |
| | Local Currency Bond | | (79 funds) | | (79 funds) | | (63 funds) | | | |
Dividend Builder | | World Stock | | 3*** | | 3*** | | 3*** | | | |
| | | | (720 funds) | | (720 funds) | | (589 funds) | | | |
Morningstar Ratings Disclosure
Global Innovators Fund ratings shown were given for Investor Class shares.
Mutual fund investing involves risk. Principal loss is possible. The Funds invest in foreign securities, which involves greater volatility and political, economic and currency risks and differences in accounting methods. These risks are greater for emerging markets countries. Non-diversified Funds' assets may be concentrated in fewer individual holdings than diversified funds. Therefore, these Funds are more exposed to individual issuer volatility than diversified funds. Investments in smaller companies involve additional risks such as limited liquidity and greater volatility. Investments in debt securities typically decrease in value when interest rates rise, which can be greater for longer-term debt securities. Investments in derivatives involve risks different from, and in certain cases, greater than the risks presented by traditional investments. Investments focused in a single geographic region may be exposed to greater risk than investments diversified among various geographies. Investments focused on the energy sector may be exposed to greater risk than an investments diversified among various sectors.
Past performance is not a guarantee of future results. The Morningstar RatingTM for funds, or "star rating", is calculated for managed products (including mutual funds, variable annuity and variable life subaccounts, exchange-traded funds, closed-end funds, and separate accounts) with at least a three-year history. Exchange-traded funds and open-ended mutual funds are considered a single population for comparative purposes. It is calculated based on a Morningstar Risk-Adjusted Return measure that accounts for variation in a managed product's monthly excess performance, placing more emphasis on downward variations and rewarding consistent performance. The top 10% of products in each product category receive 5 stars, the next 22.5% receive 4 stars, the next 35% receive 3 stars, the next 22.5% receive 2 stars, and the bottom 10% receive 1 star. The Overall Morningstar Rating for a managed product is derived from a weighted average of the performance figures associated with its three-, five-, and 10-year (if applicable) Morningstar Rating metrics. The weights are: 100% three-year rating for 36-59 months of total returns, 60% five-year rating/40% three-year rating for 60-119 months of total returns, and 50% 10-year rating/30% five-year rating/20% three-year rating for 120 or more months of total returns. While the 10-year overall star rating formula seems to give the most weight to the 10-year period, the most recent three-year period actually has the greatest impact because it is included in all three rating periods.
For each fund with at least a three-year history, Morningstar calculates a Morningstar RatingTM based on a Morningstar Risk-Adjusted Return measure that accounts for variation in a fund's monthly performance (including the effects of sales charges, loads, and redemption fees), placing more emphasis on downward variations and rewarding consistent performance. The top 10% of funds in each category receive 5 stars, the next 22.5% receive 4 stars, the next 35% receive 3 stars, the next 22.5% receive 2 stars
6
and the bottom 10% receive 1 star. (Each share class is counted as a fraction of one fund within this scale and rated separately, which may cause slight variations in distribution percentages.)
©2018 Morningstar, Inc. All Rights Reserved. The information contained herein (1) is proprietary to Morningstar (2) may not be copied or distributed and (3) is not warranted to be accurate, complete or timely. Neither Morningstar nor its content providers are responsible for any damages or losses arising from any use of this information.
The views in this letter were as of December 31, 2017 and may not necessarily reflect the same views on the date this letter is first published or any time thereafter. These views are intended to help shareholders in understanding the Funds' investment methodology and do not constitute investment advice.
7
Expense Examples (Unaudited)
As a shareholder of the Funds, you incur two types of costs: (1) redemption fees (applicable to the Asia Focus Fund, the Asia Pacific Dividend Builder Fund, the China & Hong Kong Fund, and the Renminbi Yuan & Bond Fund); and (2) ongoing costs, including advisory fees and other Fund expenses. The examples below are intended to help you understand your ongoing costs (in dollars) of investing in the Funds and to compare these costs with the ongoing costs of investing in other mutual funds.
The examples are based on an investment of $1,000 invested at the beginning of the period shown and held for the entire period from July 1, 2017 to December 31, 2017.
Actual Expenses
For each Fund, the first line of the table below provides information about actual account values and actual expenses. You may use the information in this line, together with the amount you invested, to estimate the expenses that you paid over the period. Simply divide your account value by $1,000 (for example, an $8,600 account value divided by $1,000 = 8.6), then multiply the result by the number in the first line under the heading entitled "Expenses Paid during Period" to estimate the expenses you paid on your account during this period.
Hypothetical Example for Comparison Purposes
For each Fund, the second line of the table below provides information about hypothetical account values and hypothetical expenses based on the Fund's actual expense ratios and an assumed rate of return of 5% per year before expenses, which is not the Fund's actual return. The hypothetical account values and expenses may not be used to estimate the actual ending account balance or expenses you paid for the period. You may use this information to compare the ongoing costs of investing in the Fund and other funds. To do so, compare this 5% hypothetical example with the 5% hypothetical examples that appear in the shareholder reports of the other funds.
Please note that the expenses shown in the table are meant to highlight your ongoing costs only and do not reflect any redemption fees. Therefore, the second line for each Fund of the table is useful in comparing ongoing costs only, and will not help you determine the relative total costs of owning different funds. In addition, if these redemption fees were included, your costs would have been higher.
| | | Beginning
Account
Value
(07/01/17) | | Ending
Account
Value
(12/31/17) | | Expenses Paid
During Period*
(07/01/17 to
12/31/17) | | Expense Ratios
During Period*
(07/01/17 to
12/31/17) | |
Guinness Atkinson Alternative Energy Fund Actual | | $ | 1,000.00 | | | $ | 1,105.50 | | | $ | 10.51 | | | | 1.98 | %† | |
Guinness Atkinson Alternative Energy Fund Hypothetical
(5% return before expenses) | | $ | 1,000.00 | | | $ | 1,015.22 | | | $ | 10.06 | | | | 1.98 | %† | |
Guinness Atkinson Asia Focus Fund Actual | | $ | 1,000.00 | | | $ | 1,198.10 | | | $ | 10.97 | | | | 1.98 | %† | |
Guinness Atkinson Asia Focus Fund Hypothetical
(5% return before expenses) | | $ | 1,000.00 | | | $ | 1,015.22 | | | $ | 10.06 | | | | 1.98 | %† | |
Guinness Atkinson Asia Pacific Dividend Builder Fund Actual | | $ | 1,000.00 | | | $ | 1,144.30 | | | $ | 6.05 | | | | 1.12 | %† | |
Guinness Atkinson Asia Pacific Dividend Builder Fund Hypothetical
(5% return before expenses) | | $ | 1,000.00 | | | $ | 1,019.56 | | | $ | 5.70 | | | | 1.12 | %† | |
Guinness Atkinson China & Hong Kong Fund Actual | | $ | 1,000.00 | | | $ | 1,203.00 | | | $ | 9.22 | | | | 1.66 | % | |
Guinness Atkinson China & Hong Kong Fund Hypothetical
(5% return before expenses) | | $ | 1,000.00 | | | $ | 1,016.84 | | | $ | 8.44 | | | | 1.66 | % | |
Guinness Atkinson Dividend Builder Fund Actual | | $ | 1,000.00 | | | $ | 1,080.10 | | | $ | 3.57 | | | | 0.68 | %† | |
Guinness Atkinson Dividend Builder Fund Hypothetical
(5% return before expenses) | | $ | 1,000.00 | | | $ | 1,021.78 | | | $ | 3.47 | | | | 0.68 | %† | |
Guinness Atkinson Global Energy Fund Actual | | $ | 1,000.00 | | | $ | 1,166.80 | | | $ | 7.92 | | | | 1.45 | %† | |
Guinness Atkinson Global Energy Fund Hypothetical
(5% return before expenses) | | $ | 1,000.00 | | | $ | 1,017.90 | | | $ | 7.38 | | | | 1.45 | %† | |
Guinness Atkinson Global Innovators Fund – Investor Class Actual | | $ | 1,000.00 | | | $ | 1,155.60 | | | $ | 6.74 | | | | 1.24 | %† | |
Guinness Atkinson Global Innovators Fund – Investor Class Hypothetical
(5% return before expenses) | | $ | 1,000.00 | | | $ | 1,018.95 | | | $ | 6.31 | | | | 1.24 | %† | |
Guinness Atkinson Global Innovators Fund – Institutional Class Actual | | $ | 1,000.00 | | | $ | 1,157.20 | | | $ | 5.38 | | | | 0.99 | %† | |
Guinness Atkinson Global Innovators Fund – Institutional Class
Hypothetical (5% return before expenses) | | $ | 1,000.00 | | | $ | 1,020.21 | | | $ | 5.04 | | | | 0.99 | %† | |
Guinness Atkinson Renminbi Yuan & Bond Fund Actual | | $ | 1,000.00 | | | $ | 1,050.20 | | | $ | 4.65 | | | | 0.90 | %† | |
Guinness Atkinson Renminbi Yuan & Bond Fund Hypothetical
(5% return before expenses) | | $ | 1,000.00 | | | $ | 1,020.67 | | | $ | 4.58 | | | | 0.90 | %† | |
*Expenses are equal to the Funds' annualized expense ratio as indicated, multiplied by the average account value over the period, multiplied by the number of days in most recent fiscal half-year period (184), then divided by the number of days in the fiscal year (365) (to reflect the one-half year period).
†Net of fee waivers and/or expense reimbursements. If those fee waivers and/or expense reimbursements had not been in effect, the Fund's actual expenses would have been higher.
8
GUINNESS ATKINSON ALTERNATIVE ENERGY FUND for the period ended December 31, 2017
1. Performance
AVERAGE ANNUALIZED TOTAL RETURNS
| | | 1 Year | | 3 Years | | 5 Years | | 10 Years | |
Fund | | | 20.68 | % | | | -3.97 | % | | | 4.16 | % | | | -14.39 | % | |
Benchmark Indices: | |
Wilderhill Clean Energy Index (ECO) | | | 39.81 | % | | | -0.81 | % | | | 5.15 | % | | | -15.04 | % | |
Wilderhill New Energy Global Innovation Index (NEX) | | | 28.90 | % | | | 6.98 | % | | | 13.28 | % | | | -6.24 | % | |
Over 10 years, the Fund remains ahead of the ECO Index.
The Fund's gross expense ratio is 2.60% and net expense ratio is 1.99% per the Summary Prospectus dated May 3, 2017. For the Fund's current one year expense ratios, please refer to the Financial Highlights section of this report. The Advisor has contractually agreed to waive a portion of its advisory fees and/or reimburse other Fund expenses so that the Fund's ratio of expenses to average daily net assets will not exceed 1.98% (excluding Acquired Fund Fees and Expenses, interest, taxes, dividends on short positions and extraordinary expenses) through at least June 30, 2018. To the extent that the Advisor waives fees and/or reimburses expenses, it may seek repayment of a portion or all of such amounts at any time within the three fiscal years after the fiscal year in which such amounts were waived and/or reimbursed, subject to the applicable cap.
Performance data quoted represents past performance and does not guarantee future results. The investment return and principal value of an investment in the Fund will fluctuate so that an investor's shares, when redeemed, may be worth more or less than their original cost. Current performance of the Fund may be lower or higher than the performance quoted. Performance data current to the most recent month-end may be obtained by visiting www.gafunds.com, or calling (800) 915-6565.
Total returns for certain periods reflect fee limitations in effect and, in the absence of these limitations, total returns would have been lower.
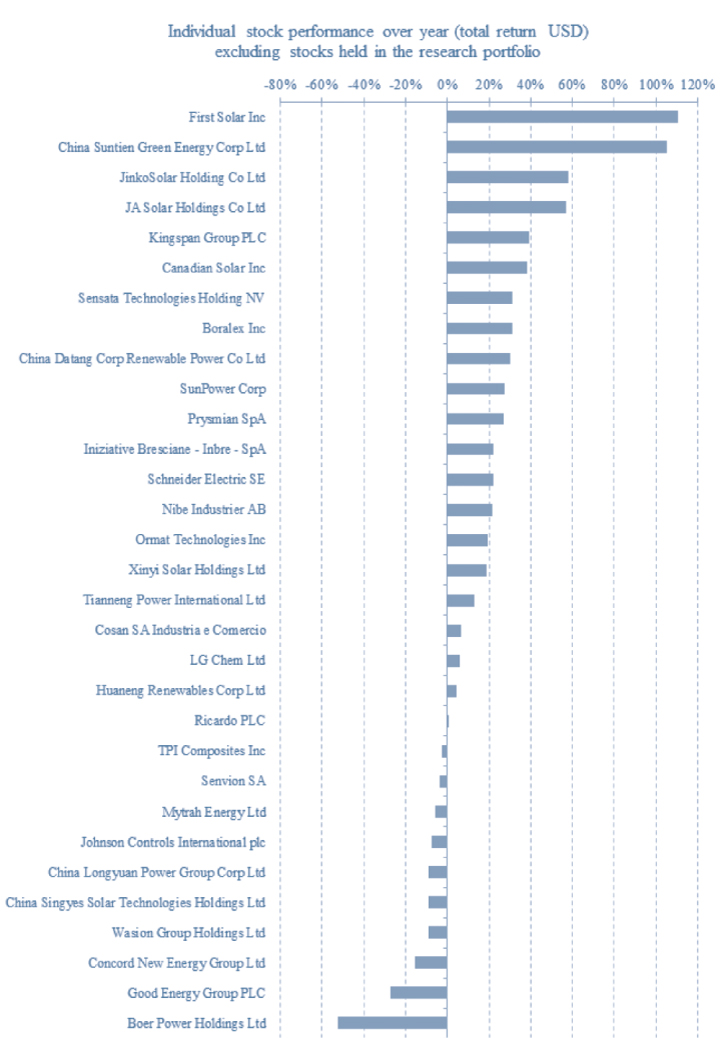
The Fund was up 20.68% in 2017. The Fund performed well throughout the year – for the first half of the year, the Fund was up 9.16% and for the second half of the year the Fund was up 10.55%. The main contributor to returns in 2017 was the solar sector. The module manufacturers largely recovered from 2016. China increased its installation targets, leading to demand for solar panels increasing by 25% year on year, when the market was expecting an increase of less than 10%. The Fund underperformed against the Wilderhill Clean Energy Index (ECO) (the "ECO Index"), which was up 18.29% for the first half of 2017 and then 18.19% for the second half of 2017. The underperformance reflected very strong index performance versus the sector and came mainly from the more speculative stocks in the ECO Index.
The best-performing subsectors in the Fund were solar, followed by hydro, geothermal, efficiency, wind and biofuels in descending order of performance. Solar had a strong year due to increased demand from China and fears of import tariffs in the US, meaning that developers were stockpiling modules, thereby stabilising prices and margins.
The Fund's one hydro holding, Italian company Iniziative Bresciane, benefitted from completion of new generating plant contributing to earnings. The Fund's one geothermal holding, Ormat Technologies, is a vertically integrated US manufacturer, developer and operator of geothermal plants. The company has successfully commissioned new plants and beat analysts' earnings expectations.
The Fund's efficiency holdings include companies involved in building efficiency, fuel efficiency, grid infrastructure, electric vehicles and batteries. These are also more exposed to global economic growth and have benefitted from strong global economy in 2017. The Fund's battery holdings fared well due to increased uptake of electric vehicles, while our grid holding benefitted from electricity grid improvements.
The Fund's wind holdings are a mixture of power producers and component manufacturers, and contributed positively to Fund performance. The Chinese wind power producers performed better due to lower wind power curtailment in China in 2017 than in 2016, while the Fund's Canadian wind power holding continued to execute its pipeline well. The biofuels sector in the Fund performed well in part because of Brazil's economic recovery.
The Fund's best performing position in 2017 was First Solar, the US-headquartered thin-film module manufacturer, closely followed by China Suntien, the Chinese photovoltaic systems installer. Both more than doubled in share price over the year. China Suntien benefitted from the surprise increase in Chinese solar demand. First Solar also benefitted from additional solar demand as well as the new tariffs the United States imposed on silicon-based solar equipment. First Solar is exempt from these import tariffs as its modules do not use silicon, even though their manufacturing locations are outside of the United States. JA Solar and JinkoSolar, two Chinese module manufacturers, were up 56.7% and 57.9%, respectively, over the year, due to increased Chinese
9
solar demand and more stable margins. The Fund's insulated panel manufacturer, Kingspan was up 39.5% due to a strong property market and demand for energy efficient building materials.
The Fund's weakest performing position, Boer Power, a Chinese distributor of energy management devices, was down 52.3% over the year as it continued to execute a major restructuring. We believe the restructuring will allow a recovery in earnings and the company's key markets remain attractive – China's distribution grid requires significant investment to deal with the influx of renewables, and particularly with the growth of rooftop solar in China this year. Good Energy, a UK-based green utility, missed expectations as a result of poor customer growth and billing system weakness. Concord New Energy suffered along with other Chinese renewable power producers as a result of delays to subsidy payments. This has been addressed and there are signs of lower generation curtailment that may support further improvements to earnings. China Singyes, a Chinese solar installer, suffered from poor prices achieved for developed sites held on its balance sheet. This part of the business has now been sold. Wasion Group, a Chinese metering provider, was down 9.1% as the Chinese government slowed its metering transition programme.
10
2. Activity
The Fund sold its position in Israel-based SolarEdge in the first quarter of 2017, due to fears of further price competition for inverters and replaced SolarEdge with Prysmian, an Italian cable manufacturing company with a global footprint. Prysmian benefits from electricity grid upgrades and expansions globally, as well as the growing market for long-distance cables. We added a position in Kingspan, an Irish insulation building materials producer to take the Fund to a full complement of 30 positions.
In the third quarter, the Fund sold its position in CEMIG, a Brazilian hydro-power utility, due to continuing concerns about the political situation in Brazil and oversupply in the Brazilian power market. The Fund acquired a position in US-based TPI Composites, a composite material provider that manufactures wind turbine blades.
In the fourth quarter, the Fund sold its position in Centrotec, a German heating and boiler installer. Sales growth had been expected after a change in law that required commercial buildings to install new boilers to meet efficiency standards. Although the growth never materialised, the Fund sold its position for roughly the same price as when it was originally introduced into the portfolio. The Fund replaced Centrotec with a position in LG Chem, a Korean chemicals and materials provider. LG Chem has reasonable valuation metrics and a leading battery business which is forecast to turn profitable in 2018. It is well placed to capitalise on the growing markets for electric vehicles and large scale stationary storage via its lithium-ion battery division.
The overall effect of these changes has been to increase the Fund's exposure to larger capitalisation companies with higher earnings visibility.
3. Portfolio Position
The Fund's largest country exposures were to China, the United States, Canada, Italy, the United Kingdom and Brazil. With China contributing half of the annual installations of wind and solar, over three-quarters of solar manufacturing capacity and over half of wind turbine manufacturing capacity, investing in China is a key part of the current investment opportunity.
On a sector basis, the Fund has been weighted between a quarter and a third in each of the energy efficiency, solar and wind sectors. The companies in other sectors, such as hydro, biofuels and geothermal, have company specific investment rationales rather than sector growth stories.
4. Outlook
Sentiment towards the alternative energy sector significantly improved over 2017. As with 2016, several tenders for power saw renewable energy undercut pricing for conventional fossil fuel plants. In emerging markets, India saw solar pricing that was lower than the price of electricity from existing coal plants. Saudi Arabia and Mexico set new records for solar, at $18/MWh and $19/MWh, respectively. In Germany, offshore wind farms to be built in 2024 forfeited per kWh subsidies in favour of the market electricity price. Although offshore wind installations in Germany have other support measures, including guaranteed and paid-for grid connections and a floor price of €0/kWh for up to six consecutive hours to protect from negative pricing, the achieved price of offshore wind has beaten most if not all expectations. Once again, renewable energy technologies are showing that they are capable of producing electricity less expensively than fossil fuel resources in an increasing number of countries. This means that the addressable market for renewables continues to increase and becomes less reliant on government support for growth.
In addition to advances in renewable energy competitiveness, batteries and electric vehicles have seen steep price decreases. With several new electric vehicle models coming to market at the same price point (with subsidies) as internal combustion engine vehicles we are confident that electric vehicles are approaching a point where they will gain significant market share. In Norway, where electric vehicles enjoy tax credits making electric cars as affordable as combustion engine vehicles, the market share of electric vehicles of new car sales reached 30% in 2016 and 39% in 2017 – up from under 1% in 2009. We expect similar growth rates for developed countries as electric vehicles become cheaper due to improvements in batteries, materials and vehicle design.
The Fund remains well positioned for growth of the alternative energy sector, and there are signs that the sector is maturing to provide investment opportunities with sustainable earnings growth. Thank you for your support.

| | 
| | | |
Edward Guinness | | Samira Rudig | | | |
The Fund invests in foreign securities, which involves political, economic and currency risks, greater volatility, and differences in accounting methods. These risks are greater for emerging markets. The Fund is non-diversified, meaning
11
that its assets may be concentrated in fewer individual holdings than diversified funds. Therefore, the Fund is more exposed to individual stock volatility than diversified funds. Investments focused in a single geographic region may be exposed to greater risk and more volatility than investments diversified among various geographies. The Fund invests in smaller companies, which involves additional risks such as limited liquidity and greater volatility.
The Wilderhill Clean Energy Index (ECO) is a modified equal US dollar-weighted index of publicly traded companies whose businesses stand to benefit substantially from societal transition toward the use of cleaner energy and conservation. The Wilderhill New Energy Global Innovation Index (NEX) is a modified US dollar-weighted index of publicly traded companies, which are active in renewable and low-carbon energy, and which stand to benefit from responses to climate change and energy security concern. These indices are unmanaged, not available for investment and do not incur expenses.
KWh – kilowatt-hour
Please refer to the Schedule of Investments for details on Fund holdings. Current and future portfolio holdings are subject to risk.
The information provided herein represents the opinion of Guinness Atkinson Asset Management, Inc. for the period stated and is not intended to be a forecast of future events, a guarantee of future results, or investment advice. Opinions, Fund holdings and sector allocations are subject to change at any time, and are not recommendations to buy or sell any security.
12
Growth of $10,000

Average Annual Total Return
Periods Ended December 31, 2017
| One Year | | Five Years | | Ten Years | |
| | 20.68 | % | | | 4.16 | % | | | -14.39 | % | |
Performance data quoted represents past performance and does not guarantee future results. The investment return and principal value of an investment will fluctuate so that an investor's shares, when redeemed, may be worth more or less than their original cost. Current performance of the Fund may be lower or higher than the performance quoted. Performance data current to the most recent month end may be obtained by visiting www.gafunds.com.
Total returns for certain periods reflect a fee waiver in effect and in the absence of this waiver, the total returns would be lower. Returns reflect the reinvestment of distributions made by the Fund, if any. The graph and the performance table above do not reflect the deduction of taxes that a shareholder would pay on Fund distribution or the redemption of Fund shares.
The Wilderhill New Energy Global Innovations Index (NEX) is a modified dollar weighted index of publicly traded companies, which are active in renewable and low-carbon energy, and which stand to benefit from responses to climate change and energy security concern. The Wilderhill Clean Energy Index (ECO) is a modified equal dollar weighted index comprised of publicly traded companies whose businesses stand to benefit substantially from societal transition toward the use of cleaner energy and conservation.
13
FUND HIGHLIGHTS at December 31, 2017
GUINNESS ATKINSON ALTERNATIVE ENERGY FUND
# of Holdings in Portfolio: | | | 31 | | |
Portfolio Turnover: | | | 32.4 | % | |
% of Stocks in Top 10: | | | 33.7 | % | |
Fund Manager: | | | |
Edward Guinness | | | |
Top 10 Holdings (% of net assets) | | | | Industry Breakdown (% of net assets) | | | |
Tianneng Power International | | | 3.8 | % | | Efficiency | | | 35.7 | % | |
LG Chem Ltd. | | | 3.6 | % | | Wind | | | 30.3 | % | |
Ormat Technologies Inc. | | | 3.4 | % | | Solar | | | 22.6 | % | |
China Suntien Green Energy Corp. Ltd. - H Shares | | | 3.4 | % | | Geothermal | | | 3.4 | % | |
Senvion S.A. | | | 3.4 | % | | Biofuel | | | 3.3 | % | |
TPI Composites Inc. | | | 3.3 | % | | Hydro | | | 2.2 | % | |
Ricardo PLC | | | 3.2 | % | | | | | | | |
Boralex Inc. - Class A | | | 3.2 | % | | | | | | | |
Xinyi Solar Holdings Ltd. | | | 3.2 | % | | | | | | | |
China Datang Corp. Renewable Power Co., Ltd. - H Shares | | | 3.2 | % | | | | | | | |
14
SCHEDULE OF INVESTMENTS
at December 31, 2017
GUINNESS ATKINSON ALTERNATIVE ENERGY FUND
Shares | | COMMON STOCKS: 97.5% | | Value | |
Biofuel: 3.3% | | | |
| | 27,600 | | | Cosan SA Industria e Comercio | | $ | 345,343 | | |
Efficiency: 35.7% | | | |
| | 1,274,000 | | | Boer Power Holdings | | | 242,277 | | |
| | 9,102 | | | Johnson Controls Inc. | | | 346,877 | | |
| | 7,970 | | | Kingspan Group PLC | | | 348,602 | | |
| | 1,000 | | | LG Chem Ltd. | | | 380,345 | | |
| | 34,235 | | | Nibe Industrier AB - B Shares | | | 328,309 | | |
| | 10,530 | | | Prysmian SpA | | | 342,864 | | |
| | 29,510 | | | Ricardo PLC | | | 353,356 | | |
| | 4,140 | | | Schneider Electric SE | | | 351,249 | | |
| | 6,800 | | | Sensata Technologies Holding* | | | 347,548 | | |
| | 388,000 | | | Tianneng Power International | | | 403,560 | | |
| | 712,000 | | | Wasion Group Holdings Ltd. | | | 348,117 | | |
| | | | | | | | 3,793,104 | | |
Geothermal: 3.4% | | | |
| | 5,659 | | | Ormat Technologies Inc. | | | 361,950 | | |
Hydro: 2.2% | | | |
| | 9,648 | | | Iniziative Bresciane - Inbre - SpA† | | | 231,523 | | |
Solar: 22.6% | | | |
| | 20,400 | | | Canadian Solar Inc.* | | | 343,944 | | |
| | 789,400 | | | China Singyes Solar Technologies Holdings Ltd. | | | 342,728 | | |
| | 5,100 | | | First Solar Inc.* | | | 344,352 | | |
| | 43,800 | | | JA Solar Holdings Co., Ltd. - ADR* | | | 326,748 | | |
| | 14,300 | | | Jinkosolar Holdings Co., - ADR* | | | 343,915 | | |
| | 41,450 | | | SunPower Corp. - Class B* | | | 349,423 | | |
| | 912,200 | | | Xinyi Solar Holdings Ltd. | | | 352,945 | | |
| | | | | | | | 2,404,055 | | |
The accompanying notes are an integral part of these financial statements.
15
Shares | | COMMON STOCKS: 97.5% (Continued) | | Value | |
Wind: 30.3% | | | |
| | 18,887 | | | Boralex Inc. - Class A | | $ | 353,098 | | |
| | 2,959,000 | | | China Datang Corp. Renewable Power Co., Ltd. - H Shares | | | 352,747 | | |
| | 453,000 | | | China Longyuan Power Group Corp. - H Shares | | | 322,701 | | |
| | 1,346,000 | | | China Suntien Green Energy Corp. Ltd. - H Shares | | | 356,644 | | |
| | 7,680,000 | | | Concord New Energy Group Ltd. | | | 338,502 | | |
| | 91,167 | | | Good Energy Group PLC† | | | 224,638 | | |
| | 1,016,000 | | | Huaneng Renewables Corp. Ltd. - H Shares | | | 345,194 | | |
| | 607,763 | | | Mytrah Energy Ltd.*† | | | 220,793 | | |
| | 28,870 | | | Senvion S.A.* | | | 356,789 | | |
| | 17,300 | | | TPI Composites Inc.* | | | 353,958 | | |
| | | | | | | | 3,225,064 | | |
| | | | | Total Common Stocks
(cost $12,454,467) | | | 10,361,039 | | |
| | | | | Total Investments in Securities
(cost $12,454,467): 97.5% | | | 10,361,039 | | |
| | | | | Other Assets less Liabilities: 2.5% | | | 267,604 | | |
| | | | | Net Assets: 100.0% | | $ | 10,628,643 | | |
* Non-income producing security.
ADR - American Depository Receipt
† The Advisor has determined these securities to be Illiquid. As of December 31, 2017, the total market value of these illiquid securities represent 6.4% of net assets.
The accompanying notes are an integral part of these financial statements.
16
GUINNESS ATKINSON ASIA FOCUS FUND for the period ended December 31, 2017
1. Performance
AVERAGE ANNUALIZED TOTAL RETURNS
| | | 1 Year | | 3 Years | | 5 Years | | 10 Years | |
Fund | | | 47.10 | % | | | 12.42 | % | | | 5.35 | % | | | 1.09 | % | |
Benchmark Indices: | |
MSCI AC Far East ex Japan Index | | | 42.32 | % | | | 11.20 | % | | | 8.15 | % | | | 4.63 | % | |
S&P 500 Index | | | 21.80 | % | | | 11.40 | % | | | 15.77 | % | | | 8.48 | % | |
The Fund's gross expense ratio is 2.24% and net expense ratio is 1.98% per the Summary Prospectus dated May 3, 2017. For the Fund's current one year expense ratio, please refer to the Financial Highlights section of this report. The Advisor has contractually agreed to waive a portion of its advisory fees and/or reimburse other Fund expenses so that the Fund's ratio of expenses to average daily net assets will not exceed 1.98% (excluding Acquired Fund Fees and Expenses, interest, taxes, dividends on short positions and extraordinary expenses) through at least June 30, 2018. To the extent that the Advisor waives fees and/or reimburses expenses, it may seek repayment of a portion or all of such amounts at any time within the three fiscal years after the fiscal year in which such amounts were waived and/or reimbursed, subject to the applicable cap.
Performance data quoted represents past performance and does not guarantee future results. The investment return and principal value of an investment in the Fund will fluctuate so that an investor's shares, when redeemed, may be worth more or less than their original cost. Current performance of the Fund may be lower or higher than the performance quoted. Performance data current to the most recent month-end may be obtained by visiting www.gafunds.com, or calling (800) 915-6565.
The Fund imposes a 2% redemption fee on the sale of shares held less than 30 days. Performance data quoted does not reflect this redemption fee. Total returns for certain periods reflect fee limitations in effect and, in the absence of these limitations, total returns would have been lower.
2017 has been a strong year for Asian equities and the Fund has performed well rising 47.10% compared to the MSCI AC Far East ex Japan Index, which rose 42.32%.
The best-performing sectors in 2017, as measured by the sector indices within the MSCI AC Far East ex Japan Index in USD terms, were Technology (up 64%), Health Care (up 62%), Real Estate (up 50%), and Consumer Discretionary (up 41%). The best countries were China (up 54%) and South Korea (up 46%). The overall story was accelerating profits growth driven by stronger-than-expected economic growth in China, a resurgence in Chinese domestic consumption and a significant upswing in Technology names related to consumer electronics, especially smartphones. We also note that Asian currencies strengthened 6% against the U.S. dollar (on a weighted average basis). The largest moves were the Korean won (up 13%), followed by the Malaysian ringgit and Thai baht (up 10%), and the Singapore dollar and New Taiwan dollar (each up 8%). However, perhaps the most important signal of improvement came from the Chinese yuan, which reversed the weakness of 2016 and rose 6.7%.
Chinese stocks, as measured by the MSCI China Index, have had their best year since 2009, marking a decisive reversal of the gloomy sentiment that has dominated for so many years. The stock market recovery is as much about what did not happen as what did. The 'near certain' banking sector crisis did not happen. We have long argued that debt servicing capacity, rather than the ratio of debt to Gross Domestic Product (GDP), is the most important metric when assessing the burden of debt and gauging financial stability. The recovery in heavy industrial profits and cash flows by 9% in 2016 and by a further 16% for the first 11 months of 2017 has improved matters considerably. According to our analysis of 3,000 listed companies in China the share of debt at risk (where operating profit does not cover their annual interest expense) has almost halved from 2015, from 30% to 17%. Government efforts to slow debt accumulation appear to be having an effect, according to the International Institute of Finance, with the stock of debt to GDP rising only 2% in 2017, compared to an average rise of 17% per annum from 2010 to 2016.
Technology has also been a big part of the investment story this year. In Asia, Technology features both in application and in production. These areas show the region at its most innovative. In the region's burgeoning consumer markets, the race is on for businesses to adapt to changing business methods, to adopt new technologies and to respond rapidly to developing consumer spending patterns. Online retail, e-commerce platforms and e-payments have taken off, which has caused the stock prices of the Chinese internet names especially, to surge. On the production side, the launch of the new iPhone has brought with it significant advances in production technology from phone casings, to camera lenses, through to facial recognition and screens. The resultant
17
increased performance requirements of handheld devices and the growth in Internet of Things has fed through to an upswing in demand for memory chips. There has been an increase in component prices, lifting profit forecasts throughout the supply chain.
South-East Asia (Indonesia, Malaysia, Philippines, Singapore and Thailand) has been out of favour for the past three years compared to North Asia, with only Thailand looking attractive, in our view. However, there are signs that Singapore's prospects are looking brighter. In 2017, full year economic growth came at the top end of the official forecast range at 3.5%. The main drivers have been a strong rebound in services and stronger external demand pushing up exports growth across all major categories, but especially in Pharmaceuticals/Biotech. There are expectations that improved productivity will support rising wages and hence lift domestic activity. The Monetary Authority of Singapore has been quick in the past to anticipate such turns and interest rate increases are possible. Mortgage rates have moved higher in anticipation.
The best performing stock this year by far was Geely Automobile, a Chinese car maker that owns Swedish carmaker Volvo. The company has revamped its model range with great success and is achieving new sales highs, but the excitement lies in the obvious success of its Volvo acquisition. Through this, the company looks likely to mount a serious challenge in the electric vehicle segment both in China and Europe. The weakest stock was China Minsheng Banking, which fell 2%. The second largest of China's private sector commercial banks, it is exposed to regulatory efforts to bring about lower leverage in the financial sector. The bank makes most of its money from the lending business, and with a smaller deposit franchise (as compared to the big state-owned banks) it is obliged to seek funding through the wholesale markets. The regulator is seeking not to eliminate this but to restrict the level of such funding both increasing costs and through rule-based limits. China Minsheng Bank's growth has therefore been under pressure, but the operations and capital base remain sound.
2. Portfolio Position
Compared to the MSCI AC Pacific ex Japan Index, on a sector basis the Fund is most overweight in Health Care with 12% in three names split between health care provision, equipment, and pharmaceuticals. The Fund is also 7% overweight in Consumer Discretionary and 3% overweight in Utilities, with two Thai positions. The Fund is 9% underweight in Financials, 4% underweight in Information Technology and 4% underweight Telecom Services. On a country basis, it is 7% overweight in China and 9% underweight in Hong Kong. The other notable positions are 7% overweight in Thailand and 7% underweight in Korea.
3. Outlook
Asian markets had a strong year in 2017, pushing valuations above their 10-year averages. In contrast to much of the past 10 years, however, corporate earnings have risen over the past year, giving us greater confidence in the more bullish analyst forecasts for 2018 and 2019. Market confidence has also been lifted by China's economic growth momentum and by the crisis that did not happen. The focus for the last five years has been on rising Chinese debt levels and the potential instability caused by efforts to tackle it. This year we have seen intensifying efforts to regulate banks' behaviour and this has carried on into the new year.
At the time of writing, the positive outlook hinges on continued acceleration in external demand, hope for a recovery in global capital expenditure and for Asian domestic demand to be lifted on the back of this. The risks to the outlook revolve around central bank policies in the US and Europe as they seek to wind down or reverse the years of quantitative easing, stretched valuations in developed markets and as ever, the possibility that China's economic outlook deteriorates.

Edmund Harriss
The Fund invests in foreign securities, which involves political, economic and currency risks, greater volatility, and differences in accounting methods. These risks are greater for emerging markets. The Fund is non-diversified, meaning that its assets may be concentrated in fewer individual holdings than diversified funds. Therefore, the Fund is more exposed to individual stock volatility than diversified funds. Investments focused in a single geographic region may be exposed to greater risk and more volatility than investments diversified among various geographies. The Fund invests in smaller companies, which involves additional risks such as limited liquidity and greater volatility.
The MSCI AC (All Country) Far East ex Japan Index is a free float-adjusted market capitalization-weighted index that is designed to measure equity market performance of the Far East, excluding Japan. The S&P 500 Index is a market capitalization-weighted index composed of 500 widely held common stocks of U.S. companies. These indices are unmanaged, not available for investment and do not incur expenses
18
Please refer to the Schedule of Investments for details on Fund holdings. Current and future portfolio holdings are subject to risk.
The information provided herein represents the opinion of Guinness Atkinson Asset Management, Inc. for the period stated and is not intended to be a forecast of future events, a guarantee of future results, or investment advice. Opinions, Fund holdings and sector allocations are subject to change at any time, and are not recommendations to buy or sell any security.
19
Growth of $10,000

Average Annual Total Return
Periods Ended December 31, 2017
| One Year | | Five Years | | Ten Years | |
| | 47.10 | % | | | 5.35 | % | | | 1.09 | % | |
Performance data quoted represents past performance and does not guarantee future results. The investment return and principal value of an investment will fluctuate so that an investor's shares, when redeemed, may be worth more or less than their original cost. Current performance of the Fund may be lower or higher than the performance quoted. Performance data current to the most recent month end may be obtained by visiting www.gafunds.com.
Total returns for certain periods reflect a fee waiver in effect and in the absence of this waiver, the total returns would be lower. Returns reflect the reinvestment of distributions made by the Fund, if any. The graph and the performance table above do not reflect the deduction of taxes that a shareholder would pay on Fund distribution or the redemption of Fund shares. The Fund imposes a 2% redemption fee on shares held less than 30 days.
The MSCI All Country Far East Free ex-Japan Index (MSCI AC Far East Free ex-Japan Index) is a free float-adjusted, capitalization-weighted index that is designed to measure equity market performance of the Far East region excluding Japan. The index referenced in this chart is not available for investment and does not incur expenses.
20
FUND HIGHLIGHTS at December 31, 2017
GUINNESS ATKINSON ASIA FOCUS FUND
# of Holdings in Portfolio: | | | 35 | | |
Portfolio Turnover: | | | 13.2 | % | |
% of Stocks in Top 10: | | | 37.3 | % | |
Fund Manager: | | | |
Edmund Harriss | | | | | |
Top 10 Holdings (% of net assets) | | | | | | | |
Sino Biopharmaceutical Ltd. | | | 5.2 | % | | Relo Holdings, Inc. | | | 3.6 | % | |
St Shine Optical Co., Ltd. | | | 4.1 | % | | Anhui Conch Cement Co., Ltd. - H Shares | | | 3.4 | % | |
Tencent Holdings Ltd. | | | 3.8 | % | | DBS Group Holdings Ltd. | | | 3.3 | % | |
Geely Automobile Holdings Ltd. | | | 3.8 | % | | New Oriental Education & Technology Group Inc. | | | 3.3 | % | |
Hanon Systems | | | 3.6 | % | | Samsung Electronics Co., Ltd. | | | 3.2 | % | |
Industry Breakdown (% of net assets) | | | | | | | |
Commercial Banks | | | 11.8 | % | | Tobacco | | | 3.0 | % | |
Semiconductor Componets - Integrated Circuits | | | 8.2 | % | | Distribution/Wholesale | | | 3.0 | % | |
Auto/Truck Parts & Equipment | | | 6.3 | % | | Oil Components - Integrated | | | 2.9 | % | |
Electric - Generation | | | 5.5 | % | | Entertainment Software | | | 2.9 | % | |
Pharmaceuticals | | | 5.2 | % | | MRI/Medical Diagnostics Imaging | | | 2.9 | % | |
Electronic Component Miscellaneous | | | 4.8 | % | | Public Thoroughfares | | | 2.9 | % | |
Optical Supplies | | | 4.1 | % | | Property/Casualty Insurance | | | 2.7 | % | |
Internet Application Software | | | 3.8 | % | | Photo Equipment & Supplies | | | 2.3 | % | |
Auto-Cars/Light Trucks | | | 3.8 | % | | Building & Construction Production - Miscellaneous | | | 2.2 | % | |
Real Estate Management/Service | | | 3.6 | % | | Real Estate Operations/Development | | | 1.5 | % | |
Building Products - Cement/Aggregates | | | 3.4 | % | | Computers | | | 0.8 | % | |
Schools | | | 3.3 | % | | Machinery-General Industry | | | 0.6 | % | |
Electronic Components - Semiconductor | | | 3.2 | % | | | | | | | |
Metal Processors & Fabricators | | | 3.1 | % | | | | | | | |
21
SCHEDULE OF INVESTMENTS
at December 31, 2017
GUINNESS ATKINSON ASIA FOCUS FUND
Shares | | COMMON STOCKS: 97.8% | | Value | |
Australia: 2.9% | | | |
| | 32,693 | | | Sonic Healthcare Ltd. | | $ | 582,999 | | |
China: 42.2% | | | |
| | 31,000 | | | AAC Technologies Holdings Inc. | | | 553,357 | | |
| | 144,500 | | | Anhui Conch Cement Co., Ltd. - H Shares | | | 680,695 | | |
| | 610,000 | | | China Construction Bank Corp. - H Shares | | | 562,358 | | |
| | 701,000 | | | China Lesso Group Holdings Ltd. | | | 454,776 | | |
| | 152,000 | | | China Merchants Bank Co., Ltd. - H Shares | | | 604,515 | | |
| | 533,500 | | | China Minsheng Banking Corp. Ltd. - H Shares | | | 534,059 | | |
| | 220,000 | | | Geely Automobile Holdings Ltd. | | | 765,518 | | |
| | 272,000 | | | Lenovo Group Ltd. | | | 153,146 | | |
| | 1,700 | | | NetEase Inc. - ADR | | | 586,619 | | |
| | 7,100 | | | New Oriental Education & Technology Group Inc. - ADR | | | 667,400 | | |
| | 286,000 | | | PICC Property & Casualty Co., Ltd. - H Shares | | | 550,211 | | |
| | 574,000 | | | Shenzhen Expressway Co., Ltd. - H Shares | | | 582,109 | | |
| | 595,000 | | | Sino Biopharmaceutical Ltd. | | | 1,058,450 | | |
| | 14,900 | | | Tencent Holdings Ltd. | | | 774,999 | | |
| | | | | | | | 8,528,212 | | |
Hong Kong: 3.5% | | | |
| | 380,000 | | | Chen Hsong Holdings† | | | 115,085 | | |
| | 1,083,000 | | | Li & Fung Ltd. | | | 594,957 | | |
| | | | | | | | 710,042 | | |
Japan: 3.6% | | | |
| | 26,300 | | | Relo Holdings, Inc. | | | 716,460 | | |
Singapore: 3.3% | | | |
| | 36,379 | | | DBS Group Holdings Ltd. | | | 675,023 | | |
South Korea: 12.5% | | | |
| | 56,100 | | | Hanon Systems | | | 730,152 | | |
| | 2,225 | | | Hyundai Mobis Co., Ltd. | | | 545,713 | | |
| | 5,530 | | | KT&G Corp. | | | 596,277 | | |
| | 271 | | | Samsung Electronics Co., Ltd. | | | 647,070 | | |
| | | | | | | | 2,519,212 | | |
Taiwan: 17.0% | | | |
| | 57,000 | | | Catcher Technology Co., Ltd. | | | 629,700 | | |
| | 120,000 | | | Elite Material Co., Ltd. | | | 409,466 | | |
| | 3,500 | | | Largan Precision Co., Ltd. | | | 472,983 | | |
| | 135,000 | | | Novatek Microelectronics Corp. | | | 514,856 | | |
| | 2 | | | Shin Zu Shing Co., Ltd. | | | 5 | | |
| | 25,000 | | | St Shine Optical Co., Ltd. | | | 819,804 | | |
| | 75,000 | | | Taiwan Semiconductor Manufacturing Co., Ltd. | | | 577,708 | | |
| | | | | | | | 3,424,522 | | |
The accompanying notes are an integral part of these financial statements.
22
Shares | | COMMON STOCKS: 97.8% (Continued) | | Value | |
Thailand: 10.0% | | | |
| | 86,700 | | | Electricity Generating PCL/Foreign | | $ | 571,379 | | |
| | 219,200 | | | Glow Energy PCL/Foreign | | | 546,140 | | |
| | 755,000 | | | LPN Development PCL/Foreign | | | 305,838 | | |
| | 44,400 | | | PTT PCL/Foreign | | | 596,774 | | |
| | | | | | | | 2,020,131 | | |
United States: 2.8% | | | |
| | 8,900 | | | QUALCOMM Inc. | | | 569,778 | | |
| | | | | Total Common Stocks
(cost $11,307,294) | | | 19,746,379 | | |
| | | | | Total Investments in Securities
(cost $11,307,294): 97.8% | | | 19,746,379 | | |
| | | | | Other Assets less Liabilities: 2.2% | | | 450,626 | | |
| | | | | Net Assets: 100.0% | | $ | 20,197,005 | | |
ADR - American Depository Receipt
† The Advisor has determined this security to be Illiquid. As of December 31, 2017, the total market value of the illiquid security represent 0.6% of net assets.
The accompanying notes are an integral part of these financial statements.
23
GUINNESS ATKINSON ASIA PACIFIC DIVIDEND BUILDER FUND for the period ended December 31, 2017
1. Performance
AVERAGE ANNUALIZED TOTAL RETURNS
| | | 1 Year | | 3 Years | | 5 Years | | 10 Years | |
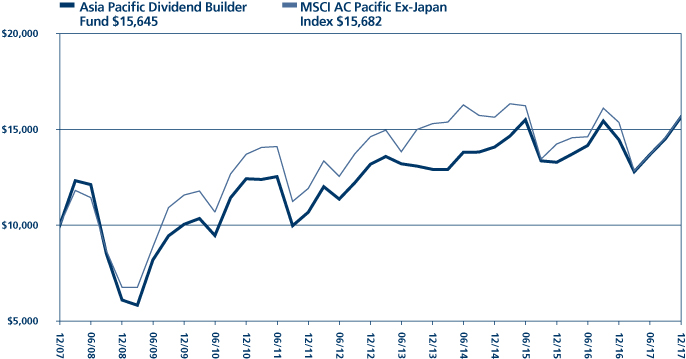
Fund | | | 36.70 | % | | | 12.37 | % | | | 8.66 | % | | | 4.69 | % | |
Benchmark Indices: | |
MSCI AC Pacific Ex Japan Index | | | 37.51 | % | | | 10.55 | % | | | 7.64 | % | | | 4.73 | % | |
S&P 500 Index | | | 21.80 | % | | | 11.40 | % | | | 15.77 | % | | | 8.48 | % | |
The Fund's gross expense ratio is 3.14% and net expense ratio is 1.11% per the Summary Prospectus dated May 3, 2017. For the Fund's current one year expense ratios, please refer to the Financial Highlights section of this report. The Advisor has contractually agreed to reduce its fees and/or pay Fund expenses in order to limit the Fund's total annual operating expenses to average daily net assets to 1.10% (excluding Acquired Fund Fees and Expenses, interest, taxes, dividends on short positions and extraordinary expenses) through June 30, 2018. To the extent that the Advisor absorbs expenses, it may seek repayment of a portion or all of such amounts at any time within the three fiscal years after the fiscal year in which such amounts were absorbed, subject to the applicable cap.
Performance data quoted represents past performance and does not guarantee future results. The investment return and principal value of an investment in the Fund will fluctuate so that an investor's shares, when redeemed, may be worth more or less than their original cost. Current performance of the Fund may be lower or higher than the performance quoted. Performance data current to the most recent month-end may be obtained by visiting www.gafunds.com, or calling (800) 915-6565.
The Fund imposes a 2% redemption fee on the sale of shares held less than 30 days. Performance data quoted does not reflect this redemption fee. Total returns for certain periods reflect expense limitations in effect and, in the absence of these imitations, total returns would have been lower.
2017 has been a strong year for Asian equities, with the market up 37.51% (as measured by the MSCI AC Pacific ex Japan Index in USD terms). The Fund has performed well, rising 36.70% and capturing 96% of the market rise. This was better than we might have expected because the nature of this Fund, with its focus on higher-quality dividend-paying stocks giving it a lower sensitivity (or Beta) to overall market movements.
The best-performing sectors in 2017, as measured by the sector indices within the MSCI AC Pacific ex Japan Index in USD terms, were Technology (up 64%), Health Care (up 52%), Consumer Discretionary (up 41%), and Real Estate (up 40%). The best countries were China (up 54%) and South Korea (up 46%). The overall story was accelerating profits and growth driven by stronger-than-expected economic growth in China, a resurgence in Chinese domestic consumption and a significant upswing in Technology names related to consumer electronics, especially smartphones. We also note that Asian currencies strengthened 6% against the U.S. dollar (on a weighted average basis). The largest moves were the Korean won (up 13%), followed by the Malaysian ringgit and Thai baht (each up 10%), and the Singapore dollar and New Taiwan dollar (each up 8%). However, perhaps the most important signal of improvement came from the Chinese yuan, which reversed the weakness of 2016 and rose 6.7%.
Chinese stocks, as measured by the MSCI China Index, have had their best year since 2009, marking a decisive reversal of the gloomy sentiment that has dominated for so many years. The stock market recovery is as much about what did not happen as what did. The 'near certain' banking sector crisis did not happen. We have long argued that debt servicing capacity, rather than the ratio of debt to Gross Domestic Product (GDP), is the most important metric when assessing the burden of debt and gauging financial stability. The recovery in heavy industrial profits and cash flows by 9% in 2016 and by a further 16% for the first 11 months of 2017 has improved matters considerably. According to our analysis of 3,000 listed companies in China, the share of debt at risk (where operating profit does not cover their annual interest expense) has almost halved from 2015, from 30% to 17%. Government efforts to slow debt accumulation appear to be having an effect, according to the International Institute of Finance, with the stock of debt to GDP rising only 2% in 2017, compared to an average rise of 17% per annum from 2010 to 2016.
Technology has also been a big part of the investment story this year. In Asia, Technology features both in application and in production. These areas show the region at its most innovative. In the region's burgeoning consumer markets, the race is on for businesses to adapt to changing business methods, to adopt new technologies and to respond rapidly to developing consumer spending patterns. Online retail, e-commerce platforms and e-payments have taken off, which has caused the stock prices of the
24
ASIA PACIFIC DIVIDEND BUILDER FUND
Chinese internet names especially, to surge. On the production side, the launch of the new iPhone has brought with it significant advances in production technology from phone casings, to camera lenses, through to facial recognition and screens. The resultant increased performance requirements of handheld devices and the growth in Internet of Things has fed through to an upswing in demand for memory chips. There has been an increase in component prices, lifting profit forecasts throughout the supply chain.
South-East Asia (Indonesia, Malaysia, Philippines, Singapore and Thailand) has been out of favour for the past three years compared to North Asia, with only Thailand looking attractive, in our view. However, there are signs that Singapore's prospects are looking brighter. In 2017, full year economic growth came at the top end of the official forecast range at 3.5%. The main drivers have been a strong rebound in services and stronger external demand pushing up exports growth across all major categories, but especially in Pharmaceuticals/Biotech. There are expectations that improved productivity will support rising wages and hence lift domestic activity. The Monetary Authority of Singapore has been quick in the past to anticipate such turns and interest rate increases are possible. Mortgage rates have moved higher in anticipation.
If it was exceptionally low market valuations that drove the recovery in Asian markets in 2016, it was profit growth that drove them in 2017. In aggregate, Asian markets saw profits reported in the 12-month period to 31 December 2017 rise 21% over the same period in 2016; and if commodity-heavy Australia is added to the mix, they were up over 30% in US dollar terms. Korea and Taiwan led the group, rising 43% and 19% respectively, while elsewhere (China, Thailand, Singapore) reported profits grew over 13%. Earnings for calendar year 2017 are not yet in and companies will be reporting in February through to April 2018. Forecasts for these have risen through the year and this too has propelled stock prices higher.
2. Activity
We made only one change to the portfolio following the acquisition of Belle International by a private equity firm in August. In its place we purchased Elite Material in Taiwan, a company that produces printed circuit boards used in smartphones, servers and the automotive sector. It is the largest producer of halogen-free laminates in the world which are increasingly being adopted due to their environmentally-friendly nature. We think that spending on servers is likely to continue growing at a rapid pace as cloud storage continues to boom. Additionally, consumers are becoming more data hungry, whether it is through using their mobile phone to watch high quality videos or through streaming on their PCs. As the 5G buildout is likely to begin soon, these trends will only accelerate, placing greater demand on data and therefore the servers behind them.
3. Portfolio Position
Compared to the MSCI AC Pacific ex Japan Index, the Fund is overweight by 10% in Consumer Discretionary, 7% in Real Estate, and 3% in Health Care. It is underweight by 6% in Materials, 4% in Industrials, 2% in Financials, and 1% in Information Technology. The Fund has no exposure to Telecoms and Utilities. On a country basis, it is underweight in Australia by 11%, in China by 7%, in Korea by 10%, and is overweight in Singapore by 5%, in Taiwan by 10%, and in Thailand by 8%. The Fund also holds two positions in US listed stocks, Aflac and Qualcomm, each of which derives over 50% of revenues from the region.
4. Outlook
Asian markets had a strong year in 2017, pushing valuations above their 10-year averages. In contrast to much of the past 10 years, however, corporate earnings have risen over the past year, giving us greater confidence in the more bullish analyst forecasts for 2018 and 2019. Market confidence has also been lifted by China's economic growth momentum and by the crisis that did not happen. The focus for the last five years has been on rising Chinese debt levels and the potential instability caused by efforts to tackle it. This year we have seen intensifying efforts to regulate banks' behaviour and this has carried on into the new year.
At the time of writing the positive outlook hinges on continued acceleration in external demand, hope for a recovery in global capital expenditure and for Asian domestic demand to be lifted on the back of this. The risks to the outlook revolve around central bank policies in the US and Europe as they seek to wind down or reverse the years of quantitative easing, stretched valuations in developed markets and as ever, the possibility that China's economic outlook deteriorates.

Edmund Harriss
The Fund invests in foreign securities, which will involve greater volatility and political, economic and currency risks and differences in accounting methods. These risks are greater for emerging markets. The Fund is non-diversified, meaning its assets may be invested in fewer individual holdings than diversified funds. Therefore, the Fund is more exposed to
25
ASIA PACIFIC DIVIDEND BUILDER FUND
individual stock volatility than diversified funds. The Fund invests in smaller companies, which involves additional risks such as limited liquidity and greater volatility.
The MSCI AC Pacific Ex-Japan Index is a market capitalization weighted index that monitors the performance of stocks from the Pacific region, excluding Japan. The Standard & Poor's 500 Index is a market capitalization-weighted index composed of 500 widely held common stocks of U.S. companies. These indices are unmanaged and not available for investment, and do not incur expenses.
Please refer to the Schedule of Investments for details on Fund holdings. Current and future portfolio holdings are subject to risk.
The information provided herein represents the opinion of Guinness Atkinson Asset Management, Inc. for the period stated and it is not intended to be a forecast of future events, a guarantee of future results, or investment advice. Opinions, Fund holdings and sector allocations are subject to change at any time, and are not recommendations to buy or sell any security.
26
ASIA PACIFIC DIVIDEND BUILDER FUND
Growth of $10,000
Average Annual Total Return
Periods Ended December 31, 2017
| One Year | | Five Years | | Ten Years | |
| | 36.70 | % | | | 8.66 | % | | | 4.69 | % | |
Performance data quoted represents past performance and does not guarantee future results. The investment return and principal value of an investment will fluctuate so that an investor's shares, when redeemed, may be worth more or less than their original cost. Current performance of the Fund may be lower or higher than the performance quoted. Performance data current to the most recent month end may be obtained by visiting www.gafunds.com.
Total returns reflect a fee waiver in effect and in the absence of this waiver, the total returns would be lower. Returns reflect the reinvestment of distributions made by the Fund, if any. The graph and the performance table above do not reflect the deduction of taxes that a shareholder would pay on Fund distribution or the redemption of Fund shares. The Fund imposes a 2% redemption fee on shares held less than 30 days.
The MSCI All Country Pacific Free ex-Japan Index (MSCI AC Pacific ex-Japan Index) is a free float-adjusted, capitalization-weighted index that is designed to measure equity market performance in the Pacific region including Japan.
27
FUND HIGHLIGHTS at December 31, 2017
GUINNESS ATKINSON ASIA PACIFIC DIVIDEND BUILDER FUND
# of Holdings in Portfolio: | | | 36 | | |
Portfolio Turnover: | | | 47.3 | % | |
% of Stocks in Top 10: | | | 30.2 | % | |
Fund Manager: | |
Edmund Harriss | | | |
Top 10 Holdings (% of net assets) | |
St Shine Optical Co., Ltd. | | | 3.5 | % | | LPN Development PCL/Foreign | | | 2.9 | % | |
Li & Fung Ltd. | | | 3.3 | % | | DBS Group Holdings Ltd. | | | 2.9 | % | |
Hanon Systems | | | 3.1 | % | | QUALCOMM Inc. | | | 2.9 | % | |
JB Hi-Fi Ltd. | | | 3.0 | % | | Sonic Healthcare Ltd. | | | 2.9 | % | |
Luk Fook Holdings International Ltd. | | | 2.9 | % | | CapitaMall Trust - REIT | | | 2.8 | % | |
Industry Breakdown (% of net assets) | |
Commercial Banks | | | 16.4 | % | | Life/Health Insurance | | | 2.8 | % | |
Electronic Component - Miscellaneous | | | 9.9 | % | | Metal Processors & Fabricators | | | 2.8 | % | |
Semiconductor Components - Integrated Circuits | | | 7.8 | % | | REITS - Diversified | | | 2.7 | % | |
REITS - Shopping Centers | | | 5.5 | % | | Computers | | | 2.7 | % | |
Optical Supplies | | | 3.5 | % | | Investment Management/Advisor Service | | | 2.7 | % | |
Distribution/Wholesale | | | 3.3 | % | | Real Estate Management/Service | | | 2.7 | % | |
Auto/Truck Parts & Equipment | | | 3.1 | % | | Textile - Products | | | 2.7 | % | |
Retail - Consumer Electronics | | | 3.0 | % | | Retail-Apparel/Shoe | | | 2.7 | % | |
Retail - Jewelry | | | 2.9 | % | | Diversified Financial Services | | | 2.6 | % | |
Real Estate Operations/Development | | | 2.9 | % | | Shipbuilding | | | 2.5 | % | |
MRI/Medical Diagnostics Imaging | | | 2.9 | % | | Cellular Telecommunications | | | 2.5 | % | |
Tobacco | | | 2.8 | % | | Photo Equipment & Supplies | | | 2.5 | % | |
Oil Company - Integrated | | | 2.8 | % | | | | | |
28
SCHEDULE OF INVESTMENTS
at December 31, 2017
GUINNESS ATKINSON ASIA PACIFIC DIVIDEND BUILDER FUND
Shares | | COMMON STOCKS: 98.7% | | Value | |
Australia: 8.5% | | | |
| | 5,336 | | | Janus Henderson Group PLC | | $ | 205,732 | | |
| | 11,537 | | | JB Hi-Fi Ltd. | | | 224,208 | | |
| | 12,184 | | | Sonic Healthcare Ltd. | | | 217,272 | | |
| | | | | | | | 647,212 | | |
China: 20.9% | | | |
| | 10,000 | | | AAC Technologies Holdings Inc. | | | 178,502 | | |
| | 231,000 | | | China Construction Bank Corp. - H Shares | | | 212,959 | | |
| | 250,000 | | | China Lilang Ltd. | | | 201,604 | | |
| | 51,000 | | | China Merchants Bank Co., Ltd. - H Shares | | | 202,831 | | |
| | 199,400 | | | China Minsheng Banking Corp. Ltd. - H Shares | | | 199,609 | | |
| | 19,000 | | | China Mobile Ltd. | | | 193,310 | | |
| | 246,000 | | | Industrial & Commercial Bank of China Ltd. - H Shares | | | 197,854 | | |
| | 176,300 | | | Yangzijiang Shipbuilding Holdings Ltd. | | | 193,830 | | |
| | | | | | | | 1,580,499 | | |
Hong Kong: 14.3% | | | |
| | 42,000 | | | BOC Hong Kong Holdings Ltd. | | | 212,906 | | |
| | 449,000 | | | Li & Fung Ltd. | | | 246,663 | | |
| | 21,500 | | | Link REIT/The | | | 199,037 | | |
| | 51,000 | | | Luk Fook Holdings International Ltd. | | | 218,998 | | |
| | 192,000 | | | Pacific Textiles Holdings Ltd. | | | 203,029 | | |
| | | | | | | | 1,080,633 | | |
Japan: 2.7% | | | |
| | 7,500 | | | Relo Holdings Inc. | | | 204,314 | | |
Singapore: 8.5% | | | |
| | 102,500 | | | Ascendas Real Estate Investment Trust - REIT | | | 208,605 | | |
| | 134,400 | | | CapitaMall Trust - REIT | | | 214,144 | | |
| | 11,764 | | | DBS Group Holdings Ltd. | | | 218,284 | | |
| | | | | | | | 641,033 | | |
South Korea: 5.9% | | | |
| | 18,100 | | | Hanon Systems | | | 235,575 | | |
| | 1,980 | | | KT&G Corp. | | | 213,495 | | |
| | | | | | | | 449,070 | | |
Taiwan: 21.6% | | | |
| | 22,000 | | | Asustek Computer Inc. | | | 206,518 | | |
| | 19,000 | | | Catcher Technology Co., Ltd. | | | 209,900 | | |
| | 61,000 | | | Elite Material Co., Ltd. | | | 208,145 | | |
| | 57,147 | | | Hon Hai Precision Industry Co., Ltd. | | | 182,878 | | |
| | 1,400 | | | Largan Precision Co., Ltd. | | | 189,193 | | |
| | 48,000 | | | Novatek Microelectronics Corp. | | | 183,060 | | |
| | 8,000 | | | St Shine Optical Co., Ltd. | | | 262,337 | | |
| | 25,000 | | | Taiwan Semiconductor Manufacturing Co., Ltd. | | | 192,569 | | |
| | | | | | | | 1,634,600 | | |
The accompanying notes are an integral part of these financial statements.
29
Shares | | COMMON STOCKS: 98.7% (Continued) | | Value | |
Thailand: 10.7% | | | |
| | 79,800 | | | Delta Electronics Thailand PCL/Foreign | | $ | 179,227 | | |
| | 538,900 | | | LPN Development PCL/Foreign | | | 218,300 | | |
| | 15,800 | | | PTT PCL/Foreign | | | 212,365 | | |
| | 73,800 | | | Tisco Financial Group PCL/Foreign | | | 199,374 | | |
| | | | | | | | 809,266 | | |
United States: 5.6% | | | |
| | 2,400 | | | Aflac Inc. | | | 210,672 | | |
| | 3,400 | | | QUALCOMM Inc. | | | 217,668 | | |
| | | | | | | | 428,340 | | |
| | | | | Total Common Stocks
(cost $5,929,660) | | | 7,474,967 | | |
| | | | | Total Investments in Securities
(cost $5,929,660): 98.7% | | | 7,474,967 | | |
| | | | | Other Assets less Liabilities: 1.3% | | | 102,326 | | |
| | | | | Net Assets: 100.0% | | $ | 7,577,293 | | |
REIT - Real Estate Investment Trust
The accompanying notes are an integral part of these financial statements.
30
GUINNESS ATKINSON CHINA & HONG KONG FUND for the period ended December 31, 2017
1. Performance
AVERAGE ANNUALIZED TOTAL RETURNS
| | | 1 Year | | 3 Years | | 5 Years | | 10 Years | |
Fund | | | 48.85 | % | | | 12.30 | % | | | 8.13 | % | | | 2.18 | % | |
Benchmark Indices: | |
Hang Seng Composite Index | | | 41.91 | % | | | 11.66 | % | | | 9.39 | % | | | 3.82 | % | |
S&P 500 Index | | | 21.80 | % | | | 11.40 | % | | | 15.77 | % | | | 8.48 | % | |
The Fund's expense ratio is 1.67% per the Summary Prospectus dated May 3, 2017. For the Fund's current one year expense ratio, please refer to the Financial Highlights section of this report.
Performance data quoted represents past performance and does not guarantee future results. The investment return and principal value of an investment in the Fund will fluctuate so that an investor's shares, when redeemed, may be worth more or less than their original cost. Current performance of the Fund may be lower or higher than the performance quoted. Performance data current to the most recent month-end may be obtained by visiting www.gafunds.com, or calling (800) 915-6565.
The Fund imposes a 2% redemption fee on the sale of shares held less than 30 days. Performance data quoted does not reflect this redemption fee. Total returns for certain periods reflect fee limitations in effect and, in the absence of these limitations, total returns would have been lower.
In 2017, the Fund rose 48.85% compared to the Hang Seng Composite Index, which rose 41.91%.
In 2015 and 2016, many were worried that the Chinese economy was about to collapse, with the cause coming from a big list including: an inability to service debt, a breakdown in the shadow banking system, a collapse in property prices and a crash in the renminbi. Instead, the economy is still growing solidly and the economy has not collapsed, leading to a rerating for Chinese stocks. The importance of positive producer price inflation cannot be understated as it has led to a recovery in the operating environment for firms in the industrials and materials sectors, which represent significant parts of the economy. The recovery in industrial profits has also led to a reduction in the non-performing loan formation rate in the banking system. In Hong Kong, the property market continued to boom despite the government introducing new rules aimed at cooling down the market.
We have long argued that debt servicing capacity, rather than the ratio of debt to Gross Domestic Product (GDP), is the most important metric when assessing the burden of debt and gauging financial stability. The recovery in heavy industrial profits and cash flows by 9% in 2016 and by a further 16% for the first 11 months of 2017 has improved matters considerably. According to our analysis of 3,000 listed companies in China, the share of debt at risk (where operating profit does not cover their annual interest expense) has almost halved from 2015, from 30% to 17%. Government efforts to slow debt accumulation appear to be having an effect, according to the International Institute of Finance, with the stock of debt to GDP, rising only 2% in 2017, compared to an average rise of 17% per annum from 2010 to 2016. The improvement in the operating environment allowed policymakers to tackle the buildup of leverage in the financial system. Policymakers introduced several new rules to curtail banks' dependence on interbank markets during 2017.
By far the best performing stock in the portfolio this year was Geely Automobile, which makes sedans and SUVs. Their new models have been well received by the market with strong volume growth. Sino Biopharmaceutical and New Oriental Education were also very strong in the year. Sino Biopharmaceutical is a leading manufacturer of generic drugs with a focus on hepatitis, cardio-vascular, and oncology. The company received approval to market its own generic version of a new second generation drug. At the same time, the company is very likely to receive approval for its generic version of Anlotinib (oncology), which has the potential to be a blockbuster drug. New Oriental Education provides tuition services for students ranging from kindergarten to high school. There is huge demand for these services in China and New Oriental is one of the biggest brands in the business. The company is an example of one that is in a very exciting space and where importantly the cash return on investment is above the cost of capital.
The worst performing stocks were Pax Global, China Minsheng Banking Corp Ltd, and Lenovo. Pax Global is a manufacturer of point-of-sale terminals, with sales coming predominantly from China and Latin America. Pax Global's sales in China have suffered due to intense competition. After an unexpected profit warning, we decided to sell the stock. China Minsheng was affected by the rising rates in the interbank market that pushed up its borrowing costs, causing its margin to narrow. Though Lenovo's personal
31
computer business remains highly cash generative, its smartphone and data centre businesses continue to struggle in the face of high competition.
2. Activity
The Fund sold two positions in 2017. In January, the Fund sold the position in the db x-trackers CSI300 UCITS ETF and bought Qualcomm. Qualcomm's share price fell 18% after it was sued by Apple over its pricing model. We felt that the market was pricing in returns that were unduly pessimistic. In November, we sold Pax Global, whose sales in China have suffered due to intense competition. After an unexpected profit warning, we decided to sell the stock.
The Fund's biggest exposures at the end of the year were technology, financials and consumer discretionary. All of the Fund's holdings are listed and traded outside mainland China.
3. Outlook
2017 was the year where attitudes towards China began turning more positive and we expect this to continue in 2018. In our opinion, in China the risks from high levels of debt have receded. Based on our analysis of 3,000 A-share companies, half of debt is incurred by firms in industrials and materials sectors. With positive producer price inflation and continued cuts in capacity in steel and coal, higher prices have generated higher cash flows for firms in these sectors to service their debt. We expect this story to continue to play out in 2018. In our opinion, a bigger risk would come from a fall in property values, which we think is unlikely. Policymakers have spent a year introducing numerous rules to cool the property market and these have worked. If property prices, for whatever reason, were to suddenly fall, then these measures could be unwound to support prices. We also expect policymakers' deleveraging efforts, specifically within the shadow banking system, to continue in 2018, which should further reduce the chances of a liquidity crisis turning into an economic crisis.

Edmund Harriss
The Fund invests in foreign securities, which involve political, economic and currency risks, greater volatility, and differences in accounting methods. These risks are greater for emerging markets. The Fund is non-diversified, meaning that its assets may be concentrated in fewer individual holdings than diversified funds. Therefore, the Fund is more exposed to individual stock volatility than diversified funds. Investments focused in a single geographic region may be exposed to greater risk and more volatility than investments diversified among various geographies. The Fund invests in smaller companies, which involve additional risks such as limited liquidity and greater volatility.
Please refer to the Schedule of Investments for details on Fund holdings. Current and future portfolio holdings are subject to risk.
The Hang Seng Composite Index is a market capitalization weighted index that covers about 95% of the total market capitalization of companies listed on the main board of the Hong Kong Stock Exchange. The Standard & Poor's 500 Index is a market capitalization-weighted index composed of 500 widely held common stocks of U.S. companies. These indices are unmanaged, not available for investment and do not incur expenses.
The information provided herein represents the opinion of Guinness Atkinson Asset Management, Inc. for the period stated and it is not intended to be a forecast of future events, a guarantee of future results, or investment advice. Opinions, Fund holdings and sector allocations are subject to change at any time, and are not recommendations to buy or sell any security.
32
Growth of $10,000
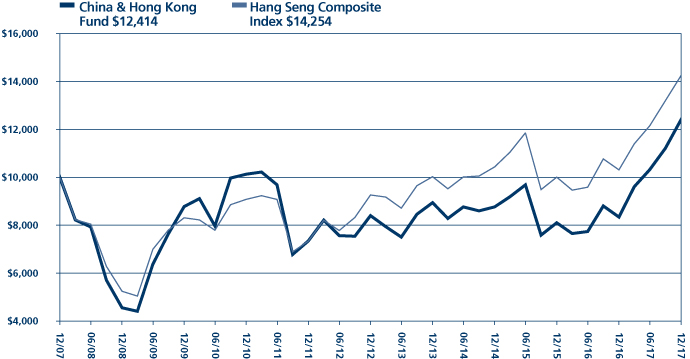
Average Annual Total Return
Periods Ended December 31, 2017
| One Year | | Five Years | | Ten Years | |
| | 48.85 | % | | | 8.13 | % | | | 2.18 | % | |
Performance data quoted represents past performance and does not guarantee future results. The investment return and principal value of an investment will fluctuate so that an investor's shares, when redeemed, may be worth more or less than their original cost. Current performance of the Fund may be lower or higher than the performance quoted. Performance data current to the most recent month end may be obtained by visiting www.gafunds.com.
Total returns for certain periods reflect a fee waiver in effect and in the absence of this waiver, the total returns would be lower. Returns reflect the reinvestment of distributions made by the Fund, if any. The graph and the performance table above do not reflect the deduction of taxes that a shareholder would pay on Fund distribution or the redemption of Fund shares. The Fund imposes a 2% redemption fee on shares held less than 30 days.
The Hang Seng Composite Index is a market-capitalization weighted index that comprises the top 200 companies listed on the Hong Kong Stock Exchange, based on the average market capitalization for the past twelve months. The index referenced in this chart is not available for investment and does not incur expenses.
33
FUND HIGHLIGHTS at December 31, 2017
GUINNESS ATKINSON CHINA & HONG KONG FUND
# of Holdings in Portfolio: | | | 32 | | |
Portfolio Turnover: | | | 20.8 | % | |
% of Stocks in Top 10: | | | 40.0 | % | |
Fund Manager: | | | |
Edmund Harriss | | | |
Top 10 Holdings (% of net assets) | | | | | | | |
Sino Biopharmaceutical Ltd. | | | 5.6 | % | | China Merchants Bank Co., Ltd. - H Shares | | | 3.8 | % | |
Geely Automobile Holdings Ltd. | | | 4.1 | % | | NetEase Inc. - ADR | | | 3.8 | % | |
Galaxy Entertainment Group Ltd. | | | 4.1 | % | | Tencent Holdings Ltd. | | | 3.7 | % | |
Ping An Insurance Group Company of China Ltd. - H Shares | | | 3.9 | % | | CNOOC Ltd. | | | 3.7 | % | |
China Medical System Holdings | | | 3.8 | % | | Industrial & Commercial Bank of China Ltd. - H Shares | | | 3.5 | % | |
Industry Breakdown (% of net assets) | | | | | | | |
Commercial Banks | | | 16.5 | % | | Auto/Truck Parts & Equipment | | | 3.2 | % | |
Pharmaceuticals | | | 9.5 | % | | Retail - Apparel/Shoe | | | 3.1 | % | |
Insurance | | | 6.7 | % | | Textile - Products | | | 3.1 | % | |
Building Products | | | 6.1 | % | | Shipbuilding | | | 3.0 | % | |
Electronic Component - Miscellaneous | | | 5.5 | % | | Appliances | | | 2.9 | % | |
Auto - Cars/Light Trucks | | | 4.1 | % | | Public Thoroughfares | | | 2.9 | % | |
Casino Hotels | | | 4.1 | % | | Computers | | | 2.9 | % | |
Internet Content - Entertainment | | | 3.8 | % | | Telecommunication Equipment | | | 2.8 | % | |
Internet Application Software | | | 3.7 | % | | Cellular Telecommunications | | | 2.7 | % | |
Oil Company - Exploration & Production | | | 3.7 | % | | Real Estate Operations/Development | | | 1.5 | % | |
Industrial Automation | | | 3.4 | % | | Machinery - General Industries | | | 0.9 | % | |
Schools | | | 3.4 | % | | Semiconductor Component-Integrated Circuit | | | 0.5 | % | |
34
SCHEDULE OF INVESTMENTS
at December 31, 2017
GUINNESS ATKINSON CHINA & HONG KONG FUND
Shares | | COMMON STOCKS: 100.0% | | Value | |
Appliances: 2.9% | | | |
| | 838,000 | | | Haier Electronics Group Co., Ltd. | | $ | 2,293,311 | | |
Auto/Truck Parts & Equipment: 3.2% | | | |
| | 2,290,480 | | | Weichai Power Co., Ltd. - H Shares | | | 2,513,676 | | |
Auto – Cars/Light Trucks: 4.1% | | | |
| | 920,000 | | | Geely Automobile Holdings Ltd. | | | 3,201,256 | | |
Building Products: 6.1% | | | |
| | 525,500 | | | Anhui Conch Cement Co., Ltd. - H Shares | | | 2,475,467 | | |
| | 3,569,000 | | | China Lesso Group Holdings Ltd. | | | 2,315,401 | | |
| | | | | | | | 4,790,868 | | |
Casino Hotels: 4.1% | | | |
| | 399,000 | | | Galaxy Entertainment Group Ltd. | | | 3,199,128 | | |
Cellular Telecommunications: 2.7% | | | |
| | 210,500 | | | China Mobile Ltd. | | | 2,141,667 | | |
Commercial Banks: 16.5% | | | |
| | 455,000 | | | BOC Hong Kong Holdings Ltd. | | | 2,306,487 | | |
| | 2,661,670 | | | China Construction Bank Corp. - H Shares | | | 2,453,790 | | |
| | 746,500 | | | China Merchants Bank Co., Ltd. - H Shares | | | 2,968,883 | | |
| | 2,476,000 | | | China Minsheng Banking Corp., Ltd. | | | 2,478,596 | | |
| | 3,399,330 | | | Industrial & Commercial Bank of China Ltd. - H Shares | | | 2,734,031 | | |
| | | | | | | | 12,941,787 | | |
Computers: 2.9% | | | |
| | 4,060,000 | | | Lenovo Group Ltd. | | | 2,285,936 | | |
Electronic Component – Miscellaneous: 5.5% | | | |
| | 118,500 | | | AAC Technologies Holdings Inc. | | | 2,115,253 | | |
| | 8,400,000 | | | Tongda Group Holdings Ltd. | | | 2,152,140 | | |
| | | | | | | | 4,267,393 | | |
Industrial Automation: 3.4% | | | |
| | 120,900 | | | Hollysys Automation Technologies Ltd. | | | 2,692,443 | | |
Insurance: 6.7% | | | |
| | 1,146,000 | | | PICC Property & Casualty Co., Ltd. - H Shares | | | 2,204,691 | | |
| | 290,000 | | | Ping An Insurance Group Company of China Ltd. - H Shares | | | 3,021,872 | | |
| | | | | | | | 5,226,563 | | |
Internet Application Software: 3.7% | | | |
| | 56,100 | | | Tencent Holdings Ltd. | | | 2,917,948 | | |
Internet Content – Entertainment: 3.8% | | | |
| | 8,575 | | | NetEase Inc. - ADR | | | 2,958,975 | | |
The accompanying notes are an integral part of these financial statements.
35
Shares | | COMMON STOCKS: 100.0% (Continued) | | Value | |
Machinery – General Industries: 0.9% | | | |
| | 2,430,000 | | | Chen Hsong Holdings† | | $ | 735,939 | | |
Oil Company – Exploration & Production: 3.7% | | | |
| | 1,998,000 | | | CNOOC Ltd. | | | 2,867,936 | | |
Pharmaceuticals: 9.5% | | | |
| | 1,277,000 | | | China Medical System Holdings | | | 2,982,672 | | |
| | 2,479,000 | | | Sino Biopharmaceutical Ltd. | | | 4,409,912 | | |
| | | | | | | | 7,392,584 | | |
Public Thoroughfares: 2.9% | | | |
| | 2,200,000 | | | Shenzhen Expressway Co., Ltd. - H Shares | | | 2,231,081 | | |
Real Estate Operations/Development: 1.5% | | | |
| | 366,000 | | | China Overseas Land & Investments Ltd. | | | 1,178,822 | | |
Retail – Apparel/Shoe: 3.1% | | | |
| | 3,044,000 | | | China Lilang Ltd. | | | 2,454,726 | | |
Schools: 3.4% | | | |
| | 27,900 | | | New Oriental Education & Technology Group Inc. - ADR | | | 2,622,600 | | |
Semiconductor Component-Integrated Circut: 0.5% | | | |
| | 6,300 | | | QUALCOMM Inc. | | | 403,326 | | |
Shipbuilding: 3.0% | | | |
| | 2,095,800 | | | Yangzijiang Shipbuilding Holdings Ltd. | | | 2,304,196 | | |
Telecommunication Equipment: 2.8% | | | |
| | 166,600 | | | VTech Holdings Ltd. | | | 2,185,623 | | |
Textile – Products: 3.1% | | | |
| | 2,268,000 | | | Pacific Textiles Holdings Ltd. | | | 2,398,278 | | |
| | | | | Total Common Stocks
(cost $49,677,881) | | | 78,206,062 | | |
| | | | | Total Investments in Securities
(cost $49,677,881): 100.0% | | | 78,206,062 | | |
| | | | | Liabilities in Excess of Other Assets: (0.0%) | | | (86 | ) | |
| | | | | Net Assets: 100.0% | | $ | 78,205,976 | | |
ADR - American Depository Receipt
† The Advisor has determined this security to be Illiquid. As of December 31, 2017, the total market value of the illiquid security represent 0.9% of net assets.
The accompanying notes are an integral part of these financial statements.
36
GUINNESS ATKINSON DIVIDEND BUILDER FUND for the period ended December 31, 2017
1. Performance
AVERAGE ANNUAL TOTAL RETURNS
| | | 1 Year | | 3 Years | | 5 Years | | Since
Inception
(March 30, 2012) | |
Fund | | | 21.34 | % | | | 7.70 | % | | | 11.23 | % | | | 10.60 | % | |
Benchmark Index: | |
MSCI World Index | | | 23.10 | % | | | 9.91 | % | | | 12.30 | % | | | 11.42 | % | |
The Fund's gross expense ratio is 2.11% and net expense ratio is 0.70% per the Summary Prospectus dated May 3, 2017. For the Fund's current six-month expense ratio, please refer to the Financial Highlights section of this report. The Advisor has contractually agreed to reimburse expenses so that the Fund's ratio of expenses to average daily net assets will not exceed 0.68% (excluding Acquired Fund Fees and Expenses, interest, taxes, dividends on short positions and extraordinary expenses) through June 30, 2018. To the extent that the Advisor absorbs expenses, it may seek repayment of a portion or all of such amounts at any time within the three fiscal years after the fiscal year in which such amounts were absorbed, subject to the applicable cap.
Performance data quoted represents past performance and does not guarantee future results. The investment return and principal value of an investment in the Fund will fluctuate so that an investor's shares, when redeemed, may be worth more or less than their original cost. Current performance of the Fund may be lower or higher than the performance quoted. Performance data current to the most recent month-end may be obtained by visiting www.gafunds.com, or calling (800) 915-6565.
Total returns for certain periods reflect expense limitations in effect and, in the absence of these imitations, total returns would have been lower.
"Political noise, market poise" suitably characterises the year of 2017. Equity markets persistently defied the sceptics, who pointed to political dysfunction, monetary policy uncertainty, and potential geopolitical crises as reasons for woe. Instead, the year saw well-diversified global growth, with many equity indices hitting new highs.
In 2017, the Dividend Builder Fund produced a total return of 21.34%, versus the MSCI World Index which was up 23.10%. The Fund therefore underperformed the MSCI World Index by 1.76% over the period.
This is reflective of what we saw in equity markets over the last 12 months, with the market preferring growth stocks to value; quality companies and defensive sectors benefitted less from the very strong equity rally. Overall, most equity investors have enjoyed a remarkably smooth and rewarding 2017 as all regions worldwide posted significant gains.
The big question going into 2018 is whether this can continue as new headwinds approach. As ever, rather than trying to pick which way the macro or political winds will blow in the near term, we maintain our focus on companies that can deliver a sustainable, rising income stream alongside capital growth over the long term. Holding good quality companies that have persistently generated high levels of cashflow return on investment gives us confidence that the Fund is well placed to weather different market conditions.
The Guinness Atkinson Dividend Builder Fund tends to outperform in down markets, and is skewed towards quality companies, at attractive valuations. This explains the Fund's slight underperformance this year as we see in the below figure that growth companies significantly outperformed value.
37
Figure 1: MSCI World style performance in 2017 (Total Return in USD). Bloomberg and Guinness Atkinson Asset Management.
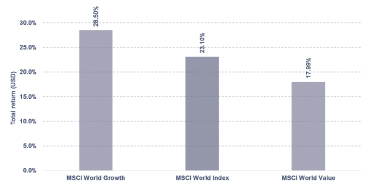
In terms of sectors, technology stocks led the way, returning almost 40% (in USD), but the market rally was relatively broad based, with materials, industrials, consumer discretionary, financials and healthcare all returning over 20% (in USD). Defensive "bond-proxy" sectors such as utilities, telecommunications, real estate, and consumer staples, lagged.
For the Fund, overweight healthcare was a small drag on performance from an allocation perspective, but good stock selection (e.g. Novo Nordisk and AbbVie) meant overall allocation to the sector added to performance. This is similar to the case with information technology (IT) stocks, where underweight to the sector dragged on performance, though we saw good returns from individual positions such as Microsoft and Cisco. We also note that although consumer staples underperformed as a sector, good stock selection meant positive contributions. It is particularly pleasing to see many of our newer additions performing well in this sector.
Figure 2: MSCI World sector performance in 2017 (Total Return in USD). Bloomberg and Guinness Atkinson Asset Management.

When we look at how individual companies within the portfolio performed in 2017 we see that out of the top five, we have two healthcare (AbbVie and Novo Nordisk), two financial (NEX Group and Deutsche Boerse), and one consumer staples stock (Wal-Mart). This is testament to the bottom-up philosophy of the Fund focusing on quality companies at attractive valuations. It
38
is also worth noting at this stage that the Fund is benchmark and sector agnostic – positions are based on high conviction, bottom-up fundamental analysis.
Of the two worst performing stocks, Mattel and Teva Pharmaceutical, we saw significant share price falls in the third quarter. In its earnings release, Teva surprised the market with significant write-downs associated with the Allergan acquisition and a large cut to the dividend, so we decided to sell our position. Mattel had been a long term holding in the Fund and performed very well from 2012 to 2015. The company saw falling sales and earnings in more recent years, and it announced a dividend cut in the third quarter, convincing us to sell our position.
2. Activity
In 2017, we sold five positions and bought five new positions, leaving the portfolio with 35 positions at the end of the year. This was more changes than in 2016, though fewer than in 2015.
In the first quarter, we made one change to the portfolio, whereby we bought Novo Nordisk and sold HR Block.
H&R Block, the US-based tax preparation company, saw some significant changes during our long term holding of the company. Of particular note was the spinning off of its banking arm in 2014, which released the company from the associated regulatory burden and capital requirements associated with that business. This was well received by the market and the company added significantly to the performance of the Fund from our first purchase in 2012 to the end of 2015. However, through 2016, the company posted a series of weak quarterly results as it appeared competition in the market place and particularly the 'do-it-yourself' online tax returns model had begun to erode its dominant position. This was reflected by sharp declines in the share price over this period. The quarterly results released in early March surprised to the upside, however, mainly as the market had become too pessimistic rather than results being obviously positive. The subsequent spike upwards in the share price provided us an opportune moment to exit our position. At the time of sale, the valuation of the company was undemanding (around 13.5x 2017 expected earnings) but we felt the quality had deteriorated as debt to equity levels began to rise significantly. We felt our conviction was not high enough to justify holding the stock.
We bought Novo Nordisk to replace H&R Block, sticking to our one-in, one-out policy. The Danish pharmaceutical company is a leader in the global insulin market and has maintained a concentrated, yet market leading, portfolio of drugs targeting diabetes – a growing disease especially in less developed countries. We liked the fact that the company's cash-flow return on investment (CFROI) has been consistently growing over the last 10 years and currently stands at 25%. Dividends per share have also been growing very quickly with a five-year dividend growth rate of over 20% per annum. The company has a very strong balance sheet with very little debt compared to its peers and has considerably more cash than debt. The company's shares sold off since mid-2016 after an increase in competitive threats, pricing pressures and uncertainty in the US healthcare reform. However, we believed that the market had been overly pessimistic given Novo Nordisk's growing drugs pipeline, strong balance sheet and significant cash generation. This gave us an attractive entry point. During the time we have held the stock, the share price has already rallied 60% (in USD).
In the second quarter, we also made one change to the portfolio. We bought ANTA Sports and sold TOTAL.
TOTAL, the global oil and gas company, was one of our two energy sector holdings. We grew increasingly worried at the company's falling cashflow return on investment (CFROI) and this was accompanied by stagnant dividend growth and capital growth. In our opinion, the company's inability to sustain healthy margins put us out of favour with the stock, especially at a time where industry-wide factors were hampering the performance of energy stocks. We believe that the stock was overvalued versus its history, based on its P/E multiple, and with an increasing amount of long-term debt maturing in the next few years, it was deemed a good time for us to sell our entire position in TOTAL.
We bought ANTA Sports to replace TOTAL. ANTA Sports is based in China and has a cashflow return on investment over 10%, for its entire 10 years of existence as a public company. The company generates revenue through the manufacture and trading of sporting goods, including footwear, apparel and accessories. Its brand portfolio includes ANTA, ANTA KIDS, FILA, FILA KIDS and NBA. It has joint ventures with new brands too, such as South Korea's Kolon. Looking at the financials, ANTA Sports has very solid margin growth alongside a surge in sales in recent years. The company is well positioned to benefit from the growing wealth in China, recovering economy, and has maintained low debt. It is the official sponsor of the Chinese Olympics team and we have conviction that the stock has potential to maintain its significant earnings growth. Since buying the stock, the company strengthened its multi-brand strategy by acquiring popular kidswear brand, KingKow. During the time we have held the stock, the share price has rallied 39% (in USD).
In the third quarter, we made two changes to the portfolio. We bought British American Tobacco and Hengan International and sold positions in Teva Pharmaceuticals and Mattel.
39
British American Tobacco (BAT) – the global tobacco leader – was on our radar due to its stellar cashflow returns on invested capital, and strong dividend profile. It's increasing market share, sales and earnings, and its successful integration of the mega $65.4bn acquisition of Reynolds American, positions the company well for future price and dividend growth. Despite rising debt, the company has large piles of cash and good interest cover. At the time, we believed that the U.S. Food & Drug Administration's proposal to reduce nicotine in cigarettes had been overly discounted, and coupled with a sell-off following bribery allegations, this provided us an attractive valuation to buy a new position. Integrating the Reynolds American deal and developing the "global drive brands" strategy is the company's focus for the next few years, as synergies from the acquisition are expected to be $400 million. "Global drive brands" continue to boost BAT's market share at higher price points and increased investment in new-generation products will allow longer-term growth.
Hengan International is one of the largest producers of sanitary napkins, diapers and tissue paper in China. Historically, the company has captured significant market share in established distribution channels (maternity stores, hypermarkets) and more recently it is seeing growth from online exposure. Management has built up an e-commerce team to take advantage of the channel shift in China, whereby consumers are increasingly purchasing everyday items online. Alongside this, there are new brand launches and a revitalised sales strategy to maintain its offline market share. Growing revenues, high and stable margins, year-on-year earnings growth and a well-covered, high dividend are some of the highlights making this a compelling addition to the Fund.
We bought TEVA Pharmaceuticals in 2013 when the stock was trading at historic low multiples and the market was overly focused on "patent cliffs" – an issue which was associated with healthcare companies in general. Over the following two years, the stock price recovered significantly as the expected pessimistic scenarios did not come about. Into 2016, the share price weakened as worries mounted regarding drug pricing in the U.S. and the company announced a significant M&A transaction, buying the generic drug business of Allergan for around $40bn. This was an exceptionally large figure for the company and raised questions as to whether TEVA had both over paid and overstretched. In the second half of 2016, the share price continued to fall, although we felt this was more sentiment-driven. However, the second quarter earnings release came as a shock to the market due to the severity of the announcement, which entailed significant write-downs associated with the Allergan business acquisition and a large cut to the dividend, in part to preserve cash to pay down debt and prevent certain covenants being breached. As a consequence of these poor results, and especially in light of the dividend cut, we were quick to sell our full position in TEVA.
Mattel is another company that has been a long term holding in the portfolio, though over the last two years it has had mixed results. Ultimately, sales have declined due to strong competition and lack of innovation from the company and the cost of goods sold have not declined in parallel – meaning earnings have been hit. With such an operationally leveraged company it has been of particular disappointment that the management had not been able to tackle costs and arrest the decline in margins. Throughout this period the company did maintain its commitment to the dividend, even as payout ratios increased from what were relatively low levels. After only two years we saw another CEO change announced in February this year, whose background was Google and Groupon, and who had a focus on modernising their product offering. Through 2017, the company continued to disappoint but the dividend cut announced by the new CEO on the second quarter earnings call further added to market worries, and as a consequence, we sold our position in the company.
In the fourth quarter of the year, we made one change. We bought Reckitt Benckiser and sold Coca Cola.
We bought Coca-Cola at the Fund's launch and the drinks manufacturer has returned close to 50% (in USD) in total return over the holding period. A sizable proportion of this has come from a large and growing dividend payment over the years, and more recently the stock has seen significant multiple expansion. The company trades at a 10-year peak forward P/E multiple of 23x, and we have seen this as a good opportunity to take profit and sell our position. Although margins have improved, the beverage company has been seeing lower sales growth with earnings increasingly supported by share buybacks. Increased debt to fund these buybacks has left the company more leveraged and reduced our conviction on future growth. Although the dividend yield is still attractive at 3.3%, we believe that there is a higher risk of multiple de-rating if emerging market sales recovery disappoints or is already "priced in". Regulation of sugary drinks and growing consumer consciousness add to the concerns for Coca-Cola, and this has translated to falling sales growth consecutively for the last 5 years.
We replaced our position in Coca-Cola with Reckitt Benckiser, a stock we had previously held between 2012 and 2015. This is a British producer of health, hygiene and home products, with 'Powerbrands' – as Reckitt Benckiser likes to call them – such as Nurofen painkillers, Durex condoms and Dettol disinfectant. We see this as a high-quality business that has underperformed the MSCI World Consumer Staples index since mid-2016 due to falling sales growth, particularly in India, Brazil and the Middle East. More recently, in October, the consumer goods firm cut its full-year sales forecast, struggling with fallout from a cyber-attack, a
40
failed product launch and a safety scandal in South Korea. In turn, we believe the market has been overly-pessimistic and recent acquisitions (e.g. $16bn purchase of baby milk maker Mead Johnson) and business re-organisation efforts have not fully been recognised. The stock is currently trading at a forward P/E multiple of 18x, compared to 24x in mid-2016. We see this as an attractive entry point, especially given that dividend growth was 10% in 2017 and earnings are forecasted to grow 6% in 2018.
3. Portfolio Position
The major effect of the changes we made to the portfolio in 2017 was to increase our exposure to consumer staples. In terms of sector weightings, the Fund continues to have a zero weighting to utilities, materials, and real estate. The largest overweight positions are to consumer staples, industrials and healthcare.
Section allocation at 12/31/17 | | | |
Consumer Discretionary | | | 8.0 | % | |
Consumer Staples | | | 25.0 | % | |
Energy | | | 2.9 | % | |
Financials | | | 14.5 | % | |
Heath Care | | | 16.4 | % | |
Industrial | | | 19.9 | % | |
Information Technology | | | 8.6 | % | |
Material | | | 0.0 | % | |
Real Estate | | | 0.0 | % | |
Telecommunication Services | | | 2.7 | % | |
Utilities | | | 0.0 | % | |
Cash | | | 2.0 | % | |
Total | | | 100.0 | % | |
4. Dividend
The trailing twelve months dividend distributed by the Fund was $0.419 per share.
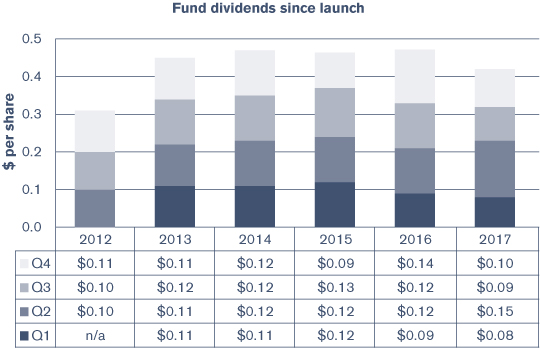
41
5. Outlook
The four key tenets to our approach are: quality, value, dividend, and conviction. We follow these metrics at the portfolio level to make sure we are providing what we say we will. Based on the measures, holistically, the high-conviction Fund has companies which are on average better quality at similar value verses the index. At the year end, we are pleased to report that the portfolio continues to deliver on all four of these measures relative to the benchmark MSCI World Index.
The Fund at the end of the fiscal year was trading on 17.2x 2018 expected price to earnings; a discount of 0.5% to the broad market. However, on a free cashflow basis, the Fund trades at a significant discount to the market. With interest rates set to rise and continuous geopolitical uncertainty around the globe, our perpetual approach of focusing on the quality of the underlying companies we own should stand us in good stead in our search for rising income streams and long-term capital growth.
As ever we would like to thank you for your continued support and we wish you all a prosperous 2018.

| | 
| | | |
Matthew Page | | Ian Mortimer | | January 2018 | |
The Fund invests in foreign securities, which involve political, economic and currency risks, greater volatility, and differences in accounting methods. These risks are greater for emerging markets. The Fund invests in small- or mid-cap companies, which involve additional risks such as limited liquidity and greater volatility. Growth stocks typically are more volatile than value stocks; however, value stocks have a lower expected growth rate in earnings and sales.
The MSCI World Index is a free float-adjusted market capitalization weighted index that is designed to measure the equity market performance of developed markets. This index is unmanaged and is not available for investment, and does not incur expenses.
PER or P/E – Price to Earnings ratio is calculated by dividing current price of the stock by the company's trailing months' earnings per share.
Earnings growth is not a measure of the Fund's future performance.
Dividend yield is calculated by annualizing the last quarterly dividend paid and dividing it by the current share price.
Diversification does not assure a profit nor protect against loss in a declining market.
Please refer to the Schedule of Investments for details on Fund holdings. Current and future portfolio holdings are subject to risk.
The information provided herein represents the opinion of Guinness Atkinson Asset Management, Inc. for the period stated and is not intended to be a forecast of future events, a guarantee of future results, or investment advice. Opinions, Fund holdings and sector allocations are subject to change at any time, and are not recommendations to buy or sell any security.
42
Growth of $10,000
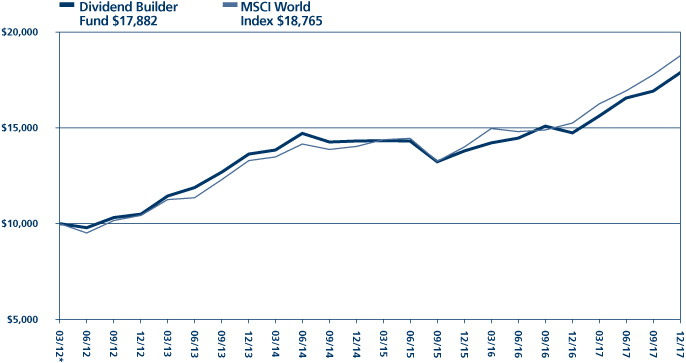
Average Annual Total Return
Periods Ended December 31, 2017
| One Year | | Five Years | | Since Inception
(03/30/12) | |
| | 21.34 | % | | | 11.23 | % | | | 10.60 | % | |
*Inception date 03/30/12.
Performance data quoted represents past performance and does not guarantee future results. The investment return and principal value of an investment will fluctuate so that an investor's shares, when redeemed, may be worth more or less than their original cost. Current performance of the Fund may be lower or higher than the performance quoted. Performance data current to the most recent month end may be obtained by visiting www.gafunds.com.
Total returns reflect a fee waiver in effect and in the absence of this waiver, the total returns would be lower. Returns reflect the reinvestment of distributions made by the Fund, if any. The graph and the performance table above do not reflect the deduction of taxes that a shareholder would pay on Fund distribution or the redemption of Fund shares.
The MSCI World Index is a free float-adjusted market capitalization weighted index that is designed to measure the equity market performance of developed markets.
43
FUND HIGHLIGHTS at December 31, 2017
GUINNESS ATKINSON DIVIDEND BUILDER FUND
# of Holdings in Portfolio: | | | 35 | | |
Portfolio Turnover: | | | 18.6 | % | |
% of Stocks in Top 10: | | | 32.2 | % | |
Fund Managers: | | | |
Dr. Ian Mortimer | | | |
Matthew Page | | | |
Top 10 Holdings (% of net assets) | | | | | |
Wal-Mart Stores Inc. | | | 3.4 | % | | Danone SA | | | 3.2 | % | |
Illinois Tool Works Inc. | | | 3.4 | % | | Hengan International Group Co. | | | 3.1 | % | |
Novo Nordisk A/S | | | 3.4 | % | | CME Group Inc. | | | 3.1 | % | |
VF Corp. | | | 3.3 | % | | Cisco Systems Inc. | | | 3.0 | % | |
Microsoft Corp. | | | 3.3 | % | | Aflac Inc. | | | 3.0 | % | |
Industry Breakdown (% of net assets) | | | | | |
Pharmaceuticals | | | 14.0 | % | | Power Conversion/Supply Equipment | | | 3.0 | % | |
Tobacco | | | 7.5 | % | | Soap & Cleaning Preparation | | | 3.0 | % | |
Diversified Manufactured Operations | | | 6.3 | % | | Insurance Brokers | | | 3.0 | % | |
Finance - Other Services | | | 6.0 | % | | Oil Company - Integrated | | | 2.9 | % | |
Aerospace/Defense | | | 5.5 | % | | Retail - Apparel/Shoe | | | 2.9 | % | |
Cosmetics & Toiletries | | | 5.4 | % | | Finance - Investment Banker/Broker | | | 2.8 | % | |
Retail - Discount | | | 3.4 | % | | MRI/Medical Diagnostics Imaging | | | 2.8 | % | |
Apparel Manufacturers | | | 3.3 | % | | Aerospace/Defense - Equipmenet | | | 2.8 | % | |
Applications Software | | | 3.3 | % | | Cellular Telecommunication | | | 2.7 | % | |
Food - Miscellaneous/Diversified | | | 3.2 | % | | Human Resources | | | 2.7 | % | |
Feminine Health Care Products | | | 3.1 | % | | Enterprise Software/Service | | | 2.5 | % | |
Networking Products | | | 3.0 | % | | Advertising Agencies | | | 2.0 | % | |
Life/Health Insurance | | | 3.0 | % | | | | | |
44
SCHEDULE OF INVESTMENTS
at December 31, 2017
GUINNESS ATKINSON DIVIDEND BUILDER FUND
Shares | | COMMON STOCKS: 100.1% | | Value | |
Australia: 2.8% | | | |
| | 14,130 | | | Sonic Healthcare Ltd. | | $ | 251,974 | | |
China: 5.9% | | | |
| | 57,000 | | | ANTA Sports Products Ltd. | | | 258,953 | | |
| | 25,000 | | | Hengan International Group Co. | | | 277,626 | | |
| | | | | | | | 536,579 | | |
Denmark: 3.4% | | | |
| | 5,650 | | | Novo Nordisk A/S | | | 304,759 | | |
France: 6.2% | | | |
| | 3,480 | | | Danone SA | | | 291,731 | | |
| | 3,190 | | | Schneider Electric SE | | | 270,648 | | |
| | | | | | | | 562,379 | | |
Germany: 2.9% | | | |
| | 2,280 | | | Deutsche Boerse AG | | | 265,243 | | |
Japan: 2.3% | | | |
| | 6,300 | | | Japan Tobacco Inc. | | | 202,748 | | |
Netherlands: 5.7% | | | |
| | 4,030 | | | Randstad Holding NV | | | 247,659 | | |
| | 7,960 | | | Royal Dutch Shell PLC - Class A | | | 265,107 | | |
| | | | | | | | 512,766 | | |
South Africa: 2.7% | | | |
| | 21,080 | | | Vodacom Group Ltd. | | | 247,635 | | |
Switzerland: 2.4% | | | |
| | 850 | | | Roche Holding AG | | | 215,152 | | |
United Kingdom: 18.3% | | | |
| | 30,740 | | | BAE Systems PLC | | | 238,114 | | |
| | 3,740 | | | British American Tobacco PLC | | | 253,430 | | |
| | 5,110 | | | Imperial Tobacco Group PLC | | | 218,427 | | |
| | 30,932 | | | NEX Group PLC | | | 253,292 | | |
| | 2,870 | | | Reckitt Benckiser Group PLC | | | 268,138 | | |
| | 4,390 | | | Unilever PLC | | | 244,474 | | |
| | 9,880 | | | WPP PLC | | | 178,816 | | |
| | | | | | | | 1,654,691 | | |
The accompanying notes are an integral part of these financial statements.
45
Shares | | COMMON STOCKS: 100.1% (Continued) | | Value | |
United States: 47.5% | | | |
| | 2,720 | | | AbbVie Inc. | | $ | 263,051 | | |
| | 3,120 | | | Aflac Inc. | | | 273,874 | | |
| | 4,220 | | | Arthur J Gallagher & Co. | | | 267,042 | | |
| | 6,810 | | | CA Inc. | | | 226,637 | | |
| | 7,160 | | | Cisco Systems Inc. | | | 274,228 | | |
| | 1,900 | | | CME Group Inc. | | | 277,495 | | |
| | 3,350 | | | Eaton Corp. PLC | | | 264,683 | | |
| | 1,260 | | | General Dynamics Corp. | | | 256,347 | �� | |
| | 1,840 | | | Illinois Tool Works Inc. | | | 307,004 | | |
| | 1,890 | | | Johnson & Johnson | | | 264,071 | | |
| | 3,810 | | | Merck & Co., Inc. | | | 214,389 | | |
| | 3,470 | | | Microsoft Corp. | | | 296,824 | | |
| | 2,590 | | | Procter & Gamble Co/The | | | 237,969 | | |
| | 1,970 | | | United Technologies Corp. | | | 251,313 | | |
| | 4,080 | | | VF Corp. | | | 301,920 | | |
| | 3,140 | | | Wal-Mart Stores Inc. | | | 310,075 | | |
| | | | | | | | 4,286,922 | | |
| | | | | Total Common Stocks
(cost $6,884,750) | | | 9,040,848 | | |
| | | | | Total Investments in Securities
(cost $6,884,750): 100.1% | | | 9,040,848 | | |
| | | | | Liabilities in Excess of Other Assets: (0.1%) | | | (13,431 | ) | |
| | | | | Net Assets: 100.0% | | $ | 9,027,417 | | |
ADR - American Depository Receipt
The accompanying notes are an integral part of these financial statements.
46
GUINNESS ATKINSON GLOBAL ENERGY FUND for the period ended December 31, 2017
1. Performance
AVERAGE ANNUAL TOTAL RETURNS
| | | 1 Year | | 3 Years | | 5 Years | | 10 Years | |
Fund | | | -1.06 | % | | | -2.81 | % | | | -1.69 | % | | | -2.10 | % | |
Benchmark Indices: | |
MSCI World Energy Index | | | 5.95 | % | | | 1.75 | % | | | 2.20 | % | | | 0.26 | % | |
S&P 500 Index | | | 21.80 | % | | | 11.40 | % | | | 15.77 | % | | | 8.48 | % | |
The Fund's gross expense ratio is 1.53% and net expense ratio is 1.45% per the Summary Prospectus dated May 3, 2017. For the Fund's current six-month expense ratio, please refer to the Financial Highlights section of this report. The Advisor has contractually agreed to reimburse expenses so that the Fund's ratio of expenses to average daily net assets will not exceed 1.45% (excluding Acquired Fund Fees and Expenses, interest, taxes, dividends on short positions and extraordinary expenses) through June 30, 2018. To the extent that the Advisor absorbs expenses, it may seek repayment of a portion or all of such amounts at any time within the three fiscal years after the fiscal year in which such amounts were absorbed, subject to the applicable cap.
Performance data quoted represents past performance and does not guarantee future results. The investment return and principal value of an investment in the Fund will fluctuate so that an investor's shares, when redeemed, may be worth more or less than their original cost. Current performance of the Fund may be lower or higher than the performance quoted. Performance data current to the most recent month-end may be obtained by visiting www.gafunds.com, or calling (800) 915-6565.
The Global Energy Fund in 2017 produced a total return of -1.06%. This compares to the total return of the MSCI World Energy Index of 5.95% and the S&P 500's total return of 21.80%.
Energy equities underperformed the broad market in 2017, after a strong year of recovery in 2016. Energy equity weakness over the first half of the year coincided with the oil price declining, as Petroleum-Exporting Countries (OPEC's) production cut took time to filter through to tightening inventories. We then saw the energy sector range trading until September, when falling inventories (led by strong demand growth) lifted oil and energy equities through to the end of the year.
As ever, the performance of the MSCI World Energy Index was only part of the story, with 2017 being a year of extreme divergence between the core energy subsectors. In particular, we saw the greatest divergence since 2011 between integrated, exploration and production (E&P), and energy service companies. Buoyed by improving free cashflows and a strong refining environment, the integrateds matched the performance of the broader market (as a group up over 20%), whilst the E&P and service sectors tended to be weak (generally down 10-30%), pulled lower by declining long-dated oil prices.
47
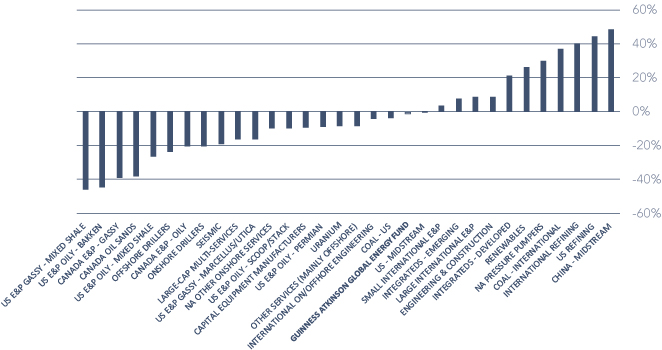
Source: Bloomberg; Guinness Atkinson Asset Management
A quick tour of some of the main energy sub-sectors paints a picture for the energy equity sector's performance in 2017:
• Integrated oil and gas companies. A year of strong performance, particularly for the European majors. 2017 was the year when the large cap integrateds demonstrated that they could cover their dividends at around $55/bbl, thanks to lower but sustainable capital spending, and rationalizing of operating costs. We saw the removal of scrip dividends for some of the majors (e.g. Shell), and the introduction of share buyback programmes (e.g.) for the first time in many years. Cashflows for the integrated group were also assisted by strong refining margins across the globe, boosting downstream profits. European integrated companies generally performed stronger than their US counterparts, having started 2017 with the advantage of being priced less expensively.
• Oil refining. One of the better performing sub-sectors, particularly in the US and Europe, with refining equities up over the year. Stronger than expected Gross Domestic Product (GDP) growth supported oil demand growth, which in turn kept refining margins at elevated levels. The Atlantic basin refining system received a boost in August/September with the heaviest hurricane season for many years causing a shortage in US Gulf Coast refining capacity and a short-term spike in refining margins. As payers of cash taxes, US refiners were also one of the main beneficiaries in the energy sector of Republican tax reforms, with corporation tax due to fall to 21%.
• Renewables. A recovery year after a poor 2016. Politically, it came as relief that President Trump initially steered away from promised attacks on renewable energy support in the US, appearing to direct his attention elsewhere. In the solar market, we saw a year of record installed capacity globally, driven by an unexpected increase from China (up from 30GW in 2016 to over 45GW in 2017). Increased solar demand meant some stabilization in module prices, after several years of price decline, supporting earnings.
• Exploration and production. Generally a weak year. Whilst spot oil prices strengthened during the year, longer dated crude prices declined, which pushed E&P equities lower. The better performers tended to internationally focused producers, enjoying exposure to Brent (where spot and long dated prices held up better than US focused West Texas Intermediate (WTI) prices). In the US, Permian producers with adequate levels of drilling inventory to expand into tended to be best insulated from the declines. At the weaker end of the spectrum, US gas producers were hit particularly hard, as were US companies with high cost/ short life shale positions and who saw the need to purchase additional inventory, particularly in the Permian basin, at high prices.
• Energy services. Generally weak. An uplift in activity was strongest in those businesses oriented towards the onshore US shale oil market (e.g. pressure pumping), though expectations leading into the year were high, and the failure of operating margins to improve as much as some had hoped lead to weaker share prices. Offshore services (offshore drillers, seismic, offshore-oriented
48
capital equipment manufacturers) continued to struggle, as capital spending continued to be diverted to shorter-cycle onshore activity.
The underperformance of the Fund versus the Index can be explained in broad terms by the Fund's higher weighting to E&P companies and corresponding lower weighting to integrateds. It was a strong year for the largest five oil and gas majors (Exxon, Chevron, Total, Shell and BP, which comprise around 45% of the Index), up on average by 14% over the year. Within the Fund, the best performing investments were generally large and mid-cap European integrateds (Statoil, Royal Dutch Shell, and BP), and refiners (OMV and Valero), all of which enjoyed the strong demand environment globally, plus solar manufacturers/developers (JA Solar and Sunpower). The weakest investments were US diversified E&Ps (QEP Resources, Carrizo, Apache, and Noble), suffering the decline in longer dated oil prices, and large cap services (Schlumberger and Halliburton), as the operating environment improves but not as rapidly as share prices in the sector had been anticipating.
2. Activity
In February, we sold our position in Exxon and purchased a position in Enbridge. Exxon, the world's largest oil & gas super-major, has provided excellent defensive characteristics for the Fund since we purchased it in 2011. However, as we move into the next cycle, we believe that there are better growth options elsewhere in the sector. Enbridge is a dual Canadian/US listed midstream company, which has recently merged with gas pipeline specialist, Spectra Energy, to form North America's largest midstream operation. With the growth of onshore oil and gas production expected in the US and Canada over the next five years, we believe Enbridge is well placed to execute its pipeline expansion plans, which offer meaningful upside to shareholders.
In June, we sold our holding in Carrizo Oil & Gas and switched into a holding in Oasis Petroleum. Both Carrizo and Oasis are US oil shale-focused companies, Carrizo operating primarily in the Eagleford basin and Oasis Petroleum operating primarily in the Bakken basin. Both companies have executed on production growth plans relatively well over the last twelve months, but we perceived a better opportunity in Oasis in terms of the depth of its inventory and improving cost base, relative to the current valuation of each stock. We expect Oasis to perform a little better than Carrizo, therefore, at lower oil prices, whilst maintaining as good leverage to a recovering oil price.
In July, we exited our 'research' position in Westernzagros. The company, which explores and produces oil and gas in Kurdistan, was taken private by Crest Energy. The deal to take Westernzagros private was completed at a substantial premium to the undisturbed price, but overall the investment has been a disappointment, with the geological and political hurdles of operating in Kurdistan proving to be far harder to overcome than entrants anticipated.
In September, we purchased a 'research' position in Reabold Resources. Reabold is a UK AIM-listed resources investment company which raised equity and announced new management in September, with the aim of investing in small E&P special situations in Europe. We are attracted to Reabold by the opportunities that the new management team is planning to exploit, at a time when valuations in pre-cashflow oil and gas assets remain close to cyclical lows.
3. Portfolio Position
The table below shows the Fund valuation in terms of historical and forward (analyst consensus estimates) price/earnings ratios versus the S&P 500 Index.
| | | 2011 | | 2012 | | 2013 | | 2014 | | 2015 | | 2016 | | 2017 | | 2018 | |
Guinness Atkinson Global Energy Fund P/E | | | 7.8 | | | | 8.1 | | | | 8.8 | | | | 9.6 | | | | 21.5 | | | | 38.2 | | | | 24.2 | | | | 18.5 | | |
S&P 500 P/E | | | 27.7 | | | | 27.6 | | | | 24.9 | | | | 23 | | | | 26.6 | | | | 25.2 | | | | 21.4 | | | | 18.4 | | |
Premium(+)/Discount(-) | | | -72 | % | | | -71 | % | | | -65 | % | | | -58 | % | | | -19 | % | | | 51 | % | | | 13 | % | | | 1 | % | |
Average oil price (WTI $) | | $ | 95/ | bbl | | $ | 94/ | bbl | | $ | 98/ | bbl | | $ | 93/ | bbl | | $ | 49/ | bbl | | $ | 43/ | bbl | | $ | 51/ | bbl | | $ | 55/ | bbl | |
Source: Standard and Poor's; Guinness Atkinson Asset Management Ltd
49
The sector and geographic weightings of the portfolio at December 31, 2017 were as follows:
Sector Breakdown | |
| | | 31 Dec 2016 | | 31 Dec 2017 | |
Integrated | | | 45.8 | | | | 41.9 | | |
Exploration and production | | | 37.3 | | | | 37.8 | | |
Drilling | | | 2.3 | | | | 1.8 | | |
Equipment and services | | | 8.9 | | | | 9.2 | | |
Refining and marketing | | | 3.6 | | | | 3.5 | | |
Storage & Transportation | | | 0.0 | | | | 3.5 | | |
Solar | | | 1.0 | | | | 2.1 | | |
Construction and engineering | | | 0.0 | | | | 0.0 | | |
Cash | | | 1.1 | | | | 0.2 | | |
Total | | | 100 | | | | 100 | | |
Geographic Breakdown | |
| | | 31 Dec 2016 | | 31 Dec 2017 | |
US | | | 51.0 | | | | 51.4 | | |
Canada | | | 10.9 | | | | 10.4 | | |
UK | | | 7.9 | | | | 9.2 | | |
Latin America | | | 0.0 | | | | 0.0 | | |
Europe | | | 18.2 | | | | 17.5 | | |
Hong Kong | | | 7.1 | | | | 7.3 | | |
Russia | | | 3.5 | | | | 3.3 | | |
Other | | | 0.3 | | | | 0.7 | | |
Cash | | | 1.1 | | | | 0.2 | | |
Total | | | 100 | | | | 100 | | |
4. Market Background
2017 was a year of modest tightening for the oil market. A combination of strong demand growth across the world and OPEC production cuts more than offset a rise in production from the US shale oil system. OPEC's adherence to production cuts was as strong as at any time in the organization's history, culminating in a commitment announced at the end of November to bring Organisation for Economic Co-operation and Development (OECD) oil inventories back to normalized levels at some point in 2018.
Volatility in the oil price was less pronounced in 2017 than the previous year, with Brent spot trading in a range from $45-67/bbl, the lows being visited in the middle of the year as it took time for OPEC's production cuts to feed through into the export market, causing the market to become skeptical of their approach. The price then recovered in the autumn of 2017 as inventories visibly tightened, before spiking at the end of the year owing to short-term supply disruption in the North Sea. The average Brent spot oil price in 2017 was $55/bl. WTI spot averaged $4/bbl lower at $51/bbl, as a combination of hurricane-induced refinery disruption and resurgent US production created the divergence to Brent.
50
The major components to oil supply/demand for 2017 were as follows:
• OPEC oil supply (including natural gas liquids (NGLs)) is likely to have declined by around 0.3m b/day (totaling 39.1m b/day, versus 39.4m b/day in 2016). Commencing on 1 January, OPEC announced 1.2m b/day of production cuts, marking a reversal of the shift to a market share strategy seen in 2014. Compliance to the cuts was generally strong, led by Saudi Arabia. Offsetting the cuts, however, we saw recovery in production from Libya and Nigeria, both of which had been left to grow after production had been disrupted due to civil war and unrest. OPEC announced in November that they would extend their production cuts to the end of 2018 in an effort to rebalance the market further;
• Non-OPEC oil supply is likely to have grown by around 0.6m b/day in 2017 (58.0m b/day, versus 57.4m b/day in 2016). Production from the US grew by 0.5m b/day, as the shale oil industry adapted to lower oil prices and the drilling rig count recovered to an average of 702 (vs 408 in 2016). Increases in production were also reported in Canada (+0.3m b/day) and Brazil (+0.2m b/day), offset by declines in Mexico (-0.2m b/day) and China (-0.1m b/day). A group of non-OPEC countries, headed by Russia, contributed around 0.3m b/day of production cuts in 2017 alongside OPEC's efforts, though Russia's average production for the year was still up slightly;
• Global oil demand is likely to have grown by around 1.5 m b/day in 2017, according to the International Energy Agency (IEA). This comprises non-OECD oil demand growth of 1.1m b/day (with China up 0.5m b/day) and OECD oil demand growth of 0.4m b/day. This represents a slightly better year for oil demand than 2016 (+1.3m b/day). Synchronized global GDP growth across many world regions, coupled with oil continuing to be priced at an 'affordable' level versus recent years, acted as the main catalysts to push demand higher. In China, gasoline demand from passenger vehicles and kerosene demand from air travel were the main areas of growth, whilst industrial demand for oil steadied;
• OECD oil inventories at the end of October 2017 were estimated to be at 2,940 million barrels, down from 3,047 million barrels at the end of October 2016, but still 7% above the 10-year average. The decline in inventories over the last 12 months implies that the market has been, on average, around 0.3m b/day undersupplied, versus an oversupply of 0.1m b/day for the prior 12 months, indicating a slightly tighter market. There have been other factors at play in 2017, notably the release of oil in offshore storage into the onshore OECD inventory system, which likely have dampened market tightness. Stripping these effects out, our assessment is that the fundamental level of global undersupply in 2017 has been closer to 0.5m b/day.
For natural gas, 2017 was a year of divergence between the US, Europe and Asia. In the US, the gas price has been anchored at around $3/mcf (averaging $3.02/mcf), representing a recovery from 2016 (when price averaged $2.55/mcf) but held back by gas to coal switching from US utility companies taking advantage of relatively lower coal prices, and a return to growth for onshore has production in the second half of the year.
5. Outlook
As we look ahead into 2018, we expect OPEC to remain disciplined in its pursuit of a balanced oil market, and will seek to manage the oil price in a $55-60/bl range. We believe OPEC are striving to find a 'happy medium' for the oil market where their own economics are better satisfied, the world economy is kept stable and US onshore oil production grows in a controlled manner.
On the supply side, we expect the US onshore shale system will grow strongly again this year, up by around 1m b/day if current oil prices persist. Efficiency gains will occur but be offset by cost inflation across the broader oil services supply chain, with bottlenecks around the availability of high quality drilling and completion equipment. Improved capital discipline from shale producers will also feature, with fewer companies outspending their cashflows. Non-OPEC (ex US onshore) supply will hold up in 2018 but coming under increasing pressure as upstream capex cuts from 2015-17 start to bite. A dearth of new project sanctions and increasing decline rates on existing fields means that non-OPEC (ex US) oil production will decline into the end of the decade, even if oil prices increase from here.
Global oil demand is likely to remain robust as GDP growth, vehicle miles travelled and consumer demand habits mean that gasoline demand continues to grow. The non-OECD will deliver most of the growth in 2018, with China and India leading the way. Electric vehicles will come, but pose no threat to current oil demand growth.
Putting this supply and demand picture together, OECD oil inventories will likely normalize by the end of the year but the path will be bumpy. Historically, a decline in inventories has been supportive for oil prices, as we saw in the second half of 2017. Looking further ahead, we believe that continued oil demand growth, and a decline in non-OPEC supply outside the US, will raise the call on the US shale system and OPEC, and allow OPEC to manage the market to a higher price.
51
Energy equity valuations remain at depressed levels. On a relative price-to-book basis (versus the S&P500), the valuation of energy equities has fallen back to a 50 year low, at 0.5x, the same level that they were at in February 2016 when Brent oil was $29/bl. Low P/B ratio for the sector have been driven by poor levels of return on capital, but with better capital discipline, returns are now improving, and will drive higher valuations.
Free cashflow will become a growing priority in 2018, having been well received as a theme in 2017. Energy companies should be able improve free cashflow returns in 2018, via cost control and a reduction in unproductive capital, even in a static oil price environment. Looking ahead to 2019/2020, assuming a $60 oil price, we expect oil & gas companies to be able to grow shareholder distributions meaningfully for the first time in a decade. Super majors have the potential to raise distributions by around 40%, whilst mid and large cap producers could raise distributions by around 80%.
Energy equities offer attractive upside if our scenario plays out. If you believe, as we do, in a supportive oil price environment, or that return on capital will normalize (or both), our sensitivity work shows upside across the energy complex of around 35-45%.

| | | |
Tim Guinness | | January 2018 | |
| |  | | | 
| |
Will Riley | | Jonathan Waghorn | |
The Fund invests in foreign securities, which involve political, economic, currency risks, greater volatility, and differences in accounting methods. These risks are greater for emerging markets. The Fund is non-diversified, meaning that its assets may be invested in fewer individual holdings than diversified funds. Therefore, the Fund is more exposed to individual stock volatility than diversified funds. The Fund invests in smaller companies, which involve additional risks such as limited liquidity and greater volatility. The Fund's focus on the energy sector to the exclusion of other sectors exposes the Fund to greater market risk and potential monetary losses than if the Fund's assets were diversified among various sectors.
The MSCI World Energy Index is an unmanaged index composed of more than 1,400 stocks listed on exchanges in the U.S., Europe, Canada, Australia, New Zealand and the Far East. The S&P 500 Index is a market capitalization-weighted index composed of 500 widely held common stocks of U.S. companies. These indices are unmanaged and are not available for investment, and do not incur expenses.
MCF is an abbreviation denoting a thousand cubic feet of natural gas.
Price to Book Ratio (P/B Ratio) a ratio used to compare a stock's market value to its book value. It is calculated by dividing the current closing price of the stock by the latest quarter's book value per share.
P/E – Price to Earnings ratio is calculated by dividing current price of the stock by the company's trailing months' earnings per share.
Please refer to the Schedule of Investments for details on Fund holdings. Current and future portfolio holdings are subject to risk.
The information provided herein represents the opinion of Guinness Atkinson Asset Management, Inc. for the period stated and it is not intended to be a forecast of future events, a guarantee of future results, or investment advice. Opinions, Fund holdings and sector allocations are subject to change at any time, and are not recommendations to buy or sell any security.
52
Growth of $10,000
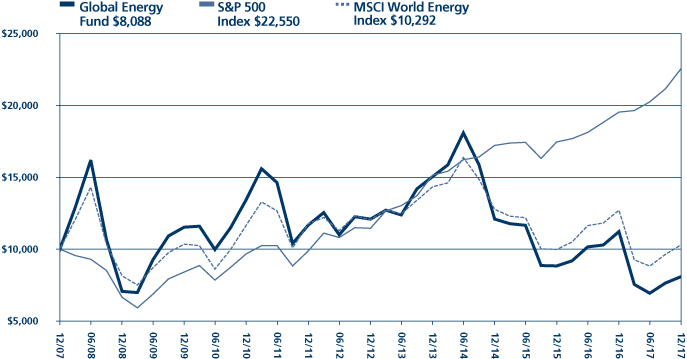
Average Annual Total Return
Periods Ended December 31, 2017
| One Years | | Five Years | | Ten Years | |
| | -1.06 | % | | | -1.69 | % | | | -2.10 | % | |
Performance data quoted represents past performance and does not guarantee future results. The investment return and principal value of an investment will fluctuate so that an investor's shares, when redeemed, may be worth more or less than their original cost. Current performance of the Fund may be lower or higher than the performance quoted. Performance data current to the most recent month end may be obtained by visiting www.gafunds.com.
Total returns for certain periods reflect a fee waiver in effect and in the absence of this waiver, the total returns would be lower. Returns reflect the reinvestment of distributions made by the Fund, if any. The graph and the performance table above do not reflect the deduction of taxes that a shareholder would pay on Fund distribution or the redemption of Fund shares.
The MSCI World Energy Index is an unmanaged index composed of more than 1,400 stocks listed on exchanges in the U.S., Europe, Canada, Australia, New Zealand and the Far East.
The S&P 500 Index is a broad based unmanaged index of 500 stocks, which is widely recognized as representative of the equity market in general. These indices are unmanaged, not available for investment and do not incur expenses.
53
FUND HIGHLIGHTS at December 31, 2017
GUINNESS ATKINSON GLOBAL ENERGY FUND
# of Holdings in Portfolio: | | | 39 | | |
Portfolio Turnover: | | | 6.3 | % | |
% of Stocks in Top 10: | | | 36.5 | % | |
Fund Managers: | |
Timothy W. N. Guinness | |
Will Riley | |
Jonathan Waghorn | |
Top 10 Holdings (% of net assets) | | | | | | | |
Suncor Energy, Inc. | | | 3.7 | % | | Royal Dutch Shell PLC - Class A | | | 3.6 | % | |
ConocoPhillips | | | 3.7 | % | | Schlumberger Ltd. | | | 3.6 | % | |
Halliburton Co. | | | 3.7 | % | | OMV AG | | | 3.6 | % | |
PetroChina Co., Ltd. - H Shares | | | 3.7 | % | | CNOOC Ltd. | | | 3.6 | % | |
Devon Energy Corp. | | | 3.7 | % | | Occidental Petroleum Corp. | | | 3.6 | % | |
Industry Breakdown (% of net assets) | | | | | | | |
Oil & Gas - Exploration & Production | | | 42.8 | % | | Energy - Alternate Sources | | | 2.2 | % | |
Oil & Gas - Integrated | | | 38.6 | % | | Oil & Gas - Drilling | | | 0.4 | % | |
Oil & Gas - Field Services | | | 9.2 | % | | Financials - Investment Companies | | | 0.3 | % | |
Oil Refining & Marketing | | | 3.6 | % | | Machinery - General Industries | | | 0.1 | % | |
Oil & Gas - Pipelines and Transportation | | | 3.5 | % | | | | | | | | | |
54
SCHEDULE OF INVESTMENTS
at December 31, 2017
GUINNESS ATKINSON GLOBAL ENERGY FUND
Shares | | COMMON STOCKS: 100.7% | | Value | |
Energy – Alternate Sources: 2.2% | | | |
| | 63,302 | | | JA Solar Holdings Co., Ltd. - ADR* | | $ | 472,233 | | |
| | 25,300 | | | SunPower Corp.* | | | 213,279 | | |
| | | | | | | | 685,512 | | |
Financials – Investment Companies: 0.3% | | | |
| | 10,000,000 | | | Reabold Resources PLC*† | | | 108,012 | | |
Machinery – General Industries: 0.1% | | | |
| | 182,956 | | | Shandong Molong Petroleum Machinery Co., Ltd. - H Shares* | | | 29,891 | | |
Oil & Gas – Drilling: 0.4% | | | |
| | 4,183,812 | | | Cluff Natural Resources PLC*† | | | 133,590 | | |
Oil & Gas – Exploration & Production: 42.8% | | | |
| | 26,409 | | | Apache Corp. | | | 1,114,988 | | |
| | 31,200 | | | Canadian Natural Resources Ltd. | | | 1,114,959 | | |
| | 798,000 | | | CNOOC Ltd. | | | 1,145,452 | | |
| | 21,200 | | | ConocoPhillips | | | 1,163,668 | | |
| | 28,000 | | | Devon Energy Corp. | | | 1,159,200 | | |
| | 988,710 | | | EnQuest PLC* | | | 381,822 | | |
| | 23,643 | | | Hess Corp. | | | 1,122,333 | | |
| | 575,230 | | | JKX Oil & Gas PLC*† | | | 84,894 | | |
| | 35,686 | | | Newfield Exploration Co.* | | | 1,125,180 | | |
| | 38,670 | | | Noble Energy Inc. | | | 1,126,844 | | |
| | 58,300 | | | Oasis Petroleum Inc.* | | | 490,303 | | |
| | 15,500 | | | Occidental Petroleum Corp. | | | 1,141,730 | | |
| | 46,199 | | | Ophir Energy PLC* | | | 42,553 | | |
| | 50,500 | | | QEP Resources Inc.* | | | 483,285 | | |
| | 1,890,000 | | | Sino Gas & Energy Holdings Ltd.* | | | 229,793 | | |
| | 249,550 | | | SOCO International PLC | | | 376,823 | | |
| | 252,040 | | | Tullow Oil PlC* | | | 705,150 | | |
| | 26,297 | | | Unit Corp.* | | | 578,534 | | |
| | | | | | | | 13,587,511 | | |
Oil & Gas – Field Services: 9.2% | | | |
| | 23,800 | | | Halliburton Co. | | | 1,163,106 | | |
| | 80,980 | | | Helix Energy Solutions Group, Inc.* | | | 610,589 | | |
| | 17,100 | | | Schlumberger Ltd. | | | 1,152,369 | | |
| | | | | | | | 2,926,064 | | |
The accompanying notes are an integral part of these financial statements.
55
Shares | | COMMON STOCKS: 100.7% (Continued) | | Value | |
Oil & Gas – Integrated: 38.6% | | | |
| | 160,120 | | | BP PLC | | $ | 1,131,265 | | |
| | 9,000 | | | Chevron Corp. | | | 1,126,710 | | |
| | 64,780 | | | ENI SpA | | | 1,074,115 | | |
| | 238,030 | | | Gazprom OAO - ADR | | | 1,049,797 | | |
| | 33,701 | | | Imperial Oil Ltd. | | | 1,051,782 | | |
| | 18,048 | | | OMV AG | | | 1,147,708 | | |
| | 1,665,000 | | | PetroChina Co., Ltd. - H Shares | | | 1,160,901 | | |
| | 34,610 | | | Royal Dutch Shell PLC - Class A | | | 1,152,682 | | |
| | 52,010 | | | Statoil ASA | | | 1,113,698 | | |
| | 31,976 | | | Suncor Energy, Inc. | | | 1,173,980 | | |
| | 19,510 | | | Total SA | | | 1,077,718 | | |
| | | | | | | | 12,260,356 | | |
Oil & Gas – Pipelines and Transportation: 3.5% | | | |
| | 28,100 | | | Enbridge Inc. | | | 1,098,991 | | |
Oil Refining & Marketing: 3.6% | | | |
| | 12,369 | | | Valero Energy, Corp. | | | 1,136,835 | | |
| | | | | Total Common Stocks
(cost $36,785,324) | | | 31,966,762 | | |
| | | | | Total Investments in Securities
(cost $36,785,324): 100.7% | | | 31,966,762 | | |
| | | | | Liabilities in Excess of Other Assets: (0.7%) | | | (207,780 | ) | |
| | | | | Net Assets: 100.0% | | $ | 31,758,982 | | |
* Non-income producing security.
ADR - American Depository Receipt
PLC - Public Limited Company
† The Advisor has determined these securities to be Illiquid. As of December 31, 2017, the total market value of these illiquid securities represent 1.0% of net assets.
The accompanying notes are an integral part of these financial statements.
56
GUINNESS ATKINSON GLOBAL INNOVATORS FUND for the period ended December 31, 2017
1. Performance
AVERAGE ANNUAL TOTAL RETURNS
| | | 1 Year | | 3 Years | | 5 Years | | 10 Years | |
Fund | |
Investor Class | | | 34.75 | % | | | 12.68 | % | | | 18.53 | % | | | 9.29 | % | |
Institutional Class | | | 35.07 | % | | | 12.87 | % | | | 18.65 | % | | | 9.35 | % | |
Benchmark Indices: | |
MSCI World Index | | | 23.10 | % | | | 9.91 | % | | | 12.30 | % | | | 5.68 | % | |
Nasdaq Composite Index | | | 29.71 | % | | | 14.83 | % | | | 19.18 | % | | | 11.35 | % | |
S&P 500 Index | | | 21.80 | % | | | 11.40 | % | | | 15.77 | % | | | 8.48 | % | |
The Fund's gross and net expense ratios for Investor Class shares are 1.35% and 1.24%, respectively, and for Institutional Class shares, 1.38% and 0.99%, respectively, per the Summary Prospectus dated May 3, 2017. For the Fund's current six-month expense ratios, please refer to the Financial Highlights section of this report. The Advisor has contractually agreed to reimburse other Fund expenses so that the Fund's ratio of expenses to average daily net assets of the Investor Class shares and Institutional Class shares will not exceed 1.24% and 0.99%, respectively (excluding Acquired Fund Fees and Expenses, interest, taxes, dividends on short positions, and extraordinary expenses) through June 30, 2018. To the extent that the Advisor absorbs expenses, it may seek repayment of a portion or all of such amounts at any time within the three fiscal years after the fiscal year in which such amounts were absorbed, subject to the applicable cap.
Performance data quoted represents past performance and does not guarantee future results. The investment return and principal value of an investment in the Fund will fluctuate so that an investor's shares, when redeemed, may be worth more or less than their original cost. Current performance of the Fund may be lower or higher than the performance quoted. Performance data current to the most recent month-end may be obtained by visiting www.gafunds.com, or calling (800) 915-6565.
Total returns for certain periods reflect expense limitations in effect and, in the absence of these imitations, total returns would have been lower.
"Political noise, market poise" suitably characterises the year of 2017. Equity markets persistently defied the sceptics, who pointed to political dysfunction, monetary policy uncertainty, and potential geopolitical crises as reasons for woe. Instead, the year saw well-diversified global growth, with many equity indices hitting new highs.
Over the period (December 31, 2016 to December 31, 2017), the Fund was up 34.75%, versus the MSCI World Index, which was up 23.10%. The Fund therefore outperformed the Index by 11.65% over the year. The short-term and long-term performance of the strategy remains very strong versus the index.
2017 provided strong global equity returns (MSCI World Index up 23.10% in USD over the year) even with continued uncertainty from the political events of 2016. Despite various warnings throughout the year from market commentators of overvalued equity markets, the year ended looking stronger than it has done in previous years, with improving economic indicators and growing earnings seen in most regions around the world. The MSCI World Index recorded its first ever year of posting a positive total return in every single month and hit a remarkable sequence of 14 months of positive returns (TR in USD).
57
Figure 1: Sector performance in 2017 (Total Return in USD). Bloomberg and Guinness Atkinson Asset Management

Figure 1 above illustrates the individual sector performances of the MSCI World Index over 2017. The big winners in 2017 were information technology (IT) companies with all other sectors posting strong performance over the period. All sectors returned 15% or above except the Telecom Services Sector and the Energy Sector, which posted total returns of "only" 7% and 6% respectively.
Geographically, Asia and the Emerging Markets were the best-performing regions, as Figure 2 below highlights. However, all regions showed strong returns, with Europe, Japan and the U.S. exceeding returns of 20% (total return, in USD). In local currency terms, Europe had a lower return of 11% whilst Japan was up 20%.
Figure 2: Regional performance in 2017 (Total Return in USD). Bloomberg and Guinness Atkinson Asset Management
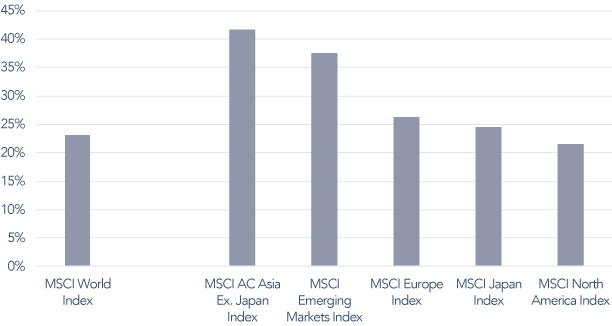
Historically, the Global Innovators Fund has tended to outperform in months where the index performance has been positive and underperform in months where the index performance has been negative. In a year where markets rallied strongly, the picture held true especially regarding the asymmetrically positive upside. The months where the Fund underperformed in positive markets were February, November and December. In February, we saw a shift into defensive stocks, with especially strong performance from Health Care, Consumer Staples and Utilities. Our current underweight to these defensive sectors meant we
58
therefore didn't partake fully in this rally. Certain cyclical sectors such as IT (which we are overweight) also performed well, which was a positive for the Fund. Corporate earnings season resulted in some larger idiosyncratic stock movements. Weaker-than-expected results from WisdomTree and Schneider Electric sent their shares down 11% and 5% respectively. H&R Block's shares declined 4% as the market continued to worry about the upcoming tax season.
In November and December, there was some notable sector rotation – perhaps a healthy way for the market to consolidate some gains without the overall market suffering to any significant degree. U.S. tax reform prompted a rotation out of Technology stocks, the year's best-performing sector, and into firms seen to benefit the most from a potential reduction in the corporate tax rate, such as banks. Technology companies are expected to see little boost, as the industry's average effective tax rate of 18.5% is already lower than the new level of 21% passed by the U.S. Congress. Smaller, more domestically focused U.S. stocks are expected to benefit the most from a lower tax rate.
Towards the end of November, the Information Technology sector sold off, which appeared to be driven by concerns raised in a Morgan Stanley analyst report that the cycle was peaking for memory chips. This resulted in chip manufacturers and equipment makers leading the sell-off. This then led to other Information Technology companies (such as Facebook, Alphabet) selling off, although this didn't seem to be driven by any fundamental changes. End-of-year profit-taking has been suggested as an explanation for the fall.
In the context of the entire year, Technology stocks – where the Fund has a big overweight (the Fund with 51% on average over 2017, versus the MSCI World Index with 16% on average) – have performed very strongly. Over the year, Information Technology was the biggest contributor to positive total attribution of the Fund. A zero weighting to Materials meant the Fund did not participate in the commodities rally significantly. Similarly, the Fund had a low exposure to the banking industry, which also rallied throughout the year as the expectation and materialisation of interest rate increases boosted the prospects for their returns.
On a stock-specific basis, strong earnings growth from companies in the Information Technology sector (Nvidia, AAC Technologies) aided performance. However, strong performance from stocks in other sectors also contributed to the overall outperformance of the Fund, such as the Industrial sector (Boeing, Fanuc and Roper Technologies) and Consumer Discretionary (primarily New Oriental Education, and Nike rallying in Q4). These strong positive returns more than offset the weaker performing stocks (Qualcomm, Schlumberger).
One factor that explains in part the strong performance of the Fund over the year is the outperformance of growth stocks that began in earnest in January 2017, as can be seen in figure 3 below.
Figure 3: Value vs growth index performance since January 2017 (Total Return in USD)
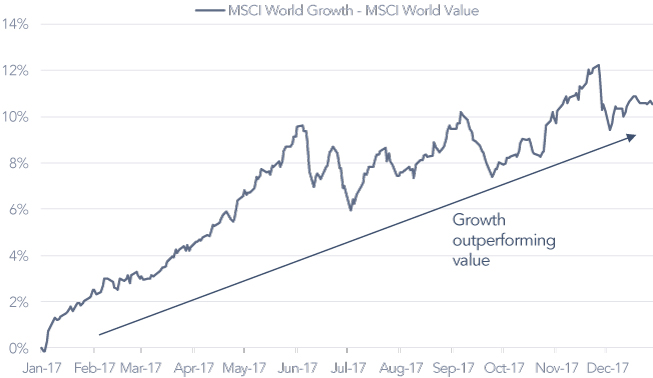
59
Although we are investing for growth, our valuation discipline and bottom-up approach means we have generally steered away from the most expensive parts of the growth universe. The growth rally we saw throughout the year benefitted some of the more cyclically-oriented businesses we held as the market began to price in the combination of improving earnings growth and better prospects for economic growth.
2. Activity
We sold four positions and initiated four new positions over the course of 2017, three less than in 2016 and slightly below the long-term turnover of the strategy.
We made one change to the portfolio in the first quarter. We sold H&R Block and replaced it with Catcher Technology.
H&R Block, the U.S.-based tax preparation company, was first purchased for the strategy in October 2012, so it had been a long-term holding. Over our holding period the company went through quite significant changes. In particular, the spinning off of its banking arm in 2014 released the company from the regulatory burden and capital requirements associated with that business. This was well received by the market and the company added significantly to the performance of the Fund from our first purchase in 2012 to the end of 2015. However, through 2016 the company posted a series of weak quarterly results as it appeared competition in the market place, particularly from the 'do-it-yourself' online tax returns model, had begun to erode its dominant position. This was reflected by sharp declines in the share price over this period. The quarterly results released in early March 2017 surprised to the upside, however, mainly as the market had become too pessimistic rather than results being obviously positive. The subsequent spike upwards in the share price provided us an opportune moment to exit our position. The valuation of the company is undemanding (around 13.5x 2017 expected earnings) but we found it hard to see where the growth we are looking for could come from and it appears that, for now at least, the company has lost its competitive edge. We felt our conviction was not strong enough to justify holding the stock through the next quarterly results (for the year ending April and released in June). These results were key as the company's earnings are so seasonally skewed due to the tax year.
Catcher Technology is a Taiwanese-listed technology company that specializes in the manufacture of metallic casing for devices. Historically, sales were dominated by notebooks, but this has shifted to smartphones as more high-end phone suppliers moved to metallic casings following Apple's iPhone 5. This does mean the company has a handful of clients dominating its revenue stream (Apple, Samsung, for example) but also provides opportunity, as these companies search for the most innovative casings for their newest phones. The latest cases will be a combination of both metal and glass (or laminate) and will be more technically difficult to produce. This is reflected in the high operating margins the company has managed to achieve (around 30%) and which we believe they can defend in the future. From a quality perspective, the company has maintained a high return on capital for a significant period and has been growing this year-on-year, suggesting management has been allocating capital successfully. The company is exposed to the business cycle and is cyclical by nature but the uptick in earnings estimates and cheap valuation (just over 10X 2017 expected earnings) give reasonable margins of safety, in our opinion.
The overall effect on the portfolio was to reduce our exposure to the Consumer Discretionary sector and the U.S. and increase our exposure to Asia and the IT sector.
We did not make any changes to the portfolio in the second quarter.
We made two changes to the portfolio in the third quarter. We sold positions in Gilead and Qualcomm and initiated new positions in Facebook and Continental.
Gilead, the U.S.-based biopharmaceutical company, has been held in the strategy since October 2010. It has done well from its innovative Hepatitis C and HIV drugs, but is losing market share due to competition and pricing from generic products, in part due to the expiry of a patent for an active ingredient in some of its key drugs. This has started to erode revenues and earnings and the amount of debt has been rising, albeit alongside a large cash pile. We therefore decided to sell our full position in Gilead. Gilead has been one of our most successful holdings, rising almost 400% over our holding period, in a time the market "only" rallied around 100% (total return in USD).
Qualcomm, the U.S. multinational semiconductor and telecommunications equipment company, designs chips for 4G and next-generation mobile technologies. The company has been held in the Global Innovators Fund since October 2013. Qualcomm's sales may be impacted by lawsuits against its royalty model from Apple and stressed by a falling share of the smartphone chip market. Qualcomm also faces revenue pressures as smartphone shipments slow and prices for its chips drop amid rising competition among the chip manufacturers. In addition, we believe over the next few years we will see more in-house chips from the major
60
smartphone manufacturers. For these reasons, in combination with a declining cash flow return on investment, we decided it was time to sell our entire position in Qualcomm.
In the quarter, we bought Facebook, the social media company, on the prospect of continued strong earnings growth which we believe the market is not appreciating. The company generates revenue through targeted advertising to over two billion users who regularly use its social media platform. There is significant earnings potential in Facebook's unmonetized apps such as WhatsApp and Messenger, which each have significant user bases. There is upside potential in the average revenue per user (ARPU) growth in the U.S., as Facebook still accounts for a relatively small percentage of the total revenue spend per person in the U.S. There is also upside potential in ARPU in the rest of the world, especially Europe and Asia. In our upside case, we note that user growth could accelerate in Asia, especially in India. Facebook's cash flow return on investment has grown considerably over the last few years. Combined with a strong balance sheet (with no debt) and stable-to-growing margins, we think this makes Facebook a good addition to the portfolio.
Continental, the German automotive manufacturing company, was traditionally known as a tire manufacturer. Today, over half its revenue comes from automotive systems, which cover a range of innovative technologies set to improve the automotive industry. Continental has expertise in safety technologies, efficiency improvement in internal combustion engines, battery management systems, comfort and security. It is well positioned to take advantage of a shift towards smarter and connected cars and autonomous driving. Continental has a stable and high cash flow return on investment, low debt, and margins which are higher than its peers, indicating its leading position in the tire and automotive industry.
The overall effect of these changes was to reduce our exposure to Health Care and increase our exposure to Consumer Discretionary. It also had the effect of increasing our exposure to Europe and reducing our exposure to the U.S.
We made one change to the portfolio in the fourth quarter. We sold our position in Schlumberger and bought a new position in Anta Sports.
Schlumberger, the global oil and gas services company, was our only Energy sector holding. In recent times we have grown increasingly worried about the company's falling cash flow return on investment and this has been accompanied by stagnant capital growth. In our opinion, the company's inability to sustain healthy margins and grow its earnings has put the stock out of favour, especially at a time where industry-wide factors are hampering the performance of energy stocks. We believe there remain significant headwinds for the company as many of their customers are drastically cutting their capital expenditure plans.
We bought ANTA Sports to replace Schlumberger, sticking to our one-in, one-out policy. ANTA Sports, based in China, has a stellar cash flow return on investment of over 10%, over the last 10 years. The company generates revenue through the manufacture and trading of sporting goods, including footwear, apparel and accessories. Its brand portfolio includes ANTA, ANTA KIDS, FILA, FILA KIDS and NBA, and the company is also looking to new brands, such as South Korea's Kolon. Looking at the financials, ANTA Sports has very solid margin growth alongside a surge in sales in recent years. The company is well positioned to benefit from the growing wealth in China and recovering economy, and has maintained low debt. We have conviction that the stock has potential to sustain its earnings growth.
The overall effect of these changes was to reduce our exposure to the Energy sector and increase our exposure to the Consumer Discretionary sector, whilst also decreasing our exposure to the U.S. and increasing our exposure to Asia.
3. Portfolio Position
The overall effect of the changes made to the portfolio over the year was to reduce our exposure to Health Care and Energy and increase our exposure to IT and Consumer Discretionary. We now have no holdings in Energy and we still have no holdings in Consumer Staples, Materials, Telecommunications, Utilities or Real Estate.
61
Sector allocation at 12/31/17 | |
Consumer Discretionary | | | 17.1 | % | |
Consumer Staples | | | 0.0 | % | |
Energy | | | 0.0 | % | |
Financials | | | 6.7 | % | |
Health Care | | | 6.7 | % | |
Industrials | | | 20.1 | % | |
Information Technology | | | 48.8 | % | |
Materials | | | 0.0 | % | |
Real Estate | | | 0.0 | % | |
Telecommunication Services | | | 0.0 | % | |
Utilities | | | 0.0 | % | |
Cash | | | 0.6 | % | |
Total | | | 100.0 | % | |
4. Outlook
As we reflect on 2017 and look forward to 2018, there is still considerable uncertainty in markets. Even though earnings growth has started to pick up, with a positive backdrop of improving economic growth around the world, we are still conscious of the historically high valuations seen in markets.
On the political front, 2017 saw populist political parties gain ground around Europe many of which have anti-immigration, anti-EU, and protectionist policies at their heart. Indeed, in December a new Austrian government took office consisting of a coalition between the conservative People's Party and the right-wing populist Freedom Party. In Germany, Angela Merkel failed to win a majority government, as the Alternative for Germany party made gains. In 2018, two major populist parties – the Five-Star Movement and the Northern League – are hoping to win Italy's May elections. As the Trump administration enters its second year, there are legislative challenges, midterm elections and threats from abroad to deal with. Republicans will be keen to progress a legislative agenda before attention shifts to the midterm elections.
Central bank policy will remain a vital driver of the markets in 2018. The solid economic performance of the U.S. in 2017 has led analysts to expect at least three rate hikes in 2018. The Eurozone is experiencing strong growth rates, but currently markets do not expect any rate hikes in 2018. The ECB has left open the option of increasing stimulus if economic conditions shift.
Uncertainty appears set to continue into the year ahead, but our investment process has never been one in which we try to position the portfolio based on a macro view or to capture any short-term trends. Even though this portfolio is focused predominantly on growth opportunities, we have always employed a value discipline and it has served us well. Value in this context does not mean simply optically cheap stocks. It means identifying companies where profitable growth opportunities exist and the market underappreciates these opportunities. More importantly, it means avoiding companies with characteristics that are statistically likely to destroy your capital. Weak businesses are one way to destroy capital. Companies with excessive valuations are another way. It is the combination of a weak business and excessive valuation that is most likely to lose you money, and we will always seek to avoid these companies. We will continue to focus on companies that can avoid the competitive threat of their peers, that have healthy balance sheets, that are earning returns on capital above their cost of capital and growing their economic profit, and that can reinvest their cash flows in profitable projects which can grow their business sustainably in the future.
In summary, the four key tenets to our approach are innovation, quality, growth, and conviction. This philosophy is reflected in the metrics of the Fund. The Fund has superior characteristics to the broad market, higher spend on intellectual property, less capital intensiveness, far higher cash flow returns on investment, net cash, with higher growth prospects, at only a slight premium in terms of valuation.
62
We wish you a happy and prosperous New Year, and we look forward to updating you on the progress of the Fund over the course of 2018.

| | 
| | | |
Matthew Page | | Ian Mortimer | | January 2018 | |
The Fund invests in foreign securities, which involve political, economic and currency risks, greater volatility, and differences in accounting methods. These risks are greater for emerging markets. The Fund is non-diversified, meaning that its assets may be invested in fewer individual holdings than diversified funds. Therefore, the Fund is more exposed to individual stock volatility than diversified funds. The Fund invests in smaller companies, which involve additional risks such as limited liquidity and greater volatility.
The approach of the Fund is not to provide access to the most innovative companies in the world but rather to look at companies using the 'prism' of innovation to highlight those we think might be winners in the future – and then only buy them if they are offering reasonable value compared to those future expectations. We are firm believers that innovative companies can outperform in the future and that a value discipline to stock selection will add meaningfully to that performance.
The MSCI World Index is a free float-adjusted market capitalization weighted index that is designed to measure the equity market performance of developed markets. The Standard & Poor's 500 Index is a market capitalization-weighted index composed of 500 widely held common stocks of U.S. companies. The Nasdaq Composite Index is a market capitalization-weighted index that is designed to represent the performance of the National Market System, which includes over 5,000 stocks traded only over-the-counter and not on an exchange. These indices are unmanaged and are not available for investment, and do not incur expenses.
Cash flow measures the cash generating capability of a company by adding non-cash charges (e.g. depreciation) and interest expense to pretax income.
Earnings growth is not representative of the Fund's future performance.
The information provided herein represents the opinion of Guinness Atkinson Asset Management, Inc. for the period stated and is not intended to be a forecast of future events, a guarantee of future results, or investment advice. Opinions, Fund holdings and sector allocations are subject to change at any time, and are not recommendations to buy or sell any security.
63
Growth of $10,000

| | | Average Annual Total Return
Periods Ended December 31, 2017 | |
| | | One Year | | Five Years | | Ten Years | |
Investor Class | | | 34.75 | % | | | 18.53 | % | | | 9.29 | % | |
Institutional Class1 | | | 35.07 | % | | | 18.65 | % | | | 9.35 | % | |
Performance data quoted represents past performance and does not guarantee future results. The investment return and principal value of an investment will fluctuate so that an investor's shares, when redeemed, may be worth more or less than their original cost. Current performance of the Fund may be lower or higher than the performance quoted. Performance data current to the most recent month end may be obtained by visiting www.gafunds.com.
The performance graph above is shown for the Fund's Investor Class shares; Institutional Class shares performance may vary.
Total returns for certain periods reflect a fee waiver in effect and in the absence of this waiver, the total returns would be lower. Returns reflect the reinvestment of distributions made by the Fund, if any. The graph and the performance table above do not reflect the deduction of taxes that a shareholder would pay on Fund distribution or the redemption of Fund shares.
The MSCI World Index is a free float-adjusted market capitalization weighted index that is designed to measure the equity market performance of developed markets. The Standard & Poor's 500 Index is an unmanaged index which is widely regarded as the standard for measuring large cap U.S. stock market performance. The Nasdaq Composite Index is a market capitalization weighted index that is designed to represent the performance of the National Market System which includes over 5,000 stocks traded only over-the-counter and not on an exchange. The indices referenced in this chart are not available for investment and do not incur expenses.
1 Performance information for the Institutional Class, prior to commencement of operations on December 31, 2015, is based on the performance of Investor Class, and adjusted for the lower expenses applicable to Institutional Class
64
FUND HIGHLIGHTS at December 31, 2017
GUINNESS ATKINSON GLOBAL INNOVATORS FUND
# of Holdings in Portfolio: | | | 30 | | |
Portfolio Turnover: | | | 19.9 | % | |
% of Stocks in Top 10: | | | 35.9 | % | |
Fund Managers: | |
Matthew Page | |
Dr. Ian Mortimer | |
Top 10 Holdings (% of net assets) | | | | | | | |
Samsung Electronics Co., Ltd. | | | 3.8 | % | | Boeing Co. | | | 3.6 | % | |
WisdomTree Investments Inc. | | | 3.7 | % | | Intel Corp. | | | 3.5 | % | |
FANUC Corp. | | | 3.6 | % | | Shire PLC | | | 3.5 | % | |
Infineon Technologies AG | | | 3.6 | % | | PayPal Holdings Inc. | | | 3.5 | % | |
New Oriental Education & Technology Group Inc. | | | 3.6 | % | | Cisco Systems Inc. | | | 3.5 | % | |
Industry Breakdown (% of net assets) | | | | | | | |
Electronic Components - Semiconductor | | | 14.2 | % | | Rubber-Tires | | | 3.4 | % | |
Diversified Manufacturing Operations | | | 9.8 | % | | Metal Processors & Fabricators | | | 3.3 | % | |
Computers | | | 5.7 | % | | Retail - Apparel | | | 3.3 | % | |
Investment Management/Advisor Service | | | 3.7 | % | | Web Portals | | | 3.3 | % | |
Aerospace/Defense | | | 3.6 | % | | Application Software | | | 3.2 | % | |
Industrial Automation/Robot | | | 3.6 | % | | Internet Content | | | 3.2 | % | |
Schools | | | 3.6 | % | | Machinery | | | 3.2 | % | |
Pharmaceuticals | | | 3.5 | % | | Power Conversion/Supply Equipment | | | 3.2 | % | |
Athletic Footwear | | | 3.4 | % | | Enterprise Software/Services | | | 3.1 | % | |
Cable/Satellite TV | | | 3.4 | % | | Semiconductor | | | 3.1 | % | |
Commercial Services | | | 3.4 | % | | Finance - Other Services | | | 3.0 | % | |
Networking Products | | | 3.4 | % | | Electronic Components - Miscelanous | | | 2.8 | % | |
65
SCHEDULE OF INVESTMENTS
at December 31, 2017
GUINNESS ATKINSON GLOBAL INNOVATORS FUND
Shares | | COMMON STOCKS: 99.4% | | Value | |
Aerospace/Defense: 3.6% | | | |
| | 27,840 | | | Boeing Co. | | $ | 8,210,294 | | |
Application Software: 3.2% | | | |
| | 72,050 | | | Check Point Software Technologies Ltd.* | | | 7,465,821 | | |
Athletic Footwear: 3.4% | | | |
| | 124,500 | | | NIKE Inc. | | | 7,787,475 | | |
Cable/Satellite TV: 3.4% | | | |
| | 196,070 | | | Comcast Corp. - Class A | | | 7,852,604 | | |
Commercial Services: 3.4% | | | |
| | 107,750 | | | Paypal Holdings, Inc.* | | | 7,932,555 | | |
Computers: 5.7% | | | |
| | 107,780 | | | Cognizant Technology Solutions Corp. - A Shares | | | 7,654,536 | | |
| | 306,710 | | | Verifone Systems Inc.* | | | 5,431,834 | | |
| | | | | | | | 13,086,370 | | |
Diversified Manufacturing Operations: 9.8% | | | |
| | 79,720 | | | Danaher Corp. | | | 7,399,610 | | |
| | 92,450 | | | Eaton Corp. PLC | | | 7,304,475 | | |
| | 55,370 | | | Siemens AG | | | 7,728,548 | | |
| | | | | | | | 22,432,633 | | |
Electronic Components – Miscelanous: 2.8% | | | |
| | 361,000 | | | AAC Technologies Holdings Inc. | | | 6,443,934 | | |
Electronic Components – Semiconductor: 14.2% | | | |
| | 300,000 | | | Infineon Technologies AG | | | 8,228,142 | | |
| | 173,930 | | | Intel Corp. | | | 8,028,609 | | |
| | 39,385 | | | NVIDIA Corp. | | | 7,620,998 | | |
| | 7,240 | | | Samsung Electronics Co., Ltd. - GDR | | | 8,697,572 | | |
| | | | | | | | 32,575,321 | | |
Enterprise Software/Services: 3.1% | | | |
| | 64,020 | | | SAP SE | | | 7,198,991 | | |
Finance – Other Services: 3.0% | | | |
| | 98,650 | | | Intercontinental Exchange, Inc. | | | 6,960,744 | | |
Industrial Automation/Robot: 3.6% | | | |
| | 34,400 | | | FANUC Corp. | | | 8,270,377 | | |
Internet Content: 3.2% | | | |
| | 42,290 | | | Facebook Inc.* | | | 7,462,493 | | |
Investment Management/Advisor Service: 3.7% | | | |
| | 669,940 | | | WisdomTree Investments Inc. | | | 8,407,747 | | |
The accompanying notes are an integral part of these financial statements.
66
Shares | | COMMON STOCKS: 99.4% (Continued) | | Value | |
Machinery: 3.2% | | | |
| | 28,190 | | | Roper Industries, Inc. | | $ | 7,301,210 | | |
Metal Processors & Fabricators: 3.3% | | | |
| | 684,000 | | | Catcher Technology Co., Ltd. | | | 7,556,399 | | |
Networking Products: 3.4% | | | |
| | 206,985 | | | Cisco Systems Inc. | | | 7,927,525 | | |
Pharmaceuticals: 3.5% | | | |
| | 151,380 | | | Shire PLC | | | 7,983,187 | | |
Power Conversion/Supply Equipment: 3.2% | | | |
| | 87,900 | | | Schneider Electric SE | | | 7,457,682 | | |
Retail – Apparel: 3.3% | | | |
| | 1,680,000 | | | ANTA Sports Products Ltd. | | | 7,632,286 | | |
Rubber-Tires: 3.4% | | | |
| | 28,750 | | | Continental AG | | | 7,783,770 | | |
Schools: 3.6% | | | |
| | 87,500 | | | New Oriental Education & Technology Group Inc. - ADR | | | 8,225,000 | | |
Semiconductor: 3.1% | | | |
| | 137,610 | | | Applied Materials Inc. | | | 7,034,623 | | |
Web Portals: 3.3% | | | |
| | 7,250 | | | Alphabet Inc. - A Shares* | | | 7,637,150 | | |
| | | | | Total Common Stocks
(cost $162,853,090) | | | 228,626,191 | | |
| | | | | Total Investments in Securities
(cost $162,853,090): 99.4% | | | 228,626,191 | | |
| | | | | Other Assets less Liabilities: 0.6% | | | 1,429,309 | | |
| | | | | Net Assets: 100.0% | | $ | 230,055,500 | | |
* Non-income producing security.
ADR - American Depository Receipt
GDR - Global Depository Receipt
PLC - Public Limited Company
The accompanying notes are an integral part of these financial statements.
67
GUINNESS ATKINSON RENMINBI YUAN & BOND FUND for the period ended December 31, 2017
1. Performance
AVERAGE ANNUALIZED TOTAL RETURN
| | | 1 Year | | 3 Years | | 5 Years | | Since
Inception
(06/30/11) | |
Fund | | | 9.79 | % | | | 0.54 | % | | | 1.17 | % | | | 1.52 | % | |
Indices: | |
RMB Cash Offshore (CNH)* | | | 7.09 | % | | | -1.55 | % | | | -0.91 | % | | | -0.12 | % | |
RMB Cash Onshore (CNY)* | | | 6.73 | % | | | -1.57 | % | | | -0.86 | % | | | -0.10 | % | |
iBoxx Hang Seng Markit Offshore RMB Overall Index | | | 11.19 | % | | | 2.41 | % | | | 2.84 | % | | | 2.72 | % | |
*Net change in exchange rate versus U.S. dollar.
The Fund's gross expense ratio is 4.35% and net expense ratio is 1.00% per the Summary Prospectus dated May 3, 2017. The Advisor has contractually agreed to waive a portion of its advisory fees and/or reimburse other Fund expenses so that the Fund's ratio of expenses to average daily net assets will not exceed 0.90% (excluding Acquired Fund Fees and Expenses, interest, taxes, dividends on short positions and extraordinary expenses) through at least June 30, 2018. To the extent that the Advisor waives fees and/or reimburses expenses, it may seek repayment of a portion or all of such amounts at any time within the three fiscal years after the fiscal year in which such amounts were waived and/or reimbursed, subject to the applicable cap.
Performance data quoted represents past performance and does not guarantee future results. The investment return and principal value of an investment will fluctuate so that an investor's shares, when redeemed, may be worth more or less than their original cost. Current performance of the Fund may be lower or higher than the performance quoted. Performance data current to the most recent month-end may be obtained by visiting www.gafunds.com, or calling (800) 915-6565.
The Fund imposes a 2% redemption fee on the sales of shares held less than 30 days. Performance data quoted does not reflect this redemption fee. Total returns for certain periods reflect expense limitations in effect and, in the absence of these limitations, total returns would have been lower.
The Fund rose 9.79% for the year to December 31. This reflects a better year for both currency and bonds. Investment Grade bonds, which form the bulk of the Fund's positions have not done quite as well as High Yield; hence the Fund has not done quite as well as the RMB Bond Offshore benchmark. However, the purpose of the Fund is to provide investors with exposure to renminbi (RMB) through investment in lower risk RMB-denominated assets, and the Fund has risen more after expenses than the 7.09% rally in the currency against the dollar in 2017.
Improvements in China have been visible this year, with stronger Gross Domestic Product (GDP) growth and improved profitability and pricing power in the non-financial corporate sector. Industrial profits grew 16% in the January to November period in 2017 compared to the same period last year, following 9% growth in 2016. Most non-financial corporate debt is concentrated here, where the rise in profits has improved companies' debt servicing capacity and eased pressure on the banking sector. In a study of 3,000 listed China A share companies, we deemed 30% of their debt was at risk; they had insufficient earnings before interest and tax (EBIT) to cover the interest expense for the year. By June 2017, debt at risk had fallen to 17% of total outstanding with the greatest improvements found amongst the materials and industrials sectors.
Further progress has been made in financial sector deleveraging and has been achieved without disruption. A steady stream of regulatory announcements has come out since November covering cash loans, liquidity management, bank trust products, entrusted loans, asset management, and a tightening of shadow-banking activity. In contrast to prior years, the banks are now being subjected to intense regulatory reform and scrutiny to ensure compliance. This improved backdrop has reduced the level and pace of capital outflows that pressured the currency last year and foreign exchange reserves have grown from the January low of $2,998 billion to $3,139 billion.
In the past year, the RMB strengthened against the dollar, ending the year at CNH6.5143:US$1 having climbed from a low of CNH6.9761 at the end of 2016. Moving into 2018, there were two more positive developments: first, the central bank removed its widely disliked 'countercyclical adjustment factor' from the fix calculation and second, the announcement of the German Bundesbank's decision (taken in June) to add the RMB to its foreign exchange reserves.
68
RENMINBI YUAN & BOND FUND
The offshore RMB bond market remains little changed, in terms of drivers, since last quarter. New issuance has been muted and dominated by financial institutions. Bond prices have been firm both as a result of improving currency expectations but also because the supply of new issuance is below the amount maturing and thus demand remains strong. The new Bond Connect scheme has not had much impact outside the sovereign area where we have seen the spread narrow between onshore and offshore yield curves to approximately 0.3%. Even there we can see that most of the convergence has come about through onshore sovereign yields rising. The 10-year yield onshore has reached 3.90% while offshore it is 4.21%
2. Portfolio Position
The portfolio is 63% invested in RMB-denominated bonds, with 36% held in RMB cash. Government and supranational issuers account for 14% of the portfolio and all but two of the portfolio's bonds are rated BBB or higher by Standard & Poor's. A further 12% of the portfolio carries no rating but we deem the bulk of those to be of equivalent quality to a BBB-rating or higher. The Fund replaced a number of bonds that matured during the period. Our approach remains, as it has since the Fund's launch, to focus on higher quality issues and to reduce risk.
3. Outlook and Strategy
We expect to see continued muted issuance in the offshore RMB bond market, which should continue to support valuations. The currency has continued to strengthen and is up 1.2% against the U.S. dollar in 2018. Financial sector reforms and the drive to bring down debt remain very much in force and we would expect this to reduce domestic liquidity and domestic growth. However, so far, the central bank has proved effective at mitigating these effects.
Attempts to predict the exchange rate are rarely successful, but we believe that today there is a 'comfort' range with outer boundaries of CNH6.30 and CNH 6.70 to one U.S. dollar. At CNH6.30 or below to one U.S. dollar, we would expect to hear protests from exporters; at CNH6.70 or greater to one U.S. dollar, we would expect mounting concerns of more capital outflows. At these boundaries, there may well be some intervention, but in between, assuming no sudden shifts, we believe it is likely the central bank, having discarded its 'adjustment factor', will leave the exchange rate alone. This, along with the financial sector reforms underway, is an important part of the preparation for the opening of the capital account.

Edmund Harriss
The Fund invests in foreign securities, which involve political, economic and currency risks, greater volatility, and differences in accounting methods. These risks are greater for emerging markets. The Fund is non-diversified, meaning that its assets may be concentrated in fewer individual holdings than diversified funds. Therefore, the Fund is more exposed to individual holding volatility than diversified funds. The Fund invests in smaller companies, which involve additional risks such as limited liquidity and greater volatility. Investments in debt securities typically decrease in value when interest rates rise, which can be greater for longer-term debt securities. The Fund may invest in derivatives, which involves risks different from, and in certain cases, greater than the risks presented by traditional investments. Investments focused in a single geographic region may be exposed to greater risk than investments diversified among various geographic regions.
The iBoxx Hang Seng Markit Offshore RMB Bond Index family is designed to track the performance of the offshore RMB bond market. This index is unmanaged and not available for investment, and does not incur expenses.
The RMB Cash Offshore (CNH) is the currency code for renminbi traded outside China in the offshore market.
The RMB Cash Onshore (CNY) is the international currency code for the renminbi.
Credit ratings are sourced from, Standard & Poor's (S&P), a nationally recognized statistical rating organization (NRSRO). The ratings represent the NSRSO's opinions as to the quality of the securities they rate. Ratings are relative and subjective, and are not absolute standards of quality. The Credit Quality Ratings reflected in this material are based on S&P's assigned rating of AAA as the highest to D as the lowest credit quality rating for each security held by the Fund. Investment grade bonds are typically those that are rated from AAA to BBB- by S&P. The credit quality breakdown does not give effect to the impact of any derivative investments, including but not limited to futures, options, and swaps, made by the Fund. Not Rated refers to a security that is not rated by the S&P, but may be rated by other NSRSOs.
69
RENMINBI YUAN & BOND FUND
EBIT is net income before interest and taxes added back to it, and can be used to analyze and compare profitability between companies and industries because it eliminates the effects of financing and accounting decisions.
Please refer to the Schedule of Investments for details on Fund holdings. Current and future portfolio holdings are subject to risk.
The information provided herein represents the opinion of Guinness Atkinson Asset Management, Inc. for the period stated and is not intended to be a forecast of future events, a guarantee of future results, or investment advice. Opinions, Fund holdings and sector allocations are subject to change at any time, and are not recommendations to buy or sell any security.
70
RENMINBI YUAN & BOND FUND
Growth of $10,000
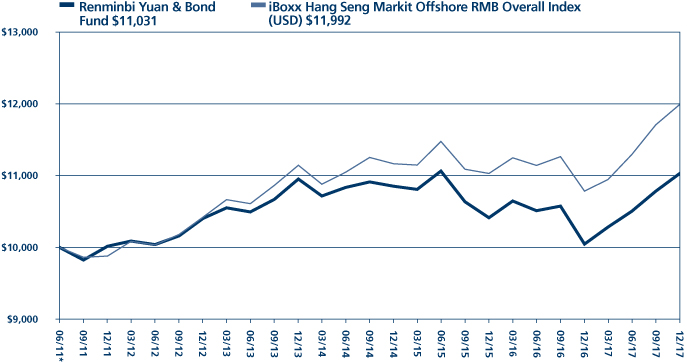
Average Annual Total Return
Periods Ended December 31, 2017
| One Year | | Five Years | | Since Inception
(06/30/11) | |
| | 9.79 | % | | | 1.17 | % | | | 1.52 | % | |
*Inception date 6/30/11.
Performance data quoted represents past performance and does not guarantee future results. The investment return and principal value of an investment will fluctuate so that an investor's shares, when redeemed, may be worth more or less than their original cost. Current performance of the Fund may be lower or higher than the performance quoted. Performance data current to the most recent month end may be obtained by visiting www.gafunds.com.
The Fund was previously benchmarked against the HSBC Offshore Bond Index. Calculation of this index ceased in April 2016 and accordingly the benchmark data is no longer available.
Total returns for certain periods reflect a fee waiver in effect and in the absence of this waiver, the total returns would be lower. Returns reflect the reinvestment of distributions made by the Fund, if any. The graph and the performance table above do not reflect the deduction of taxes that a shareholder would pay on Fund distribution or the redemption of Fund shares. The Fund imposes a 2% redemption fee on shares held less than 30 days.
The iBoxx Hang Seng Markit Offshore RMB Overall Index ("HSM iBoxx") captures the performance of debt denominated in Chinese yuan but issued and settled offshore. The index family offers a broad coverage of the offshore RMB bond universe.
71
FUND HIGHLIGHTS at December 31, 2017
GUINNESS ATKINSON RENMINBI YUAN & BOND FUND
# of Holdings in Portfolio: | | 13 | |
Portfolio Turnover: | | 66.2% | |
% of Investments in Top 10: | | 54.8% | |
Fund Manager: | |
Edmund Harriss | |
Top 10 Holdings (% of net assets) | |
Lenovo Group Ltd., 4.950%, 6/10/20 | | 5.9% | | Commonwealth Bank of Australia, 4.500%, 10/26/20 | | 5.8% | |
BMW Finance NV, 4.250% 10/18/20 | | 5.9% | | BP Capital Markets PLC, 3.650%, 02/28/19 | | 5.8% | |
BOC Aviation Pte. Ltd., 4.500%, 11/20/18 | | 5.8% | | National Bank of Canada, 4.300%, 10/11/20 | | 5.8% | |
The Korea Development Bank, 4.500%, 11/10/20 | | 5.8% | | International Finance Corp., 3.100%, 9/24/19 | | 4.1% | |
New World China Land, 5.500%, 2/06/18 | |
5.8% | | International Bank of Reconstruction &
Development, 3.250%, 7/23/18 | |
4.1% | |
Industry Breakdown (% of net assets) | | | | | | | |
Commercial Banks Non-US | | 11.5% | | Finance - Leasing Company | | 5.8% | |
Supranational Bank | | 10.9% | | Oil Company - Integrated | | 5.8% | |
Real Estate Operator/Developer | | 8.7% | | Special Purpose Banks | | 5.8% | |
Computers | | 5.9% | | Sovereign | | 2.9% | |
Auto-Cars/Light Trucks | | 5.9% | | | | | |
72
SCHEDULE OF INVESTMENTS
at December 31, 2017
GUINNESS ATKINSON RENMINBI YUAN & BOND FUND
Principal Amount (CNH) | | CORPORATE BONDS: 63.2% | | Value | |
Auto-Cars/Light Trucks: 5.9% | | | |
| | 1,000,000 | | | BMW Finance NV, 4.250% 10/18/20 | | $ | 154,070 | | |
Commercial Banks Non-US: 11.5% | | | |
| | 1,000,000 | | | Commonwealth Bank of Australia, 4.200%, 10/26/20 | | | 152,472 | | |
| | 1,000,000 | | | National Bank of Canada, 4.300%, 10/11/20 | | | 151,530 | | |
| | | | | | | | 304,002 | | |
Computers: 5.9% | | | |
| | 1,000,000 | | | Lenovo Group Ltd., 4.950%, 06/10/20 | | | 154,260 | | |
Finance – Leasing Company: 5.8% | | | |
| | 1,000,000 | | | BOC Aviation Pte. Ltd., 4.500%, 11/20/18 | | | 153,835 | | |
Oil Company – Integrated: 5.8% | | | |
| | 1,000,000 | | | BP Capital Markets PLC, 3.650%, 02/28/19 | | | 152,173 | | |
Real Estate Operator/Developer: 8.7% | | | |
| | 500,000 | | | Global Logistic Properties Ltd., 4.000%, 5/11/18 | | | 76,220 | | |
| | 1,000,000 | | | New World China Land Ltd., 5.500%, 02/06/18 | | | 153,350 | | |
| | | | | | | | 229,570 | | |
Sovereign: 2.9% | | | |
| | 500,000 | | | China Government Bond, 3.020%, 06/27/18 | | | 76,446 | | |
Special Purpose Banks: 5.8% | | | |
| | 1,000,000 | | | The Korea Development Bank, 4.500%, 11/10/20 | | | 153,445 | | |
Supranational Banks: 10.9% | | | |
| | 500,000 | | | Asian Development Bank, 2.850%,10/21/20 | | | 73,654 | | |
| | 700,000 | | | International Bank of Reconstruction & Development, 3.250%, 7/23/18 | | | 106,715 | | |
| | 710,000 | | | International Finance Corp., 3.100%, 9/24/19 | | | 107,126 | | |
| | | | | | | | 287,495 | | |
| | | | | Total Corporate Bonds
(cost $1,680,434) | | | 1,665,296 | | |
| | | | | Total Investments in Securities
(cost $1,680,434): 63.2% | | | 1,665,296 | | |
| | | | | China Yuan (Offshore): 35.6% | | | 937,325 | | |
| | | | | Other Assets less Liabilities: 1.2% | | | 32,031 | | |
| | | | | Net Assets: 100.0% | | $ | 2,634,652 | | |
The accompanying notes are an integral part of these financial statements.
73
STATEMENTS OF ASSETS AND LIABILITIES
at December 31, 2017
| | | Alternative
Energy
Fund | | Asia
Focus
Fund | | Asia Pacific
Dividend
Builder
Fund | | China &
Hong Kong
Fund | |
Assets | |
Investments in securities, at cost | | $ | 12,454,467 | | | $ | 11,307,294 | | | $ | 5,929,660 | | | $ | 49,677,881 | | |
Investments in securities, at value | | $ | 10,361,039 | | | $ | 19,746,379 | | | $ | 7,474,967 | | | $ | 78,206,062 | | |
Cash | | | 16,079 | | | | 175,563 | | | | 122,920 | | | | — | | |
Receivables: | |
Securities sold | | | 393,585 | | | | 423,203 | | | | — | | | | 225,774 | | |
Fund shares sold | | | 2,024 | | | | 20,001 | | | | 41,501 | | | | 10,324 | | |
Dividends and interest | | | 7,808 | | | | 1,459 | | | | 6,513 | | | | 86,258 | | |
Due from Advisor, net | | | — | | | | — | | | | 735 | | | | — | | |
Prepaid expenses | | | 2,636 | | | | 2,825 | | | | 1,719 | | | | 5,736 | | |
Total assets | | | 10,783,171 | | | | 20,369,430 | | | | 7,648,355 | | | | 78,534,154 | | |
Liabilities | |
Overdraft due to custodian bank | | | — | | | | — | | | | — | | | | 10,580 | | |
Payable for securities purchased | | | 30,005 | | | | — | | | | — | | | | — | | |
Payable for Fund shares redeemed | | | 29,628 | | | | 26,943 | | | | 197 | | | | 10,039 | | |
Due to Advisor, net | | | 314 | | | | 12,086 | | | | — | | | | 65,450 | | |
Accrued administration fees | | | 1,041 | | | | 1,064 | | | | 718 | | | | 2,698 | | |
Accrued shareholder servicing plan fees | | | 1,896 | | | | 2,043 | | | | 1,346 | | | | 6,803 | | |
Deferred trustees' compensation | | | 56,013 | | | | 90,828 | | | | 40,718 | | | | 182,559 | | |
Other accrued expenses | | | 35,631 | | | | 39,461 | | | | 28,083 | | | | 50,049 | | |
Total liabilities | | | 154,528 | | | | 172,425 | | | | 71,062 | | | | 328,178 | | |
Net Assets | | $ | 10,628,643 | | | $ | 20,197,005 | | | $ | 7,577,293 | | | $ | 78,205,976 | | |
Composition of Net Assets | |
Paid-in capital | | $ | 58,660,792 | | | $ | 11,738,861 | | | $ | 7,762,416 | | | $ | 49,251,403 | | |
Undistributed net investment income (loss) | | | (63,194 | ) | | | (99,273 | ) | | | (41,839 | ) | | | 473,979 | | |
Accumulated net realized gain (loss) on investments and foreign currency | | | (45,876,361 | ) | | | 118,191 | | | | (1,688,587 | ) | | | (47,532 | ) | |
Net unrealized appreciation (depreciation) on: | |
Investments | | | (2,093,428 | ) | | | 8,439,085 | | | | 1,545,307 | | | | 28,528,181 | | |
Foreign currency | | | 834 | | | | 141 | | | | (4 | ) | | | (55 | ) | |
Net Assets | | $ | 10,628,643 | | | $ | 20,197,005 | | | $ | 7,577,293 | | | $ | 78,205,976 | | |
Number of shares issued and outstanding (unlimited shares authorized,
no par value) | | | 3,518,196 | | | | 894,279 | | | | 424,489 | | | | 2,946,097 | | |
Net asset value per share | | $ | 3.02 | | | $ | 22.58 | | | $ | 17.85 | | | $ | 26.55 | | |
The accompanying notes are an integral part of these financial statements.
74
STATEMENTS OF ASSETS AND LIABILITIES
at December 31, 2017
| | | Dividend
Builder
Fund | | Global
Energy
Fund | | Global
Innovators
Fund | | Renminbi
Yuan & Bond
Fund | |
Assets | |
Investments in securities, at cost | | $ | 6,884,750 | | | $ | 36,785,324 | | | $ | 162,853,090 | | | $ | 1,680,434 | | |
Investments in securities, at value | | $ | 9,040,848 | | | $ | 31,966,762 | | | $ | 228,626,191 | | | $ | 1,665,296 | | |
Cash | | | 191,022 | | | | 130,354 | | | | 1,507,489 | | | | 60,366 | | |
Cash denominated in foreign currency (cost of $4,106, $0, $0 and
$919,483, respectively) | | | 4,106 | | | | — | | | | — | | | | 937,325 | | |
Receivables: | |
Fund shares sold | | | 7,000 | | | | 15,865 | | | | 294,106 | | | | 22,000 | | |
Dividends and interest | | | 24,256 | | | | 97,090 | | | | 68,690 | | | | 14,826 | | |
Due from Advisor, net | | | 3,118 | | | | — | | | | — | | | | 585 | | |
Prepaid expenses | | | 1,477 | | | | 4,408 | | | | 17,619 | | | | 3,890 | | |
Total assets | | | 9,271,827 | | | | 32,214,479 | | | | 230,514,095 | | | | 2,704,288 | | |
Liabilities | |
Payable for Fund shares redeemed | | | 196,886 | | | | 287,981 | | | | 99,722 | | | | — | | |
Due to Advisor, net | | | — | | | | 19,974 | | | | 91,140 | | | | — | | |
Accrued administration fees | | | 473 | | | | 1,887 | | | | 9,196 | | | | 1,624 | | |
Accrued shareholder servicing plan fees | | | 2,282 | | | | 7,022 | | | | 28,457 | | | | 1,782 | | |
Deferred trustees' compensation | | | 20,795 | | | | 89,508 | | | | 147,579 | | | | 42,906 | | |
Other accrued expenses | | | 23,974 | | | | 49,125 | | | | 82,501 | | | | 23,324 | | |
Total liabilities | | | 244,410 | | | | 455,497 | | | | 458,595 | | | | 69,636 | | |
Net Assets | | $ | 9,027,417 | | | $ | 31,758,982 | | | $ | 230,055,500 | | | $ | 2,634,652 | | |
Composition of Net Assets | |
Paid-in capital | | $ | 7,698,118 | | | $ | 56,458,919 | | | $ | 165,420,549 | | | $ | 6,912,195 | | |
Undistributed net investment gain (loss) | | | (18,315 | ) | | | (73,689 | ) | | | (147,579 | ) | | | (42,906 | ) | |
Accumulated net realized gain (loss) on investments and foreign currency | | | (808,581 | ) | | | (19,808,943 | ) | | | (993,757 | ) | | | (4,237,553 | ) | |
Net unrealized appreciation (depreciation) on: | |
Investments | | | 2,156,098 | | | | (4,818,562 | ) | | | 65,773,101 | | | | (15,138 | ) | |
Foreign currency | | | 97 | | | | 1,257 | | | | 3,186 | | | | 18,054 | | |
Net Assets | | $ | 9,027,417 | | | $ | 31,758,982 | | | $ | 230,055,500 | | | $ | 2,634,652 | | |
Number of shares issued and outstanding (unlimited shares authorized,
no par value) | | | 499,001 | | | | 1,398,478 | | | | — | | | | 219,584 | | |
Net asset value per share | | $ | 18.09 | | | $ | 22.71 | | | | — | | | $ | 12.00 | | |
Net asset value per share per Class: | |
Investor Class shares: | |
Net assets applicable to shares outstanding | | | | | | $ | 185,941,651 | | | | | | |
Shares of beneficial interest issued and outstanding | | | | | | | 4,134,288 | | | | |
Net asset value per share | | | — | | | | — | | | $ | 44.98 | | | | — | | |
Institutional Class shares: | |
Net assets applicable to shares outstanding | | | | | | $ | 44,113,849 | | | | | | |
Shares of beneficial interest issued and outstanding | | | | | | | 978,496 | | | | |
Net asset value per share | | | — | | | | — | | | $ | 45.08 | | | | — | | |
The accompanying notes are an integral part of these financial statements.
75
STATEMENTS OF OPERATIONS
For the year ended December 31, 2017
| | | Alternative
Energy
Fund | | Asia
Focus
Fund | | Asia Pacific
Dividend
Builder
Fund | | China &
Hong Kong
Fund | |
Investment Income | |
Dividends* | | $ | 194,890 | | | $ | 501,321 | | | $ | 234,408 | | | $ | 1,949,239 | | |
Total income | | | 194,890 | | | | 501,321 | | | | 234,408 | | | | 1,949,239 | | |
Expenses | |
Advisory fees | | | 104,443 | | | | 177,399 | | | | 63,668 | | | | 691,007 | | |
Shareholder servicing plan fees | | | 20,366 | | | | 22,983 | | | | 13,952 | | | | 80,020 | | |
Transfer agent fees and expenses | | | 29,369 | | | | 29,145 | | | | 19,478 | | | | 58,132 | | |
Fund accounting fee and expenses | | | 29,042 | | | | 34,631 | | | | 30,541 | | | | 55,122 | | |
Administration fees | | | 5,363 | | | | 8,277 | | | | 3,338 | | | | 32,432 | | |
Custody fees and expenses | | | 9,023 | | | | 12,264 | | | | 16,200 | | | | 22,195 | | |
Audit fees | | | 18,002 | | | | 24,499 | | | | 13,099 | | | | 24,499 | | |
Legal fees | | | 6,833 | | | | 11,554 | | | | 5,018 | | | | 45,025 | | |
Registration fees | | | 17,856 | | | | 19,849 | | | | 17,351 | | | | 20,511 | | |
Printing | | | 11,836 | | | | 7,479 | | | | 7,898 | | | | 13,932 | | |
Trustees' fees and expenses | | | 23,556 | | | | 34,249 | | | | 19,072 | | | | 67,198 | | |
Insurance | | | 1,108 | | | | 1,337 | | | | 939 | | | | 6,129 | | |
CCO fees and expenses | | | 7,677 | | | | 9,082 | | | | 8,221 | | | | 16,065 | | |
Miscellaneous | | | 2,040 | | | | 1,451 | | | | 1,884 | | | | 3,013 | | |
Interest expense | | | 220 | | | | 440 | | | | 1,165 | | | | 1,841 | | |
Total expenses | | | 286,734 | | | | 394,639 | | | | 221,824 | | | | 1,137,121 | | |
Less: fees waived and expenses absorbed | | | (79,688 | ) | | | (42,738 | ) | | | (150,454 | ) | | | — | | |
Net expenses | | | 207,046 | | | | 351,901 | | | | 71,370 | | | | 1,137,121 | | |
Net investment income (loss) | | | (12,156 | ) | | | 149,420 | | | | 163,038 | | | | 812,118 | | |
Realized and unrealized gain (loss) on investments and foreign currency | |
Net realized gain (loss) on: | |
Investments | | | (1,004,303 | ) | | | 496,560 | | | | 265,113 | | | | 4,209,914 | | |
Foreign currency | | | (6,533 | ) | | | 1,379 | | | | (3,923 | ) | | | (10,027 | ) | |
| | | | (1,010,836 | ) | | | 497,939 | | | | 261,190 | | | | 4,199,887 | | |
Net change in unrealized appreciation (depreciation) on: | |
Investments | | | 2,961,520 | | | | 6,103,537 | | | | 1,602,465 | | | | 21,938,469 | | |
Foreign currency | | | 2,991 | | | | 141 | | | | (6 | ) | | | (99 | ) | |
| | | | 2,964,511 | | | | 6,103,678 | | | | 1,602,459 | | | | 21,938,370 | | |
Net realized and unrealized gain on investments and foreign currency | | | 1,953,675 | | | | 6,601,617 | | | | 1,863,649 | | | | 26,138,257 | | |
Net increase in Net Assets from Operations | | $ | 1,941,519 | | | $ | 6,751,037 | | | $ | 2,026,687 | | | $ | 26,950,375 | | |
* Net of foreign tax withheld of $9,828, $54,670, $21,736, and $114,032, respectively.
The accompanying notes are an integral part of these financial statements.
76
STATEMENTS OF OPERATIONS
For the year ended December 31, 2017
| | | Dividend
Builder
Fund | | Global
Energy
Fund | | Global
Innovators
Fund | | Renminbi
Yuan & Bond
Fund | |
Investment Income | |
Dividends* | | $ | 264,956 | | | $ | 986,245 | | | $ | 2,845,712 | | | $ | — | | |
Interest | | | — | | | | — | | | | — | | | | 69,343 | | |
Total income | | | 264,956 | | | | 986,245 | | | | 2,845,712 | | | | 69,343 | | |
Expenses | |
Advisory fees | | | 38,084 | | | | 280,619 | | | | 1,457,726 | | | | 13,407 | | |
Shareholder servicing plan fees | | | 19,093 | | | | 80,807 | | | | — | | | | 1,963 | | |
Shareholder servicing plan fees – Investor Class | | | — | | | | — | | | | 329,521 | | | | — | | |
Transfer agent fees and expenses | | | 16,917 | | | | 32,171 | | | | — | | | | 15,996 | | |
Transfer agent fees and expenses – Investor Class | | | — | | | | — | | | | 88,098 | | | | — | | |
Transfer agent fees and expenses – Institutional Class | | | — | | | | — | | | | 19,631 | | | | — | | |
Fund accounting fee and expenses | | | 28,199 | | | | 41,003 | | | | 110,300 | | | | 21,071 | | |
Administration fees | | | 3,541 | | | | 18,617 | | | | 95,115 | | | | 1,275 | | |
Administration fees – Institutional Class | | | — | | | | — | | | | 5,624 | | | | — | | |
Custody fees and expenses | | | 3,488 | | | | 4,175 | | | | 20,586 | | | | 1,153 | | |
Audit fees | | | 12,502 | | | | 24,499 | | | | 24,664 | | | | 12,497 | | |
Legal fees | | | 3,367 | | | | 27,564 | | | | 142,447 | | | | 942 | | |
Registration fees | | | 17,114 | | | | 20,944 | | | | — | | | | 12,630 | | |
Registration fees – Investor Class | | | — | | | | — | | | | 37,970 | | | | — | | |
Registration fees – Institutional Class | | | — | | | | — | | | | 14,698 | | | | — | | |
Printing | | | 5,998 | | | | 16,137 | | | | 42,158 | | | | 3,088 | | |
Trustees' fees and expenses | | | 14,556 | | | | 39,712 | | | | 86,634 | | | | 10,189 | | |
Insurance | | | 1,633 | | | | 4,838 | | | | 17,237 | | | | 198 | | |
CCO fees and expenses | | | 7,708 | | | | 13,174 | | | | 35,099 | | | | 6,268 | | |
Miscellaneous | | | 1,923 | | | | 2,665 | | | | 9,110 | | | | 1,082 | | |
Interest expense | | | 130 | | | | 1,768 | | | | 1,891 | | | | 8 | | |
Total expenses | | | 174,253 | | | | 608,693 | | | | 2,538,509 | | | | 101,767 | | |
Less: fees waived and expenses absorbed | | | (116,547 | ) | | | (65,017 | ) | | | (210,068 | ) | | | (79,810 | ) | |
Net expenses | | | 57,706 | | | | 543,676 | | | | 2,328,441 | | | | 21,957 | | |
Net investment income | | | 207,250 | | | | 442,569 | | | | 517,271 | | | | 47,386 | | |
Realized and unrealized gain (loss) on investments and foreign currency | |
Net realized gain (loss) on: | |
Investments | | | (146,759 | ) | | | (1,550,390 | ) | | | 3,033,721 | | | | (63,923 | ) | |
Foreign currency | | | 206 | | | | (17,455 | ) | | | (3,424 | ) | | | 22,863 | | |
| | | | (146,553 | ) | | | (1,567,845 | ) | | | 3,030,297 | | | | (41,060 | ) | |
Net change in unrealized appreciation (depreciation) on: | |
Investments | | | 1,569,877 | | | | (700,540 | ) | | | 53,223,726 | | | | 192,610 | | |
Foreign currency | | | 13 | | | | 21,364 | | | | 4,598 | | | | 29,997 | | |
| | | | 1,569,890 | | | | (679,176 | ) | | | 53,228,324 | | | | 222,607 | | |
Net realized and unrealized gain (loss) on investments and foreign currency | | | 1,423,337 | | | | (2,247,021 | ) | | | 56,258,621 | | | | 181,547 | | |
Net increase (decrease) in Net Assets from Operations | | $ | 1,630,587 | | | $ | (1,804,452 | ) | | $ | 56,775,892 | | | $ | 228,933 | | |
* Net of foreign tax withheld of $12,409, $113,258, $119,333, and $0, respectively.
The accompanying notes are an integral part of these financial statements.
77
STATEMENTS OF CHANGES IN NET ASSETS
| | | Alternative Energy Fund | | Asia Focus Fund | |
| | | Year Ended
December 31, 2017 | | Year Ended
December 31, 2016 | | Year Ended
December 31, 2017 | | Year Ended
December 31, 2016 | |
Increase/(decrease) in net assets from: | |
Operations | |
Net investment income (loss) | | $ | (12,156 | ) | | $ | 28,091 | | | $ | 149,420 | | | $ | 157,059 | | |
Net realized gain (loss) on: | |
Investments | | | (1,004,303 | ) | | | (4,731,050 | ) | | | 496,560 | | | | 158,834 | | |
Foreign currency | | | (6,533 | ) | | | (421 | ) | | | 1,379 | | | | 255 | | |
Net change in unrealized appreciation on: | |
Investments | | | 2,961,520 | | | | 2,427,077 | | | | 6,103,537 | | | | 1,060,950 | | |
Foreign currency | | | 2,991 | | | | 268 | | | | 141 | | | | 6,413 | | |
Net increase from payments by affiliates | | | — | | | | 16,892 | | | | — | | | | — | | |
Net increase (decrease) in net assets resulting from operations | | | 1,941,519 | | | | (2,259,143 | ) | | | 6,751,037 | | | | 1,383,511 | | |
Distributions to shareholders | |
From net investment income | | | (30,281 | ) | | | — | | | | (180,033 | ) | | | (220,064 | ) | |
Total distributions to shareholders | | | (30,281 | ) | | | — | | | | (180,033 | ) | | | (220,064 | ) | |
Capital transactions | |
Proceeds from shares sold | | | 1,640,619 | | | | 2,674,272 | | | | 1,211,935 | | | | 2,311,768 | | |
Reinvestment of distributions | | | 29,241 | | | | — | | | | 169,156 | | | | 206,751 | | |
Cost of shares repurchased | | | (3,151,250 | ) | | | (3,860,574 | ) | | | (3,217,540 | ) | | | (3,564,108 | ) | |
Redemption fee proceeds | | | — | | | | — | | | | 8,704 | | | | — | | |
Net change in net assets from capital transactions | | | (1,481,390 | ) | | | (1,186,302 | ) | | | (1,827,745 | ) | | | (1,045,589 | ) | |
Total increase (decrease) in net assets | | | 429,848 | | | | (3,445,445 | ) | | | 4,743,259 | | | | 117,858 | | |
Net assets | |
Beginning of period | | | 10,198,795 | | | | 13,644,240 | | | | 15,453,746 | | | | 15,335,888 | | |
End of period | | $ | 10,628,643 | | | $ | 10,198,795 | | | $ | 20,197,005 | | | $ | 15,453,746 | | |
Accumulated net investment loss | | $ | (63,194 | ) | | $ | (14,224 | ) | | $ | (99,273 | ) | | $ | (70,039 | ) | |
Capital share activity | |
Shares sold | | | 586,174 | | | | 1,014,743 | | | | 60,741 | | | | 142,434 | | |
Shares issued on reinvestment | | | 10,224 | | | | — | | | | 7,770 | | | | 13,425 | | |
Shares redeemed | | | (1,137,303 | ) | | | (1,455,485 | ) | | | (171,083 | ) | | | (223,714 | ) | |
Net decrease in shares outstanding | | | (540,905 | ) | | | (440,742 | ) | | | (102,572 | ) | | | (67,855 | ) | |
The accompanying notes are an integral part of these financial statements.
78
STATEMENTS OF CHANGES IN NET ASSETS
| | | Asia Pacific Dividend Builder Fund | | China & Hong Kong Fund | |
| | | Year Ended
December 31, 2017 | | Year Ended
December 31, 2016 | | Year Ended
December 31, 2017 | | Year Ended
December 31, 2016 | |
Increase/(decrease) in net assets from: | |
Operations | |
Net investment income | | $ | 163,038 | | | $ | 228,377 | | | $ | 812,118 | | | $ | 1,028,650 | | |
Net realized gain (loss) on: | |
Investments | | | 265,113 | | | | 146,925 | | | | 4,209,914 | | | | 2,482,644 | | |
Foreign currency | | | (3,923 | ) | | | 1,749 | | | | (10,027 | ) | | | (2,564 | ) | |
Net change in unrealized appreciation (depreciation) on: | |
Investments | | | 1,602,465 | | | | 242,907 | | | | 21,938,469 | | | | (1,858,849 | ) | |
Foreign currency | | | (6 | ) | | | 34 | | | | (99 | ) | | | 44 | | |
Net increase in net assets resulting from operations | | | 2,026,687 | | | | 619,992 | | | | 26,950,375 | | | | 1,649,925 | | |
Distributions to shareholders | |
From net investment income | | | (178,143 | ) | | | (275,566 | ) | | | (450,045 | ) | | | (821,167 | ) | |
From net realized gains | | | — | | | | — | | | | (4,544,673 | ) | | | (2,195,417 | ) | |
Total distributions to shareholders | | | (178,143 | ) | | | (275,566 | ) | | | (4,994,718 | ) | | | (3,016,584 | ) | |
Capital transactions | |
Proceeds from shares sold | | | 3,770,529 | | | | 4,637,194 | | | | 3,454,532 | | | | 2,088,158 | | |
Reinvestment of distributions | | | 167,222 | | | | 268,159 | | | | 4,797,165 | | | | 2,902,054 | | |
Cost of shares repurchased | | | (6,718,803 | ) | | | (3,998,933 | ) | | | (10,264,154 | ) | | | (11,299,138 | ) | |
Redemption fee proceeds | | | 5,331 | | | | 79 | | | | 19,268 | | | | 113 | | |
Net change in net assets from capital transactions | | | (2,775,721 | ) | | | 906,499 | | | | (1,993,189 | ) | | | (6,308,813 | ) | |
Total increase (decrease) in net assets | | | (927,177 | ) | | | 1,250,925 | | | | 19,962,468 | | | | (7,675,472 | ) | |
Net assets | |
Beginning of period | | | 8,504,470 | | | | 7,253,545 | | | | 58,243,508 | | | | 65,918,980 | | |
End of period | | $ | 7,577,293 | | | $ | 8,504,470 | | | $ | 78,205,976 | | | $ | 58,243,508 | | |
Accumulated net investment income (loss) | | $ | (41,839 | ) | | $ | (41,263 | ) | | $ | 473,979 | | | $ | 121,933 | | |
Capital share activity | |
Shares sold | | | 240,260 | | | | 347,491 | | | | 137,182 | | | | 105,382 | | |
Shares issued on reinvestment | | | 10,222 | | | | 19,675 | | | | 187,756 | | | | 146,254 | | |
Shares redeemed | | | (459,145 | ) | | | (300,932 | ) | | | (429,183 | ) | | | (580,920 | ) | |
Net increase (decrease) in shares outstanding | | | (208,663 | ) | | | 66,234 | | | | (104,245 | ) | | | (329,284 | ) | |
The accompanying notes are an integral part of these financial statements.
79
STATEMENTS OF CHANGES IN NET ASSETS
| | | Dividend Builder Fund | | Global Energy Fund | |
| | | Year Ended
December 31, 2017 | | Year Ended
December 31, 2016 | | Year Ended
December 31, 2017 | | Year Ended
December 31, 2016 | |
Increase/(decrease) in net assets from: | |
Operations | |
Net investment income | | $ | 207,250 | | | $ | 280,824 | | | $ | 442,569 | | | $ | 547,256 | | |
Net realized gain (loss) on: | |
Investments | | | (146,759 | ) | | | (287,213 | ) | | | (1,550,390 | ) | | | (7,741,460 | ) | |
Foreign currency | | | 206 | | | | (572 | ) | | | (17,455 | ) | | | (5,087 | ) | |
Net change in unrealized appreciation (depreciation) on: | |
Investments | | | 1,569,877 | | | | 684,004 | | | | (700,540 | ) | | | 18,546,570 | | |
Foreign currency | | | 13 | | | | 237 | | | | 21,364 | | | | 3,381 | | |
Net increase from payments by affiliates | | | — | | | | 203 | | | | — | | | | — | | |
Net increase (decrease) in net assets resulting from operations | | | 1,630,587 | | | | 677,483 | | | | (1,804,452 | ) | | | 11,350,660 | | |
Distributions to shareholders | |
From net investment income | | | (211,862 | ) | | | (283,880 | ) | | | (450,140 | ) | | | (550,143 | ) | |
Total distributions to shareholders | | | (211,862 | ) | | | (283,880 | ) | | | (450,140 | ) | | | (550,143 | ) | |
Capital transactions | |
Proceeds from shares sold | | | 1,656,460 | | | | 3,405,113 | | | | 6,467,799 | | | | 7,508,389 | | |
Reinvestment of distributions | | | 210,782 | | | | 283,141 | | | | 438,787 | | | | 535,273 | | |
Cost of shares repurchased | | | (2,037,808 | ) | | | (7,266,459 | ) | | | (21,874,821 | ) | | | (13,905,696 | ) | |
Redemption fee proceeds | | | — | | | | — | | | | — | | | | 4 | | |
Net change in net assets from capital transactions | | | (170,566 | ) | | | (3,578,205 | ) | | | (14,968,235 | ) | | | (5,862,030 | ) | |
Total increase (decrease) in net assets | | | 1,248,159 | | | | (3,184,602 | ) | | | (17,222,827 | ) | | | 4,938,487 | | |
Net assets | |
Beginning of period | | | 7,779,258 | | | | 10,963,860 | | | | 48,981,809 | | | | 44,043,322 | | |
End of period | | $ | 9,027,417 | | | $ | 7,779,258 | | | $ | 31,758,982 | | | $ | 48,981,809 | | |
Accumulated net investment loss | | $ | (18,315 | ) | | $ | (13,909 | ) | | $ | (73,689 | ) | | $ | (48,663 | ) | |
Capital share activity | |
Shares sold | | | 99,637 | | | | 226,414 | | | | 304,663 | | | | 386,227 | | |
Shares issued on reinvestment | | | 12,412 | | | | 18,533 | | | | 20,314 | | | | 22,895 | | |
Shares redeemed | | | (122,224 | ) | | | (478,994 | ) | | | (1,029,846 | ) | | | (680,991 | ) | |
Net decrease in shares outstanding | | | (10,175 | ) | | | (234,047 | ) | | | (704,869 | ) | | | (271,869 | ) | |
The accompanying notes are an integral part of these financial statements.
80
STATEMENTS OF CHANGES IN NET ASSETS
| | | Global Innovators Fund | |
| | | Year Ended
December 31, 2017 | | Year Ended
December 31, 2016 | |
Increase/(decrease) in net assets from: | |
Operations | |
Net investment income | | $ | 517,271 | | | $ | 1,322,823 | | |
Net realized gain (loss) on: | |
Investments | | | 3,033,721 | | | | (44,840 | ) | |
Foreign currency | | | (3,424 | ) | | | 27,081 | | |
Net change in unrealized appreciation (depreciation) on: | |
Investments | | | 53,223,726 | | | | 12,832,823 | | |
Foreign currency | | | 4,598 | | | | (1,412 | ) | |
Net increase in net assets resulting from operations | | | 56,775,892 | | | | 14,136,475 | | |
Distributions to shareholders | |
From net investment income: | |
Investor Class | | | (174,209 | ) | | | (1,221,587 | ) | |
Institutional Class | | | (115,856 | ) | | | (259,179 | ) | |
From net realized gain: | |
Investor Class | | | (3,944,151 | ) | | | — | | |
Institutional Class | | | (927,419 | ) | | | — | | |
Total distributions to shareholders | | | (5,161,635 | ) | | | (1,480,766 | ) | |
Capital transactions | |
Proceeds from shares sold: | |
Investor Class | | | 44,470,842 | | | | 36,364,801 | | |
Institutional Class | | | 13,388,654 | | | | 27,748,853 | | |
Reinvestment of distributions: | |
Investor Class | | | 4,033,128 | | | | 1,194,633 | | |
Institutional Class | | | 584,355 | | | | 121,133 | | |
Cost of shares repurchased: | |
Investor Class | | | (38,915,538 | ) | | | (79,703,269 | ) | |
Institutional Class | | | (4,451,622 | ) | | | (4,059,323 | ) | |
Net change in net assets from capital transactions | | | 19,109,819 | | | | (18,333,172 | ) | |
Total increase (decrease) in net assets | | | 70,724,076 | | | | (5,677,463 | ) | |
Net assets | |
Beginning of period | | | 159,331,424 | | | | 165,008,887 | | |
End of period | | $ | 230,055,500 | | | $ | 159,331,424 | | |
Accumulated net investment income (loss) | | $ | (147,579 | ) | | $ | (98,798 | ) | |
Capital share activity | |
Shares sold: | |
Investor Class | | | 1,096,920 | | | | 1,155,255 | | |
Institutional Class | | | 327,464 | | | | 866,781 | | |
Shares issued on reinvestment: | |
Investor Class | | | 91,123 | | | | 34,799 | | |
Institutional Class | | | 13,173 | | | | 3,521 | | |
Shares redeemed: | |
Investor Class | | | (968,093 | ) | | | (2,515,617 | ) | |
Institutional Class | | | (112,182 | ) | | | (123,439 | ) | |
Net increase (decrease) in shares outstanding | | | 448,405 | | | | (578,700 | ) | |
The accompanying notes are an integral part of these financial statements.
81
STATEMENTS OF CHANGES IN NET ASSETS
| | | Renminbi Yuan & Bond Fund | |
| | | Year Ended
December 31, 2017 | | Year Ended
December 31, 2016 | |
Increase/(decrease) in net assets from: | |
Operations | |
Net investment income | | $ | 47,386 | | | $ | 71,245 | | |
Net realized loss on: | |
Investments | | | (63,923 | ) | | | (536,055 | ) | |
Foreign currency | | | 22,863 | | | | (57,718 | ) | |
Net change in unrealized appreciation on: | |
Investments | | | 192,610 | | | | 346,323 | | |
Foreign currency | | | 29,997 | | | | 10,260 | | |
Net increase (decrease) in net assets resulting from operations | | | 228,933 | | | | (165,945 | ) | |
Distributions to shareholders | |
From net investment income | | | (17,602 | ) | | | — | | |
Return of capital | | | (4,493 | ) | | | (45,290 | ) | |
Total distributions to shareholders | | | (22,095 | ) | | | (45,290 | ) | |
Capital transactions | |
Proceeds from shares sold | | | 498,207 | | | | 141,352 | | |
Reinvestment of distributions | | | 21,675 | | | | 43,704 | | |
Cost of shares repurchased | | | (422,316 | ) | | | (4,792,466 | ) | |
Redemption fee proceeds | | | — | | | | 152 | | |
Net change in net assets from capital transactions | | | 97,566 | | | | (4,607,258 | ) | |
Total increase (decrease) in net assets | | | 304,404 | | | | (4,818,493 | ) | |
Net assets | |
Beginning of period | | | 2,330,248 | | | | 7,148,741 | | |
End of period | | $ | 2,634,652 | | | $ | 2,330,248 | | |
Accumulated net investment loss | | $ | (42,906 | ) | | $ | (32,323 | ) | |
Capital share activity | |
Shares sold | | | 43,128 | | | | 12,292 | | |
Shares issued on reinvestment | | | 1,890 | | | | 3,749 | | |
Shares redeemed | | | (36,698 | ) | | | (419,569 | ) | |
Net increase (decrease) in shares outstanding | | | 8,320 | | | | (403,528 | ) | |
The accompanying notes are an integral part of these financial statements.
82
FINANCIAL HIGHLIGHTS
For a capital share outstanding throughout each period.
| | | Year Ended December 31, | |
Alternative Energy Fund | | 2017 | | 2016 | | 2015 | | 2014 | | 2013 | |
Net asset value, beginning of period | | $ | 2.51 | | | $ | 3.03 | | | $ | 3.42 | | | $ | 3.99 | | | $ | 2.47 | | |
Income from investment operations: | |
Net investment income (loss) | | | — | | | | 0.01 | | | | (0.03 | ) | | | (0.04 | ) | | | (0.04 | ) | |
Net realized and unrealized gain (loss) on investments and foreign currency | | | 0.52 | | | | (0.53 | )(3) | | | (0.36 | ) | | | (0.53 | ) | | | 1.55 | | |
Total from investment operations | | | 0.52 | | | | (0.52 | ) | | | (0.39 | ) | | | (0.57 | ) | | | 1.51 | | |
Less distributions: | |
From net investment income | | | (0.01 | ) | | | — | | | | — | | | | — | | | | — | | |
Total distributions | | | (0.01 | ) | | | — | | | | — | | | | — | | | | — | | |
Redemption fee proceeds | | | — | | | | — | | | | — | (1) | | | — | (1) | | | 0.01 | | |
Net asset value, end of period | | $ | 3.02 | | | $ | 2.51 | | | $ | 3.03 | | | $ | 3.42 | | | $ | 3.99 | | |
Total return | | | 20.68 | % | | | (17.16 | )% | | | (11.40 | )% | | | (14.29 | )% | | | 61.54 | % | |
Ratios/supplemental data: | |
Net assets, end of period (millions) | | $ | 10.6 | | | $ | 10.2 | | | $ | 13.6 | | | $ | 15.2 | | | $ | 23.8 | | |
Ratio of expenses to average net assets: | |
Before fee waived/recaptured | | | 2.74 | % | | | 2.60 | % | | | 2.31 | % | | | 2.06 | % | | | 2.13 | % | |
After fees waived/recaptured | | | 1.98 | % | | | 1.99 | % | | | 1.98 | % | | | 2.02 | % | | | 2.00 | % | |
| After fees waived/recaptured excluding interest expense(2) | | | 1.98 | % | | | 1.98 | % | | | 1.98 | % | | | 1.98 | % | | | 1.98 | % | |
Ratio of net investment income (loss) to average net assets: | |
Before fees waived/recaptured | | | (0.88 | )% | | | (0.38 | )% | | | (1.32 | )% | | | (0.74 | )% | | | (1.37 | )% | |
After fees waived/recaptured | | | (0.12 | )% | | | 0.23 | % | | | (0.99 | )% | | | (0.70 | )% | | | (1.24 | )% | |
Portfolio turnover rate | | | 32.45 | % | | | 63.95 | % | | | 28.67 | % | | | 42.27 | % | | | 60.20 | % | |
(1) Amount represents less than $0.01 per share.
(2) The Advisor has contractually agreed to limit the operating expenses of the Fund to 1.98%, excluding interest expense, expenses related to dividends on short positions, brokerage commissions, taxes and other extraordinary expenses. See Note 3.
(3) The Advisor reimbursed the Fund $16,892 for a trade error. As of December 31, 2016, the reimbursement amount represents $0.004 per share.
The accompanying notes are an integral part of these financial statements.
83
FINANCIAL HIGHLIGHTS
For a capital share outstanding throughout each period.
| | | Year Ended December 31, | |
Asia Focus Fund | | 2017 | | 2016 | | 2015 | | 2014 | | 2013 | |
Net asset value, beginning of period | | $ | 15.50 | | | $ | 14.40 | | | $ | 16.47 | | | $ | 16.33 | | | $ | 18.56 | | |
Income from investment operations: | |
Net investment income (loss) | | | 0.16 | | | | 0.15 | | | | 0.21 | | | | 0.16 | | | | 0.21 | | |
Net realized and unrealized gain (loss) on investments and foreign currency | | | 7.11 | | | | 1.17 | | | | (2.11 | ) | | | 0.15 | | | | (2.14 | ) | |
Total from investment operations | | | 7.27 | | | | 1.32 | | | | (1.90 | ) | | | 0.31 | | | | (1.93 | ) | |
Less distributions: | |
From net investment income | | | (0.20 | ) | | | (0.22 | ) | | | (0.17 | ) | | | (0.17 | ) | | | (0.30 | ) | |
Total distributions | | | (0.20 | ) | | | (0.22 | ) | | | (0.17 | ) | | | (0.17 | ) | | | (0.30 | ) | |
Redemption fee proceeds | | | 0.01 | | | | — | | | | — | (1) | | | — | (1) | | | — | (1) | |
Net asset value, end of period | | $ | 22.58 | | | $ | 15.50 | | | $ | 14.40 | | | $ | 16.47 | | | $ | 16.33 | | |
Total return | | | 47.10 | % | | | 9.20 | % | | | (11.56 | )% | | | 1.91 | % | | | (10.38 | )% | |
Ratios/supplemental data: | |
Net assets, end of period (millions) | | $ | 20.2 | | | $ | 15.5 | | | $ | 15.3 | | | $ | 19.7 | | | $ | 21.90 | | |
Ratio of expenses to average net assets: | |
Before fees waived | | | 2.22 | % | | | 2.24 | % | | | 1.98 | % | | | 1.91 | % | | | 1.87 | % | |
After fees waived | | | 1.98 | % | | | 1.98 | % | | | 1.98 | % | | | 1.91 | % | | | 1.87 | % | |
| After fees waived excluding interest expense(2) | | | 1.98 | % | | | 1.98 | % | | | 1.97 | % | | | 1.90 | % | | | 1.85 | % | |
Ratio of net investment income to average net assets: | |
Before fees waived | | | 0.60 | % | | | 0.75 | % | | | 1.24 | % | | | 0.90 | % | | | 0.73 | % | |
After fees waived | | | 0.84 | % | | | 1.01 | % | | | 1.24 | % | | | 0.90 | % | | | 0.73 | % | |
Portfolio turnover rate | | | 13.24 | % | | | 38.07 | % | | | 8.64 | % | | | 23.16 | % | | | 7.43 | % | |
(1) Amount represents less than $0.01 per share.
(2) The Advisor has contractually agreed to limit the operating expenses of the Fund to 1.98%, excluding interest expense, expenses related to dividends on short positions, brokerage commissions, taxes and other extraordinary expenses. See Note 3.
The accompanying notes are an integral part of these financial statements.
84
FINANCIAL HIGHLIGHTS
For a capital share outstanding throughout each period.
| | | Year Ended December 31, | |
Asia Pacific Dividend Builder Fund | | 2017 | | 2016 | | 2015 | | 2014 | | 2013 | |
Net asset value, beginning of period | | $ | 13.43 | | | $ | 12.79 | | | $ | 13.83 | | | $ | 12.95 | | | $ | 13.52 | | |
Income from investment operations: | |
Net investment income | | | 0.40 | | | | 0.42 | | | | 0.39 | | | | 0.31 | | | | 0.27 | | |
Net realized and unrealized gain (loss) on investments and foreign currency | | | 4.47 | | | | 0.71 | | | | (1.01 | ) | | | 0.85 | | | | (0.54 | ) | |
Total from investment operations | | | 4.87 | | | | 1.13 | | | | (0.62 | ) | | | 1.16 | | | | (0.27 | ) | |
Less distributions: | |
From net investment income | | | (0.46 | ) | | | (0.49 | ) | | | (0.42 | ) | | | (0.28 | ) | | | (0.30 | ) | |
Total distributions | | | (0.46 | ) | | | (0.49 | ) | | | (0.42 | ) | | | (0.28 | ) | | | (0.30 | ) | |
Redemption fee proceeds | | | 0.01 | | | | — | (1) | | | — | (1) | | | — | (1) | | | — | (1) | |
Net asset value, end of period | | $ | 17.85 | | | $ | 13.43 | | | $ | 12.79 | | | $ | 13.83 | | | $ | 12.95 | | |
Total return | | | 36.70 | % | | | 8.81 | % | | | (4.61 | )% | | | 9.04 | % | | | (2.06 | )% | |
Ratios/supplemental data: | |
Net assets, end of period (millions) | | $ | 7.6 | | | $ | 8.5 | | | $ | 7.3 | | | $ | 4.1 | | | $ | 4.3 | | |
Ratio of expenses to average net assets: | |
Before fees waived | | | 3.48 | % | | | 3.14 | % | | | 3.87 | % | | | 3.91 | % | | | 3.56 | % | |
After fees waived | | | 1.12 | % | | | 1.11 | % | | | 1.98 | % | | | 1.99 | % | | | 1.98 | % | |
| After fees waived excluding interest expense(2) | | | 1.10 | % | | | 1.10 | % | | | 1.98 | % | | | 1.98 | % | | | 1.98 | % | |
Ratio of net investment income to average net assets: | |
Before fees waived | | | 0.20 | % | | | 1.11 | % | | | 0.36 | % | | | 0.37 | % | | | 0.39 | % | |
After fees waived | | | 2.56 | % | | | 3.14 | % | | | 2.25 | % | | | 2.29 | % | | | 1.97 | % | |
Portfolio turnover rate | | | 47.32 | % | | | 30.91 | % | | | 28.59 | % | | | 15.76 | % | | | 56.96 | % | |
(1) Amount represents less than $0.01 per share.
(2) The Advisor has contractually agreed to limit the operating expenses of the Fund to 1.10%, prior to December 31, 2015, the limit on operating expenses was 1.98%, excluding interest expense, expenses related to dividends on short positions, brokerage commissions, taxes and other extraordinary expenses. See Note 3.
The accompanying notes are an integral part of these financial statements.
85
FINANCIAL HIGHLIGHTS
For a capital share outstanding throughout each period.
| | | Year Ended December 31, | |
China & Hong Kong Fund | | 2017 | | 2016 | | 2015 | | 2014 | | 2013 | |
Net asset value, beginning of period | | $ | 19.09 | | | $ | 19.50 | | | $ | 23.65 | | | $ | 30.86 | | | $ | 29.81 | | |
Income from investment operations: | |
Net investment income | | | 0.29 | | | | 0.34 | | | | 0.34 | | | | 0.48 | | | | 0.46 | | |
Net realized and unrealized gain (loss) on investments and foreign currency | | | 8.95 | | | | 0.26 | | | | (2.11 | ) | | | (1.12 | ) | | | 1.45 | | |
Total from investment operations | | | 9.24 | | | | 0.60 | | | | (1.77 | ) | | | (0.64 | ) | | | 1.91 | | |
Less distributions: | |
From net investment income | | | (0.16 | ) | | | (0.27 | ) | | | (0.45 | ) | | | (0.45 | ) | | | (0.43 | ) | |
From net realized gain | | | (1.63 | ) | | | (0.74 | ) | | | (1.94 | ) | | | (6.13 | ) | | | (0.44 | ) | |
Total distributions | | | (1.79 | ) | | | (1.01 | ) | | | (2.39 | ) | | | (6.58 | ) | | | (0.87 | ) | |
Redemption fee proceeds | | | 0.01 | | | | — | (1) | | | 0.01 | | | | 0.01 | | | | 0.01 | | |
Net asset value, end of period | | $ | 26.55 | | | $ | 19.09 | | | $ | 19.50 | | | $ | 23.65 | | | $ | 30.86 | | |
Total return | | | 48.85 | % | | | 2.95 | % | | | (7.58 | )% | | | (1.97 | )% | | | 6.45 | % | |
Ratios/supplemental data: | |
Net assets, end of period (millions) | | $ | 78.2 | | | $ | 58.2 | | | $ | 65.9 | | | $ | 85.6 | | | $ | 109.9 | | |
Ratio of expenses to average net assets: | |
Before fees waived | | | 1.64 | % | | | 1.66 | % | | | 1.54 | % | | | 1.52 | % | | | 1.53 | % | |
After fees waived | | | 1.64 | % | | | 1.66 | % | | | 1.54 | % | | | 1.52 | % | | | 1.53 | % | |
| After fees waived excluding interest expense(2) | | | 1.64 | % | | | 1.66 | % | | | 1.53 | % | | | 1.51 | % | | | 1.52 | % | |
Ratio of net investment income to average net assets: | | | 1.17 | % | | | 1.70 | % | | | 1.23 | % | | | 1.51 | % | | | 1.27 | % | |
Portfolio turnover rate | | | 20.78 | % | | | 28.02 | % | | | 26.50 | % | | | 15.11 | % | | | 6.90 | % | |
(1) Amount represents less than $0.01 per share.
(2) The Advisor has contractually agreed to limit the operating expenses of the Fund to 1.98%, excluding interest expense, expenses related to dividends on short positions, brokerage commissions, taxes and other extraordinary expenses. See Note 3.
The accompanying notes are an integral part of these financial statements.
86
FINANCIAL HIGHLIGHTS
For a capital share outstanding throughout each period.
| | | Year Ended December 31, | |
Dividend Builder Fund | | 2017 | | 2016 | | 2015 | | 2014 | | 2013 | |
Net asset value, beginning of period | | $ | 15.28 | | | $ | 14.75 | | | $ | 15.83 | | | $ | 15.64 | | | $ | 12.80 | | |
Income from investment operations: | |
Net investment income | | | 0.41 | | | | 0.46 | | | | 0.42 | | | | 0.52 | | | | 0.41 | | |
Net realized and unrealized gain (loss) on investments and foreign currency | | | 2.82 | | | | 0.54 | (3) | | | (0.99 | ) | | | 0.26 | | | | 3.35 | | |
Total from investment operations | | | 3.23 | | | | 1.00 | | | | (0.57 | ) | | | 0.78 | | | | 3.76 | | |
Less distributions: | |
From net investment income | | | (0.42 | ) | | | (0.47 | ) | | | (0.46 | ) | | | (0.47 | ) | | | (0.45 | ) | |
From net realized gain | | | — | | | | — | | | | (0.05 | ) | | | (0.12 | ) | | | (0.47 | ) | |
Total distributions | | | (0.42 | ) | | | (0.47 | ) | | | (0.51 | ) | | | (0.59 | ) | | | (0.92 | ) | |
Redemption fee proceeds | | | — | | | | — | | | | — | (1) | | | — | (1) | | | — | (1) | |
Net asset value, end of period | | $ | 18.09 | | | $ | 15.28 | | | $ | 14.75 | | | $ | 15.83 | | | $ | 15.64 | | |
Total return | | | 21.34 | % | | | 6.83 | % | | | (3.61 | )% | | | 4.99 | % | | | 29.77 | % | |
Ratios/supplemental data: | |
Net assets, end of period (millions) | | $ | 9.0 | | | $ | 7.8 | | | $ | 11.0 | | | $ | 5.2 | | | $ | 3.1 | | |
Ratio of expenses to average net assets: | |
Before fees waived | | | 2.06 | % | | | 2.11 | % | | | 1.77 | % | | | 2.96 | % | | | 5.47 | % | |
After fees waived | | | 0.68 | % | | | 0.70 | % | | | 0.68 | % | | | 0.68 | % | | | 0.68 | % | |
| After fees waived excluding interest expense(2) | | | 0.68 | % | | | 0.68 | % | | | 0.68 | % | | | 0.68 | % | | | 0.68 | % | |
Ratio of net investment income (loss) to average net assets: | |
Before fees waived/recaptured | | | 1.07 | % | | | 1.41 | % | | | 1.76 | % | | | 1.18 | % | | | (2.04 | )% | |
After fees waived/recaptured | | | 2.45 | % | | | 2.82 | % | | | 2.86 | % | | | 3.46 | % | | | 2.75 | % | |
Portfolio turnover rate | | | 18.61 | % | | | 21.57 | % | | | 24.94 | % | | | 7.60 | % | | | 24.88 | % | |
(1) Amount represents less than $0.01 per share.
(2) The Advisor has contractually agreed to limit the operating expenses of the Fund to 0.68%, excluding interest expense, expenses related to dividends on short positions, brokerage commissions, taxes and other extraordinary expenses. See Note 3.
(3) An affiliate of the Fund reimbursed the Fund $203.00 for a trade error. As of December 31, 2016, the reimbursement amount represents $0.000 per share.
The accompanying notes are an integral part of these financial statements.
87
FINANCIAL HIGHLIGHTS
For a capital share outstanding throughout each period.
| | | Year Ended December 31, | |
Global Energy Fund | | 2017 | | 2016 | | 2015 | | 2014 | | 2013 | |
Net asset value, beginning of period | | $ | 23.29 | | | $ | 18.54 | | | $ | 25.73 | | | $ | 32.45 | | | $ | 26.19 | | |
Income from investment operations: | |
Net investment income | | | 0.30 | | | | 0.26 | | | | 0.26 | | | | 0.28 | | | | 0.18 | | |
Net realized and unrealized gain (loss) on investments and foreign currency | | | (0.56 | ) | | | 4.75 | | | | (7.20 | ) | | | (6.66 | ) | | | 6.23 | | |
Total from investment operations | | | (0.26 | ) | | | 5.01 | | | | (6.94 | ) | | | (6.38 | ) | | | 6.41 | | |
Less distributions: | |
From net investment income | | | (0.32 | ) | | | (0.26 | ) | | | (0.25 | ) | | | (0.22 | ) | | | (0.15 | ) | |
From net realized gain | | | — | | | | — | | | | — | (1) | | | (0.13 | ) | | | — | | |
Total distributions | | | (0.32 | ) | | | (0.26 | ) | | | (0.25 | ) | | | (0.35 | ) | | | (0.15 | ) | |
Redemption fee proceeds | | | — | | | | — | (1) | | | — | (1) | | | 0.01 | | | | — | (1) | |
Net asset value, end of period | | $ | 22.71 | | | $ | 23.29 | | | $ | 18.54 | | | $ | 25.73 | | | $ | 32.45 | | |
Total return | | | (1.06 | )% | | | 27.04 | % | | | (26.97 | )% | | | (19.63 | )% | | | 24.48 | % | |
Ratios/supplemental data: | |
Net assets, end of period (millions) | | $ | 31.8 | | | $ | 49.0 | | | $ | 44.0 | | | $ | 62.9 | | | $ | 72.3 | | |
Ratio of expenses to average net assets: | |
Before fees waived | | | 1.62 | % | | | 1.53 | % | | | 1.41 | % | | | 1.30 | % | | | 1.35 | % | |
After fees waived | | | 1.45 | % | | | 1.45 | % | | | 1.41 | % | | | 1.30 | % | | | 1.35 | % | |
| After fees waived excluding interest expense(2) | | | 1.45 | % | | | 1.45 | % | | | 1.41 | % | | | 1.30 | % | | | 1.34 | % | |
Ratio of net investment income to average net assets: | |
Before fees waived/recaptured | | | 1.01 | % | | | 1.10 | % | | | 1.07 | % | | | 0.76 | % | | | 0.77 | % | |
After fees waived/recaptured | | | 1.18 | % | | | 1.18 | % | | | 1.07 | % | | | 0.76 | % | | | 0.77 | % | |
Portfolio turnover rate | | | 6.25 | % | | | 14.96 | % | | | 15.70 | % | | | 39.33 | % | | | 8.19 | % | |
(1) Amount represents less than $0.01 per share.
(2) The Advisor has contractually agreed to limit the operating expenses of the Fund to 1.45%, excluding interest expense, expenses related to dividends on short positions, brokerage commissions, taxes and other extraordinary expenses. See Note 3.
The accompanying notes are an integral part of these financial statements.
88
FINANCIAL HIGHLIGHTS
For a capital share outstanding throughout each period.
| | | Year Ended December 31, | |
Global Innovators Fund – Investor Class | | 2017 | | 2016 | | 2015 | | 2014 | | 2013 | |
Net asset value, beginning of period | | $ | 34.15 | | | $ | 31.47 | | | $ | 34.00 | | | $ | 30.65 | | | $ | 21.18 | | |
Income from investment operations: | |
Net investment income | | | 0.09 | | | | 0.30 | | | | 0.26 | | | | 0.28 | | | | 0.07 | | |
Net realized and unrealized gain (loss) on investments | | | 11.76 | | | | 2.69 | | | | (1.28 | )(3) | | | 3.57 | | | | 9.52 | | |
Total from investment operations | | | 11.85 | | | | 2.99 | | | | (1.02 | ) | | | 3.85 | | | | 9.59 | | |
Less distributions: | |
From net investment income | | | (0.04 | ) | | | (0.31 | ) | | | (0.24 | ) | | | (0.26 | ) | | | (0.12 | ) | |
From net realized gain | | | (0.98 | ) | | | — | | | | (1.27 | ) | | | (0.24 | ) | | | — | | |
Total distributions | | | (1.02 | ) | | | (0.31 | ) | | | (1.51 | ) | | | (0.50 | ) | | | (0.12 | ) | |
Redemption fee proceeds | | | — | | | | — | | | | — | (1) | | | — | (1) | | | — | (1) | |
Net asset value, end of period | | $ | 44.98 | | | $ | 34.15 | | | $ | 31.47 | | | $ | 34.00 | | | $ | 30.65 | | |
Total return | | | 34.75 | % | | | 9.51 | % | | | (3.04 | )% | | | 12.55 | % | | | 45.29 | % | |
Ratios/supplemental data: | |
Net assets, end of period (millions) | | $ | 185.9 | | | $ | 133.7 | | | $ | 164.9 | | | $ | 157.5 | | | $ | 50.7 | | |
Ratio of expenses to average net assets: | |
Before fees waived/recaptured | | | 1.33 | % | | | 1.35 | % | | | 1.27 | % | | | 1.26 | % | | | 1.47 | % | |
After fees waived/recaptured | | | 1.24 | % | | | 1.24 | % | | | 1.27 | % | | | 1.26 | % | | | 1.47 | % | |
| After fees waived/recaptured excluding interest expense(2) | | | 1.24 | % | | | 1.24 | % | | | 1.27 | % | | | 1.26 | % | | | 1.46 | % | |
Ratio of net investment income to average net assets: | |
Before fees waived/recaptured | | | 0.13 | % | | | 0.71 | % | | | 0.69 | % | | | 1.25 | % | | | 0.31 | % | |
After fees waived/recaptured | | | 0.22 | % | | | 0.82 | % | | | 0.69 | % | | | 1.25 | % | | | 0.31 | % | |
Portfolio turnover rate | | | 19.86 | % | | | 31.25 | % | | | 37.59 | % | | | 14.40 | % | | | 29.63 | % | |
(1) Amount represents less than $0.01 per share.
(2) The Advisor has contractually agreed to limit the operating expenses of the Fund's Investor Class to 1.24%, prior to December 31, 2015 the limit on operating expenses was 1.55%, excluding interest expense, related to dividends on short positions, brokerage commissions, taxes and other extraordinary expenses. See Note 3.
(3) The Advisor reimbursed the Fund $10,554 for trade errors. As of December 31, 2015, the reimbursement amount represents $0.002 per share.
The accompanying notes are an integral part of these financial statements.
89
FINANCIAL HIGHLIGHTS
For a capital share outstanding throughout each period.
| | | Year Ended December 31, | | For the
Period Ended | |
Global Innovators Fund – Institutional Class | | 2017 | | 2016 | | December 31, 2015(1) | |
Net asset value, beginning of period | | $ | 34.20 | | | $ | 31.47 | | | $ | 31.47 | | |
Income from investment operations: | |
Net investment income | | | 0.16 | | | | 0.20 | | | | — | | |
Net realized and unrealized gain on investments | | | 11.82 | | | | 2.88 | | | | — | | |
Total from investment operations | | | 11.98 | | | | 3.08 | | | | — | | |
Less distributions: | |
From net investment income | | | (0.12 | ) | | | (0.35 | ) | | | — | | |
From net realized gain | | | (0.98 | ) | | | — | | | | — | | |
Total distributions | | | (1.10 | ) | | | (0.35 | ) | | | — | | |
Redemption fee proceeds | | | — | | | | — | | | | — | | |
Net asset value, end of period | | $ | 45.08 | | | $ | 34.20 | | | $ | 31.47 | | |
Total return | | | 35.07 | % | | | 9.81 | % | | | 0.00 | % | |
Ratios/supplemental data: | |
Net assets, end of period (millions) | | $ | 44.1 | | | $ | 25.7 | | | $ | 0.0 | | |
Ratio of expenses to average net assets: | |
Before fees waived/recaptured | | | 1.17 | % | | | 1.38 | % | | | 0.00 | % | |
After fees waived/recaptured | | | 0.99 | % | | | 0.99 | % | | | 0.00 | % | |
| After fees waived/recaptured excluding interest expense(2) | | | 0.99 | % | | | 0.99 | % | | | 0.00 | % | |
Ratio of net investment income to average net assets: | |
Before fees waived/recaptured | | | 0.30 | % | | | 0.68 | % | | | 0.00 | % | |
After fees waived/recaptured | | | 0.48 | % | | | 1.07 | % | | | 0.00 | % | |
Portfolio turnover rate | | | 19.86 | % | | | 31.25 | % | | | 0.00 | % | |
(1) Commencement of Operations.
(2) The Advisor has contractually agreed to limit the operating expenses of the Fund's Institutional Class to 0.99%, excluding interest expense, expenses related to dividends on short positions, brokerage commissions, taxes and other extraordinary expenses. See Note 3.
The accompanying notes are an integral part of these financial statements.
90
FINANCIAL HIGHLIGHTS
For a capital share outstanding throughout each period.
| | | Year Ended December 31, | |
Renminbi Yuan & Bond Fund | | 2017 | | 2016 | | 2015 | | 2014 | | 2013 | |
Net asset value, beginning of period | | $ | 11.03 | | | $ | 11.63 | | | $ | 12.42 | | | $ | 12.95 | | | $ | 12.71 | | |
Income from investment operations: | |
Net investment income | | | 0.23 | | | | 0.19 | | | | 0.63 | | | | 0.32 | | | | 0.28 | | |
Net realized and unrealized gain (loss) on investments and foreign currency | | | 0.85 | | | | (0.59 | ) | | | (1.12 | ) | | | (0.44 | ) | | | 0.38 | | |
Total from investment operations | | | 1.08 | | | | (0.40 | ) | | | (0.49 | ) | | | (0.12 | ) | | | 0.66 | | |
Less distributions: | |
From net investment income | | | (0.09 | ) | | | — | | | | (0.27 | ) | | �� | (0.41 | ) | | | (0.42 | ) | |
Return of capital | | | (0.02 | ) | | | (0.20 | ) | | | (0.03 | ) | | | — | | | | — | | |
Total distributions | | | (0.11 | ) | | | (0.20 | ) | | | (0.30 | ) | | | (0.41 | ) | | | (0.42 | ) | |
Redemption fee proceeds | | | — | | | | — | (1) | | | — | (1) | | | — | (1) | | | — | (1) | |
Net asset value, end of period | | $ | 12.00 | | | $ | 11.03 | | | $ | 11.63 | | | $ | 12.42 | | | $ | 12.95 | | |
Total return | | | 9.79 | % | | | (3.52 | )% | | | (4.05 | )% | | | (0.92 | )% | | | 5.26 | % | |
Ratios/supplemental data: | |
Net assets, end of period (millions) | | $ | 2.6 | | | $ | 2.3 | | | $ | 7.1 | | | $ | 100.6 | | | $ | 94.2 | | |
Ratio of expenses to average net assets: | |
Before fees waived/recaptured | | | 4.17 | % | | | 4.35 | % | | | 1.05 | % | | | 0.95 | % | | | 0.97 | % | |
After fees waived/recaptured | | | 0.90 | % | | | 1.00 | % | | | 0.93 | % | | | 0.90 | % | | | 0.90 | % | |
| After fees waived/recaptured excluding interest expense(2) | | | 0.90 | % | | | 0.90 | % | | | 0.90 | % | | | 0.90 | % | | | 0.90 | % | |
Ratio of net investment income (loss) to average net assets: | |
Before fees waived/recaptured | | | (1.33 | )% | | | (0.71 | )% | | | 2.68 | % | | | 2.49 | % | | | 2.11 | % | |
After fees waived/recaptured | | | 1.94 | % | | | 2.64 | % | | | 2.80 | % | | | 2.54 | % | | | 2.18 | % | |
Portfolio turnover rate | | | 66.21 | % | | | 13.00 | % | | | 15.85 | % | | | 28.29 | % | | | 12.32 | % | |
(1) Amount represents less than $0.01 per share.
(2) The Advisor has contractually agreed to limit the operating expenses of the Fund to 0.90%, excluding interest expense, expenses related to dividends on short positions, brokerage commissions, taxes and other extraordinary expenses. See Note 3.
The accompanying notes are an integral part of these financial statements.
91
NOTES TO FINANCIAL STATEMENTS
Note 1
Organization
Guinness AtkinsonTM Funds (the "Trust"), was organized on April 28, 1997 as a Delaware business trust and registered under the Investment Company Act of 1940, as amended (the "1940 Act"), as an open end management investment company. Currently, the Trust offers eight separate series: Guinness Atkinson Alternative Energy Fund (the "Alternative Energy Fund"), Guinness Atkinson Asia Focus Fund (the "Asia Focus Fund"), Guinness Atkinson Asia Pacific Dividend Builder Fund (the "Asia Pacific Dividend Builder Fund"), Guinness Atkinson China & Hong Kong Fund (the "China & Hong Kong Fund"), Guinness Atkinson Global Energy Fund (the "Global Energy Fund"), Guinness Atkinson Global Innovators Fund (the "Global Innovators Fund"), Guinness Atkinson Dividend Builder Fund (the "Dividend Builder Fund") and Guinness Atkinson Renminbi Yuan & Bond Fund (the "Renminbi Yuan & Bond Fund"), all of which (each a "Fund" and collectively, the "Funds") are covered by this report. Except for the Dividend Builder Fund, each Fund is a non-diversified Fund. The China & Hong Kong Fund began operations on June 30, 1994, the Asia Focus Fund began operations on April 29, 1996, the Global Innovators Fund began operations on December 15, 1998, the Global Energy Fund began operations on June 30, 2004, the Alternative Energy Fund and the Asia Pacific Dividend Builder Fund began operations on March 31, 2006, the Renminbi Yuan & Bond Fund began operations on June 30, 2011, and the Dividend Builder Fund began operations on March 30, 2012. Each of the Funds is authorized to issue a single class of shares except for the Global Innovators Fund. The Global Innovators Fund is authorized to issue two classes of shares: Investor Class shares and Institutional Class shares. Institutional Class shares of the Global Innovators Fund commenced operations on December 31, 2015.
The shares of each class represent an interest in the same portfolio of investments of the Global Innovators Fund and have equal rights as to voting, redemptions, dividends and liquidation, subject to the approval of the Trustees. Income and expenses (other than expenses attributable to a specific class) and realized and unrealized gains and losses on investments are allocated to each class of shares in proportion to their relative shares outstanding. Shareholders of a class that bears distribution and service expenses under the terms of a distribution plan have exclusive voting rights to that distribution plan.
The Alternative Energy Fund, Asia Focus Fund, Global Energy Fund, and Global Innovator Fund's investment objective is long-term capital appreciation. The Asia Pacific Dividend Builder Fund's investment objective is to provide investors with dividend income and long-term capital growth. The China & Hong Kong Fund's investment objective is long-term capital appreciation primarily through investments in securities of China and Hong Kong. The Renminbi Yuan & Bond Fund's investment objective is to seek total return. Total return means the combination of capital appreciation and investment income, which includes changes in the value of the renminbi, the currency of China of which the yuan is the unit. The Dividend Builder Fund's investment objective is to seek a moderate level of current income and consistent dividend growth at a rate that exceeds inflation.
Note 2
Significant accounting policies
Each Fund is an investment company and accordingly follows the investment company accounting and reporting guidance of the Financial Accounting Standards Board (FASB) Accounting Standard Codification Topic 946 "Financial Services – Investment Companies".
The following is a summary of significant accounting policies consistently followed by the Funds. These policies are in conformity with accounting principles generally accepted in the United States of America. ("GAAP").
A. Security Valuation. Securities of the Funds that are traded on a principal exchange (U.S. or foreign) or NASDAQ are valued at the official closing price on each day that the exchanges are open for trading. Securities traded on an exchange for which there have been no sales, and other over-the-counter securities are valued at the mean between the bid and asked prices. Debt securities are valued based on available market quotations received from an independent pricing service approved by the Trust's Board of Trustees which may utilize both transaction data and market information such as yield, prices of securities of comparable quality, coupon rate, maturity, type of issue, trading characteristics and other market data. Securities for which quotations are not readily available are valued at their respective fair values as determined in good faith by the Funds' Valuation Committee in accordance with procedures established by the Board of Trustees. In determining fair value, the Funds' Valuation Committee take into account all relevant factors and available information. Consequently, the price of the security used to calculate its Net Asset Value may differ from quoted or published prices for the same security. Fair value pricing involves subjective judgments and there is no single standard for determining a security's fair value. As a result, different mutual funds could reasonably arrive at different fair value for the same security. It is possible that the fair value determined for a security is materially different from the value that could be realized upon the sale of that security or from the values that other mutual
92
funds may determine. Short-term investments are stated at cost, combined with accrued interest, which approximates market value. Realized gains and losses from securities transactions are calculated using the identified cost method.
Foreign securities are recorded in the financial statements after translation to U.S. dollars based on the applicable exchange rate at the end of the period. The Funds do not isolate that portion of the results of operations resulting from changes in the currency exchange rate from the fluctuations resulting from changes in the market prices of investments.
Foreign exchange gain or loss resulting from holding of a foreign currency, expiration of a currency exchange contract, difference in exchange rates between the trade date and settlement date of an investment purchased or sold, and the difference between dividends actually received compared to the amount shown in a Fund's accounting records on the date of receipt are shown as net realized gains or losses on foreign currency transactions in the respective Fund's statement of operations.
B. Forward Foreign Currency Exchange Contracts. The Funds may utilize forward foreign currency exchange contracts ("forward contracts") to hedge against foreign exchange fluctuations on foreign-denominated investments under which they are obligated to exchange currencies at specific future dates and at specified rates. All commitments are "marked-to-market" daily and any resulting unrealized gains or losses are included as unrealized appreciation (depreciation) on foreign currency denominated assets and liabilities. The Funds record realized gains or losses at the time the forward contract is settled. Risks may arise upon entering these contracts from the potential inability of a counter party to meet the terms of their contracts and from unanticipated movements in the value of a foreign currency relative to the U.S. dollar or other currencies. Counterparties to these contracts are major U.S. financial institutions. Please refer to Note 7 for further information on forward foreign currency contracts held in each Fund.
C. Restricted and Illiquid Securities. A restricted security cannot be resold to the general public without prior registration under the Securities Act of 1933. If the security is subsequently registered and resold, the issuers would typically bear the expense of all registrations at no cost to the Fund. Restricted securities are valued according to the guidelines and procedures adopted by the Funds' Board of Trustees. A security may be considered illiquid if it lacks a readily available market. Securities are generally considered liquid if they can be sold or disposed of in the ordinary course of business within seven days at approximately the price at which the security is valued by a fund. Illiquid securities may be valued under methods approved by the Board of Trustees as reflecting fair value.
D. Security Transactions, Dividend Income and Distributions. Security transactions are accounted for on the trade date. Dividend income and distributions to shareholders are recorded on the ex-dividend date. Realized gains and losses from securities transactions are calculated using the identified cost method.
E. Allocation of Expenses. Each Fund is charged for those expenses directly attributable to it. Expenses that are not directly attributable to a Fund are allocated among the Funds in proportion to their respective assets or another appropriate method. Expenses such as distribution and service fees, transfer agent fees and expenses with respect to the Global Innovators Fund, that are specific to individual share classes are accrued directly to the respective share class.
F. Cash Overdraft. Throughout the year, the Funds may have cash overdraft balances. A fee is incurred on these overdrafts, calculated by multiplying the overdraft by a rate plus London Interbank Offered Rate ("LIBOR"). Payables, if any, are reflected as Overdraft Due to Custodian Bank in the Statements of Assets and Liabilities. Expenses from cash overdrafts are included in Interest Expense in the Statements of Operations.
G. Concentration of Risk. The Alternative Energy Fund invests substantially in the alternative energy or energy technology sectors. The Asia Focus Fund invests substantially all of its assets in the Asian continent. The Asia Pacific Dividend Builder Fund invests primarily in dividend-producing equity securities of Asia Pacific companies. The China & Hong Kong Fund invests substantially all of its assets in securities that are traded in China or Hong Kong or that are issued by companies that do a substantial part of their business in China. The Global Energy Fund invests substantially in energy companies; the changes in the prices and supplies of oil and other energy fuels may affect the Fund's investments. The Renminbi Yuan & Bond Fund invests in securities issued by companies economically tied to China, which exposes the Fund to greater market risk and potential monetary losses than if the Fund's assets were diversified among other regions. The consequences of political, social, or economic changes in the countries or business sectors in which the securities are offered or the issuers conduct their operations may affect the market prices of the Funds' investments and any income generated, as well as the Funds' ability to repatriate such amounts.
H. Use of Estimates. The preparation of financial statements in conformity with accounting principles generally accepted in the United States requires management to make estimates and assumptions that affect the reported amounts of assets and liabilities and the disclosure of contingent assets and liabilities at the date of the financial statements. Actual results could differ from those estimates.
93
I. Reclassifications. Accounting principles generally accepted in the United States require that certain components of net assets be reclassified between financial and tax reporting. These reclassifications have no effect on net assets or new asset value per share and were primarily attributed to differences in the treatment of foreign currency and net investment losses. For the year ended December 31, 2017, permanent differences in book and tax accounting have been reclassified as follows:
| | | Increase (Decrease) | |
| | | Paid in Capital | | Undistributed Net
Investment
Income/(Loss) | | Accumulated
Gains/(Losses) | |
Alternative Energy Fund | | $ | (40,204,652 | ) | | $ | (6,533 | ) | | $ | 40,211,185 | | |
Asia Focus Fund | | | — | | | | 1,379 | | | | (1,379 | ) | |
Asia Pacific Dividend Builder Fund | | | (691,004 | ) | | | 14,529 | | | | 676,475 | | |
China & Hong Kong Fund | | | — | | | | (10,027 | ) | | | 10,027 | | |
Dividend Builder Fund | | | — | | | | 206 | | | | (206 | ) | |
Global Energy Fund | | | — | | | | (17,455 | ) | | | 17,455 | | |
Global Innovators Fund | | | (751,253 | ) | | | (275,987 | ) | | | 1,027,240 | | |
Renminbi Yuan& Bond Fund | | | — | | | | (40,367 | ) | | | 40,367 | | |
J. Indemnifications. Under the Trust's organizational documents, its current and former officers and trustees are indemnified against certain liabilities arising out of the performance of their duties to the Funds. In addition, in the normal course of business, the Funds enter into contracts that contain a variety of representations and warranties that provide general indemnifications. The Funds' maximum exposure under these arrangements is unknown as this would involve future claims that may be made against the Funds that have not yet occurred or that would be covered by other parties.
K. Federal Income Taxes. The Funds intend to comply with the requirements of Subchapter M of the Internal Revenue Code applicable to regulated investment companies and to distribute substantially all of their net investment income and any net realized gains to their shareholders. Therefore, no provision is made for federal income or excise taxes. Due to the timing of dividend distributions and the differences in accounting for income and realized gains and losses for financial statement and federal income tax purposes, the fiscal year in which amounts are distributed may differ from the year in which the income and realized gains and losses are recorded by the Funds.
Accounting for Uncertainty in Income Taxes (the "Income Tax Statement") requires an evaluation of tax positions taken (or expected to be taken) in the course of preparing a Funds' tax returns to determine whether these positions meet a "more-likely-than-not" standard that, based on the technical merits, have a more than fifty percent likelihood of being sustained by a taxing authority upon examination. A tax position that meets the "more-likely-than-not" recognition threshold is measured to determine the amount of benefit to recognize in the financial statements. The Funds recognize interest and penalties, if any, related to unrecognized tax benefits as income tax expense in the Statements of Operations.
The Income Tax Statement requires management of the Funds to analyze tax positions taken in the prior three open tax years, if any, and tax positions expected to be taken in the Fund's current tax year, as defined by the IRS statute of limitations for all major jurisdictions, including federal tax authorities and certain state tax authorities. As of and during the year ended December 31, 2017, the Funds did not have a liability for any unrecognized tax benefits. The Funds have no examination in progress and are not aware of any tax positions for which it is reasonably possible that the total amounts of unrecognized tax benefits will significantly change in the next twelve months.
Note 3
Investment Advisory and Other Agreements
The Trust, on behalf of each Fund, entered into an Investment Advisory Agreement with Guinness Atkinson Asset Management, Inc. (the "Advisor"), under which the Advisor provides the Funds with investment management services. The Advisor furnishes all
94
investment advice, office space, facilities, and most of the personnel needed by the Funds. As compensation for its services, the Advisor is entitled to a monthly fee at the following annual rates based upon the average daily net assets of the Funds:
Alternative Energy Fund | | 1.00% | |
Asia Focus Fund | | 1.00% | |
Asia Pacific Dividend Builder Fund | | 1.00% | |
China & Hong Kong Fund | | 1.00% | |
Dividend Builder Fund | | 0.45% | |
Global Energy Fund | | 0.75% | |
Global Innovators Fund | | 0.75% on the 1st $500 million, 0.60% thereafter | |
Renminbi Yuan & Bond Fund | | 0.55% | |
The Funds are responsible for their own operating expenses. The Advisor has contractually agreed to limit each Fund's total operating expenses (excluding interest, dividends on short positions, taxes and extraordinary expenses) by reducing all or a portion of its fees and reimbursing the Fund for expenses so that its ratio of expenses to average daily net assets will not exceed the following levels:
| | | Annual Expense Limit | | Expiration Date | |
Alternative Energy Fund | | | 1.98 | % | | June 30, 2018 | |
Asia Focus Fund | | | 1.98 | % | | June 30, 2018 | |
Asia Pacific Dividend Builder Fund | | | 1.10 | % | | June 30, 2018 | |
China & Hong Kong Fund | | | 1.98 | % | | June 30, 2018 | |
Dividend Builder Fund | | | 0.68 | % | | June 30, 2018 | |
Global Energy Fund | | | 1.45 | % | | June 30, 2018 | |
Global Innovators Fund - Investor Class | | | 1.24 | % | | June 30, 2018 | |
Global Innovators Fund - Institutional Class | | | 0.99 | % | | June 30, 2018 | |
Renminbi Yuan & Bond Fund | | | 0.90 | % | | June 30, 2018 | |
The expense ratios shown in the financial highlights may exceed these levels due to expenses incurred, but not covered by the expense limitation agreement.
To the extent that the Advisor waives fees and/or absorbs expenses it may seek repayment of a portion or all of such amounts at any time within three fiscal years after the fiscal year in which such amounts were waived or absorbed, subject to the applicable cap. For the year ended December 31, 2017, the Advisor waived fees and absorbed expenses as follows:
Alternative Energy Fund | | $ | 79,688 | | |
Asia Focus Fund | | $ | 42,738 | | |
Asia Pacific Dividend Builder Fund | | $ | 150,454 | | |
Dividend Builder Fund | | $ | 116,547 | | |
Global Energy Fund | | $ | 65,017 | | |
Global Innovators Fund | | $ | 210,068 | | |
Renminbi Yuan & Bond Fund | | $ | 79,810 | | |
Total | | $ | 744,322 | | |
95
At December 31, 2017, the Advisor may recapture a portion of the following amounts that had been paid and/or waived on behalf of the Funds no later than the dates as stated below:
Fund | | December 31, 2018 | | December 31, 2019 | | December 31, 2020 | | Total | |
Alternative Energy Fund | | $ | 48,819 | | | $ | 74,816 | | | $ | 79,688 | | | $ | 203,323 | | |
Asia Focus Fund | | | — | | | | 39,307 | | | | 42,738 | | | | 82,045 | | |
Asia Pacific Dividend Builder Fund | | | 88,425 | | | | 147,701 | | | | 150,454 | | | | 386,580 | | |
Dividend Builder Fund | | | 114,217 | | | | 140,817 | | | | 116,547 | | | | 371,581 | | |
Global Energy Fund | | | — | | | | 38,343 | | | | 65,017 | | | | 103,360 | | |
Global Innovators Fund | | | — | | | | 203,998 | | | | 210,068 | | | | 414,066 | | |
Renminbi Yuan & Bond Fund | | | 79,927 | | | | 90,419 | | | | 79,810 | | | | 250,156 | | |
Mutual Fund Administration, LLC (the "Administrator") acts as the Funds' administrator under an administration agreement. The fees paid to the Administrator for the year ended December 31, 2017 are reported on the Statements of Operations.
Foreside Fund Services, LLC acts as the Funds' principal underwriter in a continuous public offering of the Funds' shares.
Foreside Fund Officer Services, LLC provides Chief Compliance Officer ("CCO") services to the Funds. The fees paid for CCO services for the year ended December 31, 2017 are reported on the Statements of Operations.
On August 14, 1998, the Trust approved a Deferred Compensation Plan for Trustees (the "Plan"). Trustees can elect to receive payment in cash or defer payments provided for in the Plan. If a trustee elects to defer payment, the Plan provides for the creation of a deferred payment account (Phantom Share Account). This account accumulates the deferred fees earned, and the value of the account is adjusted at the end of each quarter to reflect the value that would have been earned if the account had been invested in designated investments. The Funds recognize as trustee expense amounts accrued as meetings are attended plus the change in value of the Phantom Share Account.
The change in the value of the phantom share account during the year ended December 31, 2017 is shown in the table below. These amounts included any additional contributions to the deferred compensation plan and any appreciation (depreciation) on the underlying investments.
Alternative Energy Fund | | $ | 16,362 | | |
Asia Focus Fund | | $ | 25,759 | | |
Asia Pacific Dividend Builder Fund | | $ | 12,186 | | |
China & Hong Kong Fund | | $ | 52,500 | | |
Global Energy Fund | | $ | 26,000 | | |
Global Innovators Fund | | $ | 48,781 | | |
Dividend Builder Fund | | $ | 7,074 | | |
Renminbi Yuan & Bond Fund | | $ | 12,900 | | |
The fees paid to non-interested Trustees for the year ended December 31, 2017 are reported on the Statements of Operations.
Certain officers of the Trust are also officers and/or Directors of the Advisor and the Administrator. None of these officers are compensated directly by the Funds.
96
Note 4
Shareholder Servicing Plan
Each Fund has adopted a Shareholder Servicing Plan to pay a fee at an annual rate of up to 0.25% of its daily average net assets of shares serviced by shareholder servicing agents who provide administrative and support services to their customers. The Global Innovators Fund – Institutional Class shares do not participate in the Shareholder Servicing Plan.
The fees paid under the Shareholder Servicing Plan for the year ended December 31, 2017 are reported on the Statements of Operations.
Note 5
Investment Transactions
The following table presents purchases and sales of securities during the year ended December 31, 2017 excluding short-term investments, to indicate the volume of transactions in each Fund.
| | | Purchases | | Sales | |
Alternative Energy Fund | | $ | 3,354,084 | | | $ | 5,071,089 | | |
Asia Focus Fund | | $ | 2,331,415 | | | $ | 4,647,376 | | |
Asia Pacific Dividend Builder Fund | | $ | 3,033,312 | | | $ | 5,856,546 | | |
China & Hong Kong Fund | | $ | 14,099,463 | | | $ | 20,589,435 | | |
Dividend Builder Fund | | $ | 1,559,586 | | | $ | 1,615,942 | | |
Global Energy Fund | | $ | 2,340,096 | | | $ | 16,597,508 | | |
Global Innovators Fund | | $ | 52,861,201 | | | $ | 37,911,530 | | |
Renminbi Yuan & Bond Fund | | $ | 1,079,558 | | | $ | 1,300,068 | | |
The Funds did not purchase U.S. Government securities as a part of their long-term investment strategy during the year ended December 31, 2017.
Note 6
Fair Value Measurements and Disclosures
Fair Value Measurements and Disclosures defines fair value, establishes a framework for measuring fair value in accordance with GAAP, and expands disclosure about fair value measurements. It also provides guidance on determining when there has been a significant decrease in the volume and level of activity for an asset or a liability, when a transaction is not orderly, and how that information must be incorporated into a fair value measurement.
Under Fair Value Measurements and Disclosures, various inputs are used in determining the value of each Fund's investments. These inputs are summarized into three broad Levels as described below:
Level 1 — Unadjusted quoted prices in active markets for identical assets or liabilities that a Fund has the ability to access.
Level 2 — Observable inputs other than quoted prices included in level 1 that are observable for the asset or liability, either directly or indirectly. These inputs may include quoted prices for the identical instrument on an inactive market, prices for similar instruments, interest rates, prepayment speeds, credit risk, yield curves, default rates and similar data.
Level 3 — Unobservable inputs for the asset or liability, to the extent relevant observable inputs are not available, representing the Fund's own assumptions about the assumptions a market participant would use in valuing the asset or liability, and would be based on the best information available.
The availability of observable inputs can vary from security to security and is affected by a wide variety of factors, including for example, the type of security, whether the security is new and not yet established in the marketplace, the liquidity of markets, and other characteristics particular to the security. To the extent that valuation is based on models or inputs that are less observable or unobservable in the market, the determination of fair value requires more judgment. Accordingly the degree of judgment exercised in determining fair value is greatest for instruments categorized in Level 3.
97
The inputs used to measure fair value may fall into different levels of the fair value hierarchy. In such cases, for disclosure purposes, the level in the fair value hierarchy within which the fair value measurement falls in its entirety, is determined based on the lowest level input that is significant to the fair value measurement in its entirety.
The inputs or methodology used for valuing securities are not an indication of the risk associated with investing in those securities. The following is a summary of the inputs used, as of December 31, 2017, in valuing the Funds' assets carried at fair value:
Alternative Energy Fund
Assets Table | | Level 1 | | Level 2 | | Level 3 | | Total | |
Investments, at value | |
Common Stocks:1 | |
Basic Material | | $ | — | | | $ | 380,345 | | | $ | — | | | $ | 380,345 | | |
Energy | | | 2,525,867 | | | | 1,936,928 | | | | — | | | | 4,462,795 | | |
Industrial | | | 1,043,849 | | | | 3,061,061 | | | | — | | | | 4,104,910 | | |
Utilities | | | 715,048 | | | | 697,941 | | | | — | | | | 1,412,989 | | |
Total Investments, at value | | | 4,284,764 | | | | 6,076,275 | | | | — | | | | 10,361,039 | | |
Total Assets | | $ | 4,284,764 | | | $ | 6,076,275 | | | $ | — | | | $ | 10,361,039 | | |
Asia Focus Fund
Assets Table | | Level 1 | | Level 2 | | Level 3 | | Total | |
Investments, at value | |
Common Stocks:1 | |
Communications | | $ | — | | | $ | 774,998 | | | $ | — | | | $ | 774,998 | | |
Consumer, Cyclical | | | — | | | | 2,636,341 | | | | — | | | | 2,636,341 | | |
Consumer, Non-cyclical | | | 667,400 | | | | 3,639,639 | | | | — | | | | 4,307,039 | | |
Energy | | | — | | | | 596,774 | | | | — | | | | 596,774 | | |
Financial | | | — | | | | 3,948,464 | | | | — | | | | 3,948,464 | | |
Industrial | | | — | | | | 3,316,067 | | | | — | | | | 3,316,067 | | |
Technology | | | 1,156,397 | | | | 1,892,780 | | | | — | | | | 3,049,177 | | |
Utilities | | | — | | | | 1,117,519 | | | | — | | | | 1,117,519 | | |
Total Investments, at value | | | 1,823,797 | | | | 17,922,582 | | | | — | | | | 19,746,379 | | |
Total Assets | | $ | 1,823,797 | | | $ | 17,922,582 | | | $ | — | | | $ | 19,746,379 | | |
98
Asia Pacific Dividend Builder Fund
Assets Table | | Level 1 | | Level 2 | | Level 3 | | Total | |
Investments, at value | |
Common Stocks:1 | |
Communications | | $ | — | | | $ | 193,310 | | | $ | — | | | $ | 193,310 | | |
Consumer, Cyclical | | | — | | | | 1,330,076 | | | | — | | | | 1,330,076 | | |
Consumer, Non-cyclical | | | — | | | | 693,104 | | | | — | | | | 693,104 | | |
Energy | | | — | | | | 212,365 | | | | — | | | | 212,365 | | |
Financial | | | 210,672 | | | | 2,693,948 | | | | — | | | | 2,904,620 | | |
Industrial | | | — | | | | 1,341,677 | | | | — | | | | 1,341,677 | | |
Technology | | | 217,668 | | | | 582,147 | | | | — | | | | 799,815 | | |
Total Investments, at value | | | 428,340 | | | | 7,046,627 | | | | — | | | | 7,474,967 | | |
Total Assets | | $ | 428,340 | | | $ | 7,046,627 | | | $ | — | | | $ | 7,474,967 | | |
China & Hong Kong Fund
Assets Table | | Level 1 | | Level 2 | | Level 3 | | Total | |
Investments, at value | |
Common Stocks:1 | |
Communications | | $ | — | | | $ | 7,245,237 | | | $ | — | | | $ | 7,245,237 | | |
Consumer, Cyclical | | | — | | | | 16,060,375 | | | | — | | | | 16,060,375 | | |
Consumer, Non-cyclical | | | 2,622,600 | | | | 9,623,664 | | | | — | | | | 12,246,264 | | |
Energy | | | — | | | | 2,867,936 | | | | — | | | | 2,867,936 | | |
Financial | | | — | | | | 19,347,173 | | | | — | | | | 19,347,173 | | |
Industrial | | | 2,692,443 | | | | 12,098,396 | | | | — | | | | 14,790,839 | | |
Technology | | | 3,362,302 | | | | 2,285,936 | | | | — | | | | 5,648,238 | | |
Total Investments, at value | | | 8,677,345 | | | | 69,528,717 | | | | — | | | | 78,206,062 | | |
Total Assets | | $ | 8,677,345 | | | $ | 69,528,717 | | | $ | — | | | $ | 78,206,062 | | |
99
Dividend Builder Fund
Assets Table | | Level 1 | | Level 2 | | Level 3 | | Total | |
Investments, at value | |
Common Stocks:1 | |
Communications | | $ | 274,228 | | | $ | 426,452 | | | $ | — | | | $ | 700,680 | | |
Consumer, Cyclical | | | 611,995 | | | | 258,952 | | | | — | | | | 870,947 | | |
Consumer, Non-cyclical | | | 979,480 | | | | 2,776,118 | | | | — | | | | 3,755,598 | | |
Energy | | | — | | | | 265,107 | | | | — | | | | 265,107 | | |
Financial | | | 1,071,702 | | | | 265,243 | | | | — | | | | 1,336,945 | | |
Industrial | | | 1,079,347 | | | | 508,763 | | | | — | | | | 1,588,110 | | |
Technology | | | 523,461 | | | | — | | | | — | | | | 523,461 | | |
Total Investments, at value | | | 4,540,213 | | | | 4,500,635 | | | | — | | | | 9,040,848 | | |
Total Assets | | $ | 4,540,213 | | | $ | 4,500,635 | | | $ | — | | | $ | 9,040,848 | | |
Global Energy Fund
Assets Table | | Level 1 | | Level 2 | | Level 3 | | Total | |
Investments, at value | |
Common Stocks:1 | |
Energy | | $ | 19,607,619 | | | $ | 12,007,961 | | | $ | — | | | $ | 31,615,580 | | |
Financial | | | 108,012 | | | | — | | | | — | | | | 108,012 | | |
Industrial | | | 213,279 | | | | 29,891 | | | | — | | | | 243,170 | | |
Total Investments, at value | | | 19,928,910 | | | | 12,037,852 | | | | — | | | | 31,966,762 | | |
Total Assets | | $ | 19,928,910 | | | $ | 12,037,852 | | | $ | — | | | $ | 31,966,762 | | |
Global Innovators Fund
Assets Table | | Level 1 | | Level 2 | | Level 3 | | Total | |
Investments, at value | |
Common Stocks:1 | |
Communications | | $ | 30,879,772 | | | $ | — | | | $ | — | | | $ | 30,879,772 | | |
Consumer, Cyclical | | | 7,787,475 | | | | 15,416,056 | | | | — | | | | 23,203,531 | | |
Consumer, Non-cyclical | | | 23,557,166 | | | | 7,983,187 | | | | — | | | | 31,540,353 | | |
Financial | | | 15,368,491 | | | | — | | | | — | | | | 15,368,491 | | |
Industrial | | | 22,815,979 | | | | 37,456,940 | | | | — | | | | 60,272,919 | | |
Technology | | | 43,236,420 | | | | 24,124,705 | | | | — | | | | 67,361,125 | | |
Total Investments, at value | | | 143,645,303 | | | | 84,980,888 | | | | — | | | | 228,626,191 | | |
Total Assets | | $ | 143,645,303 | | | $ | 84,980,888 | | | $ | — | | | $ | 228,626,191 | | |
100
Renminbi Yuan & Bond Fund
Assets Table | | Level 1 | | Level 2 | | Level 3 | | Total | |
Investments, at value | |
Corporate Bonds: | |
Consumer Cyclical | | $ | — | | | $ | 154,070 | | | $ | — | | | $ | 154,070 | | |
Energy | | | — | | | | 152,173 | | | | — | | | | 152,173 | | |
Financial | | | — | | | | 840,852 | | | | — | | | | 840,852 | | |
Government | | | — | | | | 363,941 | | | | — | | | | 363,941 | | |
Technology | | | — | | | | 154,260 | | | | — | | | | 154,260 | | |
Total Investments, at value | | | — | | | | 1,665,296 | | | | — | | | | 1,665,296 | | |
Total Assets | | $ | — | | | $ | 1,665,296 | | | $ | — | | | $ | 1,665,296 | | |
1 Foreign securities traded in foreign exchanges may be adjusted due to a significant change in the value of U.S. traded securities, as measured by the S&P 500 Index.
Transfers are recognized at the end of the reporting period. As of December 31, 2017, certain securities in the Alternative Energy Fund, Asia Focus Fund, Asia Pacific Dividend Builder Fund, China Hong Kong Fund, Dividend Builder Fund, Global Energy Fund and Global Innovators Fund transferred levels due to these Funds applying for value pricing to Non-U.S. securities.
| | | Alternative
Energy Fund | | Asia Focus
Fund | | Asia Pacific
Dividend
Builder
Fund | | China &
Hong Kong
Fund | | Dividend
Builder
Fund | | Global
Energy
Fund | | Global
Innovators
Fund | | Renminbi
Yuan & Bond
Fund | |
Transfers into Level 2 | | $ | 4,659,121 | | | $ | 16,930,117 | | | $ | 6,415,478 | | | $ | 66,546,046 | | | $ | 3,137,730 | | | $ | 12,037,852 | | | $ | 62,008,433 | | | $ | — | | |
Transfers out of Level 2 | | | — | | | | — | | | | — | | | | — | | | | — | | | | — | | | | — | | | | — | | |
Net transfers in (out) of
Level 2 | | $ | 4,659,121 | | | $ | 16,930,117 | | | $ | 6,415,478 | | | $ | 66,546,046 | | | $ | 3,137,730 | | | $ | 12,037,852 | | | $ | 62,008,433 | | | $ | — | | |
There were no securities transferred between Level 2 and Level 1 in the Renminbi Yuan & Bond Fund.
Note 7
Forward Foreign Currency Contracts
In order to hedge their portfolio and to protect them against possible fluctuations in foreign exchange rates pending the settlement of securities transactions, the Funds may enter into forward foreign currency contracts that obligate them to exchange currencies at specified future dates. At the maturity of a forward contract, a Fund may either make delivery of the foreign currency from currency held, if any, or from the proceeds of the portfolio securities sold. It may also terminate its obligation to deliver the foreign currency at any time by purchasing an offsetting contract. The forward values of amounts due are netted against the forward value of the currency to be delivered, and the net amount is shown as a receivable or payable in the financial statements. The Funds did not enter into forward foreign currency contracts during the year ended December 31, 2017 and did not have any outstanding forward contracts as of December 31, 2017.
101
Note 8
Tax Matters
As of December 31, 2017, the tax bases of investments were as follows:
| | | Alternative
Energy Fund | | Asia Focus
Fund | | Asia Pacific
Dividend
Builder
Fund | | China &
Hong Kong
Fund | | Dividend
Builder
Fund | | Global
Energy
Fund | | Global
Innovators
Fund | | Renminbi
Yuan & Bond
Fund | |
Cost of investments for
tax purposes | | $ | 12,492,048 | | | $ | 11,307,294 | | | $ | 6,103,273 | | | $ | 49,677,881 | | | $ | 6,885,256 | | | $ | 38,074,824 | | | $ | 163,350,006 | | | $ | 1,680,434 | | |
Gross tax unrealized
appreciation | | | 1,096,770 | | | | 8,742,000 | | | | 1,500,711 | | | | 29,296,012 | | | | 2,218,264 | | | | 4,952,959 | | | | 70,171,035 | | | | 26,614 | | |
Gross tax unrealized
(depreciation) | | | (3,227,779 | ) | | | (302,915 | ) | | | (129,017 | ) | | | (767,831 | ) | | | (62,672 | ) | | | (11,061,021 | ) | | | (4,894,850 | ) | | | (41,752 | ) | |
Net tax unrealized
appreciation
(depreciation) on
investments | | | (2,131,009 | ) | | | 8,439,085 | | | | 1,371,694 | | | | 28,528,181 | | | | 2,155,592 | | | | (6,108,062 | ) | | | 65,276,185 | | | | (15,138 | ) | |
Net tax appreciation
(depreciation) on
foreign-currency
denominated assets
and liabilities | | | 834 | | | | 141 | | | | (4 | ) | | | (55 | ) | | | 97 | | | | 1,257 | | | | 3,186 | | | | 18,054 | | |
Net tax unrealized
appreciation
(depreciation)* | | | (2,130,175 | ) | | | 8,439,226 | | | | 1,371,690 | | | | 28,528,126 | | | | 2,155,689 | | | | (6,106,805 | ) | | | 65,279,371 | | | | 2,916 | | |
Undistributed net
ordinary income** | | | 7,397 | | | | 6,760 | | | | 107,017 | | | | 709,908 | | | | 3,155 | | | | 15,969 | | | | — | | | | — | | |
Undistributed Long-term
Capital Gains | | | — | | | | 102,986 | | | | — | | | | — | | | | — | | | | — | | | | — | | | | — | | |
Post October loss*** | | | (2,417,088 | ) | | | — | | | | (12,049 | ) | | | (100,901 | ) | | | (675 | ) | | | (668,834 | ) | | | (478,157 | ) | | | — | | |
Capital loss
carryforward | | | (43,434,484 | ) | | | — | | | | (1,502,925 | ) | | | — | | | | (808,075 | ) | | | (17,850,759 | ) | | | — | | | | (4,237,553 | ) | |
Other accumulated
gain/(loss) | | | (57,799 | ) | | | (90,828 | ) | | | (148,856 | ) | | | (182,560 | ) | | | (20,795 | ) | | | (89,508 | ) | | | (166,263 | ) | | | (42,906 | ) | |
Total accumulated
gain/(loss) | | $ | (48,032,149 | ) | | $ | 8,458,144 | | | $ | (185,123 | ) | | $ | 28,954,573 | | | $ | 1,329,299 | | | $ | (24,699,937 | ) | | $ | 64,634,951 | | | $ | (4,277,543 | ) | |
* The differences between book-basis and tax-basis unrealized appreciation/(depreciation) is attributable primary to the tax deferral of losses on wash sales and passive foreign investment company (PFIC) mark to market adjustments.
** The differences between book-basis and tax-basis undistributed net ordinary income is attributed to deferred compensation, which is included in Other Accumulated Loss.
*** Under the current tax law, capital and currency losses realized after October 31 and prior to a Fund's fiscal year end may be deferred as occurring on the first day of the following year.
102
As of December 31, 2017, the Funds have the following capital loss carryforwards available to offset future realized capital gains:
Capital losses expiring in: | | Alternative
Energy Fund | | Asia Focus
Fund | | Asia Pacific
Dividend
Builder
Fund | | China &
Hong Kong
Fund | | Dividend
Builder
Fund | | Global
Energy
Fund | | Global
Innovators
Fund | | Renminbi
Yuan & Bond
Fund | |
2018 | | $ | 9,296,377 | | | $ | — | | | $ | 1,502,925 | | | $ | — | | | $ | — | | | $ | — | | | $ | — | | | $ | — | | |
2019 | | | — | | | | — | | | | — | | | | — | | | | — | | | | — | | | | — | | | | — | | |
No Expiration Long-term | | | 33,589,525 | | | | — | | | | — | | | | — | | | | 624,879 | | | | 14,894,552 | | | | — | | | | 3,272,277 | | |
No Expiration Short-term | | | 548,582 | | | | — | | | | — | | | | — | | | | 183,196 | | | | 2,956,207 | | | | — | | | | 965,276 | | |
Total | | $ | 43,434,484 | | | $ | — | | | $ | 1,502,925 | | | $ | — | | | $ | 808,075 | | | $ | 17,850,759 | | | $ | — | | | $ | 4,237,553 | | |
For the year ended December 31, 2017, the Asia Focus Fund and Asia Pacific Dividend Builder Fund utilized capital losses carryforwards of $292,669 and $407,488, respectively.
Under the enacted Regulated Investment Company Modernization Act of 2010 (the "Act"), the Funds will be permitted to carryforward capital losses incurred in taxable years beginning after December 22, 2010, for an unlimited period. However, any losses incurred during those future taxable years will be required to be utilized prior to the losses incurred in pre-enactment taxable years. As a result of this ordering rule, pre-enactment capital loss carryforwards may be more likely to expire unused. Additionally, post-enactment capital losses that are carried forward will retain their character as either short-term or long-term capital losses rather than being considered all short-term as under previous law.
The tax character of distributions (other than return of capital distributions) paid during 2017 and 2016 fiscal years are as follows:
| | | 2017 | | 2016 | |
| | | Ordinary
Income | | Long-term
Capital Gain | | Ordinary
Income | | Long-term
Capital Gain | |
Alternative Energy Fund | | $ | 30,281 | | | $ | — | | | $ | — | | | $ | — | | |
Asia Focus Fund | | | 180,033 | | | | — | | | | 220,064 | | | | — | | |
Asia Pacific Dividend Builder Fund | | | 178,143 | | | | — | | | | 275,566 | | | | — | | |
China & Hong Kong Fund | | | 1,109,662 | | | | 3,885,056 | | | | 821,167 | | | | 2,195,417 | | |
Dividend Builder Fund | | | 211,862 | | | | — | | | | 283,880 | | | | — | | |
Global Energy Fund | | | 450,140 | | | | — | | | | 550,143 | | | | — | | |
Global Innovators Fund | | | 4,093,190 | | | | 1,068,445 | | | | 1,436,454 | | | | — | | |
Renminbi Yuan & Bond Fund | | | 17,602 | | | | — | | | | — | | | | — | | |
Note 9
Recently Issued Accounting Pronouncements
Disclosure for Investments in Certain Entities that Calculate Net Asset Value per Share (or Its Equivalent) removes the requirement to categorize within the fair value hierarchy investments measured using the net asset value per share ("NAV") practical expedient, as well as removes certain disclosure requirements for investments that qualify, but do not utilize, the NAV practical expedient. Management has evaluated the impact on the Fund's financial statement disclosures and determined there is no effect.
Note 10
Events Subsequent to the Fiscal Period End
The Funds have adopted financial reporting rules regarding a subsequent event which requires an entity to recognize in the financial statements the effects of all subsequent events that provide additional evidence about conditions that existed at the date of the balance sheet. Management has evaluated the Funds' related events and transactions and has determined that there were no events or transactions that occurred that would materially impact the amounts or disclosures in the Funds' financial statements.
103
REPORT OF INDEPENDENT REGISTERED
PUBLIC ACCOUNTING FIRM
To the Shareholders and Board of Trustees
of Guinness Atkinson Funds
Opinion on the Financial Statements
We have audited the accompanying statement of assets and liabilities of Alternative Energy Fund, Asia Focus Fund, Asia Pacific Dividend Builder Fund, China & Hong Kong Fund, Global Energy Fund, Global Innovators Fund, Renminbi Yuan & Bond Fund and Dividend Builder Fund (the "Funds"), each a series of Guinness Atkinson Funds (the "Trust"), including the schedules of investments, as of December 31, 2017, the related statements of operations for the year then ended, the statements of changes in net assets for each of the two years in the period then ended, and financial highlights for each of the five years in the period then ended, and the related notes (collectively referred to as the "financial statements"). In our opinion, the financial statements present fairly, in all material respects, the financial position of the Funds as of December 31, 2017, the results of their operations for the year then ended, the changes in their net assets for each of the two years in the period then ended, and their financial highlights for each of the five years in the period then ended, in conformity with accounting principles generally accepted in the United States of America.
Basis for Opinion
These financial statements are the responsibility of the Funds' management. Our responsibility is to express an opinion on the Funds' financial statements based on our audits. We are a public accounting firm registered with the Public Company Accounting Oversight Board (United States) ("PCAOB") and are required to be independent with respect to the Funds in accordance with the U.S. federal securities laws and the applicable rules and regulations of the Securities and Exchange Commission and the PCAOB. We have served as the auditor of one or more of the funds in the Trust since 2003.
We conducted our audits in accordance with the standards of the PCAOB. Those standards require that we plan and perform the audits to obtain reasonable assurance about whether the financial statements are free of material misstatement, whether due to error or fraud. The Funds are not required to have, nor were we engaged to perform, an audit of the Funds' internal control over financial reporting. As part of our audits we are required to obtain an understanding of internal control over financial reporting, but not for the purpose of expressing an opinion on the effectiveness of the Funds' internal control over financial reporting. Accordingly, we express no such opinion.
Our audits included performing procedures to assess the risks of material misstatement of the financial statements, whether due to error or fraud, and performing procedures that respond to those risks. Such procedures included examining, on a test basis, evidence regarding the amounts and disclosures in the financial statements. Our audits also included evaluating the accounting principles used and significant estimates made by management, as well as evaluating the overall presentation of the financial statements. Our procedures included confirmation of securities owned as of December 31, 2017 by correspondence with the custodian and brokers; when replies were not received from brokers, we performed other auditing procedures. We believe that our audits provide a reasonable basis for our opinion.
TAIT, WELLER & BAKER LLP
Philadelphia, Pennsylvania
March 1, 2018
104
Additional Information (Unaudited)
Proxy Voting Procedures
The Advisor votes proxies relating to portfolio securities in accordance with procedures that have been approved by the Board. You may obtain a description of these procedures, free of charge, by calling "toll-free" (800) 915-6565. This information is also available through the Securities and Exchange Commission's website at www.sec.gov.
Proxy Voting Records
Information regarding how the Advisor voted proxies relating to portfolio securities during the latest 12-month period ended June 30 is available, without charge, by calling toll-free, (800) 915-6565. This information is also available through the Securities and Exchange Commission's website at www.sec.gov.
Form N-Q Disclosure
The Funds file their complete schedule of portfolio holdings with the Securities and Exchange Commission for the first and third quarters of each fiscal year on Form N-Q. The Funds' Form N-Q is available on the Securities and Exchange Commission's website at www.sec.gov. The Funds' Form N-Q may be reviewed and copied at the Commission's Public Reference Room in Washington, DC, and information on the operation of the Public Reference Room may be obtained by calling (800) SEC-0330. This information is also available, without charge, by calling toll-free, (800) 915-6565.
Supplemental Tax Information
For the fiscal year ended December 31, 2017, certain dividends paid by the Funds may be subject to a maximum tax rate of 15%, as provided for by the Jobs and Growth Tax Relief Reconciliation Act of 2003. The percentage of dividends declared from ordinary income designated as qualified dividend income was as follows:
Alternative Energy Fund | | | 100 | % | |
Asia Focus Fund | | | 100 | % | |
Asia Pacific Dividend Builder Fund | | | 90 | % | |
China & Hong Kong Fund | | | 92 | % | |
Dividend Builder Fund | | | 100 | % | |
Global Energy Fund | | | 100 | % | |
Global Innovators Fund | | | 78 | % | |
Renminbi Yuan & Bond Fund | | | N/A | | |
For the year ended December 31, 2017, pursuant to Section 853(b)(3) of the Internal Revenue Code, the China & Hong Kong Fund and the Global Innovators Fund designates $4,544,673 and $4,871,570 respectively, as long-term capital gains.
105
Pursuant to Section 853 of the Internal Revenue Code of 1986, as amended, the Funds designate the following income earned from foreign sources and foreign taxes paid for the year ended December 31, 2017:
| | | Foreign Sourced Income | | Foreign Taxes Paid | |
| | | Total
Amount | | Per Share
Amount | | Total
Amount | | Per Share
Amount | |
Alternative Energy Fund | | $ | 188,367 | | | $ | 0.03 | | | $ | 9,537 | | | $ | 0.00 | | |
Asia Focus Fund | | | 532,040 | | | | 0.59 | | | | 54,669 | | | | 0.06 | | |
Asia Pacific Dividend Builder Fund | | | 245,540 | | | | 0.58 | | | | 21,736 | | | | 0.05 | | |
China & Hong Kong Fund | | | 1,994,799 | | | | 0.68 | | | | 114,032 | | | | 0.04 | | |
Dividend Builder Fund | | | 148,900 | | | | 0.30 | | | | 12,408 | | | | 0.02 | | |
Global Energy Fund | | | 796,585 | | | | 0.57 | | | | 113,258 | | | | 0.08 | | |
Global Innovators Fund | | | N/A | | | | N/A | | | | N/A | | | | N/A | | |
Renminbi Yuan & Bond Fund | | | N/A | | | | N/A | | | | N/A | | | | N/A | | |
106
TRUSTEE AND OFFICER INFORMATION (Unaudited)
Unless otherwise noted, each Trustee and officer's address is 21550 Oxnard Street, Suite 850, Woodland Hills, California 91367. Trustees and officers of the Trust serve until their resignation, removal or retirement. Additional information about the Trustees is included in the Funds' Statement of Additional Information which is available, without charge, upon request by calling toll-free, 1-800-915-6565 or by visiting the Funds' website at www.gafunds.com.
| Name and Age | | Position(s)
Held with
Trust† | | Year Elected | | Principal Occupation(s) During the
Past 5 Years | | Number of
Portfolios In
Fund Complex
Overseen by
Trustee | | Other Directorships
Held by Trustee
During the Past 5 Years | |
Non-Interested Trustees | | | | | | | | | | | | | | | | | |
Dr. Gunter Dufey
(77) | | Trustee | | | 1994 | | | Executive Director of Education Exchange Ltd., a consulting firm since 2010. Professorial Fellow, Nanyang Technological University (Singapore) since 2005. Professor (Emeritus) of Ross School at The University of Michigan, where he served from 1968 to 2002. | | | 8 | | | Independent director, various subsidiaries of Ally Financial Inc. (formerly GMAC) in the United States and Canada. | |
James I. Fordwood
(70) | | Trustee | | | 1994 | | | CFO and Managing Member of Prima Marketing LLC (network of convenience stores) since 1998; President, Balmacara Production Inc. since 1986 (holding company); Treasurer, Inverness21 LLC (owns and operates office buildings) since 2007; Treasurer, JL Energy Inc. (holding company) since 1985; Treasurer, Thistle, Inc. (seismic data management) since 1984. | | | 8 | | | None. | |
Dr. Bret A. Herscher
(59) | | Trustee | | | 1994 | | | Vice President of Minnow Medical, a company that develops medical devices for treating peripheral artery disease since 2009. President of Pacific Consultants, a technical and technology management consulting company serving the electronic industry and venture capital community that he co-founded, from 1996 to 2007. | | | 8 | | | None. | |
107
| Name and Age | | Position(s)
Held with
Trust† | | Year Elected | | Principal Occupation(s) During the
Past 5 Years | | Number of
Portfolios In
Fund Complex
Overseen by
Trustee | | Other Directorships
Held by Trustee
During the Past 5 Years | |
J. Brooks Reece, Jr.
(70) | | Trustee and Chairman | | | 1994 | | | Vice President of Adcole Corp., a manufacturer of precision measuring machines and sun angle sensors for space satellites since 1984. President of Adcole Far East Ltd. since 2008. Executive Director of Adcole Measuring Equipment Shanghai Co. Ltd., since 2004. | | | 8 | | | None. | |
Susan Penry-Williams
(72) | | Trustee | | | 2016 | | | Retired; Partner Kramer Levin Naftalis & Frankel LLP, from 1994 to 2014. | | | 8 | | | None. | |
Interested Trustee | | | | | | | | | | | | | | | |
Timothy W.N. Guinness*
14 Queen Anne's Gate
London,
England SW1H 9AA
U.K.
(69) | | Trustee | | | 1998 | | | Chairman/CIO of Guinness AtkinsonTM Asset Management since November 2002. Chairman of Guinness Asset Management Ltd., investment advisor in London, since 2003. Director of Guinness Capital Management Ltd. since 2010. Director of SR Europe Investment Trust Plc since 2001. Director of Atlantis Japan Growth Fund Ltd., since 2002. Non-Executive Director of Quayle Munro since 2007. Non-Executive Director of Brompton Bicycle Ltd., since 2000. | | | 8 | | | | |
Officers | | | | | | | | | | | | | | | �� |
James Atkinson
(60) | | President | | | 2003 | | | Chief Executive Officer and Director of Guinness AtkinsonTM Asset Management since November 2002. Director of Guinness Asset Management Ltd. since 2003. Principal of Orbis Marketing, a mutual fund marketing and advertising firm, since November 2001. | | | N/A | | | N/A | |
* "Interested person" (as defined in the 1940 Act) of the Funds because of his affiliation with the Funds' Advisor, Guinness Atkinson Asset Management, Inc.
108
| Name and Age | | Position(s)
Held with
Trust† | | Year Elected | | Principal Occupation(s) During the
Past 5 Years | | Number of
Portfolios In
Fund Complex
Overseen by
Trustee | | Other Directorships
Held by Trustee
During the Past 5 Years | |
Patrick Keniston
(53) | | Chief Compliance Officer | | | 2014 | | | Managing Director, Foreside Fund Officer Services, LLC since October 2008. | | | N/A | | | | N/A | | |
Rita Dam
(51) | | Treasurer | | | 2009 | | | Co-Chief Executive Officer (2016-present), and Vice President, Mutual Fund Administration, LLC (2006-2015). | | | N/A | | | | N/A | | |
Joy Ausili
(51) | | Secretary and Assistant Treasurer | | | 2009 | | | Co-Chief Executive Officer (2016-present), and Vice President, Mutual Fund Administration, LLC (2006-2015). | | | N/A | | | | N/A | | |
Sardjono Kadiman
(42) | | Assistant Treasurer | | | 2009 | | | Vice President, Mutual Fund Administration, LLC since 2008. | | | N/A | | | | N/A | | |
Lyna Phan
(42) | | Assistant Treasurer | | | 2011 | | | Vice President, Mutual Fund Administration, LLC since 2010. | | | N/A | | | | N/A | | |
109
Privacy Notice
Guinness AtkinsonTM Funds and Guinness Atkinson Asset Management, Inc. may collect non-public information about you from the following sources:
• Information we receive about you on applications or other forms;
• Information you give us orally; and
• Information about your transactions with us.
We do not disclose any non-public personal information about our shareholders or former shareholders without the shareholder's authorization, except as required by law or in response to inquiries from governmental authorities. We restrict access to your personal and account information to those employees who need to know that information to provide products and services to you. We also may disclose that information to unaffiliated third parties (such as to brokers or custodians) only as permitted by law and only as needed for us to provide agreed services to you. We maintain physical, electronic and procedural safeguards to guard your non-public personal information.
110
Guinness AtkinsonTM Funds Information
Board of Trustees
J. Brooks Reece, Jr., Chairman | |
Dr. Gunter Dufey | |
James I. Fordwood | |
Timothy W.N. Guinness | |
Dr. Bret A. Herscher | |
Susan Penry-Williams | |
Contact Guinness AtkinsonTM Funds
P.O. Box 701 | |
Milwaukee, WI 53201-0701 | |
Shareholder Services: 800-915-6566 | |
Literature Request: 800-915-6565 | |
Website: www.gafunds.com | |
Email: mail@gafunds.com | |
Guinness AtkinsonTM Funds
Fund | | Cusip | | Ticker | | Fund# | |
Alternative Energy Fund | | 402031 50 4 | | GAAEX | | | 1298 | | |
Asia Focus Fund | | 402031 10 8 | | IASMX | | | 1096 | | |
Asia Pacific Dividend Builder Fund | | 402031 60 3 | | GAADX | | | 1299 | | |
China & Hong Kong Fund | | 402031 20 7 | | ICHKX | | | 1094 | | |
Dividend Builder Fund | | 402031 80 1 | | GAINX | | | 1092 | | |
Global Energy Fund | | 402031 40 5 | | GAGEX | | | 1098 | | |
Global Innovators Fund Investor Class | | 402031 30 6 | | IWIRX | | | 1095 | | |
Global Innovators Fund Institutional Class | | 402031 88 4 | | GINNX | | | 1095 | | |
Renminbi Yuan & Bond Fund | | 402031 70 2 | | GARBX | | | 1099 | | |
Distributed by Foreside Fund Services, LLC, Three Canal Plaza, Suite 100, Portland, ME 04101
This report is intended for shareholders of the Guinness AtkinsonTM Funds and may not be used as literature unless preceded or accompanied by a current prospectus.
111
Guinness Atkinson Funds
c/o U.S. Bancorp Fund Services, LLC
P.O. Box 701
Milwaukee, WI 53201-0701
Item 2. Code of Ethics.
The registrant has adopted a code of ethics that applies to the registrant’s principal executive officer and principal financial officer. The registrant has not made any amendments to its code of ethics during the period covered by this report. The registrant has not granted any waivers from any provisions of the code of ethics during the period covered by this report.
The registrant undertakes to provide to any person without charge, upon request, a copy of its code of ethics by mail when they call the registrant at 1-800-915-6565.
Item 3. Audit Committee Financial Expert.
The registrant’s board of trustees has determined that there is at least one audit committee financial expert serving on its audit committee. James I. Fordwood is the “audit committee financial expert” and is considered to be “independent” as each term is defined in Item 3 of Form N-CSR.
Item 4. Principal Accountant Fees and Services.
The registrant has engaged its principal accountant to perform audit services, audit-related services, tax services and other services during the past two fiscal years. “Audit services” refer to performing an audit of the registrant’s annual financial statements or services that are normally provided by the accountant in connection with statutory and regulatory filings or engagements for those fiscal years. “Audit-related services” refer to the assurance and related services by the principal accountant that are reasonably related to the performance of the audit. “Tax services” refer to professional services rendered by the principal accountant for tax compliance, tax advice, and tax planning. There were no “other services” provided by the principal accountant. The following table details the aggregate fees billed or expected to be billed for each of the last two fiscal years for audit fees, audit-related fees, tax fees and other fees by the principal accountant.
| | FYE 12/31/2017 | | FYE 12/31/2016 | |
Audit Fees | | $ | 140,900 | | $ | 140,900 | |
Audit-Related Fees | | N/A | | N/A | |
Tax Fees | | $ | 25,600 | | $ | 25,600 | |
All Other Fees | | N/A | | N/A | |
The audit committee has adopted pre-approval policies and procedures that require the audit committee to pre-approve all audit and non-audit services of the registrant, including services provided to any entity affiliated with the registrant.
The percentage of fees billed by Tait, Weller, & Baker LLP applicable to non-audit services pursuant to waiver of pre-approval requirement were as follows:
| | FYE 12/31/2017 | | FYE 12/31/2016 | |
Audit-Related Fees | | 0 | % | 0 | % |
Tax Fees | | 0 | % | 0 | % |
All Other Fees | | 0 | % | 0 | % |
All of the principal accountant’s hours spent on auditing the registrant’s financial statements were attributed to work performed by full-time permanent employees of the principal accountant.
The following table indicates the non-audit fees billed or expected to be billed by the registrant’s accountant for services to the registrant and to the registrant’s investment adviser (and any other controlling entity, etc.—not sub-adviser) for the last two years. The audit committee of the Board of Trustees has considered whether the provision of non-audit services that were rendered to the registrant’s investment adviser is compatible with maintaining the principal accountant’s independence and has concluded that the provision of such non-audit services by the accountant has not compromised the accountant’s independence.
Non-Audit Related Fees | | FYE 12/31/2017 | | FYE 12/31/2016 | |
Registrant | | N/A | | N/A | |
Registrant’s Investment Advisor | | N/A | | N/A | |
Item 5. Audit Committee of Listed Registrants.
Not applicable to registrants who are not listed issuers (as defined in Rule 10A-3 under the Securities Exchange Act of 1934).
Item 6. Schedule of Investments.
(a) Schedule of Investments is included as part of the report to shareholders filed under Item 1 of this Form.
(b) Not Applicable.
Item 7. Disclosure of Proxy Voting Policies and Procedures for Closed-End Management Investment Companies.
Not Applicable.
Item 8. Portfolio Managers of Closed-End Management Investment Companies.
Not Applicable.
Item 9. Purchases of Equity Securities by Closed-End Management Investment Company and Affiliated Purchasers.
Not Applicable.
Item 10. Submission of Matters to a Vote of Security Holders.
The registrant has not made any material changes to the procedures by which shareholders may recommend nominees to the registrant’s Board of Trustees.
Item 11. Controls and Procedures.
(a) The registrant’s principal executive officer and principal financial officer have evaluated the registrant’s disclosure controls and procedures within 90 days of this filing and have concluded based on such evaluation that the registrant’s disclosure controls and procedures were effective, as of that
date, in ensuring that information required to be disclosed by the registrant in this Form N-CSR was recorded, processed, summarized, and reported within the time periods specified in the Securities and Exchange Commission’s rules and forms.
(b) There were no changes in the registrant’s internal control over financial reporting (as defined in Rule 30a-3(d) under the Investment Company Act of 1940) that occurred during the registrant’s last fiscal quarter that have materially affected, or are reasonably likely to materially affect, the registrant’s internal control over financial reporting.
Item 12. Exhibits.
(a) (1) Any code of ethics or amendment thereto, that is subject of the disclosure required by Item 2, to the extent that the registrant intends to satisfy Item 2 requirements through filing an exhibit. Incorporated by reference to the Registrant’s Form N-CSR filed March 10, 2011.
(b)
(2) Certifications pursuant to Section 302 of the Sarbanes-Oxley Act of 2002. Filed herewith.
(3) Any written solicitation to purchase securities under Rule 23c-1 under the Act sent or given during the period covered by the report by or on behalf of the registrant to 10 or more persons. Not applicable to open-end investment companies.
(c) Certification pursuant to Section 906 of the Sarbanes-Oxley Act of 2002. Filed herewith.
SIGNATURES
Pursuant to the requirements of the Securities Exchange Act of 1934 and the Investment Company Act of 1940, the registrant has duly caused this report to be signed on its behalf by the undersigned, thereunto duly authorized.
(Registrant) Guinness Atkinson Funds |
|
By | /s/ James J. Atkinson | |
Name: | James J. Atkinson |
Title: | President |
Date: | 3/09/18 | |
| | | |
Pursuant to the requirements of the Securities Exchange Act of 1934 and the Investment Company Act of 1940, this report has been signed by the following persons on behalf of the registrant and in the capacities and on the dates indicated.
By | /s/ James J. Atkinson | |
Name: | James J. Atkinson |
Title: | President |
Date: | 3/09/18 | |
| |
| |
By | /s/ Rita Dam | |
Name: | Rita Dam |
Title: | Treasurer |
Date: | 3/09/18 | |
| | | |