UNITED STATES
SECURITIES AND EXCHANGE COMMISSION
Washington, D.C. 20549
FORM N-CSR
CERTIFIED SHAREHOLDER REPORT OF REGISTERED
MANAGEMENT INVESTMENT COMPANIES
Investment Company Act file number | 811-08360 |
|
GUINNESS ATKINSON FUNDS |
(Exact name of registrant as specified in charter) |
|
21550 Oxnard Street, Suite 850
Woodland Hills, CA | | 91367 |
(Address of principal executive offices) | | (Zip code) |
|
James J. Atkinson, Jr.
21550 Oxnard Street, Suite 850
Woodland Hills, CA 91367 |
(Name and address of agent for service) |
|
Registrant’s telephone number, including area code: | (800-915-6566) | |
|
Date of fiscal year end: | December 31 | |
|
Date of reporting period: | December 31, 2015 | |
| | | | | | | | |
Item 1. Reports to Stockholders.
The registrant’s annual report transmitted to shareholders pursuant to Rule 30e-1 under the Investment Company Act of 1940, as amended (the “Investment Company Act”), is as follows:

2
Guinness AtkinsonTM Funds
Annual Report
December 31, 2015
TABLE OF CONTENTS
| | 5 | | | Letter to Shareholders | |
| | 7 | | | Expense Example | |
| | 8 | | | Alternative Energy Fund | |
| | 15 | | | Asia Focus Fund | |
| | 21 | | | Asia Pacific Dividend Builder Fund | |
| | 28 | | | China & Hong Kong Fund | |
| | 34 | | | Dividend Builder Fund | |
| | 43 | | | Global Energy Fund | |
| | 53 | | | Global Innovators Fund | |
| | 62 | | | Renminbi Yuan & Bond Fund | |
| | 69 | | | Statements of Assets and Liabilities | |
| | 70 | | | Statements of Operations | |
| | 72 | | | Statements of Changes in Net Assets | |
| | 75 | | | Financial Highlights | |
| | 83 | | | Notes to Financial Statements | |
| | 97 | | | Report of Independent Registered Public Accounting Firm | |
| | 98 | | | Trustee and Officer Information | |
| | 103 | | | Guinness Atkinson Funds Information | |
3
The table below provides total return data for each of the Funds over the one, three, five, ten year, and from inception periods through December 31, 2015. Also included in the table is the expense ratio data from the most recent prospectus dated March 23, 2015 (or as updated December 31, 2015).
Fund (inception date) | | 1-year | | 3-year | | 5-year | | 10-year | | From Inception | | Expense Ratio | |
Alternative Energy Fund (March 31, 2006) | | | -11.40 | % | | | -7.05 | % | | | -9.78 | % | | | — | | | | -12.34 | % | | | 2.06 | % gross; 2.02% net† | |
Asia Focus (April 29, 1996) | | | -11.56 | % | | | -6.82 | % | | | -6.18 | % | | | 3.27 | % | | | 1.78 | % | | | 1.92 | %† | |
Asia Pacific Dividend Builder Fund
(March 31, 2006) | | | -4.61 | % | | | 0.64 | % | | | 1.57 | % | | | — | | | | 4.14 | % | | | 3.91 | % gross; 1.98% net† | |
China & Hong Kong (June 30, 1994) | | | -7.58 | % | | | -1.20 | % | | | -4.37 | % | | | 6.44 | % | | | 6.46 | % | | | 1.53 | %† | |
Dividend Builder Fund (March 30, 2012) | | | -3.61 | % | | | 9.54 | % | | | — | | | | — | | | | 8.92 | % | | | 2.96 | % gross; 0.68% net† | |
Global Energy Fund (June 30, 2004) | | | -26.97 | % | | | -9.91 | % | | | -8.06 | % | | | -0.30 | % | | | 5.93 | % | | | 1.30 | %† | |
Global Innovators Fund Investor Class
(December 15, 1998) | | | -3.04 | % | | | 16.61 | % | | | 12.19 | % | | | 9.01 | % | | | 6.78 | % | | | 1.26 | % gross; 1.24% net† | |
Global Innovators Fund Institutional Class
(December 31, 2015) | | | -3.04 | % | | | 16.61 | % | | | 12.19 | % | | | 9.01 | % | | | 6.78 | % | | | 1.10 | % gross; 0.99% net† | |
Renminbi Yuan & Bond Fund (June 30, 2011) | | | -4.05 | % | | | 0.03 | % | | | — | | | | — | | | | 0.90 | % | | | 0.95 | % gross; 0.90% net† | |
Periods of greater than one year are average annualized returns; one-year returns are actual returns. All returns are for the periods ended December 31, 2015.
Performance data quoted represents past performance and does not guarantee future results. The investment return and principal value of an investment will fluctuate so that an investor's shares, when redeemed, may be worth more or less than the original cost. Current performance of the Funds may be lower or higher than the performance quoted. Performance data current to the most recent month end may be obtained by visiting www.gafunds.com.
Each of the Asia Focus Fund, the Asia Pacific Dividend Builder Fund, the China & Hong Kong Fund, and the Renminbi Yuan & Bond Fund imposes a 2% redemption fee on shares held less than 30 days. Performance data quoted does not reflect this fee. If it had, total return would be lower.
Expense ratios are from the most recent prospectus (dated March 23, 2015 or amended as of December 31, 2015) and are from the most recent audited financials (period ended December 31, 2014) at the time that prospectus was completed.
†All of the Guinness Atkinson Funds, except the Global Innovators Fund, have an expense cap in place and the advisor is contractually obligated to cap the Funds' total expenses at least through June 30, 2016. The Global Innovators Fund has an expense cap in place and the advisor is contractually obligated to cap the Fund's total expenses at least through June 30, 2018.
Performance data shown for the Global Innovators, Institutional Class (GINNX), prior to its launch date on December 31, 2015, uses performance data from the Global Innovators, Investor Class (IWIRX).
4
Dear Guinness Atkinson Funds Shareholders,
This last year can only be described as not good. 2015 wasn't a disaster but it clearly wasn't a great year for the markets or the Guinness Atkinson Funds. And while we're discussing bad news, we will acknowledge that 2016 has gotten off to a poor start. Last year, none of the Guinness Atkinson Funds produced a positive return. The Guinness Atkinson Fund with the weakest performance in 2015 was the Global Energy Fund, which produced a negative total return of 26.97%. The best performing of the Guinness Atkinson Funds was the Renminbi Yuan & Bond Fund, which provided a negative total return for the calendar year of 4.05%. Complete performance details and Morningstar ratings are in the table below. Despite this poor absolute performance there are some bright spots in the Guinness Atkinson Fund family.
The Global Innovators Fund continued to be a Morningstar Five Star Fund over all time periods (see table below for complete details). Both the Dividend Builder Fund and the Renminbi Yuan & Bond Fund finished the year as Morningstar Four Star Funds over all possible time periods (overall and three-years). The Asia Pacific Dividend Builder is rated Four Stars overall and over five-years. And the Alternative Energy Fund, despite being rated Three Stars overall and two stars over the five-year period, is rated Five Stars over the three-year period.
Morningstar Ratings* Through December 31, 2015
Fund | | Category | | Overall | | 3-year | | 5-year | | 10-year | |
Alternative Energy | | Energy Equity | | 3*** | | 5***** | | 2** | | | |
| | | | | (88 funds) | | (88 funds) | | (80 funds) | | | |
Asia Focus | | Pacific/Asia | | 1* | | 1* | | 1* | | 1* | |
| | | ex-Japan | | (79 funds) | | (79 funds) | | (58 funds) | | (20 funds) | |
Asia Pacific Dividend | | Pacific/Asia | | 4**** | | 3*** | | 4**** | | | |
Builder | | ex-Japan | | (79 funds) | | (79 funds) | | (58 funds) | | | |
China & Hong Kong | | China Region | | 2** | | 1* | | 1* | | 2* | |
| | | | | (75 funds) | | (75 funds) | | (64 funds) | | (35 funds) | |
Global Energy | | Energy Equity | | 3*** | | 3*** | | 3*** | | 3*** | |
| | | | | (88 funds) | | (88 funds) | | (80 funds) | | (50 funds) | |
Global Innovators | | World Stock | | 5***** | | 5***** | | 5***** | | 5***** | |
| | | | | (984 funds) | | (984 funds) | | (781 funds) | | (417 funds) | |
Renminbi Yuan & Bond | | Emerging | | 4**** | | 4**** | | | | | |
| | | Markets Bond | | (262 funds) | | (262 funds) | | | | | |
Dividend Builder | | World Stock | | 4**** | | 4**** | | | | | |
| | | | | (984 funds) | | (984 funds) | | | | | |
*Derived from a weighted average of the Fund's three-, five- and ten-year risk adjusted return measure, if applicable.
As we write this letter the markets are lower for the year and the purported reasons for the lower market include declining oil prices, a slowing Chinese economy, a plunging yuan, worries over the global economy and worries about rising interest rates. We find it odd that the markets would fret over lower oil prices. Obviously lower oil prices are a negative for our Global Energy Fund but a positive for the US economy as a whole. And the slowing growth in China is to be expected as the world's second largest economy matures. It is still among the world's fastest growing economies, which is to say, it is still growing. News reports often confuse the concept of a slower rate of growth – which is what China is experiencing – and negative growth, which is entirely different. Returning to the price of oil, we've seen oil hit all-time highs and generational lows in recent years. At both extremes, arguments are presented (rather convincingly) that the high or low price is the new normal. The price of oil tends to be extremely cyclical: high prices tend to cause lower prices and low prices tend to cause higher prices. In the short- term, supply and demand for oil seems to be inelastic. In the long-term, it tends to be very price elastic. (For our non-economist readers, the more elastic a good is, the more supply and demand adjust for changes in price.)
Regarding the "plunging" yuan, we find the attention paid to the Chinese currency by the financial press a bit surprising. First, the yuan has been among the strongest currencies over 2015. Yes, it has declined against the US dollar, but that decline has been rather modest. The yuan lost 5.69% versus the US dollar in 2015. Among major world currencies, only the Japanese yen (up 1.77%)
5
and Swiss franc (down 1.31%) performed better against the US dollar. The British pound was down 8.71%; the Australian dollar was down 14.39%, the Canadian dollar was down 18.54% and the Brazilian real was down 36.04%. The notion that the yuan has plunged or that China has devalued its currency is simply not supported by the facts. And as we noted above, the best performing Guinness Atkinson Fund for 2015 was the Renminbi Yuan & Bond Fund. (Currency data all sourced from Bloomberg.)
We understand that equity markets go up and down over time and we are in no position to argue with the market regarding its direction in 2015 or here early in 2016. But we feel we can argue about the purported reasons for the decline. Lower oil prices, a slowing of the rate of growth of the Chinese economy and a strong dollar relative to the yuan and other major currencies does not imply economic disaster. We believe the world and US economies are stronger than most believe. Might we be wrong? Of course. What will the markets do in calendar 2016? We are optimistic but we recognize this may be a tough year. Are we concerned? Should investors be concerned? One repeated theme in our annual letters is our belief in long-term investing. Volatile markets are no fun but we have tremendous faith that in the long run, the markets will move higher. The themes that underpin the Guinness Atkinson Funds are all long-term in nature as is our investment philosophy. That may seem antiquated in our 24/7 news cycle, short-attention span society but our belief in long-term thinking and investing is unchanged.
Our investment team has provided a detailed commentary for each of the Guinness Atkinson Funds adjacent to each Fund's financial results.
As usual, we appreciate the confidence you have placed in us and our management team and look forward to what will hopefully be a great 2016.
We encourage you to visit gafunds.com for the latest news and announcements on the Guinness Atkinson Funds.
Sincerely,

| | 
| |
Timothy Guinness | | James Atkinson | |
Mutual fund investing involves risk. Principal loss is possible. The Funds invest in foreign securities, which involves greater volatility and political, economic and currency risks and differences in accounting methods. These risks are greater for emerging markets countries. Non-diversified Funds' assets may be concentrated in fewer individual holdings than diversified funds. Therefore, these Funds are more exposed to individual stock volatility than diversified funds. Investments in smaller companies involve additional risks such as limited liquidity and greater volatility. Investments in debt securities typically decrease in value when interest rates rise, which can be greater for longer-term debt securities. Investments in derivatives involve risks different from, and in certain cases, greater than the risks presented by traditional investments. Investments focused in a single geographic region may be exposed to greater risk than investments diversified among various geographies. Investments focused on the energy sector may be exposed to greater risk than an investments diversified among various sectors.
Morningstar Ratings Disclosure
Global Innovators Fund ratings shown were given for the Investor Class Share. Ratings for other share classes may differ.
For each fund with at least a three-year history, Morningstar calculates a Morningstar RatingTM based on a Morningstar Risk-Adjusted Return measure that accounts for variation in a fund's monthly performance (including the effects of sales charges, loads, and redemption fees), placing more emphasis on downward variations and rewarding consistent performance. The top 10% of funds in each category receive 5 stars, the next 22.5% receive 4 stars, the next 35% receive 3 stars, the next 22.5% receive 2 stars and the bottom 10% receive 1 star. (Each share class is counted as a fraction of one fund within this scale and rated separately, which may cause slight variations in distribution percentages.)
©2016 Morningstar, Inc. All Rights Reserved. The information contained herein (1) is proprietary to Morningstar (2) may not be copied or distributed and (3) is not warranted to be accurate, complete or timely. Neither Morningstar nor its content providers are responsible for any damages or losses arising from any use of this information. Past performance is not a guarantee of future results.
6
Expense Examples (Unaudited)
As a shareholder of the Funds, you incur two types of costs: (1) redemption fees (applicable to the Asia Focus Fund, the Asia Pacific Dividend Builder Fund, the China & Hong Kong Fund, and the Renminbi Yuan & Bond Fund); and (2) ongoing costs, including advisory fees and other Fund expenses. The examples below are intended to help you understand your ongoing costs (in dollars) of investing in the Funds and to compare these costs with the ongoing costs of investing in other mutual funds.
The examples are based on an investment of $1,000 invested at the beginning of the period shown and held for the entire period from July 1, 2015 to December 31, 2015.
Actual Expenses
For each Fund, the first line of the table below provides information about actual account values and actual expenses. You may use the information in this line, together with the amount you invested, to estimate the expenses that you paid over the period. Simply divide your account value by $1,000 (for example, an $8,600 account value divided by $1,000 = 8.6), then multiply the result by the number in the first line under the heading entitled "Expenses Paid during Period" to estimate the expenses you paid on your account during this period.
Hypothetical Example for Comparison Purposes
For each Fund, the second line of the table below provides information about hypothetical account values and hypothetical expenses based on the Fund's actual expense ratios and an assumed rate of return of 5% per year before expenses, which is not the Fund's actual return. The hypothetical account values and expenses may not be used to estimate the actual ending account balance or expenses you paid for the period. You may use this information to compare the ongoing costs of investing in the Fund and other funds. To do so, compare this 5% hypothetical example with the 5% hypothetical examples that appear in the shareholder reports of the other funds.
Please note that the expenses shown in the table are meant to highlight your ongoing costs only and do not reflect any redemption fees. Therefore, the second line for each Fund of the table is useful in comparing ongoing costs only, and will not help you determine the relative total costs of owning different funds. In addition, if these redemption fees were included, your costs would have been higher.
| | | Beginning
Account
Value
(07/01/15) | | Ending
Account
Value
(12/31/15) | | Expenses Paid
During Period*
(07/01/15 to
12/31/15) | | Expense Ratios
During Period*
(07/01/15 to
12/31/15) | |
Guinness Atkinson Alternative Energy Fund Actual | | $ | 1,000.00 | | | $ | 860.80 | | | $ | 9.29 | | | | 1.98 | %† | |
Guinness Atkinson Alternative Energy Fund Hypothetical
(5% return before expenses) | | $ | 1,000.00 | | | $ | 1,015.22 | | | $ | 10.06 | | | | 1.98 | %† | |
Guinness Atkinson Asia Focus Fund Actual | | $ | 1,000.00 | | | $ | 830.50 | | | $ | 9.14 | | | | 1.98 | % | |
Guinness Atkinson Asia Focus Fund Hypothetical
(5% return before expenses) | | $ | 1,000.00 | | | $ | 1,015.22 | | | $ | 10.06 | | | | 1.98 | % | |
Guinness Atkinson Asia Pacific Dividend Builder Fund Actual | | $ | 1,000.00 | | | $ | 866.40 | | | $ | 9.31 | | | | 1.98 | %† | |
Guinness Atkinson Asia Pacific Dividend Builder Fund Hypothetical
(5% return before expenses) | | $ | 1,000.00 | | | $ | 1,015.22 | | | $ | 10.06 | | | | 1.98 | %† | |
Guinness Atkinson China & Hong Kong Fund Actual | | $ | 1,000.00 | | | $ | 836.50 | | | $ | 7.36 | | | | 1.40 | % | |
Guinness Atkinson China & Hong Kong Fund Hypothetical
(5% return before expenses) | | $ | 1,000.00 | | | $ | 1,017.19 | | | $ | 8.08 | | | | 1.40 | % | |
Guinness Atkinson Dividend Builder Fund Actual | | $ | 1,000.00 | | | $ | 963.90 | | | $ | 3.37 | | | | 0.68 | %† | |
Guinness Atkinson Dividend Builder Fund Hypothetical
(5% return before expenses) | | $ | 1,000.00 | | | $ | 1,021.78 | | | $ | 3.47 | | | | 0.68 | %† | |
Guinness Atkinson Global Energy Fund Actual | | $ | 1,000.00 | | | $ | 757.40 | | | $ | 6.25 | | | | 1.32 | % | |
Guinness Atkinson Global Energy Fund Hypothetical
(5% return before expenses) | | $ | 1,000.00 | | | $ | 1,018.10 | | | $ | 7.17 | | | | 1.32 | % | |
Guinness Atkinson Global Innovators Fund – Investor Class Actual | | $ | 1,000.00 | | | $ | 971.90 | | | $ | 6.61 | | | | 1.25 | % | |
Guinness Atkinson Global Innovators Fund – Investor Class Hypothetical
(5% return before expenses) | | $ | 1,000.00 | | | $ | 1,018.50 | | | $ | 6.77 | | | | 1.25 | % | |
Guinness Atkinson Renminbi Yuan & Bond Fund Actual | | $ | 1,000.00 | | | $ | 941.20 | | | $ | 4.40 | | | | 0.90 | %† | |
Guinness Atkinson Renminbi Yuan & Bond Fund Hypothetical
(5% return before expenses) | | $ | 1,000.00 | | | $ | 1,020.67 | | | $ | 4.58 | | | | 0.90 | %† | |
*Expenses are equal to the Funds' annualized expense ratio as indicated, multiplied by the average account value over the period, multiplied by the number of days in most recent fiscal half-year period (184), then divided by the number of days in the fiscal year (365) (to reflect the one-half year period).
†Net of fee waivers and/or expense reimbursements. If those fee waivers and/or expense reimbursements had not been in effect, the Fund's actual expenses would have been higher.
7
ALTERNATIVE ENERGY FUND for the period ended December 31, 2015
1. Performance
AVERAGE ANNUALIZED TOTAL RETURNS
| | | 1 Year
(actual) | | 3 Years | | 5 Years | | Since
Inception
(March 31, 2006) | |
Fund | | | -11.40 | % | | | 7.05 | % | | | -9.78 | % | | | -12.34 | % | |
Benchmark Indices: | |
Wilderhill New Energy Global Innovation Index | | | 1.56 | % | | | 15.65 | % | | | -1.94 | % | | | -2.94 | % | |
Wilderhill Clean Energy Index | | | -10.36 | % | | | 5.69 | % | | | -13.54 | % | | | -13.96 | % | |
MSCI World Index | | | -0.24 | % | | | 10.32 | % | | | 8.26 | % | | | 5.08 | % | |
The Fund's expense ratio is 2.06% and net expense ratio is 2.02% per the Summary Prospectus dated March 23, 2015. The Advisor has contractually agreed to waive a portion of its advisory fees and/or reimburse other Fund expenses so that the Fund's ratio of expenses to average daily net assets will not exceed 1.98% (excluding Acquired Fund Fees and Expenses, interest, taxes, dividends on short positions and extraordinary expenses) through at least June 30, 2016. To the extent that the Advisor waives fees, it may seek repayment of a portion or all of such amounts at any time within the three fiscal years after the fiscal year in which such amounts were waived and/or reimbursed, subject to the applicable cap.
Performance data quoted represents past performance and does not guarantee future results. The investment return and principal value of an investment in the Fund will fluctuate so that an investor's shares, when redeemed, may be worth more or less than their original cost. Current performance of the Fund may be lower or higher than the performance quoted. Performance data current to the most recent month end may be obtained by visiting www.gafunds.com, or calling (800) 915-6565.
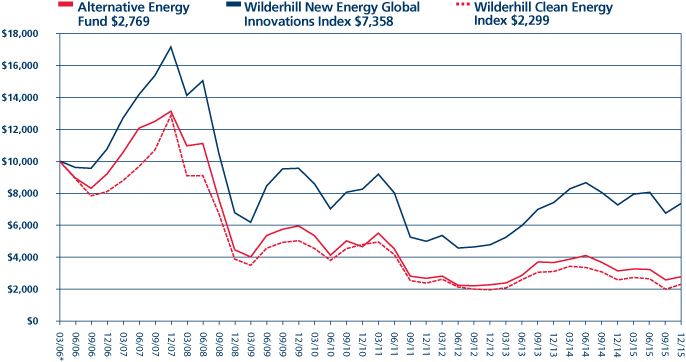
Guinness Atkinson Alternative Energy Fund was down -11.40% for 2015. This compared to a rise in the Wilderhill New Energy Global Innovation Index of 1.56% and a drop in the Wilderhill Clean Energy Index of -10.36%. The Fund suffered with the decline in the Chinese and Brazilian markets to which the Fund was more exposed than the alternative energy sector. The sector itself suffered from falling natural gas prices and deterioration in sentiment.
The main specific stock drivers of weak performance of the Fund in 2015 were two of the Fund's hydroelectric power company holdings, two of its wind holdings, and two of its solar holdings. These offset the positive performance of most of the Fund's efficiency, geothermal and solar holdings.
Stock performance of the Fund's solar holdings varied significantly. The Chinese photovoltaic module manufacturers – JA Solar, Trina Solar, Canadian Solar, Renesola and Jinkosolar – all performed well, and were up at least 10% each over 2015. Two new US solar positions, First Solar and SolarEdge, a thin-film module manufacturer and an optimiser and inverter manufacturer, respectively, performed well following the Fund's acquisition in the fourth quarter due to the extension of the US Investment Tax Credit (ITC). The Fund's microinverter holding, Enphase, a direct competitor of SolarEdge, lost significant market share but received a boost from the ITC extension. However, Enphase and SolarEdge continue to make fast progress in growing volumes and bringing costs down, so we remain confident in their future.
Unfortunately, almost all of the Fund's wind farm operator and developer holdings contributed negatively to returns, with the Chinese companies particularly affected from the uncertainty around grid constraints following the explosive growth of renewable energy in China. The poorest performer was Northern Power Systems, the Fund's only remaining wind turbine manufacturer holding, whose business has been hurt by delays in orders for its small wind turbines.
Ormat Technologies, the Fund's only current geothermal holding benefited from simplifying its ownership structure. It acquired Ormat Industries, which owned 60% of Ormat Technologies in a stock transaction that collapsed its historic holding structure, while at the same time providing better visibility on future earnings growth.
The Fund's three hydro investments performed poorly, for differing reasons. Cemig struggled with the Brazilian regulatory environment, weak hydrology, increasing debt levels and increasing interest rates. Verbund struggled with weak central European electricity pricing. Iniziative Bresciane gave back some of its gains mainly as a result of low stock liquidity.
8
Overall, this was a good year for the Fund's efficiency holdings. Wasion, the Chinese metering manufacturer, and Nibe, the global heating technology provider, both performed well, while Centrotec, the German building efficiency technology provider, underperformed.
The Fund's holding in Cosan, the Brazilian biofuels company, performed poorly as a result of the Brazilian Real, which fell 32% in 2015, and the falling oil price, although we note that only a small part of its biofuels business has direct exposure to the oil price.
Activity
The Fund sold positions in EDP Renovaveis, Acciona and Enel Green Power as they had performed well and were trading on historically high multiples. We took new positions in China Wind Power, a Chinese renewable utility, and Xinyi Solar, a manufacturer of glass for solar modules. We also increased exposure to the US solar market by taking two new positions in First Solar, a thin-film module manufacturer headquartered in the US, and SolarEdge, an inverter and optimiser manufacturer.
The position in Northern Power Systems has been frozen as a result of concerns over stock price performance. The company is a manufacturer of small wind turbines. It has been achieving strong growth but has not kept as tight control of costs as needed. The share price response reflects the illiquidity of the stock.
Outlook
The renewable energy sector had another record year for installations in 2015, peppered with good policy news from China, the United States and the UN Climate Change talks in Paris. China increased its targets for both wind and solar installations by 2020 in its 13th five-year plan (FYP) to 200 GigaWatts (GW) and 150GW, respectively.
The Obama Clean Power Plan has created a framework that should support US market growth, but we still need to see the details of individual state policy to understand its full potential. Wind and solar are likely to be prime beneficiaries, as they offer the most cost-competitive solutions today. As a year-end surprise, Congress extended the tax credits for wind and solar power to 2022.
The UN Climate talks in Paris, the 21st Conference of the Parties, gave a long-awaited affirmation from global leaders to cap the global temperature increase due to anthropogenic carbon dioxide emissions to two degrees Celsius. Although the agreement does not have an immediate impact on the renewable energy sector, the long-term impact of this agreement will likely be felt as more and more countries gradually strive to reduce the carbon footprint of their electricity sources. We are of the opinion that governments will no longer need to subsidise renewables, as these are becoming economically competitive with conventional fuels, and in the case photovoltaics (PV), take very little time to build.
The PV market grew to 57GW of annual installations, up from 45GW in 2014. We expect the following years to bring further strong growth in annual installations. The driving countries behind the growth in installations are China, the United States and Japan, while India has begun to recognise that solar offers it an attractive solution to its high energy prices and power deficit. China installed between 15 and 17GW of PV in 2015, raising its total cumulative PV capacity to 43GW. Under its 13th Five-Year Plan (FYP), the Chinese government increased its goals for PV installation to 150GW by 2020, up from 100GW, leaving 107GW to be installed in the five years including 2020. The United States gave the PV sector an early Christmas present by extending the ITC to 2022, when the market was expecting the ITC to expire by end-2016. As a result, the US is likely to install an extra 20GW of PV between 2016 and 2020. Japan remains one of the biggest PV markets, having installed approximately 13GW in 2015, although this is likely to fall over the next five years as a result of lower levels of incentives. India meanwhile increased its installations from 0.8GW in 2014 to 2.8GW in 2015. Indian Prime Minister Narendra Modi set a highly ambitious target of 100GW by 2022. We do not expect this goal to be reached, but we do expect India to increase installations to at least 5GW in 2016. India is the current home of the cheapest winning utility-scale PV bid to date. In January 2016, PV reached $64/megawatt hour (MWh) in an Indian tender for solar power.
The wind sector grew over 25% from under 50GW in 2014 to 64GW in 2015. China installed a total of 29GW in 2015, with most of its turbines being supplied by domestic manufacturers. China increased its wind target to 200GW wind by 2020 in its 13th FYP. China already has 135GW of wind at end-2015, leaving only 65GW over five years to reach the target. Wind farms in some regions of China have been plagued by curtailment due to inadequate space on the grid. Although China is working towards upgrading its grid, this may take some time to achieve. Forecasters predict that China will reach its wind target early and exceed it on the grounds of economics rather than subsidies. The United States was the second largest installer of wind turbines worldwide, with 9GW installed in 2015. Congress extended the production tax credit (PTC) for wind to 2019, and analysts expect an extra 20GW
9
to wind to be built in the US by 2020 than would have been without the tax credit. Europe remains a steady market for the wind sector, adding a further 10-12GW of onshore wind per year. Governments have had to placate nimbyism, traditional utilities and the electricity consumers who are paying for the feed-in tariffs via a levy.
In 2015, unsubsidised renewables gained traction as they were able to compete in a number of countries with fossil fuel alternatives. In Chile's October 2015 power auction that was open to all electricity generators, PV plants won with bids as low as $65/MWh. This was lower than coal, gas or wind, and reflects the new low installation costs and high levels of insulation in Chile. A wind farm in Morocco set the record for the lowest wind price at $30/MWh, compared to a local price for coal of $80/MWh.
The solar sector had a more stable year in 2015. Pricing for solar modules has declined slightly while polysilicon prices fell from over $20 per kg to around $13 per kg, which helped margins for cell and module manufacturers. There was no progress towards removing the European minimum import price (MIP) and US duties on Chinese solar modules, and the latest press releases from the EU indicate that the MIP is likely to stay in place until early 2017. Australia decided not to impose duties on Chinese solar modules. We understand that progress is being made on global trade talks to remove tariffs on sustainable technologies, but this does not appear imminent.
Alternative energy investment opportunities beyond wind and PV are judged on a case-by-case basis. Energy efficiency policy has become a key way for many European countries to reduce their overall electricity consumption. We are therefore confident that heatpumps and improved efficiency heating technologies present a good opportunity as these standards are exported from Europe.
The long term outlook for alternative energy and its related sectors remains strong. The key drivers in favour of renewable energies are: parity of renewables with traditional fuel supplies; energy security concerns; environmental issues; and climate change. We continue to position the Fund to attempt to benefit from the long term growth of the sector.


Edward Guinness Samira Rudig February 2016
The Fund invests in foreign securities, which involve political, economic and currency risks, greater volatility, and differences in accounting methods. The Fund is non-diversified meaning its assets may be concentrated in fewer individual holdings than diversified funds. Therefore, the Fund is more exposed to individual stock volatility than diversified funds. The Fund invests in smaller companies, which involve additional risks such as limited liquidity and greater volatility.
The Wilderhill New Energy Global Innovation Index (NEX) is a modified US dollar-weighted index of publicly traded companies, which are active in renewable and low-carbon energy, and which stand to benefit from responses to climate change and energy security concern. The Wilderhill Clean Energy Index (ECO) is a modified equal US dollar-weighted index of publicly traded companies whose businesses stand to benefit substantially from societal transition toward the use of cleaner energy and conservation. The MSCI World Energy Index is an unmanaged index composed of more than 1,400 stocks listed on exchanges in the U.S., Europe, Canada, Australia, New Zealand, and the Far East. These indices are unmanaged, not available for investment and do not incur expenses.
GW - gigawatt
MWh - Megawatthour
Please refer to the Schedule of Investments for details on fund holdings. Current and future portfolio holdings are subject to risk.
The information provided herein represents the opinion of Guinness Atkinson Management for the period stated and is not intended to be a forecast of future events, a guarantee of future results, nor investment advice. Opinions, fund holdings and sector allocations are subject to change at any time and are not recommendations to buy or sell any security.
10
GUINNESS ATKINSON ALTERNATIVE ENERGY FUND
Growth of $10,000
| | | Average Annual Total Return
Periods Ended December 31, 2015 | |
| | | One Year | | Five Years | | Since Inception
(03/31/06) | |
| | | | | | -11.40 | % | | | -9.78 | % | | | -12.34 | % | |
*Inception date 03/31/06.
Performance data quoted represents past performance and does not guarantee future results. The investment return and principal value of an investment will fluctuate so that an investor's shares, when redeemed, may be worth more or less than their original cost. Current performance of the Fund may be lower or higher than the performance quoted. Performance data current to the most recent month end may be obtained by visiting www.gafunds.com.
Total returns for certain periods reflect a fee waiver in effect and in the absence of this waiver, the total returns would be lower. Returns reflect the reinvestment of distributions made by the Fund, if any. The graph and the performance table above do not reflect the deduction of taxes that a shareholder would pay on Fund distribution or the redemption of Fund shares.
The Wilderhill New Energy Global Innovations Index (NEX) is a modified US dollar-weighted index of publicly traded companies, which are active in renewable and low-carbon energy, and which stand to benefit from responses to climate change and energy security concern. The Wilderhill Clean Energy Index (ECO) is a modified equal US dollar-weighted index comprised of publicly traded companies whose businesses stand to benefit substantially from societal transition toward the use of cleaner energy and conservation.
11
FUND HIGHLIGHTS at December 31, 2015
GUINNESS ATKINSON ALTERNATIVE ENERGY FUND
# of Holdings in Portfolio: | | 32 | |
Portfolio Turnover: | | 28.7% | |
% of Stocks in Top 10: | | 41.5% | |
Fund Manager: | | | |
Edward Guinness | | | |
Top 10 Holdings (% of net assets) | | | | Industry Breakdown (% of net assets) | | | |
Enphase Energy Inc. | | | 5.1 | % | | Solar | | | 41.9 | % | |
Solaredge Tech Inc. | | | 4.6 | % | | Wind | | | 29.4 | % | |
Good Energy Group PLC | | | 4.4 | % | | Efficiency | | | 11.1 | % | |
SunPower Corp. | | | 4.3 | % | | Hydro | | | 10.2 | % | |
Iniziative Bresciane - Inbre - SpA | | | 4.1 | % | | Biofuel | | | 3.1 | % | |
Canadian Solar Inc. | | | 3.9 | % | | Geothermal | | | 3.1 | % | |
Renesola Ltd. - ADR | | | 3.9 | % | | | | | | | |
Jinkosolar Holdings Co - ADR | | | 3.8 | % | | | | | | | |
Boralex Inc. - Class A | | | 3.8 | % | | | | | | | |
Trina Solar Ltd. - ADR | | | 3.6 | % | | | | | | | |
12
SCHEDULE OF INVESTMENTS
at December 31, 2015
GUINNESS ATKINSON ALTERNATIVE ENERGY FUND
Shares | | COMMON STOCKS: 98.8% | | Value | |
Biofuel: 3.1% | | | |
| | 67,400 | | | Cosan SA Industria e Comercio | | $ | 426,939 | | |
Efficiency: 11.1% | | | |
| | 76,098 | | | Carmanah Technologies Corp.* | | | 312,377 | | |
| | 28,700 | | | CENTROTEC Sustainable AG | | | 412,017 | | |
| | 12,230 | | | Nibe Industrier AB - B Shares | | | 410,611 | | |
| | 360,000 | | | Wasion Group Holdings Ltd. | | | 372,483 | | |
| | | | | | | | 1,507,488 | | |
Geothermal: 3.1% | | | |
| | 11,659 | | | Ormat Technologies Inc. | | | 425,204 | | |
Hydro: 10.2% | | | |
| | 255,604 | | | Cia Energetica de Minas Gerais - ADR* | | | 383,406 | | |
| | 26,361 | | | Iniziative Bresciane - Inbre - SpA* | | | 561,211 | | |
| | 35,110 | | | Verbund AG | | | 451,013 | | |
| | | | | | | | 1,395,630 | | |
Solar: 41.9% | | | |
| | 18,400 | | | Canadian Solar Inc.* | | | 532,864 | | |
| | 628,000 | | | China Singyes Solar Technologies Holdings Ltd. | | | 448,154 | | |
| | 196,700 | | | Enphase Energy Inc.* | | | 690,417 | | |
| | 7,000 | | | First Solar Inc.* | | | 461,930 | | |
| | 46,300 | | | JA Solar Holdings Co., Ltd. - ADR* | | | 449,110 | | |
| | 18,900 | | | Jinkosolar Holdings Co - ADR* | | | 522,963 | | |
| | 311,300 | | | Renesola Ltd. - ADR* | | | 529,210 | | |
| | 22,200 | | | Solaredge Tech Inc | | | 625,374 | | |
| | 19,450 | | | SunPower Corp. - Class B* | | | 583,695 | | |
| | 44,820 | | | Trina Solar Ltd. - ADR* | | | 493,916 | | |
| | 950,000 | | | Xinyi Solar Holdings Ltd. | | | 384,898 | | |
| | | | | | | | 5,722,531 | | |
Wind: 29.4% | | | |
| | 49,987 | | | Boralex Inc. - Class A | | | 522,376 | | |
| | 3,044,000 | | | China Datang Corp. Renewable Power Co. Ltd. - H Shares | | | 380,060 | | |
| | 460,000 | | | China Longyuan Power Group Corp. - H Shares | | | 345,021 | | |
| | 2,272,000 | | | China Suntien Green Energy Corp. Ltd. - H Shares | | | 361,650 | | |
| | 6,180,000 | | | Concord New Energy Group Ltd.* | | | 368,052 | | |
| | 200,441 | | | Good Energy Group PLC | | | 605,755 | | |
| | 325,080 | | | Greentech Energy Systems* | | | 310,064 | | |
| | 1,194,000 | | | Huaneng Renewables Corp. Ltd. - H Shares | | | 354,903 | | |
| | 467,823 | | | Mytrah Energy Ltd.* | | | 310,349 | | |
| | 228,800 | | | Northern Power Systems Corp.* | | | 41,338 | | |
| | 630,608 | | | Theolia SA* | | | 404,335 | | |
| | | | | | | | 4,003,903 | | |
| | | | | Total Common Stocks
(cost $20,996,620) | | | 13,481,695 | | |
The accompanying notes are an integral part of these financial statements.
13
Shares | | WARRANTS: 0% | | Value | |
| | 946,050 | | | Theolia SA, Expiration 6/09/16, Exercise price 0.60 EUR*† | | $ | 32,900 | | |
| | | Total Warrants
(cost $0) | | | 32,900 | | |
| | | Total Investments in Securities
(cost $20,996,620): 98.8% | | | 13,514,595 | | |
| | | Other Assets less Liabilities: 1.2% | | | 129,645 | | |
| | | Net Assets: 100.0% | | $ | 13,644,240 | | |
* Non-income producing security.
† Illiquid. Illiquid securities represent 0.0% of net assets.
ADR - American Depository Receipt
The accompanying notes are an integral part of these financial statements.
14
ASIA FOCUS FUND for the period ended December 31, 2015
1. Performance
AVERAGE ANNUALIZED TOTAL RETURNS
| | | 1 Year
(actual) | | 3 Years | | 5 Years | | 10 Years | |
Fund | | | -11.56 | % | | | -6.82 | % | | | -6.18 | % | | | 3.27 | % | |
Benchmark Indices: | |
MSCI AC Far East Free Ex Japan Index | | | -9.25 | % | | | -0.79 | % | | | 0.44 | % | | | 6.49 | % | |
S&P 500 Index | | | 1.38 | % | | | 15.11 | % | | | 12.54 | % | | | 7.29 | % | |
The Fund's gross expense ratio is 1.92% per the Summary Prospectus dated March 23, 2015.
Performance data quoted represents past performance and does not guarantee future results. The investment return and principal value of an investment in the Fund will fluctuate so that an investor's shares, when redeemed, may be worth more or less than their original cost. Current performance of the Fund may be lower or higher than the performance quoted. Performance data current to the most recent month-end may be obtained by visiting www.gafunds.com, or calling (800) 915-6565.
The Fund imposes a 2% redemption fee on the sale of shares held less than 30 days. Performance data quoted does not reflect this redemption fee. Total returns for certain periods reflect fee limitations in effect and, in the absence of these limitations, total returns would have been lower.
For calendar year 2015, the Fund fell 11.56% compared to the MSCI AC Far East Free ex Japan Index, which was down 9.25%. The year was a challenging one for emerging markets although the region as a whole held up better than those whose economies are more heavily exposed to commodity prices.
The performance of China's economy and policy reform moves to the exchange rate dominated headlines in the region. The economy is expected to have grown by less than 7% in 2015 and the concentration of weakness is to be found in the heavy industrial and construction-related sectors as China seeks to lower its reliance on investment-led growth. Weaker global demand for Asian manufactured goods has also been evident in China's export numbers, which now show around 6% year-on-year growth.
Slower fixed asset investment in China has been felt domestically by those who have high debt levels to manage and externally by commodity producers. We should emphasize, however, that there has been no collapse in Chinese demand for commodities – oil demand grew by 11% in 2015, while iron ore imports into China have declined by less than 1%. While there are those who see the fall in prices as symptomatic of weak global demand, we note that it coincides with the advent of considerable new supply. Weaker exports growth from China has also been felt by regional trading partners, notably South Korea and Taiwan, and to a lesser extent, Thailand.
Currency volatility has also been a much greater factor than in prior years. The US dollar has appreciated sharply over the past twelve months against almost all currencies, which has had knock-on effects throughout the world. Countries weakened by lower commodity prices have seen their currencies fall, while those in Asia have responded to a weaker Japaneseyen and in 2015, a weaker Chinese yuan. The weaker yen is understood and accepted, since a recovery in Japan's moribund economy is seen as beneficial. By contrast, a weaker yuan is seen as fundamentally destabilizing.
In spite of Chinese worries this year, the best stock performers in the portfolio were Netease (China Internet and gaming), China Lesso (building materials), Shenzhen Expressway (China toll roads), Tencent (China Internet services) and AAC Technology (a Chinese component supplier for high end smartphones). We also saw positive contributions for Taiwanese technology hardware names, including Catcher Technology and Taiwan Semiconductor Manufacturing, as well as from Chinese financials, including PICC Property & Casualty and China Merchants Bank. The weakest stocks over the year were concentrated amongst energy names in China, Indonesia and Thailand, including Petrochina, PTT Exploration & Production and Indonesian coal producer Indo Tambangraya Megah.
2. Portfolio Position
The country allocation remained unchanged in the first half, with overweight positions in China and Hong Kong and in Thailand. The key underweight positions were Korea, Malaysia and Singapore. On a sector basis, the Fund is overweight information technology, with exposure across China, Hong Kong, Korea and Taiwan. Looking at technology sub-sectors, the exposure is split
15
between internet services, electronic equipment, technology hardware and semiconductors. During the year, there were some stock changes in the China portion of the portfolio, with the additions of NetEase, Peoples Insurance and PICC Property and Casualty in place of HSBC, SOHO China and Weichai Power.
3. Outlook
Our view remains that the Asia region offers investors a good long-term opportunity. The long-term story is one of a rising standard of living on the back of rising real wages and increasing domestic consumption. China's economy is still expected to grow 6.5% in 2016, while the rest of the region is forecast (using International Monetary Fund (IMF) data) to grow 4.1%, compared to world growth of 2.9%. Stock market valuations in Asia, in our opinion, look cheap.
There is still considerable scope for China to adjust policy in line with economic needs. Foreign exchange reserves are still substantial at $3.3 trillion, while an expected record trade surplus is likely to give an extra buffer against capital outflows, which are likely to continue. Banking sector liquidity can be augmented by the release of deposits commercial banks have been required to place with the central bank, so-called Required Reserves. These rose from 6% of China's commercial banks' deposit base in 2003 to more than 20% in response to capital inflows by the beginning of 2015.
The key to Chinese economic stability today lies in the real estate sector and so far, property sales and prices have been solid. Longer term issues are whether China can continue its transition, cut excess production capacity at a time when debt levels are still high and not fall back into renewed credit expansion. In this respect, Premier Li Keqiang has publicly ruled out the use of strong stimulus and a flood of liquidity to propel growth. He is instead pushing for new business models and economic drivers (economic transition) and for concrete steps to reduce overcapacity.
We view the recent rise in US interest rates as being a positive development. However, the outlook is by no means clear. The first move was a tentative step and the Fed minutes suggest the decision was a closer call than initially thought. The Federal Reserve has pencilled in four interest rate rises. If they pursue this regardless of external conditions, the associated monetary tightening and liquidity withdrawal could spark a mid-recovery downturn. Further rises will likely depend of rising core PCE (Personal Consumption Expenditure) inflation. That has been weak in recent years as consumers focused on paying down debt but this process may be coming to an end. Higher consumption would be a positive and welcome development for Asia.

Edmund Harriss February 2016
The Fund invests in foreign securities, which involves political, economic and currency risks, greater volatility, and differences in accounting methods. These risks are greater for emerging markets. The Fund is non-diversified, meaning that its assets may be concentrated in fewer individual holdings than diversified funds. Therefore, the Fund is more exposed to individual stock volatility than diversified funds. Investments focused in a single geographic region may be exposed to greater risk and more volatility than investments diversified among various geographies. The Fund invests in smaller companies, which involves additional risks such as limited liquidity and greater volatility.
The MSCI AC (All Country) Far East ex Japan Index is a free float-adjusted market capitalization-weighted index that is designed to measure equity market performance of the Far East, excluding Japan. The Standard & Poor's 500 Index is a market capitalization-weighted index composed of 500 widely held common stocks of U.S. companies. These indices are unmanaged, not available for investment and do not incur expenses.
Please refer to the Schedule of Investments for details on Fund holdings. Current and future portfolio holdings are subject to risk.
The information provided herein represents the opinion of Guinness Atkinson Asset Management, Inc. for the period stated and is not intended to be a forecast of future events, a guarantee of future results, or investment advice. Opinions, Fund holdings and sector allocations are subject to change at any time, and are not recommendations to buy or sell any security.
16
GUINNESS ATKINSON ASIA FOCUS FUND
Growth of $10,000

| | | Average Annual Total Return
Periods Ended December 31, 2015 | |
| | | One Year | | Five Years | | Ten Years | |
| | | | | | -11.56 | % | | | -6.18 | % | | | 3.27 | % | |
Performance data quoted represents past performance and does not guarantee future results. The investment return and principal value of an investment will fluctuate so that an investor's shares, when redeemed, may be worth more or less than their original cost. Current performance of the Fund may be lower or higher than the performance quoted. Performance data current to the most recent month end may be obtained by visiting www.gafunds.com.
Total returns for certain periods reflect a fee waiver in effect and in the absence of this waiver, the total returns would be lower. Returns reflect the reinvestment of distributions made by the Fund, if any. The graph and the performance table above do not reflect the deduction of taxes that a shareholder would pay on Fund distribution or the redemption of Fund shares. The Fund imposes a 2% redemption fee on shares held less than 30 days.
The MSCI All Country Far East Free ex-Japan Index (MSCI AC Far East Free ex-Japan Index) is a free float-adjusted, capitalization-weighted index that is designed to measure equity market performance of the Far East region excluding Japan. The index referenced in this chart is not available for investment and does not incur expenses.
17
FUND HIGHLIGHTS at December 31, 2015
GUINNESS ATKINSON ASIA FOCUS FUND
# of Holdings in Portfolio: | | 36 | |
Portfolio Turnover: | | 8.6% | |
% of Stocks in Top 10: | | 41.5% | |
Fund Manager: | | | |
Edmund Harriss | | | |
Top 10 Holdings (% of net assets) | | | | | | | |
NetEase Inc. - ADR | | | 5.6 | % | | Shenzhen Expressway Co., Ltd. - H Shares | | | 4.0 | % | |
Samsung Electronics Co., Ltd. | | | 4.6 | % | | AAC Technologies Holdings Inc. | | | 4.0 | % | |
Taiwan Semiconductor Manufacturing Co., Ltd. | | | 4.4 | % | | Hyundai Mobis Co., Ltd. | | | 3.8 | % | |
Tencent Holdings Ltd. | | | 4.1 | % | | Sohu.com Inc. | | | 3.7 | % | |
Largan Precision Co., Ltd. | | | 4.0 | % | | Catcher Technology Co., Ltd. | | | 3.3 | % | |
Industry Breakdown (% of net assets) | | | | | | | |
Commerical Banks | | | 9.3 | % | | Casino Hotels | | | 4.0 | % | |
Semiconductor Componets - Integrated Circuits | | | 7.2 | % | | Auto/Truck Parts & Equipment | | | 3.8 | % | |
Property/Casualty Insurance | | | 6.0 | % | | Web Portals/ISP | | | 3.6 | % | |
Electric - Generation | | | 5.6 | % | | Metal Processors & Fabricators | | | 3.3 | % | |
Entertainment Software | | | 5.6 | % | | Computers | | | 3.2 | % | |
Electronic Components - Semiconductor | | | 4.6 | % | | Building Products - Cement/Aggregates | | | 3.0 | % | |
Oil Components - Integrated | | | 4.5 | % | | Exchange Traded Funds (ETFs) | | | 2.9 | % | |
Internet Application Software | | | 4.1 | % | | Building & Construction Production - Miscellaneous | | | 2.7 | % | |
Auto-Cars/Light Trucks | | | 4.1 | % | | Real Estate Operations/Development | | | 2.4 | % | |
Photo Equipment & Supplies | | | 4.0 | % | | Telecommunication Services | | | 2.2 | % | |
Public Thoroughfares | | | 4.0 | % | | Distribution/Wholesale | | | 1.8 | % | |
Electronic Components - Miscellaneous | | | 4.0 | % | | Machinery - General Industry | | | 0.6 | % | |
Oil Company - Exploration & Production | | | 4.0 | % | | Coal | | | 0.3 | % | |
18
SCHEDULE OF INVESTMENTS
at December 31, 2015
GUINNESS ATKINSON ASIA FOCUS FUND
Shares | | COMMON STOCKS: 100.7% | | Value | |
China: 55.7% | | | |
| | 94,000 | | | AAC Technologies Holdings Inc. | | $ | 611,124 | | |
| | 171,000 | | | Anhui Conch Cement Co., Ltd. - H Shares | | | 455,353 | | |
| | 739,000 | | | China Construction Bank Corp. - H Shares | | | 501,688 | | |
| | 603,000 | | | China Lesso Group Holdings Ltd. | | | 418,000 | | |
| | 218,000 | | | China Merchants Bank Co., Ltd. - H Shares | | | 509,887 | | |
| | 419,000 | | | CNOOC Ltd. | | | 430,675 | | |
| | 412,000 | | | China Minsheng Banking Corp Ltd. - H Shares | | | 406,782 | | |
| | 461,500 | | | db x-trackers CSI300 Index ETF | | | 450,886 | | |
| | 278,000 | | | Dongfeng Motor Group Co., Ltd. - H Shares | | | 368,141 | | |
| | 490,000 | | | Lenovo Group Ltd. | | | 493,764 | | |
| | 4,700 | | | NetEase Inc. - ADR | | | 851,828 | | |
| | 962,000 | | | People's Insurance Company Group of China Ltd. - H Shares | | | 467,286 | | |
| | 471,000 | | | PetroChina Co Ltd. - H Shares | | | 309,802 | | |
| | 232,000 | | | PICC Property & Casualty Co., Ltd. - H Shares | | | 456,699 | | |
| | 696,000 | | | Shenzhen Expressway Co Ltd. - H Shares | | | 611,608 | | |
| | 9,800 | | | Sohu.com Inc.* | | | 560,462 | | |
| | 32,500 | | | Tencent Holdings Ltd. | | | 634,012 | | |
| | | | | | | | 8,537,997 | | |
Hong Kong: 6.3% | | | |
| | 380,000 | | | Chen Hsong Holdings | | | 89,238 | | |
| | 86,000 | | | Galaxy Entertainment Group Ltd. | | | 268,143 | | |
| | 407,000 | | | Li & Fung Ltd. | | | 274,650 | | |
| | 532,000 | | | NagaCorp Ltd. | | | 335,295 | | |
| | | | | | | | 967,326 | | |
Indonesia: 0.3% | | | |
| | 129,000 | | | Indo Tambangraya Megah PT | | | 53,224 | | |
Malaysia: 3.9% | | | |
| | 264,000 | | | DiGi.Com Bhd | | | 330,956 | | |
| | 144,000 | | | UMW Holdings Bhd | | | 262,797 | | |
| | | | | | | | 593,753 | | |
South Korea: 8.3% | | | |
| | 2,752 | | | Hyundai Mobis Co., Ltd. | | | 574,344 | | |
| | 656 | | | Samsung Electronics Co., Ltd. | | | 700,498 | | |
| | | | | | | | 1,274,842 | | |
Taiwan: 14.5% | | | |
| | 61,000 | | | Catcher Technology Co., Ltd. | | | 510,737 | | |
| | 9,000 | | | Largan Precision Co., Ltd. | | | 614,922 | | |
| | 110,000 | | | Novatek Microelectronics Corp. | | | 427,253 | | |
| | 2 | | | Shin Zu Shing Co., Ltd. | | | 8 | | |
| | 155,000 | | | Taiwan Semiconductor Manufacturing Co., Ltd. | | | 668,837 | | |
| | | | | | | | 2,221,757 | | |
The accompanying notes are an integral part of these financial statements.
19
Shares | | COMMON STOCKS: 100.7% (Continued) | | Value | |
Thailand: 11.7% | | | |
| | 99,500 | | | Electricity Generating PCL/Foreign | | $ | 416,972 | | |
| | 216,000 | | | Glow Energy PCL/Foreign | | | 444,185 | | |
| | 824,000 | | | LPN Development PCL/Foreign | | | 365,076 | | |
| | 113,198 | | | PTT Exploration & Production PCL/Foreign | | | 180,091 | | |
| | 56,700 | | | PTT PCL/Foreign | | | 384,460 | | |
| | | | | | | | 1,790,784 | | |
| | | | | Total Common Stocks
(cost $14,165,085) | | | 15,439,683 | | |
| | | | | Total Investments in Securities
(cost $14,165,085): 100.7% | | | 15,439,683 | | |
| | | | | Liabilities in Excess of Other Assets: (0.7%) | | | (103,795 | ) | |
| | | | | Net Assets: 100.0% | | $ | 15,335,888 | | |
* Non-income producing security.
ADR - American Depository Receipt
The accompanying notes are an integral part of these financial statements.
20
ASIA PACIFIC DIVIDEND BUILDER FUND for the period ended December 31, 2015
1. Performance
AVERAGE ANNUALIZED TOTAL RETURNS
| | | 1 Year
(actual) | | 3 Years | | 5 Years | | Since
Inception
(March 31, 2006) | |
Fund | | | -4.61 | % | | | 0.64 | % | | | 1.57 | % | | | 4.14 | % | |
Benchmark Indices: | |
MSCI AC Pacific Ex Japan Index | | | -8.80 | % | | | -0.59 | % | | | 0.56 | % | | | 6.04 | % | |
S&P 500 Index | | | 1.38 | % | | | 15.11 | % | | | 12.54 | % | | | 7.04 | % | |
The Fund's gross expense ratio is 3.91% and net expense ratio is 1.10% per the Summary Prospectus dated March 23, 2015, as supplemented on December 31, 2015. Prior to January 1, 2016, the Advisor has contractually agreed to waive a portion of its advisory fees and/or reimburse other Fund expenses so that the Fund's ratio of expenses to average daily net assets will not exceed 1.98% (excluding Acquired Fund Fees and Expenses, interest, taxes, dividends on short positions and extraordinary expenses) through at least June 30, 2016. To the extent that the Advisor waives fees and/or reimburses expenses, it may seek repayment of a portion or all of such amounts at any time within the three fiscal years after the fiscal year in which such amounts were waived and/or reimbursed, subject to the applicable cap.
Performance data quoted represents past performance and does not guarantee future results. The investment return and principal value of an investment in the Fund will fluctuate so that an investor's shares, when redeemed, may be worth more or less than their original cost. Current performance of the Fund may be lower or higher than the performance quoted. Performance data current to the most recent month-end may be obtained by visiting www.gafunds.com, or calling (800) 915-6565.
The Fund imposes a 2% redemption fee on the sale of shares held less than 30 days. Performance data quoted does not reflect this redemption fee. Total returns for certain periods reflect expense limitations in effect and, in the absence of these imitations, total returns would have been lower.
In 2015, Asian markets, as measured by the MSCI AC Pacific ex Japan Index, fell 8.80%. The Fund did 4.19% better than the than the index but this still meant a decline of 4.61% for the year.
In 2015 as a whole, leading stocks were Relo Holdings, Henderson Group, St Shine Optical, Pacific Textiles, AAC Technologies, KT&G, and China Lilang. All of these rose by more than 20% over the course of the year (total return in USD) and all are in different sectors including real estate, textile, technology, health care, apparel, and retail. There is also a good geographic spread with these companies based in Australia, China, Hong Kong, Korea, Japan and Taiwan. The weakest stocks were Luk Fook (jewellery retail in Hong Kong), Belle (shoe retailing in China), LPN Development (real estate in Thailand), Qualcomm (technology, US/China), PTT (energy, Thailand) and Digi.com (mobile telecom services, Malaysia), each of which fell by 25% or more.
Across the portfolio, twenty of the thirty-six holdings outperformed the market over the whole year.
Investors have had to contend with significant geopolitical and economic uncertainty in 2015; the two are inextricably linked and there is no obvious path to a solution. Lower commodity prices have been a boon to western consumers and have also come as a relief to manufacturing economies in emerging markets. But to the producers, falling prices have revealed structural weaknesses and substantially increased economic and political instability. The diverging economic fortunes of the US and the eurozone have probably the greatest ramifications because world demand growth cannot be driven by the US alone. And running alongside all of this, although overblown, is China's economic transition and deceleration.
From an Asian perspective, in 2015 we have been relieved by the fall in the price of oil and of other commodity prices. For China, it has saved over $100 billion in the import bill just from the lower prices of oil and iron ore. China's oil product demand grew over the first ten months of 2015 by 6.7% in year-on-year terms according to International Energy Agency data (IEA data). In Indonesia, Malaysia and Thailand, the lower oil price has enabled governments to abolish fuel subsidies that proved such a drain on government coffers. For export manufacturers, it has brought down the cost of raw materials and allowed wages to rise (good for consumption) without significantly damaging margins. The fall in oil prices is not a sign of weakening demand, in our view, but a problem of oversupply from the expansion of US shale production.
21
ASIA PACIFIC DIVIDEND BUILDER FUND
Stronger economic growth in the US has provided an ongoing source of demand for Asian manufactured goods in contrast to Europe but US demand is not what it was. From 2000 up to the time of the financial crisis, Chinese exports to the US grew 20% to 30% a year while export growth in Europe was even higher. This year, exports have grown about 6%. Indications are that American consumers have focused more in recent years on paying down debt than on increasing consumption. However, US strength has also brought about a sharp appreciation in the US dollar, which on a trade weighted basis is now the strongest since 2003. In Asia, the Chinese yuan fell 4% while the rest of the region's currencies (excluding Japan) were down 8.8% on a weighted average basis against the US dollar.
All of the Fund's exposure to China is through companies listed on the Hong Kong Stock Exchange, not the Chinese domestic companies that issue 'A' shares, which have been the subject of intervention by the authorities. Hong Kong Stock Exchange companies report their accounts in accordance with International Accounting Standards or the proximate standards. We look for companies whose equity value depends on the stability and strength of future operating cash flows as well as the dividends they will pay us. Analysis of companies in emerging markets has its challenges but by looking at those with long track records and operating in competitive sectors, we can increase our confidence in their ability to cope with future uncertainty. We look at companies that have earned a return on invested capital above their cost of capital for eight consecutive years: that is long enough we believe, to suggest company has a solid business.
2. Activity
There were three stock changes in 2015. At the start of the third quarter the management of Huabao International decided, after seven years, to omit its final dividend. The company justified this by highlighting the special dividend paid on top of its ordinary dividend at the interim stage and uncertain industry conditions ahead. We sold the position and purchased Aflac Inc, a US-listed health insurer that generates much of its business in Japan. The second stock change was triggered by the acquisition of iiNet, an Internet service provider in Australia, by TPG Telecom. We purchased Largan Precision, a manufacturer of high-end camera lenses, in its place. The third change was the sale of Shenzhou International (apparel) on valuation grounds. In its place we put in Belle International, a designer and retailer of footwear in China.
3. Portfolio Position
The Fund's largest country exposures were to China (30.19%), Taiwan (19.53%) and Hong Kong (13.90%). Our large weightings in these countries are an outcome of our stock selection process, rather than a 'top-down' allocation. We believe many companies in these markets are undervalued and represent attractive investment opportunities. Conversely, we have little or no allocations to other countries, for example, Indonesia or the Philippines, because the companies that meet our screening criteria in these countries have valuations that are not, at present, sufficiently attractive.
The Fund's largest sector exposures were to Financials (33.60%), Information Technology (25.11%) and Consumer Discretionary (19.42%). Again, our allocation to Financials is due to our belief that there is sufficient undervaluation present in the sector. We note that some sectors, for example, Materials, Energy and Utilities have historically had low representation in our universe – Materials and Energy are highly cyclical industries, while utility companies are often heavily regulated, and achieve lower returns.
4. Outlook
Our view remains that the Asia region offers investors a good long term opportunity. The long term story is one of a rising standard of living on the back of rising real wages and increasing domestic consumption. China's economy is still expected to grow 6.5% in 2016 while the rest of the region is forecast (using IMF data) to grow 4.1% compared to world growth of 2.9%. Stock market valuations in Asia, as we have said, look cheap.
There is still considerable scope for China to adjust policy in line with economic needs. Foreign exchange reserves are still substantial at $3.3 trillion, while an expected record trade surplus is likely to give an extra buffer against capital outflows, which are likely to continue. Banking sector liquidity can be augmented by the release of deposits commercial banks have been required to place with the central bank, so-called Required Reserves. These rose from 6% of China's commercial banks' deposit base in 2003 to more than 20% in response to capital inflows by the beginning of 2015.
The key to Chinese economic stability today lies in the real estate sector and so far, property sales and prices have been solid. Longer term issues are whether China can continue its transition, cut excess production capacity at a time when debt levels are still high and not fall back into renewed credit expansion. In this respect, Premier Li Keqiang has publicly ruled out the use of
22
ASIA PACIFIC DIVIDEND BUILDER FUND
strong stimulus and a flood of liquidity to propel growth. He is instead pushing for new business models and economic drivers (economic transition) and for concrete steps to reduce overcapacity.
We view the recent rise in US interest rates as being a positive development. However, the outlook is by no means clear. The first move was a tentative step and the Fed minutes suggest the decision was a closer call than initially thought. The Federal Reserve has pencilled in four interest rate rises. If they pursue this regardless of external conditions, the associated monetary tightening and liquidity withdrawal could spark a mid-recovery downturn. Further rises will likely depend of rising core PCE (Personal Consumption Expenditure) inflation. That has been weak in recent years as consumers focused on paying down debt, but this process may be coming to an end. Higher consumption would be a positive and welcome development for Asia.

Edmund Harriss February 2016
The Fund invests in foreign securities, which involve greater volatility and political, economic and currency risks and differences in accounting methods. These risks are greater for emerging markets. The Fund is non-diversified, meaning its assets may be concentrated in fewer individual holdings than diversified funds. Therefore, the Fund is more exposed to individual stock volatility than diversified funds. The Fund invests in smaller companies, which involves additional risks such as limited liquidity and greater volatility.
The Standard & Poor's 500 Index is a market capitalization-weighted index composed of 500 widely held common stocks of U.S. companies. The MSCI AC Pacific Ex-Japan Index is a market capitalization weighted index that monitors the performance of stocks from the Pacific region, excluding Japan. These indices are unmanaged and not available for investment, and do not incur expenses.
Please refer to the Schedule of Investments for details on Fund holdings. Current and future portfolio holdings are subject to risk.
The information provided herein represents the opinion of Guinness Atkinson Asset Management, Inc. for the period stated and is not intended to be a forecast of future events, a guarantee of future results, or investment advice. Opinions, Fund holdings and sector allocations are subject to change at any time, and are not recommendations to buy or sell any security.
23
GUINNESS ATKINSON ASIA PACIFIC DIVIDEND BUILDER FUND
Growth of $10,000

| | | Average Annual Total Return
Periods Ended December 31, 2015 | |
| | | One Year | | Five Years | | Since Inception
(03/31/06) | |
| | | | | | -4.61 | % | | | 1.57 | % | | | 4.14 | % | |
*Inception date 03/31/06.
Performance data quoted represents past performance and does not guarantee future results. The investment return and principal value of an investment will fluctuate so that an investor's shares, when redeemed, may be worth more or less than their original cost. Current performance of the Fund may be lower or higher than the performance quoted. Performance data current to the most recent month end may be obtained by visiting www.gafunds.com.
Total returns reflect a fee waiver in effect and in the absence of this waiver, the total returns would be lower. Returns reflect the reinvestment of distributions made by the Fund, if any. The graph and the performance table above do not reflect the deduction of taxes that a shareholder would pay on Fund distribution or the redemption of Fund shares. The Fund imposes a 2% redemption fee on shares held less than 30 days.
The MSCI All Country Pacific Free ex-Japan Index (MSCI AC Pacific ex-Japan Index) is a free float-adjusted, capitalization-weighted index that is designed to measure equity market performance in the Pacific region excluding Japan.
24
FUND HIGHLIGHTS at December 31, 2015
GUINNESS ATKINSON ASIA PACIFIC DIVIDEND BUILDER FUND
# of Holdings in Portfolio: | | 38 | |
Portfolio Turnover: | | 28.6% | |
% of Stocks in Top 10: | | 30.0% | |
Fund Manager: | | | |
Edmund Harriss | | | |
Top 10 Holdings (% of net assets) | | | | | | | |
Relo Holdings Inc. | | | 3.3 | % | | Yangzijiang Shipbuilding Holdings Ltd. | | | 2.9 | % | |
Largan Precision Co., Ltd. | | | 3.2 | % | | Novatek Microelectronics Corp. | | | 2.9 | % | |
Li & Fung Ltd. | | | 3.0 | % | | Delta Electronics Thailand PCL /Foreign | | | 2.9 | % | |
JB Hi-Fi Ltd. | | | 3.0 | % | | Ascendas Real Estate Investment Trust | | | 2.9 | % | |
Henderson Group PLC | | | 3.0 | % | | DiGi.Com Bhd | | | 2.9 | % | |
Industry Breakdown (% of net assets) | | | | | | | |
Commercial Banks | | | 13.8 | % | | Oil Company - Exploration & Production | | | 2.8 | % | |
Semiconductor Components - Integrated Circuits | | | 8.4 | % | | Casino Hotels | | | 2.8 | % | |
Electronic Component - Miscellaneous | | | 8.4 | % | | Textile - Products | | | 2.8 | % | |
REITS - Shopping Centers | | | 5.6 | % | | MRI/Medical Diagnostics Imaging | | | 2.8 | % | |
Retail-Apparel/Shoe | | | 5.3 | % | | Tobacco | | | 2.8 | % | |
Real Estate Management/Service | | | 3.3 | % | | Optical Supplies | | | 2.8 | % | |
Photo Equipment & Supplies | | | 3.2 | % | | Oil Company - Integrated | | | 2.7 | % | |
Distribution/Wholesale | | | 3.0 | % | | Computers | | | 2.7 | % | |
Retail - Consumer Electronics | | | 3.0 | % | | Real Estate Operations/Development | | | 2.7 | % | |
Investment Management/Advisor Service | | | 2.9 | % | | Retail - Jewelry | | | 2.7 | % | |
Shipbuilding | | | 2.9 | % | | Cellular Telecommunications | | | 2.7 | % | |
REITS - Diversified | | | 2.9 | % | | Metal Processors & Fabricators | | | 2.7 | % | |
Telecommunication Services | | | 2.8 | % | | Life/Health Insurance | | | 2.6 | % | |
25
SCHEDULE OF INVESTMENTS
at December 31, 2015
GUINNESS ATKINSON ASIA PACIFIC DIVIDEND BUILDER FUND
Shares | | COMMON STOCKS: 101.1% | | Value | |
Australia: 8.7% | | | |
| | 46,950 | | | Henderson Group PLC | | $ | 213,850 | | |
| | 15,210 | | | JB Hi-Fi Ltd. | | | 215,047 | | |
| | 15,550 | | | Sonic Healthcare Ltd. | | | 201,487 | | |
| | | | | | | | 630,384 | | |
China: 27.7% | | | |
| | 31,000 | | | AAC Technologies Holdings Inc. | | | 201,541 | | |
| | 267,000 | | | Belle International Holdings Ltd | | | 198,048 | | |
| | 294,000 | | | China Construction Bank Corp. - H Shares | | | 199,589 | | |
| | 258,000 | | | China Lilang Ltd. | | | 189,648 | | |
| | 85,000 | | | China Merchants Bank Co., Ltd. - H Shares | | | 198,809 | | |
| | 205,900 | | | China Minsheng Banking Corp. Ltd. - H Shares | | | 203,292 | | |
| | 17,500 | | | China Mobile Ltd. | | | 196,130 | | |
| | 134,000 | | | CNOOC Ltd. | | | 137,734 | | |
| | 650 | | | CNOOC Ltd. - ADR | | | 67,847 | | |
| | 334,000 | | | Industrial & Commercial Bank of China Ltd. - H Shares | | | 200,047 | | |
| | 276,100 | | | Yangzijiang Shipbuilding Holdings Ltd. | | | 213,180 | | |
| | | | | | | | 2,005,865 | | |
Hong Kong: 16.8% | | | |
| | 65,500 | | | BOC Hong Kong Holdings Ltd. | | | 198,745 | | |
| | 322,000 | | | Li & Fung Ltd. | | | 217,290 | | |
| | 34,000 | | | Link REIT/The | | | 202,838 | | |
| | 93,000 | | | Luk Fook Holdings International Ltd. | | | 196,645 | | |
| | 322,000 | | | NagaCorp Ltd. | | | 202,941 | | |
| | 131,000 | | | Pacific Textiles Holdings Ltd. | | | 201,837 | | |
| | | | | | | | 1,220,296 | | |
Japan: 3.3% | | | |
| | 2,000 | | | Relo Holdings Inc. | | | 239,960 | | |
Malaysia: 2.8% | | | |
| | 164,900 | | | DiGi.Com Bhd | | | 206,722 | | |
Singapore: 5.6% | | | |
| | 129,500 | | | Ascendas Real Estate Investment Trust - REIT | | | 207,401 | | |
| | 148,900 | | | CapitaMall Trust - REIT | | | 201,785 | | |
| | | | | | | | 409,186 | | |
South Korea: 2.8% | | | |
| | 2,260 | | | KT&G Corp. | | | 200,562 | | |
The accompanying notes are an integral part of these financial statements.
26
Shares | | COMMON STOCKS: 101.1% (Continued) | | Value | |
Taiwan: 19.7% | | | |
| | 24,000 | | | Asustek Computer Inc. | | $ | 198,006 | | |
| | 23,000 | | | Catcher Technology Co., Ltd. | | | 192,573 | | |
| | 80,134 | | | Hon Hai Precision Industry Co., Ltd. | | | 195,993 | | |
| | 3,400 | | | Largan Precision Co., Ltd. | | | 232,304 | | |
| | 54,000 | | | Novatek Microelectronics Corp. | | | 209,742 | | |
| | 10,000 | | | St Shine Optical Co., Ltd. | | | 199,760 | | |
| | 46,000 | | | Taiwan Semiconductor Manufacturing Co., Ltd. | | | 198,494 | | |
| | | | | | | | 1,426,872 | | |
Thailand: 8.3% | | | |
| | 99,100 | | | Delta Electronics Thailand PCL/Foreign | | | 208,368 | | |
| | 445,200 | | | LPN Development PCL/Foreign | | | 197,247 | | |
| | 29,300 | | | PTT PCL/Foreign | | | 198,672 | | |
| | | | | | | | 604,287 | | |
United States: 5.4% | | | |
| | 3,200 | | | Aflac Inc. | | | 191,680 | | |
| | 4,000 | | | QUALCOMM Inc. | | | 199,940 | | |
| | | | | | | | 391,620 | | |
| | | | | Total Common Stocks
(cost $7,636,000) | | | 7,335,754 | | |
| | | RIGHTS: 0.0% | | | |
| | 4,856 | | | Ascendas Real Estate Investment Trust, Rights, Strike Price 2.218 SGD (expiring 01/13/16)*^ | | | 181 | | |
| | | | | Total Rights
(cost $0) | | | 181 | | |
| | | | | Total Investments in Securities
(cost $7,636,000): 101.1% | | | 7,335,935 | | |
| | | | | Liabilities in Excess of Other Assets: (1.1%) | | | (82,390 | ) | |
| | | | | Net Assets: 100.0% | | $ | 7,253,545 | | |
* Non-income producing security.
ADR - American Depository Receipt
REIT - Real Estate Investment Trust
^ Fair value under direction of the Board of Trustees. Fair valued securities represent 0.0% of net assets.
The accompanying notes are an integral part of these financial statements.
27
CHINA & HONG KONG FUND for the period ended December 31, 2015
1. Performance
AVERAGE ANNUALIZED TOTAL RETURNS
| | | 1 Year
(actual) | | 3 Years | | 5 Years | | 10 Years | |
Fund | | | -7.58 | % | | | -1.20 | % | | | -4.37 | % | | | 6.44 | % | |
Benchmark Indices: | |
Hang Seng Composite Index | | | -4.12 | % | | | 2.57 | % | | | 1.99 | % | | | 7.86 | % | |
S&P 500 Index | | | 1.38 | % | | | 15.11 | % | | | 12.54 | % | | | 7.29 | % | |
The Fund's gross expense ratio is 1.53% per the Summary Prospectus dated March 23, 2015.
Performance data quoted represents past performance and does not guarantee future results. The investment return and principal value of an investment in the Fund will fluctuate so that an investor's shares, when redeemed, may be worth more or less than their original cost. Current performance of the Fund may be lower or higher than the performance quoted. Performance data current to the most recent month-end may be obtained by visiting www.gafunds.com, or calling (800) 915-6565.
The Fund imposes a 2% redemption fee on the sale of shares held less than 30 days. Performance data quoted does not reflect this redemption fee. Total returns for certain periods reflect fee limitations in effect and, in the absence of these limitations, total returns would have been lower.
For calendar year 2015, the Fund fell 7.58% compared to the Hang Seng Composite Index which was down 4.12%.
Stronger performance by Chinese stocks in the first half was followed by significant weakness in the second half of the year. The strength in the early part of the year followed by a resumption of policy easing by the Chinese central bank as the underlying economy slowed due to overly tight fiscal and monetary conditions at the end of 2014 and in early 2015. Chinese stocks rallied in response to liquidity injections and increased fiscal spending, but then market sentiment turned sharply negative.
In the second half of the year, concerns had grown as to the extent of the China slowdown and whether or not the currency would be devalued as a means of boosting economic performance. A move to adjust the foreign exchange setting mechanism, to try and bring the system closer to the International Monetary Fund's (IMF's) requirements and allow inclusion of the renminbi into the elite group of international reserve currencies, sparked a sudden 2.5% fall in the renminbi's value against the US dollar. Suspicions grew, and remain, that China has entered a period of competitive devaluation.
Since then, there has been a steady stream of capital outflows from China and foreign exchange reserves dropped by $500 billion during the year. Investors have treated this as an indication of a general loss of confidence in the renminbi, making a substantial devaluation inevitable. The detail of capital flows, however, reveal much of the drop is due to companies paying down US dollar-denominated debt accumulated when the renminbi was rising against the US dollar. If the flows remain confined to this, then we believe they are harmless and will soon burn out. A more general loss of confidence remains a risk (and there are many policy responses that are open to the central bank) but it is not yet evident.
Stocks that performed well over the year were in consumer discretionary, insurance, technology, telecoms and toll roads. Netease, Geely Automobile, China Lesso, Shenzhen Expressway and Tencent were the best performers in 2015. The weakest performers were to be found amongst banks, energy, industrials and materials as well as in Macao leisure. Weichai Power, China Shenhua Energy, Galaxy Entertainment, Petrochina and Anhui Conch Cement were the biggest underperformers over the year.
2. Activity
Earlier in the year, we sold our position in HSBC and diversified our China financials exposure by taking some money out of Chinese banks and reinvesting into PICC Property & Casualty and the People's Insurance Group, a life insurance company. We made further changes in the second quarter, lowering our exposure to technology by reducing positions in Lenovo, Tencent and Netease, and added to our insurance exposure, reinvesting the proceeds in China Life Insurance and Ping An Insurance, a life and property and casualty insurer. At the end of the year, the portfolio's heaviest exposures were to technology and financials (a third of which was in insurance and the rest in banks). Industrials and consumer discretionary were the next two largest sectors. All of the Fund's holdings are listed and traded outside mainland China.
28
3. Outlook
China's underlying economic conditions point to a reacceleration from a slower period earlier in 2015. Policy settings look set to be focused on providing adequate liquidity keeping interest rates low. Currency policy, after a rocky start at the beginning of 2016 is likely to focus on stability and give credence to the repeated official statements that devaluation is not considered to be a policy option.
Over the longer term, the twin challenges of increasing the household share of Gross Domestic Product (GDP) and reducing the rate of debt accumulation remains as pressing as ever. Under China's old economic growth model, higher economic growth translates into a faster build-up of debt. The longer this persists, the harder it will be to unwind, but the markets' view that China is on the verge of a financial crisis is wrong, in our opinion. These conditions could persist for some years, but the risk is that in so doing China would then be subject to a long period of sub-par growth or stagnation. This is what China seeks to avoid, but at the same time the resolution of these structural issues carries heavy political baggage and comes against entrenched vested interests.
For investors, we see the opportunities lying in good businesses that earn a return on invested capital above the cost of capital and that serve a middle class segment that, despite China's decelerating growth, is still expanding. We look to avoid those businesses that depend on aggregate economic growth to turn a profit. Now that sentiment toward all China and Hong Kong stocks is so poor, we find that good businesses as well as bad have been sold down, presenting some good value opportunities.

Edmund Harriss February 2016
The Fund invests in foreign securities, which involve political, economic and currency risks, greater volatility, and differences in accounting methods. These risks are greater for emerging markets. The Fund is non-diversified, meaning that its assets may be concentrated in fewer individual holdings than diversified funds. Therefore, the Fund is more exposed to individual stock volatility than diversified funds. Investments focused in a single geographic region may be exposed to greater risk and more volatility than investments diversified among various geographies. The Fund invests in smaller companies, which involve additional risks such as limited liquidity and greater volatility.
Please refer to the Schedule of Investments for details on Fund holdings. Current and future portfolio holdings are subject to risk.
The Hang Seng Composite Index in a market capitalization weighted index that covers about 95% of the total market capitalization of companies listed on the main board of the Hong Kong Stock Exchange. The Standard & Poor's 500 Index is a market capitalization-weighted index composed of 500 widely held common stocks of U.S. companies. These indices are unmanaged, not available for investment and do not incur expenses.
The information provided herein represents the opinion of Guinness Atkinson Asset Management, Inc. for the period stated and is not intended to be a forecast of future events, a guarantee of future results, or investment advice. Opinions, Fund holdings and sector allocations are subject to change at any time, and are not recommendations to buy or sell any security.
29
GUINNESS ATKINSON CHINA & HONG KONG FUND
Growth of $10,000

| | | Average Annual Total Return
Periods Ended December 31, 2015 | |
| | | One Year | | Five Years | | Ten Years | |
| | | | | | -7.58 | % | | | -4.37 | % | | | 6.44 | % | |
Performance data quoted represents past performance and does not guarantee future results. The investment return and principal value of an investment will fluctuate so that an investor's shares, when redeemed, may be worth more or less than their original cost. Current performance of the Fund may be lower or higher than the performance quoted. Performance data current to the most recent month end may be obtained by visiting www.gafunds.com.
Total returns for certain periods reflect a fee waiver in effect and in the absence of this waiver, the total returns would be lower. Returns reflect the reinvestment of distributions made by the Fund, if any. The graph and the performance table above do not reflect the deduction of taxes that a shareholder would pay on Fund distribution or the redemption of Fund shares. The Fund imposes a 2% redemption fee on shares held less than 30 days.
The Hang Seng Composite Index is a market-capitalization weighted index that comprises the top 200 companies listed on the Hong Kong Stock Exchange, based on the average market capitalization for the past twelve months. The index referenced in this chart is not available for investment and does not incur expenses.
30
FUND HIGHLIGHTS at December 31, 2015
GUINNESS ATKINSON CHINA & HONG KONG FUND
# of Holdings in Portfolio: | | 36 | |
Portfolio Turnover: | | 26.5% | |
% of Stocks in Top 10: | | 41.1% | |
Fund Manager: | | | |
Edmund Harriss | | | |
Top 10 Holdings (% of net assets) | | | | | | | |
NetEase Inc. - ADR | | | 6.3 | % | | Sohu.com Inc. | | | 3.8 | % | |
Tencent Holdings Ltd. | | | 4.6 | % | | Industrial & Commercial Bank of China Ltd. - H Shares | | | 3.5 | % | |
AAC Technologies Holdings Inc. | | | 4.5 | % | | Shenzhen Expressway Co., Ltd. - H Shares | | | 3.5 | % | |
db x-trackers CSI300 Index ETF | | | 4.3 | % | | Geely Automobile Holdings Ltd. | | | 3.5 | % | |
Lenovo Group Ltd. | | | 4.0 | % | | China Construction Bank Corp. - H Shares | | | 3.1 | % | |
Industry Breakdown (% of net assets) | | | | | | | |
Commercial Banks | | | 15.7 | % | | Casino Hotels | | | 3.7 | % | |
Insurance | | | 11.0 | % | | Public Thoroughfares | | | 3.5 | % | |
Electronic Component - Miscellaneous | | | 6.8 | % | | Cellular Telecommunications | | | 3.1 | % | |
Internet Content - Entertainment | | | 6.4 | % | | Oil Company - Exploration & Production | | | 2.8 | % | |
Auto - Cars/Light Trucks | | | 6.3 | % | | Retail - Apparel/Shoe | | | 2.4 | % | |
Internet Application Software | | | 4.6 | % | | Airlines | | | 2.1 | % | |
Building Products | | | 4.4 | % | | Telecommunication Equipment | | | 2.1 | % | |
Exchange Traded Funds (ETFs) | | | 4.3 | % | | Gas - Distribution | | | 1.9 | % | |
Real Estate Operations/Development | | | 4.1 | % | | Auto/Truck Parts & Equipment | | | 1.8 | % | |
Computers | | | 4.0 | % | | Shipbuilding | | | 1.6 | % | |
Web Portals/ISP | | | 3.8 | % | | Machinery - General Industries | | | 0.9 | % | |
31
SCHEDULE OF INVESTMENTS
at December 31, 2015
GUINNESS ATKINSON CHINA & HONG KONG FUND
Shares | | COMMON STOCKS: 97.3% | | Value | |
Airlines: 2.1% | | | |
| | 792,000 | | | Cathay Pacific Airways Ltd. | | $ | 1,363,843 | | |
Auto/Truck Parts & Equipment: 1.8% | | | |
| | 1,086,240 | | | Weichai Power Co., Ltd. - H Shares | | | 1,192,231 | | |
Auto – Cars/Light Trucks: 6.3% | | | |
| | 1,416,000 | | | Dongfeng Motor Group Co., Ltd. - H Shares | | | 1,875,137 | | |
| | 4,295,000 | | | Geely Automobile Holdings Ltd. | | | 2,273,127 | | |
| | | | | | | | 4,148,264 | | |
Building Products: 4.4% | | | |
| | 471,000 | | | Anhui Conch Cement Co., Ltd. - H Shares | | | 1,254,218 | | |
| | 2,401,000 | | | China Lesso Group Holdings Ltd. | | | 1,664,375 | | |
| | | | | | | | 2,918,593 | | |
Casino Hotels: 3.7% | | | |
| | 498,000 | | | Galaxy Entertainment Group Ltd. | | | 1,552,735 | | |
| | 1,398,000 | | | NagaCorp. Ltd. | | | 881,094 | | |
| | | | | | | | 2,433,829 | | |
Cellular Telecommunications: 3.1% | | | |
| | 181,500 | | | China Mobile Ltd. | | | 2,034,150 | | |
Commercial Banks: 15.7% | | | |
| | 604,500 | | | BOC Hong Kong Holdings Ltd. | | | 1,834,223 | | |
| | 3,217,670 | | | China Construction Bank Corp. - H Shares | | | 2,184,395 | | |
| | 854,000 | | | China Merchants Bank Co., Ltd. - H Shares | | | 1,997,448 | | |
| | 1,609,000 | | | China Minsheng Banking Corp., Ltd. | | | 1,588,621 | | |
| | 87,681 | | | Dah Sing Financial Holdings Ltd. | | | 435,261 | | |
| | 3,889,330 | | | Industrial & Commercial Bank of China Ltd. - H Shares | | | 2,329,483 | | |
| | | | | | | | 10,369,431 | | |
Computers: 4.0% | | | |
| | 2,601,000 | | | Lenovo Group Ltd. | | | 2,620,982 | | |
Electronic Component – Miscellaneous: 6.8% | | | |
| | 460,000 | | | AAC Technologies Holdings Inc. | | | 2,990,604 | | |
| | 8,620,000 | | | Tongda Group Holdings Ltd. | | | 1,512,443 | | |
| | | | | | | | 4,503,047 | | |
Exchange Traded Funds (ETFs): 4.3% | | | |
| | 2,910,200 | | | db x-trackers CSI300 Index ETF | | | 2,843,265 | | |
Gas – Distribution: 1.9% | | | |
| | 211,000 | | | Beijing Enterprises Holdings Ltd. | | | 1,270,276 | | |
The accompanying notes are an integral part of these financial statements.
32
Shares | | COMMON STOCKS: 97.3% (Continued) | | Value | |
Insurance: 11.0% | | | |
| | 460,000 | | | China Life Insurance Co., Ltd. - H Shares | | $ | 1,479,834 | | |
| | 3,844,000 | | | People's Insurance Company Group of China Ltd. - H Shares | | | 1,867,201 | | |
| | 1,024,000 | | | PICC Property & Casualty Co., Ltd. - H Shares | | | 2,015,777 | | |
| | 336,000 | | | Ping An Insurance Group Company of China Ltd. - H Shares | | | 1,846,088 | | |
| | | | | | | | 7,208,900 | | |
Internet Application Software: 4.6% | | | |
| | 156,800 | | | Tencent Holdings Ltd. | | | 3,058,862 | | |
Internet Content – Entertainment: 6.4% | | | |
| | 23,075 | | | NetEase Inc. - ADR | | | 4,182,113 | | |
Machinery – General Industries: 0.9% | | | |
| | 2,430,000 | | | Chen Hsong Holdings | | | 570,654 | | |
Oil Company – Exploration & Production: 2.8% | | | |
| | 1,806,000 | | | CNOOC Ltd. | | | 1,856,323 | | |
Public Thoroughfares: 3.5% | | | |
| | 2,610,000 | | | Shenzhen Expressway Co., Ltd. - H Shares | | | 2,293,532 | | |
Real Estate Operations/Development: 4.1% | | | |
| | 180,666 | | | China Overseas Property Holdings* | | | 29,606 | | |
| | 586,000 | | | China Overseas Land & Investments Ltd. | | | 2,034,616 | | |
| | 1,381,000 | | | Soho China Ltd. | | | 666,333 | | |
| | | | | | | | 2,730,555 | | |
Retail – Apparel/Shoe: 2.4% | | | |
| | 2,111,000 | | | Belle International Holdings Ltd | | | 1,565,841 | | |
Shipbuilding: 1.6% | | | |
| | 1,396,000 | | | Yangzijiang Shipbuilding Holdings Ltd. | | | 1,077,868 | | |
Telecommunication Equipment: 2.1% | | | |
| | 135,900 | | | VTech Holdings Ltd. | | | 1,403,936 | | |
Web Portals/ISP: 3.8% | | | |
| | 43,350 | | | Sohu.com Inc.* | | | 2,479,187 | | |
| | | | | Total Common Stocks
(cost $55,677,121) | | | 64,125,682 | | |
| | | | | Total Investments in Securities
(cost $55,677,121): 97.3% | | | 64,125,682 | | |
| | | | | Other Assets less Liabilities: 2.7% | | | 1,793,298 | | |
| | | | | Net Assets: 100.0% | | $ | 65,918,980 | | |
* Non-income producing security.
ADR - American Depository Receipt
The accompanying notes are an integral part of these financial statements.
33
DIVIDEND BUILDER FUND for the period ended December 31, 2015
1. Performance
AVERAGE ANNUALIZED TOTAL RETURN
| | | 1 Year
(actual) | | 3 Years | | Since
Inception
(March 30, 2012) | |
Fund | | | -3.61 | % | | | 9.54 | % | | | 8.92 | % | |
Benchmark Index: | |
MSCI World Index | | | -0.24 | % | | | 10.32 | % | | | 9.39 | % | |
The Fund's gross expense ratio is 2.96% and net expense ratio is 0.68% per the Summary Prospectus dated March 23, 2015. The Advisor has contractually agreed to waive a portion of its advisory fees and/or reimburse other Fund expenses so that the Fund's ratio of expenses to average daily net assets will not exceed 0.68% (excluding Acquired Fund Fees and Expenses, interest, taxes, dividends on short positions and extraordinary expenses) through at least June 30, 2016. To the extent that the Advisor waives fees and/or reimburses expenses, it may seek repayment of a portion or all of such amounts at any time within the three fiscal years after the fiscal year in which such amounts were waived and/or reimbursed, subject to the applicable cap.
Performance data quoted represents past performance and does not guarantee future results. The investment return and principal value of an investment in the Fund will fluctuate so that an investor's shares, when redeemed, may be worth more or less than their original cost. Current performance of the Fund may be lower or higher than the performance quoted. Performance data current to the most recent month-end may be obtained by visiting www.gafunds.com, or calling (800) 915-6565.
In 2015, the Dividend Builder Fund produced a total return of -3.61%. The Fund underperformed the MSCI World Index by 3.37% over the period.
2. Activity
Portfolio turnover was typical for the Fund in 2015; we sold six companies and replaced them with six new companies, following our 'one in, one out' approach.
In the first and second quarter of the year, we made no changes to the portfolio.
In the third quarter, we made two changes to the portfolio. We sold our positions in Reckitt Benckiser and L-3 Communications. We decided to exit Reckitt Benckiser on valuation and dividend yield grounds. The company, in our view, remains very well run, but we began to question whether the valuation could justify continuing to hold the stock. Reckitt Benckiser has performed well over the last five years. However, the majority of this total return has come from a re-rating of the multiple the stock trades on – it rose from around 11x forward earnings at the start of 2011 to 25x when we sold. As the dividend paid by the company had only grown in the low single digits over that period (which is somewhat disappointing) the dividend yield compressed from about 4% to 2%. The market rewarded the company instead for focussing on household and personal care, cost cutting, and selling off the pharma division. We just wondered whether the market had baked-in too high estimates for what the company was likely to achieve. If we were to see the stock underperform the market in the future and move towards a more reasonable valuation, then it is certainly something we would consider owning again.
We had held L-3 Communications from the launch of the Fund on March 30, 2012. Over that time, L-3 experienced a significant valuation re-rating, broadly in line with other defence companies, all of which were deeply out of favour post the financial crisis as investors worried about US government spending cuts. L-3 never had a very large dividend yield, averaging around 2.5-3% over the last five years. The dividend did grow significantly over that time, however, averaging around 9% growth per annum. This strong dividend growth helped to support and 'drag up' the share price over time. From a valuation point of view, the company appeared to be trading at stretched multiples – certainly in respect to where the company had traded historically – and this was a concern. What really drove us to sell the company, however, was the deterioration in the underlying quality of the business. Sales growth had been negative for a number of years and we had just started to see a decline in operating margins coming through. With little or no asset growth expected, it appeared unlikely the company could reverse the decline in economic profits it was generating – and that the market was anticipating.
To replace these two sales we bought new positions in WPP and Eaton. For the new buys we identified the three things we look for in any new investment: a history of persistence of return on capital, reasonable valuation, and a sustainable and growing
34
dividend record. In the case of WPP, the global advertising business, we perceive a greater proportion of our expected total return should come from earnings and dividend growth, and only a moderate return from a multiple re-rating (as the company is trading only slightly below its medium-term multiple). Eaton, an industrial power management company based in the US, on the other hand has a higher dividend yield (just over 4%) but slower dividend growth, and we expect a greater re-rating in terms of its multiple as the stock was more out of favour and had been de-rated versus the broader market since the end of 2013.
In the fourth quarter, we made a number of changes to the portfolio, selling four positions and replacing them with another four positions – bringing the total number of companies held in the Fund to 34 at the year end.
The four companies we sold were CNOOC, ENI, Meggitt, and China Mobile.
CNOOC and ENI were two energy companies held in the Fund (from a total of four), but with quite different exposures to the oil price. CNOOC is essentially a large cap exploration and production company and is thus highly levered to the oil price. ENI, on the other hand, is the Italian national oil company, which is an integrated oil major with interests throughout the oil and gas supply chain, and thus less exposed, but by no means immune, to the changing oil price.
The reasons for sale were different, but the over-supplied nature of the oil markets in general and the uncertainty surrounding the timing and mechanism of how this over-supply would be used up – whether from increasing demand trends or a reduction in supply from within or outside Organization of the Petroleum Exporting Countries (OPEC) – gave us cause for concern. We do not profess to be able to 'call' the oil price, but we increasingly felt there were better opportunities available in other sectors that could offer better risk/reward characteristics. By maintaining a c.6% exposure to the sector (we continue to hold Royal Dutch Shell and Total) through two of the higher quality, more diversified companies, we feel the Fund can still benefit from any re-rating in the sector that may occur over the coming months.
We had held Meggitt since the Fund's inception. The company's dividend has grown from 9.55p in 2011 to 14.10p in 2015 – averaging a healthy dividend growth of 10% per annum. The company surprised the market at the end of October 2015 by releasing a profit warning – despite having issued reasonably positive guidance for the full year in their August earnings call a couple of months earlier. The stock fell over 20% on the day of the profit warning, a dramatic response.
In the August update Meggitt had reiterated the guidance it had given at the start of the year of mid-single digit organic revenue growth for the full year. Alongside this, the company announced an increase in its interim dividend of 8%. However, in its late October trading update, the company reported that trading during the third quarter was below expectations due to a marked deterioration in September, and reported that these factors were expected to persist through the fourth quarter. We concluded that this trend was likely to persist beyond the fourth quarter too. We decided there was therefore a threat to both the dividend growth and the share price over the medium term, and we thus decided to sell the company. We will continue to monitor the company closely in the future and keep an eye on how its revenue stream evolves.
China Mobile had been a long-term and successful holding in the portfolio. The performance has been quite volatile, a reflection of both the overall Chinese market and some stock-specific issues. The company remains on what appear to be reasonable multiples, especially in relation to developed markets, of around 12x 2016 expected earnings. The underlying business has been in decline over the last few years, however, with the cash flow return on investment (CFROI, our preferred measure) declining from over 10% to just 6% in 2014, which is only marginally above its real cost of capital. This type of return on capital profile, alongside the company's good stock price performance and decreasing dividend payments, prompted us to sell the position.
The five companies we bought for the Fund in the fourth quarter were CME Group, Japan Tobacco, United Technologies and CA Technologies.
CME group owns and operates a derivatives marketplace across multiple asset classes and offers both trade execution and clearing and settlement services. The company is not stand-out cheap, but is trading below its longer-term multiple. Considering the extremely high return-on-capital the company has achieved (and that we think it can continue to achieve), we are comfortable with the valuation. The current dividend yield of 2.3% at first glance appears modest, but the company has paid a large special dividend in each of the last five years. The regular cash dividends paid in 2015 totalled $2.00 per share, but this was supplemented by a special cash dividend of $2.60. Combining these regular and special dividends, the company had a dividend yield (12 month trailing) of 5.1% at the year end.
Japan Tobacco represents the first Japanese-listed company we have owned in the Fund, and therefore reduces our underweight in that region versus the benchmark. Tobacco companies have a bad name generally, and specifically as regards investment
35
potential due to long-term regulatory issues. Our experience has been that these businesses have shown the ability to maintain (and actually grow) margins in the face of such issues as they successfully pass on price increases to customers. Return-on-capital has historically been high and stable at Japan Tobacco, which has translated into growing economic profit through increased sales, offsetting any declines seen in asset growth. Dividend growth has been positive over the past five years and appears to be picking up – the company increased its final dividend by 28% to 64JPY (0.5578 US Dollar) in 2015 and 50JPY(0.4357 US Dollar) in 2014.
United Technologies and CA Technologies are two companies currently out of favour. United Technologies is a diversified industrial business and CA is a technology software company that focusses mainly on mainframe computing. United is also much larger, with a market cap. of $85bn versus CA at $12bn. However, they both have globally diversified revenues while still maintaining a decent exposure to the US (each at approximately 60% of sales) and have both been shown to be run successfully through good returns-on-capital over time. Neither company is richly valued, but both provide a history of good dividend streams, if modest dividend growth. We have had good success focussing on the more unloved end of the market, and we see these as two companies that can exemplify this.
To summarize, the overall theme (as ever) has been to sell over-valued companies, or those where we feel there is a real risk to the dividend, and to replace them with higher quality businesses and specifically those where we feel there is a good opportunity for dividend growth in the future. In today's market environment, we think this is a particularly relevant and important metric for investors to consider.
3. Portfolio Position
The effect of these changes on the sector and geographic breakdown of the portfolio was subtle, rather than dramatic. Over the 12 months, our exposure to information technology, consumer discretionary and financials all increased. Our exposure to energy healthcare, industrials and telecoms all reduced.
The Fund has maintained its zero exposure to both the materials and utilities sectors.
Sector Allocation at 12/31/15 | |
Consumer Discretionary | | | 11.5 | % | | Information Technology | | | 8.5 | % | |
Consumer Staples | | | 16.9 | % | | Materials | | | 0.0 | % | |
Energy | | | 5.3 | % | | Telecommunication Services | | | 2.6 | % | |
Financials | | | 24.1 | % | | Utilities | | | 0.0 | % | |
Health Care | | | 13.3 | % | | Cash | | | 1.6 | % | |
Industrials | | | 16.3 | % | | | | | 100.0 | % | |
36
4. Dividend
The trailing twelve months dividend distributed by the Fund was $0.464 per share.

5. Outlook
As we look forward in 2016, many of the uncertainties that existed in 2015 are still with us: the trajectory of US interest rates, the divergence of central bank policies, emerging market currency risks, weaker growth in China, and Europe grappling with various social and economic problems, to mention the most widely discussed topics.
We always try to avoid predicting the future but prefer to look at what we can know today with certainty.
A quick glance at valuations across the globe and within different sectors of the market highlight that there remains a wide divergence in investor expectations. We hope we can exploit these divergences by continuing to focus on those companies with the characteristics we seek and by looking to the long term, rather than reacting to short-term price movements or just following market momentum.
Thank you for your continued support as we look forward to updating you with the Fund's progress over the coming year.


Matthew Page Ian Mortimer January 2016
The Fund invests in foreign securities, which involve political, economic, currency risks, greater volatility, and differences in accounting methods. These risks are greater for emerging markets. The Fund invests in small- or mid-cap companies, which involve additional risks such as limited liquidity and greater volatility. Growth stocks typically are more volatile than value stocks; however, value stocks have a lower expected growth rate in earnings and sales.
The MSCI World Index is a free float-adjusted market capitalization weighted index that is designed to measure the equity market performance of developed markets. One may not directly invest in an index.
Earnings growth is not a measure of the Fund's future performance.
37
Diversification does not assure a profit nor protect against loss in a declining market.
Please refer to the Schedule of Investments for details on Fund holdings. Current and future portfolio holdings are subject to risk.
The information provided herein represents the opinion of Guinness Atkinson Asset Management, Inc. for the period stated and is not intended to be a forecast of future events, a guarantee of future results, or investment advice. Opinions, Fund holdings and sector allocations are subject to change at any time, and are not recommendations to buy or sell any security.
38
GUINNESS ATKINSON DIVIDEND BUILDER FUND
Growth of $10,000
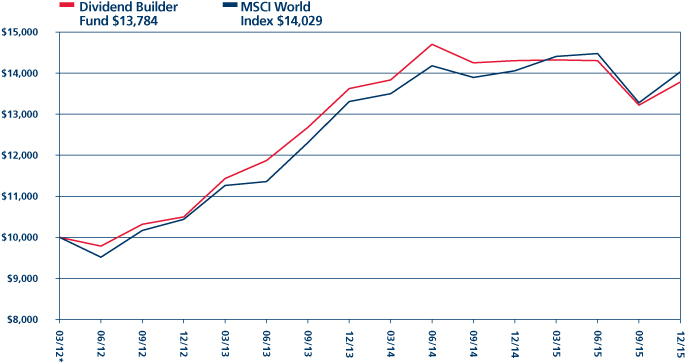
| | | Average Annual Total Return
Periods Ended December 31, 2015 | |
| | | One Year | | Three Years | | Since Inception
(03/30/12) | |
| | | | | | -3.61 | % | | | 9.54 | % | | | 8.92 | % | |
*Inception date 03/30/12.
Performance data quoted represents past performance and does not guarantee future results. The investment return and principal value of an investment will fluctuate so that an investor's shares, when redeemed, may be worth more or less than their original cost. Current performance of the Fund may be lower or higher than the performance quoted. Performance data current to the most recent month end may be obtained by visiting www.gafunds.com.
Total returns reflect a fee waiver in effect and in the absence of this waiver, the total returns would be lower. Returns reflect the reinvestment of distributions made by the Fund, if any. The graph and the performance table above do not reflect the deduction of taxes that a shareholder would pay on Fund distribution or the redemption of Fund shares.
The MSCI World Index is a free float-adjusted market capitalization weighted index that is designed to measure the equity market performance of developed markets.
39
FUND HIGHLIGHTS at December 31, 2015
GUINNESS ATKINSON DIVIDEND BUILDER FUND
# of Holdings in Portfolio: | | 34 | |
Portfolio Turnover: | | 24.9% | |
% of Stocks in Top 10: | | 30.8% | |
Fund Managers: | | | |
Dr. Ian Mortimer | | | |
Matthew Page | | | |
Top 10 Holdings (% of net assets) | | | | | | | |
H&R Block Inc. | | | 3.3 | % | | Unilever PLC | | | 3.0 | % | |
Imperial Tobacco Group PLC | | | 3.2 | % | | Li & Fung Ltd. | | | 3.0 | % | |
Deutsche Boerse AG | | | 3.2 | % | | ICAP PLC | | | 3.0 | % | |
Cisco Systems Inc. | | | 3.2 | % | | Willis Group Holdings PLC | | | 3.0 | % | |
Aflac Inc. | | | 3.0 | % | | Total SA | | | 2.9 | % | |
Industry Breakdown (% of net assets) | | | | | | | |
Pharmaceuticals | | | 8.4 | % | | Toys | | | 2.9 | % | |
Tobacco | | | 6.0 | % | | Aerospace/Defense | | | 2.9 | % | |
Finance - Other Services | | | 5.9 | % | | Advertising Agencies | | | 2.9 | % | |
Cosmetics & Toiletries | | | 5.9 | % | | Applications Software | | | 2.9 | % | |
Insurance Brokers | | | 5.8 | % | | Food - Miscellaneous/Diversified | | | 2.9 | % | |
Diversified Manufactured Operations | | | 5.8 | % | | Enterprise Software/Service | | | 2.9 | % | |
Aerospace/Defense | | | 5.7 | % | | Beverages - Non-alcoholic | | | 2.8 | % | |
Oil Company - Integrated | | | 5.5 | % | | Medical - Generic Drugs | | | 2.8 | % | |
Commercial Service - Finance | | | 3.3 | % | | MRI/Medical Diagnostics Imaging | | | 2.7 | % | |
Networking Products | | | 3.2 | % | | Cellular Telecommunication | | | 2.7 | % | |
Life/Health Insurance | | | 3.0 | % | | Power Conversion/Supply Equipment | | | 2.6 | % | |
Distribution/Wholesale | | | 3.0 | % | | Investment Management/Advisor Service | | | 2.5 | % | |
Finance - Investment Banker/Broker | | | 3.0 | % | | | | | | | |
40
SCHEDULE OF INVESTMENTS
at December 31, 2015
GUINNESS ATKINSON DIVIDEND BUILDER FUND
Shares | | COMMON STOCKS: 98.0% | | Value | |
Australia: 2.7% | | | |
| | 23,020 | | | Sonic Healthcare Ltd. | | $ | 298,278 | | |
France: 8.4% | | | |
| | 4,660 | | | Danone SA | | | 314,491 | | |
| | 5,090 | | | Schneider Electric SA | | | 289,804 | | |
| | 7,230 | | | Total SA | | | 321,995 | | |
| | | | | | | | 926,290 | | |
Germany: 3.2% | | | |
| | 3,920 | | | Deutsche Boerse AG | | | 346,727 | | |
Hong Kong: 3.0% | | | |
| | 488,000 | | | Li & Fung Ltd. | | | 329,310 | | |
Israel: 2.8% | | | |
| | 4,730 | | | Teva Pharmaceutical Industries Ltd. - ADR | | | 310,477 | | |
Japan: 2.8% | | | |
| | 8,400 | | | Japan Tobacco Inc | | | 308,424 | | |
Netherlands: 2.6% | | | |
| | 12,320 | | | Royal Dutch Shell PLC - Class A | | | 282,436 | | |
South Africa: 2.7% | | | |
| | 29,960 | | | Vodacom Group Ltd. | | | 294,880 | | |
United Kingdom: 20.5% | | | |
| | 64,330 | | | Aberdeen Asset Management PLC | | | 274,453 | | |
| | 42,520 | | | BAE Systems PLC | | | 313,164 | | |
| | 43,826 | | | ICAP PLC | | | 329,179 | | |
| | 6,690 | | | Imperial Tobacco Group PLC | | | 351,864 | | |
| | 7,780 | | | Unilever PLC | | | 333,122 | | |
| | 6,770 | | | Willis Group Holdings PLC | | | 328,819 | | |
| | 13,800 | | | WPP PLC | | | 317,645 | | |
| | | | | | | | 2,248,246 | | |
The accompanying notes are an integral part of these financial statements.
41
Shares | | COMMON STOCKS: 98.0% (Continued) | | Value | |
United States: 49.3% | | | |
| | 4,790 | | | AbbVie Inc. | | $ | 283,760 | | |
| | 5,570 | | | Aflac Inc. | | | 333,643 | | |
| | 7,480 | | | Arthur J Gallagher & Co. | | | 306,231 | | |
| | 10,990 | | | CA Inc. | | | 313,874 | | |
| | 12,720 | | | Cisco Systems Inc. | | | 345,412 | | |
| | 3,340 | | | CME Group Inc | | | 302,604 | | |
| | 7,260 | | | Coca-Cola Co/The | | | 311,890 | | |
| | 6,100 | | | Eaton Corp. PLC | | | 317,444 | | |
| | 2,310 | | | General Dynamics Corp. | | | 317,302 | | |
| | 10,720 | | | H&R Block Inc. | | | 357,083 | | |
| | 3,380 | | | Illinois Tool Works Inc. | | | 313,258 | | |
| | 3,070 | | | Johnson & Johnson | | | 315,350 | | |
| | 11,760 | | | Mattel Inc. | | | 319,519 | | |
| | 6,090 | | | Merck & Co., Inc. | | | 321,674 | | |
| | 5,670 | | | Microsoft Corp. | | | 314,572 | | |
| | 3,940 | | | Procter & Gamble Co/The | | | 312,875 | | |
| | 3,310 | | | United Technologies Corp. | | | 317,992 | | |
| | | | | | | | 5,404,483 | | |
| | | | | Total Common Stocks
(cost $10,847,334) | | | 10,749,551 | | |
| | | | | Total Investments in Securities
(cost $10,847,334): 98.0% | | | 10,749,551 | | |
| | | | | Other Assets less Liabilities: 2.0% | | | 214,309 | | |
| | | | | Net Assets: 100.0% | | $ | 10,963,860 | | |
ADR - American Depository Receipt
The accompanying notes are an integral part of these financial statements.
42
GLOBAL ENERGY FUND for the period ended December 31, 2015
1. Performance
AVERAGE ANNUALIZED TOTAL RETURNS
| | | 1 Year
(actual) | | 3 Years | | 5 Years | | 10 Years | |
Fund | | | -26.97 | % | | | -9.91 | % | | | -8.06 | % | | | -0.30 | % | |
Benchmark Indices: | |
S&P 500 Index | | | 1.38 | % | | | 15.11 | % | | | 12.54 | % | | | 7.29 | % | |
MSCI World Energy Index | | | -22.02 | % | | | -6.16 | % | | | -3.11 | % | | | 1.69 | % | |
The Fund's expense ratio is 1.30% per the Summary Prospectus dated March 23, 2015.
Performance data quoted represents past performance and does not guarantee future results. The investment return and principal value of an investment in the Fund will fluctuate so that an investor's shares, when redeemed, may be worth more or less than their original cost. Current performance of the Fund may be lower or higher than the performance quoted. Performance data current to the most recent month-end may be obtained by visiting www.gafunds.com, or calling (800) 915-6565.
The Global Energy Fund in 2015 produced a total return of -26.97%. This compares to the total return of the MSCI World Energy Index of -22.02% and the S&P 500's total return of 1.38%.
It was a second poor year for energy equities. The MSCI World Energy Index started the year positively, matching the gains made by the S&P 500 in the first four months of 2015, coinciding with the oil price rising from the mid $50s/bbl to mid $60s/bbl. Energy equities then traded weakly for most of the rest of the year, as oil fell to below $40/bbl, the energy Index ending 2015 with a total return of -22.02% versus the S&P 500 at 1.38%.
And similar to 2014, the performance of the MSCI World Energy Index was only part of the story, with a number of energy equity subsectors finishing the year down by around 30% to 60%, particularly those more levered to oil.
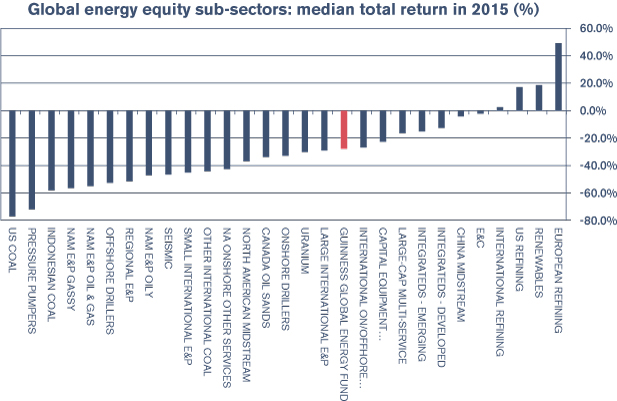
Source: Bloomberg LP; Guinness Atkinson Asset Management
43
A quick tour of some of the main energy sub-sectors paints a picture for the energy equity sector's performance as a whole in 2015, and that of the Fund:
Oil refining. The best performing sub-sector, with strong returns from European, US and international oil refiners. The low oil price generated a strong oil demand response, which in turn boosted crack spreads (refining margins) in most regions. European refiners saw the best gains, having started 2015 more depressed than their US counterparts. In the Fund, OMV in Europe and Valero in the US were the main beneficiaries.
Integrated oil and gas companies. A relative safe-haven, with the integrated model providing the defensive benefits of improved downstream (refining) margins to offset declines in upstream earnings. By way of illustration, 71% of Exxon's net income was derived from its downstream and chemicals division in the third quarter of 2015, compared to 26% in the same quarter of 2014. As a group, the integrated companies also benefitted in the downturn from lower financial leverage than most other energy sub-sectors. In the Fund, we owned the majority of the integrated oil and gas sector as holdings, with stronger relative performance from Total, ENI and Exxon.
Exploration and production. Almost all Exploration and Production (E&P) sub-sectors suffered, in particular those exposed to North American operations. With both oil and gas prices weak, there was no hiding place amongst the producers of both commodities, though in general, producers in the faster-growing shale oil basins (Permian and STACK) fared better. Globally, the biggest equity falls were suffered by E&Ps with weak balance sheets, with a number of leveraged E&Ps falling 50%+ as liquidity concerns grew. In the Fund, we saw positive performance from Newfield (improving operations in the STACK play in Oklahoma) and Dragon Oil (acquired by ENOC), but offset by several companies struggling in the low oil and gas price environment, notably Chesapeake, Southwestern, Enquest and Bankers Petroleum.
Energy services. A mixed bag, with the largest, best diversified energy service companies faring relatively well (a function of their ability to outperform smaller peers operationally, and take market share, in the downturn, coupled with stronger balance sheets); while over-leveraged onshore (e.g., most pressure pumpers) and offshore service companies (e.g., offshore drillers; seismic) were poorly placed to weather the significant cuts in capital expenditure seen across the sector. In the Fund, Wood Group and Halliburton outperformed, while Helix, Unit and Shawcor underperformed.
Coal. Generally the worst performing sub-sector, with coal prices weak. Thermal coal continued to lose market share to cheap emerging sources of natural gas, while metallurgical coal demand remained subdued thanks to the slowdown in construction activity in China. The market capitalization of the US coal sector has been reduced by over 90% since 2010. No exposure in the Fund.
Renewables. Variable performance across the renewable energy sub-sector. Solar companies were particularly mixed, with most solar manufacturers posting positive returns, while the solar development companies (or 'yield cos') performed poorly as interest rate rises and poor capital structures weighed. In the Fund, JA Solar and Trina Solar, two solar manufacturers, were both subject to takeover approaches from their respective Chairmen.
2. Activity
In February, we sold our position in Ultra Petroleum and switched into Southwestern. Southwestern is a 100% natural gas-oriented exploration and production company with assets onshore United States. The company was one of the first to develop onshore shale gas (developing the Fayetteville field) and it has since expanded operations into the Marcellus field, delivering consistent production and high quality operations. We sold our position in Ultra Petroleum to fund the purchase of Southwestern, partly increasing the Fund's exposure to natural gas E&Ps. We were increasingly concerned by the financial leverage of Ultra Petroleum post its acquisition of assets from RD/Shell and felt that Southwestern offered similar natural gas price exposure with less balance sheet risk.
In July we sold Dragon Oil, Stone Energy and Chesapeake. Dragon Oil had been subject to acquisition by its majority shareholder, the Emirates National Oil Company L.L.C. (ENOC), a company ultimately owned by the Government of Dubai. We opted to sell the position in mid July, at a small discount to ENOC's acquisition price but an all-time high price in the portfolio. Stone Energy and Chesapeake had been underperformers over the first half of the year, however we became increasingly vigilant towards balance sheet risk in the low oil price environment, and made these sales due to concerns that these companies' debt positions were uncomfortably high. Key ratios such as debt to EBITDA were looking particularly stretched into 2016 as both companies enjoyed good 2015 oil and gas production hedges which were due to roll off.
44
In July we purchased Tullow Oil and CNOOC. Tullow Oil is an international E&P with a focus on oil assets in West Africa. The company achieved notable exploration successes in the period between 2005 and 2011; since then Tullow Oil's equity securities have struggled due to a combination of weaker exploration results and developing its assets in the face of the lower oil price. We were attracted to the company by the depressed level of the equity and shift of strategy from exploration to production, which should eventually yield strong free cash flow.
We added CNOOC, the oiliest of China's three national oil & gas companies, to the portfolio as we liked the combination it brought of good upside to an oil price recovery, plus deep financial resources to weather the downturn. CNOOC's share price had been strong earlier in the year as it enjoyed the general rise in the H share market in Hong Kong, but then gave up those gains, providing what we saw as a good entry point.
3. Portfolio Position
The table below shows the Fund valuation in terms of historical and forward (analyst consensus estimates) price/earnings ratios versus the S&P 500 Index.
| | | 2010 | | 2011 | | 2012 | | 2013 | | 2014 | | 2015 | |
Guinness Atkinson Global Energy Fund P/E | | | 6.9 | | | | 6.9 | | | | 7.0 | | | | 7.5 | | | | 7.9 | | | | 16.3 | | |
S&P 500 P/E | | | 24.4 | | | | 21.2 | | | | 21.1 | | | | 19.0 | | | | 18.1 | | | | 19.2 | | |
Premium (+)/Discount (-) | | | -72 | % | | | -67 | % | | | -67 | % | | | -61 | % | | | -56 | % | | | -15 | % | |
Average oil price (WTI$) | | $ | 79.5/ | bbl | | $ | 95/ | bbl | | $ | 94/ | bbl | | $ | 98/ | bbl | | $ | 93/ | bbl | | $ | 49/ | bbl | |
Source: Standard and Poor's; Guinness Atkinson Asset Management Ltd WTI=West Texas Intermediate
The sector and geographic weightings of the portfolio at 31 December 2015 were as follows:
Sector Breakdown (%) | |
| | | Dec. 31, 2014 | | Dec. 31, 2015 | |
Integrated | | | 41.1 | | | | 40.5 | | |
Exploration and production | | | 34.5 | | | | 37.0 | | |
Drilling | | | 3.1 | | | | 1.7 | | |
Equipment and services | | | 13.1 | | | | 11.1 | | |
Refining and marketing | | | 3.5 | | | | 4.1 | | |
Coal and consumables | | | 0.0 | | | | 0.0 | | |
Solar | | | 3.5 | | | | 4.9 | | |
Construction and engineering | | | 0.0 | | | | 0.0 | | |
Cash | | | 1.2 | | | | 0.7 | | |
Total | | | 100 | | | | 100 | | |
45
Geographic Breakdown (%) | |
| | | Dec. 31, 2014 | | Dec. 31, 2015 | |
US | | | 51.1 | | | | 47.1 | | |
Canada | | | 11.7 | | | | 12.2 | | |
UK | | | 12.0 | | | | 10.7 | | |
Latin America | | | 0.0 | | | | 0.0 | | |
Europe | | | 17.0 | | | | 18.3 | | |
Hong Kong | | | 3.6 | | | | 7.4 | | |
Russia | | | 3.0 | | | | 3.4 | | |
Other | | | 0.5 | | | | 0.2 | | |
Cash | | | 1.2 | | | | 0.7 | | |
Total | | | 100 | | | | 100 | | |
4. Market Background
After the historic decision by OPEC in November 2014 to switch from a price to a market share strategy, oil benchmarks fell sharply and remained at a depressed level for much of 2015. Brent oil traded in a range from $35–68/bbl, closing 2015 near the bottom of this range, and averaging $54/bbl for the year.
North American unconventional oil production, the growth of which was the key to unbalancing the market in 2014, moved into decline, while global oil demand grew handsomely. However, the market was kept oversupplied for much of the year by OPEC's decision (notably Saudi and Iraq) to grow their production further, which added around 1.3m bbl/day to global supply. We view this move, particularly in Saudi's case, as an attempt to keep the boot on the throat of non-OPEC producers, and ensure a lasting re-set of the oil cycle.
For as long as oil inventories continue to loosen, we expect pricing volatility to persist.
The major components to oil supply/demand for 2015 were as follows:
• OPEC oil supply (including Natural Gas Liquids "NGLs") is likely to have grown by around 1.3m bbl/day (38.0m bbl/day versus 36.7m bbl/day). Saudi and Iraqi production were both higher by around 0.6m bbl/day, supported by modest rises from Kuwait and UAE. Libyan production remained depressed at around 0.4m bbl/day, similar to 2014. OPEC met in December 2015 and gave no indication that it would shift from its current strategy;
• Non-OPEC oil supply is likely to have grown by around 1.3 million barrels per day in 2015 (58.3m bbl/day versus 57.0m bbl/day), principally 0.8m bbl/day from the US (driven by shale oil which, although now declining, still averaged higher in 2015 than 2014) and small increases from Brazil, Russia, UK North Sea and China. Aside from US shale oil, growth in the rest of non-OPEC largely reflects the start-up of projects sanctioned before the fall in oil prices last year;
• Global oil demand is likely to have grown by around 1.8 million barrels per day in 2015, according to the International Energy Agency (IEA). This is made up of non-OECD oil demand growth of 1.3m bbl/day, with China up 0.7m bbl/day, and the Organisation for Economic Co-operation and Development (OECD) oil demand growth of around 0.5m bbl/day, with US and Europe both up 0.3m bbl/day. This represents the strongest year of demand growth since the post financial crisis bounce in 2010, and shows the stimulus of low gasoline prices. In the US, vehicle miles travelled are on the rise again, while market share for vehicle sales in the US and China shifted decisively in favor of SUVs over smaller cars;
• OECD oil inventories at the end of November 2015, were estimated to be at a record high of 2,969 million barrels, 11% above the 10 year average and well above the 2,705 million barrels level reported at the end of November 2014). The rise in inventories over the last 12 months implies that the market is around 0.7m bbl/day oversupplied.
46
For natural gas, 2015 ended up being a continuation of the same theme as in the past several years, with the market generally in oversupply. Production growth from newer low cost gas shales (the Marcellus in particular) along with by-product gas from new shale oil production (i.e., associated gas) regularly outran demand growth until the price dipped and coal-to-gas switching kicked in. With shale oil supply moving into decline in March and gas prices moving lower, the rate of supply growth slowed as the year went on. Henry Hub averaged $2.63/mcf in 2015, versus $4.26 in 2014. The year ended on a particularly weak note, with Henry Hub dipping below $2/mcf as an extremely mild Autumn/early winter depressed heating demand for gas. Natural gas inventories ended the year at the top end of the 10 year range.
Outside the US, natural gas prices also declined, the biggest influence being the weakening of the oil price. European natural gas averaged $6.50/mcf (vs $8/mcf in 2014) and Asian natural gas (as measured by the ICAP JKM North-East Asian Liquefied Natural Gas "LNG" contract) averaged $9.3/mcf (vs $14.4 in 2014).
5. Outlook
We expect the oil price to remain volatile for a number of months, with the market still oversupplied. We believe a recovery to $70+/bbl is likely when the market rebalances.
There are a number of positive signs that the market is rebalancing: oil demand grew strongly in 2015 and is expected to do so again in 2016; US oil production (the principle cause of the oversupply) peaked in April 2015 and its decline is accelerating; the rest of non-OPEC supply has stagnated and we see significantly reduced new project supply from 2017 onwards. An oil price below $70/bbl is not high enough to justify new investment in higher cost and more marginal non-OPEC projects. Against that, we may well see OPEC supply grow again in 2016 as Iranian production recovers post the lifting of sanctions, and if the political situation in Libya stabilizes. Neither of these events would derail the rebalancing process, only delay it by a matter of months.
In the meantime, Saudi Arabia is suffering a significant fiscal deficit (c.$100bn in 2015) but continues to act rationally in its response to a depressed oil price, realizing that an 'emergency' production cut would be a fools' errand as it would simply encourage a sharp recovery in non-OPEC growth. With that said, an extremely low price (sub $40/bbl) may well encourage them to stabilize the market, but not necessarily in a vocal fashion. Longer term, we believe that Saudi Arabia will seek a 'good' oil price, well in excess of current levels to balance its fiscal needs, realizing that patience is required to achieve that goal.
If we pull together our supply and demand expectations for 2016, our 'base' case is that OECD oil and oil product inventories will build during the start of 2016 (mainly as a result of Iranian oil production increases and the hangover of 2015 oversupply) before a reasonably rapid decline towards more normal levels in last few months of the year. If the non-OPEC supply data is supportive, it may allow Saudi Arabia to seek higher oil prices at the June OPEC meeting.
Before the market tightens, we could well see lower oil prices. We have seen oil prices drop sharply lower at the bottom of the cycle and this could happen again. Historically, oil prices have bottomed in tandem with a combination of events such as OPEC action, oil inventories becoming full, existing non-OPEC supply shut-ins and oil price forward curves moving into steep contango. The volatility and shape of the forward curve indicate that we are close to this today.
Energy equities have now underperformed the broad market for longer than they did after any of the large price declines since 1970. The weighting of energy in the S&P 500 Index at the end of 2015 was 6.4%, close to its historic lows. This also leaves the relative price-to-book ratio of energy vs the S&P 500 Index at a 50 year low. We do not expect these extremes to be sustained.
The valuation sensitivity work that we regularly perform tells us that energy equities are today discounting an oil price (into perpetuity) of around $50-55/barrel. This is above the current spot oil price and in-line with the 4 year forward prices for both the Brent and West Texas Intermediate (WTI) benchmarks.
47
In the shorter-term, stock selection remains paramount, as we traverse the tightrope of low oil prices and, in many cases, leveraged balance sheets. However, if you believe, as we do, that a recovery in the oil price to $70+/bbl is likely, the case for accumulating energy equities at this level looks good, with upside across the energy complex of around 50-60%.

Tim Guinness January 2016
Will Riley Jonathan Waghorn
Fund investment team
The Fund invests in foreign securities, which involve political, economic, currency risks, greater volatility, and differences in accounting methods. These risks are greater for emerging markets. The Fund is non-diversified, meaning that its assets may be concentrated in fewer individual holdings than diversified funds. Therefore, the Fund is more exposed to individual stock volatility than diversified funds. The Fund invests in smaller companies, which involve additional risks such as limited liquidity and greater volatility. The Fund's focus on the energy sector to the exclusion of other sectors exposes the Fund to greater market risk and potential monetary losses than if the Fund's assets were diversified among various sectors.
The MSCI World Energy Index is an unmanaged index composed of more than 1,400 stocks listed on exchanges in the U.S., Europe, Canada, Australia, New Zealand and the Far East. The Standard & Poor's 500 Index is a market capitalization-weighted index composed of 500 widely held common stocks of U.S. companies. These indices are unmanaged and not available for investment, and do not incur expenses.
Price to earnings (P/E) ratio (PER) reflects the multiple of earnings at which a stock sells and is calculated by dividing current price of the stock by the company's trailing 12 months' earnings per share.
EBITDA is net income with interest, taxes, depreciation, and amortization added back to it, and can be used to analyze and compare profitability between companies and industries because it eliminates the effects of financing and accounting decisions.
Price-to-Book Ratio (P/B Ratio) is a ratio used to compare a stock's market value to its book value. It is calculated by dividing the current closing price of the stock by the latest quarter's book value per share.
OMV AG is an international oil and gas company engaged in the upstream and downstream businesses. The Company's segments include Exploration and Production (E&P), Gas and Power (G&P) and Refining and Marketing (R&M).
Please refer to the Schedule of Investments for details on Fund holdings. Current and future portfolio holdings are subject to risk.
The information provided herein represents the opinion of Guinness Atkinson Asset Management, Inc. for the period stated and is not intended to be a forecast of future events, a guarantee of future results, or investment advice. Opinions, Fund holdings and sector allocations are subject to change at any time, and are not recommendations to buy or sell any security.
48
GUINNESS ATKINSON GLOBAL ENERGY FUND
Growth of $10,000

| | | Average Annual Total Return
Periods Ended December 31, 2015 | |
| | | One Year | | Five Years | | Ten Years | |
| | | | | | -26.97 | % | | | -8.06 | % | | | -0.30 | % | |
Performance data quoted represents past performance and does not guarantee future results. The investment return and principal value of an investment will fluctuate so that an investor's shares, when redeemed, may be worth more or less than their original cost. Current performance of the Fund may be lower or higher than the performance quoted. Performance data current to the most recent month end may be obtained by visiting www.gafunds.com.
Total returns for certain periods reflect a fee waiver in effect and in the absence of this waiver, the total returns would be lower. Returns reflect the reinvestment of distributions made by the Fund, if any. The graph and the performance table above do not reflect the deduction of taxes that a shareholder would pay on Fund distribution or the redemption of Fund shares.
The MSCI World Energy Index is an unmanaged index composed of more than 1,400 stocks listed on exchanges in the U.S., Europe, Canada, Australia, New Zealand and the Far East.
The S&P 500 Index is a broad based unmanaged index of 500 stocks, which is widely recognized as representative of the equity market in general. These indices are unmanaged, not available for investment and do not incur expenses.
49
FUND HIGHLIGHTS at December 31, 2015
GUINNESS ATKINSON GLOBAL ENERGY FUND
# of Holdings in Portfolio: | | 40 | |
Portfolio Turnover: | | 15.7% | |
% of Stocks in Top 10: | | 40.4% | |
Fund Managers: | | | |
Timothy W. N. Guinness | | | |
Will Riley | | | |
Jonathan Waghorn | | | |
Top 10 Holdings (% of net assets) | | | | | | | |
Apache Corp. | | | 4.4 | % | | Newfield Exploration Co. | | | 4.0 | % | |
OMV AG | | | 4.4 | % | | Occidental Petroleum Corp. | | | 3.9 | % | |
Suncor Energy Inc. | | | 4.1 | % | | CNOOC Ltd. | | | 3.9 | % | |
Canadian Natural Resources Ltd. | | | 4.1 | % | | Exxon Mobil Corp. | | | 3.8 | % | |
Noble Energy Inc. | | | 4.0 | % | | Statoil ASA | | | 3.8 | % | |
Industry Breakdown (% of net assets) | | | | | | | |
Oil & Gas - Integrated | | | 41.0 | % | | Oil Refining & Marketing | | | 3.2 | % | |
Oil & Gas - Exploration & Production | | | 39.2 | % | | Oil & Gas - Drilling | | | 0.4 | % | |
Oil & Gas - Field Services | | | 11.2 | % | | Machinery - General Industries | | | 0.2 | % | |
Energy - Alternate Sources | | | 3.8 | % | | | | | |
50
SCHEDULE OF INVESTMENTS
at December 31, 2015
GUINNESS ATKINSON GLOBAL ENERGY FUND
Shares | | COMMON STOCKS: 99.0% | | Value | |
Energy – Alternate Sources: 3.8% | | | |
| | 85,220 | | | JA Solar Holdings Co., Ltd. - ADR* | | $ | 826,634 | | |
| | 78,700 | | | Trina Solar Ltd. - ADR* | | | 867,274 | | |
| | | | | | | | 1,693,908 | | |
Machinery – General Industries: 0.2% | | | |
| | 182,956 | | | Shandong Molong Petroleum Machinery Co., Ltd. - H Shares | | | 73,635 | | |
Oil & Gas – Drilling: 0.4% | | | |
| | 4,183,812 | | | Cluff Natural Resources PLC* | | | 185,952 | | |
Oil & Gas – Exploration & Production: 39.2% | | | |
| | 43,509 | | | Apache Corp. | | | 1,934,845 | | |
| | 462,100 | | | Bankers Petroleum Ltd.* | | | 340,639 | | |
| | 82,000 | | | Canadian Natural Resources Ltd. | | | 1,790,879 | | |
| | 30,070 | | | Carrizo Oil & Gas Inc.* | | | 889,471 | | |
| | 1,650,000 | | | CNOOC Ltd. | | | 1,695,977 | | |
| | 43,000 | | | Devon Energy Corp | | | 1,376,000 | | |
| | 988,710 | | | EnQuest PLC* | | | 276,936 | | |
| | 575,230 | | | JKX Oil & Gas PLC* | | | 231,081 | | |
| | 53,486 | | | Newfield Exploration Co.* | | | 1,741,504 | | |
| | 53,070 | | | Noble Energy Inc. | | | 1,747,595 | | |
| | 25,200 | | | Occidental Petroleum Corp. | | | 1,703,772 | | |
| | 46,199 | | | Ophir Energy PLC* | | | 66,688 | | |
| | 63,200 | | | QEP Resources Inc. | | | 846,880 | | |
| | 1,890,000 | | | Sino Gas & Energy Holdings Ltd.* | | | 107,425 | | |
| | 249,550 | | | SOCO International PLC | | | 541,713 | | |
| | 98,000 | | | Southwestern Energy Co.* | | | 696,780 | | |
| | 200,000 | | | Tullow Oil Plc | | | 488,550 | | |
| | 25,000 | | | Triangle Petroleum Corp* | | | 19,250 | | |
| | 63,397 | | | Unit Corp.* | | | 773,443 | | |
| | 254,740 | | | WesternZagros Resources Ltd.* | | | 17,490 | | |
| | | | | | | | 17,286,918 | | |
Oil & Gas – Field Services: 11.2% | | | |
| | 44,900 | | | Halliburton Co. | | | 1,528,396 | | |
| | 103,880 | | | Helix Energy Solutions Group, Inc.* | | | 546,409 | | |
| | 147,119 | | | John Wood Group PLC | | | 1,319,261 | | |
| | 75,100 | | | ShawCor Ltd. DL | | | 1,523,493 | | |
| | | | | | | | 4,917,559 | | |
The accompanying notes are an integral part of these financial statements.
51
Shares | | COMMON STOCKS: 99.0% (Continued) | | Value | |
Oil & Gas – Integrated: 41.0% | | | |
| | 319,380 | | | BP PLC | | $ | 1,664,271 | | |
| | 99,850 | | | ENI SpA | | | 1,479,195 | | |
| | 21,600 | | | Exxon Mobil Corp. | | | 1,683,720 | | |
| | 406,460 | | | Gazprom OAO - ADR | | | 1,506,741 | | |
| | 32,543 | | | Hess Corp. | | | 1,577,685 | | |
| | 68,598 | | | OMV AG | | | 1,925,726 | | |
| | 2,365,000 | | | PetroChina Co., Ltd. - H Shares | | | 1,555,587 | | |
| | 67,430 | | | Royal Dutch Shell PLC - Class A | | | 1,545,834 | | |
| | 119,730 | | | Statoil ASA | | | 1,673,202 | | |
| | 69,976 | | | Suncor Energy, Inc. | | | 1,806,419 | | |
| | 35,860 | | | Total SA | | | 1,597,057 | | |
| | | | | | | | 18,015,437 | | |
Oil Refining & Marketing: 3.2% | | | |
| | 20,469 | | | Valero Energy, Corp. | | | 1,447,363 | | |
| | | | | Total Common Stocks
(cost $66,285,364): 99.0% | | | 43,620,772 | | |
| | | | | Total Investments in Securities
(cost $66,285,364): 99.0% | | | 43,620,772 | | |
| | | | | Other Assets less Liabilities: 1.0% | | | 422,550 | | |
| | | | | Net Assets: 100.0% | | $ | 44,043,322 | | |
* Non-income producing security.
ADR - American Depository Receipt
The accompanying notes are an integral part of these financial statements.
52
GLOBAL INNOVATORS FUND for the period ended December 31, 2015
1. Performance
AVERAGE ANNUALIZED TOTAL RETURNS
| | | 1 Year
(actual) | | 3 Years | | 5 Years | | 10 Years | |
Fund | | | | | | | | | |
Investor Class | | | -3.04 | % | | | 16.61 | % | | | 12.19 | % | | | 9.02 | % | |
Institutional Class* | | | -3.04 | % | | | 16.61 | % | | | 12.19 | % | | | 9.02 | % | |
Benchmark Indices: | |
MSCI World Index | | | -0.24 | % | | | 10.32 | % | | | 8.26 | % | | | 5.64 | % | |
S&P 500 Index | | | 1.38 | % | | | 15.11 | % | | | 12.54 | % | | | 7.29 | % | |
NASDAQ Composite Index | | | 7.11 | % | | | 19.89 | % | | | 15.01 | % | | | 9.78 | % | |
*Institutional Class commenced operations on December 31, 2015. The performance figures for the Institutional Class include the performance of the Investor Class for the periods prior to the inception date of the Institutional Class.
The Fund's Investor Class shares gross expense ratio is 1.26% and net expense ratio is 1.24% per the Summary Prospectus dated March 23, 2015. The Fund's Institutional Class shares gross expense ratio is 1.10% and net expense ratio 0.99% per the Summary Prospectus dated January 14, 2016. The Advisor has contractually agreed to waive a portion of its advisory fees and/or reimburse other Fund expenses so that the Fund's ratio of expenses to average daily net assets will not exceed 1.24% and 0.99% of the Investor Class shares and the Institutional Class shares, respectively (excluding Acquired Fund Fees and Expenses, interest, taxes, dividends on short positions and extraordinary expenses) through at least June 30, 2018. To the extent that the Advisor waives fees and/or reimburses expenses, it may seek repayment of a portion or all of such amounts at any time within the three fiscal years after the fiscal year in which such amounts were waived and/or reimbursed, subject to the applicable cap.
Performance data quoted represents past performance and does not guarantee future results. The investment return and principal value of an investment in the Fund will fluctuate so that an investor's shares, when redeemed, may be worth more or less than their original cost. Current performance of the Fund may be lower or higher than the performance quoted. Performance data current to the most recent month-end may be obtained by visiting www.gafunds.com, or calling (800) 915-6565.
The Global Innovators Fund in 2015 produced a total return of -3.04%. The Fund underperformed its benchmark MSCI World Index by 2.79% for the year. For reference, the Fund underperformed the S&P 500 Index by 4.42%; and underperformed the NASDAQ Index by 10.15% over the period.
2015 was a volatile year, with global equities swinging widely from positive to negative returns from one month to the next. Historically, the Global Innovators Fund has tended to outperform in the MSCI World Index's positive months and underperform in negative months, but outperform more on the upside than it loses on the downside. On average, that picture held true for 2015. There were only two months in the year where the MSCI World Index demonstrated strong positive performance: February and October. In both of these months, the Fund comfortably outperformed. The two largest drawdowns of the MSCI World Index were in August and September, and over these two months combined the Fund outperformed this Index.
One factor that goes a long way to explaining the underperformance in other periods was the fact that expensive growth companies (highly valued companies with strong revenue growth) outperformed companies offering attractive valuations. It has been well documented that a handful of large, expensive growth companies, such as Amazon and Facebook, drove the majority of MSCI World Index performance in the US in 2015.
We have always sought to apply a valuation discipline when running this strategy – and to avoid the temptation to invest in exciting stories at heady valuations. This discipline does not mean we won't invest in companies with high levels of anticipated growth, it just means we will only do it when we are comfortable that we are not putting your money at excessive risk from a valuation perspective. As a case in point, we invested in Netflix in 2007 when it traded on a P/E multiple of 24x during a period in which earnings were growing at over 30% per year, but we do not own it today when it trades on a 2016 P/E of 250x with earnings expected to grow at 15% in 2016.
53
US tech growth stocks as a group are now at valuations that are the furthest away from US tech value stocks that we have ever seen. We therefore think it is unlikely this trend will persist for long, and 2016 may well see this divergence in performance reverse.
Macro factors were again the dominating narrative be it interest rate rises in the US, weaker growth in China, or the eurozone struggling with the implications of its founding principles (fiscal, monetary and social). The Fund managed to weather this macro environment reasonably well. We had only a small exposure to falling commodity prices in the form of Schlumberger and BP (we sold the latter in the third quarter). Our exposure to expectations of rising interest rates in the US was really limited to our emerging market exposure, which was very much at the quality end of the spectrum. However, our holdings in Lenovo, Samsung and Li & Fung were a drag on performance. Europe underperformed the US, and the portfolio was overweight the US.
Given all the macro economic uncertainty that existed through 2015, it was not surprising to see defensive sectors like consumer staples and healthcare perform strongly. We had no exposure to the consumer staples sector and just one holding in the healthcare sector: Gilead Sciences.
2. Activity
We sold six positions and initiated six new positions over the course of 2015.
We did not make any changes to the portfolio in the first and second quarter. However, we made a number of changes to the portfolio in the third quarter.
Before we saw the sharp decline in equity markets in early August, we decided to sell our position in TD Ameritrade (the online broker), after it had shown exceptionally strong performance over the previous two and a half years. It had become the most expensive company we owned in the portfolio, trading on a PE of 25x 2015 earnings. This valuation was also the highest at which the company has traded in the last ten years.
We replaced TD Ameritrade with Verifone, the leading provider of card payment terminals and services. They provide the technology and infrastructure that allow merchants to offer a variety of payments options including chip and pin, contactless card payments and more recently the likes of Apple Pay and Google Wallet. The company has benefitted from the rollout of chip and pin technology in the US; a shift in liability on card fraud to merchants is making those that don't yet have this technology vulnerable. Despite this liability shift occurring in October this year, the US is only around a third of the way through this process and the full rollout is likely to take a few more years. Large retail chains have (unsurprisingly) been the first to adopt the technology, but this has been followed by merchants that sell high ticket items. Clearly, a shop selling high-priced electrical goods is more prone to credit card fraud than a coffee shop.
The new terminals that are being rolled out are also capable of processing contactless payments, including the Near Field Communication (NFC) chips being used by "mobile wallets" such as Apple Pay and Google Wallet. Rollout of digital wallets such as Apple Pay could intensify the pace of demand for EMV terminals from customers.
We felt there was an attractive combination of a quality, high return-on-capital business, with a number one position in many of its markets, in a secular growth trend, with a number of catalysts for margin expansion, trading on a very reasonable multiple of 18x going to 15x. While the valuation multiple leaves some potential for multiple expansion, we would expect the majority of the total return to come from earnings growth.
Although, we do not class this as an official buy-sell in the portfolio, in early July our longstanding holding in eBay spun off its PayPal business into a separate entity. The PayPal business more closely met the criteria we look for in this Fund, so we sold our remaining positon in eBay and reinvested it in PayPal. PayPal has a very strong competitive position in the mobile payments space, with an early mover and scale advantage, while at the same time being very well positioned to continue to grow at almost 20% per year.
Later in the third quarter, we sold our position in Capital One Financial and replaced it with Cognizant, the IT consultant and service provider. Capital One's valuation had re-rated substantially over the last four years, driven by their ability to generate growing revenues and earnings from a very profitable book of credit card debt with historically low delinquency rates. However, in the second quarter, these delinquency rates went up, which we felt was an opportune time to bank a profit.
We were attracted to Cognizant by its ability to generate consistently high return-on-capital with double digit growth in revenues. The company has been very good at allocating capital, making numerous successful small bolt-on acquisitions. Cognizant is also managing to take market share from its competitors. The company's growth is partly dependent on global IT spending, but its competitive positioning and reasonable valuation made it an attractive alternative to holding Capital One.
54
During the broad market correction, towards the end of August, we took the opportunity to make a number of changes to the portfolio, buying positions that had been on our 'watchlist' where we had been waiting for an opportune entry point.
We sold four companies: Ultra Electronics, Xerox, BP, and L-3 Communications.
Ultra Electronics, the UK-listed defence company, has been held in the strategy since late 2013. It was one of the smaller market cap companies we owned, at around $2bn. The company traded on modest multiples at purchase of 14x forward earnings alongside reasonable growth of 3-5%. Revenues declined in 2014 and continued into 2015. But margins held reasonably firm. The company's return-on-capital began to erode quite rapidly, however, as lower sales coincided with increased asset growth. During the turmoil in markets in the summer of 2015, Ultra actually held up very well, outperforming in that short period – perhaps on expectations of increased government defence spending in the future. We therefore took the opportunity to exit the holding at that time, as a declining return-on-capital profile is always a particular concern for us and especially if this coincides with a robust share price performance. This combination can often highlight 'value traps' where the market is ignoring the fundamentals of a business and instead focusing on the 'story' that will turn around the malaise.
Xerox was a company we held in the strategy from mid-2014 and sold in August 2015, a relatively short holding period compared to our average of four years. Over our holding period, Xerox underperformed the broad market. The underperformance was driven by a profit warning in April 2015. We try to avoid short-term numbers influencing our decisions, and indeed held the company for a number of months after the initial warning, but through that period, our conclusion was that the revenue declines seen would continue and any turnaround by management could be some time in coming. As we follow a 'one in-one out' approach we are also constantly assessing our current holdings versus any other company we might own, and we felt there were better opportunities than continuing to hold on to Xerox.
BP had been a very long-term holding in the strategy, and we have owned the company through both the financial crisis of 2008/2009 and the Macondo drilling disaster of 2010. However, the oversupplied nature of oil markets in general and the uncertainty surrounding the timing and mechanism of how this oversupply would be used up – whether from increasing demand trends or a reduction in supply from within or outside Organization of the Petroleum Exporting Countries (OPEC) – gave us cause for concern. We do not profess to be able to 'call' the oil price but we increasingly felt there were better opportunities available in other sectors. We also worried that a 'lower for longer' oil price environment would put considerable pressure on the ability of the company to maintain its dividend payment. Although we did not own the company specifically for its income, we were aware that it is an important metric for many investors in the stock, and that any dividend cut would likely add to the selling pressure we have seen over the past 18 months. Ultimately, we saw better risk/reward in other parts of the market and decided to exit the position.
From a valuation point of view, L-3 Communications appeared to be trading at stretched multiples, certainly in respect to where the company had traded historically – and this was a concern. What really drove us to sell the company, however, was the deterioration in the underlying quality of the business. Sales growth had been negative for a number of years, and we had just started to see a decline in operating margins coming through. With little or no asset growth expected, it appeared unlikely the company could reverse the decline in economic profits it was generating – and that the market was anticipating.
We replaced the sales made at the end of August with buys of SAP, Alphabet, and Eaton.
When markets get skittish and sell off, the correlation of asset returns can increase. This was exactly the case in the summer of 2015. In such instances, company fundamentals can often get ignored as investors rush for the exit, meaning all assets sell off in unison. This can often provide an opportunity to purchase good companies at better prices and this is exactly what we tried to do. Alphabet, the new name for the holding company of Google, had performed particularly well in July of last year as the market was positively surprised by its strong results and commitment to greater investor transparency. From that point to the end of August, the stock price then declined almost 13% (in USD), exactly in line with the S&P 500 Index. In light of the new results and compelling valuation compared to the long term-growth expectations (c.20x forward PE and mid-single digit earnings growth), we decided to sell Xerox and buy Alphabet.
We purchased SAP, the German-based software company, at the end of August, and under similar circumstances. SAP is a high-quality company, and has achieved consistently high cash flow return on investment for the last 20 years. Over the last five years, this return-on-capital has actually increased though a combination of acquisitions and improved performance. Combined with strong asset growth, stable margins and modest revenue growth, this has meant the company has consistently ramped up economic profits. The company has moved into the mobile and cloud computing market, which is a potentially more competitive environment, but with long-term earnings growth in the high single figures and multiples no more than the market, we believe the company can continue its good performance in the future.
55
Eaton was a company that had been focussed on electrical power components until its acquisition of Cooper Industries. The company now has a more diversified business. Although Copper represented the largest of the company's acquisitions, previous transactions have been integrated successfully. One of the attractions of the company and management was the excellent capital allocation discipline, exemplified by the progressive dividend policy and long history of high, and more recently growing, return-on-capital. We expect long-term earnings growth in the mid to high single digits. With a reasonable valuation (around 12x forward earnings), and a dividend yield well above the market, we think there is a good "margin of safety" in the price and good potential for future returns.
In the fourth quarter, we made one further purchase for the Fund: WisdomTree. This left the Fund with our target 30 holdings at the year end.
The exchange-traded fund (ETF) market has grown – and evolved – at a rapid pace over the past few years, and WisdomTree has been at the forefront of those changes. WisdomTree is a specialist ETF provider and, unlike its larger competitors, this is the only business it is in. The company launched its first ETF in 2006 and has grown its assets under management (AUM) from less than $1bn to over $50bn today. It is probably best known for its range of currency-hedged funds, which account for approximately 60% of total AUM and have been the main driver of AUM growth. This rapid success is also seen as an Achilles heel by investors, however, as the concentration of assets in relatively few products suggests those assets could decrease if investor sentiment changes towards those products. We felt this point in time provided a good entry point to buy the stock as it de-rated from a forward PE multiple of over 35x to less than 20x.
3. Portfolio Position
The portfolio on December 31, 2015, by our calculations, had a PER of 15.6x 2015 earnings, and 14.6x 2015 earnings; a discount to the MSCI World Index equivalent multiples of 17.5% and 9.3%.
Due to the purchases and sales made in the year, we increased our information technology allocation, and decreased exposure slightly to each of energy, financials, and industrials.
Sector Allocation at 12/31/15 | |
Consumer Discretionary | | | 12.5 | % | | Information Technology | | | 53.7 | % | |
Consumer Staples | | | 0.0 | % | | Materials | | | 0.0 | % | |
Energy | | | 3.2 | % | | Telecommunication Services | | | 0.0 | % | |
Financials | | | 10.3 | % | | Utilities | | | 0.0 | % | |
Health Care | | | 3.4 | % | | Cash | | | 0.1 | % | |
Industrials | | | 16.8 | % | | | | | 100.0 | % | |
4. Outlook
Even though this portfolio is focused predominantly on growth opportunities, ever since we as a firm started managing this strategy in 2003 we have always employed a value discipline, and it has served us well. Value in this context does not mean simply optically cheap stocks. It means identifying companies where profitable growth opportunities exist and where the market under-appreciates these opportunities. More importantly, it means avoiding companies with characteristics that are statistically likely to destroy your capital. Weak business are one way to destroy capital. Companies with excessive valuations are another. But most importantly, it is the combination of a weak business and excessive valuation that is most likely to lose you money, and we will always avoid these companies. Benjamin Graham's observations are well entrenched in our thinking:
"The risk of paying too high a price for good quality stocks – while a real one – is not the chief hazard... Observation over many years has taught us that the chief losses to investors come from the purchase of low quality securities at times of favourable business conditions." Benjamin Graham
With interest rates having been at historic lows as a result of untried accommodative central bank policy, one might characterize the years since the banking crisis as having been "favourable business conditions". Most importantly, this will have allowed poor quality businesses to continue operating where they may have struggled in a more difficult scenario. A combination of a more uncertain macro backdrop (slowdown in Chinese growth, currency wars or rising interest rates in the US) and low quality businesses with excessive valuations could prove to be a risky bet in 2016.
56
Only time will tell how markets evolve over the following year, but our focus remains, as ever, on quality innovative companies that have shown the ability to consistently earn high levels of return on capital over a prolonged period. We continue to believe these innovative companies can navigate the economic cycle better than the average company and therefore should be well rewarded over the long-term.


Matthew Page Ian Mortimer January 2016
The Fund invests in foreign securities, which involve political, economic and currency risks, greater volatility, and differences in accounting methods. These risks are greater for emerging markets. The Fund is non-diversified, meaning that its assets may be concentrated in fewer individual holdings than diversified funds. Therefore, the Fund is more exposed to individual stock volatility than diversified funds. The Fund invests in smaller companies, which involve additional risks such as limited liquidity and greater volatility.
The approach of the Fund is not to provide access to the most innovative companies in the world but rather to look at companies using the 'prism' of innovation to highlight those we think might be winners in the future – and then only buy them if they are offering reasonable value compared to those future expectations. We are firm believers that innovative companies can outperform in the future and that a value discipline to stock selection will add meaningfully to that performance.
The MSCI World Index is a free float-adjusted market capitalization weighted index that is designed to measure the equity market performance of developed markets. The Standard & Poor's 500 Index is a market capitalization-weighted index composed of 500 widely held common stocks of U.S. companies. The NASDAQ Composite Index is a market capitalization-weighted index that is designed to represent the performance of the National Market System, which includes over 5,000 stocks traded only over-the-counter and not on an exchange. These indices are unmanaged and not available for investment, and do not incur expenses.
PER or P/E – Price to Earnings ratio is calculated by dividing current price of the stock by the company's trailing months' earnings per share.
Correlation is a statistical measure of how two securities move in relation to each other.
Please refer to the Schedule of Investments for details on Fund holdings. Current and future portfolio holdings are subject to risk.
The information provided herein represents the opinion of Guinness Atkinson Asset Management, Inc. for the period stated and is not intended to be a forecast of future events, a guarantee of future results, or investment advice. Opinions, Fund holdings and sector allocations are subject to change at any time, and are not recommendations to buy or sell any security.
57
GUINNESS ATKINSON GLOBAL INNOVATORS FUND
Growth of $10,000

| | | Average Annual Total Return
Periods Ended December 31, 2015 | |
| | | One Year | | Five Years | | Ten Years | |
| | | | | | -3.04 | % | | | 12.19 | % | | | 9.02 | % | |
Performance data quoted represents past performance and does not guarantee future results. The investment return and principal value of an investment will fluctuate so that an investor's shares, when redeemed, may be worth more or less than their original cost. Current performance of the Fund may be lower or higher than the performance quoted. Performance data current to the most recent month end may be obtained by visiting www.gafunds.com.
Performance is shown for the Fund's Investor Class shares, Institutional Class shares performance will vary.
Total returns for certain periods reflect a fee waiver in effect and in the absence of this waiver, the total returns would be lower. Returns reflect the reinvestment of distributions made by the Fund, if any. The graph and the performance table above do not reflect the deduction of taxes that a shareholder would pay on Fund distribution or the redemption of Fund shares.
The MSCI World Index is a free float-adjusted market capitalization weighted index that is designed to measure the equity market performance of developed markets. The Standard & Poor's 500 Index is an unmanaged index which is widely regarded as the standard for measuring large cap U.S. stock market performance. The NASDAQ Composite Index is a market capitalization weighted index that is designed to represent the performance of the National Market System which includes over 5,000 stocks traded only over-the-counter and not on an exchange. The indices referenced in this chart are not available for investment and do not incur expenses.
58
FUND HIGHLIGHTS at December 31, 2015
GUINNESS ATKINSON GLOBAL INNOVATORS FUND
# of Holdings in Portfolio: | | 30 | |
Portfolio Turnover: | | 37.6% | |
% of Stocks in Top 10: | | 35.6% | |
Fund Managers: | | | |
Matthew Page | | | |
Dr. Ian Mortimer | | | |
Top 10 Holdings (% of net assets) | | | | | | | |
Roper Industries Inc. | | | 3.8 | % | | Samsung Electronics Co., Ltd. - GDR | | | 3.5 | % | |
IntercontinentalExchange Inc. | | | 3.7 | % | | PayPal Holdings Inc. | | | 3.5 | % | |
Cisco Systems Inc. | | | 3.6 | % | | Oracle Corp. | | | 3.5 | % | |
Intel Corp. | | | 3.6 | % | | Alphabet Inc. - A Shares | | | 3.4 | % | |
PTC Inc. | | | 3.6 | % | | Gilead Sciences, Inc. | | | 3.4 | % | |
Industry Breakdown (% of net assets) | | | | | | | |
Electronic Components - Semiconductor | | | 13.7 | % | | Cable/Satellite TV | | | 3.4 | % | |
Semiconductor | | | 9.7 | % | | Diversified Manufacturing Operations | | | 3.4 | % | |
Computers | | | 9.3 | % | | Web Portals | | | 3.4 | % | |
Application Software | | | 7.0 | % | | Fiduciary Banks | | | 3.3 | % | |
Medical - Biomedical | | | 7.0 | % | | Investment Management/Advisor Service | | | 3.3 | % | |
Enterprise Software/Services | | | 6.8 | % | | Oil Company - Integrated | | | 3.2 | % | |
Commercial Services | | | 6.6 | % | | Distribution/Wholesale | | | 3.0 | % | |
Machinery | | | 3.8 | % | | Power Conversion/Supply Equipment | | | 3.0 | % | |
Finance - Other Services | | | 3.7 | % | | Television | | | 3.0 | % | |
Aerospace/Defense | | | 3.4 | % | | | | | | | |
59
SCHEDULE OF INVESTMENTS
at December 31, 2015
GUINNESS ATKINSON GLOBAL INNOVATORS FUND
Shares | | COMMON STOCKS: 100.0% | | Value | |
Aerospace/Defense: 3.4% | | | |
| | 38,740 | | | Boeing Co. | | $ | 5,601,417 | | |
Application Software: 7.0% | | | |
| | 68,960 | | | Check Point Software Technologies Ltd.* | | | 5,611,965 | | |
| | 170,970 | | | PTC Inc.* | | | 5,920,691 | | |
| | | | | | | | 11,532,656 | | |
Cable/Satellite TV: 3.4% | | | |
| | 98,830 | | | Comcast Corp. - Class A | | | 5,576,977 | | |
Commercial Services: 6.6% | | | |
| | 155,250 | | | H&R Block, Inc. | | | 5,171,378 | | |
| | 157,810 | | | Paypal Holdings, Inc.* | | | 5,712,722 | | |
| | | | | | | | 10,884,100 | | |
Computers: 9.3% | | | |
| | 85,300 | | | Cognizant Technology Solutions Corp. - A Shares* | | | 5,119,706 | | |
| | 4,780,000 | | | Lenovo Group Ltd. | | | 4,816,722 | | |
| | 194,000 | | | Verifone Systems Inc.* | | | 5,435,880 | | |
| | | | | | | | 15,372,308 | | |
Distribution/Wholesale: 3.0% | | | |
| | 7,320,000 | | | Li & Fung Ltd. | | | 4,939,644 | | |
Diversified Manufacturing Operations: 3.4% | | | |
| | 59,520 | | | Danaher Corp. | | | 5,528,218 | | |
Electronic Components — Semiconductor: 13.7% | | | |
| | 105,000 | | | Eaton Corp. PLC | | | 5,464,200 | | |
| | 172,140 | | | Intel Corp. | | | 5,930,223 | | |
| | 168,045 | | | NVIDIA Corp. | | | 5,538,763 | | |
| | 10,810 | | | Samsung Electronics Co., Ltd. - GDR | | | 5,745,515 | | |
| | | | | | | | 22,678,701 | | |
Enterprise Software/Services: 6.8% | | | |
| | 156,180 | | | Oracle Corp. | | | 5,705,255 | | |
| | 69,970 | | | SAP SE | | | 5,579,813 | | |
| | | | | | | | 11,285,068 | | |
Fiduciary Banks: 3.3% | | | |
| | 80,134 | | | State Street Corp. | | | 5,317,692 | | |
Finance — Other Services: 3.7% | | | |
| | 23,990 | | | IntercontinentalExchange, Inc. | | | 6,147,677 | | |
Investment Management/Advisor Service: 3.3% | | | |
| | 351,650 | | | WisdomTree Investments Inc. | | | 5,513,872 | | |
Machinery: 3.8% | | | |
| | 33,270 | | | Roper Industries, Inc. | | | 6,314,313 | | |
The accompanying notes are an integral part of these financial statements.
60
Shares | | COMMON STOCKS: 100.0% (Continued) | | Value | |
Medical — Biomedical: 7.0% | | | |
| | 220,205 | | | Cisco Systems Inc. | | $ | 5,979,667 | | |
| | 55,510 | | | Gilead Sciences, Inc. | | | 5,617,057 | | |
| | | | | | | | 11,596,724 | | |
Oil Company — Integrated: 3.2% | | | |
| | 75,750 | | | Schlumberger Ltd. | | | 5,283,562 | | |
Power Conversion/Supply Equipment: 3.0% | | | |
| | 85,800 | | | Schneider Electric | | | 4,885,103 | | |
Semiconductor: 9.7% | | | |
| | 290,310 | | | Applied Materials Inc. | | | 5,420,088 | | |
| | 101,030 | | | QUALCOMM Inc. | | | 5,049,985 | | |
| | 240,019 | | | Taiwan Semiconductor Manufacturing Co., Ltd. - ADR | | | 5,460,432 | | |
| | | | | | | | 15,930,505 | | |
Television: 3.0% | | | |
| | 195,890 | | | TEGNA, Inc. | | | 4,999,113 | | |
Web Portals: 3.4% | | | |
| | 7,220 | | | Alphabet Inc. - A Shares* | | | 5,617,232 | | |
| | | | | Total Common Stocks
(cost $165,288,330) | | | 165,004,882 | | |
| | | | | Total Investments in Securities
(cost $165,288,330): 100.0% | | | 165,004,882 | | |
| | | | | Other Assets less Liabilities: 0.0% | | | 4,005 | | |
| | | | | Net Assets: 100.0% | | $ | 165,008,887 | | |
* Non-income producing security.
ADR - American Depository Receipt
GDR - Global Depository Receipt
The accompanying notes are an integral part of these financial statements.
61
RENMINBI YUAN & BOND FUND for the period ended December 31, 2015
1. Performance
| | | 1 Year
(actual) | | 3 Years | | Since
Inception
(June 30, 2011) | |
Fund | | | -4.05 | % | | | 0.03 | % | | | 0.90 | % | |
Comparisons: | |
RMB Cash Offshore (CNH)* | | | -5.36 | % | | | -1.78 | % | | | -0.35 | % | |
RMB Cash Onshore (CNY)* | | | -4.44 | % | | | -1.37 | % | | | -0.10 | % | |
HSBC Offshore RMB Bond Index | | | -2.63 | % | | | 1.45 | % | | | 2.26 | % | |
*Net change in exchange rate versus U.S. dollar.
The Fund's gross expense ratio is 0.95% and net expense ratio is 0.90% per the Summary Prospectus dated March 23, 2015. The Advisor has contractually agreed to waive a portion of its advisory fees and/or reimburse other Fund expenses so that the Fund's ratio of expenses to average daily net assets will not exceed 0.90% (excluding Acquired Fund Fees and Expenses, interest, taxes, dividends on short positions and extraordinary expenses) through at least June 30, 2016. To the extent that the Advisor waives fees and/or reimburses expenses, it may seek repayment of a portion or all of such amounts at any time within the three fiscal years after the fiscal year in which such amounts were waived and/or reimbursed, subject to the applicable cap.
Performance data quoted represents past performance and does not guarantee future results. The investment return and principal value of an investment will fluctuate so that an investor's shares, when redeemed, may be worth more or less than their original cost. Current performance of the Fund may be lower or higher than the performance quoted. Performance data current to the most recent month-end may be obtained by visiting www.gafunds.com, or calling (800) 915-6565.
The Fund imposes a 2% redemption fee on the sales of shares held less than 30 days. Performance data quoted does not reflect this redemption fee. Total returns for certain periods reflect expense limitations in effect and, in the absence of these limitations, total returns would have been lower.
The Fund fell 4.05% compared to the offshore renminbi (CNH), which fell 5.36% against the US dollar, and the HSBC Offshore RMB Bond Index, which fell 2.63%.
This has been a tough year for the renminbi (RMB) as China continued the transition from an administered currency regime toward one driven by market forces. The changes have come against a backdrop of a decelerating Chinese economy and global economic prospects that appear far from certain. China has not helped itself by poor market communication that has left domestic Chinese and overseas market participants sceptical about policy-makers true intentions.
China's official line has been, and remains, that the currency is on a path toward internationalization, which means making the currency freely usable outside China and eligible for inclusion in an elite group of reserve currencies. The goal in 2015 was to have the RMB included in the International Monetary Fund's (IMF's) basket of Special Drawing Rights which currently consists of the US dollar, yen, sterling, and the Swiss franc. Inclusion required meeting the IMF criteria relating to capital account openness, currency stability and convertibility. This was achieved and the currency will be included formally in 2016.
However, the process change in August to link the exchange rate setting mechanism for the RMB more closely to the market was accompanied by a sudden drop in value against the dollar, which was followed by more of the same for several days. Markets were shocked and China was suspected of trying to devalue its currency as a means of boosting exports to compensate for weaker domestic growth, a suspicion that has not gone away.
Since then, China has battled to reassure the market that devaluation is not the goal while at the same time dealing with a surge in capital outflows, over $1.2 trillion during the year which were offset by a record trade surplus of over $0.5 trillion. A detailed study of capital flows in 2015 shows the bulk are related to companies paying down debt denominated in dollars, which they accumulated when the currency was strengthening. This dollar debt was essentially a currency trade, which companies have been unwinding. These flows are benign in as far as they represent a strengthening overall financial position, but they have been
62
RENMINBI YUAN & BOND FUND
sizeable and are also a cause for concern if they persist and spill over into a broader loss of domestic confidence in the currency. This is now the focus for policymakers.
The offshore bond market through all this period has witnessed slower new issuance and rising yields. But rising yields are demanded to compensate for increased currency risk rather than for a decline in credit quality. In 2015, the yield to maturity of the bond market, as measured by the HSBC Offshore RMB Bond Index, rose from 4.54% to 4.83% even as yields in on the onshore market fell to record lows. Offshore bonds now offer a yield pick up of 2% for investment grade credits (those with an S&P rating of BBB or better) over their onshore counterparts.
2. Portfolio Position
The portfolio is 96% invested in RMB denominated bonds with a 4% held in RMB cash. Approximately 61% of the portfolio is invested in bonds issued by Chinese issuers and 35% is invested in those issued by foreign governments, corporations or supranational organizations. Investment grade credits, those which carry a credit rating by Standard & Poors of at least BBB (or equivalent) account for 75% of the portfolio. 21% of the bonds held do not carry investment ratings. The Portfolio's largest sector exposure is its 38% position in financials which compares to the overall market weighting of 40%. The maturity of the portfolio is short with a weighted average 668 days (1.8 years) to maturity.
3. Outlook and Strategy
We believe that currency factors rather than default risk will dominate in the coming year. We do not believe China is looking to devalue its currency; we think policy makers accept that such a move would bring only very limited and short-term benefit to exports which would be heavily outweighed by the impact on domestic confidence, which would translate to increasing pressure on outflows. We therefore expect currency policy to remain concentrated on the value of the RMB versus a trade weighted basket of currencies. Offshore RMB bonds look to be good value against their onshore counterparts and given that we believe there to be a low default risk and short duration, it makes sense to hold these until maturity.

Edmund Harriss February 2016
The Fund invests in foreign securities, which involve political, economic and currency risks, greater volatility, and differences in accounting methods. These risks are greater for emerging markets. The Fund is non-diversified, meaning that its assets may be concentrated in fewer individual holdings than diversified funds. Therefore, the Fund is more exposed to individual stock volatility than diversified funds. The Fund invests in smaller companies, which involve additional risks such as limited liquidity and greater volatility. Investments in debt securities typically decrease in value when interest rates rise, which can be greater for longer-term debt securities. The Fund may invest in derivatives, which involves risks different from, and in certain cases, greater than the risks presented by traditional investments. Investments focused in a single geographic region may be exposed to greater risk than investments diversified among various geographic regions.
The HSBC Offshore Renminbi Bond Index tracks total return performance of renminbi-denominated and renminbi-settled bonds and certificates of deposit issued outside the People's Republic of China. This index is unmanaged and not available for investment, and does not incur expenses.
The RMB Cash Offshore (CNH) is the currency code for renminbi traded outside China in the offshore market.
The RMB Cash Onshore (CNY) is the international currency code for the renminbi.
Investment Grade Bonds are typically those that are rated from AAA to BBB- by S&P.
Please refer to the Schedule of Investments for details on Fund holdings. Current and future portfolio holdings are subject to risk.
The information provided herein represents the opinion of Guinness Atkinson Asset Management, Inc. for the period stated and is not intended to be a forecast of future events, a guarantee of future results, or investment advice. Opinions, Fund holdings and sector allocations are subject to change at any time, and are not recommendations to buy or sell any security.
63
GUINNESS ATKINSON RENMINBI YUAN & BOND FUND
Growth of $10,000
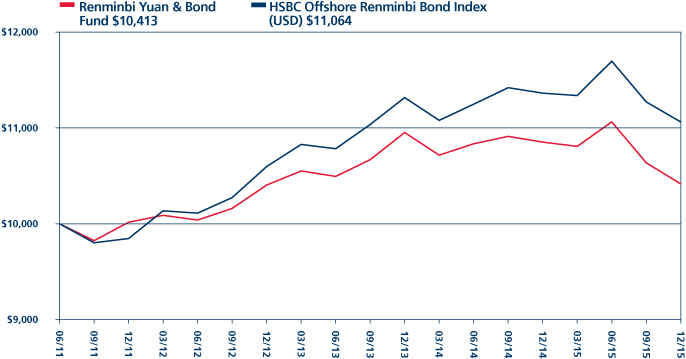
| | | Average Annual Total Return
Periods Ended December 31, 2015 | |
| | | One Year | | Three Years | | Since Inception
(06/30/11) | |
| | | | | | -4.05 | % | | | 0.03 | % | | | 0.90 | % | |
*Inception date 6/30/11.
Performance data quoted represents past performance and does not guarantee future results. The investment return and principal value of an investment will fluctuate so that an investor's shares, when redeemed, may be worth more or less than their original cost. Current performance of the Fund may be lower or higher than the performance quoted. Performance data current to the most recent month end may be obtained by visiting www.gafunds.com.
Total returns for certain periods reflect a fee waiver in effect and in the absence of this waiver, the total returns would be lower. Returns reflect the reinvestment of distributions made by the Fund, if any. The graph and the performance table above do not reflect the deduction of taxes that a shareholder would pay on Fund distribution or the redemption of Fund shares. The Fund imposes a 2% redemption fee on shares held less than 30 days.
The HSBC Offshore Renminbi Bond Index tracks total return performance of renminbi-denominated and renminbi-settled bonds and certificates of deposit issued outside the People's Republic of China. The index referenced in this chart is not available for investment and does not incur expenses.
64
FUND HIGHLIGHTS at December 31, 2015
GUINNESS ATKINSON RENMINBI YUAN & BOND FUND
# of Holdings in Portfolio: | | 34 | |
Portfolio Turnover: | | 15.9% | |
% of Investments in Top 10: | | 42.0% | |
Fund Manager: | | | |
Edmund Harriss | | | |
Top 10 Holdings (% of net assets) | | | | | | | |
Caisse D'Amort Dette, 3.800%, 2/6/17 | | | 4.2 | % | | Datang Telecommunication HK, 5.500%, 9/29/17 | | | 4.2 | % | |
New World China Land, 5.500%, 2/6/18 | | | 4.2 | % | | Air Liquide Finance, 3.000%, 9/19/16 | | | 4.2 | % | |
Industrial & Commercial Bank of China, 3.500%, 9/23/16 | | | 4.2 | % | | China Development Bank, 3.600%, 9/19/19 | | | 4.2 | % | |
Unican Ltd., 5.600%, 9/18/17 | | | 4.2 | % | | BOC Aviation Pte Ltd., 4.200%, 11/5/18 | | | 4.2 | % | |
Bank of China, 3.450%, 1/16/17 | | | 4.2 | % | | Caterpillar Financial Service Corp.,3.400%, 11/25/17 | | | 4.2 | % | |
Industry Breakdown (% of net assets) | | | | | | | |
Commerical Banks | | | 21.0 | % | | Auto - Cars/Light Trucks | | | 4.1 | % | |
Finance - Leasing Company | | | 12.6 | % | | Food - Dairy Products | | | 4.1 | % | |
Sovereign | | | 12.6 | % | | Computers | | | 2.1 | % | |
Real Estate Operator/Developer | | | 8.4 | % | | Electric - Integrated | | | 2.1 | % | |
Special Purpose Banks | | | 8.3 | % | | Finance - Diversified | | | 2.1 | % | |
Machinery | | | 6.3 | % | | Life/Health Insurance | | | 2.1 | % | |
Cellular Telecommunication | | | 4.2 | % | | Oil Company - Integrated | | | 2.1 | % | |
Industrial Gases | | | 4.2 | % | | | | | | | |
65
SCHEDULE OF INVESTMENTS
at December 31, 2015
GUINNESS ATKINSON RENMINBI YUAN & BOND FUND
Principal Amount (CNH) | | CORPORATE BONDS: 96.3% | | Value | |
Auto – Cars/Light Trucks: 4.1% | | | |
| | 2,000,000 | | | Volkswagen International Finance NV, 2.150%, 05/23/16 | | $ | 296,247 | | |
Cellular Telecommunication: 4.2% | | | |
| | 2,000,000 | | | Datang Telecom HK Co. Ltd., 5.500%, 09/29/17 | | | 301,058 | | |
Commerical Banks: 21.0% | | | |
| | 1,000,000 | | | China Construction Bank Asia Corp. Ltd., 4.000%, 11/26/17 | | | 149,957 | | |
| | 2,000,000 | | | Bank of China, 3.450%, 01/16/17 | | | 301,286 | | |
| | 1,000,000 | | | Bank of China, 3.600%, 06/30/17 | | | 149,577 | | |
| | 1,000,000 | | | BNP Paribas, 5.000%, 03/17/25 | | | 148,434 | | |
| | 1,000,000 | | | ICICI Bank Ltd., 4.000%, 06/25/16 | | | 150,109 | | |
| | 2,000,000 | | | Industrial & Commercial Bank of China Ltd., 3.500%, 9/23/16 | | | 301,436 | | |
| | 1,000,000 | | | Industrial & Commercial Bank of China Ltd., 3.350%, 11/19/16 | | | 150,147 | | |
| | 1,000,000 | | | Industrial & Commercial Bank of China Ltd., 3.950%, 9/23/21 | | | 150,642 | | |
| | | | | | | | 1,501,588 | | |
Computers: 2.1% | | | |
| | 1,000,000 | | | Lenovo Group Ltd., 4.950%, 06/10/20 | | | 151,266 | | |
Electric – Integrated: 2.1% | | | |
| | 1,000,000 | | | China Datang Corp., 3.600%, 04/25/16 | | | 151,024 | | |
Finance – Diversified: 2.1% | | | |
| | 1,000,000 | | | Shenzhen Qianhai Financial Holdings Co., Ltd., 4.550%, 10/28/17 | | | 150,910 | | |
Finance – Leasing Company: 12.6% | | | |
| | 2,000,000 | | | BOC Aviation Pte Ltd., 4.200%, 11/05/18 | | | 296,868 | | |
| | 1,000,000 | | | BOC Aviation Pte. Ltd., 4.500%, 11/20/18 | | | 149,578 | | |
| | 1,000,000 | | | Far East Horizon Ltd., 5.450%, 12/11/16 | | | 152,240 | | |
| | 2,000,000 | | | Unican Ltd., 5.600%, 09/18/17 | | | 301,436 | | |
| | | | | | | | 900,122 | | |
Food – Dairy Products: 4.1% | | | |
| | 2,000,000 | | | Fonterra Co-operative Group Ltd., 4.000%, 06/22/20 | | | 290,401 | | |
Industrial Gases: 4.2% | | | |
| | 2,000,000 | | | Air Liquide Finance SA, 3.000%, 09/19/16 | | | 299,913 | | |
Life/Health Insurance: 2.1% | | | |
| | 1,000,000 | | | Value Success International, 4.000%, 11/21/16 | | | 150,415 | | |
Machinery: 6.3% | | | |
| | 1,000,000 | | | Caterpillar Financial Services Corp., 2.950%, 03/03/16 | | | 151,831 | | |
| | 2,000,000 | | | Caterpillar Financial Services Corp., 3.400%, 11/25/17 | | | 296,412 | | |
| | | | | | | | 448,243 | | |
Oil Company – Integrated: 2.1% | | | |
| | 1,000,000 | | | BP Capital Markets PLC, 3.650%, 02/28/19 | | | 146,721 | | |
The accompanying notes are an integral part of these financial statements.
66
Principal Amount (CNH) | | CORPORATE BONDS: 96.3% (Continued) | | Value | |
Real Estate Operator/Developer: 8.4% | | | |
| | 1,000,000 | | | Agile Property Holdings Ltd., 6.500%, 02/28/17 | | $ | 148,436 | | |
| | 1,000,000 | | | Global Logistic Properties Ltd., 3.375%, 05/11/16 | | | 150,605 | | |
| | 2,000,000 | | | New World China Land Ltd., 5.500%, 02/06/18 | | | 301,591 | | |
| | | | | | | | 600,632 | | |
Sovereign: 12.6% | | | |
| | 1,000,000 | | | British Columbia, 2.850%, 11/13/16 | | | 148,892 | | |
| | 2,000,000 | | | Caisse D'Amort Dette, 3.800%, 02/06/17 | | | 302,958 | | |
| | 1,000,000 | | | China Government Bond, 2.870%, 06/27/16 | | | 151,418 | | |
| | 1,000,000 | | | China Government Bond, 3.020%, 06/27/18 | | | 150,164 | | |
| | 1,000,000 | | | United Kingdom, 2.700%, 10/21/17 | | | 148,038 | | |
| | | | | | | | 901,470 | | |
Special Purpose Banks: 8.3% | | | |
| | 1,000,000 | | | Asian Develop Bank, 3.200%, 11/10/19 | | | 148,434 | | |
| | 2,000,000 | | | China Develop Bank 3.600%, 09/19/19 | | | 296,871 | | |
| | 1,000,000 | | | Export Import Bank of China/The, 3.350%, 06/18/17 | | | 149,197 | | |
| | | | | | | | 594,502 | | |
| | | | | Total Corporate Bonds
(cost $7,438,583): 96.3% | | | 6,884,512 | | |
| | | | | Total Investments in Securities
(cost $7,438,583): 96.3% | | | 6,884,512 | | |
| | | | | China Yuan (Offshore): 11.6% | | | 831,386 | | |
| | | | | Liabilities in Excess of Other Assets: (7.9%) | | | (567,157 | ) | |
| | | | | Net Assets: 100.0% | | $ | 7,148,741 | | |
The accompanying notes are an integral part of these financial statements.
67
STATEMENTS OF ASSETS AND LIABILITIES
at December 31, 2015
| | | Alternative
Energy
Fund | | Asia
Focus
Fund | | Asia Pacific
Dividend
Builder
Fund | | China &
Hong Kong
Fund | |
Assets | |
Investments in securities, at cost | | $ | 20,996,620 | | | $ | 14,165,085 | | | $ | 7,636,000 | | | $ | 55,677,121 | | |
Investments in securities, at value | | $ | 13,514,595 | | | $ | 15,439,683 | | | $ | 7,335,935 | | | $ | 64,125,682 | | |
Cash | | | 169,696 | | | | 54,825 | | | | 11,453 | | | | 2,234,697 | | |
Receivables: | |
Fund shares sold | | | 19,249 | | | | — | | | | 6,928 | | | | 25,386 | | |
Dividends and interest | | | 25,403 | | | | 6,512 | | | | 9,441 | | | | 3,762 | | |
Due from Advisor, net | | | — | | | | — | | | | 7,805 | | | | — | | |
Prepaid expenses | | | 10,476 | | | | 5,477 | | | | 2,343 | | | | 11,930 | | |
Total assets | | | 13,739,419 | | | | 15,506,497 | | | | 7,373,905 | | | | 66,401,457 | | |
Liabilities | |
Payable for Fund shares redeemed | | | 11,115 | | | | 46,767 | | | | 64,022 | | | | 217,590 | | |
Due to Advisor, net | | | 7,217 | | | | 14,121 | | | | — | | | | 58,548 | | |
Accrued administration fees | | | 557 | | | | 180 | | | | 56 | | | | 1,776 | | |
Accrued shareholder servicing plan fees | | | 3,311 | | | | 2,416 | | | | 492 | | | | 9,902 | | |
Deferred trustees' compensation | | | 35,750 | | | | 59,789 | | | | 24,839 | | | | 119,559 | | |
Other accrued expenses | | | 37,229 | | | | 47,336 | | | | 30,951 | | | | 75,102 | | |
Total liabilities | | | 95,179 | | | | 170,609 | | | | 120,360 | | | | 482,477 | | |
Net Assets | | $ | 13,644,240 | | | $ | 15,335,888 | | | $ | 7,253,545 | | | $ | 65,918,980 | | |
Composition of Net Assets | |
Paid-in capital | | $ | 111,887,109 | | | $ | 14,633,430 | | | $ | 10,845,676 | | | $ | 57,553,405 | | |
Undistributed net investment loss | | | (41,894 | ) | | | (28,524 | ) | | | (55,477 | ) | | | (82,986 | ) | |
Accumulated net realized loss on investments and foreign currency | | | (90,716,525 | ) | | | (537,203 | ) | | | (3,236,557 | ) | | | — | | |
Net unrealized appreciation (depreciation) on: | |
Investments | | | (7,482,025 | ) | | | 1,274,598 | | | | (300,065 | ) | | | 8,448,561 | | |
Foreign currency | | | (2,425 | ) | | | (6,413 | ) | | | (32 | ) | | | — | | |
Net Assets | | $ | 13,644,240 | | | $ | 15,335,888 | | | $ | 7,253,545 | | | $ | 65,918,980 | | |
Number of shares issued and outstanding (unlimited shares authorized,
no par value) | | | 4,499,843 | | | | 1,064,705 | | | | 566,918 | | | | 3,379,626 | | |
Net asset value per share | | $ | 3.03 | | | $ | 14.40 | | | $ | 12.79 | | | $ | 19.50 | | |
The accompanying notes are an integral part of these financial statements.
68
STATEMENTS OF ASSETS AND LIABILITIES
at December 31, 2015
| | | Dividend
Builder
Fund | | Global
Energy
Fund | | Global
Innovators
Fund | | Renminbi
Yuan & Bond
Fund | |
Assets | |
Investments in securities, at cost | | $ | 10,847,334 | | | $ | 66,285,364 | | | $ | 165,288,330 | | | $ | 7,438,583 | | |
Investments in securities, at value | | $ | 10,749,551 | | | $ | 43,620,772 | | | $ | 165,004,882 | | | $ | 6,884,512 | | |
Cash | | | 154,673 | | | | — | | | | 100,000 | | | | — | | |
Cash denominated in foreign currency (cost of $4,782, $11,586, $0 and
$852,325 respectively) | | | 4,782 | | | | 11,586 | | | | — | | | | 831,386 | | |
Receivables: | |
Securities sold | | | — | | | | 895,753 | | | | — | | | | — | | |
Fund shares sold | | | 41,053 | | | | 100,202 | | | | 1,120,409 | | | | — | | |
Dividends and interest | | | 26,768 | | | | 141,774 | | | | 132,798 | | | | 58,073 | | |
Due from Advisor, net | | | 16,039 | | | | — | | | | — | | | | 14,492 | | |
Prepaid expenses | | | 5,255 | | | | 9,017 | | | | 32,871 | | | | 6,855 | | |
Total assets | | | 10,998,121 | | | | 44,779,104 | | | | 166,390,960 | | | | 7,795,318 | | |
Liabilities | |
Overdraft due to custodian bank | | | — | | | | 234,838 | | | | 691,959 | | | | 545,628 | | |
Payable for Fund shares redeemed | | | — | | | | 338,196 | | | | 395,392 | | | | 11,563 | | |
Due to Advisor, net | | | — | | | | 28,447 | | | | 108,381 | | | | — | | |
Accrued administration fees | | | 717 | | | | 1,866 | | | | 7,361 | | | | 1,778 | | |
Accrued shareholder servicing plan fees | | | 666 | | | | 10,916 | | | | 22,108 | | | | 2,426 | | |
Deferred trustees' compensation | | | 9,321 | | | | 56,508 | | | | 82,074 | | | | 23,701 | | |
Other accrued expenses | | | 23,557 | | | | 65,011 | | | | 74,798 | | | | 61,481 | | |
Total liabilities | | | 34,261 | | | | 735,782 | | | | 1,382,073 | | | | 646,577 | | |
Net Assets | | $ | 10,963,860 | | | $ | 44,043,322 | | | $ | 165,008,887 | | | $ | 7,148,741 | | |
Composition of Net Assets | |
Paid-in capital | | $ | 11,446,686 | | | $ | 77,289,184 | | | $ | 165,376,471 | | | $ | 11,561,825 | | |
Undistributed net investment loss | | | (10,281 | ) | | | (40,689 | ) | | | (84,136 | ) | | | (43,037 | ) | |
Accumulated net realized loss on investments and foreign currency | | | (374,609 | ) | | | (10,517,093 | ) | | | — | | | | (3,793,773 | ) | |
Net unrealized depreciation on: | |
Investments | | | (97,783 | ) | | | (22,664,592 | ) | | | (283,448 | ) | | | (554,071 | ) | |
Foreign currency | | | (153 | ) | | | (23,488 | ) | | | — | | | | (22,203 | ) | |
Net Assets | | $ | 10,963,860 | | | $ | 44,043,322 | | | $ | 165,008,887 | | | $ | 7,148,741 | | |
Number of shares issued and outstanding (unlimited shares authorized,
no par value) | | | 743,223 | | | | 2,375,216 | | | | — | | | | 614,792 | | |
Net asset value per share | | $ | 14.75 | | | $ | 18.54 | | | | — | | | $ | 11.63 | | |
Net asset value per share per Class: | |
Investor Class shares: | |
Net assets applicable to shares outstanding | | | | | | $ | 164,908,887 | | | | | | |
Shares of beneficial interest issued and outstanding | | | | | | | 5,239,902 | | | | |
Net asset value per share | | | — | | | | — | | | $ | 31.47 | | | | — | | |
Institutional Class shares*: | |
Net assets applicable to shares outstanding | | | | | | $ | 100,000 | | | | | | |
Shares of beneficial interest issued and outstanding | | | | | | | 3,177 | | | | |
Net asset value per share | | | — | | | | — | | | $ | 31.47 | | | | — | | |
* The Institutional Class shares commenced operations on December 31, 2015.
The accompanying notes are an integral part of these financial statements.
69
STATEMENTS OF OPERATIONS
For the year ended December 31, 2015
| | | Alternative
Energy
Fund | | Asia
Focus
Fund | | Asia Pacific
Dividend
Builder
Fund | | China &
Hong Kong
Fund | |
Investment Income | |
Dividends * | | $ | 145,051 | | | $ | 598,779 | | | $ | 198,130 | | | $ | 2,242,677 | | |
Total income | | | 145,051 | | | | 598,779 | | | | 198,130 | | | | 2,242,677 | | |
Expenses | |
Advisory fees | | | 146,568 | | | | 186,062 | | | | 46,726 | | | | 810,442 | | |
Shareholder servicing plan fees | | | 27,568 | | | | 20,499 | | | | 7,411 | | | | 101,972 | | |
Transfer agent fees and expenses | | | 38,301 | | | | 31,158 | | | | 21,933 | | | | 75,077 | | |
Fund accounting fee and expenses | | | 29,081 | | | | 31,032 | | | | 28,425 | | | | 51,696 | | |
Administration fees | | | 6,242 | | | | 7,443 | | | | 1,869 | | | | 32,430 | | |
Custody fees and expenses | | | 8,630 | | | | 12,833 | | | | 14,935 | | | | 25,912 | | |
Audit fees | | | 18,010 | | | | 24,507 | | | | 18,010 | | | | 24,507 | | |
Legal fees | | | 7,283 | | | | 8,018 | | | | 2,602 | | | | 38,466 | | |
Registration fees | | | 18,263 | | | | 18,437 | | | | 15,985 | | | | 23,305 | | |
Printing | | | 19,026 | | | | 9,972 | | | | 7,050 | | | | 16,230 | | |
Trustees' fees and expenses | | | 9,017 | | | | 5,384 | | | | 8,034 | | | | 9,105 | | |
Insurance | | | 1,384 | | | | 1,669 | | | | 329 | | | | 7,048 | | |
CCO fees and expenses | | | 7,854 | | | | 8,334 | | | | 6,635 | | | | 15,408 | | |
Miscellaneous | | | 1,797 | | | | 1,705 | | | | 1,000 | | | | 4,016 | | |
Interest expense | | | 56 | | | | 1,592 | | | | 274 | | | | 11,520 | | |
Total expenses | | | 339,080 | | | | 368,645 | | | | 181,218 | | | | 1,247,134 | | |
Less: fees waived and expenses absorbed | | | (48,819 | ) | | | — | | | | (88,425 | ) | | | — | | |
Net expenses | | | 290,261 | | | | 368,645 | | | | 92,793 | | | | 1,247,134 | | |
Net investment income (loss) | | | (145,210 | ) | | | 230,134 | | | | 105,337 | | | | 995,543 | | |
Realized and unrealized gain (loss) on investments and foreign currency | |
Net realized gain (loss) on: | |
Investments | | | (2,104,997 | ) | | | 67,804 | | | | 278,160 | | | | 6,036,799 | | |
Foreign currency | | | 9,215 | | | | (8,436 | ) | | | (15,268 | ) | | | (4,049 | ) | |
| | | | (2,095,782 | ) | | | 59,368 | | | | 262,892 | | | | 6,032,750 | | |
Net unrealized appreciation (depreciation) on: | |
Investments | | | 460,415 | | | | (2,434,871 | ) | | | (759,390 | ) | | | (11,799,137 | ) | |
Foreign currency | | | (879 | ) | | | (625 | ) | | | 5 | | | | (15 | ) | |
| | | | 459,536 | | | | (2,435,496 | ) | | | (759,385 | ) | | | (11,799,152 | ) | |
Net realized and unrealized loss on investments and foreign currency | | | (1,636,246 | ) | | | (2,376,128 | ) | | | (496,493 | ) | | | (5,766,402 | ) | |
Net Decrease in Net Assets from Operations | | $ | (1,781,456 | ) | | $ | (2,145,994 | ) | | $ | (391,156 | ) | | $ | (4,770,859 | ) | |
* Net of foreign tax withheld of $13,664, $60,300, $13,596, and $143,156 respectively.
The accompanying notes are an integral part of these financial statements.
70
STATEMENTS OF OPERATIONS
For the year ended December 31, 2015
| | | Dividend
Builder
Fund | | Global
Energy
Fund | | Global
Innovators
Fund | | Renminbi
Yuan & Bond
Fund | |
Investment Income | |
Dividends * | | $ | 369,413 | | | $ | 1,426,234 | | | $ | 3,684,344 | | | $ | — | | |
Interest | | | — | | | | — | | | | — | | | | 2,478,264 | | |
Total income | | | 369,413 | | | | 1,426,234 | | | | 3,684,344 | | | | 2,478,264 | | |
Expenses | |
Advisory fees | | | 46,900 | | | | 431,652 | | | | 1,412,213 | | | | 366,666 | | |
Shareholder servicing plan fees | | | 22,351 | | | | 113,607 | | | | 382,806 | | | | 65,354 | | |
Transfer agent fees and expenses | | | 19,016 | | | | 44,026 | | | | 128,287 | | | | 18,523 | | |
Fund accounting fee and expenses | | | 24,044 | | | | 44,176 | | | | 86,294 | | | | 47,095 | | |
Administration fees | | | 4,690 | | | | 24,021 | | | | 81,817 | | | | 29,074 | | |
Custody fees and expenses | | | 5,754 | | | | 11,127 | | | | 13,173 | | | | 18,379 | | |
Audit fees | | | 14,510 | | | | 24,507 | | | | 24,007 | | | | 18,010 | | |
Legal fees | | | 5,555 | | | | 26,328 | | | | 94,625 | | | | 41,462 | | |
Registration fees | | | 14,928 | | | | 24,168 | | | | 34,273 | | | | 22,286 | | |
Printing | | | 8,526 | | | | 30,455 | | | | 49,956 | | | | 9,902 | | |
Trustees' fees and expenses | | | 9,895 | | | | 14,436 | | | | 30,515 | | | | 15,805 | | |
Insurance | | | 422 | | | | 5,508 | | | | 11,363 | | | | 8,041 | | |
CCO fees and expenses | | | 7,264 | | | | 13,296 | | | | 27,973 | | | | 15,681 | | |
Miscellaneous | | | 1,500 | | | | 1,508 | | | | 6,797 | | | | 3,979 | | |
Interest expense | | | 98 | | | | 648 | | | | 6,510 | | | | 16,979 | | |
Total expenses | | | 185,453 | | | | 809,463 | | | | 2,390,609 | | | | 697,236 | | |
Less: fees waived and expenses absorbed | | | (114,217 | ) | | | — | | | | — | | | | (79,927 | ) | |
Net expenses | | | 71,236 | | | | 809,463 | | | | 2,390,609 | | | | 617,309 | | |
Net investment income | | | 298,177 | | | | 616,771 | | | | 1,293,735 | | | | 1,860,955 | | |
Realized and unrealized gain (loss) on investments and foreign currency | |
Net realized gain (loss) on: | |
Investments | | | (340,750 | ) | | | (5,058,206 | ) | | | 7,626,347 | | | | (3,688,544 | ) | |
Foreign currency | | | 2,828 | | | | (10,035 | ) | | | (61,688 | ) | | | (218,367 | ) | |
| | | | (337,922 | ) | | | (5,068,241 | ) | | | 7,564,659 | | | | (3,906,911 | ) | |
Net unrealized appreciation (depreciation) on: | |
Investments | | | (535,396 | ) | | | (11,979,665 | ) | | | (16,022,576 | ) | | | 440,551 | | |
Foreign currency | | | 61 | | | | (11,336 | ) | | | 281 | | | | (37,454 | ) | |
| | | | (535,335 | ) | | | (11,991,001 | ) | | | (16,022,295 | ) | | | 403,097 | | |
Net increase from payments by affiliates | | | — | | | | — | | | | 10,554 | | | | — | | |
Net realized and unrealized loss on investments and foreign currency | | | (873,257 | ) | | | (17,059,242 | ) | | | (8,447,082 | ) | | | (3,503,814 | ) | |
Net Decrease in Net Assets from Operations | | $ | (575,080 | ) | | $ | (16,442,471 | ) | | $ | (7,153,347 | ) | | $ | (1,642,859 | ) | |
* Net of foreign tax withheld of $26,802, $138,783, $77,492, and $0, respectively.
The accompanying notes are an integral part of these financial statements.
71
STATEMENTS OF CHANGES IN NET ASSETS
| | | Alternative Energy Fund | | Asia Focus Fund | | Asia Pacific Dividend Builder Fund | |
| | | Year Ended
December 31, 2015 | | Year Ended
December 31, 2014 | | Year Ended
December 31, 2015 | | Year Ended
December 31, 2014 | | Year Ended
December 31, 2015 | | Year Ended
December 31, 2014 | |
Increase/(decrease) in
net assets from: | |
Operations | |
Net investment income (loss) | | $ | (145,210 | ) | | $ | (157,293 | ) | | $ | 230,134 | | | $ | 191,107 | | | $ | 105,337 | | | $ | 95,144 | | |
Net realized gain (loss) on: | |
Investments | | | (2,104,997 | ) | | | (1,950,263 | ) | | | 67,804 | | | | 828,177 | | | | 278,160 | | | | 287,212 | | |
Foreign currency | | | 9,215 | | | | (34,888 | ) | | | (8,436 | ) | | | (8,549 | ) | | | (15,268 | ) | | | (4,879 | ) | |
Net change in unrealized
appreciation (depreciation) on: | |
Investments | | | 460,415 | | | | (462,758 | ) | | | (2,434,871 | ) | | | (673,200 | ) | | | (759,390 | ) | | | (26,763 | ) | |
Foreign currency | | | (879 | ) | | | (2,491 | ) | | | (625 | ) | | | 17 | | | | 5 | | | | (85 | ) | |
Net increase (decrease) in
net assets resulting
from operations | | | (1,781,456 | ) | | | (2,607,693 | ) | | | (2,145,994 | ) | | | 337,552 | | | | (391,156 | ) | | | 350,629 | | |
Distributions to shareholders | |
From net investment income | | | — | | | | — | | | | (179,969 | ) | | | (204,461 | ) | | | (139,312 | ) | | | (85,227 | ) | |
Total distributions to
shareholders | | | — | | | | — | | | | (179,969 | ) | | | (204,461 | ) | | | (139,312 | ) | | | (85,227 | ) | |
Capital transactions | |
Proceeds from shares sold | | | 3,661,403 | | | | 7,514,832 | | | | 1,243,379 | | | | 1,420,065 | | | | 5,502,291 | | | | 516,751 | | |
Reinvestment of distributions | | | — | | | | — | | | | 169,118 | | | | 176,160 | | | | 133,886 | | | | 81,472 | | |
Cost of shares repurchased | | | (3,437,294 | ) | | | (13,487,563 | ) | | | (3,464,807 | ) | | | (3,924,930 | ) | | | (1,912,482 | ) | | | (1,060,073 | ) | |
Redemption fee proceeds | | | 1 | | | | 6,012 | | | | 204 | | | | 6,650 | | | | 30 | | | | 2,985 | | |
Net change in net assets from
capital transactions | | | 224,110 | | | | (5,966,719 | ) | | | (2,052,106 | ) | | | (2,322,055 | ) | | | 3,723,725 | | | | (458,865 | ) | |
Total increase (decrease) in
net assets | | | (1,557,346 | ) | | | (8,574,412 | ) | | | (4,378,069 | ) | | | (2,188,964 | ) | | | 3,193,257 | | | | (193,463 | ) | |
Net assets | |
Beginning of period | | | 15,201,586 | | | | 23,775,998 | | | | 19,713,957 | | | | 21,902,921 | | | | 4,060,288 | | | | 4,253,751 | | |
End of period | | $ | 13,644,240 | | | $ | 15,201,586 | | | $ | 15,335,888 | | | $ | 19,713,957 | | | $ | 7,253,545 | | | $ | 4,060,288 | | |
Accumulated net investment
income (loss) | | $ | (41,894 | ) | | $ | (39,203 | ) | | $ | (28,524 | ) | | $ | (70,253 | ) | | $ | (55,477 | ) | | $ | (25,222 | ) | |
Capital share activity | |
Shares sold | | | 1,108,022 | | | | 1,782,301 | | | | 72,706 | | | | 79,440 | | | | 402,814 | | | | 37,760 | | |
Shares issued on reinvestment | | | — | | | | — | | | | 11,544 | | | | 10,709 | | | | 9,911 | | | | 6,027 | | |
Shares redeemed | | | (1,047,357 | ) | | | (3,304,204 | ) | | | (216,357 | ) | | | (234,391 | ) | | | (139,412 | ) | | | (78,604 | ) | |
Net increase (decrease) in
shares outstanding | | | 60,665 | | | | (1,521,903 | ) | | | (132,107 | ) | | | (144,242 | ) | | | 273,313 | | | | (34,817 | ) | |
The accompanying notes are an integral part of these financial statements.
72
STATEMENTS OF CHANGES IN NET ASSETS
| | | China & Hong Kong Fund | | Dividend Builder Fund | | Global Energy Fund | |
| | | Year Ended
December 31, 2015 | | Year Ended
December 31, 2014 | | Year Ended
December 31, 2015 | | Year Ended
December 31, 2014 | | Year Ended
December 31, 2015 | | Year Ended
December 31, 2014 | |
Increase/(decrease) in
net assets from: | |
Operations | |
Net investment income (loss) | | $ | 995,543 | | | $ | 1,418,526 | | | $ | 298,177 | | | $ | 155,020 | | | $ | 616,771 | | | $ | 655,804 | | |
Net realized gain (loss) on: | |
Investments | | | 6,036,799 | | | | 16,172,716 | | | | (340,750 | ) | | | 57,338 | | | | (5,058,206 | ) | | | (470,045 | ) | |
Foreign currency | | | (4,049 | ) | | | (3,151 | ) | | | 2,828 | | | | (1,034 | ) | | | (10,035 | ) | | | (33,711 | ) | |
Net change in unrealized
appreciation (depreciation) on: | |
Investments | | | (11,799,137 | ) | | | (20,220,281 | ) | | | (535,396 | ) | | | (20,227 | ) | | | (11,979,665 | ) | | | (20,816,478 | ) | |
Foreign currency | | | (15 | ) | | | 17 | | | | 61 | | | | (390 | ) | | | (11,336 | ) | | | (15,619 | ) | |
Net increase (decrease) in net
assets resulting from
operations | | | (4,770,859 | ) | | | (2,632,173 | ) | | | (575,080 | ) | | | 190,707 | | | | (16,442,471 | ) | | | (20,680,049 | ) | |
Distributions to shareholders | |
From net investment income | | | (1,399,854 | ) | | | (1,324,676 | ) | | | (329,153 | ) | | | (139,116 | ) | | | (590,066 | ) | | | (540,664 | ) | |
From net realized gains | | | (5,976,476 | ) | | | (18,055,782 | ) | | | (33,848 | ) | | | (38,760 | ) | | | (1,203 | ) | | | (309,365 | ) | |
Total distributions to
shareholders | | | (7,376,330 | ) | | | (19,380,458 | ) | | | (363,001 | ) | | | (177,876 | ) | | | (591,269 | ) | | | (850,029 | ) | |
Capital transactions | |
Proceeds from shares sold | | | 16,832,413 | | | | 15,260,317 | | | | 9,912,058 | | | | 5,792,295 | | | | 19,630,830 | | | | 56,236,413 | | |
Reinvestment of distributions | | | 7,134,012 | | | | 18,704,431 | | | | 362,353 | | | | 177,125 | | | | 570,859 | | | | 821,686 | | |
Cost of shares repurchased | | | (31,521,021 | ) | | | (36,249,008 | ) | | | (3,565,387 | ) | | | (3,895,760 | ) | | | (22,031,553 | ) | | | (44,969,440 | ) | |
Redemption fee proceeds | | | 36,291 | | | | 27,367 | | | | 22 | | | | 83 | | | | 782 | | | | 28,669 | | |
Net change in net assets from
capital transactions | | | (7,518,305 | ) | | | (2,256,893 | ) | | | 6,709,046 | | | | 2,073,743 | | | | (1,829,082 | ) | | | 12,117,328 | | |
Total increase (decrease) in
net assets | | | (19,665,494 | ) | | | (24,269,524 | ) | | | 5,770,965 | | | | 2,086,574 | | | | (18,862,822 | ) | | | (9,412,750 | ) | |
Net assets | |
Beginning of period | | | 85,584,474 | | | | 109,853,998 | | | | 5,192,895 | | | | 3,106,321 | | | | 62,906,144 | | | | 72,318,894 | | |
End of period | | $ | 65,918,980 | | | $ | 85,584,474 | | | $ | 10,963,860 | | | $ | 5,192,895 | | | $ | 44,043,322 | | | $ | 62,906,144 | | |
Accumulated net investment
income (loss) | | $ | (82,986 | ) | | $ | 265,187 | | | $ | (10,281 | ) | | $ | (220 | ) | | $ | (40,689 | ) | | $ | (57,213 | ) | |
Capital share activity | |
Shares sold | | | 649,553 | | | | 512,348 | | | | 621,721 | | | | 360,429 | | | | 861,946 | | | | 1,610,018 | | |
Shares issued on reinvestment | | | 361,033 | | | | 793,906 | | | | 24,315 | | | | 11,036 | | | | 31,331 | | | | 31,861 | | |
Shares redeemed | | | (1,250,130 | ) | | | (1,247,128 | ) | | | (230,771 | ) | | | (242,174 | ) | | | (963,258 | ) | | | (1,425,324 | ) | |
Net increase (decrease) in
shares outstanding | | | (239,544 | ) | | | 59,126 | | | | 415,265 | | | | 129,291 | | | | (69,981 | ) | | | 216,555 | | |
The accompanying notes are an integral part of these financial statements.
73
STATEMENTS OF CHANGES IN NET ASSETS
| | | Global Innovators Fund | | Renminbi Yuan & Bond Fund | |
| | | Year Ended
December 31, 2015 | | Year Ended
December 31, 2014 | | Year Ended
December 31, 2015 | | Year Ended
December 31, 2014 | |
Increase/(decrease) in net assets from: | |
Operations | |
Net investment income | | $ | 1,293,735 | | | $ | 1,155,295 | | | $ | 1,860,955 | | | $ | 2,490,016 | | |
Net realized gain (loss) on: | |
Investments | | | 7,626,347 | | | | 2,433,697 | | | | (3,688,544 | ) | | | 517,815 | | |
Foreign currency | | | (61,688 | ) | | | (21,957 | ) | | | (218,367 | ) | | | 25,687 | | |
Net change in unrealized appreciation (depreciation) on: | |
Investments | | | (16,022,576 | ) | | | 4,906,905 | | | | 440,551 | | | | (3,860,378 | ) | |
Foreign currency | | | 281 | | | | (281 | ) | | | (37,454 | ) | | | (65,659 | ) | |
Net increase from payments by affiliates | | | 10,554 | | | | — | | | | — | | | | — | | |
Net increase (decrease) in net assets resulting from operations | | | (7,153,347 | ) | | | 8,473,659 | | | | (1,642,859 | ) | | | (892,519 | ) | |
Distributions to shareholders | |
From net investment income: | |
Investor Class | | | (1,200,137 | ) | | | (1,179,848 | ) | | | — | | | | — | | |
From net investment income | | | — | | | | — | | | | (1,708,020 | ) | | | (3,220,427 | ) | |
From net realized gain: | |
Investor Class | | | (6,434,280 | ) | | | (1,049,989 | ) | | | — | | | | — | | |
Return of capital | | | — | | | | — | | | | (156,872 | ) | | | — | | |
Total distributions to shareholders | | | (7,634,417 | ) | | | (2,229,837 | ) | | | (1,864,892 | ) | | | (3,220,427 | ) | |
Capital transactions | |
Proceeds from shares sold: | |
Investor Class | | | 280,912,179 | | | | 129,608,055 | | | | — | | | | — | | |
Institutional Class | | | 100,000 | | | | — | | | | — | | | | — | | |
Proceeds from shares sold | | | — | | | | — | | | | 9,363,485 | | | | 18,817,422 | | |
Reinvestment of distributions: | |
Investor Class | | | 6,703,338 | | | | 2,154,069 | | | | — | | | | — | | |
Reinvestment of distributions | | | — | | | | — | | | | 1,857,389 | | | | 3,208,597 | | |
Cost of shares repurchased: | |
Investor Class | | | (265,382,485 | ) | | | (31,295,552 | ) | | | — | | | | — | | |
Cost of shares repurchased | | | — | | | | — | | | | (101,212,023 | ) | | | (11,468,535 | ) | |
Redemption fee proceeds – Investor Class | | | 926 | | | | 21,151 | | | | 1,502 | | | | 381 | | |
Net change in net assets from capital transactions | | | 22,333,958 | | | | 100,487,723 | | | | (89,989,647 | ) | | | 10,557,865 | | |
Total increase (decrease) in net assets | | | 7,546,194 | | | | 106,731,545 | | | | (93,497,398 | ) | | | 6,444,919 | | |
Net assets | |
Beginning of period | | | 157,462,693 | | | | 50,731,148 | | | | 100,646,139 | | | | 94,201,220 | | |
End of period | | $ | 165,008,887 | | | $ | 157,462,693 | | | $ | 7,148,741 | | | $ | 100,646,139 | | |
Accumulated net investment income (loss) | | $ | (84,136 | ) | | $ | (89,707 | ) | | $ | (43,037 | ) | | $ | 70,111 | | |
Capital share activity | |
Shares sold: | |
Investor Class | | | 8,638,333 | | | | 3,853,082 | | | | — | | | | — | | |
Institutional Class | | | 3,177 | | | | — | | | | — | | | | — | | |
Shares sold | | | — | | | | — | | | | 754,009 | | | | 1,476,615 | | |
Shares issued on reinvestment: | |
Investor Class | | | 212,467 | | | | 62,819 | | | | — | | | | — | | |
Shares issued on reinvestment | | | — | | | | — | | | | 151,748 | | | | 255,998 | | |
Shares redeemed: | |
Investor Class | | | (8,241,661 | ) | | | (940,210 | ) | | | — | | | | — | | |
Shares redeemed | | | — | | | | — | | | | (8,395,162 | ) | | | (904,540 | ) | |
Net increase (decrease) in shares outstanding | | | 612,316 | | | | 2,975,691 | | | | (7,489,405 | ) | | | 828,073 | | |
The accompanying notes are an integral part of these financial statements.
74
FINANCIAL HIGHLIGHTS
For a capital share outstanding throughout each period.
| | | Year Ended December 31, | |
Alternative Energy Fund | | 2015 | | 2014 | | 2013 | | 2012 | | 2011 | |
Net asset value, beginning of period | | $ | 3.42 | | | $ | 3.99 | | | $ | 2.47 | | | $ | 2.92 | | | $ | 5.17 | | |
Income (loss) from investment operations: | |
Net investment income (loss) | | | (0.03 | ) | | | (0.04 | ) | | | (0.04 | ) | | | (0.02 | ) | | | 0.06 | | |
Net realized and unrealized gain (loss) on investments and foreign currency | | | (0.36 | ) | | | (0.53 | ) | | | 1.55 | | | | (0.42 | ) | | | (2.26 | ) | |
Total from investment operations | | | (0.39 | ) | | | (0.57 | ) | | | 1.51 | | | | (0.44 | ) | | | (2.20 | ) | |
Less distributions: | |
From net investment income | | | — | | | | — | | | | — | | | | (0.01 | ) | | | (0.05 | ) | |
Total distributions | | | — | | | | — | | | | — | | | | (0.01 | ) | | | (0.05 | ) | |
Redemption fee proceeds | | | — | (1) | | | — | (1) | | | 0.01 | | | | — | (1) | | | — | (1) | |
Net asset value, end of period | | $ | 3.03 | | | $ | 3.42 | | | $ | 3.99 | | | $ | 2.47 | | | $ | 2.92 | | |
Total return | | | (11.40 | )% | | | (14.29 | )% | | | 61.54 | % | | | (15.20 | )% | | | (42.53 | )% | |
Ratios/supplemental data: | |
Net assets, end of period (millions) | | $ | 13.6 | | | $ | 15.2 | | | $ | 23.8 | | | $ | 13.0 | | | $ | 17.6 | | |
Ratio of expenses to average net assets: | |
Before fee waived/recaptured | | | 2.31 | % | | | 2.06 | % | | | 2.13 | % | | | 2.32 | % | | | 1.81 | % | |
After fees waived/recaptured | | | 1.98 | % | | | 2.02 | % | | | 2.00 | % | | | 2.02 | % | | | 1.81 | % | |
After fees waived/recaptured excluding interest expense(2) | | | 1.98 | % | | | 1.98 | % | | | 1.98 | % | | | 1.98 | % | | | 1.79 | % | |
Ratio of net investment income (loss) to average net assets: | |
Before fees waived/recaptured | | | (1.32 | )% | | | (0.74 | )% | | | (1.37 | )% | | | (1.11 | )% | | | 1.11 | % | |
After fees waived/recaptured | | | (0.99 | )% | | | (0.70 | )% | | | (1.24 | )% | | | (0.81 | )% | | | 1.11 | % | |
Portfolio turnover rate | | | 28.67 | % | | | 42.27 | % | | | 60.20 | % | | | 7.80 | % | | | 43.10 | % | |
(1) Amount represents less than $0.01 per share.
(2) The Advisor has contractually agreed to limit the operating expenses of the Fund to 1.98%, excluding interest expense, expenses related to dividends on short positions, brokerage commissions, taxes and other extraordinary expenses. See Note 3.
The accompanying notes are an integral part of these financial statements.
75
FINANCIAL HIGHLIGHTS
For a capital share outstanding throughout each period.
| | | Year Ended December 31, | |
Asia Focus Fund | | 2015 | | 2014 | | 2013 | | 2012 | | 2011 | |
Net asset value, beginning of period | | $ | 16.47 | | | $ | 16.33 | | | $ | 18.56 | | | $ | 16.23 | | | $ | 21.04 | | |
Income (loss) from investment operations: | |
Net investment income | | | 0.21 | | | | 0.16 | | | | 0.21 | | | | 0.30 | | | | 0.18 | | |
Net realized and unrealized gain (loss) on investments and foreign currency | | | (2.11 | ) | | | 0.15 | | | | (2.14 | ) | | | 2.28 | | | | (4.88 | ) | |
Total from investment operations | | | (1.90 | ) | | | 0.31 | | | | (1.93 | ) | | | 2.58 | | | | (4.70 | ) | |
Less distributions: | |
From net investment income | | | (0.17 | ) | | | (0.17 | ) | | | (0.30 | ) | | | (0.25 | ) | | | (0.11 | ) | |
Total distributions | | | (0.17 | ) | | | (0.17 | ) | | | (0.30 | ) | | | (0.25 | ) | | | (0.11 | ) | |
Redemption fee proceeds | | | — | (1) | | | — | (1) | | | — | (1) | | | — | (1) | | | — | (1) | |
Net asset value, end of period | | $ | 14.40 | | | $ | 16.47 | | | $ | 16.33 | | | $ | 18.56 | | | $ | 16.23 | | |
Total return | | | (11.56 | )% | | | 1.91 | % | | | (10.38 | )% | | | 15.89 | % | | | (22.35 | )% | |
Ratios/supplemental data: | |
Net assets, end of period (millions) | | $ | 15.3 | | | $ | 19.7 | | | $ | 21.90 | | | $ | 44.90 | | | $ | 45.8 | | |
Ratio of expenses to average net assets: | |
Before fees waived | | | 1.98 | % | | | 1.91 | % | | | 1.87 | % | | | 1.70 | % | | | 1.59 | % | |
After fees waived | | | 1.98 | % | | | 1.91 | % | | | 1.87 | % | | | 1.70 | % | | | 1.59 | % | |
After fees waived excluding interest expense(2) | | | 1.97 | % | | | 1.90 | % | | | 1.85 | % | | | 1.69 | % | | | 1.59 | % | |
Ratio of net investment income to average net assets: | |
Before fees waived | | | 1.24 | % | | | 0.90 | % | | | 0.73 | % | | | 1.56 | % | | | 0.89 | % | |
After fees waived | | | 1.24 | % | | | 0.90 | % | | | 0.73 | % | | | 1.56 | % | | | 0.89 | % | |
Portfolio turnover rate | | | 8.64 | % | | | 23.16 | % | | | 7.43 | % | | | 10.90 | % | | | 7.79 | % | |
(1) Amount represents less than $0.01 per share.
(2) The Advisor has contractually agreed to limit the operating expenses of the Fund to 1.98%, excluding interest expense, expenses related to dividends on short positions, brokerage commissions, taxes and other extraordinary expenses. See Note 3.
The accompanying notes are an integral part of these financial statements.
76
FINANCIAL HIGHLIGHTS
For a capital share outstanding throughout each period.
| | | Year Ended December 31, | |
Asia Pacific Dividend Builder Fund | | 2015 | | 2014 | | 2013 | | 2012 | | 2011 | |
Net asset value, beginning of period | | $ | 13.83 | | | $ | 12.95 | | | $ | 13.52 | | | $ | 11.23 | | | $ | 13.41 | | |
Income (loss) from investment operations: | |
Net investment income | | | 0.39 | | | | 0.31 | | | | 0.27 | | | | 0.30 | | | | 0.30 | | |
Net realized and unrealized gain (loss) on investments and foreign currency | | | (1.01 | ) | | | 0.85 | | | | (0.54 | ) | | | 2.31 | | | | (2.18 | ) | |
Total from investment operations | | | (0.62 | ) | | | 1.16 | | | | (0.27 | ) | | | 2.61 | | | | (1.88 | ) | |
Less distributions: | |
From net investment income | | | (0.42 | ) | | | (0.28 | ) | | | (0.30 | ) | | | (0.32 | ) | | | (0.30 | ) | |
Total distributions | | | (0.42 | ) | | | (0.28 | ) | | | (0.30 | ) | | | (0.32 | ) | | | (0.30 | ) | |
Redemption fee proceeds | | | — | (1) | | | — | (1) | | | — | (1) | | | — | (1) | | | — | | |
Net asset value, end of period | | $ | 12.79 | | | $ | 13.83 | | | $ | 12.95 | | | $ | 13.52 | | | $ | 11.23 | | |
Total return | | | (4.61 | )% | | | 9.04 | % | | | (2.06 | )% | | | 23.48 | % | | | (14.04 | )% | |
Ratios/supplemental data: | |
Net assets, end of period (millions) | | $ | 7.3 | | | $ | 4.1 | | | $ | 4.3 | | | $ | 4.8 | | | $ | 4.5 | | |
Ratio of expenses to average net assets: | |
Before fees waived | | | 3.87 | % | | | 3.91 | % | | | 3.56 | % | | | 3.57 | % | | | 3.26 | % | |
After fees waived | | | 1.98 | % | | | 1.99 | % | | | 1.98 | % | | | 1.98 | % | | | 1.98 | % | |
After fees waived excluding interest expense(2) | | | 1.98 | % | | | 1.98 | % | | | 1.98 | % | | | 1.98 | % | | | 1.98 | % | |
Ratio of net investment income to average net assets: | |
Before fees waived | | | 0.36 | % | | | 0.37 | % | | | 0.39 | % | | | 0.71 | % | | | 1.13 | % | |
After fees waived | | | 2.25 | % | | | 2.29 | % | | | 1.97 | % | | | 2.39 | % | | | 2.41 | % | |
Portfolio turnover rate | | | 28.59 | % | | | 15.76 | % | | | 56.96 | % | | | 10.19 | % | | | 10.67 | % | |
(1) Amount represents less than $0.01 per share.
(2) The Advisor has contractually agreed to limit the operating expenses of the Fund to 1.10%, prior to December 31, 2015 the limit on operating expenses was 1.98%, excluding interest expense, related to dividends on short positions, brokerage commissions, taxes and other extraordinary expenses. See Note 3.
The accompanying notes are an integral part of these financial statements.
77
FINANCIAL HIGHLIGHTS
For a capital share outstanding throughout each period.
| | | Year Ended December 31, | |
China & Hong Kong Fund | | 2015 | | 2014 | | 2013 | | 2012 | | 2011 | |
Net asset value, beginning of period | | $ | 23.65 | | | $ | 30.86 | | | $ | 29.81 | | | $ | 26.58 | | | $ | 38.76 | | |
Income (loss) from investment operations: | |
Net investment income | | | 0.34 | | | | 0.48 | | | | 0.46 | | | | 0.45 | | | | 0.39 | | |
Net realized and unrealized gain (loss) on investments and foreign currency | | | (2.11 | ) | | | (1.12 | ) | | | 1.45 | | | | 3.37 | | | | (11.06 | ) | |
Total from investment operations | | | (1.77 | ) | | | (0.64 | ) | | | 1.91 | | | | 3.82 | | | | (10.67 | ) | |
Less distributions: | |
From net investment income | | | (0.45 | ) | | | (0.45 | ) | | | (0.43 | ) | | | (0.59 | ) | | | (0.20 | ) | |
From net realized gain | | | (1.94 | ) | | | (6.13 | ) | | | (0.44 | ) | | | — | | | | (1.31 | ) | |
Total distributions | | | (2.39 | ) | | | (6.58 | ) | | | (0.87 | ) | | | (0.59 | ) | | | (1.51 | ) | |
Redemption fee proceeds | | | 0.01 | | | | 0.01 | | | | 0.01 | | | | — | (1) | | | — | (1) | |
Net asset value, end of period | | $ | 19.50 | | | $ | 23.65 | | | $ | 30.86 | | | $ | 29.81 | | | $ | 26.58 | | |
Total return | | | (7.58 | )% | | | (1.97 | )% | | | 6.45 | % | | | 14.42 | % | | | (27.52 | )% | |
Ratios/supplemental data: | |
Net assets, end of period (millions) | | $ | 65.9 | | | $ | 85.6 | | | $ | 109.9 | | | $ | 152.0 | | | $ | 153.0 | | |
Ratio of expenses to average net assets | |
Before fees waived | | | 1.54 | % | | | 1.52 | % | | | 1.53 | % | | | 1.51 | % | | | 1.53 | % | |
After fees waived | | | 1.54 | % | | | 1.52 | % | | | 1.53 | % | | | 1.51 | % | | | 1.53 | % | |
After fees waived excluding interest expense(2) | | | 1.53 | % | | | 1.51 | % | | | 1.52 | % | | | 1.51 | % | | | 1.52 | % | |
Ratio of net investment income to average net assets | | | 1.23 | % | | | 1.51 | % | | | 1.27 | % | | | 1.34 | % | | | 1.14 | % | |
Portfolio turnover rate | | | 26.50 | % | | | 15.11 | % | | | 6.90 | % | | | 3.85 | % | | | 7.81 | % | |
(1) Amount represents less than $0.01 per share.
(2) The Advisor has contractually agreed to limit the operating expenses of the Fund to 1.98%, excluding interest expense, expenses related to dividends on short positions, brokerage commissions, taxes and other extraordinary expenses. See Note 3.
The accompanying notes are an integral part of these financial statements.
78
FINANCIAL HIGHLIGHTS
For a capital share outstanding throughout each period.
| | | Year Ended December 31, | | March 30, 2012(1)
Through | |
Dividend Builder Fund | | 2015 | | 2014 | | 2013 | | December 31, 2012 | |
Net asset value, beginning of period | | $ | 15.83 | | | $ | 15.64 | | | $ | 12.80 | | | $ | 12.50 | | |
Income (loss) from investment operations: | |
Net investment income | | | 0.42 | | | | 0.52 | | | | 0.41 | | | | 0.31 | | |
Net realized and unrealized gain (loss) on investments and foreign currency | | | (0.99 | ) | | | 0.26 | | | | 3.35 | | | | 0.30 | | |
Total from investment operations | | | (0.57 | ) | | | 0.78 | | | | 3.76 | | | | 0.61 | | |
Less distributions: | |
From net investment income | | | (0.46 | ) | | | (0.47 | ) | | | (0.45 | ) | | | (0.31 | ) | |
From net realized gain | | | (0.05 | ) | | | (0.12 | ) | | | (0.47 | ) | | | — | | |
Total distributions | | | (0.51 | ) | | | (0.59 | ) | | | (0.92 | ) | | | (0.31 | ) | |
Redemption fee proceeds | | | — | (2) | | | — | (2) | | | — | (2) | | | — | | |
Net asset value, end of period | | $ | 14.75 | | | $ | 15.83 | | | $ | 15.64 | | | $ | 12.80 | | |
Total return | | | (3.61 | )% | | | 4.99 | % | | | 29.77 | % | | | 4.97 | %(3) | |
Ratios/supplemental data: | |
Net assets, end of period (millions) | | $ | 11.0 | | | $ | 5.2 | | | $ | 3.1 | | | $ | 1.8 | | |
Ratio of expenses to average net assets: | |
Before fees waived | | | 1.77 | % | | | 2.96 | % | | | 5.47 | % | | | 7.05 | %(4) | |
After fees waived | | | 0.68 | % | | | 0.68 | % | | | 0.68 | % | | | 0.68 | %(4) | |
After fees waived excluding interest expense(5) | | | 0.68 | % | | | 0.68 | % | | | 0.68 | % | | | 0.68 | %(4) | |
Ratio of net investment income (loss) to average net assets: | |
Before fees waived/recaptured | | | 1.76 | % | | | 1.18 | % | | | (2.04 | )% | | | (3.02 | )%(4) | |
After fees waived/recaptured | | | 2.86 | % | | | 3.46 | % | | | 2.75 | % | | | 3.35 | %(4) | |
Portfolio turnover rate | | | 24.94 | % | | | 7.60 | % | | | 24.88 | % | | | 13.33 | %(3) | |
(1) Commencement of Operations.
(2) Amount represents less than $0.01 per share.
(3) Not annualized.
(4) Annualized.
(5) The Advisor has contractually agreed to limit the operating expenses of the Fund to 0.68%, excluding interest expense, expenses related to dividends on short positions, brokerage commissions, taxes and other extraordinary expenses. See Note 3.
The accompanying notes are an integral part of these financial statements.
79
FINANCIAL HIGHLIGHTS
For a capital share outstanding throughout each period.
| | | Year Ended December 31, | |
Global Energy Fund | | 2015 | | 2014 | | 2013 | | 2012 | | 2011 | |
Net asset value, beginning of period | | $ | 25.73 | | | $ | 32.45 | | | $ | 26.19 | | | $ | 25.72 | | | $ | 29.74 | | |
Income (loss) from investment operations: | |
Net investment income | | | 0.26 | | | | 0.28 | | | | 0.18 | | | | 0.22 | | | | 0.14 | | |
Net realized and unrealized gain (loss) on investments and foreign currency | | | (7.20 | ) | | | (6.66 | ) | | | 6.23 | | | | 0.69 | | | | (4.06 | ) | |
Total from investment operations | | | (6.94 | ) | | | (6.38 | ) | | | 6.41 | | | | 0.91 | | | | (3.92 | ) | |
Less distributions: | |
From net investment income | | | (0.25 | ) | | | (0.22 | ) | | | (0.15 | ) | | | (0.44 | ) | | | (0.11 | ) | |
From net realized gain | | | — | (1) | | | (0.13 | ) | | | — | | | | — | | | | — | | |
Total distributions | | | (0.25 | ) | | | (0.35 | ) | | | (0.15 | ) | | | (0.44 | ) | | | (0.11 | ) | |
Redemption fee proceeds | | | — | (1) | | | 0.01 | | | | — | (1) | | | — | (1) | | | 0.01 | | |
Net asset value, end of period | | $ | 18.54 | | | $ | 25.73 | | | $ | 32.45 | | | $ | 26.19 | | | $ | 25.72 | | |
Total return | | | (26.97 | )% | | | (19.63 | )% | | | 24.48 | % | | | 3.53 | % | | | (13.16 | )% | |
Ratios/supplemental data: | |
Net assets, end of period (millions) | | $ | 44.0 | | | $ | 62.90 | | | $ | 72.3 | | | $ | 90.3 | | | $ | 143.1 | | |
Ratio of expenses to average net assets | |
Before fees waived | | | 1.41 | % | | | 1.30 | % | | | 1.35 | % | | | 1.35 | % | | | 1.27 | % | |
After fees waived | | | 1.41 | % | | | 1.30 | % | | | 1.35 | % | | | 1.35 | % | | | 1.27 | % | |
After fees waived excluding interest expense(2) | | | 1.41 | % | | | 1.30 | % | | | 1.34 | % | | | 1.34 | % | | | 1.27 | % | |
Ratio of net investment income to average net assets | | | 1.07 | % | | | 0.76 | % | | | 0.77 | % | | | 0.62 | % | | | 0.43 | % | |
Portfolio turnover rate | | | 15.70 | % | | | 39.33 | % | | | 8.19 | % | | | 14.02 | % | | | 28.23 | % | |
(1) Amount represents less than $0.01 per share.
(2) The Advisor has contractually agreed to limit the operating expenses of the Fund to 1.45%, excluding interest expense, expenses related to dividends on short positions, brokerage commissions, taxes and other extraordinary expenses. See Note 3.
The accompanying notes are an integral part of these financial statements.
80
FINANCIAL HIGHLIGHTS
For a capital share outstanding throughout each period.
| | | Year Ended December 31, | |
Global Innovators Fund – Investor Class | | 2015 | | 2014 | | 2013 | | 2012 | | 2011 | |
Net asset value, beginning of period | | $ | 34.00 | | | $ | 30.65 | | | $ | 21.18 | | | $ | 17.72 | | | $ | 19.00 | | |
Income (loss) from investment operations: | |
Net investment income | | | 0.26 | | | | 0.28 | | | | 0.07 | | | | 0.11 | | | | 0.04 | | |
Net realized and unrealized gain (loss) on investments | | | (1.28 | )(3) | | | 3.57 | | | | 9.52 | | | | 3.42 | | | | (1.28 | ) | |
Total from investment operations | | | (1.02 | ) | | | 3.85 | | | | 9.59 | | | | 3.53 | | | | (1.24 | ) | |
Less distributions: | |
From net investment income | | | (0.24 | ) | | | (0.26 | ) | | | (0.12 | ) | | | (0.07 | ) | | | (0.04 | ) | |
From net realized gain | | | (1.27 | ) | | | (0.24 | ) | | | — | | | | — | | | | (0.00 | ) | |
Total distributions | | | (1.51 | ) | | | (0.50 | ) | | | (0.12 | ) | | | (0.07 | ) | | | (0.04 | ) | |
Redemption fee proceeds | | | — | (1) | | | — | (1) | | | — | (1) | | | — | (1) | | | — | (1) | |
Net asset value, end of period | | $ | 31.47 | | | $ | 34.00 | | | $ | 30.65 | | | $ | 21.18 | | | $ | 17.72 | | |
Total return | | | (3.04 | )% | | | 12.55 | % | | | 45.29 | % | | | 19.91 | % | | | (6.51 | )% | |
Ratios/supplemental data: | |
Net assets, end of period (millions) | | $ | 164.9 | | | $ | 157.5 | | | $ | 50.7 | | | $ | 31.6 | | | $ | 32.4 | | |
Ratio of expenses to average net assets: | |
Before fees waived/recaptured | | | 1.27 | % | | | 1.26 | % | | | 1.47 | % | | | 1.51 | % | | | 1.42 | % | |
After fees waived/recaptured | | | 1.27 | % | | | 1.26 | % | | | 1.47 | % | | | 1.51 | % | | | 1.44 | % | |
After fees waived/recaptured excluding interest expense(2) | | | 1.27 | % | | | 1.26 | % | | | 1.46 | % | | | 1.50 | % | | | 1.44 | % | |
Ratio of net investment income to average net assets: | |
Before fees waived/recaptured | | | 0.69 | % | | | 1.25 | % | | | 0.31 | % | | | 0.49 | % | | | 0.26 | % | |
After fees waived/recaptured | | | 0.69 | % | | | 1.25 | % | | | 0.31 | % | | | 0.49 | % | | | 0.24 | % | |
Portfolio turnover rate | | | 37.59 | % | | | 14.40 | % | | | 29.63 | % | | | 6.02 | % | | | 47.40 | % | |
(1) Amount represents less than $0.01 per share.
(2) The Advisor has contractually agreed to limit the operating expenses of the Fund to 1.24%, prior to December 31, 2015 the limit on operating expenses was 1.55%, excluding interest expense, related to dividends on short positions, brokerage commissions, taxes and other extraordinary expenses. See Note 3.
(3) The Advisor reimbursed the Fund $10,554 for trade errors. As of December 31, 2015, the reimbursement amount represents $0.002 per share.
The accompanying notes are an integral part of these financial statements.
81
FINANCIAL HIGHLIGHTS
For a capital share outstanding throughout each period.
| | | Year Ended December 31, | | June 30, 2011(1)
Through | |
Renminbi Yuan & Bond Fund | | 2015 | | 2014 | | 2013 | | 2012 | | December 31, 2011 | |
Net asset value, beginning of period | | $ | 12.42 | | | $ | 12.95 | | | $ | 12.71 | | | $ | 12.52 | | | $ | 12.50 | | |
Income (loss) from investment operations: | |
Net investment income | | | 0.63 | | | | 0.32 | | | | 0.28 | | | | 0.12 | | | | — | (2) | |
Net realized and unrealized gain (loss) on investments and foreign currency | | | (1.12 | ) | | | (0.44 | ) | | | 0.38 | | | | 0.36 | | | | 0.02 | | |
Total from investment operations | | | (0.49 | ) | | | (0.12 | ) | | | 0.66 | | | | 0.48 | | | | 0.02 | | |
Less distributions: | |
From net investment income | | | (0.27 | ) | | | (0.41 | ) | | | (0.42 | ) | | | (0.29 | ) | | | — | | |
Return of capital | | | (0.03 | ) | | | — | | | | — | | | | — | | | | — | | |
Total distributions | | | (0.30 | ) | | | (0.41 | ) | | | (0.42 | ) | | | (0.29 | ) | | | — | | |
Redemption fee proceeds | | | — | (2) | | | — | (2) | | | — | (2) | | | — | (2) | | | — | (2) | |
Net asset value, end of period | | $ | 11.63 | | | $ | 12.42 | | | $ | 12.95 | | | $ | 12.71 | | | $ | 12.52 | | |
Total return | | | (4.05 | )% | | | (0.92 | )% | | | 5.26 | % | | | 3.88 | % | | | 0.16 | %(3) | |
Ratios/supplemental data: | |
Net assets, end of period (millions) | | $ | 7.1 | | | $ | 100.6 | | | $ | 94.2 | | | $ | 89.3 | | | $ | 92.7 | | |
Ratio of expenses to average net assets: | |
Before fees waived/recaptured | | | 1.05 | % | | | 0.95 | % | | | 0.97 | % | | | 0.90 | % | | | 0.92 | %(4) | |
After fees waived/recaptured | | | 0.93 | % | | | 0.90 | % | | | 0.90 | % | | | 0.90 | % | | | 0.90 | %(4) | |
After fees waived/recaptured excluding interest expense(5) | | | 0.90 | % | | | 0.90 | % | | | 0.90 | % | | | 0.90 | % | | | 0.90 | %(4) | |
Ratio of net investment income to average net assets: | |
Before fees waived/recaptured | | | 2.68 | % | | | 2.49 | % | | | 2.11 | % | | | 1.05 | % | | | 0.02 | %(4) | |
After fees waived/recaptured | | | 2.80 | % | | | 2.54 | % | | | 2.18 | % | | | 1.05 | % | | | 0.04 | %(4) | |
Portfolio turnover rate | | | 15.85 | % | | | 28.29 | % | | | 12.32 | % | | | 9.19 | % | | | 0.72 | %(3)† | |
† Restated
(1) Commencement of Operations.
(2) Amount represents less than $0.01 per share.
(3) Not annualized.
(4) Annualized.
(5) The Advisor has contractually agreed to limit the operating expenses of the Fund to 0.90%, excluding interest expense, expenses related to dividends on short positions, brokerage commissions, taxes and other extraordinary expenses. See Note 3.
The accompanying notes are an integral part of these financial statements.
82
NOTES TO FINANCIAL STATEMENTS
Note 1
Organization
Guinness AtkinsonTM Funds (the "Trust"), was organized on April 28, 1997 as a Delaware business trust and registered under the Investment Company Act of 1940, as amended (the "1940 Act"), as an open end management investment company. Currently, the Trust offers eight separate series: Guinness Atkinson Alternative Energy Fund (the "Alternative Energy Fund"), Guinness Atkinson Asia Focus Fund (the "Asia Focus Fund"), Guinness Atkinson Asia Pacific Dividend Builder Fund (formerly known as the Asia Pacific Dividend Fund) (the "Asia Pacific Dividend Builder Fund"), Guinness Atkinson China & Hong Kong Fund (the "China & Hong Kong Fund"), Guinness Atkinson Global Energy Fund (the "Global Energy Fund"), Guinness Atkinson Global Innovators Fund (the "Global Innovators Fund"), Guinness Atkinson Dividend Builder Fund (formerly known as the Inflation Managed Dividend Fund) (the "Dividend Builder Fund") and Guinness Atkinson Renminbi Yuan & Bond Fund (the "Renminbi Yuan & Bond Fund"), all of which (each a "Fund" and collectively, the "Funds") are covered by this report. Except for the Dividend Builder Fund, each Fund is a non-diversified Fund. The China & Hong Kong Fund began operations on June 30, 1994, the Asia Focus Fund began operations on April 29, 1996, the Global Innovators Fund began operations on December 15, 1998, the Global Energy Fund began operations on June 30, 2004, the Alternative Energy Fund and the Asia Pacific Dividend Builder Fund began operations on March 31, 2006, the Renminbi Yuan & Bond Fund began operations on June 30, 2011, and the Dividend Builder Fund began operations on March 30, 2012. Each of the Funds is authorized to issue a single class of shares except for the Global Innovators Fund. The Global Innovators Fund is authorized to issue two classes of shares: Investor Class shares and Institutional Class shares. On December 31, 2015, Institutional Class shares of the Global Innovators Fund were issued but did not earn income or incur expenses.
The shares of each class represent an interest in the same portfolio of investments of the Global Innovators Fund and have equal rights as to voting, redemptions, dividends and liquidation, subject to the approval of the Trustees. Income and expenses (other than expenses attributable to a specific class) and realized and unrealized gains and losses on investments are allocated to each class of shares in proportion to their relative shares outstanding. Shareholders of a class that bears distribution and service expenses under the terms of a distribution plan have exclusive voting rights to that distribution plan.
The Alternative Energy Fund, Asia Focus Fund, Global Energy Fund, and Global Innovator Fund's investment objective is long-term capital appreciation. The Asia Pacific Dividend Builder Fund's investment objective is to provide investors with dividend income and long-term capital growth. The China & Hong Kong Fund's investment objective is long-term capital appreciation primarily through investments in securities of China and Hong Kong. The Renminbi Yuan & Bond Fund's investment objective is to seek total return. Total return means the combination of capital appreciation and investment income, which includes changes in the value of the renminbi, the currency of China of which the yuan is the unit. The Dividend Builder Fund's investment objective is to seek a moderate level of current income and consistent dividend growth at a rate that exceeds inflation.
Note 2
Significant accounting policies
Each Fund is an investment company and accordingly follows the investment company accounting and reporting guidance of the Financial Accounting Standards Board (FASB) Accounting Standard Codification Topic 946 "Financial Services – Investment Companies".
The following is a summary of significant accounting policies consistently followed by the Funds. These policies are in conformity with accounting principles generally accepted in the United States of America. ("GAAP").
A. Security Valuation. Securities of the Funds that are traded on a principal exchange (U.S. or foreign) or NASDAQ are valued at the official closing price on each day that the exchanges are open for trading. Securities traded on an exchange for which there have been no sales, and other over-the-counter securities are valued at the mean between the bid and asked prices. Debt securities are valued based on available market quotations received from an independent pricing service approved by the Trust's Board of Trustees which may utilize both transaction data and market information such as yield, prices of securities of comparable quality, coupon rate, maturity, type of issue, trading characteristics and other market data. Securities for which quotations are not readily available are valued at their respective fair values as determined in good faith by the Funds' Valuation Committee in accordance with procedures established by the Board of Trustees. In determining fair value, the Funds' Valuation Committee take into account all relevant factors and available information. Consequently, the price of the security used to calculate its Net Asset Value may differ from quoted or published prices for the same security. Fair value pricing involves
83
subjective judgments and there is no single standard for determining a security's fair value. As a result, different mutual funds could reasonably arrive at different fair value for the same security. It is possible that the fair value determined for a security is materially different from the value that could be realized upon the sale of that security or from the values that other mutual funds may determine. Short-term investments are stated at cost, combined with accrued interest, which approximates market value. Realized gains and losses from securities transactions are calculated using the identified cost method.
Foreign securities are recorded in the financial statements after translation to U.S. dollars based on the applicable exchange rate at the end of the period. The Funds do not isolate that portion of the results of operations resulting from changes in the currency exchange rate from the fluctuations resulting from changes in the market prices of investments.
Foreign exchange gain or loss resulting from holding of a foreign currency, expiration of a currency exchange contract, difference in exchange rates between the trade date and settlement date of an investment purchased or sold, and the difference between dividends actually received compared to the amount shown in a Fund's accounting records on the date of receipt are shown as net realized gains or losses on foreign currency transactions in the respective Fund's statement of operations.
B. Forward Foreign Currency Exchange Contracts. The Funds may utilize forward foreign currency exchange contracts ("forward contracts") to hedge against foreign exchange fluctuations on foreign-denominated investments under which they are obligated to exchange currencies at specific future dates and at specified rates. All commitments are "marked-to-market" daily and any resulting unrealized gains or losses are included as unrealized appreciation (depreciation) on foreign currency denominated assets and liabilities. The Funds record realized gains or losses at the time the forward contract is settled. Risks may arise upon entering these contracts from the potential inability of a counter party to meet the terms of their contracts and from unanticipated movements in the value of a foreign currency relative to the U.S. dollar or other currencies. Counterparties to these contracts are major U.S. financial institutions. Please refer to Note 7 for further information on forward foreign currency contracts held in each Fund.
C. Restricted and Illiquid Securities. A restricted security cannot be resold to the general public without prior registration under the Securities Act of 1933. If the security is subsequently registered and resold, the issuers would typically bear the expense of all registrations at no cost to the Fund. Restricted securities are valued according to the guidelines and procedures adopted by the Funds' Board of Trustees. A security may be considered illiquid if it lacks a readily available market. Securities are generally considered liquid if they can be sold or disposed of in the ordinary course of business within seven days at approximately the price at which the security is valued by a fund. Illiquid securities may be valued under methods approved by the Board of Trustees as reflecting fair value.
D. Security Transactions, Dividend Income and Distributions. Security transactions are accounted for on the trade date. Dividend income and distributions to shareholders are recorded on the ex-dividend date. Realized gains and losses from securities transactions are calculated using the identified cost method.
E. Allocation of Expenses. Each Fund is charged for those expenses directly attributable to it. Expenses that are not directly attributable to a Fund are allocated among the Funds in proportion to their respective assets or another appropriate method.
F. Cash Overdraft. Throughout the year, the Funds may have cash overdraft balances. A fee is incurred on these overdrafts, calculated by multiplying the overdraft by a rate plus London Interbank Offered Rate ("LIBOR"). Payables, if any, are reflected as Overdraft Due to Custodian Bank in the Statements of Assets and Liabilities. Expenses from cash overdrafts are included in Interest Expense in the Statements of Operations.
G. Concentration of Risk. The Alternative Energy Fund invests substantially in the alternative energy or energy technology sectors. The Asia Focus Fund invests substantially all of its assets in the Asian continent. The Asia Pacific Dividend Builder Fund invests primarily in dividend-producing equity securities of Asia Pacific companies. The China & Hong Kong Fund invests substantially all of its assets in securities that are traded in China or Hong Kong or that are issued by companies that do a substantial part of their business in China. The Global Energy Fund invests substantially in energy companies; the changes in the prices and supplies of oil and other energy fuels may affect the Fund's investments. The Renminbi Yuan & Bond Fund invests in securities issued by companies economically tied to China, which exposes the Fund to greater market risk and potential monetary losses than if the Fund's assets were diversified among other regions. The consequences of political, social, or economic changes in the countries or business sectors in which the securities are offered or the issuers conduct their operations may affect the market prices of the Funds' investments and any income generated, as well as the Funds' ability to repatriate such amounts.
H. Use of Estimates. The preparation of financial statements in conformity with accounting principles generally accepted in the United States requires management to make estimates and assumptions that affect the reported amounts of assets and liabilities and the disclosure of contingent assets and liabilities at the date of the financial statements. Actual results could differ from those estimates.
84
I. Reclassifications. Accounting principles generally accepted in the United States require that certain components of net assets be reclassified between financial and tax reporting. These reclassifications have no effect on net assets or new asset value per share and were primarily attributed to differences in the treatment of foreign currency and net investment losses. For the year ended December 31, 2015, permanent differences in book and tax accounting have been reclassified as follows:
| | | Increase (Decrease) | |
| | | Paid in Capital | | Undistributed Net
Investment
Income/(Loss) | | Accumulated
Gains/(Losses) | |
Alternative Energy Fund | | $ | (133,304 | ) | | $ | 142,519 | | | $ | (9,215 | ) | |
Asia Focus Fund | | | 0 | | | | (8,436 | ) | | | 8,436 | | |
Asia Pacific Dividend Builder Fund | | | (12,511 | ) | | | 3,720 | | | | 8,791 | | |
China & Hong Kong Fund | | | (42 | ) | | | 56,138 | | | | (56,096 | ) | |
Dividend Builder Fund | | | 13,827 | | | | 20,915 | | | | (34,742 | ) | |
Global Energy Fund | | | 0 | | | | (10,181 | ) | | | 10,181 | | |
Global Innovators Fund | | | (84,884 | ) | | | (88,027 | ) | | | 172,911 | | |
Renminbi Yuan& Bond Fund | | | 0 | | | | (266,083 | ) | | | 266,083 | | |
J. Indemnifications. Under the Trust's organizational documents, its current and former officers and trustees are indemnified against certain liabilities arising out of the performance of their duties to the Funds. In addition, in the normal course of business, the Funds enter into contracts that contain a variety of representations and warranties that provide general indemnifications. The Funds' maximum exposure under these arrangements is unknown as this would involve future claims that may be made against the Funds that have not yet occurred or that would be covered by other parties.
K. Federal Income Taxes. The Funds intend to comply with the requirements of Subchapter M of the Internal Revenue Code applicable to regulated investment companies, and to distribute all of their taxable income to their shareholders. Therefore, no provision is made for federal income or excise tax.
The Funds recognize the tax benefits of uncertain tax positions only where the position is "more likely than not" to be sustained assuming examination by tax authorities. Management has analyzed the Funds' tax positions, and has concluded that no liability for unrecognized tax benefits should be recorded related to uncertain tax positions taken on returns filed for open tax years 2012 through 2014, or expected to be taken in the Funds' 2015 tax returns. The Funds identify their major tax jurisdiction as U.S. Federal, California State and foreign jurisdictions where the Funds make significant investments; however the Funds are not aware of any tax positions for which it is reasonably possible that the total amounts of unrecognized tax benefits will change materially in the next twelve months.
Note 3
Investment Advisory and Other Agreements
The Trust, on behalf of each Fund, entered into an Investment Advisory Agreement with Guinness Atkinson Asset Management, Inc. (the "Advisor"), under which the Advisor provides the Funds with investment management services. The Advisor furnishes all
85
investment advice, office space, facilities, and most of the personnel needed by the Funds. As compensation for its services, the Advisor is entitled to a monthly fee at the following annual rates based upon the average daily net assets of the Funds:
Alternative Energy Fund | | 1.00% | |
Asia Focus Fund | | 1.00% | |
Asia Pacific Dividend Builder Fund | | 1.00% | |
China & Hong Kong Fund | | 1.00% | |
Global Energy Fund | | 0.75% | |
Global Innovators Fund | | 0.75% on the 1st $500 million, 0.60% thereafter | |
Dividend Builder Fund | | 0.45% | |
Renminbi Yuan & Bond Fund | | 0.55% | |
The Funds are responsible for their own operating expenses. The Advisor has contractually agreed to limit each Fund's total operating expenses (excluding interest, dividends on short positions, taxes and extraordinary expenses) by reducing all or a portion of its fees and reimbursing the Fund for expenses so that its ratio of expenses to average daily net assets will not exceed the following levels:
| | | Annual Expense Limit | | Expiration Date | |
Alternative Energy Fund | | | 1.98 | % | | June 30, 2016 | |
Asia Focus Fund | | | 1.98 | % | | June 30, 2016 | |
Asia Pacific Dividend Builder Fund(a) | | | 1.98 | % | | June 30, 2016 | |
China & Hong Kong Fund | | | 1.98 | % | | June 30, 2016 | |
Global Energy Fund | | | 1.45 | % | | June 30, 2016 | |
Global Innovators Fund - Investor Class(b) | | | 1.24 | % | | June 30, 2018 | |
Global Innovators Fund - Institutional Class | | | 0.99 | % | | June 30, 2018 | |
Dividend Builder Fund | | | 0.68 | % | | June 30, 2016 | |
Renminbi Yuan & Bond Fund | | | 0.90 | % | | June 30, 2016 | |
(a) Effective January 1, 2016, the Advisor has agreed to reduce the limit on the Asia Pacific Dividend Builder Fund's total annual fund operating expenses by 0.88% of the Fund's average daily net assets to ensure that the Fund's total annual fund operating expenses, excluding certain expenses as stated in the Supplement dated January 4, 2016, do not exceed 1.10%.
(b) Prior to December 31, 2015, the annual expense limitation rate for Global Innovators Fund's Investor Class share was 1.55%.
The expense ratios shown in the financial highlights may exceed these levels due to expenses incurred, but not covered by the expense limitation agreement.
To the extent that the Advisor waives fees and/or absorbs expenses it may seek repayment of a portion or all of such amounts at any time within three fiscal years after the fiscal year in which such amounts were waived or absorbed, subject to the applicable cap. For the period ended December 31, 2015, the Advisor waived fees and absorbed expenses of $48,819, $88,425, $114,217 and $79,927 in the Alternative Energy Fund, the Asia Pacific Dividend Builder Fund, the Dividend Builder Fund, and the Renminbi Yuan & Bond Fund, respectively.
86
At December 31, 2015, the Advisor may recapture a portion of the following amounts that had been paid and/or waived on behalf of the Funds no later than the dates as stated below:
Fund: | | December 31, 2016 | | December 31, 2017 | | December 31, 2018 | | Total | |
Alternative Energy Fund | | $ | 24,186 | | | $ | 8,860 | | | $ | 48,819 | | | $ | 81,865 | | |
Asia Pacific Dividend Builder Fund | | | 74,741 | | | | 79,713 | | | | 88,425 | | | | 242,879 | | |
Dividend Builder Fund | | | 99,129 | | | | 102,063 | | | | 114,217 | | | | 315,409 | | |
Renminbi Yuan & Bond Fund | | | 60,089 | | | | 42,918 | | | | 79,927 | | | | 182,934 | | |
During the period ended December 31, 2015, the Advisor reimbursed the Global Innovators Fund $10,554 for trade errors. This amount is reported on the Statement of Operations under the caption "Net increase from payments by affiliates".
Mutual Fund Administration, LLC (the "Administrator") acts as the Funds' administrator under an administration agreement. The fees paid to the Administrator for the period ended December 31, 2015 are reported on the Statements of Operations.
Quasar Distributors, LLC (the "Distributor") acts as the Funds' principal underwriter in a continuous public offering of the Funds' shares.
Foreside Compliance Services, LLC provides Chief Compliance Officer ("CCO") services to the Funds. The fees paid for CCO services for the period ended December 31, 2015 are reported on the Statements of Operations.
On August 14, 1998, the Trust approved a Deferred Compensation Plan for Trustees (the "Plan"). Trustees can elect to receive payment in cash or defer payments provided for in the Plan. If a trustee elects to defer payment, the Plan provides for the creation of a deferred payment account (Phantom Share Account). This account accumulates the deferred fees earned, and the value of the account is adjusted at the end of each quarter to reflect the value that would have been earned if the account had been invested in designated investments. The Funds recognize as trustee expense amounts accrued as meetings are attended plus the change in value of the Phantom Share Account.
The change in the value of the phantom share account during the period ended December 31, 2015 is shown in the table below. These amounts included any additional contributions to the deferred compensation plan and any appreciation (depreciation) on the underlying investments.
Alternative Energy Fund | | $ | 31 | | |
Asia Focus Fund | | $ | (3,630 | ) | |
Asia Pacific Dividend Builder Fund | | $ | 500 | | |
China & Hong Kong Fund | | $ | (9,637 | ) | |
Global Energy Fund | | $ | (705 | ) | |
Global Innovators Fund | | $ | 500 | | |
Dividend Builder | | $ | 1,919 | | |
Renminbi Yuan & Bond Fund | | $ | (500 | ) | |
The fees paid to non-interested Trustees for the period ended December 31, 2015 are reported on the Statements of Operations.
Certain officers of the Trust are also officers and/or Directors of the Advisor and the Administrator. None of these officers are compensated directly by the Funds.
Note 4
Shareholder Servicing Plan
Each Fund has adopted a Shareholder Servicing Plan to pay a fee at an annual rate of up to 0.25% of its daily average net assets of shares serviced by shareholder servicing agents who provide administrative and support services to their customers. The Global Innovators Fund – Institutional Class shares do not participate in the Shareholder Servicing Plan.
87
The fees paid under the Shareholder Servicing Plan for the period ended December 31, 2015 are reported on the Statements of Operations.
Note 5
Investment Transactions
The following table presents purchases and sales of securities during the period ended December 31, 2015 excluding short-term investments, to indicate the volume of transactions in each Fund.
| | | Purchases | | Sales | |
Alternative Energy Fund | | $ | 4,249,987 | | | $ | 4,113,112 | | |
Asia Focus Fund | | $ | 1,581,165 | | | $ | 3,143,365 | | |
Asia Pacific Dividend Builder Fund | | $ | 5,169,775 | | | $ | 1,366,932 | | |
China & Hong Kong Fund | | $ | 21,190,074 | | | $ | 40,444,270 | | |
Dividend Builder Fund | | $ | 9,006,440 | | | $ | 2,467,862 | | |
Global Energy Fund | | $ | 8,871,069 | | | $ | 10,427,345 | | |
Global Innovators Fund | | $ | 93,119,483 | | | $ | 68,627,608 | | |
Renminbi Yuan & Bond Fund | | $ | 10,082,007 | | | $ | 97,794,021 | | |
The Funds did not purchase U.S. Government securities as a part of their long-term investment strategy during the period ended December 31, 2015.
Note 6
Fair Value Measurements and Disclosures
The Funds utilize various inputs in determining the value of their investments. These inputs are summarized in the three broad levels listed below:
Level 1 — Unadjusted quoted prices in active markets for identical assets or liabilities that a Fund has the ability to access.
Level 2 — Observable inputs other than quoted prices included in level 1 that are observable for the asset or liability, either directly or indirectly. These inputs may include quoted prices for the identical instrument on an inactive market, prices for similar instruments, interest rates, prepayment speeds, credit risk, yield curves, default rates and similar data.
Level 3 — Unobservable inputs for the asset or liability, to the extent relevant observable inputs are not available, representing the Fund's own assumptions about the assumptions a market participant would use in valuing the asset or liability, and would be based on the best information available.
The availability of observable inputs can vary from security to security and is affected by a wide variety of factors, including for example, the type of security, whether the security is new and not yet established in the marketplace, the liquidity of markets, and other characteristics particular to the security. To the extent that valuation is based on models or inputs that are less observable or unobservable in the market, the determination of fair value requires more judgment. Accordingly the degree of judgment exercised in determining fair value is greatest for instruments categorized in Level 3.
The inputs used to measure fair value may fall into different levels of the fair value hierarchy. In such cases, for disclosure purposes, the level in the fair value hierarchy within which the fair value measurement falls in its entirety, is determined based on the lowest level input that is significant to the fair value measurement in its entirety.
88
The inputs or methodology used for valuing securities are not an indication of the risk associated with investing in those securities. The following is a summary of the inputs used, as of December 31, 2015, in valuing the Funds' assets carried at fair value:
Alternative Energy Fund
Assets Table | | Level 1 | | Level 2 | | Level 3 | | Total | |
Investments, at Value | |
Common Stocks: | |
Energy | | $ | 6,645,079 | | | $ | 1,628,043 | | | $ | — | | | $ | 8,273,122 | | |
Industrial | | | 896,072 | | | | 1,524,803 | | | | — | | | | 2,420,875 | | |
Utilities | | | 1,669,661 | | | | 1,150,937 | | | | — | | | | 2,820,598 | | |
Total Investments, at Value | | | 9,210,812 | | | | 4,303,783 | | | | — | | | | 13,514,595 | | |
Total Assets | | $ | 9,210,812 | | | $ | 4,303,783 | | | $ | — | | | $ | 13,514,595 | | |
Asia Focus Fund
Assets Table | | Level 1 | | Level 2 | | Level 3 | | Total | |
Investments, at Value | |
Common Stocks:1 | |
Communications | | $ | 560,462 | | | $ | 964,968 | | | $ | — | | | $ | 1,525,430 | | |
Consumer, Cyclical | | | — | | | | 2,083,370 | | | | — | | | | 2,083,370 | | |
Consumer, Non-cyclical | | | — | | | | 611,608 | | | | — | | | | 611,608 | | |
Energy | | | 564,552 | | | | 793,701 | | | | — | | | | 1,358,253 | | |
Exchange Traded Funds ("ETFs") | | | — | | | | 450,886 | | | | — | | | | 450,886 | | |
Financial | | | — | | | | 2,707,419 | | | | — | | | | 2,707,419 | | |
Industrial | | | 89,238 | | | | 2,610,143 | | | | — | | | | 2,699,381 | | |
Technology | | | 851,828 | | | | 2,290,351 | | | | — | | | | 3,142,179 | | |
Utilities | | | 444,185 | | | | 416,972 | | | | — | | | | 861,157 | | |
Total Investments, at Value | | | 2,510,265 | | | | 12,929,418 | | | | — | | | | 15,439,683 | | |
Total Assets | | $ | 2,510,265 | | | $ | 12,929,418 | | | $ | — | | | $ | 15,439,683 | | |
89
Asia Pacific Dividend Builder Fund
Assets Table | | Level 1 | | Level 2 | | Level 3 | | Total | |
Investments, at Value | |
Common Stocks:1 | |
Communications | | $ | — | | | $ | 402,852 | | | $ | — | | | $ | 402,852 | | |
Consumer, Cyclical | | | — | | | | 1,622,019 | | | | — | | | | 1,622,019 | | |
Consumer, Non-cyclical | | | — | | | | 401,247 | | | | — | | | | 401,247 | | |
Energy | | | 266,519 | | | | 137,734 | | | | — | | | | 404,253 | | |
Financial | | | 191,680 | | | | 2,263,744 | | | | — | | | | 2,455,424 | | |
Industrial | | | — | | | | 1,243,958 | | | | — | | | | 1,243,958 | | |
Technology | | | 199,940 | | | | 606,242 | | | | — | | | | 806,182 | | |
Total Investments, at Value | | | 658,139 | | | | 6,677,796 | | | | — | | | | 7,335,935 | | |
Total Assets | | $ | 658,139 | | | $ | 6,677,796 | | | $ | — | | | $ | 7,335,935 | | |
China & Hong Kong Fund
Assets Table | | Level 1 | | Level 2 | | Level 3 | | Total | |
Investments, at Value | |
Common Stocks: | |
Communications | | $ | 2,479,187 | | | $ | 6,496,947 | | | $ | — | | | $ | 8,976,134 | | |
Consumer, Cyclical | | | — | | | | 10,704,008 | | | | — | | | | 10,704,008 | | |
Consumer, Non-cyclical | | | — | | | | 2,293,532 | | | | — | | | | 2,293,532 | | |
Energy | | | — | | | | 1,856,323 | | | | — | | | | 1,856,323 | | |
Exchange Traded Funds ("ETFs") | | | — | | | | 2,843,265 | | | | — | | | | 2,843,265 | | |
Financial | | | 29,606 | | | | 20,279,280 | | | | — | | | | 20,308,886 | | |
Industrial | | | 570,654 | | | | 8,499,509 | | | | — | | | | 9,070,163 | | |
Technology | | | 4,182,113 | | | | 2,620,982 | | | | — | | | | 6,803,095 | | |
Utilities | | | — | | | | 1,270,276 | | | | — | | | | 1,270,276 | | |
Total Investments, at Value | | | 7,261,560 | | | | 56,864,122 | | | | — | | | | 64,125,682 | | |
Total Assets | | $ | 7,261,560 | | | $ | 56,864,122 | | | $ | — | | | $ | 64,125,682 | | |
90
Dividend Builder Fund
Assets Table | | Level 1 | | Level 2 | | Level 3 | | Total | |
Investments, at Value | |
Common Stocks: | |
Communications | | $ | 345,411 | | | $ | 612,525 | | | $ | — | | | $ | 957,936 | | |
Consumer, Cyclical | | | 319,519 | | | | 329,310 | | | | — | | | | 648,829 | | |
Consumer, Non-cyclical | | | 2,213,109 | | | | 1,606,180 | | | | — | | | | 3,819,289 | | |
Energy | | | 282,436 | | | | 321,995 | | | | — | | | | 604,431 | | |
Financial | | | 2,221,656 | | | | — | | | | — | | | | 2,221,656 | | |
Industrial | | | 1,579,160 | | | | 289,804 | | | | — | | | | 1,868,964 | | |
Technology | | | 628,446 | | | | — | | | | — | | | | 628,446 | | |
Total Investments, at Value | | | 7,589,737 | | | | 3,159,814 | | | | — | | | | 10,749,551 | | |
Total Assets | | $ | 7,589,737 | | | $ | 3,159,814 | | | $ | — | | | $ | 10,749,551 | | |
Global Energy Fund
Assets Table | | Level 1 | | Level 2 | | Level 3 | | Total | |
Investments, at Value | |
Common Stocks: | |
Energy | | $ | 30,550,681 | | | $ | 12,996,456 | | | $ | — | | | $ | 43,547,137 | | |
Industrial | | | — | | | | 73,635 | | | | — | | | | 73,635 | | |
Total Investments, at Value | | | 30,550,681 | | | | 13,070,091 | | | | — | | | | 43,620,772 | | |
Total Assets | | $ | 30,550,681 | | | $ | 13,070,091 | | | $ | — | | | $ | 43,620,772 | | |
Global Innovators Fund
Assets Table | | Level 1 | | Level 2 | | Level 3 | | Total | |
Investments, at Value | |
Common Stocks: | |
Communications | | $ | 22,172,989 | | | $ | — | | | $ | — | | | $ | 22,172,989 | | |
Consumer, Cyclical | | | — | | | | 4,939,644 | | | | — | | | | 4,939,644 | | |
Consumer, Non-cyclical | | | 22,029,374 | | | | — | | | | — | | | | 22,029,374 | | |
Energy | | | 5,283,562 | | | | — | | | | — | | | | 5,283,562 | | |
Financial | | | 16,979,242 | | | | — | | | | — | | | | 16,979,242 | | |
Industrial | | | 17,379,930 | | | | 4,885,103 | | | | — | | | | 22,265,033 | | |
Technology | | | 66,518,316 | | | | 4,816,722 | | | | — | | | | 71,335,038 | | |
Total Investments, at Value | | | 150,363,413 | | | | 14,641,469 | | | | — | | | | 165,004,882 | | |
Total Assets | | $ | 150,363,413 | | | $ | 14,641,469 | | | $ | — | | | $ | 165,004,882 | | |
91
Renminbi Yuan & Bond Fund
Assets Table | | Level 1 | | Level 2 | | Level 3 | | Total | |
Investments, at Value | |
Corporate Bonds: | |
Basic Materials | | $ | — | | | $ | 299,913 | | | $ | — | | | $ | 299,913 | | |
Communications | | | — | | | | 301,058 | | | | — | | | | 301,058 | | |
Consumer, Cyclical | | | — | | | | 296,247 | | | | — | | | | 296,247 | | |
Consumer, Non-cyclical | | | — | | | | 290,401 | | | | — | | | | 290,401 | | |
Energy | | | — | | | | 146,722 | | | | — | | | | 146,722 | | |
Financial | | | — | | | | 3,600,537 | | | | — | | | | 3,600,537 | | |
Government | | | — | | | | 1,199,102 | | | | — | | | | 1,199,102 | | |
Industrial | | | — | | | | 448,242 | | | | — | | | | 448,242 | | |
Technology | | | — | | | | 151,266 | | | | — | | | | 151,266 | | |
Utilities | | | — | | | | 151,024 | | | | — | | | | 151,024 | | |
Total Investments, at Value | | | — | | | | 6,884,512 | | | | — | | | | 6,884,512 | | |
Total Assets | | $ | — | | | $ | 6,884,512 | | | $ | — | | | $ | 6,884,512 | | |
1 Foreign securities traded in foreign exchanges may be adjusted due to a significant change in the value of U.S. traded securities, as measured by the S&P 500 Index.
Transfers are recognized at the end of the reporting period. As of December 31, 2015, certain securities in the Alternative Energy Fund, Asia Focus Fund, Asia Pacific Dividend Builder Fund, China Hong Kong Fund, Dividend Builder Fund, Global Energy Fund and Global Innovators Fund transferred levels due to these Funds applying for value pricing to Non-U.S. securities.
| | | Alternative
Energy Fund | | Asia Focus
Fund | | Asia Pacific
Dividend
Builder
Fund | | China &
Hong Kong
Fund | | Dividend
Builder
Fund | | Global
Energy
Fund | | Global
Innovators
Fund | | Renminbi
Yuan & Bond
Fund | |
Transfers into Level 1 | | $ | 310,064 | | | $ | 653,790 | | | $ | 198,672 | | | $ | 570,654 | | | $ | 916,797 | | | $ | 2,599,276 | | | $ | 5,745,515 | | | $ | — | | |
Transfers out of Level 1 | | | (1,288,562 | ) | | | (1,405,305 | ) | | | (425,659 | ) | | | (2,843,265 | ) | | | (329,310 | ) | | | (185,952 | ) | | | (4,939,644 | ) | | | — | | |
Net transfers in (out) of
Level 1 | | $ | (978,498 | ) | | $ | (751,515 | ) | | $ | (226,987 | ) | | $ | (2,272,611 | ) | | $ | 587,487 | | | $ | 2,413,324 | | | $ | 805,871 | | | $ | — | | |
Transfers into Level 2 | | $ | 1,288,562 | | | $ | 1,405,305 | | | $ | 425,659 | | | $ | 2,843,265 | | | $ | 329,310 | | | $ | 185,952 | | | $ | 4,939,644 | | | $ | — | | |
Transfers out of Level 2 | | | (310,064 | ) | | | (653,790 | ) | | | (198,672 | ) | | | (570,654 | ) | | | (916,797 | ) | | | (2,599,276 | ) | | | (5,745,515 | ) | | | — | | |
Net transfers in (out) of
Level 2 | | $ | 978,498 | | | $ | 751,515 | | | $ | 226,987 | | | $ | 2,272,611 | | | $ | (587,487 | ) | | $ | (2,413,324 | ) | | $ | (805,871 | ) | | $ | — | | |
There were no securities transferred between Level 2 and Level 1 in the Renminbi Yuan & Bond Fund.
Note 7
Forward Foreign Currency Contracts
In order to hedge their portfolio and to protect them against possible fluctuations in foreign exchange rates pending the settlement of securities transactions, the Funds may enter into forward foreign currency contracts that obligate them to exchange currencies at specified future dates. At the maturity of a forward contract, a Fund may either make delivery of the foreign currency from currency held, if any, or from the proceeds of the portfolio securities sold. It may also terminate its obligation to deliver the foreign currency at any time by purchasing an offsetting contract. The forward values of amounts due are netted against the forward value of the currency to be delivered, and the net amount is shown as a receivable or payable in the financial statements. The Funds did
92
not enter into forward foreign currency contracts during the period ended December 31, 2015 and did not have any outstanding forward contracts as of December 31, 2015.
Note 8
Tax Matters
As of December 31, 2015, the tax bases of investments were as follows:
| | Alternative
Energy Fund | | Asia Focus
Fund | | Asia Pacific
Dividend
Builder
Fund | | China &
Hong Kong
Fund | | Dividend
Builder
Fund | | Global
Energy
Fund | | Global
Innovators
Fund | | Renminbi
Yuan & Bond
Fund | |
Cost of investments for
tax purposes | | $ | 20,996,620 | | | $ | 14,165,085 | | | $ | 7,372,021 | | | $ | 55,677,121 | | | $ | 10,847,334 | | | $ | 68,227,379 | | | $ | 165,288,330 | | | $ | 7,438,583 | | |
Gross tax unrealized
appreciation | | | 1,422,459 | | | | 3,464,431 | | | | 310,258 | | | | 13,834,099 | | | | 660,766 | | | | 2,052,706 | | | | 14,609,970 | | | | — | | |
Gross tax unrealized
(depreciation) | | | (8,904,484 | ) | | | (2,189,833 | ) | | | (619,344 | ) | | | (5,385,538 | ) | | | (758,549 | ) | | | (26,659,313 | ) | | | (14,893,418 | ) | | | (554,071 | ) | |
Net tax unrealized
appreciation
(depreciation)
on investments | | | (7,482,025 | ) | | | 1,274,598 | | | | (309,086 | ) | | | 8,448,561 | | | | (97,783 | ) | | | (24,606,607 | ) | | | (283,448 | ) | | | (554,071 | ) | |
Net tax appreciation
(depreciation)
on foreign-currency
denominated
assets and liabilities | | | (2,425 | ) | | | (6,413 | ) | | | (32 | ) | | | — | | | | (153 | ) | | | (23,488 | ) | | | — | | | | (22,203 | ) | |
Net tax unrealized
appreciation
(depreciation)* | | | (7,484,450 | ) | | | 1,268,185 | | | | (309,118 | ) | | | 8,448,561 | | | | (97,936 | ) | | | (24,630,095 | ) | | | (283,448 | ) | | | (576,274 | ) | |
Undistributed net
ordinary income** | | | — | | | | 31,265 | | | | — | | | | 36,749 | | | | — | | | | 17,117 | | | | — | | | | — | | |
Undistributed Long-term
Capital Gains | | | — | | | | — | | | | — | | | | — | | | | — | | | | — | | | | — | | | | — | | |
Post October loss*** | | | (1,772,140 | ) | | | (113,532 | ) | | | (9,352 | ) | | | (176 | ) | | | (375,569 | ) | | | (1,031,040 | ) | | | (2,062 | ) | | | (19,336 | ) | |
Capital loss carryforward | | | (88,947,611 | ) | | | (423,671 | ) | | | (3,227,536 | ) | | | — | | | | — | | | | (7,545,336 | ) | | | — | | | | (3,793,773 | ) | |
Other accumulated
gain/(loss) | | | (38,668 | ) | | | (59,789 | ) | | | (46,125 | ) | | | (119,559 | ) | | | (9,321 | ) | | | (56,508 | ) | | | (82,074 | ) | | | (23,701 | ) | |
Total accumulated
gain/(loss) | | $ | (98,242,869 | ) | | $ | 702,458 | | | $ | (3,592,131 | ) | | $ | 8,365,575 | | | $ | (482,826 | ) | | $ | (33,245,862 | ) | | $ | (367,584 | ) | | $ | (4,413,084 | ) | |
* The differences between book-basis and tax-basis unrealized appreciation/(depreciation) is attributable primary to the tax deferral of losses on wash sales and passive foreign investment company (PFIC) mark to market adjustments.
** The differences between book-basis and tax-basis undistributed net ordinary income is attributed to deferred compensation, which is included in Other Accumulated Loss.
*** Under the current tax law, capital and currency losses realized after October 31 and prior to a Fund's fiscal year end may be deferred as occurring on the first day of the following year.
93
As of December 31, 2015, the Funds have the following capital loss carryforwards available to offset future realized capital gains:
Capital losses expiring in: | | Alternative
Energy Fund | | Asia Focus
Fund | | Asia Pacific
Dividend
Builder
Fund | | China &
Hong Kong
Fund | | Dividend
Builder
Fund | | Global
Energy
Fund | | Global
Innovators
Fund | | Renminbi
Yuan & Bond
Fund | |
2016 | | $ | 10,370,865 | | | $ | — | | | $ | 608,671 | | | $ | — | | | $ | — | | | $ | — | | | $ | — | | | $ | — | | |
2017 | | | 40,204,652 | | | | — | | | | 1,115,940 | | | | — | | | | — | | | | — | | | | — | | | | — | | |
2018 | | | 9,296,377 | | | | 423,671 | | | | 1,502,925 | | | | — | | | | — | | | | — | | | | — | | | | — | | |
No Expiration Long-term | | | 28,527,135 | | | | — | | | | — | | | | — | | | | — | | | | 4,577,067 | | | | — | | | | 2,929,391 | | |
No Expiration Short-term | | | 548,582 | | | | — | | | | — | | | | — | | | | — | | | | 2,968,269 | | | | — | | | | 864,382 | | |
Total | | $ | 88,947,611 | | | $ | 423,671 | | | $ | 3,227,536 | | | $ | — | | | $ | — | | | $ | 7,545,336 | | | $ | — | | | $ | 3,793,773 | | |
For the year ended December 31, 2015, the Asia Focus Fund and Asia Pacific Dividend Builder Fund, utilized capital loss carryforwards of $181,336 and $276,584, respectively.
Under the enacted Regulated Investment Company Modernization Act of 2010 (the "Act"), the Funds will be permitted to carryforward capital losses incurred in taxable years beginning after December 22, 2010, for an unlimited period. However, any losses incurred during those future taxable years will be required to be utilized prior to the losses incurred in pre-enactment taxable years. As a result of this ordering rule, pre-enactment capital loss carryforwards may be more likely to expire unused. Additionally, post-enactment capital losses that are carried forward will retain their character as either short-term or long-term capital losses rather than being considered all short-term as under previous law.
The tax character of distributions (other than return of capital dividends) paid during 2015 and 2014 fiscal years are as follows:
| | | 2015 | | 2014 | |
| | | Ordinary
Income | | Long-term
Capital Gain | | Ordinary
Income | | Long-term
Capital Gain | |
Alternative Energy Fund | | $ | — | | | $ | — | | | $ | — | | | $ | — | | |
Asia Focus Fund | | | 179,969 | | | | — | | | | 204,461 | | | | — | | |
Asia Pacific Dividend Builder Fund | | | 139,312 | | | | — | | | | 85,227 | | | | — | | |
China & Hong Kong Fund | | | 1,399,863 | | | | 5,976,467 | | | | 1,336,756 | | | | 18,043,702 | | |
Dividend Builder | | | 329,142 | | | | 33,859 | | | | 168,735 | | | | 9,141 | | |
Global Energy Fund | | | 590,212 | | | | 1,057 | | | | 536,063 | | | | 313,966 | | |
Global Innovators Fund | | | 2,183,342 | | | | 5,451,075 | | | | 2,229,837 | | | | — | | |
Renminbi Yuan & Bond Fund | | | 1,708,020 | | | | — | | | | 3,220,427 | | | | — | | |
Note 9
Recently Issued Accounting Pronouncements
In June 2014, the Financial Accounting Standards Board ("FASB") issued Accounting Standards Update ("ASU") No. 2014-11 Repurchase-to-Maturity Transactions, Repurchase Financings, and Disclosures. The amendments in this ASU require an entity to modify accounting for repurchase-to-maturity transactions and repurchase financing arrangements, as well as modify required disclosures for repurchase agreements, securities lending transactions, and repurchase-to-maturity transactions that are accounted for as secured borrowings. The guidance is effective for fiscal years beginning on or after December 15, 2014, and for interim periods within those fiscal years. Management is currently evaluating the impact these changes will have on the Funds' financial statement disclosures.
In May 2015, the FASB issued ASU No. 2015-07 Disclosure for Investments in Certain Entities that Calculate Net Asset Value per Share (or Its Equivalent). The amendments in ASU No. 2015-07 remove the requirement to categorize within the fair value hierarchy investments measured using the net asset value per share ("NAV") practical expedient. The ASU also removes certain
94
disclosure requirements for investments that qualify, but do not utilize, the NAV practical expedient. The amendments in the ASU are effective for fiscal years beginning after December 15, 2015, and interim periods within those fiscal years. Management is currently evaluating the impact these changes will have on the Fund's financial statements and related disclosures.
Note 10
Events Subsequent to the Fiscal Period End
The Funds have adopted financial reporting rules regarding a subsequent event which requires an entity to recognize in the financial statements the effects of all subsequent events that provide additional evidence about conditions that existed at the date of the balance sheet. Management has evaluated the Funds' related events and transactions and has determined that there were no events or transactions that occurred that would materially impact the amounts or disclosures in the Funds' financial statements.
95
Additional Information (Unaudited)
Proxy Voting Procedures
The Advisor votes proxies relating to portfolio securities in accordance with procedures that have been approved by the Board. You may obtain a description of these procedures, free of charge, by calling "toll-free" (800) 915-6565. This information is also available through the Securities and Exchange Commission's website at www.sec.gov.
Proxy Voting Records
Information regarding how the Advisor voted proxies relating to portfolio securities during the latest 12-month period ended June 30 is available, without charge, by calling toll-free, (800) 915-6565. This information is also available through the Securities and Exchange Commission's website at www.sec.gov.
Form N-Q Disclosure
The Funds file their complete schedule of portfolio holdings with the Securities and Exchange Commission for the first and third quarters of each fiscal year on Form N-Q. The Funds' Form N-Q is available on the Securities and Exchange Commission's website at www.sec.gov. The Funds' Form N-Q may be reviewed and copied at the Commission's Public Reference Room in Washington, DC, and information on the operation of the Public Reference Room may be obtained by calling (800) SEC-0330. This information is also available, without charge, by calling toll-free, (800) 915-6565.
Supplemental Tax Information
For the fiscal year ended December 31, 2015, certain dividends paid by the Funds may be subject to a maximum tax rate of 15%, as provided for by the Jobs and Growth Tax Relief Reconciliation Act of 2003. The percentage of dividends declared from ordinary income designated as qualified dividend income was as follows:
Alternative Energy Fund | | | N/A | | |
Asia Focus Fund | | | 100.00 | % | |
Asia Pacific Dividend Builder Fund | | | 61.24 | % | |
China & Hong Kong Fund | | | 96.59 | % | |
Dividend Builder Fund | | | 93.58 | % | |
Global Energy Fund | | | 100.00 | % | |
Global Innovators Fund | | | 100.00 | % | |
Renminbi Yuan & Bond Fund | | | N/A | | |
For the period ended December 31, 2015, pursuant to Section 853(b)(3) of the Internal Revenue Code, the China & Hong Kong Fund, the Dividend Builder Fund, the Global Energy Fund, and the Global Innovators Fund designates $5,976,467, $33,859, $1,057 and $5,451,075 respectively, as long-term capital gains.
Pursuant to Section 853 of the Internal Revenue Code of 1986, as amended, the Funds designate the following income earned from foreign sources and foreign taxes paid for the year ended December 31, 2015:
| | | Foreign Sourced Income | | Foreign Taxes Paid | |
| | | Total
Amount | | Per Share
Amount | | Total
Amount | | Per Share
Amount | |
Alternative Energy Fund | | | N/A | | | | N/A | | | | N/A | | | | N/A | | |
Asia Focus Fund | | $ | 659,115 | | | $ | 0.62 | | | $ | 60,300 | | | $ | 0.06 | | |
| Asia Pacific Dividend Builder Fund | | | 204,920 | | | | 0.36 | | | | 13,596 | | | | 0.02 | | |
| China & Hong Kong Fund | | | 2,387,919 | | | | 0.71 | | | | 143,156 | | | | 0.04 | | |
| Dividend Builder Fund | | | 256,778 | | | | 0.35 | | | | 26,802 | | | | 0,04 | | |
| Global Energy Fund | | | 1,161,490 | | | | 0.49 | | | | 138,783 | | | | 0.06 | | |
Global Innovators Fund | | | N/A | | | | N/A | | | | N/A | | | | N/A | | |
Renminbi Yuan & Bond Fund | | | N/A | | | | N/A | | | | N/A | | | | N/A | | |
96
REPORT OF INDEPENDENT REGISTERED
PUBLIC ACCOUNTING FIRM
To the Shareholders and Board of Trustees
Guinness Atkinson Funds
Woodland Hills, California
We have audited the accompanying statements of assets and liabilities, including the schedules of investments, of the Alternative Energy Fund, Asia Focus Fund, Asia Pacific Dividend Builder Fund, China & Hong Kong Fund, Global Energy Fund, Global Innovators Fund, Renminbi Yuan & Bond Fund and Dividend Builder Fund (the "Funds"), each a series of shares of the Guinness Atkinson Funds, as of December 31, 2015, the related statements of operations for the year then ended, the statements of changes in net assets for each of the two years in the period then ended, and the financial highlights for each of the five years in the period then ended, except for Renminbi Yuan & Bond Fund the related statement of operations for the year then ended, the statement of changes in net assets for each of the two years in the period then ended and the financial highlights for each of the four years in the period then ended and for the period June 30, 2011 (commencement of operations) to December 31, 2011, and for Dividend Builder Fund the related statement of operations for the year then ended, the statement of changes in net assets for each of the two years in the period then ended and the financial highlights for each of the three years in the period then ended and the period March 30, 2012 (commencement of operations) to December 31, 2012. These financial statements and financial highlights are the responsibility of the Funds' management. Our responsibility is to express an opinion on these financial statements and financial highlights based on our audits.
We conducted our audits in accordance with the standards of the Public Company Accounting Oversight Board (United States). Those standards require that we plan and perform the audits to obtain reasonable assurance about whether the financial statements and financial highlights are free of material misstatement. The Funds are not required to have, nor were we engaged to perform, an audit of their internal control over financial reporting. Our audits included consideration of internal control over financial reporting as a basis for designing audit procedures that are appropriate in the circumstances, but not for the purpose of expressing an opinion on the effectiveness of the Funds' internal control over financial reporting. Accordingly, we express no such opinion. An audit includes examining, on a test basis, evidence supporting the amounts and disclosures in the financial statements. Our procedures included confirmation of securities owned as of December 31, 2015, by correspondence with the custodian. An audit also includes assessing the accounting principles used and significant estimates made by management, as well as evaluating the overall financial statement presentation. We believe that our audits provide a reasonable basis for our opinion.
In our opinion, the financial statements and financial highlights referred to above present fairly in all material respects, the financial position of the above mentioned Funds as of December 31, 2015, the results of their operations, the changes in their net assets and the financial highlights for the periods indicated above, in conformity with accounting principles generally accepted in the United States of America.
TAIT, WELLER & BAKER LLP
Philadelphia, Pennsylvania
February 29, 2016
97
TRUSTEE AND OFFICER INFORMATION (Unaudited)
Unless otherwise noted, each Trustee and officer's address is 21550 Oxnard Street, Suite 850, Woodland Hills, California 91367. Trustees and officers of the Trust serve until their resignation, removal or retirement. Additional information about the Trustees is included in the Funds' Statement of Additional Information which is available, without charge, upon request by calling toll-free, 1-800-915-6565 or by visiting the Funds' website at www.gafunds.com.
| Name and Age | | Position(s)
Held with
Trust† | | Year Elected | | Principal Occupation(s) During the
Past 5 Years | | Number of
Portfolios In
Fund Complex
Overseen by
Trustee | | Other Directorships
Held by Trustee
During the Past 5 Years | |
Non-Interested Trustees | | | | | | | | | | | | | | | | | | | | | |
Dr. Gunter Dufey
(75) | | Trustee | | | 1994 | | | Executive Director of Education Exchange Ltd., a consulting firm since 2010. Professorial Fellow, Nanyang Technological University (Singapore) since 2005. Professor (Emeritus) of Ross School at The University of Michigan, where he served from 1968 to 2002. | | | 8 | | | Independent director, various subsidiaries of Ally Financial Inc. (formerly GMAC) in the United States and Canada.
SmartX ETF Trust, a registered investment company | |
James I. Fordwood
(68) | | Trustee | | | 1994 | | | CFO and Managing Member of Prima Marketing LLC (network of convenience stores) since 1998. | | | 8 | | | SmartX ETF Trust, a registered investment company | |
Dr. Bret A. Herscher
(57) | | Trustee | | | 1994 | | | Vice President of Minnow Medical, a company that develops medical devices for treating peripheral artery disease since 2009. President of Pacific Consultants, a technical and technology management consulting company serving the electronic industry and venture capital community that he co-founded, from 1996 to 2007. | | | 8 | | | SmartX ETF Trust, a registered investment company | |
J. Brooks Reece, Jr.
(68) | | Trustee and Chairman | | | 1994 | | | Vice President of Adcole Corp., a manufacturer of precision measuring machines and sun angle sensors for space satellites since 1984. President of Adcole Far East Ltd. since 2008. Executive Director of Adcole Measuring Equipment Shanghai Co. Ltd., since 2004. | | | 8 | | | SmartX ETF Trust, a registered investment company | |
98
| Name and Age | | Position(s)
Held with
Trust† | | Year Elected | | Principal Occupation(s) During the
Past 5 Years | | Number of
Portfolios In
Fund Complex
Overseen by
Trustee | | Other Directorships
Held by Trustee
During the Past 5 Years | |
Interested Trustee | | | | | | | | | | | | | | | | | | | | | |
Timothy W.N.
Guinness*
14 Queen Anne's Gate
London,
England SW1H 9AA
U.K.
(67) | | Trustee | | | 1998 | | | Chairman/CIO of Guinness AtkinsonTM Asset Management since November 2002. Chairman of Guinness Asset Management Ltd., investment advisor in London, since 2003. Director of Guinness Capital Management Ltd. since 2010. Director of SR Europe Investment Trust Plc since 2001. Director of Atlantis Japan Growth Fund Ltd., since 2002. Non-Executive Director of Quayle Munro since 2007. Non-Executive Director of Brompton Bicycle Ltd., since 2000. | | | 8 | | | SmartX ETF Trust, a registered investment company | |
Officers | | | | | | | | | | | | | | | | | | | | | |
James Atkinson
(58) | | President | | | 2003 | | | Chief Executive Officer and Director of Guinness AtkinsonTM Asset Management since November 2002. Director of Guinness Asset Management Ltd. since 2003. Principal of Orbis Marketing, a mutual fund marketing and advertising firm, since November 2001. | | | N/A | | | | N/A | | |
Patrick Keniston
(51) | | Chief Compliance Officer | | | 2014 | | | Managing Director, Foreside Compliance Services, LLC since October 2008. | | | N/A | | | | N/A | | |
Rita Dam
(49) | | Treasurer | | | 2009 | | | Co-Chief Executive Officer (2016-present), and Vice President, Mutual Fund Administration, LLC (2006-2015) | | | N/A | | | | N/A | | |
Joy Ausili
(49) | | Secretary and Assistant Treasurer | | | 2009 | | | Co-Chief Executive Officer (2016-present), and Vice President, Mutual Fund Administration, LLC (2006-2015). | | | N/A | | | | N/A | | |
* "Interested person" (as defined in the 1940 Act) of the Funds because of his affiliation with the Funds' Advisor, Guinness Atkinson Asset Management, Inc.
99
| Name and Age | | Position(s)
Held with
Trust† | | Year Elected | | Principal Occupation(s) During the
Past 5 Years | | Number of
Portfolios In
Fund Complex
Overseen by
Trustee | | Other Directorships
Held by Trustee
During the Past 5 Years | |
Sardjono Kadiman
(40) | | Assistant Treasurer | | | 2009 | | | Assistant Vice President, Mutual Fund Administration, LLC since 2008. | | | N/A | | | | N/A | | |
Lyna Phan
(40) | | Assistant Treasurer | | | 2011 | | | Assistant Vice President, Mutual Fund Administration, LLC since 2010. | | | N/A | | | | N/A | | |
100
This page is Intentionally Left Blank
101
This page is Intentionally Left Blank
102
Guinness AtkinsonTM Funds Information
Board of Trustees
J. Brooks Reece, Jr., Chairman | |
Dr. Gunter Dufey | |
James I. Fordwood | |
Timothy W.N. Guinness | |
Dr. Bret A. Herscher | |
Contact Guinness AtkinsonTM Funds
P.O. Box 701 | |
Milwaukee, WI 53201-0701 | |
Shareholder Services: 800-915-6566 | |
Literature Request: 800-915-6565 | |
Website: www.gafunds.com | |
Email: mail@gafunds.com | |
Guinness AtkinsonTM Funds
Fund | | Cusip | | Ticker | | Fund# | |
Alternative Energy Fund | | 402031 50 4 | | GAAEX | | | 1298 | | |
Asia Focus Fund | | 402031 10 8 | | IASMX | | | 1096 | | |
Asia Pacific Dividend Builder Fund | | 402031 60 3 | | GAADX | | | 1299 | | |
China & Hong Kong Fund | | 402031 20 7 | | ICHKX | | | 1094 | | |
Dividend Builder Fund | | 402031 80 1 | | GAINX | | | 1092 | | |
Global Energy Fund | | 402031 40 5 | | GAGEX | | | 1098 | | |
Global Innovators Fund Investor Class | | 402031 30 6 | | IWIRX | | | 1095 | | |
Global Innovators Fund Institutional Class | | 402031 88 4 | | GINNX | | | 1095 | | |
Renminbi Yuan & Bond Fund | | 402031 70 2 | | GARBX | | | 1099 | | |
Distributed by Quasar Distributors, LLC, Milwaukee, WI 53202
This report is intended for shareholders of the Guinness AtkinsonTM Funds and may not be used as literature unless preceded or accompanied by a current prospectus.
103
Guinness Atkinson Funds
c/o U.S. Bancorp Fund Services, LLC
P.O. Box 701
Milwaukee, WI 53201-0701
Item 2. Code of Ethics.
The registrant has adopted a code of ethics that applies to the registrant’s principal executive officer and principal financial officer. The registrant has not made any amendments to its code of ethics during the period covered by this report. The registrant has not granted any waivers from any provisions of the code of ethics during the period covered by this report.
The registrant undertakes to provide to any person without charge, upon request, a copy of its code of ethics by mail when they call the registrant at 1-800-915-6565.
Item 3. Audit Committee Financial Expert.
The registrant’s board of trustees has determined that there is at least one audit committee financial expert serving on its audit committee. James I. Fordwood is the “audit committee financial expert” and is considered to be “independent” as each term is defined in Item 3 of Form N-CSR.
Item 4. Principal Accountant Fees and Services.
The registrant has engaged its principal accountant to perform audit services, audit-related services, tax services and other services during the past two fiscal years. “Audit services” refer to performing an audit of the registrant’s annual financial statements or services that are normally provided by the accountant in connection with statutory and regulatory filings or engagements for those fiscal years. “Audit-related services” refer to the assurance and related services by the principal accountant that are reasonably related to the performance of the audit. “Tax services” refer to professional services rendered by the principal accountant for tax compliance, tax advice, and tax planning. There were no “other services” provided by the principal accountant. The following table details the aggregate fees billed or expected to be billed for each of the last two fiscal years for audit fees, audit-related fees, tax fees and other fees by the principal accountant.
| | FYE 12/31/2015 | | FYE 12/31/2014 | |
Audit Fees | | $ | 140,900 | | $ | 140,900 | |
Audit-Related Fees | | N/A | | N/A | |
Tax Fees | | $ | 25,600 | | $ | 25,600 | |
All Other Fees | | N/A | | N/A | |
The audit committee has adopted pre-approval policies and procedures that require the audit committee to pre-approve all audit and non-audit services of the registrant, including services provided to any entity affiliated with the registrant.
The percentage of fees billed by Tait, Weller, & Baker LLP applicable to non-audit services pursuant to waiver of pre-approval requirement were as follows:
| | FYE 12/31/2015 | | FYE 12/31/2014 | |
Audit-Related Fees | | 0 | % | 0 | % |
Tax Fees | | 0 | % | 0 | % |
All Other Fees | | 0 | % | 0 | % |
All of the principal accountant’s hours spent on auditing the registrant’s financial statements were attributed to work performed by full-time permanent employees of the principal accountant.
The following table indicates the non-audit fees billed or expected to be billed by the registrant’s accountant for services to the registrant and to the registrant’s investment adviser (and any other controlling entity, etc.—not sub-adviser) for the last two years. The audit committee of the Board of Trustees has considered whether the provision of non-audit services that were rendered to the registrant’s investment adviser is compatible with maintaining the principal accountant’s independence and has concluded that the provision of such non-audit services by the accountant has not compromised the accountant’s independence.
Non-Audit Related Fees | | FYE 12/31/2015 | | FYE 12/31/2014 | |
Registrant | | N/A | | N/A | |
Registrant’s Investment Advisor | | N/A | | N/A | |
Item 5. Audit Committee of Listed Registrants.
Not applicable to registrants who are not listed issuers (as defined in Rule 10A-3 under the Securities Exchange Act of 1934).
Item 6. Schedule of Investments.
(a) Schedule of Investments is included as part of the report to shareholders filed under Item 1 of this Form.
(b) Not Applicable.
Item 7. Disclosure of Proxy Voting Policies and Procedures for Closed-End Management Investment Companies.
Not Applicable.
Item 8. Portfolio Managers of Closed-End Management Investment Companies.
Not Applicable.
Item 9. Purchases of Equity Securities by Closed-End Management Investment Company and Affiliated Purchasers.
Not Applicable.
Item 10. Submission of Matters to a Vote of Security Holders.
The registrant has not made any material changes to the procedures by which shareholders may recommend nominees to the registrant’s Board of Trustees.
Item 11. Controls and Procedures.
(a) The registrant’s principal executive officer and principal financial officer have evaluated the registrant’s disclosure controls and procedures within 90 days of this filing and have concluded based on such evaluation that the registrant’s disclosure controls and procedures were effective, as of that
date, in ensuring that information required to be disclosed by the registrant in this Form N-CSR was recorded, processed, summarized, and reported within the time periods specified in the Securities and Exchange Commission’s rules and forms.
(b) There were no changes in the registrant’s internal control over financial reporting (as defined in Rule 30a-3(d) under the Investment Company Act of 1940) that occurred during the registrant’s last fiscal quarter that have materially affected, or are reasonably likely to materially affect, the registrant’s internal control over financial reporting.
Item 12. Exhibits.
(a) (1) Any code of ethics or amendment thereto, that is subject of the disclosure required by Item 2, to the extent that the registrant intends to satisfy Item 2 requirements through filing an exhibit. Incorporated by reference to the Registrant’s Form N-CSR filed March 10, 2011.
(b)
(2) Certifications pursuant to Section 302 of the Sarbanes-Oxley Act of 2002. Filed herewith.
(3) Any written solicitation to purchase securities under Rule 23c-1 under the Act sent or given during the period covered by the report by or on behalf of the registrant to 10 or more persons. Not applicable to open-end investment companies.
(c) Certification pursuant to Section 906 of the Sarbanes-Oxley Act of 2002. Filed herewith.
SIGNATURES
Pursuant to the requirements of the Securities Exchange Act of 1934 and the Investment Company Act of 1940, the registrant has duly caused this report to be signed on its behalf by the undersigned, thereunto duly authorized.
(Registrant) Guinness Atkinson Funds
By | /s/ James J. Atkinson | |
Name: | James J. Atkinson | |
Title: | President | |
Date: | 3/10/16 | |
Pursuant to the requirements of the Securities Exchange Act of 1934 and the Investment Company Act of 1940, this report has been signed by the following persons on behalf of the registrant and in the capacities and on the dates indicated.
By | /s/ James J. Atkinson | |
Name: | James J. Atkinson | |
Title: | President | |
Date: | 3/10/16 | |
| | |
| | |
By | /s/ Rita Dam | |
Name: | Rita Dam | |
Title: | Treasurer | |
Date: | 3/10/16 | |