UNITED STATES
SECURITIES AND EXCHANGE COMMISSION
Washington, D.C. 20549
FORM N-CSR
CERTIFIED SHAREHOLDER REPORT OF REGISTERED
MANAGEMENT INVESTMENT COMPANIES
Investment Company Act file number | 811-08360 |
|
GUINNESS ATKINSON FUNDS |
(Exact name of registrant as specified in charter) |
|
21550 Oxnard Street, Suite 850 Woodland Hills, CA | | 91367 |
(Address of principal executive offices) | | (Zip code) |
|
James J. Atkinson, Jr. 21550 Oxnard Street, Suite 850 Woodland Hills, CA 91367 |
(Name and address of agent for service) |
|
Registrant’s telephone number, including area code: | (800-915-6566) | |
|
Date of fiscal year end: | December 31 | |
|
Date of reporting period: | December 31, 2016 | |
| | | | | | | | |
Item 1. Reports to Stockholders.
The registrant’s annual report transmitted to shareholders pursuant to Rule 30e-1 under the Investment Company Act of 1940, as amended (the “Investment Company Act”), is as follows:
2
Guinness AtkinsonTM Funds
Annual Report
December 31, 2016
TABLE OF CONTENTS
| | 5 | | | Letter to Shareholders | |
| | 7 | | | Expense Examples | |
| | 8 | | | Alternative Energy Fund | |
| | 15 | | | Asia Focus Fund | |
| | 22 | | | Asia Pacific Dividend Builder Fund | |
| | 29 | | | China & Hong Kong Fund | |
| | 36 | | | Dividend Builder Fund | |
| | 44 | | | Global Energy Fund | |
| | 54 | | | Global Innovators Fund | |
| | 64 | | | Renminbi Yuan & Bond Fund | |
| | 70 | | | Statements of Assets and Liabilities | |
| | 72 | | | Statements of Operations | |
| | 74 | | | Statements of Changes in Net Assets | |
| | 79 | | | Financial Highlights | |
| | 88 | | | Notes to Financial Statements | |
| | 103 | | | Report of Independent Registered Public Accounting Firm | |
| | 104 | | | Trustee and Officer Information | |
| | 107 | | | Privacy Notice | |
| | 111 | | | Guinness Atkinson Funds Information | |
3
The table below provides total return data for each of the Funds over the one, three, five, ten-years and since inception periods through December 31, 2016. Also included in the table is the expense ratio data from the most recent prospectus dated May 1, 2016 (or as updated August 22, 2016).
Fund (inception date) | | 1-year | | 3-year | | 5-year | | 10-year | | Since Inception | | Expense Ratio | |
Alternative Energy Fund (March 31, 2006) | | | -17.16 | % | | | -14.32 | % | | | -2.93 | % | | | -12.95 | % | | | -12.80 | % | | | 2.31 | % gross; 1.98% net† | |
Asia Focus Fund (April 29, 1996) | | | 9.20 | % | | | -0.53 | % | | | 0.44 | % | | | 1.02 | % | | | 2.13 | % | | | 2.00 | %† | |
Asia Pacific Dividend Builder Fund
(March 31, 2006) | | | 8.81 | % | | | 4.21 | % | | | 6.48 | % | | | 3.87 | % | | | 4.57 | % | | | 3.87 | % gross; 1.10% net† | |
China & Hong Kong Fund (June 30, 1994) | | | 2.95 | % | | | -2.29 | % | | | 2.58 | % | | | 3.25 | % | | | 6.30 | % | | | 1.56 | %† | |
Dividend Builder Fund (March 30, 2012) | | | 6.83 | % | | | 2.63 | % | | | — | | | | — | | | | 8.48 | % | | | 1.77 | % Gross; 0.68% net† | |
Global Energy Fund (June 30, 2004) | | | 27.04 | % | | | -9.32 | % | | | -0.79 | % | | | 1.16 | % | | | 7.48 | % | | | 1.41 | %† | |
Global Innovators Fund Investor Class
(December 15, 1998) | | | 9.51 | % | | | 6.12 | % | | | 15.80 | % | | | 8.14 | % | | | 6.93 | % | | | 1.27 | % gross; 1.24% net† | |
Global Innovators Fund Institutional Class
(December 31, 2015) | | | 9.81 | % | | | 6.22 | % | | | 15.86 | % | | | 8.17 | % | | | 6.95 | % | | | 1.07 | % gross; 0.99% net† | |
Renminbi Yuan & Bond Fund (June 30, 2011) | | | -3.52 | % | | | -2.84 | % | | | 0.06 | % | | | — | | | | 0.08 | % | | | 1.05 | % gross; 0.93% net† | |
Periods of greater than one year are average annualized returns; one year and shorter period returns are actual returns. All returns are for the periods ended December 31, 2016.
Performance data shown for the Global Innovators, Institutional Class (GINNX), prior to its inception date on December 31, 2015, uses performance data from the Global Innovators, Investor Class (IWIRX).
Performance data quoted represents past performance and does not guarantee future results. The investment return and principal value of an investment will fluctuate so that an investor's shares, when redeemed, may be worth more or less than the original cost. Current performance of the Funds may be lower or higher than the performance quoted. Performance data current to the most recent month end may be obtained by visiting www.gafunds.com.
Each of the Asia Focus Fund, the Asia Pacific Dividend Builder Fund, the China & Hong Kong Fund, and the Renminbi Yuan & Bond Fund imposes 2% redemption fee on shares held less than 30 days. Performance data quoted does not reflect this fee. If it had, total return would be lower.
Expense ratios are from the most recent prospectus (dated May 1, 2016 or amended as of August 22, 2016) and are from the most recent audited financials (period ended December 31, 2015) at the time that prospectus was completed.
†All of the Guinness Atkinson Funds, except the Global Innovators Fund, have an expense cap in place and the advisor is contractually obligated to cap the Funds' total expenses at least through June 30, 2017. The Global Innovators Fund has an expense cap in place and the advisor is contractually obligated to cap the Fund's total expenses at least through June 30, 2018.
4
Dear Guinness Atkinson Funds Shareholders,
Well, wasn't that interesting. We're referring to 2016, which was, in a word, interesting. You may have another, more judgmental word in mind; understood. The beginning of any year is a time for predictions. A year ago, all of the predictions we encountered didn't even come close to forecasting the many surprising things that happened in 2016. For starters, if you'll recall, 2016 began in a very bearish manner with predictions of a further collapse of the price of oil and the collapse of China and the yuan, a disaster in the stock markets and US and global economies, sharply rising interest rates and generally a bad year. In the end all of the things we were worrying about didn't come to pass. The markets, in fact, had a generally good year. Interest rates only rose fractionally, and the US and global economies generally improved nicely. The disaster prognosticators largely failed to predict the wave of populism sweeping the planet. Even if they had, the markets – at least the US markets – seem to be taking this populism craze in stride. The equity markets may be up because of, rather than in spite of, global political developments. At least for now.
For the Guinness Atkinson Funds, 2016 was a pretty good year, with six of our eight Funds producing positive results. The performance table on the facing page tells the story. Highlights for the year include the Global Energy Fund, which produced a total return of 27.04%. Not bad considering predictions of a continued collapse in the price of oil. The Global Innovators Fund added to its rather impressive long-term track record with a total return for the year of 9.51% for the Investor Class (9.81% for the Institutional Class). Our two Asian equity Funds, the Asia Pacific Dividend Builder Fund and the Asia Focus Fund, both had good years, with total returns for the year of 8.81% and 9.20%, respectively.
As mentioned, two of the Guinness Atkinson Funds had negative years. The Alternative Energy Fund turned in a total return of -17.16% while the Renminbi Yuan & Bond Fund produced a return of -3.52%. Notwithstanding the lackluster return for the Alternative Energy Fund, we are optimistic about this sector and this Fund. Much has been made of the political environment around alternative energy, but our view on alternative energy is apolitical: sustainable energy technologies have declined in price such that they are increasingly competitive with traditional energy, without subsidies. Going forward, we think, the success of alternative energy will be a function of free market economics and not government support. This isn't to say that government policy won't matter but rather that in the end, the economics will lead to the adoption of sustainable energy.
One other Fund we'd like to mention is our Dividend Builder Fund. This Fund has continued to quietly motor ahead. The 2016 total return for this Fund was 6.83% and from inception the Fund has an annualized 8.48% return. This Fund will reach its fifth anniversary at the end of March.
Morningstar Ratings Through December 31, 2016
Fund | | Category | | Overall | | 3-Year | | 5-Year | | 10-Year | |
Alternative Energy | | Energy Equity | | 2** | | 2** | | 2** | | 1* | |
| | | | | (102 funds) | | (102 funds) | | (84 funds) | | (65 funds) | |
Asia Focus | | Pacific/Asia | | 1* | | 2** | | 1* | | 1* | |
| | | ex-Japan | | (67 funds) | | (67 funds) | | (56 funds) | | (20 funds) | |
Asia Pacific Dividend | | Pacific/Asia | | 4**** | | 5***** | | 5***** | | 2** | |
Builder | | ex-Japan | | (67 funds) | | (67 funds) | | (56 funds) | | (20 funds) | |
China & Hong Kong | | China Region | | 2** | | 2** | | 2** | | 2** | |
| | | | | (93 funds) | | (93 funds) | | (78 funds) | | (38 funds) | |
Global Energy | | Energy Equity | | 3*** | | 3*** | | 3*** | | 3*** | |
| | | | | (102 funds) | | (102 funds) | | (84 funds) | | (65 funds) | |
Global Innovators | | World Stock | | 5***** | | 5***** | | 5***** | | 5***** | |
| | | | | (848 funds) | | (848 funds) | | (669 funds) | | (372 funds) | |
Renminbi Yuan & Bond | | Emerging Markets | | 5***** | | 4**** | | 5***** | | | |
| | | Local Currency Bond | | (77 funds) | | (77 funds) | | (60 funds) | | | |
Dividend Builder | | World Stock | | 3*** | | 3*** | | | | | |
| | | | | (848 funds) | | (848 funds) | | | | | |
5
Our investment team has provided a detailed commentary for each of the Guinness Atkinson Funds adjacent to each Fund's financial results.
As usual, we appreciate the confidence you have placed in us and our management team and look forward to what will hopefully be a great 2017.
We encourage you to visit gafunds.com for the latest news and announcements on the Guinness Atkinson Funds.
Sincerely,

| | 
| |
Timothy Guinness | | James Atkinson | |
Mutual fund investing involves risk. Principal loss is possible. The Funds invest in foreign securities, which involves greater volatility and political, economic and currency risks and differences in accounting methods. These risks are greater for emerging markets countries. Non-diversified Funds' assets may be concentrated in fewer individual holdings than diversified funds. Therefore, these Funds are more exposed to individual stock volatility than diversified funds. Investments in smaller companies involve additional risks such as limited liquidity and greater volatility. Investments in debt securities typically decrease in value when interest rates rise, which can be greater for longer-term debt securities. Investments in derivatives involve risks different from, and in certain cases, greater than the risks presented by traditional investments. Investments focused in a single geographic region may be exposed to greater risk than investments diversified among various geographies. Investments focused on the energy sector may be exposed to greater risk than an investments diversified among various sectors.
The views in this letter were as of December 31, 2016 and may not necessarily reflect the same views on the date this letter is first published or any time thereafter. These views are intended to help shareholders in understanding the fund's investment methodology and do not constitute investment advice.
Morningstar Ratings Disclosure
Global Innovators Fund ratings shown were given for the Investor Share Class.
Past performance is not a guarantee of future results. For each fund with at least a three-year history, Morningstar calculates a Morningstar RatingTM based on a Morningstar Risk-Adjusted Return measure that accounts for variation in a fund's monthly performance (including the effects of sales charges, loads, and redemption fees), placing more emphasis on downward variations and rewarding consistent performance. The top 10% of funds in each category receive 5 stars, the next 22.5% receive 4 stars, the next 35% receive 3 stars, the next 22.5% receive 2 stars and the bottom 10% receive 1 star. The Overall Morningstar Rating is derived from a weighted average of the Fund's three-, five- and ten-year risk adjusted return measure, if applicable. (Each share class is counted as a fraction of one fund within this scale and rated separately, which may cause slight variations in distribution percentages.)
©2017 Morningstar, Inc. All Rights Reserved. The information contained herein (1) is proprietary to Morningstar (2) may not be copied or distributed and (3) is not warranted to be accurate, complete or timely. Neither Morningstar nor its content providers are responsible for any damages or losses arising from any use of this information.
6
Expense Examples (Unaudited)
As a shareholder of the Funds, you incur two types of costs: (1) redemption fees (applicable to the Asia Focus Fund, the Asia Pacific Dividend Builder Fund, the China & Hong Kong Fund, and the Renminbi Yuan & Bond Fund); and (2) ongoing costs, including advisory fees and other Fund expenses. The examples below are intended to help you understand your ongoing costs (in dollars) of investing in the Funds and to compare these costs with the ongoing costs of investing in other mutual funds.
The examples are based on an investment of $1,000 invested at the beginning of the period shown and held for the entire period from July 1, 2016 to December 31, 2016.
Actual Expenses
For each Fund, the first line of the table below provides information about actual account values and actual expenses. You may use the information in this line, together with the amount you invested, to estimate the expenses that you paid over the period. Simply divide your account value by $1,000 (for example, an $8,600 account value divided by $1,000 = 8.6), then multiply the result by the number in the first line under the heading entitled "Expenses Paid during Period" to estimate the expenses you paid on your account during this period.
Hypothetical Example for Comparison Purposes
For each Fund, the second line of the table below provides information about hypothetical account values and hypothetical expenses based on the Fund's actual expense ratios and an assumed rate of return of 5% per year before expenses, which is not the Fund's actual return. The hypothetical account values and expenses may not be used to estimate the actual ending account balance or expenses you paid for the period. You may use this information to compare the ongoing costs of investing in the Fund and other funds. To do so, compare this 5% hypothetical example with the 5% hypothetical examples that appear in the shareholder reports of the other funds.
Please note that the expenses shown in the table are meant to highlight your ongoing costs only and do not reflect any redemption fees. Therefore, the second line for each Fund of the table is useful in comparing ongoing costs only, and will not help you determine the relative total costs of owning different funds. In addition, if these redemption fees were included, your costs would have been higher.
| | | Beginning
Account
Value
(07/01/16) | | Ending
Account
Value
(12/31/16) | | Expenses Paid
During Period*
(07/01/16 to
12/31/16) | | Expense Ratios
During Period*
(07/01/16 to
12/31/16) | |
Guinness Atkinson Alternative Energy Fund Actual | | $ | 1,000.00 | | | $ | 950.80 | | | $ | 9.71 | | | | 1.98 | %† | |
Guinness Atkinson Alternative Energy Fund Hypothetical
(5% return before expenses) | | $ | 1,000.00 | | | $ | 1,015.18 | | | $ | 10.03 | | | | 1.98 | %† | |
Guinness Atkinson Asia Focus Fund Actual | | $ | 1,000.00 | | | $ | 1,043.40 | | | $ | 10.22 | | | | 1.98 | %† | |
Guinness Atkinson Asia Focus Fund Hypothetical
(5% return before expenses) | | $ | 1,000.00 | | | $ | 1,015.13 | | | $ | 10.08 | | | | 1.98 | %† | |
Guinness Atkinson Asia Pacific Dividend Builder Fund Actual | | $ | 1,000.00 | | | $ | 1,020.80 | | | $ | 5.59 | | | | 1.10 | %† | |
Guinness Atkinson Asia Pacific Dividend Builder Fund Hypothetical
(5% return before expenses) | | $ | 1,000.00 | | | $ | 1,019.61 | | | $ | 5.58 | | | | 1.10 | %† | |
Guinness Atkinson China & Hong Kong Fund Actual | | $ | 1,000.00 | | | $ | 1,078.20 | | | $ | 8.62 | | | | 1.65 | % | |
Guinness Atkinson China & Hong Kong Fund Hypothetical
(5% return before expenses) | | $ | 1,000.00 | | | $ | 1,016.84 | | | $ | 8.36 | | | | 1.65 | % | |
Guinness Atkinson Dividend Builder Fund Actual | | $ | 1,000.00 | | | $ | 1,019.00 | | | $ | 3.50 | | | | 0.69 | %† | |
Guinness Atkinson Dividend Builder Fund Hypothetical
(5% return before expenses) | | $ | 1,000.00 | | | $ | 1,021.67 | | | $ | 3.51 | | | | 0.69 | %† | |
Guinness Atkinson Global Energy Fund Actual | | $ | 1,000.00 | | | $ | 1,104.70 | | | $ | 7.67 | | | | 1.45 | %† | |
Guinness Atkinson Global Energy Fund Hypothetical
(5% return before expenses) | | $ | 1,000.00 | | | $ | 1,017.85 | | | $ | 7.35 | | | | 1.45 | %† | |
Guinness Atkinson Global Innovators Fund – Investor Class Actual | | $ | 1,000.00 | | | $ | 1,121.50 | | | $ | 6.61 | | | | 1.24 | %† | |
Guinness Atkinson Global Innovators Fund – Investor Class Hypothetical
(5% return before expenses) | | $ | 1,000.00 | | | $ | 1,018.90 | | | $ | 6.29 | | | | 1.24 | %† | |
Guinness Atkinson Global Innovators Fund – Institutional Class Actual | | $ | 1,000.00 | | | $ | 1,123.10 | | | $ | 5.28 | | | | 0.99 | %† | |
Guinness Atkinson Global Innovators Fund – Institutional Class Hypothetical
(5% return before expenses) | | $ | 1,000.00 | | | $ | 1,020.16 | | | $ | 5.03 | | | | 0.99 | %† | |
Guinness Atkinson Renminbi Yuan & Bond Fund Actual | | $ | 1,000.00 | | | $ | 955.80 | | | $ | 4.42 | | | | 0.90 | %† | |
Guinness Atkinson Renminbi Yuan & Bond Fund Hypothetical
(5% return before expenses) | | $ | 1,000.00 | | | $ | 1,020.61 | | | $ | 4.57 | | | | 0.90 | %† | |
*Expenses are equal to the Funds' annualized expense ratio as indicated, multiplied by the average account value over the period, multiplied by the number of days in most recent fiscal half-year period (184), then divided by the number of days in the fiscal year (366) (to reflect the one-half year period).
† Net of fee waivers and/or expense reimbursements. If those fee waivers and/or expense reimbursements had not been in effect, the Fund's actual expenses would have been higher.
7
GUINNESS ATKINSON ALTERNATIVE ENERGY FUND for the period ended December 31, 2016
1. Performance
AVERAGE ANNUAL TOTAL RETURNS
| | | 1 Year | | 3 Years | | 5 Years | | 10 Years | |
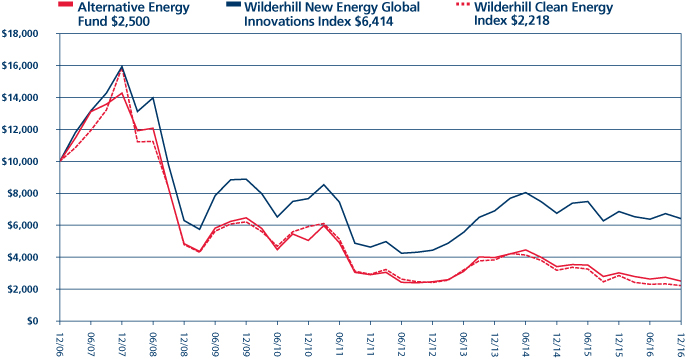
Fund | | | -17.16 | % | | | -14.32 | % | | | -2.93 | % | | | -12.95 | % | |
Benchmark Indices: | |
Wilderhill Clean Energy Index | | | -22.12 | % | | | -16.60 | % | | | -5.34 | % | | | -13.95 | % | |
Wilderhill New Energy Global Innovations Index | | | -6.43 | % | | | -2.41 | % | | | 6.75 | % | | | -4.21 | % | |
The Fund's gross expense ratio is 2.31% and net expense ratio is 1.98% per the Summary Prospectus dated May 3, 2016. For the Fund's current one year expense ratios, please refer to the Financial Highlights section of this report. The Advisor has contractually agreed to waive a portion of its advisory fees and/or reimburse other Fund expenses so that the Fund's ratio of expenses to average daily net assets will not exceed 1.98% (excluding Acquired Fund Fees and Expenses, interest, taxes, dividends on short positions and extraordinary expenses) through at least June 30, 2017. To the extent that the Advisor waives fees and/or reimburses expenses, it may seek repayment of a portion or all of such amounts at any time within the three fiscal years after the fiscal year in which such amounts were waived and/or reimbursed, subject to the applicable cap.
Performance data quoted represents past performance and does not guarantee future results. The investment return and principal value of an investment in the Fund will fluctuate so that an investor's shares, when redeemed, may be worth more or less than their original cost. Current performance of the Fund may be lower or higher than the performance quoted. Performance data current to the most recent month-end may be obtained by visiting www.gafunds.com, or calling (800) 915-6565.
Total returns for certain periods reflect fee limitations in effect and, in the absence of these limitations, total returns would have been lower.
The Fund ended the year down 17.16%, ahead of the benchmark which was down 22.12%. Overall the weak performance of the Fund on an absolute basis came mainly from the solar sector. Much of the Fund's outperformance versus the benchmark came during the second and third quarters as our biofuel and wind holdings rallied due to the recovery of our Chinese holdings from the downturn in January and February. In the third quarter, emerging market equities received a boost due to commodity prices and currencies recovering, driving up our Brazilian holdings and some of our Chinese holdings. In the fourth quarter, the Fund gave up some of its lead over the index as concerns around oversupply in the solar sector continued and the election of Donald Trump dampened sentiment across the alternative energy space.
Compared to the benchmark, the Fund was overweight wind and hydro, both of which worked in the Fund's favour. However, the Fund was underweight efficiency, which harmed performance and underweight solar which helped the Fund's relative performance. On an absolute level, it was almost exclusively the Fund's solar exposure that was responsible for the negative returns, with Boer Power a notable poor performer in the efficiency sector. All other sectors produced low but positive returns.
The solar sector has been beset by concerns around oversupply across the value chain, with some analysts believing that demand will not catch up with supply. We believe that the oversupply situation will be a short-to-mid-term problem, as solar installations outstripped expectations once again in 2016. The energy efficiency sector showed gains as energy savings remained important in the construction sector, investment in grid infrastructure to deal with higher intermittent energy sources increased and electric vehicles uptake increased yet another time.
Our best performing stock in the portfolio was Cosan, a Brazilian biofuel refiner and gas distributor, which benefited from the recovery of the Brazilian stock market. Our other Brazilian holding, Cemig, also performed well and has made some progress in securing the extension of its government concessions. Ormat Technologies, an Israeli-US geothermal equipment producer and project developer, and Boralex, a Canadian wind farm developer, also performed very well. Tianneng Power, the Chinese electric bicycle battery manufacturer, was our fifth best performing stock. The weakest stocks in the portfolio were solar holdings – Sunpower, Canadian Solar, SolarEdge and First Solar and Boer Power.
8
2. Activity
We made several changers to the portfolio in 2016, mainly in the first half of the year. In the first quarter, we sold our entire position in Verbund, an Austrian hydro utility, due to declining wholesale power prices in Europe. We initiated a new position in Boer Power, an energy management systems provider in China to increase our energy efficiency holdings.
In the second quarter, we sold our positions in Greentech and Futuren, one Danish and one French project developer, amid liquidity concerns and underperformance. We also sold our full position in Renesola, a photovoltaic solar module manufacturer. Renesola has significantly higher debt levels that its module manufacturing peers. We initiated new positions in Tianneng Power International, a Chinese electric bicycle battery manufacturer, Saft Groupe, a French battery manufacturer, Schneider Electric, a French energy management systems and power automations specialist and Johnson Controls, a US-based energy efficiency solutions provider and lithium-ion battery manufacturer. Total SA acquired Saft Groupe shortly after we initiated our position, meaning we had to initiate a new position soon after.
In the third quarter, we sold our position in Trina Solar, a leading Chinese module manufacturer, following the board recommendation of a management buyout offer. We replaced the position with Sensata, a controls and sensors company selling mainly to the automotive market. Sensata, aside from having a strong earnings history and trading on reasonable multiples, is likely to benefit from increased demand for its products as the automotive market focuses on fuel efficiency and electrification. The acquisition of Saft Groupe by Total closed at the beginning of the third quarter. We replaced the position with Senvion, a German wind-turbine manufacturer formerly known as RePower, which was trading at significantly lower multiples than its peers.
In the fourth quarter, we sold Enphase, a US microinverter manufacturer, due to liquidity concerns. We replaced the holding with Ricardo, an engineering consultancy for the automotive sector.
The overall effect of these changes has been to increase our exposure to the energy storage, transportation and 'smart grid' technology sectors. We believe these sectors will grow in importance with the increase in electric vehicle use and increase in intermittent electricity sources, like wind and solar, in electricity grids worldwide.
3. Portfolio Position
The Fund's largest country exposures were to China, the United States, Canada, the United Kingdom and Brazil. With China contributing half of the annual installations of wind and solar, over three-quarters of solar manufacturing capacity and over half of wind turbine manufacturing capacity, investing in China is inevitable.
On a sector basis, the Fund has been weighted between a quarter and a third in each of the energy efficiency, solar, and wind sectors. The companies in other sectors, such as hydro, biofuels and geothermal have more individual stories rather than sector-growth stories and are each less than 10% of assets.
4. Outlook
While the alternative energy sector continues to have woes, we think the overall news is exceedingly positive in terms of future volumes. Several tenders for power in 2016 showed that electricity from both wind and solar is dropping quickly in price, so much so that wind is now cheaper than gas and coal plants in most countries. Solar is cheaper than coal and gas plants in some sunny countries and is decreasing in cost faster than wind. It is possible that solar will be the cheapest form of electricity by the end of the decade. In the wind sector, one example of cost declines per unit of electricity produced is that average wind turbine output has increased 63% since 2010 due to increasing hub height and technology improvements (Bloomberg). This means that for a turbine with the same power rating that it had in 2010, the project would now produce 63% more electricity. For solar power, efficiencies of modules sold commercially have increased marginally, but the bulk of cost reduction has come from economies of scale and manufacturing efficiencies. We do not see these drivers slowing down drastically before 2020.
Complementing the increased competitiveness of the wind and solar technologies is the dramatic fall in battery prices. According to Bloomberg, lithium-ion batteries for electric vehicles fell 35% to $350/kWh in 2015 and fell a further 20% in 2016 to an average of $273/kWh. Some electric vehicle manufacturers are receiving lithium-ion batteries for $220/kWh (Bloomberg). Electric vehicle sales are set to continue increasing at around 50% per year in 2017 as battery prices decrease, making the largest cost component of electric vehicles shrink. In Norway, where electric vehicles have been given Value Added Tax (VAT) exemptions making electric cars as affordable as combustion engine vehicles, the market share of electric vehicles of new car sales reached 30% for 2016 and in January 2017 reached 37% – up from under 1% in 2009. Current global market share of electric vehicles is 0.8% of new car
9
sales. There are several electric vehicles models at the $30,000 price mark that have a range of over 200 miles on a single charge. We are confident that this is the sign of a global electric vehicle boom before the end of the decade.
As battery prices for electric vehicles continue to fall, so will prices for stationary electricity storage for grid stability, which would allow a higher amount of wind and solar technologies in the electricity grid. There have already been installations of batteries in the United States for use in assuring grid stability. Further grid automation and demand response measures other than batteries are also set to grow as the amount of renewable energy in the grid increases. Energy efficiency measures to reduce the amount of energy consumed in developed countries have proved highly successful and we have no reason to believe that this growth will stop.
Overall, we view that alternative energy has reached its economic inflection point, where it no longer requires subsidy to make economic sense. Energy storage and smarter grids, the keys to increasing the portion of renewables in the grid, are also becoming cheaper and will be in higher demand as alternative energy sources become less expensive than conventional power sources. We are waiting for sentiment to turn to recognise the volume – and therefore earnings – potential of this sector.


Edward Guinness Samira Rudig January 2017
The Fund invests in foreign securities, which involves political, economic and currency risks, greater volatility, and differences in accounting methods. These risks are greater for emerging markets. The Fund is non-diversified, meaning that its assets may be concentrated in fewer individual holdings than diversified funds. Therefore, the Fund is more exposed to individual stock volatility than diversified funds. Investments focused in a single geographic region may be exposed to greater risk and more volatility than investments diversified among various geographies. The Fund invests in smaller companies, which involves additional risks such as limited liquidity and greater volatility.
The Wilderhill New Energy Global Innovation Index (NEX) is a modified US dollar-weighted index of publicly traded companies, which are active in renewable and low-carbon energy, and which stand to benefit from responses to climate change and energy security concern. The Wilderhill Clean Energy Index (ECO) is a modified equal US dollar-weighted index of publicly traded companies whose businesses stand to benefit substantially from societal transition toward the use of cleaner energy and conservation. These indices are unmanaged, not available for investment and do not incur expenses.
KWh - kilowatt-hour
Please refer to the Schedule of Investments for details on Fund holdings. Current and future portfolio holdings are subject to risk.
The information provided herein represents the opinion of Guinness Atkinson Asset Management, Inc. for the period stated and is not intended to be a forecast of future events, a guarantee of future results, or investment advice. Opinions, Fund holdings and sector allocations are subject to change at any time, and are not recommendations to buy or sell any security.
10
GUINNESS ATKINSON ALTERNATIVE ENERGY FUND
Growth of $10,000
| | | Average Annual Total Return
Periods Ended December 31, 2016 | |
| | | One Year | | Five Years | | Ten Years | |
| | | | | | -17.16 | % | | | -2.93 | % | | | -12.95 | % | |
Performance data quoted represents past performance and does not guarantee future results. The investment return and principal value of an investment will fluctuate so that an investor's shares, when redeemed, may be worth more or less than their original cost. Current performance of the Fund may be lower or higher than the performance quoted. Performance data current to the most recent month end may be obtained by visiting www.gafunds.com.
Total returns for certain periods reflect a fee waiver in effect and in the absence of this waiver, the total returns would be lower. Returns reflect the reinvestment of distributions made by the Fund, if any. The graph and the performance table above do not reflect the deduction of taxes that a shareholder would pay on Fund distribution or the redemption of Fund shares.
The Wilderhill New Energy Global Innovations Index (NEX) is a modified dollar weighted index of publicly traded companies, which are active in renewable and low-carbon energy, and which stand to benefit from responses to climate change and energy security concern. The Wilderhill Clean Energy Index (ECO) is a modified equal dollar weighted index comprised of publicly traded companies whose businesses stand to benefit substantially from societal transition toward the use of cleaner energy and conservation. These indices are unmanaged, not available for investment and do not incur expenses.
11
FUND HIGHLIGHTS at December 31, 2016
GUINNESS ATKINSON ALTERNATIVE ENERGY FUND
# of Holdings in Portfolio: | | 31 | |
Portfolio Turnover: | | 64.0% | |
% of Stocks in Top 10: | | 36.6% | |
Fund Manager: | | | |
Edward Guinness | | | |
Top 10 Holdings (% of net assets) | | | | Industry Breakdown (% of net assets) | | | |
Iniziative Bresciane - Inbre - SpA | | | 5.0 | % | | Efficiency | | | 29.3 | % | |
Boralex Inc - A Shares | | | 3.8 | % | | Wind | | | 29.1 | % | |
Cosan SA Industria e Comercio | | | 3.7 | % | | Solar | | | 25.5 | % | |
Concord New Energy Group Ltd. | | | 3.6 | % | | Hydro | | | 8.3 | % | |
Good Energy Group PLC | | | 3.6 | % | | Biofuel | | | 3.7 | % | |
Ricardo PLC | | | 3.4 | % | | Geothermal | | | 3.3 | % | |
Schneider Electric SE | | | 3.4 | % | | | | | | | |
Tianneng Power International | | | 3.4 | % | | | | | | | |
Nibe Industrier AB - B Shares | | | 3.4 | % | | | | | | | |
China Longyuan Power Group Corp. Ltd. - H Shares | | | 3.3 | % | | | | | | | |
12
SCHEDULE OF INVESTMENTS
at December 31, 2016
GUINNESS ATKINSON ALTERNATIVE ENERGY FUND
Shares | | COMMON STOCKS: 99.2% | | Value | |
Biofuel: 3.7% | | | |
| | 32,100 | | | Cosan SA Industria e Comercio | | $ | 376,260 | | |
Efficiency: 29.3% | | | |
| | 851,000 | | | Boer Power Holdings | | | 339,105 | | |
| | 21,070 | | | CENTROTEC Sustainable AG | | | 339,122 | | |
| | 7,402 | | | Johnson Controls Inc. | | | 304,888 | | |
| | 43,315 | | | Nibe Industrier AB - B Shares | | | 341,362 | | |
| | 29,600 | | | Ricardo PLC | | | 351,111 | | |
| | 8,100 | | | Sensata Technologies Holding* | | | 315,495 | | |
| | 5,030 | | | Schneider Electric SE | | | 350,041 | | |
| | 374,000 | | | Tianneng Power International | | | 343,398 | | |
| | 576,000 | | | Wasion Group Holdings Ltd. | | | 309,745 | | |
| | | | | | | | 2,994,267 | | |
Geothermal: 3.3% | | | |
| | 6,259 | | | Ormat Technologies Inc. | | | 335,608 | | |
Hydro: 8.3% | | | |
| | 147,404 | | | Cia Energetica de Minas Gerais - ADR | | | 336,081 | | |
| | 26,098 | | | Iniziative Bresciane - Inbre - SpA† | | | 512,629 | | |
| | | | | | | | 848,710 | | |
Solar: 25.5% | | | |
| | 26,800 | | | Canadian Solar Inc.* | | | 326,424 | | |
| | 692,400 | | | China Singyes Solar Technologies Holdings Ltd. | | | 330,373 | | |
| | 10,200 | | | First Solar Inc.* | | | 327,318 | | |
| | 69,700 | | | JA Solar Holdings Co., Ltd. - ADR* | | | 331,772 | | |
| | 21,200 | | | Jinkosolar Holdings Co., - ADR* | | | 322,876 | | |
| | 27,400 | | | Solaredge Tech Inc.* | | | 339,760 | | |
| | 46,950 | | | SunPower Corp. - Class B* | | | 310,339 | | |
| | 962,000 | | | Xinyi Solar Holdings Ltd. | | | 312,624 | | |
| | | | | | | | 2,601,486 | | |
The accompanying notes are an integral part of these financial statements.
13
Shares | | COMMON STOCKS: 99.2% (Continued) | | Value | |
Wind: 29.1% | | | |
| | 27,487 | | | Boralex Inc. - Class A | | $ | 392,043 | | |
| | 3,370,000 | | | China Datang Corp. Renewable Power Co., Ltd. - H Shares | | | 308,556 | | |
| | 437,000 | | | China Longyuan Power Group Corp. - H Shares | | | 341,508 | | |
| | 2,425,000 | | | China Suntien Green Energy Corp. Ltd. - H Shares | | | 312,722 | | |
| | 6,950,000 | | | Concord New Energy Group Ltd. | | | 362,983 | | |
| | 107,401 | | | Good Energy Group PLC† | | | 362,669 | | |
| | 1,014,000 | | | Huaneng Renewables Corp. Ltd. - H Shares | | | 329,522 | | |
| | 607,763 | | | Mytrah Energy Ltd.*† | | | 234,065 | | |
| | 170,452 | | | Northern Power Systems Corp.*† | | | 32,373 | | |
| | 22,430 | | | Senvion S.A.* | | | 288,054 | | |
| | | | | | | | 2,964,495 | | |
| | | | | Total Common Stocks
(cost $15,175,774) | | | 10,120,826 | | |
| | | | | Total Investments in Securities
(cost $15,175,774): 99.2% | | | 10,120,826 | | |
| | | | | Other Assets less Liabilities: 0.8% | | | 77,969 | | |
| | | | | Net Assets: 100.0% | | $ | 10,198,795 | | |
* Non-income producing security.
ADR - American Depository Receipt
† The Advisor has determined these securities to be illiquid. As of December 31, 2016, the total market value of these illiquid securities represent 11.2% of net assets.
The accompanying notes are an integral part of these financial statements.
14
GUINNESS ATKINSON ASIA FOCUS FUND for the period ended December 31, 2016
1. Performance
AVERAGE ANNUAL TOTAL RETURNS
| | | 1 Year | | 3 Years | | 5 Years | | 10 Years | |
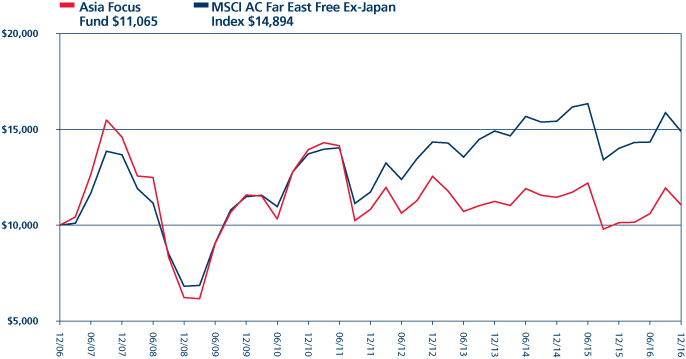
Fund | | | 9.20 | % | | | -0.53 | % | | | 0.44 | % | | | 1.02 | % | |
Benchmark Indices: | |
MSCI AC Far East Free ex-Japan Index | | | 6.30 | % | | | -0.06 | % | | | 4.91 | % | | | 4.19 | % | |
S&P 500 Index | | | 11.93 | % | | | 8.85 | % | | | 14.62 | % | | | 6.93 | % | |
The Fund's gross expense ratio is 2.00% per the Summary Prospectus dated May 3, 2016. For the Fund's current one year expense ratios, please refer to the Financial Highlights section of this report.
Performance data quoted represents past performance and does not guarantee future results. The investment return and principal value of an investment in the Fund will fluctuate so that an investor's shares, when redeemed, may be worth more or less than their original cost. Current performance of the Fund may be lower or higher than the performance quoted. Performance data current to the most recent month-end may be obtained by visiting www.gafunds.com, or calling (800) 915-6565.
The Fund imposes a 2% redemption fee on the sale of shares held less than 30 days. Performance data quoted does not reflect this redemption fee. Total returns for certain periods reflect fee limitations in effect and, in the absence of these limitations, total returns would have been lower.
The Fund ended the year up 9.20%, ahead of the benchmark up 6.30%. Much of the Fund's outperformance came during the middle of the year, as Asian markets rallied along with global emerging markets. The strength in emerging markets was particularly evident in the third quarter, as commodity prices and emerging market currencies recovered.
Despite concerns at the start of 2016 that Chinese growth would slow significantly, China's Gross Domestic Product (GDP) figures indicate robust growth in 2016, down slightly on 2015, but not the doomsday scenario some feared. Fixed asset investment has slowed but not collapsed. Higher commodity prices have begun to feed through to Producer Price Inflation, which started the year at 5.9% deflation, before recovering to end 2016 at 5.5% inflation. Stronger producer prices mean better cashflows for many of the heavy-industry state owned enterprises, particularly benefiting those companies that are struggling to meet debt repayments. Cooling measures on the property market have also begun to take effect, deflating some of the excesses that had been built up.
Commodities saw significant variations in price over the course of the year. The oil price more than doubled during the year – Brent crude touched $26.39 in January 2016, but ended the year close to a high of $55.41. Iron ore also recovered during the year, bouncing sharply in November after the US election. The victory of Donald Trump surprised many, and the resulting strength witnessed in US equity markets was also contrary to expectations. Markets quickly priced in the possibility of fiscal stimulus measures, including renewed infrastructure spending in the US.
Asian markets were less sanguine about the prospect of a Trump presidency, as fears of trade barriers and protectionist measures hit Asian stocks in November. Companies that had large exposure to export trade saw weakness during the period. Despite this volatility, some of these companies, for example, Taiwanese technology companies, ended up being some of the best performers in the Fund for the year.
Currency volatility has also been significant factor this year, as the US dollar continued to appreciate. Against this strength, the renminbi weakened by 6.50% over the course of the year. Though the People's Bank of China (PBoC) sets the currency's reference rate in relation to a basket of other currencies, many participants in the market still place considerable emphasis on the renminbi rate versus the US dollar. Other notable currency movements in the year included the Korean won weakening in the fourth quarter by 8.68%, as the political scandal involving President Park unfolded. For the region as a whole, Asian currencies depreciated by 3.38% versus the US dollar during the year (Bloomberg JP Morgan Asia Dollar Index).
Our best performing stock in the portfolio was Geely, a Chinese auto manufacturer, which saw strong domestic demand for its latest models. Several of our holdings in smartphone component manufacturers, including Largan Precision (camera lenses) and AAC Technologies (acoustic components and vibration motors), also performed well. PTT, the Thai national oil and gas company, made good gains as the oil price recovered. The weakest stocks during the year were some of our Chinese holdings, including
15
Lenovo, the computer and smartphone manufacturer, two insurers – People's Insurance Co. and PICC Property & Casualty, and Sohu.com, an internet gaming and advertising company.
2. Activity
We made a number of changes to the portfolio during 2016, the majority of which were in the first quarter. In that period, we sold our entire positions in People's Insurance Co., PetroChina, Indo Tambangraya Megah, Dongfeng Motor, Galaxy Entertainment and Sohu.com. We initiated new positions in Sino Biopharmaceutical, Relo Holdings, Geely Automobile, DBS Group, St Shine Optical, and Sonic Healthcare. Several other positions were reduced or increased to re-weight to 3% of the portfolio.
Other changes we made during the year were to sell our holdings in NagaCorp, a casino operator in Phnom Penh, Cambodia; DiGgi.com, a Malaysian mobile telecommunications provider; and UMW, an automotive manufacturer and distributor of construction, mining and agricultural equipment. We purchased new positions in KT&G, a Korean tobacco company serving domestic and export markets and New Oriental Education, a Chinese private education provider.
The overall effect of these changes has been to increase our exposure to companies that meet our definition of quality: businesses that have achieved persistently strong returns on capital, sustained over time. The other effect has been to bring the portfolio more in line with equal weighting.
3. Portfolio Position
The Fund's largest country exposures were to China, Taiwan, Thailand and Korea. We have tended to find that these countries offer good quality companies trading at attractive valuations. Conversely, we tend to find few opportunities in Indonesia, Malaysia or the Philippines, and at year-end the Fund has no exposure to those countries.
On a sector basis, the Fund has larger weighting in Information Technology, Financials and Consumer Discretionary.
4. Outlook
While growth in China has undeniably slowed, it has certainly not collapsed. We continue to believe that the 'hard landing' scenario that some fear happening in China is unlikely. The recovery in producer prices suggests that near-term stress in the heavy industry enterprises has eased, which should lead to improving earnings estimates and more positive sentiment towards the country. The steps that China is taking to resolve the build-up of bad debt in the economy seem appropriate, and we will continue to monitor the finance sector for any sign of deterioration.
Elsewhere in the region, we see infrastructure projects being a source of demand in countries such as Malaysia, which is investing in a Mass Rapid Transport project in Greater Kuala Lumpur. Government spending on infrastructure is also likely to benefit Indonesia's economy in 2017. Thailand has so far shown signs of stability following the death of King Bhumibol Adulyadej in October and we think that the operating environment for companies in the country is favourable.
Considering the region as a whole, we do not think the election of a new US President deals a fatal blow to the long-term investment case for Asia. One of the main drivers of Asian growth over the past generation has been the growth of export manufacture, and we have seen significant long-term shifts within the region (particularly in China) of companies and countries moving up the value chain in manufacturing. This shift provides the underpinning, in the form of stronger wages, for the much-heralded growth in consumption in Asia. We don't believe that these well-established patterns will disappear any time soon.

Edmund Harriss January 2017
The Fund invests in foreign securities, which involves political, economic and currency risks, greater volatility, and differences in accounting methods. These risks are greater for emerging markets. The Fund is non-diversified, meaning that its assets may be concentrated in fewer individual holdings than diversified funds. Therefore, the Fund is more exposed to individual stock volatility than diversified funds. Investments focused in a single geographic region may be exposed to greater risk and more volatility than investments diversified among various geographies. The Fund invests in smaller companies, which involves additional risks such as limited liquidity and greater volatility.
The MSCI AC (All Country) Far East ex Japan Index is a free float-adjusted market capitalization-weighted index that is designed to measure equity market performance of the Far East, excluding Japan. The Standard & Poor's 500 Index is a market
16
capitalization-weighted index composed of 500 widely held common stocks of U.S. companies. These indices are unmanaged, not available for investment and do not incur expenses. The Bloomberg JP Morgan Asia Dollar Index calculates the intraday value of Bloomberg-JPMorgan Asia Dollar Index. It is a trade and liquidity weighted index.
Please refer to the Schedule of Investments for details on Fund holdings. Current and future portfolio holdings are subject to risk.
The information provided herein represents the opinion of Guinness Atkinson Asset Management, Inc. for the period stated and is not intended to be a forecast of future events, a guarantee of future results, or investment advice. Opinions, Fund holdings and sector allocations are subject to change at any time, and are not recommendations to buy or sell any security.
17
GUINNESS ATKINSON ASIA FOCUS FUND
Growth of $10,000
| | | Average Annual Total Return
Periods Ended December 31, 2016 | |
| | | One Year | | Five Years | | Ten Years | |
| | | | | | 9.20 | % | | | 0.44 | % | | | 1.02 | % | |
Performance data quoted represents past performance and does not guarantee future results. The investment return and principal value of an investment will fluctuate so that an investor's shares, when redeemed, may be worth more or less than their original cost. Current performance of the Fund may be lower or higher than the performance quoted. Performance data current to the most recent month end may be obtained by visiting www.gafunds.com.
Total returns for certain periods reflect a fee waiver in effect and in the absence of this waiver, the total returns would be lower. Returns reflect the reinvestment of distributions made by the Fund, if any. The graph and the performance table above do not reflect the deduction of taxes that a shareholder would pay on Fund distribution or the redemption of Fund shares. The Fund imposes a 2% redemption fee on shares held less than 30 days.
The MSCI All Country Far East Free ex-Japan Index (MSCI AC Far East Free ex-Japan Index) is a free float-adjusted, capitalization-weighted index that is designed to measure equity market performance of the Far East region excluding Japan. The index referenced in this chart is not available for investment and does not incur expenses.
18
FUND HIGHLIGHTS at December 31, 2016
GUINNESS ATKINSON ASIA FOCUS FUND
# of Holdings in Portfolio: | | | 34 | | |
Portfolio Turnover: | | | 38.1 | % | |
% of Stocks in Top 10: | | | 34.0 | % | |
Fund Manager: | | | |
Edmund Harriss | | | | | |
Top 10 Holdings (% of net assets) | | | | | | | |
Largan Precision Co., Ltd. | | | 3.8 | % | | Tencent Holdings Ltd. | | | 3.3 | % | |
NetEase Inc. - ADR | | | 3.6 | % | | China Merchants Bank Co., Ltd. - H Shares | | | 3.3 | % | |
LPN Development PCL /Foreign | | | 3.5 | % | | Catcher Technology Co., Ltd. | | | 3.3 | % | |
Taiwan Semiconductor Manufacturing Co., Ltd. | | | 3.4 | % | | Glow Energy PCL /Foreign | | | 3.3 | % | |
China Construction Bank Corp. - H Shares | | | 3.3 | % | | Novatek Microelectronics Corp. | | | 3.2 | % | |
Industry Breakdown (% of net assets) | | | | | | | |
Commercial Banks | | | 12.8 | % | | Oil Company - Exploration & Production | | | 3.0 | % | |
Semiconductor Componets - Integrated Circuits | | | 6.6 | % | | Schools | | | 3.0 | % | |
Electric - Generation | | | 6.5 | % | | Computers | | | 3.0 | % | |
Auto/Truck Parts & Equipment | | | 6.1 | % | | Tobacco | | | 3.0 | % | |
Photo Equipment & Supplies | | | 3.8 | % | | Electronic Components - Semiconductor | | | 2.9 | % | |
Entertainment Software | | | 3.6 | % | | Property/Casualty Insurance | | | 2.9 | % | |
Real Estate Operations/Development | | | 3.5 | % | | Building & Construction Production - Miscellaneous | | | 2.9 | % | |
Internet Application Software | | | 3.3 | % | | Building Products - Cement/Aggregates | | | 2.8 | % | |
Metal Processors & Fabricators | | | 3.3 | % | | Distribution/Wholesale | | | 2.8 | % | |
Pharmaceuticals | | | 3.2 | % | | Real Estate Management/Service | | | 2.8 | % | |
Electronic Component Miscellaneous | | | 3.2 | % | | Public Thoroughfares | | | 2.7 | % | |
MRI/Medical Diagnostics Imaging | | | 3.1 | % | | Optical Supplies | | | 2.6 | % | |
Oil Components - Integrated | | | 3.1 | % | | Machinery - General Industry | | | 0.6 | % | |
Auto-Cars/Light Trucks | | | 3.0 | % | | | | | | | | | |
19
SCHEDULE OF INVESTMENTS
at December 31, 2016
GUINNESS ATKINSON ASIA FOCUS FUND
Shares | | COMMON STOCKS: 100.1% | | Value | |
Australia: 3.1% | | | |
| | 31,524 | | | Sonic Healthcare Ltd. | | $ | 486,835 | | |
China: 46.3% | | | |
| | 54,500 | | | AAC Technologies Holdings Inc. | | | 495,135 | | |
| | 161,500 | | | Anhui Conch Cement Co., Ltd. - H Shares | | | 439,442 | | |
| | 666,000 | | | China Construction Bank Corp. - H Shares | | | 512,737 | | |
| | 684,000 | | | China Lesso Group Holdings Ltd. | | | 443,680 | | |
| | 218,000 | | | China Merchants Bank Co., Ltd. - H Shares | | | 511,089 | | |
| | 425,000 | | | China Minsheng Banking Corp. Ltd. - H Shares | | | 454,349 | | |
| | 374,000 | | | CNOOC Ltd. | | | 467,832 | | |
| | 490,000 | | | Geely Automobile Holdings Ltd. | | | 468,231 | | |
| | 762,000 | | | Lenovo Group Ltd. | | | 461,848 | | |
| | 2,600 | | | NetEase Inc. - ADR | | | 559,884 | | |
| | 11,000 | | | New Oriental Education & Technology Group Inc.* | | | 463,100 | | |
| | 286,000 | | | PICC Property & Casualty Co., Ltd. - H Shares | | | 445,532 | | |
| | 484,000 | | | Shenzhen Expressway Co., Ltd. - H Shares | | | 413,814 | | |
| | 709,000 | | | Sino Biopharmaceutical Ltd. | | | 499,212 | | |
| | 21,000 | | | Tencent Holdings Ltd. | | | 513,728 | | |
| | | | | | | | 7,149,613 | | |
Hong Kong: 3.4% | | | |
| | 380,000 | | | Chen Hsong Holdings† | | | 94,577 | | |
| | 982,000 | | | Li & Fung Ltd. | | | 431,829 | | |
| | | | | | | | 526,406 | | |
Japan: 2.8% | | | |
| | 3,000 | | | Relo Holdings, Inc. | | | 427,636 | | |
Singapore: 3.2% | | | |
| | 41,252 | | | DBS Group Holdings | | | 493,947 | | |
South Korea: 12.0% | | | |
| | 56,000 | | | Hanon Systems | | | 477,563 | | |
| | 2,105 | | | Hyundai Mobis Co., Ltd. | | | 460,109 | | |
| | 5,530 | | | KT&G Corp. | | | 462,436 | | |
| | 301 | | | Samsung Electronics Co., Ltd. | | | 449,083 | | |
| | | | | | | | 1,849,191 | | |
Taiwan: 16.3% | | | |
| | 73,000 | | | Catcher Technology Co., Ltd. | | | 507,369 | | |
| | 5,000 | | | Largan Precision Co., Ltd. | | | 587,980 | | |
| | 152,000 | | | Novatek Microelectronics Corp. | | | 502,281 | | |
| | 2 | | | Shin Zu Shing Co., Ltd. | | | 5 | | |
| | 21,000 | | | St Shine Optical Co., Ltd. | | | 400,726 | | |
| | 93,000 | | | Taiwan Semiconductor Manufacturing Co., Ltd. | | | 523,736 | | |
| | | | | | | | 2,522,097 | | |
The accompanying notes are an integral part of these financial statements.
20
Shares | | COMMON STOCKS: 100.1% (Continued) | | Value | |
Thailand: 13.0% | | | |
| | 89,500 | | | Electricity Generating PCL/Foreign | | $ | 497,354 | | |
| | 228,000 | | | Glow Energy PCL/Foreign | | | 502,981 | | |
| | 1,579,000 | | | LPN Development PCL/Foreign | | | 533,528 | | |
| | 45,500 | | | PTT PCL/Foreign | | | 472,655 | | |
| | | | | | | | 2,006,518 | | |
| | | | | Total Common Stocks
(cost $13,126,695) | | | 15,462,243 | | |
| | | | | Total Investments in Securities
(cost $13,126,695): 100.1% | | | 15,462,243 | | |
| | | | | Liabilities in Excess of Other Assets: (0.1%) | | | (8,497 | ) | |
| | | | | Net Assets: 100.0% | | $ | 15,453,746 | | |
* Non-income producing security.
ADR - American Depository Receipt
† The Advisor has determined this security to be illiquid. As of December 31, 2016, the total market value of the illiquid security represents 0.6% of net assets.
The accompanying notes are an integral part of these financial statements.
21
GUINNESS ATKINSON ASIA PACIFIC DIVIDEND BUILDER FUND for the period ended December 31, 2016
1. Performance
AVERAGE ANNUAL TOTAL RETURNS
| | | 1 Year | | 3 Years | | 5 Years | | 10 Years | |
Fund | | | 8.81 | % | | | 4.21 | % | | | 6.48 | % | | | 3.87 | % | |
Benchmark Indices: | |
MSCI AC Pacific ex-Japan Index | | | 8.01 | % | | | -0.14 | % | | | 5.25 | % | | | 4.54 | % | |
S&P 500 Index | | | 11.93 | % | | | 8.85 | % | | | 14.62 | % | | | 6.93 | % | |
The Fund's gross expense ratio is 3.87% and net expense ratio is 1.10% per the Summary Prospectus dated May 3, 2016. For the Fund's current one year expense ratios, please refer to the Financial Highlights section of this report. The Advisor has contractually agreed to waive a portion of its advisory fees and/or reimburse other Fund expenses so that the Fund's ratio of expenses to average daily net assets will not exceed 1.10% (excluding Acquired Fund Fees and Expenses, interest, taxes, dividends on short positions and extraordinary expenses) through at least June 30, 2017. To the extent that the Advisor waives fees and/or reimburses expenses, it may seek repayment of a portion or all of such amounts at any time within the three fiscal years after the fiscal year in which such amounts were waived and/or reimbursed, subject to the applicable cap.
Performance data quoted represents past performance and does not guarantee future results. The investment return and principal value of an investment in the Fund will fluctuate so that an investor's shares, when redeemed, may be worth more or less than their original cost. Current performance of the Fund may be lower or higher than the performance quoted. Performance data current to the most recent month-end may be obtained by visiting www.gafunds.com, or calling (800) 915-6565.
The Fund imposes a 2% redemption fee on the sale of shares held less than 30 days. Performance data quoted does not reflect this redemption fee. Total returns for certain periods reflect expense limitations in effect and, in the absence of these imitations, total returns would have been lower.
In 2016, Asian markets, as measured by MSCI AC Pacific ex Japan Index, rose 8.01%. The Fund ended the year ahead of the benchmark, up 8.81%.
2016 can be divided into several distinct phases for Asian markets. In the first two months, China's domestic stock markets sold off heavily as newly applied circuit breakers on the Shanghai Exchange sparked fears among investors that they would find themselves locked in. The rest of the world looked at the falls and wondered if this was a sign that the Chinese economy was finally cracking under the weight of accumulated debt and excess industrial capacity. Commodities, industrial metals and oil all hit new lows.
The market began to recover in February, with a sharp rebound in March. The strong performance of the Fund paused for breath in April as our technology stocks underperformed, following lower forecasts for smartphone sales. The negative sentiment broadened, affecting higher-end consumer electronics manufacturers and component makers.
June saw the UK vote in a referendum to leave the EU – a result that surprised many, including us. Developed markets generally were weak, but Asia was notable for its relative strength and the Fund did well. Asian markets continued their strength in the third quarter, with emerging markets in particular benefitting from rising currency prices.
The final months of the year included three significant macro events. First, at the end of September the Organization of the Petroleum Exporting Countries (OPEC) agreed to an outline for cutting oil production, a reversal of its strategy that began in 2014. Second, the course of the US Presidential election was turned on its head with the election of Donald Trump accompanied by a substantial change in economic policy direction. Third, an issue in Korea surrounding allegations of influence peddling ballooned into a full blown political scandal that resulted in a vote to impeach the President.
The performance of the portfolio in 2016, as in previous years, has been characterised by individual stock performances, not by sector or country exposures. There have been individual months where stocks have moved together (Information technology in April and Thai stocks in December are examples), but over the year there has been dispersion. Amongst the 10 leading stocks, we have one energy name, two financials, one heath care, four information technology and two retailers. These have been drawn from Australia, China (including one US-listed company that derives significant revenues from China), Hong Kong, Taiwan and Thailand. The lagging stocks also have their individual characteristics. Amongst the weakest 10 we have one financial name,
22
ASIA PACIFIC DIVIDEND BUILDER FUND
two Industrial stocks, two retailers, two Information technology companies, one auto parts maker, one factory agent business and one real estate developer.
We seek to invest in businesses that have much greater control over their fortunes and have demonstrated as much by generating a return on investment above the cost of capital through good times and bad. For short periods, when markets are up very sharply, this can work against us but over time we believe that linking value to the persistence of operational cash flow generation is more sustainable and preferable to linking it to macro events that are binary in nature, that will or will not occur, and that may or may not lift share prices.
2. Activity
There were three portfolio changes in 2016. During April, we sold our position in CNOOC following the recovery in the oil price. The company's return on capital had fallen, and was not forecast to recover imminently. We replaced the company with DBS Group, a Singapore-listed diversified bank.
The second change we made, also in April, was to sell out of our position in NagaCorp, a casino operator in Cambodia. We had become increasingly concerned about the transformational expansion projects that the company was undertaking, in particular the effect that high capital expenditure (CapEx) would have on future free cash flow. In its place we purchased Tisco Financial, a financial services company specializing in car hire purchasing loans in Thailand.
The final change we made during the year was to sell DiGi.com, a mobile phone operator in Malaysia which is majority owned by Telenor of Norway. Digi had shown signs of losing growth momentum. The stock was replaced with Hanon Systems, a manufacturer of cooling and climate control systems for cars.
3. Portfolio Position
The Fund's largest country exposures were due to China, Taiwan, Thailand and Hong Kong. Our large weightings in these countries are an outcome of our stock selection process, rather than a 'top-down' allocation. We believe many companies in these markets are undervalued and represent attractive investment opportunities. Conversely, we have little or no allocations to other countries, for example, Indonesia or the Philippines, because the companies that meet our screening criteria in these countries have valuations that are not, at present, sufficiently attractive.
The Fund's largest sector exposures were due to Financials, Information Technology and Consumer Discretionary. Again, our allocations to Financials and Information Technology are due to our belief that there is sufficient undervaluation present in those sectors. We note that some sectors, for example, Materials, Energy and Utilities have historically had low representation in our universe – materials and energy are highly cyclical industries, while utility companies are often heavily regulated, and typically achieve lower returns.
4. Outlook
We see three potential consequences for Asia of the US election result: changes in trade policies, its effect on the US domestic economy and interest rates, and the potential for changes in Asia-focussed diplomatic relations. (The last of these factors seems to have taken a back seat recently in comparison to current diplomatic relations between the US and Russia.)
The potential negative impact of more restrictive trade policies on Asia was one of the main factors behind the sell-off in Asian equities, both preceding and immediately after the election. Our technology manufacturing stocks, including those in Taiwan, were among those that fell most heavily. Despite this period of weak performance, technology was one of the best performing sectors for 2016 as a whole. Yet again, this underlines the importance of selecting individual stocks for the long term over making short-term thematic bets, in our opinion.
We see it as unlikely that Trump will be able to impose tariffs on Asian countries to anything like the degree that he has suggested. Moreover, the appetite among US consumers to pay more for consumer electronics is simply not there. There is the potential for changes in tax treatment of overseas expenditure by US companies, but current policies appear to be at an early stage. Meanwhile the long-term shifts of globalisation march on.
The Trump administration's domestic policies are expected to be inflationary, which should secure or even accelerate interest rate rises by the US Federal Reserve. This is supposedly bad news for emerging markets including Asia, although as we wrote last month most countries in the Pacific region have little to fear from rate rises, having trade surpluses, low foreign debt exposure, well-capitalised banks and low inflation.
23
ASIA PACIFIC DIVIDEND BUILDER FUND
The manner in which many of the next administration's domestic policies have been proposed, although high profile, makes it difficult to judge how far and how quickly they will be enacted. The tone of the next round of US earnings reports will be instructive of whether corporate management is looking ahead with confidence of higher government spending and deregulation or caution around a higher dollar, rising interest rates, and rising stakes in trade policy. Not all of these are bad from an Asian perspective; a stronger dollar, if a result of a stronger US economy, is a good thing; greater restrictions on trade quite the opposite. US markets appear to be enjoying the relative certainty now that the election itself is over, although what this says about the factors above is impossible to say.
We believe the long-term case for investing in Asia remains unchanged:
• A quarter of the world's quality companies are in Asia. Of the 1,900 companies globally that meet our criteria for quality, 500 of them are located in Asia.
• Valuations are attractive. Asian equities trade at a substantial discount to global equities.
• Asia has historically provided a good source of diversified income. We target companies with moderate yields that are capable of growing their dividend over the long term. Companies in the portfolio have on average grown their dividends at 9.3% per annum over the past five years.
• We believe Asia economies are generating robust, sustainable growth. While a demographic tailwind has played a part in the region's success, the development of a regional manufacturing hub has helped countries to move up the value-chain by producing increasingly sophisticated goods. We see this clearly in China, but elsewhere in Asia too — Thailand's exports are becoming an increasingly important part of the supply chain. The long-term trends of globalisation seem unlikely to be halted any time soon.
2017 will doubtless bring uncertainties and surprises, as every year does. But, we believe a portfolio of attractively valued companies that have demonstrated an ability to deliver high returns on capital for eight years in a row, is well-positioned to cope with these challenges.

Edmund Harriss January 2017
The Fund invests in foreign securities, which will involve greater volatility and political, economic and currency risks and differences in accounting methods. These risks are greater for emerging markets. The Fund is non-diversified, meaning its assets may be invested in fewer individual holdings than diversified funds. Therefore, the Fund is more exposed to individual stock volatility than diversified funds. The Fund invests in smaller companies, which involves additional risks such as limited liquidity and greater volatility.
The MSCI AC Pacific Ex-Japan Index is a market capitalization weighted index that monitors the performance of stocks from the Pacific region, excluding Japan. The Standard & Poor's 500 Index is a market capitalization-weighted index composed of 500 widely held common stocks of U.S. companies. These indices are unmanaged and not available for investment, and do not incur expenses.
Please refer to the Schedule of Investments for details on Fund holdings. Current and future portfolio holdings are subject to risk.
The information provided herein represents the opinion of Guinness Atkinson Asset Management, Inc. for the period stated and it is not intended to be a forecast of future events, a guarantee of future results, or investment advice. Opinions, Fund holdings and sector allocations are subject to change at any time, and are not recommendations to buy or sell any security.
24
GUINNESS ATKINSON ASIA PACIFIC DIVIDEND BUILDER FUND
Growth of $10,000

| | | Average Annual Total Return
Periods Ended December 31, 2016 | |
| | | One Year | | Five Years | | Ten Years | |
| | | | | | 8.81 | % | | | 6.48 | % | | | 3.87 | % | |
Performance data quoted represents past performance and does not guarantee future results. The investment return and principal value of an investment will fluctuate so that an investor's shares, when redeemed, may be worth more or less than their original cost. Current performance of the Fund may be lower or higher than the performance quoted. Performance data current to the most recent month end may be obtained by visiting www.gafunds.com.
Total returns reflect a fee waiver in effect and in the absence of this waiver, the total returns would be lower. Returns reflect the reinvestment of distributions made by the Fund, if any. The graph and the performance table above do not reflect the deduction of taxes that a shareholder would pay on Fund distribution or the redemption of Fund shares. The Fund imposes a 2% redemption fee on shares held less than 30 days.
The MSCI All Country Pacific Free ex-Japan Index (MSCI AC Pacific ex-Japan Index) is a free float-adjusted, capitalization-weighted index that is designed to measure equity market performance in the Pacific region including Japan. The index referenced in this chart is not available for investment and does not incur expenses.
25
FUND HIGHLIGHTS at December 31, 2016
GUINNESS ATKINSON ASIA PACIFIC DIVIDEND BUILDER FUND
# of Holdings in Portfolio: | | | 37 | | |
Portfolio Turnover: | | | 30.9 | % | |
% of Stocks in Top 10: | | | 29.0 | % | |
Fund Manager: | | | |
Edmund Harriss | | | | | |
Top 10 Holdings (% of net assets) | | | | | | | | | | | |
LPN Development PCL /Foreign | | | 3.2 | % | | PTT PCL /Foreign | | | 2.9 | % | |
Relo Holdings Inc. | | | 3.0 | % | | Industrial & Commercial Bank of China Ltd. - H Shares | | | 2.8 | % | |
Hanon Systems | | | 2.9 | % | | China Minsheng Banking Corp. - H Shares | | | 2.8 | % | |
China Construction Bank Corp. - H Shares | | | 2.9 | % | | Henderson Group PLC | | | 2.8 | % | |
AAC Technologies Holdings Inc. | | | 2.9 | % | | Yangzijiang Shipbuilding Holdings Ltd. | | | 2.8 | % | |
Industry Breakdown (% of net assets) | | | | | | | | | | | |
Commercial Banks | | | 16.6 | % | | Photo Equipment & Supplies | | | 2.8 | % | |
Electronic Component - Miscellaneous | | | 8.3 | % | | Cellular Telecommunications | | | 2.7 | % | |
Semiconductor Components - Integrated Circuits | | | 8.1 | % | | Computers | | | 2.7 | % | |
Retail - Apparel/Shoe | | | 5.4 | % | | Retail - Consumer Electronics | | | 2.7 | % | |
REITS - Shopping Centers | | | 5.3 | % | | REITS - Diversified | | | 2.7 | % | |
Real Estate Operations/Development | | | 3.2 | % | | Optical Supplies | | | 2.7 | % | |
Real Estate Management/Service | | | 3.0 | % | | Retail - Jewelry | | | 2.7 | % | |
Diversified Financial Services | | | 2.9 | % | | MRI/Medical Diagnostics Imaging | | | 2.7 | % | |
Auto/Truck Parts & Equipment | | | 2.9 | % | | Distribution/Wholesale | | | 2.6 | % | |
Oil Company - Integrated | | | 2.9 | % | | Tobacco | | | 2.6 | % | |
Shipbuilding | | | 2.8 | % | | Life/Health Insurance | | | 2.6 | % | |
Investment Management/Advisor Service | | | 2.8 | % | | Textile - Products | | | 2.6 | % | |
Metal Processors & Fabricators | | | 2.8 | % | |
26
SCHEDULE OF INVESTMENTS
at December 31, 2016
GUINNESS ATKINSON ASIA PACIFIC DIVIDEND BUILDER FUND
Shares | | COMMON STOCKS: 99.1% | | Value | |
Australia: 8.1% | | | |
| | 82,330 | | | Henderson Group PLC | | $ | 238,248 | | |
| | 11,297 | | | JB Hi-Fi Ltd. | | | 228,596 | | |
| | 14,633 | | | Sonic Healthcare Ltd. | | | 225,982 | | |
| | | | | | | | 692,826 | | |
China: 25.2% | | | |
| | 27,000 | | | AAC Technologies Holdings Inc. | | | 245,296 | | |
| | 407,000 | | | Belle International Holdings Ltd. | | | 228,837 | | |
| | 322,000 | | | China Construction Bank Corp. - H Shares | | | 247,900 | | |
| | 410,000 | | | China Lilang Ltd. | | | 231,053 | | |
| | 101,000 | | | China Merchants Bank Co., Ltd. - H Shares | | | 236,789 | | |
| | 223,400 | | | China Minsheng Banking Corp. Ltd. - H Shares | | | 238,827 | | |
| | 22,000 | | | China Mobile Ltd. | | | 233,207 | | |
| | 402,000 | | | Industrial & Commercial Bank of China Ltd. - H Shares | | | 241,060 | | |
| | 423,600 | | | Yangzijiang Shipbuilding Holdings Ltd. | | | 238,397 | | |
| | | | | | | | 2,141,366 | | |
Hong Kong: 13.2% | | | |
| | 62,500 | | | BOC Hong Kong Holdings Ltd. | | | 223,661 | | |
| | 513,000 | | | Li & Fung Ltd. | | | 225,589 | | |
| | 35,000 | | | Link REIT/The | | | 227,481 | | |
| | 87,000 | | | Luk Fook Holdings International Ltd. | | | 227,191 | | |
| | 201,000 | | | Pacific Textiles Holdings Ltd. | | | 218,250 | | |
| | | | | | | | 1,122,172 | | |
Japan: 3.0% | | | |
| | 1,800 | | | Relo Holdings Inc. | | | 256,582 | | |
Singapore: 8.0% | | | |
| | 145,700 | | | Ascendas Real Estate Investment Trust - REIT | | | 228,387 | | |
| | 175,200 | | | CapitaMall Trust - REIT | | | 228,051 | | |
| | 18,808 | | | DBS Group Holdings | | | 225,205 | | |
| | | | | | | | 681,643 | | |
South Korea: 5.6% | | | |
| | 29,230 | | | Hanon Systems | | | 249,271 | | |
| | 2,690 | | | KT&G Corp. | | | 224,946 | | |
| | | | | | | | 474,217 | | |
Taiwan: 19.1% | | | |
| | 28,000 | | | Asustek Computer Inc. | | | 230,227 | | |
| | 34,000 | | | Catcher Technology Co., Ltd. | | | 236,309 | | |
| | 88,147 | | | Hon Hai Precision Industry Co., Ltd. | | | 230,290 | | |
| | 2,000 | | | Largan Precision Co., Ltd. | | | 235,192 | | |
| | 72,000 | | | Novatek Microelectronics Corp. | | | 237,922 | | |
| | 12,000 | | | St Shine Optical Co., Ltd. | | | 228,986 | | |
| | 40,000 | | | Taiwan Semiconductor Manufacturing Co., Ltd. | | | 225,263 | | |
| | | | | | | | 1,624,189 | | |
The accompanying notes are an integral part of these financial statements.
27
Shares | | COMMON STOCKS: 99.1% (Continued) | | Value | |
Thailand: 11.7% | | | |
| | 100,900 | | | Delta Electronics Thailand PCL/Foreign | | $ | 229,635 | | |
| | 794,500 | | | LPN Development PCL/Foreign | | | 268,453 | | |
| | 23,500 | | | PTT PCL/Foreign | | | 244,118 | | |
| | 133,900 | | | Tisco Financial Group PCL/Foreign | | | 225,282 | | |
| | 15,300 | | | Tisco Financial Group PCL/Foreign - NVDR | | | 25,742 | | |
| | | | | | | | 993,230 | | |
United States: 5.2% | | | |
| | 3,200 | | | Aflac Inc. | | | 222,720 | | |
| | 3,400 | | | QUALCOMM Inc. | | | 221,680 | | |
| | | | | | | | 444,400 | | |
| | | | | Total Common Stocks
(cost $8,487,783) | | | 8,430,625 | | |
| | | | | Total Investments in Securities
(cost $8,487,783): 99.1% | | | 8,430,625 | | |
| | | | | Other Assets less Liabilities: 0.9% | | | 73,845 | | |
| | | | | Net Assets: 100.0% | | $ | 8,504,470 | | |
NVDR - Non-Voting Depository Receipt
REIT - Real Estate Investment Trust
The accompanying notes are an integral part of these financial statements.
28
GUINNESS ATKINSON CHINA & HONG KONG FUND for the period ended December 31, 2016
1. Performance
AVERAGE ANNUAL TOTAL RETURNS
| | | 1 Year | | 3 Years | | 5 Years | | 10 Years | |
Fund | | | 2.95 | % | | | -2.29 | % | | | 2.58 | % | | | 3.25 | % | |
Benchmark Indices: | |
Hang Seng Composite Index | | | 3.07 | % | | | 0.93 | % | | | 7.03 | % | | | 4.02 | % | |
S&P 500 Index | | | 11.93 | % | | | 8.85 | % | | | 14.62 | % | | | 6.93 | % | |
The Fund's expense ratio is 1.56% per the Summary Prospectus dated May 3, 2016. For the Fund's current one year expense ratios, please refer to the Financial Highlights section of this report.
Performance data quoted represents past performance and does not guarantee future results. The investment return and principal value of an investment in the Fund will fluctuate so that an investor's shares, when redeemed, may be worth more or less than their original cost. Current performance of the Fund may be lower or higher than the performance quoted. Performance data current to the most recent month-end may be obtained by visiting www.gafunds.com, or calling (800) 915-6565.
The Fund imposes a 2% redemption fee on the sale of shares held less than 30 days. Performance data quoted does not reflect this redemption fee. Total returns for certain periods reflect fee limitations in effect and, in the absence of these limitations, total returns would have been lower.
In 2016, the Fund rose 2.95% compared to the benchmark, which was up 3.07%.
The year started off with mainland markets falling sharply – Shanghai fell heavily in the first few weeks of the year and this was compounded by the unexpected weakening of the reference rate for the renminbi. Together these two events led to weaker equity markets around the world. Capital outflows continued in January and February, following on from the trend seen in the second half of 2015.
At the same time, operating conditions in China were relatively weak. The official Purchasing Managers Index (PMI) was below 50 for most of the second half of 2015, indicating a contracting manufacturing sector. Policymakers responded through various ways such as loosening monetary policy and increasing the fiscal deficit. Consequently the PMI measure increased to above 50 in March and remained above 50 for nearly the rest of the year, indicating expanding manufacturing activity. The coal and steel industries were identified by policymakers as two industries with significant overcapacity with both industries contributing to producer price deflation. The State Council set a target to reduce overcapacity by 45m tons for steel and 250m tons for coal. As capacity and output was cut, the rise in steel prices contributed significantly to boosting producer prices, with producer price inflation turning positive in the second half of the year. This was important as rising producer prices lead to pricing power for firms in these industries, reflected in the fact that industrial profits grew 10% in the first 11 months of 2016 versus contracting 2% in 2015.
As the operating environment improved in China, sentiment turned more positive and capital outflows reduced significantly. Markets recovered from their lows seen in February and continued to recover even after the Brexit vote. In the second half of the year, the renminbi began to weaken further against the dollar and capital outflows started to increase again though they were not at the levels seen a year earlier. It is worth stressing that policymakers now view the renminbi against a basket of other currencies, not just the US dollar. So note that though the renminbi depreciated by 4.12% against the US dollar in the fourth quarter, it actually appreciated by 0.81% against its basket of other currencies. Nonetheless, many focus on the exchange rate between the US dollar and the renminbi and if this rate continues to weaken, then capital outflows may continue.
The best performing stocks in the Fund were Geely, Tongda Group and Weichai Power, AAC Technologies, and VTech. The worst performing stocks were Lenovo, PAX Global, Pacific Textiles, Sino Biopharmaceutical, and China Overseas Land and Investment. In 2016, the MSCI Hong Kong Index rose by 2.21% while the MSCI China Index rose by 1.05%.
2. Activity
The Fund has moved closer to being an equally weighted portfolio, with the majority of stocks being those that have generated a persistent return above the cost of capital. The Fund started the year with 41 positions. We sold the entire position in each of Baoxin Auto Group, China Overseas Property Holdings, SOHO China, Sohu.com, Dongfeng Motor, Chongqing Rural Commercial
29
Bank, Nagacorp, Great Wall Motor, ChinaCache International Holdings, China Shenhua Energy, Beijing Enterprises Holdings, PetroChina, Cathay Pacific Airways, and Dah Sing Financial. We bought Sino Biopharmaceutical, Haier Electronics, Hollysys Automation, PAX Global, New Oriental Education, and Belle International. The Fund ended the year with 33 positions.
The Fund's biggest exposures at the end of the year were technology, financials and consumer discretionary. All of the Fund's holdings are listed and traded outside mainland China.
3. Outlook
The year started off with panic regarding China's economy. Policymakers responded to a weaker economy with policies that improved operating conditions, with the improvement in producers' pricing power a significant development. But the long-term concerns are still present – mainly the buildup of debt in the Chinese economy. China is now balancing out the needs for growth against the need to rein in debt creation. Debt creation cannot stop because growth would grind to a halt, but it certainly must slow and as it does so, gross domestic product (GDP) growth will also slow. Policymakers have responded with ideas for securitization and debt-for-equity swaps which sound promising but they need to be implemented on a large scale to have a significant impact.
The election of Trump also changes the outlook for China. Trump's campaign was built on pledges to boost American employment through policies like imposing a 35% tariff on US companies that import products from their factories abroad. More generally, it may be the case that Trump will no longer accept the US running trade deficits, which means it is consuming more than it producing, which is another way of saying the excess consumption is imported. China has been a major beneficiary of this policy as it has run a trade surplus, which means it produces more than it consumes, exporting the rest abroad to trade deficit countries like the US. If Trump does indeed reduce the US's trade deficit, then it could lead to more American jobs, but possibly at the expense of American consumers who will no longer benefit from cheaper Asian production. At the same time, China will face problems as the demand for its exports will fall, which may force China to accelerate plans to shift the economy towards consumption. This can also be viewed as a good thing if one believes China's trade surplus represents a significant imbalance.
Rising yields in the US could lead to valuation compression in markets around the world. The Fund seeks to invest in good quality companies that in our opinion are undervalued by the market, and we believe this approach should do well in a more uncertain macro-environment.

Edmund Harriss January 2017
The Fund invests in foreign securities, which involve political, economic and currency risks, greater volatility, and differences in accounting methods. These risks are greater for emerging markets. The Fund is non-diversified, meaning that its assets may be concentrated in fewer individual holdings than diversified funds. Therefore, the Fund is more exposed to individual stock volatility than diversified funds. Investments focused in a single geographic region may be exposed to greater risk and more volatility than investments diversified among various geographies. The Fund invests in smaller companies, which involve additional risks such as limited liquidity and greater volatility.
Please refer to the Schedule of Investments for details on Fund holdings. Current and future portfolio holdings are subject to risk.
The Hang Seng Composite Index in a market capitalization weighted index that covers about 95% of the total market capitalization of companies listed on the main board of the Hong Kong Stock Exchange. The Standard & Poor's 500 Index is a market capitalization-weighted index composed of 500 widely held common stocks of U.S. companies. The MSCI Hong Kong Index is designed to measure the performance of the large and mid-cap segments of the Hong Kong market. With 45 Constituents, the index covers approximately 85% of the free float-adjusted market capitalization of the Hong Kong equity universe. The MSCI China Index captures large and mid-cap representation across China H shares, B shares, Red chips, P chips and foreign listings (e.g. ADRs). With 150 constituents, the index covers about 85% of this China equity universe. These indices are unmanaged, not available for investment and do not incur expenses.
The Purchasing Managers Index (PMI) is based on five major indicators: new orders, inventory levels, production, supplier deliveries and the employment environment.
30
A debt/equity swap is a transaction in which the obligations or debts of a company or individual are exchanged for something of value, equity.
The information provided herein represents the opinion of Guinness Atkinson Asset Management, Inc. for the period stated and it is not intended to be a forecast of future events, a guarantee of future results, or investment advice. Opinions, Fund holdings and sector allocations are subject to change at any time, and are not recommendations to buy or sell any security.
31
GUINNESS ATKINSON CHINA & HONG KONG FUND
Growth of $10,000
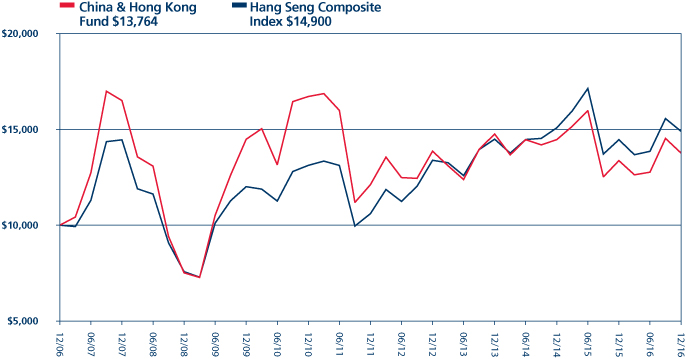
| | | Average Annual Total Return
Periods Ended December 31, 2016 | |
| | | One Year | | Five Years | | Ten Years | |
| | | | | | 2.95 | % | | | 2.58 | % | | | 3.25 | % | |
Performance data quoted represents past performance and does not guarantee future results. The investment return and principal value of an investment will fluctuate so that an investor's shares, when redeemed, may be worth more or less than their original cost. Current performance of the Fund may be lower or higher than the performance quoted. Performance data current to the most recent month end may be obtained by visiting www.gafunds.com.
Total returns for certain periods reflect a fee waiver in effect and in the absence of this waiver, the total returns would be lower. Returns reflect the reinvestment of distributions made by the Fund, if any. The graph and the performance table above do not reflect the deduction of taxes that a shareholder would pay on Fund distribution or the redemption of Fund shares. The Fund imposes a 2% redemption fee on shares held less than 30 days.
The Hang Seng Composite Index is a market-capitalization weighted index that comprises the top 200 companies listed on the Hong Kong Stock Exchange, based on the average market capitalization for the past twelve months. The index referenced in this chart is not available for investment and does not incur expenses.
32
FUND HIGHLIGHTS at December 31, 2016
GUINNESS ATKINSON CHINA & HONG KONG FUND
# of Holdings in Portfolio: | | | 33 | | |
Portfolio Turnover: | | | 28.0 | % | |
% of Stocks in Top 10: | | | 36.1 | % | |
Fund Manager: | | | |
Edmund Harriss | | | | | |
Top 10 Holdings (% of net assets) | | | | | | | |
Tencent Holdings Ltd. | | | 4.3 | % | | BOC Hong Kong Holdings Ltd. | | | 3.5 | % | |
NetEase Inc. - ADR | | | 4.1 | % | | AAC Technologies Holdings Inc. | | | 3.5 | % | |
VTech Holdings Ltd. | | | 3.7 | % | | China Merchants Bank Co., Ltd. - H Shares | | | 3.4 | % | |
China Construction Bank Corp. - H Shares | | | 3.5 | % | | China Mobile Ltd. | | | 3.3 | % | |
Galaxy Entertainment Group Ltd. | | | 3.5 | % | | Tongda Group Holdings Ltd. | | | 3.3 | % | |
Industry Breakdown (% of net assets) | | | | | | | |
Commercial Banks | | | 16.4 | % | | Oil Company - Exploration & Production | | | 3.1 | % | |
Electronic Component - Miscellaneous | | | 6.8 | % | | Pharmaceuticals | | | 3.0 | % | |
Retail - Apparel/Shoe | | | 6.3 | % | | Computers | | | 3.0 | % | |
Building Products | | | 5.9 | % | | Auto/Truck Parts & Equipment | | | 3.0 | % | |
Insurance | | | 5.6 | % | | Schools | | | 3.0 | % | |
Internet Application Software | | | 4.3 | % | | Auto - Cars/Light Trucks | | | 3.0 | % | |
Internet Content - Entertainment | | | 4.1 | % | | Public Thoroughfares | | | 2.8 | % | |
Telecommunication Equipment | | | 3.7 | % | | Textile - Products | | | 2.7 | % | |
Casino Hotels | | | 3.5 | % | | Real Estate Operations/Development | | | 2.7 | % | |
Cellular Telecommunications | | | 3.3 | % | | Exchange Traded Funds (ETFs) | | | 2.3 | % | |
Industrial Automation | | | 3.3 | % | | Shipbuilding | | | 1.3 | % | |
Computers Integrated Systems | | | 3.2 | % | | Machinery - General Industries | | | 1.0 | % | |
Appliances | | | 3.2 | % | | | | | |
33
SCHEDULE OF INVESTMENTS
at December 31, 2016
GUINNESS ATKINSON CHINA & HONG KONG FUND
Shares | | COMMON STOCKS: 100.5% | | Value | |
Appliances: 3.2% | | | |
| | 1,178,000 | | | Haier Electronics Group Co., Ltd. | | $ | 1,853,324 | | |
Auto/Truck Parts & Equipment: 3.0% | | | |
| | 1,130,240 | | | Weichai Power Co., Ltd. - H Shares | | | 1,740,288 | | |
Auto – Cars/Light Trucks: 3.0% | | | |
| | 1,805,000 | | | Geely Automobile Holdings Ltd. | | | 1,724,811 | | |
Building Products: 5.9% | | | |
| | 634,000 | | | Anhui Conch Cement Co., Ltd. - H Shares | | | 1,725,115 | �� | |
| | 2,602,000 | | | China Lesso Group Holdings Ltd. | | | 1,687,802 | | |
| | | | | | | | 3,412,917 | | |
Casino Hotels: 3.5% | | | |
| | 469,000 | | | Galaxy Entertainment Group Ltd. | | | 2,044,258 | | |
Cellular Telecommunications: 3.3% | | | |
| | 181,500 | | | China Mobile Ltd. | | | 1,923,954 | | |
Commercial Banks: 16.4% | | | |
| | 564,500 | | | BOC Hong Kong Holdings Ltd. | | | 2,020,101 | | |
| | 2,661,670 | | | China Construction Bank Corp. - H Shares | | | 2,049,155 | | |
| | 854,000 | | | China Merchants Bank Co., Ltd. - H Shares | | | 2,002,156 | | |
| | 1,609,000 | | | China Minsheng Banking Corp., Ltd. | | | 1,720,112 | | |
| | 2,960,330 | | | Industrial & Commercial Bank of China Ltd. - H Shares | | | 1,775,167 | | |
| | | | | | | | 9,566,691 | | |
Computers: 3.0% | | | |
| | 2,880,000 | | | Lenovo Group Ltd. | | | 1,745,567 | | |
Computers Integrated Systems: 3.2% | | | |
| | 2,847,000 | | | PAX Global Technologies | | | 1,887,108 | | |
Electronic Component – Miscellaneous: 6.8% | | | |
| | 222,500 | | | AAC Technologies Holdings Inc. | | | 2,021,423 | | |
| | 7,450,000 | | | Tongda Group Holdings Ltd. | | | 1,921,465 | | |
| | | | | | | | 3,942,888 | | |
Exchange Traded Funds (ETFs): 2.3% | | | |
| | 1,676,700 | | | db x-trackers CSI300 Index ETF | | | 1,327,608 | | |
Industrial Automation: 3.3% | | | |
| | 103,700 | | | Hollysys Automation Technologies Ltd. | | | 1,899,784 | | |
Insurance: 5.6% | | | |
| | 1,024,000 | | | PICC Property & Casualty Co., Ltd. - H Shares | | | 1,595,193 | | |
| | 336,000 | | | Ping An Insurance Group Company of China Ltd. - H Shares | | | 1,681,192 | | |
| | | | | | | | 3,276,385 | | |
The accompanying notes are an integral part of these financial statements.
34
Shares | | COMMON STOCKS: 100.5% (Continued) | | Value | |
Internet Application Software: 4.3% | | | |
| | 101,900 | | | Tencent Holdings Ltd. | | $ | 2,492,802 | | |
Internet Content – Entertainment: 4.1% | | | |
| | 11,175 | | | NetEase Inc. - ADR | | | 2,406,425 | | |
Machinery – General Industries: 1.0% | | | |
| | 2,430,000 | | | Chen Hsong Holdings† | | | 604,797 | | |
Oil Company – Exploration & Production: 3.1% | | | |
| | 1,461,000 | | | CNOOC Ltd. | | | 1,827,545 | | |
Pharmaceuticals: 3.0% | | | |
| | 2,479,000 | | | Sino Biopharmaceutical Ltd. | | | 1,745,482 | | |
Public Thoroughfares: 2.8% | | | |
| | 1,934,000 | | | Shenzhen Expressway Co., Ltd. - H Shares | | | 1,653,546 | | |
Real Estate Operations/Development: 2.7% | | | |
| | 586,000 | | | China Overseas Land & Investments Ltd. | | | 1,552,944 | | |
Retail – Apparel/Shoe: 6.3% | | | |
| | 3,161,000 | | | Belle International Holdings Ltd. | | | 1,777,285 | | |
| | 3,324,000 | | | China Lilang Ltd. | | | 1,873,219 | | |
| | | | | | | | 3,650,504 | | |
Schools: 3.0% | | | |
| | 40,900 | | | New Oriental Education & Technology Group Inc.* | | | 1,721,890 | | |
Shipbuilding: 1.3% | | | |
| | 1,396,000 | | | Yangzijiang Shipbuilding Holdings Ltd. | | | 785,651 | | |
Telecommunication Equipment: 3.7% | | | |
| | 162,900 | | | VTech Holdings Ltd. | | | 2,178,442 | | |
Textile – Products: 2.7% | | | |
| | 1,457,000 | | | Pacific Textiles Holdings Ltd. | | | 1,582,041 | | |
| | | | | Total Common Stocks
(cost $51,957,940) | | | 58,547,652 | | |
| | | | | Total Investments in Securities
(cost $51,957,940): 100.5% | | | 58,547,652 | | |
| | | | | Liabilities in Excess of Other Assets: (0.5%) | | | (304,144 | ) | |
| | | | | Net Assets: 100.0% | | $ | 58,243,508 | | |
* Non-income producing security.
ADR - American Depository Receipt
† The Advisor has determined this security to be illiquid. As of December 31, 2016, the total market value of the illiquid security represents 1.0% of net assets.
The accompanying notes are an integral part of these financial statements.
35
GUINNESS ATKINSON DIVIDEND BUILDER FUND for the period ended December 31, 2016
1. Performance
AVERAGE ANNUAL TOTAL RETURNS
| | | 1 Year | | 3 Years | | Since Inception
(March 30, 2012) | |
Fund | | | 6.83 | % | | | 2.63 | % | | | 8.48 | % | |
Benchmark Index: | |
MSCI World Index | | | 8.18 | % | | | 4.43 | % | | | 9.11 | % | |
The Fund's gross expense ratio is 1.77% and net expense ratio is 0.68% per the Summary Prospectus dated August 26, 2016. For the Fund's current one year expense ratios, please refer to the Financial Highlights section of this report. The Advisor has contractually agreed to waive a portion of its advisory fees and/or reimburse other Fund expenses so that the Fund's ratio of expenses to average daily net assets will not exceed 0.68% (excluding Acquired Fund Fees and Expenses, interest, taxes, dividends on short positions and extraordinary expenses) through June 30, 2017. To the extent that the Advisor waives fees and/or reimburses expenses, it may seek repayment of a portion or all of such amounts at any time within the three fiscal years after the fiscal year in which such amounts were waived and/or reimbursed, subject to the applicable cap.
Performance data quoted represents past performance and does not guarantee future results. The investment return and principal value of an investment in the Fund will fluctuate so that an investor's shares, when redeemed, may be worth more or less than their original cost. Current performance of the Fund may be lower or higher than the performance quoted. Performance data current to the most recent month-end may be obtained by visiting www.gafunds.com, or calling (800) 915-6565.
Total returns for certain periods reflect expense limitations in effect and, in the absence of these imitations, total returns would have been lower.
In 2016, the Dividend Builder Fund produced a total return of 6.83%. The Fund underperformed the MSCI World Index by 1.35% over the period.
2. Activity
Portfolio turnover was slightly below average for the Fund in 2016; we sold four companies and replaced them with four new companies, following our 'one in, one out' approach.
In the first quarter we sold our position in Aberdeen Asset Management and bought a position in Walmart and Largan Precision.
We had owned Aberdeen Asset Management since we launched the Fund but we decided to sell due to a combination of three factors – a poor outlook for emerging markets, large outflows from sovereign wealth funds of oil producing countries and declining performance of their funds. We will continue to monitor the company and look for a change in fortunes but we decided it made more sense to sell, replacing it with a company that we had owned previously and had continued to monitor in the form of Walmart.
We had previously held Walmart from the Fund launch to March 2013, and decided to take a profit then after we saw a significant valuation rerating and compression in the dividend yield we were receiving. Since then, Walmart has been facing significant challenges, including the increasing threat of Amazon, wage inflation and Foreign exchange (FX) headwinds. We have seen margins decline over the last few years as the company has been investing to catch up in e-commerce and expanding its online grocery pickup offering, which should start to have an impact this year. Last year we saw a significant decline in the valuation the market has been willing to pay. At the beginning of 2015, the company was trading towards the peak of its 10 year historical multiple and by the beginning of 2016 it was trading around one standard deviation below its 10 year average multiple.
By January this year, the dividend yield was the highest it has been for the last 10 years. We also note that Walmart has grown its dividend every year that the Fund has been alive, since March 30, 2012. Dividend growth over the last five years has been particularly impressive at an average rate of 10% per year. Whether this level of dividend growth is achievable in the next five years is hard to predict but we think the dividend certainly looks very safe; the company has generated a high return on capital well
36
above its cost of capital, its dividend currently represents a modest payout ratio of 40%, it has a Debt to EBITDA ratio of 1.5x and a AA credit rating.
We did not make any changes to the portfolio in the second and third quarter.
We made a small number of changes to the portfolio in the fourth quarter. We sold our positions in Largan Precision, Li & Fung and Willis Towers Watson. and replaced them with new positions in Roche, Randstad and VF.
We bought Largan Precision, a Taiwanese manufacturer of optical lenses for smartphones, early in the first quarter of 2016 and it went on to perform very well for the Fund. The company had demonstrated impressive growth along with margin expansion, which is a combination we always like to see. The stock price fell quite significantly over the second half of 2015 in an environment of general emerging market weakness, allowing us to find an attractive entry point towards the end of the year. Indeed, we managed to purchase the company on a P/E multiple of 11x 2016 expected earnings. Given the strong share price performance we have seen this year, the P/E multiple has since expanded to 21x 2016 expected earnings, which we felt was too rich. We continue to like the company and it will remain on our watchlist as a potential candidate to re-enter the portfolio if we see a similarly attractive entry point in the future.
We owned Willis since the launch of the Fund. We always like insurance brokers' scalable and capital-light business models. However, the company merged with Towers Watson at the beginning of this year, which led to a change in the capital structure of the business and, importantly for us, a lower dividend yield. The company has performed well in the portfolio but its dividend yield now of around 1.5%, down from 3.5% when we bought the stock, made us feel there are better opportunities elsewhere.
Li & Fung was a position where we got it wrong and decided to cut our losses and move on. We bought the company back in 2014 and we liked the company's asset-light business model as we could see how growth would translate into significant operational leverage. Growth had been weak for some time but we thought there was a reasonable chance that it would turn around. Unfortunately, that did not occur and with the election of Donald Trump, we felt the company's model of a global outsourcing business became more vulnerable. We also came to the conclusion that there is now a real risk of a dividend cut.
In the run-up to the US election, there had been a meaningful sell-off in the healthcare sector and we felt this provided an opportune time to purchase Roche for the portfolio. The one year forward P/E multiple for Roche peaked at about 20x in the middle of 2015. We managed to pick it up on a multiple of 15x, a very reasonable discount not only to its historic level but also relative to the market given the company's high quality characteristics.
We also purchased VF. The company owns clothing brands such as North Face, Timberland and Wrangler Jeans. We have followed the company closely for a number of years and noted that the company's dividend growth, while impressive at over 10% per year, had failed to keep up with share price performance, meaning the yield was below 2% for a long time. More recently, however, the company's dividend growth has remained as impressive but its share price has been weak over the last 18 months, meaning we were able to buy the company on a dividend yield of around 3%.
Finally, we added a position in the Dutch recruitment firm Randstad. We are always looking for companies that meet our quality criteria but trade on valuations towards the lows of their historic ranges. Randstad certainly met these criteria after the company's share price reacted negatively to the Brexit referendum. The market valued this high quality company on a forward P/E of 20x in the middle of 2015, yet we were able to pick it up on a forward P/E of 13x in November.
3. Portfolio Position
The most notable effects of the changes we made to the portfolio in 2016 were to increase our exposure to consumer staples, health care and industrials, while reducing our exposure to financials, consumer discretionary and IT. These were relatively modest changes in allocation given we only made four sales and five buys during the year.
37
The Fund has maintained its zero exposure to both the materials and utilities sectors.
Sector allocation at 12/31/16 | |
Consumer Discretionary | | | 11.2 | % | |
Consumer Staples | | | 19.5 | % | |
Energy | | | 5.6 | % | |
Financials | | | 14.2 | % | |
Heath Care | | | 16.9 | % | |
Industrial | | | 19.9 | % | |
Information Technology | | | 8.3 | % | |
Material | | | 0.0 | % | |
Telecommunication Services | | | 3.0 | % | |
Utilities | | | 0.0 | % | |
Cash | | | 1.4 | % | |
Total | | | 100.0 | % | |
4. Dividend
The trailing twelve months dividend distributed by the Fund was $0.472 per share.

5. Outlook
As we reflect on 2016 and look forward to 2017, there is considerable uncertainty in the markets.
In contrast, at the start of 2016 there was a strong consensus view that Britain would vote to remain in the EU and that Hilary Clinton would be elected President of the United States of America. There was also a widely held view that the US would increase interest rates four times over the course of the year. Latching on to these forecasts and building your portfolio in anticipation of these outcomes would have made for a painful 2016.
38
Today there is uncertainty surrounding the direction of Donald Trump's policies, the threat of trade wars, tariffs and broader protectionist measures. In Europe, we have a French Presidential election, a German Presidential election and the triggering of Article 50 (the provision of the Treaty on European Union that governs the process by which states may withdraw from the EU) to look forward to. All events that could move markets and this uncertainty leaves us feeling a little apprehensive. However, we have never sought to build our investment process to rely on making big decisions on macro events, let alone on binary events such as elections. We have always preferred high return on capital and strong balance sheets to a macro crystal ball, and if this uncertainty persists through 2017, then we believe the chances are these types of companies should be a more pleasant place to be invested.
So we will refrain from making any big predictions for 2017, as your inbox will almost certainly be overloaded with them already, and instead leave you a few word from Voltaire:
"Doubt is not a pleasant condition but certainty is an absurd one."
Thank you for your continued support as we look forward to updating you with the Fund's progress over the coming year.


Matthew Page Ian Mortimer January 2017
The Fund invests in foreign securities, which involve political, economic and currency risks, greater volatility, and differences in accounting methods. These risks are greater for emerging markets. The Fund invests in small- or mid-cap companies, which involve additional risks such as limited liquidity and greater volatility. Growth stocks typically are more volatile than value stocks; however, value stocks have a lower expected growth rate in earnings and sales.
The MSCI World Index is a free float-adjusted market capitalization weighted index that is designed to measure the equity market performance of developed markets. This index is unmanaged and is not available for investment, and does not incur expenses.
EBITDA is net income with interest, taxes, depreciation, and amortization added back to it, and can be used to analyze and compare profitability between companies and industries because it eliminates the effects of financing and accounting decisions.
PER or P/E – Price to Earnings ratio is calculated by dividing current price of the stock by the company's trailing months' earnings per share.
Earnings growth is not a measure of the Fund's future performance.
Standard deviation (SD) measures the volatility the fund's returns in relation to its average. It tells you how much the fund's return can deviate from the historical mean return of the scheme.
Payout ratio is the proportion of earnings paid out as dividends to shareholders, typically expressed as a percentage.
Article 50 is a part of European Union law that sets out the process by which member states may withdraw from the European Union.
Dividend yield is calculated by annualizing the last quarterly dividend paid and dividing it by the current share price.
Diversification does not assure a profit nor protect against loss in a declining market.
Please refer to the Schedule of Investments for details on Fund holdings. Current and future portfolio holdings are subject to risk.
The information provided herein represents the opinion of Guinness Atkinson Asset Management, Inc. for the period stated and is not intended to be a forecast of future events, a guarantee of future results, or investment advice. Opinions, Fund holdings and sector allocations are subject to change at any time, and are not recommendations to buy or sell any security.
39
GUINNESS ATKINSON DIVIDEND BUILDER FUND
Growth of $10,000
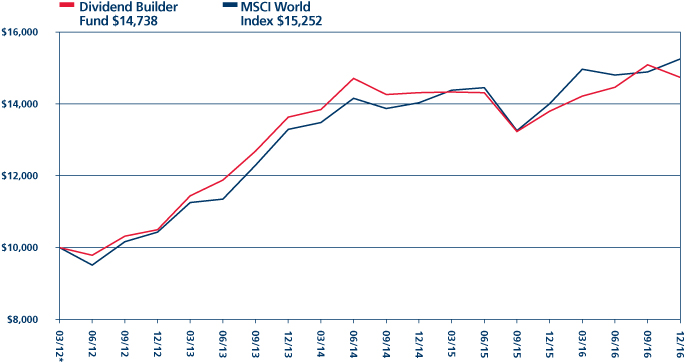
| | | Average Annual Total Return
Periods Ended December 31, 2016 | |
| | |
One Year | |
Three Years | | Since Inception
(03/30/12) | |
| | | | | | 6.83 | % | | | 2.63 | % | | | 8.48 | % | |
*Inception date 03/30/12.
Performance data quoted represents past performance and does not guarantee future results. The investment return and principal value of an investment will fluctuate so that an investor's shares, when redeemed, may be worth more or less than their original cost. Current performance of the Fund may be lower or higher than the performance quoted. Performance data current to the most recent month end may be obtained by visiting www.gafunds.com.
Total returns reflect a fee waiver in effect and in the absence of this waiver, the total returns would be lower. Returns reflect the reinvestment of distributions made by the Fund, if any. The graph and the performance table above do not reflect the deduction of taxes that a shareholder would pay on Fund distribution or the redemption of Fund shares.
The MSCI World Index is a free float-adjusted market capitalization weighted index that is designed to measure the equity market performance of developed markets. The index referenced in this chart is not available for investment and does not incur expenses.
40
FUND HIGHLIGHTS at December 31, 2016
GUINNESS ATKINSON DIVIDEND BUILDER FUND
# of Holdings in Portfolio: | | | 36 | | |
Portfolio Turnover: | | | 21.6 | % | |
% of Stocks in Top 10: | | | 28.8 | % | |
Fund Managers: | | | |
Dr. Ian Mortimer | | | | | |
Matthew Page | | | |
Top 10 Holdings (% of net assets) | | | | | | | |
Vodacom Group Ltd. | | | 3.0 | % | | Merck & Co., Inc. | | | 2.9 | % | |
Roche Holding AG | | | 2.9 | % | | Schneider Electric SE | | | 2.9 | % | |
Illinois Tool Works Inc. | | | 2.9 | % | | WPP PLC | | | 2.8 | % | |
Eaton Corp. PLC | | | 2.9 | % | | Danone SA | | | 2.8 | % | |
BAE Systems PLC | | | 2.9 | % | | Imperial Tobacco Group PLC | | | 2.8 | % | |
Industry Breakdown (% of net assets) | | | | | | | |
Pharmaceuticals | | | 14.1 | % | | MRI/Medical Diagnostics Imaging | | | 2.8 | % | |
Diversified Manufactured Operations | | | 5.8 | % | | Human Resources | | | 2.8 | % | |
Aerospace/Defense | | | 5.7 | % | | Apparel Manufacturers | | | 2.8 | % | |
Finance - Other Services | | | 5.6 | % | | Life/Health Insurance | | | 2.8 | % | |
Oil Company - Integrated | | | 5.6 | % | | Beverages - Non-alcoholic | | | 2.8 | % | |
Cosmetics & Toiletries | | | 5.6 | % | | Retail - Discount | | | 2.8 | % | |
Tobacco | | | 5.5 | % | | Aerospace/Defense - Equipmenet | | | 2.8 | % | |
Cellular Telecommunication | | | 3.0 | % | | Enterprise Software/Service | | | 2.8 | % | |
Finance - Investment Banker/Broker | | | 2.9 | % | | Networking Products | | | 2.8 | % | |
Power Conversion/Supply Equipment | | | 2.9 | % | | Applications Software | | | 2.8 | % | |
Advertising Agencies | | | 2.8 | % | | Toys | | | 2.8 | % | |
Food - Miscellaneous/Diversified | | | 2.8 | % | | Commercial Service - Finance | | | 2.8 | % | |
Insurance Brokers | | | 2.8 | % | | | | | |
41
SCHEDULE OF INVESTMENTS
at December 31, 2016
GUINNESS ATKINSON DIVIDEND BUILDER FUND
Shares | | COMMON STOCKS: 98.7% | | Value | |
Australia: 2.8% | | | |
| | 14,130 | | | Sonic Healthcare Ltd. | | $ | 218,214 | | |
France: 8.5% | | | |
| | 3,480 | | | Danone SA | | | 220,526 | | |
| | 3,190 | | | Schneider Electric SE | | | 221,994 | | |
| | 4,280 | | | Total SA | | | 219,500 | | |
| | | | | | | | 662,020 | | |
Germany: 2.8% | | | |
| | 2,690 | | | Deutsche Boerse AG* | | | 219,565 | | |
Israel: 2.7% | | | |
| | 5,820 | | | Teva Pharmaceutical Industries Ltd. - ADR | | | 210,975 | | |
Japan: 2.7% | | | |
| | 6,300 | | | Japan Tobacco Inc. | | | 207,206 | | |
Netherlands: 5.6% | | | |
| | 4,030 | | | Randstad Holding NV | | | 218,600 | | |
| | 7,960 | | | Royal Dutch Shell PLC - Class A | | | 217,731 | | |
| | | | | | | | 436,331 | | |
South Africa: 3.0% | | | |
| | 21,080 | | | Vodacom Group Ltd. | | | 233,919 | | |
Switzerland: 2.9% | | | |
| | 1,000 | | | Roche Holding AG | | | 228,420 | | |
United Kingdom: 14.3% | | | |
| | 30,740 | | | BAE Systems PLC | | | 224,084 | | |
| | 5,040 | | | Imperial Tobacco Group PLC | | | 220,035 | | |
| | 22,712 | | | NEX Group PLC | | | 130,015 | | |
| | 18,561 | | | TP ICAP PLC | | | 99,118 | | |
| | 5,310 | | | Unilever PLC | | | 215,463 | | |
| | 9,880 | | | WPP PLC | | | 221,118 | | |
| | | | | | | | 1,109,833 | | |
The accompanying notes are an integral part of these financial statements.
42
Shares | | COMMON STOCKS: 98.7% (Continued) | | Value | |
United States: 53.4% | | | |
| | 3,480 | | | AbbVie Inc. | | $ | 217,918 | | |
| | 3,120 | | | Aflac Inc. | | | 217,152 | | |
| | 4,220 | | | Arthur J Gallagher & Co. | | | 219,271 | | |
| | 6,810 | | | CA Inc. | | | 216,354 | | |
| | 7,160 | | | Cisco Systems Inc. | | | 216,375 | | |
| | 1,900 | | | CME Group Inc. | | | 219,165 | | |
| | 5,240 | | | Coca-Cola Co/The | | | 217,250 | | |
| | 3,350 | | | Eaton Corp. PLC | | | 224,751 | | |
| | 1,260 | | | General Dynamics Corp. | | | 217,552 | | |
| | 9,350 | | | H&R Block Inc. | | | 214,956 | | |
| | 1,840 | | | Illinois Tool Works Inc. | | | 225,326 | | |
| | 1,890 | | | Johnson & Johnson | | | 217,747 | | |
| | 7,820 | | | Mattel Inc. | | | 215,441 | | |
| | 3,810 | | | Merck & Co., Inc. | | | 224,295 | | |
| | 3,470 | | | Microsoft Corp. | | | 215,626 | | |
| | 2,590 | | | Procter & Gamble Co/The | | | 217,767 | | |
| | 1,970 | | | United Technologies Corp. | | | 215,951 | | |
| | 4,080 | | | VF Corp. | | | 217,668 | | |
| | 3,140 | | | Wal-Mart Stores Inc. | | | 217,037 | | |
| | | | | | | | 4,147,602 | | |
| | | | | Total Common Stocks
(cost $7,087,864) | | | 7,674,085 | | |
| | | | | Total Investments in Securities
(cost $7,087,864): 98.7% | | | 7,674,085 | | |
| | | | | Other Assets less Liabilities: 1.3% | | | 105,173 | | |
| | | | | Net Assets: 100.0% | | $ | 7,779,258 | | |
* Non-income producing security.
ADR - American Depository Receipt
The accompanying notes are an integral part of these financial statements.
43
GUINNESS ATKINSON GLOBAL ENERGY FUND for the period ended December 31, 2016
1. Performance
AVERAGE ANNUAL TOTAL RETURNS
| | | 1 Year | | 3 Years | | 5 Years | | 10 Years | |
Fund | | | 27.04 | % | | | -9.32 | % | | | -0.79 | % | | | 1.16 | % | |
Benchmark Indices: | |
MSCI World Energy Index | | | 27.54 | % | | | -3.98 | % | | | 1.54 | % | | | 2.41 | % | |
S&P 500 Index | | | 11.93 | % | | | 8.85 | % | | | 14.62 | % | | | 6.93 | % | |
The Fund's expense ratio is 1.41% per the Summary Prospectus dated May 3, 2016. For the Fund's current one year expense ratios, please refer to the Financial Highlights section of this report.
Performance data quoted represents past performance and does not guarantee future results. The investment return and principal value of an investment in the Fund will fluctuate so that an investor's shares, when redeemed, may be worth more or less than their original cost. Current performance of the Fund may be lower or higher than the performance quoted. Performance data current to the most recent month-end may be obtained by visiting www.gafunds.com, or calling (800) 915-6565.
The Global Energy Fund, in 2016 produced a total return of 27.04%. This compares to the total return of the MSCI World Energy Index of 27.54% and the S&P 500 Index total return of 11.93%.
It was a year of recovery for energy equities, albeit a volatile one. The MSCI World Energy Index started the year negatively, declining in January and February as the oil price fell below $30/bbl. Initial news in mid-February about a possible freeze to Organization of the Petroleum Exporting Countries (OPEC) production acted as a catalyst to pick the oil price off the floor and back into the $40s/bbl through March and April, with energy equities responding positively. We then saw the energy sector range trading until late September, when OPEC's announcement of a planned production cut lifted oil and energy equities through the fourth quarter. The MSCI World Energy Index ended 2016 with a total return of 27.54% versus the MSCI World at 11.93%.
As ever, the performance of the MSCI World Energy Index was only part of the story, with a number of energy equity subsectors finishing the year up by around 30% to 50%, particularly those more levered to oil. Other sectors, including renewables, utilities and refining, struggled.
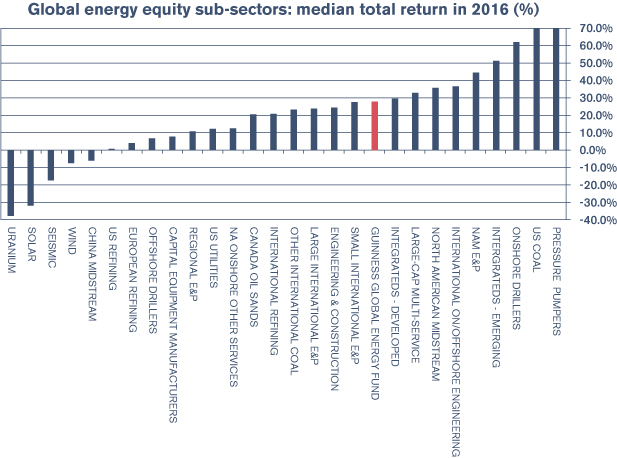
Source: Standard and Poor's; Guinness Atkinson Asset Management Ltd
44
A quick tour of some of the main energy sub-sectors paints a picture for the energy equity sector's performance in 2016:
Coal. Generally the best performing sub-sector. In the US, the recovery in thermal coal prices brought on by higher gas prices helped some coal equities up off the floor (having been down 90%+ plus from their peak). President Donald Trump's support of the sector also boosted sentiment post the US election. Internationally, a decision by local Chinese regulators to curtail production, to help restructure the industry, caused Chinese thermal and metallurgical coal prices to rise, supporting domestic coal companies and producers across Indonesia and Australia. No exposure in the Fund.
Exploration and production. E&Ps in most regions benefitted from the rebalancing of the oil and gas markets, in particular those exposed to North American operations. In the first half of the year, better performing producers tended to be those exposed to the faster growing shale oil basins (Permian and STACK), while the recovery in the oil price in the second half saw stronger recovery from companies with lower growth but greater operational and financial leverage to oil. Not all companies survived: according to US law firm Haynes and Boone, 105 North American oil and gas producers filed for bankruptcy between the beginning of 2015 and October 2016. In the Fund, we saw particularly strong performance amongst international E&Ps, including Tullow Oil, Bankers Petroleum (acquired in mid-2016 by Geo-Jade) and Canadian Natural Resources. Certain US E&Ps also outperformed, notably Devon and Apache.
Integrated oil and gas companies. Another year of relatively strong performance, with the broad market's continued search for equity income resulting in a renewed focus on the high dividend yield offered by the sector. With oil back in the $50s/bbl, the sustainability of those dividends looks significantly stronger than in a sub $50/bbl world, a reality not lost on investors. Generally, emerging market integrateds performed better than developed market integrateds, as they tend to have greater earnings leverage to the oil price. In the Fund, we owned the majority of the integrated oil and gas sector as holdings, with stronger relative performance from Chevron, Statoil and Royal Dutch Shell.
Energy services. A mixed bag. Onshore US services (pressure pumping, other completion services and land drilling) fared well, coincident with the bottoming in US onshore activity in March. The largest, best-diversified energy service companies fared relatively well, a function of their ability to outperform smaller peers operationally in the downturn and take market share, coupled with stronger balance sheets. Offshore services (offshore drillers, seismic, offshore-oriented capital equipment manufacturers) continued to struggle, as capital spending continued to be diverted to shorter-cycle onshore activity. In the Fund, Unit Corp, Helix Energy and Halliburton outperformed.
Oil refining. One of the weakest performing sub-sectors, particularly in the US and Europe, with refining equities flat to slightly down over the year. The bounce in the oil price and a (relatively) weaker year for oil demand in 2016 than in 2015 helped to put a lid on refining margins and earnings, causing valuation multiples in the sector to moderate. The Fund owned Valero throughout the year, which outperformed US refining peers but was an underperformer relative to other holdings.
Renewables. Another weak year, as falling electricity prices and the lowering of subsidies have made for a challenging market environment, despite strong underlying growth in demand for wind and solar. Sentiment in the sector was also hit hard by Trump's election, as he threatens to repeal various pieces of supportive legislation for the sector (e.g., federal tax credits), in an effort to accelerate the competitiveness of renewable technologies on an unsubsidized basis. In the Fund, JA Solar and Sunpower, two solar companies, were particularly weak.
2. Activity
In January, we sold two of our energy service companies, Wood Group and Shawcor. We continued to admire both businesses as best in class in their respective specialities, but with both likely to bear the brunt of the slowdown in large global oil & gas capital spending projects for some time to come, we felt there were better opportunities elsewhere. The decision to sell Wood Group, in particular, was also catalysed by the resilience of its earnings and share price through the downturn, with the stock essentially flat since the start of 2014 versus declines elsewhere.
We purchased one service company, Schlumberger, two integrated oil & gas companies, Imperial Oil and Chevron, and one solar company, Sunpower. Schlumberger is the global leader in diversified oil and gas service provision. Again, it is a company we have admired for many years, and have been attracted to its impressive returns on capital, but not owned it since before the financial crisis due to its premium valuation. However, Schlumberger's stock price has nearly halved since its peak in 2014, presenting a good opportunity to purchase.
45
Imperial Oil is, after Suncor, Canada's second largest integrated oil and gas company. Imperial's business is well diversified, comprising oil sands operations (producing bitumen and synthetic crude oil), oil refining and marketing and a chemicals business. The company has exhibited strong capital discipline over many years, contributing to higher than average returns on capital versus its Canadian peers. We believe the company's spread of underlying operations, and well capitalised balance sheets, leaves it well placed to weather the current low oil price environment.
We last owned Chevron in 2014 when we sold it, perceiving it to be the most expensive of the international oil and gas majors. With the stock underperforming its peers in 2015, we now see better value in the stock again versus its peers, hence choosing to include it again in our portfolio.
Our purchase of Sunpower reflected our interest in the growth of the solar sector globally, which we expect to continue in 2016. Sunpower's core business is solar project development in the US, involving both module and system sales. The company also has significant stake in a solar development company, 8point3, which it launched last year as a joint venture with First Solar. The combination of a long-term extension to the incentive tax credit system for solar installations in the US, announced in December 2015, together with a sharp fall in Sunpower's stock price in the middle of January, were the final catalysts for purchasing the stock.
In June, we sold Southwestern Energy and bought ConocoPhillips. ConocoPhillips is a US$50bn market capitalization international exploration and production (E&P) company with specific focus on North American operations. We believe that the share price is currently reflecting a long term oil price assumption of around $55-60/bl and we see an attractive upside in the equity should oil prices recover to $70-75/bl. We sold Southwestern Energy (a pure play North American gas E&P company) as we had concern over the company's financial position and saw the strong rally in the share price this year as an opportunity to reduce exposure and switch to a company offering better financial metrics.
In September, we sold Bankers Petroleum. Bankers Petroleum was acquired by Geo-Jade (a private Chinese Exploration and production company) in the third quarter of 2016, for C$2.20/share. The acquisition was first announced in early 2016 and we held the stock through the entire period while approvals were achieved from various government institutions. Bankers Petroleum operated a heavy oil field in Albania, called Patos Marinza, applying horizontal drilling technology and enhanced oil recovery techniques to recover additional oil from this very large mature oil field.
In December, we sold Trina Solar. Trina Solar is a Chinese solar cell and module manufacturer that was being taken private in the fourth quarter of 2016 by a group of investors, including its Chairman and CEO Jifan Gao, for a value of $1.1bn. Trina was founded in 1997.
3. Portfolio Position
The table below shows the Fund valuation in terms of historical and forward (analyst consensus estimates) price/earnings ratios versus the S&P500 Index.
| | | 2010 | | 2011 | | 2012 | | 2013 | | 2014 | | 2015 | | 2016 | | 2017 | |
Guinness Atkinson Global Energy Fund P/E | | | 9.3 | | | | 8.2 | | | | 8.4 | | | | 9.4 | | | | 10.3 | | | | 21.9 | | | | 36.4 | | | | 21.8 | | |
S&P 500 P/E | | | 26.7 | | | | 23.2 | | | | 23.1 | | | | 20.9 | | | | 19.8 | | | | 22.3 | | | | 20.6 | | | | 17.1 | | |
Premium (+)/Discount (-) | | | -65 | % | | | -65 | % | | | -64 | % | | | -55 | % | | | -48 | % | | | -2 | % | | | 77 | % | | | 27 | % | |
Average oil price (WTI $) | | $ | 79/ | bbl | | $ | 95/ | bbl | | $ | 94/ | bbl | | $ | 98/ | bbl | | $ | 93/ | bbl | | $ | 49/ | bbl | | $ | 43/ | bbl | | | | | |
Source: Standard and Poor's; Guinness Atkinson Asset Management Ltd WTI=West Texas Intermediate
46
The sector and geographic weightings of the portfolio at December 31, 2016 were as follows:
Sector Breakdown (%) | |
| | | Dec. 31, 2015 | | Dec. 31, 2016 | |
Integrated | | | 40.5 | | | | 45.8 | | |
Exploration and production | | | 37.0 | | | | 37.3 | | |
Drilling | | | 1.7 | | | | 2.3 | | |
Equipment and services | | | 11.1 | | | | 8.9 | | |
Refining and marketing | | | 4.1 | | | | 3.6 | | |
Coal and consumables | | | 0.0 | | | | 0.0 | | |
Solar | | | 4.9 | | | | 1.0 | | |
Construction and engineering | | | 0.0 | | | | 0.0 | | |
Cash | | | 0.7 | | | | 1.1 | | |
Total | | | 100 | | | | 100 | | |
Geographic Breakdown (%) | |
| | | Dec. 31, 2015 | | Dec. 31, 2016 | |
US | | | 47.1 | | | | 51.0 | | |
Canada | | | 12.2 | | | | 10.9 | | |
UK | | | 10.7 | | | | 7.9 | | |
Latin America | | | 0.0 | | | | 0.0 | | |
Europe | | | 18.3 | | | | 18.2 | | |
Hong Kong | | | 7.4 | | | | 7.1 | | |
Russia | | | 3.4 | | | | 3.5 | | |
Other | | | 0.2 | | | | 0.3 | | |
Cash | | | 0.7 | | | | 1.1 | | |
Total | | | 100 | | | | 100 | | |
4. Market Background
2016 was a year of rebalancing for the oil market, as a combination of demand growth and declining production from the US and the rest of the non-OPEC region more than offset a rise in production from OPEC. Nevertheless, OPEC chose in September to signal their first production cut since 2008, in an attempt to accelerate the oil market's rebalance and support the price.
It was another volatile year for the oil price, with Brent trading in a range from $28-$59/bbl, the lows being visited in January and February as oversupply in the market peaked, and the highs in November and December as OPEC's decision to cut production was digested. The average Brent oil price in 2016 was $45.1/bl, while West Texas Intermediate (WTI) averaged $43.4/bl, tending to trade a little lower than Brent throughout the year.
The major components to oil supply/demand for 2016 were as follows:
• OPEC oil supply (including natural gas liquids (NGLs)) is likely to have grown by around 1.2m b/day (totaling 39.3m b/day, versus 38.1m b/day in 2015). Iranian supply grew by 0.7m b/day, post the lifting of sanctions in January relating to Iran's nuclear programme, supported by growth of 0.4m b/day from Iraq and 0.3m b/day from Saudi. This was offset to an extent by lower Nigerian and Venezuelan production, both down by 0.2m b/day. On November 30, 2016, OPEC announced a six-month cut to production of 1.2m b/day, effective from January 1, 2017, to tighten the market, a reversal of the shift to a market share strategy seen in 2014;
47
• Non-OPEC oil supply is likely to have declined by around 0.8m b/day in 2016 (56.8m b/day, versus 57.6m b/day in 2015). Production from the US declined by 0.5m b/day, as shale oil declines accelerated through the middle of the year, while Chinese and Mexican production fell by 0.3m and 0.1m b/day. Small increases in production were reported from Russia (0.2m b/day) and Brazil (0.1m b/day), with Russia in particular benefitting from second year of lower local currency production costs as a result of the weaker Russian ruble. A group of non-OPEC countries, notably Russia, Mexico, Oman and Kazakhstan, announced a willingness to join OPEC's production cut, agreeing to reduce by 0.6m b/day from January 2017;
• Global oil demand is likely to have grown by around 1.4 m b/day in 2016, according to the International Energy Agency (IEA). This is made up of non-OECD oil demand growth of 1.3m b/day (with China up 0.4m b/day) and Organisation of Economic Co-operation and Development (OECD) oil demand growth of 0.2m b/day. This represents a slower year for oil demand than 2015 (+1.8m b/day) but still a healthy level of growth. In the US, improving fuel efficiency across the vehicle fleet was offset by another year of growth in total vehicle miles travelled. In China, sales of SUVs continued to dominate over smaller vehicles, while India (+0.3m b/day), helped by rising auto sales and an improved highway system, featured for the first time in the league table for growth;
• OECD oil inventories at the end of October 2016 were estimated to be at 3,027 million barrels, down from a record high of 3,102 million barrels in July 2016, but still 11% above the 10-year average. The rise in inventories over the last 12 months implies that the market has been, on average, around 0.1m b/day oversupplied, versus an oversupply of 0.8m b/day for the prior 12 months, indicating better balance between supply and demand.
For natural gas, 2016 was also a year of rebalancing. The US gas market started the year with inventories close to record highs, but moderated closer to normal levels as supply was held back by: (a) a shallow decline in 'associated' gas as shale oil declined, (b) a decline in Marcellus/Utica gas, as local differentials in pricing blew out; and (c) a continued decline in 'base' gas production elsewhere in the US, as the very low gas drilling rig count took effect. The Henry Hub gas price dipped below $2/mcf in February 2016, as excess supply in inventory peaked, but then recovered to above $3/mcf in the second half of the year. Overall, Henry Hub averaged $2.55/mcf, versus $2.63 in 2015.
Outside the US, gas prices also started the year at weak levels, as a warm El Niño winter translated into low demand for heating and high inventories of gas in several regions across Europe and Asia. Prices then picked up towards the end of 2016, as inventories were worked off. European natural gas averaged $4.7/mcf (vs $6.5/mcf in 2015) and Asian natural gas (as measured by the 'JKL' LNG contract) averaged $5.5/mcf (vs $7.5/mcf in 2015).
5. Outlook
We expect OPEC to manage the oil price in a $50-60/bl range, with compliance around planned OPEC production cuts and US oil production growth being the key variables for 2017. OPEC has historically delivered good compliance on production cuts and we are confident that they will deliver again this time. Saudi's fiscal balance has suffered significantly through 2015/2016 and the Kingdom will want a better oil price environment for the initial public offering (IPO) of Saudi Aramco.
Animal spirits will return to the US onshore as E&P companies repair their balance sheets and return to a growth agenda. We expect a moderation of efficiency gains and cost inflation to mute the scale and the timing of the US onshore oil production response, but we do expect it to come. Non-OPEC (outside the US) is still under pressure as upstream capital expenditure (CapEx) is likely to fall further in 2017 as oil companies defend dividends rather than invest for growth. A dearth of new project sanctions and increasing decline rates on existing fields means that non-OPEC (ex US) oil production will decline into the end of the decade, even if oil prices increase from here.
Global oil demand is likely to remain robust as population growth, vehicle miles travelled and consumer demand habits mean that gasoline demand continues to grow. The non-OECD countries will deliver most of the growth in 2017, with attention turning to India now as well as China.
OECD oil inventories will likely normalize by the end of the year as demand outstrips supply by something over 1m b/day on average in 2017. Historically, a decline in inventories has coincided with a strengthening oil price.
The inauguration of Donald Trump as US President on January 20, 2017 is likely to lessen the regulatory and environmental burden on US oil and gas companies (yielding stronger US oil supply) and improve the relative competitiveness of fossil fuels
48
versus renewable energy sources (potentially yielding stronger US oil demand). An expansionary fiscal policy could yield to greater inflation in the near term; a potential positive for both energy commodities and energy equities.
Meanwhile, energy company profitability is at an unsustainably low ebb. Energy sector return on capital employed (ROCE) fell to 0% in 2015 but is likely to recover because of efficiency gains, cost control and lower reinvestment. The valuation of energy equities is strongly correlated to ROCE and, if the relationship holds true, energy equity valuation should improve as ROCE improves.
On many metrics, energy equity valuation metrics are very low. The weighting of energy in the S&P 500 at the end of 2016 was 7.6% (still below the 25 year average of 9.5%) and the relative price-to-book ratio of energy vs the S&P500 remain close to the trough levels seen around previous oil price declines. Energy sector sentiment has improved but is still low, in our opinion.
The valuation sensitivity work that we regularly perform tells us that energy equities are today discounting an oil price (into perpetuity) of around $50-55/barrel. This is in line with the current spot oil price but below the five year forward prices for both Brent and WTI.
Energy equities offer attractive upside if our scenario plays out. If you believe, as we do, that a recovery in the oil price to $70/bl is likely, or that return on capital will normalize (or both), our sensitivity work shows upside across the energy complex of around 40-50%.

Tim Guinness January 2017
Will Riley Jonathan Waghorn
Fund investment team
The Fund invests in foreign securities, which involve political, economic, currency risks, greater volatility, and differences in accounting methods. These risks are greater for emerging markets. The Fund is non-diversified, meaning that its assets may be invested in fewer individual holdings than diversified funds. Therefore, the Fund is more exposed to individual stock volatility than diversified funds. The Fund invests in smaller companies, which involve additional risks such as limited liquidity and greater volatility. The Fund's focus on the energy sector to the exclusion of other sectors exposes the Fund to greater market risk and potential monetary losses than if the Fund's assets were diversified among various sectors.
The MSCI World Energy Index is an unmanaged index composed of more than 1,400 stocks listed on exchanges in the U.S., Europe, Canada, Australia, New Zealand and the Far East. The Standard & Poor's 500 Index is a market capitalization-weighted index composed of 500 widely held common stocks of U.S. companies. The MSCI World Index is a free float-adjusted market capitalization weighted index that is designed to measure the equity market performance of developed markets. These indices are unmanaged and are not available for investment, and do not incur expenses.
Price to Book Ratio (P/B Ratio) a ratio used to compare a stock's market value to its book value. It is calculated by dividing the current closing price of the stock by the latest quarter's book value per share.
Return on capital employed (ROCE) is a financial ratio that measures a company's profitability and the efficiency with which its capital is employed.
MCF is an abbreviation denoting a thousand cubic feet of natural gas.
Please refer to the Schedule of Investments for details on Fund holdings. Current and future portfolio holdings are subject to risk.
The information provided herein represents the opinion of Guinness Atkinson Asset Management, Inc. for the period stated and it is not intended to be a forecast of future events, a guarantee of future results, or investment advice. Opinions, Fund holdings and sector allocations are subject to change at any time, and are not recommendations to buy or sell any security.
49
GUINNESS ATKINSON GLOBAL ENERGY FUND for the period ended December 31, 2016
Growth of $10,000
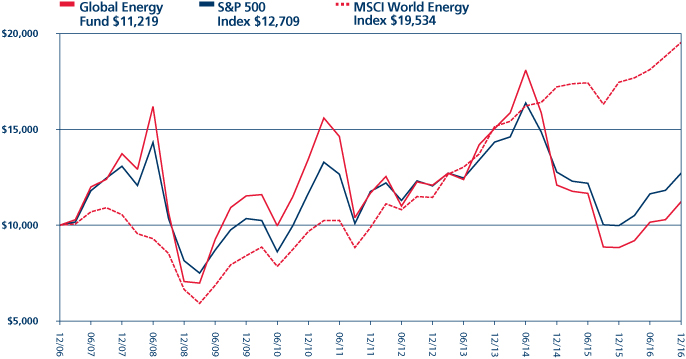
| | | Average Annual Total Return
Periods Ended December 31, 2016 | |
| | | One Year | | Five Years | | Ten Years | |
| | | | | | 27.04 | % | | | -0.79 | % | | | 1.16 | % | |
Performance data quoted represents past performance and does not guarantee future results. The investment return and principal value of an investment will fluctuate so that an investor's shares, when redeemed, may be worth more or less than their original cost. Current performance of the Fund may be lower or higher than the performance quoted. Performance data current to the most recent month end may be obtained by visiting www.gafunds.com.
Total returns for certain periods reflect a fee waiver in effect and in the absence of this waiver, the total returns would be lower. Returns reflect the reinvestment of distributions made by the Fund, if any. The graph and the performance table above do not reflect the deduction of taxes that a shareholder would pay on Fund distribution or the redemption of Fund shares.
The MSCI World Energy Index is an unmanaged index composed of more than 1,400 stocks listed on exchanges in the U.S., Europe, Canada, Australia, New Zealand and the Far East.
The S&P 500 Index is a broad based unmanaged index of 500 stocks, which is widely recognized as representative of the equity market in general. These indices are unmanaged, not available for investment and do not incur expenses.
50
FUND HIGHLIGHTS at December 31, 2016
GUINNESS ATKINSON GLOBAL ENERGY FUND
# of Holdings in Portfolio: | | | 39 | | |
Portfolio Turnover: | | | 15.0 | % | |
% of Stocks in Top 10: | | | 37.3 | % | |
Fund Managers: | | | |
Timothy W. N. Guinness | | | | | |
Will Riley | | | |
Jonathan Waghorn | | | |
Top 10 Holdings (% of net assets) | | | | | | | |
OMV AG | | | 4.0 | % | | Imperial Oil Ltd. | | | 3.7 | % | |
Statoil ASA | | | 3.8 | % | | Devon Energy Corp. | | | 3.6 | % | |
Suncor Energy Inc. | | | 3.8 | % | | Apache Corp. | | | 3.6 | % | |
Royal Dutch Shell PLC - A Shares | | | 3.8 | % | | Valero Energy Corp. | | | 3.6 | % | |
Hess Corp. | | | 3.8 | % | | PetroChina Co., Ltd. - H Shares | | | 3.6 | % | |
Industry Breakdown (% of net assets) | | | | | | | |
Oil & Gas - Integrated | | | 42.8 | % | | Energy - Alternate Sources | | | 1.0 | % | |
Oil & Gas - Exploration & Production | | | 42.4 | % | | Oil & Gas - Drilling | | | 0.3 | % | |
Oil & Gas - Field Services | | | 8.8 | % | | Machinery - General Industries | | | 0.1 | % | |
Oil Refining & Marketing | | | 3.6 | % | | | | | | | | | |
51
SCHEDULE OF INVESTMENTS
at December 31, 2016
GUINNESS ATKINSON GLOBAL ENERGY FUND
Shares | | COMMON STOCKS: 99.0% | | Value | |
Energy – Alternate Sources: 1.0% | | | |
| | 63,302 | | | JA Solar Holdings Co., Ltd. - ADR* | | $ | 301,318 | | |
| | 25,300 | | | SunPower Corp.* | | | 167,233 | | |
| | | | | | | | 468,551 | | |
Machinery – General Industries: 0.1% | | | |
| | 182,956 | | | Shandong Molong Petroleum Machinery Co., Ltd. - H Shares | | | 63,703 | | |
Oil & Gas – Drilling: 0.3% | | | |
| | 4,183,812 | | | Cluff Natural Resources PLC*† | | | 128,903 | | |
Oil & Gas – Exploration & Production: 42.4% | | | |
| | 27,909 | | | Apache Corp. | | | 1,771,384 | | |
| | 53,400 | | | Canadian Natural Resources Ltd. | | | 1,701,848 | | |
| | 30,070 | | | Carrizo Oil & Gas Inc.* | | | 1,123,114 | | |
| | 1,319,000 | | | CNOOC Ltd. | | | 1,649,919 | | |
| | 33,500 | | | ConocoPhillips | | | 1,679,690 | | |
| | 39,000 | | | Devon Energy Corp. | | | 1,781,130 | | |
| | 988,710 | | | EnQuest PLC* | | | 511,764 | | |
| | 29,543 | | | Hess Corp. | | | 1,840,233 | | |
| | 575,230 | | | JKX Oil & Gas PLC*† | | | 214,446 | | |
| | 37,386 | | | Newfield Exploration Co.* | | | 1,514,133 | | |
| | 45,070 | | | Noble Energy Inc. | | | 1,715,364 | | |
| | 21,100 | | | Occidental Petroleum Corp. | | | 1,502,953 | | |
| | 46,199 | | | Ophir Energy PLC* | | | 54,943 | | |
| | 63,200 | | | QEP Resources Inc. | | | 1,163,512 | | |
| | 1,890,000 | | | Sino Gas & Energy Holdings Ltd.* | | | 156,851 | | |
| | 249,550 | | | SOCO International PLC | | | 490,535 | | |
| | 200,000 | | | Tullow Oil PlC | | | 770,743 | | |
| | 41,297 | | | Unit Corp.* | | | 1,109,650 | | |
| | 254,740 | | | WesternZagros Resources Ltd.* | | | 16,127 | | |
| | | | | | | | 20,768,339 | | |
Oil & Gas – Field Services: 8.8% | | | |
| | 32,200 | | | Halliburton Co. | | | 1,741,698 | | |
| | 93,880 | | | Helix Energy Solutions Group, Inc.* | | | 828,022 | | |
| | 20,500 | | | Schlumberger Ltd. | | | 1,720,975 | | |
| | | | | | | | 4,290,695 | | |
The accompanying notes are an integral part of these financial statements.
52
Shares | | COMMON STOCKS: 99.0% (Continued) | | Value | |
Oil & Gas – Integrated: 42.8% | | | |
| | 268,340 | | | BP PLC | | $ | 1,685,258 | | |
| | 14,700 | | | Chevron Corp. | | | 1,730,190 | | |
| | 99,850 | | | ENI SpA | | | 1,626,008 | | |
| | 17,000 | | | Exxon Mobil Corp. | | | 1,534,420 | | |
| | 337,160 | | | Gazprom OAO - ADR | | | 1,702,658 | | |
| | 51,401 | | | Imperial Oil Ltd. | | | 1,788,210 | | |
| | 54,718 | | | OMV AG | | | 1,933,020 | | |
| | 2,365,000 | | | PetroChina Co., Ltd. - H Shares | | | 1,762,809 | | |
| | 67,430 | | | Royal Dutch Shell PLC - Class A | | | 1,844,421 | | |
| | 101,910 | | | Statoil ASA | | | 1,869,356 | | |
| | 56,876 | | | Suncor Energy, Inc. | | | 1,859,648 | | |
| | 32,070 | | | Total SA | | | 1,644,714 | | |
| | | | | | | | 20,980,712 | | |
Oil Refining & Marketing: 3.6% | | | |
| | 25,969 | | | Valero Energy, Corp. | | | 1,774,202 | | |
| | | | | Total Common Stocks
(cost $52,593,127) | | | 48,475,105 | | |
| | | | | Total Investments in Securities
(cost $52,593,127): 99.0% | | | 48,475,105 | | |
| | | | | Other Assets less Liabilities: 0.1% | | | 506,704 | | |
| | | | | Net Assets: 100.0% | | $ | 48,981,809 | | |
* Non-income producing security.
ADR - American Depository Receipt
PLC - Public Limited Company
† The Advisor has determined these securities to be illiquid. As of December 31, 2016, the total market value of these illiquid securities represents 0.7% of net assets.
The accompanying notes are an integral part of these financial statements.
53
GUINNESS ATKINSON GLOBAL INNOVATORS FUND for the period ended December 31, 2016
1. Performance
AVERAGE ANNUAL TOTAL RETURNS
| | | 1 Year | | 3 Years | | 5 Years | | 10 Years | |
Fund | | | | | | | | | |
Investor Class | | | 9.51 | % | | | 6.12 | % | | | 15.80 | % | | | 8.14 | % | |
Institutional Class* | | | 9.81 | % | | | 6.22 | % | | | 15.86 | % | | | 8.17 | % | |
Benchmark Indices: | |
MSCI World Index | | | 8.18 | % | | | 4.43 | % | | | 11.08 | % | | | 4.46 | % | |
S&P 500 Index | | | 11.93 | % | | | 8.85 | % | | | 14.62 | % | | | 6.93 | % | |
NASDAQ Composite Index | | | 8.97 | % | | | 10.24 | % | | | 17.19 | % | | | 9.60 | % | |
*Institutional Class shares commenced operations on December 31, 2015. The performance figures for the Institutional Class shares include the performance of Investor Class shares for the periods prior to the inception date of the Institutional Class shares.
The Fund's gross and net expense ratios for Investor Class shares are 1.27% and 1.24%, respectively, and for Institutional Class shares, 1.07% and 0.99%, respectively, per the Summary Prospectus dated May 3, 2016. For the Fund's current one year expense ratios, please refer to the Financial Highlights section of this report. The Advisor has contractually agreed to waive a portion of its advisory fees and/or reimburse other Fund expenses so that the Fund's ratio of expenses to average daily net assets of the Investor Class shares and Institutional Class shares will not exceed 1.24% and 0.99%, respectively (excluding Acquired Fund Fees and Expenses, interest, taxes, dividends on short positions, and extraordinary expenses) through June 30, 2018. To the extent that the Advisor waives fees and/or reimburses expenses, it may seek repayment of a portion or all of such amounts at any time within the three fiscal years after the fiscal year in which such amounts were waived and/or reimbursed, subject to the applicable cap.
Performance data quoted represents past performance and does not guarantee future results. The investment return and principal value of an investment in the Fund will fluctuate so that an investor's shares, when redeemed, may be worth more or less than their original cost. Current performance of the Fund may be lower or higher than the performance quoted. Performance data current to the most recent month-end may be obtained by visiting www.gafunds.com, or calling (800) 915-6565.
Total returns for certain periods reflect expense limitations in effect and, in the absence of these imitations, total returns would have been lower.
The Global Innovators Fund Investor Class shares, in 2016, produced a total return of 9.51%. The Fund outperformed its benchmark MSCI World Index by 1.33% in the year. For reference, the Fund underperformed the S&P 500 Index by 2.42%; and outperformed the NASDAQ Index by 0.54% over the period.
As we have highlighted in previous reviews, historically the Global Innovators Fund has tended to outperform in months where the index performance has been positive and underperform in months where the index performance has been negative. On average, that picture held true for 2016. There were eight months of positive market returns and the Fund outperformed in five of them. There were four months of negative market performance and the fund underperformed in two of them.
The months where the Fund underperformed in positive markets were in March, April and December. In March, weak results from H&R Block sent that Company's shares down 19% and were the main contributor to the underperformance of the Fund in what was a strong month for the market. In April, the Fund's overweight to IT companies was a significant drag on returns relative to the benchmark in the month. And finally the relative underperformance in December was caused mainly by New Oriental Education shares falling 16%, as Reuters reported potential academic fraud at the business (which now appears an overreaction – the shares having rallied back to the pre-sell off level as we write).
February was the month where the Fund outperformed the market in a down month. This outperformance was driven in the main by strong returns from many of the larger IT companies held in the portfolio: namely Qualcomm, Cisco, Applied Materials, and Nvidia. Good performance from Gilead outpaced the broader healthcare sector and also aided relative performance in the month.
If we consider the year as a whole, however, the Fund's low weighting to Energy (we held only one position in that sector – Schlumberger) and zero weighting to materials meant the Fund did not participate in the commodities rally significantly.
54
Similarly, the Fund had a low exposure to the banking industry which also rallied strongly in the second half of the year as the expectation of interest rate increases boosted the prospects for such companies' returns, and the potential for reduced regulations from a Trump administration served to stoke that rally after the US election. On a stock-specific basis, weaker results from stocks held in the Consumer Discretionary sector (Li&Fung, H&R Block, New Oriental Education) were more than offset by very strong returns from holdings in the IT sector, specifically in the semi-conductor industry. The Fund's large overweight to IT did not significantly add to overall performance relative to the benchmark.
We are pleased to note that not only was Nvidia the best performing stock in the portfolio but it was also the best performing stock in the S&P 500 for 2016 with a total return of 227%.
We have always sought to apply a valuation discipline when running this strategy and to avoid the temptation to invest in exciting stories at heady valuations – a style that held the Fund back in 2015 for example, as highly valued growth stocks drove market returns almost single-handedly. This discipline does not preclude investment in companies with high levels of anticipated growth, it just means we will only do so when we are comfortable that we are not taking on too much risk from a valuation perspective.
This was tested again when the Fund underperformed in the first half of 2016, despite the good valuations we saw in many of the companies held in the portfolio. However, as long term investors, we stuck to our beliefs and it was pleasing that as market sentiment began to turn the performance of those stocks that had suffered most on a relative basis were the ones that began to lead in the second half of the year.
As we mentioned above, when we look at overall stock market performance in the first half of the year versus the second half, there is a stark difference and this was also true for the Fund. In the first half of the year, the Fund was down 2.35% versus the second half of the year when the Fund was up 12.15% (all Investor Class shares total returns in USD). One factor that we think goes a long way to explaining the relative swing in performance of the Fund between the underperformance in the first half of the year versus the strong outperformance in the second half of the year is the change in sentiment towards value stocks that began in earnest in late July. Although we are investing for growth, our valuation discipline and bottom up approach means we have generally steered away from the most expensive parts of the growth universe and the value rally we saw into yearend benefitted some of the more cyclically oriented businesses we held as the market began to price in better prospects for economic growth and higher inflation. Whether this 'rotation' can be maintained is up for debate, as the move we have seen already has been particularly stark and especially considering the timescale that move occurred over.
2. Activity
We sold seven positions and initiated seven new positions over the course of 2016, which was one more than in 2015 and is in line with the long-term turnover of the strategy.
We made one change to the portfolio in the first quarter. We sold PTC and replaced it with Siemens.
PTC had been a long-term and successful holding in the strategy. We initially purchased the company in late 2006 and it provided a total return almost double that of the broad market over the period. However, as the company began its transition to a subscription-based revenue model, the strong earnings growth we enjoyed over our holding period slowed significantly. Management expectations were for operating margins to 'trough' in 2018 as this transition developed, before expanding rapidly over subsequent years alongside good growth in revenues. We remain admirers of the company and believe management have made sensible decisions. But ultimately we felt the valuation of the business no longer gave a reasonable margin of safety in light of the increased risks associated with the changes planned for the business. If the valuation of the company decreases significantly in the future and company results began to reflect expectations set, then we may well consider repurchasing the company for the portfolio.
Siemens is an industrial conglomerate that generates less than 30% of its revenues from the US and is diversified across multiple divisions. The company had underperformed the wider market, and its peers, for the last couple of years as it struggled to grow its revenues, and margins weakened alongside. Its exposure to the oil and gas sector had also been a drag. However, much of this pessimism was reflected in the share price. At purchase the stock traded on a PE multiple of just over 13x 2016 expected earnings and a stock price that reflected long-term free cash flow growth of less than 1%.
With the commitment of Siemen's management to cost savings, the high dividend yield (of over 4% at purchase) was well covered, and the most recent results had begun to indicate margin improvements. Our expectation is for earnings growth in the high single digits over the longer term which, when combined with the undemanding multiple and the company's good history of earning a return-on-capital consistently above its cost of capital, appeared good value. And especially so when compared to how the market is rewarding (and valuing) any company that can offer a reasonable growth 'story' today.
55
The overall effect on the portfolio was to reduce our exposure to the IT Sector and the US and increase our exposure to Europe and the Industrial sector.
We did not make any changes to the portfolio in the second quarter.
We made two changes to the portfolio in the third quarter. We sold positions in Oracle and Tegna and initiated new positions in Infineon and Shire.
Oracle had been a long term holding in the strategy, having been held since the end of 2003. The cumulative total return of the stock over our holding period was 222% (in USD), versus the MSCI World Index cumulative total return of 132% over the same period: a significant 2.8% annualised return difference. Over the long period we held the stock, the company's earnings improved by 441%, which came through both net income growth (c.325%) and also a reduction in the number of shares outstanding (c.21% reduction). The PE multiple contracted significantly, however, reducing by approximately 46% – which reflects the maturity of the business and its ability to grow cash flows in the future. The contribution from shareholder returns in terms of dividends was modest, as the company only began to pay a dividend in 2009. We saw the company's reasonable valuation multiple at sale as reflective of the lower prospects for growth, and this, combined with the declining return on capital suggested the business was struggling to find good projects for reinvestment of capital. The bull case was that the company is undergoing a period of restructuring as it transitions from a license-model to a "software as a service" (SaaS) model and that the higher margins afforded to the restructured segments will provide an uplift to both earnings and the multiple. We feared that the transition may be more difficult than management suggested and despite the company's market share and large size, we saw increased competition in its end markets, especially in the database segment. We therefore felt the prospects for short to medium term growth were potentially limited and that the reasonable valuation was a fair reflection of this, and that there were better opportunities elsewhere.
Tegna had been held in the strategy since October 2013, originally through the Gannett business which, subsequently split into Tegna and Gannett(NewCo) in June 2015. Gannett(NewCo) took on the publishing business and Tegna the broadcast television and digital media businesses. Part of the rationale of this split was that the faster growth, and more profitable, Tegna could command a higher multiple and ultimately we took the same view – selling our holding in Gannett(NewCo) and increasing our stake in Tegna to a full position in the portfolio.
The market rewarded the reorganisation of Gannett's business leading up to the June 2015 split, but subsequently Tegna disappointed somewhat with quarterly earnings below expectations. The company has also announced that one of its main digital media assets, cars.com, would be spun out in 2017 and that careerbuilder.com was under strategic review. We perceived the broadcast television model to be under potential long term threat, and the fact that the company was struggling despite a 'bumper' year of the Olympics and a presidential election made us question the long term opportunities for the business. The very low multiple (less than 10x 2016 expected earnings) did not, in our opinion, make up for the potential for near term earnings declines and the long term headwinds in the sector more generally. Over our holding period (adjusting for the split in June 2015), we calculate the position made a small loss versus the MSCI World Index.
Shire, a global specialty pharmaceutical company, was a business we held in the strategy previously: from October 2013 to August 2014. We sold in 2014 as the share price appreciated dramatically when a bid from Abbvie, another pharmaceutical company was tabled. Post our sale, the bid was ultimately withdrawn by Abbvie – due to the growing backlash against so-called 'tax inversions' at that time (Abbvie would have been able to utilise Shire's Dublin domicile to reduce significantly the overall group tax rate). We repurchased shares in Shire in September 2016.
In the time between the failed Abbvie bid and our purchase Shire made a number of notable product transactions itself: NPS and Dyax in 2015 and the transformation deal for Baxalta in 2016. In doing so, the company reduced its dependence on its legacy drugs, created the largest biopharma company focussed on rare diseases, and created a strong future pipeline of new drugs. We were attracted back to the company based on the fact it had increased its return on capital every year for the last three years, its potential ability to protect margins with its new focus and specialisation, and the fact we could purchase shares at reasonable valuations that were trading at the time below the average five year multiple and below the broad market.
Infineon was a new holding for the Fund. The euro17bn market cap company is listed in Germany and manufactures and designs semiconductors. Originally part of the Siemens group, it was spun out in 1999. The stock price was strong over the year preceding our purchase but we still saw good opportunities for growth. The company currently has a number 1 or number 2 position in very fast growing markets, and especially in the automotive sector where we see significant prospects for future growth through advanced driver assistance to completely autonomous vehicles. Each stage in between this transition will require a higher and higher density of chips per car to enable the increased functionality and safety features required.
56
Infineon traded at the high end of valuation multiples we are comfortable with (at around 20x forward earnings) and we recognised it as a cyclical business, but we also saw high operating margins, improving returns on capital and the prospect of growing economic profits through asset growth. When combined with a secular growth trend supporting the business more broadly,we could see earnings growth at the ~approximately 15% CAGR level over the next five years, which, if achieved, would certainly justify the current price. We also recognised that we have not factored in any significant multiple rerating into our analysis of potential future returns.
We made a number of changes to the portfolio in the fourth quarter. We sold our positions in Lenovo and State Street and bought new positions in New Oriental Education and Fanuc.
We decided to cut our losses on Lenovo after what has been a tumultuous period for the company, with falling global demand for notebook computers. In contrast, we decided to sell our position in State Street after a rapid rerating since the end of June.
New Oriental is a leading Chinese private education company. It is a mid-sized company with a market capitalisation of around $8 billion. The company operates 67 schools and nearly 800 education centres in China and they have grown rapidly. Revenues have doubled in the last four years, driven by increasing demand for language and test preparation courses. The growth in the business is attractive and we believe it has considerable scope to continue to grow for years to come. We also like the fact that the company has generated high margins and currently has no debt. It is therefore highly cash generative and importantly requires a relatively modest amount of this cash to finance its organic growth. We believed the valuation was underestimating both the quality of the business model and the long-term growth opportunity.
Fanuc is a Japanese company and is one of the largest producers of industrial robots in the world. Like New Oriental, Fanuc had no debt and a large cash pile. It is geographically diversified, with around 60% of revenues coming from Asia and the balance from Europe and the US. While New Oriental Education is on a secular growth trend Fanuc is more cyclical, and sentiment towards the company is currently quite negative. Sentiment was far more positive in the spring of last year but this change in sentiment meant we could buy the same, high quality company, at a 25-30% discount to its stock price in May of 2015.
The overall effect of these changes was to reduce our exposure to Financials and IT and increase our exposure to Industrials and Consumer Discretionary. It also had the effect of increasing our exposure to Asia and reducing our exposure to the US.
At the end of the fourth quarter we also sold positions in Li & Fung and Taiwan Semiconductor, and replaced them with new positions in Nike and AAC Technologies.
We decided to cut our losses on Li & Fung, a position we bought back in 2014 and where we ultimately got it wrong. We really liked the company's asset light business model as we could see how growth would translate into significant operational leverage. Growth had been weak for some time but we thought there was a reasonable chance that it would turn around. Unfortunately, that has not occurred and with the election of Donald Trump we felt the company's model of being a global outsourcing business was becoming more vulnerable. We also came to the conclusion that there is now a real risk of a dividend cut, which could also lead to further selling in the market.
Taiwan Semiconductor had been a very long term holding in the strategy (since 2003 in fact) and had performed extremely well over that period: providing a cumulative total return almost five times that of the MSCI World Index during the period. It is one of the highest quality businesses in its sector with very steady cash flow returns on investment despite the cyclical nature of its market. The company has more recently enjoyed good share price performance with the rotation from growth to value and from the re-rating of the semiconductor industry more generally. We noted, however, that the re-rating took the company's forward earnings multiple from a low of around 10x in late 2015 to around 15.5x, a high relative to where the company has traded historically. The speed and magnitude of this re-rating suggested to us that there was little further upside without significant earnings growth in the near term, which we felt was unlikely.
Nike was a company we had admired for some time as it had all the characteristics we seek in terms of a business with a strong balance sheet, historically good returns, and good capital allocation discipline that shows the company as selectively, and profitably re-investing cash flows. However, the market tended to over-reward the company for its growth in our view – with the company trading on over 30x forward earnings at its peak at the end of 2015. At such lofty valuations, the market inevitably expected perfect execution and if those are not met the share price reaction is usually stark and swift. This was the case for Nike through 2016; slower growth led to the share price falling 19.2% (total return in USD) from the end of 2015 to the end of November versus the S&P500 Index equivalent return of +9.8%, an almost 30% difference. The forward earnings multiple fell in unison from approximately 30x at the start of the year to just over 21x at purchase. The threat of increased competition, inventory
57
overhang, and whether future lines are well received remain but we believed the market had moved from overly optimistic to overly pessimistic – and this presented us with the opportunity to add the company to the portfolio.
AAC Technologies is an HK-listed company that is a market leader in the design and manufacture of various components for consumer electronic components. It historically specialised in acoustic parts, most notably speakers and microphones for smart phones and tablets but has been diversifying into non-acoustic parts such as haptic vibrators and RF antenna. Like many Asian technology companies, its client base is concentrated, with companies such as Apple and Samsung accounting for significant proportions of overall revenue – which poses obvious risks. However, unlike many other product manufacturers, AAC has consistently managed to maintain high operating margins of around 30% and has a strong balance sheet. Despite significant revenue growth, the company had sold off with the wider market from a high in August of 2016. This presented us with a good opportunity to purchase a high quality business, with very good growth potential, at a much more attractive valuation.
3. Portfolio Position
The portfolio on December 31, 2016, by our calculations, had a PE of 17.9x 2016 earnings, and 16.5x 2017 earnings; a discount to the MSCI World Index equivalent multiples of 6.3% and 0.1%, respectively.
The overall effect of the changes made to the portfolio over the year was to reduce our exposure to Asia and increase our exposure to the US slightly, whilst also decreasing our exposure to the IT sector.
Sector allocation at 12/31/16 | |
Consumer Discretionary | | | 12.6 | % | |
Consumer Staples | | | 0.0 | % | |
Energy | | | 3.2 | % | |
Financials | | | 6.6 | % | |
Health Care | | | 9.5 | % | |
Industrials | | | 19.9 | % | |
Information Technology | | | 47.0 | % | |
Materials | | | 0.0 | % | |
Telecommunication Services | | | 0.0 | % | |
Utilities | | | 0.0 | % | |
Cash | | | 1.2 | % | |
Total | | | 100.0 | % | |
4. Outlook
As we reflect on 2016 and look forward to 2017, there is considerable uncertainty in the markets.
On the political front the vote in the UK appeared to give a boost to populist political parties in the rest of the Europe, many of which have anti-immigration, anti-EU, and protectionist policies at their heart. Indeed we saw the resignation of Italy's prime minister, Mateo Renzi, in early December following the defeat of his referendum proposals on constitutional reform, which may leave space for the populist 5 Star Movement to gain further ground when elections are finally called. And the election cycle in France, which begins in February 2017, will see if Marine Le Pen's Front National moves into the second round run-off to decide the next President in May. Earlier in the year, we also have elections in the Netherlands, and then in September, Germany's Angela Merkel will seek a fourth term as Chancellor against a backdrop where the populist Alternative fur Deutschland has been gaining ground in regional elections consistently. We will also get a clearer picture on the actual policies the Trump administration will try to enact, and also an indication of which may ultimately come to pass.
Politics ultimately overshadowed central bank policy in the second half of 2016, despite the fact that those policy shifts have arguably been the major driver of markets since the end of the 2007-2008 financial crisis. It is likely that any decisions made by the central banks will remain an important driver of markets and market sentiment in 2017, especially as we have the beginning
58
of a divergence in policy between the US Federal Reserve, which has indicated three further rate rises in 2017, and the Bank of Japan and the European Central Bank, who look poised to continue their polices of asset purchases. We also have to assess whether any of the policies enacted in 2016, or indeed before, have the ability to unwind and undo their shorter-term benefits.
This uncertainty leaves us a little apprehensive, but our investment process has never been one in which we try and position the portfolio based on our macro view or to try and capture any short term trends. 2016 was clearly a case in point about why this type of approach can be problematic.
Instead we will continue to try to focus on looking for companies that show an ability to avoid the competitive threat of their peers, that have healthy balance sheets, that are earning returns on capital above their cost capital and growing their economic profit, and that can reinvest their cash flows in profitable projects that can grow their business sustainably in the future. The fact that the portfolio, as a whole, remains at a healthy discount to the broad market on a PE basis despite the companies we hold, we believe, having superior fundamentals is at least some demonstration that there still exists good opportunities in the market today. The expected earnings growth of the portfolio in 2017 of 9% is slightly below where the Fund has been historically but with anaemic historic and expected growth in the broader market we still see this as compelling, and especially as the Fund has not yet closed the valuation discount versus the MSCI World Index, which opened up through 2015.
May we wish you a happy and prosperous New Year, and we look forward to updating you on the progress of the Fund over the course of 2017.


Matthew Page Ian Mortimer January 2017
The Fund invests in foreign securities, which involve political, economic and currency risks, greater volatility, and differences in accounting methods. These risks are greater for emerging markets. The Fund is non-diversified, meaning that its assets may be invested in fewer individual holdings than diversified funds. Therefore, the Fund is more exposed to individual stock volatility than diversified funds. The Fund invests in smaller companies, which involve additional risks such as limited liquidity and greater volatility.
The approach of the Fund is not to provide access to the most innovative companies in the world but rather to look at companies using the 'prism' of innovation to highlight those we think might be winners in the future – and then only buy them if they are offering reasonable value compared to those future expectations. We are firm believers that innovative companies can outperform in the future and that a value discipline to stock selection will add meaningfully to that performance.
The MSCI World Index is a free float-adjusted market capitalization weighted index that is designed to measure the equity market performance of developed markets. The Standard & Poor's 500 Index is a market capitalization-weighted index composed of 500 widely held common stocks of U.S. companies. The NASDAQ Composite Index is a market capitalization-weighted index that is designed to represent the performance of the National Market System, which includes over 5,000 stocks traded only over-the-counter and not on an exchange. These indices are unmanaged and are not available for investment, and do not incur expenses.
PER or P/E – Price to Earnings ratio is calculated by dividing current price of the stock by the company's trailing months' earnings per share.
"Software as a service" (SaaS; pronounced /sæs/) is a software licensing and delivery model in which software is licensed on a subscription basis and is centrally hosted.
Cash flow measures the cash generating capability of a company by adding non-cash charges (e.g. depreciation) and interest expense to pretax income.
Earnings growth is not representative of the Fund's future performance.
The compound annual growth rate (CAGR) is a useful measure of growth over multiple time periods.
The information provided herein represents the opinion of Guinness Atkinson Asset Management, Inc. for the period stated and is not intended to be a forecast of future events, a guarantee of future results, or investment advice. Opinions, Fund holdings and sector allocations are subject to change at any time, and are not recommendations to buy or sell any security.
59
GUINNESS ATKINSON GLOBAL INNOVATORS FUND
Growth of $10,000

| | | Average Annual Total Return
Periods Ended December 31, 2016 | |
| | | One Year | | Five Years | | Ten Years | |
Investor Class | | | 9.51 | % | | | 15.80 | % | | | 8.14 | % | |
Institutional Class1 | | | 9.81 | % | | | 15.86 | % | | | 8.17 | % | |
Performance data quoted represents past performance and does not guarantee future results. The investment return and principal value of an investment will fluctuate so that an investor's shares, when redeemed, may be worth more or less than their original cost. Current performance of the Fund may be lower or higher than the performance quoted. Performance data current to the most recent month end may be obtained by visiting www.gafunds.com.
The performance graph above is shown for the Fund's Investor Class shares; Institutional Class shares performance may vary.
Total returns for certain periods reflect a fee waiver in effect and in the absence of this waiver, the total returns would be lower. Returns reflect the reinvestment of distributions made by the Fund, if any. The graph and the performance table above do not reflect the deduction of taxes that a shareholder would pay on Fund distribution or the redemption of Fund shares.
The MSCI World Index is a free float-adjusted market capitalization weighted index that is designed to measure the equity market performance of developed markets. The Standard & Poor's 500 Index is an unmanaged index which is widely regarded as the standard for measuring large cap U.S. stock market performance. The NASDAQ Composite Index is a market capitalization weighted index that is designed to represent the performance of the National Market System which includes over 5,000 stocks traded only over-the-counter and not on an exchange. The indices referenced in this chart are not available for investment and do not incur expenses.
1 Performance information for the Institutional Class, prior to commencement of operations on December 31, 2015, is based on the performance of Investor Class, and adjusted for the lower expenses applicable to Institutional Class
60
FUND HIGHLIGHTS at December 31, 2016
GUINNESS ATKINSON GLOBAL INNOVATORS FUND
# of Holdings in Portfolio: | | | 30 | | |
Portfolio Turnover: | | | 31.3 | % | |
% of Stocks in Top 10: | | | 34.6 | % | |
Fund Managers: | | | |
Matthew Page | | | | | |
Dr. Ian Mortimer | | | |
Top 10 Holdings (% of net assets) | | | | | | | |
Boeing Co. | | | 3.6 | % | | VeriFone Systems Inc. | | | 3.4 | % | |
SAP SE | | | 3.5 | % | | Siemens AG | | | 3.4 | % | |
Intercontinental Exchange, Inc. | | | 3.5 | % | | PayPal Holdings, Inc. | | | 3.4 | % | |
Applied Materials Inc. | | | 3.5 | % | | Samsung Electronics Co., Ltd. - GDR | | | 3.4 | % | |
AAC Technologies Holdings Inc. | | | 3.5 | % | | Schneider Electric SE | | | 3.4 | % | |
Industry Breakdown (% of net assets) | | | | | | | |
Electronic Components - Semiconductor | | | 13.3 | % | | Athletic Footwear | | | 3.3 | % | |
Diversified Manufacturing Operations | | | 10.0 | % | | Medical - Biomedical | | | 3.3 | % | |
Semiconductor | | | 6.8 | % | | Networking Products | | | 3.3 | % | |
Commercial Services | | | 6.7 | % | | Cable/Satellite TV | | | 3.2 | % | |
Computers | | | 6.7 | % | | Machinery | | | 3.2 | % | |
Aerospace/Defense | | | 3.6 | % | | Oil Company - Integrated | | | 3.2 | % | |
Electronic Components - Miscellaneous | | | 3.5 | % | | Web Portals/ISP | | | 3.2 | % | |
Enterprise Software/Services | | | 3.5 | % | | Investment Management/Advisor Service | | | 3.1 | % | |
Finance - Other Services | | | 3.5 | % | | Industrial Automation/Robot | | | 3.0 | % | |
Power Conversion/Supply Equipment | | | 3.4 | % | | Pharmaceuticals | | | 3.0 | % | |
Application Software | | | 3.3 | % | | Schools | | | 2.7 | % | |
61
SCHEDULE OF INVESTMENTS
at December 31, 2016
GUINNESS ATKINSON GLOBAL INNOVATORS FUND
Shares | | COMMON STOCKS: 98.8% | | Value | |
Aerospace/Defense: 3.6% | | | |
| | 36,540 | | | Boeing Co. | | $ | 5,688,547 | | |
Application Software: 3.3% | | | |
| | 62,700 | | | Check Point Software Technologies Ltd.* | | | 5,295,642 | | |
Athletic Footwear: 3.3% | | | |
| | 104,000 | | | NIKE Inc. | | | 5,286,320 | | |
Cable/Satellite TV: 3.2% | | | |
| | 74,830 | | | Comcast Corp. - Class A | | | 5,167,011 | | |
Commercial Services: 6.7% | | | |
| | 230,650 | | | H&R Block, Inc. | | | 5,302,644 | | |
| | 136,750 | | | Paypal Holdings, Inc.* | | | 5,397,522 | | |
| | | | | | | | 10,700,166 | | |
Computers: 6.7% | | | |
| | 94,180 | | | Cognizant Technology Solutions Corp. - A Shares* | | | 5,276,905 | | |
| | 306,710 | | | Verifone Systems Inc.* | | | 5,437,968 | | |
| | | | | | | | 10,714,873 | | |
Diversified Manufacturing Operations: 10.0% | | | |
| | 66,520 | | | Danaher Corp. | | | 5,177,917 | | |
| | 78,150 | | | Eaton Corp. PLC | | | 5,243,084 | | |
| | 44,180 | | | Siemens AG | | | 5,431,912 | | |
| | | | | | | | 15,852,913 | | |
Electronic Components – Miscelanous: 3.5% | | | |
| | 609,500 | | | AAC Technologies Holdings Inc. | | | 5,537,336 | | |
Electronic Components – Semiconductor: 13.3% | | | |
| | 300,000 | | | Infineon Technologies AG | | | 5,213,778 | | |
| | 143,330 | | | Intel Corp. | | | 5,198,579 | | |
| | 50,085 | | | NVIDIA Corp. | | | 5,346,073 | | |
| | 7,240 | | | Samsung Electronics Co., Ltd. - GDR | | | 5,408,280 | | |
| | | | | | | | 21,166,710 | | |
Enterprise Software/Services: 3.5% | | | |
| | 64,020 | | | SAP SE | | | 5,580,622 | | |
Finance – Other Services: 3.5% | | | |
| | 98,650 | | | Intercontinental Exchange, Inc. | | | 5,565,833 | | |
Industrial Automation/Robot: 3.0% | | | |
| | 28,400 | | | FANUC Corp. | | | 4,814,939 | | |
Investment Management/Advisor Service: 3.1% | | | |
| | 440,240 | | | WisdomTree Investments Inc. | | | 4,904,274 | | |
The accompanying notes are an integral part of these financial statements.
62
Shares | | COMMON STOCKS: 98.8% (Continued) | | Value | |
Machinery: 3.2% | | | |
| | 28,190 | | | Roper Industries, Inc. | | $ | 5,161,025 | | |
Medical – Biomedical: 3.3% | | | |
| | 72,510 | | | Gilead Sciences, Inc. | | | 5,192,441 | | |
Networking Products: 3.3% | | | |
| | 172,685 | | | Cisco Systems Inc. | | | 5,218,541 | | |
Oil Company – Integrated: 3.2% | | | |
| | 61,520 | | | Schlumberger Ltd. | | | 5,164,604 | | |
Pharmaceuticals: 3.0% | | | |
| | 82,000 | | | Shire PLC | | | 4,733,500 | | |
Power Conversion/Supply Equipment: 3.4% | | | |
| | 77,210 | | | Schneider Electric SE | | | 5,373,099 | | |
Schools: 2.7% | | | |
| | 104,000 | | | New Oriental Education & Technology Group Inc. | | | 4,378,400 | | |
Semiconductor: 6.8% | | | |
| | 172,310 | | | Applied Materials Inc. | | | 5,560,444 | | |
| | 80,330 | | | QUALCOMM Inc. | | | 5,237,516 | | |
| | | | | | | | 10,797,960 | | |
Web Portals: 3.2% | | | |
| | 6,490 | | | Alphabet Inc. - A Shares* | | | 5,143,001 | | |
| | | | | Total Common Stocks
(cost $144,888,382) | | | 157,437,757 | | |
| | | | | Total Investments in Securities
(cost $144,888,382): 98.8% | | | 157,437,757 | | |
| | | | | Other Assets less Liabilities: 1.2% | | | 1,893,667 | | |
| | | | | Net Assets: 100.0% | | $ | 159,331,424 | | |
* Non-income producing security.
GDR - Global Depository Receipt
PLC - Public Limited Company
The accompanying notes are an integral part of these financial statements.
63
GUINNESS ATKINSON RENMINBI YUAN & BOND FUND for the period ended December 31 2016
1. Performance
AVERAGE ANNUAL TOTAL RETURN
| | | 1 Year | | 3 Years | | 5 Years | | Since
Inception
(June 30, 2011) | |
Fund | | | -3.52 | % | | | -2.84 | % | | | 0.06 | % | | | 0.08 | % | |
Comparisons: | |
Hang Seng Markit iBoxx Offshore RMB Overall Index | | | -2.22 | % | | | -1.09 | % | | | 1.78 | % | | | 1.38 | % | |
RMB Cash Offshore (CNH)* | | | -5.84 | % | | | -4.60 | % | | | -1.88 | % | | | -1.51 | % | |
RMB Cash Onshore (CNY)* | | | -6.50 | % | | | -4.47 | % | | | -1.95 | % | | | -1.43 | % | |
*Net change in exchange rate versus U.S. dollar.
The Fund's gross expense ratio is 1.05% and net expense ratio is 0.93% per the Summary Prospectus dated August 26, 2016. For the Fund's current one year expense ratios, please refer to the Financial Highlights section of this report. The Advisor has contractually agreed to waive a portion of its advisory fees and/or reimburse other Fund expenses so that the Fund's ratio of expenses to average daily net assets will not exceed 0.90% (excluding Acquired Fund Fees and Expenses, interest, taxes, dividends on short positions and extraordinary expenses) through at least June 30, 2017. To the extent that the Advisor waives fees and/or reimburses expenses, it may seek repayment of a portion or all of such amounts at any time within the three fiscal years after the fiscal year in which such amounts were waived and/or reimbursed, subject to the applicable cap.
Performance data quoted represents past performance and does not guarantee future results. The investment return and principal value of an investment will fluctuate so that an investor's shares, when redeemed, may be worth more or less than their original cost. Current performance of the Fund may be lower or higher than the performance quoted. Performance data current to the most recent month-end may be obtained by visiting www.gafunds.com, or calling (800) 915-6565.
The Fund imposes a 2% redemption fee on the sales of shares held less than 30 days. Performance data quoted does not reflect this redemption fee. Total returns for certain periods reflect expense limitations in effect and, in the absence of these limitations, total returns would have been lower.
The Fund fell 3.52% compared to the offshore renminbi (CNH) which fell 5.84% against the dollar and the iBoxx Hang Seng Markit Offshore RMB Overall Index which fell 2.22%.
Chinese markets had a rough start to the year with drops in both the Hong Kong and Shanghai stock markets and a 0.5% drop in the renminbi exchange rate against the US dollar, sparking market falls around the world. However, even at the time, it was apparent to more seasoned observers that the market panic was unjustified. Although economic data had been weak, the Chinese had been adding stimulus to the economy since the middle of last year and an improvement was already becoming visible. By March, markets and the currency had stabilized. In the fourth quarter, the renminbi depreciated by 4.29% against the US dollar and over the whole year it depreciated by 5.84% against the US dollar. Capital outflows have been evident in 2016 but have moderated compared to 2015. The process of repaying US dollar debt, accumulated when the renminbi was trending steadily higher, has now run its course, but it is clear that pressures remain because the central bank, is making strenuous efforts to make such flows more difficult. The conundrum policymaker's face is whether to defend a US $3 trillion level in foreign exchange reserves or to defend CNY7:USD1. Those inside China who believe in preserving China's 'might' are in favour of defending the reserves and letting the currency slide. Others believe that the reserves are more of a burden than a help and believe that currency stability and a gradual adjustment to market forces makes more sense and are happy to see reserves drop.
If we look at reserves in terms of import cover, $2 trillion of reserves covers over a year of imports (15 months with an average monthly import bill of US $132 billion). In economic terms, a drop of US $1 trillion would not matter much; from a domestic sentiment/confidence point of view that could be just academic. There remains in China, a fine balancing act to be performed. The old investment-driven economic model has to change but a great many people, a large sum of debt, a financial system and a social system are still bound up with it. Reform, deleveraging and re-direction of productive capacity is underway but a whole framework of supports and safety valves have to be utilized to achieve it. For this Fund, financial sector, interest rate, money supply and bond market reforms are most relevant.
64
RENMINBI YUAN & BOND FUND
In this regard, we see interest rates in China now set and managed in relation to the daily Open Market Operations of the People's Bank of China (PBOC). Looking at 28 day repo rates and the Medium Term Lending facility, we see an interest rate corridor running between 2.55% and 3.25%. The stability of monetary conditions in China is evident in this range. Tracking this is important because when we look at China's overall debt position (Government and Corporate), it is evident the issue is entirely domestic. Debt to gross domestic product (GDP) ratios tell us very little; debt servicing capacity in China, the flow of liquidity and its price tells us much more. It is encouraging to us that in recent months, conditions in China's financial sector have grown easier rather than harder. Everything depends on how the additional time granted is used.
The operating environment in China has continued to improve. Producer price deflation has ended with producer prices increasing 1.2% in October, 3.3% in November and 5.5% in December. A large part of this has been driven by reductions in output and capacity in the steel and coal industries. The resulting rising coal and steel prices led to significant improvements in industrial profits as firms in these industries regained pricing power – in the first 11 months of 2016, industrial profit had grown 10% compared to a fall of 2% in the whole of 2015. The official Purchasing Managers Index (PMI) has been above 50 since August which indicates improving conditions in the manufacturing industries. The result has been improving industrial profitability and cash flows on the one hand, and slowing nonperforming loan (NPL) formation with some improvement in asset quality on the other.
The offshore CNH bond market through all this has been very quiet. With the renminbi under pressure demand for CNH has been weak and new issuance has been modest, just about keeping pace with maturation of existing bonds. The new issuers have tended to financial institutions and dominated by overseas issuers notably Australian, Canadian and Korean names raising funds primarily for trade finance purposes. The CNH sovereign yield curve has moved 0.5% higher on average over the past quarter while on the CNY curve (onshore) is unchanged which has moved the spread between offshore and onshore equivalent bonds to 0.73% reflecting weaker demand for renminbi assets amongst international investors.
2. Portfolio Position
The portfolio is 76% invested in renminbi denominated bonds with 22% held in renminbi cash. Government and supranational issuers account for 36% of the portfolio and 64% hold a credit rating of BBB or higher (using Standard & Poor's methodology). A further 12% of the portfolio carries no rating, but we deem the bulk of those to be of equivalent quality to BBB-rated issues. Our approach remains, as it has for the past five years, to focus on higher quality issues and to reduce credit risk.
3. Outlook and Strategy
In the immediate term, the outlook has been rendered a great deal less certain following the US election. In recent weeks the renminbi has strengthened, with some evidence of a short squeeze in the offshore market but also assisted by a reversal in US dollar strength following Trump's inauguration speech. We wait to see what form Trump's trade policy will take and what impact his border-tax adjustment will have, and whether or not China will be branded a currency manipulator. Twitter seems to be the best data source to follow in this regard.
Fundamentally however, we do not expect things to change much. China's position in the global supply chain now rests on far more than just cheap labour. There are enough people in China, earning enough to make their spending power matter. As the US pulls back from trade alliances, China will move to fill that gap even though Chinese consumption levels do not come close to replacing those of the US. However, at the same time we do not believe US consumers will be tolerant of sharply higher consumer prices. In short, uncertainty will rise in the short term but the direction of travel is likely to be the same. We think China's domestic development will very likely deliver a stronger renminbi over time. In the meantime, we shall focus on good quality investment grade instruments and bide our time.

Edmund Harriss January 2017
The Fund invests in foreign securities, which involve political, economic and currency risks, greater volatility, and differences in accounting methods. These risks are greater for emerging markets. The Fund is non-diversified, meaning that its assets may be concentrated in fewer individual holdings than diversified funds. Therefore, the Fund is more exposed to individual stock issuer volatility than diversified funds. The Fund invests in smaller companies, which involve additional risks such as limited liquidity and greater volatility. Investments in debt securities typically decrease in value when interest rates rise, which can be greater for longer-term debt securities. The Fund may invest in derivatives, which
65
RENMINBI YUAN & BOND FUND
involves risks different from, and in certain cases, greater than the risks presented by traditional investments. Investments focused in a single geographic region may be exposed to greater risk than investments diversified among various geographic regions.
The Hang Seng Markit iBoxx Offshore RMB Overall Index family ("HSM iBoxx") is designed to track the performance of the offshore RMB bond market. This index is unmanaged and not available for investment, and does not incur expenses.
The RMB Cash Offshore (CNH) is the currency code for renminbi traded outside China in the offshore market.
The RMB Cash Onshore (CNY) is the international currency code for the renminbi.
Investment Grade Bonds are typically those that are rated between AAA and BBB- by S&P.
Please refer to the Schedule of Investments for details on Fund holdings. Current and future portfolio holdings are subject to risk.
The information provided herein represents the opinion of Guinness Atkinson Asset Management, Inc. for the period stated and is not intended to be a forecast of future events, a guarantee of future results, or investment advice. Opinions, Fund holdings and sector allocations are subject to change at any time, and are not recommendations to buy or sell any security.
66
GUINNESS ATKINSON RENMINBI YUAN & BOND FUND
Growth of $10,000
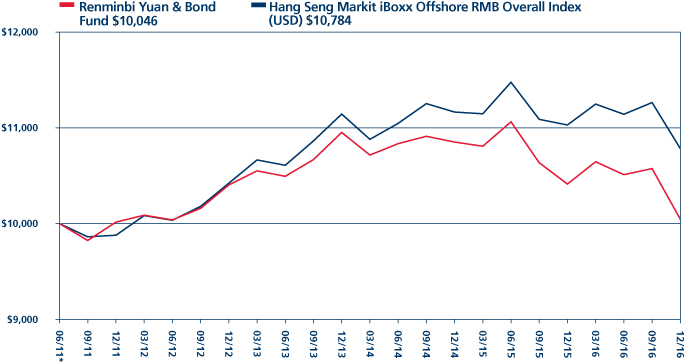
| | | Average Annual Total Return
Periods Ended December 31, 2016 | |
| | | One Year | | Three Years | | Five Years | | Since Inception
(06/30/11) | |
| | | | | | -3.52 | % | | | -2.84 | % | | | 0.06 | % | | | 0.08 | % | |
*Inception date 6/30/11.
Performance data quoted represents past performance and does not guarantee future results. The investment return and principal value of an investment will fluctuate so that an investor's shares, when redeemed, may be worth more or less than their original cost. Current performance of the Fund may be lower or higher than the performance quoted. Performance data current to the most recent month end may be obtained by visiting www.gafunds.com.
The Fund was previously benchmarked against the HSBC Offshore Bond Index. Calculation of this index ceased in April 2016 and accordingly the benchmark data is no longer available.
Total returns for certain periods reflect a fee waiver in effect and in the absence of this waiver, the total returns would be lower. Returns reflect the reinvestment of distributions made by the Fund, if any. The graph and the performance table above do not reflect the deduction of taxes that a shareholder would pay on Fund distribution or the redemption of Fund shares. The Fund imposes a 2% redemption fee on shares held less than 30 days.
The Hang Seng Markit iBoxx Offshore RMB Overall Index ("HSM iBoxx") captures the performance of debt denominated in Chinese yuan but issued and settled offshore. The index family offers a broad coverage of the offshore RMB bond universe. The index referenced in this chart is not available for investment and does not incur expenses.
67
FUND HIGHLIGHTS at December 31, 2016
GUINNESS ATKINSON RENMINBI YUAN & BOND FUND
# of Holdings in Portfolio: | | | 15 | | |
Portfolio Turnover: | | | 13.0 | % | |
% of Investments in Top 10: | | | 60.9 | % | |
Fund Manager: | | | |
Edmund Harriss | | | | | |
Top 10 Holdings (% of net assets) | | | | | | | |
China Government Bond, 3.020%, 6/27/18 | | | 6.1 | % | | United Kingdom Government Int'l Bond, 2.700%, 10/21/17 | | | 6.1 | % | |
Caisse D'Amort Dette, 3.800%, 2/6/17 | | | 6.1 | % | | BOC Aviation Pte Ltd., 4.200%, 11/5/18 | | | 6.1 | % | |
Shenzhen Qianhai Financial Holdings Co., Ltd.,
4.550%, 10/28/17 | | | 6.1 | % | | Lenovo Group Ltd., 4.950%, 6/10/20 | | | 6.1 | % | |
Export Import Bank of China, 3.350%, 6/18/17 | | | 6.1 | % | | New World China Land, 5.500%, 2/6/18 | | | 6.1 | % | |
Caterpillar Financial Service Corp.,3.400%, 11/25/17 | | | 6.1 | % | | BP Capital Markets PLC, 3.650%, 2/28/19 | | | 6.0 | % | |
Industry Breakdown (% of net assets) | | | | | | | |
Sovereign | | | 18.3 | % | | Machinery | | | 6.1 | % | |
Real Estate Operator/Developer | | | 9.1 | % | | Computers | | | 6.0 | % | |
Special Purpose Banks | | | 9.1 | % | | Finance - Leasing Company | | | 6.0 | % | |
Supranational Bank | | | 8.5 | % | | Oil Company - Integrated | | | 6.0 | % | |
Finance - Diversified | | | 6.1 | % | | | | | | | | | |
68
SCHEDULE OF INVESTMENTS
at December 31, 2016
GUINNESS ATKINSON RENMINBI YUAN & BOND FUND
Principal Amount (CNH) | | CORPORATE BONDS: 75.2% | | Value | |
Computers: 6.0% | | | |
| | 1,000,000 | | | Lenovo Group Ltd., 4.950%, 06/10/20 | | $ | 140,897 | | |
Finance-Diversified: 6.1% | | | |
| | 1,000,000 | | | Shenzhen Qianhai Financial Holdings Co., Ltd., 4.550%, 10/28/17 | | | 141,889 | | |
Finance – Leasing Company: 6.0% | | | |
| | 1,000,000 | | | BOC Aviation Pte. Ltd., 4.500%, 11/20/18 | | | 141,264 | | |
Machinery: 6.1% | | | |
| | 1,000,000 | | | Caterpillar Financial Services Corp., 3.400%, 11/25/17 | | | 141,357 | | |
Oil Company – Integrated: 6.0% | | | |
| | 1,000,000 | | | BP Capital Markets PLC, 3.650%, 02/28/19 | | | 139,736 | | |
Real Estate Operator/Developer: 9.1% | | | |
| | 500,000 | | | Global Logistic Properties Ltd., 4.000%, 05/11/18 | | | 70,764 | | |
| | 1,000,000 | | | New World China Land Ltd., 5.500%, 02/06/18 | | | 140,914 | | |
| | | | | | | | 211,678 | | |
Sovereign: 18.3% | | | |
| | 1,000,000 | | | Caisse d'Amort de la Dette Sociale, 3.800%, 02/06/17 | | | 142,179 | | |
| | 1,000,000 | | | China Government Bond, 3.020%, 06/27/18 | | | 142,447 | | |
| | 1,000,000 | | | United Kingdom Government Int'l Bond, 2.700%, 10/21/17 | | | 141,358 | | |
| | | | | | | | 425,984 | | |
Special Purpose Banks: 9.1% | | | |
| | 500,000 | | | Agricultural Development Bank of China, 3.350%, 06/22/17 | | | 71,447 | | |
| | 1,000,000 | | | Export Import Bank of China/The, 3.350%, 06/18/17 | | | 141,830 | | |
| | | | | | | | 213,277 | | |
Supranational Banks: 8.5% | | | |
| | 400,000 | | | International Bank of Reconstruction & Development, 3.250%, 07/23/18 | | | 56,071 | | |
| | 500,000 | | | International Finance Corp., 2.000%, 01/18/17 | | | 71,418 | | |
| | 500,000 | | | International Finance Corp., 3.100%, 09/24/19 | | | 69,718 | | |
| | | | | | | | 197,207 | | |
| | | | | Total Corporate Bonds
(cost $1,961,037) | | | 1,753,289 | | |
| | | | | Total Investments in Securities
(cost $1,961,037): 75.2% | | | 1,753,289 | | |
| | | | | China Yuan (Offshore): 22.5% | | | 523,491 | | |
| | | | | Other Assets less Liabilities: 2.3% | | | 53,468 | | |
| | | | | Net Assets: 100.0% | | $ | 2,330,248 | | |
The accompanying notes are an integral part of these financial statements.
69
STATEMENTS OF ASSETS AND LIABILITIES
at December 31, 2016
| | | Alternative
Energy
Fund | | Asia
Focus
Fund | | Asia Pacific
Dividend
Builder
Fund | | China &
Hong Kong
Fund | |
Assets | |
Investments in securities, at cost | | $ | 15,175,774 | | | $ | 13,126,695 | | | $ | 8,487,783 | | | $ | 51,957,940 | | |
Investments in securities, at value | | $ | 10,120,826 | | | $ | 15,462,243 | | | $ | 8,430,625 | | | $ | 58,547,652 | | |
Cash | | | 146,917 | | | | 96,310 | | | | 88,161 | | | | — | | |
Cash denominated in foreign currency (cost of $69, $0, $0 and $0, respectively) | | | 70 | | | | — | | | | — | | | | — | | |
Receivables: | |
Securities sold | | | 10,771 | | | | — | | | | — | | | | — | | |
Fund shares sold | | | 5,694 | | | | — | | | | 24,906 | | | | 4,274 | | |
Dividends and interest | | | 36,033 | | | | 686 | | | | 7,305 | | | | 60,755 | | |
Due from Advisor, net | | | 2,028 | | | | — | | | | 10,684 | | | | — | | |
Prepaid expenses | | | 4,976 | | | | 6,951 | | | | 2,817 | | | | 11,843 | | |
Total assets | | | 10,327,315 | | | | 15,566,190 | | | | 8,564,498 | | | | 58,624,524 | | |
Liabilities | |
Overdraft due to custodian bank | | | — | | | | — | | | | — | | | | 39,289 | | |
Payable for Fund shares redeemed | | | 44,632 | | | | 2,186 | | | | — | | | | 88,064 | | |
Due to Advisor, net | | | — | | | | 410 | | | | — | | | | 51,663 | | |
Accrued administration fees | | | 779 | | | | 1,242 | | | | 521 | | | | 3,171 | | |
Accrued shareholder servicing plan fees | | | 2,424 | | | | 2,061 | | | | 673 | | | | 6,388 | | |
Deferred trustees' compensation | | | 39,650 | | | | 65,069 | | | | 28,532 | | | | 130,059 | | |
Other accrued expenses | | | 41,035 | | | | 41,476 | | | | 30,302 | | | | 62,382 | | |
Total liabilities | | | 128,520 | | | | 112,444 | | | | 60,028 | | | | 381,016 | | |
Net Assets | | $ | 10,198,795 | | | $ | 15,453,746 | | | $ | 8,504,470 | | | $ | 58,243,508 | | |
Composition of Net Assets | |
Paid-in capital | | $ | 100,346,834 | | | $ | 13,566,606 | | | $ | 11,229,141 | | | $ | 51,244,592 | | |
Undistributed net investment income (loss) | | | (14,224 | ) | | | (70,039 | ) | | | (41,263 | ) | | | 121,933 | | |
Accumulated net realized gain (loss) on investments and foreign currency | | | (85,076,710 | ) | | | (378,369 | ) | | | (2,626,252 | ) | | | 287,227 | | |
Net unrealized appreciation (depreciation) on: | |
Investments | | | (5,054,948 | ) | | | 2,335,548 | | | | (57,158 | ) | | | 6,589,712 | | |
Foreign currency | | | (2,157 | ) | | | — | | | | 2 | | | | 44 | | |
Net Assets | | $ | 10,198,795 | | | $ | 15,453,746 | | | $ | 8,504,470 | | | $ | 58,243,508 | | |
Number of shares issued and outstanding (unlimited shares authorized,
no par value) | | | 4,059,101 | | | | 996,851 | | | | 633,152 | | | | 3,050,342 | | |
Net asset value per share | | $ | 2.51 | | | $ | 15.50 | | | $ | 13.43 | | | $ | 19.09 | | |
The accompanying notes are an integral part of these financial statements.
70
STATEMENTS OF ASSETS AND LIABILITIES
at December 31, 2016
| | | Dividend
Builder
Fund | | Global
Energy
Fund | | Global
Innovators
Fund | | Renminbi
Yuan & Bond
Fund | |
Assets | |
Investments in securities, at cost | | $ | 7,087,864 | | | $ | 52,593,127 | | | $ | 144,888,382 | | | $ | 1,961,037 | | |
Investments in securities, at value | | $ | 7,674,085 | | | $ | 48,475,105 | | | $ | 157,437,757 | | | $ | 1,753,289 | | |
Cash | | | — | | | | 505,885 | | | | 1,834,534 | | | | 108,144 | | |
Cash denominated in foreign currency (cost of $3,547, $1,101, $0 and
$535,181, respectively) | | | 3,547 | | | | 1,110 | | | | — | | | | 523,491 | | |
Receivables: | |
Securities sold | | | 304,600 | | | | — | | | | — | | | | — | | |
Fund shares sold | | | 14,000 | | | | 50,197 | | | | 323,417 | | | | — | | |
Dividends and interest | | | 25,508 | | | | 158,751 | | | | 161,537 | | | | 14,766 | | |
Due from Advisor, net | | | 8,957 | | | | — | | | | — | | | | 7,080 | | |
Prepaid expenses | | | 3,592 | | | | 11,173 | | | | 44,276 | | | | 2,974 | | |
Total assets | | | 8,034,289 | | | | 49,202,221 | | | | 159,801,521 | | | | 2,409,744 | | |
Liabilities | |
Overdraft due to custodian bank | | | 188,589 | | | | — | | | | — | | | | — | | |
Payable for Fund shares redeemed | | | 18,680 | | | | 63,964 | | | | 214,186 | | | | — | | |
Due to Advisor, net | | | — | | | | 18,358 | | | | 64,526 | | | | — | | |
Accrued administration fees | | | 1,029 | | | | 2,455 | | | | 5,122 | | | | 1,528 | | |
Accrued shareholder servicing plan fees | | | 676 | | | | 8,792 | | | | 11,280 | | | | 865 | | |
Deferred trustees' compensation | | | 13,721 | | | | 63,508 | | | | 98,798 | | | | 30,006 | | |
Other accrued expenses | | | 32,336 | | | | 63,335 | | | | 76,185 | | | | 47,097 | | |
Total liabilities | | | 255,031 | | | | 220,412 | | | | 470,097 | | | | 79,496 | | |
Net Assets | | $ | 7,779,258 | | | $ | 48,981,809 | | | $ | 159,331,424 | | | $ | 2,330,248 | | |
Composition of Net Assets | |
Paid-in capital | | $ | 7,868,684 | | | $ | 71,427,154 | | | $ | 147,043,299 | | | $ | 6,819,122 | | |
Undistributed net investment loss | | | (13,909 | ) | | | (48,663 | ) | | | (98,798 | ) | | | (32,323 | ) | |
Accumulated net realized loss on investments and foreign currency | | | (661,822 | ) | | | (18,258,553 | ) | | | (161,040 | ) | | | (4,236,860 | ) | |
Net unrealized appreciation (depreciation) on: | |
Investments | | | 586,221 | | | | (4,118,022 | ) | | | 12,549,375 | | | | (207,748 | ) | |
Foreign currency | | | 84 | | | | (20,107 | ) | | | (1,412 | ) | | | (11,943 | ) | |
Net Assets | | $ | 7,779,258 | | | $ | 48,981,809 | | | $ | 159,331,424 | | | $ | 2,330,248 | | |
Number of shares issued and outstanding (unlimited shares authorized,
no par value) | | | 509,176 | | | | 2,103,347 | | | | — | | | | 211,264 | | |
Net asset value per share | | $ | 15.28 | | | $ | 23.29 | | | | — | | | $ | 11.03 | | |
Net asset value per share per Class: | |
Investor Class shares: | |
Net assets applicable to shares outstanding | | | | | | $ | 133,676,632 | | | | | | |
Shares of beneficial interest issued and outstanding | | | | | | | 3,914,338 | | | | |
Net asset value per share | | | — | | | | — | | | $ | 34.15 | | | | — | | |
Institutional Class shares: | |
Net assets applicable to shares outstanding | | | | | | $ | 25,654,792 | | | | | | |
Shares of beneficial interest issued and outstanding | | | | | | | 750,041 | | | | |
Net asset value per share | | | — | | | | — | | | $ | 34.20 | | | | — | | |
The accompanying notes are an integral part of these financial statements.
71
STATEMENTS OF OPERATIONS
For the year ended December 31, 2016
| | | Alternative
Energy
Fund | | Asia
Focus
Fund | | Asia Pacific
Dividend
Builder
Fund | | China &
Hong Kong
Fund | |
Investment Income | |
Dividends* | | $ | 269,372 | | | $ | 466,470 | | | $ | 308,620 | | | $ | 2,033,589 | | |
Total income | | | 269,372 | | | | 466,470 | | | | 308,620 | | | | 2,033,589 | | |
Expenses | |
Advisory fees | | | 121,577 | | | | 155,680 | | | | 72,654 | | | | 605,362 | | |
Shareholder servicing plan fees | | | 23,708 | | | | 20,737 | | | | 15,627 | | | | 70,311 | | |
Transfer agent fees and expenses | | | 32,124 | | | | 28,493 | | | | 21,874 | | | | 63,220 | | |
Fund accounting fee and expenses | | | 31,579 | | | | 35,789 | | | | 32,669 | | | | 58,144 | | |
Administration fees | | | 7,093 | | | | 9,701 | | | | 4,467 | | | | 35,344 | | |
Custody fees and expenses | | | 8,518 | | | | 13,034 | | | | 9,726 | | | | 18,496 | | |
Audit fees | | | 18,051 | | | | 24,566 | | | | 17,870 | | | | 24,566 | | |
Legal fees | | | 10,517 | | | | 11,823 | | | | 6,299 | | | | 48,096 | | |
Registration fees | | | 20,851 | | | | 17,048 | | | | 17,000 | | | | 19,242 | | |
Printing | | | 17,462 | | | | 6,917 | | | | 8,801 | | | | 12,343 | | |
Trustees' fees and expenses | | | 12,926 | | | | 14,126 | | | | 11,400 | | | | 25,548 | | |
Insurance | | | 1,394 | | | | 1,629 | | | | 776 | | | | 7,042 | | |
CCO fees and expenses | | | 7,884 | | | | 8,378 | | | | 6,964 | | | | 14,234 | | |
Miscellaneous | | | 1,303 | | | | 504 | | | | 1,239 | | | | 2,008 | | |
Interest expense | | | 1,110 | | | | 293 | | | | 578 | | | | 983 | | |
Total expenses | | | 316,097 | | | | 348,718 | | | | 227,944 | | | | 1,004,939 | | |
Less: fees waived and expenses absorbed | | | (74,816 | ) | | | (39,307 | ) | | | (147,701 | ) | | | — | | |
Net expenses | | | 241,281 | | | | 309,411 | | | | 80,243 | | | | 1,004,939 | | |
Net investment income | | | 28,091 | | | | 157,059 | | | | 228,377 | | | | 1,028,650 | | |
Realized and unrealized gain (loss) on investments and foreign currency | |
Net realized gain (loss) on: | |
Investments | | | (4,731,050 | ) | | | 158,834 | | | | 146,925 | | | | 2,482,644 | | |
Foreign currency | | | (421 | ) | | | 255 | | | | 1,749 | | | | (2,564 | ) | |
| | | | (4,731,471 | ) | | | 159,089 | | | | 148,674 | | | | 2,480,080 | | |
Net change in unrealized appreciation (depreciation) on: | |
Investments | | | 2,427,077 | | | | 1,060,950 | | | | 242,907 | | | | (1,858,849 | ) | |
Foreign currency | | | 268 | | | | 6,413 | | | | 34 | | | | 44 | | |
| | | | 2,427,345 | | | | 1,067,363 | | | | 242,941 | | | | (1,858,805 | ) | |
Net increase from payments by affiliates | | | 16,892 | | | | — | | | | — | | | | — | | |
Net realized and unrealized gain (loss) on investments and foreign currency | | | (2,287,234 | ) | | | 1,226,452 | | | | 391,615 | | | | 621,275 | | |
Net increase (decrease) in Net Assets from Operations | | $ | (2,259,143 | ) | | $ | 1,383,511 | | | $ | 619,992 | | | $ | 1,649,925 | | |
* Net of foreign tax withheld of $10,799, $60,404, $25,230, and $85,805, respectively.
The accompanying notes are an integral part of these financial statements.
72
STATEMENTS OF OPERATIONS
For the year ended December 31, 2016
| | | Dividend
Builder
Fund | | Global
Energy
Fund | | Global
Innovators
Fund | | Renminbi
Yuan & Bond
Fund | |
Investment Income | |
Dividends* | | $ | 349,902 | | | $ | 1,218,835 | | | $ | 3,245,861 | | | $ | — | | |
Interest | | | — | | | | — | | | | — | | | | 98,124 | | |
Total income | | | 349,902 | | | | 1,218,835 | | | | 3,245,861 | | | | 98,124 | | |
Expenses | |
Advisory fees | | | 44,789 | | | | 347,486 | | | | 1,180,507 | | | | 14,865 | | |
Shareholder servicing plan fees | | | 23,902 | | | | 96,871 | | | | — | | | | 2,805 | | |
Shareholder servicing plan fees – Investor Class | | | — | | | | — | | | | 287,414 | | | | — | | |
Transfer agent fees and expenses | | | 20,250 | | | | 38,867 | | | | — | | | | 16,012 | | |
Transfer agent fees and expenses – Investor Class | | | — | | | | — | | | | 94,249 | | | | — | | |
Transfer agent fees and expenses – Institutional Class | | | — | | | | — | | | | 21,452 | | | | — | | |
Fund accounting fee and expenses | | | 32,316 | | | | 47,514 | | | | 95,532 | | | | 13,393 | | |
Fund accounting fee and expenses – Institutional Class | | | — | | | | — | | | | 4,094 | | | | — | | |
Administration fees | | | 5,979 | | | | 26,122 | | | | 85,077 | | | | 1,483 | | |
Administration fees – Institutional Class | | | — | | | | — | | | | 5,023 | | | | — | | |
Custody fees and expenses | | | 6,317 | | | | 12,540 | | | | 15,437 | | | | 2,852 | | |
Audit fees | | | 14,541 | | | | 24,566 | | | | 24,433 | | | | 17,109 | | |
Legal fees | | | 10,099 | | | | 34,352 | | | | 116,640 | | | | 2,443 | | |
Registration fees | | | 19,988 | | | | 22,059 | | | | — | | | | 19,287 | | |
Registration fees – Investor Class | | | — | | | | — | | | | 27,071 | | | | — | | |
Registration fees – Institutional Class | | | — | | | | — | | | | 15,024 | | | | — | | |
Printing | | | 8,045 | | | | 22,680 | | | | 50,499 | | | | 5,261 | | |
Trustees' fees and expenses | | | 11,921 | | | | 17,678 | | | | 41,013 | | | | 12,418 | | |
Insurance | | | 428 | | | | 3,441 | | | | 17,893 | | | | 846 | | |
CCO fees and expenses | | | 8,275 | | | | 11,516 | | | | 31,199 | | | | 4,109 | | |
Miscellaneous | | | 1,503 | | | | 2,507 | | | | 8,034 | | | | 1,769 | | |
Interest expense | | | 1,542 | | | | 1,723 | | | | 6,445 | | | | 2,646 | | |
Total expenses | | | 209,895 | | | | 709,922 | | | | 2,127,036 | | | | 117,298 | | |
Less: fees waived and expenses absorbed | | | (140,817 | ) | | | (38,343 | ) | | | (203,998 | ) | | | (90,419 | ) | |
Net expenses | | | 69,078 | | | | 671,579 | | | | 1,923,038 | | | | 26,879 | | |
Net investment income | | | 280,824 | | | | 547,256 | | | | 1,322,823 | | | | 71,245 | | |
Realized and unrealized gain (loss) on investments and foreign currency | |
Net realized gain (loss) on: | |
Investments | | | (287,213 | ) | | | (7,741,460 | ) | | | (44,840 | ) | | | (536,055 | ) | |
Foreign currency | | | (572 | ) | | | (5,087 | ) | | | 27,081 | | | | (57,718 | ) | |
| | | | (287,785 | ) | | | (7,746,547 | ) | | | (17,759 | ) | | | (593,773 | ) | |
Net change in unrealized appreciation (depreciation) on: | |
Investments | | | 684,004 | | | | 18,546,570 | | | | 12,832,823 | | | | 346,323 | | |
Foreign currency | | | 237 | | | | 3,381 | | | | (1,412 | ) | | | 10,260 | | |
| | | | 684,241 | | | | 18,549,951 | | | | 12,831,411 | | | | 356,583 | | |
Net increase from payments by affiliates | | | 203 | | | | — | | | | — | | | | — | | |
Net realized and unrealized gain (loss) on investments and foreign currency | | | 396,659 | | | | 10,803,404 | | | | 12,813,652 | | | | (237,190 | ) | |
Net increase (decrease) in Net Assets from Operations | | $ | 677,483 | | | $ | 11,350,660 | | | $ | 14,136,475 | | | $ | (165,945 | ) | |
* Net of foreign tax withheld of $15,659, $105,610, $103,002, and $0, respectively.
The accompanying notes are an integral part of these financial statements.
73
STATEMENTS OF CHANGES IN NET ASSETS
| | | Alternative Energy Fund | | Asia Focus Fund | |
| | | Year Ended
December 31, 2016 | | Year Ended
December 31, 2015 | | Year Ended
December 31, 2016 | | Year Ended
December 31, 2015 | |
Increase/(decrease) in net assets from: | |
Operations | |
Net investment income (loss) | | $ | 28,091 | | | $ | (145,210 | ) | | $ | 157,059 | | | $ | 230,134 | | |
Net realized gain (loss) on: | |
Investments | | | (4,731,050 | ) | | | (2,104,997 | ) | | | 158,834 | | | | 67,804 | | |
Foreign currency | | | (421 | ) | | | 9,215 | | | | 255 | | | | (8,436 | ) | |
Net change in unrealized appreciation (depreciation) on: | |
Investments | | | 2,427,077 | | | | 460,415 | | | | 1,060,950 | | | | (2,434,871 | ) | |
Foreign currency | | | 268 | | | | (879 | ) | | | 6,413 | | | | (625 | ) | |
Net increase from payments by affiliates | | | 16,892 | | | | — | | | | — | | | | — | | |
Net increase (decrease) in net assets resulting from operations | | | (2,259,143 | ) | | | (1,781,456 | ) | | | 1,383,511 | | | | (2,145,994 | ) | |
Distributions to shareholders | |
From net investment income | | | — | | | | — | | | | (220,064 | ) | | | (179,969 | ) | |
Total distributions to shareholders | | | — | | | | — | | | | (220,064 | ) | | | (179,969 | ) | |
Capital transactions | |
Proceeds from shares sold | | | 2,674,272 | | | | 3,661,403 | | | | 2,311,768 | | | | 1,243,379 | | |
Reinvestment of distributions | | | — | | | | — | | | | 206,751 | | | | 169,118 | | |
Cost of shares repurchased | | | (3,860,574 | ) | | | (3,437,294 | ) | | | (3,564,108 | ) | | | (3,464,807 | ) | |
Redemption fee proceeds | | | — | | | | 1 | | | | — | | | | 204 | | |
Net change in net assets from capital transactions | | | (1,186,302 | ) | | | 224,110 | | | | (1,045,589 | ) | | | (2,052,106 | ) | |
Total increase (decrease) in net assets | | | (3,445,445 | ) | | | (1,557,346 | ) | | | 117,858 | | | | (4,378,069 | ) | |
Net assets | |
Beginning of period | | | 13,644,240 | | | | 15,201,586 | | | | 15,335,888 | | | | 19,713,957 | | |
End of period | | $ | 10,198,795 | | | $ | 13,644,240 | | | $ | 15,453,746 | | | $ | 15,335,888 | | |
Accumulated net investment loss | | $ | (14,224 | ) | | $ | (41,894 | ) | | $ | (70,039 | ) | | $ | (28,524 | ) | |
Capital share activity | |
Shares sold | | | 1,014,743 | | | | 1,108,022 | | | | 142,434 | | | | 72,706 | | |
Shares issued on reinvestment | | | — | | | | — | | | | 13,425 | | | | 11,544 | | |
Shares redeemed | | | (1,455,485 | ) | | | (1,047,357 | ) | | | (223,714 | ) | | | (216,357 | ) | |
Net increase (decrease) in shares outstanding | | | (440,742 | ) | | | 60,665 | | | | (67,855 | ) | | | (132,107 | ) | |
The accompanying notes are an integral part of these financial statements.
74
STATEMENTS OF CHANGES IN NET ASSETS
| | | Asia Pacific Dividend Builder Fund | | China & Hong Kong Fund | |
| | | Year Ended
December 31, 2016 | | Year Ended
December 31, 2015 | | Year Ended
December 31, 2016 | | Year Ended
December 31, 2015 | |
Increase/(decrease) in net assets from: | |
Operations | |
Net investment income | | $ | 228,377 | | | $ | 105,337 | | | $ | 1,028,650 | | | $ | 995,543 | | |
Net realized gain (loss) on: | |
Investments | | | 146,925 | | | | 278,160 | | | | 2,482,644 | | | | 6,036,799 | | |
Foreign currency | | | 1,749 | | | | (15,268 | ) | | | (2,564 | ) | | | (4,049 | ) | |
Net change in unrealized appreciation (depreciation) on: | |
Investments | | | 242,907 | | | | (759,390 | ) | | | (1,858,849 | ) | | | (11,799,137 | ) | |
Foreign currency | | | 34 | | | | 5 | | | | 44 | | | | (15 | ) | |
Net increase (decrease) in net assets resulting from operations | | | 619,992 | | | | (391,156 | ) | | | 1,649,925 | | | | (4,770,859 | ) | |
Distributions to shareholders | |
From net investment income | | | (275,566 | ) | | | (139,312 | ) | | | (821,167 | ) | | | (1,399,854 | ) | |
From net realized gains | | | — | | | | — | | | | (2,195,417 | ) | | | (5,976,476 | ) | |
Total distributions to shareholders | | | (275,566 | ) | | | (139,312 | ) | | | (3,016,584 | ) | | | (7,376,330 | ) | |
Capital transactions | |
Proceeds from shares sold | | | 4,637,194 | | | | 5,502,291 | | | | 2,088,158 | | | | 16,832,413 | | |
Reinvestment of distributions | | | 268,159 | | | | 133,886 | | | | 2,902,054 | | | | 7,134,012 | | |
Cost of shares repurchased | | | (3,998,933 | ) | | | (1,912,482 | ) | | | (11,299,138 | ) | | | (31,521,021 | ) | |
Redemption fee proceeds | | | 79 | | | | 30 | | | | 113 | | | | 36,291 | | |
Net change in net assets from capital transactions | | | 906,499 | | | | 3,723,725 | | | | (6,308,813 | ) | | | (7,518,305 | ) | |
Total increase (decrease) in net assets | | | 1,250,925 | | | | 3,193,257 | | | | (7,675,472 | ) | | | (19,665,494 | ) | |
Net assets | |
Beginning of period | | | 7,253,545 | | | | 4,060,288 | | | | 65,918,980 | | | | 85,584,474 | | |
End of period | | $ | 8,504,470 | | | $ | 7,253,545 | | | $ | 58,243,508 | | | $ | 65,918,980 | | |
Accumulated net investment income (loss) | | $ | (41,263 | ) | | $ | (55,477 | ) | | $ | 121,933 | | | $ | (82,986 | ) | |
Capital share activity | |
Shares sold | | | 347,491 | | | | 402,814 | | | | 105,382 | | | | 649,553 | | |
Shares issued on reinvestment | | | 19,675 | | | | 9,911 | | | | 146,254 | | | | 361,033 | | |
Shares redeemed | | | (300,932 | ) | | | (139,412 | ) | | | (580,920 | ) | | | (1,250,130 | ) | |
Net increase (decrease) in shares outstanding | | | 66,234 | | | | 273,313 | | | | (329,284 | ) | | | (239,544 | ) | |
The accompanying notes are an integral part of these financial statements.
75
STATEMENTS OF CHANGES IN NET ASSETS
| | | Dividend Builder Fund | | Global Energy Fund | |
| | | Year Ended
December 31, 2016 | | Year Ended
December 31, 2015 | | Year Ended
December 31, 2016 | | Year Ended
December 31, 2015 | |
Increase/(decrease) in net assets from: | |
Operations | |
Net investment income | | $ | 280,824 | | | $ | 298,177 | | | $ | 547,256 | | | $ | 616,771 | | |
Net realized gain (loss) on: | |
Investments | | | (287,213 | ) | | | (340,750 | ) | | | (7,741,460 | ) | | | (5,058,206 | ) | |
Foreign currency | | | (572 | ) | | | 2,828 | | | | (5,087 | ) | | | (10,035 | ) | |
Net change in unrealized appreciation (depreciation) on: | |
Investments | | | 684,004 | | | | (535,396 | ) | | | 18,546,570 | | | | (11,979,665 | ) | |
Foreign currency | | | 237 | | | | 61 | | | | 3,381 | | | | (11,336 | ) | |
Net increase from payments by affiliates | | | 203 | | | | — | | | | — | | | | — | | |
Net increase (decrease) in net assets resulting from operations | | | 677,483 | | | | (575,080 | ) | | | 11,350,660 | | | | (16,442,471 | ) | |
Distributions to shareholders | |
From net investment income | | | (283,880 | ) | | | (329,153 | ) | | | (550,143 | ) | | | (590,066 | ) | |
From net realized gain | | | — | | | | (33,848 | ) | | | — | | | | (1,203 | ) | |
Total distributions to shareholders | | | (283,880 | ) | | | (363,001 | ) | | | (550,143 | ) | | | (591,269 | ) | |
Capital transactions | |
Proceeds from shares sold | | | 3,405,113 | | | | 9,912,058 | | | | 7,508,389 | | | | 19,630,830 | | |
Reinvestment of distributions | | | 283,141 | | | | 362,353 | | | | 535,273 | | | | 570,859 | | |
Cost of shares repurchased | | | (7,266,459 | ) | | | (3,565,387 | ) | | | (13,905,696 | ) | | | (22,031,553 | ) | |
Redemption fee proceeds | | | — | | | | 22 | | | | 4 | | | | 782 | | |
Net change in net assets from capital transactions | | | (3,578,205 | ) | | | 6,709,046 | | | | (5,862,030 | ) | | | (1,829,082 | ) | |
Total increase (decrease) in net assets | | | (3,184,602 | ) | | | 5,770,965 | | | | 4,938,487 | | | | (18,862,822 | ) | |
Net assets | |
Beginning of period | | | 10,963,860 | | | | 5,192,895 | | | | 44,043,322 | | | | 62,906,144 | | |
End of period | | $ | 7,779,258 | | | $ | 10,963,860 | | | $ | 48,981,809 | | | $ | 44,043,322 | | |
Accumulated net investment loss | | $ | (13,909 | ) | | $ | (10,281 | ) | | $ | (48,663 | ) | | $ | (40,689 | ) | |
Capital share activity | |
Shares sold | | | 226,414 | | | | 621,721 | | | | 386,227 | | | | 861,946 | | |
Shares issued on reinvestment | | | 18,533 | | | | 24,315 | | | | 22,895 | | | | 31,331 | | |
Shares redeemed | | | (478,994 | ) | | | (230,771 | ) | | | (680,991 | ) | | | (963,258 | ) | |
Net increase (decrease) in shares outstanding | | | (234,047 | ) | | | 415,265 | | | | (271,869 | ) | | | (69,981 | ) | |
The accompanying notes are an integral part of these financial statements.
76
STATEMENTS OF CHANGES IN NET ASSETS
| | | Global Innovators Fund | |
| | | Year Ended
December 31, 2016 | | Year Ended
December 31, 2015 | |
Increase/(decrease) in net assets from: | |
Operations | |
Net investment income | | $ | 1,322,823 | | | $ | 1,293,735 | | |
Net realized gain (loss) on: | |
Investments | | | (44,840 | ) | | | 7,626,347 | | |
Foreign currency | | | 27,081 | | | | (61,688 | ) | |
Net change in unrealized appreciation (depreciation) on: | |
Investments | | | 12,832,823 | | | | (16,022,576 | ) | |
Foreign currency | | | (1,412 | ) | | | 281 | | |
Net increase from payments by affiliates | | | — | | | | 10,554 | | |
Net increase (decrease) in net assets resulting from operations | | | 14,136,475 | | | | (7,153,347 | ) | |
Distributions to shareholders | |
From net investment income: | |
Investor Class | | | (1,221,587 | ) | | | (1,200,137 | ) | |
Institutional Class | | | (259,179 | ) | | | — | | |
From net realized gain: | |
Investor Class | | | — | | | | (6,434,280 | ) | |
Total distributions to shareholders | | | (1,480,766 | ) | | | (7,634,417 | ) | |
Capital transactions | |
Proceeds from shares sold: | |
Investor Class | | | 36,364,801 | | | | 280,912,179 | | |
Institutional Class | | | 27,748,853 | | | | 100,000 | | |
Reinvestment of distributions: | |
Investor Class | | | 1,194,633 | | | | 6,703,338 | | |
Institutional Class | | | 121,133 | | | | — | | |
Cost of shares repurchased: | |
Investor Class | | | (79,703,269 | ) | | | (265,382,485 | ) | |
Institutional Class | | | (4,059,323 | ) | | | — | | |
Redemption fee proceeds – Investor Class | | | — | | | | 926 | | |
Net change in net assets from capital transactions | | | (18,333,172 | ) | | | 22,333,958 | | |
Total increase (decrease) in net assets | | | (5,677,463 | ) | | | 7,546,194 | | |
Net assets | |
Beginning of period | | | 165,008,887 | | | | 157,462,693 | | |
End of period | | $ | 159,331,424 | | | $ | 165,008,887 | | |
Accumulated net investment loss | | $ | (98,798 | ) | | $ | (84,136 | ) | |
Capital share activity | |
Shares sold: | |
Investor Class | | | 1,155,255 | | | | 8,638,333 | | |
Institutional Class | | | 866,781 | | | | 3,177 | | |
Shares issued on reinvestment: | |
Investor Class | | | 34,799 | | | | 212,467 | | |
Institutional Class | | | 3,521 | | | | — | | |
Shares redeemed: | |
Investor Class | | | (2,515,617 | ) | | | (8,241,661 | ) | |
Institutional Class | | | (123,439 | ) | | | — | | |
Net increase (decrease) in shares outstanding | | | (578,700 | ) | | | 612,316 | | |
The accompanying notes are an integral part of these financial statements.
77
STATEMENTS OF CHANGES IN NET ASSETS
| | | Renminbi Yuan & Bond Fund | |
| | | Year Ended
December 31, 2016 | | Year Ended
December 31, 2015 | |
Increase/(decrease) in net assets from: | |
Operations | |
Net investment income | | $ | 71,245 | | | $ | 1,860,955 | | |
Net realized loss on: | |
Investments | | | (536,055 | ) | | | (3,688,544 | ) | |
Foreign currency | | | (57,718 | ) | | | (218,367 | ) | |
Net change in unrealized appreciation (depreciation) on: | |
Investments | | | 346,323 | | | | 440,551 | | |
Foreign currency | | | 10,260 | | | | (37,454 | ) | |
Net decrease in net assets resulting from operations | | | (165,945 | ) | | | (1,642,859 | ) | |
Distributions to shareholders | |
From net investment income | | | — | | | | (1,708,020 | ) | |
Return of capital | | | (45,290 | ) | | | (156,872 | ) | |
Total distributions to shareholders | | | (45,290 | ) | | | (1,864,892 | ) | |
Capital transactions | |
Proceeds from shares sold | | | 141,352 | | | | 9,363,485 | | |
Reinvestment of distributions | | | 43,704 | | | | 1,857,389 | | |
Cost of shares repurchased | | | (4,792,466 | ) | | | (101,212,023 | ) | |
Redemption fee proceeds | | | 152 | | | | 1,502 | | |
Net change in net assets from capital transactions | | | (4,607,258 | ) | | | (89,989,647 | ) | |
Total decrease in net assets | | | (4,818,493 | ) | | | (93,497,398 | ) | |
Net assets | |
Beginning of period | | | 7,148,741 | | | | 100,646,139 | | |
End of period | | $ | 2,330,248 | | | $ | 7,148,741 | | |
Accumulated net investment loss | | $ | (32,323 | ) | | $ | (43,037 | ) | |
Capital share activity | |
Shares sold | | | 12,292 | | | | 754,009 | | |
Shares issued on reinvestment | | | 3,749 | | | | 151,748 | | |
Shares redeemed | | | (419,569 | ) | | | (8,395,162 | ) | |
Net decrease in shares outstanding | | | (403,528 | ) | | | (7,489,405 | ) | |
The accompanying notes are an integral part of these financial statements.
78
FINANCIAL HIGHLIGHTS
For a capital share outstanding throughout each period.
| | | Year Ended December 31, | |
Alternative Energy Fund | | 2016 | | 2015 | | 2014 | | 2013 | | 2012 | |
Net asset value, beginning of period | | $ | 3.03 | | | $ | 3.42 | | | $ | 3.99 | | | $ | 2.47 | | | $ | 2.92 | | |
Income from investment operations: | |
Net investment income (loss) | | | 0.01 | | | | (0.03 | ) | | | (0.04 | ) | | | (0.04 | ) | | | (0.02 | ) | |
Net realized and unrealized gain (loss) on investments and foreign currency | | | (0.53 | )(3) | | | (0.36 | ) | | | (0.53 | ) | | | 1.55 | | | | (0.42 | ) | |
Total from investment operations | | | (0.52 | ) | | | (0.39 | ) | | | (0.57 | ) | | | 1.51 | | | | (0.44 | ) | |
Less distributions: | |
From net investment income | | | — | | | | — | | | | — | | | | — | | | | (0.01 | ) | |
Total distributions | | | — | | | | — | | | | — | | | | — | | | | (0.01 | ) | |
Redemption fee proceeds | | | — | | | | — | (1) | | | — | (1) | | | 0.01 | | | | — | (1) | |
Net asset value, end of period | | $ | 2.51 | | | $ | 3.03 | | | $ | 3.42 | | | $ | 3.99 | | | $ | 2.47 | | |
Total return | | | (17.16 | )% | | | (11.40 | )% | | | (14.29 | )% | | | 61.54 | % | | | (15.20 | )% | |
Ratios/supplemental data: | |
Net assets, end of period (millions) | | $ | 10.2 | | | $ | 13.6 | | | $ | 15.2 | | | $ | 23.8 | | | $ | 13.0 | | |
Ratio of expenses to average net assets: | |
Before fee waived/recaptured | | | 2.60 | % | | | 2.31 | % | | | 2.06 | % | | | 2.13 | % | | | 2.32 | % | |
After fees waived/recaptured | | | 1.99 | % | | | 1.98 | % | | | 2.02 | % | | | 2.00 | % | | | 2.02 | % | |
After fees waived/recaptured excluding interest expense(2) | | | 1.98 | % | | | 1.98 | % | | | 1.98 | % | | | 1.98 | % | | | 1.98 | % | |
Ratio of net investment income (loss) to average net assets: | |
Before fees waived/recaptured | | | (0.38 | )% | | | (1.32 | )% | | | (0.74 | )% | | | (1.37 | )% | | | (1.11 | )% | |
After fees waived/recaptured | | | 0.23 | % | | | (0.99 | )% | | | (0.70 | )% | | | (1.24 | )% | | | (0.81 | )% | |
Portfolio turnover rate | | | 63.95 | % | | | 28.67 | % | | | 42.27 | % | | | 60.20 | % | | | 7.80 | % | |
(1) Amount represents less than $0.01 per share.
(2) The Advisor has contractually agreed to limit the operating expenses of the Fund to 1.98%, excluding interest expense, expenses related to dividends on short positions, brokerage commissions, taxes and other extraordinary expenses. See Note 3.
(3) The Advisor reimbursed the Fund $16,892 for a trade error. As of December 31, 2016, the reimbursement amount represents $0.004 per share.
The accompanying notes are an integral part of these financial statements.
79
FINANCIAL HIGHLIGHTS
For a capital share outstanding throughout each period.
| | | Year Ended December 31, | |
Asia Focus Fund | | 2016 | | 2015 | | 2014 | | 2013 | | 2012 | |
Net asset value, beginning of period | | $ | 14.40 | | | $ | 16.47 | | | $ | 16.33 | | | $ | 18.56 | | | $ | 16.23 | | |
Income from investment operations: | |
Net investment income | | | 0.15 | | | | 0.21 | | | | 0.16 | | | | 0.21 | | | | 0.30 | | |
Net realized and unrealized gain (loss) on investments and foreign currency | | | 1.17 | | | | (2.11 | ) | | | 0.15 | | | | (2.14 | ) | | | 2.28 | | |
Total from investment operations | | | 1.32 | | | | (1.90 | ) | | | 0.31 | | | | (1.93 | ) | | | 2.58 | | |
Less distributions: | |
From net investment income | | | (0.22 | ) | | | (0.17 | ) | | | (0.17 | ) | | | (0.30 | ) | | | (0.25 | ) | |
Total distributions | | | (0.22 | ) | | | (0.17 | ) | | | (0.17 | ) | | | (0.30 | ) | | | (0.25 | ) | |
Redemption fee proceeds | | | — | | | | — | (1) | | | — | (1) | | | — | (1) | | | — | (1) | |
Net asset value, end of period | | $ | 15.50 | | | $ | 14.40 | | | $ | 16.47 | | | $ | 16.33 | | | $ | 18.56 | | |
Total return | | | 9.20 | % | | | (11.56 | )% | | | 1.91 | % | | | (10.38 | )% | | | 15.89 | % | |
Ratios/supplemental data: | |
Net assets, end of period (millions) | | $ | 15.5 | | | $ | 15.3 | | | $ | 19.7 | | | $ | 21.90 | | | $ | 44.90 | | |
Ratio of expenses to average net assets: | |
Before fees waived | | | 2.24 | % | | | 1.98 | % | | | 1.91 | % | | | 1.87 | % | | | 1.70 | % | |
After fees waived | | | 1.98 | % | | | 1.98 | % | | | 1.91 | % | | | 1.87 | % | | | 1.70 | % | |
After fees waived excluding interest expense(2) | | | 1.98 | % | | | 1.97 | % | | | 1.90 | % | | | 1.85 | % | | | 1.69 | % | |
Ratio of net investment income to average net assets: | |
Before fees waived | | | 0.75 | % | | | 1.24 | % | | | 0.90 | % | | | 0.73 | % | | | 1.56 | % | |
After fees waived | | | 1.01 | % | | | 1.24 | % | | | 0.90 | % | | | 0.73 | % | | | 1.56 | % | |
Portfolio turnover rate | | | 38.07 | % | | | 8.64 | % | | | 23.16 | % | | | 7.43 | % | | | 10.90 | % | |
(1) Amount represents less than $0.01 per share.
(2) The Advisor has contractually agreed to limit the operating expenses of the Fund to 1.98%, excluding interest expense, expenses related to dividends on short positions, brokerage commissions, taxes and other extraordinary expenses. See Note 3.
The accompanying notes are an integral part of these financial statements.
80
FINANCIAL HIGHLIGHTS
For a capital share outstanding throughout each period.
| | | Year Ended December 31, | |
Asia Pacific Dividend Builder Fund | | 2016 | | 2015 | | 2014 | | 2013 | | 2012 | |
Net asset value, beginning of period | | $ | 12.79 | | | $ | 13.83 | | | $ | 12.95 | | | $ | 13.52 | | | $ | 11.23 | | |
Income from investment operations: | |
Net investment income | | | 0.42 | | | | 0.39 | | | | 0.31 | | | | 0.27 | | | | 0.30 | | |
Net realized and unrealized gain (loss) on investments and foreign currency | | | 0.71 | | | | (1.01 | ) | | | 0.85 | | | | (0.54 | ) | | | 2.31 | | |
Total from investment operations | | | 1.13 | | | | (0.62 | ) | | | 1.16 | | | | (0.27 | ) | | | 2.61 | | |
Less distributions: | |
From net investment income | | | (0.49 | ) | | | (0.42 | ) | | | (0.28 | ) | | | (0.30 | ) | | | (0.32 | ) | |
Total distributions | | | (0.49 | ) | | | (0.42 | ) | | | (0.28 | ) | | | (0.30 | ) | | | (0.32 | ) | |
Redemption fee proceeds | | | — | (1) | | | — | (1) | | | — | (1) | | | — | (1) | | | — | (1) | |
Net asset value, end of period | | $ | 13.43 | | | $ | 12.79 | | | $ | 13.83 | | | $ | 12.95 | | | $ | 13.52 | | |
Total return | | | 8.81 | % | | | (4.61 | )% | | | 9.04 | % | | | (2.06 | )% | | | 23.48 | % | |
Ratios/supplemental data: | |
Net assets, end of period (millions) | | $ | 8.5 | | | $ | 7.3 | | | $ | 4.1 | | | $ | 4.3 | | | $ | 4.8 | | |
Ratio of expenses to average net assets: | |
Before fees waived | | | 3.14 | % | | | 3.87 | % | | | 3.91 | % | | | 3.56 | % | | | 3.57 | % | |
After fees waived | | | 1.11 | % | | | 1.98 | % | | | 1.99 | % | | | 1.98 | % | | | 1.98 | % | |
After fees waived excluding interest expense(2) | | | 1.10 | % | | | 1.98 | % | | | 1.98 | % | | | 1.98 | % | | | 1.98 | % | |
Ratio of net investment income to average net assets: | |
Before fees waived | | | 1.11 | % | | | 0.36 | % | | | 0.37 | % | | | 0.39 | % | | | 0.71 | % | |
After fees waived | | | 3.14 | % | | | 2.25 | % | | | 2.29 | % | | | 1.97 | % | | | 2.39 | % | |
Portfolio turnover rate | | | 30.91 | % | | | 28.59 | % | | | 15.76 | % | | | 56.96 | % | | | 10.19 | % | |
(1) Amount represents less than $0.01 per share.
(2) The Advisor has contractually agreed to limit the operating expenses of the Fund to 1.10%, prior to December 31, 2015, the limit on operating expenses was 1.98%, excluding interest expense, expenses related to dividends on short positions, brokerage commissions, taxes and other extraordinary expenses. See Note 3.
The accompanying notes are an integral part of these financial statements.
81
FINANCIAL HIGHLIGHTS
For a capital share outstanding throughout each period.
| | | Year Ended December 31, | |
China & Hong Kong Fund | | 2016 | | 2015 | | 2014 | | 2013 | | 2012 | |
Net asset value, beginning of period | | $ | 19.50 | | | $ | 23.65 | | | $ | 30.86 | | | $ | 29.81 | | | $ | 26.58 | | |
Income from investment operations: | |
Net investment income | | | 0.34 | | | | 0.34 | | | | 0.48 | | | | 0.46 | | | | 0.45 | | |
Net realized and unrealized gain (loss) on investments and foreign currency | | | 0.26 | | | | (2.11 | ) | | | (1.12 | ) | | | 1.45 | | | | 3.37 | | |
Total from investment operations | | | 0.60 | | | | (1.77 | ) | | | (0.64 | ) | | | 1.91 | | | | 3.82 | | |
Less distributions: | |
From net investment income | | | (0.27 | ) | | | (0.45 | ) | | | (0.45 | ) | | | (0.43 | ) | | | (0.59 | ) | |
From net realized gain | | | (0.74 | ) | | | (1.94 | ) | | | (6.13 | ) | | | (0.44 | ) | | | — | | |
Total distributions | | | (1.01 | ) | | | (2.39 | ) | | | (6.58 | ) | | | (0.87 | ) | | | (0.59 | ) | |
Redemption fee proceeds | | | — | (1) | | | 0.01 | | | | 0.01 | | | | 0.01 | | | | — | (1) | |
Net asset value, end of period | | $ | 19.09 | | | $ | 19.50 | | | $ | 23.65 | | | $ | 30.86 | | | $ | 29.81 | | |
Total return | | | 2.95 | % | | | (7.58 | )% | | | (1.97 | )% | | | 6.45 | % | | | 14.42 | % | |
Ratios/supplemental data: | |
Net assets, end of period (millions) | | $ | 58.2 | | | $ | 65.9 | | | $ | 85.6 | | | $ | 109.9 | | | $ | 152.0 | | |
Ratio of expenses to average net assets: | |
Before fees waived | | | 1.66 | % | | | 1.54 | % | | | 1.52 | % | | | 1.53 | % | | | 1.51 | % | |
After fees waived | | | 1.66 | % | | | 1.54 | % | | | 1.52 | % | | | 1.53 | % | | | 1.51 | % | |
After fees waived excluding interest expense(2) | | | 1.66 | % | | | 1.53 | % | | | 1.51 | % | | | 1.52 | % | | | 1.51 | % | |
Ratio of net investment income to average net assets: | | | 1.70 | % | | | 1.23 | % | | | 1.51 | % | | | 1.27 | % | | | 1.34 | % | |
Portfolio turnover rate | | | 28.02 | % | | | 26.50 | % | | | 15.11 | % | | | 6.90 | % | | | 3.85 | % | |
(1) Amount represents less than $0.01 per share.
(2) The Advisor has contractually agreed to limit the operating expenses of the Fund to 1.98%, excluding interest expense, expenses related to dividends on short positions, brokerage commissions, taxes and other extraordinary expenses. See Note 3.
The accompanying notes are an integral part of these financial statements.
82
FINANCIAL HIGHLIGHTS
For a capital share outstanding throughout each period.
| | | Year Ended December 31, | | March 30, 2012(1)
Through | |
Dividend Builder Fund | | 2016 | | 2015 | | 2014 | | 2013 | | December 31, 2012 | |
Net asset value, beginning of period | | $ | 14.75 | | | $ | 15.83 | | | $ | 15.64 | | | $ | 12.80 | | | $ | 12.50 | | |
Income from investment operations: | |
Net investment income | | | 0.46 | | | | 0.42 | | | | 0.52 | | | | 0.41 | | | | 0.31 | | |
Net realized and unrealized gain (loss) on investments and foreign currency | | | 0.54 | (6) | | | (0.99 | ) | | | 0.26 | | | | 3.35 | | | | 0.30 | | |
Total from investment operations | | | 1.00 | | | | (0.57 | ) | | | 0.78 | | | | 3.76 | | | | 0.61 | | |
Less distributions: | |
From net investment income | | | (0.47 | ) | | | (0.46 | ) | | | (0.47 | ) | | | (0.45 | ) | | | (0.31 | ) | |
From net realized gain | | | — | | | | (0.05 | ) | | | (0.12 | ) | | | (0.47 | ) | | | — | | |
Total distributions | | | (0.47 | ) | | | (0.51 | ) | | | (0.59 | ) | | | (0.92 | ) | | | (0.31 | ) | |
Redemption fee proceeds | | | — | | | | — | (2) | | | — | (2) | | | — | (2) | | | — | | |
Net asset value, end of period | | $ | 15.28 | | | $ | 14.75 | | | $ | 15.83 | | | $ | 15.64 | | | $ | 12.80 | | |
Total return | | | 6.83 | % | | | (3.61 | )% | | | 4.99 | % | | | 29.77 | % | | | 4.97 | %(3) | |
Ratios/supplemental data: | |
Net assets, end of period (millions) | | $ | 7.8 | | | $ | 11.0 | | | $ | 5.2 | | | $ | 3.1 | | | $ | 1.8 | | |
Ratio of expenses to average net assets: | |
Before fees waived | | | 2.11 | % | | | 1.77 | % | | | 2.96 | % | | | 5.47 | % | | | 7.05 | %(4) | |
After fees waived | | | 0.70 | % | | | 0.68 | % | | | 0.68 | % | | | 0.68 | % | | | 0.68 | %(4) | |
After fees waived excluding interest expense(5) | | | 0.68 | % | | | 0.68 | % | | | 0.68 | % | | | 0.68 | % | | | 0.68 | %(4) | |
Ratio of net investment income (loss) to average net assets: | |
Before fees waived/recaptured | | | 1.41 | % | | | 1.76 | % | | | 1.18 | % | | | (2.04 | )% | | | (3.02 | )%(4) | |
After fees waived/recaptured | | | 2.82 | % | | | 2.86 | % | | | 3.46 | % | | | 2.75 | % | | | 3.35 | %(4) | |
Portfolio turnover rate | | | 21.57 | % | | | 24.94 | % | | | 7.60 | % | | | 24.88 | % | | | 13.33 | %(3) | |
(1) Commencement of Operations.
(2) Amount represents less than $0.01 per share.
(3) Not annualized.
(4) Annualized.
(5) The Advisor has contractually agreed to limit the operating expenses of the Fund to 0.68%, excluding interest expense, expenses related to dividends on short positions, brokerage commissions, taxes and other extraordinary expenses. See Note 3.
(6) An affiliate of the Fund reimbursed the Fund $203.00 for a trade error. As of December 31, 2016, the reimbursement amount represents $0.000 per share.
The accompanying notes are an integral part of these financial statements.
83
FINANCIAL HIGHLIGHTS
For a capital share outstanding throughout each period.
| | | Year Ended December 31, | |
Global Energy Fund | | 2016 | | 2015 | | 2014 | | 2013 | | 2012 | |
Net asset value, beginning of period | | $ | 18.54 | | | $ | 25.73 | | | $ | 32.45 | | | $ | 26.19 | | | $ | 25.72 | | |
Income from investment operations: | |
Net investment income | | | 0.26 | | | | 0.26 | | | | 0.28 | | | | 0.18 | | | | 0.22 | | |
Net realized and unrealized gain (loss) on investments and foreign currency | | | 4.75 | | | | (7.20 | ) | | | (6.66 | ) | | | 6.23 | | | | 0.69 | | |
Total from investment operations | | | 5.01 | | | | (6.94 | ) | | | (6.38 | ) | | | 6.41 | | | | 0.91 | | |
Less distributions: | |
From net investment income | | | (0.26 | ) | | | (0.25 | ) | | | (0.22 | ) | | | (0.15 | ) | | | (0.44 | ) | |
From net realized gain | | | — | | | | — | (1) | | | (0.13 | ) | | | — | | | | — | | |
Total distributions | | | (0.26 | ) | | | (0.25 | ) | | | (0.35 | ) | | | (0.15 | ) | | | (0.44 | ) | |
Redemption fee proceeds | | | — | (1) | | | — | (1) | | | 0.01 | | | | — | (1) | | | — | (1) | |
Net asset value, end of period | | $ | 23.29 | | | $ | 18.54 | | | $ | 25.73 | | | $ | 32.45 | | | $ | 26.19 | | |
Total return | | | 27.04 | % | | | (26.97 | )% | | | (19.63 | )% | | | 24.48 | % | | | 3.53 | % | |
Ratios/supplemental data: | |
Net assets, end of period (millions) | | $ | 49.0 | | | $ | 44.0 | | | $ | 62.90 | | | $ | 72.3 | | | $ | 90.3 | | |
Ratio of expenses to average net assets: | |
Before fees waived | | | 1.53 | % | | | 1.41 | % | | | 1.30 | % | | | 1.35 | % | | | 1.35 | % | |
After fees waived | | | 1.45 | % | | | 1.41 | % | | | 1.30 | % | | | 1.35 | % | | | 1.35 | % | |
After fees waived excluding interest expense(2) | | | 1.45 | % | | | 1.41 | % | | | 1.30 | % | | | 1.34 | % | | | 1.34 | % | |
Ratio of net investment income to average net assets: | |
Before fees waived/recaptured | | | 1.10 | % | | | 1.07 | % | | | 0.76 | % | | | 0.77 | % | | | 0.62 | % | |
After fees waived/recaptured | | | 1.18 | % | | | 1.07 | % | | | 0.76 | % | | | 0.77 | % | | | 0.62 | % | |
Portfolio turnover rate | | | 14.96 | % | | | 15.70 | % | | | 39.33 | % | | | 8.19 | % | | | 14.02 | % | |
(1) Amount represents less than $0.01 per share.
(2) The Advisor has contractually agreed to limit the operating expenses of the Fund to 1.45%, excluding interest expense, expenses related to dividends on short positions, brokerage commissions, taxes and other extraordinary expenses. See Note 3.
The accompanying notes are an integral part of these financial statements.
84
FINANCIAL HIGHLIGHTS
For a capital share outstanding throughout each period.
| | | Year Ended December 31, | |
Global Innovators Fund – Investor Class | | 2016 | | 2015 | | 2014 | | 2013 | | 2012 | |
Net asset value, beginning of period | | $ | 31.47 | | | $ | 34.00 | | | $ | 30.65 | | | $ | 21.18 | | | $ | 17.72 | | |
Income from investment operations: | |
Net investment income | | | 0.30 | | | | 0.26 | | | | 0.28 | | | | 0.07 | | | | 0.11 | | |
Net realized and unrealized gain (loss) on investments | | | 2.69 | | | | (1.28 | )(3) | | | 3.57 | | | | 9.52 | | | | 3.42 | | |
Total from investment operations | | | 2.99 | | | | (1.02 | ) | | | 3.85 | | | | 9.59 | | | | 3.53 | | |
Less distributions: | |
From net investment income | | | (0.31 | ) | | | (0.24 | ) | | | (0.26 | ) | | | (0.12 | ) | | | (0.07 | ) | |
From net realized gain | | | — | | | | (1.27 | ) | | | (0.24 | ) | | | — | | | | — | | |
Total distributions | | | (0.31 | ) | | | (1.51 | ) | | | (0.50 | ) | | | (0.12 | ) | | | (0.07 | ) | |
Redemption fee proceeds | | | — | | | | — | (1) | | | — | (1) | | | — | (1) | | | — | (1) | |
Net asset value, end of period | | $ | 34.15 | | | $ | 31.47 | | | $ | 34.00 | | | $ | 30.65 | | | $ | 21.18 | | |
Total return | | | 9.51 | % | | | (3.04 | )% | | | 12.55 | % | | | 45.29 | % | | | 19.91 | % | |
Ratios/supplemental data: | |
Net assets, end of period (millions) | | $ | 133.7 | | | $ | 164.9 | | | $ | 157.5 | | | $ | 50.7 | | | $ | 31.6 | | |
Ratio of expenses to average net assets: | |
Before fees waived/recaptured | | | 1.35 | % | | | 1.27 | % | | | 1.26 | % | | | 1.47 | % | | | 1.51 | % | |
After fees waived/recaptured | | | 1.24 | % | | | 1.27 | % | | | 1.26 | % | | | 1.47 | % | | | 1.51 | % | |
After fees waived/recaptured excluding interest expense(2) | | | 1.24 | % | | | 1.27 | % | | | 1.26 | % | | | 1.46 | % | | | 1.50 | % | |
Ratio of net investment income to average net assets: | |
Before fees waived/recaptured | | | 0.71 | % | | | 0.69 | % | | | 1.25 | % | | | 0.31 | % | | | 0.49 | % | |
After fees waived/recaptured | | | 0.82 | % | | | 0.69 | % | | | 1.25 | % | | | 0.31 | % | | | 0.49 | % | |
Portfolio turnover rate | | | 31.25 | % | | | 37.59 | % | | | 14.40 | % | | | 29.63 | % | | | 6.02 | % | |
(1) Amount represents less than $0.01 per share.
(2) The Advisor has contractually agreed to limit the operating expenses of the Fund to 1.24%, prior to December 31, 2015 the limit on operating expenses was 1.55%, excluding interest expense, related to dividends on short positions, brokerage commissions, taxes and other extraordinary expenses. See Note 3.
(3) The Advisor reimbursed the Fund $10,554 for trade errors. As of December 31, 2015, the reimbursement amount represents $0.002 per share.
The accompanying notes are an integral part of these financial statements.
85
FINANCIAL HIGHLIGHTS
For a capital share outstanding throughout each period.
Global Innovators Fund – Institutional Class | | Year Ended
December 31, 2016 | | For the
Period Ended
December 31, 2015(1) | |
Net asset value, beginning of period | | $ | 31.47 | | | $ | 31.47 | | |
Income from investment operations: | |
Net investment income | | | 0.20 | | | | — | | |
Net realized and unrealized gain on investments | | | 2.88 | | | | — | | |
Total from investment operations | | | 3.08 | | | | — | | |
Less distributions: | |
From net investment income | | | (0.35 | ) | | | — | | |
From net realized gain | | | — | | | | — | | |
Total distributions | | | (0.35 | ) | | | — | | |
Redemption fee proceeds | | | — | | | | — | | |
Net asset value, end of period | | $ | 34.20 | | | $ | 31.47 | | |
Total return | | | 9.81 | % | | | 0.00 | % | |
Ratios/supplemental data: | |
Net assets, end of period (millions) | | $ | 25.7 | | | $ | 0.0 | | |
Ratio of expenses to average net assets: | |
Before fees waived/recaptured | | | 1.38 | % | | | 0.00 | % | |
After fees waived/recaptured | | | 0.99 | % | | | 0.00 | % | |
After fees waived/recaptured excluding interest expense(2) | | | 0.99 | % | | | 0.00 | % | |
Ratio of net investment income (loss) to average net assets: | |
Before fees waived/recaptured | | | 0.68 | % | | | 0.00 | % | |
After fees waived/recaptured | | | 1.07 | % | | | 0.00 | % | |
Portfolio turnover rate | | | 31.25 | % | | | 0.00 | % | |
(1) Commencement of Operations.
(2) The Advisor has contractually agreed to limit the operating expenses of the Fund to 0.99%, excluding interest expense, expenses related to dividends on short positions, brokerage commissions, taxes and other extraordinary expenses. See Note 3.
The accompanying notes are an integral part of these financial statements.
86
FINANCIAL HIGHLIGHTS
For a capital share outstanding throughout each period.
| | | Year Ended December 31, | |
Renminbi Yuan & Bond Fund | | 2016 | | 2015 | | 2014 | | 2013 | | 2012 | |
Net asset value, beginning of period | | $ | 11.63 | | | $ | 12.42 | | | $ | 12.95 | | | $ | 12.71 | | | $ | 12.52 | | |
Income from investment operations: | |
Net investment income | | | 0.19 | | | | 0.63 | | | | 0.32 | | | | 0.28 | | | | 0.12 | | |
Net realized and unrealized gain (loss) on investments and foreign currency | | | (0.59 | ) | | | (1.12 | ) | | | (0.44 | ) | | | 0.38 | | | | 0.36 | | |
Total from investment operations | | | (0.40 | ) | | | (0.49 | ) | | | (0.12 | ) | | | 0.66 | | | | 0.48 | | |
Less distributions: | |
From net investment income | | | — | | | | (0.27 | ) | | | (0.41 | ) | | | (0.42 | ) | | | (0.29 | ) | |
Return of capital | | | (0.20 | ) | | | (0.03 | ) | | | — | | | | — | | | | — | | |
Total distributions | | | (0.20 | ) | | | (0.30 | ) | | | (0.41 | ) | | | (0.42 | ) | | | (0.29 | ) | |
Redemption fee proceeds | | | — | (1) | | | — | (1) | | | — | (1) | | | — | (1) | | | — | (1) | |
Net asset value, end of period | | $ | 11.03 | | | $ | 11.63 | | | $ | 12.42 | | | $ | 12.95 | | | $ | 12.71 | | |
Total return | | | (3.52 | )% | | | (4.05 | )% | | | (0.92 | )% | | | 5.26 | % | | | 3.88 | % | |
Ratios/supplemental data: | |
Net assets, end of period (millions) | | $ | 2.3 | | | $ | 7.1 | | | $ | 100.6 | | | $ | 94.2 | | | $ | 89.3 | | |
Ratio of expenses to average net assets: | |
Before fees waived/recaptured | | | 4.35 | % | | | 1.05 | % | | | 0.95 | % | | | 0.97 | % | | | 0.90 | % | |
After fees waived/recaptured | | | 1.00 | % | | | 0.93 | % | | | 0.90 | % | | | 0.90 | % | | | 0.90 | % | |
After fees waived/recaptured excluding interest expense(2) | | | 0.90 | % | | | 0.90 | % | | | 0.90 | % | | | 0.90 | % | | | 0.90 | % | |
Ratio of net investment income (loss) to average net assets: | |
Before fees waived/recaptured | | | (0.71 | )% | | | 2.68 | % | | | 2.49 | % | | | 2.11 | % | | | 1.05 | % | |
After fees waived/recaptured | | | 2.64 | % | | | 2.80 | % | | | 2.54 | % | | | 2.18 | % | | | 1.05 | % | |
Portfolio turnover rate | | | 13.00 | % | | | 15.85 | % | | | 28.29 | % | | | 12.32 | % | | | 9.19 | % | |
(1) Amount represents less than $0.01 per share.
(2) The Advisor has contractually agreed to limit the operating expenses of the Fund to 0.90%, excluding interest expense, expenses related to dividends on short positions, brokerage commissions, taxes and other extraordinary expenses. See Note 3.
The accompanying notes are an integral part of these financial statements.
87
NOTES TO FINANCIAL STATEMENTS
Note 1
Organization
Guinness AtkinsonTM Funds (the "Trust"), was organized on April 28, 1997 as a Delaware business trust and registered under the Investment Company Act of 1940, as amended (the "1940 Act"), as an open end management investment company. Currently, the Trust offers eight separate series: Guinness Atkinson Alternative Energy Fund (the "Alternative Energy Fund"), Guinness Atkinson Asia Focus Fund (the "Asia Focus Fund"), Guinness Atkinson Asia Pacific Dividend Builder Fund (the "Asia Pacific Dividend Builder Fund"), Guinness Atkinson China & Hong Kong Fund (the "China & Hong Kong Fund"), Guinness Atkinson Global Energy Fund (the "Global Energy Fund"), Guinness Atkinson Global Innovators Fund (the "Global Innovators Fund"), Guinness Atkinson Dividend Builder Fund (the "Dividend Builder Fund") and Guinness Atkinson Renminbi Yuan & Bond Fund (the "Renminbi Yuan & Bond Fund"), all of which (each a "Fund" and collectively, the "Funds") are covered by this report. Except for the Dividend Builder Fund, each Fund is a non-diversified Fund. The China & Hong Kong Fund began operations on June 30, 1994, the Asia Focus Fund began operations on April 29, 1996, the Global Innovators Fund began operations on December 15, 1998, the Global Energy Fund began operations on June 30, 2004, the Alternative Energy Fund and the Asia Pacific Dividend Builder Fund began operations on March 31, 2006, the Renminbi Yuan & Bond Fund began operations on June 30, 2011, and the Dividend Builder Fund began operations on March 30, 2012. Each of the Funds is authorized to issue a single class of shares except for the Global Innovators Fund. The Global Innovators Fund is authorized to issue two classes of shares: Investor Class shares and Institutional Class shares. Institutional Class shares of the Global Innovators Fund commenced operations on December 31, 2015.
The shares of each class represent an interest in the same portfolio of investments of the Global Innovators Fund and have equal rights as to voting, redemptions, dividends and liquidation, subject to the approval of the Trustees. Income and expenses (other than expenses attributable to a specific class) and realized and unrealized gains and losses on investments are allocated to each class of shares in proportion to their relative shares outstanding. Shareholders of a class that bears distribution and service expenses under the terms of a distribution plan have exclusive voting rights to that distribution plan.
The Alternative Energy Fund, Asia Focus Fund, Global Energy Fund, and Global Innovator Fund's investment objective is long-term capital appreciation. The Asia Pacific Dividend Builder Fund's investment objective is to provide investors with dividend income and long-term capital growth. The China & Hong Kong Fund's investment objective is long-term capital appreciation primarily through investments in securities of China and Hong Kong. The Renminbi Yuan & Bond Fund's investment objective is to seek total return. Total return means the combination of capital appreciation and investment income, which includes changes in the value of the renminbi, the currency of China of which the yuan is the unit. The Dividend Builder Fund's investment objective is to seek a moderate level of current income and consistent dividend growth at a rate that exceeds inflation.
Note 2
Significant accounting policies
Each Fund is an investment company and accordingly follows the investment company accounting and reporting guidance of the Financial Accounting Standards Board (FASB) Accounting Standard Codification Topic 946 "Financial Services – Investment Companies".
The following is a summary of significant accounting policies consistently followed by the Funds. These policies are in conformity with accounting principles generally accepted in the United States of America. ("GAAP").
A. Security Valuation. Securities of the Funds that are traded on a principal exchange (U.S. or foreign) or NASDAQ are valued at the official closing price on each day that the exchanges are open for trading. Securities traded on an exchange for which there have been no sales, and other over-the-counter securities are valued at the mean between the bid and asked prices. Debt securities are valued based on available market quotations received from an independent pricing service approved by the Trust's Board of Trustees which may utilize both transaction data and market information such as yield, prices of securities of comparable quality, coupon rate, maturity, type of issue, trading characteristics and other market data. Securities for which quotations are not readily available are valued at their respective fair values as determined in good faith by the Funds' Valuation Committee in accordance with procedures established by the Board of Trustees. In determining fair value, the Funds' Valuation Committee take into account all relevant factors and available information. Consequently, the price of the security used to calculate its Net Asset Value may differ from quoted or published prices for the same security. Fair value pricing involves subjective judgments and there is no single standard for determining a security's fair value. As a result, different mutual funds could reasonably arrive at different fair value for the same security. It is possible that the fair value determined for a security
88
is materially different from the value that could be realized upon the sale of that security or from the values that other mutual funds may determine. Short-term investments are stated at cost, combined with accrued interest, which approximates market value. Realized gains and losses from securities transactions are calculated using the identified cost method.
Foreign securities are recorded in the financial statements after translation to U.S. dollars based on the applicable exchange rate at the end of the period. The Funds do not isolate that portion of the results of operations resulting from changes in the currency exchange rate from the fluctuations resulting from changes in the market prices of investments.
Foreign exchange gain or loss resulting from holding of a foreign currency, expiration of a currency exchange contract, difference in exchange rates between the trade date and settlement date of an investment purchased or sold, and the difference between dividends actually received compared to the amount shown in a Fund's accounting records on the date of receipt are shown as net realized gains or losses on foreign currency transactions in the respective Fund's statement of operations.
B. Forward Foreign Currency Exchange Contracts. The Funds may utilize forward foreign currency exchange contracts ("forward contracts") to hedge against foreign exchange fluctuations on foreign-denominated investments under which they are obligated to exchange currencies at specific future dates and at specified rates. All commitments are "marked-to-market" daily and any resulting unrealized gains or losses are included as unrealized appreciation (depreciation) on foreign currency denominated assets and liabilities. The Funds record realized gains or losses at the time the forward contract is settled. Risks may arise upon entering these contracts from the potential inability of a counter party to meet the terms of their contracts and from unanticipated movements in the value of a foreign currency relative to the U.S. dollar or other currencies. Counterparties to these contracts are major U.S. financial institutions. Please refer to Note 7 for further information on forward foreign currency contracts held in each Fund.
C. Restricted and Illiquid Securities. A restricted security cannot be resold to the general public without prior registration under the Securities Act of 1933. If the security is subsequently registered and resold, the issuers would typically bear the expense of all registrations at no cost to the Fund. Restricted securities are valued according to the guidelines and procedures adopted by the Funds' Board of Trustees. A security may be considered illiquid if it lacks a readily available market. Securities are generally considered liquid if they can be sold or disposed of in the ordinary course of business within seven days at approximately the price at which the security is valued by a fund. Illiquid securities may be valued under methods approved by the Board of Trustees as reflecting fair value.
D. Security Transactions, Dividend Income and Distributions. Security transactions are accounted for on the trade date. Dividend income and distributions to shareholders are recorded on the ex-dividend date. Realized gains and losses from securities transactions are calculated using the identified cost method.
E. Allocation of Expenses. Each Fund is charged for those expenses directly attributable to it. Expenses that are not directly attributable to a Fund are allocated among the Funds in proportion to their respective assets or another appropriate method. Expenses such as distribution and service fees, transfer agent fees and expenses with respect to the Global Innovators Fund, that are specific to individual share classes are accrued directly to the respective share class.
F. Cash overdraft. Throughout the year, the Funds may have cash overdraft balances. A fee is incurred on these overdrafts, calculated by multiplying the overdraft by a rate plus London Interbank Offered Rate ("LIBOR"). Payables, if any, are reflected as Overdraft Due to Custodian Bank in the Statements of Assets and Liabilities. Expenses from cash overdrafts are included in Interest Expense in the Statements of Operations.
G. Concentration of Risk. The Alternative Energy Fund invests substantially in the alternative energy or energy technology sectors. The Asia Focus Fund invests substantially all of its assets in the Asian continent. The Asia Pacific Dividend Builder Fund invests primarily in dividend-producing equity securities of Asia Pacific companies. The China & Hong Kong Fund invests substantially all of its assets in securities that are traded in China or Hong Kong or that are issued by companies that do a substantial part of their business in China. The Global Energy Fund invests substantially in energy companies; the changes in the prices and supplies of oil and other energy fuels may affect the Fund's investments. The Renminbi Yuan & Bond Fund invests in securities issued by companies economically tied to China, which exposes the Fund to greater market risk and potential monetary losses than if the Fund's assets were diversified among other regions. The consequences of political, social, or economic changes in the countries or business sectors in which the securities are offered or the issuers conduct their operations may affect the market prices of the Funds' investments and any income generated, as well as the Funds' ability to repatriate such amounts.
H. Use of Estimates. The preparation of financial statements in conformity with accounting principles generally accepted in the United States requires management to make estimates and assumptions that affect the reported amounts of assets and liabilities and the disclosure of contingent assets and liabilities at the date of the financial statements. Actual results could differ from those estimates.
89
I. Reclassifications. Accounting principles generally accepted in the United States require that certain components of net assets be reclassified between financial and tax reporting. These reclassifications have no effect on net assets or new asset value per share and were primarily attributed to differences in the treatment of foreign currency and net investment losses. For the year ended December 31, 2016, permanent differences in book and tax accounting have been reclassified as follows:
| | | Increase (Decrease) | |
| | | Paid in Capital | | Undistributed Net
Investment
Income/(Loss) | | Accumulated
Gains/(Losses) | |
Alternative Energy Fund | | $ | (10,353,972 | ) | | $ | (421 | ) | | $ | 10,354,393 | | |
Asia Focus Fund | | | (21,235 | ) | | | 21,490 | | | | (255 | ) | |
Asia Pacific Dividend Builder Fund | | | (523,034 | ) | | | 61,403 | | | | 461,631 | | |
China & Hong Kong Fund | | | — | | | | (2,564 | ) | | | 2,564 | | |
Dividend Builder Fund | | | 203 | | | | (572 | ) | | | 369 | | |
Global Energy Fund | | | — | | | | (5,087 | ) | | | 5,087 | | |
Global Innovators Fund | | | — | | | | 143,281 | | | | (143,281 | ) | |
Renminbi Yuan& Bond Fund | | | (90,155 | ) | | | (60,531 | ) | | | 150,686 | | |
J. Indemnifications. Under the Trust's organizational documents, its current and former officers and trustees are indemnified against certain liabilities arising out of the performance of their duties to the Funds. In addition, in the normal course of business, the Funds enter into contracts that contain a variety of representations and warranties that provide general indemnifications. The Funds' maximum exposure under these arrangements is unknown as this would involve future claims that may be made against the Funds that have not yet occurred or that would be covered by other parties.
K. Federal Income Taxes. The Funds intend to comply with the requirements of Subchapter M of the Internal Revenue Code applicable to regulated investment companies and to distribute substantially all of their net investment income and any net realized gains to their shareholders. Therefore, no provision is made for federal income or excise taxes. Due to the timing of dividend distributions and the differences in accounting for income and realized gains and losses for financial statement and federal income tax purposes, the fiscal year in which amounts are distributed may differ from the year in which the income and realized gains and losses are recorded by the Funds.
Accounting for Uncertainty in Income Taxes (the "Income Tax Statement") requires an evaluation of tax positions taken (or expected to be taken) in the course of preparing a Funds' tax returns to determine whether these positions meet a "more-likely-than-not" standard that, based on the technical merits, have a more than fifty percent likelihood of being sustained by a taxing authority upon examination. A tax position that meets the "more-likely-than-not" recognition threshold is measured to determine the amount of benefit to recognize in the financial statements. The Funds recognize interest and penalties, if any, related to unrecognized tax benefits as income tax expense in the Statements of Operations.
The Income Tax Statement requires management of the Funds to analyze tax positions taken in the prior three open tax years, if any, and tax positions expected to be taken in the Fund's current tax year, as defined by the IRS statute of limitations for all major jurisdictions, including federal tax authorities and certain state tax authorities. As of and during the year ended December 31, 2016, the Funds did not have a liability for any unrecognized tax benefits. The Funds have no examination in progress and are not aware of any tax positions for which it is reasonably possible that the total amounts of unrecognized tax benefits will significantly change in the next twelve months.
Note 3
Investment Advisory and Other Agreements
The Trust, on behalf of each Fund, entered into an Investment Advisory Agreement with Guinness Atkinson Asset Management, Inc. (the "Advisor"), under which the Advisor provides the Funds with investment management services. The Advisor furnishes all
90
investment advice, office space, facilities, and most of the personnel needed by the Funds. As compensation for its services, the Advisor is entitled to a monthly fee at the following annual rates based upon the average daily net assets of the Funds:
Alternative Energy Fund | | 1.00% | |
Asia Focus Fund | | 1.00% | |
Asia Pacific Dividend Builder Fund | | 1.00% | |
China & Hong Kong Fund | | 1.00% | |
Dividend Builder Fund | | 0.45% | |
Global Energy Fund | | 0.75% | |
Global Innovators Fund | | 0.75% on the 1st $500 million, 0.60% thereafter | |
Renminbi Yuan & Bond Fund | | 0.55% | |
The Funds are responsible for their own operating expenses. The Advisor has contractually agreed to limit each Fund's total operating expenses (excluding interest, dividends on short positions, taxes and extraordinary expenses) by reducing all or a portion of its fees and reimbursing the Fund for expenses so that its ratio of expenses to average daily net assets will not exceed the following levels:
| | | Annual Expense Limit | | Expiration Date | |
Alternative Energy Fund | | | 1.98 | % | | June 30, 2017 | |
Asia Focus Fund | | | 1.98 | % | | June 30, 2017 | |
Asia Pacific Dividend Builder Fund | | | 1.10 | % | | June 30, 2017 | |
China & Hong Kong Fund | | | 1.98 | % | | June 30, 2017 | |
Dividend Builder Fund | | | 0.68 | % | | June 30, 2017 | |
Global Energy Fund | | | 1.45 | % | | June 30, 2017 | |
Global Innovators Fund - Investor Class | | | 1.24 | % | | June 30, 2018 | |
Global Innovators Fund - Institutional Class | | | 0.99 | % | | June 30, 2018 | |
Renminbi Yuan & Bond Fund | | | 0.90 | % | | June 30, 2017 | |
The expense ratios shown in the financial highlights may exceed these levels due to expenses incurred, but not covered by the expense limitation agreement.
To the extent that the Advisor waives fees and/or absorbs expenses it may seek repayment of a portion or all of such amounts at any time within three fiscal years after the fiscal year in which such amounts were waived or absorbed, subject to the applicable cap. For the year ended December 31, 2016, the Advisor waived fees and absorbed expenses as follows:
Alternative Energy Fund | | $ | 74,816 | | |
Asia Focus Fund | | $ | 39,307 | | |
Asia Pacific Dividend Builder Fund | | $ | 147,701 | | |
Dividend Builder Fund | | $ | 140,817 | | |
Global Energy Fund | | $ | 38,343 | | |
Global Innovators Fund | | $ | 203,998 | | |
Renminbi Yuan & Bond Fund | | $ | 90,419 | | |
Total | | $ | 735,401 | | |
91
At December 31, 2016, the Advisor may recapture a portion of the following amounts that had been paid and/or waived on behalf of the Funds no later than the dates as stated below:
Fund | | December 31, 2017 | | December 31, 2018 | | December 31, 2019 | | Total | |
Alternative Energy Fund | | $ | 8,860 | | | $ | 48,819 | | | $ | 74,816 | | | $ | 132,495 | | |
Asia Focus Fund | | | — | | | | — | | | | 39,307 | | | | 39,307 | | |
Asia Pacific Dividend Builder Fund | | | 79,713 | | | | 88,425 | | | | 147,701 | | | | 315,839 | | |
Dividend Builder Fund | | | 102,063 | | | | 114,217 | | | | 140,817 | | | | 357,097 | | |
Global Energy Fund | | | — | | | | — | | | | 38,343 | | | | 38,343 | | |
Global Innovators Fund | | | — | | | | — | | | | 203,998 | | | | 203,998 | | |
Renminbi Yuan & Bond Fund | | | 42,918 | | | | 79,927 | | | | 90,419 | | | | 213,264 | | |
During the year ended December 31, 2016, the Advisor reimbursed the Alternative Energy Fund $16,892 for a trade error. An affiliate also reimbursed the Dividend Builder Fund $203 for a trade error. These amounts are reported on the Statement of Operations under the caption "Net increase from payments by affiliates".
Mutual Fund Administration, LLC (the "Administrator") acts as the Funds' administrator under an administration agreement. The fees paid to the Administrator for the year ended December 31, 2016 are reported on the Statements of Operations.
Foreside Fund Services, LLC (the "Distributor") acts as the Funds' principal underwriter in connection with the continuous offering of the Funds' shares. Prior to July 15, 2016 Quasar Distributors, LLC was the Funds' principal underwriter.
Foreside Fund Officer Services, LLC provides Chief Compliance Officer ("CCO") services to the Funds. The fees paid for CCO services for the year ended December 31, 2016 are reported on the Statements of Operations.
On August 14, 1998, the Trust approved a Deferred Compensation Plan for Trustees (the "Plan"). Trustees can elect to receive payment in cash or defer payments provided for in the Plan. If a trustee elects to defer payment, the Plan provides for the creation of a deferred payment account (Phantom Share Account). This account accumulates the deferred fees earned, and the value of the account is adjusted at the end of each quarter to reflect the value that would have been earned if the account had been invested in designated investments. The Funds recognize as trustee expense amounts accrued as meetings are attended plus the change in value of the Phantom Share Account.
The change in the value of the phantom share account during the year ended December 31, 2016 is shown in the table below. These amounts included any additional contributions to the deferred compensation plan and any appreciation (depreciation) on the underlying investments.
Alternative Energy Fund | | $ | 3,954 | | |
Asia Focus Fund | | $ | 5,754 | | |
Asia Pacific Dividend Builder Fund | | $ | 3,555 | | |
China & Hong Kong Fund | | $ | 12,568 | | |
Dividend Builder Fund | | $ | 4,024 | | |
Global Energy Fund | | $ | 7,142 | | |
Global Innovators Fund | | $ | 18,205 | | |
Renminbi Yuan & Bond Fund | | $ | 6,491 | | |
The fees paid to non-interested Trustees for the year ended December 31, 2016 are reported on the Statements of Operations.
Certain officers of the Trust are also officers and/or Directors of the Advisor and the Administrator. None of these officers are compensated directly by the Funds.
92
Note 4
Shareholder Servicing Plan
Each Fund has adopted a Shareholder Servicing Plan to pay a fee at an annual rate of up to 0.25% of its daily average net assets of shares serviced by shareholder servicing agents who provide administrative and support services to their customers. The Global Innovators Fund – Institutional Class shares do not participate in the Shareholder Servicing Plan.
The fees paid under the Shareholder Servicing Plan for the year ended December 31, 2016 are reported on the Statements of Operations.
Note 5
Investment Transactions
The following table presents purchases and sales of securities during the year ended December 31, 2016 excluding short-term investments, to indicate the volume of transactions in each Fund.
| | | Purchases | | Sales | |
Alternative Energy Fund | | $ | 7,718,301 | | | $ | 8,808,096 | | |
Asia Focus Fund | | $ | 5,899,897 | | | $ | 7,097,118 | | |
Asia Pacific Dividend Builder Fund | | $ | 2,977,577 | | | $ | 2,272,720 | | |
China & Hong Kong Fund | | $ | 16,910,714 | | | $ | 23,112,539 | | |
Dividend Builder Fund | | $ | 2,092,223 | | | $ | 5,564,469 | | |
Global Energy Fund | | $ | 6,901,273 | | | $ | 12,852,050 | | |
Global Innovators Fund | | $ | 49,046,951 | | | $ | 69,402,058 | | |
Renminbi Yuan & Bond Fund | | $ | 344,314 | | | $ | 5,286,709 | | |
The Funds did not purchase U.S. Government securities as a part of their long-term investment strategy during the year ended December 31, 2016.
Note 6
Fair Value Measurements and Disclosures
Fair Value Measurements and Disclosures defines fair value, establishes a framework for measuring fair value in accordance with GAAP, and expands disclosure about fair value measurements. It also provides guidance on determining when there has been a significant decrease in the volume and level of activity for an asset or a liability, when a transaction is not orderly, and how that information must be incorporated into a fair value measurement.
Under Fair Value Measurements and Disclosures, various inputs are used in determining the value of each Fund's investments. These inputs are summarized into three broad Levels as described below:
Level 1 — Unadjusted quoted prices in active markets for identical assets or liabilities that a Fund has the ability to access.
Level 2 — Observable inputs other than quoted prices included in level 1 that are observable for the asset or liability, either directly or indirectly. These inputs may include quoted prices for the identical instrument on an inactive market, prices for similar instruments, interest rates, prepayment speeds, credit risk, yield curves, default rates and similar data.
Level 3 — Unobservable inputs for the asset or liability, to the extent relevant observable inputs are not available, representing the Fund's own assumptions about the assumptions a market participant would use in valuing the asset or liability, and would be based on the best information available.
The availability of observable inputs can vary from security to security and is affected by a wide variety of factors, including for example, the type of security, whether the security is new and not yet established in the marketplace, the liquidity of markets, and other characteristics particular to the security. To the extent that valuation is based on models or inputs that are less observable or unobservable in the market, the determination of fair value requires more judgment. Accordingly the degree of judgment exercised in determining fair value is greatest for instruments categorized in Level 3.
93
The inputs used to measure fair value may fall into different levels of the fair value hierarchy. In such cases, for disclosure purposes, the level in the fair value hierarchy within which the fair value measurement falls in its entirety, is determined based on the lowest level input that is significant to the fair value measurement in its entirety.
The inputs or methodology used for valuing securities are not an indication of the risk associated with investing in those securities. The following is a summary of the inputs used, as of December 31, 2016, in valuing the Funds' assets carried at fair value:
Alternative Energy Fund
Assets Table | | Level 1 | | Level 2 | | Level 3 | | Total | |
Investments, at value | |
Common Stocks: | |
Energy | | $ | 4,784,035 | | | $ | — | | | $ | — | | | $ | 4,784,035 | | |
Industrial | | | 3,634,981 | | | | — | | | | — | | | | 3,634,981 | | |
Utilities | | | 1,701,810 | | | | — | | | | — | | | | 1,701,810 | | |
Total Investments, at value | | | 10,120,826 | | | | — | | | | — | | | | 10,120,826 | | |
Total Assets | | $ | 10,120,826 | | | $ | — | | | $ | — | | | $ | 10,120,826 | | |
Asia Focus Fund
Assets Table | | Level 1 | | Level 2 | | Level 3 | | Total | |
Investments, at value | |
Common Stocks:1 | |
Communications | | $ | 513,727 | | | $ | — | | | $ | — | | | $ | 513,727 | | |
Consumer, Cyclical | | | 1,837,732 | | | | — | | | | — | | | | 1,837,732 | | |
Consumer, Non-cyclical | | | 2,726,123 | | | | — | | | | — | | | | 2,726,123 | | |
Energy | | | 940,486 | | | | — | | | | — | | | | 940,486 | | |
Financial | | | 3,378,819 | | | | — | | | | — | | | | 3,378,819 | | |
Industrial | | | 2,568,189 | | | | — | | | | — | | | | 2,568,189 | | |
Technology | | | 2,496,832 | | | | — | | | | — | | | | 2,496,832 | | |
Utilities | | | 1,000,335 | | | | — | | | | — | | | | 1,000,335 | | |
Total Investments, at value | | | 15,462,243 | | | | — | | | | — | | | | 15,462,243 | | |
Total Assets | | $ | 15,462,243 | | | $ | — | | | $ | — | | | $ | 15,462,243 | | |
94
Asia Pacific Dividend Builder Fund
Assets Table | | Level 1 | | Level 2 | | Level 3 | | Total | |
Investments, at value | |
Common Stocks:1 | |
Communications | | $ | 233,206 | | | $ | — | | | $ | — | | | $ | 233,206 | | |
Consumer, Cyclical | | | 1,608,786 | | | | — | | | | — | | | | 1,608,786 | | |
Consumer, Non-cyclical | | | 679,915 | | | | — | | | | — | | | | 679,915 | | |
Energy | | | 244,118 | | | | — | | | | — | | | | 244,118 | | |
Financial | | | 3,334,388 | | | | — | | | | — | | | | 3,334,388 | | |
Industrial | | | 1,415,119 | | | | — | | | | — | | | | 1,415,119 | | |
Technology | | | 915,093 | | | | — | | | | — | | | | 915,093 | | |
Total Investments, at value | | | 8,430,625 | | | | — | | | | — | | | | 8,430,625 | | |
Total Assets | | $ | 8,430,625 | | | $ | — | | | $ | — | | | $ | 8,430,625 | | |
China & Hong Kong Fund
Assets Table | | Level 1 | | Level 2 | | Level 3 | | Total | |
Investments, at value | |
Common Stocks: | |
Communications | | $ | 6,595,198 | | | $ | — | | | $ | — | | | $ | 6,595,198 | | |
Consumer, Cyclical | | | 12,595,228 | | | | — | | | | — | | | | 12,595,228 | | |
Consumer, Non-cyclical | | | 5,120,918 | | | | — | | | | — | | | | 5,120,918 | | |
Energy | | | 1,827,545 | | | | — | | | | — | | | | 1,827,545 | | |
Exchange Traded Funds "ETFs") | | | 1,327,608 | | | | — | | | | — | | | | 1,327,608 | | |
Financial | | | 14,396,019 | | | | — | | | | — | | | | 14,396,019 | | |
Industrial | | | 10,646,036 | | | | — | | | | — | | | | 10,646,036 | | |
Technology | | | 6,039,100 | | | | — | | | | — | | | | 6,039,100 | | |
Total Investments, at value | | | 58,547,652 | | | | — | | | | — | | | | 58,547,652 | | |
Total Assets | | $ | 58,547,652 | | | $ | — | | | $ | — | | | $ | 58,547,652 | | |
95
Dividend Builder Fund
Assets Table | | Level 1 | | Level 2 | | Level 3 | | Total | |
Investments, at value | |
Common Stocks: | |
Communications | | $ | 671,413 | | | $ | — | | | $ | — | | | $ | 671,413 | | |
Consumer, Cyclical | | | 650,146 | | | | — | | | | — | | | | 650,146 | | |
Consumer, Non-cyclical | | | 3,049,372 | | | | — | | | | — | | | | 3,049,372 | | |
Energy | | | 437,231 | | | | — | | | | — | | | | 437,231 | | |
Financial | | | 1,104,285 | | | | — | | | | — | | | | 1,104,285 | | |
Industrial | | | 1,329,659 | | | | — | | | | — | | | | 1,329,659 | | |
Technology | | | 431,979 | | | | — | | | | — | | | | 431,979 | | |
Total Investments, at value | | | 7,674,085 | | | | — | | | | — | | | | 7,674,085 | | |
Total Assets | | $ | 7,674,085 | | | $ | — | | | $ | — | | | $ | 7,674,085 | | |
Global Energy Fund
Assets Table | | Level 1 | | Level 2 | | Level 3 | | Total | |
Investments, at value | |
Common Stocks: | |
Energy | | $ | 48,244,170 | | | $ | — | | | $ | — | | | $ | 48,244,170 | | |
Industrial | | | 230,935 | | | | — | | | | — | | | | 230,935 | | |
Total Investments, at value | | | 48,475,105 | | | | — | | | | — | | | | 48,475,105 | | |
Total Assets | | $ | 48,475,105 | | | $ | — | | | $ | — | | | $ | 48,475,105 | | |
Global Innovators Fund
Assets Table | | Level 1 | | Level 2 | | Level 3 | | Total | |
Investments, at value | |
Common Stocks: | |
Communications | | $ | 15,528,553 | | | $ | — | | | $ | — | | | $ | 15,528,553 | | |
Consumer, Cyclical | | | 5,286,320 | | | | — | | | | — | | | | 5,286,320 | | |
Consumer, Non-cyclical | | | 30,182,424 | | | | — | | | | — | | | | 30,182,424 | | |
Energy | | | 5,164,604 | | | | — | | | | — | | | | 5,164,604 | | |
Financial | | | 10,470,106 | | | | — | | | | — | | | | 10,470,106 | | |
Industrial | | | 37,249,943 | | | | — | | | | — | | | | 37,249,943 | | |
Technology | | | 53,555,807 | | | | — | | | | — | | | | 53,555,807 | | |
Total Investments, at value | | | 157,437,757 | | | | — | | | | — | | | | 157,437,757 | | |
Total Assets | | $ | 157,437,757 | | | $ | — | | | $ | — | | | $ | 157,437,757 | | |
96
Renminbi Yuan & Bond Fund
Assets Table | | Level 1 | | Level 2 | | Level 3 | | Total | |
Investments, at value | |
Corporate Bonds: | |
Energy | | $ | — | | | $ | 139,736 | | | $ | — | | | $ | 139,736 | | |
Financial | | | — | | | | 566,277 | | | | — | | | | 566,277 | | |
Government | | | — | | | | 765,022 | | | | — | | | | 765,022 | | |
Industrial | | | — | | | | 141,357 | | | | — | | | | 141,357 | | |
Technology | | | — | | | | 140,897 | | | | — | | | | 140,897 | | |
Total Investments, at value | | | — | | | | 1,753,289 | | | | — | | | | 1,753,289 | | |
Total Assets | | $ | — | | | $ | 1,753,289 | | | $ | — | | | $ | 1,753,289 | | |
1 Foreign securities traded in foreign exchanges may be adjusted due to a significant change in the value of U.S. traded securities, as measured by the S&P 500 Index.
Transfers are recognized at the end of the reporting period. As of December 31, 2016, certain securities in the Alternative Energy Fund, Asia Focus Fund, Asia Pacific Dividend Builder Fund, China Hong Kong Fund, Dividend Builder Fund, Global Energy Fund and Global Innovators Fund transferred levels due to these Funds applying for value pricing to Non-U.S. securities.
| | | Alternative
Energy Fund | | Asia Focus
Fund | | Asia Pacific
Dividend
Builder
Fund | | China &
Hong Kong
Fund | | Dividend
Builder
Fund | | Global
Energy
Fund | | Global
Innovators
Fund | | Renminbi
Yuan & Bond
Fund | |
Transfers into Level 1 | | $ | 3,325,656 | | | $ | 9,747,037 | | | $ | 7,016,607 | | | $ | 42,973,581 | | | $ | 1,757,941 | | | $ | 12,251,934 | | | $ | 5,373,099 | | | $ | — | | |
Transfers out of Level 1 | | | — | | | | — | | | | — | | | | — | | | | — | | | | — | | | | — | | | | — | | |
Net transfers in (out) of
Level 1 | | $ | 3,325,656 | | | $ | 9,747,037 | | | $ | 7,016,607 | | | $ | 42,973,581 | | | $ | 1,757,941 | | | $ | 12,251,934 | | | $ | 5,373,099 | | | $ | — | | |
Transfers into Level 2 | | $ | — | | | $ | — | | | $ | — | | | $ | — | | | $ | — | | | $ | — | | | $ | — | | | $ | — | | |
Transfers out of Level 2 | | | (3,325,656 | ) | | | (9,747,037 | ) | | | (7,016,607 | ) | | | (42,973,581 | ) | | | (1,757,941 | ) | | | (12,251,934 | ) | | | (5,373,099 | ) | | | — | | |
Net transfers in (out) of
Level 2 | | $ | (3,325,656 | ) | | $ | (9,747,037 | ) | | $ | (7,016,607 | ) | | $ | (42,973,581 | ) | | $ | (1,757,941 | ) | | $ | (12,251,934 | ) | | $ | (5,373,099 | ) | | $ | — | | |
There were no securities transferred between Level 2 and Level 1 in the Renminbi Yuan & Bond Fund.
Note 7
Forward Foreign Currency Contracts
In order to hedge their portfolio and to protect them against possible fluctuations in foreign exchange rates pending the settlement of securities transactions, the Funds may enter into forward foreign currency contracts that obligate them to exchange currencies at specified future dates. At the maturity of a forward contract, a Fund may either make delivery of the foreign currency from currency held, if any, or from the proceeds of the portfolio securities sold. It may also terminate its obligation to deliver the foreign currency at any time by purchasing an offsetting contract. The forward values of amounts due are netted against the forward value of the currency to be delivered, and the net amount is shown as a receivable or payable in the financial statements. The Funds did not enter into forward foreign currency contracts during the year ended December 31, 2016 and did not have any outstanding forward contracts as of December 31, 2016.
97
Note 8
Tax Matters
As of December 31, 2016, the tax bases of investments were as follows:
| | Alternative
Energy Fund | | Asia Focus
Fund | | Asia Pacific
Dividend
Builder
Fund | | China &
Hong Kong
Fund | | Dividend
Builder
Fund | | Global
Energy
Fund | | Global
Innovators
Fund | | Renminbi
Yuan & Bond
Fund | |
Cost of investments for
tax purposes | | $ | 15,223,792 | | | $ | 13,126,695 | | | $ | 8,495,170 | | | $ | 51,957,940 | | | $ | 7,094,508 | | | $ | 54,108,902 | | | $ | 145,385,298 | | | $ | 1,961,037 | | |
Gross tax unrealized
appreciation | | | 495,408 | | | | 3,977,355 | | | | 588,423 | | | | 12,527,507 | | | | 821,345 | | | | 6,766,294 | | | | 23,979,719 | | | | — | | |
Gross tax unrealized
(depreciation) | | | (5,598,373 | ) | | | (1,641,807 | ) | | | (663,233 | ) | | | (5,937,795 | ) | | | (241,768 | ) | | | (12,400,091 | ) | | | (11,927,260 | ) | | | (207,748 | ) | |
Net tax unrealized
appreciation
(depreciation)
on investments | | | (5,102,965 | ) | | | 2,335,548 | | | | (64,545 | ) | | | 6,589,712 | | | | 579,577 | | | | (5,633,797 | ) | | | 12,052,459 | | | | (207,748 | ) | |
Net tax appreciation
(depreciation)
on foreign-currency
denominated
assets and liabilities | | | (2,157 | ) | | | — | | | | 2 | | | | 44 | | | | 84 | | | | (20,107 | ) | | | (1,412 | ) | | | (11,943 | ) | |
Net tax unrealized
appreciation
(depreciation)* | | | (5,105,122 | ) | | | 2,335,548 | | | | (64,543 | ) | | | 6,589,756 | | | | 579,661 | | | | (5,653,904 | ) | | | 12,051,047 | | | | (219,691 | ) | |
Undistributed net
ordinary income** | | | 29,050 | | | | — | | | | — | | | | 254,807 | | | | 184 | | | | 22,796 | | | | — | | | | — | | |
Undistributed Long-term
Capital Gains | | | — | | | | — | | | | — | | | | 284,412 | | | | — | | | | — | | | | 335,876 | | | | — | | |
Post October loss*** | | | (2,551,386 | ) | | | (90,670 | ) | | | — | | | | — | | | | (51,838 | ) | | | (1,338,562 | ) | | | — | | | | (2,317 | ) | |
Capital loss carryforward | | | (82,478,579 | ) | | | (292,669 | ) | | | (2,618,865 | ) | | | — | | | | (603,712 | ) | | | (15,412,167 | ) | | | — | | | | (4,236,860 | ) | |
Other accumulated
gain/(loss) | | | (42,002 | ) | | | (65,069 | ) | | | (41,263 | ) | | | (130,059 | ) | | | (13,721 | ) | | | (63,508 | ) | | | (98,798 | ) | | | (30,006 | ) | |
Total accumulated
gain/(loss) | | $ | (90,148,039 | ) | | $ | 1,887,140 | | | $ | (2,724,671 | ) | | $ | 6,998,916 | | | $ | (89,426 | ) | | $ | (22,445,345 | ) | | $ | 12,288,125 | | | $ | (4,488,874 | ) | |
* The differences between book-basis and tax-basis unrealized appreciation/(depreciation) is attributable primary to the tax deferral of losses on wash sales and passive foreign investment company (PFIC) mark to market adjustments.
** The differences between book-basis and tax-basis undistributed net ordinary income is attributed to deferred compensation, which is included in Other Accumulated Loss.
*** Under the current tax law, capital and currency losses realized after October 31 and prior to a Fund's fiscal year end may be deferred as occurring on the first day of the following year.
98
As of December 31, 2016, the Funds have the following capital loss carryforwards available to offset future realized capital gains:
| Capital losses expiring in: | | Alternative
Energy Fund | | Asia Focus
Fund | | Asia Pacific
Dividend
Builder
Fund | | China &
Hong Kong
Fund | | Dividend
Builder
Fund | | Global
Energy
Fund | | Global
Innovators
Fund | | Renminbi
Yuan & Bond
Fund | |
2017 | | $ | 40,204,652 | | | $ | — | | | $ | 1,115,940 | | | $ | — | | | $ | — | | | $ | — | | | $ | — | | | $ | — | | |
2018 | | | 9,296,377 | | | | — | | | | 1,502,925 | | | | — | | | | — | | | | — | | | | — | | | | — | | |
2019 | | | — | | | | 292,669 | | | | — | | | | — | | | | — | | | | — | | | | — | | | | — | | |
No Expiration Long-term | | | 32,428,968 | | | | — | | | | — | | | | — | | | | 366,344 | | | | 12,155,586 | | | | — | | | | 3,271,661 | | |
No Expiration Song-term | | | 548,582 | | | | — | | | | — | | | | — | | | | 237,368 | | | | 3,256,581 | | | | — | | | | 965,199 | | |
Total | | $ | 82,478,579 | | | $ | 292,669 | | | $ | 2,618,865 | | | $ | — | | | $ | 603,712 | | | $ | 15,412,167 | | | $ | — | | | $ | 4,236,860 | | |
For the year ended December 31, 2016, the Asia Focus Fund and Asia Pacific Dividend Fund utilized capital losses carryforwards of $131,002 and $136,398, respectively.
Under the enacted Regulated Investment Company Modernization Act of 2010 (the "Act"), the Funds will be permitted to carryforward capital losses incurred in taxable years beginning after December 22, 2010, for an unlimited period. However, any losses incurred during those future taxable years will be required to be utilized prior to the losses incurred in pre-enactment taxable years. As a result of this ordering rule, pre-enactment capital loss carryforwards may be more likely to expire unused. Additionally, post-enactment capital losses that are carried forward will retain their character as either short-term or long-term capital losses rather than being considered all short-term as under previous law.
The tax character of distributions (other than return of capital dividends) paid during 2016 and 2015 fiscal years are as follows:
| | | 2016 | | 2015 | |
| | | Ordinary
Income | | Long-term
Capital Gain | | Ordinary
Income | | Long-term
Capital Gain | |
Alternative Energy Fund | | $ | — | | | $ | — | | | $ | — | | | $ | — | | |
Asia Focus Fund | | | 220,064 | | | | — | | | | 179,969 | | | | — | | |
Asia Pacific Dividend Builder Fund | | | 275,566 | | | | — | | | | 139,312 | | | | — | | |
China & Hong Kong Fund | | | 821,167 | | | | 2,195,417 | | | | 1,399,854 | | | | 5,976,476 | | |
Dividend Builder Fund | | | 283,880 | | | | — | | | | 329,153 | | | | 33,848 | | |
Global Energy Fund | | | 550,143 | | | | — | | | | 590,066 | | | | 1,203 | | |
Global Innovators Fund | | | 1,436,454 | | | | 44,312 | | | | 1,200,137 | | | | 6,434,280 | | |
Renminbi Yuan & Bond Fund | | | — | | | | — | | | | 1,864,892 | | | | — | | |
Note 9
Recently Issued Accounting Pronouncements
Disclosure for Investments in Certain Entities that Calculate Net Asset Value per Share (or Its Equivalent) removes the requirement to categorize within the fair value hierarchy investments measured using the net asset value per share ("NAV") practical expedient, as well as removes certain disclosure requirements for investments that qualify, but do not utilize, the NAV practical expedient. Management has evaluated the impact on the Fund's financial statement disclosures and determined there is no effect.
99
Note 10
Events Subsequent to the Fiscal Period End
The Funds have adopted financial reporting rules regarding a subsequent event which requires an entity to recognize in the financial statements the effects of all subsequent events that provide additional evidence about conditions that existed at the date of the balance sheet. Management has evaluated the Funds' related events and transactions and has determined that there were no events or transactions that occurred that would materially impact the amounts or disclosures in the Funds' financial statements.
100
Additional Information (Unaudited)
Proxy Voting Procedures
The Advisor votes proxies relating to portfolio securities in accordance with procedures that have been approved by the Board. You may obtain a description of these procedures, free of charge, by calling "toll-free" (800) 915-6565. This information is also available through the Securities and Exchange Commission's website at www.sec.gov.
Proxy Voting Records
Information regarding how the Advisor voted proxies relating to portfolio securities during the latest 12-month period ended June 30 is available, without charge, by calling toll-free, (800) 915-6565. This information is also available through the Securities and Exchange Commission's website at www.sec.gov.
Form N-Q Disclosure
The Funds file their complete schedule of portfolio holdings with the Securities and Exchange Commission for the first and third quarters of each fiscal year on Form N-Q. The Funds' Form N-Q is available on the Securities and Exchange Commission's website at www.sec.gov. The Funds' Form N-Q may be reviewed and copied at the Commission's Public Reference Room in Washington, DC, and information on the operation of the Public Reference Room may be obtained by calling (800) SEC-0330. This information is also available, without charge, by calling toll-free, (800) 915-6565.
Supplemental Tax Information
For the fiscal year ended December 31, 2016, certain dividends paid by the Funds may be subject to a maximum tax rate of 15%, as provided for by the Jobs and Growth Tax Relief Reconciliation Act of 2003. The percentage of dividends declared from ordinary income designated as qualified dividend income was as follows:
Alternative Energy Fund | | | N/A | | |
Asia Focus Fund | | | 100 | % | |
Asia Pacific Dividend Builder Fund | | | 100 | % | |
China & Hong Kong Fund | | | 100 | % | |
Dividend Builder Fund | | | N/A | | |
Global Energy Fund | | | N/A | | |
Global Innovators Fund | | | N/A | | |
Renminbi Yuan & Bond Fund | | | N/A | | |
For the year ended December 31, 2016, pursuant to Section 853(b)(3) of the Internal Revenue Code, the China & Hong Kong Fund designate $2,195,417 as long-term capital gains.
101
Pursuant to Section 853 of the Internal Revenue Code of 1986, as amended, the Funds designate the following income earned from foreign sources and foreign taxes paid for the year ended December 31, 2016:
| | | Foreign Sourced Income | | Foreign Taxes Paid | |
| | | Total
Amount | | Per Share
Amount | | Total
Amount | | Per Share
Amount | |
Alternative Energy Fund | | | N/A | | | | N/A | | | | N/A | | | | N/A | | |
Asia Focus Fund | | $ | 526,897 | | | $ | 0.53 | | | $ | 60,404 | | | $ | 0.06 | | |
Asia Pacific Dividend Builder Fund | | | 321,712 | | | | 0.51 | | | | 25,230 | | | | 0.04 | | |
China & Hong Kong Fund | | | 2,033,704 | | | | 0.67 | | | | 85,805 | | | | 0.03 | | |
Dividend Builder Fund | | | 256,778 | | | | 0.50 | | | | 15,659 | | | | 0.03 | | |
Global Energy Fund | | | 900,027 | | | | 0.43 | | | | N/A | | | | N/A | | |
Global Innovators Fund | | | N/A | | | | N/A | | | | N/A | | | | N/A | | |
Renminbi Yuan & Bond Fund | | | N/A | | | | N/A | | | | N/A | | | | N/A | | |
102
REPORT OF INDEPENDENT REGISTERED
PUBLIC ACCOUNTING FIRM
To the Shareholders and Board of Trustees
Guinness Atkinson Funds
Woodland Hills, California
We have audited the accompanying statements of assets and liabilities, including the schedules of investments, of the Alternative Energy Fund, Asia Focus Fund, Asia Pacific Dividend Builder Fund, China & Hong Kong Fund, Global Energy Fund, Global Innovators Fund, Renminbi Yuan & Bond Fund and Dividend Builder Fund (the "Funds"), each a series of shares of the Guinness Atkinson Funds, as of December 31, 2016, the related statements of operations for the year then ended, the statements of changes in net assets for each of the two years in the period then ended, and the financial highlights for each of the five years in the period then ended, except for Dividend Builder Fund the related statement of operations for the year then ended, the statement of changes in net assets for each of the two years in the period then ended and the financial highlights for each of the four years in the period then ended and the period March 30, 2012 (commencement of operations) to December 31, 2012. These financial statements and financial highlights are the responsibility of the Funds' management. Our responsibility is to express an opinion on these financial statements and financial highlights based on our audits.
We conducted our audits in accordance with the standards of the Public Company Accounting Oversight Board (United States). Those standards require that we plan and perform the audits to obtain reasonable assurance about whether the financial statements and financial highlights are free of material misstatement. The Funds are not required to have, nor were we engaged to perform, an audit of their internal control over financial reporting. Our audits included consideration of internal control over financial reporting as a basis for designing audit procedures that are appropriate in the circumstances, but not for the purpose of expressing an opinion on the effectiveness of the Funds' internal control over financial reporting. Accordingly, we express no such opinion. An audit includes examining, on a test basis, evidence supporting the amounts and disclosures in the financial statements. Our procedures included confirmation of securities owned as of December 31, 2016, by correspondence with the custodian. An audit also includes assessing the accounting principles used and significant estimates made by management, as well as evaluating the overall financial statement presentation. We believe that our audits provide a reasonable basis for our opinion.
In our opinion, the financial statements and financial highlights referred to above present fairly in all material respects, the financial position of the above mentioned Funds as of December 31, 2016, the results of their operations, the changes in their net assets and the financial highlights for the periods indicated above, in conformity with accounting principles generally accepted in the United States of America.
TAIT, WELLER & BAKER LLP
Philadelphia, Pennsylvania
February 27, 2017
103
TRUSTEE AND OFFICER INFORMATION (Unaudited)
Unless otherwise noted, each Trustee and officer's address is 21550 Oxnard Street, Suite 850, Woodland Hills, California 91367. Trustees and officers of the Trust serve until their resignation, removal or retirement. Additional information about the Trustees is included in the Funds' Statement of Additional Information which is available, without charge, upon request by calling toll-free, 1-800-915-6565 or by visiting the Funds' website at www.gafunds.com.
| Name and Age | | Position(s)
Held with
Trust | | Year Elected | | Principal Occupation(s) During the
Past 5 Years | | Number of
Portfolios In
Fund Complex
Overseen by
Trustee | | Other Directorships
Held by Trustee
During the Past 5 Years | |
Non-Interested Trustees | | | | | | | | | | | | | | | | | | | | | |
Dr. Gunter Dufey
(76) | | Trustee | | | 1994 | | | Executive Director of Education Exchange Ltd., a consulting firm since 2010. Professorial Fellow, Nanyang Technological University (Singapore) since 2005. Professor (Emeritus) of Ross School at The University of Michigan, where he served from 1968 to 2002. | | | 8 | | | Independent director, various subsidiaries of Ally Financial Inc. (formerly GMAC) in the United States and Canada. | |
James I. Fordwood
(69) | | Trustee | | | 1994 | | | CFO and Managing Member of Prima Marketing LLC (network of convenience stores) since 1998; President, Balmacara Production Inc. since 1986 (holding company); Treasurer, Inverness21 LLC (owns and operates office buildings) since 2007; Treasurer, JL Energy Inc. (holding company) since 1985; Treasurer, Thistle, Inc. (seismic data management) since 1984. | | | 8 | | | None. | |
Dr. Bret A. Herscher
(58) | | Trustee | | | 1994 | | | Vice President of Minnow Medical, a company that develops medical devices for treating peripheral artery disease since 2009. President of Pacific Consultants, a technical and technology management consulting company serving the electronic industry and venture capital community that he co-founded, from 1996 to 2007. | | | 8 | | | None. | |
104
| Name and Age | | Position(s)
Held with
Trust | | Year Elected | | Principal Occupation(s) During the
Past 5 Years | | Number of
Portfolios In
Fund Complex
Overseen by
Trustee | | Other Directorships
Held by Trustee
During the Past 5 Years | |
J. Brooks Reece, Jr.
(69) | | Trustee and Chairman | | | 1994 | | | Vice President of Adcole Corp., a manufacturer of precision measuring machines and sun angle sensors for space satellites since 1984. President of Adcole Far East Ltd. since 2008. Executive Director of Adcole Measuring Equipment Shanghai Co. Ltd., since 2004. | | | 8 | | | None. | |
Susan Penry-Williams
(71) | | Trustee | | | 2016 | | | Retired; Partner Kramer Levin Naftalis & Frankel LLP, from 1994 to 2014. | | | 8 | | | None. | |
Interested Trustee | | | | | | | | | | | | | | | | | | | |
Timothy W.N. Guinness*
14 Queen Anne's Gate
London,
England SW1H 9AA
U.K.
(68) | | Trustee | | | 1998 | | | Chairman/CIO of Guinness AtkinsonTM Asset Management since November 2002. Chairman of Guinness Asset Management Ltd., investment advisor in London, since 2003. Director of Guinness Capital Management Ltd. since 2010. Director of SR Europe Investment Trust Plc since 2001. Director of Atlantis Japan Growth Fund Ltd., since 2002. Non-Executive Director of Quayle Munro since 2007. Non-Executive Director of Brompton Bicycle Ltd., since 2000. | | | 8 | | | | |
Officers | | | | | | | | | | | | | | | | | | | | | |
James Atkinson
(59) | | President | | | 2003 | | | Chief Executive Officer and Director of Guinness AtkinsonTM Asset Management since November 2002. Director of Guinness Asset Management Ltd. since 2003. Principal of Orbis Marketing, a mutual fund marketing and advertising firm, since November 2001. | | | N/A | | | N/A | |
* "Interested person" (as defined in the 1940 Act) of the Funds because of his affiliation with the Funds' Advisor, Guinness Atkinson Asset Management, Inc.
105
| Name and Age | | Position(s)
Held with
Trust | | Year Elected | | Principal Occupation(s) During the
Past 5 Years | | Number of
Portfolios In
Fund Complex
Overseen by
Trustee | | Other Directorships
Held by Trustee
During the Past 5 Years | |
Patrick Keniston
(52) | | Chief Compliance Officer | | | 2014 | | | Managing Director, Foreside Fund Officer Services, LLC since October 2008. | | N/A | | N/A | |
Rita Dam
(50) | | Treasurer | | | 2009 | | | Co-Chief Executive Officer (2016-present), and Vice President, Mutual Fund Administration, LLC (2006-2015). | | N/A | | N/A | |
Joy Ausili
(50) | | Secretary and Assistant Treasurer | | | 2009 | | | Co-Chief Executive Officer (2016-present), and Vice President, Mutual Fund Administration, LLC (2006-2015). | | N/A | | N/A | |
Sardjono Kadiman
(41) | | Assistant Treasurer | | | 2009 | | | Vice President, Mutual Fund Administration, LLC since 2008. | | N/A | | N/A | |
Lyna Phan
(41) | | Assistant Treasurer | | | 2011 | | | Vice President, Mutual Fund Administration, LLC since 2010. | | N/A | | N/A | |
106
Privacy Notice
Guinness AtkinsonTM Funds and Guinness Atkinson Asset Management, Inc. may collect non-public information about you from the following sources:
• Information we receive about you on applications or other forms;
• Information you give us orally; and
• Information about your transactions with us.
We do not disclose any non-public personal information about our shareholders or former shareholders without the shareholder's authorization, except as required by law or in response to inquiries from governmental authorities. We restrict access to your personal and account information to those employees who need to know that information to provide products and services to you. We also may disclose that information to unaffiliated third parties (such as to brokers or custodians) only as permitted by law and only as needed for us to provide agreed services to you. We maintain physical, electronic and procedural safeguards to guard your non-public personal information.
107
This page is Intentionally Left Blank
108
This page is Intentionally Left Blank
109
This page is Intentionally Left Blank
110
Guinness AtkinsonTM Funds Information
Board of Trustees
J. Brooks Reece, Jr., Chairman | |
Dr. Gunter Dufey | |
James I. Fordwood | |
Timothy W.N. Guinness | |
Dr. Bret A. Herscher | |
Susan Penry-Williams | |
Contact Guinness AtkinsonTM Funds
P.O. Box 701 | |
Milwaukee, WI 53201-0701 | |
Shareholder Services: 800-915-6566 | |
Literature Request: 800-915-6565 | |
Website: www.gafunds.com | |
Email: mail@gafunds.com | |
Guinness AtkinsonTM Funds
Fund | | Cusip | | Ticker | | Fund# | |
Alternative Energy Fund | | 402031 50 4 | | GAAEX | | | 1298 | | |
Asia Focus Fund | | 402031 10 8 | | IASMX | | | 1096 | | |
Asia Pacific Dividend Builder Fund | | 402031 60 3 | | GAADX | | | 1299 | | |
China & Hong Kong Fund | | 402031 20 7 | | ICHKX | | | 1094 | | |
Dividend Builder Fund | | 402031 80 1 | | GAINX | | | 1092 | | |
Global Energy Fund | | 402031 40 5 | | GAGEX | | | 1098 | | |
Global Innovators Fund Investor Class | | 402031 30 6 | | IWIRX | | | 1095 | | |
Global Innovators Fund Institutional Class | | 402031 88 4 | | GINNX | | | 1095 | | |
Renminbi Yuan & Bond Fund | | 402031 70 2 | | GARBX | | | 1099 | | |
Distributed by Foreside Fund Services, LLC, Three Canal Plaza, Suite 100, Portland, ME 04101
This report is intended for shareholders of the Guinness AtkinsonTM Funds and may not be used as literature unless preceded or accompanied by a current prospectus.
111
Guinness Atkinson Funds
c/o U.S. Bancorp Fund Services, LLC
P.O. Box 701
Milwaukee, WI 53201-0701
Item 2. Code of Ethics.
The registrant has adopted a code of ethics that applies to the registrant’s principal executive officer and principal financial officer. The registrant has not made any amendments to its code of ethics during the period covered by this report. The registrant has not granted any waivers from any provisions of the code of ethics during the period covered by this report.
The registrant undertakes to provide to any person without charge, upon request, a copy of its code of ethics by mail when they call the registrant at 1-800-915-6565.
Item 3. Audit Committee Financial Expert.
The registrant’s board of trustees has determined that there is at least one audit committee financial expert serving on its audit committee. James I. Fordwood is the “audit committee financial expert” and is considered to be “independent” as each term is defined in Item 3 of Form N-CSR.
Item 4. Principal Accountant Fees and Services.
The registrant has engaged its principal accountant to perform audit services, audit-related services, tax services and other services during the past two fiscal years. “Audit services” refer to performing an audit of the registrant’s annual financial statements or services that are normally provided by the accountant in connection with statutory and regulatory filings or engagements for those fiscal years. “Audit-related services” refer to the assurance and related services by the principal accountant that are reasonably related to the performance of the audit. “Tax services” refer to professional services rendered by the principal accountant for tax compliance, tax advice, and tax planning. There were no “other services” provided by the principal accountant. The following table details the aggregate fees billed or expected to be billed for each of the last two fiscal years for audit fees, audit-related fees, tax fees and other fees by the principal accountant.
| | FYE 12/31/2016 | | FYE 12/31/2015 | |
Audit Fees | | $ | 140,900 | | $ | 140,900 | |
Audit-Related Fees | | N/A | | N/A | |
Tax Fees | | $ | 25,600 | | $ | 25,600 | |
All Other Fees | | N/A | | N/A | |
The audit committee has adopted pre-approval policies and procedures that require the audit committee to pre-approve all audit and non-audit services of the registrant, including services provided to any entity affiliated with the registrant.
The percentage of fees billed by Tait, Weller, & Baker LLP applicable to non-audit services pursuant to waiver of pre-approval requirement were as follows:
| | FYE 12/31/2016 | | FYE 12/31/2015 | |
Audit-Related Fees | | 0 | % | 0 | % |
Tax Fees | | 0 | % | 0 | % |
All Other Fees | | 0 | % | 0 | % |
| | | | | |
All of the principal accountant’s hours spent on auditing the registrant’s financial statements were attributed to work performed by full-time permanent employees of the principal accountant.
The following table indicates the non-audit fees billed or expected to be billed by the registrant’s accountant for services to the registrant and to the registrant’s investment adviser (and any other controlling entity, etc.—not sub-adviser) for the last two years. The audit committee of the Board of Trustees has considered whether the provision of non-audit services that were rendered to the registrant’s investment adviser is compatible with maintaining the principal accountant’s independence and has concluded that the provision of such non-audit services by the accountant has not compromised the accountant’s independence.
Non-Audit Related Fees | | FYE 12/31/2016 | | FYE 12/31/2015 |
Registrant | | N/A | | N/A |
Registrant’s Investment Advisor | | N/A | | N/A |
Item 5. Audit Committee of Listed Registrants.
Not applicable to registrants who are not listed issuers (as defined in Rule 10A-3 under the Securities Exchange Act of 1934).
Item 6. Schedule of Investments.
(a) Schedule of Investments is included as part of the report to shareholders filed under Item 1 of this Form.
(b) Not Applicable.
Item 7. Disclosure of Proxy Voting Policies and Procedures for Closed-End Management Investment Companies.
Not Applicable.
Item 8. Portfolio Managers of Closed-End Management Investment Companies.
Not Applicable.
Item 9. Purchases of Equity Securities by Closed-End Management Investment Company and Affiliated Purchasers.
Not Applicable.
Item 10. Submission of Matters to a Vote of Security Holders.
The registrant has not made any material changes to the procedures by which shareholders may recommend nominees to the registrant’s Board of Trustees.
Item 11. Controls and Procedures.
(a) The registrant’s principal executive officer and principal financial officer have evaluated the registrant’s disclosure controls and procedures within 90 days of this filing and have concluded based on such evaluation that the registrant’s disclosure controls and procedures were effective, as of that
date, in ensuring that information required to be disclosed by the registrant in this Form N-CSR was recorded, processed, summarized, and reported within the time periods specified in the Securities and Exchange Commission’s rules and forms.
(b) There were no changes in the registrant’s internal control over financial reporting (as defined in Rule 30a-3(d) under the Investment Company Act of 1940) that occurred during the registrant’s last fiscal quarter that have materially affected, or are reasonably likely to materially affect, the registrant’s internal control over financial reporting.
Item 12. Exhibits.
(a) (1) Any code of ethics or amendment thereto, that is subject of the disclosure required by Item 2, to the extent that the registrant intends to satisfy Item 2 requirements through filing an exhibit. Incorporated by reference to the Registrant’s Form N-CSR filed March 10, 2011.
(b)
(2) Certifications pursuant to Section 302 of the Sarbanes-Oxley Act of 2002. Filed herewith.
(3) Any written solicitation to purchase securities under Rule 23c-1 under the Act sent or given during the period covered by the report by or on behalf of the registrant to 10 or more persons. Not applicable to open-end investment companies.
(c) Certification pursuant to Section 906 of the Sarbanes-Oxley Act of 2002. Filed herewith.
SIGNATURES
Pursuant to the requirements of the Securities Exchange Act of 1934 and the Investment Company Act of 1940, the registrant has duly caused this report to be signed on its behalf by the undersigned, thereunto duly authorized.
(Registrant) | Guinness Atkinson Funds | |
| | |
| | |
By | /s/ James J. Atkinson | |
Name: James J. Atkinson | |
Title: President | |
Date: | 3/10/17 | |
| | | | |
Pursuant to the requirements of the Securities Exchange Act of 1934 and the Investment Company Act of 1940, this report has been signed by the following persons on behalf of the registrant and in the capacities and on the dates indicated.
By | /s/ James J. Atkinson | |
Name: James J. Atkinson | |
Title: President | |
Date: | 3/10/17 | |
| | |
| | |
By | /s/ Rita Dam | |
Name: Rita Dam | |
Title: Treasurer | |
Date: | 3/10/17 | |
| | | |