
2021 Investor Day May 6, 2021
Forward-Looking Statements This presentation, including information incorporated by reference, contains forward-looking statements within the meaning of the U.S. Private Securities Litigation Reform Act of 1995. All statements other than statements of historical fact, including statements regarding guidance, industry prospects or future results of operations or financial position, expected sources of incremental margin, strategy, financing needs, future capital expenditures and the outcome or effect of ongoing litigation, are forward-looking. This Quarterly Report uses words such as "anticipate," "believe," "expect," "estimate," "forecast," "goal," "intend," "objective," "plan," "project," "seek," "strategy," "target," "will" and similar expressions to identify forward-looking statements. These forward-looking statements are based on the beliefs and assumptions of management at the time that these statements were prepared and are inherently uncertain. Forward-looking statements are subject to risks and uncertainties that could cause actual results to differ materially from those expressed or implied in the forward-looking statements. These risks and uncertainties include, but are not limited to, general economic conditions on an international, national, state and local level; weather conditions in SJI’s marketing areas; changes in commodity costs; changes in the availability of natural gas; “non-routine” or “extraordinary” disruptions in SJI’s distribution system; regulatory, legislative and court decisions; competition; the availability and cost of capital; costs and effects of legal proceedings and environmental liabilities; the failure of customers, suppliers or business partners to fulfill their contractual obligations; changes in business strategies; and public health crises and epidemics or pandemics, such as a novel coronavirus (COVID-19). These risks and uncertainties, as well as other risks and uncertainties that could cause our actual results to differ materially from those expressed in the forward-looking statements, are described in greater detail under the heading “Item 1A. Risk Factors” in our Quarterly Reports, SJI’s and SJG's Annual Report on Form 10-K for the year ended December 31, 2020 and in any other SEC filings made by SJI or SJG during 2020 and 2021 and prior to the filing of this presentation. Non-GAAP Measures Management uses the non-GAAP financial measures of Economic Earnings and Economic Earnings per share when evaluating its results of operations. These non-GAAP financial measures should not be considered as an alternative to GAAP measures, such as net income, operating income, earnings per share from continuing operations or any other GAAP measure of financial performance. We define Economic Earnings as: Income from Continuing Operations, (i) less the change in unrealized gains and plus the change in unrealized losses on non-utility derivative transactions; (ii) less income and plus losses attributable to noncontrolling interest; and (iii) less the impact of transactions, contractual arrangements or other events where management believes period to period comparisons of SJI's operations could be difficult or potentially confusing. With respect to part (iii) of the definition of Economic Earnings, items excluded from Economic Earnings for the three months ended March 31, 2021 and 2020, are described in (A)-(D) in the table in our most recently filed 10- Q. Economic Earnings is a significant financial measure used by our management to indicate the amount and timing of income from continuing operations that we expect to earn after taking into account the impact of derivative instruments on the related transactions, as well as the impact of contractual arrangements and other events that management believes make period to period comparisons of SJI's operations difficult or potentially confusing. Management uses Economic Earnings to manage its business and to determine such items as incentive/compensation arrangements and allocation of resources. Specifically regarding derivatives, we believe that this financial measure indicates to investors the profitability of the entire derivative-related transaction and not just the portion that is subject to mark-to-market valuation under GAAP. We believe that considering only the change in market value on the derivative side of the transaction can produce a false sense as to the ultimate profitability of the total transaction as no change in value is reflected for the non- derivative portion of the transaction. Forward-Looking Statements & Non-GAAP Measures 2
AGENDA 1. DELIVERING TOMORROW’S CLEAN ENERGY Mike Renna | President & CEO 2. SUSTAINABILITY Melissa Orsen | Senior Vice President, SJI & President, South Jersey Gas 3. SJI UTILITIES Dave Robbins | Senior Vice President, SJI & President, SJI Utilities 4. NON-UTILITY OPERATIONS Steve Cocchi | Senior Vice President, SJI & CFO 5. FINANCIAL REVIEW Steve Cocchi | Senior Vice President, SJI & CFO 6. CLOSING REMARKS Mike Renna | President & CEO 3
Delivering Tomorrow’s Clean Energy Mike Renna | President & CEO 4

5 Our Mission 21st Century Clean Energy Infrastructure Company ▪ $3B+ infrastructure company supplying safe, reliable and affordable energy and supporting economic growth ▪ U.S. and New Jersey accelerating transition to low carbon and renewable energy future ▪ Launching utility-centered $3.5B, 5-year capital plan -- with ~60% for sustainability investment ▪ Utilities will remain our core growth engine -- focus on infrastructure modernization to ensure safety, reliability and redundancy to 700,000+ customers ▪ Disciplined non-utility strategy is complementary to utility business -- aligns with clean energy goals of our region focusing on decarbonization investments that generate strong project returns and predictable earnings ▪ Committed to investment grade balance sheet, ample liquidity and solid credit metrics to execute growth plan ▪ Delivers highly predictable and sustainable earnings per share growth through 2025 and beyond
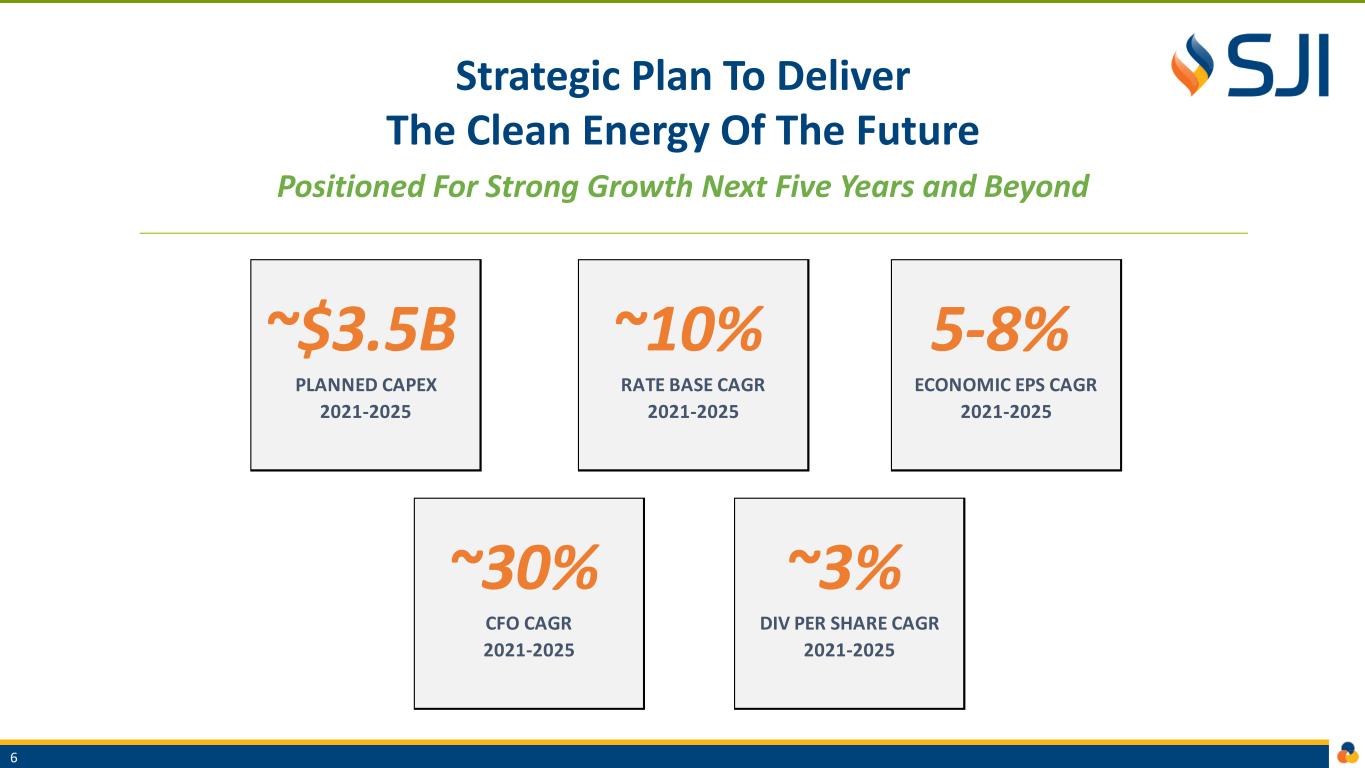
Strategic Plan To Deliver The Clean Energy Of The Future Positioned For Strong Growth Next Five Years and Beyond 6 ~$3.5B PLANNED CAPEX 2021-2025 ~10% RATE BASE CAGR 2021-2025 5-8% ECONOMIC EPS CAGR 2021-2025 ~30% CFO CAGR 2021-2025 ~3% DIV PER SHARE CAGR 2021-2025
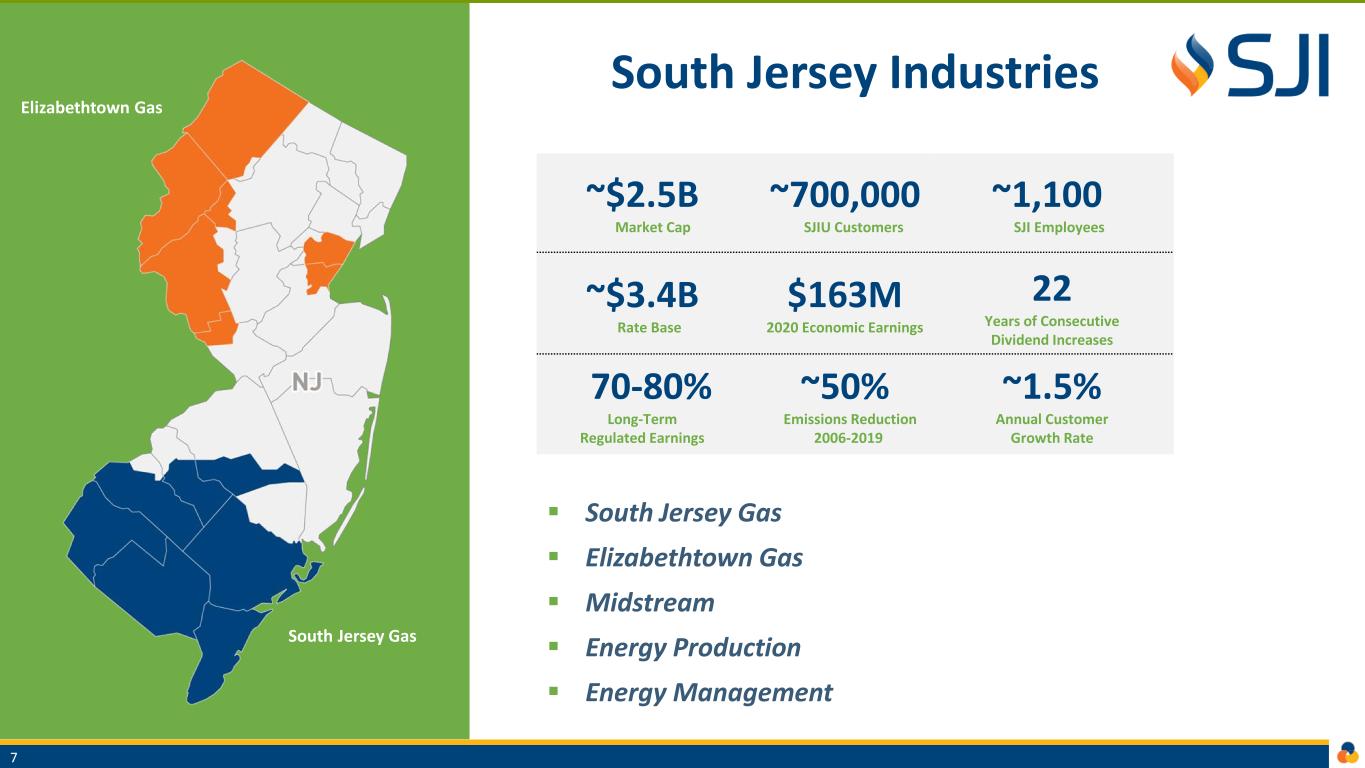
~$2.5B Market Cap ~700,000 SJIU Customers ~1,100 SJI Employees ~$3.4B Rate Base $163M 2020 Economic Earnings 22 Years of Consecutive Dividend Increases 70-80% Long-Term Regulated Earnings ~50% Emissions Reduction 2006-2019 ~1.5% Annual Customer Growth Rate South Jersey Industries South Jersey Gas Elizabethtown Gas ▪ South Jersey Gas ▪ Elizabethtown Gas ▪ Midstream ▪ Energy Production ▪ Energy Management 7

Complementary Infrastructure Businesses Across The Energy Value Chain 8

Utility Investments ▪ Drive shareholder value and customer satisfaction through: • expansion and modernization of our utility infrastructure • regulatory innovation that provides safety, reliability, value and service ▪ SJG/ETG are Growth Drivers ▪ ~10% Rate Base CAGR 2021-2025 Disciplined Growth Plan Embracing Infrastructure Modernization and Sustainability While Enhancing Cash Flow and Earnings Sustainability Investments ▪ Enhance the value of our infrastructure through: • Investment in decarbonization including RNG • Energy efficiency initiatives and innovative energy technologies ▪ RNG Development Growth Driver ▪ Fuel Cell/Solar Growth Driver Enhanced Cash Flow/ Earnings Quality ▪ 100% Decoupled Utilities ▪ ~50% of Utility CapEx benefits from timely recovery ▪ Reshaped Wholesale Business, with ~50% of earnings from annuity-like fuel management contracts ▪ RNG investments generate positive cash flow and earnings 9

Regulated Earnings Utilities Remain Our Core Growth Engine in 2021-2025 and Beyond 10 70-80% 20-30% REGULATED NON-REGULATED

Dedicated to A Clean Energy Future for New Jersey and our Region ▪ Committed to delivering safe and reliable service, reducing the carbon content of gas, lowering energy costs and improving energy efficiency ▪ Initiating carbon reduction investments across both our utility and nonutility businesses over the next five years REDUCING ENERGY CONSUMPTION/EMISSIONS DEPLOYMENT OF RENEWABLE ENERGY MAXIMIZING ENERGY EFFICIENCY MODERNIZING VIA TECHNOLOGY 11
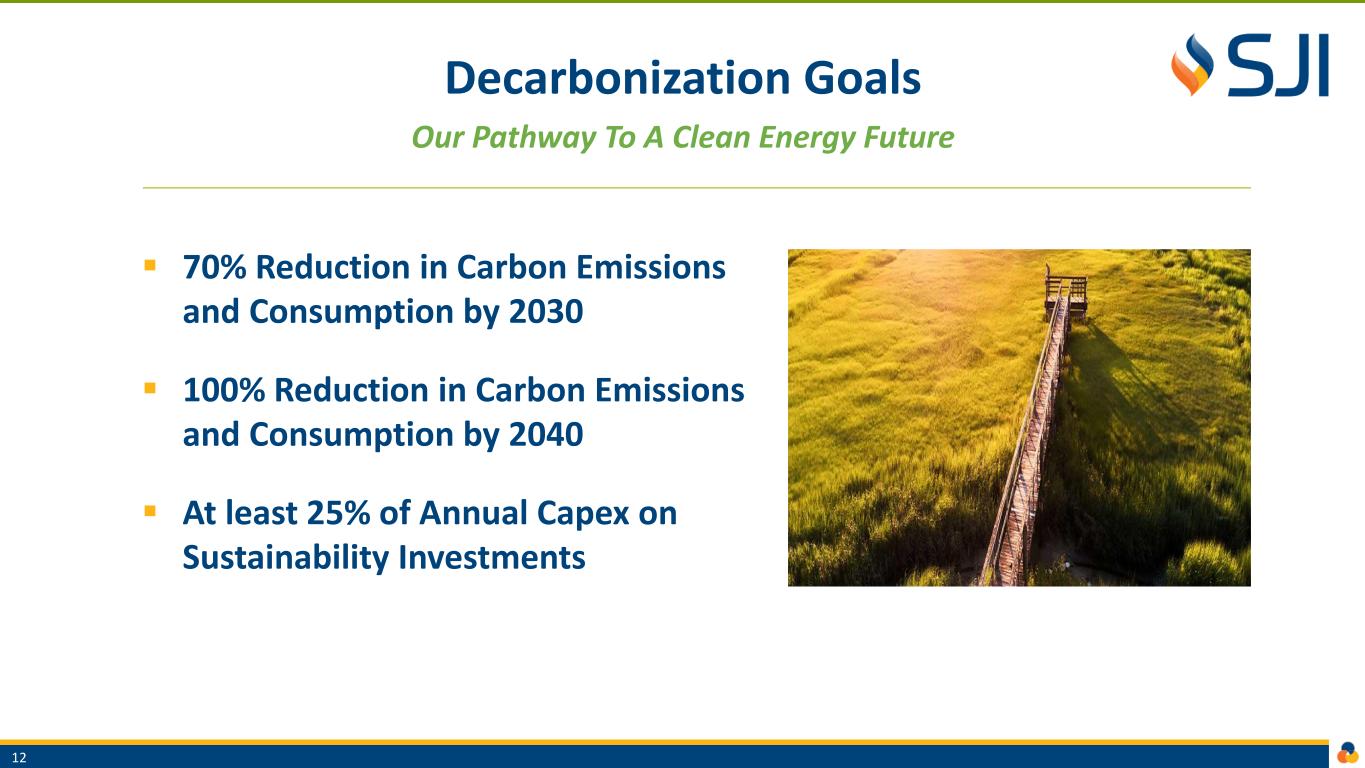
Decarbonization Goals Our Pathway To A Clean Energy Future ▪ 70% Reduction in Carbon Emissions and Consumption by 2030 ▪ 100% Reduction in Carbon Emissions and Consumption by 2040 ▪ At least 25% of Annual Capex on Sustainability Investments 12
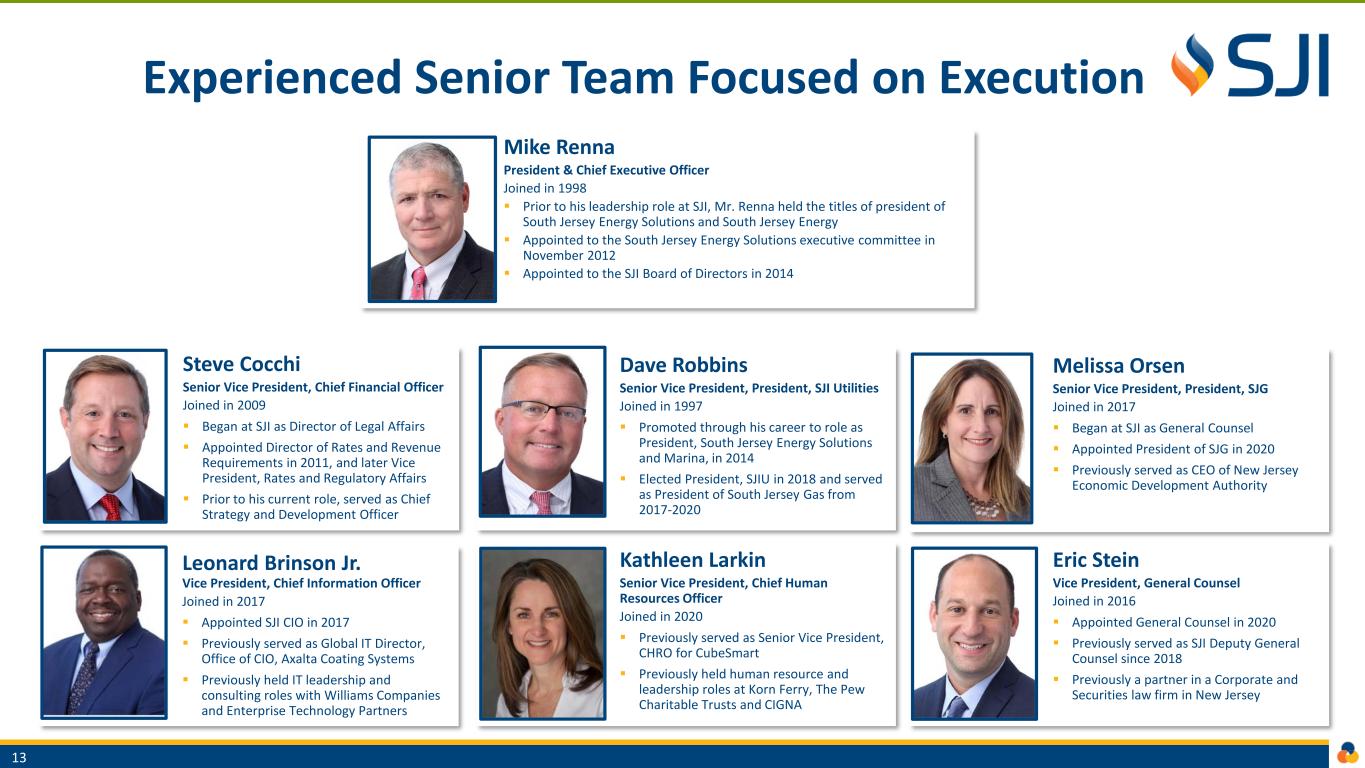
Experienced Senior Team Focused on Execution Mike Renna President & Chief Executive Officer Joined in 1998 ▪ Prior to his leadership role at SJI, Mr. Renna held the titles of president of South Jersey Energy Solutions and South Jersey Energy ▪ Appointed to the South Jersey Energy Solutions executive committee in November 2012 ▪ Appointed to the SJI Board of Directors in 2014 Steve Cocchi Senior Vice President, Chief Financial Officer Joined in 2009 ▪ Began at SJI as Director of Legal Affairs ▪ Appointed Director of Rates and Revenue Requirements in 2011, and later Vice President, Rates and Regulatory Affairs ▪ Prior to his current role, served as Chief Strategy and Development Officer Kathleen Larkin Senior Vice President, Chief Human Resources Officer Joined in 2020 ▪ Previously served as Senior Vice President, CHRO for CubeSmart ▪ Previously held human resource and leadership roles at Korn Ferry, The Pew Charitable Trusts and CIGNA Melissa Orsen Senior Vice President, President, SJG Joined in 2017 ▪ Began at SJI as General Counsel ▪ Appointed President of SJG in 2020 ▪ Previously served as CEO of New Jersey Economic Development Authority Dave Robbins Senior Vice President, President, SJI Utilities Joined in 1997 ▪ Promoted through his career to role as President, South Jersey Energy Solutions and Marina, in 2014 ▪ Elected President, SJIU in 2018 and served as President of South Jersey Gas from 2017-2020 Leonard Brinson Jr. Vice President, Chief Information Officer Joined in 2017 ▪ Appointed SJI CIO in 2017 ▪ Previously served as Global IT Director, Office of CIO, Axalta Coating Systems ▪ Previously held IT leadership and consulting roles with Williams Companies and Enterprise Technology Partners Eric Stein Vice President, General Counsel Joined in 2016 ▪ Appointed General Counsel in 2020 ▪ Previously served as SJI Deputy General Counsel since 2018 ▪ Previously a partner in a Corporate and Securities law firm in New Jersey 13

Sustainability Melissa Orsen | Senior Vice President & President, South Jersey Gas

Sustainable Business Practices SJI’s Mission and Values Reflect Strong Alignment with ESG Goals ✓ Stated goal for 70% reduction in consumption and emissions by 2030 and 100% by 2040 ✓ At least 25% of annual capital spending for sustainability investment ✓ Infrastructure built and monitored to minimize leaks ✓ Capital investment in remediation efforts and infrastructure ✓ 200+ CNG vehicles across our fleet ✓ Anticipate by 2025 we will achieve 80% reduction in our distribution system fugitive emissions from 2006 levels representing a reduction of over 214,000 metric tons of CO2 equivalent ✓ Safety and inclusion are the organization’s core values ✓ Commitment to supplier diversity ✓ 51% workforce diversity across 1,100+ employees ✓ Focused attention on Diversity, Equity, and Inclusion efforts and programs ✓ Investment in the Customer Experience ✓ Significant contributions to support community and local non- profit organizations ✓ Health and financial wellness programs to support employee engagement ✓ Corporate giving and employee giving and volunteerism programs SocialEnvironmental ✓ 30% of SJI’s board members are female ✓ 90% of board members are considered independent ✓ 90% of board members have tenure of 10 years or less ✓ Diversity and Inclusion Council provides oversight and accountability ✓ Mandatory director retirement age at 72 ✓ Annual independent third- party effectiveness evaluation ✓ Annual independent board compensation evaluation ✓ In the past three years 3 Directors have retired and 3 Directors were added Governance 15 ESG Annual Report Across our business this year, we reinforced the foundation needed for SJI to thrive - for our employees and the 700,000 customers we serve.

ESG Initiatives Demonstrated Record of Commitment to ESG Priorities SocialEnvironmental Governance ✓ Replacement of 800+ miles of vintage mains and related facilities ✓ Energy efficiency programs that reduce customer consumption and cost ✓ RNG/Hydrogen initiatives to lower carbon content of gas and reduce emissions ✓ Fuel Cell investments to reduce emissions and support grid reliability ✓ Solar installations in support of clean energy goals of our region ✓ Focus on safety and customer service ✓ 51% workforce diversity across 1,100+ employees ✓ Focused attention on Diversity, Equity, and Inclusion efforts and programs ✓ Commitment to supplier diversity ✓ Significant contributions to community & local non-profit organizations ✓ Experienced board of directors with diverse skill set across disciplines ✓ 30% of board members are female ✓ 90% of board members are considered independent ✓ ESG and Diversity Council oversight and accountability ✓ Annual independent third-party effectiveness evaluation Environmental Social Governance 16

Accomplishments and Recognitions ✓ Recognition of significant investment in Sustainability and ESG initiatives over past decade -- improving infrastructure safety and reliability, increasing workforce diversity, and supporting a clean energy future ✓ Key sustainability initiatives included accelerated pipeline replacement, storm hardening, energy efficiency, solar, fuel cells, landfills and combined heat-and-power (CHP) 17
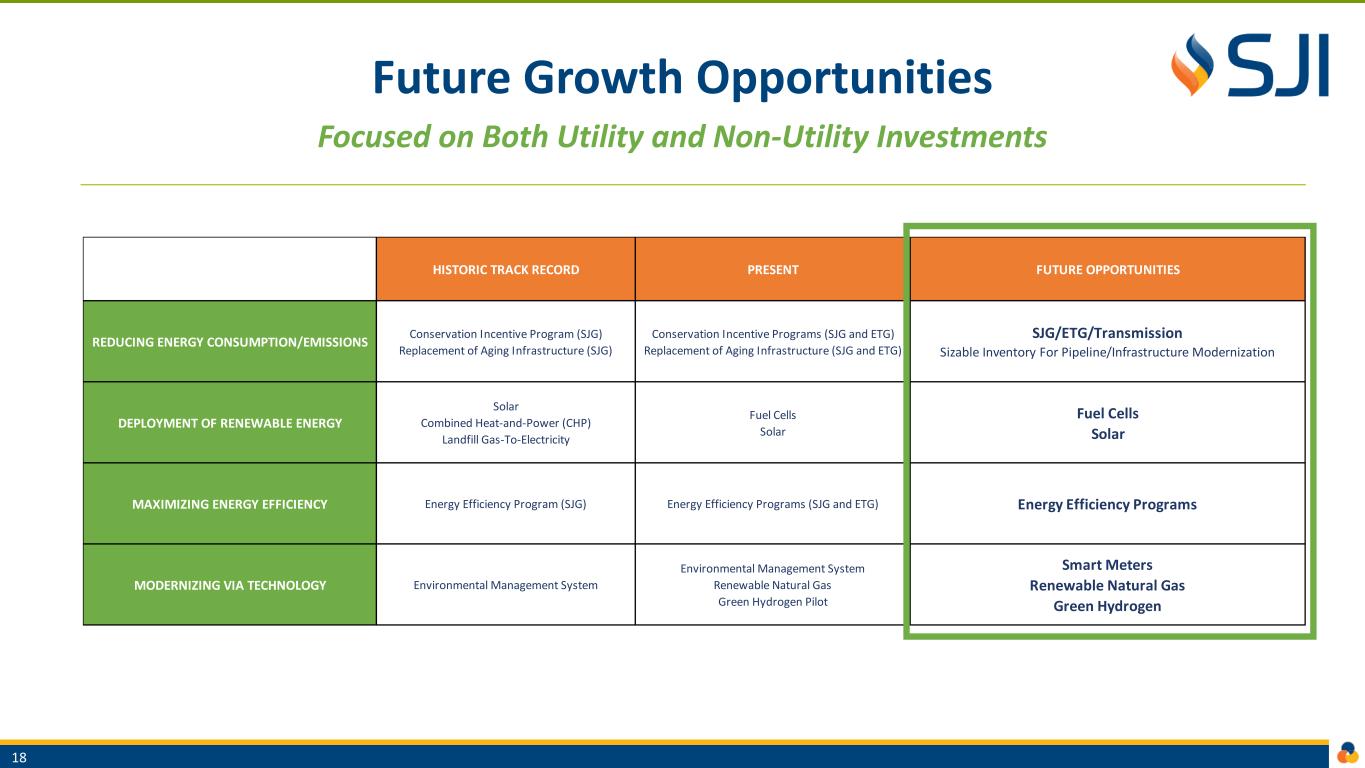
Future Growth Opportunities Focused on Both Utility and Non-Utility Investments 18 HISTORIC TRACK RECORD PRESENT FUTURE OPPORTUNITIES REDUCING ENERGY CONSUMPTION/EMISSIONS Conservation Incentive Program (SJG) Replacement of Aging Infrastructure (SJG) Conservation Incentive Programs (SJG and ETG) Replacement of Aging Infrastructure (SJG and ETG) SJG/ETG/Transmission Sizable Inventory For Pipeline/Infrastructure Modernization DEPLOYMENT OF RENEWABLE ENERGY Solar Combined Heat-and-Power (CHP) Landfill Gas-To-Electricity Fuel Cells Solar Fuel Cells Solar MAXIMIZING ENERGY EFFICIENCY Energy Efficiency Program (SJG) Energy Efficiency Programs (SJG and ETG) Energy Efficiency Programs MODERNIZING VIA TECHNOLOGY Environmental Management System Environmental Management System Renewable Natural Gas Green Hydrogen Pilot Smart Meters Renewable Natural Gas Green Hydrogen

~60% of Total CapEx over the next five years for sustainability investments Sustainability Investment ~$3.5 Billion CapEx 2021-2025, With ~60% For Sustainability Sustainability investments include RNG, pipeline replacement, energy efficiency, redundancy projects, fuel cell, solar and other clean energy initiatives 19 ~ $2,100 60% ~ $1,400 40% Sustainability Traditional ~$3.5B
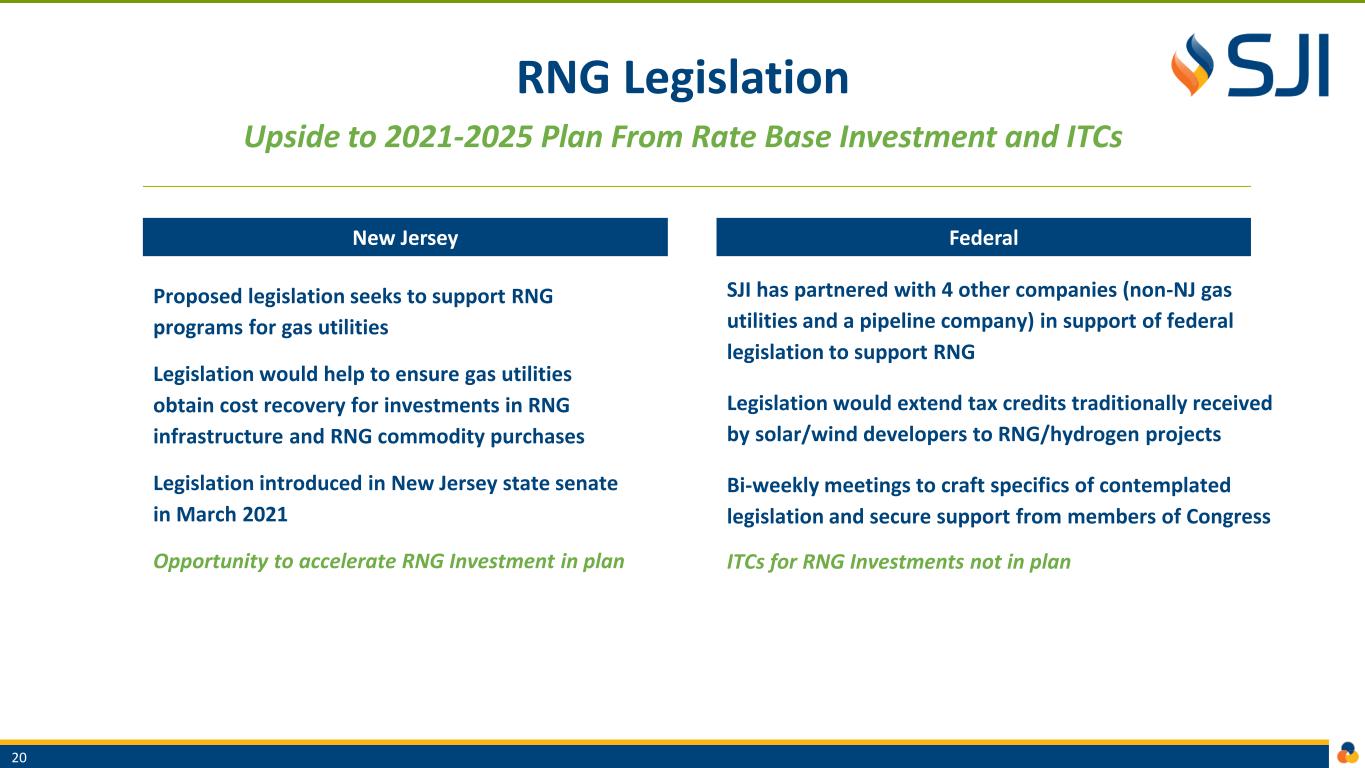
RNG Legislation Upside to 2021-2025 Plan From Rate Base Investment and ITCs Proposed legislation seeks to support RNG programs for gas utilities Legislation would help to ensure gas utilities obtain cost recovery for investments in RNG infrastructure and RNG commodity purchases Legislation introduced in New Jersey state senate in March 2021 Opportunity to accelerate RNG Investment in plan SJI has partnered with 4 other companies (non-NJ gas utilities and a pipeline company) in support of federal legislation to support RNG Legislation would extend tax credits traditionally received by solar/wind developers to RNG/hydrogen projects Bi-weekly meetings to craft specifics of contemplated legislation and secure support from members of Congress ITCs for RNG Investments not in plan New Jersey Federal 20
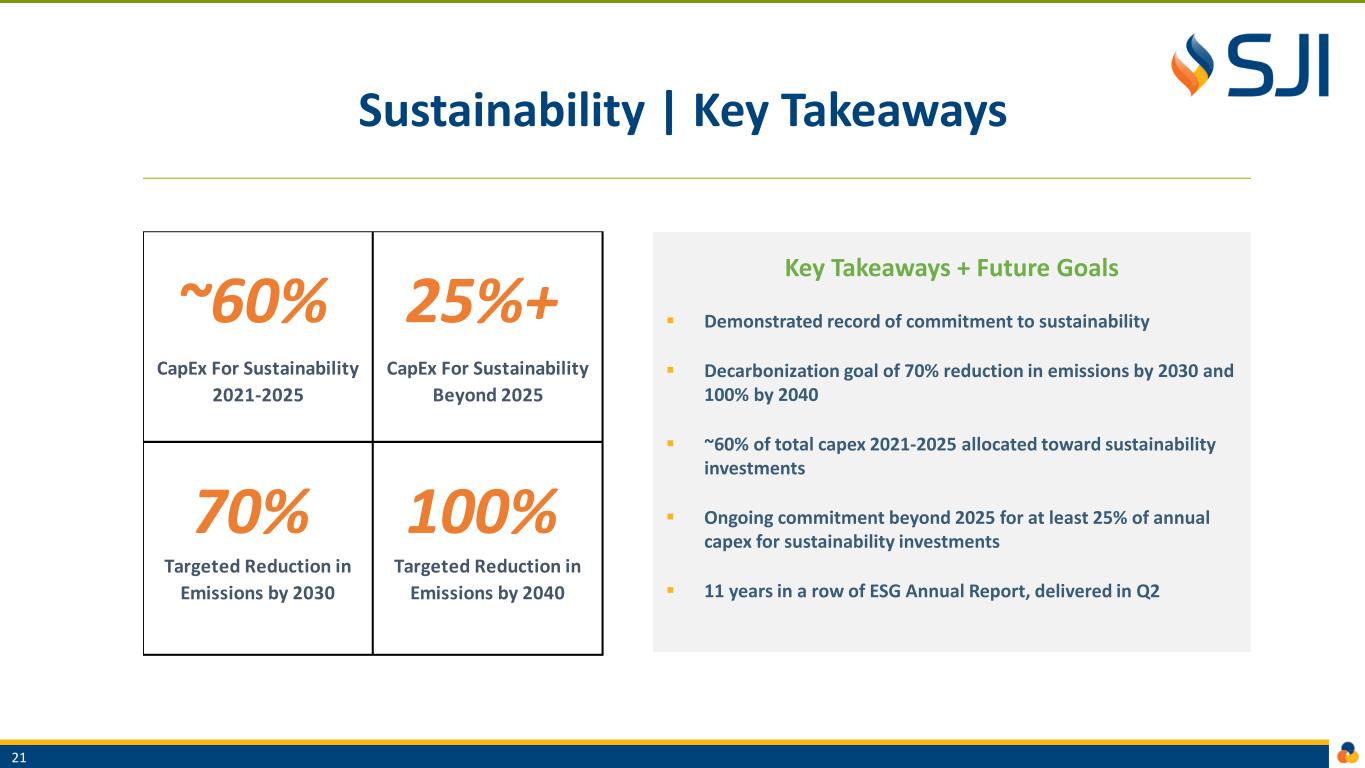
Sustainability | Key Takeaways Key Takeaways + Future Goals ▪ Demonstrated record of commitment to sustainability ▪ Decarbonization goal of 70% reduction in emissions by 2030 and 100% by 2040 ▪ ~60% of total capex 2021-2025 allocated toward sustainability investments ▪ Ongoing commitment beyond 2025 for at least 25% of annual capex for sustainability investments ▪ 11 years in a row of ESG Annual Report, delivered in Q2 21 ~60% 25%+ 70% 100% Targeted Reduction in Emissions by 2030 Targeted Reduction in Emissions by 2040 CapEx For Sustainability 2021-2025 CapEx For Sustainability Beyond 2025

SJI Utilities Dave Robbins | Senior Vice President & President, SJI Utilities
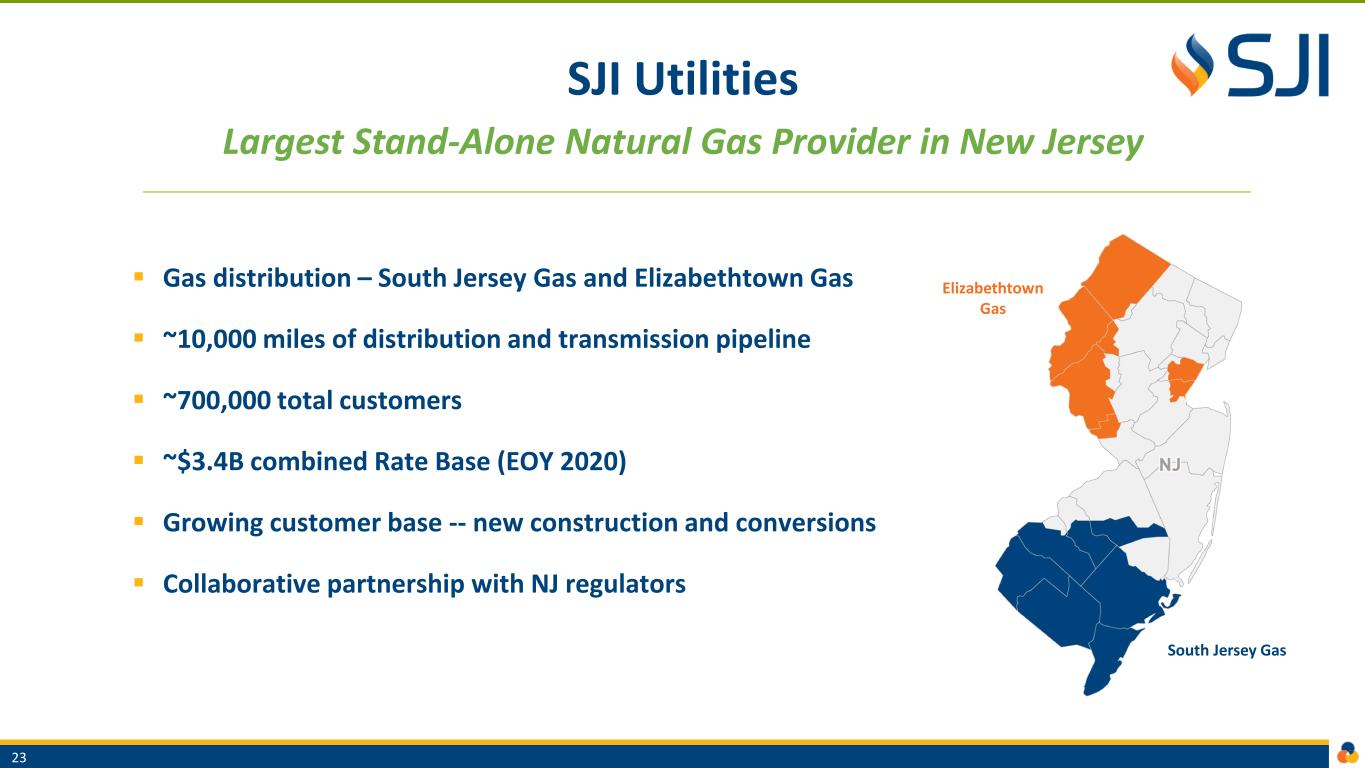
SJI Utilities Largest Stand-Alone Natural Gas Provider in New Jersey ▪ Gas distribution – South Jersey Gas and Elizabethtown Gas ▪ ~10,000 miles of distribution and transmission pipeline ▪ ~700,000 total customers ▪ ~$3.4B combined Rate Base (EOY 2020) ▪ Growing customer base -- new construction and conversions ▪ Collaborative partnership with NJ regulators Elizabethtown Gas South Jersey Gas 23
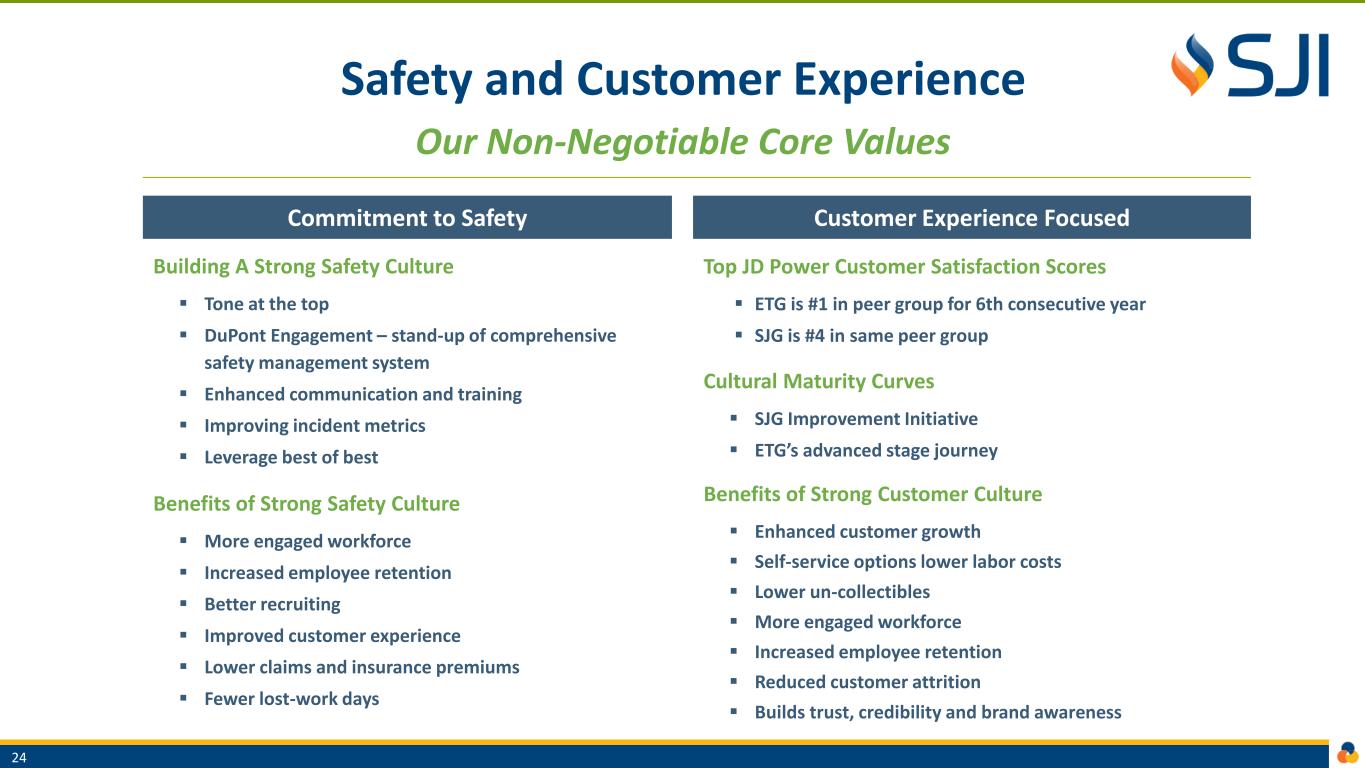
Top JD Power Customer Satisfaction Scores ▪ ETG is #1 in peer group for 6th consecutive year ▪ SJG is #4 in same peer group Cultural Maturity Curves ▪ SJG Improvement Initiative ▪ ETG’s advanced stage journey Benefits of Strong Customer Culture ▪ Enhanced customer growth ▪ Self-service options lower labor costs ▪ Lower un-collectibles ▪ More engaged workforce ▪ Increased employee retention ▪ Reduced customer attrition ▪ Builds trust, credibility and brand awareness Building A Strong Safety Culture ▪ Tone at the top ▪ DuPont Engagement – stand-up of comprehensive safety management system ▪ Enhanced communication and training ▪ Improving incident metrics ▪ Leverage best of best Benefits of Strong Safety Culture ▪ More engaged workforce ▪ Increased employee retention ▪ Better recruiting ▪ Improved customer experience ▪ Lower claims and insurance premiums ▪ Fewer lost-work days Commitment to Safety Customer Experience Focused Safety and Customer Experience Our Non-Negotiable Core Values 24

~407K Total Customers ~$2.3B Rate Base ~10% Rate Base CAGR 2021-2025E 9.6% Authorized ROE 54.0% Equity Component 1.5% Customer Growth 2021-2025E ~1.7B CapEx 2021-2025E ~50% CapEx With Timely Recovery ~60% Sustainability CapEx 2021-2025E South Jersey Gas ▪ Operates and maintains more than 6,600 miles of natural gas transportation and distribution infrastructure serving 400,000+ customers in a mix of urban, suburban, rural and coastal communities Growth Drivers ▪ Customer growth – new home construction and conversions ▪ Infrastructure modernization and efficiency programs with timely recovery ▪ Periodic base rate cases ▪ Reliability, Redundancy and Clean Energy projects South Jersey Gas 25

SJG Customer Growth Strong 1.5% Projected Growth 2021-2025, Driven By Robust Residential Conversions and New Construction Historic Growth ▪ 1.5% Annualized Growth 2010-2020 ▪ 90%+ of customers residential -- ~65% of utility gross margin ▪ Steady new construction activity, supported by growth in higher density and multi-family units ▪ Conversions from alternate fuels, including heating oil and propane, outpaced new construction adds over past decade Future Growth ▪ 1.5% Annualized Growth 2021-2025, In-Line With Historic Rate ▪ New construction activity expected to accelerate with economic re-opening ▪ Conversion activity expected to remain robust: ▪ ~60,000 residential customer conversion opportunity ▪ ~6,700 commercial customer conversion opportunity ▪ Continuation of successful “off-main” approach ▪ Partnerships with HVAC contractor network 348 351 357 362 367 373 378 384 391 397 405 300 325 350 375 400 425 2010 2011 2012 2013 2014 2015 2016 2017 2018 2019 2020 T h o u sa n d s Customer Growth 6,030 6,060 7,431 7,485 8,176 8,751 7,163 8,636 9,243 8,707 7,176 - 2,000 4,000 6,000 8,000 10,000 2010 2011 2012 2013 2014 2015 2016 2017 2018 2019 2020 T h o u sa n d s Customer Additions New Construction Conversions 26
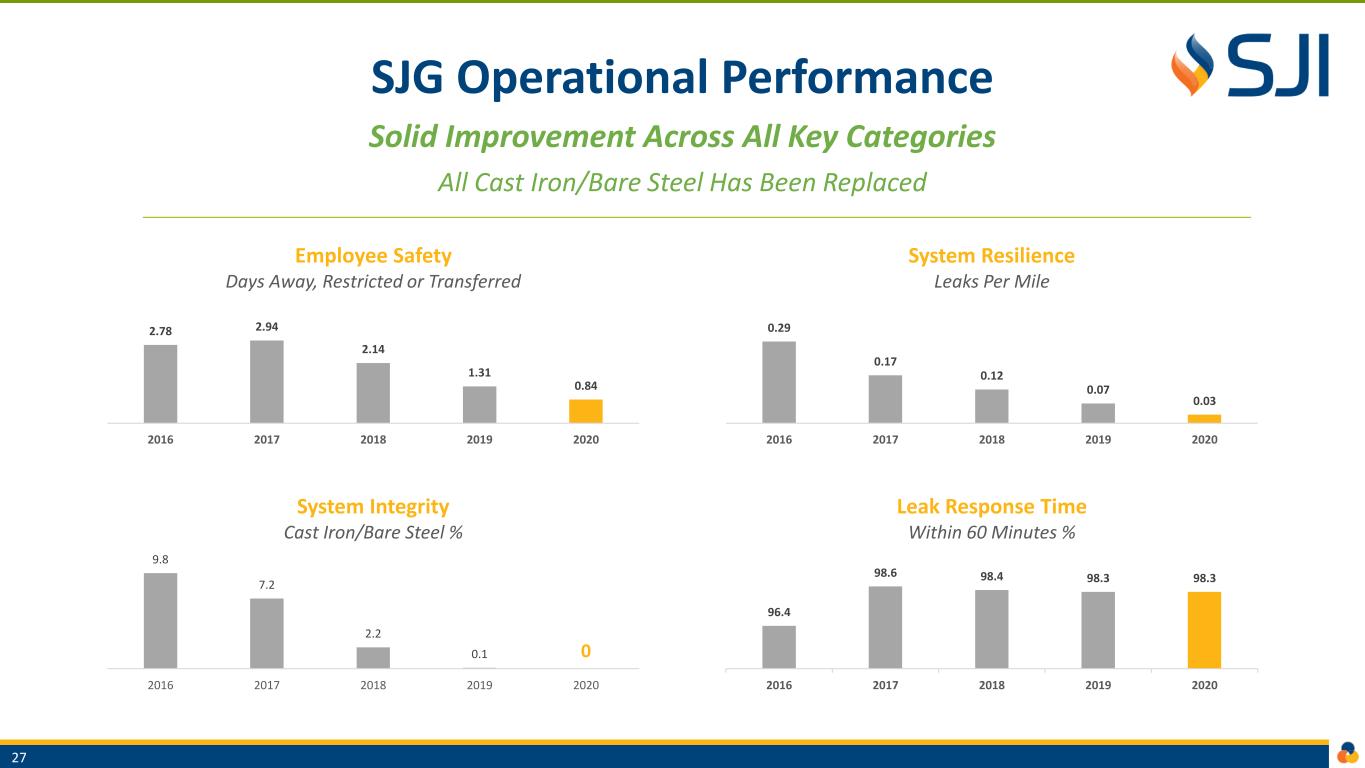
SJG Operational Performance Solid Improvement Across All Key Categories All Cast Iron/Bare Steel Has Been Replaced 2.78 2.94 2.14 1.31 0.84 2016 2017 2018 2019 2020 Employee Safety Days Away, Restricted or Transferred 0.29 0.17 0.12 0.07 0.03 2016 2017 2018 2019 2020 System Resilience Leaks Per Mile 27 96.4 98.6 98.4 98.3 98.3 2016 2017 2018 2019 2020 Leak Response Time Within 60 Minutes % 9.8 7.2 2.2 0.1 0 2016 2017 2018 2019 2020 System Integrity Cast Iron/Bare Steel %
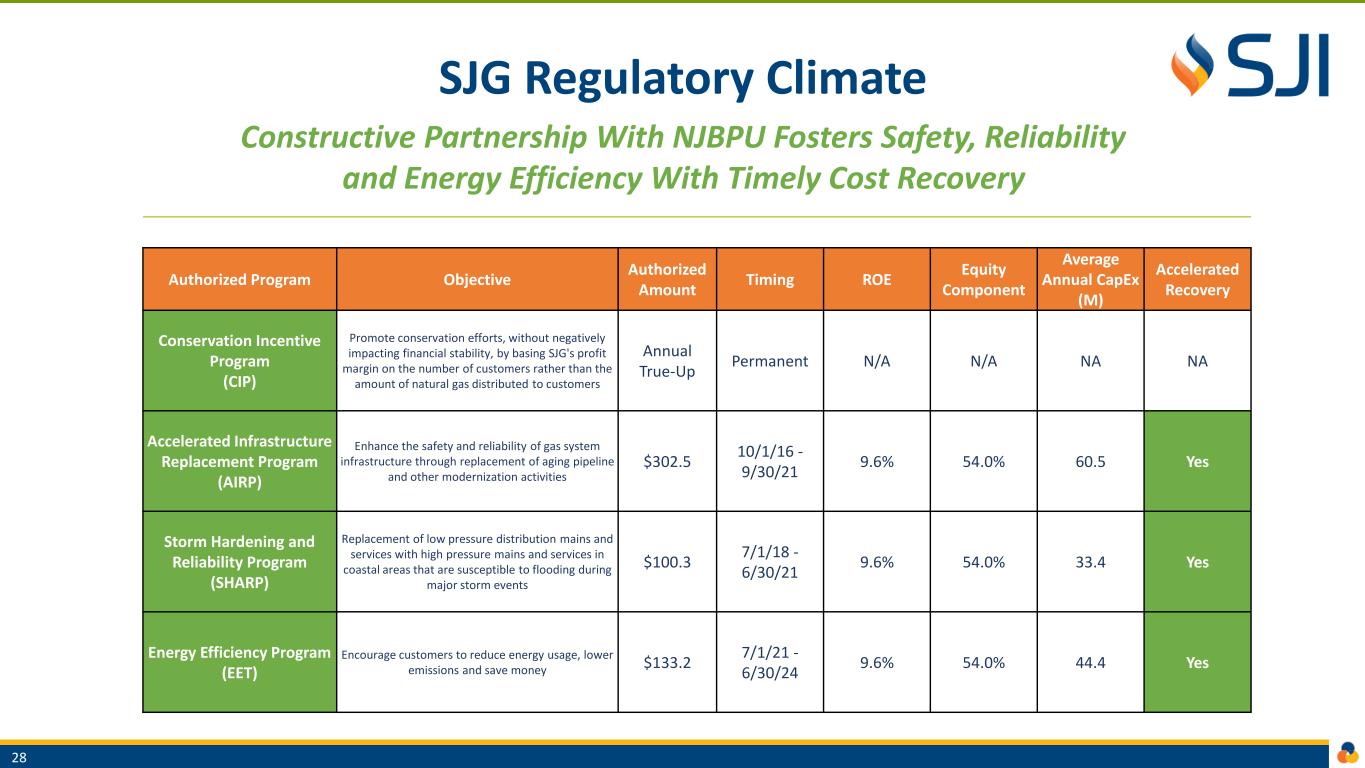
SJG Regulatory Climate Constructive Partnership With NJBPU Fosters Safety, Reliability and Energy Efficiency With Timely Cost Recovery 28 Authorized Program Objective Authorized Amount Timing ROE Equity Component Average Annual CapEx (M) Accelerated Recovery Conservation Incentive Program (CIP) Promote conservation efforts, without negatively impacting financial stability, by basing SJG's profit margin on the number of customers rather than the amount of natural gas distributed to customers Annual True-Up Permanent N/A N/A NA NA Accelerated Infrastructure Replacement Program (AIRP) Enhance the safety and reliability of gas system infrastructure through replacement of aging pipeline and other modernization activities $302.5 10/1/16 - 9/30/21 9.6% 54.0% 60.5 Yes Storm Hardening and Reliability Program (SHARP) Replacement of low pressure distribution mains and services with high pressure mains and services in coastal areas that are susceptible to flooding during major storm events $100.3 7/1/18 - 6/30/21 9.6% 54.0% 33.4 Yes Energy Efficiency Program (EET) Encourage customers to reduce energy usage, lower emissions and save money $133.2 7/1/21 - 6/30/24 9.6% 54.0% 44.4 Yes

SJG Infrastructure Modernization 800+ Miles of Vintage Steel and Plastic Pipe To Be Replaced 2021-2026 1,900+ Miles of Vintage Pipeline To Be Replaced Beyond 2026 29 Pipeline Replacement 2021-2026 Pipeline Replacement Beyond 2026

SJG Regulatory Initiatives Proposed programs accelerate safety, reliability and redundancy, create jobs, and support our ability to deliver decarbonized gas of the future Proposed $742.5M over five years to replace 825 miles of aging steel main and install excess flow valves ▪ Considerable investments over past decade to modernize system focused on replacement of cast iron/bare steel main ▪ New and much larger program will take the place of expiring AIRP/SHARP programs ▪ Enhancements ensure continued safety and reliability of SJG system ▪ Resolution of SJG’s proposal is expected this summer Proposal to construct system upgrades for planned 2.0+ Bcf liquefied natural gas facility ▪ Evaluated potential redundancy solutions in response to NJBPU call for utilities to evaluate preparedness for gas supply interruptions ▪ Solutions are critically important to ensure service is not interrupted to our customers in the event of a significant outage -- either behind our city gate, or on one of the two interstate pipelines that serve the SJG system ▪ Resolution of SJG’s proposal is expected before year end Infrastructure Investment Program (IIP) Redundancy Project (LNG) 30
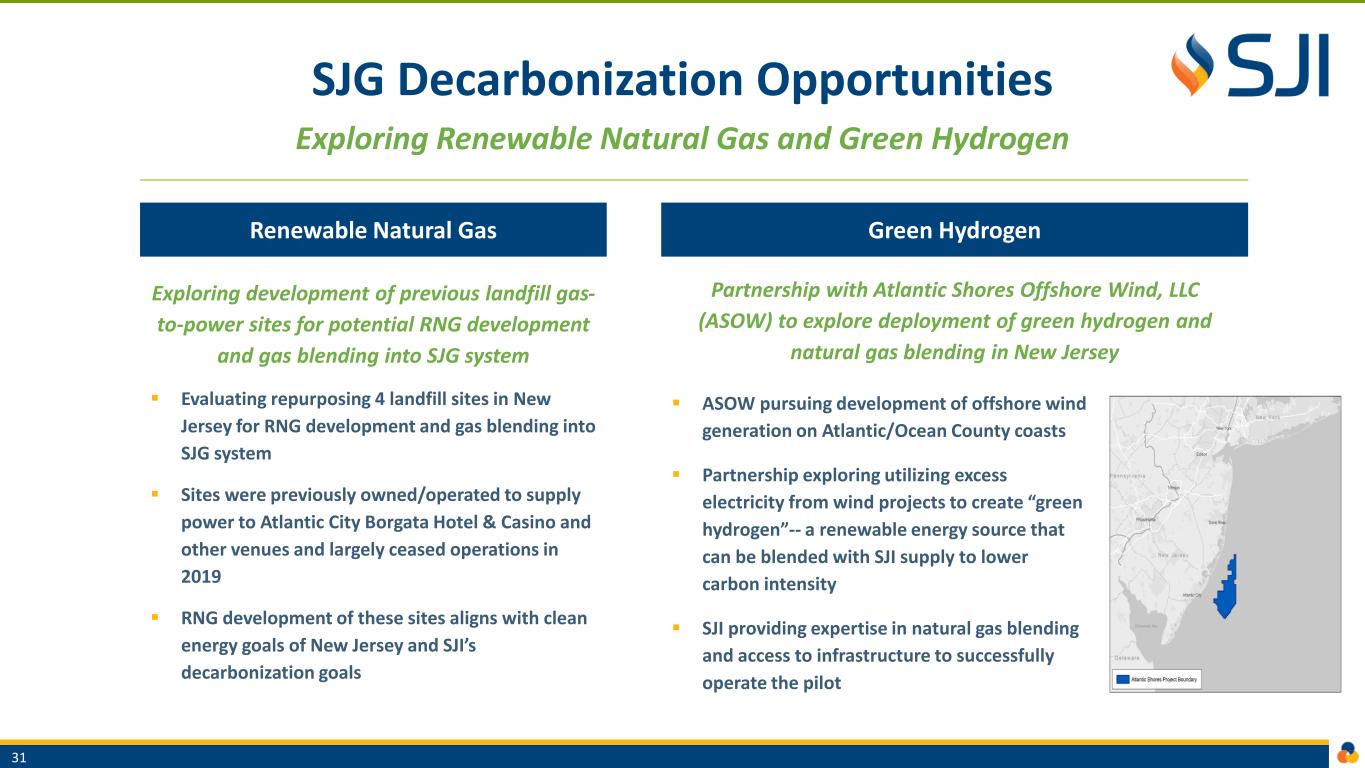
SJG Decarbonization Opportunities Exploring Renewable Natural Gas and Green Hydrogen ▪ ASOW pursuing development of offshore wind generation on Atlantic/Ocean County coasts ▪ Partnership exploring utilizing excess electricity from wind projects to create “green hydrogen”-- a renewable energy source that can be blended with SJI supply to lower carbon intensity ▪ SJI providing expertise in natural gas blending and access to infrastructure to successfully operate the pilot Exploring development of previous landfill gas- to-power sites for potential RNG development and gas blending into SJG system ▪ Evaluating repurposing 4 landfill sites in New Jersey for RNG development and gas blending into SJG system ▪ Sites were previously owned/operated to supply power to Atlantic City Borgata Hotel & Casino and other venues and largely ceased operations in 2019 ▪ RNG development of these sites aligns with clean energy goals of New Jersey and SJI’s decarbonization goals Green HydrogenRenewable Natural Gas 31 Partnership with Atlantic Shores Offshore Wind, LLC (ASOW) to explore deployment of green hydrogen and natural gas blending in New Jersey
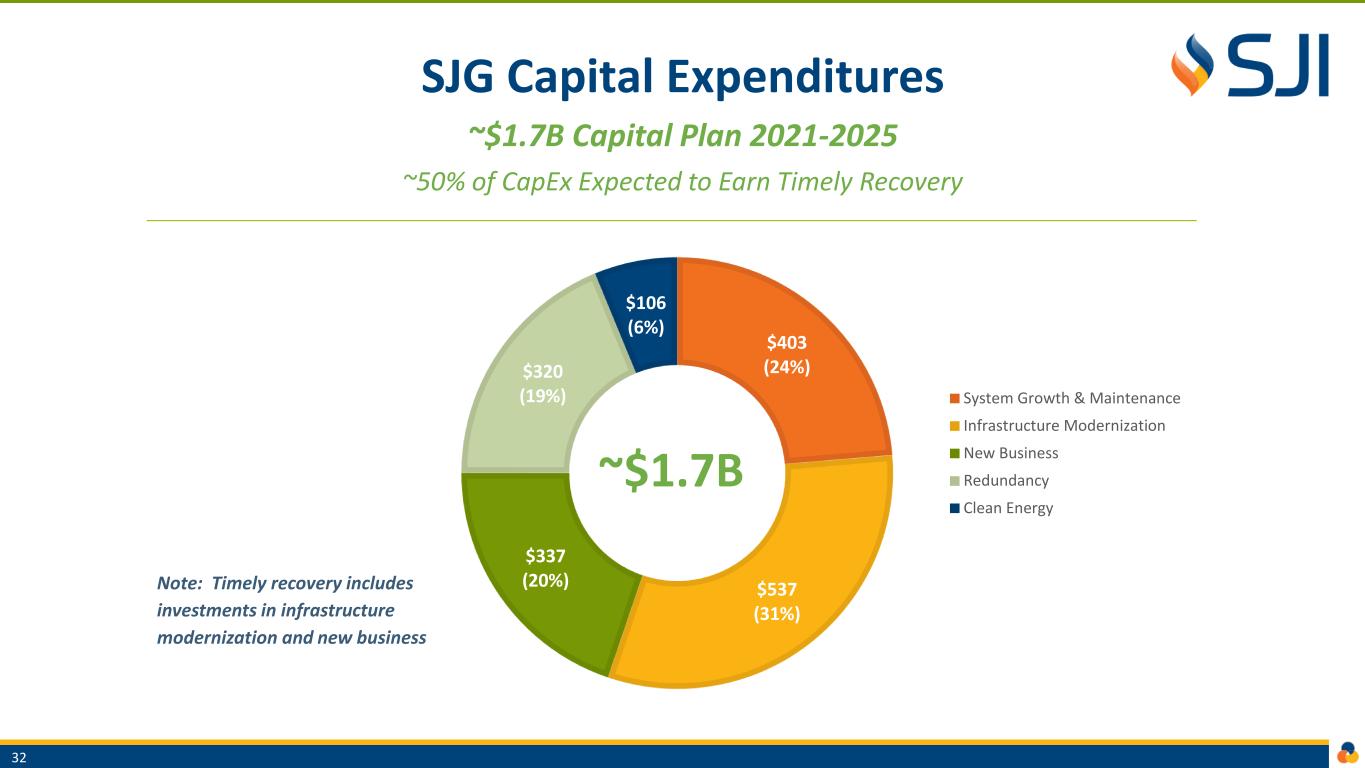
SJG Capital Expenditures ~$1.7B Capital Plan 2021-2025 ~50% of CapEx Expected to Earn Timely Recovery ~$1.7B 32 $403 (24%) $537 (31%) $337 (20%) $320 (19%) $106 (6%) System Growth & Maintenance Infrastructure Modernization New Business Redundancy Clean Energy Note: Timely recovery includes investments in infrastructure modernization and new business
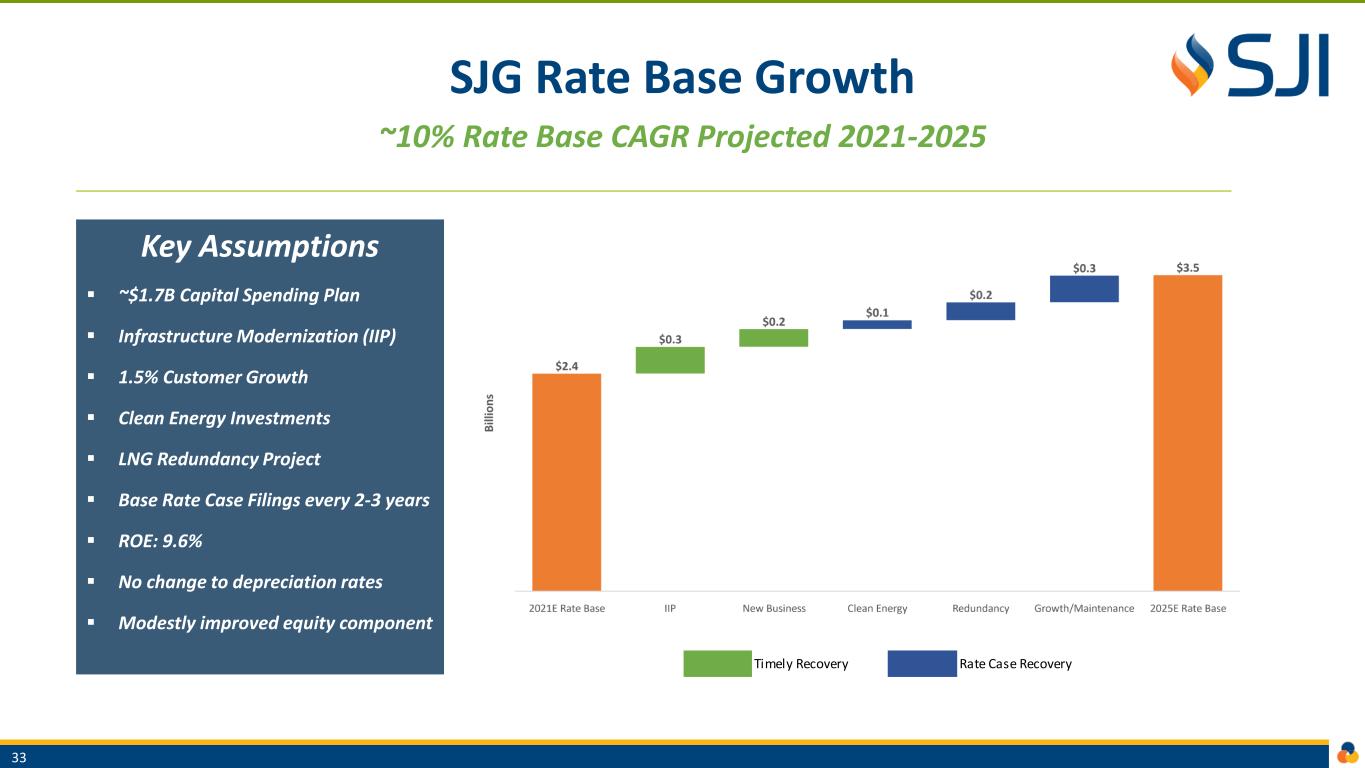
SJG Rate Base Growth ~10% Rate Base CAGR Projected 2021-2025 Key Assumptions ▪ ~$1.7B Capital Spending Plan ▪ Infrastructure Modernization (IIP) ▪ 1.5% Customer Growth ▪ Clean Energy Investments ▪ LNG Redundancy Project ▪ Base Rate Case Filings every 2-3 years ▪ ROE: 9.6% ▪ No change to depreciation rates ▪ Modestly improved equity component 33 Timely Recovery Rate Case Recovery
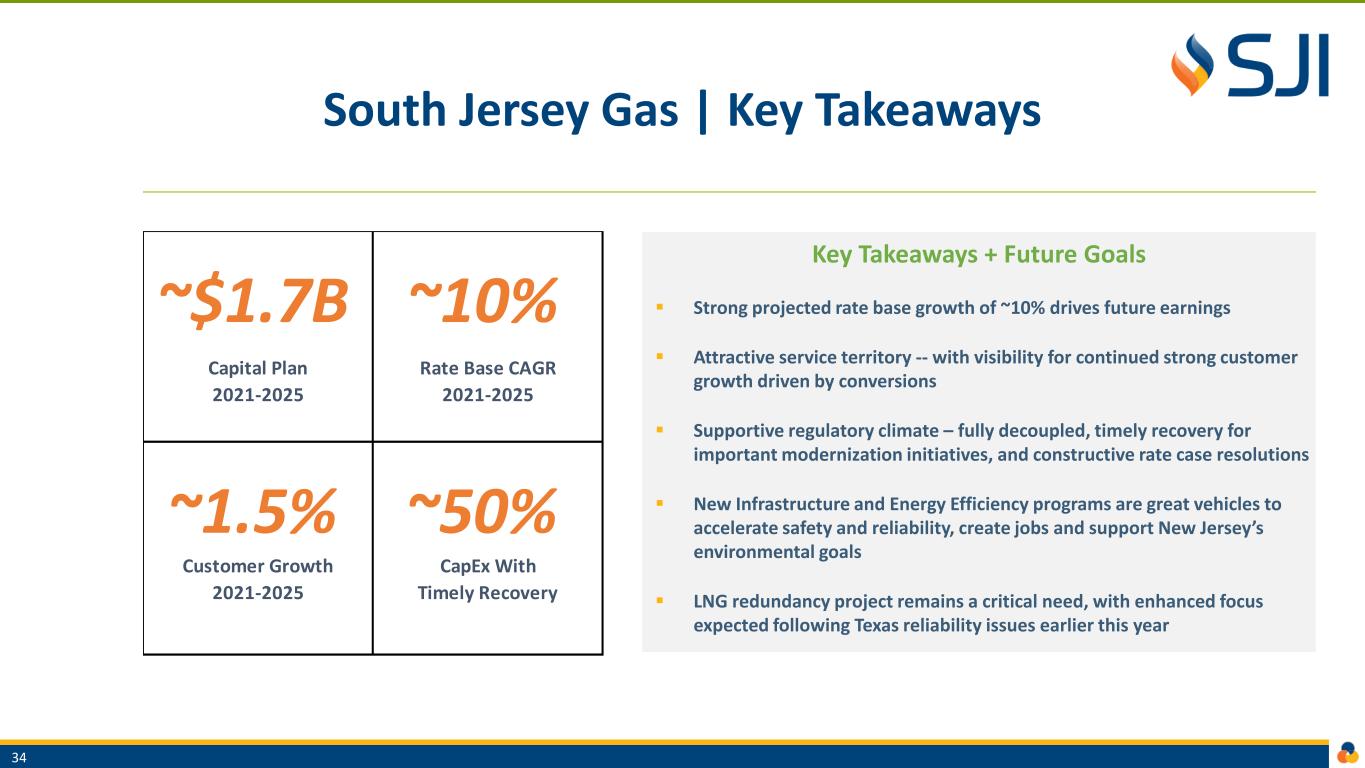
South Jersey Gas | Key Takeaways Key Takeaways + Future Goals ▪ Strong projected rate base growth of ~10% drives future earnings ▪ Attractive service territory -- with visibility for continued strong customer growth driven by conversions ▪ Supportive regulatory climate – fully decoupled, timely recovery for important modernization initiatives, and constructive rate case resolutions ▪ New Infrastructure and Energy Efficiency programs are great vehicles to accelerate safety and reliability, create jobs and support New Jersey’s environmental goals ▪ LNG redundancy project remains a critical need, with enhanced focus expected following Texas reliability issues earlier this year 34 ~$1.7B ~10% ~1.5% ~50% CapEx With Timely Recovery Capital Plan 2021-2025 Rate Base CAGR 2021-2025 Customer Growth 2021-2025
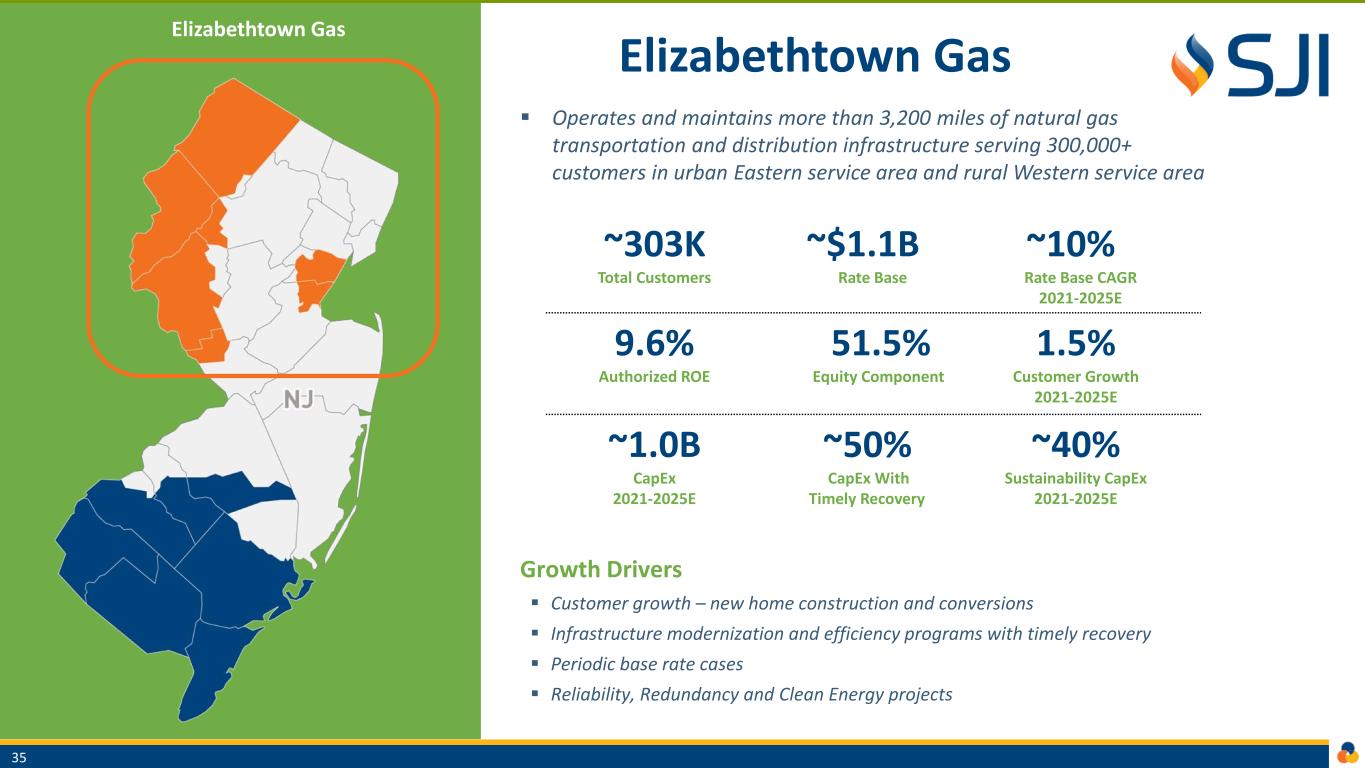
~303K Total Customers ~$1.1B Rate Base ~10% Rate Base CAGR 2021-2025E 9.6% Authorized ROE 51.5% Equity Component 1.5% Customer Growth 2021-2025E ~1.0B CapEx 2021-2025E ~50% CapEx With Timely Recovery ~40% Sustainability CapEx 2021-2025E Elizabethtown Gas ▪ Operates and maintains more than 3,200 miles of natural gas transportation and distribution infrastructure serving 300,000+ customers in urban Eastern service area and rural Western service area Growth Drivers ▪ Customer growth – new home construction and conversions ▪ Infrastructure modernization and efficiency programs with timely recovery ▪ Periodic base rate cases ▪ Reliability, Redundancy and Clean Energy projects Elizabethtown Gas 35
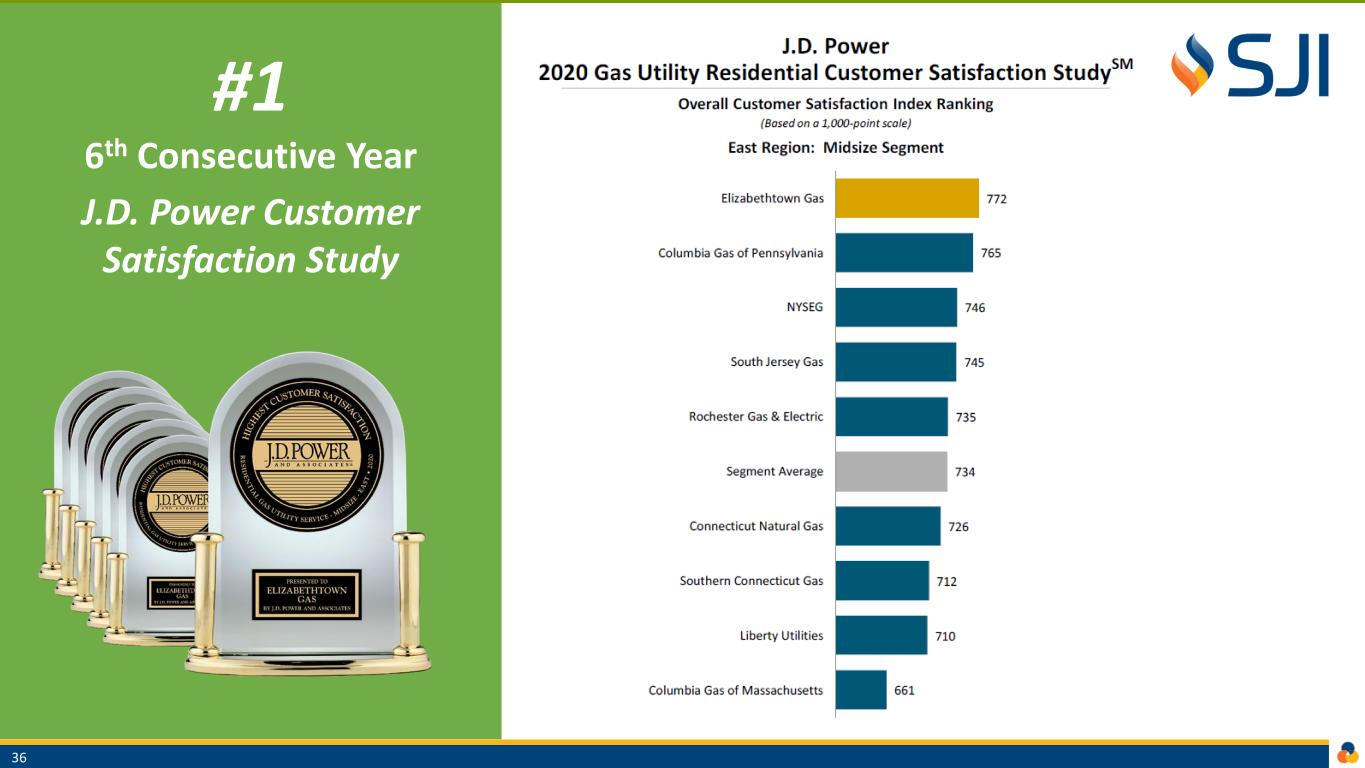
#1 6th Consecutive Year J.D. Power Customer Satisfaction Study 36
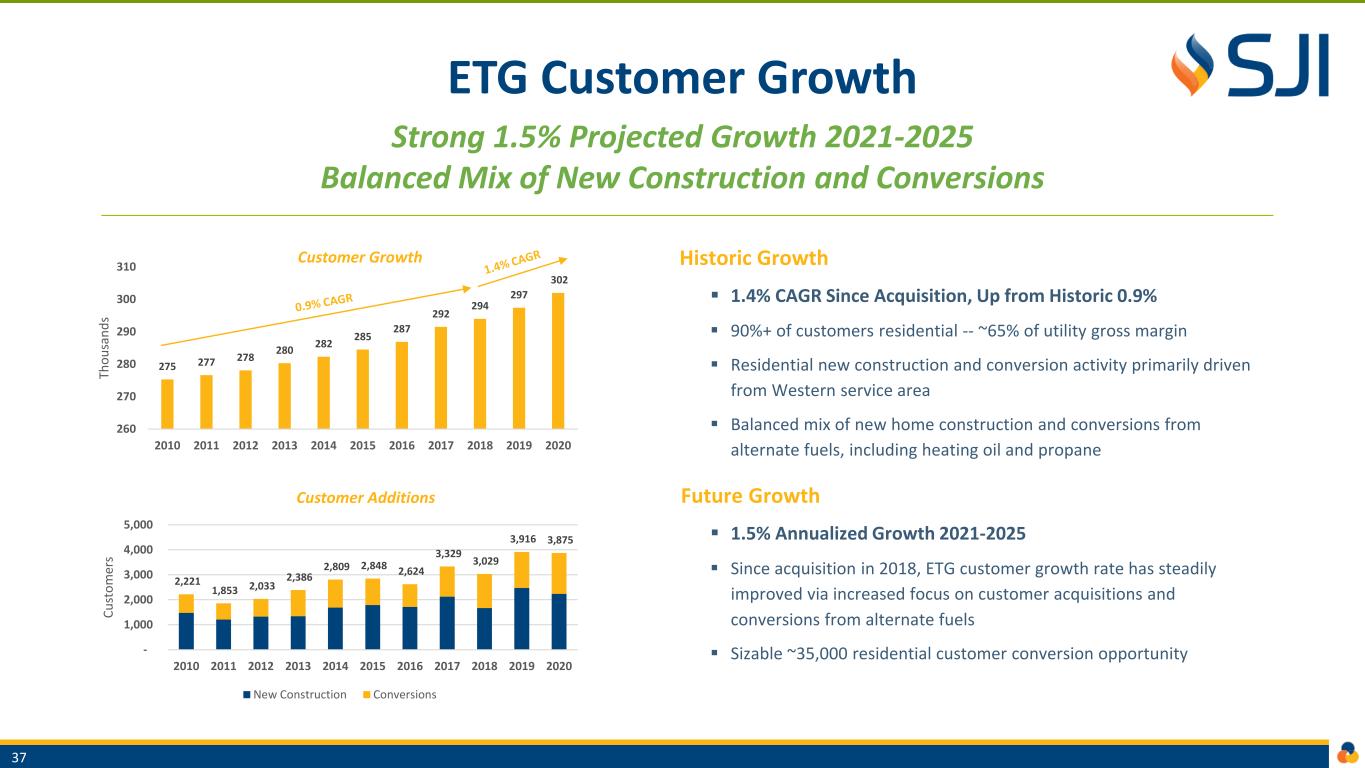
ETG Customer Growth Strong 1.5% Projected Growth 2021-2025 Balanced Mix of New Construction and Conversions Historic Growth ▪ 1.4% CAGR Since Acquisition, Up from Historic 0.9% ▪ 90%+ of customers residential -- ~65% of utility gross margin ▪ Residential new construction and conversion activity primarily driven from Western service area ▪ Balanced mix of new home construction and conversions from alternate fuels, including heating oil and propane Future Growth ▪ 1.5% Annualized Growth 2021-2025 ▪ Since acquisition in 2018, ETG customer growth rate has steadily improved via increased focus on customer acquisitions and conversions from alternate fuels ▪ Sizable ~35,000 residential customer conversion opportunity 275 277 278 280 282 285 287 292 294 297 302 260 270 280 290 300 310 2010 2011 2012 2013 2014 2015 2016 2017 2018 2019 2020 T h o u sa n d s Customer Growth 37 2,221 1,853 2,033 2,386 2,809 2,848 2,624 3,329 3,029 3,916 3,875 - 1,000 2,000 3,000 4,000 5,000 2010 2011 2012 2013 2014 2015 2016 2017 2018 2019 2020 C u st o m e rs Customer Additions New Construction Conversions
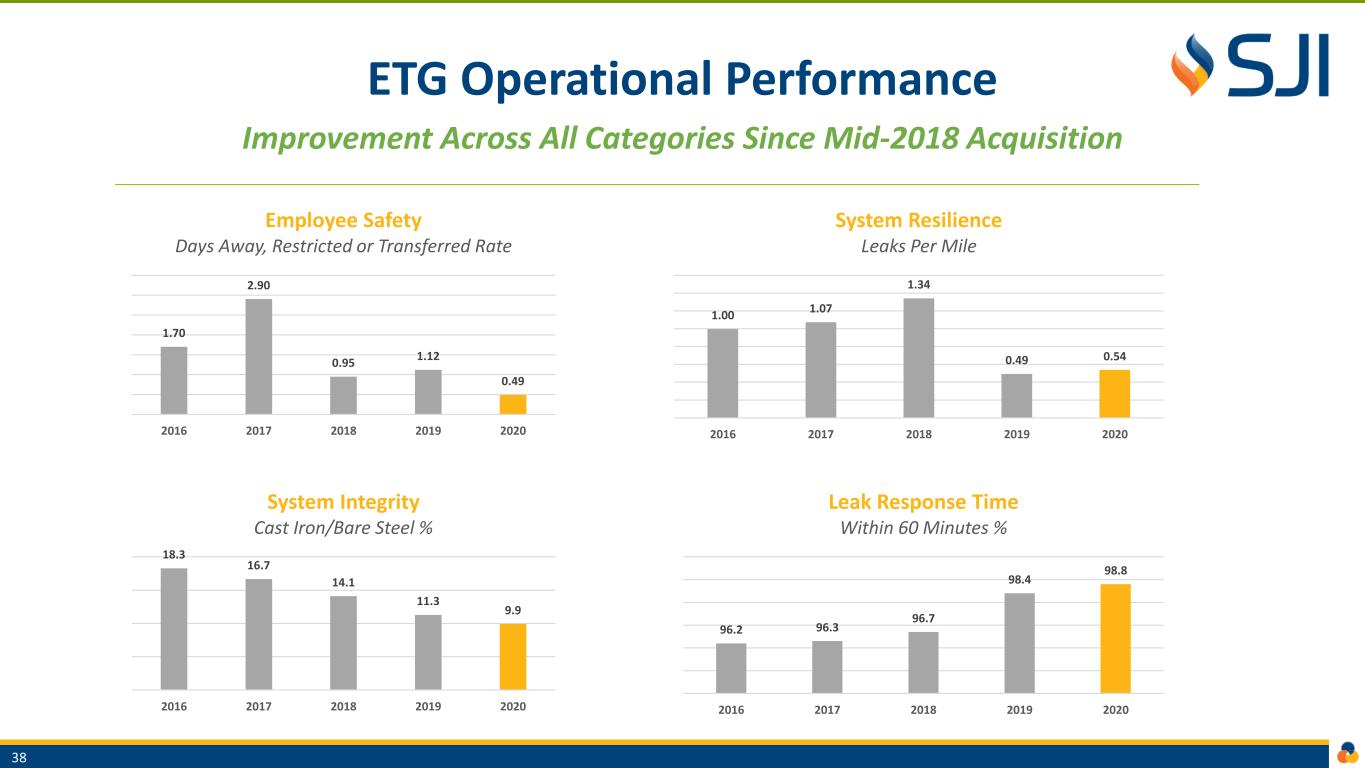
ETG Operational Performance Improvement Across All Categories Since Mid-2018 Acquisition 1.70 2.90 0.95 1.12 0.49 2016 2017 2018 2019 2020 Employee Safety Days Away, Restricted or Transferred Rate 1.00 1.07 1.34 0.49 0.54 2016 2017 2018 2019 2020 System Resilience Leaks Per Mile 18.3 16.7 14.1 11.3 9.9 2016 2017 2018 2019 2020 System Integrity Cast Iron/Bare Steel % 38 96.2 96.3 96.7 98.4 98.8 2016 2017 2018 2019 2020 Leak Response Time Within 60 Minutes %

ETG Regulatory Climate Constructive Partnership With NJBPU Fosters Safety, Reliability and Energy Efficiency With Timely Cost Recovery 39 Authorized Program Objective Authorized Amount Timing ROE Equity Component Average Annual CapEx (M) Accelerated Recovery Conservation Incentive Program (CIP) Promote conservation efforts, without negatively impacting financial stability, by basing ETG's profit margin on the number of customers rather than the amount of natural gas distributed to customers Annual True-Up Permanent N/A N/A NA NA Infrastructure Investment Program (IIP) Enhance the safety and reliability of gas system infrastructure through replacement of aging pipeline and other modernization activities $300.0 7/1/19 - 6/30/24 9.6% 51.5% 60.0 Yes Energy Efficiency Program (EET) Encourage customers to reduce energy usage, lower emissions and save money $74.0 7/1/21 - 6/30/24 9.6% 51.5% 24.7 Yes

ETG Infrastructure Modernization ~300 Miles of Cast Iron Pipeline To Be Replaced 2021-2025, ~600 Miles of Vintage Steel and Plastic Beyond 2025 40 Pipeline Replacement 2021-2025 Pipeline Replacement Beyond 2025
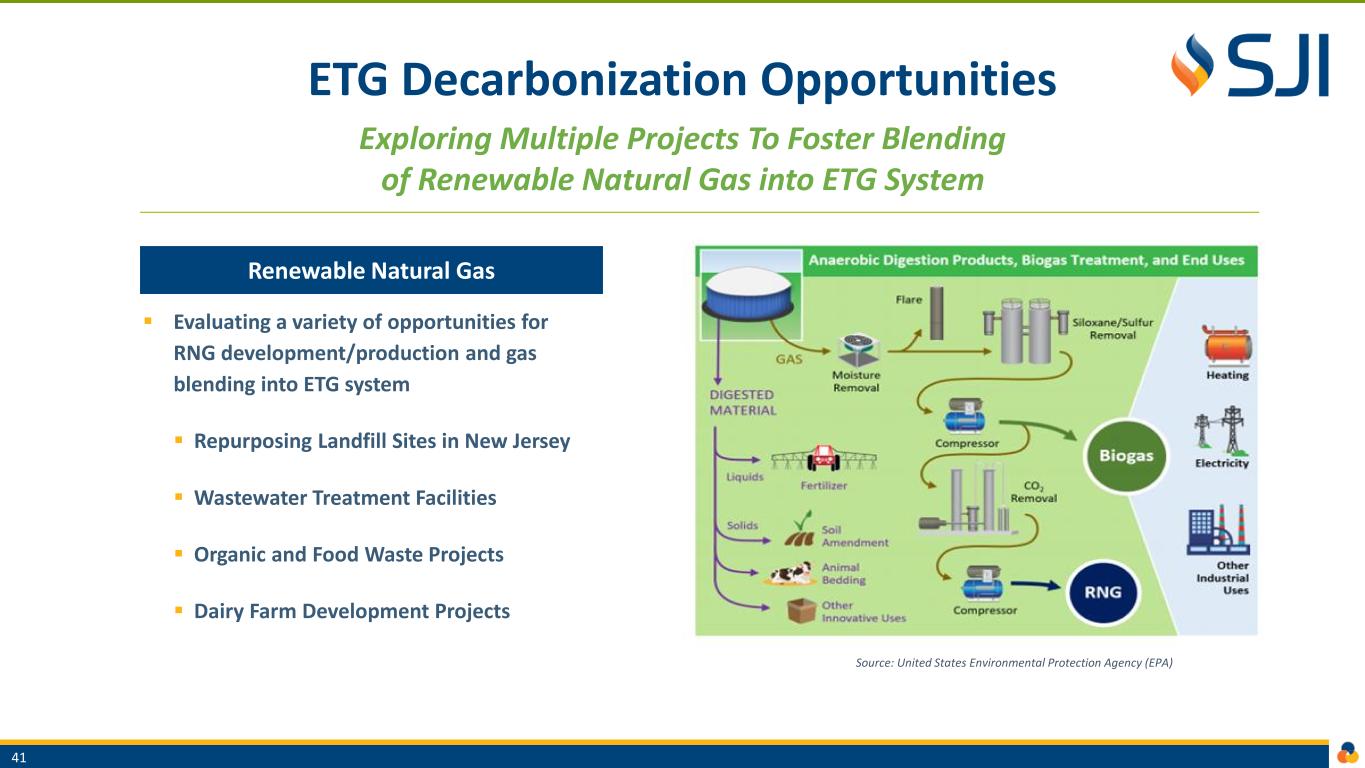
ETG Decarbonization Opportunities Exploring Multiple Projects To Foster Blending of Renewable Natural Gas into ETG System ▪ Evaluating a variety of opportunities for RNG development/production and gas blending into ETG system ▪ Repurposing Landfill Sites in New Jersey ▪ Wastewater Treatment Facilities ▪ Organic and Food Waste Projects ▪ Dairy Farm Development Projects Renewable Natural Gas 41 Source: United States Environmental Protection Agency (EPA)
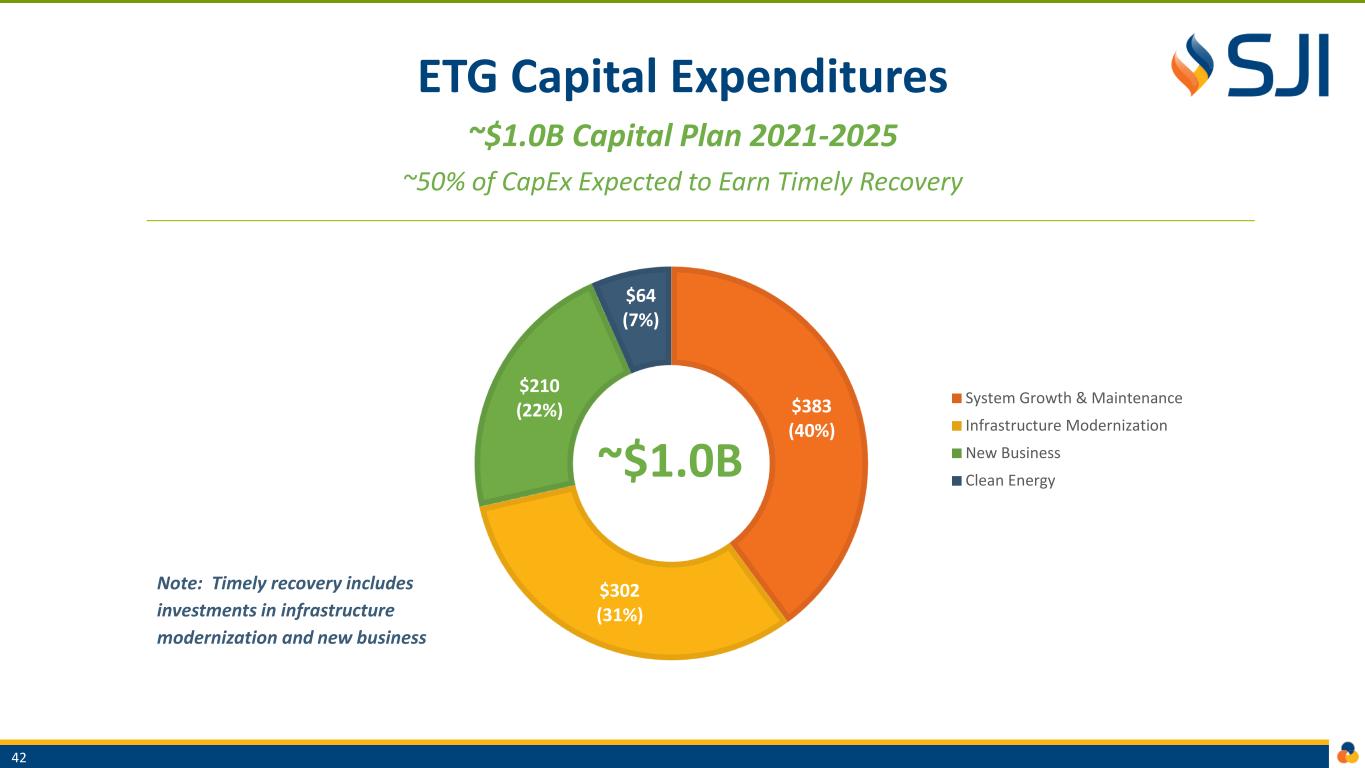
ETG Capital Expenditures ~$1.0B Capital Plan 2021-2025 ~50% of CapEx Expected to Earn Timely Recovery ~$1.0B 42 Note: Timely recovery includes investments in infrastructure modernization and new business $383 (40%) $302 (31%) $210 (22%) $64 (7%) System Growth & Maintenance Infrastructure Modernization New Business Clean Energy
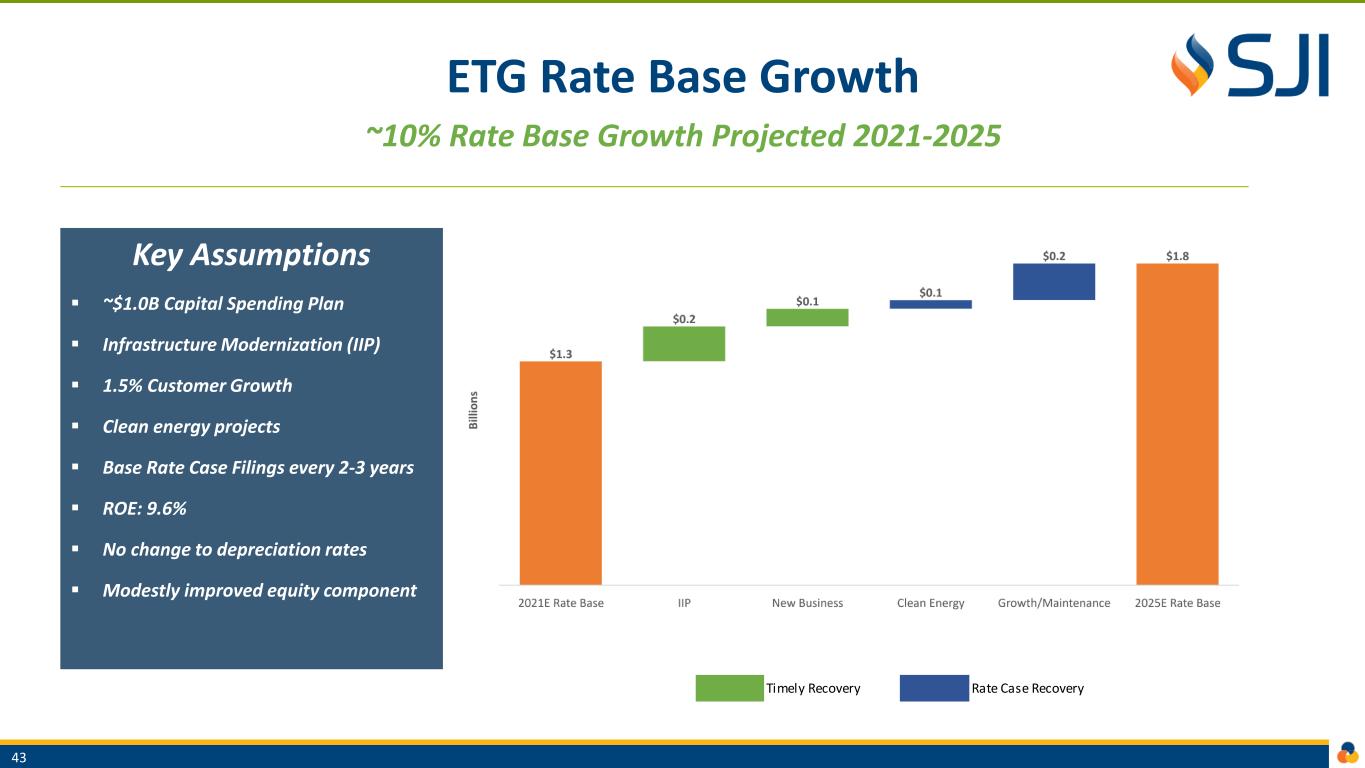
ETG Rate Base Growth ~10% Rate Base Growth Projected 2021-2025 Key Assumptions ▪ ~$1.0B Capital Spending Plan ▪ Infrastructure Modernization (IIP) ▪ 1.5% Customer Growth ▪ Clean energy projects ▪ Base Rate Case Filings every 2-3 years ▪ ROE: 9.6% ▪ No change to depreciation rates ▪ Modestly improved equity component 43 Timely Recovery Rate Case Recovery
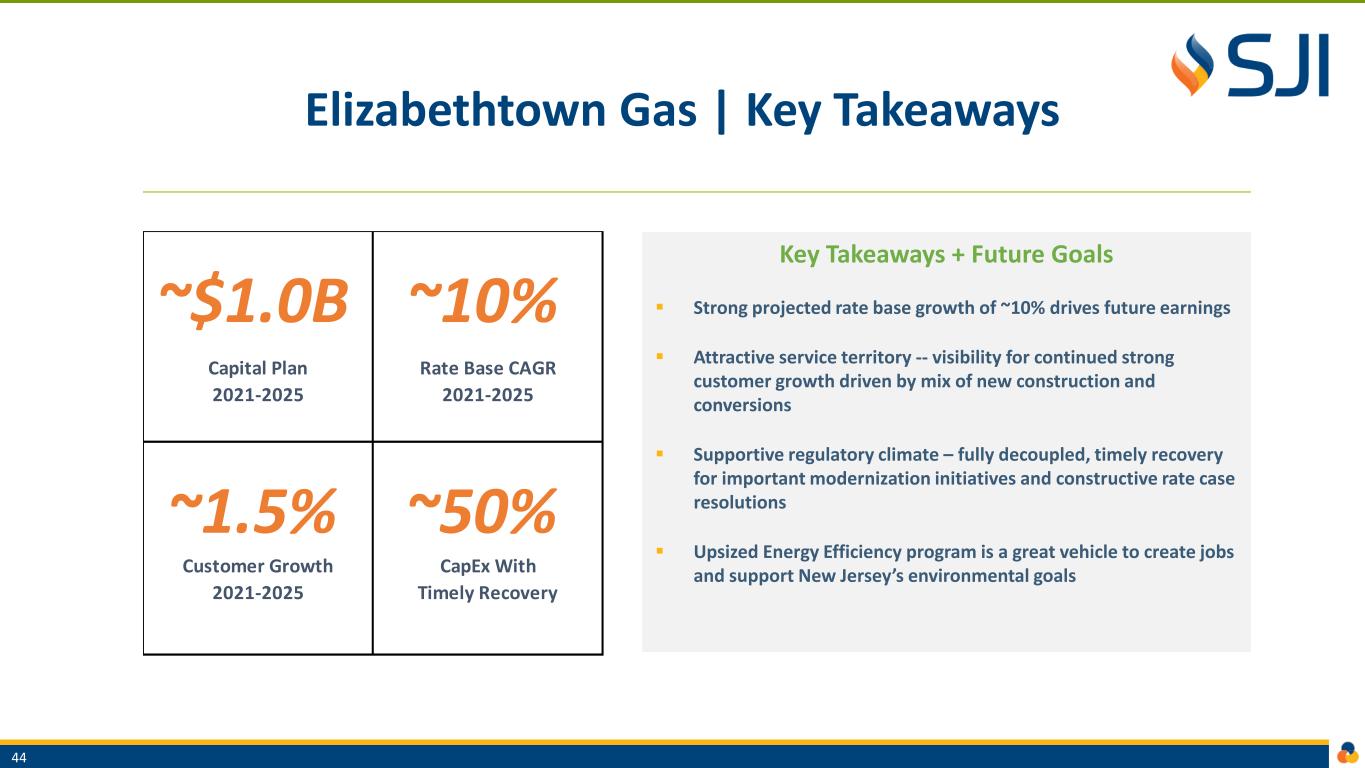
Elizabethtown Gas | Key Takeaways Key Takeaways + Future Goals ▪ Strong projected rate base growth of ~10% drives future earnings ▪ Attractive service territory -- visibility for continued strong customer growth driven by mix of new construction and conversions ▪ Supportive regulatory climate – fully decoupled, timely recovery for important modernization initiatives and constructive rate case resolutions ▪ Upsized Energy Efficiency program is a great vehicle to create jobs and support New Jersey’s environmental goals 44 ~$1.0B ~10% ~1.5% ~50% CapEx With Timely Recovery Capital Plan 2021-2025 Rate Base CAGR 2021-2025 Customer Growth 2021-2025
Non-Utility Operations Steve Cocchi | Senior Vice President & CFO
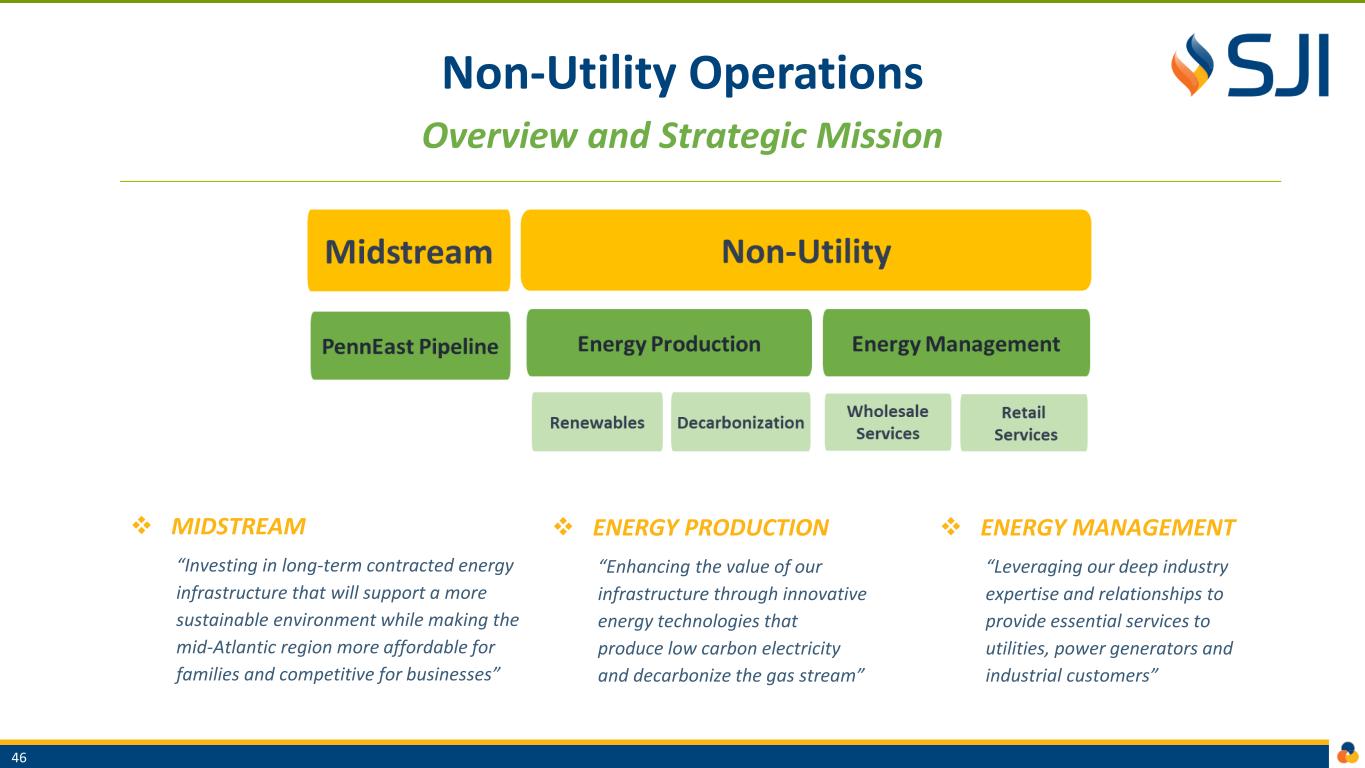
Non-Utility Operations Overview and Strategic Mission ❖ ENERGY MANAGEMENT “Leveraging our deep industry expertise and relationships to provide essential services to utilities, power generators and industrial customers” NON-UTILITY 46 ❖ ENERGY PRODUCTION “Enhancing the value of our infrastructure through innovative energy technologies that produce low carbon electricity and decarbonize the gas stream” ❖ MIDSTREAM “Investing in long-term contracted energy infrastructure that will support a more sustainable environment while making the mid-Atlantic region more affordable for families and competitive for businesses”

Midstream PennEast Pipeline Addresses Critical Supply Need 2021-2025 Forecast Only Includes Phase One ▪ 20% equity owner in 1.1 Bcf/d, 120-mile interstate pipeline from Marcellus region of Pennsylvania into New Jersey ▪ Access to low-cost supply benefits customers/local economies ▪ 100% subscribed; 80%+ capacity under 15-year agreements ▪ SJI investment $68M to date ▪ Phase One projected CapEx ~$110M in 2021/2022 Note: 2017 includes prior years’ AFUDC catch-up ▪ Jan 2020 - Filed with FERC requesting amendment of the certificate to allow project to proceed on a phased basis: ▪ Phase One: 68 miles; 36” pipe; constructed entirely within PA ▪ Phase Two: Remaining route in PA and NJ ▪ Feb 2021 - Supreme Court of U.S. (SCOTUS) granted certiorari to review lower court decision concerning condemnation authority ▪ SCOTUS expected to deliver ruling in June 2021 PennEast Pipeline Recent Actions 47 $4.6 $3.1 $4.2 $4.2 2017 2018 2019 2020 M il li o n s Midstream Earnings
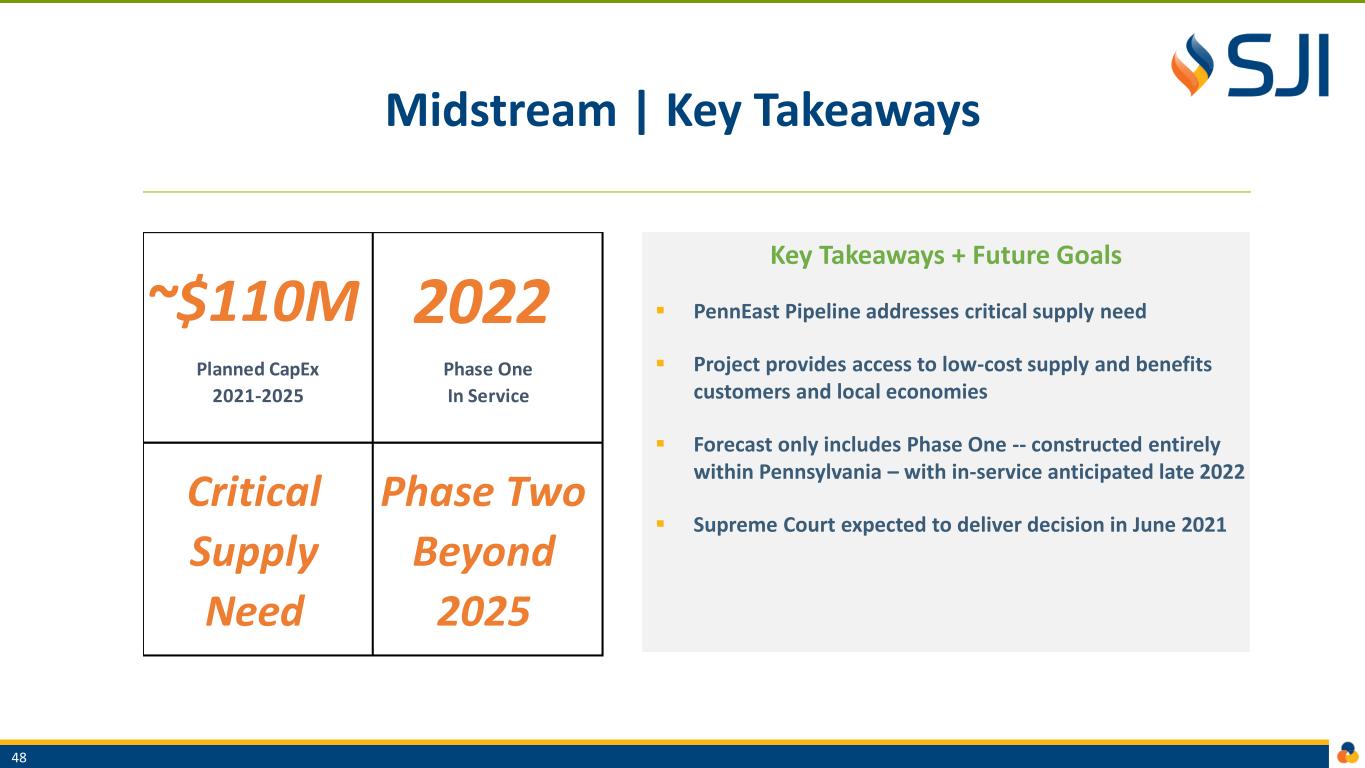
Midstream | Key Takeaways Key Takeaways + Future Goals ▪ PennEast Pipeline addresses critical supply need ▪ Project provides access to low-cost supply and benefits customers and local economies ▪ Forecast only includes Phase One -- constructed entirely within Pennsylvania – with in-service anticipated late 2022 ▪ Supreme Court expected to deliver decision in June 2021 48 ~$110M 2022 Planned CapEx 2021-2025 Phase One In Service Phase Two Beyond 2025 Critical Supply Need

Energy Production Well Positioned For Low Carbon and Renewable Energy Future ▪ Key Pillars -- reducing energy consumption and emissions; strategic deployment of renewables; maximizing energy efficiency; and modernizing via technology ▪ SJI well positioned to support investment opportunities that align with these goals ▪ Primary focus on cash-flow generating decarbonization investments including renewable natural gas (RNG) and hydrogen REDUCING ENERGY CONSUMPTION/EMISSIONS DEPLOYMENT OF RENEWABLE ENERGY MAXIMIZING ENERGY EFFICIENCY MODERNIZING VIA TECHNOLOGY 49
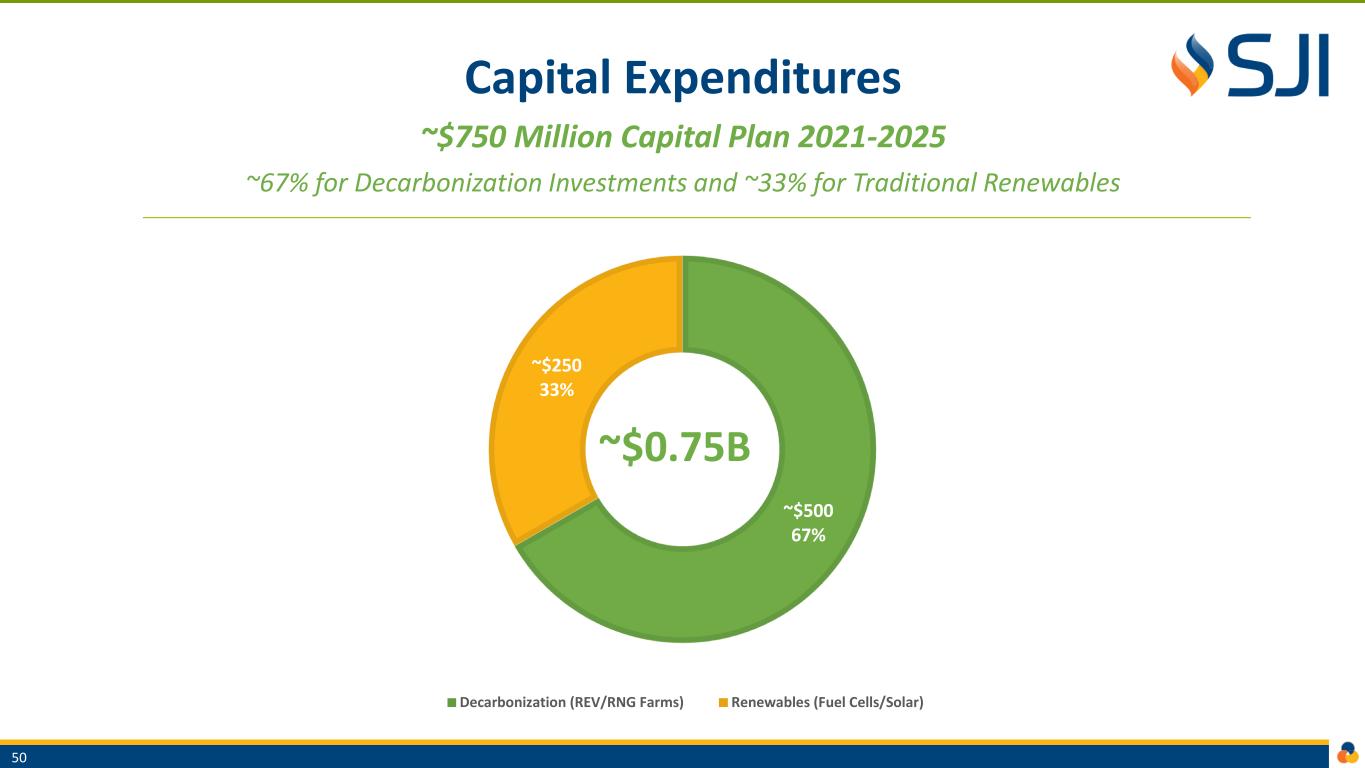
Capital Expenditures ~$750 Million Capital Plan 2021-2025 ~67% for Decarbonization Investments and ~33% for Traditional Renewables ~$0.75B 50 ~$500 67% ~$250 33% Decarbonization (REV/RNG Farms) Renewables (Fuel Cells/Solar)
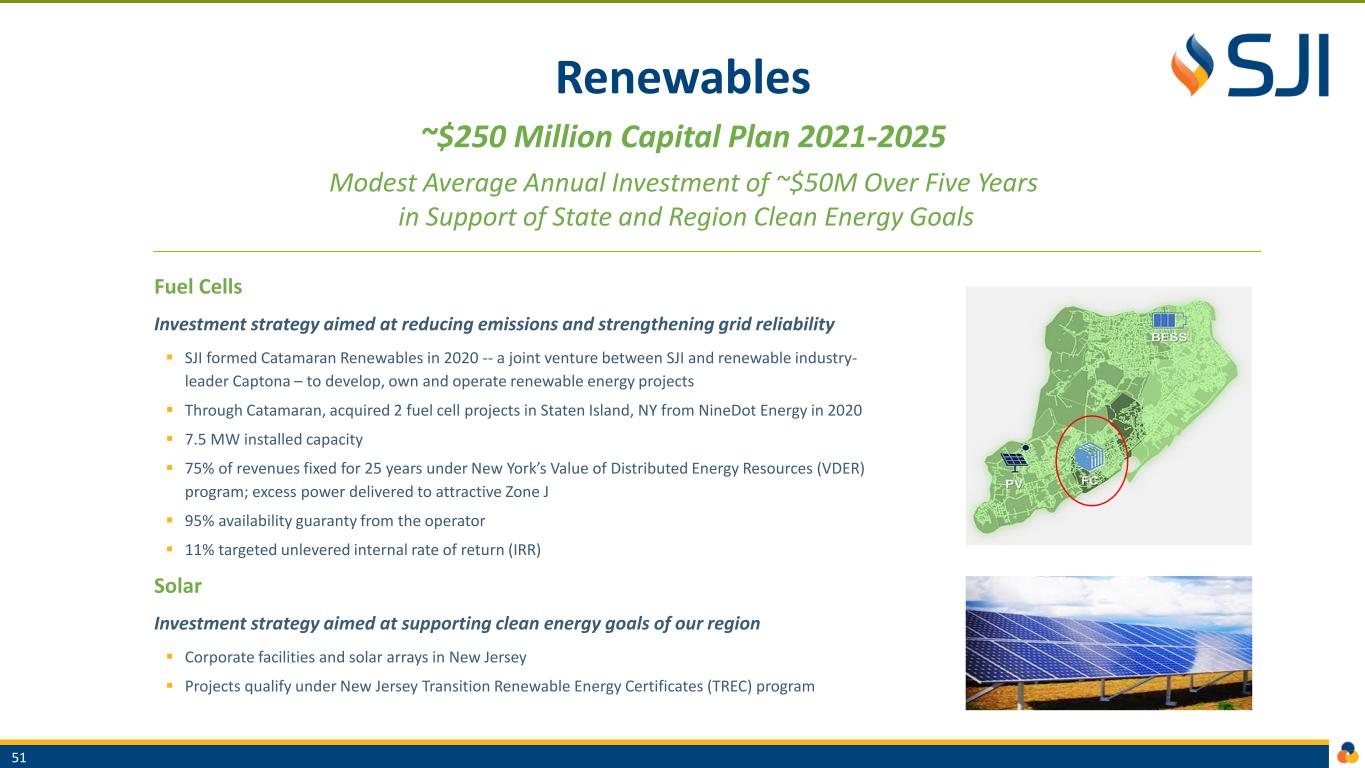
Renewables ~$250 Million Capital Plan 2021-2025 Modest Average Annual Investment of ~$50M Over Five Years in Support of State and Region Clean Energy Goals Fuel Cells Investment strategy aimed at reducing emissions and strengthening grid reliability ▪ SJI formed Catamaran Renewables in 2020 -- a joint venture between SJI and renewable industry- leader Captona – to develop, own and operate renewable energy projects ▪ Through Catamaran, acquired 2 fuel cell projects in Staten Island, NY from NineDot Energy in 2020 ▪ 7.5 MW installed capacity ▪ 75% of revenues fixed for 25 years under New York’s Value of Distributed Energy Resources (VDER) program; excess power delivered to attractive Zone J ▪ 95% availability guaranty from the operator ▪ 11% targeted unlevered internal rate of return (IRR) Solar Investment strategy aimed at supporting clean energy goals of our region ▪ Corporate facilities and solar arrays in New Jersey ▪ Projects qualify under New Jersey Transition Renewable Energy Certificates (TREC) program 51
Decarbonization ~$500 Million Capital Plan 2021-2025 Targeted Investment in RNG Entity and RNG Project Development Acquired minority interest in REV LNG, LLC in 2020, along with rights to develop anaerobic digesters at a portfolio of dairy farms to produce RNG ▪ REV is a leading renewable energy project development and mobile energy services company ▪ REV specializes in providing innovative RNG solutions paired with vertically integrated mobile service capabilities focused on the production, supply, transportation, and distribution of LNG, CNG and RNG ▪ Structured for SJI to purchase remaining outstanding equity of REV as company achieves financial milestones ✓ Immediate opportunity to execute on decarbonization strategy and support clean energy goals of our region ✓ Equity/Royalty interest in operating RNG projects with creditworthy off-takers and strong cash flows ✓ Complementary to utility rate base opportunities in New Jersey at landfills and wastewater treatment facilities ✓ Proven track record of successful energy development, management and operations ✓ Accretive to SJI cash flow and earnings and supports additional improvement in credit metrics Investment Opportunity Strategic Rationale 52
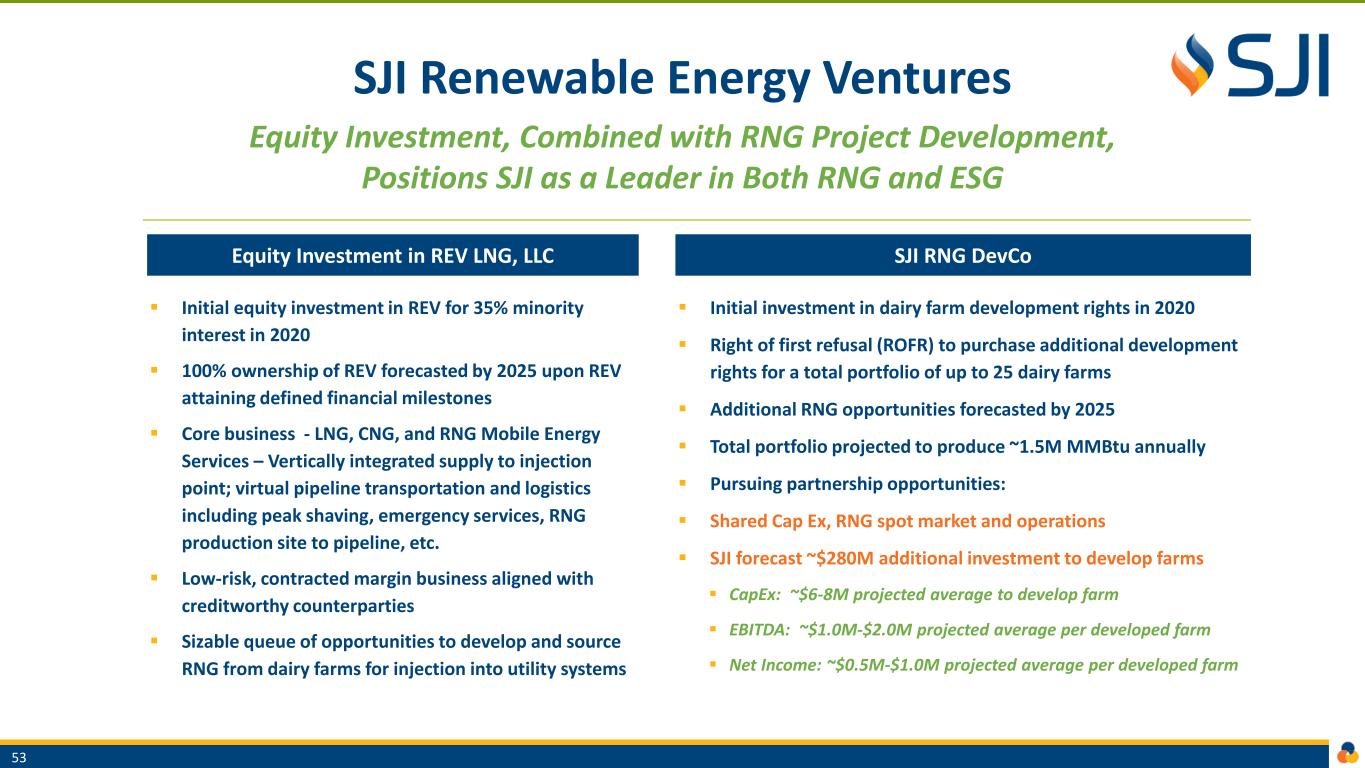
SJI Renewable Energy Ventures Equity Investment, Combined with RNG Project Development, Positions SJI as a Leader in Both RNG and ESG ▪ Initial equity investment in REV for 35% minority interest in 2020 ▪ 100% ownership of REV forecasted by 2025 upon REV attaining defined financial milestones ▪ Core business - LNG, CNG, and RNG Mobile Energy Services – Vertically integrated supply to injection point; virtual pipeline transportation and logistics including peak shaving, emergency services, RNG production site to pipeline, etc. ▪ Low-risk, contracted margin business aligned with creditworthy counterparties ▪ Sizable queue of opportunities to develop and source RNG from dairy farms for injection into utility systems ▪ Initial investment in dairy farm development rights in 2020 ▪ Right of first refusal (ROFR) to purchase additional development rights for a total portfolio of up to 25 dairy farms ▪ Additional RNG opportunities forecasted by 2025 ▪ Total portfolio projected to produce ~1.5M MMBtu annually ▪ Pursuing partnership opportunities: ▪ Shared Cap Ex, RNG spot market and operations ▪ SJI forecast ~$280M additional investment to develop farms ▪ CapEx: ~$6-8M projected average to develop farm ▪ EBITDA: ~$1.0M-$2.0M projected average per developed farm ▪ Net Income: ~$0.5M-$1.0M projected average per developed farm Equity Investment in REV LNG, LLC SJI RNG DevCo 53
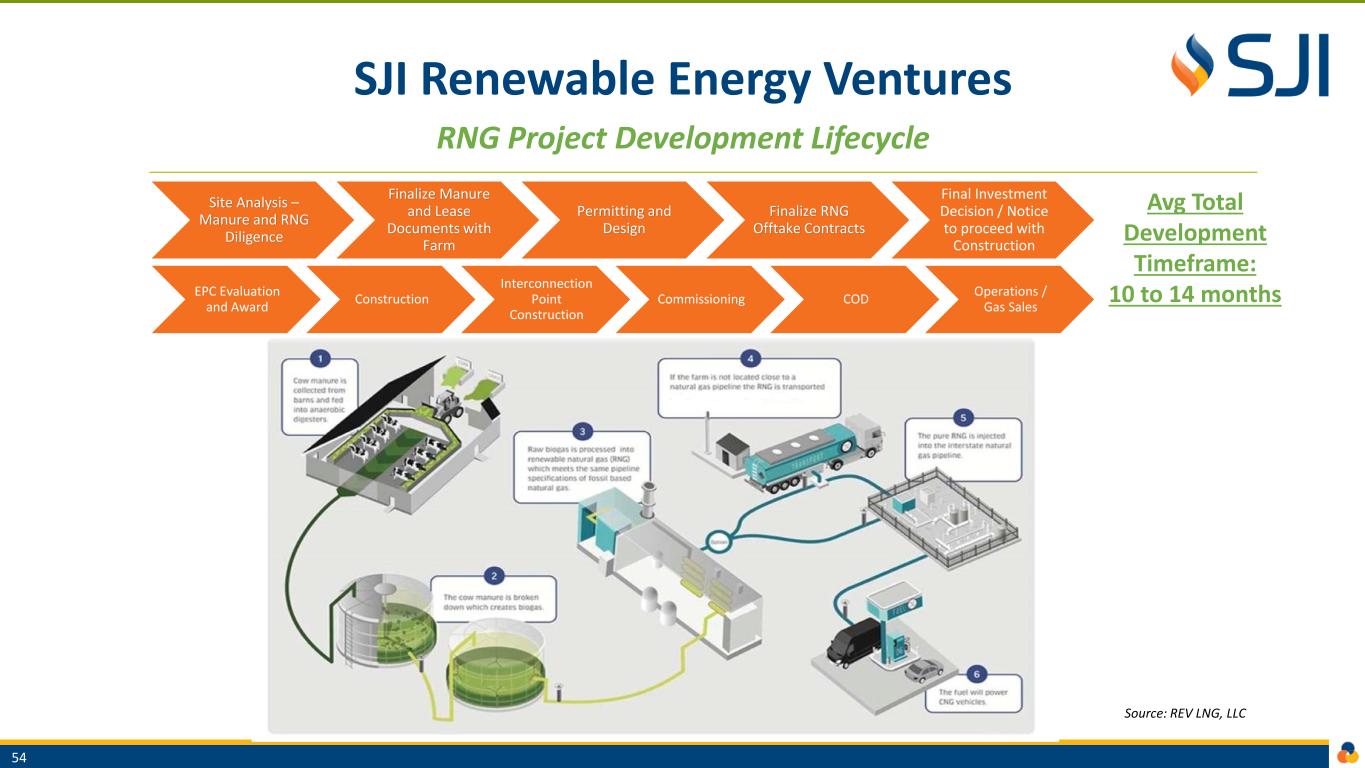
SJI Renewable Energy Ventures RNG Project Development Lifecycle 54 Site Analysis – Manure and RNG Diligence Finalize Manure and Lease Documents with Farm Permitting and Design Finalize RNG Offtake Contracts Final Investment Decision / Notice to proceed with Construction EPC Evaluation and Award Construction Interconnection Point Construction Commissioning COD Operations / Gas Sales Avg Total Development Timeframe: 10 to 14 months Source: REV LNG, LLC
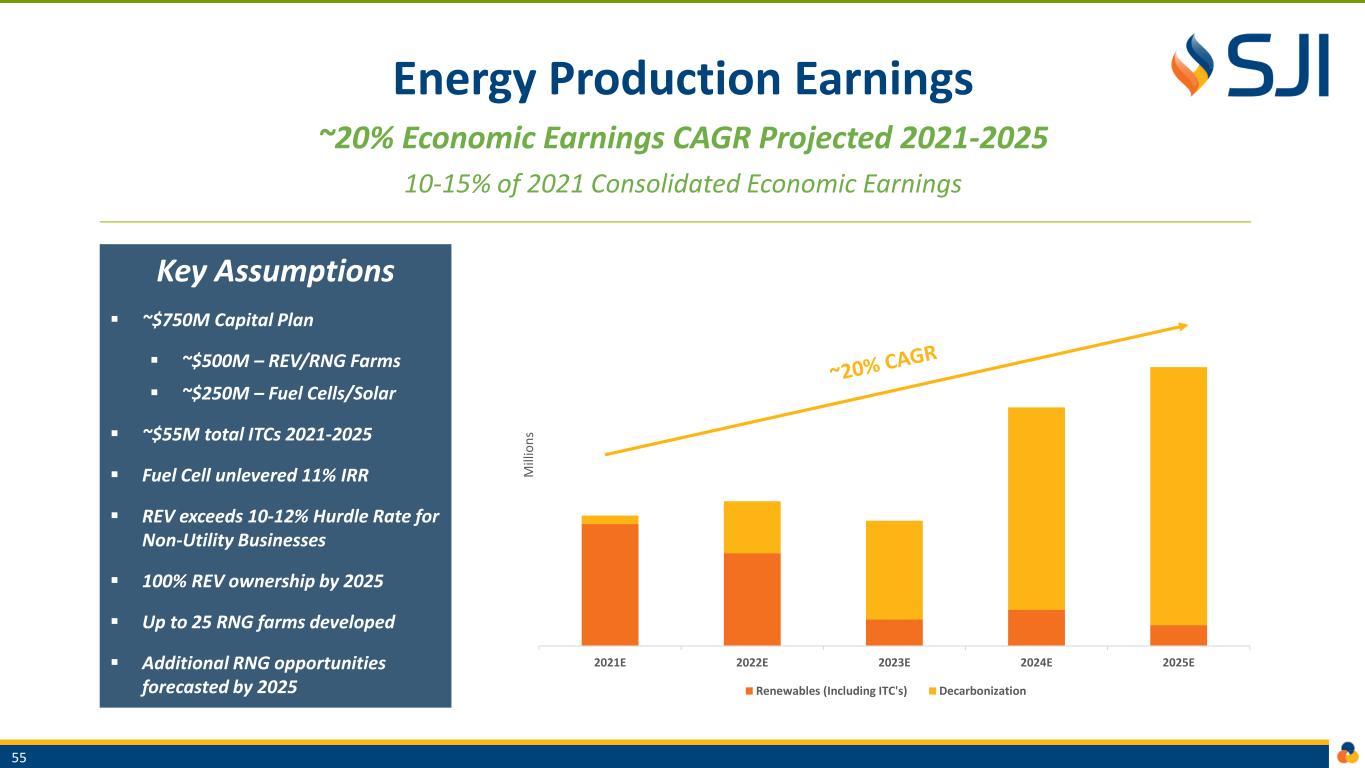
Energy Production Earnings ~20% Economic Earnings CAGR Projected 2021-2025 10-15% of 2021 Consolidated Economic Earnings Key Assumptions ▪ ~$750M Capital Plan ▪ ~$500M – REV/RNG Farms ▪ ~$250M – Fuel Cells/Solar ▪ ~$55M total ITCs 2021-2025 ▪ Fuel Cell unlevered 11% IRR ▪ REV exceeds 10-12% Hurdle Rate for Non-Utility Businesses ▪ 100% REV ownership by 2025 ▪ Up to 25 RNG farms developed ▪ Additional RNG opportunities forecasted by 2025 55 2021E 2022E 2023E 2024E 2025E M il li o n s Renewables (Including ITC's) Decarbonization

Energy Production | Key Takeaways Key Takeaways + Future Goals ▪ SJI well positioned to support accelerating trend toward clean energy and decarbonization ▪ ~$750M investment plan focused on decarbonization and renewables drives ~20% economic earnings CAGR 2021-2025 ▪ REV equity investment, combined with sizable farm development opportunity, provides low-risk contracted margin, and positions SJI as a leader in both RNG and ESG ▪ New Jersey and Federal legislation could result in rate-basing of RNG/Hydrogen investments and ITCs, respectively – representing potential upside to 2021-2025 plan 56 ~20% ~$0.75B Earnings CAGR 2021-2025 Capital Plan 2021-2025 Low-Risk Contracted Margin RNG Legislation Potential
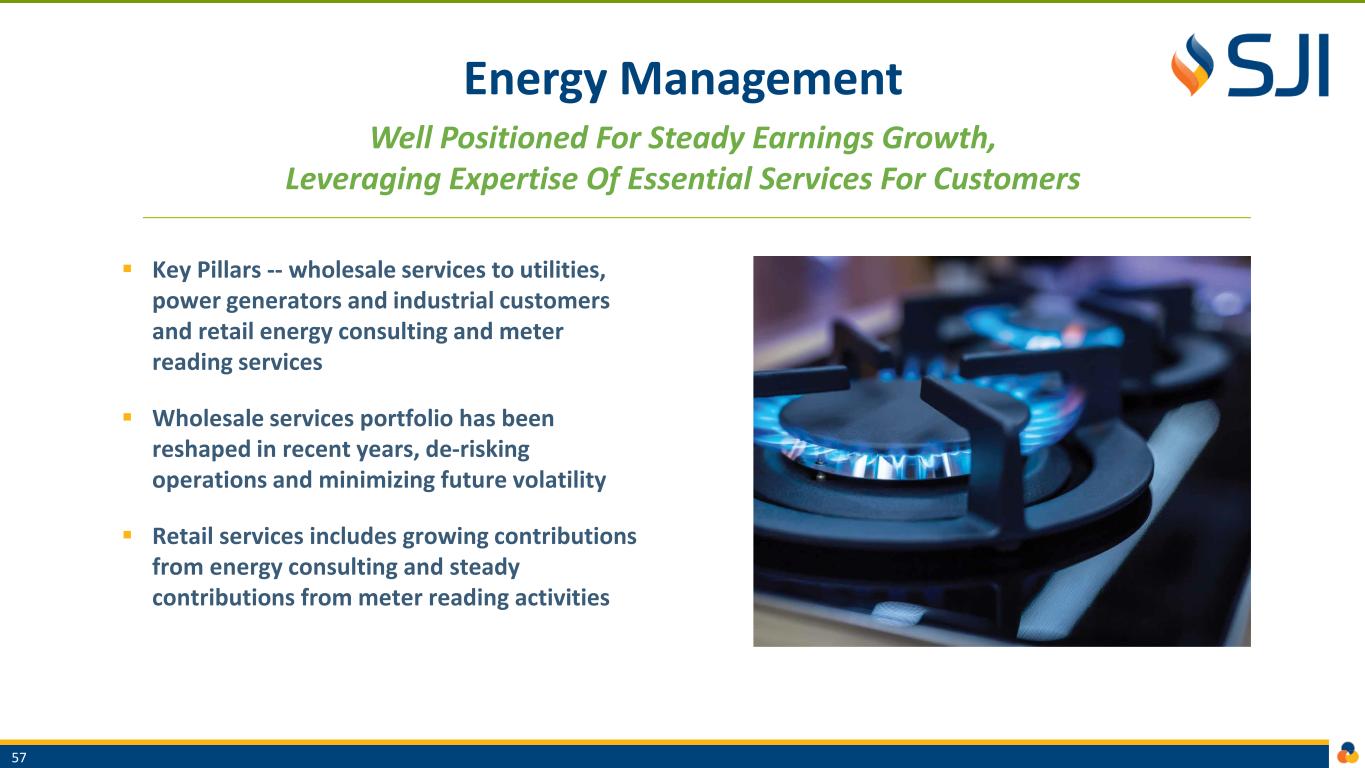
Energy Management Well Positioned For Steady Earnings Growth, Leveraging Expertise Of Essential Services For Customers ▪ Key Pillars -- wholesale services to utilities, power generators and industrial customers and retail energy consulting and meter reading services ▪ Wholesale services portfolio has been reshaped in recent years, de-risking operations and minimizing future volatility ▪ Retail services includes growing contributions from energy consulting and steady contributions from meter reading activities 57
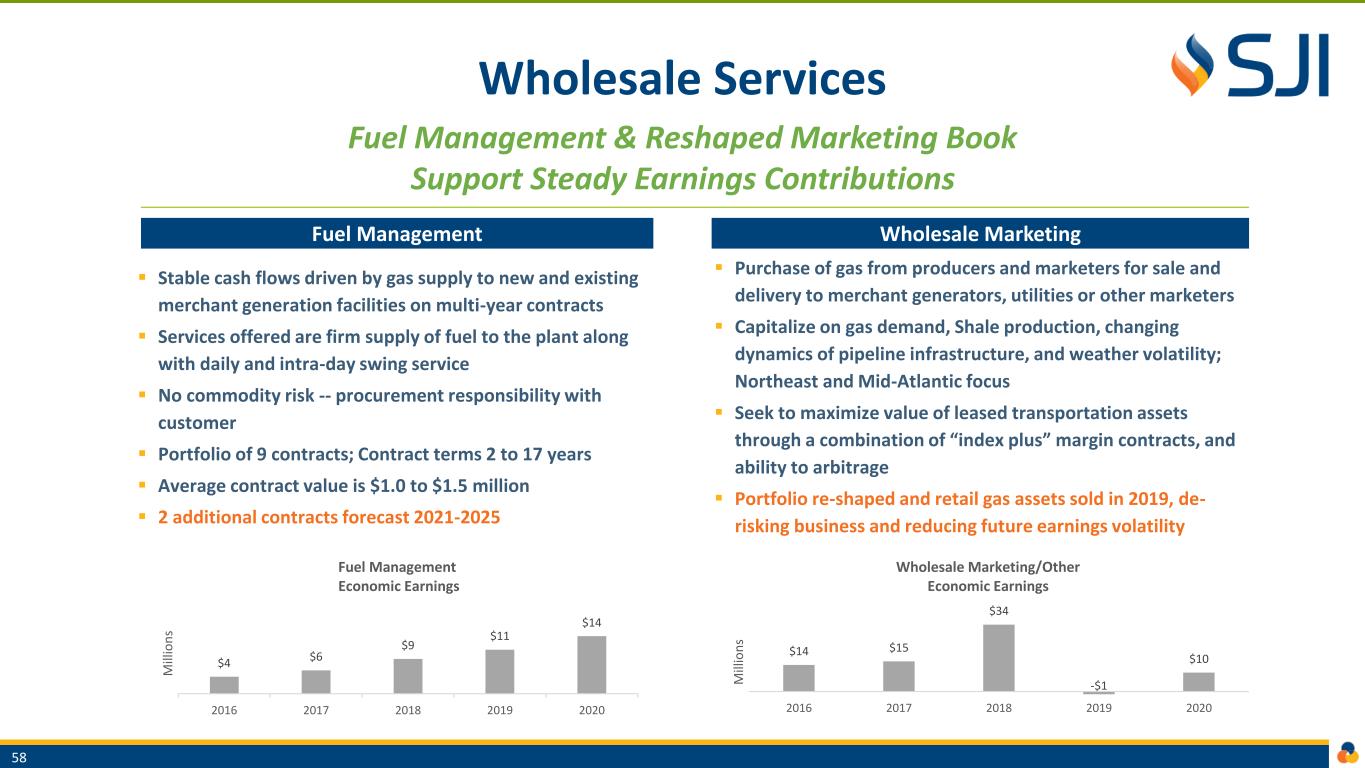
Wholesale Services Fuel Management & Reshaped Marketing Book Support Steady Earnings Contributions ▪ Stable cash flows driven by gas supply to new and existing merchant generation facilities on multi-year contracts ▪ Services offered are firm supply of fuel to the plant along with daily and intra-day swing service ▪ No commodity risk -- procurement responsibility with customer ▪ Portfolio of 9 contracts; Contract terms 2 to 17 years ▪ Average contract value is $1.0 to $1.5 million ▪ 2 additional contracts forecast 2021-2025 ▪ Purchase of gas from producers and marketers for sale and delivery to merchant generators, utilities or other marketers ▪ Capitalize on gas demand, Shale production, changing dynamics of pipeline infrastructure, and weather volatility; Northeast and Mid-Atlantic focus ▪ Seek to maximize value of leased transportation assets through a combination of “index plus” margin contracts, and ability to arbitrage ▪ Portfolio re-shaped and retail gas assets sold in 2019, de- risking business and reducing future earnings volatility Fuel Management Wholesale Marketing 58 $4 $6 $9 $11 $14 2016 2017 2018 2019 2020 M il li o n s Fuel Management Economic Earnings $14 $15 $34 -$1 $10 2016 2017 2018 2019 2020 M il li o n s Wholesale Marketing/Other Economic Earnings
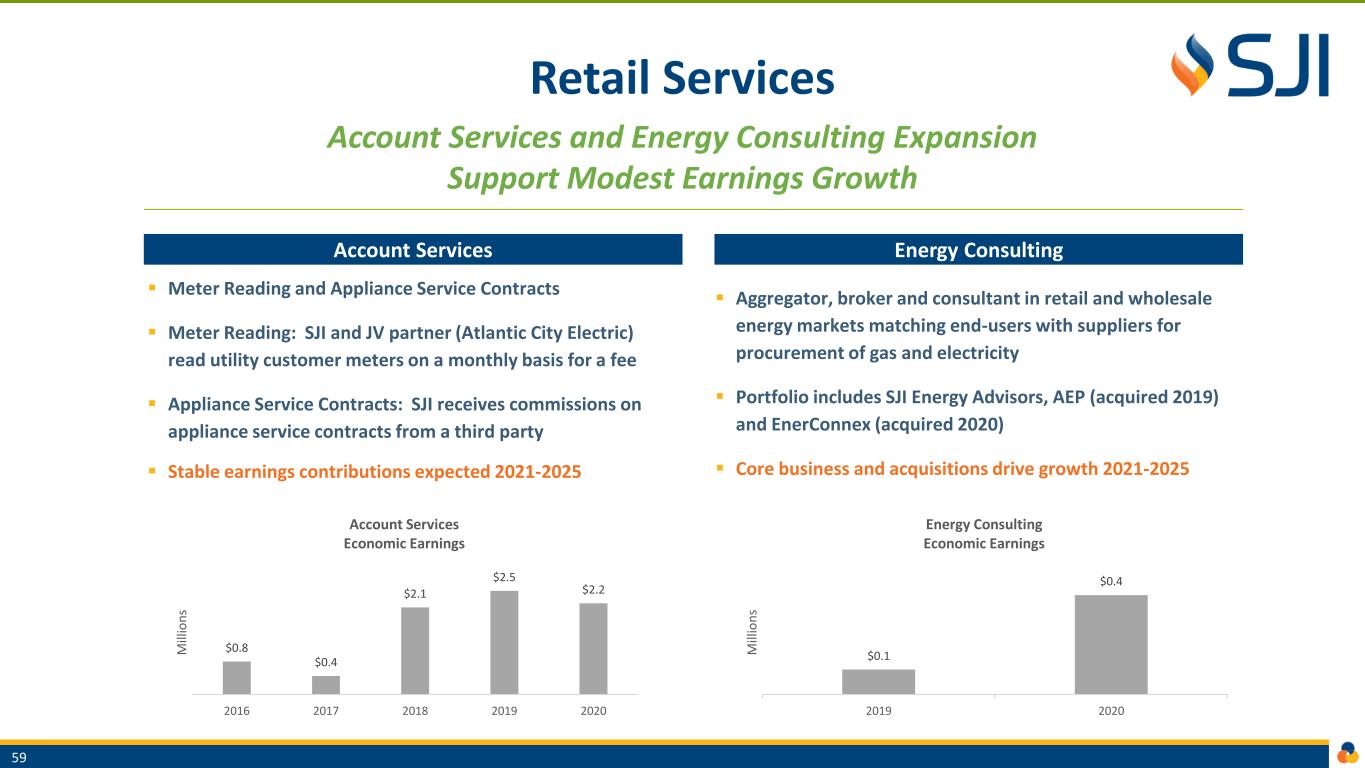
Retail Services Account Services and Energy Consulting Expansion Support Modest Earnings Growth ▪ Meter Reading and Appliance Service Contracts ▪ Meter Reading: SJI and JV partner (Atlantic City Electric) read utility customer meters on a monthly basis for a fee ▪ Appliance Service Contracts: SJI receives commissions on appliance service contracts from a third party ▪ Stable earnings contributions expected 2021-2025 ▪ Aggregator, broker and consultant in retail and wholesale energy markets matching end-users with suppliers for procurement of gas and electricity ▪ Portfolio includes SJI Energy Advisors, AEP (acquired 2019) and EnerConnex (acquired 2020) ▪ Core business and acquisitions drive growth 2021-2025 Account Services Energy Consulting 59 $0.8 $0.4 $2.1 $2.5 $2.2 2016 2017 2018 2019 2020 M il li o n s Account Services Economic Earnings $0.1 $0.4 2019 2020 M il li o n s Energy Consulting Economic Earnings
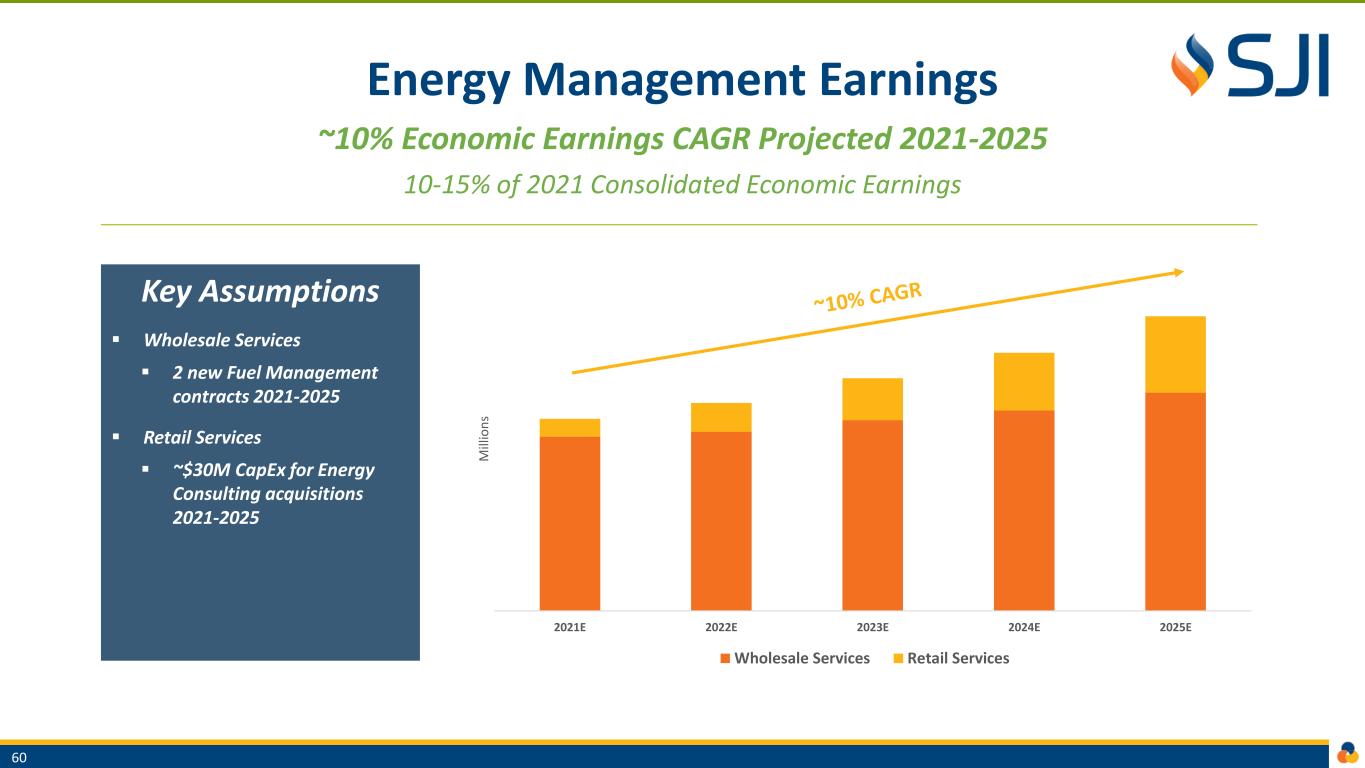
Energy Management Earnings ~10% Economic Earnings CAGR Projected 2021-2025 10-15% of 2021 Consolidated Economic Earnings Key Assumptions ▪ Wholesale Services ▪ 2 new Fuel Management contracts 2021-2025 ▪ Retail Services ▪ ~$30M CapEx for Energy Consulting acquisitions 2021-2025 60 2021E 2022E 2023E 2024E 2025E M il li o n s Wholesale Services Retail Services

Energy Management | Key Takeaways Key Takeaways + Future Goals ▪ Well positioned for ~10% economic earnings CAGR 2021-2025 ▪ Steady cash flows expected from wholesale and retail services ▪ Wholesale services portfolio has been reshaped in recent years -- de-risking the business and minimizing future earnings volatility ▪ Two new fuel management contracts projected 2021-2025 ▪ Retail services growth targeted through expansion of low-risk, energy consulting activities 61 ~10% 2 ~$30M Earnings CAGR 2021-2025 New Fuel Management Contracts Planned CapEx 2021-2025 Stable Cash Flows

Financial Review Steve Cocchi | Senior Vice President & CFO
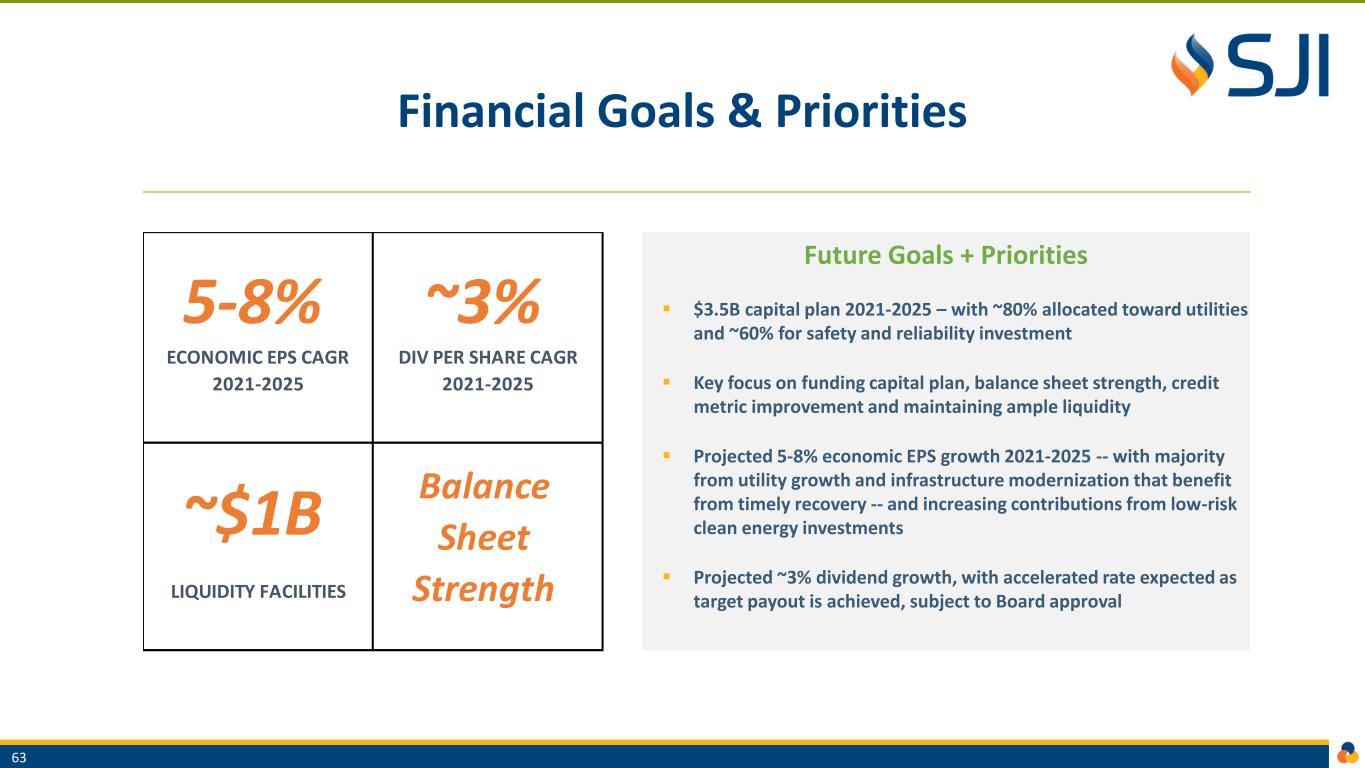
Financial Goals & Priorities Future Goals + Priorities ▪ $3.5B capital plan 2021-2025 – with ~80% allocated toward utilities and ~60% for safety and reliability investment ▪ Key focus on funding capital plan, balance sheet strength, credit metric improvement and maintaining ample liquidity ▪ Projected 5-8% economic EPS growth 2021-2025 -- with majority from utility growth and infrastructure modernization that benefit from timely recovery -- and increasing contributions from low-risk clean energy investments ▪ Projected ~3% dividend growth, with accelerated rate expected as target payout is achieved, subject to Board approval 63 5-8% ~3% ECONOMIC EPS CAGR DIV PER SHARE CAGR 2021-2025 2021-2025 ~$1B LIQUIDITY FACILITIES Balance Sheet Strength

Capital Allocation Disciplined Approach Balances Financial Strength With Strong Growth 64 Capital Allocation Priority 2021-2025 Plan Allocate capital first at utility operating companies to ensure system safety and reliability ~60% of 5-year capital plan dedicated to safety and reliability investments at SJG/ETG Invest in system growth and maintenance at utility operating companies ~80% of 5-year capital plan dedicated to SJG/ETG Invest in clean energy renewable and decarbonization projects that provide attractive risk-adjusted returns Expected to exceed hurdle rate of 10-12% return on unlevered basis for non-utility businesses Continue strengthening balance sheet and credit metrics Equity-to-Total Cap target 40-45% FFO-to-Debt target 12%+ BBB/Stable credit ratings target Return cash to shareholders 70 years paying dividends 22 consecutive years raising dividend

Capital Expenditures ~$3.5 Billion Capital Plan 2021-2025 ~80% for Utilities (SJG/ETG) ~60% for Safety & Reliability ~60% for Sustainability 65 ~ $2,100 60% ~ $1,400 40% Sustainability Traditional ~ $2,000 57% ~ $500 14% ~ $1,000 29% Safety & Reliability New Business Clean Energy ~$2,700 78% ~$800 23% Utilities Non-Utility
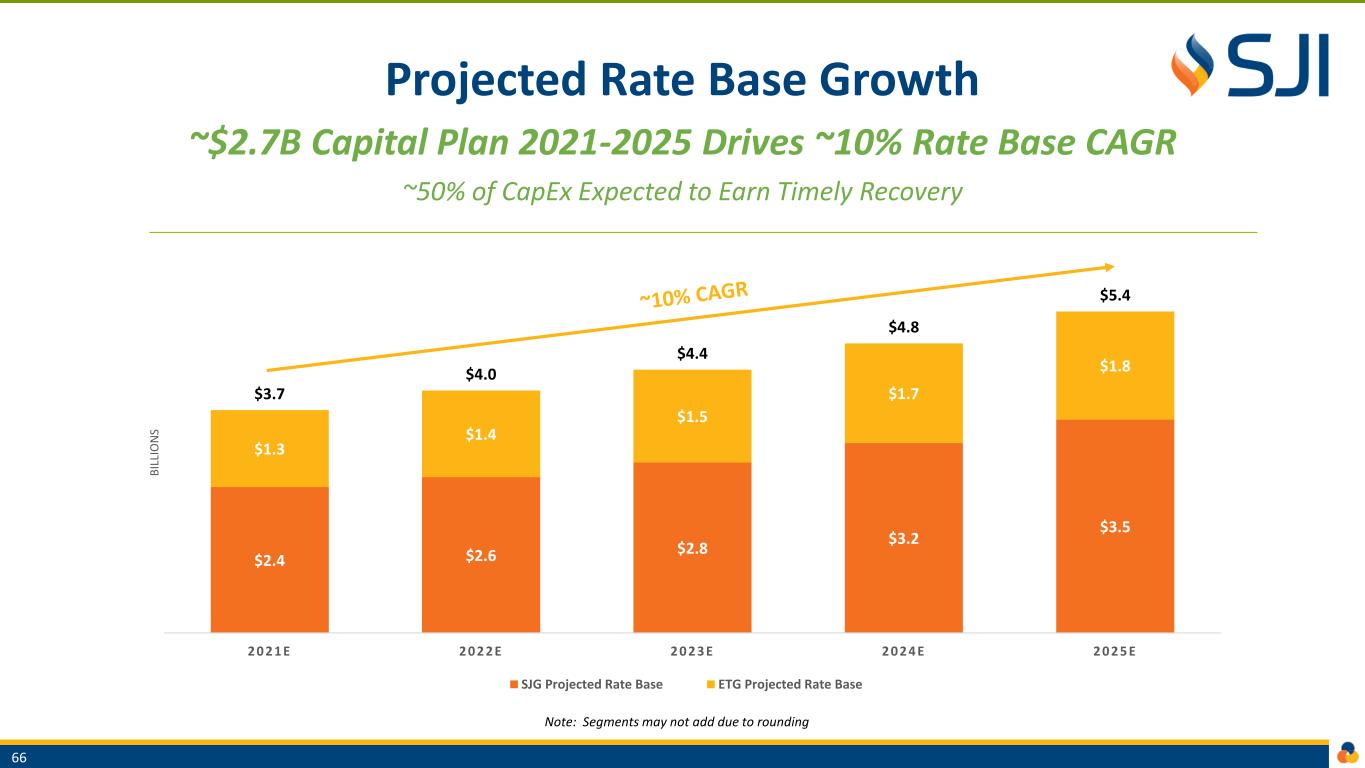
Projected Rate Base Growth ~$2.7B Capital Plan 2021-2025 Drives ~10% Rate Base CAGR ~50% of CapEx Expected to Earn Timely Recovery $2.4 $2.6 $2.8 $3.2 $3.5 $1.3 $1.4 $1.5 $1.7 $1.8 $3.7 $4.0 $4.4 $4.8 $5.4 2 0 2 1 E 2 0 2 2 E 2 0 2 3 E 2 0 2 4 E 2 0 2 5 E B IL LI O N S SJG Projected Rate Base ETG Projected Rate Base 66 Note: Segments may not add due to rounding
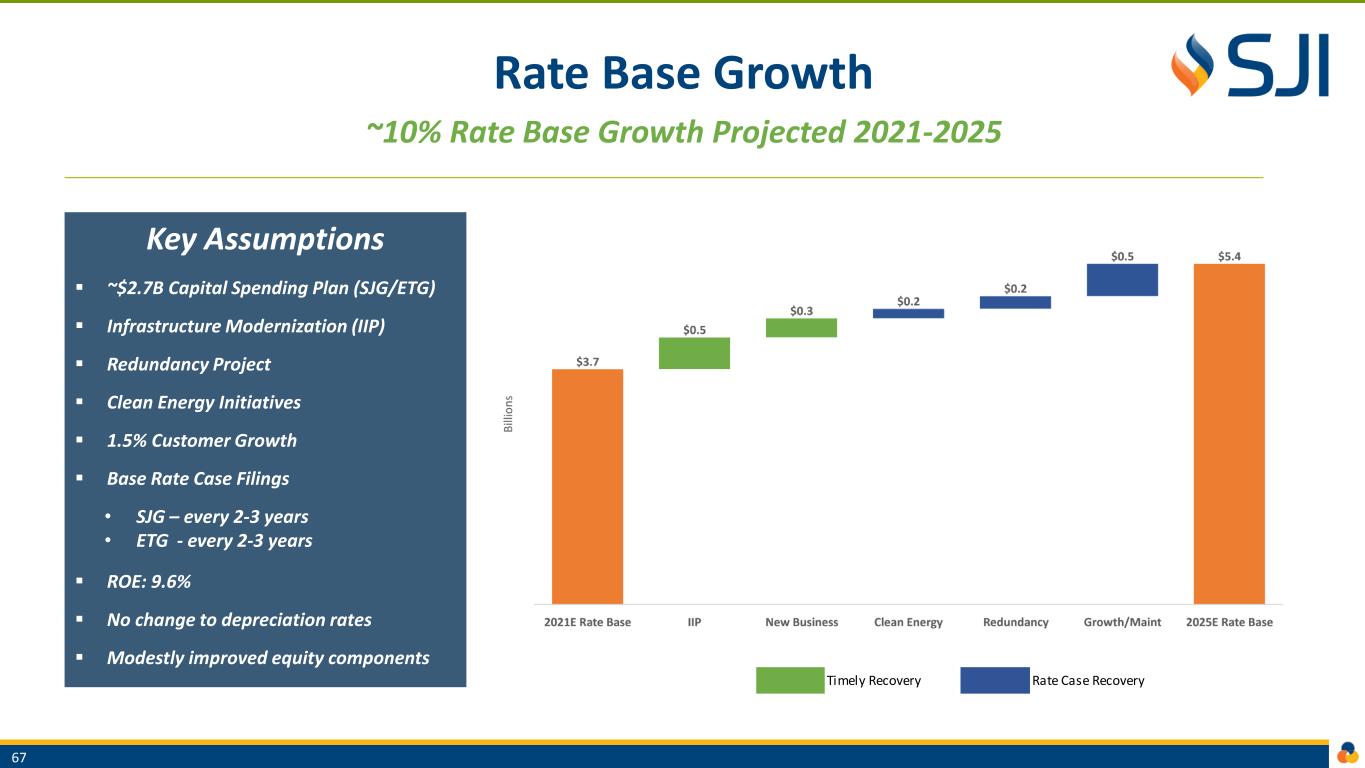
Rate Base Growth ~10% Rate Base Growth Projected 2021-2025 Key Assumptions ▪ ~$2.7B Capital Spending Plan (SJG/ETG) ▪ Infrastructure Modernization (IIP) ▪ Redundancy Project ▪ Clean Energy Initiatives ▪ 1.5% Customer Growth ▪ Base Rate Case Filings • SJG – every 2-3 years • ETG - every 2-3 years ▪ ROE: 9.6% ▪ No change to depreciation rates ▪ Modestly improved equity components 67 Timely Recovery Rate Case Recovery
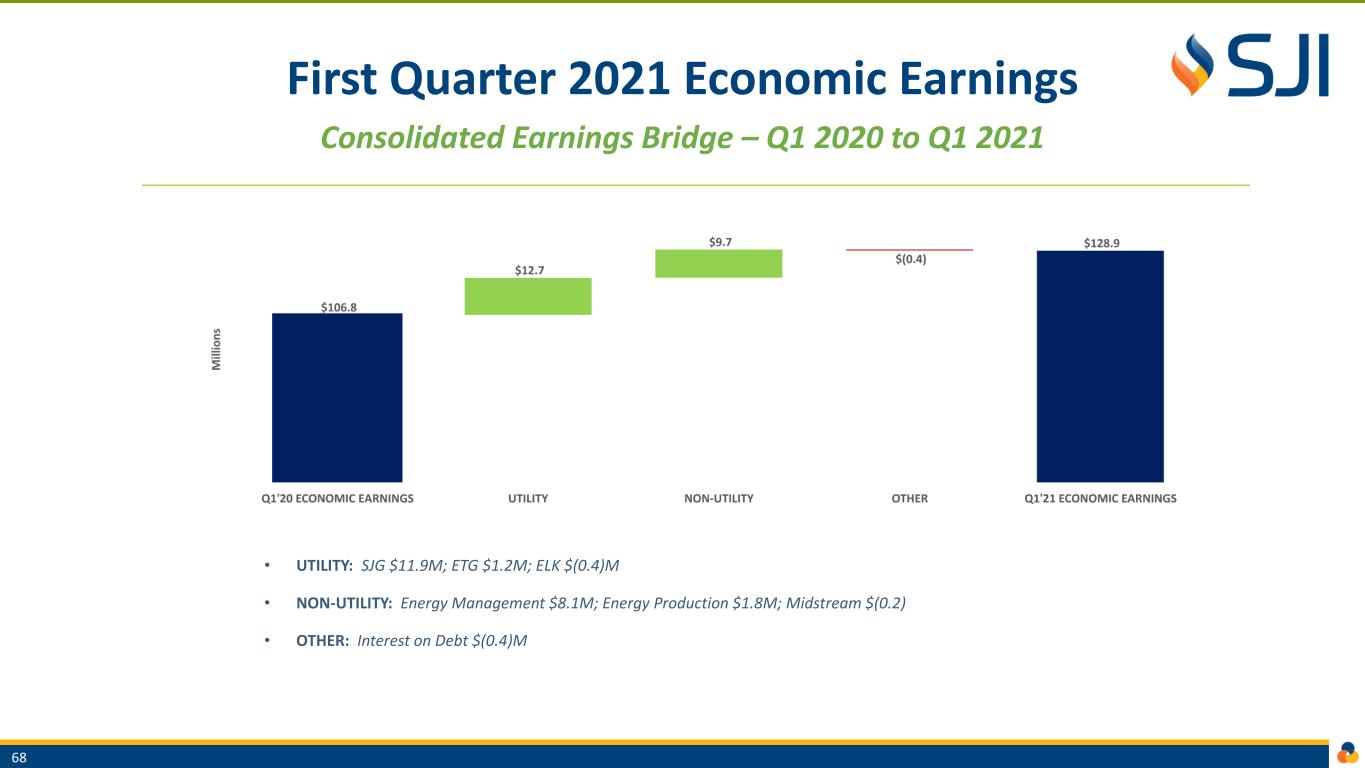
First Quarter 2021 Economic Earnings Consolidated Earnings Bridge – Q1 2020 to Q1 2021 68 • UTILITY: SJG $11.9M; ETG $1.2M; ELK $(0.4)M • NON-UTILITY: Energy Management $8.1M; Energy Production $1.8M; Midstream $(0.2) • OTHER: Interest on Debt $(0.4)M
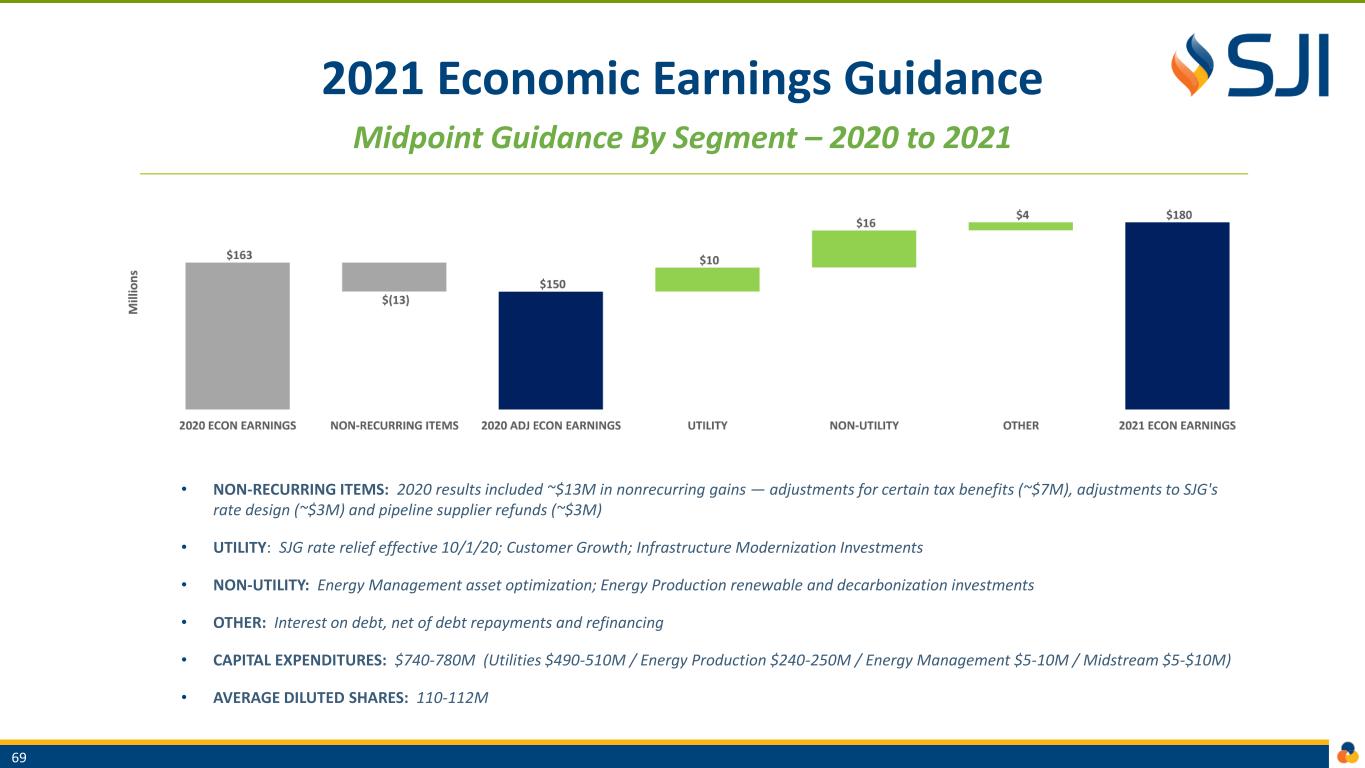
2021 Economic Earnings Guidance Midpoint Guidance By Segment – 2020 to 2021 69 • NON-RECURRING ITEMS: 2020 results included ~$13M in nonrecurring gains — adjustments for certain tax benefits (~$7M), adjustments to SJG's rate design (~$3M) and pipeline supplier refunds (~$3M) • UTILITY: SJG rate relief effective 10/1/20; Customer Growth; Infrastructure Modernization Investments • NON-UTILITY: Energy Management asset optimization; Energy Production renewable and decarbonization investments • OTHER: Interest on debt, net of debt repayments and refinancing • CAPITAL EXPENDITURES: $740-780M (Utilities $490-510M / Energy Production $240-250M / Energy Management $5-10M / Midstream $5-$10M) • AVERAGE DILUTED SHARES: 110-112M
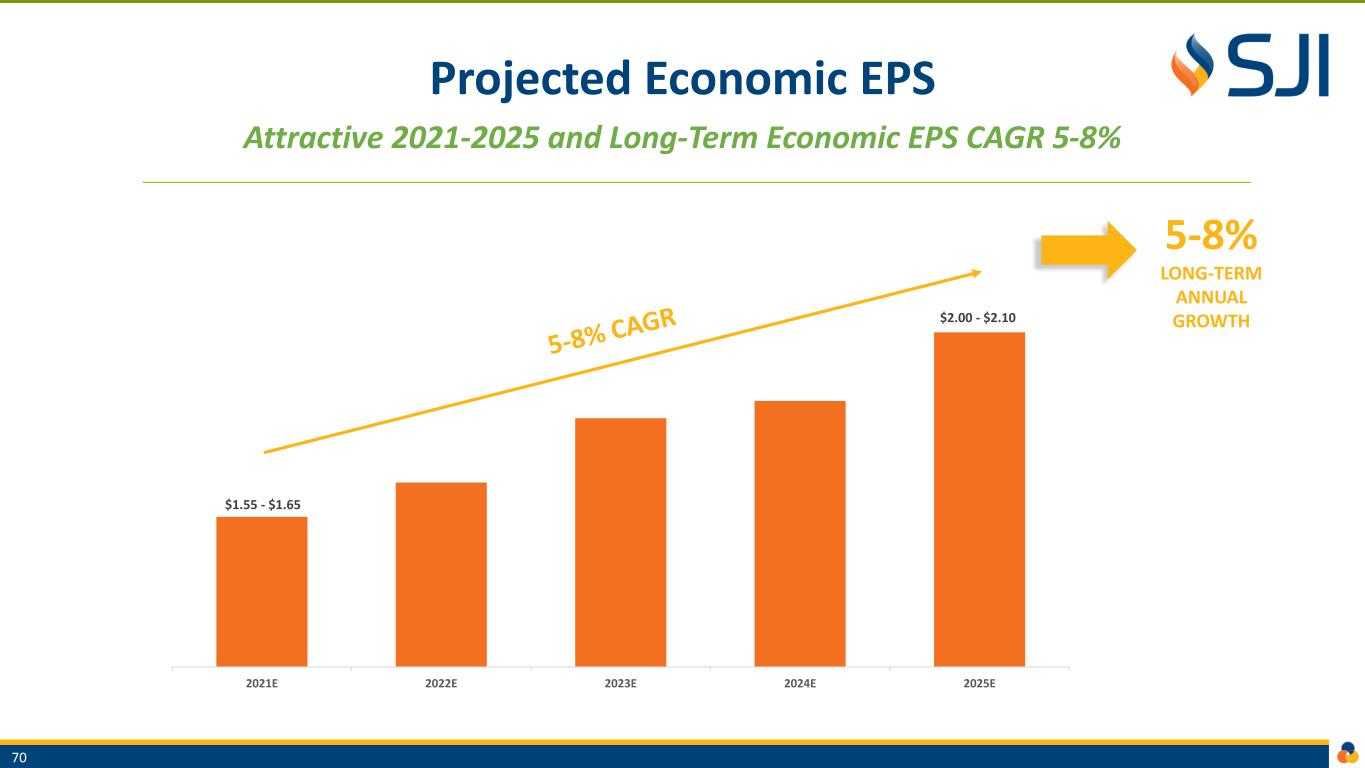
Projected Economic EPS Attractive 2021-2025 and Long-Term Economic EPS CAGR 5-8% 5-8% LONG-TERM ANNUAL GROWTH 70 $1.55 - $1.65 $2.00 - $2.10 2021E 2022E 2023E 2024E 2025E

Segment Contributions Utility Operations Continue to Generate Majority of Economic EPS in 2021-2025 Plan 5-8% LONG-TERM ANNUAL GROWTH 71 Note: Excludes interest on debt, including debt associated with past acquisitions $1.55 - $1.65 $2.00 - $2.10 2021E 2022E 2023E 2024E 2025E Utility Non-Utility
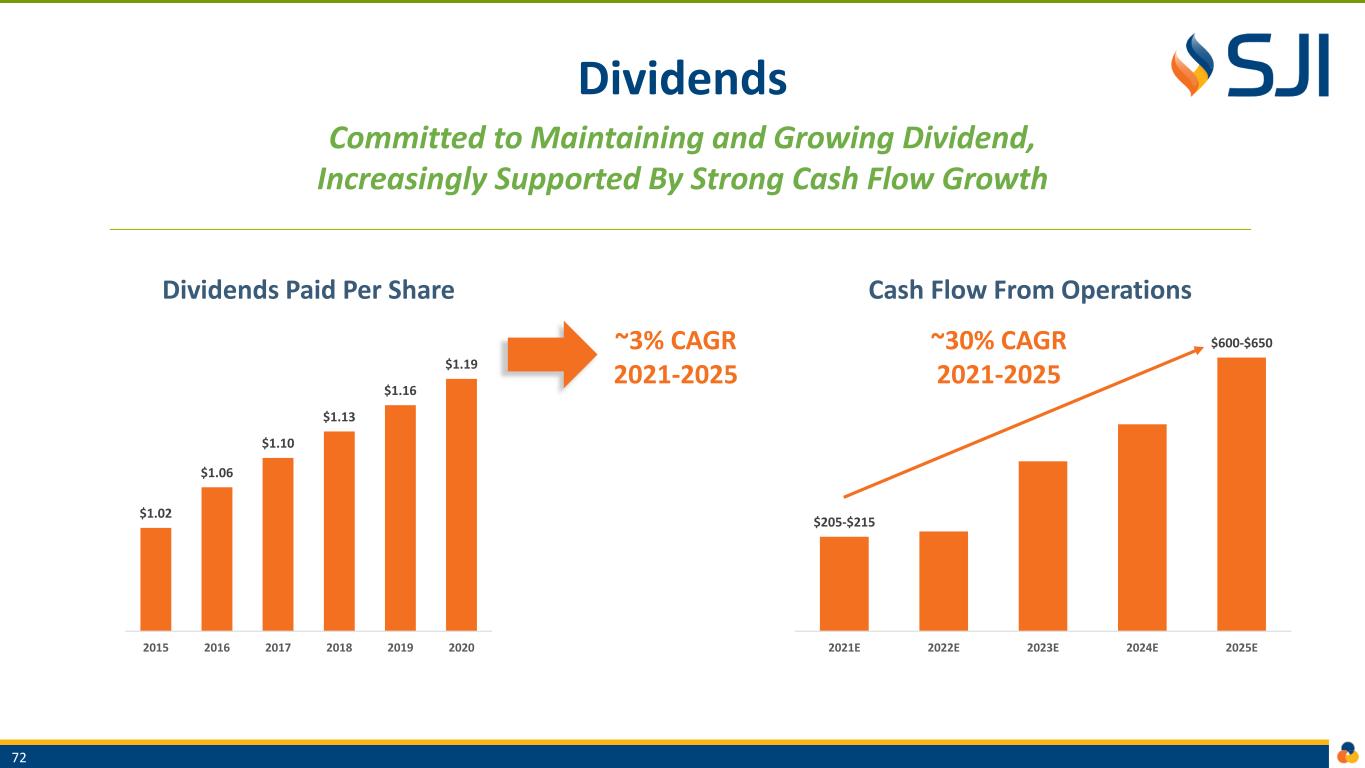
Dividends Committed to Maintaining and Growing Dividend, Increasingly Supported By Strong Cash Flow Growth ~3% CAGR 2021-2025 $1.02 $1.06 $1.10 $1.13 $1.16 $1.19 2015 2016 2017 2018 2019 2020 Dividends Paid Per Share ~30% CAGR 2021-2025 72 $205-$215 $600-$650 2021E 2022E 2023E 2024E 2025E Cash Flow From Operations

Dividend Payout Payout Ratio Improves During Plan Period, With Enhanced Quality As Lower Percentage of CFO Target Payout: 55-65% of Economic EPS Dividend-to-CFO Decrease to ~30% 73 75-78% 65-68% 2021E 2022E 2023E 2024E 2025E Dividend As % of Economic EPS 63-66% 31-34% 2021E 2022E 2023E 2024E 2025E Dividend As % of CFO
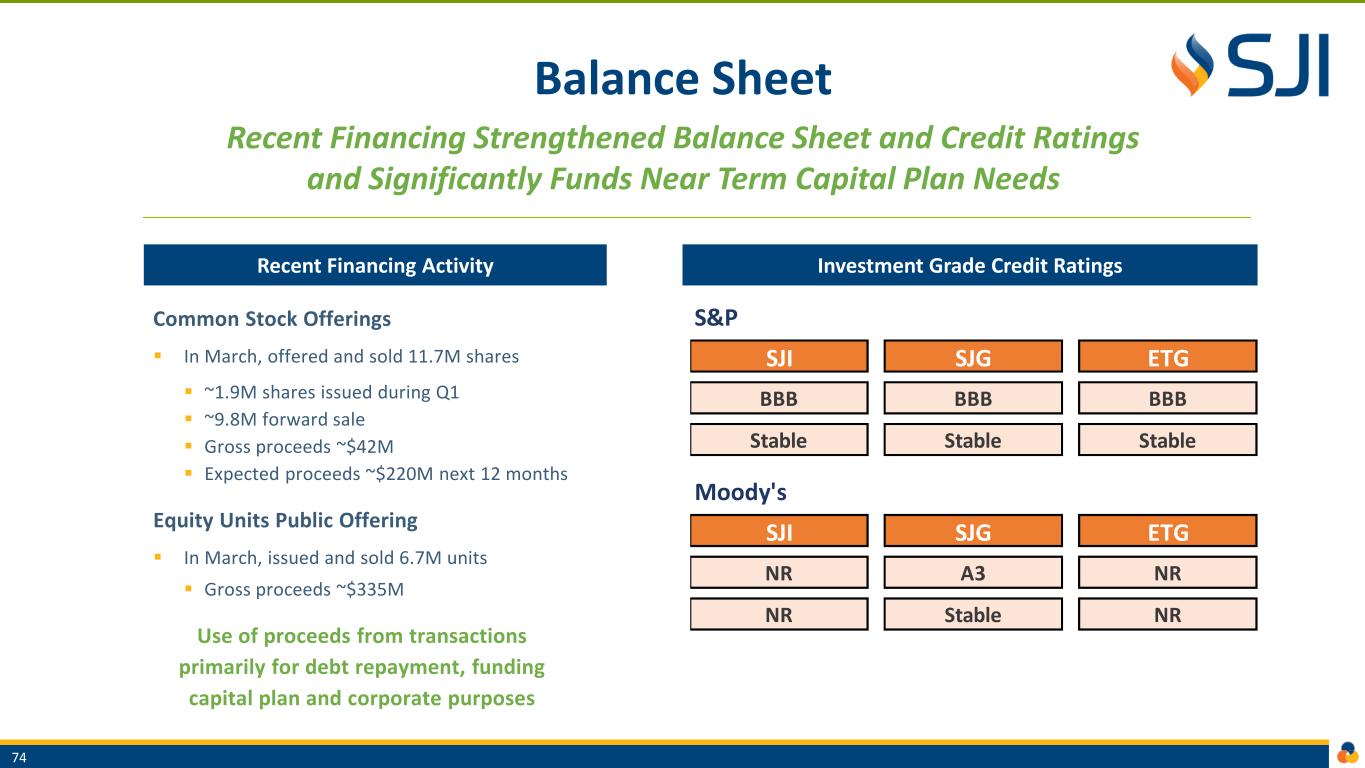
Balance Sheet Recent Financing Strengthened Balance Sheet and Credit Ratings and Significantly Funds Near Term Capital Plan Needs Recent Financing Activity Investment Grade Credit Ratings Common Stock Offerings ▪ In March, offered and sold 11.7M shares ▪ ~1.9M shares issued during Q1 ▪ ~9.8M forward sale ▪ Gross proceeds ~$42M ▪ Expected proceeds ~$220M next 12 months Equity Units Public Offering ▪ In March, issued and sold 6.7M units ▪ Gross proceeds ~$335M Use of proceeds from transactions primarily for debt repayment, funding capital plan and corporate purposes 74 S&P SJI SJG ETG BBB BBB BBB Stable Stable Stable Moody's SJI SJG ETG NR A3 NR NR Stable NR

Liquidity and Debt Maturities Ample Liquidity Available at SJI and Utilities No Significant Debt Maturities Next Five Years Long-Term Debt Maturities As of March 31, 2021, Millions Liquidity As of March 31, 2021, Millions 75 - 100 200 300 400 500 600 SJI SJG ETG Note: Excludes $335 million mandatory convertible equity units due 2024
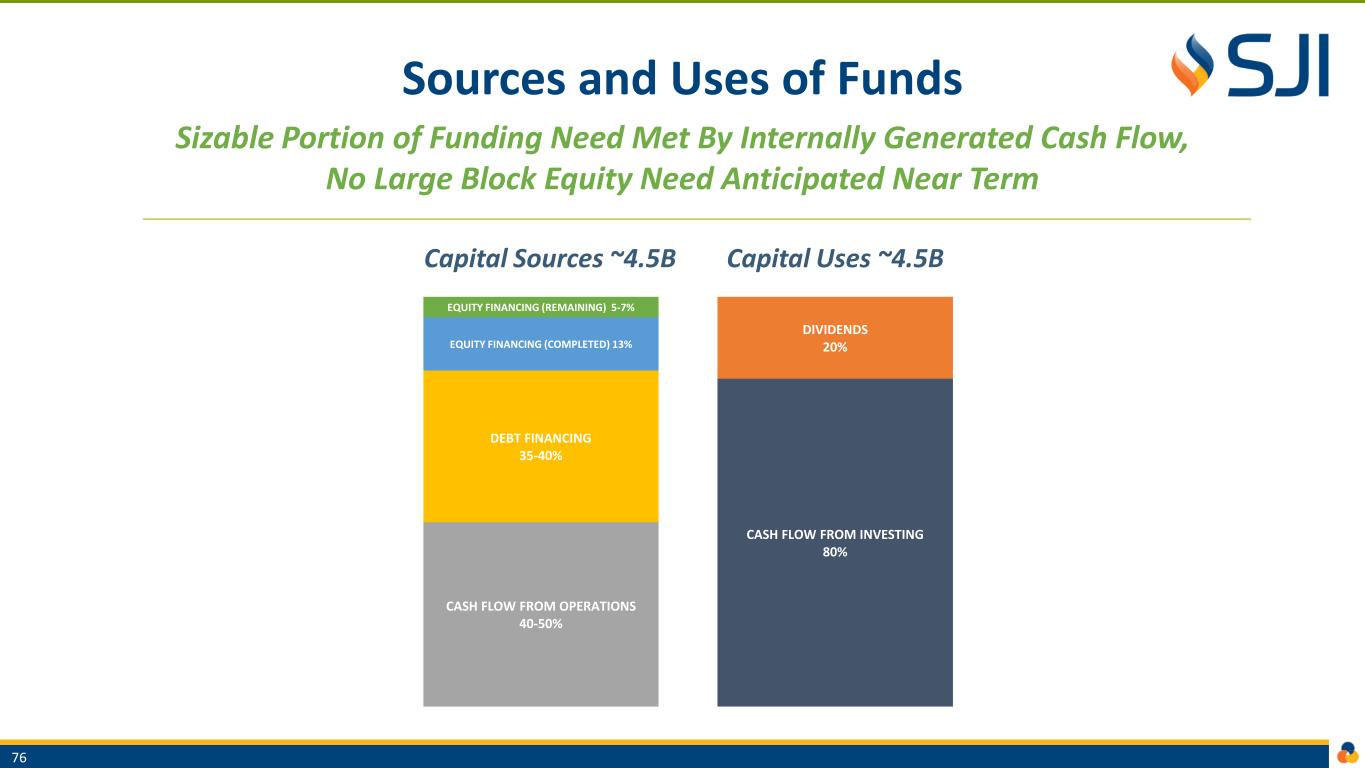
Sources and Uses of Funds Sizable Portion of Funding Need Met By Internally Generated Cash Flow, No Large Block Equity Need Anticipated Near Term Capital Sources ~4.5B Capital Uses ~4.5B 76 CASH FLOW FROM INVESTING 80% DIVIDENDS 20% CASH FLOW FROM OPERATIONS 40-50% DEBT FINANCING 35-40% EQUITY FINANCING (COMPLETED) 13% EQUITY FINANCING (REMAINING) 5-7%
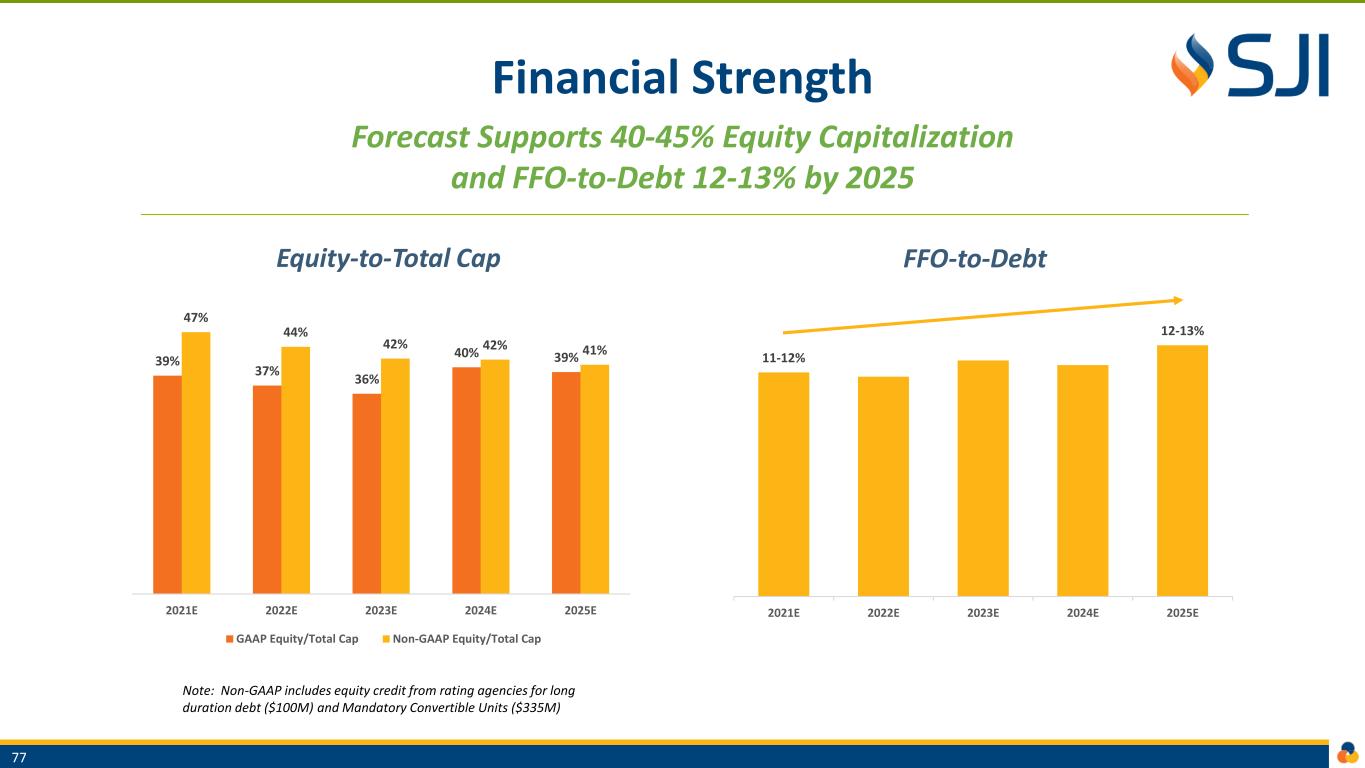
Financial Strength Forecast Supports 40-45% Equity Capitalization and FFO-to-Debt 12-13% by 2025 Equity-to-Total Cap FFO-to-Debt 77 Note: Non-GAAP includes equity credit from rating agencies for long duration debt ($100M) and Mandatory Convertible Units ($335M) 11-12% 12-13% 2021E 2022E 2023E 2024E 2025E 39% 37% 36% 40% 39% 47% 44% 42% 42% 41% 2021E 2022E 2023E 2024E 2025E GAAP Equity/Total Cap Non-GAAP Equity/Total Cap
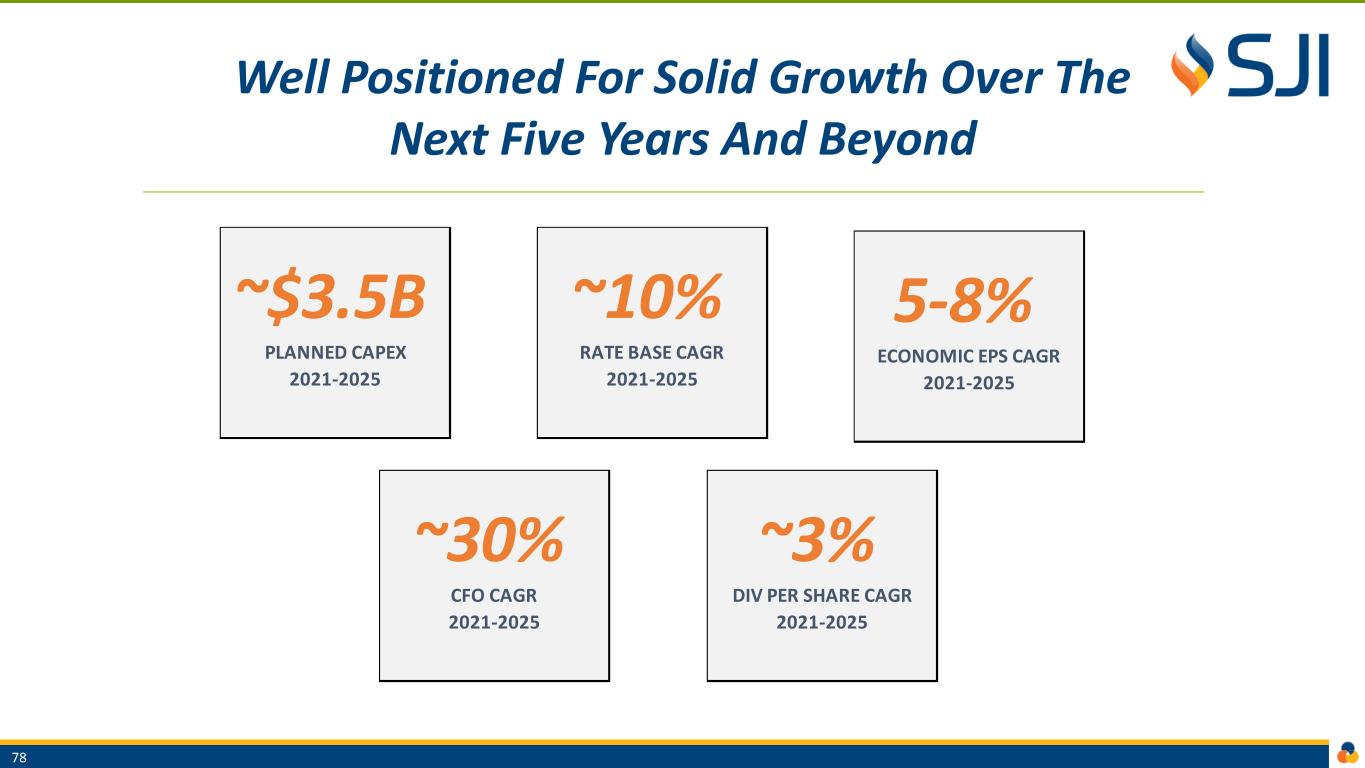
Well Positioned For Solid Growth Over The Next Five Years And Beyond 78 ~$3.5B PLANNED CAPEX 2021-2025 ~10% RATE BASE CAGR 2021-2025 5-8% ECONOMIC EPS CAGR 2021-2025 ~30% CFO CAGR 2021-2025 ~3% DIV PER SHARE CAGR 2021-2025

Closing Remarks Mike Renna | President & CEO
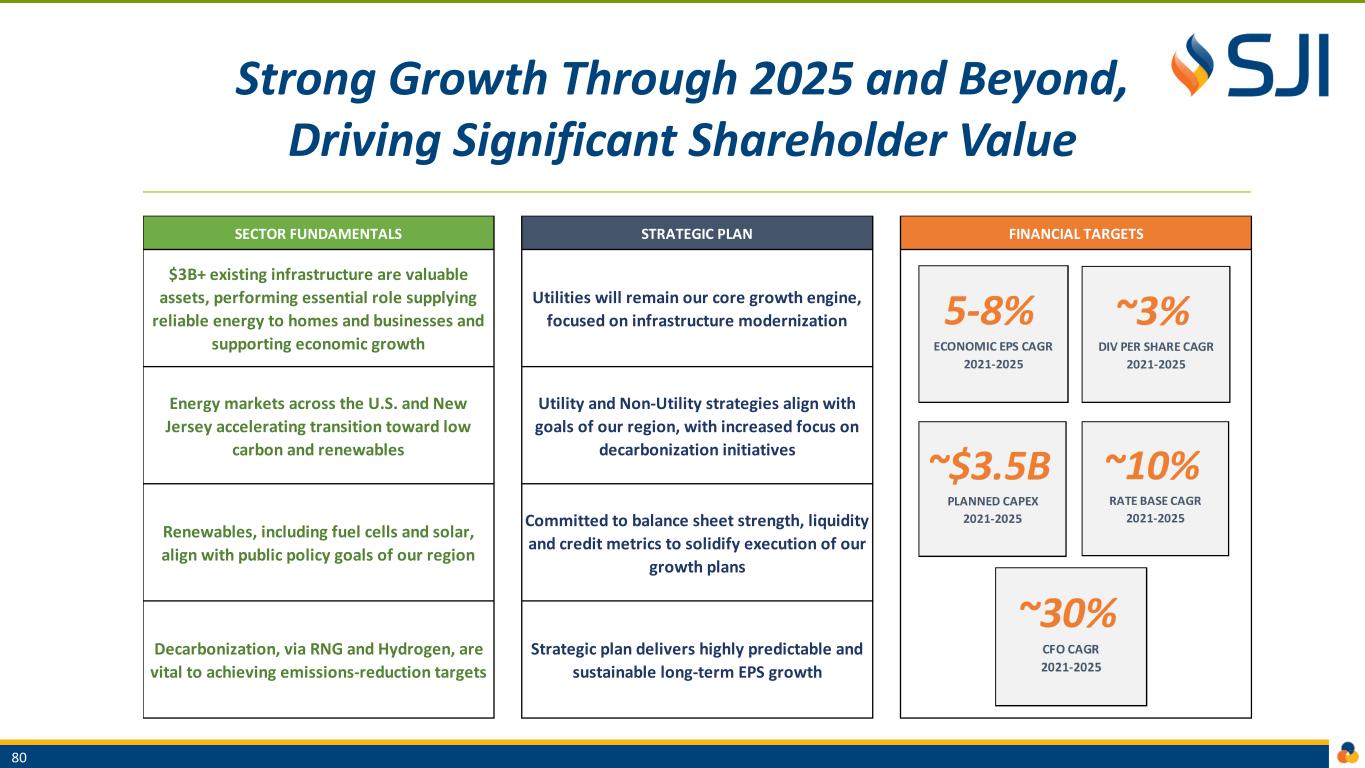
Strong Growth Through 2025 and Beyond, Driving Significant Shareholder Value 80 SECTOR FUNDAMENTALS STRATEGIC PLAN FINANCIAL TARGETS $3B+ existing infrastructure are valuable assets, performing essential role supplying reliable energy to homes and businesses and supporting economic growth Utilities will remain our core growth engine, focused on infrastructure modernization Energy markets across the U.S. and New Jersey accelerating transition toward low carbon and renewables Utility and Non-Utility strategies align with goals of our region, with increased focus on decarbonization initiatives Renewables, including fuel cells and solar, align with public policy goals of our region Committed to balance sheet strength, liquidity and credit metrics to solidify execution of our growth plans Decarbonization, via RNG and Hydrogen, are vital to achieving emissions-reduction targets Strategic plan delivers highly predictable and sustainable long-term EPS growth

Q&A
Appendix

COVID Update Business Operations Continue To Function Effectively During Pandemic 83 • COST RECOVERY: NJBPU has authorized deferral of incremental costs and bad debt for future recovery • PENDING PROCEEDINGS: NJBPU continues to hold regular commission agenda meetings • SERVICE: Operations and delivery of natural gas to customers have not been materially impacted and have not experienced significant reductions in sales volumes • WORKFORCE: Through proper planning and the innovative use of technology, all our employees have been working productively -- from employees in the field to those working from home • LIQUIDITY: Strengthened liquidity to ensure funding of capital program; Confident in ability to manage through impacts • COLLECTIONS: To date, we have seen a manageable impact on accounts receivable; continue to monitor very closely • PENSION: No near-term cash requirements • CAPEX: While certain construction programs were temporarily halted, we are back to normal operation. Expect an uptick in construction activity moving forward • O&M: While we have incurred modest incremental operating costs due to the virus, NJBPU has authorized deferral for future recovery RegulatoryUtility OperationsLiquidity Financial
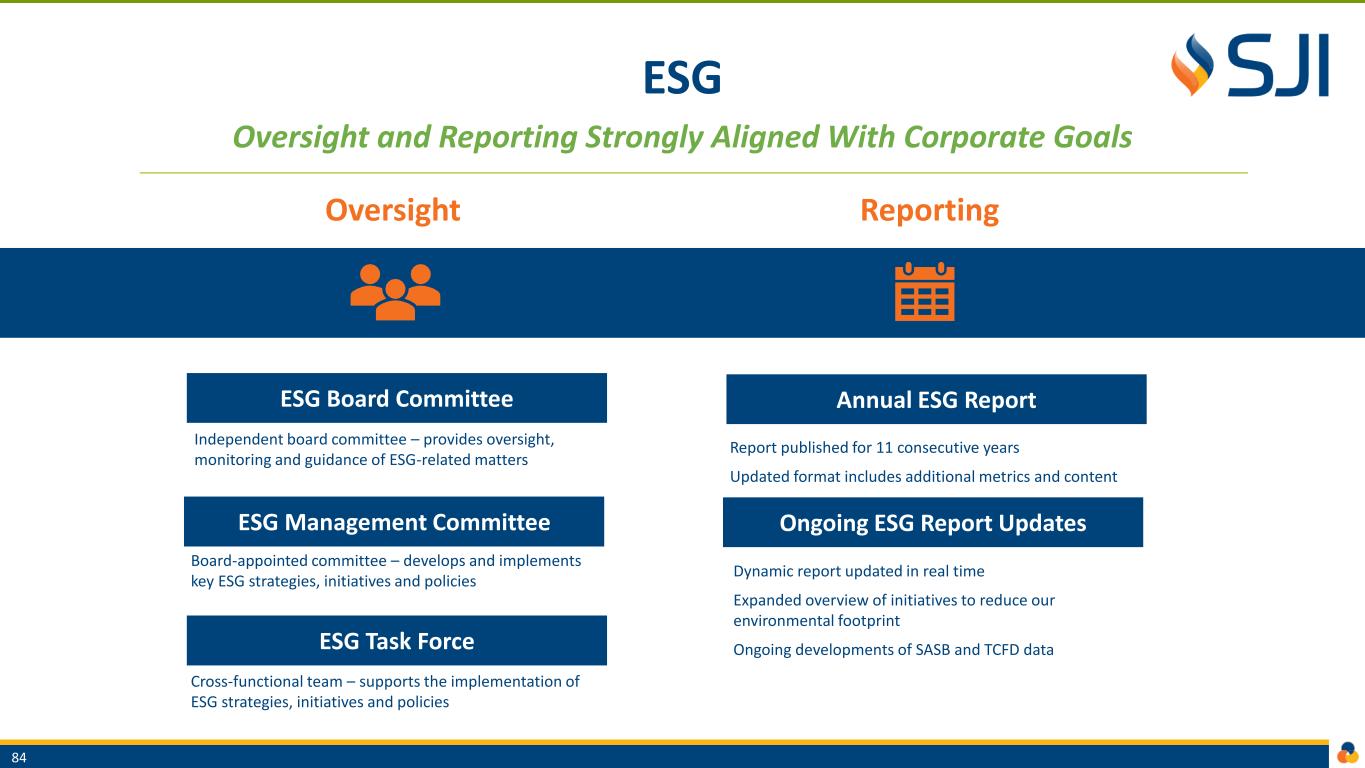
ESG Board Committee ESG Management Committee ESG Task Force Annual ESG Report Ongoing ESG Report Updates Oversight Reporting Report published for 11 consecutive years Updated format includes additional metrics and content Dynamic report updated in real time Expanded overview of initiatives to reduce our environmental footprint Ongoing developments of SASB and TCFD data Independent board committee – provides oversight, monitoring and guidance of ESG-related matters Cross-functional team – supports the implementation of ESG strategies, initiatives and policies Board-appointed committee – develops and implements key ESG strategies, initiatives and policies ESG Oversight and Reporting Strongly Aligned With Corporate Goals 84
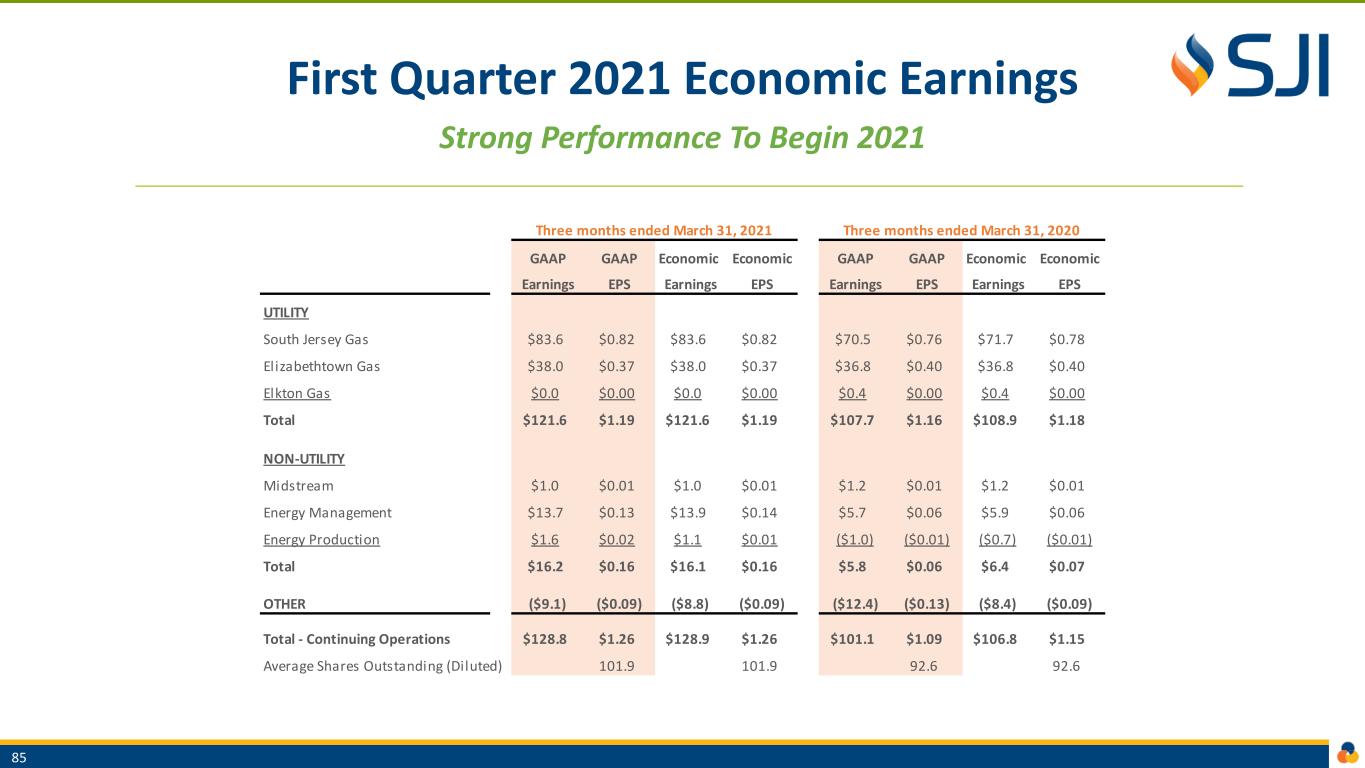
First Quarter 2021 Economic Earnings Strong Performance To Begin 2021 85 GAAP GAAP Economic Economic GAAP GAAP Economic Economic Earnings EPS Earnings EPS Earnings EPS Earnings EPS UTILITY South Jersey Gas $83.6 $0.82 $83.6 $0.82 $70.5 $0.76 $71.7 $0.78 Elizabethtown Gas $38.0 $0.37 $38.0 $0.37 $36.8 $0.40 $36.8 $0.40 Elkton Gas $0.0 $0.00 $0.0 $0.00 $0.4 $0.00 $0.4 $0.00 Total $121.6 $1.19 $121.6 $1.19 $107.7 $1.16 $108.9 $1.18 NON-UTILITY Midstream $1.0 $0.01 $1.0 $0.01 $1.2 $0.01 $1.2 $0.01 Energy Management $13.7 $0.13 $13.9 $0.14 $5.7 $0.06 $5.9 $0.06 Energy Production $1.6 $0.02 $1.1 $0.01 ($1.0) ($0.01) ($0.7) ($0.01) Total $16.2 $0.16 $16.1 $0.16 $5.8 $0.06 $6.4 $0.07 OTHER ($9.1) ($0.09) ($8.8) ($0.09) ($12.4) ($0.13) ($8.4) ($0.09) Total - Continuing Operations $128.8 $1.26 $128.9 $1.26 $101.1 $1.09 $106.8 $1.15 Average Shares Outstanding (Diluted) 101.9 101.9 92.6 92.6 Three months ended March 31, 2021 Three months ended March 31, 2020
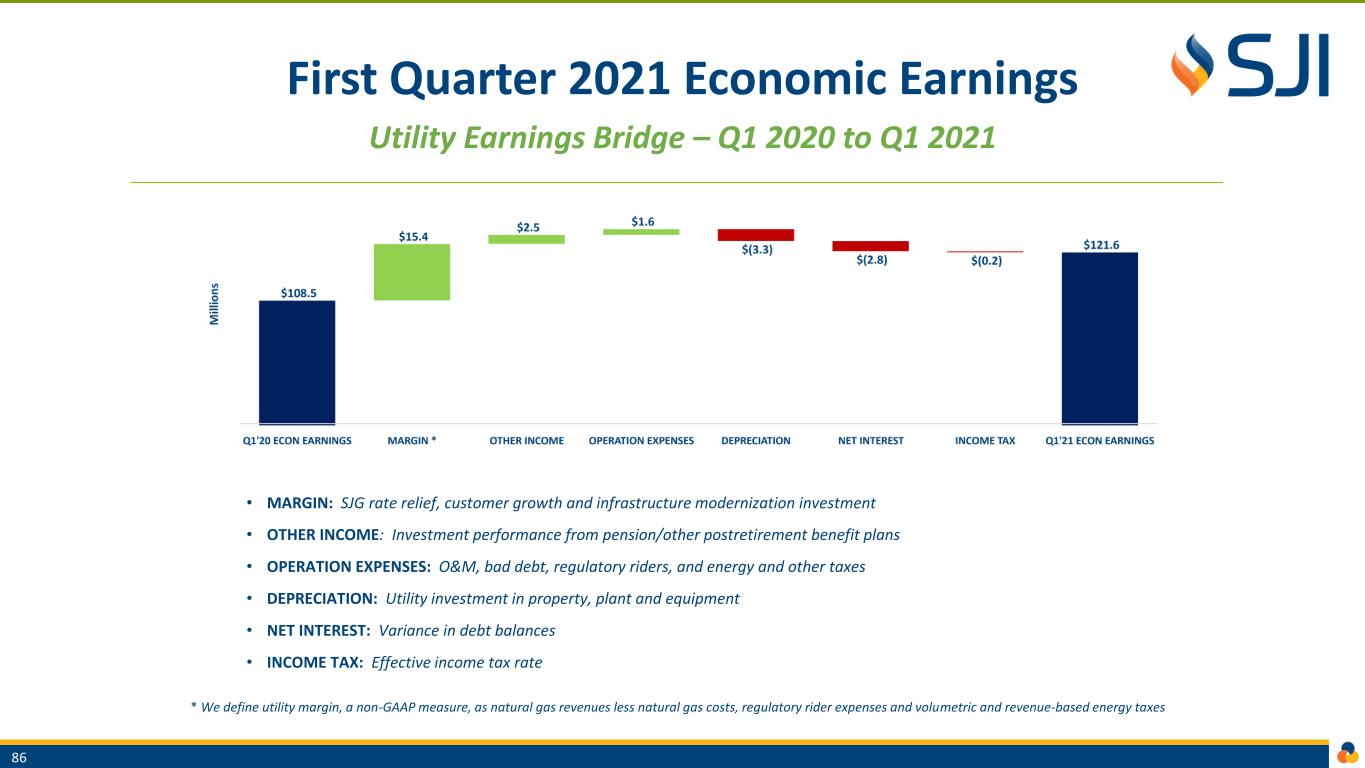
First Quarter 2021 Economic Earnings Utility Earnings Bridge – Q1 2020 to Q1 2021 86 • MARGIN: SJG rate relief, customer growth and infrastructure modernization investment • OTHER INCOME: Investment performance from pension/other postretirement benefit plans • OPERATION EXPENSES: O&M, bad debt, regulatory riders, and energy and other taxes • DEPRECIATION: Utility investment in property, plant and equipment • NET INTEREST: Variance in debt balances • INCOME TAX: Effective income tax rate * We define utility margin, a non-GAAP measure, as natural gas revenues less natural gas costs, regulatory rider expenses and volumetric and revenue-based energy taxes
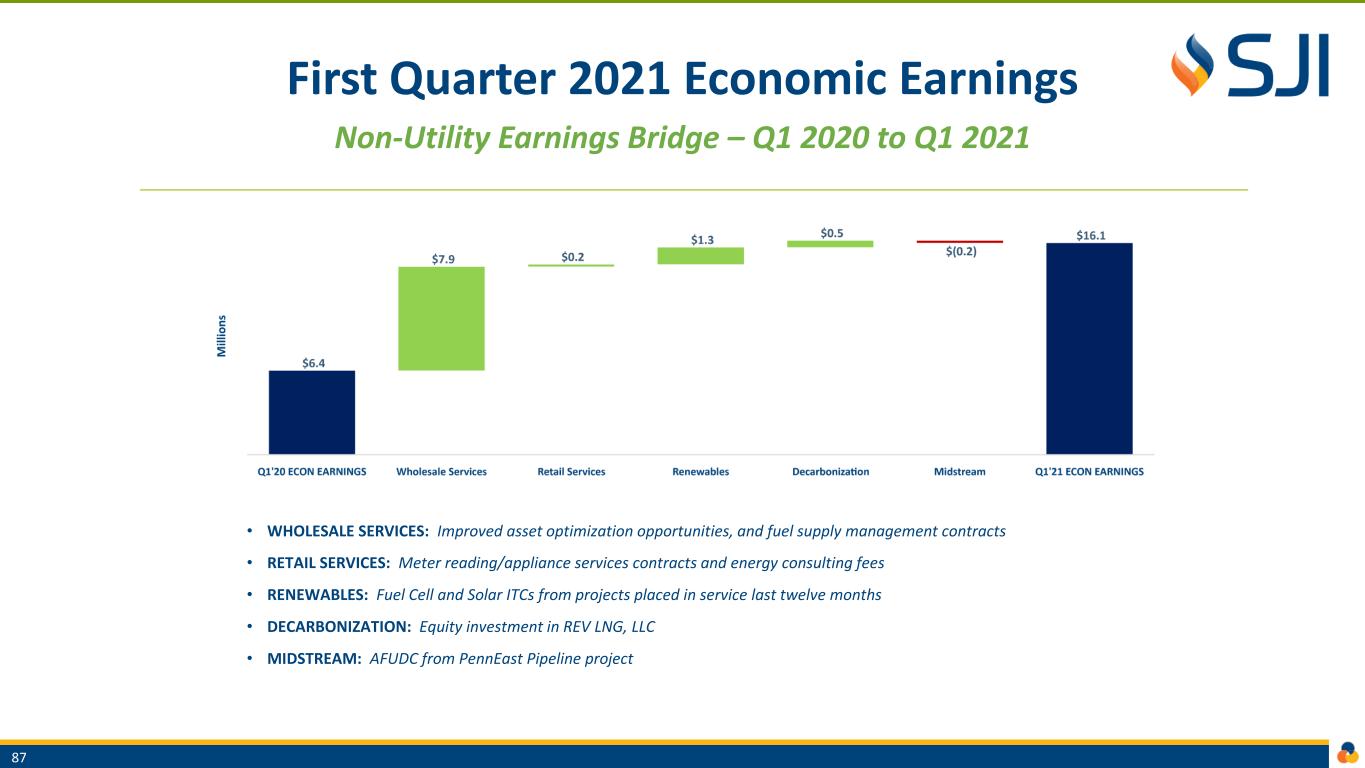
First Quarter 2021 Economic Earnings Non-Utility Earnings Bridge – Q1 2020 to Q1 2021 87 • WHOLESALE SERVICES: Improved asset optimization opportunities, and fuel supply management contracts • RETAIL SERVICES: Meter reading/appliance services contracts and energy consulting fees • RENEWABLES: Fuel Cell and Solar ITCs from projects placed in service last twelve months • DECARBONIZATION: Equity investment in REV LNG, LLC • MIDSTREAM: AFUDC from PennEast Pipeline project


