UNITED STATES
SECURITIES AND EXCHANGE COMMISSION
Washington, D.C. 20549
FORM N-CSR
CERTIFIED SHAREHOLDER REPORT OF REGISTERED MANAGEMENT
INVESTMENT COMPANIES
Investment Company Act file number 811-08510 Matthews Asian Funds
(Exact name of registrant as specified in charter) 456 Montgomery St., STE 1200
San Francisco, California 94104
(Address of principal executive offices) (Zip code) James E. Walter
Matthews Asian Funds
456 Montgomery St., STE 1200
San Francisco, California 94104
(Name and address of agent for service)Registrant’s telephone number, including area code: 1-800-789-ASIA (2742) Date of fiscal year end: August 31, 2003 Date of reporting period: February 28, 2003 Form N-CSR is to be used by management investment companies to file reports with the Commission not later than 10 days after the transmission to stockholders of any report that is required to be transmitted to stockholders under Rule 30e-1 under the Investment Company Act of 1940 (17 CFR 270.30e-1). The Commission may use the information provided on Form N-CSR in its regulatory, disclosure review, inspection, and policymaking roles.
A registrant is required to disclose the information specified by Form N-CSR, and the Commission will make this information public. A registrant is not required to respond to the collection of information contained in Form N-CSR unless the Form displays a currently valid Office of Management and Budget (“OMB”) control number. Please direct comments concerning the accuracy of the information collection burden estimate and any suggestions for reducing the burden to Secretary, Securities and Exchange Commission, 450 Fifth Street, NW, Washington, DC 20549-0609. The OMB has reviewed this collection of information under the clearance requirements of 44 U.S.C. § 3507.
Item 1. Reports to Stockholders.


Matthews Asian Funds
| www.matthewsfunds.com | Semi-Annual Report
February 28, 2003
Matthews Pacific Tiger Fund
Matthews Asian Growth and Income Fund
Matthews Korea Fund
Matthews China Fund
Matthews Japan Fund
Matthews Asian Technology Fund |
Matthews Asian Funds
| 2 | | Message to Shareholders |
| |
| 4 | | Matthews Pacific Tiger Fund |
| |
| 6 | | Matthews Asian Growth and Income Fund |
| |
| 8 | | Matthews Korea Fund |
| |
| 10 | | Matthews China Fund |
| |
| 12 | | Matthews Japan Fund |
| |
| 14 | | Matthews Asian Technology Fund |
| |
| 16 | | Schedule of Investments |
| |
| 28 | | Statement of Assets and Liabilities |
| |
| 30 | | Statement of Operations |
| |
| 32 | | Statement of Changes in Net Assets |
| |
| 36 | | Financial Highlights |
| |
| 42 | | Notes |
A Message to Our Shareholders
| | Dear Fellow Shareholders,
The six months that ended February 28, 2003, were unusually challenging for investors around the world. Geo-political events in the Middle East and Korea dominated most of the international headlines, while growing concerns over the strength of the U.S. and European economic recoveries further added to investor anxieties.
|
| | Against this background, many Asian economies continued to perform well, with Mainland China’s extraordinary recent performance emerging as the primary growth story in the region. One of the most remarkable aspects of the success that China has enjoyed under the economic stewardship of Zhou Rhongji (who recently stepped down and was replaced with his handpicked successor Wen Jiabao) has been the relative balance that has been achieved between growth in exports and the expansion of the domestic economy. This pattern of growth is different from that enjoyed by other Asian countries at a similar stage of development. Private consumption as well as government spending has buoyed domestic economic growth in China. With consumer spending starting from a very low base, we believe that this is a trend that will last for many years. China’s economy will not be immune to economic cycles, and great challenges remain as the private sector gradually offsets the potential problems of the old state dominated sector, but China’s recent economic achievements stand out in an economically challenged world.
While China’s emergence at the forefront of Asia’s economic growth has continued to surprise, Japan’s relative underperformance has not. We continue to believe that following fourteen years of generally declining equity prices, there are some uncommon values to be found in Japan. We also believe that many individual companies are showing leadership in their restructuring efforts that will reward their shareholders well in the long term. Unfortunately, the macro management of Japan continues to be characterized by an aversion to strong measures and while this aversion continues, the values that are so apparent at the micro level may remain dormant.
During the past six months, the performance of the Matthews Asian Funds ranged from –20.08% in the case of the Matthews Korea Fund to +1.96% for the Matthews China Fund. All of our Funds continue to focus on identifying and investing in companies that we believe are well positioned to benefit from long term growth trends in Asia. Our |
| 2 w w w . m a t t h e w s f u nd s . c o m | 8 0 0 - 7 8 9 - A S I A [ 2 7 4 2 ] |
| bottom-up approach to stock selection remains focused on companies with a proven long-term history of growth and whose management teams have consistently demonstrated their abilities. We are frequent visitors to those management teams to allow us to develop and retain high levels of confidence in their abilities to deliver consistent results. We believe that such frequent “on the ground” contacts have been important contributors to our long-term relative performance. |
| During the past six months, China’s financial markets have been the bright spot in an otherwise mixed period. Fears of slowing demand in their major export markets added to the problems facing Japanese manufacturers in the final months of calendar year 2002. Similar concerns affected exporters in South Korea, Taiwan, Singapore, and Malaysia. While exports to and trade with China grew for all of these countries, China’s role is not yet sufficient to offset weakness in Europe and the United States. Around the region, domestic growth remained stronger than many had anticipated. We continue to believe that the long-term trend towards proportionately higher consumer spending and commensurately lower savings rates is likely to be sustained for some years. Consequently, our stock selection continues to emphasize companies that are positioned in the path of this trend, and this is the case in almost every country in which we invest. | 

|
| The rising tensions between North Korea and the rest of the world have particularly affected the financial markets in South Korea in recent weeks. While most South Koreans remain confident that the issues can and will be resolved diplomatically, the lack of a clear path to diplomacy is adding to uncertainty there. South Korea’s economy continues to be one of the region’s strongest although “aftershocks” to the 1997/98 Asian Crisis continue to occur. The new administration of President Roh Moo-hyun appears keen to retain the mantel of financial reform that was loosely grasped by the previous administration, which we welcome. | G. Paul Matthews,
Chairman and
Chief Investment Officer (left)

Mark W. Headley,
President and Portfolio Manager |
| Overall, we remain enthusiastic in our long-term outlook for Asia’s economic and financial markets. |
| | M e s s a g e t o S h a r e h o l d e r s 3 |
Matthews Pacific Tiger Fund
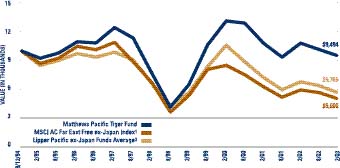
The Matthews Pacific Tiger Fund is an all-capitalization, core equity fund focusing on the broad range of equity markets in Asia ex-Japan. Historically, the Fund has not invested in Australia or New Zealand, which we do not consider part of Asia, nor has it invested in India, although it may eventually.
| | The Matthews Pacific Tiger Fund fell 6.44% in the six months ended February 28, 2003, declining less than its index, the MSCI All Country Far East Free ex-Japan index. During this period, Asian markets were affected by a combination of global geo-political concerns and doubts about the sustainability of an economic recovery in the United States and Europe. While this environment has not been an easy one, we believe that, in the aggregate, the companies represented in the Fund’s portfolio have continued to grow their underlying businesses. Much of the impetus for growth in Asia is now coming from China, where both manufacturing exports and domestic demand are growing strongly.
|
| | The Fund’s strong relative performance was helped by individual contributions from companies in a diverse range of industries, from cellular phones in Thailand to pharmaceutical companies in China to Internet companies in South Korea. A number of positions in financial companies and consumer demand-related businesses in South Korea were relatively weak over this period. By country, the weakest performance in the period came from our positions in South Korea, which had been one of the better performers in the prior fiscal year ended August 31, 2002. In general, our below index weighting position in Taiwan contributed to the Fund’s relative performance. |
PORTFOLIO MANAGERS:
G. Paul Matthews
Mark W. Headley | Growth companies in Asia have been faced with an extremely challenging economic environment in recent years, but we believe they are beginning to benefit from improving conditions in a number of areas. We believe that China’s contribution in this respect cannot be underestimated, and we are starting to see an increasing emphasis on a “China strategy” in almost all parts of Asia. In addition to China, the growing role of the consumer throughout Asia is bringing a greater balance to Asia’s economic growth than was evident in the 1980’s and 1990’s. We believe that increased regional trade and growing financial ties in the region will benefit regional growth businesses in the coming years. |
| 4 w w w . m a t t h e w s f u nd s . c o m | 8 0 0 - 7 8 9 - A S I A [ 2 7 4 2 ] |
Fund Performance
AVERAGE ANNUAL RETURNS AS OF FEBRUARY 28, 2003
                                                                                SINCE
                                                                            INCEPTION
                                                      1 YEAR     5 YEARS      9/12/94


Matthews Pacific Tiger Fund                         (12.20%)      4.30%       (0.61%)

MSCI All Country Far East Free ex-Japan Index(1)    (15.89%)     (5.72%)      (7.86%)

Lipper Pacific ex-Japan Funds Average(2)            (16.59%)     (2.42%)      (5.70%)*

* From 9/30/94
GROWTH OF A $10,000 INVESTMENT
Past performance is not indicative of future results. Before taxes on distributions or redemptions of Fund shares.
| 1 | | The MSCI All Country Far East Free ex-Japan Index is an unmanaged capitalization-weighted index of stock markets of Hong Kong, Taiwan, Singapore, Korea, Indonesia, Malaysia, Philippines, Thailand and China that excludes securities not available to foreign investors. Taiwan is only represented at 50% of its total market cap. |
| 2 | | As of 2/28/03, the Lipper Pacific Ex-Japan Funds Average consisted of 62 funds for the one-year period, 52 funds for the three-year period, 47 funds for the five-year period, and 22 funds since 8/31/94. Lipper Analytical Services, Inc. fund performance does not reflect sales charges and is based on total return, including reinvestment of dividends and capital gains for the stated periods. |
| 3 | | For Lipper Pacific ex-Japan Funds Average, graph start date is 8/31/94. |
| | M a t t h e w s P a c i f i c T i g e r F u n d 5 |
Matthews Asian Growth and Income Fund
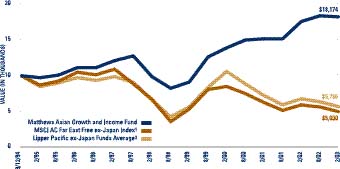
| | The Matthews Asian Growth and Income Fund seeks long-term capital appreciation and some current income through investments in higher-yielding equities, convertible bonds, and preferred shares of Asia-based companies. |
| For the six months ended February 28, 2003, the Matthews Asian Growth and Income Fund declined slightly less than 1.0%, less than its index, the MSCI All Country Far East Free ex-Japan Index. In general, the Fund’s positions in gas and electric utilities in China, its Special Administrative Region of Hong Kong, and South Korea, produced positive returns over the period, while positions in bank equities and other non-bank financial institutions in Asia were marginally negative.
|
|
| | The region’s financial markets are awaiting clear evidence of the likely direction of the U.S. economy for the remainder of 2003 and are, of course, anxious to see an easing of the current geo-political tensions in the Middle East and on the Korean peninsula. Asian central banks are eyeing the recent volatility in oil prices with some concern but for the most part remain accommodating. Interest rates around the region remain close to historical lows, and confidence has been buoyed by the continued strong relative performance of the Mainland China economy.
While Hong Kong has been challenged by growing competition from China, there are some areas of the Hong Kong economy that are benefiting from China’s continued strong economic performance. One such area is in financial services, where Hong Kong is not only continuing to see good demand for private banking, but is particularly benefiting from the important role that it is playing as a listing center for Chinese corporations anxious to tap the global equity markets. It is expected that 2003 will see additional listings of Mainland China companies, and these listings will likely include a number of large insurance companies. |
| |
PORTFOLIO MANAGER:
G. Paul Matthews | We remain overweight in our exposure to Mainland China through companies listed in Hong Kong because we believe that the regulatory oversight in Hong Kong remains of a higher standard than that of financial centers in Mainland China. |
| 6 w w w . m a t t h e w s f u nd s . c o m | 8 0 0 - 7 8 9 - A S I A [ 2 7 4 2 ] |
Fund Performance
AVERAGE ANNUAL RETURNS AS OF FEBRUARY 28, 2003
                                                                                      SINCE
                                                                                  INCEPTION
                                                           1 YEAR      5 YEARS      9/12/94

Matthews Asian Growth and Income Fund                       3.67%      12.98%        7.31%

MSCI All Country Far East Free ex-Japan Index(1)          (15.89%)     (5.72%)      (7.86%)

Lipper Pacific ex-Japan Funds Average(2)                  (16.59%)     (2.42%)      (5.70%)*

* From 9/30/94
GROWTH OF A $10,000 INVESTMENT
Past performance is not indicative of future results. Before taxes on distributions or redemptions of Fund shares.
| 1 | | The MSCI All Country Far East Free ex-Japan Index is an unmanaged capitalization-weighted index of stock markets of Hong Kong, Taiwan, Singapore, Korea, Indonesia, Malaysia, Philippines, Thailand and China that excludes securities not available to foreign investors. Taiwan is only represented at 50% of its total market cap. |
| 2 | | As of 2/28/03, the Lipper Pacific Ex-Japan Funds Average consisted of 62 funds for the one-year period, 52 funds for the three-year period, 47 funds for the five-year period, and 22 funds since 8/31/94. Lipper Analytical Services, Inc. fund performance does not reflect sales charges and is based on total return, including reinvestment of dividends and capital gains for the stated periods. |
| 3 | | For Lipper Pacific ex-Japan Funds Average, graph start date is 8/31/94. |
| | M a t t h e w s A s i a n G r o w t h a n d I n c o m e F u n d 7 |
Matthews Korea Fund
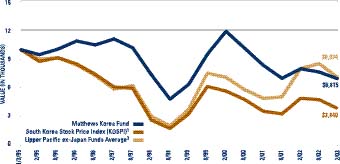
| | The Matthews Korea Fund is an all-capitalization equity fund with diversified exposure across a wide range of Korean equities.
The six months ended February 28, 2003, were a challenging time for the South Korean equity market. South Korea was plagued by the North Korean threat, the U.S. war with Iraq, a consumer credit crunch, and weak consumer spending. All of these events coupled with a new administration gave enough uncertainties for Korean equities to underperform other equity markets in Asia. The Fund was down 20.08% while its benchmark KOSPI Index was down 19.62%. The Fund has done relatively well considering its traditionally heavy exposure to the consumer and financials sectors.
|
| | | Consumer spending was the key contributor to South Korea’s economy’s strong performance last year. However, as global uncertainties and geographical risks grew in the latter part of 2002, consumer spending slowed dramatically and turned against the market. We expect consumer spending to pick up rather dramatically when most of the uncertainties become clear and as consumer spending habits continue to change. The consumer credit crunch has been the by-product of fast credit card growth, especially among young Koreans. The government has been too focused on the growth of credit card usage, overlooking the associated risks. However, it has recognized the problem and shifted its policy since working closely with the banks.
The new South Korean president, Mr. Noh Moo-hyun, took office in February 2003, promising to put an end to corruption and continue to restructure the economy. The ability of the new government is already being tested as they are faced with rising tensions in North Korea and a slowing economy. The new government’s take on these issues will be a major factor during the next general election. |
PORTFOLIO MANAGERS:
G. Paul Matthews
Mark W. Headley | | Despite these difficulties, the general status of the South Korean economy remains healthy. South Korea has more than US $100 billion in foreign reserves and consistently registers trade surpluses. More Korean companies are going global and the export sector remains strong. We believe that, generally, corporate governance is improving despite the recent SK Group scandal.
We continue to believe that the consumer and financials sectors will lead the economy while technology companies will lead productivity growth. |
| 8 w w w . m a t t h e w s f u nd s . c o m | 8 0 0 - 7 8 9 - A S I A [ 2 7 4 2 ] |
Fund Performance
AVERAGE ANNUAL RETURNS AS OF FEBRUARY 28, 2003
                                                                           SINCE
                                                                       INCEPTION
                                                1 YEAR      5 YEARS       1/3/95

Matthews Korea Fund                           (15.29%)      17.47%       (4.59%)

KOSPI Index(1)                                (20.70%)       8.12%      (11.07%)

Lipper Pacific ex-Japan Funds Average(2)      (16.59%)      (7.96%)      (5.11%)*

* From 12/31/94
GROWTH OF A $10,000 INVESTMENT
Past performance is not indicative of future results. Before taxes on distributions or redemptions of Fund shares.
| 1 | | KOSPI: The South Korea Stock Price Index is a capitalization-weighted index of all common stocks listed on the Korean Stock Exchange. |
| 2 | | As of 2/28/03, the Lipper Pacific Ex-Japan Funds Average consisted of 62 funds for the one-year period, 52 funds for the three-year period, 47 funds for the five-year period, and 25 funds since 12/31/94. Lipper Analytical Services, Inc. fund performance does not reflect sales charges and is based on total return, including reinvestment of dividends and capital gains for the stated periods. |
| 3 | | For Lipper Pacific ex-Japan Funds Average, graph start date is 12/31/94. |
| | M a t t h e w s K o r e a F u n d 9 |
Matthews China Fund
| | The Matthews China Fund is an all-capitalization equity fund that invests in a diversified portfolio of Chinese securities.
For the six months ended February 28, 2003, the Matthews China Fund was up 1.96%, outperforming its benchmarks, the MSCI China Free and CLSA China World Indices, which were down 5.23% and up 0.50% respectively.
|
| | | Despite the weakness of the global stock markets during the period, Chinese stocks performed relatively well. Our overweight positions in the pharmaceutical, consumer, energy, and utilities sectors helped the Fund outperform its benchmark indices. Our holdings in the infrastructure and utilities sectors, which we view as growth sectors in China, performed extremely well, taking advantage of strong economic growth in China. Consumer stocks were also major contributors to our performance, as domestic consumer demand continues to accelerate. After a sharp decline in corporate profits in 2001 due to continued deflation and rising competition, we are pleased to see that corporate profits are accelerating again. The average earnings growth of the companies in the portfolio is expected to be more than 11% this year. The fact that these companies can manage double-digit earnings growth during a prolonged period of deflation suggest that there have been huge productivity gains. |
PORTFOLIO MANAGERS:
G. Paul Matthews
Mark W. Headley
Richard H. Gao | | China’s economy continues to shine amid the weakness of the global economy. Strong domestic demand, a surge in exports, and foreign direct investment are the major reasons behind its growth. Chinese manufacturers have been gaining market share on a global scale, and these gains have allowed Chinese export growth to do well. The Fund is well positioned to take advantage of global outsourcing trends and we are adding to our positions in export-related companies in the portfolio.
The past six months also saw a successful transition of China’s leadership. The new leadership, lead by new President Hu Jintao, consists of professional technocrats who will continue to adopt reform and open door policies in China. Financial sector reform is on the agenda of the new leadership. We expect to see more and more financial companies list on the Hong Kong stock exchange, widely expanding the investment universe for the Matthews China Fund. |
| 10 w w w . m a t t h e w s f u nd s . c o m | 8 0 0 - 7 8 9 - A S I A [ 2 7 4 2 ] |
Fund Performance
AVERAGE ANNUAL RETURNS AS OF FEBRUARY 28, 2003
                                                                                 SINCE
                                                                             INCEPTION
                                                    1 YEAR       5 YEARS       2/19/98

Matthews China Fund                                (4.74%)       (1.04%)        0.14%

MSCI China Free Index(1)                           (3.86%)      (14.30%)      (21.45%)

Credit Lyonnais China World Index(2)               (3.75%)       (8.65%)       (6.34%)

Lipper China Region Funds Average(3)              (10.21%)       (3.18%)       (3.18%)*

* From 2/28/98
GROWTH OF A $10,000 INVESTMENT

Past performance is not indicative of future results. Before taxes on distributions or redemptions of Fund shares.
| 1 | | The MSCI China Free Index is an unmanaged capitalization-weighted index of Chinese equities that includes Red Chips and H shares listed on the Hong Kong exchange, and B shares listed on the Shanghai and Shenzhen exchanges. Red Chips are Chinese companies that are incorporated in Hong Kong but have at least 35% of their shares held by Chinese state-owned organizations. |
| 2 | | The Credit Lyonnais China World Index is an unmanaged capitalization-weighted index of Chinese equities that are listed on the Hong Kong, Shanghai and Shenzhen stock exchanges. |
| 3 | | As of 2/28/03, the Lipper China Region Funds Average consisted of 23 funds for the one-year period, 21 funds for the three-year period, 17 funds for the five-year period, and 17 funds since 2/28/98. Lipper Analytical Services, Inc. fund performance does not reflect sales charges and is based on total return, including reinvestment of dividends and capital gains for the stated periods. |
| 4 | | For Lipper China Region Funds Average, graph start date is 2/28/98. |
| | M a t t h e w s C h i n a F u n d 11 |
Matthews Japan Fund
| | The Matthews Japan Fund is an all-capitalization core equity fund with diversified exposure across a wide range of corporate Japan.
The Matthews Japan Fund underperformed its benchmarks for the six-month period ended February 28, 2003. This result was primarily due to weak performance in financials. In particular, Mizuho Holdings was sold off due to continued uncertainty in Japan’s banking sector. The sharp decline in Mizuho’s share price alone accounted for over 20% of the Fund’s negative performance.
|
| | | In our view, an element of panic pricing is now creeping into the financials sector. Mizuho serves as a good example. The company is the world’s largest bank by assets and currently trades at a 79% discount to book value and 1 times forward operating earnings. In our opinion, the bank is too big to fail and even with some form of government nationalization, equity holders will not be 100% diluted. We therefore believe that patience will be rewarded over the long term.
Outside of financials, our exposure to telecommunication services and information technology has proven to be a bright spot. We are gaining confidence that the worst is over for the NTT group as it scales back its global ambitions and realizes a more conservative capital expenditure plan. We have positioned NTT DoCoMo, a leading mobile telecommunications provider, as one of the top holdings in the Fund. |
PORTFOLIO MANAGER:
Mark W. Headley | | Our performance in small caps has been mixed. On the one hand, technology picks such as Access, a mobile Internet software provider, and NIWS, a computer systems integrator, have delivered outstanding gains over the period. On the other hand, we have been punished for niche discretionary holdings such as Kyoto Kimono and Arc Land Sakamoto. In response, we have increased our position in Kyoto Kimono and cut our exposure to Arc Land Sakamoto.
Finally, large caps have disappointed over the period. With notable exceptions such as Canon and Aflac, the deterioration in the macro outlook has weighed heavily on core holdings such as Honda, Nintendo, and Sony. |
| 12 w w w . m a t t h e w s f u nd s . c o m | 8 0 0 - 7 8 9 - A S I A [ 2 7 4 2 ] |
Fund Performance
AVERAGE ANNUAL RETURNS AS OF FEBRUARY 28, 2003
                                                             SINCE
                                                         INCEPTION
                                              1 YEAR      12/31/98

Matthews Japan Fund                          (8.44%)       (2.18%)

MSCI Developed Market Japan Index(2)         (9.63%)       (7.77%)

TOPIX Index(1)                               (7.61%)       (6.48%)

Lipper Japanese Funds Average(3)            (13.15%)       (6.27%)
GROWTH OF A $10,000 INVESTMENT

Past performance is not indicative of future results. Before taxes on distributions or redemptions of Fund shares.
| 1 | | TOPIX: The Tokyo Price Index is a capitalization-weighted index of all companies listed on the First Section of the Tokyo Stock Exchange. |
| 2 | | The MSCI Developed Market Japan Index is an unmanaged capitalization-weighted index of all Japanese equities. |
| 3 | | As of 2/28/03, the Lipper Japanese Funds Average consisted of 52 funds for the one-year period, 44 funds for the three-year period, and 37 funds since 12/31/98. Lipper Analytical Services, Inc. fund performance does not reflect sales charges and is based on total return, including reinvestment of dividends and capital gains for the stated periods. |
| | M a t t h e w s J a p a n F u n d 13 |
Matthews Asian Technology Fund
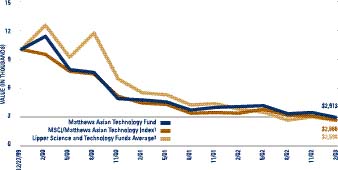
| | | The Matthews Asian Technology Fund invests in companies located in Asia that derive a substantial portion of their revenue from technology-related industries and services. |
| | For the six-month period ended February 28, 2003, the Matthews Asian Technology Fund was down 11.82% while its benchmark, the MSCI/Matthews Asian Technology Index was down 14.98%. Increasing global uncertainties and the lack of a “must-have” product depressed the Asian technology sector over the six-month period.
|
| | | The Asian technology sector has seen the emergence of a new era where digital products are replacing analog products. The number of new digital consumer products such as DVD players, LCD monitors, and digital cameras are growing fast, replacing analog products such as the VHS player, CRT monitor and film camera. At the same time, new digital products such as handsets and PDAs are creating new markets, expanding the Asian technology universe. However, none of these new products have had a big enough impact on sales to be labeled as a “must-have” product.
The last “must-have” was the personal computer (PC). Now, replacment PC sales are greater than new PC buyer sales.
Nevertheless, we believe that a new “must-have” product will appear in the market eventually lifting up overall demand, as a new era of digital convergence arrives. Combining new digital products with different standards onto one device will be a major hurdle for every company in the sector. However, we believe that the process has already begun as more partnerships and integrated moves between companies are made towards the inter-changeability and compatibility between different digital products. |
PORTFOLIO MANAGERS:
G. Paul Matthews
Mark W. Headley | | Discovering and identifying companies that will lead the digital era and the digital convergence trend will be major factors in choosing companies for the Fund. We continue to look for leaders in the new digital convergence era and for those that will benefit the most in the Asian technology sector. |
| 14 w w w . m a t t h e w s f u nd s . c o m | 8 0 0 - 7 8 9 - A S I A [ 2 7 4 2 ] |
Fund Performance
AVERAGE ANNUAL RETURNS AS OF FEBRUARY 28, 2003
                                                                          SINCE
                                                                      INCEPTION
                                                         1 YEAR        12/27/99

Matthews Asian Technology Fund                         (28.13%)        (32.21%)

MSCI/Matthews Asian Technology Index(1)                (20.74%)        (34.05%)

Lipper Science and Technology Funds Average(2)         (32.57%)        (35.78%)*


* From 12/31/99
GROWTH OF A $10,000 INVESTMENT
Past performance is not indicative of future results. Before taxes on distributions or redemptions of Fund shares.
| 1 | | The MSCI/Matthews Asian Technology Index is an unmanaged capitalization-weighted index of Asian equities tracking a broad range of technology stocks including: semiconductor equipment and products, communications equipment, computers and peripherals, electronic equipment and instruments, office electronics, software, IT consulting and services, Internet software and services, diversified telecommunications services, and wireless telecommunications services. |
| 2 | | As of 2/28/03, the Lipper Science and Technology Funds Average consisted of 358 funds for the one-year period, 170 funds for the three-year period, and 161 funds since 12/31/99. Lipper Analytical Services, Inc. fund performance does not reflect sales charges and is based on total return, including reinvestment of dividends and capital gains for the stated periods. |
| 3 | | For Lipper Science and Technology Funds Average, graph start date is 12/31/99. |
| | M a t t h e w s A s i a n T e c h n o l o g y F u n d 15 |
- ----------------------------------------------------------------------------
Schedule of Investments                        FEBRUARY 28, 2003 (unaudited)
- ----------------------------------------------------------------------------
Matthews Pacific Tiger Fund
- ----------------------------------------------------------------------------
[DRAGON LOGO]                                      SHARES             VALUE
                                       -------------------------------------
EQUITIES: 99.43%*

China/Hong Kong: 39.50%
Asia Satellite Telecommunications
  Holdings Ltd.                                 1,476,600        $1,883,824
AsiaInfo Holdings, Inc.**                         327,200         1,217,184
Bank of East Asia Ltd.                            803,400         1,498,819
China Insurance International
  Holdings Co., Ltd.                              902,000           491,530
China Mobile HK Ltd.**                          1,074,717         2,315,036
China Mobile HK Ltd. ADR**                        165,850         1,814,399
China Pharmaceutical Enterprise
  and Investment Corp., Ltd.                    8,681,000         2,192,756
Dah Sing Financial Group                          838,400         4,063,474
Giordano International, Ltd.                   11,781,000         3,549,804
Huaneng Power
  International, Inc. ADR                         108,000         3,916,080
Legend Group Ltd.                              13,372,000         4,586,428
Shangri-La Asia Ltd.                            6,022,000         4,323,975
Swire Pacific Ltd. - Class A                    1,062,000         4,493,584
Television Broadcasts Ltd.                        554,700         1,689,181
Tsingtao Brewery Co., Ltd.                      1,656,000           992,650
Vitasoy International
  Holdings, Ltd.                                8,948,750         1,939,115
                                                                 ----------
Total China/Hong Kong                                            40,967,839
- ---------------------------------------------------------------------------

Indonesia: 5.75%
PT Astra International                         10,558,230         2,793,026
PT Bank Central Asia                            5,695,000         1,586,664
PT Ramayana Lestari Sentosa                     6,387,000         1,581,742
                                                                 ----------
Total Indonesia                                                   5,961,432
- ---------------------------------------------------------------------------

Philippines: 0.66%
SM Prime Holdings, Inc.                         7,030,000           683,337
                                                                 ----------

Singapore: 12.29%
DBS Group Holdings Ltd.                           539,750         2,979,318
Fraser & Neave Ltd.                               809,500         3,723,572
Great Eastern Holdings Ltd.                       442,500         2,162,645
Venture Corp., Ltd.                               503,800         3,881,646
                                                                 ----------
Total Singapore                                                  12,747,181
- ---------------------------------------------------------------------------
| 16 w w w . m a t t h e w s f u nd s . c o m | 8 0 0 - 7 8 9 - A S I A [ 2 7 4 2 ] |
- ----------------------------------------------------------------------------

- ----------------------------------------------------------------------------

- ----------------------------------------------------------------------------
                                                   SHARES             VALUE
                                       -------------------------------------

South Korea: 24.93%
Amorepacific Corp.                                 22,330        $1,702,367
Hana Bank                                         361,237         4,842,116
Hite Brewery Co., Ltd.                             52,127         2,283,954
Hyundai Marine &
  Fire Insurance Co., Ltd.                         65,740         1,219,906
Internet Auction Co., Ltd.**                      147,960         3,383,997
Kookmin Credit Card Co., Ltd.**                    88,790         1,324,058
KT Corp. ADR                                       66,000         1,221,000
Nong Shim Co., Ltd.                                36,510         2,186,960
Pulmuone Co., Ltd.                                 71,270         2,203,211
Samsung Electronics Co., Ltd.                      15,503         3,630,116
SK Telecom Co., Ltd.                                4,945           683,555
SK Telecom Co., Ltd. ADR                           76,500         1,177,335
                                                                 ----------
Total South Korea                                                25,858,575
- ---------------------------------------------------------------------------

Taiwan: 5.63%
Hon Hai Precision Industry Co., Ltd.              721,750         2,326,213
SinoPac Holdings Co.**                          5,276,966         2,019,671
Taiwan Semiconductor
  Manufacturing Co., Ltd.**                     1,130,620         1,366,503
Via Technologies, Inc.                            129,446           128,515
                                                                 ----------
Total Taiwan                                                      5,840,902
- ---------------------------------------------------------------------------

Thailand: 10.67%
Advanced Info Service
  Public Co., Ltd.                              5,935,900         5,410,775
Bangkok Bank Public Co., Ltd.**                 2,838,500         4,212,800
Serm Suk Public Co., Ltd.**                       311,100         1,439,705
                                                                 ----------
Total Thailand                                                   11,063,280
- ---------------------------------------------------------------------------

TOTAL INVESTMENTS: 99.43%                                       103,122,546
(Cost $109,633,262***)

CASH AND OTHER ASSETS,
LESS LIABILITIES: 0.57%                                             586,056
- ---------------------------------------------------------------------------

NET ASSETS: 100.00%                                            $103,708,602
===========================================================================

*     As a percentage of net assets as of February 28, 2003
**    Non-income producing security.
***   Cost for Federal income tax purposes is $109,633,262
      and net unrealized depreciation consists of:
      Gross unrealized appreciation       $11,126,507
      Gross unrealized depreciation       (17,637,223)
                                          -----------
      Net unrealized depreciation         $(6,510,716)
                                          ===========
ADR   American Depositary Receipt


MARKET SECTOR DIVERSIFICATION
As a Percentage of Total Value
of Investment in Securities

Consumer Discretionary                                                19.11%
  Distributors                                                         2.71%
  Hotels, Restaurants & Leisure                                        4.19%
  Internet & Catalog Retail                                            3.28%
  Media                                                                1.64%
  Multiline Retail                                                     2.20%
  Specialty Retail                                                     5.09%

Consumer Staples                                                      14.32%
  Beverages                                                            8.18%
  Food Products                                                        6.14%

Financials                                                            29.96%
  Banks                                                               23.46%
  Diversified Financials                                               2.74%
  Insurance                                                            3.76%

Health Care                                                            2.13%
  Health Care Providers & Services                                     2.13%

Information Technology                                                16.61%
  Computers & Peripherals                                              6.70%
  Electronic Equipment & Instruments                                   3.76%
  IT Consulting & Services                                             1.18%
  Semiconductor Equipment & Products                                   4.97%

Telecommunication Services                                            14.07%
  Diversified Telecommunication Services                               3.01%
  Wireless Telecommunication Services                                 11.06%

Utilities                                                              3.80%
  Electric Utilities                                                   3.80%
                                                                     -------

TOTAL INVESTMENTS                                                    100.00%
============================================================================


See accompanying notes to financial statements
| | S c h e d u l e o f I n v e s t m e n t s 17 |
- ----------------------------------------------------------------------------
Schedule of Investments                       FEBRUARY 28, 2003 (unaudited)
- ----------------------------------------------------------------------------
Matthews Asian Growth and Income Fund
- ----------------------------------------------------------------------------
[DRAGON LOGO]                                      SHARES             VALUE
                                       -------------------------------------

EQUITIES: 60.23%*

China/Hong Kong: 32.21%
Bank of East Asia Ltd.                          2,084,000        $3,887,900
BOC Hong Kong Holdings Ltd.**                   2,539,500         2,604,909
Cafe De Coral Holdings Ltd.                     4,647,100         2,904,765
Cheung Kong Infrastructure
  Holdings Ltd.                                 1,946,500         3,544,028
China Hong Kong Photo Products
  Holdings Ltd.                                 8,810,003           587,400
CLP Holdings Ltd.                               1,168,700         4,795,207
Dickson Concepts International, Ltd.            1,735,500           376,067
Hang Seng Bank Ltd.                               351,600         3,843,241
Hong Kong & China Gas Co., Ltd.                 3,798,000         4,674,989
Hongkong Electric Holdings Ltd.                 1,230,000         4,691,875
Hongkong Land Holdings Ltd.                     2,868,000         3,527,640
Huaneng Power International,
  Inc. ADR                                         94,950         3,442,887
Kerry Properties, Ltd.                          3,071,000         2,598,832
MTR Corp., Ltd.                                 2,420,000         2,684,020
PetroChina Co., Ltd. H Shares                  14,286,000         2,985,744
PetroChina Co., Ltd. ADR                          130,700         2,743,393
Shandong International
Power Development Co., Ltd.                    10,408,000         2,335,392
Shangri-La Asia Ltd.                            6,115,000         4,390,752
Television Broadcasts Ltd.                      1,220,000         3,715,163
The Wharf Holdings Ltd.                         3,238,000         6,642,801
Vitasoy International
  Holdings Ltd.                                17,725,000         3,840,850
                                                                 ----------
Total China/Hong Kong                                            70,817,855
- ---------------------------------------------------------------------------

Indonesia: 0.82%
PT Indonesian Satellite Corp. ADR                  93,000           809,100
PT Tempo Scan Pacific                           2,004,000           992,582
                                                                 ----------
Total Indonesia                                                   1,801,682
- ---------------------------------------------------------------------------

Japan: 0.85%
Japan Retail Fund Investment Corp. REIT               209           924,568
Nippon Building Fund, Inc. REIT                       194           950,104
                                                                 ----------
Total Japan                                                       1,874,672
- ---------------------------------------------------------------------------

Singapore: 5.81%
Fraser & Neave Ltd.                             1,720,800         7,915,409
Singapore Exchange, Ltd.                        4,742,000         3,380,930
Singapore Press Holdings, Ltd.                    142,000         1,485,979
                                                                 ----------
Total Singapore                                                  12,782,318
- ---------------------------------------------------------------------------
| 18 w w w . m a t t h e w s f u nd s . c o m | 8 0 0 - 7 8 9 - A S I A [ 2 7 4 2 ] |
- ----------------------------------------------------------------------------

- ----------------------------------------------------------------------------

- ----------------------------------------------------------------------------
                                                   SHARES             VALUE
- ----------------------------------------------------------------------------

South Korea: 13.95%
Daehan City Gas Co., Ltd.                         235,780        $2,409,849
Hyundai Motor Co., Ltd., Pfd.                     443,890         4,685,640
Korea Electric Power Corp,. ADR                   125,250         1,033,313
Korea Gas Corp.                                   148,870         3,117,957
Korean Reinsurance Co.                            142,290         2,366,235
LG Household & Health
  Care Ltd. Pfd.                                  177,830         2,428,374
Samsung Electronics Co., Ltd., Pfd.                35,480         3,983,010
Samsung Fire & Marine
  Insurance Co., Ltd., Pfd.                       131,590         3,307,251
Shinhan Financial Group Co., Ltd.                 339,900         3,573,698
Sindo Ricoh Co., Ltd.                              77,130         3,773,629
                                                                 ----------
Total South Korea                                                30,678,956
- ---------------------------------------------------------------------------

Thailand: 4.84%
Bangkok Bank Public Co., Ltd.**                 1,625,000         2,411,767
Charoen Pokphand Foods
  Public Co., Ltd.                              7,790,000           764,707
Charoen Pokphand Foods
  Public Co., Ltd., Foreign                    18,005,000         1,767,464
Charoen Pokphand Foods
  Public Co., Ltd., Warrants**                    638,000            35,192
PTT PCL                                           490,000           501,051
PTT Farmers Bank Public Co., Ltd.               3,150,000         3,165,828
Thai Farmers Bank
  Public Co., Ltd.**                              560,000           376,300
Thai Farmers Bank
  Public Co., Ltd., Foreign**                     304,000           232,698
Thai Reinsurance Public Co., Ltd.               1,563,000         1,379,065
                                                                 ----------
Total Thailand                                                   10,634,072
- ---------------------------------------------------------------------------

United Kingdom: 1.75%
HSBC Holdings PLC ADR                              71,800         3,852,788
                                                                -----------
TOTAL EQUITIES                                                  132,442,343
- ---------------------------------------------------------------------------
(Cost $134,764,252)


- ----------------------------------------------------------------------------

- ----------------------------------------------------------------------------

- ----------------------------------------------------------------------------
                                              FACE AMOUNT             VALUE
INTERNATIONAL DOLLAR BONDS: 35.22%*

China/Hong Kong: 11.12%
Hang Lung Prop., Ltd., Cnv.
5.500%, 12/29/49                                6,500,000        $5,443,750
China Mobile Hong Kong Ltd., Cnv.
2.250%, 11/03/05                               11,150,000        11,038,500
New World Capital Finance Ltd., Cnv.
3.000%, 06/09/04                                1,100,000         1,331,000
New World Infrastructure Cnv.
1.000%, 04/15/03                                  400,000           566,000
PCCW Capital II Ltd., Cnv
1.000%, 01/29/07                                2,050,000         2,093,563
Tingyi (C.I.) Holding Corp.
3.500%, 06/04/05                                3,500,000         3,963,750
                                                                 ----------
Total China/Hong Kong                                            24,436,563
- ---------------------------------------------------------------------------

Singapore: 2.42%
Finlayson Global Corp., Cnv.
0.000%, 02/19/04                                4,000,000         5,010,000
Finlayson Global Corp., Cnv.***
0.000%, 02/19/04                                  250,000           313,125
                                                                  ---------
Total Singapore                                                   5,323,125
- ---------------------------------------------------------------------------

South Korea: 11.58%
HMC Cayman Finance Co., Cnv.
3.000%, 08/17/03                                5,200,000         5,284,500
Korea Deposit Insurance Corp., Cnv.
2.250%, 10/11/05                                8,320,000        10,150,400
Korea Telecom Corp., Cnv.
0.250%, 01/04/07                                9,325,000         9,628,062
Korea Telecom Corp., Cnv.***
0.250%, 01/04/07                                  375,000           387,188
                                                                 ----------
Total South Korea                                                25,450,150
- ---------------------------------------------------------------------------

Taiwan: 7.95%
Cathay Financial Holding Co., Cnv.
0.000%, 05/20/07                                6,600,000         6,760,908
Fubon Financial Holding Co., Ltd., Cnv.
0.000%, 07/10/04                                6,000,000         6,337,500
Sinopac Holdings Cnv.
0.000%, 07/12/07                                4,000,000         4,390,000
                                                                 ----------
Total Taiwan                                                     17,488,408
- ---------------------------------------------------------------------------
| | S c h e d u l e o f I n v e s t m e n t s 19 |
- ----------------------------------------------------------------------------
Schedule of Investments                       FEBRUARY 28, 2003 (unaudited)
- ----------------------------------------------------------------------------
< Matthews Asian Growth and Income Fund
- ----------------------------------------------------------------------------
                                              FACE AMOUNT             VALUE
- ----------------------------------------------------------------------------

Thailand: 2.15%
Bangkok Bank Public Co., Ltd., Cnv.
4.589%, 03/03/04                                7,700,000        $4,735,500
                                                                 ----------
Total Thailand                                                    4,735,500
- ---------------------------------------------------------------------------

TOTAL INTERNATIONAL
DOLLAR BONDS                                                     77,433,746
- ---------------------------------------------------------------------------
(Cost $78,261,466)

TOTAL INVESTMENTS: 95.45%*                                      209,876,089
(Cost $213,025,718****)

CASH AND OTHER ASSETS,
  LESS LIABILITIES: 4.55%                                         9,997,310
- ---------------------------------------------------------------------------

NET ASSETS: 100.00%                                            $219,873,399
===========================================================================


*     As a percentage of net assets as of February 28, 2003
**    Non-income producing security.
***   Securities exempt from registration under rule 144A of the Securities Act of 1933. These securities
      may be resold in transactions exempt from registration, normally to qualified, institutional buyers.
      At February 28, 2003, the value of these securities amounted to $700,313 or 0.32% of net assets.
****  Cost for Federal income tax purposes is $213,025,718
      and net unrealized depreciation consists of:
      Gross unrealized appreciation        $6,683,236
      Gross unrealized depreciation        (9,832,865)
                                          -----------
      Net unrealized depreciation         $(3,149,629)
                                          ===========
ADR   American Depositary Receipt
Pfd.  Preferred
Cnv.  Convertible
REIT  Real Estate Investment Trust


MARKET SECTOR DIVERSIFICATION
As a Percentage of Total Value of
Investment in Securities

Consumer Discretionary                                                8.82%
  Automobiles                                                         2.23%
  Hotels, Restaurants & Leisure                                       3.48%
  Household Products                                                  1.16%
  Media                                                               1.77%
  Textiles & Apparel                                                  0.18%

Consumer Staples                                                      7.49%
  Beverages                                                           3.77%
  Food Products                                                       3.72%

Energy                                                                5.96%
  Oil & Gas                                                           5.96%

Financials                                                           40.72%
  Banks                                                              11.75%
  Diversified Financials                                             18.57%
  Insurance                                                           3.36%
  Real Estate                                                         7.04%

Health Care                                                           0.47%
  Medical & Pharmaceutical                                            0.47%

Industrials                                                           8.40%
  Agriculture                                                         1.22%
  Commercial Services & Supplies                                      2.40%
  Distributors                                                        1.43%
  Electrical Equipment                                                1.80%
  Transportation Infrastructure                                       1.55%

Information Technology                                                1.90%
  Semiconductor Equipment & Products                                  1.90%

Telecommunication Services                                           11.41%
  Diversified Telecommunication Services                              6.15%
  Wireless Telecommunication Services                                 5.26%

Utilities                                                            14.83%
  Electric Utilities                                                 12.60%
  Gas Utilities                                                       2.23%

TOTAL INVESTMENTS                                                   100.00%
===========================================================================


See accompanying notes to financial statements
| 20 w w w . m a t t h e w s f u nd s . c o m | 8 0 0 - 7 8 9 - A S I A [ 2 7 4 2 ] |
- ----------------------------------------------------------------------------
Matthews Korea Fund >
- ----------------------------------------------------------------------------
                                                   SHARES             VALUE
- ----------------------------------------------------------------------------

EQUITIES: SOUTH KOREA: 97.60%*

BUSINESS SERVICES: 2.89%
Media: 2.89%
Cheil Communications, Inc.                         24,740        $2,072,634
CJ Entertainment, Inc.                            285,757         2,609,434
                                                                 ----------
Total Business Services                                           4,682,068
- ---------------------------------------------------------------------------


CONSUMER DISCRETIONARY: 8.79%
Automobiles: 3.86%
Hyundai Motor Co., Ltd.                           137,361         2,888,419
Hyundai Motor Co., Ltd., Pfd.                     318,850         3,365,735
                                                                  ---------
                                                                  6,254,154
                                                                  ---------
Automobile Parts: 0.20%
Global & Yuasa Battery Co., Ltd.                  224,800           323,928
                                                                  ---------
Internet & Catalog Retail: 3.43%
Internet Auction Co., Ltd.**                      183,507         4,196,993
LG Home Shopping, Inc.                             20,443         1,349,565
                                                                  ---------
                                                                  5,546,558
                                                                  ---------
Retail: 1.30%
Hyundai Department Store Co., Ltd.                124,360         2,099,321
                                                                  ---------
Total Consumer Discretionary                                     14,223,961
- ---------------------------------------------------------------------------


CONSUMER STAPLES - 17.46%
Beverages: 4.28%
Hite Brewery Co., Ltd.                             93,041         4,076,609
Lotte Chilsung Beverage Co.                         6,450         2,853,098
                                                                  ---------
                                                                  6,929,707
                                                                  ---------
Consumer Products: 4.04%
Amorepacific Corp.                                 54,700         4,170,150
Handsome Co., Ltd.                                114,290           669,281
Hanssem Co., Ltd.                                  90,900           841,490
Plenus Entertainment, Inc.                         92,740           854,639
                                                                  ---------
                                                                  6,535,560
                                                                  ---------
Food Products: 7.80%
CJ Corp.                                           42,200         1,435,362
Lotte Confectionery Co., Ltd.                       8,010         2,660,717
Nong Shim Co., Ltd.                                83,778         5,018,328
Pulmuone Co., Ltd.                                 66,210         2,046,788
Tong Yang Confectionery Corp.                      35,000         1,466,091
                                                                 ----------
                                                                 12,627,286
                                                                 ----------
Household Products/Ware: 1.34%
LG Household & Health Care, Ltd., Pfd.            159,270         2,174,927
                                                                 ----------
Total Consumer Staples                                           28,267,480
- ---------------------------------------------------------------------------


- ----------------------------------------------------------------------------

- ----------------------------------------------------------------------------
                                                   SHARES             VALUE
- ----------------------------------------------------------------------------

FINANCIALS: 21.16%
Banks: 12.62%
Hana Bank                                         681,874        $9,140,019
Kookmin Bank                                      195,163         5,967,788
Kookmin Bank ADR**                                 68,939         2,104,018
Shinhan Financial Group Co., Ltd.                 306,592         3,223,499
                                                                 ----------
                                                                 20,435,324
                                                                 ----------
Diversified Financials: 3.11%
Kookmin Credit Card Co., Ltd.**                    85,750         1,278,725
Samsung Securities Co., Ltd.                      163,495         3,752,996
                                                                 ----------
                                                                  5,031,721
                                                                 ----------
Insurance: 5.43%
Hyundai Marine & Fire Insurance Co.                73,510         1,364,090
Samsung Fire & Marine
  Insurance Co., Ltd.                             103,853         4,959,260
Samsung Fire & Marine
  Insurance Co., Ltd., Pfd.                        98,000         2,463,034
                                                                 ----------
                                                                  8,786,384
                                                                 ----------
Total Financials                                                 34,253,429
- ---------------------------------------------------------------------------

HEALTH CARE: 2.59%
Health Care Equipment & Supplies: 0.44%
Shinhung Co., Ltd.                                342,700           709,143
                                                                 ----------
Pharmaceuticals: 2.15%
Yuhan Corp.                                        83,118         3,481,674
                                                                 ----------
Total Health Care                                                 4,190,817
- ---------------------------------------------------------------------------


INDUSTRIALS: 6.82%
Commercial Services: 2.49%
S1 Corp.                                          245,895         4,027,351
                                                                 ----------
Construction: 2.48%
Tae Young Corp.                                   154,310         4,007,548
                                                                 ----------
Metals & Mining: 1.85%
Poongsan Corp.                                    368,840         2,997,318
                                                                 ----------
Total Industrials                                                11,032,217
- ---------------------------------------------------------------------------
| | S c h e d u l e o f I n v e s t m e n t s 21 |
- ----------------------------------------------------------------------------
Schedule of Investments                      FEBRUARY 28, 2003 (unaudited)
- ----------------------------------------------------------------------------
< Matthews Korea Fund
- ----------------------------------------------------------------------------
                                                   SHARES             VALUE
- ----------------------------------------------------------------------------

INFORMATION TECHNOLOGY: 20.02%
Electrical & Electronic Equipment: 1.93%
Daeduck Electronics Co., Ltd.                     428,433        $3,129,842
                                                                 ----------

Internet Software & Services: 2.98%
NCsoft Corp.**                                     46,472         3,819,297
NHN Corp.                                          21,400         1,002,187
                                                                 ----------
                                                                  4,821,484
                                                                 ----------
Office Electronics: 3.20%
Sindo Ricoh Co.                                   105,986         5,185,425
                                                                 ----------
Semiconductor Equipment & Products: 11.91%
Samsung Electronics                                68,051        15,934,532
Samsung Electronics Co., Ltd., Pfd.                29,640         3,327,408
                                                                 ----------
                                                                 19,261,940
                                                                 ----------
Total Information Technology                                     32,398,691
- ---------------------------------------------------------------------------


TELECOMMUNICATION SERVICES: 14.10%
Telecommunication Services: 6.30%
KT Corp.                                          109,020         3,986,699
KT Corp., ADR                                     335,500         6,206,750
                                                                 ----------
                                                                 10,193,449
                                                                 ----------
Wireless Telecommunication Services: 7.80%
KT Freetel Co., Ltd.**                            222,301         4,562,790
SK Telecom Co., Ltd.                               45,155         6,241,842
SK Telecom Co., Ltd., ADR                         118,600         1,825,254
                                                                 ----------
                                                                 12,629,886
                                                                 ----------
Total Telecommunication Services                                 22,823,335
- ---------------------------------------------------------------------------


UTILITIES: 3.77%
Daehan City Gas Co., Ltd.                          57,492           587,611
Korea Electric Power (KEPCO) Corp.                138,610         2,084,405
Korea Gas Corp.                                   163,750         3,429,607
                                                                 ----------
Total Utilities                                                   6,101,623
- ---------------------------------------------------------------------------


TOTAL EQUITIES: SOUTH KOREA                                     157,973,621
- ---------------------------------------------------------------------------
(Cost $152,222,277)


- ----------------------------------------------------------------------------
                                              FACE AMOUNT             VALUE
- ----------------------------------------------------------------------------

INTERNATIONAL DOLLAR BONDS:
SOUTH KOREA: 0.98%*

FINANCIALS: 0.15%
Insurance: 0.15%
Korea Deposit Insurance Cnv.
2.250%, 10/11/05                                  200,000          $244,000
                                                                 ----------


TELECOMMUNICATION SERVICES: 0.83%
Telecommunication Services: 0.83%
Korea Telecom Co.
0.250%, 01/04/07                                  925,000           955,062
Korea Telecom Co.
0.250%, 01/04/07 ***                              375,000           387,188
                                                                 ----------
                                                                  1,342,250
                                                                 ----------

TOTAL INTERNATIONAL DOLLAR BONDS:
SOUTH KOREA                                                       1,586,250
- ---------------------------------------------------------------------------
(Cost $1,628,905)

TOTAL INVESTMENTS: 98.58%                                       159,559,871
(Cost $153,851,182****)

CASH AND OTHER ASSETS,
  LESS LIABILITIES: 1.42%                                         2,296,397
- ---------------------------------------------------------------------------

NET ASSETS: 100.00%                                            $161,856,268
===========================================================================


*        As a percentage of net assets as of February 28, 2003
**       Non - income producing security.
***      Securities exempt from registration under rule 144A of the Securities Act of 1933. These securities
         may be resold in transactions exempt from registration, normally to qualified, institutional buyers. At February
         28, 2003, the value of these securities amounted to $387,188 or 0.24% of net assets.
****     Cost for Federal income tax purposes is $153,851,182
         and net unrealized depreciation consists of:
         Gross unrealized appreciation       $25,633,248
         Gross unrealized depreciation       (19,924,559)
                                             -----------
         Net unrealized appreciation          $5,708,689
                                             ===========
ADR      American Depositary Receipt
Cnv.     Convertible
Pfd.     Preferred


See accompanying notes to financial statements
| 22 w w w . m a t t h e w s f u nd s . c o m | 8 0 0 - 7 8 9 - A S I A [ 2 7 4 2 ] |
- ----------------------------------------------------------------------------
Matthews China Fund >
- ----------------------------------------------------------------------------
                                                   SHARES             VALUE
- ----------------------------------------------------------------------------

EQUITIES: CHINA/HONG KONG: 97.64%*

CONSUMER DISCRETIONARY: 25.00%
Automobiles & Components: 4.08%
Denway Motors, Ltd.                             5,586,600        $2,148,935
                                                                -----------
Consumer Durable & Apparel: 6.13%
Lerado Group Co., Ltd.                          4,442,000           746,112
TCL International Holdings, Ltd.                3,110,000           817,464
Texwinca Holdings, Ltd.                         2,180,000         1,663,136
                                                                -----------
                                                                  3,226,712
                                                                -----------
Distributors: 0.97%
Li & Fung, Ltd.                                   520,000           510,058
                                                                -----------
Hotels, Restaurants & Leisure: 8.03%
Cafe De Coral Holdings, Ltd.                    1,006,100           628,883
Shangri-La Asia, Ltd.                           2,499,000         1,794,356
Tsingtao Brewery Co. H Shares                   3,016,000         1,807,871
                                                                -----------
                                                                  4,231,110
                                                                -----------
Media: 3.61%
Clear Media, Ltd. **                            1,873,000           912,590
Television Broadcasts, Ltd.                       325,000           989,695
                                                                -----------
                                                                  1,902,285
                                                                -----------
Retail: 1.29%
Giordano International, Ltd.                    2,256,000           679,769
                                                                -----------
Travel & Recreation: 0.89%
China Travel International
  Investment Hong Kong, Ltd.                    2,702,000           467,707
                                                                -----------
Total Consumer Discretionary                                     13,166,576
- ---------------------------------------------------------------------------

ENERGY: 12.12%
Oil & Gas: 12.12%
China Oilfield Services, Ltd.**                 4,728,000         1,176,071
CNOOC, Ltd.                                       951,500         1,335,910
Hong Kong and China Gas Co., Ltd.                 981,400         1,208,013
PetroChina Co., Ltd. H Shares                   5,334,000         1,114,795
Sinopec Zhenhai Refining &
  Chemical Co., Ltd.                            4,938,000         1,551,214
                                                                -----------
Total Energy                                                      6,386,003
- ---------------------------------------------------------------------------

FINANCIALS: 9.35%
Banks: 2.05%
BOC Hong Kong (Holdings) Ltd. **                1,051,500        $1,078,583
                                                                -----------
Diversified Financials: 2.56%
Swire Pacific, Ltd. A Shares                      319,000         1,349,768
                                                                -----------
Insurance: 3.46%
China Insurance International
  Holdings Co., Ltd.                            3,348,000         1,824,437
                                                                -----------
Real Estate: 1.28%
China Vanke Co., Ltd. B Shares                    841,733           672,383
                                                                -----------
Total Financials                                                  4,925,171
- ---------------------------------------------------------------------------


HEALTH CARE: 3.93%
Pharmaceuticals: 3.93%
China Pharmaceutical Enterprise
  and Investment Corp., Ltd.                    8,204,000         2,072,270
                                                                -----------
Total Health Care                                                 2,072,270
- ---------------------------------------------------------------------------


INDUSTRIALS: 25.23%
Airlines: 4.93%
Beijing Capital International
  Airport Co. H Shares                          8,214,000         1,948,412
China Southern Airlines Co.,
  Ltd. H Shares                                 2,378,000           647,926
                                                                -----------
                                                                  2,596,338
                                                                -----------
Industrial Conglomerates: 13.72%
Beijing Enterprises Holdings, Ltd.
  H Shares                                        808,000           792,551
BYD Co., Ltd. **                                  428,500           868,085
Cheung Kong Infrastructure                      1,166,500         2,123,868
China Merchants Holdings
  International Co., Ltd.                       2,234,000         1,732,978
Shanghai Industrial Holdings, Ltd.              1,101,000         1,708,154
                                                                -----------
                                                                  7,225,636
                                                                -----------
Machinery: 0.90%
Shanghai Zhenhua Port
  Machinery Co., Ltd. B Shares                    515,500           473,229
                                                                -----------
Transportation: 5.68%
Zhejiang Expressway Co.,
  Ltd. H Shares                                 4,046,000         1,776,809
Sinotrans, Ltd.**                               4,222,000         1,218,022
                                                                  2,994,831
                                                                -----------
Total Industrials                                                13,290,034
- ---------------------------------------------------------------------------
| | S c h e d u l e o f I n v e s t m e n t s 23 |
- ----------------------------------------------------------------------------
Schedule of Investments                    FEBRUARY 28, 2003 (unaudited)
- ----------------------------------------------------------------------------
< Matthews China Fund
- ----------------------------------------------------------------------------
                                                   SHARES             VALUE
- ----------------------------------------------------------------------------

INFORMATION TECHNOLOGY: 6.60%
Computer Software: 3.48%
Travelsky Technology, Ltd. H Shares             2,465,000        $1,833,156
                                                                 ----------
Computers & Peripherals: 2.31%
Legend Holdings, Ltd.                           3,542,000         1,214,861
                                                                 ----------
IT Consulting & Services: 0.81%
AsiaInfo Holdings, Inc.**                         115,263           428,778
                                                                 ----------
Total Information Technology                                      3,476,795
- ---------------------------------------------------------------------------


TELECOMMUNICATION SERVICES: 4.85%
Wireless Telecommunication Services: 4.85%
China Mobile HK, Ltd.**                           471,083         1,014,755
China Mobile HK, Ltd. ADR**                        21,500           235,210
China Unicom, Ltd.**                            1,988,000         1,204,405
China Unicom, Ltd. ADR**                           16,200            99,954
                                                                 ----------
Total Telecommunication Services                                  2,554,324
- ---------------------------------------------------------------------------


UTILITIES: 10.56%
Beijing Datang Power Generation,
  Co., Ltd. H Shares                            3,918,000         1,331,266
Huaneng Power International,
  Inc. ADR                                         39,400         1,428,644
Huaneng Power International,
  Inc. H Shares                                 1,652,000         1,472,140
Shandong International Power
  Development Co., Ltd. H Shares                5,920,000         1,328,355
                                                                 ----------
Total Utilities                                                   5,560,405
- ---------------------------------------------------------------------------

TOTAL INVESTMENTS: 97.64%                                        51,431,578
(Cost $53,474,454***)


CASH AND OTHER ASSETS,
  LESS LIABILITIES: 2.36%                                         1,237,449
- ---------------------------------------------------------------------------

NET ASSETS: 100.00%                                             $52,669,027
===========================================================================

*        As a percentage of net assets as of February 28, 2003
**       Non - income producing security.
ADR      American Depositary Receipt
***      Cost for Federal income tax purposes is $53,474,454
         and net unrealized depreciation consists of:
         Gross unrealized appreciation     $4,377,631
         Gross unrealized depreciation     (6,420,507)
                                          -----------
         Net unrealized depreciation      $(2,042,876)
                                          ===========


- ----------------------------------------------------------------------------
Matthews Japan Fund >
- ----------------------------------------------------------------------------
                                                   SHARES             VALUE
- ----------------------------------------------------------------------------

EQUITIES: JAPAN: 98.85%*

CONSUMER DISCRETIONARY: 38.22%
Automobiles: 10.40%
Gulliver International Co., Ltd.                   12,200          $303,388
Honda Motor Co., Ltd. ADR                          20,500           376,585
                                                                 ----------
                                                                    679,973
                                                                 ----------
Bicycle Manufacturing: 2.31%
Shimano, Inc.                                      11,500           150,772
                                                                 ----------
Household Durables: 7.69%
Arc Land Sakamoto Co., Ltd.                           600             4,212
Nintendo Co., Ltd.                                  3,665           292,332
Sony Corp. ADR                                      5,435           206,367
                                                                 ----------
                                                                    502,911
                                                                 ----------
Media: 4.35%
Fuji Television Network, Inc.                          81           284,331
                                                                 ----------

Retail: 13.47%
Belluna Co., Ltd.                                   7,024           213,289
Don Quijote Co., Ltd.                               3,500           279,171
Fast Retailing Co., Ltd.                            3,900           103,912
Kyoto Kimono Yuzen Co., Ltd.                          111           197,166
Paris Miki, Inc.                                    8,500            88,433
                                                                 ----------
                                                                    881,971
                                                                 ----------
Total Consumer Discretionary                                      2,499,958
- ---------------------------------------------------------------------------


CONSUMER STAPLES: 6.15%
Beverages: 3.48%
ITO En, Ltd.                                        7,300           227,228
                                                                 ----------
Food: 2.67%
Nissin Healthcare Food
  Service Co., Ltd.                                10,600           174,836
                                                                 ----------
Total Consumer Staples                                              402,064
- ---------------------------------------------------------------------------


See accompanying notes to financial statements
| 24 w w w . m a t t h e w s f u nd s . c o m | 8 0 0 - 7 8 9 - A S I A [ 2 7 4 2 ] |
- ----------------------------------------------------------------------------

- ----------------------------------------------------------------------------

- ----------------------------------------------------------------------------
                                                   SHARES             VALUE
- ----------------------------------------------------------------------------

FINANCIALS: 25.50%
Banks: 10.77%
Mizuho Financial Group, Inc.**                        338          $300,190
The Joyo Bank, Ltd.                                53,000           146,145
The Sumitomo Trust and
  Banking Co., Ltd.                                74,000           258,507
                                                                 ----------
                                                                    704,842
                                                                 ----------
Diversified Financials: 8.46%
Japan Securities Finance Co., Ltd.                 31,000           103,574
Monex, Inc. **                                      1,631           155,892
Nomura Holdings, Inc.                              25,000           293,931
                                                                 ----------
                                                                    553,397
                                                                 ----------
Insurance: 3.25%
AFLAC, Inc.                                         6,800           212,500
                                                                 ----------
Real Estate: 3.02%
Able, Inc.                                          9,600           197,319
                                                                 ----------
Total Financials                                                  1,668,058
- ---------------------------------------------------------------------------

INFORMATION TECHNOLOGY: 12.87%
Electronic Equipment & Instruments: 6.74%
Canon, Inc.                                         2,000            72,235
Canon, Inc. ADR                                     3,900           140,205
Niws Co., Ltd.                                        173           228,277
                                                                 ----------
                                                                    440,717
                                                                 ----------
Semiconductor Equipment: 2.10%
Rohm Co., Ltd.                                      1,200           137,534
                                                                 ----------
Software: 4.03%
Access Co., Ltd. **                                    18           263,396
                                                                 ----------
Total Information Technology                                        841,647
- ---------------------------------------------------------------------------


MANUFACTURING: 8.49%
Agricultural: 2.69%
Hokuto Corp.                                        9,800           176,147
                                                                 ----------
Electronics: 2.55%
Murata Manufacturing Co., Ltd.                      4,400           166,733
                                                                 ----------
Equipment & Products: 3.25%
Yushin Precision Equipment Co., Ltd.                4,500            70,417
Nakanishi, Inc.                                     6,000           142,102
                                                                    212,519
                                                                 ----------
Total Manufacturing                                                 555,399
- ---------------------------------------------------------------------------


- ----------------------------------------------------------------------------
                                                   SHARES             VALUE
- ----------------------------------------------------------------------------

TELECOMMUNICATION SERVICES: 7.62%
Diversified Telecommunication Services: 7.62%
NTT DoCoMo, Inc.                                      127          $239,552
Nippon Telegraph &
  Telephone Corp. ADR**                            14,325           259,139
                                                                 ----------
Total Telecommunication Services                                    498,691
- ---------------------------------------------------------------------------


TOTAL INVESTMENTS: 98.85%                                         6,465,817
(Cost $7,624,243***)

CASH AND OTHER ASSETS,
LESS LIABILITIES: 1.15%                                              74,955
- ---------------------------------------------------------------------------

NET ASSETS: 100.00%                                              $6,540,772
===========================================================================

*        As a percentage of net assets as of February 28, 2003
**       Non - income producing security.
***      Cost for Federal income tax purposes is $7,624,243
         and net unrealized depreciation consists of:
         Gross unrealized appreciation        $178,459
         Gross unrealized depreciation      (1,336,885)
                                           -----------
         Net unrealized depreciation       $(1,158,426)
                                           ===========
ADR      American Depositary Receipt


See accompanying notes to financial statements
| | S c h e d u l e o f I n v e s t m e n t s 25 |
- ----------------------------------------------------------------------------
Schedule of Investments                     FEBRUARY 28, 2003 (unaudited)
- ----------------------------------------------------------------------------
Matthews Asian Technology Fund
- ----------------------------------------------------------------------------
[DRAGON LOGO]                                      SHARES             VALUE
- ----------------------------------------------------------------------------

EQUITIES: 99.30%*

China/Hong Kong: 14.81%
Asia Satellite Telecommunications
  Holdings Ltd.                                    82,900          $105,762
AsiaInfo Holdings, Inc. **                         21,000            78,120
China Mobile HK Ltd. **                            44,500            95,857
China Mobile HK Ltd. ADR **                        10,900           119,246
Legend Group Ltd.                                 789,000           270,617
TPV Technology Ltd.                               446,000           130,098
                                                                 ----------
Total China/Hong Kong                                               799,700
- ---------------------------------------------------------------------------

India: 2.20%
Wipro Ltd. ADR                                      3,900           118,482
                                                                 ----------

Japan: 32.01%
Access Co., Ltd. **                                    16           234,130
Canon, Inc.                                         3,000           108,353
Canon, Inc. ADR                                     3,300           118,635
Nakanishi Inc.                                      7,000           165,785
Nintendo Co., Ltd.                                  2,935           234,105
Niws Co., Ltd.                                        186           245,430
NTT DoCoMo, Inc.                                      119           224,462
Rohm Co., Ltd.                                        800            91,690
Sony Corp.                                          2,800           106,340
Sony Corp. ADR                                      2,175            82,585
Yushin Precision Equipment Co., Ltd.                7,400           115,796
                                                                 ----------
Total Japan                                                       1,727,311
- ---------------------------------------------------------------------------

Singapore: 4.20%
Venture Corp., Ltd.                                29,400           226,519
                                                                 ----------

South Korea: 24.22%
DGI Co., Ltd.                                      13,610           153,357
Intelligent Digital Intergrated
  Security Co., Ltd.                               10,071           153,556
Internet Auction Co., Ltd. **                       7,196           164,580
KT Corp.                                            4,120           150,662
KT Corp. ADR                                        5,000            92,500
NCsoft Corp. **                                     1,851           152,124
NHN Corp.                                           1,000            46,831
Samsung Electronics Co., Ltd.                       1,038           243,054
SK Telecom Co., Ltd.                                1,089           150,534
                                                                 ----------
Total South Korea                                                 1,307,198
- ---------------------------------------------------------------------------
| 26 w w w . m a t t h e w s f u nd s . c o m | 8 0 0 - 7 8 9 - A S I A [ 2 7 4 2 ] |
- ----------------------------------------------------------------------------

- ----------------------------------------------------------------------------

- ----------------------------------------------------------------------------
                                                   SHARES             VALUE
- ----------------------------------------------------------------------------

Taiwan: 15.29%
Hon Hai Precision Industry Co., Ltd.               79,140          $255,070
LITE-ON IT Corp.                                   59,800           147,994
Realtek Semiconductor Corp.                        28,750            63,705
Sunplus Technology Co., Ltd.                      119,500           169,879
Taiwan Semiconductor
  Manufacturing Co., Ltd. **                      155,989           188,533
                                                                  ---------
Total Taiwan                                                        825,181
- ---------------------------------------------------------------------------

Thailand: 6.57%
Advanced Info Service
  Public Co., Ltd.                                316,800           288,774
Shin Satellite Public Co., Ltd. **                266,000            65,902
                                                                  ---------
Total Thailand                                                      354,676
- ---------------------------------------------------------------------------

TOTAL INVESTMENTS: 99.30%                                         5,359,067
(Cost $6,435,590***)


LIABILITIES, LESS CASH
AND OTHER ASSETS: 0.70%                                              37,829
- ---------------------------------------------------------------------------

NET ASSETS: 100.00%                                              $5,396,896
===========================================================================


*      As a percentage of net assets as of February 28, 2003
**     Non - income producing security.
ADR    American Depositary Receipt
***    Cost for Federal income tax purposes is $6,435,590
       and net unrealized depreciation consists of:
       Gross unrealized appreciation          $206,709
       Gross unrealized depreciation        (1,283,232)
                                           -----------
       Net unrealized depreciation         $(1,076,523)
                                           ===========


MARKET SECTOR DIVERSIFICATION
As a Percentage of Total Value of
Investment in Securities

Consumer Discretionary                                                9.87%
  Leisure Equipment & Products                                        9.87%


Industrials                                                           2.16%
  Commercial Services & Supplies                                      2.16%


Information Technology                                               62.71%
  Computers & Peripherals                                             2.86%
  Electronic Equipment & Instruments                                 23.83%
  Internet Software & Services                                       11.15%
  IT Consulting & Services                                            1.46%
  Semiconductor Equipment & Products                                 23.41%


Manufacturing                                                         3.09%
  Equipment & Products                                                3.09%


Telecommunication Services                                            22.17%
  Diversified Telecommunication Services                              22.17%


TOTAL INVESTMENTS                                                   100.00%
===========================================================================

See accompanying notes to financial statements
| | S c h e d u l e o f I n v e s t m e n t s 27 |
- -----------------------------------------------------------------------------------------------------------
Statement of Assets and Liabilities                                     FEBRUARY 28, 2003 (unaudited)
- -----------------------------------------------------------------------------------------------------------
                                                                      MATTHEWS               MATTHEWS
                                                                 PACIFIC TIGER       ASIAN GROWTH AND
                                                                          FUND            INCOME FUND
- -----------------------------------------------------------------------------------------------------------


Assets:
Investments at value (A)                                          $103,122,546           $209,876,089
Cash                                                                    16,870             10,033,213
Dividends and interest receivable                                      344,148              1,226,953
Receivable for securities sold                                       1,330,099                     --
Receivable for capital shares sold                                     167,047              2,043,353
Other assets                                                             7,824                 12,742
- -----------------------------------------------------------------------------------------------------------
Total assets                                                       104,988,534            223,192,350
- -----------------------------------------------------------------------------------------------------------

Liabilities:
Payable for securities purchased                                       936,850              2,910,439
Payable for capital shares redeemed                                    135,596                 64,448
Cash overdraft                                                              --                     --
Due to Advisor (Note 2)                                                 81,416                155,431
Payable for shareholder service fee                                     12,212                 23,315
Accrued expenses                                                       113,858                164,146
Other liabilities                                                           --                  1,172
- -----------------------------------------------------------------------------------------------------------
Total liabilities                                                    1,279,932              3,318,951
- -----------------------------------------------------------------------------------------------------------

Net Assets:                                                       $103,708,602           $219,873,399
===========================================================================================================

Shares Outstanding:
  (shares of beneficial interest issued and outstanding,
  respectively, unlimited number of shares authorized
  with a $0.001 par value)                                          12,971,730             21,141,837
===========================================================================================================

Net asset value, offering price and redemption price                     $7.99                 $10.40
===========================================================================================================

Net Assets Consist of:
Capital paid-in                                                   $121,263,370           $222,520,211
Accumulated undistributed net investment income (loss)                (260,120)               549,113
Accumulated net realized gain (loss) on investments                (10,784,710)               (48,575)
Net unrealized appreciation (depreciation) on investments
   and foreign currency related transactions                        (6,509,938)            (3,147,350)
- -----------------------------------------------------------------------------------------------------------

Net Assets:                                                       $103,708,602           $219,873,399
===========================================================================================================

(A) Investments at cost                                           $109,633,262           $213,025,718
===========================================================================================================


See accompanying notes to financial statements.

- -----------------------------------------------------------------------------------------------------------
| 28 w w w . m a t t h e w s f u nd s . c o m | 8 0 0 - 7 8 9 - A S I A [ 2 7 4 2 ] |
- -------------------------------------------------------------------------------------------

- -------------------------------------------------------------------------------------------

           MATTHEWS             MATTHEWS              MATTHEWS         MATTHEWS ASIAN
         KOREA FUND           CHINA FUND            JAPAN FUND        TECHNOLOGY FUND
- -------------------------------------------------------------------------------------------


       $159,559,871          $51,431,578            $6,465,817             $5,359,067
                 --            2,397,740                    --                 86,423
          2,665,768                  298                 4,955                  9,045
          1,735,274                   --               481,841                     --
             60,959               62,784                    --                  5,669
             14,996                2,491                   475                    472
- -------------------------------------------------------------------------------------------
        164,036,868           53,894,891             6,953,088              5,460,676
- -------------------------------------------------------------------------------------------


          1,246,839            1,003,945                    --                 46,397
            101,333              138,749                    --                     --
            437,873                   --               403,282                     --
            129,651               36,296                 6,019                  3,612
             19,448                5,444                   821                    633
            245,456               41,430                 2,194                 13,138
                 --                   --                    --                     --
- -------------------------------------------------------------------------------------------
          2,180,600            1,225,864               412,316                 63,780
- -------------------------------------------------------------------------------------------

       $161,856,268          $52,669,027            $6,540,772             $5,396,896
===========================================================================================


         50,378,876            5,856,424               825,549              1,955,609
===========================================================================================

              $3.21                $8.99                 $7.92                  $2.76
===========================================================================================


       $144,585,475          $58,076,469           $16,537,917            $25,327,715
            516,350             (126,638)              (85,633)               (52,296)
         11,039,219           (3,237,928)           (8,753,109)           (18,802,237)

          5,715,224           (2,042,876)           (1,158,403)            (1,076,286)
- -------------------------------------------------------------------------------------------

       $161,856,268          $52,669,027            $6,540,772             $5,396,896
===========================================================================================

       $153,851,182          $53,474,454            $7,624,243             $6,435,590
===========================================================================================


- -------------------------------------------------------------------------------------------
| | S t a t e m e n t o f A s s e t s a n d L i a b i l i t i e s 29 |
- -----------------------------------------------------------------------------------------------------
Statement of Operations                      For the six months ended FEBRUARY 28, 2003 (unaudited)
- -----------------------------------------------------------------------------------------------------
                                                                       MATTHEWS              MATTHEWS
                                                                  PACIFIC TIGER      ASIAN GROWTH AND
                                                                           FUND           INCOME FUND
- -----------------------------------------------------------------------------------------------------

Investment Income:
Dividends                                                              $864,409            $1,799,700
Interest                                                                     --             1,501,099
Foreign withholding tax                                                (108,770)             (177,509)
- -----------------------------------------------------------------------------------------------------
    Total investment income                                             755,639             3,123,290
- -----------------------------------------------------------------------------------------------------

Expenses:
Investment advisory fees (Note 2)                                       533,130               845,859
Transfer agent fees                                                     111,366               168,417
Administration and accounting fees                                       82,300               129,555
Professional fees                                                        10,975                17,411
Custodian fees                                                           52,905                76,151
Directors fees (Note 2)                                                   2,998                 4,756
Shareholder service fee                                                 113,737               175,643
Insurance expense                                                         3,668                 3,096
Amortization of organization costs (Note 1-F)                                --                    --
Printing expense                                                         12,133                14,558
Registration expenses                                                    14,199                22,229
Other expenses                                                            1,323                 2,126
- -----------------------------------------------------------------------------------------------------
    Total expenses                                                      938,734             1,459,801

Expenses waived, reimbursed or recaptured (Note 2)                           --                    --
- -----------------------------------------------------------------------------------------------------
    Net expenses                                                        938,734             1,459,801
- -----------------------------------------------------------------------------------------------------

Net Investment Income (Loss)                                           (183,095)            1,663,489
=====================================================================================================

Realized and Unrealized Gain (Loss) on Investments
    and Foreign Currency Related Transactions:
Net realized gain (loss) on investments                              (4,645,518)               31,882
Net realized loss on foreign currency related transactions               (9,964)              (72,860)
Net change in unrealized appreciation (depreciation) on
    investments and foreign currency related transactions            (2,421,454)           (3,281,195)
- -----------------------------------------------------------------------------------------------------
Net realized and unrealized gain (loss) on investments
    and foreign currency related transactions                        (7,076,936)           (3,322,173)
- -----------------------------------------------------------------------------------------------------

Net Increase (Decrease) in Net Assets from Operations               ($7,260,031)          ($1,658,684)
=====================================================================================================


See accompanying notes to financial statements.


- -----------------------------------------------------------------------------------------------------
| 30 w w w . m a t t h e w s f u nd s . c o m | 8 0 0 - 7 8 9 - A S I A [ 2 7 4 2 ] |
- ------------------------------------------------------------------------------------------------------------

- ------------------------------------------------------------------------------------------------------------
          MATTHEWS                    MATTHEWS                    MATTHEWS               MATTHEWS ASIAN
        KOREA FUND                  CHINA FUND                  JAPAN FUND              TECHNOLOGY FUND
- ------------------------------------------------------------------------------------------------------------

        $3,178,382                    $300,415                     $21,016                      $20,622
                --                         972                          --                           --
          (530,546)                         --                      (2,784)                      (3,760)
- --------------------------------------------------------------------------------------------------------
         2,647,836                     301,387                      18,232                       16,862
- --------------------------------------------------------------------------------------------------------


         1,001,624                     178,126                      37,816                       30,336
           199,481                      35,376                       7,547                        6,024
           155,303                      27,349                       5,877                        4,692
            20,672                       3,651                         780                          625
           114,142                      17,080                       3,678                       10,277
             5,646                         997                         213                          171
           208,620                      36,980                       7,883                        6,313
             7,551                       1,079                         285                          413
                --                       1,452                          --                           --
            16,686                       5,616                       1,433                        1,570
            26,580                      11,137                       7,562                        8,366
             2,459                         449                          96                           75
- --------------------------------------------------------------------------------------------------------
         1,758,764                     319,292                      73,170                       68,862
                --                       6,379                       2,463                       (8,191)
- --------------------------------------------------------------------------------------------------------
         1,758,764                     325,671                      75,633                       60,671
- --------------------------------------------------------------------------------------------------------
           889,072                     (24,284)                    (57,401)                     (43,809)
========================================================================================================


        15,833,447                  (1,291,612)                   (317,059)                    (972,503)
          (201,173)                        (10)                       (284)                      (3,207)

       (63,028,907)                  1,674,400                  (1,131,417)                     299,115
- --------------------------------------------------------------------------------------------------------

       (47,396,633)                    382,778                  (1,448,760)                    (676,595)
- --------------------------------------------------------------------------------------------------------

      ($46,507,561)                   $358,494                 ($1,506,161)                   ($720,404)
========================================================================================================


- --------------------------------------------------------------------------------------------------------
| | S t a t e m e n t o f O p e r a t i o n s 31 |
- --------------------------------------------------------------------------------------------------------------------------
Statement of Changes in Net Assets
- --------------------------------------------------------------------------------------------------------------------------
                                                                               MATTHEWS PACIFIC TIGER FUND
- --------------------------------------------------------------------------------------------------------------------------

                                                                               Six Months Ended
                                                                              February 28, 2003             Year Ended
                                                                                    (unaudited)        August 31, 2002

Operations:
Net investment income (loss)                                                         ($183,095)             ($170,789)
Net realized gain (loss) on investments and foreign currency
  related transactions                                                              (4,655,482)            (3,768,796)
Net change in unrealized appreciation (depreciation) on
  investments and foreign currency related transactions                             (2,421,454)             5,883,551
- --------------------------------------------------------------------------------------------------------------------------
Net increase (decrease) in net assets from operations                               (7,260,031)             1,943,966
- --------------------------------------------------------------------------------------------------------------------------

Dividends and Distributions to Shareholders from:
Net investment income                                                                       --               (104,784)
Realized gains on investments                                                               --               (274,572)

- --------------------------------------------------------------------------------------------------------------------------
Net decrease in net assets resulting from distributions                                     --               (379,356)
- --------------------------------------------------------------------------------------------------------------------------

Capital Share Transactions (net) (Note 1-K):                                        (3,829,448)            36,730,362
- --------------------------------------------------------------------------------------------------------------------------
Total increase (decrease) in net assets                                            (11,089,479)            38,294,972
- --------------------------------------------------------------------------------------------------------------------------

Net Assets:
Beginning of period                                                                114,798,081             76,503,109
- --------------------------------------------------------------------------------------------------------------------------
End of period (including undistributed net investment
income (loss) of $(260,120), $(77,025), $549,113,
$17,691, $516,350, and $(372,722) respectively)                                   $103,708,602           $114,798,081
==========================================================================================================================


See accompanying notes to financial statements.


- --------------------------------------------------------------------------------------------------------------------------
| 32 w w w . m a t t h e w s f u nd s . c o m | 8 0 0 - 7 8 9 - A S I A [ 2 7 4 2 ] |
- ------------------------------------------------------------------------------------------------------------
       MATTHEWS ASIAN GROWTH AND INCOME FUND                             MATTHEWS KOREA FUND
- ------------------------------------------------------------------------------------------------------------

       Six Months Ended                                    Six Months Ended
      February 28, 2003             Year Ended            February 28, 2003               Year Ended
            (unaudited)        August 31, 2002                  (unaudited)          August 31, 2002


             $1,663,489             $1,329,018                    $889,072               ($1,421,124)

                (40,978)             3,303,008                  15,632,274                34,090,693

             (3,281,195)              (280,755)                (63,028,907)               57,069,545
- ----------------------------------------------------------------------------------------------------
             (1,658,684)             4,351,271                 (46,507,561)               89,739,114
- ----------------------------------------------------------------------------------------------------


             (1,132,067)            (1,362,799)                         --                  (467,505)
             (2,386,434)                    --                 (19,371,082)               (3,455,469)


- ----------------------------------------------------------------------------------------------------
             (3,518,501)            (1,362,799)                (19,371,082)               (3,922,974)
- ----------------------------------------------------------------------------------------------------

             72,369,383            125,246,184                 (25,268,552)               50,055,031
- ----------------------------------------------------------------------------------------------------
             67,192,198            128,234,656                 (91,147,195)              135,871,171
- ----------------------------------------------------------------------------------------------------


            152,681,201             24,446,545                 253,003,463               117,132,292
- ----------------------------------------------------------------------------------------------------


           $219,873,399           $152,681,201                $161,856,268              $253,003,463
====================================================================================================


- ----------------------------------------------------------------------------------------------------
| | S t a t e m e n t o f C h a n g e s i n N e t A s s e t s 33 |
- --------------------------------------------------------------------------------------------------------------------------
Statement of Changes in Net Assets
- --------------------------------------------------------------------------------------------------------------------------
                                                                                   MATTHEWS CHINA FUND
- --------------------------------------------------------------------------------------------------------------------------

                                                                             Six Months Ended
                                                                            February 28, 2003              Year Ended
                                                                                  (unaudited)         August 31, 2002

Operations:
Net investment income (loss)                                                         ($24,284)               $278,449
Net realized gain (loss) on investments and foreign currency
  related transactions                                                             (1,291,622)               (841,054)
Net change in unrealized appreciation (depreciation) on
  investments and foreign currency related transactions                             1,674,400              (1,608,943)
- --------------------------------------------------------------------------------------------------------------------------
Net increase (decrease) in net assets from operations                                 358,494              (2,171,548)
- --------------------------------------------------------------------------------------------------------------------------

Dividends and Distributions to Shareholders from:
Net investment income                                                                (542,079)               (381,550)
Realized gains on investments                                                              --                      --

- --------------------------------------------------------------------------------------------------------------------------
Net decrease in net assets resulting from distributions                              (542,079)               (381,550)
- --------------------------------------------------------------------------------------------------------------------------

Capital Share Transactions (net) (Note 1-K):                                       19,177,339              16,385,313
- --------------------------------------------------------------------------------------------------------------------------
Total increase (decrease) in net assets                                            18,993,754              13,832,215
- --------------------------------------------------------------------------------------------------------------------------

Net Assets:
Beginning of period                                                                33,675,273              19,843,058
- --------------------------------------------------------------------------------------------------------------------------
End of period (including undistributed net investment
  income (loss) of $(126,638), $439,725, $(85,633),
  $(28,232), $(52,296) and $(8,487), respectively)                                $52,669,027             $33,675,273
==========================================================================================================================


See accompanying notes to financial statements.


- -----------------------------------------------------------------------------------------------------------
| 34 w w w . m a t t h e w s f u nd s . c o m | 8 0 0 - 7 8 9 - A S I A [ 2 7 4 2 ] |
- --------------------------------------------------------------------------------------------------------------
                 MATTHEWS JAPAN FUND                                  MATTHEWS ASIAN TECHNOLOGY FUND
- --------------------------------------------------------------------------------------------------------------


  Six Months Ended                                         Six Months Ended
 February 28, 2003                  Year Ended            February 28, 2003                Year Ended
       (unaudited)             August 31, 2002                  (unaudited)           August 31, 2002


          ($57,401)                  ($128,812)                   ($43,809)                 ($172,594)


          (317,343)                 (4,233,549)                   (975,710)                (2,212,212)


        (1,131,417)                  3,160,981                     299,115                  1,639,640
- -----------------------------------------------------------------------------------------------------
        (1,506,161)                 (1,201,380)                   (720,404)                  (745,166)
- -----------------------------------------------------------------------------------------------------


                --                    (182,412)                         --                   (142,101)

                --                          --                          --                         --

- -----------------------------------------------------------------------------------------------------
                --                    (182,412)                         --                   (142,101)
- -----------------------------------------------------------------------------------------------------

        (1,351,662)                  3,024,383                    (761,867)                (1,840,654)
- -----------------------------------------------------------------------------------------------------
        (2,857,863)                  1,640,591                  (1,482,271)                (2,727,921)
- -----------------------------------------------------------------------------------------------------


         9,398,595                   7,758,004                   6,879,167                  9,607,088
- -----------------------------------------------------------------------------------------------------


        $6,540,772                  $9,398,595                  $5,396,896                 $6,879,167
=====================================================================================================


- -----------------------------------------------------------------------------------------------------------
| | S t a t e m e n t o f C h a n g e s i n N e t A s s e t s 35 |
- ---------------------------------------------------------------------------------------------------------------------------------
Financial Highlights
- ---------------------------------------------------------------------------------------------------------------------------------
Matthews Pacific Tiger Fund
- ---------------------------------------------------------------------------------------------------------------------------------
The table below sets forth financial data for a share of beneficial interest outstanding throughout each year
presented.

                                               Six Months Ended                           Year Ended August 31,
                                                  Feb. 28, 2003      ------------------------------------------------------------
                                                    (unaudited)           2002        2001         2000        1999         1998

Net Asset Value, beginning of period                       $8.54         $7.91      $12.35       $10.41       $4.07       $11.30
- ---------------------------------------------------------------------------------------------------------------------------------

Income (loss) from Investment Operations:
Net investment income (loss)                               (0.02)        (0.01)       0.02         0.18        0.18         0.02
Net realized gain (loss) and unrealized
  appreciation (depreciation) on investments
  and foreign currency                                     (0.54)         0.66       (3.37)        2.01        6.15        (7.20)
- ---------------------------------------------------------------------------------------------------------------------------------
    Total from investment operations                       (0.56)         0.65       (3.35)        2.19        6.33        (7.18)
- ---------------------------------------------------------------------------------------------------------------------------------

Less Distributions from:
Net investment income                                         --         (0.01)      (0.31)       (0.27)      (0.02)       (0.01)
Net realized gains on investments                             --         (0.03)      (0.84)          --          --        (0.06)
- ---------------------------------------------------------------------------------------------------------------------------------
    Total distributions                                     0.00         (0.04)      (1.15)       (0.27)      (0.02)       (0.07)
- ---------------------------------------------------------------------------------------------------------------------------------
Paid-in Capital from Redemption Fees (Note 1K)              0.01          0.02        0.06         0.02        0.03         0.02
- ---------------------------------------------------------------------------------------------------------------------------------
Net Asset Value, end of period                             $7.99         $8.54       $7.91       $12.35      $10.41        $4.07
=================================================================================================================================

Total Return                                               (6.44%)(2)     8.44%     (27.46%)      21.28%     156.28%      (63.43%)

Ratios/Supplemental Data
Net assets, end of period (in 000's)                    $103,709      $114,798     $76,503     $111,502    $109,936      $31,319

Ratio of expenses to average net assets
  before reimbursement, waiver or recapture
  of expenses by Advisor and Administrator                  1.76%(1)      1.79%       1.90%        1.88%       1.90%        2.06%

Ratio of expenses to average net assets after
  reimbursement, waiver or recapture of expenses
  by Advisor and Administrator (Note 2)                     1.76%(1)      1.87%       1.90%        1.81%       1.90%        1.90%

Ratio of net investment income (loss) to average net
  assets before reimbursement, waiver or recapture
  of expenses by Advisor and Administrator                 (0.34%)(1)    (0.17%)      0.67%        1.49%       3.35%        0.14%

Ratio of net investment income (loss) to average net
  assets after reimbursement, waiver or recapture
  of expenses by Advisor and Administrator                 (0.34%)(1)    (0.17%)      0.67%        1.56%       3.35%        0.30%

Portfolio turnover                                         14.37%(2)     57.00%      63.59%       52.11%      98.74%       73.09%

1 Annualized.
2 Not annualized.

See accompanying notes to financial statements.

- ---------------------------------------------------------------------------------------------------------------------------------
| 36 w w w . m a t t h e w s f u nd s . c o m | 8 0 0 - 7 8 9 - A S I A [ 2 7 4 2 ] |
- ---------------------------------------------------------------------------------------------------------------------------------
Matthews Asian Growth and Income Fund
- ---------------------------------------------------------------------------------------------------------------------------------
The table below sets forth financial data for a share of beneficial interest outstanding throughout each year
presented.


                                               Six Months Ended                           Year Ended August 31,
                                                  Feb. 28, 2003      ------------------------------------------------------------
                                                    (unaudited)           2002        2001         2000        1999         1998

Net Asset Value, beginning of period                     $10.71          $9.08      $10.50        $9.37       $6.54       $11.71
- ---------------------------------------------------------------------------------------------------------------------------------

Income (loss) from Investment Operations:
Net investment income                                      0.09           0.18        0.54         0.61        0.58         0.13
Net realized gain (loss) and unrealized
  appreciation (depreciation) on investments
  and foreign currency                                    (0.19)          1.70       (0.49)        1.09        2.75        (4.16)
- ---------------------------------------------------------------------------------------------------------------------------------
     Total from investment operations                     (0.10)          1.88        0.05         1.70        3.33        (4.03)
- ---------------------------------------------------------------------------------------------------------------------------------

Less Distributions from:
Net investment income                                     (0.07)         (0.27)      (0.60)       (0.59)      (0.51)       (0.10)
Net realized gains on investments                         (0.15)            --       (0.88)          --          --        (1.05)
- ---------------------------------------------------------------------------------------------------------------------------------
     Total distributions                                  (0.22)         (0.27)      (1.48)       (0.59)      (0.51)       (1.15)
- ---------------------------------------------------------------------------------------------------------------------------------
Paid-in Capital from Redemption Fees (Note 1K)             0.01           0.02        0.01         0.02        0.01         0.01
- ---------------------------------------------------------------------------------------------------------------------------------
Net Asset Value, end of period                           $10.40         $10.71       $9.08       $10.50       $9.37        $6.54
=================================================================================================================================

Total Return                                              (0.82%)(2)     21.11%       1.15%       18.68%      52.65%      (35.27%)

Ratios/Supplemental Data
Net assets, end of period (in 000's)                   $219,873       $152,681     $24,447      $11,469     $10,644       $4,063

Ratio of expenses to average net assets
  before reimbursement, waiver or recapture
  of expenses by Advisor and Administrator                 1.73%(1)       1.77%       1.90%        1.97%       2.05%        3.76%

Ratio of expenses to average net assets after
  reimbursement, waiver or recapture of expenses
  by Advisor and Administrator (Note 2)                    1.73%(1)       1.79%       1.90%        1.90%       1.90%        1.90%

Ratio of net investment income (loss) to average net
  assets before reimbursement, waiver or recapture
  of expenses by Advisor and Administrator                 1.97%(1)       2.13%       7.71%        6.17%       7.98%       (0.36%)

Ratio of net investment income (loss) to average net
  assets after reimbursement, waiver or recapture
  of expenses by Advisor and Administrator                 1.97%(1)       2.11%       7.71%        6.24%       8.13%        1.50%

Portfolio turnover                                         3.84%(2)      32.37%      33.94%       62.23%      34.82%       54.67%

1 Annualized.
2 Not annualized.

See accompanying notes to financial statements.

- ---------------------------------------------------------------------------------------------------------------------------------
| | F i n a n c i a l H i g h l i g h t s 37 |
- ---------------------------------------------------------------------------------------------------------------------------------
Financial Highlights
- ---------------------------------------------------------------------------------------------------------------------------------
Matthews Korea Fund
- ---------------------------------------------------------------------------------------------------------------------------------
The table below sets forth financial data for a share of beneficial interest outstanding throughout each year
presented.


                                               Six Months Ended                           Year Ended August 31,
                                                  Feb. 28, 2003      ------------------------------------------------------------
                                                    (unaudited)           2002        2001         2000        1999         1998

Net Asset Value, beginning of period                      $4.42          $2.68       $5.19        $7.49       $2.03        $6.19
- ---------------------------------------------------------------------------------------------------------------------------------

Income (loss) from Investment Operations:
Net investment income (loss)                               0.02          (0.02)      (0.01)       (0.01)      (0.01)       (0.05)
Net realized gain (loss) and unrealized
  appreciation (depreciation) on investments
  and foreign currency                                    (0.85)          1.81       (0.90)       (1.45)       5.43        (4.13)
- ---------------------------------------------------------------------------------------------------------------------------------
    Total from investment operations                      (0.83)          1.79       (0.91)       (1.46)       5.42        (4.18)
- ---------------------------------------------------------------------------------------------------------------------------------

Less Distributions from:
Net investment income                                        --          (0.01)         --           --          --           --
Net realized gains on investments                         (0.39)         (0.07)      (1.63)       (0.88)         --           --
- ---------------------------------------------------------------------------------------------------------------------------------
    Total distributions                                   (0.39)         (0.08)      (1.63)       (0.88)         --           --
- ---------------------------------------------------------------------------------------------------------------------------------
Paid-in Capital from Redemption Fees (Note 1K)             0.01           0.03        0.03         0.04        0.04         0.02
- ---------------------------------------------------------------------------------------------------------------------------------
Net Asset Value, end of period                            $3.21          $4.42       $2.68        $5.19       $7.49        $2.03
=================================================================================================================================

Total Return                                             (20.08%)(2)     68.49%     (13.09%)     (22.92%)    268.97%      (67.21%)


Ratios/Supplemental Data
Net assets, end of period (in 000's)                   $161,856       $253,003    $117,138     $115,158    $230,846      $66,607

Ratio of expenses to average net assets
  before reimbursement, waiver or recapture
  of expenses by Advisor and Administrator                 1.76%(1)       1.75%       1.78%        1.75%       1.77%        2.07%

Ratio of expenses to average net assets after
  reimbursement, waiver or recapture of expenses
  by Advisor and Administrator (Note 2)                    1.76%(1)       1.75%       1.78%        1.75%       1.77%        2.06%

Ratio of net investment income (loss) to average net
  assets before reimbursement, waiver or recapture
  of expenses by Advisor and Administrator                 0.89%(1)      (0.64%)      0.75%        0.42%      (0.37%)      (1.13%)

Ratio of net investment income (loss) to average net
  assets after reimbursement, waiver or recapture
  of expenses by Advisor and Administrator                 0.89%(1)      (0.64%)      0.75%        0.42%      (0.37%)      (1.12%)

Portfolio turnover                                         6.13%(2)      46.52%      81.96%       47.80%      57.06%       94.01%

1 Annualized.
2 Not annualized.

See accompanying notes to financial statements.


- ---------------------------------------------------------------------------------------------------------------------------------
| 38 w w w . m a t t h e w s f u nd s . c o m | 8 0 0 - 7 8 9 - A S I A [ 2 7 4 2 ] |
- ---------------------------------------------------------------------------------------------------------------------------------
Matthews China Fund
- ---------------------------------------------------------------------------------------------------------------------------------
The table below sets forth financial data for a share of beneficial interest outstanding throughout each year
presented.

                                               Six Months Ended                     Year Ended August 31,              Period Ended
                                                  Feb. 28, 2003      ----------------------------------------------      August 31,
                                                    (unaudited)           2002        2001         2000        1999         1999(1)

Net Asset Value, beginning of period                      $8.96          $9.21       $9.93        $8.48       $4.36          $10.00
- ------------------------------------------------------------------------------------------------------------------------------------

Income (loss) from Investment Operations:
Net investment income                                        --           0.05        0.24         0.09        0.07            0.10
Net realized gain (loss) and unrealized
  appreciation (depreciation) on investments
  and foreign currency                                     0.16          (0.20)      (0.61)        1.44        4.11           (5.75)
- ------------------------------------------------------------------------------------------------------------------------------------
    Total from investment operations                       0.16          (0.15)      (0.37)        1.53        4.18           (5.65)
- ------------------------------------------------------------------------------------------------------------------------------------

Less Distributions from:
Net investment income                                     (0.14)         (0.15)      (0.15)       (0.11)      (0.11)             --
Net realized gains on investments                            --             --       (0.28)          --          --              --
- ------------------------------------------------------------------------------------------------------------------------------------
  Total distributions                                     (0.14)         (0.15)      (0.43)       (0.11)      (0.11)             --
- ------------------------------------------------------------------------------------------------------------------------------------
Paid-in Capital from Redemption Fees (Note 1K)             0.01           0.05        0.08         0.03        0.05            0.01
- ------------------------------------------------------------------------------------------------------------------------------------
Net Asset Value, end of period                            $8.99          $8.96       $9.21        $9.93       $8.48           $4.36
====================================================================================================================================
Total Return                                               1.96%(3)      (1.16%)     (2.23%)      18.54%      97.79%         (56.40%)(3)

Ratios/Supplemental Data
Net assets, end of period (in 000's)                    $52,669        $33,675     $19,843       $9,232      $6,245          $1,576

Ratio of expenses to average net assets
  before reimbursement, waiver or recapture
  of expenses by Advisor and Administrator                 1.79%(2)       1.97%       2.00%        2.15%       2.09%           7.84%(2)

Ratio of expenses to average net assets after
  reimbursement, waiver or recapture of expenses
  by Advisor and Administrator (Note 2)                    1.83%(2)       2.00%       2.00%        2.00%       2.00%           2.00%(2)

Ratio of net investment income (loss) to average net
  assets before reimbursement, waiver or recapture
  of expenses by Advisor and Administrator                (0.10%)(2)      0.99%       2.62%        1.54%       2.93%          (3.45%)(2)

Ratio of net investment income (loss) to average net
  assets after reimbursement, waiver or recapture
  of expenses by Advisor and Administrator                (0.14%)(2)      0.96%       2.62%        1.69%       3.02%           2.38%(2)

Portfolio turnover                                        10.17%(3)      43.84%      61.07%       80.90%      40.27%          11.84%(3)

1 The China Fund commenced operations on February 19, 1998.
2 Annualized.
3 Not annualized.

See accompanying notes to financial statements.

- ------------------------------------------------------------------------------------------------------------------------------------
| | F i n a n c i a l H i g h l i g h t s 39 |
- ---------------------------------------------------------------------------------------------------------------------------------
Financial Highlights
- ---------------------------------------------------------------------------------------------------------------------------------
Matthews Japan Fund
- ---------------------------------------------------------------------------------------------------------------------------------
The table below sets forth financial data for a share of beneficial interest outstanding throughout each period
presented.


                                               Six Months Ended            Year Ended August 31,           Period Ended
                                                  Feb. 28, 2003      ----------------------------------      August 31,
                                                    (unaudited)           2002        2001         2000         1999(1)


Net Asset Value, beginning of period                      $9.60         $11.22      $20.76       $21.70         $10.00
- -----------------------------------------------------------------------------------------------------------------------

Income (loss) from Investment Operations:
Net investment income (loss)                              (0.08)         (0.07)      (0.26)       (0.24)         (0.06)
Net realized gain (loss) and unrealized
  appreciation (depreciation) on investments
  and foreign currency                                    (1.63)         (1.39)      (7.99)       (0.29)         11.74
- -----------------------------------------------------------------------------------------------------------------------
    Total from investment operations                      (1.71)         (1.46)      (8.25)       (0.53)         11.68
- -----------------------------------------------------------------------------------------------------------------------

Less Distributions from:
Net investment income                                        --          (0.27)      (0.37)          --             --
Net realized gains on investments                            --             --       (1.03)       (0.54)            --
- -----------------------------------------------------------------------------------------------------------------------
    Total distributions                                      --          (0.27)      (1.40)       (0.54)            --
- -----------------------------------------------------------------------------------------------------------------------
Paid-in Capital from Redemption Fees (Note 1K)             0.03           0.11        0.11         0.13           0.02
- -----------------------------------------------------------------------------------------------------------------------
Net Asset Value, end of period                            $7.92          $9.60      $11.22       $20.76         $21.70
=======================================================================================================================

Total Return                                             (17.50%)(3)    (12.20%)    (40.92%)      (1.75%)       117.00%(3)

Ratios/Supplemental Data
Net assets, end of period (in 000's)                     $6,541         $9,399      $7,758      $23,869        $24,486

Ratio of expenses to average net assets
  before reimbursement, waiver or recapture
  of expenses by Advisor and Administrator                 1.93%(2)       1.91%       2.08%        1.88%          3.45%(2)

Ratio of expenses to average net assets after
  reimbursement, waiver or recapture of expenses
  by Advisor and Administrator (Note 2)                    2.00%(2)       2.00%       2.00%        2.00%          2.00%(2)

Ratio of net investment income (loss) to average net
  assets before reimbursement, waiver or recapture
  of expenses by Advisor and Administrator                (1.45%)(2)     (1.25%)     (0.90%)      (0.36%)        (2.54%)(2)

Ratio of net investment income (loss) to average net
  assets after reimbursement, waiver or recapture
  of expenses by Advisor and Administrator                (1.52%)(2)     (1.34%)     (0.82%)      (0.48%)        (1.09%)(2)

Portfolio turnover                                        46.21%(3)     113.23%      71.09%       23.00%         28.92%(3)

1 The Japan Fund commenced operations on December 31, 1998.
2 Annualized.
3 Not annualized.

See accompanying notes to financial statements.


- ---------------------------------------------------------------------------------------------------------------------------------
| 40 w w w . m a t t h e w s f u nd s . c o m | 8 0 0 - 7 8 9 - A S I A [ 2 7 4 2 ] |
- ------------------------------------------------------------------------------------------------------------------

- ------------------------------------------------------------------------------------------------------------------
Matthews Asian Technology Fund
- ------------------------------------------------------------------------------------------------------------------
The table below sets forth financial data for a share of beneficial interest outstanding throughout each period
presented.

                                              Six Months Ended     Year Ended       Year Ended        Period Ended
                                             February 28, 2003     August 31,       August 31,          August 31,
                                                   (unaudited)           2002             2001             2000(1)


Net Asset Value, beginning of period                     $3.13          $3.53            $7.61              $10.00
- ------------------------------------------------------------------------------------------------------------------

Income (loss) from Investment Operations:
Net investment income (loss)                             (0.02)         (0.10)           (0.05)               0.22
Net realized gain (loss) and unrealized
  appreciation (depreciation) on investments
  and foreign currency                                   (0.37)         (0.31)           (3.97)              (2.65)
- ------------------------------------------------------------------------------------------------------------------
    Total from investment operations                     (0.39)         (0.41)           (4.02)              (2.43)
- ------------------------------------------------------------------------------------------------------------------

Less Distributions from:
Net investment income                                       --          (0.04)           (0.22)                 --
Net realized gains on investments                           --             --               --                  --
- ------------------------------------------------------------------------------------------------------------------

    Total distributions                                     --          (0.04)           (0.22)                 --
- ------------------------------------------------------------------------------------------------------------------
Paid-in Capital from Redemption Fees (Note 1K)            0.02           0.05             0.16                0.04
- ------------------------------------------------------------------------------------------------------------------
Net Asset Value, end of period                           $2.76          $3.13            $3.53               $7.61
==================================================================================================================

Total Return                                            (11.82%)(3)    (10.40%)         (51.54%)            (23.90%)(3)


Ratios/Supplemental Data
Net assets, end of period (in 000's)                    $5,397         $6,879           $9,607             $24,570

Ratio of expenses to average net assets
  before reimbursement, waiver or recapture
  of expenses by Advisor and Administrator                2.27%(2)       2.01%            2.69%               2.66%(2)

Ratio of expenses to average net assets after
  reimbursement, waiver or recapture of expenses
  by Advisor and Administrator (Note 2)                   2.00%(2)       2.00%            2.00%               2.00%(2)

Ratio of net investment income (loss) to average net
  assets before reimbursement, waiver or recapture
  of expenses by Advisor and Administrator               (1.71%)(2)     (1.56%)           1.14%               3.75%(2)

Ratio of net investment income (loss) to average net
  assets after reimbursement, waiver or recapture
  of expenses by Advisor and Administrator               (1.44%)(2)     (1.55%)           1.83%               4.41%(2)

Portfolio turnover                                       42.00%(3)     103.60%          181.24%              50.35%(3)

1 The Asian Technology Fund commenced operations on December 27, 1999.
2 Annualized.
3 Not annualized.

See accompanying notes to financial statements.

- ------------------------------------------------------------------------------------------------------------------
| | F i n a n c i a l H i g h l i g h t s 41 |
| Notes to Financial Statements | FEBRUARY 28, 2003 (unaudited) |
1. Significant Accounting Policies Matthews Asian Funds (the “Company”) is an open-end investment management company registered under the Investment Company Act of 1940, as amended (the “Act”). The Company currently issues six separate series of shares (each a “Fund” and collectively, the “Funds”): Matthews Pacific Tiger Fund, Matthews Asian Growth and Income Fund, Matthews Korea Fund, Matthews China Fund, Matthews Japan Fund and Matthews Asian Technology Fund. Matthews Pacific Tiger, Matthews Korea Fund and Matthews China Fund are authorized to offer two classes of shares: Class I shares and Class A shares. Currently, only Class I shares are offered. Matthews Pacific Tiger Fund, Matthews Korea Fund, Matthews China Fund, Matthews Japan Fund and Matthews Asian Technology Fund seek to maximize capital appreciation by investing, under normal circumstances, at least 80% of their total assets in equity securities of Pacific Tiger economies, South Korean companies, Chinese companies and Japanese companies, respectively. Pacific Tiger economies include Hong Kong, Singapore, South Korea, Taiwan, Indonesia, Malaysia, Philippines, Thailand and China. Matthews Asian Growth and Income Fund seeks capital appreciation and current income by investing, under normal circumstances, at least 80% of its total assets in the convertible bonds and dividend-paying equity securities of Asian economies. Asian economies include Hong Kong, Japan, Singapore, South Korea, Taiwan, Indonesia, Malaysia,Philippines, Thailand, China and India. The following is a summary of significant accounting policies consistently followed by the Funds in the preparation of their financial statements.
A. Security Valuation: Securities listed on any national securities exchange are valued at their last sale price on the exchange where the securities are principally traded or, if there has been no sale on that date, at the mean between the last reported bid and asked prices. Securities traded over-the-counter are priced at the mean of the last bid and asked prices. All other securities are valued through valuations obtained from a commercial pricing service or at the most recent mean of the bid and asked prices provided by investment dealers in accordance with procedures established by the Board of Trustees.
The books and records of the Funds are maintained in U.S. Dollars. Transactions denominated in foreign currencies are recorded at the current prevailing exchange rates. All assets and liabilities denominated in foreign currencies are translated into U.S. Dollars at the current exchange rate. Translation gains or losses resulting from changes in the exchange rate during the reporting period and realized gains and losses on the settlement of foreign currency transactions are reported in the results of operations for the current period. The Funds do not isolate that portion of gains and losses on investment in equity securities which is due to changes in the foreign exchange rate from that which is due to changes in market prices of equity securities. International dollar bonds are issued offshore, pay interest and principal in U.S. Dollars, and are denominated in U.S. Dollars.
Portfolio securities traded on a foreign exchange are generally valued at the respective current prevailing exchange rates. The securities’ values are translated into U.S.
| 42 w w w . m a t t h e w s f u nd s . c o m | 8 0 0 - 7 8 9 - A S I A [ 2 7 4 2 ] |
Dollars using these rates. If subsequent to the time a rate as been established and it has been determined to have materially changed, the fair value of those securities, (considering the changing conditions) will be determined by (or under the direction of) the Funds’ Board of Trustees.
B. Forward Foreign Exchange Contracts: The Funds may engage in forward foreign exchange contracts for hedging a specific transaction in which the currency is denominated as deemed appropriate by Matthews International Capital Management, LLC (the “Advisor”). Forward foreign exchange contracts are valued at the forward rate and are marked-to-market daily. The change in market value is recorded by the Funds as an unrealized gain or loss. When the contract is closed, the Funds record a realized gain or loss equal to the difference between the value of the contract at the time it was opened and the value at the time it was closed.
The use of forward foreign exchange contracts does not eliminate fluctuations in the underlying prices of the Funds’ portfolio securities, but it does establish a rate of exchange that can be achieved in the future. Although forward foreign exchange contracts limit the risk of loss due to a decline in the value of the hedged currency, they also limit any potential gain that might result should the value of the currency increase. In addition, the Funds could be exposed to risks if the counterparts to the contract are unable to meet the terms of their contracts.
C. Risks Associated with Foreign Securities: Investments by the Funds in the securities of foreign issuers may involve investment risks different from those of U.S. issuers including possible political or economical instability of the country of the issuer, the difficulty in predicting international trade patterns, the possibility of currency exchange controls, the possible imposition of foreign withholding tax on the interest income payable on such instruments, the possible establishment of foreign controls, the possible seizure or nationalization of foreign deposits or assets, or the adoption of other foreign government restrictions that might adversely affect the foreign securities held by the Funds. Foreign securities may also be subject to greater fluctuations in price than securities of domestic corporations or the U.S. Government.
D. Federal Income Taxes: It is the policy of the Funds to comply with all requirements of the Internal Revenue Code of 1986, as amended (“the Code”) applicable to regulated investment companies and to distribute substantially all of their taxable income to their shareholders. The Funds have met the requirements of the Code applicable to regulated investment companies for the six months ended February 28, 2003. Therefore, no federal income tax provision is required. Income and capital gains of the Funds are determined in accordance with both tax regulations and accounting principles generally accepted in the United States of America. Such may result in temporary and permanent differences between tax basis earnings and earnings reported for financial statement purposes. These reclassifications, which have no impact on the net asset value of the Funds, are primarily attributable to certain differences in computation of distributable income and capital gains under federal tax rules versus accounting principles generally accepted in the United States of America and the use of the tax accounting practice known as equalization.
E. Determination of Gains or Losses on Sales of Securities: Gains or losses on the sale of securities are determined on the identified cost basis.
| | N o t e s t o F i n a n c i a l S t a t e m e n t s 43 |
F. Organization Costs: Organization costs are amortized on a straight-line basis over five years from each Fund’s respective commencement of operations with the exception of the Matthews Japan Fund and Matthews Asian Technology Fund, which were amortized on a straight-line basis over one year from their respective commencement of operations. In the event that any of the initial shares are redeemed during the period of amortization of the Funds’ organization costs, the redemption proceeds will be reduced by any such unamortized organization costs in the same proportion as the number of shares being redeemed bears to the number of those shares outstanding at the time of redemption.
G. Distribution to Shareholders: It is the policy of Matthews Asian Growth and Income Fund to distribute net investment income on a semi-annual basis and capital gains, if any, annually. Matthews Pacific Tiger Fund, Matthews Korea Fund, Matthews China Fund, Matthews Japan Fund, and Matthews Asian Technology Fund each distribute net investment income and capital gains, if any, annually. Distributions to shareholders are recorded on the ex-dividend date. Income and capital gain distributions are determined in accordance with income tax regulations which may differ from accounting principles generally accepted in the United States of America. Net investment losses may not be utilized to offset net investment income in future periods for tax purposes.
For federal income tax purposes, the Funds indicated below have capital loss carryforwards, which expire in the year indicated, as of August 31, 2002, which are available to offset future capital gains, if any:
                                                        Losses Deferred Expiring in:
                                                  2008             2009              2010

Matthews Pacific Tiger Fund                        $--              $--        $3,234,939
Matthews Asian Growth and Income Fund               --               --                --
Matthews Korea Fund                                 --               --                --
Matthews China Fund                                 --               --         1,131,447
Matthews Japan Fund                                 --           35,094         4,506,064
Matthews Asian Technology Fund               2,390,436        5,375,361         5,967,059
H. Fund Expense Allocations: The Funds account separately for the assets, liabilities and operations of each Fund. Direct expenses of each Fund are charged to the Fund while general expenses are allocated pro-rata among the Funds based on net assets.
I. Use of Estimates: The preparation of financial statements in conformity with accounting principles generally accepted in the United States of America requires management to make estimates and assumptions that affect the amounts reported in the financial statements and accompanying notes. Actual results may differ from those estimates.
J. Other: Securities transactions are accounted for on the date the securities are purchased or sold. Interest income is recorded on the accrual basis and dividend income on the ex-dividend date.
K. Capital Share Transactions: Each Fund is authorized to issue an unlimited number of shares of beneficial interest with a par value of $0.001 per share.
| 44 w w w . m a t t h e w s f u nd s . c o m | 8 0 0 - 7 8 9 - A S I A [ 2 7 4 2 ] |
MATTHEWS PACIFIC TIGER FUND

                    Six Months Ended February 28, 2003 (unaudited)          Year Ended August 31, 2002
                                        Shares              Amount          Shares              Amount
Shares sold                          3,805,964         $31,000,329      11,728,059        $106,314,158
Shares issued through
 reinvestment of dividends                  --                  --          40,762             366,041
Shares redeemed                     (4,278,309)        (34,829,777)     (7,999,842)        (69,949,837)
- ----------------------------------------------------------------------------------------------------------
Net increase (decrease)               (472,345)        $(3,829,448)      3,768,979         $36,730,362
==========================================================================================================

MATTHEWS ASIAN GROWTH AND INCOME FUND

                    Six Months Ended February 28, 2003 (unaudited)          Year Ended August 31, 2002
                                        Shares              Amount          Shares              Amount
Shares sold                         11,690,457        $122,518,771      15,326,669        $164,304,863
Shares issued through
 reinvestment of dividends             318,367           3,342,849         127,019           1,302,597
Shares redeemed                     (5,125,094)        (53,492,237)     (3,886,595)        (40,361,276)
- ----------------------------------------------------------------------------------------------------------
Net increase (decrease)              6,883,730         $72,369,383      11,567,093        $125,246,184
==========================================================================================================

MATTHEWS KOREA FUND

                    Six Months Ended February 28, 2003 (unaudited)          Year Ended August 31, 2002
                                        Shares              Amount          Shares              Amount
Shares sold                         11,894,680         $45,576,660      61,630,311        $249,365,417
Shares issued through
 reinvestment of dividends           3,512,114          13,486,520         864,565           3,086,494
Shares redeemed                    (22,314,139)        (84,331,732)    (48,911,935)       (202,396,880)
- ----------------------------------------------------------------------------------------------------------
Net increase (decrease)             (6,907,345)       $(25,268,552)     13,582,941         $50,055,031
==========================================================================================================

MATTHEWS CHINA FUND

                    Six Months Ended February 28, 2003 (unaudited)          Year Ended August 31, 2002
                                        Shares              Amount          Shares              Amount
Shares sold                          3,035,244         $27,289,474       4,355,329         $42,461,853
Shares issued through
 reinvestment of dividends              57,638             506,058          37,306             354,407
Shares redeemed                       (994,934)         (8,618,193)     (2,789,691)        (26,430,947)
- ----------------------------------------------------------------------------------------------------------
Net increase (decrease)              2,097,948         $19,177,339       1,602,944         $16,385,313
==========================================================================================================

MATTHEWS JAPAN FUND

                    Six Months Ended February 28, 2003 (unaudited)          Year Ended August 31, 2002
                                        Shares              Amount          Shares              Amount
Shares sold                            546,453          $4,703,125       1,870,946         $18,771,725
Shares issued through
 reinvestment of dividends                  --                  --          16,933             176,103
Shares redeemed                       (699,920)         (6,054,787)     (1,600,390)        (15,923,445)
- ----------------------------------------------------------------------------------------------------------
Net increase (decrease)               (153,467)        $(1,351,662)        287,489          $3,024,383
==========================================================================================================

MATTHEWS ASIAN TECHNOLOGY FUND

                    Six Months Ended February 28, 2003 (unaudited)          Year Ended August 31, 2002
                                        Shares              Amount          Shares              Amount
Shares sold                          1,568,024          $4,607,669       4,672,505         $17,384,394
Shares issued through
 reinvestment of dividends                  --                  --          33,973             138,271
Shares redeemed                     (1,810,491)         (5,369,536)     (5,233,008)        (19,363,319)
- ----------------------------------------------------------------------------------------------------------
Net increase (decrease)               (242,467)          $(761,867)       (526,530)        $(1,840,654)
==========================================================================================================
| | N o t e s t o F i n a n c i a l S t a t e m e n t s 45 |
The Funds impose a redemption fee of 2.00% on shares that are redeemed within ninety days of purchase. The charge is assessed on an amount equal to the net asset value of the shares at the time of redemption. The redemption fee is deducted from the proceeds otherwise payable to the redeeming shareholder. The redemption fees were returned to the assets of the Matthews Pacific Tiger Fund, Matthews Asian Growth and Income Fund, Matthews Korea Fund, Matthews China Fund, Matthews Japan Fund, and Matthews Asian Technology Fund in the amounts of $61,515, $155,198, $473,488, $26,555, $22,454, and and $32,572, respectively for the six months ended February 28, 2003, and $198,248, $285,809, $1,677,238, $184,114, $103,243, and $107,488 respectively, for the fiscal year ended August 31, 2002.
2. Investment Advisory Fees and Other Transactions with Affiliates The Advisor, a registered investment advisor under the Investment Advisers Act of 1940, as amended, provides the Funds with investment management services. As compensation for these services, the Advisor charges the Funds a monthly fee of 1/12th of 1% on each Fund’s resepective average daily net assets. Certain officers and Trustees of the Funds are also officers and directors of the Advisor. All officers serve without direct compensation from the Funds. Investment advisory fees and other transactions with affiliates, for the six months ended February 28, 2003, were as follows:
                                        Investment         Voluntary
                                          Advisory           Expense
                                          Fee Rate        Limitation       Advisory Fees

Matthews Pacific Tiger Fund                  1.00%             1.90%            $533,130
Matthews Asian Growth and Income Fund        1.00%             1.90%             845,859
Matthews Korea Fund                          1.00%             2.00%           1,001,624
Matthews China Fund                          1.00%             2.00%             178,126
Matthews Japan Fund                          1.00%             2.00%              37,816
Matthews Asian Technology Fund               1.00%             2.00%              30,336

                                                                                            Remaining
                                          Expenses Waived               Expenses           Recoupable
                                           and Reimbursed               Recouped             Expenses
                                           by the Advisor         by the Advisor            Available

Matthews Pacific Tiger Fund                           $--                    $--                  $--
Matthews Asian Growth and Income Fund                  --                     --                   --
Matthews Korea Fund                                    --                     --                   --
Matthews China Fund                                    --                  6,379                   --
Matthews Japan Fund                                    --                  2,463                7,983
Matthews Asian Technology Fund                      8,191                     --              179,144
Effective March 1, 2002 the voluntary expense limitation for Matthews Korea Fund was reduced from 2.50% to 2.00%.
The Advisor agrees to reimburse money to the Funds if their expense ratio exceeds the Voluntary Expense Limitation shown in the above table. The investment advisory agreements provide that any reductions made by the Advisor in its fees are subject to reimbursements by the Funds within the following three years provided that the Funds are able to effect such reimbursements and remain in compliance with applicable expense limitations. This agreement will continue through at least August 31, 2003.
| 46 w w w . m a t t h e w s f u nd s . c o m | 8 0 0 - 7 8 9 - A S I A [ 2 7 4 2 ] |
Effective March 1, 2002, the Funds’ shareholder servicing plan was activated, pursuant to which the Funds reimburse the Advisor for shareholder servicing activities at an annual rate of 0.15% of each Fund’s respective average daily net assets. Under the agreement, the Funds can be charged a maximum of 0.25%. Fees charged under the shareholder servicing fee arrangement are as follows for the six months ended February 28, 2003, were as follows:
                                             Shareholder
                                          Servicing Fees

Matthews Pacific Tiger Fund                      $79,969
Matthews Asian Growth and Income Fund            126,879
Matthews Korea Fund                              150,244
Matthews China Fund                               26,719
Matthews Japan Fund                                5,672
Matthews Asian Technology Fund                     4,550
The Funds bear a portion of the fees paid to certain service providers (exclusive of the Funds’ transfer agent) which provide transfer agency and shareholder servicing to certain shareholders. Fees accrued to pay such service providers for the six months ended February 28, 2003, are reflected in the Statement of Operations as follows:
                                            Transfer    Shareholder
                                               Agent      Servicing          Total

Matthews Pacific Tiger Fund                  $67,533        $33,768       $101,301
Matthews Asian Growth and Income Fund         99,006         48,764        147,770
Matthews Korea Fund                          116,749         58,376        175,125
Matthews China Fund                           20,833         10,261         31,094
Matthews Japan Fund                            4,422          2,211          6,633
Matthews Asian Technology Fund                 3,527          1,763          5,290
PFPC Inc. (“PFPC”), an indirect wholly-owned subsidiary of PNC Bank, serves as the Trust’s Administrator and, in that capacity, performs various administrative and accounting services for each Fund. PFPC also serves as the Trust’s Transfer Agent, dividend disbursing agent and registrar. An officer of PFPC serves as Assistant Treasurer to the Trust. Total fees received by PFPC for the six months ended February 28, 2003, were $390,262 for administrative and accounting services and $131,482 for transfer agent services. The Bank of New York serves as custodian to the Trust. PFPC Distributors, Inc. (the “Distributor”) serves as the Fund’s Distributor pursuant to an Underwriting Agreement.
3. Investment Transactions Investment transactions for the six months ended February 28, 2003, excluding short-term investments, were as follows:
                                                                  Proceeds
                                             Purchases          from Sales

Matthews Pacific Tiger Fund                $15,246,859         $19,000,068
Matthews Asian Growth and Income Fund       70,522,883           6,411,727
Matthews Korea Fund                         12,301,516          58,365,189
Matthews China Fund                         21,411,517           3,642,046
Matthews Japan Fund                          3,511,673           4,989,505
Matthew Asian Technology Fund                2,598,934           3,476,006
| | N o t e s t o F i n a n c i a l S t a t e m e n t s 47 |
| | | | Board of Trustees
RICHARD K. LYONS, CHAIRMAN
G. PAUL MATTHEWS
ROBERT K. CONNOLLY
DAVID FITZWILLIAM-LAY
NORMAN W. BERRYESSA
JOHN H. DRACOTT, EMERITUS |
| | For more information about
Matthews Asian Funds
visit our Web site at
www.matthewsfunds.com
or call toll-free
800-789-ASIA [2742]. | | Officers
G. PAUL MATTHEWS
MARK W. HEADLEY
JAMES E. WALTER
DOWNEY L. HEBBLE
Investment Advisor
MATTHEWS INTERNATIONAL CAPITAL MANAGEMENT, LLC
456 MONTGOMERY STREET, SUITE 1200
SAN FRANCISCO, CA 94104
800-789-ASIA [2742] |
| | | | Shareholder Services
PFPC INC.
760 MOORE ROAD
KING OF PRUSSIA, PA 19406
800-892-0382 |
| |
| | | | Custodian
THE BANK OF NEW YORK
ONE WALL STREET
NEW YORK, NY 10286 |
| |
| | | | Legal Counsel
PAUL, HASTINGS, JANOFSKY & WALKER, LLP
55 SECOND STREET
SAN FRANCISCO, CA 94105
Distributed by PFPC Distributors, Inc. |
| |
| |
| |
| |
| |
| |
| |
| |
| | | |
| | |
|
| | | Matthews Asian Funds
www.matthewsfunds.com |
| |
| |
| |
| |
| |
| |
| |
| |
| |
| |
| |
| | | |
| | |
|
| | | Matthews Asian Funds
www.matthewsfunds.com
456 Montgomery Street, Suite 1200
San Francisco, CA 94104
800-789-ASIA [2742] |
| |
| |
| |
| SAR/G-0403-41.5M-PDG | |
Item 2. Code of Ethics.
Not applicable.
Item 3. Audit Committee Financial Expert.
Not applicable.
Items 4-8. [Reserved]
Item 9. Controls and Procedures.
| (b) | | There were no significant changes in the registrant’s internal controls or in other factors that could significantly affect these controls subsequent to the date of their evaluation, including any corrective actions with regard to significant deficiencies and material weaknesses. |
Item 10. Exhibits.
| (b) | | Certifications pursuant to Section 302 and 906 of the Sarbanes-Oxley Act of 2002 are attached hereto. |
SIGNATURES
Pursuant to the requirements of the Securities Exchange Act of 1934 and the Investment Company Act of 1940, the registrant has duly caused this report to be signed on its behalf by the undersigned, thereunto duly authorized.
(Registrant) Matthews Asian Funds
By (Signature and Title)* /s/ G. Paul Matthews
G. Paul Matthews, Chairman
(principal executive officer)
Date April 11, 2003
Pursuant to the requirements of the Securities Exchange Act of 1934 and the Investment Company Act of 1940, this report has been signed below by the following persons on behalf of the registrant and in the capacities and on the dates indicated.
By (Signature and Title)* /s/ G. Paul Matthews
G. Paul Matthews, Chairman
(principal executive officer)
Date April 11, 2003
By (Signature and Title)* /s/ James E. Walter
James E. Walter, Treasurer
(principal financial officer)
Date April 11, 2003
* Print the name and title of each signing officer under his or her signature.