UNITED STATES
SECURITIES AND EXCHANGE COMMISSION
Washington, D.C. 20549
FORM N-CSR
CERTIFIED SHAREHOLDER REPORT OF REGISTERED MANAGEMENT
INVESTMENT COMPANIES
Investment Company Act file number 811-8510
Matthews International Funds
(Exact name of registrant as specified in charter)
456 Montgomery Street, Suite 1200
San Francisco, CA 94104-1245
(Address of principal executive offices) (Zip code)
G. Paul Matthews, President
456 Montgomery Street, Suite 1200
San Francisco, CA 94104-1245
(Name and address of agent for service)
Registrant’s telephone number, including area code: 415-788-7553
Date of fiscal year end: August 31, 2003
Date of reporting period: August 31, 2003
Form N-CSR is to be used by management investment companies to file reports with the Commission not later than 10 days after the transmission to stockholders of any report that is required to be transmitted to stockholders under Rule 30e-1 under the Investment Company Act of 1940 (17 CFR 270.30e-1). The Commission may use the information provided on Form N-CSR in its regulatory, disclosure review, inspection, and policymaking roles.
A registrant is required to disclose the information specified by Form N-CSR, and the Commission will make this information public. A registrant is not required to respond to the collection of information contained in Form N-CSR unless the Form displays a currently valid Office of Management and Budget (“OMB”) control number. Please direct comments concerning the accuracy of the information collection burden estimate and any suggestions for reducing the burden to Secretary, Securities and Exchange Commission, 450 Fifth Street, NW, Washington, DC 20549-0609. The OMB has reviewed this collection of information under the clearance requirements of 44 U.S.C. § 3507.
Item 1. Reports to Stockholders.
 Matthews Asian Funds


Investing in a region as complex and diverse as Asia requires knowledge, focus and commitment.
At Matthews Asian Funds, we invest exclusively in the Asian markets. While these markets certainly can be volatile, we are strong believers in the long-term prospects for this region.
www.matthewsfunds.com
CONTENTS

Message to Shareholders              2

Morningstar Analysis                 6

Manager Comments,
Performance and
Schedule of Investments:

   Matthews Pacific Tiger Fund       8

   Matthews Asian Growth
   and Income Fund                  12

   Matthews Korea Fund              18

   Matthews China Fund              22

   Matthews Japan Fund              26

   Matthews Asian
   Technology Fund                  30

Statement of
Assets and Liabilities              34

Statement of Operations             36

Statement of
Changes in Net Assets               38

Financial Highlights                42

Notes to Financial Statements       48

Report of Independent
Certified Public Accountants        55

Trustees and Officers               56
MESSAGE TO SHAREHOLDERS
Dear Fellow Shareholders,
It is with pleasure that we present this Annual Report for the Matthews Asian Funds for the fiscal year ended August 31, 2003. We are particularly pleased to be able to report that during this period all six of our funds, collectively comprising the Matthews Asian Funds family, achieved positive returns.
As all of you who have been long-term owners of our funds can attest, it has by no means been a smooth ride and, as always, we would caution that Asian financial markets are likely to remain more volatile than their counterparts in the Western world.
Additionally, we are able to report that the four funds in our family that have been in existence for a full five years all provided positive returns for the five-year period ended August 31.
As all of you who have been long-term owners of our funds can attest, it has by no means been a smooth ride and, as always, we would caution that Asian financial markets are likely to remain more volatile than their counterparts in the Western world. Nevertheless, we remain enthusiastic about the long-term prospects for continued economic growth in Asia, which increasingly is being driven by the emergence of China as a truly global competitor.
The two events that had the most influence on Asian market sentiment during the 12 months ended August 31 were the war in Iraq and the outbreak and subsequent containment of the deadly SARS virus. The lead-up to the war created much uncertainty in Asia and caused wide fluctuations in world oil prices, which has a particular impact on a region that is generally dependent on imported oil. The end of the war and subsequent stabilization of oil prices were therefore greeted with some relief in the region, and Asia’s markets were generally stronger following the cessation of large-scale hostilities.
Shortly after this event, however, the outbreak of SARS dealt a short-lived shock to the financial systems of the region, with many commentators suggesting that its economic impact would rival that of the
2 MATTHEWS ASIAN FUNDS
financial crisis of 1997/98. With hindsight, this has clearly not been the case, and even the worst-hit sectors of Asian industry (notably tourism) have bounced back strongly from the dark days of March and April.
A third influence on sentiment amongst investors in Asia during this period has been the ups and downs of the negotiations between North Korea, the United States, Japan, South Korea and China regarding the longstanding dispute over North Korea’s nuclear program. This issue remains extremely complex, and the outcome of current negotiations is impossible to predict. Suffice it to say that any positive progress in this respect would be well received by investors in the region, and any setbacks are likely to cause weaker markets, in South Korea in particular.
On the economic front, the major developments over the past year have been the continued strong performance of the economy in mainland China and the nascent signs of life in the long-stagnant economy of Japan.

G. Paul Matthews Chairman and Chief Investment Officer (left)
Mark W. Headley President and Portfolio Manager
On the economic front, the major developments over the past year have been the continued strong performance of the economy in mainland China and the nascent signs of life in the long-stagnant economy of Japan. The question of how these two countries in particular have managed their currency regimes is currently the topic of much debate. Whether or not the large trade deficit of the United States can be addressed by changing the way in which Asia manages its exchange rate policies is a difficult question to answer. Generally speaking, we are supportive of the idea that exchange rates should be set by market forces, but we also believe that it is critically important that China engage in large-scale
800.789.ASIA (2742) www.matthewsfunds.com 3
MESSAGE TO SHAREHOLDERS
bank sector reform as a precursor to opening its currency on the capital account. A destabilized China would threaten global economic growth, and without addressing the problem of the high level of non-performing loans in the Chinese banking system, a freely floating renminbi could lead to such instability.
We have long sought to discourage market timing and are appalled at the “late trading” activity that has apparently occurred, which we view as illegal and amounting to simple theft. We support comprehensive regulation that assists fund companies in their efforts to serve shareholders.
One of the most encouraging changes in recent months, in our opinion, has been a renewed sense of confidence among the people of Hong Kong. Sentiment has been much improved there due to the strong recovery from SARS, as well as the aftermath to the political protests that led to a half-million people marching peacefully in the streets in Hong Kong in early June. That such demonstrations can still occur in Hong Kong is testimony to China’s willingness to abide by its undertakings to the people of Hong Kong at the time of the handover in 1997. Furthermore, China has taken a number of steps to help restore economic growth by encouraging mainland visitors to Hong Kong and by introducing a series of measures to further encourage integration with the mainland economy.
We would like to emphasize that Hong Kong is increasingly becoming an integral part of China—but a part that enjoys a strong legal structure, a well-regulated market and a free media. In our opinion, Hong Kong will remain the primary market for those equity investors seeking exposure to China’s opportunities for many years to come.
On a separate subject, we are pleased to announce the addition of the seventh fund in the Matthews Asian Funds series with the October 31, 2003, launch of the Matthews Asia Pacific Fund. A number of our investors have requested a portfolio that combines Japan with the rest of Asia. We believe that the region overall is becoming increasingly integrated into an economic
4 MATTHEWS ASIAN FUNDS
whole—with long-term implications for Asia’s entire corporate community. Combining the entire universe of Asian equities, including Australia and New Zealand, is an exciting challenge for our team.
No Message to Shareholders today would be complete without a discussion of the investigation into inappropriate trading activities within the mutual fund industry. While market timing is a legal activity that we have long sought to discourage through redemption fees and the banning of abusive parties, as well as the more recent emphasis on fair-value pricing, the “late trading” activity that has apparently occurred is illegal and amounts to simple theft. We support comprehensive regulation that assists fund companies in their efforts to serve shareholders. We believe that mutual funds remain one of the best vehicles available in the financial world for the long-term savings of individuals and institutions.
As always, we encourage you to visit our website at www.matthewsfunds.com, where a wide range of regular and ongoing e-mail communications on Asia and our Funds is available to shareholders.
Our sincere thanks to you, our fellow shareholders, for your continued support.

G. Paul Matthews
Chairman and Chief Investment Officer

Mark W. Headley
President and Portfolio Manager
| | OPENING OCTOBER 31, 2003 | |
| | | |
| | THE MATTHEWS ASIA PACIFIC FUND | |
| | | |
| | For information on this new fund and its investment objectives, visit our website at www.matthewsfunds.com. | |
| | | |
800.789.ASIA (2742) www.matthewsfunds.com 5
MATTHEWS PACIFIC TIGER FUND

Overall Morningstar rating as of 8/31/03 out of 75 Pacific/Asia ex-Japan Funds.
Investors seeking a bit of Asian spice for their overseas portfolio should consider this fund.
Matthews Pacific Tiger always has plenty of pop. Managers Mark Headley and Paul Matthews pay a lot of attention to phone- and computer-related stocks as they pursue issues with robust earnings prospects and moderate valuations. The Thai mobile-phone-system operator Advanced Information Systems is their top holding at 5% of assets, while the Taiwanese computer-parts maker Hon Hai Precision Instruments is their number-two holding at 4.4% of assets. Overall, the fund has 30% of its assets in telecom and tech names, which is twice the category norm.
Moreover, Headley and Matthews don’t hesitate to search beyond the region’s biggest markets and companies for good growth opportunities. While many of its peers have limited stakes in Indonesia, the fund has a 6% weighting in that market, ranging from the moderately popular carmaker Astra to the largely ignored department store chain Ramayana. And small caps, such as the Korean health-food manufacturer Pulmuone, currently make up about one fourth of the portfolio. Thus, the fund’s holdings have less overlap with the emerging-Asian exposure of the average foreign-stock offering than the stocks of the typical Pacific/Asia ex-Japan stock fund do.
The performance is just as appealing as the portfolio here. The fund has thrived in the recent surge. Whereas its typical peer soared 24% in the three months ending July 10, it zoomed 28%, fueled by larger-cap telecom names like Advanced Information Systems, smaller-cap tech names such as Internet Auction, and its Indonesia holdings, among other picks. And the fund has also prospered in past rallies, so it has handily outpaced its average peer since opening in late 1994.
In short, while it’s volatile, this fund is a terrific choice for investors who want a zesty Asian complement to their core foreign offering.
—William Samuel Rocco
Senior Analyst, Morningstar
July 11, 2003
Investing in foreign securities may involve certain additional risks including exchange rate fluctuations, reduced liquidity, greater volatility, and less regulation. Past performance does not guarantee future results. Investment return and principal value of mutual funds will vary with market conditions, so that shares, when redeemed, may be worth more or less than their original cost. As of 6/30/03, the 1-year total return for the Matthews Asian Growth and Income Fund was 7.55%, the 5-year average annual total return was 17.39% and since inception (9/12/94) the average annual total return was 8.10%. As of August 31, 2003, the Matthews Asian Growth and Income Fund received an Overall Morningstar Rating™ of 5 stars out of 75 funds in the Pacific/Asia ex-Japan stock category, 5 stars out of 75 funds for the 3-year period, and 5 stars out of 64 funds
6 MATTHEWS ASIAN FUNDS
MATTHEWS ASIAN GROWTH AND INCOME FUND
Overall Morningstar rating as of 8/31/03 out of 75 Pacific/Asia ex-Japan Funds.
This moderate play on emerging Asia has done what it’s supposed to, and then some.
Matthews Asian Growth & Income Fund continues to sport the safest portfolio in its category. It’s still the only offering in the group that invests significantly in convertibles bonds, and these issues, which currently make up 32% of assets, are relatively resilient due to their bond features. And, manager Paul Matthews remains focused on modest valuations and ample dividends while picking stocks. He picked up a couple of cheap Japanese REITs yielding 6% early this year, for example, as well as a similarly attractive Singapore REIT this spring. Thus, the fund’s equity stake, which is now 60% of assets, is also rather buoyant, as is its small position in preferred stocks.
Moreover, the fund pays more attention to issue diversification than most of its rivals. And Matthews’ focus on price and dividends while choosing stocks, as well as the industry composition of the convertibles market, skews the portfolio toward the value sectors.
Given all the conservative aspects of the fund’s style, it’s no surprise that the fund is the least volatile member of its category by far. The fund has a five-year standard deviation of 15, while the second tamest offering in the group has a five-year standard deviation of 22, and the category average is 33.
The fund’s safety features have their drawbacks, of course. The fund has lagged markedly as emerging Asia’s markets have surged this spring, and it has disappointed during other strong rallies. But it has acquitted itself well in more-moderate upturns in the region, and it has thrived during downturns. As a result, this fund has gained 8% per year since opening in late 1994, whereas its typical rival has lost 3% per year during that period.
We continue to think that this fund is a terrific way to make a play on emerging Asia without incurring a lot of risk.
—William Samuel Rocco
Senior Analyst, Morningstar
July 11, 2003
for the 5-year period. For each fund with at least a three-year history, Morningstar calculates a Morningstar Rating™ based on a Morningstar Risk-Adjusted Return measure that accounts for variation in a fund’s monthly performance (including the effects of sales charges, loads, and redemption fees), placing more emphasis on downward variations and rewarding consistent performance. The top 10% of funds in each category receive 5 stars, the next 22.5% receive 4 stars, the next 35% receive 3 stars, the next 22.5% receive 2 stars and the bottom 10% receive 1 star. (Each share class is counted as a fraction of one fund within this scale and rated separately, which may cause slight variations in the distribution percentages.) The Overall Morningstar Rating for a fund is derived from a weighted-average of the performance figures associated with its three-, five- and ten-year (if applicable) Morningstar Rating metrics. A fund’s rating may change at a ny time based on new data. Ratings are historical and do not represent future performance. Past performance is no guarantee of future results. Reprinted by permission of Morningstar.
800.789.ASIA (2742) www.matthewsfunds.com 7
MATTHEWS PACIFIC TIGER FUND
| | |
| | CO-PORTFOLIO MANAGERS
G. Paul Matthews
Mark W. Headley
The Matthews Pacific Tiger Fund is an all-capitalization, core equity fund focusing on the broad range of equity markets in Asia ex-Japan. |
| | |
PORTFOLIO MANAGER COMMENTS
For the fiscal year ended August 31, 2003, the Matthews Pacific Tiger Fund gained 31.15%, outperforming its benchmark, the MSCI All Country Far East Free ex-Japan Index, which gained 17.23%. The peer group measured by the Lipper Pacific ex-Japan Funds Average gained 16.13%.
The Matthews Pacific Tiger Fund’s performance relative to its benchmark indices over the fiscal year benefited from overweight positions in consumer and information technology industries. By country, the primary contributors to positive returns were Hong Kong and South Korea. The Fund’s investment returns were positive in all countries with the exception of the Philippines, which produced a modest loss. The bottom-up nature of the Fund’s investment style was reflected in the fact that the top five individual contributors to performance during the year were based in different markets. The three positions with the most negative impact on performance were South Korean-listed companies, two of which were financial companies.
The Matthews Pacific Tiger Fund has now entered its tenth year of operations, and the environment in Asia has changed dramatically since its inception in September 1994. Markets that were once restricted, such as South Korea, are now largely open to foreign investment. China has taken an ever-more significant role in the Asian financial and economic universe. Hong Kong has successfully returned to Chinese sovereignty. In 1997 and 1998, the region weathered one of the most severe financial crises of the 20th century, and emerged stronger for it. The Fund’s focus on corporations that drive change in Asia helped it outperform its benchmark and peer group in all the standard time periods—one year, three years, five years and since its inception.
The Fund remains driven by “bottom-up” stock selection, with careful consideration of the local environment in which companies must operate. Diversification is achieved across nations, industries and market capitalization. A careful balance is maintained between companies that derive their earnings from domestic operations and those that compete in the global market. That balance has, for several years, been weighted toward those companies that operate primarily within their local economies or within the region. This bias is accomplished through a focus on consumer/retail companies and financials. We believe that these sectors are poorly understood by global investors and offer a purer play on Asia’s long-term progress than do export-related companies.
As we look forward, we see an Asian region that is increasingly integrated and open to trade and investment flows from neighbors as well as from other regions such as the United States and Europe. We are convinced that Asian governmental policy is slowly grasping the importance of domestically driven growth that complements the region’s export prowess. A more mature and well-balanced Asian environment is emerging, and the Matthews Pacific Tiger Fund continues to participate in this trend.
8 MATTHEWS ASIAN FUNDS
FUND PERFORMANCE
Average Annual Returns as of August 31, 2003
- ------------------------------------------------------------------------------
                                           MSCI ALL COUNTRY
                        MATTHEWS PACIFIC    FAR EAST FREE      LIPPER PACIFIC
                            TIGER FUND     EX-JAPAN INDEX(1)   EX-JAPAN FUNDS
                                                                 AVERAGE(2)
- ------------------------------------------------------------------------------
One Year                     31.15%            17.23%             16.13%
- ------------------------------------------------------------------------------
Five Years                   26.24%            12.77%             13.23%
- ------------------------------------------------------------------------------
Since Inception (9/12/94)     3.24%            -4.48%             -3.09%*
- ------------------------------------------------------------------------------
*From 8/31/94
GROWTH OF A $10,000 INVESTMENT
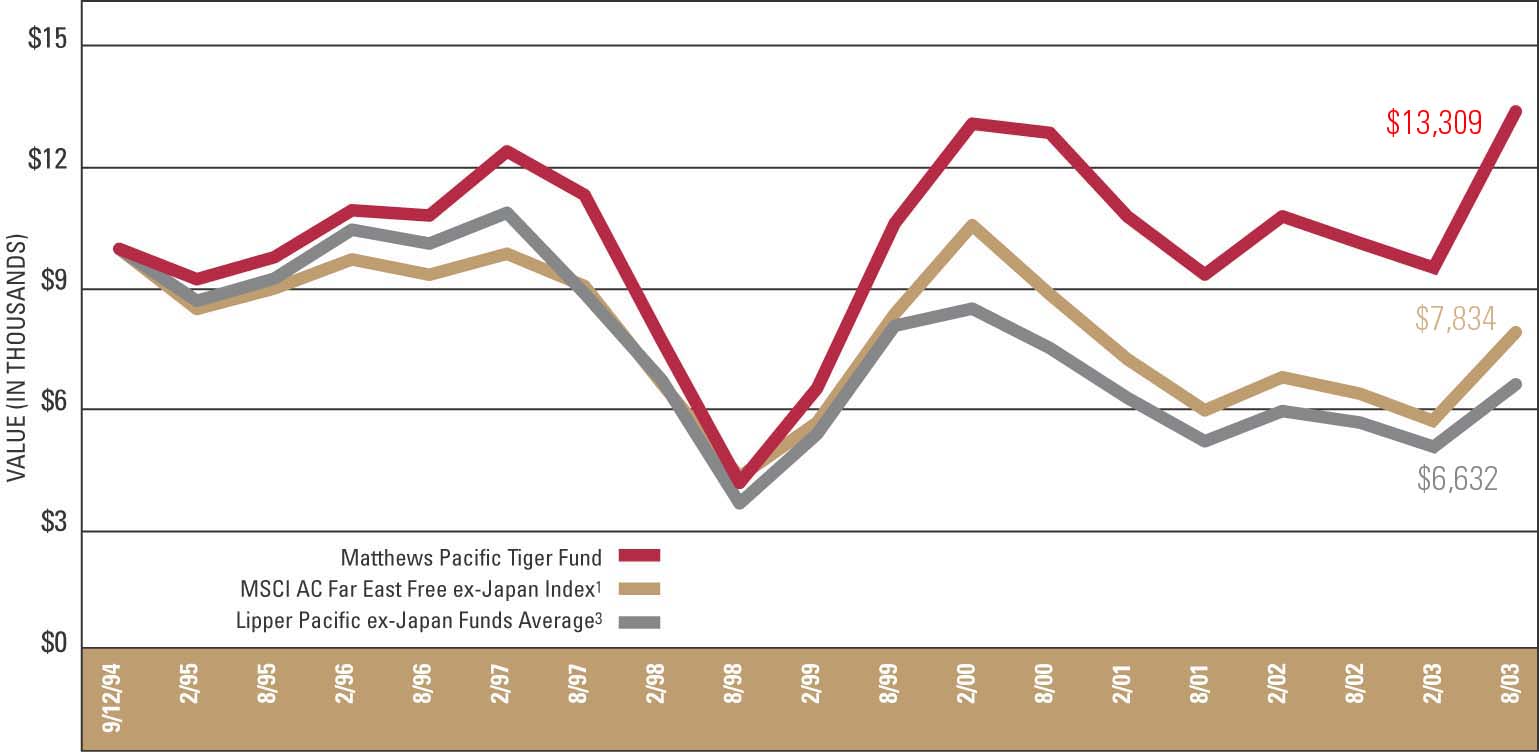
| | | Past performance is not indicative of future results. Before taxes on distributions or redemptions of Fund shares. |
| (1) | | The MSCI All Country Far East Free ex-Japan Index is an unmanaged capitalization-weighted index of stock markets of Hong Kong, Taiwan, Singapore, Korea, Indonesia, Malaysia, Philippines, Thailand and China that excludes securities not available to foreign investors. Taiwan is represented at only 50% of its total market cap. |
| (2) | | As of 8/31/03, the Lipper Pacific ex-Japan Funds Average consisted of 66 funds for the one-year period, 48 funds for the five-year period, and 20 funds since 8/31/94. Lipper, Inc. fund performance does not reflect sales charges and is based on total return, including reinvestment of dividends and capital gains for the stated periods. |
| (3) | | For Lipper Pacific ex-Japan Funds Average, graph start date is 8/31/94. |
800.789.ASIA (2742) www.matthewsfunds.com 9
MATTHEWS PACIFIC TIGER FUND
SCHEDULE OF INVESTMENTS
EQUITIES: 95.82%*
                                                      SHARES          VALUE
===========================================================================

CHINA/HONG KONG: 38.34%

Asia Satellite Telecommunications
  Holdings, Ltd.                                   1,476,600     $2,357,074
China Insurance International
  Holdings Co., Ltd.                               6,182,000      3,388,490
China Merchants Holdings
  International Co., Ltd.                          3,496,000      3,899,705
China Mobile HK, Ltd.                              1,552,717      3,991,606
China Mobile HK, Ltd. ADR                            165,850      2,151,075
China Pharmaceutical Group, Ltd.                   9,291,000      3,365,286
Dah Sing Financial Group                           1,504,400      8,911,408
Giordano International, Ltd.                      20,923,000      8,718,632
Hang Lung Group, Ltd.                              6,015,000      6,169,737
Huaneng Power International,
  Inc. ADR                                           100,200      5,500,980
Legend Group, Ltd.                                18,124,000      7,784,664
Moulin International
  Holdings, Ltd.                                   6,370,000      3,756,975
Sa Sa International
  Holdings, Ltd.                                   3,410,000        699,545
Shangri-La Asia, Ltd.                              6,022,000      5,018,745
Swire Pacific, Ltd.  A Shares                      1,647,500      9,252,105
Television Broadcasts, Ltd.                        1,324,700      5,587,975
Travelsky Technology,
  Ltd. H Shares                                    1,180,000      1,013,673
Tsingtao Brewery Co.,
  Ltd. H Shares                                    5,032,000      4,225,936
Vitasoy International
  Holdings, Ltd.                                   8,948,750      2,180,003
- ---------------------------------------------------------------------------

Total China/Hong Kong                                            87,973,614
===========================================================================

INDIA: 2.28%

Hero Honda Motors, Ltd.                              469,000      2,972,686
Infosys Technologies, Ltd.                            26,500      2,260,593
- ---------------------------------------------------------------------------

Total India                                                       5,233,279
===========================================================================

INDONESIA: 4.47%

PT Astra International  **                         7,261,230      3,251,935
PT Bank Central Asia                               8,660,000      2,985,327
PT Ramayana Lestari Sentosa                       11,554,000      4,017,006
- ---------------------------------------------------------------------------

Total Indonesia                                                  10,254,268
===========================================================================

                                                      SHARES          VALUE
===========================================================================

PHILIPPINES: 0.30%

SM Prime Holdings                                  7,030,000       $690,595
===========================================================================

SINGAPORE: 14.97%

DBS Group Holdings, Ltd.                           1,114,750      8,012,921
Fraser & Neave, Ltd.                               1,301,500      7,239,218
Great Eastern Holdings, Ltd.                         767,500      4,509,812
Hyflux, Ltd.                                       4,343,000      4,311,039
Parkway Holdings, Ltd.                             4,329,000      2,160,919
Venture Corp., Ltd.                                  704,800      8,121,946
- ---------------------------------------------------------------------------

Total Singapore                                                  34,355,855
===========================================================================

SOUTH KOREA: 22.04%

Amorepacific Corp.                                    37,680      4,732,985
Hana Bank                                            573,587      8,348,837
Hite Brewery Co., Ltd.                                89,977      5,108,815
Internet Auction Co., Ltd. **                         61,200      4,072,209
Kookmin Bank                                         103,970      3,789,952
KT Corp. ADR                                          66,000      1,244,100
Nong Shim Co., Ltd.                                   20,508      2,262,712
Pulmuone Co., Ltd.                                    75,970      3,339,907
Samsung Electronics Co., Ltd.                         16,713      6,170,299
Samsung Securities Co., Ltd.                         180,580      4,582,510
SK Telecom Co., Ltd.                                  25,305      4,316,830
SK Telecom Co., Ltd. ADR                             136,500      2,601,690
- ---------------------------------------------------------------------------

Total South Korea                                                50,570,846
===========================================================================

TAIWAN: 5.24%

Hon Hai Precision Industry
  Co., Ltd.                                        2,145,300      8,855,538
Taiwan Semiconductor
  Manufacturing Co., Ltd. **                       1,614,189      3,166,190
- ---------------------------------------------------------------------------

Total Taiwan                                                     12,021,728
===========================================================================

THAILAND: 8.18%

Advanced Info Service
  Public Co., Ltd.                                 5,502,900      7,432,734
Bangkok Bank Public Co., Ltd. **                   4,034,800      8,297,413
Serm Suk Public Co., Ltd.                          4,241,000      3,044,768
- ---------------------------------------------------------------------------

Total Thailand                                                   18,774,915
===========================================================================
See accompanying notes to financial statements.
10 MATTHEWS ASIAN FUNDS
                                                                      VALUE
===========================================================================

TOTAL INVESTMENTS: 95.82%                                      $219,875,100
(Cost $176,309,686***)

CASH AND OTHER ASSETS,
LESS LIABILITIES: 4.18%                                           9,591,837
- ---------------------------------------------------------------------------

NET ASSETS: 100.00%                                            $229,466,937
===========================================================================


*     As a percentage of net assets as of August 31, 2003
**    Non - income producing security.
ADR   American Depositary Receipt
***   Cost for Federal income tax purposes is $176,894,084 and
      net unrealized appreciation consists of:
      Gross unrealized appreciation                            $46,968,628
      Gross unrealized depreciation                             (3,987,612)
                                                               -----------
      Net unrealized appreciation                              $42,981,016
                                                               ===========
MARKET SECTOR DIVERSIFICATION
As a Percentage of Total Value of Investment in Securities
Consumer Discretionary                                               21.52%

Automobile                                                            1.35%
Cosmetics                                                             0.32%
Distributors                                                          1.48%
Hotels, Restaurants & Leisure                                         2.28%
Internet & Catalog Retail                                             1.85%
Media                                                                 4.46%
Retail                                                                9.78%

Consumer Staples                                                     12.69%

Beverages                                                             9.15%
Food Products                                                         3.54%

Financials                                                           31.05%

Banks                                                                18.36%
Diversified Financials                                                6.29%
Insurance                                                             3.59%
Real Estate                                                           2.81%

Health Care                                                           2.51%

Pharmaceuticals                                                       2.51%

Information Technology                                               17.00%

Computer Software                                                     1.49%
Computers & Peripherals                                               3.54%
Electronic Equipment & Instruments                                    7.72%
Semiconductor Equipment & Products                                    4.25%

Industrial                                                            1.77%

Industrial Conglomerates                                              1.77%

Telecommunication Services                                           10.96%

Diversified Telecommunication Services                                5.02%
Wireless Telecommunication Services                                   5.94%

Utilities                                                             2.50%

Electric Utilities                                                    2.50%
===========================================================================
TOTAL INVESTMENTS                                                   100.00%
See accompanying notes to financial statements.
800.789.ASIA (2742) www.matthewsfunds.com 11
MATTHEWS ASIAN GROWTH AND INCOME FUND
| | |
| | PORTFOLIO MANAGER
G. Paul Matthews
The Matthews Asian Growth and Income Fund seeks long-term capital appreciation and some current income through investments in higher-yielding equities, convertible bonds, and preferred shares of Asia-based companies. |
| | |
PORTFOLIO MANAGER COMMENTS
For the fiscal year ended August 31, 2003, the Matthews Asian Growth and Income Fund gained 17.81%, while its benchmark, the MSCI All Country Far East Free ex-Japan Index, gained 17.23%. Generally speaking, the Fund outperformed its benchmark in the first half of the year but lagged in the second half, ending the year almost exactly in line with its benchmark. The Fund seeks both capital gains and some income through investing in dividend-paying stocks and convertible bonds in Asia, so its performance characteristics are likely to differ over time from pure equity benchmarks.
In general, during periods of strong equity market performance the Fund is likely to rise less than the indices, but it also is intended to fall less than those indices during periods of weak equity market performance. One of our objectives over long periods of time is to generate less-volatile returns than have historically been achieved by pure equity funds in the region, although of course there can be no guarantee that this will always be the case.
During the fiscal year, the Fund reduced its exposure to convertible bonds from approximately 40% of fund assets to approximately 26%, based on our view that the environment was more positive for dividend-paying equities than for more bond-like securities. By country, the portfolio remained well diversified, although its exposure to South Korea was reduced to approximately 17%; weightings in Singapore rose to approximately 13%, and a small exposure was added in Japanese REITs.
Outside of REITs, the Fund has invested in real estate-related businesses in Hong Kong, and those positions were increased during the year and contributed positively to investment. New positions were also added during the year to energy-related companies, which also made significant positive contributions to the Fund’s performance. The investments that did least well for the Fund were the positions in convertible bonds of Asian telecommunications companies, which underperformed during the year.
It is encouraging to note that many companies in Asia are actively developing policies to increase dividend payouts. Overall, we believe that focusing on dividend-paying companies in Asia remains an appropriate strategy for less-aggressive investors in Asia.
12 MATTHEWS ASIAN FUNDS
FUND PERFORMANCE
Average Annual Returns as of August 31, 2003
- ------------------------------------------------------------------------------
                            MATTHEWS ASIAN  MSCI ALL COUNTRY   LIPPER PACIFIC
                              GROWTH AND      FAR EAST FREE    EX-JAPAN FUNDS
                             INCOME FUND    EX-JAPAN INDEX(1)     AVERAGE(2)
- ------------------------------------------------------------------------------
One Year                        17.81%            17.23%           16.13%
- ------------------------------------------------------------------------------
Five Years                      21.20%            12.77%           13.23%
- ------------------------------------------------------------------------------
Since Inception (9/12/94)        8.96%            -4.48%           -3.09%*
- ------------------------------------------------------------------------------
*From 8/31/94
GROWTH OF A $10,000 INVESTMENT
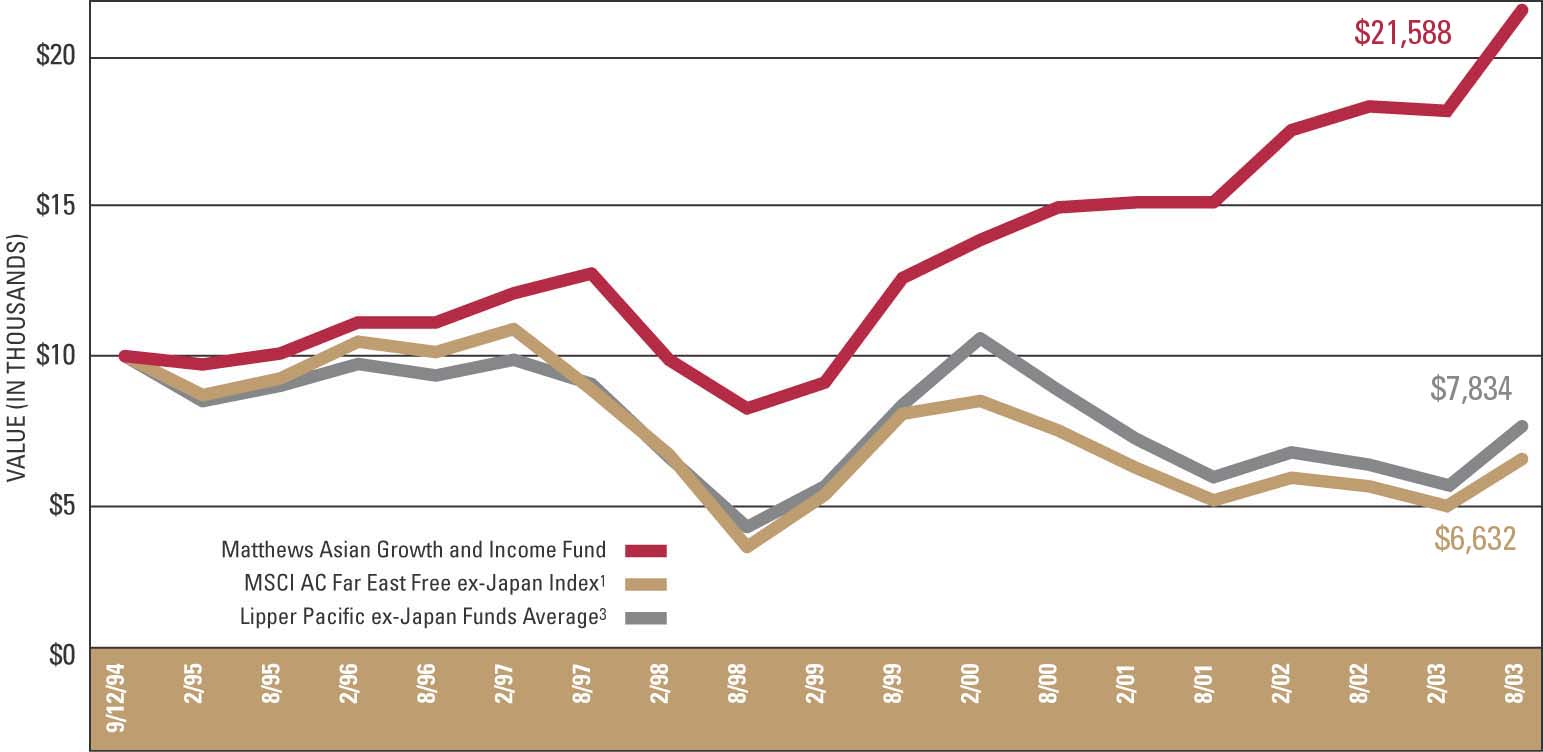
| | | Past performance is not indicative of future results. Before taxes on distributions or redemptions of Fund shares. |
| (1) | | The MSCI All Country Far East Free ex-Japan Index is an unmanaged capitalization-weighted index of stock markets of Hong Kong, Taiwan, Singapore, Korea, Indonesia, Malaysia, Philippines, Thailand and China that excludes securities not available to foreign investors. Taiwan is represented at only 50% of its total market cap. |
| (2) | | As of 8/31/03, the Lipper Pacific ex-Japan Funds Average consisted of 66 funds for the one-year period, 48 funds for the five-year period, and 20 funds since 8/31/94. Lipper, Inc. fund performance does not reflect sales charges and is based on total return, including reinvestment of dividends and capital gains for the stated periods. |
| (3) | | For Lipper Pacific ex-Japan Funds Average, graph start date is 8/31/94. |
800.789.ASIA (2742) www.matthewsfunds.com 13
MATTHEWS ASIAN GROWTH AND INCOME FUND
SCHEDULE OF INVESTMENTS
EQUITIES: 69.62%*
                                                      SHARES          VALUE
===========================================================================
CHINA/HONG KONG: 33.15%

BOC Hong Kong Holdings, Ltd.                       1,937,000     $2,483,537
Cafe De Coral Holdings, Ltd.                      11,275,100      9,396,688
Cheung Kong Infrastructure
  Holdings, Ltd.                                   3,547,500      7,345,747
China Hong Kong Photo Products
  Holdings, Ltd.                                   8,810,003        609,973
CLP Holdings, Ltd.                                 2,753,700     12,145,519
Giordano International, Ltd.                      24,585,000     10,244,591
Hang Lung Group, Ltd.                              4,156,000      4,262,914
Hang Seng Bank, Ltd.                                 720,000      7,985,271
Hengan International Group Co.,
  Ltd.                                            11,018,000      4,803,112
Hong Kong and China Gas Co.,
  Ltd.                                             6,550,000      8,818,031
Hongkong Electric Holdings, Ltd.                   2,360,000      9,319,739
Hongkong Land Holdings, Ltd.                       6,035,000      8,086,900
Kerry Properties, Ltd.                             2,989,901      3,986,862
Lerado Group Holding Co., Ltd.                     2,950,000        521,966
MTR Corp., Ltd.                                    4,025,000      5,057,466
PetroChina Co., Ltd. ADR                             173,900      6,216,925
PetroChina Co., Ltd. H Shares                     27,016,000      9,439,057
Shandong International
  Power Development Co., Ltd.
  H Shares                                        11,644,000      3,396,445
Shangri-La Asia, Ltd.                             11,287,000      9,406,605
Sun Hung Kai Properties, Ltd.                      2,651,000     19,119,357
Television Broadcasts, Ltd.                        3,152,000     13,296,065
The Bank of East Asia, Ltd.                        2,084,000      4,916,506
The Wharf Holdings, Ltd.                           4,634,000     10,872,969
Vitasoy International Holdings,
  Ltd.                                            20,765,000      5,058,556
- ---------------------------------------------------------------------------

Total China/Hong Kong                                           176,790,801
===========================================================================


                                                      SHARES          VALUE
===========================================================================

INDONESIA: 2.20%

PT Indonesian Satellite Corp. ADR                    171,000     $1,631,340
PT Ramayana Lestari Sentosa                        2,747,000        955,056
PT Telekomunikasi Indonesia                          880,000        474,484
PT Telekomunikasi Indonesia ADR                      388,500      4,351,200
PT Tempo Scan Pacific                              7,162,500      4,305,097
- ---------------------------------------------------------------------------

Total Indonesia                                                  11,717,177
===========================================================================

JAPAN: 2.17%

Japan Retail Fund Investment
  Corp. REIT                                           1,409      7,426,594
Nippon Building Fund, Inc. REIT                          759      4,156,676
- ---------------------------------------------------------------------------

Total Japan                                                      11,583,270
===========================================================================

SINGAPORE: 10.54%

CapitaMall Trust REIT                              9,426,000      6,345,302
Fraser & Neave, Ltd.                               2,999,800     16,685,521
Singapore Exchange, Ltd.                           9,189,000      8,649,581
Singapore Press Holdings, Ltd.                     1,137,000     12,129,557
Singapore Telecommunications,
  Ltd.                                            12,789,000     12,403,046
- ---------------------------------------------------------------------------

Total Singapore                                                  56,213,007
===========================================================================
See accompanying notes to financial statements.
14 MATTHEWS ASIAN FUNDS
                                                      SHARES          VALUE
===========================================================================

SOUTH KOREA: 11.69%

Daehan City Gas Co., Ltd.                            280,300     $3,568,428
Hyundai Motor Co., Ltd., Pfd.                        721,890     10,966,969
Hyundai Motor Co., Ltd., 2nd Pfd.                    173,390      2,648,861
Korea Electric Power Corp.                           129,500      2,121,239
Korea Electric Power Corp. ADR                       343,250      3,168,197
Korea Gas Corp.                                       60,870      1,358,694
Korean Reinsurance Co.                               159,300      4,096,575
LG Household & Health Care,
  Ltd., Pfd.                                         177,830      2,641,226
Samsung Electronics Co., Ltd., Pfd.                   58,440     10,564,583
Samsung Fire & Marine Insurance
  Co., Ltd.                                           56,590      3,121,876
Samsung Fire & Marine Insurance
  Co., Ltd., Pfd.                                    142,820      3,781,866
Shinhan Financial Group Co., Ltd.                    619,300      8,409,760
Sindo Ricoh Co., Ltd.                                 94,290      5,913,881
- ---------------------------------------------------------------------------

Total South Korea                                                62,362,155
===========================================================================

TAIWAN: 1.72%
Chunghwa Telecom Co., Ltd.                           648,000        927,666
Chunghwa Telecom Co., Ltd. ADR                       582,200      8,220,664
- ---------------------------------------------------------------------------

Total Taiwan                                                      9,148,330
===========================================================================


                                                      SHARES          VALUE
===========================================================================

THAILAND: 4.78%
Bangkok Bank Public Co., Ltd. **                   2,926,300     $6,017,825
Charoen Pokphand Foods Public
  Co., Ltd.                                       33,805,000      4,360,344
Charoen Pokphand Foods Public
  Co., Ltd., Foreign                               9,260,000      1,194,403
Charoen Pokphand Foods Public
  Co., Ltd., Warrants **                             638,000        106,359
PTT Public Co., Ltd.                                 990,000      1,758,823
PTT Public Co., Ltd., Foreign                      5,199,000      9,236,483
Thai Reinsurance Public
  Co., Ltd.                                       25,672,800      2,836,567
- ---------------------------------------------------------------------------

Total Thailand                                                   25,510,804
===========================================================================

UNITED KINGDOM: 3.37%
HSBC Holdings PLC                                    329,600      4,289,378
HSBC Holdings PLC ADR                                213,000     13,700,160
- ---------------------------------------------------------------------------

Total United Kingdom                                             17,989,538
===========================================================================

TOTAL EQUITIES                                                  371,315,082
(Cost $316,323,157)
===========================================================================

*  As a percentage of net assets as of August 31, 2003
** Non - income producing security.
See accompanying notes to financial statements.
800.789.ASIA (2742) www.matthewsfunds.com 15
MATTHEWS ASIAN GROWTH AND INCOME FUND
SCHEDULE OF INVESTMENTS (continued)
INTERNATIONAL DOLLAR BONDS: 26.26%*
                                                 FACE AMOUNT          VALUE
===========================================================================

CHINA/HONG KONG: 11.47%

China Mobile Hong Kong, Ltd., Cnv.
  2.250%, 11/03/05                               $25,150,000    $24,929,937
Hang Lung Properties., Ltd., Cnv.
  5.500%, 12/29/49                                11,550,000     10,972,500
New World Capital Finance, Ltd., Cnv.
  3.000%, 06/09/04                                 3,600,000      4,396,500
PCCW Capital II, Ltd., Cnv.
  1.000%, 01/29/07                                16,050,000     16,992,938
Tingyi  (C.I.) Holding Corp., Cnv.
  3.500%, 06/04/05                                 3,500,000      3,885,000
- ---------------------------------------------------------------------------

Total China/Hong Kong                                            61,176,875
===========================================================================

SINGAPORE: 2.48%

Finlayson Global Corp., Cnv.
  0.000%, 02/19/04                                10,150,000     13,080,813
Finlayson Global Corp., Cnv. ***
  0.000%, 02/19/04                                   100,000        128,875
- ---------------------------------------------------------------------------

Total Singapore                                                  13,209,688
===========================================================================

SOUTH KOREA: 5.97%

Korea Deposit Insurance Corp., Cnv.
  2.250%, 10/11/05                                 8,820,000     10,837,575
Korea Telecom Corp., Cnv.
  0.250%, 01/04/07                                20,325,000     20,604,469
Korea Telecom Corp., Cnv.***
  0.250%, 01/04/07                                   375,000        380,156
- ---------------------------------------------------------------------------

Total South Korea                                                31,822,200
===========================================================================


                                                 FACE AMOUNT          VALUE
===========================================================================
TAIWAN: 5.36%

Cathay Financial Holding Co., Cnv.
  0.000%, 05/20/07                               $10,600,000    $11,236,000
Fubon Financial Holding Co., Ltd., Cnv.
  0.000%, 07/10/04                                11,000,000     11,728,750
Sinopac Holdings Co., Cnv.
  0.000%, 07/12/07                                 5,000,000      5,631,250
- ---------------------------------------------------------------------------

Total Taiwan                                                     28,596,000
===========================================================================

THAILAND: 0.98%

Bangkok Bank Public Co., Ltd., Cnv.
  4.589%, 03/03/04                                 8,450,000      5,217,875
- ---------------------------------------------------------------------------

TOTAL INTERNATIONAL DOLLAR BONDS                                140,022,638
(Cost $141,223,233)
- ---------------------------------------------------------------------------

TOTAL INVESTMENTS: 95.88%*                                      511,337,720
(Cost $457,546,390****)

CASH AND OTHER ASSETS,
LESS LIABILITIES: 4.12%                                          21,964,688
- ---------------------------------------------------------------------------

NET ASSETS: 100.00%                                            $533,302,408
===========================================================================

*    As a percentage of net assets as of August 31, 2003
**   Non - income producing security.
***  Securities exempt from registration under rule 144A of the Securities Act
     of 1933. These securities may be resold in transactions exempt from
     registration, normally to qualified, institutional buyers. At August 31,
     2003, the value of these securities amounted to $509,031 or 0.10% of net
     assets.
ADR  American Depositary Receipt
Pfd. Preferred
Cnv. Convertible
REIT Real Estate Investment Trust
**** Cost for Federal income tax purposes is $457,724,749 and
     net unrealized appreciation consists of:
     Gross unrealized appreciation                                   $58,157,124
     Gross unrealized depreciation                                    (4,544,153)
                                                                     -----------
     Net unrealized appreciation                                     $53,612,971
                                                                     ===========
See accompanying notes to financial statements.
16 MATTHEWS ASIAN FUNDS
MARKET SECTOR DIVERSIFICATION
As a Percentage of Total Value of Investment in Securities
Consumer Discretionary                          16.21%
Automobiles                                      2.66%
Hotels, Restaurants & Leisure                    7.42%
Media                                            2.60%
Retail                                           3.53%

Consumer Staples                                 5.52%
Beverages                                        3.25%
Food Products                                    1.75%
Household Products                               0.52%

Energy                                           5.47%
Oil & Gas                                        5.47%

Financials                                      35.67%
Banks                                           11.32%
Diversified Financials                          11.05%
Insurance                                        4.83%
Real Estate                                      8.47%

Health Care                                      1.78%
Medical & Pharmaceutical                         1.78%

Industrials                                      6.73%
Agriculture                                      1.11%
Distributors                                     0.82%
Industrial Conglomerates                         3.81%
Transportation Infrastructure                    0.99%

Information Technology                           3.22%
Semiconductor Equipment & Products               3.22%

Telecommunication Services                      17.78%
Diversified Telecommunication Services          12.90%
Wireless Telecommunication Services              4.88%

Utilities                                        7.62%
Electric Utilities                               5.90%
Gas Utilities                                    1.72%
=======================================================
TOTAL INVESTMENTS                              100.00%
See accompanying notes to financial statements.
800.789.ASIA (2742) www.matthewsfunds.com 17
MATTHEWS KOREA FUND
CO-PORTFOLIO MANAGERS
G. Paul Matthews
Mark W. Headley
The Matthews Korea Fund is an all-capitalization equity fund with diversified exposure across a wide range of Korean equities.
PORTFOLIO MANAGER COMMENTS
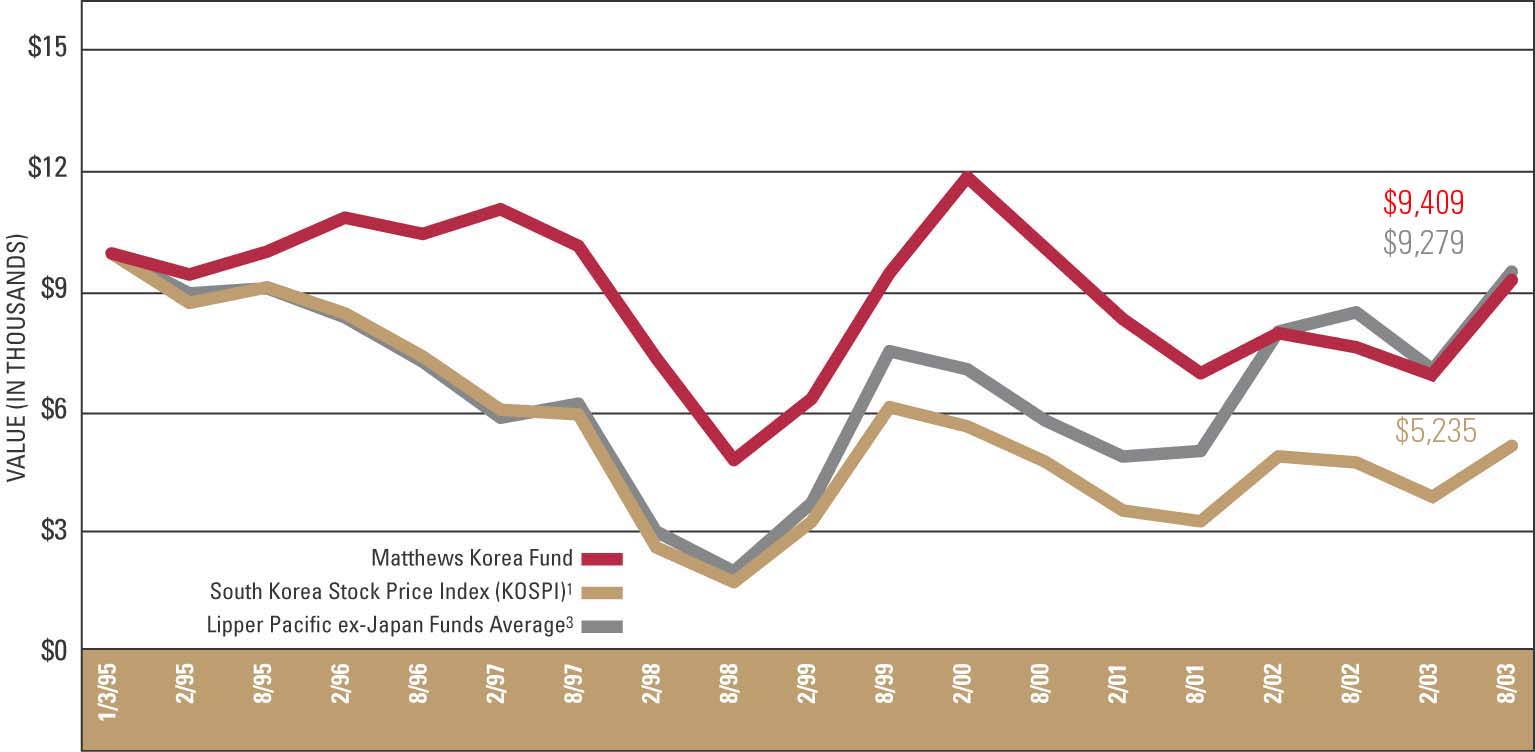
Korean equities experienced a challenging environment during the fiscal year ended August 31, 2003, clouded by the North Korean threat, the U.S. war with Iraq and weak consumer spending. However, since Korea’s market bottom in March, the expectation of a consumer-spending recovery along with the resilient performance of exporters gave investors enough confidence to pull the market out of negative territory. For the fiscal year, the Fund gained 8.80%, while the benchmark KOSPI Index gained 7.49%.
Consumer spending was the key contributor behind the Korean economy’s resilient performance during the fiscal year. However, as global uncertainties and geographical risks grew late in the second half of 2002, consumer spending slowed dramatically and turned against the market. Consumer spending remains weak, with no concrete signs of recovery yet in evidence. The asset quality for many Korean banks remains problematic despite the government buying billions of dollars worth of non-performing loans. The ongoing North Korean issue remains one of the major risks for the South Korean market and one that is difficult to quantify.
While foreign investors worried about North Korea, domestic politics have been a bigger issue for South Korean local investors. New president Roh Moo-hyun and his cabinet took office in February 2003, promising to put an end to corruption and to continue to restructure the economy; however, the latest approval rating for President Roh was the lowest ever for a newly elected president. The president’s relatively young and inexperienced cabinet members have been heavily criticized for inconsistent public policies and poor public relations—especially by the local media.
Despite these difficulties, however, the general status of the Korean economy remains healthy. South Korea has more than US$130 billion in foreign reserves and consistently registers trade surpluses. Exports remain resilient despite Korea’s strengthening currency and a slow global recovery. Korean companies are becoming more globally competitive and continue to expand market share in major markets. A key to further market progress remains the reform of the domestic asset management industry that, unlike the banking system, remains mired in past practices and discourages market participation by domestic investors. We continue to believe that the long-term growth prospects of the South Korean economy remain attractive.
18 MATTHEWS ASIAN FUNDS
FUND PERFORMANCE
Average Annual Returns as of August 31, 2003
- -----------------------------------------------------------------------------------
                                    MATTHEWS                       LIPPER PACIFIC
                                   KOREA FUND     KOSPI INDEX(1)   EX-JAPAN FUNDS
                                                                     AVERAGE(2)
- -----------------------------------------------------------------------------------
One Year                              8.80%           7.49%           16.13%
- -----------------------------------------------------------------------------------
Five Years                           35.28%          24.10%           13.23%
- -----------------------------------------------------------------------------------
Since Inception (1/3/95)             -0.86%          -7.41%           -1.37%*
- -----------------------------------------------------------------------------------
*From 12/31/94
GROWTH OF A $10,000 INVESTMENT
Past performance is not indicative of future results. Before taxes on distributions or redemptions of Fund shares.
| (1) | KOSPI: The South Korea Stock Price Index is a capitalization-weighted index of all common stocks listed on the Korean Stock Exchange. |
| (2) | As of 8/31/03, the Lipper Pacific ex-Japan Funds Average consisted of 66 funds for the one-year period, 48 funds for the five-year period, and 25 funds since 12/31/94. Lipper, Inc. fund performance does not reflect sales charges and is based on total return, including reinvestment of dividends and capital gains for the stated periods. |
| (3) | For Lipper Pacific ex-Japan Funds Average, graph start date is 12/31/94. |
800.789.ASIA (2742) www.matthewsfunds.com 19
MATTHEWS KOREA FUND
SCHEDULE OF INVESTMENTS
EQUITIES: SOUTH KOREA: 102.85%*
                                                   SHARES             VALUE
==============================================================================
BUSINESS SERVICES: 3.58%

Media: 3.58%
Cheil Communications, Inc.                         24,740        $2,687,647
CJ Entertainment, Inc.                            353,357         5,083,302
- ------------------------------------------------------------------------------
Total Business Services                                           7,770,949
==============================================================================

CONSUMER DISCRETIONARY: 11.06%

Automobiles: 4.69%
Hyundai Motor Co., Ltd.                           176,361         5,867,474
Hyundai Motor Co., Ltd., Pfd.                     285,320         4,334,588
- ------------------------------------------------------------------------------
                                                                 10,202,062
- ------------------------------------------------------------------------------
Department Stores: 0.45%
Taegu Department Store Co., Ltd.                  121,300           983,166
- ------------------------------------------------------------------------------

Internet & Catalog Retail: 3.98%
Internet Auction Co., Ltd. **                      84,197         5,602,414
LG Home Shopping, Inc.                             46,483         3,037,718
- ------------------------------------------------------------------------------
                                                                  8,640,132
- ------------------------------------------------------------------------------
Retail: 1.94%
Hyundai Department Store Co., Ltd.                150,610         4,218,230
- ------------------------------------------------------------------------------
Total Consumer Discretionary                                     24,043,590
==============================================================================

CONSUMER STAPLES: 16.24%

Beverages: 3.42%
Hite Brewery Co., Ltd.                            111,001         6,302,539
Lotte Chilsung Beverage Co., Ltd.                   2,330         1,137,068
- ------------------------------------------------------------------------------
                                                                  7,439,607
- ------------------------------------------------------------------------------
Consumer Products: 4.75%
Amorepacific Corp.                                 54,200         6,808,063
Handsome Co., Ltd.                                385,029         3,512,889
- ------------------------------------------------------------------------------
                                                                 10,320,952
- ------------------------------------------------------------------------------
Food Products: 7.21%
CJ Corp.                                           81,250         3,585,826
Nong Shim Co., Ltd.                                48,400         5,340,123
ORION Corp.                                        62,540         4,405,534
Pulmuone Co., Ltd.                                 53,000         2,330,066
- ------------------------------------------------------------------------------
                                                                 15,661,549
- ------------------------------------------------------------------------------
Household Products / Ware: 0.86%

LG Household & Health Care, Ltd.,
 Pfd.                                             126,050         1,872,162
- ------------------------------------------------------------------------------
Total Consumer Staples                                           35,294,270
==============================================================================

                                                   SHARES             VALUE
==============================================================================
FINANCIALS: 23.65%

Banks: 15.79%
Hana Bank                                         871,854       $12,690,257
Kookmin Bank                                      311,933        11,370,696
Kookmin Bank ADR                                   93,139         3,464,771
Shinhan Financial Group Co., Ltd.                 500,062         6,790,572
- ------------------------------------------------------------------------------
                                                                 34,316,296
- ------------------------------------------------------------------------------
Diversified Financials: 3.89%
Kookmin Credit Card Co., Ltd. **                  144,000         2,309,866
Samsung Securities Co., Ltd.                      241,885         6,138,223
- ------------------------------------------------------------------------------
                                                                  8,448,089
- ------------------------------------------------------------------------------
Insurance: 3.97%
Samsung Fire & Marine Insurance
 Co., Ltd.                                        109,303         6,029,870
Samsung Fire & Marine Insurance
 Co., Ltd., Pfd.                                   98,000         2,595,035
- ------------------------------------------------------------------------------
                                                                  8,624,905
- ------------------------------------------------------------------------------
Total Financials                                                 51,389,290
==============================================================================


HEALTH CARE: 4.44%

Pharmaceuticals: 4.44%
Hanmi Pharm Co., Ltd.                             195,000         4,418,841
Yuhan Corp.                                        92,767         5,219,989
- ------------------------------------------------------------------------------
Total Health Care                                                 9,638,830
==============================================================================


INDUSTRIALS: 7.62%

Commercial Services: 2.43%
S1 Corp.                                          273,615         5,271,428

Construction: 2.73%
Tae Young Corp.                                   157,330         5,942,020

Electrical Products: 0.92%
Korea Electric Terminal Co., Ltd.                 109,720         2,002,105

Manufacturing Industries: 0.44%
Daewoo International Corp. **                     264,900           951,010

Metals & Mining: 1.10%
Poongsan Corp.                                    303,540         2,388,131
- ------------------------------------------------------------------------------
Total Industrials                                                16,554,694
==============================================================================

See accompanying notes to financial statements.
20 MATTHEWS ASIAN FUNDS
                                                   SHARES             VALUE
==============================================================================
INFORMATION TECHNOLOGY: 23.38%

Electrical & Electronic Equipment: 3.58%
Daeduck Electronics Co., Ltd.                     489,933        $4,740,281
Daeduck GDS Co., Ltd.                             282,150         3,041,209
- ------------------------------------------------------------------------------
                                                                  7,781,490
- ------------------------------------------------------------------------------
Internet Software & Services: 4.21%
NCsoft Corp. **                                    99,686         5,127,071
NHN Corp.                                          26,916         4,020,552
- ------------------------------------------------------------------------------
                                                                  9,147,623
- ------------------------------------------------------------------------------
Office Electronics: 2.82%
Sindo Ricoh Co., Ltd.                              97,596         6,121,234
- ------------------------------------------------------------------------------
Semiconductor Equipment
& Products: 12.77%
Samsung Electronics Co., Ltd.                      60,641        22,388,147
Samsung Electronics Co., Ltd., Pfd.                29,640         5,358,218
- ------------------------------------------------------------------------------
                                                                 27,746,365
- ------------------------------------------------------------------------------
Total Information Technology                                     50,796,712
==============================================================================

TELECOMMUNICATION SERVICES: 11.83%

Diversified Telecommunication
Services: 4.31%
KT Corp.                                           79,920         3,042,149
KT Corp. ADR                                      335,500         6,324,175
- ------------------------------------------------------------------------------
                                                                  9,366,324

Wireless Telecommunication
Services: 7.52%
KT Freetel  **                                    183,801         3,517,685
SK Telecom Co., Ltd.                               54,595         9,313,469
SK Telecom Co., Ltd.  ADR                         184,300         3,512,758
- ------------------------------------------------------------------------------
                                                                 16,343,912
- ------------------------------------------------------------------------------
Total Telecommunication Services                                 25,710,236
==============================================================================


UTILITIES: 1.05%
Korea Electric Power (KEPCO) Corp.                138,610         2,270,463
==============================================================================
TOTAL EQUITIES: SOUTH KOREA                                     223,469,034
(Cost $172,394,546)
- ------------------------------------------------------------------------------
INTERNATIONAL DOLLAR BONDS:
SOUTH KOREA: 0.72%*
                                              FACE AMOUNT             VALUE
==============================================================================
FINANCIALS: 0.11%

Insurance: 0.11%
Korea Deposit Insurance Cnv.
  2.250%, 10/11/05                               $200,000          $245,750
- ------------------------------------------------------------------------------

TELECOMMUNICATION
SERVICES: 0.61%

Korea Telecom Co., Cnv.
   0.250%, 01/04/07                               925,000           936,719
Korea Telecom Co., Cnv.
   0.250%, 01/04/07 ***                           375,000           381,156
- ------------------------------------------------------------------------------
Total Telecommunication Services                                  1,317,875
==============================================================================

TOTAL INTERNATIONAL DOLLAR BONDS                                  1,563,625
(Cost $1,619,522)
- ------------------------------------------------------------------------------
TOTAL INVESTMENTS: 103.57%*                                     225,032,659
(Cost $174,014,068****)

LIABILITIES, LESS CASH AND
OTHER ASSETS: (3.57%)                                           (7,765,921)
- ------------------------------------------------------------------------------
NET ASSETS: 100.00%                                            $217,266,738
==============================================================================

*    As a percentage of net assets as of August 31, 2003
**   Non - income producing security.
***  Securities exempt from registration under rule 144A of the Securities Act of
     1933. These securities may be resold in transactions exempt from
     registration, normally to qualified, institutional buyers. At August 31,
     2003, the value of these securities amounted to $381,156 or 0.18% of net
     assets.
**** Cost for Federal income tax purposes is $177,075,252 and net unrealized
     appreciation consists of:
     Gross unrealized appreciation                                    $57,892,618
     Gross unrealized depreciation                                     (9,935,211)
                                                                      -----------
     Net unrealized appreciation                                      $47,957,407
                                                                      ===========
ADR  American Depositary Receipt
Cnv. Convertible
Pfd. Preferred
See accompanying notes to financial statements.
800.789.ASIA (2742) www.matthewsfunds.com 21
MATTHEWS CHINA FUND
CO-PORTFOLIO MANAGERS
G. Paul Matthews
Mark W. Headley
Richard H. Gao
The Matthews China Fund is an all-capitalization equity fund that invests in a diversified portfolio of Chinese securities.
PORTFOLIO MANAGER COMMENTS
The Matthews China Fund was up 30.88% for the fiscal year ended August 31, 2003, outperforming its benchmark, the MSCI China Free Index, which was up 28.35% during the same period. The Fund also outperformed its benchmark index on a one- and five-year basis over this period. The Fund’s overweight positions in the utility, energy and consumer sectors were the major contributors to its outperformance.
During the fiscal year, China’s economy continued to expand, and it remains one of the world’s fastest-growing economies. Although its growth rate slowed a bit in the second quarter of 2003 due to the SARS virus, it recovered strongly and regained the momentum it had recorded in early 2003. Strong domestic consumption, increasing exports and growing foreign direct investment are the driving forces of the Chinese economy. With the rapid increase of average personal incomes, Chinese consumers are showing their strong purchasing power in such areas as automobiles, property and luxury goods. On the other hand, China’s weak banking system remains the biggest risk for the economy, although official numbers show a reduction in non-performing loans.
The Fund’s strategy has been in line with the development trend of China’s economy. Companies in the consumer sector have always been among the top holdings in the Fund, and our exposure is broad—from automakers and textile manufacturers to retailers and media players. Other areas in which we remain overweight are the utility and energy sectors. Companies like PetroChina and CNOOC are dominant upstream oil explorers in China, and we believe that strong domestic consumption will drive up demand for utilities and energy. The Fund also benefited from the strong performance of its H shares; historically trading at deep discounts against Hong Kong companies, these mainland Chinese companies are undergoing a re-rating in the market thanks to their improving profit picture and management capabilities.
The Fund has been increasing its investment in companies that have significant exposure to Hong Kong. With the support of the central government and the gradual recovery of the global economy, we are starting to see early signs of improvement in Hong Kong’s economy.
22 MATTHEWS ASIAN FUNDS
FUND PERFORMANCE
Average Annual Returns as of August 31, 2003
- ------------------------------------------------------------------------------------
                                    MATTHEWS          MSCI CHINA      LIPPER CHINA
                                   CHINA FUND        FREE INDEX(1)    REGION FUNDS
                                                                       AVERAGE(2)
- ------------------------------------------------------------------------------------
One Year                             30.88%             28.35%           27.75%
- ------------------------------------------------------------------------------------
Five Years                           24.28%              1.00%           16.00%
- ------------------------------------------------------------------------------------
Since Inception (2/19/98)             4.76%            -15.19%            2.30%*
- ------------------------------------------------------------------------------------
*From 2/28/98
GROWTH OF A $10,000 INVESTMENT

Past performance is not indicative of future results. Before taxes on distributions or redemptions of Fund shares.
| (1) | The MSCI China Free Index is an unmanaged capitalization-weighted index of Chinese equities that includes Red Chips and H shares listed on the Hong Kong exchange, and B shares listed on the Shanghai and Shenzhen exchanges. Red Chips are Chinese companies that are incorporated in Hong Kong but have at least 35% of their shares held by Chinese state-owned organizations. |
| (2) | As of 8/31/03, the Lipper China Region Funds Average consisted of 22 funds for the one-year period, 20 funds for the five-year period, and 16 funds since 2/28/98. Lipper, Inc. fund performance does not reflect sales charges and is based on total return, including reinvestment of dividends and capital gains for the stated periods. |
| (3) | For Lipper China Region Funds Average, graph start date is 2/28/98. |
800.789.ASIA (2742) www.matthewsfunds.com 23
MATTHEWS CHINA FUND
SCHEDULE OF INVESTMENTS
EQUITIES: CHINA/HONG KONG: 96.85%*
                                                   SHARES             VALUE
==============================================================================
CONSUMER DISCRETIONARY: 30.83%

Automobiles & Components: 3.21%
Denway Motors, Ltd.                             6,362,600        $3,589,453
- ------------------------------------------------------------------------------

Consumer Durables & Apparel: 6.99%
Lerado Group Holding Co., Ltd.                 14,052,000         2,486,327
TCL International Holdings, Ltd.                8,408,000         2,452,535
Texwinca Holdings, Ltd.                         3,724,000         2,888,724
- ------------------------------------------------------------------------------
                                                                  7,827,586
- ------------------------------------------------------------------------------
Distributors: 3.19%
Li & Fung, Ltd.                                 2,100,000         3,567,600
- ------------------------------------------------------------------------------

Hotels, Restaurants & Leisure: 7.54%
Cafe De Coral Holdings, Ltd.                    1,840,100         1,533,542
Shangri-La Asia, Ltd.                           3,979,000         3,316,105
Tsingtao Brewery Co., Ltd. H
 Shares                                         4,284,000         3,597,757
- ------------------------------------------------------------------------------
                                                                  8,447,404
- ------------------------------------------------------------------------------
Media: 4.58%
Clear Media, Ltd. **                            3,394,000         1,892,963
Television Broadcasts, Ltd.                       767,000         3,235,432
- ------------------------------------------------------------------------------
                                                                  5,128,395
- ------------------------------------------------------------------------------
Retail: 4.86%
Giordano International, Ltd.                    9,118,000         3,799,478
Moulin International Holdings,
 Ltd.                                           2,776,000         1,637,263
- ------------------------------------------------------------------------------
                                                                  5,436,741
- ------------------------------------------------------------------------------
Travel & Recreation: 0.46%
China Travel International Investment
 Hong Kong, Ltd.                                2,702,000           516,194
- ------------------------------------------------------------------------------
Total Consumer Discretionary                                     34,513,373
==============================================================================


                                                   SHARES             VALUE
==============================================================================
ENERGY: 12.18%

Oil & Gas: 12.18%
China Oilfield Services, Ltd. H
 Shares                                         8,740,000        $2,409,300
CNOOC, Ltd.                                     2,025,500         3,791,632
Hong Kong and China Gas Co.,
 Ltd.                                           1,706,400         2,297,265
PetroChina Co., Ltd. H Shares                   7,744,000         2,705,658
Sinopec Zhenhai Refining &
 Chemical Co., Ltd.                             4,618,000         2,427,609
- ------------------------------------------------------------------------------
Total Energy                                                     13,631,464
==============================================================================

FINANCIALS: 9.34%

Banks: 1.54%
BOC Hong Kong Holdings, Ltd.                    1,348,500         1,728,988

Diversified Financials: 3.70%
Swire Pacific, Ltd. A Shares                      737,000         4,138,878

Insurance: 2.47%
China Insurance International
 Holdings Co., Ltd.                             5,034,000         2,759,246

Real Estate: 1.63%
China Vanke Co., Ltd. B Shares                  3,419,466         1,828,249
- ------------------------------------------------------------------------------
Total Financials                                                 10,455,361
==============================================================================

HEALTH CARE: 2.39%

Pharmaceuticals: 2.39%
China Pharmaceutical Group, Ltd.                7,392,000         2,677,451
- ------------------------------------------------------------------------------
Total Health Care                                                 2,677,451
==============================================================================
See accompanying notes to financial statements.
24 MATTHEWS ASIAN FUNDS
                                                   SHARES             VALUE
==============================================================================
INDUSTRIALS: 21.79%

Airlines: 3.19%
Beijing Capital International
 Airport Co., Ltd. H Shares                     8,976,000        $2,531,900
China Southern Airlines Co., Ltd.
 H Shares **                                    3,138,000         1,036,027
- ------------------------------------------------------------------------------
                                                                  3,567,927
- ------------------------------------------------------------------------------
Industrial Conglomerates: 11.23%
Beijing Enterprises Holdings, Ltd.                760,000           755,190
BYD Co., Ltd. H Shares                            857,000         2,362,437
Cheung Kong Infrastructure
 Holdings, Ltd.                                 1,675,500         3,469,429
China Merchants Holdings
 International Co., Ltd.                        3,946,000         4,401,669
Shanghai Industrial Holdings, Ltd.                948,000         1,580,130
- ------------------------------------------------------------------------------
                                                                 12,568,855
- ------------------------------------------------------------------------------
Machinery: 1.04%
Shanghai Zhenhua Port Machinery
 Co., Ltd. B Shares                             1,341,700         1,168,621
- ------------------------------------------------------------------------------
Transportation: 6.33%
GZI Transport, Ltd.                             2,396,000           611,337
Sinotrans, Ltd. H Shares **                     8,601,000         2,922,374
Zhejiang Expressway Co., Ltd. H
 Shares                                         7,302,000         3,557,677
- ------------------------------------------------------------------------------
                                                                  7,091,388
- ------------------------------------------------------------------------------
Total Industrials                                                24,396,791
==============================================================================

INFORMATION
TECHNOLOGY: 6.96%

Computer Software: 2.77%
Travelsky Technology, Ltd. H
 Shares                                         3,605,000         3,096,857
- ------------------------------------------------------------------------------
Computers & Peripherals: 4.19%
Legend Group, Ltd.                             10,928,000         4,693,821
- ------------------------------------------------------------------------------
Total Information Technology                                      7,790,678
==============================================================================


                                                   SHARES             VALUE
==============================================================================
TELECOMMUNICATION
SERVICES: 4.43%

Wireless Telecommunication
Services: 4.43%
China Mobile HK, Ltd.                           1,111,083        $2,856,288
China Mobile HK, Ltd. ADR                          21,500           278,855
China Unicom, Ltd.                              2,398,000         1,706,409
China Unicom, Ltd. ADR                             16,200           116,154
- ------------------------------------------------------------------------------
Total Telecommunication Services                                  4,957,706
==============================================================================

UTILITIES: 8.93%
Beijing Datang Power Generation,
 Co., Ltd. H Shares                             6,056,000         3,280,603
Huaneng Power International,
 Inc. ADR                                          39,400         2,163,060
Huaneng Power International,
 Inc. H Shares                                  1,844,000         2,529,797
Shandong International Power
 Development Co., Ltd. H Shares                 6,940,000         2,024,333
- ------------------------------------------------------------------------------
Total Utilities                                                   9,997,793
==============================================================================

TOTAL INVESTMENTS: 96.85%*                                     $108,420,617
(Cost $92,460,817***)

CASH AND OTHER ASSETS,
LESS LIABILITIES: 3.15%                                           3,529,478
- ------------------------------------------------------------------------------

NET ASSETS: 100.00%                                            $111,950,095
==============================================================================


*     As a percentage of net assets as of August 31, 2003
**    Non - income producing security.
ADR   American Depositary Receipt
***   Cost for Federal income tax purposes is $92,885,392 and net unrealized
      appreciation consists of:
      Gross unrealized appreciation                              $17,963,076
      Gross unrealized depreciation                               (2,427,851)
                                                                 -----------
      Net unrealized appreciation                                $15,535,225
                                                                 ===========
See accompanying notes to financial statements.
800.789.ASIA (2742) www.matthewsfunds.com 25
MATTHEWS JAPAN FUND
PORTFOLIO MANAGER
Mark W. Headley
The Matthews Japan Fund is an all-capitalization core equity fund with diversified exposure across a wide range of corporate Japan
PORTFOLIO MANAGER COMMENTS
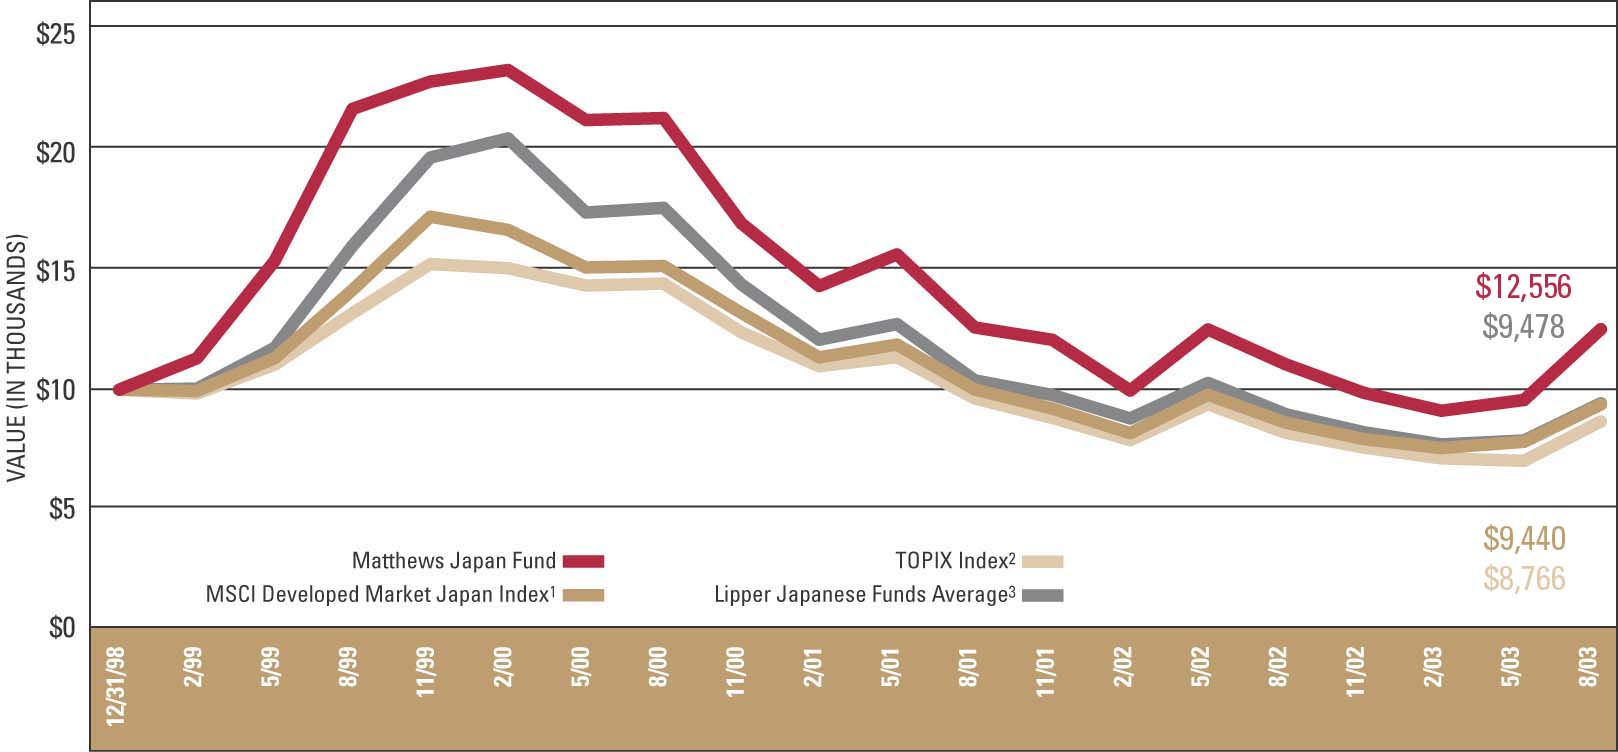
For the fiscal year ended August 31, 2003, the Matthews Japan Fund gained 13.54%, outperforming its benchmarks, the MSCI Developed Market Japan and TOPIX indices, which gained 6.92% and 9.45%, respectively. After a difficult stretch in the first quarter, the Fund enjoyed strong performance against its peers throughout the remainder of the year. In particular, the Fund benefited from its exposure to financial, technology and smaller-capitalization issues. Consumption related issues were relatively weak.
The Fund remains focused on three primary areas of the Japanese equity market: consumer, financials and technology. Our focus is founded on the belief that these areas will benefit from Japan’s ongoing transition from a manufacturing-based economy toward a service-driven one. We have tended to favor the lesser-known, more domestically oriented companies as opposed to the higher-profile exporters. We have also attempted to strike an even balance between what we would classify as “large-cap, restructuring” Japan and “small-cap, growth” Japan. We believe that both of these areas represent sound long-term opportunities, particularly in light of an increasing awareness in Japan of shareholder value and return on investment.
The outlook for the Japanese economy, while weak in comparison to its Asian neighbors, appears better than it has been over the past 14 years. Although we have yet to see a truly robust recovery in consumption, excess capacity is being reduced, labor mobility is increasing, and greater efficiency in production and distribution appears to be laying the foundation for improved economic growth. Undoubtedly, there will be setbacks along the way, but a fundamental change seems to have occurred: Japan no longer sees itself as apart from the rest of Asia. As such, Japan’s collaboration with the rest of Asia is a positive development, allowing Japan to reduce competitive overlap, focus on higher value-added areas, and participate in growth across the region, particularly in China.
The Matthews Japan Fund remains fully invested and well diversified. Over the past decade, investment in Japan has generally been a perilous undertaking. While the market will likely continue to generate its fair share of disappointments, we believe that there is plenty of room for optimism. Patience should be rewarded over the long term.
26 MATTHEWS ASIAN FUNDS
FUND PERFORMANCE
Average Annual Returns as of August 31, 2003
- --------------------------------------------------------------------------------------------------------------
                                      MATTHEWS       MSCI DEVELOPED                              LIPPER
                                     JAPAN FUND       MARKET JAPAN         TOPIX INDEX(2)    JAPANESE FUNDS
                                                        INDEX(1)                               AVERAGE(3)
- --------------------------------------------------------------------------------------------------------------
One Year                               13.54%             6.92%                9.45%              5.89%
- --------------------------------------------------------------------------------------------------------------
Since Inception (12/31/98)              5.00%            -2.78%               -1.23%             -1.45%
- --------------------------------------------------------------------------------------------------------------
GROWTH OF A $10,000 INVESTMENT
Past performance is not indicative of future results. Before taxes on distributions or redemptions of Fund shares.
| (1) | The MSCI Developed Market Japan Index is an unmanaged capitalization-weighted index of all Japanese equities. |
| (2) | TOPIX: The Tokyo Price Index is a capitalization-weighted index of all companies listed on the First Section of the Tokyo Stock Exchange. |
| (3) | As of 8/31/03, the Lipper Japanese Funds Average consisted of 55 funds for the one-year period and 37 funds since 12/31/98. Lipper, Inc. fund performance does not reflect sales charges and is based on total return, including reinvestment of dividends and capital gains for the stated periods. |
800.789.ASIA (2742) www.matthewsfunds.com 27
MATTHEWS JAPAN FUND
SCHEDULE OF INVESTMENTS
EQUITIES: 96.76%*
                                                   SHARES             VALUE
==============================================================================
CONSUMER DISCRETIONARY: 29.13%

Apparel & Textiles: 2.34%
Shiseido Co., Ltd.                                 53,000          $554,619
- ------------------------------------------------------------------------------

Automobiles: 7.66%
Gulliver International Co., Ltd.                   24,500         1,060,379
Honda Motor Co., Ltd. ADR                          36,900           751,284
- ------------------------------------------------------------------------------
                                                                  1,811,663
- ------------------------------------------------------------------------------
Bicycle Manufacturing: 3.08%
Shimano, Inc.                                      40,100           728,591
- ------------------------------------------------------------------------------

Cosmetics: 3.36%
Dr. Ci:Labo Co., Ltd.                                 149           794,292
- ------------------------------------------------------------------------------

Household Durables: 3.75%
Nintendo Co., Ltd.                                 10,665           887,531
- ------------------------------------------------------------------------------

Media: 3.64%
Fuji Television Network, Inc.                         181           860,944
- ------------------------------------------------------------------------------

Retail: 5.30%
Belluna Co., Ltd.                                      24               946
Belluna Co., Ltd. Warrants **                         622             3,049
Don Quijote Co., Ltd.                               1,700            84,505
Kyoto Kimono Yuzen Co., Ltd.                          216           431,334
Paris Miki, Inc.                                   58,000           733,202
- ------------------------------------------------------------------------------
                                                                  1,253,036
- ------------------------------------------------------------------------------
Total Consumer Discretionary                                      6,890,676
==============================================================================

CONSUMER STAPLES: 4.46%

Beverages: 2.84%
ITO EN, Ltd.                                       18,400           670,209
- ------------------------------------------------------------------------------

Food: 1.62%
Nissin Healthcare Food Service Co.,
 Ltd.                                             20,200           384,333
- ------------------------------------------------------------------------------
Total Consumer Staples                                            1,054,542
==============================================================================


                                                   SHARES             VALUE
==============================================================================
FINANCIALS: 22.32%

Banks: 10.03%
Mizuho Financial Group, Inc. **                       768          $954,405
The Joyo Bank, Ltd.                               177,000           482,396
The Sumitomo Trust and Banking
 Co., Ltd.                                        208,000           937,676
- ------------------------------------------------------------------------------
                                                                  2,374,477
- ------------------------------------------------------------------------------
Diversified Financials: 6.41%
Monex, Inc. **                                      2,583           641,987
Nomura Holdings, Inc.                              60,000           873,157
- ------------------------------------------------------------------------------
                                                                  1,515,144
- ------------------------------------------------------------------------------
Insurance: 2.94%
Taiyo Life Insurance Co. **                           587           694,258
- ------------------------------------------------------------------------------

Real Estate: 2.94%
Japan Retail Fund Investment Corp.
 REIT                                                 132           695,749
- ------------------------------------------------------------------------------
Total Financials                                                  5,279,628
==============================================================================

INFORMATION TECHNOLOGY: 16.80%

Electronic Equipment & Instruments: 9.41%
Disco Corp.                                        14,200           711,947
Niws Co., Ltd.                                        287           981,428
Secom Co., Ltd.                                    15,500           531,368
- ------------------------------------------------------------------------------
                                                                  2,224,743
- ------------------------------------------------------------------------------
Semiconductor Equipment: 4.13%
Macnica, Inc.                                      32,900           978,428
- ------------------------------------------------------------------------------

Software: 3.26%
Access Co., Ltd. **                                    28           770,312
- ------------------------------------------------------------------------------
Total Information Technology                                      3,973,483
==============================================================================
See accompanying notes to financial statements.
28 MATTHEWS ASIAN FUNDS
                                                   SHARES             VALUE
==============================================================================
MANUFACTURING: 16.29%

Agricultural: 3.85%
Hokuto Corp.                                       67,580          $910,488
- ------------------------------------------------------------------------------

Electronics: 7.98%
Matsushita Electric Industrial
 Co., Ltd.                                         81,000         1,032,979
Murata Manufacturing Co., Ltd.                     15,200           854,577
- ------------------------------------------------------------------------------
                                                                  1,887,556
- ------------------------------------------------------------------------------
Equipment & Products: 2.44%
Nakanishi, Inc.                                    14,000           575,934
- ------------------------------------------------------------------------------

Printing: 2.02%
Toppan Forms Co., Ltd.                             43,800           478,617
- ------------------------------------------------------------------------------
Total Manufacturing                                               3,852,595
==============================================================================

TELECOMMUNICATION
SERVICES: 7.76%

Diversified Telecommunication
Services: 7.76%
NTT DoCoMo, Inc.                                      312           802,194
Nippon Telegraph & Telephone
 Corp. ADR                                         46,625         1,034,609
- ------------------------------------------------------------------------------
Total Telecommunication Services                                  1,836,803
==============================================================================

TOTAL INVESTMENTS: 96.76%*                                       22,887,727
(Cost $20,089,046***)

CASH AND OTHER ASSETS,
LESS LIABILITIES: 3.24%                                             765,696
- ------------------------------------------------------------------------------
NET ASSETS: 100.00%                                             $23,653,423
==============================================================================

*     As a percentage of net assets as of August 31, 2003
**    Non - income producing security.
ADR   American Depositary Receipt
REIT  Real Estate Investment Trust
***   Cost for Federal income tax purposes is $20,483,765 and net unrealized
      appreciation consists of:
      Gross unrealized appreciation                               $3,060,795
      Gross unrealized depreciation                                 (656,833)
                                                                  ----------
      Net unrealized appreciation                                 $2,403,962
                                                                  ==========
See accompanying notes to financial statements.
800.789.ASIA (2742) www.matthewsfunds.com 29
MATTHEWS ASIAN TECHNOLOGY FUND
CO-PORTFOLIO MANAGERS
G. Paul Matthews
Mark W. Headley
The Matthews Asian Technology Fund invests in companies located in Asia that derive a substantial portion of their revenue from technology-related industries and services.
PORTFOLIO MANAGER COMMENTS
For the fiscal year ended August 31, 2003, the Matthews Asian Technology Fund gained 37.38%, substantially outperforming its benchmark, the MSCI/Matthews Asian Technology Index, which gained 18.10%. The Fund, however, remains significantly down since its inception in 1999.
The Matthews Asian Technology Fund has enjoyed a strong rally since March 2003, when signs of life were perceived in the global technology industry. That performance was enhanced by strong rallies in two of the primary markets for the Fund: Japan and South Korea. It is interesting to note that of the four top contributors to performance in the fiscal year, three were Korean companies with Internet-based business models, and one was a Japanese information technology services company. All of these companies earn most—if not all—of their revenue from their local economies. Domestic activity within the Asian technology industry remains a prime focus of the Fund, with exposure ranging from relatively conservative telecommunications companies to unique Internet businesses.
The overall environment for technology remains highly diverse and challenging. One of the stronger areas of sustained activity is the outsourcing to low-cost bases in Asia of medium- to high-end manufacturing of all sorts of electronic products. Asia is home to a number of extremely sophisticated companies providing competitive design and manufacturing services to global companies seeking to reduce costs or focus their efforts on their highest value-added activities. Some signs of recovery have been seen in the demand for such goods as microchips and laptop computers. Digital products of all sorts, but especially cameras, are rapidly gaining a wider audience. The rapid evolution of the mobile phone remains an area of potential transformation, with video capabilities soon to be a reality in Japan. New services and revenue models continue to be constantly tested in the world’s most-wired country, South Korea, which enjoys a more than 50% household penetration of broad band services.
The Fund remains diversified across a wide range of technology industry activities, and we believe that, for those who can withstand the volatility inherent in this market sector, the outlook is encouraging.
30 MATTHEWS ASIAN FUNDS
FUND PERFORMANCE
Average Annual Returns as of August 31, 2003
- --------------------------------------------------------------------------------------------------
                                     MATTHEWS            MSCI/MATTHEWS          LIPPER SCIENCE
                                 ASIAN TECHNOLOGY      ASIAN TECHNOLOGY         AND TECHNOLOGY
                                       FUND                INDEX(1)            FUNDS AVERAGE(2)
- --------------------------------------------------------------------------------------------------
One Year                              37.38%                18.10%                   41.44%
- --------------------------------------------------------------------------------------------------
Since Inception (12/27/99)           -19.32%               -23.66%                  -25.24%*
- --------------------------------------------------------------------------------------------------
*From 12/31/99
GROWTH OF A $10,000 INVESTMENT
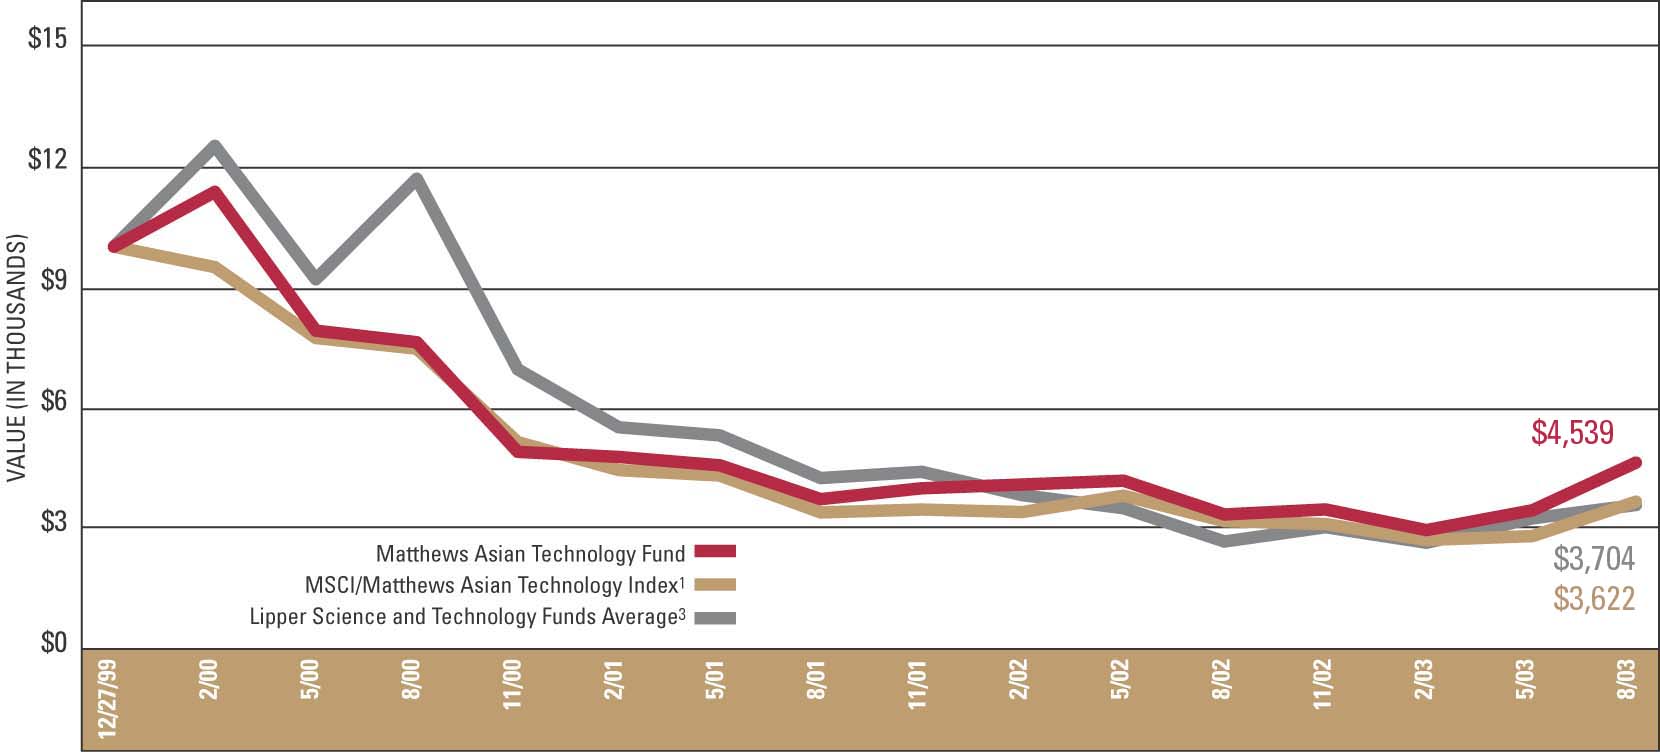
Past performance is not indicative of future results. Before taxes on distributions or redemptions of Fund shares.
| (1) | The MSCI/Matthews Asian Technology Index is an unmanaged capitalization-weighted index of Asian equities tracking a broad range of technology stocks including semiconductor equipment and products, communications equipment, computers and peripherals, electronic equipment and instruments, office electronics, software, IT consulting and services, Internet software and services, diversified telecommunications services, and wireless telecommunications services. |
| (2) | As of 8/31/03, the Lipper Science and Technology Funds Average consisted of 342 funds for the one-year period and 148 funds since 12/31/99. Lipper, Inc. fund performance does not reflect sales charges and is based on total return, including reinvestment of dividends and capital gains for the stated periods. |
| (3) | For Lipper Science and Technology Funds Average, graph start date is 12/31/99. |
800.789.ASIA (2742) www.matthewsfunds.com 31
MATTHEWS ASIAN TECHNOLOGY FUND
SCHEDULE OF INVESTMENTS
EQUITIES: 91.20%*
                                                   SHARES             VALUE
==============================================================================
CHINA/HONG KONG: 11.31%
Asia Satellite Telecommunications
 Holdings, Ltd.                                   260,900          $416,471
China Mobile HK, Ltd. ADR                          20,900           271,073
Legend Group, Ltd.                              1,519,000           652,445
TCL International Holdings, Ltd.                1,336,000           389,699
TPV Technology, Ltd.                              950,000           392,821
- ------------------------------------------------------------------------------
Total China/Hong Kong                                             2,122,509
==============================================================================

INDIA: 3.51%
Wipro, Ltd. ADR                                    25,300           659,065
- ------------------------------------------------------------------------------

INDONESIA: 1.27%
PT Telekomunikasi Indonesia ADR                    21,200           237,440
- ------------------------------------------------------------------------------

JAPAN: 30.67%
Access Co., Ltd. **                                    21           577,734
Arisawa Manufacturing Co., Ltd.                    14,900           498,029
Canon, Inc. ADR                                     3,300           159,918
Disco Corp.                                        12,500           626,714
Macnica, Inc.                                      19,000           565,050
Matsushita Electric
 Industrial Co., Ltd.                              60,000           765,170
Nakanishi Inc.                                     11,000           452,520
Nintendo Co., Ltd.                                  8,635           718,597
Niws Co., Ltd.                                        191           653,145
NTT DoCoMo, Inc.                                      214           550,223
Yushin Precision Equipment Co., Ltd.                7,400           189,947
- ------------------------------------------------------------------------------
Total Japan                                                       5,757,047
==============================================================================


                                                   SHARES             VALUE
==============================================================================
SINGAPORE: 4.09%
Venture Corp., Ltd.                                66,600          $767,482
- ------------------------------------------------------------------------------
SOUTH KOREA: 21.67%
Daeduck GDS Co., Ltd.                              33,820           364,535
Intelligent Digital Integrated
 Security Co., Ltd.                                10,071           133,767
Internet Auction Co., Ltd. **                       3,566           237,279
KT Corp.                                            4,120           156,827
KT Corp. ADR                                       10,300           194,155
Kumho Electric, Inc.                               13,050           491,763
NCsoft Corp. **                                     7,593           390,525
NHN Corp.                                           3,410           509,365
Samsung Electronics Co., Ltd.                       2,198           811,483
SK Telecom Co., Ltd.                                3,899           665,138
Webzen Inc. **                                      1,000           112,879
- ------------------------------------------------------------------------------
Total South Korea                                                 4,067,716
==============================================================================

TAIWAN: 14.33%
Ambit Microsystems Corp.                          120,900           330,937
Hon Hai Precision Industry Co., Ltd.              158,968           656,201
LITE-ON IT Corp.                                  130,750           466,992
Quanta Computer, Inc.                             200,100           495,007
Sunplus Technology Co., Ltd.                      229,450           366,094
Taiwan Semiconductor
 Manufacturing Co., Ltd. **                       190,668           373,990
- ------------------------------------------------------------------------------
Total Taiwan                                                      2,689,221
==============================================================================

THAILAND: 4.35%
Advanced Info Service
 Public Co., Ltd.                                 429,300           579,853
Shin Satellite Public Co., Ltd. **                426,000           236,379
- ------------------------------------------------------------------------------
Total Thailand                                                      816,232
==============================================================================
See accompanying notes to financial statements.
32 MATTHEWS ASIAN FUNDS
                                                                      VALUE
==============================================================================
TOTAL INVESTMENTS: 91.20%                                       $17,116,712
(Cost $14,283,101***)

CASH AND OTHER ASSETS,
LESS LIABILITIES: 8.80%                                           1,651,856
- ------------------------------------------------------------------------------

NET ASSETS: 100.00%                                             $18,768,568
==============================================================================

*     As a percentage of net assets as of August 31, 2003
**    Non-income producing security.
ADR   American Depositary Receipt
GDS   Global Depositary Shares
***   Cost for Federal income tax purposes is $14,892,088 and net unrealized
      appreciation consists of:
      Gross unrealized appreciation            $3,247,145
      Gross unrealized depreciation            (1,022,521)
                                               ----------
      Net unrealized appreciation              $2,224,624
                                               ==========


MARKET SECTOR DIVERSIFICATION

As a Percentage of Total Value of Investment in Securities

Consumer Discretionary                              5.58%
Household Durables                                  4.19%
Internet & Catalog Retail                           1.39%

Industrials                                         1.11%
Commercial Services & Supplies                      1.11%

Information Technology                             58.82%
Computers & Peripherals                             8.64%
Electronic Equipment & Instruments                 27.59%
Internet Software & Services                        9.29%
Semiconductor Equipment & Products                 13.30%

Manufacturing                                      15.17%
Electronics                                         4.47%
Equipment & Products                                8.42%
Household Durables                                  2.28%

Telecommunication Services                         19.32%
Diversified Telecommunication Services             15.43%
Wireless Telecommunication Services                 3.89%
===========================================================
TOTAL INVESTMENTS                                 100.00%
See accompanying notes to financial statements.
800.789.ASIA (2742) www.matthewsfunds.com 33
STATEMENT OF ASSETS AND LIABILITIES
                                                                   Matthews             Matthews
                                                              Pacific Tiger     Asian Growth and
                                                                       Fund          Income Fund

Assets:
   Investments at value (A)                                    $219,875,100         $511,337,720
   Cash                                                           3,450,265           16,886,676
   Foreign currency at value (B)                                  2,741,806            1,103,240
   Dividends and interest receivable                                874,035            2,050,074
   Receivable for securities sold                                        --            2,965,565
   Receivable for capital shares sold                             7,821,827           10,163,765
   Other assets                                                       2,155                3,598
- ----------------------------------------------------------------------------------------------------------
Total Assets                                                    234,765,188          544,510,638
- ----------------------------------------------------------------------------------------------------------

Liabilities:
   Payable for securities purchased                               4,751,841           10,146,190
   Payable for capital shares redeemed                              205,835              271,125
   Cash overdraft                                                        --                   --
   Administration and accounting fees payable                        20,008               47,061
   Transfer agent fees payable                                       16,489               37,362
   Custodian fees payable                                            31,544               58,513
   Due to Advisor (Note 2)                                          166,900              409,668
   Payable for shareholder service fee                               25,035               61,450
   Accrued expenses payable                                          80,599              176,861
- ----------------------------------------------------------------------------------------------------------
Total Liabilities                                                 5,298,251           11,208,230
- ----------------------------------------------------------------------------------------------------------

Net Assets                                                     $229,466,937         $533,302,408
==========================================================================================================

Shares Outstanding
   (shares of beneficial interest issued and outstanding,
   respectively, unlimited number of shares authorized with
   a $0.001 par value)                                           20,495,388           43,659,816
- ----------------------------------------------------------------------------------------------------------
   Net asset value, offering price and redemption price              $11.20               $12.21
==========================================================================================================

Net Assets Consist of:
   Capital paid-in                                             $195,848,883         $473,492,838
   Accumulated undistributed net investment income (loss)         1,315,552               41,181
   Accumulated net realized gain (loss) on investments          (11,264,919)           5,977,493
   Net unrealized appreciation (depreciation) on investments
    and foreign currency related transactions                    43,567,421           53,790,896
- ----------------------------------------------------------------------------------------------------------
Net Assets                                                     $229,466,937         $533,302,408
==========================================================================================================

   (A) Investments at cost                                     $176,309,686         $457,546,390
==========================================================================================================

   (B) Foreign currency at cost                                  $2,740,706           $1,103,240
==========================================================================================================
See accompanying notes to financial statements.
34 MATTHEWS ASIAN FUNDS
AUGUST 31, 2003
                                                                          Matthews
    Matthews                Matthews               Matthews       Asian Technology
  Korea Fund              China Fund             Japan Fund                   Fund

$225,032,659            $108,420,617            $22,887,727            $17,116,712
          --               3,875,257              2,222,168                498,060
     570,278                 459,304                441,816                224,809
       1,829                 232,832                 22,952                 33,789
   8,003,659                      --                     --                     --
     253,958               1,445,382                325,545              1,171,284
       6,893                     249                    218                    137
- -------------------------------------------------------------------------------------
 233,869,276             114,433,641             25,900,426             19,044,791
- -------------------------------------------------------------------------------------


   1,075,461               2,074,473              2,094,838                183,939
  14,675,184                 236,930                116,673                 58,956
     458,744                      --                     --                     --
      23,246                   9,495                  1,861                  1,449
      22,074                   6,807                    974                  1,421
      43,208                  19,778                  1,614                  6,252
     191,273                  82,660                 18,370                 13,390
      28,691                  12,399                  2,351                  1,870
      84,657                  41,004                 10,322                  8,946
- -------------------------------------------------------------------------------------
  16,602,538               2,483,546              2,247,003                276,223
- -------------------------------------------------------------------------------------

$217,266,738            $111,950,095            $23,653,423            $18,768,568
=====================================================================================


  49,682,935               9,698,309              2,170,369              4,368,994
- -------------------------------------------------------------------------------------
       $4.37                  $11.54                 $10.90                  $4.30
=====================================================================================


$147,035,494             $98,633,797            $29,650,042            $34,761,993
   1,453,786               1,039,670                   (68)                  8,943
  17,758,708             (3,683,166)             8,795,381)           (18,836,308)

  51,018,750              15,959,794              2,798,830              2,833,940
- -------------------------------------------------------------------------------------
$217,266,738            $111,950,095            $23,653,423            $18,768,568
=====================================================================================

$174,014,068             $92,460,817            $20,089,046            $14,283,101
=====================================================================================

    $570,278                $459,304               $441,816               $224,774
=====================================================================================
800.789.ASIA (2742) www.matthewsfunds.com 35
STATEMENT OF OPERATIONS
                                                                               Matthews             Matthews
                                                                          Pacific Tiger     Asian Growth and
                                                                                   Fund          Income Fund

Investment Income:
   Dividends                                                                 $3,674,376           $8,170,442
   Interest                                                                          37            3,876,413
   Foreign withholding tax                                                    (252,498)            (558,585)
- -------------------------------------------------------------------------------------------------------------------
   Total investment income                                                    3,421,915           11,488,270
- -------------------------------------------------------------------------------------------------------------------

Expenses:
   Investment advisory fees (Note 2)                                          1,228,434            2,621,177
   Transfer agent fees                                                          254,329              487,898
   Administration and accounting fees                                           172,777              360,349
   Professional fees                                                             21,476               44,036
   Custodian fees                                                               123,323              192,789
   Trustees fees                                                                  6,134               12,665
   Shareholder service fee (Note 2)                                             263,704              537,808
   Insurance expense                                                              9,396               11,371
   Amortization of organization costs (Note 1-F)                                     --                   --
   Printing expense                                                              39,550               85,433
   Registration expenses                                                         25,098               71,612
   Other expenses                                                                 3,286                7,102
- -------------------------------------------------------------------------------------------------------------------
   Total expenses                                                             2,147,507            4,432,240
- -------------------------------------------------------------------------------------------------------------------

   Expenses waived, reimbursed or recaptured (Note 2)                                 --                   --
- -------------------------------------------------------------------------------------------------------------------
   Net expenses                                                               2,147,507            4,432,240
- -------------------------------------------------------------------------------------------------------------------

Net Investment Income (Loss)                                                  1,274,408            7,056,030
===================================================================================================================

Realized and Unrealized Gain (Loss) on Investments and
Foreign Currency-Related Transactions:
   Net realized gain (loss) on investments                                  (5,135,691)            5,985,091
   Net realized gain (loss) on foreign currency related transactions           (82,683)            (165,147)
   Net change in unrealized appreciation (depreciation) on investments
     and foreign currency related transactions                               47,655,905           53,657,051
- -------------------------------------------------------------------------------------------------------------------
   Net realized and unrealized gain on investments
     and foreign currency related transactions                               42,437,531           59,476,995
- -------------------------------------------------------------------------------------------------------------------

Net Increase in Net Assets from Operations                                  $43,711,939          $66,533,025
===================================================================================================================

See accompanying notes to financial statements.
36 MATTHEWS ASIAN FUNDS
FOR THE YEAR ENDED AUGUST 31, 2003
                                                                   Matthews
    Matthews               Matthews             Matthews      Asian Technology
  Korea Fund             China Fund           Japan Fund                  Fund


  $4,359,275             $1,914,756              $95,001              $119,415
          --                  1,632                   --                    --
   (723,871)                     --             (10,015)              (19,107)
- -------------------------------------------------------------------------------------
   3,635,404              1,916,388               84,986               100,308
- -------------------------------------------------------------------------------------


   1,926,780                514,561               89,871                71,807
     366,581                 96,427               17,044                13,630
     276,040                 71,071               12,503                 9,979
      34,775                  8,627                1,519                 1,226
     200,052                 63,031                8,651                17,218
       9,804                  2,476                  438                   353
     397,355                106,045               18,531                14,798
      17,787                  3,193                  663                   750
          --                  1,452                   --                    --
      48,293                 24,896                4,424                 5,316
      30,386                 22,932               18,561                15,664
       5,098                  1,381                  230                   186
- -------------------------------------------------------------------------------------
   3,312,951                916,092              172,435               150,927
- -------------------------------------------------------------------------------------

          --                  6,379                7,306               (7,313)
- -------------------------------------------------------------------------------------
   3,312,951                922,471              179,741               143,614
- -------------------------------------------------------------------------------------

     322,453                993,917             (94,755)              (43,306)
=====================================================================================


  29,654,689            (1,736,860)            (347,192)           (1,009,781)
   (452,572)                     17                 (46)              (10,101)

(17,725,381)             19,677,070            2,825,816             4,209,341
- -------------------------------------------------------------------------------------

  11,476,736             17,940,227            2,478,578             3,189,459
- -------------------------------------------------------------------------------------

 $11,799,189            $18,934,144           $2,383,823            $3,146,153
=====================================================================================
800.789.ASIA (2742) www.matthewsfunds.com 37
STATEMENT OF CHANGES IN NET ASSETS
                                                                          Matthews Pacific Tiger Fund
                                                                          Year Ended           Year Ended
                                                                     August 31, 2003      August 31, 2002

Operations:
   Net investment income (loss)                                           $1,274,408           ($170,789)
   Net realized gain (loss) on investments and foreign currency
      related transactions                                               (5,218,374)          (3,768,796)
   Net change in unrealized appreciation (depreciation) on
      investments and foreign currency related transactions               47,655,905            5,883,551
- -------------------------------------------------------------------------------------------------------------

   Net increase in net assets from operations                             43,711,939            1,943,966
- -------------------------------------------------------------------------------------------------------------

Dividends and Distributions to Shareholders from:
   Net investment income                                                          --            (104,784)
   Realized gains on investments                                                  --            (274,572)
- -------------------------------------------------------------------------------------------------------------

   Net decrease in net assets resulting from distributions                        --            (379,356)
- -------------------------------------------------------------------------------------------------------------

Capital Share Transactions (net) (Note 1-L):                              70,956,917           36,730,362
- -------------------------------------------------------------------------------------------------------------
   Total increase (decrease) in net assets                               114,668,856           38,294,972
- -------------------------------------------------------------------------------------------------------------

Net Assets:
   Beginning of year                                                     114,798,081           76,503,109
- -------------------------------------------------------------------------------------------------------------
   End of year (including undistributed net investment income
   (loss) of $1,315,552, ($77,025), $41,181, $17,691, $1,453,786 and
   ($372,722) respectively)                                             $229,466,937         $114,798,081
=============================================================================================================

See accompanying notes to financial statements.
38 MATTHEWS ASIAN FUNDS
  Matthews Asian Growth and Income Fund                       Matthews Korea Fund
     Year Ended               Year Ended                Year Ended                Year Ended
August 31, 2003          August 31, 2002           August 31, 2003           August 31, 2002


    $7,056,030                $1,329,018                  $322,453              ($1,421,124)

     5,819,944                 3,303,008                29,202,117                34,090,693

    53,657,051                 (280,755)              (17,725,381)                57,069,545
- ---------------------------------------------------------------------------------------------

    66,533,025                 4,351,271                11,799,189                89,739,114
- ---------------------------------------------------------------------------------------------


    (5,777,923)              (1,362,799)                        --                 (467,505)

    (2,386,434)                       --              (19,371,082)               (3,455,469)
- ---------------------------------------------------------------------------------------------


    (8,164,357)              (1,362,799)              (19,371,082)               (3,922,974)
- ---------------------------------------------------------------------------------------------


   322,252,539               125,246,184              (28,164,832)                50,055,031
- ---------------------------------------------------------------------------------------------


   380,621,207               128,234,656              (35,736,725)               135,871,171
- ---------------------------------------------------------------------------------------------


   152,681,201                24,446,545               253,003,463               117,132,292
- ---------------------------------------------------------------------------------------------


  $533,302,408              $152,681,201              $217,266,738              $253,003,463
=============================================================================================
800.789.ASIA (2742) www.matthewsfunds.com 39
STATEMENT OF CHANGES IN NET ASSETS
                                                                                 Matthews China Fund
                                                                             Year Ended           Year Ended
                                                                        August 31, 2003      August 31, 2002

Operations:
   Net investment income (loss)                                                $993,917             $278,449
   Net realized loss on investments and foreign currency
     related transactions                                                   (1,736,843)            (841,054)
   Net change in unrealized appreciation (depreciation) on
      investments and foreign currency related transactions                  19,677,070          (1,608,943)
- ---------------------------------------------------------------------------------------------------------------

   Net increase (decrease) in net assets from operations                     18,934,144          (2,171,548)
- ---------------------------------------------------------------------------------------------------------------

Dividends and Distributions to Shareholders from:
   Net investment income                                                      (542,079)            (381,550)
   Realized gains on investments                                                     --                   --
- ---------------------------------------------------------------------------------------------------------------

   Net decrease in net assets resulting from distributions                    (542,079)            (381,550)
- ---------------------------------------------------------------------------------------------------------------

Capital Share Transactions (net) (Note 1-L):                                 59,882,757           16,385,313
- ---------------------------------------------------------------------------------------------------------------
   Total increase (decrease) in net assets                                   78,274,822           13,832,215
- ---------------------------------------------------------------------------------------------------------------

Net Assets:
   Beginning of year                                                         33,675,273           19,843,058
- ---------------------------------------------------------------------------------------------------------------
   End of year (including undistributed net investment income
   (loss) of $1,039,670, $439,725, ($68), ($28,232), $8,943
   and ($8,487) respectively)                                              $111,950,095          $33,675,273
===============================================================================================================

See accompanying notes to financial statements.
40 MATTHEWS ASIAN FUNDS
            Matthews Japan Fund                                  Matthews Asian Technology Fund
     Year Ended              Year Ended                          Year Ended              Year Ended
August 31, 2003         August 31, 2002                     August 31, 2003         August 31, 2002


      ($94,755)              ($128,812)                           ($43,306)              ($172,594)

      (347,238)             (4,233,549)                         (1,019,882)             (2,212,212)

      2,825,816               3,160,981                           4,209,341               1,639,640
- ----------------------------------------------------------------------------------------------------------

      2,383,823             (1,201,380)                           3,146,153               (745,166)
- ----------------------------------------------------------------------------------------------------------


             --               (182,412)                                  --               (142,101)
             --                      --                                  --                      --
- ----------------------------------------------------------------------------------------------------------

             --               (182,412)                                  --               (142,101)
- ----------------------------------------------------------------------------------------------------------

     11,871,005               3,024,383                           8,743,248             (1,840,654)
- ----------------------------------------------------------------------------------------------------------
     14,254,828               1,640,591                          11,889,401             (2,727,921)
- ----------------------------------------------------------------------------------------------------------


      9,398,595               7,758,004                           6,879,167               9,607,088
- ----------------------------------------------------------------------------------------------------------


    $23,653,423              $9,398,595                         $18,768,568              $6,879,167
==========================================================================================================
800.789.ASIA (2742) www.matthewsfunds.com 41
FINANCIAL HIGHLIGHTS
MATTHEWS PACIFIC TIGER FUND
The table below sets forth financial data for a share of beneficial interest outstanding throughout each year presented.
YEAR ENDED AUGUST 31                                                   2003        2002        2001        2000        1999

Net Asset Value, beginning of year                                    $8.54       $7.91      $12.35      $10.41       $4.07
- ----------------------------------------------------------------------------------------------------------------------------
   INCOME (LOSS) FROM INVESTMENT OPERATIONS
   Net investment income (loss)                                        0.07      (0.01)        0.02        0.18        0.18
   Net realized gain (loss) and unrealized appreciation
    (depreciation) on investments and foreign currency                 2.58        0.66      (3.37)        2.01        6.15
- ----------------------------------------------------------------------------------------------------------------------------
       Total from investment operations                                2.65        0.65      (3.35)        2.19        6.33
- ----------------------------------------------------------------------------------------------------------------------------
   LESS DISTRIBUTIONS FROM:
   Net investment income                                                 --      (0.01)      (0.31)      (0.27)      (0.02)
   Net realized gains on investments                                     --      (0.03)      (0.84)          --          --
- ----------------------------------------------------------------------------------------------------------------------------
       Total distributions                                             0.00      (0.04)      (1.15)      (0.27)      (0.02)
- ----------------------------------------------------------------------------------------------------------------------------
   Paid-in Capital from Redemption Fees (Note 1L)                      0.01        0.02        0.06        0.02        0.03
- ----------------------------------------------------------------------------------------------------------------------------

Net Asset Value, end of year                                         $11.20       $8.54       $7.91      $12.35      $10.41
- ----------------------------------------------------------------------------------------------------------------------------

TOTAL RETURN                                                         31.15%       8.44%    (27.46%)      21.28%     156.28%
============================================================================================================================


RATIOS/SUPPLEMENTAL DATA
Net assets, end of year (in 000's)                                 $229,467    $114,798     $76,503    $111,502    $109,936
- ----------------------------------------------------------------------------------------------------------------------------
Ratio of expenses to average net assets before reimbursement,
waiver or recapture of expenses by Advisor and Administrator          1.75%       1.79%       1.90%       1.88%       1.90%
- ----------------------------------------------------------------------------------------------------------------------------
Ratio of expenses to average net assets after reimbursement, waiver
or recapture of expenses by Advisor and Administrator (Note 2)        1.75%       1.87%       1.90%       1.81%       1.90%
- ----------------------------------------------------------------------------------------------------------------------------
Ratio of net investment income (loss) to average net assets before
reimbursement, waiver or recapture of expenses by Advisor
and Administrator                                                     1.04%     (0.17%)       0.67%       1.49%       3.35%
- ----------------------------------------------------------------------------------------------------------------------------
Ratio of net investment income (loss) to average net assets after
reimbursement, waiver or recapture of expenses by Advisor
and Administrator                                                     1.04%     (0.09%)       0.67%       1.56%       3.35%
- ----------------------------------------------------------------------------------------------------------------------------
Portfolio turnover                                                   28.24%      57.00%      63.59%      52.11%      98.74%
- ----------------------------------------------------------------------------------------------------------------------------
See accompanying notes to financial statements.
42 MATTHEWS ASIAN FUNDS
MATTHEWS ASIAN GROWTH AND INCOME FUND
The table below sets forth financial data for a share of beneficial interest outstanding throughout each year presented.
YEAR ENDED AUGUST 31                                                   2003        2002        2001        2000        1999

Net Asset Value, beginning of year                                   $10.71       $9.08      $10.50       $9.37       $6.54
- ----------------------------------------------------------------------------------------------------------------------------

     INCOME FROM INVESTMENT OPERATIONS
     Net investment income                                             0.23        0.18        0.54        0.61        0.58
     Net realized gain (loss) and unrealized appreciation
      (depreciation) on investments and foreign currency               1.61        1.70      (0.49)        1.09        2.75
- ----------------------------------------------------------------------------------------------------------------------------
         Total from investment operations                              1.84        1.88        0.05        1.70        3.33
- ----------------------------------------------------------------------------------------------------------------------------
     LESS DISTRIBUTIONS FROM:
     Net investment income                                           (0.20)      (0.27)      (0.60)      (0.59)      (0.51)
     Net realized gains on investments                               (0.15)          --      (0.88)          --          --
- ----------------------------------------------------------------------------------------------------------------------------
         Total distributions                                         (0.35)      (0.27)      (1.48)      (0.59)      (0.51)
- ----------------------------------------------------------------------------------------------------------------------------
     Paid-in Capital from Redemption Fees (Note 1L)                    0.01        0.02        0.01        0.02        0.01
- ----------------------------------------------------------------------------------------------------------------------------

Net Asset Value, end of year                                         $12.21      $10.71       $9.08      $10.50       $9.37
- ----------------------------------------------------------------------------------------------------------------------------

TOTAL RETURN                                                         17.81%      21.11%       1.15%      18.68%      52.65%
============================================================================================================================


RATIOS/SUPPLEMENTAL DATA
Net assets, end of year (in 000's)                                 $533,302    $152,681     $24,447     $11,469     $10,644
- ----------------------------------------------------------------------------------------------------------------------------
Ratio of expenses to average net assets before reimbursement,
waiver or recapture of expenses by Advisor and Administrator          1.69%       1.77%       1.90%       1.97%       2.05%
- ----------------------------------------------------------------------------------------------------------------------------
Ratio of expenses to average net assets after reimbursement, waiver
or recapture of expenses by Advisor and Administrator (Note 2)        1.69%       1.79%       1.90%       1.90%       1.90%
- ----------------------------------------------------------------------------------------------------------------------------
Ratio of net investment income to average net assets before
reimbursement, waiver or recapture of expenses by Advisor
and Administrator                                                     2.69%       2.13%       7.71%       6.17%       7.98%
- ----------------------------------------------------------------------------------------------------------------------------
Ratio of net investment income to average net assets after
reimbursement, waiver or recapture of expenses by Advisor
and Administrator                                                     2.69%       2.11%       7.71%       6.24%       8.13%
- ----------------------------------------------------------------------------------------------------------------------------
Portfolio turnover                                                   13.33%      32.37%      33.94%      62.23%      34.82%
- ----------------------------------------------------------------------------------------------------------------------------
800.789.ASIA (2742) www.matthewsfunds.com 43
FINANCIAL HIGHLIGHTS
MATTHEWS KOREA FUND
The table below sets forth financial data for a share of beneficial interest outstanding throughout each year presented.
YEAR ENDED AUGUST 31                                                   2003        2002        2001        2000        1999

Net Asset Value, beginning of year                                    $4.42       $2.68       $5.19       $7.49       $2.03
- ----------------------------------------------------------------------------------------------------------------------------
     INCOME (LOSS) FROM INVESTMENT OPERATIONS
     Net investment income (loss)                                      0.01      (0.02)      (0.01)      (0.01)      (0.01)
     Net realized gain (loss) and unrealized appreciation
      (depreciation) on investments and foreign currency               0.32        1.81      (0.90)      (1.45)        5.43
- ----------------------------------------------------------------------------------------------------------------------------
         Total from investment operations                              0.33        1.79      (0.91)      (1.46)        5.42
- ----------------------------------------------------------------------------------------------------------------------------
     LESS DISTRIBUTIONS FROM:
     Net investment income                                               --      (0.01)          --          --          --
     Net realized gains on investments                               (0.39)      (0.07)      (1.63)      (0.88)          --
- ----------------------------------------------------------------------------------------------------------------------------
         Total distributions                                         (0.39)      (0.08)      (1.63)      (0.88)          --
- ----------------------------------------------------------------------------------------------------------------------------
     Paid-in Capital from Redemption Fees (Note 1L)                    0.01        0.03        0.03        0.04        0.04
- ----------------------------------------------------------------------------------------------------------------------------
Net Asset Value, end of year                                          $4.37       $4.42       $2.68       $5.19       $7.49
- ----------------------------------------------------------------------------------------------------------------------------

TOTAL RETURN                                                          8.80%      68.49%    (13.09%)    (22.92%)     268.97%
============================================================================================================================


RATIOS/SUPPLEMENTAL DATA
Net assets, end of year (in 000's)                                 $217,267    $253,003    $117,138    $115,158    $230,846
- ----------------------------------------------------------------------------------------------------------------------------
Ratio of expenses to average net assets before reimbursement,
waiver or recapture of expenses by Advisor and Administrator          1.72%       1.75%       1.78%       1.75%       1.77%
- ----------------------------------------------------------------------------------------------------------------------------
Ratio of expenses to average net assets after reimbursement, waiver
or recapture of expenses by Advisor and Administrator (Note 2)        1.72%       1.75%       1.78%       1.75%       1.77%
- ----------------------------------------------------------------------------------------------------------------------------
Ratio of net investment income (loss) to average net assets before
reimbursement, waiver or recapture of expenses by Advisor
and Administrator                                                     0.17%     (0.64%)       0.75%       0.42%     (0.37%)
- ----------------------------------------------------------------------------------------------------------------------------
Ratio of net investment income (loss) to average net assets after
reimbursement, waiver or recapture of expenses by Advisor
and Administrator                                                     0.17%     (0.64%)       0.75%       0.42%     (0.37%)
- ----------------------------------------------------------------------------------------------------------------------------
Portfolio turnover                                                   29.90%      46.52%      81.96%      47.80%      57.06%
- ----------------------------------------------------------------------------------------------------------------------------
See accompanying notes to financial statements.
44 MATTHEWS ASIAN FUNDS
MATTHEWS CHINA FUND
The table below sets forth financial data for a share of beneficial interest outstanding throughout each year presented.
YEAR ENDED AUGUST 31                                                   2003        2002        2001        2000        1999


Net Asset Value, beginning of year                                    $8.96       $9.21       $9.93       $8.48       $4.36
- ----------------------------------------------------------------------------------------------------------------------------

     INCOME (LOSS) FROM INVESTMENT OPERATIONS
     Net investment income                                             0.11        0.05        0.24        0.09        0.07
     Net realized gain (loss) and unrealized appreciation
      (depreciation) on investments and foreign currency               2.59      (0.20)      (0.61)        1.44        4.11
- ----------------------------------------------------------------------------------------------------------------------------
         Total from investment operations                              2.70      (0.15)      (0.37)        1.53        4.18
- ----------------------------------------------------------------------------------------------------------------------------
     LESS DISTRIBUTIONS FROM:
     Net investment income                                           (0.14)      (0.15)      (0.15)      (0.11)      (0.11)
     Net realized gains on investments                                   --          --      (0.28)          --          --
- ----------------------------------------------------------------------------------------------------------------------------
         Total distributions                                         (0.14)      (0.15)      (0.43)      (0.11)      (0.11)
- ----------------------------------------------------------------------------------------------------------------------------
     Paid-in Capital from Redemption Fees (Note 1L)                    0.02        0.05        0.08        0.03        0.05
- ----------------------------------------------------------------------------------------------------------------------------

Net Asset Value, end of year                                         $11.54       $8.96       $9.21       $9.93       $8.48
- ----------------------------------------------------------------------------------------------------------------------------

TOTAL RETURN                                                         30.88%     (1.16%)     (2.23%)      18.54%      97.79%
============================================================================================================================

RATIOS/SUPPLEMENTAL DATA
Net assets, end of year (in 000's)                                 $111,950     $33,675     $19,843      $9,232      $6,245
- ----------------------------------------------------------------------------------------------------------------------------
Ratio of expenses to average net assets before reimbursement,
waiver or recapture of expenses by Advisor and Administrator          1.78%       1.97%       2.00%       2.15%       2.09%
- ----------------------------------------------------------------------------------------------------------------------------
Ratio of expenses to average net assets after reimbursement, waiver
or recapture of expenses by Advisor and Administrator (Note 2)        1.79%       2.00%       2.00%       2.00%       2.00%
- ----------------------------------------------------------------------------------------------------------------------------
Ratio of net investment income to average net assets before
reimbursement, waiver or recapture of expenses by Advisor
and Administrator                                                     1.94%       0.99%       2.62%       1.54%       2.93%
- ----------------------------------------------------------------------------------------------------------------------------
Ratio of net investment income to average net assets after
reimbursement, waiver or recapture of expenses by Advisor
and Administrator                                                     1.93%       0.96%       2.62%       1.69%       3.02%
- ----------------------------------------------------------------------------------------------------------------------------
Portfolio turnover                                                   19.34%      43.84%      61.07%      80.90%      40.27%
- ----------------------------------------------------------------------------------------------------------------------------
800.789.ASIA (2742) www.matthewsfunds.com 45
FINANCIAL HIGHLIGHTS
MATTHEWS JAPAN FUND
The table below sets forth financial data for a share of beneficial interest outstanding throughout each period presented.
YEAR ENDED AUGUST 31                                                   2003        2002        2001        2000       1999(1)

Net Asset Value, beginning of period                                  $9.60      $11.22      $20.76      $21.70     $10.00
- ----------------------------------------------------------------------------------------------------------------------------

     INCOME (LOSS) FROM INVESTMENT OPERATIONS
     Net investment loss                                             (0.03)      (0.07)      (0.26)      (0.24)     (0.06)
     Net realized gain (loss) and unrealized appreciation
      (depreciation) on investments and foreign currency               1.30      (1.39)      (7.99)      (0.29)      11.74
- ----------------------------------------------------------------------------------------------------------------------------
         Total from investment operations                              1.27      (1.46)      (8.25)      (0.53)      11.68
- ----------------------------------------------------------------------------------------------------------------------------
     LESS DISTRIBUTIONS FROM:
     Net investment income                                               --      (0.27)      (0.37)          --         --
     Net realized gains on investments                                   --          --      (1.03)      (0.54)         --
- ----------------------------------------------------------------------------------------------------------------------------
         Total distributions                                             --      (0.27)      (1.40)      (0.54)         --
- ----------------------------------------------------------------------------------------------------------------------------


     Paid-in Capital from Redemption Fees (Note 1L)                    0.03        0.11        0.11        0.13       0.02
- ----------------------------------------------------------------------------------------------------------------------------

Net Asset Value, end of period                                       $10.90       $9.60      $11.22      $20.76     $21.70
- ----------------------------------------------------------------------------------------------------------------------------

TOTAL RETURN                                                         13.54%    (12.20%)    (40.92%)     (1.75%)    117.00%(3)
============================================================================================================================

RATIOS/SUPPLEMENTAL DATA
Net assets, end of period (in 000's)                                $23,653      $9,399      $7,758     $23,869    $24,486
- ----------------------------------------------------------------------------------------------------------------------------
Ratio of expenses to average net assets before reimbursement,
waiver or recapture of expenses by Advisor and Administrator          1.92%       1.91%       2.08%       1.88%      3.45%(2)
- ----------------------------------------------------------------------------------------------------------------------------
Ratio of expenses to average net assets after reimbursement, waiver
or recapture of expenses by Advisor and Administrator (Note 2)        2.00%       2.00%       2.00%       2.00%      2.00%(2)
- ----------------------------------------------------------------------------------------------------------------------------
Ratio of net investment loss to average net assets before
reimbursement, waiver or recapture of expenses by Advisor
and Administrator                                                   (0.97%)     (1.25%)     (0.90%)     (0.36%)    (2.54%)(2)
- ----------------------------------------------------------------------------------------------------------------------------
Ratio of net investment loss to average net assets after
reimbursement, waiver or recapture of expenses by Advisor
and Administrator                                                   (1.05%)     (1.34%)     (0.82%)     (0.48%)    (1.09%)(2)
- ----------------------------------------------------------------------------------------------------------------------------
Portfolio turnover                                                   77.30%     113.23%      71.09%      23.00%     28.92%(3)
- ----------------------------------------------------------------------------------------------------------------------------


(1)  The Japan Fund commenced operations on December 31, 1998.
(2)  Annualized.
(3)  Not annualized.
See accompanying notes to financial statements.
46 MATTHEWS ASIAN FUNDS
MATTHEWS ASIAN TECHNOLOGY FUND
The table below sets forth financial data for a share of beneficial interest outstanding throughout each period presented.
YEAR ENDED AUGUST 31                                                   2003        2002        2001        2000(1)

Net Asset Value, beginning of period                                  $3.13       $3.53       $7.61      $10.00
- ----------------------------------------------------------------------------------------------------------------------------
     INCOME (LOSS) FROM INVESTMENT OPERATIONS
     Net investment income (loss)                                    (0.01)      (0.10)      (0.05)        0.22
     Net realized gain (loss) and unrealized appreciation
      (depreciation) on investments and foreign currency               1.16      (0.31)      (3.97)      (2.65)
- ----------------------------------------------------------------------------------------------------------------------------
         Total from investment operations                              1.15      (0.41)      (4.02)      (2.43)
- ----------------------------------------------------------------------------------------------------------------------------
     LESS DISTRIBUTIONS FROM:
     Net investment income                                               --      (0.04)      (0.22)          --
     Net realized gains on investments                                   --          --          --          --
- ----------------------------------------------------------------------------------------------------------------------------
         Total distributions                                             --      (0.04)      (0.22)          --
- ----------------------------------------------------------------------------------------------------------------------------

     Paid-in Capital from Redemption Fees (Note 1L)                    0.02        0.05        0.16        0.04
- ----------------------------------------------------------------------------------------------------------------------------

Net Asset Value, end of period                                        $4.30       $3.13       $3.53       $7.61
- ----------------------------------------------------------------------------------------------------------------------------

TOTAL RETURN                                                         37.38%    (10.40%)    (51.54%)    (23.90%)(3)
============================================================================================================================

RATIOS/SUPPLEMENTAL DATA
Net assets, end of period (in 000's)                                $18,769      $6,879      $9,607     $24,570
- ----------------------------------------------------------------------------------------------------------------------------
Ratio of expenses to average net assets before reimbursement,
waiver or recapture of expenses by Advisor and Administrator          2.10%       2.01%       2.69%       2.66%(2)
- ----------------------------------------------------------------------------------------------------------------------------
Ratio of expenses to average net assets after reimbursement, waiver
or recapture of expenses by Advisor and Administrator (Note 2)        2.00%       2.00%       2.00%       2.00%(2)
- ----------------------------------------------------------------------------------------------------------------------------
Ratio of net investment income (loss) to average net assets before
reimbursement, waiver or recapture of expenses by Advisor
and Administrator                                                   (0.71%)     (1.56%)       1.14%       3.75%(2)
- ----------------------------------------------------------------------------------------------------------------------------
Ratio of net investment income (loss) to average net assets after
reimbursement, waiver or recapture of expenses by Advisor
and Administrator                                                   (0.61%)     (1.55%)       1.83%       4.41%(2)
- ----------------------------------------------------------------------------------------------------------------------------
Portfolio turnover                                                   72.03%     103.60%     181.24%      50.35%(3)
- ----------------------------------------------------------------------------------------------------------------------------


(1)  The Asian Technology Fund commenced operations on December 27, 1999.
(2)  Annualized.
(3)  Not annualized.
800.789.ASIA (2742) www.matthewsfunds.com 47
NOTES TO FINANCIAL STATEMENTS
| 1. | SIGNIFICANT ACCOUNTING POLICIES Matthews Asian Funds (the “Company”) is an open-end investment management company registered under the Investment Company Act of 1940, as amended (the “Act”). The Company currently issues six separate series of shares (each a “Fund” and collectively, the “Funds”): Matthews Pacific Tiger Fund, Matthews Asian Growth and Income Fund, Matthews Korea Fund, Matthews China Fund, Matthews Japan Fund and Matthews Asian Technology Fund. Matthews Pacific Tiger Fund, Matthews Korea Fund and Matthews China Fund are authorized to offer two classes of shares: Class I shares and Class A shares. Currently, only Class I shares are offered. Matthews Pacific Tiger Fund, Matthews Korea Fund, Matthews China Fund, Matthews Japan Fund and Matthews Asian Technology Fund seek to maximize capital appreciation by investing, under normal circumstances, at least 80% of their total assets in equity securities of Pacific Tiger econom ies, South Korean companies, Chinese companies and Japanese companies, respectively. Pacific Tiger economies include Hong Kong, Singapore, South Korea, Taiwan, Indonesia, Malaysia, the Philippines, Thailand and China. Matthews Asian Growth and Income Fund seeks capital appreciation and current income by investing, under normal circumstances, at least 80% of its total assets in the convertible bonds and dividend-paying equity securities of Asian economies. Asian economies include Hong Kong, Japan, Singapore, South Korea, Taiwan, Indonesia, Malaysia, the Philippines, Thailand, China and India. The following is a summary of significant accounting policies consistently followed by the Funds in the preparation of their financial statements. |
| | |
| | A. SECURITY VALUATION: Securities listed on any national securities exchange are valued at their last sale price on the exchange where the securities are principally traded or, if there has been no sale on that date, at the mean between the last reported bid and asked prices. Securities traded over-the-counter are priced at the mean of the last bid and asked prices. All other securities are valued through valuations obtained from a commercial pricing service or at the most recent mean of the bid and asked prices provided by investment dealers in accordance with procedures established by the Board of Trustees. When no market quotations are available, the Funds’ equity securities are valued at their fair value as determined in good faith by or under the direction of the Board of Trustees. The books and records of the Funds are maintained in U.S. Dollars. Transactions denominated in foreign currencies are recorded at the current prevailing exchange rates. All assets and liabilities denominated in foreign currencies are translated into U.S. Dollars at the current exchange rate. Translation gains or losses resulting from changes in the exchange rate during the reporting period and realized gains and losses on the settlement of foreign currency transactions are reported in the results of operations for the current period. The Funds do not isolate that portion of gains and losses on investment in equity securities which is due to changes in the foreign exchange rate from that which is due to changes in market prices of equity securities. International dollar bonds are issued offshore, pay interest and principal in U.S. Dollars, and are denominated in U.S. Dollars. Portfolio securities traded on a foreign exchange are generally valued at the respective current prevailing exchange rates. The securities’ values are translated into U.S. Dollars using these rates. If subsequent to the time a rate has been established and it has been determined to have materially changed, the f air value of those securities, (considering the changing conditions) will be determined by (or under the direction of) the Funds’ Board of Trustees. |
| | |
| | Foreign currency exchange rates are generally determined prior to the close of trading on the New York Stock Exchange, Inc. (“NYSE”). Occasionally, events affecting the value of foreign investments and such exchange rates occur between the time at which they are determined and the close of trading on the NYSE. If events that materially affect the value of the Funds’ foreign investments or the foreign currency exchange rates occur during such period, the investments will be valued at their fair value as determined in good faith by or under the direction of the Board of Trustees. |
| | |
| | B. FORWARD FOREIGN CURRENCY EXCHANGE CONTRACTS: The Funds may engage in forward foreign currency exchange contracts for hedging a specific transaction in which the currency is denominated as deemed appropriate by Matthews International Capital Management, LLC (the “Advisor”). Forward foreign currency exchange contracts are valued at the forward rate and are marked-to-market daily. The change in market |
48 MATTHEWS ASIAN FUNDS
AUGUST 31, 2003
| | value is recorded by the Funds as an unrealized gain or loss. When the contract is closed, the Funds record a realized gain or loss equal to the difference between the value of the contract at the time it was opened and the value at the time it was closed. The use of forward foreign currency exchange contracts does not eliminate fluctuations in the underlying prices of the Funds’ portfolio securities, but it does establish a rate of exchange that can be achieved in the future. Although forward foreign currency exchange contracts limit the risk of loss due to a decline in the value of the hedged currency, they also limit any potential gain that might result should the value of the currency increase. In addition, the Funds could be exposed to risks if the counterparts to the contracts are unable to meet the terms of their contracts. |
| | |
| | C. RISKS ASSOCIATED WITH FOREIGN SECURITIES: Investments by the Funds in the securities of foreign issuers may involve investment risks different from those of U.S. issuers including possible political or economical instability of the country of the issuer, the difficulty in predicting international trade patterns, the possibility of currency exchange controls, the possible imposition of foreign withholding tax on the interest income payable on such instruments, the possible establishment of foreign controls, the possible seizure or nationalization of foreign deposits or assets, or the adoption of other foreign government restrictions that might adversely affect the foreign securities held by the Funds. Foreign securities may also be subject to greater fluctuations in price than securities of domestic corporations or the U.S. Government. |
| | |
| | D. FEDERAL INCOME TAXES: all requirements of the Internal Revenue Code of 1986, as amended (the “Code”) applicable to regulated investment companies and to distribute substantially all of their taxable income to their shareholders. The Funds have met the requirements of the Code applicable to regulated investment companies for the fiscal year ended August 31, 2003. Therefore, no federal income tax provision is required. Income and capital gains of the Funds are determined in accordance with both tax regulations and accounting principles generally accepted in the United States. Such may result in temporary and permanent differences between tax basis earnings and earnings reported for financial statement purposes. These reclassifications, which have no impact on the net asset value of the Funds, are primarily attributable to certain differences in computation of distributable income and capital gains under federal tax rules versus accounting principles generally ac cepted in the United States and the use of the tax accounting practice known as equalization. |
| | |
| | E. DETERMINATION OF GAINS OR LOSSES ON SALES OF SECURITIES: Gains or losses on the sale of securities are determined on the identified cost basis. |
| | |
| | F. ORGANIZATION COSTS: Organization costs are amortized on a straight-line basis over five years from each Fund’s respective commencement of operations with the exception of the Matthews Japan Fund and Matthews Asian Technology Fund which were amortized on a straight-line basis over one year from each Fund’s commencement of operations. In the event that any of the initial shares are redeemed during the period of amortization of a Fund’s organization costs, the redemption proceeds will be reduced by any such unamortized organization costs in the same proportion as the number of shares being redeemed bears to the number of those shares outstanding at the time of redemption. |
| | |
| | G. DISTRIBUTIONS TO SHAREHOLDERS: It is the policy of Matthews Asian Growth and Income Fund to distribute net investment income on a semi-annual basis and capital gains, if any, annually. Matthews Pacific Tiger Fund, Matthews Korea Fund, Matthews China Fund, Matthews Japan Fund, and Matthews Asian Technology Fund distribute net investment income and capital gains, if any, annually. Distributions to shareholders are recorded on the ex-dividend date. Income and capital gain distributions are determined in accordance with income tax regulations which may differ from accounting principles generally accepted in the United States. Net investment losses may not be utilized to offset net investment income in future periods for tax purposes. |
| | |
| | The tax character of distributions paid for the fiscal years ended August 31, 2002 and August 31, 2003 were as follows: |
800.789.ASIA (2742) www.matthewsfunds.com 49
NOTES TO FINANCIAL STATEMENTS
2002 TAXABLE DISTRIBUTIONS                       ORDINARY           NET LONG TERM           TOTAL TAXABLE
                                                   INCOME           CAPITAL GAINS           DISTRIBUTIONS

Matthews Pacific Tiger Fund                      $238,674                $140,682                $379,356
Matthews Asian Growth and Income Fund           1,362,799                      --               1,362,799
Matthews Korea Fund                               468,712               3,454,262               3,922,974
Matthews China Fund                               381,550                      --                 381,550
Matthews Japan Fund                               182,412                      --                 182,412
Matthews Asian Technology Fund                    142,101                      --                 142,101

2003 TAXABLE DISTRIBUTIONS                       ORDINARY           NET LONG TERM           TOTAL TAXABLE
                                                   INCOME           CAPITAL GAINS           DISTRIBUTIONS

Matthews Pacific Tiger Fund                          $ --                    $ --                    $ --
Matthews Asian Growth and Income Fund           7,795,759                 368,598               8,164,357
Matthews Korea Fund                                    --              19,371,082              19,371,082
Matthews China Fund                               542,079                      --                 542,079
Matthews Japan Fund                                    --                      --                      --
Matthews Asian Technology Fund                         --                      --
As of August 31, 2003, the components of distributable earnings/(deficit) on a tax basis were as follows:
                                            UNDISTRIBUTED     UNDISTRIBUTED           CAPITAL         POST OCT.
                                                 ORDINARY         LONG TERM        LOSS CARRY           CAPITAL
                                                   INCOME     CAPITAL GAINS          FORWARDS           LOSSES*

Matthews Pacific Tiger Fund                    $1,396,706              $ --     ($10,061,328)        ($619,193)
Matthews Asian Growth and Income Fund           2,828,612         3,541,425                --                --
Matthews Korea Fund                             1,785,809        20,791,937                --                --
Matthews China Fund                             1,039,670                --       (2,712,934)         (545,657)
Matthews Japan Fund                                    --                --       (7,862,507)         (538,155)
Matthews Asian Technology Fund                     17,951                --      (17,194,054)       (1,033,267)


                                                                       UNREALIZED                   TOTAL
                                                POST OCT.           APPRECIATION/             ACCUMULATED
                                         CURRENCY LOSSES*        (DEPRECIATION)**      EARNINGS/(DEFICIT)

Matthews Pacific Tiger Fund                     ($81,154)             $42,983,023             $33,618,054
Matthews Asian Growth and Income Fund           (173,004)              53,612,537              59,809,570
Matthews Korea Fund                             (304,068)              47,957,566              70,231,244
Matthews China Fund                                    --              15,535,219              13,316,298
Matthews Japan Fund                                  (68)               2,404,111             (5,996,619)
Matthews Asian Technology Fund                    (9,008)               2,224,953            (15,993,425)

*  Under the current tax law, capital losses realized after October 31 and prior to
the Fund's fiscal year end may be deferred as occurring on the first day of the
following fiscal year.

** The differences between book-basis and tax-basis unrealized
appreciation/(depreciation) is attributable primarily to the tax deferral of losses
on wash sales and the realization for tax purposes of unrealized gains/losses on
investments in passive foreign investment companies.
50 MATTHEWS ASIAN FUNDS
| | For Federal income tax purposes, the Funds indicated below have capital loss carryforwards, which expire in the year indicated, as of August 31, 2003, which are available to offset future capital gains, if any: |
LOSSES DEFERRED EXPIRING IN:                         2008              2009              2010              2011

Matthews Pacific Tiger Fund                          $ --              $ --        $3,234,939       $ 6,826,389
Matthews Asian Growth and Income Fund                  --                --                --                --
Matthews Korea Fund                                    --                --                --                --
Matthews China Fund                                    --                --         1,131,447         1,581,487
Matthews Japan Fund                                    --            35,094         4,213,197         3,614,216
Matthews Asian Technology Fund                  2,390,436         5,375,361         5,967,059         3,461,198
| | H. RECLASSIFICATIONS: Accounting principles generally accepted in the United States of America require that certain components of net assets be reclassified between financial and tax reporting. These reclassifications have no effect on net assets or net asset value per share. For the year ended August 31, 2003, permanent differences in book and tax accounting have been reclassified to paid-in capital, undistri-buted net investment income/(loss) and accumulated realized gain/(loss) as follows: |
                                                              INCREASE/(DECREASE)               INCREASE/
                                                INCREASE/       UNDISTRIBUTED NET              (DECREASE)
                                               (DECREASE)              INVESTMENT             ACCUMULATED
                                          PAID-IN CAPITAL           INCOME/(LOSS)    REALIZED GAIN/(LOSS)

Matthews Pacific Tiger Fund                    ($200,852)                $118,169                 $82,683
Matthews Asian Growth and Income Fund           1,089,469             (1,254,616)                 165,147
Matthews Korea Fund                             5,346,299               1,504,055             (6,850,354)
Matthews China Fund                             (148,090)                 148,107                    (17)
Matthews Japan Fund                             (110,542)                 122,919                (12,377)
Matthews Asian Technology Fund                   (70,837)                  60,736                  10,101
| | I. FUND EXPENSE ALLOCATIONS: The Funds account separately for the assets, liabilities and operations of each Fund. Direct expenses of each Fund are charged to the Fund while general expenses are allocated pro-rata among the Funds based on net assets. |
| | |
| | J. USE OF ESTIMATES: The preparation of financial statements in conformity with accounting principles generally accepted in the United States requires management to make estimates and assumptions that affect the amounts reported in the financial statements and accompanying notes. Actual results may differ from those estimates. |
| | |
| | K. OTHER: Securities transactions are accounted for on the date the securities are purchased or sold. Interest income is recorded on the accrual basis and dividend income on the ex-dividend date. |
| | |
| | L. CAPITAL SHARE TRANSACTIONS: Each Fund is authorized to issue an unlimited number of shares of beneficial interest with a par value of $0.001 per share. |
| | |
| | MATTHEWS PACIFIC TIGER FUND |
                                                    YEAR ENDED AUGUST 31, 2003       YEAR ENDED AUGUST 31, 2002
                                                         SHARES         AMOUNT            SHARES         AMOUNT

Shares sold                                          15,023,339   $137,306,760        11,728,059   $106,314,158
Shares issued through reinvestment of dividends              --             --            40,762        366,041
Shares redeemed                                     (7,972,026)   (66,349,843)       (7,999,842)   (69,949,837)
- ---------------------------------------------------------------------------------------------------------------
Net increase                                          7,051,313    $70,956,917         3,768,979    $36,730,362
===============================================================================================================
800.789.ASIA (2742) www.matthewsfunds.com 51
NOTES TO FINANCIAL STATEMENTS
| | MATTHEWS ASIAN GROWTH AND INCOME FUND |
                                                       YEAR ENDED AUGUST 31, 2003          YEAR ENDED AUGUST 31, 2002
                                                         SHARES            AMOUNT            SHARES            AMOUNT

Shares sold                                          39,973,007      $435,370,172        15,326,669      $164,304,863
Shares issued through reinvestment of dividends         669,460         7,282,120           127,019         1,302,597
Shares redeemed                                    (11,240,758)     (120,399,753)       (3,886,595)      (40,361,276)
- ---------------------------------------------------------------------------------------------------------------------
Net increase                                         29,401,709      $322,252,539        11,567,093      $125,246,184
=====================================================================================================================
                                                       YEAR ENDED AUGUST 31, 2003          YEAR ENDED AUGUST 31, 2002
                                                         SHARES            AMOUNT            SHARES            AMOUNT

Shares sold                                          26,969,605      $101,436,079        61,630,311      $249,365,417
Shares issued through reinvestment of dividends       3,512,115        13,486,520           864,565         3,086,494
Shares redeemed                                    (38,085,006)     (143,087,431)      (48,911,935)     (202,396,880)
- ---------------------------------------------------------------------------------------------------------------------
Net increase (decrease)                             (7,603,286)     ($28,164,832)        13,582,941       $50,055,031
=====================================================================================================================
                                                       YEAR ENDED AUGUST 31, 2003          YEAR ENDED AUGUST 31, 2002
                                                         SHARES            AMOUNT            SHARES            AMOUNT

Shares sold                                           9,399,794       $91,503,345         4,355,329       $42,461,853
Shares issued through reinvestment of dividends          57,638           506,057            37,306           354,407
Shares redeemed                                     (3,517,599)      (32,126,645)       (2,789,691)      (26,430,947)
- ---------------------------------------------------------------------------------------------------------------------
Net increase                                          5,939,833       $59,882,757         1,602,944       $16,385,313
=====================================================================================================================
                                                       YEAR ENDED AUGUST 31, 2003          YEAR ENDED AUGUST 31, 2002
                                                         SHARES            AMOUNT            SHARES            AMOUNT

Shares sold                                           2,461,873       $23,056,012         1,870,946       $18,771,725
Shares issued through reinvestment of dividends              --                --            16,933           176,103
Shares redeemed                                     (1,270,520)      (11,185,007)       (1,600,390)      (15,923,445)
- ---------------------------------------------------------------------------------------------------------------------
Net increase                                          1,191,353       $11,871,005           287,489        $3,024,383
=====================================================================================================================
| | MATTHEWS ASIAN TECHNOLOGY FUND |
                                                       YEAR ENDED AUGUST 31, 2003          YEAR ENDED AUGUST 31, 2002
                                                         SHARES            AMOUNT            SHARES            AMOUNT

Shares sold                                           5,319,636       $18,618,111         4,672,505       $17,384,394
Shares issued through reinvestment of dividends              --                --            33,973           138,271
Shares redeemed                                     (3,148,718)       (9,874,863)       (5,233,008)      (19,363,319)
- ---------------------------------------------------------------------------------------------------------------------
Net increase (decrease)                               2,170,918        $8,743,248         (526,530)      ($1,840,654)
=====================================================================================================================
| | The Funds impose a redemption fee of 2.00% on shares that are redeemed within ninety days of purchase. The charge is assessed on an amount equal to the net asset value of the shares at the time of redemption. The redemption fee is deducted from the proceeds otherwise payable to the redeeming shareholder. The redemption fees were returned to the assets of the Matthews Pacific Tiger Fund, Matthews Asian Growth and Income Fund, Matthews Korea Fund, Matthews China Fund, Matthews Japan Fund, and Matthews Asian Technology Fund in the amounts of $200,852, $344,510, $737,918, $148,090, $76,633, and $70,837, respectively, for the year ended August 31, 2003, and $198,248, $285,809, $1,677,238, $184,114, $103,243, and $107,488, respectively, for the year ended August 31, 2002. |
52 MATTHEWS ASIAN FUNDS
| | |
| 2. | INVESTMENT ADVISORY FEES AND OTHER TRANSACTIONS WITH AFFILIATES The Advisor, a registered investment advisor under the Investment Advisers Act of 1940, as amended, provides the Funds with investment management services. As compensation for these services, the Advisor charges the Funds a monthly fee of 1/12th of 1% of each Fund’s respective average daily net assets. Certain officers and Trustees of the Funds are also officers and directors of the Advisor. All officers serve without direct compensation from the Funds. Investment advisory fees and other transactions with affiliates, for the year ended August 31, 2003, were as follows: |
                                                INVESTMENT       VOLUNTARY EXPENSE
                                         ADVISORY FEE RATE              LIMITATION           ADVISORY FEES

Matthews Pacific Tiger Fund                          1.00%                   1.90%              $1,228,434
Matthews Asian Growth and Income Fund                1.00%                   1.90%               2,621,177
Matthews Korea Fund                                  1.00%                   2.00%               1,926,780
Matthews China Fund                                  1.00%                   2.00%                 514,561
Matthews Japan Fund                                  1.00%                   2.00%                  89,871
Matthews Asian Technology Fund                       1.00%                   2.00%                  71,807

                                           EXPENSES WAIVED                EXPENSES               REMAINING
                                            AND REIMBURSED                RECOUPED              RECOUPABLE
                                            BY THE ADVISOR          BY THE ADVISOR      EXPENSES AVAILABLE

Matthews Pacific Tiger Fund                           $ --                    $ --                    $ --
Matthews Asian Growth and Income Fund                   --                      --                      --
Matthews Korea Fund                                     --                      --                      --
Matthews China Fund                                     --                   6,379                      --
Matthews Japan Fund                                     --                   7,306                   3,140
Matthews Asian Technology Fund                       7,313                      --                  99,722
| | The investment advisory agreements provide that any reductions made by the Advisor in its fees are subject to reimbursements by the Funds within the following three years provided that the Funds are able to effect such reimbursements and remain in compliance with applicable expense limitations. |
| | |
| | The Funds have a shareholder servicing plan, pursuant to which, during the fiscal year 2003, the Funds reimbursed the Advisor for shareholder servicing activities at an annual rate of 0.15% of each Fund’s respective average daily net assets. For the fiscal year 2004, this rate has been reduced to 0.10% of each Fund’s respective average daily net assets. Under the plan, the Funds can be charged a maximum of 0.25%. Fees charged under the shareholder servicing fee plan for the year ended August 31, 2003, were as follows: |
                                                                 SHAREHOLDER
                                                              SERVICING FEES

Matthews Pacific Tiger Fund                                         $184,265
Matthews Asian Growth and Income Fund                                393,176
Matthews Korea Fund                                                  289,018
Matthews China Fund                                                   77,184
Matthews Japan Fund                                                   13,481
Matthews Asian Technology Fund                                        10,771
800.789.ASIA (2742) www.matthewsfunds.com 53
| NOTES TO FINANCIAL STATEMENTS | AUGUST 31, 2003 |
| | The Funds bear a portion of the fees paid to certain service providers (exclusive of the Funds’ transfer agent) which provide transfer agency and shareholder servicing to certain shareholders. Fees accrued to pay to such service providers for the year ended August 31, 2003 are reflected in the Statement of Operations as follows: |
                                                  TRANSFER       SHAREHOLDER
                                                     AGENT         SERVICING             TOTAL
Matthews Pacific Tiger Fund                       $158,877           $79,439          $238,316
Matthews Asian Growth and Income Fund              289,263           144,632           433,895
Matthews Korea Fund                                216,674           108,337           325,011
Matthews China Fund                                 57,723            28,861            86,584
Matthews Japan Fund                                 10,102             5,050            15,152
Matthews Asian Technology Fund                       8,053             4,027            12,080
| | PFPC Inc. (“PFPC”), an indirect wholly-owned subsidiary of The PNC Financial Services Group, serves as the Trust’s Administrator and, in that capacity, performs various administrative and accounting services for each Fund. PFPC also serves as the Trust’s Transfer Agent, dividend disbursing agent and registrar. An officer of PFPC serves as Assistant Treasurer to the Trust. Total fees received by PFPC for the year ended August 31, 2003 were $835,824 for administrative and accounting services and $276,247 for transfer agent services. The Bank of New York serves as custodian to the Trust. |
| | |
| | PFPC Distributors, Inc. (the “Distributor”) serves as the Funds’ Distributor pursuant to an Underwriting Agreement. |
| | |
| 3. | INVESTMENT TRANSACTIONS |
| | Investment transactions for the year ended August 31, 2003, excluding short-term investments, were as follows: |
                                                 PURCHASES    PROCEEDS FROM SALES
Matthews Pacific Tiger Fund                    $98,803,331            $35,389,943
Matthews Asian Growth and Income Fund          336,368,368             34,636,847
Matthews Korea Fund                             58,417,091             98,129,736
Matthews China Fund                             67,192,886              9,991,804
Matthews Japan Fund                             18,206,500              7,189,982
Matthews Asian Technology Fund                  12,372,228              5,364,512
54 MATTHEWS ASIAN FUNDS
REPORT OF INDEPENDENT CPA
To the Shareholders and Board of Trustees of Matthews Asian Funds,
We have audited the accompanying statements of assets and liabilities of Matthews Asian Funds (comprising the Matthews Pacific Tiger Fund, Matthews Asian Growth and Income Fund, Matthews Korea Fund, Matthews China Fund, Matthews Japan Fund and Matthews Asian Technology Fund, collectively referred to as the “Funds”) including the schedules of investments as of August 31, 2003, and the related statements of operations for the year then ended, statements of changes in net assets for each of the two years in the period then ended and financial highlights for the periods indicated thereon. These financial statements and financial highlights are the responsibility of the Funds’ management. Our responsibility is to express an opinion on these financial statements and financial highlights based on our audits.
We conducted our audits in accordance with auditing standards generally accepted in the United States of America. Those standards require that we plan and perform the audits to obtain reasonable assurance about whether the financial statements and financial highlights are free of material misstatement. An audit includes examining, on a test basis, evidence supporting the amounts and disclosures in the financial statements. Our procedures included confirmation of securities owned as of August 31, 2003, by correspondence with the custodian and brokers or by other appropriate auditing procedures where replies from brokers were not received. An audit also includes assessing the accounting principles used and significant estimates made by management, as well as evaluating the overall financial statement presentation. We believe that our audits provide a reasonable basis for our opinion.
In our opinion, the financial statements and financial highlights referred to above present fairly, in all material respects, the financial position of the Matthews Asian Funds as of August 31, 2003, the results of their operations for the year then ended, changes in their net assets for each of the two years in the period then ended and the financial highlights for each of the periods indicated thereon, in conformity with accounting principles generally accepted in the United States of America.
TAIT, WELLER & BAKER
Philadelphia, Pennsylvania
October 2, 2003
800.789.ASIA (2742) www.matthewsfunds.com 55
TRUSTEES AND OFFICERS OF THE FUNDS (UNAUDITED)
The operations of each Fund are under the direction of the Board of Trustees. The Board of Trustees establishes each Fund’s policies and oversees and reviews the management of each Fund. The Board meets regularly to review the activities of the officers, who are responsible for the day-to-day operations of the Funds. The Statement of Additional Information, which includes additional information about Fund trustees, is available without charge by calling (800) 789-ASIA . The Trustees and executive officers of the Funds, their dates of birth, business address and their principal occupations during the past five years are set forth below:
- -------------------------------------------------------------------------------------------------------------------------------------
                                                                                      Number of
                                    Term of                                           Portfolios
                                    Office and                                        in Fund       Other Trusteeships/
Name, Date of Birth,                Length                                            Complex       Directorships
Address and Position(s)             of Time       Principal Occupation(s)             Overseen by   (number of portfolios)
Held with Trust                     Served(1)     During Past 5 Years                 Trustee       Held by Trustee

DISINTERESTED TRUSTEES

Richard K. Lyons                    Since 1994    Professor, Haas School of              6          Director, iShares Fund
D.O.B. February 10, 1961                          Business University of                            Complex, consisting of
Haas School of Business, S545                     California since 1993.                            iShares, Inc. and iShares
University of California                                                                            Trust managed by Barclays
Berkeley, CA 94720                                                                                  Global Investors (83
Chairman of the Board of                                                                            portfolios); Trustee,
Trustees and Trustee                                                                                Barclays Global Investor
                                                                                                    Fund Complex, consisting of
Robert K. Connolly                  Since 1994    Retired since 8/90.  Prior             6          Barclays Global Investor
D.O.B. September 16, 1932                         thereto: Institutional                            Funds and Barclays Master
P.O. Box 941990                                   Sales Manager and Securities                      Investment Portfolios
Sonoma, CA 95476                                  Analyst for Barrington                            (13 portfolios).
Trustee                                           Research Associates.

Norman W. Berryessa                 Since 1996    Registered Investment                  6
D.O.B. November 11, 1928                          Advisor since 1996;
100 Bush Street, Suite 1000                       Independent Contractor,
San Francisco, CA 94109                           Emmett Larkin Co., since 1983.
Trustee

INTERESTED TRUSTEES(2)

G. Paul Matthews                    Since 2001    Chairman, Co-Chief                      6
D.O.B. April 14, 1956                             Executive Officer
456 Montgomery Street                             and Chief Investment
Suite 1200                                        Officer, Matthews
San Francisco, CA 94104                           International Capital
Trustee                                           Management, LLC since 1991.

David FitzWilliam-Lay               Since 1994    Retired in 1993.                        6         Director, Fidelity Asian
D.O.B. October 12, 1931                           Prior thereto Chairman                            Values Investment Trust;
Bloxham                                           of GT Management, PLC,                            Director, Eastern European
Great Bedwyn                                      United Kingdom                                    Investment Trust; Director
Marlborough                                                                                         and Chairman, Prospect
Wiltshire, UK SN8 3NT                                                                               Japan Investment Trust
Trustee                                                                                             all UK closed-end
                                                                                                    investment trusts listed
John H. Dracott                     Since 1994    International mutual fund               6         on the London stock exchange.
D.O.B. April 17, 1928               Emeritus      consultant.
P.O. Box 162                        since 1998.
Tiburon, CA 94920
Trustee Emeritus

OFFICER(S) WHO ARE NOT TRUSTEES(2)

Mark W. Headley                     Since 1999    Co-Chief Executive Officer,            N/A              N/A
D.O.B. February 12, 1959                          President and Portfolio
456 Montgomery Street                             Manager, Matthews International
Suite 1200                                        Capital Management, LLC since
San Francisco, CA 94104                           2001; President and Portfolio
Vice President                                    Manager, 1999-2001; Portfolio
                                                  Manager and Managing Director
                                                  1996-1999.

James E. Walter                     Since 2000    Vice President, Investment             N/A              N/A
D.O.B. April 6, 1970                              Operations, Matthews
456 Montgomery Street                             International Capital
Suite 1200                                        Management, LLC since 2000;
San Francisco, CA 94104                           Operations Manager, 1998-2000;
Treasurer                                         Fund Accountant, 1996-1998.

Downey H. Blount                    Since 2001    Senior Vice President,                 N/A              N/A
D.O.B. July 28, 1970                              Matthews International
456 Montgomery Street                             Capital Management, LLC
Suite 1200                                        since 2001; Vice President,
San Francisco, CA 94104                           1999-2001; Manager, Montgomery
Secretary                                         Asset Management LLC, 1997-1999;
                                                  Marketing Manager, Matthews
                                                  International Capital Management,
                                                  LLC, 1995-1997.
- ----------------------------------------------------------------------------------------------------------------------------------
| (1) | | Each Trustee serves for an indefinite term, until retirement age or until his/her successor is elected. Officers serve at the pleasure of the Board of Trustees. |
| (2) | | These Trustees and officers are considered “interested persons” of the Trust as defined under the Act either because of an ownership interest in the Advisor or an office held with the Trust. |
56 MATTHEWS ASIAN FUNDS
MATTHEWS ASIAN FUNDS
BOARD OF TRUSTEES
Richard K. Lyons, Chairman
G. Paul Matthews
Robert K. Connolly
David FitzWilliam-Lay
Norman W. Berryessa
John H. Dracott, Emeritus
OFFICERS
G. Paul Matthews
Mark W. Headley
James E. Walter
Downey H. Blount
INVESTMENT ADVISOR
Matthews International Capital Management, LLC
456 Montgomery Street, Suite 1200
San Francisco, CA 94104
800-789-ASIA [2742]
ACCOUNT SERVICES
PFPC Inc.
760 Moore Road
King of Prussia, PA 19406
800-892-0382
CUSTODIAN
The Bank of New York
One Wall Street
New York, NY 10286
LEGAL COUNSEL
Paul, Hastings, Janofsky & Walker, LLP
55 Second Street
San Francisco, CA 94105
This report is submitted for the general information of the shareholders of the Matthews Asian Funds. It is not authorized for distribution to prospective investors unless preceded or accompanied by a current prospectus. Please read the prospectus carefully before you invest or send money. Shares of the Matthews Asian Funds are distributed by PFPC Distributors, Inc., 760 Moore Road, King of Prussia, PA 19406.
Item 2. Code of Ethics.
| | (a) | | The registrant, as of the end of the period covered by this report, has adopted a code of ethics that applies to the registrant’s principal executive officer, principal financial officer, principal accounting officer or controller, or persons performing similar functions, regardless of whether these individuals are employed by the registrant or a third party. |
| | (b) | | There have been no amendments, during the period covered by this report, to a provision of the code of ethics that applies to the registrant’s principal executive officer, principal financial officer, principal accounting officer or controller, or persons performing similar functions, regardless of whether these individuals are employed by the registrant or a third party, and that relates to any element of the code of ethics description. |
| | (c) | | The registrant has not granted any waivers, including an implicit waiver, from a provision of the code of ethics that applies to the registrant’s principal executive officer, principal financial officer, principal accounting officer or controller, or persons performing similar functions, regardless of whether these individuals are employed by the registrant or a third party, that relates to one or more of the items set forth in paragraph (b) of this item’s instructions. |
Item 3. Audit Committee Financial Expert.
| | (a) | | As of the end of the period covered by the report, the registrant’s board of directors has determined that the registrant has at least one audit committee financial expert serving on its audit committee and that person is “independent.” |
| | (b) | | Professor Richard K. Lyons has been a professor of International Finance at the Haas School of Business at UC Berkeley for 10 years. He regularly reviews current research in accounting both for use in instruction of courses and for internal faculty evaluation. He has experience analyzing and evaluating financial statements at the appropriate level of complexity through his instruction of International Finance at the graduate level. As a student, he completed courses at UC Berkeley in financial and managerial accounting and later received a PhD from M.I.T. in Economics. Mr. Lyons has gained additional accounting expertise as the Audit Committee Chair of Matthews Asian Funds. |
Item 4. Principal Accountant Fees and Services.
Not applicable.
Item 5. Audit Committee of Listed Registrants.
Not applicable.
Item 6. [Reserved]
Item 7. Disclosure of Proxy Voting Policies and Procedures for Closed-End Management Investment Companies.
Not applicable.
Item 8. [Reserved]
Item 9. Controls and Procedures.
| | (a) | | The registrant’s principal executive and principal financial officers, or persons performing similar functions, have concluded that the registrant’s disclosure controls and procedures (as defined in Rule 30a-3(c) under the Investment Company Act of 1940, as amended (the “1940 Act”) (17 CFR 270.30a-3(c))) are effective, as of a date within 90 days of the filing date of the report that includes the disclosure required by this paragraph, based on their evaluation of these controls and procedures required by Rule 30a-3(b) under the 1940 Act (17 CFR 270.30a-3(b)) and Rules 13a-15(b) or 15d-15(b) under the Exchange Act (17 CFR 240.13a-15(b) or 240.15d-15(b)). |
| | (b) | | There were no changes in the registrant’s internal control over financial reporting (as defined in Rule 30a-3(d) under the 1940 Act (17 CFR 270.30a-3(d)) that occurred during the registrant’s last fiscal half-year (the registrant’s second fiscal half-year in the case of an annual report) that has materially affected, or is reasonably likely to materially affect, the registrant’s internal control over financial reporting. |
Item 10. Exhibits.
| | (a)(1) Code of ethics, or any amendment thereto, that is the subject of disclosure required by Item 2 is attached hereto. |
| | (a)(2) Certifications pursuant to Section 302 of the Sarbanes-Oxley Act of 2002 are attached hereto. |
| | (b) Certifications pursuant to Section 906 of the Sarbanes-Oxley Act of 2002 are attached hereto. |
SIGNATURES
Pursuant to the requirements of the Securities Exchange Act of 1934 and the Investment Company Act of 1940, the registrant has duly caused this report to be signed on its behalf by the undersigned, thereunto duly authorized.
(registrant) Matthews International Funds
By (Signature and Title)* /s/ G. Paul Matthews
G. Paul Matthews, Chairman, Chief Investment Officer & Co-Chief
Executive Officer
(principal executive officer)
Date October 17, 2003
Pursuant to the requirements of the Securities Exchange Act of 1934 and the Investment Company Act of 1940, this report has been signed below by the following persons on behalf of the registrant and in the capacities and on the dates indicated.
By (Signature and Title)* /s/ G. Paul Matthews
G. Paul Matthews, Chairman, Chief Investment Officer & Co-Chief
Executive Officer
(principal executive officer)
Date October 17, 2003
By (Signature and Title)* /s/ James Walter
James Walter, Vice President, Investment Operations
(principal financial officer)
Date October 17, 2003
* Print the name and title of each signing officer under his or her signature.
EX-99.CODE ETH
MATTHEWS ASIAN FUNDS
Supplemental Code of Ethics for
Principal Officers and Senior Financial Officers
The Board of Trustees (the “Board”) of Matthews Asian Funds (the “Trust”) has adopted this Supplemental Code of Ethics (the “Code”) for the Trust’s Principal Officers and Senior Financial Officers (collectively, the “Officers”) to guide and remind the Officers of their responsibilities to the Trust, other officers, shareholders of the series of the Trusts (the “Funds”), and governmental authorities. Officers are expected to act in accordance with the guidance and standards set forth in this Code.
For the purposes of this Code, the Trust’s Principal Officers and Senior Financial Officers shall include: the Principal Executive Officer; the Principal Financial Officer; the Principal Accounting Officer; the Controller; and any persons performing similar functions on behalf of the Trust, regardless of whether such persons are employed by the Trust or a third party.
This Code is intended to serve as the code of ethics described in Section 406 of The Sarbanes-Oxley Act of 2002 and Form N-CSR. To the extent that an Officer is subject to the Trust’s code of ethics adopted pursuant to Rule 17j-1 of the Investment Company Act of 1940, as amended (the “Rule 17j-1 Code”), this Code is intended to supplement and be interpreted in the context of the Rule 17j-1 Code. This Code also should be interpreted in the context of all applicable laws, regulations, the Trust’s Agreement and Declaration of Trust and Bylaws, as amended, and all other governance and disclosure policies and documents adopted by the Board. All Officers must become familiar and fully comply with this Code. Because this Code cannot and does not cover every applicable law or provide answers to all questions that might arise, all Officers are expected to use common sense about what is right and wrong, including a sense of when it is proper to seek guidance from others on the appropriate course of conduct.
The purpose of this Code is to set standards for the Officers that are reasonably designed to deter wrongdoing and are necessary to promote:
| 1. | honest and ethical conduct, including the ethical handling of actual or apparent conflicts of interest between personal and professional relationships; |
| 2. | full, fair, accurate, timely, and understandable disclosure in reports and documents that the Trust files with, or submits to, the Securities and Exchange Commission (the “SEC”) and in any other public communications by the Trust; |
| 3. | compliance with applicable governmental laws, rules and regulations; |
| 4. | the prompt internal reporting of violations of the Code to the appropriate persons as set forth in the Code; and |
| 5. | accountability for adherence to the Code. |
| 1. | HONEST AND ETHICAL CONDUCT |
Honesty, Diligence and Professional Responsibility
Officers are expected to observe both the form and the spirit of the ethical principles contained in this Code. Officers must perform their duties and responsibilities for the Trust:
Officers who are certified public accountants are expected carry out their duties and responsibilities in a manner consistent with the principles governing the accounting profession, including any guidelines or principles issued by the Public Company Accounting Oversight Board or the American Institute of Certified Public Accountants from time to time.
Objectivity / Avoidance of Undisclosed Conflicts of Interest
Officers are expected to maintain objectivity and avoid undisclosed conflicts of interest. In the performance of their duties and responsibilities for the Trust, Officers must not subordinate their judgment to personal gain and advantage, or be unduly influenced by their own interests or by the interests of others. Officers must avoid participation in any activity or relationship that constitutes a conflict of interest unless that conflict has been completely disclosed to affected parties. Further, Officers should avoid participation in any activity or relationship that could create the appearance of a conflict of interest.
A conflict of interest would generally arise if an Officer directly or indirectly participated in any investment, interest, association, activity or relationship that may impair or appear to impair the Officer’s objectivity.
Any Officer who may be involved in a situation or activity that might be a conflict of interest or give the appearance of a conflict of interest should consider reporting such situation or activity using the reporting procedures set forth in Section 4 (Reporting of Illegal or Unethical Behavior) of this Code.
The Audit Committee of the Trust (the “Audit Committee”) will not be responsible for monitoring or enforcing this conflict of interest policy, but rather each Officer is responsible for self-compliance with this conflict of interest policy.
Preparation of Financial Statements
Officers must not knowingly make any misrepresentations regarding the Funds’ financial statements or any facts in the preparation of the Funds’ financial statements, and must comply with all applicable laws, standards, principles, guidelines, rules and regulations in the preparation of the Fund’s financial statements. This section is intended to prohibit:
- making, or permitting or directing another to make, materially false or misleading entries in the Funds’ financial statements or records;
- failing to correct the Funds’ financial statements or records that are materially false or misleading when he or she has the authority to record an entry; and
- signing, or permitting or directing another to sign, a document containing materially false or misleading financial information.
Officers must be scrupulous in their application of generally accepted accounting principles. No Officer may (i) express an opinion or state affirmatively that the financial statements or other financial data of the Trust are presented in conformity with generally accepted accounting principles, or (ii) state that he or she is not aware of any material modifications that should be made to such statements or data in order for them to be in conformity with generally accepted accounting principles, if such statements or data contain any departure from generally accepted accounting principles then in effect in the United States.
Officers must follow the laws, standards, principles, guidelines, rules and regulations established by all applicable governmental bodies, commissions or other regulatory agencies in the preparation of financial statements, records and related information. If an Officer prepares financial statements, records or related information for purposes of reporting to such bodies,
commissions or regulatory agencies, the Officer must follow the requirements of such organizations in addition to generally accepted accounting principles.
If an Officer and his or her supervisor have a disagreement or dispute relating to the preparation of financial statements or the recording of transactions, the Officer should take the following steps to ensure that the situation does not constitute an impermissible subordination of judgment:
The Officer should consider whether (i) the entry or the failure to record a transaction in the records, or (ii) the financial statement presentation or the nature or omission of disclosure in the financial statements, as proposed by the supervisor, represents the use of an acceptable alternative and does not materially misrepresent the facts or result in an omission of a material fact. If, after appropriate research or consultation, the Officer concludes that the matter has authoritative support and/or does not result in a material misrepresentation, the Officer need do nothing further.
If the Officer concludes that the financial statements or records could be materially misstated as a result of the supervisor’s determination, the Officer should follow the reporting procedures set forth in Section 4 (Reporting of Illegal or Unethical Behavior) of this Code.
Obligations to the Independent Auditor of the Fund
In dealing with the Funds’ independent auditor, Officers must be candid and not knowingly misrepresent facts or knowingly fail to disclose material facts, and must respond to specific inquiries and requests by the Funds’ independent auditor.
Officers must not take any action, or direct any person to take any action, to fraudulently influence, coerce, manipulate or mislead the Funds’ independent auditor in the performance of an audit of the Funds’ financial statements for the purpose of rendering such financial statements materially misleading.
| 2. | FULL, FAIR, ACCURATE TIMELY AND UNDERSTANDABLE DISCLOSURE |
It is the Trust’s policy to provide full, fair, accurate, timely, and understandable disclosure in reports and documents that the Trust files with, or submits to, the SEC and in any other public communications by the Trust. The Trust has designed and implemented Disclosure Controls and Procedures to carry out this policy.
Officers are expected to use their best efforts to promote, facilitate, and prepare full, fair, accurate, timely, and understandable disclosure in all reports and documents that the Trust files with, or submits to, the SEC and in any other public communications by the Trust.
Officers must review the Trust’s Disclosure Controls and Procedures to ensure they are aware of and carry out their duties and responsibilities in accordance with the Disclosure Controls and Procedures and the public reporting obligations of the Trust. Officers are responsible for monitoring the integrity and effectiveness of the Trust’s Disclosure Controls and Procedures.
| 3. | COMPLIANCE WITH APPLICABLE LAWS, RULES AND REGULATIONS |
Officers are expected to know, respect and comply with all laws, rules and regulations applicable to the conduct of the Trust’s business. If an Officer is in doubt about the legality or propriety of an action, business practice or policy, the Officer should seek advice from the Officer’s supervisor or the Trust’s legal counsel.
In the performance of their work, Officers must not knowingly be a party to any illegal activity or engage in acts that are discreditable to the Trust.
Officers are expected to promote the Trust’s compliance with applicable laws, rules and regulations. To promote such compliance, Officers may establish and maintain mechanisms to educate employees carrying out the finance and compliance functions of the Trust about any applicable laws, rules or regulations that affect the operation of the finance and compliance functions and the Trust generally.
| 4. | REPORTING OF ILLEGAL OR UNETHICAL BEHAVIOR |
Officers should promptly report any conduct or actions by an Officer that do not comply with the law or with this Code. Officers and the Trust shall adhere to the following reporting procedures:
- Any Officer who questions whether a situation, activity or practice is acceptable must immediately report such practice to the Principal Executive Officer of the Trust (or to an Officer who is the functional equivalent of this position) or to the Trust’s legal counsel. The person receiving the report shall consider the matter and respond to the Officer within a reasonable amount of time.
- If the Officer is not satisfied with the response of the Principal Executive Officer or counsel, the Officer must report the matter to the Chairman of the Audit Committee. If the Chairman is unavailable, the Officer may report the matter to any other member of the Audit Committee. The person receiving the report shall consider the matter, refer it to the full Audit Committee if he or she deems appropriate, and respond to the Officer within a reasonable amount of time.
- If, after receiving a response, the Officer concludes that appropriate action was not taken, he or she should consider any responsibility that may exist to communicate to third parties, such as regulatory authorities or the Fund’s independent auditor. In this matter, the Officer may wish to consult with his or her own legal counsel.
- The Audit Committee and the Trust will not be responsible for monitoring or enforcing this reporting of violations policy, but rather each Officer is responsible for self-compliance with this reporting of violations policy.
- To the extent possible and as allowed by law, reports will be treated as confidential.
- If the Audit Committee determines that an Officer violated this Code, failed to report a known or suspected violation of this Code, or provided intentionally false or malicious information in connection with an alleged violation of this Code, the Trust may take disciplinary action against any such Officer to the extent the Audit Committee deems appropriate. No Officer will be disciplined for reporting a concern in good faith.
- The Trust and the Audit Committee may report violations of the law to the appropriate authorities.
| 5. | ACCOUNTABILITY AND APPLICABILITY |
All Officers will be held accountable for adherence to this Code. On an annual basis, within 30 days of the beginning of each calendar year, each Officer shall certify in writing his or her receipt, familiarity and commitment to compliance with this Code, by signing the Acknowledgment Form (Appendix A to this Code).
This Code is applicable to all Officers, regardless of whether such persons are employed by the Trust or a third party. If an Officer is aware of a person (“Potential Officer”) who may be considered an Officer as defined by this Code, the Officer should inform legal counsel to the Trust of such Potential Officer so that a determination can be made regarding whether such Potential Officer has completed or should complete an Acknowledgment Form. However, the absence of such a determination will not be deemed to relieve any person of his or her duties under this Code.
| 6. | DISCLOSURE OF THIS CODE |
This Code shall be disclosed by at least one of the following methods in the manner prescribed by the SEC, unless otherwise required by law:
- by filing a copy of the Code with the SEC;
- by posting the text of the Code on the Trust’s website; or
- by providing, without charge, a copy of the Code to any person upon request.
Any waiver of this Code, including an implicit waiver, that has been granted to an Officer, may be made only by the Board or a committee of the Board to which such responsibility has been delegated, and must be disclosed by the Trust in the manner prescribed by law and as set forth above in Section 6 (Disclosure of this Code).
This Code may be amended by the affirmative vote of a majority of the Board. Any amendment of this Code, must be disclosed by the Trust in the manner prescribed by law and as set forth above in Section 6 (Disclosure of this Code), unless such amendment is deemed to be technical, administrative, or otherwise non-substantive. Any amendments to this Code will be provided to the Officers.
Approved by the Board of Trustees on May 16, 2003.
APPENDIX A
Matthews Asian Funds
Certification and Acknowledgment of Receipt of Supplemental Code of Ethics for Principal Officers and Senior Financial Officers
I acknowledge and certify that I have received a copy of Matthews Asian Funds’ Supplemental Code of Ethics for Principal Officers and Senior Financial Officers (the “Code”). I understand and agree that it is my responsibility to read and familiarize myself with the policies and procedures contained in the Code and to abide by those policies and procedures.
I acknowledge my commitment to comply with the Code.
| __________________________________ | | __________________________________ | |
| Officer Name (Please Print) | | Officer Signature | |
| |
| | | __________________________________
Date |
