UNITED STATES
SECURITIES AND EXCHANGE COMMISSION
Washington, D.C. 20549
FORM N-CSR
CERTIFIED SHAREHOLDER REPORT OF REGISTERED MANAGEMENT
INVESTMENT COMPANIES
Investment Company Act file number 811-08510
Matthews International Funds
(Exact name of registrant as specified in charter)
Four Embarcadero Center, Suite 550
San Francisco, CA 94111
(Address of principal executive offices) (Zip code)
William J. Guilfoyle, President
Four Embarcadero Center, Suite 550
San Francisco, CA 94111
(Name and address of agent for service)
Registrant’s telephone number, including area code: 415-788-6036
Date of fiscal year end: December 31
Date of reporting period: June 30, 2008
Form N-CSR is to be used by management investment companies to file reports with the Commission not later than 10 days after the transmission to stockholders of any report that is required to be transmitted to stockholders under Rule 30e-1 under the Investment Company Act of 1940 (17 CFR 270.30e-1). The Commission may use the information provided on Form N-CSR in its regulatory, disclosure review, inspection, and policymaking roles.
A registrant is required to disclose the information specified by Form N-CSR, and the Commission will make this information public. A registrant is not required to respond to the collection of information contained in Form N-CSR unless the Form displays a currently valid Office of Management and Budget (“OMB”) control number. Please direct comments concerning the accuracy of the information collection burden estimate and any suggestions for reducing the burden to Secretary, Securities and Exchange Commission, 100 F Street, NE, Washington, DC 20549. The OMB has reviewed this collection of information under the clearance requirements of 44 U.S.C. § 3507.
| Item 1. | Reports to Stockholders. |
The Report to Shareholders is attached herewith.

| | | | | | | | |
| | | | | | Investing in the future | | |
| | | | | | of Asia since 1994 | | |
E-mail communications on Asia and the Funds
are available at www.matthewsfunds.com
| • | | AsiaNow Special Reports |
| • | | Occasional Fund Updates |
CONTENTS
This report has been prepared for Matthews Asian Funds shareholders. It is not authorized for distribution to prospective investors unless accompanied or preceded by a current Matthews Asian Funds prospectus, which contains more complete information about the Funds’ investment objectives, risks and expenses. You should read the prospectus carefully before investing. Additional copies of the prospectus may be obtained at www.matthewsfunds.com. Please read the prospectus carefully before you invest or send money.
The Matthews Asian Funds are distributed by:
PFPC Distributors, Inc.
760 Moore Road
King of Prussia, PA 19406
MESSAGE TO SHAREHOLDERS
FROM THE INVESTMENT ADVISOR
Dear Valued Shareholders,
The first quarter of 2008 will undoubtedly be remembered for its caustic markets, and the second quarter saw no respite. Equities around the world generally continued their descent, and shares in Asian markets suffered in tandem. Stocks retreated on concerns that the global economy might slow substantially, with U.S. financial institutions under severe pressure. These fears have weighed heavily on overseas markets, including Asia, though the U.S. credit market’s collapse has had only a limited impact on fundamentals in the region so far. Thus, cumulative losses announced by Asian banks have been relatively small, less than 10% of the $400 billion estimated to have been lost globally. Meanwhile, the Asian region is still projected to grow at a healthy, albeit moderated rate: the International Monetary Fund forecasts that the economies of the developing nations of Asia will grow at 8.4% this year, and Japan at 1.5%.
If there are greater concerns ahead for the region, they emanate from two other sources: accelerating inflation on consumer goods, and high energy prices, especially for oil. The latest readings of prices in the region generally suggest that inflation is running at the highest levels seen in the last one to two decades. As we have highlighted in recent commentaries posted on our website, this is not necessarily damaging in and of itself, provided that such inflation does not escalate to even higher levels. In our view, Asia’s greater challenge arises not from issues affecting the U.S., but rather the potential for policy errors by governments in reaction to burgeoning inflation. Many consumers in the region are expecting local governments to blunt or contain the impact of inflation on their living standards. Governments, in a bid to shore up voter support, have in turn sought to intervene in markets, typically via subsidies, price controls or trading restrictions. It is our experience that such intervention typically serves to exacerbate inflationary pressures, or makes them more structurally permanent. The region’s greatest risks are ultimately that policy overreaction may lead to greater market distortions and more permanent inflation, or may otherwise hinder the region’s growth prospects.
Oil prices have posed a second stumbling block to the region. Only a few decades ago, the region outside Japan and Australia was a relatively small consumer of oil and other natural resources. Several large markets, such as China and Indonesia, were once net exporters of oil. However, as the region’s economies have developed, local governments have done little to wean their industries off of hydrocarbon-based production and transportation systems. Worse, many governments have sought to subsidize energy prices domestically, so as to make fuels more affordable for end consumers (especially households). While this has meant that local economies have expanded smoothly in recent years, it has also meant growing distortions in the structure of the economies: many domestic consumers have not been forced to pay a market-based price for their energy consumption, and this has arguably led to excessive consumption and waste.
The bill for such subsidies, incurred by rising fiscal deficits in the region, has grown sharply in recent quarters as oil prices have surpassed $140 per barrel. Some currencies around the region have begun to swoon from such fiscal
2 MATTHEWS ASIAN FUNDS
JUNE 30, 2008
pressure. There is a small silver lining to this situation, though: during the last quarter, many Asian countries have been forced to reduce their subsidies, or depart from them entirely, as the sheer financial cost has proved too great. As market participants are forced to pay market prices for their consumption, it may induce greater conservation and efficiency in the future.
Asian markets have been decidedly weak in the first half, and we would make no predictions about their near-term course. Investors’ attention has rightly been focused on the current slump; however, to illustrate ways in which the region continues to evolve, we would like to highlight a few notable news events from the second quarter. During times such as these, it is important to cultivate an understanding of this evolution. It is this ongoing development that we, as long-term investors, remain excited about, even as the present condition of markets might be frustrating.
Perhaps the most notable of all these events was China’s growing political complexity and sophistication. During the past six months, China has been confronted with considerable challenges: severe blizzards threatened lives and crippled transport; the country’s relationship with Darfur was roundly criticized; suppression in Tibet invoked global scorn; and a tragic earthquake wrought destruction, killing more than 69,000. China’s leadership was tested on each of these occasions, and the results are safely interpreted as mixed. China’s slow movement on Darfur has come at terrible cost, and its suppression of Tibetan unrest has left even the country’s enthusiasts disappointed. Yet it would be a mistake not to acknowledge that there is also a different strain of thought emerging in the government, one characterized by a new sort of transparency, responsiveness and civic orientation.
While the affairs of Tibet remain murky, one could not help but notice that protests this spring garnered a greater level of international media coverage than in times past. Improved media access was even more apparent in May, following the earthquake that hit the Sichuan region. Journalists had nearly unrestrained access to disaster zones, as they reported on the devastation, the government’s response, and most importantly on the political unrest that ensued. Press reports included accounts from bereaved parents who decried corruption, shoddy building codes and lax enforcement as reasons that many schools in the earthquake zone collapsed. While the media presented images of prostrate officials, kneeling before wrathful parents holding photos of their lost loved ones, many stories also praised the central government for its swift and thorough response to the crisis.
In our view, this sort of openness about a national catastrophe and its causes, as well as the responsiveness that ensued, is something new to China. The earthquake even initiated a small but notable political détente: for the first time since World War II, a Japanese naval ship was allowed into a Chinese port—this time with the intent of offering assistance. This small but symbolic gesture was accompanied by a landmark agreement between Japan and China to co-develop a set of underwater gas fields in long-disputed territory in the East China Sea.
continued on page 4
800.789.ASIA [2742] www.matthewsfunds.com 3
MESSAGE TO SHAREHOLDERS
continued from page 3
A thawing of sorts also came to China’s dealings with Taiwan. More frequent dialogue has helped bridge some of the worst sources of tension between the two parties. The mood in Taiwan itself has shifted, as there appears to be increasing recognition that the country’s economic destiny (if not its political center) is forever intertwined with the mainland. Taiwan’s recent political election hints at as much, as the opposition party overturned the incumbent primarily on a platform that espoused better ties with China. Though few changes have taken place to cement such ties, direct airline flights between the two countries began on July 4—an important symbol of the growing links between the two former foes. While there is much ground still to cover, this shift in the cross-strait relations, if it should deepen and become more permanent, would alleviate one of the greatest security threats hanging over the region.
In another part of the region, there was one more important change to Asia’s security sphere: North Korea took small but deliberate steps toward defusing its own status as a hostile threat. The country destroyed a cooling tower at one of its main nuclear facilities, and then shared details of its nuclear planning framework with international inspectors. For this, the U.S. has undertaken to remove North Korea from the U.S. watch list of terrorist-sponsoring nations. These events do not, by any means, constitute an end to the North Korea problem, but they do represent one of the biggest steps forward in relations with the country in the last decade.
Thus, even as financial markets have been shaken, the landscape in Asia continues to evolve in an encouraging fashion. Fundamentals in the region, including earnings growth, will undoubtedly suffer some in the current environment, though it has been encouraging to see that export and economic activity in the region remains robust, at least thus far. Valuations, of course, have declined, particularly as multiples have fallen faster than earnings estimates. This is a glass that is at once half full and half empty. Capital has been lost as markets have declined, but valuations are beginning to look more reasonable, and arguably are healthier, than they were not long ago. Most importantly, we see Asian corporates and consumers to be in fairly healthy shape, with high savings rates, income growth and low rates of leverage. It is this sort of condition that makes us confident in the long-term prospects for the region, even as present markets are challenging.
It is our great privilege to serve as your investment advisor in Asia. We appreciate your persistence amid difficult markets, and we pledge to continue to seek out Asia’s investment potential in the years ahead.
Sincerely
|
/s/ Andrew T. Foster |
| Andrew T. Foster |
| Acting Chief Investment Officer |
| Matthews International Capital Management, LLC |
|
/s/ G. Paul Matthews |
| G. Paul Matthews |
| Chairman |
| Matthews International Capital Management, LLC |
4 MATTHEWS ASIAN FUNDS
JUNE 30, 2008
REDEMPTION FEE POLICY
Market timing can disrupt the management of a Fund’s investment portfolio and cause the targeted Fund to incur costs to accommodate frequent buying and selling of shares by the market timer. These costs are borne by the Fund’s non-redeeming shareholders. As part of their efforts to discourage market timing activity, the Funds attempt to allocate these costs, to the extent permissible, to redeeming shareholders through the assessment of a redemption fee of 2.00% of the total redemption proceeds of shareholders who sell or exchange shares within 90 calendar days after purchasing them. This fee is payable directly to the Funds. For purposes of determining whether the redemption fee applies, the shares that have been held longest will be redeemed first. The Funds may grant exemptions from the redemption fee where the Funds believe the transaction or account will not involve market timing activity. The Funds reserve the right at any time to restrict purchases or exchanges or impose conditions that are more restrictive on excessive or disruptive trading, and to modify or eliminate the redemption fee at any time, without notice to shareholders. You will receive notice of any material changes to the Funds’ redemption fee policies. For more information on this policy, please see the Funds’ prospectus. Additional restrictions may apply to shareholders who purchase shares of the Funds through a financial intermediary; please consult your intermediary.
INVESTOR DISCLOSURE
Past Performance: All performance quoted in this report is past performance and is no guarantee of future results. Investment return and principal value will fluctuate with changing market conditions so that when redeemed, shares may be worth more or less than their original cost. Current performance may be lower or higher than the returns quoted. If certain of the Funds’ fees and expenses had not been waived, returns would have been lower. For the Funds’ most recent month-end performance, please call 1-800-789-ASIA [2742] or visit www.matthewsfunds.com.
Investment Risk: Mutual fund shares are not deposits or obligations of, or guaranteed by, any depositary institution. Shares are not insured by the FDIC, Federal Reserve Board or any government agency and are subject to investment risks, including possible loss of principal amount invested. Investing in international markets may involve additional risks, such as social and political instability, market illiquidity, exchange-rate fluctuations, a high level of volatility and limited regulation. In addition, single-country and sector funds may be subject to a higher degree of market risk than diversified funds because of concentration in a specific industry, sector or geographic location. Please see the Funds’ prospectus and Statement of Additional Information for more risk disclosure.
Fund Holdings: The Fund holdings shown in this report are as of June 30, 2008. Holdings are subject to change at any time, so holdings shown in this report may not reflect current Fund holdings. The Funds file complete schedules of portfolio holdings with the Securities and Exchange Commission (the “SEC”) for the first and third quarters of each fiscal year on Form N-Q. The Funds’ Form N-Q is filed with the SEC within 60 days of the end of the quarter to which it relates, and is available on the SEC’s website at www.sec.gov. It may also be reviewed and copied at the Commission’s Public Reference Room in Washington, D.C. Information on the operation of the Public Reference Room may be obtained by calling 800-SEC-0330.
Proxy Voting Record: The Funds’ Statement of Additional Information containing a description of the policies and procedures that the Funds have used to vote proxies relating to portfolio securities, along with each Fund’s proxy voting record relating to portfolio securities held during the 12-month period ended June 30, 2008, is available upon request, at no charge, at the Funds’ website at www.matthewsfunds.com or by calling 1-800-789-ASIA [2742], or on the SEC’s website at www.sec.gov.
Shareholder Reports and Prospectuses: To reduce the Funds’ expenses, we try to identify related shareholders in a household and send only one copy of the Funds’ prospectus and financial reports to that address. This process, called “householding,” will continue indefinitely unless you instruct us otherwise. At any time you may view the Funds’ current prospectus and financial reports on our website. If you prefer to receive individual copies of the Funds’ prospectus or financial reports, please call us at 1-800-789-ASIA [2742].
800.789.ASIA [2742] www.matthewsfunds.com 5
MATTHEWS ASIA PACIFIC EQUITY INCOME FUND
| | |
| FUND OBJECTIVE AND STRATEGY | | SYMBOL: MAPIX |
Objective: Total return with an emphasis on providing current income. Total return includes current income (dividends and distributions paid to shareholders) and capital gains (share price appreciation). The Fund measures total return over longer periods.
Strategy: Under normal market conditions, the Matthews Asia Pacific Equity Income Fund seeks to achieve its investment objective by investing at least 80% of its total net assets, which include borrowings for investment purposes, in income-paying publicly traded common stocks, preferred stocks, convertible preferred stocks, and other equity-related instruments (including, for example, investment trusts and other financial instruments) of companies located in the Asia Pacific region, which includes Australia, China, Hong Kong, India, Indonesia, Japan, Malaysia, New Zealand, Pakistan, Philippines, Singapore, South Korea, Taiwan, Thailand and Vietnam.
| | |
| PORTFOLIO MANAGERS | | |
| |
| Lead Manager: Jesper Madsen, CFA | | Co-Manager: Andrew T. Foster |
PORTFOLIO MANAGER COMMENTARY
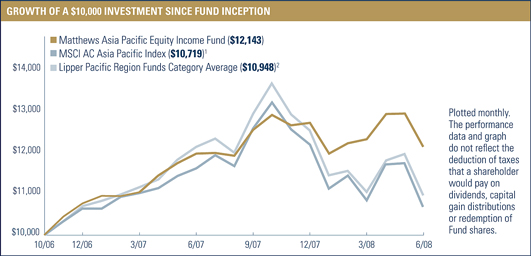
The Matthews Asia Pacific Equity Income Fund declined -4.66% during the first six months of 2008, while its benchmark, the MSCI All Country Asia Pacific Index, fell -12.18%. During the quarter ending June 30, 2008, the Fund distributed its second quarterly dividend of 7.53 cents, bringing the total year-to-date income distribution to 13.39 cents per share.
Inflation fears, driven by rising oil and food prices, as well as worries about the impact of a potential U.S. recession on corporate profits in Asia, weighed on equities across the region. Equity markets in Asia Pacific continued to exhibit a high degree of correlation with global markets. However, a short-term singular focus on the correlation in equity markets misses the point that when it comes to dividend payments, Asian companies are moving to a different beat than their U.S. counterparts. The balance sheets of companies in the region generally remain as healthy as they have been during the past decade, while earnings growth has continued to support dividend payments. This is important for long-term investors since sustainable and growing dividends can help mitigate some downside volatility during periods of pull-backs in equity markets. The Fund’s relative outperformance for the period may, in part, be reflective of this. For dividends to offer support to share prices though, they must at a minimum be “sustainable.” Once the dividend is cut or market participants suspect it cannot be maintained, share prices tend to suffer as a consequence. The financial sector in the U.S. during the past 12 months has shown evidence of this.
The Fund seeks to invest in companies we believe will grow dividends over time. Dividends may not always grow in a straight line from year to year and in some cases, may even be cut. This holds particularly true for smaller companies, with more volatile earnings, less access to capital markets and therefore, a greater need to maintain capital on the balance sheet. The attraction of successful smaller companies, though, is their potential
continued on page 9
6 MATTHEWS ASIAN FUNDS
ALL DATA IS AS OF JUNE 30, 2008, UNLESS OTHERWISE NOTED
| | | | | | | | | | | | |
PERFORMANCE AS OF JUNE 30, 2008 | |
| Fund Inception: 10/31/06 | | 3 MO | | | YTD | | | Average Annual Total Returns | |
| | | | 1 YR | | | SINCE
INCEPTION | |
Matthews Asia Pacific Equity Income Fund | | –1.60 | % | | –4.66 | % | | 1.57 | % | | 12.39 | % |
MSCI All Country Asia Pacific Index1 | | –1.37 | % | | –12.18 | % | | –8.43 | % | | 4.26 | % |
Lipper Pacific Region Funds Category Average2 | | –1.62 | % | | –12.69 | % | | –9.85 | % | | 5.50 | % |
All performance quoted is past performance and is no guarantee of future results. Assumes reinvestment of all dividends and/or distributions. Unusually high returns may not be sustainable. Investment return and principal value will fluctuate with changing market conditions so that shares, when redeemed, may be worth more or less than their original cost. Current performance may be lower or higher than the return figures quoted. Returns would have been lower if certain of the Fund’s fees and expenses had not been waived. For the Fund’s most recent month-end performance please call 800-789-ASIA [2742] or visit www.matthewsfunds.com.
| | | | | | | | | | | | | | |
| INCOME DISTRIBUTION HISTORY | | Q1 | | | Q2 | | | Q3 | | Q4 | | | TOTAL | |
2008 | | 5.86 | ¢ | | 7.53 | ¢ | | N/A | | N/A | | | N/A | |
2007 | | — | | | 10.30 | ¢ | | — | | 17.12 | ¢ | | 27.42 | ¢ |
2006 (Fund inception: 10/31/06) | | | | | | | | | | 1.97 | ¢ | | 1.97 | ¢ |
In March 2008, the Fund began to distribute investment income dividends on a quarterly rather than semiannual basis. For additional details regarding Fund distributions, visit www.matthewsfunds.com.
| | | | | | | | |
FISCAL YEAR 2007 RATIOS | | | | | | | | |
Gross Operating Expense:3 1.41% | | | | Portfolio Turnover: | 4 | | 26.95 | % |
1 | The MSCI All Country Asia Pacific Index is a free float–adjusted market capitalization–weighted index of the stock markets of Australia, China, Hong Kong, India, Indonesia, Japan, Malaysia, New Zealand, Pakistan, Philippines, Singapore, South Korea, Taiwan and Thailand. The Fund invests in countries that are not included in the MSCI All Country Asia Pacific Index. It is not possible to invest directly in an index. Source: Index data from Morgan Stanley Capital International; total return calculations performed by PNC Global Investment Servicing (“PNC”), formerly known as PFPC Inc. |
2 | Lipper, Inc. fund performance does not reflect sales charges and is based on total return, including reinvestment of dividends and capital gains, for the stated periods. |
3 | Ratio has been restated to reflect current management and administrative and shareholder servicing fees expected to be incurred by the Funds and paid to Matthews International Capital Management (the “Advisor”). The Advisor has contractually agreed to waive fees and reimburse expenses to the extent needed to limit total annual operating expenses to 1.50% until October 31, 2009. Matthews Asian Funds do not charge 12b-1 fees. |
4 | The lesser of fiscal year 2007 long-term purchase costs or sales proceeds divided by the average monthly market value of long-term securities. |
800.789.ASIA [2742] www.matthewsfunds.com 7
MATTHEWS ASIA PACIFIC EQUITY INCOME FUND
| | | | | |
TOP TEN HOLDINGS1 | | | | | |
| | | COUNTRY | | % OF NET ASSETS | |
Taiwan Semiconductor Manufacturing Co., Ltd. | | Taiwan | | 4.8 | % |
Lawson, Inc. | | Japan | | 3.7 | % |
HSBC Holdings PLC | | United Kingdom | | 3.5 | % |
Singapore Press Holdings, Ltd. | | Singapore | | 3.3 | % |
Monex Group, Inc. | | Japan | | 3.2 | % |
Globe Telecom, Inc. | | Philippines | | 2.9 | % |
VTech Holdings, Ltd. | | China/Hong Kong | | 2.8 | % |
The Sumitomo Trust & Banking Co., Ltd. | | Japan | | 2.7 | % |
Ito En, Ltd., Pfd. | | Japan | | 2.6 | % |
BOC Hong Kong Holdings, Ltd. | | China/Hong Kong | | 2.6 | % |
% OF ASSETS IN TOP 10 | | | | 32.1 | % |
| | | |
COUNTRY ALLOCATION | | | |
Japan | | 22.9 | % |
China/Hong Kong | | 21.3 | % |
Taiwan | | 15.8 | % |
Singapore | | 7.4 | % |
Malaysia | | 7.4 | % |
Australia | | 7.0 | % |
United Kingdom2 | | 3.5 | % |
South Korea | | 3.4 | % |
Thailand | | 3.2 | % |
India | | 3.0 | % |
Philippines | | 3.0 | % |
Indonesia | | 1.6 | % |
Cash and other assets, less liabilities | | 0.5 | % |
| | | |
SECTOR ALLOCATION | | | |
Consumer Discretionary | | 24.4 | % |
Financials | | 22.8 | % |
Information Technology | | 16.7 | % |
Telecommunication Services | | 10.7 | % |
Consumer Staples | | 10.1 | % |
Health Care | | 5.9 | % |
Utilities | | 3.6 | % |
Industrials | | 3.4 | % |
Energy | | 1.9 | % |
Cash and other assets, less liabilities | | 0.5 | % |
| | | |
MARKET CAP EXPOSURE3 | | | |
Large cap (over $5 billion) | | 43.3 | % |
Mid cap ($1–$5 billion) | | 34.5 | % |
Small cap (under $1 billion) | | 21.7 | % |
Cash and other assets, less liabilities | | 0.5 | % |
| | | | | | | | |
NUMBER OF SECURITIES | | NAV | | FUND ASSETS | | REDEMPTION FEE | | 12b-1 FEES |
56 | | $11.29 | | $99.1 million | | 2.00% within 90 calendar days | | None |
1 | Holdings may combine more than one security from same issuer and related depositary receipts. |
2 | The United Kingdom is not included in the MSCI All Country Asia Pacific Index. |
3 | Source: FactSet Research Systems. Percentage values in data are rounded to the nearest tenth of one percent; the values may not sum to 100% due to rounding. |
8 MATTHEWS ASIAN FUNDS
ALL DATA IS AS OF JUNE 30, 2008, UNLESS OTHERWISE NOTED
PORTFOLIO MANAGER COMMENTARY continued from page 6
to grow the dividend at a faster rate over the longer term. To mitigate the risk of dividend cuts, the Fund is diversified across 51 companies along the market capitalization spectrum, residing in 12 countries and operating in nine different economic sectors. While five of the Fund’s holdings cut dividends during the last fiscal year, as of the end of June, 36 have raised dividends, resulting in a weighted 13% increase in the dividend per share at the portfolio level. The companies that cut their dividends were of small or medium capitalization.
Lawson, Inc., Japan’s second-largest convenience store operator with more than 8,500 stores, was the Fund’s primary contributor to performance during the first six months of 2008. Japan has been a challenging environment for retailers for years. Deflationary pressures made it difficult for retailers to increase prices and general spending was subdued due to stagnant wage growth. Retailers generally benefit from a moderate level of inflation since it allows them to pass through price increases that, in turn, underpin same-store sales growth. Furthermore, the convenience store segment in Japan has become increasingly competitive as the main convenience store operators have pursued aggressive store roll-outs. Even given these challenges, Lawson, Inc., a holding since the Fund’s inception, has done well: while same-store sales had experienced protracted declines in recent years, the company still managed to grow cash flows and dividends. The company has been at the forefront in Japan when it comes to capital management. Lawson’s estimated dividend payment for the current fiscal year represents an increase of 45% compared to the previous year. The company is also engaging in share buybacks in order to improve capital efficiency. Furthermore, should inflation take root in Japan, Lawson, Inc., could be a primary beneficiary.
The Fund’s Indian holdings were the main detractors to performance as foreign portfolio flows continued to exit the country. With wholesale inflation accelerating from 3.8% at the end of 2007 to 11.9% at the end of June, investors expect the Reserve Bank of India (RBI) to become increasingly assertive in its stance toward inflation. The RBI has already twice raised the repurchase rate, increasing it from 7.75% to 8.50% during the month of June. The higher credit costs mixed with a hike in fuel prices represented two strong headwinds for Ashok Leyland, India’s second-largest commercial vehicle manufacturer, making it the Fund’s main detractor to performance during the first six months.
The Fund continues to invest in companies we believe can sustain or grow their dividends, even during periods of rising cost pressures. We continue to find attractive investment candidates, especially in companies that enjoy a strong market position. This standing can derive from brand power or from dominant market share within their respective industries. These companies retain a greater ability to pass through costs via higher prices, thereby maintaining margins and the cash flows to fund dividend payments.
800.789.ASIA [2742] www.matthewsfunds.com 9
MATTHEWS ASIA PACIFIC EQUITY INCOME FUND
SCHEDULE OF INVESTMENTSa (UNAUDITED)
COMMON EQUITIES: 96.8%
| | | | | |
| | | SHARES | | VALUE |
CHINA/HONG KONG: 21.3% | | | | | |
VTech Holdings, Ltd. | | 452,000 | | $ | 2,727,260 |
BOC Hong Kong Holdings, Ltd. | | 966,000 | | | 2,560,602 |
CLP Holdings, Ltd. | | 289,500 | | | 2,482,694 |
Hang Seng Bank, Ltd. | | 100,100 | | | 2,113,523 |
Television Broadcasts, Ltd. | | 352,000 | | | 2,033,194 |
ASM Pacific Technology, Ltd. | | 242,000 | | | 1,829,052 |
Sa Sa International Holdings, Ltd. | | 3,800,000 | | | 1,721,450 |
Café de Coral Holdings, Ltd. | | 912,000 | | | 1,636,700 |
Pico Far East Holdings, Ltd. | | 10,696,000 | | | 1,628,208 |
Next Media, Ltd. | | 3,466,000 | | | 1,331,615 |
Huaneng Power International, Inc. H Shares | | 836,000 | | | 580,093 |
Huaneng Power International, Inc. ADR | | 17,500 | | | 483,875 |
| | | | | |
Total China/Hong Kong | | | | | 21,128,266 |
| | | | | |
JAPAN: 20.2% | | | | | |
Lawson, Inc. | | 75,700 | | | 3,685,728 |
Monex Group, Inc. | | 4,594 | | | 3,123,669 |
The Sumitomo Trust & Banking Co., Ltd. | | 383,000 | | | 2,676,329 |
Eisai Co., Ltd. | | 69,800 | | | 2,465,037 |
Benesse Corp. | | 54,800 | | | 2,219,146 |
Hitachi Koki Co., Ltd. | | 108,000 | | | 1,777,878 |
Nomura Research Institute, Ltd. | | 67,000 | | | 1,571,126 |
Tokyu REIT, Inc. | | 155 | | | 1,259,735 |
Takeda Pharmaceutical Co., Ltd. | | 24,700 | | | 1,256,110 |
| | | | | |
Total Japan | | | | | 20,034,758 |
| | | | | |
TAIWAN: 15.8% | | | | | |
Taiwan Semiconductor Manufacturing Co., Ltd. | | 1,986,298 | | | 4,253,595 |
Cyberlink Corp. | | 535,000 | | | 2,555,761 |
Chunghwa Telecom Co., Ltd. | | 857,727 | | | 2,218,284 |
Johnson Health Tech Co., Ltd. | | 1,193,000 | | | 1,918,044 |
President Chain Store Corp. | | 485,000 | | | 1,613,844 |
Giant Manufacturing Co., Ltd. | | 527,000 | | | 1,415,033 |
Taiwan Secom Co., Ltd. | | 609,000 | | | 1,157,688 |
Taiwan Semiconductor Manufacturing Co., Ltd. ADR | | 50,087 | | | 546,449 |
| | | | | |
Total Taiwan | | | | | 15,678,698 |
| | | | | |
SINGAPORE: 7.4% | | | | | |
Singapore Press Holdings, Ltd. | | 1,036,000 | | | 3,236,191 |
Venture Corp., Ltd. | | 275,000 | | | 1,982,838 |
Parkway Life REIT | | 1,430,868 | | | 1,188,402 |
Singapore Post, Ltd. | | 1,142,000 | | | 923,303 |
| | | | | |
Total Singapore | | | | | 7,330,734 |
| | | | | |
MALAYSIA: 7.4% | | | | | |
Public Bank BHD | | 676,000 | | | 2,151,614 |
Top Glove Corp. BHD | | 1,637,100 | | | 2,124,347 |
Media Prima BHD | | 3,235,900 | | | 1,792,496 |
Berjaya Sports Toto BHD | | 811,200 | | | 1,206,559 |
| | | | | |
Total Malaysia | | | | | 7,275,016 |
| | | | | |
AUSTRALIA: 7.0% | | | | | |
Coca-Cola Amatil, Ltd. | | 309,730 | | | 2,081,434 |
AXA Asia Pacific Holdings, Ltd. | | 413,439 | | | 1,854,892 |
Billabong International, Ltd. | | 160,951 | | | 1,666,399 |
Insurance Australia Group, Ltd. | | 230,121 | | | 765,504 |
Tabcorp Holdings, Ltd. | | 61,523 | | | 578,586 |
| | | | | |
Total Australia | | | | | 6,946,815 |
| | | | | |
10 MATTHEWS ASIAN FUNDS
JUNE 30, 2008
| | | | | |
| | | SHARES | | VALUE |
UNITED KINGDOM: 3.5% | | | | | |
HSBC Holdings PLC ADR | | 26,900 | | $ | 2,063,230 |
HSBC Holdings PLC | | 90,800 | | | 1,399,576 |
| | | | | |
Total United Kingdom | | | | | 3,462,806 |
| | | | | |
SOUTH KOREA: 3.4% | | | | | |
Hana Financial Group, Inc. | | 37,640 | | | 1,448,315 |
SK Telecom Co., Ltd. | | 6,570 | | | 1,196,487 |
SK Telecom Co., Ltd. ADR | | 36,300 | | | 753,951 |
| | | | | |
Total South Korea | | | | | 3,398,753 |
| | | | | |
THAILAND: 3.2% | | | | | |
Advanced Info Service Public Co., Ltd. | | 710,600 | | | 1,965,919 |
PTT Public Co., Ltd. | | 136,500 | | | 1,232,930 |
| | | | | |
Total Thailand | | | | | 3,198,849 |
| | | | | |
INDIA: 3.0% | | | | | |
Ashok Leyland, Ltd. | | 1,845,000 | | | 1,224,282 |
HCL-Infosystems, Ltd. | | 340,167 | | | 1,108,854 |
Chennai Petroleum Corp., Ltd. | | 105,000 | | | 653,916 |
| | | | | |
Total India | | | | | 2,987,052 |
| | | | | |
PHILIPPINES: 3.0% | | | | | |
Globe Telecom, Inc. | | 110,560 | | | 2,905,909 |
| | | | | |
Total Philippines | | | | | 2,905,909 |
| | | | | |
INDONESIA: 1.6% | | | | | |
PT Telekomunikasi Indonesia ADR | | 35,200 | | | 1,135,200 |
PT Telekomunikasi Indonesia | | 559,000 | | | 442,592 |
| | | | | |
Total Indonesia | | | | | 1,577,792 |
| | | | | |
TOTAL COMMON EQUITIES | | | | | 95,925,448 |
(Cost $96,237,073) | | | | | |
| | | | | |
PREFERRED EQUITIES: 2.7% | | | |
JAPAN: 2.7% | | | | | |
Ito En, Ltd., Pfd. | | 246,700 | | | 2,625,333 |
| | | | | |
Total Japan | | | | | 2,625,333 |
| | | | | |
TOTAL PREFERRED EQUITIES | | | | | 2,625,333 |
(Cost $2,711,890) | | | | | |
| | | | | |
TOTAL INVESTMENTS: 99.5% | | | | | 98,550,781 |
(Cost $98,948,963b) | | | | | |
| | |
CASH AND OTHER ASSETS, LESS LIABILITIES: 0.5% | | | | | 525,524 |
| | | | | |
NET ASSETS: 100.0% | | | | | 99,076,305 |
| | | | | |
| a | Certain securities were fair valued under the discretion of the Board of Trustees (Note 1-A). |
| b | Cost of investments is $98,948,963 and net unrealized depreciation consists of: |
| | | | |
Gross unrealized appreciation | | $ | 7,768,055 | |
Gross unrealized depreciation | | | (8,166,237 | ) |
| | | | |
Net unrealized depreciation | | $ | (398,182 | ) |
| | | | |
| ADR | American Depositary Receipt |
| REIT | Real Estate Investment Trust |
See accompanying notes to financial statements.
800.789.ASIA [2742] www.matthewsfunds.com 11
MATTHEWS ASIAN GROWTH AND INCOME FUND
(CLOSED TO MOST NEW INVESTORS)
| | |
| FUND OBJECTIVE AND STRATEGY | | SYMBOL: MACSX |
Objective: Long-term capital appreciation. The Fund also seeks to provide some current income.
Strategy: Under normal market conditions, the Matthews Asian Growth and Income Fund seeks to achieve its investment objective by investing at least 80% of its total net assets, which include borrowings for investment purposes, in dividend-paying equity securities and the convertible securities, of any duration or quality, of companies located in Asia. Asia includes China, Hong Kong, India, Indonesia, Japan, Malaysia, Pakistan, Philippines, Singapore, South Korea, Taiwan, Thailand and Vietnam.
PORTFOLIO MANAGERS
| | |
| Lead Manager: Andrew T. Foster | | Co-Manager: G. Paul Matthews |
PORTFOLIO MANAGER COMMENTARY
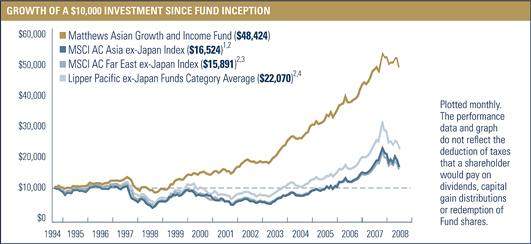
During the first half of 2008, the Matthews Asian Growth and Income Fund declined –8.04%, while its primary benchmark, the MSCI All Country Asia ex-Japan Index, fell –21.10% and the MSCI All Country Far East ex-Japan Index dropped –18.21% during the same period. On June 25, the Fund paid a semi-annual distribution of approximately 68 cents per share, of which about 25 cents represented income, and 43 cents was capital gain.
During the second quarter, markets around the world, and especially in Asia, continued the slump that commenced earlier in the year. Asian shares were hit particularly hard, by a dual set of headwinds: inflation and energy prices. Throughout the region, inflation measurements suggest that price increases for most goods and services are running at levels not seen in a decade. Meanwhile, high and rapidly rising prices for oil, coal and other resources have given markets pause. Energy prices have risen to such levels as to prove daunting for many Asian governments, several of which have been forced to abandon energy-related subsidies for consumers for fear of incurring enormous fiscal liabilities.
The twin difficulties of inflationary pressures and high oil prices put central banks in the region in an awkward spot. Most central banks have halfheartedly tried to quell inflation by raising interest rates or by other means. However, most banks have moved cautiously, as there is considerable concern that high oil prices, against the backdrop of what may be a slowing global economy, might temper Asian growth and demand. The fear that such central bankers share is that as they act to reign in inflation, they will do so at a time when the growth of their respective economies may already be drifting lower—and thus their actions could initiate or aggravate a downturn in growth.
Such fears weighed heavily on markets, as they discounted the likelihood of rising rates and the possibility of slower growth. The Fund was unable to escape such downside in markets. However, we are generally pleased that the Fund’s defensive nature is reflected in its relative outperformance for the period. We have for some time now been wary of valuations in the region: fundamental growth has been strong; but after five years of nearly uninterrupted gains in share price, very few segments of the market offered the sort of low valuations that this Fund seeks
continued on page 15
12 MATTHEWS ASIAN FUNDS
ALL DATA IS AS OF JUNE 30, 2008, UNLESS OTHERWISE NOTED
PERFORMANCE AS OF JUNE 30, 2008
| | | | | | | | | | | | | | | | | | | | | |
Fund Inception: 9/12/94 | | 3 MO | | | YTD | | | Average Annual Total Returns | |
| | | | 1 YR | | | 3 YRS | | | 5 YRS | | | 10 YRS | | | SINCE
INCEPTION | |
Matthews Asian Growth and Income Fund | | –3.96 | % | | –8.04 | % | | 0.19 | % | | 15.02 | % | | 19.54 | % | | 18.46 | % | | 12.11 | % |
MSCI All Country Asia ex-Japan Index1 | | –7.88 | % | | –21.10 | % | | –5.48 | % | | 19.89 | % | | 23.53 | % | | 13.85 | % | | 3.70 | %2 |
MSCI All Country Far East ex-Japan Index3 | | –6.40 | % | | –18.21 | % | | –4.50 | % | | 19.52 | % | | 22.81 | % | | 13.64 | % | | 3.40 | %2 |
Lipper Pacific ex-Japan Funds Category Average4 | | –6.40 | % | | –19.67 | % | | –5.93 | % | | 19.41 | % | | 22.62 | % | | 14.78 | % | | 5.72 | %2 |
All performance quoted is past performance and is no guarantee of future results. Assumes reinvestment of all dividends and/or distributions. Unusually high returns may not be sustainable. Investment return and principal value will fluctuate with changing market conditions so that shares, when redeemed, may be worth more or less than their original cost. Current performance may be lower or higher than the return figures quoted. Returns would have been lower if certain of the Fund’s fees and expenses had not been waived. For the Fund’s most recent month-end performance please call 800-789-ASIA [2742] or visit www.matthewsfunds.com.
INCOME DISTRIBUTION HISTORY
| | | | | | | | | | | | |
| | | JUNE | | | DECEMBER | | | TOTAL | |
2008 | | | 24.82 | ¢ | | | N/A | | | | N/A | |
2007 | | | 21.51 | ¢ | | | 68.91 | ¢ | | | 90.42 | ¢ |
2006 | | | 21.89 | ¢ | | | 39.85 | ¢ | | | 61.74 | ¢ |
1994–2005 | | $ | 1.88 | | | $ | 2.07 | | | $ | 3.95 | |
For a history of the Fund’s distributions since its inception, visit www.matthewsfunds.com.
FISCAL YEAR 2007 RATIOS
| | |
Gross Operating Expense:5 1.15% | | Portfolio Turnover:6 27.93% |
1 | The MSCI All Country Asia ex-Japan Index is a free float–adjusted market capitalization–weighted index of the stock of markets of China, Hong Kong, India, Indonesia, Malaysia, Pakistan, Philippines, Singapore, South Korea, Taiwan, and Thailand. It is not possible to invest directly in an index. Source: Index data from Morgan Stanley Capital International; total return calculations performed by PNC. |
2 | Calculated from 8/31/94. |
3 | The MSCI All Country Far East ex-Japan Index is a free float–adjusted market capitalization–weighted index of the stock markets of China, Hong Kong, Indonesia, Malaysia, Philippines, Singapore, South Korea, Taiwan and Thailand. The Fund invests in countries that are not included in the MSCI All Country Far East ex-Japan Index. It is not possible to invest directly in an index. Source: Index data from Morgan Stanley Capital International; total return calculations performed by PNC. |
4 | Lipper, Inc. fund performance does not reflect sales charges and is based on total return, including reinvestment of dividends and capital gains, for the stated periods. |
5 | Ratio has been restated to reflect current management and administrative and shareholder servicing fees expected to be incurred by the Funds and paid to the Advisor. Matthews Asian Funds do not charge 12b-1 fees. |
6 | The lesser of fiscal year 2007 long-term purchase costs or sales proceeds divided by the average monthly market value of long-term securities. |
800.789.ASIA [2742] www.matthewsfunds.com 13
MATTHEWS ASIAN GROWTH AND INCOME FUND
(CLOSED TO MOST NEW INVESTORS)
| | | | | | | |
TOP TEN HOLDINGS1 | | | | | | | |
| | | COUNTRY | | SECURITY TYPE | | % OF NET ASSETS | |
Taiwan Semiconductor Manufacturing Co., Ltd. | | Taiwan | | Equity | | 3.5 | % |
Singapore Press Holdings, Ltd. | | Singapore | | Equity | | 3.5 | % |
CLP Holdings, Ltd. | | China/Hong Kong | | Equity | | 3.2 | % |
HSBC Holdings PLC | | United Kingdom | | Equity | | 3.0 | % |
Hongkong Land CB 2005, Ltd., Cnv., 2.750%, 12/21/12 | | China/Hong Kong | | Convertible Bond | | 3.0 | % |
Chungwa Telecom Co., Ltd. | | Taiwan | | Equity | | 2.9 | % |
SK Telecom Co., Ltd. | | South Korea | | Equity | | 2.9 | % |
Advanced Info Service Public Co., Ltd. | | Thailand | | Equity | | 2.7 | % |
Rafflesia Capital, Ltd., Cnv., 1.250%, 10/04/11 | | Malaysia | | Convertible Bond | | 2.5 | % |
Far EasTone Telecommunications Co., Ltd. | | Taiwan | | Equity | | 2.4 | % |
% OF ASSETS IN TOP 10 | | | | | | 29.6 | % |
| | | |
COUNTRY ALLOCATION | | | |
China/Hong Kong | | 32.9 | % |
Singapore | | 14.2 | % |
Taiwan | | 12.7 | % |
South Korea | | 10.7 | % |
Malaysia | | 6.0 | % |
India | | 5.5 | % |
Thailand | | 4.7 | % |
Japan2 | | 4.0 | % |
United Kingdom2 | | 3.0 | % |
Australia2 | | 2.9 | % |
Indonesia | | 1.7 | % |
Philippines | | 1.1 | % |
Cash and other assets, less liabilities | | 0.6 | % |
| | | |
SECTOR ALLOCATION | | | |
Financials | | 25.6 | % |
Telecommunication Services | | 22.1 | % |
Consumer Discretionary | | 16.7 | % |
Industrials | | 8.1 | % |
Information Technology | | 8.0 | % |
Utilities | | 7.0 | % |
Health Care | | 5.0 | % |
Consumer Staples | | 4.8 | % |
Energy | | 2.1 | % |
Cash and other assets, less liabilities | | 0.6 | % |
| | | |
MARKET CAP EXPOSURE3 | | | |
Large cap (over $5 billion) | | 57.3 | % |
Mid cap ($1–$5 billion) | | 28.4 | % |
Small cap (under $1 billion) | | 13.7 | % |
Cash and other assets, less liabilities | | 0.6 | % |
| | | |
BREAKDOWN BY SECURITY | | | |
Common Equities | | 77.8 | % |
Convertible Bonds4 | | 19.4 | % |
Preferred Equities | | 2.2 | % |
Cash and other assets, less liabilities | | 0.6 | % |
| | | | | | | | | |
| NUMBER OF SECURITIES | | NAV | | FUND ASSETS | | REDEMPTION FEE | | 12b-1 FEES |
| 74 | | $ | 17.52 | | $2.0 billion | | 2.00% within 90 calendar days | | None |
1 | Holdings may combine more than one security from same issuer and related depositary receipts. |
2 | Australia, the United Kingdom and Japan are not included in the MSCI All Country Asia ex-Japan Index. |
3 | Source: FactSet Research Systems. Percentage values in data are rounded to the nearest tenth of one percent; the values may not sum to 100% due to rounding. |
4 | Convertible bonds are not included in the MSCI All Country Asia ex-Japan Index. |
14 MATTHEWS ASIAN FUNDS
ALL DATA IS AS OF JUNE 30, 2008, UNLESS OTHERWISE NOTED
PORTFOLIO MANAGER COMMENTARY continued from page 12
as a means to shelter financial storms. However, despite these general concerns, we have remained fully invested throughout the recent cycle, without retreating to cash.
We remain fully invested for two reasons. First, at Matthews we strongly believe that it is often impractical to attempt to time market cycles, and thus we adopt a discipline of being fully invested over longer horizons. Second, during market volatility such as the present, it is important to return to the original investment premise: that is, it remains an exciting time to be a long-term investor in Asia’s economic evolution. This is particularly true now when the Fund has begun to identify a handful of new opportunities emerging as a result of the market’s contraction.
One such opportunity came in the form of a convertible bond issued by a smaller company called FUJI Foods. FUJI is engaged in the industrial catering business in mainland China. In its large-scale, centralized kitchens, it has the capacity to prepare 1 million meal sets per day and deliver to canteens and cafeterias in corporate parks throughout the country. Though FUJI’s business model is relatively simple, it represented the emergence of yet another new industry in China, unique to the current landscape, but comparable to businesses overseas. Efficiency, hygiene and cost pressures are forcing the market to transition away from sub-scale “mom and pop” caterers to industrial players. FUJI is the largest such caterer in the country, and yet it has less than 1% share of the national market. Despite its small size, and the substantial competition it faces in the market, FUJI enjoys profit margins vastly superior to those of comparable caterers in Europe. In order to finance its growth, the company issued a Chinese renminbi-denominated convertible bond, a relatively rare instrument in the Asian landscape, and one in which the Fund has established a small position. Convertible bonds, such as the one issued by FUJI, illustrate the Fund’s aim: to discover investments that trace the evolution of Asia’s markets, yet offer some downside protection even amidst volatility.
The Fund’s experience has been mixed amidst the market’s decline. For several years now, the Fund’s largest exposure has been to SK Telecom, South Korea’s largest and most profitable mobile phone company. Unfortunately, the position has been one of the largest detractors to performance so far this year; its shares have stumbled due to increasing regulatory burdens at home, and some misfiring investments abroad. Yet we remain convinced of the company’s strong fundamentals, particularly its strong cash flow, which in turn underwrites an attractive dividend on the company’s shares.
Meanwhile, the Fund has taken up the largest sector exposure to technology and light manufacturing it has had in several years. A number of companies in such industries have seen their valuations depressed on perceptions of a cyclical decline in growth. Yet we have added several such companies to the portfolio, having found them to be well-run, to offer strong cash flow and to have strong balance sheets. These new positions have performed marginally to the Fund’s benefit in the short-run. More importantly, however, we believe that such companies will be well positioned to trace the rise of consumer demand in Asia, whether for electronics or manufactured goods. It is this evolution that is at the heart of the Fund’s construct, and what makes us enthusiastic long-term investors in Asia, despite what are currently rocky markets.
800.789.ASIA [2742] www.matthewsfunds.com 15
MATTHEWS ASIAN GROWTH AND INCOME FUND
SCHEDULE OF INVESTMENTSa (UNAUDITED)
COMMON EQUITIES: 77.8%
| | | | | |
| | | SHARES | | VALUE |
CHINA/HONG KONG: 25.6% | | | | | |
CLP Holdings, Ltd. | | 7,370,200 | | $ | 63,205,366 |
Hang Seng Bank, Ltd. | | 2,040,900 | | | 43,091,805 |
Television Broadcasts, Ltd. | | 6,280,000 | | | 36,274,032 |
HongKong Electric Holdings, Ltd. | | 5,858,000 | | | 35,052,368 |
PCCW, Ltd. | | 48,711,000 | | | 29,501,140 |
Hang Lung Group, Ltd. | | 6,586,000 | | | 29,373,756 |
Café de Coral Holdings, Ltd. | | 16,281,100 | | | 29,218,499 |
Next Media, Ltd. | | 75,042,000 | | | 28,830,651 |
BOC Hong Kong Holdings, Ltd. | | 10,562,000 | | | 27,996,978 |
Giordano International, Ltd. | | 66,675,000 | | | 27,342,381 |
VTech Holdings, Ltd. | | 4,331,300 | | | 26,134,034 |
Vitasoy International Holdings, Ltd. | | 50,051,000 | | | 23,759,488 |
ASM Pacific Technology, Ltd. | | 2,986,800 | | | 22,574,430 |
CITIC Pacific, Ltd. | | 6,095,000 | | | 22,541,322 |
Hong Kong & China Gas Co., Ltd. | | 8,553,490 | | | 20,353,595 |
I-CABLE Communications, Ltd.† | | 129,832,000 | | | 19,117,178 |
Hang Lung Properties, Ltd. | | 5,935,920 | | | 19,056,479 |
China-Hong Kong Photo Products Holdings, Ltd. | | 14,998,003 | | | 1,308,637 |
| | | | | |
Total China/Hong Kong | | | | | 504,732,139 |
| | | | | |
SINGAPORE: 14.2% | | | | | |
Singapore Press Holdings, Ltd. | | 22,020,500 | | | 68,786,245 |
Ascendas REIT | | 23,690,000 | | | 38,480,688 |
Parkway Holdings, Ltd. | | 19,699,093 | | | 33,590,751 |
Fraser and Neave, Ltd. | | 10,006,100 | | | 33,315,669 |
DBS Group Holdings, Ltd. | | 2,382,000 | | | 33,019,382 |
Singapore Post, Ltd. | | 29,248,000 | | | 23,646,908 |
Cerebos Pacific, Ltd. | | 8,208,000 | | | 23,105,832 |
Parkway Life REIT | | 26,137,110 | | | 21,708,084 |
Yellow Pages (Singapore), Ltd. | | 6,638,000 | | | 3,366,447 |
Hong Leong Finance, Ltd. | | 157,000 | | | 400,419 |
| | | | | |
Total Singapore | | | | | 279,420,425 |
| | | | | |
TAIWAN: 12.7% | | | | | |
Taiwan Semiconductor Manufacturing Co., Ltd. | | 31,361,352 | | | 67,159,354 |
Chunghwa Telecom Co., Ltd. ADR | | 2,009,404 | | | 50,978,580 |
Far EasTone Telecommunications Co., Ltd. | | 29,485,611 | | | 46,871,174 |
President Chain Store Corp. | | 11,192,000 | | | 37,241,525 |
Cathay Financial Holding Co., Ltd. | | 8,973,705 | | | 19,512,553 |
Cyberlink Corp. | | 2,946,000 | | | 14,073,403 |
Chunghwa Telecom Co., Ltd. | | 2,561,960 | | | 6,625,831 |
Taiwan Secom Co., Ltd. | | 3,010,779 | | | 5,723,386 |
Taiwan Semiconductor Manufacturing Co., Ltd. ADR | | 200,000 | | | 2,182,000 |
| | | | | |
Total Taiwan | | | | | 250,367,806 |
| | | | | |
SOUTH KOREA: 6.8% | | | | | |
SK Telecom Co., Ltd. | | 254,760 | | | 46,395,278 |
Hana Financial Group, Inc. | | 751,889 | | | 28,931,248 |
KT Corp. | | 505,730 | | | 21,635,120 |
KT Corp. ADR | | 718,800 | | | 15,324,816 |
SK Telecom Co., Ltd. ADR | | 522,200 | | | 10,846,094 |
Daehan City Gas Co., Ltd. | | 280,300 | | | 9,057,062 |
G11R, Inc. | | 309,540 | | | 2,352,510 |
| | | | | |
Total South Korea | | | | | 134,542,128 |
| | | | | |
THAILAND: 4.7% | | | | | |
Advanced Info Service Public Co., Ltd. | | 18,935,000 | | | 52,384,851 |
BEC World Public Co., Ltd. | | 47,386,400 | | | 34,723,099 |
Thai Reinsurance Public Co., Ltd. | | 25,672,800 | | | 4,683,837 |
| | | | | |
Total Thailand | | | | | 91,791,787 |
| | | | | |
16 MATTHEWS ASIAN FUNDS
JUNE 30, 2008
| | | | | |
| | | SHARES | | VALUE |
JAPAN: 4.0% | | | | | |
Nippon Building Fund, Inc. REIT | | 2,865 | | $ | 33,726,515 |
Trend Micro, Inc. | | 749,500 | | | 24,704,525 |
Japan Real Estate Investment Corp. REIT | | 1,911 | | | 20,156,519 |
| | | | | |
Total Japan | | | | | 78,587,559 |
| | | | | |
UNITED KINGDOM: 3.0% | | | | | |
HSBC Holdings PLC ADR | | 741,600 | | | 56,880,720 |
HSBC Holdings PLC | | 196,800 | | | 3,033,441 |
| | | | | |
Total United Kingdom | | | | | 59,914,161 |
| | | | | |
AUSTRALIA: 2.9% | | | | | |
AXA Asia Pacific Holdings, Ltd. | | 6,744,925 | | | 30,261,079 |
Insurance Australia Group, Ltd. | | 7,851,267 | | | 26,117,443 |
| | | | | |
Total Australia | | | | | 56,378,522 |
| | | | | |
INDONESIA: 1.7% | | | | | |
PT Telekomunikasi Indonesia ADR | | 745,500 | | | 24,042,375 |
PT Tempo Scan Pacific | | 139,445,000 | | | 10,284,447 |
| | | | | |
Total Indonesia | | | | | 34,326,822 |
| | | | | |
PHILIPPINES: 1.1% | | | | | |
Globe Telecom, Inc. | | 856,190 | | | 22,503,713 |
| | | | | |
Total Philippines | | | | | 22,503,713 |
| | | | | |
INDIA: 1.1% | | | | | |
Sun Pharmaceutical Industries, Ltd. | | 674,811 | | | 21,972,724 |
| | | | | |
Total Philippines | | | | | 21,972,724 |
| | | | | |
TOTAL COMMON EQUITIES | | | | | 1,534,537,786 |
(Cost $1,244,293,766) | | | | | |
| | | | | |
PREFERRED EQUITIES: 2.2% | | | | | |
SOUTH KOREA: 2.2% | | | | | |
Hyundai Motor Co., Ltd., Pfd. | | 566,280 | | | 14,643,539 |
LG Household & Health Care, Ltd., Pfd. | | 177,830 | | | 10,421,088 |
Samsung Fire & Marine Insurance Co., Ltd., Pfd. | | 119,550 | | | 9,085,823 |
Hyundai Motor Co., Ltd., 2nd Pfd. | | 305,760 | | | 8,359,768 |
| | | | | |
Total South Korea | | | | | 42,510,218 |
| | | | | |
TOTAL PREFERRED EQUITIES | | | | | 42,510,218 |
(Cost $19,413,954) | | | | | |
| | | | | |
See footnotes on page 19.
800.789.ASIA [2742] www.matthewsfunds.com 17
MATTHEWS ASIAN GROWTH AND INCOME FUND
SCHEDULE OF INVESTMENTSa (UNAUDITED) (continued)
INTERNATIONAL DOLLAR BONDS: 19.4%
| | | | | | | |
| | | FACE AMOUNT | | | VALUE |
CHINA/HONG KONG: 7.3% | | | | | | | |
Hongkong Land CB 2005, Ltd., Cnv. | | | | | | | |
2.750%, 12/21/12 | | $ | 49,200,000 | | | $ | 58,671,000 |
China Petroleum & Chemical Corp., (Sinopec), Cnv. | | | | | | | |
0.000%, 04/24/14 | | | 295,950,000 | b | | | 40,377,262 |
FU JI Food and Catering Services Holdings, Ltd., Cnv. | | | | | | | |
0.000%, 10/18/10 | | | 247,500,000 | b | | | 28,933,917 |
Brilliance China Finance, Ltd., Cnv. | | | | | | | |
0.000%, 06/07/11 | | | 14,950,000 | | | | 15,376,075 |
| | | | | | | |
Total China/Hong Kong | | | | | | | 143,358,254 |
| | | | | | | |
MALAYSIA: 6.0% | | | | | | | |
Rafflesia Capital, Ltd., Cnv. | | | | | | | |
1.250%,c 10/04/11 | | | 42,100,000 | | | | 49,046,500 |
Cherating Capital, Ltd., Cnv. | | | | | | | |
2.000%, 07/05/12 | | | 44,900,000 | | | | 45,519,620 |
Prime Venture Labuan, Ltd., Cnv. | | | | | | | |
1.000%, 12/12/08 | | | 11,170,000 | | | | 12,552,287 |
YTL Power Finance Cayman, Ltd., Cnv. | | | | | | | |
0.000%, 05/09/10 | | | 9,400,000 | | | | 11,233,000 |
| | | | | | | |
Total Malaysia | | | | | | | 118,351,407 |
| | | | | | | |
INDIA: 4.4% | | | | | | | |
Ranbaxy Laboratories, Ltd., Cnv. | | | | | | | |
0.000%, 03/18/11 | | | 29,326,000 | | | | 33,175,038 |
Tata Motors, Ltd., Cnv. | | | | | | | |
1.000%, 04/27/11 | | | 27,349,000 | | | | 27,827,608 |
Reliance Communications, Ltd., Cnv. | | | | | | | |
0.000%, 05/10/11 | | | 22,290,000 | | | | 25,744,950 |
| | | | | | | |
Total India | | | | | | | 86,747,596 |
| | | | | | | |
SOUTH KOREA: 1.7% | | | | | | | |
SK Telecom Co., Ltd., Cnv. | | | | | | | |
0.000%, 05/27/09 | | | 29,430,000 | | | | 32,991,030 |
| | | | | | | |
Total South Korea | | | | | | | 32,991,030 |
| | | | | | | |
TOTAL INTERNATIONAL DOLLAR BONDS | | | | | | | 381,448,287 |
(Cost $376,384,411) | | | | | | | |
| | | | | | | |
18 MATTHEWS ASIAN FUNDS
JUNE 30, 2008
| | | |
| | | VALUE |
TOTAL INVESTMENTS: 99.4% | | $ | 1,958,496,291 |
(Cost $1,640,092,131d) | | | |
| |
CASH AND OTHER ASSETS, LESS LIABILITIES: 0.6% | | | 12,043,622 |
| | | |
NET ASSETS: 100.0% | | $ | 1,970,539,913 |
| | | |
| a | Certain securities were fair valued under the discretion of the Board of Trustees (Note 1-A). |
| b | Face amount reflects principal in local currency. |
| c | Variable rate security. The rate represents the rate in effect at June 30, 2008. |
| d | Cost of investments is $1,640,092,131 and net unrealized appreciation consists of: |
| | | | |
Gross unrealized appreciation | | $ | 368,515,768 | |
Gross unrealized depreciation | | | (50,111,608 | ) |
| | | | |
Net unrealized appreciation | | $ | 318,404,160 | |
| | | | |
| † | Affiliated Issuer, as defined under the Investment Company Act of 1940 (ownership of 5% or more of the outstanding voting securities of this issuer) |
| ADR | American Depositary Receipt |
| REIT | Real Estate Investment Trust |
See accompanying notes to financial statements.
800.789.ASIA [2742] www.matthewsfunds.com 19
MATTHEWS ASIA PACIFIC FUND
| | |
| FUND OBJECTIVE AND STRATEGY | | SYMBOL: MPACX |
Objective: Long-term capital appreciation.
Strategy: Under normal market conditions, the Matthews Asia Pacific Fund seeks to achieve its investment objective by investing at least 80% of its total net assets, which include borrowings for investment purposes, in the common and preferred stocks of companies located in the Asia Pacific region. The Asia Pacific region includes Australia, China, Hong Kong, India, Indonesia, Japan, Malaysia, New Zealand, Pakistan, Philippines, Singapore, South Korea, Taiwan, Thailand and Vietnam. The Fund may also invest in the convertible securities, of any duration or quality, of Asia Pacific companies.
PORTFOLIO MANAGERS
| | | | |
Lead Manager: Taizo Ishida | | | | Co-Manager: Sharat Shroff, CFA |
PORTFOLIO MANAGER COMMENTARY
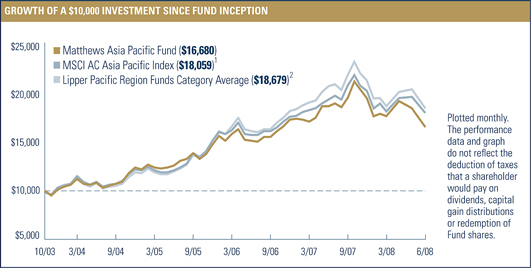
The Matthews Asia Pacific Fund declined –15.38% during the first half of 2008, compared with its benchmark, the MSCI All Country Asia Pacific Index, which fell –12.18%.
The Asia Pacific markets continued through tough times in the second quarter of 2008 as prices for food and energy jumped to record levels. Ongoing problems related to U.S. financial institutions also continued to be a drag on market sentiment. While the second quarter marked declines throughout the region, these varied widely by country and, in some cases, even among different exchanges within the same country: the domestic Chinese A share market declined another 26% in the second quarter after falling 29% in the first quarter. The MSCI China Index, however, was down just under 5% in the second quarter. The India portion of the MSCI All Country Asia Pacific Index declined 41%, while Japan was down only 5%.
We have, however, seen encouraging signs in recently passed legislation that, we believe, should help Chinese manufacturers reduce inefficiencies in the years to come. A new Chinese labor law that raises the minimum wage by an annual double-digit percentage increase, coupled with annual appreciation of China’s currency against the U.S. dollar, should prompt factories to shift manufacturing methods so they are more capital-intensive and less labor-intensive.
In addition, new regulations to battle pollution should help produce better conditions. Improved factory automation is something that has been emerging in China and some Japanese companies are big beneficiaries of this. Two of the portfolio’s holdings, FANUC and Keyence, both Japanese, are good examples of this trend in Chinese factories. FANUC is a leading supplier of industrial robots to Chinese companies and Keyence offers Chinese firms automation technology mainly through its advanced sensors.
continued on page 23
20 MATTHEWS ASIAN FUNDS
ALL DATA IS AS OF JUNE 30, 2008, UNLESS OTHERWISE NOTED
| | | | | | | | | | | | | | | |
PERFORMANCE AS OF JUNE 30, 2008 | |
Fund Inception: 10/31/03 | | 3 MO | | | YTD | | | Average Annual Total Returns | |
| | | | 1 YR | | | 3 YRS | | | SINCE
INCEPTION | |
Matthews Asia Pacific Fund | | –7.05 | % | | –15.38 | % | | –12.01 | % | | 9.32 | % | | 11.59 | % |
MSCI All Country Asia Pacific Index1 | | –1.37 | % | | –12.18 | % | | –8.43 | % | | 13.75 | % | | 13.50 | % |
Lipper Pacific Region Funds Category Average2 | | –1.62 | % | | –12.69 | % | | –9.85 | % | | 15.14 | % | | 14.23 | % |
All performance quoted is past performance and is no guarantee of future results. Assumes reinvestment of all dividends and/or distributions. Unusually high returns may not be sustainable. Investment return and principal value will fluctuate with changing market conditions so that shares, when redeemed, may be worth more or less than their original cost. Current performance may be lower or higher than the return figures quoted. Returns would have been lower if certain of the Fund’s fees and expenses had not been waived. For the Fund’s most recent month-end performance please call 800-789-ASIA [2742] or visit www.matthewsfunds.com.
| | | | | |
FISCAL YEAR 2007 RATIOS | | | | | |
Gross Operating Expense:3 1.20% | | Portfolio Turnover:4 | | 40.49 | % |
1 | The MSCI All Country Asia Pacific Index is a free float–adjusted market capitalization–weighted index of the stock markets of Australia, China, Hong Kong, India, Indonesia, Japan, Malaysia, New Zealand, Pakistan, Philippines, Singapore, South Korea, Taiwan and Thailand. It is not possible to invest directly in an index. Source: Index data from Morgan Stanley Capital International; total return calculations performed by PNC. |
2 | Lipper, Inc. fund performance does not reflect sales charges and is based on total return, including reinvestment of dividends and capital gains, for the stated periods. |
3 | Ratio has been restated to reflect current management and administrative and shareholder servicing fees expected to be incurred by the Funds and paid to the Advisor. Matthews Asian Funds do not charge 12b-1 fees. |
4 | The lesser of fiscal year 2007 long-term purchase costs or sales proceeds divided by the average monthly market value of long-term securities. |
800.789.ASIA [2742] www.matthewsfunds.com 21
MATTHEWS ASIA PACIFIC FUND
| | | | | |
TOP TEN HOLDINGS1 | | | | | |
| | | COUNTRY | | % OF NET ASSETS | |
Nintendo Co., Ltd. | | Japan | | 2.9 | % |
Funai Zaisan Consultants Co., Ltd. | | Japan | | 2.6 | % |
Unicharm Petcare Corp. | | Japan | | 2.4 | % |
Benesse Corp. | | Japan | | 2.2 | % |
Sony Corp. | | Japan | | 2.1 | % |
China Mobile, Ltd. | | China/Hong Kong | | 2.1 | % |
The Sumitomo Trust & Banking Co., Ltd. | | Japan | | 2.0 | % |
Taiwan Semiconductor Manufacturing Co., Ltd. | | Taiwan | | 2.0 | % |
Ichiyoshi Securities Co., Ltd. | | Japan | | 1.9 | % |
Sekisui House, Ltd. | | Japan | | 1.9 | % |
% OF ASSETS IN TOP 10 | | | | 22.1 | % |
| | | |
COUNTRY ALLOCATION | | | |
Japan | | 47.0 | % |
China/Hong Kong | | 21.2 | % |
South Korea | | 8.2 | % |
India | | 6.8 | % |
Thailand | | 4.1 | % |
Taiwan | | 3.7 | % |
Australia | | 3.5 | % |
Singapore | | 3.2 | % |
Indonesia | | 2.1 | % |
Cash and other assets, less liabilities | | 0.2 | % |
| | | |
SECTOR ALLOCATION | | | |
Financials | | 32.6 | % |
Information Technology | | 20.7 | % |
Consumer Discretionary | | 16.8 | % |
Consumer Staples | | 9.7 | % |
Industrials | | 7.0 | % |
Health Care | | 6.6 | % |
Telecommunication Services | | 4.3 | % |
Materials | | 2.1 | % |
Cash and other assets, less liabilities | | 0.2 | % |
| | | |
MARKET CAP EXPOSURE2 | | | |
Large cap (over $5 billion) | | 58.2 | % |
Mid cap ($1–$5 billion) | | 23.4 | % |
Small cap (under $1 billion) | | 18.2 | % |
Cash and other assets, less liabilities | | 0.2 | % |
| | | | | | | | |
| NUMBER OF SECURITIES | | NAV | | FUND ASSETS | | REDEMPTION FEE | | 12b-1 FEES |
| 77 | | $14.63 | | $369.3 million | | 2.00% within
90 calendar days | | None |
1 | Holdings may combine more than one security from same issuer and related depositary receipts. |
2 | Source: FactSet Research Systems. Percentage values in data are rounded to the nearest tenth of one percent; the values may not sum to 100% due to rounding. |
22 MATTHEWS ASIAN FUNDS
ALL DATA IS AS OF JUNE 30, 2008, UNLESS OTHERWISE NOTED
PORTFOLIO MANAGER COMMENTARY continued from page 20
One of the Fund’s new holdings serves as another example of efficient manufacturing: China’s Tingyi is one of the country’s best food and beverage companies, and the country’s top instant noodle maker with dominant market share. What is so attractive about this company is its efficient manufacturing technologies, which are competitive with those of its Japanese and Korean peers. The company possesses a rare combination of both impressive factory automation and efforts to make daily improvements, which is the basic driving force behind the industry’s consolidation. These improvements are reminiscent of Toyota’s “kaizen,” a Japanese philosophy of bettering standardized activities and processes through daily activities to eliminate waste.
The Fund has traditionally avoided commodity companies where we believe forward earnings are unpredictable due to the cyclical nature of these firms. Because of this, we have typically underweighted Australia due to its large commodities and energy sectors. This hurt performance in the first half of 2008 as commodities prices rose. Our overweight in Korean stocks also hurt the Fund as Korea has faced a rapid depreciation of its currency against the U.S. dollar, which has pushed up import costs. From a valuation standpoint, China and India now appear more attractive, and the Fund has a growing list of new investment opportunities in solid companies with attractive long-term growth prospects. We also retain conviction in our current holdings.
The Fund attempts to capture the growth prospects for the entire Asia Pacific region, in which Japan is becoming more and more relevant. Japan’s domestic growth potential may not be as high as that of Asia-ex Japan, but it is our belief that more Japanese companies will benefit from growth in the region. It is important to note that we have been witnessing more regional cooperation, both economically and politically, over the last six months than we have at any time in the last decade. Looking ahead, one of the key questions facing investors is the ability of the region to withstand a global slowdown. In that context, it is encouraging to see these signs of greater integration within the Asia Pacific region, despite the current downturn in Asian equity markets.
800.789.ASIA [2742] www.matthewsfunds.com 23
MATTHEWS ASIA PACIFIC FUND
SCHEDULE OF INVESTMENTSa (UNAUDITED)
COMMON EQUITIES: 99.8%
| | | | | |
| | | SHARES | | VALUE |
JAPAN: 47.0% | | | | | |
Nintendo Co., Ltd. | | 18,800 | | $ | 10,605,264 |
Funai Zaisan Consultants Co., Ltd.† | | 7,081 | | | 9,469,341 |
Unicharm Petcare Corp. | | 299,100 | | | 8,929,199 |
Benesse Corp. | | 203,900 | | | 8,257,004 |
Sony Corp. ADR | | 180,100 | | | 7,877,574 |
The Sumitomo Trust & Banking Co., Ltd. | | 1,078,000 | | | 7,532,853 |
Ichiyoshi Securities Co., Ltd. | | 764,900 | | | 7,008,972 |
Sekisui House, Ltd. | | 738,000 | | | 6,887,583 |
Yahoo! Japan Corp. | | 17,612 | | | 6,783,734 |
Pigeon Corp. | | 334,300 | | | 6,721,576 |
Daibiru Corp. | | 598,700 | | | 6,647,524 |
Nomura Research Institute, Ltd. | | 282,800 | | | 6,631,558 |
Sysmex Corp. | | 159,800 | | | 6,290,568 |
GCA Savvian Group Corp. | | 1,776 | | | 6,171,719 |
ORIX Corp. | | 37,950 | | | 5,428,832 |
Nidec Corp. | | 79,500 | | | 5,293,262 |
Nitto Denko Corp. | | 137,700 | | | 5,290,917 |
Takeda Pharmaceutical Co., Ltd. | | 95,600 | | | 4,861,704 |
Sumitomo Realty & Development Co., Ltd. | | 234,000 | | | 4,649,809 |
Hoya Corp. | | 189,400 | | | 4,378,933 |
Toyota Motor Corp. ADR | | 45,600 | | | 4,286,400 |
Canon, Inc. ADR | | 82,650 | | | 4,232,507 |
NGK Insulators, Ltd. | | 216,000 | | | 4,200,593 |
Monex Group, Inc. | | 6,094 | | | 4,143,587 |
Takeuchi Manufacturing Co., Ltd. | | 154,500 | | | 3,790,295 |
Mitsubishi Estate Co., Ltd. | | 162,000 | | | 3,707,303 |
Fanuc, Ltd. | | 36,800 | | | 3,593,879 |
Keyence Corp. | | 14,600 | | | 3,477,271 |
Honda Motor Co., Ltd. ADR | | 81,200 | | | 2,763,236 |
Toray Industries, Inc. | | 459,000 | | | 2,459,585 |
Mori Trust Sogo REIT, Inc. | | 135 | | | 1,271,366 |
| | | | | |
Total Japan | | | | | 173,643,948 |
| | | | | |
CHINA/HONG KONG: 21.2% | | | | | |
China Mobile, Ltd. ADR | | 117,400 | | | 7,859,930 |
Hang Lung Group, Ltd. | | 1,379,000 | | | 6,150,381 |
Lenovo Group, Ltd. | | 8,928,000 | | | 6,073,731 |
Pico Far East Holdings, Ltd. | | 37,582,000 | | | 5,720,952 |
China Life Insurance Co., Ltd. H Shares | | 1,528,000 | | | 5,323,453 |
China Merchants Bank Co., Ltd. H Shares | | 1,625,000 | | | 5,117,621 |
Dairy Farm International Holdings, Ltd. | | 1,041,300 | | | 5,039,892 |
China Vanke Co., Ltd. B Shares | | 3,693,722 | | | 4,725,877 |
Shangri-La Asia, Ltd. | | 1,988,000 | | | 4,657,993 |
Ping An Insurance (Group) Co. of China, Ltd. H Shares | | 574,000 | | | 4,277,996 |
NetEase.com, Inc. ADRb | | 194,800 | | | 4,244,692 |
Kingdee International Software Group Co., Ltd. | | 19,448,000 | | | 4,002,119 |
Ctrip.com International, Ltd. ADR | | 73,900 | | | 3,383,142 |
China Merchants Holdings International Co., Ltd. | | 848,000 | | | 3,282,010 |
Tingyi (Cayman Islands) Holding Corp. | | 2,378,000 | | | 2,940,899 |
China Yurun Food Group, Ltd. | | 1,254,000 | | | 2,062,870 |
Dongfeng Motor Group Co., Ltd. H Shares | | 5,012,000 | | | 2,007,841 |
Television Broadcasts, Ltd. | | 231,000 | | | 1,334,284 |
| | | | | |
Total China/Hong Kong | | | | | 78,205,683 |
| | | | | |
SOUTH KOREA: 8.2% | | | | | |
Hanmi Pharmaceutical Co., Ltd. | | 46,114 | | | 6,788,926 |
Shinhan Financial Group Co., Ltd. | | 113,517 | | | 5,132,980 |
Amorepacific Corp. | | 8,254 | | | 5,113,134 |
Hyundai Department Store Co., Ltd. | | 45,970 | | | 3,722,249 |
Kiwoom Securities Co., Ltd. | | 100,715 | | | 3,610,547 |
NHN Corp.b | | 20,470 | | | 3,571,316 |
CDNetworks Co., Ltd.b | | 107,409 | | | 1,185,961 |
Modetour Network, Inc. | | 49,754 | | | 1,117,747 |
| | | | | |
Total South Korea | | | | | 30,242,860 |
| | | | | |
24 MATTHEWS ASIAN FUNDS
JUNE 30, 2008
| | | | | |
| | | SHARES | | VALUE |
INDIA: 6.8% | | | | | |
Sun Pharmaceutical Industries, Ltd. | | 201,218 | | $ | 6,551,920 |
HDFC Bank, Ltd. | | 221,500 | | | 5,186,266 |
Dabur India, Ltd. | | 2,788,605 | | | 5,123,515 |
Infosys Technologies, Ltd. | | 90,990 | | | 3,673,014 |
Bharti Airtel, Ltd.b | | 205,528 | | | 3,445,371 |
Financial Technologies (India), Ltd. | | 30,015 | | | 1,172,800 |
| | | | | |
Total India | | | | | 25,152,886 |
| | | | | |
THAILAND: 4.1% | | | | | |
Land & Houses Public Co., Ltd. | | 22,417,300 | | | 4,961,508 |
Advanced Info Service Public Co., Ltd. | | 1,658,600 | | | 4,588,620 |
Major Cineplex Group Public Co., Ltd. | | 7,285,400 | | | 3,181,302 |
Siam Commercial Bank Public Co., Ltd. | | 1,014,400 | | | 2,351,309 |
| | | | | |
Total Thailand | | | | | 15,082,739 |
| | | | | |
TAIWAN: 3.7% | | | | | |
Taiwan Semiconductor Manufacturing Co., Ltd. | | 3,393,029 | | | 7,266,065 |
Taiwan Secom Co., Ltd. | | 3,348,160 | | | 6,364,736 |
| | | | | |
Total Taiwan | | | | | 13,630,801 |
| | | | | |
AUSTRALIA: 3.5% | | | | | |
AXA Asia Pacific Holdings, Ltd. | | 1,424,589 | | | 6,391,413 |
Computershare, Ltd. | | 437,302 | | | 3,861,024 |
Tabcorp Holdings, Ltd. | | 297,625 | | | 2,798,980 |
| | | | | |
Total Australia | | | | | 13,051,417 |
| | | | | |
SINGAPORE: 3.2% | | | | | |
Hyflux, Ltd. | | 2,130,812 | | | 4,682,759 |
DBS Group Holdings, Ltd. | | 269,700 | | | 3,738,592 |
Keppel Land, Ltd. | | 951,000 | | | 3,466,951 |
| | | | | |
Total Singapore | | | | | 11,888,302 |
| | | | | |
INDONESIA: 2.1% | | | | | |
Bank Rakyat Indonesia | | 6,988,500 | | | 3,865,656 |
PT Astra International | | 1,827,000 | | | 3,814,507 |
| | | | | |
Total Indonesia | | | | | 7,680,163 |
| | | | | |
TOTAL INVESTMENTS: 99.8% | | | | | 368,578,799 |
(Cost $361,846,264c) | | | | | |
| | |
CASH AND OTHER ASSETS, LESS LIABILITIES: 0.2% | | | | | 753,756 |
| | | | | |
NET ASSETS: 100.0% | | | | $ | 369,332,555 |
| | | | | |
| a | Certain securities were fair valued under the discretion of the Board of Trustees (Note 1-A). |
| b | Non–income producing security |
| c | Cost of investments is $361,846,264 and net unrealized appreciation consists of: |
| | | | |
Gross unrealized appreciation | | $ | 54,610,733 | |
Gross unrealized depreciation | | | (47,878,198 | ) |
| | | | |
Net unrealized appreciation | | $ | 6,732,535 | |
| | | | |
| † | Affiliated Issuer, as defined under the Investment Company Act of 1940 (ownership of 5% or more of the outstanding voting securities of this issuer) |
| ADR | American Depositary Receipt |
See accompanying notes to financial statements.
800.789.ASIA [2742] www.matthewsfunds.com 25
MATTHEWS PACIFIC TIGER FUND (CLOSED TO MOST NEW INVESTORS)
| | |
| FUND OBJECTIVE AND STRATEGY | | SYMBOL: MAPTX |
Objective: Long-term capital appreciation.
Strategy: Under normal market conditions, the Matthews Pacific Tiger Fund seeks to achieve its investment objective by investing at least 80% of its total net assets, which include borrowings for investment purposes, in the common and preferred stocks of companies located in the Pacific Tiger countries of China, Hong Kong, India, Indonesia, Malaysia, Pakistan, Philippines, Singapore, South Korea, Taiwan, Thailand and Vietnam.
PORTFOLIO MANAGERS
| | |
| Lead Managers: Richard H. Gao and Sharat Shroff, CFA | | Co-Manager: Mark W. Headley |
PORTFOLIO MANAGER COMMENTARY
For the six months ending June 30, 2008, the Matthews Pacific Tiger Fund declined –19.20%, while its primary benchmark, the MSCI All Country Asia ex-Japan Index, fell –21.10%. During the same period, the MSCI All Country Far East ex-Japan Index was down –18.21%.
Various stocks from across the region helped the Fund’s relative performance, but were unable to offset broader weakness in the markets. Asia ex-Japan equities ended the first half of the year with one of the worst performances in recent history. The economic environment across large parts of the region worsened in the second quarter, and any partial attempts at a recovery in the markets in April proved to be short-lived.
Inflationary levels have increased across the region to multi-year highs, led by rising food and fuel costs, which account for almost half of the consumer’s basket. Meanwhile, pricing pressures may become more systemic. With the exception of Taiwan and Korea, wages are also starting to rise in the region, threatening the longer-term viability of many export-oriented businesses, particularly as currencies appreciate. To mitigate this affect, we have consciously avoided business models that rely solely on a weaker currency to arbitrage labor costs. Where the Fund does have exposure to export-oriented companies, the investment is predicated on the ability of management teams to generate sustainable sources of competitive advantage. A case in point is Sun Pharmaceuticals. The Indian company has managed to carve out a niche within the generic pharmaceuticals sector in domestic and overseas markets such as the U.S. Compared to some of its peers in India, Sun’s focus on specialty therapy areas including psychiatry, neurology and cardiology have allowed it to maintain healthy operating margins in excess of 35%. One reason behind its success has been its continued investment in research and development, regularly exceeding 10% of sales.
Beyond the near-term imperatives of inflation, the structural challenge for policy makers in the region is to continue to liberalize currency regimes, and rebalance growth by stimulating domestic consumption. Rising domestic
continued on page 29
26 MATTHEWS ASIAN FUNDS
ALL DATA IS AS OF JUNE 30, 2008, UNLESS OTHERWISE NOTED
| | | | | | | | | | | | | | | | | | | | | |
| PERFORMANCE AS OF JUNE 30, 2008 | | | | | | | | | | | | | | | | | | | | | |
| Fund Inception: 9/12/94 | | 3 MO | | | YTD | | | Average Annual Total Returns | |
| | | | 1 YR | | | 3 YRS | | | 5 YRS | | | 10 YRS | | | SINCE
INCEPTION | |
Matthews Pacific Tiger Fund | | –8.20 | % | | –19.20 | % | | –6.79 | % | | 17.73 | % | | 23.54 | % | | 20.13 | % | | 8.93 | % |
MSCI All Country Asia ex-Japan Index1 | | –7.88 | % | | –21.10 | % | | –5.48 | % | | 19.89 | % | | 23.53 | % | | 13.85 | % | | 3.70 | %2 |
MSCI All Country Far East ex-Japan Index3 | | –6.40 | % | | –18.21 | % | | –4.50 | % | | 19.52 | % | | 22.81 | % | | 13.64 | % | | 3.40 | %2 |
Lipper Pacific ex-Japan Funds Category Average4 | | –6.40 | % | | –19.67 | % | | –5.93 | % | | 19.41 | % | | 22.62 | % | | 14.78 | % | | 5.72 | %2 |
All performance quoted is past performance and is no guarantee of future results. Assumes reinvestment of all dividends and/or distributions. Unusually high returns may not be sustainable. Investment return and principal value will fluctuate with changing market conditions so that shares, when redeemed, may be worth more or less than their original cost. Current performance may be lower or higher than the return figures quoted. Returns would have been lower if certain of the Fund’s fees and expenses had not been waived. For the Fund’s most recent month-end performance please call 800-789-ASIA [2742] or visit www.matthewsfunds.com.
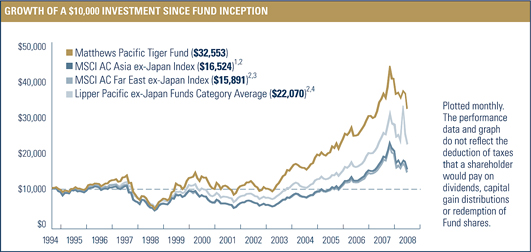
| | | | | | |
| FISCAL YEAR 2007 RATIOS | | | | | | |
Gross Operating Expense:5 1.10% | | Portfolio Turnover: | 6 | | 24.09 | % |
1 | The MSCI All Country Asia ex-Japan Index is a free float–adjusted market capitalization–weighted index of the stock of markets of China, Hong Kong, India, Indonesia, Malaysia, Pakistan, Philippines, Singapore, South Korea, Taiwan, and Thailand. It is not possible to invest directly in an index. Source: Index data from Morgan Stanley Capital International; total return calculations performed by PNC. |
2 | Calculated from 8/31/94. |
3 | The MSCI All Country Far East ex-Japan Index is a free float–adjusted market capitalization–weighted index of the stock markets of China, Hong Kong, Indonesia, Malaysia, Philippines, Singapore, South Korea, Taiwan and Thailand. The Fund invests in countries that are not included in the MSCI All Country Far East ex-Japan Index. It is not possible to invest directly in an index. Source: Index data from Morgan Stanley Capital International; total return calculations performed by PNC. |
4 | Lipper, Inc. fund performance does not reflect sales charges and is based on total return, including reinvestment of dividends and capital gains, for the stated periods. |
5 | Ratio has been restated to reflect current management and administrative and shareholder servicing fees expected to be incurred by the Funds and paid to the Advisor. Matthews Asian Funds do not charge 12b-1 fees. |
6 | The lesser of fiscal year 2007 long-term purchase costs or sales proceeds divided by the average monthly market value of long-term securities. |
800.789.ASIA [2742] www.matthewsfunds.com 27
MATTHEWS PACIFIC TIGER FUND (CLOSED TO MOST NEW INVESTORS)
| | | | | |
| TOP TEN HOLDINGS1 | | | | | |
| | | COUNTRY | | % OF NET ASSETS | |
Lenovo Group, Ltd. | | China/Hong Kong | | 3.0 | % |
Sun Pharmaceutical Industries, Ltd. | | India | | 2.7 | % |
Hang Lung Group, Ltd. | | China/Hong Kong | | 2.7 | % |
President Chain Store Corp. | | Taiwan | | 2.6 | % |
Amorepacific Corp. | | South Korea | | 2.6 | % |
Swire Pacific, Ltd. | | China/Hong Kong | | 2.6 | % |
Advanced Info Service Public Co., Ltd. | | Thailand | | 2.5 | % |
DBS Group Holdings, Ltd. | | Singapore | | 2.3 | % |
Hanmi Pharmaceutical Co., Ltd. | | South Korea | | 2.3 | % |
Tencent Holdings, Ltd. | | China/Hong Kong | | 2.2 | % |
% OF ASSETS IN TOP 10 | | | | 25.5 | % |
| | | |
| COUNTRY ALLOCATION | | | |
China/Hong Kong | | 34.8 | % |
South Korea | | 16.7 | % |
India | | 15.2 | % |
Singapore | | 9.4 | % |
Thailand | | 6.6 | % |
Taiwan | | 5.1 | % |
Indonesia | | 4.9 | % |
Malaysia | | 3.9 | % |
Philippines | | 0.4 | % |
Cash and other assets, less liabilities | | 3.0 | % |
| | | |
SECTOR ALLOCATION | | | |
Financials | | 27.8 | % |
Consumer Discretionary | | 15.7 | % |
Information Technology | | 14.2 | % |
Health Care | | 12.2 | % |
Consumer Staples | | 9.6 | % |
Industrials | | 9.6 | % |
Telecommunication Services | | 7.0 | % |
Utilities | | 0.9 | % |
Cash and other assets, less liabilities | | 3.0 | % |
| | | |
MARKET CAP EXPOSURE2 | | | |
Large cap (over $5 billion) | | 48.7 | % |
Mid cap ($1–$5 billion) | | 40.6 | % |
Small cap (under $1 billion) | | 7.7 | % |
Cash and other assets, less liabilities | | 3.0 | % |
| | | | | | | | |
NUMBER OF SECURITIES | | NAV | | FUND ASSETS | | REDEMPTION FEE | | 12b-1 FEES |
71 | | $22.51 | | $2.8 billion | | 2.00% within 90 calendar days | | None |
1 | Holdings may combine more than one security from same issuer and related depositary receipts. |
2 | Source: FactSet Research Systems. Percentage values in data are rounded to the nearest tenth of one percent; the values may not sum to 100% due to rounding. |
28 MATTHEWS ASIAN FUNDS
ALL DATA IS AS OF JUNE 30, 2008, UNLESS OTHERWISE NOTED
PORTFOLIO MANAGER COMMENTARY continued from page 26
consumption would alleviate the dependence on exports, and provide greater flexibility to currencies. Consumers in Asia have been resilient so far, although there are signs of moderating demand. Higher interest rates are crimping the ability to spend, particularly on big-ticket items. But Asian households are still sitting on trillions of dollars of savings that can help buffer rising cost pressures, although that is unlikely to happen immediately.
In the long term, the next big story to unfold will be China’s gradual shift from being a producer to becoming a consumer. Our strategy has been to focus on the creation of newer markets that are aided by an environment of liberalization and deregulation. One good example of such an approach is Dongfeng Motors, one of the largest auto manufacturing companies in China. The availability of auto financing has gained momentum in China only in the last few years. That, combined with rising household wealth, has translated into growing demand for automobiles. In the near term, rising interest rates, surging commodity costs and costlier gasoline have created an overhang for Dongfeng. We believe the company has been proactive in rolling out new models, and has demonstrated the ability to grow consistently at 20% over the past several years. It is well placed to benefit from rising consumption in China.
Even though it has been painful, the Fund remains consistent with its discipline of staying fully invested through these volatile markets. Our approach to risk mitigation stems from focused security selection instead of trying to build cash levels in anticipation of the next trough in the market. Asian equities have been correcting since early November, with India peaking in the first week of January. What began as a healthy adjustment to investor expectations has appeared more indiscriminate in recent weeks. We continue to believe that Asian lifestyles have improved significantly in the last decade, and will continue to improve in the coming years. Some of the recent additions to the portfolio, particularly in the media and tourism sectors, are likely to benefit from this trend. We have also raised stakes in some of our holdings that offer wealth management sendees in the region.
Asia is currently in an unusual position. On the one hand, the world sees it as one of the few engines of growth globally. In fact, on the basis of purchasing power parity, Asia accounts for more than 40% of global GDP growth. Yet, there are considerable uncertainties that may cause some pain for companies and consumers. Political shifts in countries such as Thailand and Malaysia add another layer of uncertainty. However, we remain enthused by the flexibility of Asian economies to evolve. During the Asian crisis, many pundits predicted a lost decade for Asia, but the region was able to turnaround in less than 18 months and resume growth. Even as many parts of the Western world are experiencing some devastation to wealth, there is a secular trend toward wealth creation in Asia, and we believe our portfolios are positioned to participate in that.
800.789.ASIA [2742] www.matthewsfunds.com 29
MATTHEWS PACIFIC TIGER FUND
SCHEDULE OF INVESTMENTSa (UNAUDITED)
COMMON EQUITIES: 97.0%
| | | | | |
| | | SHARES | | VALUE |
CHINA/HONG KONG: 34.8% | | | | | |
Lenovo Group, Ltd. | | 123,704,000 | | $ | 84,156,003 |
Hang Lung Group, Ltd. | | 17,068,000 | | | 76,123,788 |
Swire Pacific, Ltd. A Shares | | 7,187,500 | | | 73,570,125 |
Tencent Holdings, Ltd. | | 8,190,600 | | | 63,524,763 |
NWS Holdings, Ltd. | | 22,086,636 | | | 57,676,209 |
Dairy Farm International Holdings, Ltd. | | 10,937,300 | | | 52,936,532 |
Ping An Insurance (Group) Co. of China, Ltd. H Shares | | 6,858,000 | | | 51,112,362 |
Television Broadcasts, Ltd. | | 8,590,700 | | | 49,620,912 |
Shangri-La Asia, Ltd. | | 19,268,000 | | | 45,145,985 |
China Vanke Co., Ltd. B Shares | | 31,972,360 | | | 40,906,558 |
China Mobile, Ltd. ADR | | 610,550 | | | 40,876,323 |
NetEase.com, Inc. ADRb | | 1,825,100 | | | 39,768,929 |
China Merchants Bank Co., Ltd. H Shares | | 11,084,500 | | | 34,908,475 |
Dongfeng Motor Group Co., Ltd. H Shares | | 78,810,000 | | | 31,571,818 |
China Resources Enterprise, Ltd. | | 10,250,000 | | | 29,301,953 |
Focus Media Holding, Ltd. ADRb | | 973,913 | | | 26,996,868 |
Ctrip.com International, Ltd. ADR | | 587,475 | | | 26,894,606 |
Travelsky Technology, Ltd. H Shares† | | 40,812,000 | | | 26,836,403 |
Towngas China Co., Ltd.b | | 51,937,000 | | | 24,909,238 |
Dickson Concepts International, Ltd.† | | 32,547,900 | | | 22,671,509 |
Dah Sing Financial H oldings, Ltd. | | 2,568,800 | | | 20,753,456 |
Integrated Distribution Services Group, Ltd. | | 10,491,000 | | | 20,590,347 |
Glorious Sun Enterprises, Ltd. | | 41,262,000 | | | 20,335,756 |
China Yurun Food Group, Ltd. | | 8,885,000 | | | 14,616,106 |
Dynasty Fine Wines Group, Ltd. | | 34,175,000 | | | 6,004,724 |
New Oriental Education & Technology Group, Inc. ADRb | | 90,000 | | | 5,257,800 |
| | | | | |
Total China/Hong Kong | | | | | 987,067,548 |
| | | | | |
SOUTH KOREA: 16.7% | | | | | |
Amorepacific Corp. | | 120,429 | | | 74,602,550 |
Hanmi Pharmaceutical Co., Ltd.† | | 435,636 | | | 64,134,548 |
NHN Corp.b | | 335,268 | | | 58,492,816 |
Hana Financial Group, Inc. | | 1,445,743 | | | 55,629,421 |
S1 Corp. | | 907,944 | | | 54,508,755 |
MegaStudy Co., Ltd. | | 156,037 | | | 49,404,383 |
Yuhan Corp. | | 218,497 | | | 45,744,318 |
Samsung Securities Co., Ltd. | | 514,989 | | | 32,148,350 |
Hyundai Development Co. | | 541,382 | | | 27,430,090 |
ON*Media Corp.b | | 3,798,200 | | | 13,271,279 |
| | | | | |
Total South Korea | | | | | 475,366,510 |
| | | | | |
INDIA: 15.2% | | | | | |
Sun Pharmaceutical Industries, Ltd. | | 2,341,856 | | | 76,253,879 |
Infosys Technologies, Ltd. | | 1,513,401 | | | 61,091,804 |
Cipla, Ltd. | | 11,729,421 | | | 57,536,184 |
Dabur India, Ltd. | | 27,630,888 | | | 50,766,338 |
HDFC Bank, Ltd. | | 2,152,568 | | | 50,400,860 |
Bharti Airtel, Ltd.b | | 2,732,503 | | | 45,806,340 |
Titan Industries, Ltd. | | 1,406,895 | | | 32,449,326 |
Sintex Industries, Ltd.b | | 2,719,170 | | | 19,525,568 |
Bank of Baroda | | 3,993,505 | | | 18,879,231 |
Kotak Mahindra Bank, Ltd. | | 1,119,670 | | | 12,009,941 |
Sun TV Network, Ltd. | | 950,000 | | | 6,268,565 |
Sun Pharma Advanced Research Co., Ltd.b | | 737,126 | | | 1,375,740 |
| | | | | |
Total India | | | | | 432,363,776 |
| | | | | |
SINGAPORE: 9.4% | | | | | |
DBS Group Holdings, Ltd. | | 4,695,750 | | | 65,092,679 |
Hyflux, Ltd. | | 24,508,187 | | | 53,860,188 |
Parkway Holdings, Ltd. | | 28,144,540 | | | 47,991,866 |
Fraser and Neave, Ltd. | | 12,713,750 | | | 42,330,886 |
Keppel Land, Ltd. | | 11,182,000 | | | 40,764,926 |
Tat Hong Holdings, Ltd. | | 11,947,000 | | | 16,683,915 |
| | | | | |
Total Singapore | | | | | 266,724,460 |
| | | | | |
30 MATTHEWS ASIAN FUNDS
JUNE 30, 2008
| | | | | |
| | | SHARES | | VALUE |
THAILAND: 6.6% | | | | | |
Advanced Info Service Public Co., Ltd. | | 25,188,500 | | $ | 69,685,547 |
Bank of Ayudhya Public Co., Ltd., NVDRb | | 60,278,900 | | | 39,663,101 |
Land & Houses Public Co., Ltd. | | 154,102,800 | | | 34,106,796 |
Bangkok Bank Public Co., Ltd. | | 6,440,000 | | | 23,113,504 |
Amata Corp. Public Co., Ltd. † | | 58,667,900 | | | 21,933,565 |
| | | | | |
Total Thailand | | | | | 188,502,513 |
| | | | | |
TAIWAN: 5.1% | | | | | |
President Chain Store Corp. | | 22,545,000 | | | 75,018,779 |
Taiwan Semiconductor Manufacturing Co., Ltd. | | 24,259,053 | | | 51,950,003 |
Hon Hai Precision Industry Co., Ltd. | | 3,393,000 | | | 16,711,808 |
| | | | | |
Total Taiwan | | | | | 143,680,590 |
| | | | | |
INDONESIA: 4.9% | | | | | |
PT Bank Central Asia | | 137,025,000 | | | 36,782,741 |
PT Telekomunikasi Indonesia | | 44,860,500 | | | 35,518,617 |
PT Kalbe Farmab | | 348,388,000 | | | 32,118,200 |
PT Astra International | | 13,017,230 | | | 27,178,056 |
PT Telekomunikasi Indonesia ADR | | 259,500 | | | 8,368,875 |
| | | | | |
Total Indonesia | | | | | 139,966,489 |
| | | | | |
MALAYSIA: 3.9% | | | | | |
Public Bank BHD | | 15,777,900 | | | 50,218,871 |
Resorts World BHD | | 49,121,200 | | | 39,086,494 |
Top Glove Corp. BHD † | | 15,609,880 | | | 20,255,820 |
| | | | | |
Total Malaysia | | | | | 109,561,185 |
| | | | | |
PHILIPPINES: 0.4% | | | | | |
SM Prime Holdings, Inc. | | 68,769,117 | | | 10,722,437 |
| | | | | |
Total Philippines | | | | | 10,722,437 |
| | | | | |
TOTAL INVESTMENTS: 97.0% | | | | $ | 2,753,955,508 |
(Cost $2,282,421,218c) | | | | | |
| | |
CASH AND OTHER ASSETS, LESS LIABILITIES: 3.0% | | | | | 85,806,318 |
| | | | | |
NET ASSETS: 100.0% | | | | $ | 2,839,761,826 |
| | | | | |
| a | Certain securities were fair valued under the discretion of the Board of Trustees (Note 1-A). |
| b | Non–income producing security |
| c | Cost of investments is $2,282,421,218 and net unrealized appreciation consists of: |
| | | | |
Gross unrealized appreciation | | $ | 681,131,209 | |
Gross unrealized depreciation | | | (209,596,919 | ) |
| | | | |
Net unrealized appreciation | | $ | 471,534,290 | |
| | | | |
| † | Affiliated Issuer, as defined under the Investment Company Act of 1940 (ownership of 5% or more of the outstanding voting securities of this issuer) |
| ADR | American Depositary Receipt |
| NVDR | Non-voting Depositary Receipt |
See accompanying notes to financial statements.
800.789.ASIA [2742] www.matthewsfunds.com 31
MATTHEWS ASIAN TECHNOLOGY FUND
| | |
| FUND OBJECTIVE AND STRATEGY | | SYMBOL: MATFX |
Objective: Long-term capital appreciation.
Strategy: Under normal market conditions, the Matthews Asian Technology Fund seeks to achieve its investment objective by investing at least 80% of its total net assets, which include borrowings for investment purposes, in the common and preferred stocks of companies located in Asia that derive greater than 50% of their revenues from the sale of products or services in technology-related industries and services. Asia includes China, Hong Kong, India, Indonesia, Japan, Malaysia, Pakistan, Philippines, Singapore, South Korea, Taiwan, Thailand and Vietnam.
Matthews considers technology-related industries and businesses to include, but not be limited to, the following: telecommunications, telecommunications equipment, computers, semiconductors, semiconductor capital equipment, networking, Internet and online service companies, media, office automation, server hardware producers, software companies (e.g., design, consumer and industrial), biotechnology and medical device technology companies, pharmaceuticals and companies involved in the distribution and servicing of these products.
PORTFOLIO MANAGERS
| | |
| Lead Manager: J. Michael Oh | | Co-Managers: Mark W. Headley and Lydia So |
PORTFOLIO MANAGER COMMENTARY
For the six months ending June 30, 2008, the Matthews Asian Technology Fund lost –22.04%, underperforming its benchmark, the MSCI/Matthews Asian Technology Index, which declined –11.27%.
The Fund continued to look for long-term opportunities in a broad range of technology industries that we believe are poised to benefit from increasing demand from Asian consumers and overall growth in the Asia Pacific region. During the first half of 2008, the Asian technology sector corrected due to a worsening macroeconomic environment that stemmed from worries over the U.S. credit crisis, high oil prices and increasing fears of a recession in the U.S. market. This period was, likewise, a challenging one for the Fund.
On a sector basis, the software and services segment experienced the most significant decline, making it the worst performer for the Fund. Over the years, the Fund has benefited from its software and services holdings, and the segment’s growth outlook in the region still remains solid. Demand for various Internet services such as keyword search, casual and massively multiplayer online role-playing games (MMORPG), multimedia content and social networking sites also remains strong. Despite short-term volatility in share prices, we believe that the long-term growth potential of the Asian Internet sector remains attractive. The Fund added to core holdings in the sector where we saw good long-term investment opportunities. In this same period, the Fund also benefited from some exposure to pharmaceutical companies in India, which can be defensive and outperform during volatile market environments.
The technology hardware and equipment sector was also hit by the difficult global macro environment during the period. The U.S. remains one of the most important markets for Asian technology equipment, and a slowdown in consumer demand in the U.S. remains a key concern for the sector. In response, we have
continued on page 35
32 MATTHEWS ASIAN FUNDS
ALL DATA IS AS OF JUNE 30, 2008, UNLESS OTHERWISE NOTED
| | | | | | | | | | | | | | | | | | |
PERFORMANCE AS OF JUNE 30, 2008 | |
| Fund Inception: 12/27/99 | | 3 MO | | | YTD | | | Average Annual Total Returns | |
| | | | 1 YR | | | 3 YRS | | | 5 YRS | | | SINCE
INCEPTION | |
Matthews Asian Technology Fund | | –6.94 | % | | –22.04 | % | | –13.48 | % | | 11.78 | % | | 17.25 | % | | –2.49 | % |
MSCI/Matthews Asian Technology Index1 | | –2.32 | % | | –11.27 | % | | –7.50 | % | | 10.66 | % | | 12.13 | % | | –6.86 | %2 |
Lipper Global Science & Technology Funds Category Avg3 | | 1.87 | % | | –15.08 | % | | –10.36 | % | | 6.88 | % | | 8.37 | % | | –7.84 | %2 |
All performance quoted is past performance and is no guarantee of future results. Assumes reinvestment of all dividends and/or distributions. Unusually high returns may not be sustainable. Investment return and principal value will fluctuate with changing market conditions so that shares, when redeemed, may be worth more or less than their original cost. Current performance may be lower or higher than the return figures quoted. Returns would have been lower if certain of the Fund’s fees and expenses had not been waived. For the Fund’s most recent month-end performance please call 800-789-ASIA [2742] or visit www.matthewsfunds.com.
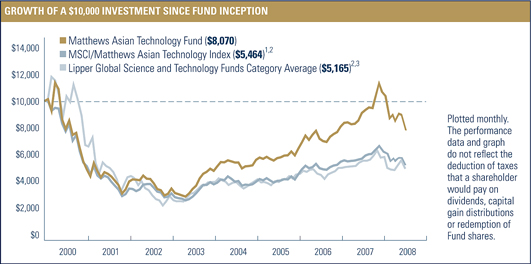
| | | | | | |
FISCAL YEAR 2007 RATIOS | | | | | | |
Gross Operating Expense:4 1.25% | | Portfolio Turnover: | 5 | | 33.21 | % |
1 | The MSCI/Matthews Asian Technology Index is a free float–adjusted market capitalization–weighted index of Asian equities tracking a broad range of technology stocks including semiconductor equipment and products, communications equipment, computers and peripherals, electronic equipment and instruments, office electronics, software, IT consulting and services, Internet software and services, diversified telecommunications services, and wireless telecommunications services. It is not possible to invest directly in an index. Source: Index data from Morgan Stanley Capital International; total return calculations performed by PNC. |
2 | Calculated from 12/31/99. |
3 | Lipper, Inc. fund performance does not reflect sales charges and is based on total return, including reinvestment of dividends and capital gains, for the stated periods. |
4 | Ratio has been restated to reflect current management and administrative and shareholder servicing fees expected to be incurred by the Funds and paid to the Advisor. Matthews Asian Funds do not charge 12b-1 fees. |
5 | The lesser of fiscal year 2007 long-term purchase costs or sales proceeds divided by the average monthly market value of long-term securities. |
800.789.ASIA [2742] www.matthewsfunds.com 33
MATTHEWS ASIAN TECHNOLOGY FUND
| | | | | |
TOP TEN HOLDINGS1 | | | | | |
| | | COUNTRY | | % OF NET ASSETS | |
Nintendo Co., Ltd. | | Japan | | 4.4 | % |
Baidu.com, Inc. | | China/Hong Kong | | 4.4 | % |
Tencent Holdings, Ltd. | | China/Hong Kong | | 4.2 | % |
NHN Corp. | | South Korea | | 4.2 | % |
Samsung Electronics Co., Ltd. | | South Korea | | 4.1 | % |
China Mobile, Ltd. | | China/Hong Kong | | 3.8 | % |
Sony Corp. | | Japan | | 2.9 | % |
New Oriental Education & Technology Group, Inc. | | China/Hong Kong | | 2.9 | % |
Sina Corp. | | China/Hong Kong | | 2.8 | % |
Bharti Airtel, Ltd. | | India | | 2.7 | % |
% OF ASSETS IN TOP 10 | | | | 36.4 | % |
| | | |
COUNTRY ALLOCATION | | | |
China/Hong Kong | | 31.5 | % |
Japan | | 23.2 | % |
South Korea | | 16.6 | % |
India | | 13.6 | % |
Taiwan | | 11.1 | % |
Thailand | | 1.8 | % |
Indonesia | | 1.6 | % |
Malaysia | | 1.0 | % |
Liabilities in excess of cash and other assets | | –0.4 | % |
| | | |
SECTOR ALLOCATION | | | |
Information Technology | | 58.8 | % |
Consumer Discretionary | | 17.2 | % |
Telecommunication Services | | 11.5 | % |
Health Care | | 5.1 | % |
Industrials | | 4.0 | % |
Materials | | 3.8 | % |
Liabilities in excess of cash and other assets | | –0.4 | % |
| | | |
MARKET CAP EXPOSURE2 | | | |
Large cap (over $5 billion) | | 62.0 | % |
Mid cap ($1–$5 billion) | | 23.6 | % |
Small cap (under $1 billion) | | 14.8 | % |
Liabilities in excess of cash and other assets | | –0.4 | % |
| | | | | | | | |
NUMBER OF SECURITIES | | NAV | | FUND ASSETS | | REDEMPTION FEE | | 12b-1 FEES |
52 | | $7.64 | | $178.4 million | | 2.00% within 90 calendar days | | None |
1 | Holdings may combine more than one security from same issuer and related depositary receipts. |
2 | Source: FactSet Research Systems. Percentage values in data are rounded to the nearest tenth of one percent; the values may not sum to 100% due to rounding. |
34 MATTHEWS ASIAN FUNDS
ALL DATA IS AS OF JUNE 30, 2008 UNLESS OTHERWISE NOTED
PORTFOLIO MANAGER COMMENTARY continued from page 32
increased our focus on specialized components and manufacturers of specialty materials that may have less cyclical margin structures than other technology hardware manufacturers.
During the first half of 2008, the Fund’s Chinese and Indian technology holdings saw the biggest corrections. After strongly outperforming last year, these stocks had high valuations relative to other technology stocks in the region. Small-cap holdings in South Korea also underperformed the broader technology universe, hurt by a weak macro environment. These Korean small-cap firms were also impacted by the rapid depreciation of the Korean currency, the won. The Fund’s overweight exposure to China, India and South Korea as well as its underweight in Japan and Taiwan hurt its performance relative to its benchmark during the period.
On a company basis, the Fund’s performance was helped most by China’s Tencent Holdings, which provides value-added services for the Internet as well as online advertising. Despite the overall weakness of the Internet sector, Shenzhen-based Tencent held up relatively better than specialized service providers due to its diverse exposure to various Internet services such as casual games, community-based portals, instant messenger services and other value-added Internet services. Kingdee International Software was the second-largest contributor to the Fund. Kingdee provides enterprise management and accounting solutions to small- to medium-sized companies in China.
The Fund’s worst performers were Mixi, Inc. in Japan and NHN in Korea. Mixi, Inc. is a social networking site in Japan that was hurt by slower-than-expected profit growth. Mixi, Inc. operates one of the largest social networking sites in Japan and is popular among Japanese youth. The company continues to see its core asset—membership—grow, and we believe that its management should be able to find more ways to monetize its user base in the future. NHN, Korea’s largest Internet company providing search, casual games, e-commerce and news, was hurt by increasing regulatory risks involving its media business and slower-than-expected growth in the search business. We view these issues as short-term in nature and expect NHN to continue its growth in various Internet services, and believe it should maintain its dominant position in Korea.
Overall returns were strongest in Hong Kong and Thailand while China was the Fund’s worst-performing country. We took advantage of the short-term volatility in Chinese and Indian technology companies, to increase the portfolio’s weightings in some key holdings where we have seen good, long-term investment opportunities. We also have added to leading consumer services companies in Korea and China. The Fund has continued to maintain its overweight positions in China, India and Korea as well as its underweight positions in Japan and Taiwan.
Over the next six months, high energy prices, high inflation and a dampened U.S. consumer spending trend will remain key concerns for Asian technology industries. Despite short-term volatility in the technology sector and the overall equity market, we continue to look for long-term opportunities, and we believe the Fund is well positioned to capture growth from the increasing wealth of Asian consumers, and the rise of Asia’s leading global technology companies.
800.789.ASIA [2742] www.matthewsfunds.com 35
MATTHEWS ASIAN TECHNOLOGY FUND
SCHEDULE OF INVESTMENTSa (UNAUDITED)
COMMON EQUITIES: 100.4%
| | | | | |
| | | SHARES | | VALUE |
CHINA/HONG KONG: 31.5% | | | | | |
Baidu.com, Inc. ADRb | | 24,800 | | $ | 7,761,408 |
Tencent Holdings, Ltd. | | 973,000 | | | 7,546,406 |
China Mobile, Ltd. ADR | | 101,500 | | | 6,795,425 |
New Oriental Education & Technology Group, Inc. ADRb | | 88,500 | | | 5,170,170 |
Sina Corp.b | | 119,400 | | | 5,080,470 |
Ctrip.com International, Ltd. ADR | | 102,000 | | | 4,669,560 |
Perfect World Co., Ltd. ADRb | | 160,324 | | | 4,006,497 |
Mindray Medical International, Ltd. ADR | | 85,000 | | | 3,172,200 |
China Communications Services Corp., Ltd. H Shares | | 3,892,000 | | | 2,838,952 |
Kingdee International Software Group Co., Ltd. | | 13,080,000 | | | 2,691,676 |
Focus Media Holding, Ltd. ADRb | | 96,700 | | | 2,680,524 |
The9, Ltd. ADRb | | 85,860 | | | 1,938,719 |
Lenovo Group, Ltd. | | 2,748,000 | | | 1,869,468 |
| | | | | |
Total China/Hong Kong | | | | | 56,221,475 |
| | | | | |
JAPAN: 23.2% | | | | | |
Nintendo Co., Ltd. | | 13,885 | | | 7,832,665 |
Sony Corp. | | 120,200 | | | 5,252,418 |
Nikon Corp. | | 129,000 | | | 3,766,068 |
Yahoo! Japan Corp. | | 9,361 | | | 3,605,640 |
Nidec Corp. | | 43,300 | | | 2,882,997 |
Sumco Corp. | | 129,400 | | | 2,863,775 |
Nomura Research Institute, Ltd. | | 113,000 | | | 2,649,809 |
Toray Industries, Inc. | | 454,000 | | | 2,432,792 |
Mixi, Inc.b | | 370 | | | 2,327,636 |
Nitto Denko Corp. | | 58,500 | | | 2,247,775 |
Ibiden Co., Ltd. | | 53,700 | | | 1,952,084 |
Keyence Corp. | | 7,600 | | | 1,810,086 |
Fanuc, Ltd. | | 18,500 | | | 1,806,705 |
| | | | | |
Total Japan | | | | | 41,430,450 |
| | | | | |
SOUTH KOREA: 16.6% | | | | | |
NHN Corp.b | | 42,447 | | | 7,405,552 |
Samsung Electronics Co., Ltd. | | 12,337 | | | 7,371,182 |
JVM Co., Ltd. | | 113,775 | | | 4,236,448 |
LG Electronics, Inc. | | 29,189 | | | 3,306,626 |
SSCP Co., Ltd.b | | 134,644 | | | 2,078,773 |
CDNetworks Co., Ltd.b | | 138,265 | | | 1,526,658 |
ON*Media Corp.b | | 431,150 | | | 1,506,480 |
SFA Engineering Corp. | | 17,513 | | | 1,113,345 |
MegaStudy Co., Ltd. | | 3,138 | | | 993,553 |
| | | | | |
Total South Korea | | | | | 29,538,617 |
| | | | | |
INDIA: 13.6% | | | | | |
Bharti Airtel, Ltd.b | | 289,743 | | | 4,857,110 |
Glenmark Pharmaceuticals, Ltd. | | 251,680 | | | 3,724,455 |
Rolta India, Ltd. | | 584,443 | | | 3,341,615 |
Infosys Technologies, Ltd. | | 81,427 | | | 3,286,982 |
Tata Consultancy Services, Ltd. | | 150,408 | | | 3,000,120 |
Info Edge (India), Ltd. | | 106,177 | | | 2,350,577 |
Sun Pharmaceutical Industries, Ltd. | | 68,365 | | | 2,226,053 |
Television Eighteen India, Ltd. | | 281,976 | | | 1,434,620 |
| | | | | |
Total India | | | | | 24,221,532 |
| | | | | |
TAIWAN: 11.1% | | | | | |
MediaTek, Inc. | | 394,970 | | | 4,554,393 |
Hon Hai Precision Industry Co., Ltd. | | 885,261 | | | 4,360,245 |
Taiwan Semiconductor Manufacturing Co., Ltd. | | 1,769,930 | | | 3,790,250 |
Synnex Technology International Corp. | | 1,710,000 | | | 3,521,069 |
InnoLux Display Corp. | | 1,058,258 | | | 1,900,144 |
Epistar Corp. | | 904,643 | | | 1,633,263 |
| | | | | |
Total Taiwan | | | | | 19,759,364 |
| | | | | |
THAILAND: 1.8% | | | | | |
Advanced Info Service Public Co., Ltd. | | 1,131,100 | | | 3,129,258 |
| | | | | |
Total Thailand | | | | | 3,129,258 |
| | | | | |
36 MATTHEWS ASIAN FUNDS
JUNE 30, 2008
| | | | | | |
| | | SHARES | | VALUE | |
INDONESIA: 1.6% | | | | | | |
PT Telekomunikasi Indonesia ADR | | 90,600 | | $ | 2,921,850 | |
| | | | | | |
Total Indonesia | | | | | 2,921,850 | |
| | | | | | |
MALAYSIA: 1.0% | | | | | | |
Media Prima BHD | | 3,259,300 | | | 1,805,458 | |
| | | | | | |
Total Malaysia | | | | | 1,805,458 | |
| | | | | | |
TOTAL INVESTMENTS: 100.4% | | | | | 179,028,004 | |
(Cost $173,420,788c) | | | | | | |
| | |
LIABILITIES IN EXCESS OF CASH AND OTHER ASSETS: –0.4% | | | | | (658,535 | ) |
| | | | | | |
NET ASSETS: 100.0% | | | | $ | 178,369,469 | |
| | | | | | |
| a | Certain securities were fair valued under the discretion of the Board of Trustees (Note 1-A ). |
| b | Non–income producing security |
| c | Cost of investments is $173,420,788 and net unrealized appreciation consists of: |
| | | | |
Gross unrealized appreciation | | $ | 30,688,685 | |
Gross unrealized depreciation | | | (25,081,469 | ) |
| | | | |
Net unrealized appreciation | | $ | 5,607,216 | |
| | | | |
| ADR | American Depositary Receipt |
See accompanying notes to financial statements.
800.789.ASIA [2742] www.matthewsfunds.com 37
MATTHEWS CHINA FUND
| | |
| FUND OBJECTIVE AND STRATEGY | | SYMBOL: MCHFX |
Objective: Long-term capital appreciation.
Strategy: Under normal market conditions, the Matthews China Fund seeks to achieve its investment objective by investing at least 80% of its total net assets, which include borrowings for investment purposes, in the common and preferred stocks of companies located in China. China includes its political, administrative and other districts, such as Hong Kong.
| | |
| PORTFOLIO MANAGERS | | |
| |
| Lead Manager: Richard H. Gao | | Co-Managers: Mark W. Headley and Andrew T. Foster |
PORTFOLIO MANAGER COMMENTARY
The Matthews China Fund ended the first six months of 2008 down-23.99%, while its benchmark, the MSCI China Index, fen–26.33%.
After a sharp decline in the first quarter, Chinese equities staged a strong rally in April, supported by early optimism that the global economy was hitting bottom, and by better-than-expected 2007 corporate earnings results. However, all April gains were wiped out in the following two months as the market refocused on record oil prices and China’s continued battle with inflation.
The first half of 2008 posed several challenges for China’s economy, stock markets and its people. As China prepared to celebrate its Lunar New Year holiday in late January, the country suffered its biggest snow storm in 50 years, affecting tens of millions of travelers. The country’s next crisis came when a devastating 7.9 magnitude earthquake struck western China in May, resulting in a tragic human toll of more than 55,000 dead. Although the overall economic impact from the two natural disasters was limited, some short-term disruptions in economic activity and consumer behavior were seen. With respect to inflation, the central bank seems to have made some progress as food-driven inflation trended down from its peak level by the second quarter. However, China’s latest move to raise both fuel and electricity prices added some renewed pressure on overall inflation. In the stock markets, the domestic A share market’s sharp decline of about 55% from its peak levels in 2007 (the Fund does not invest in A shares) had a negative spillover effect on Chinese equities listed in Hong Kong.
The Fund seeks to invest where we identify new markets emerging. With the ongoing rise of China’s middle class many of these markets tend to be in the consumer and financial sectors. What we have seen and heard during recent visits to China have reaffirmed our view that rapid income growth has been generating increasing consumer demands, and the momentum does not appear to be slowing. We also see banks and insurance companies continuing to improve efficiencies and expand into new business areas. We, therefore, continue to have overweight positions in these
continued on page 41
38 MATTHEWS ASIAN FUNDS
ALL DATA IS AS OF JUNE 30, 2008, UNLESS OTHERWISE NOTED
| | | | | | | | | | | | | | | | | | | | | |
| PERFORMANCE AS OF JUNE 30, 2008 | |
| Fund Inception: 2/19/98 | | 3 MO | | | YTD | | | Average Annual Total Returns | |
| | | | 1YR | | | 3 YRS | | | 5 YRS | | | 10 YRS | | | SINCE
INCEPTION | |
Matthews China Fund | | –1.98 | % | | –23.99 | % | | 0.15 | % | | 31.25 | % | | 28.01 | % | | 18.15 | % | | 13.65 | % |
MSCI China Index1 | | –3.46 | % | | –26.33 | % | | 0.72 | % | | 36.59 | % | | 34.14 | % | | 8.81 | % | | 3.93 | %2 |
Lipper China Region Funds Category Average3 | | –5.14 | % | | –25.36 | % | | –7.47 | % | | 25.86 | % | | 24.47 | % | | 15.82 | % | | 11.01 | %2 |
All performance quoted is past performance and is no guarantee of future results. Assumes reinvestment of all dividends and/or distributions. Unusually high returns may not be sustainable. Investment return and principal value will fluctuate with changing market conditions so that shares, when redeemed, may be worth more or less than their original cost. Current performance may be lower or higher than the return figures quoted. Returns would have been lower if certain of the Fund’s fees and expenses had not been waived. For the Fund’s most recent month-end performance please call 800-789-ASIA [2742] or visit www.matthewsfunds.com.
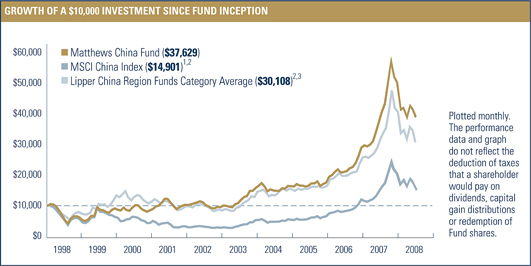
| | | | | |
| FISCAL YEAR 2007 RATIOS | | | | | |
Gross Operating Expense:4 1.17% | | Portfolio Turnover:5 | | 22.13 | % |
1 | The MSCI China Index is a free float–adjusted market capitalization–weighted index of Chinese equities that includes China-affiliated corporations and H shares listed on the Hong Kong Exchange, and B shares listed on the Shanghai and Shenzhen exchanges. Source: Index data from Morgan Stanley Capital International; total return calculations performed by PNC. |
2 | Calculated from 2/28/98. |
3 | Lipper, Inc. fund performance does not reflect sales charges and is based on total return, including reinvestment of dividends and capital gains, for the stated periods. |
4 | Ratio has been restated to reflect current management and administrative and shareholder servicing fees expected to be incurred by the Funds and paid to the Advisor. Matthews Asian Funds do not charge 12b-1 fees. |
5 | The lesser of fiscal year 2007 long-term purchase costs or sales proceeds divided by the average monthly market value of long-term securities. |
800.789.ASIA [2742] www.matthewsfunds.com 39
MATTHEWS CHINA FUND
| | | | | |
| TOP TEN HOLDINGS1 | | | | | |
| | | SECTOR | | % OF NET ASSETS | |
China Mobile, Ltd. | | Telecommunication Services | | 5.2 | % |
Cheung Kong Infrastructure Holdings, Ltd. | | Utilities | | 3.4 | % |
CNOOC, Ltd. | | Energy | | 3.4 | % |
Sina Corp. | | Information Technology | | 3.3 | % |
Hong Kong & China Gas Co., Ltd. | | Utilities | | 3.3 | % |
China Vanke Co., Ltd. | | Financials | | 2.8 | % |
Dongfeng Motor Group Co., Ltd. | | Consumer Discretionary | | 2.6 | % |
Ping An Insurance (Group) Co. of China, Ltd. | | Financials | | 2.6 | % |
NWS Holdings, Ltd. | | Industrials | | 2.3 | % |
China High Speed Transmission Equipment Group Co., Ltd. | | Industrials | | 2.3 | % |
% OF ASSETS IN TOP 10 | | | | 31.3 | % |
| | | |
| CHINA EXPOSURE2,3 | | | |
SAR (Hong Kong) | | 37.4 | % |
H Share | | 30.3 | % |
China-affiliated corporations | | 18.2 | % |
Overseas Listed | | 9.7 | % |
B Share | | 4.1 | % |
Cash and other assets, less liabilities | | 0.3 | % |
| | | |
| SECTOR ALLOCATION | | | |
Consumer Discretionary | | 21.0 | % |
Financials | | 18.4 | % |
Information Technology | | 15.0 | % |
Industrials | | 12.4 | % |
Utilities | | 10.4 | % |
Energy | | 7.7 | % |
Telecommunication Services | | 6.7 | % |
Consumer Staples | | 6.2 | % |
Materials | | 1.9 | % |
Cash and other assets, less liabilities | | 0.3 | % |
| | | |
| MARKET CAP EXPOSURE3 | | | |
Large cap (over $5 billion) | | 55.0 | % |
Mid cap ($1–$5 billion) | | 33.9 | % |
Small cap (under $1 billion) | | 10.7 | % |
Cash and other assets, less liabilities | | 0.3 | % |
| | | | | | | | | | |
NUMBER OF SECURITIES | | NAV | | FUND ASSETS | | REDEMPTION FEE | | 12b-1 FEES |
| 64 | | $ | 30.20 | | $ | 1.3 billion | | 2.00% within
90 calendar days | | None |
1 | Holdings may combine more than one security from same issuer and related depositary receipts. |
2 | SA R (Hong Kong) companies are companies that conduct business in Hong Kong and/or mainland China. H Shares are mainland China companies listed on the Hong Kong exchange but incorporated in mainland China. China-affiliated corporations, also known as “Red Chips,” are mainland China companies with partial state ownership listed and incorporated in Hong Kong. Overseas Listed companies are companies that conduct business in mainland China but are listed in overseas markets such as Japan, Singapore, Taiwan and the United States. B Shares are mainland Chinese companies listed on the Shanghai and Shenzhen stock exchanges, available to both Chinese and non-Chinese investors. |
3 | Source: FactSet Research Systems. Percentage values in data are rounded to the nearest tenth of one percent; the values may not sum to 100% due to rounding. |
40 MATTHEWS ASIAN FUNDS
ALL DATA IS AS OF JUNE 30, 2008, UNLESS OTHERWISE NOTED
PORTFOLIO MANAGER COMMENTARY continued from page 38
areas. However, the Fund saw heavy selling pressure on most sectors in which it is invested. The consumer discretionary, industrials and financial sectors were again the worst-performing sectors in the second quarter after suffering the most sell-offs in the first quarter. The financial sector’s woes came mainly from the decline of the A share market. Consumer companies were hurt by the correction in the high-flying and high-valuation consumer discretionary sector.
The information technology sector has been a bright spot in the portfolio. Internet-related companies in the sector stood out as relatively strong performers during the period. Our holdings in this area include China’s top online gaming companies, the country’s most popular web portal, and the company that built China’s biggest online community. Internet-related firms still make up a high-growth segment in China, and these companies are all market leaders in their respective business segments.
During the first half of 2008, the Fund was fully invested and we made very few changes to the portfolio. The Fund continued to be oriented for domestic growth with diversified allocations to different sectors. During this volatile market environment the Fund showed its relative defensiveness as a result of our diversified approach, and stuck with quality companies in which we have long-term convictions. We did, however, sell Petro China, and in turn increased our position in CNOOC. Although Petro China is the country’s largest upstream oil explorer, it has not benefited from recent oil price spikes. Its upstream profits have been offset by its downstream oil refining losses as the government has placed strict controls on downstream products. The Fund has also started a position in the online travel agency Ctrip International. Ctrip, which offers hotel and airline bookings, has secured its dominant position in this new and rapidly growing industry. In building up the portfolio’s consumer holdings, we have been looking not only at traditional consumer companies but also at companies that tap into new areas of consumption growth. Ctrip is one such company to create a niche new market, and it has been experiencing strong growth.
February 19, 2008 marked a decade since the Fund’s inception, and through the end of June it posted a 10-year average annual total return of 18.15%. Since the Fund’s launch, China has experienced the Asian financial crisis, the dotcom crash and the outbreak of a viral illness known as the severe acute respiratory syndrome (SARS), which all had devastating short-term effects on the Chinese economy China is currently facing some challenging issues—among them are growing inflationary pressures and the challenge of balancing growth while controlling inflation—and we believe the stock market will likely be volatile in the near term. However, we are convinced that the long-term economic fundamentals remain solid and the domestic consumption growth story remains unchanged. As always, we try not to overreact to short-term market volatilities, and instead focus on holding quality stocks that will ride through tough times and stand out as winners in the end.
800.789.ASIA [2742] www.matthewsfunds.com 41
MATTHEWS CHINA FUND
SCHEDULE OF INVESTMENTSa (UNAUDITED)
COMMON EQUITIES: CHINA/HONG KONG: 99.7%
| | | | | |
| | | SHARES | | VALUE |
CONSUMER DISCRETIONARY: 21.0% | | | | | |
| | |
Hotels, Restaurants & Leisure: 4.0% | | | | | |
Café de Coral Holdings, Ltd. | | 12,784,100 | | $ | 22,942,689 |
Shangri-La Asia, Ltd. | | 7,315,600 | | | 17,140,854 |
China Travel International Investment HK, Ltd. | | 38,412,000 | | | 10,411,845 |
Ctrip.com International, Ltd. ADR | | 72,000 | | | 3,296,160 |
| | | | | |
| | | | | 53,791,548 |
| | | | | |
Distributors: 3.0% | | | | | |
China Resources Enterprise, Ltd. | | 8,962,000 | | | 25,619,912 |
Li & Fung, Ltd. | | 5,001,200 | | | 15,090,910 |
| | | | | |
| | | | | 40,710,822 |
| | | | | |
Media: 3.0% | | | | | |
Television Broadcasts, Ltd. | | 2,542,000 | | | 14,682,896 |
AirMedia Group, Inc. ADRb | | 630,200 | | | 9,100,088 |
Clear Media, Ltd.b | | 10,128,000 | | | 8,829,342 |
Pico Far East Holdings, Ltd. | | 49,062,000 | | | 7,468,505 |
| | | | | |
| | | | | 40,080,831 |
| | | | | |
Textiles, Apparel & Luxury Goods: 2.9% | | | | | |
Ports Design, Ltd. | | 7,813,500 | | | 22,407,780 |
Glorious Sun Enterprises, Ltd. | | 33,994,000 | | | 16,753,761 |
| | | | | |
| | | | | 39,161,541 |
| | | | | |
Automobiles: 2.6% | | | | | |
Dongfeng Motor Group Co., Ltd. H Shares | | 86,208,000 | | | 34,535,507 |
| | | | | |
Diversified Consumer Services: 1.8% | | | | | |
New Oriental Education & Technology Group, Inc. ADRb | | 411,800 | | | 24,057,356 |
| | | | | |
Specialty Retail: 1.3% | | | | | |
Belle International Holdings, Ltd. | | 20,036,000 | | | 18,077,939 |
| | | | | |
Multiline Retail: 1.2% | | | | | |
Golden Eagle Retail Group, Ltd. | | 17,277,000 | | | 16,824,976 |
| | | | | |
Leisure Equipment & Products: 1.2% | | | | | |
Li Ning Co., Ltd. | | 6,686,500 | | | 15,495,267 |
| | | | | |
Total Consumer Discretionary | | | | | 282,735,787 |
| | | | | |
FINANCIALS: 18.4% | | | | | |
| | |
Real Estate Management & Development: 7.6% | | | | | |
China Vanke Co., Ltd. B Shares | | 29,628,448 | | | 37,907,675 |
Swire Pacific, Ltd. A Shares | | 2,815,000 | | | 28,813,899 |
Hang Lung Group, Ltd. | | 5,235,000 | | | 23,348,256 |
Agile Property Holdings, Ltd. | | 13,704,000 | | | 11,960,739 |
| | | | | |
| | | | | 102,030,569 |
| | | | | |
Commercial Banks: 6.8% | | | | | |
China Merchants Bank Co., Ltd. H Shares | | 9,349,000 | | | 29,442,856 |
BOC Hong Kong H oldings, Ltd. | | 9,420,500 | | | 24,971,174 |
Bank of Communications Co., Ltd. H Shares | | 16,264,000 | | | 19,109,174 |
China Construction Bank Corp. H Shares | | 22,953,000 | | | 18,521,255 |
| | | | | |
| | | | | 92,044,459 |
| | | | | |
Insurance: 4.0% | | | | | |
Ping An Insurance (Group) Co. of China, Ltd. H Shares | | 4,619,500 | | | 34,428,923 |
China Life Insurance Co., Ltd. H Shares | | 5,508,000 | | | 19,189,515 |
| | | | | |
| | | | | 53,618,438 |
| | | | | |
Total Financials | | | | | 247,693,466 |
| | | | | |
42 MATTHEWS ASIAN FUNDS
JUNE 30, 2008
| | | | | |
| | | SHARES | | VALUE |
INFORMATION TECHNOLOGY: 15.0% | | | | | |
| | |
Internet Software & Services: 6.8% | | | | | |
Sina Corp.b | | 1,051,300 | | $ | 44,732,815 |
Tencent Holdings, Ltd. | | 3,159,000 | | | 24,500,614 |
NetEase.com, Inc. ADRb | | 997,000 | | | 21,724,630 |
| | | | | |
| | | | | 90,958,059 |
| | | | | |
Computers & Peripherals: 3.1% | | | | | |
Lenovo Group, Ltd. | | 37,890,000 | | | 25,776,620 |
TPV Technology, Ltd. | | 31,868,000 | | | 16,628,971 |
| | | | | |
| | | | | 42,405,591 |
| | | | | |
Software: 2.5% | | | | | |
Kingdee International Software Group Co., Ltd.† | | 102,944,000 | | | 21,184,396 |
The9, Ltd. ADRb | | 532,300 | | | 12,019,334 |
| | | | | |
| | | | | 33,203,730 |
| | | | | |
Communications Equipment: 2.0% | | | | | |
ZTE Corp. H Shares | | 5,538,120 | | | 26,650,298 |
| | | | | |
IT Services: 0.6% | | | | | |
Travelsky Technology, Ltd. H Shares | | 12,178,000 | | | 8,007,785 |
| | | | | |
Total Information Technology | | | | | 201,225,463 |
| | | | | |
INDUSTRIALS: 12.4% | | | | | |
| | |
Transportation Infrastructure: 4.0% | | | | | |
GZI Transport, Ltd. | | 36,765,000 | | | 17,716,800 |
China Merchants Holdings International Co., Ltd. | | 3,732,581 | | | 14,446,191 |
Beijing Capital International Airport Co., Ltd. H Shares | | 13,332,000 | | | 11,122,758 |
COSCO Pacific, Ltd. | | 6,730,000 | | | 11,048,428 |
| | | | | |
| | | | | 54,334,177 |
| | | | | |
Industrial Conglomerates: 2.3% | | | | | |
NWS Holdings, Ltd. | | 12,021,276 | | | 31,391,907 |
| | | | | |
Electrical Equipment: 2.3% | | | | | |
China High Speed Transmission Equipment Group Co., Ltd. | | 14,850,000 | | | 30,477,740 |
| | | | | |
Construction & Engineering: 1.9% | | | | | |
China Communications Construction Co., Ltd. H Shares | | 10,709,000 | | | 18,359,122 |
China Railway Construction Corp., Ltd. H Sharesb | | 4,802,000 | | | 6,774,439 |
| | | | | |
| | | | | 25,133,561 |
| | | | | |
Machinery: 1.3% | | | | | |
Shanghai Zhenhua Port Machinery Co., Ltd. B Shares | | 11,989,906 | | | 17,360,101 |
| | | | | |
Airlines: 0.6% | | | | | |
Air China, Ltd. H Shares | | 16,937,900 | | | 8,367,815 |
| | | | | |
Total Industrials | | | | | 167,065,301 |
| | | | | |
See footnotes on page 45.
800.789.ASIA [2742] www.matthewsfunds.com 43
MATTHEWS CHINA FUND
SCHEDULE OF INVESTMENTSa (UNAUDITED) (continued)
COMMON EQUITIES: CHINA/HONG KONG (continued)
| | | | | |
| | | SHARES | | VALUE |
UTILITIES: 10.4% | | | | | |
| | |
Independent Power Producers & Energy Traders: 3.7% | | | | | |
Datang International Power Generation Co., Ltd. H Shares | | 39,968,000 | | $ | 23,755,127 |
Huaneng Power International, Inc. H Shares | | 28,088,000 | | | 19,490,030 |
Huaneng Power International, Inc. ADR | | 213,400 | | | 5,900,510 |
| | | | | |
| | | | | 49,145,667 |
| | | | | |
Electric Utilities: 3.4% | | | | | |
Cheung Kong Infrastructure Holdings, Ltd. | | 10,955,500 | | | 46,420,673 |
| | | | | |
| | |
Gas Utilities: 3.3% | | | | | |
Hong Kong & China Gas Co., Ltd. | | 18,733,594 | | | 44,577,826 |
| | | | | |
| | |
Total Utilities | | | | | 140,144,166 |
| | | | | |
ENERGY: 7.7% | | | | | |
| | |
Oil, Gas & Consumable Fuels: 6.0% | | | | | |
CNOOC, Ltd. | | 26,595,000 | | | 46,166,570 |
China Shenhua Energy Co., Ltd. H Shares | | 4,824,000 | | | 18,985,747 |
China Petroleum & Chemical Corp. (Sinopec) H Shares | | 16,242,000 | | | 15,181,711 |
| | | | | |
| | | | | 80,334,028 |
| | | | | |
Energy Equipment & Services: 1.7% | | | | | |
China Oilfield Services, Ltd. H Shares | | 12,740,000 | | | 22,953,077 |
| | | | | |
Total Energy | | | | | 103,287,105 |
| | | | | |
TELECOMMUNICATION SERVICES: 6.7% | | | | | |
| | |
Wireless Telecommunication Services: 5.2% | | | | | |
China Mobile, Ltd. | | 3,503,583 | | | 47,028,046 |
China Mobile, Ltd. ADR | | 345,400 | | | 23,124,530 |
| | | | | |
| | | | | 70,152,576 |
| | | | | |
Diversified Telecommunication Services: 1.5% | | | | | |
China Communications Services Corp., Ltd. H Shares | | 27,438,000 | | | 20,014,174 |
| | | | | |
Total Telecommunication Services | | | | | 90,166,750 |
| | | | | |
CONSUMER STAPLES: 6.2% | | | | | |
| | |
Food Products: 4.0% | | | | | |
China Yurun Food Group, Ltd. | | 17,085,000 | | | 28,105,366 |
Tingyi (Cayman Islands) Holding Corp. | | 21,379,000 | | | 26,439,650 |
| | | | | |
| | | | | 54,545,016 |
| | | | | |
Food & Staples Retailing: 1.3% | | | | | |
Lianhua Supermarket Holdings Co.,Ltd. H Shares† | | 13,648,000 | | | 17,519,239 |
| | | | | |
Beverages: 0.9% | | | | | |
Tsingtao Brewery Co., Ltd. H Shares | | 5,727,000 | | | 11,687,026 |
| | | | | |
Total Consumer Staples | | | | | 83,751,281 |
| | | | | |
MATERIALS: 1.9% | | | | | |
| | |
Construction Materials: 1.3% | | | | | |
China National Building Material Co., Ltd. H Shares | | 9,112,000 | | | 17,582,538 |
| | | | | |
Paper & Forest Products: 0.6% | | | | | |
Nine Dragons Paper Holdings, Ltd. | | 10,157,000 | | | 7,939,659 |
| | | | | |
Total Materials | | | | | 25,522,197 |
| | | | | |
44 MATTHEWS ASIAN FUNDS
JUNE 30, 2008
| | | |
| | | VALUE |
TOTAL INVESTMENTS: 99.7% | | $ | 1,341,591,516 |
(Cost $1,209,259,927c) | | | |
| |
CASH AND OTHER ASSETS, LESS LIABILITIES: 0.3% | | | 4,449,342 |
| | | |
NET ASSETS: 100.0% | | $ | 1,346,040,858 |
| | | |
| a | Certain securities were fair valued under the discretion of the Board of Trustees (Note 1-A). |
| b | Non–income producing security |
| c | Cost of investments is $1,209,259,927 and net unrealized appreciation consists of: |
| | | | |
Gross unrealized appreciation | | $ | 241,986,531 | |
Gross unrealized depreciation | | | (109,654,942 | ) |
| | | | |
Net unrealized appreciation | | $ | 132,331,589 | |
| | | | |
| † | Affiliated Issuer, as defined under the Investment Company Act of 1940 (ownership of 5% or more of the outstanding voting securities of this issuer) |
| ADR | American Depositary Receipt |
See accompanying notes to financial statements.
800.789.ASIA [2742] www.matthewsfunds.com 45
MATTHEWS INDIA FUND
| | |
| FUND OBJECTIVE AND STRATEGY | | SYMBOL: MINDX |
Objective: Long-term capital appreciation.
Strategy: Under normal market conditions, the Matthews India Fund, a non-diversified fund, seeks to achieve its investment objective by investing at least 80% of its total net assets, which include borrowings for investment purposes, in publicly traded common stocks, preferred stocks and convertible securities of companies located in India.
PORTFOLIO MANAGERS
| | | | |
| Lead Manager: Andrew T. Foster | | Co-Manager: Sharat Shroff, CFA |
PORTFOLIO MANAGER COMMENTARY
During the first half of 2008, the Matthews India Fund declined –37.36%, while its benchmark, the Bombay Stock Exchange 100 Index, fell –42.03%.
Indian shares suffered a sharp collapse during the second quarter, buffeted by two intertwined storms: inflation and record oil prices. We have been concerned about the pace of inflation in the country for some time now, dating back to the Fund’s launch in October of 2005. We had seemingly been wrong to harbor such concerns: until the beginning of this year, inflation had been remarkably quiescent. It is not certain whether this was testament to the growing efficiencies of the domestic economy or, what may be more worrisome, the result of faulty measurement (India does not measure consumer price inflation at the national level). Whatever the case, inflationary pressures returned with a vengeance this year, with wholesale prices currently rising in excess of 11% per annum. This has created a headwind for stocks for dual reasons: first, corporate profits must contend with rising prices on most inputs, possibly squeezing margins; second, and more importantly, the national central bank, the Reserve Bank of India (RBI), has been prompted to raise rates. India owes its growth in recent years to many underlying causes, not least a relatively benign interest rate environment. However, the RBI is one of the most independent and capable central banks in all of Asia; and with pricing pressures mounting again, we would expect the bank to fight inflation doggedly, raising and holding firm interest rates, as it has already done.
Indian markets have also suffered from higher oil prices. For some time now, India’s government has adopted a policy that subsidizes energy prices for some domestic constituencies—especially for cooking, heating and transportation. However, India’s own hydrocarbon resources are very limited; this has meant that as global oil prices have risen, the fiscal deficit arising from the subsidy policy has overshadowed the markets. India has famously suffered from one of the largest fiscal deficits in the world (measured relative to the size of the local
continued on page 49
46 MATTHEWS ASIAN FUNDS
ALL DATA IS AS OF JUNE 30, 2008, UNLESS OTHERWISE NOTED
PERFORMANCE AS OF JUNE 30, 2008
| | | | | | | | | | | | |
Fund Inception: 10/31/05 | | 3 MO | | | YTD | | | Average Annual Total Returns | |
| | | | 1YR | | | SINCE
INCEPTION | |
Matthews India Fund | | –18.69 | % | | –37.36 | % | | –13.05 | % | | 18.98 | % |
Bombay Stock Exchange 100 Index1 | | –20.14 | % | | –42.03 | % | | –11.84 | % | | 25.35 | % |
Lipper Emerging Markets Funds Category Average2 | | –1.05 | % | | –12.37 | % | | 2.55 | % | | 24.77 | % |
All performance quoted is past performance and is no guarantee of future results. Assumes reinvestment of all dividends and/or distributions. Unusually high returns may not be sustainable. Investment return and principal value will fluctuate with changing market conditions so that shares, when redeemed, may be worth more or less than their original cost. Current performance may be lower or higher than the return figures quoted. Returns would have been lower if certain of the Fund’s fees and expenses had not been waived. For the Fund’s most recent month-end performance please call 800-789-ASIA [2742] or visit www.matthewsfunds.com.
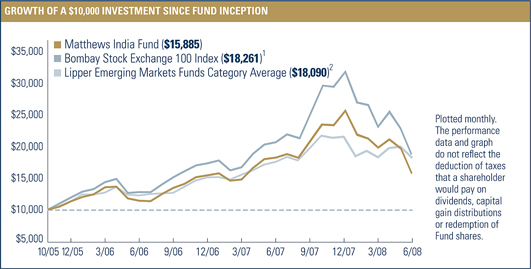
FISCAL YEAR 2007 RATIOS
| | |
Gross Operating Expense:3 1.28% | | Portfolio Turnover:4 25.59% |
1 | The Bombay Stock Exchange 100 (BSE 100) Index is a free float–adjusted market capitalization–weighted index of the 100 stocks listed on the Bombay Stock Exchange. It is not possible to invest in an index. Source: Index data from Bloomberg; total return calculations performed by PNC. |
2 | Lipper, Inc. fund performance does not reflect sales charges and is based on total return, including reinvestment of dividends and capital gains, for the stated periods. |
3 | Ratio has been restated to reflect current management and administrative and shareholder servicing fees expected to be incurred by the Funds and paid to the Advisor. Matthews Asian Funds do not charge 12b-1 fees. |
4 | The lesser of fiscal year 2007 long-term purchase costs or sales proceeds divided by the average monthly market value of long-term securities. |
800.789.ASIA [2742] www.matthewsfunds.com 47
MATTHEWS INDIA FUND
| | | | | |
| TOP TEN HOLDINGS1 | | | | | |
| | | SECTOR | | % OF NET ASSETS | |
| Sun Pharmaceutical Industries, Ltd. | | Health Care | | 4.8 | % |
| Infosys Technologies, Ltd. | | Information Technology | | 4.7 | % |
| Glenmark Pharmaceuticals, Ltd. | | Health Care | | 4.5 | % |
| Dabur India, Ltd. | | Consumer Staples | | 4.5 | % |
| Bharti Airtel, Ltd. | | Telecommunication Services | | 4.4 | % |
| HDFC Bank, Ltd. | | Financials | | 3.5 | % |
| Ashok Leyland, Ltd. | | Industrials | | 3.0 | % |
| Gail (India), Ltd. | | Utilities | | 3.0 | % |
| Reliance Communications, Ltd. | | Telecommunication Services | | 2.9 | % |
| Axis Bank, Ltd. | | Financials | | 2.8 | % |
% OF ASSETS IN TOP 10 | | | | 38.1 | % |
| | | |
| COUNTRY ALLOCATION | | | |
India | | 100.3 | % |
Liabilities in excess of cash and other assets | | –0.3 | % |
| | | |
| SECTOR ALLOCATION | | | |
Financials | | 16.8 | % |
Information Technology | | 15.4 | % |
Consumer Discretionary | | 13.6 | % |
Health Care | | 13.2 | % |
Industrials | | 13.0 | % |
Consumer Staples | | 9.7 | % |
Telecommunication Services | | 7.4 | % |
Utilities | | 6.5 | % |
Energy | | 4.7 | % |
Liabilities in excess of cash and other assets | | –0.3 | % |
| | | |
| MARKET CAP EXPOSURE2 | | | |
Large cap (over $5 billion) | | 37.7 | % |
Mid cap ($1–$5 billion) | | 28.9 | % |
Small cap (under $1 billion) | | 33.7 | % |
Liabilities in excess of cash and other assets | | –0.3 | % |
| | | | | | | | |
NUMBER OF SECURITIES | | NAV | | FUND ASSETS | | REDEMPTION FEE | | 12b-1 FEES |
56 | | $15.31 | | $707.6 million | | 2.00% within 90 calendar days | | None |
1 | Holdings may combine more than one security from same issuer and related depositary receipts. |
2 | Source: FactSet Research Systems. Percentage values in data are rounded to the nearest tenth of one percent; the values may not sum 100% due to rounding. |
48 MATTHEWS ASIAN FUNDS
ALL DATA IS AS OF JUNE 30, 2008, UNLESS OTHERWISE NOTED
PORTFOLIO MANAGER COMMENTARY continued from page 46
economy). Unfortunately, even as tax revenues have grown at record rates during the past few years, government spending has not slowed, meaning that the deficit is quite large even before taking into account the impact of the energy subsidy. Yet now as oil prices have accelerated, the energy subsidy has begun to dwarf nearly all other components of the deficit. Consequently, global investors have lost a measure of faith in the local currency, as well as the country’s growth prospects. This in turn has pushed India’s currency, the rupee, and stock prices substantially lower.
Amid a very difficult six months, there was little shelter in the marketplace. From the portfolio’s perspective, the greatest positive returns arose from its holdings in pharmaceuticals. Indian pharmaceutical companies continue to make inroads to the global marketplace, particularly as the cost of health care around the world dictates that many seek cheaper drug alternatives—which India is well-suited to provide. Two of the Fund’s best-performing positions during the first half, Sun Pharmaceuticals and Glenmark Pharmaceuticals, exemplify this idea. Both enjoyed profits derived from the domestic marketplace, but their performance during the quarter was even more linked to the perception that each has begun to successfully tap the global market for generic drugs.
At present, nearly all of the Fund’s gains from last year have been surrendered amid the market’s broader decline. However, the Fund’s emphasis continues to be to generate long-term returns, rather than to beat a benchmark in a given quarter. The Fund has offered a modicum of relative outperformance, falling less than the market as a whole. Notably, this has been achieved without retreating to cash, but rather via security selection and diversification. Nevertheless, this sort of relative outperformance is of little consolation to those shareholders who have invested with the Fund more recently
It is in this regard we remain focused on improving the Fund’s long-term record, despite its losses in recent months. This long-term perspective is important because, as you will note, from its inception to the present, the Fund has offered substantial absolute gains, and has outpaced the S&P 500. More importantly, even as India may stumble from time to time, we remain enthusiastic long-term investors in the country. We believe that the economic evolution and modernization that has taken hold there is neither transitory nor reversible. Volatility, often in the extreme, is to be expected from such a transition; yet we also believe that over the long term, the inherent risks will be compensated with commensurate reward.
800.789.ASIA [2742] www.matthewsfunds.com 49
MATTHEWS INDIA FUND
SCHEDULE OF INVESTMENTS (UNAUDITED)
COMMON EQUITIES: INDIA: 98.3%
| | | | | |
| | | SHARES | | VALUE |
FINANCIALS: 16.8% | | | | | |
| | |
Commercial Banks: 10.1% | | | | | |
HDFC Bank, Ltd. | | 970,533 | | $ | 22,724,345 |
Axis Bank, Ltd. | | 1,424,200 | | | 20,028,175 |
Corporation Bank | | 3,159,331 | | | 19,168,933 |
Oriental Bank of Commerce | | 2,596,834 | | | 7,779,940 |
HDFC Bank, Ltd. ADR | | 27,500 | | | 1,970,650 |
| | | | | |
| | | | | 71,672,043 |
| | | | | |
Thrifts & Mortgage Finance: 1.9% | | | | | |
Housing Development Finance Corp. | | 289,973 | | | 13,242,381 |
| | | | | |
Real Estate Management & Development: 1.4% | | | | | |
Unitech, Ltd. | | 2,588,777 | | | 10,312,990 |
| | | | | |
Consumer Finance: 1.2% | | | | | |
Shriram Transport Finance Co., Ltd. | | 1,280,000 | | | 8,557,629 |
| | | | | |
Diversified Financial Services: 1.1% | | | | | |
SREI Infrastructure Finance, Ltd. | | 3,750,000 | | | 7,791,981 |
| | | | | |
Capital Markets: 1.1% | | | | | |
IL&FS Investsmart, Ltd. | | 1,674,537 | | | 7,513,524 |
| | | | | |
Total Financials | | | | | 119,090,548 |
| | | | | |
INFORMATION TECHNOLOGY: 15.4% | | | | | |
| | |
IT Services: 11.0% | | | | | |
Infosys Technologies, Ltd. | | 717,591 | | | 28,967,160 |
Rolta India, Ltd. | | 2,833,990 | | | 16,203,638 |
Wipro, Ltd. | | 1,397,435 | | | 14,289,402 |
HCL-Infosystems, Ltd. | | 4,253,185 | | | 13,864,246 |
Infosys Technologies, Ltd. ADR | | 104,500 | | | 4,541,570 |
| | | | | |
| | | | | 77,866,016 |
| | | | | |
Internet Software & Services: 2.2% | | | | | |
Info Edge (India), Ltd. | | 566,727 | | | 12,546,368 |
Sify Technologies, Ltd. ADRa | | 861,724 | | | 3,309,020 |
| | | | | |
| | | | | 15,855,388 |
| | | | | |
Software: 2.2% | | | | | |
Financial Technologies (India), Ltd. | | 399,855 | | | 15,623,852 |
| | | | | |
Total Information Technology | | | | | 109,345,256 |
| | | | | |
CONSUMER DISCRETIONARY: 13.6% | | | | | |
| | |
Media: 5.6% | | | | | |
Sun TV Network, Ltd. | | 1,500,091 | | | 9,898,334 |
HT Media, Ltd. | | 3,777,688 | | | 8,714,365 |
Zee Entertainment Enterprises, Ltd. | | 1,618,908 | | | 7,525,429 |
Television Eighteen India, Ltd. | | 801,847 | | | 4,079,589 |
Dish TV India, Ltd.a | | 4,737,097 | | | 3,308,536 |
PVR, Ltd. | | 879,751 | | | 3,297,149 |
Inox Leisure, Ltd. | | 1,516,527 | | | 2,566,024 |
| | | | | |
| | | | | 39,389,426 |
| | | | | |
Automobiles: 2.1% | | | | | |
Mahindra & Mahindra, Ltd. | | 1,302,500 | | | 14,789,922 |
| | | | | |
Multiline Retail: 1.8% | | | | | |
Vishal Retail, Ltd.a | | 916,436 | | | 12,774,724 |
| | | | | |
Hotels, Restaurants & Leisure: 1.6% | | | | | |
Indian Hotels Co., Ltd. | | 6,274,840 | | | 11,288,149 |
| | | | | |
Auto Components: 1.3% | | | | | |
Bharat Forge, Ltd. | | 1,706,000 | | | 9,322,036 |
| | | | | |
Textiles, Apparel & Luxury Goods: 1.2% | | | | | |
Titan Industries, Ltd. | | 369,589 | | | 8,524,385 |
| | | | | |
Total Consumer Discretionary | | | | | 96,088,642 |
| | | | | |
INDUSTRIALS: 13.0% | | | | | |
| | |
Machinery: 6.3% | | | | | |
Ashok Leyland, Ltd. | | 32,311,277 | | | 21,440,720 |
Jain Irrigation Systems, Ltd. | | 1,281,590 | | | 14,530,148 |
Thermax, Ltd. | | 990,000 | | | 8,596,490 |
| | | | | |
| | | | | 44,567,358 |
| | | | | |
Building Products: 2.2% | | | | | |
Sintex Industries, Ltd.a | | 2,131,834 | | | 15,308,079 |
| | | | | |
Construction & Engineering: 1.9% | | | | | |
Larsen & Toubro, Ltd. | | 266,330 | | | 13,523,560 |
| | | | | |
Industrial Conglomerates: 1.4% | | | | | |
MAX India, Ltd.a | | 2,303,102 | | | 8,318,467 |
Siemens India, Ltd. | | 146,473 | | | 1,314,597 |
| | | | | |
| | | | | 9,633,064 |
| | | | | |
50 MATTHEWS ASIAN FUNDS
JUNE 30, 2008
| | | | | | | |
| | | SHARES | | VALUE | |
Air Freight & Logistics: 0.8% | | | | | | | |
Gati, Ltd. | | | 3,281,339 | | $ | 5,594,101 | |
| | | | | | | |
Road & Rail: 0.4% | | | | | | | |
Container Corp. of India, Ltd. | | | 170,557 | | | 3,074,387 | |
| | | | | | | |
Total Industrials | | | | | | 91,700,549 | |
| | | | | | | |
HEALTH CARE: 12.2% | | | | | | | |
| | |
Pharmaceuticals: 12.2% | | | | | | | |
Sun Pharmaceutical Industries, Ltd. | | | 1,034,260 | | | 33,676,852 | |
Glenmark Pharmaceuticals, Ltd. | | | 2,163,570 | | | 32,017,316 | |
Cipla, Ltd. | | | 3,994,657 | | | 19,594,941 | |
Sun Pharma Advanced Research Co., Ltd.a | | | 594,260 | | | 1,109,101 | |
| | | | | | | |
Total Health Care | | | | | | 86,398,210 | |
| | | | | | | |
CONSUMER STAPLES: 8.7% | | | | | | | |
| | |
Personal Products: 6.3% | | | | | | | |
Dabur India, Ltd. | | | 17,324,779 | | | 31,830,884 | |
Marico, Ltd. | | | 10,555,233 | | | 13,100,510 | |
| | | | | | | |
| | | | | | 44,931,394 | |
| | | | | | | |
Household Products: 1.9% | | | | | | | |
Hindustan Unilever, Ltd. | | | 2,792,269 | | | 13,443,777 | |
| | | | | | | |
Beverages: 0.5% | | | | | | | |
Radico Khaitan, Ltd. | | | 1,542,000 | | | 3,386,845 | |
| | | | | | | |
Total Consumer Staples | | | | | | 61,762,016 | |
| | | | | | | |
TELECOMMUNICATION SERVICES: 7.4% | | | | | | | |
| | |
Wireless Telecommunication Services: 7.4% | | | | | | | |
Bharti Airtel, Ltd.a | | | 1,864,191 | | | 31,250,384 | |
Reliance Communications, Ltd. | | | 2,024,755 | | | 20,838,152 | |
| | | | | | | |
Total Telecommunication Services | | | | | | 52,088,536 | |
| | | | | | | |
UTILITIES: 6.5% | | | | | | | |
| | |
Gas Utilities: 4.3% | | | | | | | |
Gail (India), Ltd. | | | 2,756,501 | | | 21,344,063 | |
Gujarat State Petronet, Ltd. | | | 7,075,000 | | | 9,167,490 | |
| | | | | | | |
| | | | | | 30,511,553 | |
| | | | | | | |
Electric Utilities: 2.2% | | | | | | | |
CESC, Ltd. | | | 1,666,117 | | | 15,234,176 | |
| | | | | | | |
Total Utilities | | | | | | 45,745,729 | |
| | | | | | | |
ENERGY: 4.7% | | | | | | | |
| | |
Oil, Gas & Consumable Fuels: 4.7% | | | | | | | |
Reliance Industries, Ltd. | | | 339,371 | | | 16,526,046 | |
Chennai Petroleum Corp., Ltd. | | | 2,652,744 | | | 16,520,692 | |
| | | | | | | |
Total Energy | | | | | | 33,046,738 | |
| | | | | | | |
TOTAL COMMON EQUITIES: INDIA | | | | | | 695,266,224 | |
(Cost $707,438,481) | | | | | | | |
| | | | | | | |
| | |
| INTERNATIONAL DOLLAR BONDS: 2.0% | | | | | | | |
| | |
| | | FACE AMOUNT | | VALUE | |
HEALTH CARE: 1.0% | | | | | | | |
| | |
Pharmaceuticals: 1.0% | | | | | | | |
Ranbaxy Laboratories, Ltd., Cnv. | | | | | | | |
0.000%, 03/18/11 | | $ | 6,500,000 | | | 7,353,125 | |
| | | | | | | |
Total Health Care | | | | | | 7,353,125 | |
| | | | | | | |
CONSUMER STAPLES: 1.0% | | | | | | | |
| | |
Beverages: 1.0% | | | | | | | |
Radico Khaitan, Ltd., Cnv. | | | | | | | |
3.500%, 07/27/11 | | | 7,000,000 | | | 7,035,000 | |
| | | | | | | |
Total Consumer Staples | | | | | | 7,035,000 | |
| | | | | | | |
TOTAL INTERNATIONAL DOLLAR BONDS | | | | | | 14,388,125 | |
(Cost $15,641,444) | | | | | | | |
| | | | | | | |
TOTAL INVESTMENTS: 100.3% | | | | | | 709,654,349 | |
(Cost $723,079,925b) | | | | | | | |
| | |
LIABILITIES IN EXCESS OF CASH AND OTHER ASSETS: –0.3% | | | | | | (2,047,828 | ) |
| | | | | | | |
NET ASSETS: 100.0% | | | | | $ | 707,606,521 | |
| | | | | | | |
| a | Non–income producing security |
| b | Cost of investments is $723,079,925 and net unrealized depreciation consists of: |
| | | | |
Gross unrealized appreciation | | $ | 106,382,208 | |
Gross unrealized depreciation | | | (119,807,784 | ) |
| | | | |
Net unrealized depreciation | | $ | (13,425,576 | ) |
| | | | |
| ADR | American Depositary Receipt |
See accompanying notes to financial statements.
800.789.ASIA [2742] www.matthewsfunds.com 51
MATTHEWS JAPAN FUND
| | |
| FUND OBJECTIVE AND STRATEGY | | SYMBOL: MJFOX |
Objective: Long-term capital appreciation.
Strategy: Under normal market conditions, the Matthews Japan Fund seeks to achieve its investment objective by investing at least 80% of its total net assets, which include borrowings for investment purposes, in the common and preferred stocks of companies located in Japan.
PORTFOLIO MANAGER
Lead Manager: Taizo Ishida
PORTFOLIO MANAGER COMMENTARY
During the first half of 2008, the Matthews Japan Fund was down -7.29%, while its benchmark, the MSCI Japan Index, fell -5.46%. In the same period, the Tokyo Stock Price Index declined -4.07%.
During the first half of 2008, Japan’s economy grew due to strong export demand from Asia, Europe and the Middle East. In this sense, it is safe to say that Japan is less dependent on the U.S. than it once was. However, a healthy U.S. economy is still a requisite for a healthy global economy. When the U.S. economy does recover, we believe, Japan should also benefit. During the second half of 2008, we believe that inflation will pose an even bigger issue for Japanese companies, as we expect companies will have a tough time transferring higher costs to customers. However, inflation tends to put upward pressure on wage growth, which should be positive for Japan’s domestic demand. We believe this should discourage the Bank of Japan from cutting its current 0.5% key policy rate.
During the second quarter of 2008, the Fund fen -3.23%, while the MSCI Japan Index rose 2.48%, and the Tokyo Stock Price Index gained 2.42%. After hitting a low in the middle of March, the Japanese market rallied in April and May, led by foreign buying of large-cap firms as is typically the case in major rallies. After a long absence from the Japanese market, foreign investors returned mainly to cover short-selling, and continued buying throughout the second quarter—a major factor behind the market’s relatively strong performance during this period.
The Fund’s concentration in small- and medium-cap firms held back performance during the market’s surge. More specifically, the rally in Japan’s financial sector was led by the country’s top three mega-banks: Mitsubishi UFJ, Mizuho and Sumitomo Mitsui financial groups. Our exposure in the Japanese mergers and acquisitions, wealth management and real estate industries also suffered in part because of lackluster retail investment activity stemming from a battered global economy.
continued on page 55
52 MATTHEWS ASIAN FUNDS
ALL DATA IS AS OF JUNE 30, 2008, UNLESS OTHERWISE NOTED
| | | | | | | | | | | | | | | | | | |
PERFORMANCE AS OF JUNE 30, 2008 | |
| | | | | | | | | Average Annual Total Returns | |
| Fund Inception: 12/31/98 | | 3 MO | | | YTD | | | 1 YR | | | 3 YRS | | | 5 YRS | | | SINCE
INCEPTION | |
Matthews Japan Fund | | –3.23 | % | | –7.29 | % | | –15.49 | % | | –2.45 | % | | 9.72 | % | | 5.39 | % |
MSCI Japan Index1 | | 2.48 | % | | –5.46 | % | | –11.93 | % | | 8.72 | % | | 13.14 | % | | 3.71 | % |
Tokyo Stock Price Index (TOPIX)2 | | 2.42 | % | | –4.07 | % | | –12.38 | % | | 6.59 | % | | 11.75 | % | | 3.91 | % |
Lipper Japanese Funds Category Average3 | | 1.33 | % | | –7.50 | % | | –16.97 | % | | 4.40 | % | | 10.24 | % | | 3.77 | % |
All performance quoted is past performance and is no guarantee of future results. Assumes reinvestment of all dividends and/or distributions. Unusually high returns may not be sustainable. Investment return and principal value will fluctuate with changing market conditions so that shares, when redeemed, may be worth more or less than their original cost. Current performance may be lower or higher than the return figures quoted. Returns would have been lower if certain of the Fund’s fees and expenses had not been waived. For the Fund’s most recent month-end performance please call 800-789-ASIA [2742] or visit www.matthewsfunds.com.
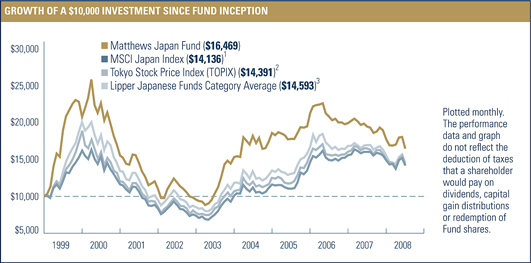
| | |
FISCAL YEAR 2007 RATIOS | | |
Gross Operating Expense:4 1.23% | | Portfolio Turnover:5 45.51% |
1 | The MSCI Japan Index is a free float–adjusted market capitalization–weighted index of Japanese equities listed in Japan. It is not possible to invest in an index. Source: Index data from Morgan Stanley Capital International; total return calculations performed by PNC. |
2 | The Tokyo Stock Price Index (TOPIX) is a market capitalization–weighted index of all companies listed on the First Section of the Tokyo Stock Exchange. It is not possible to invest in an index. Source: Index data from Bloomberg; total return calculations performed by PNC. |
3 | Lipper, Inc. fund performance does not reflect sales charges and is based on total return, including reinvestment of dividends and capital gains, for the stated periods. |
4 | Ratio has been restated to reflect current management and administrative and shareholder servicing fees expected to be incurred by the Funds and paid to the Advisor. Matthews Asian Funds do not charge 12b-1 fees. |
5 | The lesser of fiscal year 2007 long-term purchase costs or sales proceeds divided by the average monthly market value of long-term securities. |
800.789.ASIA [2742] www.matthewsfunds.com 53
MATTHEWS JAPAN FUND
| | | | | |
| TOP TEN HOLDINGS1 | | | | | |
| | | SECTOR | | % OF NET ASSETS | |
Nintendo Co., Ltd. | | Information Technology | | 3.4 | % |
Toyota Motor Corp. | | Consumer Discretionary | | 3.3 | % |
Sony Corp. | | Consumer Discretionary | | 3.0 | % |
Pigeon Corp. | | Consumer Staples | | 3.0 | % |
Mitsubishi UFJ Financial Group, Inc. | | Financials | | 2.7 | % |
Unicharm Petcare Corp. | | Consumer Staples | | 2.4 | % |
The Sumitomo Trust & Banking Co., Ltd. | | Financials | | 2.2 | % |
Sysmex Corp. | | Health Care | | 2.2 | % |
Benesse Corp. | | Consumer Discretionary | | 2.1 | % |
Keyence Corp. | | Information Technology | | 2.1 | % |
% OF ASSETS IN TOP 10 | | | | 26.4 | % |
| | | |
| COUNTRY ALLOCATION | | | |
Japan | | 99.7 | % |
Cash and other assets, less liabilities | | 0.3 | % |
| | | |
SECTOR ALLOCATION | | | |
Financials | | 26.9 | % |
Information Technology | | 19.9 | % |
Consumer Discretionary | | 17.6 | % |
Industrials | | 16.7 | % |
Health Care | | 6.9 | % |
Consumer Staples | | 6.4 | % |
Materials | | 3.0 | % |
Energy | | 1.8 | % |
Telecommunication Services | | 0.5 | % |
Cash and other assets, less liabilities | | 0.3 | % |
| | | |
MARKET CAP EXPOSURE2 | | | |
Large cap (over $5 billion) | | 55.4 | % |
Mid cap ($1–$5 billion) | | 22.7 | % |
Small cap (under $1 billion) | | 21.5 | % |
Cash and other assets, less liabilities | | 0.3 | % |
| | | | | | | | | | |
| NUMBER OF SECURITIES | | NAV | | FUND ASSETS | | REDEMPTION FEE | | 12b-1 FEES |
| 71 | | $ | 13.49 | | $ | 200.6 million | | 2.00% within 90 calendar days | | None |
1 | Holdings may combine more than one security from same issuer and related depositary receipts. |
2 | Source: FactSet Research Systems. Percentage values in data are rounded to the nearest tenth of one percent; the values may not sum to 100% due to rounding. |
54 MATTHEWS ASIAN FUNDS
ALL DATA IS AS OF JUNE 30, 2008, UNLESS OTHERWISE NOTED
PORTFOLIO MANAGER COMMENTARY continued from page 52
Contributing to the continued weakness in the small-cap arena was the dearth of Japanese retail investors in so-called emerging new markets, such as the Tokyo Stock Exchange’s Mothers market (Market of the High-Growth and Emerging Stocks) and the Osaka Hercules exchange.
Three sectors that helped the Fund’s performance during the first half of the year were consumer staples, industrials and energy. Some of these companies offer exposure in consumer businesses we expect should grow, such as the Japanese pet care business and China’s baby care industry. The Fund also added holdings in the industrials sector, which have been positive for performance. The decision to add them was triggered by attractive valuations and global leadership in each sub-segment. Our holdings in the energy sector also served the Fund well as a result of rising oil prices.
As for Japan’s domestic political landscape, a general election is likely to take place by the end of this fiscal year. With Japanese Prime Minister Yasuo Fukuda’s approval rating at a historic low, the market may welcome change. Company earnings should remain relatively healthy, provided there are no drastic changes in the exchange rate as most companies already discounted a strengthened yen in March, at the end of the fiscal year for Japanese firms.
Finally, we are seeing some progress in Japan’s corporate governance. While this year’s annual shareholder meetings in June did not reveal ground-breaking progress, we did note dramatically increased pressure from domestic shareholders for higher returns. Japanese companies are well-aware of greater expectations from shareholders, and have raised dividend payout ratios to almost 30% of earnings in the last fiscal year-end, along with increasing share buybacks, which accounted for about 20% of earnings. Overall, we are cautiously optimistic about the Japanese equity market going forward, with an eye on the long-term growth prospects for each holding in the portfolio.
800.789.ASIA [2742] www.matthewsfunds.com 55
MATTHEWS JAPAN FUND
SCHEDULE OF INVESTMENTS (UNAUDITED)
COMMON EQUITIES: JAPAN: 99.7%
| | | | | |
| | | SHARES | | VALUE |
FINANCIALS: 26.9% | | | | | |
| | |
Commercial Banks: 7.3% | | | | | |
The Sumitomo Trust & Banking Co., Ltd. | | 632,000 | | $ | 4,416,292 |
Mitsubishi UFJ Financial Group, Inc. | | 471,930 | | | 4,182,193 |
The Chiba Bank, Ltd. | | 338,000 | | | 2,368,244 |
The Joyo Bank, Ltd. | | 462,000 | | | 2,245,063 |
Mitsubishi UFJ Financial Group, Inc. ADR | | 150,400 | | | 1,323,520 |
| | | | | |
| | | | | 14,535,312 |
| | | | | |
Real Estate Management & Development: 6.4% | | | | | |
Daibiru Corp. | | 309,800 | | | 3,439,791 |
Funai Zaisan Consultants Co., Ltd. | | 2,409 | | | 3,221,528 |
Sumitomo Realty & Development Co., Ltd. | | 127,000 | | | 2,523,614 |
Mitsubishi Estate Co., Ltd. | | 88,000 | | | 2,013,844 |
Shoei Co., Ltd. | | 113,080 | | | 1,324,778 |
JOINT Corp. | | 75,100 | | | 376,260 |
| | | | | |
| | | | | 12,899,815 |
| | | | | |
Capital Markets: 5.1% | | | | | |
GCA Savvian Group Corp. | | 1,141 | | | 3,965,052 |
Ichiyoshi Securities Co., Ltd. | | 369,200 | | | 3,383,073 |
Monex Group, Inc. | | 4,240 | | | 2,882,968 |
| | | | | |
| | | | | 10,231,093 |
| | | | | |
Real Estate Investment Trusts: 4.4% | | | | | |
Tokyu REIT, Inc. | | 304 | | | 2,470,707 |
Nomura Real Estate Office Fund, Inc., REIT | | 233 | | | 1,753,232 |
Japan Logistics Fund, Inc., REIT | | 267 | | | 1,734,991 |
Global One Real Estate Investment Corp., REIT | | 143 | | | 1,616,047 |
United Urban Investment Corp., REIT | | 273 | | | 1,228,931 |
| | | | | |
| | | | | 8,803,908 |
| | | | | |
Consumer Finance: 2.0% | | | | | |
ORIX Corp. | | 28,250 | | | 4,041,225 |
| | | | | |
Insurance: 1.7% | | | | | |
The Fuji Fire & Marine Insurance Co., Ltd. | | 1,302,000 | | | 3,470,038 |
| | | | | |
Total Financials | | | | | 53,981,391 |
| | | | | |
INFORMATION TECHNOLOGY: 19.9% | | | |
| |
Electronic Equipment & Instruments: 7.7% | | | |
Keyence Corp. | | 17,870 | | | 4,256,084 |
Nidec Corp. | | 57,200 | | | 3,808,485 |
Murata Manufacturing Co., Ltd. | | 55,000 | | | 2,589,820 |
Topcon Corp. | | 263,700 | | | 2,498,302 |
Hoya Corp. | | 95,500 | | | 2,207,962 |
| | | | | |
| | | | | 15,360,653 |
| | | | | |
Software: 3.4% | | | | | |
Nintendo Co., Ltd. | | 12,215 | | | 6,890,601 |
| | | | | |
Internet Software & Services: 2.5% | | | | | |
Yahoo! Japan Corp. | | 7,680 | | | 2,958,158 |
Gourmet Navigator, Inc. | | 935 | | | 1,937,185 |
| | | | | |
| | | | | 4,895,343 |
| | | | | |
Office Electronics: 2.0% | | | | | |
Canon, Inc. ADR | | 79,450 | | | 4,068,635 |
| | | | | |
IT Services: 1.9% | | | | | |
Nomura Research Institute, Ltd. | | 164,600 | | | 3,859,811 |
| | | | | |
Computers & Peripherals: 1.3% | | | | | |
Melco Holdings, Inc. | | 130,500 | | | 2,562,438 |
| | | | | |
Semiconductors & Semiconductor Equipment: 1.1% | | | | | |
Sumco Corp. | | 100,800 | | | 2,230,824 |
| | | | | |
Total Information Technology | | | | | 39,868,305 |
| | | | | |
CONSUMER DISCRETIONARY: 17.6% | | | | | |
| | |
Household Durables: 6.3% | | | | | |
Sekisui House, Ltd. | | 438,000 | | | 4,087,753 |
Sony Corp. ADR | | 75,900 | | | 3,319,866 |
Sony Corp. | | 62,700 | | | 2,739,822 |
Matsushita Electric Industrial Co., Ltd. | | 121,000 | | | 2,609,502 |
| | | | | |
| | | | | 12,756,943 |
| | | | | |
Automobiles: 4.7% | | | | | |
Toyota Motor Corp. ADR | | 53,100 | | | 4,991,400 |
Honda Motor Co., Ltd. ADR | | 81,200 | | | 2,763,236 |
Toyota Motor Corp. | | 34,600 | | | 1,632,490 |
| | | | | |
| | | | | 9,387,126 |
| | | | | |
Hotels, Restaurants & Leisure: 2.8% | | | | | |
Pacific Golf Group International Holdings KK | | 3,478 | | | 3,471,940 |
Doutor Nichires Holdings Co., Ltd. | | 136,300 | | | 2,076,879 |
| | | | | |
| | | | | 5,548,819 |
| | | | | |
56 MATTHEWS ASIAN FUNDS
JUNE 30, 2008
| | | | | |
| | | SHARES | | VALUE |
Diversified Consumer Services: 2.1% | | | | | |
Benesse Corp. | | 105,700 | | $ | 4,280,360 |
| | | | | |
Specialty Retail: 1.7% | | | | | |
Nitori Co., Ltd. | | 66,100 | | | 3,398,842 |
| | | | | |
Total Consumer Discretionary | | | | | 35,372,090 |
| | | | | |
INDUSTRIALS: 16.7% | | | | | |
| | |
Machinery: 10.4% | | | | | |
Fanuc, Ltd. | | 40,000 | | | 3,906,390 |
Mitsubishi Heavy Industries, Ltd. | | 777,000 | | | 3,702,613 |
NGK Insulators, Ltd. | | 180,000 | | | 3,500,494 |
Komatsu, Ltd. | | 95,600 | | | 2,664,934 |
OSG Corp. | | 205,100 | | | 2,317,842 |
Takeuchi Manufacturing Co., Ltd. | | 81,400 | | | 1,996,958 |
OKUMA Corp. | | 183,000 | | | 1,818,195 |
Aichi Corp. | | 142,300 | | | 989,004 |
| | | | | |
| | | | | 20,896,430 |
| | | | | |
Commercial Services & Supplies: 1.6% | | | | | |
Daiseki Co., Ltd. | | 65,890 | | | 2,097,360 |
Secom Co., Ltd. | | 22,300 | | | 1,083,656 |
| | | | | |
| | | | | 3,181,016 |
| | | | | |
Trading Companies & Distributors: 1.4% | | | | | |
Mitsubishi Corp. | | 87,000 | | | 2,867,637 |
| | | | | |
Airlines: 1.2% | | | | | |
Japan Airlines Corp.a | | 1,101,000 | | | 2,312,219 |
| | | | | |
Road & Rail: 1.1% | | | | | |
East Japan Railway Co. | | 267 | | | 2,175,025 |
| | | | | |
Construction & Engineering: 1.0% | | | | | |
JGC Corp. | | 105,000 | | | 2,066,676 |
| | | | | |
Total Industrials | | | | | 33,499,003 |
| | | | | |
HEALTH CARE: 6.9% | | | | | |
| | |
Health Care Equipment & Supplies: 5.4% | | | | | |
Sysmex Corp. | | 111,300 | | | 4,381,353 |
Nakanishi, Inc. | | 28,300 | | | 3,048,943 |
Terumo Corp. | | 54,000 | | | 2,756,322 |
ASAHI INTECC Co., Ltd. | | 88,400 | | | 590,249 |
| | | | | |
| | | | | 10,776,867 |
| | | | | |
Pharmaceuticals: 1.5% | | | | | |
Takeda Pharmaceutical Co., Ltd. | | 60,400 | | | 3,071,620 |
| | | | | |
Total Health Care | | | | | 13,848,487 |
| | | | | |
CONSUMER STAPLES: 6.4% | | | | | |
| | |
Household Products: 3.0% | | | | | |
Pigeon Corp. | | 296,500 | | | 5,961,553 |
| | | | | |
Food Products: 2.4% | | | | | |
Unicharm Petcare Corp. | | 163,600 | | | 4,884,042 |
| | | | | |
Personal Products: 1.0% | | | | | |
Shiseido Co., Ltd. | | 87,000 | | | 1,990,959 |
| | | | | |
Total Consumer Staples | | | | | 12,836,554 |
| | | | | |
MATERIALS: 3.0% | | | | | |
| | |
Chemicals: 3.0% | | | | | |
Toray Industries, Inc. | | 488,000 | | | 2,614,983 |
Nitto Denko Corp. | | 50,100 | | | 1,925,018 |
OHARA, Inc. | | 76,300 | | | 1,362,385 |
| | | | | |
Total Materials | | | | | 5,902,386 |
| | | | | |
ENERGY: 1.8% | | | | | |
| | |
Oil, Gas & Consumable Fuels: 1.8% | | | | | |
Inpex Holdings, Inc. | | 278 | | | 3,508,217 |
| | | | | |
Total Energy | | | | | 3,508,217 |
| | | | | |
TELECOMMUNICATION SERVICES: 0.5% | | | | | |
| | |
Wireless Telecommunication Services: 0.5% | | | | | |
KDDI Corp. | | 177 | | | 1,093,488 |
| | | | | |
Total Telecommunication Services | | | | | 1,093,488 |
| | | | | |
TOTAL INVESTMENTS: 99.7% | | | | | 199,909,921 |
(Cost $223,734,885b) | | | | | |
| | |
CASH AND OTHER ASSETS, LESS LIABILITIES: 0.3% | | | | | 694,348 |
| | | | | |
NET ASSETS: 100.0% | | | | $ | 200,604,269 |
| | | | | |
| a | Non–income producing security |
| b | Cost of investments is $223,734,885 and net unrealized depreciation consists of: |
| | | | |
Gross unrealized appreciation | | $ | 11,657,290 | |
Gross unrealized depreciation | | | (35,482,254 | ) |
| | | | |
Net unrealized depreciation | | $ | (23,824,964 | ) |
| | | | |
| ADR | American Depositary Receipt |
| REIT | Real Estate Investment Trust |
See accompanying notes to financial statements.
800.789.ASIA [2742] www.matthewsfunds.com 57
MATTHEWS KOREA FUND
| | |
| FUND OBJECTIVE AND STRATEGY | | SYMBOL: MAKOX |
Objective: Long-term capital appreciation.
Strategy: Under normal market conditions, the Matthews Korea Fund, a non-diversified fund, seeks to achieve its investment objective by investing at least 80% of its total net assets, which include borrowings for investment purposes, in the common and preferred stocks of companies located in South Korea.
PORTFOLIO MANAGER
| | |
Lead Manager: J. Michael Oh | | Co-Managers: Mark W. Headley and Michael B. Han, CFA |
PORTFOLIO MANAGER COMMENTARY
For the six months ending June 30, 2008, the Matthews Korea Fund lost -24.09%, while its benchmark, the Korea Composite Stock Price Index (KOSPI), declined -21.12%.
The Korean equity market faced various obstacles during this period, including a weakened currency, high inflation and dampened consumer sentiment. A weak currency is generally positive for exports, and as the Korean won has fallen against the U.S. dollar, Korean exports have remained strong. Auto-related sales were up 9.2% for the first half of the year, compared to a year ago. However, a steep currency depreciation does more harm than good to the economy, particularly in light of high energy costs. South Korea’s recent challenges have also involved falling currency reserves and rising short-term foreign currency debt. Inflation has negatively impacted domestic consumption, which is already at a low. Foreign investors continued to sell Korean equities during the first half of the year, and foreign ownership in KOSPI-listed securities fell to a low not seen since about 2001. The combined effects of a weaker won and record oil prices kept South Korea’s current account balance—the country’s broadest measure of trade—at a deficit for the first six months of the year.
Hopes for positive change were high with the late-February inauguration of President Lee Myung Bak, a former chairman of Hyundai who was welcomed by Korea’s business community. President Lee pledged to cut taxes and speed up deregulations to encourage investment and boost economic growth. But just months after taking office, Lee’s administration met with backlash over a U.S. beef trade deal that the public felt could expose them to mad cow disease. Following extensive public protests in May, President Lee amended the import deal, publicly apologized for not being more sensitive to concerns and reshuffled his cabinet. Despite his efforts, however, the beef issue remains largely unresolved and demonstrations continued into June.
The second quarter did, however, see some notable progress with South Korea’s neighbors to the North. In June, North Korea made a gesture toward dismantling its nuclear program by demolishing a cooling tower at its main nuclear reactor. The action was welcomed by nations involved in multilateral talks with North Korea. In particular, the U.S. government said that it would lift some economic sanctions against the isolated country, and remove it from a U.S. State Department list of state-sponsored terrorism. The moves seem to be encouraging steps that could signal greater regional cooperation.
continued on page 61
58 MATTHEWS ASIAN FUNDS
ALL DATA IS AS OF JUNE 30, 2008, UNLESS OTHERWISE NOTED
| | | | | | | | | | | | | | | | | | | | | |
PERFORMANCE AS OF JUNE 30, 2008 | |
| | | | | | | | | Average Annual Total Returns | |
| Fund Inception: 1/3/95 | | 3 MO | | | YTD | | | 1 YR | | | 3 YRS | | | 5 YRS | | | 10 YRS | | | SINCE
INCEPTION | |
Matthews Korea Fund | | –9.12 | % | | –24.09 | % | | –20.01 | % | | 13.23 | % | | 19.30 | % | | 25.73 | % | | 5.24 | % |
Korea Composite Stock Price Index (KOSPI)1 | | –6.98 | % | | –21.12 | % | | –14.08 | % | | 18.69 | % | | 23.87 | % | | 22.73 | % | | 2.11 | %2 |
Lipper Pacific ex-Japan Funds Category Average3 | | –6.40 | % | | –19.67 | % | | –5.93 | % | | 19.41 | % | | 22.62 | % | | 14.78 | % | | 7.52 | %2 |
All performance quoted is past performance and is no guarantee of future results. Assumes reinvestment of all dividends and/or distributions. Unusually high returns may not be sustainable. Investment return and principal value will fluctuate with changing market conditions so that shares, when redeemed, may be worth more or less than their original cost. Current performance may be lower or higher than the return figures quoted. Returns would have been lower if certain of the Fund’s fees and expenses had not been waived. For the Fund’s most recent month-end performance please call 800-789-ASIA [2742] or visit www.matthewsfunds.com.
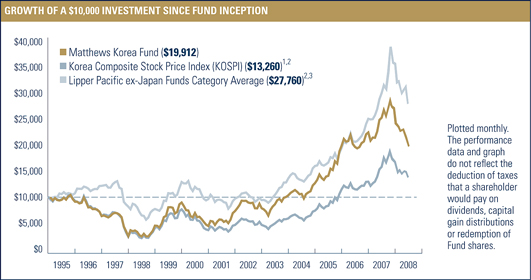
| | |
FISCAL YEAR 2007 RATIOS | | |
Gross Operating Expense:4 1.21% | | Portfolio Turnover:5 24.20% |
1 | The Korea Composite Stock Price Index (KOSPI) is a market–capitalization weighted index of all common stocks listed on the Korea Stock Exchange. It is not possible to invest in an index. Source: Index data from Bloomberg; total return calculations performed by PNC. |
2 | Calculated from 12/31/94. |
3 | Lipper, Inc. fund performance does not reflect sales charges and is based on total return, including reinvestment of dividends and capital gains, for the stated periods. |
4 | Ratio has been restated to reflect current management and administrative and shareholder servicing fees expected to be incurred by the Funds and paid to the Advisor. Matthews Asian Funds do not charge 12b-1 fees. |
5 | The lesser of fiscal year 2007 long-term purchase costs or sales proceeds divided by the average monthly market value of long-term securities. |
800.789.ASIA [2742] www.matthewsfunds.com 59
MATTHEWS KOREA FUND
| | | | | |
TOP TEN HOLDINGS1 | |
| | | SECTOR | | % OF NET ASSETS | |
Samsung Electronics Co., Ltd. | | Information Technology | | 8.5 | % |
Samsung Fire & Marine Insurance Co., Ltd. | | Financials | | 4.4 | % |
NHN Corp. | | Information Technology | | 4.3 | % |
S1 Corp. | | Industrials | | 4.3 | % |
Shinhan Financial Group Co., Ltd. | | Financials | | 4.2 | % |
Kookmin Bank | | Financials | | 3.7 | % |
Amorepacific Corp. | | Consumer Staples | | 3.5 | % |
SK Telecom Co., Ltd. | | Telecommunication Services | | 3.5 | % |
Yuhan Corp. | | Health Care | | 3.4 | % |
Hanmi Pharmaceutical Co., Ltd. | | Health Care | | 3.4 | % |
% OF ASSETS IN TOP 10 | | | | 43.2 | % |
| | | |
COUNTRY ALLOCATION | | | |
South Korea | | 100.3 | % |
Liabilities in excess of cash and other assets | | –0.3 | % |
| | | |
SECTOR ALLOCATION | | | |
Financials | | 22.5 | % |
Information Technology | | 15.0 | % |
Industrials | | 14.9 | % |
Consumer Discretionary | | 13.2 | % |
Consumer Staples | | 12.2 | % |
Health Care | | 10.0 | % |
Telecommunication Services | | 4.9 | % |
Materials | | 4.5 | % |
Energy | | 3.1 | % |
Liabilities in excess of cash and other assets | | –0.3 | % |
| | | |
MARKET CAP EXPOSURE2 | | | |
Large cap (over $5 billion) | | 45.8 | % |
Mid cap ($1–$5 billion) | | 33.9 | % |
Small cap (under $1 billion) | | 20.6 | % |
Liabilities in excess of cash and other assets | | –0.3 | % |
| | | | | | | | | |
| NUMBER OF SECURITIES | | NAV | | FUND ASSETS | | REDEMPTION FEE | | 12b-1 FEES |
| 50 | | $ | 4.98 | | $160.4 million | | 2.00% within 90 calendar days | | None |
1 | Holdings may combine more than one security from same issuer and related depositary receipts. |
2 | Source: FactSet Research Systems. Percentage values in data are rounded to the nearest tenth of one percent; the values may not sum to 100% due to rounding. |
60 MATTHEWS ASIAN FUNDS
ALL DATA IS AS OF JUNE 30, 2008, UNLESS OTHERWISE NOTED
PORTFOLIO MANAGER COMMENTARY continued from page 58
During the second quarter of the year, the Fund trailed its benchmark primarily due to its positions in financials, particularly in brokerage firms, as well as in consumer sectors. The weak equity market and an increase in the number of new brokerage licenses continued to dampen the outlook for the brokerage industry. Additionally, weak domestic consumer sentiment and slow growth in real disposable incomes hurt the consumer sector. The Fund’s small-cap exposure also detracted from performance during the first half of the year. Small-cap companies are typically more volatile than large-cap companies, and premiums enjoyed by small-cap firms were eroded during the period’s weak equity environment. Additionally, some small-cap companies suffered currency woes as most did not anticipate the won’s rapid depreciation. However, we remain committed to these firms and their long-term prospects.
On a company basis, the biggest contribution to Fund performance came from LG Electronics, which benefited from stronger-than-expected mobile phone sales, and diverse exposure to emerging markets. LG has been a pioneer in emerging markets, such as China and India, and currently dominates market share in the appliances segment of several of these markets. During the first half of the year, Samsung Electronics also held up well, benefiting from the expected recovery of the memory chip industry and market share gains in the mobile phone handset market, especially in the U.S. Generally, large-cap companies fared better than small- to mid-cap companies during the downturn.
The Fund’s worst performers during the period were Samsung Securities and Kiwoom Securities, which faced intensifying competition in the domestic brokerage business. The overall profitability of the industry declined as competition to attract new clients intensified amid the weak market environment. Though the financial sector has suffered from an unclear regulatory environment, intensifying competition and subdued domestic sentiment, it still holds one of the most attractive valuations in the region, particularly in banks and brokerage firms. We believe that our financial holdings in the Fund are well-positioned to benefit once the sector recovers from currently unfavorable conditions.
In recent years, the Korean equity market has been led by segments of the industrials sector. This has been due in part to limited supply capacity and increasing demand from emerging countries. While the margin expansion of some industrial companies has been impressive, it is hard to believe that the current margins are sustainable in the long term, especially given increasing capacity within the emerging countries. We have evaluated long-term investment opportunities within the industrials sector, especially in the components and specialized parts industries, but the Fund continues to underweight industrials compared to its benchmark. The Fund continues to maintain overweight positions in the consumer, financials and information technology sectors. We believe that in the long term, these sectors will create sustainable value and returns for shareholders.
800.789.ASIA [2742] www.matthewsfunds.com 61
MATTHEWS KOREA FUND
SCHEDULE OF INVESTMENTS (UNAUDITED)
COMMON EQUITIES: SOUTH KOREA: 99.4%
| | | | | |
| | | SHARES | | VALUE |
FINANCIALS: 22.5% | | | | | |
| | |
Commercial Banks: 11.0% | | | | | |
Shinhan Financial Group Co., Ltd. | | 148,937 | | $ | 6,734,592 |
Kookmin Bank | | 86,782 | | | 5,127,028 |
Hana Financial Group, Inc. | | 128,022 | | | 4,926,041 |
Kookmin Bank ADR | | 13,839 | | | 809,720 |
| | | | | |
| | | | | 17,597,381 |
| | | | | |
Insurance: 6.4% | | | | | |
Samsung Fire & Marine Insurance Co., Ltd. | | 33,909 | | | 7,082,947 |
Meritz Fire & Marine Insurance Co., Ltd. | | 330,960 | | | 3,195,541 |
| | | | | |
| | | | | 10,278,488 |
| | | | | |
Capital Markets: 5.1% | | | | | |
Samsung Securities Co., Ltd. | | 63,790 | | | 3,982,111 |
Kiwoom Securities Co., Ltd. | | 81,319 | | | 2,915,216 |
Korea Investment Holdings Co., Ltd. | | 34,232 | | | 1,369,542 |
| | | | | |
| | | | | 8,266,869 |
| | | | | |
Total Financials | | | | | 36,142,738 |
| | | | | |
INFORMATION TECHNOLOGY: 15.0% | | | | | |
| | |
Semiconductors & Semiconductor Equipment: 8.5% | | | | | |
Samsung Electronics Co., Ltd. | | 22,707 | | | 13,567,110 |
| | | | | |
Internet Software & Services: 5.1% | | | | | |
NHN Corp.a | | 39,418 | | | 6,877,095 |
CDNetworks Co., Ltd.a | | 118,492 | | | 1,308,334 |
| | | | | |
| | | | | 8,185,429 |
| | | | | |
Electronic Equipment & Instruments: 1.4% | | | | | |
Thinkware Systems Corp.a | | 66,724 | | | 1,492,607 |
SFA Engineering Corp. | | 13,055 | | | 829,939 |
| | | | | |
| | | | | 2,322,546 |
| | | | | |
Total Information Technology | | | | | 24,075,085 |
| | | | | |
| | |
INDUSTRIALS: 14.9% | | | | | |
Commercial Services & Supplies: 4.3% | | | | | |
S1 Corp. | | 114,137 | | | 6,852,257 |
| | | | | |
Industrial Conglomerates: 3.8% | | | | | |
Orion Corp. | | 15,887 | | | 3,364,056 |
Samsung Techwin Co., Ltd. | | 61,012 | | | 2,703,414 |
| | | | | |
| | | | | 6,067,470 |
| | | | | |
Machinery: 3.3% | | | | | |
JVM Co., Ltd. | | 102,874 | | | 3,830,546 |
STX Engine Co., Ltd. | | 38,140 | | | 1,489,431 |
| | | | | |
| | | | | 5,319,977 |
| | | | | |
Construction & Engineering: 2.5% | | | | | |
GS Engineering & Construction Corp. | | 20,657 | | | 2,261,103 |
Hyundai Development Co. | | 21,875 | | | 1,108,336 |
Samsung Engineering Co., Ltd. | | 7,874 | | | 589,392 |
| | | | | |
| | | | | 3,958,831 |
| | | | | |
Building Products: 1.0% | | | | | |
Sung Kwang Bend Co., Ltd. | | 60,113 | | | 1,701,013 |
| | | | | |
Total Industrials | | | | | 23,899,548 |
| | | | | |
CONSUMER DISCRETIONARY: 13.2% | | | | | |
| | |
Household Durabales: 2.9% | | | | | |
LG Electronics, Inc. | | 27,465 | | | 3,111,326 |
Intelligent Digital Integrated Security Co., Ltd. | | 92,332 | | | 1,584,398 |
| | | | | |
| | | | | 4,695,724 |
| | | | | |
Media: 2.7% | | | | | |
Cheil Communications, Inc. | | 12,437 | | | 2,948,593 |
ON*Media Corp.a | | 397,700 | | | 1,389,602 |
| | | | | |
| | | | | 4,338,195 |
| | | | | |
Multiline Retail: 2.5% | | | | | |
Hyundai Department Store Co., Ltd. | | 49,311 | | | 3,992,774 |
| | | | | |
Auto Components: 2.3% | | | | | |
Hankook Tire Co., Ltd. | | 194,340 | | | 2,703,166 |
S&T Daewoo Co., Ltd. | | 29,130 | | | 1,008,084 |
| | | | | |
| | | | | 3,711,250 |
| | | | | |
Automobiles: 1.6% | | | | | |
Hyundai Motor Co. | | 37,055 | | | 2,515,085 |
| | | | | |
62 MATTHEWS ASIAN FUNDS
JUNE 30, 2008
| | | | | | |
| | | SHARES | | VALUE | |
Hotels, Restaurants & Leisure: 1.2% | | | | | | |
Modetour Network, Inc. | | 82,735 | | $ | 1,858,680 | |
| | | | | | |
Total Consumer Discretionary | | | | | 21,111,708 | |
| | | | | | |
CONSUMER STAPLES: 11.3% | | | | | | |
| | |
Food & Staples Retailing: 5.7% | | | | | | |
Shinsegae Co., Ltd. | | 9,878 | | | 5,316,490 | |
Shinsegae Food Co., Ltd. | | 59,441 | | | 3,807,224 | |
| | | | | | |
| | | | | 9,123,714 | |
| | | | | | |
Personal Products: 3.5% | | | | | | |
Amorepacific Corp. | | 9,121 | | | 5,650,216 | |
| | | | | | |
Beverages: 1.8% | | | | | | |
Hite Brewery Co., Ltd.b | | 25,422 | | | 2,842,617 | |
| | | | | | |
Food Products: 0.3% | | | | | | |
CJ CheilJedang Corp.a | | 2,278 | | | 595,605 | |
| | | | | | |
Total Consumer Staples | | | | | 18,212,152 | |
| | | | | | |
HEALTH CARE: 10.0% | | | | | | |
| | |
Pharmaceuticals: 10.0% | | | | | | |
Yuhan Corp. | | 26,421 | | | 5,531,475 | |
Hanmi Pharmaceutical Co., Ltd. | | 36,792 | | | 5,416,536 | |
Daewoong Pharmaceutical Co., Ltd. | | 61,669 | | | 5,093,640 | |
| | | | | | |
Total Health Care | | | | | 16,041,651 | |
| | | | | | |
TELECOMMUNICATION SERVICES: 4.9% | | | | | | |
| | |
Wireless Telecommunication Services: 3.5% | | | | | | |
SK Telecom Co., Ltd. | | 20,249 | | | 3,687,620 | |
SK Telecom Co., Ltd. ADR | | 89,500 | | | 1,858,915 | |
| | | | | | |
| | | | | 5,546,535 | |
| | | | | | |
Diversified Telecommunication Services: 1.4% | | | | | | |
KT Corp. | | 35,630 | | | 1,524,251 | |
KT Corp. ADR | | 36,900 | | | 786,708 | |
| | | | | | |
| | | | | 2,310,959 | |
| | | | | | |
Total Telecommunication Services | | | | | 7,857,494 | |
| | | | | | |
MATERIALS: 4.5% | | | | | | |
| | |
Chemicals: 2.8% | | | | | | |
LG Chem, Ltd. | | 29,515 | | | 2,821,567 | |
SSCP Co., Ltd.a | | 107,380 | | | 1,657,843 | |
| | | | | | |
| | | | | 4,479,410 | |
| | | | | | |
Metals & Mining: 1.7% | | | | | | |
POSCO ADR | | 20,500 | | | 2,660,490 | |
| | | | | | |
Total Materials | | | | | 7,139,900 | |
| | | | | | |
ENERGY: 3.1% | | | | | | |
| | |
Oil, Gas & Consumable Fuels: 3.1% | | | | | | |
GS Holdings Corp. | | 84,337 | | | 3,224,970 | |
S-Oil Corp. | | 27,358 | | | 1,757,524 | |
| | | | | | |
Total Energy | | | | | 4,982,494 | |
| | | | | | |
TOTAL COMMON EQUITIES: 99.4% | | | | | 159,462,770 | |
(Cost $134,246,434) | | | | | | |
| | | | | | |
PREFERRED EQUITIES: SOUTH KOREA: 0.9% | | | | | | |
| | |
CONSUMER STAPLES: 0.9% | | | | | | |
Food Products: 0.9% | | | | | | |
CJ CheilJedang Corp., 2nd Pfd.a | | 5,626 | | | 1,392,987 | |
| | | | | | |
Total Consumer Staples | | | | | 1,392,987 | |
| | | | | | |
TOTAL PREFERRED EQUITIES | | | | | 1,392,987 | |
(Cost $1,298,118) | | | | | | |
| | | | | | |
TOTAL INVESTMENTS: 100.3% | | | | | 160,855,757 | |
(Cost $135,544,552c) | | | | | | |
LIABILITIES IN EXCESS OF CASH AND OTHER ASSETS: –0.3% | | | | | (480,158 | ) |
| | | | | | |
NET ASSETS: 100.0% | | | | $ | 160,375,599 | |
| | | | | | |
| a | Non–income producing security |
| c | Cost of investments is $135,544,552 and net unrealized appreciation consists of: |
| | | | |
| Gross unrealized appreciation | | $ | 43,810,683 | |
| Gross unrealized depreciation | | | (18,499,478 | ) |
| | | | |
| Net unrealized appreciation | | $ | 25,311,205 | |
| | | | |
| ADR | American Depositary Receipt |
See accompanying notes to financial statements.
800.789.ASIA [2742] www.matthewsfunds.com 63
DISCLOSURE OF FUND EXPENSES (Unaudited)
We believe it is important for you to understand the impact of fees regarding your investment. All mutual funds have operating expenses. As a shareholder of a mutual fund, you incur ongoing costs, which include costs for portfolio management, administrative services, and shareholder reports (like this one), among others. Operating expenses, which are deducted from a fund’s gross income, directly reduce the investment return of the fund. A fund’s operating expenses are expressed as a percentage of its average net assets. This figure is known as the expense ratio. The following examples are intended to help you understand the ongoing fees (in dollars) of investing in your Fund and to compare these costs with those of other mutual funds. The examples are based on an investment of $1,000 made at the beginning of the period shown and held for the entire period.
This table illustrates your fund’s costs in two ways:
Actual Fund Return: This section helps you to estimate the actual operating expenses, after any applicable fee waivers, that you paid over the period. The “Ending Account Value” shown is derived from the Fund’s actual return for the past six month period, the “Expense Ratio” column shows the period’s annualized expense ratio, and the “Operating Expenses Paid During Period” column shows the dollar amount that would have been paid by an investor who started with $1,000 in the fund at the beginning of the period.
You may use the information here, together with your account value, to estimate the expenses that you paid over the period. To do so, simply divide your account value by $1,000 (for example, an $8,600 account value divided by $1,000 = 8.6), then multiply the result by the number given for your Fund in the first line under the heading entitled “Operating Expenses Paid During Period.”
Hypothetical 5% Return: This section is intended to help you compare your Fund’s costs with those of other mutual funds. It assumes that the Fund had an annual return of 5% before operating expenses, but that the expense ratio is unchanged. In this case, because the return used is not the Fund’s actual return, the results do not apply to your investment. This example is useful in making comparisons to other mutual funds because the Securities and Exchange Commission requires all mutual funds to calculate expenses based on an assumed 5% annual return. You can assess your Fund’s costs by comparing this hypothetical example with the hypothetical examples that appear in shareholder reports of other funds.
Please note that the operating expenses shown in the table are meant to highlight and help you compare your ongoing costs only and do not reflect any transactional costs such as sales charges (loads), redemption fees, or exchange fees. The Funds assess a redemption fee of 2.00% of the total redemption proceeds if you sell or exchange your shares within 90 calendar days after purchasing them. The redemption fee is paid directly to the Funds and is designed to discourage frequent short-term trading and to offset transaction costs associated with such trading of Fund shares. For purposes of determining whether the redemption fee applies, the shares that have been held the longest will be redeemed first. The redemption fee does not apply to redemptions of shares held in certain omnibus accounts and retirement plans that cannot currently implement the redemption fee. While these exceptions exist, the Funds are not accepting any new accounts which cannot implement the redemption fee. In addition, the Funds are actively discussing a schedule for implementation of the fee with these providers.
For more information on this policy, please see the Funds’ prospectus.
The Matthews Asian Funds do not charge any sales loads, exchange fees, or 12b-1 fees, but these may be present in other funds to which you compare this data. Therefore, the hypothetical portions of the table are useful in comparing ongoing costs only, and will not help you determine the relative total costs of owning different funds.
64 MATTHEWS ASIAN FUNDS
JUNE 30, 2008
| | | | | | | | | | | | |
| | | Beginning Account
Value 1/1/08 | | Ending Account
Value 6/30/08 | | Expense
Ratio1 | | | Expenses Paid
During Period
1/1/08–6/30/082 |
Matthews Asia Pacific Equity Income Fund | | | | | | | | | | | | |
Actual Fund Return | | $ | 1,000.00 | | $ | 953.40 | | 1.22 | % | | $ | 5.93 |
Hypothetical 5% Return | | $ | 1,000.00 | | $ | 1,018.80 | | 1.22 | % | | $ | 6.12 |
| | | | |
Matthews Asian Growth and Income Fund | | | | | | | | | | | | |
Actual Fund Return | | $ | 1,000.00 | | $ | 919.60 | | 1.15 | % | | $ | 5.49 |
Hypothetical 5% Return | | $ | 1,000.00 | | $ | 1,019.14 | | 1.15 | % | | $ | 5.77 |
| | | | |
Matthews Asia Pacific Fund | | | | | | | | | | | | |
Actual Fund Return | | $ | 1,000.00 | | $ | 846.20 | | 1.23 | % | | $ | 5.65 |
Hypothetical 5% Return | | $ | 1,000.00 | | $ | 1,018.75 | | 1.23 | % | | $ | 6.17 |
| | | | |
Matthews Pacific Tiger Fund | | | | | | | | | | | | |
Actual Fund Return | | $ | 1,000.00 | | $ | 808.00 | | 1.12 | % | | $ | 5.03 |
Hypothetical 5% Return | | $ | 1,000.00 | | $ | 1,019.29 | | 1.12 | % | | $ | 5.62 |
| | | | |
Matthews Asian Technology Fund | | | | | | | | | | | | |
Actual Fund Return | | $ | 1,000.00 | | $ | 779.60 | | 1.27 | % | | $ | 5.62 |
Hypothetical 5% Return | | $ | 1,000.00 | | $ | 1,018.55 | | 1.27 | % | | $ | 6.37 |
| | | | |
Matthews China Fund | | | | | | | | | | | | |
Actual Fund Return | | $ | 1,000.00 | | $ | 760.10 | | 1.23 | % | | $ | 5.38 |
Hypothetical 5% Return | | $ | 1,000.00 | | $ | 1,018.75 | | 1.23 | % | | $ | 6.17 |
| | | | |
Matthews India Fund | | | | | | | | | | | | |
Actual Fund Return | | $ | 1,000.00 | | $ | 626.40 | | 1.29 | % | | $ | 5.22 |
Hypothetical 5% Return | | $ | 1,000.00 | | $ | 1,018.45 | | 1.29 | % | | $ | 6.47 |
| | | | |
Matthews Japan Fund | | | | | | | | | | | | |
Actual Fund Return | | $ | 1,000.00 | | $ | 927.10 | | 1.25 | % | | $ | 5.99 |
Hypothetical 5% Return | | $ | 1,000.00 | | $ | 1,018.65 | | 1.25 | % | | $ | 6.27 |
| | | | |
Matthews Korea Fund | | | | | | | | | | | | |
Actual Fund Return | | $ | 1,000.00 | | $ | 759.10 | | 1.24 | % | | $ | 5.42 |
Hypothetical 5% Return | | $ | 1,000.00 | | $ | 1,018.70 | | 1.24 | % | | $ | 6.22 |
1 | Annualized, based on the Fund’s most recent fiscal half-year expenses. |
2 | Operating expenses are equal to the Fund’s annualized expense ratio multiplied by the average account value over the period, multiplied by the number of days in the most recent fiscal half-year, then divided by 366. |
800.789.ASIA [2742] www.matthewsfunds.com 65
STATEMENTS OF ASSETS AND LIABILITIES
| | | | | | | | | | | |
| UNAUDITED | | Matthews Asia
Pacific Equity
Income Fund | | | Matthews Asian
Growth and
Income Fund | | | Matthews
Asia Pacific
Fund |
Assets: | | | | | | | | | | | |
Investments at value (A) (Note 1-A and 5): | | | | | | | | | | | |
Unaffiliated issuers | | $ | 98,550,781 | | | $ | 1,939,379,113 | | | $ | 359,109,458 |
Affiliated issuers | | | — | | | | 19,117,178 | | | | 9,469,341 |
| | | | | | | | | | | |
Total investments | | | 98,550,781 | | | | 1,958,496,291 | | | | 368,578,799 |
Cash | | | 1,076,076 | | | | 12,820,419 | | | | — |
Foreign currency at value (B] | | | 13 | | | | 802,269 | | | | — |
Dividends and interest receivable | | | 233,762 | | | | 2,776,416 | | | | 1,005,892 |
Receivable for securities sold | | | 1,115,442 | | | | 1,720,430 | | | | 8,346,611 |
Receivable for capital shares sold | | | 257,780 | | | | 1,291,532 | | | | 906,770 |
Prepaid expenses and other assets | | | 36,477 | | | | 47,334 | | | | 27,631 |
| | | | | | | | | | | |
Total assets | | | 101,270,331 | | | | 1,977,954,691 | | | | 378,865,703 |
| | | | | | | | | | | |
Liabilities: | | | | | | | | | | | |
Payable for securities purchased | | | 595,459 | | | | 1,262,583 | | | | 3,287,390 |
Payable for capital shares redeemed | | | 1,502,339 | | | | 3,917,043 | | | | 1,655,275 |
Cash overdraft | | | — | | | | — | | | | 3,888,432 |
Deferred tax liability (Note 1-D) | | | — | | | | — | | | | 135,026 |
Due to Advisor (Note 3) | | | 56,141 | | | | 1,120,591 | | | | 213,539 |
Administration and accounting fees payable | | | 1,469 | | | | 29,336 | | | | 5,586 |
Administration and shareholder servicing fees payable | | | 14,941 | | | | 457,536 | | | | 96,113 |
Custodian fees payable | | | 6,526 | | | | 87,361 | | | | 20,034 |
Transfer agent fees payable | | | 4,309 | | | | 334,844 | | | | 87,701 |
Accrued expenses payable | | | 12,842 | | | | 205,484 | | | | 144,052 |
| | | | | | | | | | | |
Total liabilities | | | 2,194,026 | | | | 7,414,778 | | | | 9,533,148 |
| | | | | | | | | | | |
Net Assets | | $ | 99,076,305 | | | $ | 1,970,539,913 | | | $ | 369,332,555 |
| | | | | | | | | | | |
Shares Outstanding: | | | | | | | | | | | |
(shares of beneficial interest issued and outstanding, respectively, unlimited number of shares authorized with a $0.001 par value) | | | 8,778,237 | | | | 112,502,667 | | | | 25,251,787 |
| | | | | | | | | | | |
Net asset value, offering price and redemption price | | $ | 11.29 | | | $ | 17.52 | | | $ | 14.63 |
| | | | | | | | | | | |
Net Assets Consist of: | | | | | | | | | | | |
Capital paid-in | | $ | 99,724,988 | | | $ | 1,581,359,686 | | | $ | 343,625,098 |
Undistributed/accumulated net investment income (loss) | | | (182,266 | ) | | | (19,544,558 | ) | | | 1,594,675 |
Undistributed/accumulated net realized gain (loss) on investments and foreign currency related transactions | | | (66,657 | ) | | | 90,309,595 | | | | 17,540,852 |
Net unrealized appreciation/depreciation on investments, foreign currency transactions and deferred taxes | | | (399,760 | ) | | | 318,415,190 | | | | 6,571,930 |
| | | | | | | | | | | |
Net Assets | | $ | 99,076,305 | | | $ | 1,970,539,913 | | | $ | 369,332,555 |
| | | | | | | | | | | |
(A) Investments at cost: | | | | | | | | | | | |
Unaffiliated issuers | | $ | 98,948,963 | | | $ | 1,604,040,457 | | | $ | 347,331,624 |
Affiliated issuers | | | — | | | | 36,051,674 | | | | 14,514,640 |
| | | | | | | | | | | |
Total investments at cost | | $ | 98,948,963 | | | $ | 1,640,092,131 | | | $ | 361,846,264 |
| | | | | | | | | | | |
(B) Foreign currency at cost | | $ | 12 | | | $ | 802,262 | | | $ | — |
| | | | | | | | | | | |
See accompanying notes to financial statements.
66 MATTHEWS ASIAN FUNDS
JUNE 30, 2008
| | | | | | | | | | | | | | | | | | | |
Matthews Fund Pacific
Tiger | | Matthews
Asian Technology
Fund | | | Matthews
China Fund | | Matthews
India Fund | | | Matthews
Japan Fund | | | Matthews
Korea Fund |
| $ | 2,598,123,663 | | $ | 179,028,004 | | | $ | 1,302,887,881 | | $ | 709,654,349 | | | $ | 199,909,921 | | | $ | 160,855,757 |
| | 155,831,845 | | | — | | | | 38,703,635 | | | — | | | | — | | | | — |
| | | | | | | | | | | | | | | | | | | | |
| | 2,753,955,508 | | | 179,028,004 | | | | 1,341,591,516 | | | 709,654,349 | | | | 199,909,921 | | | | 160,855,757 |
| | 41,633,653 | | | 436,670 | | | | 6,113,187 | | | — | | | | 296,475 | | | | — |
| | 6,006,290 | | | 92 | | | | — | | | 3,470,337 | | | | — | | | | — |
| | 4,103,927 | | | 318,294 | | | | 5,287,879 | | | 1,773,416 | | | | 732,609 | | | | 2,966 |
| | 49,754,501 | | | 1,154,031 | | | | 7,816,803 | | | 6,838,007 | | | | 3,747,031 | | | | 963,301 |
| | 779,037 | | | 218,252 | | | | 1,301,884 | | | 1,360,662 | | | | 439,421 | | | | 153,050 |
| | 64,383 | | | 21,368 | | | | 111,421 | | | 116,580 | | | | 20,772 | | | | 21,047 |
| | | | | | | | | | | | | | | | | | | | |
| | 2,856,297,299 | | | 181,176,711 | | | | 1,362,222,690 | | | 723,213,351 | | | | 205,146,229 | | | | 161,996,121 |
| | | | | | | | | | | | | | | | | | | | |
| | 1,777,383 | | | 481,147 | | | | 3,315,017 | | | 546,341 | | | | 3,819,223 | | | | 335,131 |
| | 10,411,679 | | | 1,986,742 | | | | 11,146,722 | | | 8,334,356 | | | | 415,269 | | | | 958,224 |
| | — | | | — | | | | — | | | 4,113,526 | | | | — | | | | 58,322 |
| | 989,953 | | | 99,177 | | | | — | | | 1,344,880 | | | | — | | | | — |
| | 1,651,579 | | | 106,800 | | | | 793,466 | | | 454,741 | | | | 113,425 | | | | 95,701 |
| | 43,185 | | | 2,791 | | | | 20,707 | | | 11,889 | | | | 2,969 | | | | 2,503 |
| | 640,189 | | | 43,321 | | | | 399,834 | | | 179,372 | | | | 46,790 | | | | 46,523 |
| | 186,209 | | | 11,475 | | | | 59,642 | | | 95,788 | | | | 1,800 | | | | 8,793 |
| | 456,269 | | | 36,376 | | | | 416,918 | | | 141,617 | | | | 38,771 | | | | 52,517 |
| | 379,027 | | | 39,413 | | | | 29,526 | | | 384,320 | | | | 103,713 | | | | 62,808 |
| | | | | | | | | | | | | | | | | | | | |
| | 16,535,473 | | | 2,807,242 | | | | 16,181,832 | | | 15,606,830 | | | | 4,541,960 | | | | 1,620,522 |
| | | | | | | | | | | | | | | | | | | | |
| $ | 2,839,761,826 | | $ | 178,369,469 | | | $ | 1,346,040,858 | | $ | 707,606,521 | | | $ | 200,604,269 | | | $ | 160,375,599 |
| | | | | | | | | | | | | | | | | | | | |
| | 126,136,226 | | | 23,343,515 | | | | 44,575,884 | | | 46,232,740 | | | | 14,869,427 | | | | 32,173,159 |
| | | | | | | | | | | | | | | | | | | | |
| | $22.51 | | $ | 7.64 | | | $ | 30.20 | | $ | 15.31 | | | $ | 13.49 | | | $ | 4.98 |
| | | | | | | | | | | | | | | | | | | | |
| $ | 1,997,753,115 | | $ | 183,885,445 | | | $ | 884,345,615 | | $ | 692,591,610 | | | $ | 229,011,670 | | | $ | 103,193,485 |
| | 13,596,502 | | | (348,019 | ) | | | 10,760,946 | | | (13,021,559 | ) | | | 256,870 | | | | 960,765 |
| | 357,917,956 | | | (10,663,276 | ) | | | 318,600,423 | | | 42,833,740 | | | | (4,804,571 | ) | | | 30,912,870 |
| | 470,494,253 | | | 5,495,319 | | | | 132,333,874 | | | (14,797,270 | ) | | | (23,859,700 | ) | | | 25,308,479 |
| | | | | | | | | | | | | | | | | | | | |
| $ | 2,839,761,826 | | $ | 178,369,469 | | | $ | 1,346,040,858 | | $ | 707,606,521 | | | $ | 200,604,269 | | | $ | 160,375,599 |
| | | | | | | | | | | | | | | | | | | | |
| $ | 2,110,187,596 | | $ | 173,420,788 | | | $ | 1,180,418,560 | | $ | 723,079,925 | | | $ | 223,734,885 | | | $ | 135,544,552 |
| | 172,233,622 | | | — | | | | 28,841,367 | | | — | | | | — | | | | — |
| | | | | | | | | | | | | | | | | | | | |
| $ | 2,282,421,218 | | $ | 173,420,788 | | | $ | 1,209,259,927 | | $ | 723,079,925 | | | $ | 223,734,885 | | | $ | 135,544,552 |
| | | | | | | | | | | | | | | | | | | | |
| | $6,006,273 | | $ | 91 | | | $ | — | | $ | 3,470,337 | | | $ | — | | | $ | — |
| | | | | | | | | | | | | | | | | | | | |
800.789.ASIA [2742] www.matthewsfunds.com 67
STATEMENTS OF OPERATIONS
| | | | | | | | | | | | |
| UNAUDITED | | Matthews
Asia Pacific
Equity
Income Fund | | | Matthews Asian
Growth and
Income Fund | | | Matthews
Asia Pacific
Fund | |
Investment Income: | | | | | | | | | | | | |
Dividends—Unaffiliated Issuers (Note 1-F) | | $ | 1,567,248 | | | $ | 30,747,169 | | | $ | 4,315,013 | |
Dividends—Affiliated Issuers (Note 5) | | | — | | | | 832,294 | | | | 49,103 | |
Interest | | | 144 | | | | 5,692,856 | | | | 25 | |
Foreign withholding tax | | | (46,949 | ) | | | (921,425 | ) | | | (225,059 | ) |
| | | | | | | | | | | | |
Total investment income | | | 1,520,443 | | | | 36,350,894 | | | | 4,139,082 | |
| | | | | | | | | | | | |
Expenses: | | | | | | | | | | | | |
Investment advisory fees (Note 3) | | | 304,675 | | | | 7,177,950 | | | | 1,410,309 | |
Administration and accounting fees | | | 7,858 | | | | 184,955 | | | | 36,330 | |
Administration and shareholder servicing fees (Note 3) | | | 95,822 | | | | 2,576,863 | | | | 506,181 | |
Custodian fees | | | 25,376 | | | | 301,670 | | | | 67,718 | |
Insurance fees | | | 590 | | | | 16,888 | | | | 3,591 | |
Printing fees | | | 5,951 | | | | 212,636 | | | | 121,148 | |
Professional fees | | | 18,685 | | | | 53,382 | | | | 28,054 | |
Registration fees | | | 16,275 | | | | 17,644 | | | | 15,627 | |
Transfer agent fees | | | 52,966 | | | | 1,474,712 | | | | 316,514 | |
Trustees fees | | | 1,347 | | | | 42,761 | | | | 8,712 | |
Other expenses | | | 14,424 | | | | 66,458 | | | | 30,223 | |
| | | | | | | | | | | | |
Total expenses | | | 543,969 | | | | 12,125,919 | | | | 2,544,407 | |
| | | | | | | | | | | | |
Net Investment Income (Loss) | | | 976,474 | | | | 24,224,975 | | | | 1,594,675 | |
| | | | | | | | | | | | |
Realized and Unrealized (Loss) on Investments | | | | | | | | | | | | |
Foreign Currency Related Transactions and Deferred Taxes: | | | | | | | | | | | | |
Net realized gain (loss) on investments—Unaffiliated Issuers | | | 471 | | | | 91,338,517 | | | | 5,085,930 | |
Net realized gain on investments—Affiliated Issuers | | | — | | | | — | | | | — | |
Net realized capital gains tax | | | — | | | | (233,652 | ) | | | — | |
Net realized loss on foreign currency-related transactions | | | (12,230 | ) | | | (793,777 | ) | | | (100,665 | ) |
Net change in unrealized appreciation/depreciation on investments | | | (5,530,316 | ) | | | (294,787,743 | ) | | | (76,931,076 | ) |
Net change in deferred taxes on unrealized appreciation | | | — | | | | — | | | | (135,026 | ) |
Net change in unrealized appreciation/depreciation on foreign currency-related transactions | | | (2,047 | ) | | | (78,457 | ) | | | (28,488 | ) |
| | | | | | | | | | | | |
Net realized and unrealized loss on investments, foreign currency related transactions and deferred taxes | | | (5,544,122 | ) | | | (204,555,112 | ) | | | (72,109,325 | ) |
| | | | | | | | | | | | |
Net Decrease in Net Assets from Operations | | $ | (4,567,648 | ) | | $ | (180,330,137 | ) | | $ | (70,514,650 | ) |
| | | | | | | | | | | | |
See accompanying notes to financial statements.
68 MATTHEWS ASIAN FUNDS
JUNE 30, 2008
| | | | | | | | | | | | | | | | | | | | | |
Matthews Pacific Tiger
Fund | | Matthews
Asian Technology
Fund | | | Matthews
China Fund | | | Matthews
India Fund | | | Matthews
Japan Fund | | | Matthews
Korea Fund | |
| $ | 31,372,478 | | $ | 1,002,911 | | | $ | 19,812,048 | | | $ | 4,699,813 | | | $ | 1,839,899 | | | $ | 640,663 | |
| | 1,659,725 | | | — | | | | 514,743 | | | | — | | | | — | | | | — | |
| | 1,436 | | | 265 | | | | — | | | | 628,406 | | | | — | | | | — | |
| | (1,101,926) | | | (45,350 | ) | | | — | | | | — | | | | (128,095 | ) | | | (105,917 | ) |
| | | | | | | | | | | | | | | | | | | | | | |
| | 31,931,713 | | | 957,826 | | | | 20,326,791 | | | | 5,328,219 | | | | 1,711,804 | | | | 534,746 | |
| | | | | | | | | | | | | | | | | | | | | | |
| | 11,070,771 | | | 701,060 | | | | 5,661,059 | | | | 3,556,841 | | | | 638,255 | | | | 678,670 | |
| | 285,131 | | | 18,054 | | | | 145,666 | | | | 91,531 | | | | 16,462 | | | | 17,473 | |
| | 3,680,333 | | | 256,930 | | | | 2,124,930 | | | | 1,295,420 | | | | 227,661 | | | | 242,000 | |
| | 627,140 | | | 42,589 | | | | 328,970 | | | | 371,298 | | | | 20,090 | | | | 32,231 | |
| | 28,399 | | | 1,858 | | | | 17,447 | | | | 9,166 | | | | 1,434 | | | | 1,885 | |
| | 351,726 | | | 35,326 | | | | 176,481 | | | | 145,919 | | | | 62,002 | | | | 39,268 | |
| | 72,819 | | | 24,455 | | | | 37,926 | | | | 148,033 | | | | 20,212 | | | | 20,652 | |
| | 16,732 | | | 17,062 | | | | 89,604 | | | | 82,938 | | | | 16,048 | | | | 9,804 | |
| | 1,803,479 | | | 182,898 | | | | 1,491,722 | | | | 874,879 | | | | 142,777 | | | | 172,746 | |
| | 67,315 | | | 4,014 | | | | 34,318 | | | | 21,087 | | | | 4,237 | | | | 4,800 | |
| | 110,952 | | | 21,599 | | | | 125,993 | | | | 100,889 | | | | 18,149 | | | | 17,310 | |
| | | | | | | | | | | | | | | | | | | | | | |
| | 18,114,797 | | | 1,305,845 | | | | 10,234,116 | | | | 6,698,001 | | | | 1,167,327 | | | | 1,236,839 | |
| | | | | | | | | | | | | | | | | | | | | | |
| | 13,816,916 | | | (348,019 | ) | | | 10,092,675 | | | | (1,369,782 | ) | | | 544,477 | | | | (702,093 | ) |
| | | | | | | | | | | | | | | | | | | | | | |
| | 188,715,956 | | | 1,121,116 | | | | 211,733,975 | | | | 31,702,232 | | | | (7,051,983 | ) | | | 24,065,948 | |
| | 6,446,247 | | | — | | | | — | | | | — | | | | — | | | | — | |
| | — | | | (4,066 | ) | | | — | | | | (128,095 | ) | | | — | | | | — | |
| | (944,039) | | | (55,748 | ) | | | (31,489 | ) | | | (415,833 | ) | | | (29,947 | ) | | | (198,678 | ) |
| | (914,733,883) | | | (55,557,251 | ) | | | (746,504,263 | ) | | | (520,244,971 | ) | | | (6,540,299 | ) | | | (79,880,255 | ) |
| | (989,953) | | | (99,178 | ) | | | — | | | | 1,361,787 | | | | — | | | | — | |
| | (69,009) | | | (13,257 | ) | | | 3,132 | | | | (44,517 | ) | | | (37,429 | ) | | | (13,300 | ) |
| | | | | | | | | | | | | | | | | | | | | | |
| | (721,574,681) | | | (54,608,384 | ) | | | (534,798,645 | ) | | | (487,769,397 | ) | | | (13,659,658 | ) | | | (56,026,285 | ) |
| | | | | | | | | | | | | | | | | | | | | | |
| $ | (707,757,765) | | $ | (54,956,403 | ) | | $ | (524,705,970 | ) | | $ | (489,139,179 | ) | | $ | (13,115,181 | ) | | $ | (56,728,378 | ) |
| | | | | | | | | | | | | | | | | | | | | | |
800.789.ASIA [2742] www.matthewsfunds.com 69
STATEMENTS OF CHANGES IN NET ASSETS
| | | | | | | | |
| Matthews Asia Pacific Equity Income Fund | | Six-Month Period
Ended June 30, 2008
(unaudited) | | | Year Ended
December 31, 2007 | |
Operations: | | | | | | | | |
Net investment income (Note 1-F) | | $ | 976,474 | | | $ | 1,565,379 | |
Net realized gain (loss) on investments and foreign currency-related transactions | | | (11,759 | ) | | | 3,363,363 | |
Net change in unrealized appreciation/depreciation on investments and foreign currency related transactions | | | (5,532,363 | ) | | | 4,107,245 | |
| | | | | | | | |
Net increase (decrease) in net assets resulting from operations | | | (4,567,648 | ) | | | 9,035,987 | |
| | | | | | | | |
Distributions to Shareholders from: | | | | | | | | |
Net investment income | | | (1,118,325 | ) | | | (1,596,567 | ) |
Realized gains on investments | | | (142,301 | ) | | | (2,815,658 | ) |
| | | | | | | | |
Net decrease in net assets resulting from distributions | | | (1,260,626 | ) | | | (4,412,225 | ) |
| | | | | | | | |
Capital Share Transactions (net) (Note 2) | | | 23,252,747 | | | | 51,177,008 | |
| | | | | | | | |
Redemption Fees | | | 27,777 | | | | 83,071 | |
| | | | | | | | |
Total increase in net assets | | | 17,452,250 | | | | 55,883,841 | |
| | | | | | | | |
Net Assets | | | | | | | | |
Beginning of period | | | 81,624,055 | | | | 25,740,214 | |
| | | | | | | | |
End of period (including distributions in excess of net investment income of ($182,266) and ($40,415), respectively) | | $ | 99,076,305 | | | $ | 81,624,055 | |
| | | | | | | | |
| | | | | | | | |
| Matthews Asian Growth and Income Fund | | Six-Month Period
Ended June 30, 2008
(unaudited) | | | Year Ended
December 31, 2007 | |
Operations: | | | | | | | | |
Net investment income (Note 1-F) | | $ | 24,224,975 | | | $ | 56,457,307 | |
Net realized gain on investments and foreign currency-related transactions | | | 90,311,088 | | | | 278,910,606 | |
Net change in unrealized appreciation/depreciation on investments and foreign currency related transactions | | | (294,866,200 | ) | | | 90,739,295 | |
| | | | | | | | |
Net increase (decrease) in net assets resulting from operations | | | (180,330,137 | ) | | | 426,107,208 | |
| | | | | | | | |
Distributions to Shareholders from: | | | | | | | | |
Net investment income | | | (27,170,730 | ) | | | (96,264,281 | ) |
Realized gains on investments | | | (47,215,410 | ) | | | (212,785,553 | ) |
| | | | | | | | |
Net decrease in net assets resulting from distributions | | | (74,386,140 | ) | | | (309,049,834 | ) |
| | | | | | | | |
Capital Share Transactions (net) (Note 2) | | | (48,234,478 | ) | | | 134,811,741 | |
| | | | | | | | |
Redemption Fees | | | 83,088 | | | | 175,559 | |
| | | | | | | | |
Total increase (decrease) in net assets | | | (302,867,667 | ) | | | 252,044,674 | |
| | | | | | | | |
Net Assets: | | | | | | | | |
Beginning of period | | | 2,273,407,580 | | | | 2,021,362,906 | |
| | | | | | | | |
End of period (including distributions in excess of net investment income of ($19,544,558) and ($16,598,803), respectively) | | $ | 1,970,539,913 | | | $ | 2,273,407,580 | |
| | | | | | | | |
See accompanying notes to financial statements.
70 MATTHEWS ASIAN FUNDS
JUNE 30, 2008
Matthews Asia Pacific Fund
| | | | | | | | |
| | | Six-Month Period
Ended June 30, 2008
(unaudited) | | | Year Ended
December 31, 2007 | |
Operations: | | | | | | | | |
Net investment income (Note 1-F) | | $ | 1,594,675 | | | $ | 2,836,437 | |
Net realized gain on investments and foreign currency-related transactions | | | 4,985,265 | | | | 56,028,503 | |
Net change in unrealized appreciation/depreciation on investments and foreign currency related transactions | | | (76,959,564 | ) | | | (6,309,200 | ) |
Net change in deferred taxes on unrealized appreciation | | | (135,026 | ) | | | — | |
| | | | | | | | |
Net increase (decrease) in net assets resulting from operations | | | (70,514,650 | ) | | | 52,555,740 | |
| | | | | | | | |
Distributions to Shareholders from: | | | | | | | | |
Net investment income | | | — | | | | (2,370,383 | ) |
Realized gains on investments | | | — | | | | (42,227,483 | ) |
| | | | | | | | |
Net decrease in net assets resulting from distributions | | | — | | | | (44,597,866 | ) |
| | | | | | | | |
Capital Share Transactions (net) (Note 2) | | | (31,263,646 | ) | | | 13,108,865 | |
| | | | | | | | |
Redemption Fees | | | 56,385 | | | | 289,043 | |
| | | | | | | | |
Total increase (decrease) in net assets | | | (101,721,911 | ) | | | 21,355,782 | |
| | | | | | | | |
Net Assets: | | | | | | | | |
Beginning of period | | | 471,054,466 | | | | 449,698,684 | |
| | | | | | | | |
End of period (including undistributed net investment income of $1,594,675 and $0, respectively) | | $ | 369,332,555 | | | $ | 471,054,466 | |
| | | | | | | | |
| | |
| Matthews Pacific Tiger Fund | | | | | | | | |
| | |
| | | Six-Month Period
Ended June 30, 2008
(unaudited) | | | Year Ended
December 31, 2007 | |
Operations: | | | | | | | | |
Net investment income (Note 1-F) | | $ | 13,816,916 | | | $ | 40,633,130 | |
Net realized gain on investments and foreign currency-related transactions | | | 194,218,164 | | | | 616,532,248 | |
Net change in unrealized appreciation/depreciation on investments and foreign currency related transactions | | | (914,802,892 | ) | | | 401,089,243 | |
Net change in deferred taxes on unrealized appreciation | | | (989,953 | ) | | | — | |
| | | | | | | | |
Net increase (decrease) in net assets resulting from operations | | | (707,757,765 | ) | | | 1,058,254,621 | |
| | | | | | | | |
Distributions to Shareholders from: | | | | | | | | |
Net investment income | | | — | | | | (39,622,673 | ) |
Realized gains on investments | | | — | | | | (456,164,472 | ) |
| | | | | | | | |
Net decrease in net assets resulting from distributions | | | — | | | | (495,787,145 | ) |
| | | | | | | | |
Capital Share Transactions (net) (Note 2) | | | (259,337,693 | ) | | | (59,741,167 | ) |
| | | | | | | | |
Redemption Fees | | | 142,813 | | | | 270,920 | |
| | | | | | | | |
Total increase (decrease) in net assets | | | (966,952,645 | ) | | | 502,997,229 | |
| | | | | | | | |
Net Assets: | | | | | | | | |
Beginning of period | | | 3,806,714,471 | | | | 3,303,717,242 | |
| | | | | | | | |
End of period (including undistributed/(distributions in excess of) net investment income of $13,596,502 and ($220,414) respectively) | | $ | 2,839,761,826 | | | $ | 3,806,714,471 | |
| | | | | | | | |
See accompanying notes to financial statements.
800.789.ASIA [2742] www.matthewsfunds.com 71
STATEMENTS OF CHANGES IN NET ASSETS
Matthews Asian Technology Fund
| | | | | | | | |
| | | Six-Month Period
Ended June 30, 2008
(unaudited) | | | Year Ended
December 31, 2007 | |
Operations: | | | | | | | | |
Net investment loss (Note 1-F) | | $ | (348,019 | ) | | $ | (536,127 | ) |
Net realized gain on investments and foreign currency-related transactions | | | 1,061,302 | | | | 908,230 | |
Net change in unrealized appreciation/depreciation on investments and foreign currency related transactions | | | (55,570,508 | ) | | | 33,855,661 | |
Net change in deferred taxes on unrealized appreciation | | | (99,178 | ) | | | — | |
| | | | | | | | |
Net increase (decrease) in net assets resulting from operations | | | (54,956,403 | ) | | | 34,227,764 | |
| | | | | | | | |
Capital Share Transactions (net) (Note 2) | | | (19,118,389 | ) | | | 88,052,034 | |
| | | | | | | | |
Redemption Fees | | | 140,174 | | | | 205,263 | |
| | | | | | | | |
Total increase (decrease) in net assets | | | (73,934,618 | ) | | | 122,485,061 | |
| | | | | | | | |
Net Assets: | | | | | | | | |
Beginning of period | | | 252,304,087 | | | | 129,819,026 | |
| | | | | | | | |
End of period (including undistributed net investment income/accumulated net investment loss of ($348,019) and $0, respectively) | | $ | 178,369,469 | | | $ | 252,304,087 | |
| | | | | | | | |
Matthews China Fund
| | | | | | | | |
| | | Six-Month Period
Ended June 30, 2008
(unaudited) | | | Year Ended
December 31, 2007 | |
Operations: | | | | | | | | |
Net investment income | | $ | 10,092,675 | | | $ | 7,829,613 | |
Net realized gain on investments and foreign currency-related transactions | | | 211,702,486 | | | | 227,250,534 | |
Net change in unrealized appreciation/depreciation on investments and foreign currency related transactions | | | (746,501,131 | ) | | | 511,274,206 | |
| | | | | | | | |
Net increase (decrease) in net assets resulting from operations | | | (524,705,970 | ) | | | 746,354,353 | |
| | | | | | | | |
Distributions to Shareholders from: | | | | | | | | |
Net investment income | | | — | | | | (6,158,810 | ) |
Realized gains on investments | | | — | | | | (77,731,715 | ) |
| | | | | | | | |
Net decrease in net assets resulting from distributions | | | — | | | | (83,890,525 | ) |
| | | | | | | | |
Capital Share Transactions (net) (Note 2) | | | (466,191,272 | ) | | | 701,616,219 | |
| | | | | | | | |
Redemption Fees | | | 1,535,961 | | | | 4,794,051 | |
| | | | | | | | |
Total increase (decrease) in net assets | | | (989,361,281 | ) | | | 1,368,874,098 | |
| | | | | | | | |
Net Assets: | | | | | | | | |
Beginning of period | | | 2,335,402,139 | | | | 966,528,041 | |
| | | | | | | | |
End of period (including undistributed net investment income of $10,760,946 and $668,271, respectively) | | $ | 1,346,040,858 | | | $ | 2,335,402,139 | |
| | | | | | | | |
See accompanying notes to financial statements.
72 MATTHEWS ASIAN FUNDS
JUNE 30, 2008
Matthews India Fund
| | | | | | | | |
| | | Six-Month Period
Ended June 30, 2008
(unaudited) | | | Year Ended
December 31, 2007 | |
Operations: | | | | | | | | |
Net investment loss | | $ | (1,369,782 | ) | | $ | (333,161 | ) |
Net realized gain on investments and foreign currency-related transactions | | | 31,158,304 | | | | 53,166,317 | |
Net change in unrealized appreciation/depreciation on investments and foreign currency related transactions | | | (520,289,488 | ) | | | 394,310,928 | |
Net change in deferred taxes on unrealized appreciation | | | 1,361,787 | | | | (2,706,668 | ) |
| | | | | | | | |
Net increase (decrease) in net assets resulting from operations | | | (489,139,179 | ) | | | 444,437,416 | |
| | | | | | | | |
Distributions to Shareholders from: | | | | | | | | |
Net investment income | | | — | | | | (10,292,742 | ) |
Realized gains on investments | | | — | | | | (33,448,687 | ) |
| | | | | | | | |
Net decrease in net assets resulting from distributions | | | — | | | | (43,741,429 | ) |
| | | | | | | | |
Capital Share Transactions (net) (Note 2) | | | (115,566,600 | ) | | | 239,741,332 | |
| | | | | | | | |
Redemption Fees | | | 1,240,610 | | | | 991,445 | |
| | | | | | | | |
Total increase (decrease) in net assets | | | (603,465,169 | ) | | | 641,428,764 | |
| | | | | | | | |
Net Assets: | | | | | | | | |
Beginning of period | | | 1,311,071,690 | | | | 669,642,926 | |
| | | | | | | | |
End of period (including accumulated net investment loss/(distributions in excess of net investment income) of ($13,021,559) and ($11,651,777) respectively) | | $ | 707,606,521 | | | $ | 1,311,071,690 | |
| | | | | | | | |
Matthews Japan Fund
| | | | | | | | |
| | | Six-Month Period
Ended June 30, 2008
(unaudited) | | | Year Ended
December 31, 2007 | |
Operations: | | | | | | | | |
Net investment income (loss) | | $ | 544,477 | | | $ | (33,074 | ) |
Net realized gain (loss) on investments and foreign currency-related transactions | | | (7,081,930 | ) | | | 11,569,558 | |
Net change in unrealized appreciation/depreciation on investments and foreign currency related transactions | | | (6,577,728 | ) | | | (41,405,843 | ) |
| | | | | | | | |
Net decrease in net assets resulting from operations | | | (13,115,181 | ) | | | (29,869,359 | ) |
| | | | | | | | |
Distributions to Shareholders from: | | | | | | | | |
Net investment income | | | — | | | | (82,767 | ) |
Realized gains on investments | | | — | | | | (11,302,469 | ) |
| | | | | | | | |
Net decrease in net assets resulting from distributions | | | — | | | | (11,385,236 | ) |
| | | | | | | | |
Capital Share Transactions (net) (Note 2) | | | 46,809,583 | | | | (68,606,284 | ) |
| | | | | | | | |
Redemption Fees | | | 49,636 | | | | 65,210 | |
| | | | | | | | |
Total increase (decrease) in net assets | | | 33,744,038 | | | | (109,795,669 | ) |
| | | | | | | | |
Net Assets: | | | | | | | | |
Beginning of period | | | 166,860,231 | | | | 276,655,900 | |
| | | | | | | | |
End of period (including undistributed (distributions in excess of) net investment income of $256,870 and ($287,607), respectively) | | $ | 200,604,269 | | | $ | 166,860,231 | |
| | | | | | | | |
See accompanying notes to financial statements.
800.789.ASIA [2742] www.matthewsfunds.com 73
STATEMENTS OF CHANGES IN NET ASSETS
Matthews Korea Fund
| | | | | | | | |
| | | Six-Month Period
Ended June 30, 2008
(unaudited) | | | Year Ended
December 31, 2007 | |
Operations: | | | | | | | | |
Net investment income (loss) (Note 1-F) | | $ | (702,093 | ) | | $ | 2,792,938 | |
Net realized gain on investments and foreign currency-related transactions | | | 23,867,270 | | | | 28,585,298 | |
Net change in unrealized appreciation/depreciation on investments and foreign currency related transactions | | | (79,893,555 | ) | | | 6,798,387 | |
| | | | | | | | |
Net increase (decrease) in net assets resulting from operations | | | (56,728,378 | ) | | | 38,176,623 | |
| | | | | | | | |
Distributions to Shareholders from: | | | | | | | | |
Net investment income | | | — | | | | (627,099 | ) |
Realized gains on investments | | | — | | | | (30,040,481 | ) |
| | | | | | | | |
Net decrease in net assets resulting from distributions | | | — | | | | (30,667,580 | ) |
| | | | | | | | |
Capital Share Transactions (net) (Note 2) | | | (33,364,847 | ) | | | 1,773,202 | |
| | | | | | | | |
Redemption Fees | | | 47,395 | | | | 136,425 | |
| | | | | | | | |
Total increase (decrease) in net assets | | | (90,045,830 | ) | | | 9,418,670 | |
| | | | | | | | |
Net Assets: | | | | | | | | |
Beginning of period | | | 250,421,429 | | | | 241,002,759 | |
| | | | | | | | |
End of period (including undistributed net investment income of $960,765 and $1,662,858, respectively) | | $ | 160,375,599 | | | $ | 250,421,429 | |
| | | | | | | | |
See accompanying notes to financial statements.
74 MATTHEWS ASIAN FUNDS
| | |
| FINANCIAL HIGHLIGHTS | | JUNE 30, 2008 |
Matthews Asia Pacific Equity Income Fund
The table below sets forth financial data for a share of beneficial interest outstanding throughout each period presented.
| | | | | | | | | | | | |
| | | Six-Month Period
Ended June 30, 2008
(unaudited) | | | Year Ended
Dec. 31, 2007 | | | Period Ended
Dec. 31, 20061 | |
Net Asset Value, beginning of period | | $ | 12.00 | | | $ | 10.77 | | | $ | 10.00 | |
| | | | | | | | | | | | |
INCOME (LOSS) FROM INVESTMENT OPERATIONS: | | | | | | | | | | | | |
Net investment income | | | 0.13 | 2 | | | 0.27 | | | | 0.02 | |
Net realized gain (loss) and unrealized appreciation (depreciation) on investments and foreign currency | | | (0.69 | ) | | | 1.67 | | | | 0.77 | |
| | | | | | | | | | | | |
Total from investment operations | | | (0.56 | ) | | | 1.94 | | | | 0.79 | |
| | | | | | | | | | | | |
LESS DISTRIBUTIONS FROM: | | | | | | | | | | | | |
Net investment income | | | (0.13 | ) | | | (0.27 | ) | | | (0.02 | ) |
Net realized gains on investments | | | (0.02 | ) | | | (0.45 | ) | | | — | |
| | | | | | | | | | | | |
Total distributions | | | (0.15 | ) | | | (0.72 | ) | | | (0.02 | ) |
| | | | | | | | | | | | |
Paid-in capital from redemption fees (Note 2) | | | — | 3 | | | 0.01 | | | | — | 3 |
| | | | | | | | | | | | |
Net Asset Value, end of period | | $ | 11.29 | | | $ | 12.00 | | | $ | 10.77 | |
| | | | | | | | | | | | |
TOTAL RETURN | | | (4.66 | )%4 | | | 18.05 | % | | | 7.90 | %4 |
| | | | | | | | | | | | |
| | | |
RATIOS/SUPPLEMENTAL DATA | | | | | | | | | | | | |
Net assets, end of period (in 000’s) | | $ | 99,076 | | | $ | 81,624 | | | $ | 25,740 | |
| | | | | | | | | | | | |
Ratio of expenses to average net assets before reimbursement, waiver or recapture of expenses by Advisor and Administrator (Note 3) | | | 1.22 | %5 | | | 1.42 | % | | | 2.93 | %5 |
| | | | | | | | | | | | |
Ratio of expenses to average net assets after reimbursement, waiver or recapture of expenses by Advisor and Administrator | | | 1.22 | %5 | | | 1.39 | % | | | 1.50 | %5 |
| | | | | | | | | | | | |
Ratio of net investment income to average net assets (Note 1-F) | | | 2.19 | %5 | | | 2.66 | % | | | 1.34 | %5 |
| | | | | | | | | | | | |
Portfolio turnover | | | 16.49 | %4 | | | 26.95 | % | | | 0.00 | %4 |
| | | | | | | | | | | | |
1 | The Matthews Asia Pacific Equity Income Fund commenced operations on October 31, 2006. |
2 | Calculated using the average daily shares method. |
3 | Less than $0.01 per share. |
See accompanying notes to financial statements.
800.789.ASIA [2742] www.matthewsfunds.com 75
FINANCIAL HIGHLIGHTS
Matthews Asian Growth and Income Fund
The table below sets forth financial data for a share of beneficial interest outstanding throughout each period presented.
| | | | | | | | | | | | | | | | | | | | | | | | | | | | |
| | | Six-Month
Period Ended
June 30, 2008
(unaudited) | | | Years Ended Dec. 31, | | | Four-Month
Period Ended
Dec. 31,
20041 | | | Years Ended
August 31, | |
| | | 2007 | | | 2006 | | | 2005 | | | | 2004 | | | 2003 | |
Net Asset Value, beginning of period | | $ | 19.78 | | | $ | 18.68 | | | $ | 17.14 | | | $ | 15.82 | | | $ | 14.65 | | | $ | 12.21 | | | $ | 10.71 | |
| | | | | | | | | | | | | | | | | | | | | | | | | | | | |
INCOME FROM INVESTMENT OPERATIONS: | | | | | | | | | | | | | | | | | | | | | | | | | | | | |
Net investment income | | | 0.22 | 2 | | | 1.07 | | | | 0.46 | | | | 0.45 | | | | 0.11 | | | | 0.32 | | | | 0.23 | |
Net realized gain and unrealized appreciation (depreciation) on investments and foreign currency | | | (1.80 | ) | | | 2.93 | | | | 3.47 | | | | 2.02 | | | | 1.83 | | | | 2.56 | | | | 1.61 | |
| | | | | | | | | | | | | | | | | | | | | | | | | | | | |
Total from investment operations | | | (1.58 | ) | | | 4.00 | | | | 3.93 | | | | 2.47 | | | | 1.94 | | | | 2.88 | | | | 1.84 | |
| | | | | | | | | | | | | | | | | | | | | | | | | | | | |
LESS DISTRIBUTIONS FROM: | | | | | | | | | | | | | | | | | | | | | | | | | | | | |
Net investment income | | | (0.25 | ) | | | (0.90 | ) | | | (0.62 | ) | | | (0.43 | ) | | | (0.38 | ) | | | (0.25 | ) | | | (0.20 | ) |
Net realized gains on investments | | | (0.43 | ) | | | (2.00 | ) | | | (1.77 | ) | | | (0.72 | ) | | | (0.39 | ) | | | (0.20 | ) | | | (0.15 | ) |
| | | | | | | | | | | | | | | | | | | | | | | | | | | | |
Total distributions | | | (0.68 | ) | | | (2.90 | ) | | | (2.39 | ) | | | (1.15 | ) | | | (0.77 | ) | | | (0.45 | ) | | | (0.35 | ) |
| | | | | | | | | | | | | | | | | | | | | | | | | | | | |
Paid-in capital from redemption fees (Note 2) | | | — | 3 | | | — | 3 | | | — | 3 | | | — | 3 | | | — | 3 | | | 0.01 | | | | 0.01 | |
| | | | | | | | | | | | | | | | | | | | | | | | | | | | |
Net Asset Value, end of period | | $ | 17.52 | | | $ | 19.78 | | | $ | 18.68 | | | $ | 17.14 | | | $ | 15.82 | | | $ | 14.65 | | | $ | 12.21 | |
| | | | | | | | | | | | | | | | | | | | | | | | | | | | |
TOTAL RETURN | | | (8.04 | )%4 | | | 21.54 | % | | | 23.38 | % | | | 15.76 | % | | | 13.32 | %4 | | | 23.99 | % | | | 17.81 | % |
| | | | | | | | | | | | | | | | | | | | | | | | | | | | |
| | | | | | | |
RATIOS/SUPPLEMENTAL DATA | | | | | | | | | | | | | | | | | | | | | | | | | | | | |
Net assets, end of period (in 000’s) | | $ | 1,970,540 | | | $ | 2,273,408 | | | $ | 2,021,363 | | | $ | 1,676,559 | | | $ | 1,236,491 | | | $ | 1,007,187 | | | $ | 533,302 | |
| | | | | | | | | | | | | | | | | | | | | | | | | | | | |
Ratio of expenses to average net assets before reimbursement, waiver or recapture of expenses by Advisor and Administrator (Note 3) | | | 1.15 | %5 | | | 1.16 | % | | | 1.20 | % | | | 1.28 | % | | | 1.35 | %5 | | | 1.45 | % | | | 1.69 | % |
| | | | | | | | | | | | | | | | | | | | | | | | | | | | |
Ratio of expenses to average net assets after reimbursement, waiver or recapture of expenses by Advisor and Administrator | | | 1.15 | %5 | | | 1.15 | % | | | 1.19 | % | | | 1.27 | % | | | 1.31 | %5 | | | 1.44 | % | | | 1.69 | % |
| | | | | | | | | | | | | | | | | | | | | | | | | | | | |
Ratio of net investment income to average net assets (Note 1-F) | | | 2.30 | %5 | | | 2.59 | % | | | 2.27 | % | | | 2.60 | % | | | 2.19 | %5 | | | 2.28 | % | | | 2.69 | % |
| | | | | | | | | | | | | | | | | | | | | | | | | | | | |
Portfolio turnover | | | 20.21 | %4 | | | 27.93 | % | | | 28.37 | % | | | 20.16 | % | | | 7.32 | %4 | | | 17.46 | % | | | 13.33 | % |
| | | | | | | | | | | | | | | | | | | | | | | | | | | | |
1 | The Fund’s fiscal year-end changed from August 31 to December 31, effective December 31, 2004. |
2 | Calculated using the average daily shares method. |
3 | Less than $0.01 per share. |
See accompanying notes to financial statements.
76 MATTHEWS ASIAN FUNDS
JUNE 30, 2008
Matthews Asia Pacific Fund
The table below sets forth financial data for a share of beneficial interest outstanding throughout each period presented.
| | | | | | | | | | | | | | | | | | | | | | | | |
| | | Six-Month
Period Ended
June 30, 2008
(unaudited) | | | Years Ended Dec. 31, | | | Four-Month
Period Ended
Dec. 31,
20041 | | | Period Ended
Aug. 31, 20042 | |
| | | 2007 | | | 2006 | | | 2005 | | | |
Net Asset Value, beginning of period | | $ | 17.29 | | | $ | 16.92 | | | $ | 14.89 | | | $ | 12.58 | | | $ | 10.70 | | | $ | 10.00 | |
| | | | | | | | | | | | | | | | | | | | | | | | |
INCOME (LOSS) FROM INVESTMENT OPERATIONS: | | | | | | | | | | | | | | | | | | | | | | | | |
Net investment income (loss) | | | 0.06 | 3 | | | 0.09 | | | | 0.07 | | | | 0.07 | | | | (0.01 | ) | | | 0.02 | |
Net realized gain and unrealized appreciation (depreciation) on investments and foreign currency | | | (2.72 | ) | | | 2.02 | | | | 2.50 | | | | 2.30 | | | | 1.93 | | | | 0.66 | |
| | | | | | | | | | | | | | | | | | | | | | | | |
Total from investment operations | | | (2.66 | ) | | | 2.11 | | | | 2.57 | | | | 2.37 | | | | 1.92 | | | | 0.68 | |
| | | | | | | | | | | | | | | | | | | | | | | | |
LESS DISTRIBUTIONS FROM: | | | | | | | | | | | | | | | | | | | | | | | | |
Net investment income | | | — | | | | (0.09 | ) | | | (0.07 | ) | | | (0.06 | ) | | | (0.02 | ) | | | — | |
Net realized gains on investments | | | — | | | | (1.66 | ) | | | (0.48 | ) | | | — | | | | (0.02 | ) | | | — | |
| | | | | | | | | | | | | | | | | | | | | | | | |
Total distributions | | | — | | | | (1.75 | ) | | | (0.55 | ) | | | (0.06 | ) | | | (0.04 | ) | | | — | |
| | | | | | | | | | | | | | | | | | | | | | | | |
Paid-in capital from redemption fees (Note 2) | | | — | 4 | | | 0.01 | | | | 0.01 | | | | — | 4 | | | — | 4 | | | 0.02 | |
| | | | | | | | | | | | | | | | | | | | | | | | |
Net Asset Value, end of period | | $ | 14.63 | | | $ | 17.29 | | | $ | 16.92 | | | $ | 14.89 | | | $ | 12.58 | | | $ | 10.70 | |
| | | | | | | | | | | | | | | | | | | | | | | | |
TOTAL RETURN | | | (15.38 | )%5 | | | 11.92 | % | | | 17.39 | % | | | 18.84 | % | | | 18.00 | %5 | | | 7.00 | %5 |
| | | | | | | | | | | | | | | | | | | | | | | | |
| | | | | | |
RATIOS/SUPPLEMENTAL DATA | | | | | | | | | | | | | | | | | | | | | | | | |
Net assets, end of period (in 000’s) | | $ | 369,333 | | | $ | 471,054 | | | $ | 449,699 | | | $ | 285,169 | | | $ | 112,043 | | | $ | 76,222 | |
| | | | | | | | | | | | | | | | | | | | | | | | |
Ratio of expenses to average net assets before reimbursement, waiver or recapture of expenses by Advisor and Administrator (Note 3) | | | 1.23 | %6 | | | 1.20 | % | | | 1.26 | % | | | 1.35 | % | | | 1.52 | %6 | | | 1.67 | %6 |
| | | | | | | | | | | | | | | | | | | | | | | | |
Ratio of expenses to average net assets after reimbursement, waiver or recapture of expenses by Advisor and Administrator | | | 1.23 | %6 | | | 1.20 | % | | | 1.24 | % | | | 1.34 | % | | | 1.51 | %6 | | | 1.66 | %6 |
| | | | | | | | | | | | | | | | | | | | | | | | |
Ratio of net investment income (loss) to average net assets (Note 1-F) | | | 0.77 | %6 | | | 0.60 | % | | | 0.47 | % | | | 0.67 | % | | | (0.30 | )%6 | | | 0.39 | %6 |
| | | | | | | | | | | | | | | | | | | | | | | | |
Portfolio turnover | | | 37.46 | %5 | | | 40.49 | % | | | 40.45 | % | | | 15.84 | % | | | 1.28 | %5 | | | 10.75 | %5 |
| | | | | | | | | | | | | | | | | | | | | | | | |
1 | The Fund’s fiscal year-end changed from August 31 to December 31, effective December 31, 2004. |
2 | The Matthews Asia Pacific Fund commenced operations on October 31, 2003. |
3 | Calculated using the average daily shares method. |
4 | Less than $0.01 per share. |
See accompanying notes to financial statements.
800.789.ASIA [2742] www.matthewsfunds.com 77
FINANCIAL HIGHLIGHTS
Matthews Pacific Tiger Fund
The table below sets forth financial data for a share of beneficial interest outstanding throughout each period presented.
| | | | | | | | | | | | | | | | | | | | | | | | | | | | |
| | | Six-Month
Period Ended
June 30, 2008
(unaudited) | | | Years Ended Dec. 31, | | | Four-Month
Period Ended
Dec. 31,
20041 | | | Years Ended
August 31, | |
| | | 2007 | | | 2006 | | | 2005 | | | | 2004 | | | 2003 | |
Net Asset Value, beginning of period | | $ | 27.86 | | | $ | 23.71 | | | $ | 19.27 | | | $ | 15.90 | | | $ | 13.22 | | | $ | 11.20 | | | $ | 8.54 | |
| | | | | | | | | | | | | | | | | | | | | | | | | | | | |
INCOME (LOSS) FROM INVESTMENT OPERATIONS: | | | | | | | | | | | | | | | | | | | | | | | | | | | | |
Net investment income (loss) | | | 0.11 | 2 | | | 0.30 | | | | 0.22 | | | | 0.14 | | | | (0.01 | ) | | | 0.09 | | | | 0.07 | |
Net realized gain and unrealized appreciation (depreciation) on investments and foreign currency | | | (5.46 | ) | | | 7.78 | | | | 5.01 | | | | 3.43 | | | | 3.00 | | | | 1.95 | | | | 2.58 | |
| | | | | | | | | | | | | | | | | | | | | | | | | | | | |
Total from investment operations | | | (5.35 | ) | | | 8.08 | | | | 5.23 | | | | 3.57 | | | | 2.99 | | | | 2.04 | | | | 2.65 | |
| | | | | | | | | | | | | | | | | | | | | | | | | | | | |
LESS DISTRIBUTIONS FROM: | | | | | | | | | | | | | | | | | | | | | | | | | | | | |
Net investment income | | | — | | | | (0.31 | ) | | | (0.21 | ) | | | (0.12 | ) | | | (0.10 | ) | | | (0.04 | ) | | | — | |
Net realized gains on investments | | | — | | | | (3.62 | ) | | | (0.58 | ) | | | (0.09 | ) | | | (0.21 | ) | | | — | | | | — | |
| | | | | | | | | | | | | | | | | | | | | | | | | | | | |
Total distributions | | | — | | | | (3.93 | ) | | | (0.79 | ) | | | (0.21 | ) | | | (0.31 | ) | | | (0.04 | ) | | | — | |
| | | | | | | | | | | | | | | | | | | | | | | | | | | | |
Paid-in capital from redemption fees (Note 2) | | | — | 3 | | | — | 3 | | | — | 3 | | | 0.01 | | | | — | 3 | | | 0.02 | | | | 0.01 | |
| | | | | | | | | | | | | | | | | | | | | | | | | | | | |
Net Asset Value, end of period | | $ | 22.51 | | | $ | 27.86 | | | $ | 23.71 | | | $ | 19.27 | | | $ | 15.90 | | | $ | 13.22 | | | $ | 11.20 | |
| | | | | | | | | | | | | | | | | | | | | | | | | | | | |
TOTAL RETURN | | | (19.20 | )%4 | | | 33.66 | % | | | 27.22 | % | | | 22.51 | % | | | 22.69 | %4 | | | 18.45 | % | | | 31.15 | % |
| | | | | | | | | | | | | | | | | | | | | | | | | | | | |
| | | | | | | |
RATIOS/SUPPLEMENTAL DATA | | | | | | | | | | | | | | | | | | | | | | | | | | | | |
Net assets, end of period (in 000’s) | | $ | 2,839,762 | | | $ | 3,806,714 | | | $ | 3,303,717 | | | $ | 2,031,995 | | | $ | 855,153 | | | $ | 587,133 | | | $ | 229,467 | |
| | | | | | | | | | | | | | | | | | | | | | | | | | | | |
Ratio of expenses to average net assets before reimbursement, waiver or recapture of expenses by Advisor and Administrator (Note 3) | | | 1.12 | %5 | | | 1.11 | % | | | 1.18 | % | | | 1.31 | % | | | 1.39 | %5 | | | 1.50 | % | | | 1.75 | % |
| | | | | | | | | | | | | | | | | | | | | | �� | | | | | | |
Ratio of expenses to average net assets after reimbursement, waiver or recapture of expenses by Advisor and Administrator | | | 1.12 | %5 | | | 1.10 | % | | | 1.16 | % | | | 1.31 | % | | | 1.36 | %5 | | | 1.48 | % | | | 1.75 | % |
| | | | | | | | | | | | | | | | | | | | | | | | | | | | |
Ratio of net investment income (loss) to average net assets (Note 1-F) | | | 0.85 | %5 | | | 1.12 | % | | | 1.12 | % | | | 1.10 | % | | | (0.16 | )%5 | | | 0.95 | % | | | 1.04 | % |
| | | | | | | | | | | | | | | | | | | | | | | | | | | | |
Portfolio turnover | | | 18.02 | %4 | | | 24.09 | % | | | 18.80 | % | | | 3.03 | % | | | 3.82 | %4 | | | 15.16 | % | | | 28.24 | % |
| | | | | | | | | | | | | | | | | | | | | | | | | | | | |
1 | The Fund’s fiscal year-end changed from August 31 to December 31, effective December 31, 2004. |
2 | Calculated using the average daily shares method. |
3 | Less than $0.01 per share. |
See accompanying notes to financial statements.
78 MATTHEWS ASIAN FUNDS
JUNE 30, 2008
Matthews Asian Technology Fund
The table below sets forth financial data for a share of beneficial interest outstanding throughout each period presented.
| | | | | | | | | | | | | | | | | | | | | | | | | | | | |
| | | Six-Month
Period Ended
June 30, 2008
(unaudited) | | | Years Ended Dec. 31, | | | Four-Month
Period Ended
Dec. 31,
20041 | | | Years Ended
August 31, | |
| | | 2007 | | | 2006 | | | 2005 | | | | 2004 | | | 2003 | |
Net Asset Value, beginning of period | | $ | 9.80 | | | $ | 7.92 | | | $ | 6.53 | | | $ | 5.45 | | | $ | 4.83 | | | $ | 4.30 | | | $ | 3.13 | |
| | | | | | | | | | | | | | | | | | | | | | | | | | | | |
INCOME (LOSS) FROM | | | | | | | | | | | | | | | | | | | | | | | | | | | | |
INVESTMENT OPERATIONS: | | | | | | | | | | | | | | | | | | | | | | | | | | | | |
Net investment income (loss) | | | (0.01 | )2 | | | — | 3 | | | (0.02 | ) | | | — | 3 | | | (0.02 | ) | | | (0.02 | ) | | | (0.01 | ) |
Net realized gain and unrealized appreciation (depreciation) on investments and foreign currency | | | (2.16 | ) | | | 1.87 | | | | 1.40 | | | | 1.08 | | | | 0.64 | | | | 0.53 | | | | 1.16 | |
| | | | | | | | | | | | | | | | | | | | | | | | | | | | |
Total from investment operations | | | (2.17 | ) | | | 1.87 | | | | 1.38 | | | | 1.08 | | | | 0.62 | | | | 0.51 | | | | 1.15 | |
| | | | | | | | | | | | | | | | | | | | | | | | | | | | |
Paid-in capital from redemption fees (Note 2) | | | 0.01 | | | | 0.01 | | | | 0.01 | | | | — | 3 | | | — | 3 | | | 0.02 | | | | 0.02 | |
| | | | | | | | | | | | | | | | | | | | | | | | | | | | |
Net Asset Value, end of period | | $ | 7.64 | | | $ | 9.80 | | | $ | 7.92 | | | $ | 6.53 | | | $ | 5.45 | | | $ | 4.83 | | | $ | 4.30 | |
| | | | | | | | | | | | | | | | | | | | | | | | | | | | |
TOTAL RETURN | | | (22.04 | )%4 | | | 23.74 | % | | | 21.29 | % | | | 19.82 | % | | | 12.84 | %4 | | | 12.40 | % | | | 37.38 | % |
| | | | | | | | | | | | | | | | | | | | | | | | | | | | |
RATIOS/SUPPLEMENTAL DATA | | | | | | | | | | | | | | | | | | | | | | | | | | | | |
Net assets, end of period (in 000’s) | | $ | 178,369 | | | $ | 252,304 | | | $ | 129,819 | | | $ | 50,426 | | | $ | 38,865 | | | $ | 34,297 | | | $ | 18,769 | |
| | | | | | | | | | | | | | | | | | | | | | | | | | | | |
Ratio of expenses to average net assets before reimbursement, waiver or recapture of expenses by Advisor and Administrator (Note 3) | | | 1.27 | %5 | | | 1.26 | % | | | 1.41 | % | | | 1.49 | % | | | 1.64 | %5 | | | 1.63 | % | | | 2.10 | % |
| | | | | | | | | | | | | | | | | | | | | | | | | | | | |
Ratio of expenses to average net assets after reimbursement, waiver or recapture of expenses by Advisor and Administrator | | | 1.27 | %5 | | | 1.25 | % | | | 1.39 | % | | | 1.48 | % | | | 1.60 | %5 | | | 1.91 | % | | | 2.00 | % |
| | | | | | | | | | | | | | | | | | | | | | | | | | | | |
Ratio of net investment income (loss) to average net assets (Note 1-F) | | | (0.34 | )%5 | | | (0.30 | )% | | | (0.29 | )% | | | 0.08 | % | | | (0.85 | )%5 | | | (0.31 | )% | | | (0.61 | )% |
| | | | | | | | | | | | | | | | | | | | | | | | | | | | |
Portfolio turnover | | | 44.64 | %4 | | | 33.21 | % | | | 34.77 | % | | | 29.76 | % | | | 7.36 | %4 | | | 41.25 | % | | | 72.03 | % |
| | | | | | | | | | | | | | | | | | | | | | | | | | | | |
1 | The Fund’s fiscal year-end changed from August 31 to December 31, effective December 31, 2004. |
2 | Calculated using the average daily shares method. |
3 | Less than $0.01 per share. |
See accompanying notes to financial statements.
800.789.ASIA [2742] www.matthewsfunds.com 79
FINANCIAL HIGHLIGHTS
Matthews China Fund
The table below sets forth financial data for a share of beneficial interest outstanding throughout each period presented.
| | | | | | | | | | | | | | | | | | | | | | | | | | | | |
| | | Six-Month
Period Ended
June 30, 2008
(unaudited) | | | Years Ended Dec. 31, | | | Four-Month
Period Ended
Dec. 31,
20041 | | | Years Ended
August 31, | |
| | | 2007 | | | 2006 | | | 2005 | | | | 2004 | | | 2003 | |
Net Asset Value, beginning of period | | $ | 39.73 | | | $ | 24.16 | | | $ | 14.76 | | | $ | 14.01 | | | $ | 13.26 | | | $ | 11.54 | | | $ | 8.96 | |
| | | | | | | | | | | | | | | | | | | | | | | | | | | | |
INCOME FROM | | | | | | | | | | | | | | | | | | | | | | | | | | | | |
INVESTMENT OPERATIONS: | | | | | | | | | | | | | | | | | | | | | | | | | | | | |
Net investment income | | | 0.20 | 2 | | | 0.12 | | | | 0.15 | | | | 0.22 | | | | 0.03 | | | | 0.08 | | | | 0.11 | |
Net realized gain and unrealized appreciation (depreciation) on investments and foreign currency | | | (9.76 | ) | | | 16.85 | | | | 9.39 | | | | 0.74 | | | | 1.38 | | | | 1.67 | | | | 2.59 | |
| | | | | | | | | | | | | | | | | | | | | | | | | | | | |
Total from investment operations | | | (9.56 | ) | | | 16.97 | | | | 9.54 | | | | 0.96 | | | | 1.41 | | | | 1.75 | | | | 2.70 | |
| | | | | | | | | | | | | | | | | | | | | | | | | | | | |
LESS DISTRIBUTIONS FROM: | | | | | | | | | | | | | | | | | | | | | | | | | | | | |
Net investment income | | | — | | | | (0.11 | ) | | | (0.15 | ) | | | (0.22 | ) | | | (0.14 | ) | | | (0.07 | ) | | | (0.14 | ) |
Net realized gains on investments | | | — | | | | (1.37 | ) | | | — | | | | — | | | | (0.53 | ) | | | — | | | | — | |
Return of capital | | | — | | | | — | | | | — | 3 | | | — | | | | — | | | | — | | | | — | |
| | | | | | | | | | | | | | | | | | | | | | | | | | | | |
Total distributions | | | — | | | | (1.48 | ) | | | (0.15 | ) | | | (0.22 | ) | | | (0.67 | ) | | | (0.07 | ) | | | (0.14 | ) |
| | | | | | | | | | | | | | | | | | | | | | | | | | | | |
Paid-in capital from redemption fees (Note 2) | | | 0.03 | | | | 0.08 | | | | 0.01 | | | | 0.01 | | | | 0.01 | | | | 0.04 | | | | 0.02 | |
| | | | | | | | | | | | | | | | | | | | | | | | | | | | |
Net Asset Value, end of period | | $ | 30.20 | | | $ | 39.73 | | | $ | 24.16 | | | $ | 14.76 | | | $ | 14.01 | | | $ | 13.26 | | | $ | 11.54 | |
| | | | | | | | | | | | | | | | | | | | | | | | | | | | |
TOTAL RETURN | | | (23.99 | )%4 | | | 70.14 | % | | | 64.81 | % | | | 6.91 | % | | | 10.61 | %4 | | | 15.48 | % | | | 30.88 | % |
| | | | | | | | | | | | | | | | | | | | | | | | | | | | |
RATIOS/SUPPLEMENTAL DATA | | | | | | | | | | | | | | | | | | | | | | | | | | | | |
Net assets, end of period (in 000’s) | | $ | 1,346,041 | | | $ | 2,335,402 | | | $ | 966,528 | | | $ | 388,950 | | | $ | 380,121 | | | $ | 340,251 | | | $ | 111,950 | |
| | | | | | | | | | | | | | | | | | | | | | | | | | | | |
Ratio of expenses to average net assets before reimbursement, waiver or recapture of expenses by Advisor and Administrator (Note 3) | | | 1.23 | %5 | | | 1.18 | % | | | 1.27 | % | | | 1.31 | % | | | 1.47 | %5 | | | 1.52 | % | | | 1.78 | % |
| | | | | | | | | | | | | | | | | | | | | | | | | | | | |
Ratio of expenses to average net assets after reimbursement, waiver or recapture of expenses by Advisor and Administrator | | | 1.23 | %5 | | | 1.17 | % | | | 1.26 | % | | | 1.30 | % | | | 1.43 | %5 | | | 1.50 | % | | | 1.79 | % |
| | | | | | | | | | | | | | | | | | | | | | | | | | | | |
Ratio of net investment income to average net assets | | | 1.22 | %5 | | | 0.49 | % | | | 0.96 | % | | | 1.46 | % | | | 0.85 | %5 | | | 1.04 | % | | | 1.93 | % |
| | | | | | | | | | | | | | | | | | | | | | | | | | | | |
Portfolio turnover | | | 5.57 | %4 | | | 22.13 | % | | | 11.65 | % | | | 11.82 | % | | | 4.99 | %4 | | | 28.99 | % | | | 19.34 | % |
| | | | | | | | | | | | | | | | | | | | | | | | | | | | |
1 | The Fund’s fiscal year-end changed from August 31 to December 31, effective December 31, 2004. |
2 | Calculated using the average daily shares method. |
3 | Less than $0.01 per share. |
See accompanying notes to financial statements.
80 MATTHEWS ASIAN FUNDS
JUNE 30, 2008
Matthews India Fund
The table below sets forth financial data for a share of beneficial interest outstanding throughout each period presented.
| | | | | | | | | | | | | | | | |
| | | Six-Month
Period Ended
June 30, 2008
(unaudited) | | | Years Ended Dec. 31, | | | Period Ended
Dec. 31,
20051 | |
| | | | 2007 | | | 2006 | | |
Net Asset Value, beginning of period | | $ | 24.44 | | | $ | 15.45 | | | $ | 11.32 | | | $ | 10.00 | |
| | | | | | | | | | | | | | | | |
INCOME (LOSS) FROM | | | | | | | | | | | | | | | | |
INVESTMENT OPERATIONS: | | | | | | | | | | | | | | | | |
Net investment loss | | | (0.03 | )2 | | | (0.01 | ) | | | (0.01 | ) | | | (0.01 | ) |
Net realized gain and unrealized appreciation (depreciation) on investments and foreign currency | | | (9.12 | ) | | | (9.12 | ) | | | 4.11 | | | | 1.33 | |
| | | | | | | | | | | | | | | | |
Total from investment operations | | | (9.15 | ) | | | 9.86 | | | | 4.10 | | | | 1.32 | |
| | | | | | | | | | | | | | | | |
LESS DISTRIBUTIONS FROM: | | | | | | | | | | | | | | | | |
Net investment income | | | — | | | | (0.21 | ) | | | — | | | | — | |
Net realized gains on investments | | | — | | | | (0.68 | ) | | | — | | | | — | |
| | | | | | | | | | | | | | | | |
Total distributions | | | — | | | | (0.89 | ) | | | — | | | | — | |
| | | | | | | | | | | | | | | | |
Paid-in capital from redemption fees (Note 2) | | | 0.02 | | | | 0.02 | | | | 0.03 | | | | — | 3 |
| | | | | | | | | | | | | | | | |
Net Asset Value, end of period | | $ | 15.31 | | | $ | 24.44 | | | $ | 15.45 | | | $ | 11.32 | |
| | | | | | | | | | | | | | | | |
TOTAL RETURN | | | (37.36 | )%4 | | | 64.13 | % | | | 36.48 | % | | | 13.20 | %4 |
| | | | | | | | | | | | | | | | |
RATIOS/SUPPLEMENTAL DATA | | | | | | | | | | | | | | | | |
Net assets, end of period (in 000’s) | | $ | 707,607 | | | $ | 1,311,072 | | | $ | 669,643 | | | $ | 80,897 | |
| | | | | | | | | | | | | | | | |
Ratio of expenses to average net assets before reimbursement, waiver or recapture of expenses by Advisor and Administrator (Note 3) | | | 1.29 | %5 | | | 1.29 | % | | | 1.41 | % | | | 2.75 | %5 |
| | | | | | | | | | | | | | | | |
Ratio of expenses to average net assets after reimbursement, waiver or recapture of expenses by Advisor and Administrator | | | 1.29 | %5 | | | 1.28 | % | | | 1.41 | % | | | 2.00 | %5 |
| | | | | | | | | | | | | | | | |
Ratio of net investment loss to average net assets | | | (0.26 | )%5 | | | (0.04 | )% | | | (0.08 | )% | | | (1.17 | )%5 |
| | | | | | | | | | | | | | | | |
Portfolio turnover | | | 27.01 | %4 | | | 25.59 | % | | | 21.57 | % | | | 0.00 | %4 |
| | | | | | | | | | | | | | | | |
1 | The Matthews India Fund commenced operations on October 31, 2005. |
2 | Calculated using the average daily shares method. |
3 | Less than $0.01 per share. |
See accompanying notes to financial statements.
800.789.ASIA [2742] www.matthewsfunds.com 81
FINANCIAL HIGHLIGHTS
Matthews Japan Fund
The table below sets forth financial data for a share of beneficial interest outstanding throughout each period presented.
| | | | | | | | | | | | | | | | | | | | | | | | | | | | |
| | | Six-Month
Period Ended
June 30, 2008
(unaudited) | | | Years Ended Dec. 31, | | | Four-Month
Period Ended
Dec. 31,
20041 | | | Years Ended
August 31, | |
| | | | 2007 | | | 2006 | | | 2005 | | | | 2004 | | | 2003 | |
Net Asset Value, beginning of period | | $ | 14.55 | | | $ | 17.29 | | | $ | 18.48 | | | $ | 16.12 | | | $ | 14.73 | | | $ | 10.90 | | | $ | 9.60 | |
| | | | | | | | | | | | | | | | | | | | | | | | | | | | |
INCOME (LOSS) FROM | | | | | | | | | | | | | | | | | | | | | | | | | | | | |
INVESTMENT OPERATIONS: | | | | | | | | | | | | | | | | | | | | | | | | | | | | |
Net investment income (loss) | | | 0.04 | 2 | | | 0.03 | | | | (0.08 | ) | | | 0.02 | | | | (0.02 | ) | | | (0.05 | ) | | | (0.03 | ) |
Net realized gain (loss) and unrealized appreciation (depreciation) on investments and foreign currency | | | (1.10 | ) | | | (1.86 | ) | | | (1.12 | ) | | | 2.36 | | | | 1.40 | | | | 3.82 | | | | 1.30 | |
| | | | | | | | | | | | | | | | | | | | | | | | | | | | |
Total from investment operations | | | (1.06 | ) | | | (1.83 | ) | | | (1.20 | ) | | | 2.38 | | | | 1.38 | | | | 3.77 | | | | 1.27 | |
| | | | | | | | | | | | | | | | | | | | | | | | | | | | |
LESS DISTRIBUTIONS FROM: | | | | | | | | | | | | | | | | | | | | | | | | | | | | |
Net investment income | | | — | | | | (0.01 | ) | | | — | | | | (0.03 | ) | | | — | | | | — | | | | — | |
Net realized gains on investments | | | — | | | | (0.91 | ) | | | — | | | | — | | | | — | | | | — | | | | — | |
| | | | | | | | | | | | | | | | | | | | | | | | | | | | |
Total distributions | | | — | | | | (0.92 | ) | | | — | | | | (0.03 | ) | | | — | | | | — | | | | — | |
| | | | | | | | | | | | | | | | | | | | | | | | | | | | |
Paid-in capital from redemption fees (Note 2) | | | — | 3 | | | 0.01 | | | | 0.01 | | | | 0.01 | | | | 0.01 | | | | 0.06 | | | | 0.03 | |
| | | | | | | | | | | | | | | | | | | | | | | | | | | | |
Net Asset Value, end of period | | $ | 13.49 | | | $ | 14.55 | | | $ | 17.29 | | | $ | 18.48 | | | $ | 16.12 | | | $ | 14.73 | | | $ | 10.90 | |
| | | | | | | | | | | | | | | | | | | | | | | | | | | | |
TOTAL RETURN | | | (7.29 | )%4 | | | (10.96 | )% | | | (6.44 | )% | | | 14.83 | % | | | 9.44 | %4 | | | 35.14 | % | | | 13.54 | % |
| | | | | | | | | | | | | | | | | | | | | | | | | | | | |
RATIOS/SUPPLEMENTAL DATA | | | | | | | | | | | | | | | | | | | | | | | | | | | | |
Net assets, end of period (in 000’s) | | $ | 200,604 | | | $ | 166,860 | | | $ | 276,656 | | | $ | 367,618 | | | $ | 200,482 | | | $ | 195,256 | | | $ | 23,653 | |
| | | | | | | | | | | | | | | | | | | | | | | | | | | | |
Ratio of expenses to average net assets before reimbursement, waiver or recapture of expenses by Advisor and Administrator (Note 3) | | | 1.25 | %5 | | | 1.24 | % | | | 1.25 | % | | | 1.29 | % | | | 1.40 | %5 | | | 1.46 | % | | | 1.92 | % |
| | | | | | | | | | | | | | | | | | | | | | | | | | | | |
Ratio of expenses to average net assets after reimbursement, waiver or recapture of expenses by Advisor and Administrator | | | 1.25 | %5 | | | 1.23 | % | | | 1.24 | % | | | 1.28 | % | | | 1.38 | %5 | | | 1.45 | % | | | 2.00 | % |
| | | | | | | | | | | | | | | | | | | | | | | | | | | | |
Ratio of net investment income (loss) to average net assets | | | 0.58 | %5 | | | (0.01 | )% | | | (0.29 | )% | | | (0.10 | )% | | | (0.31 | )%5 | | | (0.71 | )% | | | (1.05 | )% |
| | | | | | | | | | | | | | | | | | | | | | | | | | | | |
Portfolio turnover | | | 43.18 | %4 | | | 45.51 | % | | | 59.95 | % | | | 20.88 | % | | | 5.30 | %4 | | | 14.57 | % | | | 77.30 | % |
| | | | | | | | | | | | | | | | | | | | | | | | | | | | |
1 | The Fund’s fiscal year-end changed from August 31 to December 31, effective December 31, 2004. |
2 | Calculated using the average daily shares method. |
3 | Less than $0.01 per share. |
See accompanying notes to financial statements.
82 MATTHEWS ASIAN FUNDS
JUNE 30, 2008
Matthews Korea Fund
The table below sets forth financial data for a share of beneficial interest outstanding throughout each period presented.
| | | | | | | | | | | | | | | | | | | | | | | | | | | | |
| | | Six-Month
Period Ended
June 30, 2008
(unaudited) | | | Years Ended Dec. 31, | | | Four-Month
Period Ended
Dec. 31,
20041 | | | Years Ended
August 31, | |
| | | | 2007 | | | 2006 | | | 2005 | | | | 2004 | | | 2003 | |
Net Asset Value, beginning of period | | $ | 6.56 | | | $ | 6.23 | | | $ | 6.37 | | | $ | 4.08 | | | $ | 3.94 | | | $ | 4.37 | | | $ | 4.42 | |
| | | | | | | | | | | | | | | | | | | | | | | | | | | | |
INCOME (LOSS) FROM | | | | | | | | | | | | | | | | | | | | | | | | | | | | |
INVESTMENT OPERATIONS: | | | | | | | | | | | | | | | | | | | | | | | | | | | | |
Net investment income (loss) | | | (0.02 | )2 | | | 0.07 | | | | 0.01 | | | | 0.01 | | | | — | | | | 0.04 | | | | 0.01 | |
Net realized gain and unrealized appreciation (depreciation) on investments and foreign currency | | | (1.56 | ) | | | 1.15 | | | | 0.80 | | | | 2.39 | | | | 0.78 | | | | 0.34 | | | | 0.32 | |
| | | | | | | | | | | | | | | | | | | | | | | | | | | | |
Total from investment operations | | | (1.58 | ) | | | 1.22 | | | | 0.81 | | | | 2.40 | | | | 0.78 | | | | 0.38 | | | | 0.33 | |
| | | | | | | | | | | | | | | | | | | | | | | | | | | | |
LESS DISTRIBUTIONS FROM: | | | | | | | | | | | | | | | | | | | | | | | | | | | | |
Net investment income | | | — | | | | (0.02 | ) | | | (0.01 | ) | | | — | | | | (0.01 | ) | | | — | | | | — | |
Net realized gains on investments | | | — | | | | (0.87 | ) | | | (0.95 | ) | | | (0.11 | ) | | | (0.63 | ) | | | (0.82 | ) | | | (0.39 | ) |
| | | | | | | | | | | | | | | | | | | | | | | | | | | | |
Total distributions | | | — | | | | (0.89 | ) | | | (0.96 | ) | | | (0.11 | ) | | | (0.64 | ) | | | (0.82 | ) | | | (0.39 | ) |
| | | | | | | | | | | | | | | | | | | | | | | | | | | | |
Paid-in capital from redemption fees (Note 2) | | | — | 3 | | | — | 3 | | | 0.01 | | | | — | 3 | | | — | 3 | | | 0.01 | | | | 0.01 | |
| | | | | | | | | | | | | | | | | | | | | | | | | | | | |
Net Asset Value, end of period | | $ | 4.98 | | | $ | 6.56 | | | $ | 6.23 | | | $ | 6.37 | | | $ | 4.08 | | | $ | 3.94 | | | $ | 4.37 | |
| | | | | | | | | | | | | | | | | | | | | | | | | | | | |
TOTAL RETURN | | | (24.09 | )%4 | | | 18.90 | % | | | 12.99 | % | | | 58.76 | % | | | 20.60 | %4 | | | 9.91 | % | | | 8.80 | % |
| | | | | | | | | | | | | | | | | | | | | | | | | | | | |
RATIOS/SUPPLEMENTAL DATA | | | | | | | | | | | | | | | | | | | | | | | | | | | | |
Net assets, end of period (in 000’s) | | $ | 160,376 | | | $ | 250,421 | | | $ | 241,003 | | | $ | 269,925 | | | $ | 127,794 | | | $ | 110,199 | | | $ | 217,267 | |
| | | | | | | | | | | | | | | | | | | | | | | | | | | | |
Ratio of expenses to average net assets before reimbursement, waiver or recapture of expenses by Advisor and Administrator (Note 3) | | | 1.24 | %5 | | | 1.21 | % | | | 1.30 | % | | | 1.35 | % | | | 1.49 | %5 | | | 1.51 | % | | | 1.72 | % |
| | | | | | | | | | | | | | | | | | | | | | | | | | | | |
Ratio of expenses to average net assets after reimbursement, waiver or recapture of expenses by Advisor and Administrator | | | 1.24 | %5 | | | 1.21 | % | | | 1.28 | % | | | 1.35 | % | | | 1.31 | %5 | | | 1.50 | % | | | 1.72 | % |
| | | | | | | | | | | | | | | | | | | | | | | | | | | | |
Ratio of net investment income (loss) to average net assets | | | (0.71 | )%5 | | | 1.17 | % | | | (0.09 | )% | | | 0.27 | % | | | (0.69 | )%5 | | | 0.29 | % | | | 0.17 | % |
| | | | | | | | | | | | | | | | | | | | | | | | | | | | |
Portfolio turnover | | | 29.78 | %4 | | | 24.20 | % | | | 25.82 | % | | | 10.13 | % | | | 6.53 | %4 | | | 18.40 | % | | | 29.90 | % |
| | | | | | | | | | | | | | | | | | | | | | | | | | | | |
1 | The Fund’s fiscal year-end changed from August 31 to December 31, effective December 31, 2004. |
2 | Calculated using the average daily shares method. |
3 | Less than $0.01 per share. |
See accompanying notes to financial statements.
800.789.ASIA [2742] www.matthewsfunds.com 83
NOTES TO FINANCIAL STATEMENTS (Unaudited)
| 1. | SIGNIFICANT ACCOUNTING POLICIES |
Matthews Asian Funds (the “Trust”) is an open-end investment management company registered under the Investment Company Act of 1940, as amended (the “Act”). The Trust currently issues nine separate series of shares (each a “Fund” and collectively, the “Funds”): Matthews Asia Pacific Equity Income Fund, Matthews Asian Growth and Income Fund, Matthews Asia Pacific Fund, Matthews Pacific Tiger Fund, Matthews Asian Technology Fund, Matthews China Fund, Matthews India Fund, Matthews Japan Fund and Matthews Korea Fund. Matthews Pacific Tiger Fund, Matthews China Fund and Matthews Korea Fund are authorized to offer two classes of shares: Class I shares and Class A shares. Currently, only Class I shares are offered. Effective December 31, 2004, the Funds fiscal year end changed from August 31 to December 31. The following is a summary of significant accounting policies consistently followed by the Funds in preparation of their financial statements.
| A. | SECURITY VALUATION: The Funds’ equity securities are valued based on market quotations or at fair value as determined in good faith by or under the direction of the Board of Trustees (the “Board”) when no market quotations are available or when market quotations have become unreliable. The Board has delegated the responsibility of making fair value determinations to the Funds’ Valuation Committee (the “Valuation Committee”), subject to the Funds’ Pricing Policies. The Funds have retained third-party pricing services which may be utilized by the Valuation Committee under circumstances described in the Pricing Policies to provide fair value prices for certain securities held by the Funds. When fair value pricing is employed, the prices of securities used by a Fund to calculate its NAV differ from quoted or published prices for the same securities for that day. All fair value determinations are made subject to the Board’s oversight. |
The books and records of the Funds are maintained in U.S. dollars. Transactions denominated in foreign currencies are recorded at the current prevailing exchange rates. All assets and liabilities denominated in foreign currencies are translated into U.S. dollars at the current exchange rate. Translation gains or losses resulting from changes in the exchange rate during the reporting period and realized gains and losses on the settlement of foreign currency transactions are reported in the results of operations for the current period. The Funds do not isolate that portion of gains and losses on investments in equity securities which is due to changes in the foreign exchange rate from that which is due to changes in market prices of equity securities. International dollar bonds are issued offshore, pay interest and principal in U.S. dollars, and are denominated in U.S. dollars.
Market values for equity securities are determined based on the last sale price on the principal (or most advantageous) market on which the security is traded. If a reliable last sale price is not available, market values for equity securities are determined using the mean between the last available bid and asked price. Securities are valued through valuations obtained from a commercial pricing service or at the most recent mean of the bid and asked prices provided by investment dealers in accordance with procedures established by the Board.
Foreign securities are valued as of the close of trading on the primary (or most advantageous) market on which they trade. The value is then converted to U.S. dollars using current exchange rates and in accordance with the Pricing Policies. Foreign currency exchange rates are determined as of the close of trading on the New York Stock Exchange, Inc. (“NYSE”).
Events affecting the value of foreign investments occur between the time at which they are determined and the close of trading on the NYSE. Such events would not normally be reflected in a calculation of a Funds’ NAV on that day. If events that materially affect the value of the Funds’ foreign investments occur during such period and the impact of such events can be reasonably determined, the investments will be valued at their fair value as described above.
Foreign securities held by the Funds may be traded on days and at times when the NYSE is closed. Accordingly, the NAV of the Funds may be significantly affected on days when shareholders have no access to the Funds. For valuation purposes, quotations of foreign portfolio securities, other assets and liabilities, and forward contracts stated in foreign currency are translated into U.S. dollar equivalents at the prevailing market rates.
| B. | ADOPTION OF STATEMENT OF FINANCIAL ACCOUNTING STANDARDS NO. 157 “FAIR VALUE MEASUREMENTS” (“FAS 157”): In September 2006, the Financial Accounting Standards Board issued FAS 157 effective for fiscal years beginning after November 15, 2007. This standard clarifies the definition of fair value for financial reporting, establishes a framework for measuring fair value and requires additional disclosures about the use of fair value measurements. The Funds have adopted FAS 157 as of January 1,2008. The three levels of the fair value hierarchy under FAS 157 are described below: |
Level 1: Quoted prices in active markets for identical securities
84 MATTHEWS ASIAN FUNDS
JUNE 30, 2008
Level 2: Other significant observable inputs (including quoted prices for similar securities, interest rates, prepayment speeds, credit risk, etc.]
Level 3: Significant unobservable inputs (including the Fund’s own assumptions in determining the fair value of investments)
The inputs or methodology used for valuing securities are not necessarily an indication of the risk associated with investing in those securities.
The summary of inputs used to value the Fund’s net assets as of June 30, 2008 is as follows:
| | | | | | | | | | | | | | | | | |
| | | MATTHEWS ASIA
PACIFIC EQUITY
INCOME FUND | | | MATTHEWS
ASIAN
GROWTH AND
INCOME FUND | | | MATTHEWS
ASIA
PACIFIC FUND | | MATTHEWS
PACIFIC
TIGER FUND | | MATTHEWS
ASIAN
TECHNOLOGY
FUND |
Level 1: Quoted Prices | | $ | 74,540,895 | | | $ | 1,161,465,456 | | | $ | 303,130,850 | | $ | 1,867,999,906 | | $ | 160,952,243 |
Level 2: Other Significant Observable Inputs | | | 24,009,886 | | | | 797,030,835 | | | | 65,447,949 | | | 885,955,602 | | | 18,075,761 |
Level 3: Significant Unobservable Inputs | | | — | | | | — | | | | — | | | — | | | — |
| | | | | | | | | | | | | | | | | |
Total Market Value of Investments | | $ | 98,550,781 | | | $ | 1,958,496,291 | | | $ | 368,578,799 | | $ | 2,753,955,508 | | $ | 179,028,004 |
| | | | | | | | | | | | | | | | | |
| | | | | |
| | | MATTHEWS
CHINA FUND | | | MATTHEWS
INDIA FUND | | | MATTHEWS
JAPAN FUND | | MATTHEWS
KOREA FUND | | |
Level 1: Quoted Prices | | $ | 168,089,964 | | | $ | 695,266,224 | | | $ | 199,909,921 | | $ | 158,013,140 | | | |
Level 2: Other Significant Observable Inputs | | | 1,173,501,552 | | | | 14,388,125 | | | | — | | | — | | | |
Level 3: Significant Unobservable Inputs | | | — | | | | — | | | | — | | | 2,842,617 | | | |
| | | | | | | | | | | | | | | | | |
Total Market Value of Investments | | $ | 1,341,591,516 | | | $ | 709,654,349 | | | $ | 199,909,921 | | $ | 160,855,757 | | | |
| | | | | | | | | | | | | | | | | |
Following is reconciliation of Level 3 investments for which significant unobservable inputs were used to determine fair value: |
| | | MATTHEWS ASIA
PACIFIC EQUITY
INCOME FUND | | | MATTHEWS
ASIAN
GROWTH AND
INCOME FUND | | | MATTHEWS
KOREA FUND | | | | |
Balance as of 12/31/07 (market value) | | $ | 2,115,979 | | | $ | 6,791,533 | | | $ | — | | | | | | |
Transfers in and/or out of Level 3 | | | (2,115,979 | ) | | | (6,791,533 | ) | | | 2,842,617 | | | | | | |
| | | | | | | | | | | | | | | | | |
Balance as of 6/30/08 (market value) | | $ | — | | | $ | — | | | $ | 2,842,617 | | | | | | |
| | | | | | | | | | | | | | | | | |
| C. | RISKS ASSOCIATED WITH NON-U.S. COMPANIES: Investments by the Funds in the securities of non-U.S. companies may involve investment risks different from those of U.S. issuers including possible political or economical instability of the country of the issuer, the possibility of disruption to international trade patterns, the possibility of currency crises and exchange controls, the possible imposition of foreign withholding tax on the interest income payable on such instruments, the possible establishment of foreign controls, the possible seizure or nationalization of foreign deposits or assets, or the adoption of other foreign government restrictions that might adversely affect the foreign securities held by the Funds. Foreign securities may also be subject to greater fluctuations in price than securities of domestic corporations or the U.S. government. There may be less publicly available information about a non-U.S. company than about a U.S. company. Sometimes non-U.S. companies are subject to different accounting, auditing, and financial reporting standards, practices, and requirements than U.S. companies. There is generally less government regulation of stock exchanges, brokers, and listed companies abroad than in the U.S., which may result in less transparency with respect to a company’s operations. The absence of negotiated brokerage commissions in certain countries may result in higher brokerage fees. With respect to certain non-U.S. countries, there is a possibility of expropriation, nationalization, confiscatory taxation, or diplomatic developments that could affect investments in those countries. |
800.789.ASIA [2742] www.matthewsfunds.com 85
NOTES TO FINANCIAL STATEMENTS
| D. | FEDERAL INCOME TAXES: It is the policy of the Funds to comply with all requirements of the Internal Revenue Code of 1986, as amended (“the Code”) applicable to regulated investment companies and to distribute substantially all of their taxable income to their shareholders. The Funds have met the requirements of the Code applicable to regulated investment companies for the period ended June 30,2008. Therefore, no federal income tax provision is required. Income and capital gains of the Funds are determined in accordance with both tax regulations and accounting principles generally accepted in the U.S. (GAAP). Such treatment may result in temporary and permanent differences between tax basis earnings and earnings reported for financial statement purposes. These reclassifications, which have no impact on the net asset value of the Funds, are primarily attributable to certain differences in computation of distributable income and capital gains under federal tax rules versus GAAP. and the use of the tax accounting practice known as equalization. |
In addition to the requirements of the Code, the Funds may also be subject to capital gains tax in India on gains realized upon sale of Indian securities, payable upon repatriation of sales proceeds. Any realized losses in excess of gains may be carried forward to offset future gains. Funds with exposure to Indian securities may accrue a deferred liability for unrealized gains in excess of available carryforwards on Indian securities based on existing tax rates and holding periods of the securities. As of June 30,2008, the Matthews Asia Pacific Fund, Matthews Pacific Tiger Fund, Matthews Asia Technology Funds and Matthews India Fund have recorded a payable of $135,026, $989,953, $99,177 and $1,344,880, respectively as an estimate for potential future India capital gains taxes.
The Funds adopted the provisions of FASB Interpretation No. 48 (“FIN48”), Accounting for Uncertainty in Income Taxes, on June 29,2007 and was applied to all open tax years as of the date of effectiveness. The implementation of FIN48 resulted in no material liability for unrecognized tax benefits and no material change to the beginning net asset value of the Funds. As of and during the period ended June 30,2008, the Funds did not have a liability for any unrecognized tax benefits. The Funds recognize interest and penalties, if any, related to unrecognized tax benefits as income tax expense in the Statements of Operations. During the period, the Funds did not incur any interest or penalties.
Under the current tax law, capital and currency losses realized after October 31 and prior to the Fund’s fiscal year end may be deferred as occurring on the first day of the following fiscal year. Post October losses at the fiscal year ended December 31, 2007 were as follows:
| | | | | | | | |
| | | POST-OCTOBER
CAPITAL LOSSES | | | POST-OCTOBER
CURRENCY LOSSES | |
Matthews Asian Growth and Income Fund | | $ | — | | | $ | (22,680 | ) |
Matthews Pacific Tiger Fund | | | — | | | | (220,413 | ) |
Matthews Asian Technology Fund | | | (587,611 | ) | | | — | |
Matthews China Fund | | | — | | | | (19,959 | ) |
Matthews India Fund | | | — | | | | (31,442 | ) |
Matthews Korea Fund | | | — | | | | (10,385 | ) |
For federal income tax purposes, the Funds indicated below have capital loss carryforwards, which expire in the year indicated, as of December 31, 2007, which are available to offset future capital gains, if any:
| | | | | | | | | | | | | | | | |
| LOSSES DEFERRED EXPIRING IN: | | 2008 | | | 2009 | | | 2010 | | | TOTAL | |
Matthews Asian Technology Fund | | $ | (1,570,881 | ) | | $ | (5,967,059 | ) | | $ | (3,461,198 | ) | | $ | (10,999,138 | ) |
| E. | DISTRIBUTIONS TO SHAREHOLDERS: It is the policy of Matthews Asia Pacific Equity Income Fund to distribute net investment income on a quarterly basis and capital gains, if any, annually. It is the policy of Matthews Asian Growth and Income Fund to distribute net investment income on a semi-annual basis and capital gains, if any, annually. Matthews Asia Pacific Fund, Matthews Pacific Tiger Fund, Matthews Asian Technology Fund, Matthews China Fund, Matthews India Fund, Matthews Japan Fund and Matthews Korea Fund distribute net investment income and capital gains, if any, annually. Distributions to shareholders are recorded on the ex-dividend date. Income and capital gain distributions are determined in accordance with income tax regulations which may differ from GAAP. Net investment losses may not be utilized to offset net investment income in future periods for tax purposes. |
86 MATTHEWS ASIAN FUNDS
JUNE 30, 2008
The tax character of distributions paid for the fiscal year December 31, 2007 were as follows:
| | | | | | | | | |
| YEAR ENDED DECEMBER 31, 2007 | | ORDINARY
INCOME | | NET LONG-TERM
CAPITAL GAINS | | TOTAL TAXABLE
DISTRIBUTIONS |
Matthews Asia Pacific Equity Income Fund | | $ | 4,412,225 | | $ | — | | $ | 4,412,225 |
Matthews Asian Growth and Income Fund | | | 113,973,409 | | | 195,076,425 | | | 309,049,834 |
Matthews Asia Pacific Fund | | | 5,198,959 | | | 39,398,907 | | | 44,597,866 |
Matthews Pacific Tiger Fund | | | 47,688,902 | | | 448,098,243 | | | 495,787,145 |
Matthews China Fund | | | 6,158,810 | | | 77,731,715 | | | 83,890,525 |
Matthews India Fund | | | 11,776,278 | | | 31,965,151 | | | 43,741,429 |
Matthews Japan Fund | | | 82,727 | | | 11,302,509 | | | 11,385,236 |
Matthews Korea Fund | | | 627,099 | | | 30,040,481 | | | 30,667,580 |
| F. | INVESTMENT TRANSACTIONS AND INCOME: Securities transactions are accounted for on the date the securities are purchased or sold. Gains or losses on the sale of securities are determined on the identified cost basis. Interest income is recorded on the accrual basis. Dividend income is recorded on the ex-dividend date. |
For the year ended December 31,2007, the Funds changed the method by which it records and recognizes dividend income for Korean equity securities held in the Funds as a result of, among other things, establishing a reasonable basis to estimate for Korean dividends at ex-date. Prior to 2007, it had been the policy of the Funds to record dividends for certain Korean securities following the annual general meeting of shareholders of such companies. These dividends were records in the next fiscal year following the ex-date of these distributions. Dividend income is now recorded in the current fiscal year on ex-date based on estimated dividend rates. Estimated dividends are updated as additional information becomes available.
As a result of this change, there was an increase in dividend income and the net investment income ratio for the fiscal year ended December 31, 2007, as follows:
| | | | | | | | | |
| | | INCREASE IN
DIVIDEND INCOME | | INCREASE IN 1- YEAR
TOTAL RETURN | | | INCREASE IN
NET INVESTMENT
INCOME RATIO | |
Matthews Asia Pacific Equity Income Fund | | $ | 58,830 | | 0.10 | % | | 0.10 | % |
Matthews Asian Growth and Income Fund | | | 5,529,268 | | 0.30 | % | | 0.25 | % |
Matthews Asia Pacific Fund | | | 310,558 | | 0.06 | % | | 0.07 | % |
Matthews Pacific Tiger Fund | | | 4,117,625 | | 0.14 | % | | 0.11 | % |
Matthews Asian Technology Fund | | | 110,740 | | 0.00 | % | | 0.06 | % |
Matthews Korea Fund | | | 2,308,504 | | 1.09 | % | | 0.97 | % |
| G. | FUND EXPENSE ALLOCATIONS: The Funds account separately for the assets, liabilities and operations of each Fund. Direct expenses of each Fund are charged to the Fund while general expenses are allocated pro-rata among the Funds based on net assets. |
| H. | USE OF ESTIMATES: The preparation of financial statements in conformity with GAAP requires management to make estimates and assumptions that affect the amounts reported in the financial statements and accompanying notes. Actual results may differ from those estimates. |
800.789.ASIA [2742] www.matthewsfunds.com 87
NOTES TO FINANCIAL STATEMENTS (Unaudited)
| 2. | CAPITAL SHARE TRANSACTIONS: |
Each Fund is authorized to issue an unlimited number of shares of beneficial interest with a par value of $0.001 per share.
MATTHEWS ASIA PACIFIC EQUITY INCOME FUND
| | | | | | | | | | | | | | |
| | | SIX-MONTH PERIOD ENDED
JUNE 30, 2008 (UNAUDITED) | | | YEAR ENDED
DECEMBER 31, 2007 | |
| | | SHARES | | | AMOUNT | | | SHARES | | | AMOUNT | |
Shares sold | | 3,353,021 | | | $ | 39,072,273 | | | 6,323,727 | | | $ | 73,333,655 | |
Shares issued through reinvestment of distributions | | 101,414 | | | | 1,158,301 | | | 344,963 | | | | 4,244,205 | |
Shares redeemed | | (1,478,095 | ) | | | (16,977,827 | ) | | (2,257,812 | ) | | | (26,400,852 | ) |
| | | | | | | | | | | | | | |
Net increase | | 1,976,340 | | | $ | 23,252,747 | | | 4,410,878 | | | $ | 51,177,008 | |
| | | | | | | | | | | | | | |
|
| MATTHEWS ASIAN GROWTH AND INCOME FUND | |
| | |
| | | SIX-MONTH PERIOD ENDED
JUNE 30, 2008 (UNAUDITED) | | | YEAR ENDED
DECEMBER 31, 2007 | |
| | | SHARES | | | AMOUNT | | | SHARES | | | AMOUNT | |
Shares sold | | 7,145,580 | | | $ | 135,889,055 | | | 14,935,556 | | | $ | 298,658,709 | |
Shares issued through reinvestment of distributions | | 3,990,838 | | | | 70,854,156 | | | 14,482,732 | | | | 291,967,013 | |
Shares redeemed | | (13,553,120 | ) | | | (254,977,689 | ) | | (22,714,991 | ) | | | (455,813,981 | ) |
| | | | | | | | | | | | | | |
Net increase (decrease) | | (2,416,702 | ) | | $ | (48,234,478 | ) | | 6,703,297 | | | $ | 134,811,741 | |
| | | | | | | | | | | | | | |
|
| MATTHEWS ASIA PACIFIC FUND | |
| | |
| | | SIX-MONTH PERIOD ENDED
JUNE 30, 2008 (UNAUDITED) | | | YEAR ENDED
DECEMBER 31, 2007 | |
| | | SHARES | | | AMOUNT | | | SHARES | | | AMOUNT | |
Shares sold | | 2,632,557 | | | $ | 41,632,770 | | | 9,065,758 | | | $ | 160,241,353 | |
Shares issued through reinvestment of distributions | | 6 | | | | 108 | | | 1,758,055 | | | | 32,330,674 | |
Shares redeemed | | (4,627,694 | ) | | | (72,896,524 | ) | | (10,147,960 | ) | | | (179,463,162 | ) |
| | | | | | | | | | | | | | |
Net increase (decrease) | | (1,995,131 | ) | | $ | (31,263,646 | ) | | 675,853 | | | $ | 13,108,865 | |
| | | | | | | | | | | | | | |
| | | | |
| MATTHEWS PACIFIC TIGER FUND | | | | | | | | | | | | | | |
| | |
| | | SIX-MONTH PERIOD ENDED
JUNE 30, 2008 (UNAUDITED) | | | YEAR ENDED
DECEMBER 31, 2007 | |
| | | SHARES | | | AMOUNT | | | SHARES | | | AMOUNT | |
Shares sold | | 6,967,710 | | | $ | 174,564,748 | | | 15,328,359 | | | $ | 411,688,821 | |
Shares issued through reinvestment of distributions | | 1,775 | | | | 50,864 | | | 12,817,908 | | | | 367,232,760 | |
Shares redeemed | | (17,450,078 | ) | | | (433,953,305 | ) | | (30,872,328 | ) | | | (838,662,748 | ) |
| | | | | | | | | | | | | | |
Net decrease | | (10,480,593 | ) | | $ | (259,337,693 | ) | | (2,726,061 | ) | | $ | (59,741,167 | ) |
| | | | | | | | | | | | | | |
|
| MATTHEWS ASIAN TECHNOLOGY FUND | |
| | |
| | | SIX-MONTH PERIOD ENDED
JUNE 30, 2008 (UNAUDITED) | | | YEAR ENDED
DECEMBER 31, 2007 | |
| | | SHARES | | | AMOUNT | | | SHARES | | | AMOUNT | |
Shares sold | | 5,236,940 | | | $ | 45,589,204 | | | 17,487,919 | | | $ | 157,985,546 | |
Shares redeemed | | (7,639,741 | ) | | | (64,707,593 | ) | | (8,141,399 | ) | | | (69,933,512 | ) |
| | | | | | | | | | | | | | |
Net increase (decrease) | | (2,402,801 | ) | | $ | (19,118,389 | ) | | 9,346,520 | | | $ | 88,052,034 | |
| | | | | | | | | | | | | | |
88 MATTHEWS ASIAN FUNDS
JUNE 30, 2008
| | | | | | | | | | | | | | |
| MATTHEWS CHINA FUND | |
| | |
| | | SIX-MONTH PERIOD ENDED
JUNE 30, 2008 (UNAUDITED) | | | YEAR ENDED
DECEMBER 31, 2007 | |
| | | SHARES | | | AMOUNT | | | SHARES | | | AMOUNT | |
Shares sold | | 8,442,268 | | | $ | 289,645,868 | | | 48,359,909 | | | $ | 1,656,572,773 | |
Shares issued through reinvestment of distributions | | 19 | | | | — | | | 1,903,538 | | | | 81,509,428 | |
Shares redeemed | | (22,652,955 | ) | | | (755,837,140 | ) | | (31,479,275 | ) | | | (1,036,465,982 | ) |
| | | | | | | | | | | | | | |
Net increase (decrease) | | (14,210,668 | ) | | $ | (466,191,272 | ) | | 18,784,172 | | | $ | 701,616,219 | |
| | | | | | | | | | | | | | |
| | | | |
| MATTHEWS INDIA FUND | | | | | | | | | | | | | | |
| | |
| | | SIX-MONTH PERIOD ENDED
JUNE 30, 2008 (UNAUDITED) | | | YEAR ENDED
DECEMBER 31, 2007 | |
| | | SHARES | | | AMOUNT | | | SHARES | | | AMOUNT | |
Shares sold | | 13,652,672 | | | $ | 288,431,878 | | | 30,843,762 | | | $ | 585,830,908 | |
Shares issued through reinvestment of distributions | | 44 | | | | 960 | | | 1,800,066 | | | | 42,355,560 | |
Shares redeemed | | (21,069,491 | ) | | | (403,999,438 | ) | | (22,324,006 | ) | | | (388,445,136 | ) |
| | | | | | | | | | | | | | |
Net increase (decrease) | | (7,416,775 | ) | | $ | (115,566,600 | ) | | 10,319,822 | | | $ | 239,741,332 | |
| | | | | | | | | | | | | | |
|
| MATTHEWS JAPAN FUND | |
| | |
| | | SIX-MONTH PERIOD ENDED
JUNE 30, 2008 (UNAUDITED) | | | YEAR ENDED
DECEMBER 31, 2007 | |
| | | SHARES | | | AMOUNT | | | SHARES | | | AMOUNT | |
Shares sold | | 6,084,219 | | | $ | 83,987,817 | | | 7,269,785 | | | $ | 122,963,016 | |
Shares issued through reinvestment of distributions | | — | | | | 7 | | | 675,084 | | | | 10,605,563 | |
Shares redeemed | | (2,680,885 | ) | | | (37,178,241 | ) | | (12,481,836 | ) | | | (202,174,863 | ) |
| | | | | | | | | | | | | | |
Net increase (decrease) | | 3,403,334 | | | $ | 46,809,583 | | | (4,536,967 | ) | | $ | (68,606,284 | ) |
| | | | | | | | | | | | | | |
|
| MATTHEWS KOREA FUND | |
| | |
| | | SIX-MONTH PERIOD ENDED
JUNE 30, 2008 (UNAUDITED) | | | YEAR ENDED
DECEMBER 31, 2007 | |
| | | SHARES | | | AMOUNT | | | SHARES | | | AMOUNT | |
Shares sold | | 2,614,749 | | | $ | 15,044,265 | | | 11,259,470 | | | $ | 78,007,171 | |
Shares issued through reinvestment of distributions | | — | | | | (1,702 | ) | | 4,266,568 | | | | 29,311,398 | |
Shares redeemed | | (8,627,632 | ) | | | (48,407,410 | ) | | (16,053,299 | ) | | | (105,545,367 | ) |
| | | | | | | | | | | | | | |
Net decrease | | (6,012,883 | ) | | $ | (33,364,847 | ) | | (527,261 | ) | | $ | 1,773,202 | |
| | | | | | | | | | | | | | |
The Funds assess a redemption fee of 2.00% of the total redemption proceeds if you sell or exchange your shares within 90 calendar days after purchasing them. The redemption fee is paid directly to the Funds and is designed to discourage frequent short-term trading and to offset transaction costs associated with such trading of Fund shares. For purposes of determining whether the redemption fee applies, the shares that have been held the longest will be redeemed first. The redemption fee does not apply to redemptions of shares held in certain omnibus accounts and retirement plans that cannot currently implement the redemption fee. While these exceptions exist, the Funds are not accepting any new accounts which cannot implement the redemption fee. In addition, the Funds are actively discussing a schedule for implementation of the fee with these providers. For more information on this policy, please see the Funds’ prospectus. The redemption fees returned to the assets of the Funds are stated in the Statements of Changes in Net Assets.
800.789.ASIA [2742] www.matthewsfunds.com 89
NOTES TO FINANCIAL STATEMENTS (Unaudited)
| 3. | INVESTMENT ADVISORY FEES AND OTHER TRANSACTIONS WITH AFFILIATES |
Matthews International Capital Management, LLC (the “Advisor”), a registered investment advisor under the Investment Advisers Act of 1940, as amended, provides the Funds with investment management services. As compensation for these services, the Advisor charges the Funds an annual investment management fee payable at the end of each calendar month based on each Fund’s respective average daily net assets for the month. The fee is charged at a rate of 0.75% of average daily net assets in the Trust complex (the “Complex”) from $0 to $2 billion, 0.6834% of average daily net assets within the Complex between $2 billion and $5 billion, and 0.65% of average daily net assets within the Complex over $5 billion.
Investment advisory fees charged, for the six-month period ended June 30, 2008, were as follows:
| | | | | | |
| | | VOLUNTARY EXPENSE
LIMITATION | | | GROSS
ADVISORY FEES |
Matthews Asia Pacific Equity Income Fund | | 1.50 | % | | $ | 304,675 |
Matthews Asian Growth and Income Fund | | 1.90 | % | | | 7,177,950 |
Matthews Asia Pacific Fund | | 1.90 | % | | | 1,410,309 |
Matthews Pacific Tiger Fund | | 1.90 | % | | | 11,070,771 |
Matthews Asian Technology Fund | | 2.00 | % | | | 701,060 |
Matthews China Fund | | 2.00 | % | | | 5,661,059 |
Matthews India Fund | | 2.00 | % | | | 3,556,841 |
Matthews Japan Fund | | 2.00 | % | | | 638,255 |
Matthews Korea Fund | | 2.00 | % | | | 678,670 |
The investment advisory agreements provide that any reductions made by the Advisor in its fees, in the event a Fund’s expenses exceed the voluntary expense limitation, are subject to reimbursements by such Fund within the following three years provided that such Fund is able to effect such reimbursements and remain in compliance with applicable expense limitations. At June 30, 2008, there was no recoupment by the Advisor.
Certain officers and Trustees of the Funds are also officers and directors of the Advisor. All officers serve without direct compensation from the Funds. The Funds paid the Independent Trustees $188,591 in aggregate for regular compensation during the six-month period ended June 30,2008; no special compensation was paid during this period.
The Funds have an administration shareholder servicing agreement, pursuant to which, the Funds reimburse the Advisor for administration and shareholder servicing activities based on each Fund’s average daily net assets. The fee is charged at a rate of 0.25% of average daily net assets in the Complex from $0 to $2 billion, 0.1834% of average daily net assets in the Complex between $2 billion and $5 billion, and 0.15% of average daily net assets in the Complex between $5 billion and $7.5 billion, and 0.125% of average daily net assets in the Complex over $7.5 billion.
Administration and shareholder servicing fees charged, for the six-month period ended June 30, 2008, were as follows:
| | | |
| | | ADMINISTRATION &
SHAREHOLDER
SERVICING FEES |
Matthews Asia Pacific Equity Income Fund | | $ | 79,637 |
Matthews Asian Growth and Income Fund | | | 1,873,738 |
Matthews Asia Pacific Fund | | | 368,014 |
Matthews Pacific Tiger Fund | | | 2,888,125 |
Matthews Asian Technology Fund | | | 182,869 |
Matthews China Fund | | | 1,474,976 |
Matthews India Fund | | | 926,855 |
Matthews Japan Fund | | | 166,832 |
Matthews Korea Fund | | | 176,971 |
90 MATTHEWS ASIAN FUNDS
JUNE 30, 2008
The Funds bear a portion of the fees paid to certain services providers (exclusive of the Funds’ transfer agent) which provide transfer agency and shareholder servicing to certain shareholders. Fees accrued to pay to such service providers for the six-month period ended June 30, 2008 are reflected in the Statements of Operations as follows:
| | | | | | | | | |
| | | TRANSFER
AGENT
FEES | | ADMINISTRATION &
SHAREHOLDER
SERVICING FEES | | TOTAL |
Matthews Asia Pacific Equity Income Fund | | $ | 32,369 | | $ | 16,184 | | $ | 48,553 |
Matthews Asian Growth and Income Fund | | | 1,406,249 | | | 703,125 | | | 2,109,374 |
Matthews Asia Pacific Fund | | | 276,334 | | | 138,167 | | | 414,501 |
Matthews Pacific Tiger Fund | | | 1,584,417 | | | 792,208 | | | 2,376,625 |
Matthews Asian Technology Fund | | | 148,122 | | | 74,061 | | | 222,183 |
Matthews China Fund | | | 1,299,904 | | | 649,952 | | | 1,949,856 |
Matthews India Fund | | | 737,130 | | | 368,565 | | | 1,105,695 |
Matthews Japan Fund | | | 121,656 | | | 60,828 | | | 182,484 |
Matthews Korea Fund | | | 130,057 | | | 65,029 | | | 195,086 |
PNC Global Investment Servicing (“PNC”), formerly known as PFPC Inc., an indirect wholly-owned subsidiary of The PNC Financial Services Group, serves as the Trust’s administrator, and in that capacity, performs various administrative and accounting services for each Fund. PNC also serves as the Trust’s transfer agent, dividend disbursing agent and registrar. An officer of PNC serves as Assistant Treasurer to the Trust. Total fees accrued by the Funds for administration and accounting services for the six-month period ended June 30, 2008 were as follows:
| | | |
| | | ADMINISTRATION &
ACCOUNTING FEES |
Matthews Asia Pacific Equity Income Fund | | $ | 7,858 |
Matthews Asian Growth and Income Fund | | | 184,955 |
Matthews Asia Pacific Fund | | | 36,330 |
Matthews Pacific Tiger Fund | | | 285,131 |
Matthews Asian Technology Fund | | | 18,054 |
Matthews China Fund | | | 145,666 |
Matthews India Fund | | | 91,531 |
Matthews Japan Fund | | | 16,462 |
Matthews Korea Fund | | | 17,473 |
Brown Brothers Harriman & Co. serves as custodian to the Trust. PFPC Distributors, Inc. (the “Distributor”) serves as the Fund’s Distributor pursuant to an Underwriting Agreement.
| 4. | INVESTMENT TRANSACTIONS |
The value of investment transactions made for affiliated and unaffiliated holdings for the six-month period ended June 30, 2008, excluding short-term investments, were as follows:
| | | | | | | | | | | | |
| | | AFFILIATED
PURCHASES | | AFFILIATED
PROCEEDS
FROM SALES | | UNAFFILIATED
PURCHASES | | UNAFFILIATED
PROCEEDS
FROM SALES |
Matthews Asia Pacific Equity Income Fund | | $ | — | | $ | — | | $ | 32,024,525 | | $ | 7,306,073 |
Matthews Asian Growth and Income Fund | | | 101,841 | | | — | | | 210,708,598 | | | 323,448,155 |
Matthews Asia Pacific Fund | | | 2,615,959 | | | — | | | 75,358,948 | | | 109,227,428 |
Matthews Pacific Tiger Fund | | | — | | | 38,025,628 | | | 291,705,107 | | | 577,164,735 |
Matthews Asian Technology Fund | | | — | | | — | | | 45,878,745 | | | 61,785,065 |
Matthews China Fund | | | — | | | — | | | 46,656,633 | | | 467,966,048 |
Matthews India Fund | | | — | | | — | | | 139,497,909 | | | 224,182,307 |
Matthews Japan Fund | | | — | | | — | | | 87,665,483 | | | 40,102,269 |
Matthews Korea Fund | | | — | | | — | | | 29,689,528 | | | 61,467,228 |
800.789.ASIA [2742] www.matthewsfunds.com 91
NOTES TO FINANCIAL STATEMENTS (Unaudited)
| 5. | HOLDINGS OF 5% VOTING SHARES OF PORTFOLIO COMPANIES |
The Act defines “affiliated companies” to include investments in portfolio companies in which a fund owns 5% or more of the outstanding voting shares. During the period January 1, 2008 through June 30, 2008, the Funds below held 5% or more of the outstanding voting shares of the noted portfolio companies. During this period, other Funds in the Trust may also have held voting shares of the issuers at levels below 5%.
Investments in affiliates:
A summary of the Funds’ transactions in securities of affiliated issuers for the six-month period ended June 30, 2008 is set forth below:
| | | | | | | | | | | | | | | |
| | | SHARES HELD
AT 12/31/07 | | SHARES
PURCHASED | | | SHARES
SOLD | | SHARES HELD
AT 6/30/08 | | VALUE
AT 6/30/08 | | DIVIDEND
INCOME
1/1/08–6/30/08 |
MATTHEWS ASIAN GROWTH AND INCOME FUND |
| | | | | | |
I-CABLE Communications, Ltd. | | 129,144,000 | | 688,000 | | | — | | 129,832,000 | | $ | 19,117,178 | | $ | 832,294 |
| | | | | | | | | | | | | | | |
Total Affiliates | | | | | | | | | | | $ | 19,117,178 | | $ | 832,294 |
| | | | | | | | | | | | | | | |
|
MATTHEWS ASIA PACIFIC FUND |
| | | | | | |
Funai Zaisan Consultants Co., Ltd. | | 5,310 | | 1,771 | | | — | | 7,081 | | $ | 9,469,341 | | $ | 49,103 |
| | | | | | | | | | | | | | | |
Total Affiliates | | | | | | | | | | | $ | 9,469,341 | | $ | 49,103 |
| | | | | | | | | | | | | | | |
|
MATTHEWS PACIFIC TIGER FUND |
| | | | | | |
Amata Corp. Public Co., Ltd. | | 59,894,900 | | — | | | 1,227,000 | | 58,667,900 | | $ | 21,933,565 | | $ | 649,257 |
Dickson Concepts International, Ltd. | | 32,715,400 | | — | | | 167,500 | | 32,547,900 | | | 22,671,509 | | | — |
Dynasty Fine Wines Group, Ltd.* | | 89,260,000 | | — | | | 55,085,000 | | 34,175,000 | | | — | | | — |
Hanmi Pharmaceutical Co., Ltd. | | 462,747 | | — | | | 27,111 | | 435,636 | | | 64,134,548 | | | — |
Hyflux, Ltd.* | | 33,427,187 | | — | | | 8,919,000 | | 24,508,187 | | | — | | | — |
Top Glove Corp. BHD | | 15,609,880 | | — | | | — | | 15,609,880 | | | 20,255,820 | | | 251,609 |
Travelsky Technology, Ltd. H Shares | | 40,812,000 | | — | | | — | | 40,812,000 | | | 26,836,403 | | | 758,859 |
| | | | | | | | | | | | | | | |
Total Affiliates | | | | | | | | | | | $ | 155,831,845 | | $ | 1,659,725 |
| | | | | | | | | | | | | | | |
|
MATTHEWS CHINA FUND |
| | | | | | |
Kingdee International Software Group Co., Ltd. | | 25,736,000 | | 77,208,000 | † | | — | | 102,944,000 | | $ | 21,184,396 | | $ | 280,613 |
Lianhua Supermarket Holdings Co., Ltd. H Shares | | 13,648,000 | | — | | | — | | 13,648,000 | | | 17,519,239 | | | 234,130 |
| | | | | | | | | | | | | | | |
Total Affiliates | | | | | | | | | | | $ | 38,703,635 | | $ | 514,743 |
| | | | | | | | | | | | | | | |
| * | Issuer was not an affiliated company as of June 30, 2008. |
| † | Increase due to 4-for-1 stock split during the period. |
92 MATTHEWS ASIAN FUNDS
MATTHEWS ASIAN FUNDS
BOARD OF TRUSTEES
Independent Trustees:
Geoffrey H. Bobroff, Chairman
Rhoda Rossman
Toshi Shibano
Jonathan Zeschin
Interested Trustee:1
G. Paul Matthews
OFFICERS
William J. Guilfoyle
John P. McGowan
Shai A. Malka
Andrew T. Foster
William J. Hackett
Timothy B. Parker
Manoj K. Pombra
INVESTMENT ADVISOR
Matthews International Capital Management, LLC
Four Embarcadero Center, Suite 550
San Francisco, CA 94111
800-789-ASIA [2742]
ACCOUNT SERVICES
PNC Global Investment Servicing, formerly known as PFPC Inc.
P.O. Box 9791
Providence, RI 02940
800-789-ASIA [2742]
1 | As defined under the Investment Company Act of as amended. |
Not applicable.
| Item 3. | Audit Committee Financial Expert. |
Not applicable.
| Item 4. | Principal Accountant Fees and Services. |
Not applicable.
| Item 5. | Audit Committee of Listed registrants. |
Not applicable.
| | (a) | Schedule of Investments in securities of unaffiliated issuers as of the close of the reporting period is included as part of the report to shareholders filed under Item 1 of this form. |
| Item 7. | Disclosure of Proxy Voting Policies and Procedures for Closed-End Management Investment Companies. |
Not applicable.
| Item 8. | Portfolio Managers of Closed-End Management Investment Companies. |
Not applicable.
| Item 9. | Purchases of Equity Securities by Closed-End Management Investment Company and Affiliated Purchasers. |
Not applicable.
| Item 10. | Submission of Matters to a Vote of Security Holders. |
There have been no material changes to the procedures by which the shareholders may recommend nominees to the registrant’s board of directors, where those changes were implemented after the registrant last provided disclosure in response to the requirements of Item 407(c)(2)(iv) of Regulation S-K (17 CFR 229.407) (as required by Item 22(b)(15) of Schedule 14A (17 CFR 240.14a-101)), or this Item.
| Item 11. | Controls and Procedures. |
| | (a) | The registrant’s principal executive and principal financial officers, or persons performing similar functions, have concluded that the registrant’s disclosure controls and procedures (as defined in Rule 30a-3(c) under the Investment Company Act of 1940, as amended (the “1940 Act”) (17 CFR 270.30a-3(c))) are effective, as of a date within 90 days of the filing date of the report that includes the disclosure required by this paragraph, based on their evaluation of these controls and procedures required by Rule 30a-3(b) under the 1940 Act (17 CFR 270.30a-3(b)) and Rules 13a-15(b) or 15d-15(b) under the Securities Exchange Act of 1934, as amended (17 CFR 240.13a-15(b) or 240.15d-15(b)). |
| | (b) | There were no changes in the registrant’s internal control over financial reporting (as defined in Rule 30a-3(d) under the 1940 Act (17 CFR 270.30a-3(d)) that occurred during the registrant’s second fiscal quarter of the period covered by this report that has materially affected, or is reasonably likely to materially affect, the registrant’s internal control over financial reporting. |
| | (a)(2) | Certifications pursuant to Rule 30a-2(a) under the 1940 Act and Section 302 of the Sarbanes-Oxley Act of 2002 are attached hereto. |
| | (b) | Certifications pursuant to Rule 30a-2(b) under the 1940 Act and Section 906 of the Sarbanes-Oxley Act of 2002 are attached hereto. |
SIGNATURES
Pursuant to the requirements of the Securities Exchange Act of 1934 and the Investment Company Act of 1940, the registrant has duly caused this report to be signed on its behalf by the undersigned, thereunto duly authorized.
(registrant) Matthews International Funds
| | |
| |
| By (Signature and Title)* | | /s/ William J. Guilfoyle |
| | William J. Guilfoyle, President (principal executive officer) |
Date August 20, 2008
Pursuant to the requirements of the Securities Exchange Act of 1934 and the Investment Company Act of 1940, this report has been signed below by the following persons on behalf of the registrant and in the capacities and on the dates indicated.
| | |
| |
| By (Signature and Title)* | | /s/ William J. Guilfoyle |
| | William J. Guilfoyle, President (principal executive officer) |
Date August 20, 2008
| | |
| |
| By (Signature and Title)* | | /s/ Shai Malka |
| | Shai Malka, Treasurer (principal financial officer) |
Date August 20, 2008
* | Print the name and title of each signing officer under his or her signature. |