Table of Contents
UNITED STATES
SECURITIES AND EXCHANGE COMMISSION
Washington, D.C. 20549
FORMN-CSR
CERTIFIED SHAREHOLDER REPORT OF REGISTERED MANAGEMENT
INVESTMENT COMPANIES
Investment Company Act file number 811-08510
Matthews International Funds
(Exact name of registrant as specified in charter)
Four Embarcadero Center, Suite 550
San Francisco, CA 94111
(Address of principal executive offices) (Zip code)
William J. Hackett, President
Four Embarcadero Center, Suite 550
San Francisco, CA 94111
(Name and address of agent for service)
Registrant’s telephone number, including area code: 415-788-7553
Date of fiscal year end: December 31
Date of reporting period:December 31, 2018
FormN-CSR is to be used by management investment companies to file reports with the Commission not later than 10 days after the transmission to stockholders of any report that is required to be transmitted to stockholders under Rule30e-1 under the Investment Company Act of 1940 (17 CFR270.30e-1). The Commission may use the information provided on FormN-CSR in its regulatory, disclosure review, inspection, and policymaking roles.
A registrant is required to disclose the information specified by FormN-CSR, and the Commission will make this information public. A registrant is not required to respond to the collection of information contained inForm N-CSR unless the Form displays a currently valid Office of Management and Budget (“OMB”) control number. Please direct comments concerning the accuracy of the information collection burden estimate and any suggestions for reducing the burden to Secretary, Securities and Exchange Commission, 450 Fifth Street, NW, Washington, DC 20549-0609. The OMB has reviewed this collection of information under the clearance requirements of 44 U.S.C. § 3507.
Table of Contents
Item 1. Reports to Stockholders.
The Report to Shareholders is attached herewith.
Table of Contents
Matthews Asia Funds | Annual Report
December 31, 2018 | matthewsasia.com
ASIA FIXED INCOME STRATEGIES
Matthews Asia Strategic Income Fund
Matthews Asia Credit Opportunities Fund
ASIA GROWTH AND INCOME STRATEGIES
Matthews Asian Growth and Income Fund
Matthews Asia Dividend Fund
Matthews China Dividend Fund
ASIA VALUE STRATEGY
Matthews Asia Value Fund
ASIA GROWTH STRATEGIES
Matthews Asia Focus Fund
Matthews Asia Growth Fund
Matthews Pacific Tiger Fund
Matthews Asia ESG Fund
Matthews Emerging Asia Fund
Matthews Asia Innovators Fund
Matthews China Fund
Matthews India Fund
Matthews Japan Fund
Matthews Korea Fund
ASIA SMALL COMPANY STRATEGIES
Matthews Asia Small Companies Fund
Matthews China Small Companies Fund

Beginning on January 1, 2021, as permitted by regulations adopted by the Securities and Exchange Commission, paper copies of the Funds’ annual andsemi-annual shareholder reports will no longer be sent by mail, unless you specifically request paper copies of the reports. Instead, the reports will be made available on the Funds’ website matthewsasia.com, and you will be notified by mail each time a report is posted and provided with a website link to access the report. If you already elected to receive shareholder reports electronically, you will not be affected by this change and you need not take any action. You may elect to receive shareholder reports and other communications from the Funds electronically anytime by contacting your financial intermediary (such as a broker-dealer or bank) or, if you are a direct investor, by calling 800.789.ASIA (2742).
Beginning on January 1, 2019, you may elect to receive all future reports in paper free of charge. If you invest through a financial intermediary, you can contact your financial intermediary to request that you continue to receive paper copies of your shareholder reports. If you invest directly with a Fund, you can call 800.789.ASIA (2742) to let the Fund know you wish to continue receiving paper copies of your shareholder reports. Your election to receive reports in paper will apply to all Funds held in your account if you invest through your financial intermediary or all Funds held directly with Matthews Asia Funds.

Table of Contents
Investor Class Performance and Expenses(December 31, 2018)
|
| Average Annual Total Return† | Inception Date | 2018 Annual Operating Expenses* | 2018 Annual Operating Expenses after Fee Waiver and Expense Reimbursement** | Prospectus Annual Operating Expense Ratios‡ | Prospectus Annual Operating Expense Ratios after Fee Waiver and Expense Reimbursement‡ | ||||||||||||||||||||||||||||||
| Investor Class | 1 year | 5 years | 10 years | Since Inception | ||||||||||||||||||||||||||||||||
ASIA FIXED INCOME STRATEGIES | ||||||||||||||||||||||||||||||||||||
Asia Strategic Income Fund (MAINX) | -4.05% | 3.10% | n.a. | 3.89% | 11/30/11 | 1.23% | 1.15% | 2 | 1.19% | 1 | 1.15% | 2 | ||||||||||||||||||||||||
Asia Credit Opportunities Fund (MCRDX) | -2.88% | n.a. | n.a. | 3.50% | 4/29/16 | 1.44% | 1.15% | 2 | 1.76% | 1 | 1.15% | 2 | ||||||||||||||||||||||||
ASIA GROWTH AND INCOME STRATEGIES |
| |||||||||||||||||||||||||||||||||||
Asian Growth and Income Fund (MACSX) | -10.96% | 0.85% | 7.65% | 8.63% | 9/12/94 | 1.08% | 1.08% | 1.07% | 1.07% | |||||||||||||||||||||||||||
Asia Dividend Fund (MAPIX) | -12.72% | 4.85% | 10.84% | 8.30% | 10/31/06 | 1.02% | 1.01% | 3 | 1.03% | 1.02% | 3 | |||||||||||||||||||||||||
China Dividend Fund (MCDFX) | -9.98% | 7.70% | n.a. | 9.28% | 11/30/09 | 1.15% | 1.15% | 1.19% | 1.19% | |||||||||||||||||||||||||||
ASIA VALUE STRATEGY | ||||||||||||||||||||||||||||||||||||
Asia Value Fund (MAVRX) | -10.93% | n.a. | n.a. | 8.47% | 11/30/15 | 1.77% | 1.50% | 4 | 2.32% | 1.50% | 4 | |||||||||||||||||||||||||
ASIA GROWTH STRATEGIES | ||||||||||||||||||||||||||||||||||||
Asia Focus Fund (MAFSX) | -17.24% | 1.75% | n.a. | 1.07% | 4/30/13 | 3.18% | 1.50% | 4 | 2.45% | 1.50% | 4 | |||||||||||||||||||||||||
Asia Growth Fund (MPACX) | -16.25% | 3.62% | 10.39% | 8.22% | 10/31/03 | 1.10% | 1.10% | 1.12% | 1.12% | |||||||||||||||||||||||||||
Pacific Tiger Fund (MAPTX) | -11.11% | 6.50% | 12.56% | 8.39% | 9/12/94 | 1.07% | 1.04% | 3 | 1.08% | 1.06% | 3 | |||||||||||||||||||||||||
Asia ESG Fund (MASGX) | -9.73% | n.a. | n.a. | 2.73% | 4/30/15 | 2.20% | 1.50% | 4 | 2.65% | 1.50% | 4 | |||||||||||||||||||||||||
Emerging Asia Fund (MEASX) | -17.58% | 5.89% | n.a. | 5.06% | 4/30/13 | 1.66% | 1.48% | 4 | 1.70% | 1.48% | 4 | |||||||||||||||||||||||||
Asia Innovators Fund (MATFX) | -18.62% | 5.24% | 13.27% | 2.93% | 12/27/99 | 1.19% | 1.19% | 1.24% | 1.24% | |||||||||||||||||||||||||||
China Fund (MCHFX) | -21.42% | 3.06% | 8.81% | 8.86% | 2/19/98 | 1.10% | 1.10% | 1.09% | 1.09% | |||||||||||||||||||||||||||
India Fund (MINDX) | -10.09% | 14.78% | 15.14% | 10.92% | 10/31/05 | 1.09% | 1.09% | 1.09% | 1.09% | |||||||||||||||||||||||||||
Japan Fund (MJFOX) | -20.18% | 4.66% | 8.27% | 5.31% | 12/31/98 | 0.91% | 0.91% | 3 | 0.95% | 0.94% | 3 | |||||||||||||||||||||||||
Korea Fund (MAKOX) | -22.21% | 3.67% | 11.75% | 5.69% | 1/3/95 | 1.14% | 1.14% | 1.15% | 1.15% | |||||||||||||||||||||||||||
ASIA SMALL COMPANY STRATEGIES | ||||||||||||||||||||||||||||||||||||
Asia Small Companies Fund (MSMLX) | -18.05% | 1.25% | 12.01% | 9.12% | 9/15/08 | 1.51% | 1.46% | 4 | 1.49% | 1.46% | 4 | |||||||||||||||||||||||||
China Small Companies Fund (MCSMX) | -17.68% | 4.47% | n.a. | 2.98% | 5/31/11 | 1.97% | 1.50% | 4 | 2.34% | 1.50% | 4 | |||||||||||||||||||||||||
| * | Before fee waivers and expense reimbursement. |
| ** | Expense ratio represents the actual expense ratio a shareholder would have paid if they had been invested the entire year. |
| † | Annualized performance for periods of at least one year, otherwise cumulative. |
| ‡ | These figures are from the Funds’ prospectus dated as of April 30, 2018, and may differ from the actual expense ratios for fiscal year 2018, as shown in the financial highlights section of this report. |
| 1 | Effective October 1, 2018. |
| 2 | Matthews has contractually agreed (i) to waive fees and reimburse expenses to the extent needed to limit Total Annual Fund Operating Expenses (excluding Rule 12b-1 fees, taxes, interest, brokerage commissions, short sale dividend expenses, expenses incurred in connection with any merger or reorganization or extraordinary expenses such as litigation) of the Institutional Class to 0.90% first by waiving class specific expenses (i.e., shareholder service fees specific to a particular class) of the Institutional Class and then, to the extent necessary, by waiving non-class specific expenses of the Institutional Class, and (ii) if any Fund-wide expenses (i.e., expenses that apply to both the Institutional Class and the Investor Class) are waived for the Institutional Class to maintain the 0.90% expense limitation, to waive an equal amount (in annual percentage terms) of those same expenses for the Investor Class. The Total Annual Fund Operating Expenses After Fee Waiver and Expense Reimbursement for the Investor Class may vary from year to year and will in some years exceed 0.90%. If the operating expenses fall below the expense limitation in a year within three years after Matthews has made a waiver or reimbursement, the Fund may reimburse Matthews up to an amount that does not cause the expenses for that year to exceed the lesser of the (i) expense limitation applicable at the time of that fee waiver and/or expense reimbursement or (ii) the expense limitation in effect at the time of recoupment. This agreement will remain in place until April 30, 2019 and may be terminated at any time by the Board of Trustees on behalf of the Fund on 60 days’ written notice to Matthews. Matthews may decline to renew this agreement by written notice to the Trust at least 30 days before its annual expiration date. |
| 3 | Matthews has contractually agreed to waive a portion of its advisory fee and administrative and shareholder services fee if the Fund’s average daily net assets are over $3 billion, as follows: for every $2.5 billion average daily net assets of the Fund that are over $3 billion, the advisory fee rate and the administrative and shareholder services fee rate for the Fund with respect to such excess average daily net assets will be each reduced by 0.01%, in each case without reducing such fee rate below 0.00%. Any amount waived by Matthews pursuant to this agreement may not be recouped by Matthews. This agreement will remain in place until April 30, 2019 and may be terminated (i) at any time by the Board of Trustees upon 60 days’ prior written notice to Matthews; or (ii) by Matthews at the annual expiration date of the agreement upon 60 days’ prior written notice to the Trust, in each case without payment of any penalty. |
| 4 | Matthews has contractually agreed (i) to waive fees and reimburse expenses to the extent needed to limit Total Annual Fund Operating Expenses (excluding Rule 12b-1 fees, taxes, interest, brokerage commissions, short sale dividend expenses, expenses incurred in connection with any merger or reorganization or extraordinary expenses such as litigation) of the Institutional Class to 1.25% first by waiving class specific expenses (i.e., shareholder service fees specific to a particular class) of the Institutional Class and then, to the extent necessary, by waiving non-class specific expenses of the Institutional Class, and (ii) if any Fund-wide expenses (i.e., expenses that apply to both the Institutional Class and the Investor Class) are waived for the Institutional Class to maintain the 1.25% expense limitation, to waive an equal amount (in annual percentage terms) of those same expenses for the Investor Class. The Total Annual Fund Operating Expenses After Fee Waiver and Expense Reimbursement for the Investor Class may vary from year to year and will in some years exceed 1.25%. If the operating expenses fall below the expense limitation in a year within three years after Matthews has made a waiver or reimbursement, the Fund may reimburse Matthews up to an amount that does not cause the expenses for that year to exceed the lesser of (i) the expense limitation applicable at the time of that fee waiver and/or expense reimbursement or (ii) the expense limitation in effect at the time of recoupment. This agreement will remain in place until April 30, 2019 and may be terminated at any time by the Board of Trustees on behalf of the Fund on 60 days’ written notice to Matthews. Matthews may decline to renew this agreement by written notice to the Trust at least 30 days before its annual expiration date. |
| 1 | MATTHEWS ASIA FUNDS |
Table of Contents
Institutional Class Performance and Expenses(December 31, 2018)
|
| Average Annual Total Return† | Inception Date | 2018 Annual Operating Expenses* | 2018 Annual Operating Expenses after Fee Waiver and Expense Reimbursement** | Prospectus Annual Operating Expense Ratios‡ | Prospectus Annual Operating Expense Ratios after Fee Waiver and Expense Reimbursement‡ | ||||||||||||||||||||||||||||||
| Institutional Class | 1 year | 5 years | 10 years | Since Inception | ||||||||||||||||||||||||||||||||
ASIA FIXED INCOME STRATEGIES | ||||||||||||||||||||||||||||||||||||
Asia Strategic Income Fund (MINCX) | -3.78% | 3.32% | n.a. | 4.11% | 11/30/11 | 1.04% | 0.90% | 2 | 0.98% | 1 | 0.90% | 2 | ||||||||||||||||||||||||
Asia Credit Opportunities Fund (MICPX) | -2.75% | n.a. | n.a. | 3.71% | 4/29/16 | 1.25% | 0.90% | 2 | 1.52% | 1 | 0.90% | 2 | ||||||||||||||||||||||||
ASIA GROWTH AND INCOME STRATEGIES | ||||||||||||||||||||||||||||||||||||
Asian Growth and Income Fund (MICSX) | -10.84% | 0.99% | n.a. | 3.13% | 10/29/10 | 0.93% | 0.93% | 0.93% | 0.93% | |||||||||||||||||||||||||||
Asia Dividend Fund (MIPIX) | -12.64% | 4.97% | n.a. | 5.94% | 10/29/10 | 0.91% | 0.90% | 3 | 0.92% | 0.91% | 3 | |||||||||||||||||||||||||
China Dividend Fund (MICDX) | -9.83% | 7.87% | n.a. | 8.12% | 10/29/10 | 1.01% | 1.01% | 1.04% | 1.04% | |||||||||||||||||||||||||||
ASIA VALUE STRATEGY | ||||||||||||||||||||||||||||||||||||
Asia Value Fund (MAVAX) | -10.65% | n.a. | n.a. | 8.75% | 11/30/15 | 1.54% | 1.25% | 4 | 2.08% | 1.25% | 4 | |||||||||||||||||||||||||
ASIA GROWTH STRATEGIES | ||||||||||||||||||||||||||||||||||||
Asia Focus Fund (MIFSX) | -17.04% | 2.00% | n.a. | 1.31% | 4/30/13 | 2.98% | 1.25% | 4 | 2.27% | 1.25% | 4 | |||||||||||||||||||||||||
Asia Growth Fund (MIAPX) | -16.10% | 3.82% | n.a. | 5.30% | 10/29/10 | 0.93% | 0.93% | 0.93% | 0.93% | |||||||||||||||||||||||||||
Pacific Tiger Fund (MIPTX) | -10.94% | 6.70% | n.a. | 5.54% | 10/29/10 | 0.90% | 0.88% | 3 | 0.91% | 0.89% | 3 | |||||||||||||||||||||||||
Asia ESG Fund (MISFX) | -9.52% | n.a. | n.a. | 2.98% | 4/30/15 | 2.01% | 1.25% | 4 | 2.46% | 1.25% | 4 | |||||||||||||||||||||||||
Emerging Asia Fund (MIASX) | -17.41% | 6.15% | n.a. | 5.30% | 4/30/13 | 1.50% | 1.25% | 4 | 1.52% | 1.25% | 4 | |||||||||||||||||||||||||
Asia Innovators Fund (MITEX) | -18.40% | 5.46% | n.a. | 9.01% | 4/30/13 | 1.02% | 1.02% | 1.05% | 1.05% | |||||||||||||||||||||||||||
China Fund (MICFX) | -21.32% | 3.21% | n.a. | 1.43% | 10/29/10 | 0.91% | 0.91% | 0.93% | 0.93% | |||||||||||||||||||||||||||
India Fund (MIDNX) | -9.92% | 14.98% | n.a. | 5.57% | 10/29/10 | 0.90% | 0.90% | 0.89% | 0.89% | |||||||||||||||||||||||||||
Japan Fund (MIJFX) | -20.08% | 4.77% | n.a. | 8.08% | 10/29/10 | 0.85% | 0.84% | 3 | 0.87% | 0.86% | 3 | |||||||||||||||||||||||||
Korea Fund (MIKOX) | -22.15% | 3.83% | n.a. | 6.54% | 10/29/10 | 1.02% | 1.02% | 1.01% | 1.01% | |||||||||||||||||||||||||||
ASIA SMALL COMPANY STRATEGIES | ||||||||||||||||||||||||||||||||||||
Asia Small Companies Fund (MISMX) | -17.86% | 1.47% | n.a. | 1.32% | 4/30/13 | 1.37% | 1.25% | 4 | 1.35% | 1.25% | 4 | |||||||||||||||||||||||||
China Small Companies Fund (MICHX) | -17.48% | 4.53% | n.a. | 3.01% | 11/30/17 | 1.79% | 1.25% | 4 | 2.09% | 1.25% | 4 | |||||||||||||||||||||||||
| * | Before fee waivers and expense reimbursement. |
| ** | Expense ratio represents the actual expense ratio a shareholder would have paid if they had been invested the entire year. |
| † | Annualized performance for periods of at least one year, otherwise cumulative. |
| ‡ | These figures are from the Funds’ prospectus dated as of April 30, 2018, and may differ from the actual expense ratios for fiscal year 2018, as shown in the financial highlights section of this report. |
| 1 | Effective October 1, 2018. |
| 2 | Matthews has contractually agreed to waive fees and reimburse expenses to the extent needed to limit Total Annual Fund Operating Expenses (excluding Rule 12b-1 fees, taxes, interest, brokerage commissions, short sale dividend expenses, expenses incurred in connection with any merger or reorganization or extraordinary expenses such as litigation) of the Institutional Class to 0.90%. If the operating expenses fall below the expense limitation in a year within three years after Matthews has made a waiver or reimbursement, the Fund may reimburse Matthews up to an amount that does not cause the expenses for that year to exceed the lesser of (i) the expense limitation applicable at the time of that fee waiver and/or expense reimbursement or (ii) the expense limitation in effect at the time of recoupment. This agreement will remain in place until April 30, 2019 and may be terminated at any time by the Board of Trustees on behalf of the Fund on 60 days’ written notice to Matthews. Matthews may decline to renew this agreement by written notice to the Trust at least 30 days before its annual expiration date. |
| 3 | Matthews has contractually agreed to waive a portion of its advisory fee and administrative and shareholder services fee if the Fund’s average daily net assets are over $3 billion, as follows: for every $2.5 billion average daily net assets of the Fund that are over $3 billion, the advisory fee rate and the administrative and shareholder services fee rate for the Fund with respect to such excess average daily net assets will be each reduced by 0.01%, in each case without reducing such fee rate below 0.00%. Any amount waived by Matthews pursuant to this agreement may not be recouped by Matthews. This agreement will remain in place until April 30, 2019 and may be terminated (i) at any time by the Board of Trustees upon 60 days’ prior written notice to Matthews; or (ii) by Matthews at the annual expiration date of the agreement upon 60 days’ prior written notice to the Trust, in each case without payment of any penalty. |
| 4 | Matthews has contractually agreed to waive fees and reimburse expenses to the extent needed to limit Total Annual Fund Operating Expenses (excluding Rule 12b-1 fees, taxes, interest, brokerage commissions, short sale dividend expenses, expenses incurred in connection with any merger or reorganization or extraordinary expenses such as litigation) of the Institutional Class to 1.25%. If the operating expenses fall below the expense limitation in a year within three years after Matthews has made a waiver or reimbursement, the Fund may reimburse Matthews up to an amount that does not cause the expenses for that year to exceed the lesser of (i) the expense limitation applicable at the time of that fee waiver and/or expense reimbursement or (ii) the expense limitation in effect at the time of recoupment. This agreement will remain in place until April 30, 2019 and may be terminated at any time by the Board of Trustees on behalf of the Fund on 60 days’ written notice to Matthews. Matthews may decline to renew this agreement by written notice to the Trust at least 30 days before its annual expiration date. |
Past Performance: All performance quoted in this report is past performance and is no guarantee of future results. Investment return and principal value will fluctuate with changing market conditions so that when redeemed, shares may be worth more or less than their original cost. Current performance may be lower or higher than the returns quoted. If certain of the Funds’ fees and expenses had not been waived, returns would have been lower. For the Funds’ most recent month-end performance, please call 800.789.ASIA (2742) or visit matthewsasia.com.
| matthewsasia.com | 800.789.ASIA | 2 |
Table of Contents

Table of Contents
Cover photo: Chinese New Year lantern and gold coin decorations along the Hong Kong harbor.
This report has been prepared for Matthews International Funds (d/b/a Matthews Asia Funds) shareholders. It is not authorized for distribution to prospective investors unless accompanied or preceded by a current Matthews Asia Funds prospectus, which contains more complete information about the Funds’ investment objectives, risks and expenses. Additional copies of the prospectus or summary prospectus may be obtained at matthewsasia.com. Please read the prospectus carefully before you invest or send money.
The views and opinions in this report were current as of December 31, 2018. They are not guarantees of performance or investment results and should not be taken as investment advice. Investment decisions reflect a variety of factors, and the managers reserve the right to change their views about individual stocks, sectors and the markets at any time. As a result, the views expressed should not be relied upon as a forecast of a Fund’s future investment intent. Current and future portfolio holdings are subject to risk.
Statements of fact are from sources considered reliable, but neither the Funds nor the Investment Advisor makes any representation or guarantee as to their completeness or accuracy.
Investment Risk: Mutual fund shares are not deposits or obligations of, or guaranteed by, any depositary institution. Shares are not insured by the FDIC, Federal Reserve Board or any government agency and are subject to investment risks, including possible loss of principal amount invested. Investing in international and emerging markets may involve additional risks, such as social and political instability, market illiquidity, exchange-rate fluctuations, a high level of volatility and limited regulation. Fixed income investments are subject to additional risks, including, but not limited to, interest rate, credit and inflation risks. In addition, single-country and sector funds may be subject to a higher degree of market risk than diversified funds because of a concentration in a specific industry, sector or geographic location. Investing in small and mid-size companies is more risky than investing in large companies as they may be more volatile and less liquid than larger companies. Please see the Funds’ Prospectuses and Statement of Additional Information for more risk disclosure.
Table of Contents

Message to Shareholders from the
President of the Matthews Asia Funds
Dear Valued Shareholder,
Asia’s markets endured a challenging year in 2018. Investor sentiment was negatively affected by macro headwinds including U.S.–China trade tensions, a string of interest rate increases by the U.S. Federal Reserve, as well as the end of global quantitative easing policies by central banks (as discussed in the year-end shareholder letter from our chief investment officer). Against this backdrop of generally weak markets across Asia in 2018—which appears to have been driven largely by a short-term shift in sentiment, rather than a deterioration of fundamentals—the performance across the Matthews Asia Funds was mixed overall. However, I am proud that many of our regional strategies outperformed their benchmarks amid this difficult environment.
At Matthews Asia, we have experienced this type of volatility and swings in sentiment in the past, and Asia’s markets are bound to face—and surmount—similar struggles in the future. Such turbulence is a byproduct of the significant changes taking place as the region continues its rapid pace of growth. The long-term investment case for Asia remains solid, particularly with the continued rise of its emerging and frontier economies, and the ongoing reform and liberalization of China’s economy. We firmly believe that patience, resilience and focus will help us to deliver the most favorable results for our valued and growing shareholder base.
China as an Investment
Over the past few years, China has been making significant efforts to further open its capital markets, including its domestic A-share market. In recognition of this, index provider MSCI over the past year began including China’s select domestic A-shares into its Emerging Markets Index. We believe China’s A-share market has simply been too big to be overlooked by global investors—and indeed our Funds have been accessing A-share listed companies via the Qualified Foreign Institutional Investor program and more recently through the “Stock Connect” programs, which link the Shanghai and Shenzhen Stock Exchanges to the Hong Kong Stock Exchange. But we are increasingly seeing investors paying more attention to China as a dedicated investment in their portfolios.
We believe our role is to help them understand the risk and opportunities and how best to access them. Our view is that identifying quality companies as part of an active strategy remains an essential part of investing in the country. A theme we are seeing not only in China but across Asia is that a more innovation-led economy can lead to new investment opportunities. Yes, China’s market can be volatile as it remains a developing market, but we believe this is all the more reason to take an active approach rather than passively following market indices.
2019 and Beyond
Despite the volatility of the past year, we continue to be optimistic about the prospects for Asia securities. We are hopeful that the U.S.–China trade talks will bring a positive outcome and that there will be a marked improvement in relations between the two nations in the coming year. Chinese business sentiment is improving and the markets have reflected that in early 2019. The attention paid to trade issues may fade as the year progresses and other important events such as elections in India come into focus.
As the global investment management industry continues to evolve, we remain prepared to not only keep pace but to lead the way through innovation—continuously evaluating client needs, industry issues and the competitive landscape while enhancing our investment capabilities. Active managers must deliver superior investment performance and this will remain our primary focus in the coming year and well beyond. Matthews Asia continues to offer a singular and distinctive approach to investing in Asia. The region represents the world’s growth engine, and arguably the single most important part of the world when it comes to future growth and investment opportunities. There may be some near-term market uncertainty on the horizon in the coming year, but along with that comes opportunities for active investors. Our investment team will continue to do its utmost in identifying well-managed, sustainable businesses, trading at reasonable valuations, on behalf of our clients. Thank you for being a valued shareholder.

William J. Hackett
President of Matthews Asia Funds
| 4 | MATTHEWS ASIA FUNDS |
Table of Contents
Message to Shareholders from the Investment Advisor
Dear Valued Investors,
2018 was a bad year for Asia’s stock markets, but Asia’s markets are not the same as their economies, which for the most part remained unscathed. Not just unscathed but in fact remarkably resilient given the tightening monetary policy in the U.S. and China and the fractious political relationship between the two countries over trade. And although it is true that we are investing in the markets, not the economies, having a stable economic background is important as it underpins both Asia’s currencies and the profits of the firms whose bonds and equities we hold.
So, why have the markets been so weak? Well, as I have mentioned, tighter money has been a big part of this. The tight money in the U.S. may well continue and there is an increasing risk that the U.S. Federal Reserve may tighten too far. Its job is complicated by low unemployment levels and corporate profits that are likely to struggle to maintain the growth rates of recent years. That is a headwind for all markets but it is surely going to have its biggest impact in the U.S. (Indeed, as I write this, Asia’s markets have fallen just 6% in December as the Nasdaq has tumbled 14%.) Currencies such as Indonesia’s rupiah seem to have stabilized. The Asian markets seem further along through this market downturn—and they are already showing good value for patient investors. Indeed, the dividend yield on a broad universe of Asia equities is higher than it has been for 90% of the past 15 years.
So, why is Asia further through this downturn and why does it seem so reasonably priced? Because the main reason for Asia’s weakness was probably not the Fed, but the People’s Bank of China. Tighter money in China has depressed nominal demand and also had a knock-on effect to other countries in the region, from Vietnam to Japan to Australia. Tighter money in China has not been a deliberate policy choice, but rather a side effect of trying to make the debt issues in local government finance vehicles both more transparent and easier to resolve. This is an important step for China and the fact that the government decided to tackle it while the global economy was still strong will likely be seen as wise in hindsight. The global economy may not be as strong in 2019, and the Chinese have taken the opportunity to deal with the issue while they could.
So, my best guess is that 2019 will be a year of moderate stimulus for the Asian region. I do not anticipate that China will try to loosen aggressively, not while the U.S. may still be tightening. But having dealt with the lion’s share of the local government debt issue, it need no longer face the unintended consequences of that policy. Core inflation is likely to rise somewhat on the back of better monetary policy and that is likely to be good for profits.
Profit growth has certainly been disappointing in Asia over the last few years—slower than Europe, Latin America, and the U.S. (although Japan has done well). Why is this? Well, a Western-centric view of the world would likely put it down to superior standards of governance and regulation—that somehow Western economic systems just work better than the ones in Asia. There is some truth to this. But the West is not as superior as it may think. For how superior can a system be that has allowed profits to grow so quickly on the back of squeezing wages and pumping up profits with one last, one-sided tax bill as we recently saw in the U.S.? Asia underwent a similar cycle in the 2000s but attitudes have changed since the global financial crisis of 2008. The first decade of the century was about “growth” and growth at almost any price—be it the environment or social cohesion. But then the Chinese emphasized not growth but “stability” as they sought to redistribute the gains from economic growth to labor and beyond their own borders to people in the rest of Asia. And now, they emphasize “quality” of economic growth in order to share the growth equally between capital and labor and to achieve better standards of life, including environmental, social, and governance. The West, therefore, is not entirely superior to Asia in many of these respects. And it does seem to be the case that the leadership in the world may be pivoting from West to East.
How to take account of this in our investments and in our portfolios? First is to maintain our focus on domestic demand. This is not just about consumer stocks but all aspects of domestic demand—health care, capital goods and finance. And that will increasingly mean taking advantage of the profitable opportunities offered by the demands of citizens for “quality.” Now is certainly not the time to get pessimistic about Asia’s long-term prospects. That may seem the sensible thing to do and there are many trading the Asian equity and fixed income markets who, having shorter time horizons than we try to maintain, are focused on the potentially difficult weeks and months ahead. But, no, the opportunities that Asia offers are too varied and enticing in the long term and can be bought at relatively inexpensive prices, such that now is the time for portfolios to maintain their focus on growth—growth of the leading entrepreneurs and businesses in industries that we believe will prosper in Asia over the next few decades.
That remains our task as researchers and investors in the region and it is one that we tackle with great passion. We are, as always, privileged to be your Asia investment advisor.

Robert Horrocks, PhD
Chief Investment Officer
Matthews International Capital Management, LLC
| matthewsasia.com | 800.789.ASIA | 5 |
Table of Contents

| PORTFOLIO MANAGERS | ||||
| Teresa Kong, CFA | ||||
Lead Manager | ||||
| Satya Patel | Wei Zhang | |||
Co-Manager | Co-Manager | |||
| FUND FACTS | ||||
| Investor | Institutional | |||
Ticker | MAINX | MINCX | ||
CUSIP | 577125503 | 577125602 | ||
Inception | 11/30/11 | 11/30/11 | ||
NAV | $10.25 | $10.25 | ||
Initial Investment | $2,500 | $100,000 | ||
Gross Expense Ratio1 | 1.23% | 1.04% | ||
After Fee Waiver and Reimbursement2 | 1.15% | 0.90% | ||
Portfolio Statistics | ||||
Total # of Positions | 35 | |||
Net Assets | $100.7 million | |||
Modified Duration3 | 3.09 | |||
Portfolio Turnover4 | 82.32% | |||
Benchmark | ||||
Markit iBoxx Asian Local Bond Index* | ||||
OBJECTIVE
Total return over the long term with an emphasis on income.
STRATEGY
Under normal market conditions, the Fund seeks to achieve its investment objective by investing at least 80% of its net assets, which include borrowings for investment purposes, in income-producing securities including, but not limited to, dividend paying equity securities, and debt and debt-related instruments issued by governments, quasi-governmental entities, supra-national institutions, and companies in Asia. Asia consists of all countries and markets in Asia, such as China and India, and includes developed, emerging, and frontier countries and markets in the Asian region. Investments may be denominated in any currency, and may represent any part of a company’s capital structure from debt to equity or with features of both.
Matthews Asia Strategic Income Fund
Portfolio Manager Commentary (unaudited)
For the year ending December 31, 2018, the Matthews Asia Strategic Income Fund returned –4.05% (Investor Class) and –3.78% (Institutional Class) while its benchmark, the Markit iBoxx Asian Local Bond Index, returned –0.44%. For the fourth quarter, the Fund was flat at 0.0% (Investor and Institutional Classes) versus 3.51% for the Index.
Market Environment:
Asia’s fixed income markets faced challenges in 2018. Starting in the second quarter, volatility was persistent across Asian credit, currencies and interest rates. This was driven by factors such as trade, stress in emerging markets, policy normalization from the U.S. Federal Reserve and an environment that transitioned from synchronized global growth to one in which U.S. growth remained robust while other regions slowed.
The yield on the 10-year U.S. Treasury peaked in early November at 3.24%, up 83 basis points (0.83%) in the year. Late in 2018, as the threat of a disruptive trade war waned and commentary from the Fed became more dovish, U.S. rates moved lower. The shift led to a supportive environment for Asia’s currencies, which outperformed the U.S. dollar into year end.
As we move into 2019, some big risks facing Asian economies have begun to fade. In the second half of 2018, consensus views of the U.S.–China trade dispute shifted toward an escalated and protracted conflict encompassing trade, investment, technology transfer and national security. A turning point was the G-20 meetings in Buenos Aires in November as market volatility motivated both sides to talk. This paradigm shift was reflected in currency markets across the region, which depreciated versus the dollar in the first 10 months of the year, before rebounding as trade tensions dissipated. For instance, in the first 10 months of the year, high beta currencies such as the Indian rupee (–13.6%) and the Indonesian rupiah (–10.8%) depreciated significantly against the U.S. dollar. As trade tensions dissipated late in the year, both the rupee and the rupiah rebounded, with the rupee gaining 6.0% and the rupiah gaining 5.7%.
Returns in Asia credit were negative for the first time in five years, with spreads across investment grade and high yield issuers widening on the year amid the challenging macro environment. In general, performance was a function of credit quality, with issuers from the more highly rated economies of South Korea and Taiwan outperforming while issuers from Sri Lanka and Indonesia underperformed.
Stress in emerging market countries, such as Argentina and Turkey, also weighed on investor sentiment. While market sell-offs in Argentina and Turkey did not directly spread to Asia, high beta markets such as India and Indonesia, nevertheless, struggled in the third quarter. We believe this is unlikely to be repeated in 2019.
Performance Contributors and Detractors:
For the full year, among the biggest contributors to portfolio returns were bonds denominated in Thai baht, Malaysian ringgit and Chinese renminbi (RMB). Our Thai baht performance was driven by the convertible bonds of Bangkok Dusit Medical Services, a Thai hospital company, which performed well on the strength of the underlying equity. Our Malaysian ringgit bonds were driven by government bonds,
(continued)
| * | The Index performance reflects the returns of the discontinued predecessor HSBC Asian Local Bond Index up to December 31, 2012 and the returns of the successor Markit iBoxx Asian Local Bond Index thereafter. |
| 1 | Actual 2018 expense ratios. |
| 2 | Matthews has contractually agreed (i) to waive fees and reimburse expenses to the extent needed to limit Total Annual Fund Operating Expenses (excluding Rule 12b-1 fees, taxes, interest, brokerage commissions, short sale dividend expenses, expenses incurred in connection with any merger or reorganization or extraordinary expenses such as litigation) of the Institutional Class to 0.90% first by waiving class specific expenses (i.e., shareholder service fees specific to a particular class) of the Institutional Class and then, to the extent necessary, by waiving non-class specific expenses of the Institutional Class, and (ii) if any Fund-wide expenses (i.e., expenses that apply to both the Institutional Class and the Investor Class) are waived for the Institutional Class to maintain the 0.90% expense limitation, to waive an equal amount (in annual percentage terms) of those same expenses for the Investor Class. The Total Annual Fund Operating Expenses After Fee Waiver and Expense Reimbursement for the Investor Class may vary from year to year and will in some years exceed 0.90%. If the operating expenses fall below the expense limitation in a year within three years after Matthews has made a waiver or reimbursement, the Fund may reimburse Matthews up to an amount that does not cause the expenses for that year to exceed the lesser of (i) the expense limitation applicable at the time of that fee waiver and/or expense reimbursement or (ii) the expense limitation in effect at the time of recoupment. This agreement will remain in place until April 30, 2019 and may be terminated at any time by the Board of Trustees on behalf of the Fund on 60 days’ written notice to Matthews. Matthews may decline to renew this agreement by written notice to the Trust at least 30 days before its annual expiration date. |
| 3 | Modified duration measures the percent change in value of the fixed income portion of the portfolio in response to a 1% change in interest rates. In a multi-currency denominated portfolio with sensitivities to different interest rate regimes, modified duration will not accurately reflect the change in value of the overall portfolio from a change in any one interest rate regime. |
| 4 | The lesser of fiscal year 2018 long-term purchase costs or sales proceeds divided by the average monthly market value of long-term securities. |
| 6 | MATTHEWS ASIA FUNDS |
Table of Contents
| PERFORMANCE AS OF DECEMBER 31, 2018 | ||||||||||||||||||||||||
|
|
| Average Annual Total Returns
|
| |||||||||||||||||||||
| 3 Months | 1 Year | 3 Years | 5 Years | Since Inception | Inception Date | |||||||||||||||||||
| Investor Class (MAINX) | 0.00% | -4.05% | 4.54% | 3.10% | 3.89% | 11/30/11 | ||||||||||||||||||
| Institutional Class (MINCX) | 0.00% | -3.78% | 4.78% | 3.32% | 4.11% | 11/30/11 | ||||||||||||||||||
| Markit iBoxx Asian Local Bond Index5 | 3.51% | -0.44% | 3.99% | 2.67% | 2.25% | |||||||||||||||||||
Performance assumes reinvestment of all dividends and/or distributions before taxes. All performance quoted represents past performance and is no guarantee of future results. Investment return and principal value will fluctuate with market conditions so that when redeemed, shares may be worth more or less than their original cost. Current performance may be lower or higher than the return figures quoted. Returns would have been lower if certain of the Fund’s fees and expenses had not been waived. For the Fund’s most recent month-end performance visit matthewsasia.com.
| INCOME DISTRIBUTION HISTORY | ||||||||||||||||||||||||||||||||||||||||||||
| 2018
| 2017
| |||||||||||||||||||||||||||||||||||||||||||
| Q1 | Q2 | Q3 | Q4 | Total | Q1 | Q2 | Q3 | Q4 | Total | |||||||||||||||||||||||||||||||||||
| Investor (MAINX) | $ | 0.12 | $ | 0.10 | $ | 0.07 | $ | 0.00 | $ | 0.29 | $ | 0.07 | $ | 0.08 | $ | 0.13 | $ | 0.14 | $ | 0.42 | ||||||||||||||||||||||||
| Inst’l (MINCX) | $ | 0.13 | $ | 0.11 | $ | 0.08 | $ | 0.00 | $ | 0.31 | $ | 0.08 | $ | 0.08 | $ | 0.14 | $ | 0.15 | $ | 0.45 | ||||||||||||||||||||||||
Note: This table does not include capital gains distributions. Totals may differ by $0.02 due to rounding. For income distribution history, visit matthewsasia.com.
30-DAY YIELD:
Investor Class: 5.29% (5.19% excluding waivers) Institutional Class: 5.54% (5.32% excluding waivers)
The 30-Day Yield represents net investment income earned by the Fund over the 30-day period ended 12/31/18, expressed as an annual percentage rate based on the Fund’s share price at the end of the 30-day period. The 30-Day Yield should be regarded as an estimate of the Fund’s rate of investment income, and it may not equal the Fund’s actual income distribution rate.
Source: BNY Mellon Investment Servicing (US) Inc. | YIELD TO WORST: 7.46%
Yield to worst is the lowest yield that can be received on a bond assuming that the issuer does not default. It is calculated by utilizing the worst case assumptions for a bond with respect to certain income-reducing factors, including prepayment, call or sinking fund provisions. It does not represent the yield that an investor should expect to receive. Past yields are no guarantee of future yields.
Source: FactSet Research Systems | |||
GROWTH OF A $10,000 INVESTMENT SINCE INCEPTION—INVESTOR CLASS
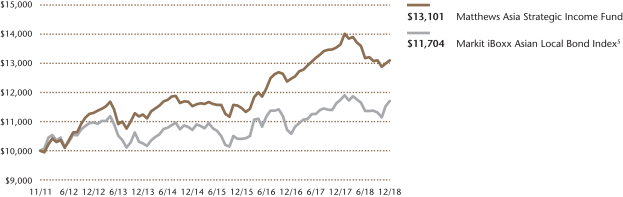
Plotted monthly. The performance data and graph do not reflect the deduction of taxes that a shareholder would pay on dividends, capital gains distributions or redemption of Fund shares. Values are in US$.
| 5 | It is not possible to invest directly in an index. Source: Index data from HSBC, Markit iBoxx and Bloomberg; total return calculations performed by BNY Mellon Investment Servicing (US) Inc. Please see page 91 for index definitions. The Index performance reflects the returns of the discontinued predecessor HSBC Asian Local Bond Index up to December 31, 2012 and the returns of the successor Markit iBoxx Asian Local Bond Index thereafter. |
| TOP TEN HOLDINGS | ||||||||
| Sector | Currency | % of Net Assets | ||||||
| Ctrip.com International, Ltd., Cnv., 1.250%, 09/15/2022 | Consumer Discretionary | U.S. Dollar | 5.3% | |||||
| Debt and Asset Trading Corp., 1.000%, 10/10/2025 | Financials | U.S. Dollar | 4.8% | |||||
| Wanda Properties International Co., Ltd., 7.250%, 01/29/2024 | Real Estate | U.S. Dollar | 4.7% | |||||
| Zhongsheng Group Holdings, Ltd., Cnv., 0.000%, 05/23/2023 | Consumer Discretionary | Hong Kong Dollar | 4.4% | |||||
| Standard Chartered PLC, 6.500%, 12/29/2049 | Financials | U.S. Dollar | 4.2% | |||||
| SoftBank Group Corp., 6.000%, 07/19/2049 | Communication Services | U.S. Dollar | 4.0% | |||||
| KWG Group Holdings, Ltd., 6.000%, 09/15/2022 | Real Estate | U.S. Dollar | 4.0% | |||||
| Chinalco Capital Holdings, Ltd., 4.000%, 08/25/2021 | Materials | U.S. Dollar | 3.9% | |||||
| Indonesia Government Bond, 8.250%, 05/15/2029 | Foreign Government Bonds | Indonesian Rupiah | 3.8% | |||||
| ICTSI Treasury BV, 4.625%, 01/16/2023 | Industrials | U.S. Dollar | 3.4% | |||||
| % OF ASSETS IN TOP TEN | 42.5% | |||||||
| matthewsasia.com | 800.789.ASIA | 7 |
Table of Contents
| CURRENCY ALLOCATION (%)6,7 | ||||
| US Dollar | 73.6 | |||
| Indonesian Rupiah | 6.4 | |||
| Indian Rupee | 5.7 | |||
| Hong Kong Dollar | 4.4 | |||
| Vietnam Dong | 1.9 | |||
| China Renminbi | 1.0 | |||
| Philippine Peso | 0.7 | |||
| South Korean Won | 0.4 | |||
| Cash and Other Assets, Less Liabilities | 5.9 | |||
| COUNTRY ALLOCATION (%)6,7,8 | ||||
| China/Hong Kong | 44.3 | |||
| Indonesia | 13.6 | |||
| India | 7.6 | |||
| Vietnam | 6.6 | |||
| Thailand | 6.3 | |||
| Philippines | 4.2 | |||
| Japan | 4.0 | |||
| Singapore | 3.4 | |||
| Sri Lanka | 1.9 | |||
| United States | 1.8 | |||
| South Korea | 0.4 | |||
| Cash and Other Assets, Less Liabilities | 5.9 | |||
| SECTOR ALLOCATION (%)6,7 | ||||
| Financials | 22.4 | |||
| Real Estate | 16.3 | |||
| Consumer Discretionary | 12.6 | |||
| Foreign Government Bonds | 9.4 | |||
| Materials | 8.5 | |||
| Consumer Staples | 7.8 | |||
| Communication Services | 7.7 | |||
| Industrials | 5.6 | |||
| Utilities | 3.8 | |||
| Cash and Other Assets, Less Liabilities | 5.9 | |||
Please note: Foreign Government Bonds category includes Supranationals.
| ASSET TYPE BREAKDOWN (%)6,7 | ||||
| Non-Convertible Corporate Bonds | 63.8 | |||
| Government Bonds | 14.1 | |||
| Convertible Corporate Bonds | 16.2 | |||
| Cash and Other Assets, Less Liabilities | 5.9 | |||
| 6 | Source: FactSet Research Systems. Percentage values in data are rounded to the nearest tenth of one percent, so the values may not sum to 100% due to rounding. Percentage values may be derived from different data sources and may not be consistent with other Fund literature. |
| 7 | Cash and other assets may include forward currency exchange contracts and certain derivative instruments that have been marked-to-market. |
| 8 | Not all countries where the Fund may invest are included in the benchmark index. |
Matthews Asia Strategic Income Fund
Portfolio Manager Commentary (unaudited) (continued)
which provided attractive carry with minimal impact from currency depreciation. Our gains in Chinese RMB-denominated bonds were driven by a combination of RMB-denominated convertible bonds of China Railway Construction, and our allocation for much of the year to the high-quality onshore bonds of Chinese issuers.
Among the largest detractors to Fund performance in 2018 were our holdings in U.S. dollar-denominated credits, as well as Indian rupee (INR)- and Indonesian rupiah (IDR)-denominated bonds. Asian credit spreads widened throughout the year, with issuers across the region coming under pressure. The Fund’s holdings in companies such as Lippo Karawaci and Modernland in Indonesia, and Ctrip and Tsinghua Unigroup in China, detracted from performance. Our holdings in INR-denominated corporate bonds and IDR-denominated government bonds also performed poorly on a combination of currency depreciation and rising local interest rates.
Notable Portfolio Changes:
In the fourth quarter, we made a number of portfolio changes aimed at increasing our allocation to local currencies. We increased our currency exposure to countries across the region, including South Korea, Singapore, Thailand and Indonesia. South Korea, Singapore and Thailand are low-yielding countries, with interest rates lower than those in many developed countries. With little short-term upside to rates, we increased our exposure through currency forwards. In Indonesia, interest rates were significantly higher in 2018 as the central bank raised rates to defend the currency, and foreigners sold bonds and exited the market. We see room for interest rates to fall in Indonesia, and chose to add duration as well as currency exposure in the country.
In the fourth quarter, we exited a handful of positions as we reshaped the portfolio. We sold the U.S. dollar-denominated high yield bonds of Lippo Karawaci, as well as the convertible bonds of Vipshop and China Overseas Land & Investment. We also significantly decreased our exposure to the RMB. We sold our holdings of onshore bonds issued by state-linked entities after rates and credit spreads came down. We also sold the dim sum bond of China Jinmao (Franshion Brilliant), a high-quality property developer.
Outlook:
After significant repricing in 2018, we see the elements for strong performance across Asian credit, currencies and interest rates.
Since the Fed hiked rates four times in 2018 and stayed the course on balance sheet reduction, we expect no more rate hikes by the Fed in 2019. This would give Asia’s policymakers the ability to slow their pace of rate hikes as well, and given that inflation remains low across the region, we see a broader drop in Asian interest rates.
Our outlook for Asian currencies is also positive. With U.S. growth still positive but decelerating and the Fed appearing to be on hold, we expect Asia’s currencies to outperform. The significant drop in oil prices in the fourth quarter of 2018 also helped shore up oil-importing countries across Asia, providing a boost to foreign exchange reserves, current accounts and fiscal balances.
Finally, Asia high yield spreads offer attractive values for the long-term investor. With 12-month trailing default rates at 1.03% and spreads hovering around 6% at the end of 2018, the market has priced in substantially higher expected future defaults than the current run rate. We believe the major risks to the region, including a further slowdown in global growth, any escalation in trade shocks or further outflows stemming from policy normalization in the U.S., are priced in at these levels. Furthermore, based on our solvency and liquidity analysis, we do not expect any of the securities in the portfolio to default. As such, the relatively attractive yields in Asia offer a strong base for positive returns.
In sum, we see value in U.S. dollar-denominated debt of corporations in Asia because the valuation can be grounded in intrinsic value. As long as we maintain a long-term investment horizon of greater than three years and experience no defaults, the total return potential for Asia credit offers a compelling investment opportunity at current levels.
| 8 | MATTHEWS ASIA FUNDS |
Table of Contents
Matthews Asia Strategic Income Fund
December 31, 2018
Schedule of Investmentsa
NON-CONVERTIBLE CORPORATE BONDS: 63.7%
| Face Amount* | Value | |||||||
| CHINA/HONG KONG: 30.9% | ||||||||
Wanda Properties International Co., Ltd. | 5,000,000 | $4,754,080 | ||||||
Standard Chartered PLC | 4,350,000 | 4,257,562 | ||||||
KWG Group Holdings, Ltd. | 4,500,000 | 4,009,091 | ||||||
Chinalco Capital Holdings, Ltd. | 4,100,000 | 3,941,285 | ||||||
CIFI Holdings Group Co., Ltd. | 3,200,000 | 3,129,936 | ||||||
Huaneng Hong Kong Capital, Ltd. | 3,300,000 | 2,975,937 | ||||||
West China Cement, Ltd. | 2,800,000 | 2,807,437 | ||||||
HSBC Holdings PLC | 2,500,000 | 2,400,000 | ||||||
China Minmetals Corp. | 2,000,000 | 1,806,592 | ||||||
Franshion Brilliant, Ltd. | CNY 7,000,000 | 1,015,352 | ||||||
|
| |||||||
Total China/Hong Kong | 31,097,272 | |||||||
|
| |||||||
| INDIA: 7.7% | ||||||||
Housing Development Finance Corp., SeriesU-5 |
| |||||||
9.000%, 11/29/28 | INR 200,000,000 | 2,894,347 | ||||||
LIC Housing Finance, Ltd., Series 372 | INR 200,000,000 | 2,860,385 | ||||||
Bharti Airtel, Ltd. | 2,138,000 | 1,944,992 | ||||||
|
| |||||||
Total India | 7,699,724 | |||||||
|
| |||||||
| INDONESIA: 7.2% | ||||||||
PB International BV | 3,000,000 | 2,899,704 | ||||||
Modernland Overseas Pte, Ltd. | 1,900,000 | 1,561,819 | ||||||
Alam Synergy Pte, Ltd. | 1,500,000 | 1,427,700 | ||||||
Listrindo Capital BV | 1,000,000 | 886,500 | ||||||
Alam Synergy Pte, Ltd. | 500,000 | 475,900 | ||||||
|
| |||||||
Total Indonesia | 7,251,623 | |||||||
|
| |||||||
| JAPAN: 4.0% | ||||||||
SoftBank Group Corp. | 4,850,000 | 4,023,075 | ||||||
|
| |||||||
Total Japan | 4,023,075 | |||||||
|
| |||||||
| PHILIPPINES: 3.4% | ||||||||
ICTSI Treasury BV | 3,500,000 | 3,449,600 | ||||||
|
| |||||||
Total Philippines | 3,449,600 | |||||||
|
| |||||||
| SINGAPORE: 3.4% | ||||||||
Olam International, Ltd. | 3,500,000 | 3,441,928 | ||||||
|
| |||||||
Total Singapore | 3,441,928 | |||||||
|
| |||||||
Face Amount* | Value | |||||||
| THAILAND: 3.4% | ||||||||
Krung Thai Bank Public Co., Ltd. | 3,400,000 | $3,429,005 | ||||||
|
| |||||||
Total Thailand | 3,429,005 | |||||||
|
| |||||||
| SRI LANKA: 1.9% | ||||||||
National Savings Bank | 2,000,000 | 1,950,820 | ||||||
|
| |||||||
Total Sri Lanka | 1,950,820 | |||||||
|
| |||||||
| UNITED STATES: 1.8% | ||||||||
Sprint Communications, Inc. | 1,863,000 | 1,828,218 | ||||||
|
| |||||||
Total United States | 1,828,218 | |||||||
|
| |||||||
| TOTALNON-CONVERTIBLE CORPORATE BONDS |
| 64,171,265 | ||||||
|
| |||||||
(Cost $65,448,802) | ||||||||
CONVERTIBLE CORPORATE BONDS: 16.2% |
| |||||||
| CHINA/HONG KONG: 13.4% | ||||||||
Ctrip.com International, Ltd., Cnv. | 5,500,000 | 5,317,928 | ||||||
Zhongsheng Group Holdings, Ltd., Cnv. | ||||||||
0.000%, 05/23/23b | HKD 38,000,000 | 4,463,885 | ||||||
Johnson Electric Holdings, Ltd., Cnv. | 2,000,000 | 2,154,550 | ||||||
China Mengniu Dairy Co., Ltd., Series 2319, Cnv. |
| |||||||
0.000%, 06/05/22b | 1,600,000 | 1,521,266 | ||||||
|
| |||||||
Total China/Hong Kong | 13,457,629 | |||||||
|
| |||||||
| THAILAND: 2.8% | ||||||||
CP Foods Holdings, Ltd., Cnv. | 2,800,000 | 2,876,524 | ||||||
|
| |||||||
Total Thailand | 2,876,524 | |||||||
|
| |||||||
| TOTAL CONVERTIBLE CORPORATE BONDS |
| 16,334,153 | ||||||
|
| |||||||
(Cost $17,090,154) | ||||||||
FOREIGN GOVERNMENT OBLIGATIONS: 14.2% |
| |||||||
| VIETNAM: 6.7% | ||||||||
Debt and Asset Trading Corp. | 6,969,000 | 4,791,187 | ||||||
Socialist Republic of Vietnam | VND 43,000,000,000 | 1,901,505 | ||||||
|
| |||||||
Total Vietnam | 6,692,692 | |||||||
|
| |||||||
| INDONESIA: 6.4% | ||||||||
Indonesia Government Bond | IDR 53,550,000,000 | 3,805,890 | ||||||
Indonesia Government Bond | IDR 38,000,000,000 | 2,638,883 | ||||||
|
| |||||||
Total Indonesia | 6,444,773 | |||||||
|
| |||||||
| matthewsasia.com | 800.789.ASIA | 9 |
Table of Contents
Matthews Asia Strategic Income Fund
December 31, 2018
Schedule of Investmentsa(continued)
FOREIGN GOVERNMENT OBLIGATIONS(continued)
Face Amount* | Value | |||||||
| PHILIPPINES: 0.7% | ||||||||
Republic of Philippines | PHP 40,000,000 | $745,779 | ||||||
|
| |||||||
Total Philippines | 745,779 | |||||||
|
| |||||||
| SOUTH KOREA: 0.4% | ||||||||
Korea Treasury Bond | KRW 400,000,000 | 385,606 | ||||||
|
| |||||||
Total South Korea | 385,606 | |||||||
|
| |||||||
| TOTAL FOREIGN GOVERNMENT OBLIGATIONS |
| 14,268,850 | ||||||
|
| |||||||
(Cost $14,640,649) | ||||||||
| TOTAL INVESTMENTS: 94.1% | 94,774,268 | |||||||
(Cost $97,179,605) | ||||||||
| CASH AND OTHER ASSETS, LESS LIABILITIES: 5.9% | 5,940,915 | |||||||
|
| |||||||
NET ASSETS: 100.0% | $100,715,183 | |||||||
|
| |||||||
| a | Certain securities were fair valued under the valuation policies approved by the Board of Trustees (Note2-A). |
| b | The securities may be resold to qualified foreign investors and foreign institutional buyers under Regulation S of the Securities Act of 1933. |
| c | Security is a fix-to-float security, which carries a fixed coupon until a certain date, upon which it switches to a floating rate. Reference rate and spread are provided if the rate is currently floating. |
| d | Perpetual security with no stated maturity date. First call date is disclosed. |
| e | Security exempt from registration under Rule 144A of the Securities Act of 1933, as amended. The security may be resold in transactions exempt from registration normally to qualified institutional buyers. The security has been determined to be liquid in accordance with procedures adopted by the Funds’ Board of Trustees. At December 31, 2018, the aggregate value is $1,427,700, which is 1.42% of net assets. |
| * | All Values in USD unless otherwise specified |
| Cnv. | Convertible |
| CNY | Chinese Renminbi (Yuan) |
| HKD | Hong Kong Dollar |
| IDR | Indonesian Rupiah |
| INR | Indian Rupee |
| KRW | Korean Won |
| PHP | Philippine Peso |
| SGD | Singapore Dollar |
| THB | Thai Baht |
| USD | U.S. Dollar |
| VND | Vietnamese Dong |
FORWARD FOREIGN CURRENCY EXCHANGE CONTRACTS
Currency | Currency Sold | Counterparty | Settlement Date | Unrealized Appreciation (Depreciation) | ||||||||||
CNY 25,000,000 | USD 3,586,029 | Merrill Lynch & Co., Inc. | 01/17/19 | $54,010 | ||||||||||
CNY 26,436,797 | USD 3,796,481 | Merrill Lynch & Co., Inc. | 01/17/19 | 52,758 | ||||||||||
IDR 105,630,000,000 | USD 7,000,000 | Merrill Lynch & Co., Inc. | 02/11/19 | 293,270 | ||||||||||
INR 545,084,000 | USD 7,400,000 | Merrill Lynch & Co., Inc. | 02/11/19 | 404,514 | ||||||||||
KRW 10,054,752,500 | USD 9,025,000 | Merrill Lynch & Co., Inc. | 03/04/19 | 23,343 | ||||||||||
SGD 9,387,888 | USD 6,865,000 | Merrill Lynch & Co., Inc. | 03/04/19 | 32,808 | ||||||||||
THB 148,114,575 | USD 4,515,000 | Merrill Lynch & Co., Inc. | 03/04/19 | 72,082 | ||||||||||
|
| |||||||||||||
| 932,785 | ||||||||||||||
|
| |||||||||||||
USD 7,393,000 | CNY 51,436,797 | Merrill Lynch & Co., Inc. | 01/17/19 | (96,278 | ) | |||||||||
USD 4,912,999 | IDR 72,000,000,000 | Merrill Lynch & Co., Inc. | 02/11/19 | (58,273 | ) | |||||||||
USD 6,215,567 | INR 440,000,000 | Merrill Lynch & Co., Inc. | 02/11/19 | (84,354 | ) | |||||||||
|
| |||||||||||||
| (238,905 | ) | |||||||||||||
|
| |||||||||||||
Net Unrealized Appreciation | $693,880 | |||||||||||||
|
| |||||||||||||
See accompanying notes to financial statements.
| 10 | MATTHEWS ASIA FUNDS |
Table of Contents
| PORTFOLIO MANAGERS | ||||
| Teresa Kong, CFA | Satya Patel | |||
Lead Manager | Lead Manager | |||
| FUND FACTS | ||||
| Investor | Institutional | |||
Ticker | MCRDX | MICPX | ||
CUSIP | 577130677 | 577130669 | ||
Inception | 4/29/16 | 4/29/16 | ||
NAV | $9.76 | $9.75 | ||
Initial Investment | $2,500 | $100,000 | ||
Gross Expense Ratio1 | 1.44% | 1.25% | ||
After Fee Waiver and Reimbursement2 | 1.15% | 0.90% | ||
Portfolio Statistics | ||||
Total # of Positions | 33 | |||
Net Assets | $39.8 million | |||
Modified Duration3 | 2.91 | |||
Portfolio Turnover4 | 49.06% | |||
Benchmark | ||||
J.P. Morgan Asia Credit Index | ||||
OBJECTIVE
Total return over the long term.
STRATEGY
Under normal market conditions, the Fund seeks to achieve its investment objective by investing at least 80% of its net assets, which include borrowings for investment purposes, in debt and debt-related instruments issued by companies as well as governments, quasi-governmental entities, and supra-national institutions in Asia. Debt and debt-related instruments typically include bonds, debentures, bills, securitized instruments (which are vehicles backed by pools of assets such as loans or other receivables), notes, certificates of deposit and other bank obligations, bank loans, senior secured bank debt, convertible debt securities, exchangeable bonds, credit-linked notes, inflation-linked instruments, repurchase agreements, payment-in-kind securities and derivative instruments with fixed income characteristics. Asia consists of all countries and markets in Asia, such as China and Indonesia, in addition to the developed, emerging, and frontier countries and markets in the Asian region.
Matthews Asia Credit Opportunities Fund
Portfolio Manager Commentary (unaudited)
For the year ending December 31, 2018, the Matthews Asia Credit Opportunities Fund returned –2.88% (Investor Class) and –2.75% (Institutional Class), while its benchmark, the J.P. Morgan Asia Credit Index, returned –0.77% over the same period. For the fourth quarter, the Fund returned –0.68% (Investor Class) and –0.72% (Institutional Class), while its benchmark returned 0.65% over the same period.
Market Environment:
2018 was notable as the impact of strong growth in the U.S. and macroeconomic headwinds in China led to tighter financial conditions and wider credit spreads across Asia. The U.S. economy decoupled from the rest of the world as U.S. growth strengthened despite softness in other regions. The U.S. Federal Reserve raised interest rates four times and continued the balance sheet reduction it started in 2017. With a divergence in growth and tighter policy in the U.S., volatility in emerging market asset classes around the world was higher in 2018.
Asia’s credit markets were not immune to tighter financial conditions and higher volatility in 2018. High yield spreads in Asia widened 169 basis points (1.69%) in 2018 from 437 basis points (4.37%) to 606 basis points (6.06%) above U.S. Treasuries. Trade tensions between the U.S. and China, as well as the Chinese government’s deleveraging campaign, led to weaker sentiment. Amid this backdrop, the new issue market was noticeably quieter, with many high yield deals done with a one- to three-year maturity, rather than the more typical three to five years. The most challenged Asian markets included Indonesia, where weakness in the rupiah led to a repricing of U.S. dollar-denominated corporate bonds, and Sri Lanka, where political turmoil led to uncertainty.
Performance Contributors and Detractors:
In 2018, among the biggest contributors to portfolio returns were our holdings in the bonds of Bangkok Dusit Medical Services, Socialist Republic of Vietnam and Pan Brothers International (PB International). Bangkok Dusit Medical is a hospital operator in Thailand. With Bangkok Dusit Medical’s improving results and guidance, its convertible bonds performed well as the underlying equity rallied. We exited the holding in June as we reached our price target. Socialist Republic of Vietnam bonds are Brady bonds issued in 1998. With part of the principal secured by U.S. Treasuries and the ongoing amortization of principal, the bonds earn an attractive coupon with minimal price volatility. Pan Brothers International is a high-quality Indonesian garment manufacturer.
Among the largest detractors to Fund performance in 2018 were our holdings in Lippo Karawaci (Theta Capital Pte.), Modernland and Softbank. Lippo Karawaci and Modernland are property developers in Indonesia. Lippo Karawaci bonds were downgraded by ratings agencies based on the company’s limited liquidity without executing asset sales. Modernland bonds fell on weakness in the Indonesian rupiah and continued softness in Jakarta’s property market. Softbank bonds weakened as investor skepticism of its portfolio of high tech investments rose with the rising volatility of the Nasdaq.
(continued)
| 1 | Actual 2018 expense ratios. |
| 2 | Matthews has contractually agreed (i) to waive fees and reimburse expenses to the extent needed to limit Total Annual Fund Operating Expenses (excluding Rule 12b-1 fees, taxes, interest, brokerage commissions, short sale dividend expenses, expenses incurred in connection with any merger or reorganization or extraordinary expenses such as litigation) of the Institutional Class to 0.90% first by waiving class specific expenses (i.e., shareholder service fees specific to a particular class) of the Institutional Class and then, to the extent necessary, by waiving non-class specific expenses of the Institutional Class, and (ii) if any Fund-wide expenses (i.e., expenses that apply to both the Institutional Class and the Investor Class) are waived for the Institutional Class to maintain the 0.90% expense limitation, to waive an equal amount (in annual percentage terms) of those same expenses for the Investor Class. The Total Annual Fund Operating Expenses After Fee Waiver and Expense Reimbursement for the Investor Class may vary from year to year and will in some years exceed 0.90%. If the operating expenses fall below the expense limitation in a year within three years after Matthews has made a waiver or reimbursement, the Fund may reimburse Matthews up to an amount that does not cause the expenses for that year to exceed the lesser of (i) the expense limitation applicable at the time of that fee waiver and/or expense reimbursement or (ii) the expense limitation in effect at the time of recoupment. This agreement will remain in place until April 30, 2019 and may be terminated at any time by the Board of Trustees on behalf of the Fund on 60 days’ written notice to Matthews. Matthews may decline to renew this agreement by written notice to the Trust at least 30 days before its annual expiration date. |
| 3 | Modified duration measures the percent change in value of the fixed income portion of the portfolio in response to a 1% change in interest rates. In a multi-currency denominated portfolio with sensitivities to different interest rate regimes, modified duration will not accurately reflect the change in value of the overall portfolio from a change in any one interest rate regime. |
| 4 | The lesser of fiscal year 2018 long-term purchase costs or sales proceeds divided by the average monthly market value of long-term securities. |
| matthewsasia.com | 800.789.ASIA | 11 |
Table of Contents
| PERFORMANCE AS OF DECEMBER 31, 2018 | ||||||||||||||||
|
|
| Average Annual Total Returns
| ||||||||||||||
| 3 Months | 1 Year | Since Inception | Inception Date | |||||||||||||
| Investor Class (MCRDX) | -0.68% | -2.88% | 3.50% | 4/29/2016 | ||||||||||||
| Institutional Class (MICPX) | -0.72% | -2.75% | 3.71% | 4/29/2016 | ||||||||||||
| J.P. Morgan Asia Credit Index5 | 0.65% | -0.77% | 2.36% | |||||||||||||
Performance assumes reinvestment of all dividends and/or distributions before taxes. All performance quoted represents past performance and is no guarantee of future results.Investment return and principal value will fluctuate with market conditions so that when redeemed, shares may be worth moreor less than their original cost. Current performance may be lower or higher than the return figures quoted. Returns would have been lower if certain of the Fund’s fees and expenses had not been waived. For the Fund’s most recent month-endperformance, visit matthewsasia.com.
| INCOME DISTRIBUTION HISTORY | ||||||||||||||||||||||||||||||||||||||||||||
| 2018
| 2017
| |||||||||||||||||||||||||||||||||||||||||||
| Q1 | Q2 | Q3 | Q4 | Total | Q1 | Q2 | Q3 | Q4 | Total | |||||||||||||||||||||||||||||||||||
| Investor (MCRDX) | $ | 0.09 | $ | 0.09 | $ | 0.06 | $ | 0.10 | $ | 0.33 | $ | 0.12 | $ | 0.08 | $ | 0.14 | $ | 0.10 | $ | 0.43 | ||||||||||||||||||||||||
| Inst’l (MICPX) | $ | 0.09 | $ | 0.09 | $ | 0.06 | $ | 0.11 | $ | 0.36 | $ | 0.12 | $ | 0.08 | $ | 0.15 | $ | 0.10 | $ | 0.46 | ||||||||||||||||||||||||
Note: This table does not include capital gains distributions. Totals may differ by $0.02 due to rounding. For income distribution history, visit matthewsasia.com.
30-DAY YIELD:
Investor Class: 5.40% (4.70% excluding waivers) Institutional Class: 5.58% (4.94% excluding waivers)
The 30-Day Yield represents net investment income earned by the Fund over the 30-day period ended 12/31/18, expressed as an annual percentage rate based on the Fund’s share price at the end of the 30-day period. The 30-Day Yield should be regarded as an estimate of the Fund’s rate of investment income, and it may not equal the Fund’s actual income distribution rate.
Source: BNY Mellon Investment Servicing (US) Inc. | YIELD TO WORST: 7.17%
Yield to worst is the lowest yield that can be received on a bond assuming that the issuer does not default. It is calculated by utilizing the worst case assumptions for a bond with respect to certain income-reducing factors, including prepayment, call or sinking fund provisions. It does not represent the yield that an investor should expect to receive. Past yields are no guarantee of future yields.
Source: FactSet Research Systems | |||
GROWTH OF A $10,000 INVESTMENT SINCE INCEPTION—INVESTOR CLASS
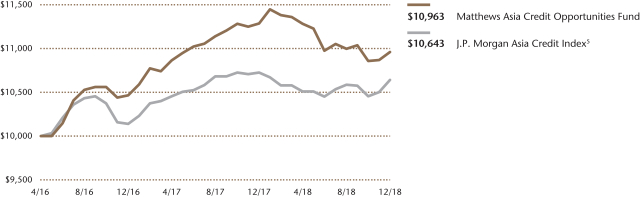
Plotted monthly. The performance data and graph do not reflect the deduction of taxes that a shareholder would pay on dividends, capital gains distributions, or redemption of Fund shares. Values are in US$.
| 5 | It is not possible to invest directly in an index. Source: Index data from J.P. Morgan and Bloomberg; total return calculations performed by BNY Mellon Investment Servicing (US) Inc. Please see page 91 for index definition. |
| TOP TEN HOLDINGS | ||||||||
| Sector | Currency | % of Net Assets | ||||||
| Zhongsheng Group Holdings, Ltd., Cnv., 0.000%, 05/23/2023 | Consumer Discretionary | Hong Kong Dollar | 5.0% | |||||
| Debt and Asset Trading Corp., 1.000%, 10/10/2025 | Financials | U.S. Dollar | 4.7% | |||||
| Standard Chartered PLC, 6.500%, 12/29/2049 | Financials | U.S. Dollar | 4.6% | |||||
| Ctrip.com International, Ltd., Cnv., 1.250%, 09/15/2022 | Consumer Discretionary | U.S. Dollar | 4.5% | |||||
| SoftBank Group Corp., 6.000%, 07/19/2049 | Communication Services | U.S. Dollar | 4.2% | |||||
| China Overseas Finance Investment Cayman V, Ltd., Cnv., 0.000%, 01/05/2023 | Real Estate | U.S. Dollar | 3.7% | |||||
| Chinalco Capital Holdings, Ltd., 4.000%, 08/25/2021 | Materials | U.S. Dollar | 3.7% | |||||
| Olam International, Ltd., 4.500%, 04/12/2021 | Consumer Staples | U.S. Dollar | 3.7% | |||||
| Wanda Properties International Co., Ltd., 7.250%, 01/29/2024 | Real Estate | U.S. Dollar | 3.7% | |||||
| West China Cement, Ltd., 6.500%, 09/11/2019 | Materials | U.S. Dollar | 3.6% | |||||
| % OF ASSETS IN TOP TEN | 41.4% | |||||||
| 12 | MATTHEWS ASIA FUNDS |
Table of Contents
Matthews Asia Credit Opportunities Fund
Portfolio Manager Commentary (unaudited) (continued)
Notable Portfolio Changes:
We made a number of changes to the portfolio in the fourth quarter, adding high quality credits across the region while exiting two credits in Indonesia and China. We added a handful of U.S. dollar-denominated bonds that we believe have attractive yields relative to the risk we are taking. For instance, we initiated a position in China Minmetals, a state-owned enterprise with minimal default risk and attractive upside from our expectation that the company will call the bonds at a higher price. We also added the bonds of Pan Brothers International. Its expertise in performance fabrics along with its strong financials and solid management team are an attractive combination. We also added the bonds of Bharti Airtel, an Indian telecom operator. The bonds are pricing in a downgrade from investment grade to high yield, but we believe many of Bharti’s challenges are behind it.
We sold the bonds of Lippo Karawaci and the convertible bonds of China Railway Construction. In 2018, Lippo Karawaci announced asset sales to help recapitalize its balance sheet, but we believe it will take several years for the company to complete its targeted divestments and normalize operations. We also exited the convertible bonds of China Railway Construction. As the underlying equity rallied, our bonds performed well and reached our price target.
Outlook:
In our view, Asian high yield bonds offer attractive value for the long-term investor. Asian high yield credit spreads are 150 basis points (1.5%) above their historic averages, and this is the first time in several years that Asian spreads have reached a level one standard deviation above their historic averages. In contrast, spreads for U.S. high yield spreads are 20 basis points (0.2%) below average and European high yield spreads are 80 basis points (0.8%) below average. In simple terms, Asian high yield bonds are compensating investors for taking credit risk even with continued volatility.
To be sure, there continue to be risks on the horizon. If a further slowdown in global growth materializes, we expect investor appetite for emerging markets to diminish. Any escalation in trade shocks or further outflows stemming from policy normalization in the U.S. could also put pressure on Asian fixed income markets. If the Chinese economy deteriorates, corporate defaults will likely rise, and Asian credit could come under pressure. Indeed, we see much of this scenario already factored into current valuations as trailing 12-month default rates are hovering at only 1% per annum. Based on our solvency and liquidity analysis, we do not expect any of the securities in the portfolio to default. As such, the relatively attractive yields in Asia offer a strong base for positive returns in 2019.
| CURRENCY ALLOCATION (%)6,7 | ||||
| US Dollar | 92.1 | |||
| Hong Kong Dollar | 5.0 | |||
| Cash and Other Assets, Less Liabilities | 2.9 | |||
| COUNTRY ALLOCATION (%)6,7,8 | ||||
| China/Hong Kong | 50.7 | |||
| Indonesia | 13.6 | |||
| Vietnam | 9.3 | |||
| Thailand | 5.4 | |||
| Philippines | 5.3 | |||
| Japan | 4.2 | |||
| Singapore | 3.7 | |||
| Sri Lanka | 2.0 | |||
| India | 1.9 | |||
| United States | 1.0 | |||
| Cash and Other Assets, Less Liabilities | 2.9 | |||
| SECTOR ALLOCATION (%)6,7 | ||||
| Real Estate | 22.2 | |||
| Financials | 15.2 | |||
| Consumer Discretionary | 12.4 | |||
| Communication Services | 10.6 | |||
| Materials | 9.2 | |||
| Consumer Staples | 8.2 | |||
| Industrials | 7.3 | |||
| Foreign Government Bonds | 6.6 | |||
| Utilities | 5.4 | |||
| Cash and Other Assets, Less Liabilities | 2.9 | |||
| ASSET TYPE BREAKDOWN (%)6,7 | ||||
| Non-Convertible Corporate Bonds | 66.1 | |||
| Convertible Corporate Bonds | 19.8 | |||
| Government Bonds | 11.3 | |||
| Cash and Other Assets, Less Liabilities | 2.9 | |||
| 6 | Source: FactSet Research Systems. Percentage values in data are rounded to the nearest tenth of one percent, so the values may not sum to 100% due to rounding. Percentage values may be derived from different data sources and may not be consistent with other Fund literature. |
| 7 | Cash and other assets may include forward currency exchange contracts and certain derivative instruments that have been marked-to-market. |
| 8 | Not all countries where the Fund may invest are included in the benchmark index. |
| matthewsasia.com | 800.789.ASIA | 13 |
Table of Contents
Matthews Asia Credit Opportunities Fund
December 31, 2018
Schedule of Investmentsa
NON-CONVERTIBLE CORPORATE BONDS: 66.1%
| Face Amount* | Value | |||||||
| CHINA/HONG KONG: 33.0% | ||||||||
Standard Chartered PLC | 1,850,000 | $1,810,687 | ||||||
Chinalco Capital Holdings, Ltd. | 1,543,000 | 1,483,269 | ||||||
Wanda Properties International Co., Ltd. | 1,550,000 | 1,473,765 | ||||||
West China Cement, Ltd. | 1,440,000 | 1,443,825 | ||||||
KWG Group Holdings, Ltd. | 1,500,000 | 1,336,364 | ||||||
Huaneng Hong Kong Capital, Ltd. | 1,400,000 | 1,262,519 | ||||||
HSBC Holdings PLC | 1,100,000 | 1,056,000 | ||||||
CIFI Holdings Group Co., Ltd. | 1,000,000 | 978,105 | ||||||
KWG Group Holdings, Ltd. | 800,000 | 801,622 | ||||||
Shimao Property Holdings, Ltd. | 800,000 | 752,578 | ||||||
China Minmetals Corp. | 800,000 | 722,637 | ||||||
|
| |||||||
Total China/Hong Kong | 13,121,371 | |||||||
|
| |||||||
| INDONESIA: 13.6% | ||||||||
TBG Global Pte, Ltd. | 1,400,000 | 1,369,712 | ||||||
PB International BV | 1,200,000 | 1,159,882 | ||||||
Modernland Overseas Pte, Ltd. | 1,400,000 | 1,150,814 | ||||||
Listrindo Capital BV | 1,000,000 | 886,500 | ||||||
Alam Synergy Pte, Ltd. | 900,000 | 856,620 | ||||||
|
| |||||||
Total Indonesia | 5,423,528 | |||||||
|
| |||||||
| PHILIPPINES: 5.3% | ||||||||
ICTSI Treasury BV | 1,300,000 | 1,281,280 | ||||||
ICTSI Treasury BV | 800,000 | 812,400 | ||||||
|
| |||||||
Total Philippines | 2,093,680 | |||||||
|
| |||||||
| JAPAN: 4.2% | ||||||||
SoftBank Group Corp. | 2,000,000 | 1,659,000 | ||||||
|
| |||||||
Total Japan | 1,659,000 | |||||||
|
| |||||||
| SINGAPORE: 3.7% | ||||||||
Olam International, Ltd. | 1,500,000 | 1,475,112 | ||||||
|
| |||||||
Total Singapore | 1,475,112 | |||||||
|
| |||||||
| THAILAND: 3.3% | ||||||||
Krung Thai Bank Public Co., Ltd. | 1,300,000 | 1,311,090 | ||||||
|
| |||||||
Total Thailand | 1,311,090 | |||||||
|
| |||||||
| Face Amount* | Value | |||||||
| INDIA: 2.0% | ||||||||
Bharti Airtel, Ltd. | 850,000 | $773,266 | ||||||
|
| |||||||
Total India | 773,266 | |||||||
|
| |||||||
| UNITED STATES: 1.0% | ||||||||
Sprint Communications, Inc. | 420,000 | 412,159 | ||||||
|
| |||||||
Total United States | 412,159 | |||||||
|
| |||||||
| TOTALNON-CONVERTIBLE CORPORATE BONDS |
| 26,269,206 | ||||||
|
| |||||||
(Cost $27,295,608) | ||||||||
CONVERTIBLE CORPORATE BONDS: 19.7% |
| |||||||
| CHINA/HONG KONG: 17.7% | ||||||||
Zhongsheng Group Holdings, Ltd., Cnv. | HKD 17,000,000 | 1,997,001 | ||||||
Ctrip.com International, Ltd., Cnv. | 1,850,000 | 1,788,758 | ||||||
China Overseas Finance Investment Cayman V, Ltd., Cnv. |
| |||||||
0.000%, 01/05/23d | 1,400,000 | 1,490,542 | ||||||
China Mengniu Dairy Co., Ltd., Series 2319, Cnv. |
| |||||||
0.000%, 06/05/22d | 1,000,000 | 950,791 | ||||||
Johnson Electric Holdings, Ltd., Cnv. | 750,000 | 807,956 | ||||||
|
| |||||||
Total China/Hong Kong | 7,035,048 | |||||||
|
| |||||||
| THAILAND: 2.0% | ||||||||
CP Foods Holdings, Ltd., Cnv. | 800,000 | 821,864 | ||||||
|
| |||||||
Total Thailand | 821,864 | |||||||
|
| |||||||
| TOTAL CONVERTIBLE CORPORATE BONDS |
| 7,856,912 | ||||||
|
| |||||||
(Cost $8,130,987) | ||||||||
FOREIGN GOVERNMENT OBLIGATIONS: 11.3% |
| |||||||
| VIETNAM: 9.3% | ||||||||
Debt and Asset Trading Corp. | 2,700,000 | 1,856,250 | ||||||
Socialist Republic of Vietnam | 1,440,000 | 1,425,787 | ||||||
Socialist Republic of Vietnam | 400,000 | 403,173 | ||||||
|
| |||||||
Total Vietnam | 3,685,210 | |||||||
|
| |||||||
| SRI LANKA: 2.0% | ||||||||
Sri Lanka Government Bond | 900,000 | 807,881 | ||||||
|
| |||||||
Total Sri Lanka | 807,881 | |||||||
|
| |||||||
| TOTAL FOREIGN GOVERNMENT OBLIGATIONS |
| 4,493,091 | ||||||
|
| |||||||
(Cost $4,617,439) | ||||||||
| 14 | MATTHEWS ASIA FUNDS |
Table of Contents
Matthews Asia Credit Opportunities Fund
December 31, 2018
Schedule of Investmentsa(continued)
FOREIGN GOVERNMENT OBLIGATIONS(continued)
| Value | ||||||||
| TOTAL INVESTMENTS: 97.1% | $38,619,209 | |||||||
(Cost $40,044,034) | ||||||||
| CASH AND OTHER ASSETS, LESS LIABILITIES: 2.9% | 1,133,759 | |||||||
|
| |||||||
NET ASSETS: 100.0% | $39,752,968 | |||||||
|
| |||||||
| a | Certain securities were fair valued under the valuation policies approved by the Board of Trustees (Note2-A). |
| b | Security is a fix-to-float security, which carries a fixed coupon until a certain date, upon which it switches to a floating rate. Reference rate and spread are provided if the rate is currently floating. |
| c | Perpetual security with no stated maturity date. First call date is disclosed. |
| d | The securities may be resold to qualified foreign investors and foreign institutional buyers under Regulation S of the Securities Act of 1933. |
| * | All Values in USD unless otherwise specified |
| Cnv. | Convertible |
| CNY | Chinese Renminbi (Yuan) |
| HKD | Hong Kong Dollar |
| USD | U.S. Dollar |
| FORWARD FOREIGN CURRENCY EXCHANGE CONTRACTS | ||||||||||||||
Currency | Currency Sold | Counterparty | Settlement Date | Unrealized Appreciation (Depreciation) | ||||||||||
CNY 5,879,088 | USD 844,272 | Merrill Lynch & Co., Inc. | 01/17/19 | $11,732 | ||||||||||
USD 845,000 | CNY 5,879,088 | Merrill Lynch & Co., Inc. | 01/17/19 | (11,004 | ) | |||||||||
|
| |||||||||||||
Net Unrealized Appreciation | $728 | |||||||||||||
|
| |||||||||||||
See accompanying notes to financial statements.
| matthewsasia.com | 800.789.ASIA | 15 |
Table of Contents

| PORTFOLIO MANAGERS | ||||
Robert J. Horrocks, PhD | Kenneth Lowe, CFA | |||
Lead Manager | Lead Manager | |||
John Paul Lech | ||||
Co-Manager | ||||
| FUND FACTS | ||||
| Investor | Institutional | |||
Ticker | MACSX | MICSX | ||
CUSIP | 577130206 | 577130842 | ||
Inception | 9/12/94 | 10/29/10 | ||
NAV | $13.92 | $13.89 | ||
Initial Investment | $2,500 | $100,000 | ||
Gross Expense Ratio1 | 1.08% | 0.93% | ||
Portfolio Statistics | ||||
Total # of Positions | 62 | |||
Net Assets | $1.4 billion | |||
Weighted Average Market Cap | $46.4 billion | |||
Portfolio Turnover2 | 32.24% | |||
Benchmark | ||||
MSCI AC Asia ex Japan Index | ||||
OBJECTIVE
Long-term capital appreciation. The Fund also seeks to provide some current income.
STRATEGY
Under normal market conditions, the Fund seeks to achieve its investment objective by investing at least 80% of its net assets, which include borrowings for investment purposes, in dividend-paying common stock, preferred stock and other equity securities, and convertible securities as well as fixed-income securities, of any duration or quality, including high yield securities, of companies located in Asia, which consists of all countries and markets in Asia, including developed, emerging and frontier countries and markets in the Asian region.
Matthews Asian Growth and Income Fund
Portfolio Manager Commentary (unaudited)
For the year ending December 31, 2018, the Matthews Asian Growth and Income Fund returned –10.96% (Investor Class) and –10.84% (Institutional Class), while its benchmark, the MSCI All Country Asia ex Japan Index, returned –14.12%. For the fourth quarter, the Fund returned –6.57% (Investor Class) and –6.59% (Institutional Class) versus –8.60% for the Index.
Market Environment:
The last few weeks of 2018 were somewhat emblematic of a year that was rife with volatility. A confluence of geopolitical tension between the U.S. and China manifesting in the trade war as well as tightening U.S. dollar liquidity, slowing growth in China and Eurozone concerns all weighed on asset values. With this, the 2016-2017 narrative of globally synchronized growth swiftly ended. This was compounded by a reminder that developed markets are late in the market cycle, valuations are stretched and global debt levels remain egregiously high.
These factors led all Asian equity markets to finish lower for the year, as price-to-earnings ratios contracted, growth came in below expectations and currencies fell against the greenback. The weakest of these markets were South Korea and China, with much of the prior year’s price rally unwound.
Performance Contributors and Detractors:
The portfolio’s more-conservative nature alongside its allocation to convertible bonds were both helpful to protecting the strategy from some of the drop in markets that began in earnest in January. Contributors to returns for the year came largely from the utilities and health care sectors. Guangdong Investment rose as the water utility displayed solid operating profit growth and as there was some excitement over the company’s role within the mainland government’s vision for the Greater Bay Area. Fellow utilities CLP Holdings and Glow Energy, power producers in Hong Kong and Thailand respectively, gained due to their defensive nature. Within the health care sector, Australian blood plasma derivatives company CSL Limited delivered double-digit growth as core products delivered and the company maintains a strong R&D pipeline. Sleep apnea device maker ResMed gained as strong mask and device growth was driven by its impressive connected-care strategy. Elsewhere, the portfolio’s holdings in communication services helped relative performance as shares of telecoms such as HKT Trust gained on price increases in unlimited data plans, and as shares of new addition Tencent Holdings rose from their low in October as fears ended over freezes in the game-approval process in China. This helped to drive performance in the fourth quarter.
The largest detractors to performance for the year came from stock-specific challenges. The weakest of these was South Korean insurer Orange Life. The former ING business witnessed a majority stake sale by a local private equity fund to Shinhan Financial Group at a premium. Unfortunately, the stock dropped on concerns that poor corporate governance standards in South Korea allow no tag-along rights for minority shareholders. Consumer stocks such as Genting Malaysia also fell as the government raised its casino license fee and gaming taxes more than expected to increase fiscal revenues. Further, the company suffered as previous theme park partner Twenty-First Century Fox pulled out of its memorandum of agreement after much of the project had already been built but prior to opening. Genting launched a lawsuit in an attempt to reclaim these expenses as well as to seek punitive damages. Indonesian department store Matahari fell as rising competition from online and specialty retail, alongside some corporate governance concerns, weighed on the stock. We exited our position earlier in the year.
(continued)
| 1 | Actual 2018 expense ratios. |
| 2 | The lesser of fiscal year 2018 long-term purchase costs or sales proceeds divided by the average monthly market value of long-term securities. |
| 16 | MATTHEWS ASIA FUNDS |
Table of Contents
| PERFORMANCE AS OF DECEMBER 31, 2018 | ||||||||||||||||||||||||||||
|
|
| Average Annual Total Returns |
| |||||||||||||||||||||||||
| 3 Months | 1 Year | 3 Years | 5 Years | 10 Years | Since Inception | Inception Date | ||||||||||||||||||||||
| Investor Class (MACSX) | -6.57% | -10.96% | 3.21% | 0.85% | 7.65% | 8.63% | 9/12/94 | |||||||||||||||||||||
| Institutional Class (MICSX) | -6.59% | -10.84% | 3.33% | 0.99% | n.a. | 3.13% | 10/29/10 | |||||||||||||||||||||
| MSCI AC Asia ex Japan Index3 | -8.60% | -14.12% | 8.87% | 4.32% | 10.40% | 4.15% | 4 | |||||||||||||||||||||
Performance assumes reinvestment of all dividends and/or distributions before taxes. All performance quoted represents past performance and is no guarantee of future results. Investment return and principal value will fluctuate with market conditions so that when redeemed, shares may be worth more or less than their original cost. Current performance may be lower or higher than the return figures quoted. Returns would have been lower if certain of the Fund’s fees and expenses had not been waived. For the Fund’s most recent month-end performance, visit matthewsasia.com.
| INCOME DISTRIBUTION HISTORY | ||||||||||||||||||||||||||||
| 2018
| 2017
| |||||||||||||||||||||||||||
| June | December | Total | June | December | Total | |||||||||||||||||||||||
| Investor (MACSX) | $ | 0.22 | $ | 0.10 | $ | 0.32 | $ | 0.10 | $ | 0.36 | $ | 0.46 | ||||||||||||||||
| Inst’l (MICSX) | $ | 0.24 | $ | 0.11 | $ | 0.35 | $ | 0.12 | $ | 0.37 | $ | 0.49 | ||||||||||||||||
Note: This table does not include capital gains distributions. Totals may differ by $0.01 due to rounding. For income distribution history, visit matthewsasia.com.
30-DAY YIELD:
2.50% (Investor Class) 2.56% (Institutional Class)
The 30-Day Yield represents net investment income earned by the Fund over the 30-day period ended 12/31/18, expressed as an annual percentage rate based on the Fund’s share price at the end of the 30-day period. The 30-Day Yield should be regarded as an estimate of the Fund’s rate of investment income, and it may not equal the Fund’s actual income distribution rate.
Source: BNY Mellon Investment Servicing (US) Inc. | DIVIDEND YIELD: 3.70%
The dividend yield (trailing) for the portfolio is the weighted average sum of the dividends paid by each equity security held by the Fund over the 12 months ended 12/31/18 divided by the current price of each equity as of 12/31/18. The annualized dividend yield for the Fund is for the equity-only portion of the portfolio. Please note that this is based on gross equity portfolio holdings and does not reflect the actual yield an investor in the Fund would receive. Past yields are no guarantee of future yields.
Source: FactSet Research Systems, Bloomberg, MICM | |||
GROWTH OF A $10,000 INVESTMENT SINCE INCEPTION—INVESTOR CLASS
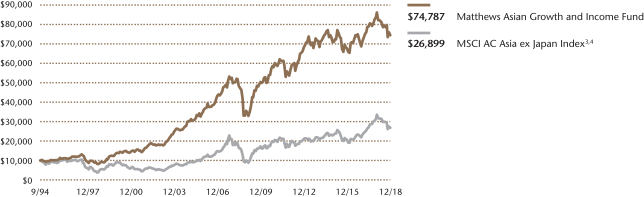
Plotted monthly. The performance data and graph do not reflect the deduction of taxes that a shareholder would pay on dividends, capital gains distributions or redemption of Fund shares. Values are in US$.
| 3 | It is not possible to invest directly in an index. Source: Index data from Morgan Stanley Capital International and Bloomberg; total return calculations performed by BNY Mellon Investment Servicing (US) Inc. Please see page 91 for index definition. |
| 4 | Calculated from 8/31/94. |
| TOP TEN HOLDINGS5 | ||||||||
| Sector | Country | % of Net Assets | ||||||
| Taiwan Semiconductor Manufacturing Co., Ltd. | Information Technology | Taiwan | 3.9% | |||||
| AIA Group, Ltd. | Financials | China/Hong Kong | 3.5% | |||||
| Tencent Holdings, Ltd. | Communication Services | China/Hong Kong | 2.5% | |||||
| Samsung Electronics Co., Ltd. | Information Technology | South Korea | 2.3% | |||||
| United Overseas Bank, Ltd. | Financials | Singapore | 2.3% | |||||
| Broadcom, Inc. | Information Technology | United States | 2.2% | |||||
| Jardine Matheson Holdings, Ltd. | Industrials | China/Hong Kong | 2.0% | |||||
| Housing Development Finance Corp., Ltd. | Financials | India | 2.0% | |||||
| Techtronic Industries Co., Ltd. | Consumer Discretionary | China/Hong Kong | 2.0% | |||||
| Ascendas, REIT | Real Estate | Singapore | 1.9% | |||||
| % OF ASSETS IN TOP TEN | 24.6% | |||||||
| 5 | Holdings may combine more than one security from same issuer and related depositary receipts. |
| matthewsasia.com | 800.789.ASIA | 17 |
Table of Contents
| COUNTRY ALLOCATION (%)6,7 | ||||
| China/Hong Kong | 42.0 | |||
| South Korea | 12.5 | |||
| Singapore | 11.0 | |||
| Taiwan | 7.5 | |||
| Thailand | 4.5 | |||
| Australia | 4.0 | |||
| United States | 3.8 | |||
| India | 3.4 | |||
| Japan | 2.6 | |||
| Indonesia | 1.8 | |||
| United Kingdom | 1.7 | |||
| Philippines | 1.6 | |||
| Vietnam | 1.5 | |||
| France | 1.5 | |||
| Malaysia | 1.3 | |||
| Liabilities in Excess of Cash and Other Assets | -0.5 | |||
| SECTOR ALLOCATION (%)7 | ||||
| Financials | 20.3 | |||
| Consumer Discretionary | 17.6 | |||
| Information Technology | 14.3 | |||
| Consumer Staples | 12.9 | |||
| Industrials | 12.0 | |||
| Communication Services | 10.5 | |||
| Real Estate | 6.8 | |||
| Materials | 2.9 | |||
| Utilities | 1.6 | |||
| Health Care | 1.6 | |||
| Liabilities in Excess of Cash and Other Assets | -0.5 | |||
| MARKET CAP EXPOSURE (%)7 | ||||
| Mega Cap (over $25B) | 44.2 | |||
| Large Cap ($10B–$25B) | 16.2 | |||
| Mid Cap ($3B–10B) | 24.6 | |||
| Small Cap (under $3B) | 15.4 | |||
| Liabilities in Excess of Cash and Other Assets | -0.5 | |||
| ASSET TYPE BREAKDOWN (%)7,8 | ||||
| Common Equities and ADRs | 81.0 | |||
| Convertible Corporate Bonds | 17.6 | |||
| Preferred Equities | 1.8 | |||
| Liabilities in Excess of Cash and Other Assets | -0.5 | |||
| 6 | Not all countries where the Fund may invest are included in the benchmark index. |
| 7 | Source: FactSet Research Systems. Percentage values in data are rounded to the nearest tenth of one percent, so the values may not sum to 100% due to rounding. Percentage values may be derived from different data sources and may not be consistent with other Fund literature. |
| 8 | Bonds are not included in the MSCI All Country Asia ex Japan Index. |
Matthews Asian Growth and Income Fund
Portfolio Manager Commentary (unaudited) (continued)
Notable Portfolio Changes:
2018 continued to be an active year in the fourth quarter as we added two new equity holdings and one convertible bond.
We have long been admirers of Tencent’s business model as it is clearly the No. 1 games and social networking service within China, offering a huge range of services to its customers. Those network effects are enhanced by a high-caliber management team that helps to create a strong economic moat. Further, corporate governance is better than in much of the sector and there is scope for continued high growth through mobile games, advertising revenues, other services and principal investments. Our challenge with the stock had been valuation, but the 46% drop in its share price earlier this year allowed us to take a position at a more reasonable, although not cheap, 26X P/E.
We also added a position in Australian packaging and distribution company Orora. We believe that the company has a strong moat through its customer relationships, cost advantages and manufacturing sophistication. Further, there are still opportunities for organic growth through volumes rising for paperboard as well as some cost savings accompanied by potential inorganic M&A. We believe that the stock is attractively valued for a leader at 9X EBITDA and a 4.3% dividend yield.
The convertible bond addition was in Huazhu Group where we gained what we think is exposure to the high-growth sector of Chinese hotels through a market leader that operates the second-largest chain in the country. We entered the hybrid as we believed it offered compelling positive asymmetry in its prospective outcomes given an underlying equity that can be fairly volatile.
We funded these new positions through the sales of Japan Tobacco, Hang Lung Properties and SkyCity Entertainment Group.
Outlook:
A continuation of the rise in volatility is likely to be the order of the day in 2019 as a number of the macroeconomic concerns mentioned above are expected to dominate headlines. The U.S.–China trade war and geopolitical tensions are here to stay. They are accompanied by slower growth in China, potential deflationary pressure, a heavy election year across Asia, sputtering reform in much of the region and a continuation of quantitative tightening from G-3 central banks. These are all potential macroeconomic volatility generators.
Despite this, the microeconomic picture appears more positive. Headline valuations for the MSCI All Country Asia ex Japan Index are supportive at around 11.5X P/E and, although earnings estimates are being cut, they are still pointing to reasonable growth in the high single-digit range. Further, we are constructive on the outlook for the strategy as it typically fares better in periods of increased volatility and dispersion. 2018 was a fairly active year, allowing us to add to our stable of what we believe to be leading companies at reasonable valuations. That leaves the portfolio trading at 14.5X P/E, a 3.5% dividend yield and with companies growing in the mid to high single-digit range, providing fairly attractive portfolio metrics.
| 18 | MATTHEWS ASIA FUNDS |
Table of Contents
Matthews Asian Growth and Income Fund
December 31, 2018
Schedule of Investmentsa
COMMON EQUITIES: 81.0%
| Shares | Value | |||||||
| CHINA/HONG KONG: 32.0% | ||||||||
AIA Group, Ltd. | 5,866,200 | $48,729,433 | ||||||
Tencent Holdings, Ltd. | 856,600 | 34,332,828 | ||||||
Jardine Matheson Holdings, Ltd. | 408,700 | 28,457,269 | ||||||
Techtronic Industries Co., Ltd. | 5,140,000 | 27,276,269 | ||||||
CK Hutchison Holdings, Ltd. | 2,454,172 | 23,555,660 | ||||||
CLP Holdings, Ltd. | 1,939,700 | 21,920,350 | ||||||
Jiangsu Expressway Co., Ltd. H Shares | 15,674,000 | 21,878,068 | ||||||
HKT Trust & HKT, Ltd. | 15,134,000 | 21,800,988 | ||||||
Pacific Textiles Holdings, Ltd. | 24,255,000 | 21,555,668 | ||||||
NetEase, Inc. ADR | 90,400 | 21,277,448 | ||||||
Inner Mongolia Yili Industrial Group Co., Ltd. A Shares | 6,308,875 | 21,071,008 | ||||||
Jiangsu Yanghe Brewery Joint-Stock Co., Ltd. A Shares | 1,472,083 | 20,392,726 | ||||||
HSBC Holdings PLC ADR | 491,833 | 20,219,255 | ||||||
CK Asset Holdings, Ltd. | 2,726,172 | 19,946,255 | ||||||
Zhejiang Supor Co., Ltd. A Shares | 2,425,870 | 18,566,082 | ||||||
Minth Group, Ltd. | 5,740,000 | 18,522,812 | ||||||
Midea Group Co., Ltd. A Shares | 3,423,001 | 18,481,304 | ||||||
VTech Holdings, Ltd. | 1,864,800 | 15,467,272 | ||||||
Café de Coral Holdings, Ltd. | 5,672,000 | 13,735,689 | ||||||
China Mobile, Ltd. ADR | 210,200 | 10,089,600 | ||||||
|
| |||||||
Total China/Hong Kong | 447,275,984 | |||||||
|
| |||||||
| SINGAPORE: 9.1% | ||||||||
United Overseas Bank, Ltd. | 1,740,700 | 31,489,242 | ||||||
Ascendas REIT | 14,206,400 | 26,810,201 | ||||||
Singapore Technologies Engineering, Ltd. | 9,728,125 | 24,937,982 | ||||||
Singapore Telecommunications, Ltd. | 11,375,800 | 24,483,389 | ||||||
Venture Corp., Ltd. | 1,894,900 | 19,454,595 | ||||||
|
| |||||||
Total Singapore | 127,175,409 | |||||||
|
| |||||||
| SOUTH KOREA: 7.8% | ||||||||
Samsung Electronics Co., Ltd. | 909,313 | 31,654,748 | ||||||
Macquarie Korea Infrastructure Fund | 2,862,946 | 23,826,276 | ||||||
Coway Co., Ltd. | 313,557 | 20,823,242 | ||||||
Orange Life Insurance, Ltd.b,c | 810,923 | 20,343,575 | ||||||
KT&G Corp. | 142,105 | 12,938,177 | ||||||
|
| |||||||
Total South Korea | 109,586,018 | |||||||
|
| |||||||
| TAIWAN: 7.5% | ||||||||
Taiwan Semiconductor Manufacturing Co., Ltd. | 7,386,187 | 53,962,888 | ||||||
Advantech Co., Ltd. | 3,866,000 | 26,573,116 | ||||||
Taiwan Secom Co., Ltd. | 8,269,000 | 23,902,073 | ||||||
|
| |||||||
Total Taiwan | 104,438,077 | |||||||
|
| |||||||
| AUSTRALIA: 4.0% | ||||||||
Macquarie Group, Ltd. | 263,780 | 20,204,476 | ||||||
Orora, Ltd. | 9,011,165 | 19,507,765 | ||||||
Domino’s Pizza Enterprises, Ltd. | 541,502 | 15,512,491 | ||||||
|
| |||||||
Total Australia | 55,224,732 | |||||||
|
| |||||||
| Shares | Value | |||||||
| UNITED STATES: 3.8% | ||||||||
Broadcom, Inc. | 120,000 | $30,513,600 | ||||||
Cognizant Technology Solutions Corp. Class A | 349,400 | 22,179,912 | ||||||
|
| |||||||
Total United States | 52,693,512 | |||||||
|
| |||||||
| INDIA: 3.4% | ||||||||
Housing Development Finance Corp., Ltd. | 979,513 | 27,597,084 | ||||||
Bharti Infratel, Ltd. | 5,211,100 | 19,328,474 | ||||||
|
| |||||||
Total India | 46,925,558 | |||||||
|
| |||||||
| JAPAN: 2.6% | ||||||||
Kao Corp. | 294,300 | 21,783,391 | ||||||
KDDI Corp. | 618,000 | 14,767,061 | ||||||
|
| |||||||
Total Japan | 36,550,452 | |||||||
|
| |||||||
| INDONESIA: 1.8% | ||||||||
PT Bank Rakyat Indonesia Persero | 98,206,700 | 25,018,979 | ||||||
|
| |||||||
Total Indonesia | 25,018,979 | |||||||
|
| |||||||
| UNITED KINGDOM: 1.7% | ||||||||
Prudential PLC | 1,313,572 | 23,455,745 | ||||||
|
| |||||||
Total United Kingdom | 23,455,745 | |||||||
|
| |||||||
| PHILIPPINES: 1.6% | ||||||||
Bank of the Philippine Islands | 12,774,954 | 22,815,422 | ||||||
|
| |||||||
Total Philippines | 22,815,422 | |||||||
|
| |||||||
| VIETNAM: 1.5% | ||||||||
Vietnam Dairy Products JSC | 4,087,063 | 21,198,920 | ||||||
|
| |||||||
Total Vietnam | 21,198,920 | |||||||
|
| |||||||
| FRANCE: 1.5% | ||||||||
Pernod Ricard SA | 128,913 | 21,157,297 | ||||||
|
| |||||||
Total France | 21,157,297 | |||||||
|
| |||||||
| THAILAND: 1.4% | ||||||||
Kasikornbank Public Co., Ltd. | 3,451,600 | 19,768,154 | ||||||
|
| |||||||
Total Thailand | 19,768,154 | |||||||
|
| |||||||
| MALAYSIA: 1.3% | ||||||||
Genting Malaysia BHD | 24,159,400 | 17,640,606 | ||||||
|
| |||||||
Total Malaysia | 17,640,606 | |||||||
|
| |||||||
| TOTAL COMMON EQUITIES | 1,130,924,865 | |||||||
|
| |||||||
(Cost $1,117,069,718) | ||||||||
| matthewsasia.com | 800.789.ASIA | 19 |
Table of Contents
Matthews Asian Growth and Income Fund
December 31, 2018
Schedule of Investmentsa(continued)
| CONVERTIBLE CORPORATE BONDS: 17.6% | PREFERRED EQUITIES: 1.9% |
| Face Amount* | Value | |||||||
| CHINA/HONG KONG: 9.9% | ||||||||
Johnson Electric Holdings, Ltd., Cnv. |
| |||||||
1.000%, 04/02/21c | 21,250,000 | $22,892,094 | ||||||
China Overseas Finance Investment Cayman V, Ltd., Cnv. |
| |||||||
0.000%, 01/05/23c | 20,800,000 | 22,145,198 | ||||||
Haitian International Holdings, Ltd., Cnv. |
| |||||||
2.000%, 02/13/19c | 21,500,000 | 21,282,162 | ||||||
Harvest International Co., Cnv. | HKD 171,000,000 | 20,614,514 | ||||||
Zhongsheng Group Holdings, Ltd., Cnv. |
| |||||||
0.000%, 05/23/23c | HKD 175,000,000 | 20,557,365 | ||||||
China Mengniu Dairy Co., Ltd., Series 2319, Cnv. |
| |||||||
0.000%, 06/05/22c | 17,000,000 | 16,163,447 | ||||||
Huazhu Group, Ltd., Cnv. | ||||||||
0.375%, 11/01/22 | 14,521,000 | 14,185,202 | ||||||
|
| |||||||
Total China/Hong Kong | 137,839,982 | |||||||
|
| |||||||
| THAILAND: 3.1% | ||||||||
Bangkok Dusit Medical Services Public Co., Ltd., Cnv. |
| |||||||
0.000%, 09/18/19c | THB 623,000,000 | 22,888,604 | ||||||
CP Foods Holdings, Ltd., Cnv. | ||||||||
0.500%, 09/22/21c | 19,600,000 | 20,135,668 | ||||||
|
| |||||||
Total Thailand | 43,024,272 | |||||||
|
| |||||||
| SOUTH KOREA: 2.8% | ||||||||
LG Chem, Ltd., Series USD, Cnv. | ||||||||
0.000%, 04/16/21c | 20,600,000 | 20,412,725 | ||||||
Lotte Shopping Co., Ltd., Cnv. | ||||||||
0.000%, 04/04/23c | KRW 22,600,000,000 | 18,537,611 | ||||||
|
| |||||||
Total South Korea | 38,950,336 | |||||||
|
| |||||||
| SINGAPORE: 1.8% | ||||||||
CapitaLand, Ltd., Cnv. | ||||||||
1.950%, 10/17/23c | SGD 37,250,000 | 25,708,800 | ||||||
|
| |||||||
Total Singapore | 25,708,800 | |||||||
|
| |||||||
| TOTAL CONVERTIBLE CORPORATE BONDS |
| 245,523,390 | ||||||
|
| |||||||
(Cost $255,377,003) | ||||||||
| Shares | Value | |||||||
| SOUTH KOREA: 1.9% | ||||||||
LG Household & Health Care, Ltd., Pfd. | 43,474 | $25,597,242 | ||||||
|
| |||||||
Total South Korea | 25,597,242 | |||||||
|
| |||||||
| TOTAL PREFERRED EQUITIES | 25,597,242 | |||||||
|
| |||||||
(Cost $11,641,919) | ||||||||
| TOTAL INVESTMENTS: 100.5% | 1,402,045,497 | |||||||
(Cost $1,384,088,640) | ||||||||
| LIABILITIES IN EXCESS OF CASH AND OTHER ASSETS: (0.5%) | (6,354,124 | ) | ||||||
|
| |||||||
NET ASSETS: 100.0% | $1,395,691,373 | |||||||
|
| |||||||
| a | Certain securities were fair valued under the valuation policies approved by the Board of Trustees (Note2-A). |
| b | Security exempt from registration under Rule 144A of the Securities Act of 1933, as amended. The security may be resold in transactions exempt from registration normally to qualified institutional buyers. The security has been determined to be liquid in accordance with procedures adopted by the Funds’ Board of Trustees. At December 31, 2018, the aggregate value is $20,343,575, which is 1.46% of net assets. |
| c | The securities may be resold to qualified foreign investors and foreign institutional buyers under Regulation S of the Securities Act of 1933. |
| * | All Values in USD unless otherwise specified |
| ADR | American Depositary Receipt |
| BHD | Berhad |
| Cnv. | Convertible |
| HKD | Hong Kong Dollar |
| JSC | Joint Stock Co. |
| KRW | Korean Won |
| Pfd. | Preferred |
| REIT | Real Estate Investment Trust |
| SGD | Singapore Dollar |
| THB | Thai Baht |
| USD | U.S. Dollar |
See accompanying notes to financial statements.
| 20 | MATTHEWS ASIA FUNDS |
Table of Contents
| PORTFOLIO MANAGERS | ||||
| Yu Zhang, CFA | ||||
Lead Manager | ||||
| Robert Horrocks, PhD | Vivek Tanneeru | |||
Co-Manager | Co-Manager | |||
| Sherwood Zhang, CFA | ||||
Co-Manager | ||||
| FUND FACTS | ||||
| Investor | Institutional | |||
Ticker | MAPIX | MIPIX | ||
CUSIP | 577125107 | 577130750 | ||
Inception | 10/31/06 | 10/29/10 | ||
NAV | $16.05 | $16.04 | ||
Initial Investment | $2,500 | $100,000 | ||
Gross Expense Ratio1 | 1.02% | 0.91% | ||
After Fee Waiver and Reimbursement2 | 1.01% | 0.90% | ||
Portfolio Statistics | ||||
Total # of Positions | 62 | |||
Net Assets | $5.8 billion | |||
Weighted Average Market Cap | $24.5 billion | |||
Portfolio Turnover3 | 39.75% | |||
Benchmark | ||||
MSCI AC Asia Pacific Index | ||||
OBJECTIVE
Total return with an emphasis on providing current income.
STRATEGY
Under normal market conditions, the Fund seeks to achieve its investment objective by investing at least 80% of its net assets, which include borrowings for investment purposes, in dividend-paying equity securities of companies located in Asia. Asia consists of all countries and markets in Asia, and includes developed, emerging and frontier countries and markets in the Asian region. The Fund may also invest in convertible debt and equity securities of companies located in Asia.
Portfolio Manager Commentary (unaudited)
For the year ending December 31, 2018, the Matthews Asia Dividend Fund returned –12.72% (Investor Class) and –12.64% (Institutional Class), while its benchmark, the MSCI All Country Asia Pacific Index, returned –13.25%. For the fourth quarter of the year, the Fund returned –9.89% (Investor Class) and –9.92% (Institutional Class) while its benchmark returned –10.92%. The Fund began 2018 with a share price of US$19.74 (Investor Class) or US$19.73 (Institutional Class), and shareholders who were invested throughout the year would have received total distributions of approximately US$1.23 (Investor Class) or US$1.25 (Institutional Class) per share.
Market Environment:
2018 was a year of turbulence for Asian equities. Protracted U.S.–China trade tensions and rising U.S. interest rates became significant overhangs for Asia’s equities and its currencies. Within Asia, China’s financial deleveraging campaign, which is designed to rein in excessive shadow-banking activities and reduce systemic risk, nevertheless caused a near-term economic slowdown. Facing such external and internal headwinds, investors became increasingly concerned about a potential deceleration in global growth. Most major Asian equity markets suffered steep, double-digit losses. Only individual markets that had lower exposure to global trade but were more driven by domestic consumption, such as India, were able to contain equity market losses.
Performance Contributors and Detractors:
Fund performance in 2018 was lackluster, finishing the full year only slightly ahead of its broad Asia Pacific benchmark. Our approach toward dividend investing is anchored by what we call a “total return” approach—one that balances stable, high dividend-yielding stocks with slightly more cyclical, but higher dividend, growth stocks. Following a very strong 2017 for Asian equities, the Fund’s outperformance by some of our dividend growth holdings started to make valuations less compelling. This prompted us to re-position the overall portfolio by gradually reducing some cyclical dividend growth stocks while adding exposure to higher dividend-payout stocks with stable cash flow that were trading at more reasonable valuations. While such rebalancing positively contributed to the Fund’s relative outperformance, the year’s market volatility was more severe than we initially anticipated. Ultimately, the portfolio struggled to provide better downside protection as we had hoped.
Given the overall fragile market sentiment, those of our holdings that were in a good position to deliver solid earnings growth, generate healthy cash flow and maintain a resilient balance sheet performed well during the market downturn. One of those stocks was a long-term holding, Shenzhou International Group, a Chinese textile original equipment manufacturing business that had a healthy share price return and was a top contributor to Fund performance for the year. In addition to its cost competitiveness, owing to its vertical integration, Shenzhou International Group is one of the few mainland Chinese exporters to have successfully diversified its manufacturing bases beyond mainland China by expanding into other low-cost countries such as Vietnam. Today, about 30% of the production capacity is outside of China. This diversification minimizes the risk from U.S.–China trade tensions, a development welcomed by investors in 2018. With the founder and his family owning more than 50% of the listed entity, the firm’s dividends over the years have also grown steadily alongside strong earnings growth.
On a sector basis, communication services and the Fund’s overweight in the consumer staples sector were the top contributors to performance for the full year
(continued)
| 1 | Actual 2018 expense ratios. |
| 2 | Matthews has contractually agreed to waive a portion of its advisory fee and administrative and shareholder services fee if the Fund’s average daily net assets are over $3 billion, as follows: for every $2.5 billion average daily net assets of the Fund that are over $3 billion, the advisory fee rate and the administrative and shareholder services fee rate for the Fund with respect to such excess average daily net assets will be each reduced by 0.01%, in each case without reducing such fee rate below 0.00%. Any amount waived by Matthews pursuant to this agreement may not be recouped by Matthews. This agreement will remain in place until April 30, 2019 and may be terminated (i) at any time by the Board of Trustees upon 60 days’ prior written notice to Matthews; or (ii) by Matthews at the annual expiration date of the agreement upon 60 days’ prior written notice to the Trust, in each case without payment of any penalty. |
| 3 | The lesser of fiscal year 2018 long-term purchase costs or sales proceeds divided by the average monthly market value of long-term securities. |
| matthewsasia.com | 800.789.ASIA | 21 |
Table of Contents
| PERFORMANCE AS OF DECEMBER 31, 2018 | ||||||||||||||||||||||||||||
|
|
| Average Annual Total Returns |
| |||||||||||||||||||||||||
| 3 Months | 1 Year | 3 Years | 5 Years | 10 Years | Since Inception | Inception Date | ||||||||||||||||||||||
| Investor Class (MAPIX) | -9.89% | -12.72% | 6.97% | 4.85% | 10.84% | 8.30% | 10/31/06 | |||||||||||||||||||||
| Institutional Class (MIPIX) | -9.92% | -12.64% | 7.10% | 4.97% | n.a. | 5.94% | 10/29/10 | |||||||||||||||||||||
| MSCI AC Asia Pacific Index4 | -10.92% | -13.25% | 6.42% | 3.51% | 7.94% | 3.55% | 5 | |||||||||||||||||||||
Performance assumes reinvestment of all dividends and/or distributions before taxes. All performance quoted represents past performance and is no guarantee of future results.Investment return and principal value will fluctuate with market conditions so that when redeemed, shares may be worth more or less than their original cost. Current performance may be lower or higher than the return figures quoted. Returns would have been lower if certain of the Fund’s fees and expenses had not been waived. For the Fund’s most recent month-end performance, visit matthewsasia.com.
| INCOME DISTRIBUTION HISTORY | ||||||||||||||||||||||||||||||||||||||||||||
| 2018
| 2017
| |||||||||||||||||||||||||||||||||||||||||||
| Q1 | Q2 | Q3 | Q4 | Total | Q1 | Q2 | Q3 | Q4 | Total | |||||||||||||||||||||||||||||||||||
| Investor (MAPIX) | $ | 0.01 | $ | 0.19 | $ | 0.11 | $ | 0.00 | $ | 0.31 | $ | 0.02 | $ | 0.15 | $ | 0.09 | $ | 0.43 | $ | 0.69 | ||||||||||||||||||||||||
| Inst’l (MIPIX) | $ | 0.02 | $ | 0.20 | $ | 0.11 | $ | 0.00 | $ | 0.33 | $ | 0.03 | $ | 0.15 | $ | 0.10 | $ | 0.43 | $ | 0.71 | ||||||||||||||||||||||||
Totals may differ by $0.01 due to rounding and a return of capital. For distribution history please visit matthewsasia.com.
30-DAY YIELD:
Investor Class: 2.03% (2.02% excluding waivers) Institutional Class: 2.09% (2.07% excluding waivers)
The 30-Day Yield represents net investment income earned by the Fund over the 30-day period ended 12/31/18, expressed as an annual percentage rate based on the Fund’s share price at the end of the 30-day period. The 30-Day Yield should be regarded as an estimate of the Fund’s rate of investment income, and it may not equal the Fund’s actual income distribution rate.
Source: BNY Mellon Investment Servicing (US) Inc. | DIVIDEND YIELD: 3.13%
The dividend yield (trailing) for the portfolio is the weighted average sum of the dividends paid by each equity security held by the Fund over the 12 months ended 12/31/18 divided by the current price of each equity as of 12/31/18. The annualized dividend yield for the Fund is for the equity-only portion of the portfolio. Please note that this is based on gross equity portfolio holdings and does not reflect the actual yield an investor in the Fund would receive. Past yields are no guarantee of future yields.
Source: FactSet Research Systems, Bloomberg, MICM. | |||
GROWTH OF A $10,000 INVESTMENT SINCE INCEPTION—INVESTOR CLASS
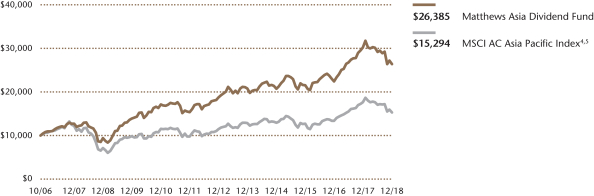
Plotted monthly. The performance data and graph do not reflect the deduction of taxes that a shareholder would pay on dividends, capital gains distributions or redemption of Fund shares. Values are in US$.
| 4 | It is not possible to invest directly in an index. Source: Index data from Morgan Stanley Capital International and Bloomberg; total return calculations performed by BNY Mellon Investment Servicing (US) Inc. Please see page 91 for index definition. |
| 5 | Calculated from 10/31/06. |
| TOP TEN HOLDINGS6 | ||||||||
| Sector | Country | % of Net Assets | ||||||
| Shenzhou International Group Holdings, Ltd. | Consumer Discretionary | China/Hong Kong | 4.1% | |||||
| Minth Group, Ltd. | Consumer Discretionary | China/Hong Kong | 3.8% | |||||
| Taiwan Semiconductor Manufacturing Co., Ltd. | Information Technology | Taiwan | 3.3% | |||||
| Hyundai Mobis Co., Ltd. | Consumer Discretionary | South Korea | 3.1% | |||||
| BGF Retail Co., Ltd. | Consumer Staples | South Korea | 3.0% | |||||
| NTT DoCoMo, Inc. | Communication Services | Japan | 3.0% | |||||
| Seven & i Holdings Co., Ltd. | Consumer Staples | Japan | 2.8% | |||||
| Kao Corp. | Consumer Staples | Japan | 2.8% | |||||
| Hoya Corp. | Health Care | Japan | 2.5% | |||||
| China Petroleum & Chemical Corp. | Energy | China/Hong Kong | 2.5% | |||||
| % OF ASSETS IN TOP TEN | 30.9% | |||||||
| 6 | Holdings may combine more than one security from same issuer and related depositary receipts. |
| 22 | MATTHEWS ASIA FUNDS |
Table of Contents
Matthews Asia Dividend Fund
Portfolio Manager Commentary (unaudited) (continued)
period. Stable cash flows, strong balance sheets and high dividend payouts all contributed to the “defensiveness” of the performance of those stocks, especially amid market turmoil. On the other hand, the Fund’s overweight in the consumer discretionary sector was detrimental to its overall performance. Specifically, several of the Fund’s holdings of auto parts companies within the Asian region, such as Minth Group, Fuyao Glass Industry Group, Nifco and Hyundai Mobis, suffered significant share price setbacks, partially due to the overall automobile industry slowdown and partially due to investor concerns about their exposure to U.S. tariff risks. For Minth, Fuyao Glass and Nifco, we believe the de-rating of those stocks was driven by a cyclical factor and we expect their long-term competitiveness to remain intact. In addition to industry cyclicality, Hyundai Mobis’s share price underperformance followed a delay of the Hyundai Group’s restructuring.
On a country basis, our holdings in China/Hong Kong were the top contributors to Fund performance. Good stock selection, including companies such as Shenzhou International Group, China Gas Holdings and HKBN, more than offset the negative effort from the Fund’s overweight allocation to China/Hong Kong. On the flip side, the Fund’s exposure to India was the top detractor to performance. Both our underweight in India, which held up significantly better than the broad Asia market, and poor stock selection, including companies such as Bharti Infratel, detracted from the Fund’s relative performance.
Notable Portfolio Changes:
During the fourth quarter, the Fund initiated a new position in WH Group, a China-based, major global pork processing company with significant business presence both in mainland China and in the U.S. WH Group’s share price declined significantly in 2018 as the company was caught in the crossfire of the U.S.–China trade spat. An outbreak of African swine fever, a viral disease that spread through China in August, also hurt sentiment toward the stock. We saw WH Group as an attractive investment opportunity at its valuation late in 2018. The company’s main earnings come from its downstream, branded meat product business (sausage, ham, etc.) in mainland China, which is rather stable and quite cash-generative.
Also during the fourth quarter, we reduced our exposure to sectors that tend to be more sensitive to economic cycles, mostly by reducing our holdings in several commercial banking businesses in the region. The capital was partially redeployed into a few newly initiated positions, including WH Group.
Outlook:
Near-term market volatility is likely to remain elevated as investors grapple with a decelerating Chinese economy and a possible slowdown in U.S. GDP growth. Ironically, such reversals in growth trajectories might pave the way for removing two large external overhangs for Asian equities—a full-blown trade war between China and the U.S. and U.S. dollar strength driven by monetary tightening efforts. A dimmer growth outlook in China and the U.S. could add both incentive and a sense of urgency for the two nations to reach a deal. While the struggle between China and the U.S. goes well beyond just trade deficit issues, a trade compromise that averts an all-out trade war could still significantly reduce market uncertainty. Similarly, if the U.S. dollar starts to weaken on the back of less hawkish U.S. Federal Reserve policy, emerging markets, including Asia, could also start to recover. Chinese policymakers have already prioritized the stabilization of the country’s economic growth with both fiscal policy support and more accommodating monetary conditions. A combination of the above policy outcome, together with an Asian equity valuation that is already well below its long-term average after the 2018 sell-off, could set the stage for an equity market recovery. However, investors should be mindful that policymakers are walking a tightrope, leaving little room for making policy errors. Therefore, while the current market sell-off is giving us an increasing number of attractive investment opportunities, we believe it is prudent to position the portfolio neutrally between dividend growth and dividend yield at this juncture.
| COUNTRY ALLOCATION (%)7,8 | ||||
| China/Hong Kong | 37.0 | |||
| Japan | 31.2 | |||
| South Korea | 10.9 | |||
| Taiwan | 4.5 | |||
| Singapore | 3.8 | |||
| India | 3.1 | |||
| Indonesia | 2.0 | |||
| Australia | 1.6 | |||
| Thailand | 1.5 | |||
| Philippines | 1.5 | |||
| Vietnam | 1.4 | |||
| Bangladesh | 1.2 | |||
| Cash and Other Assets, Less Liabilities | 0.3 | |||
| SECTOR ALLOCATION (%)8 | ||||
| Consumer Staples | 23.6 | |||
| Consumer Discretionary | 21.7 | |||
| Information Technology | 8.8 | |||
| Industrials | 8.5 | |||
| Communication Services | 8.5 | |||
| Financials | 7.8 | |||
| Utilities | 6.5 | |||
| Materials | 5.0 | |||
| Energy | 4.0 | |||
| Health Care | 3.8 | |||
| Real Estate | 1.7 | |||
| Cash and Other Assets, Less Liabilities | 0.3 | |||
| MARKET CAP EXPOSURE (%)8 | ||||
| Mega Cap (over $25B) | 22.7 | |||
| Large Cap ($10B–$25B) | 23.3 | |||
| Mid Cap ($3B–10B) | 27.9 | |||
| Small Cap (under $3B) | 25.8 | |||
| Cash and Other Assets, Less Liabilities | 0.3 | |||
| 7 | Not all countries where the Fund may invest are included in the benchmark index. |
| 8 | Source: FactSet Research Systems. Percentage values in data are rounded to the nearest tenth of one percent, so the values may not sum to 100% due to rounding. Percentage values may be derived from different data sources and may not be consistent with other Fund literature. |
| matthewsasia.com | 800.789.ASIA | 23 |
Table of Contents
Matthews Asia Dividend Fund
December 31, 2018
Schedule of Investmentsa
COMMON EQUITIES: 97.5%
| Shares | Value | |||||||
| CHINA/HONG KONG: 37.0% | ||||||||
Shenzhou International Group Holdings, Ltd. | 20,935,000 | $237,944,130 | ||||||
Minth Group, Ltd.† | 68,147,000 | 219,908,372 | ||||||
China Petroleum & Chemical Corp. H Shares | 183,964,000 | 131,131,386 | ||||||
China Gas Holdings, Ltd. | 34,903,000 | 124,456,917 | ||||||
China Resources Power Holdings Co., Ltd. | 60,274,000 | 115,933,108 | ||||||
Huaneng Power International, Inc. H Shares | 161,530,000 | 102,529,561 | ||||||
Beijing Capital International Airport Co., Ltd. H Shares† | 94,084,000 | 99,853,768 | ||||||
Chongqing Brewery Co., Ltd. A Shares | 21,070,370 | 94,677,560 | ||||||
WH Group, Ltd.b,c | 119,822,000 | 92,028,942 | ||||||
Sun Art Retail Group, Ltd. | 88,093,500 | 89,585,279 | ||||||
HKBN, Ltd.† | 56,401,123 | 85,506,443 | ||||||
Fuyao Glass Industry Group Co., Ltd. H | ||||||||
Sharesb,c | 23,075,200 | 73,879,247 | ||||||
Yuexiu Transport Infrastructure, Ltd.† | 97,328,000 | 73,834,708 | ||||||
Hua Hong Semiconductor, Ltd.b,c | 39,475,000 | 72,992,327 | ||||||
Dairy Farm International Holdings, Ltd. | 7,158,000 | 64,881,615 | ||||||
Far East Horizon, Ltd. | 61,980,000 | 62,530,107 | ||||||
China Mobile, Ltd. | 6,312,500 | 61,083,519 | ||||||
Crystal International Group, Ltd.b,c | 116,044,000 | 58,878,892 | ||||||
Postal Savings Bank of China Co., Ltd. H Sharesb,c | 107,790,000 | 56,770,235 | ||||||
Fanhua, Inc. ADR | 2,503,300 | 54,947,435 | ||||||
China Education Group Holdings, Ltd.c,d | 43,736,000 | 53,470,973 | ||||||
Shanghai Jin Jiang International Hotels Group Co., Ltd. H Shares† | 173,612,000 | 42,026,409 | ||||||
Café de Coral Holdings, Ltd. | 17,330,000 | 41,967,470 | ||||||
China Mobile, Ltd. ADR | 245,200 | 11,769,600 | ||||||
China Petroleum & Chemical Corp. ADR | 153,800 | 10,858,280 | ||||||
|
| |||||||
Total China/Hong Kong | 2,133,446,283 | |||||||
|
| |||||||
| JAPAN: 31.2% | ||||||||
NTT DoCoMo, Inc. | 7,671,500 | 172,372,670 | ||||||
Seven & i Holdings Co., Ltd. | 3,733,500 | 162,239,644 | ||||||
Kao Corp. | 2,186,100 | 161,809,959 | ||||||
Hoya Corp. | 2,362,400 | 142,452,819 | ||||||
Pigeon Corp. | 3,077,300 | 131,255,148 | ||||||
Anritsu Corp.† | 9,384,700 | 129,966,714 | ||||||
Japan Tobacco, Inc. | 5,369,600 | 127,587,590 | ||||||
MISUMI Group, Inc. | 5,869,600 | 123,653,506 | ||||||
Nitori Holdings Co., Ltd. | 969,900 | 121,470,590 | ||||||
Rohm Co., Ltd. | 1,796,900 | 114,687,162 | ||||||
Fuji Seal International, Inc. | 2,621,000 | 92,384,407 | ||||||
Eiken Chemical Co., Ltd.† | 3,493,200 | 76,416,687 | ||||||
Nifco, Inc. | 2,943,300 | 69,634,917 | ||||||
BELLSYSTEM24 Holdings, Inc.† | 5,597,000 | 65,691,365 | ||||||
Outsourcing, Inc. | 5,932,400 | 56,738,739 | ||||||
Mitsubishi Pencil Co., Ltd. | 2,628,400 | 51,974,556 | ||||||
|
| |||||||
Total Japan | 1,800,336,473 | |||||||
|
| |||||||
| Shares | Value | |||||||
| SOUTH KOREA: 8.7% | ||||||||
Hyundai Mobis Co., Ltd. | 1,033,075 | $176,257,399 | ||||||
BGF Retail Co., Ltd.† | 961,660 | 175,532,359 | ||||||
Woori Bank | 5,472,430 | 76,525,882 | ||||||
Samsung Fire & Marine Insurance Co., Ltd. | 310,982 | 74,778,495 | ||||||
|
| |||||||
Total South Korea | 503,094,135 | |||||||
|
| |||||||
| TAIWAN: 4.5% | ||||||||
Taiwan Semiconductor Manufacturing Co., Ltd. | 13,740,469 | 100,386,761 | ||||||
Taiwan Semiconductor Manufacturing Co., Ltd. ADR | 2,362,340 | 87,193,969 | ||||||
China Steel Chemical Corp.† | 15,589,000 | 69,943,970 | ||||||
|
| |||||||
Total Taiwan | 257,524,700 | |||||||
|
| |||||||
| SINGAPORE: 3.8% | ||||||||
United Overseas Bank, Ltd. | 6,954,100 | 125,799,585 | ||||||
CapitaLand Retail China Trust REIT† | 49,800,000 | 49,706,389 | ||||||
Ascendas India Trust† | 57,863,800 | 45,851,208 | ||||||
|
| |||||||
Total Singapore | 221,357,182 | |||||||
|
| |||||||
| INDIA: 3.1% | ||||||||
ITC, Ltd. | 24,818,730 | 100,070,891 | ||||||
Minda Industries, Ltd.† | 13,962,765 | 64,533,029 | ||||||
Gujarat Pipavav Port, Ltd. | 10,652,487 | 15,648,719 | ||||||
|
| |||||||
Total India | 180,252,639 | |||||||
|
| |||||||
| INDONESIA: 2.0% | ||||||||
PT United Tractors | 46,212,800 | 87,977,741 | ||||||
PT Cikarang Listrindob,c | 477,480,200 | 29,484,985 | ||||||
|
| |||||||
Total Indonesia | 117,462,726 | |||||||
|
| |||||||
| AUSTRALIA: 1.6% | ||||||||
Breville Group, Ltd.† | 12,185,538 | 91,527,205 | ||||||
|
| |||||||
Total Australia | 91,527,205 | |||||||
|
| |||||||
| PHILIPPINES: 1.5% | ||||||||
Globe Telecom, Inc. | 2,442,785 | 88,060,194 | ||||||
|
| |||||||
Total Philippines | 88,060,194 | |||||||
|
| |||||||
| THAILAND: 1.5% | ||||||||
Thai Beverage Public Co., Ltd. | 189,041,400 | 84,743,725 | ||||||
|
| |||||||
Total Thailand | 84,743,725 | |||||||
|
| |||||||
| VIETNAM: 1.4% | ||||||||
Vietnam Dairy Products JSC | 15,017,385 | 77,892,692 | ||||||
|
| |||||||
Total Vietnam | 77,892,692 | |||||||
|
| |||||||
| BANGLADESH: 1.2% | ||||||||
GrameenPhone, Ltd. | 16,109,639 | 70,525,273 | ||||||
|
| |||||||
Total Bangladesh | 70,525,273 | |||||||
|
| |||||||
| TOTAL COMMON EQUITIES | 5,626,223,227 | |||||||
|
| |||||||
(Cost $5,171,528,760) | ||||||||
| 24 | MATTHEWS ASIA FUNDS |
Table of Contents
Matthews Asia Dividend Fund
December 31, 2018
Schedule of Investmentsa(continued)
PREFERRED EQUITIES: 2.2%
| Shares | Value | |||||||
| SOUTH KOREA: 2.2% | ||||||||
LG Chem, Ltd., Pfd. | 706,538 | $123,882,568 | ||||||
|
| |||||||
Total South Korea | 123,882,568 | |||||||
|
| |||||||
| TOTAL PREFERRED EQUITIES | 123,882,568 | |||||||
|
| |||||||
(Cost $71,218,508) | ||||||||
| TOTAL INVESTMENTS: 99.7% | 5,750,105,795 | |||||||
(Cost $5,242,747,268) | ||||||||
| CASH AND OTHER ASSETS, LESS LIABILITIES: 0.3% | 17,719,552 | |||||||
|
| |||||||
NET ASSETS: 100.0% | $5,767,825,347 | |||||||
|
| |||||||
| a | Certain securities were fair valued under the valuation policies approved by the Board of Trustees (Note2-A). |
| b | Security exempt from registration under Rule 144A of the Securities Act of 1933, as amended. The security may be resold in transactions exempt from registration normally to qualified institutional buyers. The security has been determined to be liquid in accordance with procedures adopted by the Funds’ Board of Trustees. At December 31, 2018, the aggregate value is $384,034,628, which is 6.66% of net assets. |
| c | The securities may be resold to qualified foreign investors and foreign institutional buyers under Regulation S of the Securities Act of 1933. |
| d | Non-income producing security. |
| † | Affiliated Issuer, as defined under the Investment Company Act of 1940 (ownership of 5% or more of the outstanding voting securities of this issuer) |
| ADR | American Depositary Receipt |
| JSC | Joint Stock Co. |
| Pfd. | Preferred |
| REIT | Real Estate Investment Trust |
See accompanying notes to financial statements.
| matthewsasia.com | 800.789.ASIA | 25 |
Table of Contents
| PORTFOLIO MANAGERS | ||||
| Sherwood Zhang, CFA | ||||
Lead Manager | ||||
| Yu Zhang, CFA | ||||
Co-Manager | ||||
| FUND FACTS | ||||
| Investor | Institutional | |||
Ticker | MCDFX | MICDX | ||
CUSIP | 577125305 | 577130735 | ||
Inception | 11/30/09 | 10/29/10 | ||
NAV | $14.32 | $14.32 | ||
Initial Investment | $2,500 | $100,000 | ||
Gross Expense Ratio1 | 1.15% | 1.01% | ||
Portfolio Statistics | ||||
Total # of Positions | 53 | |||
Net Assets | $269.7 million | |||
Weighted Average Market Cap | $38.1 billion | |||
Portfolio Turnover2 | 66.47% | |||
Benchmark | ||||
MSCI China Index | ||||
OBJECTIVE
Total return with an emphasis on providing current income.
STRATEGY
Under normal market conditions, the Fund seeks to achieve its investment objective by investing at least 80% of its net assets, which include borrowings for investment purposes, in dividend-paying equity securities of companies located in China. China includes its administrative and other districts, such as Hong Kong. The Fund may also invest in convertible debt and equity securities of companies located in China.
Portfolio Manager Commentary (unaudited)
For the year ending December 31, 2018, the Matthews China Dividend Fund returned –9.98% (Investor Class) and –9.83% (Institutional Class), while its benchmark, the MSCI China Index, fell –18.75%. For the fourth quarter, the Fund returned –6.94% (Investor Class) and –6.92% (Institutional Class) versus –10.73% for the Index. The Fund began 2018 with a share price of US$17.61 for both the Investor and Institutional Classes, and shareholders who were invested throughout the year would have received total distributions of approximately US$1.61 (Investor Class) or $1.64 (Institutional Class) per share.
Market Environment:
2018 was a year of turbulence for Chinese equities. Protracted U.S.–China trade tensions and rising U.S. interest rates became two significant overhangs for Chinese markets. In addition, China’s financial de-leveraging campaign, which is designed to rein in excessive shadow-banking activities and to reduce systemic risk, nevertheless caused a near-term economic slowdown. A further worsening of sentiment stemmed from policy flip-flops that left investors casting doubts on some industries, such as education services and pharmaceuticals, which have long been perceived as benefiting from China’s secular growth potential. Facing such external and internal headwinds, Chinese equity markets across domestic A-shares, listings in Hong Kong and U.S. American Depositary Receipts all suffered steep, double-digit losses.
Performance Contributors and Detractors:
Given the fragile market sentiment in 2018, those of our holdings that were in a good position to ensure earnings growth, generate healthy cash flow and maintain resilient balance sheets performed well during the downturn. Not surprisingly, the Fund’s top three performance contributors for the year, CITIC Telecom International Holdings, HKBN and China Gas Holdings, all shared these characteristics.
On the contrary, companies with shorter track records of being publicly listed, as well as those that faced uncertain regulatory environments, performed badly. Hope Education Group, the Fund’s top performance detractor, unfortunately fell into this category as it completed its IPO during the year. Its management team fell short in delivering on an acquisition that it had planned to complete before the IPO. This failure, combined with an uncertain regulatory environment for China’s private education industry, led to its shares being sold off aggressively. We are closely monitoring the situation.
On a sector basis, stock selection in the newly created communication services sector contributed most to relative performance. Shares of telecom operators CITIC Telecom International and HKBN outperformed those of internet service companies in the sector. In 2018, our stock selection in the energy sector posed a drag as two small-cap energy companies underperformed their larger peers. Our small-cap holdings overall for the year, however, generated significantly more relative positive performance than our larger-cap holdings. This highlighted that a total return approach can be beneficial in selecting attractive investment opportunities even when small-cap companies face a challenging market environment.
Notable Portfolio Changes:
During the fourth quarter, we switched out one Chinese property management company for another. We exited A-Living Services and initiated a position in China Overseas Property Holdings. As valuations for the two companies neared the same level, we felt compelled to swap holdings in favor of the company that we believe has more organic growth potential.
(continued)
| 1 | Actual 2018 expense ratio. |
| 2 | The lesser of fiscal year 2018 long-term purchase costs or sales proceeds divided by the average monthly market value of long-term securities. |
| 26 | MATTHEWS ASIA FUNDS |
Table of Contents
| PERFORMANCE AS OF DECEMBER 31, 2018 | ||||||||||||||||||||||||
|
|
| Average Annual Total Returns |
| |||||||||||||||||||||
| 3 Months | 1 Year | 3 Year | 5 Year | Since Inception | Inception Date | |||||||||||||||||||
| Investor Class (MCDFX) | -6.94% | -9.98% | 9.43% | 7.70% | 9.28% | 11/30/09 | ||||||||||||||||||
| Institutional Class (MICDX) | -6.92% | -9.83% | 9.60% | 7.87% | 8.12% | 10/29/10 | ||||||||||||||||||
| MSCI China Index3 | -10.73% | -18.75% | 8.23% | 4.86% | 3.75% | 4 | ||||||||||||||||||
Performance assumes reinvestment of all dividends and/or distributions before taxes. All performance quoted represents past performance and is no guarantee of future results. Investment return and principal value will fluctuate with market conditions so that when redeemed, shares may be worth more or less than their original cost. Current performance may be lower or higher than the return figures quoted. For the Fund’s most recent month-end performance, visit matthewsasia.com.
| INCOME DISTRIBUTION HISTORY | ||||||||||||||||||||||||||||
| 2018 | 2017 | |||||||||||||||||||||||||||
| June | December | Total | June | December | Total | |||||||||||||||||||||||
| Investor (MCDFX) | $ | 0.34 | $ | 0.06 | $ | 0.40 | $ | 0.20 | $ | 0.29 | $ | 0.49 | ||||||||||||||||
| Inst’l (MICDX) | $ | 0.36 | $ | 0.07 | $ | 0.43 | $ | 0.21 | $ | 0.30 | $ | 0.51 | ||||||||||||||||
Note: This table does not include capital gains distributions. Totals may differ by $0.01 due to rounding. For income distribution history, visit matthewsasia.com.
30-DAY YIELD:
2.51% (Investor Class) 2.51% (Institutional Class)
The 30-Day Yield represents net investment income earned by the Fund over the 30-day period ended 12/31/18, expressed as an annual percentage rate based on the Fund’s share price at the end of the 30-day period. The 30-Day Yield should be regarded as an estimate of the Fund’s rate of investment income, and it may not equal the Fund’s actual income distribution rate.
Source: BNY Mellon Investment Servicing (US) Inc. | DIVIDEND YIELD: 4.22%
The dividend yield (trailing) for the portfolio is the weighted average sum of the dividends paid by each equity security held by the Fund over the 12 months ended 12/31/18 divided by the current price of each equity as of 12/31/18. The annualized dividend yield for the Fund is for the equity-only portion of the portfolio. Please note that this is based on gross equity portfolio holdings and does not reflect the actual yield an investor in the Fund would receive. Past yields are no guarantee of future yields.
Source: FactSet Research Systems, Bloomberg, MICM. | |||
GROWTH OF A $10,000 INVESTMENT SINCE INCEPTION—INVESTOR CLASS
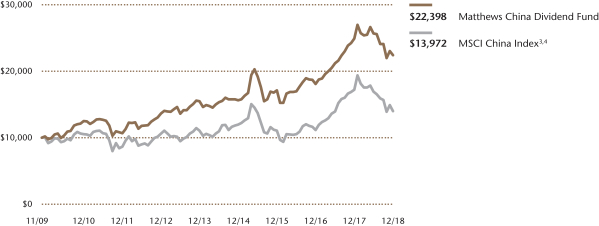
Plotted monthly. The performance data and graph do not reflect the deduction of taxes that a shareholder would pay on dividends, capital gains distributions or redemption of Fund shares. Values are in US$.
| 3 | It is not possible to invest directly in an index. Source: Index data from Morgan Stanley Capital International and Bloomberg; total return calculations performed by BNY Mellon Investment Servicing (US) Inc. Please see page 91 for index definition. |
| 4 | Calculated from 11/30/09. |
| TOP TEN HOLDINGS5 | ||||||||
| Sector | % of Net Assets | |||||||
| CITIC Telecom International Holdings, Ltd. | Communication Services | 4.0% | ||||||
| HKBN, Ltd. | Communication Services | 3.7% | ||||||
| Tencent Holdings, Ltd. | Communication Services | 3.6% | ||||||
| China Resources Power Holdings Co., Ltd. | Utilities | 3.2% | ||||||
| HSBC Holdings PLC | Financials | 3.0% | ||||||
| China Mobile, Ltd. | Communication Services | 3.0% | ||||||
| Bank of China, Ltd. | Financials | 2.8% | ||||||
| WH Group, Ltd. | Consumer Staples | 2.8% | ||||||
| China Petroleum & Chemical Corp. | Energy | 2.7% | ||||||
| Inner Mongolia Yili Industrial Group Co., Ltd. | Consumer Staples | 2.7% | ||||||
| % OF ASSETS IN TOP TEN | 31.5% | |||||||
| 5 | Holdings may combine more than one security from same issuer and related depositary receipts. |
| matthewsasia.com | 800.789.ASIA | 27 |
Table of Contents
| COUNTRY ALLOCATION (%)6,7 | ||||
| China/Hong Kong | 92.8 | |||
| Taiwan | 3.7 | |||
| Singapore | 2.2 | |||
| Cash and Other Assets, Less Liabilities | 1.2 | |||
SECTOR ALLOCATION (%)7 | ||||
| Communication Services | 14.3 | |||
| Consumer Discretionary | 13.2 | |||
| Industrials | 12.6 | |||
| Financials | 12.4 | |||
| Consumer Staples | 12.1 | |||
| Real Estate | 6.5 | |||
| Information Technology | 6.4 | |||
| Health Care | 6.3 | |||
| Materials | 5.6 | |||
| Utilities | 5.1 | |||
| Energy | 4.4 | |||
| Cash and Other Assets, Less Liabilities | 1.2 | |||
MARKET CAP EXPOSURE (%)7 | ||||
| Mega Cap (over $25B) | 17.2 | |||
| Large Cap ($10B–$25B) | 9.4 | |||
| Mid Cap ($3B–10B) | 17.1 | |||
| Small Cap (under $3B) | 55.1 | |||
| Cash and Other Assets, Less Liabilities | 1.2 | |||
| 6 | Not all countries where the Fund may invest are included in the benchmark index. |
| 7 | Source: FactSet Research Systems. Percentage values in data are rounded to the nearest tenth of one percent, so the values may not sum to 100% due to rounding. Percentage values may be derived from different data sources and may not be consistent with other Fund literature. |
Matthews China Dividend Fund
Portfolio Manager Commentary (unaudited) (continued)
In addition, we exited a few positions, including Sporton International and China Aviation Oil, as their total return potential no longer met our criteria.
Outlook:
Near-term market volatility is likely to remain elevated as investors grapple with a decelerating Chinese economy and a possible slowdown in U.S. GDP growth. Ironically, such reversals in growth trajectories might pave the way for removing two large external overhangs for Chinese equities—a full-blown trade war between China and the U.S. and U.S. dollar strength driven by monetary tightening. A dimmer growth outlook in China and the U.S. could add both incentive and a sense of urgency for the two nations to reach a deal. While the struggle between China and the U.S. goes well beyond just trade issues, a compromise that averts an all-out trade war could still significantly reduce market uncertainty. Similarly, if the U.S. dollar starts to weaken on the back of less hawkish U.S. Federal Reserve policy, emerging markets, led by China, could also start to recover. Chinese policymakers have already prioritized the stabilization of the country’s economic growth with both fiscal policy support and more accommodating monetary conditions. A combination of the above policy outcome, together with a Chinese equity valuation that is already well below its long-term average after the 2018 sell-off, could set the stage for an equity market recovery.
| 28 | MATTHEWS ASIA FUNDS |
Table of Contents
Matthews China Dividend Fund
December 31, 2018
Schedule of Investmentsa
COMMON EQUITIES: 98.7%
| Shares | Value | |||||||
| COMMUNICATION SERVICES: 14.3% | ||||||||
Diversified Telecommunication Services: 7.7% |
| |||||||
CITIC Telecom International Holdings, Ltd. | 30,357,000 | $10,653,184 | ||||||
HKBN, Ltd. | 6,669,457 | 10,111,174 | ||||||
|
| |||||||
| 20,764,358 | ||||||||
|
| |||||||
Interactive Media & Services: 3.6% | ||||||||
Tencent Holdings, Ltd. | 242,300 | 9,711,469 | ||||||
|
| |||||||
Wireless Telecommunication Services: 3.0% | ||||||||
China Mobile, Ltd. ADR | 169,130 | 8,118,240 | ||||||
|
| |||||||
Total Communication Services | 38,594,067 | |||||||
|
| |||||||
| CONSUMER DISCRETIONARY: 13.1% | ||||||||
Textiles, Apparel & Luxury Goods: 6.3% | ||||||||
Nan Liu Enterprise Co., Ltd. | 993,000 | 5,055,931 | ||||||
Pacific Textiles Holdings, Ltd. | 4,597,000 | 4,085,401 | ||||||
HLA Corp., Ltd. A Shares | 2,443,388 | 3,024,347 | ||||||
Crystal International Group, Ltd.b,c | 5,330,500 | 2,704,612 | ||||||
HLA Corp., Ltd. A Shares | 1,699,224 | 2,102,449 | ||||||
|
| |||||||
| 16,972,740 | ||||||||
|
| |||||||
Hotels, Restaurants & Leisure: 5.9% | ||||||||
Café de Coral Holdings, Ltd. | 2,044,000 | 4,949,885 | ||||||
Shanghai Jin Jiang International Hotels Group Co., Ltd. H Shares | 17,454,000 | 4,225,105 | ||||||
China International Travel Service Corp., Ltd. A Shares | 313,954 | 2,757,024 | ||||||
China International Travel Service Corp., Ltd. A Shares | 311,284 | 2,732,542 | ||||||
Haichang Ocean Park Holdings, Ltd.b,c,d | 6,266,000 | 1,257,625 | ||||||
|
| |||||||
| 15,922,181 | ||||||||
|
| |||||||
Diversified Consumer Services: 0.9% | ||||||||
Hope Education Group Co., Ltd.b,c,d | 22,788,000 | 2,487,237 | ||||||
|
| |||||||
Total Consumer Discretionary | 35,382,158 | |||||||
|
| |||||||
| INDUSTRIALS: 12.6% | ||||||||
Transportation Infrastructure: 4.6% | ||||||||
Guangdong Provincial Expressway Development Co., Ltd. B Shares | 8,336,021 | 6,360,287 | ||||||
Xiamen International Airport Co., Ltd. A Shares | 1,948,410 | 6,049,093 | ||||||
|
| |||||||
| 12,409,380 | ||||||||
|
| |||||||
Machinery: 4.0% | ||||||||
Yangzijiang Shipbuilding Holdings, Ltd. | 7,038,000 | 6,466,812 | ||||||
Shanghai Mechanical and Electrical Industry Co., Ltd. B Shares | 2,616,675 | 4,412,546 | ||||||
|
| |||||||
| 10,879,358 | ||||||||
|
| |||||||
Marine: 2.1% | ||||||||
SITC International Holdings Co., Ltd. | 5,940,000 | 5,598,952 | ||||||
|
| |||||||
Commercial Services & Supplies: 1.9% | ||||||||
Sunny Friend Environmental Technology Co., Ltd. | 758,000 | 5,029,672 | ||||||
|
| |||||||
Total Industrials | 33,917,362 | |||||||
|
| |||||||
| Shares | Value | |||||||
| FINANCIALS: 12.4% | ||||||||
Banks: 7.4% |
| |||||||
HSBC Holdings PLC | 988,800 | $8,158,980 | ||||||
Bank of China, Ltd. H Shares | 17,440,000 | 7,518,427 | ||||||
Dah Sing Financial Holdings, Ltd. | 816,800 | 4,038,327 | ||||||
Postal Savings Bank of China Co., Ltd. H Sharesb,c | 623,000 | 328,118 | ||||||
|
| |||||||
| 20,043,852 | ||||||||
|
| |||||||
Insurance: 2.9% | ||||||||
Ping An Insurance Group Co. of China, Ltd. H Shares | 597,500 | 5,271,155 | ||||||
Fanhua, Inc. ADR | 108,200 | 2,374,990 | ||||||
|
| |||||||
| 7,646,145 | ||||||||
|
| |||||||
Capital Markets: 2.1% | ||||||||
China International Capital Corp., Ltd. H Sharesb,c | 3,033,600 | 5,680,801 | ||||||
|
| |||||||
Total Financials | 33,370,798 | |||||||
|
| |||||||
| CONSUMER STAPLES: 12.1% | ||||||||
Food Products: 7.3% | ||||||||
WH Group, Ltd.b,c | 9,750,500 | 7,488,843 | ||||||
Inner Mongolia Yili Industrial Group Co., Ltd. A Shares | 2,147,111 | 7,171,135 | ||||||
Nissin Foods Co., Ltd. | 11,147,000 | 5,118,302 | ||||||
|
| |||||||
| 19,778,280 | ||||||||
|
| |||||||
Food & Staples Retailing: 3.1% | ||||||||
Sun Art Retail Group, Ltd. | 6,749,000 | 6,863,288 | ||||||
Shanghai Bailian Group Co., Ltd. B Shares | 1,543,974 | 1,490,795 | ||||||
|
| |||||||
| 8,354,083 | ||||||||
|
| |||||||
Personal Products: 1.7% | ||||||||
Chlitina Holding, Ltd. | 542,000 | 4,564,427 | ||||||
|
| |||||||
Total Consumer Staples | 32,696,790 | |||||||
|
| |||||||
| REAL ESTATE: 6.5% | ||||||||
Real Estate Management & Development: 4.3% |
| |||||||
China Jinmao Holdings Group, Ltd. | 13,624,000 | 6,133,758 | ||||||
China Overseas Property Holdings, Ltd. | 18,085,000 | 5,282,462 | ||||||
|
| |||||||
| 11,416,220 | ||||||||
|
| |||||||
Equity REITs: 2.2% | ||||||||
CapitaLand Retail China Trust, REIT | 6,011,300 | 6,000,000 | ||||||
|
| |||||||
Total Real Estate | 17,416,220 | |||||||
|
| |||||||
| INFORMATION TECHNOLOGY: 6.4% | ||||||||
Software: 2.4% | ||||||||
Shanghai Baosight Software Co., Ltd. B Shares | 3,849,918 | 6,559,179 | ||||||
|
| |||||||
IT Services: 2.3% | ||||||||
SUNeVision Holdings, Ltd. | 10,235,000 | 6,073,286 | ||||||
|
| |||||||
Semiconductors & Semiconductor Equipment: 1.7% |
| |||||||
Hua Hong Semiconductor, Ltd.b,c | 2,473,000 | 4,572,768 | ||||||
|
| |||||||
Total Information Technology | 17,205,233 | |||||||
|
| |||||||
| matthewsasia.com | 800.789.ASIA | 29 |
Table of Contents
Matthews China Dividend Fund
December 31, 2018
Schedule of Investmentsa(continued)
| COMMON EQUITIES(continued) | CONVERTIBLE CORPORATE BONDS: 0.1% |
| Shares | Value | |||||||
| HEALTH CARE: 6.3% | ||||||||
Health Care Providers & Services: 3.0% | ||||||||
Genertec Universal Medical Group Co., Ltd.b,c | 7,541,000 | $5,638,676 | ||||||
China National Accord Medicines Corp., Ltd. B Shares | 715,033 | 2,386,650 | ||||||
|
| |||||||
| 8,025,326 | ||||||||
|
| |||||||
Pharmaceuticals: 1.5% | ||||||||
Tianjin ZhongXin Pharmaceutical Group Corp., Ltd. S Shares | 4,698,300 | 3,996,844 | ||||||
|
| |||||||
Life Sciences Tools & Services: 0.9% | ||||||||
BBI Life Sciences Corp.c | 8,710,500 | 2,553,527 | ||||||
|
| |||||||
Biotechnology: 0.9% | ||||||||
Shanghai Haohai Biological Technology Co., Ltd. H Sharesb,c | 491,400 | 2,444,092 | ||||||
|
| |||||||
Total Health Care | 17,019,789 | |||||||
|
| |||||||
| MATERIALS: 5.6% | ||||||||
Containers & Packaging: 3.9% | ||||||||
Greatview Aseptic Packaging Co., Ltd. | 10,610,000 | 5,781,062 | ||||||
CPMC Holdings, Ltd. | 9,610,000 | 4,603,006 | ||||||
|
| |||||||
| 10,384,068 | ||||||||
|
| |||||||
Construction Materials: 1.7% | ||||||||
Huaxin Cement Co., Ltd. B Shares | 2,754,897 | 4,707,417 | ||||||
|
| |||||||
Total Materials | 15,091,485 | |||||||
|
| |||||||
| UTILITIES: 5.1% | ||||||||
Independent Power and Renewable Electricity Producers: 3.2% |
| |||||||
China Resources Power Holdings Co., Ltd. | 4,500,000 | 8,655,456 | ||||||
|
| |||||||
Gas Utilities: 1.9% | ||||||||
China Gas Holdings, Ltd. | 1,423,400 | 5,075,552 | ||||||
|
| |||||||
Total Utilities | 13,731,008 | |||||||
|
| |||||||
| ENERGY: 4.3% | ||||||||
Oil, Gas & Consumable Fuels: 4.3% | ||||||||
China Petroleum & Chemical Corp. H Shares | 10,234,000 | 7,294,898 | ||||||
Sinopec Kantons Holdings, Ltd. | 10,032,000 | 4,436,063 | ||||||
|
| |||||||
Total Energy | 11,730,961 | |||||||
|
| |||||||
| TOTAL COMMON EQUITIES | 266,155,871 | |||||||
|
| |||||||
(Cost $280,877,944) | ||||||||
| Face Amount | Value | |||||||
| CONSUMER DISCRETIONARY: 0.1% | ||||||||
Textiles, Apparel & Luxury Goods: 0.1% |
| |||||||
HLA Corp Ltd., Cnv. STEP | ||||||||
0.300%, 07/12/2024 | CNY 1,361,000 | $194,441 | ||||||
|
| |||||||
Total Consumer Discretionary | 194,441 | |||||||
|
| |||||||
| TOTAL CONVERTIBLE CORPORATE BONDS |
| 194,441 | ||||||
|
| |||||||
(Cost $203,420) | ||||||||
| TOTAL INVESTMENTS: 98.8% | 266,350,312 | |||||||
(Cost $281,081,364) | ||||||||
| CASH AND OTHER ASSETS, LESS LIABILITIES: 1.2% | 3,309,009 | |||||||
|
| |||||||
NET ASSETS: 100.0% | $269,659,321 | |||||||
|
| |||||||
| a | Certain securities were fair valued under the valuation policies approved by the Board of Trustees (Note2-A). |
| b | Security exempt from registration under Rule 144A of the Securities Act of 1933, as amended. The security may be resold in transactions exempt from registration normally to qualified institutional buyers. The security has been determined to be liquid in accordance with procedures adopted by the Funds’ Board of Trustees. At December 31, 2018, the aggregate value is $32,602,772, which is 12.09% of net assets. |
| c | The securities may be resold to qualified foreign investors and foreign institutional buyers under Regulation S of the Securities Act of 1933. |
| d | Non-income producing security. |
| ADR | American Depositary Receipt |
| Cnv. | Convertible |
| CNY | Chinese Renminbi (Yuan) |
| REIT | Real Estate Investment Trust |
| STEP | Step-up coupon |
See accompanying notes to financial statements.
| 30 | MATTHEWS ASIA FUNDS |
Table of Contents

| PORTFOLIO MANAGERS | ||||
| Beini Zhou, CFA | ||||
Lead Manager | ||||
| Michael B. Han, CFA | ||||
Co-Manager | ||||
| FUND FACTS | ||||
| Investor | Institutional | |||
Ticker | MAVRX | MAVAX | ||
CUSIP | 577130693 | 577130685 | ||
Inception | 11/30/15 | 11/30/15 | ||
NAV | $10.86 | $10.78 | ||
Initial Investment | $2,500 | $100,000 | ||
Gross Expense Ratio1 | 1.77% | 1.54% | ||
After Fee Waiver and Reimbursement2 | 1.50% | 1.25% | ||
Portfolio Statistics | ||||
Total # of Positions | 37 | |||
Net Assets | $23.2 million | |||
Weighted Average Market Cap | $15.5 billion | |||
Portfolio Turnover3 | 48.29% | |||
Benchmark | ||||
MSCI AC Asia ex Japan Index | ||||
OBJECTIVE
Long-term capital appreciation.
STRATEGY
Under normal market conditions, the Fund seeks to achieve its investment objective by investing at least 80% of its net assets, which include borrowings for investment purposes, in common stock, preferred stock and other equity securities, and convertible securities of companies located in Asia. The Fund seeks to create an investable universe of value companies that it believes trade at market values with discounts to their intrinsic value, have strong financial and market positions, have strong management and are oriented to creating value for their shareholders. Matthews assesses companies within this universe according to each of these factors.
Portfolio Manager Commentary (unaudited)
For the year ending December 31, 2018, the Matthews Asia Value Fund returned –10.93% (Investor Class) and –10.65% (Institutional Class), while its benchmark, the MSCI All Country Asia ex Japan Index, returned –14.12%. For the fourth quarter, the Fund returned –8.06% (Investor Class) and –7.98% (Institutional Class) versus –8.60% for the Index.
Market Environment:
Volatility returned with a vengeance globally in 2018. A U.S. market rout in early February gave an early sign of what was to come. Global markets subsequently appeared to trade on news flows related to U.S.–China trade tensions and U.S. Federal Reserve remarks on interest rates. In early December, on the same day that Presidents Trump and Xi apparently made progress during their Argentina summit on the U.S.–China trade dispute, the CFO of China’s Huawei Technologies was reportedly arrested in a Canadian airport at the request of the U.S. This threw a wrench into the anticipated thawing of the bilateral trade row. A few weeks later, the Fed hiked interest rates by another 25 basis points (0.25%) while appearing less dovish than what the market expected. One event after another sent the global stock market into a tailspin toward year-end. In a telling sign, the S&P 500 Index seesawed between gains and losses more than a dozen times within a single day, December 28.
Performance Contributors and Detractors:
Our overweight in South Korea hurt the Fund’s performance in the year since the South Korean market was one of the worst-performing markets in Asia. Nonetheless, thanks to bottom-up stock selection, the Fund outperformed its benchmark by more than three percentage points for the year.
Clear Media was the biggest contributor in the fourth quarter. Shares of Clear Media, China’s largest bus shelter advertising company, finally resumed trading in the fourth quarter after being suspended for seven and a half months. The firm concluded its independent investigation and implemented remedial measures to tighten its internal control process as a prerequisite to resume trading. Crucially, there were no negative findings on the integrity of senior management. The incident that led to the trading suspension was due to a few rogue junior-level employees, who misappropriated money from the company around 2010. Since trading resumed, the firm’s share price recovered to above the level at which it was when trading was suspended.
Yamada Consulting Group was the biggest detractor in the quarter. The management consulting company, serving small- and medium-size enterprises (SMEs) in Japan, reported weak earnings in the quarter. The company still expected to meet its full year guidance but revenues and profits are expected to concentrate in the final quarter of the fiscal year, which ends in March. Its share price fell sharply in the fourth quarter and we added to the position when it dropped to approximately 8X earnings before interest and taxes (EBIT).
Notable Portfolio Changes:
We continued to consolidate the portfolio and upgrade its overall quality by taking advantage of market volatility. We exited seven companies, initiated positions in three companies, and thus ended the quarter with fewer than 40 companies. One
(continued)
| 1 | Actual 2018 expense ratios. |
| 2 | Matthews has contractually agreed (i) to waive fees and reimburse expenses to the extent needed to limit Total Annual Fund Operating Expenses (excluding Rule 12b-1 fees, taxes, interest, brokerage commissions, short sale dividend expenses, expenses incurred in connection with any merger or reorganization or extraordinary expenses such as litigation) of the Institutional Class to 1.25% first by waiving class specific expenses (i.e., shareholder service fees specific to a particular class) of the Institutional Class and then, to the extent necessary, by waiving non-class specific expenses of the Institutional Class, and (ii) if any Fund-wide expenses (i.e., expenses that apply to both the Institutional Class and the Investor Class) are waived for the Institutional Class to maintain the 1.25% expense limitation, to waive an equal amount (in annual percentage terms) of those same expenses for the Investor Class. The Total Annual Fund Operating Expenses After Fee Waiver and Expense Reimbursement for the Investor Class may vary from year to year and will in some years exceed 1.25%. If the operating expenses fall below the expense limitation in a year within three years after Matthews has made a waiver or reimbursement, the Fund may reimburse Matthews up to an amount that does not cause the expenses for that year to exceed the lesser of (i) the expense limitation applicable at the time of that fee waiver and/or expense reimbursement or (ii) the expense limitation in effect at the time of recoupment. This agreement will remain in place until April 30, 2019 and may be terminated at any time by the Board of Trustees on behalf of the Fund on 60 days’ written notice to Matthews. Matthews may decline to renew this agreement by written notice to the Trust at least 30 days before its annual expiration date. |
| 3 | The lesser of fiscal year 2018 long-term purchase costs or sales proceeds divided by the average monthly market value of long-term securities. |
| matthewsasia.com | 800.789.ASIA | 31 |
Table of Contents
| PERFORMANCE AS OF DECEMBER 31, 2018 | ||||||||||||||||||||
|
|
| Average Annual Total Returns |
| |||||||||||||||||
| 3 Months | 1 Year | 3 Years | Since Inception | Inception Date | ||||||||||||||||
| Investor Class (MAVRX) | -8.06% | -10.93% | 9.21% | 8.47% | 11/30/15 | |||||||||||||||
| Institutional Class (MAVAX) | -7.98% | -10.65% | 9.48% | 8.75% | 11/30/15 | |||||||||||||||
| MSCI AC Asia ex Japan Index4 | -8.60% | -14.12% | 8.87% | 8.47% | ||||||||||||||||
Performance assumes reinvestment of all dividends and/or distributions before taxes. All performance quoted represents past performance and is no guarantee of future results. Investment return and principal value will fluctuate with market conditions so that when redeemed, shares may be worth more or less than their original cost. Current performance may be lower or higher than the return figures quoted. Returns would have been lower if certain of the Fund’s fees and expenses had not been waived. For the Fund’s most recent month-end performance visit matthewsasia.com.
GROWTH OF A $10,000 INVESTMENT SINCE INCEPTION—INVESTOR CLASS
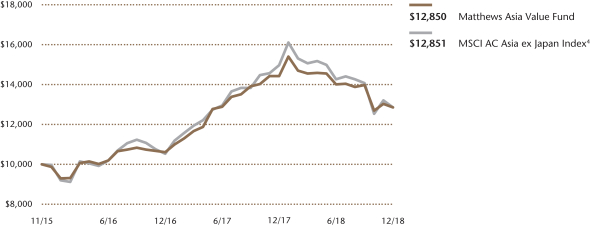
Plotted monthly. The performance data and graph do not reflect the deduction of taxes that a shareholder would pay on dividends, capital gain distributions or redemption of Fund shares. Values are in US$.
| 4 | It is not possible to invest directly in an index. Source: Index data from Morgan Stanley Capital International and Bloomberg; total return calculations performed by BNY Mellon Investment Servicing (US) Inc. Please see page 91 for index definition. |
| TOP TEN HOLDINGS5 | ||||||||
| Sector | Country | % of Net Assets | ||||||
| China National Accord Medicines Corp., Ltd. | Health Care | China/Hong Kong | 5.0% | |||||
| MPHB Capital BHD | Financials | Malaysia | 4.9% | |||||
| Clear Media, Ltd. | Communication Services | China/Hong Kong | 4.7% | |||||
| CK Hutchison Holdings, Ltd. | Industrials | China/Hong Kong | 4.4% | |||||
| Samsung SDI Co., Ltd., Pfd. | Information Technology | South Korea | 3.9% | |||||
| Straits Trading Co., Ltd. | Materials | Singapore | 3.0% | |||||
| Shinyoung Securities Co., Ltd. | Financials | South Korea | 2.8% | |||||
| China Mobile, Ltd. | Communication Services | China/Hong Kong | 2.7% | |||||
| Haw Par Corp., Ltd. | Health Care | Singapore | 2.7% | |||||
| Geumhwa PSC Co., Ltd. | Industrials | South Korea | 2.4% | |||||
| % OF ASSETS IN TOP TEN | 36.5% | |||||||
| 5 | Holdings may combine more than one security from same issuer and related depositary receipts. |
| 32 | MATTHEWS ASIA FUNDS |
Table of Contents
Matthews Asia Value Fund
Portfolio Manager Commentary (unaudited) (continued)
of the three we bought in the quarter was Cognizant Technology Solutions, an IT service provider in which we successfully invested in the past and exited in the second half of 2017. Its share price recently corrected along with the market so we picked it up again at low-teen times free cash flow (FCF).
We initiated a position in Naver, the dominant search engine in South Korea. Its recent earnings growth has been disappointing primarily because its consolidated subsidiary Line, the dominant messaging app in Japan, has been investing in payment-related growth initiatives, which in the short term is depressing its reported profit. Line is listed in Japan and Naver’s roughly 70% stake in Line is now valued at around US$5 billion. We bought shares of Naver at a price that implied a no higher than mid-teen times earnings multiple for its core Korean internet powerhouse business, even if we assigned zero value to its stake in Line. We exited Baidu, the dominant search engine in China, earlier in the year after a successful investment. Valuation-wise, Baidu is no more expensive than Naver, which begs the question: why Naver but not Baidu in our portfolio? We believe that Naver in South Korea is far more competitively positioned than Baidu in China since in South Korea there are no equivalents of dominant digital platforms like Tencent and Alibaba that pose significant competitive threats to Baidu.
Unlike some orthodox value investors, we have no reservations about investing in the technology sector. We have a technology background both academically and professionally, which helps in evaluating the sector. We apply our existing valuation framework to technology stocks. We have studied many technology companies in Asia and have a buy price for some of them on our watch list. We are being patient and waiting for what we believe is the right entry point, just like we did with Baidu two years ago, South-Africa-based media conglomerate Naspers in the third quarter and Naver in the fourth quarter.
Outlook:
The markets and media continue to pay close attention to the U.S.–China trade dispute. But we believe the markets are missing the true elephant in the room—that is, the U.S. and China are undeniably and increasingly competing on multiple fronts, including but not limited to trade, that require both sides to make tactical as well as strategic moves for many years to come. The differences between China and the U.S. are deeply rooted and, to a great degree, cultural in nature. Therefore, any short-term trade resolution announcement in the next few months is unlikely to be anything more than a quick fix.
As long-term value investors, we are happy in some way to see the market distracted by the U.S.–China trade dispute. We view it as little more than a side show because the resulting volatility has created undervalued opportunities for us that would not be available otherwise. We remain focused on bottom-up stock selection and on judging whether recent share price drops on many of those stocks have more than discounted potential upcoming earnings-related bad news.
The Fund recently hit its three-year anniversary. From 2016 through 2018, our Fund returns slightly beat the benchmark at 9.2% versus an 8.9% compound annual growth rate (CAGR) for its benchmark, the MSCI All Country Asia ex Japan Index. This was even with the total return of the S&P 500 Index. We are encouraged by the performance, considering that the value investing style has been deeply out of favor globally in recent years. While cognizant of macro factors, we are 100% bottom-up stock pickers. Looking at the Fund from a top-down country or sector asset allocation perspective, it could hardly get any worse. Nonetheless, good bottom-up stock picking has more than offset top-down headwinds. We believe the Fund has so far delivered what a value strategy is supposed to deliver—outperformance in weak markets (2016 and 2018) while not lagging too much in a bull market (2017). We remain confident that stock-by-stock value investing very much works in Asia.
| COUNTRY ALLOCATION (%)6,7 | ||||
| China/Hong Kong | 30.9 | |||
| South Korea | 22.7 | |||
| Japan | 8.8 | |||
| Malaysia | 6.3 | |||
| Singapore | 5.7 | |||
| Taiwan | 1.4 | |||
| United States | 1.4 | |||
| India | 0.7 | |||
| Cash and Other Assets, Less Liabilities | 22.1 | |||
| SECTOR ALLOCATION (%)7 | ||||
| Health Care | 13.0 | |||
| Industrials | 12.6 | |||
| Financials | 12.2 | |||
| Communication Services | 11.1 | |||
| Consumer Discretionary | 9.1 | |||
| Information Technology | 7.9 | |||
| Consumer Staples | 7.0 | |||
| Materials | 5.0 | |||
| Cash and Other Assets, Less Liabilities | 22.1 | |||
| MARKET CAP EXPOSURE (%)7 | ||||
| Mega Cap (over $25B) | 12.8 | |||
| Large Cap ($10B–$25B) | 8.2 | |||
| Mid Cap ($3B–10B) | 9.6 | |||
| Small Cap (under $3B) | 47.3 | |||
| Cash and Other Assets, Less Liabilities | 22.1 | |||
| 6 | Not all countries where the Fund may invest are included in the benchmark index. |
| 7 | Source: FactSet Research Systems. Percentage values in data are rounded to the nearest tenth of one percent, so the values may not sum to 100% due to rounding. Percentage values may be derived from different data sources and may not be consistent with other Fund literature. |
| matthewsasia.com | 800.789.ASIA | 33 |
Table of Contents
Matthews Asia Value Fund
December 31, 2018
Schedule of Investmentsa
COMMON EQUITIES: 69.9%
| Shares | Value | |||||||
| CHINA/HONG KONG: 30.9% | ||||||||
China National Accord Medicines Corp., Ltd. B Shares | 348,607 | $1,163,587 | ||||||
Clear Media, Ltd. | 1,393,000 | 1,086,933 | ||||||
CK Hutchison Holdings, Ltd. | 107,000 | 1,027,009 | ||||||
China Mobile, Ltd. | 65,500 | 633,817 | ||||||
Naspers, Ltd. N Shares ADR | 13,000 | 515,515 | ||||||
Anhui Gujing Distillery Co., Ltd. B Shares | 102,900 | 512,424 | ||||||
China Isotope & Radiation Corp. | 251,800 | 499,077 | ||||||
Huifu Payment, Ltd.b,c,d | 1,062,000 | 437,454 | ||||||
Nissin Foods Co., Ltd. | 783,000 | 359,525 | ||||||
Shandong Weigao Group Medical Polymer Co., Ltd. H Shares | 296,000 | 239,116 | ||||||
Huangshan Tourism Development Co., Ltd. B Shares | 161,487 | 195,344 | ||||||
Goldlion Holdings, Ltd. | 496,000 | 195,094 | ||||||
COSCO SHIPPING International Hong Kong Co., Ltd. | 568,000 | 195,012 | ||||||
PW Medtech Group, Ltd.c | 818,000 | 106,422 | ||||||
|
| |||||||
Total China/Hong Kong | 7,166,329 | |||||||
|
| |||||||
| SOUTH KOREA: 14.7% | ||||||||
Shinyoung Securities Co., Ltd. | 12,323 | 653,547 | ||||||
Geumhwa PSC Co., Ltd. | 20,901 | 558,056 | ||||||
DGB Financial Group, Inc. | 73,827 | 549,956 | ||||||
Hyundai Greenfood Co., Ltd. | 37,451 | 480,015 | ||||||
Young Poong Corp. | 697 | 464,400 | ||||||
Samho Development Co., Ltd. | 81,436 | 368,312 | ||||||
NAVER Corp. | 3,110 | 340,843 | ||||||
|
| |||||||
Total South Korea | 3,415,129 | |||||||
|
| |||||||
| JAPAN: 8.8% | ||||||||
YAMADA Consulting Group Co., Ltd. | 29,100 | 440,830 | ||||||
Medikit Co., Ltd. | 7,400 | 374,230 | ||||||
Honma Golf, Ltd.b,d | 311,000 | 358,033 | ||||||
Asante, Inc. | 16,500 | 300,956 | ||||||
Ohashi Technica, Inc. | 27,300 | 288,722 | ||||||
San-A Co., Ltd. | 7,100 | 268,436 | ||||||
|
| |||||||
Total Japan | 2,031,207 | |||||||
|
| |||||||
| MALAYSIA: 6.3% | ||||||||
MPHB Capital BHDc | 4,317,000 | 1,147,684 | ||||||
Genting BHD | 212,500 | 313,497 | ||||||
|
| |||||||
Total Malaysia | 1,461,181 | |||||||
|
| |||||||
| SINGAPORE: 5.7% | ||||||||
Straits Trading Co., Ltd. | 459,600 | 689,571 | ||||||
Haw Par Corp., Ltd. | 70,900 | 625,274 | ||||||
|
| |||||||
Total Singapore | 1,314,845 | |||||||
|
| |||||||
| TAIWAN: 1.4% | ||||||||
P-Duke Technology Co., Ltd. | 133,000 | 329,387 | ||||||
|
| |||||||
Total Taiwan | 329,387 | |||||||
|
| |||||||
| UNITED STATES: 1.4% | ||||||||
Cognizant Technology Solutions Corp. Class A | 5,100 | 323,748 | ||||||
|
| |||||||
Total United States | 323,748 | |||||||
|
| |||||||
| Shares | Value | |||||||
| INDIA: 0.7% | ||||||||
Wipro, Ltd. | 36,722 | $173,781 | ||||||
|
| |||||||
Total India | 173,781 | |||||||
|
| |||||||
| TOTAL COMMON EQUITIES | 16,215,607 | |||||||
|
| |||||||
(Cost $17,756,220) | ||||||||
PREFERRED EQUITIES: 8.0% | ||||||||
| SOUTH KOREA: 8.0% | ||||||||
Samsung SDI Co., Ltd., Pfd. | 11,654 | 901,739 | ||||||
Samsung Fire & Marine Insurance Co., Ltd., Pfd. | 3,133 | 487,583 | ||||||
Hyundai Motor Co., Ltd., 2nd Pfd. | 6,764 | 466,751 | ||||||
|
| |||||||
Total South Korea | 1,856,073 | |||||||
|
| |||||||
| TOTAL PREFERRED EQUITIES | 1,856,073 | |||||||
|
| |||||||
(Cost $2,034,097) | ||||||||
| TOTAL INVESTMENTS: 77.9% | 18,071,680 | |||||||
(Cost $19,790,317) | ||||||||
| CASH AND OTHER ASSETS, LESS LIABILITIES: 22.1% | 5,123,329 | |||||||
|
| |||||||
NET ASSETS: 100.0% | $23,195,009 | |||||||
|
| |||||||
| a | Certain securities were fair valued under the valuation policies approved by the Board of Trustees (Note2-A). |
| b | Security exempt from registration under Rule 144A of the Securities Act of 1933, as amended. The security may be resold in transactions exempt from registration normally to qualified institutional buyers. The security has been determined to be liquid in accordance with procedures adopted by the Funds’ Board of Trustees. At December 31, 2018, the aggregate value is $795,487, which is 3.43% of net assets. |
| c | Non-income producing security. |
| d | The securities may be resold to qualified foreign investors and foreign institutional buyers under Regulation S of the Securities Act of 1933. |
| ADR | American Depositary Receipt |
| BHD | Berhad |
| Pfd. | Preferred |
See accompanying notes to financial statements.
| 34 | MATTHEWS ASIA FUNDS |
Table of Contents

| PORTFOLIO MANAGERS | ||||
| Kenneth Lowe, CFA | ||||
Lead Manager | ||||
| S. Joyce Li, CFA | ||||
Co-Manager | ||||
| FUND FACTS | ||||
| Investor | Institutional | |||
Ticker | MAFSX | MIFSX | ||
CUSIP | 577125701 | 577125800 | ||
Inception | 4/30/13 | 4/30/13 | ||
NAV | $9.26 | $9.27 | ||
Initial Investment | $2,500 | $100,000 | ||
Gross Expense Ratio1 | 3.18% | 2.98% | ||
After Fee Waiver and Reimbursement2 | 1.50% | 1.25% | ||
Portfolio Statistics | ||||
Total # of Positions | 35 | |||
Net Assets | $6.6 million | |||
Weighted Average Market Cap | $68.1 billion | |||
Portfolio Turnover3 | 29.42% | |||
Benchmark | ||||
MSCI AC Asia ex Japan Index | ||||
OBJECTIVE
Long-term capital appreciation.
STRATEGY
Under normal market conditions, the Fund seeks to achieve its investment objective by investing at least 80% of its net assets, which include borrowings for investment purposes, in the common and preferred stocks of companies located in Asia ex Japan, which consists of all countries and markets in Asia excluding Japan, but including all other developed, emerging and frontier countries and markets in the Asian region. The Fund is currently expected to hold stocks of between 25 and 35 companies under normal market conditions.
Portfolio Manager Commentary (unaudited)
Period ended December 31, 2018
For the year ending December 31, 2018, the Matthews Asia Focus Fund returned –17.24% (Investor Class) and –17.04% (Institutional Class), while its benchmark, the MSCI All Country Asia ex Japan Index, returned –14.12%. For the fourth quarter, the Fund returned –7.44% (Investor and Institutional Class) versus –8.60% for the Index.
Market Environment:
2018 closed with yet another increase in volatility for global asset prices as the prior years of globally synchronized growth with limited tail risks seemed a distant memory. The combination of tightening U.S. dollar liquidity, as G-3 central banks began exiting the decade-long experiment of quantitative easing, and rising geopolitical tension and slowing growth in China, were major factors in driving a risk-off environment. We are unquestionably long in this economic cycle and it is understandable that slowing growth accompanied by high valuations and egregious levels of outstanding debt led many market participants to take pause and reduce risk.
With this backdrop, all Asian markets struggled in U.S. dollar terms, particularly as many currencies depreciated against the greenback. The weakest of these were the export-heavy North Asian markets of China and South Korea, whilst the more domestic demand-oriented countries of Southeast Asia held up relatively better.
Performance Contributors and Detractors:
The largest contributors to portfolio returns for the full year came from the consumer staples and health care sectors. Heineken Malaysia gained during the first half as the brewer returned to attractive top-line growth through strong marketing campaigns and new branch launches. This, however, failed to translate into equivalent growth in earnings and we exited the position earlier in the year. Singaporean supermarket chain Sheng Siong Group also rose, with solid earnings growth driven by new store openings and improving margins as the company increased its mix of fresh food and improved efficiencies from its distribution centers. Within health care, sleep apnea device maker ResMed delivered strong performance on sustained mask and device growth, driven by its impressive connected care strategy.
During the fourth quarter, the portfolio’s holdings in India and Indonesia were the strongest contributors. Both countries benefited from the drop in oil prices as that helped fiscal and current account deficits. Financial stocks Bank Rakyat Indonesia and HDFC (Housing Development Finance Corp.) gained in this environment of looser liquidity, easing asset quality and growth concerns.
For the full year, the largest detractors to returns came from some stock-specific challenges within Southeast Asia. Malaysia casino operator Genting Malaysia fell as the government raised its casino license fee and gaming taxes more than anticipated to increase fiscal revenues. Further, the company suffered as previous theme park partner Twenty-First Century Fox pulled out of its memorandum of agreement after much of the project had already been built but prior to opening. Genting has launched a lawsuit in an attempt to reclaim these expenses and punitive damages. Indonesian department store Matahari fell as rising competition from
(continued)
| 1 | Actual 2018 expense ratios. |
| 2 | Matthews has contractually agreed (i) to waive fees and reimburse expenses to the extent needed to limit Total Annual Fund Operating Expenses (excluding Rule 12b-1 fees, taxes, interest, brokerage commissions, short sale dividend expenses, expenses incurred in connection with any merger or reorganization or extraordinary expenses such as litigation) of the Institutional Class to 1.25% first by waiving class specific expenses (i.e., shareholder service fees specific to a particular class) of the Institutional Class and then, to the extent necessary, by waiving non-class specific expenses of the Institutional Class, and (ii) if any Fund-wide expenses (i.e., expenses that apply to both the Institutional Class and the Investor Class) are waived for the Institutional Class to maintain the 1.25% expense limitation, to waive an equal amount (in annual percentage terms) of those same expenses for the Investor Class. The Total Annual Fund Operating Expenses After Fee Waiver and Expense Reimbursement for the Investor Class may vary from year to year and will in some years exceed 1.25%. If the operating expenses fall below the expense limitation in a year within three years after Matthews has made a waiver or reimbursement, the Fund may reimburse Matthews up to an amount that does not cause the expenses for that year to exceed the lesser of (i) the expense limitation applicable at the time of that fee waiver and/or expense reimbursement or (ii) the expense limitation in effect at the time of recoupment. This agreement will remain in place until April 30, 2019 and may be terminated at any time by the Board of Trustees on behalf of the Fund on 60 days’ written notice to Matthews. Matthews may decline to renew this agreement by written notice to the Trust at least 30 days before its annual expiration date. |
| 3 | The lesser of fiscal year 2018 long-term purchase costs or sales proceeds divided by the average monthly market value of long-term securities. |
| matthewsasia.com | 800.789.ASIA | 35 |
Table of Contents
| PERFORMANCE AS OF DECEMBER 31, 2018 | ||||||||||||||||||||||||
|
|
| Average Annual Total Returns |
| |||||||||||||||||||||
| 3 Months | 1 Year | 3 Years | 5 Years | Since Inception | Inception Date | |||||||||||||||||||
| Investor Class (MAFSX) | -7.44% | -17.24% | 5.92% | 1.75% | 1.07% | 4/30/13 | ||||||||||||||||||
| Institutional Class (MIFSX) | -7.44% | -17.04% | 6.18% | 2.00% | 1.31% | 4/30/13 | ||||||||||||||||||
| MSCI AC Asia ex Japan Index4 | -8.60% | -14.12% | 8.87% | 4.32% | 4.16% | |||||||||||||||||||
Performance assumes reinvestment of all dividends and/or distributions before taxes. All performance quoted represents past performance and is no guarantee of future results. Investment return and principal value will fluctuate with market conditions so that when redeemed, shares may be worth more or less than their original cost. Current performance may be lower or higher than the return figures quoted. Returns would have been lower if certain of the Fund’s fees and expenses had not been waived. For the Fund’s most recent month-end performance visit matthewsasia.com.
GROWTH OF A $10,000 INVESTMENT SINCE INCEPTION—INVESTOR CLASS
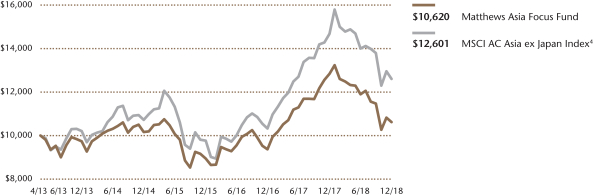
Plotted monthly. The performance data and graph do not reflect the deduction of taxes that a shareholder would pay on dividends, capital gain distributions or redemption of Fund shares. Values are in US$.
| 4 | It is not possible to invest directly in an index. Source: Index data from Morgan Stanley Capital International and Bloomberg; total return calculations performed by BNY Mellon Investment Servicing (US) Inc. Please see page 91 for index definition. |
| TOP TEN HOLDINGS5 | ||||||||
| Sector | Country | % of Net Assets | ||||||
| AIA Group, Ltd. | Financials | China/Hong Kong | 6.1% | |||||
| Tencent Holdings, Ltd. | Communication Services | China/Hong Kong | 5.2% | |||||
| Taiwan Semiconductor Manufacturing Co., Ltd. | Information Technology | Taiwan | 4.3% | |||||
| PT Bank Rakyat Indonesia Persero | Financials | Indonesia | 3.6% | |||||
| Jardine Matheson Holdings, Ltd. | Industrials | China/Hong Kong | 3.6% | |||||
| Housing Development Finance Corp., Ltd. | Financials | India | 3.5% | |||||
| Singapore Technologies Engineering, Ltd. | Industrials | Singapore | 3.5% | |||||
| United Overseas Bank, Ltd. | Financials | Singapore | 3.1% | |||||
| CK Hutchison Holdings, Ltd. | Industrials | China/Hong Kong | 3.1% | |||||
| Singapore Telecommunications, Ltd. | Communication Services | Singapore | 3.0% | |||||
| % OF ASSETS IN TOP TEN | 39.0% | |||||||
| 5 | Holdings may combine more than one security from same issuer and related depositary receipts. |
| 36 | MATTHEWS ASIA FUNDS |
Table of Contents
Matthews Asia Focus Fund
Portfolio Manager Commentary (unaudited) (continued)
online and specialty retail, alongside some corporate governance concerns, weighed on the stock. We exited our position in response to this. Beyond this, Chinese social networking and games operator Tencent Holdings dropped significantly after previously strong performance and concerns over the Chinese government freezing game approvals.
Notable Portfolio Changes:
We added one new position to the portfolio during the quarter, Taiwanese specialty store Poya International. The company’s stores focus on lower priced beauty products as well as clothing, accessories and food primarily for female customers. We believe that its vast product offering and price point is a solid moat that helps the business generate healthy margins and a return on equity over 40%. Further, management pays out most of the company’s cash generation through dividends and the stock is yielding more than 4.5% and trades at around 18X P/E. There are also additional growth opportunities for the company through a return to positive same-store sales growth, an increase in store count, weakening competition and improved labor productivity.
Outlook:
The reasons for elevated volatility to persist throughout 2019 appear fairly lengthy in nature. Although tariff negotiations are ongoing in the U.S.–China trade war, the rise of geopolitical tension between the two nations is likely here to stay given differing economic and political ideologies. Additionally, there continues to be risk of policy errors as the U.S. Federal Reserve attempts to find a balance of discovering the elusive neutral rate as well as reduce the existing scale of its balance sheet. Further, global growth rates are slowing with China and parts of Europe particularly weak, albeit China has both the willingness and firepower to stimulate if growth rates become uncomfortably low. Beyond this, it is a heavy election year in Asia as countries from Thailand to India go to the polls and this always provides scope for increased volatility.
The macroeconomic backdrop suggests significant tail risks. However, the microeconomic backdrop appears more constructive. Valuations for the MSCI All Country Asia ex Japan Index are approximately 11.4X P/E and growth is still forecasted to be positive and likely to be in the high single-digit range. Despite the negativity, that provides us with an exciting environment where active management becomes important once again. Growth is still available but selectivity is key as volatility is likely to create opportunities for us to enter into quality businesses at attractive price points.
| COUNTRY ALLOCATION (%)6,7 | ||||
| China/Hong Kong | 42.3 | |||
| Singapore | 12.2 | |||
| Taiwan | 7.8 | |||
| South Korea | 7.1 | |||
| India | 6.2 | |||
| United States | 5.2 | |||
| Indonesia | 3.6 | |||
| Philippines | 3.0 | |||
| Switzerland | 2.8 | |||
| Thailand | 2.7 | |||
| Australia | 2.4 | |||
| United Kingdom | 2.2 | |||
| Malaysia | 1.8 | |||
| Cash and Other Assets, Less Liabilities | 0.9 | |||
SECTOR ALLOCATION (%)7 | ||||
| Financials | 30.6 | |||
| Consumer Discretionary | 19.6 | |||
| Communication Services | 16.2 | |||
| Information Technology | 13.4 | |||
| Industrials | 12.0 | |||
| Consumer Staples | 4.6 | |||
| Real Estate | 2.7 | |||
| Cash and Other Assets, Less Liabilities | 0.9 | |||
MARKET CAP EXPOSURE (%)7 | ||||
| Mega Cap (over $25B) | 58.3 | |||
| Large Cap ($10B–$25B) | 8.2 | |||
| Mid Cap ($3B–10B) | 15.2 | |||
| Small Cap (under $3B) | 17.5 | |||
| Cash and Other Assets, Less Liabilities | 0.9 | |||
| 6 | Not all countries where the Fund may invest are included in the benchmark index. |
| 7 | Source: FactSet Research Systems. Percentage values in data are rounded to the nearest tenth of one percent, so the values may not sum to 100% due to rounding. Percentage values may be derived from different data sources and may not be consistent with other Fund literature. |
| matthewsasia.com | 800.789.ASIA | 37 |
Table of Contents
Matthews Asia Focus Fund
December 31, 2018
Schedule of Investmentsa
COMMON EQUITIES: 99.1%
| Shares | Value | |||||||
| CHINA/HONG KONG: 42.2% | ||||||||
AIA Group, Ltd. | 48,400 | $402,050 | ||||||
Tencent Holdings, Ltd. | 8,500 | 340,683 | ||||||
Jardine Matheson Holdings, Ltd. | 3,400 | 236,738 | ||||||
CK Hutchison Holdings, Ltd. | 21,228 | 203,751 | ||||||
China Mobile, Ltd. | 19,500 | 188,694 | ||||||
China Overseas Property Holdings, Ltd. | 615,000 | 179,636 | ||||||
Xiabuxiabu Catering Management China Holdings Co., Ltd.b,c | 112,500 | 175,872 | ||||||
HSBC Holdings PLC | 20,000 | 165,028 | ||||||
JNBY Design, Ltd.c | 117,000 | 163,981 | ||||||
NetEase, Inc. ADR | 690 | 162,405 | ||||||
Techtronic Industries Co., Ltd. | 30,000 | 159,200 | ||||||
Zhejiang Supor Co., Ltd. A Shares | 20,400 | 156,129 | ||||||
Jiangsu Yanghe Brewery Joint-Stock Co., Ltd. A Shares | 9,600 | 132,988 | ||||||
Johnson Electric Holdings, Ltd. | 62,000 | 126,462 | ||||||
|
| |||||||
Total China/Hong Kong | 2,793,617 | |||||||
|
| |||||||
| SINGAPORE: 12.2% | ||||||||
Singapore Technologies Engineering, Ltd. | 89,700 | 229,945 | ||||||
United Overseas Bank, Ltd. | 11,400 | 206,226 | ||||||
Singapore Telecommunications, Ltd. | 92,500 | 199,082 | ||||||
Sheng Siong Group, Ltd. | 221,400 | 172,097 | ||||||
|
| |||||||
Total Singapore | 807,350 | |||||||
|
| |||||||
| TAIWAN: 7.8% | ||||||||
Taiwan Semiconductor Manufacturing Co., Ltd. | 39,000 | 284,931 | ||||||
Poya International Co., Ltd. | 14,000 | 145,148 | ||||||
Ennoconn Corp. | 11,000 | 88,352 | ||||||
|
| |||||||
Total Taiwan | 518,431 | |||||||
|
| |||||||
| SOUTH KOREA: 7.1% | ||||||||
Coway Co., Ltd. | 2,944 | 195,510 | ||||||
Samsung Electronics Co., Ltd. | 4,865 | 169,359 | ||||||
Orange Life Insurance, Ltd.b,c | 4,187 | 105,039 | ||||||
|
| |||||||
Total South Korea | 469,908 | |||||||
|
| |||||||
| INDIA: 6.2% | ||||||||
Housing Development Finance Corp., Ltd. | 8,264 | 232,832 | ||||||
Bharti Infratel, Ltd. | 48,551 | 180,081 | ||||||
|
| |||||||
Total India | 412,913 | |||||||
|
| |||||||
| UNITED STATES: 5.2% | ||||||||
Broadcom, Inc. | 780 | 198,338 | ||||||
Cognizant Technology Solutions Corp. Class A | 2,270 | 144,100 | ||||||
|
| |||||||
Total United States | 342,438 | |||||||
|
| |||||||
| INDONESIA: 3.6% | ||||||||
PT Bank Rakyat Indonesia Persero | 938,100 | 238,989 | ||||||
|
| |||||||
Total Indonesia | 238,989 | |||||||
|
| |||||||
| PHILIPPINES: 3.0% | ||||||||
Bank of the Philippine Islands | 109,645 | 195,820 | ||||||
|
| |||||||
Total Philippines | 195,820 | |||||||
|
| |||||||
| Shares | Value | |||||||
| SWITZERLAND: 2.8% | ||||||||
Cie Financiere Richemont SA | 2,879 | $185,660 | ||||||
|
| |||||||
Total Switzerland | 185,660 | |||||||
|
| |||||||
| THAILAND: 2.7% | ||||||||
Kasikornbank Public Co., Ltd. | 30,800 | 176,399 | ||||||
|
| |||||||
Total Thailand | 176,399 | |||||||
|
| |||||||
| AUSTRALIA: 2.3% | ||||||||
Macquarie Group, Ltd. | 2,033 | 155,720 | ||||||
|
| |||||||
Total Australia | 155,720 | |||||||
|
| |||||||
| UNITED KINGDOM: 2.2% | ||||||||
Prudential PLC | 8,024 | 143,280 | ||||||
|
| |||||||
Total United Kingdom | 143,280 | |||||||
|
| |||||||
| MALAYSIA: 1.8% | ||||||||
Genting Malaysia BHD | 159,600 | 116,536 | ||||||
|
| |||||||
Total Malaysia | 116,536 | |||||||
|
| |||||||
| TOTAL INVESTMENTS: 99.1% | 6,557,061 | |||||||
(Cost $6,944,734) | ||||||||
| CASH AND OTHER ASSETS, LESS LIABILITIES: 0.9% | 57,457 | |||||||
|
| |||||||
NET ASSETS: 100.0% | $6,614,518 | |||||||
|
| |||||||
| a | Certain securities were fair valued under the valuation policies approved by the Board of Trustees (Note2-A). |
| b | Security exempt from registration under Rule 144A of the Securities Act of 1933, as amended. The security may be resold in transactions exempt from registration normally to qualified institutional buyers. The security has been determined to be liquid in accordance with procedures adopted by the Funds’ Board of Trustees. At December 31, 2018, the aggregate value is $280,911, which is 4.25% of net assets. |
| c | The securities may be resold to qualified foreign investors and foreign institutional buyers under Regulation S of the Securities Act of 1933. |
| ADR | American Depositary Receipt |
| BHD | Berhad |
See accompanying notes to financial statements.
| 38 | MATTHEWS ASIA FUNDS |
Table of Contents
| PORTFOLIO MANAGERS | ||||
| Taizo Ishida | ||||
Lead Manager | ||||
| Sharat Shroff, CFA | ||||
Co-Manager | ||||
| FUND FACTS | ||||
| Investor | Institutional | |||
Ticker | MPACX | MIAPX | ||
CUSIP | 577130867 | 577130776 | ||
Inception | 10/31/03 | 10/29/10 | ||
NAV | $22.49 | $22.65 | ||
Initial Investment | $2,500 | $100,000 | ||
Gross Expense Ratio1 | 1.10% | 0.93% | ||
Portfolio Statistics | ||||
Total # of Positions | 55 | |||
Net Assets | $930.3 million | |||
Weighted Average Market Cap | $27.0 billion | |||
Portfolio Turnover2 | 12.12% | |||
Benchmark | ||||
MSCI AC Asia Pacific Index | ||||
OBJECTIVE
Long-term capital appreciation.
STRATEGY
Under normal market conditions, the Fund seeks to achieve its investment objective by investing at least 80% of its net assets, which include borrowings for investment purposes, in the common and preferred stocks of companies located in Asia. Asia consists of all countries and markets in Asia, and includes developed, emerging and frontier countries and markets in the Asian region. The Fund may also invest in the convertible securities, of any duration or quality, of Asian companies.
Portfolio Manager Commentary (unaudited)
For the year ending December 31, 2018, the Matthews Asia Growth Fund returned –16.25% (Investor Class) and –16.10% (Institutional Class), while its benchmark, the MSCI All Country Asia Pacific Index, returned –13.25%. For the fourth quarter, the Fund returned –14.98% (Investor Class) and –14.92% (Institutional Class) versus –10.92% for the Index.
Market Environment:
Japanese equity returns were some of the strongest in the region from January through September 2018. Prime Minister Shinzo Abe was elected for the third time on September 20 which provided market participants with a sense of continuity of policy. However, volatility erupted in the fourth quarter as Japanese shares were some of the weakest in the region during October. Trade tensions between the U.S. and China exacerbated fears that China and the rest of the global economy could slow. Therefore, growth stocks in Japan, especially those that sell into China were some of the hardest hit.
China underperformed broad emerging markets in 2018 with the majority of its relative weakness occurring from May through October as trade tensions escalated and fears of Chinese economic slowdown pressured markets. Finally, green shoots appeared for Chinese equities beginning in the fourth quarter. The Chinese government reiterated its willingness to stimulate the economy if needed and corporate earnings showed resilience and stability amid lowered expectations.
Indonesia’s equity market was volatile during the year, but ended on a stronger note. The country’s current account deficit continues to be a prominent concern for Bank Indonesia (BI), its central bank. BI stated close collaboration with the government to enhance external sector resilience. Lower oil prices are likely to ease pressures on the trade balance, and other measures taken to slow imports are starting to show their effect.
Performance Contributors and Detractors:
While Japanese equities had been strong performers earlier in the year, the fourth quarter presented challenges. Japan’s broader market corrected sharply on trade concerns and weakening global growth sentiment in October, with high valuation stocks experiencing some of the largest declines. Our strategy has meaningful exposure to Japan, as well to higher valuation stocks because we tend to favor quality growth stocks that can trade at a premium. Accordingly, our holdings in Japan were a significant detractor from performance for the fourth quarter, as well as for the full year. Japanese holdings that experienced declines over the full year included drug maker Sosei Group, retailer Seria and robotics maker Cyberdyne.
Also detracting from performance during the fourth quarter and full year were our health care holdings. This was a dramatic reversal from the full year 2017, when health care holdings were among the Fund’s top contributors to performance. While many of our health care holdings suffered in 2018, we continue to see health care innovation as an important secular growth trend in Asia with the potential to generate attractive returns over a full market cycle.
A bright spot in the year included our holdings in Indonesia. Indonesia’s economy tends to be more localized, moving in its own independent cycles. While sentiment toward emerging markets isn’t much improved, Indonesia’s economy was coming off of two prior years of recession and was primed for a recovery. Equity valuations were very attractive, so there was room for stock prices to rise. Securities experiencing attractive gains for the year included hardware retailer ACE Hardware Indonesia, food producer Indofood CBP Sukses Makmur and consumer products maker Mayora Indah.
(continued)
| 1 | Actual 2018 expense ratios. |
| 2 | The lesser of fiscal year 2018 long-term purchase costs or sales proceeds divided by the average monthly market value of long-term securities. |
| matthewsasia.com | 800.789.ASIA | 39 |
Table of Contents
| PERFORMANCE AS OF DECEMBER 31, 2018 | ||||||||||||||||||||||||||||
|
|
| Average Annual Total Returns |
| |||||||||||||||||||||||||
| 3 Months | 1 Year | 3 Years | 5 Years | 10 Years | Since Inception | Inception Date | ||||||||||||||||||||||
| Investor Class (MPACX) | -14.98% | -16.25% | 5.61% | 3.62% | 10.39% | 8.22% | 10/31/03 | |||||||||||||||||||||
| Institutional Class (MIAPX) | -14.92% | -16.10% | 5.79% | 3.82% | n.a. | 5.30% | 10/29/10 | |||||||||||||||||||||
| MSCI AC Asia Pacific Index3 | -10.92% | -13.25% | 6.42% | 3.51% | 7.94% | 6.44% | 4 | |||||||||||||||||||||
Performance assumes reinvestment of all dividends and/or distributions before taxes. All performance quoted represents past performance and is no guarantee of future results. Investment return and principal value will fluctuate with market conditions so that when redeemed, shares may be worth more or less than their original cost. Current performance may be lower or higher than the return figures quoted. For the Fund’s most recent month-end performance, visit matthewsasia.com.
GROWTH OF A $10,000 INVESTMENT SINCE INCEPTION—INVESTOR CLASS
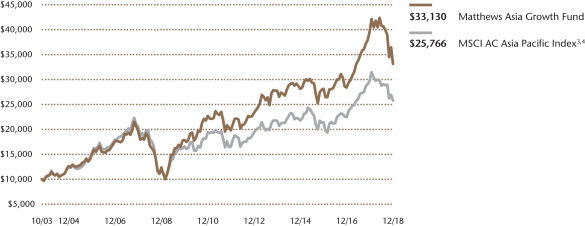
Plotted monthly. The performance data and graph do not reflect the deduction of taxes that a shareholder would pay on dividends, capital gains distributions or redemption of Fund shares. Values are in US$.
| 3 | It is not possible to invest directly in an index. Source: Index data from Morgan Stanley Capital International and Bloomberg; total return calculations performed by BNY Mellon Investment Servicing (US) Inc. Please see page 91 for index definition. |
| 4 | Calculated from 10/31/03. |
| TOP TEN HOLDINGS5 | ||||||||
| Sector | Country | % of Net Assets | ||||||
| PT Bank Rakyat Indonesia Persero | Financials | Indonesia | 4.2% | |||||
| Shenzhou International Group Holdings, Ltd. | Consumer Discretionary | China/Hong Kong | 3.9% | |||||
| HDFC Bank, Ltd. | Financials | India | 3.8% | |||||
| CSL, Ltd. | Health Care | Australia | 3.4% | |||||
| Terumo Corp. | Health Care | Japan | 3.0% | |||||
| Wuxi Biologics Cayman, Inc. | Health Care | China/Hong Kong | 2.9% | |||||
| Square Pharmaceuticals, Ltd. | Health Care | Bangladesh | 2.9% | |||||
| PT Astra International | Consumer Discretionary | Indonesia | 2.7% | |||||
| Nidec Corp. | Industrials | Japan | 2.7% | |||||
| Baozun, Inc. | Consumer Discretionary | China/Hong Kong | 2.6% | |||||
| % OF ASSETS IN TOP TEN | 32.1% | |||||||
| 5 | Holdings may combine more than one security from same issuer and related depositary receipts. |
| 40 | MATTHEWS ASIA FUNDS |
Table of Contents
Matthews Asia Growth Fund
Portfolio Manager Commentary (unaudited) (continued)
Notable Portfolio Changes:
There were no notable portfolio changes in the fourth quarter. We took advantage of market volatility to rotate capital toward some of our higher conviction holdings in the portfolio. Market declines offered opportunities to add to some of our existing holdings with strong growth potential at very attractive valuations.
Outlook:
Looking ahead, macroeconomic risks—including trade conflicts and potentially slower global growth—could linger. Accordingly, we remain cautious in our macroeconomic outlook. As bottom-up investors, we are more focused on microeconomics, defined by the health and future prospects of individual companies. From a bottom-up perspective, market volatility can create opportunities to buy quality growth companies at lower valuations.
We remain bullish on health care, despite the sector’s rough patch in 2018. While technology and industrials can be highly impacted by trade skirmishes, health care companies are often less impacted. We see aging populations across Asia, rising incomes and increased focus on quality of life as secular drivers of attractive long-term growth potential in the health care sector.
Over a full market cycle, we remain optimistic about the prospects for high-quality growth companies across Asia. We’ll continue to look for companies with above-average profitability that are consistently growing their businesses. As household wealth continues to rise in Asia and innovation continues, investing with a long-term view can help capture the potential of Asia’s most appealing growth companies.
| COUNTRY ALLOCATION (%)6,7 | ||||
| Japan | 36.8 | |||
| China/Hong Kong | 25.1 | |||
| Indonesia | 11.1 | |||
| India | 5.5 | |||
| Australia | 4.7 | |||
| Bangladesh | 4.3 | |||
| Sri Lanka | 2.9 | |||
| Philippines | 1.7 | |||
| Vietnam | 1.7 | |||
| Thailand | 1.3 | |||
| Taiwan | 1.2 | |||
| Cash and Other Assets, Less Liabilities | 3.5 | |||
| SECTOR ALLOCATION (%)7 | ||||
| Health Care | 30.0 | |||
| Consumer Discretionary | 25.2 | |||
| Financials | 14.4 | |||
| Consumer Staples | 10.7 | |||
| Communication Services | 5.6 | |||
| Industrials | 5.3 | |||
| Information Technology | 3.0 | |||
| Energy | 1.3 | |||
| Materials | 1.0 | |||
| Cash and Other Assets, Less Liabilities | 3.5 | |||
| MARKET CAP EXPOSURE (%)7 | ||||
| Mega Cap (over $25B) | 28.3 | |||
| Large Cap ($10B–$25B) | 18.2 | |||
| Mid Cap ($3B–10B) | 24.2 | |||
| Small Cap (under $3B) | 25.8 | |||
| Cash and Other Assets, Less Liabilities | 3.5 | |||
| 6 | Not all countries where the Fund may invest are included in the benchmark index. |
| 7 | Source: FactSet Research Systems. Percentage values in data are rounded to the nearest tenth of one percent, so the values may not sum to 100% due to rounding. Percentage values may be derived from different data sources and may not be consistent with other Fund literature. |
| matthewsasia.com | 800.789.ASIA | 41 |
Table of Contents
Matthews Asia Growth Fund
December 31, 2018
Schedule of Investmentsa
COMMON EQUITIES: 96.5%
| Shares | Value | |||||||
| JAPAN: 36.8% | ||||||||
Terumo Corp. | 496,600 | $28,010,785 | ||||||
Nidec Corp. | 218,500 | 24,722,613 | ||||||
Pigeon Corp. | 544,900 | 23,241,455 | ||||||
Sony Corp. | 479,700 | 23,126,154 | ||||||
Keyence Corp. | 43,800 | 22,138,529 | ||||||
SoftBank Group Corp. | 306,900 | 20,101,703 | ||||||
M3, Inc. | 1,488,500 | 20,051,922 | ||||||
ORIX Corp. | 1,329,200 | 19,422,169 | ||||||
Seria Co., Ltd. | 550,900 | 18,734,876 | ||||||
Nitori Holdings Co., Ltd. | 133,400 | 16,707,059 | ||||||
PeptiDream, Inc.b | 411,000 | 16,226,444 | ||||||
Eisai Co., Ltd. | 202,900 | 15,708,484 | ||||||
TechnoPro Holdings, Inc. | 359,200 | 14,756,724 | ||||||
ZOZO, Inc. | 690,500 | 12,650,697 | ||||||
Ariake Japan Co., Ltd. | 194,800 | 12,636,860 | ||||||
Sysmex Corp. | 264,100 | 12,542,399 | ||||||
FANUC Corp. | 63,400 | 9,621,565 | ||||||
Nitto Denko Corp. | 184,700 | 9,263,523 | ||||||
Mercari, Inc.b | 531,300 | 8,869,450 | ||||||
HEALIOS KKb | 380,100 | 5,816,469 | ||||||
Sosei Group Corp.b | 682,400 | 4,941,627 | ||||||
CYBERDYNE, Inc.b | 768,500 | 3,368,720 | ||||||
|
| |||||||
Total Japan | 342,660,227 | |||||||
|
| |||||||
| CHINA/HONG KONG: 25.1% | ||||||||
Shenzhou International Group Holdings, Ltd. | 3,155,000 | 35,859,266 | ||||||
Wuxi Biologics Cayman, Inc.b,c,d | 4,160,500 | 26,579,625 | ||||||
Baozun, Inc. ADRb | 818,500 | 23,908,385 | ||||||
BeiGene, Ltd. ADRb | 169,500 | 23,774,070 | ||||||
Jiangsu Hengrui Medicine Co., Ltd. A Shares | 2,603,187 | 20,064,451 | ||||||
Huazhu Group, Ltd. ADR | 686,700 | 19,660,221 | ||||||
Alibaba Group Holding, Ltd. ADRb | 127,200 | 17,435,304 | ||||||
Yunnan Baiyao Group Co., Ltd. A Shares | 1,424,788 | 15,354,220 | ||||||
Autohome, Inc. ADR | 145,500 | 11,382,465 | ||||||
Shanghai Haohai Biological Technology Co., Ltd. H Sharesc,d | 1,873,800 | 9,319,778 | ||||||
Genscript Biotech Corp.b | 6,426,000 | 8,601,879 | ||||||
Yunnan Hongxiang Yixintang Pharmaceutical Co., Ltd. A Shares | 3,201,296 | 8,292,562 | ||||||
Baidu, Inc. ADRb | 51,600 | 8,183,760 | ||||||
Tongda Group Holdings, Ltd. | 54,370,000 | 5,395,236 | ||||||
|
| |||||||
Total China/Hong Kong | 233,811,222 | |||||||
|
| |||||||
| INDONESIA: 11.1% | ||||||||
PT Bank Rakyat Indonesia Persero | 155,115,800 | 39,517,049 | ||||||
PT Astra International | 44,275,300 | 25,364,956 | ||||||
PT Ace Hardware Indonesia | 154,466,000 | 16,023,588 | ||||||
PT Indofood CBP Sukses Makmur | 18,774,200 | 13,660,299 | ||||||
PT Mayora Indah | 47,580,700 | 8,673,764 | ||||||
|
| |||||||
Total Indonesia | 103,239,656 | |||||||
|
| |||||||
| INDIA: 5.5% | ||||||||
HDFC Bank, Ltd. | 1,148,086 | 34,924,601 | ||||||
ITC, Ltd. | 2,925,894 | 11,797,413 | ||||||
PC Jeweller, Ltd. | 3,698,554 | 4,555,109 | ||||||
|
| |||||||
Total India | 51,277,123 | |||||||
|
| |||||||
| Shares | Value | |||||||
| AUSTRALIA: 4.7% | ||||||||
CSL, Ltd. | 240,892 | $31,464,787 | ||||||
Oil Search, Ltd. | 2,481,915 | 12,501,424 | ||||||
|
| |||||||
Total Australia | 43,966,211 | |||||||
|
| |||||||
| BANGLADESH: 4.3% | ||||||||
Square Pharmaceuticals, Ltd. | 8,767,712 | 26,532,487 | ||||||
BRAC Bank, Ltd.b | 15,589,353 | 13,508,295 | ||||||
|
| |||||||
Total Bangladesh | 40,040,782 | |||||||
|
| |||||||
| SRI LANKA: 2.9% | ||||||||
Sampath Bank PLC†,b | 16,126,387 | 20,720,071 | ||||||
Lanka Orix Leasing Co. PLCb | 12,121,473 | 5,958,012 | ||||||
|
| |||||||
Total Sri Lanka | 26,678,083 | |||||||
|
| |||||||
| PHILIPPINES: 1.8% | ||||||||
Jollibee Foods Corp. | 2,007,890 | 11,141,806 | ||||||
Emperador, Inc. | 37,942,500 | 5,130,193 | ||||||
|
| |||||||
Total Philippines | 16,271,999 | |||||||
|
| |||||||
| VIETNAM: 1.8% | ||||||||
Vietnam Dairy Products JSC | 3,116,592 | 16,165,247 | ||||||
|
| |||||||
Total Vietnam | 16,165,247 | |||||||
|
| |||||||
| THAILAND: 1.3% | ||||||||
Major Cineplex Group Public Co., Ltd. | 18,967,100 | 12,087,487 | ||||||
|
| |||||||
Total Thailand | 12,087,487 | |||||||
|
| |||||||
| TAIWAN: 1.2% | ||||||||
St. Shine Optical Co., Ltd. | 630,000 | 11,132,450 | ||||||
|
| |||||||
Total Taiwan | 11,132,450 | |||||||
|
| |||||||
| TOTAL INVESTMENTS: 96.5% | 897,330,487 | |||||||
(Cost $819,722,836) | ||||||||
| CASH AND OTHER ASSETS, LESS LIABILITIES: 3.5% | 33,003,069 | |||||||
|
| |||||||
NET ASSETS: 100.0% | $930,333,556 | |||||||
|
| |||||||
| a | Certain securities were fair valued under the valuation policies approved by the Board of Trustees (Note2-A). |
| b | Non-income producing security. |
| c | Security exempt from registration under Rule 144A of the Securities Act of 1933, as amended. The security may be resold in transactions exempt from registration normally to qualified institutional buyers. The security has been determined to be liquid in accordance with procedures adopted by the Funds’ Board of Trustees. At December 31, 2018, the aggregate value is $35,899,403, which is 3.86% of net assets. |
| d | The securities may be resold to qualified foreign investors and foreign institutional buyers under Regulation S of the Securities Act of 1933. |
| † | Affiliated Issuer, as defined under the Investment Company Act of 1940 (ownership of 5% or more of the outstanding voting securities of this issuer) |
| ADR | American Depositary Receipt |
| JSC | Joint Stock Co. |
See accompanying notes to financial statements.
| 42 | MATTHEWS ASIA FUNDS |
Table of Contents
| PORTFOLIO MANAGERS | ||||
| Sharat Shroff, CFA | ||||
Lead Manager | ||||
| Rahul Gupta | ||||
Co-Manager | ||||
| FUND FACTS | ||||
| Investor | Institutional | |||
Ticker | MAPTX | MIPTX | ||
CUSIP | 577130107 | 577130834 | ||
Inception | 9/12/94 | 10/29/10 | ||
NAV | $26.86 | $26.83 | ||
Initial Investment | $2,500 | $100,000 | ||
Gross Expense Ratio1 | 1.07% | 0.90% | ||
After Fee Waiver and Reimbursement2 | 1.04% | 0.88% | ||
Portfolio Statistics | ||||
Total # of Positions | 63 | |||
Net Assets | $8.3 billion | |||
Weighted Average Market Cap | $51.5 billion | |||
Portfolio Turnover3 | 11.48% | |||
Benchmark | ||||
MSCI AC Asia ex Japan Index | ||||
OBJECTIVE
Long-term capital appreciation.
STRATEGY
Under normal market conditions, the Fund seeks to achieve its investment objective by investing at least 80% of its net assets, which include borrowings for investment purposes, in the common and preferred stocks of companies located in Asia ex Japan, which consists of all countries and markets in Asia excluding Japan, but including all other developed, emerging and frontier countries and markets in the Asian region.
Portfolio Manager Commentary (unaudited)
For the year ending December 31, 2018, the Matthews Pacific Tiger Fund returned –11.11% (Investor Class) and –10.94% (Institutional Class), while its benchmark, the MSCI All Country Asia ex Japan Index, returned –14.12%. For the fourth quarter, the Fund returned –3.72% (Investor Class) and –3.70% (Institutional Class) versus –8.60% for the Index.
Market Environment:
Asian markets were volatile throughout 2018. Macro headwinds included the U.S. Federal Reserve’s tightening of monetary policy, as well as trade conflicts between the U.S. and China and fluctuating oil prices. In our view, domestic factors, such as China’s continued emphasis on slowing credit formation and financial sector concerns in India, played a larger role in generating market uncertainty than trade concerns. Fluctuating oil prices also injected an element of turbulence into markets, with oil prices rising during much of the year before collapsing by year end.
At the start of 2018, we had anticipated the pace of earnings growth to slow, but at the same time for earnings growth to broaden across geographies (beyond China) and sectors (beyond technology and energy). Even as the pace of earnings decelerated in China, there was not a vigorous pickup in economies such as India and Indonesia. From a sectoral standpoint, the recovery in service-oriented sectors such as financials and health care has been negatively affected by regulatory factors.
Small and midsize companies continued to struggle throughout 2018—the third-consecutive year that Asian small-cap stocks underperformed their larger-cap peers. This underperformance partly reflected a challenging environment for smaller companies. While many economies in Asia are healthy, growth sentiment has been weak, reflecting some of the macro headwinds mentioned above.
Performance Contributors and Detractors:
The portfolio’s weightings in India and Indonesia, and its exposures to the information technology (IT) and energy sectors, had the completely opposing effects as the year unfolded. During the first three quarters, these allocations were detractors from relative performance, causing the Fund to trail its benchmark. By the fourth quarter, however, these allocations became significant positive contributors to performance, as India’s and Indonesia’s financial markets held up better than other parts of Asia, and the prices of technology and energy stocks experienced greater declines than other sectors.
Being underweight in the technology sector has been a challenge for the Fund’s relative performance in the past, including for the 2017 full-year period. But this underweight helped protect performance during the fourth quarter of 2018. We believe some technology companies came under greater scrutiny by investors as their earnings were likely declining. Within IT hardware, we have long believed the level of profitability of some tech companies is not sufficient to underwrite the volatility in their business models. We continue to invest in the IT sector, but with a discerning eye on valuations, profitability and sustainable growth models.
Detracting from performance for the full year 2018 was our allocation to small and midsize companies. Our small and midsize holdings, however, were positive contributors to relative performance in the fourth quarter, primarily due to stock selection. Over a full market cycle, we expect small and midsize companies to offer more attractive growth potential to larger ones, so we believe that small and midsize stocks should have a meaningful place in a growth-oriented portfolio.
(continued)
| 1 | Actual 2018 expense ratios. |
| 2 | Matthews has contractually agreed to waive a portion of its advisory fee and administrative and shareholder services fee if the Fund’s average daily net assets are over $3 billion, as follows: for every $2.5 billion average daily net assets of the Fund that are over $3 billion, the advisory fee rate and the administrative and shareholder services fee rate for the Fund with respect to such excess average daily net assets will be each reduced by 0.01%, in each case without reducing such fee rate below 0.00%. Any amount waived by Matthews pursuant to this agreement may not be recouped by Matthews. This agreement will remain in place until April 30, 2019 and may be terminated (i) at any time by the Board of Trustees upon 60 days’ prior written notice to Matthews; or (ii) by Matthews at the annual expiration date of the agreement upon 60 days’ prior written notice to the Trust, in each case without payment of any penalty. |
| 3 | The lesser of fiscal year 2018 long-term purchase costs or sales proceeds divided by the average monthly market value of long-term securities. |
| matthewsasia.com | 800.789.ASIA | 43 |
Table of Contents
| PERFORMANCE AS OF DECEMBER 31, 2018 | ||||||||||||||||||||||||||||
|
|
| Average Annual Total Returns |
| |||||||||||||||||||||||||
| 3 Months | 1 Year | 3 Years | 5 Years | 10 Years | Since Inception | Inception Date | ||||||||||||||||||||||
| Investor Class (MAPTX) | -3.72% | -11.11% | 7.50% | 6.50% | 12.56% | 8.39% | 9/12/94 | |||||||||||||||||||||
| Institutional Class (MIPTX) | -3.70% | -10.94% | 7.68% | 6.70% | n.a. | 5.54% | 10/29/10 | |||||||||||||||||||||
| MSCI AC Asia ex Japan Index4 | -8.60% | -14.12% | 8.87% | 4.32% | 10.40% | 4.15% | 5 | |||||||||||||||||||||
Performance assumes reinvestment of all dividends and/or distributions before taxes. All performance quoted represents past performance and is no guarantee of future results. Investment return and principal value will fluctuate with market conditions so that when redeemed, shares may be worth more or less than their original cost. Current performance may be lower or higher than the return figures quoted. Returns would have been lower if certain of the Fund’s fees and expenses had not been waived. For the Fund’s most recent month-end performance, visit matthewsasia.com.
GROWTH OF A $10,000 INVESTMENT SINCE INCEPTION—INVESTOR CLASS

Plotted monthly. The performance data and graph do not reflect the deduction of taxes that a shareholder would pay on dividends, capital gains distributions or redemption of Fund shares. Values are in US$.
| 4 | It is not possible to invest directly in an index. Source: Index data from Morgan Stanley Capital International and Bloomberg; total return calculations performed by BNY Mellon Investment Servicing (US) Inc. Please see page 91 for index definition. |
| 5 | Calculated from 8/31/94. |
| TOP TEN HOLDINGS6 | ||||||||
| Sector | Country | % of Net Assets | ||||||
| Tencent Holdings, Ltd. | Communication Services | China/Hong Kong | 3.4% | |||||
| Ping An Insurance Group Co. of China, Ltd. | Financials | China/Hong Kong | 3.4% | |||||
| Kotak Mahindra Bank, Ltd. | Financials | India | 3.0% | |||||
| China Resources Land, Ltd. | Real Estate | China/Hong Kong | 2.8% | |||||
| Central Pattana Public Co., Ltd. | Real Estate | Thailand | 2.7% | |||||
| Inner Mongolia Yili Industrial Group Co., Ltd. | Consumer Staples | China/Hong Kong | 2.7% | |||||
| DB Insurance Co., Ltd. | Financials | South Korea | 2.7% | |||||
| China Resources Beer Holdings Co., Ltd. | Consumer Staples | China/Hong Kong | 2.7% | |||||
| Sinopharm Group Co., Ltd. | Health Care | China/Hong Kong | 2.6% | |||||
| NAVER Corp. | Communication Services | South Korea | 2.6% | |||||
| % OF ASSETS IN TOP TEN | 28.6% | |||||||
| 6 | Holdings may combine more than one security from same issuer and related depositary receipts. |
| 44 | MATTHEWS ASIA FUNDS |
Table of Contents
Matthews Pacific Tiger Fund
Portfolio Manager Commentary (unaudited) (continued)
Notable Portfolio Changes:
During the year, we incrementally expanded our exposure to some of the ASEAN (Association of Southeast Asian Nations) economies, including Indonesia. We also added new small-cap companies to the portfolio as valuations were highly attractive following three years of relative underperformance by small caps. A common theme across many of our portfolio additions was exposure to the Asian consumer, whose rising incomes and household wealth remain a key structural driver for Asia’s growth.
Companies we exited in the fourth quarter included Guangdong Advertising Group, a Chinese advertising agency that missed some key milestones we had set for the business. We also exited Hengan International Group, a Chinese manufacturer of diapers and personal hygiene products, in order to consolidate our consumer staples exposure in China.
Outlook:
As we look ahead, the nature of the risk facing Asian economies is shifting—away from concerns around U.S. dollar appreciation and balance sheet issues, and toward the outlook for growth and profitability. In that context, some factors that were headwinds for Asian markets in 2018 may be easing. Monetary policy could relax a bit in the region, trade conflicts may ease even if they are unlikely to be fully resolved and oil prices could remain lower through the first half of 2019. We continue to believe in the resiliency of domestically oriented factors that should benefit relatively more from some of the above factors.
In China, we find a number of well-run companies trading at attractive valuations. Our emphasis continues to be in the services sector, which caters to the rising aspirations of the consumer and helps corporations gain efficiency in their operations. In India, meanwhile, valuations are still in line or slightly above their historic norms. Earnings are still somewhat depressed in India and anything short of a forceful recovery in growth may test premium multiples. India will also hold elections in 2019, which could impact sentiment either favorably or negatively, depending on the tone and outcome of the campaigns. As we look across the rest of South Asia, we also see opportunities. In Indonesia, domestic households are starting to return to normalcy after suffering multiple shocks in the form of rising interest rates, weakening subsidies and plateauing income levels over the past few years, and may drive consumption growth in coming periods.
Instead of worrying about macro headlines, we continue to spend our energy in identifying the businesses most likely to drive Asia’s growth in the coming periods. At current valuation levels, investors may not be factoring this growth appropriately. As long-term investors, we look to take advantage of these opportunities.
| COUNTRY ALLOCATION (%)7,8 | ||||
| China/Hong Kong | 35.1 | |||
| India | 21.9 | |||
| South Korea | 12.2 | |||
| Indonesia | 7.3 | |||
| Thailand | 5.2 | |||
| Taiwan | 4.9 | |||
| Malaysia | 4.0 | |||
| Philippines | 2.4 | |||
| Switzerland | 2.4 | |||
| Vietnam | 2.1 | |||
| United States | 1.7 | |||
| Japan | 0.1 | |||
| Cash and Other Assets, Less Liabilities | 0.7 | |||
| SECTOR ALLOCATION (%)8 | ||||
| Financials | 25.6 | |||
| Consumer Staples | 20.1 | |||
| Communication Services | 15.4 | |||
| Consumer Discretionary | 7.1 | |||
| Health Care | 7.0 | |||
| Real Estate | 6.8 | |||
| Information Technology | 6.4 | |||
| Industrials | 5.5 | |||
| Utilities | 4.2 | |||
| Materials | 1.2 | |||
| Cash and Other Assets, Less Liabilities | 0.7 | |||
| MARKET CAP EXPOSURE (%)8 | ||||
| Mega Cap (over $25B) | 37.3 | |||
| Large Cap ($10B–$25B) | 35.5 | |||
| Mid Cap ($3B–10B) | 16.5 | |||
| Small Cap (under $3B) | 10.1 | |||
| Cash and Other Assets, Less Liabilities | 0.7 | |||
| 7 | Not all countries where the Fund may invest are included in the benchmark index. |
| 8 | Source: FactSet Research Systems. Percentage values in data are rounded to the nearest tenth of one percent, so the values may not sum to 100% due to rounding. Percentage values may be derived from different data sources and may not be consistent with other Fund literature. |
| matthewsasia.com | 800.789.ASIA | 45 |
Table of Contents
Matthews Pacific Tiger Fund
December 31, 2018
Schedule of Investmentsa
COMMON EQUITIES: 99.3%
| Shares | Value | |||||||
| CHINA/HONG KONG: 35.1% | ||||||||
Tencent Holdings, Ltd. | 7,067,800 | $283,279,903 | ||||||
Ping An Insurance Group Co. of China, Ltd. H Shares | 31,734,000 | 279,957,851 | ||||||
China Resources Land, Ltd. | 59,880,000 | 230,338,764 | ||||||
Inner Mongolia Yili Industrial Group Co., Ltd. A Shares | 67,762,443 | 226,319,742 | ||||||
China Resources Beer Holdings Co., Ltd. | 64,029,775 | 223,860,007 | ||||||
Sinopharm Group Co., Ltd. H Shares | 52,157,600 | 219,596,798 | ||||||
AIA Group, Ltd. | 25,040,800 | 208,009,271 | ||||||
Dairy Farm International Holdings, Ltd. | 22,254,946 | 201,723,504 | ||||||
China Mobile, Ltd. ADR | 3,479,226 | 167,002,848 | ||||||
Hong Kong Exchanges & Clearing, Ltd. | 5,403,000 | 156,192,968 | ||||||
Alibaba Group Holding, Ltd. ADRb | 1,088,500 | 149,200,695 | ||||||
Yum China Holdings, Inc. | 3,721,510 | 124,782,230 | ||||||
Fuyao Glass Industry Group Co., Ltd. H Shares†,c,d | 34,726,400 | 111,182,580 | ||||||
Baidu, Inc. ADRb | 632,185 | 100,264,541 | ||||||
Guotai Junan Securities Co., Ltd. H Sharesc,d | 43,100,000 | 86,942,148 | ||||||
Tasly Pharmaceutical Group Co., Ltd. A Shares | 21,587,690 | 60,473,213 | ||||||
Wise Talent Information Technology Co., Ltd.b,d | 15,057,400 | 55,764,587 | ||||||
iQIYI, Inc. ADRb | 1,328,600 | 19,756,282 | ||||||
Fuyao Glass Industry Group Co., Ltd. A Shares | 3,589,387 | 11,951,346 | ||||||
|
| |||||||
Total China/Hong Kong | 2,916,599,278 | |||||||
|
| |||||||
| INDIA: 21.9% | ||||||||
Kotak Mahindra Bank, Ltd. | 13,788,122 | 248,036,437 | ||||||
Tata Power Co., Ltd.† | 180,316,487 | 198,263,749 | ||||||
HDFC Bank, Ltd. | 6,223,409 | 189,315,153 | ||||||
Housing Development Finance Corp., Ltd. | 6,154,197 | 173,390,135 | ||||||
ITC, Ltd. | 39,202,500 | 158,067,279 | ||||||
GAIL India, Ltd. | 28,645,237 | 147,804,063 | ||||||
Sun Pharmaceutical Industries, Ltd. | 22,768,349 | 140,304,996 | ||||||
Container Corp. of India, Ltd. | 13,679,990 | 134,704,815 | ||||||
Dabur India, Ltd. | 21,117,482 | 130,211,202 | ||||||
Titan Co., Ltd. | 9,765,327 | 130,186,573 | ||||||
Thermax, Ltd. | 5,310,034 | 85,162,592 | ||||||
United Spirits, Ltd.b | 6,778,030 | 61,671,126 | ||||||
Just Dial, Ltd.†,b | 3,557,718 | 25,558,400 | ||||||
|
| |||||||
Total India | 1,822,676,520 | |||||||
|
| |||||||
| SOUTH KOREA: 12.2% | ||||||||
DB Insurance Co., Ltd.† | 3,570,463 | 224,865,683 | ||||||
NAVER Corp. | 1,968,424 | 215,731,217 | ||||||
Samsung Electronics Co., Ltd. | 4,755,250 | 165,538,423 | ||||||
Cheil Worldwide, Inc.† | 7,315,882 | 147,448,645 | ||||||
Orion Holdings Corp.† | 5,656,566 | 86,522,603 | ||||||
E-Mart, Inc. | 362,002 | 59,118,679 | ||||||
S-1 Corp. | 471,910 | 42,399,723 | ||||||
Green Cross Corp. | 318,334 | 38,828,044 | ||||||
Amorepacific Corp. | 175,449 | 33,011,728 | ||||||
|
| |||||||
Total South Korea | 1,013,464,745 | |||||||
|
| |||||||
| Shares | Value | |||||||
| INDONESIA: 7.3% | ||||||||
PT Bank Central Asia | 100,580,000 | $181,893,835 | ||||||
PT Telekomunikasi Indonesia Persero | 589,405,600 | 154,090,349 | ||||||
PT Indofood CBP Sukses Makmur | 181,522,600 | 132,077,690 | ||||||
PT Surya Citra Media | 533,163,200 | 69,444,236 | ||||||
PT Mitra Keluarga Karyasehatb,d | 383,065,700 | 41,976,269 | ||||||
PT Telekomunikasi Indonesia Persero ADR | 1,177,440 | 30,860,703 | ||||||
|
| |||||||
Total Indonesia | 610,343,082 | |||||||
|
| |||||||
| THAILAND: 5.2% | ||||||||
Central Pattana Public Co., Ltd. | 97,969,000 | 226,637,855 | ||||||
Kasikornbank Public Co., Ltd. | 18,431,800 | 105,563,409 | ||||||
The Siam Cement Public Co., Ltd. | 7,522,950 | 101,466,272 | ||||||
|
| |||||||
Total Thailand | 433,667,536 | |||||||
|
| |||||||
| TAIWAN: 4.9% | ||||||||
President Chain Store Corp. | 17,811,608 | 180,556,481 | ||||||
Delta Electronics, Inc. | 33,921,182 | 143,646,821 | ||||||
Synnex Technology International Corp. | 73,050,921 | 86,844,154 | ||||||
|
| |||||||
Total Taiwan | 411,047,456 | |||||||
|
| |||||||
| MALAYSIA: 4.0% | ||||||||
Public Bank BHD | 31,488,394 | 188,513,216 | ||||||
Genting BHD | 42,546,775 | 62,768,544 | ||||||
IHH Healthcare BHD | 47,676,300 | 62,071,070 | ||||||
IHH Healthcare BHD | 11,543,000 | 15,171,260 | ||||||
|
| |||||||
Total Malaysia | 328,524,090 | |||||||
|
| |||||||
| SWITZERLAND: 2.4% | ||||||||
DKSH Holding AG | 2,861,150 | 197,817,440 | ||||||
|
| |||||||
Total Switzerland | 197,817,440 | |||||||
|
| |||||||
| PHILIPPINES: 2.4% | ||||||||
SM Prime Holdings, Inc. | 164,670,771 | 111,989,057 | ||||||
GT Capital Holdings, Inc. | 4,499,704 | 83,402,520 | ||||||
|
| |||||||
Total Philippines | 195,391,577 | |||||||
|
| |||||||
| VIETNAM: 2.1% | ||||||||
Vietnam Dairy Products JSC | 34,361,440 | 178,227,105 | ||||||
|
| |||||||
Total Vietnam | 178,227,105 | |||||||
|
| |||||||
| UNITED STATES: 1.7% | ||||||||
Cognizant Technology Solutions Corp. Class A | 2,186,600 | 138,805,368 | ||||||
|
| |||||||
Total United States | 138,805,368 | |||||||
|
| |||||||
| JAPAN: 0.1% | ||||||||
LINE Corp. ADRb | 195,200 | 6,658,272 | ||||||
|
| |||||||
Total Japan | 6,658,272 | |||||||
|
| |||||||
| 46 | MATTHEWS ASIA FUNDS |
Table of Contents
Matthews Pacific Tiger Fund
December 31, 2018
Schedule of Investmentsa(continued)
COMMON EQUITIES(continued)
| Value | ||||||||
| TOTAL INVESTMENTS: 99.3% | $8,253,222,469 | |||||||
(Cost $6,055,853,455) | ||||||||
| CASH AND OTHER ASSETS, LESS LIABILITIES: 0.7% | 54,011,734 | |||||||
|
| |||||||
NET ASSETS: 100.0% | $8,307,234,203 | |||||||
|
| |||||||
| a | Certain securities were fair valued under the valuation policies approved by the Board of Trustees (Note2-A). |
| b | Non-income producing security. |
| c | Security exempt from registration under Rule 144A of the Securities Act of 1933, as amended. The security may be resold in transactions exempt from registration normally to qualified institutional buyers. The security has been determined to be liquid in accordance with procedures adopted by the Funds’ Board of Trustees. At December 31, 2018, the aggregate value is $198,124,728, which is 2.38% of net assets. |
| d | The securities may be resold to qualified foreign investors and foreign institutional buyers under Regulation S of the Securities Act of 1933. |
| † | Affiliated Issuer, as defined under the Investment Company Act of 1940 (ownership of 5% or more of the outstanding voting securities of this issuer) |
| ADR | American Depositary Receipt |
| BHD | Berhad |
| JSC | Joint Stock Co. |
See accompanying notes to financial statements.
| matthewsasia.com | 800.789.ASIA | 47 |
Table of Contents
| PORTFOLIO MANAGERS | ||||
| Vivek Tanneeru | ||||
Lead Manager | ||||
| Winnie Chwang | ||||
Co-Manager | ||||
| FUND FACTS | ||||
| Investor | Institutional | |||
Ticker | MASGX | MISFX | ||
CUSIP | 577130727 | 577130719 | ||
Inception | 4/30/15 | 4/30/15 | ||
NAV | $9.98 | $9.96 | ||
Initial Investment | $2,500 | $100,000 | ||
Gross Expense Ratio1 | 2.20% | 2.01% | ||
After Fee Waiver and Reimbursement2 | 1.50% | 1.25% | ||
Portfolio Statistics | ||||
Total # of Positions | 63 | |||
Net Assets | $32.5 million | |||
Weighted Average | $11.4 billion | |||
Portfolio Turnover3 | 22.93% | |||
Benchmark | ||||
MSCI AC Asia ex Japan Index | ||||
OBJECTIVE
Long-term capital appreciation.
STRATEGY
Under normal market conditions, the Fund seeks to achieve its investment objective by investing at least 80% of its net assets, which include borrowings for investment purposes, in the common and preferred stocks of companies of any market capitalization located in Asia that Matthews believes satisfy one or more of its environmental, social and governance (“ESG”) standards. Asia consists of all countries and markets in Asia and includes developed, emerging, and frontier countries and markets in the Asia region. The Fund may also invest in convertible securities and fixed-income securities, of any duration or quality, including high yield securities, of Asian companies.
Portfolio Manager Commentary (unaudited)
For the year ending December 31, 2018, the Matthews Asia ESG Fund returned –9.73% (Investor Class) and –9.52% (Institutional Class), while its benchmark, the MSCI All Country Asia ex Japan Index, returned –14.12%. For the fourth quarter, the Fund returned –6.58% (Investor Class) and –6.51% (Institutional Class) versus –8.60% for the Index.
Market Environment:
The full range of market emotions was on display in Asia in 2018—from expectations of a “melt-up” in early 2018 and midyear worries about a meltdown due to U.S.–China trade tensions, to fewer worries amid signs of a thaw in trade tensions toward year-end. 2018 was also the year of a strong U.S. dollar. All major Asian currencies except the Japanese yen (up 2.7%) and Thai baht (up 0.1%) depreciated against it, with the worst-performing currencies being in South and Southeast Asia (Indian rupee down 8.5%; Indonesian rupiah down 5.7%).
Pakistan and South Korea were the worst-performing markets during the year, while Thailand and Malaysia held up reasonably well in a difficult year for Asia. Utilities was the best-performing sector, while consumer discretionary was the worst-performing sector.
Performance Contributors and Detractors:
Most of the outperformance in 2018 was generated from stock selection. At the country level, China/Hong Kong were the biggest contributors to relative performance, while Vietnam and the Philippines slightly detracted from performance. From a sector standpoint, consumer discretionary and information technology were the biggest positive contributors, while financials detracted the most from performance.
At the stock level, Wuxi Biologics was the biggest contributor to performance. The company is a vertically integrated Chinese contract development and manufacturing organization (CDMO) that enables cost-efficient and time-efficient drug discovery, development and manufacturing of biologics. Wuxi Biologics plays an important role in speeding up the innovation cycle in the global biotech industry in general and the Chinese biotech industry in particular by helping both global majors as well as Chinese biotech startups through its scaled-up CDMO model. The company continued to execute well on its strategic plan and experienced faster migration of contracts into the higher value clinical trial stage from the pre-clinical trial stage.
On the other hand, Inner Mongolia Yili Industrial Group was the biggest detractor from performance. Yili’s performance was in line with that of the weak ChinaA-share market performance as investors worried about the impact of the U.S.–China trade friction, alongside the impacts of the deleveraging campaign and the property market cooling efforts by the Chinese government on China’s economy. From a fundamental standpoint, the company executed well, with the impact of higher raw material prices somewhat offset by an improving product mix. We continue to like Yili’s long-term business prospects and added further to our position during 2018.
Notable Portfolio Changes:
During the fourth quarter, the Fund initiated a position in Unicharm, a Japanese personal care company that focuses on baby diapers, feminine care products and
(continued)
| 1 | Actual 2018 expense ratios. |
| 2 | Matthews has contractually agreed (i) to waive fees and reimburse expenses to the extent needed to limit Total Annual Fund Operating Expenses (excluding Rule 12b-1 fees, taxes, interest, brokerage commissions, short sale dividend expenses, expenses incurred in connection with any merger or reorganization or extraordinary expenses such as litigation) of the Institutional Class to 1.25% first by waiving class specific expenses (i.e., shareholder service fees specific to a particular class) of the Institutional Class and then, to the extent necessary, by waiving non-class specific expenses of the Institutional Class, and (ii) if any Fund-wide expenses (i.e., expenses that apply to both the Institutional Class and the Investor Class) are waived for the Institutional Class to maintain the 1.25% expense limitation, to waive an equal amount (in annual percentage terms) of those same expenses for the Investor Class. The Total Annual Fund Operating Expenses After Fee Waiver and Expense Reimbursement for the Investor Class may vary from year to year and will in some years exceed 1.25%. If the operating expenses fall below the expense limitation in a year within three years after Matthews has made a waiver or reimbursement, the Fund may reimburse Matthews up to an amount that does not cause the expenses for that year to exceed the lesser of (i) the expense limitation applicable at the time of that fee waiver and/or expense reimbursement or (ii) the expense limitation in effect at the time of recoupment. This agreement will remain in place until April 30, 2019 and may be terminated at any time by the Board of Trustees on behalf of the Fund on 60 days’ written notice to Matthews. Matthews may decline to renew this agreement by written notice to the Trust at least 30 days before its annual expiration date. |
| 3 | The lesser of fiscal year 2018 long-term purchase costs or sales proceeds divided by the average monthly market value of long-term securities. |
| 48 | MATTHEWS ASIA FUNDS |
Table of Contents
| PERFORMANCE AS OF DECEMBER 31, 2018 | ||||||||||||||||||||
|
|
| Average Annual Total Returns |
| |||||||||||||||||
| 3 Months | 1 Year | 3 Year | Since Inception | Inception Date | ||||||||||||||||
| Investor Class (MASGX) | -6.58% | -9.73% | 5.99% | 2.73% | 4/30/15 | |||||||||||||||
| Institutional Class (MISFX) | -6.51% | -9.52% | 6.25% | 2.98% | 4/30/15 | |||||||||||||||
| MSCI AC Asia ex Japan Index4 | -8.60% | -14.12% | 8.87% | 1.21% | ||||||||||||||||
Performance assumes reinvestment of all dividends and/or distributions before taxes. All performance quoted represents past performance and is no guarantee of future results. Investment return and principal value will fluctuate with market conditions so that when redeemed, shares may be worth more or less than their original cost. Current performance may be lower or higher than the return figures quoted. Returns would have been lower if certain of the Fund’s fees and expenses had not been waived. For the Fund’s most recent month-end performance visit matthewsasia.com.
GROWTH OF A $10,000 INVESTMENT SINCE INCEPTION—INVESTOR CLASS
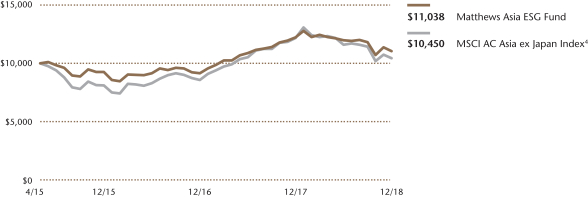
Plotted Monthly. The performance data and graph do not reflect the deduction of taxes that a shareholder would pay on dividends, capital gain distributions or redemption of Fund shares. Values are in US$.
| 4 | It is not possible to invest directly in an index. Source: Index data from Morgan Stanley Capital International; total return calculations performed by BNY Mellon Investment Servicing (US) Inc. Please see page 91 for index definition. |
| TOP TEN HOLDINGS5 | ||||||||
| Sector | Country | % of Net Assets | ||||||
| Samsung SDI Co., Ltd., Pfd. | Information Technology | South Korea | 4.3% | |||||
| Inner Mongolia Yili Industrial Group Co., Ltd. | Consumer Staples | China/Hong Kong | 4.2% | |||||
| PT Bank Rakyat Indonesia Persero | Financials | Indonesia | 3.2% | |||||
| Unicharm Corp. | Consumer Staples | Japan | 3.0% | |||||
| BRAC Bank, Ltd. | Financials | Bangladesh | 2.5% | |||||
| Fuji Seal International, Inc. | Materials | Japan | 2.4% | |||||
| MTR Corp., Ltd. | Industrials | China/Hong Kong | 2.4% | |||||
| Total Access Communication Public Co., Ltd. NVDR | Communication Services | Thailand | 2.4% | |||||
| Mahindra & Mahindra, Ltd. | Consumer Discretionary | India | 2.4% | |||||
| Shriram City Union Finance, Ltd. | Financials | India | 2.3% | |||||
| % OF ASSETS IN TOP TEN | 29.1% | |||||||
| 5 | Holdings may combine more than one security from same issuer and related depositary receipts. |
| matthewsasia.com | 800.789.ASIA | 49 |
Table of Contents
| COUNTRY ALLOCATION (%)6,7 | ||||
| China/Hong Kong | 21.5 | |||
| India | 13.7 | |||
| Japan | 12.9 | |||
| South Korea | 8.8 | |||
| Taiwan | 8.2 | |||
| Indonesia | 5.6 | |||
| Bangladesh | 5.3 | |||
| Singapore | 3.5 | |||
| Thailand | 2.4 | |||
| Philippines | 1.5 | |||
| Vietnam | 1.1 | |||
| Pakistan | 0.8 | |||
| Luxembourg | 0.6 | |||
| Cash and Other Assets, Less Liabilities | 14.1 | |||
| SECTOR ALLOCATION (%)7 | ||||
| Industrials | 16.0 | |||
| Financials | 14.7 | |||
| Health Care | 13.0 | |||
| Information Technology | 10.5 | |||
| Consumer Staples | 9.8 | |||
| Consumer Discretionary | 8.9 | |||
| Communication Services | 6.8 | |||
| Materials | 2.4 | |||
| Real Estate | 1.9 | |||
| Utilities | 1.9 | |||
| Cash and Other Assets, Less Liabilities | 14.1 | |||
| MARKET CAP EXPOSURE (%)7 | ||||
| Mega Cap (over $25B) | 8.7 | |||
| Large Cap ($10B–$25B) | 20.3 | |||
| Mid Cap ($3B–10B) | 18.4 | |||
| Small Cap (under $3B) | 38.6 | |||
| Cash and Other Assets, Less Liabilities | 14.1 | |||
| 6 | Not all countries are included in the benchmark index. |
| 7 | Source: FactSet Research Systems. Percentage values in data are rounded to the nearest tenth of one percent, so the values may not sum to 100% due to rounding. Percentage values may be derived from different data sources and may not be consistent with other Fund literature. |
Matthews Asia ESG Fund
Portfolio Manager Commentary (unaudited) (continued)
adult incontinence products. Unicharm is Asia’s largest and the world’s third-largest company in the disposable hygiene category. The company has a dominant position in Japan’s adult diaper market and is poised to benefit from aging populations and rising life expectancy in other parts of Asia. Unicharm also has market-leading positions in baby diapers and feminine hygiene products across several Asian markets. The company has strong programs to reduce its footprint and has a plan to achieve 100% third-party certification that its paper and pulp, a key raw material, is environmentally sourced by 2020. The company is also in the process of commercializing a diaper recycling system that should materially reduce the raw material intensity of the business over time. Unicharm is focused on shareholder returns and has a 50% total return (dividends and buybacks) policy.
Outlook:
U.S.–China trade friction, which escalated sharply up until the G-20 summit meeting in Argentina in November, seems to be de-escalating but we continue to monitor progress very closely. We believe China has the ability to at least partially address the shorter-term drag on growth by way of stimulus. And the broad contours of such stimulus are slowly taking shape in the form of targeted infrastructure investments, reduced banking reserve requirement ratios and tax relief. Also, we are watching for sharp oil price movements that could impact the current account balances of South and Southeast Asian countries, with implications for their currencies.
The recent sell-off has selectively provided attractive entry opportunities in Asia and we continue to employ a fundamental, bottom-up investment process and use any further market dislocation in Asia as an opportunity to buy shares of what we consider to be high-quality companies with best-in-class ESG attributes at reasonable prices.
We are confident in Asia’s ability to effectively address global ESG challenges through its leadership position in areas including electric vehicles, access to affordable health care and financial inclusion, among others. This leadership provides an encouraging backdrop for ESG-focused investing in Asia. We also find that investing in companies that are improving the quality of life in Asia is a way to address the aspirations of the newly emergent and increasingly sophisticated middle class.
| 50 | MATTHEWS ASIA FUNDS |
Table of Contents
Matthews Asia ESG Fund
December 31, 2018
Schedule of Investmentsa
COMMON EQUITIES: 81.6%
| Shares | Value | |||||||
| CHINA/HONG KONG: 21.5% | ||||||||
Inner Mongolia Yili Industrial Group Co., Ltd. A Shares | 406,300 | $1,357,001 | ||||||
MTR Corp., Ltd. | 148,000 | 778,898 | ||||||
HKBN, Ltd. | 453,000 | 686,767 | ||||||
China Conch Venture Holdings, Ltd. | 212,000 | 631,233 | ||||||
CSPC Pharmaceutical Group, Ltd. | 406,000 | 582,801 | ||||||
Haier Electronics Group Co., Ltd. | 220,000 | 541,101 | ||||||
Wuxi Biologics Cayman, Inc.b,c,d | 75,000 | 479,142 | ||||||
Hong Kong Exchanges & Clearing, Ltd. | 15,400 | 445,192 | ||||||
Han’s Laser Technology Industry Group Co., Ltd. A Shares | 96,675 | 429,197 | ||||||
Guangdong Investment, Ltd. | 218,000 | 421,215 | ||||||
Contemporary Amperex Technology Co., Ltd. A Sharesc | 29,000 | 313,645 | ||||||
AIA Group, Ltd. | 25,200 | 209,332 | ||||||
Beijing Urban Construction Design & Development Group Co., Ltd. H Sharesb,d | 370,000 | 128,523 | ||||||
|
| |||||||
Total China/Hong Kong | 7,004,047 | |||||||
|
| |||||||
| INDIA: 13.7% | ||||||||
Mahindra & Mahindra, Ltd. | 66,975 | 770,621 | ||||||
Shriram City Union Finance, Ltd. | 32,473 | 739,018 | ||||||
IndusInd Bank, Ltd. | 25,411 | 581,854 | ||||||
Syngene International, Ltd.b,d | 63,721 | 512,204 | ||||||
Bharat Financial Inclusion, Ltd.c | 33,441 | 484,768 | ||||||
Lupin, Ltd. | 36,292 | 438,492 | ||||||
TeamLease Services, Ltd.c | 7,379 | 302,508 | ||||||
Ipca Laboratories, Ltd. | 22,284 | 255,773 | ||||||
Power Grid Corp. of India, Ltd. | 66,930 | 190,366 | ||||||
Wipro, Ltd. | 36,513 | 172,792 | ||||||
|
| |||||||
Total India | 4,448,396 | |||||||
|
| |||||||
| JAPAN: 12.9% | ||||||||
Unicharm Corp. | 30,600 | 989,664 | ||||||
Fuji Seal International, Inc. | 22,300 | 786,025 | ||||||
Sohgo Security Services Co., Ltd. | 15,300 | 714,857 | ||||||
Tsukui Corp. | 89,000 | 677,155 | ||||||
Bunka Shutter Co., Ltd. | 51,400 | 334,004 | ||||||
LITALICO, Inc.c | 17,900 | 263,889 | ||||||
Koa Corp. | 18,400 | 217,277 | ||||||
Sosei Group Corp.c | 19,200 | 139,038 | ||||||
Career Co., Ltd. | 13,600 | 77,309 | ||||||
|
| |||||||
Total Japan | 4,199,218 | |||||||
|
| |||||||
| TAIWAN: 8.2% | ||||||||
Poya International Co., Ltd. | 40,000 | 414,708 | ||||||
Sporton International, Inc. | 86,903 | 404,612 | ||||||
Delta Electronics, Inc. | 92,000 | 389,595 | ||||||
Zhen Ding Technology Holding, Ltd. | 136,000 | 355,936 | ||||||
Taiwan Semiconductor Manufacturing Co., Ltd. | 47,000 | 343,378 | ||||||
Sitronix Technology Corp. | 94,000 | 310,062 | ||||||
Merida Industry Co., Ltd. | 52,000 | 234,456 | ||||||
Merry Electronics Co., Ltd. | 55,000 | 220,934 | ||||||
|
| |||||||
Total Taiwan | 2,673,681 | |||||||
|
| |||||||
| Shares | Value | |||||||
| INDONESIA: 5.6% | ||||||||
PT Bank Rakyat Indonesia Persero | 4,102,100 | $1,045,044 | ||||||
PT Arwana Citramulia | 10,550,200 | 308,484 | ||||||
PT Jaya Real Property | 4,774,000 | 245,672 | ||||||
PT BFI Finance Indonesia | 5,086,800 | 235,238 | ||||||
|
| |||||||
Total Indonesia | 1,834,438 | |||||||
|
| |||||||
| BANGLADESH: 5.3% | ||||||||
BRAC Bank, Ltd.c | 946,839 | 820,443 | ||||||
Square Pharmaceuticals, Ltd. | 151,616 | 458,814 | ||||||
GrameenPhone, Ltd. | 98,057 | 429,277 | ||||||
|
| |||||||
Total Bangladesh | 1,708,534 | |||||||
|
| |||||||
| SOUTH KOREA: 4.4% | ||||||||
Hanon Systems | 50,663 | 490,950 | ||||||
KT Skylife Co., Ltd. | 30,220 | 311,437 | ||||||
iMarketKorea, Inc. | 48,851 | 303,210 | ||||||
DGB Financial Group, Inc. | 28,334 | 211,067 | ||||||
Samjin Pharmaceutical Co., Ltd. | 3,337 | 120,383 | ||||||
|
| |||||||
Total South Korea | 1,437,047 | |||||||
|
| |||||||
| SINGAPORE: 3.6% | ||||||||
SATS, Ltd. | 135,400 | 463,754 | ||||||
Delfi, Ltd. | 382,300 | 367,338 | ||||||
Raffles Medical Group, Ltd. | 398,900 | 322,061 | ||||||
|
| |||||||
Total Singapore | 1,153,153 | |||||||
|
| |||||||
| THAILAND: 2.4% | ||||||||
Total Access Communication Public Co., Ltd. NVDR | 579,000 | 774,926 | ||||||
|
| |||||||
Total Thailand | 774,926 | |||||||
|
| |||||||
| PHILIPPINES: 1.5% | ||||||||
Puregold Price Club, Inc. | 596,630 | 487,391 | ||||||
|
| |||||||
Total Philippines | 487,391 | |||||||
|
| |||||||
| VIETNAM: 1.1% | ||||||||
Nam Long Investment Corp. | 327,423 | 365,601 | ||||||
|
| |||||||
Total Vietnam | 365,601 | |||||||
|
| |||||||
| PAKISTAN: 0.8% | ||||||||
Abbott Laboratories Pakistan, Ltd. | 54,500 | 246,038 | ||||||
Bank Alfalah, Ltd. | 17,850 | 5,228 | ||||||
|
| |||||||
Total Pakistan | 251,266 | |||||||
|
| |||||||
| LUXEMBOURG: 0.6% | ||||||||
L’Occitane International SA | 105,250 | 191,545 | ||||||
|
| |||||||
Total Luxembourg | 191,545 | |||||||
|
| |||||||
| TOTAL COMMON EQUITIES | 26,529,243 | |||||||
|
| |||||||
(Cost $26,498,070) | ||||||||
| matthewsasia.com | 800.789.ASIA | 51 |
Table of Contents
Matthews Asia ESG Fund
December 31, 2018
Schedule of Investmentsa(continued)
PREFERRED EQUITIES: 4.3%
| Shares | Value | |||||||
| SOUTH KOREA: 4.3% | ||||||||
Samsung SDI Co., Ltd., Pfd. | 18,258 | $1,412,730 | ||||||
|
| |||||||
Total South Korea | 1,412,730 | |||||||
|
| |||||||
| TOTAL PREFERRED EQUITIES | 1,412,730 | |||||||
|
| |||||||
(Cost $1,229,935) | ||||||||
RIGHTS: 0.0% | ||||||||
| TAIWAN: 0.0% | ||||||||
Merry Electronics Co., Ltd., Rights, | 886 | 311 | ||||||
|
| |||||||
Total Taiwan | 311 | |||||||
|
| |||||||
| TOTAL RIGHTS | 311 | |||||||
|
| |||||||
(Cost $0) | ||||||||
| TOTAL INVESTMENTS: 85.9% | 27,942,284 | |||||||
(Cost $27,728,005) | ||||||||
| CASH AND OTHER ASSETS, LESS LIABILITIES: 14.1% | 4,589,509 | |||||||
|
| |||||||
NET ASSETS: 100.0% | $32,531,793 | |||||||
|
| |||||||
| a | Certain securities were fair valued under the valuation policies approved by the Board of Trustees (Note2-A). |
| b | Security exempt from registration under Rule 144A of the Securities Act of 1933, as amended. The security may be resold in transactions exempt from registration normally to qualified institutional buyers. The security has been determined to be liquid in accordance with procedures adopted by the Funds’ Board of Trustees. At December 31, 2018, the aggregate value is $1,119,869, which is 3.44% of net assets. |
| c | Non-income producing security. |
| d | The securities may be resold to qualified foreign investors and foreign institutional buyers under Regulation S of the Securities Act of 1933. |
| NVDR | Non-Voting Depositary Receipt |
| Pfd. | Preferred |
See accompanying notes to financial statements.
| 52 | MATTHEWS ASIA FUNDS |
Table of Contents
| PORTFOLIO MANAGERS | ||||
| Taizo Ishida | Robert Harvey, CFA | |||
Lead Manager | Lead Manager | |||
| FUND FACTS | ||||
| Investor | Institutional | |||
Ticker | MEASX | MIASX | ||
CUSIP | 577125883 | 577125875 | ||
Inception | 4/30/13 | 4/30/13 | ||
NAV | $12.50 | $12.54 | ||
Initial Investment | $2,500 | $100,000 | ||
Gross Expense Ratio1 | 1.66% | 1.50% | ||
After Fee Waiver and Reimbursement2 | 1.48% | 1.25% | ||
Portfolio Statistics | ||||
Total # of Positions | 63 | |||
Net Assets | $375.2 million | |||
Weighted Average Market Cap | $2.1 billion | |||
Portfolio Turnover3 | 26.09% | |||
Benchmark | ||||
MSCI Emerging Markets Asia Index | ||||
Redemption Fee | ||||
2% within first 90 calendar days of purchase | ||||
OBJECTIVE
Long-term capital appreciation.
STRATEGY
Under normal market conditions, the Fund seeks to achieve its investment objective by investing at least 80% of its net assets, which include borrowings for investment purposes, in the common and preferred stocks of companies located in Asia excluding Japan, South Korea, Hong Kong and Singapore. The Fund may also invest in the convertible securities, of any duration or quality, of companies located in Asia excluding Japan, South Korea, Hong Kong and Singapore. Under normal market conditions, the Fund is expected to invest a substantial portion of its net assets in the emerging countries and markets in the Asian region, including, but not limited to, Bangladesh, Cambodia, China (including Taiwan, but excluding Hong Kong), India, Indonesia, Laos, Malaysia, Mongolia, Myanmar, Pakistan, Papua New Guinea, Philippines, Sri Lanka, Thailand, and Vietnam.
Portfolio Manager Commentary (unaudited)
For the year ending December 31, 2018, the Matthews Emerging Asia Fund returned –17.58% (Investor Class) and –17.41% (Institutional Class), while its benchmark, the MSCI Emerging Markets Asia Index, returned –15.16%. For the fourth quarter, the Fund returned –3.38% (Investor Class) and –3.32% (Institutional Class), versus –9.23% for the Index.
Market Environment:
Asian markets were volatile in 2018, with emerging and frontier markets particularly hard hit by negative growth sentiment. Macro headwinds included tight monetary policy, trade conflicts and rollercoaster oil prices. Oil prices in particular roiled many Asian currencies. Toward the end of the year, there was a slight reprieve for some Asian markets, as falling oil prices and a softer U.S. dollar helped ease macro challenges a bit.
Amid U.S.–China trade conflicts, some manufacturers began to shift production out of China and into other markets. Vietnam has been a natural beneficiary of this trend. With a young, sophisticated workforce, Vietnam’s economy is poised for significant growth. While Vietnam’s broader equity markets were down for the year, the Fund’s holding in Vietnam generated positive absolute returns in 2018, which we discuss in the next section. We remain optimistic about Vietnam’s long-term prospects.
Meanwhile, equity markets in India and Indonesia both experienced significant volatility throughout the year, as rising oil prices and rising U.S. interest rates negatively impacted their respective currencies. By year-end, however, both India’s and Indonesia’s equity markets represented brighter spots in the region, generating positive returns in November and December.
Pakistan was also heavily impacted by rising oil prices, which disrupted its trade balance, especially when combined with strong domestic demand for imported products. The weakening external accounts were combined with an election where the military disappointingly flexed its muscle. These challenges were enough to crush local and international appetite for equities, and the market fell.
Performance Contributors and Detractors:
For the full year 2018, stock selection in India was the largest detractor from performance. Three stocks in particular were poor performers for the year—jewelry maker PC Jeweller, convenience store operator Vakrangee and dairy company Kwality. We visited all three companies in October 2018, reinforcing our conviction to hold and add to PC Jeweller and Vakrangee but to exit Kwality.
Bright spots for the portfolio were our holdings in the consumer staples sector, which generated positive absolute and relative returns during the full year, as well as in the fourth quarter. Part of the structural growth of emerging markets within Asia is rising income, which translates into rising consumer spending power. Our focus on the consumer is an anchor of our approach, as we believe following the consumer is a consistent way to capture the growth of the region.
Another bright spot for the portfolio was the Fund’s overweight allocation to Vietnam. Vietnam’s equity market is too small to be in the Fund’s benchmark, but the
(continued)
| 1 | Actual 2018 expense ratios. |
| 2 | Matthews has contractually agreed (i) to waive fees and reimburse expenses to the extent needed to limit Total Annual Fund Operating Expenses (excluding Rule 12b-1 fees, taxes, interest, brokerage commissions, short sale dividend expenses, expenses incurred in connection with any merger or reorganization or extraordinary expenses such as litigation) of the Institutional Class to 1.25% first by waiving class specific expenses (i.e., shareholder service fees specific to a particular class) of the Institutional Class and then, to the extent necessary, by waiving non-class specific expenses of the Institutional Class, and (ii) if any Fund-wide expenses (i.e., expenses that apply to both the Institutional Class and the Investor Class) are waived for the Institutional Class to maintain the 1.25% expense limitation, to waive an equal amount (in annual percentage terms) of those same expenses for the Investor Class. The Total Annual Fund Operating Expenses After Fee Waiver and Expense Reimbursement for the Investor Class may vary from year to year and will in some years exceed 1.25%. If the operating expenses fall below the expense limitation in a year within three years after Matthews has made a waiver or reimbursement, the Fund may reimburse Matthews up to an amount that does not cause the expenses for that year to exceed the lesser of (i) the expense limitation applicable at the time of that fee waiver and/or expense reimbursement or (ii) the expense limitation in effect at the time of recoupment. This agreement will remain in place until April 30, 2019 and may be terminated at any time by the Board of Trustees on behalf of the Fund on 60 days’ written notice to Matthews. Matthews may decline to renew this agreement by written notice to the Trust at least 30 days before its annual expiration date. |
| 3 | The lesser of fiscal year 2018 long-term purchase costs or sales proceeds divided by the average monthly market value of long-term securities. |
| matthewsasia.com | 800.789.ASIA | 53 |
Table of Contents
| PERFORMANCE AS OF DECEMBER 31, 2018 | ||||||||||||||||||||||||
|
|
| Average Annual Total Returns |
| |||||||||||||||||||||
| 3 Months | 1 Year | 3 Years | 5 Years | Since Inception | Inception Date | |||||||||||||||||||
| Investor Class (MEASX) | -3.38% | -17.58% | 5.19% | 5.89% | 5.06% | 4/30/13 | ||||||||||||||||||
| Institutional Class (MIASX) | -3.32% | -17.41% | 5.45% | 6.15% | 5.30% | 4/30/13 | ||||||||||||||||||
| MSCI Emerging Markets Asia Index4 | -9.23% | -15.16% | 8.99% | 4.30% | 4.16% | |||||||||||||||||||
Performance assumes reinvestment of all dividends and/or distributions before taxes. All performance quoted represents past performance and is no guarantee of future results. Investment return and principal value will fluctuate with market conditions so that when redeemed, shares may be worth more or less than their original cost. Current performance may be lower or higher than the return figures quoted. Returns would have been lower if certain of the Fund’s fees and expenses had not been waived. For the Fund’s most recent month-end performance visit matthewsasia.com.
GROWTH OF A $10,000 INVESTMENT SINCE INCEPTION—INVESTOR CLASS
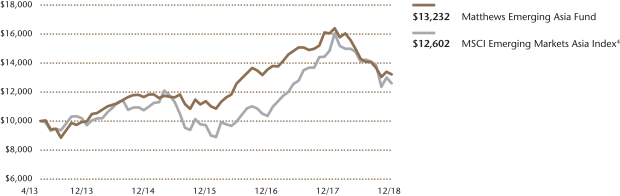
Plotted monthly. The performance data and graph do not reflect the deduction of taxes that a shareholder would pay on dividends, capital gain distributions or redemption of Fund shares. Values are in US$.
| 4 | It is not possible to invest directly in an index. Source: Index data from Morgan Stanley Capital International and Bloomberg; total return calculations performed by BNY Mellon Investment Servicing (US) Inc. Please see page 91 for index definition. |
| TOP TEN HOLDINGS5 | ||||||||
| Sector | Country | % of Net Assets | ||||||
| Vinh Hoan Corp. | Consumer Staples | Vietnam | 4.0% | |||||
| Saigon Beer Alcohol Beverage Corp. | Consumer Staples | Vietnam | 3.8% | |||||
| Cosco Capital, Inc. | Consumer Staples | Philippines | 3.5% | |||||
| British American Tobacco Bangladesh Co., Ltd. | Consumer Staples | Bangladesh | 3.5% | |||||
| Phu Nhuan Jewelry JSC | Consumer Discretionary | Vietnam | 3.3% | |||||
| PT Gudang Garam | Consumer Staples | Indonesia | 3.1% | |||||
| Square Pharmaceuticals, Ltd. | Health Care | Bangladesh | 3.0% | |||||
| PT Kino Indonesia | Consumer Staples | Indonesia | 3.0% | |||||
| PT Bank Mandiri Persero | Financials | Indonesia | 3.0% | |||||
| BRAC Bank, Ltd. | Financials | Bangladesh | 2.9% | |||||
| % OF ASSETS IN TOP TEN | 33.1% | |||||||
| 5 | Holdings may combine more than one security from same issuer and related depositary receipts. |
| 54 | MATTHEWS ASIA FUNDS |
Table of Contents
Matthews Emerging Asia Fund
Portfolio Manager Commentary (unaudited) (continued)
Fund maintained roughly one-fifth of its portfolio to this dynamic, fast-growing country during 2018. Top contributors for the full year included Vietnamese consumer-staples companies Vinh Hoan and Saigon Beer Alcohol Beverage. As ever, we believe targeting companies that capture the growth of the Asian consumer is a highly effective long-term strategy.
Notable Portfolio Changes:
During the fourth quarter, we exited Kwality, an Indian dairy producer, as it has balance sheet challenges that may prove insurmountable. We visited India in the fourth quarter and lost confidence in the company’s management team. Accordingly, we exited the stock. We also exited Shenzhou International, a Chinese textiles company that we sold at a profit. And we sold our position in Balkrishna Industries, an Indian truck and auto equipment maker, as valuations were high and we wanted to lock in gains. We added no new positions in the fourth quarter.
Outlook:
Looking ahead, macroeconomic risks remain on the horizon, but some have the potential to ease. Pakistan’s equity markets have seen significant declines over the past two years, largely because of currency devaluation and a change in political leadership. Both challenges to equity prices may be largely behind us, especially if oil prices remain softer. In addition, central banks in India, Indonesia and the Philippines could relax monetary policy, creating a more favorable environment for equities, particularly small caps.
Valuations are currently at or near historic lows in many parts of Emerging Asia, indicating that a lot of negative sentiment has already been priced into these markets. Drawing on insights from nearly 25 years of investing in emerging and frontier markets, I’m optimistic about investing at this point in the cycle. Coming off a low base, corporate earnings have room to grow and stock-price multiples have room to expand.
The Matthews Emerging Asia Fund offers investors access to some of the world’s fastest-growing economies, including both emerging and frontier markets within Asia. As many of these markets are underrepresented within investor portfolios, we believe they offer an opportunity to generate attractive returns over a full market cycle and longer. The key is investing with a long-term view, employing a bottom-up approach to stock selection and capturing a meaningful share of rising consumer incomes in the region.
| COUNTRY ALLOCATION (%)6,7 | ||||
| Vietnam | 23.5 | |||
| Indonesia | 20.1 | |||
| Bangladesh | 14.5 | |||
| Pakistan | 11.8 | |||
| Sri Lanka | 10.1 | |||
| Philippines | 7.0 | |||
| India | 6.7 | |||
| China/Hong Kong | 4.4 | |||
| Singapore | 0.7 | |||
| Australia | 0.6 | |||
| Cash and Other Assets, Less Liabilities | 0.4 | |||
| SECTOR ALLOCATION (%)7 | ||||
| Consumer Staples | 32.7 | |||
| Consumer Discretionary | 22.2 | |||
| Financials | 19.5 | |||
| Industrials | 7.2 | |||
| Health Care | 6.0 | |||
| Materials | 4.3 | |||
| Information Technology | 3.3 | |||
| Real Estate | 3.1 | |||
| Energy | 1.1 | |||
| Communication Services | 0.2 | |||
| Cash and Other Assets, Less Liabilities | 0.4 | |||
| MARKET CAP EXPOSURE (%)7 | ||||
| Mega Cap (over $25B) | 0.0 | |||
| Large Cap ($10B–$25B) | 6.1 | |||
| Mid Cap ($3B–10B) | 6.7 | |||
| Small Cap (under $3B) | 86.8 | |||
| Cash and Other Assets, Less Liabilities | 0.4 | |||
| 6 | Not all countries where the Fund may invest are included in the benchmark index. |
| 7 | Source: FactSet Research Systems. Percentage values in data are rounded to the nearest tenth of one percent, so the values may not sum to 100% due to rounding. Percentage values may be derived from different data sources and may not be consistent with other Fund literature. |
| matthewsasia.com | 800.789.ASIA | 55 |
Table of Contents
Matthews Emerging Asia Fund
December 31, 2018
Schedule of Investmentsa
COMMON EQUITIES: 99.6%
| Shares | Value | |||||||
| VIETNAM: 23.5% | ||||||||
Vinh Hoan Corp. | 3,648,160 | $14,929,862 | ||||||
Saigon Beer Alcohol Beverage Corp. | 1,226,670 | 14,181,643 | ||||||
Phu Nhuan Jewelry JSC | 3,095,523 | 12,505,413 | ||||||
Nam Long Investment Corp. | 7,913,321 | 8,836,032 | ||||||
Taisun International Holding Corp.† | 2,127,000 | 8,786,929 | ||||||
Mobile World Investment Corp. | 1,360,605 | 5,108,334 | ||||||
Thien Long Group Corp. | 1,717,046 | 4,829,319 | ||||||
Military Commercial Joint Stock Bank | 5,602,258 | 4,714,747 | ||||||
National Seed JSC† | 1,126,522 | 4,371,071 | ||||||
Domesco Medical Import Export JSC | 1,104,310 | 3,586,169 | ||||||
Tien Phong Plastic JSC | 1,861,224 | 3,249,820 | ||||||
Lix Detergent JSC | 1,254,405 | 2,591,015 | ||||||
Dinh Vu Port Investment & Development JSC | 252,030 | 455,209 | ||||||
|
| |||||||
Total Vietnam | 88,145,563 | |||||||
|
| |||||||
| INDONESIA: 20.2% |
| |||||||
PT Gudang Garam | 2,005,200 | 11,683,675 | ||||||
PT Kino Indonesia | 57,504,900 | 11,196,301 | ||||||
PT Bank Mandiri Persero | 21,792,900 | 11,179,120 | ||||||
PT Ramayana Lestari Sentosa | 99,165,900 | 9,803,404 | ||||||
PT Adira Dinamika Multi Finance | 11,372,900 | 7,197,037 | ||||||
PT Bank Tabungan Pensiunan Nasional Syariahb | 47,530,100 | 5,935,505 | ||||||
PT Hexindo Adiperkasa | 22,802,000 | 4,519,172 | ||||||
PT Matahari Department Store | 10,458,400 | 4,070,545 | ||||||
PT Mayora Indah | 21,437,800 | 3,908,022 | ||||||
PT BFI Finance Indonesia | 73,579,500 | 3,402,668 | ||||||
PT Catur Sentosa Adiprana | 70,131,000 | 2,667,715 | ||||||
|
| |||||||
Total Indonesia | 75,563,164 | |||||||
|
| |||||||
| BANGLADESH: 14.5% |
| |||||||
British American Tobacco Bangladesh Co., Ltd. | 306,755 | 12,949,156 | ||||||
Square Pharmaceuticals, Ltd. | 3,706,390 | 11,216,124 | ||||||
BRAC Bank, Ltd.b | 12,728,656 | 11,029,479 | ||||||
Berger Paints Bangladesh, Ltd. | 547,198 | 8,766,255 | ||||||
Marico Bangladesh, Ltd. | 275,493 | 3,932,307 | ||||||
Olympic Industries, Ltd. | 1,416,833 | 3,651,005 | ||||||
The City Bank, Ltd. | 8,021,270 | 2,908,653 | ||||||
|
| |||||||
Total Bangladesh | 54,452,979 | |||||||
|
| |||||||
| PAKISTAN: 11.8% |
| |||||||
Indus Motor Co., Ltd. | 1,084,910 | 9,533,451 | ||||||
Meezan Bank, Ltd. | 11,418,816 | 7,600,752 | ||||||
ICI Pakistan, Ltd. | 936,350 | 5,358,850 | ||||||
GlaxoSmithKline Consumer Healthcare Pakistan, Ltd. | 2,493,557 | 4,785,725 | ||||||
Hascol Petroleum, Ltd. | 3,902,125 | 4,156,768 | ||||||
Shifa International Hospitals, Ltd.† | 2,783,351 | 4,139,332 | ||||||
PAK Suzuki Motor Co., Ltd. | 3,287,600 | 4,124,659 | ||||||
Akzo Nobel Pakistan, Ltd. | 1,975,300 | 2,188,912 | ||||||
Pakistan Petroleum, Ltd. | 1,670,095 | 1,798,747 | ||||||
Hum Network, Ltd.b | 17,939,500 | 568,687 | ||||||
|
| |||||||
Total Pakistan | 44,255,883 | |||||||
|
| |||||||
| Shares | Value | |||||||
| SRI LANKA: 10.2% |
| |||||||
Sampath Bank PLCb | 8,406,406 | $10,801,014 | ||||||
John Keells Holdings PLC | 9,253,493 | 8,079,731 | ||||||
Ceylon Cold Stores PLC | 1,387,119 | 5,445,333 | ||||||
Teejay Lanka PLC | 29,116,858 | 5,173,854 | ||||||
Lanka Orix Leasing Co. PLCb | 7,511,241 | 3,691,966 | ||||||
Ceylon Tobacco Co. PLC | 361,292 | 2,795,124 | ||||||
Expolanka Holdings PLCb | 94,231,424 | 2,060,829 | ||||||
|
| |||||||
Total Sri Lanka | 38,047,851 | |||||||
|
| |||||||
| PHILIPPINES: 7.0% |
| |||||||
Cosco Capital, Inc. | 103,332,600 | 13,185,543 | ||||||
Shakey’s Pizza Asia Ventures, Inc. | 22,796,200 | 5,158,786 | ||||||
Emperador, Inc. | 30,712,800 | 4,152,667 | ||||||
STI Education Systems Holdings, Inc. | 254,154,000 | 3,818,231 | ||||||
|
| |||||||
Total Philippines | 26,315,227 | |||||||
|
| |||||||
| INDIA: 6.7% |
| |||||||
PC Jeweller, Ltd. | 6,189,535 | 7,622,981 | ||||||
Vakrangee, Ltd. | 11,406,947 | 5,434,820 | ||||||
Shriram Transport Finance Co., Ltd. | 268,352 | 4,763,620 | ||||||
Praj Industries, Ltd. | 2,525,370 | 3,964,664 | ||||||
Caplin Point Laboratories, Ltd. | 489,805 | 2,677,620 | ||||||
Poly Medicure, Ltd. | 234,582 | 747,507 | ||||||
|
| |||||||
Total India | 25,211,212 | |||||||
|
| |||||||
| CHINA/HONG KONG: 4.4% |
| |||||||
Luk Fook Holdings International, Ltd. | 2,797,000 | 7,981,882 | ||||||
Tongda Group Holdings, Ltd. | 69,640,000 | 6,910,506 | ||||||
Future Bright Holdings, Ltd. | 17,196,000 | 1,661,770 | ||||||
|
| |||||||
Total China/Hong Kong | 16,554,158 | |||||||
|
| |||||||
| SINGAPORE: 0.7% |
| |||||||
Yoma Strategic Holdings, Ltd. | 10,610,166 | 2,645,563 | ||||||
|
| |||||||
Total Singapore | 2,645,563 | |||||||
|
| |||||||
| AUSTRALIA: 0.6% |
| |||||||
Oil Search, Ltd. | 467,309 | 2,353,839 | ||||||
|
| |||||||
Total Australia | 2,353,839 | |||||||
|
| |||||||
| TOTAL INVESTMENTS: 99.6% |
| 373,545,439 | ||||||
(Cost $401,661,869) | ||||||||
| CASH AND OTHER ASSETS, LESS LIABILITIES: 0.4% |
| 1,629,322 | ||||||
|
| |||||||
NET ASSETS: 100.0% |
| $375,174,761 | ||||||
|
| |||||||
| a | Certain securities were fair valued under the valuation policies approved by the Board of Trustees (Note2-A). |
| b | Non-income producing security. |
| † | Affiliated Issuer, as defined under the Investment Company Act of 1940 (ownership of 5% or more of the outstanding voting securities of this issuer) |
| JSC | Joint Stock Co. |
See accompanying notes to financial statements.
| 56 | MATTHEWS ASIA FUNDS |
Table of Contents
| PORTFOLIO MANAGERS | ||||
| Michael J. Oh, CFA | ||||
Lead Manager | ||||
| Sunil Asnani | Tiffany Hsiao, CFA | |||
Co-Manager | Co-Manager | |||
| FUND FACTS | ||||
| Investor | Institutional | |||
Ticker | MATFX | MITEX | ||
CUSIP | 577130883 | 577125859 | ||
Inception | 12/27/99 | 4/30/13 | ||
NAV | $11.26 | $11.32 | ||
Initial Investment | $2,500 | $100,000 | ||
Gross Expense Ratio1 | 1.19% | 1.02% | ||
Portfolio Statistics | ||||
Total # of Positions | 46 | |||
Net Assets | $244.2 million | |||
Weighted Average Market Cap | $78.1 billion | |||
Portfolio Turnover2 | 85.73% | |||
Benchmark | ||||
MSCI AC Asia ex Japan Index | ||||
OBJECTIVE
Long-term capital appreciation.
STRATEGY
Under normal market conditions, the Fund seeks to achieve its investment objective by investing at least 80% of its net assets, which include borrowings for investment purposes, in the common and preferred stocks of companies located in Asia that Matthews believes are innovators in their products, services, processes, business models, management, use of technology, or approach to creating, expanding or servicing their markets. Asia consists of all countries and markets in Asia, including developed, emerging, and frontier countries and markets in the Asian region.
Portfolio Manager Commentary (unaudited)
For the year ending December 31, 2018, the Matthews Asia Innovators Fund returned –18.62% (Investor Class) and –18.40% (Institutional Class), while its benchmark, the MSCI All Country Asia ex Japan Index, returned –14.12%. For the fourth quarter of the year, the Fund returned –10.27% (Investor Class) and –10.22% (Institutional Class) versus –8.60% for the Index.
Market Environment:
Asian markets were volatile throughout 2018. Macro headwinds included tight monetary policy in many parts of Asia, as well as trade conflicts between the U.S. and China and fluctuating oil prices. Monetary tightening by the U.S. Federal Reserve and the People’s Bank of China began to take its toll on global liquidity throughout the year, hitting emerging markets the hardest. Fluctuating oil prices injected an additional degree of turbulence into markets, with oil prices rising during much of the year before collapsing by year end.
China underperformed broad emerging markets in 2018 with the majority of its relative weakness occurring from May through October. In the fourth quarter, green shoots finally appeared for Chinese equities as the Chinese government reiterated its willingness to stimulate the economy if needed. Chinese corporate earnings showed resilience and stability amid lowered expectations. South Korea’s equities were among the region’s weakest in 2018 as investors contemplated how trade talks between the U.S., China and Europe could affect South Korean exports and how prospects of a potential hike in the country’s minimum wage could affect corporate earnings.
Meanwhile India and Indonesia were volatile for much of the year, but ended the year on a stronger note. India’s equity market experienced wide swings in the first three quarters, but closed out 2018 with two months of strong relative performance. As oil prices eased and other macro headwinds lessened, India equities stabilized. Meanwhile in Southeast Asia, Indonesia equities also ended the year on a stronger note. Lower oil prices benefited Indonesia’s currency and economy, easing pressures on its trade balance.
Performance Contributors and Detractors:
Amid negative growth sentiment, growth companies trading at higher price multiples experienced sharper declines than broader markets. Detracting from performance for the full-year 2018 were the Fund’s holdings in China and Korea, as well as its holdings in the communication services and consumer discretionary sectors. Contributing to performance for the full-year 2018 were our stock selection and overweight in health care, and stock selection in financials. Health care companies generally held up well during the year, although many experienced price corrections in the fourth quarter. We continue to see health care as one of the better growth opportunities in the region, where health care spending per capita is still much lower than in other developed regions.
During the fourth quarter, the top detractors from performance were our holdings in China. Many Chinese equities declined on concerns over trade conflicts. However, we believe the market overreacted. Accordingly, we took advantage of market volatility to add to our holdings in China. Even if China’s economic growth slows modestly, we believe China still has the potential to maintain attractive levels of economic growth. The top contributors to performance in the fourth quarter included stock selection in financials and our underweight to the information technology sector. Innovation in the financial sector is a theme we’ll continue to follow, as Asian consumers expand their interest in insurance and other financial products.
(continued)
| 1 | Actual 2018 expense ratios. |
| 2 | The lesser of fiscal year 2018 long-term purchase costs or sales proceeds divided by the average monthly market value of long-term securities. |
| matthewsasia.com | 800.789.ASIA | 57 |
Table of Contents
| PERFORMANCE AS OF DECEMBER 31, 2018 | ||||||||||||||||||||||||||||
|
|
| Average Annual Total Returns |
| |||||||||||||||||||||||||
| 3 Months | 1 Year | 3 Years | 5 Years | 10 Years | Since Inception | Inception Date | ||||||||||||||||||||||
| Investor Class (MATFX) | -10.27% | -18.62% | 4.19% | 5.24% | 13.27% | 2.93% | 12/27/1999 | |||||||||||||||||||||
| Institutional Class (MITEX) | -10.22% | -18.40% | 4.42% | 5.46% | n.a. | 9.01% | 4/30/2013 | |||||||||||||||||||||
| MSCI AC Asia ex Japan Index3 | -8.60% | -14.12% | 8.87% | 4.32% | 10.40% | 5.84% | 4 | |||||||||||||||||||||
Performance assumes reinvestment of all dividends and/or distributions before taxes. All performance quoted represents past performance and is no guarantee of future results.Investment return and principal value will fluctuate with market conditions so that when redeemed, shares may be worth more or less than their original cost. Current performance may be lower or higher than the return figures quoted. For the Fund’s most recent month-end performance, visit matthewsasia.com.
GROWTH OF A $10,000 INVESTMENT SINCE INCEPTION—INVESTOR CLASS
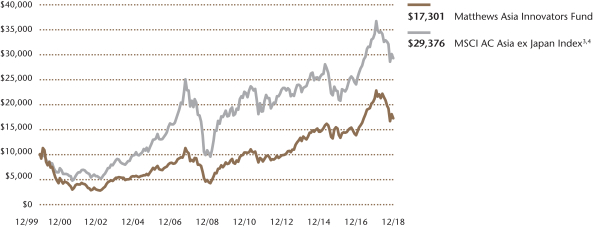
Plotted monthly. The performance data and graph do not reflect the deduction of taxes that a shareholder would pay on dividends, capital gains distributions or redemption of Fund shares. Values are in US$.
| 3 | It is not possible to invest directly in an index. Source: Index data from Morgan Stanley Capital International and Bloomberg; total return calculations performed by BNY Mellon Investment Servicing (US) Inc. Please see page 91 for index definition. |
| 4 | Calculated from 12/31/99. |
| TOP TEN HOLDINGS5 | ||||||||
| Sector | Country | % of Net Assets | ||||||
| Tencent Holdings, Ltd. | Communication Services | China/Hong Kong | 6.9% | |||||
| Alibaba Group Holding, Ltd. | Consumer Discretionary | China/Hong Kong | 6.0% | |||||
| HDFC Bank, Ltd. | Financials | India | 5.7% | |||||
| Ping An Insurance Group Co. of China, Ltd. | Financials | China/Hong Kong | 4.2% | |||||
| AIA Group, Ltd. | Financials | China/Hong Kong | 3.2% | |||||
| China International Travel Service Corp., Ltd. | Consumer Discretionary | China/Hong Kong | 3.0% | |||||
| Jiangsu Yanghe Brewery Joint-Stock Co., Ltd. | Consumer Staples | China/Hong Kong | 3.0% | |||||
| Jiangsu Hengrui Medicine Co., Ltd. | Health Care | China/Hong Kong | 2.9% | |||||
| Inner Mongolia Yili Industrial Group Co., Ltd. | Consumer Staples | China/Hong Kong | 2.9% | |||||
| Orion Corp. | Consumer Staples | South Korea | 2.9% | |||||
| % OF ASSETS IN TOP TEN | 40.7% | |||||||
| 5 | Holdings may combine more than one security from same issuer and related depositary receipts. |
| 58 | MATTHEWS ASIA FUNDS |
Table of Contents
Matthews Asia Innovators Fund
Portfolio Manager Commentary (unaudited) (continued)
Notable Portfolio Changes:
During the year, there was a notable pickup in regulatory risk in China, particularly impacting the education, internet and health care sectors. This led to higher than usual changes in the portfolio over the full year. In particular, we shifted away from some holdings that we believe now face higher regulatory risks.
In the fourth quarter, we swapped our preferred shares for common shares in Samsung SDI, a South Korean battery manufacturer. We also initiated a new position in Contemporary Amperex Technology, a Chinese battery manufacturer with the largest market share in China. In addition, we initiated a new position in iQIYI, a Chinese provider of original streaming video content. We believe the environment in China is very favorable to original content producers, benefiting from a trend of improving intellectual property protection in China.
In the fourth quarter, we exited our position in Samsung Electronics, a South Korean semiconductor manufacturer. We believe the overall semiconductor industry has peaked and we are finding more appealing growth opportunities in other sectors. We also exited our position in CSPC Pharmaceutical Group, a Chinese drug manufacturer. Regulatory risk has been rising in the Chinese health care sector, including increased government regulation over the pricing of generics, so we decided to exit the position.
Outlook:
As we look ahead, some factors that were headwinds for Asian markets in 2018 may be easing. There is the potential for monetary policy to relax, trade conflicts could ease even if they aren’t fully resolved, and oil prices could remain softer. Currencies also started to become a tailwind for some Asian economies, as oil prices have retreated from their 2018 high-water mark and the U.S. dollar has softened.
Notably, there could be additional volatility in the first half of 2019. Risks to global markets include the potential for slower growth in the U.S. and China, as well as general geopolitical risks. If there is a silver lining to be found, a lot of negative sentiment is already priced into Asian markets. Asian ex-Japan markets currently offer much more attractive valuations than developed markets and we are optimistic about the long-term growth prospects of the region.
As always, we seek to invest in innovative companies benefiting from rising consumer income in Asia. As China and other countries in the region transition to economies driven by gains in productivity, we believe the most innovative companies have the potential to outperform the broader markets over a full market cycle. We are excited by the trends of innovation we see across the region and look forward to identifying the next generation of innovation leaders in Asia.
| COUNTRY ALLOCATION (%)6,7 | ||||
| China/Hong Kong | 55.1 | |||
| South Korea | 14.2 | |||
| India | 11.3 | |||
| Bangladesh | 3.8 | |||
| Vietnam | 3.1 | |||
| Singapore | 2.8 | |||
| Indonesia | 2.6 | |||
| Taiwan | 2.5 | |||
| Philippines | 1.5 | |||
| Thailand | 1.4 | |||
| Cash and Other Assets, Less Liabilities | 1.6 | |||
| SECTOR ALLOCATION (%)7 | ||||
| Financials | 27.9 | |||
| Communication Services | 17.9 | |||
| Consumer Discretionary | 17.4 | |||
| Consumer Staples | 16.6 | |||
| Health Care | 9.7 | |||
| Information Technology | 8.1 | |||
| Industrials | 0.8 | |||
| Cash and Other Assets, Less Liabilities | 1.6 | |||
| MARKET CAP EXPOSURE (%)7 | ||||
| Mega Cap (over $25B) | 41.0 | |||
| Large Cap ($10B–$25B) | 23.4 | |||
| Mid Cap ($3B–10B) | 16.4 | |||
| Small Cap (under $3B) | 17.6 | |||
| Cash and Other Assets, Less Liabilities | 1.6 | |||
| 6 | Not all countries are included in the benchmark index. |
| 7 | Source: FactSet Research Systems. Percentage values in data are rounded to the nearest tenth of one percent, so the values may not sum to 100% due to rounding. Percentage values may be derived from different data sources and may not be consistent with other Fund literature. |
| matthewsasia.com | 800.789.ASIA | 59 |
Table of Contents
Matthews Asia Innovators Fund
December 31, 2018
Schedule of Investmentsa
COMMON EQUITIES: 98.4%
| Shares | Value | |||||||
| CHINA/HONG KONG: 55.1% | ||||||||
Tencent Holdings, Ltd. | 423,200 | $16,962,004 | ||||||
Alibaba Group Holding, Ltd. ADRb | 106,900 | 14,652,783 | ||||||
Ping An Insurance Group Co. of China, Ltd. H Shares | 1,171,000 | 10,330,581 | ||||||
AIA Group, Ltd. | 933,800 | 7,756,903 | ||||||
China International Travel Service Corp., Ltd. A Shares | 838,863 | 7,363,784 | ||||||
Jiangsu Yanghe Brewery Joint-Stock Co., Ltd. A Shares | 527,735 | 7,310,699 | ||||||
Jiangsu Hengrui Medicine Co., Ltd. A Shares | 931,713 | 7,181,317 | ||||||
Inner Mongolia Yili Industrial Group Co., Ltd. A Shares | 2,126,136 | 7,101,080 | ||||||
GreenTree Hospitality Group, Ltd. ADRb | 525,177 | 6,822,049 | ||||||
58.com, Inc. ADRb | 93,000 | 5,041,530 | ||||||
Sun Art Retail Group, Ltd. | 4,806,500 | 4,887,893 | ||||||
Wuxi Biologics Cayman, Inc.b,c,d | 750,500 | 4,794,618 | ||||||
Bilibili, Inc. ADRb | 275,500 | 4,019,545 | ||||||
Midea Group Co., Ltd. A Shares | 688,521 | 3,717,430 | ||||||
Wise Talent Information Technology Co., Ltd.b,d | 898,400 | 3,327,195 | ||||||
BeiGene, Ltd. ADRb | 21,700 | 3,043,642 | ||||||
Momo, Inc. ADRb | 127,800 | 3,035,250 | ||||||
SUNeVision Holdings, Ltd. | 4,985,000 | 2,958,020 | ||||||
Silergy Corp. | 178,000 | 2,635,511 | ||||||
Haidilao International Holding, Ltd.b,c,d | 1,117,000 | 2,445,752 | ||||||
China National Accord Medicines Corp., Ltd. B Shares | 731,170 | 2,440,513 | ||||||
iQIYI, Inc. ADRb | 156,900 | 2,333,103 | ||||||
Contemporary Amperex Technology Co., Ltd. A Sharesb | 184,200 | 1,992,183 | ||||||
BeiGene, Ltd.b | 140,939 | 1,505,785 | ||||||
Ctrip.com International, Ltd. ADRb | 34,000 | 920,040 | ||||||
|
| |||||||
Total China/Hong Kong | 134,579,210 | |||||||
|
| |||||||
| SOUTH KOREA: 14.2% | ||||||||
Orion Corp. | 66,040 | 7,082,602 | ||||||
LG Household & Health Care, Ltd. | 6,319 | 6,245,171 | ||||||
NAVER Corp. | 50,581 | 5,543,471 | ||||||
Samsung SDI Co., Ltd. | 24,215 | 4,759,651 | ||||||
BGF Retail Co., Ltd. | 23,332 | 4,258,804 | ||||||
Samsung Fire & Marine Insurance Co., Ltd. | 14,879 | 3,577,793 | ||||||
Cafe24 Corp.b | 32,625 | 3,217,090 | ||||||
|
| |||||||
Total South Korea | 34,684,582 | |||||||
|
| |||||||
| INDIA: 11.3% | ||||||||
HDFC Bank, Ltd. | 459,935 | 13,991,152 | ||||||
Housing Development Finance Corp., Ltd. | 211,876 | 5,969,456 | ||||||
IndusInd Bank, Ltd. | 174,769 | 4,001,813 | ||||||
Info Edge India, Ltd. | 172,029 | 3,547,294 | ||||||
|
| |||||||
Total India | 27,509,715 | |||||||
|
| |||||||
| BANGLADESH: 3.8% | ||||||||
BRAC Bank, Ltd.b | 6,501,254 | 5,633,387 | ||||||
Square Pharmaceuticals, Ltd. | 1,215,785 | 3,679,158 | ||||||
|
| |||||||
Total Bangladesh | 9,312,545 | |||||||
|
| |||||||
| Shares | Value | |||||||
| VIETNAM: 3.1% | ||||||||
Mobile World Investment Corp. | 983,293 | $3,691,732 | ||||||
Phu Nhuan Jewelry JSC | 720,190 | 2,909,452 | ||||||
Domesco Medical Import Export JSC | 325,220 | 1,056,129 | ||||||
|
| |||||||
Total Vietnam | 7,657,313 | |||||||
|
| |||||||
| SINGAPORE: 2.9% | ||||||||
DBS Group Holdings, Ltd. | 399,200 | 6,942,029 | ||||||
|
| |||||||
Total Singapore | 6,942,029 | |||||||
|
| |||||||
| INDONESIA: 2.6% | ||||||||
PT Bank Rakyat Indonesia Persero | 25,019,200 | 6,373,851 | ||||||
|
| |||||||
Total Indonesia | 6,373,851 | |||||||
|
| |||||||
| TAIWAN: 2.5% | ||||||||
Taiwan Semiconductor Manufacturing Co., Ltd. | 846,000 | 6,180,808 | ||||||
|
| |||||||
Total Taiwan | 6,180,808 | |||||||
|
| |||||||
| PHILIPPINES: 1.5% | ||||||||
Puregold Price Club, Inc. | 4,348,270 | 3,552,127 | ||||||
|
| |||||||
Total Philippines | 3,552,127 | |||||||
|
| |||||||
| THAILAND: 1.4% | ||||||||
Kasikornbank Public Co., Ltd. | 612,800 | 3,509,655 | ||||||
|
| |||||||
Total Thailand | 3,509,655 | |||||||
|
| |||||||
| TOTAL INVESTMENTS: 98.4% | 240,301,835 | |||||||
(Cost $241,162,670) | ||||||||
| CASH AND OTHER ASSETS, LESS LIABILITIES: 1.6% |
| 3,916,020 | ||||||
|
| |||||||
NET ASSETS: 100.0% |
| $244,217,855 | ||||||
|
| |||||||
| a | Certain securities were fair valued under the valuation policies approved by the Board of Trustees (Note2-A). |
| b | Non-income producing security. |
| c | Security exempt from registration under Rule 144A of the Securities Act of 1933, as amended. The security may be resold in transactions exempt from registration normally to qualified institutional buyers. The security has been determined to be liquid in accordance with procedures adopted by the Funds’ Board of Trustees. At December 31, 2018, the aggregate value is $7,240,370, which is 2.96% of net assets. |
| d | The securities may be resold to qualified foreign investors and foreign institutional buyers under Regulation S of the Securities Act of 1933. |
| ADR | American Depositary Receipt |
| JSC | Joint Stock Co. |
See accompanying notes to financial statements.
| 60 | MATTHEWS ASIA FUNDS |
Table of Contents
| PORTFOLIO MANAGERS* | ||||
| Andrew Mattock, CFA | ||||
Lead Manager | ||||
| Winnie Chwang | ||||
Co-Manager |
| |||
* Effective January 11, 2019 | ||||
| FUND FACTS | ||||
| Investor | Institutional | |||
Ticker | MCHFX | MICFX | ||
CUSIP | 577130701 | 577130818 | ||
Inception | 2/19/98 | 10/29/10 | ||
NAV | $14.37 | $14.33 | ||
Initial Investment | $2,500 | $100,000 | ||
Gross Expense Ratio1 | 1.10% | 0.91% | ||
Portfolio Statistics | ||||
Total # of Positions | 44 | |||
Net Assets | $613.1 million | |||
Weighted Average | $129.9 billion | |||
Portfolio Turnover2 | 96.98% | |||
Benchmark | ||||
MSCI China Index | ||||
OBJECTIVE
Long-term capital appreciation.
STRATEGY
Under normal market conditions, the Fund seeks to achieve its investment objective by investing at least 80% of its net assets, which include borrowings for investment purposes, in the common and preferred stocks of companies located in China. China includes its administrative and other districts, such as Hong Kong.
Portfolio Manager Commentary (unaudited)
For the year ending December 31, 2018, the Matthews China Fund returned –21.42% (Investor Class) and –21.32% (Institutional Class), while its benchmark, the MSCI China Index returned –18.75%. For the fourth quarter of the year, the Fund returned –12.51% (Investor Class) and –12.52% (Institutional Class) versus –10.73% for the Index.
Market Environment:
2018 was a challenging year for Chinese equity markets. Negative headlines of deteriorating U.S.–China relations amid the trade war plagued market confidence for much of the year. In addition, the reversal of a multiyear global quantitative easing program and worries of higher interest rates slowing global growth contributed to weak market performance. China faced both external and internal challenges in 2018. Externally, China was cautious in its response to managing difficult trade tensions with the U.S. Internally, China continued to work through deleveraging efforts in its banking system and held a tight rein on its property market. Weak domestic stock market performance also affected local sentiment. But despite these challenges, we have seen mild easing of economic stimulus and believe that China will refrain from rolling out any major stimulus. Rather, more targeted areas of stimulus—such as personal income tax cuts and support for its domestic private sector economy—appear to support China’s longer-term interests, which are the strength of its domestic economy and a reduced reliance on the outside world for economic growth.
Performance Contributors and Detractors:
In 2018, the real estate and energy sectors performed well. China Resources Land and China Petroleum & Chemical (Sinopec) were two of the top contributors to the Fund’s performance. China Resources Land, a leading integrated urban developer in China, has continued to achieve strong growth in both residential development sales and investment properties rentals—even in the face of macroeconomic headwinds. With an impressive balance sheet and quality assets, the company demonstrated its ability to withstand market turbulence. Sinopec, one of China’s largest energy and chemical producers, also performed well, supported by its strong cash flow and generous dividend payouts.
On the other hand, our holdings in the consumer discretionary and communication services sectors were among the major detractors to the Fund’s absolute performance for the year. Brilliance China Automotive Holdings, a joint-venture partner with BMW in China, suffered a sharp sell-off after the company announced it would sell its 25% stake in the BMW joint venture at a price well below investors’ expectations. We believed that the company’s share price dropped significantly below its business’s intrinsic value, and we added further to our position. While internet services provider Tencent Holdings and e-commerce platform provider Alibaba Group were among the top detractors to the Fund’s absolute return, they were relative contributors during the year as together they accounted for a much higher weighting in the index. We believed their leadership positions remained intact in their respective arenas, and the two companies continued to represent our largest portfolio positions.
Notable Portfolio Changes:
During the fourth quarter, we initiated a position in China International Travel Service, a leading duty-free operator with over 150 duty-free stores throughout China. With the country’s middle class rising and tourism increasing, we believe the firm is a direct beneficiary of these secular growth trends. Duty-free stores on China’s Hainan Island have been major profit contributors for the company. To
(continued)
| 1 | Actual 2018 expense ratios. |
| 2 | The lesser of fiscal year 2018 long-term purchase costs or sales proceeds divided by the average monthly market value of long-term securities. |
| matthewsasia.com | 800.789.ASIA | 61 |
Table of Contents
| PERFORMANCE AS OF DECEMBER 31, 2018 | ||||||||||||||||||||||||||||
|
|
| Average Annual Total Returns |
| |||||||||||||||||||||||||
| 3 Months | 1 Year | 3 Years | 5 Years | 10 Years | Since Inception | Inception Date | ||||||||||||||||||||||
| Investor Class (MCHFX) | -12.51% | -21.42% | 5.90% | 3.06% | 8.81% | 8.86% | 2/19/98 | |||||||||||||||||||||
| Institutional Class (MICFX) | -12.52% | -21.32% | 6.06% | 3.21% | n.a. | 1.43% | 10/29/10 | |||||||||||||||||||||
| MSCI China Index3 | -10.73% | -18.75% | 8.23% | 4.86% | 8.50% | 3.97% | 4 | |||||||||||||||||||||
Performance assumes reinvestment of all dividends and/or distributions before taxes. All performance quoted represents past performance and is no guarantee of future results.Investment return and principal value will fluctuate with market conditions so that when redeemed, shares may be worth more or less than their original cost. Current performance may be lower or higher than the return figures quoted. For the Fund’s most recent month-end performance, visit matthewsasia.com.
GROWTH OF A $10,000 INVESTMENT SINCE INCEPTION—INVESTOR CLASS
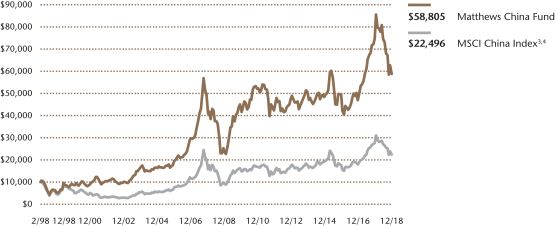
Plotted monthly. The performance data and graph do not reflect the deduction of taxes that a shareholder would pay on dividends, capital gains distributions or redemption of Fund shares. Values are in US$.
| 3 | It is not possible to invest directly in an index. Source: Index data from Morgan Stanley Capital International and Bloomberg; total return calculations performed by BNY Mellon Investment Servicing (US) Inc. Please see page 91 for index definition. |
| 4 | Calculated from 2/28/98. |
| TOP TEN HOLDINGS5 | ||||||||
| Sector | % of Net Assets | |||||||
| Tencent Holdings, Ltd. | Communication Services | 10.6% | ||||||
| Alibaba Group Holding, Ltd. | Consumer Discretionary | 10.3% | ||||||
| Ping An Insurance Group Co. of China, Ltd. | Financials | 5.8% | ||||||
| Agricultural Bank of China, Ltd. | Financials | 4.9% | ||||||
| China Construction Bank Corp. | Financials | 4.9% | ||||||
| Industrial & Commercial Bank of China, Ltd. | Financials | 4.9% | ||||||
| New China Life Insurance Co., Ltd. | Financials | 4.3% | ||||||
| China Resources Land, Ltd. | Real Estate | 2.7% | ||||||
| AIA Group, Ltd. | Financials | 2.6% | ||||||
| CIFI Holdings Group Co., Ltd. | Real Estate | 2.4% | ||||||
| % OF ASSETS IN TOP TEN | 53.4% | |||||||
| 5 | Holdings may combine more than one security from same issuer and related depositary receipts. |
| 62 | MATTHEWS ASIA FUNDS |
Table of Contents
Matthews China Fund
Portfolio Manager Commentary (unaudited) (continued)
boost domestic consumption, a recent government policy increased its duty-free shopping quota in Hainan from approximately US$2,335 (16,000 renminbi) to roughly US$4,380 (30,000 renminbi) and should enable the company to deliver strong growth.
Meanwhile, we exited our position in Han’s Laser Technology Industry Group, China’s largest laser equipment manufacturer, due to the company’s large exposure to Apple and a significant slowdown in sales of Apple products. In addition, the trade conflicts between the U.S. and China caused additional uncertainty about the company’s operation. We also sold our position in China Life Insurance, a state-owned life insurer, after the company delivered results below our expectations.
Outlook:
The global macroeconomic environment remains uncertain and many market participants are bracing for more volatile trading environments in the coming year. As we reflect on the performance of China’s equity markets for 2018, we believe disconnects remain between stock performance and fundamentals. We continue to position our portfolio according to our long-term beliefs that China’s domestic economy remains healthy, and that there are secular growth opportunities in both China’s new and old economy sectors that stand to benefit from the rising levels of affluence among domestic consumers. In China today, for example, growth opportunities are rapidly shifting from coastal areas to inland cities. We have learned that consumers in many lower tier cities have reached affordability levels that can propel a repeat of the economic growth expansion witnessed in China’s major cities about a decade ago. The development of China’s new economy sectors is also framed around a transition to higher value-adding services and technological development. While the trade war may have tempered what were once more ambitious plans, we believe that this progression toward technological advancements has not been derailed, and that China’s ambitions for further innovation will still gradually be achieved. Elsewhere in China’s economy, we think that financial risks in the banking system have remained contained. We support the government’s deleveraging efforts and continued supply-side reforms as these efforts would help lower risks and enhance efficiencies at its state-owned enterprises. As in previous years, we remain most cautious about the multiyear, meteoric rise of the property market in China. A recent loosening of what has been tight policies around property purchases and resales is something to monitor, and we would be highly cautious if there were meaningful relaxation of these policies.
Over the next year, we believe that China will continue negotiations with the U.S. and provide the concessions needed to repair any damage to consumer sentiment since tariffs on Chinese exports started to be imposed. It remains uncertain whether such concessions will be enough; we remain cautiously optimistic about some resolution as we believe that an extended trade war hurts everyone. It is unclear, though, how much time it will take to reach a positive outcome. We believe that China is also preparing for prolonged discussions. Unfortunately, these macroeconomic factors remain an overhang and may temporarily hinder the continuation of the strong corporate earnings growth environment we saw in China in 2017 and 2018. Given a confluence of negative headlines already reflected in prices, the risk-reward scenario remains particularly favorable given attractive, high single-digit valuations and an outlook that should increasingly improve.
| COUNTRY ALLOCATION (%)6 | ||||
| China/Hong Kong | 99.8 | |||
| Cash and Other Assets, Less Liabilities | 0.2 | |||
| SECTOR ALLOCATION (%)6 | ||||
| Financials | 32.6 | |||
| Consumer Discretionary | 22.6 | |||
| Communication Services | 16.0 | |||
| Real Estate | 6.6 | |||
| Materials | 5.6 | |||
| Information Technology | 4.6 | |||
| Consumer Staples | 4.2 | |||
| Industrials | 2.8 | |||
| Health Care | 2.1 | |||
| Energy | 1.9 | |||
| Utilities | 0.8 | |||
| Cash and Other Assets, Less Liabilities | 0.2 | |||
| MARKET CAP EXPOSURE (%)6 | ||||
| Mega Cap (over $25B) | 60.1 | |||
| Large Cap ($10B–$25B) | 9.8 | |||
| Mid Cap ($3B–10B) | 25.9 | |||
| Small Cap (under $3B) | 4.0 | |||
| Cash and Other Assets, Less Liabilities | 0.2 | |||
| 6 | Source: FactSet Research Systems. Percentage values in data are rounded to the nearest tenth of one percent, so the values may not sum to 100% due to rounding. Percentage values may be derived from different data sources and may not be consistent with other Fund literature. |
| matthewsasia.com | 800.789.ASIA | 63 |
Table of Contents
Matthews China Fund
December 31, 2018
Schedule of Investmentsa
COMMON EQUITIES: 99.8%
| Shares | Value | |||||||
| FINANCIALS: 32.6% | ||||||||
Banks: 14.6% | ||||||||
Agricultural Bank of China, Ltd. H Shares | 68,425,000 | $29,969,923 | ||||||
China Construction Bank Corp. H Shares | 36,592,660 | 29,964,022 | ||||||
Industrial & Commercial Bank of China, Ltd. H Shares | 42,102,000 | 29,945,466 | ||||||
|
| |||||||
| 89,879,411 | ||||||||
|
| |||||||
Insurance: 12.7% | ||||||||
Ping An Insurance Group Co. of China, Ltd. H Shares | 4,050,000 | 35,729,164 | ||||||
New China Life Insurance Co., Ltd. H Shares | 6,627,800 | 26,298,751 | ||||||
AIA Group, Ltd. | 1,903,400 | 15,811,190 | ||||||
|
| |||||||
| 77,839,105 | ||||||||
|
| |||||||
Capital Markets: 5.3% | ||||||||
Hong Kong Exchanges & Clearing, Ltd. | 486,700 | 14,069,798 | ||||||
China International Capital Corp., Ltd. H Sharesb,c | 6,168,400 | 11,551,112 | ||||||
CITIC Securities Co., Ltd. H Shares | 3,863,500 | 6,655,064 | ||||||
|
| |||||||
| 32,275,974 | ||||||||
|
| |||||||
Total Financials | 199,994,490 | |||||||
|
| |||||||
| CONSUMER DISCRETIONARY: 22.6% | ||||||||
Internet & Direct Marketing Retail: 11.4% | ||||||||
Alibaba Group Holding, Ltd. ADRd | 460,600 | 63,134,442 | ||||||
JD.com, Inc. ADRd | 328,679 | 6,879,252 | ||||||
|
| |||||||
| 70,013,694 | ||||||||
|
| |||||||
Hotels, Restaurants & Leisure: 5.8% | ||||||||
Galaxy Entertainment Group, Ltd. | 1,968,000 | 12,431,173 | ||||||
China International Travel Service Corp., Ltd. A Shares | 1,366,478 | 11,995,343 | ||||||
Shangri-La Asia, Ltd. | 7,706,000 | 11,376,089 | ||||||
|
| |||||||
| 35,802,605 | ||||||||
|
| |||||||
Household Durables: 2.0% | ||||||||
Midea Group Co., Ltd. A Shares | 2,242,615 | 12,108,220 | ||||||
|
| |||||||
Specialty Retail: 1.8% | ||||||||
Zhongsheng Group Holdings, Ltd. | 5,533,000 | 10,972,671 | ||||||
|
| |||||||
Automobiles: 1.6% | ||||||||
Brilliance China Automotive Holdings, Ltd. | 12,718,000 | 9,465,897 | ||||||
|
| |||||||
Total Consumer Discretionary | 138,363,087 | |||||||
|
| |||||||
| COMMUNICATION SERVICES: 16.0% | ||||||||
Interactive Media & Services: 15.6% | ||||||||
Tencent Holdings, Ltd. | 1,615,000 | 64,729,766 | ||||||
SINA Corp.d | 143,400 | 7,691,976 | ||||||
58.com, Inc. ADRd | 125,700 | 6,814,197 | ||||||
Baidu, Inc. ADRd | 39,000 | 6,185,400 | ||||||
YY, Inc. ADRd | 102,600 | 6,141,636 | ||||||
Momo, Inc. ADRd | 163,200 | 3,876,000 | ||||||
|
| |||||||
| 95,438,975 | ||||||||
|
| |||||||
Entertainment: 0.4% | ||||||||
iQIYI, Inc. ADRd | 175,800 | 2,614,146 | ||||||
|
| |||||||
Total Communication Services | 98,053,121 | |||||||
|
| |||||||
| Shares | Value | |||||||
| REAL ESTATE: 6.6% | ||||||||
Real Estate Management & Development: 6.6% |
| |||||||
China Resources Land, Ltd. | 4,248,000 | $16,340,666 | ||||||
CIFI Holdings Group Co., Ltd. | 27,816,000 | 14,744,277 | ||||||
Times China Holdings, Ltd. | 8,233,000 | 9,137,441 | ||||||
|
| |||||||
Total Real Estate | 40,222,384 | |||||||
|
| |||||||
| MATERIALS: 5.6% | ||||||||
Construction Materials: 3.4% | ||||||||
China National Building Material Co., Ltd. H Shares | 17,281,300 | 11,824,909 | ||||||
China Jushi Co., Ltd. A Shares | 6,498,177 | 9,184,725 | ||||||
|
| |||||||
| 21,009,634 | ||||||||
|
| |||||||
Metals & Mining: 1.2% | ||||||||
MMG, Ltd.d | 17,436,000 | 7,490,560 | ||||||
|
| |||||||
Chemicals: 1.0% | ||||||||
Wanhua Chemical Group Co., Ltd. A Shares | 1,465,700 | 5,985,883 | ||||||
|
| |||||||
Total Materials | 34,486,077 | |||||||
|
| |||||||
| INFORMATION TECHNOLOGY: 4.6% | ||||||||
Electronic Equipment, Instruments & Components: 1.9% |
| |||||||
AVIC Jonhon OptronicTechnology Co., Ltd. A Shares | 1,221,652 | 6,010,150 | ||||||
Kingboard Holdings, Ltd. | 2,117,000 | 5,647,614 | ||||||
|
| |||||||
| 11,657,764 | ||||||||
|
| |||||||
IT Services: 1.6% | ||||||||
Chinasoft International, Ltd. | 20,048,000 | 9,981,623 | ||||||
|
| |||||||
Semiconductors & Semiconductor Equipment: 1.1% |
| |||||||
ASM Pacific Technology, Ltd. | 666,900 | 6,438,377 | ||||||
|
| |||||||
Total Information Technology | 28,077,764 | |||||||
|
| |||||||
| CONSUMER STAPLES: 4.2% | ||||||||
Food Products: 2.1% | ||||||||
Inner Mongolia Yili Industrial Group Co., Ltd. A Shares | 3,921,197 | 13,096,404 | ||||||
|
| |||||||
Beverages: 2.1% | ||||||||
Wuliangye Yibin Co., Ltd. A Shares | 1,724,879 | 12,821,808 | ||||||
|
| |||||||
Total Consumer Staples | 25,918,212 | |||||||
|
| |||||||
| INDUSTRIALS: 2.8% | ||||||||
Commercial Services & Supplies: 1.4% | ||||||||
China Everbright International, Ltd. | 9,750,740 | 8,737,913 | ||||||
|
| |||||||
Professional Services: 1.4% | ||||||||
51job, Inc. ADRd | 132,500 | 8,273,300 | ||||||
|
| |||||||
Total Industrials | 17,011,213 | |||||||
|
| |||||||
| HEALTH CARE: 2.1% | ||||||||
Pharmaceuticals: 1.1% | ||||||||
Sino Biopharmaceutical, Ltd. | 10,110,000 | 6,655,296 | ||||||
|
| |||||||
Health Care Technology: 1.0% | ||||||||
Ping An Healthcare and Technology Co., Ltd.b,c,d | 1,784,500 | 6,274,122 | ||||||
|
| |||||||
Total Health Care | 12,929,418 | |||||||
|
| |||||||
| 64 | MATTHEWS ASIA FUNDS |
Table of Contents
Matthews China Fund
December 31, 2018
Schedule of Investmentsa(continued)
COMMON EQUITIES(continued)
| Shares | Value | |||||||
| ENERGY: 1.9% | ||||||||
Oil, Gas & Consumable Fuels: 1.9% | ||||||||
China Shenhua Energy Co., Ltd. H Shares | 2,835,500 | $6,184,069 | ||||||
China Petroleum & Chemical Corp. H Shares | 8,036,000 | 5,728,142 | ||||||
|
| |||||||
Total Energy | 11,912,211 | |||||||
|
| |||||||
| UTILITIES: 0.8% | ||||||||
Water Utilities: 0.8% | ||||||||
Beijing Enterprises Water Group, Ltd. | 9,994,000 | 5,101,191 | ||||||
|
| |||||||
Total Utilities | 5,101,191 | |||||||
|
| |||||||
| TOTAL INVESTMENTS: 99.8% | 612,069,168 | |||||||
(Cost $728,809,132) | ||||||||
| CASH AND OTHER ASSETS, LESS LIABILITIES: 0.2% | 1,043,546 | |||||||
|
| |||||||
NET ASSETS: 100.0% | $613,112,714 | |||||||
|
| |||||||
| a | Certain securities were fair valued under the valuation policies approved by the Board of Trustees (Note2-A). |
| b | Security exempt from registration under Rule 144A of the Securities Act of 1933, as amended. The security may be resold in transactions exempt from registration normally to qualified institutional buyers. The security has been determined to be liquid in accordance with procedures adopted by the Funds’ Board of Trustees. At December 31, 2018, the aggregate value is $17,825,234, which is 2.91% of net assets. |
| c | The securities may be resold to qualified foreign investors and foreign institutional buyers under Regulation S of the Securities Act of 1933. |
| d | Non-income producing security. |
| ADR | American Depositary Receipt |
See accompanying notes to financial statements.
| matthewsasia.com | 800.789.ASIA | 65 |
Table of Contents
| PORTFOLIO MANAGERS | ||||
| Sunil Asnani | ||||
Lead Manager | ||||
| Sharat Shroff, CFA | Peeyush Mittal | |||
Co-Manager | Co-Manager | |||
| FUND FACTS | ||||
| Investor | Institutional | |||
Ticker | MINDX | MIDNX | ||
CUSIP | 577130859 | 577130768 | ||
Inception | 10/31/05 | 10/29/10 | ||
NAV | $26.32 | $26.56 | ||
Initial Investment | $2,500 | $100,000 | ||
Gross Expense Ratio1 | 1.09% | 0.90% | ||
Portfolio Statistics | ||||
Total # of Positions | 48 | |||
Net Assets | $1.5 billion | |||
Weighted Average Market Cap | $14.9 billion | |||
Portfolio Turnover2 | 20.87% | |||
Benchmark | ||||
S&P Bombay Stock Exchange 100 Index | ||||
OBJECTIVE
Long-term capital appreciation.
STRATEGY
Under normal market conditions, the Fund seeks to achieve its investment objective by investing at least 80% of its net assets, which include borrowings for investment purposes, in publicly traded common stocks, preferred stocks and convertible securities of companies located in India.
Portfolio Manager Commentary (unaudited)
For the year ending December 31, 2018, the Matthews India Fund returned –10.09% (Investor Class) and –9.92% (Institutional Class) while its benchmark, the S&P Bombay Stock Exchange 100 Index, returned –6.00%. For the fourth quarter of the year, the Fund returned 3.76% (Investor Class) and 3.83% (Institutional Class) versus 4.54% for the Index.
Market Environment:
During 2018, India’s stock market experienced volatility alongside global stock market indices. Despite higher global oil prices, a weaker rupee and tighter monetary policy, its stock market delivered positive returns through the year until August. Improving GDP growth numbers and globally positive equity sentiment fueled a rally in India’s equity market for much of the year. In late summer, however, the equity market changed course on account of domestic and global factors. By September, a quasi-governmental entity in India defaulted on its debt payments, which led to tight liquidity and a higher cost of capital across the board. This was accentuated by a global equity sell-off on the back of trade-related tensions between the U.S. and China. India’s equity market approached year-end with some investor anxiety over questions around the autonomy of India’s central bank, the Reserve Bank of India, as well as concerns over the potentially waning popularity and influence of Prime Minister Narendra Modi’s government. Despite these challenges, December was more upbeat for India as a change of guard at the central bank signaled to investors the end of a hawkish monetary policy regime.
Performance Contributors and Detractors:
The portfolio’s higher allocation to small-cap stocks and lower allocation to mega-cap stocks hurt our relative performance, which was mitigated by stock-specific factors. Small-cap stocks had become highly overvalued following India’s demonetization as savings moved from physical assets to financial assets. While the Fund has reduced its exposure to small caps over time, we continue to have fairly significant exposure given our belief that the stocks we hold have solid underlying business fundamentals. By sector, our higher allocation to health care and consumer staples versus the benchmark detracted from our relative performance. Within health care, customer consolidation and a faster pace of new drug approvals by U.S. regulators led to significant pricing pressure for generic drug manufacturers. Within consumer staples, some of our exposure to small- and mid-cap companies struggled as they adapted to India’s new regulatory environment imposed by its Goods and Services Tax and demonetization. In the third quarter of the year, India’s credit markets took a hit after Infrastructure Leasing and Financial Services (IL&FS), a major financier of infrastructure and power plants, announced a default. The portfolio’s higher allocation to non-banking financials became a detractor to performance given the liquidity concerns that resulted.
Our avoidance of holdings in the utilities and metals sectors, and stock-specific factors within communication services and consumer discretionary were performance contributors amid a volatile market. One such stock was Info Edge India, which owns an online classified ads business focused on recruitment, matrimony and real estate. Info Edge also has investments in Zomato, which is a privately held restaurant search and discovery service. Info Edge’s stock did well after Zomato’s valuations rose after it struck an agreement over fundraising with China’s Alibaba Group.
Notable Portfolio Changes:
During the year, we exited or trimmed many companies across sectors where we deemed the risk/reward asymmetry to be unfavorable. We also added to new
(continued)
| 1 | Actual 2018 expense ratios. |
| 2 | The lesser of fiscal year 2018 long-term purchase costs or sales proceeds divided by the average monthly market value of long-term securities. |
| 66 | MATTHEWS ASIA FUNDS |
Table of Contents
| PERFORMANCE AS OF DECEMBER 31, 2018 | ||||||||||||||||||||||||||||
|
|
| Average Annual Total Returns |
| |||||||||||||||||||||||||
| 3 Months | 1 Year | 3 Years | 5 Years | 10 Years | Since Inception | Inception Date | ||||||||||||||||||||||
| Investor Class (MINDX) | 3.76% | -10.09% | 6.44% | 14.78% | 15.14% | 10.92% | 10/31/05 | |||||||||||||||||||||
| Institutional Class (MIDNX) | 3.83% | -9.92% | 6.66% | 14.98% | n.a. | 5.57% | 10/29/10 | |||||||||||||||||||||
| S&P Bombay Stock Exchange 100 Index3 | 4.54% | -6.00% | 10.92% | 10.91% | 11.98% | 10.17% | 4 | |||||||||||||||||||||
Performance assumes reinvestment of all dividends and/or distributions before taxes. All performance quoted represents past performance and is no guarantee of future results.Investment return and principal value will fluctuate with market conditions so that when redeemed, shares may be worth more or less than their original cost. Current performance may be lower or higher than the return figures quoted. For the Fund’s most recent month-end performance, visit matthewsasia.com.
GROWTH OF A $10,000 INVESTMENT SINCE INCEPTION—INVESTOR CLASS
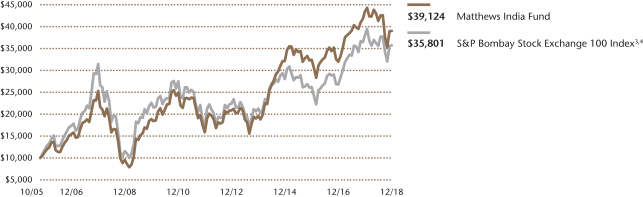
Plotted monthly. The performance data and graph do not reflect the deduction of taxes that a shareholder would pay on dividends, capital gains distributions or redemption of Fund shares. Values are in US$.
| 3 | It is not possible to invest directly in an index. Source: Index data from S&P BSE 100 Index and Bloomberg; total return calculations performed by BNY Mellon Investment Servicing (US) Inc. Please see page 91 for index definition. |
| 4 | Calculated from 10/31/05. |
| TOP TEN HOLDINGS5 | ||||||||
| Sector | % of Net Assets | |||||||
| IndusInd Bank, Ltd. | Financials | 6.6% | ||||||
| Suzuki Motor Corp. | Consumer Discretionary | 6.0% | ||||||
| Eicher Motors, Ltd. | Consumer Discretionary | 5.7% | ||||||
| HDFC Bank, Ltd. | Financials | 5.2% | ||||||
| InterGlobe Aviation, Ltd. | Industrials | 4.1% | ||||||
| Kotak Mahindra Bank, Ltd. | Financials | 3.9% | ||||||
| Bajaj Finance, Ltd. | Financials | 3.6% | ||||||
| VST Industries, Ltd. | Consumer Staples | 3.5% | ||||||
| Ajanta Pharma, Ltd. | Health Care | 3.5% | ||||||
| Cholamandalam Investment and Finance Co., Ltd. | Financials | 3.1% | ||||||
| % OF ASSETS IN TOP TEN | 45.2% | |||||||
| 5 | Holdings may combine more than one security from same issuer and related depositary receipts. |
| matthewsasia.com | 800.789.ASIA | 67 |
Table of Contents
| COUNTRY ALLOCATION (%)6 | ||||
| India | 92.8 | |||
| Japan | 6.0 | |||
| United States | 1.7 | |||
| Liabilities in Excess of Cash and Other Assets | -0.5 | |||
| SECTOR ALLOCATION (%)6 | ||||
| Financials | 35.4 | |||
| Consumer Discretionary | 14.4 | |||
| Consumer Staples | 13.6 | |||
| Health Care | 12.0 | |||
| Information Technology | 9.4 | |||
| Industrials | 9.4 | |||
| Materials | 4.6 | |||
| Communication Services | 1.7 | |||
| Liabilities in Excess of Cash and Other Assets | -0.5 | |||
| MARKET CAP EXPOSURE (%)6 | ||||
| Mega Cap (over $25B) | 15.5 | |||
| Large Cap ($10B–$25B) | 22.4 | |||
| Mid Cap ($3B–10B) | 18.3 | |||
| Small Cap (under $3B) | 44.3 | |||
| Liabilities in Excess of Cash and Other Assets | -0.5 | |||
| 6 | Source: FactSet Research Systems. Percentage values in data are rounded to the nearest tenth of one percent, so the values may not sum to 100% due to rounding. Percentage values may be derived from different data sources and may not be consistent with other Fund literature. |
Matthews India Fund
Portfolio Manager Commentary (unaudited) (continued)
positions across sectors like information technology, financials, pharmaceuticals and materials. One such addition was UPL, a crop protection business that sells generic agrochemicals, industrial chemicals and seeds. UPL’s stock had corrected following its acquisition of agrochemical firm Arysta LifeScience amid concerns over equity dilution and significant debt on its balance sheet. UPL, however, has a good track record with acquisitions. We believe its potential for synergy was far higher than most realized and its stock was trading at very attractive valuations.
Outlook:
Volatility in the short term is likely to persist. Modi’s government is likely to push populist measures such as farm loan waivers, which will have a positive impact on consumption in the near term. There seems to be increasing sentiment, however, that India’s upcoming general elections may likely result in a coalition government, which may not be popular with India’s market participants. Given the correction in oil prices, coupled with the sustained low consumer price inflation we saw in 2018, it is likely that the Reserve Bank of India will become more dovish in its monetary policy outlook. Leading indicators suggest that corporate-level stress is past its peak and some of the corporate-focused banks are beginning to heal rapidly. This should result in greater availability of credit to corporate India. Lower cost of capital and greater availability of credit should bode well for the revival of private capital expenditure over the short to medium term. Valuations for large-cap stocks are in line with history and India’s large-cap universe remains a good hunting ground for investments. There were sharp corrections within mid-caps and small-caps throughout 2018. Valuations seem to have normalized within mid-caps, and we are excited to now find more opportunities for bottom-up stock picking compared to 2017.
| 68 | MATTHEWS ASIA FUNDS |
Table of Contents
Matthews India Fund
December 31, 2018
Schedule of Investmentsa
COMMON EQUITIES: 100.5%
| Shares | Value | |||||||
| FINANCIALS: 35.4% | ||||||||
Banks: 21.6% | ||||||||
IndusInd Bank, Ltd. | 4,431,794 | $101,478,008 | ||||||
HDFC Bank, Ltd. | 2,638,903 | 80,275,027 | ||||||
Kotak Mahindra Bank, Ltd. | 3,313,246 | 59,602,441 | ||||||
Yes Bank, Ltd. | 15,689,348 | 40,828,317 | ||||||
DCB Bank, Ltd. | 12,644,736 | 30,622,045 | ||||||
Axis Bank, Ltd.b | 2,272,610 | 20,151,403 | ||||||
|
| |||||||
| 332,957,241 | ||||||||
|
| |||||||
Consumer Finance: 10.4% | ||||||||
Bajaj Finance, Ltd. | 1,475,943 | 55,863,407 | ||||||
Cholamandalam Investment and Finance Co., Ltd. | 2,667,055 | 48,090,504 | ||||||
Shriram City Union Finance, Ltd. | 1,873,192 | 42,629,956 | ||||||
Sundaram Finance, Ltd. | 695,531 | 14,326,343 | ||||||
|
| |||||||
| 160,910,210 | ||||||||
|
| |||||||
Capital Markets: 1.9% | ||||||||
CRISIL, Ltd. | 1,271,030 | 29,365,665 | ||||||
|
| |||||||
Thrifts & Mortgage Finance: 1.5% | ||||||||
Housing Development Finance Corp., Ltd. | 809,266 | 22,800,495 | ||||||
|
| |||||||
Total Financials | 546,033,611 | |||||||
|
| |||||||
| CONSUMER DISCRETIONARY: 14.4% | ||||||||
Automobiles: 11.7% | ||||||||
Suzuki Motor Corp. | 1,839,100 | 92,711,682 | ||||||
Eicher Motors, Ltd. | 266,539 | 88,347,625 | ||||||
|
| |||||||
| 181,059,307 | ||||||||
|
| |||||||
Household Durables: 2.7% | ||||||||
Symphony, Ltd. | 1,927,475 | 32,186,000 | ||||||
LA Opala RG, Ltd. | 2,937,800 | 9,252,861 | ||||||
|
| |||||||
| 41,438,861 | ||||||||
|
| |||||||
Total Consumer Discretionary | 222,498,168 | |||||||
|
| |||||||
| CONSUMER STAPLES: 13.6% | ||||||||
Tobacco: 6.5% | ||||||||
VST Industries, Ltd.† | 1,167,175 | 54,669,836 | ||||||
ITC, Ltd. | 11,237,066 | 45,308,652 | ||||||
|
| |||||||
| 99,978,488 | ||||||||
|
| |||||||
Personal Products: 4.9% | ||||||||
Bajaj Corp., Ltd. | 6,083,908 | 32,153,539 | ||||||
Emami, Ltd. | 4,500,244 | 27,075,677 | ||||||
Dabur India, Ltd. | 1,513,060 | 9,329,586 | ||||||
Marico, Ltd. | 1,374,168 | 7,346,349 | ||||||
|
| |||||||
| 75,905,151 | ||||||||
|
| |||||||
Food Products: 2.2% | ||||||||
Zydus Wellness, Ltd. | 1,466,021 | 28,563,270 | ||||||
Nestle India, Ltd. | 30,163 | 4,785,911 | ||||||
|
| |||||||
| 33,349,181 | ||||||||
|
| |||||||
Total Consumer Staples | 209,232,820 | |||||||
|
| |||||||
| Shares | Value | |||||||
| HEALTH CARE: 12.0% | ||||||||
Pharmaceuticals: 11.3% | ||||||||
Ajanta Pharma, Ltd. | 3,153,172 | $53,500,563 | ||||||
Alembic Pharmaceuticals, Ltd. | 4,147,557 | 35,595,123 | ||||||
Natco Pharma, Ltd. | 2,712,192 | 26,405,287 | ||||||
Caplin Point Laboratories, Ltd.† | 3,870,311 | 21,157,850 | ||||||
Eris Lifesciences, Ltd.b,c,d | 1,950,176 | 19,193,018 | ||||||
Sun Pharmaceutical Industries, Ltd. | 2,959,885 | 18,239,647 | ||||||
|
| |||||||
| 174,091,488 | ||||||||
|
| |||||||
Health Care Equipment & Supplies: 0.7% | ||||||||
Poly Medicure, Ltd. | 3,594,824 | 11,455,082 | ||||||
|
| |||||||
Total Health Care | 185,546,570 | |||||||
|
| |||||||
| INDUSTRIALS: 9.4% | ||||||||
Airlines: 4.1% | ||||||||
InterGlobe Aviation, Ltd.c,d | 3,822,617 | 63,734,147 | ||||||
|
| |||||||
Machinery: 3.8% | ||||||||
AIA Engineering, Ltd. | 1,327,732 | 31,867,307 | ||||||
Ashok Leyland, Ltd. | 18,445,155 | 27,054,588 | ||||||
|
| |||||||
| 58,921,895 | ||||||||
|
| |||||||
Air Freight & Logistics: 1.5% | ||||||||
Blue Dart Express, Ltd. | 475,939 | 22,975,724 | ||||||
|
| |||||||
Total Industrials | 145,631,766 | |||||||
|
| |||||||
| INFORMATION TECHNOLOGY: 9.4% | ||||||||
IT Services: 8.5% | ||||||||
Wipro, Ltd. | 9,035,571 | 42,759,413 | ||||||
eClerx Services, Ltd.† | 2,390,594 | 36,787,720 | ||||||
Cognizant Technology Solutions Corp. Class A | 418,300 | 26,553,684 | ||||||
Mphasis, Ltd. | 1,464,076 | 21,353,532 | ||||||
Tata Consultancy Services, Ltd. | 137,397 | 3,725,500 | ||||||
|
| |||||||
| 131,179,849 | ||||||||
|
| |||||||
Software: 0.9% | ||||||||
NIIT Technologies, Ltd. | 797,552 | 13,124,957 | ||||||
|
| |||||||
Total Information Technology | 144,304,806 | |||||||
|
| |||||||
| MATERIALS: 4.6% | ||||||||
Chemicals: 4.4% | ||||||||
UPL, Ltd. | 4,276,460 | 46,416,757 | ||||||
Castrol India, Ltd. | 6,307,813 | 13,658,591 | ||||||
Pidilite Industries, Ltd. | 322,373 | 5,113,100 | ||||||
Gulf Oil Lubricants India, Ltd. | 105,452 | 1,239,880 | ||||||
Supreme Industries, Ltd. | 42,996 | 722,719 | ||||||
|
| |||||||
| 67,151,047 | ||||||||
|
| |||||||
Metals & Mining: 0.2% | ||||||||
NMDC, Ltd. | 2,713,195 | 3,760,709 | ||||||
|
| |||||||
Total Materials | 70,911,756 | |||||||
|
| |||||||
| matthewsasia.com | 800.789.ASIA | 69 |
Table of Contents
Matthews India Fund
December 31, 2018
Schedule of Investmentsa(continued)
COMMON EQUITIES(continued)
| Shares | Value | |||||||
| COMMUNICATION SERVICES: 1.7% | ||||||||
Interactive Media & Services: 1.7% | ||||||||
Info Edge India, Ltd. | 1,236,353 | $25,494,003 | ||||||
|
| |||||||
Total Communication Services | 25,494,003 | |||||||
|
| |||||||
| TOTAL INVESTMENTS: 100.5% | 1,549,653,500 | |||||||
(Cost $1,385,998,849) | ||||||||
| LIABILITIES IN EXCESS OF CASH AND OTHER ASSETS: (0.5%) | (7,873,477 | ) | ||||||
|
| |||||||
NET ASSETS: 100.0% | $1,541,780,023 | |||||||
|
| |||||||
| a | Certain securities were fair valued under the valuation policies approved by the Board of Trustees (Note2-A). |
| b | Non-income producing security. |
| c | Security exempt from registration under Rule 144A of the Securities Act of 1933, as amended. The security may be resold in transactions exempt from registration normally to qualified institutional buyers. The security has been determined to be liquid in accordance with procedures adopted by the Funds’ Board of Trustees. At December 31, 2018, the aggregate value is $82,927,165, which is 5.38% of net assets. |
| d | The securities may be resold to qualified foreign investors and foreign institutional buyers under Regulation S of the Securities Act of 1933. |
| † | Affiliated Issuer, as defined under the Investment Company Act of 1940 (ownership of 5% or more of the outstanding voting securities of this issuer) |
See accompanying notes to financial statements.
| 70 | MATTHEWS ASIA FUNDS |
Table of Contents
PORTFOLIO MANAGERS* | ||||
| Taizo Ishida | ||||
Lead Manager | ||||
| Shuntaro Takeuchi | ||||
Co-Manager | ||||
* Effective January 22, 2019 | ||||
| FUND FACTS | ||||
| Investor | Institutional | |||
Ticker | MJFOX | MIJFX | ||
CUSIP | 577130800 | 577130792 | ||
Inception | 12/31/98 | 10/29/10 | ||
NAV | $18.53 | $18.57 | ||
Initial Investment | $2,500 | $100,000 | ||
Gross Expense Ratio1 | 0.91% | 0.85% | ||
After Fee Waiver and Reimbursement2 | 0.91% | 0.84% | ||
Portfolio Statistics | ||||
Total # of Positions | 54 | |||
Net Assets | $2.9 billion | |||
Weighted Average Market Cap | $22.1 billion | |||
Portfolio Turnover3 | 46.11% | |||
Benchmark | ||||
MSCI Japan Index | ||||
OBJECTIVE
Long-term capital appreciation.
STRATEGY
Under normal market conditions, the Fund seeks to achieve its investment objective by investing at least 80% of its net assets, which include borrowings for investment purposes, in the common and preferred stocks of companies located in Japan.
Portfolio Manager Commentary (unaudited)
For the year ending December 31, 2018, the Matthews Japan Fund returned –20.18% (Investor Class) and –20.08% (Institutional Class) while its benchmark, the MSCI Japan Index, returned –12.58%. For the fourth quarter of the year, the Fund returned –20.38% (Investor Class) and –20.35% (Institutional Class), versus –14.20% for the Index.
Market Environment:
2018 was a rough and volatile year for Japan’s equity markets. Fears over worsening U.S.–China trade troubles combined with continued tightening by the U.S. Federal Reserve, which triggered a U.S. yield curve inversion, cast a shadow on investor sentiment—particularly toward the last quarter of the year. The impact of the trade war negatively impacted consensus earnings expectations, and led to a compression in multiples in sectors where growth expectations had been relatively high. Investor flows exacerbated conditions as overseas investors, who are typically geared toward quality names, pulled more than US$53 billion out of Japanese cash equities. An even larger amount was also pulled out of Japanese index futures. Additionally, steepening losses among the margin trading accounts of retail investors toward the end of the year strained the performance of small-cap stocks relative to their larger-cap peers.
Meanwhile, Japan’s macroeconomic growth slowed during the year, in line with our expectations. GDP growth, in fact, turned negative in the first and third quarters, though the latter was largely due to one-off natural disasters. Business investment into production capacity expansion, enhancement and IT systems remained a driver of growth. Some cracks began to show, however, as corporate managers hesitated to invest more given the uncertain external environment. At the same time, consumption remained sluggish despite rising employment and wages.
Performance Contributors and Detractors:
The Fund severely underperformed its benchmark for both the full year and fourth quarter periods due to poor stock selection in the industrials and consumer staples sectors. For the full year, holdings in the consumer discretionary sector also posed a drag on performance. Additionally, our small- and mid-cap positions underperformed relative to their large-cap peers. Due to the acute correction, retail investors accumulated large losses in margin trading accounts, prompting margin calls that exacerbated the downside in small-cap stocks. The Fund is positioned as a quality growth-oriented portfolio but the selling activity we observed during the quarter was indiscriminant of quality or growth. Companies with valuation levels higher than market averages were sold off regardless of fundamentals that may justify those higher multiples. We believe the market is pricing in the possibility of a recession in 2019 after seeing the yield curve inversion in the U.S.
Our industrials sector holdings detracted the most from relative performance. Staffing companies such as Persol Holdings, TechnoPro Holdings, Recruit Holdings and Outsourcing were sold off as the market priced in a significant deceleration in future growth despite continued delivery of solid results amid Japan’s labor shortages. We believe shares of these companies have been widely held by overseas investors for their quality and cash flow generation capability but were sold as investor funds flowed out of Japan.
The portfolio’s consumer staples sector holdings also detracted from relative performance for the year. Firms with exposure to China, such as baby product company Pigeon, cosmetics company Kose and toiletry company Kao have been experiencing slower revenue growth in China amid softer consumption and emerging competition with local brands.
(continued)
| 1 | Actual 2018 expense ratios. |
| 2 | Matthews has contractually agreed to waive a portion of its advisory fee and administrative and shareholder services fee if the Fund’s average daily net assets are over $3 billion, as follows: for every $2.5 billion average daily net assets of the Fund that are over $3 billion, the advisory fee rate and the administrative and shareholder services fee rate for the Fund with respect to such excess average daily net assets will be each reduced by 0.01%, in each case without reducing such fee rate below 0.00%. Any amount waived by Matthews pursuant to this agreement may not be recouped by Matthews. This agreement will remain in place until April 30, 2019 and may be terminated (i) at any time by the Board of Trustees upon 60 days’ prior written notice to Matthews; or (ii) by Matthews at the annual expiration date of the agreement upon 60 days’ prior written notice to the Trust, in each case without payment of any penalty. |
| 3 | The lesser of fiscal year 2018 long-term purchase costs or sales proceeds divided by the average monthly market value of long-term securities. |
| matthewsasia.com | 800.789.ASIA | 71 |
Table of Contents
| PERFORMANCE AS OF DECEMBER 31, 2018 | ||||||||||||||||||||||||||||
|
|
| Average Annual Total Returns |
| |||||||||||||||||||||||||
| 3 Months | 1 Year | 3 Years | 5 Years | 10 Years | Since Inception | Inception Date | ||||||||||||||||||||||
| Investor Class (MJFOX) | -20.38% | -20.18% | 2.18% | 4.66% | 8.27% | 5.31% | 12/31/98 | |||||||||||||||||||||
| Institutional Class (MIJFX) | -20.35% | -20.08% | 2.29% | 4.77% | n.a. | 8.08% | 10/29/10 | |||||||||||||||||||||
| MSCI Japan Index4 | -14.20% | -12.58% | 3.76% | 3.40% | 5.58% | 3.05% | 5 | |||||||||||||||||||||
Performance assumes reinvestment of all dividends and/or distributions before taxes. All performance quoted represents past performance and is no guarantee of future results. Investment return and principal value will fluctuate with market conditions so that when redeemed, shares may be worth more or less than their original cost. Current performance may be lower or higher than the return figures quoted. For the Fund’s most recent month-end performance, visit matthewsasia.com.
GROWTH OF A $10,000 INVESTMENT SINCE INCEPTION—INVESTOR CLASS
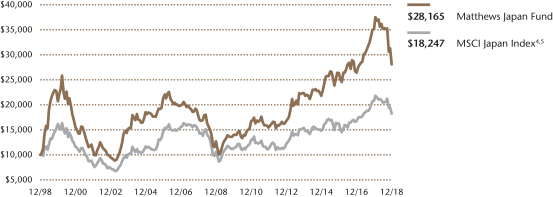
Plotted monthly. The performance data and graph do not reflect the deduction of taxes that a shareholder would pay on dividends, capital gains distributions or redemption of Fund shares. Values are in US$.
| 4 | It is not possible to invest directly in an index. Source: Index data from Morgan Stanley Capital International and Bloomberg; total return calculations performed by BNY Mellon Investment Servicing (US) Inc. Please see page 91 for index definitions. |
| 5 | Calculated from 12/31/98. |
| TOP TEN HOLDINGS6 | ||||||||
| Sector | % of Net Assets | |||||||
| Tokio Marine Holdings, Inc. | Financials | 3.7% | ||||||
| Nippon Telegraph & Telephone Corp. | Communication Services | 3.4% | ||||||
| Keyence Corp. | Information Technology | 3.4% | ||||||
| Mitsubishi UFJ Financial Group, Inc. | Financials | 3.2% | ||||||
| Terumo Corp. | Health Care | 3.1% | ||||||
| Nitori Holdings Co., Ltd. | Consumer Discretionary | 3.0% | ||||||
| Kose Corp. | Consumer Staples | 3.0% | ||||||
| ORIX Corp. | Financials | 2.7% | ||||||
| SoftBank Group Corp. | Communication Services | 2.6% | ||||||
| Kyowa Exeo Corp. | Industrials | 2.5% | ||||||
| % OF ASSETS IN TOP TEN | 30.6% | |||||||
| 6 | Holdings may combine more than one security from same issuer and related depositary receipts. |
| 72 | MATTHEWS ASIA FUNDS |
Table of Contents
Matthews Japan Fund
Portfolio Manager Commentary (unaudited) (continued)
Meanwhile, our underweight position in the financials sector helped our relative returns. Our core holding non-life insurer Tokio Marine Holdings and non-bank financial service company Orix managed to outperform the broad sector while banks underperformed due to the flattening yield curve.
Notable Portfolio Changes:
During the fourth quarter, we added NTT (Nippon Telegraph & Telephone), the state-owned fixed line telecom company that also owns a majority stake in the largest wireless service provider NTT DoCoMo. We had been wary of engaging in Japan’s telecom sector due to intense pressure from the government to lower mobile tariffs. This culminated in the announcement by NTT DoCoMo in late October that it would sharply lower its mobile phone fees in 2019, resulting in a correction of share prices in the telecom sector. We began adding NTT after this event as we believed the negative impact from tariff cuts will not be as severe as touted while we also expected declining capital intensity and a reduction in working capital combined with the rollout of 5G services would lead to a gradual expansion in the future returns on invested capital.
During the quarter, we also added Sony. The company has gone through a substantial restructuring over the past decade, shifting its revenue away from consumer electronics, and toward recurring revenue businesses primarily in games and media. Sony’s gaming platform PlayStation Plus boasts over 34 million paying members globally while its music publishing business, which recently added EMI Music Publishing, benefits from the proliferation of various music streaming offerings. As the proportion of recurring revenue business increases, we believe there is room for Sony to be rerated in line with other media companies, rather than as a consumer electronics company.
To fund these positions, we sold out of several technology and industrial holdings including industrial conglomerate Hitachi, automotive components company Mabuchi Motor and electronic materials company Nitto Denko. For Hitachi after meeting with senior management, we decided it would be prudent to exit the holding for the time being until there is more clarity surrounding its U.K. nuclear plant project. Mabuchi Motor was negatively affected by slowing car sales in China and the U.S. We believe Nitto Denko’s optoelectronics business will likely face severe erosion in profitability with the saturation of smartphone sales volume while its health care business faces some obstacles following the cancellation of a major order.
Outlook:
We are cautiously optimistic on the outlook for Japanese equities. We expect earnings growth for Japanese companies to slow and possibly turn negative for the fiscal year starting April 2019 given slowing growth in the U.S. and China—Japan’s two most important trade partners. Japanese corporate earnings tend to be pro-cyclical with higher earnings volatility than developed-market peers. A stronger yen, which can develop in an environment of “flight to safety,” may also be a source of earnings volatility for export-oriented businesses. As a result of the large correction in the recent quarter, however, valuations have already come down quite significantly. The MSCI Japan Index’s price-to-book ratio has declined to 1.1X—nearing the trough level in the era of Prime Minister Shinzo Abe. A handful of stocks that we’ve been monitoring closely are approaching the levels at which we would feel comfortable investing in over the mid to long term.
We believe the earnings capability of Japanese companies has improved meaningfully over the past economic cycle due to better governance and a higher focus on capital efficiency. While earnings growth may be challenging amid a potential economic downturn, tougher times may also reinvigorate Japan Inc.’s resolve to further strengthen and enhance productivity. We believe a patient and constructive approach to Japan can reward investors over the long term.
| COUNTRY ALLOCATION (%)7 | ||||
| Japan | 99.0 | |||
| Cash and Other Assets, Less Liabilities | 1.0 | |||
| SECTOR ALLOCATION (%)7 | ||||
| Industrials | 24.7 | |||
| Information Technology | 16.5 | |||
| Consumer Discretionary | 16.4 | |||
| Health Care | 10.9 | |||
| Consumer Staples | 10.0 | |||
| Financials | 9.5 | |||
| Communication Services | 6.1 | |||
| Materials | 2.5 | |||
| Real Estate | 2.3 | |||
| Cash and Other Assets, Less Liabilities | 1.0 | |||
| MARKET CAP EXPOSURE (%)7 | ||||
| Mega Cap (over $25B) | 36.0 | |||
| Large Cap ($10B–$25B) | 12.5 | |||
| Mid Cap ($3B–10B) | 27.9 | |||
| Small Cap (under $3B) | 22.6 | |||
| Cash and Other Assets, Less Liabilities | 1.0 | |||
| 7 | Source: FactSet Research Systems. Percentage values in data are rounded to the nearest tenth of one percent, so the values may not sum to 100% due to rounding. Percentage values may be derived from different data sources and may not be consistent with other Fund literature. |
| matthewsasia.com | 800.789.ASIA | 73 |
Table of Contents
Matthews Japan Fund
December 31, 2018
Schedule of Investmentsa
COMMON EQUITIES: 99.0%
| Shares | Value | |||||||
| INDUSTRIALS: 24.7% | ||||||||
Professional Services: 7.0% | ||||||||
Recruit Holdings Co., Ltd. | 2,471,700 | $59,713,142 | ||||||
Nihon M&A Center, Inc. | 2,297,300 | 46,239,809 | ||||||
Persol Holdings Co., Ltd. | 2,644,700 | 39,230,058 | ||||||
TechnoPro Holdings, Inc. | 707,700 | 29,073,869 | ||||||
Outsourcing, Inc. | 2,831,300 | 27,079,157 | ||||||
|
| |||||||
| 201,336,035 | ||||||||
|
| |||||||
Building Products: 5.7% | ||||||||
Sanwa Holdings Corp. | 4,976,200 | 56,499,331 | ||||||
Daikin Industries, Ltd. | 521,200 | 55,380,342 | ||||||
Aica Kogyo Co., Ltd. | 1,511,500 | 50,542,278 | ||||||
|
| |||||||
| 162,421,951 | ||||||||
|
| |||||||
Machinery: 3.7% | ||||||||
MINEBEA MITSUMI, Inc. | 2,193,300 | 31,627,413 | ||||||
MISUMI Group, Inc. | 1,385,900 | 29,196,435 | ||||||
SMC Corp. | 90,500 | 27,247,074 | ||||||
CKD Corp. | 2,164,800 | 18,315,523 | ||||||
|
| |||||||
| 106,386,445 | ||||||||
|
| |||||||
Trading Companies & Distributors: 3.4% | ||||||||
Mitsui & Co., Ltd. | 3,387,500 | 52,043,222 | ||||||
Mitsubishi Corp. | 1,693,400 | 46,427,199 | ||||||
|
| |||||||
| 98,470,421 | ||||||||
|
| |||||||
Construction & Engineering: 2.5% | ||||||||
Kyowa Exeo Corp. | 3,090,000 | 72,352,953 | ||||||
|
| |||||||
Electrical Equipment: 2.4% | ||||||||
Nidec Corp. | 614,100 | 69,483,554 | ||||||
|
| |||||||
Total Industrials | 710,451,359 | |||||||
|
| |||||||
| INFORMATION TECHNOLOGY: 16.5% | ||||||||
Electronic Equipment, Instruments & Components: 7.0% |
| |||||||
Keyence Corp. | 191,900 | 96,995,063 | ||||||
Murata Manufacturing Co., Ltd. | 454,300 | 61,216,845 | ||||||
Shimadzu Corp. | 2,112,800 | 41,664,089 | ||||||
|
| |||||||
| 199,875,997 | ||||||||
|
| |||||||
IT Services: 5.3% | ||||||||
ITOCHU Techno-Solutions Corp. | 3,404,100 | 65,918,828 | ||||||
NET One Systems Co., Ltd. | 2,818,100 | 49,708,399 | ||||||
Otsuka Corp. | 1,309,800 | 36,047,608 | ||||||
|
| |||||||
| 151,674,835 | ||||||||
|
| |||||||
Semiconductors & Semiconductor Equipment: 2.8% |
| |||||||
Rohm Co., Ltd. | 667,500 | 42,603,195 | ||||||
Lasertec Corp. | 1,522,200 | 38,869,692 | ||||||
|
| |||||||
| 81,472,887 | ||||||||
|
| |||||||
Software: 1.4% | ||||||||
Infomart Corp. | 4,512,300 | 41,192,662 | ||||||
|
| |||||||
Total Information Technology | 474,216,381 | |||||||
|
| |||||||
| CONSUMER DISCRETIONARY: 16.4% | ||||||||
Auto Components: 3.9% | ||||||||
Denso Corp. | 1,381,400 | 61,151,385 | ||||||
Nifco, Inc. | 2,146,600 | 50,785,959 | ||||||
|
| |||||||
| 111,937,344 | ||||||||
|
| |||||||
| Shares | Value | |||||||
Specialty Retail: 3.0% | ||||||||
Nitori Holdings Co., Ltd. | 694,700 | $87,004,453 | ||||||
|
| |||||||
Multiline Retail: 2.6% | ||||||||
Seria Co., Ltd. | 1,112,500 | 37,833,634 | ||||||
Ryohin Keikaku Co., Ltd. | 150,200 | 36,465,960 | ||||||
|
| |||||||
| 74,299,594 | ||||||||
|
| |||||||
Household Durables: 2.2% | ||||||||
Sony Corp. | 1,284,000 | 61,901,149 | ||||||
|
| |||||||
Automobiles: 1.8% | ||||||||
Suzuki Motor Corp. | 1,011,700 | 51,001,255 | ||||||
|
| |||||||
Distributors: 1.7% | ||||||||
PALTAC Corp. | 1,068,200 | 50,377,242 | ||||||
|
| |||||||
Internet & Direct Marketing Retail: 1.2% |
| |||||||
ZOZO, Inc. | 1,333,200 | 24,425,648 | ||||||
Mercari, Inc.b | 643,200 | 10,737,493 | ||||||
|
| |||||||
| 35,163,141 | ||||||||
|
| |||||||
Total Consumer Discretionary | 471,684,178 | |||||||
|
| |||||||
| HEALTH CARE: 11.0% | ||||||||
Health Care Equipment & Supplies: 8.0% |
| |||||||
Terumo Corp. | 1,555,200 | 87,721,249 | ||||||
Asahi Intecc Co., Ltd. | 1,673,200 | 70,785,473 | ||||||
Nakanishi, Inc. | 2,276,800 | 38,824,214 | ||||||
Sysmex Corp. | 652,900 | 31,006,939 | ||||||
|
| |||||||
| 228,337,875 | ||||||||
|
| |||||||
Biotechnology: 1.5% | ||||||||
PeptiDream, Inc.b | 1,090,500 | 43,053,375 | ||||||
|
| |||||||
Health Care Technology: 1.5% | ||||||||
M3, Inc. | 3,195,100 | 43,041,919 | ||||||
|
| |||||||
Total Health Care | 314,433,169 | |||||||
|
| |||||||
| CONSUMER STAPLES: 10.0% | ||||||||
Personal Products: 4.9% | ||||||||
Kose Corp. | 551,500 | 86,628,456 | ||||||
Kao Corp. | 714,800 | 52,907,808 | ||||||
|
| |||||||
| 139,536,264 | ||||||||
|
| |||||||
Food Products: 1.9% | ||||||||
Ariake Japan Co., Ltd. | 824,500 | 53,486,093 | ||||||
|
| |||||||
Household Products: 1.7% | ||||||||
Pigeon Corp. | 1,159,100 | 49,438,742 | ||||||
|
| |||||||
Food & Staples Retailing: 1.5% | ||||||||
San-A Co., Ltd. | 1,177,800 | 44,530,211 | ||||||
|
| |||||||
Total Consumer Staples | 286,991,310 | |||||||
|
| |||||||
| FINANCIALS: 9.5% | ||||||||
Insurance: 3.7% | ||||||||
Tokio Marine Holdings, Inc. | 2,250,400 | 106,913,631 | ||||||
|
| |||||||
Banks: 3.1% | ||||||||
Mitsubishi UFJ Financial Group, Inc. | 18,483,200 | 90,709,173 | ||||||
|
| |||||||
Diversified Financial Services: 2.7% | ||||||||
ORIX Corp. | 5,227,600 | 76,385,291 | ||||||
|
| |||||||
Total Financials | 274,008,095 | |||||||
|
| |||||||
| 74 | MATTHEWS ASIA FUNDS |
Table of Contents
Matthews Japan Fund
December 31, 2018
Schedule of Investmentsa(continued)
COMMON EQUITIES(continued)
| Shares | Value | |||||||
| COMMUNICATION SERVICES: 6.1% | ||||||||
Diversified Telecommunication Services: 3.5% |
| |||||||
Nippon Telegraph & Telephone Corp. | 2,415,000 | $98,530,363 | ||||||
|
| |||||||
Wireless Telecommunication Services: 2.6% |
| |||||||
SoftBank Group Corp. | 1,150,700 | 75,369,923 | ||||||
|
| |||||||
Total Communication Services | 173,900,286 | |||||||
|
| |||||||
| MATERIALS: 2.5% | ||||||||
Chemicals: 2.5% | ||||||||
Shin-Etsu Chemical Co., Ltd. | 569,200 | 43,733,248 | ||||||
Fuso Chemical Co., Ltd. | 1,538,700 | 27,819,514 | ||||||
|
| |||||||
Total Materials | 71,552,762 | |||||||
|
| |||||||
| REAL ESTATE: 2.3% | ||||||||
Real Estate Management & Development: 2.3% |
| |||||||
Relo Group, Inc. | 2,810,900 | 65,651,920 | ||||||
|
| |||||||
Total Real Estate | 65,651,920 | |||||||
|
| |||||||
| TOTAL INVESTMENTS: 99.0% | 2,842,889,460 | |||||||
(Cost $2,928,440,724) | ||||||||
| CASH AND OTHER ASSETS, LESS LIABILITIES: 1.0% | 28,684,859 | |||||||
|
| |||||||
NET ASSETS: 100.0% | $2,871,574,319 | |||||||
|
| |||||||
| a | Certain securities were fair valued under the valuation policies approved by the Board of Trustees (Note2-A). |
| b | Non-income producing security. |
See accompanying notes to financial statements.
| matthewsasia.com | 800.789.ASIA | 75 |
Table of Contents
| PORTFOLIO MANAGERS | ||||
| Michael J. Oh, CFA | ||||
Lead Manager | ||||
| Michael B. Han, CFA | ||||
Co-Manager | ||||
| FUND FACTS | ||||
| Investor | Institutional | |||
Ticker | MAKOX | MIKOX | ||
CUSIP | 577130305 | 577130826 | ||
Inception | 1/3/95 | 10/29/10 | ||
NAV | $4.58 | $4.61 | ||
Initial Investment | $2,500 | $100,000 | ||
Gross Expense Ratio1 | 1.14% | 1.02% | ||
Portfolio Statistics | ||||
Total # of Positions | 40 | |||
Net Assets | $146.5 million | |||
Weighted Average | $32.4 billion | |||
Portfolio Turnover2 | 35.60% | |||
Benchmark | ||||
Korea Composite Stock Price Index | ||||
OBJECTIVE
Long-term capital appreciation.
STRATEGY
Under normal market conditions, the Fund seeks to achieve its investment objective by investing at least 80% of its net assets, which include borrowings for investment purposes, in the common and preferred stocks of companies located in South Korea.
Portfolio Manager Commentary (unaudited)
For the year ending December 31, 2018, the Matthews Korea Fund returned –22.21% (Investor Class) and –22.15% (Institutional Class), while its benchmark, the Korea Composite Stock Price Index, returned –20.07%. For the fourth quarter, the Fund returned –10.56% (Investor Class) and –10.57% (Institutional Class) versus –13.29% for the Index.
Market Environment:
In 2018, North Korean leader Kim Jong Un made history by stepping into South Korea for the first time. Delegates from the two Koreas agreed to pursue talks with the U.S. to officially end the Korean War, a conflict nearly six decades old. While diplomatic overtures provide a positive backdrop for growth, South Korean equities were among the region’s weakest in 2018. Investors contemplated how trade talks among the U.S., China and rest of the world could affect South Korean exports. South Korea’s economy also faced other difficulties, as a rising minimum wage pressured small- and medium-sized businesses. In addition, property prices surged over the past two years, resulting in historically high levels of household mortgage debt, and led to slowing disposable income growth.
Performance Contributors and Detractors:
For the full-year 2018, detractors from performance included automaker Hyundai Motors and auto-parts manufacturer Hyundai Mobis, part of the larger Hyundai Motors group. Global automotive demand slowed and the Hyundai Motors group struggled to maintain its market share in China. A delay in restructuring plans further disappointed the market. Meanwhile, Naver, South Korea’s largest search engine provider, also detracted from performance. Naver entered a heavy investment cycle in 2018, lowering its near-term profitability. However, we believe these steps are necessary for Naver’s long-term growth, helping the company continue to maintain a position of market leadership.
During the fourth quarter, the Fund held up better than its benchmark on a relative basis. Underweights in the information technology and industrials sectors have hurt the Fund’s performance in the past, but helped during the fourth quarter. Among the top contributors in the fourth quarter were household product maker Lock & Lock and confectionary maker Orion. We expect Lock & Lock’s share price to remain volatile during an upcoming restructuring process, but also expect the company to expand its addressable market and improve business efficiency. Orion’s China operations were weak in 2017, but recovered in 2018. Orion’s domestic business also gained market share with new products.
Notable Portfolio Changes:
There were no significant portfolio changes during the quarter. We took advantage of market volatility to rotate capital within the portfolio, adding to existing holdings. We purchased additional shares in Lock & Lock, pharmaceutical maker Hugel and tour operator Modetour Network. All three companies reported disappointing earnings in the third quarter, but we feel confident that each has the potential to grow earnings over time. Notably, many of the positions for which we increased our holdings are consumer companies, further increasing consumer exposure in the portfolio.
Outlook:
During the fourth quarter, Korean equities dropped to levels of low valuations last seen in 2008, during the Global Financial Crisis. Amid historically low stock prices, the dividend yield of Korean equities is very attractive, with more upside possible in the near future. What’s more, we continue to see signs of improved corporate governance and shareholder return policies, welcome news for long-term investors.
(continued)
| 1 | Actual 2018 expense ratios. |
| 2 | The lesser of fiscal year 2018 long-term purchase costs or sales proceeds divided by the average monthly market value of long-term securities. |
| 76 | MATTHEWS ASIA FUNDS |
Table of Contents
| PERFORMANCE AS OF DECEMBER 31, 2018 | ||||||||||||||||||||||||||||
|
|
| Average Annual Total Returns |
| |||||||||||||||||||||||||
| 3 Months | 1 Year | 3 Years | 5 Years | 10 Years | Since Inception | Inception Date | ||||||||||||||||||||||
| Investor Class (MAKOX) | -10.56% | -22.21% | 1.55% | 3.67% | 11.75% | 5.69% | 01/03/95 | |||||||||||||||||||||
| Institutional Class (MIKOX) | -10.57% | -22.15% | 1.67% | 3.83% | n.a. | 6.54% | 10/29/10 | |||||||||||||||||||||
| Korea Composite Stock Price Index3 | -13.29% | -20.07% | 4.63% | 0.62% | 9.25% | 2.96% | 4 | |||||||||||||||||||||
Performance assumes reinvestment of all dividends and/or distributions before taxes. All performance quoted represents past performance and is no guarantee of future results.Investment return and principal value will fluctuate with market conditions so that when redeemed, shares may be worth more or less than their original cost. Current performance may be lower or higher than the return figures quoted. For the Fund’s most recent month-end performance, visit matthewsasia.com.
GROWTH OF A $10,000 INVESTMENT SINCE INCEPTION—INVESTOR CLASS
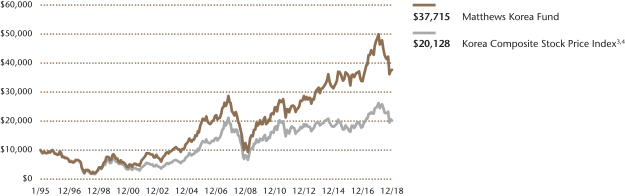
Plotted monthly. The performance data and graph do not reflect the deduction of taxes that a shareholder would pay on dividends, capital gains distributions or redemption of Fund shares. Values are in US$.
| 3 | Korea Composite Stock Price Index performance data may be readjusted periodically by the Korea Exchange due to certain factors, including the declaration of dividends. It is not possible to invest directly in an index. Source: Index data from Korea Composite Stock Price Index and Bloomberg; total return calculations performed by BNY Mellon Investment Servicing (US) Inc. Please see page 91 for index definition. |
| 4 | Calculated from 1/3/95. |
| TOP TEN HOLDINGS5 | ||||||||
| Sector | % of Net Assets | |||||||
| Samsung Electronics Co., Ltd., Pfd. | Information Technology | 6.3% | ||||||
| Samsung Fire & Marine Insurance Co., Ltd., Pfd. | Financials | 4.4% | ||||||
| BGF Retail Co., Ltd. | Consumer Staples | 4.3% | ||||||
| LG Household & Health Care, Ltd., Pfd. | Consumer Staples | 4.2% | ||||||
| Hyundai Mobis Co., Ltd. | Consumer Discretionary | 3.8% | ||||||
| NAVER Corp. | Communication Services | 3.7% | ||||||
| Samsung Electronics Co., Ltd. | Information Technology | 3.4% | ||||||
| Lock&Lock Co., Ltd. | Materials | 3.3% | ||||||
| Samsung SDI Co., Ltd. | Information Technology | 3.2% | ||||||
| LG Chem, Ltd., Pfd. | Materials | 3.2% | ||||||
| % OF ASSETS IN TOP TEN | 39.8% | |||||||
| 5 | Holdings may combine more than one security from same issuer and related depositary receipts. |
| matthewsasia.com | 800.789.ASIA | 77 |
Table of Contents
| COUNTRY ALLOCATION (%)6 | ||||
| South Korea | 94.9 | |||
| Cash and Other Assets, Less Liabilities | 5.1 | |||
| SECTOR ALLOCATION (%)6 | ||||
| Financials | 21.0 | |||
| Consumer Staples | 16.1 | |||
| Information Technology | 15.7 | |||
| Consumer Discretionary | 15.6 | |||
| Materials | 8.6 | |||
| Health Care | 7.3 | |||
| Communication Services | 5.1 | |||
| Energy | 3.1 | |||
| Industrials | 2.4 | |||
| Cash and Other Assets, Less Liabilities | 5.1 | |||
| MARKET CAP EXPOSURE (%)6 | ||||
| Mega Cap (over $25B) | 13.4 | |||
| Large Cap ($10B–$25B) | 35.4 | |||
| Mid Cap ($3B–10B) | 21.1 | |||
| Small Cap (under $3B) | 25.0 | |||
| Cash and Other Assets, Less Liabilities | 5.1 | |||
| 6 | Source: FactSet Research Systems. Percentage values in data are rounded to the nearest tenth of one percent, so the values may not sum to 100% due to rounding. Percentage values may be derived from different data sources and may not be consistent with other Fund literature. |
Matthews Korea Fund
Portfolio Manager Commentary (unaudited) (continued)
Korean equity markets seem to have priced in considerable negative sentiment, but risks remain. Government regulatory policies have shown mixed results as corporate earnings and hiring tendencies have been negatively affected by stiff hikes in the minimum wage over the past two years. Though the Korean government is trying to mitigate past policy missteps, regulatory risks could linger.
Looking ahead, we will continue to look for innovative companies with the potential to improve their shareholder returns over a full market cycle. We believe the consumer will play an important role in Korea’s future, so we expect to maintain meaningful exposure to consumer-driven sectors across the portfolio. As always, we will continue to research individual companies and securities from the bottom up, focusing on those with the most attractive long-term growth potential.
| 78 | MATTHEWS ASIA FUNDS |
Table of Contents
Matthews Korea Fund
December 31, 2018
Schedule of Investmentsa
COMMON EQUITIES: 70.2%
| Shares | Value | |||||||
| FINANCIALS: 16.6% | ||||||||
Banks: 9.2% | ||||||||
Shinhan Financial Group Co., Ltd. | 130,109 | $4,613,161 | ||||||
KB Financial Group, Inc. | 108,801 | 4,538,832 | ||||||
Hana Financial Group, Inc. | 132,859 | 4,320,951 | ||||||
|
| |||||||
| 13,472,944 | ||||||||
|
| |||||||
Capital Markets: 4.5% | ||||||||
Kiwoom Securities Co., Ltd. | 49,791 | 3,501,968 | ||||||
Shinyoung Securities Co., Ltd. | 59,040 | 3,131,169 | ||||||
|
| |||||||
| 6,633,137 | ||||||||
|
| |||||||
Insurance: 2.9% | ||||||||
DB Insurance Co., Ltd. | 66,261 | 4,173,079 | ||||||
|
| |||||||
Total Financials | 24,279,160 | |||||||
|
| |||||||
| CONSUMER DISCRETIONARY: 12.0% | ||||||||
Auto Components: 6.4% | ||||||||
Hyundai Mobis Co., Ltd. | 32,833 | 5,601,781 | ||||||
Hankook Tire Co., Ltd. | 103,370 | 3,715,307 | ||||||
|
| |||||||
| 9,317,088 | ||||||||
|
| |||||||
Specialty Retail: 3.2% |
| |||||||
Cuckoo Homesys Co., Ltd.b | 15,114 | 2,418,337 | ||||||
LOTTE Himart Co., Ltd. | 54,113 | 2,267,412 | ||||||
|
| |||||||
| 4,685,749 | ||||||||
|
| |||||||
Hotels, Restaurants & Leisure: 2.4% |
| |||||||
Modetour Network, Inc. | 164,766 | 3,556,323 | ||||||
|
| |||||||
Total Consumer Discretionary | 17,559,160 | |||||||
|
| |||||||
| CONSUMER STAPLES: 10.2% | ||||||||
Food & Staples Retailing: 5.9% | ||||||||
BGF Retail Co., Ltd. | 34,197 | 6,241,998 | ||||||
E-Mart, Inc. | 14,554 | 2,376,819 | ||||||
|
| |||||||
| 8,618,817 | ||||||||
|
| |||||||
Food Products: 4.3% | ||||||||
Orion Corp. | 36,400 | 3,903,797 | ||||||
Orion Holdings Corp. | 158,884 | 2,430,283 | ||||||
|
| |||||||
| 6,334,080 | ||||||||
|
| |||||||
Total Consumer Staples | 14,952,897 | |||||||
|
| |||||||
| INFORMATION TECHNOLOGY: 9.4% | ||||||||
Technology Hardware, Storage & Peripherals: 3.4% |
| |||||||
Samsung Electronics Co., Ltd. | 144,009 | 5,013,201 | ||||||
|
| |||||||
Electronic Equipment, Instruments & Components: 3.2% |
| |||||||
Samsung SDI Co., Ltd. | 24,121 | 4,741,174 | ||||||
|
| |||||||
IT Services: 1.4% |
| |||||||
Cafe24 Corp.b | 20,258 | 1,997,603 | ||||||
|
| |||||||
Semiconductors & Semiconductor Equipment: 1.4% |
| |||||||
Koh Young Technology, Inc. | 26,481 | 1,960,470 | ||||||
|
| |||||||
Total Information Technology | 13,712,448 | |||||||
|
| |||||||
| Shares | Value | |||||||
| HEALTH CARE: 7.3% | ||||||||
Pharmaceuticals: 3.8% | ||||||||
Yuhan Corp. | 16,950 | $3,110,633 | ||||||
DongKook Pharmaceutical Co., Ltd. | 46,758 | 2,426,080 | ||||||
|
| |||||||
| 5,536,713 | ||||||||
|
| |||||||
Biotechnology: 1.8% | ||||||||
Hugel, Inc.b | 7,836 | 2,687,752 | ||||||
|
| |||||||
Health Care Equipment & Supplies: 1.7% | ||||||||
Interojo Co., Ltd. | 108,571 | 2,402,540 | ||||||
|
| |||||||
Total Health Care | 10,627,005 | |||||||
|
| |||||||
| MATERIALS: 5.4% | ||||||||
Containers & Packaging: 3.3% | ||||||||
Lock&Lock Co., Ltd. | 256,734 | 4,767,179 | ||||||
|
| |||||||
Metals & Mining: 2.1% | ||||||||
Korea Zinc Co., Ltd. | 4,310 | 1,668,862 | ||||||
POSCO | 6,603 | 1,444,286 | ||||||
|
| |||||||
| 3,113,148 | ||||||||
|
| |||||||
Total Materials | 7,880,327 | |||||||
|
| |||||||
| COMMUNICATION SERVICES: 5.1% | ||||||||
Interactive Media & Services: 3.7% | ||||||||
NAVER Corp. | 49,692 | 5,446,040 | ||||||
|
| |||||||
Wireless Telecommunication Services: 1.4% | ||||||||
SK Telecom Co., Ltd. ADR | 76,900 | 2,060,920 | ||||||
|
| |||||||
Total Communication Services | 7,506,960 | |||||||
|
| |||||||
| INDUSTRIALS: 2.4% | ||||||||
Commercial Services & Supplies: 2.4% | ||||||||
S-1 Corp. | 39,273 | 3,528,563 | ||||||
|
| |||||||
Total Industrials | 3,528,563 | |||||||
|
| |||||||
| ENERGY: 1.8% | ||||||||
Oil, Gas & Consumable Fuels: 1.8% | ||||||||
SK Innovation Co., Ltd. | 11,055 | 1,774,486 | ||||||
S-Oil Corp. | 10,594 | 924,071 | ||||||
|
| |||||||
Total Energy | 2,698,557 | |||||||
|
| |||||||
| TOTAL COMMON EQUITIES | 102,745,077 | |||||||
|
| |||||||
(Cost $99,067,834) | ||||||||
PREFERRED EQUITIES: 24.7% | ||||||||
| INFORMATION TECHNOLOGY: 6.3% | ||||||||
Technology Hardware, Storage & Peripherals: 6.3% |
| |||||||
Samsung Electronics Co., Ltd., Pfd. | 324,033 | 9,258,810 | ||||||
|
| |||||||
Total Information Technology | 9,258,810 | |||||||
|
| |||||||
| CONSUMER STAPLES: 5.9% | ||||||||
Personal Products: 5.9% | ||||||||
LG Household & Health Care, Ltd., Pfd. | 10,360 | 6,099,909 | ||||||
Amorepacific Corp., Pfd. | 16,486 | 1,519,288 | ||||||
AMOREPACIFIC Group, Pfd. | 34,619 | 953,386 | ||||||
|
| |||||||
Total Consumer Staples | 8,572,583 | |||||||
|
| |||||||
| matthewsasia.com | 800.789.ASIA | 79 |
Table of Contents
Matthews Korea Fund
December 31, 2018
Schedule of Investmentsa (continued)
PREFERRED EQUITIES(continued)
| Shares | Value | |||||||
| FINANCIALS: 4.4% | ||||||||
Insurance: 4.4% | ||||||||
Samsung Fire & Marine Insurance Co., Ltd., Pfd. | 41,618 | $6,476,933 | ||||||
|
| |||||||
Total Financials | 6,476,933 | |||||||
|
| |||||||
| CONSUMER DISCRETIONARY: 3.6% | ||||||||
Automobiles: 3.6% | ||||||||
Hyundai Motor Co., Ltd., 2nd Pfd. | 60,892 | 4,201,859 | ||||||
Hyundai Motor Co., Ltd., Pfd. | 18,115 | 1,140,277 | ||||||
|
| |||||||
Total Consumer Discretionary | 5,342,136 | |||||||
|
| |||||||
| MATERIALS: 3.2% | ||||||||
Chemicals: 3.2% | ||||||||
LG Chem, Ltd., Pfd. | 26,548 | 4,654,859 | ||||||
|
| |||||||
Total Materials | 4,654,859 | |||||||
|
| |||||||
| ENERGY: 1.3% | ||||||||
Oil, Gas & Consumable Fuels: 1.3% | ||||||||
S-Oil Corp., Pfd. | 30,354 | 1,912,812 | ||||||
|
| |||||||
Total Energy | 1,912,812 | |||||||
|
| |||||||
| TOTAL PREFERRED EQUITIES | 36,218,133 | |||||||
|
| |||||||
(Cost $31,236,859) | ||||||||
| TOTAL INVESTMENTS: 94.9% | 138,963,210 | |||||||
(Cost $130,304,693) | ||||||||
| CASH AND OTHER ASSETS, LESS LIABILITIES: 5.1% | 7,493,860 | |||||||
|
| |||||||
NET ASSETS: 100.0% | $146,457,070 | |||||||
|
| |||||||
| a | Certain securities were fair valued under the valuation policies approved by the Board of Trustees (Note2-A). |
| b | Non-income producing security. |
| ADR | American Depositary Receipt |
| Pfd. | Preferred |
See accompanying notes to financial statements.
| 80 | MATTHEWS ASIA FUNDS |
Table of Contents

| PORTFOLIO MANAGERS | ||||
| Lydia So, CFA | ||||
Lead Manager | ||||
| Beini Zhou, CFA | Tiffany Hsiao, CFA | |||
| Co-Manager | Co-Manager | |||
| FUND FACTS | ||||
| Investor | Institutional | |||
Ticker | MSMLX | MISMX | ||
CUSIP | 577125206 | 577125867 | ||
Inception | 9/15/08 | 4/30/13 | ||
NAV | $15.50 | $15.46 | ||
Initial Investment | $2,500 | $100,000 | ||
Gross Expense Ratio1 | 1.51% | 1.37% | ||
After Fee Waiver and Reimbursement2 | 1.46% | 1.25% | ||
Portfolio Statistics | ||||
Total # of Positions | 68 | |||
Net Assets | $186.4 million | |||
Weighted Average | $1.2 billion | |||
Portfolio Turnover3 | 69.79% | |||
Benchmark | ||||
MSCI AC Asia ex Japan Small Cap Index | ||||
Redemption Fee | ||||
2% within first 90 calendar days of purchase | ||||
OBJECTIVE
Long-term capital appreciation.
STRATEGY
Under normal market conditions, the Fund seeks to achieve its investment objective by investing at least 80% of its net assets, which include borrowings for investment purposes, in the common and preferred stocks of Small Companies located in Asia ex Japan, which consists of all countries and markets in Asia excluding Japan, but including all other developed, emerging and frontier countries and markets in the Asian region.
Matthews Asia Small Companies Fund
Portfolio Manager Commentary (unaudited)
For the year ending December 31, 2018, the Matthews Asia Small Companies Fund returned –18.05% (Investor Class) and –17.86% (Institutional Class), while its benchmark, the MSCI All Country Asia ex Japan Small Cap Index, returned –18.63%. For the fourth quarter, the Fund returned –8.85% (Investor Class) and –8.81% (Institutional Class), while its benchmark returned –8.35%.
Market Environment:
Throughout most of 2018, market sentiment was dominated by macroeconomic factors. Ongoing U.S.–China trade tensions were arguably the main drivers of global market volatility. U.S protectionist trade policies that were expected to be one-off in nature had intensified, resulting in retaliatory gestures between the two countries. Such negative developments posed further challenges in gauging the prospects of corporate profits in the Asia region. China’s economic slowdown was also a headwind. Discretionary spending on large-ticket items, such as autos and home furnishings, experienced noticeable weaknesses in China. During the third quarter of 2018, market sentiment toward Chinese equities soured even more as many of China’s domestic policies toward regulating certain domestic services industries were deemed unfriendly to markets.
Meanwhile, the U.S. Federal Reserve continued to raise interest rates in 2018. Emerging market equities and currencies were hit hard as the strengthening U.S. dollar put further stress on some emerging market countries such as Argentina and Turkey. Within Asia, India’s rupee and Indonesia’s rupiah were among the worst-performing Asian currencies due to their capital account deficits and reliance on imported oil. In India, domestic liquidity in its financials sector tightened further since September following a default on a bond payment by a leading infrastructure finance company.
Performance Contributors and Detractors:
The Fund experienced some outperformance in the first half of the year; most of the portfolio holdings, however, saw their stock prices suffer along with the broader market during the second half of the year.
The largest absolute detractors to performance were our holdings in Taiwan as they were impacted by supply-chain weakness among handset hardware firms as well as slowing demand for their respective products in the uncertain trade environment. There were also some negative company-specific developments in some holdings elsewhere in the region. CLIO Cosmetics, for example, was a major detractor to performance in 2018. South Korean companies generally have suffered from poor sales in China due to geopolitical tensions, and CLIO Cosmetics was impacted consequentially. Performance among our Southeast Asia holdings was also hit by concerns over the economic growth outlook both locally and globally. Meanwhile, select holdings in China, South Korea and India generated decent absolute returns in a challenging market environment thanks to the defensive nature of their businesses.
By sector, our holdings in consumer discretionary, real estate, and industrials hurt relative performance due to their sensitivity to economic slowdowns. Our stock selection and overweight in information technology, health care and financials, however, benefited relative performance.
(continued)
| 1 | Actual 2018 expense ratios. |
| 2 | Matthews has contractually agreed (i) to waive fees and reimburse expenses to the extent needed to limit Total Annual Fund Operating Expenses (excluding Rule 12b-1 fees, taxes, interest, brokerage commissions, short sale dividend expenses, expenses incurred in connection with any merger or reorganization or extraordinary expenses such as litigation) of the Institutional Class to 1.25% first by waiving class specific expenses (i.e., shareholder service fees specific to a particular class) of the Institutional Class and then, to the extent necessary, by waiving non-class specific expenses of the Institutional Class, and (ii) if any Fund-wide expenses (i.e., expenses that apply to both the Institutional Class and the Investor Class) are waived for the Institutional Class to maintain the 1.25% expense limitation, to waive an equal amount (in annual percentage terms) of those same expenses for the Investor Class. The Total Annual Fund Operating Expenses After Fee Waiver and Expense Reimbursement for the Investor Class may vary from year to year and will in some years exceed 1.25%. If the operating expenses fall below the expense limitation in a year within three years after Matthews has made a waiver or reimbursement, the Fund may reimburse Matthews up to an amount that does not cause the expenses for that year to exceed the lesser of (i) the expense limitation applicable at the time of that fee waiver and/or expense reimbursement or (ii) the expense limitation in effect at the time of recoupment. This agreement will remain in place until April 30, 2019 and may be terminated at any time by the Board of Trustees on behalf of the Fund on 60 days’ written notice to Matthews. Matthews may decline to renew this agreement by written notice to the Trust at least 30 days before its annual expiration date. |
| 3 | The lesser of fiscal year 2018 long-term purchase costs or sales proceeds divided by the average monthly market value of long-term securities. |
| matthewsasia.com | 800.789.ASIA | 81 |
Table of Contents
| PERFORMANCE AS OF DECEMBER 31, 2018 | ||||||||||||||||||||||||||||
|
|
| Average Annual Total Returns |
| |||||||||||||||||||||||||
| 3 Months | 1 Year | 3 Years | 5 Years | 10 Years | Since Inception | Inception Date | ||||||||||||||||||||||
| Investor Class (MSMLX) | -8.85% | -18.05% | 1.79% | 1.25% | 12.01% | 9.12% | 09/15/08 | |||||||||||||||||||||
| Institutional Class (MISMX) | -8.81% | -17.86% | 2.01% | 1.47% | n.a. | 1.32% | 04/30/13 | |||||||||||||||||||||
| MSCI AC Asia ex Japan Small Cap Index4 | -8.35% | -18.63% | 2.18% | 1.13% | 10.51% | 6.23% | 5 | |||||||||||||||||||||
Performance assumes reinvestment of all dividends and/or distributions before taxes. All performance quoted represents past performance and is no guarantee of future results.Investment return and principal value will fluctuate with market conditions so that when redeemed, shares may be worth more or less than their original cost. Current performance may be lower or higher than the return figures quoted. Returns would have been lower if certain of the Fund’s fees and expenses had not been waived. For the Fund’s most recent month-end performance, visit matthewsasia.com.
GROWTH OF A $10,000 INVESTMENT SINCE INCEPTION—INVESTOR CLASS
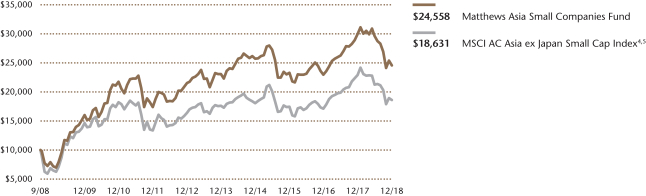
Plotted monthly. The performance data and graph do not reflect the deduction of taxes that a shareholder would pay on dividends, capital gains distributions or redemption of Fund shares. Values are in US$.
| 4 | It is not possible to invest directly in an index. Source: Index data from Morgan Stanley Capital International and Bloomberg; total return calculations performed by BNY Mellon Investment Servicing (US) Inc. Please see page 91 for index definition. |
| 5 | Calculated from 9/15/08. |
| TOP TEN HOLDINGS6 | ||||||||
| Sector | Country | % of Net Assets | ||||||
| SUNeVision Holdings, Ltd. | Information Technology | China/Hong Kong | 3.4% | |||||
| PT Bank Tabungan Pensiunan Nasional | Financials | Indonesia | 3.2% | |||||
| Vitasoy International Holdings, Ltd. | Consumer Staples | China/Hong Kong | 2.8% | |||||
| Silergy Corp. | Information Technology | China/Hong Kong | 2.6% | |||||
| BBI Life Sciences Corp. | Health Care | China/Hong Kong | 2.5% | |||||
| GRUH Finance, Ltd. | Financials | India | 2.4% | |||||
| Yeah1 Group Corp. | Communication Services | Vietnam | 2.3% | |||||
| Merck, Ltd. | Health Care | India | 2.1% | |||||
| Precision Tsugami China Corp., Ltd. | Industrials | China/Hong Kong | 2.1% | |||||
| Sunny Friend Environmental Technology Co., Ltd. | Industrials | Taiwan | 2.0% | |||||
| % OF ASSETS IN TOP TEN | 25.4% | |||||||
| 6 | Holdings may combine more than one security from same issuer and related depositary receipts. |
| 82 | MATTHEWS ASIA FUNDS |
Table of Contents
Matthews Asia Small Companies Fund
Portfolio Manager Commentary (unaudited) (continued)
Notable Portfolio Changes:
We exited a number of highfliers in health care and information technology to lock in profits during the first half of the year. We exited Hutchison China MediTech, a China-based pharmaceutical company, and GDS Holdings, a China-based data center operator, after strong run-ups in share prices where we believed the valuations had become rich relative to company fundamentals. We initiated a few new holdings in Vietnam during the year as we identified attractive companies that are leveraged to structural growth trends in the country. Saigon Cargo Service is one of Vietnam’s leading air cargo handling operators. The company grew its customer base in Vietnam’s busiest airport, Tan Son Nhat International in Ho Chi Minh, and also expanded its profitability due to efficiency improvements.
In the second half of the year, we also exited positions in companies across multiple sectors where we believed the growth outlook was compromised. We took profits and reduced our exposure to India’s non-bank financial companies such as Cholamandalam Investment and Finance as we believed the liquidity and asset-quality profile of the sector turned less favorable. However, we are still constructive on some Indian companies on a bottom-up basis, especially companies with predictable and recurring revenue streams. In the fourth quarter, we initiated a position in Galaxy Surfactants, an Indian manufacturer of specialty chemicals for personal-care products. We are constructive on the company’s positioning in supplying to reputable fast-moving consumer goods (FMCG) companies domestically and abroad. We believe the company’s long-term growth trajectory is promising.
Outlook:
The outlook for global growth has turned increasingly negative amid uncertainties over U.S.–China trade tensions and the impact of higher U.S. interest rates. We are cautious about various macroeconomic factors impacting corporate profits and the heightened capital market volatility. As such, we maintain our bias toward companies with strong balance sheets and cash flows, as well as business models that are not overly capital-intensive. That said, China has since taken steps to stabilize its internal markets through fiscal and monetary policies and currency management. We are hopeful that structural growth drivers for China’s private sector such as domestic consumption, productivity improvements and innovations in the fields of science and technology remain sound.
In 2019, key elections are slated to take place in Thailand, Indonesia and India. There could be volatility leading up to the events or related to the election outcomes, which we will monitor and assess in terms of the implications for company fundamentals.
On the positive side, valuations of many high-quality, small-cap companies have turned attractive after the recent market correction, which should present opportunities for long-term investors. We believe that after an extended period of negative macroeconomic news surrounding global markets, investor expectations are very low. We will continue to seek growth companies with sound fundamentals and management teams that can weather short-term challenges and emerge stronger in the long term.
| COUNTRY ALLOCATION (%)7,8 | ||||
| China/Hong Kong | 34.2 | |||
| Taiwan | 14.3 | |||
| India | 13.9 | |||
| South Korea | 9.4 | |||
| Vietnam | 8.3 | |||
| Thailand | 6.9 | |||
| Indonesia | 6.6 | |||
| Malaysia | 3.3 | |||
| Japan | 2.5 | |||
| Singapore | 1.3 | |||
| Philippines | 1.2 | |||
| Australia | 1.2 | |||
| United States | 0.7 | |||
| Liabilities in Excess of Cash and Other Assets | -3.8 | |||
| SECTOR ALLOCATION (%)8 | ||||
| Information Technology | 19.7 | |||
| Industrials | 15.8 | |||
| Health Care | 14.2 | |||
| Consumer Discretionary | 11.7 | |||
| Consumer Staples | 11.1 | |||
| Communication Services | 10.6 | |||
| Financials | 10.1 | |||
| Materials | 5.2 | |||
| Real Estate | 4.3 | |||
| Energy | 1.1 | |||
| Liabilities in Excess of Cash and Other Assets | -3.8 | |||
| MARKET CAP EXPOSURE (%)8,9 | ||||
| Mega Cap (over $25B) | 0.0 | |||
| Large Cap ($10B–$25B) | 0.0 | |||
| Mid Cap ($3B–10B) | 7.4 | |||
| Small Cap (under $3B) | 96.3 | |||
| Liabilities in Excess of Cash and Other Assets | -3.8 | |||
| 7 | Not all countries where the Fund may invest are included in the benchmark index. |
| 8 | Source: FactSet Research Systems. Percentage values in data are rounded to the nearest tenth of one percent, so the values may not sum to 100% due to rounding. Percentage values may be derived from different data sources and may not be consistent with other Fund literature. |
| 9 | The Fund defines Small Companies as companies with market capitalization generally between $100 million and $3 billion or the largest company included in the Fund’s primary benchmark, the MSCI All Country Asia ex Japan Small Cap Index. |
| matthewsasia.com | 800.789.ASIA | 83 |
Table of Contents
Matthews Asia Small Companies Fund
December 31, 2018
Schedule of Investmentsa
COMMON EQUITIES: 103.8%
| Shares | Value | |||||||
| CHINA/HONG KONG: 34.2% | ||||||||
SUNeVision Holdings, Ltd. | 10,683,000 | $6,339,122 | ||||||
Vitasoy International Holdings, Ltd. | 1,378,000 | 5,245,598 | ||||||
Silergy Corp. | 331,000 | 4,900,865 | ||||||
BBI Life Sciences Corp.b | 15,931,500 | 4,670,400 | ||||||
Precision Tsugami China Corp., Ltd.b | 4,256,000 | 3,881,206 | ||||||
Shanghai Haohai Biological Technology Co., Ltd. H Sharesb,c | 751,100 | 3,735,770 | ||||||
Yihai International Holding, Ltd. | 1,339,000 | 3,259,289 | ||||||
Times China Holdings, Ltd. | 2,886,000 | 3,203,043 | ||||||
Wise Talent Information Technology Co., Ltd.b,d | 841,600 | 3,116,838 | ||||||
China Yuhua Education Corp., Ltd.b,c | 7,558,000 | 3,063,401 | ||||||
Kingdee International Software Group Co., Ltd. | 3,384,000 | 2,991,766 | ||||||
SITC International Holdings Co., Ltd. | 3,132,000 | 2,952,175 | ||||||
TK Group Holdings, Ltd. | 5,102,000 | 2,763,798 | ||||||
Microport Scientific Corp. | 2,728,000 | 2,686,674 | ||||||
BeiGene, Ltd.d | 246,879 | 2,637,643 | ||||||
Huifu Payment, Ltd.b,c,d | 5,615,200 | 2,312,988 | ||||||
China Aviation Oil Singapore Corp., Ltd. | 2,606,200 | 2,032,016 | ||||||
Bilibili, Inc. ADRd | 107,200 | 1,564,048 | ||||||
Baozun, Inc. ADRd | 41,400 | 1,209,294 | ||||||
Genscript Biotech Corp.d | 858,000 | 1,148,524 | ||||||
|
| |||||||
Total China/Hong Kong | 63,714,458 | |||||||
|
| |||||||
| TAIWAN: 14.3% | ||||||||
Sunny Friend Environmental Technology Co., Ltd. | 568,000 | 3,768,936 | ||||||
Chief Telecom, Inc. | 677,000 | 3,345,210 | ||||||
Great Tree Pharmacy Co., Ltd. | 1,577,414 | 3,094,983 | ||||||
KS Terminals, Inc. | 1,988,000 | 2,830,638 | ||||||
Global PMX Co., Ltd. | 767,000 | 2,733,478 | ||||||
Advanced Ceramic X Corp. | 335,000 | 2,681,674 | ||||||
ITEQ Corp. | 1,621,000 | 2,667,130 | ||||||
Taiwan Paiho, Ltd. | 1,434,000 | 2,319,815 | ||||||
HIM International Music, Inc. | 818,050 | 2,306,878 | ||||||
Kuobrothers Corp. | 517,000 | 835,676 | ||||||
|
| |||||||
Total Taiwan | 26,584,418 | |||||||
|
| |||||||
| INDIA: 13.9% | ||||||||
GRUH Finance, Ltd. | 978,552 | 4,425,838 | ||||||
Merck, Ltd. | 90,692 | 3,993,464 | ||||||
AIA Engineering, Ltd. | 136,454 | 3,275,075 | ||||||
Syngene International, Ltd.b,c | 356,897 | 2,868,819 | ||||||
NIIT Technologies, Ltd. | 173,867 | 2,861,252 | ||||||
Natco Pharma, Ltd. | 280,240 | 2,728,353 | ||||||
Gabriel India, Ltd. | 1,310,276 | 2,663,714 | ||||||
Galaxy Surfactants, Ltd.b | 151,046 | 2,649,016 | ||||||
DCB Bank, Ltd. | 217,784 | 527,413 | ||||||
|
| |||||||
Total India | 25,992,944 | |||||||
|
| |||||||
| Shares | Value | |||||||
| SOUTH KOREA: 9.4% | ||||||||
Douzone Bizon Co., Ltd. | 69,745 | $3,250,160 | ||||||
Cosmecca Korea Co., Ltd. | 102,259 | 2,998,576 | ||||||
Tongyang Pile, Inc. | 561,078 | 2,529,078 | ||||||
Cafe24 Corp.d | 24,788 | 2,444,298 | ||||||
Incross Co., Ltd.d | 164,781 | 2,338,893 | ||||||
Value Added Technology Co., Ltd. | 105,537 | 2,048,857 | ||||||
Hy-Lok Corp. | 128,309 | 1,893,505 | ||||||
|
| |||||||
Total South Korea | 17,503,367 | |||||||
|
| |||||||
| VIETNAM: 8.3% | ||||||||
Yeah1 Group Corp.d | 421,320 | 4,268,601 | ||||||
Saigon Cargo Service Corp. | 524,060 | 3,268,521 | ||||||
FPT Digital Retail JSCd | 1,027,390 | 3,184,710 | ||||||
Nam Long Investment Corp. | 2,402,294 | 2,682,407 | ||||||
Ho Chi Minh City Securities Corp. | 1,033,270 | 2,090,013 | ||||||
|
| |||||||
Total Vietnam | 15,494,252 | |||||||
|
| |||||||
| THAILAND: 6.9% | ||||||||
Rich Sport Public Co., Ltd. | 27,098,300 | 3,114,082 | ||||||
Plan B Media Public Co., Ltd. F Shares | 14,691,700 | 2,773,943 | ||||||
Humanica Public Co., Ltd. | 8,559,900 | 2,463,841 | ||||||
TOA Paint Thailand Public Co., Ltd. | 2,311,600 | 2,362,071 | ||||||
AP Thailand Public Co., Ltd. | 11,203,100 | 2,082,068 | ||||||
|
| |||||||
Total Thailand | 12,796,005 | |||||||
|
| |||||||
| INDONESIA: 6.6% | ||||||||
PT Bank Tabungan Pensiunan Nasional | 25,182,200 | 6,024,115 | ||||||
PT BFI Finance Indonesia | 69,940,700 | 3,234,392 | ||||||
PT Arwana Citramulia | 101,227,300 | 2,959,852 | ||||||
|
| |||||||
Total Indonesia | 12,218,359 | |||||||
|
| |||||||
| MALAYSIA: 3.3% | ||||||||
D&O Green Technologies BHD | 14,747,500 | 2,549,852 | ||||||
Bursa Malaysia BHD | 1,483,000 | 2,452,108 | ||||||
Karex BHD | 10,820,825 | 1,229,913 | ||||||
|
| |||||||
Total Malaysia | 6,231,873 | |||||||
|
| |||||||
| JAPAN: 2.5% | ||||||||
Honma Golf, Ltd.b,c | 2,406,000 | 2,769,864 | ||||||
CKD Corp. | 212,700 | 1,799,571 | ||||||
|
| |||||||
Total Japan | 4,569,435 | |||||||
|
| |||||||
| SINGAPORE: 1.3% | ||||||||
Delfi, Ltd. | 2,611,400 | 2,509,199 | ||||||
|
| |||||||
Total Singapore | 2,509,199 | |||||||
|
| |||||||
| PHILIPPINES: 1.2% | ||||||||
Philippine Seven Corp. | 963,791 | 2,272,703 | ||||||
|
| |||||||
Total Philippines | 2,272,703 | |||||||
|
| |||||||
| AUSTRALIA: 1.2% | ||||||||
OZ Minerals, Ltd. | 357,435 | 2,216,045 | ||||||
|
| |||||||
Total Australia | 2,216,045 | |||||||
|
| |||||||
| 84 | MATTHEWS ASIA FUNDS |
Table of Contents
Matthews Asia Small Companies Fund
December 31, 2018
Schedule of Investmentsa(continued)
COMMON EQUITIES(continued)
| Shares | Value | |||||||
| UNITED STATES: 0.7% | ||||||||
Knowles Corp.d | 99,400 | $1,323,014 | ||||||
|
| |||||||
Total United States | 1,323,014 | |||||||
|
| |||||||
| TOTAL INVESTMENTS: 103.8% | 193,426,072 | |||||||
(Cost $222,997,222) | ||||||||
| LIABILITIES IN EXCESS OF CASH AND OTHER ASSETS: (3.8%) | (7,035,652 | ) | ||||||
|
| |||||||
NET ASSETS: 100.0% | $186,390,420 | |||||||
|
| |||||||
| a | Certain securities were fair valued under the valuation policies approved by the Board of Trustees (Note2-A). |
| b | The securities may be resold to qualified foreign investors and foreign institutional buyers under Regulation S of the Securities Act of 1933. |
| c | Security exempt from registration under Rule 144A of the Securities Act of 1933, as amended. The security may be resold in transactions exempt from registration normally to qualified institutional buyers. The security has been determined to be liquid in accordance with procedures adopted by the Funds’ Board of Trustees. At December 31, 2018, the aggregate value is $14,750,842, which is 7.91% of net assets. |
| d | Non-income producing security. |
| ADR | American Depositary Receipt |
| BHD | Berhad |
| JSC | Joint Stock Co. |
See accompanying notes to financial statements.
| matthewsasia.com | 800.789.ASIA | 85 |
Table of Contents
| PORTFOLIO MANAGERS* | ||||
| Tiffany Hsiao, CFA | ||||
Lead Manager | ||||
* Effective January 22, 2019 | ||||
| FUND FACTS | ||||
| Investor | Institutional | |||
Ticker | MCSMX | MICHX | ||
CUSIP | 577125404 | 577125842 | ||
Inception | 5/31/11 | 11/30/17 | ||
NAV | $9.58 | $9.59 | ||
Initial Investment | $2,500 | $100,000 | ||
Gross Expense Ratio1 | 1.97% | 1.79% | ||
After Fee Waiver and Reimbursement2 | 1.50% | 1.25% | ||
Portfolio Statistics | ||||
Total # of Positions | 51 | |||
Net Assets | $62.5 million | |||
Weighted Average Market Cap | $1.8 billion | |||
Portfolio Turnover3 | 76.67% | |||
Benchmark | ||||
MSCI China Small Cap Index | ||||
Redemption Fee | ||||
2% within first 90 calendar days of purchase | ||||
OBJECTIVE
Long-term capital appreciation.
STRATEGY
Under normal market conditions, the Fund seeks to achieve its investment objective by investing at least 80% of its net assets, which include borrowings for investment purposes, in the common and preferred stocks of Small Companies located in China. China includes its administrative and other districts, such as Hong Kong.
Matthews China Small Companies Fund
Portfolio Manager Commentary (unaudited)
For the year ending December 31, 2018, the Matthews China Small Companies Fund returned –17.68% (Investor Class) and –17.48% (Institutional Class), outperforming its benchmark, the MSCI China Small Cap Index, which returned –19.53% over the same period. For the fourth quarter of the year, the Fund returned –11.66% (Investor Class) and –11.59% (Institutional Class), versus –11.24% for the Index.
Market Environment:
There was no shortage of alarming headlines in 2018. Trade war tensions, geopolitical risks and worries about a structural China slowdown dominated headlines throughout the year. These factors all negatively impacted China’s equity markets in terms of both performance and volatility. For the first time in a while, we saw a noticeable slowdown in domestic retail consumption of large-ticket items, such as autos and home decorations, driven by domestic deleveraging. Even though retail sales and industrial production figures continued to meet expectations through August, investors worried about a downward trajectory in the near term—thus ignoring the strong August data. China’s central bank, the People’s Bank of China, appeared to be cognizant of the near-term policy and geopolitical headwinds and therefore continued to be accommodative by lowering interest rates. The government’s determination in steering China’s longer term structural reform, however, remains solid as it maintained its strict controls over the riskier parts of the nation’s lending system.
From both a top-down and bottom-up perspective, we continue to anticipate long-term sustainable growth in the Chinese economy and in corporate earnings. The market’s concerns over escalating trade tensions should, in our view, have little impact on China’s smaller companies given their domestic focus and lower dependence on financial leverage. China’s recent policies toward the consumer services economy, however, do have near-term negative impacts on sentiment for smaller companies.
Performance Contributors and Detractors:
In 2018, our strong stock selection in the industrials and communication services sectors contributed most to the Fund’s outperformance versus the benchmark. Our underweight position in the asset-heavy communication services sector also contributed positively to performance. The biggest drag to our performance came from the consumer discretionary sector due to poor stock selection.
Among the top contributors to Fund performance during 2018 were CIFI Holdings and Yihai International Holding. CIFI Holdings is a top residential property developer in China with a sound land-banking strategy around cities with high productivity growth and a strong balance sheet. We exited CIFI early in the year as it “graduated,” meaning its market capitalizations evolved beyond our small-cap range. Yihai International Holding manufactures and sells a leading hot pot soup base and condiment brand for both restaurants and retail consumers. We believe the company has strong growth visibility given the popularity of its associated hot pot restaurant chain and its rapidly growing new business in restaurant supplies.
Silergy, China’s analog semiconductor company, and China Aviation Oil Singapore, China’s sole jet fuel importer and key stakeholder in Shanghai Pudong Airport’s
(continued)
| 1 | Actual 2018 expense ratios. |
| 2 | Matthews has contractually agreed (i) to waive fees and reimburse expenses to the extent needed to limit Total Annual Fund Operating Expenses (excluding Rule 12b-1 fees, taxes, interest, brokerage commissions, short sale dividend expenses, expenses incurred in connection with any merger or reorganization or extraordinary expenses such as litigation) of the Institutional Class to 1.25% first by waiving class specific expenses (i.e., shareholder service fees specific to a particular class) of the Institutional Class and then, to the extent necessary, by waiving non-class specific expenses of the Institutional Class, and (ii) if any Fund-wide expenses (i.e., expenses that apply to both the Institutional Class and the Investor Class) are waived for the Institutional Class to maintain the 1.25% expense limitation, to waive an equal amount (in annual percentage terms) of those same expenses for the Investor Class. The Total Annual Fund Operating Expenses After Fee Waiver and Expense Reimbursement for the Investor Class may vary from year to year and will in some years exceed 1.25%. If the operating expenses fall below the expense limitation in a year within three years after Matthews has made a waiver or reimbursement, the Fund may reimburse Matthews up to an amount that does not cause the expenses for that year to exceed the lesser of (i) the expense limitation applicable at the time of that fee waiver and/or expense reimbursement or (ii) the expense limitation in effect at the time of recoupment. This agreement will remain in place until April 30, 2019 and may be terminated at any time by the Board of Trustees on behalf of the Fund on 60 days’ written notice to Matthews. Matthews may decline to renew this agreement by written notice to the Trust at least 30 days before its annual expiration date. |
| 3 | The lesser of fiscal year 2018 long-term purchase costs or sales proceeds divided by the average monthly market value of long-term securities. |
| 86 | MATTHEWS ASIA FUNDS |
Table of Contents
| PERFORMANCE AS OF DECEMBER 31, 2018 | ||||||||||||||||||||||||
|
|
| Average Annual Total Returns |
| |||||||||||||||||||||
| 3 Months | 1 Year | 3 Years | 5 Years | Since Inception | Inception date | |||||||||||||||||||
| Investor Class (MCSMX) | -11.66% | -17.68% | 7.35% | 4.47% | 2.98% | 05/31/11 | ||||||||||||||||||
| Institutional Class (MICHX) | -11.59% | -17.48% | 7.44% | 4.53% | 3.01% | 11/30/17 | ||||||||||||||||||
| MSCI China Small Cap Index4 | -11.24% | -19.53% | -1.93% | -0.55% | -1.05% | 5 | ||||||||||||||||||
Performance assumes reinvestment of all dividends and/or distributions before taxes. All performance quoted represents past performance and is no guarantee of future results.Investment return and principal value will fluctuate with market conditions so that when redeemed, shares may be worth more or less than their original cost. Current performance may be lower or higher than the return figures quoted. Returns would have been lower if certain of the Fund’s fees and expenses had not been waived. For the Fund’s most recent month-end performance, visit matthewsasia.com.
GROWTH OF A $10,000 INVESTMENT SINCE INCEPTION—INVESTOR CLASS
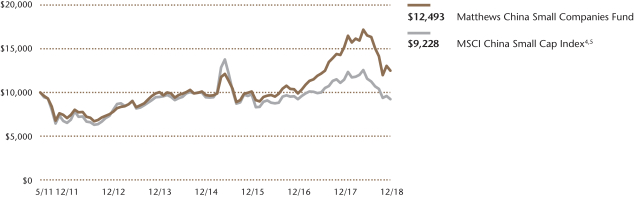
Plotted monthly. The performance data and graph do not reflect the deduction of taxes that a shareholder would pay on dividends, capital gains distributions or redemption of Fund shares. Values are in US$.
| 4 | It is not possible to invest directly in an index. Source: Index data from Morgan Stanley Capital International and Bloomberg; total return calculations performed by BNY Mellon Investment Servicing (US) Inc. Please see page 91 for index definition. |
| 5 | Calculated from 5/31/11 |
| TOP TEN HOLDINGS6 | ||||||||
| Sector | % of Net Assets | |||||||
| Silergy Corp. | Information Technology | 7.7% | ||||||
| Sunny Friend Environmental Technology Co., Ltd. | Industrials | 4.3% | ||||||
| SITC International Holdings Co., Ltd. | Industrials | 3.7% | ||||||
| Honma Golf, Ltd. | Consumer Discretionary | 3.5% | ||||||
| Joy City Property, Ltd. | Real Estate | 3.4% | ||||||
| TK Group Holdings, Ltd. | Industrials | 3.3% | ||||||
| China Youzan, Ltd. | Information Technology | 3.0% | ||||||
| SUNeVision Holdings, Ltd. | Information Technology | 2.8% | ||||||
| Yihai International Holding, Ltd. | Consumer Staples | 2.7% | ||||||
| Greentown Service Group Co., Ltd. | Industrials | 2.6% | ||||||
| % OF ASSETS IN TOP TEN | 37.0% | |||||||
| 6 | Holdings may combine more than one security from same issuer and related depositary receipts. |
| matthewsasia.com | 800.789.ASIA | 87 |
Table of Contents
| COUNTRY ALLOCATION (%)7 | ||||
| China/Hong Kong | 79.0 | |||
| Taiwan | 5.3 | |||
| Japan | 3.5 | |||
| Cash and Other Assets, Less Liabilities | 12.3 | |||
| SECTOR ALLOCATION (%)7 | ||||
| Information Technology | 20.4 | |||
| Industrials | 16.0 | |||
| Consumer Discretionary | 15.0 | |||
| Health Care | 10.4 | |||
| Materials | 7.5 | |||
| Real Estate | 6.1 | |||
| Consumer Staples | 5.1 | |||
| Energy | 4.4 | |||
| Communication Services | 1.6 | |||
| Financials | 1.1 | |||
| Cash and Other Assets, Less Liabilities | 12.3 | |||
| MARKET CAP EXPOSURE (%)7,8 | ||||
| Mega Cap (over $25B) | 0.0 | |||
| Large Cap ($10B–$25B) | 1.1 | |||
| Mid Cap ($3B–10B) | 7.8 | |||
| Small Cap (under $3B) | 78.8 | |||
| Cash and Other Assets, Less Liabilities | 12.3 | |||
| 7 | Source: FactSet Research Systems. Percentage values in data are rounded to the nearest tenth of one percent, so the values may not sum to 100% due to rounding. Percentage values may be derived from different data sources and may not be consistent with other Fund literature. |
| 8 | The Fund defines Small Companies as companies with market capitalization generally between $100 million and $3 billion or the largest company included in the Fund’s primary benchmark, the MSCI China Small Cap Index. |
Matthews China Small Companies Fund
Portfolio Manager Commentary (unaudited) (continued)
refueling operations, were among the top individual detractors to Fund performance in 2018. Over the long run we firmly believe Silergy will continue to benefit from China’s plans to become self-sufficient in semiconductor production. However, during the third quarter, Silergy was hit with a wall of worry as the global semiconductor industry was sold off on cyclical concerns. We believe these concerns over Silergy are misplaced because analog semiconductors are much less cyclical and the trade war actually accelerates China’s need for self-sufficiency in the production of semiconductors. China Aviation Oil’s price decline was due to worries about outbound travel from China as the economy weakened. However, over the long run, we see structural growth in China’s outbound tourism market and continue to see China Aviation Oil as a key beneficiary.
Notable Portfolio Changes:
We have consistently held the belief that small-cap companies should compete on innovation and high returns on capital. During the year, we further reduced our exposure to companies with higher debt burdens and selectively added innovative companies to our portfolio, especially in the technology and consumer-related sectors. We believe that China’s small-cap universe continues to be a fertile hunting ground for finding cash flow-rich growth stocks at reasonable valuations, and we have been able to easily replace our “graduates” with attractive new holdings.
During the final quarter of 2018, we initiated a position in Innovent Biologics, a leading biotech company in China. In our view, the company has strong growth visibility given its product pipeline in more than a dozen biosimilars, which are similarly effective but less expensive versions of biopharmaceutical drugs whose patents have expired, and has strong execution capabilities to serve China’s significant unmet oncology drug needs. We also reinitiated a position in GDS Holdings, which is a key data center partner for China’s top internet companies. GDS Holdings had graduated from our portfolio earlier in the year but returned into the realm of our small-cap universe during the market sell-off in the second half of the year. We believe the company’s execution remains firmly on track. We did not close out any positions during the fourth quarter of 2018.
Outlook:
We remain cautiously optimistic about China’s small-cap market despite heightened market volatility as we focus rigorously on the sound fundamentals of our portfolio companies. From a macroeconomic perspective, we continue to believe China has the ability to stabilize its economy through fiscal spending, interest rate adjustments and currency management. In addition, steps taken to correct China’s structural issues are continuing on the right track, despite the near-term pains of a deleveraging economy. We are focused on seeking innovative and capital-efficient small companies that are relatively insulated from macroeconomic uncertainties. We will continue to seek companies with sustainable, quality earnings streams, strong cash flows and good balance sheets that can weather uncertain economic conditions. We believe sectors such as industrial automation, health care and technology are among the most attractive from a secular growth perspective.
| 88 | MATTHEWS ASIA FUNDS |
Table of Contents
Matthews China Small Companies Fund
December 31, 2018
Schedule of Investmentsa
COMMON EQUITIES: 87.7%
| Shares | Value | |||||||
| INFORMATION TECHNOLOGY: 20.4% | ||||||||
Semiconductors & Semiconductor Equipment: 10.3% |
| |||||||
Silergy Corp. | 326,000 | $4,826,834 | ||||||
Hua Hong Semiconductor, Ltd.b,c | 662,000 | 1,224,089 | ||||||
SG Micro Corp. A Shares | 41,946 | 420,595 | ||||||
|
| |||||||
| 6,471,518 | ||||||||
|
| |||||||
Electronic Equipment, Instruments & Components: 3.9% |
| |||||||
China Youzan, Ltd.d | 25,028,000 | 1,855,335 | ||||||
Merry Electronics Co., Ltd. | 144,000 | 578,447 | ||||||
China High Precision Automation Group, Ltd.d,e | 195,000 | 249 | ||||||
|
| |||||||
| 2,434,031 | ||||||||
|
| |||||||
IT Services: 3.8% | ||||||||
SUNeVision Holdings, Ltd. | 2,920,000 | 1,732,682 | ||||||
GDS Holdings, Ltd. ADRd | 27,000 | 623,430 | ||||||
|
| |||||||
| 2,356,112 | ||||||||
|
| |||||||
Software: 2.4% | ||||||||
Kingdee International Software Group Co., Ltd. | 1,683,000 | 1,487,926 | ||||||
|
| |||||||
Total Information Technology | 12,749,587 | |||||||
|
| |||||||
| INDUSTRIALS: 16.0% | ||||||||
Commercial Services & Supplies: 7.0% | ||||||||
Sunny Friend Environmental Technology Co., Ltd. | 409,000 | 2,713,900 | ||||||
Greentown Service Group Co., Ltd.c | 2,142,000 | 1,640,345 | ||||||
|
| |||||||
| 4,354,245 | ||||||||
|
| |||||||
Machinery: 5.3% | ||||||||
TK Group Holdings, Ltd. | 3,800,000 | 2,058,493 | ||||||
Precision Tsugami China Corp., Ltd.c | 1,384,000 | 1,262,122 | ||||||
|
| |||||||
| 3,320,615 | ||||||||
|
| |||||||
Marine: 3.7% | ||||||||
SITC International Holdings Co., Ltd. | 2,485,000 | 2,342,322 | ||||||
|
| |||||||
Total Industrials | 10,017,182 | |||||||
|
| |||||||
| CONSUMER DISCRETIONARY: 15.0% | ||||||||
Leisure Products: 3.5% | ||||||||
Honma Golf, Ltd.b,c | 1,881,000 | 2,165,467 | ||||||
|
| |||||||
Diversified Consumer Services: 3.1% | ||||||||
China Yuhua Education Corp., Ltd.b,c | 3,328,000 | 1,348,901 | ||||||
China Maple Leaf Educational Systems, Ltd. | 1,308,000 | 582,450 | ||||||
|
| |||||||
| 1,931,351 | ||||||||
|
| |||||||
Hotels, Restaurants & Leisure: 3.1% | ||||||||
Huangshan Tourism Development Co., Ltd. B Shares | 609,008 | 736,689 | ||||||
Haidilao International Holding, Ltd.b,c,d | 309,000 | 676,578 | ||||||
Future Bright Holdings, Ltd. | 5,202,000 | 502,706 | ||||||
|
| |||||||
| 1,915,973 | ||||||||
|
| |||||||
Internet & Direct Marketing Retail: 2.2% | ||||||||
Baozun, Inc. ADRd | 46,700 | 1,364,107 | ||||||
|
| |||||||
Specialty Retail: 2.1% | ||||||||
China Meidong Auto Holdings, Ltd. | 2,082,000 | 788,489 | ||||||
Chow Sang Sang Holdings International, Ltd. | 377,000 | 560,341 | ||||||
|
| |||||||
| 1,348,830 | ||||||||
|
| |||||||
| Shares | Value | |||||||
Textiles, Apparel & Luxury Goods: 1.0% | ||||||||
Pacific Textiles Holdings, Ltd. | 747,000 | $663,867 | ||||||
|
| |||||||
Total Consumer Discretionary | 9,389,595 | |||||||
|
| |||||||
| HEALTH CARE: 10.4% | ||||||||
Biotechnology: 6.5% | ||||||||
Shanghai Haohai Biological Technology Co., Ltd. H Sharesb,c | 201,800 | 1,003,699 | ||||||
BeiGene, Ltd. ADRd | 6,700 | 939,742 | ||||||
Innovent Biologics, Inc.b,c,d | 237,000 | 729,417 | ||||||
Amoy Diagnostics Co., Ltd. A Shares | 109,960 | 657,131 | ||||||
BeiGene, Ltd.d | 32,727 | 349,654 | ||||||
Shanghai Junshi Biosciences Co., Ltd. H Sharesb,c,d | 92,000 | 284,324 | ||||||
Zai Lab, Ltd. ADRd | 5,300 | 123,066 | ||||||
|
| |||||||
| 4,087,033 | ||||||||
|
| |||||||
Health Care Equipment & Supplies: 1.6% | ||||||||
Microport Scientific Corp. | 990,000 | 975,002 | ||||||
|
| |||||||
Life Sciences Tools & Services: 1.5% | ||||||||
BBI Life Sciences Corp.c | 2,253,000 | 660,479 | ||||||
Genscript Biotech Corp.d | 212,000 | 283,784 | ||||||
|
| |||||||
| 944,263 | ||||||||
|
| |||||||
Health Care Providers & Services: 0.8% | ||||||||
C-MER Eye Care Holdings, Ltd.c,d | 766,000 | 489,587 | ||||||
|
| |||||||
Total Health Care | 6,495,885 | |||||||
|
| |||||||
| MATERIALS: 7.6% | ||||||||
Chemicals: 3.0% | ||||||||
China BlueChemical, Ltd. H Shares | 4,020,000 | 1,262,988 | ||||||
Shanghai Putailai New Energy Technology Co., Ltd. A Shares | 88,400 | 611,958 | ||||||
|
| |||||||
| 1,874,946 | ||||||||
|
| |||||||
Containers & Packaging: 1.9% | ||||||||
CPMC Holdings, Ltd. | 2,488,000 | 1,191,704 | ||||||
|
| |||||||
Construction Materials: 1.5% | ||||||||
Asia Cement China Holdings Corp. | 1,286,500 | 902,131 | ||||||
|
| |||||||
Metals & Mining: 1.2% | ||||||||
MMG, Ltd.d | 1,732,000 | 744,073 | ||||||
|
| |||||||
Total Materials | 4,712,854 | |||||||
|
| |||||||
| REAL ESTATE: 6.1% | ||||||||
Real Estate Management & Development: 6.1% |
| |||||||
Joy City Property, Ltd. | 19,364,000 | 2,099,685 | ||||||
Times China Holdings, Ltd. | 884,000 | 981,112 | ||||||
China Overseas Property Holdings, Ltd. | 2,550,000 | 744,832 | ||||||
|
| |||||||
Total Real Estate | 3,825,629 | |||||||
|
| |||||||
| CONSUMER STAPLES: 5.1% | ||||||||
Food Products: 5.1% | ||||||||
Yihai International Holding, Ltd. | 689,000 | 1,677,110 | ||||||
JonjeeHi-Tech Industrial And Commercial Holding Co., Ltd. A Shares | 252,924 | 1,088,475 | ||||||
JonjeeHi-Tech Industrial And Commercial Holding Co., Ltd. A Shares | 94,800 | 408,132 | ||||||
|
| |||||||
Total Consumer Staples | 3,173,717 | |||||||
|
| |||||||
| matthewsasia.com | 800.789.ASIA | 89 |
Table of Contents
Matthews China Small Companies Fund
December 31, 2018
Schedule of Investmentsa(continued)
COMMON EQUITIES(continued)
| Shares | Value | |||||||
| ENERGY: 4.4% | ||||||||
Oil, Gas & Consumable Fuels: 4.4% | ||||||||
China Aviation Oil Singapore Corp., Ltd. | 1,898,200 | $1,479,999 | ||||||
Sinopec Kantons Holdings, Ltd. | 2,930,000 | 1,295,620 | ||||||
|
| |||||||
Total Energy | 2,775,619 | |||||||
|
| |||||||
| COMMUNICATION SERVICES: 1.6% | ||||||||
Interactive Media & Services: 1.6% | ||||||||
Wise Talent Information Technology Co., Ltd.c,d | 266,400 | 986,604 | ||||||
|
| |||||||
Total Communication Services | 986,604 | |||||||
|
| |||||||
| FINANCIALS: 1.1% | ||||||||
Banks: 1.1% | ||||||||
Dah Sing Banking Group, Ltd. | 386,000 | 681,436 | ||||||
|
| |||||||
Total Financials | 681,436 | |||||||
|
| |||||||
| TOTAL COMMON EQUITIES | 54,808,108 | |||||||
|
| |||||||
(Cost $65,644,948) | ||||||||
RIGHTS: 0.0% | ||||||||
| INFORMATION TECHNOLOGY: 0.0% | ||||||||
Electronic Equipment, Instruments & Components: 0.0 |
| |||||||
Merry Electronics Co., Ltd., Rights, Expires 01/15/19d | 2,320 | 814 | ||||||
|
| |||||||
Total Information Technology | 814 | |||||||
|
| |||||||
| TOTAL RIGHTS | 814 | |||||||
|
| |||||||
(Cost $0) | ||||||||
| TOTAL INVESTMENTS: 87.7% | 54,808,922 | |||||||
(Cost $65,644,948) | ||||||||
| CASH AND OTHER ASSETS, LESS LIABILITIES: 12.3% | 7,670,733 | |||||||
|
| |||||||
NET ASSETS: 100.0% | $62,479,655 | |||||||
|
| |||||||
| a | Certain securities were fair valued under the valuation policies approved by the Board of Trustees (Note2-A). |
| b | Security exempt from registration under Rule 144A of the Securities Act of 1933, as amended. The security may be resold in transactions exempt from registration normally to qualified institutional buyers. The security has been determined to be liquid in accordance with procedures adopted by the Funds’ Board of Trustees. At December 31, 2018, the aggregate value is $7,432,475, which is 11.90% of net assets. |
| c | The securities may be resold to qualified foreign investors and foreign institutional buyers under Regulation S of the Securities Act of 1933. |
| d | Non-income producing security. |
| e | Security is valued using significant unobservable inputs and is classified as Level 3 in the fair value hierarchy. |
| ADR | American Depositary Receipt |
See accompanying notes to financial statements.
| 90 | MATTHEWS ASIA FUNDS |
Table of Contents
TheMarkit iBoxx Asian Local Bond Index (ALBI) tracks the total return performance of a bond portfolio consisting of local currency denominated, high quality and liquid bonds in Asiaex-Japan. The ALBI includes bonds from the following countries: China, Hong Kong, India, Indonesia, Malaysia, Philippines, Singapore, South Korea, Taiwan and Thailand.
TheJ.P. Morgan Asia Credit Index (JACI) tracks the total return performance of the Asia fixed-rate dollar bond market. JACI is a market cap-weighted index comprising sovereign, quasisovereign and corporate bonds and is partitioned by country, sector and credit rating. JACI includes bonds from the following countries: China, Hong Kong, India, Indonesia, Malaysia, Philippines, Singapore, South Korea, and Thailand.
TheMSCI All Country Asia ex Japan Index is a free float–adjusted market capitalization–weighted index of the stock markets of China, Hong Kong, India, Indonesia, Malaysia, Pakistan, Philippines, Singapore, South Korea, Taiwan and Thailand.
TheMSCI All Country Asia Pacific Index is a free float–adjusted market capitalization–weighted index of the stock markets of Australia, China, Hong Kong, India, Indonesia, Japan, Malaysia, New Zealand, Pakistan, Philippines, Singapore, South Korea, Taiwan and Thailand.
TheMSCI Emerging Markets (EM) Asia Index is a free float–adjusted market capitalization-weighted index of the stock markets of China, India, Indonesia, Malaysia, Pakistan, Philippines, South Korea, Taiwan and Thailand.
TheMSCI China Index is a free float–adjusted market capitalization-weighted index of Chinese equities that includes China affiliated corporations and H shares listed on the Hong Kong exchange, and B shares listed on the Shanghai and Shenzhen exchanges.
TheS&P Bombay Stock Exchange (BSE) 100 Index is a free float–adjusted market capitalization-weighted index of the 100 stocks listed on the Bombay Stock Exchange.
TheMSCI Japan Index is a free float–adjusted market capitalization–weighted index of Japanese equities listed in Japan.
TheKorea Composite Stock Price Index (KOSPI) is a market capitalization–weighted index of all common stocks listed on the Korea Stock Exchange.
TheMSCI All Country Asia ex Japan Small Cap Index is a free float–adjusted market capitalization–weighted small cap index of the stock markets of China, Hong Kong, India, Indonesia, Malaysia, Pakistan, Philippines, Singapore, South Korea, Taiwan and Thailand.
TheMSCI China Small Cap Index is a free float–adjusted market capitalization–weighted small cap index of the Chinese equity securities markets, including H shares listed on the Hong Kong exchange, B shares listed on the Shanghai and Shenzhen exchanges, and Hong Kong-listed securities known as Red Chips (issued by entities owned by national or local governments in China) and P Chips (issued by companies controlled by individuals in China and deriving substantial revenues in China).
| matthewsasia.com | 800.789.ASIA | 91 |
Table of Contents
Fund Holdings: The Fund holdings shown in this report are as of December 31, 2018. Holdings are subject to change at any time, so holdings shown in this report may not reflect current Fund holdings. The Funds file complete schedules of portfolio holdings with the Securities and Exchange Commission (the “SEC”) for the first and third quarters of each fiscal year on Form N-Q. The Funds’Forms N-Q are available on the SEC’s website at www.sec.gov. Complete schedules of investments are also available without charge, upon request, from the Funds by calling us at 800.789.ASIA (2742).
Proxy Voting Record: The Funds’ Statement of Additional Information containing a description of the policies and procedures that the Funds have used to vote proxies relating to portfolio securities, along with each Fund’s proxy voting record
relating to portfolio securities held during the most recent 12-month period ended June 30, is available upon request, at no charge, at the Funds’ website at matthewsasia.com or by calling 800.789.ASIA (2742), or on the SEC’s website at www.sec.gov.
Shareholder Reports and Prospectuses: To reduce the Funds’ expenses, we try to identify related shareholders in a household and send only one copy of the Funds’ prospectus and financial reports to that address. This process, called “householding,” will continue indefinitely unless you instruct us otherwise. At any time you may view the Funds’ current prospectus, summary prospectus and financial reports on our website. If you prefer to receive individual copies of the Funds’ prospectus or financial reports, please call us at 800.789.ASIA (2742).
| 92 | MATTHEWS ASIA FUNDS |
Table of Contents
Disclosure of Fund Expenses(unaudited)
We believe it is important for you to understand the impact of fees regarding your investment. All mutual funds have operating expenses. As a shareholder of a mutual fund, you incur ongoing costs, which include costs for portfolio management, administrative services, and shareholder reports (like this one), among others. Operating expenses, which are deducted from a fund’s gross income, directly reduce the investment return of the fund. A fund’s operating expenses are expressed as a percentage of its average net assets. This figure is known as the expense ratio. The following examples are intended to help you understand the ongoing fees (in dollars) of investing in your fund and to compare these costs with those of other mutual funds. The examples are based on an investment of $1,000 made at the beginning of the period shown and held for the entire period.
This table illustrates your fund’s costs in two ways:
Actual Fund Return: This section helps you to estimate the actual operating expenses, after any applicable fee waivers, that you paid over the period. The “Ending Account Value” shown is derived from the fund’s actual return for the past six month period, the “Expense Ratio” column shows the period’s annualized expense ratio, and the “Operating Expenses Paid During Period” column shows the dollar amount that would have been paid by an investor who started with $1,000 in the fund at the beginning of the period. You may use the information here, together with your account value, to estimate the expenses that you paid over the period. To do so, simply divide your account value by $1,000 (for example, an
$8,600 account value divided by $1,000 = 8.6), then multiply the result by the number given for your fund in the first line under the heading entitled “Operating Expenses Paid During Period.”
Hypothetical 5% Return: This section is intended to help you compare your fund’s costs with those of other mutual funds. It assumes that the fund had an annual return of 5% before operating expenses, but that the expense ratio is unchanged. In this case, because the return used is not the fund’s actual return, the results do not apply to your investment. This example is useful in making comparisons to other mutual funds because the Securities and Exchange Commission requires all mutual funds to calculate expenses based on an assumed 5% annual return. You can assess your fund’s costs by comparing this hypothetical example with the hypothetical examples that appear in shareholder reports of other funds.
Please note that the operating expenses shown in the table are meant to highlight and help you compare your ongoing costs only and do not reflect any transactional costs such as sales charges (loads), redemption fees, or exchange fees.
Matthews Asia Funds does not charge any sales loads, exchange fees, or 12b-1 fees, but these may be present in other funds to which you compare this data. Therefore, the hypothetical portions of the table are useful in comparing ongoing costs only, and will not help you determine the relative total costs of owning different funds.
| matthewsasia.com | 800.789.ASIA | 93 |
Table of Contents
December 31, 2018
Disclosure of Fund Expenses(unaudited) (continued)
| INVESTOR CLASS | INSTITUTIONAL CLASS | |||||||||||||||||||||||||||||||||||
Beginning Value 7/1/18 | Ending Value | Expense Ratio | Operating Expenses Paid During Period 7/1/18– 12/31/181 | Beginning Value 7/1/18 | Ending Value | Expense Ratio | Operating Expenses Paid During Period 7/1/18– 12/31/181 | |||||||||||||||||||||||||||||
| ASIA FIXED INCOME STRATEGIES |
| |||||||||||||||||||||||||||||||||||
Matthews Asia Strategic Income Fund |
| |||||||||||||||||||||||||||||||||||
Actual Fund Return | $1,000.00 | $994.20 | 1.15% | $5.78 | $1,000.00 | $994.80 | 0.90% | $4.53 | ||||||||||||||||||||||||||||
Hypothetical 5% Returns | $1,000.00 | $1,019.41 | 1.15% | $5.85 | $1,000.00 | $1,020.67 | 0.90% | $4.58 | ||||||||||||||||||||||||||||
Matthews Asia Credit Opportunities Fund |
| |||||||||||||||||||||||||||||||||||
Actual Fund Return | $1,000.00 | $998.80 | 1.15% | $5.79 | $1,000.00 | $1,000.00 | 0.90% | $4.54 | ||||||||||||||||||||||||||||
Hypothetical 5% Returns | $1,000.00 | $1,019.41 | 1.15% | $5.85 | $1,000.00 | $1,020.67 | 0.90% | $4.58 | ||||||||||||||||||||||||||||
| ASIA GROWTH AND INCOME STRATEGIES |
| |||||||||||||||||||||||||||||||||||
Matthews Asian Growth and Income Fund |
| |||||||||||||||||||||||||||||||||||
Actual Fund Return | $1,000.00 | $949.30 | 1.03% | $5.06 | $1,000.00 | $949.70 | 0.92% | $4.52 | ||||||||||||||||||||||||||||
Hypothetical 5% Returns | $1,000.00 | $1,020.01 | 1.03% | $5.24 | $1,000.00 | $1,020.57 | 0.92% | $4.69 | ||||||||||||||||||||||||||||
Matthews Asia Dividend Fund | ||||||||||||||||||||||||||||||||||||
Actual Fund Return | $1,000.00 | $903.90 | 1.02% | $4.89 | $1,000.00 | $904.30 | 0.91% | $4.37 | ||||||||||||||||||||||||||||
Hypothetical 5% Returns | $1,000.00 | $1,020.06 | 1.02% | $5.19 | $1,000.00 | $1,020.62 | 0.91% | $4.63 | ||||||||||||||||||||||||||||
Matthews China Dividend Fund | ||||||||||||||||||||||||||||||||||||
Actual Fund Return | $1,000.00 | $873.20 | 1.19% | $5.62 | $1,000.00 | $873.80 | 1.04% | $4.91 | ||||||||||||||||||||||||||||
Hypothetical 5% Returns | $1,000.00 | $1,019.21 | 1.19% | $6.06 | $1,000.00 | $1,019.96 | 1.04% | $5.30 | ||||||||||||||||||||||||||||
| ASIA VALUE STRATEGY | ||||||||||||||||||||||||||||||||||||
Matthews Asia Value Fund | ||||||||||||||||||||||||||||||||||||
Actual Fund Return | $1,000.00 | $917.90 | 1.50% | $7.25 | $1,000.00 | $919.50 | 1.25% | $6.05 | ||||||||||||||||||||||||||||
Hypothetical 5% Returns | $1,000.00 | $1,017.64 | 1.50% | $7.63 | $1,000.00 | $1,018.90 | 1.25% | $6.36 | ||||||||||||||||||||||||||||
| ASIA GROWTH STRATEGIES | ||||||||||||||||||||||||||||||||||||
Matthews Asia Focus Fund | ||||||||||||||||||||||||||||||||||||
Actual Fund Return | $1,000.00 | $892.80 | 1.50% | $7.16 | $1,000.00 | $893.80 | 1.25% | $5.97 | ||||||||||||||||||||||||||||
Hypothetical 5% Returns | $1,000.00 | $1,017.64 | 1.50% | $7.63 | $1,000.00 | $1,018.90 | 1.25% | $6.36 | ||||||||||||||||||||||||||||
Matthews Asia Growth Fund | ||||||||||||||||||||||||||||||||||||
Actual Fund Return | $1,000.00 | $813.30 | 1.14% | $5.21 | $1,000.00 | $814.10 | 0.95% | $4.34 | ||||||||||||||||||||||||||||
Hypothetical 5% Returns | $1,000.00 | $1,019.46 | 1.14% | $5.80 | $1,000.00 | $1,020.42 | 0.95% | $4.84 | ||||||||||||||||||||||||||||
Matthews Pacific Tiger Fund | ||||||||||||||||||||||||||||||||||||
Actual Fund Return | $1,000.00 | $939.70 | 1.05% | $5.13 | $1,000.00 | $940.50 | 0.89% | $4.35 | ||||||||||||||||||||||||||||
Hypothetical 5% Returns | $1,000.00 | $1,019.91 | 1.05% | $5.35 | $1,000.00 | $1,020.72 | 0.89% | $4.53 | ||||||||||||||||||||||||||||
Matthews Asia ESG Fund | ||||||||||||||||||||||||||||||||||||
Actual Fund Return | $1,000.00 | $921.80 | 1.50% | $7.27 | $1,000.00 | $922.40 | 1.25% | $6.06 | ||||||||||||||||||||||||||||
Hypothetical 5% Returns | $1,000.00 | $1,017.64 | 1.50% | $7.63 | $1,000.00 | $1,018.90 | 1.25% | $6.36 | ||||||||||||||||||||||||||||
Matthews Emerging Asia Fund | ||||||||||||||||||||||||||||||||||||
Actual Fund Return | $1,000.00 | $925.00 | 1.47% | $7.13 | $1,000.00 | $926.40 | 1.25% | $6.07 | ||||||||||||||||||||||||||||
Hypothetical 5% Returns | $1,000.00 | $1,017.80 | 1.47% | $7.48 | $1,000.00 | $1,018.90 | 1.25% | $6.36 | ||||||||||||||||||||||||||||
Matthews Asia Innovators Fund | ||||||||||||||||||||||||||||||||||||
Actual Fund Return | $1,000.00 | $803.10 | 1.27% | $5.77 | $1,000.00 | $804.70 | 1.06% | $4.82 | ||||||||||||||||||||||||||||
Hypothetical 5% Returns | $1,000.00 | $1,018.80 | 1.27% | $6.46 | $1,000.00 | $1,019.86 | 1.06% | $5.40 | ||||||||||||||||||||||||||||
Matthews China Fund | ||||||||||||||||||||||||||||||||||||
Actual Fund Return | $1,000.00 | $786.90 | 1.15% | $5.18 | $1,000.00 | $787.50 | 0.94% | $4.24 | ||||||||||||||||||||||||||||
Hypothetical 5% Returns | $1,000.00 | $1,019.41 | 1.15% | $5.85 | $1,000.00 | $1,020.47 | 0.94% | $4.79 | ||||||||||||||||||||||||||||
Matthews India Fund | ||||||||||||||||||||||||||||||||||||
Actual Fund Return | $1,000.00 | $945.60 | 1.10% | $5.39 | $1,000.00 | $946.60 | 0.92% | $4.51 | ||||||||||||||||||||||||||||
Hypothetical 5% Returns | $1,000.00 | $1,019.66 | 1.10% | $5.60 | $1,000.00 | $1,020.57 | 0.92% | $4.69 | ||||||||||||||||||||||||||||
| 1 | Operating expenses are equal to the Fund’s annualized expense ratio multiplied by the average account value over the period, multiplied by 184 days, then divided by 365. |
| 94 | MATTHEWS ASIA FUNDS |
Table of Contents
December 31, 2018
Disclosure of Fund Expenses(unaudited) (continued)
| INVESTOR CLASS | INSTITUTIONAL CLASS | |||||||||||||||||||||||||||||||||||
Beginning Value 7/1/18 | Ending Value | Expense Ratio | Operating Expenses Paid During Period 7/1/18– 12/31/181 | Beginning Value 7/1/18 | Ending Value | Expense Ratio | Operating Expenses Paid During Period 7/1/18– 12/31/181 | |||||||||||||||||||||||||||||
| ASIA GROWTH STRATEGIES (continued) |
| |||||||||||||||||||||||||||||||||||
Matthews Japan Fund |
| |||||||||||||||||||||||||||||||||||
Actual Fund Return | $1,000.00 | $797.50 | 0.93% | $4.21 | $1,000.00 | $798.20 | 0.86% | $3.90 | ||||||||||||||||||||||||||||
Hypothetical 5% Returns | $1,000.00 | $1,020.52 | 0.93% | $4.74 | $1,000.00 | $1,020.87 | 0.86% | $4.38 | ||||||||||||||||||||||||||||
Matthews Korea Fund |
| |||||||||||||||||||||||||||||||||||
Actual Fund Return | $1,000.00 | $881.20 | 1.17% | $5.55 | $1,000.00 | $881.20 | 1.07% | $5.07 | ||||||||||||||||||||||||||||
Hypothetical 5% Returns | $1,000.00 | $1,019.31 | 1.17% | $5.96 | $1,000.00 | $1,019.81 | 1.07% | $5.45 | ||||||||||||||||||||||||||||
| ASIA SMALL COMPANY STRATEGIES |
| |||||||||||||||||||||||||||||||||||
Matthews Asia Small Companies Fund |
| |||||||||||||||||||||||||||||||||||
Actual Fund Return | $1,000.00 | $828.20 | 1.46% | $6.73 | $1,000.00 | $829.00 | 1.25% | $5.76 | ||||||||||||||||||||||||||||
Hypothetical 5% Returns | $1,000.00 | $1,017.85 | 1.46% | $7.43 | $1,000.00 | $1,018.90 | 1.25% | $6.36 | ||||||||||||||||||||||||||||
Matthews China Small Companies Fund |
| |||||||||||||||||||||||||||||||||||
Actual Fund Return | $1,000.00 | $755.30 | 1.50% | $6.64 | $1,000.00 | $756.40 | 1.25% | $5.53 | ||||||||||||||||||||||||||||
Hypothetical 5% Returns | $1,000.00 | $1,017.64 | 1.50% | $7.63 | $1,000.00 | $1,018.90 | 1.25% | $6.36 | ||||||||||||||||||||||||||||
| 1 | Operating expenses are equal to the Fund’s annualized expense ratio multiplied by the average account value over the period, multiplied by 184 days, then divided by 365. |
| matthewsasia.com | 800.789.ASIA | 95 |
Table of Contents
| Statements of Assets and Liabilities | December 31, 2018 |
| Matthews Asia Strategic Income Fund | Matthews Asia Credit Opportunities Fund | Matthews Asian Growth and Income Fund | ||||||||||
ASSETS: | ||||||||||||
Investments at value (A) (Note 2-A and 7): | ||||||||||||
Unaffiliated issuers | $94,774,268 | $38,619,209 | $1,402,045,497 | |||||||||
Cash | 5,093,393 | 1,725,714 | — | |||||||||
Segregated foreign currency at value | 20,411 | 6,990 | — | |||||||||
Foreign currency at value (B) | — | 68 | 976,001 | |||||||||
Dividends, interest and other receivable | 1,648,253 | 670,934 | 4,992,003 | |||||||||
Receivable for securities sold | 271,837 | 352,052 | 11,477,764 | |||||||||
Receivable for capital shares sold | 20,714 | 1,418,426 | 11,191,759 | |||||||||
Due from Advisor (Note 5) | — | 1,891 | — | |||||||||
Unrealized appreciation on forward foreign currency exchange contracts | 932,785 | 11,732 | — | |||||||||
Prepaid expenses | 22,608 | 13,267 | 24,023 | |||||||||
TOTAL ASSETS | 102,784,269 | 42,820,283 | $1,430,707,047 | |||||||||
LIABILITIES: | ||||||||||||
Cash overdraft | — | — | 4,781,316 | |||||||||
Foreign currency overdraft | 1,015 | — | — | |||||||||
Cash received as collateral for forward foreign currency exchange contracts | 610,000 | — | — | |||||||||
Payable for securities purchased | — | — | 12,687 | |||||||||
Payable for capital shares redeemed | 1,069,160 | 2,991,869 | 28,256,247 | |||||||||
Unrealized depreciation on forward foreign currency exchange contracts | 238,905 | 11,004 | — | |||||||||
Deferred foreign capital gains tax liability (Note 2-F) | 97 | — | 243,880 | |||||||||
Due to Advisor (Note 5) | 33,625 | — | 879,510 | |||||||||
Administration and accounting fees payable (Note 5) | 2,811 | 1,126 | 48,337 | |||||||||
Administration and shareholder servicing fees payable (Note 5) | 11,909 | 4,861 | 184,575 | |||||||||
Custodian fees payable | 9,179 | 4,701 | 114,357 | |||||||||
Intermediary service fees payable (Note 5) | 36,376 | 7,759 | 322,223 | |||||||||
Professional fees payable | 42,244 | 39,587 | 50,910 | |||||||||
Transfer agent fees payable | 847 | 204 | 10,594 | |||||||||
Accrued other expenses payable | 12,918 | 6,204 | 111,038 | |||||||||
TOTAL LIABILITIES | 2,069,086 | 3,067,315 | 35,015,674 | |||||||||
NET ASSETS | $100,715,183 | $39,752,968 | $1,395,691,373 | |||||||||
NET ASSETS: | ||||||||||||
Investor Class | $40,697,793 | $8,667,775 | $799,327,810 | |||||||||
Institutional Class | 60,017,390 | 31,085,193 | 596,363,563 | |||||||||
TOTAL | $100,715,183 | $39,752,968 | $1,395,691,373 | |||||||||
See accompanying notes to financial statements.
| 96 | MATTHEWS ASIA FUNDS |
Table of Contents
Statements of Assets and Liabilities(continued) | December 31, 2018 |
| Matthews Asia Strategic Income Fund | Matthews Asia Credit Opportunities Fund | Matthews Asian Growth and Income Fund | ||||||||||
SHARES OUTSTANDING: | ||||||||||||
(shares of beneficial interest issued and outstanding, respectively, unlimited number of shares authorized with a $0.001 par value) | ||||||||||||
Investor Class | 3,969,553 | 888,392 | 57,431,989 | |||||||||
Institutional Class | 5,853,345 | 3,186,790 | 42,922,859 | |||||||||
TOTAL | 9,822,898 | 4,075,182 | 100,354,848 | |||||||||
NET ASSET VALUE: | ||||||||||||
Investor Class, offering price and redemption price | $10.25 | $9.76 | $13.92 | |||||||||
Institutional Class, offering price and redemption price | $10.25 | $9.75 | $13.89 | |||||||||
NET ASSETS CONSISTS OF: | ||||||||||||
Capital paid-in | $107,260,343 | $41,866,139 | $1,386,642,636 | |||||||||
Total distributable earnings/(accumulated loss) | (6,545,160 | ) | (2,113,171 | ) | 9,048,737 | |||||||
NET ASSETS | $100,715,183 | $39,752,968 | $1,395,691,373 | |||||||||
(A) Investments at cost: | ||||||||||||
Unaffiliated Issuers | $97,179,605 | $40,044,034 | $1,384,088,640 | |||||||||
(B) Foreign Currency at Cost | $— | $68 | $972,480 | |||||||||
See accompanying notes to financial statements.
| matthewsasia.com | 800.789.ASIA | 97 |
Table of Contents
Statements of Assets and Liabilities (continued) | December 31, 2018 |
| Matthews Asia Dividend Fund | Matthews China Dividend Fund | Matthews Asia Value Fund | ||||||||||
ASSETS: | ||||||||||||
Investments at value (A) (Note 2-A and 7): | ||||||||||||
Unaffiliated issuers | $4,459,807,169 | $266,350,312 | $18,071,680 | |||||||||
Affiliated issuers | 1,290,298,626 | — | — | |||||||||
Cash | — | — | 5,681,233 | |||||||||
Segregated foreign currency at value | 163,672 | 13,358 | — | |||||||||
Foreign currency at value (B) | 2,872,653 | 1,280,140 | 4,792 | |||||||||
Dividends, interest and other receivable | 22,677,339 | 273,873 | 107,033 | |||||||||
Receivable for securities sold | 68,450,784 | 6,951,006 | 494 | |||||||||
Receivable for capital shares sold | 21,030,318 | 1,296,905 | 311,671 | |||||||||
Prepaid expenses | 108,819 | 25,873 | 19,626 | |||||||||
TOTAL ASSETS | 5,865,409,380 | 276,191,467 | 24,196,529 | |||||||||
LIABILITIES: | ||||||||||||
Cash overdraft | 43,346,706 | 3,784,132 | — | |||||||||
Payable for securities purchased | 9,374,310 | 122,555 | 850,768 | |||||||||
Payable for capital shares redeemed | 34,156,753 | 2,256,746 | 75,443 | |||||||||
Deferred foreign capital gains tax liability (Note 2-F) | 4,810,331 | — | 4,103 | |||||||||
Due to Advisor (Note 5) | 3,378,117 | 156,963 | 1,419 | |||||||||
Administration and accounting fees payable (Note 5) | 173,123 | 7,974 | 605 | |||||||||
Administration and shareholder servicing fees payable (Note 5) | 685,048 | 32,958 | 2,467 | |||||||||
Custodian fees payable | 329,692 | 24,137 | 5,323 | |||||||||
Intermediary service fees payable (Note 5) | 961,746 | 58,249 | 10,060 | |||||||||
Professional fees payable | 60,383 | 45,630 | 29,353 | |||||||||
Transfer agent fees payable | 22,364 | 2,174 | 395 | |||||||||
Accrued other expenses payable | 285,460 | 40,628 | 21,584 | |||||||||
TOTAL LIABILITIES | 97,584,033 | 6,532,146 | 1,001,520 | |||||||||
NET ASSETS | $5,767,825,347 | $269,659,321 | $23,195,009 | |||||||||
NET ASSETS: | ||||||||||||
Investor Class | $2,728,598,956 | $196,625,908 | $16,326,228 | |||||||||
Institutional Class | 3,039,226,391 | 73,033,413 | 6,868,781 | |||||||||
TOTAL | $5,767,825,347 | $269,659,321 | $23,195,009 | |||||||||
See accompanying notes to financial statements.
| 98 | MATTHEWS ASIA FUNDS |
Table of Contents
| Statements of Assets and Liabilities (continued) | December 31, 2018 |
| Matthews Asia Dividend Fund | Matthews China Dividend Fund | Matthews Asia Value Fund | ||||||||||
SHARES OUTSTANDING: | ||||||||||||
(shares of beneficial interest issued and outstanding, respectively, unlimited number of shares authorized with a $0.001 par value) | |
|
| |||||||||
Investor Class | 170,047,238 | 13,734,838 | 1,502,650 | |||||||||
Institutional Class | 189,451,424 | 5,101,317 | 636,953 | |||||||||
TOTAL | 359,498,662 | 18,836,155 | 2,139,603 | |||||||||
NET ASSET VALUE: | ||||||||||||
Investor Class, offering price and redemption price | $16.05 | $14.32 | $10.86 | |||||||||
Institutional Class, offering price and redemption price | $16.04 | $14.32 | $10.78 | |||||||||
NET ASSETS CONSISTS OF: | ||||||||||||
Capital paid-in | $5,334,233,351 | $287,866,820 | $26,156,468 | |||||||||
Total distributable earnings/(accumulated loss) | 433,591,996 | (18,207,499 | ) | (2,961,459 | ) | |||||||
NET ASSETS | $5,767,825,347 | $269,659,321 | $23,195,009 | |||||||||
(A) Investments at cost: | ||||||||||||
Unaffiliated Issuers | $4,126,596,177 | $281,081,364 | $19,790,317 | |||||||||
Affiliated Issuers | 1,116,151,091 | — | — | |||||||||
(B) Foreign Currency at Cost | $2,990,227 | $1,280,140 | $4,792 | |||||||||
See accompanying notes to financial statements.
| matthewsasia.com | 800.789.ASIA | 99 |
Table of Contents
| Statements of Assets and Liabilities(continued) | December 31, 2018 |
| Matthews Asia Focus Fund | Matthews Asia Growth Fund | Matthews Pacific Tiger Fund | ||||||||||
ASSETS: | ||||||||||||
Investments at value (A) (Note 2-A and 7): | ||||||||||||
Unaffiliated issuers | $6,557,061 | $876,610,416 | $7,459,380,809 | |||||||||
Affiliated issuers | — | 20,720,071 | 793,841,660 | |||||||||
Cash | 75,222 | 26,546,523 | 6,250,910 | |||||||||
Segregated foreign currency at value | — | — | 142,012 | |||||||||
Foreign currency at value (B) | — | — | 29,468,473 | |||||||||
Dividends, interest and other receivable | 25,258 | 823,239 | 23,153,868 | |||||||||
Receivable for securities sold | — | — | 4,856,067 | |||||||||
Receivable for capital shares sold | 1,336 | 11,206,801 | 50,658,094 | |||||||||
Due from Advisor (Note 5) | 11,026 | — | — | |||||||||
Prepaid expenses | 7,436 | 37,904 | 140,266 | |||||||||
TOTAL ASSETS | 6,677,339 | 935,944,954 | 8,367,892,159 | |||||||||
LIABILITIES: | ||||||||||||
Foreign currency overdraft | — | 15 | — | |||||||||
Payable for securities purchased | — | — | 19,202 | |||||||||
Payable for capital shares redeemed | 77 | 3,786,569 | 37,060,097 | |||||||||
Deferred foreign capital gains tax liability (Note 2-F) | 182 | 758,216 | 15,919,785 | |||||||||
Due to Advisor (Note 5) | — | 544,491 | 4,640,456 | |||||||||
Administration and accounting fees payable (Note 5) | 192 | 27,724 | 227,791 | |||||||||
Administration and shareholder servicing fees payable (Note 5) | 798 | 114,313 | 916,672 | |||||||||
Custodian fees payable | 3,675 | 78,212 | 609,574 | |||||||||
Foreign capital gains tax payable (Note 2-F) | — | 889 | — | |||||||||
Intermediary service fees payable (Note 5) | — | 188,209 | 953,823 | |||||||||
Professional fees payable | 40,884 | 51,672 | 83,434 | |||||||||
Transfer agent fees payable | 412 | 5,368 | 21,178 | |||||||||
Accrued other expenses payable | 16,601 | 55,720 | 205,944 | |||||||||
TOTAL LIABILITIES | 62,821 | 5,611,398 | 60,657,956 | |||||||||
NET ASSETS | $6,614,518 | $930,333,556 | $8,307,234,203 | |||||||||
NET ASSETS: | ||||||||||||
Investor Class | $2,827,451 | $463,600,459 | $2,618,155,440 | |||||||||
Institutional Class | 3,787,067 | 466,733,097 | 5,689,078,763 | |||||||||
TOTAL | $6,614,518 | $930,333,556 | $8,307,234,203 | |||||||||
See accompanying notes to financial statements.
| 100 | MATTHEWS ASIA FUNDS |
Table of Contents
Statements of Assets and Liabilities (continued) | December 31, 2018 |
| Matthews Asia Focus Fund | Matthews Asia Growth Fund | Matthews Pacific Tiger Fund | ||||||||||
SHARES OUTSTANDING: | ||||||||||||
(shares of beneficial interest issued and outstanding, respectively, unlimited number of shares authorized with a $0.001 par value) | ||||||||||||
Investor Class | 305,353 | 20,611,132 | 97,465,137 | |||||||||
Institutional Class | 408,440 | 20,605,584 | 212,023,154 | |||||||||
TOTAL | 713,793 | 41,216,716 | 309,488,291 | |||||||||
NET ASSET VALUE: | ||||||||||||
Investor Class, offering price and redemption price | $9.26 | $22.49 | $26.86 | |||||||||
Institutional Class, offering price and redemption price | $9.27 | $22.65 | $26.83 | |||||||||
NET ASSETS CONSISTS OF: | ||||||||||||
Capital paid-in | $7,031,595 | $856,246,399 | $6,013,414,670 | |||||||||
Total distributable earnings/(accumulated loss) | (417,077 | ) | 74,087,157 | 2,293,819,533 | ||||||||
NET ASSETS | $6,614,518 | $930,333,556 | $8,307,234,203 | |||||||||
(A) Investments at cost: | ||||||||||||
Unaffiliated Issuers | $6,944,734 | $794,817,847 | $5,169,445,000 | |||||||||
Affiliated Issuers | — | 24,904,989 | 886,408,455 | |||||||||
(B) Foreign Currency at Cost | $— | $— | $29,401,654 | |||||||||
See accompanying notes to financial statements.
| matthewsasia.com | 800.789.ASIA | 101 |
Table of Contents
| Statements of Assets and Liabilities (continued) | December 31, 2018 |
| Matthews Asia ESG Fund | Matthews Emerging Asia Fund | Matthews Asia Innovators Fund | ||||||||||
ASSETS: | ||||||||||||
Investments at value (A) (Note 2-A and 7): | ||||||||||||
Unaffiliated issuers | $27,942,284 | $356,248,107 | $240,301,835 | |||||||||
Affiliated issuers | — | 17,297,332 | — | |||||||||
Cash | 4,849,721 | — | 3,393,095 | |||||||||
Segregated foreign currency at value | 630 | — | 3,338 | |||||||||
Foreign currency at value (B) | 780,925 | 4,487,010 | 904,638 | |||||||||
Dividends, interest and other receivable | 66,310 | 619,241 | 357,098 | |||||||||
Receivable for securities sold | 3,110 | 3,711,921 | 1,309,096 | |||||||||
Receivable for capital shares sold | 360,600 | 6,556,951 | 514,838 | |||||||||
Prepaid expenses | 7,706 | 18,391 | 21,150 | |||||||||
TOTAL ASSETS | 34,011,286 | 388,938,953 | 246,805,088 | |||||||||
LIABILITIES: | ||||||||||||
Cash overdraft | — | 4,411,997 | — | |||||||||
Payable for securities purchased | 1,104,643 | 19,399 | 716,559 | |||||||||
Payable for capital shares redeemed | 236,211 | 5,803,566 | 1,112,295 | |||||||||
Deferred foreign capital gains tax liability (Note 2-F) | 33,258 | 2,570,918 | 421,027 | |||||||||
Due to Advisor (Note 5) | 5,323 | 249,427 | 140,890 | |||||||||
Administration and accounting fees payable (Note 5) | 618 | 11,487 | 6,454 | |||||||||
Administration and shareholder servicing fees payable (Note 5) | 3,096 | 45,846 | 29,587 | |||||||||
Custodian fees payable | 13,542 | 179,336 | 31,975 | |||||||||
Foreign capital gains tax payable (Note 2-F) | 1,825 | 316,862 | — | |||||||||
Intermediary service fees payable (Note 5) | 7,329 | 61,152 | 45,334 | |||||||||
Professional fees payable | 45,758 | 44,039 | 46,546 | |||||||||
Transfer agent fees payable | 206 | 2,147 | 3,368 | |||||||||
Accrued other expenses payable | 27,684 | 48,016 | 33,198 | |||||||||
TOTAL LIABILITIES | 1,479,493 | 13,764,192 | 2,587,233 | |||||||||
NET ASSETS | $32,531,793 | $375,174,761 | $244,217,855 | |||||||||
NET ASSETS: | ||||||||||||
Investor Class | $9,283,237 | $118,505,314 | $152,448,931 | |||||||||
Institutional Class | 23,248,556 | 256,669,447 | 91,768,924 | |||||||||
TOTAL | $32,531,793 | $375,174,761 | $244,217,855 | |||||||||
See accompanying notes to financial statements.
| 102 | MATTHEWS ASIA FUNDS |
Table of Contents
Statements of Assets and Liabilities(continued)
December 31, 2018
| Matthews Asia ESG Fund | Matthews Emerging Asia Fund | Matthews Asia Innovators Fund | ||||||||||
SHARES OUTSTANDING: | ||||||||||||
(shares of beneficial interest issued and outstanding, respectively, unlimited number of shares authorized with a $0.001 par value) | ||||||||||||
Investor Class | 930,137 | 9,480,972 | 13,537,238 | |||||||||
Institutional Class | 2,334,448 | 20,473,976 | 8,110,271 | |||||||||
TOTAL | 3,264,585 | 29,954,948 | 21,647,509 | |||||||||
NET ASSET VALUE: | ||||||||||||
Investor Class, offering price and redemption price | $9.98 | $12.50 | $11.26 | |||||||||
Institutional Class, offering price and redemption price | $9.96 | $12.54 | $11.32 | |||||||||
NET ASSETS CONSISTS OF: | ||||||||||||
Capital paid-in | $32,684,828 | $403,057,362 | $246,206,473 | |||||||||
Total distributable earnings/(accumulated loss) | (153,035 | ) | (27,882,601 | ) | (1,988,618 | ) | ||||||
NET ASSETS | $32,531,793 | $375,174,761 | $244,217,855 | |||||||||
(A) Investments at cost: | ||||||||||||
Unaffiliated Issuers | $27,728,005 | $381,063,166 | $241,162,670 | |||||||||
Affiliated Issuers | — | 20,598,703 | — | |||||||||
(B) Foreign Currency at Cost | $778,040 | $4,466,848 | $899,410 | |||||||||
See accompanying notes to financial statements.
| matthewsasia.com | 800.789.ASIA | 103 |
Table of Contents
Statements of Assets and Liabilities (continued)
December 31, 2018
| Matthews China Fund | Matthews India Fund | Matthews Japan Fund | ||||||||||
ASSETS: | ||||||||||||
Investments at value (A) (Note 2-A and 7): | ||||||||||||
Unaffiliated issuers | $612,069,168 | $1,437,038,094 | $2,842,889,460 | |||||||||
Affiliated issuers | — | 112,615,406 | — | |||||||||
Cash | — | 1,154,182 | 20,509,190 | |||||||||
Segregated foreign currency at value | 35,071 | — | — | |||||||||
Foreign currency at value (B) | 732 | 433,066 | — | |||||||||
Dividends, interest and other receivable | 5,550 | 377,085 | 2,497,324 | |||||||||
Receivable for securities sold | 14,851,247 | 10,703,300 | 18,396,700 | |||||||||
Receivable for capital shares sold | 4,057,297 | 3,666,199 | 29,921,971 | |||||||||
Prepaid expenses | 25,434 | 32,241 | 22,544 | |||||||||
TOTAL ASSETS | 631,044,499 | 1,566,019,573 | 2,914,237,189 | |||||||||
LIABILITIES: | ||||||||||||
Cash overdraft | 8,897,296 | — | — | |||||||||
Foreign currency overdraft | — | — | 255 | |||||||||
Payable for securities purchased | 6,879 | — | 148,197 | |||||||||
Payable for capital shares redeemed | 8,098,153 | 10,568,657 | 39,554,486 | |||||||||
Deferred foreign capital gains tax liability (Note 2-F) | — | 11,872,759 | — | |||||||||
Due to Advisor (Note 5) | 370,250 | 900,765 | 1,765,785 | |||||||||
Administration and accounting fees payable (Note 5) | 19,522 | 46,345 | 99,129 | |||||||||
Administration and shareholder servicing fees payable (Note 5) | 77,705 | 189,091 | 369,410 | |||||||||
Custodian fees payable | 34,203 | 159,719 | 81,201 | |||||||||
Foreign capital gains tax payable (Note 2-F) | — | 92,435 | — | |||||||||
Intermediary service fees payable (Note 5) | 136,645 | 250,476 | 372,186 | |||||||||
Professional fees payable | 45,034 | 47,434 | 53,824 | |||||||||
Transfer agent fees payable | 13,288 | 14,258 | 22,354 | |||||||||
Accrued other expenses payable | 232,810 | 97,611 | 196,043 | |||||||||
TOTAL LIABILITIES | 17,931,785 | 24,239,550 | 42,662,870 | |||||||||
NET ASSETS | $613,112,714 | $1,541,780,023 | $2,871,574,319 | |||||||||
NET ASSETS: | ||||||||||||
Investor Class | $566,455,898 | $1,077,990,095 | $1,704,101,984 | |||||||||
Institutional Class | 46,656,816 | 463,789,928 | 1,167,472,335 | |||||||||
TOTAL | $613,112,714 | $1,541,780,023 | $2,871,574,319 | |||||||||
See accompanying notes to financial statements.
| 104 | MATTHEWS ASIA FUNDS |
Table of Contents
| Statements of Assets and Liabilities (continued) | December 31, 2018 |
| Matthews China Fund | Matthews India Fund | Matthews Japan Fund | ||||||||||
SHARES OUTSTANDING: | ||||||||||||
(shares of beneficial interest issued and outstanding, respectively, unlimited number of shares authorized with a $0.001 par value) |
|
|
| |||||||||
Investor Class | 39,431,506 | 40,950,814 | 91,952,955 | |||||||||
Institutional Class | 3,256,562 | 17,461,087 | 62,884,691 | |||||||||
TOTAL | 42,688,068 | 58,411,901 | 154,837,646 | |||||||||
NET ASSET VALUE: | ||||||||||||
Investor Class, offering price and redemption price | $14.37 | $26.32 | $18.53 | |||||||||
Institutional Class, offering price and redemption price | $14.33 | $26.56 | $18.57 | |||||||||
NET ASSETS CONSISTS OF: | ||||||||||||
Capital paid-in | $749,715,381 | $1,285,853,162 | $2,899,013,824 | |||||||||
Total distributable earnings/(accumulated loss) | (136,602,667 | ) | 255,926,861 | (27,439,505 | ) | |||||||
NET ASSETS | $613,112,714 | $1,541,780,023 | $2,871,574,319 | |||||||||
(A) Investments at cost: | ||||||||||||
Unaffiliated Issuers | $728,809,132 | $1,301,270,478 | $2,928,440,724 | |||||||||
Affiliated Issuers | — | 84,728,371 | — | |||||||||
(B) Foreign Currency at Cost | $731 | $431,214 | $— | |||||||||
See accompanying notes to financial statements.
| matthewsasia.com | 800.789.ASIA | 105 |
Table of Contents
| Statements of Assets and Liabilities (continued) | December 31, 2018 |
| Matthews Korea Fund | Matthews Asia Small Companies Fund | Matthews China Small Companies Fund | ||||||||||
ASSETS: | ||||||||||||
Investments at value (A) (Note 2-A and 7): | ||||||||||||
Unaffiliated issuers | $138,963,210 | $193,426,072 | $54,808,922 | |||||||||
Cash | 4,815,239 | — | 8,235,046 | |||||||||
Segregated foreign currency at value | — | — | 4,216 | |||||||||
Foreign currency at value (B) | — | 303,005 | 484,180 | |||||||||
Dividends, interest and other receivable | 2,817,184 | 180,437 | 1,188 | |||||||||
Receivable for securities sold | — | 5,948,378 | 637 | |||||||||
Receivable for capital shares sold | 454,576 | 695,677 | 2,674,265 | |||||||||
Prepaid expenses | 15,566 | 18,622 | 16,588 | |||||||||
TOTAL ASSETS | 147,065,775 | 200,572,191 | 66,225,042 | |||||||||
LIABILITIES: | ||||||||||||
Cash overdraft | — | 2,140,609 | — | |||||||||
Payable for securities purchased | — | 29,699 | 2,676,157 | |||||||||
Payable for capital shares redeemed | 386,291 | 10,602,089 | 927,528 | |||||||||
Deferred foreign capital gains tax liability (Note 2-F) | — | 996,843 | — | |||||||||
Due to Advisor (Note 5) | 84,741 | 183,962 | 21,716 | |||||||||
Administration and accounting fees payable (Note 5) | 4,470 | 8,045 | 1,604 | |||||||||
Administration and shareholder servicing fees payable (Note 5) | 17,789 | 27,054 | 6,969 | |||||||||
Custodian fees payable | 8,494 | 55,097 | 13,510 | |||||||||
Intermediary service fees payable (Note 5) | 33,430 | 48,788 | 25,777 | |||||||||
Professional fees payable | 42,779 | 44,763 | 44,822 | |||||||||
Transfer agent fees payable | 3,850 | 2,916 | 1,135 | |||||||||
Accrued other expenses payable | 26,861 | 41,906 | 26,169 | |||||||||
TOTAL LIABILITIES | 608,705 | 14,181,771 | 3,745,387 | |||||||||
NET ASSETS | $146,457,070 | $186,390,420 | $62,479,655 | |||||||||
NET ASSETS: | ||||||||||||
Investor Class | $127,079,624 | $111,455,726 | $41,739,682 | |||||||||
Institutional Class | 19,377,446 | 74,934,694 | 20,739,973 | |||||||||
TOTAL | $146,457,070 | $186,390,420 | $62,479,655 | |||||||||
See accompanying notes to financial statements.
| 106 | MATTHEWS ASIA FUNDS |
Table of Contents
Statements of Assets and Liabilities (continued)
December 31, 2018
| Matthews Korea Fund | Matthews Asia Small Companies Fund | Matthews China Small Companies Fund | ||||||||||
SHARES OUTSTANDING: | ||||||||||||
(shares of beneficial interest issued and outstanding, respectively, unlimited number of shares authorized with a $0.001 par value) | ||||||||||||
Investor Class | 27,733,055 | 7,189,406 | 4,358,254 | |||||||||
Institutional Class | 4,199,563 | 4,846,132 | 2,163,136 | |||||||||
TOTAL | 31,932,618 | 12,035,538 | 6,521,390 | |||||||||
NET ASSET VALUE: | ||||||||||||
Investor Class, offering price and redemption price | $4.58 | $15.50 | $9.58 | |||||||||
Institutional Class, offering price and redemption price | $4.61 | $15.46 | $9.59 | |||||||||
NET ASSETS CONSISTS OF: | ||||||||||||
Capital paid-in | $129,666,794 | $217,544,137 | $73,329,732 | |||||||||
Total distributable earnings/(accumulated loss) | 16,790,276 | (31,153,717 | ) | (10,850,077 | ) | |||||||
NET ASSETS | $146,457,070 | $186,390,420 | $62,479,655 | |||||||||
(A) Investments at cost: | ||||||||||||
Unaffiliated Issuers | $130,304,693 | $222,997,222 | $65,644,948 | |||||||||
(B) Foreign Currency at Cost | $— | $302,353 | $479,392 | |||||||||
See accompanying notes to financial statements.
| matthewsasia.com | 800.789.ASIA | 107 |
Table of Contents
| Statements of Operations | Year Ended December 31, 2018 |
| Matthews Asia Strategic Income Fund | Matthews Asia Credit Opportunities Fund | Matthews Asian Growth and Income Fund | ||||||||||
INVESTMENT INCOME: | ||||||||||||
Dividends—Unaffiliated Issuers | $68,528 | $38,076 | $69,432,944 | |||||||||
Interest | 5,437,620 | 1,892,604 | 3,067,470 | |||||||||
Foreign withholding tax | (93,383 | ) | (13,714 | ) | (4,841,469 | ) | ||||||
TOTAL INVESTMENT INCOME | 5,412,765 | 1,916,966 | 67,658,945 | |||||||||
EXPENSES: | ||||||||||||
Investment advisory fees (Note 5) | 688,789 | 249,572 | 14,652,157 | |||||||||
Administration and accounting fees (Note 5) | 8,795 | 3,201 | 177,692 | |||||||||
Administration and shareholder servicing fees (Note 5) | 144,374 | 52,668 | 2,906,300 | |||||||||
Accounting out-of-pocket fees | 25,606 | 19,277 | 59,159 | |||||||||
Custodian fees | 56,605 | 31,927 | 771,220 | |||||||||
Printing fees | 33,897 | 27,217 | 165,795 | |||||||||
Intermediary service fees (Note 5) | 175,568 | 42,427 | 3,207,950 | |||||||||
Professional fees | 56,693 | 51,406 | 69,262 | |||||||||
Registration fees | 43,894 | 36,257 | 60,073 | |||||||||
Transfer agent fees | 5,265 | 1,209 | 70,886 | |||||||||
Trustees fees | 4,121 | 1,437 | 94,599 | |||||||||
Other expenses | 6,679 | 3,147 | 142,955 | |||||||||
TOTAL EXPENSES | 1,250,286 | 519,745 | 22,378,048 | |||||||||
Advisory fees waived and expenses waived or reimbursed (Note 5) | (117,480 | ) | (132,801 | ) | — | |||||||
NET EXPENSES | 1,132,806 | 386,944 | 22,378,048 | |||||||||
NET INVESTMENT INCOME (LOSS) | 4,279,959 | 1,530,022 | 45,280,897 | |||||||||
| REALIZED AND UNREALIZED GAIN (LOSS) ON INVESTMENTS, FORWARD FOREIGN CURRENCY EXCHANGE CONTRACTS, FOREIGN CURRENCY RELATED TRANSACTIONS, AND FOREIGN CAPITAL GAINS TAXES: | ||||||||||||
Net realized gain (loss) on investments—Unaffiliated Issuers | (1,798,367 | ) | (683,386 | ) | 109,957,855 | |||||||
Net realized gain (loss) on forward foreign currency exchange contracts | (1,119,992 | ) | — | — | ||||||||
Net realized foreign capital gains tax | (37,779 | ) | — | — | ||||||||
Net realized gain (loss) on foreign currency related transactions | (1,741,418 | ) | (124,400 | ) | (1,484,534 | ) | ||||||
Net change in unrealized appreciation/depreciation on investments—Unaffiliated Issuers | (5,247,289 | ) | (1,914,517 | ) | (403,072,042 | ) | ||||||
Net change in unrealized appreciation/depreciation forward foreign currency exchange contracts | 367,451 | 728 | — | |||||||||
Net change in deferred foreign capital gains taxes on unrealized appreciation | 72,858 | — | (107,296 | ) | ||||||||
Net change in unrealized appreciation/depreciation on foreign currency related translations | (6,321 | ) | (793 | ) | (10,401 | ) | ||||||
Net realized and unrealized gain (loss) on investments, forward foreign currency exchange contracts, foreign currency related transactions, and foreign capital gains taxes | (9,510,857 | ) | (2,722,368 | ) | (294,716,418 | ) | ||||||
NET INCREASE (DECREASE) IN NET ASSETS FROM OPERATIONS | ($5,230,898 | ) | ($1,192,346 | ) | ($249,435,521 | ) | ||||||
See accompanying notes to financial statements.
| 108 | MATTHEWS ASIA FUNDS |
Table of Contents
Statements of Operations(continued)
Year Ended December 31, 2018
| Matthews Asia Dividend Fund | Matthews China Dividend Fund | Matthews Asia Value Fund | ||||||||||
INVESTMENT INCOME: | ||||||||||||
Dividends—Unaffiliated Issuers | $193,108,602 | $11,992,581 | $773,329 | |||||||||
Dividends—Affiliated Issuers (Note 7) | 31,942,844 | — | — | |||||||||
Interest | — | 1,373 | — | |||||||||
Foreign withholding tax | (17,075,233 | ) | (612,639 | ) | (65,135 | ) | ||||||
TOTAL INVESTMENT INCOME | 207,976,213 | 11,381,315 | 708,194 | |||||||||
EXPENSES: | ||||||||||||
Investment advisory fees (Note 5) | 45,979,350 | 2,161,370 | 200,873 | |||||||||
Administration and accounting fees (Note 5) | 557,472 | 26,206 | 2,436 | |||||||||
Administration and shareholder servicing fees (Note 5) | 9,143,871 | 429,732 | 39,819 | |||||||||
Accounting out-of-pocket fees | 69,429 | 50,852 | 48,130 | |||||||||
Custodian fees | 2,123,963 | 186,836 | 52,394 | |||||||||
Printing fees | 309,473 | 55,225 | 23,926 | |||||||||
Intermediary service fees (Note 5) | 8,180,227 | 612,290 | 66,226 | |||||||||
Professional fees | 134,353 | 50,514 | 41,458 | |||||||||
Registration fees | 279,920 | 39,230 | 40,707 | |||||||||
Transfer agent fees | 173,652 | 13,542 | 2,386 | |||||||||
Trustees fees | 271,923 | 12,743 | 1,231 | |||||||||
Other expenses | 262,185 | 16,223 | 8,255 | |||||||||
TOTAL EXPENSES | 67,485,818 | 3,654,763 | 527,841 | |||||||||
Advisory fees waived and expenses waived or reimbursed (Note 5) | (543,681 | ) | — | (81,767 | ) | |||||||
Administration fees waived (Note 5) | (543,681 | ) | — | — | ||||||||
NET EXPENSES | 66,398,456 | 3,654,763 | 446,074 | |||||||||
NET INVESTMENT INCOME (LOSS) | 141,577,757 | 7,726,552 | 262,120 | |||||||||
| REALIZED AND UNREALIZED GAIN (LOSS) ON INVESTMENTS, FORWARD FOREIGN CURRENCY EXCHANGE CONTRACTS, FOREIGN CURRENCY RELATED TRANSACTIONS, AND FOREIGN CAPITAL GAINS TAXES: | | | ||||||||||
Net realized gain (loss) on investments—Unaffiliated Issuers | 402,599,126 | 23,287,396 | (59,435 | ) | ||||||||
Net realized gain (loss) on investments—Affiliated Issuers | 3,145,410 | — | — | |||||||||
Net realized foreign capital gains tax | — | — | (66,109 | ) | ||||||||
Net realized gain (loss) on foreign currency related transactions | (2,658,159 | ) | 113,233 | (640 | ) | |||||||
Net change in unrealized appreciation/depreciation on investments—Unaffiliated Issuers | | (1,194,443,241 | ) | (66,365,996 | ) | (3,582,384 | ) | |||||
Net change in unrealized appreciation/depreciation on investments—Affiliated Issuers | | (274,776,253 | ) | — | — | |||||||
Net change in deferred foreign capital gains taxes on unrealized appreciation | | (160,170 | ) | — | (4,103 | ) | ||||||
Net change in unrealized appreciation/depreciation on foreign currency related translations | | (365,757 | ) | (153,590 | ) | (280 | ) | |||||
Net realized and unrealized gain (loss) on investments, forward foreign currency exchange contracts, foreign currency related transactions, and foreign capital gains taxes | |
(1,066,659,044 |
) | (43,118,957 | ) | (3,712,951 | ) | |||||
NET INCREASE (DECREASE) IN NET ASSETS FROM OPERATIONS | ($925,081,287 | ) | ($35,392,405 | ) | ($3,450,831 | ) | ||||||
See accompanying notes to financial statements.
| matthewsasia.com | 800.789.ASIA | 109 |
Table of Contents
| Statements of Operations(continued) | Year Ended December 31, 2018 |
| Matthews Asia Focus Fund | Matthews Asia Growth Fund | Matthews Pacific Tiger Fund | ||||||||||
INVESTMENT INCOME: | ||||||||||||
Dividends—Unaffiliated Issuers | $262,606 | $12,935,296 | $161,313,613 | |||||||||
Dividends—Affiliated Issuers (Note 7) | — | — | 25,727,209 | |||||||||
Foreign withholding tax | (15,508 | ) | (1,133,736 | ) | (18,171,777 | ) | ||||||
TOTAL INVESTMENT INCOME | 247,098 | 11,801,560 | 168,869,045 | |||||||||
EXPENSES: | ||||||||||||
Investment advisory fees (Note 5) | 61,045 | 7,071,401 | 60,867,735 | |||||||||
Administration and accounting fees (Note 5) | 740 | 85,729 | 737,992 | |||||||||
Administration and shareholder servicing fees (Note 5) | 12,098 | 1,407,585 | 12,103,887 | |||||||||
Accounting out-of-pocket fees | 38,260 | 54,552 | 69,375 | |||||||||
Custodian fees | 33,602 | 528,285 | 3,913,366 | |||||||||
Printing fees | 27,005 | 73,480 | 246,549 | |||||||||
Intermediary service fees (Note 5) | 12,039 | 1,542,988 | 9,391,360 | |||||||||
Professional fees | 58,182 | 57,425 | 170,888 | |||||||||
Registration fees | 31,788 | 53,577 | 243,189 | |||||||||
Transfer agent fees | 2,696 | 31,851 | 138,553 | |||||||||
Trustees fees | 434 | 39,293 | 361,835 | |||||||||
Other expenses | 5,030 | 28,241 | 262,003 | |||||||||
TOTAL EXPENSES | 282,919 | 10,974,407 | 88,506,732 | |||||||||
Advisory fees waived and expenses waived or reimbursed (Note 5) | (158,102 | ) | — | (1,117,473 | ) | |||||||
Administration fees waived (Note 5) | — | — | (1,117,473 | ) | ||||||||
NET EXPENSES | 124,817 | 10,974,407 | 86,271,786 | |||||||||
NET INVESTMENT INCOME (LOSS) | 122,281 | 827,153 | 82,597,259 | |||||||||
| REALIZED AND UNREALIZED GAIN (LOSS) ON INVESTMENTS, FORWARD FOREIGN CURRENCY EXCHANGE CONTRACTS, FOREIGN CURRENCY RELATED TRANSACTIONS, AND FOREIGN CAPITAL GAINS TAXES: | ||||||||||||
Net realized gain (loss) on investments—Unaffiliated Issuers | 1,199,526 | 5,913,066 | 317,396,298 | |||||||||
Net realized gain (loss) on investments—Affiliated Issuers | — | — | (1,881,463 | ) | ||||||||
Net realized foreign capital gains tax | — | (889 | ) | (384,016 | ) | |||||||
Net realized gain (loss) on foreign currency related transactions | (859 | ) | (419,045 | ) | (1,088,731 | ) | ||||||
Net change in unrealized appreciation/depreciation on investments—Unaffiliated Issuers | (2,878,590 | ) | (198,675,663 | ) | (1,295,973,720 | ) | ||||||
Net change in unrealized appreciation/depreciation on investments—Affiliated Issuers | — | (9,855,991 | ) | (160,185,435 | ) | |||||||
Net change in deferred foreign capital gains taxes on unrealized appreciation | 7,332 | 1,093,836 | (12,961,619 | ) | ||||||||
Net change in unrealized appreciation/depreciation on foreign currency related translations | (153 | ) | 1,156 | (92,233 | ) | |||||||
Net realized and unrealized gain (loss) on investments, forward foreign currency exchange contracts, foreign currency related transactions, and foreign capital gains taxes | (1,672,744 | ) | (201,943,530 | ) | (1,155,170,919 | ) | ||||||
NET INCREASE (DECREASE) IN NET ASSETS FROM OPERATIONS | ($1,550,463 | ) | ($201,116,377 | ) | ($1,072,573,660 | ) | ||||||
See accompanying notes to financial statements.
| 110 | MATTHEWS ASIA FUNDS |
Table of Contents
Statements of Operations(continued)
Year Ended December 31, 2018
| Matthews Asia ESG Fund | Matthews Emerging Asia Fund | Matthews Asia Innovators Fund | ||||||||||
INVESTMENT INCOME: | ||||||||||||
Dividends—Unaffiliated Issuers | $430,568 | $11,437,497 | $3,197,110 | |||||||||
Dividends—Affiliated Issuers (Note 7) | — | 393,632 | — | |||||||||
Foreign withholding tax | (48,936 | ) | (1,169,895 | ) | (287,258 | ) | ||||||
TOTAL INVESTMENT INCOME | 381,632 | 10,661,234 | 2,909,852 | |||||||||
EXPENSES: | ||||||||||||
Investment advisory fees (Note 5) | 141,312 | 4,809,759 | 1,733,007 | |||||||||
Administration and accounting fees (Note 5) | 1,713 | 38,478 | 21,011 | |||||||||
Administration and shareholder servicing fees (Note 5) | 28,204 | 630,593 | 344,756 | |||||||||
Accounting out-of-pocket fees | 57,683 | 65,667 | 42,833 | |||||||||
Custodian fees | 73,482 | 1,106,305 | 185,427 | |||||||||
Printing fees | 22,161 | 53,819 | 49,723 | |||||||||
Intermediary service fees (Note 5) | 34,875 | 605,418 | 476,634 | |||||||||
Professional fees | 52,913 | 53,348 | 56,623 | |||||||||
Registration fees | 31,848 | 77,360 | 59,346 | |||||||||
Transfer agent fees | 1,270 | 14,179 | 23,902 | |||||||||
Trustees fees | 765 | 18,998 | 9,721 | |||||||||
Other expenses | 6,809 | 27,489 | 10,107 | |||||||||
TOTAL EXPENSES | 453,035 | 7,501,413 | 3,013,090 | |||||||||
Advisory fees waived and expenses waived or reimbursed (Note 5) | (156,459 | ) | (1,073,964 | ) | — | |||||||
NET EXPENSES | 296,576 | 6,427,449 | 3,013,090 | |||||||||
NET INVESTMENT INCOME (LOSS) | 85,056 | 4,233,785 | (103,238 | ) | ||||||||
| REALIZED AND UNREALIZED GAIN (LOSS) ON INVESTMENTS, FOREIGN CURRENCY RELATED TRANSACTIONS, AND FOREIGN CAPITAL GAINS TAXES: | ||||||||||||
Net realized gain (loss) on investments—Unaffiliated Issuers | 651,080 | 12,954,505 | 2,757,014 | |||||||||
Net realized foreign capital gains tax | (13,525 | ) | (1,095,710 | ) | (76,758 | ) | ||||||
Net realized gain (loss) on foreign currency related transactions | (22,598 | ) | (665,987 | ) | (133,300 | ) | ||||||
Net change in unrealized appreciation/depreciation on investments—Unaffiliated Issuers | (2,812,559 | ) | (108,599,178 | ) | (59,886,680 | ) | ||||||
Net change in unrealized appreciation/depreciation on investments—Affiliated Issuers | — | (3,616,972 | ) | — | ||||||||
Net change in deferred foreign capital gains taxes on unrealized appreciation | 34,007 | 1,804,989 | (5,393 | ) | ||||||||
Net change in unrealized appreciation/depreciation on foreign currency related translations | (1,008 | ) | 1,818 | 7,892 | ||||||||
Net realized and unrealized gain (loss) on investments, foreign currency related transactions, and foreign capital gains taxes | (2,164,603 | ) | (99,216,535 | ) | (57,337,225 | ) | ||||||
NET INCREASE (DECREASE) IN NET ASSETS FROM OPERATIONS | ($2,079,547 | ) | ($94,982,750 | ) | ($57,440,463 | ) | ||||||
See accompanying notes to financial statements.
| matthewsasia.com | 800.789.ASIA | 111 |
Table of Contents
| Statements of Operations(continued) | Year Ended December 31, 2018 |
| Matthews China Fund | Matthews India Fund | Matthews Japan Fund | ||||||||||
INVESTMENT INCOME: | ||||||||||||
Dividends—Unaffiliated Issuers | $21,589,441 | $17,969,546 | $62,912,043 | |||||||||
Dividends—Affiliated Issuers (Note 7) | — | 1,389,541 | — | |||||||||
Foreign withholding tax | (1,575,820 | ) | (160,070 | ) | (6,159,843 | ) | ||||||
TOTAL INVESTMENT INCOME | 20,013,621 | 19,199,017 | 56,752,200 | |||||||||
EXPENSES: | ||||||||||||
Investment advisory fees (Note 5) | 6,197,416 | 13,687,034 | 28,673,493 | |||||||||
Administration and accounting fees (Note 5) | 75,161 | 165,976 | 347,699 | |||||||||
Administration and shareholder servicing fees (Note 5) | 1,228,837 | 2,716,954 | 5,693,255 | |||||||||
Accounting out-of-pocket fees | 46,680 | 56,603 | 65,075 | |||||||||
Custodian fees | 248,389 | 1,002,155 | 508,447 | |||||||||
Printing fees | 120,151 | 141,126 | 337,039 | |||||||||
Intermediary service fees (Note 5) | 1,876,054 | 3,059,768 | 2,411,996 | |||||||||
Professional fees | 56,889 | 101,477 | 99,179 | |||||||||
Registration fees | 97,127 | 79,458 | — | |||||||||
Transfer agent fees | 83,338 | 89,237 | 137,902 | |||||||||
Trustees fees | 37,344 | 85,352 | 171,442 | |||||||||
Other expenses | 69,634 | 84,047 | 103,748 | |||||||||
TOTAL EXPENSES | 10,137,020 | 21,269,187 | 38,549,275 | |||||||||
Advisory fees waived and expenses waived or reimbursed (Note 5) | — | — | (134,957 | ) | ||||||||
Administration fees waived (Note 5) | — | — | (134,957 | ) | ||||||||
NET EXPENSES | 10,137,020 | 21,269,187 | 38,279,361 | |||||||||
NET INVESTMENT INCOME (LOSS) | 9,876,601 | (2,070,170 | ) | 18,472,839 | ||||||||
| REALIZED AND UNREALIZED GAIN (LOSS) ON INVESTMENTS, FOREIGN CURRENCY RELATED TRANSACTIONS, AND FOREIGN CAPITAL GAINS TAXES: | ||||||||||||
Net realized gain (loss) on investments—Unaffiliated Issuers | 111,609,629 | 342,926,703 | 196,072,553 | |||||||||
Net realized gain (loss) on investments—Affiliated Issuers | — | 501,315 | — | |||||||||
Net realized foreign capital gains tax | — | (9,329,692 | ) | — | ||||||||
Net realized gain (loss) on foreign currency related transactions | (98,711 | ) | (2,886,913 | ) | (1,858,744 | ) | ||||||
Net change in unrealized appreciation/depreciation on investments—Unaffiliated Issuers | (335,759,625 | ) | (523,964,475 | ) | (1,069,629,341 | ) | ||||||
Net change in unrealized appreciation/depreciation on investments—Affiliated Issuers | — | (43,056,633 | ) | — | ||||||||
Net change in deferred foreign capital gains taxes on unrealized appreciation | — | (2,413,851 | ) | — | ||||||||
Net change in unrealized appreciation/depreciation on foreign currency related translations | (55,712 | ) | 1,925 | (12,585 | ) | |||||||
Net realized and unrealized gain (loss) on investments, foreign currency related transactions, and foreign capital gains taxes | (224,304,419 | ) | (238,221,621 | ) | (875,428,117 | ) | ||||||
NET INCREASE (DECREASE) IN NET ASSETS FROM OPERATIONS | ($214,427,818 | ) | ($240,291,791 | ) | ($856,955,278 | ) | ||||||
See accompanying notes to financial statements.
| 112 | MATTHEWS ASIA FUNDS |
Table of Contents
Statements of Operations(continued)
Year Ended December 31, 2018
| Matthews Korea Fund | Matthews Asia Small Companies Fund | Matthews China Small Companies Fund | ||||||||||
INVESTMENT INCOME: | ||||||||||||
Dividends—Unaffiliated Issuers | $4,922,179 | $8,193,339 | $1,372,248 | |||||||||
Foreign withholding tax | (809,944 | ) | (636,467 | ) | (63,922 | ) | ||||||
TOTAL INVESTMENT INCOME | 4,112,235 | 7,556,872 | 1,308,326 | |||||||||
EXPENSES: | ||||||||||||
Investment advisory fees (Note 5) | 1,309,107 | 3,802,489 | 574,396 | |||||||||
Administration and accounting fees (Note 5) | 15,875 | 30,420 | 4,595 | |||||||||
Administration and shareholder servicing fees (Note 5) | 259,882 | 497,320 | 75,616 | |||||||||
Accounting out-of-pocket fees | 45,263 | 64,878 | 57,889 | |||||||||
Custodian fees | 67,080 | 328,846 | 115,270 | |||||||||
Printing fees | 32,150 | 38,598 | 36,295 | |||||||||
Intermediary service fees (Note 5) | 362,387 | 527,950 | 130,754 | |||||||||
Professional fees | 50,213 | 60,902 | 65,391 | |||||||||
Registration fees | 37,900 | 45,790 | 45,583 | |||||||||
Transfer agent fees | 24,012 | 18,512 | 6,624 | |||||||||
Trustees fees | 8,113 | 15,831 | 1,967 | |||||||||
Other expenses | 12,448 | 16,826 | 4,652 | |||||||||
TOTAL EXPENSES | 2,224,430 | 5,448,362 | 1,119,032 | |||||||||
Advisory fees waived and expenses waived or reimbursed (Note 5) | — | (308,001 | ) | (275,220 | ) | |||||||
NET EXPENSES | 2,224,430 | 5,140,361 | 843,812 | |||||||||
NET INVESTMENT INCOME (LOSS) | 1,887,805 | 2,416,511 | 464,514 | |||||||||
| REALIZED AND UNREALIZED GAIN (LOSS) ON INVESTMENTS, FOREIGN CURRENCY RELATED TRANSACTIONS, AND FOREIGN CAPITAL GAINS TAXES: | ||||||||||||
Net realized gain (loss) on investments—Unaffiliated Issuers | 30,394,284 | 33,064,024 | 1,513,972 | |||||||||
Net realized foreign capital gains tax | — | (832,066 | ) | — | ||||||||
Net realized gain (loss) on foreign currency related transactions | (96,189 | ) | (171,683 | ) | (5,290 | ) | ||||||
Net change in unrealized appreciation/depreciation on investments—Unaffiliated Issuers | (83,122,558 | ) | (104,118,196 | ) | (17,738,153 | ) | ||||||
Net change in deferred foreign capital gains taxes on unrealized appreciation | — | (535,103 | ) | — | ||||||||
Net change in unrealized appreciation/depreciation on foreign currency related translations | 9,494 | 5,215 | 5,418 | |||||||||
Net realized and unrealized gain (loss) on investments, foreign currency related transactions, and foreign capital gains taxes | (52,814,969 | ) | (72,587,809 | ) | (16,224,053 | ) | ||||||
NET INCREASE (DECREASE) IN NET ASSETS FROM OPERATIONS | ($50,927,164 | ) | ($70,171,298 | ) | ($15,759,539 | ) | ||||||
See accompanying notes to financial statements.
| matthewsasia.com | 800.789.ASIA | 113 |
Table of Contents
Statements of Changes in Net Assets
| MATTHEWS ASIA STRATEGIC INCOME FUND | Year Ended December 31, 2018 | Year Ended December 31, 2017 | ||||||
OPERATIONS: | ||||||||
Net investment income (loss) | $4,279,959 | $3,781,069 | ||||||
Net realized gain (loss) on investments and foreign currency related transactions | (4,697,556 | ) | 443,332 | |||||
Net change in unrealized appreciation/depreciation on investments and foreign currency related translations | (4,886,159 | ) | 2,824,795 | |||||
Net change on foreign capital gains taxes on unrealized appreciation | 72,858 | (56,325 | ) | |||||
Net change in unrealized appreciation/depreciation on swaps | — | 30,907 | ||||||
Net increase (decrease) in net assets resulting from operations | (5,230,898 | ) | 7,023,778 | |||||
DISTRIBUTIONS TO SHAREHOLDERS: | ||||||||
Investor Class | (1,482,265 | ) | (2,199,871 | ) | ||||
Institutional Class | (1,402,339 | ) | (1,075,141 | ) | ||||
Return of Capital: | ||||||||
Investor Class | (194,306 | ) | — | |||||
Institutional Class | (187,644 | ) | — | |||||
Net decrease in net assets resulting from distributions | (3,266,554 | ) | (3,275,012 | )* | ||||
CAPITAL SHARE TRANSACTIONS (net) (Note 4) | 14,620,480 | 22,036,526 | ||||||
Total increase (decrease) in net assets | 6,123,028 | 25,785,292 | ||||||
NET ASSETS: | ||||||||
Beginning of year | 94,592,155 | 68,806,863 | ||||||
End of year | $100,715,183 | $94,592,155 | ||||||
* For the year ended December 31, 2017, the distributions to shareholders from net investment income were $2,199,871 (Investor Class) and $1,075,141 (Institutional Class). |
| |||||||
| MATTHEWS ASIA CREDIT OPPORTUNITIES FUND | Year Ended December 31, 2018 | Year Ended December 31, 2017 | ||||||
OPERATIONS: | ||||||||
Net investment income (loss) | $1,530,022 | $902,332 | ||||||
Net realized gain (loss) on investments and foreign currency related transactions | (807,786 | ) | 233,717 | |||||
Net change in unrealized appreciation/depreciation on investments and foreign currency related translations | (1,914,582 | ) | 353,676 | |||||
Net change in unrealized appreciation/depreciation on swaps | — | 7,727 | ||||||
Net increase (decrease) in net assets resulting from operations | (1,192,346 | ) | 1,497,452 | |||||
DISTRIBUTIONS TO SHAREHOLDERS: | ||||||||
Investor Class | (346,586 | ) | (425,333 | ) | ||||
Institutional Class | (1,064,779 | ) | (785,915 | ) | ||||
Net decrease in net assets resulting from distributions | (1,411,365 | ) | (1,211,248 | )** | ||||
CAPITAL SHARE TRANSACTIONS (net) (Note 4) | 10,664,938 | 15,081,567 | ||||||
Total increase (decrease) in net assets | 8,061,227 | 15,367,771 | ||||||
NET ASSETS: | ||||||||
Beginning of year | 31,691,741 | 16,323,970 | ||||||
End of year | $39,752,968 | $31,691,741 | ||||||
| ** | For the year ended December 31, 2017, the distributions to the shareholders from net investment income and net realized gain were $340,862 and $84,471 (Investor Class), and $596,265 and $189,650 (Institutional Class), respectively. |
See accompanying notes to financial statements.
| 114 | MATTHEWS ASIA FUNDS |
Table of Contents
Statements of Changes in Net Assets(continued)
| MATTHEWS ASIAN GROWTH AND INCOME FUND | Year Ended December 31, 2018 | Year Ended December 31, 2017 | ||||||
OPERATIONS: | ||||||||
Net investment income (loss) | $45,280,897 | $57,127,376 | ||||||
Net realized gain (loss) on investments and foreign currency related transactions | 108,473,321 | 118,819,624 | ||||||
Net change in unrealized appreciation/depreciation on investments and foreign currency related translations | (403,082,443 | ) | 368,131,814 | |||||
Net change on foreign capital gains taxes on unrealized appreciation | (107,296 | ) | (136,584 | ) | ||||
Net increase (decrease) in net assets resulting from operations | (249,435,521 | ) | 543,942,230 | |||||
DISTRIBUTIONS TO SHAREHOLDERS: | ||||||||
Investor Class | (94,856,451 | ) | (64,585,057 | ) | ||||
Institutional Class | (85,765,453 | ) | (54,689,873 | ) | ||||
Net decrease in net assets resulting from distributions | (180,621,904 | ) | (119,274,930 | )* | ||||
CAPITAL SHARE TRANSACTIONS (net) (Note 4) | (1,020,164,659 | ) | (72,995,282 | ) | ||||
REDEMPTION FEES | — | 7 | ||||||
Total increase (decrease) in net assets | (1,450,222,084 | ) | 351,672,025 | |||||
NET ASSETS: | ||||||||
Beginning of year | 2,845,913,457 | 2,494,241,432 | ||||||
End of year | $1,395,691,373 | $2,845,913,457 | ||||||
* For the year ended December 31, 2017, the distributions to shareholders from net investment income and net realized gain were were $41,460,084 and $23,124,973 (Investor Class), and $35,174,360 and $19,515,513 (Institutional Class), respectively. |
| |||||||
| MATTHEWS ASIA DIVIDEND FUND | Year Ended December 31, 2018 | Year Ended December 31, 2017 | ||||||
OPERATIONS: | ||||||||
Net investment income (loss) | $141,577,757 | $102,427,133 | ||||||
Net realized gain (loss) on investments and foreign currency related transactions | 403,086,377 | 179,902,338 | ||||||
Net change in unrealized appreciation/depreciation on investments and foreign currency related translations | (1,469,585,251 | ) | 1,439,899,346 | |||||
Net change on foreign capital gains taxes on unrealized appreciation | (160,170 | ) | (4,650,161 | ) | ||||
Net increase (decrease) in net assets resulting from operations | (925,081,287 | ) | 1,717,578,656 | |||||
DISTRIBUTIONS TO SHAREHOLDERS: | ||||||||
Investor Class | (211,389,650 | ) | (199,397,670 | ) | ||||
Institutional Class | (237,144,125 | ) | (182,080,476 | ) | ||||
Net decrease in net assets resulting from distributions | (448,533,775 | ) | (381,478,146 | )** | ||||
CAPITAL SHARE TRANSACTIONS (net) (Note 4) | 144,094,328 | 976,358,238 | ||||||
REDEMPTION FEES | — | 374 | ||||||
Total increase (decrease) in net assets | (1,229,520,734 | ) | 2,312,459,122 | |||||
NET ASSETS: | ||||||||
Beginning of year | 6,997,346,081 | 4,684,886,959 | ||||||
End of year | $5,767,825,347 | $6,997,346,081 | ||||||
| ** | For the year ended December 31, 2017, the distributions to the shareholders from net investment income and net realized gain were $123,635,282 and $75,762,388 (Investor Class), and $113,776,897 and $68,303,579 (Institutional Class), respectively. |
See accompanying notes to financial statements.
| matthewsasia.com | 800.789.ASIA | 115 |
Table of Contents
Statements of Changes in Net Assets(continued)
| MATTHEWS CHINA DIVIDEND FUND | Year Ended December 31, 2018 | Year Ended December 31, 2017 | ||||||
OPERATIONS: | ||||||||
Net investment income (loss) | $7,726,552 | $5,225,463 | ||||||
Net realized gain (loss) on investments and foreign currency related transactions | 23,400,629 | 23,957,987 | ||||||
Net change in unrealized appreciation/depreciation on investments and foreign currency related translations | (66,519,586 | ) | 48,354,739 | |||||
Net increase (decrease) in net assets resulting from operations | (35,392,405 | ) | 77,538,189 | |||||
DISTRIBUTIONS TO SHAREHOLDERS: | ||||||||
Investor Class | (21,468,293 | ) | (22,639,606 | ) | ||||
Institutional Class | (8,057,266 | ) | (4,725,910 | ) | ||||
Net decrease in net assets resulting from distributions | (29,525,559 | ) | (27,365,516 | )* | ||||
CAPITAL SHARE TRANSACTIONS (net) (Note 4) | 19,837,199 | 76,410,254 | ||||||
Total increase (decrease) in net assets | (45,080,765 | ) | 126,582,927 | |||||
NET ASSETS: | ||||||||
Beginning of year | 314,740,086 | 188,157,159 | ||||||
End of year | $269,659,321 | $314,740,086 | ||||||
* For the year ended December 31, 2017, the distributions to shareholders from net investment income and net realized gain were were $6,366,143 and $16,273,463 (Investor Class), and $1,342,316 and $3,383,594 (Institutional Class), respectively. |
| |||||||
| MATTHEWS ASIA VALUE FUND | Year Ended December 31, 2018 | Year Ended December 31, 2017 | ||||||
OPERATIONS: | ||||||||
Net investment income (loss) | $262,120 | $168,044 | ||||||
Net realized gain (loss) on investments and foreign currency related transactions | (126,184 | ) | 1,381,014 | |||||
Net change in unrealized appreciation/depreciation on investments and foreign currency related translations | (3,582,664 | ) | 1,774,677 | |||||
Net change on foreign capital gains taxes on unrealized appreciation | (4,103 | ) | — | |||||
Net increase (decrease) in net assets resulting from operations | (3,450,831 | ) | 3,323,735 | |||||
DISTRIBUTIONS TO SHAREHOLDERS: | ||||||||
Investor Class | (795,360 | ) | (1,422,804 | ) | ||||
Institutional Class | (257,755 | ) | (163,547 | ) | ||||
Net decrease in net assets resulting from distributions | (1,053,115 | ) | (1,586,351 | )** | ||||
CAPITAL SHARE TRANSACTIONS (net) (Note 4) | (3,035,025 | ) | 26,293,036 | |||||
Total increase (decrease) in net assets | (7,538,971 | ) | 28,030,420 | |||||
NET ASSETS: | ||||||||
Beginning of year | 30,733,980 | 2,703,560 | ||||||
End of year | $23,195,009 | $30,733,980 | ||||||
| ** | For the year ended December 31, 2017, the distributions to the shareholders from net investment income and net realized gain were $565,960 and $856,844 (Investor Class), and $61,206 and $102,341 (Institutional Class), respectively. |
See accompanying notes to financial statements.
| 116 | MATTHEWS ASIA FUNDS |
Table of Contents
Statements of Changes in Net Assets(continued)
| MATTHEWS ASIA FOCUS FUND | Year Ended December 31, 2018 | Year Ended December 31, 2017 | ||||||
OPERATIONS: | ||||||||
Net investment income (loss) | $122,281 | $140,651 | ||||||
Net realized gain (loss) on investments and foreign currency related transactions | 1,198,667 | 262,782 | ||||||
Net change in unrealized appreciation/depreciation on investments and foreign currency related translations | (2,878,743 | ) | 3,355,299 | |||||
Net change on foreign capital gains taxes on unrealized appreciation | 7,332 | (7,514 | ) | |||||
Net increase (decrease) in net assets resulting from operations | (1,550,463 | ) | 3,751,218 | |||||
DISTRIBUTIONS TO SHAREHOLDERS: | ||||||||
Investor Class | (238,795 | ) | (47,315 | ) | ||||
Institutional Class | (339,389 | ) | (89,956 | ) | ||||
Net decrease in net assets resulting from distributions | (578,184 | ) | (137,271 | )* | ||||
CAPITAL SHARE TRANSACTIONS (net) (Note 4) | (6,802,976 | ) | 1,823,093 | |||||
Total increase (decrease) in net assets | (8,931,623 | ) | 5,437,040 | |||||
NET ASSETS: | ||||||||
Beginning of year | 15,546,141 | 10,109,101 | ||||||
End of year | $6,614,518 | $15,546,141 | ||||||
* For the year ended December 31, 2017, the distributions to shareholders from net investment income were were $47,315 (Investor Class) and $89,954 (Institutional Class). |
| |||||||
| MATTHEWS ASIA GROWTH FUND | Year Ended December 31, 2018 | Year Ended December 31, 2017 | ||||||
OPERATIONS: | ||||||||
Net investment income (loss) | $827,153 | $1,602,747 | ||||||
Net realized gain (loss) on investments and foreign currency related transactions | 5,493,132 | 64,866,788 | ||||||
Net change in unrealized appreciation/depreciation on investments and foreign currency related translations | (208,530,498 | ) | 172,387,587 | |||||
Net change on foreign capital gains taxes on unrealized appreciation | 1,093,836 | (1,318,787 | ) | |||||
Net increase (decrease) in net assets resulting from operations | (201,116,377 | ) | 237,538,335 | |||||
DISTRIBUTIONS TO SHAREHOLDERS: | ||||||||
Investor Class | (7,253,289 | ) | (37,228,620 | ) | ||||
Institutional Class | (8,131,385 | ) | (19,906,269 | ) | ||||
Net decrease in net assets resulting from distributions | (15,384,674 | ) | (57,134,889 | )** | ||||
CAPITAL SHARE TRANSACTIONS (net) (Note 4) | 296,272,663 | 54,693,413 | ||||||
Total increase (decrease) in net assets | 79,771,612 | 235,096,859 | ||||||
NET ASSETS: | ||||||||
Beginning of year | 850,561,944 | 615,465,085 | ||||||
End of year | $930,333,556 | $850,561,944 | ||||||
| ** | For the year ended December 31, 2017, the distributions to the shareholders from net investment income and net realized gain were $3,030,603 and $34,198,017 (Investor Class), and $2,036,373 and $17,869,896 (Institutional Class), respectively. |
See accompanying notes to financial statements.
| matthewsasia.com | 800.789.ASIA | 117 |
Table of Contents
Statements of Changes in Net Assets(continued)
| MATTHEWS PACIFIC TIGER FUND | Year Ended December 31, 2018 | Year Ended December 31, 2017 | ||||||
OPERATIONS: | ||||||||
Net investment income (loss) | $82,597,259 | $60,409,177 | ||||||
Net realized gain (loss) on investments and foreign currency related transactions | 314,042,088 | 222,239,704 | ||||||
Net change in unrealized appreciation/depreciation on investments and foreign currency related translations | (1,456,251,388 | ) | 2,432,709,872 | |||||
Net change on foreign capital gains taxes on unrealized appreciation | (12,961,619 | ) | (2,958,166 | ) | ||||
Net increase (decrease) in net assets resulting from operations | (1,072,573,660 | ) | 2,712,400,587 | |||||
DISTRIBUTIONS TO SHAREHOLDERS: | ||||||||
Investor Class | (121,255,981 | ) | (41,057,755 | ) | ||||
Institutional Class | (275,120,994 | ) | (88,069,398 | ) | ||||
Net decrease in net assets resulting from distributions | (396,376,975 | ) | (129,127,153 | )* | ||||
CAPITAL SHARE TRANSACTIONS (net) (Note 4) | 51,147,953 | 489,072,525 | ||||||
REDEMPTION FEES | — | 55 | ||||||
Total increase (decrease) in net assets | (1,417,802,682 | ) | 3,072,346,014 | |||||
NET ASSETS: | ||||||||
Beginning of year | 9,725,036,885 | 6,652,690,871 | ||||||
End of year | $8,307,234,203 | $9,725,036,885 | ||||||
* For the year ended December 31, 2017, the distributions to shareholders from net investment income and net realized gain were were $18,058,687 and $22,999,068 (Investor Class), and $43,981,805 and $44,087,593 (Institutional Class), respectively. |
| |||||||
| MATTHEWS ASIA ESG FUND | Year Ended December 31, 2018 | Year Ended December 31, 2017 | ||||||
OPERATIONS: | ||||||||
Net investment income (loss) | $85,056 | $73,969 | ||||||
Net realized gain (loss) on investments and foreign currency related transactions | 614,957 | 589,052 | ||||||
Net change in unrealized appreciation/depreciation on investments and foreign currency related translations | (2,813,567 | ) | 3,092,492 | |||||
Net change on foreign capital gains taxes on unrealized appreciation | 34,007 | (47,151 | ) | |||||
Net increase (decrease) in net assets resulting from operations | (2,079,547 | ) | 3,708,362 | |||||
DISTRIBUTIONS TO SHAREHOLDERS: | ||||||||
Investor Class | (389,328 | ) | (373,342 | ) | ||||
Institutional Class | (560,925 | ) | (270,964 | ) | ||||
Net decrease in net assets resulting from distributions | (950,253 | ) | (644,306 | )** | ||||
CAPITAL SHARE TRANSACTIONS (net) (Note 4) | 17,507,714 | 6,232,396 | ||||||
Total increase (decrease) in net assets | 14,477,914 | 9,296,452 | ||||||
NET ASSETS: | ||||||||
Beginning of year | 18,053,879 | 8,757,427 | ||||||
End of year | $32,531,793 | $18,053,879 | ||||||
| ** | For the year ended December 31, 2017, the distributions to the shareholders from net investment income and net realized gain were $237,703 and $135,639 (Investor Class), and $177,118 and $93,846 (Institutional Class), respectively. |
See accompanying notes to financial statements.
| 118 | MATTHEWS ASIA FUNDS |
Table of Contents
Statements of Changes in Net Assets(continued)
| MATTHEWS EMERGING ASIA FUND | Year Ended December 31, 2018 | Year Ended December 31, 2017 | ||||||
OPERATIONS: | ||||||||
Net investment income (loss) | $4,233,785 | $2,115,876 | ||||||
Net realized gain (loss) on investments and foreign currency related transactions | 11,192,808 | 1,465,495 | ||||||
Net change in unrealized appreciation/depreciation on investments and foreign currency related translations | (112,214,332 | ) | 56,666,449 | |||||
Net change on foreign capital gains taxes on unrealized appreciation | 1,804,989 | (1,432,546 | ) | |||||
Net increase (decrease) in net assets resulting from operations | (94,982,750 | ) | 58,815,274 | |||||
DISTRIBUTIONS TO SHAREHOLDERS: | ||||||||
Investor Class | (2,684,365 | ) | (1,329,209 | ) | ||||
Institutional Class | (6,570,784 | ) | (2,030,285 | ) | ||||
Net decrease in net assets resulting from distributions | (9,255,149 | ) | (3,359,494 | )* | ||||
CAPITAL SHARE TRANSACTIONS (net) (Note 4) | (15,498,956 | ) | 198,378,112 | |||||
REDEMPTION FEES | 82,599 | 107,142 | ||||||
Total increase (decrease) in net assets | (119,654,256 | ) | 253,941,034 | |||||
NET ASSETS: | ||||||||
Beginning of year | 494,829,017 | 240,887,983 | ||||||
End of year | $375,174,761 | $494,829,017 | ||||||
* For the year ended December 31, 2017, the distributions to shareholders from net investment income and net realized gain were were $586,858 and $742,351 (Investor Class), and $1,117,042 and $913,243 (Institutional Class), respectively. |
| |||||||
| MATTHEWS ASIA INNOVATORS FUND | Year Ended December 31, 2018 | Year Ended December 31, 2017 | ||||||
OPERATIONS: | ||||||||
Net investment income (loss) | ($103,238 | ) | ($207,551 | ) | ||||
Net realized gain (loss) on investments and foreign currency related transactions | 2,546,956 | 14,409,121 | ||||||
Net change in unrealized appreciation/depreciation on investments and foreign currency related translations | (59,878,788 | ) | 43,969,452 | |||||
Net change on foreign capital gains taxes on unrealized appreciation | (5,393 | ) | (397,832 | ) | ||||
Net increase (decrease) in net assets resulting from operations | (57,440,463 | ) | 57,773,190 | |||||
DISTRIBUTIONS TO SHAREHOLDERS: | ||||||||
Investor Class | (3,970,300 | ) | (13,935,514 | ) | ||||
Institutional Class | (2,656,060 | ) | (2,353,455 | ) | ||||
Net decrease in net assets resulting from distributions | (6,626,360 | ) | (16,288,969 | )** | ||||
CAPITAL SHARE TRANSACTIONS (net) (Note 4) | 101,996,223 | 64,333,280 | ||||||
Total increase (decrease) in net assets | 37,929,400 | 105,817,501 | ||||||
NET ASSETS: | ||||||||
Beginning of year | 206,288,455 | 100,470,954 | ||||||
End of year | $244,217,855 | $206,288,455 | ||||||
| ** | For the year ended December 31, 2017, the distributions to the shareholders from net investment income and net realized gain were $2,843,003 and $11,092,511 (Investor Class), and $527,368 and $1,826,087 (Institutional Class), respectively. |
See accompanying notes to financial statements.
| matthewsasia.com | 800.789.ASIA | 119 |
Table of Contents
Statements of Changes in Net Assets(continued)
| MATTHEWS CHINA FUND | Year Ended December 31, 2018 | Year Ended December 31, 2017 | ||||||
OPERATIONS: | ||||||||
Net investment income (loss) | $9,876,601 | $5,476,621 | ||||||
Net realized gain (loss) on investments and foreign currency related transactions | 111,510,918 | 93,812,220 | ||||||
Net change in unrealized appreciation/depreciation on investments and foreign currency related translations | (335,815,337 | ) | 206,141,171 | |||||
Net increase (decrease) in net assets resulting from operations | (214,427,818 | ) | 305,430,012 | |||||
DISTRIBUTIONS TO SHAREHOLDERS: | ||||||||
Investor Class | (109,557,899 | ) | (78,979,793 | ) | ||||
Institutional Class | (9,475,103 | ) | (4,955,612 | ) | ||||
Net decrease in net assets resulting from distributions | (119,033,002 | ) | (83,935,405 | )* | ||||
CAPITAL SHARE TRANSACTIONS (net) (Note 4) | 41,090,545 | 172,214,277 | ||||||
Total increase (decrease) in net assets | (292,370,275 | ) | 393,708,884 | |||||
NET ASSETS: | ||||||||
Beginning of year | 905,482,989 | 511,774,105 | ||||||
End of year | $613,112,714 | $905,482,989 | ||||||
* For the year ended December 31, 2017, the distributions to shareholders from net investment income and net realized gain were were $12,781,233 and $66,198,560 (Investor Class), and $857,930 and $4,097,682 (Institutional Class), respectively. |
| |||||||
| MATTHEWS INDIA FUND | Year Ended December 31, 2018 | Year Ended December 31, 2017 | ||||||
OPERATIONS: | ||||||||
Net investment income (loss) | ($2,070,170 | ) | ($4,427,103 | ) | ||||
Net realized gain (loss) on investments and foreign currency related transactions | 331,211,413 | 69,824,307 | ||||||
Net change in unrealized appreciation/depreciation on investments and foreign currency related translations | (567,019,183 | ) | 538,480,031 | |||||
Net change on foreign capital gains taxes on unrealized appreciation | (2,413,851 | ) | (9,458,908 | ) | ||||
Net increase (decrease) in net assets resulting from operations | (240,291,791 | ) | 594,418,327 | |||||
DISTRIBUTIONS TO SHAREHOLDERS: | ||||||||
Investor Class | (159,591,192 | ) | (20,884,465 | ) | ||||
Institutional Class | (75,460,576 | ) | (12,168,833 | ) | ||||
Net decrease in net assets resulting from distributions | (235,051,768 | ) | (33,053,298 | )** | ||||
CAPITAL SHARE TRANSACTIONS (net) (Note 4) | (255,309,634 | ) | 192,857,560 | |||||
Total increase (decrease) in net assets | (730,653,193 | ) | 754,222,589 | |||||
NET ASSETS: | ||||||||
Beginning of year | 2,272,433,216 | 1,518,210,627 | ||||||
End of year | $1,541,780,023 | $2,272,433,216 | ||||||
| ** | For the year ended December 31, 2017, the distributions to the shareholders from net investment income and net realized gain were $0 and $20,884,465 (Investor Class), and $624,793 and $11,544,040 (Institutional Class), respectively. |
See accompanying notes to financial statements.
| 120 | MATTHEWS ASIA FUNDS |
Table of Contents
Statements of Changes in Net Assets(continued)
| MATTHEWS JAPAN FUND | Year Ended December 31, 2018 | Year Ended December 31, 2017 | ||||||
OPERATIONS: | ||||||||
Net investment income (loss) | $18,472,839 | $15,025,592 | ||||||
Net realized gain (loss) on investments and foreign currency related transactions | 194,213,809 | 89,972,198 | ||||||
Net change in unrealized appreciation/depreciation on investments and foreign currency related translations | (1,069,641,926 | ) | 898,130,312 | |||||
Net increase (decrease) in net assets resulting from operations | (856,955,278 | ) | 1,003,128,102 | |||||
DISTRIBUTIONS TO SHAREHOLDERS: | ||||||||
Investor Class | (71,970,442 | ) | (80,407,865 | ) | ||||
Institutional Class | (51,381,225 | ) | (75,281,445 | ) | ||||
Net decrease in net assets resulting from distributions | (123,351,667 | ) | (155,689,310 | )* | ||||
CAPITAL SHARE TRANSACTIONS (net) (Note 4) | (260,612,861 | ) | 276,866,712 | |||||
Total increase (decrease) in net assets | (1,240,919,806 | ) | 1,124,305,504 | |||||
NET ASSETS: | ||||||||
Beginning of year | 4,112,494,125 | 2,988,188,621 | ||||||
End of year | $2,871,574,319 | $4,112,494,125 | ||||||
* For the year ended December 31, 2017, the distributions to shareholders from net investment income and net realized gain were were $17,075,382 and $63,332,483 (Investor Class), and $17,097,356 and $58,184,089 (Institutional Class), respectively. |
| |||||||
| MATTHEWS KOREA FUND | Year Ended December 31, 2018 | Year Ended December 31, 2017 | ||||||
OPERATIONS: | ||||||||
Net investment income (loss) | $1,887,805 | $1,893,845 | ||||||
Net realized gain (loss) on investments and foreign currency related transactions | 30,298,095 | 13,644,251 | ||||||
Net change in unrealized appreciation/depreciation on investments and foreign currency related translations | (83,113,064 | ) | 53,260,081 | |||||
Net increase (decrease) in net assets resulting from operations | (50,927,164 | ) | 68,798,177 | |||||
DISTRIBUTIONS TO SHAREHOLDERS: | ||||||||
Investor Class | (19,838,627 | ) | (16,300,211 | ) | ||||
Institutional Class | (2,831,158 | ) | (2,677,346 | ) | ||||
Net decrease in net assets resulting from distributions | (22,669,785 | ) | (18,977,557 | )** | ||||
CAPITAL SHARE TRANSACTIONS (net) (Note 4) | (4,964,199 | ) | 25,009,807 | |||||
Total increase (decrease) in net assets | (78,561,148 | ) | 74,830,427 | |||||
NET ASSETS: | ||||||||
Beginning of year | 225,018,218 | 150,187,791 | ||||||
End of year | $146,457,070 | $225,018,218 | ||||||
| ** | For the year ended December 31, 2017, the distributions to the shareholders from net investment income and net realized gain were $7,705,028 and $8,595,183 (Investor Class), and $1,296,962 and $1,380,384 (Institutional Class), respectively. |
See accompanying notes to financial statements.
| matthewsasia.com | 800.789.ASIA | 121 |
Table of Contents
Statements of Changes in Net Assets(continued)
| MATTHEWS ASIA SMALL COMPANIES FUND | Year Ended December 31, 2018 | Year Ended December 31, 2017 | ||||||
OPERATIONS: | ||||||||
Net investment income (loss) | $2,416,511 | $877,973 | ||||||
Net realized gain (loss) on investments and foreign currency related transactions | 32,060,275 | 46,927,254 | ||||||
Net change in unrealized appreciation/depreciation on investments and foreign currency related translations | (104,112,981 | ) | 63,650,293 | |||||
Net change on foreign capital gains taxes on unrealized appreciation | (535,103 | ) | (461,740 | ) | ||||
Net increase (decrease) in net assets resulting from operations | (70,171,298 | ) | 110,993,780 | |||||
DISTRIBUTIONS TO SHAREHOLDERS: | ||||||||
Investor Class | (22,501,099 | ) | (15,804,026 | ) | ||||
Institutional Class | (18,262,086 | ) | (18,276,759 | ) | ||||
Net decrease in net assets resulting from distributions | (40,763,185 | ) | (34,080,785 | )* | ||||
CAPITAL SHARE TRANSACTIONS (net) (Note 4) | (144,037,484 | ) | (64,823,384 | ) | ||||
REDEMPTION FEES | 69,377 | 16,089 | ||||||
Total increase (decrease) in net assets | (254,902,590 | ) | 12,105,700 | |||||
NET ASSETS: | ||||||||
Beginning of year | 441,293,010 | 429,187,310 | ||||||
End of year | $186,390,420 | $441,293,010 | ||||||
* For the year ended December 31, 2017, the distributions to shareholders from net investment income and net realized gain were were $842,375 and $14,961,651 (Investor Class), and $1,420,106 and $16,856,653 (Institutional Class), respectively. |
| |||||||
| MATTHEWS CHINA SMALL COMPANIES FUND | Year Ended December 31, 2018 | Year Ended December 31, 2017 | ||||||
OPERATIONS: | ||||||||
Net investment income (loss) | $464,514 | $144,568 | ||||||
Net realized gain (loss) on investments and foreign currency related transactions | 1,508,682 | 2,217,853 | ||||||
Net change in unrealized appreciation/depreciation on investments and foreign currency related translations | (17,732,735 | ) | 7,138,457 | |||||
Net increase (decrease) in net assets resulting from operations | (15,759,539 | ) | 9,500,878 | |||||
DISTRIBUTIONS TO SHAREHOLDERS: | ||||||||
Investor Class | (958,588 | ) | (1,795,430 | ) | ||||
Institutional Class | (327,972 | ) | (8,409 | ) | ||||
Net decrease in net assets resulting from distributions | (1,286,560 | ) | (1,803,839 | )** | ||||
CAPITAL SHARE TRANSACTIONS (net) (Note 4) | 43,659,977 | 11,870,931 | ||||||
REDEMPTION FEES | 180,654 | 15,930 | ||||||
Total increase (decrease) in net assets | 26,794,532 | 19,583,900 | ||||||
NET ASSETS: | ||||||||
Beginning of year | 35,685,123 | 16,101,223 | ||||||
End of year | $62,479,655 | $35,685,123 | ||||||
| ** | For the year ended December 31, 2017, the distributions to the shareholders from net investment income and net realized gain were $303,637 and $1,491,793 (Investor Class), and $1,629 and $6,780 (Institutional Class), respectively. |
See accompanying notes to financial statements.
| 122 | MATTHEWS ASIA FUNDS |
Table of Contents
Matthews Asia Strategic Income Fund
The tables below set forth financial data for a share of beneficial interest outstanding throughout each period presented.
|
| Year Ended Dec. 31 | |||||||||||||||||||
| INVESTOR CLASS | 2018 | 2017 | 2016 | 2015 | 2014 | |||||||||||||||
Net Asset Value, beginning of year | $10.98 | $10.43 | $9.96 | $10.31 | $10.42 | |||||||||||||||
INCOME (LOSS) FROM INVESTMENT OPERATIONS: | ||||||||||||||||||||
Net investment income (loss)1 | 0.40 | 0.51 | 0.50 | 0.47 | 0.46 | |||||||||||||||
Net realized gain (loss) and unrealized appreciation/depreciation on investments, forward foreign currency exchange contracts, foreign currency related transactions, and foreign capital gains taxes | (0.84 | ) | 0.46 | 0.38 | (0.53 | ) | (0.19 | ) | ||||||||||||
Total from investment operations | (0.44 | ) | 0.97 | 0.88 | (0.06 | ) | 0.27 | |||||||||||||
LESS DISTRIBUTIONS FROM: | ||||||||||||||||||||
Net investment income | (0.25 | ) | (0.42 | ) | (0.41 | ) | (0.29 | ) | (0.38 | ) | ||||||||||
Return of capital | (0.04 | ) | — | — | — | — | ||||||||||||||
Total distributions | (0.29 | ) | (0.42 | ) | (0.41 | ) | (0.29 | ) | (0.38 | ) | ||||||||||
Paid-in capital from redemption fees (Note 4) | — | — | — | — | 2 | — | 2 | |||||||||||||
Net Asset Value, end of year | $10.25 | $10.98 | $10.43 | $9.96 | $10.31 | |||||||||||||||
TOTAL RETURN | (4.05% | ) | 9.40% | 8.85% | (0.58% | ) | 2.54% | |||||||||||||
RATIOS/SUPPLEMENTAL DATA | ||||||||||||||||||||
Net assets, end of year (in 000’s) | $40,698 | $63,437 | $55,409 | $51,130 | $58,594 | |||||||||||||||
Ratio of expenses to average net assets before any reimbursement, waiver or recapture of expenses by Advisor and Administrator (Note 5) | 1.23% | 1.29% | 1.33% | 1.28% | 1.27% | |||||||||||||||
Ratio of expenses to average net assets after any reimbursement, waiver or recapture of expenses by Advisor and Administrator | 1.15% | 1.15% | 1.15% | 1.12% | 1.13% | |||||||||||||||
Ratio of net investment income (loss) to average net assets | 3.76% | 4.70% | 4.85% | 4.57% | 4.36% | |||||||||||||||
Portfolio turnover3 | 82.32% | 36.58% | 71.50% | 50.09% | 34.28% | |||||||||||||||
|
| Year Ended Dec. 31 | |||||||||||||||||||
| INSTITUTIONAL CLASS | 2018 | 2017 | 2016 | 2015 | 2014 | |||||||||||||||
Net Asset Value, beginning of year | $10.97 | $10.42 | $9.96 | $10.30 | $10.42 | |||||||||||||||
INCOME (LOSS) FROM INVESTMENT OPERATIONS: | ||||||||||||||||||||
Net investment income (loss)1 | 0.42 | 0.53 | 0.53 | 0.49 | 0.48 | |||||||||||||||
Net realized gain (loss) and unrealized appreciation/depreciation on investments, forward foreign currency exchange contracts, foreign currency related transactions, and foreign capital gains taxes | (0.83 | ) | 0.47 | 0.36 | (0.52 | ) | (0.20 | ) | ||||||||||||
Total from investment operations | (0.41 | ) | 1.00 | 0.89 | (0.03 | ) | 0.28 | |||||||||||||
LESS DISTRIBUTIONS FROM: | ||||||||||||||||||||
Net investment income | (0.27 | ) | (0.45 | ) | (0.43 | ) | (0.31 | ) | (0.40 | ) | ||||||||||
Return of capital | (0.04 | ) | — | — | — | — | ||||||||||||||
Total distributions | (0.31 | ) | (0.45 | ) | (0.43 | ) | (0.31 | ) | (0.40 | ) | ||||||||||
Paid-in capital from redemption fees (Note 4) | — | — | — | — | 2 | — | 2 | |||||||||||||
Net Asset Value, end of year | $10.25 | $10.97 | $10.42 | $9.96 | $10.30 | |||||||||||||||
TOTAL RETURN | (3.78% | ) | 9.67% | 9.02% | (0.27% | ) | 2.64% | |||||||||||||
RATIOS/SUPPLEMENTAL DATA | ||||||||||||||||||||
Net assets, end of year (in 000’s) | $60,017 | $31,155 | $13,398 | $11,001 | $7,840 | |||||||||||||||
Ratio of expenses to average net assets before any reimbursement, waiver or recapture of expenses by Advisor and Administrator (Note 5) | 1.04% | 1.08% | 1.12% | 1.09% | 1.07% | |||||||||||||||
Ratio of expenses to average net assets after any reimbursement, waiver or recapture of expenses by Advisor and Administrator | 0.90% | 0.90% | 0.90% | 0.90% | 0.93% | |||||||||||||||
Ratio of net investment income (loss) to average net assets | 4.03% | 4.93% | 5.13% | 4.81% | 4.55% | |||||||||||||||
Portfolio turnover3 | 82.32% | 36.58% | 71.50% | 50.09% | 34.28% | |||||||||||||||
| 1 | Calculated using the average daily shares method. |
| 2 | Less than $0.01 per share. |
| 3 | The portfolio turnover rate is calculated on the Fund as a whole without distinguishing between classes of shares issued. |
See accompanying notes to financial statements.
| matthewsasia.com | 800.789.ASIA | 123 |
Table of Contents
Financial Highlights(continued)
Matthews Asia Credit Opportunities Fund
The tables below set forth financial data for a share of beneficial interest outstanding throughout each period presented.
| INVESTOR CLASS | Year Ended Dec. 31 | | Period Ended Dec. 31, 20161 | | ||||||||
| 2018 | 2017 | |||||||||||
Net Asset Value, beginning of period | $10.39 | $10.13 | $10.00 | |||||||||
INCOME (LOSS) FROM INVESTMENT OPERATIONS: | ||||||||||||
Net investment income (loss)2 | 0.37 | 0.44 | 0.29 | |||||||||
Net realized gain (loss) and unrealized appreciation/depreciation on investments, swaps, and foreign currency related transactions | (0.67 | ) | 0.35 | 0.18 | ||||||||
Total from investment operations | (0.30 | ) | 0.79 | 0.47 | ||||||||
LESS DISTRIBUTIONS FROM: | ||||||||||||
Net investment income | (0.33 | ) | (0.43 | ) | (0.32 | ) | ||||||
Net realized gains on investments | — | (0.10 | ) | (0.02 | ) | |||||||
Total distributions | (0.33 | ) | (0.53 | ) | (0.34 | ) | ||||||
Net Asset Value, end of period | $9.76 | $10.39 | $10.13 | |||||||||
TOTAL RETURN | (2.88% | ) | 7.86% | 4.66% | 3 | |||||||
RATIOS/SUPPLEMENTAL DATA | ||||||||||||
Net assets, end of period (in 000’s) | $8,668 | $10,201 | $10,119 | |||||||||
Ratio of expenses to average net assets before any reimbursement, waiver or recapture of expenses by Advisor and Administrator (Note 5) | 1.44% | 1.86% | 2.24% | 4 | ||||||||
Ratio of expenses to average net assets after any reimbursement, waiver or recapture of expenses by Advisor and Administrator | 1.15% | 1.15% | 1.15% | 4 | ||||||||
Ratio of net investment income (loss) to average net assets | 3.62% | 4.17% | 4.12% | 4 | ||||||||
Portfolio turnover5 | 49.06% | 27.86% | 18.80% | 3 | ||||||||
| INSTITUTIONAL CLASS | Year Ended Dec. 31 | Period Ended Dec. 31, 20161 | ||||||||||
| 2018 | 2017 | |||||||||||
Net Asset Value, beginning of period | $10.39 | $10.13 | $10.00 | |||||||||
INCOME (LOSS) FROM INVESTMENT OPERATIONS: | ||||||||||||
Net investment income (loss)2 | 0.39 | 0.46 | 0.30 | |||||||||
Net realized gain (loss) and unrealized appreciation/depreciation on investments, swaps, and foreign currency related transactions | (0.67 | ) | 0.36 | 0.18 | ||||||||
Total from investment operations | (0.28 | ) | 0.82 | 0.48 | ||||||||
LESS DISTRIBUTIONS FROM: | ||||||||||||
Net investment income | (0.36 | ) | (0.46 | ) | (0.33 | ) | ||||||
Net realized gains on investments | — | (0.10 | ) | (0.02 | ) | |||||||
Total distributions | (0.36 | ) | (0.56 | ) | (0.35 | ) | ||||||
Net Asset Value, end of period | $9.75 | $10.39 | $10.13 | |||||||||
TOTAL RETURN | (2.75% | ) | 8.13% | 4.82% | 3 | |||||||
RATIOS/SUPPLEMENTAL DATA | ||||||||||||
Net assets, end of period (in 000’s) | $31,085 | $21,491 | $6,205 | |||||||||
Ratio of expenses to average net assets before any reimbursement, waiver or recapture of expenses by Advisor and Administrator (Note 5) | 1.25% | 1.62% | 1.99% | 4 | ||||||||
Ratio of expenses to average net assets after any reimbursement, waiver or recapture of expenses by Advisor and Administrator | 0.90% | 0.90% | 0.90% | 4 | ||||||||
Ratio of net investment income (loss) to average net assets | 3.90% | 4.45% | 4.28% | 4 | ||||||||
Portfolio turnover5 | 49.06% | 27.86% | 18.80% | 3 | ||||||||
| 1 | Commenced operations on April, 29 2016. |
| 2 | Calculated using the average daily shares method. |
| 3 | Not annualized. |
| 4 | Annualized. |
| 5 | The portfolio turnover rate is calculated on the Fund as a whole without distinguishing between classes of shares issued. |
See accompanying notes to financial statements.
| 124 | MATTHEWS ASIA FUNDS |
Table of Contents
Financial Highlights(continued)
Matthews Asian Growth And Income Fund
The tables below set forth financial data for a share of beneficial interest outstanding throughout each period presented.
|
| Year Ended Dec. 31 | |||||||||||||||||||
| INVESTOR CLASS | 2018 | 2017 | 2016 | 2015 | 2014 | |||||||||||||||
Net Asset Value, beginning of year | $17.46 | $14.94 | $16.03 | $18.01 | $18.91 | |||||||||||||||
INCOME (LOSS) FROM INVESTMENT OPERATIONS: | ||||||||||||||||||||
Net investment income (loss)1 | 0.32 | 0.33 | 0.32 | 0.39 | 0.39 | |||||||||||||||
Net realized gain (loss) and unrealized appreciation/depreciation on investments and foreign currency related transactions | (2.20 | ) | 2.92 | (0.06 | ) | (1.19 | ) | (0.50 | ) | |||||||||||
Total from investment operations | (1.88 | ) | 3.25 | 0.26 | (0.80 | ) | (0.11 | ) | ||||||||||||
LESS DISTRIBUTIONS FROM: | ||||||||||||||||||||
Net investment income | (0.32 | ) | (0.46 | ) | (0.48 | ) | (0.42 | ) | (0.35 | ) | ||||||||||
Net realized gains on investments | (1.34 | ) | (0.27 | ) | (0.87 | ) | (0.76 | ) | (0.44 | ) | ||||||||||
Total distributions | (1.66 | ) | (0.73 | ) | (1.35 | ) | (1.18 | ) | (0.79 | ) | ||||||||||
Paid-in capital from redemption fees (Note 4) | — | — | 2 | — | — | 2 | — | 2 | ||||||||||||
Net Asset Value, end of year | $13.92 | $17.46 | $14.94 | $16.03 | $18.01 | |||||||||||||||
TOTAL RETURN | (10.96% | ) | 21.85% | 1.34% | (4.50% | ) | (0.65% | ) | ||||||||||||
RATIOS/SUPPLEMENTAL DATA | ||||||||||||||||||||
Net assets, end of year (in 000’s) | $799,328 | $1,535,746 | $1,684,987 | $2,045,435 | $3,052,565 | |||||||||||||||
Ratio of expenses to average net assets before any reimbursement, waiver or recapture of expenses by Advisor and Administrator (Note 5) | 1.08% | 1.07% | 1.09% | 1.09% | 1.08% | |||||||||||||||
Ratio of net investment income (loss) to average net assets | 1.95% | 1.95% | 1.90% | 2.17% | 2.03% | |||||||||||||||
Portfolio turnover3 | 32.24% | 23.23% | 15.64% | 16.48% | 16.79% | |||||||||||||||
|
| Year Ended Dec. 31 | |||||||||||||||||||
| INSTITUTIONAL CLASS | 2018 | 2017 | 2016 | 2015 | 2014 | |||||||||||||||
Net Asset Value, beginning of year | $17.43 | $14.92 | $16.02 | $18.00 | $18.90 | |||||||||||||||
INCOME (LOSS) FROM INVESTMENT OPERATIONS: | ||||||||||||||||||||
Net investment income (loss)1 | 0.35 | 0.36 | 0.34 | 0.42 | 0.42 | |||||||||||||||
Net realized gain (loss) and unrealized appreciation/depreciation on investments and foreign currency related transactions | (2.20 | ) | 2.91 | (0.07 | ) | (1.19 | ) | (0 50 | ) | |||||||||||
Total from investment operations | (1.85 | ) | 3.27 | 0.27 | (0.77 | ) | (0.08 | ) | ||||||||||||
LESS DISTRIBUTIONS FROM: | ||||||||||||||||||||
Net investment income | (0.35 | ) | (0.49 | ) | (0.50 | ) | (0.45 | ) | (0.38 | ) | ||||||||||
Net realized gains on investments | (1.34 | ) | (0.27 | ) | (0.87 | ) | (0.76 | ) | (0.44 | ) | ||||||||||
Total distributions | (1.69 | ) | (0.76 | ) | (1.37 | ) | (1.21 | ) | (0.82 | ) | ||||||||||
Paid-in capital from redemption fees (Note 4) | — | — | 2 | — | — | 2 | — | 2 | ||||||||||||
Net Asset Value, end of year | $13.89 | $17.43 | $14.92 | $16.02 | $18.00 | |||||||||||||||
TOTAL RETURN | (10.84% | ) | 22.00% | 1.44% | (4.33% | ) | (0.48% | ) | ||||||||||||
RATIOS/SUPPLEMENTAL DATA | ||||||||||||||||||||
Net assets, end of year (in 000’s) | $596,364 | $1,310,168 | $809,254 | $823,619 | $1,182,690 | |||||||||||||||
Ratio of expenses to average net assets before any reimbursement, waiver or recapture of expenses by Advisor and Administrator (Note 5) | 0.93% | 0.93% | 0.94% | 0.92% | 0.92% | |||||||||||||||
Ratio of net investment income (loss) to average net assets | 2.14% | 2.16% | 2.06% | 2.34% | 2.19% | |||||||||||||||
Portfolio turnover3 | 32.24% | 23.23% | 15.64% | 16.48% | 16.79% | |||||||||||||||
| 1 | Calculated using the average daily shares method. |
| 2 | Less than $0.01 per share. |
| 3 | The portfolio turnover rate is calculated on the Fund as a whole without distinguishing between classes of shares issued. |
See accompanying notes to financial statements.
| matthewsasia.com | 800.789.ASIA | 125 |
Table of Contents
Financial Highlights(continued)
Matthews Asia Dividend Fund
The tables below set forth financial data for a share of beneficial interest outstanding throughout each period presented.
| Year Ended Dec. 31 | |||||||||||||||||||
| INVESTOR CLASS | 2018 | 2017 | 20161 | 20151 | 20141 | |||||||||||||||
Net Asset Value, beginning of year | $19.74 | $15.52 | $15.36 | $15.26 | $15.60 | |||||||||||||||
INCOME (LOSS) FROM INVESTMENT OPERATIONS: | ||||||||||||||||||||
Net investment income (loss)2 | 0.37 | 0.31 | 0.28 | 0.29 | 0.30 | |||||||||||||||
Net realized gain (loss) and unrealized appreciation/depreciation on investments and foreign currency related transactions | (2.83 | ) | 5.02 | 0.37 | 0.31 | (0.34 | ) | |||||||||||||
Total from investment operations | (2.46 | ) | 5.33 | 0.65 | 0.60 | (0.04 | ) | |||||||||||||
LESS DISTRIBUTIONS FROM: | ||||||||||||||||||||
Net investment income | (0.31 | ) | (0.69 | ) | (0.29 | ) | (0.27 | ) | (0.23 | ) | ||||||||||
Net realized gains on investments | (0.92 | ) | (0.42 | ) | (0.11 | ) | (0.23 | ) | — | |||||||||||
Return of capital | — | — | (0.09 | ) | — | (0.07 | ) | |||||||||||||
Total distributions | (1.23 | ) | (1.11 | ) | (0.49 | ) | (0.50 | ) | (0.30 | ) | ||||||||||
Paid-in capital from redemption fees (Note 4) | — | — | 3 | — | — | 3 | — | 3 | ||||||||||||
Net Asset Value, end of year | $16.05 | $19.74 | $15.52 | $15.36 | $15.26 | |||||||||||||||
TOTAL RETURN | (12.72% | ) | 34.69% | 4.13% | 3.86% | (0.32% | ) | |||||||||||||
RATIOS/SUPPLEMENTAL DATA | ||||||||||||||||||||
Net assets, end of year (in 000’s) | $2,728,599 | $3,713,276 | $2,650,611 | $2,757,910 | $2,918,228 | |||||||||||||||
Ratio of expenses to average net assets before any reimbursement, waiver or recapture of expenses by Advisor and Administrator (Note 5) | 1.02% | 1.03% | 1.06% | 1.06% | 1.06% | |||||||||||||||
Ratio of expenses to average net assets after any reimbursement, waiver or recapture of expenses by Advisor and Administrator | 1.01% | 1.02% | 1.06% | 1.05% | 1.05% | |||||||||||||||
Ratio of net investment income (loss) to average net assets | 1.97% | 1.67% | 1.79% | 1.82% | 1.89% | |||||||||||||||
Portfolio turnover4 | 39.75% | 28.11% | 39.76% | 35.98% | 20.06% | |||||||||||||||
| Year Ended Dec. 31 | |||||||||||||||||||
| INSTITUTIONAL CLASS | 2018 | 2017 | 20161 | 20151 | 20141 | |||||||||||||||
Net Asset Value, beginning of year | $19.73 | $15.52 | $15.35 | $15.26 | $15.59 | |||||||||||||||
INCOME (LOSS) FROM INVESTMENT OPERATIONS: | ||||||||||||||||||||
Net investment income (loss)2 | 0.39 | 0.33 | 0.30 | 0.32 | 0.32 | |||||||||||||||
Net realized gain (loss) and unrealized appreciation/depreciation on investments and foreign currency related transactions | (2.83 | ) | 5.01 | 0.38 | 0.29 | (0.33 | ) | |||||||||||||
Total from investment operations | (2.44 | ) | 5.34 | 0.68 | 0.61 | (0.01 | ) | |||||||||||||
LESS DISTRIBUTIONS FROM: | ||||||||||||||||||||
Net investment income | (0.33 | ) | (0.71 | ) | (0.31 | ) | (0.29 | ) | (0.25 | ) | ||||||||||
Net realized gains on investments | (0.92 | ) | (0.42 | ) | (0.11 | ) | (0.23 | ) | — | |||||||||||
Return of capital | — | — | (0.09 | ) | — | (0.07 | ) | |||||||||||||
Total distributions | (1.25 | ) | (1.13 | ) | (0.51 | ) | (0.52 | ) | (0.32 | ) | ||||||||||
Paid-in capital from redemption fees (Note 4) | — | — | 3 | — | — | 3 | — | 3 | ||||||||||||
Net Asset Value, end of year | $16.04 | $19.73 | $15.52 | $15.35 | $15.26 | |||||||||||||||
TOTAL RETURN | (12.64% | ) | 34.77% | 4.33% | 3.93% | (0.18% | ) | |||||||||||||
RATIOS/SUPPLEMENTAL DATA | ||||||||||||||||||||
Net assets, end of year (in 000’s) | $3,039,226 | $3,284,070 | $2,034,276 | $2,045,713 | $2,107,371 | |||||||||||||||
Ratio of expenses to average net assets before any reimbursement, waiver or recapture of expenses by Advisor and Administrator (Note 5) | 0.91% | 0.92% | 0.94% | 0.93% | 0.93% | |||||||||||||||
Ratio of expenses to average net assets after any reimbursement, waiver or recapture of expenses by Advisor and Administrator | 0.90% | 0.91% | 0.93% | 0.92% | 0.93% | |||||||||||||||
Ratio of net investment income (loss) to average net assets | 2.09% | 1.81% | 1.91% | 1.98% | 2.02% | |||||||||||||||
Portfolio turnover4 | 39.75% | 28.11% | 39.76% | 35.98% | 20.06% | |||||||||||||||
| 1 | Consolidated Financial Highlights. See Note 2-C. |
| 2 | Calculated using the average daily shares method. |
| 3 | Less than $0.01 per share. |
| 4 | The portfolio turnover rate is calculated on the Fund as a whole without distinguishing between classes of shares issued. |
See accompanying notes to financial statements.
| 126 | MATTHEWS ASIA FUNDS |
Table of Contents
Financial Highlights(continued)
Matthews China Dividend Fund
The tables below set forth financial data for a share of beneficial interest outstanding throughout each period presented.
|
| Year Ended Dec. 31 | |||||||||||||||||||
| INVESTOR CLASS | 2018 | 2017 | 2016 | 2015 | 2014 | |||||||||||||||
Net Asset Value, beginning of year | $17.61 | $14.09 | $13.79 | $13.37 | $13.74 | |||||||||||||||
INCOME (LOSS) FROM INVESTMENT OPERATIONS: | ||||||||||||||||||||
Net investment income (loss)1 | 0.41 | 0.35 | 0.31 | 0.29 | 0.25 | |||||||||||||||
Net realized gain (loss) and unrealized appreciation/depreciation on investments and foreign currency related transactions | (2.09 | ) | 4.85 | 0.47 | 1.01 | (0.12 | ) | |||||||||||||
Total from investment operations | (1.68 | ) | 5.20 | 0.78 | 1.30 | 0.13 | ||||||||||||||
LESS DISTRIBUTIONS FROM: | ||||||||||||||||||||
Net investment income | (0.40 | ) | (0.49 | ) | (0.28 | ) | (0.28 | ) | (0.36 | ) | ||||||||||
Net realized gains on investments | (1.21 | ) | (1.19 | ) | (0.20 | ) | (0.60 | ) | (0.14 | ) | ||||||||||
Total distributions | (1.61 | ) | (1.68 | ) | (0.48 | ) | (0.88 | ) | (0.50 | ) | ||||||||||
Paid-in capital from redemption fees (Note 4) | — | — | — | — | 2 | — | 2 | |||||||||||||
Net Asset Value, end of year | $14.32 | $17.61 | $14.09 | $13.79 | $13.37 | |||||||||||||||
TOTAL RETURN | (9.98% | ) | 37.69% | 5.70% | 9.54% | 0.93% | ||||||||||||||
RATIOS/SUPPLEMENTAL DATA | ||||||||||||||||||||
Net assets, end of year (in 000’s) | $196,626 | $260,593 | $160,400 | $165,514 | $116,954 | |||||||||||||||
Ratio of expenses to average net assets before any reimbursement, waiver or recapture of expenses by Advisor and Administrator (Note 5) | 1.15% | 1.19% | 1.22% | 1.19% | 1.19% | |||||||||||||||
Ratio of net investment income (loss) to average net assets | 2.33% | 2.12% | 2.28% | 1.97% | 1.88% | |||||||||||||||
Portfolio turnover3 | 66.47% | 69.14% | 72.96% | 79.91% | 25.43% | |||||||||||||||
|
| Year Ended Dec. 31 | |||||||||||||||||||
| INSTITUTIONAL CLASS | 2018 | 2017 | 2016 | 2015 | 2014 | |||||||||||||||
Net Asset Value, beginning of year | $17.61 | $14.09 | $13.79 | $13.37 | $13.74 | |||||||||||||||
INCOME (LOSS) FROM INVESTMENT OPERATIONS: | ||||||||||||||||||||
Net investment income (loss)1 | 0.42 | 0.37 | 0.29 | 0.28 | 0.28 | |||||||||||||||
Net realized gain (loss) and unrealized appreciation/depreciation on investments and foreign currency related transactions | (2.07 | ) | 4.85 | 0.51 | 1.04 | (0.13 | ) | |||||||||||||
Total from investment operations | (1.65 | ) | 5.22 | 0.80 | 1.32 | 0.15 | ||||||||||||||
LESS DISTRIBUTIONS FROM: | ||||||||||||||||||||
Net investment income | (0.43 | ) | (0.51 | ) | (0.30 | ) | (0.30 | ) | (0.38 | ) | ||||||||||
Net realized gains on investments | (1.21 | ) | (1.19 | ) | (0.20 | ) | (0.60 | ) | (0.14 | ) | ||||||||||
Total distributions | (1.64 | ) | (1.70 | ) | (0.50 | ) | (0.90 | ) | (0.52 | ) | ||||||||||
Paid-in capital from redemption fees (Note 4) | — | — | — | — | 2 | — | 2 | |||||||||||||
Net Asset Value, end of year | $14.32 | $17.61 | $14.09 | $13.79 | $13.37 | |||||||||||||||
TOTAL RETURN | (9.83% | ) | 37.88% | 5.90% | 9.71% | 1.11% | ||||||||||||||
RATIOS/SUPPLEMENTAL DATA | ||||||||||||||||||||
Net assets, end of year (in 000’s) | $73,033 | $54,147 | $27,758 | $15,406 | $30,662 | |||||||||||||||
Ratio of expenses to average net assets before any reimbursement, waiver or recapture of expenses by Advisor and Administrator (Note 5) | 1.01% | 1.04% | 1.06% | 1.00% | 1.01% | |||||||||||||||
Ratio of net investment income (loss) to average net assets | 2.44% | 2.25% | 2.09% | 1.89% | 2.06% | |||||||||||||||
Portfolio turnover3 | 66.47% | 69.14% | 72.96% | 79.91% | 25.43% | |||||||||||||||
| 1 | Calculated using the average daily shares method. |
| 2 | Less than $0.01 per share. |
| 3 | The portfolio turnover rate is calculated on the Fund as a whole without distinguishing between classes of shares issued. |
See accompanying notes to financial statements.
| matthewsasia.com | 800.789.ASIA | 127 |
Table of Contents
Financial Highlights(continued)
Matthews Asia Value Fund
The tables below set forth financial data for a share of beneficial interest outstanding throughout each period presented.
| Year Ended Dec. 31 | | Period Ended Dec. 31, 20151 |
| ||||||||||||
| INVESTOR CLASS | 2018 | 2017 | 2016 | |||||||||||||
Net Asset Value, beginning of period | $12.83 | $9.96 | $9.85 | $10.00 | ||||||||||||
INCOME (LOSS) FROM INVESTMENT OPERATIONS: | ||||||||||||||||
Net investment income (loss)2 | 0.10 | 0.14 | 0.09 | 0.02 | ||||||||||||
Net realized gain (loss) and unrealized appreciation/depreciation on investments and foreign currency related transactions | (1.49 | ) | 3.45 | 0.65 | (0.16 | ) | ||||||||||
Total from investment operations | (1.39 | ) | 3.59 | 0.74 | (0.14 | ) | ||||||||||
LESS DISTRIBUTIONS FROM: | ||||||||||||||||
Net investment income | (0.16 | ) | (0.29 | ) | (0.59 | ) | (0.01 | ) | ||||||||
Net realized gains on investments | (0.42 | ) | (0.43 | ) | (0.04 | ) | — | |||||||||
Total distributions | (0.58 | ) | (0.72 | ) | (0.63 | ) | (0.01 | ) | ||||||||
Net Asset Value, end of period | $10.86 | $12.83 | $9.96 | $9.85 | ||||||||||||
TOTAL RETURN | (10.93% | ) | 36.12% | 7.43% | (1.35% | )3 | ||||||||||
RATIOS/SUPPLEMENTAL DATA | ||||||||||||||||
Net assets, end of period (in 000’s) | $16,326 | $27,346 | $2,548 | $1,589 | ||||||||||||
Ratio of expenses to average net assets before any reimbursement, waiver or recapture of expenses by Advisor and Administrator (Note 5) | 1.77% | 2.32% | 11.48% | 36.42% | 4 | |||||||||||
Ratio of expenses to average net assets after any reimbursement, waiver or recapture of expenses by Advisor and Administrator | 1.50% | 1.50% | 1.50% | 1.50% | 4 | |||||||||||
Ratio of net investment income (loss) to average net assets | 0.81% | 1.10% | 0.84% | 2.70% | 4 | |||||||||||
Portfolio turnover5 | 48.29% | 31.93% | 19.60% | 10.80% | 3 | |||||||||||
| | Year Ended Dec. 31 | | | Period Ended Dec. 31, 20151 |
| ||||||||||
| INSTITUTIONAL CLASS | 2018 | 2017 | 2016 | |||||||||||||
Net Asset Value, beginning of period | $12.73 | $9.85 | $9.83 | $10.00 | ||||||||||||
INCOME (LOSS) FROM INVESTMENT OPERATIONS: | ||||||||||||||||
Net investment income (loss)2 | 0.14 | 0.32 | 0.10 | 0.02 | ||||||||||||
Net realized gain (loss) and unrealized appreciation/depreciation on investments and foreign currency related transactions | (1.49 | ) | 3.25 | 0.67 | (0.15 | ) | ||||||||||
Total from investment operations | (1.35 | ) | 3.57 | 0.77 | (0.13 | ) | ||||||||||
LESS DISTRIBUTIONS FROM: | ||||||||||||||||
Net investment income | (0.18 | ) | (0.26 | ) | (0.71 | ) | (0.04 | ) | ||||||||
Net realized gains on investments | (0.42 | ) | (0.43 | ) | (0.04 | ) | — | |||||||||
Total distributions | (0.60 | ) | (0.69 | ) | (0.75 | ) | (0.04 | ) | ||||||||
Net Asset Value, end of period | $10.78 | $12.73 | $9.85 | $9.83 | ||||||||||||
TOTAL RETURN | (10.65% | ) | 36.35% | 7.72% | (1.30% | )3 | ||||||||||
RATIOS/SUPPLEMENTAL DATA | ||||||||||||||||
Net assets, end of period (in 000’s) | $6,869 | $3,388 | $155 | $143 | ||||||||||||
Ratio of expenses to average net assets before any reimbursement, waiver or recapture of expenses by Advisor and Administrator (Note 5) | 1.54% | 2.08% | 11.26% | 36.17% | 4 | |||||||||||
Ratio of expenses to average net assets after any reimbursement, waiver or recapture of expenses by Advisor and Administrator | 1.25% | 1.25% | 1.25% | 1.25% | 4 | |||||||||||
Ratio of net investment income (loss) to average net assets | 1.18% | 2.59% | 1.01% | 2.41% | 4 | |||||||||||
Portfolio turnover5 | 48.29% | 31.93% | 19.60% | 10.80% | 3 | |||||||||||
| 1 | Commenced operations on November 30, 2015. |
| 2 | Calculated using the average daily shares method. |
| 3 | Not annualized. |
| 4 | Annualized. |
| 5 | The portfolio turnover rate is calculated on the Fund as a whole without distinguishing between classes of shares issued. |
See accompanying notes to financial statements.
| 128 | MATTHEWS ASIA FUNDS |
Table of Contents
Financial Highlights(continued)
Matthews Asia Focus Fund
The tables below set forth financial data for a share of beneficial interest outstanding throughout each period presented.
|
| Year Ended Dec. 31 | |||||||||||||||||||
| INVESTOR CLASS | 2018 | 2017 | 2016 | 2015 | 2014 | |||||||||||||||
Net Asset Value, beginning of year | $12.18 | $8.98 | $8.69 | $10.01 | $9.66 | |||||||||||||||
INCOME (LOSS) FROM INVESTMENT OPERATIONS: | ||||||||||||||||||||
Net investment income (loss)1 | 0.16 | 0.11 | 0.10 | 0.11 | 0.09 | |||||||||||||||
Net realized gain (loss) and unrealized appreciation/depreciation on investments and foreign currency related transactions | (2.25 | ) | 3.21 | 0.32 | (1.31 | ) | 0.33 | |||||||||||||
Total from investment operations | (2.09 | ) | 3.32 | 0.42 | (1.20 | ) | 0.42 | |||||||||||||
LESS DISTRIBUTIONS FROM: | ||||||||||||||||||||
Net investment income | (0.23 | ) | (0.12 | ) | (0.13 | ) | (0.07 | ) | (0.07 | ) | ||||||||||
Net realized gains on investments | (0.60 | ) | — | — | (0.05 | ) | — | |||||||||||||
Total distributions | (0.83 | ) | (0.12 | ) | (0.13 | ) | (0.12 | ) | (0.07 | ) | ||||||||||
Paid-in capital from redemption fees (Note 4) | — | — | — | — | 2 | — | 2 | |||||||||||||
Net Asset Value, end of year | $9.26 | $12.18 | $8.98 | $8.69 | $10.01 | |||||||||||||||
TOTAL RETURN | (17.24% | ) | 36.98% | 4.82% | (12.07% | ) | 4.38% | |||||||||||||
RATIOS/SUPPLEMENTAL DATA | ||||||||||||||||||||
Net assets, end of year (in 000’s) | $2,827 | $4,838 | $4,713 | $5,474 | �� | $7,839 | ||||||||||||||
Ratio of expenses to average net assets before any reimbursement, waiver or recapture of expenses by Advisor and Administrator (Note 5) | 3.18% | 2.45% | 2.47% | 2.07% | 2.16% | |||||||||||||||
Ratio of expenses to average net assets after any reimbursement, waiver or recapture of expenses by Advisor and Administrator | 1.50% | 1.50% | 1.50% | 1.50% | 1.57% | |||||||||||||||
Ratio of net investment income (loss) to average net assets | 1.38% | 1.01% | 1.14% | 1.08% | 0.87% | |||||||||||||||
Portfolio turnover3 | 29.42% | 28.42% | 21.10% | 23.60% | 24.12% | |||||||||||||||
|
| Year Ended Dec. 31 | |||||||||||||||||||
| INSTITUTIONAL CLASS | 2018 | 2017 | 2016 | 2015 | 2014 | |||||||||||||||
Net Asset Value, beginning of year | $12.24 | $8.99 | $8.69 | $10.04 | $9.66 | |||||||||||||||
INCOME (LOSS) FROM INVESTMENT OPERATIONS: | ||||||||||||||||||||
Net investment income (loss)1 | 0.15 | 0.14 | 0.13 | 0.13 | 0.10 | |||||||||||||||
Net realized gain (loss) and unrealized appreciation/depreciation on investments and foreign currency related transactions | (2.23 | ) | 3.21 | 0.31 | (1.33 | ) | 0.36 | |||||||||||||
Total from investment operations | (2.08 | ) | 3.35 | 0.44 | (1.20 | ) | 0.46 | |||||||||||||
LESS DISTRIBUTIONS FROM: | ||||||||||||||||||||
Net investment income | (0.29 | ) | (0.10 | ) | (0.14 | ) | (0.10 | ) | (0.08 | ) | ||||||||||
Net realized gains on investments | (0.60 | ) | — | — | (0.05 | ) | — | |||||||||||||
Total distributions | (0.89 | ) | (0.10 | ) | (0.14 | ) | (0.15 | ) | (0.08 | ) | ||||||||||
Paid-in capital from redemption fees (Note 4) | — | — | — | — | 2 | — | 2 | |||||||||||||
Net Asset Value, end of year | $9.27 | $12.24 | $8.99 | $8.69 | $10.04 | |||||||||||||||
TOTAL RETURN | (17.04% | ) | 37.35% | 5.05% | (11.96% | ) | 4.77% | |||||||||||||
RATIOS/SUPPLEMENTAL DATA | ||||||||||||||||||||
Net assets, end of year (in 000’s) | $3,787 | $10,708 | $5,397 | $5,700 | $7,148 | |||||||||||||||
Ratio of expenses to average net assets before any reimbursement, waiver or recapture of expenses by Advisor and Administrator (Note 5) | 2.98% | 2.27% | 2.29% | 1.91% | 1.94% | |||||||||||||||
Ratio of expenses to average net assets after any reimbursement, waiver or recapture of expenses by Advisor and Administrator | 1.25% | 1.25% | 1.25% | 1.25% | 1.31% | |||||||||||||||
Ratio of net investment income (loss) to average net assets | 1.28% | 1.28% | 1.37% | 1.30% | 0.96% | |||||||||||||||
Portfolio turnover3 | 29.42% | 28.42% | 21.10% | 23.60% | 24.12% | |||||||||||||||
| 1 | Calculated using the average daily shares method. |
| 2 | Less than $0.01 per share. |
| 3 | The portfolio turnover rate is calculated on the Fund as a whole without distinguishing between classes of shares issued. |
See accompanying notes to financial statements.
| matthewsasia.com | 800.789.ASIA | 129 |
Table of Contents
Financial Highlights(continued)
Matthews Asia Growth Fund
The tables below set forth financial data for a share of beneficial interest outstanding throughout each period presented.
|
| Year Ended Dec. 31 | |||||||||||||||||||
| INVESTOR CLASS | 2018 | 2017 | 2016 | 2015 | 2014 | |||||||||||||||
Net Asset Value, beginning of year | $27.25 | $21.05 | $21.09 | $21.10 | $21.17 | |||||||||||||||
INCOME (LOSS) FROM INVESTMENT OPERATIONS: | ||||||||||||||||||||
Net investment income (loss)1 | — | 2 | 0.04 | 0.06 | 0.11 | 0.12 | ||||||||||||||
Net realized gain (loss) and unrealized appreciation/depreciation on investments and foreign currency related transactions | (4.41 | ) | 8.14 | 0.13 | (0.12 | ) | 0.19 | |||||||||||||
Total from investment operations | (4.41 | ) | 8.18 | 0.19 | (0.01 | ) | 0.31 | |||||||||||||
LESS DISTRIBUTIONS FROM: | ||||||||||||||||||||
Net investment income | (0.03 | ) | (0.16 | ) | (0.23 | ) | — | (0.38 | ) | |||||||||||
Net realized gains on investments | (0.32 | ) | (1.82 | ) | — | — | — | |||||||||||||
Total distributions | (0.35 | ) | (1.98 | ) | (0.23 | ) | — | (0.38 | ) | |||||||||||
Paid-in capital from redemption fees (Note 4) | — | — | — | — | 2 | — | 2 | |||||||||||||
Net Asset Value, end of year | $22.49 | $27.25 | $21.05 | $21.09 | $21.10 | |||||||||||||||
TOTAL RETURN | (16.25% | ) | 39.39% | 0.92% | (0.05% | ) | 1.49% | |||||||||||||
RATIOS/SUPPLEMENTAL DATA | ||||||||||||||||||||
Net assets, end of year (in 000’s) | $463,600 | $554,309 | $419,516 | $526,969 | $561,922 | |||||||||||||||
Ratio of expenses to average net assets | 1.10% | 1.12% | 1.14% | 1.11% | 1.11% | |||||||||||||||
Ratio of net investment income (loss) to average net assets | —% | 3 | 0.16% | 0.30% | 0.49% | 0.55% | ||||||||||||||
Portfolio turnover4 | 12.12% | 23.19% | 13.61% | 29.51% | 22.24% | |||||||||||||||
| Year Ended Dec. 31 | |||||||||||||||||||
| INSTITUTIONAL CLASS | 2018 | 2017 | 2016 | 2015 | 2014 | |||||||||||||||
Net Asset Value, beginning of year | $27.45 | $21.19 | $21.24 | $21.19 | $21.26 | |||||||||||||||
INCOME (LOSS) FROM INVESTMENT OPERATIONS: | ||||||||||||||||||||
Net investment income (loss)1 | 0.05 | 0.09 | 0.10 | 0.16 | 0.16 | |||||||||||||||
Net realized gain (loss) and unrealized appreciation/depreciation on investments and foreign currency related transactions | (4.45 | ) | 8.20 | 0.13 | (0.11 | ) | 0.19 | |||||||||||||
Total from investment operations | (4.40 | ) | 8.29 | 0.23 | 0.05 | 0.35 | ||||||||||||||
LESS DISTRIBUTIONS FROM: | ||||||||||||||||||||
Net investment income | (0.08 | ) | (0.21 | ) | (0.28 | ) | — | (0.42 | ) | |||||||||||
Net realized gains on investments | (0.32 | ) | (1.82 | ) | — | — | — | |||||||||||||
Total distributions | (0.40 | ) | (2.03 | ) | (0.28 | ) | — | (0.42 | ) | |||||||||||
Paid-in capital from redemption fees (Note 4) | — | — | — | — | 2 | — | 2 | |||||||||||||
Net Asset Value, end of year | $22.65 | $27.45 | $21.19 | $21.24 | $21.19 | |||||||||||||||
TOTAL RETURN | (16.10% | ) | 39.64% | 1.06% | 0.24% | 1.63% | ||||||||||||||
RATIOS/SUPPLEMENTAL DATA | ||||||||||||||||||||
Net assets, end of year (in 000’s) | $466,733 | $296,253 | $195,949 | $249,886 | $287,262 | |||||||||||||||
Ratio of expenses to average net assets | 0.93% | 0.93% | 0.96% | 0.91% | 0.91% | |||||||||||||||
Ratio of net investment income (loss) to average net assets | 0.17% | 0.35% | 0.47% | 0.72% | 0.74% | |||||||||||||||
Portfolio turnover4 | 12.12% | 23.19% | 13.61% | 29.51% | 22.24% | |||||||||||||||
| 1 | Calculated using the average daily shares method. |
| 2 | Less than $0.01 per share. |
| 3 | Less than 0.01%. |
| 4 | The portfolio turnover rate is calculated on the Fund as a whole without distinguishing between classes of shares issued. |
See accompanying notes to financial statements.
| 130 | MATTHEWS ASIA FUNDS |
Table of Contents
Financial Highlights(continued)
Matthews Pacific Tiger Fund
The tables below set forth financial data for a share of beneficial interest outstanding throughout each period presented.
|
| Year Ended Dec. 31 | |||||||||||||||||||
| INVESTOR CLASS | 2018 | 2017 | 2016 | 2015 | 2014 | |||||||||||||||
Net Asset Value, beginning of year | $31.66 | $22.92 | $23.54 | $26.57 | $24.99 | |||||||||||||||
INCOME (LOSS) FROM INVESTMENT OPERATIONS: | ||||||||||||||||||||
Net investment income (loss)1 | 0.24 | 0.17 | 0.11 | 0.42 | 0.14 | |||||||||||||||
Net realized gain (loss) and unrealized appreciation/depreciation on investments and foreign currency related transactions | (3.75 | ) | 8.96 | (0.13 | ) | (0.82 | ) | 2.80 | ||||||||||||
Total from investment operations | (3.51 | ) | 9.13 | (0.02 | ) | (0.40 | ) | 2.94 | ||||||||||||
LESS DISTRIBUTIONS FROM: | ||||||||||||||||||||
Net investment income | (0.21 | ) | (0.17 | ) | (0.13 | ) | (0.42 | ) | (0.13 | ) | ||||||||||
Net realized gains on investments | (1.08 | ) | (0.22 | ) | (0.47 | ) | (2.21 | ) | (1.23 | ) | ||||||||||
Total distributions | (1.29 | ) | (0.39 | ) | (0.60 | ) | (2.63 | ) | (1.36 | ) | ||||||||||
Paid-in capital from redemption fees (Note 4) | — | — | 2 | — | — | 2 | — | 2 | ||||||||||||
Net Asset Value, end of year | $26.86 | $31.66 | $22.92 | $23.54 | $26.57 | |||||||||||||||
TOTAL RETURN | (11.11% | ) | 39.96% | (0.16% | ) | (1.30% | ) | 11.79% | ||||||||||||
RATIOS/SUPPLEMENTAL DATA | ||||||||||||||||||||
Net assets, end of year (in 000’s) | $2,618,155 | $3,335,795 | $2,445,183 | $2,720,869 | $3,047,077 | |||||||||||||||
Ratio of expenses to average net assets before any reimbursement, waiver or recapture of expenses by Advisor and Administrator (Note 5) | 1.07% | 1.08% | 1.09% | 1.09% | 1.09% | |||||||||||||||
Ratio of expenses to average net assets after any reimbursement, waiver or recapture of expenses by Advisor and Administrator | 1.04% | 1.06% | 1.08% | 1.07% | 1.08% | |||||||||||||||
Ratio of net investment income (loss) to average net assets | 0.79% | 0.63% | 0.47% | 1.53% | 0.52% | |||||||||||||||
Portfolio turnover3 | 11.48% | 9.18% | 5.73% | 12.56% | 11.38% | |||||||||||||||
| Year Ended Dec. 31 | |||||||||||||||||||
| INSTITUTIONAL CLASS | 2018 | 2017 | 2016 | 2015 | 2014 | |||||||||||||||
Net Asset Value, beginning of year | $31.63 | $22.90 | $23.52 | $26.56 | $24.97 | |||||||||||||||
INCOME (LOSS) FROM INVESTMENT OPERATIONS: | ||||||||||||||||||||
Net investment income (loss)1 | 0.28 | 0.22 | 0.16 | 0.44 | 0.18 | |||||||||||||||
Net realized gain (loss) and unrealized appreciation/depreciation on investments and foreign currency related transactions | (3.74 | ) | 8.95 | (0.14 | ) | (0.80 | ) | 2.82 | ||||||||||||
Total from investment operations | (3.46 | ) | 9.17 | 0.02 | (0.36 | ) | 3.00 | |||||||||||||
LESS DISTRIBUTIONS FROM: | ||||||||||||||||||||
Net investment income | (0.26 | ) | (0.22 | ) | (0.17 | ) | (0.47 | ) | (0.18 | ) | ||||||||||
Net realized gains on investments | (1.08 | ) | (0.22 | ) | (0.47 | ) | (2.21 | ) | (1.23 | ) | ||||||||||
Total distributions | (1.34 | ) | (0.44 | ) | (0.64 | ) | (2.68 | ) | (1.41 | ) | ||||||||||
Paid-in capital from redemption fees (Note 4) | — | — | 2 | — | — | 2 | — | 2 | ||||||||||||
Net Asset Value, end of year | $26.83 | $31.63 | $22.90 | $23.52 | $26.56 | |||||||||||||||
TOTAL RETURN | (10.94% | ) | 40.17% | 0.03% | (1.15% | ) | 12.03% | |||||||||||||
RATIOS/SUPPLEMENTAL DATA | ||||||||||||||||||||
Net assets, end of year (in 000’s) | $5,689,079 | $6,389,242 | $4,207,508 | $3,964,547 | $5,049,643 | |||||||||||||||
Ratio of expenses to average net assets before any reimbursement, waiver or recapture of expenses by Advisor and Administrator (Note 5) | 0.90% | 0.91% | 0.91% | 0.91% | 0.92% | |||||||||||||||
Ratio of expenses to average net assets after any reimbursement, waiver or recapture of expenses by Advisor and Administrator | 0.88% | 0.89% | 0.90% | 0.89% | 0.91% | |||||||||||||||
Ratio of net investment income (loss) to average net assets | 0.95% | 0.80% | 0.65% | 1.61% | 0.68% | |||||||||||||||
Portfolio turnover3 | 11.48% | 9.18% | 5.73% | 12.56% | 11.38% | |||||||||||||||
| 1 | Calculated using the average daily shares method. |
| 2 | Less than $0.01 per share. |
| 3 | The portfolio turnover rate is calculated on the Fund as a whole without distinguishing between classes of shares issued. |
See accompanying notes to financial statements.
| matthewsasia.com | 800.789.ASIA | 131 |
Table of Contents
Financial Highlights(continued)
Matthews Asia ESG Fund
The tables below set forth financial data for a share of beneficial interest outstanding throughout each period presented.
| Year Ended Dec. 31 | | Period Ended Dec. 31, 20151 | | ||||||||||||
| INVESTOR CLASS | 2018 | 2017 | 2016 | |||||||||||||
Net Asset Value, beginning of period | $11.56 | $8.97 | $9.23 | $10.00 | ||||||||||||
INCOME (LOSS) FROM INVESTMENT OPERATIONS: | ||||||||||||||||
Net investment income (loss)2 | 0.03 | 0.05 | 0.07 | 0.02 | ||||||||||||
Net realized gain (loss) and unrealized appreciation/depreciation on investments and foreign currency related transactions | (1.16 | ) | 2.97 | (0.20 | ) | (0.75 | ) | |||||||||
Total from investment operations | (1.13 | ) | 3.02 | (0.13 | ) | (0.73 | ) | |||||||||
LESS DISTRIBUTIONS FROM: | ||||||||||||||||
Net investment income | (0.02 | ) | (0.27 | ) | (0.13 | ) | (0.04 | ) | ||||||||
Net realized gains on investments | (0.43 | ) | (0.16 | ) | — | — | ||||||||||
Total distributions | (0.45 | ) | (0.43 | ) | (0.13 | ) | (0.04 | ) | ||||||||
Net Asset Value, end of period | $9.98 | $11.56 | $8.97 | $9.23 | ||||||||||||
TOTAL RETURN | (9.73% | ) | 33.79% | (1.40% | ) | (7.30% | )3 | |||||||||
RATIOS/SUPPLEMENTAL DATA | ||||||||||||||||
Net assets, end of period (in 000’s) | $9,283 | $10,695 | $5,376 | $3,248 | ||||||||||||
Ratio of expenses to average net assets before any reimbursement, waiver or recapture of expenses by Advisor and Administrator (Note 5) | 2.20% | 2.65% | 3.54% | 9.09% | 4 | |||||||||||
Ratio of expenses to average net assets after any reimbursement, waiver or recapture of expenses by Advisor and Administrator | 1.50% | 1.50% | 1.48% | 1.44% | 4 | |||||||||||
Ratio of net investment income (loss) to average net assets | 0.27% | 0.45% | 0.77% | 0.25% | 4 | |||||||||||
Portfolio turnover5 | 22.93% | 28.82% | 16.10% | 21.72% | 3 | |||||||||||
| Year Ended Dec. 31 | | Period Ended Dec. 31, 20151 | | ||||||||||||
| INSTITUTIONAL CLASS | 2018 | 2017 | 2016 | |||||||||||||
Net Asset Value, beginning of period | $11.50 | $8.92 | $9.17 | $10.00 | ||||||||||||
INCOME (LOSS) FROM INVESTMENT OPERATIONS: | ||||||||||||||||
Net investment income (loss)2 | 0.06 | 0.08 | 0.09 | 0.05 | ||||||||||||
Net realized gain (loss) and unrealized appreciation/depreciation on investments and foreign currency related transactions | (1.16 | ) | 2.95 | (0.19 | ) | (0.77 | ) | |||||||||
Total from investment operations | (1.10 | ) | 3.03 | (0.10 | ) | (0.72 | ) | |||||||||
LESS DISTRIBUTIONS FROM: | ||||||||||||||||
Net investment income | (0.01 | ) | (0.29 | ) | (0.15 | ) | (0.11 | ) | ||||||||
Net realized gains on investments | (0.43 | ) | (0.16 | ) | — | — | ||||||||||
Total distributions | (0.44 | ) | (0.45 | ) | (0.15 | ) | (0.11 | ) | ||||||||
Net Asset Value, end of period | $9.96 | $11.50 | $8.92 | $9.17 | ||||||||||||
TOTAL RETURN | (9.52% | ) | 34.11% | (1.16% | ) | (7.14% | )3 | |||||||||
RATIOS/SUPPLEMENTAL DATA | ||||||||||||||||
Net assets, end of period (in 000’s) | $23,249 | $7,359 | $3,382 | $1,686 | ||||||||||||
Ratio of expenses to average net assets before any reimbursement, waiver or recapture of expenses by Advisor and Administrator (Note 5) | 2.01% | 2.46% | 3.36% | 8.90% | 4 | |||||||||||
Ratio of expenses to average net assets after any reimbursement, waiver or recapture of expenses by Advisor and Administrator | 1.25% | 1.25% | 1.25% | 1.25% | 4 | |||||||||||
Ratio of net investment income (loss) to average net assets | 0.55% | 0.71% | 0.97% | 0.75% | 4 | |||||||||||
Portfolio turnover5 | 22.93% | 28.82% | 16.10% | 21.72% | 3 | |||||||||||
| 1 | Commenced operations on April 30, 2015. |
| 2 | Calculated using the average daily shares method. |
| 3 | Not annualized. |
| 4 | Annualized. |
| 5 | The portfolio turnover rate is calculated on the Fund as a whole without distinguishing between classes of shares issued. |
See accompanying notes to financial statements.
| 132 | MATTHEWS ASIA FUNDS |
Table of Contents
Financial Highlights(continued)
Matthews Emerging Asia Fund
The tables below set forth financial data for a share of beneficial interest outstanding throughout each period presented.
|
| Year Ended Dec. 31 | |||||||||||||||||||
| INVESTOR CLASS | 2018 | 2017 | 2016 | 2015 | 2014 | |||||||||||||||
Net Asset Value, beginning of year | $15.51 | $13.18 | $11.27 | $11.60 | $9.93 | |||||||||||||||
INCOME (LOSS) FROM INVESTMENT OPERATIONS: | ||||||||||||||||||||
Net investment income (loss)1 | 0.10 | 0.07 | 0.15 | 0.04 | 0.04 | |||||||||||||||
Net realized gain (loss) and unrealized appreciation/depreciation on investments and foreign currency related transactions | (2.82 | ) | 2.35 | 2.01 | (0.34 | ) | 1.69 | |||||||||||||
Total from investment operations | (2.72 | ) | 2.42 | 2.16 | (0.30 | ) | 1.73 | |||||||||||||
LESS DISTRIBUTIONS FROM: | ||||||||||||||||||||
Net investment income | (0.10 | ) | (0.04 | ) | (0.13 | ) | — | 2 | (0.06 | ) | ||||||||||
Net realized gains on investments | (0.19 | ) | (0.05 | ) | (0.13 | ) | (0.03 | ) | — | |||||||||||
Total distributions | (0.29 | ) | (0.09 | ) | (0.26 | ) | (0.03 | ) | (0.06 | ) | ||||||||||
Paid-in capital from redemption fees (Note 4) | — | 2 | — | 2 | 0.01 | — | 2 | — | 2 | |||||||||||
Net Asset Value, end of year | $12.50 | $15.51 | $13.18 | $11.27 | $11.60 | |||||||||||||||
TOTAL RETURN | (17.58% | ) | 18.42% | 19.25% | (2.56% | ) | 17.39% | |||||||||||||
RATIOS/SUPPLEMENTAL DATA | ||||||||||||||||||||
Net assets, end of year (in 000’s) | $118,505 | $219,596 | $145,164 | $114,590 | $110,363 | |||||||||||||||
Ratio of expenses to average net assets before any reimbursement, waiver or recapture of expenses by Advisor and Administrator (Note 5) | 1.66% | 1.70% | 1.77% | 1.75% | 1.78% | |||||||||||||||
Ratio of expenses to average net assets after any reimbursement, waiver or recapture of expenses by Advisor and Administrator | 1.48% | 1.48% | 1.47% | 1.50% | 1.58% | |||||||||||||||
Ratio of net investment income (loss) to average net assets | 0.72% | 0.49% | 1.26% | 0.33% | 0.34% | |||||||||||||||
Portfolio turnover3 | 26.09% | 7.74% | 34.90% | 12.14% | 8.21% | |||||||||||||||
|
| Year Ended Dec. 31 | |||||||||||||||||||
| INSTITUTIONAL CLASS | 2018 | 2017 | 2016 | 2015 | 2014 | |||||||||||||||
Net Asset Value, beginning of year | $15.57 | $13.22 | $11.29 | $11.60 | $9.92 | |||||||||||||||
INCOME (LOSS) FROM INVESTMENT OPERATIONS: | ||||||||||||||||||||
Net investment income (loss)1 | 0.14 | 0.10 | 0.21 | 0.07 | 0.06 | |||||||||||||||
Net realized gain (loss) and unrealized appreciation/depreciation on investments and foreign currency related transactions | (2.85 | ) | 2.37 | 1.99 | (0.34 | ) | 1.69 | |||||||||||||
Total from investment operations | (2.71 | ) | 2.47 | 2.20 | (0.27 | ) | 1.75 | |||||||||||||
LESS DISTRIBUTIONS FROM: | ||||||||||||||||||||
Net investment income | (0.13 | ) | (0.07 | ) | (0.15 | ) | (0.01 | ) | (0.07 | ) | ||||||||||
Net realized gains on investments | (0.19 | ) | (0.05 | ) | (0.13 | ) | (0.03 | ) | — | |||||||||||
Total distributions | (0.32 | ) | (0.12 | ) | (0.28 | ) | (0.04 | ) | (0.07 | ) | ||||||||||
Paid-in capital from redemption fees (Note 4) | — | 2 | — | 2 | 0.01 | — | 2 | — | 2 | |||||||||||
Net Asset Value, end of year | $12.54 | $15.57 | $13.22 | $11.29 | $11.60 | |||||||||||||||
TOTAL RETURN | (17.41% | ) | 18.70% | 19.61% | (2.33% | ) | 17.68% | |||||||||||||
RATIOS/SUPPLEMENTAL DATA | ||||||||||||||||||||
Net assets, end of year (in 000’s) | $256,669 | $275,233 | $95,724 | $55,278 | $21,350 | |||||||||||||||
Ratio of expenses to average net assets before any reimbursement, waiver or recapture of expenses by Advisor and Administrator (Note 5) | 1.50% | 1.52% | 1.62% | 1.57% | 1.59% | |||||||||||||||
Ratio of expenses to average net assets after any reimbursement, waiver or recapture of expenses by Advisor and Administrator | 1.25% | 1.25% | 1.25% | 1.25% | 1.33% | |||||||||||||||
Ratio of net investment income (loss) to average net assets | 0.97% | 0.70% | 1.72% | 0.65% | 0.55% | |||||||||||||||
Portfolio turnover3 | 26.09% | 7.74% | 34.90% | 12.14% | 8.21% | |||||||||||||||
| 1 | Calculated using the average daily shares method. |
| 2 | Less than $0.01 per share. |
| 3 | The portfolio turnover rate is calculated on the Fund as a whole without distinguishing between classes of shares issued. |
See accompanying notes to financial statements.
| matthewsasia.com | 800.789.ASIA | 133 |
Table of Contents
Financial Highlights(continued)
Matthews Asia Innovators Fund
The tables below set forth financial data for a share of beneficial interest outstanding throughout each period presented.
|
| Year Ended Dec. 31 | |||||||||||||||||||
| INVESTOR CLASS | 2018 | 2017 | 2016 | 2015 | 2014 | |||||||||||||||
Net Asset Value, beginning of year | $14.19 | $10.10 | $12.32 | $13.61 | $12.59 | |||||||||||||||
INCOME (LOSS) FROM INVESTMENT OPERATIONS: | ||||||||||||||||||||
Net investment income (loss)1 | (0.01 | ) | (0.02 | ) | (0.02 | ) | (0.05 | ) | — | 2 | ||||||||||
Net realized gain (loss) and unrealized appreciation/depreciation on investments and foreign currency related transactions | (2.62 | ) | 5.31 | (1.07 | ) | 0.64 | 1.16 | |||||||||||||
Total from investment operations | (2.63 | ) | 5.29 | (1.09 | ) | 0.59 | 1.16 | |||||||||||||
LESS DISTRIBUTIONS FROM: | ||||||||||||||||||||
Net investment income | (0.04 | ) | (0.24 | ) | — | — | (0.06 | ) | ||||||||||||
Net realized gains on investments | (0.26 | ) | (0.96 | ) | (1.13 | ) | (1.88 | ) | (0.08 | ) | ||||||||||
Total distributions | (0.30 | ) | (1.20 | ) | (1.13 | ) | (1.88 | ) | (0.14 | ) | ||||||||||
Net Asset Value, end of year | $11.26 | $14.19 | $10.10 | $12.32 | $13.61 | |||||||||||||||
TOTAL RETURN | (18.62% | ) | 52.88% | (9.10% | ) | 4.48% | 9.24% | |||||||||||||
RATIOS/SUPPLEMENTAL DATA | ||||||||||||||||||||
Net assets, end of year (in 000’s) | $152,449 | $175,331 | $83,926 | $129,763 | $125,612 | |||||||||||||||
Ratio of expenses to average net assets | 1.19% | 1.24% | 1.24% | 1.18% | 1.16% | |||||||||||||||
Ratio of net investment income (loss) to average net assets | (0.07% | ) | (0.18% | ) | (0.19% | ) | (0.33% | ) | (0.02% | ) | ||||||||||
Portfolio turnover3 | 85.73% | 66.51% | 92.25% | 72.85% | 62.99% | |||||||||||||||
|
| Year Ended Dec. 31 | |||||||||||||||||||
| INSTITUTIONAL CLASS | 2018 | 2017 | 2016 | 2015 | 2014 | |||||||||||||||
Net Asset Value, beginning of year | $14.26 | $10.14 | $12.34 | $13.61 | $12.58 | |||||||||||||||
INCOME (LOSS) FROM INVESTMENT OPERATIONS: | ||||||||||||||||||||
Net investment income (loss)1 | 0.01 | 0.01 | 0.01 | (0.02 | ) | 0.03 | ||||||||||||||
Net realized gain (loss) and unrealized appreciation/depreciation on investments and foreign currency related transactions | (2.62 | ) | 5.33 | (1.08 | ) | 0.63 | 1.17 | |||||||||||||
Total from investment operations | (2.61 | ) | 5.34 | (1.07 | ) | 0.61 | 1.20 | |||||||||||||
LESS DISTRIBUTIONS FROM: | ||||||||||||||||||||
Net investment income | (0.07 | ) | (0.26 | ) | — | — | (0.09 | ) | ||||||||||||
Net realized gains on investments | (0.26 | ) | (0.96 | ) | (1.13 | ) | (1.88 | ) | (0.08 | ) | ||||||||||
Total distributions | (0.33 | ) | (1.22 | ) | (1.13 | ) | (1.88 | ) | (0.17 | ) | ||||||||||
Net Asset Value, end of year | $11.32 | $14.26 | $10.14 | $12.34 | $13.61 | |||||||||||||||
TOTAL RETURN | (18.40% | ) | 53.18% | (8.92% | ) | 4.63% | 9.54% | |||||||||||||
RATIOS/SUPPLEMENTAL DATA | ||||||||||||||||||||
Net assets, end of year (in 000’s) | $91,769 | $30,957 | $16,545 | $36,770 | $61,088 | |||||||||||||||
Ratio of expenses to average net assets | 1.02% | 1.05% | 1.01% | 0.97% | 0.95% | |||||||||||||||
Ratio of net investment income (loss) to average net assets | 0.07% | 0.06% | 0.06% | (0.16% | ) | 0.21% | ||||||||||||||
Portfolio turnover3 | 85.73% | 66.51% | 92.25% | 72.85% | 62.99% | |||||||||||||||
| 1 | Calculated using the average daily shares method. |
| 2 | Less than $0.01 per share. |
| 3 | The portfolio turnover rate is calculated on the Fund as a whole without distinguishing between classes of shares issued. |
See accompanying notes to financial statements.
| 134 | MATTHEWS ASIA FUNDS |
Table of Contents
Financial Highlights(continued)
Matthews China Fund
The tables below set forth financial data for a share of beneficial interest outstanding throughout each period presented.
|
| Year Ended Dec. 31 | |||||||||||||||||||
| INVESTOR CLASS | 2018 | 2017 | 20161 | 20151 | 20141 | |||||||||||||||
Net Asset Value, beginning of year | $22.20 | $15.47 | $18.42 | $21.46 | $22.84 | |||||||||||||||
INCOME (LOSS) FROM INVESTMENT OPERATIONS: | ||||||||||||||||||||
Net investment income (loss)2 | 0.21 | 0.16 | 0.21 | 0.20 | 0.24 | |||||||||||||||
Net realized gain (loss) and unrealized appreciation/depreciation on investments and foreign currency related transactions | (4.84 | ) | 8.86 | (1.04 | ) | 0.30 | (1.25 | ) | ||||||||||||
Total from investment operations | (4.63 | ) | 9.02 | (0.83 | ) | 0.50 | (1.01 | ) | ||||||||||||
LESS DISTRIBUTIONS FROM: | ||||||||||||||||||||
Net investment income | (0.29 | ) | (0.37 | ) | (0.26 | ) | (0.21 | ) | (0.27 | ) | ||||||||||
Net realized gains on investments | (2.91 | ) | (1.92 | ) | (1.29 | ) | (3.33 | ) | (0.10 | ) | ||||||||||
Return of capital | — | — | (0.57 | ) | — | — | ||||||||||||||
Total distributions | (3.20 | ) | (2.29 | ) | (2.12 | ) | (3.54 | ) | (0.37 | ) | ||||||||||
Paid-in capital from redemption fees (Note 4) | — | — | — | 3 | — | 3 | — | 3 | ||||||||||||
Net Asset Value, end of year | $14.37 | $22.20 | $15.47 | $18.42 | $21.46 | |||||||||||||||
TOTAL RETURN | (21.42% | ) | 59.37% | (5.18% | ) | 2.41% | (4.42% | ) | ||||||||||||
RATIOS/SUPPLEMENTAL DATA | ||||||||||||||||||||
Net assets, end of year (in 000’s) | $566,456 | $843,508 | $495,900 | $709,767 | $947,740 | |||||||||||||||
Ratio of expenses to average net assets | 1.10% | 1.09% | 1.18% | 1.14% | 1.11% | |||||||||||||||
Ratio of net investment income (loss) to average net assets | 1.00% | 0.78% | 1.24% | 0.89% | 1.09% | |||||||||||||||
Portfolio turnover4 | 96.98% | 78.74% | 83.82% | 66.22% | 10.23% | |||||||||||||||
|
| Year Ended Dec. 31 | |||||||||||||||||||
| INSTITUTIONAL CLASS | 2018 | 2017 | 20161 | 20151 | 20141 | |||||||||||||||
Net Asset Value, beginning of year | $22.17 | $15.44 | $18.39 | $21.44 | $22.81 | |||||||||||||||
INCOME (LOSS) FROM INVESTMENT OPERATIONS: | ||||||||||||||||||||
Net investment income (loss)2 | 0.33 | 0.21 | 0.22 | 0.25 | 0.28 | |||||||||||||||
Net realized gain (loss) and unrealized appreciation/depreciation on investments and foreign currency related transactions | (4.93 | ) | 8.84 | (1.03 | ) | 0.27 | (1.25 | ) | ||||||||||||
Total from investment operations | (4.60 | ) | 9.05 | (0.81 | ) | 0.52 | (0.97 | ) | ||||||||||||
LESS DISTRIBUTIONS FROM: | ||||||||||||||||||||
Net investment income | (0.33 | ) | (0.40 | ) | (0.28 | ) | (0.24 | ) | (0.30 | ) | ||||||||||
Net realized gains on investments | (2.91 | ) | (1.92 | ) | (1.29 | ) | (3.33 | ) | (0.10 | ) | ||||||||||
Return of capital | — | — | (0.57 | ) | — | — | ||||||||||||||
Total distributions | (3.24 | ) | (2.32 | ) | (2.14 | ) | (3.57 | ) | (0.40 | ) | ||||||||||
Paid-in capital from redemption fees (Note 4) | — | — | — | 3 | — | 3 | — | 3 | ||||||||||||
Net Asset Value, end of year | $14.33 | $22.17 | $15.44 | $18.39 | $21.44 | |||||||||||||||
TOTAL RETURN | (21.32% | ) | 59.71% | (5.06% | ) | 2.50% | (4.22% | ) | ||||||||||||
RATIOS/SUPPLEMENTAL DATA | ||||||||||||||||||||
Net assets, end of year (in 000’s) | $46,657 | $61,975 | $15,874 | $24,276 | $52,478 | |||||||||||||||
Ratio of expenses to average net assets | 0.91% | 0.93% | 1.03% | 0.99% | 0.95% | |||||||||||||||
Ratio of net investment income (loss) to average net assets | 1.53% | 0.99% | 1.32% | 1.09% | 1.27% | |||||||||||||||
Portfolio turnover4 | 96.98% | 78.74% | 83.82% | 66.22% | 10.23% | |||||||||||||||
| 1 | Consolidated Financial Highlights. See Note 2-C. |
| 2 | Calculated using the average daily shares method. |
| 3 | Less than $0.01 per share. |
| 4 | The portfolio turnover rate is calculated on the Fund as a whole without distinguishing between classes of shares issued. |
See accompanying notes to financial statements.
| matthewsasia.com | 800.789.ASIA | 135 |
Table of Contents
Financial Highlights(continued)
Matthews India Fund
The tables below set forth financial data for a share of beneficial interest outstanding throughout each period presented.
|
| Year Ended Dec. 31 | |||||||||||||||||||
| INVESTOR CLASS | 2018 | 2017 | 2016 | 2015 | 2014 | |||||||||||||||
Net Asset Value, beginning of year | $34.31 | $25.65 | $26.43 | $26.46 | $16.28 | |||||||||||||||
INCOME (LOSS) FROM INVESTMENT OPERATIONS: | ||||||||||||||||||||
Net investment income (loss)1 | (0.05 | ) | (0.09 | ) | 0.01 | (0.05 | ) | 0.07 | ||||||||||||
Net realized gain (loss) and unrealized appreciation/depreciation on investments and foreign currency related transactions | (3.60 | ) | 9.24 | (0.33 | ) | 0.26 | 10.29 | |||||||||||||
Total from investment operations | (3.65 | ) | 9.15 | (0.32 | ) | 0.21 | 10.36 | |||||||||||||
LESS DISTRIBUTIONS FROM: | ||||||||||||||||||||
Net investment income | — | — | — | (0.03 | ) | (0.05 | ) | |||||||||||||
Net realized gains on investments | (4.34 | ) | (0.49 | ) | (0.46 | ) | (0.23 | ) | (0.14 | ) | ||||||||||
Total distributions | (4.34 | ) | (0.49 | ) | (0.46 | ) | (0.26 | ) | (0.19 | ) | ||||||||||
Paid-in capital from redemption fees (Note 4) | — | — | — | 0.02 | 0.01 | |||||||||||||||
Net Asset Value, end of year | $26.32 | $34.31 | $25.65 | $26.43 | $26.46 | |||||||||||||||
TOTAL RETURN | (10.09% | ) | 35.79% | (1.23% | ) | 0.90% | 63.71% | |||||||||||||
RATIOS/SUPPLEMENTAL DATA | ||||||||||||||||||||
Net assets, end of year (in 000’s) | $1,077,990 | $1,484,045 | $967,009 | $1,151,948 | $974,838 | |||||||||||||||
Ratio of expenses to average net assets | 1.09% | 1.09% | 1.12% | 1.11% | 1.12% | |||||||||||||||
Ratio of net investment income (loss) to average net assets | (0.16% | ) | (0.30% | ) | 0.02% | (0.17% | ) | 0.32% | ||||||||||||
Portfolio turnover2 | 20.87% | 16.81% | 15.76% | 9.51% | 14.86% | |||||||||||||||
|
| Year Ended Dec. 31 | |||||||||||||||||||
| INSTITUTIONAL CLASS | 2018 | 2017 | 2016 | 2015 | 2014 | |||||||||||||||
Net Asset Value, beginning of year | $34.51 | $25.77 | $26.49 | $26.49 | $16.31 | |||||||||||||||
INCOME (LOSS) FROM INVESTMENT OPERATIONS: | ||||||||||||||||||||
Net investment income (loss)1 | 0.01 | (0.03 | ) | 0.04 | 0.01 | 0.09 | ||||||||||||||
Net realized gain (loss) and unrealized appreciation/depreciation on investments and foreign currency related transactions | (3.62 | ) | 9.29 | (0.30 | ) | 0.26 | 10.29 | |||||||||||||
Total from investment operations | (3.61 | ) | 9.26 | (0.26 | ) | 0.27 | 10.38 | |||||||||||||
LESS DISTRIBUTIONS FROM: | ||||||||||||||||||||
Net investment income | — | (0.03 | ) | — | (0.06 | ) | (0.08 | ) | ||||||||||||
Net realized gains on investments | (4.34 | ) | (0.49 | ) | (0.46 | ) | (0.23 | ) | (0.14 | ) | ||||||||||
Total distributions | (4.34 | ) | (0.52 | ) | (0.46 | ) | (0.29 | ) | (0.22 | ) | ||||||||||
Paid-in capital from redemption fees (Note 4) | — | — | — | 0.02 | 0.02 | |||||||||||||||
Net Asset Value, end of year | $26.56 | $34.51 | $25.77 | $26.49 | $26.49 | |||||||||||||||
TOTAL RETURN | (9.92% | ) | 36.05% | (1.00% | ) | 1.12% | 63.80% | |||||||||||||
RATIOS/SUPPLEMENTAL DATA | ||||||||||||||||||||
Net assets, end of year (in 000’s) | $463,790 | $788,388 | $551,202 | $353,879 | $109,331 | |||||||||||||||
Ratio of expenses to average net assets | 0.90% | 0.89% | 0.91% | 0.90% | 0.94% | |||||||||||||||
Ratio of net investment income (loss) to average net assets | 0.02% | (0.08% | ) | 0.16% | 0.02% | 0.38% | ||||||||||||||
Portfolio turnover2 | 20.87% | 16.81% | 15.76% | 9.51% | 14.86% | |||||||||||||||
| 1 | Calculated using the average daily shares method. |
| 2 | The portfolio turnover rate is calculated on the Fund as a whole without distinguishing between classes of shares issued. |
See accompanying notes to financial statements.
| 136 | MATTHEWS ASIA FUNDS |
Table of Contents
Financial Highlights(continued)
Matthews Japan Fund
The tables below set forth financial data for a share of beneficial interest outstanding throughout each period presented.
|
| Year Ended Dec. 31 | |||||||||||||||||||
| INVESTOR CLASS | 2018 | 2017 | 2016 | 2015 | 2014 | |||||||||||||||
Net Asset Value, beginning of year | $24.12 | $18.83 | $18.97 | $15.70 | $16.20 | |||||||||||||||
INCOME (LOSS) FROM INVESTMENT OPERATIONS: | ||||||||||||||||||||
Net investment income (loss)1 | 0.09 | 0.09 | 0.08 | 0.04 | 0.05 | |||||||||||||||
Net realized gain (loss) and unrealized appreciation/depreciation on investments and foreign currency related transactions | (4.91 | ) | 6.13 | (0.01 | ) | 3.23 | (0.48 | ) | ||||||||||||
Total from investment operations | (4.82 | ) | 6.22 | 0.07 | 3.27 | (0.43 | ) | |||||||||||||
LESS DISTRIBUTIONS FROM: | ||||||||||||||||||||
Net investment income | (0.06 | ) | (0.20 | ) | (0.16 | ) | — | (0.08 | ) | |||||||||||
Net realized gains on investments | (0.71 | ) | (0.73 | ) | (0.05 | ) | — | — | ||||||||||||
Total distributions | (0.77 | ) | (0.93 | ) | (0.21 | ) | — | (0.08 | ) | |||||||||||
Paid-in capital from redemption fees (Note 4) | — | — | — | — | 2 | 0.01 | ||||||||||||||
Net Asset Value, end of year | $18.53 | $24.12 | $18.83 | $18.97 | $15.70 | |||||||||||||||
TOTAL RETURN | (20.18% | ) | 33.14% | 0.40% | 20.83% | (2.60% | ) | |||||||||||||
RATIOS/SUPPLEMENTAL DATA | ||||||||||||||||||||
Net assets, end of year (in 000’s) | $1,704,102 | $2,155,280 | $1,685,872 | $1,330,743 | $467,854 | |||||||||||||||
Ratio of expenses to average net assets before any reimbursement, waiver or recapture of expenses by Advisor and Administrator (Note 5) | 0.91% | 0.95% | 0.98% | 0.99% | 1.03% | |||||||||||||||
Ratio of expenses to average net assets after any reimbursement, waiver or recapture of expenses by Advisor and Administrator | 0.91% | 0.94% | 0.98% | 0.99% | 1.03% | |||||||||||||||
Ratio of net investment income (loss) to average net assets | 0.40% | 0.40% | 0.43% | 0.22% | 0.32% | |||||||||||||||
Portfolio turnover3 | 46.11% | 44.34% | 55.15% | 24.19% | 42.52% | |||||||||||||||
|
| Year Ended Dec. 31 | |||||||||||||||||||
| INSTITUTIONAL CLASS | 2018 | 2017 | 2016 | 2015 | 2014 | |||||||||||||||
Net Asset Value, beginning of year | $24.16 | $18.86 | $19.00 | $15.71 | $16.20 | |||||||||||||||
INCOME (LOSS) FROM INVESTMENT OPERATIONS: | ||||||||||||||||||||
Net investment income (loss)1 | 0.11 | 0.10 | 0.10 | 0.05 | 0.09 | |||||||||||||||
Net realized gain (loss) and unrealized appreciation/depreciation on investments and foreign currency related transactions | (4.91 | ) | 6.14 | — | 2 | 3.24 | (0.50 | ) | ||||||||||||
Total from investment operations | (4.80 | ) | 6.24 | 0.10 | 3.29 | (0.41 | ) | |||||||||||||
LESS DISTRIBUTIONS FROM: | ||||||||||||||||||||
Net investment income | (0.08 | ) | (0.21 | ) | (0.19 | ) | — | (0.09 | ) | |||||||||||
Net realized gains on investments | (0.71 | ) | (0.73 | ) | (0.05 | ) | — | — | ||||||||||||
Total distributions | (0.79 | ) | (0.94 | ) | (0.24 | ) | — | (0.09 | ) | |||||||||||
Paid-in capital from redemption fees (Note 4) | — | — | — | — | 2 | 0.01 | ||||||||||||||
Net Asset Value, end of year | $18.57 | $24.16 | $18.86 | $19.00 | $15.71 | |||||||||||||||
TOTAL RETURN | (20.08% | ) | 33.23% | 0.51% | 20.94% | (2.47% | ) | |||||||||||||
RATIOS/SUPPLEMENTAL DATA | ||||||||||||||||||||
Net assets, end of year (in 000’s) | $1,167,472 | $1,957,214 | $1,302,317 | $618,583 | $154,750 | |||||||||||||||
Ratio of expenses to average net assets before any reimbursement, waiver or recapture of expenses by Advisor and Administrator (Note 5) | 0.85% | 0.87% | 0.88% | 0.87% | 0.90% | |||||||||||||||
Ratio of expenses to average net assets after any reimbursement, waiver or recapture of expenses by Advisor and Administrator | 0.84% | 0.86% | 0.88% | 0.87% | 0.90% | |||||||||||||||
Ratio of net investment income (loss) to average net assets | 0.46% | 0.46% | 0.54% | 0.28% | 0.58% | |||||||||||||||
Portfolio turnover3 | 46.11% | 44.34% | 55.15% | 24.19% | 42.52% | |||||||||||||||
| 1 | Calculated using the average daily shares method. |
| 2 | Less than $0.01 per share. |
| 3 | The portfolio turnover rate is calculated on the Fund as a whole without distinguishing between classes of shares issued. |
See accompanying notes to financial statements.
| matthewsasia.com | 800.789.ASIA | 137 |
Table of Contents
Financial Highlights(continued)
Matthews Korea Fund
The tables below set forth financial data for a share of beneficial interest outstanding throughout each period presented.
|
| Year Ended Dec. 31 | |||||||||||||||||||
| INVESTOR CLASS | 2018 | 2017 | 2016 | 2015 | 2014 | |||||||||||||||
Net Asset Value, beginning of year | $6.91 | $5.25 | $6.15 | $5.65 | $5.95 | |||||||||||||||
INCOME (LOSS) FROM INVESTMENT OPERATIONS: | ||||||||||||||||||||
Net investment income (loss)1 | 0.06 | 0.06 | 0.02 | 0.01 | — | 2 | ||||||||||||||
Net realized gain (loss) and unrealized appreciation/depreciation on investments and foreign currency related transactions | (1.61 | ) | 2.22 | (0.41 | ) | 0.83 | (0.05 | ) | ||||||||||||
Total from investment operations | (1.55 | ) | 2.28 | (0.39 | ) | 0.84 | (0.05 | ) | ||||||||||||
LESS DISTRIBUTIONS FROM: | ||||||||||||||||||||
Net investment income | (0.13 | ) | (0.29 | ) | (0.08 | ) | (0.01 | ) | — | |||||||||||
Net realized gains on investments | (0.65 | ) | (0.33 | ) | (0.43 | ) | (0.33 | ) | (0.25 | ) | ||||||||||
Total distributions | (0.78 | ) | (0.62 | ) | (0.51 | ) | (0.34 | ) | (0.25 | ) | ||||||||||
Paid-in capital from redemption fees (Note 4) | — | — | — | — | 2 | — | 2 | |||||||||||||
Net Asset Value, end of year | $4.58 | $6.91 | $5.25 | $6.15 | $5.65 | |||||||||||||||
TOTAL RETURN | (22.21% | ) | 43.70% | (6.32% | ) | 15.16% | (0.73% | ) | ||||||||||||
RATIOS/SUPPLEMENTAL DATA | ||||||||||||||||||||
Net assets, end of year (in 000’s) | $127,080 | $192,431 | $142,726 | $147,685 | $127,774 | |||||||||||||||
Ratio of expenses to average net assets | 1.14% | 1.15% | 1.15% | 1.10% | 1.11% | |||||||||||||||
Ratio of net investment income (loss) to average net assets | 1.01% | 0.90% | 0.41% | 0.18% | 0.04% | |||||||||||||||
Portfolio turnover3 | 35.60% | 25.37% | 34.73% | 20.36% | 17.37% | |||||||||||||||
|
| Year Ended Dec. 31 | |||||||||||||||||||
| INSTITUTIONAL CLASS | 2018 | 2017 | 2016 | 2015 | 2014 | |||||||||||||||
Net Asset Value, beginning of year | $6.95 | $5.27 | $6.18 | $5.68 | $5.96 | |||||||||||||||
INCOME (LOSS) FROM INVESTMENT OPERATIONS: | ||||||||||||||||||||
Net investment income (loss)1 | 0.04 | 0.10 | (0.02 | ) | 0.02 | 0.05 | ||||||||||||||
Net realized gain (loss) and unrealized appreciation/depreciation on investments and foreign currency related transactions | (1.60 | ) | 2.21 | (0.37 | ) | 0.83 | (0.08 | ) | ||||||||||||
Total from investment operations | (1.56 | ) | 2.31 | (0.39 | ) | 0.85 | (0.03 | ) | ||||||||||||
LESS DISTRIBUTIONS FROM: | ||||||||||||||||||||
Net investment income | (0.13 | ) | (0.30 | ) | (0.09 | ) | (0.02 | ) | — | |||||||||||
Net realized gains on investments | (0.65 | ) | (0.33 | ) | (0.43 | ) | (0.33 | ) | (0.25 | ) | ||||||||||
Total distributions | (0.78 | ) | (0.63 | ) | (0.52 | ) | (0.35 | ) | (0.25 | ) | ||||||||||
Paid-in capital from redemption fees (Note 4) | — | — | — | — | 2 | — | 2 | |||||||||||||
Net Asset Value, end of year | $4.61 | $6.95 | $5.27 | $6.18 | $5.68 | |||||||||||||||
TOTAL RETURN | (22.15% | ) | 44.11% | (6.31% | ) | 15.27% | (0.39% | ) | ||||||||||||
RATIOS/SUPPLEMENTAL DATA | ||||||||||||||||||||
Net assets, end of year (in 000’s) | $19,377 | $32,587 | $7,462 | $59,982 | $91,431 | |||||||||||||||
Ratio of expenses to average net assets | 1.02% | 1.01% | 0.97% | 0.93% | 0.93% | |||||||||||||||
Ratio of net investment income (loss) to average net assets | 0.67% | 1.51% | (0.31% | ) | 0.28% | 0.87% | ||||||||||||||
Portfolio turnover3 | 35.60% | 25.37% | 34.73% | 20.36% | 17.37% | |||||||||||||||
| 1 | Calculated using the average daily shares method. |
| 2 | Less than $0.01 per share. |
| 3 | The portfolio turnover rate is calculated on the Fund as a whole without distinguishing between classes of shares issued. |
See accompanying notes to financial statements.
| 138 | MATTHEWS ASIA FUNDS |
Table of Contents
Financial Highlights(continued)
Matthews Asia Small Companies Fund
The tables below set forth financial data for a share of beneficial interest outstanding throughout each period presented.
|
| Year Ended Dec. 31 | |||||||||||||||||||
| INVESTOR CLASS | 2018 | 2017 | 2016 | 2015 | 2014 | |||||||||||||||
Net Asset Value, beginning of year | $22.89 | $19.05 | $19.41 | $21.46 | $19.34 | |||||||||||||||
INCOME (LOSS) FROM INVESTMENT OPERATIONS: | ||||||||||||||||||||
Net investment income (loss)1 | 0.12 | 0.02 | 0.09 | 0.02 | 0.09 | |||||||||||||||
Net realized gain (loss) and unrealized appreciation/depreciation on investments and foreign currency related transactions | (4.20 | ) | 5.68 | (0.37 | ) | (2.05 | ) | 2.11 | ||||||||||||
Total from investment operations | (4.08 | ) | 5.70 | (0.28 | ) | (2.03 | ) | 2.20 | ||||||||||||
LESS DISTRIBUTIONS FROM: | ||||||||||||||||||||
Net investment income | (0.08 | ) | (0.10 | ) | (0.08 | ) | (0.03 | ) | (0.08 | ) | ||||||||||
Net realized gains on investments | (3.23 | ) | (1.76 | ) | — | — | — | |||||||||||||
Total distributions | (3.31 | ) | (1.86 | ) | (0.08 | ) | (0.03 | ) | (0.08 | ) | ||||||||||
Paid-in capital from redemption fees (Note 4) | — | 2 | — | 2 | — | 2 | 0.01 | — | 2 | |||||||||||
Net Asset Value, end of year | $15.50 | $22.89 | $19.05 | $19.41 | $21.46 | |||||||||||||||
TOTAL RETURN | (18.05% | ) | 30.59% | (1.44% | ) | (9.43% | ) | 11.39% | ||||||||||||
RATIOS/SUPPLEMENTAL DATA | ||||||||||||||||||||
Net assets, end of year (in 000’s) | $111,456 | $208,339 | $254,226 | $387,747 | $599,082 | |||||||||||||||
Ratio of expenses to average net assets before any reimbursement, waiver or recapture of expenses by Advisor and Administrator (Note 5) | 1.51% | 1.49% | 1.49% | 1.48% | 1.47% | |||||||||||||||
Ratio of expenses to average net assets after any reimbursement, waiver or recapture of expenses by Advisor and Administrator | 1.46% | 1.46% | 1.47% | 1.47% | 1.47% | |||||||||||||||
Ratio of net investment income (loss) to average net assets | 0.53% | 0.09% | 0.45% | 0.08% | 0.44% | |||||||||||||||
Portfolio turnover3 | 69.79% | 67.13% | 44.44% | 48.29% | 21.70% | |||||||||||||||
|
| Year Ended Dec. 31 | |||||||||||||||||||
| INSTITUTIONAL CLASS | 2018 | 2017 | 2016 | 2015 | 2014 | |||||||||||||||
Net Asset Value, beginning of year | $22.86 | $19.03 | $19.40 | $21.46 | $19.33 | |||||||||||||||
INCOME (LOSS) FROM INVESTMENT OPERATIONS: | ||||||||||||||||||||
Net investment income (loss)1 | 0.16 | 0.07 | 0.12 | 0.11 | 0.15 | |||||||||||||||
Net realized gain (loss) and unrealized appreciation/depreciation on investments and foreign currency related transactions | (4.19 | ) | 5.67 | (0.36 | ) | (2.10 | ) | 2.10 | ||||||||||||
Total from investment operations | (4.03 | ) | 5.74 | (0.24 | ) | (1.99 | ) | 2.25 | ||||||||||||
LESS DISTRIBUTIONS FROM: | ||||||||||||||||||||
Net investment income | (0.14 | ) | (0.15 | ) | (0.13 | ) | (0.08 | ) | (0.12 | ) | ||||||||||
Net realized gains on investments | (3.23 | ) | (1.76 | ) | — | — | — | |||||||||||||
Total distributions | (3.37 | ) | (1.91 | ) | (0.13 | ) | (0.08 | ) | (0.12 | ) | ||||||||||
Paid-in capital from redemption fees (Note 4) | — | 2 | — | 2 | — | 2 | 0.01 | — | 2 | |||||||||||
Net Asset Value, end of year | $15.46 | $22.86 | $19.03 | $19.40 | $21.46 | |||||||||||||||
TOTAL RETURN | (17.86% | ) | 30.85% | (1.24% | ) | (9.23% | ) | 11.65% | ||||||||||||
RATIOS/SUPPLEMENTAL DATA | ||||||||||||||||||||
Net assets, end of year (in 000’s) | $74,935 | $232,954 | $174,962 | $222,168 | $77,168 | |||||||||||||||
Ratio of expenses to average net assets before any reimbursement, waiver or recapture of expenses by Advisor and Administrator (Note 5) | 1.37% | 1.35% | 1.34% | 1.30% | 1.27% | |||||||||||||||
Ratio of expenses to average net assets after any reimbursement, waiver or recapture of expenses by Advisor and Administrator | 1.25% | 1.25% | 1.25% | 1.25% | 1.26% | |||||||||||||||
Ratio of net investment income (loss) to average net assets | 0.73% | 0.34% | 0.64% | 0.53% | 0.70% | |||||||||||||||
Portfolio turnover3 | 69.79% | 67.13% | 44.44% | 48.29% | 21.70% | |||||||||||||||
| 1 | Calculated using the average daily shares method. |
| 2 | Less than $0.01 per share. |
| 3 | The portfolio turnover rate is calculated on the Fund as a whole without distinguishing between classes of shares issued. |
See accompanying notes to financial statements.
| matthewsasia.com | 800.789.ASIA | 139 |
Table of Contents
Financial Highlights(continued)
Matthews China Small Companies Fund
The tables below set forth financial data for a share of beneficial interest outstanding throughout each period presented.
|
| Year Ended Dec. 31 | |||||||||||||||||||
| INVESTOR CLASS | 2018 | 2017 | 2016 | 2015 | 2014 | |||||||||||||||
Net Asset Value, beginning of year | $11.89 | $8.21 | $8.79 | $9.21 | $9.89 | |||||||||||||||
INCOME (LOSS) FROM INVESTMENT OPERATIONS: | ||||||||||||||||||||
Net investment income (loss)1 | 0.09 | 0.07 | 0.10 | 0.08 | 0.01 | |||||||||||||||
Net realized gain (loss) and unrealized appreciation/depreciation on investments and foreign currency related transactions | (2.23 | ) | 4.27 | (0.28 | ) | 0.27 | (0.33 | ) | ||||||||||||
Total from investment operations | (2.14 | ) | 4.34 | (0.18 | ) | 0.35 | (0.32 | ) | ||||||||||||
LESS DISTRIBUTIONS FROM: | ||||||||||||||||||||
Net investment income | (0.05 | ) | (0.11 | ) | (0.03 | ) | (0.06 | ) | (0.02 | ) | ||||||||||
Net realized gains on investments | (0.16 | ) | (0.56 | ) | (0.37 | ) | (0.72 | ) | — | |||||||||||
Return of capital | — | — | — | — | (0.34 | ) | ||||||||||||||
Total distributions | (0.21 | ) | (0.67 | ) | (0.40 | ) | (0.78 | ) | (0.36 | ) | ||||||||||
Paid-in capital from redemption fees (Note 4) | 0.04 | 0.01 | — | 2 | 0.01 | — | 2 | |||||||||||||
Net Asset Value, end of year | $9.58 | $11.89 | $8.21 | $8.79 | $9.21 | |||||||||||||||
TOTAL RETURN | (17.68% | ) | 53.88% | (2.35% | ) | 4.07% | (3.33% | ) | ||||||||||||
RATIOS/SUPPLEMENTAL DATA | ||||||||||||||||||||
Net assets, end of year (in 000’s) | $41,740 | $35,209 | $16,101 | $21,546 | $22,068 | |||||||||||||||
Ratio of expenses to average net assets before any reimbursement, waiver or recapture of expenses by Advisor and Administrator (Note 5) | 1.97% | 2.34% | 2.24% | 2.10% | 1.90% | |||||||||||||||
Ratio of expenses to average net assets after any reimbursement, waiver or recapture of expenses by Advisor and Administrator | 1.50% | 1.50% | 1.50% | 1.50% | 1.67% | |||||||||||||||
Ratio of net investment income (loss) to average net assets | 0.78% | 0.66% | 1.17% | 0.80% | 0.14% | |||||||||||||||
Portfolio turnover3 | 76.67% | 67.22% | 63.15% | 72.49% | 32.42% | |||||||||||||||
| INSTITUTIONAL CLASS | Year Ended Dec. 31, 2018 | Period Ended Dec. 31, 20174 | ||||||||||||||||||
Net Asset Value, beginning of period | $11.87 | $11.90 | ||||||||||||||||||
INCOME (LOSS) FROM INVESTMENT OPERATIONS: | ||||||||||||||||||||
Net investment income (loss)1 | 0.11 | (0.01 | ) | |||||||||||||||||
Net realized gain (loss) and unrealized appreciation/depreciation on investments and foreign currency related transactions | (2.21 | ) | 0.67 | |||||||||||||||||
Total from investment operations | (2.10 | ) | 0.66 | |||||||||||||||||
LESS DISTRIBUTIONS FROM: | ||||||||||||||||||||
Net investment income | (0.05 | ) | (0.13 | ) | ||||||||||||||||
Net realized gains on investments | (0.16 | ) | (0.56 | ) | ||||||||||||||||
Total distributions | (0.21 | ) | (0.69 | ) | ||||||||||||||||
Paid-in capital from redemption fees (Note 4) | 0.03 | — | ||||||||||||||||||
Net Asset Value, end of period | $9.59 | $11.87 | ||||||||||||||||||
TOTAL RETURN | (17.48% | ) | 6.19% | 5 | ||||||||||||||||
RATIOS/SUPPLEMENTAL DATA | ||||||||||||||||||||
Net assets, end of period (in 000’s) | $20,740 | $476 | ||||||||||||||||||
Ratio of expenses to average net assets before any reimbursement, waiver or recapture of expenses by Advisor and Administrator (Note 5) | 1.79% | 2.09% | 6 | |||||||||||||||||
Ratio of expenses to average net assets after any reimbursement, waiver or recapture of expenses by Advisor and Administrator | 1.25% | 1.25% | 6 | |||||||||||||||||
Ratio of net investment income (loss) to average net assets | 1.05% | (1.20% | )6 | |||||||||||||||||
Portfolio turnover3 | 76.67% | 67.22% | 5 | |||||||||||||||||
| 1 | Calculated using the average daily shares method. |
| 2 | Less than $0.01 per share. |
| 3 | The portfolio turnover rate is calculated on the Fund as a whole without distinguishing between classes of shares issued. |
| 4 | Institutional Class commenced operations on November 30, 2017. |
| 5 | Not annualized. |
| 6 | Annualized. |
See accompanying notes to financial statements.
| 140 | MATTHEWS ASIA FUNDS |
Table of Contents
| 1. | ORGANIZATION |
Matthews Asia Funds (the “Trust”) is an open-end management investment company registered under the Investment Company Act of 1940, as amended (the “1940 Act”). The Trust currently issues eighteen separate series of shares (each a “Fund”, and collectively, the “Funds”): Matthews Asia Strategic Income Fund, Matthews Asia Credit Opportunities Fund, Matthews Asian Growth and Income Fund, Matthews Asia Dividend Fund, Matthews China Dividend Fund, Matthews Asia Value Fund, Matthews Asia Focus Fund, Matthews Asia Growth Fund, Matthews Pacific Tiger Fund, Matthews Asia ESG Fund, Matthews Emerging Asia Fund, Matthews Asia Innovators Fund, Matthews China Fund, Matthews India Fund, Matthews Japan Fund, Matthews Korea Fund, Matthews Asia Small Companies Fund, and Matthews China Small Companies Fund. Each Fund currently offers two classes of shares: Investor Class and Institutional Class. Each class of shares has identical voting, dividend, liquidation and other rights and the same terms and conditions, except each class may be subject to different class expenses as outlined in the relevant prospectus and each class has exclusive voting rights with respect to matters solely affecting such class.
| 2. | SIGNIFICANT ACCOUNTING POLICIES |
The following is a summary of significant accounting policies consistently followed by the Funds in preparation of their financial statements.
| A. | SECURITY VALUATION: The value of the Trust’s securities is based on market quotations for those securities, or on their fair value determined by the valuation policies approved by the Funds’ Board of Trustees (the “Board”). Market quotations and valuation information are provided by commercial pricing services or securities dealers that are independent of the Funds and Matthews International Capital Management, LLC (“Matthews”), in accordance with procedures established by the Funds’ Board. Foreign exchange-traded securities are valued as of the close of trading on the primary exchange on which they trade. Securities that trade in over-the-counter markets, including most debt securities (bonds), may be valued by other third-party vendors or by using indicative bid quotations from dealers or market makers, or other available market information. Market values for securities are determined based on quotations, market data or other information from the principal (or most advantageous) market on which the security is traded. Market quotations for equity securities used by the Funds include last reported sale prices, or, if such prices are not reported or available, bid and ask prices. Swap agreements are valued utilizing quotes received daily by the Funds’ pricing service or through brokers, which are derived using daily swap curves and models that incorporate a number of market data factors, such as discounted cash flows, trades and values of the underlying reference instruments. Foreign currency exchange contracts are valued at the mean between the bid and ask prices and are determined at the close of business on the New York Stock Exchange (“NYSE”). Interpolated values are derived when the settlement date of the contract is an interim date for which quotations are not available. The Funds may also utilize independent pricing services to assist them in determining a current market value for each security based on sources believed to be reliable. |
The Board has delegated to the Board’s Valuation Committee the responsibility for oversight of the fair valuation process under the Trust’s Valuation and Pricing Policy. The Board’s Valuation Committee, in turn, has delegated the determination of fair value prices under Matthews’ Valuation and Pricing Procedures to Matthews’ Valuation Committee (the “Valuation Committee”). The Board’s Valuation Committee will review and approve fair value determinations by Matthews’ Valuation Committee in accordance with the Valuation and Pricing Policy. When fair value pricing is employed, the prices of securities used by a Fund to calculate its Net Asset Value (“NAV”) may differ from any quoted or published prices for the same securities for that day. All fair value determinations are made subject to the Board’s oversight. Events affecting the value of foreign investments may occur between the time at which they are determined and when the Funds calculate their NAV, which is normally the close of trading on the NYSE. If such events render market quotations unreliable, and the impact of such events can be reasonably determined, the investments will be valued at their fair value in accordance with pricing policies. The fair value of a security held by the Funds may be determined using the services of third-party pricing services to assist in this process.
The books and records of the Funds are maintained in U.S. dollars. Transactions, portfolio securities, and assets and liabilities denominated in a foreign currency are translated and recorded in U.S. dollars at the prevailing exchange rate as of the close of trading on the NYSE. Translation gains or losses resulting from changes in the exchange rate during the reporting period and realized gains and losses on the settlement of foreign currency transactions are reported in the results of operations for the current period. The Funds isolate that portion of gains and losses on investments in fixed income securities that is due to changes in foreign exchange rate from that which is due to changes in market prices of securities.
Foreign securities held by the Funds may be traded on days and at times when the NYSE is closed. Accordingly, the value of the Funds may be significantly affected on days when shareholders have no access to the Funds.
| B. | FAIR VALUE MEASUREMENTS: In accordance with the guidance on fair value measurements and disclosures under generally accepted accounting principles in the United States (“U.S. GAAP”), the Funds prioritize the determination of the fair value of their investments and derivative financial instruments using a hierarchy based on the inputs used to measure the fair value. |
The hierarchy and the inputs utilized are as follows:
Level 1: Quoted prices in active markets for identical securities (foreign securities that are valued based on market quotations).
Level 2: Other significant observable inputs. Certain foreign securities may be fair valued by Matthews using information such as quoted prices for similar securities, interest rates, prepayment speeds, credit risk, and foreign exchange. Additionally, external pricing services are used when the Funds determine that events affecting the value of foreign securities which occur between the time at which they are determined and the close of trading on the NYSE render market quotations unreliable.
Level 3: Significant unobservable inputs. As described in Note 2-A, Level 3 securities are valued based on significant unobservable inputs as determined under the direction of the Board. Characterization of such securities as Level 3 securities are not necessarily an indication of their liquidity or the risk associated with investing in these securities. A significant change in the unobservable inputs could result in a significantly lower or higher value in such Level 3 securities and could impact overall Fund performance. Level 3 securities consisted of equities that, as of December 31, 2018, were suspended from trading.
| matthewsasia.com | 800.789.ASIA | 141 |
Table of Contents
Notes to Financial Statements(continued)
Levels for Multi-Country Funds (1 of 2):
Summary of inputs used to determine the fair valuation of the multi-country Funds’ investments as of December 31, 2018.
| Matthews Asia Strategic Income Fund | Matthews Asia Credit Opportunities Fund | Matthews Asian Growth and Income Fund | Matthews Asia Dividend Fund | Matthews Asia Value Fund | Matthews Asia Focus Fund | Matthews Asia Growth Fund | ||||||||||||||||||||||
| Assets: | ||||||||||||||||||||||||||||
| Investments: | ||||||||||||||||||||||||||||
Level 1: Quoted Prices | ||||||||||||||||||||||||||||
Common Equities: | ||||||||||||||||||||||||||||
Bangladesh | $— | $— | $— | $70,525,273 | $— | $— | $13,508,295 | |||||||||||||||||||||
China/Hong Kong | — | — | 51,586,303 | 140,105,422 | 1,797,542 | 162,405 | 104,344,205 | |||||||||||||||||||||
Philippines | — | — | — | — | — | — | 5,130,193 | |||||||||||||||||||||
Singapore | — | — | — | 45,851,208 | 625,274 | — | — | |||||||||||||||||||||
South Korea | — | — | 20,823,242 | — | — | 195,510 | — | |||||||||||||||||||||
Sri Lanka | — | — | — | — | — | — | 26,678,083 | |||||||||||||||||||||
Taiwan | — | — | — | 87,193,969 | — | — | — | |||||||||||||||||||||
United States | — | — | 52,693,512 | — | 323,748 | 342,438 | — | |||||||||||||||||||||
Level 2: Other Significant Observable Inputs | ||||||||||||||||||||||||||||
Foreign Government Obligationsa | 14,268,850 | 4,493,091 | — | — | — | — | — | |||||||||||||||||||||
Non-Convertible Corporate Bondsa | 64,171,265 | 26,269,206 | — | — | — | — | — | |||||||||||||||||||||
Convertible Corporate Bondsa | 16,334,153 | 7,856,912 | 245,523,390 | — | — | — | — | |||||||||||||||||||||
Common Equities: | ||||||||||||||||||||||||||||
Australia | — | — | 55,224,732 | 91,527,205 | — | 155,720 | 43,966,211 | |||||||||||||||||||||
Bangladesh | — | — | — | — | — | — | 26,532,487 | |||||||||||||||||||||
China/Hong Kong | — | — | 395,689,681 | 1,993,340,861 | 5,368,787 | 2,631,212 | 129,467,017 | |||||||||||||||||||||
France | — | — | 21,157,297 | — | — | — | — | |||||||||||||||||||||
India | — | — | 46,925,558 | 180,252,639 | 173,781 | 412,913 | 51,277,123 | |||||||||||||||||||||
Indonesia | — | — | 25,018,979 | 117,462,726 | — | 238,989 | 103,239,656 | |||||||||||||||||||||
Japan | — | — | 36,550,452 | 1,800,336,473 | 2,031,207 | — | 342,660,227 | |||||||||||||||||||||
Luxembourg | — | — | — | — | — | — | — | |||||||||||||||||||||
Malaysia | — | — | 17,640,606 | — | 1,461,181 | 116,536 | — | |||||||||||||||||||||
Philippines | — | — | 22,815,422 | 88,060,194 | — | 195,820 | 11,141,806 | |||||||||||||||||||||
Singapore | — | — | 127,175,409 | 175,505,974 | 689,571 | 807,350 | — | |||||||||||||||||||||
South Korea | — | — | 88,762,776 | 503,094,135 | 3,415,129 | 274,398 | — | |||||||||||||||||||||
Switzerland | — | — | — | — | — | 185,660 | — | |||||||||||||||||||||
Taiwan | — | — | 104,438,077 | 170,330,731 | 329,387 | 518,431 | 11,132,450 | |||||||||||||||||||||
Thailand | — | — | 19,768,154 | 84,743,725 | — | 176,399 | 12,087,487 | |||||||||||||||||||||
United Kingdom | — | — | 23,455,745 | — | — | 143,280 | — | |||||||||||||||||||||
Vietnam | — | — | 21,198,920 | 77,892,692 | — | — | 16,165,247 | |||||||||||||||||||||
Preferred Equities: | ||||||||||||||||||||||||||||
South Korea | — | — | 25,597,242 | 123,882,568 | 1,856,073 | — | — | |||||||||||||||||||||
Level 3: Significant Unobservable Inputs | — | — | — | — | — | — | — | |||||||||||||||||||||
Total Market Value of Investments | $94,774,268 | $38,619,209 | $1,402,045,497 | $5,750,105,795 | $18,071,680 | $6,557,061 | $897,330,487 | |||||||||||||||||||||
| a | Industry, countries, or security types are disclosed on the Schedule of Investments. |
| 142 | MATTHEWS ASIA FUNDS |
Table of Contents
Notes to Financial Statements(continued)
Levels for Multi-Country Funds (2 of 2):
Summary of inputs used to determine the fair valuation of the multi-country Funds’ investments as of December 31, 2018.
| Matthews Pacific Tiger Fund | Matthews Asia ESG Fund | Matthews Emerging Asia Fund | Matthews Asia Innovators Fund | Matthews Asia Small Companies Fund | ||||||||||||||||
| Assets: | ||||||||||||||||||||
| Investments: | ||||||||||||||||||||
Level 1: Quoted Prices | ||||||||||||||||||||
Common Equities: | ||||||||||||||||||||
Bangladesh | $— | $1,249,720 | $36,395,895 | $5,633,387 | $— | |||||||||||||||
China/Hong Kong | 616,771,183 | 128,523 | — | 43,195,137 | 5,890,180 | |||||||||||||||
Indonesia | 30,860,703 | 480,910 | 15,118,877 | — | 9,258,507 | |||||||||||||||
Japan | 6,658,272 | — | — | — | — | |||||||||||||||
Pakistan | — | — | 38,300,368 | — | — | |||||||||||||||
Philippines | — | — | 26,315,227 | — | 2,272,703 | |||||||||||||||
Sri Lanka | — | — | 38,047,851 | — | — | |||||||||||||||
United States | 138,805,368 | — | — | — | 1,323,014 | |||||||||||||||
Vietnam | — | — | 7,620,891 | — | 7,453,311 | |||||||||||||||
Level 2: Other Significant Observable Inputs | ||||||||||||||||||||
Common Equities: | ||||||||||||||||||||
Australia | — | — | 2,353,839 | — | 2,216,045 | |||||||||||||||
Bangladesh | — | 458,814 | 18,057,084 | 3,679,158 | — | |||||||||||||||
China/Hong Kong | 2,299,828,095 | 6,875,524 | 16,554,158 | 91,384,073 | 57,824,278 | |||||||||||||||
India | 1,822,676,520 | 4,448,396 | 25,211,212 | 27,509,715 | 25,992,944 | |||||||||||||||
Indonesia | 579,482,379 | 1,353,528 | 60,444,287 | 6,373,851 | 2,959,852 | |||||||||||||||
Japan | — | 4,199,218 | — | — | 4,569,435 | |||||||||||||||
Luxembourg | — | 191,545 | — | — | — | |||||||||||||||
Malaysia | 328,524,090 | — | — | — | 6,231,873 | |||||||||||||||
Pakistan | — | 251,266 | 5,955,515 | — | — | |||||||||||||||
Philippines | 195,391,577 | 487,391 | — | 3,552,127 | — | |||||||||||||||
Singapore | — | 1,153,153 | 2,645,563 | 6,942,029 | 2,509,199 | |||||||||||||||
South Korea | 1,013,464,745 | 1,437,047 | — | 34,684,582 | 17,503,367 | |||||||||||||||
Switzerland | 197,817,440 | — | — | — | — | |||||||||||||||
Taiwan | 411,047,456 | 2,673,681 | — | 6,180,808 | 26,584,418 | |||||||||||||||
Thailand | 433,667,536 | 774,926 | — | 3,509,655 | 12,796,005 | |||||||||||||||
Vietnam | 178,227,105 | 365,601 | 80,524,672 | 7,657,313 | 8,040,941 | |||||||||||||||
Preferred Equities: | ||||||||||||||||||||
South Korea | — | 1,412,730 | — | — | — | |||||||||||||||
Rights: | ||||||||||||||||||||
Taiwan | — | 311 | — | — | — | |||||||||||||||
Level 3: Significant Unobservable Inputs | — | — | — | — | — | |||||||||||||||
Total Market Value of Investments | $8,253,222,469 | $27,942,284 | $373,545,439 | $240,301,835 | $193,426,072 | |||||||||||||||
| matthewsasia.com | 800.789.ASIA | 143 |
Table of Contents
Notes to Financial Statements(continued)
Levels for Single Country Funds:
Summary of inputs used to determine the fair valuation of the single country Funds’ investments as of December 31, 2018.
| Matthews China Dividend Fund | Matthews China Fund | Matthews India Fund | Matthews Japan Fund | Matthews Korea Fund | Matthews China Small Companies Fund | |||||||||||||||||||
| Assets: | ||||||||||||||||||||||||
| Investments: | ||||||||||||||||||||||||
Level 1: Quoted Prices | ||||||||||||||||||||||||
Common Equities: | ||||||||||||||||||||||||
Consumer Discretionary | $— | $70,013,694 | $— | $— | $— | $1,364,107 | ||||||||||||||||||
Communication Services | 8,118,240 | 33,323,355 | — | — | 2,060,920 | 986,604 | ||||||||||||||||||
Financials | 2,374,990 | — | — | — | — | — | ||||||||||||||||||
Health Care | — | — | — | — | — | 2,076,549 | ||||||||||||||||||
Industrials | — | 8,273,300 | — | — | — | — | ||||||||||||||||||
Information Technology | — | — | 63,341,404 | — | — | 623,430 | ||||||||||||||||||
Level 2: Other Significant Observable Inputs | ||||||||||||||||||||||||
Common Equities: | ||||||||||||||||||||||||
Consumer Discretionary | 35,382,158 | 68,349,393 | 222,498,168 | 471,684,178 | 17,559,160 | 8,025,488 | ||||||||||||||||||
Communication Services | 30,475,827 | 64,729,766 | 25,494,003 | 173,900,286 | 5,446,040 | — | ||||||||||||||||||
Consumer Staples | 32,696,790 | 25,918,212 | 209,232,820 | 286,991,310 | 14,952,897 | 3,173,717 | ||||||||||||||||||
Energy | 11,730,961 | 11,912,211 | — | — | 2,698,557 | 2,775,619 | ||||||||||||||||||
Financials | 30,995,808 | 199,994,490 | 546,033,611 | 274,008,095 | 24,279,160 | 681,436 | ||||||||||||||||||
Health Care | 17,019,789 | 12,929,418 | 185,546,570 | 314,433,169 | 10,627,005 | 4,419,336 | ||||||||||||||||||
Industrials | 33,917,362 | 8,737,913 | 145,631,766 | 710,451,359 | 3,528,563 | 10,017,182 | ||||||||||||||||||
Information Technology | 17,205,233 | 28,077,764 | 80,963,402 | 474,216,381 | 13,712,448 | 12,125,908 | ||||||||||||||||||
Materials | 15,091,485 | 34,486,077 | 70,911,756 | 71,552,762 | 7,880,327 | 4,712,854 | ||||||||||||||||||
Real Estate | 17,416,220 | 40,222,384 | — | 65,651,920 | — | 3,825,629 | ||||||||||||||||||
Utilities | 13,731,008 | 5,101,191 | — | — | — | — | ||||||||||||||||||
Preferred Equities: | ||||||||||||||||||||||||
Consumer Discretionary | — | — | — | — | 5,342,136 | — | ||||||||||||||||||
Consumer Staples | — | — | — | — | 8,572,583 | — | ||||||||||||||||||
Energy | — | — | — | — | 1,912,812 | — | ||||||||||||||||||
Financials | — | — | — | — | 6,476,933 | — | ||||||||||||||||||
Information Technology | — | — | — | — | 9,258,810 | — | ||||||||||||||||||
Materials | — | — | — | — | 4,654,859 | — | ||||||||||||||||||
Rights: | ||||||||||||||||||||||||
Information Technology | — | — | — | — | — | 814 | ||||||||||||||||||
Convertible Corporate Bonds: | ||||||||||||||||||||||||
Consumer Discretionary | 194,441 | — | — | — | — | — | ||||||||||||||||||
Level 3: Significant Unobservable Inputs | ||||||||||||||||||||||||
Common Equities: | ||||||||||||||||||||||||
Information Technology | — | — | — | — | — | 249 | ||||||||||||||||||
Total Market Value of Investments | $266,350,312 | $612,069,168 | $1,549,653,500 | $2,842,889,460 | $138,963,210 | $54,808,922 | ||||||||||||||||||
Levels for Derivative Financial Instruments:
Summary of inputs used to determine the fair valuation of the Funds’ derivative financial instruments as of December 31, 2018.
| Matthews Asia Strategic Income Fund | Matthews Asia Credit Opportunities Fund | |||||||||||||||||||||||||||||||
| Derivative Financial Instruments1 | ||||||||||||||||||||||||||||||||
Assets | ||||||||||||||||||||||||||||||||
Level 2: Other Significant Observable Inputs | ||||||||||||||||||||||||||||||||
Forward Foreign Currency Exchange Contracts | $932,785 | $11,732 | ||||||||||||||||||||||||||||||
|
| |||||||||||||||||||||||||||||||
Liabilities | ||||||||||||||||||||||||||||||||
Level 2: Other Significant Observable Inputs | ||||||||||||||||||||||||||||||||
Forward Foreign Currency Exchange Contracts | ($238,905 | ) | ($11,004 | ) | ||||||||||||||||||||||||||||
|
| |||||||||||||||||||||||||||||||
| 1 | Derivative financial instruments are forward foreign currency exchange contracts. Forward foreign currency exchange contracts are valued at the unrealized appreciation/depreciation on the instrument. |
| 144 | MATTHEWS ASIA FUNDS |
Table of Contents
Notes to Financial Statements(continued)
Changes in the Balances of Level 3 Securities:
The Funds’ policy is to recognize transfers in and transfers out of Level 3 during the reporting period.
| Matthews Korea Fund | Matthews Asia Small Companies Fund | Matthews China Small Companies Fund | ||||||||||
| Common Equities — Consumer Discretionary | Common Equities — South Korea | Common Equities — Information Technology | ||||||||||
| Balance as of 12/31/17 (market value) | $2,158,539 | $3,491,660 | $250 | |||||||||
| Accrued discounts/premiums | — | — | — | |||||||||
| Realized gain/(loss) | (1,060,424 | ) | 1,368,937 | — | ||||||||
| Change in unrealized appreciation/ (depreciation) | (407,564 | ) | 1,012,653 | (1 | ) | |||||||
| Purchases | — | — | — | |||||||||
| Sales | (690,551 | ) | (5,873,250 | ) | — | |||||||
| Transfers in to Level 3* | — | — | — | |||||||||
| Transfer out of Level 3* | — | — | — | |||||||||
| Balance as of 12/31/18 (market value) | $— | $— | $249 | |||||||||
| Net change in unrealized appreciation/depreciation on Level 3 investments held as of 12/31/18** | $— | $— | ($1 | ) | ||||||||
| * | The Funds’ policy is to recognize transfers in and transfers out as of the beginning of the reporting period. |
| ** | Included in the related amounts on the Statements of Operations. |
Certain foreign securities, for which market quotations are not readily available, may be fair valued and classified as either Level 2 or Level 3. When the underlying inputs include significant observable inputs obtained from sources independent of the Funds, the securities are classified as Level 2. These inputs include evaluated prices from the Funds’ pricing vendors, day-on-day price changes, primary and ancillary pricing sources, and other available independent market indicators of value. When the underlying inputs include significant unobservable inputs and reflect assumptions of market participants, the securities are classified as Level 3. Certain securities held by the Funds that were suspended from trading and classified as Level 3 on December 31, 2017 subsequently resumed trading and were transferred from Level 3 to Level 1, Level 2 or were sold.
| C. | BASIS OF CONSOLIDATION: The accompanying consolidated financial statements of Matthews China Fund and Matthews Asia Dividend Fund (the “Investing Funds”) for the 2014-2016 period include the accounts of the Matthews CF-U Series and Matthews ADF-U Series (the “U Series Funds”), respectively. The U Series Funds were series of Matthews A Share Selections Fund, LLC, a Delaware limited liability company registered under the 1940 Act. All of the interests offered by U Series Funds were exclusively owned by the Investing Funds. The U Series Funds primarily invested in the stocks of Chinese companies listed on Mainland China Stock Exchanges, and traded and denominated in the currency of China, the renminbi. To allow U Series Funds to invest in China A Shares Matthews applied for and received a license from the China Securities Regulatory Commission as a Qualified Foreign Institutional Investor (“QFII”) and had been allocated by the State Administration of Foreign Exchange of China an initial quota of $100 million in June 2014, and an additional quota of $440 million in July 2015, representing the equivalent value in renminbi of China A Shares that the Funds could purchase. Access to the quota was subject to Matthews’ trade allocation procedures and access allocation procedures. The U Series Funds were subject to the same investment policies and restrictions that apply to Investing Funds. Intercompany accounts and transactions, if any, have been eliminated in the consolidation process. The U Series Funds were intended to be disregarded entities for tax purposes. Therefore, no federal tax provision was required. Consolidated financial statements include expenses that are accrued for and paid by the Investing Funds. These include on-going operational costs as well as costs in connection with the launching of the U Series Funds. |
In September 2016, the Board of Directors of the Matthews A Share Selections Fund, LLC adopted resolutions authorizing the termination and liquidation of the Matthews A Share Selections Fund, LLC. Consequently, as of September 30, 2016, the U Series Funds sold their securities and effectively ceased investment operations. The outstanding interests of each U Series Fund were redeemed by its respective Investing Fund. The Matthews A Share Selections Fund, LLC filed an initial application for deregistration as a registered investment company with the U.S. Securities and Exchange Commission in October 2016, which was subsequently granted in February 2017.
| D. | RISKS ASSOCIATED WITH NON-U.S. COMPANIES: Investments by the Funds in the securities of non-U.S. companies may involve investment risks not typically associated with investments in U.S. issuers. These risks include possible political, economic, social and religious instability, inadequate investor protection; changes in laws or regulations of countries within the Asia Pacific region (including in countries where the Funds may invest, as well as in the broader region); international relations with other nations; natural disasters; corruption; and military activity. Foreign securities may be subject to greater fluctuations in price than securities of domestic corporations or the U.S. government. Foreign investing may also include the risk of expropriation or confiscatory taxation, limitation on the removal of funds or other assets, currency crises and exchange controls, the imposition of foreign withholding tax on the interest income payable on such instruments, the possible seizure or nationalization of foreign deposits or assets, or the adoption of other foreign government restrictions that might adversely affect the foreign securities held by the Funds. Additionally, Asia Pacific countries may utilize formal or informal currency exchange controls or “capital controls” that may limit the ability to repatriate investments or income or adversely affect the value of portfolio investments. The economies of many Asia Pacific countries differ from the economies of more developed countries in many respects, such as their rate of growth, inflation, capital reinvestment, resource self-sufficiency and dependence on other economies, financial system stability, the national balance of payments position and sensitivity to changes in global trade. |
Certain Asia Pacific countries are highly dependent upon and may be affected by developments in the economies of other countries. Non-U.S. companies are subject to different accounting, auditing, and financial reporting standards, practices, and requirements than U.S. companies. There is generally less government regulation of stock exchanges, brokers, and listed companies abroad than in the United States, which may result in less transparency with respect to a company’s operations, and make obtaining information about them more difficult (or such information may be unavailable).
| matthewsasia.com | 800.789.ASIA | 145 |
Table of Contents
Notes to Financial Statements(continued)
Foreign stock markets may not be as developed or efficient as those in the United States, and the absence of negotiated brokerage commissions in certain countries may result in higher brokerage fees. The time between the trade and settlement dates of securities transactions on foreign exchanges ranges from one day to four weeks or longer and may result in higher custody charges. Custodial arrangements may be less well developed than in the United States. Foreign securities are generally denominated and pay distributions in foreign currencies, exposing the Funds to changes in foreign currency exchange rates. Investing in any country in the Asia Pacific region will also entail risks specific and unique to that country, and these risks can be significant and change rapidly.
Changes in interest rates in each of the countries in which the Funds may invest, as well as interest rates in more-developed countries, may cause a decline in the market value of an investment. Generally, fixed income securities will decrease in value when interest rates rise and can be expected to rise in value when interest rates decline. As interest rates decline, debt issuers may repay or refinance their loans or obligations earlier than anticipated. The issuers of fixed income securities may, therefore, repay principal in advance. This would force the Funds to reinvest the proceeds from the principal prepayments at lower rates, which reduces the Funds’ income.
| E. | DISTRIBUTIONS TO SHAREHOLDERS: It is the policy of Matthews Asian Growth and Income Fund and Matthews China Dividend Fund to distribute net investment income on a semi-annual basis and capital gains, if any, annually. It is the policy of Matthews Asia Dividend Fund, Matthews Asia Strategic Income Fund and Matthews Asia Credit Opportunities Fund to distribute net investment income on a quarterly basis and capital gains, if any, annually. Each of the other Funds distributes a net investment income and capital gains, if any, annually. Distributions to shareholders are recorded on the ex-dividend date. Income and capital gain distributions are determined in accordance with income tax regulations which may differ from U.S. GAAP. |
The tax character of distributions paid for the fiscal year ended December 31, 2018 and December 31, 2017 were as follows:
| YEAR ENDED DECEMBER 31, 2018 | Ordinary Income | Net Long-Term Capital Gains | Total Taxable Distributions | Return of Capital | ||||||||||||
| Matthews Asia Strategic Income Fund | $2,884,604 | $— | $2,884,604 | $381,950 | ||||||||||||
| Matthews Asia Credit Opportunities Fund | 1,411,365 | — | 1,411,365 | — | ||||||||||||
| Matthews Asian Growth and Income Fund | 46,680,045 | 180,408,534 | 227,088,579 | — | ||||||||||||
| Matthews Asia Dividend Fund | 226,081,829 | 266,855,532 | 492,937,361 | — | ||||||||||||
| Matthews China Dividend Fund | 11,590,471 | 24,594,264 | 36,184,735 | — | ||||||||||||
| Matthews Asia Value Fund | 1,125,780 | 159,629 | 1,285,409 | — | ||||||||||||
| Matthews Asia Focus Fund | 189,489 | 550,312 | 739,801 | — | ||||||||||||
| Matthews Asia Growth Fund | 8,510,896 | 6,873,778 | 15,384,674 | — | ||||||||||||
| Matthews Pacific Tiger Fund | 192,063,450 | 248,646,631 | 440,710,081 | — | ||||||||||||
| Matthews Asia ESG Fund | 110,310 | 861,827 | 972,137 | — | ||||||||||||
| Matthews Emerging Asia Fund | 3,675,977 | 8,952,247 | 12,628,224 | — | ||||||||||||
| Matthews Asia Innovators Fund | 1,092,195 | 8,851,877 | 9,944,072 | — | ||||||||||||
| Matthews China Fund | 9,777,889 | 126,839,507 | 136,617,396 | — | ||||||||||||
| Matthews India Fund | — | 279,269,366 | 279,269,366 | — | ||||||||||||
| Matthews Japan Fund | 19,888,292 | 136,613,164 | 156,501,456 | — | ||||||||||||
| Matthews Korea Fund | 2,951,789 | 24,410,239 | 27,362,028 | — | ||||||||||||
| Matthews Asia Small Companies Fund | 2,523,811 | 43,064,299 | 45,588,110 | — | ||||||||||||
| Matthews China Small Companies Fund | 368,243 | 2,204,423 | 2,572,666 | — | ||||||||||||
| YEAR ENDED DECEMBER 31, 2017 | Ordinary Income | Net Long-Term Capital Gains | Total Taxable Distributions | |||||||||||||
| Matthews Asia Strategic Income Fund | $3,275,012 | $— | $3,275,012 | |||||||||||||
| Matthews Asia Credit Opportunities Fund | 1,099,964 | 111,284 | 1,211,248 | |||||||||||||
| Matthews Asian Growth and Income Fund | 76,634,444 | 42,640,486 | 119,274,930 | |||||||||||||
| Matthews Asia Dividend Fund | 237,413,324 | 144,064,822 | 381,478,146 | |||||||||||||
| Matthews China Dividend Fund | 17,609,713 | 12,048,945 | 29,658,658 | |||||||||||||
| Matthews Asia Value Fund | 1,364,007 | 265,211 | 1,629,218 | |||||||||||||
| Matthews Asia Focus Fund | 137,271 | — | 137,271 | |||||||||||||
| Matthews Asia Growth Fund | 13,817,623 | 45,847,848 | 59,665,471 | |||||||||||||
| Matthews Pacific Tiger Fund | 74,772,355 | 54,354,798 | 129,127,153 | |||||||||||||
| Matthews Asia ESG Fund | 502,242 | 142,064 | 644,306 | |||||||||||||
| Matthews Emerging Asia Fund | 2,448,800 | 910,694 | 3,359,494 | |||||||||||||
| Matthews Asia Innovators Fund | 3,439,895 | 13,051,975 | 16,491,870 | |||||||||||||
| Matthews China Fund | 58,708,744 | 33,489,520 | 92,198,264 | |||||||||||||
| Matthews India Fund | 624,624 | 32,428,674 | 33,053,298 | |||||||||||||
| Matthews Japan Fund | 37,593,412 | 118,095,898 | 155,689,310 | |||||||||||||
| Matthews Korea Fund | 9,264,412 | 10,189,013 | 19,453,425 | |||||||||||||
| Matthews Asia Small Companies Fund | 15,911,087 | 20,779,556 | 36,690,643 | |||||||||||||
| Matthews China Small Companies Fund | 1,230,339 | 842,837 | 2,073,176 | |||||||||||||
| F. | INVESTMENT TRANSACTIONS AND INCOME: Securities transactions are accounted for on the date the securities are purchased or sold or on the following business day. Financial statements reflect security transactions on trade date. Gains or losses on the sale of securities are determined on the identified cost basis. Interest income is recorded on the accrual basis. Interest income, including amortization and accretion of premiums and discounts |
| 146 | MATTHEWS ASIA FUNDS |
Table of Contents
Notes to Financial Statements(continued)
| on debt securities, is recognized daily on an accrual basis. For convertible securities, premiums attributable to the conversion feature are not amortized. Dividend income is generally recorded on the ex-dividend date net of any foreign taxes withheld at the source. Dividend income for certain issuers headquartered in countries which the Funds invest may not be recorded until approved by the shareholders (which may occur after the ex-dividend date) if, in the judgment of management, such dividends are not reasonably determined as of the ex-dividend date. Income and realized and unrealized gains or losses on investments are allocated to each class of shares based on its relative net assets. |
The Funds may be subject to foreign taxation related to income received, capital gains on the sale of securities and certain foreign currency transactions in the foreign jurisdictions in which they invest. Foreign taxes, if any, are recorded based on the tax regulations and rates that exist in the foreign markets in which the Funds invest. When a capital gain tax is determined to apply, the Funds record an estimated deferred tax liability in an amount that may be payable if the securities were disposed of on the valuation date.
| G. | FUND EXPENSE ALLOCATIONS: The Funds account separately for the assets, liabilities and operations of each Fund. Estimated expenses are accrued daily. Direct expenses of each Fund or class are charged to that Fund or class while general expenses are allocated pro-rata among the Funds based on net assets or other appropriate methods. |
| H. | CASH, CASH OVERDRAFTS, AND FOREIGN CURRENCY: QFII accounts (i.e., the accounts through which the QFII quota is accessed) are required by the local market to maintain a cash reserve. The cash reserve is based upon a fixed ratio of the QFII’s approved investment quota, which is defined as the amount remitted into its special renminbi (RMB) cash account. These amounts, if any, are included in “Segregated foreign currency at value” on the Statements of Assets and Liabilities. The fixed ratio is set at 0.08 percent for the Shanghai and 0.06 percent for the Shenzhen market. When any of the Funds’ cash balances are overdrawn, a Fund is charged an overdraft fee by the custodian of 1.00% above the 30-day LIBOR rate on outstanding balances. These amounts, if any, are included in “Other expenses” on the Statements of Operations. |
| I. | USE OF ESTIMATES: The preparation of financial statements in conformity with U.S. GAAP requires management to make estimates and assumptions that affect the amounts reported in the financial statements and accompanying notes. Actual results may differ from those estimates. |
| J. | RECENT ACCOUNTING GUIDANCE: In March 2017, the Financial Accounting Standards Board issued amended guidance to shorten the amortization period for certain callable debt securities, held at premium. The guidance is effective for fiscal years and interim periods beginning after December 15, 2018. Adoption will have no effect on the Funds’ net assets. Management is evaluating the impact, if any, of this guidance on the Funds’ results of operations and financial disclosures. |
The Securities and Exchange Commission (SEC) adopted changes to Regulation S-X to simplify the reporting of information by registered investment companies in financial statements. The amendments require presentation of the total, rather than the components, of distributable earnings on the Statements of Assets and Liabilities and also require presentation of the total, rather than the components, of distributions to shareholders, except for tax return of capital distributions, if any, on the Statements of Changes in Net Assets. The amendments also removed the requirement for parenthetical disclosure of undistributed net investment income on the Statements of Changes in Net Assets. These Regulation S-X amendments are reflected in the Funds financial statements for the year ended December 31, 2018. As a result of adopting these amendments, the distributions to shareholders in the December 31, 2017 Statements of Changes in Net Assets presented herein have been reclassified to conform to the current year presentation.
On August 28, 2018, the FASB issued ASU 2018-13, “Disclosure Framework—Changes to the Disclosure Requirements for Fair Value Measurement”, which amends the fair value measurement disclosure requirements under U.S. GAAP. The amendments of ASU 2018-13 include new, eliminated, and modified disclosure requirements. In addition, the amendments clarify that materiality is an appropriate consideration of entities when evaluating disclosure requirements. The ASU is effective for all entities for fiscal years beginning after December 15, 2019, including interim periods therein. An entity is permitted to early adopt any eliminated or modified disclosures upon issuance of this ASU and delay adoption of the new disclosures until their effective date. As such, each Fund has early adopted the eliminated and modified disclosures, including the amount of and reasons for transfers between Level 1 and Level 2 of the fair value hierarchy, as permitted by this ASU. Management is currently evaluating the impact that the adoption of the new disclosures will have on the Funds’ financial statements.
| 3. | DERIVATIVE FINANCIAL INSTRUMENTS |
Each of the Matthews Asia Strategic Income Fund and the Matthews Asia Credit Opportunities Fund engages in derivative transactions for a variety of purposes, including managing interest rate, currency and credit exposure. Derivative transactions in which each Fund may engage include financial futures contracts, swaps and/or forward foreign currency exchange contracts.
Certain derivative transactions may result in each Fund’s exposure to a currency to exceed the value of the Fund’s assets and the Fund could be exposed to currency risk whether or not it holds a bond or other instrument denominated in that currency. The gross notional value of derivative financial instruments and transactions could exceed the value of the Fund’s net assets, although the net market value of these instruments and transactions, on a marked-to-market basis, at most times, is expected to be substantially lower.
The primary risks associated with the use of derivative financial instruments are: (i) Matthews may not correctly predict the direction of currency exchange rates, interest rates, security prices, or other economic factors; (ii) Matthews may not correctly predict changes in the value of derivative financial instruments and related underlying instruments or assets, which may result in disproportionately increased losses and/or reduced opportunities for gains; (iii) imperfect correlation between the change in market value of the securities held by a Fund and the price of financial futures contracts and credit default swaps contracts; (iv) the lack of, or a reduction in the liquidity of, any secondary market for the instrument, and the resulting inability to close the position (or exit the position) when desired; (v) losses, which are potentially unlimited, due to unanticipated market movements; (vi) the value of the instrument may change unfavorably due to movements in the value of the referenced foreign currencies; (vii) a Fund may suffer disproportionately heavy losses relative to the amount invested; (viii) changes in the value of the derivatives may not match or fully offset changes in the value of hedged or related portfolio securities, thereby failing to achieve the hedging or investment purpose for the derivative transaction; and (ix) the other party to the instrument may fail to fulfill its obligation.
Forward Foreign Currency Exchange Contracts: The Matthews Asia Strategic Income Fund and the Matthews Asia Credit Opportunities Fund enter into forward foreign currency exchange contracts to gain or reduce exposure to foreign currency exchange rate risk. A forward foreign currency exchange contract is an agreement between two parties to buy and sell a currency at a set exchange rate on a future date. The contract is marked-to-market daily and the change in market value is recorded by the Fund as an unrealized gain or loss. When the contract is closed, the Fund records a realized gain or loss equal to the difference between the value at the time it was opened and the value at the time it was closed. The Matthews Asia Strategic Income Fund and the Matthews Asia Credit Opportunities Fund do not offset financial assets and financial liabilities on forward foreign currency contacts in the Statements of Assets and Liabilities as they are not subject to netting arrangements.
Swaps: The Matthews Asia Strategic Income Fund and the Matthews Asia Credit Opportunities Fund enter into swap contracts to manage exposure to issuers, markets and securities to reduce their risk exposure to defaults of corporate and/or sovereign issuers or to create exposure to corporate and/or sovereign issuers to which they are not otherwise exposed (credit risk). Such contracts are agreements between the Funds and a counterparty to make periodic net payments on a specified notional amount or a net payment upon termination. Swap agreements are privately negotiated in the OTC market and may be entered into as a bilateral contract (“OTC Swaps”) or centrally cleared (“centrally cleared swaps”).
For OTC swaps, any upfront premiums paid and any upfront fees received are shown as swap premiums paid and swap premiums received, respectively, in the Statements of Assets and Liabilities and amortized over the term of the contract. The daily fluctuation in market value is recorded as unrealized appreciation (depreciation) on OTC Swaps in the Statements of Assets and Liabilities. Payments received or paid are recorded in the
| matthewsasia.com | 800.789.ASIA | 147 |
Table of Contents
Notes to Financial Statements(continued)
Statements of Operations as realized gains or losses, respectively. When an OTC swap is terminated, a realized gain or loss is recorded in the Statements of Operations equal to the difference between the proceeds from (or cost of) the closing transaction and the Funds’ basis in the contract, if any. Generally, the basis of the contract is the amortized premium received or paid.
The Funds may buy credit default swaps on single-name issuers (corporate or sovereign), a combination or basket of single-name issuers or traded indexes. Credit default swaps are agreements in which the protection buyer pays fixed periodic payments to the seller in consideration for a promise from the protection seller to make a specific payment should a negative credit event take place with respect to the referenced entity (e.g., bankruptcy, failure to pay, obligation acceleration, repudiation, moratorium or restructuring). As a buyer, if an underlying credit event occurs, the Funds will either (i) receive from the seller an amount equal to the notional amount of the swap and deliver the referenced security or underlying securities comprising the index, or (ii) receive a net settlement of cash equal to the notional amount of the swap less the recovery value of the security or underlying securities comprising the index.
Counterparty Credit Risk: A derivative contract may suffer a mark to market loss if the value of the contract decreases due to an unfavorable change in the market rates or values of the underlying instrument. Losses can also occur if the counterparty does not perform under the contract.
A Fund’s risk of loss from counterparty credit risk on OTC derivatives is generally limited to the aggregate unrealized gain netted against any collateral held by such Fund.
With exchange traded futures and centrally cleared swaps, there is less counterparty credit risk to the Funds since the exchange or clearinghouse, as counterparty to such instruments, guarantees against a possible default. The clearinghouse stands between the buyer and the seller of the contract; therefore, the credit risk is limited to failure of the clearinghouse. While offset rights may exist under applicable law, a Fund does not have a contractual right of offset against a clearing broker or clearinghouse in the event of a default (including the bankruptcy or insolvency) of the clearing broker or clearinghouse. Additionally, credit risk exists in exchange traded futures and centrally cleared swaps with respect to initial and variation margin that is held in a clearing broker’s customer accounts. While clearing brokers are required to segregate customer margin from their own assets, in the event that a clearing broker becomes insolvent or goes into bankruptcy and at that time there is a shortfall in the aggregate amount of margin held by the clearing broker for all its clients, typically the shortfall would be allocated on a pro rata basis across all the clearing broker’s customers, potentially resulting in losses to the Funds.
In order to better define its contractual rights and to secure rights that will help the Funds mitigate their counterparty risk, a Fund may enter into an International Swaps and Derivatives Association, Inc. Master Agreement (“ISDA Master Agreement”) or similar agreement with its derivative contract counterparties. An ISDA Master Agreement is a bilateral agreement between each Fund and a counterparty that governs OTC derivatives and typically contains, among other things, collateral posting terms and netting provisions in the event of a default and/or termination event. Under an ISDA Master Agreement, each Fund may, under certain circumstances, offset with the counterparty certain derivative financial instruments’ payables and/ or receivables with collateral held and/or posted and create one single net payment. The provisions of the ISDA Master Agreement typically permit a single net payment in the event of default including the bankruptcy or insolvency of the counterparty. However, bankruptcy or insolvency laws of a particular jurisdiction may impose restrictions on or prohibitions against the right of offset in bankruptcy, insolvency or other events. In addition, certain ISDA Master Agreements allow counterparties to OTC derivatives to terminate derivative contracts prior to maturity in the event a Fund’s net assets decline by a stated percentage or the Fund fails to meet the terms of its ISDA Master Agreements, which would cause the Fund to accelerate payment of any net liability owed to the counterparty.
Collateral requirements: For derivatives traded under an ISDA Master Agreement, the collateral requirements are typically calculated by netting the mark to market amount for each transaction under such agreement and comparing that amount to the value of any collateral currently pledged by a Fund and the counterparty. Cash collateral that has been pledged to cover obligations of a Fund, if any, is reported separately on the Statements of Assets and Liabilities as cash pledged as collateral. Non-cash collateral pledged by a Fund, if any, is noted in the Schedules of Investments.
For financial reporting purposes, the Funds do not offset derivative assets and derivative liabilities that are subject to netting arrangements in the Statements of Assets and Liabilities.
The Funds have implemented the disclosure requirements pursuant to FASB Accounting Standards update No. 2011-11, Disclosures about Offsetting Assets and Liabilities, that requires disclosures to make financial statements that are prepared under U.S. GAAP more comparable to those prepared under International Financial Reporting Standards. Under this guidance the Funds disclose in the Statements of Assets and Liabilities both gross and net information about instruments and transactions eligible for offset such as instruments and transactions subject to an agreement similar to a master netting arrangement. In addition, the Funds disclose collateral received and posted in connection with master netting agreements or similar arrangements.
Derivative Financial Instruments Categorized by Risk Exposure:
As of December 31, 2018, the fair values of derivative financial instruments were as follows:
| Statements of Assets and Liabilities Location | Matthews Asia Strategic Income Fund | Matthews Asia Credit Opportunities Fund | ||||||||
| Asset Derivatives | ||||||||||
| Forward foreign currency exchange contracts | Unrealized appreciation on forward foreign currency exchange contracts | $932,785 | $11,732 | |||||||
|
|
|
| |||||||
| Liability Derivatives | ||||||||||
| Unrealized depreciation on forward foreign currency exchange contracts | ($238,905 | ) | ($11,004 | ) | ||||||
|
|
|
| |||||||
For the fiscal year ended December 31, 2018, the effects of derivative financial instruments on the Statements of Operations were as follows:
| Derivative type | Statements of Operations Location | Matthews Asia Strategic Income Fund | Matthews Asia Credit Opportunities Fund | |||||||
Net Realized Gain (Loss) | ||||||||||
| Foreign currency contracts: | ||||||||||
Forward foreign currency exchange contracts | Net realized gain (loss) on forward foreign currency exchange contracts | ($1,119,992 | ) | $— | ||||||
|
|
|
| |||||||
Net Change In Unrealized Appreciation (Depreciation) | ||||||||||
| Foreign currency contracts: | ||||||||||
Forward foreign currency exchange contracts | Net change in unrealized appreciation/ depreciation on forward foreign currency exchange contracts | $367,451 | $728 | |||||||
|
|
|
| |||||||
| 148 | MATTHEWS ASIA FUNDS |
Table of Contents
Notes to Financial Statements(continued)
Forward foreign currency exchange contracts entered into by the Matthews Asia Strategic Income Fund and the Matthews Asia Credit Opportunities Fund, the average notional ending quarterly amounts purchased in USD were $12,540,456 and $211,250, and the average notional ending quarterly amounts sold in USD were $30,871,878 and $211,068, respectively. Matthews Asia Credit Opportunities Fund held forward foreign currency exchange contracts only during the fourth quarter of 2018. As such, the average notional calculation for the Fund includes zero values for the first three quarters of the year.
| 4. | CAPITAL SHARE TRANSACTIONS |
| Year Ended December 31, 2018 | Year Ended December 31, 2017 | |||||||||||||||
| Shares | Amount | Shares | Amount | |||||||||||||
MATTHEWS ASIA STRATEGIC INCOME FUND | ||||||||||||||||
Investor Class | ||||||||||||||||
Shares sold | 2,673,655 | $29,287,179 | 2,471,612 | $26,893,366 | ||||||||||||
Shares issued through reinvestment of distributions | 155,200 | 1,663,927 | 201,006 | 2,186,689 | ||||||||||||
Shares redeemed | (4,636,979 | ) | (49,347,994 | ) | (2,206,966 | ) | (23,732,650 | ) | ||||||||
Net increase (decrease) | (1,808,124 | ) | ($18,396,888 | ) | 465,652 | $5,347,405 | ||||||||||
Institutional Class | ||||||||||||||||
Shares sold | 4,881,483 | $52,321,637 | 1,614,574 | $17,337,778 | ||||||||||||
Shares issued through reinvestment of distributions | 114,737 | 1,209,687 | 53,679 | 584,224 | ||||||||||||
Shares redeemed | (1,981,621 | ) | (20,513,956 | ) | (114,814 | ) | (1,232,881 | ) | ||||||||
Net increase | 3,014,599 | $33,017,368 | 1,553,439 | $16,689,121 | ||||||||||||
MATTHEWS ASIA CREDIT OPPORTUNITIES FUND | ||||||||||||||||
Investor Class | ||||||||||||||||
Shares sold | 621,546 | $6,369,451 | 752,191 | $7,854,221 | ||||||||||||
Shares issued through reinvestment of distributions | 34,462 | 346,195 | 40,940 | 425,058 | ||||||||||||
Shares redeemed | (749,130 | ) | (7,545,536 | ) | (810,572 | ) | (8,398,269 | ) | ||||||||
Net (decrease) | (93,122 | ) | ($829,890 | ) | (17,441 | ) | ($118,990 | ) | ||||||||
Institutional Class | ||||||||||||||||
Shares sold | 1,955,614 | $19,773,740 | 1,540,693 | $16,092,601 | ||||||||||||
Shares issued through reinvestment of distributions | 70,100 | 697,699 | 27,293 | 283,653 | ||||||||||||
Shares redeemed | (907,590 | ) | (8,976,611 | ) | (111,862 | ) | (1,175,697 | ) | ||||||||
Net increase | 1,118,124 | $11,494,828 | 1,456,124 | $15,200,557 | ||||||||||||
MATTHEWS ASIAN GROWTH AND INCOME FUND | ||||||||||||||||
Investor Class | ||||||||||||||||
Shares sold | 7,692,701 | $124,999,548 | 14,640,738 | $241,575,990 | ||||||||||||
Shares issued through reinvestment of distributions | 6,291,585 | 90,673,150 | 3,602,819 | 61,730,211 | ||||||||||||
Shares redeemed | (44,530,783 | ) | (727,925,822 | ) | (43,082,130 | ) | (721,414,206 | ) | ||||||||
Net (decrease) | (30,546,497 | ) | ($512,253,124 | ) | (24,838,573 | ) | ($418,108,005 | ) | ||||||||
Institutional Class | ||||||||||||||||
Shares sold | 19,468,288 | $325,288,280 | 36,133,398 | $604,837,817 | ||||||||||||
Shares issued through reinvestment of distributions | 5,846,765 | 84,477,052 | 3,077,228 | 52,660,292 | ||||||||||||
Shares redeemed | (57,543,636 | ) | (917,676,867 | ) | (18,309,223 | ) | (312,385,386 | ) | ||||||||
Net increase (decrease) | (32,228,583 | ) | ($507,911,535 | ) | 20,901,403 | $345,112,723 | ||||||||||
MATTHEWS ASIA DIVIDEND FUND | ||||||||||||||||
Investor Class | ||||||||||||||||
Shares sold | 41,217,543 | $788,692,238 | 46,067,788 | $837,987,289 | ||||||||||||
Shares issued through reinvestment of distributions | 11,593,833 | 197,404,775 | 9,772,567 | 187,636,316 | ||||||||||||
Shares redeemed | (70,902,063 | ) | (1,313,499,842 | ) | (38,470,520 | ) | (679,700,431 | ) | ||||||||
Net increase (decrease) | (18,090,687 | ) | ($327,402,829 | ) | 17,369,835 | $345,923,174 | ||||||||||
Institutional Class | ||||||||||||||||
Shares sold | 60,848,321 | $1,153,786,170 | 48,661,134 | $863,508,784 | ||||||||||||
Shares issued through reinvestment of distributions | 13,060,327 | 222,009,324 | 7,450,686 | 142,974,481 | ||||||||||||
Shares redeemed | (50,882,787 | ) | (904,298,337 | ) | (20,774,459 | ) | (376,048,201 | ) | ||||||||
Net increase | 23,025,861 | $471,497,157 | 35,337,361 | $630,435,064 | ||||||||||||
| matthewsasia.com | 800.789.ASIA | 149 |
Table of Contents
Notes to Financial Statements(continued)
| Year Ended December 31, 2018 | Year Ended December 31, 2017 | |||||||||||||||
| Shares | Amount | Shares | Amount | |||||||||||||
MATTHEWS CHINA DIVIDEND FUND | ||||||||||||||||
Investor Class | ||||||||||||||||
Shares sold | 5,966,861 | $103,895,668 | 5,731,788 | $94,790,959 | ||||||||||||
Shares issued through reinvestment of distributions | 1,359,166 | 20,830,044 | 1,334,478 | 22,238,460 | ||||||||||||
Shares redeemed | (8,392,276 | ) | (143,578,333 | ) | (3,649,309 | ) | (58,975,597 | ) | ||||||||
Net increase (decrease) | (1,066,249 | ) | ($18,852,621 | ) | 3,416,957 | $58,053,822 | ||||||||||
Institutional Class | ||||||||||||||||
Shares sold | 3,759,608 | $67,020,667 | 1,139,266 | $19,168,584 | ||||||||||||
Shares issued through reinvestment of distributions | 525,095 | 8,055,027 | 283,364 | 4,723,368 | ||||||||||||
Shares redeemed | (2,258,122 | ) | (36,385,874 | ) | (317,830 | ) | (5,535,520 | ) | ||||||||
Net increase | 2,026,581 | $38,689,820 | 1,104,800 | $18,356,432 | ||||||||||||
MATTHEWS ASIA VALUE FUND | ||||||||||||||||
Investor Class | ||||||||||||||||
Shares sold | 1,051,874 | $13,252,147 | 1,946,342 | $23,869,389 | ||||||||||||
Shares issued through reinvestment of distributions | 72,411 | 795,079 | 111,073 | 1,409,511 | ||||||||||||
Shares redeemed | (1,753,683 | ) | (21,328,776 | ) | (181,234 | ) | (2,270,540 | ) | ||||||||
Net increase (decrease) | (629,398 | ) | ($7,281,550 | ) | 1,876,181 | $23,008,360 | ||||||||||
Institutional Class | ||||||||||||||||
Shares sold | 466,954 | $5,447,710 | 247,950 | $3,257,066 | ||||||||||||
Shares issued through reinvestment of distributions | 18,592 | 202,462 | 12,396 | 156,066 | ||||||||||||
Shares redeemed | (114,752 | ) | (1,403,647 | ) | (9,941 | ) | (128,456 | ) | ||||||||
Net increase | 370,794 | $4,246,525 | 250,405 | $3,284,676 | ||||||||||||
MATTHEWS ASIA FOCUS FUND | ||||||||||||||||
Investor Class | ||||||||||||||||
Shares sold | 58,104 | $675,404 | 64,321 | $704,275 | ||||||||||||
Shares issued through reinvestment of distributions | 25,354 | 235,792 | 3,983 | 46,882 | ||||||||||||
Shares redeemed | (175,259 | ) | (2,023,450 | ) | (196,120 | ) | (2,150,907 | ) | ||||||||
Net (decrease) | (91,801 | ) | ($1,112,254 | ) | (127,816 | ) | ($1,399,750 | ) | ||||||||
Institutional Class | ||||||||||||||||
Shares sold | 110,274 | $1,269,838 | 279,502 | $3,274,793 | ||||||||||||
Shares issued through reinvestment of distributions | 36,415 | 339,389 | 7,611 | 89,956 | ||||||||||||
Shares redeemed | (612,856 | ) | (7,299,949 | ) | (12,872 | ) | (141,906 | ) | ||||||||
Net increase (decrease) | (466,167 | ) | ($5,690,722 | ) | 274,241 | $3,222,843 | ||||||||||
MATTHEWS ASIA GROWTH FUND | ||||||||||||||||
Investor Class | ||||||||||||||||
Shares sold | 10,786,092 | $298,040,265 | 4,079,531 | $102,687,689 | ||||||||||||
Shares issued through reinvestment of distributions | 261,406 | 6,250,221 | 1,217,730 | 31,490,493 | ||||||||||||
Shares redeemed | (10,780,916 | ) | (285,324,564 | ) | (4,883,819 | ) | (118,388,884 | ) | ||||||||
Net increase | 266,582 | $18,965,922 | 413,442 | $15,789,298 | ||||||||||||
Institutional Class | ||||||||||||||||
Shares sold | 13,280,478 | $366,402,524 | 3,002,726 | $76,546,224 | ||||||||||||
Shares issued through reinvestment of distributions | 254,228 | 6,121,801 | 471,874 | 12,287,614 | ||||||||||||
Shares redeemed | (3,723,336 | ) | (95,217,584 | ) | (1,929,007 | ) | (49,929,723 | ) | ||||||||
Net increase | 9,811,370 | $277,306,741 | 1,545,593 | $38,904,115 | ||||||||||||
MATTHEWS PACIFIC TIGER FUND | ||||||||||||||||
Investor Class | ||||||||||||||||
Shares sold | 23,880,091 | $723,000,071 | 21,730,132 | $599,219,782 | ||||||||||||
Shares issued through reinvestment of distributions | 4,100,739 | 110,309,880 | 1,299,802 | 38,957,121 | ||||||||||||
Shares redeemed | (35,883,150 | ) | (1,069,368,504 | ) | (24,341,900 | ) | (662,177,549 | ) | ||||||||
Net (decrease) | (7,902,320 | ) | ($236,058,553 | ) | (1,311,966 | ) | ($24,000,646 | ) | ||||||||
Institutional Class | ||||||||||||||||
Shares sold | 73,569,231 | $2,205,765,648 | 56,008,953 | $1,551,287,735 | ||||||||||||
Shares issued through reinvestment of distributions | 8,621,801 | 231,581,567 | 1,955,641 | 58,557,191 | ||||||||||||
Shares redeemed | (72,136,270 | ) | (2,150,140,709 | ) | (39,727,419 | ) | (1,096,771,755 | ) | ||||||||
Net increase | 10,054,762 | $287,206,506 | 18,237,175 | $513,073,171 | ||||||||||||
| 150 | MATTHEWS ASIA FUNDS |
Table of Contents
Notes to Financial Statements(continued)
| Year Ended December 31, 2018 | Year Ended December 31, 2017 | |||||||||||||||
| Shares | Amount | Shares | Amount | |||||||||||||
MATTHEWS ASIA ESG FUND | ||||||||||||||||
Investor Class | ||||||||||||||||
Shares sold | 518,131 | $5,764,694 | 429,011 | $4,551,575 | ||||||||||||
Shares issued through reinvestment of distributions | 39,314 | 388,821 | 33,239 | 372,274 | ||||||||||||
Shares redeemed | (552,444 | ) | (5,766,903 | ) | (136,139 | ) | (1,448,047 | ) | ||||||||
Net increase | 5,001 | $386,612 | 326,111 | $3,475,802 | ||||||||||||
Institutional Class | ||||||||||||||||
Shares sold | 1,862,932 | $18,844,975 | 369,352 | $3,869,597 | ||||||||||||
Shares issued through reinvestment of distributions | 56,216 | 554,851 | 23,910 | 266,353 | ||||||||||||
Shares redeemed | (224,650 | ) | (2,278,724 | ) | (132,288 | ) | (1,379,356 | ) | ||||||||
Net increase | 1,694,498 | $17,121,102 | 260,974 | $2,756,594 | ||||||||||||
MATTHEWS EMERGING ASIA FUND | ||||||||||||||||
Investor Class | ||||||||||||||||
Shares sold | 4,620,696 | $65,897,785 | 8,666,298 | $123,504,046 | ||||||||||||
Shares issued through reinvestment of distributions | 212,377 | 2,658,966 | 85,107 | 1,320,905 | ||||||||||||
Shares redeemed | (9,507,354 | ) | (133,149,866 | ) | (5,606,324 | ) | (80,014,289 | ) | ||||||||
Net increase (decrease) | (4,674,281 | ) | ($64,593,115 | ) | 3,145,081 | $44,810,662 | ||||||||||
Institutional Class | ||||||||||||||||
Shares sold | 13,299,754 | $190,322,581 | 11,622,115 | $170,654,093 | ||||||||||||
Shares issued through reinvestment of distributions | 477,196 | 5,993,576 | 118,430 | 1,843,997 | ||||||||||||
Shares redeemed | (10,983,928 | ) | (147,221,998 | ) | (1,300,786 | ) | (18,930,640 | ) | ||||||||
Net increase | 2,793,022 | $49,094,159 | 10,439,759 | $153,567,450 | ||||||||||||
MATTHEWS ASIA INNOVATORS FUND | ||||||||||||||||
Investor Class | ||||||||||||||||
Shares sold | 10,925,559 | $155,176,262 | 8,154,384 | $110,598,339 | ||||||||||||
Shares issued through reinvestment of distributions | 334,533 | 3,867,195 | 986,202 | 13,510,372 | ||||||||||||
Shares redeemed | (10,079,828 | ) | (140,682,243 | ) | (5,092,537 | ) | (66,640,478 | ) | ||||||||
Net increase | 1,180,264 | $18,361,214 | 4,048,049 | $57,468,233 | ||||||||||||
Institutional Class | ||||||||||||||||
Shares sold | 8,564,706 | $117,389,330 | 1,210,987 | $16,535,812 | ||||||||||||
Shares issued through reinvestment of distributions | 219,506 | 2,550,665 | 145,969 | 2,009,294 | ||||||||||||
Shares redeemed | (2,844,442 | ) | (36,304,986 | ) | (817,521 | ) | (11,680,059 | ) | ||||||||
Net increase | 5,939,770 | $83,635,009 | 539,435 | $6,865,047 | ||||||||||||
MATTHEWS CHINA FUND | ||||||||||||||||
Investor Class | ||||||||||||||||
Shares sold | 15,121,019 | $340,339,102 | 10,522,294 | $228,825,245 | ||||||||||||
Shares issued through reinvestment of distributions | 7,011,755 | 104,895,844 | 3,700,905 | 76,608,446 | ||||||||||||
Shares redeemed | (20,695,099 | ) | (427,936,552 | ) | (8,287,540 | ) | (168,142,345 | ) | ||||||||
Net increase | 1,437,675 | $17,298,394 | 5,935,659 | $137,291,346 | ||||||||||||
Institutional Class | ||||||||||||||||
Shares sold | 6,614,792 | $150,104,126 | 2,708,363 | $55,763,860 | ||||||||||||
Shares issued through reinvestment of distributions | 588,948 | 8,792,993 | 200,924 | 4,151,093 | ||||||||||||
Shares redeemed | (6,742,777 | ) | (135,104,968 | ) | (1,141,616 | ) | (24,992,022 | ) | ||||||||
Net increase | 460,963 | $23,792,151 | 1,767,671 | $34,922,931 | ||||||||||||
MATTHEWS INDIA FUND | ||||||||||||||||
Investor Class | ||||||||||||||||
Shares sold | 10,324,568 | $334,912,011 | 14,535,681 | $444,075,766 | ||||||||||||
Shares issued through reinvestment of distributions | 5,722,656 | 144,439,816 | 578,888 | 18,854,400 | ||||||||||||
Shares redeemed | (18,347,443 | ) | (565,381,775 | ) | (9,557,043 | ) | (292,422,842 | ) | ||||||||
Net increase (decrease) | (2,300,219 | ) | ($86,029,948 | ) | 5,557,526 | $170,507,324 | ||||||||||
Institutional Class | ||||||||||||||||
Shares sold | 6,465,401 | $215,871,605 | 10,938,379 | $326,819,057 | ||||||||||||
Shares issued through reinvestment of distributions | 1,158,242 | 29,500,413 | 94,003 | 3,078,591 | ||||||||||||
Shares redeemed | (13,006,329 | ) | (414,651,704 | ) | (9,578,020 | ) | (307,547,412 | ) | ||||||||
Net increase (decrease) | (5,382,686 | ) | ($169,279,686 | ) | 1,454,362 | $22,350,236 | ||||||||||
| matthewsasia.com | 800.789.ASIA | 151 |
Table of Contents
Notes to Financial Statements(continued)
| Year Ended December 31, 2018 | Year Ended December 31, 2017 | |||||||||||||||
| Shares | Amount | Shares | Amount | |||||||||||||
MATTHEWS JAPAN FUND | ||||||||||||||||
Investor Class | ||||||||||||||||
Shares sold | 35,434,821 | $838,074,072 | 27,038,482 | $577,083,165 | ||||||||||||
Shares issued through reinvestment of distributions | 3,537,698 | 69,727,510 | 3,303,132 | 77,557,315 | ||||||||||||
Shares redeemed | (36,383,495 | ) | (791,989,983 | ) | (30,502,087 | ) | (650,099,638 | ) | ||||||||
Net increase (decrease) | 2,589,024 | $115,811,599 | (160,473 | ) | $4,540,842 | |||||||||||
Institutional Class | ||||||||||||||||
Shares sold | 28,126,973 | $681,080,915 | 27,236,482 | $598,412,144 | ||||||||||||
Shares issued through reinvestment of distributions | 788,439 | 15,563,790 | 731,710 | 17,217,127 | ||||||||||||
Shares redeemed | (47,031,577 | ) | (1,073,069,165 | ) | (16,017,190 | ) | (343,303,401 | ) | ||||||||
Net increase (decrease) | (18,116,165 | ) | ($376,424,460 | ) | 11,951,002 | $272,325,870 | ||||||||||
MATTHEWS KOREA FUND | ||||||||||||||||
Investor Class | ||||||||||||||||
Shares sold | 4,808,867 | $28,840,215 | 5,564,488 | $34,796,556 | ||||||||||||
Shares issued through reinvestment of distributions | 4,259,343 | 19,124,478 | 2,324,365 | 15,751,872 | ||||||||||||
Shares redeemed | (9,178,750 | ) | (52,897,760 | ) | (7,247,886 | ) | (46,248,343 | ) | ||||||||
Net increase (decrease) | (110,540 | ) | ($4,933,067 | ) | 640,967 | $4,300,085 | ||||||||||
Institutional Class | ||||||||||||||||
Shares sold | 4,291,986 | $26,760,451 | 3,283,807 | $20,683,708 | ||||||||||||
Shares issued through reinvestment of distributions | 605,040 | 2,734,781 | 384,519 | 2,621,405 | ||||||||||||
Shares redeemed | (5,384,782 | ) | (29,526,364 | ) | (395,768 | ) | (2,595,391 | ) | ||||||||
Net increase (decrease) | (487,756 | ) | ($31,132 | ) | 3,272,558 | $20,709,722 | ||||||||||
MATTHEWS ASIA SMALL COMPANIES FUND | ||||||||||||||||
Investor Class | ||||||||||||||||
Shares sold | 1,341,878 | $28,839,901 | 1,344,836 | $29,213,685 | ||||||||||||
Shares issued through reinvestment of distributions | 1,344,976 | 21,129,567 | 693,887 | 14,856,114 | ||||||||||||
Shares redeemed | (4,600,698 | ) | (92,122,082 | ) | (6,279,829 | ) | (130,940,312 | ) | ||||||||
Net (decrease) | (1,913,844 | ) | ($42,152,614 | ) | (4,241,106 | ) | ($86,870,513 | ) | ||||||||
Institutional Class | ||||||||||||||||
Shares sold | 2,031,529 | $42,209,221 | 2,953,870 | $62,967,705 | ||||||||||||
Shares issued through reinvestment of distributions | 1,164,500 | 18,247,712 | 833,944 | 17,829,734 | ||||||||||||
Shares redeemed | (8,539,680 | ) | (162,341,803 | ) | (2,791,566 | ) | (58,750,310 | ) | ||||||||
Net increase (decrease) | (5,343,651 | ) | ($101,884,870 | ) | 996,248 | $22,047,129 | ||||||||||
MATTHEWS CHINA SMALL COMPANIES FUND | ||||||||||||||||
Investor Class | ||||||||||||||||
Shares sold | 4,586,645 | $55,688,924 | 1,951,872 | $21,481,987 | ||||||||||||
Shares issued through reinvestment of distributions | 95,152 | 942,955 | 165,109 | 1,778,217 | ||||||||||||
Shares redeemed | (3,284,316 | ) | (36,655,946 | ) | (1,116,609 | ) | (11,848,256 | ) | ||||||||
Net increase | 1,397,481 | $19,975,933 | 1,000,372 | $11,411,948 | ||||||||||||
Institutional Class* | ||||||||||||||||
Shares sold | 2,620,573 | $28,921,075 | 39,317 | $450,574 | ||||||||||||
Shares issued through reinvestment of distributions | 32,751 | 324,895 | 782 | 8,409 | ||||||||||||
Shares redeemed | (530,287 | ) | (5,561,926 | ) | — | — | ||||||||||
Net increase | 2,123,037 | $23,684,044 | 40,099 | $458,983 | ||||||||||||
| * | Institutional Class commenced operations on November 30, 2017. |
Through December 31, 2018, a 2.00% redemption fee was assessed on the sale or exchange of shares of the Matthews Emerging Asia Fund, Matthews Asia Small Companies Fund and Matthews China Small Companies Fund (collectively, the “Covered Funds”) within 90 days after the date an investor purchases shares of the Covered Funds. This fee is payable directly to the Covered Funds.
To determine whether the redemption fee applies, the Covered Funds do not count the day that shares were purchased, and first redeem the shares that have been held the longest.
The redemption fees returned to the assets of the Funds are stated in the Statements of Changes in Net Assets.
| 152 | MATTHEWS ASIA FUNDS |
Table of Contents
Notes to Financial Statements(continued)
| 5. | INVESTMENT ADVISORY FEES AND OTHER TRANSACTIONS WITH AFFILIATES |
Matthews, a registered investment advisor under the 1940 Act, provides the Funds with investment management services. Pursuant to the prior Investment Advisory Agreement dated August 13, 2004, as amended (the “Prior Advisory Agreement”) and the current Investment Advisory Agreement dated February 1, 2016, as amended (the “Current Advisory Agreement,” and together with the Prior Advisory Agreement, the “Advisory Agreement”), the Funds pay Matthews (i) for management and advisory services; and (ii) for certain administrative services, an annual fee as a percentage of average daily net assets. Under the Advisory Agreement each of the Funds, other than Matthews Asia Strategic Income Fund, Matthews Asia Credit Opportunities Fund, Matthews Emerging Asia Fund, Matthews Asia Small Companies Fund, and Matthews China Small Companies Fund (the “Family-Priced Funds”), pays Matthews 0.75% of their aggregate average daily net assets up to $2 billion, 0.6834% of their aggregate average daily net assets over $2 billion up to $5 billion, 0.65% of their aggregate average daily net assets over $5 billion up to $25 billion, 0.64% of their aggregate average daily net assets over $25 billion up to $30 billion, 0.63% of their aggregate average daily net assets over $30 billion up to $35 billion, 0.62% of their aggregate average daily net assets over $35 billion up to $40 billion, 0.61% of their aggregate average daily net assets over $40 billion up to $45 billion, and 0.60% of their aggregate average daily net assets over $45 billion. Each of the Matthews Asia Strategic Income Fund and Matthews Asia Credit Opportunities Fund paid Matthews an annual fee of 0.65% of such Fund’s annual average daily net assets pursuant to the Advisory Agreement up to September 30, 2018. Effective October 1, 2018, the annual fee rate has been decreased to 0.55% for these two Funds. Each of the Matthews Emerging Asia Fund, Matthews Asia Small Companies Fund, and the Matthews China Small Companies Fund pays Matthews an annual fee of 1.00% of the average daily net assets of such Fund up to $1 billion and 0.95% of the average daily net assets of such Fund over $1 billion pursuant to the Advisory Agreement. Each Fund pays Matthews a monthly fee at the annual rate using the applicable management fee calculated based on the actual number of days of that month and based on the Fund’s average daily net asset value for the month.
Pursuant to a fee waiver letter agreement, effective as of September 1, 2014, between the Trust, on behalf of the Family-Priced Funds, and Matthews (as amended from time to time, the “Fee Waiver Agreement”), for each Family-Priced Fund, Matthews has agreed to waive a portion of the fee payable under the Advisory Agreement and a portion of the fee payable under the Administration and Shareholder Services Agreement, if any Family-Priced Fund’s average daily net assets are over $3 billion, as follows: for every $2.5 billion average daily net assets of a Family-Priced Fund that are over $3 billion, the fee rates that otherwise would be applied for calculating fees payable under the Advisory Agreement and the Administration and Shareholder Services Agreement for such Family-Priced Fund with respect to such excess average daily net assets will be each reduced by 0.01%, in each case without reducing such fee rate below 0.00%.
Investment advisory fees charged, waived fees and reimbursed additional expenses for the year ended December 31, 2018, were as follows:
| Gross Advisory Fees | Advisory Fees Reimbursed in | Net Advisory Fee/ Reimbursement | ||||||||||
| Matthews Asia Strategic Income Fund | $688,789 | ($117,480 | ) | $571,309 | ||||||||
| Matthews Asia Credit Opportunities Fund | 249,572 | (132,801 | ) | 116,771 | ||||||||
| Matthews Asian Growth and Income Fund | 14,652,157 | — | 14,652,157 | |||||||||
| Matthews Asia Dividend Fund | 45,979,350 | (543,681 | ) | 45,435,669 | ||||||||
| Matthews China Dividend Fund | 2,161,370 | — | 2,161,370 | |||||||||
| Matthews Asia Value Fund | 200,873 | (81,767 | ) | 119,106 | ||||||||
| Matthews Asia Focus Fund | 61,045 | (158,102 | ) | (97,057 | ) | |||||||
| Matthews Asia Growth Fund | 7,071,401 | — | 7,071,401 | |||||||||
| Matthews Pacific Tiger Fund | 60,867,735 | (1,117,473 | ) | 59,750,262 | ||||||||
| Matthews Asia ESG Fund | 141,312 | (156,459 | ) | (15,147 | ) | |||||||
| Matthews Emerging Asia Fund | 4,809,759 | (1,073,964 | ) | 3,735,795 | ||||||||
| Matthews Asia Innovators Fund | 1,733,007 | — | 1,733,007 | |||||||||
| Matthews China Fund | 6,197,416 | — | 6,197,416 | |||||||||
| Matthews India Fund | 13,687,034 | — | 13,687,034 | |||||||||
| Matthews Japan Fund | 28,673,493 | (134,957 | ) | 28,538,536 | ||||||||
| Matthews Korea Fund | 1,309,107 | — | 1,309,107 | |||||||||
| Matthews Asia Small Companies Fund | 3,802,489 | (308,001 | ) | 3,494,488 | ||||||||
| Matthews China Small Companies Fund | 574,396 | (275,220 | ) | 299,176 | ||||||||
Under a written agreement between the Funds and Matthews (the “Operating Expense Agreement”), Matthews agrees to waive fees and reimburse expenses to a Fund if its expense ratio exceeds a certain percentage level. Effective November 30, 2017 for all Funds, except Matthews Asia Strategic Income Fund and the Matthews Asia Credit Opportunities Fund, this level is 1.25% for the Institutional Class. Matthews agrees to reduce the expense ratio by waiving an equal amount of non-class specific expenses for the Investor Class. Because certain expenses of the Investor Class may be higher than those of the Institutional Class and because class specific expenses may be waived solely for the Institutional Class, total annual Fund expenses for the Investor Class may exceed 1.25%. For Matthews Asia Strategic Income Fund and Matthews Asia Credit Opportunities Fund this level is 0.90% for the Institutional Class. Matthews agrees to reduce the expense ratio by waiving an equal amount of non-class specific expenses for the Investor Class. Because certain expenses of the Investor Class may be higher than those of the Institutional Class and because class specific expenses may be waived solely for the Institutional Class, total annual Fund expenses for the Investor Class may exceed 0.90%. In turn, if a Fund’s expenses fall below the level noted within three years after Matthews has made such a reimbursement, the Fund may reimburse Matthews up to an amount of the recoupment available not to exceed the lesser of (i) the expense limitation applicable at the time of that fee waiver and/or expense reimbursement or (ii) the expense limitation in effect at the time of recoupment. This agreement will continue through April 30, 2019, may be extended for additional periods not exceeding one year, and may be terminated at any time by the Board of Trustees on behalf of the Fund on 60 days’ written notice to Matthews. Matthews may decline to renew this agreement by written notice to the Trust at least 30 days before its annual expiration date.
| matthewsasia.com | 800.789.ASIA | 153 |
Table of Contents
Notes to Financial Statements(continued)
Waived Fees Subject to Possible Future Recoupment
Effective October 1, 2018, Matthews will not recoup any prior waived fees for the Matthews Asia Strategic Income Fund and the Matthews Asia Credit Opportunities Fund. On December 31, 2018, the amounts subject to possible future recoupment under the expense limitation agreement are as follows:
| Expiring December 31, | ||||||||||||
| 2019 | 2020 | 2021 | ||||||||||
| Matthews Asia Value Fund | 211,035 | 119,683 | 81,767 | |||||||||
| Matthews Asia Focus Fund | 111,801 | 119,705 | 158,102 | |||||||||
| Matthews Asia ESG Fund | 163,853 | 156,429 | 156,459 | |||||||||
| Matthews Emerging Asia Fund | 553,167 | 878,171 | 1,073,964 | |||||||||
| Matthews Asia Small Companies Fund | 252,008 | 272,597 | 308,001 | |||||||||
| Matthews China Small Companies Fund | 142,295 | 184,162 | 275,220 | |||||||||
Matthews Asia Strategic Income Fund, Matthews Asia Value Fund, Matthews Asia Focus Fund, Matthews Asia ESG Fund, Matthews Emerging Asia Fund, Matthews Asia Small Companies Fund and Matthews China Small Companies Fund had $113,621, $41,279, $87,252, $183,985, $452,048, $113,037 and $133,327, respectively, of recoupment that expired on December 31, 2018. Matthews Asian Growth and Income Fund, Matthews Asia Dividend Fund, Matthews China Dividend Fund, Matthews Asia Growth Fund, Matthews Pacific Tiger Fund, Matthews Asia Innovators Fund, Matthews China Fund, Matthews India Fund, Matthews Japan Fund and Matthews Korea Fund had no amounts available for recoupment and no amounts recouped during the year ended December 31, 2018.
The Funds have an Administration and Shareholder Services Agreement dated August 13, 2004, as amended (the “Shareholder Services Agreement” or “Services Agreement”), in which the Funds pay an annual administration and shareholder servicing fee to Matthews, as a percentage of the average daily net assets of each Fund in aggregate, computed and prorated on a daily basis. Under the Shareholder Services Agreement, the Funds in the aggregate pay Matthews 0.25% of their aggregate average daily net assets up to $2 billion, 0.1834% of their aggregate average daily net assets over $2 billion up to $5 billion, 0.15% of their aggregate average daily net assets over $5 billion up to $7.5 billion, 0.125% of their aggregate average daily net assets over $7.5 billion up to $15 billion, 0.11% of their aggregate average daily net assets over $15 billion up to $22.5 billion, 0.10% of their aggregate average daily net assets over $22.5 billion up to $25 billion, 0.09% of their aggregate average daily net assets over $25 billion up to $30 billion, 0.08% of their aggregate average daily net assets over $30 billion up to $35 billion, 0.07% of their aggregate average daily net assets over $35 billion up to $40 billion, 0.06% of their aggregate average daily net assets over $40 billion up to $45 billion, and 0.05% of their aggregate average daily net assets over $45 billion.
Administration and shareholder servicing fees charged, for the year ended December 31, 2018, were as follows:
| Gross Administration and Shareholder Servicing Fees | Administration and Shareholder Servicing Fees Waived in Excess of Expense Limitation | Net Administration and Shareholder Servicing Fees | ||||||||||
| Matthews Asia Strategic Income Fund | $144,374 | $— | $144,374 | |||||||||
| Matthews Asia Credit Opportunities Fund | 52,668 | — | 52,668 | |||||||||
| Matthews Asian Growth and Income Fund | 2,906,300 | — | 2,906,300 | |||||||||
| Matthews Asia Dividend Fund | 9,143,871 | (543,681 | ) | 8,600,190 | ||||||||
| Matthews China Dividend Fund | 429,732 | — | 429,732 | |||||||||
| Matthews Asia Value Fund | 39,819 | — | 39,819 | |||||||||
| Matthews Asia Focus Fund | 12,098 | — | 12,098 | |||||||||
| Matthews Asia Growth Fund | 1,407,585 | — | 1,407,585 | |||||||||
| Matthews Pacific Tiger Fund | 12,103,887 | (1,117,473 | ) | 10,986,414 | ||||||||
| Matthews Asia ESG Fund | 28,204 | — | 28,204 | |||||||||
| Matthews Emerging Asia Fund | 630,593 | — | 630,593 | |||||||||
| Matthews Asia Innovators Fund | 344,756 | — | 344,756 | |||||||||
| Matthews China Fund | 1,228,837 | — | 1,228,837 | |||||||||
| Matthews India Fund | 2,716,954 | — | 2,716,954 | |||||||||
| Matthews Japan Fund | 5,693,255 | (134,957 | ) | 5,558,298 | ||||||||
| Matthews Korea Fund | 259,882 | — | 259,882 | |||||||||
| Matthews Asia Small Companies Fund | 497,320 | — | 497,320 | |||||||||
| Matthews China Small Companies Fund | 75,616 | — | 75,616 | |||||||||
In addition to the fees paid to the Funds’ transfer agent, the Funds bear the cost of fees paid to certain service providers or intermediaries, including supermarkets, which provide transfer agency, record-keeping and shareholder servicing to certain shareholders. These fees are referred to as intermediary service fees on the Statements of Assets and Liabilities as well as the Statements of Operations. Additional information concerning these services and fees is contained in the Funds’ prospectuses.
| 154 | MATTHEWS ASIA FUNDS |
Table of Contents
Notes to Financial Statements(continued)
BNY Mellon Investment Servicing (US) Inc. (“BNY Mellon”), an indirect wholly owned subsidiary of The Bank of New York Mellon Corporation, serves as the Funds’ administrator, and in that capacity, performs various administrative and accounting services for each Fund. BNY Mellon also serves as the Funds’ transfer agent, dividend disbursing agent and registrar. An officer of BNY Mellon serves as Assistant Treasurer to the Funds. Total fees accrued by the Funds for administration and accounting services for the year ended December 31, 2018 were as follows:
| Administration and Accounting fees | ||||
| Matthews Asia Strategic Income Fund | $8,795 | |||
| Matthews Asia Credit Opportunities Fund | 3,201 | |||
| Matthews Asian Growth and Income Fund | 177,692 | |||
| Matthews Asia Dividend Fund | 557,472 | |||
| Matthews China Dividend Fund | 26,206 | |||
| Matthews Asia Value Fund | 2,436 | |||
| Matthews Asia Focus Fund | 740 | |||
| Matthews Asia Growth Fund | 85,729 | |||
| Matthews Pacific Tiger Fund | 737,992 | |||
| Matthews Asia ESG Fund | 1,713 | |||
| Matthews Emerging Asia Fund | 38,478 | |||
| Matthews Asia Innovators Fund | 21,011 | |||
| Matthews China Fund | 75,161 | |||
| Matthews India Fund | 165,976 | |||
| Matthews Japan Fund | 347,699 | |||
| Matthews Korea Fund | 15,875 | |||
| Matthews Asia Small Companies Fund | 30,420 | |||
| Matthews China Small Companies Fund | 4,595 | |||
Brown Brothers Harriman & Co. serves as the Funds’ custodian. Foreside Funds Distributors LLC, serves as the Funds’ distributor in the United States pursuant to an Underwriting Agreement. Matthews Asia Funds are distributed in Latin America by HMC Partners.
Cross trades for the year ended December 31, 2018, were executed by the Funds pursuant to Rule 17a-7 under the 1940 Act. Cross trading is the buying or selling of portfolio securities between funds to which Matthews International Capital Management, LLC serves as investment advisor. At its regularly scheduled quarterly meetings, the Board reviews such transactions as of the most recent calendar quarter for compliance with the requirements and restrictions set forth by Rule 17a-7. For the year ended December 31, 2018, the purchase and sale transactions with an affiliated fund in compliance with Rule 17a-7 under the 1940 Act were as follows:
| Purchases | Sales | |||||||
| Matthews Asia Dividend Fund | $506,605 | $— | ||||||
| Matthews China Dividend Fund | — | 506,605 | ||||||
As of December 31, 2018, Matthews and its affiliates held significant shares in the Funds as follows:
| Shares held by Matthews and its Affiliates | Percentage of Outstanding Shares | |||||||
| Matthews Asia Strategic Income Fund | 989,073 | 10% | ||||||
| Matthews Asia Credit Opportunities Fund | 1,118,662 | 27% | ||||||
| Matthews Asia Focus Fund | 72,567 | 10% | ||||||
| Matthews Asia ESG Fund | 1,042,851 | 32% | ||||||
Certain officers and Trustees of the Funds are also officers and directors of Matthews. All officers serve without compensation from the Funds. The Funds paid the Independent Trustees $1,078,350 in aggregate for regular compensation during the year ended December 31, 2018.
| matthewsasia.com | 800.789.ASIA | 155 |
Table of Contents
Notes to Financial Statements(continued)
| 6. | INVESTMENTS |
The value of investment transactions made for affiliated and unaffiliated holdings for the year ended December 31, 2018 were as follows:
| Affiliated Purchases | Proceeds from Affiliated Sales | Unaffiliated Purchases | Proceeds from Unaffiliated Sales | |||||||||||||
| Matthews Asia Strategic Income Fund | $— | $— | $98,422,006 | $82,577,019 | ||||||||||||
| Matthews Asia Credit Opportunities Fund | — | — | 30,825,779 | 17,375,191 | ||||||||||||
| Matthews Asian Growth and Income Fund | — | — | 703,914,281 | 1,769,648,867 | ||||||||||||
| Matthews Asia Dividend Fund | 477,180,039 | 4,037,979 | 2,206,015,580 | 2,840,739,539 | ||||||||||||
| Matthews China Dividend Fund | — | — | 213,322,451 | 208,637,597 | ||||||||||||
| Matthews Asia Value Fund | — | — | 12,988,882 | 18,357,547 | ||||||||||||
| Matthews Asia Focus Fund | — | — | 2,702,396 | 9,663,955 | ||||||||||||
| Matthews Asia Growth Fund | 10,100,871 | — | 399,629,125 | 120,719,145 | ||||||||||||
| Matthews Pacific Tiger Fund | 43,707,241 | 136,442 | 1,006,142,557 | 1,160,555,839 | ||||||||||||
| Matthews Asia ESG Fund | — | — | 17,138,700 | 4,946,791 | ||||||||||||
| Matthews Emerging Asia Fund | 6,559,332 | — | 115,041,331 | 120,006,875 | ||||||||||||
| Matthews Asia Innovators Fund | — | — | 314,027,865 | 215,433,126 | ||||||||||||
| Matthews China Fund | — | — | 890,253,290 | 945,747,426 | ||||||||||||
| Matthews India Fund | 6,172,553 | 5,788,624 | 423,596,663 | 903,648,061 | ||||||||||||
| Matthews Japan Fund | — | — | 1,930,745,459 | 2,219,929,863 | ||||||||||||
| Matthews Korea Fund | — | — | 68,895,311 | 96,541,322 | ||||||||||||
| Matthews Asia Small Companies Fund | — | — | 251,851,153 | 406,281,686 | ||||||||||||
| Matthews China Small Companies Fund | — | — | 78,226,312 | 41,401,588 | ||||||||||||
| 7. | HOLDINGS OF 5% VOTING SHARES OF PORTFOLIO COMPANIES |
The 1940 Act defines “affiliated companies” to include investments in portfolio companies in which a fund owns 5% or more of the outstanding voting shares. During the year ended December 31, 2018, the Funds below held 5% or more of the outstanding voting shares of the noted portfolio companies. During this period, other Funds in the Trust may also have held voting shares of the issuers at levels below 5%.
Investments in affiliates:
A summary of transactions in securities of issuers affiliated with a Fund for the year ended December 31, 2018 is as follows:
Shares Held at Dec. 31, 2017 | Shares Purchsed | Shares Sold | Shares Held at Dec. 31, 2018 | Value at Dec. 31, 2018 | Dividend Income Jan. 1, 2018– Dec. 31, 2018 | Net Realized Gain (Loss) Jan. 1, 2018– Dec. 31, 2018 | Change in Unrealized Appreciation (Depreciation) | |||||||||||||||||||||||||
| MATTHEWS ASIA DIVIDEND FUND |
| |||||||||||||||||||||||||||||||
| Name of Issuer: | ||||||||||||||||||||||||||||||||
Anritsu Corp. | 9,384,700 | — | — | 9,384,700 | $129,966,714 | $1,236,516 | $— | $24,317,314 | ||||||||||||||||||||||||
Ascendas India Trust | 53,470,700 | 4,393,100 | — | 57,863,800 | 45,851,208 | 2,930,210 | — | (3,561,234 | ) | |||||||||||||||||||||||
Beijing Capital International Airport Co., Ltd. H Shares | — | 94,084,000 | — | 94,084,000 | 99,853,768 | 1,277,181 | — | (6,960,655 | ) | |||||||||||||||||||||||
BELLSYSTEM24 Holdings, Inc. | — | 5,597,000 | — | 5,597,000 | 65,691,365 | 628,725 | — | (24,164,706 | ) | |||||||||||||||||||||||
BGF Retail Co., Ltd. | 816,439 | 145,221 | — | 961,660 | 175,532,359 | 1,354,108 | — | (5,596,982 | ) | |||||||||||||||||||||||
Breville Group, Ltd. | 10,644,019 | 1,541,519 | — | 12,185,538 | 91,527,205 | 2,647,589 | — | (25,920,518 | ) | |||||||||||||||||||||||
CapitaLand Retail China Trust REIT | 49,800,000 | — | — | 49,800,000 | 49,706,389 | 2,282,861 | — | (10,614,371 | ) | |||||||||||||||||||||||
China Steel Chemical Corp. | — | 15,589,000 | — | 15,589,000 | 69,943,970 | 1,856,542 | — | (8,123,802 | ) | |||||||||||||||||||||||
Eiken Chemical Co., Ltd. | 1,033,500 | 2,459,700 | † | — | 3,493,200 | 76,416,687 | 717,978 | — | (6,402,324 | ) | ||||||||||||||||||||||
Greencross, Ltd.†† | 3,825,449 | 5,734,833 | 9,560,282 | — | — | — | — | — | ||||||||||||||||||||||||
HKBN, Ltd. | 45,415,623 | 10,985,500 | — | 56,401,123 | 85,506,443 | 3,670,142 | — | 11,894,572 | ||||||||||||||||||||||||
Minda Industries, Ltd. | 2,849,938 | 11,112,827 | † | — | 13,962,765 | 64,533,029 | 130,187 | — | (18,937,276 | ) | ||||||||||||||||||||||
Minth Group, Ltd. | 60,675,000 | 8,126,000 | 654,000 | 68,147,000 | 219,908,372 | 6,726,674 | 3,145,410 | (174,535,063 | ) | |||||||||||||||||||||||
Shanghai Jin Jiang International Hotels Group Co., Ltd. H Shares | 44,450,000 | 129,162,000 | — | 173,612,000 | 42,026,409 | 1,824,110 | — | (28,376,009 | ) | |||||||||||||||||||||||
Yuexiu Transport Infrastructure, Ltd. | 92,646,000 | 4,682,000 | — | 97,328,000 | 73,834,708 | 4,660,021 | — | 2,204,801 | ||||||||||||||||||||||||
Total Affiliates | $1,290,298,626 | $31,942,844 | $3,145,410 | ($274,776,253 | ) | |||||||||||||||||||||||||||
| MATTHEWS ASIA GROWTH FUND |
| |||||||||||||||||||||||||||||||
| Name of Issuer: | ||||||||||||||||||||||||||||||||
Sampath Bank PLC | 9,955,478 | 6,170,909 | † | — | 16,126,387 | $20,720,071 | $— | $— | ($9,855,991 | ) | ||||||||||||||||||||||
| 156 | MATTHEWS ASIA FUNDS |
Table of Contents
Notes to Financial Statements(continued)
Shares Held at Dec. 31, 2017 | Shares Purchsed | Shares Sold | Shares Held at Dec. 31, 2018 | Value at Dec. 31, 2018 | Dividend Income Jan. 1, 2018– Dec. 31, 2018 | Net Realized Gain (Loss) Jan. 1, 2018– Dec. 31, 2018 | Change in Unrealized Appreciation (Depreciation) | |||||||||||||||||||||||||
| MATTHEWS PACIFIC TIGER FUND |
| |||||||||||||||||||||||||||||||
| Name of Issuer: | ||||||||||||||||||||||||||||||||
Cheil Worldwide, Inc. | 6,554,297 | 761,585 | — | 7,315,882 | $147,448,645 | $6,499,349 | $— | $3,728,440 | ||||||||||||||||||||||||
DB Insurance Co., Ltd. | 3,499,380 | 71,083 | — | 3,570,463 | 224,865,683 | 7,901,303 | — | (11,727,295 | ) | |||||||||||||||||||||||
Fuyao Glass Industry Group Co., Ltd. H Shares | 32,976,400 | 1,750,000 | — | 34,726,400 | 111,182,580 | 5,392,280 | — | (33,751,099 | ) | |||||||||||||||||||||||
Green Cross Corp.†† | 620,785 | — | 302,451 | 318,334 | — | — | — | — | ||||||||||||||||||||||||
Just Dial, Ltd. | 3,557,718 | — | — | 3,557,718 | 25,558,400 | — | — | (3,548,808 | ) | |||||||||||||||||||||||
Orion Holdings Corp. | 5,666,538 | — | 9,972 | 5,656,566 | 86,522,603 | 2,527,877 | (1,881,463 | ) | (52,520,851 | ) | ||||||||||||||||||||||
Sinopharm Group Co., Ltd. H Shares†† | 61,139,600 | 5,006,800 | 13,988,800 | 52,157,600 | — | — | — | — | ||||||||||||||||||||||||
Synnex Technology International Corp.†† | 95,600,921 | — | 22,550,000 | 73,050,921 | — | — | — | — | ||||||||||||||||||||||||
Tata Power Co., Ltd. | 164,620,436 | 15,696,051 | — | 180,316,487 | 198,263,749 | 3,406,400 | — | (62,365,822 | ) | |||||||||||||||||||||||
Total Affiliates | $793,841,660 | $25,727,209 | ($1,881,463 | ) | ($160,185,435 | ) | ||||||||||||||||||||||||||
| MATTHEWS EMERGING ASIA FUND |
| |||||||||||||||||||||||||||||||
| Name of Issuer: | ||||||||||||||||||||||||||||||||
National Seed JSC | 979,585 | 146,937 | † | — | 1,126,522 | $4,371,071 | $64,703 | $— | ($300,601 | ) | ||||||||||||||||||||||
Shifa International Hospitals, Ltd. | 2,519,051 | 264,300 | — | 2,783,351 | 4,139,332 | 80,441 | — | (3,484,033 | ) | |||||||||||||||||||||||
Taisun International Holding Corp. | 654,000 | 1,473,000 | † | — | 2,127,000 | 8,786,929 | 248,488 | — | 167,662 | |||||||||||||||||||||||
Total Affiliates | $17,297,332 | $393,632 | $— | ($3,616,972 | ) | |||||||||||||||||||||||||||
| MATTHEWS INDIA FUND |
| |||||||||||||||||||||||||||||||
| Name of Issuer: | ||||||||||||||||||||||||||||||||
Caplin Point Laboratories, Ltd. | 3,028,687 | 841,624 | — | 3,870,311 | $21,157,850 | $105,765 | $— | ($14,906,797 | ) | |||||||||||||||||||||||
eClerx Services, Ltd. | 2,701,931 | — | 311,337 | 2,390,594 | 36,787,720 | 34,987 | 501,315 | (24,217,276 | ) | |||||||||||||||||||||||
VST Industries, Ltd. | 1,167,175 | — | — | 1,167,175 | 54,669,836 | 1,248,789 | — | (3,932,560 | ) | |||||||||||||||||||||||
Total Affiliates | $112,615,406 | $1,389,541 | $501,315 | ($43,056,633 | ) | |||||||||||||||||||||||||||
| MATTHEWS JAPAN FUND |
| |||||||||||||||||||||||||||||||
| Name of Issuer: | ||||||||||||||||||||||||||||||||
Infomart Corp.†† | 7,697,300 | — | 3,185,000 | 4,512,300 | $— | $— | $— | $— | ||||||||||||||||||||||||
TechnoPro Holdings, Inc.†† | 1,719,500 | — | 1,011,800 | 707,700 | — | — | — | — | ||||||||||||||||||||||||
W-Scope Corp.†† | 2,047,600 | — | 2,047,600 | — | — | — | — | — | ||||||||||||||||||||||||
Total Affiliates | $— | $— | $— | $— | ||||||||||||||||||||||||||||
| † | Includes stock spin-off and stock dividend during the period. |
| †† | Issuer was not an affiliated company as of December 31, 2018. |
| 8. | INCOME TAX INFORMATION |
It is the policy of the Funds to comply with all requirements of the Internal Revenue Code of 1986, as amended (“the Code”), applicable to regulated investment companies and to distribute substantially all of their taxable income to their shareholders. The Funds have met the requirements of the Code applicable to regulated investment companies for the year ended December 31, 2018. Therefore, no federal income tax provision is required.
Management has analyzed the Funds’ tax positions taken on federal income tax returns for all open tax years (current and prior three tax years), and has concluded that no provision for federal income tax is required in the Funds’ financial statements. The Funds’ federal and state income and federal excise tax returns for tax years for which the applicable statutes of limitations have not expired are subject to examination by the Internal Revenue Service and state departments of revenue.
As of December 31, 2018, the components of accumulated earnings/deficit on tax basis were as follows:
| Undistributed Ordinary Income | Undistributed Long-Term Capital Gains | Capital Loss Carryforwards | ||||||||||
| Matthews Asia Strategic Income Fund | $— | $— | ($4,312,398 | ) | ||||||||
| Matthews Asia Credit Opportunities Fund | — | — | (683,386 | ) | ||||||||
| Matthews Asian Growth and Income Fund | 5,031,142 | — | — | |||||||||
| Matthews Asia Dividend Fund | 5,177,492 | — | — | |||||||||
| Matthews China Dividend Fund | 746,299 | — | — | |||||||||
| Matthews Asia Value Fund | — | — | — | |||||||||
| matthewsasia.com | 800.789.ASIA | 157 |
Table of Contents
Notes to Financial Statements(continued)
| Undistributed Ordinary Income | Undistributed Long-Term Capital Gains | Capital Loss Carryforwards | ||||||||||
| Matthews Asia Focus Fund | $— | $— | $— | |||||||||
| Matthews Asia Growth Fund | — | 1,418,745 | — | |||||||||
| Matthews Pacific Tiger Fund | — | 113,082,784 | — | |||||||||
| Matthews Asia ESG Fund | — | 133,700 | — | |||||||||
| Matthews Emerging Asia Fund | — | 8,355,290 | — | |||||||||
| Matthews Asia Innovators Fund | — | 877,702 | — | |||||||||
| Matthews China Fund | — | — | — | |||||||||
| Matthews India Fund | — | 108,837,080 | — | |||||||||
| Matthews Japan Fund | 4,710,457 | 74,558,049 | — | |||||||||
| Matthews Korea Fund | — | 10,920,521 | — | |||||||||
| Matthews Asia Small Companies Fund | — | — | — | |||||||||
| Matthews China Small Companies Fund | 90,981 | — | — | |||||||||
| Late Year Losses* | Other Temporary Differences | Unrealized Appreciation (Depreciation)** | Total Accumulated Earnings/(Deficit) | |||||||||||||
| Matthews Asia Strategic Income Fund | ($109,716 | ) | $— | ($2,123,046 | ) | ($6,545,160 | ) | |||||||||
| Matthews Asia Credit Opportunities Fund | (4,708 | ) | — | (1,425,077 | ) | (2,113,171 | ) | |||||||||
| Matthews Asian Growth and Income Fund | (9,108,081 | ) | — | 13,125,676 | 9,048,737 | |||||||||||
| Matthews Asia Dividend Fund | (41,320,881 | ) | — | 469,735,385 | 433,591,996 | |||||||||||
| Matthews China Dividend Fund | (1,209,434 | ) | — | (17,744,364 | ) | (18,207,499 | ) | |||||||||
| Matthews Asia Value Fund | (841,114 | ) | — | (2,120,345 | ) | (2,961,459 | ) | |||||||||
| Matthews Asia Focus Fund | (16,127 | ) | — | (400,950 | ) | (417,077 | ) | |||||||||
| Matthews Asia Growth Fund | (1,448,783 | ) | — | 74,117,195 | 74,087,157 | |||||||||||
| Matthews Pacific Tiger Fund | — | — | 2,180,736,749 | 2,293,819,533 | ||||||||||||
| Matthews Asia ESG Fund | (73,756 | ) | — | (212,979 | ) | (153,035 | ) | |||||||||
| Matthews Emerging Asia Fund | (1,133,192 | ) | — | (35,104,699 | ) | (27,882,601 | ) | |||||||||
| Matthews Asia Innovators Fund | (42,130 | ) | — | (2,824,190 | ) | (1,988,618 | ) | |||||||||
| Matthews China Fund | — | — | (136,602,667 | ) | (136,602,667 | ) | ||||||||||
| Matthews India Fund | (2,591,650 | ) | (3,877 | ) | 149,685,308 | 255,926,861 | ||||||||||
| Matthews Japan Fund | — | — | (106,708,011 | ) | (27,439,505 | ) | ||||||||||
| Matthews Korea Fund | (272,844 | ) | 6,142,599 | 16,790,276 | ||||||||||||
| Matthews Asia Small Companies Fund | — | — | (31,153,717 | ) | (31,153,717 | ) | ||||||||||
| Matthews China Small Companies Fund | (47,359 | ) | — | (10,893,699 | ) | (10,850,077 | ) | |||||||||
| * | The Funds have elected to defer certain qualified late-year losses and recognize such losses in the next fiscal year. |
| ** | The differences between book-basis and tax-basis unrealized appreciation/depreciation is attributable primarily to the tax deferral of losses on wash sales and passive foreign investment company (PFIC) mark to market adjustments. |
As of December 31, 2018, the Funds have capital loss carryforwards available to offset future realized capital gains through the indicated expiration dates as follows:
| Amount With No Expiration | ||||||||||||
Short-term Losses | Long-term Losses | Total | ||||||||||
| Matthews Asia Strategic Income Fund | $4,165,505 | $146,893 | $4,312,398 | |||||||||
| Matthews Asia Credit Opportunities Fund | 520,152 | 163,234 | 683,386 | |||||||||
The following Fund utilized capital loss carryforwards in the current year:
Utilized Capital Loss Carryforwards | ||||
| Matthews Asia Focus Fund | $641,455 | |||
Under the Regulated Investment Company Modernization Act of 2010, the Funds are permitted to carry forward capital losses incurred in taxable years beginning after December 22, 2010 for an unlimited period. However, any losses incurred during those future taxable years will be required to be utilized prior to any losses incurred in pre-enactment taxable years, which generally expire after eight years from when they are incurred. Additionally, post-enactment capital losses that are carried forward will retain their character as either short-term or long-term capital losses rather than being considered all short-term as under previous law.
U.S. GAAP requires that certain components of net assets be reclassified between financial and tax reporting. These reclassifications have no effect on net assets or NAV. The permanent differences are primarily attributable to investments in PFICs, non-deductible expenses, foreign currency reclassification,
| 158 | MATTHEWS ASIA FUNDS |
Table of Contents
Notes to Financial Statements(continued)
NOL (net operating loss) adjustments, capital gains tax, distributions in excess of current earnings and profits, re-characterization of distributions, investment in swaps, adjustments on distributions related to taxable spinoffs and the utilization of accumulated earnings and profits distributed to shareholders on redemptions of shares as part of the dividends paid deduction for income tax purposes. For the year ended December 31, 2018, permanent differences in book and tax accounting have been reclassified to paid-in capital, undistributed net investment income (loss) and accumulated realized gain (loss) as follows:
| Increase/ (Decrease) Capital paid-in | Increase/(Decrease) Total Distributable Earnings/(Accumulated Loss) | |||||||
| Matthews Asia Strategic Income Fund | ($381,950 | ) | $381,950 | |||||
| Matthews Asia Credit Opportunities Fund | — | — | ||||||
| Matthews Asian Growth and Income Fund | 46,466,674 | (46,466,674 | ) | |||||
| Matthews Asia Dividend Fund | 44,403,587 | (44,403,587 | ) | |||||
| Matthews China Dividend Fund | 6,659,177 | (6,659,177 | ) | |||||
| Matthews Asia Value Fund | 232,294 | ($232,294 | ) | |||||
| Matthews Asia Focus Fund | 161,617 | (161,617 | ) | |||||
| Matthews Asia Growth Fund | (379,203 | ) | 379,203 | |||||
| Matthews Pacific Tiger Fund | 44,333,106 | (44,333,106 | ) | |||||
| Matthews Asia ESG Fund | 21,883 | (21,883 | ) | |||||
| Matthews Emerging Asia Fund | 3,373,075 | (3,373,075 | ) | |||||
| Matthews Asia Innovators Fund | 3,056,003 | (3,056,003 | ) | |||||
| Matthews China Fund | 17,583,789 | (17,583,789 | ) | |||||
| Matthews India Fund | 41,073,117 | (41,073,117 | ) | |||||
| Matthews Japan Fund | 33,149,790 | (33,149,790 | ) | |||||
| Matthews Korea Fund | 4,692,243 | (4,692,243 | ) | |||||
| Matthews Asia Small Companies Fund | 4,824,924 | (4,824,924 | ) | |||||
| Matthews China Small Companies Fund | 1,286,106 | (1,286,106 | ) | |||||
As of December 31, 2018, the tax cost of investments, including derivatives, and the related net unrealized appreciation and depreciation were as follows:
| Tax Cost | Gross Unrealized Appreciation | Gross Unrealized Depreciation | Net Unrealized Appreciation (Depreciation) | |||||||||||||
| Matthews Asia Strategic Income Fund | $97,238,252 | $731,623 | $(2,855,720 | ) | $(2,124,097 | ) | ||||||||||
| Matthews Asia Credit Opportunities Fund | 40,044,034 | 91,019 | (1,515,844 | ) | (1,424,825 | ) | ||||||||||
| Matthews Asian Growth and Income Fund | 1,388,716,935 | 165,126,736 | (151,798,174 | ) | 13,328,562 | |||||||||||
| Matthews Asia Dividend Fund | 5,276,047,933 | 1,113,721,528 | (639,665,254 | ) | 474,056,274 | |||||||||||
| Matthews China Dividend Fund | 284,090,076 | 16,436,368 | (34,178,815 | ) | (17,742,447 | ) | ||||||||||
| Matthews Asia Value Fund | 20,188,533 | 294,811 | (2,411,173 | ) | (2,116,362 | ) | ||||||||||
| Matthews Asia Focus Fund | 6,957,815 | 707,231 | (1,107,985 | ) | (400,754 | ) | ||||||||||
| Matthews Asia Growth Fund | 822,451,162 | 215,041,111 | (140,161,786 | ) | 74,879,325 | |||||||||||
| Matthews Pacific Tiger Fund | 6,056,742,263 | 2,936,276,579 | (739,815,575 | ) | 2,196,461,004 | |||||||||||
| Matthews Asia ESG Fund | 28,118,389 | 2,042,519 | (2,218,337 | ) | (175,818 | ) | ||||||||||
| Matthews Emerging Asia Fund | 406,078,010 | 68,694,554 | (101,227,192 | ) | (32,532,638 | ) | ||||||||||
| Matthews Asia Innovators Fund | 242,715,389 | 18,975,110 | (21,388,664 | ) | (2,413,554 | ) | ||||||||||
| Matthews China Fund | 748,663,244 | 18,122,214 | (154,723,169 | ) | (136,600,955 | ) | ||||||||||
| Matthews India Fund | 1,387,991,274 | 324,826,410 | (163,164,185 | ) | 161,662,225 | |||||||||||
| Matthews Japan Fund | 2,949,722,042 | 248,331,453 | (355,164,035 | ) | (106,832,582 | ) | ||||||||||
| Matthews Korea Fund | 132,843,912 | 17,398,694 | (11,279,396 | ) | 6,119,298 | |||||||||||
| Matthews Asia Small Companies Fund | 223,573,838 | 18,907,948 | (49,057,198 | ) | (30,149,250 | ) | ||||||||||
| Matthews China Small Companies Fund | 65,708,042 | 1,458,171 | (12,356,669 | ) | (10,898,498 | ) | ||||||||||
| 9. | SUBSEQUENT EVENTS |
On February 27, 2019, the Board of Trustees of the Matthews International Funds (d/b/a Matthews Asia Funds) approved a proposal to close the Matthews Asia Focus Fund (the “Focus Fund”) to purchases and thereafter to liquidate the Focus Fund. Accordingly, effective on March 1, 2019 the Focus Fund will no longer accept purchase orders. On or about March 29, 2019 (the “Liquidation Date”), all of the assets of the Focus Fund will be liquidated completely, the shares of any interest holders on the Liquidation Date will be redeemed at the NAV per share and the Focus Fund will then be terminated as a series of the Trust.
| matthewsasia.com | 800.789.ASIA | 159 |
Table of Contents
Report of Independent Registered Public Accounting Firm
To the Board of Trustees of Matthews Asia Funds and Shareholders of Matthews Asia Strategic Income Fund, Matthews Asia Credit Opportunities Fund, Matthews Asian Growth and Income Fund, Matthews Asia Dividend Fund, Matthews China Dividend Fund, Matthews Asia Value Fund, Matthews Asia Focus Fund, Matthews Asia Growth Fund, Matthews Pacific Tiger Fund, Matthews Asia ESG Fund, Matthews Emerging Asia Fund, Matthews Asia Innovators Fund, Matthews China Fund, Matthews India Fund, Matthews Japan Fund, Matthews Korea Fund, Matthews Asia Small Companies Fund, and Matthews China Small Companies Fund
Opinions on the Financial Statements
We have audited the accompanying statements of assets and liabilities, including the schedules of investments, of Matthews Asia Strategic Income Fund, Matthews Asia Credit Opportunities Fund, Matthews Asian Growth and Income Fund, Matthews Asia Dividend Fund, Matthews China Dividend Fund, Matthews Asia Value Fund, Matthews Asia Focus Fund, Matthews Asia Growth Fund, Matthews Pacific Tiger Fund, Matthews Asia ESG Fund, Matthews Emerging Asia Fund, Matthews Asia Innovators Fund, Matthews China Fund, Matthews India Fund, Matthews Japan Fund, Matthews Korea Fund, Matthews Asia Small Companies Fund and Matthews China Small Companies Fund (constituting Matthews Asia Funds, hereafter collectively referred to as the “Funds”) as of December 31, 2018, the related statements of operations for the year ended December 31, 2018, the statements of changes in net assets for each of the two years in the period ended December 31, 2018, including the related notes, and the financial highlights for each of the periods indicated therein (collectively referred to as the “financial statements”). In our opinion, the financial statements present fairly, in all material respects, the financial position of each of the Funds as of December 31, 2018, the results of each of their operations for the year then ended, the changes in each of their net assets for each of the two years in the period ended December 31, 2018, and the financial highlights for each of the periods indicated therein in conformity with accounting principles generally accepted in the United States of America.
Basis for Opinions
These financial statements are the responsibility of the Funds’ management. Our responsibility is to express an opinion on the Funds’ financial statements based on our audits. We are a public accounting firm registered with the Public Company Accounting Oversight Board (United States) (“PCAOB”) and are required to be independent with respect to the Funds in accordance with the U.S. federal securities laws and the applicable rules and regulations of the Securities and Exchange Commission and the PCAOB.
We conducted our audits of these financial statements in accordance with the standards of the PCAOB. Those standards require that we plan and perform the audit to obtain reasonable assurance about whether the financial statements are free of material misstatement, whether due to error or fraud.
Our audits included performing procedures to assess the risks of material misstatement of the financial statements, whether due to error or fraud, and performing procedures that respond to those risks. Such procedures included examining, on a test basis, evidence regarding the amounts and disclosures in the financial statements. Our audits also included evaluating the accounting principles used and significant estimates made by management, as well as evaluating the overall presentation of the financial statements. Our procedures included confirmation of securities owned as of December 31, 2018 by correspondence with the custodian and brokers; when replies were not received from brokers, we performed other auditing procedures. We believe that our audits provide a reasonable basis for our opinions.
PricewaterhouseCoopers LLP
San Francisco, CA
February 27, 2019
We have served as the auditor of one or more investment companies in Matthews Asia Funds since 2007.
| 160 | MATTHEWS ASIA FUNDS |
Table of Contents
For shareholders who do not have a December 31, 2018 tax year-end, this notice is for informational purposes. For the period January 1, 2018 to December 31, 2018, the Funds report the following items with regard to distributions paid during the period. All reports are based on financial information available as of the date of this annual report and, accordingly, are subject to change. For each item, it is the intention of each Fund to report the maximum amount permitted under the Internal Revenue Code and the regulations thereunder.
1. Qualified Dividend Income
The Funds report a portion of the ordinary income distributed during the year ended December 31, 2018 as Qualified Dividend Income (“QDI”) as defined in the Internal Revenue code as follows:
| QDI Portion | ||||
| Matthews Asia Strategic Income Fund | 0.00% | |||
| Matthews Asia Credit Opportunities Fund | 0.00% | |||
| Matthews Asian Growth and Income Fund | 70.28% | |||
| Matthews Asia Dividend Fund | 65.81% | |||
| Matthews China Dividend Fund | 49.90% | |||
| Matthews Asia Value Fund | 25.23% | |||
| Matthews Asia Focus Fund | 83.91% | |||
| Matthews Asia Growth Fund | 37.33% | |||
| Matthews Pacific Tiger Fund | 75.07% | |||
| Matthews Asia ESG Fund | 21.96% | |||
| Matthews Emerging Asia Fund | 100.00% | |||
| Matthews Asia Innovators Fund | 74.43% | |||
| Matthews China Fund | 100.00% | |||
| Matthews India Fund | 0.00% | |||
| Matthews Japan Fund | 79.86% | |||
| Matthews Korea Fund | 91.06% | |||
| Matthews Asia Small Companies Fund | 68.50% | |||
| Matthews China Small Companies Fund | 34.15% | |||
2. Dividends Received Deduction
The Funds report a Dividend Received Deduction pursuant to Section 854 of the Internal Revenue Code for the year ended December 31, 2018 as follows:
| Matthews Asia Strategic Income Fund | 0.00% | |||
| Matthews Asia Credit Opportunities Fund | 0.00% | |||
| Matthews Asian Growth and Income Fund | 6.76% | |||
| Matthews Asia Dividend Fund | 0.00% | |||
| Matthews China Dividend Fund | 0.00% | |||
| Matthews Asia Value Fund | 1.95% | |||
| Matthews Asia Focus Fund | 5.03% | |||
| Matthews Asia Growth Fund | 0.00% | |||
| Matthews Pacific Tiger Fund | 1.94% | |||
| Matthews Asia ESG Fund | 0.00% | |||
| Matthews Emerging Asia Fund | 0.00% | |||
| Matthews Asia Innovators Fund | 0.00% | |||
| Matthews China Fund | 0.00% | |||
| Matthews India Fund | 0.00% | |||
| Matthews Japan Fund | 0.00% | |||
| Matthews Korea Fund | 0.00% | |||
| Matthews Asia Small Companies Fund | 0.00% | |||
| Matthews China Small Companies Fund | 0.00% |
| matthewsasia.com | 800.789.ASIA | 161 |
Table of Contents
Tax Information(unaudited) (continued)
3. Long-Term Capital Gain Distributions
The Funds report Long-Term Capital Gain distributions pursuant to Section 852(b)(3) of the Internal Revenue Code for the year ended December 31, 2018 as follows:
| Long-Term Capital Gains | ||||
| Matthews Asia Strategic Income Fund | $— | |||
| Matthews Asia Credit Opportunities Fund | — | |||
| Matthews Asian Growth and Income Fund | 180,408,534 | |||
| Matthews Asia Dividend Fund | 266,855,532 | |||
| Matthews China Dividend Fund | 24,594,264 | |||
| Matthews Asia Value Fund | 159,629 | |||
| Matthews Asia Focus Fund | 550,312 | |||
| Matthews Asia Growth Fund | 6,873,778 | |||
| Matthews Pacific Tiger Fund | 248,646,631 | |||
| Matthews Asia ESG Fund | 861,827 | |||
| Matthews Emerging Asia Fund | 8,952,247 | |||
| Matthews Asia Innovators Fund | 8,851,877 | |||
| Matthews China Fund | 126,839,507 | |||
| Matthews India Fund | 279,269,366 | |||
| Matthews Japan Fund | 136,613,164 | |||
| Matthews Korea Fund | 24,410,239 | |||
| Matthews Asia Small Companies Fund | 43,064,299 | |||
| Matthews China Small Companies Fund | 2,204,423 | |||
4. Foreign Taxes Paid
The Funds have elected to pass through to their shareholders the foreign taxes paid for year ended December 31, 2018 as follows:
| Foreign Source Income | Foreign Taxes Paid | |||||||
| Matthews Asia Strategic Income Fund | $5,334,559 | $93,383 | ||||||
| Matthews Asia Credit Opportunities Fund | — | — | ||||||
| Matthews Asian Growth and Income Fund | 71,072,279 | 4,098,276 | ||||||
| Matthews Asia Dividend Fund | 222,844,771 | 16,579,381 | ||||||
| Matthews China Dividend Fund | 11,879,090 | 548,173 | ||||||
| Matthews Asia Value Fund | 713,451 | 62,132 | ||||||
| Matthews Asia Focus Fund | 252,622 | 14,422 | ||||||
| Matthews Asia Growth Fund | — | — | ||||||
| Matthews Pacific Tiger Fund | 182,938,212 | 17,333,806 | ||||||
| Matthews Asia ESG Fund | — | — | ||||||
| Matthews Emerging Asia Fund | 11,719,097 | 1,169,895 | ||||||
| Matthews Asia Innovators Fund | — | — | ||||||
| Matthews China Fund | 21,508,020 | 1,514,885 | ||||||
| Matthews India Fund | — | — | ||||||
| Matthews Japan Fund | 61,852,797 | 6,159,843 | ||||||
| Matthews Korea Fund | 6,357,482 | 809,944 | ||||||
| Matthews Asia Small Companies Fund | 8,017,320 | 638,494 | ||||||
| Matthews China Small Companies Fund | 1,331,093 | 60,196 | ||||||
| 162 | MATTHEWS ASIA FUNDS |
Table of Contents
5. Qualified Interest Income
The Funds report a portion of the net income dividends distributed during the year ended December 31, 2018, as Qualified Interest Income (QII), as defined in the Internal Revenue Code as follows:
| QII Portion | ||||
| Matthews Asia Strategic Income Fund | 5.48% | |||
| Matthews Asia Credit Opportunities Fund | 3.99% | |||
| Matthews Asian Growth and Income Fund | 0.39% | |||
| Matthews Asia Dividend Fund | 1.06% | |||
| Matthews China Dividend Fund | 0.83% | |||
| Matthews Asia Value Fund | 6.43% | |||
| Matthews Asia Focus Fund | 0.75% | |||
| Matthews Asia Growth Fund | 0.98% | |||
| Matthews Pacific Tiger Fund | 0.53% | |||
| Matthews Asia ESG Fund | 0.30% | |||
| Matthews Emerging Asia Fund | 1.66% | |||
| Matthews Asia Innovators Fund | 0.16% | |||
| Matthews China Fund | 0.48% | |||
| Matthews India Fund | 0.00% | |||
| Matthews Japan Fund | 0.54% | |||
| Matthews Korea Fund | 0.56% | |||
| Matthews Asia Small Companies Fund | 2.45% | |||
| Matthews China Small Companies Fund | 3.01% | |||
6. Qualified Short-Term Capital Gain Dividends
The Funds designate a portion of the short term capital gain dividends distributed during the year ended December 31, 2018, as Qualified Short Term Gain, as defined in the Internal Revenue Code as follows:
| Short-Term Gains | ||||
| Matthews Asia Strategic Income Fund | 0.00% | |||
| Matthews Asia Credit Opportunities Fund | 0.00% | |||
| Matthews Asian Growth and Income Fund | 0.00% | |||
| Matthews Asia Dividend Fund | 100.00% | |||
| Matthews China Dividend Fund | 100.00% | |||
| Matthews Asia Value Fund | 100.00% | |||
| Matthews Asia Focus Fund | 0.00% | |||
| Matthews Asia Growth Fund | 100.00% | |||
| Matthews Pacific Tiger Fund | 100.00% | |||
| Matthews Asia ESG Fund | 100.00% | |||
| Matthews Emerging Asia Fund | 0.00% | |||
| Matthews Asia Innovators Fund | 0.00% | |||
| Matthews China Fund | 0.00% | |||
| Matthews India Fund | 0.00% | |||
| Matthews Japan Fund | 100.00% | |||
| Matthews Korea Fund | 0.00% | |||
| Matthews Asia Small Companies Fund | 100.00% | |||
| Matthews China Small Companies Fund | 0.00% | |||
| matthewsasia.com | 800.789.ASIA | 163 |
Table of Contents
Approval of Investment Advisory Agreement(unaudited)
The Funds, which are series of the Trust, have retained Matthews International Capital Management, LLC (“Matthews”) to manage their assets pursuant to an Investment Advisory Agreement dated as of February 1, 2016, as amended (the “Advisory Agreement”), which has been approved by the Board of Trustees of the Funds, including all of the Trustees who are not “interested persons” (“Independent Trustees”), within the meaning of the Investment Company Act of 1940, as amended (the “1940 Act”), as well as by the shareholders of each Fund in accordance with the requirements of the 1940 Act. Following an initial two-year term with respect to each Fund upon its commencement of operations, the Advisory Agreement continues in effect from year-to-year provided that the continuance is specifically approved at least annually by the vote of the holders of at least a majority of the outstanding shares of the Funds, or by the Board of Trustees, and, in either event, by a majority of the Independent Trustees of the Trust casting votes in person at a meeting called for that purpose (the “Annual 15(c) Process”).
At a meeting held on August 29 and 30, 2018 (the “Meeting”), the Board, including the Independent Trustees of the Trust, approved the continuation of the Advisory Agreement for an additional one-year term beginning February 1, 2019 with respect to each Fund.
At the Meeting and at prior meetings, the Board received and considered information (both written and oral) provided to assist it in the review of the Advisory Agreement and made assessments with respect to each Fund. The Independent Trustees were advised by independent legal counsel with respect to these matters. In addition, the Board received in-person presentations about the Funds throughout the year. Among the information considered by the Board were responses to a detailed information request sent on behalf of the Independent Trustees by their independent legal counsel. Matthews furnished extensive information in response to this request with respect to many subjects relating to the Advisory Agreement and intended to address many of the factors discussed below, including but not limited to information about the services provided by Matthews, its structure, organization, operations and personnel, the financial condition of Matthews and the profitability to Matthews from the Advisory Agreement, compliance procedures and resources, investment performance of the Funds, expenses of the Funds, brokerage and portfolio transactions, distribution and marketing of the Funds, shareholder services and relationships with intermediaries, and other information considered relevant.
In considering information relating to management fee levels, which the Board considers to be the combination of the advisory and administrative fees, the Board considered, among other things, information provided by Matthews as to Fund management services and fees as compared to advisory services and fees charged by Matthews to its institutional clients and pooled vehicles organized outside of the United States. The Trustees also considered information provided by an independent data provider, Broadridge, comparing the investment performance and the fee and expense levels of each Fund to appropriate peer groups of mutual funds. The
Independent Trustees also considered that in the previous year they had engaged an Independent Consultant (“Independent Consultant”) with substantial industry experience in providing fund boards with analysis to assist them in their Annual 15(c) Process. The Independent Trustees considered the work and analysis performed by the Independent Consultant in that engagement to review the process for selecting appropriate peer groups for the Funds as helpful in their review for this year’s Annual 15(c) Process. Furthermore, throughout the course of the year, the Board received a wide variety of materials relating to the services provided by Matthews, including reports on each Fund’s investment results, portfolio composition, portfolio trading practices, shareholder services, and other information relating to the nature, extent, and quality of services provided by Matthews to the Funds. The Board also took into account that, under the Administration and Shareholder Services Agreement, Matthews provides additional services to the Funds that are essential to the operation of the Funds and that, although Matthews is separately compensated under that agreement, these additional services are provided in connection with Matthews’ advisory relationship with the Funds.
In addition to the information furnished by Matthews, the Trustees were provided with a legal memorandum from their independent legal counsel discussing their fiduciary duties related to their approval of the continuation of the Advisory Agreement and discussed these matters with their counsel.
Prior to the Meeting, a working group of Independent Trustees and independent legal counsel had met with representatives of Matthews to review relevant information in connection with the Annual 15(c) Process. Thereafter, the Independent Trustees had met separately with their independent legal counsel to review all of the information provided in connection with the Annual 15(c) Process. At these sessions, the Independent Trustees asked Matthews to provide certain additional information and to respond to certain additional questions at the Meeting. The Independent Trustees then reviewed this supplemental information which was provided prior to and at the Meeting. The Independent Trustees discussed the renewal of the Advisory Agreement with representatives of Matthews and among themselves in private sessions on various occasions at which no representatives of Matthews were present.
The Trustees’ determinations at the Meeting were made on the basis of each Trustee’s business judgment after consideration of all the information presented. In deciding to recommend the renewal of the Advisory Agreement with respect to each Fund, the Independent Trustees did not identify any single or particular piece of information that, in isolation, was the controlling factor. Each Independent Trustee may also have weighed factors differently. This summary describes the most important, but not all, of the factors considered by the Board and the Independent Trustees.
| 1. | The nature, extent and quality of the services provided by Matthews under the Advisory Agreement. |
The Trustees considered the overall financial strength and stability of Matthews and its ability to provide a high level
| 164 | MATTHEWS ASIA FUNDS |
Table of Contents
Approval of Investment Advisory Agreement(unaudited) (continued)
and quality of services to the Funds. The Trustees considered the experience and qualifications of the executive and portfolio management personnel at Matthews who are responsible for providing services to the Funds and who are responsible for the daily management of the Funds’ portfolios. The Trustees noted that Matthews has expanded its professional staff at both senior and junior levels over the past several years, and has enjoyed relative stability of its senior executives and portfolio management. They also reviewed Matthews’ recent hirings to further strengthen or maintain current capabilities and to support future potential growth of assets and the expansion of its business. Among the improved capabilities noted by the Independent Trustees over the past several years are enhanced risk analytical resources and related professionals, including the appointment of a new Global Head of Risk and Compliance and ongoing enhancements to compliance, risk management, technology, business infrastructure, operations, marketing and client service, as well as enhancements to financial intermediary oversight and valuation practices.
The Trustees considered Matthews as well positioned to continue to provide high quality services to the Funds under various market conditions, as demonstrated by past periods of volatile and challenging securities markets that have caused either contracting revenues or rapidly expanding assets at different times. The Trustees attributed much of that past stability to Matthews’ emphasis on preserving and enhancing portfolio management team resources, careful business planning and management, as well as its solid financial condition and strong cash reserves.
As in past years, the Trustees considered the technical capabilities of Matthews, including the design and implementation of its disaster recovery and business continuity infrastructure. The Trustees also considered the Chief Compliance Officer’s report regarding Matthews’ compliance resources, risk assessment and other compliance initiatives and programs. The Trustees concluded that Matthews has implemented a robust and diligent compliance process, and demonstrates a strong commitment to a culture of compliance. The Independent Trustees took into consideration Matthews’ description of its supervision of the activities of the Funds’ various service providers, as well as supporting the Independent Trustees’ responsibilities and requests and its responsiveness to questions and/or concerns raised by the Trustees throughout the year.
The Trustees noted the significant role played by Matthews with respect to the valuation of portfolio securities, including research and analysis related to fair valued securities and due diligence and oversight of pricing vendors.
The Trustees concluded that Matthews had the quality of personnel and other investment resources essential to performing its duties under the Advisory Agreement, and that the nature, overall quality, cost and extent of such management services are fully satisfactory.
| 2. | The investment performance of the Funds. |
The Trustees reviewed the short-term and long-term performance of each Fund on both an absolute basis and in comparison
to appropriate peer funds and benchmark indices for various periods ending June 30, 2018. The Trustees considered investment results in light of each Funds’ objective, strategies and market conditions, noting periods during which there were challenging investment conditions in various Asian markets. The Trustees also noted the difficulty of fairly benchmarking performance for certain of the Funds as well as the difficulty of establishing appropriate peer groups or benchmark indices for certain of the Funds because of the lack of other funds with a similar investment focus. The Independent Trustees reviewed information as to peer group selections presented by Broadridge and took into account the work done by the Independent Consultant in the previous year in reviewing the peer group selection process.
The Trustees reviewed each Fund’s performance on a case-by-case basis and noted that some Funds had outperformed their Selected Performance Peer Group over certain periods and/or exceeded the return of their respective benchmark while others underperformed their Selected Performance Peer Group over certain periods and/or trailed the return of their respective benchmark. In considering each Fund’s investment results, the Board placed greater emphasis on each Fund’s long-term performance track record rather than shorter-term performance. The Board also took into account that each Fund’s track record was measured as of a specific ending date, and that track records can vary as of different measurement dates. Therefore, in reviewing a Fund that is currently underperforming, the Trustees also considered the broader perspective of the Fund’s performance over varying time periods, the market conditions experienced during the periods under review, as well as the outlook for the Fund going forward in light of expected future market conditions.
The Trustees discussed with Matthews the fact that certain periods of underperformance may be transitory while other periods of underperformance may be caused by factors that warrant further consideration. To the extent of any concerns about performance with respect to any particular period for a Fund, the Trustees noted that Matthews had provided an explanation for that performance and explained its reasons for maintaining a consistent investment philosophy. In addition, the Trustees recognized actions taken by Matthews from time to time in response to performance concerns, such as changes to members of a portfolio management team. A summary of each Fund’s performance track record is provided below.
ForMatthews Pacific Tiger Fund, the Trustees noted that the Fund’s performance was very strong in the five-year and since-inception periods, ranking in the first quintile for those periods against the peer group, in the third quintile for three years and second quintile for one-year but still above the median.
ForMatthews Asian Growth and Income Fund, the Trustees noted that the Fund has experienced difficult performance, ranking in the fourth or fifth quintile of its peer group for the one-year, three-year, five-year and since-inception periods. The Trustees noted Matthews’ explanation that much of the recent underperformance was the result of a relatively weak
| matthewsasia.com | 800.789.ASIA | 165 |
Table of Contents
Approval of Investment Advisory Agreement(unaudited) (continued)
2016, but that the Fund had less volatility compared to the peer group. The Board also considered that Matthews had recently made changes to the portfolio management and research teams for the Fund and determined to monitor the performance of the new teams in the upcoming year.
ForMatthews Korea Fund, the Trustees noted that the Fund had enjoyed favorable relative performance for the three-year, five-year, and since-inception periods, but below the median for the one-year period. The Trustees took into account, however, that the peer universe for the Fund was very small, with only a few comparable funds and that, therefore, relative peer performance was less useful than if the peer universe were larger. The Trustees also considered the mostly favorable performance of the Fund compared to a Korean-focused benchmark index despite various limitations with respect to that comparison (such as the large single-issuer concentration of the index).
ForMatthews China Fund, the Trustees noted that the Fund had outperformed the median of its peer funds over the one-year, three-year and five-year periods, ranking in the first or second quintile for those periods. The Fund ranked in the third quintile for the period since inception, with performance slightly below the median.
ForMatthews Japan Fund, the Trustees noted that the Fund’s performance was favorable compared to its peer funds over the one-year, three-year, five-year and since-inception periods, exceeding the median.
ForMatthews Asia Innovators Fund, the Trustees noted that the Fund’s performance was well above the median of its peer funds over the one-year, three-year, five-year and since-inception periods, ranking in the first quintile for those periods. The Trustees noted the absence of a directly comparable peer group with the same Asia focused industry concentration even though the Fund slightly expanded its investment focus starting in 2016.
ForMatthews Asia Growth Fund, the Trustees noted that the Fund’s performance compared favorably against the median of its peers for the one-year, three-year, five-year and since-inception periods, ranking in the first quintile for those periods. The Trustees took into account, however, that the peer universe for the Fund was small, with only a few comparable funds and that therefore relative peer performance was of less use than if the peer universe were larger or more comparable.
ForMatthews India Fund, the Trustees noted that the Fund had outperformed the median of its peer funds over the one-year, three-year, five-year and since inception periods, ranking in the first or second quintile for those periods.
ForMatthews Asia Dividend Fund, the Trustees noted that the Fund outperformed or matched the median performance of its peer group for the three-year, five-year and since-inception periods, but lagged the median for the peer group for the one-year period with positive performance that was still strong.
ForMatthews Asia Small Companies Fund, the Trustees noted that the Fund ranked above the median for the one-year period and below the median for the three-year period, with only two funds in the peer group (and was the only fund in the peer group for the five-year and since-inception periods). A possible larger peer group was reviewed and determined not to be sufficiently similar to the Fund. The Trustees considered further that most of the peer group funds were not focused on Asian small cap investments and, therefore, were considered to be of limited use in evaluating the Fund’s performance.
ForMatthews China Dividend Fund, the Trustees noted the Fund’s strong relative performance, ranking in the first quintile of its peer group for the one-year, three-year, five-year and since inception periods.
ForMatthews China Small Companies Fund, the Trustees noted that the Fund’s performance exceeded the median for its peer group for the since-inception period with only two funds in the peer group.
ForMatthews Asia Strategic Income Fund, the Trustees noted that the Fund’s performance had ranked in the first or second quintile for the one-year, three-year and five-year periods, but slightly below the median for the period since inception. The Trustees recognized that the peer groups included mostly broader emerging market hard currency debt funds not focused on Asia, making the peer group less useful in comparing relative performance than if they were more closely aligned with the Fund’s investment focus.
ForMatthews Asia Focus Fund, the Trustees noted that the Fund’s performance had ranked below the median of its peer group for all relevant periods. The Board also discussed with portfolio management recent enhancements to its portfolio construction process that is intended to help improve performance. The Board determined to continue to monitor the Fund closely.
ForMatthews Emerging Asia Fund, the Trustees noted that the Fund’s performance had ranked well above the median of its peer group for the three-year, five-year and since-inception periods, ranking in the first quintile, but had experienced a difficult one-year period, ranking in the fifth quintile among its peers. The Trustees discussed with Matthews the reasons for the underperformance over the short term and their view that recent short term underperformance was transitory.
ForMatthews Asia ESG Fund, the Trustees noted that the Fund’s performance had ranked slightly below the peer group median for the one-year and three-year periods, and slightly above the median for the since-inception period. The Trustees noted that the peer group funds did not closely match the ESG strategy of the Fund.
ForMatthews Asia Value Fund, the Trustees noted that the Fund’s performance fell slightly below the peer group median for the one-year period, but exceeded the peer group median for the since -inception period with strong positive performance. The Trustees noted that the Fund was a newer Fund, without a long-term record at this time.
| 166 | MATTHEWS ASIA FUNDS |
Table of Contents
Approval of Investment Advisory Agreement(unaudited) (continued)
ForMatthews Asia Credit Opportunities Funds, the Trustees noted that the Fund’s performance had ranked below the peer group median for the one-year period and above the median for the period since inception. The Trustees noted that the Fund was a newer Fund, without a long-term record at this time.
After review, the Trustees concluded that each Fund’s overall performance was satisfactory or was being addressed as needed. The Trustees also reviewed Matthews’ trading policies and efforts to obtain best overall execution for the Funds in the various markets in which the Funds trade securities. The Trustees noted the relatively low turnover rates in the various equity Funds and Matthews’ consistent adherence to its long-standing investment approach, which emphasizes fundamental bottom-up driven investment selection in light of its view of regional economic conditions.
| 3. | The extent to which Matthews realizes economies of scale as the Funds grow larger and whether Fund investors benefit from any economies of scale. |
The Trustees first noted the substantial work done over recent years between the Board and Matthews to establish fee structures for both the Advisory Agreement and other agreements that recognize the sharing of economies of scale that can arise as assets in the Funds grow through the use of breakpoints. In particular, they noted that the management fee structure contains breakpoints for the group-priced Funds as well as for certain individually priced Funds. That structure enhances the ability of the Funds and their shareholders to benefit from past and future potential economies of scale. They discussed the structure and level of these breakpoints and concluded that they continue to be appropriate given the sizes of the Funds and potential future growth. The Trustees further noted that additional economies of scale have been and will continue to be shared with shareholders of the Funds through fee waivers and/or expense reimbursements pursuant to the Operating Expenses Agreement, fee waivers pursuant to the Fee Waiver Agreement, and the breakpoints in the fees payable under the Services Agreement.
The Trustees next discussed Matthews’ ongoing investment in its technology, systems, staffing and other aspects of its business that can benefit the Funds, noting that all these endeavors are a means by which Matthews is sharing economies of scale with the Funds and their shareholders through reinvestment in products and services that are designed to benefit the Funds and their shareholders. The Trustees considered the new personnel hired over recent years, as well as planned hiring, and the extent to which that hiring could be expected to benefit shareholders. The Trustees also recognize that the Funds’ total assets have fluctuated over the past few years, which may continue, especially in certain strategies. Those fluctuations affect any economies of scale that could be enjoyed. As a result, the Trustees remain satisfied about the extent to which economies of scale have been and will continue to be shared with the Funds and their shareholders.
| 4. | The costs of the services provided by Matthews and others. |
The Trustees considered the management fees and total fees and expenses of each Fund in comparison to the management and advisory fees and other fees and expenses of other funds
in each Fund’s relevant peer group. The Trustees reviewed information developed by Broadridge as to appropriate peer groups for each Fund for these purposes and took into account the work done by the Independent Consultant in the previous year in reviewing these peer groups. Both the Board and Broadridge generally used management fees, which include both advisory and administrative fees, as the basis of comparisons rather than only advisory fees.
The Trustees considered both the gross management fee rates charged by Matthews, as well as the effective management fee rates after taking into consideration the fees waived and expenses reimbursed pursuant to the Operating Expenses Agreement and the Fee Waiver Agreement. The Trustees found that the contractual advisory rates (excluding administrative services) for the Funds were generally very competitive and often lower than those of the relevant peer group averages. The Trustees also found that the total expense ratios paid by shareholders of the Funds, which are most representative of a shareholder’s net investment results, were also very competitive, with all but the relatively newer or smaller Funds ranking below the peer group averages. The Trustees noted that Matthews’ continued efforts in recent years had resulted in, for many of the Funds, reduced expenses over time.
The Trustees also compared Matthews’ advisory fees with those of Matthews’ separate accounts and other investment products, noting that the Funds’ advisory expenses were not disadvantageous (not being substantially higher than the separate accounts’ rates). The Trustees agreed that advisory fee for the Funds appeared to be appropriate in comparison and taking into account the services differences between these products and the Funds, including the differences in the frequency of net asset value calculations and other operational and compliance activities.
The Trustees’ overall assessment with respect to each Fund was that, subject to the considerations and exceptions noted below, the contractual advisory fee rates, the total expense ratio, and the effective or net advisory fee rates were fair and reasonable.
For theMatthews Asia Strategic Income Fund and theMatthews Asia Credit Opportunities Fund, the Trustees discussed with Matthews means to reduce the Funds’ management fee to be more in line with the peer group. After discussion with Matthews, Matthews agreed to a reduction in its advisory fee rate from 0.65% to 0.55% and further agreed to forego recovery of any previously waived fees.
For theMatthews Asia Small Companies Fund, Matthews Asia Focus Fund, Matthews Asia Value Fund and the Matthews China Small Companies Fund, the actual management fees were above the peer group medians due to their small size, but the contractual management fee for the Matthews Asia Value Fund and the Matthews China Small Companies Fund were below their peer group medians. The Trustees noted that these Funds each had breakpoints in its management fee schedule and discussed with Matthews efforts to grow the Funds in order to attempt to achieve further economies of scale.
| matthewsasia.com | 800.789.ASIA | 167 |
Table of Contents
Approval of Investment Advisory Agreement(unaudited) (continued)
| 5. | The profits to be realized by Matthews and its affiliates from the relationships with the Funds. |
The Trustees reviewed information provided by Matthews regarding the costs of sponsoring and operating the Funds and information regarding the profitability to Matthews of the Advisory Agreement both on a fund-by-fund basis and overall for the family of Funds. In considering profitability, the Trustees discussed and considered the methodology employed by Matthews in calculating profit margins but also considered other elements relevant to discussions of profitability, such as the entrepreneurial risk undertaken by Matthews in sponsoring and maintaining the Funds and risks associated with commitments to maintain Fund expense ratios. The Trustees also reviewed information provided regarding the structure and manner in which Matthews’ investment professionals were compensated and their respective views of the relationship of such compensation to the attraction and retention of quality personnel. The Trustees considered Matthews’ willingness to invest in technology, infrastructure and professional staff to reinforce and offer services and to accommodate changing regulatory requirements and industry practices.
The Trustees noted that Matthews appeared to be sufficiently profitable to operate as a viable investment management firm, able to honor its obligations as a sponsor of the Funds, including the Funds that did not generate a profit for Matthews, without earning excessive profits from any particular Fund or from the overall relationship with the Funds. The Trustees noted that, with fluctuations in asset levels in some prior years, volatility in revenues and profitability could be expected from time to time in the future, but they also noted the continued expenditures on personnel and other resources. The Board also considered information relating to the profitability of a limited number of publicly traded investment advisers, although the Board noted that this information was
of limited utility because it was comprised of a limited universe of advisers, did not provide any information as to how profitability was determined and did not limit profitability analysis to the performance of advisory services to registered investment companies. The Board further noted that these advisers differed significantly from Matthews because they were not solely dedicated to investment in the Asian markets.
Based on information received, the Trustees noted that Matthews’ overall profitability from the Advisory Agreement appeared not to be excessive at the current time, whether considered inclusive or exclusive of distribution costs.
| 6. | Ancillary benefits. |
The Trustees requested and received from Matthews information concerning other benefits received by Matthews as a result of its respective relationship with the Funds, including various service arrangements with Matthews and the use of soft-dollars.
The Board concluded that such benefits were consistent with those generally derived by investment advisers to mutual funds or were otherwise not unusual.
| 7. | Conclusions. |
Based on their review, including their consideration of each of the factors referred to above, and assisted by the advice of independent counsel to the Independent Trustees, the Board, including the Independent Trustees, concluded that the Advisory Agreement was fair and reasonable with respect to each Fund and its shareholders, and that the renewal of the Advisory Agreement would be in the best interests of each Fund and its shareholders. The Board did not indicate that any single factor was determinative of its decision to approve the Advisory Agreement, but indicated that the Board based its determination on the total mix of information available to it.
| 168 | MATTHEWS ASIA FUNDS |
Table of Contents
Trustees and Officers of the Funds(unaudited)
The operations of each Fund are under the direction of the Board of Trustees. The Board of Trustees establishes each Fund’s policies and oversees and reviews the management of each Fund. The Board meets regularly to review the activities of the officers, who are responsible for the day-to-day operations of the Funds. The Statement of Additional Information, which includes additional information about Fund Trustees, is available without charge by calling 800.789.2742 or by visiting the Funds’ website, matthewsasia.com. The Trustees and executive officers of the Funds, their year of birth, business address, principal occupations during the past five years and other trusteeships/directorships are set forth below:
Name, Year of Birth, Address and Position(s) Held with Trust | Term of Office and Length of Time Served1 | Principal Occupation(s) During Past 5 Years | Number of Portfolios in Fund Complex Overseen by Trustee | Other Trusteeships/Directorships (number of portfolios) Held by Trustee | ||||
| INDEPENDENT TRUSTEES | ||||||||
JONATHAN F. ZESCHIN Born 1953 Four Embarcadero Center Suite 550 San Francisco, CA 94111 Chairman of the Board of Trustees and Trustee | Trustee since 2007 and Chairman of the Board since 2014 | Partner (since 2009), Essential Investment Partners, LLC (investment advisory and wealth management). | 18 | Trustee (since February 1, 2019), Russell Investment Funds (9 portfolios) and Russell Investment Company (32 portfolios); Trustee and Chairman of the Board (2005–2011), DCA Total Return Fund (1 Portfolio). | ||||
TOSHI SHIBANO Born 1950 Four Embarcadero Center Suite 550 San Francisco, CA 94111 Trustee | Since 2003 | Faculty (since 2000), General Electric’s John F. Welch Leadership Center; President (since 1995), Executive Financial Literacy, Inc. (financial executive development programs); Faculty Director and Executive Education Lecturer (1995–2016), Center for Executive Education, Haas School of Business, UC Berkeley; Adjunct Professor (2000–2011), Columbia Graduate School of Business; Associate Professor (2001–2005), Thunderbird School of Global Management; Visiting Assistant Professor (2000), Stanford Graduate School of Business; Assistant Professor (1995–2000), University of Chicago Graduate School of Business; Assistant Professor (1988–1995), Haas School of Business, UC Berkeley. | 18 | |||||
RHODA ROSSMAN Born 1958 Four Embarcadero Center Suite 550 San Francisco, CA 94111 Trustee | Since 2006 | Vice President, Corporate Investment Officer (2007–2010), Senior Vice President and Treasurer (2003–2007), The PMI Group, Inc. (mortgage insurer). | 18 | |||||
RICHARD K. LYONS Born 1961 Four Embarcadero Center Suite 550 San Francisco, CA 94111 Trustee | Since 2010 | Dean (2008–2018), Haas School of Business, UC Berkeley; Chief Learning Officer (2006–2008), Goldman Sachs (investment banking and investment management); Executive Associate Dean (2005–2006), Haas School of Business, UC Berkeley. | 18 | Trustee (since 2018), Syntax ETF Trust; Trustee (2001–2006), Barclays Global Investor Funds and Master Investment Portfolios (15 Portfolios); Trustee (2000–2006), iShares, Inc. (24 Portfolios) and iShares Trust (over 70 Portfolios); Trustee (1994–2006) and Chairman of the Board (2000–2006), Matthews Asia Funds (9 Portfolios) | ||||
| 1 | Each Trustee serves for an indefinite term, until retirement age or until his/her successor is elected. Officers serve at the pleasure of the Board of Trustees. |
| matthewsasia.com | 800.789.ASIA | 169 |
Table of Contents
Trustees and Officers of the Funds(unaudited)
Name, Year of Birth, Address and Position(s) Held with Trust | Term of Office and Length of Time Served1 | Principal Occupation(s) During Past 5 Years | Number of Portfolios in Fund Complex Overseen by Trustee | Other Trusteeships/Directorships (number of portfolios) Held by Trustee | ||||
| INDEPENDENT TRUSTEES | ||||||||
CHRISTOPHER LEE Born 1967 Four Embarcadero Center Suite 550 San Francisco, CA 94111 Trustee | Since 2015 | Consultant and Associate Professor (since 2017), Hong Kong University of Science and Technology; Lecturer (part-time) (since 2013), The Chinese University of Hong Kong; Private Investor and Partner (since 2012), FAA Investments (financial holding company); Managing Director, Asia Region, and Head of Global Markets Investment Products & db-X (2010–2012), Deutsche Bank AG (financial services); Managing Director, Equity Risk Management Products, and Head of Intermediary Business (2002–2010), UBS AG (financial services); Vice President, Global Markets & Investment Bank (2000–2002), Vice President, International Private Clients Group (1997–2000), Associate, Debt and Equity Markets Group (1995–1997), Merrill Lynch & Co., Inc. (brokerage and investment management). | 18 | Director (since 2017), Hong Kong Securities and Investment Institute; Director (2013–2018), Asian Master Funds (Australia) (1 Portfolio); Trustee (since 2013), African Wildlife Foundation; Trustee (2010-2016), Oakland Museum of California. | ||||
GALE K. CARUSO Born 1957 Four Embarcadero Center Suite 550 San Francisco, CA 94111 Trustee | Since 2015 | Formerly President and Chief Executive Officer (1999–2003), Zurich Kemper Life (life insurance and annuities); Chairman, President and Chief Executive Officer (1994–1999), Scudder Canada Investor Services, Ltd. (investment management); Managing Director (1986–1999), Scudder Kemper Investments, Inc. (investment management). | 18 | Trustee (since 2006), Pacific Select Fund (58 Portfolios) and Pacific Funds Series Trust (33 Portfolios); Director (2005–2012),Make-A-Wish Foundation of Maine; Director (2005–2009), LandAmerica Financial Group, Inc.; Director (2001–2003), Make-A-Wish of Northern Illinois; former member of the Board of Directors, Illinois Life Insurance Council. | ||||
Name, Year of Birth, Address and Position(s) Held with Trust | Term of Office and Length of Time Served1 | Principal Occupation(s) During Past 5 Years | Number of Portfolios in Fund Complex Overseen by Trustee | Other Trusteeships/Directorships (number of portfolios) Held by Trustee | ||||
| INTERESTED TRUSTEES2 | ||||||||
WILLIAM J. HACKETT Born 1967 Four Embarcadero Center Suite 550 San Francisco, CA 94111 Trustee and President | President since 2008 and Trustee since 2015 | Director (since 2016), Chief Executive Officer (since 2009), President (since 2008) and Secretary (2007-2016), Matthews (investment management); President (2013-2017), Matthews A Share Selections Fund, LLC (registered investment company); Manager (since 2010), Matthews Global Investors S.à r.l. (Luxembourg) (investment management); Director (since 2010), Matthews Global Investors (Hong Kong) Limited (investment management); Partner (2002–2007), Deloitte & Touche, LLP (accounting). | 18 | Chairman (since 2010), Director (since 2009), Matthews Asia Funds SICAV (Luxembourg) (12 Portfolios); Director (since 2009), Matthews Asian Selections Funds, PLC (Ireland) (1 Portfolio). | ||||
ROBERT J. HORROCKS, PhD Born 1968 Four Embarcadero Center Suite 550 San Francisco, CA 94111 Vice President | Since 2009 | Chief Investment Officer (since 2009), Director of Research (2008–2009), Matthews (investment management); Head of Research (2006–2008), Mirae Asset Management (investment management); Chief Investment Officer (2003–2006), Everbright Pramerica (investment management). | 18 | None | ||||
| 1 | Each trustee serves for an indefinite term, until retirement age or until his/her successor is elected. Officers serve at the pleasure of the Board of Trustees. |
| 2 | A trustee is considered an “interested person” of the Trust as defined under the 1940 Act because of an ownership interest in the Advisor or an office held with the Trust or the Advisor. |
| 170 | MATTHEWS ASIA FUNDS |
Table of Contents
Trustees and Officers of the Funds(unaudited)
Name, Year of Birth, Address and Position(s) Held with Trust | Term of Office and Length of Time Served1 | Principal Occupation(s) During Past 5 Years | Other Trusteeships/ Directorships (number of portfolios) Held by Officer | |||
| OFFICERS WHO ARE NOT TRUSTEES | ||||||
JOHN P. McGOWAN Born 1964 Four Embarcadero Center Suite 550 San Francisco, CA 94111 Vice President and Secretary | Since 2005 | Head of Fund Administration (since 2009), Chief Administrative Officer (2007–2008), Chief Operating Officer (2004–2007), Matthews (investment management); Vice President and Secretary (2013-2017), Matthews A Share Selections Fund, LLC (registered investment company); Director (since 2010), Matthews Asia Funds SICAV (Luxembourg) (investments); Director (since 2010), Matthews Global Investors S.à r.l. (Luxembourg) (investment management); Director (since 2004), Matthews Asian Selections Funds, PLC (Ireland) (investments). | Director, Matthews Asian Selections Funds Plc (1 Portfolio); Director, Matthews Asia Funds SICAV (Luxembourg) (12 Portfolios). | |||
SHAI A. MALKA Born 1973 Four Embarcadero Center Suite 550 San Francisco, CA 94111 Treasurer | Since 2005 | Vice President of Fund Accounting and Operations (since 2010), Senior Manager of Fund Accounting and Operations (2004–2009), Matthews (investment management); Treasurer (2013-2017), Matthews A Share Selections Fund, LLC (registered investment company). | None | |||
DAVID MONROE Born 1963 Four Embarcadero Center Suite 550 San Francisco, CA 94111 Vice President | Since 2014 | General Counsel (since 2015), Deputy General Counsel (2014), Matthews (investment management); Chief Legal Officer (2006–2013), Nikko Asset Management Co., Ltd. (investment management). | None | |||
J. DAVID KAST Born 1966 Four Embarcadero Center Suite 550 San Francisco, CA 94111 Chief Compliance Officer and Anti-Money Laundering Officer | Since 2018 | Chief Compliance Officer and Anti-Money Laundering Officer (since 2018) and Global Head of Risk and Compliance (since 2017), Matthews (investment management); Managing Director (2009–2017), Goldman Sachs (investment management). | None | |||
| 1 | Each trustee serves for an indefinite term, until retirement age or until his/her successor is elected. Officers serve at the pleasure of the Board of Trustees. |
| matthewsasia.com | 800.789.ASIA | 171 |
Table of Contents

| 172 |
Table of Contents

| 173 |
Table of Contents
| Matthews Asia Funds | ||
INVESTMENT ADVISOR Matthews International Capital Management, LLC Four Embarcadero Center, Suite 550 San Francisco, CA 94111 800.789.ASIA
CUSTODIAN Brown Brothers Harriman & Co. 50 Milk Street Boston, MA 02109 | ACCOUNT SERVICES Matthews Asia Funds P.O. Box 9791 Providence, RI 02940 800.789.ASIA
LEGAL COUNSEL Paul Hastings LLP 101 California Street, 48th Floor San Francisco, CA 94111 | |

P.O. Box 9791 | Providence, RI 02940 | matthewsasia.com | 800.789.ASIA (2742)
Matthews Asia Funds are distributed in the United States by Foreside Funds Distributors LLC, Berwyn, Pennsylvania
Matthews Asia Funds are distributed in Latin America by HMC Partners

AR-1218
174
Table of Contents
Item 2. Code of Ethics.
| (a) | The registrant, as of the end of the period covered by this report, has adopted a code of ethics that applies to the registrant’s principal executive officer, principal financial officer, principal accounting officer or controller, or persons performing similar functions, regardless of whether these individuals are employed by the registrant or a third party. |
| (c) | There have been no amendments, during the period covered by this report, to a provision of the code of ethics that applies to the registrant’s principal executive officer, principal financial officer, principal accounting officer or controller, or persons performing similar functions, regardless of whether these individuals are employed by the registrant or a third party, and that relates to any element of the code of ethics description. |
| (d) | The registrant has not granted any waivers, including an implicit waiver, from a provision of the code of ethics that applies to the registrant’s principal executive officer, principal financial officer, principal accounting officer or controller, or persons performing similar functions, regardless of whether these individuals are employed by the registrant or a third party, that relates to one or more of the items set forth in paragraph (b) of this item’s instructions. |
Item 3. Audit Committee Financial Expert.
(a) | As of the end of the period covered by the report, the registrant’s board of directors has determined that the registrant has two audit committee financial experts serving on its audit committee, Toshi Shibano and Jonathan F. Zeschin, and that both are “independent.” | |
(b) | Prof. Shibano is a member of the Faculty of the General Electric Corporate Leadership Development Center. He has served as an Executive Education Lecturer at the Haas School of Business at the University of California, Berkeley, an Adjunct Professor at the Columbia Graduate School of Business, and on the faculties of Thunderbird American Graduate School of International Management, Stanford Graduate School of Business, the University of Chicago School of Business and the Australian Graduate School of Management at the University of New South Wales. He regularly reviews current research in accounting both for use in instruction of courses and for internal faculty evaluation. He has experience analyzing and evaluating financial statements at the appropriate level of complexity through his professional activities on the educational faculties referenced above. | |
Prof. Shibano also has extensive experience in executive education worldwide (Hong Kong, Taiwan, Singapore, Finland, Italy, Mexico, India) and has developed innovative new programs in financial analysis, management control systems and strategy implementation. Prof. Shibano has published in the Journal of Accounting Research, the Journal of Accounting and Economics, the Rand Journal of Economics, and the Journal of Applied Corporate Finance, on the topics of strategic audit risk, accounting standard setting, international accounting standards, tax minimization, foreign currency risk management, and organizational structure. Prof. Shibano received his MBA from the Haas School at UC Berkeley and earned his PhD at the Stanford Graduate School of Business, earning the highest academic honors in both programs. Prof. Shibano has gained additional accounting expertise as the Audit Committee Chair of Matthews International Funds. | ||
Mr. Zeschin is Partner of Essential Investment Partners, LLC, a wealth management and investment advisory firm. He is also the portfolio manager for that firm’s Essential Growth Portfolio. Essential Investment Partners, LLC succeeded to the business of Essential | ||
Table of Contents
Advisers, Inc. Prior to forming Essential Advisers, Inc., Mr. Zeschin held senior executive positions with Founders Asset Management, Inc., Invesco Funds Group, and Stein Roe & Farnham, Inc. Mr. Zeschin holds a Masters of Management from the Kellogg School at Northwestern University, with majors in Finance and Marketing, and a Bachelor in Business Administration in Accounting with distinction from the University of Michigan. He holds a Certified Public Accountant license from the state of Colorado and is a Certified Financial Planner certificant. Mr. Zeschin is a former chair of the ICI’s Accounting Treasurer’s Committee and a former member of the AICPA Investment Companies committee. Mr. Zeschin was previously the chairman of the Board of Trustees of two NYSE listedclosed-end funds. He has served on the audit committees of mutual fund boards since 2002. He has experience analyzing and evaluating financial statements at the appropriate level of complexity through his professional activities referenced above. Mr. Zeschin has gained additional expertise as a member of the Audit Committee of Matthews International Funds. |
Item 4. Principal Accountant Fees and Services.
Audit Fees
| (a) | The aggregate fees billed for each of the last two fiscal years for professional services rendered by the principal accountant for the audit of the registrant’s annual financial statements or services that are normally provided by the accountant in connection with statutory and regulatory filings or engagements for those fiscal years are $641,574 in 2017 and $596,970 in 2018. |
Audit-Related Fees
| (b) | The aggregate fees billed in each of the last two fiscal years for assurance and related services by the principal accountant that are reasonably related to the performance of the audit of the registrant’s financial statements and are not reported under paragraph (a) of this Item are $0 in 2017 and $0 in 2018. |
Tax Fees
| (c) | The aggregate fees billed in each of the last two fiscal years for professional services rendered by the principal accountant for tax compliance, tax advice, and tax planning are $146,250 in 2017 and $149,220 in 2018. Tax fees include services provided by the principal accountant for tax return preparations. |
All Other Fees
| (d) | The aggregate fees billed in each of the last two fiscal years for products and services provided by the principal accountant, other than the services reported in paragraphs (a) through (c) of this Item are $0 in 2017 and $0 in 2018. |
Table of Contents
(e)(1) Disclose the audit committee’spre-approval policies and procedures described in paragraph (c)(7) of Rule2-01 of RegulationS-X.
Pre-Approval of Auditor Services.
Pre-Approval Requirements. Before the Auditor is engaged by the Trust to render audit related or permissiblenon-audit services,either:
| (i) | The Audit Committee shallpre-approve all audit related services and permissiblenon-audit services (e.g., tax services) to be provided to the Trust; or |
| (ii) | The Audit Committee shall establish policies and procedures governing the Auditor’s engagement. Any such policies and procedures must (1) be detailed as to the particular service and (2) not involve any delegation of the Audit Committee’s responsibilities to the Adviser. The Audit Committee may delegate to one or more of its members the authority to grantpre-approvals. Thepre-approval policies and procedures shall include the requirement that the decisions of any member to whom authority is delegated under this Section 4(e) shall be presented to the full Audit Committee at its next scheduled meeting. |
De Minimis Exceptions toPre-Approval Requirements.Pre-approval for a service provided to the Trust other than audit, review or attest services is not required if: (1) the aggregate amount of all suchnon-audit services provided to the Trust constitutes not more than 5 percent of the total amount of revenues paid by the Trust to the Auditor during the fiscal year in which thenon-audit services are provided; (2) such services were not recognized by the Trust at the time of the engagement to benon-audit services; and (3) such services are promptly brought to the attention of the Audit Committee and are approved by the Audit Committee or by one or more members of the Audit Committee to whom authority to grant such approvals has been delegated by the Audit Committee.
Pre-Approval ofNon-Audit Services Provided to the Adviser and Certain Control Persons. With respect to services that have a direct impact on the operations or financial reporting of the Trust, the Audit Committee shallpre-approve all suchnon-audit services proposed to be provided by the Auditor to (i) the Adviser and (ii) any entity controlling, controlled by, or under common control with the Adviser that provides ongoing services to the Trust.
Application of De Minimis Exception: Thede minimis exceptions set forth above under Section 4(e)(ii) apply topre-approvals under this Section 4(e)(iii) as well, except that the “total amount of revenues” calculation for Section 4(e)(iii) services is based on the total amount of revenues paid to the Auditor by the Trust and any other entity that has its services approved under this Section (i.e.,the Adviser or any control person).
(e)(2) The percentage of services described in each of paragraphs (b) through (d) of this Item that were approved by the audit committee pursuant to paragraph (c)(7)(i)(C) of Rule2-01 of RegulationS-X are as follows:
(b) Not applicable
(c) 100%
Table of Contents
(d) Not applicable
| (f) | The percentage of hours expended on the principal accountant’s engagement to audit the registrant’s financial statements for the most recent fiscal year that were attributed to work performed by persons other than the principal accountant’s full-time, permanent employees was 0%. |
| (g) | The aggregatenon-audit fees billed by the registrant’s accountant for services rendered to the registrant, and rendered to the registrant’s investment adviser (not including anysub-adviser whose role is primarily portfolio management and is subcontracted with or overseen by another investment adviser), and any entity controlling, controlled by, or under common control with the adviser that provides ongoing services to the registrant for each of the last two fiscal years of the registrant was $296,800 in 2017 and $408,760 in 2018. |
| (h) | The registrant’s audit committee of the board of directorshas considered whether the provision ofnon-audit services that were rendered to the registrant’s investment adviser (not including anysub-adviser whose role is primarily portfolio management and is subcontracted with or overseen by another investment adviser), and any entity controlling, controlled by, or under common control with the investment adviser that provides ongoing services to the registrant that were notpre-approved pursuant to paragraph (c)(7)(ii) of Rule2-01 of RegulationS-X is compatible with maintaining the principal accountant’s independence. |
Item 5. Audit Committee of Listed Registrants.
Not applicable.
Item 6. Investments.
| (a) | Schedule of Investments in securities of unaffiliated issuers as of the close of the reporting period is included as part of the report to shareholders filed under Item 1 of this form. |
| (b) | Not applicable. |
| Item 7. | Disclosure of Proxy Voting Policies and Procedures forClosed-End Management Investment Companies. |
Not applicable.
Item 8. Portfolio Managers ofClosed-End Management Investment Companies.
Not applicable.
| Item 9. | Purchases of Equity Securities byClosed-End Management Investment Company and Affiliated Purchasers. |
Not applicable.
Table of Contents
Item 10. Submission of Matters to a Vote of Security Holders.
There have been no material changes to the procedures by which the shareholders may recommend nominees to the registrant’s board of directors, where those changes were implemented after the registrant last provided disclosure in response to the requirements of Item 407(c)(2)(iv) of RegulationS-K (17 CFR 229.407) (as required by Item 22(b)(15) of Schedule 14A (17 CFR240.14a-101)), or this Item.
Item 11. Controls and Procedures.
| (a) | The registrant’s principal executive and principal financial officers, or persons performing similar functions, have concluded that the registrant’s disclosure controls and procedures (as defined in Rule30a-3(c) under the Investment Company Act of 1940, as amended (the “1940 Act”) (17 CFR270.30a-3(c))) are effective, as of a date within 90 days of the filing date of the report that includes the disclosure required by this paragraph, based on their evaluation of these controls and procedures required by Rule30a-3(b) under the 1940 Act (17 CFR270.30a-3(b)) and Rules13a-15(b) or15d-15(b) under the Securities Exchange Act of 1934, as amended (17 CFR240.13a-15(b) or240.15d-15(b)). |
| (b) | There were no changes in the registrant’s internal control over financial reporting (as defined in Rule30a-3(d) under the 1940 Act (17 CFR270.30a-3(d))) that occurred during the registrant’s last fiscal quarterthat has materially affected, or is reasonably likely to materially affect, the registrant’s internal control over financial reporting. |
Item 12. Disclosure of Securities Lending Activities forClosed-End Management Investment Companies.
Not applicable.
Item 13. Exhibits.
| (a)(1) | Code of ethics, or any amendment thereto, that is the subject of disclosure required by Item 2 is attached hereto. | |
| (a)(2) | Certifications pursuant to Rule30a-2(a) under the 1940 Act and Section 302 of the Sarbanes-Oxley Act of 2002 are attached hereto. | |
| (a)(3) | Not applicable. | |
| (a)(4) | Not applicable. | |
| (b) | Certifications pursuant to Rule30a-2(b) under the 1940 Act and Section 906 of the Sarbanes-Oxley Act of 2002 are attached hereto. | |
Table of Contents
SIGNATURES
Pursuant to the requirements of the Securities Exchange Act of 1934 and the Investment Company Act of 1940, the registrant has duly caused this report to be signed on its behalf by the undersigned, thereunto duly authorized.
| (Registrant) Matthews International Funds | ||
| By (Signature and Title)* /s/ William J. Hackett | ||
| William J. Hackett, President | ||
| (principal executive officer) | ||
| Date March 7, 2019 | ||
Pursuant to the requirements of the Securities Exchange Act of 1934 and the Investment Company Act of 1940, this report has been signed below by the following persons on behalf of the registrant and in the capacities and on the dates indicated.
| By (Signature and Title)* /s/ William J. Hackett | ||
| William J. Hackett, President | ||
| (principal executive officer) | ||
| Date March 7, 2019 | ||
| By (Signature and Title)* /s/ Shai Malka | ||
| Shai Malka, Treasurer | ||
| (principal financial officer) | ||
| Date March 7, 2019 | ||
* Print the name and title of each signing officer under his or her signature.