UNITED STATES
SECURITIES AND EXCHANGE COMMISSION
Washington, D.C. 20549
FORM N-CSR
CERTIFIED SHAREHOLDER REPORT OF REGISTERED MANAGEMENT
INVESTMENT COMPANIES
Investment Company Act file number 811-08510
Matthews International Funds
(Exact name of registrant as specified in charter)
Four Embarcadero Center, Suite 550
San Francisco, CA 94111
(Address of principal executive offices) (Zip code)
William J. Hackett, President
Four Embarcadero Center, Suite 550
San Francisco, CA 94111
(Name and address of agent for service)
Registrant’s telephone number, including area code: 415-788-7553
Date of fiscal year end: December 31
Date of reporting period: December 31, 2017
Form N-CSR is to be used by management investment companies to file reports with the Commission not later than 10 days after the transmission to stockholders of any report that is required to be transmitted to stockholders under Rule 30e-1 under the Investment Company Act of 1940 (17 CFR 270.30e-1). The Commission may use the information provided on Form N-CSR in its regulatory, disclosure review, inspection, and policymaking roles.
A registrant is required to disclose the information specified by Form N-CSR, and the Commission will make this information public. A registrant is not required to respond to the collection of information contained in Form N-CSR unless the Form displays a currently valid Office of Management and Budget (“OMB”) control number. Please direct comments concerning the accuracy of the information collection burden estimate and any suggestions for reducing the burden to Secretary, Securities and Exchange Commission, 450 Fifth Street, NW, Washington, DC 20549-0609. The OMB has reviewed this collection of information under the clearance requirements of 44 U.S.C. § 3507.
Item 1. Reports to Stockholders.
The Report to Shareholders is attached herewith.
Matthews Asia Funds | Annual Report
December 31, 2017 | matthewsasia.com
ASIA FIXED INCOME STRATEGIES
Matthews Asia Strategic Income Fund
Matthews Asia Credit Opportunities Fund
ASIA GROWTH AND INCOME STRATEGIES
Matthews Asian Growth and Income Fund
Matthews Asia Dividend Fund
Matthews China Dividend Fund
ASIA VALUE STRATEGY
Matthews Asia Value Fund
ASIA GROWTH STRATEGIES
Matthews Asia Focus Fund
Matthews Asia Growth Fund
Matthews Pacific Tiger Fund
Matthews Asia ESG Fund
Matthews Emerging Asia Fund
Matthews Asia Innovators Fund
Matthews China Fund
Matthews India Fund
Matthews Japan Fund
Matthews Korea Fund
ASIA SMALL COMPANY STRATEGIES
Matthews Asia Small Companies Fund
Matthews China Small Companies Fund

Investor Class Performance and Expenses (December 31, 2017)
| | | | | | | | | | | | | | | | | | | | | | | | | | | | | | | | | | | | |
| Investor Class | | | | | Average Annual Total Return† | | | Inception
Date | | | 2017 Annual
Operating
Expenses** | | | 2017 Annual
Operating Expenses
after Fee Waiver and Expense
Reimbursement* | | | Prospectus
Expense
Ratios‡ | | | Prospectus
Expense Ratios
after Fee Waiver
and Expense
Reimbursement‡ | |
| | 1 year | | | 5 years | | | 10 years | | | Since
Inception | | | | | | |
ASIA FIXED INCOME STRATEGIES | | | | | | | | | | | | | | | | | | | | | | | | | | | | | | | | | | | | |
Asia Strategic Income Fund (MAINX) | | | 9.40% | | | | 3.85% | | | | n.a. | | | | 5.25% | | | | 11/30/11 | | | | 1.29% | | | | 1.15% | 1 | | | 1.33% | | | | 1.15% | 1 |
Asia Credit Opportunities Fund (MCRDX) | | | 7.86% | | | | n.a. | | | | n.a. | | | | 7.52% | | | | 4/29/16 | | | | 1.86% | | | | 1.15% | 1 | | | 2.24% | | | | 1.15% | 1 |
ASIA GROWTH AND INCOME STRATEGIES | | | | | | | | | | | | | | | | | | | | | | | | | | | | | | | | | | | | |
Asian Growth and Income Fund (MACSX) | | | 21.85% | | | | 4.20% | | | | 4.78% | | | | 9.56% | | | | 9/12/94 | | | | 1.07% | | | | 1.07% | 2 | | | 1.09% | | | | 1.09% | |
Asia Dividend Fund (MAPIX) | | | 34.69% | | | | 10.07% | | | | 9.03% | | | | 10.41% | | | | 10/31/06 | | | | 1.03% | | | | 1.02% | 3 | | | 1.06% | | | | 1.06% | |
China Dividend Fund (MCDFX) | | | 37.69% | | | | 12.77% | | | | n.a. | | | | 11.93% | | | | 11/30/09 | | | | 1.19% | | | | 1.19% | 2 | | | 1.22% | | | | 1.22% | |
ASIA VALUE STRATEGY | | | | | | | | | | | | | | | | | | | | | | | | | | | | | | | | | | | | |
Asia Value Fund (MAVRX) | | | 36.12% | | | | n.a. | | | | n.a. | | | | 19.22% | | | | 11/30/15 | | | | 2.32% | | | | 1.50% | 4 | | | 11.48% | | | | 1.50% | 4 |
ASIA GROWTH STRATEGIES | | | | | | | | | | | | | | | | | | | | | | | | | | | | | | | | | | | | |
Asia Focus Fund (MAFSX) | | | 36.98% | | | | n.a. | | | | n.a. | | | | 5.48% | | | | 4/30/13 | | | | 2.45% | | | | 1.50% | 4 | | | 2.47% | | | | 1.50% | 4 |
Asia Growth Fund (MPACX) | | | 39.39% | | | | 11.23% | | | | 7.21% | | | | 10.19% | | | | 10/31/03 | | | | 1.12% | | | | 1.12% | 2 | | | 1.14% | | | | 1.14% | |
Pacific Tiger Fund (MAPTX) | | | 39.96% | | | | 9.83% | | | | 7.07% | | | | 9.32% | | | | 9/12/94 | | | | 1.08% | | | | 1.06% | 3 | | | 1.09% | | | | 1.08% | 3 |
Asia ESG Fund (MASGX) | | | 33.79% | | | | n.a. | | | | n.a. | | | | 7.82% | | | | 4/30/15 | | | | 2.65% | | | | 1.50% | 4 | | | 3.54% | | | | 1.48% | 4 |
Emerging Asia Fund (MEASX) | | | 18.42% | | | | n.a. | | | | n.a. | | | | 10.67% | | | | 4/30/13 | | | | 1.70% | | | | 1.48% | 4 | | | 1.77% | | | | 1.47% | 4 |
Asia Innovators Fund (MATFX) | | | 52.88% | | | | 16.55% | | | | 7.46% | | | | 4.28% | | | | 12/27/99 | | | | 1.24% | | | | 1.24% | 2 | | | 1.24% | | | | 1.24% | |
China Fund (MCHFX) | | | 59.37% | | | | 9.59% | | | | 4.22% | | | | 10.66% | | | | 2/19/98 | | | | 1.09% | | | | 1.09% | 2 | | | 1.18% | | | | 1.18% | |
India Fund (MINDX) | | | 35.79% | | | | 15.83% | | | | 5.55% | | | | 12.85% | | | | 10/31/05 | | | | 1.09% | | | | 1.09% | 2 | | | 1.12% | | | | 1.12% | |
Japan Fund (MJFOX) | | | 33.14% | | | | 16.09% | | | | 7.11% | | | | 6.86% | | | | 12/31/98 | | | | 0.95% | | | | 0.94% | 3 | | | 0.98% | | | | 0.98% | |
Korea Fund (MAKOX) | | | 43.70% | | | | 11.13% | | | | 6.34% | | | | 7.11% | | | | 1/3/95 | | | | 1.15% | | | | 1.15% | 2 | | | 1.15% | | | | 1.15% | |
ASIA SMALL COMPANY STRATEGIES | | | | | | | | | | | | | | | | | | | | | | | | | | | | | | | | | | | | |
Asia Small Companies Fund (MSMLX) | | | 30.59% | | | | 6.83% | | | | n.a. | | | | 12.54% | | | | 9/15/08 | | | | 1.49% | | | | 1.46% | 4 | | | 1.49% | | | | 1.47% | 4 |
China Small Companies Fund (MCSMX) | | | 53.88% | | | | 14.26% | | | | n.a. | | | | 6.54% | | | | 5/31/11 | | | | 2.34% | | | | 1.50% | 4 | | | 2.24% | | | | 1.50% | 4 |
| * | Expense ratio represents the actual expense ratio a shareholder would have paid if they had been invested the entire year. |
| ** | Before fee waivers and expense reimbursement. |
| † | Annualized performance for periods of at least one year, otherwise cumulative. |
| ‡ | These figures are from the Funds’ prospectus dated as of April 28, 2017, and may differ from the actual expense ratios for fiscal year 2017, as shown in the financial highlights section of this report. |
| 1 | Matthews has contractually agreed (i) to waive fees and reimburse expenses to the extent needed to limit Total Annual Fund Operating Expenses (excluding Rule 12b-1 fees, taxes, interest, brokerage commissions, short sale dividend expenses, expenses incurred in connection with any merger or reorganization or extraordinary expenses such as litigation) of the Institutional Class to 0.90% first by waiving class specific expenses (i.e., shareholder service fees specific to a particular class) of the Institutional Class and then, to the extent necessary, by waiving non-class specific expenses of the Institutional Class, and (ii) if any Fund-wide expenses (i.e., expenses that apply to both the Institutional Class and the Investor Class) are waived for the Institutional Class to maintain the 0.90% expense limitation, to waive an equal amount (in annual percentage terms) of those same expenses for the Investor Class. The Total Annual Fund Operating Expenses After Fee Waiver and Expense Reimbursement for the Investor Class may vary from year to year and will in some years exceed 0.90%. If the operating expenses fall below the expense limitation in a year within three years after Matthews has made a waiver or reimbursement, the Fund may reimburse Matthews up to an amount that does not cause the expenses for that year to exceed the lesser of the (i) expense limitation applicable at the time of that fee waiver and/or expense reimbursement or (ii) the expense limitation in effect at the time of recoupment. This agreement will remain in place until April 30, 2019 and may be terminated at any time by the Board of Trustees on behalf of the Fund on 60 days’ written notice to Matthews. Matthews may decline to renew this agreement by written notice to the Trust at least 30 days before its annual expiration date. |
| 2 | Fund had no waivers or reimbursements. |
| 3 | Matthews has contractually agreed to waive a portion of its advisory fee and administrative and shareholder services fee if the Fund’s average daily net assets are over $3 billion, as follows: for every $2.5 billion average daily net assets of the Fund that are over $3 billion, the advisory fee rate and the administrative and shareholder services fee rate for the Fund with respect to such excess average daily net assets will be each reduced by 0.01%, in each case without reducing such fee rate below 0.00%. Any amount waived by Matthews pursuant to this agreement may not be recouped by Matthews. This agreement will remain in place until April 30, 2019 and may be terminated at any time (i) by the Trust on behalf of the Fund or by the Board of Trustees upon 60 days’ prior written notice to Matthews; or (ii) by Matthews upon 60 days’ prior written notice to the Trust, in each case without payment of any penalty. |
| 4 | Matthews has contractually agreed (i) to waive fees and reimburse expenses to the extent needed to limit Total Annual Fund Operating Expenses (excluding Rule 12b-1 fees, taxes, interest, brokerage commissions, short sale dividend expenses, expenses incurred in connection with any merger or reorganization or extraordinary expenses such as litigation) of the Institutional Class to 1.25% first by waiving class specific expenses (i.e., shareholder service fees specific to a particular class) of the Institutional Class and then, to the extent necessary, by waiving non-class specific expenses of the Institutional Class, and (ii) if any Fund-wide expenses (i.e., expenses that apply to both the Institutional Class and the Investor Class) are waived for the Institutional Class to maintain the 1.25% expense limitation, to waive an equal amount (in annual percentage terms) of those same expenses for the Investor Class. The Total Annual Fund Operating Expenses After Fee Waiver and Expense Reimbursement for the Investor Class may vary from year to year and will in some years exceed 1.25%. If the operating expenses fall below the expense limitation in a year within three years after Matthews has made a waiver or reimbursement, the Fund may reimburse Matthews up to an amount that does not cause the expenses for that year to exceed the lesser of (i) the expense limitation applicable at the time of that fee waiver and/or expense reimbursement or (ii) the expense limitation in effect at the time of recoupment. This agreement will remain in place until April 30, 2019 and may be terminated at any time by the Board of Trustees on behalf of the Fund on 60 days’ written notice to Matthews. Matthews may decline to renew this agreement by written notice to the Trust at least 30 days before its annual expiration date. |
Institutional Class Performance and Expenses (December 31, 2017)
| | | | | | | | | | | | | | | | | | | | | | | | | | | | | | | | | | | | |
| Institutional Class | | | | | Average Annual Total Return† | | | Inception
Date | | | 2017
Annual
Operating
Expenses** | | | 2017 Annual
Operating Expenses
after Fee Waiver and Expense
Reimbursement* | | | Prospectus
Expense
Ratios‡ | | | Prospectus
Expense Ratios
after Fee Waiver
and Expense
Reimbursement‡ | |
| | 1 year | | | 5 years | | | 10 years | | | Since
Inception | | | | | | |
ASIA FIXED INCOME STRATEGIES | | | | | | | | | | | | | | | | | | | | | | | | | | | | | | | | | | | | |
Asia Strategic Income Fund (MINCX) | | | 9.67% | | | | 4.08% | | | | n.a. | | | | 5.46% | | | | 11/30/11 | | | | 1.08% | | | | 0.90% | 1 | | | 1.12% | | | | 0.90% | 1 |
Asia Credit Opportunities Fund (MICPX) | | | 8.13% | | | | n.a. | | | | n.a. | | | | 7.78% | | | | 4/29/16 | | | | 1.62% | | | | 0.90% | 1 | | | 1.99% | | | | 0.90% | 1 |
ASIA GROWTH AND INCOME STRATEGIES | | | | | | | | | | | | | | | | | | | | | | | | | | | | | | | | | | | | |
Asian Growth and Income Fund (MICSX) | | | 22.00% | | | | 4.36% | | | | n.a. | | | | 5.24% | | | | 10/29/10 | | | | 0.93% | | | | 0.93% | 2 | | | 0.94% | | | | 0.94% | |
Asia Dividend Fund (MIPIX) | | | 34.77% | | | | 10.20% | | | | n.a. | | | | 8.83% | | | | 10/29/10 | | | | 0.92% | | | | 0.91% | 3 | | | 0.94% | | | | 0.93% | 3 |
China Dividend Fund (MICDX) | | | 37.88% | | | | 12.99% | | | | n.a. | | | | 10.90% | | | | 10/29/10 | | | | 1.04% | | | | 1.04% | 2 | | | 1.06% | | | | 1.06% | |
ASIA VALUE STRATEGY | | | | | | | | | | | | | | | | | | | | | | | | | | | | | | | | | | | | |
Asia Value Fund (MAVAX) | | | 36.35% | | | | n.a. | | | | n.a. | | | | 19.50% | | | | 11/30/15 | | | | 2.08% | | | | 1.25% | 4 | | | 11.26% | | | | 1.25% | 4 |
ASIA GROWTH STRATEGIES | | | | | | | | | | | | | | | | | | | | | | | | | | | | | | | | | | | | |
Asia Focus Fund (MIFSX) | | | 37.35% | | | | n.a. | | | | n.a. | | | | 5.74% | | | | 4/30/13 | | | | 2.27% | | | | 1.25% | 4 | | | 2.29% | | | | 1.25% | 4 |
Asia Growth Fund (MIAPX) | | | 39.64% | | | | 11.46% | | | | n.a. | | | | 8.68% | | | | 10/29/10 | | | | 0.93% | | | | 0.93% | 2 | | | 0.96% | | | | 0.96% | |
Pacific Tiger Fund (MIPTX) | | | 40.17% | | | | 10.01% | | | | n.a. | | | | 8.07% | | | | 10/29/10 | | | | 0.91% | | | | 0.89% | 3 | | | 0.91% | | | | 0.90% | 3 |
Asia ESG Fund (MISFX) | | | 34.11% | | | | n.a. | | | | n.a. | | | | 8.09% | | | | 4/30/15 | | | | 2.46% | | | | 1.25% | 4 | | | 3.36% | | | | 1.25% | 4 |
Emerging Asia Fund (MIASX) | | | 18.70% | | | | n.a. | | | | n.a. | | | | 10.92% | | | | 4/30/13 | | | | 1.52% | | | | 1.25% | 4 | | | 1.62% | | | | 1.25% | 4 |
Asia Innovators Fund (MITEX) | | | 53.18% | | | | n.a. | | | | n.a. | | | | 15.98% | | | | 4/30/13 | | | | 1.05% | | | | 1.05% | 2 | | | 1.01% | | | | 1.01% | |
China Fund (MICFX) | | | 59.71% | | | | 9.75% | | | | n.a. | | | | 5.09% | | | | 10/29/10 | | | | 0.93% | | | | 0.93% | 2 | | | 1.03% | | | | 1.03% | |
India Fund (MIDNX) | | | 36.05% | | | | 16.04% | | | | n.a. | | | | 7.93% | | | | 10/29/10 | | | | 0.89% | | | | 0.89% | 2 | | | 0.91% | | | | 0.91% | |
Japan Fund (MIJFX) | | | 33.23% | | | | 16.23% | | | | n.a. | | | | 12.72% | | | | 10/29/10 | | | | 0.87% | | | | 0.86% | 3 | | | 0.88% | | | | 0.88% | |
Korea Fund (MIKOX) | | | 44.11% | | | | 11.24% | | | | n.a. | | | | 11.31% | | | | 10/29/10 | | | | 1.01% | | | | 1.01% | 2 | | | 0.97% | | | | 0.97% | |
ASIA SMALL COMPANY STRATEGIES | | | | | | | | | | | | | | | | | | | | | | | | | | | | | | | | | | | | |
Asia Small Companies Fund (MISMX) | | | 30.85% | | | | n.a. | | | | n.a. | | | | 5.98% | | | | 4/30/13 | | | | 1.35% | | | | 1.25% | 4 | | | 1.34% | | | | 1.25% | 4 |
China Small Companies Fund (MICHX)5 | | | 53.92% | | | | 14.27% | | | | n.a. | | | | 6.54% | | | | 11/30/17 | | | | 2.09% | | | | 1.25% | 4 | | | 2.19% | | | | 1.25% | 4 |
| * | Expense ratio represents the actual expense ratio a shareholder would have paid if they had been invested the entire year. |
| ** | Before fee waivers and expense reimbursement. |
| † | Annualized performance for periods of at least one year, otherwise cumulative. |
| ‡ | These figures are from the Funds’ prospectus dated as of April 28, 2017, and may differ from the actual expense ratios for fiscal year 2017, as shown in the financial highlights section of this report. |
| 1 | Matthews has contractually agreed (i) to waive fees and reimburse expenses to the extent needed to limit Total Annual Fund Operating Expenses (excluding Rule 12b-1 fees, taxes, interest, brokerage commissions, short sale dividend expenses, expenses incurred in connection with any merger or reorganization or extraordinary expenses such as litigation) of the Institutional Class to 0.90% first by waiving class specific expenses (i.e., shareholder service fees specific to a particular class) of the Institutional Class and then, to the extent necessary, by waiving non-class specific expenses of the Institutional Class, and (ii) if any Fund-wide expenses (i.e., expenses that apply to both the Institutional Class and the Investor Class) are waived for the Institutional Class to maintain the 0.90% expense limitation, to waive an equal amount (in annual percentage terms) of those same expenses for the Investor Class. The Total Annual Fund Operating Expenses After Fee Waiver and Expense Reimbursement for the Investor Class may vary from year to year and will in some years exceed 0.90%. If the operating expenses fall below the expense limitation in a year within three years after Matthews has made a waiver or reimbursement, the Fund may reimburse Matthews up to an amount that does not cause the expenses for that year to exceed the lesser of the (i) expense limitation applicable at the time of that fee waiver and/or expense reimbursement or (ii) the expense limitation in effect at the time of recoupment. This agreement will remain in place until April 30, 2019 and may be terminated at any time by the Board of Trustees on behalf of the Fund on 60 days’ written notice to Matthews. Matthews may decline to renew this agreement by written notice to the Trust at least 30 days before its annual expiration date. |
| 2 | Fund had no waivers or reimbursements. |
| 3 | Matthews has contractually agreed to waive a portion of its advisory fee and administrative and shareholder services fee if the Fund’s average daily net assets are over $3 billion, as follows: for every $2.5 billion average daily net assets of the Fund that are over $3 billion, the advisory fee rate and the administrative and shareholder services fee rate for the Fund with respect to such excess average daily net assets will be each reduced by 0.01%, in each case without reducing such fee rate below 0.00%. Any amount waived by Matthews pursuant to this agreement may not be recouped by Matthews. This agreement will remain in place until April 30, 2019 and may be terminated at any time (i) by the Trust on behalf of the Fund or by the Board of Trustees upon 60 days’ prior written notice to Matthews; or (ii) by Matthews upon 60 days’ prior written notice to the Trust, in each case without payment of any penalty. |
| 4 | Matthews has contractually agreed (i) to waive fees and reimburse expenses to the extent needed to limit Total Annual Fund Operating Expenses (excluding Rule 12b-1 fees, taxes, interest, brokerage commissions, short sale dividend expenses, expenses incurred in connection with any merger or reorganization or extraordinary expenses such as litigation) of the Institutional Class to 1.25% first by waiving class specific expenses (i.e., shareholder service fees specific to a particular class) of the Institutional Class and then, to the extent necessary, by waiving non-class specific expenses of the Institutional Class, and (ii) if any Fund-wide expenses (i.e., expenses that apply to both the Institutional Class and the Investor Class) are waived for the Institutional Class to maintain the 1.25% expense limitation, to waive an equal amount (in annual percentage terms) of those same expenses for the Investor Class. The Total Annual Fund Operating Expenses After Fee Waiver and Expense Reimbursement for the Investor Class may vary from year to year and will in some years exceed 1.25%. If the operating expenses fall below the expense limitation in a year within three years after Matthews has made a waiver or reimbursement, the Fund may reimburse Matthews up to an amount that does not cause the expenses for that year to exceed the lesser of (i) the expense limitation applicable at the time of that fee waiver and/or expense reimbursement or (ii) the expense limitation in effect at the time of recoupment. This agreement will remain in place until April 30, 2019 and may be terminated at any time by the Board of Trustees on behalf of the Fund on 60 days’ written notice to Matthews. Matthews may decline to renew this agreement by written notice to the Trust at least 30 days before its annual expiration date. |
| 5 | Institutional Class Shares were first offered on November 30, 2017. For performance since that date, please see the Fund’s performance table in the report. Performance for the Institutional Class Shares prior to its inception represents the performance of the Investor Class. Performance differences between the Institutional Class and Investor Class may arise due to differences in fees charged to each class. |
Past Performance: All performance quoted in this report is past performance and is no guarantee of future results. Investment return and principal value will fluctuate with changing market conditions so that when redeemed, shares may be worth more or less than their original cost. Current performance may be lower or higher than the returns quoted. If certain of the Funds’ fees and expenses had not been waived, returns would have been lower. For the Funds’ most recent month-end performance, please call 800.789.ASIA (2742) or visit matthewsasia.com.
| | | | |
| matthewsasia.com | 800.789.ASIA | | | 2 | |

Contents
Cover photo: Beautiful garden with Chinese architectural bridge and reflection in the lake.
This report has been prepared for Matthews International Funds (d/b/a Matthews Asia Funds) shareholders. It is not authorized for distribution to prospective investors unless accompanied or preceded by a current Matthews Asia Funds prospectus, which contains more complete information about the Funds’ investment objectives, risks and expenses. Additional copies of the prospectus or summary prospectus may be obtained at matthewsasia.com. Please read the prospectus carefully before you invest or send money.
The views and opinions in this report were current as of December 31, 2017. They are not guarantees of performance or investment results and should not be taken as investment advice. Investment decisions reflect a variety of factors, and the managers reserve the right to change their views about individual stocks, sectors and the markets at any time. As a result, the views expressed should not be relied upon as a forecast of a Fund’s future investment intent. Current and future portfolio holdings are subject to risk.
Statements of fact are from sources considered reliable, but neither the Funds nor the Investment Advisor makes any representation or guarantee as to their completeness or accuracy.
Investment Risk: Mutual fund shares are not deposits or obligations of, or guaranteed by, any depositary institution. Shares are not insured by the FDIC, Federal Reserve Board or any government agency and are subject to investment risks, including possible loss of principal amount invested. Investing in international and emerging markets may involve additional risks, such as social and political instability, market illiquidity, exchange-rate fluctuations, a high level of volatility and limited regulation. Fixed income investments are subject to additional risks, including, but not limited to, interest rate, credit and inflation risks. In addition, single-country and sector funds may be subject to a higher degree of market risk than diversified funds because of a concentration in a specific industry, sector or geographic location. Investing in small and mid-size companies is more risky than investing in large companies as they may be more volatile and less liquid than larger companies. Please see the Funds’ prospectus and Statement of Additional Information for more risk disclosure.
Message to Shareholders from the
President of the Matthews Asia Funds
Dear Valued Shareholder,
Asian and other emerging equity markets delivered strong absolute performance during 2017 with the world’s two largest economies, the U.S. and China, posting solid economic results. 2017 will be remembered as a year of renewal for Asia markets as the region delivered the best results since 2009, with strong earnings growth, reform-minded governments and the continued opening of China’s equity and fixed income markets. Against this backdrop, I am proud of the strong absolute performance across all the Matthews Asia Funds with noteworthy performance from our three dedicated China strategies.
The shift in sentiment and views toward China, and the role it plays in global investment allocations became a focus once again for investors in 2017 with the inclusion of China’s domestic A-shares in the MSCI indices—a welcome development that will continue to have significant implications in the months and years to come. In recent years, we have witnessed the evolution of China’s A-share market, not only in terms of the number of listed companies, which have been growing substantially, but also in overall quality. There were improvements made to China’s general regulatory and corporate governance environment and accessibility with schemes such as the “Stock Connect” programs of the Shanghai and Shenzhen stock exchanges and the Mainland China–Hong Kong Bond Market Connect. With China’s A-share market no longer ignored, we believe global asset allocators will rightly focus on the unique opportunity to participate directly in companies that are benefiting from the world’s second-largest economy.
Asia continues to be one of the world’s most dynamic and fastest-growing regions, representing one-third of global GDP and one-fifth of the world stock market capitalization. Yet, Asia still remains fundamentally underweighted and underappreciated by most global investors, or lumped together within an Emerging Markets (EM) construct. Grouping countries together in the early days of the EM asset class might have made sense. Today, however, the economic growth engines of the countries within EM are fundamentally different. With a combination of large populations, relatively high economic growth, rising wages and a shift toward sophisticated services and consumption, the economies of Asia stand out relative to other EM countries. Asia will continue to be an ever-increasing contributor to global growth and consumption over the next several decades. Ensuring Asia has its own distinct allocation is essential in a globally diversified portfolio.
2018 and Beyond
For 2018, we are optimistic about the prospects for Asian securities with continued economic growth, stable politics and reformist governments. Far from being a single homogeneous region dependent on exports, the economies in Asia today are as varied as the countries themselves. This has broadened the investment universe and the diversity of the region creates new and significant investment opportunities and, with it, the potential for investors to gain exposure to different aspects of the region’s economy. But successful investment in Asia doesn’t come from passively following market indices—it requires actively identifying individual companies that stand to benefit from Asia’s rising wealth and changing consumption patterns. It requires feet on the ground, conducting company analysis, getting a first-hand, face-to-face evaluation of both prospective and current portfolio companies that we believe are best-positioned to grow profitably over the years to come.
I’m pleased that Matthews Asia continues to provide a distinctive active approach to investing in Asia for the benefit of our valued and growing shareholder base. Our investment team continues to seek sustainable opportunities that are being created by Asia’s ongoing transformation, looking for well-managed, transformative businesses that are trading at reasonable valuations on behalf of our clients. Thank you for being a valued shareholder.

William Hackett
President of the Matthews Asia Funds
Message to Shareholders from the Investment Advisor
Dear Valued Investors,
2017 was a strong year for Asia’s markets. Japan continued to reflate and China joined it. This allowed corporate profit growth to accelerate. The rest of the region also saw improved performance, but policymakers in India and throughout most of Southeast Asia did not move to significantly stimulate their economies. As a consequence, currencies across the region were strong, and it was their strength that helped fixed income returns and bolstered confidence among foreign investors to the region. However, I would’ve thought a bit more stimulus was warranted in several economies. Had they received such stimulus, currencies might not have been quite as strong, but equity returns might well have been even better.
For the benchmarks, most of the performance was concentrated in relatively few names, which made the benchmarks tough to beat. This is largely a portfolio construction issue. Although some of the best-performing names were indeed good companies and companies that we held in our portfolios, it is not always wise to hold such concentrated positions from a risk standpoint. In single country portfolios, there may be greater justification for large positions in individual names, but it is a bit harder to justify doing so in core regional portfolios that aim to diversify across country and sector. For the dividend-focused portfolios, the issue was complicated further by the fact that many of these companies did not pay a dividend, or they had yields that were severely compressed by expensive valuations. These strong-performing names were largely in the technology sector and thus the relative performance of portfolios was impacted this year by technology weightings relative to benchmarks.
Even where portfolio managers were unable or felt it unwise to build outsize positions in some of these mega-cap growth companies, however, they were able to find good ideas elsewhere. Many of our portfolios benefited from stock picking in mid- and small-cap companies and particularly among China’s domestically listed A-shares, where years of research is now paying off for clients, as access to these companies has improved dramatically over the course of the past 24 months.
In 2017, we also saw some signs of excess. The bitcoin phenomenon has been an exhilarating one to watch, even as the idea of intrinsic value remains elusive for cryptocurrencies and underappreciated by their backers. Hong Kong’s IPO market ran hot too as retail participation soared. This speculation, coupled with the extreme concentration of returns in a few stocks, led some to fear that markets are vulnerable to a setback. Whilst this may be true in the limited sense of the benchmarks, I am less concerned about broad markets and economies. In a broad sense, economic growth seems strong globally and monetary policy is relatively benign. The big risks seem to be the possibility of overtightening by the Fed or understimulation by ASEAN (Association of Southeast Asian Nations). However, risks of a big monetary mistake by policymakers appear slight at the moment. If this is so, then growth can continue to be strong and hopefully market performance can continue to broaden across sectors, countries and down the market-cap spectrum. It may be a year in which markets do better than benchmarks.
In such an improved atmosphere for economic growth, as growth becomes less scarce, I would expect mid- and small-cap companies to do better and growth-at-a-reasonable-price stocks to outperform pure growth strategies. It will be interesting to see if investor sentiment changes too—whilst global clients have generally become less bearish on Asia, few are overweight the region. Much of the allocations we have seen this year appear to be tactical in nature and focused on large exchange-traded funds. It could be that next year might see more enthusiasm for active strategies.
A Word on Valuations
Whereas average valuations in the region might appear neither obviously cheap nor extremely expensive, this average does obscure a significant divergence in valuations between fast-growing and slower-growing companies. Whilst such a divergence always exists, in my opinion it is currently quite large. This doesn’t necessarily have implications for the performance of the broader market but it does mean that long-term investors have to be cautious when they think about growth. As all businesses can face disruptions and competition, it is risky to “straight-line” current growth into the far future. If it appears that market valuations imply such expectations, it may be wise to explore better value in stocks that perhaps have not been so much the focus of attention recently.
For me personally, I remain optimistic about economies and markets. However, I am one of life’s worriers and I am disturbed by the speculative activity in some stocks, IPOs and yes, the cryptocurrencies. It can be hard as fundamental investors to watch these trends unfold and accelerate, even while trying to remain calm. But that is why we have a committed team of portfolio managers seeking to filter out fundamental nuggets from the silt of rumor and noise. It’s our job to keep our heads clear and focused on long-term, bottom-up investing in Asia’s businesses and domestic growth. If we can do that and avoid the excess, I am hopeful that we will do a good job and manage the risks.
As always, it is a privilege to be your investment advisor. Here’s to a great 2018 in everything you do!

Robert Horrocks, PhD
Chief Investment Officer
Matthews International Capital Management, LLC
| | | | |
| matthewsasia.com | 800.789.ASIA | | | 5 | |

| | | | |
| PORTFOLIO MANAGERS |
| Teresa Kong, CFA | | |
Lead Manager | | |
| Satya Patel | | |
Co-Manager | | |
|
| FUND FACTS |
| | | Investor | | Institutional |
Ticker | | MAINX | | MINCX |
CUSIP | | 577125503 | | 577125602 |
Inception | | 11/30/11 | | 11/30/11 |
NAV | | $10.98 | | $10.97 |
Initial Investment | | $2,500 | | $100,000 |
Gross Expense Ratio1 | | 1.29% | | 1.08% |
After Fee Waiver and Reimbursement2 | | 1.15% | | 0.90% |
Portfolio Statistics | | | | |
Total # of Positions | | 37 |
Net Assets | | $94.6 million |
Modified Duration3 | | 3.14 |
Portfolio Turnover4 | | 36.58% |
Benchmark | | |
Markit iBoxx Asian Local Bond Index* |
OBJECTIVE
Total return over the long term with an emphasis on income.
STRATEGY
Under normal market conditions, the Fund seeks to achieve its investment objective by investing at least 80% of its net assets, which include borrowings for investment purposes, in income-producing securities including, but not limited to, dividend paying equity securities, and debt and debt-related instruments issued by governments, quasi-governmental entities, supra-national institutions, and companies in Asia. Asia consists of all countries and markets in Asia, such as China and India, and includes developed, emerging, and frontier countries and markets in the Asian region. Investments may be denominated in any currency, and may represent any part of a company’s capital structure from debt to equity or with features of both.
Matthews Asia Strategic Income Fund
Portfolio Manager Commentary (unaudited)
For the year ending December 31, 2017, the Matthews Asia Strategic Income Fund returned 9.40% (Investor Class) and 9.67% (Institutional Class) while its benchmark, the Markit iBoxx Asian Local Bond Index, returned 11.04%. For the fourth quarter, the Fund returned 1.37% (Investor Class) and 1.43% (Institutional Class) versus 2.98% for the Index.
Market Environment:
2017 was characterized by synchronized global growth for the first time since the financial crisis of 2007–2008. The world’s three biggest economic areas (the U.S., Europe and China) all posted solid growth. Inflation was nevertheless lower than expected, driving interest rates lower across many Asian countries. This meant Asian bonds experienced tailwinds in 2017 from all three drivers of returns: credit, currencies and interest rates.
While interest rates fell across most Asian countries, some countries did experience rising rates as markets priced in higher inflation and an increased supply of government bonds to fund fiscal spending. These countries included the Philippines and India. Another notable exception was China, where the government sought to lower financial leverage given to retail investors through lending and wealth management products by tightening liquidity in the interbank market.
Most Asian currencies saw strong gains versus the U.S. dollar in 2017, led by the currencies of open, export-oriented economies such as South Korea, Malaysia and Thailand. The Pakistani rupee and the Sri Lankan rupee underperformed the U.S. dollar by the greatest margin. Both are currencies of relatively closed economies that did not benefit from the recovery in global trade.
Credit spreads were relatively stable throughout the year, with high yield Asian spreads closing the year 12 basis points (0.12%) tighter. Dispersion among credit was also very low, driven by continued demand for yield among global investors. We viewed lower dispersion as a signal of a more selective investor base.
Performance Contributors and Detractors:
The biggest contributors to returns in 2017 were our holdings of rupiah-denominated bonds issued by the Indonesian government, followed by our holdings of ringgit-denominated Malaysian government bonds and U.S. dollar-denominated debt of Vietnam’s Debt and Asset Trading. On the back of currency stability, falling rates and expectation of its inclusion into the Barclays Global Aggregate Index, our Indonesian government bonds outperformed. Malaysian government bonds recovered on improved fundamentals and capital outflows reversed to inflows on expectations of currency appreciation and stable interest rates. The biggest detractors from our performance were currency forwards, including shorts in the South Korean won, Taiwanese dollar, and our long in the Australian dollar.
In the fourth quarter, the biggest contributors were our holdings in Malaysian government bonds, Debt and Asset Trading, and CP Foods. The Malaysian ringgit was one of the strongest-performing Asian currencies in the fourth quarter, and it drove returns of our Malaysian government bonds. Vietnam’s Debt and Asset Trading bonds improved as Vietnam’s banking system recovery continued and nonperforming loans stabilized. The convertible bonds of CP Foods performed well as
(continued)
| * | The Index performance reflects the returns of the discontinued predecessor HSBC Asian Local Bond Index up to December 31, 2012 and the returns of the successor Markit iBoxx Asian Local Bond Index thereafter. |
| 1 | Actual 2017 expense ratios. |
| 2 | Matthews has contractually agreed (i) to waive fees and reimburse expenses to the extent needed to limit Total Annual Fund Operating Expenses (excluding Rule 12b-1 fees, taxes, interest, brokerage commissions, short sale dividend expenses, expenses incurred in connection with any merger or reorganization or extraordinary expenses such as litigation) of the Institutional Class to 0.90% first by waiving class specific expenses (i.e., shareholder service fees specific to a particular class) of the Institutional Class and then, to the extent necessary, by waiving non-class specific expenses of the Institutional Class, and (ii) if any Fund-wide expenses (i.e., expenses that apply to both the Institutional Class and the Investor Class) are waived for the Institutional Class to maintain the 0.90% expense limitation, to waive an equal amount (in annual percentage terms) of those same expenses for the Investor Class. The Total Annual Fund Operating Expenses After Fee Waiver and Expense Reimbursement for the Investor Class may vary from year to year and will in some years exceed 0.90%. If the operating expenses fall below the expense limitation in a year within three years after Matthews has made a waiver or reimbursement, the Fund may reimburse Matthews up to an amount that does not cause the expenses for that year to exceed the lesser of (i) the expense limitation applicable at the time of that fee waiver and/or expense reimbursement or (ii) the expense limitation in effect at the time of recoupment. This agreement will remain in place until April 30, 2019 and may be terminated at any time by the Board of Trustees on behalf of the Fund on 60 days’ written notice to Matthews. Matthews may decline to renew this agreement by written notice to the Trust at least 30 days before its annual expiration date. |
| 3 | Modified duration measures the percent change in value of the fixed income portion of the portfolio in response to a 1% change in interest rates. In a multi-currency denominated portfolio with sensitivities to different interest rate regimes, modified duration will not accurately reflect the change in value of the overall portfolio from a change in any one interest rate regime. |
| 4 | The lesser of fiscal year 2017 long-term purchase costs or sales proceeds divided by the average monthly market value of long-term securities. |
| | | | | | | | | | | | | | | | | | | | | | | | |
| | | | | | | |
| PERFORMANCE AS OF DECEMBER 31, 2017 | | | | | | | | | | | | | | | | | | |
| | | | | | | | | Average Annual Total Returns | | | | |
| | | 3 Months | | | 1 Year | | | 3 Years | | | 5 Years | | | Since
Inception | | | Inception
Date | |
| Investor Class (MAINX) | | | 1.37% | | | | 9.40% | | | | 5.79% | | | | 3.85% | | | | 5.25% | | | | 11/30/11 | |
| Institutional Class (MINCX) | | | 1.43% | | | | 9.67% | | | | 6.04% | | | | 4.08% | | | | 5.46% | | | | 11/30/11 | |
| Markit iBoxx Asian Local Bond Index5 | | | 2.98% | | | | 11.04% | | | | 3.14% | | | | 1.38% | | | | 2.69% | | | | | |
| Lipper Emerging Markets Hard Currency Debt Funds Category Average6 | | | 0.74% | | | | 10.67% | | | | 5.83% | | | | 2.39% | | | | 5.05% | | | | | |
Performance assumes reinvestment of all dividends and/or distributions before taxes. All performance quoted represents past performance and is no guarantee of future results. Investment return and principal value will fluctuate with market conditions so that when redeemed, shares may be worth more or less than their original cost. Current performance may be lower or higher than the return figures quoted. Returns would have been lower if certain of the Fund’s fees and expenses had not been waived. For the Fund’s most recent month-end performance visit matthewsasia.com.
| | | | | | | | | | | | | | | | | | | | | | | | | | | | | | | | | | | | | | | | | | | | |
| | | | | | | | | | |
| INCOME DISTRIBUTION HISTORY | | | | | | | | | | | | | | | | | | | | | | | | | | | | |
| | | 2017 | | | | | | 2016 | |
| | | Q1 | | | Q2 | | | Q3 | | | Q4 | | | Total | | | | | | Q1 | | | Q2 | | | Q3 | | | Q4 | | | Total | |
| Investor (MAINX) | | $ | 0.07 | | | $ | 0.08 | | | $ | 0.13 | | | $ | 0.14 | | | $ | 0.42 | | | | | | | $ | 0.06 | | | $ | 0.11 | | | $ | 0.11 | | | $ | 0.13 | | | $ | 0.41 | |
| Inst’l (MINCX) | | $ | 0.08 | | | $ | 0.08 | | | $ | 0.14 | | | $ | 0.15 | | | $ | 0.45 | | | | | | | $ | 0.06 | | | $ | 0.12 | | | $ | 0.12 | | | $ | 0.13 | | | $ | 0.43 | |
Note: This table does not include capital gains distributions. Totals may differ by $0.02 due to rounding. For income distribution history, visit matthewsasia.com.
| | | | |
30-DAY YIELD: Investor Class: 4.28% (4.16% excluding waivers) Institutional Class: 4.53% (4.36% excluding waivers) The 30-Day Yield represents net investment income earned by the Fund over the 30-day period ended 12/31/17, expressed as an annual percentage rate based on the Fund’s share price at the end of the 30-day period. The 30-Day Yield should be regarded as an estimate of the Fund’s rate of investment income, and it may not equal the Fund’s actual income distribution rate. Source: BNY Mellon Investment Servicing (US) Inc. | | | | YIELD TO WORST: 5.88% Yield to worst is the lowest yield that can be received on a bond assuming that the issuer does not default. It is calculated by utilizing the worst case assumptions for a bond with respect to certain income-reducing factors, including prepayment, call or sinking fund provisions. It does not represent the yield that an investor should expect to receive. Past yields are no guarantee of future yields. Source: FactSet Research Systems |
GROWTH OF A $10,000 INVESTMENT SINCE INCEPTION—INVESTOR CLASS
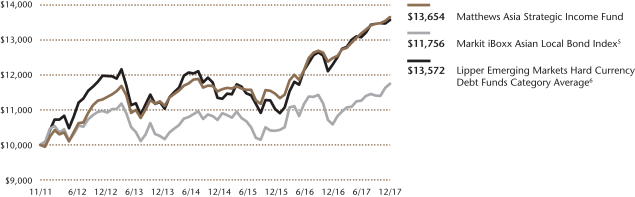
Plotted monthly. The performance data and graph do not reflect the deduction of taxes that a shareholder would pay on dividends, capital gains distributions or redemption of Fund shares. Values are in US$.
| | 5 | It is not possible to invest directly in an index. Source: Index data from HSBC, Markit iBoxx and Bloomberg; total return calculations performed by BNY Mellon Investment Servicing (US) Inc. Please see page 92 for index definitions. The Index performance reflects the returns of the discontinued predecessor HSBC Asian Local Bond Index up to December 31, 2012 and the returns of the successor Markit iBoxx Asian Local Bond Index thereafter. |
| | 6 | The Lipper Category Average does not reflect sales charges and is based on total return, including reinvestment of dividends and capital gains for the stated periods. |
| | | | | | | | |
| | | | |
| TOP TEN HOLDINGS | | | | | | | |
| | | Sector | | Currency | | % of Net Assets | |
| Malaysia Government Investment Issue, 3.508%, 05/15/2018 | | Foreign Government Bonds | | Malaysian Ringgit | | | 4.5% | |
| Malaysia Government Investment Issue, 3.226%, 04/15/2020 | | Foreign Government Bonds | | Malaysian Ringgit | | | 4.3% | |
| Wanda Properties International Co., Ltd., 7.250%, 01/29/2024 | | Real Estate | | U.S. Dollar | | | 4.2% | |
| Debt and Asset Trading Corp., 1.000%, 10/10/2025 | | Financials | | U.S. Dollar | | | 4.1% | |
| Standard Chartered PLC, 6.500%, 12/29/2049 | | Financials | | U.S. Dollar | | | 4.0% | |
| LIC Housing Finance, Ltd., 7.830%, 09/25/2026 | | Financials | | Indian Rupee | | | 4.0% | |
| Delta Investment Horizon International, Ltd., Cnv., 3.000%, 05/26/2020 | | Telecommunication Services | | U.S. Dollar | | | 3.7% | |
| Indonesia Treasury Bond, 8.375%, 03/15/2034 | | Foreign Government Bonds | | Indonesian Rupiah | | | 3.6% | |
| Ctrip.com International, Ltd., Cnv., 1.250%, 09/15/2022 | | Consumer Discretionary | | U.S. Dollar | | | 3.6% | |
| Indonesia Treasury Bond, 8.375%, 03/15/2024 | | Foreign Government Bonds | | Indonesian Rupiah | | | 3.5% | |
| % OF ASSETS IN TOP TEN | | | | | | | 39.5% | |
| | | | |
| matthewsasia.com | 800.789.ASIA | | | 7 | |
| | | | |
| |
| CURRENCY ALLOCATION (%)7,8 | |
U.S. Dollar (USD) | | | 44.6 | |
Chinese Renminbi (CNY) | | | 13.0 | |
Indian Rupee (INR) | | | 11.6 | |
Indonesian Rupiah (IDR) | | | 11.3 | |
Malaysian Ringgit (MYR) | | | 10.3 | |
Vietnamese Dong (VND) | | | 2.1 | |
South Korean Won (KRW) | | | 0.4 | |
Cash and Other Assets, Less Liabilities | | | 6.8 | |
| | | | |
| |
| COUNTRY ALLOCATION (%)7,8,9 | |
| China/Hong Kong | | | 32.5 | |
| Indonesia | | | 19.2 | |
| India | | | 11.6 | |
| Malaysia | | | 10.3 | |
| Vietnam | | | 6.2 | |
| Sri Lanka | | | 5.0 | |
| Thailand | | | 3.3 | |
| Japan | | | 2.8 | |
| United States | | | 2.0 | |
| South Korea | | | 0.4 | |
| Cash and Other Assets, Less Liabilities | | | 6.8 | |
| | | | |
| |
| SECTOR ALLOCATION (%)7,8 | |
| Foreign Government Bonds | | | 27.5 | |
| Financials | | | 26.6 | |
| Telecommunication Services | | | 8.4 | |
| Real Estate | | | 8.4 | |
| Utilities | | | 5.8 | |
| Consumer Discretionary | | | 5.4 | |
| Energy | | | 4.6 | |
| Consumer Staples | | | 3.3 | |
| Materials | | | 3.2 | |
| Cash and Other Assets, Less Liabilities | | | 6.8 | |
Please note: Foreign Government Bonds category includes Supranationals.
| | | | |
| |
| ASSET TYPE BREAKDOWN (%)7,8 | |
| Non-Convertible Corporate Bonds | | | 49.3 | |
| Government Bonds | | | 31.6 | |
| Convertible Corporate Bonds | | | 12.3 | |
| Cash and Other Assets, Less Liabilities | | | 6.8 | |
| 7 | Source: FactSet Research Systems. Percentage values in data are rounded to the nearest tenth of one percent, so the values may not sum to 100% due to rounding. Percentage values may be derived from different data sources and may not be consistent with other Fund literature. |
| 8 | Cash and other assets may include forward currency exchange contracts and certain derivative instruments that have been marked-to-market. |
| 9 | Not all countries where the Fund may invest are included in the benchmark index. |
Matthews Asia Strategic Income Fund
Portfolio Manager Commentary (unaudited) (continued)
shares in the underlying equity rallied 15% on the back of solid results and strengthening domestic operations. The biggest detractors were our holdings in the convertible bonds of Ctrip.com and Sprint.
Notable Portfolio Changes:
Through 2017, we steadily increased our exposure to local currency bonds as the global recovery gathered steam. We started the year with the conviction that Asian currencies would end the year outperforming the U.S. dollar, but that the momentum in U.S. dollar strength would continue into the first quarter of 2017. The biggest increases in currency allocation were in the South Korean won, the Chinese renminbi and the Singapore dollar. Our expectation was for rates to rise in South Korea and Singapore, thus, we expressed our positive investment thesis in currency forward. In the case of China, our favorable view on the currency and short-end rates translated into our purchase of local currency bonds instead.
In the fourth quarter, we added local currency bonds issued by the Malaysian government, as well as Petrochina, and U.S. dollar-denominated bonds issued by Softbank Group and Vipshop. We also sold a handful of longer-duration U.S. dollar-denominated sovereign bonds, including issues from Pakistan, Vietnam and Sri Lanka.
Outlook:
We expect Asian fixed income to continue to be attractive in 2018. Credit spreads and currency appreciation will likely be tailwinds that drive returns, while interest rates could present a slight headwind in some countries.
We expect U.S. rates to set the tone for local rates in Asia as the U.S. economic cycle gathers momentum and finally starts to create mild inflation. The next Federal Reserve Chairman, Jerome Powell, will likely continue on the current dovish path, raising the Fed’s target benchmark rate an estimated three times over the next year. The gentle tapping of the economic brakes at this stage of the economic cycle is a prudent measure to slow a robust U.S. economy and should not disrupt the current synchronous growth story.
The factors behind the strong Asian currency performance in 2017 will likely continue next year. They include synchronized global growth, a recovery in world exports and a relative undervaluation of several Asian currencies. While much uncertainty surrounds the recently passed U.S. tax bill, we do not think it will result in dollar strength as large U.S. multinationals are already flush with cash and have been deploying capital to buy back stock. Whether corporate cash is in local currency or U.S. dollars is dictated more by business needs like working capital than by the U.S. tax code. Thus, we don’t expect the tax bill to reverse the depreciation trend for the U.S. dollar. We expect currencies of countries with growing current accounts to disproportionately benefit from synchronized global growth. In terms of further currency depreciation, the one country we are most concerned about is Pakistan. As such, we have no exposure to the country either in U.S. dollars or local currency.
Finally, we expect credit spreads to remain at current levels or even tighten in 2018, offsetting any headwinds from rising rates. Asia high yield spreads are still hovering around historical averages, with room to fall more at this stage of the economic cycle. Given default rates of less than 2%, and the attractive relative value of Asia high yield relative to its U.S. and European counterparts, we expect more inflows into Asia, which should also drive spreads lower.
Fixed income investments are subject to risks, including, but not limited to, interest rate, credit and inflation risks. Investing in emerging markets involves different and greater risks, as these countries are substantially smaller, less liquid and more volatile than securities markets in more developed markets.
Matthews Asia Strategic Income Fund
December 31, 2017
Schedule of Investmentsa
NON-CONVERTIBLE CORPORATE BONDS: 49.3%
| | | | | | | | |
| | | Face Amount* | | | Value | |
| CHINA/HONG KONG: 23.7% | |
Wanda Properties International Co., Ltd.
7.250%, 01/29/24c | | | 4,000,000 | | | | $4,005,164 | |
Standard Chartered PLC
6.500%b, 04/02/20c,d | | | 3,700,000 | | | | 3,783,250 | |
China Hongqiao Group, Ltd.
6.875%, 05/03/18c | | | 3,000,000 | | | | 3,007,494 | |
PetroChina Co., Ltd., Series A
3.030%, 01/19/21 | | | CNY 20,000,000 | | | | 2,888,747 | |
State Grid Corp. of China, Series B
3.150%, 11/14/21 | | | CNY 20,000,000 | | | | 2,855,802 | |
HSBC Holdings PLC
6.375%b, 03/30/25d | | | 2,500,000 | | | | 2,687,500 | |
China Southern Power Grid Co., Ltd.
3.140%, 03/11/21 | | | CNY 12,000,000 | | | | 1,734,195 | |
China National Petroleum Corp., Series INBK | |
4.690%, 01/11/22 | | | CNY 10,000,000 | | | | 1,507,852 | |
| | | | | | | | |
Total China/Hong Kong | | | | | | | 22,470,004 | |
| | | | | | | | |
| | | | | | | | |
| INDIA: 11.6% | | | | | | | | |
LIC Housing Finance, Ltd., Series 309
7.830%, 09/25/26 | | | INR 240,000,000 | | | | 3,744,342 | |
Housing Development Finance Corp., Ltd., | |
Series M009 9.240%, 06/24/24 | | | INR 100,000,000 | | | | 1,653,784 | |
Housing Development Finance Corp., Ltd., | |
Series K-24 8.950%, 03/21/23 | | | INR 100,000,000 | | | | 1,621,567 | |
Power Finance Corp., Ltd., Series 151A
7.470%, 09/16/21 | | | INR 90,000,000 | | | | 1,386,952 | |
Power Grid Corp. of India, Ltd., Series B
9.300%, 09/04/24 | | | INR 52,000,000 | | | | 873,491 | |
Rural Electrification Corp., Ltd., Series 123
9.340%, 08/25/24 | | | INR 52,000,000 | | | | 870,480 | |
Rural Electrification Corp., Ltd., Series 122
9.020%, 06/18/19 | | | INR 50,000,000 | | | | 798,219 | |
| | | | | | | | |
Total India | | | | | | | 10,948,835 | |
| | | | | | | | |
| | | | | | | | |
| SRI LANKA: 5.0% | | | | | | | | |
DFCC Bank PLC
9.625%, 10/31/18c | | | 2,650,000 | | | | 2,730,109 | |
National Savings Bank
5.150%, 09/10/19c | | | 2,000,000 | | | | 2,024,800 | |
| | | | | | | | |
Total Sri Lanka | | | | | | | 4,754,909 | |
| | | | | | | | |
| | | | | | | | |
| INDONESIA: 4.2% | | | | | | | | |
Modernland Overseas Pte, Ltd.
6.950%, 04/13/24c | | | 1,900,000 | | | | 1,939,218 | |
Alam Synergy Pte, Ltd.
6.950%, 03/27/20d,e | | | 1,500,000 | | | | 1,515,000 | |
Alam Synergy Pte, Ltd.
6.950%, 03/27/20c | | | 500,000 | | | | 505,000 | |
| | | | | | | | |
Total Indonesia | | | | | | | 3,959,218 | |
| | | | | | | | |
| | | | | | | | |
| JAPAN: 2.8% | | | | | | | | |
SoftBank Group Corp.
6.000%b, 07/19/23c,d | | | 2,650,000 | | | | 2,617,723 | |
| | | | | | | | |
Total Japan | | | | | | | 2,617,723 | |
| | | | | | | | |
| | | | | | | | |
| | | Face Amount* | | | Value | |
| UNITED STATES: 2.0% | |
Sprint Communications, Inc.
6.000%, 11/15/22 | | | 1,863,000 | | | | $1,863,000 | |
| | | | | | | | |
Total United States | | | | | | | 1,863,000 | |
| | | | | | | | |
| | | | | | | | |
| TOTAL NON-CONVERTIBLE CORPORATE BONDS | | | | 46,613,689 | |
| | | | | | | | |
(Cost $45,661,707) | | | | | | | | |
| | | | | | | | |
FOREIGN GOVERNMENT OBLIGATIONS: 31.6% | | | | | |
| INDONESIA: 11.3% | | | | | | | | |
Indonesia Treasury Bond
8.375%, 03/15/34 | | | IDR 42,000,000,000 | | | | 3,451,631 | |
Indonesia Treasury Bond
8.375%, 03/15/24 | | | IDR 40,500,000,000 | | | | 3,318,839 | |
Indonesia Treasury Bond
7.875%, 04/15/19 | | | IDR 38,000,000,000 | | | | 2,887,154 | |
Indonesia Treasury Bond
7.000%, 05/15/27 | | | IDR 13,000,000,000 | | | | 1,004,164 | |
| | | | | | | | |
Total Indonesia | | | | | | | 10,661,788 | |
| | | | | | | | |
| | | | | | | | |
| MALAYSIA: 10.3% | | | | | | | | |
Malaysia Government Investment Issue | |
3.508%, 05/15/18 | | | MYR 17,300,000 | | | | 4,280,602 | |
Malaysia Government Investment Issue | |
3.226%, 04/15/20 | | | MYR 16,600,000 | | | | 4,078,477 | |
Malaysia Government Investment Issue | |
3.872%, 08/30/18 | | | MYR 5,500,000 | | | | 1,364,769 | |
| | | | | | | | |
Total Malaysia | | | | | | | 9,723,848 | |
| | | | | | | | |
| | | | | | | | |
| VIETNAM: 6.1% | | | | | | | | |
Debt and Asset Trading Corp.
1.000%, 10/10/25c | | | 5,469,000 | | | | 3,863,165 | |
Socialist Republic of Vietnam
5.200%, 01/12/22 | | | VND 43,000,000,000 | | | | 1,972,639 | |
| | | | | | | | |
Total Vietnam | | | | | | | 5,835,804 | |
| | | | | | | | |
| | | | | | | | |
| CHINA/HONG KONG: 3.5% | | | | | | | | |
China Government Bond
3.550%, 12/12/21c | | | CNY 22,000,000 | | | | 3,282,945 | |
| | | | | | | | |
Total China/Hong Kong | | | | | | | 3,282,945 | |
| | | | | | | | |
| | | | | | | | |
| SOUTH KOREA: 0.4% | | | | | | | | |
Korea Treasury Bond
3.500%, 03/10/24 | | | KRW 400,000,000 | | | | 396,486 | |
| | | | | | | | |
Total South Korea | | | | | | | 396,486 | |
| | | | | | | | |
| | | | | | | | |
| TOTAL FOREIGN GOVERNMENT OBLIGATIONS | | | | 29,900,871 | |
| | | | | | | | |
(Cost $28,241,769) | | | | | | | | |
| | | | | | | | |
CONVERTIBLE CORPORATE BONDS: 12.3% | | | | | |
| CHINA/HONG KONG: 5.3% | | | | | | | | |
Ctrip.com International, Ltd., Cnv.
1.250%, 09/15/22 | | | 3,300,000 | | | | 3,370,125 | |
Vipshop Holdings, Ltd., Cnv.
1.500%, 03/15/19 | | | 1,700,000 | | | | 1,691,500 | |
| | | | | | | | |
Total China/Hong Kong | | | | | | | 5,061,625 | |
| | | | | | | | |
| | | | |
| matthewsasia.com | 800.789.ASIA | | | 9 | |
Matthews Asia Strategic Income Fund
December 31, 2017
Schedule of Investmentsa (continued)
CONVERTIBLE CORPORATE BONDS (continued)
| | | | | | | | |
| | | Face Amount* | | | Value | |
| INDONESIA: 3.7% | | | | | | | | |
Delta Investment Horizon International, Ltd., Cnv. | |
3.000%, 05/26/20c | | | 3,500,000 | | | | $3,504,375 | |
| | | | | | | | |
Total Indonesia | | | | 3,504,375 | |
| | | | | | | | |
| | | | | | | | |
| THAILAND: 3.3% | | | | | | | | |
CP Foods Holdings, Ltd., Cnv.
0.500%, 09/22/21c | | | 2,800,000 | | | | 3,094,000 | |
| | | | | | | | |
Total Thailand | | | | 3,094,000 | |
| | | | | | | | |
| | | | | | | | |
| TOTAL CONVERTIBLE CORPORATE BONDS | | | | 11,660,000 | |
| | | | | | | | |
(Cost $11,429,132) | | | | | | | | |
| | | | | | | | |
| TOTAL INVESTMENTS: 93.2% | | | | | | | 88,174,560 | |
(Cost $85,332,608) | | | | | | | | |
| | | | | | | | |
CASH AND OTHER ASSETS,
LESS LIABILITIES: 6.8% | | | | | | | 6,417,595 | |
| | | | | | | | |
| | |
NET ASSETS: 100.0% | | | | | | | $94,592,155 | |
| | | | | | | | |
| a | Certain securities were fair valued under the valuation policies approved by the Board of Trustees (Note 2-A). |
| b | Variable rate security. Security may be issued at a fixed coupon rate, which converts to a variable rate at a specified date. Rate shown is the rate in effect as of period end. |
| c | The securities may be resold to qualified foreign investors and foreign institutional buyers under Regulation S of the Securities Act of 1933. |
| d | Perpetual security with no stated maturity date. First call date is disclosed. |
| e | Security exempt from registration under Rule 144A of the Securities Act of 1933, as amended. The security may be resold in transactions exempt from registration normally to qualified institutional buyers. The security has been determined to be liquid in accordance with procedures adopted by the Fund’s Board of Trustees. At December 31, 2017, the aggregate value is $1,515,000, which is 1.60% of net assets. |
| * | All Values in USD unless otherwise specified |
| CNY | Chinese Renminbi (Yuan) |
FORWARD FOREIGN CURRENCY EXCHANGE CONTRACTS:
| | | | | | | | | | | | | | | | | | |
| | | Currency Purchased | | | Currency Sold | | | Counterparty | | Settlement
Date | | | Unrealized
Appreciation | |
| | THB | 174,930,000 | | | | USD 5,250,000 | | | Merrill Lynch & Co., Inc. | | | 01/12/18 | | | | $119,736 | |
| | SGD | 9,517,550 | | | | USD 7,000,000 | | | Merrill Lynch & Co., Inc. | | | 01/29/18 | | | | 119,758 | |
| | KRW | 3,908,880,000 | | | | USD 3,600,000 | | | Merrill Lynch & Co., Inc. | | | 03/21/18 | | | | 65,942 | |
| | KRW | 2,154,800,000 | | | | USD 2,000,000 | | | Merrill Lynch & Co., Inc. | | | 03/28/18 | | | | 20,993 | |
| | | | | | | | | | | | | | | | | | |
| | | | | | | | | | | | | | | | | $326,429 | |
| | | | | | | | | | | | | | | | | | |
See accompanying notes to financial statements.
| | | | |
| PORTFOLIO MANAGERS |
| Teresa Kong, CFA | | Satya Patel |
Lead Manager | | Lead Manager |
| | |
| FUND FACTS | | | | |
| | | Investor | | Institutional |
Ticker | | MCRDX | | MICPX |
CUSIP | | 577130677 | | 577130669 |
Inception | | 4/29/16 | | 4/29/16 |
NAV | | $10.39 | | $10.39 |
Initial Investment | | $2,500 | | $100,000 |
Gross Expense Ratio1 | | 1.86% | | 1.62% |
After Fee Waiver and Reimbursement2 | | 1.15% | | 0.90% |
Portfolio Statistics | | |
Total # of Positions | | 30 |
Net Assets | | $31.7 million |
Modified Duration3 | | 3.47 |
Portfolio Turnover4 | | 27.86% |
Benchmark | | | | |
J.P. Morgan Asia Credit Index |
OBJECTIVE
Total return over the long term.
STRATEGY
Under normal market conditions, the Fund seeks to achieve its investment objective by investing at least 80% of its net assets, which include borrowings for investment purposes, in debt and debt-related instruments issued by companies as well as governments, quasi-governmental entities, and supranational institutions in Asia. Debt and debt-related instruments typically include bonds, debentures, bills, securitized instruments (which are vehicles backed by pools of assets such as loans or other receivables), notes, certificates of deposit and other bank obligations, bank loans, senior secured bank debt, convertible debt securities, credit-linked notes, inflation linked instruments, repurchase agreements, payment-in-kind securities and derivative instruments with fixed income characteristics. Asia consists of all countries and markets in Asia, such as China and Indonesia, in addition to the developed, emerging, and frontier countries and markets in the Asian region.
Matthews Asia Credit Opportunities Fund
Portfolio Manager Commentary (unaudited)
For the year ending December 31, 2017, the Matthews Asia Credit Opportunities Fund returned 7.86% (Investor Class) and 8.13% (Institutional Class) while its benchmark, the J.P. Morgan Asia Credit Index, returned 5.77% over the same period. For the fourth quarter, the Fund returned 0.70% (Investor Class) and 0.73% (Institutional Class) while its benchmark returned 0.41% over the same period.
Market Environment:
2017 was another great year for Asia credit, with the J.P. Morgan Asia Credit Index (JACI) returning 5.77% for the year. We were prescient in reminding our investors earlier that this credit cycle might be atypical in length and strength compared to past cycles. Asia high yield continued to be attractive compared with its U.S., European and Latin America counterparts as spreads hovered around historical averages for the year. U.S., Europe and Latin American high yield spreads, meanwhile, were trading within 200 to 500 basis points (2.0% to 5.0%) of historical averages.
2017 was a banner year in terms of U.S. dollar (USD) issuance, with the highest issuance by Asian borrowers in USD in the past decade. This trend was driven by the low all-in cost of financing for most Asian companies, even as U.S. interest rates inched up over the year, with credit spreads tightening and Asian currencies appreciating. Most of the issuance came from China. As the renminbi resumed its appreciation trend relative to the U.S. dollar and local interest rates and credit spreads rose, many Chinese corporations found USD funding attractive relative to local currency funding.
Performance Contributors and Detractors:
For 2017, the biggest contributors to returns were our holdings of Debt and Asset Trading Corp., Standard Chartered PLC and Sri Lanka government bonds. The price of Vietnam’s Debt and Asset Trading Corp. bonds rose as Vietnam’s banks’ recovery continued and nonperforming loans stabilized. Standard Chartered PLC’s contingent convertible bonds recovered as worries about Europe’s banks subsided. Finally, Sri Lanka government bonds traded higher on further stability of the country’s currency and fiscal accounts under the International Monetary Fund program.
The only detractor to returns in 2017 was the holding in renminbi-denominated bonds of PetroChina. Onshore Chinese bond yields rose late in the year, causing the price of the bond to fall and leading to a slight loss on the position.
In the fourth quarter, the biggest contributors to returns were our holdings in Debt and Asset Trading Corp., CP Foods and China Hongqiao Group. The convertible bonds of CP Foods performed well as shares in the underlying equity rallied 15% on the back of solid results and strengthening domestic operations. China Hongqiao performed well as the company’s shares resumed trading after a halt following a short seller report earlier in the year.
The largest detractors in the fourth quarter were the bonds of Ctrip.com and Sprint. Ctrip shares were weak in the quarter over concerns that regulatory actions against automatic bundling of travel services could impact earnings in the
(continued)
| 1 | Actual 2017 expense ratios. |
| 2 | Matthews has contractually agreed (i) to waive fees and reimburse expenses to the extent needed to limit Total Annual Fund Operating Expenses (excluding Rule 12b-1 fees, taxes, interest, brokerage commissions, short sale dividend expenses, expenses incurred in connection with any merger or reorganization or extraordinary expenses such as litigation) of the Institutional Class to 0.90% first by waiving class specific expenses (i.e., shareholder service fees specific to a particular class) of the Institutional Class and then, to the extent necessary, by waiving non-class specific expenses of the Institutional Class, and (ii) if any Fund-wide expenses (i.e., expenses that apply to both the Institutional Class and the Investor Class) are waived for the Institutional Class to maintain the 0.90% expense limitation, to waive an equal amount (in annual percentage terms) of those same expenses for the Investor Class. The Total Annual Fund Operating Expenses After Fee Waiver and Expense Reimbursement for the Investor Class may vary from year to year and will in some years exceed 0.90%. If the operating expenses fall below the expense limitation in a year within three years after Matthews has made a waiver or reimbursement, the Fund may reimburse Matthews up to an amount that does not cause the expenses for that year to exceed the lesser of (i) the expense limitation applicable at the time of that fee waiver and/or expense reimbursement or (ii) the expense limitation in effect at the time of recoupment. This agreement will remain in place until April 30, 2019 and may be terminated at any time by the Board of Trustees on behalf of the Fund on 60 days’ written notice to Matthews. Matthews may decline to renew this agreement by written notice to the Trust at least 30 days before its annual expiration date. |
| 3 | Modified duration measures the percent change in value of the fixed income portion of the portfolio in response to a 1% change in interest rates. In a multi-currency denominated portfolio with sensitivities to different interest rate regimes, modified duration will not accurately reflect the change in value of the overall portfolio from a change in any one interest rate regime. |
| 4 | The lesser of fiscal year 2017 long-term purchase costs or sales proceeds divided by the average monthly market value of long-term securities. |
| | | | |
| matthewsasia.com | 800.789.ASIA | | | 11 | |
| | | | | | | | | | | | | | | | |
| | | | |
| PERFORMANCE AS OF DECEMBER 31, 2017 | | | | | | | | | |
| | | | | | | | | Average Annual
Total Returns | |
| | | 3 Months | | | 1 Year | | | Since Inception | | | Inception
Date | |
| Investor Class (MCRDX) | | | 0.70% | | | | 7.86% | | | | 7.52% | | | | 4/29/2016 | |
| Institutional Class (MICPX) | | | 0.73% | | | | 8.13% | | | | 7.78% | | | | 4/29/2016 | |
| J.P. Morgan Asia Credit Index5 | | | 0.41% | | | | 5.77% | | | | 4.28% | | | | | |
| Lipper Alternative Credit Focus Funds Category Average6 | | | 0.37% | | | | 4.26% | | | | 8.07% | | | | | |
Performance assumes reinvestment of all dividends and/or distributions before taxes. All performance quoted represents past performance and is no guarantee of future results. Investment return and principal value will fluctuate with market conditions so that when redeemed, shares may be worth more or less than their original cost. Current performance may be lower or higher than the return figures quoted. Returns would have been lower if certain of the Fund’s fees and expenses had not been waived. For the Fund’s most recent month-end performance, visit matthewsasia.com.
| | | | | | | | | | | | | | | | | | | | | | | | | | | | | | | | | | | | | | | | | | | | |
| | | | |
| INCOME DISTRIBUTION HISTORY | | | | | | | | | |
| | | 2017 | | | | | | 2016 | |
| | | Q1 | | | Q2 | | | Q3 | | | Q4 | | | Total | | | | | | Q1 | | | Q2 | | | Q3 | | | Q4 | | | Total | |
| Investor (MCRDX) | | $ | 0.12 | | | $ | 0.08 | | | $ | 0.14 | | | $ | 0.10 | | | $ | 0.43 | | | | | | | | n.a. | | | $ | 0.06 | | | $ | 0.10 | | | $ | 0.16 | | | $ | 0.32 | |
| Inst’l (MICPX) | | $ | 0.12 | | | $ | 0.08 | | | $ | 0.15 | | | $ | 0.10 | | | $ | 0.46 | | | | | | | | n.a. | | | $ | 0.06 | | | $ | 0.11 | | | $ | 0.16 | | | $ | 0.33 | |
Note: This table does not include capital gains distributions. Totals may differ by $0.02 due to rounding. For income distribution history, visit matthewsasia.com.
| | | | |
30-DAY YIELD: Investor Class: 3.69% (3.13% excluding waivers) Institutional Class: 3.94% (3.30% excluding waivers) The 30-Day Yield represents net investment income earned by the Fund over the 30-day period ended 12/31/17, expressed as an annual percentage rate based on the Fund’s share price at the end of the 30-day period. The 30-Day Yield should be regarded as an estimate of the Fund’s rate of investment income, and it may not equal the Fund’s actual income distribution rate. Source: BNY Mellon Investment Servicing (US) Inc. | | | | YIELD TO WORST: 5.58% Yield to worst is the lowest yield that can be received on a bond assuming that the issuer does not default. It is calculated by utilizing the worst case assumptions for a bond with respect to certain income-reducing factors, including prepayment, call or sinking fund provisions. It does not represent the yield that an investor should expect to receive. Past yields are no guarantee of future yields. Source: FactSet Research Systems |
GROWTH OF A $10,000 INVESTMENT SINCE INCEPTION—INVESTOR CLASS
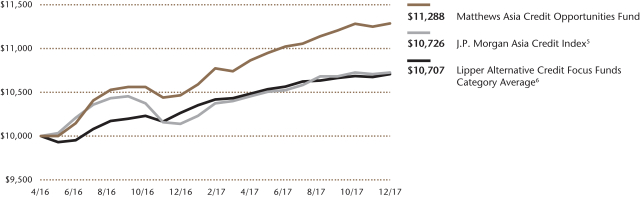
Plotted monthly. The performance data and graph do not reflect the deduction of taxes that a shareholder would pay on dividends, capital gains distributions, or redemption of Fund shares. Values are in US$.
| | 5 | It is not possible to invest directly in an index. Source: Index data from J.P. Morgan and Bloomberg; total return calculations performed by BNY Mellon Investment Servicing (US) Inc. Please see page 92 for index definition. |
| | 6 | The Lipper Category Average does not reflect sales charges and is based on total return, including reinvestment of dividends and capital gains for the stated periods. |
| | | | | | | | |
| | | | |
| TOP TEN HOLDINGS | | | | | | | |
| | | Sector | | Currency | | % of Net Assets | |
| Socialist Republic of Vietnam, 4.000%, 03/12/2028 | | Foreign Government Bonds | | U.S. Dollar | | | 4.7% | |
| Standard Chartered PLC, 6.500%, 12/29/2049 | | Financials | | U.S. Dollar | | | 4.2% | |
| Delta Investment Horizon International, Ltd., Cnv., 3.000%, 05/26/2020 | | Telecommunication Services | | U.S. Dollar | | | 4.1% | |
| Wanda Properties International Co., Ltd., 7.250%, 01/29/2024 | | Real Estate | | U.S. Dollar | | | 3.9% | |
| DFCC Bank PLC, 9.625%, 10/31/2018 | | Financials | | U.S. Dollar | | | 3.9% | |
| Ctrip.com International, Ltd., Cnv., 1.250%, 09/15/2022 | | Consumer Discretionary | | U.S. Dollar | | | 3.9% | |
| Modernland Overseas Pte, Ltd., 6.950%, 04/13/2024 | | Real Estate | | U.S. Dollar | | | 3.9% | |
| Debt and Asset Trading Corp., 1.000%, 10/10/2025 | | Financials | | U.S. Dollar | | | 3.8% | |
| SoftBank Group Corp., 6.000%, 07/19/2049 | | Telecommunication Services | | U.S. Dollar | | | 3.7% | |
| HSBC Holdings PLC, 6.375%, 12/29/2049 | | Financials | | U.S. Dollar | | | 3.7% | |
| % OF ASSETS IN TOP TEN | | | | | | | 39.8% | |
Matthews Asia Credit Opportunities Fund
Portfolio Manager Commentary (unaudited) (continued)
short term. Sprint bonds were down as the company decided not to pursue a merger with its competitor, T-Mobile, the mobile communications subsidiary of German telecommunications company Deutsche Telekom AG.
Notable Portfolio Changes:
In 2017, the biggest change in our portfolio was our increase in holdings of local currency bonds of Chinese state-owned enterprises (SOEs). During the year, Chinese authorities sought to bring down leverage in retail and wealth management products by tightening liquidity in the interbank market. Not only did short-end rates rise, but credit spreads also widened—especially for high-quality corporate bonds. We took advantage of this classic credit opportunity and bought bonds of several Chinese SOEs. Notable reductions in exposure included selling our holdings of Pakistan government bonds and reducing our holdings in Sprint bonds as we saw more downside than upside potential at what we considered to be expensive valuations.
For the fourth quarter, we added a number of positions, including bonds of Vipshop and the Socialist Republic of Vietnam. Tencent and JD.com acquired a stake in Vipshop, which is a leading online discount retailer in China. We bought Vipshop’s convertible bonds as the company’s fundamentals could improve via this partnership. We also bought “Brady Bonds” issued by Vietnam in 1998. These bonds have an attractive yield and have limited credit risk because they are partly collateralized by U.S. Treasuries.*
Outlook:
In our view, Asia high yield bonds look reasonably valued, while U.S. and European high yield bonds appear overvalued. Credit spreads for Asia high yield bonds are near historic averages. In contrast, spreads for U.S. high yield bonds are about 200 basis points (2.0%) below average while spreads for European high yield bonds are 300 basis points (3.0%) below average. In simple terms, Asia high yield bonds are compensating investors for taking credit risk, in our view, while U.S. and European high yield bonds are not.
In 2018, we expect to see a bit more volatility in bond prices and credit spreads. At the same time, the relatively attractive yields in Asia offer a strong base for positive returns. A bond that starts with a 5% yield and has 25 basis points (0.25%) of credit spread compression, for example, could potentially generate attractive returns for investors.
In terms of risks, we expect some headwinds from regions such as the Middle East to potentially affect investors’ appetite for emerging markets. The current political unrest in Saudi Arabia and Iran will remain at the front of our minds. We see most of these risks as idiosyncratic, however, and unlikely to spread to Asia.
| * | The reference to bonds partially collateralized by U.S. Treasuries refers to an underlying security in the portfolio. The Fund itself is not guaranteed by the U.S. Government or any governmental agency. |
| | | | |
| |
| CURRENCY ALLOCATION (%)7,8 | |
| U.S. Dollar (USD) | | | 79.0 | |
| Chinese Renminbi (CNY) | | | 8.6 | |
| Cash and Other Assets, Less Liabilities | | | 12.4 | |
| | | | |
| |
| COUNTRY ALLOCATION (%)7,8,9 | |
| China/Hong Kong | | | 34.9 | |
| Indonesia | | | 23.3 | |
| Vietnam | | | 9.8 | |
| Sri Lanka | | | 8.9 | |
| Japan | | | 3.7 | |
| Thailand | | | 2.8 | |
| Philippines | | | 2.8 | |
| United States | | | 1.3 | |
| Cash and Other Assets, Less Liabilities | | | 12.4 | |
| | | | |
| |
| SECTOR ALLOCATION (%)7,8 | |
| Real Estate | | | 21.0 | |
| Financials | | | 17.6 | |
| Telecommunication Services | | | 12.1 | |
| Foreign Government Bonds | | | 9.1 | |
| Utilities | | | 6.8 | |
| Consumer Discretionary | | | 5.8 | |
| Industrials | | | 5.5 | |
| Materials | | | 3.5 | |
| Consumer Staples | | | 2.8 | |
| Energy | | | 2.3 | |
| Information Technology | | | 1.3 | |
| Cash and Other Assets, Less Liabilities | | | 12.4 | |
| | | | |
| |
| ASSET TYPE BREAKDOWN (%)7,8 | |
| Non-Convertible Corporate Bonds | | | 62.1 | |
| Convertible Corporate Bonds | | | 12.8 | |
| Government Bonds | | | 12.6 | |
| Cash and Other Assets, Less Liabilities | | | 12.4 | |
| 7 | Source: FactSet Research Systems. Percentage values in data are rounded to the nearest tenth of one percent, so the values may not sum to 100% due to rounding. Percentage values may be derived from different data sources and may not be consistent with other Fund literature. |
| 8 | Cash and other assets may include forward currency exchange contracts and certain derivative instruments that have been marked-to-market. |
| 9 | Not all countries where the Fund may invest are included in the benchmark index. |
| | | | |
| matthewsasia.com | 800.789.ASIA | | | 13 | |
Matthews Asia Credit Opportunities Fund
December 31, 2017
Schedule of Investmentsa
NON-CONVERTIBLE CORPORATE BONDS: 62.1%
| | | | | | | | |
| | | Face Amount* | | | Value | |
| CHINA/HONG KONG: 29.2% | | | | | | | | |
Standard Chartered PLC | | | | | | | | |
6.500%b, 04/02/20c,d | | | 1,300,000 | | | | $1,329,250 | |
Wanda Properties International Co., Ltd. | | | | | | | | |
7.250%, 01/29/24c | | | 1,250,000 | | | | 1,251,614 | |
HSBC Holdings PLC | | | | | | | | |
6.375%b, 03/30/25d | | | 1,100,000 | | | | 1,182,500 | |
China Hongqiao Group, Ltd. | | | | | | | | |
6.875%, 05/03/18c | | | 1,100,000 | | | | 1,102,748 | |
Air China, Ltd. | | | | | | | | |
3.080%, 10/20/21 | | | CNY 6,000,000 | | | | 851,176 | |
KWG Property Holding, Ltd. | | | | | | | | |
8.975%, 01/14/19c | | | 800,000 | | | | 820,000 | |
PetroChina Co., Ltd., Series A | | | | | | | | |
3.030%, 01/19/21 | | | CNY 5,000,000 | | | | 722,187 | |
China Southern Power Grid Co., Ltd. | | | | | | | | |
3.140%, 03/11/21 | | | CNY 4,000,000 | | | | 578,065 | |
State Grid Corp. of China, Series B | | | | | | | | |
3.150%, 11/14/21 | | | CNY 4,000,000 | | | | 571,160 | |
Shimao Property Holdings, Ltd. | | | | | | | | |
8.125%, 01/22/21c | | | 400,000 | | | | 417,224 | |
Unigroup International Holdings, Ltd. | | | | | | | | |
6.000%, 12/10/20c | | | 400,000 | | | | 416,039 | |
| | | | | | | | |
Total China/Hong Kong | | | | | | | 9,241,963 | |
| | | | | | | | |
| | | | | | | | |
| INDONESIA: 19.2% | | | | | | | | |
Modernland Overseas Pte, Ltd. | | | | | | | | |
6.950%, 04/13/24c | | | 1,200,000 | | | | 1,224,769 | |
Jababeka International BV | | | | | | | | |
6.500%, 10/05/23c | | | 1,100,000 | | | | 1,134,703 | |
Listrindo Capital BV | | | | | | | | |
4.950%, 09/14/26c | | | 1,000,000 | | | | 1,010,000 | |
TBG Global Pte, Ltd. | | | | | | | | |
5.250%, 02/10/22c | | | 900,000 | | | | 918,095 | |
Alam Synergy Pte, Ltd. | | | | | | | | |
6.950%, 03/27/20c | | | 900,000 | | | | 909,000 | |
Theta Capital Pte, Ltd. | | | | | | | | |
6.750%, 10/31/26 | | | 900,000 | | | | 896,132 | |
| | | | | | | | |
Total Indonesia | | | | | | | 6,092,699 | |
| | | | | | | | |
| | | | | | | | |
| SRI LANKA: 5.9% | | | | | | | | |
DFCC Bank PLC | | | | | | | | |
9.625%, 10/31/18c | | | 1,200,000 | | | | 1,236,276 | |
National Savings Bank | | | | | | | | |
8.875%, 09/18/18c | | | 600,000 | | | | 619,200 | |
| | | | | | | | |
Total Sri Lanka | | | | | | | 1,855,476 | |
| | | | | | | | |
| | | | | | | | |
| JAPAN: 3.7% | | | | | | | | |
SoftBank Group Corp. | | | | | | | | |
6.000%b, 07/19/23c,d | | | 1,200,000 | | | | 1,185,384 | |
| | | | | | | | |
Total Japan | | | | | | | 1,185,384 | |
| | | | | | | | |
| | | | | | | | |
| PHILIPPINES: 2.8% | | | | | | | | |
ICTSI Treasury BV | | | | | | | | |
5.875%, 09/17/25c | | | 800,000 | | | | 880,440 | |
| | | | | | | | |
Total Philippines | | | | | | | 880,440 | |
| | | | | | | | |
| | | | | | | | |
| | | | | | | | |
| | | Face Amount* | | | Value | |
| UNITED STATES: 1.3% | | | | | | | | |
Sprint Communications, Inc. | | | | | | | | |
6.000%, 11/15/22 | | | 420,000 | | | | $420,000 | |
| | | | | | | | |
Total United States | | | | | | | 420,000 | |
| | | | | | | | |
| | | | | | | | |
| TOTAL NON-CONVERTIBLE CORPORATE BONDS | | | | 19,675,962 | |
| | | | | | | | |
(Cost $19,484,135) | | | | | | | | |
| | | | | | | | |
FOREIGN GOVERNMENT OBLIGATIONS: 12.9% | | | | | |
| VIETNAM: 9.9% | | | | | | | | |
Socialist Republic of Vietnam | | | | | | | | |
4.000%b, 03/12/28 | | | 1,500,000 | | | | 1,493,160 | |
Debt and Asset Trading Corp. | | | | | | | | |
1.000%, 10/10/25c | | | 1,700,000 | | | | 1,200,838 | |
Socialist Republic of Vietnam | | | | | | | | |
4.800%, 11/19/24c | | | 400,000 | | | | 426,622 | |
| | | | | | | | |
Total Vietnam | | | | | | | 3,120,620 | |
| | | | | | | | |
| | | | | | | | |
| SRI LANKA: 3.0% | | | | | | | | |
Sri Lanka Government Bond | | | | | | | | |
6.125%, 06/03/25c | | | 900,000 | | | | 951,343 | |
| | | | | | | | |
Total Sri Lanka | | | | | | | 951,343 | |
| | | | | | | | |
| | | | | | | | |
| TOTAL FOREIGN GOVERNMENT OBLIGATIONS | | | | 4,071,963 | |
| | | | | | | | |
(Cost $3,839,837) | | | | | | | | |
| | | | | | | | |
CONVERTIBLE CORPORATE BONDS: 12.6% | | | | | |
| CHINA/HONG KONG: 5.7% | | | | | | | | |
Ctrip.com International, Ltd., Cnv. | | | | | | | | |
1.250%, 09/15/22 | | | 1,200,000 | | | | 1,225,500 | |
Vipshop Holdings, Ltd., Cnv. | | | | | | | | |
1.500%, 03/15/19 | | | 600,000 | | | | 597,000 | |
| | | | | | | | |
Total China/Hong Kong | | | | | | | 1,822,500 | |
| | | | | | | | |
| | | | | | | | |
| INDONESIA: 4.1% | | | | | | | | |
Delta Investment Horizon International, Ltd., Cnv. | | | | | |
3.000%, 05/26/20c | | | 1,300,000 | | | | 1,301,625 | |
| | | | | | | | |
Total Indonesia | | | | | | | 1,301,625 | |
| | | | | | | | |
| | | | | | | | |
Matthews Asia Credit Opportunities Fund
December 31, 2017
Schedule of Investmentsa (continued)
CONVERTIBLE CORPORATE BONDS (continued)
| | | | | | | | |
| | | Face Amount* | | | Value | |
| THAILAND: 2.8% | | | | | | | | |
CP Foods Holdings, Ltd., Cnv. | | | | | | | | |
0.500%, 09/22/21 | | | 800,000 | | | | $884,000 | |
| | | | | | | | |
Total Thailand | | | | | | | 884,000 | |
| | | | | | | | |
| | | | | | | | |
| TOTAL CONVERTIBLE CORPORATE BONDS | | | | 4,008,125 | |
| | | | | | | | |
(Cost $3,942,386) | | | | | | | | |
| | | | | | | | |
| TOTAL INVESTMENTS: 87.6% | | | | | | | 27,756,050 | |
(Cost $27,266,358) | | | | | | | | |
| | | | | | | | |
CASH AND OTHER ASSETS,
LESS LIABILITIES: 12.4% | | | | | | | 3,935,691 | |
| | | | | | | | |
| | |
NET ASSETS: 100.0% | | | | | | | $31,691,741 | |
| | | | | | | | |
| a | Certain securities were fair valued under the valuation policies approved by the Board of Trustees (Note 2-A). |
| b | Variable rate security. Security may be issued at a fixed coupon rate, which converts to a variable rate at a specified date. Rate shown is the rate in effect as of period end. |
| c | The securities may be resold to qualified foreign investors and foreign institutional buyers under Regulation S of the Securities Act of 1933. |
| d | Perpetual security with no stated maturity date. First call date is disclosed. |
| * | All Values in USD unless otherwise specified |
| CNY | Chinese Renminbi (Yuan) |
See accompanying notes to financial statements.
| | | | |
| matthewsasia.com | 800.789.ASIA | | | 15 | |

| | | | |
| PORTFOLIO MANAGERS |
| Robert J. Horrocks, PhD | | |
Lead Manager | | |
| Kenneth Lowe, CFA | | |
Lead Manager | | | | |
|
| FUND FACTS |
| | | Investor | | Institutional |
Ticker | | MACSX | | MICSX |
CUSIP | | 577130206 | | 577130842 |
Inception | | 9/12/94 | | 10/29/10 |
NAV | | $17.46 | | $17.43 |
Initial Investment | | $2,500 | | $100,000 |
Gross Expense Ratio1 | | 1.07% | | 0.93% |
Portfolio Statistics | | | | |
Total # of Positions | | 61 |
Net Assets | | $2.9 billion |
Weighted Average Market Cap | | $44.1 billion |
Portfolio Turnover2 | | 23.23% |
Benchmark | | |
MSCI AC Asia ex Japan Index |
OBJECTIVE
Long-term capital appreciation. The Fund also seeks to provide some current income.
STRATEGY
Under normal market conditions, the Fund seeks to achieve its investment objective by investing at least 80% of its total net assets, which include borrowings for investment purposes, in dividend-paying common stock, preferred stock and other equity securities, and convertible securities as well as fixed-income securities, of any duration or quality, of companies located in Asia, which consists of all countries and markets in Asia, including developed, emerging and frontier countries and markets in the Asian region.
Matthews Asian Growth and Income Fund
Portfolio Manager Commentary (unaudited)
For the year ending December 31, 2017, the Matthews Asian Growth and Income Fund returned 21.85% (Investor Class) and 22.00% (Institutional Class) while its benchmark, the MSCI All Country Asia ex Japan Index, returned 42.08%. For the fourth quarter, the Fund returned 5.58% (Investor Class) and 5.53% (Institutional Class) while its benchmark returned 8.27%
Market Environment:
Markets rallied substantially in 2017 following over five years of negligible earnings growth in U.S. dollar terms for the Asia region, alongside valuations and currencies that had become relatively attractive compared with those in the U.S. This was helped by resurgent earnings, as global trade resumed with the world entering a “Goldilocks” environment of accommodative monetary policy, limited inflation and synchronized growth. The fourth quarter continued this trend as markets again rose aggressively, accompanied by remarkably low levels of volatility.
The quarter witnessed a number of important events. In the U.S., the Federal Reserve again raised its benchmark interest rate and planned for a change in stewardship from Chair Janet Yellen to Jerome Powell. There was also the passing of the new tax law in the U.S. despite the country’s economy appearing to be on a solid footing already. In Asia, the 19th National Congress took place in China in October with President Xi Jinping further cementing his status as his name and ideas were put into the Party Constitution. Elsewhere, India’s government cleared plans to inject more than US$30 billion of capital into its state-run lenders over the next few years in its drive to repair balance sheets within the sector. This helped lead India to the region’s best performance over the fourth quarter, although all sectors and geographies ended in positive territory. For the full year, China and South Korea were the strongest-performing markets.
Performance Contributors and Detractors:
The strategy underperformed its benchmark during the fourth quarter given our more conservative mandate. It did deliver in line with our expectations, however, at around two-thirds of upside capture. Some of the strongest performance for the portfolio came from our holdings within Hong Kong and China. The largest of these for both the quarter and full year was again pan-Asian life insurer AIA Group. Its growth in value of new business continued and recent liberalization in the Chinese financial market may allow the company to expand into more provinces in the mainland. Newer holding NetEase also rose on solid earnings and as concerns over the company’s game pipeline were pushed to one side on the successful launch of survival-shooter games Wilderness and Terminator 2.
A number of financial and consumer companies delivered well for the portfolio. Others included Vietnam Diary Products on solid revenue growth as the company won more market share in products such as liquid milk and infant formula. ING Life Insurance in South Korea rallied on higher-than-peer protection premium growth due to its superior capital position, while United Overseas Bank in Singapore benefited from rising rates and improving asset quality.
More negatively, Café de Coral was the portfolio’s weakest performer during the fourth quarter on weaker-than-expected results as, despite reasonable revenue growth, staff costs rose on higher minimum wages and retention costs. In what has been the case for some time, the Fund’s more defensive holdings within the telecommunication services and utilities sectors also were detrimental to returns. Telekom Indonesia was weak on rising competition and Japanese operator KDDI suffered on the potential of a fourth entrant coming into the market. Singaporean industrial companies such as SIA Engineering and ST Engineering were also detractors to performance on weaker-than-expected results.
(continued)
| 1 | Actual 2017 expense ratios. |
| 2 | The lesser of fiscal year 2017 long-term purchase costs or sales proceeds divided by the average monthly market value of long-term securities. |
| | | | | | | | | | | | | | | | | | | | | | | | | | | | |
| | |
| PERFORMANCE AS OF DECEMBER 31, 2017 | | | | |
| | | | | | | | | Average Annual Total Returns | | | | |
| | | 3 Months | | | 1 Year | | | 3 Years | | | 5 Years | | | 10 Years | | | Since
Inception | | | Inception
Date | |
| Investor Class (MACSX) | | | 5.58% | | | | 21.85% | | | | 5.65% | | | | 4.20% | | | | 4.78% | | | | 9.56% | | | | 9/12/94 | |
| Institutional Class (MICSX) | | | 5.53% | | | | 22.00% | | | | 5.79% | | | | 4.36% | | | | n.a. | | | | 5.24% | | | | 10/29/10 | |
| MSCI AC Asia ex Japan Index3 | | | 8.27% | | | | 42.08% | | | | 11.03% | | | | 8.26% | | | | 4.11% | | | | 5.01% | 4 | | | | |
| Lipper Pacific Region Funds Category Average5 | | | 8.22% | | | | 33.60% | | | | 10.61% | | | | 8.27% | | | | 3.69% | | | | 4.48% | 4 | | | | |
Performance assumes reinvestment of all dividends and/or distributions before taxes. All performance quoted represents past performance and is no guarantee of future results. Investment return and principal value will fluctuate with market conditions so that when redeemed, shares may be worth more or less than their original cost. Current performance may be lower or higher than the return figures quoted. Returns would have been lower if certain of the Fund’s fees and expenses had not been waived. For the Fund’s most recent month-end performance, visit matthewsasia.com.
| | | | | | | | | | | | | | | | | | | | | | | | | | | | |
| | | | | | | | |
| INCOME DISTRIBUTION HISTORY | | | | | | | | | | | | | | | | | | | | | |
| | | 2017 | | | | | | 2016 | |
| | | June | | | December | | | Total | | | | | | June | | | December | | | Total | |
| Investor (MACSX) | | $ | 0.10 | | | $ | 0.36 | | | $ | 0.46 | | | | | | | $ | 0.15 | | | $ | 0.33 | | | $ | 0.48 | |
| Inst’l (MICSX) | | $ | 0.12 | | | $ | 0.37 | | | $ | 0.49 | | | | | | | $ | 0.16 | | | $ | 0.34 | | | $ | 0.50 | |
Note: This table does not include capital gains distributions. Totals may differ by $0.01 due to rounding. For income distribution history, visit matthewsasia.com.
| | | | |
30-DAY YIELD: 1.98% (Investor Class) 2.04% (Institutional Class) The 30-Day Yield represents net investment income earned by the Fund over the 30-day period ended 12/31/17, expressed as an annual percentage rate based on the Fund’s share price at the end of the 30-day period. The 30-Day Yield should be regarded as an estimate of the Fund’s rate of investment income, and it may not equal the Fund’s actual income distribution rate. Source: BNY Mellon Investment Servicing (US) Inc. | | | | DIVIDEND YIELD: 3.33% The dividend yield (trailing) for the portfolio is the weighted average sum of the dividends paid by each equity security held by the Fund over the 12 months ended 12/31/17 divided by the current price of each equity as of 12/31/17. The annualized dividend yield for the Fund is for the equity-only portion of the portfolio. Please note that this is based on gross equity portfolio holdings and does not reflect the actual yield an investor in the Fund would receive. Past yields are no guarantee of future yields. Source: FactSet Research Systems, Bloomberg, MICM |
GROWTH OF A $10,000 INVESTMENT SINCE INCEPTION—INVESTOR CLASS
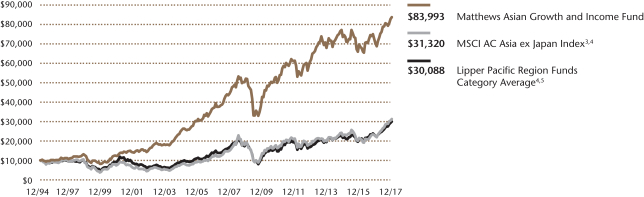
Plotted monthly. The performance data and graph do not reflect the deduction of taxes that a shareholder would pay on dividends, capital gains distributions or redemption of Fund shares. Values are in US$.
| | 3 | It is not possible to invest directly in an index. Source: Index data from Morgan Stanley Capital International and Bloomberg; total return calculations performed by BNY Mellon Investment Servicing (US) Inc. Please see page 92 for index definition. |
| | 4 | Calculated from 8/31/94. |
| | 5 | The Lipper Category Average does not reflect sales charges and is based on total return, including reinvestment of dividends and capital gains for the stated periods. |
| | | | | | | | |
| | | | |
| TOP TEN HOLDINGS6 | | | | | | | |
| | | Sector | | Country | | % of Net Assets | |
| Taiwan Semiconductor Manufacturing Co., Ltd. | | Information Technology | | Taiwan | | | 3.7% | |
| AIA Group, Ltd. | | Financials | | China/Hong Kong | | | 3.4% | |
| United Overseas Bank, Ltd. | | Financials | | Singapore | | | 2.6% | |
| Singapore Telecommunications, Ltd. | | Telecommunication Services | | Singapore | | | 2.3% | |
| Ascendas, REIT | | Real Estate | | Singapore | | | 2.2% | |
| Genting Malaysia BHD | | Consumer Discretionary | | Malaysia | | | 2.2% | |
| CapitaLand, Ltd., Cnv., 1.950%, 10/17/2023 | | Real Estate | | Singapore | | | 2.1% | |
| Samsung Electronics Co., Ltd. | | Information Technology | | South Korea | | | 2.0% | |
| HSBC Holdings PLC | | Financials | | China/Hong Kong | | | 2.0% | |
| Broadcom, Ltd. | | Information Technology | | United States | | | 2.0% | |
| % OF ASSETS IN TOP TEN | | | | | | | 24.5% | |
| | 6 | Holdings may combine more than one security from same issuer and related depositary receipts. |
| | | | |
| matthewsasia.com | 800.789.ASIA | | | 17 | |
| | | | |
| |
| COUNTRY ALLOCATION (%)7,8 | |
| China/Hong Kong | | | 31.1 | |
| Singapore | | | 12.1 | |
| South Korea | | | 11.7 | |
| Taiwan | | | 6.1 | |
| Australia | | | 6.0 | |
| Japan | | | 5.8 | |
| Indonesia | | | 4.8 | |
| Thailand | | | 4.0 | |
| United States | | | 3.7 | |
| Malaysia | | | 3.7 | |
| India | | | 1.8 | |
| Norway | | | 1.6 | |
| Philippines | | | 1.6 | |
| Vietnam | | | 1.6 | |
| New Zealand | | | 1.4 | |
| Cash and Other Assets, Less Liabilities | | | 3.0 | |
| | | | |
| |
| SECTOR ALLOCATION (%)8 | |
| Consumer Discretionary | | | 16.2 | |
| Financials | | | 14.8 | |
| Consumer Staples | | | 13.2 | |
| Industrials | | | 12.9 | |
| Information Technology | | | 12.3 | |
| Telecommunication Services | | | 11.6 | |
| Real Estate | | | 6.9 | |
| Utilities | | | 4.6 | |
| Health Care | | | 4.5 | |
| Cash and Other Assets, Less Liabilities | | | 3.0 | |
| | | | |
| |
| MARKET CAP EXPOSURE (%)8 | |
| Mega Cap (over $25B) | | | 41.9 | |
| Large Cap ($10B–$25B) | | | 19.4 | |
| Mid Cap ($3B–10B) | | | 25.1 | |
| Small Cap (under $3B) | | | 10.6 | |
| Cash and Other Assets, Less Liabilities | | | 3.0 | |
| | | | |
| |
| ASSET TYPE BREAKDOWN (%)8,9 | |
| Common Equities and ADRs | | | 85.9 | |
| Convertible Corporate Bonds | | | 8.6 | |
| Preferred Equities | | | 2.5 | |
| Cash and Other Assets, Less Liabilities | | | 3.0 | |
| 7 | Not all countries where the Fund may invest are included in the benchmark index. |
| 8 | Source: FactSet Research Systems. Percentage values in data are rounded to the nearest tenth of one percent, so the values may not sum to 100% due to rounding. Percentage values may be derived from different data sources and may not be consistent with other Fund literature. |
| 9 | Bonds are not included in the MSCI All Country Asia ex Japan Index. |
Matthews Asian Growth and Income Fund
Portfolio Manager Commentary (unaudited) (continued)
For the full year and as we have noted previously, the largest drag on relative returns for the portfolio came from the Fund’s underweight within the information technology sector and in higher-beta and reflationary-oriented companies in Greater China. Within these areas, we continue to struggle to find quality businesses with strong corporate governance standards and sustainable growth at attractive valuations, particularly given a dearth of dividends in many cases.
Notable Portfolio Changes:
We made a number of alterations to the portfolio during the fourth quarter, including the addition of five new positions in high-quality companies at attractive valuations, funded through the closure of five lower-conviction positions.
Despite a rallying market, we were able to add companies such as Indonesian department store group Matahari at only 14x P/E and a 4.5% dividend yield as Indonesian consumption patterns have been weak. We agree with management that this is likely transitory and that solid sustainable growth is likely for this leading operator. Also within the consumer sector, we added Korean water and air purification rental equipment business Coway. Despite a product recall in 2016, the company has done a good job managing cancellation rates and is showing healthy profit growth alongside an attractive dividend yield of 3.8%. Other additions included Chinese toll road company Jiangsu Expressway, Bank of the Philippine Islands and Taiwanese IPC company Advantech—all leaders in their respective fields.
These were funded through the sale of Indonesian gas pipeline business Perusahaan Gas Negara Persero, Korean shopping channel operator GS Home Shopping, Philippines telecom Globe, Taiwanese telecom Chunghwa and Singaporean transport business ComfortDelGro.
Outlook:
Looking forward to 2018, there do not appear to be many reasons to cause an end to the synchronized global growth cycle, particularly as the U.S. adds fiscal stimulus through tax cuts and as Chinese income growth continues. Further, from an Asian equity market perspective, valuations on average are still reasonable at around 14.5x P/E with expectations for around 12% earnings growth in 2018.
Although that backdrop is fairly constructive, risks remain within markets. Monetary tightening in the U.S. creates the potential for policy errors, as does China’s goals of alleviating poverty, pollution and major financial and regulatory risks. It is also worth noting that the market rally in 2017 was fairly narrow as certain leaders enjoyed outsize returns. The top 10 companies within the Asia ex Japan benchmark, for example, accounted for over 35% of total returns for the index and information technology companies such as Alibaba and Tencent were up 96% and 113% respectively. That leaves select areas of the market as rather expensive. It does, however, also leave the Matthews Asian Growth and Income Fund in the rather healthy position of trading roughly in-line with markets on a P/E basis and at an attractive 3.4% dividend yield due to the Fund’s recent underperformance. It is rare for us to find the portfolio trading at such levels relative to overall markets given our bias for quality companies that are capable of visible and sustainable growth.
Matthews Asian Growth and Income Fund
December 31, 2017
Schedule of Investmentsa
COMMON EQUITIES: 85.9%
| | | | | | | | |
| | | Shares | | | Value | |
| CHINA/HONG KONG: 27.1% | | | | | | | | |
AIA Group, Ltd. | | | 11,311,600 | | | | $96,212,484 | |
HSBC Holdings PLC ADR | | | 1,102,033 | | | | 56,908,984 | |
CK Hutchison Holdings, Ltd. | | | 4,438,672 | | | | 55,617,898 | |
Techtronic Industries Co., Ltd. | | | 7,821,000 | | | | 50,878,981 | |
NetEase, Inc. ADR | | | 146,000 | | | | 50,380,220 | |
CLP Holdings, Ltd. | | | 4,667,200 | | | | 47,760,118 | |
Jardine Matheson Holdings, Ltd. | | | 781,400 | | | | 47,409,497 | |
China Mobile, Ltd. ADR | | | 904,900 | | | | 45,733,646 | |
Guangdong Investment, Ltd. | | | 32,744,000 | | | | 43,778,844 | |
Pacific Textiles Holdings, Ltd. | | | 41,291,000 | | | | 43,601,343 | |
HKT Trust & HKT, Ltd. | | | 32,395,000 | | | | 41,297,887 | |
CK Asset Holdings, Ltd. | | | 4,400,172 | | | | 38,357,046 | |
Hang Lung Properties, Ltd. | | | 15,220,920 | | | | 37,077,768 | |
VTech Holdings, Ltd. | | | 2,704,000 | | | | 35,365,743 | |
Café de Coral Holdings, Ltd. | | | 10,968,000 | | | | 30,112,392 | |
Vitasoy International Holdings, Ltd. | | | 11,143,000 | | | | 28,492,221 | |
Jiangsu Expressway Co., Ltd. H Shares | | | 14,770,000 | | | | 22,454,784 | |
| | | | | | | | |
Total China/Hong Kong | | | | | | | 771,439,856 | |
| | | | | | | | |
| | | | | | | | |
| SINGAPORE: 10.1% | | | | | | | | |
United Overseas Bank, Ltd. | | | 3,796,000 | | | | 74,830,614 | |
Singapore Telecommunications, Ltd. | | | 24,329,100 | | | | 64,864,460 | |
Ascendas REIT | | | 31,398,600 | | | | 63,725,037 | |
Singapore Technologies Engineering, Ltd. | | | 21,623,025 | | | | 52,606,332 | |
SIA Engineering Co., Ltd. | | | 13,615,300 | | | | 31,828,106 | |
| | | | | | | | |
Total Singapore | | | | | | | 287,854,549 | |
| | | | | | | | |
| | | | | | | | |
| SOUTH KOREA: 9.2% | | | | | | | | |
Samsung Electronics Co., Ltd. | | | 24,541 | | | | 58,307,239 | |
ING Life Insurance Korea, Ltd.b,c | | | 946,537 | | | | 47,080,126 | |
Kangwon Land, Inc. | | | 1,399,273 | | | | 45,483,579 | |
KT&G Corp. | | | 415,828 | | | | 44,863,046 | |
Coway Co., Ltd. | | | 450,074 | | | | 41,014,908 | |
KEPCO Plant Service & Engineering Co., Ltd. | | | 634,668 | | | | 24,045,132 | |
| | | | | | | | |
Total South Korea | | | | | | | 260,794,030 | |
| | | | | | | | |
| | | | | | | | |
| TAIWAN: 6.1% | | | | | | | | |
Taiwan Semiconductor Manufacturing Co., Ltd. | | | 11,282,187 | | | | 86,388,553 | |
Advantech Co., Ltd. | | | 6,367,000 | | | | 44,988,502 | |
Taiwan Secom Co., Ltd. | | | 7,684,000 | | | | 23,641,499 | |
Taiwan Semiconductor Manufacturing Co., Ltd. ADR | | | 477,024 | | | | 18,914,002 | |
| | | | | | | | |
Total Taiwan | | | | | | | 173,932,556 | |
| | | | | | | | |
| | | | | | | | |
| AUSTRALIA: 6.0% | | | | | | | | |
Macquarie Group, Ltd. | | | 641,394 | | | | 49,608,548 | |
Brambles, Ltd. | | | 5,238,566 | | | | 41,055,011 | |
Domino’s Pizza Enterprises, Ltd. | | | 1,124,361 | | | | 40,865,997 | |
CSL, Ltd. | | | 355,133 | | | | 39,026,896 | |
| | | | | | | | |
Total Australia | | | | | | | 170,556,452 | |
| | | | | | | | |
| | | | | | | | |
| | | | | | | | |
| | | Shares | | | Value | |
| JAPAN: 5.8% | | | | | | | | |
Japan Tobacco, Inc. | | | 1,528,200 | | | | $49,212,804 | |
Kao Corp. | | | 658,100 | | | | 44,467,558 | |
KDDI Corp. | | | 1,480,800 | | | | 36,782,382 | |
USS Co., Ltd. | | | 1,681,400 | | | | 35,556,123 | |
| | | | | | | | |
Total Japan | | | | | | | 166,018,867 | |
| | | | | | | | |
| | | | | | | | |
| INDONESIA: 4.8% | | | | | | | | |
PT Bank Rakyat Indonesia Persero | | | 191,600,000 | | | | 51,296,274 | |
PT Telekomunikasi Indonesia Persero ADR | | | 1,435,400 | | | | 46,248,588 | |
PT Matahari Department Store | | | 54,091,500 | | | | 39,737,448 | |
| | | | | | | | |
Total Indonesia | | | | | | | 137,282,310 | |
| | | | | | | | |
| | | | | | | | |
| UNITED STATES: 3.7% | | | | | | | | |
Broadcom, Ltd. | | | 220,100 | | | | 56,543,690 | |
ResMed, Inc. | | | 589,000 | | | | 49,882,410 | |
| | | | | | | | |
Total United States | | | | | | | 106,426,100 | |
| | | | | | | | |
| | | | | | | | |
| MALAYSIA: 3.7% | | | | | | | | |
Genting Malaysia BHD | | | 45,440,800 | | | | 63,215,148 | |
British American Tobacco Malaysia BHD | | | 4,166,700 | | | | 41,183,099 | |
| | | | | | | | |
Total Malaysia | | | | | | | 104,398,247 | |
| | | | | | | | |
| | | | | | | | |
| INDIA: 1.8% | | | | | | | | |
Bharti Infratel, Ltd. | | | 8,473,114 | | | | 50,144,444 | |
| | | | | | | | |
Total India | | | | | | | 50,144,444 | |
| | | | | | | | |
| | | | | | | | |
| NORWAY: 1.6% | | | | | | | | |
Telenor ASA | | | 2,142,616 | | | | 45,866,544 | |
| | | | | | | | |
Total Norway | | | | | | | 45,866,544 | |
| | | | | | | | |
| | | | | | | | |
| PHILIPPINES: 1.6% | | | | | | | | |
Bank of the Philippine Islands | | | 20,978,600 | | | | 45,411,646 | |
| | | | | | | | |
Total Philippines | | | | | | | 45,411,646 | |
| | | | | | | | |
| | | | | | | | |
| VIETNAM: 1.6% | | | | | | | | |
Vietnam Dairy Products JSC | | | 4,920,211 | | | | 45,112,570 | |
| | | | | | | | |
Total Vietnam | | | | | | | 45,112,570 | |
| | | | | | | | |
| | | | | | | | |
| NEW ZEALAND: 1.4% | | | | | | | | |
SKYCITY Entertainment Group, Ltd. | | | 13,775,057 | | | | 40,445,786 | |
| | | | | | | | |
Total New Zealand | | | | | | | 40,445,786 | |
| | | | | | | | |
| | | | | | | | |
| THAILAND: 1.4% | | | | | | | | |
Glow Energy Public Co., Ltd. | | | 15,554,000 | | | | 38,777,616 | |
| | | | | | | | |
Total Thailand | | | | | | | 38,777,616 | |
| | | | | | | | |
| | | | | | | | |
| TOTAL COMMON EQUITIES | | | | | | | 2,444,461,573 | |
| | | | | | | | |
(Cost $2,075,746,333) | | | | | | | | |
| | | | |
| matthewsasia.com | 800.789.ASIA | | | 19 | |
Matthews Asian Growth and Income Fund
December 31, 2017
Schedule of Investmentsa (continued)
| | |
| CONVERTIBLE CORPORATE BONDS: 8.6% | | PREFERRED EQUITIES: 2.5% |
| | | | | | | | |
| | | Face Amount* | | | Value | |
| CHINA/HONG KONG: 4.0% | | | | | | | | |
Hengan International Group Co., Ltd., Cnv. | |
0.000%, 06/27/18c | | | HKD 339,000,000 | | | | $45,993,459 | |
Johnson Electric Holdings, Ltd., Cnv. | |
1.000%, 04/02/21c | | | 38,500,000 | | | | 43,649,375 | |
Haitian International Holdings, Ltd., Cnv. | |
2.000%, 02/13/19c | | | 21,500,000 | | | | 24,106,875 | |
| | | | | | | | |
Total China/Hong Kong | | | | | | | 113,749,709 | |
| | | | | | | | |
| | | | | | | | |
| THAILAND: 2.6% | | | | | | | | |
Bangkok Dusit Medical Services Public Co., Ltd., Cnv. | |
0.000%, 09/18/19c | | | THB 1,163,000,000 | | | | 38,005,370 | |
CP Foods Holdings, Ltd., Cnv. | |
0.500%, 09/22/21 | | | 31,600,000 | | | | 34,918,000 | |
| | | | | | | | |
Total Thailand | | | | | | | 72,923,370 | |
| | | | | | | | |
| | | | | | | | |
| SINGAPORE: 2.0% | | | | | | | | |
CapitaLand, Ltd., Cnv. | | | | | | | | |
1.950%, 10/17/23c | | | SGD 77,500,000 | | | | 58,380,687 | |
| | | | | | | | |
Total Singapore | | | | | | | 58,380,687 | |
| | | | | | | | |
| | | | | | | | |
| TOTAL CONVERTIBLE CORPORATE BONDS | | | | 245,053,766 | |
| | | | | | | | |
(Cost $243,336,470) | | | | | | | | |
| | | | | | | | |
| | | Shares | | | Value | |
| SOUTH KOREA: 2.5% | | | | | | | | |
LG Household & Health Care, Ltd., Pfd. | | | 61,595 | | | | $40,160,021 | |
Hyundai Motor Co., Ltd., Pfd. | | | 355,983 | | | | 31,097,172 | |
| | | | | | | | |
Total South Korea | | | | | | | 71,257,193 | |
| | | | | | | | |
| | | | | | | | |
| TOTAL PREFERRED EQUITIES | | | | 71,257,193 | |
| | | | | | | | |
(Cost $20,660,830) | | | | | | | | |
| | | | | | | | |
| TOTAL INVESTMENTS: 97.0% | | | | | | | 2,760,772,532 | |
(Cost $2,339,743,633) | | | | | | | | |
| | | | | | | | |
CASH AND OTHER ASSETS,
LESS LIABILITIES: 3.0% | | | | | | | 85,140,925 | |
| | | | | | | | |
| | |
NET ASSETS: 100.0% | | | | | | | $2,845,913,457 | |
| | | | | | | | |
| a | Certain securities were fair valued under the valuation policies approved by the Board of Trustees (Note 2-A). |
| b | Security exempt from registration under Rule 144A of the Securities Act of 1933, as amended. The security may be resold in transactions exempt from registration normally to qualified institutional buyers. The security has been determined to be liquid in accordance with procedures adopted by the Fund’s Board of Trustees. At December 31, 2017, the aggregate value is $47,080,126, which is 1.65% of net assets. |
| c | The securities may be resold to qualified foreign investors and foreign institutional buyers under Regulation S of the Securities Act of 1933. |
| * | All Values in USD unless otherwise specified |
| ADR | American Depositary Receipt |
| REIT | Real Estate Investment Trust |
See accompanying notes to financial statements.
| | | | |
| PORTFOLIO MANAGERS |
| Yu Zhang, CFA | | Robert Horrocks, PhD |
Lead Manager | | Lead Manager |
| Vivek Tanneeru | | |
Co-Manager | | | | |
|
| FUND FACTS |
| | | Investor | | Institutional |
Ticker | | MAPIX | | MIPIX |
CUSIP | | 577125107 | | 577130750 |
Inception | | 10/31/06 | | 10/29/10 |
NAV | | $19.74 | | $19.73 |
Initial Investment | | $2,500 | | $100,000 |
Gross Expense Ratio1 | | 1.03% | | 0.92% |
After Fee Waiver and Reimbursement2 | | 1.02% | | 0.91% |
Portfolio Statistics |
Total # of Positions | | 67 |
Net Assets | | $7.0 billion |
Weighted Average Market Cap | | $55.2 billion |
Portfolio Turnover3 | | 28.11% |
Benchmark | | | | |
MSCI AC Asia Pacific Index |
OBJECTIVE
Total return with an emphasis on providing current income.
STRATEGY
Under normal market conditions, the Fund seeks to achieve its investment objective by investing at least 80% of its total net assets, which include borrowings for investment purposes, in dividend-paying equity securities of companies located in Asia. Asia consists of all countries and markets in Asia, and includes developed, emerging and frontier countries and markets in the Asian region. The Fund may also invest in convertible debt and equity securities.
Matthews Asia Dividend Fund
Portfolio Manager Commentary (unaudited)
For the year ending December 31, 2017, the Matthews Asia Dividend Fund returned 34.69% (Investor Class) and 34.77% (Institutional Class) outperforming its benchmark, the MSCI All Country Asia Pacific Index, which returned 32.04%. For the fourth quarter of the year, the Fund returned 8.89% (Investor Class) and 8.86% (Institutional Class) versus 8.19% for the Index.
The Fund began 2017 with a share price of US$15.52 (Investor and Institutional Class), and shareholders who were invested throughout the year would have received total distributions of approximately US$1.11 (Investor Class) or US$1.13 (Institutional Class) per share.
Market Environment:
After several years of lackluster performance, Asian equities bounced back strongly in 2017. Improving inflationary conditions, coupled with moderate monetary policy from Asia’s central banks, created a “Goldilocks scenario” that set the stage for the region’s strong corporate earnings recovery, followed by strong performance by its equity market. Concerns over potential systemic risks also subsided, most evident in the stabilizing Chinese economy. Reflecting the improving macroeconomic environment, Asian currencies mostly strengthened against the U.S. dollar in another tailwind for Asian equities. Within the asset class, cyclical growth stocks in the information technology and financial sectors led in share price outperformance as investors concluded these sectors were better-positioned during the early stages of their earnings rebound. Defensive stocks, such as those in the utilities and telecommunication sectors, were laggards amid the market rally as they were perceived to offer less of a growth outlook than their cyclical peers.
Performance Contributors and Detractors:
As always, we have been taking a total return approach to portfolio construction, investing in both dividend payers and dividend growers. Dividend payers are usually companies that have mature, defensive business models and offer significant dividend yield pickup by paying out the majority of the underlying free cash flow as dividends to shareholders. Dividend growers, on the other hand, are often companies that operate cyclical businesses that have significant untapped growth potential. Their dividends, while typically not as high as those paid by the mature dividend payers, tend to grow at a much faster rate, supported by a better growth profile in their underlying earnings. Since late 2016, we began tilting our overall exposure more toward dividend growers, positioning the portfolio for a potential pickup in Asia’s earnings recovery. This paid off during 2017 as some of these dividend growers, such as Chinese life insurer Ping An Insurance, became the top contributors to Fund performance. With enhanced free cash flow generation, companies such as Ping An proactively raised their dividend payout ratios, resulting in significant year-on-year growth in dividends. The market rewarded those dividend growers with higher share prices. China Gas Holdings, a city gas distributor, also delivered strong dividend growth.
By sector, the Fund’s overweight in the consumer discretionary and consumer staples sectors helped performance for the full year. Individual holdings within these consumer-facing sectors, such as auto parts marker Minth Group and Kweichow Moutai, a Chinese hard liquor business, experienced substantial share price appreciation. The Fund’s underweight in the information technology sector was
(continued)
| 1 | Actual 2017 expense ratios. |
| 2 | Matthews has contractually agreed to waive a portion of its advisory fee and administrative and shareholder services fee if the Fund’s average daily net assets are over $3 billion, as follows: for every $2.5 billion average daily net assets of the Fund that are over $3 billion, the advisory fee rate and the administrative and shareholder services fee rate for the Fund with respect to such excess average daily net assets will be each reduced by 0.01%, in each case without reducing such fee rate below 0.00%. Any amount waived by Matthews pursuant to this agreement may not be recouped by Matthews. This agreement will remain in place until April 30, 2019 and may be terminated at any time (i) by the Trust on behalf of the Fund or by the Board of Trustees upon 60 days’ prior written notice to Matthews; or (ii) by Matthews upon 60 days’ prior written notice to the Trust, in each case without payment of any penalty. |
| 3 | The lesser of fiscal year 2017 long-term purchase costs or sales proceeds divided by the average monthly market value of long-term securities. |
| | | | |
| matthewsasia.com | 800.789.ASIA | | | 21 | |
| | | | | | | | | | | | | | | | | | | | | | | | | | | | |
| | | | | | | | |
| PERFORMANCE AS OF DECEMBER 31, 2017 | | | | | | | | | | | | | | | | | | | | | |
| | | | | | | | | Average Annual Total Returns | | | | |
| | | 3 Months | | | 1 Year | | | 3 Years | | | 5 Years | | | 10 Years | | | Since
Inception | | | Inception
Date | |
| Investor Class (MAPIX) | | | 8.89% | | | | 34.69% | | | | 13.36% | | | | 10.07% | | | | 9.03% | | | | 10.41% | | | | 10/31/06 | |
| Institutional Class (MIPIX) | | | 8.86% | | | | 34.77% | | | | 13.48% | | | | 10.20% | | | | n.a. | | | | 8.83% | | | | 10/29/10 | |
| MSCI AC Asia Pacific Index4 | | | 8.19% | | | | 32.04% | | | | 10.95% | | | | 8.98% | | | | 3.75% | | | | 5.21% | 5 | | | | |
| Lipper International Equity Income Funds Category Average6 | | | 3.48% | | | | 22.68% | | | | 5.82% | | | | 4.97% | | | | 1.44% | | | | 3.26% | 5 | | | | |
Performance assumes reinvestment of all dividends and/or distributions before taxes. All performance quoted represents past performance and is no guarantee of future results. Investment return and principal value will fluctuate with market conditions so that when redeemed, shares may be worth more or less than their original cost. Current performance may be lower or higher than the return figures quoted. Returns would have been lower if certain of the Fund’s fees and expenses had not been waived. For the Fund’s most recent month-end performance, visit matthewsasia.com.
| | | | | | | | | | | | | | | | | | | | | | | | | | | | | | | | | | | | | | | | | | | | |
| | | | | | | | | | |
| INCOME DISTRIBUTION HISTORY | | | | | | | | | | | | | | | | | | | | | | | | | | | | |
| | | 2017 | | | | | | 2016 | |
| | | Q1 | | | Q2 | | | Q3 | | | Q4 | | | Total | | | | | | Q1 | | | Q2 | | | Q3 | | | Q4 | | | Total | |
| Investor (MAPIX) | | $ | 0.02 | | | $ | 0.15 | | | $ | 0.09 | | | $ | 0.43 | | | $ | 0.69 | | | | | | | $ | 0.01 | | | $ | 0.19 | | | $ | 0.06 | | | $ | 0.04 | | | $ | 0.29 | |
| Inst’l (MIPIX) | | $ | 0.03 | | | $ | 0.15 | | | $ | 0.10 | | | $ | 0.43 | | | $ | 0.71 | | | | | | | $ | 0.02 | | | $ | 0.19 | | | $ | 0.07 | | | $ | 0.05 | | | $ | 0.32 | |
Totals may differ by $0.01 due to rounding and a return of capital. For distribution history please visit matthewsasia.com.
| | | | |
30-DAY YIELD: 1.00% (Investor Class) 1.11% (Institutional Class) The 30-Day Yield represents net investment income earned by the Fund over the 30-day period ended 12/31/17, expressed as an annual percentage rate based on the Fund’s share price at the end of the 30-day period. The 30-Day Yield should be regarded as an estimate of the Fund’s rate of investment income, and it may not equal the Fund’s actual income distribution rate. Source: BNY Mellon Investment Servicing (US) Inc. | | | | DIVIDEND YIELD: 2.35% The dividend yield (trailing) for the portfolio is the weighted average sum of the dividends paid by each equity security held by the Fund over the 12 months ended 12/31/17 divided by the current price of each equity as of 12/31/17. The annualized dividend yield for the Fund is for the equity-only portion of the portfolio. Please note that this is based on gross equity portfolio holdings and does not reflect the actual yield an investor in the Fund would receive. Past yields are no guarantee of future yields. Source: FactSet Research Systems, Bloomberg, MICM. |
GROWTH OF A $10,000 INVESTMENT SINCE INCEPTION—INVESTOR CLASS
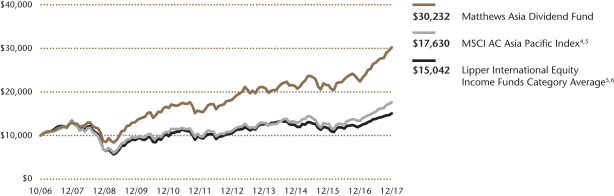
Plotted monthly. The performance data and graph do not reflect the deduction of taxes that a shareholder would pay on dividends, capital gains distributions or redemption of Fund shares. Values are in US$.
| | 4 | It is not possible to invest directly in an index. Source: Index data from Morgan Stanley Capital International and Bloomberg; total return calculations performed by BNY Mellon Investment Servicing (US) Inc. Please see page 92 for index definition. |
| | 5 | Calculated from 10/31/06. |
| | 6 | The Lipper Category Average does not reflect sales charges and is based on total return, including reinvestment of dividends and capital gains for the stated periods. |
| | | | | | | | |
| | | | |
| TOP TEN HOLDINGS7 | | | | | | | |
| | | Sector | | Country | | % of Net Assets | |
| Minth Group, Ltd. | | Consumer Discretionary | | China/Hong Kong | | | 5.2% | |
| Shenzhou International Group Holdings, Ltd. | | Consumer Discretionary | | China/Hong Kong | | | 3.5% | |
| Ping An Insurance Group Co. of China, Ltd. | | Financials | | China/Hong Kong | | | 3.3% | |
| Hyundai Mobis Co., Ltd. | | Consumer Discretionary | | South Korea | | | 3.2% | |
| China Construction Bank Corp. | | Financials | | China/Hong Kong | | | 3.1% | |
| LG Chem, Ltd., Pfd. | | Materials | | South Korea | | | 3.0% | |
| Samsung Electronics Co., Ltd., Pfd. | | Information Technology | | South Korea | | | 3.0% | |
| HSBC Holdings PLC | | Financials | | China/Hong Kong | | | 2.8% | |
| Midea Group Co., Ltd. | | Consumer Discretionary | | China/Hong Kong | | | 2.8% | |
| Nitori Holdings Co., Ltd. | | Consumer Discretionary | | Japan | | | 2.3% | |
| % OF ASSETS IN TOP TEN | | | | | | | 32.2% | |
| | 7 | Holdings may combine more than one security from same issuer and related depositary receipts. |
Matthews Asia Dividend Fund
Portfolio Manager Commentary (unaudited) (continued)
the largest relative performance detractor as we avoided some major internet companies that were heavily weighted in the index and which performed well during the year. We decided not to own shares of these businesses because of concerns about valuations.
By country, China/Hong Kong was the top contributor to Fund performance. Chinese companies listed in Hong Kong, which offered some of the most attractive equity valuations at the start of the year, were among the best-performing stocks within Asia. The portfolio’s overweight in Hong Kong H-share stocks and China A-share stocks boosted performance. On the flip side, the Fund’s exposure to Korea was a major detractor to performance. While some of our Korean holdings still delivered positive returns, they underperformed South Korea’s broad market rally.
Notable Portfolio Changes:
During the fourth quarter, we initiated a new position in Rohm, a Japanese semiconductor manufacturer. While its products are traditionally used mostly in consumer electronics, the firm has been focused on expanding its production application into automotive and industrial machinery in recent years. The improved, more diversified product mix has not only reduced its earnings volatility, but also has created new growth opportunities, including power management integrated-circuit products used in electric vehicles and factory automation. With a net cash balance sheet and an accelerating earnings growth trend, Rohm’s shareholder-return stance has improved. In addition to paying out regular dividends, the company has returned profits to shareholders through special dividends and share buybacks.
To fund our addition of Rohm and some other new positions, we exited our holdings in Itochu, where we viewed valuations as no longer attractive. We also shed China Mobile and Singapore Technology Engineering, both of which face challenging business fundamentals with increased industry competition. Despite their inexpensive valuations, we became less confident in their management teams’ ability to engineer a swift turnaround and we re-deployed capital elsewhere.
Outlook:
The strong earnings growth among Asia companies provided a solid foundation for the equity market rally in 2017. Valuations for the broader market have been kept in check and continue to hover around long-term averages. Investors should not lose sight, however, of potential sources of market volatility—a phenomenon that was noticeably absent in 2017. As the pace of growth picks up globally, major central banks in developed economies are also starting to unwind their aggressive monetary easing policies. It remains to be seen how well financial markets will adapt to such changes. Within Asia, a pickup in inflation is also posing certain challenges to policymakers in terms of how to stay ahead of the curve. Then, there is China. At this moment, China is facing a delicate situation of managing an orderly financial deleveraging while still maintaining a stable growth rate. Such a balancing act could have potentially significant market implications. As bottom-up stock pickers focused on solid dividend payers, we continue to pay attention to firms with the following attractive characteristics: sustainable business models; a strong capacity for generating free cash flow; and management teams that make smart capital allocations between funding business growth and returning excess cash to shareholders. As always, we are mindful about how much we pay for the shares of businesses. Asia equities today provide intriguing total return opportunities for investors, anchored by attractive dividend yields and improving dividend growth prospects.
| | | | |
| |
| COUNTRY ALLOCATION (%)8,9 | |
| China/Hong Kong | | | 37.3 | |
| Japan | | | 26.5 | |
| South Korea | | | 15.3 | |
| Singapore | | | 5.4 | |
| India | | | 4.5 | |
| Indonesia | | | 2.5 | |
| Thailand | | | 1.9 | |
| Australia | | | 1.8 | |
| Taiwan | | | 1.7 | |
| Vietnam | | | 1.5 | |
| Philippines | | | 0.8 | |
| Luxembourg | | | 0.5 | |
| Cash and Other Assets, Less Liabilities | | | 0.3 | |
| | | | |
| SECTOR ALLOCATION (%)9 | |
| Consumer Discretionary | | | 26.1 | |
| Consumer Staples | | | 18.5 | |
| Financials | | | 18.3 | |
| Information Technology | | | 9.5 | |
| Industrials | | | 7.1 | |
| Materials | | | 4.1 | |
| Telecommunication Services | | | 3.8 | |
| Energy | | | 3.8 | |
| Real Estate | | | 3.3 | |
| Health Care | | | 2.8 | |
| Utilities | | | 2.5 | |
| Cash and Other Assets, Less Liabilities | | | 0.3 | |
| | | | |
| MARKET CAP EXPOSURE (%)9 | |
| Mega Cap (over $25B) | | | 35.7 | |
| Large Cap ($10B–$25B) | | | 28.7 | |
| Mid Cap ($3B–10B) | | | 20.3 | |
| Small Cap (under $3B) | | | 14.9 | |
| Cash and Other Assets, Less Liabilities | | | 0.3 | |
| 8 | Not all countries where the Fund may invest are included in the benchmark index. |
| 9 | Source: FactSet Research Systems. Percentage values in data are rounded to the nearest tenth of one percent, so the values may not sum to 100% due to rounding. Percentage values may be derived from different data sources and may not be consistent with other Fund literature. |
| | | | |
| matthewsasia.com | 800.789.ASIA | | | 23 | |
Matthews Asia Dividend Fund
December 31, 2017
Schedule of Investmentsa
| | | | | | | | |
| | | Shares | | | Value | |
| CHINA/HONG KONG: 37.3% | | | | | | | | |
Minth Group, Ltd.† | | | 60,675,000 | | | | $364,868,612 | |
Shenzhou International Group Holdings, Ltd. | | | 25,854,000 | | | | 245,566,090 | |
Ping An Insurance Group Co. of China, Ltd. H Shares | | | 22,332,500 | | | | 231,634,233 | |
China Construction Bank Corp. H Shares | | | 238,266,000 | | | | 219,336,405 | |
Midea Group Co., Ltd. A Shares | | | 22,819,730 | | | | 193,929,546 | |
HSBC Holdings PLC | | | 16,976,400 | | | | 174,539,753 | |
Kweichow Moutai Co., Ltd. A Shares | | | 1,374,392 | | | | 147,163,751 | |
Sands China, Ltd. | | | 27,533,600 | | | | 141,722,132 | |
China Gas Holdings, Ltd. | | | 47,510,000 | | | | 131,068,030 | |
China Petroleum & Chemical Corp. H Shares | | | 168,640,000 | | | | 123,517,562 | |
Fuyao Glass Industry Group Co., Ltd. H Sharesb,d | | | 21,248,000 | | | | 89,388,354 | |
Hua Hong Semiconductor, Ltd.b,d | | | 37,265,000 | | | | 78,804,406 | |
Yuexiu Transport Infrastructure, Ltd.† | | | 92,646,000 | | | | 68,005,900 | |
Sun Art Retail Group, Ltd. | | | 64,442,500 | | | | 67,975,135 | |
Dairy Farm International Holdings, Ltd. | | | 7,861,300 | | | | 61,680,601 | |
Crystal International Group, Ltd.b,c,d | | | 60,531,000 | | | | 58,572,014 | |
Far East Horizon, Ltd. | | | 67,294,000 | | | | 57,450,352 | |
HKBN, Ltd. | | | 45,415,623 | | | | 57,431,841 | |
Café de Coral Holdings, Ltd. | | | 17,330,000 | | | | 47,579,116 | |
HSBC Holdings PLC ADR | | | 447,700 | | | | 23,119,228 | |
Shanghai Jin Jiang International Hotels Group Co., Ltd. H Shares | | | 44,450,000 | | | | 15,424,873 | |
China Petroleum & Chemical Corp. ADR | | | 153,000 | | | | 11,225,610 | |
| | | | | | | | |
Total China/Hong Kong | | | | | | | 2,610,003,544 | |
| | | | | | | | |
| | | | | | | | |
| JAPAN: 26.5% | | | | | | | | |
Nitori Holdings Co., Ltd. | | | 1,126,600 | | | | 160,342,791 | |
Japan Tobacco, Inc. | | | 4,631,500 | | | | 149,148,739 | |
Hoya Corp. | | | 2,966,000 | | | | 147,716,268 | |
MISUMI Group, Inc. | | | 4,617,000 | | | | 134,041,354 | |
Mitsubishi UFJ Financial Group, Inc. | | | 18,008,000 | | | | 131,061,598 | |
Sumitomo Mitsui Financial Group, Inc. | | | 3,037,100 | | | | 130,912,721 | |
Rohm Co., Ltd. | | | 1,160,100 | | | | 127,798,664 | |
Pigeon Corp. | | | 3,077,300 | | | | 116,922,448 | |
Anritsu Corp.† | | | 9,384,700 | | | | 105,649,400 | |
Sohgo Security Services Co., Ltd. | | | 1,758,100 | | | | 95,553,715 | |
Kao Corp. | | | 1,402,700 | | | | 94,779,886 | |
Seven & i Holdings Co., Ltd. | | | 2,162,900 | | | | 89,601,183 | |
Nifco, Inc. | | | 1,090,500 | | | | 74,236,739 | |
Fuji Seal International, Inc. | | | 2,217,500 | | | | 72,395,195 | |
Kyushu Railway Co. | | | 2,016,800 | | | | 62,424,686 | |
Mitsubishi Pencil Co., Ltd. | | | 2,628,400 | | | | 57,386,998 | |
NTT DOCOMO, Inc. | | | 2,367,700 | | | | 55,981,913 | |
Eiken Chemical Co., Ltd. | | | 1,033,500 | | | | 49,354,934 | |
| | | | | | | | |
Total Japan | | | | | | | 1,855,309,232 | |
| | | | | | | | |
| | | | | | | | |
| SOUTH KOREA: 9.3% | | | | | | | | |
Hyundai Mobis Co., Ltd. | | | 899,136 | | | | 220,889,046 | |
BGF Retail Co., Ltd.c | | | 816,439 | | | | 160,153,371 | |
Woori Bank | | | 9,201,720 | | | | 135,268,777 | |
KT&G Corp. | | | 761,468 | | | | 82,153,616 | |
S-1 Corp. | | | 305,105 | | | | 30,494,825 | |
Samsung Electronics Co., Ltd. | | | 8,762 | | | | 20,817,735 | |
| | | | | | | | |
Total South Korea | | | | | | | 649,777,370 | |
| | | | | | | | |
| | | | | | | | |
| | | Shares | | | Value | |
| SINGAPORE: 5.4% | | | | | | | | |
United Overseas Bank, Ltd. | | | 7,406,100 | | | | $145,996,577 | |
CapitaLand, Ltd. | | | 46,995,800 | | | | 123,631,334 | |
CapitaLand Retail China Trust REIT† | | | 49,800,000 | | | | 60,320,760 | |
Ascendas India Trust† | | | 53,470,700 | | | | 45,976,526 | |
| | | | | | | | |
Total Singapore | | | | | | | 375,925,197 | |
| | | | | | | | |
| | | | | | | | |
| INDIA: 4.5% | | | | | | | | |
Bharti Infratel, Ltd. | | | 17,014,689 | | | | 100,694,045 | |
ITC, Ltd. | | | 20,701,500 | | | | 85,251,270 | |
Minda Industries, Ltd. | | | 2,849,938 | | | | 57,299,889 | |
Gujarat Pipavav Port, Ltd. | | | 21,381,946 | | | | 45,726,930 | |
Shriram City Union Finance, Ltd. | | | 851,887 | | | | 28,120,179 | |
| | | | | | | | |
Total India | | | | | | | 317,092,313 | |
| | | | | | | | |
| | | | | | | | |
| INDONESIA: 2.5% | | | | | | | | |
PT United Tractors | | | 51,000,100 | | | | 133,068,254 | |
PT Cikarang Listrindob,d | | | 445,485,800 | | | | 42,685,207 | |
| | | | | | | | |
Total Indonesia | | | | | | | 175,753,461 | |
| | | | | | | | |
| | | | | | | | |
| THAILAND: 1.9% | | | | | | | | |
Thai Beverage Public Co., Ltd. | | | 189,041,400 | | | | 130,037,077 | |
| | | | | | | | |
Total Thailand | | | | | | | 130,037,077 | |
| | | | | | | | |
| | | | | | | | |
| AUSTRALIA: 1.8% | | | | | | | | |
Breville Group, Ltd.† | | | 10,644,019 | | | | 104,301,304 | |
Greencross, Ltd. | | | 3,825,449 | | | | 18,746,843 | |
| | | | | | | | |
Total Australia | | | | | | | 123,048,147 | |
| | | | | | | | |
| | | | | | | | |
| TAIWAN: 1.7% | | | | | | | | |
Taiwan Semiconductor Manufacturing Co., Ltd. ADR | | | 2,642,940 | | | | 104,792,571 | |
Taiwan Semiconductor Manufacturing Co., Ltd. | | | 2,336,469 | | | | 17,890,518 | |
| | | | | | | | |
Total Taiwan | | | | | | | 122,683,089 | |
| | | | | | | | |
| | | | | | | | |
| VIETNAM: 1.5% | | | | | | | | |
Vietnam Dairy Products JSC | | | 11,887,938 | | | | 108,998,464 | |
| | | | | | | | |
Total Vietnam | | | | | | | 108,998,464 | |
| | | | | | | | |
| | | | | | | | |
| PHILIPPINES: 0.8% | | | | | | | | |
Globe Telecom, Inc. | | | 1,447,730 | | | | 55,101,903 | |
| | | | | | | | |
Total Philippines | | | | | | | 55,101,903 | |
| | | | | | | | |
| | | | | | | | |
| LUXEMBOURG: 0.5% | | | | | | | | |
L’Occitane International SA | | | 17,584,750 | | | | 32,230,699 | |
| | | | | | | | |
Total Luxembourg | | | | | | | 32,230,699 | |
| | | | | | | | |
| | | | | | | | |
| TOTAL COMMON EQUITIES | | | | | | | 6,555,960,496 | |
| | | | | | | | |
(Cost $4,773,874,853) | | | | | | | | |
| | | | | | | | |
Matthews Asia Dividend Fund
December 31, 2017
Schedule of Investmentsa (continued)
PREFERRED EQUITIES: 6.0%
| | | | | | | | |
| | | Shares | | | Value | |
| SOUTH KOREA: 6.0% | | | | | | | | |
LG Chem, Ltd., Pfd. | | | 909,328 | | | | $211,212,665 | |
Samsung Electronics Co., Ltd., Pfd. | | | 106,803 | | | | 207,989,490 | |
| | | | | | | | |
Total South Korea | | | | | | | 419,202,155 | |
| | | | | | | | |
| | | | | | | | |
| TOTAL PREFERRED EQUITIES | | | | | | | 419,202,155 | |
| | | | | | | | |
(Cost $224,709,777) | | | | | | | | |
| | | | | | | | |
| TOTAL INVESTMENTS: 99.7% | | | | | | | 6,975,162,651 | |
(Cost $4,998,584,630) | | | | | | | | |
| | | | | | | | |
CASH AND OTHER ASSETS,
LESS LIABILITIES: 0.3% | | | | | | | 22,183,430 | |
| | | | | | | | |
| | |
NET ASSETS: 100.0% | | | | | | | $6,997,346,081 | |
| | | | | | | | |
| a | Certain securities were fair valued under the valuation policies approved by the Board of Trustees (Note 2-A). |
| b | Security exempt from registration under Rule 144A of the Securities Act of 1933, as amended. The security may be resold in transactions exempt from registration normally to qualified institutional buyers. The security has been determined to be liquid in accordance with procedures adopted by the Fund’s Board of Trustees. At December 31, 2017, the aggregate value is $269,449,981, which is 3.85% of net assets. |
| c | Non-income producing security. |
| d | The securities may be resold to qualified foreign investors and foreign institutional buyers under Regulation S of the Securities Act of 1933. |
| † | Affiliated Issuer, as defined under the Investment Company Act of 1940 (ownership of 5% or more of the outstanding voting securities of this issuer) |
| ADR | American Depositary Receipt |
| REIT | Real Estate Investment Trust |
See accompanying notes to financial statements.
| | | | |
| matthewsasia.com | 800.789.ASIA | | | 25 | |
| | | | |
| PORTFOLIO MANAGERS |
| Yu Zhang, CFA | | |
Lead Manager | | | | |
| Sherwood Zhang, CFA | | |
Co-Manager | | | | |
| | |
| FUND FACTS | | | | |
| | | Investor | | Institutional |
Ticker | | MCDFX | | MICDX |
CUSIP | | 577125305 | | 577130735 |
Inception | | 11/30/09 | | 10/29/10 |
NAV | | $17.61 | | $17.61 |
Initial Investment | | $2,500 | | $100,000 |
Gross Expense Ratio1 | | 1.19% | | 1.04% |
Portfolio Statistics | | |
Total # of Positions | | 50 |
Net Assets | | $314.7 million |
Weighted Average Market Cap | | $70.3 billion |
Portfolio Turnover2 | | 69.14% |
Benchmark | | | | |
MSCI China Index |
OBJECTIVE
Total return with an emphasis on providing current income.
STRATEGY
Under normal market conditions, the Fund seeks to achieve its investment objective by investing at least 80% of its total net assets, which include borrowings for investment purposes, in dividend-paying equity securities of companies located in China. China includes its administrative and other districts, such as Hong Kong. The Fund may also invest in convertible debt and equity securities.
Matthews China Dividend Fund
Portfolio Manager Commentary (unaudited)
For the year ending December 31, 2017, the Matthews China Dividend Fund returned 37.69% (Investor Class) and 37.88% (Institutional Class) while its benchmark, the MSCI China Index, returned 54.33%. For the fourth quarter of the year, the Fund returned 8.46% (Investor Class) and 8.47% (Institutional Class) versus 7.62% for the Index.
The Fund began 2017 with a share price of US$14.09 for both the Investor and Institutional Classes, and shareholders who were invested throughout the year would have received total distributions of approximately US$1.68 (Investor Class) or $1.70 (Institutional Class) per share.
Market Environment:
After several years of lackluster performance, Chinese equities bounced back strongly in 2017. Improving inflationary conditions, which were driven by China’s supply-side reform, coupled with moderate monetary policy from global central banks, created a “Goldilocks” scenario that set the stage for a strong corporate earnings recovery in China, and equity market performance followed. On the other hand, concerns over China’s potential systemic risks also greatly subsided, most evident in a stable and appreciating currency, which many pundits had predicted would collapse. Within the asset class, cyclical growth stocks, such as those in the real estate and information technology sectors, led in share price outperformance as investors concluded these sectors were better-positioned during the early stages of an earnings rebound. Defensive stocks, such as those in the utilities and telecommunication sectors, were laggards amid the market rally as they were perceived to offer less of a growth outlook than their cyclical peers.
Performance Contributors and Detractors:
The Fund’s full year return during 2017 marked its highest returns in absolute terms since inception. Its relative performance, however, underperformed the benchmark during the 12-month period.
We would like to remind our investors that we have been taking a total-return approach to investing in both so-called dividend payers and dividend growers. Dividend payers are usually companies that have mature, defensive business models and offer significant dividend yield pickup by paying out the majority of the underlying free cash flow as dividends to shareholders. Dividend growers, on the other hand, are often companies that operate cyclical businesses that have significant untapped growth potential. Their dividends, while typically not as high as those paid by the mature dividend payers, tend to grow at a much faster rate, supported by a better growth profile in their underlying earnings. Both types of stocks hold complementary attributes for our portfolio in terms of income stability and growth optionality. Since late 2016, we began tilting our overall exposure more toward dividend growers, positioning the portfolio for a potential pickup in China’s earnings recovery, investing in Tencent, Ping An Insurance and Midea Group—our top three performance contributors for the year. Dividend payers largely lagged behind in terms of performance during the year. These dividend payers provide a more predictable income stream to the Fund and also provide downside protection during market sell-offs.
Downside protection has been a key to the Fund’s performance since inception. Not surprisingly, when Chinese equities experienced a meaningful pullback during the fourth quarter, the Fund started to generate positive relative performance.
On a sector basis, the biggest drags on relative performance for the year were the Fund’s underweight allocation in the information technology sector and
(continued)
| 1 | Actual 2017 expense ratio. |
| 2 | The lesser of fiscal year 2017 long-term purchase costs or sales proceeds divided by the average monthly market value of long-term securities. |
| | | | | | | | | | | | | | | | | | | | | | | | | | | | |
| | |
| PERFORMANCE AS OF DECEMBER 31, 2017 | | | | |
| | | | | | | | | | | | Average Annual Total Returns | | | | |
| | | | | | 3 Months | | | 1 Year | | | 3 Years | | | 5 Years | | | Since
Inception | | | Inception
Date | |
| Investor Class (MCDFX) | | | | | | | 8.46% | | | | 37.69% | | | | 16.82% | | | | 12.77% | | | | 11.93% | | | | 11/30/09 | |
| Institutional Class (MICDX) | | | | | | | 8.47% | | | | 37.88% | | | | 17.01% | | | | 12.99% | | | | 10.90% | | | | 10/29/10 | |
| MSCI China Index3 | | | | | | | 7.62% | | | | 54.33% | | | | 12.96% | | | | 10.16% | | | | 6.94% | 4 | | | | |
| Lipper China Region Funds Category Average5 | | | | 7.29% | | | | 43.89% | | | | 11.28% | | | | 9.37% | | | | 6.84% | 4 | | | | |
Performance assumes reinvestment of all dividends and/or distributions before taxes. All performance quoted represents past performance and is no guarantee of future results. Investment return and principal value will fluctuate with market conditions so that when redeemed, shares may be worth more or less than their original cost. Current performance may be lower or higher than the return figures quoted. For the Fund’s most recent month-end performance, visit matthewsasia.com.
| | | | | | | | | | | | | | | | | | | | | | | | | | | | |
| | | | | | |
| INCOME DISTRIBUTION HISTORY | | | | | | | | | | | | | | | | |
| | | 2017 | | | | | | 2016 | |
| | | June | | | December | | | Total | | | | | | June | | | December | | | Total | |
| Investor (MCDFX) | | $ | 0.20 | | | $ | 0.29 | | | $ | 0.49 | | | | | | | $ | 0.21 | | | $ | 0.07 | | | $ | 0.28 | |
| Inst’l (MICDX) | | $ | 0.21 | | | $ | 0.30 | | | $ | 0.51 | | | | | | | $ | 0.22 | | | $ | 0.08 | | | $ | 0.30 | |
Note: This table does not include capital gains distributions. Totals may differ by $0.01 due to rounding. For income distribution history, visit matthewsasia.com.
| | | | |
30-DAY YIELD: 1.14% (Investor Class) 1.31% (Institutional Class) The 30-Day Yield represents net investment income earned by the Fund over the 30-day period ended 12/31/17, expressed as an annual percentage rate based on the Fund’s share price at the end of the 30-day period. The 30-Day Yield should be regarded as an estimate of the Fund’s rate of investment income, and it may not equal the Fund’s actual income distribution rate. Source: BNY Mellon Investment Servicing (US) Inc. | | | | DIVIDEND YIELD: 2.58% The dividend yield (trailing) for the portfolio is the weighted average sum of the dividends paid by each equity security held by the Fund over the 12 months ended 12/31/17 divided by the current price of each equity as of 12/31/17. The annualized dividend yield for the Fund is for the equity-only portion of the portfolio. Please note that this is based on gross equity portfolio holdings and does not reflect the actual yield an investor in the Fund would receive. Past yields are no guarantee of future yields. Source: FactSet Research Systems, Bloomberg, MICM. |
GROWTH OF A $10,000 INVESTMENT SINCE INCEPTION—INVESTOR CLASS
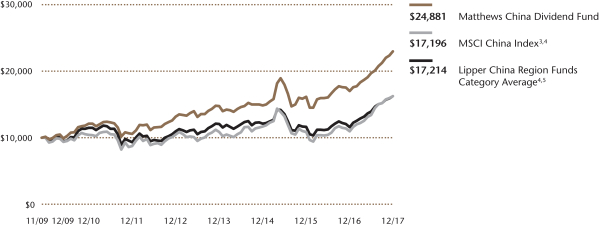
Plotted monthly. The performance data and graph do not reflect the deduction of taxes that a shareholder would pay on dividends, capital gains distributions or redemption of Fund shares. Values are in US$.
| | 3 | It is not possible to invest directly in an index. Source: Index data from Morgan Stanley Capital International and Bloomberg; total return calculations performed by BNY Mellon Investment Servicing (US) Inc. Please see page 92 for index definition. |
| | 4 | Calculated from 11/30/09. |
| | 5 | The Lipper Category Average does not reflect sales charges and is based on total return, including reinvestment of dividends and capital gains for the stated periods. |
| | | | | | | | |
| | | | |
| TOP TEN HOLDINGS6 | | | | | | | |
| | | Sector | | | | % of Net Assets | |
| Tencent Holdings, Ltd. | �� | Information Technology | | | | | 6.5% | |
| Altaba, Inc. | | Information Technology | | | | | 4.1% | |
| Ping An Insurance Group Co. of China, Ltd. | | Financials | | | | | 4.0% | |
| WH Group, Ltd. | | Consumer Staples | | | | | 3.0% | |
| China Petroleum & Chemical Corp. | | Energy | | | | | 2.9% | |
| Hua Hong Semiconductor, Ltd. | | Information Technology | | | | | 2.8% | |
| HSBC Holdings PLC | | Financials | | | | | 2.7% | |
| Guangdong Provincial Expressway Development Co., Ltd. | | Industrials | | | | | 2.7% | |
| Sun Hung Kai Properties, Ltd. | | Real Estate | | | | | 2.6% | |
| Bank of China, Ltd. | | Financials | | | | | 2.6% | |
| % OF ASSETS IN TOP TEN | | | | | | | 33.9% | |
| | 6 | Holdings may combine more than one security from same issuer and related depositary receipts. |
| | | | |
| matthewsasia.com | 800.789.ASIA | | | 27 | |
| | | | |
| |
| COUNTRY ALLOCATION (%)7,8 | |
| China/Hong Kong | | | 91.0 | |
| Taiwan | | | 4.1 | |
| Singapore | | | 1.7 | |
| Cash and Other Assets, Less Liabilities | | | 3.2 | |
| | | | |
SECTOR ALLOCATION (%)8 | |
| Financials | | | 20.4 | |
| Information Technology | | | 18.2 | |
| Consumer Discretionary | | | 14.2 | |
| Industrials | | | 9.4 | |
| Consumer Staples | | | 7.8 | |
| Telecommunication Services | | | 6.5 | |
| Energy | | | 5.6 | |
| Health Care | | | 4.9 | |
| Real Estate | | | 4.3 | |
| Materials | | | 3.8 | |
| Utilities | | | 1.7 | |
| Cash and Other Assets, Less Liabilities | | | 3.2 | |
| | | | |
MARKET CAP EXPOSURE (%)8 | |
| Mega Cap (over $25B) | | | 37.2 | |
| Large Cap ($10B-$25B) | | | 10.8 | |
| Mid Cap ($3B-10B) | | | 11.8 | |
| Small Cap (under $3B) | | | 37.0 | |
| Cash and Other Assets, Less Liabilities | | | 3.2 | |
| 7 | Not all countries where the Fund may invest are included in the benchmark index. |
| 8 | Source: FactSet Research Systems. Percentage values in data are rounded to the nearest tenth of one percent, so the values may not sum to 100% due to rounding. Percentage values may be derived from different data sources and may not be consistent with other Fund literature. |
Matthews China Dividend Fund
Portfolio Manager Commentary (unaudited) (continued)
disappointing securities selection in health care sector. In terms of market-cap exposure, our holdings in smaller-cap holdings also underperformed significantly compared with our mega- and large-cap holdings.
Notable Portfolio Changes:
During the fourth quarter, we initiated a new position in Sun Art Retail Group, the largest operator of hypermarkets in China. After the company announced a strategic and capital alliance with Alibaba Group, its share price experienced a sharp sell-off as its share placement to Alibaba was at a significant discount to the market price. We viewed this as a good opportunity to invest in Sun Art Retail, a leading brick-and-mortar retail operator that we believe is attuned to China’s new retailing environment. The company uses Alibaba’s digital ecosystem along with its own to maximize efficient operations. This could revive its top-line growth and sustain its earnings growth. We also initiated an investment in Xiabuxiabu Catering Management China Holdings, China’s leading hot pot restaurant operator. The hot pot restaurant business model is highly scalable and has high operating margins as it does not depend on culinary skills. In addition, we believe Xiabuxiabu is on a solid path to becoming a true national player after changing its store model to adjust to tastes in the country’s southern regions.
We also trimmed Chow Tai Fook Jewellery Group in the fourth quarter after strong jewelry sales recovery in Hong Kong and mainland China drove up its share price. We took profits to deploy capital elsewhere in opportunities that we believed were more attractively priced.
Outlook:
The strong earnings growth among Chinese companies provided a solid foundation for the equity market rally in 2017. Valuations for the broader market have been kept in check and continue to hover around long-term averages. Investors should not lose sight, however, of potential sources of market volatility—a phenomenon that was noticeably absent in 2017. As the pace of growth picks up globally, major central banks in developed economies are also starting to unwind their aggressive monetary easing policies. It remains to be seen how well financial markets will adapt to such changes. China is facing a delicate situation of managing an orderly financial deleveraging while still maintaining a stable growth rate. Such a balancing act could have potentially significant market implications. With those macro conditions in mind and as fundamental investors focused on dividend-paying stocks, we continue to believe in picking companies with these attributes: sustainable business models; a strong capacity for generating free cash flow; and management teams that make smart capital allocations between funding business growth and returning excess cash to shareholders. As always, we are mindful about how much we pay for the shares of businesses. Chinese equities today remain an intriguing total return opportunity for investors, anchored by attractive dividend yields and improving dividend growth prospects.
Matthews China Dividend Fund
December 31, 2017
Schedule of Investmentsa
COMMON EQUITIES: 92.7%
| | | | | | | | |
| | | Shares | | | Value | |
| FINANCIALS: 20.4% | | | | | | | | |
Banks: 8.9% | | | | | | | | |
HSBC Holdings PLC | | | 832,000 | | | | $8,554,056 | |
Bank of China, Ltd. H Shares | | | 16,556,000 | | | | 8,108,074 | |
Postal Savings Bank of China Co., Ltd. H Sharesb,d | | | 13,482,000 | | | | 6,991,777 | |
Dah Sing Financial Holdings, Ltd. | | | 676,400 | | | | 4,333,095 | |
| | | | | | | | |
| | | | | | | 27,987,002 | |
| | | | | | | | |
| | | | | | | | |
Insurance: 7.9% | | | | | | | | |
Ping An Insurance Group Co. of China, Ltd. H Shares | | | 1,225,000 | | | | 12,705,785 | |
Fanhua, Inc. ADR | | | 312,100 | | | | 6,747,602 | |
PICC Property & Casualty Co., Ltd. H Shares | | | 2,870,000 | | | | 5,498,276 | |
| | | | | | | | |
| | | | | | | 24,951,663 | |
| | | | | | | | |
| | | | | | | | |
Capital Markets: 3.5% | | | | | | | | |
China International Capital Corp., Ltd. H Sharesb,d | | | 3,200,000 | | | | 6,642,250 | |
China Everbright, Ltd. | | | 1,994,000 | | | | 4,448,724 | |
| | | | | | | | |
| | | | | | | 11,090,974 | |
| | | | | | | | |
| | | | | | | | |
Consumer Finance: 0.1% | | | | | | | | |
Yixin Group, Ltd.b,c,d | | | 313,500 | | | | 251,591 | |
| | | | | | | | |
Total Financials | | | | | | | 64,281,230 | |
| | | | | | | | |
| | | | | | | | |
| CONSUMER DISCRETIONARY: 14.2% | | | | | | | | |
Hotels, Restaurants & Leisure: 4.9% | | | | | | | | |
Shanghai Jin Jiang International Hotels Group Co., Ltd. H Shares | | | 18,054,000 | | | | 6,265,031 | |
Xiabuxiabu Catering Management China Holdings Co., Ltd.b,d | | | 3,107,000 | | | | 6,259,455 | |
China International Travel Service Corp., Ltd. A Shares | | | 464,960 | | | | 3,094,716 | |
| | | | | | | | |
| | | | | | | 15,619,202 | |
| | | | | | | | |
| | | | | | | | |
Diversified Consumer Services: 3.5% | | | | | | | | |
China Maple Leaf Educational Systems, Ltd. | | | 6,112,000 | | | | 7,157,285 | |
Tarena International, Inc. ADR | | | 253,300 | | | | 3,796,967 | |
| | | | | | | | |
| | | | | | | 10,954,252 | |
| | | | | | | | |
| | | | | | | | |
Textiles, Apparel & Luxury Goods: 2.7% | | | | | | | | |
Crystal International Group, Ltd.b,c,d | | | 4,842,000 | | | | 4,685,297 | |
Nan Liu Enterprise Co., Ltd. | | | 735,000 | | | | 3,815,968 | |
| | | | | | | | |
| | | | | | | 8,501,265 | |
| | | | | | | | |
| | | | | | | | |
Household Durables: 2.2% | | | | | | | | |
Midea Group Co., Ltd. A Shares | | | 801,911 | | | | 6,814,903 | |
| | | | | | | | |
| | | | | | | | |
Specialty Retail: 0.9% | | | | | | | | |
Chow Tai Fook Jewellery Group, Ltd. | | | 2,798,400 | | | | 2,932,937 | |
| | | | | | | | |
Total Consumer Discretionary | | | | | | | 44,822,559 | |
| | | | | | | | |
| | | | | | | | |
| INFORMATION TECHNOLOGY: 14.1% | | | | | | | | |
Internet Software & Services: 8.8% | | | | | | | | |
Tencent Holdings, Ltd. | | | 393,000 | | | | 20,340,876 | |
NetEase, Inc. ADR | | | 21,300 | | | | 7,349,991 | |
| | | | | | | | |
| | | | | | | 27,690,867 | |
| | | | | | | | |
| | | | | | | | |
Semiconductors & Semiconductor Equipment: 2.8% | |
Hua Hong Semiconductor, Ltd.b,d | | | 4,114,000 | | | | 8,699,888 | |
| | | | | | | | |
| | | | | | | | |
| | | | | | | | |
| | | Shares | | | Value | |
Electronic Equipment, Instruments & Components: 2.5% | |
FIT Hon Teng, Ltd.b,d | | | 6,534,000 | | | | $4,400,915 | |
Hangzhou Hikvision Digital Technology Co., Ltd. A Shares | | | 578,900 | | | | 3,466,999 | |
| | | | | | | | |
| | | | | | | 7,867,914 | |
| | | | | | | | |
Total Information Technology | | | | | | | 44,258,669 | |
| | | | | | | | |
| | | | | | | | |
| INDUSTRIALS: 9.4% | | | | | | | | |
Transportation Infrastructure: 4.8% | | | | | | | | |
Guangdong Provincial Expressway Development Co., Ltd. B Shares | | | 9,809,806 | | | | 8,518,647 | |
Shanghai International Airport Co., Ltd. A Shares | | | 949,315 | | | | 6,561,528 | |
| | | | | | | | |
| | | | | | | 15,080,175 | |
| | | | | | | | |
| | | | | | | | |
Marine: 1.9% | | | | | | | | |
SITC International Holdings Co., Ltd. | | | 6,087,000 | | | | 6,008,919 | |
| | | | | | | | |
| | | | | | | | |
Machinery: 1.3% | | | | | | | | |
Shanghai Mechanical and Electrical Industry Co., Ltd. B Shares | | | 1,825,613 | | | | 4,009,046 | |
| | | | | | | | |
| | | | | | | | |
Road & Rail: 0.8% | | | | | | | | |
Guangshen Railway Co., Ltd. H Shares | | | 3,280,000 | | | | 2,200,030 | |
Guangshen Railway Co., Ltd. ADR | | | 14,400 | | | | 482,400 | |
| | | | | | | | |
| | | | | | | 2,682,430 | |
| | | | | | | | |
| | | | | | | | |
Professional Services: 0.6% | | | | | | | | |
Sporton International, Inc. | | | 346,430 | | | | 1,868,075 | |
| | | | | | | | |
Total Industrials | | | | | | | 29,648,645 | |
| | | | | | | | |
| | | | | | | | |
| CONSUMER STAPLES: 7.8% | | | | | | | | |
Food & Staples Retailing: 4.8% | | | | | | | | |
Sun Art Retail Group, Ltd. | | | 6,234,500 | | | | 6,576,265 | |
Shanghai Bailian Group Co., Ltd. B Shares | | | 3,876,043 | | | | 5,457,469 | |
Taiwan FamilyMart Co., Ltd. | | | 487,000 | | | | 2,912,983 | |
| | | | | | | | |
| | | | | | | 14,946,717 | |
| | | | | | | | |
| | | | | | | | |
Food Products: 3.0% | | | | | | | | |
WH Group, Ltd.b,d | | | 8,411,500 | | | | 9,495,821 | |
| | | | | | | | |
Total Consumer Staples | | | | | | | 24,442,538 | |
| | | | | | | | |
| | | | | | | | |
| TELECOMMUNICATION SERVICES: 6.5% | |
Diversified Telecommunication Services: 4.3% | |
HKBN, Ltd. | | | 6,314,457 | | | | 7,985,157 | |
CITIC Telecom International Holdings, Ltd. | | | 20,810,000 | | | | 5,506,622 | |
| | | | | | | | |
| | | | | | | 13,491,779 | |
| | | | | | | | |
| | | | | | | | |
Wireless Telecommunication Services: 2.2% | |
China Mobile, Ltd. ADR | | | 134,430 | | | | 6,794,092 | |
| | | | | | | | |
Total Telecommunication Services | | | | | | | 20,285,871 | |
| | | | | | | | |
| | | | | | | | |
| ENERGY: 5.6% | | | | | | | | |
Oil, Gas & Consumable Fuels: 5.6% | | | | | | | | |
China Petroleum & Chemical Corp. H Shares | | | 12,566,000 | | | | 9,203,758 | |
Sinopec Kantons Holdings, Ltd. | | | 8,872,000 | | | | 5,718,300 | |
China Aviation Oil Singapore Corp., Ltd. | | | 2,271,000 | | | | 2,744,851 | |
| | | | | | | | |
Total Energy | | | | | | | 17,666,909 | |
| | | | | | | | |
| | | | | | | | |
| | | | |
| matthewsasia.com | 800.789.ASIA | | | 29 | |
Matthews China Dividend Fund
December 31, 2017
Schedule of Investmentsa (continued)
| | |
| COMMON EQUITIES (continued) | | CLOSED-END FUNDS: 4.1% |
| | | | | | | | |
| | | Shares | | | Value | |
| HEALTH CARE: 4.9% | | | | | | | | |
Health Care Providers & Services: 3.3% | |
Universal Medical Financial & Technical Advisory Services Co., Ltd.b,d | | | 6,447,500 | | | | $6,187,114 | |
China National Accord Medicines Corp., Ltd. B Shares | | | 843,333 | | | | 4,134,170 | |
| | | | | | | | |
| | | | | | | 10,321,284 | |
| | | | | | | | |
| | | | | | | | |
Health Care Equipment & Supplies: 1.6% | |
Shandong Weigao Group Medical Polymer Co., Ltd. H Shares | | | 6,872,000 | | | | 4,994,102 | |
| | | | | | | | |
Total Health Care | | | | | | | 15,315,386 | |
| | | | | | | | |
| | | | | | | | |
| REAL ESTATE: 4.3% | | | | | | | | |
Real Estate Management & Development: 2.6% | |
Sun Hung Kai Properties, Ltd. | | | 494,000 | | | | 8,224,635 | |
| | | | | | | | |
| | | | | | | | |
Equity REITs: 1.7% | | | | | | | | |
CapitaLand Retail China Trust REIT | | | 4,399,400 | | | | 5,328,818 | |
| | | | | | | | |
Total Real Estate | | | | | | | 13,553,453 | |
| | | | | | | | |
| | | | | | | | |
| MATERIALS: 3.8% | | | | | | | | |
Containers & Packaging: 2.2% | |
Greatview Aseptic Packaging Co., Ltd. | | | 9,555,000 | | | | 6,971,016 | |
| | | | | | | | |
| | | | | | | | |
Construction Materials: 1.6% | | | | | | | | |
Huaxin Cement Co., Ltd., B Shares | | | 4,152,078 | | | | 5,061,383 | |
| | | | | | | | |
Total Materials | | | | | | | 12,032,399 | |
| | | | | | | | |
| | | | | | | | |
| UTILITIES: 1.7% | | | | | | | | |
Gas Utilities: 1.7% | |
China Gas Holdings, Ltd. | | | 1,976,000 | | | | 5,451,283 | |
| | | | | | | | |
Total Utilities | | | | | | | 5,451,283 | |
| | | | | | | | |
| | | | | | | | |
| TOTAL COMMON EQUITIES | | | | 291,758,942 | |
| | | | | | | | |
(Cost $242,177,815) | | | | | | | | |
| | | | | | | | |
| | | | | | | | |
| | | Shares | | | Value | |
| INFORMATION TECHNOLOGY: 4.1% | | | | | | | | |
Internet Software & Services: 4.1% | | | | | | | | |
Altaba, Inc.c | | | 185,900 | | | | $12,985,115 | |
| | | | | | | | |
Total Information Technology | | | | | | | 12,985,115 | |
| | | | | | | | |
| | | | | | | | |
| TOTAL CLOSED-END FUNDS | | | | 12,985,115 | |
| | | | | | | | |
(Cost $10,931,298) | | | | | | | | |
| | | | | | | | |
| TOTAL INVESTMENTS: 96.8% | | | | | | | 304,744,057 | |
(Cost $253,109,113) | | | | | | | | |
| | | | | | | | |
CASH AND OTHER ASSETS,
LESS LIABILITIES: 3.2% | | | | | | | 9,996,029 | |
| | | | | | | | |
| | |
NET ASSETS: 100.0% | | | | | | | $314,740,086 | |
| | | | | | | | |
| a | Certain securities were fair valued under the valuation policies approved by the Board of Trustees (Note 2-A). |
| b | Security exempt from registration under Rule 144A of the Securities Act of 1933, as amended. The security may be resold in transactions exempt from registration normally to qualified institutional buyers. The security has been determined to be liquid in accordance with procedures adopted by the Fund’s Board of Trustees. At December 31, 2017, the aggregate value is $53,614,108, which is 17.03% of net assets. |
| c | Non-income producing security. |
| d | The securities may be resold to qualified foreign investors and foreign institutional buyers under Regulation S of the Securities Act of 1933. |
| ADR | American Depositary Receipt |
| REIT | Real Estate Investment Trust |
See accompanying notes to financial statements.

| | | | |
| PORTFOLIO MANAGERS |
| Beini Zhou, CFA |
Lead Manager |
| Michael B. Han, CFA |
Co-Manager |
| | |
| FUND FACTS | | | | |
| | | Investor | | Institutional |
Ticker | | MAVRX | | MAVAX |
CUSIP | | 577130693 | | 577130685 |
Inception | | 11/30/15 | | 11/30/15 |
NAV | | $12.83 | | $12.73 |
Initial Investment | | $2,500 | | $100,000 |
Gross Expense Ratio1 | | 2.32% | | 2.08% |
After Fee Waiver and Reimbursement2 | | 1.50% | | 1.25% |
Portfolio Statistics | | | | |
Total # of Positions | | 45 |
Net Assets | | $30.7 million |
Weighted Average Market Cap | | $18.3 billion |
Portfolio Turnover3 | | 31.93% |
Benchmark | | | | |
MSCI AC Asia ex Japan Index |
OBJECTIVE
Long term capital appreciation.
STRATEGY
Under normal market conditions, the Fund seeks to achieve its investment objective by investing at least 80% of its net assets, which include borrowings for investment purposes, in common stock, preferred stock and other equity securities, and convertible securities of companies located in Asia. The Fund seeks to create an investable universe of value companies that it believes trade at market values with discounts to their intrinsic value, have strong financial and market positions, have strong management and are oriented to creating value for their shareholders. Matthews assesses companies within this universe according to each of these factors.
Matthews Asia Value Fund
Portfolio Manager Commentary (unaudited)
For the year ending December 31, 2017, the Matthews Asia Value Fund returned 36.12% (Investor Class) and 36.35% (Institutional Class), underperforming its benchmark, the MSCI All Country Asia ex Japan Index, which returned 42.08%. For the fourth quarter, the Fund returned 3.73% (Investor Class) and 3.79% (Institutional Class), while its benchmark returned 8.27%.
Market Environment:
2017 marked the first time since 2007 that all 45 countries monitored by the Organization for Economic Cooperation and Development showed economic growth. Against this backdrop, it appeared the market could not rise any further, especially in light of geopolitical tensions and elevated asset valuations. The Asia ex Japan market, however, led by technology shares such as Alibaba and Tencent, rose by more than eight percentage points in the quarter and ended the year with a 42.08% return in U.S. dollars. This stellar market performance was helped by appreciating currencies against the U.S. dollar in most Asian countries in 2017.
The Fund underperformed its benchmark by about six percentage points for the full year. All of the difference came in the fourth quarter since the Fund was nearly even with the index at the end of the third quarter. Considering, however, that the bull market has been led by high-flying technology stocks and that value investing globally has thus been declared “dead” by some, we do not view 2017 as a disappointment after finishing the year reasonably close to the index. Most importantly, we did not suffer any blow-ups or what we regard as permanent capital destruction in the portfolio in the year. This is important because as value investors, we worry about downside risks before we consider upside potential.
Performance Contributors and Detractors:
Positive contribution to Fund performance came from a diverse set of businesses. Kweichow Moutai in China and Faraday Technology in Taiwan were the two biggest contributors to the Fund’s performance in the fourth quarter. Kweichow Moutai, China’s premier white liquor business and a holding in the portfolio since the Fund’s inception, was a strong performer over the past two years. Our aim is to buy stocks of quality businesses at what we consider an inexpensive price and sell when their value has been fully realized. Kweichow Moutai perfectly fit the bill in these respects. During the quarter, we exited the position after its share price more than tripled to over 25x earnings two years later.
Taiwan’s Faraday Technology, an asset-light semiconductor foundry service provider, was a new addition to the portfolio. Faraday has two business lines—ASIC (application specific integrated circuit) chip and IP (intellectual property). In the former, it works with foundries such as United Microelectronics and provides turnkey services in design and production for fabless chip customers. In this business, it effectively acts as a conduit or value-added service provider for many relatively small fabless players to access foundry capacity. In the latter segment, it owns IP, on which it collects royalties and licensing fees. These IP products are pre-designed circuits that engineers use as components of larger chip designs rather than (re)design those circuits themselves. Faraday’s new CEO came in two years
(continued)
| 1 | Actual 2017 expense ratios. |
| 2 | Matthews has contractually agreed (i) to waive fees and reimburse expenses to the extent needed to limit Total Annual Fund Operating Expenses (excluding Rule 12b-1 fees, taxes, interest, brokerage commissions, short sale dividend expenses, expenses incurred in connection with any merger or reorganization or extraordinary expenses such as litigation) of the Institutional Class to 1.25% first by waiving class specific expenses (i.e., shareholder service fees specific to a particular class) of the Institutional Class and then, to the extent necessary, by waiving non-class specific expenses of the Institutional Class, and (ii) if any Fund-wide expenses (i.e., expenses that apply to both the Institutional Class and the Investor Class) are waived for the Institutional Class to maintain the 1.25% expense limitation, to waive an equal amount (in annual percentage terms) of those same expenses for the Investor Class. The Total Annual Fund Operating Expenses After Fee Waiver and Expense Reimbursement for the Investor Class may vary from year to year and will in some years exceed 1.25%. If the operating expenses fall below the expense limitation in a year within three years after Matthews has made a waiver or reimbursement, the Fund may reimburse Matthews up to an amount that does not cause the expenses for that year to exceed the lesser of (i) the expense limitation applicable at the time of that fee waiver and/or expense reimbursement or (ii) the expense limitation in effect at the time of recoupment. This agreement will remain in place until April 30, 2019 and may be terminated at any time by the Board of Trustees on behalf of the Fund on 60 days’ written notice to Matthews. Matthews may decline to renew this agreement by written notice to the Trust at least 30 days before its annual expiration date. |
| 3 | The lesser of fiscal year 2017 long-term purchase costs or sales proceeds divided by the average monthly market value of long-term securities. |
| | | | |
| matthewsasia.com | 800.789.ASIA | | | 31 | |
| | | | | | | | | | | | | | | | |
| | | | | |
| PERFORMANCE AS OF DECEMBER 31, 2017 | | | | | | | | | | | | |
| | | | | | | | | Average Annual
Total Returns | | | | |
| | | 3 Months | | | 1 Year | | | Since Inception | | | Inception
Date | |
| Investor Class (MAVRX) | | | 3.73% | | | | 36.12% | | | | 19.22% | | | | 11/30/15 | |
| Institutional Class (MAVAX) | | | 3.79% | | | | 36.35% | | | | 19.50% | | | | 11/30/15 | |
| MSCI AC Asia ex Japan Index4 | | | 8.27% | | | | 42.08% | | | | 21.32% | | | | | |
| Lipper Pacific Region Funds Category Average5 | | | 8.22% | | | | 33.60% | | | | 17.12% | | | | | |
Performance assumes reinvestment of all dividends and/or distributions before taxes. All performance quoted represents past performance and is no guarantee of future results. Investment return and principal value will fluctuate with market conditions so that when redeemed, shares may be worth more or less than their original cost. Current performance may be lower or higher than the return figures quoted. Returns would have been lower if certain of the Fund’s fees and expenses had not been waived. For the Fund’s most recent month-end performance visit matthewsasia.com.
GROWTH OF A $10,000 INVESTMENT SINCE INCEPTION—INVESTOR CLASS
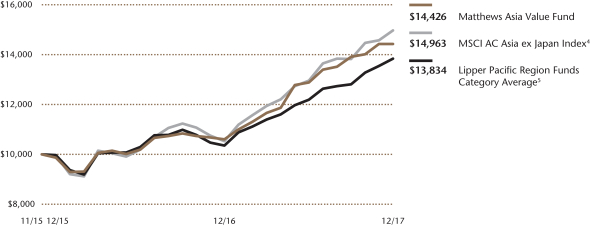
Plotted monthly. The performance data and graph do not reflect the deduction of taxes that a shareholder would pay on dividends, capital gain distributions or redemption of Fund shares. Values are in US$.
| | 4 | It is not possible to invest directly in an index. Source: Index data from Morgan Stanley Capital International and Bloomberg; total return calculations performed by BNY Mellon Investment Servicing (US) Inc. Please see page 92 for index definition. |
| | 5 | The Lipper Category Average does not reflect sales charges and is based on total return, including reinvestment of dividends and capital gains for the stated periods. |
| | | | | | | | |
| | | | |
| TOP TEN HOLDINGS6 | | | | | | | |
| | | Sector | | Country | | % of Net Assets | |
| YAMADA Consulting Group Co., Ltd. | | Industrials | | Japan | | | 6.0% | |
| China National Accord Medicines Corp., Ltd. | | Health Care | | China/Hong Kong | | | 4.8% | |
| MPHB Capital BHD | | Financials | | Malaysia | | | 4.5% | |
| CK Hutchison Holdings, Ltd. | | Industrials | | China/Hong Kong | | | 4.4% | |
| Samsung SDI Co., Ltd., Pfd. | | Information Technology | | South Korea | | | 4.4% | |
| Clear Media, Ltd. | | Consumer Discretionary | | China/Hong Kong | | | 3.3% | |
| Baidu, Inc. | | Information Technology | | China/Hong Kong | | | 3.0% | |
| Shinyoung Securities Co., Ltd. | | Financials | | South Korea | | | 2.9% | |
| Kwangju Bank Co., Ltd. | | Financials | | South Korea | | | 2.6% | |
| DGB Financial Group, Inc. | | Financials | | South Korea | | | 2.6% | |
| % OF ASSETS IN TOP TEN | | | | | | | 38.5% | |
| | 6 | Holdings may combine more than one security from same issuer and related depositary receipts. |
Matthews Asia Value Fund
Portfolio Manager Commentary (unaudited) (continued)
ago and has been repositioning the company toward higher-margin contracts with longer product life cycles. New management has also been focusing to grow its IP business in Asia. Its share price appeared expensive on trailing earnings but this was on trough 2016 earnings. We believe its earnings will grow substantially over the medium term given new management’s initiatives, the booming semiconductor industry and the proliferating number of ASIC chip design houses in China.
On the other hand, Clear Media of China and MPHB Capital of Malaysia were detractors during the quarter. Clear Media sells advertising on bus shelters and is the biggest player in this space in China. We did not find any negative news about its business fundamentals. We believe it is likely to be a relatively mundane business that was simply ignored in the current bull market. We took advantage of this and added to our position. MPHB Capital’s share price continued to decline in the fourth quarter. Market sentiment toward MPHB continued to be negative after regulators in Malaysia rejected its application to sell an additional 20% stake in the company’s property and casualty (P&C) insurance business to Italy-based insurer Generali. We believed its share price to be substantially undervalued and added to our position as its share price drifted down toward half of book value. It is now one of the biggest positions in the portfolio.
Notable Portfolio Changes:
In addition to Kweichow Moutai, we also exited China’s Sohu.com in the fourth quarter as the stock reached our intrinsic value estimate. Meanwhile, we initiated a position in four new names, including South Korean infrastructure construction firm Samho Development. It is a classic value name in the sense that it was trading at less than cash value on the balance sheet. While investors chased high-flying momentum stocks, we were glad to pick up an unglamorous business that constructs highways and bores tunnels for a bargain.
Outlook:
We marked several stocks on our watch list with an entry price in 2017. Some of those stocks dropped close to our entry prices but did not meet them. As a result, we did not initiate positions—only to watch them soar shortly afterward. We could have been tempted to raise our entry price in the current era of euphoria but we stayed with our strategy. We continue to believe that, by owning a collection of undervalued quality businesses while keeping more than 10% in cash, we are well-prepared for market corrections that could present buying opportunities.
Could 2018 be like 1998? Just when you feel the market is peaking, there is always a chance the rally could continue for another year or possibly longer. Regardless of the answer to the question, our investment process remains the same: We are not swayed by the flavor of the day; we continue to be opportunistic, bottom-up stock-pickers; and we continue to buy and hold undervalued businesses that are run by sensible people and whose value we believe will appreciate over time.
| | | | |
| |
| COUNTRY ALLOCATION (%)7,8 | |
| South Korea | | | 28.5 | |
| China/Hong Kong | | | 27.4 | |
| Japan | | | 12.3 | |
| Malaysia | | | 5.9 | |
| Taiwan | | | 5.7 | |
| Singapore | | | 4.3 | |
| United States | | | 2.3 | |
| Switzerland | | | 1.1 | |
| Israel | | | 0.6 | |
| Cash and Other Assets, Less Liabilities | | | 11.9 | |
| | | | |
| |
| SECTOR ALLOCATION (%)8 | |
| Consumer Discretionary | | | 20.8 | |
| Industrials | | | 19.0 | |
| Information Technology | | | 14.4 | |
| Financials | | | 12.5 | |
| Health Care | | | 10.2 | |
| Consumer Staples | | | 7.9 | |
| Materials | | | 3.4 | |
| Cash and Other Assets, Less Liabilities | | | 11.9 | |
| | | | |
| |
| MARKET CAP EXPOSURE (%)8 | |
| Mega Cap (over $25B) | | | 13.9 | |
| Large Cap ($10B–$25B) | | | 4.4 | |
| Mid Cap ($3B–10B) | | | 12.1 | |
| Small Cap (under $3B) | | | 57.8 | |
| Cash and Other Assets, Less Liabilities | | | 11.9 | |
| 7 | Not all countries where the Fund may invest are included in the benchmark index. |
| 8 | Source: FactSet Research Systems. Percentage values in data are rounded to the nearest tenth of one percent, so the values may not sum to 100% due to rounding. Percentage values may be derived from different data sources and may not be consistent with other Fund literature. |
| | | | |
| matthewsasia.com | 800.789.ASIA | | | 33 | |
Matthews Asia Value Fund
December 31, 2017
Schedule of Investmentsa
COMMON EQUITIES: 80.0%
| | | | | | | | |
| | | Shares | | | Value | |
| CHINA/HONG KONG: 27.4% | | | | | | | | |
China National Accord Medicines Corp., Ltd. B Shares | | | 299,252 | | | | $1,466,987 | |
CK Hutchison Holdings, Ltd. | | | 109,000 | | | | 1,365,803 | |
Clear Media, Ltd. | | | 1,021,000 | | | | 1,015,400 | |
Baidu, Inc. ADRb | | | 3,900 | | | | 913,419 | |
COSCO SHIPPING International Hong Kong Co., Ltd. | | | 1,764,000 | | | | 684,119 | |
Texwinca Holdings, Ltd. | | | 1,004,000 | | | | 551,874 | |
QUALCOMM, Inc. | | | 8,100 | | | | 518,562 | |
Anhui Gujing Distillery Co., Ltd. B Shares | | | 90,500 | | | | 511,527 | |
Goldlion Holdings, Ltd. | | | 1,229,000 | | | | 486,072 | |
Shandong Weigao Group Medical Polymer Co., Ltd. H Shares | | | 584,000 | | | | 424,411 | |
Nissin Foods Co., Ltd.b | | | 627,000 | | | | 263,228 | |
Jiangling Motors Corp., Ltd. B Shares | | | 127,779 | | | | 209,017 | |
| | | | | | | | |
Total China/Hong Kong | | | | | | | 8,410,419 | |
| | | | | | | | |
| | | | | | | | |
| SOUTH KOREA: 20.4% | | | | | | | | |
Shinyoung Securities Co., Ltd. | | | 16,555 | | | | 876,477 | |
Kwangju Bank Co., Ltd. | | | 71,482 | | | | 801,184 | |
DGB Financial Group, Inc. | | | 80,420 | | | | 791,350 | |
Hyundai Greenfood Co., Ltd. | | | 47,226 | | | | 659,016 | |
CMS Edu Co., Ltd. | | | 63,533 | | | | 524,208 | |
Kangnam Jevisco Co., Ltd. | | | 14,232 | | | | 498,682 | |
Geumhwa PSC Co., Ltd. | | | 12,062 | | | | 482,747 | |
Nice Information & Telecommunication, Inc. | | | 22,094 | | | | 471,578 | |
Samho Development Co., Ltd. | | | 106,173 | | | | 453,235 | |
Grand Korea Leisure Co., Ltd. | | | 12,298 | | | | 336,011 | |
Hy-Lok Corp. | | | 9,185 | | | | 193,043 | |
Orion Holdings Corp. | | | 7,747 | | | | 192,852 | |
| | | | | | | | |
Total South Korea | | | | | | | 6,280,383 | |
| | | | | | | | |
| | | | | | | | |
| JAPAN: 12.3% | | | | | | | | |
YAMADA Consulting Group Co., Ltd. | | | 76,100 | | | | 1,837,999 | |
Ohashi Technica, Inc. | | | 39,300 | | | | 619,730 | |
Asante, Inc. | | | 21,800 | | | | 368,045 | |
San-A Co., Ltd. | | | 7,100 | | | | 343,067 | |
Honma Golf, Ltd.c | | | 339,000 | | | | 339,310 | |
Medikit Co., Ltd. | | | 5,600 | | | | 260,928 | |
Naigai Trans Line, Ltd. | | | 1,200 | | | | 21,653 | |
| | | | | | | | |
Total Japan | | | | | | | 3,790,732 | |
| | | | | | | | |
| | | | | | | | |
| MALAYSIA: 5.9% | | | | | | | | |
MPHB Capital BHDb | | | 4,574,100 | | | | 1,378,898 | |
Genting BHD | | | 191,200 | | | | 434,304 | |
| | | | | | | | |
Total Malaysia | | | | | | | 1,813,202 | |
| | | | | | | | |
| | | | | | | | |
| TAIWAN: 5.7% | | | | | | | | |
Faraday Technology Corp. | | | 264,000 | | | | 510,846 | |
Tehmag Foods Corp. | | | 57,300 | | | | 452,493 | |
P-Duke Technology Co., Ltd. | | | 199,000 | | | | 448,040 | |
Lumax International Corp., Ltd. | | | 182,900 | | | | 343,143 | |
| | | | | | | | |
Total Taiwan | | | | | | | 1,754,522 | |
| | | | | | | | |
| | | | | | | | |
| | | | | | | | |
| | | Shares | | | Value | |
| SINGAPORE: 4.3% | | | | | | | | |
Haw Par Corp., Ltd. | | | 93,200 | | | | $790,923 | |
Straits Trading Co., Ltd. | | | 312,800 | | | | 547,274 | |
| | | | | | | | |
Total Singapore | | | | | | | 1,338,197 | |
| | | | | | | | |
| | | | | | | | |
| UNITED STATES: 2.3% | | | | | | | | |
News Corp. Class B | | | 42,200 | | | | 700,520 | |
| | | | | | | | |
Total United States | | | | | | | 700,520 | |
| | | | | | | | |
| | | | | | | | |
| SWITZERLAND: 1.1% | | | | | | | | |
Cie Financiere Richemont SA | | | 3,640 | | | | 329,667 | |
| | | | | | | | |
Total Switzerland | | | | | | | 329,667 | |
| | | | | | | | |
| | | | | | | | |
| ISRAEL: 0.6% | | | | | | | | |
Taro Pharmaceutical Industries, Ltd.b | | | 1,700 | | | | 178,007 | |
| | | | | | | | |
Total Israel | | | | | | | 178,007 | |
| | | | | | | | |
| | | | | | | | |
| TOTAL COMMON EQUITIES | | | | 24,595,649 | |
| | | | | | | | |
(Cost $23,112,837) | | | | | | | | |
| | | | | | | | |
| | | | | | | | |
PREFERRED EQUITIES: 8.1% | | | | | | | | |
| SOUTH KOREA: 8.1% | | | | | | | | |
Samsung SDI Co., Ltd., Pfd. | | | 15,518 | | | | 1,353,388 | |
Samsung Electronics Co., Ltd., Pfd. | | | 332 | | | | 646,541 | |
Hyundai Motor Co., Ltd., 2nd Pfd. | | | 5,107 | | | | 486,586 | |
| | | | | | | | |
Total South Korea | | | | | | | 2,486,515 | |
| | | | | | | | |
| | | | | | | | |
| TOTAL PREFERRED EQUITIES | | | | 2,486,515 | |
| | | | | | | | |
(Cost $2,105,580) | | | | | | | | |
| | | | | | | | |
| TOTAL INVESTMENTS: 88.1% | | | | 27,082,164 | |
(Cost $25,218,417) | | | | | | | | |
| | | | | | | | |
CASH AND OTHER ASSETS,
LESS LIABILITIES: 11.9% | | | | | | | 3,651,816 | |
| | | | | | | | |
| | |
NET ASSETS: 100.0% | | | | | | | $30,733,980 | |
| | | | | | | | |
| a | Certain securities were fair valued under the valuation policies approved by the Board of Trustees (Note 2-A). |
| b | Non-income producing security. |
| c | Security exempt from registration under Rule 144A of the Securities Act of 1933, as amended. The security may be resold in transactions exempt from registration normally to qualified institutional buyers. The security has been determined to be liquid in accordance with procedures adopted by the Fund’s Board of Trustees. At December 31, 2017, the aggregate value is $339,310, which is 1.10% of net assets. |
| ADR | American Depositary Receipt |
See accompanying notes to financial statements.

| | | | |
| PORTFOLIO MANAGERS |
| Kenneth Lowe, CFA | | |
Lead Manager | | | | |
| S. Joyce Li, CFA | | |
Co-Manager | | |
|
| FUND FACTS |
| | | Investor | | Institutional |
Ticker | | MAFSX | | MIFSX |
CUSIP | | 577125701 | | 577125800 |
Inception | | 4/30/13 | | 4/30/13 |
NAV | | $12.18 | | $12.24 |
Initial Investment | | $2,500 | | $100,000 |
Gross Expense Ratio1 | | 2.45% | | 2.27% |
After Fee Waiver and Reimbursement2 | | 1.50% | | 1.25% |
Portfolio Statistics |
Total # of Positions | | 34 |
Net Assets | | $15.6 million |
Weighted Average Market Cap | | $82.2 billion |
Portfolio Turnover3 | | 28.42% |
Benchmark |
MSCI AC Asia ex Japan Index |
OBJECTIVE
Long term capital appreciation.
STRATEGY
Under normal market conditions, the Fund seeks to achieve its investment objective by investing at least 80% of its total assets, which include borrowings for investment purposes, in the common and preferred stocks of companies located in Asia excluding Japan, but including all other developed, emerging and frontier countries and markets in the Asian region. The Fund is currently expected to hold stocks of between 25 and 35 companies under normal market conditions.
Matthews Asia Focus Fund
Portfolio Manager Commentary (unaudited)
For the year ending December 31, 2017, the Matthews Asia Focus Fund returned 36.98% (Investor Class) and 37.35% (Institutional Class) while its benchmark, the MSCI All Country Asia ex Japan Index, returned 42.08%. For the fourth quarter, the Fund returned 9.93% (Investor Class) and 9.95% (Institutional Class) while its benchmark returned 8.27%.
Market Environment:
A combination of relatively attractive equity valuations and currencies, alongside the return of earnings growth in Asia after six years of persistent downgrades, helped to lead markets to a rather astonishing rise during the year.
Despite the U.S. Federal Reserve’s benchmark rate increase in December, the “Goldilocks” environment of accommodative monetary policy, contained inflation and globally synchronized growth is still the order of the day. This helped to propel markets further in the fourth quarter. In Asia, the major political event was the 19th National Congress in China with President Xi Jinping further cementing his influence as his name and ideas were put into the Party’s constitution. Elsewhere, positive steps in India occurred in the financial system as the government agreed to inject over US$30 billion of capital into its currently stressed public sector banks. Although timing is uncertain, this should provide much needed help to balance sheets and was a factor in driving India to the region’s best performance during the quarter. Over the course of 2017, North Asian markets China and South Korea were the leading performers.
Performance Contributors and Detractors:
The Fund outperformed its benchmark during the quarter on strong stock selection. This was particularly the case in Hong Kong and China, with these markets contributing around 50% of the total return for the portfolio. The largest contributor of these was XiabuXiabu Catering Management, China’s leading hotpot chain. The company has demonstrated strong growth through a combination of solid same-store sales growth, restaurant openings and the addition of its new, higher-end brand Coucou. The portfolio’s two largest positions, AIA Group and Tencent, were also major contributors to returns. The former rose as its value of new business again grew impressively and as recent liberalization in the Chinese financial market may allow the company to expand into more mainland provinces. Tencent gained on continued growth and monetization of its almost 1 billion users via its gaming, social, advertising and finance businesses. Management has done an impressive job in broadening the company’s product offering in areas such as music, literature and video in order to increase user stickiness and profitability.
A number of the portfolio’s holdings in the financials sector also contributed strongly to returns. Shares of Southeast Asian banks such as Kasikornbank, Bank Rakyat Indonesia and United Overseas Bank gained on improving asset quality and prospective book growth.
The largest detractor to performance came from our holdings within the telecommunication services sector, with tower company Bharti Infratel the weakest of these. The stock suffered from slower growth in the number of tenants (operators) using the company’s towers and a belief that industry consolidation will negatively
(continued)
| 1 | Actual 2017 expense ratios. |
| 2 | Matthews has contractually agreed (i) to waive fees and reimburse expenses to the extent needed to limit Total Annual Fund Operating Expenses (excluding Rule 12b-1 fees, taxes, interest, brokerage commissions, short sale dividend expenses, expenses incurred in connection with any merger or reorganization or extraordinary expenses such as litigation) of the Institutional Class to 1.25% first by waiving class specific expenses (i.e., shareholder service fees specific to a particular class) of the Institutional Class and then, to the extent necessary, by waiving non-class specific expenses of the Institutional Class, and (ii) if any Fund-wide expenses (i.e., expenses that apply to both the Institutional Class and the Investor Class) are waived for the Institutional Class to maintain the 1.25% expense limitation, to waive an equal amount (in annual percentage terms) of those same expenses for the Investor Class. The Total Annual Fund Operating Expenses After Fee Waiver and Expense Reimbursement for the Investor Class may vary from year to year and will in some years exceed 1.25%. If the operating expenses fall below the expense limitation in a year within three years after Matthews has made a waiver or reimbursement, the Fund may reimburse Matthews up to an amount that does not cause the expenses for that year to exceed the lesser of (i) the expense limitation applicable at the time of that fee waiver and/or expense reimbursement or (ii) the expense limitation in effect at the time of recoupment. This agreement will remain in place until April 30, 2019 and may be terminated at any time by the Board of Trustees on behalf of the Fund on 60 days’ written notice to Matthews. Matthews may decline to renew this agreement by written notice to the Trust at least 30 days before its annual expiration date. |
| 3 | The lesser of fiscal year 2017 long-term purchase costs or sales proceeds divided by the average monthly market value of long-term securities. |
| | | | |
| matthewsasia.com | 800.789.ASIA | | | 35 | |
| | | | | | | | | | | | | | | | | | | | |
| | | | | | |
| PERFORMANCE AS OF DECEMBER 31, 2017 | | | | | | | | | | | | | | | |
| | | | | | | | | Average Annual Total Returns | | | | |
| | | 3 Months | | | 1 Year | | | 3 Years | | | Since
Inception | | | Inception
Date | |
| Investor Class (MAFSX) | | | 9.93% | | | | 36.98% | | | | 8.08% | | | | 5.48% | | | | 4/30/13 | |
| Institutional Class (MIFSX) | | | 9.95% | | | | 37.35% | | | | 8.30% | | | | 5.74% | | | | 4/30/13 | |
| MSCI AC Asia ex Japan Index4 | | | 8.27% | | | | 42.08% | | | | 11.03% | | | | 8.55% | | | | | |
| Lipper Pacific ex Japan Funds Category Average5 | | | 8.50% | | | | 39.66% | | | | 10.19% | | | | 7.32% | | | | | |
Performance assumes reinvestment of all dividends and/or distributions before taxes. All performance quoted represents past performance and is no guarantee of future results. Investment return and principal value will fluctuate with market conditions so that when redeemed, shares may be worth more or less than their original cost. Current performance may be lower or higher than the return figures quoted. Returns would have been lower if certain of the Fund’s fees and expenses had not been waived. For the Fund’s most recent month-end performance visit matthewsasia.com.
GROWTH OF A $10,000 INVESTMENT SINCE INCEPTION—INVESTOR CLASS
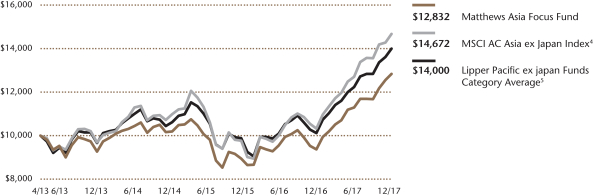
Plotted monthly. The performance data and graph do not reflect the deduction of taxes that a shareholder would pay on dividends, capital gain distributions or redemption of Fund shares. Values are in US$.
| | 4 | It is not possible to invest directly in an index. Source: Index data from Morgan Stanley Capital International and Bloomberg; total return calculations performed by BNY Mellon Investment Servicing (US) Inc. Please see page 92 for index definition. |
| | 5 | The Lipper Category Average does not reflect sales charges and is based on total return, including reinvestment of dividends and capital gains for the stated periods. |
| | | | | | | | |
| | | | |
| TOP TEN HOLDINGS6 | | | | | | | |
| | | Sector | | Country | | % of Net Assets | |
| AIA Group, Ltd. | | Financials | | China/Hong Kong | | | 6.9% | |
| Tencent Holdings, Ltd. | | Information Technology | | China/Hong Kong | | | 5.4% | |
| Samsung Electronics Co., Ltd. | | Information Technology | | South Korea | | | 3.5% | |
| PT Matahari Department Store | | Consumer Discretionary | | Indonesia | | | 3.3% | |
| PT Bank Rakyat Indonesia Persero | | Financials | | Indonesia | | | 3.3% | |
| Xiabuxiabu Catering Management China Holdings Co., Ltd. | | Consumer Discretionary | | China/Hong Kong | | | 3.2% | |
| Bharti Infratel, Ltd. | | Telecommunication Services | | India | | | 3.2% | |
| Taiwan Semiconductor Manufacturing Co., Ltd. | | Information Technology | | Taiwan | | | 3.1% | |
| HSBC Holdings PLC | | Financials | | China/Hong Kong | | | 3.0% | |
| Broadcom, Ltd. | | Information Technology | | United States | | | 3.0% | |
| % OF ASSETS IN TOP TEN | | | | | | | 37.9% | |
| | 6 | Holdings may combine more than one security from same issuer and related depositary receipts. |
Matthews Asia Focus Fund
Portfolio Manager Commentary (unaudited) (continued)
impact profitability. Shares of Hong Kong-based industrial conglomerates Jardine Matheson and CK Hutchison were also weak during the quarter as discounts to net asset values widened due to investors allocating capital to more thematic and higher growth areas of the market.
For the full year, the Fund underperformed its benchmark despite positive stock selection. Much of this can be attributed to our underweight within the information technology sector. This area now makes up around 32% of the benchmark, and it has been a challenge to keep pace with this as we do not find enough companies that exhibit our key characteristics of a wide economic moat, a strong management team, sensible capital structure, good capital allocation policies and high corporate governance standards at attractive valuations.
Notable Portfolio Changes:
We added two new holdings to the portfolio during the fourth quarter. The first of these was Matahari Department Store in Indonesia. The company has a leading position in the affordable segment, operating over 150 stores, and generates impressive cash flow given returns on capital of over 100% and negative working capital requirements. The stock has been weak due to poor consumption patterns in Indonesia, but we agree with management that this is likely transitory and purchased the stock at an attractive valuation of ~14.5x price-to-earnings ratio (P/E) and a 4.5% dividend yield.
We also added Bank of the Philippine Islands. The bank is the second-largest in the country, but has the highest profitability given its more conservative stance in loan growth and best-in-class cost/income ratio. We believe it was trading at a discount to its intrinsic value, at around 1.9x price-to-book ratio (P/B) and a 1.85% dividend yield and took advantage of relative weakness. Further, the growth outlook for the company is strong on spread expansion and solid book growth.
Outlook:
Although the U.S. is likely to be fairly late in the cycle, the recent tax cuts add fiscal stimulus to an economy that is already performing reasonably well and this should help to continue the current synchronized global growth cycle. This is further helped by income growth in Asia that appears robust and an improving European economy. For equity markets, the Asia region is trading at a moderately reasonable 14.5x P/E and this is accompanied by sensible earnings expectations for 12% growth.
These points are all constructive for equities into 2018; it is prudent to note, however, that risks are still present. The sharp rise of equity markets has been accompanied by a lack of breadth with some rather large outsize gainers in areas such as technology. This leaves certain sectors vulnerable given expensive valuations. Additionally, although policy is currently favorable, a new chair of the Federal Reserve and the withdrawal of quantitative easing create room for policy missteps in the U.S. This risk is also present in China as debt levels remain high and the government is attempting to partially de-risk the financial system.
Given that backdrop, we are avoiding these expensive thematic areas and remain disciplined in deploying our long-term, patient capital into leading businesses that we believe are trading at market prices that are more inexpensive than their intrinsic value.
| | | | |
| |
| COUNTRY ALLOCATION (%)7,8 | |
| China/Hong Kong | | | 33.7 | |
| South Korea | | | 10.5 | |
| Singapore | | | 10.2 | |
| Taiwan | | | 7.8 | |
| Indonesia | | | 6.6 | |
| India | | | 5.7 | |
| United States | | | 5.4 | |
| Malaysia | | | 5.2 | |
| Thailand | | | 2.7 | |
| Philippines | | | 2.6 | |
| Japan | | | 2.6 | |
| Australia | | | 2.6 | |
| Switzerland | | | 2.2 | |
| Cash and Other Assets, Less Liabilities | | | 2.2 | |
| | | | |
SECTOR ALLOCATION (%)8 | |
| Financials | | | 24.0 | |
| Consumer Discretionary | | | 21.9 | |
| Information Technology | | | 19.8 | |
| Industrials | | | 10.4 | |
| Consumer Staples | | | 9.4 | |
| Telecommunication Services | | | 8.1 | |
| Health Care | | | 2.5 | |
| Real Estate | | | 1.7 | |
| Cash and Other Assets, Less Liabilities | | | 2.2 | |
| | | | |
MARKET CAP EXPOSURE (%)8 | |
| Mega Cap (over $25B) | | | 51.5 | |
| Large Cap ($10B–$25B) | | | 18.1 | |
| Mid Cap ($3B–10B) | | | 12.0 | |
| Small Cap (under $3B) | | | 16.1 | |
| Cash and Other Assets, Less Liabilities | | | 2.2 | |
| 7 | Not all countries where the Fund may invest are included in the benchmark index. |
| 8 | Source: FactSet Research Systems. Percentage values in data are rounded to the nearest tenth of one percent, so the values may not sum to 100% due to rounding. Percentage values may be derived from different data sources and may not be consistent with other Fund literature. |
| | | | |
| matthewsasia.com | 800.789.ASIA | | | 37 | |
Matthews Asia Focus Fund
December 31, 2017
Schedule of Investmentsa
COMMON EQUITIES: 97.8%
| | | | | | | | |
| | | Shares | | | Value | |
| CHINA/HONG KONG: 33.7% | |
AIA Group, Ltd. | | | 126,800 | | | | $1,078,516 | |
Tencent Holdings, Ltd. | | | 16,100 | | | | 833,303 | |
Xiabuxiabu Catering Management China Holdings Co., Ltd.b,c | | | 247,500 | | | | 498,621 | |
HSBC Holdings PLC | | | 46,000 | | | | 472,941 | |
Techtronic Industries Co., Ltd. | | | 70,000 | | | | 455,380 | |
CK Hutchison Holdings, Ltd. | | | 35,728 | | | | 447,683 | |
NetEase, Inc. ADR | | | 1,200 | | | | 414,084 | |
Jardine Matheson Holdings, Ltd. | | | 6,600 | | | | 400,438 | |
China Mobile, Ltd. | | | 37,500 | | | | 379,202 | |
Hang Lung Group, Ltd. | | | 71,000 | | | | 261,049 | |
| | | | | | | | |
Total China/Hong Kong | | | | | | | 5,241,217 | |
| | | | | | | | |
| | | | | | | | |
| SOUTH KOREA: 10.5% | |
Samsung Electronics Co., Ltd. | | | 229 | | | | 544,084 | |
Coway Co., Ltd. | | | 4,693 | | | | 427,670 | |
Kangwon Land, Inc. | | | 10,922 | | | | 355,021 | |
LG Household & Health Care, Ltd. | | | 267 | | | | 296,005 | |
| | | | | | | | |
Total South Korea | | | | | | | 1,622,780 | |
| | | | | | | | |
| | | | | | | | |
| SINGAPORE: 10.2% | |
United Overseas Bank, Ltd. | | | 22,500 | | | | 443,543 | |
Singapore Telecommunications, Ltd. | | | 147,300 | | | | 392,721 | |
Singapore Technologies Engineering, Ltd. | | | 156,800 | | | | 381,476 | |
Sheng Siong Group, Ltd. | | | 525,800 | | | | 363,651 | |
| | | | | | | | |
Total Singapore | | | | | | | 1,581,391 | |
| | | | | | | | |
| | | | | | | | |
| TAIWAN: 7.8% | |
Taiwan Semiconductor Manufacturing Co., Ltd. | | | 63,000 | | | | 482,395 | |
Aerospace Industrial Development Corp. | | | 311,029 | | | | 387,238 | |
Ennoconn Corp. | | | 23,000 | | | | 346,634 | |
| | | | | | | | |
Total Taiwan | | | | | | | 1,216,267 | |
| | | | | | | | |
| | | | | | | | |
| INDONESIA: 6.6% | |
PT Matahari Department Store | | | 706,000 | | | | 518,651 | |
PT Bank Rakyat Indonesia Persero | | | 1,913,000 | | | | 512,160 | |
| | | | | | | | |
Total Indonesia | | | | | | | 1,030,811 | |
| | | | | | | | |
| | | | | | | | |
| INDIA: 5.7% | |
Bharti Infratel, Ltd. | | | 83,638 | | | | 494,975 | |
Tata Motors, Ltd.c,d | | | 58,440 | | | | 394,323 | |
| | | | | | | | |
Total India | | | | | | | 889,298 | |
| | | | | | | | |
| | | | | | | | |
| UNITED STATES: 5.4% | |
Broadcom, Ltd. | | | 1,800 | | | | 462,420 | |
ResMed, Inc. | | | 4,500 | | | | 381,105 | |
| | | | | | | | |
Total United States | | | | | | | 843,525 | |
| | | | | | | | |
| | | | | | | | |
| MALAYSIA: 5.2% | |
Genting Malaysia BHD | | | 296,900 | | | | 413,033 | |
Heineken Malaysia BHD | | | 84,500 | | | | 394,626 | |
| | | | | | | | |
Total Malaysia | | | | | | | 807,659 | |
| | | | | | | | |
| | | | | | | | |
| | | | | | | | |
| | | Shares | | | Value | |
| THAILAND: 2.7% | |
Kasikornbank Public Co., Ltd. | | | 58,700 | | | | $416,906 | |
| | | | | | | | |
Total Thailand | | | | | | | 416,906 | |
| | | | | | | | |
| | | | | | | | |
| PHILIPPINES: 2.6% | |
Bank of the Philippine Islands | | | 187,440 | | | | 405,745 | |
| | | | | | | | |
Total Philippines | | | | | | | 405,745 | |
| | | | | | | | |
| | | | | | | | |
| JAPAN: 2.6% | |
Japan Tobacco, Inc. | | | 12,400 | | | | 399,319 | |
| | | | | | | | |
Total Japan | | | | | | | 399,319 | |
| | | | | | | | |
| | | | | | | | |
| AUSTRALIA: 2.6% | |
Macquarie Group, Ltd. | | | 5,156 | | | | 398,790 | |
| | | | | | | | |
Total Australia | | | | | | | 398,790 | |
| | | | | | | | |
| | | | | | | | |
| SWITZERLAND: 2.2% | |
Cie Financiere Richemont SA | | | 3,798 | | | | 343,977 | |
| | | | | | | | |
Total Switzerland | | | | | | | 343,977 | |
| | | | | | | | |
| | | | | | | | |
| TOTAL INVESTMENTS: 97.8% | | | | 15,197,685 | |
(Cost $12,706,768) | | | | | | | | |
| | | | | | | | |
CASH AND OTHER ASSETS,
LESS LIABILITIES: 2.2% | | | | | | | 348,456 | |
| | | | | | | | |
| | |
NET ASSETS: 100.0% | | | | | | | $15,546,141 | |
| | | | | | | | |
| a | Certain securities were fair valued under the valuation policies approved by the Board of Trustees (Note 2-A). |
| b | Security exempt from registration under Rule 144A of the Securities Act of 1933, as amended. The security may be resold in transactions exempt from registration normally to qualified institutional buyers. The security has been determined to be liquid in accordance with procedures adopted by the Fund’s Board of Trustees. At December 31, 2017, the aggregate value is $498,621, which is 3.21% of net assets. |
| c | The securities may be resold to qualified foreign investors and foreign institutional buyers under Regulation S of the Securities Act of 1933. |
| d | Non-income producing security. |
| ADR | American Depositary Receipt |
See accompanying notes to financial statements.
| | | | |
| PORTFOLIO MANAGERS |
| Taizo Ishida | | |
Lead Manager | | |
| Sharat Shroff, CFA | | |
Co-Manager | | |
|
| FUND FACTS |
| | | Investor | | Institutional |
Ticker | | MPACX | | MIAPX |
CUSIP | | 577130867 | | 577130776 |
Inception | | 10/31/03 | | 10/29/10 |
NAV | | $27.25 | | $27.45 |
Initial Investment | | $2,500 | | $100,000 |
Gross Expense Ratio1 | | 1.12% | | 0.93% |
Portfolio Statistics | | | | |
Total # of Positions | | | | 56 |
Net Assets | | | | $850.6 million |
Weighted Average Market Cap | | $28.9 billion |
Portfolio Turnover2 | | | | 23.19% |
Benchmark |
MSCI AC Asia Pacific Index |
OBJECTIVE
Long-term capital appreciation.
STRATEGY
Under normal market conditions, the Fund seeks to achieve its investment objective by investing at least 80% of its total net assets, which include borrowings for investment purposes, in the common and preferred stocks of companies located in Asia. Asia consists of all countries and markets in Asia, and includes developed, emerging and frontier countries and markets in the Asian region. The Fund may also invest in the convertible securities, of any duration or quality, of Asian companies.
Matthews Asia Growth Fund
Portfolio Manager Commentary (unaudited)
For the year ending December 31, 2017, the Matthews Asia Growth Fund returned 39.39% (Investor Class) and 39.64% (Institutional Class), outperforming its benchmark, the MSCI All Country Asia Pacific Index, which returned 32.04%. For the fourth quarter, the Fund returned 9.64% (Investor Class) and 9.72% (Institutional Class), versus 8.19% for the Index.
Market Environment:
2017 ended on a strong note after a rare year that included four consecutive quarters of positive returns for global markets. By country, Vietnam performed notably well, rising about 35% for the fourth quarter as some large-capitalization securities experienced solid gains—partly due to robust foreign flows that were encouraged by a gradual opening of foreign share limits. It was also a solid year for both Japan’s economy and its equity market. In this climate, our Japanese holdings boosted the Fund’s performance. China also saw outperformance, which was driven in part by positive investor sentiment toward its tech sector and strong flows into emerging market exchange traded funds (ETFs).
In Indonesia, the Jokowi government pursued infrastructure-related stimulus and reforms but also removed economic subsidies, which hurt discretionary spending. Overall consumption growth was disappointing despite decent GDP growth due to a pickup in commodity prices. This hurt some retail and food-related portfolio holdings.
Performance Contributors and Detractors:
The Fund delivered strong absolute and relative returns, with the consumer discretionary and health care sectors performing well for the full year. Health care was a dominant contributor in the fourth quarter after lagging behind over the first three quarters of the year. For both the full year and the fourth quarter, Nanjing-based Chinese biotech firm Genscript Biotech was a top contributor to the Fund’s absolute performance. The firm is a global leader in gene synthesis and positive trials for a new therapy developed to treat multiple myeloma drew market enthusiasm during the year. Additionally, two Japanese health care firms, M3, a med-tech company, and Cyberdyne, a medical robot company, both performed well. Vietnam Dairy Products, a long-time holding, was also a solid contributor to Fund performance for the full year and particularly in the fourth quarter.
The portfolio’s materials and energy sector holdings were among the biggest detractors for the full year. The financials sector was a laggard in the fourth quarter. In terms of individual securities, Qudian, a Chinese peer-to-peer microfinance company, detracted from absolute performance. Subsequent to the firm’s IPO in mid-October, its stock had come under pressure partly due to government efforts to rein in online microlenders. We believe this additional scrutiny will likely drive smaller lenders out of the market, helping Qudian, an established player, emerge over the long term.
Notable Portfolio Changes:
During the fourth quarter, we participated in the IPO of Chinese logistics firm Best, adding a small position to the portfolio. A one-stop supply chain solutions provider for both online and offline merchants in China, the company seemed attractively valued relative to its high growth potential. We decided to exit the holding, however, after discussions with its management team revealed what we believed to be unrealistic profitability expectations.
(continued)
| 1 | Actual 2017 expense ratios. |
| 2 | The lesser of fiscal year 2017 long-term purchase costs or sales proceeds divided by the average monthly market value of long-term securities. |
| | | | |
| matthewsasia.com | 800.789.ASIA | | | 39 | |
| | | | | | | | | | | | | | | | | | | | | | | | | | | | |
| | |
| PERFORMANCE AS OF DECEMBER 31, 2017 | | | | |
| | | | | | | | | Average Annual Total Returns | | | | |
| | | 3 Months | | | 1 Year | | | 3 Years | | | 5 Years | | | 10 Years | | | Since
Inception | | | Inception
Date | |
| Investor Class (MPACX) | | | 9.64% | | | | 39.39% | | | | 12.03% | | | | 11.23% | | | | 7.21% | | | | 10.19% | | | | 10/31/03 | |
| Institutional Class (MIAPX) | | | 9.72% | | | | 39.64% | | | | 12.26% | | | | 11.46% | | | | n.a. | | | | 8.68% | | | | 10/29/10 | |
| MSCI AC Asia Pacific Index3 | | | 8.19% | | | | 32.04% | | | | 10.95% | | | | 8.98% | | | | 3.75% | | | | 7.99% | 4 | | | | |
| Lipper Pacific Region Funds Category Average5 | | | 8.22% | | | | 33.60% | | | | 10.61% | | | | 8.27% | | | | 3.69% | | | | 8.41% | 4 | | | | |
Performance assumes reinvestment of all dividends and/or distributions before taxes. All performance quoted represents past performance and is no guarantee of future results. Investment return and principal value will fluctuate with market conditions so that when redeemed, shares may be worth more or less than their original cost. Current performance may be lower or higher than the return figures quoted. For the Fund’s most recent month-end performance, visit matthewsasia.com.
GROWTH OF A $10,000 INVESTMENT SINCE INCEPTION—INVESTOR CLASS
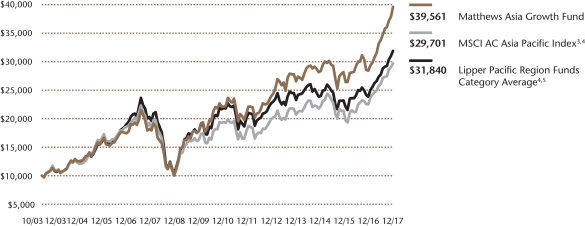
Plotted monthly. The performance data and graph do not reflect the deduction of taxes that a shareholder would pay on dividends, capital gains distributions or redemption of Fund shares. Values are in US$.
| | 3 | It is not possible to invest directly in an index. Source: Index data from Morgan Stanley Capital International and Bloomberg; total return calculations performed by BNY Mellon Investment Servicing (US) Inc. Please see page 92 for index definition. |
| | 4 | Calculated from 10/31/03. |
| | 5 | The Lipper Category Average does not reflect sales charges and is based on total return, including reinvestment of dividends and capital gains for the stated periods. |
| | | | | | | | |
| | | | |
| TOP TEN HOLDINGS6 | | | | | | | |
| | | Sector | | Country | | % of Net Assets | |
Shenzhou International Group Holdings, Ltd. | | Consumer Discretionary | | China/Hong Kong | | | 4.7% | |
PT Bank Rakyat Indonesia Persero | | Financials | | Indonesia | | | 4.6% | |
HDFC Bank, Ltd. | | Financials | | India | | | 3.8% | |
M3, Inc. | | Health Care | | Japan | | | 3.7% | |
Start Today Co., Ltd. | | Consumer Discretionary | | Japan | | | 3.6% | |
PT Astra International | | Consumer Discretionary | | Indonesia | | | 3.1% | |
Nidec Corp. | | Industrials | | Japan | | | 2.9% | |
Baozun, Inc. | | Information Technology | | China/Hong Kong | | | 2.8% | |
Vietnam Dairy Products JSC | | Consumer Staples | | Vietnam | | | 2.8% | |
ORIX Corp. | | Financials | | Japan | | | 2.7% | |
% OF ASSETS IN TOP TEN | | | | | | | 34.7% | |
| | 6 | Holdings may combine more than one security from same issuer and related depositary receipts. |
Matthews Asia Growth Fund
Portfolio Manager Commentary (unaudited) (continued)
During the first half of the year, we were pleased to find many intriguing Chinese health care holdings. As a result, our weighting in this sector expanded significantly. This increase in the health care sector followed rapid changes in the biotech/pharmaceutical industry, encouraged by the government’s deregulation of its drug approval process. We also found a compelling hunting ground for Chinese firms in this sector in the Shenzhen stock market via the new Shenzhen–Hong Kong Stock Connect program.
Outlook:
We look forward to 2018 with a bias for growth-oriented holdings over more value-oriented ones. We anticipate some changes among the region’s market leaders, however, compared to what we found in 2017. Asia’s information technology sector dominated over the full year in 2017, with select large-cap holdings in China, South Korea and Taiwan. That trend may continue if investor flows into emerging market ETFs continue. Strong earnings growth would still be a key factor in performance. Given our growth bias, we are excited to explore many new and innovative developments in areas such as artificial intelligence, robotics, cell therapy and non-fossil fuel engine technology as we believe they are all deep and compelling areas for investment opportunities.
| | | | |
| |
| COUNTRY ALLOCATION (%)7,8 | |
Japan | | | 36.5 | |
China/Hong Kong | | | 20.0 | |
Indonesia | | | 12.2 | |
India | | | 7.2 | |
Australia | | | 4.1 | |
Bangladesh | | | 4.1 | |
Sri Lanka | | | 3.5 | |
Vietnam | | | 3.1 | |
Philippines | | | 2.5 | |
Thailand | | | 0.8 | |
Pakistan | | | 0.7 | |
Taiwan | | | 0.6 | |
Cash and Other Assets, Less Liabilities | | | 4.7 | |
| | | | |
| |
| SECTOR ALLOCATION (%)8 | |
Consumer Discretionary | | | 22.3 | |
Health Care | | | 21.2 | |
Financials | | | 17.7 | |
Consumer Staples | | | 11.8 | |
Information Technology | | | 8.7 | |
Industrials | | | 7.3 | |
Telecommunication Services | | | 2.2 | |
Materials | | | 1.8 | |
Energy | | | 1.8 | |
Real Estate | | | 0.6 | |
Cash and Other Assets, Less Liabilities | | | 4.7 | |
| | | | |
| |
| MARKET CAP EXPOSURE (%)8 | |
Mega Cap (over $25B) | | | 24.4 | |
Large Cap ($10B–$25B) | | | 25.2 | |
Mid Cap ($3B–10B) | | | 18.7 | |
Small Cap (under $3B) | | | 27.1 | |
Cash and Other Assets, Less Liabilities | | | 4.7 | |
| 7 | Not all countries where the Fund may invest are included in the benchmark index. |
| 8 | Source: FactSet Research Systems. Percentage values in data are rounded to the nearest tenth of one percent, so the values may not sum to 100% due to rounding. Percentage values may be derived from different data sources and may not be consistent with other Fund literature. |
| | | | |
| matthewsasia.com | 800.789.ASIA | | | 41 | |
Matthews Asia Growth Fund
December 31, 2017
Schedule of Investmentsa
COMMON EQUITIES: 95.3%
| | | | | | | | |
| | | Shares | | | Value | |
| JAPAN: 36.5% | |
M3, Inc. | | | 891,000 | | | | $31,233,264 | |
Start Today Co., Ltd. | | | 1,009,800 | | | | 30,650,569 | |
Nidec Corp. | | | 178,600 | | | | 25,007,045 | |
ORIX Corp. | | | 1,358,300 | | | | 22,902,134 | |
Pigeon Corp. | | | 544,900 | | | | 20,703,552 | |
SoftBank Group Corp. | | | 234,100 | | | | 18,533,833 | |
Ariake Japan Co., Ltd. | | | 194,800 | | | | 16,614,710 | |
Nitori Holdings Co., Ltd. | | | 111,800 | | | | 15,911,880 | |
Nitto Denko Corp. | | | 171,400 | | | | 15,160,111 | |
TechnoPro Holdings, Inc. | | | 257,800 | | | | 13,976,691 | |
CYBERDYNE, Inc.b | | | 768,500 | | | | 13,211,232 | |
PeptiDream, Inc.b | | | 384,400 | | | | 13,112,666 | |
Sysmex Corp. | | | 163,500 | | | | 12,838,184 | |
Gunosy, Inc.b | | | 350,100 | | | | 10,621,616 | |
Komatsu, Ltd. | | | 288,200 | | | | 10,415,467 | |
Seria Co., Ltd. | | | 140,400 | | | | 8,448,853 | |
Kakaku.com, Inc. | | | 497,700 | | | | 8,401,511 | |
Sosei Group Corp.b | | | 86,600 | | | | 8,362,875 | |
FANUC Corp. | | | 29,600 | | | | 7,100,935 | |
Daiken Medical Co., Ltd. | | | 542,100 | | | | 3,718,226 | |
HEALIOS KKb | | | 203,200 | | | | 3,488,446 | |
| | | | | | | | |
Total Japan | | | | | | | 310,413,800 | |
| | | | | | | | |
| | | | | | | | |
| CHINA/HONG KONG: 20.0% | |
Shenzhou International Group Holdings, Ltd. | | | 4,205,000 | | | | 39,939,870 | |
Baozun, Inc. ADRb | | | 767,600 | | | | 24,225,456 | |
Alibaba Group Holding, Ltd. ADRb | | | 116,200 | | | | 20,036,366 | |
China Lodging Group, Ltd. ADS | | | 118,600 | | | | 17,129,398 | |
Jiangsu Hengrui Medicine Co., Ltd. A Shares | | | 1,598,983 | | | | 16,932,430 | |
Baidu, Inc. ADRb | | | 44,600 | | | | 10,445,766 | |
Yunnan Baiyao Group Co., Ltd. A Shares | | | 556,727 | | | | 8,699,607 | |
Shanghai Haohai Biological Technology Co., Ltd. H Sharesc,d | | | 1,736,300 | | | | 8,331,766 | |
Genscript Biotech Corp. | | | 2,984,000 | | | | 7,606,527 | |
Wuxi Biologics Cayman, Inc.b,c,d | | | 1,149,000 | | | | 6,426,758 | |
Qudian, Inc. ADRb | | | 470,300 | | | | 5,897,562 | |
Yunnan Hongxiang Yixintang Pharmaceutical | | | | | | | | |
Co., Ltd. A Shares | | | 1,416,091 | | | | 4,369,578 | |
| | | | | | | | |
Total China/Hong Kong | | | | | | | 170,041,084 | |
| | | | | | | | |
| | | | | | | | |
| INDONESIA: 12.2% | |
PT Bank Rakyat Indonesia Persero | | | 147,675,500 | | | | 39,536,550 | |
PT Astra International | | | 43,107,700 | | | | 26,331,509 | |
PT Ace Hardware Indonesia | | | 154,466,000 | | | | 13,149,676 | |
PT Indofood CBP Sukses Makmur | | | 18,774,200 | | | | 12,315,488 | |
PT Mayora Indah | | | 47,580,700 | | | | 7,084,062 | |
PT Arwana Citramulia | | | 214,668,400 | | | | 5,390,853 | |
| | | | | | | | |
Total Indonesia | | | | | | | 103,808,138 | |
| | | | | | | | |
| | | | | | | | |
| INDIA: 7.2% | |
HDFC Bank, Ltd. | | | 1,102,893 | | | | 32,368,797 | |
PC Jeweller, Ltd. | | | 3,008,043 | | | | 21,464,507 | |
ITC, Ltd. | | | 1,740,937 | | | | 7,169,388 | |
| | | | | | | | |
Total India | | | | | | | 61,002,692 | |
| | | | | | | | |
| | | | | | | | |
| AUSTRALIA: 4.1% | |
CSL, Ltd. | | | 181,525 | | | | 19,948,462 | |
Oil Search, Ltd. | | | 2,481,915 | | | | 15,027,025 | |
| | | | | | | | |
Total Australia | | | | | | | 34,975,487 | |
| | | | | | | | |
| | | | | | | | |
| | | Shares | | | Value | |
| BANGLADESH: 4.1% | |
Square Pharmaceuticals, Ltd. | | | 5,703,131 | | | | $20,815,782 | |
BRAC Bank, Ltd. | | | 10,614,188 | | | | 13,937,371 | |
| | | | | | | | |
Total Bangladesh | | | | | | | 34,753,153 | |
| | | | | | | | |
| | | | | | | | |
| SRI LANKA: 3.5% | |
Sampath Bank PLC | | | 9,955,478 | | | | 20,475,208 | |
Lanka Orix Leasing Co. PLCb | | | 12,121,473 | | | | 9,108,154 | |
| | | | | | | | |
Total Sri Lanka | | | | | | | 29,583,362 | |
| | | | | | | | |
| | | | | | | | |
| VIETNAM: 3.1% | |
Vietnam Dairy Products JSC | | | 2,597,160 | | | | 23,812,914 | |
Taisun International Holding Corp. | | | 648,000 | | | | 2,765,462 | |
| | | | | | | | |
Total Vietnam | | | | | | | 26,578,376 | |
| | | | | | | | |
| | | | | | | | |
| PHILIPPINES: 2.5% | |
Jollibee Foods Corp. | | | 2,007,890 | | | | 10,176,205 | |
Emperador, Inc. | | | 37,942,500 | | | | 5,586,486 | |
Vista Land & Lifescapes, Inc. | | | 45,560,400 | | | | 5,466,883 | |
| | | | | | | | |
Total Philippines | | | | | | | 21,229,574 | |
| | | | | | | | |
| | | | | | | | |
| THAILAND: 0.8% | |
Major Cineplex Group Public Co., Ltd. | | | 7,714,400 | | | | 6,849,055 | |
| | | | | | | | |
Total Thailand | | | | | | | 6,849,055 | |
| | | | | | | | |
| | | | | | | | |
| PAKISTAN: 0.7% | |
Habib Bank, Ltd. | | | 4,001,000 | | | | 6,058,243 | |
| | | | | | | | |
Total Pakistan | | | | | | | 6,058,243 | |
| | | | | | | | |
| | | | | | | | |
| TAIWAN: 0.6% | |
St. Shine Optical Co., Ltd. | | | 173,000 | | | | 5,645,260 | |
| | | | | | | | |
Total Taiwan | | | | | | | 5,645,260 | |
| | | | | | | | |
| | | | | | | | |
| TOTAL INVESTMENTS: 95.3% | | | | 810,938,224 | |
(Cost $524,798,919) | | | | | | | | |
| | | | | | | | |
CASH AND OTHER ASSETS,
LESS LIABILITIES: 4.7% | | | | | | | 39,623,720 | |
| | | | | | | | |
| | |
NET ASSETS: 100.0% | | | | | | | $850,561,944 | |
| | | | | | | | |
| a | Certain securities were fair valued under the valuation policies approved by the Board of Trustees (Note 2-A). |
| b | Non-income producing security. |
| c | Security exempt from registration under Rule 144A of the Securities Act of 1933, as amended. The security may be resold in transactions exempt from registration normally to qualified institutional buyers. The security has been determined to be liquid in accordance with procedures adopted by the Fund’s Board of Trustees. At December 31, 2017, the aggregate value is $14,758,524, which is 1.74% of net assets. |
| d | The securities may be resold to qualified foreign investors and foreign institutional buyers under Regulation S of the Securities Act of 1933. |
| ADR | American Depositary Receipt |
| ADS | American Depositary Share |
See accompanying notes to financial statements.
| | | | |
| PORTFOLIO MANAGERS |
| Sharat Shroff, CFA | | | | |
Lead Manager | | | | |
| Rahul Gupta | | | | |
Co-Manager | | | | |
| | |
| FUND FACTS | | | | |
| | | Investor | | Institutional |
Ticker | | MAPTX | | MIPTX |
CUSIP | | 577130107 | | 577130834 |
Inception | | 9/12/94 | | 10/29/10 |
NAV | | $31.66 | | $31.63 |
Initial Investment | | $2,500 | | $100,000 |
Gross Expense Ratio1 | | 1.08% | | 0.91% |
After Fee Waiver and Reimbursement2 | | 1.06% | | 0.89% |
Portfolio Statistics | | |
Total # of Positions | | 68 |
Net Assets | | $9.7 billion |
Weighted Average Market Cap | | $63.7 billion |
Portfolio Turnover3 | | | | 9.18% |
Benchmark |
MSCI AC Asia ex Japan Index |
OBJECTIVE
Long-term capital appreciation.
STRATEGY
Under normal market conditions, the Fund seeks to achieve its investment objective by investing at least 80% of its total net assets, which include borrowings for investment purposes, in the common and preferred stocks of companies located in Asia ex Japan, which consists of all countries and markets in Asia excluding Japan, but including all other developed, emerging and frontier countries and markets in the Asian region.
Matthews Pacific Tiger Fund
Portfolio Manager Commentary (unaudited)
For the year ending December 31, 2017, the Matthews Pacific Tiger Fund returned 39.96% (Investor Class) and 40.17% (Institutional Class) while its benchmark, the MSCI All Country Asia ex Japan Index, returned 42.08%. For the fourth quarter, the Fund returned 11.23% (Investor Class) and 11.26% (Institutional Class) while its benchmark, the MSCI All Country Asia ex Japan Index, returned 8.27%.
Market Environment:
Capital markets in Asia ex Japan recovered in dramatic fashion in 2017 from the swoon in the fourth quarter of 2016, powered by a surge across the region in the information technology (IT) sector. The IT sector contributed nearly half of the gains during 2017 for the MSCI AC Asia ex Japan Index. This reflected sustained earnings growth for Chinese e-commerce companies and investor enthusiasm for a semiconductor upcycle predicated on the success of short-term drivers (like the launch of iPhone X) and long-term trends including autonomous driving and artificial intelligence. The gains in the benchmark index reflected an improved backdrop for Asian earnings, driven by the IT sector. In addition, as 2017 progressed, the impact of stimulus in 2015 and 2016 and continued supply-side initiatives in China provided stable to recovering demand for certain segments within China’s industrials sector.
Smaller companies lagged behind their larger-cap peers across most of the region, with the notable exception of India and Taiwan. Indian small-cap companies that are perceived to be beneficiaries of initiatives to reform the financials sector (demonetization, financial inclusion), and to even the playing field for parts of the organized and unorganized sector through the implementation of the Goods and Services Tax (GST), experienced sharp appreciation in their stock prices.
Asian currencies recovered during the year, helped by sustained overseas inflows—particularly into fixed income markets across the region as real interest rates remained attractive relative to other global economies.
During the fourth quarter of 2017, the MSCI AC Asia ex Japan Index continued the trend of positive returns, although the drivers were a bit different in at least two ways. The sources of returns for the benchmark were relatively more diversified across countries and sectors compared to the first nine months of the year. Second, smaller companies outperformed their larger-cap peers.
Performance Contributors and Detractors:
The portfolio’s absolute gains were driven by a variety of stocks spread across the consumer, financials and IT sectors. Ping An was the biggest positive contributor to absolute performance as its life insurance business continues to gain market share in China. Investors are starting to recognize the company’s capabilities in data gathering and analysis to deliver superior efficiency than its peers. Among the detractors, Guangdong Advertising, a new addition to the portfolio, is undergoing a transition in its business model toward digital advertising. This is causing a near-term disruption to the financials of the company but the opportunity to participate in a rapidly growing industry remains attractive in our view.
From a relative perspective, the primary source of underperformance stems from a negative allocation effect resulting from lower exposure to the IT sector. The portfolio did not carry enough in semiconductor and IT hardware stocks as we believe the level of profitability is not sufficient to underwrite the volatility in the business models for some of these companies. Within IT services, the Fund has invested in opportunities diversified across China, India and South Korea. Not all of the positions, however, were able to match the appreciation experienced by Tencent and Alibaba. Health care positions also were a drag on portfolio performance in 2017 as regulations continue to pose a challenge, but we are looking at the weakness as an opportunity to add to some of our existing holdings. The financials
(continued)
| 1 | Actual 2017 expense ratios. |
| 2 | Matthews has contractually agreed to waive a portion of its advisory fee and administrative and shareholder services fee if the Fund’s average daily net assets are over $3 billion, as follows: for every $2.5 billion average daily net assets of the Fund that are over $3 billion, the advisory fee rate and the administrative and shareholder services fee rate for the Fund with respect to such excess average daily net assets will be each reduced by 0.01%, in each case without reducing such fee rate below 0.00%. Any amount waived by Matthews pursuant to this agreement may not be recouped by Matthews. This agreement will remain in place until April 30, 2019 and may be terminated at any time (i) by the Trust on behalf of the Fund or by the Board of Trustees upon 60 days’ prior written notice to Matthews; or (ii) by Matthews upon 60 days’ prior written notice to the Trust, in each case without payment of any penalty. |
| 3 | The lesser of fiscal year 2017 long-term purchase costs or sales proceeds divided by the average monthly market value of long-term securities. |
| | | | |
| matthewsasia.com | 800.789.ASIA | | | 43 | |
| | | | | | | | | | | | | | | | | | | | | | | | | | | | |
| |
| PERFORMANCE AS OF DECEMBER 31, 2017 | |
| | | | | | | | | Average Annual Total Returns | | | | |
| | | 3 Months | | | 1 Year | | | 3 Years | | | 5 Years | | | 10 Years | | | Since
Inception | | | Inception
Date | |
| Investor Class (MAPTX) | | | 11.23% | | | | 39.96% | | | | 11.31% | | | | 9.83% | | | | 7.07% | | | | 9.32% | | | | 9/12/94 | |
| Institutional Class (MIPTX) | | | 11.26% | | | | 40.17% | | | | 11.49% | | | | 10.01% | | | | n.a. | | | | 8.07% | | | | 10/29/10 | |
| MSCI AC Asia ex Japan Index4 | | | 8.27% | | | | 42.08% | | | | 11.03% | | | | 8.26% | | | | 4.11% | | | | 5.01% | 5 | | | | |
| Lipper Pacific ex Japan Funds Category Average6 | | | 8.50% | | | | 39.66% | | | | 10.19% | | | | 7.61% | | | | 4.23% | | | | 5.82% | 5 | | | | |
Performance assumes reinvestment of all dividends and/or distributions before taxes. All performance quoted represents past performance and is no guarantee of future results. Investment return and principal value will fluctuate with market conditions so that when redeemed, shares may be worth more or less than their original cost. Current performance may be lower or higher than the return figures quoted. Returns would have been lower if certain of the Fund’s fees and expenses had not been waived. For the Fund’s most recent month-end performance, visit matthewsasia.com.
GROWTH OF A $10,000 INVESTMENT SINCE INCEPTION—INVESTOR CLASS
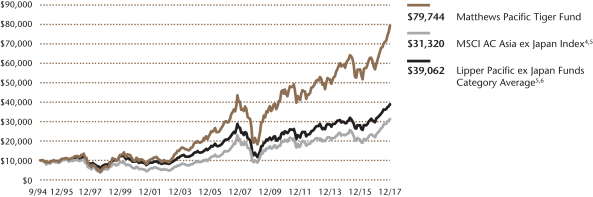
Plotted monthly. The performance data and graph do not reflect the deduction of taxes that a shareholder would pay on dividends, capital gains distributions or redemption of Fund shares. Values are in US$.
| | 4 | It is not possible to invest directly in an index. Source: Index data from Morgan Stanley Capital International and Bloomberg; total return calculations performed by BNY Mellon Investment Servicing (US) Inc. Please see page 92 for index definition. |
| | 5 | Calculated from 8/31/94. |
| | 6 | The Lipper Category Average does not reflect sales charges and is based on total return, including reinvestment of dividends and capital gains for the stated periods. |
| | | | | | | | |
| | | | |
| TOP TEN HOLDINGS7 | | | | | | | |
| | | Sector | | Country | | % of Net Assets | |
| Ping An Insurance Group Co. of China, Ltd. | | Financials | | China/Hong Kong | | | 3.7% | |
| Tencent Holdings, Ltd. | | Information Technology | | China/Hong Kong | | | 3.1% | |
| Central Pattana Public Co., Ltd. | | Real Estate | | Thailand | | | 3.1% | |
| Baidu, Inc. | | Information Technology | | China/Hong Kong | | | 2.9% | |
| China Resources Beer Holdings Co., Ltd. | | Consumer Staples | | China/Hong Kong | | | 2.8% | |
| Vietnam Dairy Products JSC | | Consumer Staples | | Vietnam | | | 2.8% | |
| Sinopharm Group Co., Ltd. | | Health Care | | China/Hong Kong | | | 2.7% | |
| Titan Co., Ltd. | | Consumer Discretionary | | India | | | 2.6% | |
| Kotak Mahindra Bank, Ltd. | | Financials | | India | | | 2.6% | |
| Tata Power Co., Ltd. | | Utilities | | India | | | 2.5% | |
| % OF ASSETS IN TOP TEN | | | | | | | 28.8% | |
| | 7 | Holdings may combine more than one security from same issuer and related depositary receipts. |
Matthews Pacific Tiger Fund
Portfolio Manager Commentary (unaudited) (continued)
sector holdings in China and India were the biggest positive contributors to relative performance as structural developments in both these countries seem to favor private sector organizations like Ping An and Kotak Mahindra Bank.
Notable Portfolio Changes:
New positions we added to the portfolio reflect our long-term belief in Asia’s continuing structural changes. Our new investment in China’s Guotai Junan Securities is an attempt to capture the ongoing liberalization of the country’s capital markets. In India and Indonesia, two new positions are poised to benefit from a pickup in consumer spending. United Spirits is a leading brand in alcohol and spirits in India. We have known the company for quite some time but under the new management of Diageo, we believe it will be able to re-establish its supremacy, particularly in premium products. The investment in Surya Citra Media in Indonesia comes after multiple years of engagement with the management team, and a better risk-reward ratio as the stock corrected meaningfully due to short-term disruption in its advertising business. Both United Spirits and Surya Citra Media are midsize companies and we will continue to monitor milestones before increasing allocations in the portfolio.
Some of the investments were funded through continued trimming of holdings in South Korea’s Amorepacific, and more recently, from sales of shares of India’s Titan. While Titan continues to have a stronghold in the jewelry business in India, we believed the sharp appreciation of its share price merited an appropriate adjustment in the weight in the portfolio.
Outlook:
Chinese policymakers continue to set the tone for the Asia region on enacting structural reforms. It seems highly probable that supply-side initiatives are likely to continue, the private sector is likely to gain even more prominence and continued investments into areas like robotics, and artificial intelligence may at least partly offset the long-term demographic impact in China. However, it is also possible that government’s efforts to manage the formation of credit in China may lead to some volatility, especially in the property sector, but should be good for the long term. One consequence of all this is that systemic risk in China may continue to ease in the years ahead, leading to long-term value creation for both equity and fixed income investors in our view. Likewise, efforts to enhance the governance of conglomerates in South Korea are starting to yield more transparency and greater access to cash flows for minority shareholders but there remains a long way to go.
While China and Korea continue to focus on improving the allocation of capital, India and Indonesia are still trying to catalyze an investment cycle. The most noticeable impact of the various recent structural changes in India has been to lower the cost of capital, but that still has not translated into a pickup in private sector investments. The leveling of the playing field for the organized and unorganized sectors (through implementation of the GST) may eventually lead to market share gains for publicly traded companies with private sector roots. The spate of capital being raised by Indian banks (following the proposed injection of capital) suggests that management teams may be girding for an uptick in capital expenditure by corporations.
With the exception of China, domestic demand across many other parts of Asia has not recovered, reflecting a hesitant stance by policymakers to indulge in fiscally stimulating their respective economies. As economic growth becomes a bigger imperative for policymakers, it is likely that greater fiscal stimulus may offset some of the monetary tailwinds that are likely to wane in coming periods. Furthermore, the prospect of a normalized pricing environment for labor, capital and commodities may support the recovery in nominal growth in the region, which provides a favorable backdrop for companies and businesses. If the global recovery maintains its current trajectory, that may also favor parts of Asia that are tied to the export cycle.
The risks that we see stem from valuation and mispricing, but these risks are more pronounced in only a few sectors in our view. Many of the usual systemic risks have been addressed over the past few years. Newer geopolitical risks continue to emerge, however, and are difficult to handicap. The Fund continues to find opportunities to invest in domestic demand in Asia without having to take undue risk.
| | | | |
| |
| COUNTRY ALLOCATION (%)8,9 | |
| China/Hong Kong | | | 34.8 | |
| India | | | 20.5 | |
| South Korea | | | 12.2 | |
| Indonesia | | | 6.0 | |
| Thailand | | | 5.6 | |
| Taiwan | | | 5.0 | |
| Malaysia | | | 3.8 | |
| Vietnam | | | 2.8 | |
| Philippines | | | 2.4 | |
| Switzerland | | | 2.4 | |
| United States | | | 2.1 | |
| Japan | | | 0.1 | |
| Cash and Other Assets, Less Liabilities | | | 2.3 | |
| | | | |
| |
| SECTOR ALLOCATION (%)9 | |
| Financials | | | 22.0 | |
| Consumer Staples | | | 20.3 | |
| Information Technology | | | 17.7 | |
| Consumer Discretionary | | | 9.8 | |
| Health Care | | | 7.9 | |
| Real Estate | | | 5.8 | |
| Industrials | | | 5.2 | |
| Utilities | | | 4.7 | |
| Telecommunication Services | | | 3.3 | |
| Materials | | | 1.1 | |
| Cash and Other Assets, Less Liabilities | | | 2.3 | |
| | | | |
| |
| MARKET CAP EXPOSURE (%)9 | |
| Mega Cap (over $25B) | | | 36.4 | |
| Large Cap ($10B–$25B) | | | 34.3 | |
| Mid Cap ($3B–10B) | | | 19.1 | |
| Small Cap (under $3B) | | | 7.9 | |
| Cash and Other Assets, Less Liabilities | | | 2.3 | |
| 8 | Not all countries where the Fund may invest are included in the benchmark index. |
| 9 | Source: FactSet Research Systems. Percentage values in data are rounded to the nearest tenth of one percent, so the values may not sum to 100% due to rounding. Percentage values may be derived from different data sources and may not be consistent with other Fund literature. |
| | | | |
| matthewsasia.com | 800.789.ASIA | | | 45 | |
Matthews Pacific Tiger Fund
December 31, 2017
Schedule of Investmentsa
COMMON EQUITIES: 97.7%
| | | | | | | | |
| | | Shares | | | Value | |
| CHINA/HONG KONG: 34.8% | |
Ping An Insurance Group Co. of China, Ltd. H Shares | | | 34,443,000 | | | | $357,245,176 | |
Tencent Holdings, Ltd. | | | 5,886,500 | | | | 304,673,201 | |
Baidu, Inc. ADRb | | | 1,211,800 | | | | 283,815,678 | |
China Resources Beer Holdings Co., Ltd. | | | 75,359,775 | | | | 269,974,020 | |
Sinopharm Group Co., Ltd. H Shares† | | | 61,139,600 | | | | 263,376,635 | |
Alibaba Group Holding, Ltd. ADRb | | | 1,291,700 | | | | 222,727,831 | |
AIA Group, Ltd. | | | 24,540,800 | | | | 208,735,397 | |
Inner Mongolia Yili Industrial Group Co., Ltd. A Shares | | | 39,266,682 | | | | 194,042,753 | |
Hengan International Group Co., Ltd. | | | 17,048,500 | | | | 188,760,797 | |
China Mobile, Ltd. ADR | | | 3,130,026 | | | | 158,191,514 | |
Dairy Farm International Holdings, Ltd. | | | 20,154,946 | | | | 158,137,863 | |
Hong Kong Exchanges & Clearing, Ltd. | | | 4,978,000 | | | | 152,268,407 | |
China Resources Land, Ltd. | | | 47,814,000 | | | | 140,269,171 | |
Fuyao Glass Industry Group Co., Ltd. H Shares†,c,d | | | 32,976,400 | | | | 138,728,638 | |
Tasly Pharmaceutical Group Co., Ltd. A Shares | | | 15,419,779 | | | | 84,224,092 | |
Guotai Junan Securities Co., Ltd. H Sharesb,c,d | | | 34,600,000 | | | | 76,913,685 | |
Yum China Holdings, Inc. | | | 1,759,410 | | | | 70,411,588 | |
Guangdong Advertising Group Co., Ltd. A Shares | | | 66,324,441 | | | | 54,285,822 | |
Shandong Weigao Group Medical Polymer Co., Ltd. H Shares | | | 62,424,000 | | | | 45,365,517 | |
Fuyao Glass Industry Group Co., Ltd. A Shares | | | 2,589,387 | | | | 11,515,961 | |
China Literature, Ltd.b,c,d | | | 527,091 | | | | 5,623,177 | |
| | | | | | | | |
Total China/Hong Kong | | | | | | | 3,389,286,923 | |
| | | | | | | | |
| | | | | | | | |
| INDIA: 20.5% | |
Titan Co., Ltd. | | | 19,118,799 | | | | 257,049,036 | |
Kotak Mahindra Bank, Ltd. | | | 16,123,409 | | | | 254,924,251 | |
Tata Power Co., Ltd.† | | | 164,620,436 | | | | 240,910,125 | |
HDFC Bank, Ltd. | | | 6,223,409 | | | | 182,650,775 | |
GAIL India, Ltd. | | | 22,209,369 | | | | 173,572,295 | |
Sun Pharmaceutical Industries, Ltd. | | | 17,892,624 | | | | 159,574,630 | |
Container Corp. of India, Ltd. | | | 6,839,995 | | | | 147,579,533 | |
ITC, Ltd. | | | 32,702,500 | | | | 134,672,834 | |
Housing Development Finance Corp., Ltd. | | | 4,935,685 | | | | 132,170,973 | |
Dabur India, Ltd. | | | 21,117,482 | | | | 115,466,879 | |
Thermax, Ltd. | | | 5,310,034 | | | | 101,808,063 | |
United Spirits, Ltd.b | | | 1,180,000 | | | | 67,724,615 | |
Just Dial, Ltd.†,b | | | 3,557,718 | | | | 29,107,208 | |
| | | | | | | | |
Total India | | | | | | | 1,997,211,217 | |
| | | | | | | | |
| | | | | | | | |
| SOUTH KOREA: 12.2% | |
DB Insurance Co., Ltd. | | | 3,499,380 | | | | 232,736,309 | |
Samsung Electronics Co., Ltd. | | | 95,105 | | | | 225,961,043 | |
NAVER Corp. | | | 249,865 | | | | 202,985,248 | |
Orion Holdings Corp.† | | | 5,666,538 | | | | 141,061,359 | |
Green Cross Corp.† | | | 620,785 | | | | 130,938,011 | |
Cheil Worldwide, Inc.† | | | 6,554,297 | | | | 129,794,121 | |
Amorepacific Corp. | | | 280,972 | | | | 79,917,775 | |
S-1 Corp. | | | 239,810 | | | | 23,968,680 | |
Orion Corp.b | | | 211,758 | | | | 20,635,036 | |
| | | | | | | | |
Total South Korea | | | | | | | 1,187,997,582 | |
| | | | | | | | |
| | | | | | | | |
| | | Shares | | | Value | |
| INDONESIA: 6.0% | |
PT Bank Central Asia | | | 100,580,000 | | | | $162,280,309 | |
PT Telekomunikasi Indonesia Persero | | | 421,304,300 | | | | 137,890,159 | |
PT Indofood CBP Sukses Makmur | | | 191,522,600 | | | | 125,634,873 | |
PT Surya Citra Media | | | 285,000,000 | | | | 51,983,545 | |
PT Astra International | | | 66,745,900 | | | | 40,770,448 | |
PT Perusahaan Gas Negara Persero | | | 298,485,100 | | | | 38,446,356 | |
PT Telekomunikasi Indonesia Persero ADR | | | 728,140 | | | | 23,460,671 | |
| | | | | | | | |
Total Indonesia | | | | | | | 580,466,361 | |
| | | | | | | | |
| | | | | | | | |
| THAILAND: 5.6% | |
Central Pattana Public Co., Ltd. | | | 115,426,500 | | | | 301,500,159 | |
Kasikornbank Public Co., Ltd. | | | 18,431,800 | | | | 130,908,597 | |
The Siam Cement Public Co., Ltd. | | | 7,522,950 | | | | 111,556,784 | |
| | | | | | | | |
Total Thailand | | | | | | | 543,965,540 | |
| | | | | | | | |
| | | | | | | | |
| TAIWAN: 5.0% | |
President Chain Store Corp. | | | 21,986,608 | | | | 209,393,869 | |
Delta Electronics, Inc. | | | 31,251,182 | | | | 150,142,165 | |
Synnex Technology International Corp.† | | | 95,600,921 | | | | 130,031,465 | |
| | | | | | | | |
Total Taiwan | | | | | | | 489,567,499 | |
| | | | | | | | |
| | | | | | | | |
| MALAYSIA: 3.8% | |
Genting BHD | | | 65,134,875 | | | | 147,951,382 | |
Public Bank BHD | | | 26,374,994 | | | | 135,356,136 | |
IHH Healthcare BHD | | | 47,676,300 | | | | 69,034,623 | |
IHH Healthcare BHD | | | 11,543,000 | | | | 16,778,246 | |
| | | | | | | | |
Total Malaysia | | | | | | | 369,120,387 | |
| | | | | | | | |
| | | | | | | | |
| VIETNAM: 2.8% | |
Vietnam Dairy Products JSC | | | 29,334,534 | | | | 268,963,309 | |
| | | | | | | | |
Total Vietnam | | | | | | | 268,963,309 | |
| | | | | | | | |
| | | | | | | | |
| PHILIPPINES: 2.4% | |
SM Prime Holdings, Inc. | | | 164,670,771 | | | | 123,701,000 | |
GT Capital Holdings, Inc. | | | 4,347,540 | | | | 112,520,466 | |
| | | | | | | | |
Total Philippines | | | | | | | 236,221,466 | |
| | | | | | | | |
| | | | | | | | |
| SWITZERLAND: 2.4% | |
DKSH Holding AG | | | 2,638,062 | | | | 230,784,261 | |
| | | | | | | | |
Total Switzerland | | | | | | | 230,784,261 | |
| | | | | | | | |
| | | | | | | | |
| UNITED STATES: 2.1% | |
Cognizant Technology Solutions Corp. Class A | | | 2,186,600 | | | | 155,292,332 | |
Yum! Brands, Inc. | | | 579,910 | | | | 47,326,455 | |
| | | | | | | | |
Total United States | | | | | | | 202,618,787 | |
| | | | | | | | |
| | | | | | | | |
| JAPAN: 0.1% | |
LINE Corp. ADRb | | | 195,200 | | | | 8,001,248 | |
| | | | | | | | |
Total Japan | | | | | | | 8,001,248 | |
| | | | | | | | |
| | | | | | | | |
| SINGAPORE: 0.0% | |
Hyflux, Ltd. | | | 1,800,000 | | | | 504,692 | |
| | | | | | | | |
Total Singapore | | | | | | | 504,692 | |
| | | | | | | | |
| | | | | | | | |
Matthews Pacific Tiger Fund
December 31, 2017
Schedule of Investmentsa (continued)
COMMON EQUITIES (continued)
| | | | | | | | |
| | | | | | Value | |
| TOTAL INVESTMENTS: 97.7% | | | | | | | $9,504,709,272 | |
(Cost $5,851,181,103) | | | | | | | | |
| | | | | | | | |
CASH AND OTHER ASSETS,
LESS LIABILITIES: 2.3% | | | | | | | 220,327,613 | |
| | | | | | | | |
| | |
NET ASSETS: 100.0% | | | | | | | $9,725,036,885 | |
| | | | | | | | |
| a | Certain securities were fair valued under the valuation policies approved by the Board of Trustees (Note 2-A). |
| b | Non-income producing security. |
| c | Security exempt from registration under Rule 144A of the Securities Act of 1933, as amended. The security may be resold in transactions exempt from registration normally to qualified institutional buyers. The security has been determined to be liquid in accordance with procedures adopted by the Fund’s Board of Trustees. At December 31, 2017, the aggregate value is $221,265,500, which is 2.28% of net assets. |
| d | The securities may be resold to qualified foreign investors and foreign institutional buyers under Regulation S of the Securities Act of 1933. |
| † | Affiliated Issuer, as defined under the Investment Company Act of 1940 (ownership of 5% or more of the outstanding voting securities of this issuer) |
| ADR | American Depositary Receipt |
See accompanying notes to financial statements.
| | | | |
| matthewsasia.com | 800.789.ASIA | | | 47 | |
| | | | |
| PORTFOLIO MANAGERS |
| Vivek Tanneeru | | |
Lead Manager | | |
| Winnie Chwang | | |
Co-Manager | | | | |
|
| FUND FACTS |
| | | Investor | | Institutional |
Ticker | | MASGX | | MISFX |
CUSIP | | 577130727 | | 577130719 |
Inception | | 4/30/15 | | 4/30/15 |
NAV | | $11.56 | | $11.50 |
Initial Investment | | $2,500 | | $100,000 |
Gross Expense Ratio1 | | 2.65% | | 2.46% |
After Fee Waiver and Reimbursement2 | | 1.50% | | 1.25% |
Portfolio Statistics | | | | |
Total # of Positions | | 59 |
Net Assets | | $18.1 million |
Weighted Average
Market Cap | | $18.3 billion |
Portfolio Turnover3 | | 28.82% |
Benchmark | | |
MSCI AC Asia ex Japan Index |
OBJECTIVE
Long term capital appreciation.
STRATEGY
Under normal market conditions, the Fund seeks to achieve its investment objective by investing at least 80% of its total assets, which include borrowings for investment purposes, in the common and preferred stocks of companies of any market capitalization located in Asia that Matthews believes satisfy one or more of its environmental, social and governance (“ESG”) standards. Asia consists of all countries and markets in Asia and includes developed, emerging, and frontier countries and markets in the Asia region. The Fund may also invest in convertible securities and fixed-income securities, of any duration or quality, including high yield securities of Asian companies.
Matthews Asia ESG Fund
Portfolio Manager Commentary (unaudited)
For the year ending December 31, 2017, the Matthews Asia ESG Fund returned 33.79% (Investor Class) and 34.11% (Institutional Class), while its benchmark, the MSCI All Country Asia ex Japan Index, returned 42.08%. For the fourth quarter, the Fund returned 7.15% (Investor Class) and 7.19% (Institutional Class) versus 8.27% for its benchmark.
Market Environment:
Asia’s markets had a strong finish to 2017 as a synchronized global recovery and pick up in global trade boosted Asian corporate earnings in a relatively accommodative global monetary environment. A reflationary cycle set in motion in 2016 by higher global energy and commodity prices as well as capacity shutdowns and industry consolidation in China provided further tailwinds in 2017. Asian currencies appreciated strongly against the U.S. dollar with South Korean won (up 12.8%) and Malaysian ringgit (up 10.9%) leading the gains and providing further tailwinds for Asian equities.
North Asian markets performed well compared with Southeast Asian markets during the year. China/Hong Kong was the best-performing market (up more than 50%). Pakistan was the worst performer (down about 24%) as the country faced political uncertainty among other factors. From a sector standpoint cyclical sectors generally outperformed defensive sectors. The information technology sector was by far the best performer (up 61.5%) along with real estate (up 50%), while telecommunication services (up 14.4%) and utilities (up 17.9%) were the worst-performing sectors.
Performance Contributors and Detractors:
From a sector perspective, stock selection in telecom and financials contributed most to performance in 2017. On the flip side, an underweight allocation to the information technology sector (in particular to China internet and South Korean memory names on account of ESG considerations) and overweight allocation to the health care sector detracted from performance during the year.
From a country perspective, our overweight allocation to Bangladesh and stock selection in Indonesia contributed positively in 2017, while an underweight allocation to China/Hong Kong and an overweight allocation to Pakistan detracted from performance. At the stock level, Samsung SDI, a South Korean battery and electronic materials company, was the biggest contributor to performance in 2017, while Lupin, an Indian generics pharmaceutical company, was the biggest detractor.
For the fourth quarter, BRAC Bank in Bangladesh was the biggest contributor, while the portfolio’s health care holdings in India and Pakistan detracted from performance.
Notable Portfolio Changes:
During 2017, the portfolio’s financials sector weighting rose meaningfully, aided both by strong performance and also new additions. We continue to find financial institutions that offer attractive growth opportunities while addressing financial-inclusion challenges in developing and frontier parts of Asia.
(continued)
| 1 | Actual 2017 expense ratio. |
| 2 | Matthews has contractually agreed (i) to waive fees and reimburse expenses to the extent needed to limit Total Annual Fund Operating Expenses (excluding Rule 12b-1 fees, taxes, interest, brokerage commissions, short sale dividend expenses, expenses incurred in connection with any merger or reorganization or extraordinary expenses such as litigation) of the Institutional Class to 1.25% first by waiving class specific expenses (i.e., shareholder service fees specific to a particular class) of the Institutional Class and then, to the extent necessary, by waiving non-class specific expenses of the Institutional Class, and (ii) if any Fund-wide expenses (i.e., expenses that apply to both the Institutional Class and the Investor Class) are waived for the Institutional Class to maintain the 1.25% expense limitation, to waive an equal amount (in annual percentage terms) of those same expenses for the Investor Class. The Total Annual Fund Operating Expenses After Fee Waiver and Expense Reimbursement for the Investor Class may vary from year to year and will in some years exceed 1.25%. If the operating expenses fall below the expense limitation in a year within three years after Matthews has made a waiver or reimbursement, the Fund may reimburse Matthews up to an amount that does not cause the expenses for that year to exceed the lesser of (i) the expense limitation applicable at the time of that fee waiver and/or expense reimbursement or (ii) the expense limitation in effect at the time of recoupment. This agreement will remain in place until April 30, 2019 and may be terminated at any time by the Board of Trustees on behalf of the Fund on 60 days’ written notice to Matthews. Matthews may decline to renew this agreement by written notice to the Trust at least 30 days before its annual expiration date. |
| 3 | The lesser of fiscal year 2017 long-term purchase costs or sales proceeds divided by the average monthly market value of long-term securities. |
| | | | | | | | | | | | | | | | |
| | | | | |
| PERFORMANCE AS OF DECEMBER 31, 2017 | | | | | | | | | | | | |
| | | | | | | | | Average Annual
Total Returns | | | | |
| | | 3 Months | | | 1 Year | | | Since
Inception | | | Inception
Date | |
| Investor Class (MASGX) | | | 7.15% | | | | 33.79% | | | | 7.82% | | | | 4/30/15 | |
| Institutional Class (MISFX) | | | 7.19% | | | | 34.11% | | | | 8.09% | | | | 4/30/15 | |
| MSCI AC Asia ex Japan Index4 | | | 8.27% | | | | 42.08% | | | | 7.62% | | | | | |
| Lipper Pacific Region Funds Category Average5 | | | 8.22% | | | | 33.60% | | | | 8.06% | | | | | |
Performance assumes reinvestment of all dividends and/or distributions before taxes. All performance quoted represents past performance and is no guarantee of future results. Investment return and principal value will fluctuate with market conditions so that when redeemed, shares may be worth more or less than their original cost. Current performance may be lower or higher than the return figures quoted. Returns would have been lower if certain of the Fund’s fees and expenses had not been waived. For the Fund’s most recent month-end performance visit matthewsasia.com.
GROWTH OF A $10,000 INVESTMENT SINCE INCEPTION—INVESTOR CLASS
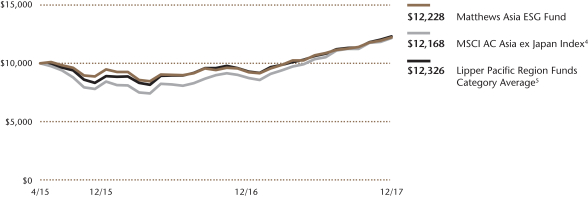
Plotted Monthly. The performance data and graph do not reflect the deduction of taxes that a shareholder would pay on dividends, capital gain distributions or redemption of Fund shares. Values are in US$.
| | 4 | It is not possible to invest directly in an index. Source: Index data from Morgan Stanley Capital International; total return calculations performed by BNY Mellon Investment Servicing (US) Inc. Please see page 92 for index definition. |
| | 5 | The Lipper Category Average does not reflect sales charges and is based on total return, including reinvestment of dividends and capital gains for the stated periods. |
| | | | | | | | |
| | | | |
| TOP TEN HOLDINGS6 | | | | | | | |
| | | Sector | | Country | | % of Net Assets | |
| Samsung SDI Co., Ltd., Pfd. | | Information Technology | | South Korea | | | 6.0% | |
| Inner Mongolia Yili Industrial Group Co., Ltd. | | Consumer Staples | | China/Hong Kong | | | 3.7% | |
| Shriram City Union Finance, Ltd. | | Financials | | India | | | 3.5% | |
| PT Bank Rakyat Indonesia Persero | | Financials | | Indonesia | | | 3.5% | |
| BRAC Bank, Ltd. | | Financials | | Bangladesh | | | 3.5% | |
| Taiwan Semiconductor Manufacturing Co., Ltd. | | Information Technology | | Taiwan | | | 3.3% | |
| JD.com, Inc. | | Consumer Discretionary | | China/Hong Kong | | | 3.1% | |
| Hanon Systems | | Consumer Discretionary | | South Korea | | | 2.9% | |
| Mahindra & Mahindra, Ltd. | | Consumer Discretionary | | India | | | 2.8% | |
| Lupin, Ltd. | | Health Care | | India | | | 2.6% | |
| % OF ASSETS IN TOP TEN | | | | | | | 34.9% | |
| | 6 | Holdings may combine more than one security from same issuer and related depositary receipts. |
| | | | |
| matthewsasia.com | 800.789.ASIA | | | 49 | |
| | | | |
| | |
| COUNTRY ALLOCATION (%)7 | | | |
| China/Hong Kong | | | 21.7 | |
| India | | | 15.1 | |
| South Korea | | | 14.7 | |
| Japan | | | 13.9 | |
| Taiwan | | | 8.8 | |
| Bangladesh | | | 5.8 | |
| Indonesia | | | 4.8 | |
| Singapore | | | 4.1 | |
| Thailand | | | 3.4 | |
| Philippines | | | 3.0 | |
| Pakistan | | | 1.6 | |
| Vietnam | | | 1.4 | |
| Luxembourg | | | 0.9 | |
| Cash and Other Assets, Less Liabilities | | | 0.8 | |
| | | | |
| | |
| SECTOR ALLOCATION (%)8 | | | |
| Financials | | | 21.4 | |
| Health Care | | | 15.1 | |
| Consumer Discretionary | | | 14.3 | |
| Industrials | | | 14.1 | |
| Information Technology | | | 13.6 | |
| Consumer Staples | | | 8.9 | |
| Telecommunication Services | | | 5.7 | |
| Utilities | | | 2.2 | |
| Real Estate | | | 2.1 | |
| Materials | | | 1.9 | |
| Cash and Other Assets, Less Liabilities | | | 0.8 | |
| | | | |
| | |
| MARKET CAP EXPOSURE (%)8 | | | |
| Mega Cap (over $25B) | | | 20.7 | |
| Large Cap ($10B–$25B) | | | 16.0 | |
| Mid Cap ($3B–10B) | | | 19.7 | |
| Small Cap (under $3B) | | | 42.9 | |
| Cash and Other Assets, Less Liabilities | | | 0.8 | |
| 7 | Not all countries are included in the benchmark index. |
| 8 | Source: FactSet Research Systems. Percentage values in data are rounded to the nearest tenth of one percent, so the values may not sum to 100% due to rounding. Percentage values may be derived from different data sources and may not be consistent with other Fund literature. |
Matthews Asia ESG Fund
Portfolio Manager Commentary (unaudited) (continued)
During the fourth quarter, we initiated a position in IndusInd Bank, a large, well-run private sector bank in India ahead of its proposed share-swap merger with Bharat Financial Inclusion, a micro-finance company that has been part of the portfolio since the Fund’s inception. In the past, IndusInd Bank’s senior management team had led ABN AMRO, a Dutch bank known for its sustainable banking focus, in the region and has a strong sustainability focus. IndusInd Bank proposed to accelerate financial inclusion in rural India by marrying its robust balance sheet and low cost of funds advantage with Bharat Financial Inclusion’s best-in-class reach and operational expertise. At the same time, this merger also is expected to reduce the political risks microfinance institutions are subjected to occasionally in India.
We are also positive about the turnaround in India’s rural economy in general on account of growing farm incomes (due to better monsoons, better farm-produce pricing, loan waivers and improving irrigation facilities) and nonfarm incomes (direct benefit transfer programs, rural electrification and infrastructure programs). Therefore, during the fourth quarter we also added Mahindra & Mahindra, an Indian conglomerate with a strong ESG focus. Mahindra has a very strong and growing market share in areas such as tractors and light commercial vehicles, and also has a strong presence in rural financing through an affiliate and was very attractively valued.
Outlook:
The economic turnaround and accommodative monetary cycle that led to a remarkably smooth Asian equity market run in 2017, where every month of the year saw positive returns except for September, are largely still in place. After a strong 2017, the markets are not as attractively priced as at the beginning of 2017, but in aggregate they historically are not very expensive either. We continue to watch for signs of higher volatility, due to factors such as a strong pickup in inflation, which might cause central banks to raise interest rates or reduce liquidity much faster than expected. We also are watching for possible risks such as changes in U.S-China trade policies or any geopolitical flare-ups.
We continue to be confident in Asia’s ability to effectively address global ESG challenges through its leadership position in areas including electric vehicles, renewable energy and financial inclusion, among others. It is this leadership that provides an encouraging backdrop for pursuing ESG-focused investing in Asia. We will also continue to employ a fundamental, bottom-up investment process and use any market dislocation in Asia as an opportunity to buy what we consider to be high-quality companies with best-in-class ESG attributes at reasonable prices.
Matthews Asia ESG Fund
December 31, 2017
Schedule of Investmentsa
COMMON EQUITIES: 93.2%
| | | | | | | | |
| | | Shares | | | Value | |
| | | | | | | | |
| CHINA/HONG KONG: 21.7% | | | | | | | | |
Inner Mongolia Yili Industrial Group Co., Ltd. A Shares | | | 135,600 | | | | $670,090 | |
JD.com, Inc. ADRb | | | 13,300 | | | | 550,886 | |
MTR Corp., Ltd. | | | 73,500 | | | | 430,205 | |
Wuxi Biologics Cayman, Inc.b,c,d | | | 73,500 | | | | 411,111 | |
HKBN, Ltd. | | | 274,000 | | | | 346,496 | |
AIA Group, Ltd. | | | 31,800 | | | | 270,479 | |
CSPC Pharmaceutical Group, Ltd. | | | 130,000 | | | | 261,901 | |
China Conch Venture Holdings, Ltd. | | | 95,000 | | | | 219,785 | |
Hong Kong Exchanges & Clearing, Ltd. | | | 6,800 | | | | 208,000 | |
Guangdong Investment, Ltd. | | | 118,000 | | | | 157,766 | |
Haier Electronics Group Co., Ltd. | | | 55,000 | | | | 149,918 | |
Beijing Urban Construction Design & Development Group Co., Ltd. H Sharesc,d | | | 231,000 | | | | 133,962 | |
Qudian, Inc. ADRb | | | 8,900 | | | | 111,606 | |
| | | | | | | | |
Total China/Hong Kong | | | | | | | 3,922,205 | |
| | | | | | | | |
| | | | | | | | |
| INDIA: 15.1% | | | | | | | | |
Shriram City Union Finance, Ltd. | | | 19,376 | | | | 639,588 | |
Mahindra & Mahindra, Ltd. | | | 42,334 | | | | 497,354 | |
Lupin, Ltd. | | | 34,280 | | | | 475,042 | |
Bharat Financial Inclusion, Ltd.b | | | 21,869 | | | | 341,705 | |
IndusInd Bank, Ltd. | | | 10,492 | | | | 270,700 | |
Ipca Laboratories, Ltd. | | | 27,668 | | | | 259,352 | |
Power Grid Corp. of India, Ltd. | | | 79,217 | | | | 248,249 | |
| | | | | | | | |
Total India | | | | | | | 2,731,990 | |
| | | | | | | | |
| | | | | | | | |
| JAPAN: 13.9% | | | | | | | | |
Sohgo Security Services Co., Ltd. | | | 7,300 | | | | 396,759 | |
Tsukui Corp. | | | 43,700 | | | | 392,156 | |
Daikin Industries, Ltd. | | | 3,300 | | | | 389,938 | |
Fuji Seal International, Inc. | | | 10,400 | | | | 339,531 | |
Ain Holdings, Inc. | | | 3,700 | | | | 221,035 | |
Bunka Shutter Co., Ltd. | | | 22,500 | | | | 216,134 | |
Koa Corp. | | | 9,900 | | | | 203,904 | |
Koito Manufacturing Co., Ltd. | | | 2,600 | | | | 182,035 | |
Hoya Corp. | | | 3,200 | | | | 159,370 | |
| | | | | | | | |
Total Japan | | | | | | | 2,500,862 | |
| | | | | | | | |
| | | | | | | | |
| TAIWAN: 8.8% | | | | | | | | |
Taiwan Semiconductor Manufacturing Co., Ltd. | | | 77,000 | | | | 589,595 | |
Sitronix Technology Corp. | | | 101,000 | | | | 283,473 | |
Zhen Ding Technology Holding, Ltd. | | | 128,000 | | | | 280,266 | |
Tehmag Foods Corp. | | | 24,100 | | | | 190,315 | |
Merida Industry Co., Ltd. | | | 33,000 | | | | 138,280 | |
Sporton International, Inc. | | | 18,429 | | | | 99,376 | |
| | | | | | | | |
Total Taiwan | | | | | | | 1,581,305 | |
| | | | | | | | |
| | | | | | | | |
| SOUTH KOREA: 8.7% | | | | | | | | |
Hanon Systems | | | 40,255 | | | | 522,814 | |
KT Skylife Co., Ltd. | | | 29,102 | | | | 365,627 | |
iMarketKorea, Inc. | | | 34,262 | | | | 287,718 | |
DGB Financial Group, Inc. | | | 20,296 | | | | 199,717 | |
Samjin Pharmaceutical Co., Ltd. | | | 5,932 | | | | 198,648 | |
| | | | | | | | |
Total South Korea | | | | | | | 1,574,524 | |
| | | | | | | | |
| | | | | | | | |
| | | Shares | | | Value | |
| | | | | | | | |
| BANGLADESH: 5.8% | | | | | | | | |
BRAC Bank, Ltd. | | | 477,002 | | | | $626,346 | |
GrameenPhone, Ltd. | | | 40,983 | | | | 233,293 | |
Square Pharmaceuticals, Ltd. | | | 48,951 | | | | 178,665 | |
| | | | | | | | |
Total Bangladesh | | | | | | | 1,038,304 | |
| | | | | | | | |
| | | | | | | | |
| INDONESIA: 4.8% | | | | | | | | |
PT Bank Rakyat Indonesia Persero | | | 2,365,400 | | | | 633,279 | |
PT Arwana Citramulia | | | 5,567,000 | | | | 139,801 | |
PT BFI Finance Indonesia | | | 2,000,900 | | | | 100,285 | |
| | | | | | | | |
Total Indonesia | | | | | | | 873,365 | |
| | | | | | | | |
| | | | | | | | |
| SINGAPORE: 4.1% | | | | | | | | |
SATS, Ltd. | | | 61,000 | | | | 236,754 | |
Raffles Medical Group, Ltd. | | | 255,800 | | | | 214,211 | |
Delfi, Ltd. | | | 156,000 | | | | 165,629 | |
Parkway Life REIT | | | 56,900 | | | | 127,059 | |
| | | | | | | | |
Total Singapore | | | | | | | 743,653 | |
| | | | | | | | |
| | | | | | | | |
| THAILAND: 3.4% | | | | | | | | |
Total Access Communication Public Co., Ltd. NVDRb | | | 296,800 | | | | 445,230 | |
Kasikornbank Public Co., Ltd. NVDR | | | 24,100 | | | | 171,166 | |
| | | | | | | | |
Total Thailand | | | | | | | 616,396 | |
| | | | | | | | |
| | | | | | | | |
| PHILIPPINES: 3.0% | | | | | | | | |
Puregold Price Club, Inc. | | | 353,330 | | | | 353,398 | |
Security Bank Corp. | | | 37,580 | | | | 189,255 | |
| | | | | | | | |
Total Philippines | | | | | | | 542,653 | |
| | | | | | | | |
| | | | | | | | |
| PAKISTAN: 1.6% | | | | | | | | |
Abbott Laboratories Pakistan, Ltd. | | | 27,650 | | | | 174,797 | |
Bank Alfalah, Ltd.b | | | 276,500 | | | | 106,491 | |
| | | | | | | | |
Total Pakistan | | | | | | | 281,288 | |
| | | | | | | | |
| | | | | | | | |
| VIETNAM: 1.4% | | | | | | | | |
Nam Long Investment Corp. | | | 186,850 | | | | 247,663 | |
| | | | | | | | |
Total Vietnam | | | | | | | 247,663 | |
| | | | | | | | |
| | | | | | | | |
| LUXEMBOURG: 0.9% | | | | | | | | |
L’Occitane International SA | | | 91,750 | | | | 168,167 | |
| | | | | | | | |
Total Luxembourg | | | | | | | 168,167 | |
| | | | | | | | |
| | | | | | | | |
| TOTAL COMMON EQUITIES | | | | 16,822,375 | |
| | | | | | | | |
(Cost $14,146,987) | | | | | | | | |
| | | | |
| matthewsasia.com | 800.789.ASIA | | | 51 | |
Matthews Asia ESG Fund
December 31, 2017
Schedule of Investmentsa (continued)
PREFERRED EQUITIES: 6.0%
| | | | | | | | |
| | | Shares | | | Value | |
| | | | | | | | |
| SOUTH KOREA: 6.0% | | | | | | | | |
Samsung SDI Co., Ltd., Pfd. | | | 12,492 | | | | $1,089,478 | |
| | | | | | | | |
Total South Korea | | | | | | | 1,089,478 | |
| | | | | | | | |
| | | | | | | | |
| TOTAL PREFERRED EQUITIES | | | | | | | 1,089,478 | |
| | | | | | | | |
(Cost $738,028) | | | | | | | | |
| | | | | | | | |
| TOTAL INVESTMENTS: 99.2% | | | | | | | 17,911,853 | |
(Cost $14,885,015) | | | | | | | | |
| | | | | | | | |
CASH AND OTHER ASSETS,
LESS LIABILITIES: 0.8% | | | | | | | 142,026 | |
| | | | | | | | |
| | |
NET ASSETS: 100.0% | | | | | | | $18,053,879 | |
| | | | | | | | |
| a | Certain securities were fair valued under the valuation policies approved by the Board of Trustees (Note 2-A). |
| b | Non-income producing security. |
| c | Security exempt from registration under Rule 144A of the Securities Act of 1933, as amended. The security may be resold in transactions exempt from registration normally to qualified institutional buyers. The security has been determined to be liquid in accordance with procedures adopted by the Fund’s Board of Trustees. At December 31, 2017, the aggregate value is $545,073, which is 3.02% of net assets. |
| d | The securities may be resold to qualified foreign investors and foreign institutional buyers under Regulation S of the Securities Act of 1933. |
| ADR | American Depositary Receipt |
| NVDR | Non-voting Depositary Receipt |
| REIT | Real Estate Investment Trust |
See accompanying notes to financial statements.
| | | | |
| PORTFOLIO MANAGERS |
| Taizo Ishida | | Robert Harvey, CFA |
Lead Manager | | Lead Manager |
|
| FUND FACTS |
| | | Investor | | Institutional |
Ticker | | MEASX | | MIASX |
CUSIP | | 577125883 | | 577125875 |
Inception | | 4/30/13 | | 4/30/13 |
NAV | | $15.51 | | $15.57 |
Initial Investment | | $2,500 | | $100,000 |
Gross Expense Ratio1 | | 1.70% | | 1.52% |
After Fee Waiver and Reimbursement2 | | 1.48% | | 1.25% |
Portfolio Statistics |
Total # of Positions | | 77 |
Net Assets | | $494.8 million |
Weighted Average Market Cap | | $3.1 billion |
Portfolio Turnover3 | | 7.74% |
Benchmark |
MSCI Emerging Markets Asia Index |
Redemption Fee |
2% within first 90 calendar days of purchase |
OBJECTIVE
Long term capital appreciation.
STRATEGY
Under normal market conditions, the Fund seeks to achieve its investment objective by investing at least 80% of its total assets, which include borrowings for investment purposes, in the common and preferred stocks of companies located in Asia excluding Japan, South Korea, Hong Kong and Singapore. The Fund may also invest in the convertible securities, of any duration or quality of companies located in Asia excluding Japan, South Korea, Hong Kong and Singapore. Under normal market conditions, the Fund is expected to invest a substantial portion of its net assets in the emerging countries and markets in the Asian region, including, but not limited to, Bangladesh, Cambodia, China (including Taiwan, but excluding Hong Kong), India, Indonesia, Laos, Malaysia, Mongolia, Myanmar, Pakistan, Papua New Guinea, Philippines, Sri Lanka, Thailand, and Vietnam.
Matthews Emerging Asia Fund
Portfolio Manager Commentary (unaudited)
For the year ending December 31, 2017, the Matthews Emerging Asia Fund returned 18.42% (Investor Class) and 18.70% (Institutional Class), while its benchmark, the MSCI Emerging Markets Asia Index, returned 43.27%. For the fourth quarter of the year, the Fund returned 7.12% (Investor Class) and 7.25% (Institutional Class) versus 8.41% for the Index.
Market Environment:
Within Asia’s emerging markets, 2017 was a tale of two markets. The strongest performance took place in China, where the overall stock market rose 54% during the year. The worst performance took place in Pakistan, where the broader markets dropped by nearly -26%. Thus, we ended the year with highly divergent regional results. China’s outperformance was driven in part by positive investor sentiment toward China’s tech sector and strong flows into emerging market exchange traded funds (ETFs). China makes up roughly 40% of the MSCI Emerging Markets Asia benchmark. Leading large-cap technology names in China, such as Alibaba and Tencent, experienced enthusiastic buying from investors in 2017, requiring ETFs that track capitalization-weighted benchmarks to make large purchases of these index leaders to keep up. Pakistan, by contrast, experienced considerable negative investor sentiment in 2017. Former Prime Minister Nawaz Sharif was removed from office on corruption charges mid-year. The country also faced the prospect of a weakening currency driven by an imbalance of imports over exports, and rising oil prices. In addition, Pakistan moved from the “frontier” to “emerging” markets category for many indices during the year, but the country’s overall stock market represents only a very small slice of major indices. Following these index changes, Pakistan has not experienced major investment inflows from ETFs and it has mostly been ignored because of its small weighting in emerging markets indices. We reflect on conditions in these two particular markets because they illustrate some of the extreme differences in financial returns across the region in 2017.
Performance Contributors and Detractors:
The Fund delivered attractive absolute performance in 2017, but underperformed its benchmark. The Fund was underweight China relative to its benchmark and overweight Pakistan which detracted from performance. Our bottom-up stock selection process is focused on offering exposure to Asia’s least developed economies such as India, Bangladesh and Vietnam, and is benchmark-agnostic by design. Among our top-performing securities, PC Jeweller based in India, benefited from a robust local jewelry market as well as positive political and market sentiment. BRAC Bank, Ltd. in Bangladesh owns 51% of bKash, a mobile-payment company which has more customers than the entire brick-and-mortar banking system in Bangladesh. Balkrishna Industries in India runs a highly profitable business creating specialized tires for companies such as John Deere. And Phu Nhuan Jewelry in Vietnam is growing its store base, while also increasing same-store sales. These are all examples of solid local businesses with attractive long-term prospects. The largest detractors from performance in 2017 were the Fund’s holding in Pakistan. Among the Fund’s bottom 10 performers, five are based in Pakistan, where negative investor sentiment has dragged down the stock prices of all companies, even those with good business models. We believe Pakistan is likely to remain under negative political and macro
(continued)
| 1 | Actual 2017 expense ratios. |
| 2 | Matthews has contractually agreed (i) to waive fees and reimburse expenses to the extent needed to limit Total Annual Fund Operating Expenses (excluding Rule 12b-1 fees, taxes, interest, brokerage commissions, short sale dividend expenses, expenses incurred in connection with any merger or reorganization or extraordinary expenses such as litigation) of the Institutional Class to 1.25% first by waiving class specific expenses (i.e., shareholder service fees specific to a particular class) of the Institutional Class and then, to the extent necessary, by waiving non-class specific expenses of the Institutional Class, and (ii) if any Fund-wide expenses (i.e., expenses that apply to both the Institutional Class and the Investor Class) are waived for the Institutional Class to maintain the 1.25% expense limitation, to waive an equal amount (in annual percentage terms) of those same expenses for the Investor Class. The Total Annual Fund Operating Expenses After Fee Waiver and Expense Reimbursement for the Investor Class may vary from year to year and will in some years exceed 1.25%. If the operating expenses fall below the expense limitation in a year within three years after Matthews has made a waiver or reimbursement, the Fund may reimburse Matthews up to an amount that does not cause the expenses for that year to exceed the lesser of (i) the expense limitation applicable at the time of that fee waiver and/or expense reimbursement or (ii) the expense limitation in effect at the time of recoupment. This agreement will remain in place until April 30, 2019 and may be terminated at any time by the Board of Trustees on behalf of the Fund on 60 days’ written notice to Matthews. Matthews may decline to renew this agreement by written notice to the Trust at least 30 days before its annual expiration date. |
| 3 | The lesser of fiscal year 2017 long-term purchase costs or sales proceeds divided by the average monthly market value of long-term securities. |
| | | | |
| matthewsasia.com | 800.789.ASIA | | | 53 | |
| | | | | | | | | | | | | | | | | | | | |
| |
| PERFORMANCE AS OF DECEMBER 31, 2017 | |
| | | | | | | | | Average Annual
Total Returns | | | | |
| | | 3 Months | | | 1 Year | | | 3 Years | | | Since
Inception | | | Inception
Date | |
| Investor Class (MEASX) | | | 7.12% | | | | 18.42% | | | | 11.23% | | | | 10.67% | | | | 4/30/13 | |
| Institutional Class (MIASX) | | | 7.25% | | | | 18.70% | | | | 11.51% | | | | 10.92% | | | | 4/30/13 | |
| MSCI Emerging Markets Asia Index4 | | | 8.41% | | | | 43.27% | | | | 11.38% | | | | 8.84% | | | | | |
| Lipper Emerging Markets Funds Category Average5 | | | 6.26% | | | | 34.57% | | | | 7.98% | | | | 4.25% | | | | | |
Performance assumes reinvestment of all dividends and/or distributions before taxes. All performance quoted represents past performance and is no guarantee of future results. Investment return and principal value will fluctuate with market conditions so that when redeemed, shares may be worth more or less than their original cost. Current performance may be lower or higher than the return figures quoted. Returns would have been lower if certain of the Fund’s fees and expenses had not been waived. For the Fund’s most recent month-end performance visit matthewsasia.com.
GROWTH OF A $10,000 INVESTMENT SINCE INCEPTION—INVESTOR CLASS
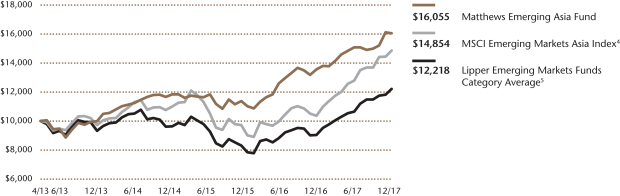
Plotted monthly. The performance data and graph do not reflect the deduction of taxes that a shareholder would pay on dividends, capital gain distributions or redemption of Fund shares. Values are in US$.
| | 4 | It is not possible to invest directly in an index. Source: Index data from Morgan Stanley Capital International and Bloomberg; total return calculations performed by BNY Mellon Investment Servicing (US) Inc. Please see page 92 for index definition. |
| | 5 | The Lipper Category Average does not reflect sales charges and is based on total return, including reinvestment of dividends and capital gains for the stated periods. |
| | | | | | | | |
| | | | |
| TOP TEN HOLDINGS6 | | | | | | | |
| | | Sector | | Country | | % of Net Assets | |
PC Jeweller, Ltd. | | Consumer Discretionary | | India | | | 3.6% | |
Shenzhou International Group Holdings, Ltd. | | Consumer Discretionary | | China/Hong Kong | | | 3.4% | |
Saigon Beer Alcohol Beverage Corp. | | Consumer Staples | | Vietnam | | | 3.2% | |
Cosco Capital, Inc. | | Consumer Staples | | Philippines | | | 3.2% | |
BRAC Bank, Ltd. | | Financials | | Bangladesh | | | 3.0% | |
PT Bank Mandiri Persero | | Financials | | Indonesia | | | 2.9% | |
Masan Group Corp. | | Consumer Staples | | Vietnam | | | 2.5% | |
Phu Nhuan Jewelry JSC | | Consumer Discretionary | | Vietnam | | | 2.5% | |
Balkrishna Industries, Ltd. | | Consumer Discretionary | | India | | | 2.4% | |
British American Tobacco Bangladesh Co., Ltd. | | Consumer Staples | | Bangladesh | | | 2.3% | |
% OF ASSETS IN TOP TEN | | | | | | | 29.0% | |
| | 6 | Holdings may combine more than one security from same issuer and related depositary receipts. |
Matthews Emerging Asia Fund
Portfolio Manager Commentary (unaudited) (continued)
pressures for another six to 12 months, yet we remain cautiously optimistic about our individual holdings in Pakistan for the long term. Accordingly, we did not make meaningful changes to our securities holdings in Pakistan in 2017.
Notable Portfolio Changes:
Qudian was a material addition to the portfolio in the fourth quarter of 2017. As a U.S.-listed microlender in China, Qudian conducts online lending. Over the short term, the company’s stock price had sharp negative performance in reaction to the Chinese government’s new guidance over prospective regulations for microlenders. We also increased our exposure to Pakistan’s K-Electric, which supplies energy to about half the city of Karachi. K-Electric is a turnaround story of a company improving its management and operations. The stock was priced very reasonably compared to its earning potential, so we expanded our position throughout the year. We also sold some securities during the year, including National Development Bank in Sri Lanka. National Development Bank experienced various issues, including disappointing earnings and the unexpected departure of its CEO. As the Fund has grown, we have made an effort to reduce our exposure to illiquid securities, including National Development Bank. We also sold most of our small position in Indonesian convenience store retailer Alfamart, whose stock is listed as Sumber Alfaria Trijaya, another illiquid security with what we believe is an increasingly overvalued stock price.
Outlook:
Looking toward 2018, we will continue to hunt for companies with strong earnings growth and attractive valuations. In our view, these are more likely to come from smaller, lesser-known companies. Synchronized global growth (U.S., China, Europe) is driving positive trade flows, supportive for commodities and lower risk premiums. Rising wages in China should result in a continuing flow of low-cost manufacturing jobs into ASEAN and Asia’s frontier countries. The fundamentals for smaller Asian markets remain supportive and we are cautiously optimistic for the future. A promising global environment is driving positive sentiment toward emerging markets, which could result in solid flows into the region, possibly impacting companies that are larger constituents of regional indices. Investment flows into passive funds have been a material driver of performance for some markets, and bullishness remains as investors talk about the “stars aligning” for emerging markets. When sentiment eventually turns sour, however, the resulting passive fund outflows could create substantial market volatility. With regard to finding attractive valuations among smaller-cap names through our active stock-selection process, Indonesia and the Philippines are two markets we are closely watching. Indonesia has been politically stable and we think the run-up to the upcoming election cycle will create more spending on both infrastructure and domestic consumption. In the Philippines, we are discovering individual companies we find attractive. Both markets afford opportunities to buy the type of smaller, under-the-radar companies we tend to invest in—those with attractive valuations and strong long-term growth potential driven by fast-growing economies.
| | | | |
| |
| COUNTRY ALLOCATION (%)7,8 | |
| Vietnam | | | 19.6 | |
| Pakistan | | | 13.3 | |
| Indonesia | | | 12.9 | |
| India | | | 12.6 | |
| Bangladesh | | | 11.6 | |
| China/Hong Kong | | | 8.3 | |
| Philippines | | | 7.7 | |
| Sri Lanka | | | 7.5 | |
| Singapore | | | 0.8 | |
| Australia | | | 0.6 | |
| Thailand | | | 0.3 | |
| Cash and Other Assets, Less Liabilities | | | 4.8 | |
| | | | |
| |
| SECTOR ALLOCATION (%)8 | |
| Consumer Staples | | | 29.7 | |
| Consumer Discretionary | | | 24.8 | |
| Financials | | | 15.4 | |
| Industrials | | | 7.4 | |
| Health Care | | | 6.8 | |
| Real Estate | | | 3.5 | |
| Materials | | | 3.4 | |
| Information Technology | | | 1.4 | |
| Utilities | | | 1.4 | |
| Energy | | | 1.4 | |
| Cash and Other Assets, Less Liabilities | | | 4.8 | |
| | | | |
| |
| MARKET CAP EXPOSURE (%)8 | |
| Mega Cap (over $25B) | | | 2.9 | |
| Large Cap ($10B–$25B) | | | 5.5 | |
| Mid Cap ($3B–10B) | | | 13.6 | |
| Small Cap (under $3B) | | | 73.2 | |
| Cash and Other Assets, Less Liabilities | | | 4.8 | |
| 7 | Not all countries where the Fund may invest are included in the benchmark index. |
| 8 | Source: FactSet Research Systems. Percentage values in data are rounded to the nearest tenth of one percent, so the values may not sum to 100% due to rounding. Percentage values may be derived from different data sources and may not be consistent with other Fund literature. |
| | | | |
| matthewsasia.com | 800.789.ASIA | | | 55 | |
Matthews Emerging Asia Fund
December 31, 2017
Schedule of Investmentsa
COMMON EQUITIES: 95.2%
| | | | | | | | |
| | | Shares | | | Value | |
| VIETNAM: 19.6% | |
Saigon Beer Alcohol Beverage Corp. | | | 1,462,000 | | | | $15,976,543 | |
Masan Group Corp. | | | 3,707,680 | | | | 12,504,411 | |
Phu Nhuan Jewelry JSC | | | 2,063,683 | | | | 12,449,891 | |
Vinh Hoan Corp.b | | | 4,421,900 | | | | 10,378,584 | |
Nam Long Investment Corp. | | | 6,232,507 | | | | 8,260,974 | |
Mobile World Investment Corp. | | | 1,020,454 | | | | 5,879,707 | |
Tien Phong Plastic JSC | | | 1,861,224 | | | | 5,737,183 | |
Thien Long Group Corp. | | | 1,178,125 | | | | 5,298,256 | |
Military Commercial Joint Stock Bank | | | 4,707,780 | | | | 5,265,649 | |
National Seed JSC† | | | 979,585 | | | | 4,671,674 | |
Domesco Medical Import Export JSC | | | 842,780 | | | | 4,249,387 | |
Taisun International Holding Corp. | | | 654,000 | | | | 2,791,068 | |
Lix Detergent JSC | | | 1,168,815 | | | | 2,218,324 | |
Dinh Vu Port Investment & Development JSC | | | 517,550 | | | | 1,452,771 | |
| | | | | | | | |
Total Vietnam | | | | | | | 97,134,422 | |
| | | | | | | | |
| | | | | | | | |
| PAKISTAN: 13.3% | |
Indus Motor Co., Ltd. | | | 682,950 | | | | 10,398,479 | |
PAK Suzuki Motor Co., Ltd. | | | 1,663,250 | | | | 7,502,637 | |
K-Electric, Ltd.b | | | 122,221,500 | | | | 6,988,833 | |
Shifa International Hospitals, Ltd. | | | 2,519,051 | | | | 6,892,233 | |
Hascol Petroleum, Ltd. | | | 2,966,300 | | | | 6,640,641 | |
The Searle Company, Ltd. | | | 1,452,834 | | | | 4,134,208 | |
Pakistan Petroleum, Ltd. | | | 2,127,300 | | | | 3,958,856 | |
Akzo Nobel Pakistan, Ltd. | | | 1,975,300 | | | | 3,812,768 | |
GlaxoSmithKline Consumer Healthcare Pakistan, Ltd.b | | | 1,098,957 | | | | 3,229,549 | |
ICI Pakistan, Ltd. | | | 451,900 | | | | 3,130,619 | |
Habib Bank, Ltd. | | | 1,885,000 | | | | 2,854,233 | |
National Foods, Ltd. | | | 958,500 | | | | 2,815,653 | |
Meezan Bank, Ltd. | | | 3,472,560 | | | | 2,111,543 | |
Hum Network, Ltd. | | | 17,939,500 | | | | 1,328,190 | |
| | | | | | | | |
Total Pakistan | | | | | | | 65,798,442 | |
| | | | | | | | |
| | | | | | | | |
| INDONESIA: 12.9% | |
PT Bank Mandiri Persero | | | 24,454,000 | | | | 14,399,895 | |
PT Gudang Garam | | | 1,731,000 | | | | 10,691,564 | |
PT Kino Indonesia | | | 62,128,100 | | | | 9,732,560 | |
PT Matahari Department Store | | | 9,141,500 | | | | 6,715,655 | |
PT Adira Dinamika Multi Finance | | | 11,372,900 | | | | 5,965,659 | |
PT Hexindo Adiperkasa | | | 22,802,000 | | | | 5,030,653 | |
PT BFI Finance Indonesia | | | 73,579,500 | | | | 3,687,788 | |
PT Mayora Indah | | | 24,273,200 | | | | 3,613,920 | |
PT Catur Sentosa Adiprana | | | 70,131,000 | | | | 2,346,746 | |
PT Sumber Alfaria Trijaya | | | 37,265,200 | | | | 1,679,660 | |
| | | | | | | | |
Total Indonesia | | | | | | | 63,864,100 | |
| | | | | | | | |
| | | | | | | | |
| | | | | | | | |
| | | Shares | | | Value | |
| INDIA: 12.6% | |
PC Jeweller, Ltd. | | | 2,519,017 | | | | $17,974,962 | |
Balkrishna Industries, Ltd. | | | 649,064 | | | | 12,119,343 | |
Praj Industries, Ltd. | | | 3,594,497 | | | | 6,298,923 | |
Shriram Transport Finance Co., Ltd. | | | 268,352 | | | | 6,220,448 | |
Caplin Point Laboratories, Ltd. | | | 489,805 | | | | 4,834,206 | |
Kwality, Ltd. | | | 2,533,204 | | | | 4,473,081 | |
Supreme Industries, Ltd. | | | 178,934 | | | | 3,615,865 | |
VST Industries, Ltd. | | | 60,083 | | | | 3,016,692 | |
Cipla India, Ltd. | | | 311,919 | | | | 2,965,766 | |
Poly Medicure, Ltd. | | | 234,582 | | | | 1,026,314 | |
| | | | | | | | |
Total India | | | | | | | 62,545,600 | |
| | | | | | | | |
| | | | | | | | |
| BANGLADESH: 11.6% | |
BRAC Bank, Ltd. | | | 11,209,139 | | | | 14,718,595 | |
British American Tobacco Bangladesh Co., Ltd. | | | 278,950 | | | | 11,497,981 | |
Square Pharmaceuticals, Ltd. | | | 2,626,233 | | | | 9,585,453 | |
The City Bank, Ltd. | | | 9,945,509 | | | | 6,398,804 | |
Berger Paints Bangladesh, Ltd. | | | 251,708 | | | | 6,279,953 | |
Olympic Industries, Ltd. | | | 1,416,833 | | | | 4,939,960 | |
Marico Bangladesh, Ltd. | | | 289,217 | | | | 3,868,818 | |
| | | | | | | | |
Total Bangladesh | | | | | | | 57,289,564 | |
| | | | | | | | |
| | | | | | | | |
| CHINA/HONG KONG: 8.3% | |
Shenzhou International Group Holdings, Ltd. | | | 1,761,000 | | | | 16,726,305 | |
Luk Fook Holdings International, Ltd. | | | 1,986,000 | | | | 8,512,655 | |
Tongda Group Holdings, Ltd. | | | 27,650,000 | | | | 7,047,272 | |
Red Star Macalline Group Corp., Ltd. H Sharesc,d | | | 2,429,000 | | | | 3,935,970 | |
Qudian, Inc. ADRb | | | 245,600 | | | | 3,079,824 | |
Future Bright Holdings, Ltd. | | | 18,612,000 | | | | 1,715,205 | |
The 13 Holdings, Ltd.b | | | 5,608,000 | | | | 225,319 | |
| | | | | | | | |
Total China/Hong Kong | | | | | | | 41,242,550 | |
| | | | | | | | |
| | | | | | | | |
| PHILIPPINES: 7.7% | |
Cosco Capital, Inc. | | | 103,552,400 | | | | 15,972,626 | |
STI Education Systems Holdings, Inc. | | | 254,154,000 | | | | 8,298,698 | |
San Miguel Pure Foods Co., Inc. | | | 753,370 | | | | 7,983,428 | |
Emperador, Inc. | | | 28,727,700 | | | | 4,229,739 | |
Vista Land & Lifescapes, Inc. | | | 12,519,100 | | | | 1,502,192 | |
| | | | | | | | |
Total Philippines | | | | | | | 37,986,683 | |
| | | | | | | | |
| | | | | | | | |
| SRI LANKA: 7.5% | |
Sampath Bank PLC | | | 5,289,790 | | | | 10,879,392 | |
Ceylon Cold Stores PLC | | | 1,364,787 | | | | 8,445,676 | |
John Keells Holdings PLC | | | 7,687,955 | | | | 7,437,533 | |
Teejay Lanka PLC | | | 18,872,680 | | | | 4,182,405 | |
Expolanka Holdings PLC | | | 94,231,424 | | | | 3,253,593 | |
Ceylon Tobacco Co. PLC | | | 359,928 | | | | 2,355,360 | |
Lanka Orix Leasing Co. PLCb | | | 573,466 | | | | 430,906 | |
| | | | | | | | |
Total Sri Lanka | | | | | | | 36,984,865 | |
| | | | | | | | |
| | | | | | | | |
Matthews Emerging Asia Fund
December 31, 2017
Schedule of Investmentsa (continued)
COMMON EQUITIES (continued)
| | | | | | | | |
| | | Shares | | | Value | |
| SINGAPORE: 0.8% | |
Yoma Strategic Holdings, Ltd.
| | | 9,489,466 | | | | $3,820,598 | |
| | | | | | | | |
Total Singapore | | | | | | | 3,820,598 | |
| | | | | | | | |
| | | | | | | | |
| AUSTRALIA: 0.6% | |
Oil Search, Ltd. | | | 467,309 | | | | 2,829,373 | |
| | | | | | | | |
Total Australia | | | | | | | 2,829,373 | |
| | | | | | | | |
| | | | | | | | |
| THAILAND: 0.3% | |
SNC Former Public Co., Ltd. | | | 4,002,800 | | | | 1,717,100 | |
| | | | | | | | |
Total Thailand | | | | | | | 1,717,100 | |
| | | | | | | | |
| | | | | | | | |
| TOTAL INVESTMENTS: 95.2% | | | | 471,213,297 | |
(Cost $387,113,577) | | | | | | | | |
| | | | | | | | |
CASH AND OTHER ASSETS,
LESS LIABILITIES: 4.8% | | | | | | | 23,615,720 | |
| | | | | | | | |
| | |
NET ASSETS: 100.0% | | | | | | | $494,829,017 | |
| | | | | | | | |
| a | Certain securities were fair valued under the valuation policies approved by the Board of Trustees (Note 2-A). |
| b | Non-income producing security. |
| c | Security exempt from registration under Rule 144A of the Securities Act of 1933, as amended. The security may be resold in transactions exempt from registration normally to qualified institutional buyers. The security has been determined to be liquid in accordance with procedures adopted by the Fund’s Board of Trustees. At December 31, 2017, the aggregate value is $3,935,970, which is 0.80% of net assets. |
| d | The securities may be resold to qualified foreign investors and foreign institutional buyers under Regulation S of the Securities Act of 1933. |
| † | Affiliated Issuer, as defined under the Investment Company Act of 1940 (ownership of 5% or more of the outstanding voting securities of this issuer) |
| ADR | American Depositary Receipt |
See accompanying notes to financial statements.
| | | | |
| matthewsasia.com | 800.789.ASIA | | | 57 | |
| | | | |
| PORTFOLIO MANAGERS |
| Michael J. Oh, CFA | | |
Lead Manager | | | | |
| Lydia So, CFA | | Robert Harvey, CFA |
Co-Manager | | Co-Manager |
| | |
| FUND FACTS | | | | |
| | | Investor | | Institutional |
Ticker | | MATFX | | MITEX |
CUSIP | | 577130883 | | 577125859 |
Inception | | 12/27/99 | | 4/30/13 |
NAV | | $14.19 | | $14.26 |
Initial Investment | | $2,500 | | $100,000 |
Gross Expense Ratio1 | | 1.24% | | 1.05% |
Portfolio Statistics | | | | |
Total # of Positions | | 40 |
Net Assets | | $206.3 million |
Weighted Average Market Cap | | $109.8 billion |
Portfolio Turnover2 | | 66.51% |
Benchmark | | | | |
MSCI AC Asia ex Japan Index |
OBJECTIVE
Long-term capital appreciation.
STRATEGY
Under normal market conditions, the Fund seeks to achieve its investment objective by investing at least 80% of its net assets, which include borrowings for investment purposes, in the common and preferred stocks of companies located in Asia that Matthews believes are innovators in their products, services, processes, business models, management, use of technology, or approach to creating, expanding or servicing their markets. Asia consists of all countries and markets in Asia, including developed, emerging, and frontier countries and markets in the Asian region.
Matthews Asia Innovators Fund
Portfolio Manager Commentary (unaudited)
For the year ending December 31, 2017, the Matthews Asia Innovators Fund returned 52.88% (Investor Class) and 53.18% (Institutional Class), while its benchmark, the MSCI All Country Asia ex Japan Index, returned 42.08%. For the fourth quarter of the year, the Fund returned 9.67% (Investor Class) and 9.69% (Institutional Class) versus 8.27% for the Index.
Market Environment:
Asia equity markets showed strong performance in 2017, as the region comfortably digested three rate increases by the U.S. Federal Reserve. At the beginning of the year, U.S. President Trump’s rhetoric toward trade relations with China was highly protectionist, creating uncertainty and unease among investors. As the year progressed, however, worries abated of a trade war between the U.S. and China. Investor sentiment greatly improved by year end. The overall growth in the global economy had a positive impact on Asia. Asian currencies strengthened during the year and markets remained relatively calm, despite military tensions in North Korea and the absence of specifics around Trump’s future trade policies with Asia. Amid the geopolitical risks, the fundamentals of companies we invest in remained solid. Corporate earnings were strong in 2017—especially within the internet and technology sectors. We expect this trend to continue into 2018. Meanwhile, consumption in China is holding up well, especially in the services industry. As household incomes rose, consumers in Asia upgraded their products, creating attractive opportunities for innovative companies in the region. We remain optimistic in our outlook for innovative companies as we expect growth drivers for Asia’s economies to continue to shift from labor and capital inputs to productivity gains driven by innovation.
Performance Contributors and Detractors:
Our top-performing securities represent a diverse group of sectors, including consumer discretionary, financials and health care. This diversity of sectors illustrates how innovation across Asia is taking place in a broad range of industries and businesses beyond information technology. Two notable companies that made a positive contribution to performance during the year were TAL Education Group and Jiangsu Hengrui Medicine. TAL Education Group provides afterschool education services in China, including college preparation study courses. As discretionary spending in China continues to rise, many families are spending that extra money on education, as well as health care. TAL Education Group has a strong online education platform, making their business model scalable for future growth.
We believe Hengrui Medicine is at the forefront of innovation in China’s growing pharmaceutical industry. In our view, Hengrui has the potential to become a global pharmaceutical leader. China is already one of the world’s largest pharmaceutical markets and it continues to expand its reach.
Securities that detracted from performance were not necessarily clustered around any specific sectors or geographic exposures. Rather, detractors from performance were simply companies that had lost a competitive edge within their respective industries or were facing new headwinds in their business models. The Fund’s worst-performing securities for the year included Momo and China Biologic Products. We ultimately exited both positions in 2017, changes we discuss in the next section.
Notable Portfolio Changes:
In 2017, we expanded our exposure to the financials sector, and our holdings in this sector were a positive contributor to performance. Ping An, for example, is an
(continued)
| 1 | Actual 2017 expense ratios. |
| 2 | The lesser of fiscal year 2017 long-term purchase costs or sales proceeds divided by the average monthly market value of long-term securities. |
| | | | | | | | | | | | | | | | | | | | | | | | | | | | |
| | | | | | | | |
| PERFORMANCE AS OF DECEMBER 31, 2017 | | | | | | | | | | | | | | | | | | | | | |
| | | | | | | | | Average Annual Total Returns | | | | |
| | | 3 Months | | | 1 Year | | | 3 Years | | | 5 Years | | | 10 Years | | | Since
Inception | | | Inception
Date | |
| Investor Class (MATFX) | | | 9.67% | | | | 52.88% | | | | 13.24% | | | | 16.55% | | | | 7.46% | | | | 4.28% | | | | 12/27/99 | |
| Institutional Class (MITEX) | | | 9.69% | | | | 53.18% | | | | 13.44% | | | | n.a. | | | | n.a. | | | | 15.98% | | | | 4/30/13 | |
| MSCI AC Asia ex Japan Index3 | | | 8.27% | | | | 42.08% | | | | 11.03% | | | | 8.26% | | | | 4.11% | | | | 7.07% | 4 | | | | |
| Lipper Pacific ex Japan Funds Category Average5 | | | 8.50% | | | | 39.66% | | | | 10.19% | | | | 7.61% | | | | 4.23% | | | | 6.69% | 4 | | | | |
Performance assumes reinvestment of all dividends and/or distributions before taxes. All performance quoted represents past performance and is no guarantee of future results. Investment return and principal value will fluctuate with market conditions so that when redeemed, shares may be worth more or less than their original cost. Current performance may be lower or higher than the return figures quoted. For the Fund’s most recent month-end performance, visit matthewsasia.com.
GROWTH OF A $10,000 INVESTMENT SINCE INCEPTION—INVESTOR CLASS
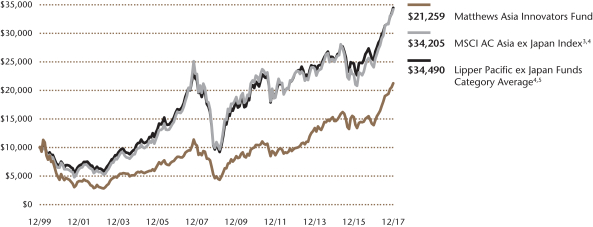
Plotted monthly. The performance data and graph do not reflect the deduction of taxes that a shareholder would pay on dividends, capital gains distributions or redemption of Fund shares. Values are in US$.
| | 3 | It is not possible to invest directly in an index. Source: Index data from Morgan Stanley Capital International and Bloomberg; total return calculations performed by BNY Mellon Investment Servicing (US) Inc. Please see page 92 for index definition. |
| | 4 | Calculated from 12/31/99. |
| | 5 | The Lipper Category Average does not reflect sales charges and is based on total return, including reinvestment of dividends and capital gains for the stated periods. |
| | | | | | | | |
| | | | |
| TOP TEN HOLDINGS6 | | | | | | | |
| | | Sector | | Country | | % of Net Assets | |
| Tencent Holdings, Ltd. | | Information Technology | | China/Hong Kong | | | 5.0% | |
| Ping An Insurance Group Co. of China, Ltd. | | Financials | | China/Hong Kong | | | 4.7% | |
| Jiangsu Hengrui Medicine Co., Ltd. | | Health Care | | China/Hong Kong | | | 4.3% | |
| Alibaba Group Holding, Ltd. | | Information Technology | | China/Hong Kong | | | 4.3% | |
| HDFC Bank, Ltd. | | Financials | | India | | | 3.8% | |
| Samsung Electronics Co., Ltd., Pfd. | | Information Technology | | South Korea | | | 3.6% | |
| Wuliangye Yibin Co., Ltd. | | Consumer Staples | | China/Hong Kong | | | 3.2% | |
| NAVER Corp. | | Information Technology | | South Korea | | | 3.1% | |
| Midea Group Co., Ltd. | | Consumer Discretionary | | China/Hong Kong | | | 3.1% | |
| Taiwan Semiconductor Manufacturing Co., Ltd. | | Information Technology | | Taiwan | | | 2.9% | |
| % OF ASSETS IN TOP TEN | | | | | | | 38.0% | |
| | 6 | Holdings may combine more than one security from same issuer and related depositary receipts. |
| | | | |
| matthewsasia.com | 800.789.ASIA | | | 59 | |
| | | | |
| | |
| COUNTRY ALLOCATION (%)7,8 | | | |
| China/Hong Kong | | | 49.7 | |
| South Korea | | | 20.1 | |
| India | | | 10.8 | |
| Indonesia | | | 3.0 | |
| Taiwan | | | 2.9 | |
| Bangladesh | | | 2.9 | |
| Thailand | | | 2.8 | |
| Vietnam | | | 2.8 | |
| Philippines | | | 1.4 | |
| Cash and Other Assets, Less Liabilities | | | 3.6 | |
| | | | |
| | |
| SECTOR ALLOCATION (%)8 | | | |
| Financials | | | 30.1 | |
| Information Technology | | | 27.7 | |
| Consumer Discretionary | | | 17.1 | |
| Consumer Staples | | | 11.4 | |
| Health Care | | | 8.5 | |
| Industrials | | | 1.4 | |
| Cash and Other Assets, Less Liabilities | | | 3.6 | |
| | | | |
| | |
| MARKET CAP EXPOSURE (%)8 | | | |
| Mega Cap (over $25B) | | | 57.7 | |
| Large Cap ($10B–$25B) | | | 16.2 | |
| Mid Cap ($3B–10B) | | | 7.7 | |
| Small Cap (under $3B) | | | 14.8 | |
| Cash and Other Assets, Less Liabilities | | | 3.6 | |
| | 7 | Not all countries are included in the benchmark index(es). |
| | 8 | Source: FactSet Research Systems. Percentage values in data are rounded to the nearest tenth of one percent, so the values may not sum to 100% due to rounding. Percentage values may be derived from different data sources and may not be consistent with other Fund literature. |
Matthews Asia Innovators Fund
Portfolio Manager Commentary (unaudited) (continued)
insurance company with an innovative technology platform. Serving hundreds of millions of users, Ping An offers several different apps to help consumers. The apps serve as a complementary offering to their traditional insurance products. We think the firm’s approach is highly differentiated in the marketplace because it marries traditional insurance services with a mobile interface. Also in the financials sector, we added HDFC Bank of India. As a private bank, HDFC is taking market share from India’s state-owned banks and benefiting from financial reforms that are directing increased liquidity into the formal, taxable economy. We sold our position in Momo, a Chinese social media platform, because we did not see the growth we expected from the company. Compared to other internet platforms in China, Momo has generated weak performance and lost its competitive edge, in our view. We also sold China Biologic Products because we saw worrying signs of deteriorating corporate governance issues.
Outlook:
Our outlook for 2018 is positive for Asia’s technology, financials and consumer sectors. Fundamentals for technology companies remain strong and we expect the sector to continue to perform well, even though it may not match its 2017 performance. The financial services sector also is poised for continued growth. Many households in Asia lack basic banking services and reaching underserved consumers via mobile and other technologies represents a significant opportunity for financial services companies. A key trend we continue to watch in the consumer sector is the rise of the middle class. As incomes rise, consumers tend to spend more on entertainment, travel, health care and on products and services that improve their enjoyment and quality of life. Keeping an eye on regional politics, we expect China’s relationship with South Korea to improve. Trading relationships should resume and deepen. With regard to military tensions with North Korea, we believe Kim Jong Un’s regime is focused primarily on its own survival. If the U.S. and North Korea were to hold talks in 2018, that would be a highly positive development for stability and economic growth across the region.
Matthews Asia Innovators Fund
December 31, 2017
Schedule of Investmentsa
COMMON EQUITIES: 92.8%
| | | | | | | | |
| | | Shares | | | Value | |
| | | | | | | | |
| CHINA/HONG KONG: 49.7% | |
Tencent Holdings, Ltd. | | | 198,600 | | | | $10,279,130 | |
Ping An Insurance Group Co. of China, Ltd. H Shares | | | 940,000 | | | | 9,749,745 | |
Jiangsu Hengrui Medicine Co., Ltd. A Shares | | | 829,388 | | | | 8,782,804 | |
Alibaba Group Holding, Ltd. ADRb | | | 50,900 | | | | 8,776,687 | |
Wuliangye Yibin Co., Ltd. A Shares | | | 537,099 | | | | 6,586,348 | |
Midea Group Co., Ltd. A Shares | | | 756,809 | | | | 6,431,611 | |
AIA Group, Ltd. | | | 691,000 | | | | 5,877,402 | |
TAL Education Group ADR | | | 183,600 | | | | 5,454,756 | |
China Construction Bank Corp. H Shares | | | 5,911,000 | | | | 5,441,387 | |
NetEase, Inc. ADR | | | 15,600 | | | | 5,383,092 | |
Ctrip.com International, Ltd. ADRb | | | 107,300 | | | | 4,731,930 | |
JD.com, Inc. ADRb | | | 109,800 | | | | 4,547,916 | |
China International Travel Service Corp., Ltd. A Shares | | | 625,336 | | | | 4,162,158 | |
CSPC Pharmaceutical Group, Ltd. | | | 1,944,000 | | | | 3,916,425 | |
Shenzhen Inovance Technology Co., Ltd. A Shares | | | 660,522 | | | | 2,942,639 | |
Industrial & Commercial Bank of China, Ltd. H Shares | | | 3,470,000 | | | | 2,781,673 | |
Baidu, Inc. ADRb | | | 10,300 | | | | 2,412,363 | |
Hangzhou Hikvision Digital Technology Co., Ltd. A Shares | | | 382,926 | | | | 2,292,618 | |
Silergy Corp. | | | 90,000 | | | | 2,056,555 | |
| | | | | | | | |
Total China/Hong Kong | | | | | | | 102,607,239 | |
| | | | | | | | |
| | | | | | | | |
| SOUTH KOREA: 16.5% | |
NAVER Corp. | | | 7,963 | | | | 6,468,979 | |
Hana Tour Service, Inc. | | | 61,835 | | | | 5,938,206 | |
Orion Corp.b | | | 60,814 | | | | 5,926,100 | |
KB Financial Group, Inc. | | | 90,347 | | | | 5,347,017 | |
BGF Retail Co., Ltd.b | | | 22,579 | | | | 4,429,116 | |
Hugel, Inc.b | | | 6,326 | | | | 3,294,528 | |
Samsung Electronics Co., Ltd. | | | 1,088 | | | | 2,584,991 | |
| | | | | | | | |
Total South Korea | | | | | | | 33,988,937 | |
| | | | | | | | |
| | | | | | | | |
| INDIA: 10.8% | |
HDFC Bank, Ltd. | | | 267,879 | | | | 7,861,978 | |
Housing Development Finance Corp., Ltd. | | | 159,163 | | | | 4,262,170 | |
IndusInd Bank, Ltd. | | | 157,731 | | | | 4,069,558 | |
Info Edge India, Ltd. | | | 158,665 | | | | 3,456,810 | |
Britannia Industries, Ltd. | | | 34,455 | | | | 2,539,110 | |
| | | | | | | | |
Total India | | | | | | | 22,189,626 | |
| | | | | | | | |
| | | | | | | | |
| INDONESIA: 3.0% | |
PT Bank Mandiri Persero | | | 8,572,500 | | | | 5,047,972 | |
PT Sumber Alfaria Trijaya | | | 25,922,200 | | | | 1,168,395 | |
| | | | | | | | |
Total Indonesia | | | | | | | 6,216,367 | |
| | | | | | | | |
| | | | | | | | |
| TAIWAN: 2.9% | |
Taiwan Semiconductor Manufacturing Co., Ltd. | | | 779,000 | | | | 5,964,862 | |
| | | | | | | | |
Total Taiwan | | | | | | | 5,964,862 | |
| | | | | | | | |
| | | | | | | | |
| BANGLADESH: 2.9% | | | | | | | | |
BRAC Bank, Ltd. | | | 4,504,413 | | | | 5,914,694 | |
| | | | | | | | |
Total Bangladesh | | | | | | | 5,914,694 | |
| | | | | | | | |
| | | | | | | | |
| | | | | | | | |
| | | Shares | | | Value | |
| | | | | | | | |
| THAILAND: 2.8% | |
Kasikornbank Public Co., Ltd. | | | 821,700 | | | | $5,835,979 | |
| | | | | | | | |
Total Thailand | | | | | | | 5,835,979 | |
| | | | | | | | |
| | | | | | | | |
| VIETNAM: 2.8% | |
Mobile World Investment Corp. | | | 707,470 | | | | 4,076,339 | |
Domesco Medical Import Export JSC | | | 325,220 | | | | 1,639,794 | |
| | | | | | | | |
Total Vietnam | | | | | | | 5,716,133 | |
| | | | | | | | |
| | | | | | | | |
| PHILIPPINES: 1.4% | |
Puregold Price Club, Inc. | | | 2,924,300 | | | | 2,924,862 | |
| | | | | | | | |
Total Philippines | | | | | | | 2,924,862 | |
| | | | | | | | |
| | | | | | | | |
| TOTAL COMMON EQUITIES | | | | | | | 191,358,699 | |
| | | | | | | | |
(Cost $135,217,220) | | | | | | | | |
| | | | | | | | |
PREFERRED EQUITIES: 3.6% | | | | | | | | |
| SOUTH KOREA: 3.6% | |
Samsung Electronics Co., Ltd., Pfd. | | | 3,840 | | | | 7,478,064 | |
| | | | | | | | |
Total South Korea | | | | | | | 7,478,064 | |
| | | | | | | | |
| | | | | | | | |
| TOTAL PREFERRED EQUITIES | | | | 7,478,064 | |
| | | | | | | | |
(Cost $4,593,698) | | | | | | | | |
| | | | | | | | |
| TOTAL INVESTMENTS: 96.4% | | | | 198,836,763 | |
(Cost $139,810,918) | | | | | | | | |
| | | | | | | | |
CASH AND OTHER ASSETS,
LESS LIABILITIES: 3.6% | | | | | | | 7,451,692 | |
| | | | | | | | |
| | |
NET ASSETS: 100.0% | | | | | | | $206,288,455 | |
| | | | | | | | |
| a | Certain securities were fair valued under the valuation policies approved by the Board of Trustees (Note 2-A). |
| b | Non-income producing security. |
| ADR | American Depositary Receipt |
See accompanying notes to financial statements.
| | | | |
| matthewsasia.com | 800.789.ASIA | | | 61 | |
| | | | |
| PORTFOLIO MANAGERS |
| Andrew Mattock, CFA | | |
Lead Manager | | |
| Henry Zhang, CFA | | Winnie Chwang |
Co-Manager | | Co-Manager |
| | |
| FUND FACTS | | | | |
| | | Investor | | Institutional |
Ticker | | MCHFX | | MICFX |
CUSIP | | 577130701 | | 577130818 |
Inception | | 2/19/98 | | 10/29/10 |
NAV | | $22.20 | | $22.17 |
Initial Investment | | $2,500 | | $100,000 |
Gross Expense Ratio1 | | 1.09% | | 0.93% |
Portfolio Statistics |
Total # of Positions | | 45 |
Net Assets | | $905.5 million |
Weighted Average
Market Cap | | $143.8 billion |
Portfolio Turnover2 | | 78.74% |
Benchmark |
MSCI China Index |
OBJECTIVE
Long-term capital appreciation.
STRATEGY
Under normal market conditions, the Fund seeks to achieve its investment objective by investing at least 80% of its total net assets, which include borrowings for investment purposes, in the common and preferred stocks of companies located in China. China includes its administrative and other districts, such as Hong Kong.
Matthews China Fund
Portfolio Manager Commentary (unaudited)
For the year ending December 31, 2017, the Matthews China Fund returned 59.37% (Investor Class) and 59.71% (Institutional Class), outperforming its benchmark, the MSCI China Index, which returned 54.33%. For the fourth quarter of the year, the Fund rose 9.58% (Investor Class) and 9.65% (Institutional Class) versus 7.62% for the Index.
Market Environment:
2017 marked a noticeable year of outperformance for Chinese equity markets after an extended period of mediocre returns. We believe that this inflection point for China was reached following years of concerted government effort in transitioning its economy to one that focuses on domestic consumption and sustainable, quality growth. For the first time in many years, China’s equity markets did not disappoint in terms of corporate earnings growth expectations. Underscoring the economy’s robust earnings growth has been the further implementation of China’s supply-side and state-owned enterprise reforms as well as the continuation of a stable macroeconomic environment, which further promotes investment and income growth. While the global political environment remains noisy, the popularity of President Xi Jinping provides welcome stability and ensures his market-oriented reforms for the mainland continue to benefit the economy. Xi’s goals for quality growth and increased innovation were reiterated at the 19th National Congress of the Communist Party meetings and aligned with what we believe are long-term growth opportunities in China.
Performance Contributors and Detractors:
During both the fourth quarter and 12-month period, stock selection was the main driver of the Fund’s outperformance against the benchmark. For 2017, the portfolio’s best-performing sectors were information technology, financials and consumer discretionary. Ping An Insurance Group, a financial conglomerate and China’s second-largest life insurer, was one of the top contributors to Fund performance. We expect the company to maintain sustainable and quality growth as its focus on long-term protection products and its success in consumer finance business start to bear fruit. China Merchants Bank, a leading retail bank, also was a top performer during the year. The firm delivered strong results thanks to its solid retail franchise, high asset quality and solid risk management. While internet services provider Tencent Holdings and e-commerce platform provider Alibaba Group were the top contributors to the Fund’s absolute return, they were relative detractors during the year as together they accounted for a much higher weighting in the index, about 27%. Both companies delivered results above expectations and further solidified their dominance in their respective arenas.
Conversely, Semiconductor Manufacturing International, the largest semiconductor manufacturer in mainland China, was a detractor to Fund performance. We exited the position early in the year amid a major management change that we believed could significantly impact its future operation. Bitauto Holdings, a leading auto information and financing platform operator, also performed poorly as investors became concerned about margin pressure due to expenses associated with a separate listing of its spin-off division. We maintain a position in Bitauto, however, as we believe the company’s longer-term outlook remains intact.
Notable Portfolio Changes:
During the fourth quarter, we initiated a position in Minth Group, a leading manufacturer of auto body parts and trim. With its strong R&D and solid execution, we expect Minth to increase its market share for its existing product
(continued)
| 1 | Actual 2017 expense ratios. |
| 2 | The lesser of fiscal year 2017 long-term purchase costs or sales proceeds divided by the average monthly market value of long-term securities. |
| | | | | | | | | | | | | | | | | | | | | | | | | | | | |
| |
| PERFORMANCE AS OF DECEMBER 31, 2017 | |
| | | | | | | | | Average Annual Total Returns | | | | |
| | | 3 Months | | | 1 Year | | | 3 Years | | | 5 Years | | | 10 Years | | | Since
Inception | | | Inception
Date | |
| Investor Class (MCHFX) | | | 9.58% | | | | 59.37% | | | | 15.67% | | | | 9.59% | | | | 4.22% | | | | 10.66% | | | | 2/19/98 | |
| Institutional Class (MICFX) | | | 9.65% | | | | 59.71% | | | | 15.84% | | | | 9.75% | | | | n.a. | | | | 5.09% | | | | 10/29/10 | |
| MSCI China Index3 | | | 7.62% | | | | 54.33% | | | | 12.96% | | | | 10.16% | | | | 3.19% | | | | 5.27% | 4 | | | | |
| Lipper China Region Funds Category Average5 | | | 7.29% | | | | 43.89% | | | | 11.28% | | | | 9.37% | | | | 2.80% | | | | 8.18% | 4 | | | | |
Performance assumes reinvestment of all dividends and/or distributions before taxes. All performance quoted represents past performance and is no guarantee of future results. Investment return and principal value will fluctuate with market conditions so that when redeemed, shares may be worth more or less than their original cost. Current performance may be lower or higher than the return figures quoted. For the Fund’s most recent month-end performance, visit matthewsasia.com.
GROWTH OF A $10,000 INVESTMENT SINCE INCEPTION—INVESTOR CLASS
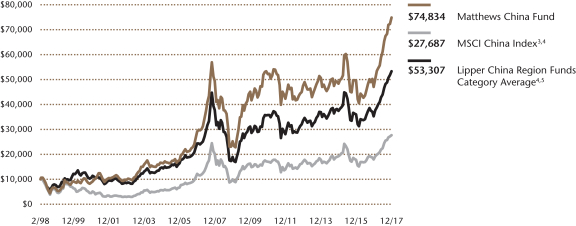
Plotted monthly. The performance data and graph do not reflect the deduction of taxes that a shareholder would pay on dividends, capital gains distributions or redemption of Fund shares. Values are in US$.
| | 3 | It is not possible to invest directly in an index. Source: Index data from Morgan Stanley Capital International and Bloomberg; total return calculations performed by BNY Mellon Investment Servicing (US) Inc. Please see page 92 for index definition. |
| | 4 | Calculated from 2/28/98. |
| | 5 | The Lipper Category Average does not reflect sales charges and is based on total return, including reinvestment of dividends and capital gains for the stated periods. |
| | | | | | | | |
| | | | |
| TOP TEN HOLDINGS6 | | | | | | | |
| | | Sector | | | | % of Net Assets | |
| Tencent Holdings, Ltd. | | Information Technology | | | | | 10.1% | |
| Alibaba Group Holding, Ltd. | | Information Technology | | | | | 7.1% | |
| China Life Insurance Co., Ltd. | | Financials | | | | | 6.6% | |
| Ping An Insurance Group Co. of China, Ltd. | | Financials | | | | | 5.2% | |
| China Construction Bank Corp. | | Financials | | | | | 4.9% | |
| Agricultural Bank of China, Ltd. | | Financials | | | | | 3.7% | |
| Industrial & Commercial Bank of China, Ltd. | | Financials | | | | | 3.0% | |
| Sino Biopharmaceutical, Ltd. | | Health Care | | | | | 2.6% | |
| Baidu, Inc. | | Information Technology | | | | | 2.6% | |
| KWG Property Holding, Ltd. | | Real Estate | | | | | 2.5% | |
| % OF ASSETS IN TOP TEN | | | | | | | 48.3% | |
| | 6 | Holdings may combine more than one security from same issuer and related depositary receipts. |
| | | | |
| matthewsasia.com | 800.789.ASIA | | | 63 | |
| | | | |
| |
| COUNTRY ALLOCATION (%)7 | |
| China/Hong Kong | | | 98.5 | |
| Cash and Other Assets, Less Liabilities | | | 1.5 | |
| | | | |
| |
| SECTOR ALLOCATION (%)7 | |
| Information Technology | | | 31.2 | |
| Financials | | | 29.2 | |
| Consumer Discretionary | | | 12.0 | |
| Industrials | | | 5.2 | |
| Energy | | | 4.8 | |
| Real Estate | | | 4.6 | |
| Health Care | | | 3.7 | |
| Materials | | | 3.2 | |
| Consumer Staples | | | 3.1 | |
| Utilities | | | 1.5 | |
| Cash and Other Assets, Less Liabilities | | | 1.5 | |
| | | | |
| |
| MARKET CAP EXPOSURE (%)7 | |
| Mega Cap (over $25B) | | | 58.2 | |
| Large Cap ($10B–$25B) | | | 5.3 | |
| Mid Cap ($3B–10B) | | | 27.3 | |
| Small Cap (under $3B) | | | 7.7 | |
| Liabilities in Excess of Cash and Other Assets | | | 1.5 | |
| 7 | Source: FactSet Research Systems. Percentage values in data are rounded to the nearest tenth of one percent, so the values may not sum to 100% due to rounding. Percentage values may be derived from different data sources and may not be consistent with other Fund literature. |
Matthews China Fund
Portfolio Manager Commentary (unaudited) (continued)
line and also to expand into new product areas. We also added CIFI Holdings, a residential real estate developer focused on the Yangtze River Delta and Pan-Bohai Rim areas of China. We believe the company’s ample land bank in these highly sought-after regions will provide high visibility to its future growth.
During the quarter, we exited our positions in Beijing Capital International Airport due to uncertainty surrounding a second airport in the capital and a new round of import tariff cuts in China.
Outlook:
Despite the strong equity performance in 2017, we found the lack of market volatility throughout the year to be surprising. This has led us to believe that many global investors have not participated in the rally and may reconsider their underweight exposures to China in the coming year. From a fundamental standpoint, we are optimistic that 2018 will continue to show solid corporate earnings growth. While the property sector is expected to slow as the government reins in rapid price appreciation, consumer discretionary items such as home appliances should benefit as new homeowners begin to outfit new residences. In the heavy industrials segment, we expect moderate growth as a lack of demand could translate into inadequate volume growth. Despite this forecast, we believe pricing trends should improve as consolidation continues to remove excess capacity in the system. The debate over whether China could face a banking crisis may continue in 2018 as it has every year over the past decade. As in years past, we continue to believe that financial system risks are contained and the likelihood of China experiencing any widespread banking collapse remains small. As China remains firm in controlling its debt levels, its banking system may see further regulation security within areas such as wealth management products. We are also encouraged that banks continue to position their loan books toward healthier mortgage loans. On the political front, we expect a stable environment under the leadership of President Xi and continued progress in the country’s reforms. In addition, yearlong worries of a trade war between China and the U.S. faded during the second half of 2017, and should become less topical in the coming year. Trade is only a small engine for China’s overall growth and will continue to diminish in significance as its domestic economy continues to evolve and grow.
Matthews China Fund
December 31, 2017
Schedule of Investmentsa
COMMON EQUITIES: 98.5%
| | | | | | | | |
| | | Shares | | | Value | |
| INFORMATION TECHNOLOGY: 31.2% | |
Internet Software & Services: 23.1% | | | | | | | | |
Tencent Holdings, Ltd. | | | 1,762,100 | | | | $91,202,692 | |
Alibaba Group Holding, Ltd. ADRb | | | 372,800 | | | | 64,281,904 | |
Baidu, Inc. ADRb | | | 101,500 | | | | 23,772,315 | |
SINA Corp.b | | | 186,900 | | | | 18,747,939 | |
Bitauto Holdings, Ltd. ADRb | | | 238,900 | | | | 7,597,020 | |
Baozun, Inc. ADRb | | | 111,841 | | | | 3,529,702 | |
| | | | | | | | |
| | | | | | | 209,131,572 | |
| | | | | | | | |
Electronic Equipment, Instruments & Components: 2.5% | | | | | |
AVIC Jonhon OptronicTechnology Co., Ltd. A Shares | | | 2,255,452 | | | | 13,628,132 | |
Hangzhou Hikvision Digital Technology Co., Ltd. A Shares | | | 1,565,400 | | | | 9,375,092 | |
| | | | | | | | |
| | | | | | | 23,003,224 | |
| | | | | | | | |
IT Services: 2.1% | | | | | |
Chinasoft International, Ltd. | | | 29,074,000 | | | | 19,270,403 | |
| | | | | | | | |
Semiconductors & Semiconductor Equipment: 2.0% | | | | | |
ASM Pacific Technology, Ltd. | | | 1,281,200 | | | | 17,774,140 | |
| | | | | | | | |
Communications Equipment: 1.5% | | | | | |
ZTE Corp. H Sharesb | | | 3,701,400 | | | | 13,834,903 | |
| | | | | | | | |
Total Information Technology | | | | 283,014,242 | |
| | | | | | | | |
| | | | | | | | |
| FINANCIALS: 29.2% | |
Banks: 13.5% | | | | | | | | |
China Construction Bank Corp. H Shares | | | 48,195,660 | | | | 44,366,644 | |
Agricultural Bank of China, Ltd. H Shares | | | 71,482,000 | | | | 33,220,528 | |
Industrial & Commercial Bank of China, Ltd. H Shares | | | 34,085,000 | | | | 27,323,720 | |
China Merchants Bank Co., Ltd. H Shares | | | 4,465,643 | | | | 17,679,760 | |
| | | | | | | | |
| | | | | | | 122,590,652 | |
| | | | | | | | |
Insurance: 11.8% | | | | | | | | |
China Life Insurance Co., Ltd. H Shares | | | 19,061,000 | | | | 59,441,980 | |
Ping An Insurance Group Co. of China, Ltd. H Shares | | | 4,558,500 | | | | 47,281,077 | |
| | | | | | | | |
| | | | | | | 106,723,057 | |
| | | | | | | | |
Capital Markets: 3.9% | | | | | | | | |
CITIC Securities Co., Ltd. H Shares | | | 10,324,000 | | | | 21,234,803 | |
China International Capital Corp., Ltd. H Sharesc,d | | | 6,560,000 | | | | 13,616,612 | |
| | | | | | | | |
| | | | | | | 34,851,415 | |
| | | | | | | | |
Total Financials | | | | | | | 264,165,124 | |
| | | | | | | | |
| | | | | | | | |
| CONSUMER DISCRETIONARY: 12.0% | |
Auto Components: 4.5% | | | | | | | | |
Nexteer Automotive Group, Ltd. | | | 7,462,000 | | | | 17,732,879 | |
Minth Group, Ltd. | | | 2,090,000 | | | | 12,568,198 | |
Huayu Automotive Systems Co., Ltd. A Shares | | | 2,306,250 | | | | 10,511,600 | |
| | | | | | | | |
| | | | | | | 40,812,677 | |
| | | | | | | | |
Household Durables: 3.8% | | | | | | | | |
Midea Group Co., Ltd. A Shares | | | 1,584,954 | | | | 13,469,459 | |
Gree Electric Appliances, Inc. of Zhuhai A Shares | | | 1,857,000 | | | | 12,459,035 | |
Zhejiang Supor Cookware Co., Ltd. A Shares | | | 1,450,059 | | | | 8,970,982 | |
| | | | | | | | |
| | | | | | | 34,899,476 | |
| | | | | | | | |
| | | | | | | | |
| | | Shares | | | Value | |
Internet & Direct Marketing Retail: 2.5% | | | | | | | | |
JD.com, Inc. ADRb | | | 540,179 | | | | $22,374,214 | |
| | | | | | | | |
Hotels, Restaurants & Leisure: 1.2% | | | | | | | | |
Shangri-La Asia, Ltd. | | | 4,650,000 | | | | 10,530,373 | |
| | | | | | | | |
Total Consumer Discretionary | | | | | | | 108,616,740 | |
| | | | | | | | |
| | | | | | | | |
| INDUSTRIALS: 5.2% | |
Commercial Services & Supplies: 3.4% | | | | | | | | |
China Everbright International, Ltd. | | | 12,763,000 | | | | 18,208,283 | |
Focused Photonics Hangzhou, Inc. A Shares | | | 2,282,032 | | | | 12,454,135 | |
| | | | | | | | |
| | | | | | | 30,662,418 | |
| | | | | | | | |
Professional Services: 1.3% | | | | | | | | |
51job, Inc. ADRb | | | 193,500 | | | | 11,774,475 | |
| | | | | | | | |
Machinery: 0.5% | | | | | | | | |
Han’s Laser Technology Industry Group Co., Ltd. A Shares | | | 571,858 | | | | 4,329,914 | |
| | | | | | | | |
Total Industrials | | | | | | | 46,766,807 | |
| | | | | | | | |
| | | | | | | | |
| ENERGY: 4.8% | |
Oil, Gas & Consumable Fuels: 4.8% | | | | | | | | |
Yanzhou Coal Mining Co., Ltd. H Shares | | | 14,884,000 | | | | 17,357,536 | |
China Petroleum & Chemical Corp. H Shares | | | 21,478,000 | | | | 15,731,204 | |
China Shenhua Energy Co., Ltd. H Shares | | | 4,129,000 | | | | 10,667,038 | |
| | | | | | | | |
Total Energy | | | | | | | 43,755,778 | |
| | | | | | | | |
| | | | | | | | |
| REAL ESTATE: 4.6% | |
Real Estate Management & Development: 4.6% | | | | | |
KWG Property Holding, Ltd. | | | 19,569,000 | | | | 22,810,528 | |
CIFI Holdings Group Co., Ltd. | | | 15,904,000 | | | | 9,555,414 | |
China Overseas Grand Oceans Group, Ltd. | | | 17,114,000 | | | | 9,341,160 | |
| | | | | | | | |
Total Real Estate | | | | | | | 41,707,102 | |
| | | | | | | | |
| | | | | | | | |
| HEALTH CARE: 3.7% | |
Pharmaceuticals: 2.7% | | | | | | | | |
Sino Biopharmaceutical, Ltd. | | | 13,529,000 | | | | 23,918,057 | |
| | | | | | | | |
Biotechnology: 1.0% | | | | | | | | |
3SBio, Inc.b,c,d | | | 4,775,500 | | | | 9,360,997 | |
| | | | | | | | |
Total Health Care | | | | | | | 33,279,054 | |
| | | | | | | | |
| | | | | | | | |
| MATERIALS: 3.2% | |
Construction Materials: 2.0% | | | | | | | | |
China National Materials Co., Ltd. H Shares | | | 23,858,000 | | | | 17,790,113 | |
| | | | | | | | |
Metals & Mining: 1.2% | | | | | | | | |
MMG, Ltd.b | | | 22,808,000 | | | | 11,284,236 | |
| | | | | | | | |
Total Materials | | | | | | | 29,074,349 | |
| | | | | | | | |
| | | | | | | | |
| CONSUMER STAPLES: 3.1% | |
Food Products: 1.7% | | | | | | | | |
Angel Yeast Co., Ltd. A Shares | | | 3,055,027 | | | | 15,345,484 | |
| | | | | | | | |
Beverages: 1.4% | |
Wuliangye Yibin Co., Ltd. A Shares | | | 703,708 | | | | 8,629,443 | |
Wuliangye Yibin Co., Ltd. A Shares | | | 331,649 | | | | 4,068,201 | |
| | | | | | | | |
| | | | | | | 12,697,644 | |
| | | | | | | | |
Total Consumer Staples | | | | | | | 28,043,128 | |
| | | | | | | | |
| | | | | | | | |
| | | | |
| matthewsasia.com | 800.789.ASIA | | | 65 | |
Matthews China Fund
December 31, 2017
Schedule of Investmentsa (continued)
COMMON EQUITIES (continued)
| | | | | | | | |
| | | Shares | | | Value | |
| UTILITIES: 1.5% | |
Water Utilities: 1.5% | | | | | | | | |
Beijing Enterprises Water Group, Ltd. | | | 17,204,000 | | | | $13,290,976 | |
| | | | | | | | |
Total Utilities | | | | | | | 13,290,976 | |
| | | | | | | | |
| | | | | | | | |
| TOTAL INVESTMENTS: 98.5% | | | | 891,713,300 | |
(Cost $672,693,639) | | | | | | | | |
| | | | | | | | |
CASH AND OTHER ASSETS,
LESS LIABILITIES: 1.5% | | | | | | | 13,769,689 | |
| | | | | | | | |
| | |
NET ASSETS: 100.0% | | | | | | | $905,482,989 | |
| | | | | | | | |
| a | Certain securities were fair valued under the valuation policies approved by the Board of Trustees (Note 2-A). |
| b | Non-income producing security. |
| c | Security exempt from registration under Rule 144A of the Securities Act of 1933, as amended. The security may be resold in transactions exempt from registration normally to qualified institutional buyers. The security has been determined to be liquid in accordance with procedures adopted by the Fund’s Board of Trustees. At December 31, 2017, the aggregate value is $22,977,609, which is 2.54% of net assets. |
| d | The securities may be resold to qualified foreign investors and foreign institutional buyers under Regulation S of the Securities Act of 1933. |
| ADR | American Depositary Receipt |
See accompanying notes to financial statements.
| | | | |
| PORTFOLIO MANAGERS |
| Sunil Asnani | | | | |
Lead Manager | | | | |
| Sharat Shroff, CFA | | |
Co-Manager | | | | |
|
| FUND FACTS |
| | | Investor | | Institutional |
Ticker | | MINDX | | MIDNX |
CUSIP | | 577130859 | | 577130768 |
Inception | | 10/31/05 | | 10/29/10 |
NAV | | $34.31 | | $34.51 |
Initial Investment | | $2,500 | | $100,000 |
Gross Expense Ratio1 | | 1.09% | | 0.89% |
Portfolio Statistics | | | | |
Total # of Positions | | 52 |
Net Assets | | $2.3 billion |
Weighted Average Market Cap | | $17.0 billion |
Portfolio Turnover2 | | 16.81% |
Benchmark | | |
S&P Bombay Stock Exchange 100 Index |
OBJECTIVE
Long-term capital appreciation.
STRATEGY
Under normal market conditions, the Fund seeks to achieve its investment objective by investing at least 80% of its total net assets, which include borrowings for investment purposes, in publicly traded common stocks, preferred stocks and convertible securities of companies located in India.
Matthews India Fund
Portfolio Manager Commentary (unaudited)
For the year ending December 31, 2017, the Matthews India Fund returned 35.79% (Investor Class) and 36.05% (Institutional Class) while its benchmark, the S&P Bombay Stock Exchange 100 Index, returned 41.88%. For the fourth quarter of the year, the Fund returned 10.05% (Investor Class) and 10.11% (Institutional Class) versus 11.12% for the Index.
Market Environment:
During 2017, India’s stock market rallied amid liquidity fueled by demonetization despite economic fundamentals that had worsened. Ongoing pressure spurred by the demonetization and supply chain disruption ahead of July’s Goods and Services Tax (GST) pushed gross domestic product growth to a three-year low of 5.7% in the April to June quarter before rebounding to 6.3% in the July to September quarter. Corporate earnings across most sectors remained depressed except for energy and metals companies, which benefited from a rise in commodity prices. Inflation surged to a 15-month high of 4.88%, which kept India’s central bank from loosening monetary policy further. The ailing state-owned banking sector got a new lifeline after the government announced a massive bank recapitalization program, using a portion of banking deposits to inject equity into its banks. During the year, the Bharatiya Janata Party (BJP), which constitutes the central government, won elections in multiple states including Uttar Pradesh, Himachal Pradesh and Gujarat, further strengthening Prime Minister Narendra Modi’s power base.
Performance Contributors and Detractors:
The portfolio’s higher cash position toward the beginning of the year, and its lower allocation to energy and metals stocks, which benefited from rising commodity prices, contributed to its underperformance against the benchmark. Our financials sector holdings contributed most to the Fund’s absolute performance for the year. Our avoidance of state-owned banks, however, hurt our relative Fund performance during the second half of the year when their stock prices rallied suddenly following the recapitalization plans for these ailing banks. In our assessment, the amount of government recapitalization is barely sufficient to meet provisional requirements for only some of these banks and not enough to grow their loan book. We believe well-run private sector banks should continue to grow profitably and gain market share. Our higher allocation to information technology (IT) and health care stocks was also a detractor amid pricing pressures in developed markets. Some of this should reverse going forward should the U.S. Federal Reserve raise interest rates, and help profitability.
Stock-specific factors within the consumer discretionary, IT and health care sectors partially mitigated the relative drag. One such consumer stock was Titan, a Tata Group-owned company that sells branded jewelry, watches and other accessories. Titan has extensively benefited from the government’s drive to level the playing fields for the organized and unorganized sectors through demonetization and GST, which has led to a significant shift of business from the unorganized players to organized ones like Titan.
Notable Portfolio Changes:
During the year, we exited or trimmed many companies across sectors where the risk/reward asymmetry was becoming unfavorable. We also added new positions across varied industries such as autos, IT and materials. One new addition was Mphasis, a small-cap IT services company undergoing a business transformation and new ownership structure. The company caters primarily to banking and financial services clients who might benefit from rising Fed rates going forward. The macroeconomic tailwinds along with a renewed management team should help the company grow profitably.
(continued)
| 1 | Actual 2017 expense ratios. |
| 2 | The lesser of fiscal year 2017 long-term purchase costs or sales proceeds divided by the average monthly market value of long-term securities. |
| | | | |
| matthewsasia.com | 800.789.ASIA | | | 67 | |
| | | | | | | | | | | | | | | | | | | | | | | | | | | | |
| | | | | | | | |
| PERFORMANCE AS OF DECEMBER 31, 2017 | | | | | | | | | | | | | | | | | | | | | |
| | | | | | | | | Average Annual Total Returns | | | | |
| | | 3 Months | | | 1 Year | | | 3 Years | | | 5 Years | | | 10 Years | | | Since
Inception | | | Inception
Date | |
| Investor Class (MINDX) | | | 10.05% | | | | 35.79% | | | | 10.61% | | | | 15.83% | | | | 5.55% | | | | 12.85% | | | | 10/31/05 | |
| Institutional Class (MIDNX) | | | 10.11% | | | | 36.05% | | | | 10.85% | | | | 16.04% | | | | n.a. | | | | 7.93% | | | | 10/29/10 | |
| S&P Bombay Stock Exchange 100 Index3 | | | 11.12% | | | | 41.88% | | | | 10.75% | | | | 11.21% | | | | 1.92% | | | | 11.62% | 4 | | | | |
| Lipper India Region Funds Category Average5 | | | 12.60% | | | | 44.04% | | | | 11.49% | | | | 12.48% | | | | 1.59% | | | | 10.00% | 4 | | | | |
Performance assumes reinvestment of all dividends and/or distributions before taxes. All performance quoted represents past performance and is no guarantee of future results. Investment return and principal value will fluctuate with market conditions so that when redeemed, shares may be worth more or less than their original cost. Current performance may be lower or higher than the return figures quoted. For the Fund’s most recent month-end performance, visit matthewsasia.com.
GROWTH OF A $10,000 INVESTMENT SINCE INCEPTION—INVESTOR CLASS
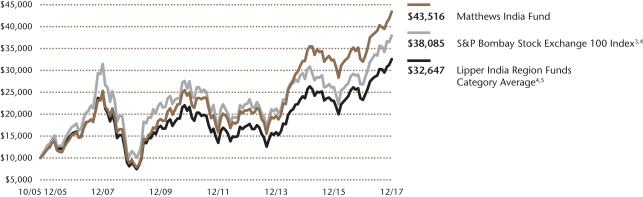
Plotted monthly. The performance data and graph do not reflect the deduction of taxes that a shareholder would pay on dividends, capital gains distributions or redemption of Fund shares. Values are in US$.
| | 3 | It is not possible to invest directly in an index. Source: Index data from S&P BSE 100 Index and Bloomberg; total return calculations performed by BNY Mellon Investment Servicing (US) Inc. Please see page 92 for index definition. |
| | 4 | Calculated from 10/31/05. |
| | 5 | The Lipper Category Average does not reflect sales charges and is based on total return, including reinvestment of dividends and capital gains for the stated periods. |
| | | | | | | | |
| | | | |
| TOP TEN HOLDINGS6 | | | | | | | |
| | | Sector | | | | % of Net Assets | |
| Suzuki Motor Corp. | | Consumer Discretionary | | | | | 6.2% | |
| HDFC Bank, Ltd. | | Financials | | | | | 5.6% | |
| Eicher Motors, Ltd. | | Industrials | | | | | 5.3% | |
| IndusInd Bank, Ltd. | | Financials | | | | | 5.0% | |
| Kotak Mahindra Bank, Ltd. | | Financials | | | | | 4.7% | |
| ITC, Ltd. | | Consumer Staples | | | | | 4.6% | |
| Info Edge India, Ltd. | | Information Technology | | | | | 3.1% | |
| Bharat Financial Inclusion, Ltd. | | Financials | | | | | 3.1% | |
| Ajanta Pharma, Ltd. | | Health Care | | | | | 3.1% | |
| eClerx Services, Ltd. | | Information Technology | | | | | 2.9% | |
| % OF ASSETS IN TOP TEN | | | | | | | 43.6% | |
| | 6 | Holdings may combine more than one security from same issuer and related depositary receipts. |
Matthews India Fund
Portfolio Manager Commentary (unaudited) (continued)
Outlook:
Current valuations are closer to the highs seen in 2007 and 2010, however, earnings have been relatively depressed. We believe the liquidity driving the markets might continue for some time amid a conversion of savings from physical assets to financial ones. Corporate earnings may rebound from their recent lows over the short to medium term as the formalization of India’s economy starts to yield positive results. Public spending on infrastructure, including logistics and housing, would possibly increase as the government attempts to make up for the lack of private capital expenditure and create more jobs to woo voters in the lead up to the 2019 national elections. We anticipate this infrastructure spending, along with the government’s new program to make direct bank deposits to consumers receiving subsidies, should lead to more consumer spending, especially from rural areas. The aftereffects of the country’s demonetization and GST implementation might continue to dampen India’s private investment climate. In the medium term, however, we believe the GST implementation should lead to better tax collection and mitigate deficit formation, and we will continue to be watchful of any surges in inflation.
| | | | |
| |
| COUNTRY ALLOCATION (%)7 | |
| India | | | 89.2 | |
| Japan | | | 6.2 | |
| Israel | | | 2.0 | |
| United States | | | 1.8 | |
| Cash and Other Assets, Less Liabilities | | | 0.9 | |
| | | | |
| |
| SECTOR ALLOCATION (%)7 | |
| Financials | | | 33.7 | |
| Consumer Staples | | | 17.9 | |
| Information Technology | | | 12.9 | |
| Industrials | | | 11.4 | |
| Consumer Discretionary | | | 10.7 | |
| Health Care | | | 9.0 | |
| Materials | | | 3.5 | |
| Cash and Other Assets, Less Liabilities | | | 0.9 | |
| | | | |
| |
| MARKET CAP EXPOSURE (%)7 | |
| Mega Cap (over $25B) | | | 27.5 | |
| Large Cap ($10B–$25B) | | | 14.7 | |
| Mid Cap ($3B–10B) | | | 15.5 | |
| Small Cap (under $3B) | | | 41.4 | |
| Cash and Other Assets, Less Liabilities | | | 0.9 | |
| 7 | Source: FactSet Research Systems. Percentage values in data are rounded to the nearest tenth of one percent, so the values may not sum to 100% due to rounding. Percentage values may be derived from different data sources and may not be consistent with other Fund literature. |
| | | | |
| matthewsasia.com | 800.789.ASIA | | | 69 | |
Matthews India Fund
December 31, 2017
Schedule of Investmentsa
COMMON EQUITIES: 99.1%
| | | | | | | | |
| | | Shares | | | Value | |
| FINANCIALS: 33.7% | | | | | | | | |
Banks: 18.7% | | | | | | | | |
HDFC Bank, Ltd. | | | 4,345,349 | | | | $127,531,609 | |
IndusInd Bank, Ltd. | | | 4,431,794 | | | | 114,343,045 | |
Kotak Mahindra Bank, Ltd. | | | 6,697,258 | | | | 105,889,113 | |
DCB Bank, Ltd. | | | 11,586,779 | | | | 35,524,530 | |
Yes Bank, Ltd. | | | 6,036,920 | | | | 29,742,507 | |
IDFC Bank, Ltd. | | | 13,650,467 | | | | 11,577,924 | |
HDFC Bank, Ltd. ADR | | | 8,422 | | | | 856,265 | |
| | | | | | | | |
| | | | | | | 425,464,993 | |
| | | | | | | | |
| | | | | | | | |
Consumer Finance: 9.0% | | | | | | | | |
Bharat Financial Inclusion, Ltd.b | | | 4,499,665 | | | | 70,307,649 | |
Shriram City Union Finance, Ltd. | | | 1,873,192 | | | | 61,832,725 | |
Cholamandalam Investment and Finance Co., Ltd. | | | 2,512,456 | | | | 51,154,474 | |
Sundaram Finance, Ltd. | | | 695,531 | | | | 20,443,763 | |
| | | | | | | | |
| | | | | | | 203,738,611 | |
| | | | | | | | |
| | | | | | | | |
Thrifts & Mortgage Finance: 4.3% | | | | | | | | |
Housing Development Finance Corp., Ltd. | | | 2,458,810 | | | | 65,843,608 | |
GRUH Finance, Ltd. | | | 4,220,641 | | | | 33,208,372 | |
| | | | | | | | |
| | | | | | | 99,051,980 | |
| | | | | | | | |
| | | | | | | | |
Capital Markets: 1.7% | | | | | | | | |
CRISIL, Ltd. | | | 1,306,990 | | | | 38,384,992 | |
| | | | | | | | |
Total Financials | | | | | | | 766,640,576 | |
| | | | | | | | |
| | | | | | | | |
| CONSUMER STAPLES: 17.9% | | | | | | | | |
Personal Products: 8.2% | | | | | | | | |
Dabur India, Ltd. | | | 11,252,176 | | | | 61,525,027 | |
Emami, Ltd. | | | 2,250,122 | | | | 46,876,047 | |
Bajaj Corp., Ltd. | | | 6,201,714 | | | | 46,473,382 | |
Marico, Ltd. | | | 6,222,328 | | | | 31,386,407 | |
| | | | | | | | |
| | | | | | | 186,260,863 | |
| | | | | | | | |
| | | | | | | | |
Tobacco: 7.2% | | | | | | | | |
ITC, Ltd. | | | 25,171,965 | | | | 103,661,184 | |
VST Industries, Ltd.† | | | 1,167,175 | | | | 58,602,396 | |
| | | | | | | | |
| | | | | | | 162,263,580 | |
| | | | | | | | |
| | | | | | | | |
Food Products: 2.5% | | | | | | | | |
Nestle India, Ltd. | | | 244,636 | | | | 30,151,574 | |
Zydus Wellness, Ltd. | | | 1,670,471 | | | | 27,225,948 | |
| | | | | | | | |
| | | | | | | 57,377,522 | |
| | | | | | | | |
Total Consumer Staples | | | | | | | 405,901,965 | |
| | | | | | | | |
| | | | | | | | |
| INFORMATION TECHNOLOGY: 12.9% | | | | | | | | |
IT Services: 9.8% | | | | | | | | |
eClerx Services, Ltd.† | | | 2,701,931 | | | | 66,292,305 | |
Mindtree, Ltd. | | | 4,936,665 | | | | 47,365,378 | |
Cognizant Technology Solutions Corp. Class A | | | 573,500 | | | | 40,729,970 | |
Tata Consultancy Services, Ltd. | | | 950,000 | | | | 40,167,815 | |
Mphasis, Ltd. | | | 2,450,000 | | | | 27,801,184 | |
| | | | | | | | |
| | | | | | | 222,356,652 | |
| | | | | | | | |
| | | | | | | | |
Internet Software & Services: 3.1% | | | | | | | | |
Info Edge India, Ltd. | | | 3,230,761 | | | | 70,388,097 | |
| | | | | | | | |
Total Information Technology | | | | | | | 292,744,749 | |
| | | | | | | | |
| | | | | | | | |
| | | Shares | | | Value | |
| INDUSTRIALS: 11.4% | | | | | | | | |
Machinery: 9.2% | | | | | | | | |
Eicher Motors, Ltd. | | | 254,500 | | | | $120,686,295 | |
AIA Engineering, Ltd. | | | 2,658,638 | | | | 64,577,485 | |
Ashok Leyland, Ltd. | | | 13,156,152 | | | | 24,491,794 | |
| | | | | | | | |
| | | | | | | 209,755,574 | |
| | | | | | | | |
| | | | | | | | |
Air Freight & Logistics: 1.2% | | | | | | | | |
Blue Dart Express, Ltd. | | | 380,973 | | | | 27,175,010 | |
| | | | | | | | |
| | | | | | | | |
Road & Rail: 0.7% | | | | | | | | |
Container Corp. of India, Ltd. | | | 782,568 | | | | 16,884,664 | |
| | | | | | | | |
| | | | | | | | |
Airlines: 0.3% | | | | | | | | |
InterGlobe Aviation, Ltd.c,d | | | 320,000 | | | | 6,029,000 | |
| | | | | | | | |
Total Industrials | | | | | | | 259,844,248 | |
| | | | | | | | |
| | | | | | | | |
| CONSUMER DISCRETIONARY: 10.7% | | | | | | | | |
Automobiles: 6.2% | | | | | | | | |
Suzuki Motor Corp. | | | 2,427,000 | | | | 140,483,630 | |
| | | | | | | | |
| | | | | | | | |
Household Durables: 3.3% | | | | | | | | |
Symphony, Ltd. | | | 2,023,202 | | | | 55,368,424 | |
LA Opala RG, Ltd. | | | 1,481,323 | | | | 14,216,199 | |
Dixon Technologies India, Ltd.b,d | | | 95,000 | | | | 6,237,754 | |
| | | | | | | | |
| | | | | | | 75,822,377 | |
| | | | | | | | |
| | | | | | | | |
Textiles, Apparel & Luxury Goods: 1.2% | | | | | | | | |
Page Industries, Ltd. | | | 53,100 | | | | 21,198,035 | |
Titan Co., Ltd. | | | 428,691 | | | | 5,763,678 | |
| | | | | | | | |
| | | | | | | 26,961,713 | |
| | | | | | | | |
Total Consumer Discretionary | | | | | | | 243,267,720 | |
| | | | | | | | |
| | | | | | | | |
| HEALTH CARE: 9.0% | | | | | | | | |
Pharmaceuticals: 8.2% | | | | | | | | |
Ajanta Pharma, Ltd. | | | 2,992,070 | | | | 69,915,362 | |
Taro Pharmaceutical Industries, Ltd.b | | | 435,900 | | | | 45,643,089 | |
Caplin Point Laboratories, Ltd. | | | 3,028,687 | | | | 29,892,094 | |
Alembic Pharmaceuticals, Ltd. | | | 3,498,862 | | | | 29,096,818 | |
Sun Pharmaceutical Industries, Ltd. | | | 1,352,917 | | | | 12,065,934 | |
Eris Lifesciences, Ltd.b,c,d | | | 5,462 | | | | 67,976 | |
| | | | | | | | |
| | | | | | | 186,681,273 | |
| | | | | | | | |
| | | | | | | | |
Health Care Equipment & Supplies: 0.8% | | | | | | | | |
Poly Medicure, Ltd. | | | 4,153,464 | | | | 18,171,710 | |
| | | | | | | | |
Total Health Care | | | | | | | 204,852,983 | |
| | | | | | | | |
| | | | | | | | |
| MATERIALS: 3.5% | | | | | | | | |
Chemicals: 3.4% | | | | | | | | |
Pidilite Industries, Ltd. | | | 1,800,000 | | | | 25,446,206 | |
Asian Paints, Ltd. | | | 1,176,000 | | | | 21,315,942 | |
Supreme Industries, Ltd. | | | 871,965 | | | | 17,620,507 | |
Castrol India, Ltd. | | | 4,598,126 | | | | 13,884,146 | |
| | | | | | | | |
| | | | | | | 78,266,801 | |
| | | | | | | | |
| | | | | | | | |
Metals & Mining: 0.1% | | | | | | | | |
NMDC, Ltd. | | | 646,157 | | | | 1,395,017 | |
| | | | | | | | |
Total Materials | | | | | | | 79,661,818 | |
| | | | | | | | |
| | | | | | | | |
Matthews India Fund
December 31, 2017
Schedule of Investmentsa (continued)
COMMON EQUITIES (continued)
| | | | | | | | |
| | | | | | Value | |
| TOTAL INVESTMENTS: 99.1% | | | | | | | $2,252,914,059 | |
(Cost $1,522,238,300) | | | | | | | | |
| | | | | | | | |
CASH AND OTHER ASSETS,
LESS LIABILITIES: 0.9% | | | | | | | 19,519,157 | |
| | | | | | | | |
| | |
NET ASSETS: 100.0% | | | | | | | $2,272,433,216 | |
| | | | | | | | |
| a | Certain securities were fair valued under the valuation policies approved by the Board of Trustees (Note 2-A). |
| b | Non-income producing security. |
| c | Security exempt from registration under Rule 144A of the Securities Act of 1933, as amended. The security may be resold in transactions exempt from registration normally to qualified institutional buyers. The security has been determined to be liquid in accordance with procedures adopted by the Fund’s Board of Trustees. At December 31, 2017, the aggregate value is $6,096,976, which is 0.27% of net assets. |
| d | The securities may be resold to qualified foreign investors and foreign institutional buyers under Regulation S of the Securities Act of 1933. |
| † | Affiliated Issuer, as defined under the Investment Company Act of 1940 (ownership of 5% or more of the outstanding voting securities of this issuer) |
| ADR | American Depositary Receipt |
See accompanying notes to financial statements.
| | | | |
| matthewsasia.com | 800.789.ASIA | | | 71 | |
| | | | |
PORTFOLIO MANAGERS |
| Kenichi Amaki | | | | |
Lead Manager | | | | |
| Taizo Ishida | | | | |
Co-Manager | | | | |
|
| FUND FACTS |
| | | Investor | | Institutional |
Ticker | | MJFOX | | MIJFX |
CUSIP | | 577130800 | | 577130792 |
Inception | | 12/31/98 | | 10/29/10 |
NAV | | $24.12 | | $24.16 |
Initial Investment | | $2,500 | | $100,000 |
Gross Expense Ratio1 | | 0.95% | | 0.87% |
After Fee Waiver and Reimbursement2 | | 0.94% | | 0.86% |
Portfolio Statistics | | | | |
Total # of Positions | | 59 |
Net Assets | | $4.1 billion |
Weighted Average Market Cap | | $24.3 billion |
Portfolio Turnover3 | | 44.34% |
Benchmark |
MSCI Japan Index |
OBJECTIVE
Long-term capital appreciation.
STRATEGY
Under normal market conditions, the Fund seeks to achieve its investment objective by investing at least 80% of its total net assets, which include borrowings for investment purposes, in the common and preferred stocks of companies located in Japan.
Matthews Japan Fund*
Portfolio Manager Commentary (unaudited)
For the year ending December 31, 2017, the Matthews Japan Fund returned 33.14% (Investor Class) and 33.23% (Institutional Class), outperforming its benchmark, the MSCI Japan Index, which returned 24.39%. For the fourth quarter of the year, the Fund returned 8.25% (Investor Class) and 8.21% (Institutional Class), versus 8.52% for the Index.
Market Environment:
2017 was a solid year for Japan’s economy and equity markets. Japan delivered firm macroeconomic growth during the year. Up to the third quarter of 2017, Japan recorded seven consecutive quarters of positive real GDP growth, the longest growth streak in 16 years. This was not an easy feat considering the country’s declining population level. Both the Nikkei 225 Index and Tokyo Stock Price Index (TOPIX), meanwhile, surpassed multiyear highs on the back of robust corporate profit growth. This was despite a slight strengthening of the yen during the year against the U.S. dollar. In the past, we made the case that a weak yen was not a prerequisite for Japanese equities to perform well. We are glad to see that realized.
Low volatility was also a hallmark of 2017. Equity markets globally experienced historically low levels of volatility during the year and Japan was no exception. Due to low market volatility, we notice an expansion in valuations for businesses that are more cyclical in nature. That is something we will need to watch. Additionally, small-cap stocks in Japan continued to outperform their larger-cap peers. That was in contrast to the United States and other Asian markets where small caps underperformed and may be a reflection of the impact of equity purchases by the Bank of Japan.
Performance Contributors and Detractors:
Japanese equities rallied during the fourth quarter as investors cheered the landslide victory by Prime Minister Shinzo Abe and his ruling Liberal Democratic Party in October’s lower house elections. This prompted a massive inflow into Japanese equities from overseas investors. The Fund slightly underperformed its benchmark during the quarter primarily due to its larger allocation to small caps, as we would expect in times of acute liquidity-driven rallies.
The industrials sector continued to be the top contributor to relative performance. Miniature ball bearing and motor manufacturer MinebeaMitsumi performed well on the back of broad demand growth for its products. Mining and construction equipment company Komatsu also performed well as higher commodity prices led to a recovery in equipment spending by major mining companies.
On the other hand, the consumer discretionary sector was the largest detractor from performance. Small-cap optical retailer JINS corrected after announcing weaker-than-expected quarterly earnings. Sales growth for its Japan business slowed as it dealt with tough comparable figures from the previous year while its China business faced increased competition. Fashion e-commerce company Start Today also corrected slightly as profit growth slowed amid higher business development spending for its planned expansion into private brand apparel.
Notable Portfolio Changes:
During the quarter, we initiated positions related to 5G telecommunication technology, which is expected to commence service in Japan in 2020. We added Itochu
(continued)
| * | The Matthews Japan Fund closed to most new investors effective after market closing on July 29, 2016, but will continue to accept investments from existing shareholders. |
| 1 | Actual 2017 expense ratios. |
| 2 | Matthews has contractually agreed to waive a portion of its advisory fee and administrative and shareholder services fee if the Fund’s average daily net assets are over $3 billion, as follows: for every $2.5 billion average daily net assets of the Fund that are over $3 billion, the advisory fee rate and the administrative and shareholder services fee rate for the Fund with respect to such excess average daily net assets will be each reduced by 0.01%, in each case without reducing such fee rate below 0.00%. Any amount waived by Matthews pursuant to this agreement may not be recouped by Matthews. This agreement will remain in place until April 30, 2019 and may be terminated at any time (i) by the Trust on behalf of the Fund or by the Board of Trustees upon 60 days’ prior written notice to Matthews; or (ii) by Matthews upon 60 days’ prior written notice to the Trust, in each case without payment of any penalty. |
| 3 | The lesser of fiscal year 2017 long-term purchase costs or sales proceeds divided by the average monthly market value of long-term securities. |
| | | | | | | | | | | | | | | | | | | | | | | | | | | | |
| |
| PERFORMANCE AS OF DECEMBER 31, 2017 | |
| | | | | | | | | Average Annual Total Returns | | | | |
| | | 3 Months | | | 1 Year | | | 3 Years | | | 5 Years | | | 10 Years | | | Since
Inception | | | Inception
Date | |
| Investor Class (MJFOX) | | | 8.25% | | | | 33.14% | | | | 17.33% | | | | 16.09% | | | | 7.11% | | | | 6.86% | | | | 12/31/98 | |
| Institutional Class (MIJFX) | | | 8.21% | | | | 33.23% | | | | 17.44% | | | | 16.23% | | | | n.a. | | | | 12.72% | | | | 10/29/10 | |
| MSCI Japan Index3 | | | 8.52% | | | | 24.39% | | | | 11.98% | | | | 11.48% | | | | 3.39% | | | | 3.95% | 4 | | | | |
| Lipper Japanese Funds Category Average5 | | | 8.60% | | | | 27.62% | | | | 13.67% | | | | 13.70% | | | | 6.12% | | | | 5.28% | 4 | | | | |
Performance assumes reinvestment of all dividends and/or distributions before taxes. All performance quoted represents past performance and is no guarantee of future results. Investment return and principal value will fluctuate with market conditions so that when redeemed, shares may be worth more or less than their original cost. Current performance may be lower or higher than the return figures quoted. For the Fund’s most recent month-end performance, visit matthewsasia.com.
GROWTH OF A $10,000 INVESTMENT SINCE INCEPTION—INVESTOR CLASS
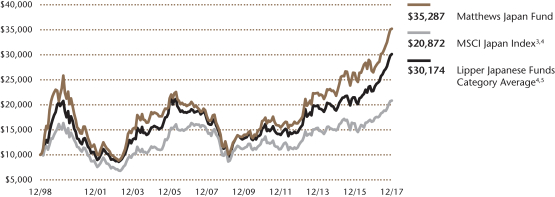
Plotted monthly. The performance data and graph do not reflect the deduction of taxes that a shareholder would pay on dividends, capital gains distributions or redemption of Fund shares. Values are in US$.
| | 3 | It is not possible to invest directly in an index. Source: Index data from Morgan Stanley Capital International and Bloomberg; total return calculations performed by BNY Mellon Investment Servicing (US) Inc. Please see page 92 for index definitions. |
| | 4 | Calculated from 12/31/98. |
| | 5 | The Lipper Category Average does not reflect sales charges and is based on total return, including reinvestment of dividends and capital gains for the stated periods. |
| | | | | | | | |
| | | | |
| TOP TEN HOLDINGS6 | | | | | | | |
| | | Sector | | | | % of Net Assets | |
| Mitsubishi UFJ Financial Group, Inc. | | Financials | | | | | 3.7% | |
| Suzuki Motor Corp. | | Consumer Discretionary | | | | | 3.0% | |
| Keyence Corp. | | Information Technology | | | | | 3.0% | |
| Sumitomo Mitsui Financial Group, Inc. | | Financials | | | | | 2.7% | |
| Nidec Corp. | | Industrials | | | | | 2.6% | |
| Nitori Holdings Co., Ltd. | | Consumer Discretionary | | | | | 2.5% | |
| Relo Group, Inc. | | Real Estate | | | | | 2.4% | |
| TechnoPro Holdings, Inc. | | Industrials | | | | | 2.3% | |
| SoftBank Group Corp. | | Telecommunication Services | | | | | 2.2% | |
| Tokio Marine Holdings, Inc. | | Financials | | | | | 2.2% | |
| % OF ASSETS IN TOP TEN | | | | | | | 26.6% | |
| | 6 | Holdings may combine more than one security from same issuer and related depositary receipts. |
| | | | |
| matthewsasia.com | 800.789.ASIA | | | 73 | |
| | | | |
| |
| COUNTRY ALLOCATION (%)7 | |
| Japan | | | 97.4 | |
| Cash and Other Assets, Less Liabilities | | | 2.6 | |
| | | | |
| | |
| SECTOR ALLOCATION (%)7 | | | |
| Industrials | | | 27.7 | |
| Consumer Discretionary | | | 15.2 | |
| Information Technology | | | 12.8 | |
| Financials | | | 12.3 | |
| Health Care | | | 9.8 | |
| Consumer Staples | | | 9.7 | |
| Materials | | | 5.3 | |
| Real Estate | | | 2.4 | |
| Telecommunication Services | | | 2.2 | |
| Cash and Other Assets, Less Liabilities | | | 2.6 | |
| | | | |
| | |
| MARKET CAP EXPOSURE (%)7 | | | |
| Mega Cap (over $25B) | | | 37.8 | |
| Large Cap ($10B–$25B) | | | 16.3 | |
| Mid Cap ($3B–10B) | | | 27.9 | |
| Small Cap (under $3B) | | | 15.5 | |
| Cash and Other Assets, Less Liabilities | | | 2.6 | |
| 7 | Source: FactSet Research Systems. Percentage values in data are rounded to the nearest tenth of one percent, so the values may not sum to 100% due to rounding. Percentage values may be derived from different data sources and may not be consistent with other Fund literature. |
Matthews Japan Fund
Portfolio Manager Commentary (unaudited) (continued)
Techno-Solutions, a major provider of system solutions to Japan’s telecom carriers, as we believe its addressable market will expand along with opportunities to improve margins as 5G networks are rolled out. We also added telecommunication construction company Kyowa Exeo, which benefited from improved pricing power for telecom carriers thanks to industry consolidation.
In turn, we exited measuring equipment company Horiba, automobile manufacturer Subaru and real estate developer Mitsui Fudosan. Horiba’s business was doing well on the back of strong demand for semiconductor production equipment but we believe near-term upside is now limited. For Subaru, we were disappointed by the compliance issues that have recently come to light and believe it will take time for the company to improve its internal controls. Mitsui Fudosan faced a tough outlook for its shopping center operations in Japan.
Additionally, we sought to upgrade the portfolio’s consumer related holdings by adding 100-yen store operator Seria, drugstore operator Tsuruha and cosmetics company Kose. All of these companies delivered solid top-line growth driven by sound strategies to capture market share. To fund these positions, we exited convenience store operator Seven & i Holdings, confectionary company Ezaki Glico and wholesaler Doshisha. These companies experienced slower growth in recent years and we believe the potential for future improvements is not attractive.
Outlook:
We believe Japan’s macroeconomic growth may slow in 2018 due to fiscal tightening by the government. We are disappointed by the fiscally conservative approach at a time when a more expansionary fiscal policy seems appropriate given low inflation levels and highly accommodative monetary policy by the Bank of Japan.
Private sector spending, meanwhile, remains firm amid a tight labor market. Labor shortages are prompting companies to seek productivity improvement measures such as automation, information technology and artificial intelligence. This had led to solid demand for such services. The government seems intent on supporting higher wages as it considers a proposal to lower corporate tax rates for companies that increase wages. There are nascent signs that such wage inflation may lead to higher pricing in various industries.
Based on earnings results so far, we believe Japan’s listed-company profits may deliver robust growth and reach a record high in the fiscal year ending March 2018. We believe the rate of profit growth is likely to slow for the March 2019 fiscal year, however, due to tougher comparable figures. Given such an outlook, we retain a cautious stance toward Japanese equities and will continue to favor solidly managed companies that we believe can drive their own destinies.
Matthews Japan Fund
December 31, 2017
Schedule of Investmentsa
COMMON EQUITIES: 97.4%
| | | | | | | | |
| | | Shares | | | Value | |
| INDUSTRIALS: 27.7% | | | | | | | | |
Machinery: 7.9% | | | | | | | | |
Komatsu, Ltd. | | | 2,351,900 | | | | $84,997,005 | |
SMC Corp. | | | 179,000 | | | | 73,458,808 | |
CKD Corp. | | | 2,833,200 | | | | 63,505,000 | |
MINEBEA MITSUMI, Inc. | | | 2,538,900 | | | | 52,954,271 | |
Harmonic Drive Systems, Inc. | | | 860,800 | | | | 50,102,177 | |
| | | | | | | | |
| | | | | | | 325,017,261 | |
| | | | | | | | |
| | | | | | | | |
Professional Services: 7.5% | | | | | | | | |
TechnoPro Holdings, Inc.† | | | 1,719,500 | | | | 93,223,119 | |
Persol Holdings Co., Ltd. | | | 3,150,200 | | | | 78,869,588 | |
Recruit Holdings Co., Ltd. | | | 3,114,500 | | | | 77,332,911 | |
Nihon M&A Center, Inc. | | | 1,257,000 | | | | 59,846,558 | |
| | | | | | | | |
| | | | | | | 309,272,176 | |
| | | | | | | | |
| | | | | | | | |
Electrical Equipment: 4.5% | | | | | | | | |
Nidec Corp. | | | 777,900 | | | | 108,919,263 | |
Mabuchi Motor Co., Ltd. | | | 1,418,700 | | | | 76,687,091 | |
| | | | | | | | |
| | | | | | | 185,606,354 | |
| | | | | | | | |
| | | | | | | | |
Trading Companies & Distributors: 3.6% | | | | | | | | |
Mitsui & Co., Ltd. | | | 5,370,100 | | | | 87,121,439 | |
MISUMI Group, Inc. | | | 2,118,100 | | | | 61,492,959 | |
| | | | | | | | |
| | | | | | | 148,614,398 | |
| | | | | | | | |
| | | | | | | | |
Building Products: 3.1% | | | | | | | | |
Daikin Industries, Ltd. | | | 672,900 | | | | 79,511,867 | |
Aica Kogyo Co., Ltd. | | | 1,228,400 | | | | 45,538,540 | |
| | | | | | | | |
| | | | | | | 125,050,407 | |
| | | | | | | | |
| | | | | | | | |
Construction & Engineering: 1.1% | | | | | | | | |
Kyowa Exeo Corp. | | | 1,742,300 | | | | 45,043,087 | |
| | | | | | | | |
Total Industrials | | | | | | | 1,138,603,683 | |
| | | | | | | | |
| | | | | | | | |
| CONSUMER DISCRETIONARY: 15.2% | | | | | | | | |
Specialty Retail: 3.7% | | | | | | | | |
Nitori Holdings Co., Ltd. | | | 726,900 | | | | 103,455,685 | |
JINS, Inc. | | | 900,200 | | | | 47,262,517 | |
| | | | | | | | |
| | | | | | | 150,718,202 | |
| | | | | | | | |
| | | | | | | | |
Auto Components: 3.5% | | | | | | | | |
Denso Corp. | | | 1,036,500 | | | | 62,095,446 | |
Nifco, Inc. | | | 777,700 | | | | 52,942,606 | |
Nippon Seiki Co., Ltd. | | | 1,397,300 | | | | 29,974,947 | |
| | | | | | | | |
| | | | | | | 145,012,999 | |
| | | | | | | | |
| | | | | | | | |
Multiline Retail: 3.2% | | | | | | | | |
Ryohin Keikaku Co., Ltd. | | | 264,600 | | | | 82,367,097 | |
Seria Co., Ltd. | | | 810,000 | | | | 48,743,383 | |
| | | | | | | | |
| | | | | | | 131,110,480 | |
| | | | | | | | |
Automobiles: 3.0% | | | | | | | | |
Suzuki Motor Corp. | | | 2,130,900 | | | | 123,344,280 | |
| | | | | | | | |
| | | | | | | | |
Internet & Direct Marketing Retail: 1.8% | | | | | | | | |
Start Today Co., Ltd. | | | 2,400,100 | | | | 72,850,496 | |
| | | | | | | | |
Total Consumer Discretionary | | | | | | | 623,036,457 | |
| | | | | | | | |
| | | | | | | | |
| | | | | | | | |
| | | Shares | | | Value | |
| INFORMATION TECHNOLOGY: 12.8% | | | | | | | | |
Electronic Equipment, Instruments & Components: 5.0% | |
Keyence Corp. | | | 217,400 | | | | $121,446,456 | |
Murata Manufacturing Co., Ltd. | | | 649,300 | | | | 86,933,548 | |
| | | | | | | | |
| | | | | | | 208,380,004 | |
| | | | | | | | |
| | | | | | | | |
Semiconductors & Semiconductor Equipment: 3.2% | |
Lasertec Corp. | | | 2,315,300 | | | | 58,144,651 | |
Rohm Co., Ltd. | | | 512,000 | | | | 56,402,824 | |
Optorun Co., Ltd. | | | 634,700 | | | | 16,110,424 | |
| | | | | | | | |
| | | | | | | 130,657,899 | |
| | | | | | | | |
| | | | | | | | |
Software: 2.3% | | | | | | | | |
Oracle Corp. Japan | | | 769,300 | | | | 63,668,066 | |
Square Enix Holdings Co., Ltd. | | | 634,100 | | | | 30,086,659 | |
| | | | | | | | |
| | | | | | | 93,754,725 | |
| | | | | | | | |
| | | | | | | | |
IT Services: 1.2% | | | | | | | | |
ITOCHU Techno-Solutions Corp. | | | 1,147,900 | | | | 49,788,126 | |
| | | | | | | | |
| | | | | | | | |
Internet Software & Services: 1.1% | | | | | | | | |
Infomart Corp.† | | | 7,697,300 | | | | 45,805,360 | |
| | | | | | | | |
Total Information Technology | | | | | | | 528,386,114 | |
| | | | | | | | |
| | | | | | | | |
| FINANCIALS: 12.3% | | | | | | | | |
Banks: 6.4% | | | | | | | | |
Mitsubishi UFJ Financial Group, Inc. | | | 21,100,800 | | | | 153,570,889 | |
Sumitomo Mitsui Financial Group, Inc. | | | 2,548,200 | | | | 109,838,924 | |
| | | | | | | | |
| | | | | | | 263,409,813 | |
| | | | | | | | |
| | | | | | | | |
Insurance: 4.2% | | | | | | | | |
Tokio Marine Holdings, Inc. | | | 2,012,700 | | | | 91,543,736 | |
Dai-ichi Life Holdings, Inc. | | | 4,059,300 | | | | 83,427,319 | |
| | | | | | | | |
| | | | | | | 174,971,055 | |
| | | | | | | | |
| | | | | | | | |
Diversified Financial Services: 1.7% | | | | | | | | |
ORIX Corp. | | | 4,059,600 | | | | 68,448,430 | |
| | | | | | | | |
Total Financials | | | | | | | 506,829,298 | |
| | | | | | | | |
| | | | | | | | |
| HEALTH CARE: 9.8% | | | | | | | | |
Health Care Equipment & Supplies: 6.0% | | | | | | | | |
Asahi Intecc Co., Ltd. | | | 2,667,800 | | | | 91,433,936 | |
Sysmex Corp. | | | 1,126,300 | | | | 88,438,206 | |
Hoya Corp. | | | 1,225,200 | | | | 61,018,871 | |
Daiken Medical Co., Ltd. | | | 987,300 | | | | 6,771,822 | |
| | | | | | | | |
| | | | | | | 247,662,835 | |
| | | | | | | | |
| | | | | | | | |
Health Care Technology: 1.7% | | | | | | | | |
M3, Inc. | | | 2,039,100 | | | | 71,478,954 | |
| | | | | | | | |
| | | | | | | | |
Biotechnology: 1.1% | | | | | | | | |
PeptiDream, Inc.b | | | 1,336,900 | | | | 45,604,378 | |
| | | | | | | | |
| | | | | | | | |
Health Care Providers & Services: 1.0% | | | | | | | | |
Japan Lifeline Co., Ltd. | | | 1,901,200 | | | | 39,452,099 | |
| | | | | | | | |
Total Health Care | | | | | | | 404,198,266 | |
| | | | | | | | |
| | | | | | | | |
| | | | |
| matthewsasia.com | 800.789.ASIA | | | 75 | |
Matthews Japan Fund
December 31, 2017
Schedule of Investmentsa (continued)
COMMON EQUITIES (continued)
| | | | | | | | |
| | | Shares | | | Value | |
| CONSUMER STAPLES: 9.7% | | | | | | | | |
Personal Products: 3.3% | | | | | | | | |
Kao Corp. | | | 1,202,300 | | | | $81,238,937 | |
Kose Corp. | | | 337,300 | | | | 52,560,488 | |
| | | | | | | | |
| | | | | | | 133,799,425 | |
| | | | | | | | |
Food & Staples Retailing: 2.4% | | | | | | | | |
San-A Co., Ltd. | | | 1,168,800 | | | | 56,475,542 | |
Tsuruha Holdings, Inc. | | | 300,600 | | | | 40,830,485 | |
| | | | | | | | |
| | | | | | | 97,306,027 | |
| | | | | | | | |
| | | | | | | | |
Tobacco: 1.4% | | | | | | | | |
Japan Tobacco, Inc. | | | 1,813,300 | | | | 58,393,913 | |
| | | | | | | | |
| | | | | | | | |
Household Products: 1.4% | | | | | | | | |
Pigeon Corp. | | | 1,512,700 | | | | 57,475,250 | |
| | | | | | | | |
| | | | | | | | |
Food Products: 1.2% | | | | | | | | |
Ariake Japan Co., Ltd. | | | 593,100 | | | | 50,586,164 | |
| | | | | | | | |
Total Consumer Staples | | | | | | | 397,560,779 | |
| | | | | | | | |
| | | | | | | | |
| MATERIALS: 5.3% | | | | | | | | |
Chemicals: 5.3% | | | | | | | | |
Nitto Denko Corp. | | | 832,400 | | | | 73,624,718 | |
Shin-Etsu Chemical Co., Ltd. | | | 602,300 | | | | 61,026,845 | |
W-Scope Corp.† | | | 2,047,600 | | | | 42,311,292 | |
Fuso Chemical Co., Ltd. | | | 1,496,900 | | | | 40,577,834 | |
| | | | | | | | |
Total Materials | | | | | | | 217,540,689 | |
| | | | | | | | |
| | | | | | | | |
| | | | | | | | |
| | | Shares | | | Value | |
| REAL ESTATE: 2.4% | | | | | | | | |
Real Estate Management & Development: 2.4% | | | | | |
Relo Group, Inc. | | | 3,583,400 | | | | 97,456,045 | |
| | | | | | | | |
Total Real Estate | | | | | | | 97,456,045 | |
| | | | | | | | |
| | | | | | | | |
| TELECOMMUNICATION SERVICES: 2.2% | |
Wireless Telecommunication Services: 2.2% | |
SoftBank Group Corp. | | | 1,164,400 | | | | 92,186,222 | |
| | | | | | | | |
Total Telecommunication Services | | | | | | | 92,186,222 | |
| | | | | | | | |
| | | | | | | | |
| TOTAL INVESTMENTS: 97.4% | | | | | | | 4,005,797,553 | |
(Cost $3,021,719,476) | | | | | | | | |
| | | | | | | | |
CASH AND OTHER ASSETS,
LESS LIABILITIES: 2.6% | | | | | | | 106,696,572 | |
| | | | | | | | |
| | |
NET ASSETS: 100.0% | | | | | | | $4,112,494,125 | |
| | | | | | | | |
| a | Certain securities were fair valued under the valuation policies approved by the Board of Trustees (Note 2-A). |
| b | Non-income producing security. |
| † | Affiliated Issuer, as defined under the Investment Company Act of 1940 (ownership of 5% or more of the outstanding voting securities of this issuer) |
See accompanying notes to financial statements.
| | | | |
| PORTFOLIO MANAGERS |
| Michael J. Oh, CFA | | | | |
Lead Manager | | | | |
| Michael B. Han, CFA | | |
Co-Manager | | | | |
|
| FUND FACTS |
| | | Investor | | Institutional |
Ticker | | MAKOX | | MIKOX |
CUSIP | | 577130305 | | 577130826 |
Inception | | 1/3/95 | | 10/29/10 |
NAV | | $6.91 | | $6.95 |
Initial Investment | | $2,500 | | $100,000 |
Gross Expense Ratio1 | | 1.15% | | 1.01% |
Portfolio Statistics |
Total # of Positions | | 39 |
Net Assets | | $225.0 million |
Weighted Average
Market Cap | | $71.2 billion |
Portfolio Turnover2 | | 25.37% |
Benchmark |
Korea Composite Stock Price Index |
OBJECTIVE
Long-term capital appreciation.
STRATEGY
Under normal market conditions, the Fund seeks to achieve its investment objective by investing at least 80% of its total net assets, which include borrowings for investment purposes, in the common and preferred stocks of companies located in South Korea.
Matthews Korea Fund
Portfolio Manager Commentary (unaudited)
For the year ending December 31, 2017, the Matthews Korea Fund returned 43.70% (Investor Class) and 44.11% (Institutional Class), while its benchmark, the Korea Composite Stock Price Index, returned 37.71%. For the fourth quarter of the year, the Fund returned 12.94% (Investor Class) and 13.02% (Institutional Class) versus 10.17% for the Index.
Market Environment:
In March 2017, South Korea’s Constitutional Court unanimously ruled in favor of impeaching President Park Geun-hye on charges of corruption and cronyism. The country held a special election, with current President Moon Jae-in winning by a wide margin. The South Korean market performed well following the snap election. Geopolitical tensions included North Korea’s continued missile tests and China’s informal sanctions against South Korea, which began in 2016 in response to U.S. deployment of the THAAD (Terminal High Altitude Area Defense) missile system. In November 2017, China and South Korea began to normalize trade relations, giving South Korea’s economy a boost. While China’s informal sanctions are not yet fully lifted, relations between China and South Korea have vastly improved. Over the course of the year, South Korea’s currency appreciated about 13% versus the U.S. dollar. South Korea’s stock market and government bond yields largely remained calm, meanwhile, despite geopolitical pressures.
Performance Contributors and Detractors:
Top-performing securities held by the Fund in 2017 included Samsung Electronics and Hana Financial Group. Samsung is benefiting from strong, global demand for semiconductors. Despite past leadership scandals and well-publicized problems with their batteries, the firm generated strong full-year results. We believe the company’s strong position in its core component businesses (semiconductors and displays), an improved outlook for corporate governance and plans for new phone models all contributed to its solid share-price performance. Samsung Electronics’ flash memory business in particular stands out as the company leads other industry peers in technology and scale. We believe that the current favorable industry cycle may last longer than previous cycles due to industry consolidation. Hana Financial, one of South Korea’s largest bank holding companies, was also a top contributor during the year. We believe banks will benefit from a favorable interest rate cycle in the coming years, and Hana is well-positioned to take advantage of growing demand for financial services in South Korea. We purchased the holding at a very attractive valuation and expect the company and other banks to continue raising their dividends for years to come.
Among our biggest detractors to Fund performance during the year were cosmetics company Amorepacific and Hyundai Department Store, a traditional brick-and-mortar retailer. Amorepacific had previously done well and benefited from an uptick in business with Chinese tourists, but as tourism from China to South Korea has sharply declined following China’s informal sanctions, the company’s sales suffered. While we expect tourism to resume, we sold Amorepacific Corp. during the year and replaced it with positions in its parent company Amorepacific Group as we found it to be more attractively valued. We also found Hyundai Department Store to be suffering from the same fate as many department stores in the U.S. and elsewhere. Stiff competition from online retailing has meant declining sales for the chain. Hyundai’s online platform is fairly weak and in-store sales are falling. As we expect consumers in South Korea to continue to migrate to online shopping, we exited our position in this security.
(continued)
| 1 | Actual 2017 expense ratios. |
| 2 | The lesser of fiscal year 2017 long-term purchase costs or sales proceeds divided by the average monthly market value of long-term securities. |
| | | | |
| matthewsasia.com | 800.789.ASIA | | | 77 | |
| | | | | | | | | | | | | | | | | | | | | | | | | | | | |
| | | | | | | | |
| PERFORMANCE AS OF DECEMBER 31, 2017 | | | | | | | | | | | | | | | | | | | | | |
| | | | | | | | | Average Annual Total Returns | | | | |
| | | 3 Months | | | 1 Year | | | 3 Years | | | 5 Years | | | 10 Years | | | Since
Inception | | | Inception
Date | |
| Investor Class (MAKOX) | | | 12.94% | | | | 43.70% | | | | 15.74% | | | | 11.13% | | | | 6.34% | | | | 7.11% | | | | 1/3/95 | |
| Institutional Class (MIKOX) | | | 13.02% | | | | 44.11% | | | | 15.89% | | | | 11.24% | | | | n.a. | | | | 11.31% | | | | 10/29/10 | |
| Korea Composite Stock Price Index3 | | | 10.17% | | | | 37.71% | | | | 11.07% | | | | 5.59% | | | | 2.68% | | | | 4.04% | 4 | | | | |
| Lipper Pacific ex Japan Funds Category Average5 | | | 8.50% | | | | 39.66% | | | | 10.19% | | | | 7.61% | | | | 4.23% | | | | 6.72% | 4 | | | | |
Performance assumes reinvestment of all dividends and/or distributions before taxes. All performance quoted represents past performance and is no guarantee of future results. Investment return and principal value will fluctuate with market conditions so that when redeemed, shares may be worth more or less than their original cost. Current performance may be lower or higher than the return figures quoted. For the Fund’s most recent month-end performance, visit matthewsasia.com.
GROWTH OF A $10,000 INVESTMENT SINCE INCEPTION—INVESTOR CLASS
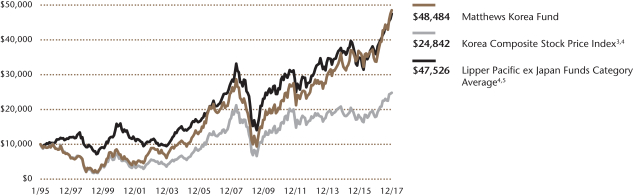
Plotted monthly. The performance data and graph do not reflect the deduction of taxes that a shareholder would pay on dividends, capital gains distributions or redemption of Fund shares. Values are in US$.
| | 3 | Korea Composite Stock Price Index performance data may be readjusted periodically by the Korea Exchange due to certain factors, including the declaration of dividends. It is not possible to invest directly in an index. Source: Index data from Korea Composite Stock Price Index and Bloomberg; total return calculations performed by BNY Mellon Investment Servicing (US) Inc. Please see page 92 for index definition. |
| | 5 | The Lipper Category Average does not reflect sales charges and is based on total return, including reinvestment of dividends and capital gains for the stated periods. |
| | | | | | | | |
| | | | |
| TOP TEN HOLDINGS6 | | | | | | | |
| | | Sector | | | | % of Net Assets | |
| Samsung Electronics Co., Ltd., Pfd. | | Information Technology | | | | | 9.2% | |
| Samsung Electronics Co., Ltd. | | Information Technology | | | | | 7.7% | |
| KB Financial Group, Inc. | | Financials | | | | | 3.8% | |
| Hyundai Mobis Co., Ltd. | | Consumer Discretionary | | | | | 3.5% | |
| LG Household & Health Care, Ltd., Pfd. | | Consumer Staples | | | | | 3.5% | |
| Hana Financial Group, Inc. | | Financials | | | | | 3.5% | |
| NAVER Corp. | | Information Technology | | | | | 3.4% | |
| Modetour Network, Inc. | | Consumer Discretionary | | | | | 3.3% | |
| Hyundai Motor Co., Ltd., 2nd Pfd. | | Consumer Discretionary | | | | | 3.2% | |
| Shinhan Financial Group Co., Ltd. | | Financials | | | | | 3.2% | |
| % OF ASSETS IN TOP TEN | | | | | | | 44.3% | |
| | 6 | Holdings may combine more than one security from same issuer and related depositary receipts. |
Matthews Korea Fund
Portfolio Manager Commentary (unaudited) (continued)
Notable Portfolio Changes:
During 2017, South Korea’s financials sector performed fairly well and we increased our exposure to the sector, adding to existing holdings such as KB Financials. We also purchased Lock&Lock, a kitchenware company with strong sales in China and other emerging markets in the region. We had previously invested in the company a few years ago, but sold our original investment because we lost faith in how the company was being run by its founder. Since then, the firm has been sold to a private equity company in Hong Kong. We believe that now under new management, Lock&Lock is well-positioned to improve its business operations, sales and marketing. Since we repurchased the security, it has provided attractive performance returns.
Outlook:
We expect South Korea’s relationship with China to continue improving. Trade relations should resume and deepen. With regard to tensions with North Korea, we believe Kim Jong Un’s regime is focused primarily on its own survival. Talks between the U.S. and North Korea in 2018 would be a positive development for stability in the region. President Moon’s pragmatic approach to pursuing dialogue with North Korea is also de-escalating tensions. A stronger won could dampen the environment for South Korean exporters, but it would be good news for domestic consumption—a major area of focus for the Fund. Looking ahead to 2018, we are optimistic about South Korea’s prospects for economic growth.
| | | | |
| |
| COUNTRY ALLOCATION (%)7 | |
| South Korea | | | 97.5 | |
| Cash and Other Assets, Less Liabilities | | | 2.5 | |
| | | | |
| |
| SECTOR ALLOCATION (%)7 | |
| Information Technology | | | 26.4 | |
| Financials | | | 18.2 | |
| Consumer Discretionary | | | 17.8 | |
| Consumer Staples | | | 9.9 | |
| Materials | | | 9.3 | |
| Health Care | | | 6.2 | |
| Energy | | | 4.6 | |
| Telecommunication Services | | | 3.4 | |
| Industrials | | | 1.7 | |
| Cash and Other Assets, Less Liabilities | | | 2.5 | |
| | | | |
| |
| MARKET CAP EXPOSURE (%)7 | |
| Mega Cap (over $25B) | | | 29.5 | % |
| Large Cap ($10B–$25B) | | | 31.9 | |
| Mid Cap ($3B–10B) | | | 12.8 | |
| Small Cap (under $3B) | | | 23.3 | |
| Cash and Other Assets, Less Liabilities | | | 2.5 | |
| 7 | Source: FactSet Research Systems. Percentage values in data are rounded to the nearest tenth of one percent, so the values may not sum to 100% due to rounding. Percentage values may be derived from different data sources and may not be consistent with other Fund literature. |
| | | | |
| matthewsasia.com | 800.789.ASIA | | | 79 | |
Matthews Korea Fund
December 31, 2017
Schedule of Investmentsa
COMMON EQUITIES: 74.0%
| | | | | | | | |
| | | Shares | | | Value | |
| INFORMATION TECHNOLOGY: 17.1% | | | | | | | | |
Technology Hardware, Storage & Peripherals: 7.7% | |
Samsung Electronics Co., Ltd. | | | 7,283 | | | | $17,303,762 | |
| | | | | | | | |
| | | | | | | | |
Semiconductors & Semiconductor Equipment: 4.0% | | | | | |
SK Hynix, Inc. | | | 88,762 | | | | 6,304,440 | |
Koh Young Technology, Inc. | | | 35,261 | | | | 2,710,972 | |
| | | | | | | | |
| | | | | | | 9,015,412 | |
| | | | | | | | |
| | | | | | | | |
Internet Software & Services: 3.4% | | | | | | | | |
NAVER Corp. | | | 9,444 | | | | 7,672,114 | |
| | | | | | | | |
| | | | | | | | |
Electronic Equipment, Instruments & Components: 2.0% | |
Samsung SDI Co., Ltd. | | | 23,292 | | | | 4,440,523 | |
| | | | | | | | |
Total Information Technology | | | | | | | 38,431,811 | |
| | | | | | | | |
| | | | | | | | |
| FINANCIALS: 15.8% | | | | | | | | |
Banks: 10.5% | |
KB Financial Group, Inc. | | | 144,905 | | | | 8,575,930 | |
Hana Financial Group, Inc. | | | 168,641 | | | | 7,838,678 | |
Shinhan Financial Group Co., Ltd. | | | 156,686 | | | | 7,232,192 | |
| | | | | | | | |
| | | | | | | 23,646,800 | |
| | | | | | | | |
| | | | | | | | |
Capital Markets: 3.6% | |
KIWOOM Securities Co., Ltd. | | | 56,570 | | | | 4,624,387 | |
Shinyoung Securities Co., Ltd. | | | 63,434 | | | | 3,358,410 | |
| | | | | | | | |
| | | | | | | 7,982,797 | |
| | | | | | | | |
| | | | | | | | |
Insurance: 1.7% | |
DB Insurance Co., Ltd. | | | 57,666 | | | | 3,835,243 | |
| | | | | | | | |
Total Financials | | | | | | | 35,464,840 | |
| | | | | | | | |
| | | | | | | | |
| CONSUMER DISCRETIONARY: 14.6% | | | | | | | | |
Auto Components: 5.4% | |
Hyundai Mobis Co., Ltd. | | | 32,503 | | | | 7,984,951 | |
Hankook Tire Co., Ltd. | | | 81,800 | | | | 4,167,504 | |
| | | | | | | | |
| | | | | | | 12,152,455 | |
| | | | | | | | |
| | | | | | | | |
Hotels, Restaurants & Leisure: 5.1% | |
Modetour Network, Inc. | | | 257,801 | | | | 7,344,758 | |
Kangwon Land, Inc. | | | 125,386 | | | | 4,075,691 | |
| | | | | | | | |
| | | | | | | 11,420,449 | |
| | | | | | | | |
| | | | | | | | |
Specialty Retail: 1.8% | | | | | | | | |
LOTTE Himart Co., Ltd. | | | 63,834 | | | | 4,108,320 | |
| | | | | | | | |
| | | | | | | | |
Media: 1.3% | | | | | | | | |
Innocean Worldwide, Inc. | | | 44,713 | | | | 3,057,299 | |
| | | | | | | | |
| | | | | | | | |
Household Durables: 1.0% | |
Cuckoo Electronics Co., Ltd.c | | | 13,958 | | | | 2,158,539 | |
| | | | | | | | |
Total Consumer Discretionary | | | | | | | 32,897,062 | |
| | | | | | | | |
| | | | | | | | |
| MATERIALS: 7.2% | | | | | | | | |
Metals & Mining: 4.9% | |
POSCO | | | 22,432 | | | | 6,977,500 | |
Korea Zinc Co., Ltd. | | | 8,959 | | | | 4,125,718 | |
| | | | | | | | |
| | | | | | | 11,103,218 | |
| | | | | | | | |
| | | | | | | | |
| | | Shares | | | Value | |
Containers & Packaging: 2.3% | | | | | | | | |
Lock&Lock Co., Ltd.b | | | 201,646 | | | | $5,132,739 | |
| | | | | | | | |
Total Materials | | | | | | | 16,235,957 | |
| | | | | | | | |
| | | | | | | | |
| HEALTH CARE: 6.2% | | | | | | | | |
Biotechnology: 2.3% | | | | | | | | |
Hugel, Inc.b | | | 9,774 | | | | 5,090,218 | |
| | | | | | | | |
| | | | | | | | |
Pharmaceuticals: 2.2% | | | | | | | | |
Yuhan Corp. | | | 15,533 | | | | 3,174,695 | |
DongKook Pharmaceutical Co., Ltd. | | | 32,401 | | | | 1,915,205 | |
| | | | | | | | |
| | | | | | | 5,089,900 | |
| | | | | | | | |
| | | | | | | | |
Health Care Equipment & Supplies: 1.7% | | | | | | | | |
Interojo Co., Ltd. | | | 105,282 | | | | 3,820,671 | |
| | | | | | | | |
Total Health Care | | | | | | | 14,000,789 | |
| | | | | | | | |
| | | | | | | | |
| CONSUMER STAPLES: 5.0% | | | | | | | | |
Food Products: 2.6% | | | | | | | | |
Orion Holdings Corp. | | | 238,457 | | | | 5,936,088 | |
| | | | | | | | |
| | | | | | | | |
Food & Staples Retailing: 2.4% | | | | | | | | |
BGF Retail Co., Ltd.b | | | 27,509 | | | | 5,396,189 | |
| | | | | | | | |
Total Consumer Staples | | | | | | | 11,332,277 | |
| | | | | | | | |
| | | | | | | | |
| TELECOMMUNICATION SERVICES: 3.4% | | | | | | | | |
Wireless Telecommunication Services: 1.9% | | | | | | | | |
SK Telecom Co., Ltd. ADR | | | 151,300 | | | | 4,222,783 | |
| | | | | | | | |
| | | | | | | | |
Diversified Telecommunication Services: 1.5% | | | | | | | | |
KT Corp. ADR | | | 211,500 | | | | 3,301,515 | |
| | | | | | | | |
Total Telecommunication Services | | | | | | | 7,524,298 | |
| | | | | | | | |
| | | | | | | | |
| ENERGY: 3.0% | | | | | | | | |
Oil, Gas & Consumable Fuels: 3.0% | | | | | | | | |
SK Innovation Co., Ltd. | | | 24,541 | | | | 4,681,708 | |
S-Oil Corp. | | | 18,205 | | | | 1,988,428 | |
| | | | | | | | |
Total Energy | | | | | | | 6,670,136 | |
| | | | | | | | |
| | | | | | | | |
| INDUSTRIALS: 1.7% | | | | | | | | |
Commercial Services & Supplies: 1.7% | | | | | | | | |
S-1 Corp. | | | 38,951 | | | | 3,893,099 | |
| | | | | | | | |
Total Industrials | | | | | | | 3,893,099 | |
| | | | | | | | |
| | | | | | | | |
| TOTAL COMMON EQUITIES | | | | 166,450,269 | |
| | | | | | | | |
(Cost $99,177,903) | | | | | | | | |
| | | | | | | | |
PREFERRED EQUITIES: 23.5% | | | | | | | | |
| INFORMATION TECHNOLOGY: 9.3% | | | | | | | | |
Technology Hardware, Storage & Peripherals: 9.3% | |
Samsung Electronics Co., Ltd., Pfd. | | | 10,685 | | | | 20,808,102 | |
| | | | | | | | |
Total Information Technology | | | | | | | 20,808,102 | |
| | | | | | | | |
| | | | | | | | |
| CONSUMER STAPLES: 4.9% | | | | | | | | |
Personal Products: 4.9% | | | | | | | | |
LG Household & Health Care, Ltd., Pfd. | | | 12,118 | | | | 7,900,952 | |
AMOREPACIFIC Group, Pfd. | | | 58,118 | | | | 3,181,275 | |
| | | | | | | | |
Total Consumer Staples | | | | 11,082,227 | |
| | | | | | | | |
| | | | | | | | |
Matthews Korea Fund
December 31, 2017
Schedule of Investmentsa (continued)
PREFERRED EQUITIES (continued)
| | | | | | | | |
| | | Shares | | | Value | |
| CONSUMER DISCRETIONARY: 3.2% | | | | | | | | |
Automobiles: 3.2% | | | | | | | | |
Hyundai Motor Co., Ltd., 2nd Pfd. | | | 76,518 | | | | $7,290,492 | |
| | | | | | | | |
Total Consumer Discretionary | | | | 7,290,492 | |
| | | | | | | | |
| | | | | | | | |
| FINANCIALS: 2.4% | | | | | | | | |
Insurance: 2.4% | | | | | | | | |
Samsung Fire & Marine Insurance Co., Ltd., Pfd. | | | 33,053 | | | | 5,464,837 | |
| | | | | | | | |
Total Financials | | | | 5,464,837 | |
| | | | | | | | |
| | | | | | | | |
| MATERIALS: 2.1% | | | | | | | | |
Chemicals: 2.1% | | | | | | | | |
LG Chem, Ltd., Pfd. | | | 20,241 | | | | 4,701,445 | |
| | | | | | | | |
Total Materials | | | | 4,701,445 | |
| | | | | | | | |
| | | | | | | | |
| ENERGY: 1.6% | | | | | | | | |
Oil, Gas & Consumable Fuels: 1.6% | | | | | | | | |
S-Oil Corp., Pfd. | | | 38,278 | | | | 3,540,123 | |
| | | | | | | | |
Total Energy | | | | 3,540,123 | |
| | | | | | | | |
| | | | | | | | |
| TOTAL PREFERRED EQUITIES | | | | | | | 52,887,226 | |
| | | | | | | | |
(Cost $28,378,517) | | | | | | | | |
| | | | | | | | |
| TOTAL INVESTMENTS: 97.5% | | | | | | | 219,337,495 | |
(Cost $127,556,420) | | | | | | | | |
| | | | | | | | |
CASH AND OTHER ASSETS,
LESS LIABILITIES: 2.5% | | | | | | | 5,680,723 | |
| | | | | | | | |
| | |
NET ASSETS: 100.0% | | | | | | | $225,018,218 | |
| | | | | | | | |
| a | Certain securities were fair valued under the valuation policies approved by the Board of Trustees (Note 2-A). |
| b | Non-income producing security. |
| c | Security is valued using significant unobservable inputs and is classified as Level 3 in the fair value hierarchy. |
| ADR | American Depositary Receipt |
See accompanying notes to financial statements.
| | | | |
| matthewsasia.com | 800.789.ASIA | | | 81 | |

| | | | |
| PORTFOLIO MANAGERS |
| Lydia So, CFA | | |
Lead Manager | | |
| Kenichi Amaki | | Beini Zhou, CFA |
Co-Manager | | Co-Manager |
|
| FUND FACTS |
| | | Investor | | Institutional |
Ticker | | MSMLX | | MISMX |
CUSIP | | 577125206 | | 577125867 |
Inception | | 9/15/08 | | 4/30/13 |
NAV | | $22.89 | | $22.86 |
Initial Investment | | $2,500 | | $100,000 |
Gross Expense Ratio1 | | 1.49% | | 1.35% |
After Fee Waiver and Reimbursement2 | | 1.46% | | 1.25% |
Portfolio Statistics | | |
Total # of Positions | | 75 |
Net Assets | | $441.3 million |
Weighted Average
Market Cap | | $1.3 billion |
Portfolio Turnover3 | | 67.13% |
Benchmark | | |
MSCI AC Asia ex Japan Small Cap Index |
Redemption Fee | | |
2% within first 90 calendar days of purchase |
OBJECTIVE
Long-term capital appreciation.
STRATEGY
Under normal market conditions, the Fund seeks to achieve its investment objective by investing at least 80% of its total net assets, which include borrowings for investment purposes, in the common and preferred stocks of Small Companies located in Asia ex Japan, which consists of all countries and markets in Asia excluding Japan, but including all other developed, emerging and frontier countries and markets in the Asian region.
Matthews Asia Small Companies Fund
Portfolio Manager Commentary (unaudited)
For the year ending December 31, 2017, the Matthews Asia Small Companies Fund returned 30.59% (Investor Class) and 30.85% (Institutional Class), underperforming its benchmark, the MSCI All Country Asia ex Japan Small Cap Index, which returned 33.84%. For the fourth quarter, the Fund returned 7.65% (Investor Class) and 7.66% (Institutional Class), while its benchmark returned 10.01%.
Market Environment:
Entering 2017, investors were mildly concerned about the economic implications of U.S.-China trade relations. Geopolitical tensions on the Korean peninsula and unpredictable U.S. foreign policies also caused market unease during the year. Asian markets broadly have generated solid gains, however, due to various factors including improvements in company fundamentals and a broader economic recovery.
In China, supply-side reforms that addressed overcapacity issues in capital-intensive industries since 2009 started to bear fruit, including an earnings recovery among Chinese companies. Indian equities also generated notable gains, despite concerns over the implementation of the Goods & Services Tax (GST). Although actual earnings growth among Indian corporations was modest, participation by domestic investors continued to support India’s equity market. The technology cycle was another notable driver for strong gains in many Asian companies in the technology sector, which experienced robust earnings momentum during the year. In the United States, the Federal Reserve raised interest rates three times in 2017 as the country’s economic data continued to firm up. The Fed’s tightening measures did not adversely affect Asia’s robust markets during 2017.
Performance Contributors and Detractors:
During the quarter ended December 31, 2017, several health care holdings contributed to the Fund’s positive performance. Genscript Biotech in China performed strongly after a run-up in its share price for the majority of the year thanks to positive corporate developments for one of its drugs. Taimide Tech in Taiwan was another positive contributor. The company makes polyimide film materials used in flexible printed circuit-board production. Due to the booming mobile electronic device market, demand for such specialty materials is projected to be robust, which excited investors and drove up valuations for the company’s shares. On the other hand, some Chinese companies in the portfolio detracted from performance. Ten Pao, a Chinese power supply unit manufacturer, suffered a sharp sell-off after the market grew wary of sharp inflation for materials costs that might have a negative impact on the company’s profitability in the short to medium term.
For 2017, holdings in China/Hong Kong, India and Taiwan contributed the bulk of the absolute return, while holdings in Singapore and Indonesia were performance detractors. Unfavorable stock picking and an underweight in South Korea also hurt our relative performance. By sector, holdings in health care, consumer discretionary and industrials performed strongly, driven by favorable company-specific factors. An underweight allocation and less robust stock selections in information technology, however, contributed to some of the Fund’s underperformance for the year.
(continued)
| 1 | Actual 2017 expense ratios. |
| 2 | Matthews has contractually agreed (i) to waive fees and reimburse expenses to the extent needed to limit Total Annual Fund Operating Expenses (excluding Rule 12b-1 fees, taxes, interest, brokerage commissions, short sale dividend expenses, expenses incurred in connection with any merger or reorganization or extraordinary expenses such as litigation) of the Institutional Class to 1.25% first by waiving class specific expenses (i.e., shareholder service fees specific to a particular class) of the Institutional Class and then, to the extent necessary, by waiving non-class specific expenses of the Institutional Class, and (ii) if any Fund-wide expenses (i.e., expenses that apply to both the Institutional Class and the Investor Class) are waived for the Institutional Class to maintain the 1.25% expense limitation, to waive an equal amount (in annual percentage terms) of those same expenses for the Investor Class. The Total Annual Fund Operating Expenses After Fee Waiver and Expense Reimbursement for the Investor Class may vary from year to year and will in some years exceed 1.25%. If the operating expenses fall below the expense limitation in a year within three years after Matthews has made a waiver or reimbursement, the Fund may reimburse Matthews up to an amount that does not cause the expenses for that year to exceed the lesser of (i) the expense limitation applicable at the time of that fee waiver and/or expense reimbursement or (ii) the expense limitation in effect at the time of recoupment. This agreement will remain in place until April 30, 2019 and may be terminated at any time by the Board of Trustees on behalf of the Fund on 60 days’ written notice to Matthews. Matthews may decline to renew this agreement by written notice to the Trust at least 30 days before its annual expiration date. |
| 3 | The lesser of fiscal year 2017 long-term purchase costs or sales proceeds divided by the average monthly market value of long-term securities. |
| | | | | | | | | | | | | | | | | | | | | | | | |
| |
| PERFORMANCE AS OF DECEMBER 31, 2017 | |
| | | | | | | | | Average Annual Total Returns | | | | |
| | | 3 Months | | | 1 Year | | | 3 Years | | | 5 Years | | | Since
Inception | | | Inception
Date | |
| Investor Class (MSMLX) | | | 7.65% | | | | 30.59% | | | | 5.24% | | | | 6.83% | | | | 12.54% | | | | 9/15/08 | |
| Institutional Class (MISMX) | | | 7.66% | | | | 30.85% | | | | 5.47% | | | | n.a. | | | | 5.98% | | | | 4/30/13 | |
| MSCI AC Asia ex Japan Small Cap Index4 | | | 10.01% | | | | 33.84% | | | | 8.23% | | | | 6.86% | | | | 9.32% | 5 | | | | |
| Lipper Pacific ex Japan Funds Category Average6 | | | 8.50% | | | | 39.66% | | | | 10.19% | | | | 7.61% | | | | 9.69% | 7 | | | | |
Performance assumes reinvestment of all dividends and/or distributions before taxes. All performance quoted represents past performance and is no guarantee of future results. Investment return and principal value will fluctuate with market conditions so that when redeemed, shares may be worth more or less than their original cost. Current performance may be lower or higher than the return figures quoted. Returns would have been lower if certain of the Fund’s fees and expenses had not been waived. For the Fund’s most recent month-end performance, visit matthewsasia.com.
GROWTH OF A $10,000 INVESTMENT SINCE INCEPTION—INVESTOR CLASS
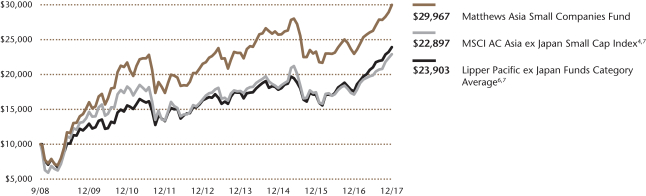
Plotted monthly. The performance data and graph do not reflect the deduction of taxes that a shareholder would pay on dividends, capital gains distributions or redemption of Fund shares. Values are in US$.
| | 4 | It is not possible to invest directly in an index. Source: Index data from Morgan Stanley Capital International and Bloomberg; total return calculations performed by BNY Mellon Investment Servicing (US) Inc. Please see page 92 for index definition. |
| | 5 | Calculated from 9/15/08. |
| | 6 | The Lipper Category Average does not reflect sales charges and is based on total return, including reinvestment of dividends and capital gains for the stated periods. |
| | 7 | Calculated from 9/30/08. |
| | | | | | | | |
| | | | |
| TOP TEN HOLDINGS8 | | | | | | | |
| | | Sector | | Country | | % of Net Assets | |
| Genscript Biotech Corp. | | Health Care | | China/Hong Kong | | | 2.7% | |
| Hutchison China MediTech, Ltd. | | Health Care | | China/Hong Kong | | | 1.9% | |
| Silergy Corp. | | Information Technology | | China/Hong Kong | | | 1.9% | |
| Vitasoy International Holdings, Ltd. | | Consumer Staples | | China/Hong Kong | | | 1.8% | |
| GRUH Finance, Ltd. | | Financials | | India | | | 1.8% | |
| Advanced Ceramic X Corp. | | Information Technology | | Taiwan | | | 1.8% | |
| Taimide Tech, Inc. | | Materials | | Taiwan | | | 1.7% | |
| CLIO Cosmetics Co., Ltd. | | Consumer Staples | | South Korea | | | 1.6% | |
| Sinbon Electronics Co., Ltd. | | Information Technology | | Taiwan | | | 1.6% | |
| Value Added Technology Co., Ltd. | | Health Care | | South Korea | | | 1.6% | |
| % OF ASSETS IN TOP TEN | | | | | | | 18.4% | |
| | 8 | Holdings may combine more than one security from same issuer and related depositary receipts. |
| | | | |
| matthewsasia.com | 800.789.ASIA | | | 83 | |
| | | | |
| |
| COUNTRY ALLOCATION (%)9,10 | |
| China/Hong Kong | | | 32.3 | |
| Taiwan | | | 16.6 | |
| India | | | 13.3 | |
| South Korea | | | 12.7 | |
| Indonesia | | | 6.8 | |
| Malaysia | | | 4.6 | |
| Japan | | | 3.7 | |
| Thailand | | | 2.1 | |
| Philippines | | | 1.3 | |
| Singapore | | | 0.9 | |
| Australia | | | 0.6 | |
| Cash and Other Assets, Less Liabilities | | | 5.1 | |
| | | | |
| |
| SECTOR ALLOCATION (%)10 | |
| Information Technology | | | 17.9 | |
| Consumer Discretionary | | | 14.7 | |
| Health Care | | | 13.7 | |
| Industrials | | | 12.7 | |
| Consumer Staples | | | 11.8 | |
| Financials | | | 10.6 | |
| Materials | | | 8.5 | |
| Energy | | | 2.8 | |
| Real Estate | | | 2.3 | |
| Cash and Other Assets, Less Liabilities | | | 5.1 | |
| | | | |
| |
| MARKET CAP EXPOSURE (%)10,11 | |
| Mega Cap (over $25B) | | | 0.0 | |
| Large Cap ($10B–$25B) | | | 0.0 | |
| Mid Cap ($3B–10B) | | | 8.4 | |
| Small Cap (under $3B) | | | 86.5 | |
| Cash and Other Assets, Less Liabilities | | | 5.1 | |
| 9 | Not all countries where the Fund may invest are included in the benchmark index. |
| 10 | Source: FactSet Research Systems. Percentage values in data are rounded to the nearest tenth of one percent, so the values may not sum to 100% due to rounding. Percentage values may be derived from different data sources and may not be consistent with other Fund literature. |
| 11 | The Fund defines Small Companies as companies with market capitalization generally between $100 million and $3 billion or the largest company included in the Fund’s primary benchmark, the MSCI All Country Asia ex Japan Small Cap Index. |
Matthews Asia Small Companies Fund
Portfolio Manager Commentary (unaudited) (continued)
Notable Portfolio Changes:
Throughout the year, we trimmed and sold positions where valuations have expanded excessively. We also exited holdings in companies in which growth and earning appeared to have deteriorated to make room for higher-quality companies that were trading at more reasonable valuations.
During the quarter ended December 31, 2017, similar adjustments were made to the portfolio to reposition the portfolio to better capture secular growth opportunities. We exited Gridsum, a China-based data analysis software company, due to the delays in achieving our desired level of profitability. We also exited our holding in Q Technology, a Chinese camera-module maker. The company’s share price rose substantially in 2017 and we believed that most of the positive news and growth prospects were reflected in the share price. Similarly we exited Elite Material, a Taiwan-based manufacturer of copper-clad laminates used in the printed circuit board industry, due to valuation concerns despite a solid business outlook.
We introduced several new companies to the portfolio across other industries in the fourth quarter. We initiated a new position in TOA Paint in Thailand. The company has a long operating track record and a dominant market share in its home market. We like that the company has a valuable brand and hence pricing power. With strong cash flow and balance sheet, we believe the company will be able to invest and grow in new markets in neighboring countries. We also started a position in D&O Green Technologies in Malaysia. The company manufactures LED lights for automobiles. It has a reasonably diversified customer base and improving profitability. We believe the company is well positioned to grow with the rising adoption of LED lights in automobiles globally.
Outlook:
Corporate earnings trends were fairly strong for the most part in Asia in 2017, an encouraging change from the past several years. The underlying health of major Asian economies and consumer sentiments remained sound, meanwhile, notwithstanding the potential global macroeconomic risks such as geopolitical tensions in Asia, rising interest rates and uncertainty over policies in the U.S. Even though various reforms and policies might have caused some economic slowdown in the short term, the long-term effects on the sustainability of growth should be positive. We incrementally have become more positive on the outlook for corporate profitability and companies’ growth trajectories.
Looking ahead, we continue to be optimistic about secular trends in Asia such as consumer product upgrades, innovations in the technology and medical fields, and the adoption of automation in industrial functions and even in service industries to boost productivity. We are encouraged that a rising number of innovative companies are now listed publicly, which improved the breadth and depth of the Asian small company investment universe. We aim to invest in companies that might not be fully understood or appreciated by the market but are growing and showing prudence in capital allocations and growth strategies. Bottom-up, fundamental research will remain the core focus as we build conviction in our investments.
Matthews Asia Small Companies Fund
December 31, 2017
Schedule of Investmentsa
COMMON EQUITIES: 94.9%
| | | | | | | | |
| | | Shares | | | Value | |
| CHINA/HONG KONG: 32.3% | | | | | | | | |
Genscript Biotech Corp. | | | 4,676,000 | | | | $11,919,611 | |
Hutchison China MediTech, Ltd. ADRb | | | 208,000 | | | | 8,199,360 | |
Silergy Corp. | | | 358,000 | | | | 8,180,520 | |
Vitasoy International Holdings, Ltd. | | | 3,188,000 | | | | 8,151,593 | |
Times Property Holdings, Ltd. | | | 6,991,000 | | | | 6,866,134 | |
Zhou Hei Ya International Holdings Co., Ltd.c,d | | | 6,350,500 | | | | 6,655,962 | |
China Aviation Oil Singapore Corp., Ltd. | | | 5,386,900 | | | | 6,510,893 | |
China Meidong Auto Holdings, Ltd. | | | 20,818,000 | | | | 6,501,586 | |
SITC International Holdings Co., Ltd. | | | 6,484,000 | | | | 6,400,826 | |
Shanghai Haohai Biological Technology Co., Ltd. H Sharesc,d | | | 1,271,200 | | | | 6,099,949 | |
Jacobson Pharma Corp., Ltd. | | | 22,130,000 | | | | 6,018,205 | |
China BlueChemical, Ltd. H Shares | | | 18,708,000 | | | | 5,899,574 | |
Sinopec Kantons Holdings, Ltd. | | | 8,828,000 | | | | 5,689,941 | |
Guotai Junan International Holdings, Ltd. | | | 18,178,000 | | | | 5,685,328 | |
Lifetech Scientific Corp.b | | | 23,304,000 | | | | 5,577,796 | |
Ten Pao Group Holdings, Ltd. | | | 24,760,000 | | | | 5,528,995 | |
BBI Life Sciences Corp.d | | | 10,720,500 | | | | 5,404,013 | |
Beijing Urban Construction Design & Development Group Co., Ltd. H Sharesc,d | | | 9,158,000 | | | | 5,310,919 | |
Valuetronics Holdings, Ltd. | | | 7,547,900 | | | | 5,123,362 | |
AK Medical Holdings, Ltd.b,c,d | | | 12,674,000 | | | | 4,947,708 | |
Melco International Development, Ltd. | | | 1,448,000 | | | | 4,246,251 | |
Clear Media, Ltd. | | | 3,906,000 | | | | 3,884,577 | |
GDS Holdings, Ltd. ADRb | | | 166,400 | | | | 3,748,992 | |
| | | | | | | | |
Total China/Hong Kong | | | | | | | 142,552,095 | |
| | | | | | | | |
| | | | | | | | |
| TAIWAN: 16.6% | |
Advanced Ceramic X Corp. | | | 592,000 | | | | 7,904,491 | |
Taimide Tech, Inc. | | | 2,644,000 | | | | 7,463,279 | |
Sinbon Electronics Co., Ltd. | | | 2,445,060 | | | | 7,076,346 | |
Sunny Friend Environmental Technology Co., Ltd. | | | 815,000 | | | | 6,968,627 | |
Kinik Co. | | | 2,272,000 | | | | 6,617,143 | |
Taiwan Paiho, Ltd. | | | 1,608,000 | | | | 6,538,233 | |
ITEQ Corp. | | | 2,654,000 | | | | 5,810,155 | |
KS Terminals, Inc. | | | 2,526,000 | | | | 5,374,812 | |
Chilisin Electronics Corp. | | | 1,609,000 | | | | 5,306,089 | |
Tong Hsing Electronic Industries, Ltd. | | | 1,158,000 | | | | 5,228,036 | |
Global PMX Co., Ltd. | | | 812,000 | | | | 4,477,470 | |
Great Tree Pharmacy Co., Ltd. | | | 1,507,600 | | | | 4,316,331 | |
| | | | | | | | |
Total Taiwan | | | | | | | 73,081,012 | |
| | | | | | | | |
| | | | | | | | |
| INDIA: 13.3% | |
GRUH Finance, Ltd. | | | 1,026,839 | | | | 8,079,259 | |
Page Industries, Ltd. | | | 17,004 | | | | 6,788,162 | |
Bharat Financial Inclusion, Ltd.b | | | 404,903 | | | | 6,326,644 | |
Cholamandalam Investment and Finance Co., Ltd. | | | 287,338 | | | | 5,850,301 | |
Gabriel India, Ltd. | | | 1,792,084 | | | | 5,582,026 | |
AIA Engineering, Ltd. | | | 227,923 | | | | 5,536,178 | |
DCB Bank, Ltd. | | | 1,756,753 | | | | 5,386,124 | |
Merck, Ltd. | | | 265,282 | | | | 5,360,502 | |
LA Opala RG, Ltd. | | | 540,917 | | | | 5,191,159 | |
Supreme Industries, Ltd. | | | 234,579 | | | | 4,740,329 | |
| | | | | | | | |
Total India | | | | | | | 58,840,684 | |
| | | | | | | | |
| | | | | | | | |
| | | Shares | | | Value | |
| SOUTH KOREA: 12.7% | |
CLIO Cosmetics Co., Ltd. | | | 209,552 | | | | $7,193,532 | |
Value Added Technology Co., Ltd. | | | 222,776 | | | | 7,074,643 | |
Yonwoo Co., Ltd.b | | | 251,496 | | | | 7,056,536 | |
Incross Co., Ltd.b | | | 321,458 | | | | 6,891,281 | |
Wonik Materials Co., Ltd.b | | | 97,924 | | | | 6,343,065 | |
LEENO Industrial, Inc. | | | 117,100 | | | | 6,289,524 | |
Douzone Bizon Co., Ltd. | | | 198,021 | | | | 6,145,593 | |
Cosmecca Korea Co., Ltd.b | | | 88,778 | | | | 5,390,285 | |
Vitzrocell Co., Ltd.b,e | | | 467,524 | | | | 3,491,660 | |
| | | | | | | | |
Total South Korea | | | | | | | 55,876,119 | |
| | | | | | | | |
| | | | | | | | |
| INDONESIA: 6.8% | |
PT Bank Tabungan Pensiunan Nasional | | | 26,131,200 | | | | 4,737,995 | |
PT Ultrajaya Milk Industry & Trading Co. | | | 48,826,000 | | | | 4,660,377 | |
PT BFI Finance Indonesia | | | 88,195,000 | | | | 4,420,313 | |
PT Sumber Alfaria Trijaya | | | 83,560,700 | | | | 3,766,344 | |
PT Astra Otoparts | | | 24,680,425 | | | | 3,747,314 | |
PT Puradelta Lestari | | | 272,647,300 | | | | 3,442,461 | |
PT Arwana Citramulia | | | 116,884,900 | | | | 2,935,268 | |
PT M Cash Integrasib | | | 15,996,200 | | | | 2,334,437 | |
| | | | | | | | |
Total Indonesia | | | | | | | 30,044,509 | |
| | | | | | | | |
| | | | | | | | |
| MALAYSIA: 4.6% | |
Unisem M BHD | | | 6,872,600 | | | | 6,198,416 | |
Bursa Malaysia BHD | | | 2,450,200 | | | | 6,127,014 | |
D&O Green Technologies BHD | | | 25,433,600 | | | | 4,669,488 | |
Karex BHD | | | 10,820,825 | | | | 3,475,926 | |
| | | | | | | | |
Total Malaysia | | | | | | | 20,470,844 | |
| | | | | | | | |
| | | | | | | | |
| JAPAN: 3.7% | |
CKD Corp. | | | 287,700 | | | | 6,448,676 | |
Tri Chemical Laboratories, Inc. | | | 139,600 | | | | 5,002,469 | |
Honma Golf, Ltd.c,d | | | 4,941,500 | | | | 4,946,022 | |
| | | | | | | | |
Total Japan | | | | | | | 16,397,167 | |
| | | | | | | | |
| | | | | | | | |
| THAILAND: 2.1% | |
Plan B Media Public Co., Ltd. F Shares | | | 30,458,900 | | | | 5,962,994 | |
TOA Paint Thailand Public Co., Ltd.b | | | 3,364,000 | | | | 3,354,710 | |
| | | | | | | | |
Total Thailand | | | | | | | 9,317,704 | |
| | | | | | | | |
| | | | | | | | |
| PHILIPPINES: 1.3% | |
Philippine Seven Corp. | | | 2,008,531 | | | | 4,587,441 | |
Concepcion Industrial Corp. | | | 1,041,463 | | | | 1,318,519 | |
| | | | | | | | |
Total Philippines | | | | | | | 5,905,960 | |
| | | | | | | | |
| | | | | | | | |
| SINGAPORE: 0.9% | | | | | | | | |
Delfi, Ltd. | | | 3,563,300 | | | | 3,783,234 | |
| | | | | | | | |
Total Singapore | | | | | | | 3,783,234 | |
| | | | | | | | |
| | | | | | | | |
| AUSTRALIA: 0.6% | |
OZ Minerals, Ltd. | | | 371,904 | | | | 2,641,448 | |
| | | | | | | | |
Total Australia | | | | | | | 2,641,448 | |
| | | | | | | | |
| | | | | | | | |
| | | | |
| matthewsasia.com | 800.789.ASIA | | | 85 | |
Matthews Asia Small Companies Fund
December 31, 2017
Schedule of Investmentsa (continued)
COMMON EQUITIES (continued)
| | | | | | | | |
| | | | | | Value | |
| TOTAL INVESTMENTS: 94.9% | | | | $418,910,776 | |
(Cost $344,363,730) | | | | | | | | |
| | | | | | | | |
CASH AND OTHER ASSETS,
LESS LIABILITIES: 5.1% | | | | | | | 22,382,234 | |
| | | | | | | | |
| | |
NET ASSETS: 100.0% | | | | | | | $441,293,010 | |
| | | | | | | | |
| a | Certain securities were fair valued under the valuation policies approved by the Board of Trustees (Note 2-A). |
| b | Non-income producing security. |
| c | Security exempt from registration under Rule 144A of the Securities Act of 1933, as amended. The security may be resold in transactions exempt from registration normally to qualified institutional buyers. The security has been determined to be liquid in accordance with procedures adopted by the Fund’s Board of Trustees. At December 31, 2017, the aggregate value is $27,960,560, which is 6.34% of net assets. |
| d | The securities may be resold to qualified foreign investors and foreign institutional buyers under Regulation S of the Securities Act of 1933. |
| e | Security is valued using significant unobservable inputs and is classified as Level 3 in the fair value hierarchy. |
| ADR | American Depositary Receipt |
See accompanying notes to financial statements.
| | | | |
| PORTFOLIO MANAGERS | | |
| Tiffany Hsiao, CFA | | | | |
Lead Manager | | | | |
| Kenichi Amaki | | | | |
Co-Manager | | | | |
| |
| FUND FACTS | | |
| | | Investor | | Institutional |
Ticker | | MCSMX | | MICHX |
CUSIP | | 577125404 | | 577125842 |
Inception | | 5/31/11 | | 11/30/17 |
NAV | | $11.89 | | $11.87 |
Initial Investment | | $2,500 | | $100,000 |
Gross Expense Ratio1 | | 2.34% | | 2.09% |
After Fee Waiver and Reimbursement2 | | 1.50% | | 1.25% |
Portfolio Statistics | | |
Total # of Positions | | 63 |
Net Assets | | $35.7 million |
Weighted Average Market Cap | | $2.2 billion |
Portfolio Turnover3 | | 67.22% |
Benchmark | | |
MSCI China Small Cap Index |
Redemption Fee | | |
2% within first 90 calendar days of purchase |
OBJECTIVE
Long-term capital appreciation.
STRATEGY
Under normal market conditions, the Fund seeks to achieve its investment objective by investing at least 80% of its total net assets, which include borrowings for investment purposes, in the common and preferred stocks of Small Companies located in China. China includes its administrative and other districts, such as Hong Kong.
Matthews China Small Companies Fund
Portfolio Manager Commentary (unaudited)
For the year ending December 31, 2017, the Matthews China Small Companies Fund returned 53.88% (Investor Class) and 53.92%* (Institutional Class), while its benchmark, the MSCI China Small Cap Index, returned 24.62%. For the fourth quarter of the year, the Fund returned 8.91% (Investor Class) and 8.93% (Institutional Class), versus 1.42% for the Index.
Market Environment:
China’s equity markets saw a strong start to 2017, which may have resulted from it being oversold in the fourth quarter of 2016 when investors held deeper concerns over U.S.-China trade relations. As the year progressed, markets continued to improve on what we believe to be a fundamentals-supported broad-based earnings recovery in China. Amid mild global reflation and stable nominal GDP growth of approximately 6.9% during the first three quarters of 2017, we are optimistic over the revenue growth outlook for Chinese corporations. On the cost side, China has been decelerating its loan growth and cleaning up overcapacity since 2009. This has led to a recovery in corporate margins despite a rebound in the producer price index. Demand for goods appears to be strong and we are encouraged that property sales and consumption continued at a steady pace even as the government started tightening liquidity and restricting home purchases during the year. From both a top-down and a bottom-up perspective, we see a likely sustainable recovery in the Chinese economy, albeit at a slower pace compared with the sharp rebound that we witnessed over the past 12 months.
Performance Contributors and Detractors:
For the full year, our strong stock selection in the industrials, consumer discretionary and health care sectors contributed to the Fund’s outperformance versus the benchmark. The only drag on our portfolio during the year was our significant underweight in the real estate sector, where we believe smaller companies do not hold an advantage. In the fourth quarter, our holdings in the information technology sector also slightly detracted from Fund performance.
In 2017, our top individual contributors to performance for the year were Genscript Biotech, a global leader in gene synthesis, and Q Technology Group, an emerging leader in optical solutions. Genscript Biotech, which also performed well during the fourth quarter, grew by diversifying and expanding its product categories and applications while showing impressive, strong execution capabilities versus that of its competition. The firm’s breakthrough into biotech oncology treatments was a key to the stock’s re-rating during the year.
Another top performer in the fourth quarter was waste treatment company Sunny Friend Environmental. The firm’s capacity expansion plans have progressed well and drove the share price higher. We believe waste treatment is an important focus area for the Chinese government and that this firm is well-positioned to take advantage of the secular trend.
Among our top detractors to Fund performance for the full year were Honma Golf, a premium golf equipment brand, and China Biologic Products, a leading blood plasma provider in China. Honma Golf continued to execute well despite its disappointing share performance. We believe IPOs such as Honma will need time to
(continued)
| * | Institutional Class Shares were first offered on November 30, 2017. Performance for the Institutional Class Shares prior to its inception represents the performance of the Investor Class. Performance differences between the Institutional Class and the Investor Class may arise due to differences in fees charged to each class. |
| 1 | Actual 2017 expense ratios. |
| 2 | Matthews has contractually agreed (i) to waive fees and reimburse expenses to the extent needed to limit Total Annual Fund Operating Expenses (excluding Rule 12b-1 fees, taxes, interest, brokerage commissions, short sale dividend expenses, expenses incurred in connection with any merger or reorganization or extraordinary expenses such as litigation) of the Institutional Class to 1.25% first by waiving class specific expenses (i.e., shareholder service fees specific to a particular class) of the Institutional Class and then, to the extent necessary, by waiving non-class specific expenses of the Institutional Class, and (ii) if any Fund-wide expenses (i.e., expenses that apply to both the Institutional Class and the Investor Class) are waived for the Institutional Class to maintain the 1.25% expense limitation, to waive an equal amount (in annual percentage terms) of those same expenses for the Investor Class. The Total Annual Fund Operating Expenses After Fee Waiver and Expense Reimbursement for the Investor Class may vary from year to year and will in some years exceed 1.25%. If the operating expenses fall below the expense limitation in a year within three years after Matthews has made a waiver or reimbursement, the Fund may reimburse Matthews up to an amount that does not cause the expenses for that year to exceed the lesser of (i) the expense limitation applicable at the time of that fee waiver and/or expense reimbursement or (ii) the expense limitation in effect at the time of recoupment. This agreement will remain in place until April 30, 2019 and may be terminated at any time by the Board of Trustees on behalf of the Fund on 60 days’ written notice to Matthews. Matthews may decline to renew this agreement by written notice to the Trust at least 30 days before its annual expiration date. |
| 3 | The lesser of fiscal year 2017 long-term purchase costs or sales proceeds divided by the average monthly market value of long-term securities. |
| | | | |
| matthewsasia.com | 800.789.ASIA | | | 87 | |
| | | | | | | | | | | | | | | | | | | | | | | | |
| | | | | | | |
| PERFORMANCE AS OF DECEMBER 31, 2017 | | | | | | | | | | | | | | | | | | |
Institutional Class Shares were first offered on November 30, 2017. Performance since that date was 6.19%. Performance for the Institutional Class
Shares prior to its inception represents the performance of the Investor Class. Performance differences between the Institutional Class and the
Investor Class may arise due to differences in fees charged to each class. | |
| | | | |
| | | | | | | | | Average Annual Total Returns | | | | |
| | | 3 Months | | | 1 Year | | | 3 Years | | | 5 Years | | | Since
Inception | | | Inception
date | |
| Investor Class (MCSMX) | | | 8.91% | | | | 53.88% | | | | 16.07% | | | | 14.26% | | | | 6.54% | | | | 5/31/11 | |
| Institutional Class (MICHX) | | | 8.93% | | | | 53.92% | | | | 16.08% | | | | 14.27% | | | | 6.54% | | | | 11/30/17 | |
| MSCI China Small Cap Index4 | | | 1.42% | | | | 24.62% | | | | 6.64% | | | | 7.48% | | | | 2.10% | 5 | | | | |
| Lipper China Region Funds Category Average | | | 7.29% | | | | 43.89% | | | | 11.28% | | | | 9.37% | | | | 5.52% | 5 | | | | |
Performance assumes reinvestment of all dividends and/or distributions before taxes. All performance quoted represents past performance and is no guarantee of future results. Investment return and principal value will fluctuate with market conditions so that when redeemed, shares may be worth more or less than their original cost. Current performance may be lower or higher than the return figures quoted. Returns would have been lower if certain of the Fund’s fees and expenses had not been waived. For the Fund’s most recent month-end performance, visit matthewsasia.com.
GROWTH OF A $10,000 INVESTMENT SINCE INCEPTION—INVESTOR CLASS
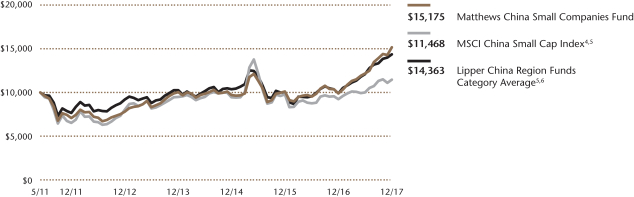
Plotted monthly. The performance data and graph do not reflect the deduction of taxes that a shareholder would pay on dividends, capital gains distributions or redemption of Fund shares. Values are in US$.
| | 4 | It is not possible to invest directly in an index. Source: Index data from Morgan Stanley Capital International and Bloomberg; total return calculations performed by BNY Mellon Investment Servicing (US) Inc. Please see page 92 for index definition. |
| | 6 | The Lipper Category Average does not reflect sales charges and is based on total return, including reinvestment of dividends and capital gains for the stated periods. |
| | | | | | | | |
| | | | |
| TOP TEN HOLDINGS6 | | | | | | | |
| | | Sector | | | | % of Net Assets | |
| Silergy Corp. | | Information Technology | | | | | 6.7% | |
| Sunny Friend Environmental Technology Co., Ltd. | | Industrials | | | | | 4.4% | |
| SITC International Holdings Co., Ltd. | | Industrials | | | | | 4.0% | |
| Genscript Biotech Corp. | | Health Care | | | | | 3.8% | |
| TK Group Holdings, Ltd. | | Industrials | | | | | 3.8% | |
| China Aviation Oil Singapore Corp., Ltd. | | Energy | | | | | 3.1% | |
| Wuxi Little Swan Co., Ltd. | | Consumer Discretionary | | | | | 2.2% | |
| Vatti Corp., Ltd. | | Consumer Discretionary | | | | | 2.2% | |
| China Resources Cement Holdings, Ltd. | | Materials | | | | | 2.2% | |
| CIFI Holdings Group Co., Ltd. | | Real Estate | | | | | 2.1% | |
| % OF ASSETS IN TOP TEN | | | | | | | 34.5% | |
| | 6 | Holdings may combine more than one security from same issuer and related depositary receipts. |
Matthews China Small Companies Fund
Portfolio Manager Commentary (unaudited) (continued)
build a sustainable track record for investors to take notice. China Biologic Products made a significant acquisition during the year. We believed this was not the best use of capital and exited the stock as a result.
Notable Portfolio Changes:
Camera module maker Q Technology rode the popularity of dual camera and 3D sensing applications on smartphones in 2017 and its stock performed better than we expected. Given its good stock performance over the years and our belief that the share price had come to reflect a large degree of the firm’s near-term growth, we exited this holding in the fourth quarter. We continue to selectively add innovative companies to our portfolio, especially in the technology and health care sectors. Late in the year, we added Truly International, an emerging leader in automotive displays and 3D sensing components for smartphones and home appliances. We also added BBI Life Sciences, a leading DNA synthesis and gene sequencing company as we strongly believe Chinese technology and health care firms should see years of strong growth ahead as the government continues to encourage innovation amid its shift in economic structure. For the fourth quarter, the top detractors were Oclaro, a leading optical component manufacturer, and enterprise software provider Gridsum. Both companies struggled with a fast-changing market environment and we exited both positions as we believed their edge in the market was quickly eroding.
Outlook:
Considering both the positives and risks, we are cautiously optimistic in 2018. Uncertainty surrounding global trade policies and geopolitical tensions will likely linger for years. We continue to believe that Chinese companies, however, have fundamentally emerged from the Global Financial Crisis stronger and healthier with a positive earnings outlook ahead. On a macro level, China also has the ability to stabilize its economy through fiscal spending, interest rate adjustments and currency management. In addition, steps taken to correct China’s structural issues continue to progress. For now, we are focused on seeking innovative and capital-efficient small companies that are relatively insulated from macroeconomic uncertainties. We will continue to seek companies that we believe can weather uncertain economic conditions with sustainable, quality earnings streams, strong cash flows and solid balance sheets. We believe sectors such as industrial automation, health care and consumer discretionary are among the most attractive from a secular growth perspective.
| | | | |
| |
| COUNTRY ALLOCATION (%)7 | |
| China/Hong Kong | | | 76.5 | |
| Taiwan | | | 14.6 | |
| United Kingdom | | | 1.8 | |
| Switzerland | | | 1.1 | |
| Japan | | | 1.0 | |
| United States | | | 0.9 | |
| Cash and Other Assets, Less Liabilities | | | 4.1 | |
| | | | |
| |
| SECTOR ALLOCATION (%)7 | |
| Industrials | | | 21.7 | |
| Information Technology | | | 21.5 | |
| Health Care | | | 15.0 | |
| Consumer Discretionary | | | 13.7 | |
| Materials | | | 7.6 | |
| Real Estate | | | 7.5 | |
| Energy | | | 4.7 | |
| Consumer Staples | | | 3.2 | |
| Financials | | | 1.0 | |
| Cash and Other Assets, Less Liabilities | | | 4.1 | |
| | | | |
| | |
| MARKET CAP EXPOSURE (%)7,8 | | | |
| Mega Cap (over $25B) | | | 0.0 | |
| Large Cap ($10B–$25B) | | | 0.0 | |
| Mid Cap ($3B–10B) | | | 23.6 | |
| Small Cap (under $3B) | | | 72.2 | |
| Cash and Other Assets, Less Liabilities | | | 4.1 | |
| 7 | Source: FactSet Research Systems. Percentage values in data are rounded to the nearest tenth of one percent, so the values may not sum to 100% due to rounding. Percentage values may be derived from different data sources and may not be consistent with other Fund literature. |
| 8 | The Fund defines Small Companies as companies with market capitalization generally between $100 million and $3 billion or the largest company included in the Fund’s primary benchmark, the MSCI China Small Cap Index. |
| | | | |
| matthewsasia.com | 800.789.ASIA | | | 89 | |
Matthews China Small Companies Fund
December 31, 2017
Schedule of Investmentsa
COMMON EQUITIES: 95.9%
| | | | | | | | |
| | | Shares | | | Value | |
| INDUSTRIALS: 21.7% | | | | | | | | |
Commercial Services & Supplies: 6.3% | | | | | | | | |
Sunny Friend Environmental Technology Co., Ltd. | | | 182,000 | | | | $1,556,184 | |
Greentown Service Group Co., Ltd.b | | | 882,000 | | | | 689,126 | |
| | | | | | | | |
| | | | | | | 2,245,310 | |
| | | | | | | | |
| | | | | | | | |
Machinery: 4.5% | | | | | | | | |
TK Group Holdings, Ltd. | | | 2,156,000 | | | | 1,346,663 | |
Mirle Automation Corp. | | | 161,000 | | | | 259,378 | |
| | | | | | | | |
| | | | | | | 1,606,041 | |
| | | | | | | | |
| | | | | | | | |
Marine: 4.0% | | | | | | | | |
SITC International Holdings Co., Ltd. | | | 1,451,000 | | | | 1,432,387 | |
| | | | | | | | |
| | | | | | | | |
Transportation Infrastructure: 3.2% | | | | | | | | |
Qingdao Port International Co., Ltd. H Sharesb,c | | | 1,021,000 | | | | 684,775 | |
Yuexiu Transport Infrastructure, Ltd. | | | 644,000 | | | | 472,722 | |
| | | | | | | | |
| | | | | | | 1,157,497 | |
| | | | | | | | |
| | | | | | | | |
Electrical Equipment: 1.9% | | | | | | | | |
Voltronic Power Technology Corp. | | | 28,974 | | | | 501,424 | |
KS Terminals, Inc. | | | 76,000 | | | | 161,712 | |
| | | | | | | | |
| | | | | | | 663,136 | |
| | | | | | | | |
| | | | | | | | |
Air Freight & Logistics: 1.1% | | | | | | | | |
Kerry Logistics Network, Ltd. | | | 272,000 | | | | 385,347 | |
| | | | | | | | |
| | | | | | | | |
Professional Services: 0.7% | | | | | | | | |
51job, Inc. ADRc | | | 4,224 | | | | 257,030 | |
| | | | | | | | |
Total Industrials | | | | | | | 7,746,748 | |
| | | | | | | | |
| | | | | | | | |
| INFORMATION TECHNOLOGY: 21.5% | | | | | | | | |
Semiconductors & Semiconductor Equipment: 12.0% | | | | | |
Silergy Corp. | | | 104,000 | | | | 2,376,464 | |
Hua Hong Semiconductor, Ltd.b,c | | | 289,000 | | | | 611,149 | |
Parade Technologies, Ltd. | | | 25,000 | | | | 492,941 | |
Advanced Energy Industries, Inc.d | | | 4,600 | | | | 310,408 | |
IQE PLCd | | | 164,306 | | | | 301,540 | |
SG Micro Corp. A Sharesd | | | 12,400 | | | | 179,373 | |
| | | | | | | | |
| | | | | | | 4,271,875 | |
| | | | | | | | |
| | | | | | | | |
Electronic Equipment, Instruments & Components: 4.8% | | | | | |
Tong Hsing Electronic Industries, Ltd. | | | 104,000 | | | | 469,530 | |
Merry Electronics Co., Ltd. | | | 57,000 | | | | 370,152 | |
Truly International Holdings, Ltd. | | | 792,000 | | | | 341,903 | |
All Ring Tech Co., Ltd. | | | 141,000 | | | | 303,719 | |
ITEQ Corp. | | | 105,000 | | | | 229,867 | |
China High Precision Automation Group, Ltd.d,e | | | 195,000 | | | | 250 | |
| | | | | | | | |
| | | | | | | 1,715,421 | |
| | | | | | | | |
| | | | | | | | |
IT Services: 1.8% | | | | | | | | |
GDS Holdings, Ltd. ADRd | | | 27,700 | | | | 624,081 | |
| | | | | | | | |
| | | | | | | | |
Internet Software & Services: 1.7% | | | | | | | | |
Baozun, Inc. ADRd | | | 19,700 | | | | 621,732 | |
| | | | | | | | |
| | | | | | | | |
Communications Equipment: 1.2% | | | | | | | | |
Advanced Ceramic X Corp. | | | 33,000 | | | | 440,622 | |
| | | | | | | | |
Total Information Technology | | | | | | | 7,673,731 | |
| | | | | | | | |
| | | | | | | | |
| | | Shares | | | Value | |
| HEALTH CARE: 15.0% | | | | | | | | |
Life Sciences Tools & Services: 4.9% | | | | | | | | |
Genscript Biotech Corp. | | | 538,000 | | | | $1,371,418 | |
Tecan Group AG | | | 1,817 | | | | 377,366 | |
| | | | | | | | |
| | | | | | | 1,748,784 | |
| | | | | | | | |
| | | | | | | | |
Biotechnology: 4.2% | | | | | | | | |
Shanghai Haohai Biological Technology Co., Ltd. H Sharesb,c | | | 121,500 | | | | 583,027 | |
BBI Life Sciences Corp.b | | | 1,117,500 | | | | 563,312 | |
Abcam PLC | | | 24,333 | | | | 346,600 | |
| | | | | | | | |
| | | | | | | 1,492,939 | |
| | | | | | | | |
| | | | | | | | |
Pharmaceuticals: 2.8% | | | | | | | | |
Hutchison China MediTech, Ltd. ADRd | | | 16,800 | | | | 662,256 | |
Jacobson Pharma Corp., Ltd.b | | | 1,220,000 | | | | 331,776 | |
| | | | | | | | |
| | | | | | | 994,032 | |
| | | | | | | | |
| | | | | | | | |
Health Care Equipment & Supplies: 1.9% | | | | | | | | |
AK Medical Holdings, Ltd.b,c,d | | | 890,000 | | | | 347,440 | |
Shandong Weigao Group Medical Polymer Co., Ltd. H Shares | | | 440,000 | | | | 319,762 | |
| | | | | | | | |
| | | | | | | 667,202 | |
| | | | | | | | |
| | | | | | | | |
Health Care Providers & Services: 1.2% | | | | | | | | |
Dian Diagnostics Group Co., Ltd. A Shares | | | 67,300 | | | | 244,107 | |
Dian Diagnostics Group Co., Ltd. A Shares | | | 53,400 | | | | 193,631 | |
| | | | | | | | |
| | | | | | | 437,738 | |
| | | | | | | | |
Total Health Care | | | | | | | 5,340,695 | |
| | | | | | | | |
| | | | | | | | |
| CONSUMER DISCRETIONARY: 13.7% | | | | | | | | |
Household Durables: 5.5% | | | | | | | | |
Wuxi Little Swan Co., Ltd. B Shares | | | 138,055 | | | | 783,499 | |
Vatti Corp., Ltd. A Shares | | | 168,914 | | | | 781,798 | |
Guangdong Xinbao Electrical Appliances Holdings Co., Ltd. A Shares | | | 215,800 | | | | 407,432 | |
| | | | | | | | |
| | | | | | | 1,972,729 | |
| | | | | | | | |
| | | | | | | | |
Hotels, Restaurants & Leisure: 2.8% | | | | | | | | |
Melco International Development, Ltd. | | | 171,000 | | | | 501,457 | |
Mandarin Oriental International, Ltd. | | | 239,900 | | | | 484,598 | |
| | | | | | | | |
| | | | | | | 986,055 | |
| | | | | | | | |
| | | | | | | | |
Specialty Retail: 1.9% | | | | | | | | |
China ZhengTong Auto Services Holdings, Ltd. | | | 424,000 | | | | 428,078 | |
China Meidong Auto Holdings, Ltd. | | | 802,000 | | | | 250,469 | |
| | | | | | | | |
| | | | | | | 678,547 | |
| | | | | | | | |
| | | | | | | | |
Diversified Consumer Services: 1.7% | | | | | | | | |
China Maple Leaf Educational Systems, Ltd. | | | 524,000 | | | | 613,616 | |
| | | | | | | | |
| | | | | | | | |
Leisure Products: 1.0% | | | | | | | | |
Honma Golf, Ltd.b,c | | | 354,500 | | | | 354,824 | |
| | | | | | | | |
| | | | | | | | |
Media: 0.8% | | | | | | | | |
Clear Media, Ltd. | | | 278,000 | | | | 276,475 | |
| | | | | | | | |
Total Consumer Discretionary | | | | | | | 4,882,246 | |
| | | | | | | | |
Matthews China Small Companies Fund
December 31, 2017
Schedule of Investmentsa (continued)
COMMON EQUITIES (continued)
| | | | | | | | |
| | | Shares | | | Value | |
| MATERIALS: 7.6% | | | | | | | | |
Chemicals: 2.4% | | | | | | | | |
China BlueChemical, Ltd. H Shares | | | 1,872,000 | | | | $590,336 | |
Shanghai Putailai New Energy Technology Co., Ltd. A Sharesd | | | 33,000 | | | | 280,338 | |
| | | | | | | | |
| | | | | | | 870,674 | |
| | | | | | | | |
| | | | | | | | |
Construction Materials: 2.2% | | | | | | | | |
China Resources Cement Holdings, Ltd. | | | 1,182,000 | | | | 775,601 | |
| | | | | | | | |
| | | | | | | | |
Metals & Mining: 1.5% | | | | | | | | |
MMG, Ltd.d | | | 1,096,000 | | | | 542,245 | |
| | | | | | | | |
| | | | | | | | |
Containers & Packaging: 1.5% | | | | | | | | |
CPMC Holdings, Ltd. | | | 668,000 | | | | 529,246 | |
| | | | | | | | |
Total Materials | | | | | | | 2,717,766 | |
| | | | | | | | |
| | | | | | | | |
| REAL ESTATE: 7.5% | | | | | | | | |
Real Estate Management & Development: 7.5% | | | | | |
CIFI Holdings Group Co., Ltd. | | | 1,248,000 | | | | 749,821 | |
Times Property Holdings, Ltd. | | | 735,000 | | | | 721,872 | |
KWG Property Holding, Ltd. | | | 526,000 | | | | 613,130 | |
Joy City Property, Ltd. | | | 3,784,000 | | | | 609,151 | |
| | | | | | | | |
Total Real Estate | | | | | | | 2,693,974 | |
| | | | | | | | |
| | | | | | | | |
| ENERGY: 4.7% | | | | | | | | |
Oil, Gas & Consumable Fuels: 4.7% | | | | | | | | |
China Aviation Oil Singapore Corp., Ltd. | | | 902,900 | | | | 1,091,293 | |
Sinopec Kantons Holdings, Ltd. | | | 904,000 | | | | 582,658 | |
| | | | | | | | |
Total Energy | | | | | | | 1,673,951 | |
| | | | | | | | |
| | | | | | | | |
| CONSUMER STAPLES: 3.2% | | | | | | | | |
Food Products: 3.2% | | | | | | | | |
Tehmag Foods Corp. | | | 55,000 | | | | 434,330 | |
Jonjee Hi-Tech Industrial And Commercial Holding Co., Ltd. A Shares | | | 94,800 | | | | 360,449 | |
Jonjee Hi-Tech Industrial And Commercial Holding Co., Ltd. A Shares | | | 50,700 | | | | 192,713 | |
Vitasoy International Holdings, Ltd. | | | 58,000 | | | | 148,304 | |
| | | | | | | | |
Total Consumer Staples | | | | | | | 1,135,796 | |
| | | | | | | | |
| | | | | | | | |
| | | Shares | | | Value | |
| FINANCIALS: 1.0% | | | | | | | | |
Banks: 1.0% | | | | | | | | |
Dah Sing Banking Group, Ltd. | | | 158,400 | | | | $343,473 | |
| | | | | | | | |
Total Financials | | | | | | | 343,473 | |
| | | | | | | | |
| | | | | | | | |
| TOTAL INVESTMENTS: 95.9% | | | | | | | 34,208,380 | |
(Cost $27,306,253) | | | | | | | | |
| | | | | | | | |
CASH AND OTHER ASSETS,
LESS LIABILITIES: 4.1% | | | | | | | 1,476,743 | |
| | | | | | | | |
| | |
NET ASSETS: 100.0% | | | | | | | $35,685,123 | |
| | | | | | | | |
| a | Certain securities were fair valued under the valuation policies approved by the Board of Trustees (Note 2-A). |
| b | The securities may be resold to qualified foreign investors and foreign institutional buyers under Regulation S of the Securities Act of 1933. |
| c | Security exempt from registration under Rule 144A of the Securities Act of 1933, as amended. The security may be resold in transactions exempt from registration normally to qualified institutional buyers. The security has been determined to be liquid in accordance with procedures adopted by the Fund’s Board of Trustees. At December 31, 2017, the aggregate value is $2,581,215, which is 7.23% of net assets. |
| d | Non-income producing security. |
| e | Security is valued using significant unobservable inputs and is classified as Level 3 in the fair value hierarchy. |
| ADR | American Depositary Receipt |
See accompanying notes to financial statements.
| | | | |
| matthewsasia.com | 800.789.ASIA | | | 91 | |
Index Definitions
The Markit iBoxx Asian Local Bond Index (ALBI) tracks the total return performance of a bond portfolio consisting of local-currency denominated, high quality and liquid bonds in Asia ex-Japan. The ALBI includes bonds from the following countries: Korea, Hong Kong, India, Singapore, Taiwan, Malaysia, Thailand, Philippines, Indonesia and China.
The J.P. Morgan Asia Credit Index (JACI) tracks the total return performance of the Asia fixed-rate dollar bond market. JACI is a market cap-weighted index comprising sovereign, quasi-sovereign and corporate bonds and is partitioned by country, sector and credit rating. JACI includes bonds from the following countries: China, Hong Kong, India, Indonesia, Korea, Philippines, Thailand and Singapore.
The MSCI All Country Asia ex Japan Index is a free float–adjusted market capitalization–weighted index of the stock markets of China, Hong Kong, India, Indonesia, Malaysia, Philippines, Singapore, South Korea, Taiwan and Thailand.
The MSCI All Country Asia Pacific Index is a free float–adjusted market capitalization–weighted index of the stock markets of Australia, China, Hong Kong, India, Indonesia, Japan, Malaysia, New Zealand, Philippines, Singapore, South Korea, Taiwan and Thailand.
The MSCI Emerging Markets (EM) Asia Index is a free float-adjusted market capitalization weighted index of the stock markets of China, India, Indonesia, Korea, Malaysia, Philippines, Taiwan and Thailand.
The MSCI China Index is a free float–adjusted market capitalization–weighted index of Chinese equities that includes China-affiliated corporations and H shares listed on the Hong Kong
exchange, and B shares listed on the Shanghai and Shenzhen exchanges.
The S&P Bombay Stock Exchange (BSE) 100 Index is a free float–adjusted market capitalization–weighted index of the 100 stocks listed on the Bombay Stock Exchange.
The MSCI Japan Index is a free float–adjusted market capitalization–weighted index of Japanese equities listed in Japan.
The Korea Composite Stock Price Index (KOSPI) is a market capitalization–weighted index of all common stocks listed on the Korea Stock Exchange.
The MSCI All Country Asia ex Japan Small Cap Index is a free float–adjusted market capitalization–weighted small cap index of the stock markets of China, Hong Kong, India, Indonesia, Malaysia, Philippines, Singapore, South Korea, Taiwan and Thailand.
The MSCI China Small Cap Index is a free float–adjusted market capitalization–weighted small cap index of the Chinese equity securities markets, including H shares listed on the Hong Kong exchange, B shares listed on the Shanghai and Shenzhen exchanges, and Hong Kong-listed securities known as Red Chips (issued by entities owned by national or local governments in China) and P Chips (issued by companies controlled by individuals in China and deriving substantial revenues in China).
The MSCI All Country Asia Index is a free float–adjusted market capitalization–weighted index of the stock markets of China, Hong Kong, India, Indonesia, Japan, Malaysia, Philippines, Singapore, South Korea, Taiwan and Thailand.
Disclosures
Fund Holdings: The Fund holdings shown in this report are as of December 31, 2017. Holdings are subject to change at any time, so holdings shown in this report may not reflect current Fund holdings. The Funds file complete schedules of portfolio holdings with the U.S. Securities and Exchange Commission (the “SEC”) for the first and third quarters of each fiscal year on Form N-Q. The Funds’ Form N-Q is filed with the SEC within 60 days of the end of the quarter to which it relates, and is available on the SEC’s website at www.sec.gov. It may also be reviewed and copied at the Commission’s Public Reference Room in Washington, D.C. Information on the operation of the Public Reference Room may be obtained by calling 800.SEC.0330. Complete schedules of investments are also available without charge, upon request, from the Funds by calling us at 800.789.ASIA (2742).
Proxy Voting Record: The Funds’ Statement of Additional Information containing a description of the policies and procedures that the Funds have used to vote proxies relating to portfolio securities, along with each Fund’s proxy voting record relating to portfolio securities held during the most recent 12-month period ended June 30, is available upon request, at no charge, at the Funds’ website at matthewsasia.com or by calling 800.789.ASIA (2742), or on the SEC’s website at www.sec.gov.
Shareholder Reports and Prospectuses: To reduce the Funds’ expenses, we try to identify related shareholders in a household and send only one copy of the Funds’ prospectus and financial reports to that address. This process, called “householding,” will continue indefinitely unless you instruct us otherwise. At any time you may view the Funds’ current prospectus, summary prospectus and financial reports on our website. If you prefer to receive individual copies of the Funds’ prospectus or financial reports, please call us at 800.789.ASIA (2742).
Redemption Fee Policy: Through December 31, 2017, a 2.00% redemption fee was assessed on the sale or exchange of shares of the Matthews Emerging Asia Fund, Matthews Asia Small Companies Fund and Matthews China Small Companies Fund
(collectively, the “Covered Funds”) within 90 days after the date an investor purchases shares of the Covered Funds. The imposition of redemption fees pursuant to the Funds’ Short-Term Trading Redemption Fee Policy for the Covered Funds may assist the Covered Funds in discouraging market timing activity.
The redemption fee is also imposed to discourage short-term buying and selling of shares of the Covered Funds, which can disrupt the management of the Covered Funds’ investment portfolios and may have detrimental effects on the Covered Funds and other shareholders, and to allocate the costs the Covered Funds incur as a result of short-term trading and market timing. This fee is payable directly to the Covered Funds.
To determine whether the redemption fee applies, the Covered Funds do not count the day that shares were purchased, and first redeem the shares that have been held the longest.
The Covered Funds may grant exemptions from the redemption fee in certain circumstances. For more information on this policy, please see the Funds’ prospectus.
The Funds (or their agents) attempt to contact shareholders whom the Funds (or their agents) believe have violated the Funds’ policies and procedures related to short-term trading and market-timing activity, and notify them that they will no longer be permitted to buy (or exchange) shares of the Funds. When a shareholder has purchased shares of the Funds through an intermediary, the Funds may not be able to notify the shareholder of a violation of the Funds’ policies or that the Funds have taken steps to address the situation (for example, the Funds may be unable to notify a shareholder that his or her privileges to purchase or exchange shares of the Funds have been terminated). Nonetheless, additional purchase and exchange orders for such investors will not be accepted by the Funds.
The Funds may reject for any reason, or cancel as permitted or required by law, any purchase or exchange, including transactions deemed to represent excessive trading, at any time.
| | | | |
| matthewsasia.com | 800.789.ASIA | | | 93 | |
Disclosure of Fund Expenses (unaudited)
We believe it is important for you to understand the impact of fees regarding your investment. All mutual funds have operating expenses. As a shareholder of a mutual fund, you incur ongoing costs, which include costs for portfolio management, administrative services, and shareholder reports (like this one), among others. Operating expenses, which are deducted from a fund’s gross income, directly reduce the investment return of the fund. A fund’s operating expenses are expressed as a percentage of its average net assets. This figure is known as the expense ratio. The following examples are intended to help you understand the ongoing fees (in dollars) of investing in your fund and to compare these costs with those of other mutual funds. The examples are based on an investment of $1,000 made at the beginning of the period shown and held for the entire period.
This table illustrates your fund’s costs in two ways:
Actual Fund Return: This section helps you to estimate the actual operating expenses, after any applicable fee waivers, that you paid over the period. The “Ending Account Value” shown is derived from the fund’s actual return for the past six month period, the “Expense Ratio” column shows the period’s annualized expense ratio, and the “Operating Expenses Paid During Period” column shows the dollar amount that would have been paid by an investor who started with $1,000 in the fund at the beginning of the period. You may use the information here, together with your account value, to estimate the expenses that you paid over the period. To do so, simply divide your account value by $1,000 (for example, an
$8,600 account value divided by $1,000 = 8.6), then multiply the result by the number given for your fund in the first line under the heading entitled “Operating Expenses Paid During Period.”
Hypothetical 5% Return: This section is intended to help you compare your fund’s costs with those of other mutual funds. It assumes that the fund had an annual return of 5% before operating expenses, but that the expense ratio is unchanged. In this case, because the return used is not the fund’s actual return, the results do not apply to your investment. This example is useful in making comparisons to other mutual funds because the U.S. Securities and Exchange Commission requires all mutual funds to calculate expenses based on an assumed 5% annual return. You can assess your fund’s costs by comparing this hypothetical example with the hypothetical examples that appear in shareholder reports of other funds.
Please note that the operating expenses shown in the table are meant to highlight and help you compare your ongoing costs only and do not reflect any transactional costs such as sales charges (loads), redemption fees, or exchange fees.
Matthews Asia Funds does not charge any sales loads, exchange fees, or 12b-1 fees, but these may be present in other funds to which you compare this data. Therefore, the hypothetical portions of the table are useful in comparing ongoing costs only, and will not help you determine the relative total costs of owning different funds.
December 31, 2017
Disclosure of Fund Expenses (unaudited) (continued)
| | | | | | | | | | | | | | | | | | | | | | | | | | | | | | | | | | | | |
| | | INVESTOR CLASS | | | | | | INSTITUTIONAL CLASS | |
| | | Beginning
Account Value 7/1/17 | | | Ending
Account Value
12/31/17 | | | Expense
Ratio | | | Operating
Expenses
Paid During
Period
7/1/17–
12/31/171 | | | | | | Beginning
Account Value 7/1/17 | | | Ending
Account Value
12/31/17 | | | Expense
Ratio | | | Operating
Expenses
Paid During
Period
7/1/17–
12/31/171 | |
| ASIA FIXED INCOME STRATEGIES | | | | | | | | | | | | | | | | | | | | | | | | | | | | | | | | | | | | |
Matthews Asia Strategic Income Fund | | | | | | | | | | | | | | | | | | | | | | | | | | | | | | | | | | | | |
Actual Fund Return | | | $1,000.00 | | | | $1,035.20 | | | | 1.15% | | | | $5.90 | | | | | | | | $1,000.00 | | | | $1,036.50 | | | | 0.90% | | | | $4.62 | |
Hypothetical 5% Returns | | | $1,000.00 | | | | $1,019.41 | | | | 1.15% | | | | $5.85 | | | | | | | | $1,000.00 | | | | $1,020.67 | | | | 0.90% | | | | $4.58 | |
Matthews Asia Credit Opportunities Fund | | | | | | | | | | | | | | | | | | | | | | | | | | | | | | | | | | | | |
Actual Fund Return | | | $1,000.00 | | | | $1,023.80 | | | | 1.15% | | | | $5.87 | | | | | | | | $1,000.00 | | | | $1,025.50 | | | | 0.90% | | | | $4.59 | |
Hypothetical 5% Returns | | | $1,000.00 | | | | $1,019.41 | | | | 1.15% | | | | $5.85 | | | | | | | | $1,000.00 | | | | $1,020.67 | | | | 0.90% | | | | $4.58 | |
| | | | | | | | | |
| ASIA GROWTH AND INCOME STRATEGIES | | | | | | | | | | | | | | | | | | | | | | | | | | | | | | | | | | | | |
Matthews Asian Growth and Income Fund | | | | | | | | | | | | | | | | | | | | | | | | | | | | | | | | | | | | |
Actual Fund Return | | | $1,000.00 | | | | $1,060.80 | | | | 1.03% | | | | $5.35 | | | | | | | | $1,000.00 | | | | $1,060.90 | | | | 0.92% | | | | $4.78 | |
Hypothetical 5% Returns | | | $1,000.00 | | | | $1,020.01 | | | | 1.03% | | | | $5.24 | | | | | | | | $1,000.00 | | | | $1,020.57 | | | | 0.92% | | | | $4.69 | |
Matthews Asia Dividend Fund | | | | | | | | | | | | | | | | | | | | | | | | | | | | | | | | | | | | |
Actual Fund Return | | | $1,000.00 | | | | $1,131.70 | | | | 1.01% | | | | $5.43 | | | | | | | | $1,000.00 | | | | $1,132.30 | | | | 0.91% | | | | $4.89 | |
Hypothetical 5% Returns | | | $1,000.00 | | | | $1,020.11 | | | | 1.01% | | | | $5.14 | | | | | | | | $1,000.00 | | | | $1,020.62 | | | | 0.91% | | | | $4.63 | |
Matthews China Dividend Fund | | | | | | | | | | | | | | | | | | | | | | | | | | | | | | | | | | | | |
Actual Fund Return | | | $1,000.00 | | | | $1,175.80 | | | | 1.19% | | | | $6.53 | | | | | | | | $1,000.00 | | | | $1,176.50 | | | | 1.05% | | | | $5.76 | |
Hypothetical 5% Returns | | | $1,000.00 | | | | $1,019.21 | | | | 1.19% | | | | $6.06 | | | | | | | | $1,000.00 | | | | $1,019.91 | | | | 1.05% | | | | $5.35 | |
| | | | | | | | | |
| ASIA VALUE STRATEGY | | | | | | | | | | | | | | | | | | | | | | | | | | | | | | | | | | | | |
Matthews Asia Value Fund | | | | | | | | | | | | | | | | | | | | | | | | | | | | | | | | | | | | |
Actual Fund Return | | | $1,000.00 | | | | $1,119.60 | | | | 1.50% | | | | $8.01 | | | | | | | | $1,000.00 | | | | $1,120.20 | | | | 1.25% | | | | $6.68 | |
Hypothetical 5% Returns | | | $1,000.00 | | | | $1,017.64 | | | | 1.50% | | | | $7.63 | | | | | | | | $1,000.00 | | | | $1,018.90 | | | | 1.25% | | | | $6.36 | |
| | | | | | | | | |
| ASIA GROWTH STRATEGIES | | | | | | | | | | | | | | | | | | | | | | | | | | | | | | | | | | | | |
Matthews Asia Focus Fund | | | | | | | | | | | | | | | | | | | | | | | | | | | | | | | | | | | | |
Actual Fund Return | | | $1,000.00 | | | | $1,136.90 | | | | 1.50% | | | | $8.08 | | | | | | | | $1,000.00 | | | | $1,138.10 | | | | 1.25% | | | | $6.74 | |
Hypothetical 5% Returns | | | $1,000.00 | | | | $1,017.64 | | | | 1.50% | | | | $7.63 | | | | | | | | $1,000.00 | | | | $1,018.90 | | | | 1.25% | | | | $6.36 | |
Matthews Asia Growth Fund | | | | | | | | | | | | | | | | | | | | | | | | | | | | | | | | | | | | |
Actual Fund Return | | | $1,000.00 | | | | $1,171.30 | | | | 1.10% | | | | $6.02 | | | | | | | | $1,000.00 | | | | $1,172.40 | | | | 0.92% | | | | $5.04 | |
Hypothetical 5% Returns | | | $1,000.00 | | | | $1,019.66 | | | | 1.10% | | | | $5.60 | | | | | | | | $1,000.00 | | | | $1,020.57 | | | | 0.92% | | | | $4.69 | |
Matthews Pacific Tiger Fund | | | | | | | | | | | | | | | | | | | | | | | | | | | | | | | | | | | | |
Actual Fund Return | | | $1,000.00 | | | | $1,164.40 | | | | 1.04% | | | | $5.67 | | | | | | | | $1,000.00 | | | | $1,165.10 | | | | 0.88% | | | | $4.80 | |
Hypothetical 5% Returns | | | $1,000.00 | | | | $1,019.96 | | | | 1.04% | | | | $5.30 | | | | | | | | $1,000.00 | | | | $1,020.77 | | | | 0.88% | | | | $4.48 | |
Matthews Asia ESG Fund | | | | | | | | | | | | | | | | | | | | | | | | | | | | | | | | | | | | |
Actual Fund Return | | | $1,000.00 | | | | $1,122.60 | | | | 1.50% | | | | $8.03 | | | | | | | | $1,000.00 | | | | $1,124.30 | | | | 1.25% | | | | $6.69 | |
Hypothetical 5% Returns | | | $1,000.00 | | | | $1,017.64 | | | | 1.50% | | | | $7.63 | | | | | | | | $1,000.00 | | | | $1,018.90 | | | | 1.25% | | | | $6.36 | |
Matthews Emerging Asia Fund | | | | | | | | | | | | | | | | | | | | | | | | | | | | | | | | | | | | |
Actual Fund Return | | | $1,000.00 | | | | $1,064.70 | | | | 1.51% | | | | $7.86 | | | | | | | | $1,000.00 | | | | $1,066.70 | | | | 1.25% | | | | $6.51 | |
Hypothetical 5% Returns | | | $1,000.00 | | | | $1,017.59 | | | | 1.51% | | | | $7.68 | | | | | | | | $1,000.00 | | | | $1,018.90 | | | | 1.25% | | | | $6.36 | |
Matthews Asia Innovators Fund | | | | | | | | | | | | | | | | | | | | | | | | | | | | | | | | | | | | |
Actual Fund Return | | | $1,000.00 | | | | $1,175.10 | | | | 1.23% | | | | $6.74 | | | | | | | | $1,000.00 | | | | $1,175.80 | | | | 1.05% | | | | $5.76 | |
Hypothetical 5% Returns | | | $1,000.00 | | | | $1,019.00 | | | | 1.23% | | | | $6.26 | | | | | | | | $1,000.00 | | | | $1,019.91 | | | | 1.05% | | | | $5.35 | |
Matthews China Fund | | | | | | | | | | | | | | | | | | | | | | | | | | | | | | | | | | | | |
Actual Fund Return | | | $1,000.00 | | | | $1,225.40 | | | | 1.06% | | | | $5.95 | | | | | | | | $1,000.00 | | | | $1,226.80 | | | | 0.90% | | | | $5.05 | |
Hypothetical 5% Returns | | | $1,000.00 | | | | $1,019.86 | | | | 1.06% | | | | $5.40 | | | | | | | | $1,000.00 | | | | $1,020.67 | | | | 0.90% | | | | $4.58 | |
Matthews India Fund | | | | | | | | | | | | | | | | | | | | | | | | | | | | | | | | | | | | |
Actual Fund Return | | | $1,000.00 | | | | $1,111.40 | | | | 1.09% | | | | $5.80 | | | | | | | | $1,000.00 | | | | $1,112.30 | | | | 0.89% | | | | $4.74 | |
Hypothetical 5% Returns | | | $1,000.00 | | | | $1,019.71 | | | | 1.09% | | | | $5.55 | | | | | | | | $1,000.00 | | | | $1,020.72 | | | | 0.89% | | | | $4.53 | |
Matthews Japan Fund | | | | | | | | | | | | | | | | | | | | | | | | | | | | | | | | | | | | |
Actual Fund Return | | | $1,000.00 | | | | $1,161.70 | | | | 0.93% | | | | $5.07 | | | | | | | | $1,000.00 | | | | $1,162.20 | | | | 0.87% | | | | $4.74 | |
Hypothetical 5% Returns | | | $1,000.00 | | | | $1,020.52 | | | | 0.93% | | | | $4.74 | | | | | | | | $1,000.00 | | | | $1,020.82 | | | | 0.87% | | | | $4.43 | |
Matthews Korea Fund | | | | | | | | | | | | | | | | | | | | | | | | | | | | | | | | | | | | |
Actual Fund Return | | | $1,000.00 | | | | $1,132.80 | | | | 1.17% | | | | $6.29 | | | | | | | | $1,000.00 | | | | $1,133.50 | | | | 1.01% | | | | $5.43 | |
Hypothetical 5% Returns | | | $1,000.00 | | | | $1,019.31 | | | | 1.17% | | | | $5.96 | | | | | | | | $1,000.00 | | | | $1,020.11 | | | | 1.01% | | | | $5.14 | |
| | | | |
| matthewsasia.com | 800.789.ASIA | | | 95 | |
Disclosure of Fund Expenses (unaudited) (continued)
| | | | | | | | | | | | | | | | | | | | | | | | | | | | | | | | | | | | |
| | | INVESTOR CLASS | | | | | | INSTITUTIONAL CLASS | |
| | | Beginning
Account Value 7/1/17 | | | Ending
Account Value
12/31/17 | | | Expense
Ratio | | | Operating
Expenses
Paid During
Period
7/1/17–
12/31/171 | | | | | | Beginning
Account Value 7/1/17 | | | Ending
Account Value
12/31/17 | | | Expense
Ratio | | | Operating
Expenses
Paid During
Period
7/1/17–
12/31/171 | |
| ASIA SMALL COMPANY STRATEGIES | | | | | | | | | | | | | | | | | | | | | | | | | | | | | | | | | | | | |
Matthews Asia Small Companies Fund | | | | | | | | | | | | | | | | | | | | | | | | | | | | | | | | | | | | |
Actual Fund Return | | | $1,000.00 | | | | $1,140.70 | | | | 1.41% | | | | $7.61 | | | | | | | | $1,000.00 | | | | $1,141.20 | | | | 1.25% | | | | $6.75 | |
Hypothetical 5% Returns | | | $1,000.00 | | | | $1,018.10 | | | | 1.41% | | | | $7.17 | | | | | | | | $1,000.00 | | | | $1,018.90 | | | | 1.25% | | | | $6.36 | |
Matthews China Small Companies Fund2 | | | | | | | | | | | | | | | | | | | | | | | | | | | | | | | | | | | | |
Actual Fund Return | | | $1,000.00 | | | | $1,249.60 | | | | 1.50% | | | | $8.51 | | | | | | | | $1,000.00 | | | | $1,061.90 | | | | 1.25% | | | | $1.09 | |
Hypothetical 5% Returns | | | $1,000.00 | | | | $1,017.64 | | | | 1.50% | | | | $7.63 | | | | | | | | $1,000.00 | | | | $1,003.18 | | | | 1.25% | | | | $1.06 | |
| 1 | Operating expenses are equal to the Fund’s annualized expense ratio multiplied by the average account value over the period, multiplied by 184 days, then divided by 365. |
| 2 | Institutional Class commenced operations on November 30, 2017. |
(This Page Intentionally Left Blank)
| | | | |
| matthewsasia.com | 800.789.ASIA | | | 97 | |
Statements of Assets and Liabilities
| | | | | | | | | | | | |
| | | Matthews Asia
Strategic
Income Fund | | | Matthews Asia
Credit
Opportunities Fund | | | Matthews Asian
Growth and
Income Fund | |
ASSETS: | | | | | | | | | | | | |
Investments at value (A) (Note 2-A and 7): | | | | | | | | | | | | |
Unaffiliated issuers | | | $88,174,560 | | | | $27,756,050 | | | | $2,760,772,532 | |
Affiliated issuers | | | — | | | | — | | | | — | |
Cash | | | 3,940,775 | | | | 3,462,067 | | | | 79,465,921 | |
Segregated foreign currency at value | | | 13,334 | | | | 4,179 | | | | — | |
Foreign currency at value (B) | | | 155 | | | | 92 | | | | 181,060 | |
Dividends, interest and other receivable | | | 1,668,437 | | | | 465,656 | | | | 11,532,191 | |
Receivable for securities sold | | | — | | | | — | | | | 515,779 | |
Receivable for capital shares sold | | | 669,696 | | | | 57,774 | | | | 3,950,342 | |
Due from Advisor (Note 5) | | | — | | | | — | | | | — | |
Unrealized appreciation on forward foreign currency exchange contracts | | | 326,429 | | | | — | | | | — | |
Prepaid expenses and other assets | | | 20,119 | | | | 5,873 | | | | 23,224 | |
TOTAL ASSETS | | | 94,813,505 | | | | 31,751,691 | | | | 2,856,441,049 | |
LIABILITIES: | | | | | | | | | | | | |
Cash overdraft | | | — | | | | — | | | | — | |
Payable for securities purchased | | | — | | | | — | | | | 646,105 | |
Payable for capital shares redeemed | | | 17,785 | | | | 6,815 | | | | 7,001,352 | |
Deferred foreign capital gains tax liability (Note 2-G) | | | 72,955 | | | | — | | | | 136,584 | |
Due to Advisor (Note 5) | | | 39,916 | | | | 1,046 | | | | 1,589,456 | |
Administration and accounting fees payable (Note 5) | | | 1,826 | | | | 527 | | | | 57,970 | |
Administration and shareholder servicing fees payable (Note 5) | | | 10,232 | | | | 3,390 | | | | 315,674 | |
Custodian fees payable | | | 9,524 | | | | 3,891 | | | | 176,628 | |
Intermediary service fees payable (Note 5) | | | 24,724 | | | | 4,106 | | | | 435,579 | |
Professional fees payable | | | 36,442 | | | | 35,051 | | | | 51,529 | |
Transfer agent fees payable | | | 860 | | | | 198 | | | | 17,677 | |
Trustees fees payable | | | 24 | | | | 6 | | | | 858 | |
Accrued other expenses payable | | | 7,062 | | | | 4,920 | | | | 98,180 | |
TOTAL LIABILITIES | | | 221,350 | | | | 59,950 | | | | 10,527,592 | |
NET ASSETS | | | $94,592,155 | | | | $31,691,741 | | | | $2,845,913,457 | |
NET ASSETS: | | | | | | | | | | | | |
Investor Class | | | $63,437,452 | | | | $10,200,619 | | | | $1,535,745,955 | |
Institutional Class | | | 31,154,703 | | | | 21,491,122 | | | | 1,310,167,502 | |
TOTAL | | | $94,592,155 | | | | $31,691,741 | | | | $2,845,913,457 | |
See accompanying notes to financial statements.
December 31, 2017
| | | | | | | | | | | | | | | | | | | | | | |
Matthews Asia
Dividend Fund | | | Matthews China
Dividend Fund | | | Matthews Asia
Value Fund | | | Matthews Asia
Focus Fund | | | Matthews Asia
Growth Fund | | | Matthews Pacific
Tiger Fund | |
| | | | | | | | | | | | | | | | | | | | | | |
| | | | | | | | | | | | | | | | | | | | | | |
| | $6,226,040,149 | | | | $304,744,057 | | | | $27,082,164 | | | | $15,197,685 | | | | $810,938,224 | | | | $8,300,761,710 | |
| | 749,122,502 | | | | — | | | | — | | | | — | | | | — | | | | 1,203,947,562 | |
| | — | | | | 6,517,143 | | | | 3,246,542 | | | | 321,553 | | | | 38,632,180 | | | | 204,127,836 | |
| | 34,078 | | | | 4,655 | | | | — | | | | — | | | | — | | | | 127,499 | |
| | 19,960,024 | | | | 3,497,514 | | | | 7 | | | | — | | | | — | | | | 7,305,600 | |
| | 18,163,067 | | | | 186,020 | | | | 149,055 | | | | 41,585 | | | | 475,302 | | | | 21,325,717 | |
| | 37,503,553 | | | | 997,071 | | | | 180,494 | | | | — | | | | — | | | | 1,791,385 | |
| | 18,344,878 | | | | 953,322 | | | | 326,670 | | | | 30,101 | | | | 4,080,337 | | | | 10,559,853 | |
| | — | | | | — | | | | — | | | | 3,544 | | | | — | | | | — | |
| | — | | | | — | | | | — | | | | — | | | | — | | | | — | |
| | 58,892 | | | | 12,929 | | | | 22,857 | | | | 5,847 | | | | 12,161 | | | | 44,903 | |
| | 7,069,227,143 | | | | 316,912,711 | | | | 31,007,789 | | | | 15,600,315 | | | | 854,138,204 | | | | 9,749,992,065 | |
| | | | | | | | | | | | | | | | | | | | | | |
| | 25,390,667 | | | | — | | | | — | | | | — | | | | — | | | | — | |
| | 9,427,424 | | | | 1,545,861 | | | | 174,898 | | | | — | | | | — | | | | 10,246,190 | |
| | 26,078,455 | | | | 284,006 | | | | 13,979 | | | | — | | | | 888,268 | | | | 3,412,772 | |
| | 4,650,161 | | | | — | | | | — | | | | 7,514 | | | | 1,852,052 | | | | 2,958,166 | |
| | 3,812,743 | | | | 171,699 | | | | 26,786 | | | | — | | | | 456,635 | | | | 5,161,332 | |
| | 136,143 | | | | 6,049 | | | | 535 | | | | 273 | | | | 16,039 | | | | 184,434 | |
| | 721,340 | | | | 34,098 | | | | 3,285 | | | | 1,656 | | | | 90,682 | | | | 945,607 | |
| | 391,614 | | | | 19,319 | | | | 5,418 | | | | 6,513 | | | | 80,741 | | | | 836,340 | |
| | 848,660 | | | | 49,079 | | | | 6,806 | | | | — | | | | 111,097 | | | | 920,472 | |
| | 63,820 | | | | 35,991 | | | | 33,929 | | | | 35,086 | | | | 46,596 | | | | 81,929 | |
| | 107,794 | | | | 2,249 | | | | 277 | | | | 490 | | | | 5,065 | | | | 36,000 | |
| | 1,784 | | | | 73 | | | | 4 | | | | 4 | | | | 217 | | | | 2,468 | |
| | 250,457 | | | | 24,201 | | | | 7,892 | | | | 2,638 | | | | 28,868 | | | | 169,470 | |
| | 71,881,062 | | | | 2,172,625 | | | | 273,809 | | | | 54,174 | | | | 3,576,260 | | | | 24,955,180 | |
| | $6,997,346,081 | | | | $314,740,086 | | | | $30,733,980 | | | | $15,546,141 | | | | $850,561,944 | | | | $9,725,036,885 | |
| | | | | | | | | | | | | | | | | | | | | | |
| | $3,713,276,239 | | | | $260,593,454 | | | | $27,345,776 | | | | $4,838,475 | | | | $554,308,905 | | | | $3,335,795,191 | |
| | 3,284,069,842 | | | | 54,146,632 | | | | 3,388,204 | | | | 10,707,666 | | | | 296,253,039 | | | | 6,389,241,694 | |
| | $6,997,346,081 | | | | $314,740,086 | | | | $30,733,980 | | | | $15,546,141 | | | | $850,561,944 | | | | $9,725,036,885 | |
| | | | |
| matthewsasia.com | 800.789.ASIA | | | 99 | |
Statements of Assets and Liabilities (continued)
| | | | | | | | | | | | |
| | | Matthews Asia
Strategic
Income Fund | | | Matthews Asia
Credit
Opportunities Fund | | | Matthews Asian
Growth and
Income Fund | |
SHARES OUTSTANDING: | | | | | | | | | | | | |
(shares of beneficial interest issued and outstanding, respectively, unlimited number of shares authorized with a $0.001 par value) | | | | | | | | | | | | |
Investor Class | | | 5,777,677 | | | | 981,514 | | | | 87,978,486 | |
Institutional Class | | | 2,838,746 | | | | 2,068,666 | | | | 75,151,442 | |
TOTAL | | | 8,616,423 | | | | 3,050,180 | | | | 163,129,928 | |
NET ASSET VALUE: | | | | | | | | | | | | |
Investor Class, offering price and redemption price | | | $10.98 | | | | $10.39 | | | | $17.46 | |
Institutional Class, offering price and redemption price | | | $10.97 | | | | $10.39 | | | | $17.43 | |
NET ASSETS CONSISTS OF: | | | | | | | | | | | | |
Capital paid-in | | | $93,021,813 | | | | $31,201,201 | | | | $2,360,340,621 | |
Undistributed (distribution in excess of) net investment income (loss) | | | 200,731 | | | | — | | | | (9,140,356 | ) |
Undistributed/accumulated net realized gain (loss) on investments, and foreign currency related transactions | | | (1,733,284 | ) | | | 308 | | | | 73,770,051 | |
Net unrealized appreciation (depreciation) on investments, foreign currency translations and foreign capital gains taxes | | | 3,102,895 | | | | 490,232 | | | | 420,943,141 | |
NET ASSETS | | | $94,592,155 | | | | $31,691,741 | | | | $2,845,913,457 | |
(A) Investments at cost: | | | | | | | | | | | | |
Unaffiliated Issuers | | | $85,332,608 | | | | $27,266,358 | | | | $2,339,743,633 | |
Affiliated Issuers | | | — | | | | — | | | | — | |
(B) Foreign Currency at Cost | | | $154 | | | | $91 | | | | $181,041 | |
See accompanying notes to financial statements.
December 31, 2017
| | | | | | | | | | | | | | | | | | | | | | |
Matthews Asia
Dividend Fund | | | Matthews China
Dividend Fund | | | Matthews Asia
Value Fund | | | Matthews Asia
Focus Fund | | | Matthews Asia
Growth Fund | | | Matthews Pacific
Tiger Fund | |
| | | | | | | | | | | | | | | | | | | | | | |
| | | | | | | | | | | | | | | | | | | | | | |
| | 188,137,925 | | | | 14,801,087 | | | | 2,132,048 | | | | 397,154 | | | | 20,344,550 | | | | 105,367,457 | |
| | 166,425,563 | | | | 3,074,736 | | | | 266,159 | | | | 874,607 | | | | 10,794,214 | | | | 201,968,392 | |
| | 354,563,488 | | | | 17,875,823 | | | | 2,398,207 | | | | 1,271,761 | | | | 31,138,764 | | | | 307,335,849 | |
| | | | | | | | | | | | | | | | | | | | | | |
| | $19.74 | | | | $17.61 | | | | $12.83 | | | | $12.18 | | | | $27.25 | | | | $31.66 | |
| | $19.73 | | | | $17.61 | | | | $12.73 | | | | $12.24 | | | | $27.45 | | | | $31.63 | |
| | | | | | | | | | | | | | | | | | | | | | |
| | $5,145,735,436 | | | | $261,370,444 | | | | $28,959,199 | | | | $13,672,954 | | | | $560,352,939 | | | | $5,917,933,611 | |
| | (31,069,204 | ) | | | (2,977,166 | ) | | | (485,810 | ) | | | 67,097 | | | | (6,114,312 | ) | | | (923,629 | ) |
| | (89,641,919 | ) | |
|
4,562,875 |
| | | 395,952 | | | | (677,452 | ) | | | 12,041,135 | | | | 157,188,339 | |
|
1,972,321,768 |
| | | 51,783,933 | | | | 1,864,639 | | | | 2,483,542 | | | | 284,282,182 | | | | 3,650,838,564 | |
| | $6,997,346,081 | | | | $314,740,086 | | | | $30,733,980 | | | | $15,546,141 | | | | $850,561,944 | | | | $9,725,036,885 | |
| | | | | | | | | | | | | | | | | | | | | | |
| | $4,621,362,175 | | | | $253,109,113 | | | | $25,218,417 | | | | $12,706,768 | | | | $524,798,919 | | | | $4,698,737,588 | |
| | 377,222,455 | | | | — | | | | — | | | | — | | | | — | | | | 1,152,443,515 | |
| | $19,638,820 | | | | $3,348,611 | | | | $7 | | | | $— | | | | $— | | | | $7,128,439 | |
| | | | |
| matthewsasia.com | 800.789.ASIA | | | 101 | |
Statements of Assets and Liabilities (continued)
| | | | | | | | | | | | |
| | | Matthews Asia ESG Fund | | | Matthews Emerging
Asia Fund | | | Matthews Asia
Innovators Fund | |
ASSETS: | | | | | | | | | | | | |
Investments at value (A) (Note 2-A and 7): | | | | | | | | | | | | |
Unaffiliated issuers | | | $17,911,853 | | | | $466,541,623 | | | | $198,836,763 | |
Affiliated issuers | | | — | | | | 4,671,674 | | | | — | |
Cash | | | 314,873 | | | | 19,637,646 | | | | 4,825,963 | |
Segregated foreign currency at value | | | — | | | | — | | | | — | |
Foreign currency at value (B) | | | 218,677 | | | | 12,501,661 | | | | 1,160,000 | |
Dividends, interest and other receivable | | | 52,768 | | | | 467,526 | | | | 226,751 | |
Receivable for securities sold | | | 83,014 | | | | 573,022 | | | | 1,435,012 | |
Receivable for capital shares sold | | | 65,318 | | | | 2,598,832 | | | | 1,363,051 | |
Prepaid expenses and other assets | | | 6,288 | | | | 24,358 | | | | 18,389 | |
TOTAL ASSETS | | | 18,652,791 | | | | 507,016,342 | | | | 207,865,929 | |
LIABILITIES: | | | | | | | | | | | | |
Payable for securities purchased | | | 460,721 | | | | 6,685,004 | | | | 503,250 | |
Payable for capital shares redeemed | | | 10,182 | | | | 419,059 | | | | 416,278 | |
Deferred foreign capital gains tax liability (Note 2-G) | | | 67,265 | | | | 4,375,907 | | | | 415,633 | |
Due to Advisor (Note 5) | | | 4,418 | | | | 307,159 | | | | 111,231 | |
Administration and accounting fees payable (Note 5) | | | 338 | | | | 8,786 | | | | 3,795 | |
Administration and shareholder servicing fees payable (Note 5) | | | 1,936 | | | | 52,815 | | | | 22,089 | |
Custodian fees payable | | | 7,007 | | | | 205,597 | | | | 26,006 | |
Intermediary service fees payable (Note 5) | | | 2,998 | | | | 53,844 | | | | 26,005 | |
Professional fees payable | | | 35,545 | | | | 37,762 | | | | 36,223 | |
Transfer agent fees payable | | | 174 | | | | 2,567 | | | | 3,142 | |
Trustees fees payable | | | 4 | | | | 107 | | | | 44 | |
Accrued other expenses payable | | | 8,324 | | | | 38,718 | | | | 13,778 | |
TOTAL LIABILITIES | | | 598,912 | | | | 12,187,325 | | | | 1,577,474 | |
NET ASSETS | | | $18,053,879 | | | | $494,829,017 | | | | $206,288,455 | |
NET ASSETS: | | | | | | | | | | | | |
Investor Class | | | $10,694,755 | | | | $219,596,204 | | | | $175,331,276 | |
Institutional Class | | | 7,359,124 | | | | 275,232,813 | | | | 30,957,179 | |
TOTAL | | | $18,053,879 | | | | $494,829,017 | | | | $206,288,455 | |
See accompanying notes to financial statements.
December 31, 2017
| | | | | | | | | | | | | | | | | | | | | | |
Matthews
China Fund | | | Matthews
India Fund | | | Matthews
Japan Fund | | | Matthews
Korea Fund | | | Matthews Asia
Small Companies
Fund | | | Matthews China Small Companies Fund | |
| | | | | | | | | | | | | | | | | | | | | | |
| | | | | | | | | | | | | | | | | | | | | | |
| | $891,713,300 | | | | $2,128,019,358 | | | | $3,824,457,782 | | | | $219,337,495 | | | | $418,910,776 | | | | $34,208,380 | |
| | — | | | | 124,894,701 | | | | 181,339,771 | | | | — | | | | — | | | | — | |
| | 8,373,414 | | | | 25,997,426 | | | | 111,061,304 | | | | 2,874,266 | | | | 23,700,754 | | | | 2,013,339 | |
| | 32,221 | | | | — | | | | — | | | | — | | | | — | | | | 1,474 | |
| | 4,907,942 | | | | 3,746,463 | | | | — | | | | — | | | | 674,887 | | | | 201,123 | |
| | 284,617 | | | | 405,001 | | | | 3,477,780 | | | | 2,874,857 | | | | 355,189 | | | | 8,049 | |
| | — | | | | 1,771,682 | | | | 3,480,898 | | | | — | | | | 2,938,999 | | | | 54,388 | |
| | 2,948,294 | | | | 3,917,309 | | | | 5,811,954 | | | | 223,579 | | | | 1,348,580 | | | | 224,953 | |
| | 35,009 | | | | 39,404 | | | | 21,877 | | | | 13,070 | | | | 14,717 | | | | 21,279 | |
| | 908,294,797 | | | | 2,288,791,344 | | | | 4,129,651,366 | | | | 225,323,267 | | | | 447,943,902 | | | | 36,732,985 | |
| | | | | | | | | | | | | | | | | | | | | | |
| | — | | | | 2,744,861 | | | | 9,835,310 | | | | — | | | | 4,035,316 | | | | 878,018 | |
| | 1,772,715 | | | | 1,956,134 | | | | 3,792,870 | | | | 57,680 | | | | 1,549,209 | | | | 97,106 | |
| | — | | | | 9,458,908 | | | | — | | | | — | | | | 461,740 | | | | — | |
| | 490,096 | | | | 1,244,980 | | | | 2,283,816 | | | | 123,402 | | | | 380,881 | | | | 6,963 | |
| | 17,386 | | | | 45,101 | | | | 81,164 | | | | 4,391 | | | | 8,538 | | | | 603 | |
| | 97,324 | | | | 247,250 | | | | 446,129 | | | | 24,508 | | | | 47,297 | | | | 3,635 | |
| | 38,670 | | | | 238,423 | | | | 92,894 | | | | 12,829 | | | | 43,676 | | | | 4,759 | |
| | 135,921 | | | | 263,333 | | | | 298,025 | | | | 32,185 | | | | 58,162 | | | | 9,247 | |
| | 35,564 | | | | 41,273 | | | | 46,644 | | | | 33,600 | | | | 41,228 | | | | 35,124 | |
| | 14,480 | | | | 15,816 | | | | 24,423 | | | | 4,230 | | | | 3,325 | | | | 798 | |
| | 207 | | | | 626 | | | | 1,062 | | | | 60 | | | | 125 | | | | 7 | |
| | 209,445 | | | | 101,423 | | | | 254,904 | | | | 12,164 | | | | 21,395 | | | | 11,602 | |
| | 2,811,808 | | | | 16,358,128 | | | | 17,157,241 | | | | 305,049 | | | | 6,650,892 | | | | 1,047,862 | |
| | $905,482,989 | | | | $2,272,433,216 | | | | $4,112,494,125 | | | | $225,018,218 | | | | $441,293,010 | | | | $35,685,123 | |
| | | | | | | | | | | | | | | | | | | | | | |
| | $843,508,334 | | | | $1,484,044,910 | | | | $2,155,280,387 | | | | $192,430,828 | | | | $208,338,567 | | | | $35,209,234 | |
| | 61,974,655 | | | | 788,388,306 | | | | 1,957,213,738 | | | | 32,587,390 | | | | 232,954,443 | | | | 475,889 | |
| | $905,482,989 | | | | $2,272,433,216 | | | | $4,112,494,125 | | | | $225,018,218 | | | | $441,293,010 | | | | $35,685,123 | |
| | | | |
| matthewsasia.com | 800.789.ASIA | | | 103 | |
Statements of Assets and Liabilities (continued)
| | | | | | | | | | | | |
| | | Matthews Asia ESG Fund | | | Matthews Emerging
Asia Fund | | | Matthews Asia
Innovators Fund | |
SHARES OUTSTANDING: | | | | | | | | | | | | |
(shares of beneficial interest issued and outstanding, respectively, unlimited number of shares authorized with a $0.001 par value) | | | | | | | | | | | | |
Investor Class | | | 925,136 | | | | 14,155,253 | | | | 12,356,974 | |
Institutional Class | | | 639,950 | | | | 17,680,954 | | | | 2,170,501 | |
TOTAL | | | 1,565,086 | | | | 31,836,207 | | | | 14,527,475 | |
NET ASSET VALUE: | | | | | | | | | | | | |
Investor Class, offering price and redemption price | | | $11.56 | | | | $15.51 | | | | $14.19 | |
Institutional Class, offering price and redemption price | | | $11.50 | | | | $15.57 | | | | $14.26 | |
NET ASSETS CONSISTS OF: | | | | | | | | | | | | |
Capital paid-in | | | $15,155,231 | | | | $415,100,644 | | | | $141,154,247 | |
Undistributed (distribution in excess of) net investment income (loss) | | | (347,895 | ) | | | — | | | | 1,091,966 | |
Undistributed/accumulated net realized gain (loss) on investments, and foreign currency related transactions | | | 286,760 | | | | 7,588 | | | | 5,429,533 | |
Net unrealized appreciation (depreciation) on investments, foreign currency translations and foreign capital gains taxes | | | 2,959,783 | | | | 79,720,785 | | | | 58,612,709 | |
NET ASSETS | | | $18,053,879 | | | | $494,829,017 | | | | $206,288,455 | |
(A) Investments at cost: | | | | | | | | | | | | |
Unaffiliated Issuers | | | $14,885,015 | | | | $383,180,536 | | | | $139,810,918 | |
Affiliated Issuers | | | — | | | | 3,933,041 | | | | — | |
(B) Foreign Currency at Cost | | | $217,719 | | | | $12,501,948 | | | | $1,160,000 | |
See accompanying notes to financial statements.
December 31, 2017
| | | | | | | | | | | | | | | | | | | | | | |
Matthews
China Fund | | | Matthews
India Fund | | | Matthews
Japan Fund | | | Matthews
Korea Fund | | | Matthews Asia Small Companies Fund | | | Matthews China
Small Companies
Fund | |
| | | | | | | | | | | | | | | | | | | | | | |
| | | | | | | | | | | | | | | | | | | | | | |
| | 37,993,831 | | | | 43,251,033 | | | | 89,363,931 | | | | 27,843,595 | | | | 9,103,250 | | | | 2,960,773 | |
| | 2,795,599 | | | | 22,843,773 | | | | 81,000,856 | | | | 4,687,319 | | | | 10,189,783 | | | | 40,099 | |
| | 40,789,430 | | | | 66,094,806 | | | | 170,364,787 | | | | 32,530,914 | | | | 19,293,033 | | | | 3,000,872 | |
| | | | | | | | | | | | | | | | | | | | | | |
| | $22.20 | | | | $34.31 | | | | $24.12 | | | | $6.91 | | | | $22.89 | | | | $11.89 | |
| | $22.17 | | | | $34.51 | | | | $24.16 | | | | $6.95 | | | | $22.86 | | | | $11.87 | |
| | | | | | | | | | | | | | | | | | | | | | |
| | $691,041,047 | | | | $1,500,089,679 | | | | $3,126,476,895 | | | | $129,938,750 | | | | $356,687,320 | | | | $28,202,995 | |
| | (6,335,510 | ) | | | (36,193 | ) | | | (26,448,443 | ) | | | (4,128,561 | ) | | | (1,588 | ) | | | (61,126 | ) |
| 1,710,670 | | | | 51,268,963 | | | | 28,398,638 | | | | 7,413,148 | | | | 10,536,297 | | | | 641,124 | |
| 219,066,782 | | | | 721,110,767 | | | | 984,067,035 | | | | 91,794,881 | | | | 74,070,981 | | | | 6,902,130 | |
| | $905,482,989 | | | | $2,272,433,216 | | | | $4,112,494,125 | | | | $225,018,218 | | | | $441,293,010 | | | | $35,685,123 | |
| | | | | | | | | | | | | | | | | | | | | | |
| | $672,693,639 | | | | $1,447,026,172 | | | | $2,894,701,212 | | | | $127,556,420 | | | | $344,363,730 | | | | $27,306,253 | |
| | — | | | | 75,212,128 | | | | 127,018,264 | | | | — | | | | — | | | | — | |
| | $4,860,818 | | | | $3,741,999 | | | | $— | | | | $— | | | | $674,882 | | | | $201,123 | |
| | | | |
| matthewsasia.com | 800.789.ASIA | | | 105 | |
Statements of Operations
| | | | | | | | | | | | |
| | | Matthews Asia
Strategic Income Fund | | | Matthews Asia
Credit
Opportunities Fund | | | Matthews Asian
Growth and
Income Fund | |
INVESTMENT INCOME: | | | | | | | | | | | | |
Dividends—Unaffiliated Issuers | | | $8,454 | | | | $9,177 | | | | $86,060,435 | |
Dividends—Affiliated Issuers (Note 7) | | | — | | | | — | | | | — | |
Interest | | | 4,775,702 | | | | 1,115,545 | | | | 4,923,975 | |
Foreign withholding tax | | | (151,034 | ) | | | (14,473 | ) | | | (5,372,702 | ) |
TOTAL INVESTMENT INCOME | | | 4,633,122 | | | | 1,110,249 | | | | 85,611,708 | |
EXPENSES: | | | | | | | | | | | | |
Investment advisory fees (Note 5) | | | 515,422 | | | | 135,246 | | | | 18,612,020 | |
Administration and accounting fees (Note 5) | | | 6,344 | | | | 1,665 | | | | 224,907 | |
Administration and shareholder servicing fees (Note 5) | | | 108,149 | | | | 28,321 | | | | 3,842,449 | |
Accounting out-of-pocket fees | | | 18,364 | | | | 13,929 | | | | 40,816 | |
Custodian fees | | | 45,888 | | | | 22,438 | | | | 829,680 | |
Printing fees | | | 13,179 | | | | 7,804 | | | | 132,809 | |
Intermediary service fees (Note 5) | | | 146,770 | | | | 22,423 | | | | 4,316,121 | |
Professional fees | | | 58,566 | | | | 58,080 | | | | 106,593 | |
Registration fees | | | 44,271 | | | | 31,896 | | | | 108,679 | |
Transfer agent fees | | | 3,824 | | | | 775 | | | | 73,039 | |
Trustees fees | | | 3,532 | | | | 836 | | | | 135,796 | |
Offering costs (Note 2-E) | | | — | | | | 33,230 | | | | — | |
Other expenses | | | 8,908 | | | | 431 | | | | 61,423 | |
TOTAL EXPENSES | | | 973,217 | | | | 357,074 | | | | 28,484,332 | |
Advisory fees waived and expenses waived or reimbursed (Note 5) | | | (121,164 | ) | | | (149,157 | ) | | | — | |
Administration fees waived (Note 5) | | | — | | | | — | | | | — | |
NET EXPENSES | | | 852,053 | | | | 207,917 | | | | 28,484,332 | |
NET INVESTMENT INCOME (LOSS) | | | 3,781,069 | | | | 902,332 | | | | 57,127,376 | |
| REALIZED AND UNREALIZED GAIN (LOSS) ON INVESTMENTS, FORWARD FOREIGN CURRENCY EXCHANGE CONTRACTS, FOREIGN CURRENCY RELATED TRANSACTIONS, SWAPS AND FOREIGN CAPITAL GAINS TAXES: | | | | | | | | | | | | |
Net realized gain (loss) on investments—Unaffiliated Issuers | | | 1,281,716 | | | | 238,222 | | | | 119,053,423 | |
Net realized gain (loss) on investments—Affiliated Issuers | | | — | | | | — | | | | — | |
Net realized gain (loss) on forward foreign currency exchange contracts | | | (628,735 | ) | | | — | | | | — | |
Net realized gain (loss) on swaps | | | (19,449 | ) | | | (4,862 | ) | | | — | |
Net realized foreign capital gains tax | | | — | | | | — | | | | — | |
Net realized gain (loss) on foreign currency related transactions | | | (190,200 | ) | | | 357 | | | | (233,799 | ) |
Net change in unrealized appreciation/depreciation on investments—Unaffiliated Issuers | | | 2,665,574 | | | | 353,137 | | | | 368,090,114 | |
Net change in unrealized appreciation/depreciation on investments—Affiliated Issuers | | | — | | | | — | | | | — | |
Net change in unrealized appreciation/depreciation on forward foreign currency exchange contracts | | | 143,892 | | | | — | | | | — | |
Net change in unrealized appreciation/depreciation on swaps | | | 30,907 | | | | 7,727 | | | | — | |
Net change in deferred foreign capital gains taxes on unrealized appreciation | | | (56,325 | ) | | | — | | | | (136,584 | ) |
Net change in unrealized appreciation/depreciation on foreign currency related translations | | | 15,329 | | | | 539 | | | | 41,700 | |
Net realized and unrealized gain (loss) on investments, forward foreign currency exchange contracts, foreign currency related transactions, swaps and foreign capital gains taxes | | | 3,242,709 | | | | 595,120 | | | | 486,814,854 | |
| | | |
NET INCREASE (DECREASE) IN NET ASSETS FROM OPERATIONS | | | $7,023,778 | | | | $1,497,452 | | | | $543,942,230 | |
See accompanying notes to financial statements.
Year Ended December 31, 2017
| | | | | | | | | | | | | | | | | | | | | | |
Matthews Asia
Dividend Fund | | | Matthews China Dividend Fund | | | Matthews Asia
Value Fund | | | Matthews Asia
Focus Fund | | | Matthews Asia
Growth Fund | | | Matthews Pacific
Tiger Fund | |
| | | | | | | | | | | | | | | | | | | | | | |
| | $151,627,833 | | | | $8,496,660 | | | | $424,671 | | | | $323,094 | | | | $9,994,363 | | | | $134,400,218 | |
| | 19,723,581 | | | | — | | | | — | | | | — | | | | — | | | | 17,494,158 | |
| | 9,474 | | | | — | | | | — | | | | — | | | | — | | | | — | |
| | (11,721,754 | ) | | | (424,137 | ) | | | (40,556 | ) | | | (18,908 | ) | | | (835,109 | ) | | | (14,233,681 | ) |
| | 159,639,134 | | | | 8,072,523 | | | | 384,115 | | | | 304,186 | | | | 9,159,254 | | | | 137,660,695 | |
| | | | | | | | | | | | | | | | | | | | | | |
| | 39,070,331 | | | | 1,616,495 | | | | 95,878 | | | | 79,915 | | | | 4,745,493 | | | | 54,037,849 | |
| | 472,231 | | | | 19,547 | | | | 1,160 | | | | 966 | | | | 57,352 | | | | 653,337 | |
| | 8,047,481 | | | | 332,574 | | | | 19,450 | | | | 16,471 | | | | 978,261 | | | | 11,136,774 | |
| | 47,177 | | | | 34,702 | | | | 32,317 | | | | 27,719 | | | | 35,992 | | | | 44,253 | |
| | 1,544,383 | | | | 179,016 | | | | 55,916 | | | | 39,341 | | | | 404,260 | | | | 3,339,240 | |
| | 309,698 | | | | 33,087 | | | | 6,304 | | | | 4,819 | | | | 42,680 | | | | 283,723 | |
| | 7,211,890 | | | | 477,672 | | | | 34,831 | | | | 17,427 | | | | 1,065,221 | | | | 8,351,361 | |
| | 161,962 | | | | 60,857 | | | | 45,121 | | | | 48,879 | | | | 80,180 | | | | 210,018 | |
| | 150,493 | | | | 63,009 | | | | 38,828 | | | | 37,739 | | | | 70,501 | | | | 142,855 | |
| | 499,112 | | | | 10,116 | | | | 1,081 | | | | 2,170 | | | | 23,015 | | | | 172,816 | |
| | 261,728 | | | | 10,602 | | | | 379 | | | | 500 | | | | 32,792 | | | | 369,640 | |
| | — | | | | — | | | | — | | | | — | | | | — | | | | — | |
| | 123,883 | | | | 9,383 | | | | 4,489 | | | | 7,294 | | | | 20,760 | | | | 159,720 | |
| | 57,900,369 | | | | 2,847,060 | | | | 335,754 | | | | 283,240 | | | | 7,556,507 | | | | 78,901,586 | |
| | (344,184 | ) | | | — | | | | (119,683 | ) | | | (119,705 | ) | | | — | | | | (825,034 | ) |
| | (344,184 | ) | | | — | | | | — | | | | — | | | | — | | | | (825,034 | ) |
| | 57,212,001 | | | | 2,847,060 | | | | 216,071 | | | | 163,535 | | | | 7,556,507 | | | | 77,251,518 | |
| | 102,427,133 | | | | 5,225,463 | | | | 168,044 | | | | 140,651 | | | | 1,602,747 | | | | 60,409,177 | |
| | | | | |
| | | | | | | | | | | | | | | | | | | | | | | |
| | | | | |
| | 169,000,504 | | | | 23,955,031 | | | | 1,391,613 | | | | 261,031 | | | | 64,858,460 | | | | 231,751,341 | |
| | 10,522,110 | | | | — | | | | — | | | | — | | | | — | | | | (9,998,398 | ) |
|
— |
| | | — | | | | — | | | | 506 | | | | — | | | | — | |
| | — | | | | — | | | | — | | | | — | | | | — | | | | — | |
| | (189,341 | ) | | | — | | | | — | | | | — | | | | — | | | | — | |
| | 569,065 | | | | 2,956 | | | | (10,599 | ) | | | 1,245 | | | | 8,328 | | | | 486,761 | |
|
1,163,206,907 |
| | | 48,206,618 | | | | 1,773,843 | | | | 3,354,901 | | | | 172,389,682 | | | | 2,234,699,788 | |
|
276,227,853 |
| | | — | | | | — | | | | — | | | | — | | | | 197,538,458 | |
|
— |
| | | — | | | | — | | | | — | | | | — | | | | — | |
| | — | | | | — | | | | — | | | | — | | | | — | | | | — | |
| | (4,650,161 | ) | | | — | | |
|
— |
| | | (7,514 | ) | | | (1,318,787 | ) | | | (2,958,166 | ) |
|
464,586 |
| | | 148,121 | | | | 834 | | | | 398 | | | | (2,095 | ) | | | 471,626 | |
| | | | | |
| | 1,615,151,523 | | | | 72,312,726 | | | | 3,155,691 | | | | 3,610,567 | | | | 235,935,588 | | | | 2,651,991,410 | |
| | | | | |
| | $1,717,578,656 | | | | $77,538,189 | | | | $3,323,735 | | | | $3,751,218 | | | | $237,538,335 | | | | $2,712,400,587 | |
| | | | |
| matthewsasia.com | 800.789.ASIA | | | 107 | |
Statements of Operations (continued)
| | | | | | | | | | | | |
| | | |
| | | Matthews Asia
ESG Fund | | | Matthews Emerging
Asia Fund | | | Matthews Asia
Innovators Fund | |
INVESTMENT INCOME: | | | | | | | | | | | | |
Dividends—Unaffiliated Issuers | | | $297,845 | | | | $7,600,015 | | | | $1,807,653 | |
Dividends—Affiliated Issuers (Note 7) | | | — | | | | 129,408 | | | | — | |
Interest | | | — | | | | — | | | | — | |
Foreign withholding tax | | | (37,411 | ) | | | (718,154 | ) | | | (236,611 | ) |
TOTAL INVESTMENT INCOME | | | 260,434 | | | | 7,011,269 | | | | 1,571,042 | |
EXPENSES: | | | | | | | | | | | | |
Investment advisory fees (Note 5) | | | 88,213 | | | | 3,573,026 | | | | 973,613 | |
Administration and accounting fees (Note 5) | | | 1,170 | | | | 28,583 | | | | 11,773 | |
Administration and shareholder servicing fees (Note 5) | | | 18,131 | | | | 486,176 | | | | 200,013 | |
Accounting out-of-pocket fees | | | 39,165 | | | | 45,064 | | | | 32,847 | |
Custodian fees | | | 77,480 | | | | 886,506 | | | | 148,803 | |
Printing fees | | | 463 | | | | 41,794 | | | | 20,447 | |
Intermediary service fees (Note 5) | | | 22,808 | | | | 517,545 | | | | 250,446 | |
Professional fees | | | 50,955 | | | | 59,318 | | | | 61,424 | |
Registration fees | | | 35,477 | | | | 88,285 | | | | 42,870 | |
Transfer agent fees | | | 690 | | | | 11,350 | | | | 13,925 | |
Trustees fees | | | 96 | | | | 14,633 | | | | 6,888 | |
Other expenses | | | 8,246 | | | | 21,284 | | | | 15,544 | |
TOTAL EXPENSES | | | 342,894 | | | | 5,773,564 | | | | 1,778,593 | |
Advisory fees waived and expenses waived or reimbursed (Note 5) | | | (156,429 | ) | | | (878,171 | ) | | | — | |
Administration fees waived (Note 5) | | | — | | | | — | | | | — | |
NET EXPENSES | | | 186,465 | | | | 4,895,393 | | | | 1,778,593 | |
NET INVESTMENT INCOME (LOSS) | | | 73,969 | | | | 2,115,876 | | | | (207,551 | ) |
| REALIZED AND UNREALIZED GAIN (LOSS) ON INVESTMENTS, FOREIGN CURRENCY RELATED TRANSACTIONS, AND FOREIGN CAPITAL GAINS TAXES: | | | | | | | | | | | | |
Net realized gain (loss) on investments—Unaffiliated Issuers | | | 598,679 | | | | 2,012,191 | | | | 14,468,602 | |
Net realized gain (loss) on investments—Affiliated Issuers | | | — | | | | — | | | | — | |
Net realized foreign capital gains tax | | | (5,945 | ) | | | (202,710 | ) | | | — | |
Net realized gain (loss) on foreign currency related transactions | | | (3,682 | ) | | | (343,986 | ) | | | (59,481 | ) |
Net change in unrealized appreciation/depreciation on investments—Unaffiliated Issuers | | | 3,090,546 | | | | 55,984,297 | | | | 43,966,061 | |
Net change in unrealized appreciation/depreciation on investments—Affiliated Issuers | | | — | | | | 685,903 | | | | — | |
Net change in deferred foreign capital gains taxes on unrealized appreciation | | | (47,151 | ) | | | (1,432,546 | ) | | | (397,832 | ) |
Net change in unrealized appreciation/depreciation on foreign currency related translations | | | 1,946 | | | | (3,751 | ) | | | 3,391 | |
Net realized and unrealized gain (loss) on investments, foreign currency related transactions, and foreign capital gains taxes | | | 3,634,393 | | | | 56,699,398 | | | | 57,980,741 | |
| | | |
NET INCREASE (DECREASE) IN NET ASSETS FROM OPERATIONS | | | $3,708,362 | | | | $58,815,274 | | | | $57,773,190 | |
See accompanying notes to financial statements.
Year Ended December 31, 2017
| | | | | | | | | | | | | | | | | | | | | | |
Matthews
China Fund | | | Matthews
India Fund | | | Matthews Japan Fund | | | Matthews
Korea Fund | | | Matthews Asia
Small Companies
Fund | | | Matthews China
Small Companies
Fund | |
| | | | | | | | | | | | | | | | | | | | | | |
| | $14,100,177 | | | | $15,013,777 | | | | $48,856,897 | | | | $4,906,802 | | | | $7,119,511 | | | | $496,362 | |
| | — | | | | 1,424,577 | | | | 2,123,341 | | | | — | | | | — | | | | — | |
| | 114 | | | | 14,660 | | | | — | | | | — | | | | 2,216 | | | | — | |
| | (1,151,245 | ) | | | (30,245 | ) | | | (4,116,658 | ) | | | (780,392 | ) | | | (658,017 | ) | | | (21,850 | ) |
| | 12,949,046 | | | | 16,422,769 | | | | 46,863,580 | | | | 4,126,410 | | | | 6,463,710 | | | | 474,512 | |
| | | | | | | | | | | | | | | | | | | | | | |
| | 4,563,241 | | | | 13,638,302 | | | | 23,243,975 | | | | 1,301,570 | | | | 4,121,027 | | | | 219,991 | |
| | 55,187 | | | | 164,822 | | | | 280,885 | | | | 15,731 | | | | 32,979 | | | | 1,761 | |
| | 938,535 | | | | 2,809,954 | | | | 4,789,166 | | | | 268,228 | | | | 563,760 | | | | 29,900 | |
| | 30,984 | | | | 37,665 | | | | 43,079 | | | | 34,413 | | | | 45,474 | | | | 45,898 | |
| | 238,641 | | | | 930,501 | | | | 426,586 | | | | 79,876 | | | | 298,894 | | | | 73,647 | |
| | 37,958 | | | | 114,423 | | | | 348,855 | | | | 17,086 | | | | 23,190 | | | | 7,122 | |
| | 1,362,517 | | | | 2,689,973 | | | | 2,111,523 | | | | 365,480 | | | | 567,254 | | | | 54,940 | |
| | 56,876 | | | | 118,236 | | | | 119,785 | | | | 50,728 | | | | 73,121 | | | | 48,912 | |
| | 64,189 | | | | 132,431 | | | | 231,169 | | | | 43,864 | | | | 73,941 | | | | 23,978 | |
| | 66,301 | | | | 72,656 | | | | 111,954 | | | | 19,594 | | | | 15,317 | | | | 3,469 | |
| | 30,145 | | | | 92,430 | | | | 160,397 | | | | 10,245 | | | | 21,301 | | | | 932 | |
| | 27,851 | | | | 48,479 | | | | 72,862 | | | | 25,750 | | | | 22,076 | | | | 3,556 | |
| | 7,472,425 | | | | 20,849,872 | | | | 31,940,236 | | | | 2,232,565 | | | | 5,858,334 | | | | 514,106 | |
| | — | | | | — | | | | (51,124 | ) | | | — | | | | (272,597 | ) | | | (184,162 | ) |
| | — | | | | — | | | | (51,124 | ) | | | — | | | | — | | | | — | |
| | 7,472,425 | | | | 20,849,872 | | | | 31,837,988 | | | | 2,232,565 | | | | 5,585,737 | | | | 329,944 | |
| | 5,476,621 | | | | (4,427,103 | ) | | | 15,025,592 | | | | 1,893,845 | | | | 877,973 | | | | 144,568 | |
| | | | | |
| | | | | | | | | | | | | | | | | | | | | | |
| | 93,679,827 | | | | 69,676,101 | | | | 85,389,371 | | | | 13,539,806 | | | | 46,946,641 | | | | 2,207,910 | |
| | — | | | | 675,376 | | | | 5,013,471 | | | | — | | | | — | | | | — | |
| | — | | | | — | | | | — | | | | — | | | | (372 | ) | | | — | |
| | 132,393 | | | | (527,170 | ) | | | (430,644 | ) | | | 104,445 | | | | (19,015 | ) | | | 9,943 | |
|
206,059,855 |
| | | 511,006,141 | | | | 850,420,325 | | | | 53,249,815 | | | | 63,649,990 | | | | 7,138,481 | |
|
— |
| | | 27,453,007 | | | | 47,736,060 | | | | — | | | | — | | | | — | |
|
— |
| | | (9,458,908 | ) | | | — | | | | — | | | | (461,740 | ) | | | — | |
|
81,316 |
| | | 20,883 | | | | (26,073 | ) | | | 10,266 | | | | 303 | | | | (24 | ) |
|
299,953,391 |
| | | 598,845,430 | | | | 988,102,510 | | | | 66,904,332 | | | | 110,115,807 | | | | 9,356,310 | |
| | | | | |
| | $305,430,012 | | | | $594,418,327 | | | | $1,003,128,102 | | | | $68,798,177 | | | | $110,993,780 | | | | $9,500,878 | |
| | | | |
| matthewsasia.com | 800.789.ASIA | | | 109 | |
Statements of Changes in Net Assets
| | | | | | | | |
| MATTHEWS ASIA STRATEGIC INCOME FUND | | Year Ended
December 31, 2017 | | | Year Ended
December 31, 2016 | |
OPERATIONS: | | | | | | | | |
Net investment income (loss) | | | $3,781,069 | | | | $3,216,131 | |
Net realized gain (loss) on investments and foreign currency related transactions | | | 443,332 | | | | (1,417,663 | ) |
Net change in unrealized appreciation/depreciation on investments and foreign currency related translations | | | 2,824,795 | | | | 3,618,263 | |
Net change on foreign capital gains taxes on unrealized appreciation | | | (56,325 | ) | | | (15,665 | ) |
Net change in unrealized appreciation/depreciation on swaps | | | 30,907 | | | | (30,907 | ) |
Net increase (decrease) in net assets resulting from operations | | | 7,023,778 | | | | 5,370,159 | |
DISTRIBUTIONS TO SHAREHOLDERS FROM: | | | | | | | | |
Net investment income: | | | | | | | | |
Investor Class | | | (2,199,871 | ) | | | (2,093,040 | ) |
Institutional Class | | | (1,075,141 | ) | | | (510,269 | ) |
Net decrease in net assets resulting from distributions | | | (3,275,012 | ) | | | (2,603,309 | ) |
CAPITAL SHARE TRANSACTIONS (net) (Note 4) | | | 22,036,526 | | | | 3,909,410 | |
Total increase (decrease) in net assets | | | 25,785,292 | | | | 6,676,260 | |
NET ASSETS: | | | | | | | | |
Beginning of year | | | 68,806,863 | | | | 62,130,603 | |
End of year (including undistributed/(distributions in excess of) net investment income of $200,731 and ($278,404), respectively) | | | $94,592,155 | | | | $68,806,863 | |
| | |
| MATTHEWS ASIA CREDIT OPPORTUNITIES FUND | | Year Ended
December 31, 2017 | | | Period Ended
December 31, 20161 | |
OPERATIONS: | | | | | | | | |
Net investment income (loss) | | | $902,332 | | | | $424,556 | |
Net realized gain (loss) on investments and foreign currency related transactions | | | 233,717 | | | | 67,487 | |
Net change in unrealized appreciation/depreciation on investments and foreign currency related translations | | | 353,676 | | | | 136,556 | |
Net change in unrealized appreciation/depreciation on swaps | | | 7,727 | | | | (7,727 | ) |
Net increase (decrease) in net assets resulting from operations | | | 1,497,452 | | | | 620,872 | |
DISTRIBUTIONS TO SHAREHOLDERS FROM: | | | | | | | | |
Net investment income: | | | | | | | | |
Investor Class | | | (340,862 | ) | | | (323,728 | ) |
Institutional Class | | | (596,265 | ) | | | (168,476 | ) |
Realized gains on investments: | | | | | | | | |
Investor Class | | | (84,471 | ) | | | (16,637 | ) |
Institutional Class | | | (189,650 | ) | | | (8,450 | ) |
Net decrease in net assets resulting from distributions | | | (1,211,248 | ) | | | (517,291 | ) |
CAPITAL SHARE TRANSACTIONS (net) (Note 4) | | | 15,081,567 | | | | 16,220,389 | |
Total increase (decrease) in net assets | | | 15,367,771 | | | | 16,323,970 | |
NET ASSETS: | | | | | | | | |
Beginning of year | | | 16,323,970 | | | | — | |
End of year (including undistributed net investment income of $0 and $6,393, respectively) | | | $31,691,741 | | | | $16,323,970 | |
| 1 | Matthews Asia Credit Opportunities Fund commenced operations on April 29, 2016. |
See accompanying notes to financial statements.
| | | | | | | | |
| MATTHEWS ASIAN GROWTH AND INCOME FUND | | Year Ended
December 31, 2017 | | | Year Ended
December 31, 2016 | |
OPERATIONS: | | | | | | | | |
Net investment income (loss) | | | $57,127,376 | | | | $57,141,212 | |
Net realized gain (loss) on investments and foreign currency related transactions | | | 118,819,624 | | | | 148,265,239 | |
Net change in unrealized appreciation/depreciation on investments and foreign currency related translations | | | 368,131,814 | | | | (163,358,332 | ) |
Net change on foreign capital gains taxes on unrealized appreciation | | | (136,584 | ) | | | — | |
Net increase (decrease) in net assets resulting from operations | | | 543,942,230 | | | | 42,048,119 | |
DISTRIBUTIONS TO SHAREHOLDERS FROM: | | | | | | | | |
Net investment income: | | | | | | | | |
Investor Class | | | (41,460,084 | ) | | | (54,001,197 | ) |
Institutional Class | | | (35,174,360 | ) | | | (28,340,600 | ) |
Realized gains on investments: | | | | | | | | |
Investor Class | | | (23,124,973 | ) | | | (96,373,726 | ) |
Institutional Class | | | (19,515,513 | ) | | | (49,003,449 | ) |
Net decrease in net assets resulting from distributions | | | (119,274,930 | ) | | | (227,718,972 | ) |
CAPITAL SHARE TRANSACTIONS (net) (Note 4) | | | (72,995,282 | ) | | | (189,142,084 | ) |
REDEMPTION FEES | | | 7 | | | | — | |
Total increase (decrease) in net assets | | | 351,672,025 | | | | (374,812,937 | ) |
NET ASSETS: | | | | | | | | |
Beginning of year | | | 2,494,241,432 | | | | 2,869,054,369 | |
End of year (including distributions in excess of net investment income of ($9,140,356) and ($35,270,959), respectively) | | | $2,845,913,457 | | | | $2,494,241,432 | |
| | |
| MATTHEWS ASIA DIVIDEND FUND | | Year Ended
December 31, 2017 | | | Year Ended
December 31, 20161 | |
OPERATIONS: | | | | | | | | |
Net investment income (loss) | | | $102,427,133 | | | | $87,117,020 | |
Net realized gain (loss) on investments and foreign currency related transactions | | | 179,902,338 | | | | 55,403,187 | |
Net change in unrealized appreciation/depreciation on investments and foreign currency related translations | | | 1,439,899,346 | | | | 36,474,493 | |
Net change on foreign capital gains taxes on unrealized appreciation | | | (4,650,161 | ) | | | — | |
Net increase (decrease) in net assets resulting from operations | | | 1,717,578,656 | | | | 178,994,700 | |
DISTRIBUTIONS TO SHAREHOLDERS FROM: | | | | | | | | |
Net investment income: | | | | | | | | |
Investor Class | | | (123,635,282 | ) | | | (49,010,082 | ) |
Institutional Class | | | (113,776,897 | ) | | | (39,312,230 | ) |
Realized gains on investments: | | | | | | | | |
Investor Class | | | (75,762,388 | ) | | | (17,325,153 | ) |
Institutional Class | | | (68,303,579 | ) | | | (13,260,152 | ) |
Return of Capital | | | | | | | | |
Investor Class | | | — | | | | (15,297,114 | ) |
Institutional Class | | | — | | | | (11,747,472 | ) |
Net decrease in net assets resulting from distributions | | | (381,478,146 | ) | | | (145,952,203 | ) |
CAPITAL SHARE TRANSACTIONS (net) (Note 4) | | | 976,358,238 | | | | (151,779,230 | ) |
REDEMPTION FEES | | | 374 | | | | 9 | |
Total increase (decrease) in net assets | | | 2,312,459,122 | | | | (118,736,724 | ) |
NET ASSETS: | | | | | | | | |
Beginning of year | | | 4,684,886,959 | | | | 4,803,623,683 | |
End of year (including distributions in excess of net investment income of ($31,069,204) and ($8,048,067), respectively) | | | $6,997,346,081 | | | | $4,684,886,959 | |
| 1 | Consolidated Statement of Changes in Net Assets. See Note 2-C. |
See accompanying notes to financial statements.
| | | | |
| matthewsasia.com | 800.789.ASIA | | | 111 | |
Statements of Changes in Net Assets (continued)
| | | | | | | | |
| MATTHEWS CHINA DIVIDEND FUND | | Year Ended
December 31, 2017 | | | Year Ended
December 31, 2016 | |
OPERATIONS: | | | | | | | | |
Net investment income (loss) | | | $5,225,463 | | | | $3,827,576 | |
Net realized gain (loss) on investments and foreign currency related transactions | | | 23,957,987 | | | | 4,186,024 | |
Net change in unrealized appreciation/depreciation on investments and foreign currency related translations | | | 48,354,739 | | | | (1,681,925 | ) |
Net increase (decrease) in net assets resulting from operations | | | 77,538,189 | | | | 6,331,675 | |
DISTRIBUTIONS TO SHAREHOLDERS FROM: | | | | | | | | |
Net investment income: | | | | | | | | |
Investor Class | | | (6,366,143 | ) | | | (3,001,665 | ) |
Institutional Class | | | (1,342,316 | ) | | | (469,585 | ) |
Realized gains on investments: | | | | | | | | |
Investor Class | | | (16,273,463 | ) | | | (2,247,824 | ) |
Institutional Class | | | (3,383,594 | ) | | | (382,120 | ) |
Net decrease in net assets resulting from distributions | | | (27,365,516 | ) | | | (6,101,194 | ) |
CAPITAL SHARE TRANSACTIONS (net) (Note 4) | | | 76,410,254 | | | | 7,006,687 | |
Total increase (decrease) in net assets | | | 126,582,927 | | | | 7,237,168 | |
NET ASSETS: | | | | | | | | |
Beginning of year | | | 188,157,159 | | | | 180,919,991 | |
End of year (including distributions in excess of net investment income of ($2,977,166) and ($21,078), respectively) | | | $314,740,086 | | | | $188,157,159 | |
| | |
| MATTHEWS ASIA VALUE FUND | | Year Ended
December 31, 2017 | | | Year Ended
December 31, 2016 | |
OPERATIONS: | | | | | | | | |
Net investment income (loss) | | | $168,044 | | | | $18,087 | |
Net realized gain (loss) on investments and foreign currency related transactions | | | 1,381,014 | | | | 25,479 | |
Net change in unrealized appreciation/depreciation on investments and foreign currency related translations | | | 1,774,677 | | | | 106,708 | |
Net increase (decrease) in net assets resulting from operations | | | 3,323,735 | | | | 150,274 | |
DISTRIBUTIONS TO SHAREHOLDERS FROM: | | | | | | | | |
Net investment income: | | | | | | | | |
Investor Class | | | (565,960 | ) | | | (129,547 | ) |
Institutional Class | | | (61,206 | ) | | | (10,399 | ) |
Realized gains on investments: | | | | | | | | |
Investor Class | | | (856,844 | ) | | | (8,096 | ) |
Institutional Class | | | (102,341 | ) | | | (542 | ) |
Net decrease in net assets resulting from distributions | | | (1,586,351 | ) | | | (148,584 | ) |
CAPITAL SHARE TRANSACTIONS (net) (Note 4) | | | 26,293,036 | | | | 969,275 | |
Total increase (decrease) in net assets | | | 28,030,420 | | | | 970,965 | |
NET ASSETS: | | | | | | | | |
Beginning of year | | | 2,703,560 | | | | 1,732,595 | |
End of year (including distributions in excess of net investment income of ($485,810) and ($5,575), respectively) | | | $30,733,980 | | | | $2,703,560 | |
See accompanying notes to financial statements.
| | | | | | | | |
| MATTHEWS ASIA FOCUS FUND | | Year Ended
December 31, 2017 | | | Year Ended
December 31, 2016 | |
OPERATIONS: | | | | | | | | |
Net investment income (loss) | | | $140,651 | | | | $140,261 | |
Net realized gain (loss) on investments and foreign currency related transactions | | | 262,782 | | | | (230,413 | ) |
Net change in unrealized appreciation/depreciation on investments and foreign currency related translations | | | 3,355,299 | | | | 597,323 | |
Net change on foreign capital gains taxes on unrealized appreciation | | | (7,514 | ) | | | — | |
Net increase (decrease) in net assets resulting from operations | | | 3,751,218 | | | | 507,171 | |
DISTRIBUTIONS TO SHAREHOLDERS FROM: | | | | | | | | |
Net investment income: | | | | | | | | |
Investor Class | | | (47,315 | ) | | | (70,761 | ) |
Institutional Class | | | (89,956 | ) | | | (87,218 | ) |
Net decrease in net assets resulting from distributions | | | (137,271 | ) | | | (157,979 | ) |
CAPITAL SHARE TRANSACTIONS (net) (Note 4) | | | 1,823,093 | | | | (1,414,939 | ) |
Total increase (decrease) in net assets | | | 5,437,040 | | | | (1,065,747 | ) |
NET ASSETS: | | | | | | | | |
Beginning of year | | | 10,109,101 | | | | 11,174,848 | |
End of year (including undistributed net investment income of $67,097 and $61,966, respectively) | | | $15,546,141 | | | | $10,109,101 | |
| | |
| MATTHEWS ASIA GROWTH FUND | | Year Ended
December 31, 2017 | | | Year Ended
December 31, 2016 | |
OPERATIONS: | | | | | | | | |
Net investment income (loss) | | | $1,602,747 | | | | $2,400,166 | |
Net realized gain (loss) on investments and foreign currency related transactions | | | 64,866,788 | | | | 23,160,593 | |
Net change in unrealized appreciation/depreciation on investments and foreign currency related translations | | | 172,387,587 | | | | (21,403,951 | ) |
Net change on foreign capital gains taxes on unrealized appreciation | | | (1,318,787 | ) | | | (391,511 | ) |
Net increase (decrease) in net assets resulting from operations | | | 237,538,335 | | | | 3,765,297 | |
DISTRIBUTIONS TO SHAREHOLDERS FROM: | | | | | | | | |
Net investment income: | | | | | | | | |
Investor Class | | | (3,030,603 | ) | | | (4,658,025 | ) |
Institutional Class | | | (2,036,373 | ) | | | (2,552,696 | ) |
Realized gains on investments: | | | | | | | | |
Investor Class | | | (34,198,017 | ) | | | — | |
Institutional Class | | | (17,869,896 | ) | | | — | |
Net decrease in net assets resulting from distributions | | | (57,134,889 | ) | | | (7,210,721 | ) |
CAPITAL SHARE TRANSACTIONS (net) (Note 4) | | | 54,693,413 | | | | (157,945,254 | ) |
Total increase (decrease) in net assets | | | 235,096,859 | | | | (161,390,678 | ) |
NET ASSETS: | | | | | | | | |
Beginning of year | | | 615,465,085 | | | | 776,855,763 | |
End of year (including distributions in excess of net investment income of ($6,114,312) and ($4,567,404), respectively) | | | $850,561,944 | | | | $615,465,085 | |
See accompanying notes to financial statements.
| | | | |
| matthewsasia.com | 800.789.ASIA | | | 113 | |
Statements of Changes in Net Assets (continued)
| | | | | | | | |
| MATTHEWS PACIFIC TIGER FUND | | Year Ended
December 31, 2017 | | | Year Ended
December 31, 2016 | |
OPERATIONS: | | | | | | | | |
Net investment income (loss) | | | $60,409,177 | | | | $39,910,764 | |
Net realized gain (loss) on investments and foreign currency related transactions | | | 222,239,704 | | | | 131,856,477 | |
Net change in unrealized appreciation/depreciation on investments and foreign currency related translations | | | 2,432,709,872 | | | | (195,810,377 | ) |
Net change on foreign capital gains taxes on unrealized appreciation | | | (2,958,166 | ) | | | — | |
Net increase (decrease) in net assets resulting from operations | | | 2,712,400,587 | | | | (24,043,136 | ) |
DISTRIBUTIONS TO SHAREHOLDERS FROM: | | | | | | | | |
Net investment income: | | | | | | | | |
Investor Class | | | (18,058,687 | ) | | | (13,577,737 | ) |
Institutional Class | | | (43,981,805 | ) | | | (31,600,912 | ) |
Realized gains on investments: | | | | | | | | |
Investor Class | | | (22,999,068 | ) | | | (50,432,820 | ) |
Institutional Class | | | (44,087,593 | ) | | | (86,777,397 | ) |
Net decrease in net assets resulting from distributions | | | (129,127,153 | ) | | | (182,388,866 | ) |
CAPITAL SHARE TRANSACTIONS (net) (Note 4) | | | 489,072,525 | | | | 173,707,489 | |
REDEMPTION FEES | | | 55 | | | | 30 | |
Total increase (decrease) in net assets | | | 3,072,346,014 | | | | (32,724,483 | ) |
NET ASSETS: | | | | | | | | |
Beginning of year | | | 6,652,690,871 | | | | 6,685,415,354 | |
End of year (including undistributed/(distributions in excess of) net investment income of ($923,629) and $220,925, respectively) | | | $9,725,036,885 | | | | $6,652,690,871 | |
| | |
| MATTHEWS ASIA ESG FUND | | Year Ended
December 31, 2017 | | | Year Ended
December 31, 2016 | |
OPERATIONS: | | | | | | | | |
Net investment income (loss) | | | $73,969 | | | | $66,399 | |
Net realized gain (loss) on investments and foreign currency related transactions | | | 589,052 | | | | (10,559 | ) |
Net change in unrealized appreciation/depreciation on investments and foreign currency related translations | | | 3,092,492 | | | | 53,654 | |
Net change on foreign capital gains taxes on unrealized appreciation | | | (47,151 | ) | | | (10,279 | ) |
Net increase (decrease) in net assets resulting from operations | | | 3,708,362 | | | | 99,215 | |
DISTRIBUTIONS TO SHAREHOLDERS FROM: | | | | | | | | |
Net investment income: | | | | | | | | |
Investor Class | | | (237,703 | ) | | | (85,420 | ) |
Institutional Class | | | (177,118 | ) | | | (54,320 | ) |
Realized gains on investments: | | | | | | | | |
Investor Class | | | (135,639 | ) | | | — | |
Institutional Class | | | (93,846 | ) | | | — | |
Net decrease in net assets resulting from distributions | | | (644,306 | ) | | | (139,740 | ) |
CAPITAL SHARE TRANSACTIONS (net) (Note 4) | | | 6,232,396 | | | | 3,863,601 | |
Total increase (decrease) in net assets | | | 9,296,452 | | | | 3,823,076 | |
NET ASSETS: | | | | | | | | |
Beginning of year | | | 8,757,427 | | | | 4,934,351 | |
End of year (including distributions in excess of net investment income of ($347,895) and ($20,477), respectively) | | | $18,053,879 | | | | $8,757,427 | |
See accompanying notes to financial statements.
| | | | | | | | |
| MATTHEWS EMERGING ASIA FUND | | Year Ended
December 31, 2017 | | | Year Ended
December 31, 2016 | |
OPERATIONS: | | | | | | | | |
Net investment income (loss) | | | $2,115,876 | | | | $2,490,968 | |
Net realized gain (loss) on investments and foreign currency related transactions | | | 1,465,495 | | | | 2,695,061 | |
Net change in unrealized appreciation/depreciation on investments and foreign currency related translations | | | 56,666,449 | | | | 21,190,343 | |
Net change on foreign capital gains taxes on unrealized appreciation | | | (1,432,546 | ) | | | (1,282,859 | ) |
Net increase (decrease) in net assets resulting from operations | | | 58,815,274 | | | | 25,093,513 | |
DISTRIBUTIONS TO SHAREHOLDERS FROM: | | | | | | | | |
Net investment income: | | | | | | | | |
Investor Class | | | (586,858 | ) | | | (1,321,879 | ) |
Institutional Class | | | (1,117,042 | ) | | | (1,048,573 | ) |
Realized gains on investments: | | | | | | | | |
Investor Class | | | (742,351 | ) | | | (1,325,678 | ) |
Institutional Class | | | (913,243 | ) | | | (887,884 | ) |
Net decrease in net assets resulting from distributions | | | (3,359,494 | ) | | | (4,584,014 | ) |
CAPITAL SHARE TRANSACTIONS (net) (Note 4) | | | 198,378,112 | | | | 50,373,123 | |
REDEMPTION FEES | | | 107,142 | | | | 136,866 | |
Total increase (decrease) in net assets | | | 253,941,034 | | | | 71,019,488 | |
NET ASSETS: | | | | | | | | |
Beginning of year | | | 240,887,983 | | | | 169,868,495 | |
End of year (including distributions in excess of net investment income of $0 and ($151,736), respectively) | | | $494,829,017 | | | | $240,887,983 | |
| | |
| MATTHEWS ASIA INNOVATORS FUND | | Year Ended
December 31, 2017 | | | Year Ended
December 31, 2016 | |
OPERATIONS: | | | | | | | | |
Net investment income (loss) | | | ($207,551 | ) | | | ($190,585 | ) |
Net realized gain (loss) on investments and foreign currency related transactions | | | 14,409,121 | | | | 8,883,438 | |
Net change in unrealized appreciation/depreciation on investments and foreign currency related translations | | | 43,969,452 | | | | (23,846,357 | ) |
Net change on foreign capital gains taxes on unrealized appreciation | | | (397,832 | ) | | | (17,802 | ) |
Net increase (decrease) in net assets resulting from operations | | | 57,773,190 | | | | (15,171,306 | ) |
DISTRIBUTIONS TO SHAREHOLDERS FROM: | | | | | | | | |
Net investment income: | | | | | | | | |
Investor Class | | | (2,843,003 | ) | | | — | |
Institutional Class | | | (527,368 | ) | | | — | |
Realized gains on investments: | | | | | | | | |
Investor Class | | | (11,092,511 | ) | | | (8,895,423 | ) |
Institutional Class | | | (1,826,087 | ) | | | (1,728,457 | ) |
Net decrease in net assets resulting from distributions | | | (16,288,969 | ) | | | (10,623,880 | ) |
CAPITAL SHARE TRANSACTIONS (net) (Note 4) | | | 64,333,280 | | | | (40,266,401 | ) |
Total increase (decrease) in net assets | | | 105,817,501 | | | | (66,061,587 | ) |
NET ASSETS: | | | | | | | | |
Beginning of year | | | 100,470,954 | | | | 166,532,541 | |
End of year (including undistributed (distributions in excess of) net investment income of $1,091,966 and ($122,197), respectively) | | | $206,288,455 | | | | $100,470,954 | |
See accompanying notes to financial statements.
| | | | |
| matthewsasia.com | 800.789.ASIA | | | 115 | |
Statements of Changes in Net Assets (continued)
| | | | | | | | |
| MATTHEWS CHINA FUND | | Year Ended
December 31, 2017 | | | Year Ended
December 31, 20161 | |
OPERATIONS: | | | | | | | | |
Net investment income (loss) | | | $5,476,621 | | | | $7,458,536 | |
Net realized gain (loss) on investments and foreign currency related transactions | | | 93,812,220 | | | | 13,454,903 | |
Net change in unrealized appreciation/depreciation on investments and foreign currency related translations | | | 206,141,171 | | | | (61,441,961 | ) |
Net change on foreign capital gains taxes on unrealized appreciation | | | — | | | | (17,605 | ) |
Net increase (decrease) in net assets resulting from operations | | | 305,430,012 | | | | (40,546,127 | ) |
DISTRIBUTIONS TO SHAREHOLDERS FROM: | | | | | | | | |
Net investment income: | | | | | | | | |
Investor Class | | | (12,781,233 | ) | | | (7,918,085 | ) |
Institutional Class | | | (857,930 | ) | | | (287,088 | ) |
Realized gains on investments: | | | | | | | | |
Investor Class | | | (66,198,560 | ) | | | (38,601,123 | ) |
Institutional Class | | | (4,097,682 | ) | | | (1,268,492 | ) |
Return of Capital | | | | | | | | |
Investor Class | | | — | | | | (17,371,599 | ) |
Institutional Class | | | — | | | | (571,054 | ) |
Net decrease in net assets resulting from distributions | | | (83,935,405 | ) | | | (66,017,441 | ) |
CAPITAL SHARE TRANSACTIONS (net) (Note 4) | | | 172,214,277 | | | | (115,705,461 | ) |
REDEMPTION FEES | | | — | | | | 51 | |
Total increase (decrease) in net assets | | | 393,708,884 | | | | (222,268,978 | ) |
NET ASSETS: | | | | | | | | |
Beginning of year | | | 511,774,105 | | | | 734,043,083 | |
End of year (including distributions in excess of net investment income of ($6,335,510) and ($16,878), respectively) | | | $905,482,989 | | | | $511,774,105 | |
| | |
1 Consolidated Statement of Changes in Net Assets. See Note 2-C. | | | | | | | | |
| | |
| MATTHEWS INDIA FUND | | Year Ended
December 31, 2017 | | | Year Ended
December 31, 2016 | |
OPERATIONS: | | | | | | | | |
Net investment income (loss) | | | ($4,427,103 | ) | | | $1,007,080 | |
Net realized gain (loss) on investments and foreign currency related transactions | | | 69,824,307 | | | | 28,818,985 | |
Net change in unrealized appreciation/depreciation on investments and foreign currency related translations | | | 538,480,031 | | | | (50,411,276 | ) |
Net change on foreign capital gains taxes on unrealized appreciation | | | (9,458,908 | ) | | | 1,942,487 | |
Net increase (decrease) in net assets resulting from operations | | | 594,418,327 | | | | (18,642,724 | ) |
DISTRIBUTIONS TO SHAREHOLDERS FROM: | | | | | | | | |
Net investment income: | | | | | | | | |
Institutional Class | | | (624,793 | ) | | | — | |
Realized gains on investments: | | | | | | | | |
Investor Class | | | (20,884,465 | ) | | | (17,649,381 | ) |
Institutional Class | | | (11,544,040 | ) | | | (9,260,856 | ) |
Net decrease in net assets resulting from distributions | | | (33,053,298 | ) | | | (26,910,237 | ) |
CAPITAL SHARE TRANSACTIONS (net) (Note 4) | | | 192,857,560 | | | | 57,936,594 | |
Total increase (decrease) in net assets | | | 754,222,589 | | | | 12,383,633 | |
NET ASSETS: | | | | | | | | |
Beginning of year | | | 1,518,210,627 | | | | 1,505,826,994 | |
End of year (including undistributed/(distributions in excess of) net investment income of ($36,193) and $615,562, respectively) | | | $2,272,433,216 | | | | $1,518,210,627 | |
See accompanying notes to financial statements.
| | | | | | | | |
| MATTHEWS JAPAN FUND | | Year Ended
December 31, 2017 | | | Year Ended
December 31, 2016 | |
OPERATIONS: | | | | | | | | |
Net investment income (loss) | | | $15,025,592 | | | | $13,934,587 | |
Net realized gain (loss) on investments and foreign currency related transactions | | | 89,972,198 | | | | 140,692,829 | |
Net change in unrealized appreciation/depreciation on investments and foreign currency related translations | | | 898,130,312 | | | | (83,399,840 | ) |
Net increase (decrease) in net assets resulting from operations | | | 1,003,128,102 | | | | 71,227,576 | |
DISTRIBUTIONS TO SHAREHOLDERS FROM: | | | | | | | | |
Net investment income: | | | | | | | | |
Investor Class | | | (17,075,382 | ) | | | (14,892,806 | ) |
Institutional Class | | | (17,097,356 | ) | | | (12,780,128 | ) |
Realized gains on investments: | | | | | | | | |
Investor Class | | | (63,332,483 | ) | | | (4,615,399 | ) |
Institutional Class | | | (58,184,089 | ) | | | (3,490,954 | ) |
Net decrease in net assets resulting from distributions | | | (155,689,310 | ) | | | (35,779,287 | ) |
CAPITAL SHARE TRANSACTIONS (net) (Note 4) | | | 276,866,712 | | | | 1,003,413,662 | |
Total increase (decrease) in net assets | | | 1,124,305,504 | | | | 1,038,861,951 | |
NET ASSETS: | | | | | | | | |
Beginning of year | | | 2,988,188,621 | | | | 1,949,326,670 | |
End of year (including distributions in excess of net investment income of ($26,448,443) and ($8,574,832), respectively) | | | $4,112,494,125 | | | | $2,988,188,621 | |
| | |
| MATTHEWS KOREA FUND | | Year Ended
December 31, 2017 | | | Year Ended
December 31, 2016 | |
OPERATIONS: | | | | | | | | |
Net investment income (loss) | | | $1,893,845 | | | | $434,470 | |
Net realized gain (loss) on investments and foreign currency related transactions | | | 13,644,251 | | | | 16,478,510 | |
Net change in unrealized appreciation/depreciation on investments and foreign currency related translations | | | 53,260,081 | | | | (27,906,464 | ) |
Net increase (decrease) in net assets resulting from operations | | | 68,798,177 | | | | (10,993,484 | ) |
DISTRIBUTIONS TO SHAREHOLDERS FROM: | | | | | | | | |
Net investment income: | | | | | | | | |
Investor Class | | | (7,705,028 | ) | | | (2,065,275 | ) |
Institutional Class | | | (1,296,962 | ) | | | (116,928 | ) |
Realized gains on investments: | | | | | | | | |
Investor Class | | | (8,595,183 | ) | | | (10,912,600 | ) |
Institutional Class | | | (1,380,384 | ) | | | (554,186 | ) |
Net decrease in net assets resulting from distributions | | | (18,977,557 | ) | | | (13,648,989 | ) |
CAPITAL SHARE TRANSACTIONS (net) (Note 4) | | | 25,009,807 | | | | (32,836,778 | ) |
Total increase (decrease) in net assets | | | 74,830,427 | | | | (57,479,251 | ) |
NET ASSETS: | | | | | | | | |
Beginning of year | | | 150,187,791 | | | | 207,667,042 | |
End of year (including distributions in excess of net investment income of ($4,128,561) and ($1,721,768), respectively) | | | $225,018,218 | | | | $150,187,791 | |
See accompanying notes to financial statements.
| | | | |
| matthewsasia.com | 800.789.ASIA | | | 117 | |
Statements of Changes in Net Assets (continued)
| | | | | | | | |
| MATTHEWS ASIA SMALL COMPANIES FUND | | Year Ended
December 31, 2017 | | | Year Ended
December 31, 2016 | |
OPERATIONS: | | | | | | | | |
Net investment income (loss) | | | $877,973 | | | | $2,775,600 | |
Net realized gain (loss) on investments and foreign currency related transactions | | | 46,927,254 | | | | 11,047,982 | |
Net change in unrealized appreciation/depreciation on investments and foreign currency related translations | | | 63,650,293 | | | | (19,272,943 | ) |
Net change on foreign capital gains taxes on unrealized appreciation | | | (461,740 | ) | | | 56,811 | |
Net increase (decrease) in net assets resulting from operations | | | 110,993,780 | | | | (5,392,550 | ) |
DISTRIBUTIONS TO SHAREHOLDERS FROM: | | | | | | | | |
Net investment income: | | | | | | | | |
Investor Class | | | (842,375 | ) | | | (1,145,221 | ) |
Institutional Class | | | (1,420,106 | ) | | | (1,307,167 | ) |
Realized gains on investments: | | | | | | | | |
Investor Class | | | (14,961,651 | ) | | | — | |
Institutional Class | | | (16,856,653 | ) | | | — | |
Net decrease in net assets resulting from distributions | | | (34,080,785 | ) | | | (2,452,388 | ) |
CAPITAL SHARE TRANSACTIONS (net) (Note 4) | | | (64,823,384 | ) | | | (173,006,090 | ) |
REDEMPTION FEES | | | 16,089 | | | | 123,630 | |
Total increase (decrease) in net assets | | | 12,105,700 | | | | (180,727,398 | ) |
NET ASSETS: | | | | | | | | |
Beginning of year | | | 429,187,310 | | | | 609,914,708 | |
End of year (including undistributed/(distributions in excess of) net investment income of ($1,588) and $1,443,823, respectively) | | | $441,293,010 | | | | $429,187,310 | |
| | |
| MATTHEWS CHINA SMALL COMPANIES FUND1 | | Year Ended
December 31, 2017 | | | Year Ended
December 31, 2016 | |
OPERATIONS: | | | | | | | | |
Net investment income (loss) | | | $144,568 | | | | $224,432 | |
Net realized gain (loss) on investments and foreign currency related transactions | | | 2,217,853 | | | | 168,743 | |
Net change in unrealized appreciation/depreciation on investments and foreign currency related translations | | | 7,138,457 | | | | (882,977 | ) |
Net increase (decrease) in net assets resulting from operations | | | 9,500,878 | | | | (489,802 | ) |
DISTRIBUTIONS TO SHAREHOLDERS FROM: | | | | | | | | |
Net investment income: | | | | | | | | |
Investor Class | | | (303,637 | ) | | | (57,353 | ) |
Institutional Class | | | (1,629 | ) | | | — | |
Realized gains on investments: | | | | | | | | |
Investor Class | | | (1,491,793 | ) | | | (747,907 | ) |
Institutional Class | | | (6,780 | ) | | | — | |
Net decrease in net assets resulting from distributions | | | (1,803,839 | ) | | | (805,260 | ) |
CAPITAL SHARE TRANSACTIONS (net) (Note 4) | | | 11,870,931 | | | | (4,154,641 | ) |
REDEMPTION FEES | | | 15,930 | | | | 4,924 | |
Total increase (decrease) in net assets | | | 19,583,900 | | | | (5,444,779 | ) |
NET ASSETS: | | | | | | | | |
Beginning of year | | | 16,101,223 | | | | 21,546,002 | |
End of year (including undistributed/(distributions in excess of) net investment income of ($61,126) and $168,416, respectively) | | | $35,685,123 | | | | $16,101,223 | |
| 1 | The Fund’s Institutional Class commenced operations on November 30, 2017 |
See accompanying notes to financial statements.
Financial Highlights
Matthews Asia Strategic Income Fund
The tables below set forth financial data for a share of beneficial interest outstanding throughout each period presented.
| | | | | | | | | | | | | | | | | | | | |
| INVESTOR CLASS | | Year Ended Dec. 31 | |
| | 2017 | | | 2016 | | | 2015 | | | 2014 | | | 2013 | |
Net Asset Value, beginning of year | | | $10.43 | | | | $9.96 | | | | $10.31 | | | | $10.42 | | | | $10.84 | |
INCOME (LOSS) FROM INVESTMENT OPERATIONS: | | | | | | | | | | | | | | | | | | | | |
Net investment income (loss)1 | | | 0.51 | | | | 0.50 | | | | 0.47 | | | | 0.46 | | | | 0.40 | |
Net realized gain (loss) and unrealized appreciation/depreciation on investments, financial futures contracts, forward foreign currency exchange contracts, foreign currency related transactions, swaps and foreign capital gains taxes | | | 0.46 | | | | 0.38 | | | | (0.53 | ) | | | (0.19 | ) | | | (0.48 | ) |
Total from investment operations | | | 0.97 | | | | 0.88 | | | | (0.06 | ) | | | 0.27 | | | | (0.08 | ) |
LESS DISTRIBUTIONS FROM: | | | | | | | | | | | | | | | | | | | | |
Net investment income | | | (0.42 | ) | | | (0.41 | ) | | | (0.29 | ) | | | (0.38 | ) | | | (0.35 | ) |
Net realized gains on investments | | | — | | | | — | | | | — | | | | — | | | | (0.01 | ) |
Total distributions | | | (0.42 | ) | | | (0.41 | ) | | | (0.29 | ) | | | (0.38 | ) | | | (0.36 | ) |
Paid-in capital from redemption fees (Note 4) | | | — | | | | — | | | | — | 2 | | | — | 2 | | | 0.02 | |
Net Asset Value, end of year | | | $10.98 | | | | $10.43 | | | | $9.96 | | | | $10.31 | | | | $10.42 | |
TOTAL RETURN | | | 9.40% | | | | 8.85% | | | | (0.58% | ) | | | 2.54% | | | | (0.50% | ) |
| | | | | |
RATIOS/SUPPLEMENTAL DATA | | | | | | | | | | | | | | | | | | | | |
Net assets, end of year (in 000’s) | | | $63,437 | | | | $55,409 | | | | $51,130 | | | | $58,594 | | | | $38,051 | |
Ratio of expenses to average net assets before any reimbursement, waiver or recapture of expenses by Advisor and Administrator (Note 5) | | | 1.29% | | | | 1.33% | | | | 1.28% | | | | 1.27% | | | | 1.28% | |
Ratio of expenses to average net assets after any reimbursement, waiver or recapture of expenses by Advisor and Administrator | | | 1.15% | | | | 1.15% | | | | 1.12% | | | | 1.13% | | | | 1.20% | |
Ratio of net investment income (loss) to average net assets | | | 4.70% | | | | 4.85% | | | | 4.57% | | | | 4.36% | | | | 3.75% | |
Portfolio turnover3 | | | 36.58% | | | | 71.50% | | | | 50.09% | | | | 34.28% | | | | 48.71% | |
| |
| INSTITUTIONAL CLASS | | Year Ended Dec. 31 | |
| | 2017 | | | 2016 | | | 2015 | | | 2014 | | | 2013 | |
Net Asset Value, beginning of year | | | $10.42 | | | | $9.96 | | | | $10.30 | | | | $10.42 | | | | $10.83 | |
INCOME (LOSS) FROM INVESTMENT OPERATIONS: | | | | | | | | | | | | | | | | | | | | |
Net investment income (loss)1 | | | 0.53 | | | | 0.53 | | | | 0.49 | | | | 0.48 | | | | 0.42 | |
Net realized gain (loss) and unrealized appreciation/depreciation on investments, financial futures contracts, forward foreign currency exchange contracts, foreign currency related transactions, swaps and foreign capital gains taxes | | | 0.47 | | | | 0.36 | | | | (0.52 | ) | | | (0.20 | ) | | | (0.46 | ) |
Total from investment operations | | | 1.00 | | | | 0.89 | | | | (0.03 | ) | | | 0.28 | | | | (0.04 | ) |
LESS DISTRIBUTIONS FROM: | | | | | | | | | | | | | | | | | | | | |
Net investment income | | | (0.45 | ) | | | (0.43 | ) | | | (0.31 | ) | | | (0.40 | ) | | | (0.38 | ) |
Net realized gains on investments | | | — | | | | — | | | | — | | | | — | | | | (0.01 | ) |
Total distributions | | | (0.45 | ) | | | (0.43 | ) | | | (0.31 | ) | | | (0.40 | ) | | | (0.39 | ) |
Paid-in capital from redemption fees (Note 4) | | | — | | | | — | | | | — | 2 | | | — | 2 | | | 0.02 | |
Net Asset Value, end of year | | | $10.97 | | | | $10.42 | | | | $9.96 | | | | $10.30 | | | | $10.42 | |
TOTAL RETURN | | | 9.67% | | | | 9.02% | | | | (0.27% | ) | | | 2.64% | | | | (0.20% | ) |
| | | | | |
RATIOS/SUPPLEMENTAL DATA | | | | | | | | | | | | | | | | | | | | |
Net assets, end of year (in 000’s) | | | $31,155 | | | | $13,398 | | | | $11,001 | | | | $7,840 | | | | $7,662 | |
Ratio of expenses to average net assets before any reimbursement, waiver or recapture of expenses by Advisor and Administrator (Note 5) | | | 1.08% | | | | 1.12% | | | | 1.09% | | | | 1.07% | | | | 1.09% | |
Ratio of expenses to average net assets after any reimbursement, waiver or recapture of expenses by Advisor and Administrator | | | 0.90% | | | | 0.90% | | | | 0.90% | | | | 0.93% | | | | 1.00% | |
Ratio of net investment income (loss) to average net assets | | | 4.93% | | | | 5.13% | | | | 4.81% | | | | 4.55% | | | | 3.99% | |
Portfolio turnover3 | | | 36.58% | | | | 71.50% | | | | 50.09% | | | | 34.28% | | | | 48.71% | |
| 1 | Calculated using the average daily shares method. |
| 2 | Less than $0.01 per share. |
| 3 | The portfolio turnover rate is calculated on the Fund as a whole without distinguishing between classes of shares issued. |
See accompanying notes to financial statements.
| | | | |
| matthewsasia.com | 800.789.ASIA | | | 119 | |
Financial Highlights (continued)
Matthews Asia Credit Opportunities Fund
The tables below set forth financial data for a share of beneficial interest outstanding throughout each period presented.
| | | | | | | | |
| INVESTOR CLASS | | Year Ended
Dec. 31, 2017 | | | Period Ended
Dec. 31, 20161 | |
Net Asset Value, beginning of period | | | $10.13 | | | | $10.00 | |
INCOME (LOSS) FROM INVESTMENT OPERATIONS: | | | | | | | | |
Net investment income (loss)2 | | | 0.44 | | | | 0.29 | |
Net realized gain (loss) and unrealized appreciation/depreciation on investments, swaps, and foreign currency related transactions | | | 0.35 | | | | 0.18 | |
Total from investment operations | | | 0.79 | | | | 0.47 | |
LESS DISTRIBUTIONS FROM: | | | | | | | | |
Net investment income | | | (0.43 | ) | | | (0.32 | ) |
Net realized gains on investments | | | (0.10 | ) | | | (0.02 | ) |
Total distributions | | | (0.53 | ) | | | (0.34 | ) |
Net Asset Value, end of period | | | $10.39 | | | | $10.13 | |
TOTAL RETURN | | | 7.86% | | | | 4.66% | 3 |
| | |
RATIOS/SUPPLEMENTAL DATA | | | | | | | | |
Net assets, end of period (in 000’s) | | | $10,201 | | | | $10,119 | |
Ratio of expenses to average net assets before any reimbursement, waiver or recapture of expenses by Advisor and Administrator (Note 5) | | | 1.86% | | | | 2.24% | 4 |
Ratio of expenses to average net assets after any reimbursement, waiver or recapture of expenses by Advisor and Administrator | | | 1.15% | | | | 1.15% | 4 |
Ratio of net investment income (loss) to average net assets | | | 4.17% | | | | 4.12% | 4 |
Portfolio turnover5 | | | 27.86% | | | | 18.80% | 3 |
| | |
| INSTITUTIONAL CLASS | | Year Ended
Dec. 31, 2017 | | | Period Ended
Dec. 31, 20161 | |
Net Asset Value, beginning of period | | | $10.13 | | | | $10.00 | |
INCOME (LOSS) FROM INVESTMENT OPERATIONS: | | | | | | | | |
Net investment income (loss)2 | | | 0.46 | | | | 0.30 | |
Net realized gain (loss) and unrealized appreciation/depreciation on investments, swaps, and foreign currency related transactions | | | 0.36 | | | | 0.18 | |
Total from investment operations | | | 0.82 | | | | 0.48 | |
LESS DISTRIBUTIONS FROM: | | | | | | | | |
Net investment income | | | (0.46 | ) | | | (0.33 | ) |
Net realized gains on investments | | | (0.10 | ) | | | (0.02 | ) |
Total distributions | | | (0.56 | ) | | | (0.35 | ) |
Net Asset Value, end of period | | | $10.39 | | | | $10.13 | |
TOTAL RETURN | | | 8.13% | | | | 4.82% | 3 |
| | |
RATIOS/SUPPLEMENTAL DATA | | | | | | | | |
Net assets, end of period (in 000’s) | | | $21,491 | | | | $6,205 | |
Ratio of expenses to average net assets before any reimbursement, waiver or recapture of expenses by Advisor and Administrator (Note 5) | | | 1.62% | | | | 1.99% | 4 |
Ratio of expenses to average net assets after any reimbursement, waiver or recapture of expenses by Advisor and Administrator | | | 0.90% | | | | 0.90% | 4 |
Ratio of net investment income (loss) to average net assets | | | 4.45% | | | | 4.28% | 4 |
Portfolio turnover5 | | | 27.86% | | | | 18.80% | 3 |
| 1 | Matthews Asia Credit Opportunities Fund commenced operations on April 29, 2016. |
| 2 | Calculated using the average daily shares method. |
| 5 | The portfolio turnover rate is calculated on the Fund as a whole without distinguishing between classes of shares issued. |
See accompanying notes to financial statements.
Matthews Asian Growth And Income Fund
The tables below set forth financial data for a share of beneficial interest outstanding throughout each period presented.
| | | | | | | | | | | | | | | | | | | | |
| INVESTOR CLASS | | Year Ended Dec. 31 | |
| | 2017 | | | 2016 | | | 2015 | | | 2014 | | | 2013 | |
Net Asset Value, beginning of year | | | $14.94 | | | | $16.03 | | | | $18.01 | | | | $18.91 | | | | $18.61 | |
INCOME (LOSS) FROM INVESTMENT OPERATIONS: | | | | | | | | | | | | | | | | | | | | |
Net investment income (loss)1 | | | 0.33 | | | | 0.32 | | | | 0.39 | | | | 0.39 | | | | 0.41 | |
Net realized gain (loss) and unrealized appreciation/depreciation on investments, foreign currency related transactions, and foreign capital gains taxes | | | 2.92 | | | | (0.06 | ) | | | (1.19 | ) | | | (0.50 | ) | | | 0.47 | |
Total from investment operations | | | 3.25 | | | | 0.26 | | | | (0.80 | ) | | | (0.11 | ) | | | 0.88 | |
LESS DISTRIBUTIONS FROM: | | | | | | | | | | | | | | | | | | | | |
Net investment income | | | (0.46 | ) | | | (0.48 | ) | | | (0.42 | ) | | | (0.35 | ) | | | (0.46 | ) |
Net realized gains on investments | | | (0.27 | ) | | | (0.87 | ) | | | (0.76 | ) | | | (0.44 | ) | | | (0.12 | ) |
Total distributions | | | (0.73 | ) | | | (1.35 | ) | | | (1.18 | ) | | | (0.79 | ) | | | (0.58 | ) |
Paid-in capital from redemption fees (Note 4) | | | — | 2 | | | — | | | | — | 2 | | | — | 2 | | | — | 2 |
Net Asset Value, end of year | | | $17.46 | | | | $14.94 | | | | $16.03 | | | | $18.01 | | | | $18.91 | |
TOTAL RETURN | | | 21.85% | | | | 1.34% | | | | (4.50% | ) | | | (0.65% | ) | | | 4.83% | |
| | | | | |
RATIOS/SUPPLEMENTAL DATA | | | | | | | | | | | | | | | | | | | | |
Net assets, end of year (in 000’s) | | | $1,535,746 | | | | $1,684,987 | | | | $2,045,435 | | | | $3,052,565 | | | | $3,278,586 | |
Ratio of expenses to average net assets before any reimbursement, waiver or recapture of expenses by Advisor and Administrator (Note 5) | | | 1.07% | | | | 1.09% | | | | 1.09% | | | | 1.08% | | | | 1.08% | |
Ratio of net investment income (loss) to average net assets | | | 1.95% | | | | 1.90% | | | | 2.17% | | | | 2.03% | | | | 2.14% | |
Portfolio turnover3 | | | 23.23% | | | | 15.64% | | | | 16.48% | | | | 16.79% | | | | 15.27% | |
| |
| INSTITUTIONAL CLASS | | Year Ended Dec. 31 | |
| | 2017 | | | 2016 | | | 2015 | | | 2014 | | | 2013 | |
Net Asset Value, beginning of year | | | $14.92 | | | | $16.02 | | | | $18.00 | | | | $18.90 | | | | $18.60 | |
INCOME (LOSS) FROM INVESTMENT OPERATIONS: | | | | | | | | | | | | | | | | | | | | |
Net investment income (loss)1 | | | 0.36 | | | | 0.34 | | | | 0.42 | | | | 0.42 | | | | 0.44 | |
Net realized gain (loss) and unrealized appreciation/depreciation on investments, foreign currency related transactions, and foreign capital gains taxes | | | 2.91 | | | | (0.07 | ) | | | (1.19 | ) | | | (0.50 | ) | | | 0.48 | |
Total from investment operations | | | 3.27 | | | | 0.27 | | | | (0.77 | ) | | | (0.08 | ) | | | 0.92 | |
LESS DISTRIBUTIONS FROM: | | | | | | | | | | | | | | | | | | | | |
Net investment income | | | (0.49 | ) | | | (0.50 | ) | | | (0.45 | ) | | | (0.38 | ) | | | (0.50 | ) |
Net realized gains on investments | | | (0.27 | ) | | | (0.87 | ) | | | (0.76 | ) | | | (0.44 | ) | | | (0.12 | ) |
Total distributions | | | (0.76 | ) | | | (1.37 | ) | | | (1.21 | ) | | | (0.82 | ) | | | (0.62 | ) |
Paid-in capital from redemption fees (Note 4) | | | — | 2 | | | — | | | | — | 2 | | | — | 2 | | | — | 2 |
Net Asset Value, end of year | | | $17.43 | | | | $14.92 | | | | $16.02 | | | | $18.00 | | | | $18.90 | |
TOTAL RETURN | | | 22.00% | | | | 1.44% | | | | (4.33% | ) | | | (0.48% | ) | | | 5.04% | |
| | | | | |
RATIOS/SUPPLEMENTAL DATA | | | | | | | | | | | | | | | | | | | | |
Net assets, end of year (in 000’s) | | | $1,310,168 | | | | $809,254 | | | | $823,619 | | | | $1,182,690 | | | | $1,120,218 | |
Ratio of expenses to average net assets before any reimbursement, waiver or recapture of expenses by Advisor and Administrator (Note 5) | | | 0.93% | | | | 0.94% | | | | 0.92% | | | | 0.92% | | | | 0.93% | |
Ratio of net investment income (loss) to average net assets | | | 2.16% | | | | 2.06% | | | | 2.34% | | | | 2.19% | | | | 2.30% | |
Portfolio turnover3 | | | 23.23% | | | | 15.64% | | | | 16.48% | | | | 16.79% | | | | 15.27% | |
| 1 | Calculated using the average daily shares method. |
| 2 | Less than $0.01 per share. |
| 3 | The portfolio turnover rate is calculated on the Fund as a whole without distinguishing between classes of shares issued. |
See accompanying notes to financial statements.
| | | | |
| matthewsasia.com | 800.789.ASIA | | | 121 | |
Financial Highlights (continued)
Matthews Asia Dividend Fund
The tables below set forth financial data for a share of beneficial interest outstanding throughout each period presented.
| | | | | | | | | | | | | | | | | | | | |
| INVESTOR CLASS | | Year Ended Dec. 31 | |
| | 2017 | | | 20161 | | | 20151 | | | 20141 | | | 2013 | |
Net Asset Value, beginning of year | | | $15.52 | | | | $15.36 | | | | $15.26 | | | | $15.60 | | | | $14.58 | |
INCOME (LOSS) FROM INVESTMENT OPERATIONS: | | | | | | | | | | | | | | | | | | | | |
Net investment income (loss)2 | | | 0.31 | | | | 0.28 | | | | 0.29 | | | | 0.30 | | | | 0.32 | |
Net realized gain (loss) and unrealized appreciation/depreciation on investments, foreign currency related transactions, and foreign capital gains taxes | | | 5.02 | | | | 0.37 | | | | 0.31 | | | | (0.34 | ) | | | 1.30 | |
Total from investment operations | | | 5.33 | | | | 0.65 | | | | 0.60 | | | | (0.04 | ) | | | 1.62 | |
LESS DISTRIBUTIONS FROM: | | | | | | | | | | | | | | | | | | | | |
Net investment income | | | (0.69 | ) | | | (0.29 | ) | | | (0.27 | ) | | | (0.23 | ) | | | (0.60 | ) |
Net realized gains on investments | | | (0.42 | ) | | | (0.11 | ) | | | (0.23 | ) | | | — | | | | — | |
Return of capital | | | — | | | | (0.09 | ) | | | — | | | | (0.07 | ) | | | — | |
Total distributions | | | (1.11 | ) | | | (0.49 | ) | | | (0.50 | ) | | | (0.30 | ) | | | (0.60 | ) |
Paid-in capital from redemption fees (Note 4) | | | — | 3 | | | — | | | | — | 3 | | | — | 3 | | | — | 3 |
Net Asset Value, end of year | | | $19.74 | | | | $15.52 | | | | $15.36 | | | | $15.26 | | | | $15.60 | |
TOTAL RETURN | | | 34.69% | | | | 4.13% | | | | 3.86% | | | | (0.32% | ) | | | 11.27% | |
| | | | | |
RATIOS/SUPPLEMENTAL DATA | | | | | | | | | | | | | | | | | | | | |
Net assets, end of year (in 000’s) | | | $3,713,276 | | | | $2,650,611 | | | | $2,757,910 | | | | $2,918,228 | | | | $3,669,690 | |
Ratio of expenses to average net assets before any reimbursement, waiver or recapture of expenses by Advisor and Administrator (Note 5) | | | 1.03% | | | | 1.06% | | | | 1.06% | | | | 1.06% | | | | 1.06% | |
Ratio of expenses to average net assets after any reimbursement, waiver or recapture of expenses by Advisor and Administrator | | | 1.02% | | | | 1.06% | | | | 1.05% | | | | 1.05% | | | | 1.06% | |
Ratio of net investment income (loss) to average net assets | | | 1.67% | | | | 1.79% | | | | 1.82% | | | | 1.89% | | | | 2.04% | |
Portfolio turnover4 | | | 28.11% | | | | 39.76% | | | | 35.98% | | | | 20.06% | | | | 14.06% | |
| |
| INSTITUTIONAL CLASS | | Year Ended Dec. 31 | |
| | 2017 | | | 20161 | | | 20151 | | | 20141 | | | 2013 | |
Net Asset Value, beginning of year | | | $15.52 | | | | $15.35 | | | | $15.26 | | | | $15.59 | | | | $14.57 | |
INCOME (LOSS) FROM INVESTMENT OPERATIONS: | | | | | | | | | | | | | | | | | | | | |
Net investment income (loss)2 | | | 0.33 | | | | 0.30 | | | | 0.32 | | | | 0.32 | | | | 0.34 | |
Net realized gain (loss) and unrealized appreciation/depreciation on investments, foreign currency related transactions, and foreign capital gains taxes | | | 5.01 | | | | 0.38 | | | | 0.29 | | | | (0.33 | ) | | | 1.30 | |
Total from investment operations | | | 5.34 | | | | 0.68 | | | | 0.61 | | | | (0.01 | ) | | | 1.64 | |
LESS DISTRIBUTIONS FROM: | | | | | | | | | | | | | | | | | | | | |
Net investment income | | | (0.71 | ) | | | (0.31 | ) | | | (0.29 | ) | | | (0.25 | ) | | | (0.62 | ) |
Net realized gains on investments | | | (0.42 | ) | | | (0.11 | ) | | | (0.23 | ) | | | — | | | | — | |
Return of capital | | | — | | | | (0.09 | ) | | | — | | | | (0.07 | ) | | | — | |
Total distributions | | | (1.13 | ) | | | (0.51 | ) | | | (0.52 | ) | | | (0.32 | ) | | | (0.62 | ) |
Paid-in capital from redemption fees (Note 4) | | | — | 3 | | | — | | | | — | 3 | | | — | 3 | | | — | 3 |
Net Asset Value, end of year | | | $19.73 | | | | $15.52 | | | | $15.35 | | | | $15.26 | | | | $15.59 | |
TOTAL RETURN | | | 34.77% | | | | 4.33% | | | | 3.93% | | | | (0.18% | ) | | | 11.43% | |
| | | | | |
RATIOS/SUPPLEMENTAL DATA | | | | | | | | | | | | | | | | | | | | |
Net assets, end of year (in 000’s) | | | $3,284,070 | | | | $2,034,276 | | | | $2,045,713 | | | | $2,107,371 | | | | $2,124,214 | |
Ratio of expenses to average net assets before any reimbursement, waiver or recapture of expenses by Advisor and Administrator (Note 5) | | | 0.92% | | | | 0.94% | | | | 0.93% | | | | 0.93% | | | | 0.93% | |
Ratio of expenses to average net assets after any reimbursement, waiver or recapture of expenses by Advisor and Administrator | | | 0.91% | | | | 0.93% | | | | 0.92% | | | | 0.93% | | | | 0.93% | |
Ratio of net investment income (loss) to average net assets | | | 1.81% | | | | 1.91% | | | | 1.98% | | | | 2.02% | | | | 2.17% | |
Portfolio turnover4 | | | 28.11% | | | | 39.76% | | | | 35.98% | | | | 20.06% | | | | 14.06% | |
| 1 | Consolidated Financial Highlights. See Note 2-C. |
| 2 | Calculated using the average daily shares method. |
| 3 | Less than $0.01 per share. |
| 4 | The portfolio turnover rate is calculated on the Fund as a whole without distinguishing between classes of shares issued. |
See accompanying notes to financial statements.
Matthews China Dividend Fund
The tables below set forth financial data for a share of beneficial interest outstanding throughout each period presented.
| | | | | | | | | | | | | | | | | | | | |
| INVESTOR CLASS | | Year Ended Dec. 31 | |
| | 2017 | | | 2016 | | | 2015 | | | 2014 | | | 2013 | |
Net Asset Value, beginning of year | | | $14.09 | | | | $13.79 | | | | $13.37 | | | | $13.74 | | | | $12.35 | |
INCOME (LOSS) FROM INVESTMENT OPERATIONS: | | | | | | | | | | | | | | | | | | | | |
Net investment income (loss)1 | | | 0.35 | | | | 0.31 | | | | 0.29 | | | | 0.25 | | | | 0.25 | |
Net realized gain (loss) and unrealized appreciation/depreciation on investments and foreign currency related transactions | | | 4.85 | | | | 0.47 | | | | 1.01 | | | | (0.12 | ) | | | 1.35 | |
Total from investment operations | | | 5.20 | | | | 0.78 | | | | 1.30 | | | | 0.13 | | | | 1.60 | |
LESS DISTRIBUTIONS FROM: | | | | | | | | | | | | | | | | | | | | |
Net investment income | | | (0.49 | ) | | | (0.28 | ) | | | (0.28 | ) | | | (0.36 | ) | | | (0.23 | ) |
Net realized gains on investments | | | (1.19 | ) | | | (0.20 | ) | | | (0.60 | ) | | | (0.14 | ) | | | — | |
Total distributions | | | (1.68 | ) | | | (0.48 | ) | | | (0.88 | ) | | | (0.50 | ) | | | (0.23 | ) |
Paid-in capital from redemption fees (Note 4) | | | — | | | | — | | | | — | 2 | | | — | 2 | | | 0.02 | |
Net Asset Value, end of year | | | $17.61 | | | | $14.09 | | | | $13.79 | | | | $13.37 | | | | $13.74 | |
TOTAL RETURN | | | 37.69% | | | | 5.70% | | | | 9.54% | | | | 0.93% | | | | 13.35% | |
| | | | | |
RATIOS/SUPPLEMENTAL DATA | | | | | | | | | | | | | | | | | | | | |
Net assets, end of year (in 000’s) | | | $260,593 | | | | $160,400 | | | | $165,514 | | | | $116,954 | | | | $125,965 | |
Ratio of expenses to average net assets before any reimbursement, waiver or recapture of expenses by Advisor and Administrator (Note 5) | | | 1.19% | | | | 1.22% | | | | 1.19% | | | | 1.19% | | | | 1.24% | |
Ratio of net investment income (loss) to average net assets | | | 2.12% | | | | 2.28% | | | | 1.97% | | | | 1.88% | | | | 1.94% | |
Portfolio turnover3 | | | 69.14% | | | | 72.96% | | | | 79.91% | | | | 25.43% | | | | 20.52% | |
| |
| INSTITUTIONAL CLASS | | Year Ended Dec. 31 | |
| | 2017 | | | 2016 | | | 2015 | | | 2014 | | | 2013 | |
Net Asset Value, beginning of year | | | $14.09 | | | | $13.79 | | | | $13.37 | | | | $13.74 | | | | $12.34 | |
INCOME (LOSS) FROM INVESTMENT OPERATIONS: | | | | | | | | | | | | | | | | | | | | |
Net investment income (loss)1 | | | 0.37 | | | | 0.29 | | | | 0.28 | | | | 0.28 | | | | 0.33 | |
Net realized gain (loss) and unrealized appreciation/depreciation on investments and foreign currency related transactions | | | 4.85 | | | | 0.51 | | | | 1.04 | | | | (0.13 | ) | | | 1.32 | |
Total from investment operations | | | 5.22 | | | | 0.80 | | | | 1.32 | | | | 0.15 | | | | 1.65 | |
LESS DISTRIBUTIONS FROM: | | | | | | | | | | | | | | | | | | | | |
Net investment income | | | (0.51 | ) | | | (0.30 | ) | | | (0.30 | ) | | | (0.38 | ) | | | (0.26 | ) |
Net realized gains on investments | | | (1.19 | ) | | | (0.20 | ) | | | (0.60 | ) | | | (0.14 | ) | | | — | |
Total distributions | | | (1.70 | ) | | | (0.50 | ) | | | (0.90 | ) | | | (0.52 | ) | | | (0.26 | ) |
Paid-in capital from redemption fees (Note 4) | | | — | | | | — | | | | — | 2 | | | — | 2 | | | 0.01 | |
Net Asset Value, end of year | | | $17.61 | | | | $14.09 | | | | $13.79 | | | | $13.37 | | | | $13.74 | |
TOTAL RETURN | | | 37.88% | | | | 5.90% | | | | 9.71% | | | | 1.11% | | | | 13.72% | |
| | | | | |
RATIOS/SUPPLEMENTAL DATA | | | | | | | | | | | | | | | | | | | | |
Net assets, end of year (in 000’s) | | | $54,147 | | | | $27,758 | | | | $15,406 | | | | $30,662 | | | | $24,790 | |
Ratio of expenses to average net assets before any reimbursement, waiver or recapture of expenses by Advisor and Administrator (Note 5) | | | 1.04% | | | | 1.06% | | | | 1.00% | | | | 1.01% | | | | 1.08% | |
Ratio of net investment income (loss) to average net assets | | | 2.25% | | | | 2.09% | | | | 1.89% | | | | 2.06% | | | | 2.54% | |
Portfolio turnover3 | | | 69.14% | | | | 72.96% | | | | 79.91% | | | | 25.43% | | | | 20.52% | |
| 1 | Calculated using the average daily shares method. |
| 2 | Less than $0.01 per share. |
| 3 | The portfolio turnover rate is calculated on the Fund as a whole without distinguishing between classes of shares issued. |
See accompanying notes to financial statements.
| | | | |
| matthewsasia.com | 800.789.ASIA | | | 123 | |
Financial Highlights (continued)
Matthews Asia Value Fund
The tables below set forth financial data for a share of beneficial interest outstanding throughout each period presented.
| | | | | | | | | | | | |
| INVESTOR CLASS | | Year Ended Dec. 31 | | | Period Ended
Dec. 31, 20151 | |
| | 2017 | | | 2016 | | |
Net Asset Value, beginning of period | | | $9.96 | | | | $9.85 | | | | $10.00 | |
INCOME (LOSS) FROM INVESTMENT OPERATIONS: | | | | | | | | | | | | |
Net investment income (loss)2 | | | 0.14 | | | | 0.09 | | | | 0.02 | |
Net realized gain (loss) and unrealized appreciation/depreciation on investments and foreign currency related transactions | | | 3.45 | | | | 0.65 | | | | (0.16 | ) |
Total from investment operations | | | 3.59 | | | | 0.74 | | | | (0.14 | ) |
LESS DISTRIBUTIONS FROM: | | | | | | | | | | | | |
Net investment income | | | (0.29 | ) | | | (0.59 | ) | | | (0.01 | ) |
Net realized gains on investments | | | (0.43 | ) | | | (0.04 | ) | | | — | |
Total distributions | | | (0.72 | ) | | | (0.63 | ) | | | (0.01 | ) |
Net Asset Value, end of period | | | $12.83 | | | | $9.96 | | | | $9.85 | |
TOTAL RETURN | | | 36.12% | | | | 7.43% | | | | (1.35% | )3 |
| | | |
RATIOS/SUPPLEMENTAL DATA | | | | | | | | | | | | |
Net assets, end of period (in 000’s) | | | $27,346 | | | | $2,548 | | | | $1,589 | |
Ratio of expenses to average net assets before any reimbursement, waiver or recapture of expenses by Advisor and Administrator (Note 5) | | | 2.32% | | | | 11.48% | | | | 36.42% | 4 |
Ratio of expenses to average net assets after any reimbursement, waiver or recapture of expenses by Advisor and Administrator | | | 1.50% | | | | 1.50% | | | | 1.50% | 4 |
Ratio of net investment income (loss) to average net assets | | | 1.10% | | | | 0.84% | | | | 2.70% | 4 |
Portfolio turnover5 | | | 31.93% | | | | 19.60% | | | | 10.80% | 3 |
| | |
| INSTITUTIONAL CLASS | | Year Ended Dec. 31 | | | Period Ended
Dec. 31, 20151 | |
| | 2017 | | | 2016 | | |
Net Asset Value, beginning of period | | | $9.85 | | | | $9.83 | | | | $10.00 | |
INCOME (LOSS) FROM INVESTMENT OPERATIONS: | | | | | | | | | | | | |
Net investment income (loss)2 | | | 0.32 | | | | 0.10 | | | | 0.02 | |
Net realized gain (loss) and unrealized appreciation/depreciation on investments and foreign currency related transactions | | | 3.25 | | | | 0.67 | | | | (0.15 | ) |
Total from investment operations | | | 3.57 | | | | 0.77 | | | | (0.13 | ) |
LESS DISTRIBUTIONS FROM: | | | | | | | | | | | | |
Net investment income | | | (0.26 | ) | | | (0.71 | ) | | | (0.04 | ) |
Net realized gains on investments | | | (0.43 | ) | | | (0.04 | ) | | | — | |
Total distributions | | | (0.69 | ) | | | (0.75 | ) | | | (0.04 | ) |
Net Asset Value, end of period | | | $12.73 | | | | $9.85 | | | | $9.83 | |
TOTAL RETURN | | | 36.35% | | | | 7.72% | | | | (1.30% | )3 |
| | | |
RATIOS/SUPPLEMENTAL DATA | | | | | | | | | | | | |
Net assets, end of period (in 000’s) | | | $3,388 | | | | $155 | | | | $143 | |
Ratio of expenses to average net assets before any reimbursement, waiver or recapture of expenses by Advisor and Administrator (Note 5) | | | 2.08% | | | | 11.26% | | | | 36.17% | 4 |
Ratio of expenses to average net assets after any reimbursement, waiver or recapture of expenses by Advisor and Administrator | | | 1.25% | | | | 1.25% | | | | 1.25% | 4 |
Ratio of net investment income (loss) to average net assets | | | 2.59% | | | | 1.01% | | | | 2.41% | 4 |
Portfolio turnover5 | | | 31.93% | | | | 19.60% | | | | 10.80% | 3 |
| 1 | Commenced operations on November 30, 2015. |
| 2 | Calculated using the average daily shares method. |
| 5 | The portfolio turnover rate is calculated on the Fund as a whole without distinguishing between classes of shares issued. |
See accompanying notes to financial statements.
Matthews Asia Focus Fund
The tables below set forth financial data for a share of beneficial interest outstanding throughout each period presented.
| | | | | | | | | | | | | | | | | | | | |
| INVESTOR CLASS | | Year Ended Dec. 31 | | | Period Ended
Dec. 31, 20131 | |
| | 2017 | | | 2016 | | | 2015 | | | 2014 | | |
Net Asset Value, beginning of period | | | $8.98 | | | | $8.69 | | | | $10.01 | | | | $9.66 | | | | $10.00 | |
INCOME (LOSS) FROM INVESTMENT OPERATIONS: | | | | | | | | | | | | | | | | | | | | |
Net investment income (loss)2 | | | 0.11 | | | | 0.10 | | | | 0.11 | | | | 0.09 | | | | 0.04 | |
Net realized gain (loss) and unrealized appreciation/depreciation on investments, foreign currency related transactions, and foreign capital gains taxes | | | 3.21 | | | | 0.32 | | | | (1.31 | ) | | | 0.33 | | | | (0.30 | ) |
Total from investment operations | | | 3.32 | | | | 0.42 | | | | (1.20 | ) | | | 0.42 | | | | (0.26 | ) |
LESS DISTRIBUTIONS FROM: | | | | | | | | | | | | | | | | | | | | |
Net investment income | | | (0.12 | ) | | | (0.13 | ) | | | (0.07 | ) | | | (0.07 | ) | | | (0.08 | ) |
Net realized gains on investments | | | — | | | | — | | | | (0.05 | ) | | | — | | | | — | |
Total distributions | | | (0.12 | ) | | | (0.13 | ) | | | (0.12 | ) | | | (0.07 | ) | | | (0.08 | ) |
Paid-in capital from redemption fees (Note 4) | | | — | | | | — | | | | — | 3 | | | — | 3 | | | — | 3 |
Net Asset Value, end of period | | | $12.18 | | | | $8.98 | | | | $8.69 | | | | $10.01 | | | | $9.66 | |
TOTAL RETURN | | | 36.98% | | | | 4.82% | | | | (12.07% | ) | | | 4.38% | | | | (2.63% | )4 |
| | | | | |
RATIOS/SUPPLEMENTAL DATA | | | | | | | | | | | | | | | | | | | | |
Net assets, end of period (in 000’s) | | | $4,838 | | | | $4,713 | | | | $5,474 | | | | $7,839 | | | | $6,258 | |
Ratio of expenses to average net assets before any reimbursement, waiver or recapture of expenses by Advisor and Administrator (Note 5) | | | 2.45% | | | | 2.47% | | | | 2.07% | | | | 2.16% | | | | 3.50% | 5 |
Ratio of expenses to average net assets after any reimbursement, waiver or recapture of expenses by Advisor and Administrator | | | 1.50% | | | | 1.50% | | | | 1.50% | | | | 1.57% | | | | 1.71% | 5 |
Ratio of net investment income (loss) to average net assets | | | 1.01% | | | | 1.14% | | | | 1.08% | | | | 0.87% | | | | 0.64% | 5 |
Portfolio turnover6 | | | 28.42% | | | | 21.10% | | | | 23.60% | | | | 24.12% | | | | 16.23% | 4 |
| | |
INSTITUTIONAL CLASS | | Year Ended Dec. 31 | | | Period Ended
Dec. 31, 20131 | |
| | 2017 | | | 2016 | | | 2015 | | | 2014 | | |
Net Asset Value, beginning of period | | | $8.99 | | | | $8.69 | | | | $10.04 | | | | $9.66 | | | | $10.00 | |
INCOME (LOSS) FROM INVESTMENT OPERATIONS: | | | | | | | | | | | | | | | | | | | | |
Net investment income (loss)2 | | | 0.14 | | | | 0.13 | | | | 0.13 | | | | 0.10 | | | | 0.05 | |
Net realized gain (loss) and unrealized appreciation/depreciation on investments, foreign currency related transactions, and foreign capital gains taxes | | | 3.21 | | | | 0.31 | | | | (1.33 | ) | | | 0.36 | | | | (0.30 | ) |
Total from investment operations | | | 3.35 | | | | 0.44 | | | | (1.20 | ) | | | 0.46 | | | | (0.25 | ) |
LESS DISTRIBUTIONS FROM: | | | | | | | | | | | | | | | | | | | | |
Net investment income | | | (0.10 | ) | | | (0.14 | ) | | | (0.10 | ) | | | (0.08 | ) | | | (0.09 | ) |
Net realized gains on investments | | | — | | | | — | | | | (0.05 | ) | | | — | | | | — | |
Total distributions | | | (0.10 | ) | | | (0.14 | ) | | | (0.15 | ) | | | (0.08 | ) | | | (0.09 | ) |
Paid-in capital from redemption fees (Note 4) | | | — | | | | — | | | | — | 3 | | | — | 3 | | | — | 3 |
Net Asset Value, end of period | | | $12.24 | | | | $8.99 | | | | $8.69 | | | | $10.04 | | | | $9.66 | |
TOTAL RETURN | | | 37.35% | | | | 5.05% | | | | (11.96% | ) | | | 4.77% | | | | (2.48% | )4 |
| | | | | |
RATIOS/SUPPLEMENTAL DATA | | | | | | | | | | | | | | | | | | | | |
Net assets, end of period (in 000’s) | | | $10,708 | | | | $5,397 | | | | $5,700 | | | | $7,148 | | | | $2,118 | |
Ratio of expenses to average net assets before any reimbursement, waiver or recapture of expenses by Advisor and Administrator (Note 5) | | | 2.27% | | | | 2.29% | | | | 1.91% | | | | 1.94% | | | | 3.32% | 5 |
Ratio of expenses to average net assets after any reimbursement, waiver or recapture of expenses by Advisor and Administrator | | | 1.25% | | | | 1.25% | | | | 1.25% | | | | 1.31% | | | | 1.50% | 5 |
Ratio of net investment income (loss) to average net assets | | | 1.28% | | | | 1.37% | | | | 1.30% | | | | 0.96% | | | | 0.79% | 5 |
Portfolio turnover6 | | | 28.42% | | | | 21.10% | | | | 23.60% | | | | 24.12% | | | | 16.23% | 4 |
| 1 | Commenced operations on April 30, 2013. |
| 2 | Calculated using the average daily shares method. |
| 3 | Less than $0.01 per share. |
| 6 | The portfolio turnover rate is calculated on the Fund as a whole without distinguishing between classes of shares issued. |
See accompanying notes to financial statements.
| | | | |
| matthewsasia.com | 800.789.ASIA | | | 125 | |
Financial Highlights (continued)
Matthews Asia Growth Fund
The tables below set forth financial data for a share of beneficial interest outstanding throughout each period presented.
| | | | | | | | | | | | | | | | | | | | |
| INVESTOR CLASS | | Year Ended Dec. 31 | |
| | 2017 | | | 2016 | | | 2015 | | | 2014 | | | 2013 | |
Net Asset Value, beginning of year | | | $21.05 | | | | $21.09 | | | | $21.10 | | | | $21.17 | | | | $18.02 | |
INCOME (LOSS) FROM INVESTMENT OPERATIONS: | | | | | | | | | | | | | | | | | | | | |
Net investment income (loss)1 | | | 0.04 | | | | 0.06 | | | | 0.11 | | | | 0.12 | | | | 0.11 | |
Net realized gain (loss) and unrealized appreciation/depreciation on investments, foreign currency related transactions, and foreign capital gains taxes | | | 8.14 | | | | 0.13 | | | | (0.12 | ) | | | 0.19 | | | | 3.37 | |
Total from investment operations | | | 8.18 | | | | 0.19 | | | | (0.01 | ) | | | 0.31 | | | | 3.48 | |
LESS DISTRIBUTIONS FROM: | | | | | | | | | | | | | | | | | | | | |
Net investment income | | | (0.16 | ) | | | (0.23 | ) | | | — | | | | (0.38 | ) | | | (0.33 | ) |
Net realized gains on investments | | | (1.82 | ) | | | — | | | | — | | | | — | | | | — | |
Total distributions | | | (1.98 | ) | | | (0.23 | ) | | | — | | | | (0.38 | ) | | | (0.33 | ) |
Paid-in capital from redemption fees (Note 4) | | | — | | | | — | | | | — | 2 | | | — | 2 | | | — | 2 |
Net Asset Value, end of year | | | $27.25 | | | | $21.05 | | | | $21.09 | | | | $21.10 | | | | $21.17 | |
TOTAL RETURN | | | 39.39% | | | | 0.92% | | | | (0.05% | ) | | | 1.49% | | | | 19.35% | |
| | | | | |
RATIOS/SUPPLEMENTAL DATA | | | | | | | | | | | | | | | | | | | | |
Net assets, end of year (in 000’s) | | | $554,309 | | | | $419,516 | | | | $526,969 | | | | $561,922 | | | | $558,407 | |
Ratio of expenses to average net assets | | | 1.12% | | | | 1.14% | | | | 1.11% | | | | 1.11% | | | | 1.12% | |
Ratio of net investment income (loss) to average net assets | | | 0.16% | | | | 0.30% | | | | 0.49% | | | | 0.55% | | | | 0.55% | |
Portfolio turnover3 | | | 23.19% | | | | 13.61% | | | | 29.51% | | | | 22.24% | | | | 10.77% | |
| |
| INSTITUTIONAL CLASS | | Year Ended Dec. 31 | |
| | 2017 | | | 2016 | | | 2015 | | | 2014 | | | 2013 | |
Net Asset Value, beginning of year | | | $21.19 | | | | $21.24 | | | | $21.19 | | | | $21.26 | | | | $18.08 | |
INCOME (LOSS) FROM INVESTMENT OPERATIONS: | | | | | | | | | | | | | | | | | | | | |
Net investment income (loss)1 | | | 0.09 | | | | 0.10 | | | | 0.16 | | | | 0.16 | | | | 0.15 | |
Net realized gain (loss) and unrealized appreciation/depreciation on investments, foreign currency related transactions, and foreign capital gains taxes | | | 8.20 | | | | 0.13 | | | | (0.11 | ) | | | 0.19 | | | | 3.39 | |
Total from investment operations | | | 8.29 | | | | 0.23 | | | | 0.05 | | | | 0.35 | | | | 3.54 | |
LESS DISTRIBUTIONS FROM: | | | | | | | | | | | | | | | | | | | | |
Net investment income | | | (0.21 | ) | | | (0.28 | ) | | | — | | | | (0.42 | ) | | | (0.36 | ) |
Net realized gains on investments | | | (1.82 | ) | | | — | | | | — | | | | — | | | | — | |
Total distributions | | | (2.03 | ) | | | (0.28 | ) | | | — | | | | (0.42 | ) | | | (0.36 | ) |
Paid-in capital from redemption fees (Note 4) | | | — | | | | — | | | | — | 2 | | | — | 2 | | | — | 2 |
Net Asset Value, end of year | | | $27.45 | | | | $21.19 | | | | $21.24 | | | | $21.19 | | | | $21.26 | |
TOTAL RETURN | | | 39.64% | | | | 1.06% | | | | 0.24% | | | | 1.63% | | | | 19.63% | |
| | | | | |
RATIOS/SUPPLEMENTAL DATA | | | | | | | | | | | | | | | | | | | | |
Net assets, end of year (in 000’s) | | | $296,253 | | | | $195,949 | | | | $249,886 | | | | $287,262 | | | | $227,852 | |
Ratio of expenses to average net assets | | | 0.93% | | | | 0.96% | | | | 0.91% | | | | 0.91% | | | | 0.93% | |
Ratio of net investment income (loss) to average net assets | | | 0.35% | | | | 0.47% | | | | 0.72% | | | | 0.74% | | | | 0.73% | |
Portfolio turnover3 | | | 23.19% | | | | 13.61% | | | | 29.51% | | | | 22.24% | | | | 10.77% | |
| 1 | Calculated using the average daily shares method. |
| 2 | Less than $0.01 per share. |
| 3 | The portfolio turnover rate is calculated on the Fund as a whole without distinguishing between classes of shares issued. |
See accompanying notes to financial statements.
Matthews Pacific Tiger Fund
The tables below set forth financial data for a share of beneficial interest outstanding throughout each period presented.
| | | | | | | | | | | | | | | | | | | | |
INVESTOR CLASS | | Year Ended Dec. 31 | |
| | 2017 | | | 2016 | | | 2015 | | | 2014 | | | 2013 | |
Net Asset Value, beginning of year | | | $22.92 | | | | $23.54 | | | | $26.57 | | | | $24.99 | | | | $24.42 | |
INCOME (LOSS) FROM INVESTMENT OPERATIONS: | | | | | | | | | | | | | | | | | | | | |
Net investment income (loss)1 | | | 0.17 | | | | 0.11 | | | | 0.42 | | | | 0.14 | | | | 0.17 | |
Net realized gain (loss) and unrealized appreciation/depreciation on investments, foreign currency related transactions, and foreign capital gains taxes | | | 8.96 | | | | (0.13 | ) | | | (0.82 | ) | | | 2.80 | | | | 0.72 | |
Total from investment operations | | | 9.13 | | | | (0.02 | ) | | | (0.40 | ) | | | 2.94 | | | | 0.89 | |
LESS DISTRIBUTIONS FROM: | | | | | | | | | | | | | | | | | | | | |
Net investment income | | | (0.17 | ) | | | (0.13 | ) | | | (0.42 | ) | | | (0.13 | ) | | | (0.16 | ) |
Net realized gains on investments | | | (0.22 | ) | | | (0.47 | ) | | | (2.21 | ) | | | (1.23 | ) | | | (0.16 | ) |
Total distributions | | | (0.39 | ) | | | (0.60 | ) | | | (2.63 | ) | | | (1.36 | ) | | | (0.32 | ) |
Paid-in capital from redemption fees (Note 4) | | | — | 2 | | | — | | | | — | 2 | | | — | 2 | | | — | 2 |
Net Asset Value, end of year | | | $31.66 | | | | $22.92 | | | | $23.54 | | | | $26.57 | | | | $24.99 | |
TOTAL RETURN | | | 39.96% | | | | (0.16% | ) | | | (1.30% | ) | | | 11.79% | | | | 3.63% | |
| | | | | |
RATIOS/SUPPLEMENTAL DATA | | | | | | | | | | | | | | | | | | | | |
Net assets, end of year (in 000’s) | | | $3,335,795 | | | | $2,445,183 | | | | $2,720,869 | | | | $3,047,077 | | | | $2,954,108 | |
Ratio of expenses to average net assets before any reimbursement, waiver or recapture of expenses by Advisor and Administrator (Note 5) | | | 1.08% | | | | 1.09% | | | | 1.09% | | | | 1.09% | | | | 1.09% | |
Ratio of expenses to average net assets after any reimbursement, waiver or recapture of expenses by Advisor and Administrator | | | 1.06% | | | | 1.08% | | | | 1.07% | | | | 1.08% | | | | 1.09% | |
Ratio of net investment income (loss) to average net assets | | | 0.63% | | | | 0.47% | | | | 1.53% | | | | 0.52% | | | | 0.67% | |
Portfolio turnover3 | | | 9.18% | | | | 5.73% | | | | 12.56% | | | | 11.38% | | | | 7.73% | |
| |
| | | Year Ended Dec. 31 | |
| INSTITUTIONAL CLASS | | 2017 | | | 2016 | | | 2015 | | | 2014 | | | 2013 | |
Net Asset Value, beginning of year | | | $22.90 | | | | $23.52 | | | | $26.56 | | | | $24.97 | | | | $24.41 | |
INCOME (LOSS) FROM INVESTMENT OPERATIONS: | | | | | | | | | | | | | | | | | | | | |
Net investment income (loss)1 | | | 0.22 | | | | 0.16 | | | | 0.44 | | | | 0.18 | | | | 0.21 | |
Net realized gain (loss) and unrealized appreciation/depreciation on investments, foreign currency related transactions, and foreign capital gains taxes | | | 8.95 | | | | (0.14 | ) | | | (0.80 | ) | | | 2.82 | | | | 0.71 | |
Total from investment operations | | | 9.17 | | | | 0.02 | | | | (0.36 | ) | | | 3.00 | | | | 0.92 | |
LESS DISTRIBUTIONS FROM: | | | | | | | | | | | | | | | | | | | | |
Net investment income | | | (0.22 | ) | | | (0.17 | ) | | | (0.47 | ) | | | (0.18 | ) | | | (0.20 | ) |
Net realized gains on investments | | | (0.22 | ) | | | (0.47 | ) | | | (2.21 | ) | | | (1.23 | ) | | | (0.16 | ) |
Total distributions | | | (0.44 | ) | | | (0.64 | ) | | | (2.68 | ) | | | (1.41 | ) | | | (0.36 | ) |
Paid-in capital from redemption fees (Note 4) | | | — | 2 | | | — | | | | — | 2 | | | — | 2 | | | — | 2 |
Net Asset Value, end of year | | | $31.63 | | | | $22.90 | | | | $23.52 | | | | $26.56 | | | | $24.97 | |
TOTAL RETURN | | | 40.17% | | | | 0.03% | | | | (1.15% | ) | | | 12.03% | | | | 3.78% | |
| | | | | |
RATIOS/SUPPLEMENTAL DATA | | | | | | | | | | | | | | | | | | | | |
Net assets, end of year (in 000’s) | | | $6,389,242 | | | | $4,207,508 | | | | $3,964,547 | | | | $5,049,643 | | | | $4,679,039 | |
Ratio of expenses to average net assets before any reimbursement, waiver or recapture of expenses by Advisor and Administrator (Note 5) | | | 0.91% | | | | 0.91% | | | | 0.91% | | | | 0.92% | | | | 0.92% | |
Ratio of expenses to average net assets after any reimbursement, waiver or recapture of expenses by Advisor and Administrator | | | 0.89% | | | | 0.90% | | | | 0.89% | | | | 0.91% | | | | 0.92% | |
Ratio of net investment income (loss) to average net assets | | | 0.80% | | | | 0.65% | | | | 1.61% | | | | 0.68% | | | | 0.83% | |
Portfolio turnover3 | | | 9.18% | | | | 5.73% | | | | 12.56% | | | | 11.38% | | | | 7.73% | |
| 1 | Calculated using the average daily shares method. |
| 2 | Less than $0.01 per share. |
| 3 | The portfolio turnover rate is calculated on the Fund as a whole without distinguishing between classes of shares issued. |
See accompanying notes to financial statements.
| | | | |
| matthewsasia.com | 800.789.ASIA | | | 127 | |
Financial Highlights (continued)
Matthews Asia ESG Fund
The tables below set forth financial data for a share of beneficial interest outstanding throughout each period presented.
| | | | | | | | | | | | |
INVESTOR CLASS | | Year Ended Dec. 31 | | | Period Ended
Dec. 31, 20151 | |
| | 2017 | | | 2016 | | |
Net Asset Value, beginning of period | | | $8.97 | | | | $9.23 | | | | $10.00 | |
INCOME (LOSS) FROM INVESTMENT OPERATIONS: | | | | | | | | | | | | |
Net investment income (loss)2 | | | 0.05 | | | | 0.07 | | | | 0.02 | |
Net realized gain (loss) and unrealized appreciation/depreciation on investments, foreign currency related transactions, and foreign capital gains taxes | | | 2.97 | | | | (0.20 | ) | | | (0.75 | ) |
Total from investment operations | | | 3.02 | | | | (0.13 | ) | | | (0.73 | ) |
LESS DISTRIBUTIONS FROM: | | | | | | | | | | | | |
Net investment income | | | (0.27 | ) | | | (0.13 | ) | | | (0.04 | ) |
Net realized gains on investments | | | (0.16 | ) | | | — | | | | — | |
Total distributions | | | (0.43 | ) | | | (0.13 | ) | | | (0.04 | ) |
Net Asset Value, end of period | | | $11.56 | | | | $8.97 | | | | $9.23 | |
TOTAL RETURN | | | 33.79% | | | | (1.40% | ) | | | (7.30% | )3 |
| | | |
RATIOS/SUPPLEMENTAL DATA | | | | | | | | | | | | |
Net assets, end of period (in 000’s) | | | $10,695 | | | | $5,376 | | | | $3,248 | |
Ratio of expenses to average net assets before any reimbursement, waiver or recapture of expenses by Advisor and Administrator (Note 5) | | | 2.65% | | | | 3.54% | | | | 9.09% | 4 |
Ratio of expenses to average net assets after any reimbursement, waiver or recapture of expenses by Advisor and Administrator | | | 1.50% | | | | 1.48% | | | | 1.44% | 4 |
Ratio of net investment income (loss) to average net assets | | | 0.45% | | | | 0.77% | | | | 0.25% | 4 |
Portfolio turnover5 | | | 28.82% | | | | 16.10% | | | | 21.72% | 3 |
| | |
INSTITUTIONAL CLASS | | Year Ended Dec. 31 | | | Period Ended
Dec. 31, 20151 | |
| | 2017 | | | 2016 | | |
Net Asset Value, beginning of period | | | $8.92 | | | | $9.17 | | | | $10.00 | |
INCOME (LOSS) FROM INVESTMENT OPERATIONS: | | | | | | | | | | | | |
Net investment income (loss)2 | | | 0.08 | | | | 0.09 | | | | 0.05 | |
Net realized gain (loss) and unrealized appreciation/depreciation on investments, foreign currency related transactions, and foreign capital gains taxes | | | 2.95 | | | | (0.19 | ) | | | (0.77 | ) |
Total from investment operations | | | 3.03 | | | | (0.10 | ) | | | (0.72 | ) |
LESS DISTRIBUTIONS FROM: | | | | | | | | | | | | |
Net investment income | | | (0.29 | ) | | | (0.15 | ) | | | (0.11 | ) |
Net realized gains on investments | | | (0.16 | ) | | | — | | | | — | |
Total distributions | | | (0.45 | ) | | | (0.15 | ) | | | (0.11 | ) |
Net Asset Value, end of period | | | $11.50 | | | | $8.92 | | | | $9.17 | |
TOTAL RETURN | | | 34.11% | | | | (1.16% | ) | | | (7.14% | )3 |
| | | |
RATIOS/SUPPLEMENTAL DATA | | | | | | | | | | | | |
Net assets, end of period (in 000’s) | | | $7,359 | | | | $3,382 | | | | $1,686 | |
Ratio of expenses to average net assets before any reimbursement, waiver or recapture of expenses by Advisor and Administrator (Note 5) | | | 2.46% | | | | 3.36% | | | | 8.90% | 4 |
Ratio of expenses to average net assets after any reimbursement, waiver or recapture of expenses by Advisor and Administrator | | | 1.25% | | | | 1.25% | | | | 1.25% | 4 |
Ratio of net investment income (loss) to average net assets | | | 0.71% | | | | 0.97% | | | | 0.75% | 4 |
Portfolio turnover5 | | | 28.82% | | | | 16.10% | | | | 21.72% | 3 |
| 1 | Commenced operations on April 30, 2015. |
| 2 | Calculated using the average daily shares method. |
| 5 | The portfolio turnover rate is calculated on the Fund as a whole without distinguishing between classes of shares issued. |
See accompanying notes to financial statements.
Matthews Emerging Asia Fund
The tables below set forth financial data for a share of beneficial interest outstanding throughout each period presented.
| | | | | | | | | | | | | | | | | | | | |
| INVESTOR CLASS | | Year Ended Dec. 31 | | | Period Ended
Dec. 31, 20131 | |
| | 2017 | | | 2016 | | | 2015 | | | 2014 | | |
Net Asset Value, beginning of period | | | $13.18 | | | | $11.27 | | | | $11.60 | | | | $9.93 | | | | $10.00 | |
INCOME (LOSS) FROM INVESTMENT OPERATIONS: | | | | | | | | | | | | | | | | | | | | |
Net investment income (loss)2 | | | 0.07 | | | | 0.15 | | | | 0.04 | | | | 0.04 | | | | (0.01 | ) |
Net realized gain (loss) and unrealized appreciation/depreciation on investments, foreign currency related transactions, and foreign capital gains taxes | | | 2.35 | | | | 2.01 | | | | (0.34 | ) | | | 1.69 | | | | (0.05 | ) |
Total from investment operations | | | 2.42 | | | | 2.16 | | | | (0.30 | ) | | | 1.73 | | | | (0.06 | ) |
LESS DISTRIBUTIONS FROM: | | | | | | | | | | | | | | | | | | | | |
Net investment income | | | (0.04 | ) | | | (0.13 | ) | | | — | 3 | | | (0.06 | ) | | | — | 3 |
Net realized gains on investments | | | (0.05 | ) | | | (0.13 | ) | | | (0.03 | ) | | | — | | | | — | |
Return of capital | | | — | | | | — | | | | — | | | | — | | | | (0.01 | ) |
Total distributions | | | (0.09 | ) | | | (0.26 | ) | | | (0.03 | ) | | | (0.06 | ) | | | (0.01 | ) |
Paid-in capital from redemption fees (Note 4) | | | — | 3 | | | 0.01 | | | | — | 3 | | | — | 3 | | | — | 3 |
Net Asset Value, end of period | | | $15.51 | | | | $13.18 | | | | $11.27 | | | | $11.60 | | | | $9.93 | |
TOTAL RETURN | | | 18.42% | | | | 19.25% | | | | (2.56% | ) | | | 17.39% | | | | (0.61% | )4 |
| | | | | |
RATIOS/SUPPLEMENTAL DATA | | | | | | | | | | | | | | | | | | | | |
Net assets, end of period (in 000’s) | | | $219,596 | | | | $145,164 | | | | $114,590 | | | | $110,363 | | | | $38,022 | |
Ratio of expenses to average net assets before any reimbursement, waiver or recapture of expenses by Advisor and Administrator (Note 5) | | | 1.70% | | | | 1.77% | | | | 1.75% | | | | 1.78% | | | | 2.39% | 5 |
Ratio of expenses to average net assets after any reimbursement, waiver or recapture of expenses by Advisor and Administrator | | | 1.48% | | | | 1.47% | | | | 1.50% | | | | 1.58% | | | | 1.98% | 5 |
Ratio of net investment income (loss) to average net assets | | | 0.49% | | | | 1.26% | | | | 0.33% | | | | 0.34% | | | | (0.08% | )5 |
Portfolio turnover6 | | | 7.74% | | | | 34.90% | | | | 12.14% | | | | 8.21% | | | | 1.66% | 4 |
| | |
| INSTITUTIONAL CLASS | | Year Ended Dec. 31 | | | Period Ended
Dec. 31, 20131 | |
| | 2017 | | | 2016 | | | 2015 | | | 2014 | | |
Net Asset Value, beginning of period | | | $13.22 | | | | $11.29 | | | | $11.60 | | | | $9.92 | | | | $10.00 | |
INCOME (LOSS) FROM INVESTMENT OPERATIONS: | | | | | | | | | | | | | | | | | | | | |
Net investment income (loss)2 | | | 0.10 | | | | 0.21 | | | | 0.07 | | | | 0.06 | | | | 0.01 | |
Net realized gain (loss) and unrealized appreciation/depreciation on investments, foreign currency related transactions, and foreign capital gains taxes | | | 2.37 | | | | 1.99 | | | | (0.34 | ) | | | 1.69 | | | | (0.07 | ) |
Total from investment operations | | | 2.47 | | | | 2.20 | | | | (0.27 | ) | | | 1.75 | | | | (0.06 | ) |
LESS DISTRIBUTIONS FROM: | | | | | | | | | | | | | | | | | | | | |
Net investment income | | | (0.07 | ) | | | (0.15 | ) | | | (0.01 | ) | | | (0.07 | ) | | | — | 3 |
Net realized gains on investments | | | (0.05 | ) | | | (0.13 | ) | | | (0.03 | ) | | | — | | | | — | |
Return of capital | | | — | | | | — | | | | — | | | | — | | | | (0.02 | ) |
Total distributions | | | (0.12 | ) | | | (0.28 | ) | | | (0.04 | ) | | | (0.07 | ) | | | (0.02 | ) |
Paid-in capital from redemption fees (Note 4) | | | — | 3 | | | 0.01 | | | | — | 3 | | | — | 3 | | | — | 3 |
Net Asset Value, end of period | | | $15.57 | | | | $13.22 | | | | $11.29 | | | | $11.60 | | | | $9.92 | |
TOTAL RETURN | | | 18.70% | | | | 19.61% | | | | (2.33% | ) | | | 17.68% | | | | (0.55% | )4 |
| | | | | |
RATIOS/SUPPLEMENTAL DATA | | | | | | | | | | | | | | | | | | | | |
Net assets, end of period (in 000’s) | | | $275,233 | | | | $95,724 | | | | $55,278 | | | | $21,350 | | | | $2,017 | |
Ratio of expenses to average net assets before any reimbursement, waiver or recapture of expenses by Advisor and Administrator (Note 5) | | | 1.52% | | | | 1.62% | | | | 1.57% | | | | 1.59% | | | | 2.21% | 5 |
Ratio of expenses to average net assets after any reimbursement, waiver or recapture of expenses by Advisor and Administrator | | | 1.25% | | | | 1.25% | | | | 1.25% | | | | 1.33% | | | | 1.75% | 5 |
Ratio of net investment income (loss) to average net assets | | | 0.70% | | | | 1.72% | | | | 0.65% | | | | 0.55% | | | | 0.19% | 5 |
Portfolio turnover6 | | | 7.74% | | | | 34.90% | | | | 12.14% | | | | 8.21% | | | | 1.66% | 4 |
| 1 | Commenced operations on April 30, 2013. |
| 2 | Calculated using the average daily shares method. |
| 3 | Less than $0.01 per share. |
| 6 | The portfolio turnover rate is calculated on the Fund as a whole without distinguishing between classes of shares issued. |
See accompanying notes to financial statements.
| | | | |
| matthewsasia.com | 800.789.ASIA | | | 129 | |
Financial Highlights (continued)
Matthews Asia Innovators Fund
The tables below set forth financial data for a share of beneficial interest outstanding throughout each period presented.
| | | | | | | | | | | | | | | | | | | | |
| INVESTOR CLASS | | Year Ended Dec. 31 | |
| | 2017 | | | 2016 | | | 2015 | | | 2014 | | | 2013 | |
Net Asset Value, beginning of year | | | $10.10 | | | | $12.32 | | | | $13.61 | | | | $12.59 | | | | $9.29 | |
INCOME (LOSS) FROM INVESTMENT OPERATIONS: | | | | | | | | | | | | | | | | | | | | |
Net investment income (loss)1 | | | (0.02 | ) | | | (0.02 | ) | | | (0.05 | ) | | | — | 2 | | | 0.01 | |
Net realized gain (loss) and unrealized appreciation/depreciation on investments, foreign currency related transactions, and foreign capital gains taxes | | | 5.31 | | | | (1.07 | ) | | | 0.64 | | | | 1.16 | | | | 3.30 | |
Total from investment operations | | | 5.29 | | | | (1.09 | ) | | | 0.59 | | | | 1.16 | | | | 3.31 | |
LESS DISTRIBUTIONS FROM: | | | | | | | | | | | | | | | | | | | | |
Net investment income | | | (0.24 | ) | | | — | | | | — | | | | (0.06 | ) | | | (0.01 | ) |
Net realized gains on investments | | | (0.96 | ) | | | (1.13 | ) | | | (1.88 | ) | | | (0.08 | ) | | | — | |
Total distributions | | | (1.20 | ) | | | (1.13 | ) | | | (1.88 | ) | | | (0.14 | ) | | | (0.01 | ) |
Net Asset Value, end of year | | | $14.19 | | | | $10.10 | | | | $12.32 | | | | $13.61 | | | | $12.59 | |
TOTAL RETURN | | | 52.88% | | | | (9.10% | ) | | | 4.48% | | | | 9.24% | | | | 35.61% | |
| | | | | |
RATIOS/SUPPLEMENTAL DATA | | | | | | | | | | | | | | | | | | | | |
Net assets, end of year (in 000’s) | | | $175,331 | | | | $83,926 | | | | $129,763 | | | | $125,612 | | | | $111,751 | |
Ratio of expenses to average net assets | | | 1.24% | | | | 1.24% | | | | 1.18% | | | | 1.16% | | | | 1.18% | |
Ratio of net investment income (loss) to average net assets | | | (0.18% | ) | | | (0.19% | ) | | | (0.33% | ) | | | (0.02% | ) | | | 0.07% | |
Portfolio turnover3 | | | 66.51% | | | | 92.25% | | | | 72.85% | | | | 62.99% | | | | 62.04% | |
| | |
| INSTITUTIONAL CLASS | | Year Ended Dec. 31 | | | Period Ended
Dec. 31, 20134 | |
| | 2017 | | | 2016 | | | 2015 | | | 2014 | | |
Net Asset Value, beginning of period | | | $10.14 | | | | $12.34 | | | | $13.61 | | | | $12.58 | | | | $10.09 | |
INCOME (LOSS) FROM INVESTMENT OPERATIONS: | | | | | | | | | | | | | | | | | | | | |
Net investment income (loss)1 | | | 0.01 | | | | 0.01 | | | | (0.02 | ) | | | 0.03 | | | | 0.04 | |
Net realized gain (loss) and unrealized appreciation/depreciation on investments, foreign currency related transactions, and foreign capital gains taxes | | | 5.33 | | | | (1.08 | ) | | | 0.63 | | | | 1.17 | | | | 2.48 | |
Total from investment operations | | | 5.34 | | | | (1.07 | ) | | | 0.61 | | | | 1.20 | | | | 2.52 | |
LESS DISTRIBUTIONS FROM: | | | | | | | | | | | | | | | | | | | | |
Net investment income | | | (0.26 | ) | | | — | | | | — | | | | (0.09 | ) | | | (0.03 | ) |
Net realized gains on investments | | | (0.96 | ) | | | (1.13 | ) | | | (1.88 | ) | | | (0.08 | ) | | | — | |
Total distributions | | | (1.22 | ) | | | (1.13 | ) | | | (1.88 | ) | | | (0.17 | ) | | | (0.03 | ) |
Net Asset Value, end of period | | | $14.26 | | | | $10.14 | | | | $12.34 | | | | $13.61 | | | | $12.58 | |
TOTAL RETURN | | | 53.18% | | | | (8.92% | ) | | | 4.63% | | | | 9.54% | | | | 24.99% | 5 |
| | | | | |
RATIOS/SUPPLEMENTAL DATA | | | | | | | | | | | | | | | | | | | | |
Net assets, end of period (in 000’s) | | | $30,957 | | | | $16,545 | | | | $36,770 | | | | $61,088 | | | | $49,236 | |
Ratio of expenses to average net assets | | | 1.05% | | | | 1.01% | | | | 0.97% | | | | 0.95% | | | | 1.00% | 6 |
Ratio of net investment income (loss) to average net assets | | | 0.06% | | | | 0.06% | | | | (0.16% | ) | | | 0.21% | | | | 0.56% | 6 |
Portfolio turnover3 | | | 66.51% | | | | 92.25% | | | | 72.85% | | | | 62.99% | | | | 62.04% | 5 |
| 1 | Calculated using the average daily shares method. |
| 2 | Less than $0.01 per share. |
| 3 | The portfolio turnover rate is calculated on the Fund as a whole without distinguishing between classes of shares issued. |
| 4 | Institutional Class commenced operations on April 30, 2013. |
See accompanying notes to financial statements.
Matthews China Fund
The tables below set forth financial data for a share of beneficial interest outstanding throughout each period presented.
| | | | | | | | | | | | | | | | | | | | |
| INVESTOR CLASS | | Year Ended Dec. 31 | |
| | 2017 | | | 20161 | | | 20151 | | | 20141 | | | 2013 | |
Net Asset Value, beginning of year | | | $15.47 | | | | $18.42 | | | | $21.46 | | | | $22.84 | | | | $23.47 | |
INCOME (LOSS) FROM INVESTMENT OPERATIONS: | | | | | | | | | | | | | | | | | | | | |
Net investment income (loss) | | | 0.16 | | | | 0.21 | | | | 0.20 | | | | 0.24 | | | | 0.25 | |
Net realized gain (loss) and unrealized appreciation/depreciation on investments and foreign currency related transactions | | | 8.86 | | | | (1.04 | ) | | | 0.30 | | | | (1.25 | ) | | | 1.33 | |
Total from investment operations | | | 9.02 | | | | (0.83 | ) | | | 0.50 | | | | (1.01 | ) | | | 1.58 | |
LESS DISTRIBUTIONS FROM: | | | | | | | | | | | | | | | | | | | | |
Net investment income2 | | | (0.37 | ) | | | (0.26 | ) | | | (0.21 | ) | | | (0.27 | ) | | | (0.26 | ) |
Net realized gains on investments | | | (1.92 | ) | | | (1.29 | ) | | | (3.33 | ) | | | (0.10 | ) | | | (1.95 | ) |
Return of capital | | | — | | | | (0.57 | ) | | | — | | | | — | | | | — | |
Total distributions | | | (2.29 | ) | | | (2.12 | ) | | | (3.54 | ) | | | (0.37 | ) | | | (2.21 | ) |
Paid-in capital from redemption fees (Note 4) | | | — | | | | — | 3 | | | — | 3 | | | — | 3 | | | — | 3 |
Net Asset Value, end of year | | | $22.20 | | | | $15.47 | | | | $18.42 | | | | $21.46 | | | | $22.84 | |
TOTAL RETURN | | | 59.37% | | | | (5.18% | ) | | | 2.41% | | | | (4.42% | ) | | | 6.84% | |
| | | | | |
RATIOS/SUPPLEMENTAL DATA | | | | | | | | | | | | | | | | | | | | |
Net assets, end of year (in 000’s) | | | $843,508 | | | | $495,900 | | | | $709,767 | | | | $947,740 | | | | $1,286,309 | |
Ratio of expenses to average net assets | | | 1.09% | | | | 1.18% | | | | 1.14% | | | | 1.11% | | | | 1.08% | |
Ratio of net investment income (loss) to average net assets | | | 0.78% | | | | 1.24% | | | | 0.89% | | | | 1.09% | | | | 1.06% | |
Portfolio turnover4 | | | 78.74% | | | | 83.82% | | | | 66.22% | | | | 10.23% | | | | 6.29% | |
| |
| INSTITUTIONAL CLASS | | Year Ended Dec. 31 | |
| | 2017 | | | 20161 | | | 20151 | | | 20141 | | | 2013 | |
Net Asset Value, beginning of year | | | $15.44 | | | | $18.39 | | | | $21.44 | | | | $22.81 | | | | $23.45 | |
INCOME (LOSS) FROM INVESTMENT OPERATIONS: | | | | | | | | | | | | | | | | | | | | |
Net investment income (loss)2 | | | 0.21 | | | | 0.22 | | | | 0.25 | | | | 0.28 | | | | 0.26 | |
Net realized gain (loss) and unrealized appreciation/depreciation on investments and foreign currency related transactions | | | 8.84 | | | | (1.03 | ) | | | 0.27 | | | | (1.25 | ) | | | 1.36 | |
Total from investment operations | | | 9.05 | | | | (0.81 | ) | | | 0.52 | | | | (0.97 | ) | | | 1.62 | |
LESS DISTRIBUTIONS FROM: | | | | | | | | | | | | | | | | | | | | |
Net investment income | | | (0.40 | ) | | | (0.28 | ) | | | (0.24 | ) | | | (0.30 | ) | | | (0.31 | ) |
Net realized gains on investments | | | (1.92 | ) | | | (1.29 | ) | | | (3.33 | ) | | | (0.10 | ) | | | (1.95 | ) |
Return of capital | | | — | | | | (0.57 | ) | | | — | | | | — | | | | — | |
Total distributions | | | (2.32 | ) | | | (2.14 | ) | | | (3.57 | ) | | | (0.40 | ) | | | (2.26 | ) |
Paid-in capital from redemption fees (Note 4) | | | — | | | | — | 3 | | | — | 3 | | | — | 3 | | | — | 3 |
Net Asset Value, end of year | | | $22.17 | | | | $15.44 | | | | $18.39 | | | | $21.44 | | | | $22.81 | |
TOTAL RETURN | | | 59.71% | | | | (5.06% | ) | | | 2.50% | | | | (4.22% | ) | | | 6.97% | |
| | | | | |
RATIOS/SUPPLEMENTAL DATA | | | | | | | | | | | | | | | | | | | | |
Net assets, end of year (in 000’s) | | | $61,975 | | | | $15,874 | | | | $24,276 | | | | $52,478 | | | | $117,678 | |
Ratio of expenses to average net assets | | | 0.93% | | | | 1.03% | | | | 0.99% | | | | 0.95% | | | | 0.91% | |
Ratio of net investment income (loss) to average net assets | | | 0.99% | | | | 1.32% | | | | 1.09% | | | | 1.27% | | | | 1.13% | |
Portfolio turnover4 | | | 78.74% | | | | 83.82% | | | | 66.22% | | | | 10.23% | | | | 6.29% | |
| 1 | Consolidated Financial Highlights. See Note 2-C. |
| 2 | Calculated using the average daily shares method. |
| 3 | Less than $0.01 per share. |
| 4 | The portfolio turnover rate is calculated on the Fund as a whole without distinguishing between classes of shares issued. |
See accompanying notes to financial statements.
| | | | |
| matthewsasia.com | 800.789.ASIA | | | 131 | |
Financial Highlights (continued)
Matthews India Fund
The tables below set forth financial data for a share of beneficial interest outstanding throughout each period presented.
| | | | | | | | | | | | | | | | | | | | |
| INVESTOR CLASS | | Year Ended Dec. 31 | |
| | 2017 | | | 2016 | | | 2015 | | | 2014 | | | 2013 | |
Net Asset Value, beginning of year | | | $25.65 | | | | $26.43 | | | | $26.46 | | | | $16.28 | | | | $17.51 | |
INCOME (LOSS) FROM INVESTMENT OPERATIONS: | | | | | | | | | | | | | | | | | | | | |
Net investment income (loss)1 | | | (0.09 | ) | | | 0.01 | | | | (0.05 | ) | | | 0.07 | | | | 0.08 | |
Net realized gain (loss) and unrealized appreciation/depreciation on investments, foreign currency related transactions, and foreign capital gains taxes | | | 9.24 | | | | (0.33 | ) | | | 0.26 | | | | 10.29 | | | | (1.13 | ) |
Total from investment operations | | | 9.15 | | | | (0.32 | ) | | | 0.21 | | | | 10.36 | | | | (1.05 | ) |
LESS DISTRIBUTIONS FROM: | | | | | | | | | | | | | | | | | | | | |
Net investment income | | | — | | | | — | | | | (0.03 | ) | | | (0.05 | ) | | | (0.18 | ) |
Net realized gains on investments | | | (0.49 | ) | | | (0.46 | ) | | | (0.23 | ) | | | (0.14 | ) | | | (0.01 | ) |
Total distributions | | | (0.49 | ) | | | (0.46 | ) | | | (0.26 | ) | | | (0.19 | ) | | | (0.19 | ) |
Paid-in capital from redemption fees (Note 4) | | | — | | | | — | | | | 0.02 | | | | 0.01 | | | | 0.01 | |
Net Asset Value, end of year | | | $34.31 | | | | $25.65 | | | | $26.43 | | | | $26.46 | | | | $16.28 | |
TOTAL RETURN | | | 35.79% | | | | (1.23% | ) | | | 0.90% | | | | 63.71% | | | | (5.90% | ) |
| | | | | |
RATIOS/SUPPLEMENTAL DATA | | | | | | | | | | | | | | | | | | | | |
Net assets, end of year (in 000’s) | | | $1,484,045 | | | | $967,009 | | | | $1,151,948 | | | | $974,838 | | | | $427,861 | |
Ratio of expenses to average net assets | | | 1.09% | | | | 1.12% | | | | 1.11% | | | | 1.12% | | | | 1.13% | |
Ratio of net investment income (loss) to average net assets | | | (0.30% | ) | | | 0.02% | | | | (0.17% | ) | | | 0.32% | | | | 0.48% | |
Portfolio turnover2 | | | 16.81% | | | | 15.76% | | | | 9.51% | | | | 14.86% | | | | 8.70% | |
| |
| INSTITUTIONAL CLASS | | Year Ended Dec. 31 | |
| | 2017 | | | 2016 | | | 2015 | | | 2014 | | | 2013 | |
Net Asset Value, beginning of year | | | $25.77 | | | | $26.49 | | | | $26.49 | | | | $16.31 | | | | $17.53 | |
INCOME (LOSS) FROM INVESTMENT OPERATIONS: | | | | | | | | | | | | | | | | | | | | |
Net investment income (loss)1 | | | (0.03 | ) | | | 0.04 | | | | 0.01 | | | | 0.09 | | | | 0.10 | |
Net realized gain (loss) and unrealized appreciation/depreciation on investments, foreign currency related transactions, and foreign capital gains taxes | | | 9.29 | | | | (0.30 | ) | | | 0.26 | | | | 10.29 | | | | (1.11 | ) |
Total from investment operations | | | 9.26 | | | | (0.26 | ) | | | 0.27 | | | | 10.38 | | | | (1.01 | ) |
LESS DISTRIBUTIONS FROM: | | | | | | | | | | | | | | | | | | | | |
Net investment income | | | (0.03 | ) | | | — | | | | (0.06 | ) | | | (0.08 | ) | | | (0.21 | ) |
Net realized gains on investments | | | (0.49 | ) | | | (0.46 | ) | | | (0.23 | ) | | | (0.14 | ) | | | (0.01 | ) |
Total distributions | | | (0.52 | ) | | | (0.46 | ) | | | (0.29 | ) | | | (0.22 | ) | | | (0.22 | ) |
Paid-in capital from redemption fees (Note 4) | | | — | | | | — | | | | 0.02 | | | | 0.02 | | | | 0.01 | |
Net Asset Value, end of year | | | $34.51 | | | | $25.77 | | | | $26.49 | | | | $26.49 | | | | $16.31 | |
TOTAL RETURN | | | 36.05% | | | | (1.00% | ) | | | 1.12% | | | | 63.80% | | | | (5.67% | ) |
| | | | | |
RATIOS/SUPPLEMENTAL DATA | | | | | | | | | | | | | | | | | | | | |
Net assets, end of year (in 000’s) | | | $788,388 | | | | $551,202 | | | | $353,879 | | | | $109,331 | | | | $3,234 | |
Ratio of expenses to average net assets | | | 0.89% | | | | 0.91% | | | | 0.90% | | | | 0.94% | | | | 0.95% | |
Ratio of net investment income (loss) to average net assets | | | (0.08% | ) | | | 0.16% | | | | 0.02% | | | | 0.38% | | | | 0.61% | |
Portfolio turnover2 | | | 16.81% | | | | 15.76% | | | | 9.51% | | | | 14.86% | | | | 8.70% | |
| 1 | Calculated using the average daily shares method. |
| 2 | The portfolio turnover rate is calculated on the Fund as a whole without distinguishing between classes of shares issued. |
See accompanying notes to financial statements.
Matthews Japan Fund
The tables below set forth financial data for a share of beneficial interest outstanding throughout each period presented.
| | | | | | | | | | | | | | | | | | | | |
| INVESTOR CLASS | | Year Ended Dec. 31 | |
| | 2017 | | | 2016 | | | 2015 | | | 2014 | | | 2013 | |
Net Asset Value, beginning of year | | | $18.83 | | | | $18.97 | | | | $15.70 | | | | $16.20 | | | | $12.27 | |
INCOME (LOSS) FROM INVESTMENT OPERATIONS: | | | | | | | | | | | | | | | | | | | | |
Net investment income (loss)1 | | | 0.09 | | | | 0.08 | | | | 0.04 | | | | 0.05 | | | | 0.03 | |
Net realized gain (loss) and unrealized appreciation/depreciation on investments and foreign currency related transactions | | | 6.13 | | | | (0.01 | ) | | | 3.23 | | | | (0.48 | ) | | | 4.12 | |
Total from investment operations | | | 6.22 | | | | 0.07 | | | | 3.27 | | | | (0.43 | ) | | | 4.15 | |
LESS DISTRIBUTIONS FROM: | | | | | | | | | | | | | | | | | | | | |
Net investment income | | | (0.20 | ) | | | (0.16 | ) | | | — | | | | (0.08 | ) | | | (0.24 | ) |
Net realized gains on investments | | | (0.73 | ) | | | (0.05 | ) | | | — | | | | — | | | | — | |
Total distributions | | | (0.93 | ) | | | (0.21 | ) | | | — | | | | (0.08 | ) | | | (0.24 | ) |
Paid-in capital from redemption fees (Note 4) | | | — | | | | — | | | | — | 2 | | | 0.01 | | | | 0.02 | |
Net Asset Value, end of year | | | $24.12 | | | | $18.83 | | | | $18.97 | | | | $15.70 | | | | $16.20 | |
TOTAL RETURN3 | | | 33.14% | | | | 0.40% | | | | 20.83% | | | | (2.60% | ) | | | 34.03% | |
| | | | | |
RATIOS/SUPPLEMENTAL DATA | | | | | | | | | | | | | | | | | | | | |
Net assets, end of year (in 000’s) | | | $2,155,280 | | | | $1,685,872 | | | | $1,330,743 | | | | $467,854 | | | | $312,988 | |
Ratio of expenses to average net assets before any reimbursement, waiver or recapture of expenses by Advisor and Administrator (Note 5) | | | 0.95% | | | | 0.98% | | | | 0.99% | | | | 1.03% | | | | 1.10% | |
Ratio of expenses to average net assets after any reimbursement, waiver or recapture of expenses by Advisor and Administrator | | | 0.94% | | | | 0.98% | | | | 0.99% | | | | 1.03% | | | | 1.10% | |
Ratio of net investment income (loss) to average net assets | | | 0.40% | | | | 0.43% | | | | 0.22% | | | | 0.32% | | | | 0.19% | |
Portfolio turnover3 | | | 44.34% | | | | 55.15% | | | | 24.19% | | | | 42.52% | | | | 22.72% | |
| |
| | | Year Ended Dec. 31 | |
| INSTITUTIONAL CLASS | | 2017 | | | 2016 | | | 2015 | | | 2014 | | | 2013 | |
Net Asset Value, beginning of year | | | $18.86 | | | | $19.00 | | | | $15.71 | | | | $16.20 | | | | $12.26 | |
INCOME (LOSS) FROM INVESTMENT OPERATIONS: | | | | | | | | | | | | | | | | | | | | |
Net investment income (loss)1 | | | 0.10 | | | | 0.10 | | | | 0.05 | | | | 0.09 | | | | 0.06 | |
Net realized gain (loss) and unrealized appreciation/depreciation on investments and foreign currency related transactions | | | 6.14 | | | | — | 2 | | | 3.24 | | | | (0.50 | ) | | | 4.12 | |
Total from investment operations | | | 6.24 | | | | 0.10 | | | | 3.29 | | | | (0.41 | ) | | | 4.18 | |
LESS DISTRIBUTIONS FROM: | | | | | | | | | | | | | | | | | | | | |
Net investment income | | | (0.21 | ) | | | (0.19 | ) | | | — | | | | (0.09 | ) | | | (0.26 | ) |
Net realized gains on investments | | | (0.73 | ) | | | (0.05 | ) | | | — | | | | — | | | | — | |
Total distributions | | | (0.94 | ) | | | (0.24 | ) | | | — | | | | (0.09 | ) | | | (0.26 | ) |
Paid-in capital from redemption fees (Note 4) | | | — | | | | — | | | | — | 2 | | | 0.01 | | | | 0.02 | |
Net Asset Value, end of year | | | $24.16 | | | | $18.86 | | | | $19.00 | | | | $15.71 | | | | $16.20 | |
TOTAL RETURN3 | | | 33.23% | | | | 0.51% | | | | 20.94% | | | | (2.47% | ) | | | 34.27% | |
| | | | | |
RATIOS/SUPPLEMENTAL DATA | | | | | | | | | | | | | | | | | | | | |
Net assets, end of year (in 000’s) | | | $1,957,214 | | | | $1,302,317 | | | | $618,583 | | | | $154,750 | | | | $59,702 | |
Ratio of expenses to average net assets before any reimbursement, waiver or recapture of expenses by Advisor and Administrator (Note 5) | | | 0.87% | | | | 0.88% | | | | 0.87% | | | | 0.90% | | | | 0.96% | |
Ratio of expenses to average net assets after any reimbursement, waiver or recapture of expenses by Advisor and Administrator | | | 0.86% | | | | 0.88% | | | | 0.87% | | | | 0.90% | | | | 0.96% | |
Ratio of net investment income (loss) to average net assets | | | 0.46% | | | | 0.54% | | | | 0.28% | | | | 0.58% | | | | 0.41% | |
Portfolio turnover | | | 44.34% | | | | 55.15% | | | | 24.19% | | | | 42.52% | | | | 22.72% | |
| 1 | Calculated using the average daily shares method. |
| 2 | Less than $0.01 per share. |
| 3 | The portfolio turnover rate is calculated on the Fund as a whole without distinguishing between classes of shares issued. |
See accompanying notes to financial statements.
| | | | |
| matthewsasia.com | 800.789.ASIA | | | 133 | |
Financial Highlights (continued)
Matthews Korea Fund
The tables below set forth financial data for a share of beneficial interest outstanding throughout each period presented.
| | | | | | | | | | | | | | | | | | | | |
| INVESTOR CLASS | | Year Ended Dec. 31 | |
| | 2017 | | | 2016 | | | 2015 | | | 2014 | | | 2013 | |
Net Asset Value, beginning of year | | | $5.25 | | | | $6.15 | | | | $5.65 | | | | $5.95 | | | | $5.64 | |
INCOME (LOSS) FROM INVESTMENT OPERATIONS: | | | | | | | | | | | | | | | | | | | | |
Net investment income (loss)1 | | | 0.06 | | | | 0.02 | | | | 0.01 | | | | — | 2 | | | — | 2 |
Net realized gain (loss) and unrealized appreciation/depreciation on investments and foreign currency related transactions | | | 2.22 | | | | (0.41 | ) | | | 0.83 | | | | (0.05 | ) | | | 0.57 | |
Total from investment operations | | | 2.28 | | | | (0.39 | ) | | | 0.84 | | | | (0.05 | ) | | | 0.57 | |
LESS DISTRIBUTIONS FROM: | | | | | | | | | | | | | | | | | | | | |
Net investment income | | | (0.29 | ) | | | (0.08 | ) | | | (0.01 | ) | | | — | | | | (0.02 | ) |
Net realized gains on investments | | | (0.33 | ) | | | (0.43 | ) | | | (0.33 | ) | | | (0.25 | ) | | | (0.24 | ) |
Total distributions | | | (0.62 | ) | | | (0.51 | ) | | | (0.34 | ) | | | (0.25 | ) | | | (0.26 | ) |
Paid-in capital from redemption fees (Note 4) | | | — | | | | — | | | | — | 2 | | | — | 2 | | | — | 2 |
Net Asset Value, end of year | | | $6.91 | | | | $5.25 | | | | $6.15 | | | | $5.65 | | | | $5.95 | |
TOTAL RETURN | | | 43.70% | | | | (6.32% | ) | | | 15.16% | | | | (0.73% | ) | | | 10.11% | |
| | | | | |
RATIOS/SUPPLEMENTAL DATA | | | | | | | | | | | | | | | | | | | | |
Net assets, end of year (in 000’s) | | | $192,431 | | | | $142,726 | | | | $147,685 | | | | $127,774 | | | | $138,830 | |
Ratio of expenses to average net assets | | | 1.15% | | | | 1.15% | | | | 1.10% | | | | 1.11% | | | | 1.13% | |
Ratio of net investment income (loss) to average net assets | | | 0.90% | | | | 0.41% | | | | 0.18% | | | | 0.04% | | | | 0.02% | |
Portfolio turnover3 | | | 25.37% | | | | 34.73% | | | | 20.36% | | | | 17.37% | | | | 46.20% | |
| |
| INSTITUTIONAL CLASS | | Year Ended Dec. 31 | |
| | 2017 | | | 2016 | | | 2015 | | | 2014 | | | 2013 | |
Net Asset Value, beginning of year | | | $5.27 | | | | $6.18 | | | | $5.68 | | | | $5.96 | | | | $5.67 | |
INCOME (LOSS) FROM INVESTMENT OPERATIONS: | | | | | | | | | | | | | | | | | | | | |
Net investment income (loss)1 | | | 0.10 | | | | (0.02 | ) | | | 0.02 | | | | 0.05 | | | | — | 2 |
Net realized gain (loss) and unrealized appreciation/depreciation on investments and foreign currency related transactions | | | 2.21 | | | | (0.37 | ) | | | 0.83 | | | | (0.08 | ) | | | 0.56 | |
Total from investment operations | | | 2.31 | | | | (0.39 | ) | | | 0.85 | | | | (0.03 | ) | | | 0.56 | |
LESS DISTRIBUTIONS FROM: | | | | | | | | | | | | | | | | | | | | |
Net investment income | | | (0.30 | ) | | | (0.09 | ) | | | (0.02 | ) | | | — | | | | (0.03 | ) |
Net realized gains on investments | | | (0.33 | ) | | | (0.43 | ) | | | (0.33 | ) | | | (0.25 | ) | | | (0.24 | ) |
Total distributions | | | (0.63 | ) | | | (0.52 | ) | | | (0.35 | ) | | | (0.25 | ) | | | (0.27 | ) |
Paid-in capital from redemption fees (Note 4) | | | — | | | | — | | | | — | 2 | | | — | 2 | | | — | 2 |
Net Asset Value, end of year | | | $6.95 | | | | $5.27 | | | | $6.18 | | | | $5.68 | | | | $5.96 | |
TOTAL RETURN | | | 44.11% | | | | (6.31% | ) | | | 15.27% | | | | (0.39% | ) | | | 9.87% | |
| | | | | |
RATIOS/SUPPLEMENTAL DATA | | | | | | | | | | | | | | | | | | | | |
Net assets, end of year (in 000’s) | | | $32,587 | | | | $7,462 | | | | $59,982 | | | | $91,431 | | | | $12,283 | |
Ratio of expenses to average net assets | | | 1.01% | | | | 0.97% | | | | 0.93% | | | | 0.93% | | | | 0.97% | |
Ratio of net investment income (loss) to average net assets | | | 1.51% | | | | (0.31% | ) | | | 0.28% | | | | 0.87% | | | | (0.03% | ) |
Portfolio turnover3 | | | 25.37% | | | | 34.73% | | | | 20.36% | | | | 17.37% | | | | 46.20% | |
| 1 | Calculated using the average daily shares method. |
| 2 | Less than $0.01 per share. |
| 3 | The portfolio turnover rate is calculated on the Fund as a whole without distinguishing between classes of shares issued. |
See accompanying notes to financial statements.
Matthews Asia Small Companies Fund
The tables below set forth financial data for a share of beneficial interest outstanding throughout each period presented.
| | | | | | | | | | | | | | | | | | | | |
INVESTOR CLASS | | Year Ended Dec. 31 | |
| | 2017 | | | 2016 | | | 2015 | | | 2014 | | | 2013 | |
Net Asset Value, beginning of year | | | $19.05 | | | | $19.41 | | | | $21.46 | | | | $19.34 | | | | $18.13 | |
INCOME (LOSS) FROM INVESTMENT OPERATIONS: | | | | | | | | | | | | | | | | | | | | |
Net investment income (loss)1 | | | 0.02 | | | | 0.09 | | | | 0.02 | | | | 0.09 | | | | 0.11 | |
Net realized gain (loss) and unrealized appreciation/depreciation on investments, foreign currency related transactions, and foreign capital gains taxes | | | 5.68 | | | | (0.37 | ) | | | (2.05 | ) | | | 2.11 | | | | 1.19 | |
Total from investment operations | | | 5.70 | | | | (0.28 | ) | | | (2.03 | ) | | | 2.20 | | | | 1.30 | |
LESS DISTRIBUTIONS FROM: | | | | | | | | | | | | | | | | | | | | |
Net investment income | | | (0.10 | ) | | | (0.08 | ) | | | (0.03 | ) | | | (0.08 | ) | | | (0.09 | ) |
Net realized gains on investments | | | (1.76 | ) | | | — | | | | — | | | | — | | | | — | |
Total distributions | | | (1.86 | ) | | | (0.08 | ) | | | (0.03 | ) | | | (0.08 | ) | | | (0.09 | ) |
Paid-in capital from redemption fees (Note 4) | | | — | 2 | | | — | 2 | | | 0.01 | | | | — | 2 | | | — | 2 |
Net Asset Value, end of year | | | $22.89 | | | | $19.05 | | | | $19.41 | | | | $21.46 | | | | $19.34 | |
TOTAL RETURN | | | 30.59% | | | | (1.44% | ) | | | (9.43% | ) | | | 11.39% | | | | 7.19% | |
| | | | | |
RATIOS/SUPPLEMENTAL DATA | | | | | | | | | | | | | | | | | | | | |
Net assets, end of year (in 000’s) | | | $208,339 | | | | $254,226 | | | | $387,747 | | | | $599,082 | | | | $407,352 | |
Ratio of expenses to average net assets before any reimbursement, waiver or recapture of expenses by Advisor and Administrator (Note 5) | | | 1.49% | | | | 1.49% | | | | 1.48% | | | | 1.47% | | | | 1.47% | |
Ratio of expenses to average net assets after any reimbursement, waiver or recapture of expenses by Advisor and Administrator | | | 1.46% | | | | 1.47% | | | | 1.47% | | | | 1.47% | | | | 1.47% | |
Ratio of net investment income (loss) to average net assets | | | 0.09% | | | | 0.45% | | | | 0.08% | | | | 0.44% | | | | 0.58% | |
Portfolio turnover3 | | | 67.13% | | | | 44.44% | | | | 48.29% | | | | 21.70% | | | | 37.01% | |
| | |
| INSTITUTIONAL CLASS | | Year Ended Dec. 31 | | | Period Ended Dec. 31, 20134 | |
| | 2017 | | | 2016 | | | 2015 | | | 2014 | | |
Net Asset Value, beginning of period | | | $19.03 | | | | $19.40 | | | | $21.46 | | | | $19.33 | | | | $19.44 | |
INCOME (LOSS) FROM INVESTMENT OPERATIONS: | | | | | | | | | | | | | | | | | | | | |
Net investment income (loss)1 | | | 0.07 | | | | 0.12 | | | | 0.11 | | | | 0.15 | | | | 0.18 | |
Net realized gain (loss) and unrealized appreciation/depreciation on investments, foreign currency related transactions, and foreign capital gains taxes | | | 5.67 | | | | (0.36 | ) | | | (2.10 | ) | | | 2.10 | | | | (0.16 | ) |
Total from investment operations | | | 5.74 | | | | (0.24 | ) | | | (1.99 | ) | | | 2.25 | | | | 0.02 | |
LESS DISTRIBUTIONS FROM: | | | | | | | | | | | | | | | | | | | | |
Net investment income | | | (0.15 | ) | | | (0.13 | ) | | | (0.08 | ) | | | (0.12 | ) | | | (0.13 | ) |
Net realized gains on investments | | | (1.76 | ) | | | — | | | | — | | | | — | | | | — | |
Total distributions | | | (1.91 | ) | | | (0.13 | ) | | | (0.08 | ) | | | (0.12 | ) | | | (0.13 | ) |
Paid-in capital from redemption fees (Note 4) | | | — | 2 | | | — | 2 | | | 0.01 | | | | — | 2 | | | — | 2 |
Net Asset Value, end of period | | | $22.86 | | | | $19.03 | | | | $19.40 | | | | $21.46 | | | | $19.33 | |
TOTAL RETURN | | | 30.85% | | | | (1.24% | ) | | | (9.23% | ) | | | 11.65% | | | | 0.13% | 5 |
| | | | | |
RATIOS/SUPPLEMENTAL DATA | | | | | | | | | | | | | | | | | | | | |
Net assets, end of period (in 000’s) | | | $232,954 | | | | $174,962 | | | | $222,168 | | | | $77,168 | | | | $44,769 | |
Ratio of expenses to average net assets before any reimbursement, waiver or recapture of expenses by Advisor and Administrator (Note 5) | | | 1.35% | | | | 1.34% | | | | 1.30% | | | | 1.27% | | | | 1.25% | 6 |
Ratio of expenses to average net assets after any reimbursement, waiver or recapture of expenses by Advisor and Administrator | | | 1.25% | | | | 1.25% | | | | 1.25% | | | | 1.26% | | | | 1.25% | 6 |
Ratio of net investment income (loss) to average net assets | | | 0.34% | | | | 0.64% | | | | 0.53% | | | | 0.70% | | | | 1.39% | 6 |
Portfolio turnover3 | | | 67.13% | | | | 44.44% | | | | 48.29% | | | | 21.70% | | | | 37.01% | 5 |
| 1 | Calculated using the average daily shares method. |
| 2 | Less than $0.01 per share. |
| 3 | The portfolio turnover rate is calculated on the Fund as a whole without distinguishing between classes of shares issued. |
| 4 | Institutional Class commenced operations on April 30, 2013. |
See accompanying notes to financial statements.
| | | | |
| matthewsasia.com | 800.789.ASIA | | | 135 | |
Financial Highlights (continued)
Matthews China Small Companies Fund
The tables below set forth financial data for a share of beneficial interest outstanding throughout each period presented.
| | | | | | | | | | | | | | | | | | | | |
| | | Year Ended Dec. 31 | |
| INVESTOR CLASS | | 2017 | | | 2016 | | | 2015 | | | 2014 | | | 2013 | |
Net Asset Value, beginning of year | | | $8.21 | | | | $8.79 | | | | $9.21 | | | | $9.89 | | | | $7.76 | |
INCOME (LOSS) FROM INVESTMENT OPERATIONS: | | | | | | | | | | | | | | | | | | | | |
Net investment income (loss)1 | | | 0.07 | | | | 0.10 | | | | 0.08 | | | | 0.01 | | | | 0.02 | |
Net realized gain (loss) and unrealized appreciation/depreciation on investments and foreign currency related transactions | | | 4.27 | | | | (0.28 | ) | | | 0.27 | | | | (0.33 | ) | | | 2.22 | |
Total from investment operations | | | 4.34 | | | | (0.18 | ) | | | 0.35 | | | | (0.32 | ) | | | 2.24 | |
LESS DISTRIBUTIONS FROM: | | | | | | | | | | | | | | | | | | | | |
Net investment income | | | (0.11 | ) | | | (0.03 | ) | | | (0.06 | ) | | | (0.02 | ) | | | (0.11 | ) |
Net realized gains on investments | | | (0.56 | ) | | | (0.37 | ) | | | (0.72 | ) | | | — | | | | — | |
Return of capital | | | — | | | | — | | | | — | | | | (0.34 | ) | | | — | |
Total distributions | | | (0.67 | ) | | | (0.40 | ) | | | (0.78 | ) | | | (0.36 | ) | | | (0.11 | ) |
Paid-in capital from redemption fees (Note 4) | | | 0.01 | | | | — | 2 | | | 0.01 | | | | — | 2 | | | — | 2 |
Net Asset Value, end of year | | | $11.89 | | | | $8.21 | | | | $8.79 | | | | $9.21 | | | | $9.89 | |
TOTAL RETURN | | | 53.88% | | | | (2.35% | ) | | | 4.07% | | | | (3.33% | ) | | | 28.85% | |
| | | | | |
RATIOS/SUPPLEMENTAL DATA | | | | | | | | | | | | | | | | | | | | |
Net assets, end of year (in 000’s) | | | $35,209 | | | | $16,101 | | | | $21,546 | | | | $22,068 | | | | $26,674 | |
Ratio of expenses to average net assets before any reimbursement, waiver or recapture of expenses by Advisor and Administrator (Note 5) | | | 2.34% | | | | 2.24% | | | | 2.10% | | | | 1.90% | | | | 2.04% | |
Ratio of expenses to average net assets after any reimbursement, waiver or recapture of expenses by Advisor and Administrator | | | 1.50% | | | | 1.50% | | | | 1.50% | | | | 1.67% | | | | 2.00% | |
Ratio of net investment income (loss) to average net assets | | | 0.66% | | | | 1.17% | | | | 0.80% | | | | 0.14% | | | | 0.17% | |
Portfolio turnover3 | | | 67.22% | | | | 63.15% | | | | 72.49% | | | | 32.42% | | | | 10.28% | |
| | | | | |
| INSTITUTIONAL CLASS | | | | | | | | | | | | | | Period Ended
Dec. 31, 20174 | |
Net Asset Value, beginning of period | | | | | | | | | | | | | | | | | | | $11.90 | |
INCOME (LOSS) FROM INVESTMENT OPERATIONS: | | | | | | | | | | | | | | | | | | | | |
Net investment income (loss)1 | | | | | | | | | | | | | | | | | | | (0.01 | ) |
Net realized gain (loss) and unrealized appreciation/depreciation on investments and foreign currency related transactions | | | | | | | | | | | | | | | | | | | 0.67 | |
Total from investment operations | | | | | | | | | | | | | | | | | | | 0.66 | |
LESS DISTRIBUTIONS FROM: | | | | | | | | | | | | | | | | | | | | |
Net investment income | | | | | | | | | | | | | | | | | | | (0.13 | ) |
Net realized gains on investments | | | | | | | | | | | (0.56 | ) |
Total distributions | | | | | | | | | | | | | | | | | | | (0.69 | ) |
Net Asset Value, end of period | | | | | | | | | | | | | | | | | | | $11.87 | |
TOTAL RETURN | | | | | | | | | | | | | | | | | | | 6.19% | 5 |
| | | | | |
RATIOS/SUPPLEMENTAL DATA | | | | | | | | | | | | | | | | | | | | |
Net assets, end of period (in 000’s) | | | | | | | | | | | | | | | | | | | $476 | |
Ratio of expenses to average net assets before any reimbursement, waiver or recapture of expenses by Advisor and Administrator (Note 5) | | | | | | | | | | | | | | | | | | | 2.09% | 6 |
Ratio of expenses to average net assets after any reimbursement, waiver or recapture of expenses by Advisor and Administrator | | | | | | | | | | | | | | | | | | | 1.25% | 6 |
Ratio of net investment income (loss) to average net assets | | | | | | | | | | | | | | | | | | | (1.20% | )6 |
Portfolio turnover3 | | | | | | | | | | | | | | | | | | | 67.22% | 5 |
| 1 | Calculated using the average daily shares method. |
| 2 | Less than $0.01 per share. |
| 3 | The portfolio turnover rate is calculated on the Fund as a whole without distinguishing between classes of shares issued. |
| 4 | Institutional Class commenced operations on November 30, 2017. |
See accompanying notes to financial statements.
Notes to Financial Statements
Matthews Asia Funds (the “Trust”) is an open-end management investment company registered under the Investment Company Act of 1940, as amended (the “1940 Act”). The Trust currently issues eighteen separate series of shares (each a “Fund” and collectively, the “Funds”): Matthews Asia Strategic Income Fund, Matthews Asia Credit Opportunities Fund, Matthews Asian Growth and Income Fund, Matthews Asia Dividend Fund, Matthews China Dividend Fund, Matthews Asia Value Fund, Matthews Asia Focus Fund, Matthews Asia Growth Fund, Matthews Pacific Tiger Fund, Matthews Asia ESG Fund, Matthews Emerging Asia Fund, Matthews Asia Innovators Fund, Matthews China Fund, Matthews India Fund, Matthews Japan Fund, Matthews Korea Fund, Matthews Asia Small Companies Fund, and Matthews China Small Companies Fund. Each Fund currently offers two classes of shares: Investor Class and Institutional Class. Matthews China Small Companies Fund Institutional Class shares commenced operations on November 30, 2017. Each class of shares has identical voting, dividend, liquidation and other rights and the same terms and conditions, except each class may be subject to different class expenses as outlined in the relevant prospectus and each class has exclusive voting rights with respect to matters solely affecting such class.
The Matthews Japan Fund closed to most new investors effective after market closing on July 29, 2016, but will continue to accept investments from existing shareholders.
| 2. | SIGNIFICANT ACCOUNTING POLICIES |
The following is a summary of significant accounting policies consistently followed by the Funds in preparation of their financial statements.
| A. | SECURITY VALUATION: The value of the Matthews Asia Funds’ (each a “Fund”, and collectively the “Funds” or the “Trust”) securities is based on market quotations for those securities, or on their fair value determined by the valuation policies approved by the Funds’ Board of Trustees (the “Board”). Market quotations and valuation information are provided by commercial pricing services or securities dealers that are independent of the Funds and Matthews International Capital Management, LLC (“Matthews”), in accordance with procedures established by the Funds’ Board. Foreign exchange-traded securities are valued as of the close of trading on the primary exchange on which they trade. Securities that trade in over-the-counter markets, including most debt securities (bonds), may be valued by other third-party vendors or by using indicative bid quotations from dealers or market makers, or other available market information. Market values for securities are determined based on quotations, market data or other information from the principal (or most advantageous) market on which the security is traded. Market quotations for equity securities used by the Funds include last reported sale prices, or, if such prices are not reported or available, bid and ask prices. Swap agreements are valued utilizing quotes received daily by the Funds’ pricing service or through brokers, which are derived using daily swap curves and models that incorporate a number of market data factors, such as discounted cash flows, trades and values of the underlying reference instruments. Foreign currency exchange contracts are valued at the mean between the bid and ask prices and are determined at the close of business on the New York Stock Exchange (“NYSE”). Interpolated values are derived when the settlement date of the contract is an interim date for which quotations are not available. The Funds may also utilize independent pricing services to assist them in determining a current market value for each security based on sources believed to be reliable. |
The Board has delegated to the Board’s Valuation Committee the responsibility for oversight of the fair valuation process under the Trust’s Valuation and Pricing Policy. The Board’s Valuation Committee, in turn, has delegated the determination of fair value prices under Matthews’ Valuation and Pricing Procedures to Matthews’ Valuation Committee (the “Valuation Committee”). The Board’s Valuation Committee will review and approve fair value determinations by Matthews’ Valuation Committee in accordance with the Valuation and Pricing Policy. When fair value pricing is employed, the prices of securities used by a Fund to calculate its Net Asset Value (“NAV”) may differ from any quoted or published prices for the same securities for that day. All fair value determinations are made subject to the Board’s oversight. Events affecting the value of foreign investments may occur between the time at which they are determined and when the Funds calculate their NAV, which is normally the close of trading on the NYSE. If such events render market quotations unreliable, and the impact of such events can be reasonably determined, the investments will be valued at their fair value in accordance with pricing policies. The fair value of a security held by the Funds may be determined using the services of third-party pricing services to assist in this process.
The books and records of the Funds are maintained in U.S. dollars. Transactions, portfolio securities, and assets and liabilities denominated in a foreign currency are translated and recorded in U.S. dollars at the prevailing exchange rate as of the close of trading on the NYSE. Translation gains or losses resulting from changes in the exchange rate during the reporting period and realized gains and losses on the settlement of foreign currency transactions are reported in the results of operations for the current period. The Funds isolate that portion of gains and losses on investments in fixed income securities that is due to changes in foreign exchange rate from that which is due to changes in market prices of securities.
Foreign securities held by the Funds may be traded on days and at times when the NYSE is closed. Accordingly, the value of the Funds may be significantly affected on days when shareholders have no access to the Funds.
| B. | FAIR VALUE MEASUREMENTS: In accordance with the guidance on fair value measurements and disclosures under generally accepted accounting principles in the United States (“U.S. GAAP”), the Funds disclose the fair value of their investments and derivative financial instruments in a hierarchy that prioritizes the inputs to valuation techniques used to measure the fair value. The hierarchy gives the highest priority to valuations based upon unadjusted quoted prices in active markets for identical assets or liabilities (Level 1 measurements) and the lowest priority to valuations based upon unobservable inputs that are significant to the valuation (Level 3 measurements). Various inputs are used in determining the fair value of investments and derivative financial instruments, which are as follows: |
Level 1: Quoted prices in active markets for identical securities.
Level 2: Other significant observable inputs (including quoted prices for similar securities, interest rates, prepayment speeds, credit risk, foreign exchange, etc.).
Level 3: Significant unobservable inputs (including the Funds’ own assumptions in determining the fair value of investments and derivative financial instruments).
| | | | |
| matthewsasia.com | 800.789.ASIA | | | 137 | |
Notes to Financial Statements (continued)
The summary of inputs used to determine the fair valuation of the Funds’ investments and derivative financial instruments as of December 31, 2017 is as follows:
| | | | | | | | | | | | | | | | | | | | | | | | | | | | |
| | | Matthews Asia
Strategic
Income Fund | | | Matthews Asia
Credit
Opportunities Fund | | | Matthews Asian
Growth and
Income Fund | | | Matthews Asia
Dividend Fund | | | Matthews Asia
Value Fund | | | Matthews Asia
Focus Fund | | | Matthews Asia
Growth Fund | |
| Assets: | | | | | | | | | | | | | | | | | | | | | | | | | | | | |
| Investments: | | | | | | | | | | | | | | | | | | | | | | | | | | | | |
Level 1: Quoted Prices | | | | | | | | | | | | | | | | | | | | | | | | | | | | |
Bangladesh | | | $— | | | | $— | | | | $— | | | | $— | | | | $— | | | | $— | | | | $20,815,782 | |
China/Hong Kong | | | — | | | | — | | | | 315,794,590 | | | | 402,541,912 | | | | 6,068,331 | | | | 912,705 | | | | 114,162,921 | |
India | | | — | | | | — | | | | — | | | | 73,847,109 | | | | — | | | | — | | | | — | |
Indonesia | | | — | | | | — | | | | 46,248,588 | | | | 175,753,461 | | | | — | | | | — | | | | 32,549,226 | |
Israel | | | — | | | | — | | | | — | | | | — | | | | 178,007 | | | | — | | | | — | |
Japan | | | — | | | | — | | | | — | | | | — | | | | 600,238 | | | | — | | | | — | |
Luxembourg | | | — | | | | — | | | | — | | | | 32,230,699 | | | | — | | | | — | | | | — | |
Malaysia | | | — | | | | — | | | | 104,398,247 | | | | — | | | | 1,378,898 | | | | 807,659 | | | | — | |
Pakistan | | | — | | | | — | | | | — | | | | — | | | | — | | | | — | | | | 6,058,243 | |
Philippines | | | — | | | | — | | | | — | | | | 55,101,903 | | | | — | | | | — | | | | 21,229,574 | |
Singapore | | | — | | | | — | | | | — | | | | 106,297,286 | | | | 1,338,197 | | | | 363,651 | | | | — | |
South Korea | | | — | | | | — | | | | 44,863,046 | | | | 493,690,858 | | | | 1,646,719 | | | | — | | | | — | |
Sri Lanka | | | — | | | | — | | | | — | | | | — | | | | — | | | | — | | | | 20,475,208 | |
Taiwan | | | — | | | | — | | | | 18,914,002 | | | | 104,792,571 | | | | 900,533 | | | | 387,238 | | | | — | |
Thailand | | | — | | | | — | | | | — | | | | 130,037,077 | | | | — | | | | — | | | | — | |
United States | | | — | | | | — | | | | 106,426,100 | | | | — | | | | 700,520 | | | | 843,525 | | | | — | |
Vietnam | | | — | | | | — | | | | — | | | | — | | | | — | | | | — | | | | 2,765,462 | |
Preferred Equities: | | | | | | | | | | | | | | | | | | | | | | | | | | | | |
South Korea | | | — | | | | — | | | | 40,160,021 | | | | — | | | | 486,586 | | | | — | | | | — | |
Level 2: Other Significant Observable Inputs | | | | | | | | | | | | | | | | | | | | | | | | | | | | |
Foreign Government Obligationsa | | | 29,900,871 | | | | 4,071,963 | | | | — | | | | — | | | | — | | | | — | | | | — | |
Non-Convertible Corporate Bondsa | | | 46,613,689 | | | | 19,675,962 | | | | — | | | | — | | | | — | | | | — | | | | — | |
Convertible Corporate Bondsa | | | 11,660,000 | | | | 4,008,125 | | | | 245,053,766 | | | | — | | | | — | | | | — | | | | — | |
Common Equities: | | | | | | | | | | | | | | | | | | | | | | | | | | | | |
Australia | | | — | | | | — | | | | 170,556,452 | | | | 123,048,147 | | | | — | | | | 398,790 | | | | 34,975,487 | |
Bangladesh | | | — | | | | — | | | | — | | | | — | | | | — | | | | — | | | | 13,937,371 | |
China/Hong Kong | | | — | | | | — | | | | 455,645,266 | | | | 2,207,461,632 | | | | 2,342,088 | | | | 4,328,512 | | | | 55,878,163 | |
India | | | — | | | | — | | | | 50,144,444 | | | | 243,245,204 | | | | — | | | | 889,298 | | | | 61,002,692 | |
Indonesia | | | — | | | | — | | | | 91,033,722 | | | | — | | | | — | | | | 1,030,811 | | | | 71,258,912 | |
Japan | | | — | | | | — | | | | 166,018,867 | | | | 1,855,309,232 | | | | 3,190,494 | | | | 399,319 | | | | 310,413,800 | |
Malaysia | | | — | | | | — | | | | — | | | | — | | | | 434,304 | | | | — | | | | — | |
New Zealand | | | — | | | | — | | | | 40,445,786 | | | | — | | | | — | | | | — | | | | — | |
Norway | | | — | | | | — | | | | 45,866,544 | | | | — | | | | — | | | | — | | | | — | |
Philippines | | | — | | | | — | | | | 45,411,646 | | | | — | | | | — | | | | 405,745 | | | | — | |
Singapore | | | — | | | | — | | | | 287,854,549 | | | | 269,627,911 | | | | — | | | | 1,217,740 | | | | — | |
South Korea | | | — | | | | — | | | | 215,930,984 | | | | 156,086,512 | | | | 4,633,664 | | | | 1,622,780 | | | | — | |
Sri Lanka | | | — | | | | — | | | | — | | | | — | | | | — | | | | — | | | | 9,108,154 | |
Switzerland | | | — | | | | — | | | | — | | | | — | | | | 329,667 | | | | 343,977 | | | | — | |
Taiwan | | | — | | | | — | | | | 155,018,554 | | | | 17,890,518 | | | | 853,989 | | | | 829,029 | | | | 5,645,260 | |
Thailand | | | — | | | | — | | | | 38,777,616 | | | | — | | | | — | | | | 416,906 | | | | 6,849,055 | |
Vietnam | | | — | | | | — | | | | 45,112,570 | | | | 108,998,464 | | | | — | | | | — | | | | 23,812,914 | |
Preferred Equities: | | | | | | | | | | | | | | | | | | | | | | | | | | | | |
South Korea | | | — | | | | — | | | | 31,097,172 | | | | 419,202,155 | | | | 1,999,929 | | | | — | | | | — | |
Total Market Value of Investments | | | $88,174,560 | | | | $27,756,050 | | | | $2,760,772,532 | | | | $6,975,162,651 | | | | $27,082,164 | | | | $15,197,685 | | | | $810,938,224 | |
| a | Industry, countries, or security types are disclosed on the Schedule of Investments. |
| | | | | | | | | | | | | | | | | | |
| | | | | | | | | | | | | | | | | Matthews Asia
Strategic Income
Fund | |
Derivative Financial Instruments1 | | | | | | | | | | | | | | | | | | |
Assets | | | | | | | | | | | | | | | | | | |
| Level 2: Other Significant Observable Inputs | | | | | | | | | | | | | | | | | | |
Forward Foreign Currency Exchange Contracts | | | | | | | | | | | | | | | | | $326,429 | |
| | | | | | | | | | | | | | | | | | |
| 1 | Derivative financial instruments are forward foreign currency exchange contracts. Forward foreign currency exchange contracts are valued at the unrealized appreciation/depreciation on the instrument. |
| | | | | | | | | | | | | | | | | | | | | | | | |
| | | Matthews China
Dividend Fund | | | Matthews China Fund | | | Matthews India Fund | | | Matthews Japan Fund | | | Matthews Korea Fund | | | Matthews
China Small
Companies
Fund | |
| Assets: | | | | | | | | | | | | | | | | | | | | | | | | |
| Investments: | | | | | | | | | | | | | | | | | | | | | | | | |
Level 1: Quoted Prices | | | | | | | | | | | | | | | | | | | | | | | | |
Common Equities: | | | | | | | | | | | | | | | | | | | | | | | | |
Consumer Discretionary | | | $18,557,687 | | | | $32,885,814 | | | | $81,586,055 | | | | $— | | | | $22,495,328 | | | | $2,931,663 | |
Consumer Staples | | | 17,866,273 | | | | 28,043,128 | | | | 46,473,382 | | | | — | | | | 11,332,277 | | | | 987,492 | |
Financials | | | 11,332,288 | | | | — | | | | 152,228,456 | | | | — | | | | 3,835,243 | | | | — | |
Health Care | | | 4,134,170 | | | | — | | | | 133,798,137 | | | | — | | | | 3,820,671 | | | | 1,794,034 | |
Industrials | | | 11,052,974 | | | | 24,228,610 | | | | 91,752,495 | | | | — | | | | 3,893,099 | | | | 2,789,892 | |
Information Technology | | | 10,816,990 | | | | 127,303,972 | | | | 158,483,445 | | | | 16,110,424 | | | | — | | | | 4,112,058 | |
Materials | | | 12,032,399 | | | | — | | | | 1,395,017 | | | | — | | | | 9,258,457 | | | | 809,584 | |
Real Estate | | | 5,328,818 | | | | — | | | | — | | | | — | | | | — | | | | — | |
Telecommunication Services | | | 14,779,249 | | | | — | | | | — | | | | — | | | | 7,524,298 | | | | — | |
Preferred Equities: | | | | | | | | | | | | | | | | | | | | | | | | |
Consumer Discretionary | | | — | | | | — | | | | — | | | | — | | | | 7,290,492 | | | | — | |
Consumer Staples | | | — | | | | — | | | | — | | | | — | | | | 11,082,227 | | | | — | |
Financials | | | — | | | | — | | | | — | | | | — | | | | 5,464,837 | | | | — | |
Closed-End Fund: | | | | | | | | | | | | | | | | | | | | | | | | |
Information Technology | | | 12,985,115 | | | | — | | | | — | | | | — | | | | — | | | | — | |
Level 2: Other Significant Observable Inputs | | | | | | | | | | | | | | | | | | | | | | | | |
Common Equities: | | | | | | | | | | | | | | | | | | | | | | | | |
Consumer Discretionary | | | 26,264,872 | | | | 75,730,926 | | | | 161,681,665 | | | | 623,036,457 | | | | 8,243,195 | | | | 1,950,583 | |
Consumer Staples | | | 6,576,265 | | | | — | | | | 359,428,583 | | | | 397,560,779 | | | | — | | | | 148,304 | |
Energy | | | 17,666,909 | | | | 43,755,778 | | | | — | | | | — | | | | 6,670,136 | | | | 1,673,951 | |
Financials | | | 52,948,942 | | | | 264,165,124 | | | | 614,412,120 | | | | 506,829,298 | | | | 31,629,597 | | | | 343,473 | |
Health Care | | | 11,181,216 | | | | 33,279,054 | | | | 71,054,846 | | | | 404,198,266 | | | | 10,180,118 | | | | 3,546,661 | |
Industrials | | | 18,595,671 | | | | 22,538,197 | | | | 168,091,753 | | | | 1,138,603,683 | | | | — | | | | 4,956,856 | |
Information Technology | | | 33,441,679 | | | | 155,710,270 | | | | 134,261,304 | | | | 512,275,690 | | | | 38,431,811 | | | | 3,561,423 | |
Materials | | | — | | | | 29,074,349 | | | | 78,266,801 | | | | 217,540,689 | | | | 6,977,500 | | | | 1,908,182 | |
Real Estate | | | 8,224,635 | | | | 41,707,102 | | | | — | | | | 97,456,045 | | | | — | | | | 2,693,974 | |
Telecommunication Services | | | 5,506,622 | | | | — | | | | — | | | | 92,186,222 | | | | — | | | | — | |
Utilities | | | 5,451,283 | | | | 13,290,976 | | | | — | | | | — | | | | — | | | | — | |
Preferred Equities: | | | | | | | | | | | | | | | | | | | | | | | | |
Energy | | | — | | | | — | | | | — | | | | — | | | | 3,540,123 | | | | — | |
Information Technology | | | — | | | | — | | | | — | | | | — | | | | 20,808,102 | | | | — | |
Materials | | | — | | | | — | | | | — | | | | — | | | | 4,701,445 | | | | — | |
Level 3: Significant Unobservable Inputs | | | | | | | | | | | | | | | | | | | | | | | | |
Common Equities: | | | | | | | | | | | | | | | | | | | | | | | | |
Consumer Discretionary | | | — | | | | — | | | | — | | | | — | | | | 2,158,539 | | | | — | |
Information Technology | | | — | | | | — | | | | — | | | | — | | | | — | | | | 250 | |
Total Market Value of Investments | | | $304,744,057 | | | | $891,713,300 | | | | $2,252,914,059 | | | | $4,005,797,553 | | | | $219,337,495 | | | | $34,208,380 | |
| | | | |
| matthewsasia.com | 800.789.ASIA | | | 139 | |
Notes to Financial Statements (continued)
| | | | | | | | | | | | | | | | | | | | |
| | | Matthews Pacific
Tiger Fund | | | Matthews
Asia ESG
Fund | | | Matthews
Emerging Asia
Fund | | | Matthews Asia
Innovators
Fund | | | Matthews Asia
Small Companies
Fund | |
| Assets: | | | | | | | | | | | | | | | | | | | | |
| Investments: | | | | | | | | | | | | | | | | | | | | |
Level 1: Quoted Prices | | | | | | | | | | | | | | | | | | | | |
Common Equities: | | | | | | | | | | | | | | | | | | | | |
Bangladesh | | | $— | | | | $178,665 | | | | $31,072,988 | | | | $— | | | | $— | |
China/Hong Kong | | | 1,073,322,455 | | | | 2,090,189 | | | | 8,730,999 | | | | 53,967,708 | | | | 41,040,539 | |
India | | | 387,964,307 | | | | 898,940 | | | | 7,325,237 | | | | 3,456,810 | | | | 21,938,140 | |
Indonesia | | | 149,095,544 | | | | 100,285 | | | | 20,340,018 | | | | — | | | | 19,900,436 | |
Japan | | | 8,001,248 | | | | — | | | | — | | | | — | | | | 4,946,022 | |
Luxembourg | | | — | | | | 168,167 | | | | — | | | | — | | | | — | |
Malaysia | | | 69,034,623 | | | | — | | | | — | | | | — | | | | 15,801,356 | |
Pakistan | | | — | | | | 281,288 | | | | 47,682,526 | | | | — | | | | — | |
Philippines | | | 236,221,466 | | | | 189,255 | | | | 37,986,683 | | | | — | | | | 1,318,519 | |
Singapore | | | 504,692 | | | | 379,840 | | | | — | | | | — | | | | 3,783,234 | |
South Korea | | | 607,478,244 | | | | 564,275 | | | | — | | | | 4,429,116 | | | | 25,764,622 | |
Sri Lanka | | | — | | | | — | | | | 32,371,554 | | | | — | | | | — | |
Taiwan | | | — | | | | 190,315 | | | | — | | | | — | | | | 18,317,843 | |
United States | | | 202,618,787 | | | | — | | | | — | | | | — | | | | — | |
Vietnam | | | — | | | | 247,663 | | | | 51,773,347 | | | | — | | | | — | |
Level 2: Other Significant Observable Inputs | | | | | | | | | | | | | | | | | | | | |
Common Equities: | | | | | | | | | | | | | | | | | | | | |
Australia | | | — | | | | — | | | | 2,829,373 | | | | — | | | | 2,641,448 | |
Bangladesh | | | — | | | | 859,639 | | | | 26,216,576 | | | | 5,914,694 | | | | — | |
China/Hong Kong | | | 2,315,964,468 | | | | 1,832,016 | | | | 32,511,551 | | | | 48,639,531 | | | | 101,511,556 | |
India | | | 1,609,246,910 | | | | 1,833,050 | | | | 55,220,363 | | | | 18,732,816 | | | | 36,902,544 | |
Indonesia | | | 431,370,817 | | | | 773,080 | | | | 43,524,082 | | | | 6,216,367 | | | | 10,144,073 | |
Japan | | | — | | | | 2,500,862 | | | | — | | | | — | | | | 11,451,145 | |
Malaysia | | | 300,085,764 | | | | — | | | | — | | | | — | | | | 4,669,488 | |
Pakistan | | | — | | | | — | | | | 18,115,916 | | | | — | | | | — | |
Philippines | | | — | | | | 353,398 | | | | — | | | | 2,924,862 | | | | 4,587,441 | |
Singapore | | | — | | | | 363,813 | | | | 3,820,598 | | | | — | | | | — | |
South Korea | | | 580,519,338 | | | | 1,010,249 | | | | — | | | | 29,559,821 | | | | 26,619,837 | |
Sri Lanka | | | — | | | | — | | | | 4,613,311 | | | | — | | | | — | |
Switzerland | | | 230,784,261 | | | | — | | | | — | | | | — | | | | — | |
Taiwan | | | 489,567,499 | | | | 1,390,990 | | | | — | | | | 5,964,862 | | | | 54,763,169 | |
Thailand | | | 543,965,540 | | | | 616,396 | | | | 1,717,100 | | | | 5,835,979 | | | | 9,317,704 | |
Vietnam | | | 268,963,309 | | | | — | | | | 45,361,075 | | | | 5,716,133 | | | | — | |
Preferred Equities: | | | | | | | | | | | | | | | | | | | | |
South Korea | | | — | | | | 1,089,478 | | | | — | | | | 7,478,064 | | | | — | |
Level 3: Significant Unobservable Inputs | | | | | | | | | | | | | | | | | | | | |
Common Equities: | | | | | | | | | | | | | | | | | | | | |
South Korea | | | — | | | | — | | | | — | | | | — | | | | 3,491,660 | |
Total Market Value of Investments | | | $9,504,709,272 | | | | $17,911,853 | | | | $471,213,297 | | | | $198,836,763 | | | | $418,910,776 | |
Foreign securities that are valued based on market quotations are categorized as Level 1 in the fair value hierarchy. Certain foreign securities may be fair valued by external pricing services when the Funds determine that events affecting the value of foreign securities which occur between the time at which they are determined and the close of trading on the NYSE render market quotations unreliable. Such fair valuations are typically categorized as Level 2 in the fair value hierarchy. The Funds’ policy is to recognize transfers in and transfers out as of the beginning of the reporting period. At December 31, 2017, the Funds utilized third-party pricing services to fair value certain securities, some of which were different than the securities which had been valued by third-party pricing services at December 31, 2016. As a result, certain securities held by the Funds were transferred from Level 2 into Level 1 and certain securities held by the Funds were transferred from Level 1 to Level 2 with beginning of period values as follows:
| | | | | | | | |
| | | Transfer to Level 1
from Level 2 | | | Transfer to Level 2
from Level 1 | |
| Matthews Asian Growth and Income Fund | | | $257,120,270 | | | | $— | |
| Matthews Asia Dividend Fund | | | 702,697,144 | | | | 56,089,309 | |
| Matthews China Dividend Fund | | | 18,904,005 | | | | 359,738 | |
| Matthews Asia Value Fund | | | 221,519 | | | | — | |
| Matthews Asia Focus Fund | | | 1,054,250 | | | | — | |
| Matthews Asia Growth Fund | | | 38,167,201 | | | | 5,597,269 | |
| Matthews Pacific Tiger Fund | | | 1,151,629,185 | | | | 73,200,268 | |
| Matthews Asia ESG Fund | | | 1,329,424 | | | | 693,836 | |
| Matthews Emerging Asia Fund | | | 52,317,970 | | | | 41,562,093 | |
| Matthews Asia Innovators Fund | | | 4,821,063 | | | | 3,638,015 | |
| Matthews China Fund | | | 13,376,310 | | | | — | |
| Matthews India Fund | | | 381,346,695 | | | | 98,785,305 | |
| Matthews Korea Fund | | | 33,958,324 | | | | — | |
| Matthews Asia Small Companies Fund | | | 40,400,927 | | | | 12,617,103 | |
| Matthews China Small Companies Fund | | | 1,802,350 | | | | — | |
Level 3 securities consisted of equities that, as of December 31, 2017, were suspended from trading. As described in Note 2-A, these securities are valued based on their fair value as determined under the direction of the Board. The significant unobservable inputs, the methodology used for valuing such securities, and the characterization of such securities as Level 3 securities are not necessarily an indication of liquidity, or the risk associated with investing in these securities. A significant change in the unobservable inputs could result in a significantly lower or higher value in such Level 3 securities and could impact overall Fund performance.
A reconciliation of Level 3 investments for which significant unobservable inputs were used to determine value are as follows:
| | | | | | | | | | | | | | | | | | | | |
| | | Matthews
Pacific Tiger
Fund | | | Matthews
Emerging
Asia Fund | | | Matthews Korea Fund | | | Matthews Asia Small
Companies
Fund | | | Matthews China Small Companies
Fund | |
| | | Common
Equities —
China/
Hong Kong | | | Common
Equities —
Pakistan | | | Common
Equities —
Consumer
Discretionary | | | Common
Equities —
South Korea | | | Common
Equities —
Information
Technology | |
Balance as of 12/31/16 (market value) | | | $43,840,293 | | | | $332,382 | | | | $— | | | | $— | | | | $251 | |
| | | | | |
| Accrued discounts/premiums | | | — | | | | — | | | | — | | | | — | | | | — | |
| | | | | |
| Realized gain/(loss) | | | — | | | | — | | | | (29,535 | ) | | | 25,445 | | | | — | |
| | | | | |
| Change in unrealized appreciation/(depreciation) | | | — | | | | — | | | | 708,507 | | | | (979,047 | ) | | | (1 | ) |
| | | | | |
| Purchases | | | — | | | | — | | | | — | | | | 3,476,934 | | | | — | |
| | | | | |
| Sales | | | — | | | | — | | | | (193,989 | ) | | | (250,047 | ) | | | — | |
| | | | | |
| Transfers in to Level 3* | | | — | | | | — | | | | 1,673,556 | | | | 1,218,375 | | | | — | |
| | | | | |
| Transfer out of Level 3* | | | (43,840,293 | ) | | | (332,382 | ) | | | — | | | | — | | | | — | |
| Balance as of 12/31/17 (market value) | | | $— | | | | $— | | | | $2,158,539 | | | | $3,491,660 | | | | $250 | |
Net change in unrealized appreciation/depreciation on Level 3 investments held as of 12/31/17** | | | $— | | | | $— | | | | $708,507 | | | | ($979,047 | ) | | | ($1) | |
| * | The Funds’ policy is to recognize transfers in and transfers out as of the beginning of the reporting period. |
| ** | Included in the related amounts on the Statements of Operations. |
Certain foreign securities, for which market quotations are not readily available, may be fair valued and classified as either Level 2 or Level 3. When the underlying inputs include significant observable inputs obtained from sources independent of the Funds, the securities are classified as Level 2. These inputs include evaluated prices from the Funds’ pricing vendors, day-on-day price changes, primary and ancillary pricing sources, and other available independent market indicators of value. When the underlying inputs include significant unobservable inputs and reflect assumptions of market participants, the securities are classified as Level 3. As of December 31, 2017, the Funds that previously used quoted prices or observable inputs now also utilize significant unobservable inputs for certain securities that were suspended from trading. As a result, certain securities held by the Funds that were previously classified as Level 1 or Level 2 were transferred to Level 3. Certain securities held by the Funds that were suspended from trading and classified as Level 3 on December 31, 2016 subsequently resumed trading and were transferred from Level 3 to Level 1, Level 2 or were sold.
| | | | |
| matthewsasia.com | 800.789.ASIA | | | 141 | |
Notes to Financial Statements (continued)
The following table summarizes the valuation techniques used and unobservable inputs developed by the Valuation Committee to determine the fair value of certain material Level 3 investments:
| | | | | | | | | | | | |
| | | Value | | | Valuation Technique | | Unobservable Input1 | | Fair Value
Adjustment | |
| Matthews Korea Fund Assets: | | | | | | | | | | | | |
Common Equity - Consumer Discretionary | | | $2,158,539 | | | Last Price2 Adjusted by Proxy factor3 | | Proxy factor3 | | | 0% | |
| | | | |
| Matthews Asia Small Companies Fund Assets: | | | | | | | | | | | | |
Common Equity - South Korea | | | $3,491,660 | | | Last Price2 Adjusted by Proxy factor4/Discount for Company Specific Events | | Proxy factor4/Assessment of Company Specific Events | | | -34% | |
| 1 | Increase in unobservable input may result in a significant increase to value, while a decrease in unobservable input may result in a significant decrease to value. |
| 2 | Last Price could include closing price, last reported sales price, or last fair valued price as described in Note 2-A. |
| 3 | Proxy factor considers movement of The Korea Composite Stock Price Index. |
| 4 | Proxy factor considers movement of Vitzro Tech Co., Ltd. |
| C. | BASIS OF CONSOLIDATION: The accompanying consolidated financial statements of Matthews China Fund and Matthews Asia Dividend Fund (the “Investing Funds”) for the 2014-2016 period include the accounts of the Matthews CF-U Series and Matthews ADF-U Series (the “U Series Funds”), respectively. The U Series Funds were series of Matthews A Share Selections Fund, LLC, a Delaware limited liability company registered under the 1940 Act. All of the interests offered by U Series Funds were exclusively owned by the Investing Funds. The U Series Funds primarily invested in the stocks of Chinese companies listed on Mainland China Stock Exchanges, and traded and denominated in the currency of China, the Renminbi. To allow U Series Funds to invest in China A Shares Matthews applied for and received a license from the China Securities Regulatory Commission as a Qualified Foreign Institutional Investor (“QFII”) and had been allocated by the State Administration of Foreign Exchange of China an initial quota of $100 million in June 2014, and an additional quota of $440 million in July 2015, representing the equivalent value in Renminbi of China A Shares that the Funds could purchase. Access to the quota was subject to Matthews’ trade allocation procedures and access allocation procedures. The U Series Funds were subject to the same investment policies and restrictions that applied to Investing Funds. Intercompany accounts and transactions, if any, have been eliminated in the consolidation process. The U Series Funds were intended to be disregarded entities for tax purposes. Therefore, no federal tax provision was required. Consolidated financial statements include expenses that are accrued for and paid by the Investing Funds. These include on-going operational costs as well as costs in connection with the launching of the U Series Funds. |
In September 2016, the Board of Directors of the Matthews A Share Selections Fund, LLC adopted resolutions authorizing the termination and liquidation of the Matthews A Share Selections Fund, LLC. Consequently, as of September 30, 2016, the U Series Funds sold their securities and effectively ceased investment operations. The outstanding interests of each U Series Fund were redeemed by its respective Investing Fund. The Matthews A Share Selections Fund, LLC filed an initial application for deregistration as a registered investment company with the U.S. Securities and Exchange Commission in October 2016, which was subsequently granted in February 2017.
| D. | RISKS ASSOCIATED WITH NON-U.S. COMPANIES: Investments by the Funds in the securities of non-U.S. companies may involve investment risks not typically associated with investments in U.S. issuers. These risks include possible political, economic, social and religious instability, inadequate investor protection; changes in laws or regulations of countries within the Asia Pacific region (including in countries where the Funds may invest, as well as in the broader region); international relations with other nations; natural disasters; corruption; and military activity. Foreign securities may be subject to greater fluctuations in price than securities of domestic corporations or the U.S. government. Foreign investing may also include the risk of expropriation or confiscatory taxation, limitation on the removal of funds or other assets, currency crises and exchange controls, the imposition of foreign withholding tax on the interest income payable on such instruments, the possible seizure or nationalization of foreign deposits or assets, or the adoption of other foreign government restrictions that might adversely affect the foreign securities held by the Funds. Additionally, Asia Pacific countries may utilize formal or informal currency exchange controls or “capital controls” that may limit the ability to repatriate investments or income or adversely affect the value of portfolio investments. The economies of many Asia Pacific countries differ from the economies of more developed countries in many respects, such as their rate of growth, inflation, capital reinvestment, resource self-sufficiency and dependence on other economies, financial system stability, the national balance of payments position and sensitivity to changes in global trade. |
Certain Asia Pacific countries are highly dependent upon and may be affected by developments in the economies of other countries. Non-U.S. companies are subject to different accounting, auditing, and financial reporting standards, practices, and requirements than U.S. companies. There is generally less government regulation of stock exchanges, brokers, and listed companies abroad than in the United States, which may result in less transparency with respect to a company’s operations, and make obtaining information about them more difficult (or such information may be unavailable).
Foreign stock markets may not be as developed or efficient as those in the United States, and the absence of negotiated brokerage commissions in certain countries may result in higher brokerage fees. The time between the trade and settlement dates of securities transactions on foreign exchanges ranges from one day to four weeks or longer and may result in higher custody charges. Custodial arrangements may be less well developed than in the United States. Foreign securities are generally denominated and pay distributions in foreign currencies, exposing the Funds to changes in foreign currency exchange rates. Investing in any country in the Asia Pacific region will also entail risks specific and unique to that country, and these risks can be significant and change rapidly.
Changes in interest rates in each of the countries in which the Funds may invest, as well as interest rates in more-developed countries, may cause a decline in the market value of an investment. Generally, fixed income securities will decrease in value when interest rates rise and can be expected to
rise in value when interest rates decline. As interest rates decline, debt issuers may repay or refinance their loans or obligations earlier than anticipated. The issuers of fixed income securities may, therefore, repay principal in advance. This would force the Funds to reinvest the proceeds from the principal prepayments at lower rates, which reduces the Funds’ income.
| E. | OFFERING COSTS: Offering costs are amortized on a straight-line basis over one year from each Fund’s respective commencement of operations. In the event that any of the initial shares are redeemed during the period of amortization of the Fund’s offering costs, the redemption proceeds will be reduced by any such unamortized offering costs in the same proportion as the number of shares being redeemed bears to the number of those shares outstanding at the time of redemption. |
| F. | DISTRIBUTIONS TO SHAREHOLDERS: It is the policy of Matthews Asian Growth and Income Fund and Matthews China Dividend Fund to distribute net investment income on a semi-annual basis and capital gains, if any, annually. It is the policy of Matthews Asia Dividend Fund, Matthews Asia Strategic Income Fund and Matthews Asia Credit Opportunities Fund to distribute net investment income on a quarterly basis and capital gains, if any, annually. Each of the other Funds distributes a net investment income and capital gains, if any, annually. Distributions to shareholders are recorded on the ex-dividend date. Income and capital gain distributions are determined in accordance with income tax regulations which may differ from U.S. GAAP. |
The tax character of distributions paid for the fiscal year ended December 31, 2017 and December 31, 2016 were as follows:
| | | | | | | | | | | | |
| YEAR ENDED DECEMBER 31, 2017 | | Ordinary
Income | | | Net Long-
Term Capital
Gains | | | Total Taxable
Distributions | |
| Matthews Asia Strategic Income Fund | | | $3,275,012 | | | | $— | | | | $3,275,012 | |
| Matthews Asia Credit Opportunities Fund | | | 1,099,964 | | | | 111,284 | | | | 1,211,248 | |
| Matthews Asian Growth and Income Fund | | | 76,634,444 | | | | 42,640,486 | | | | 119,274,930 | |
| Matthews Asia Dividend Fund | | | 237,413,324 | | | | 144,064,822 | | | | 381,478,146 | |
| Matthews China Dividend Fund | | | 17,609,713 | | | | 12,048,945 | | | | 29,658,658 | |
| Matthews Asia Value Fund | | | 1,364,007 | | | | 265,211 | | | | 1,629,218 | |
| Matthews Asia Focus Fund | | | 137,271 | | | | — | | | | 137,271 | |
| Matthews Asia Growth Fund | | | 13,817,623 | | | | 45,847,848 | | | | 59,665,471 | |
| Matthews Pacific Tiger Fund | | | 74,772,355 | | | | 54,354,798 | | | | 129,127,153 | |
| Matthews Asia ESG Fund | | | 502,242 | | | | 142,064 | | | | 644,306 | |
| Matthews Emerging Asia Fund | | | 2,448,800 | | | | 910,694 | | | | 3,359,494 | |
| Matthews Asia Innovators Fund | | | 3,439,895 | | | | 13,051,975 | | | | 16,491,870 | |
| Matthews China Fund | | | 58,708,744 | | | | 33,489,520 | | | | 92,198,264 | |
| Matthews India Fund | | | 624,624 | | | | 32,428,674 | | | | 33,053,298 | |
| Matthews Japan Fund | | | 37,593,412 | | | | 118,095,898 | | | | 155,689,310 | |
| Matthews Korea Fund | | | 9,264,412 | | | | 10,189,013 | | | | 19,453,425 | |
| Matthews Asia Small Companies Fund | | | 15,911,087 | | | | 20,779,556 | | | | 36,690,643 | |
| Matthews China Small Companies Fund | | | 1,230,339 | | | | 842,837 | | | | 2,073,176 | |
| | | | | | | | | | | | | | | | |
| YEAR ENDED DECEMBER 31, 2016 | | Ordinary Income | | | Net Long-
Term Capital
Gains | | | Total Taxable
Distributions | | | Return of
Capital | |
| Matthews Asia Strategic Income Fund | | | $2,603,309 | | | | $— | | | | $2,603,309 | | | | $— | |
| Matthews Asia Credit Opportunities Fund | | | 517,291 | | | | — | | | | 517,291 | | | | — | |
| Matthews Asian Growth and Income Fund | | | 82,341,797 | | | | 145,377,175 | | | | 227,718,972 | | | | — | |
| Matthews Asia Dividend Fund | | | 88,322,312 | | | | 30,585,305 | | | | 118,907,617 | | | | 27,044,586 | |
| Matthews China Dividend Fund | | | 3,471,251 | | | | 2,629,943 | | | | 6,101,194 | | | | — | |
| Matthews Asia Value Fund | | | 148,584 | | | | — | | | | 148,584 | | | | — | |
| Matthews Asia Focus Fund | | | 157,979 | | | | — | | | | 157,979 | | | | — | |
| Matthews Asia Growth Fund | | | 7,210,721 | | | | — | | | | 7,210,721 | | | | — | |
| Matthews Pacific Tiger Fund | | | 60,675,860 | | | | 121,713,006 | | | | 182,388,866 | | | | — | |
| Matthews Asia ESG Fund | | | 139,740 | | | | — | | | | 139,740 | | | | — | |
| Matthews Emerging Asia Fund | | | 2,483,804 | | | | 2,100,210 | | | | 4,584,014 | | | | — | |
| Matthews Asia Innovators Fund | | | — | | | | 10,623,880 | | | | 10,623,880 | | | | — | |
| Matthews China Fund | | | 8,205,173 | | | | 39,869,615 | | | | 48,074,788 | | | | 17,942,653 | |
| Matthews India Fund | | | 112,375 | | | | 26,797,862 | | | | 26,910,237 | | | | — | |
| Matthews Japan Fund | | | 26,243,561 | | | | 9,535,726 | | | | 35,779,287 | | | | — | |
| Matthews Korea Fund | | | 2,252,578 | | | | 13,672,732 | | | | 15,925,310 | | | | — | |
| Matthews Asia Small Companies Fund | | | 2,452,388 | | | | — | | | | 2,452,388 | | | | — | |
| Matthews China Small Companies Fund | | | 57,353 | | | | 747,907 | | | | 805,260 | | | | — | |
| G. | INVESTMENT TRANSACTIONS AND INCOME: Securities transactions are accounted for on the date the securities are purchased or sold or on the following business day. Financial statements reflect security transactions on trade date. Gains or losses on the sale of securities are determined on the identified cost basis. Interest income is recorded on the accrual basis. Interest income, including amortization and accretion of premiums and discounts on debt securities, is recognized daily on an accrual basis. Dividend income is generally recorded on the ex-dividend date net of any foreign taxes withheld at the source. Dividend income for certain issuers headquartered in countries which the Funds invest may not be recorded until approved by the shareholders (which may occur after the ex-dividend date) if, in the judgment of management, such dividends are not reasonably determined as of the ex-dividend date. Income and realized and unrealized gains or losses on investments are allocated to each class of shares based on its relative net assets. |
| | | | |
| matthewsasia.com | 800.789.ASIA | | | 143 | |
Notes to Financial Statements (continued)
The Funds may be subject to foreign taxation related to income received, capital gains on the sale of securities and certain foreign currency transactions in the foreign jurisdictions in which they invest. Foreign taxes, if any, are recorded based on the tax regulations and rates that exist in the foreign markets in which the Funds invest. When a capital gain tax is determined to apply, the Funds record an estimated deferred tax liability in an amount that may be payable if the securities were disposed of on the valuation date.
| H. | FUND EXPENSE ALLOCATIONS: The Funds account separately for the assets, liabilities and operations of each Fund. Estimated expenses are accrued daily. Direct expenses of each Fund or class are charged to that Fund or class while general expenses are allocated pro-rata among the Funds based on net assets or other appropriate methods. |
| I. | CASH, CASH OVERDRAFTS, AND FOREIGN CURRENCY: QFII accounts (i.e., the accounts through which the QFII quota is accessed) are required by the local market to maintain a cash reserve. The cash reserve is based upon a fixed ratio of the QFII’s approved investment quota, which is defined as the amount remitted into its special renminbi (RMB) cash account. These amounts, if any, are included in “Segregated foreign currency at value” on the Statements of Assets and Liabilities. The fixed ratio is set at 0.08 percent for the Shanghai and 0.06 percent for the Shenzhen market. When any of the Funds’ cash balances are overdrawn, a Fund is charged an overdraft fee by the custodian of 1.00% above the 30-day LIBOR rate on outstanding balances. These amounts, if any, are included in “Other expenses” on the Statements of Operations. |
| J. | USE OF ESTIMATES: The preparation of financial statements in conformity with U.S. GAAP requires management to make estimates and assumptions that affect the amounts reported in the financial statements and accompanying notes. Actual results may differ from those estimates. |
| K. | RECENT ACCOUNTING GUIDANCE: In March 2017, the Financial Accounting Standards Board issued amended guidance to shorten the amortization period for certain callable debt securities, held at premium. The guidance is effective for fiscal years and interim periods beginning after December 15, 2018. Adoption will have no effect on the Funds’ net assets. Management is evaluating the impact, if any, of this guidance on the Funds’ results of operations and financial statement disclosures. |
| 3. | DERIVATIVE FINANCIAL INSTRUMENTS |
Each of the Matthews Asia Strategic Income Fund and the Matthews Asia Credit Opportunities Fund engages in derivative transactions for a variety of purposes, including managing interest rate, currency and credit exposure. Derivative transactions in which each Fund may engage include financial futures contracts, swaps and/or forward foreign currency exchange contracts. In particular, the Matthews Asia Strategic Income Fund may also employ a currency overlay strategy, involving long and short positions on one or more currencies, in an effort to enhance returns and moderate volatility.
Certain derivative transactions may result in each Fund’s exposure to a currency to exceed the value of the Fund’s assets and the Fund could be exposed to currency risk whether or not it holds a bond or other instrument denominated in that currency. The gross notional value of derivative financial instruments and transactions could exceed the value of the Fund’s net assets, although the net market value of these instruments and transactions, on a marked-to-market basis, at most times, is expected to be substantially lower.
The primary risks associated with the use of derivative financial instruments are: (i) Matthews may not correctly predict the direction of currency exchange rates, interest rates, security prices, or other economic factors; (ii) Matthews may not correctly predict changes in the value of derivative financial instruments and related underlying instruments or assets, which may result in disproportionately increased losses and/or reduced opportunities for gains; (iii) imperfect correlation between the change in market value of the securities held by a Fund and the price of financial futures contracts and credit default swaps contracts; (iv) the lack of, or a reduction in the liquidity of, any secondary market for the instrument, and the resulting inability to close the position (or exit the position) when desired; (v) losses, which are potentially unlimited, due to unanticipated market movements; (vi) the value of the instrument may change unfavorably due to movements in the value of the referenced foreign currencies; (vii) a Fund may suffer disproportionately heavy losses relative to the amount invested; (viii) changes in the value of the derivatives may not match or fully offset changes in the value of hedged or related portfolio securities, thereby failing to achieve the hedging or investment purpose for the derivative transaction; and (ix) the other party to the instrument may fail to fulfill its obligation.
Forward Foreign Currency Exchange Contracts: The Matthews Asia Strategic Income Fund enters into forward foreign currency exchange contracts to gain or reduce exposure to foreign currency exchange rate risk. A forward foreign currency exchange contract is an agreement between two parties to buy and sell a currency at a set exchange rate on a future date. The contract is marked-to-market daily and the change in market value is recorded by the Fund as an unrealized gain or loss. When the contract is closed, the Fund records a realized gain or loss equal to the difference between the value at the time it was opened and the value at the time it was closed. The Matthews Asia Strategic Income Fund does not offset financial assets and financial liabilities on forward foreign currency contacts in the Statements of Assets and Liabilities as they are not subject to netting arrangements.
Swaps: The Matthews Asia Strategic Income Fund and the Matthews Asia Credit Opportunities Fund enter into swap contracts to manage exposure to issuers, markets and securities to reduce their risk exposure to defaults of corporate and/or sovereign issuers or to create exposure to corporate and/or sovereign issuers to which they are not otherwise exposed (credit risk). Such contracts are agreements between the Funds and a counterparty to make periodic net payments on a specified notional amount or a net payment upon termination. Swap agreements are privately negotiated in the OTC market and may be entered into as a bilateral contract (“OTC Swaps”) or centrally cleared (“centrally cleared swaps”).
For OTC swaps, any upfront premiums paid and any upfront fees received are shown as swap premiums paid and swap premiums received, respectively, in the Statements of Assets and Liabilities and amortized over the term of the contract. The daily fluctuation in market value is recorded as unrealized appreciation (depreciation) on OTC Swaps in the Statements of Assets and Liabilities. Payments received or paid are recorded in the Statements of Operations as realized gains or losses, respectively. When an OTC swap is terminated, a realized gain or loss is recorded in the Statements of Operations equal to the difference between the proceeds from (or cost of) the closing transaction and the Funds’ basis in the contract, if any. Generally, the basis of the contract is the amortized premium received or paid.
The Funds may buy credit default swaps on single-name issuers (corporate or sovereign), a combination or basket of single-name issuers or traded indexes. Credit default swaps are agreements in which the protection buyer pays fixed periodic payments to the seller in consideration for a promise from the protection seller to make a specific payment should a negative credit event take place with respect to the referenced entity (e.g., bankruptcy, failure to pay, obligation acceleration, repudiation, moratorium or restructuring). As a buyer, if an underlying credit event occurs, the Funds will either (i) receive from the seller an amount equal to the notional amount of the swap and deliver the referenced security or underlying securities comprising the index, or (ii) receive a net settlement of cash equal to the notional amount of the swap less the recovery value of the security or underlying securities comprising the index.
Counterparty Credit Risk: A derivative contract may suffer a mark to market loss if the value of the contract decreases due to an unfavorable change in the market rates or values of the underlying instrument. Losses can also occur if the counterparty does not perform under the contract.
A Fund’s risk of loss from counterparty credit risk on OTC derivatives is generally limited to the aggregate unrealized gain netted against any collateral held by such Fund.
With exchange traded futures and centrally cleared swaps, there is less counterparty credit risk to the Funds since the exchange or clearinghouse, as counterparty to such instruments, guarantees against a possible default. The clearinghouse stands between the buyer and the seller of the contract; therefore, the credit risk is limited to failure of the clearinghouse. While offset rights may exist under applicable law, a Fund does not have a contractual right of offset against a clearing broker or clearinghouse in the event of a default (including the bankruptcy or insolvency) of the clearing broker or clearinghouse. Additionally, credit risk exists in exchange traded futures and centrally cleared swaps with respect to initial and variation margin that is held in a clearing broker’s customer accounts. While clearing brokers are required to segregate customer margin from their own assets, in the event that a clearing broker becomes insolvent or goes into bankruptcy and at that time there is a shortfall in the aggregate amount of margin held by the clearing broker for all its clients, typically the shortfall would be allocated on a pro rata basis across all the clearing broker’s customers, potentially resulting in losses to the Funds.
In order to better define its contractual rights and to secure rights that will help the Funds mitigate their counterparty risk, a Fund may enter into an International Swaps and Derivatives Association, Inc. Master Agreement (“ISDA Master Agreement”) or similar agreement with its derivative contract counterparties. An ISDA Master Agreement is a bilateral agreement between each Fund and a counterparty that governs OTC derivatives and typically contains, among other things, collateral posting terms and netting provisions in the event of a default and/or termination event. Under an ISDA Master Agreement, each Fund may, under certain circumstances, offset with the counterparty certain derivative financial instruments’ payables and/ or receivables with collateral held and/or posted and create one single net payment. The provisions of the ISDA Master Agreement typically permit a single net payment in the event of default including the bankruptcy or insolvency of the counterparty. However, bankruptcy or insolvency laws of a particular jurisdiction may impose restrictions on or prohibitions against the right of offset in bankruptcy, insolvency or other events. In addition, certain ISDA Master Agreements allow counterparties to OTC derivatives to terminate derivative contracts prior to maturity in the event a Fund’s net assets decline by a stated percentage or the Fund fails to meet the terms of its ISDA Master Agreements, which would cause the Fund to accelerate payment of any net liability owed to the counterparty.
Collateral requirements: For derivatives traded under an ISDA Master Agreement, the collateral requirements are typically calculated by netting the mark to market amount for each transaction under such agreement and comparing that amount to the value of any collateral currently pledged by a Fund and the counterparty. Cash collateral that has been pledged to cover obligations of a Fund, if any, is reported separately on the Statements of Assets and Liabilities as cash pledged as collateral. Non-cash collateral pledged by a Fund, if any, is noted in the Schedules of Investments. No swaps were held by any Funds on December 31, 2017.
For financial reporting purposes, the Funds do not offset derivative assets and derivative liabilities that are subject to netting arrangements in the Statements of Assets and Liabilities.
The Funds have implemented the disclosure requirements pursuant to FASB Accounting Standards update No. 2011-11, Disclosures about Offsetting Assets and Liabilities, that require disclosures to make financial statements that are prepared under U.S. GAAP more comparable to those prepared under International Financial Reporting Standards. Under this guidance the Funds disclose in the Statements of Assets and Liabilities both gross and net information about instruments and transactions eligible for offset such as instruments and transactions subject to an agreement similar to a master netting arrangement. In addition, the Funds disclose collateral received and posted in connection with master netting agreements or similar arrangements.
Derivative Financial Instruments Categorized by Risk Exposure:
As of December 31, 2017, the fair values of derivative financial instruments were as follows:
| | | | | | | | | | | | | | |
| | | Statements of Assets and Liabilities Location | | | | | | | | Matthews Asia
Strategic Income
Fund | |
| | Asset Derivatives | | | | | | | | | | | | |
| | Unrealized appreciation on forward foreign | | | | | | | | | | | | |
Forward foreign currency exchange contracts | | currency exchange contracts | | | | | | | | | | | $326,429 | |
| | | | | | | | | | | | | | |
For the fiscal year ended December 31, 2017, the effects of derivative financial instruments on the Statements of Operations were as follows:
| | | | | | | | | | |
Derivative type | | Statements of Operations Location | | Matthews Asia
Strategic Income
Fund | | | Matthews Asia
Credit Opportunities
Fund | |
Net Realized Gain (Loss) | | | | | | | | | | |
| Foreign currency contracts: | | | | | | | | | | |
Forward foreign currency exchange contracts | | Net realized gain (loss) on forward foreign currency exchange contracts | | | ($628,735 | ) | | | $— | |
| Credit default swaps: | | | | | | | | | | |
Credit contracts | | Net realized gain (loss) on swaps | | | (19,449 | ) | | | (4,862 | ) |
| | | | | | | | | | |
| Total | | | | | ($648,184 | ) | | | ($4,862 | ) |
| | | | | | | | | | |
| | | |
Net Change In Unrealized Appreciation (Depreciation) | | | | | | | | | | |
| Foreign currency contracts: | | | | | | | | | | |
Forward foreign currency exchange contracts | | Net change in unrealized appreciation/ depreciation on forward foreign currency exchange contracts | | | $143,892 | | | | $— | |
| Credit default swaps: | | | | | | | | | | |
Credit Contracts | | Net change in unrealized appreciation/ depreciation on swaps | | | 30,907 | | | | 7,727 | |
| | | | | | | | | | |
| Total | | | | | $174,799 | | | | $7,727 | |
| | | | | | | | | | |
The notional amounts for buy protection on credit default swaps for the period January 1, 2017-July 5, 2017 (period in which swaps were held) for Matthews Asia Strategic Income Fund and Matthews Credit Opportunities Fund were $8,000,000 and $2,000,000, respectively. Regarding forward foreign currency exchange contracts entered into by the Matthews Asia Strategic Income Fund, the average notional ending quarterly amounts purchased in USD were $4,337,024 and the average notional ending quarterly amounts sold in USD were $17,112,843.
| | | | |
| matthewsasia.com | 800.789.ASIA | | | 145 | |
Notes to Financial Statements (continued)
| 4. | CAPITAL SHARE TRANSACTIONS |
Each Fund is authorized to issue an unlimited number of shares of beneficial interest with a par value of $0.001 per share.
| | | | | | | | | | | | | | | | |
| | | Year Ended December 31, 2017 | | | Year Ended December 31, 2016 | |
| | | Shares | | | Amount | | | Shares | | | Amount | |
MATTHEWS ASIA STRATEGIC INCOME FUND | | | | | | | | | | | | | | | | |
Investor Class | | | | | | | | | | | | | | | | |
Shares sold | | | 2,471,612 | | | | $26,893,366 | | | | 1,159,976 | | | | $12,036,561 | |
Shares issued through reinvestment of distributions | | | 201,006 | | | | 2,186,689 | | | | 200,404 | | | | 2,086,240 | |
Shares redeemed | | | (2,206,966 | ) | | | (23,732,650 | ) | | | (1,179,567 | ) | | | (12,189,837 | ) |
Net increase | | | 465,652 | | | | $5,347,405 | | | | 180,813 | | | | $1,932,964 | |
Institutional Class | | | | | | | | | | | | | | | | |
Shares sold | | | 1,614,574 | | | | $17,337,778 | | | | 394,381 | | | | $4,226,734 | |
Shares issued through reinvestment of distributions | | | 53,679 | | | | 584,224 | | | | 48,941 | | | | 509,450 | |
Shares redeemed | | | (114,814 | ) | | | (1,232,881 | ) | | | (262,800 | ) | | | (2,759,738 | ) |
Net increase | | | 1,553,439 | | | | $16,689,121 | | | | 180,522 | | | | $1,976,446 | |
MATTHEWS ASIA CREDIT OPPORTUNITIES FUND | | | | | | | | | | | | | | | | |
Investor Class | | | | | | | | | | | | | | | | |
Shares sold | | | 752,191 | | | | $7,854,221 | | | | 1,262,312 | | | | $12,795,706 | |
Shares issued through reinvestment of distributions | | | 40,940 | | | | 425,058 | | | | 33,461 | | | | 340,366 | |
Shares redeemed | | | (810,572 | ) | | | (8,398,269 | ) | | | (296,818 | ) | | | (3,053,588 | ) |
Net increase (decrease) | | | (17,441 | ) | | | ($118,990 | ) | | | 998,955 | | | | $10,082,484 | |
Institutional Class | | | | | | | | | | | | | | | | |
Shares sold | | | 1,540,693 | | | | $16,092,601 | | | | 604,202 | | | | $6,052,800 | |
Shares issued through reinvestment of distributions | | | 27,293 | | | | 283,653 | | | | 8,340 | | | | 85,105 | |
Shares redeemed | | | (111,862 | ) | | | (1,175,697 | ) | | | — | | | | — | |
Net increase | | | 1,456,124 | | | | $15,200,557 | | | | 612,542 | | | | $6,137,905 | |
MATTHEWS ASIAN GROWTH AND INCOME FUND | | | | | | | | | | | | | | | | |
Investor Class | | | | | | | | | | | | | | | | |
Shares sold | | | 14,640,738 | | | | $241,575,990 | | | | 22,685,379 | | | | $370,706,327 | |
Shares issued through reinvestment of distributions | | | 3,602,819 | | | | 61,730,211 | | | | 9,221,755 | | | | 142,699,973 | |
Shares redeemed | | | (43,082,130 | ) | | | (721,414,206 | ) | | | (46,658,662 | ) | | | (755,701,576 | ) |
Net (decrease) | | | (24,838,573 | ) | | | ($418,108,005 | ) | | | (14,751,528 | ) | | | ($242,295,276 | ) |
Institutional Class | | | | | | | | | | | | | | | | |
Shares sold | | | 36,133,398 | | | | $604,837,817 | | | | 20,043,072 | | | | $329,220,035 | |
Shares issued through reinvestment of distributions | | | 3,077,228 | | | | 52,660,292 | | | | 4,935,874 | | | | 76,286,208 | |
Shares redeemed | | | (18,309,223 | ) | | | (312,385,386 | ) | | | (22,147,192 | ) | | | (352,353,051 | ) |
Net increase | | | 20,901,403 | | | | $345,112,723 | | | | 2,831,754 | | | | $53,153,192 | |
MATTHEWS ASIA DIVIDEND FUND | | | | | | | | | | | | | | | | |
Investor Class | | | | | | | | | | | | | | | | |
Shares sold | | | 46,067,788 | | | | $837,987,289 | | | | 27,984,752 | | | | $444,670,505 | |
Shares issued through reinvestment of distributions | | | 9,772,567 | | | | 187,636,316 | | | | 4,679,731 | | | | 75,148,885 | |
Shares redeemed | | | (38,470,520 | ) | | | (679,700,431 | ) | | | (41,501,686 | ) | | | (644,529,546 | ) |
Net increase (decrease) | | | 17,369,835 | | | | $345,923,174 | | | | (8,837,203 | ) | | | ($124,710,156 | ) |
Institutional Class | | | | | | | | | | | | | | | | |
Shares sold | | | 48,661,134 | | | | $863,508,784 | | | | 30,119,651 | | | | $475,655,888 | |
Shares issued through reinvestment of distributions | | | 7,450,686 | | | | 142,974,481 | | | | 2,741,360 | | | | 44,022,850 | |
Shares redeemed | | | (20,774,459 | ) | | | (376,048,201 | ) | | | (35,037,220 | ) | | | (546,747,812 | ) |
Net increase (decrease) | | | 35,337,361 | | | | $630,435,064 | | | | (2,176,209 | ) | | | ($27,069,074 | ) |
MATTHEWS CHINA DIVIDEND FUND | | | | | | | | | | | | | | | | |
Investor Class | | | | | | | | | | | | | | | | |
Shares sold | | | 5,731,788 | | | | $94,790,959 | | | | 3,715,788 | | | | $52,252,711 | |
Shares issued through reinvestment of distributions | | | 1,334,478 | | | | 22,238,460 | | | | 373,101 | | | | 5,189,800 | |
Shares redeemed | | | (3,649,309 | ) | | | (58,975,597 | ) | | | (4,710,228 | ) | | | (63,571,849 | ) |
Net increase (decrease) | | | 3,416,957 | | | | $58,053,822 | | | | (621,339 | ) | | | ($6,129,338 | ) |
Institutional Class | | | | | | | | | | | | | | | | |
Shares sold | | | 1,139,266 | | | | $19,168,584 | | | | 1,816,522 | | | | $24,989,758 | |
Shares issued through reinvestment of distributions | | | 283,364 | | | | 4,723,368 | | | | 60,896 | | | | 851,567 | |
Shares redeemed | | | (317,830 | ) | | | (5,535,520 | ) | | | (1,024,910 | ) | | | (12,705,300 | ) |
Net increase | | | 1,104,800 | | | | $18,356,432 | | | | 852,508 | | | | $13,136,025 | |
| | | | | | | | | | | | | | | | |
| | | Year Ended December 31, 2017 | | | Year Ended December 31, 2016 | |
| | | Shares | | | Amount | | | Shares | | | Amount | |
MATTHEWS ASIA VALUE FUND | | | | | | | | | | | | | | | | |
Investor Class | | | | | | | | | | | | | | | | |
Shares sold | | | 1,946,342 | | | | $23,869,389 | | | | 116,636 | | | | $1,176,796 | |
Shares issued through reinvestment of distributions | | | 111,073 | | | | 1,409,511 | | | | 13,611 | | | | 137,070 | |
Shares redeemed | | | (181,234 | ) | | | (2,270,540 | ) | | | (35,718 | ) | | | (356,533 | ) |
Net increase | | | 1,876,181 | | | | $23,008,360 | | | | 94,529 | | | | $957,333 | |
Institutional Class | | | | | | | | | | | | | | | | |
Shares sold | | | 247,950 | | | | $3,257,066 | | | | 94 | | | | $1,000 | |
Shares issued through reinvestment of distributions | | | 12,396 | | | | 156,066 | | | | 1,100 | | | | 10,942 | |
Shares redeemed | | | (9,941 | ) | | | (128,456 | ) | | | — | | | | — | |
Net increase | | | 250,405 | | | | $3,284,676 | | | | 1,194 | | | | $11,942 | |
MATTHEWS ASIA FOCUS FUND | | | | | | | | | | | | | | | | |
Investor Class | | | | | | | | | | | | | | | | |
Shares sold | | | 64,321 | | | | $704,275 | | | | 50,201 | | | | $471,150 | |
Shares issued through reinvestment of distributions | | | 3,983 | | | | 46,882 | | | | 7,605 | | | | 70,199 | |
Shares redeemed | | | (196,120 | ) | | | (2,150,907 | ) | | | (162,641 | ) | | | (1,484,289 | ) |
Net (decrease) | | | (127,816 | ) | | | ($1,399,750 | ) | | | (104,835 | ) | | | ($942,940 | ) |
Institutional Class | | | | | | | | | | | | | | | | |
Shares sold | | | 279,502 | | | | $3,274,793 | | | | 43,659 | | | | $429,950 | |
Shares issued through reinvestment of distributions | | | 7,611 | | | | 89,956 | | | | 9,439 | | | | 87,218 | |
Shares redeemed | | | (12,872 | ) | | | (141,906 | ) | | | (108,595 | ) | | | (989,167 | ) |
Net increase (decrease) | | | 274,241 | | | | $3,222,843 | | | | (55,497 | ) | | | ($471,999 | ) |
MATTHEWS ASIA GROWTH FUND | | | | | | | | | | | | | | | | |
Investor Class | | | | | | | | | | | | | | | | |
Shares sold | | | 4,079,531 | | | | $102,687,689 | | | | 2,949,928 | | | | $63,405,015 | |
Shares issued through reinvestment of distributions | | | 1,217,730 | | | | 31,490,493 | | | | 188,951 | | | | 3,971,819 | |
Shares redeemed | | | (4,883,819 | ) | | | (118,388,884 | ) | | | (8,189,460 | ) | | | (174,198,638 | ) |
Net increase (decrease) | | | 413,442 | | | | $15,789,298 | | | | (5,050,581 | ) | | | ($106,821,804 | ) |
Institutional Class | | | | | | | | | | | | | | | | |
Shares sold | | | 3,002,726 | | | | $76,546,224 | | | | 3,415,256 | | | | $73,020,609 | |
Shares issued through reinvestment of distributions | | | 471,874 | | | | 12,287,614 | | | | 74,896 | | | | 1,584,032 | |
Shares redeemed | | | (1,929,007 | ) | | | (49,929,723 | ) | | | (6,008,790 | ) | | | (125,728,091 | ) |
Net increase (decrease) | | | 1,545,593 | | | | $38,904,115 | | | | (2,518,638 | ) | | | ($51,123,450 | ) |
MATTHEWS PACIFIC TIGER FUND | | | | | | | | | | | | | | | | |
Investor Class | | | | | | | | | | | | | | | | |
Shares sold | | | 21,730,132 | | | | $599,219,782 | | | | 17,131,149 | | | | $413,602,913 | |
Shares issued through reinvestment of distributions | | | 1,299,802 | | | | 38,957,121 | | | | 2,559,033 | | | | 60,214,039 | |
Shares redeemed | | | (24,341,900 | ) | | | (662,177,549 | ) | | | (28,593,668 | ) | | | (674,989,402 | ) |
Net (decrease) | | | (1,311,966 | ) | | | ($24,000,646 | ) | | | (8,903,486 | ) | | | ($201,172,450 | ) |
Institutional Class | | | | | | | | | | | | | | | | |
Shares sold | | | 56,008,953 | | | | $1,551,287,735 | | | | 56,472,145 | | | | $1,339,949,453 | |
Shares issued through reinvestment of distributions | | | 1,955,641 | | | | 58,557,191 | | | | 2,784,965 | | | | 65,450,776 | |
Shares redeemed | | | (39,727,419 | ) | | | (1,096,771,755 | ) | | | (44,079,703 | ) | | | (1,030,520,290 | ) |
Net increase | | | 18,237,175 | | | | $513,073,171 | | | | 15,177,407 | | | | $374,879,939 | |
MATTHEWS ASIA ESG FUND | | | | | | | | | | | | | | | | |
Investor Class | | | | | | | | | | | | | | | | |
Shares sold | | | 429,011 | | | | $4,551,575 | | | | 392,569 | | | | $3,433,859 | |
Shares issued through reinvestment of distributions | | | 33,239 | | | | 372,274 | | | | 9,403 | | | | 85,286 | |
Shares redeemed | | | (136,139 | ) | | | (1,448,047 | ) | | | (154,929 | ) | | | (1,375,756 | ) |
Net increase | | | 326,111 | | | | $3,475,802 | | | | 247,043 | | | | $2,143,389 | |
Institutional Class | | | | | | | | | | | | | | | | |
Shares sold | | | 369,352 | | | | $3,869,597 | | | | 190,080 | | | | $1,675,988 | |
Shares issued through reinvestment of distributions | | | 23,910 | | | | 266,353 | | | | 6,022 | | | | 54,320 | |
Shares redeemed | | | (132,288 | ) | | | (1,379,356 | ) | | | (1,101 | ) | | | (10,096 | ) |
Net increase | | | 260,974 | | | | $2,756,594 | | | | 195,001 | | | | $1,720,212 | |
| | | | |
| matthewsasia.com | 800.789.ASIA | | | 147 | |
Notes to Financial Statements (continued)
| | | | | | | | | | | | | | | | |
| | | Year Ended December 31, 2017 | | | Year Ended December 31, 2016 | |
| | | Shares | | | Amount | | | Shares | | | Amount | |
MATTHEWS EMERGING ASIA FUND | | | | | | | | | | | | | | | | |
Investor Class | | | | | | | | | | | | | | | | |
Shares sold | | | 8,666,298 | | | | $123,504,046 | | | | 7,191,280 | | | | $93,797,154 | |
Shares issued through reinvestment of distributions | | | 85,107 | | | | 1,320,905 | | | | 201,637 | | | | 2,637,405 | |
Shares redeemed | | | (5,606,324 | ) | | | (80,014,289 | ) | | | (6,553,598 | ) | | | (74,847,077 | ) |
Net increase | | | 3,145,081 | | | | $44,810,662 | | | | 839,319 | | | | $21,587,482 | |
Institutional Class | | | | | | | | | | | | | | | | |
Shares sold | | | 11,622,115 | | | | $170,654,093 | | | | 3,585,928 | | | | $43,671,071 | |
Shares issued through reinvestment of distributions | | | 118,430 | | | | 1,843,997 | | | | 147,701 | | | | 1,936,356 | |
Shares redeemed | | | (1,300,786 | ) | | | (18,930,640 | ) | | | (1,388,856 | ) | | | (16,821,786 | ) |
Net increase | | | 10,439,759 | | | | $153,567,450 | | | | 2,344,773 | | | | $28,785,641 | |
MATTHEWS ASIA INNOVATORS FUND | | | | | | | | | | | | | | | | |
Investor Class | | | | | | | | | | | | | | | | |
Shares sold | | | 8,154,384 | | | | $110,598,339 | | | | 1,489,685 | | | | $17,976,640 | |
Shares issued through reinvestment of distributions | | | 986,202 | | | | 13,510,372 | | | | 824,801 | | | | 8,528,446 | |
Shares redeemed | | | (5,092,537 | ) | | | (66,640,478 | ) | | | (4,537,543 | ) | | | (51,381,223 | ) |
Net increase (decrease) | | | 4,048,049 | | | | $57,468,233 | | | | (2,223,057 | ) | | | ($24,876,137 | ) |
Institutional Class | | | | | | | | | | | | | | | | |
Shares sold | | | 1,210,987 | | | | $16,535,812 | | | | 338,687 | | | | $3,702,742 | |
Shares issued through reinvestment of distributions | | | 145,969 | | | | 2,009,294 | | | | 76,287 | | | | 791,856 | |
Shares redeemed | | | (817,521 | ) | | | (11,680,059 | ) | | | (1,763,369 | ) | | | (19,884,862 | ) |
Net increase (decrease) | | | 539,435 | | | | $6,865,047 | | | | (1,348,395 | ) | | | ($15,390,264 | ) |
MATTHEWS CHINA FUND | | | | | | | | | | | | | | | | |
Investor Class | | | | | | | | | | | | | | | | |
Shares sold | | | 10,522,294 | | | | $228,825,245 | | | | 2,148,342 | | | | $35,732,757 | |
Shares issued through reinvestment of distributions | | | 3,700,905 | | | | 76,608,446 | | | | 3,793,239 | | | | 62,095,323 | |
Shares redeemed | | | (8,287,540 | ) | | | (168,142,345 | ) | | | (12,420,378 | ) | | | (207,255,992 | ) |
Net increase (decrease) | | | 5,935,659 | | | | $137,291,346 | | | | (6,478,797 | ) | | | ($109,427,912 | ) |
Institutional Class | | | | | | | | | | | | | | | | |
Shares sold | | | 2,708,363 | | | | $55,763,860 | | | | 499,092 | | | | $7,772,205 | |
Shares issued through reinvestment of distributions | | | 200,924 | | | | 4,151,093 | | | | 130,030 | | | | 2,125,988 | |
Shares redeemed | | | (1,141,616 | ) | | | (24,992,022 | ) | | | (921,220 | ) | | | (16,175,742 | ) |
Net increase (decrease) | | | 1,767,671 | | | | $34,922,931 | | | | (292,098 | ) | | | ($6,277,549 | ) |
MATTHEWS INDIA FUND | | | | | | | | | | | | | | | | |
Investor Class | | | | | | | | | | | | | | | | |
Shares sold | | | 14,535,681 | | | | $444,075,766 | | | | 9,247,717 | | | | $242,746,822 | |
Shares issued through reinvestment of distributions | | | 578,888 | | | | 18,854,400 | | | | 624,141 | | | | 16,190,215 | |
Shares redeemed | | | (9,557,043 | ) | | | (292,422,842 | ) | | | (15,766,962 | ) | | | (410,982,081 | ) |
Net increase (decrease) | | | 5,557,526 | | | | $170,507,324 | | | | (5,895,104 | ) | | | ($152,045,044 | ) |
Institutional Class | | | | | | | | | | | | | | | | |
Shares sold | | | 10,938,379 | | | | $326,819,057 | | | | 11,428,013 | | | | $300,476,619 | |
Shares issued through reinvestment of distributions | | | 94,003 | | | | 3,078,591 | | | | 105,665 | | | | 2,753,632 | |
Shares redeemed | | | (9,578,020 | ) | | | (307,547,412 | ) | | | (3,502,779 | ) | | | (93,248,613 | ) |
Net increase | | | 1,454,362 | | | | $22,350,236 | | | | 8,030,899 | | | | $209,981,638 | |
MATTHEWS JAPAN FUND | | | | | | | | | | | | | | | | |
Investor Class | | | | | | | | | | | | | | | | |
Shares sold | | | 27,038,482 | | | | $577,083,165 | | | | 74,348,475 | | | | $1,376,674,296 | |
Shares issued through reinvestment of distributions | | | 3,303,132 | | | | 77,557,315 | | | | 1,004,971 | | | | 18,963,796 | |
Shares redeemed | | | (30,502,087 | ) | | | (650,099,638 | ) | | | (55,996,138 | ) | | | (1,083,210,353 | ) |
Net increase (decrease) | | | (160,473 | ) | | | $4,540,842 | | | | 19,357,308 | | | | $312,427,739 | |
Institutional Class | | | | | | | | | | | | | | | | |
Shares sold | | | 27,236,482 | | | | $598,412,144 | | | | 46,376,072 | | | | $877,486,384 | |
Shares issued through reinvestment of distributions | | | 731,710 | | | | 17,217,127 | | | | 187,215 | | | | 3,536,499 | |
Shares redeemed | | | (16,017,190 | ) | | | (343,303,401 | ) | | | (10,076,300 | ) | | | (190,036,960 | ) |
Net increase | | | 11,951,002 | | | | $272,325,870 | | | | 36,486,987 | | | | $690,985,923 | |
| | | | | | | | | | | | | | | | |
| | | Year Ended December 31, 2017 | | | Year Ended December 31, 2016 | |
| | | Shares | | | Amount | | | Shares | | | Amount | |
MATTHEWS KOREA FUND | | | | | | | | | | | | | | | | |
Investor Class | | | | | | | | | | | | | | | | |
Shares sold | | | 5,564,488 | | | | $34,796,556 | | | | 8,524,610 | | | | $50,478,123 | |
Shares issued through reinvestment of distributions | | | 2,324,365 | | | | 15,751,872 | | | | 2,345,781 | | | | 12,432,626 | |
Shares redeemed | | | (7,247,886 | ) | | | (46,248,343 | ) | | | (7,683,043 | ) | | | (45,259,031 | ) |
Net increase | | | 640,967 | | | | $4,300,085 | | | | 3,187,348 | | | | $17,651,718 | |
Institutional Class | | | | | | | | | | | | | | | | |
Shares sold | | | 3,283,807 | | | | $20,683,708 | | | | 3,215,987 | | | | $19,291,961 | |
Shares issued through reinvestment of distributions | | | 384,519 | | | | 2,621,405 | | | | 125,391 | | | | 668,333 | |
Shares redeemed | | | (395,768 | ) | | | (2,595,391 | ) | | | (11,634,445 | ) | | | (70,448,790 | ) |
Net increase (decrease) | | | 3,272,558 | | | | $20,709,722 | | | | (8,293,067 | ) | | | ($50,488,496 | ) |
MATTHEWS ASIA SMALL COMPANIES FUND | | | | | | | | | | | | | | | | |
Investor Class | | | | | | | | | | | | | | | | |
Shares sold | | | 1,344,836 | | | | $29,213,685 | | | | 1,475,764 | | | | $28,101,064 | |
Shares issued through reinvestment of distributions | | | 693,887 | | | | 14,856,114 | | | | 55,224 | | | | 1,077,417 | |
Shares redeemed | | | (6,279,829 | ) | | | (130,940,312 | ) | | | (8,162,469 | ) | | | (159,237,120 | ) |
Net (decrease) | | | (4,241,106 | ) | | | ($86,870,513 | ) | | | (6,631,481 | ) | | | ($130,058,639 | ) |
Institutional Class | | | | | | | | | | | | | | | | |
Shares sold | | | 2,953,870 | | | | $62,967,705 | | | | 1,431,111 | | | | $26,873,891 | |
Shares issued through reinvestment of distributions | | | 833,944 | | | | 17,829,734 | | | | 66,423 | | | | 1,294,585 | |
Shares redeemed | | | (2,791,566 | ) | | | (58,750,310 | ) | | | (3,758,085 | ) | | | (71,115,927 | ) |
Net increase (decrease) | | | 996,248 | | | | $22,047,129 | | | | (2,260,551 | ) | | | ($42,947,451 | ) |
MATTHEWS CHINA SMALL COMPANIES FUND | | | | | | | | | | | | | | | | |
Investor Class | | | | | | | | | | | | | | | | |
Shares sold | | | 1,951,872 | | | | $21,481,987 | | | | 253,087 | | | | $2,130,881 | |
Shares issued through reinvestment of distributions | | | 165,109 | | | | 1,778,217 | | | | 91,953 | | | | 794,479 | |
Shares redeemed | | | (1,116,609 | ) | | | (11,848,256 | ) | | | (837,034 | ) | | | (7,080,001 | ) |
Net increase (decrease) | | | 1,000,372 | | | | $11,411,948 | | | | (491,994 | ) | | | ($4,154,641 | ) |
Institutional Class* | | | | | | | | | | | | | | | | |
Shares sold | | | 39,317 | | | | $450,574 | | | | — | | | | — | |
Shares issued through reinvestment of distributions | | | 782 | | | | 8,409 | | | | — | | | | — | |
Shares redeemed | | | — | | | | — | | | | — | | | | — | |
Net increase | | | 40,099 | | | | $458,983 | | | | — | | | | — | |
| * | Institutional Class commenced operations on November 30, 2017. |
Through December 31, 2017, a 2.00% redemption fee was assessed on the sale or exchange of shares of the Matthews Emerging Asia Fund, Matthews Asia Small Companies Fund and Matthews China Small Companies Fund (collectively, the “Covered Funds”) within 90 days after the date an investor purchases shares of the Covered Funds. The imposition of redemption fees pursuant to the Funds’ Short-Term Trading Redemption Fee Policy for the Covered Funds may assist the Covered Funds in discouraging market timing activity.
The redemption fee is imposed to discourage market timing and short-term buying and selling of shares of the Covered Funds, which can disrupt the management of the Covered Funds’ investment portfolios and may have detrimental effects on the Covered Funds and other shareholders, and to allocate the costs the Covered Funds incur as a result of short-term trading and market timing. This fee is payable directly to the Covered Funds.
To determine whether the redemption fee applies, the Covered Funds do not count the day that shares were purchased, and first redeem the shares that have been held the longest.
The Covered Funds may grant an exemption from the redemption fee when the Covered Funds have previously received assurances that transactions do not involve a substantial risk of the type of harm that the policy is designed to avoid. The Covered Funds may also waive the imposition of redemption fees in certain circumstances. For more information on this policy, please see the Funds’ prospectuses. The redemption fees returned to the assets of the Funds are stated in the Statements of Changes in Net Assets.
The Funds (or their agents) attempt to contact shareholders whom the Funds (or their agents) believe have violated the Funds’ policies and procedures related to short-term trading and market-timing activity, and notify them that they will no longer be permitted to buy (or exchange) shares of the Funds. When a shareholder has purchased shares of the Funds through an intermediary, the Funds may not be able to notify the shareholder of a violation of the Funds’ policies or that the Funds have taken steps to address the situation (for example, the Funds may be unable to notify a shareholder that his or her privileges to purchase or exchange shares of the Funds have been terminated). Nonetheless, additional purchase and exchange orders for such investors will not be accepted by the Funds.
The Funds may reject for any reason, or cancel as permitted or required by law, any purchase or exchange, including transactions deemed to represent excessive trading, at any time.
| | | | |
| matthewsasia.com | 800.789.ASIA | | | 149 | |
Notes to Financial Statements (continued)
| 5. | INVESTMENT ADVISORY FEES AND OTHER TRANSACTIONS WITH AFFILIATES |
Matthews, a registered investment advisor under the 1940 Act, provides the Funds with investment management services. Pursuant to the prior Investment Advisory Agreement dated August 13, 2004, as amended (the “Prior Advisory Agreement”) and the current Investment Advisory Agreement dated February 1, 2016, as amended (the “Current Advisory Agreement,” and together with the Prior Advisory Agreement, the “Advisory Agreement”), the Funds pay Matthews (i) for management and advisory services; and (ii) for certain administrative services, an annual fee as a percentage of average daily net assets. Under the Advisory Agreement each of the Funds, other than Matthews Asia Strategic Income Fund, Matthews Asia Credit Opportunities Fund, Matthews Emerging Asia Fund, Matthews Asia Small Companies Fund, and Matthews China Small Companies Fund (the “Family-Priced Funds”), pays Matthews 0.75% of their aggregate average daily net assets up to $2 billion, 0.6834% of their aggregate average daily net assets over $2 billion up to $5 billion, 0.65% of their aggregate average daily net assets over $5 billion up to $25 billion, 0.64% of their aggregate average daily net assets over $25 billion up to $30 billion, 0.63% of their aggregate average daily net assets over $30 billion up to $35 billion, 0.62% of their aggregate average daily net assets over $35 billion up to $40 billion, 0.61% of their aggregate average daily net assets over $40 billion up to $45 billion, and 0.60% of their aggregate average daily net assets over $45 billion. Each of the Matthews Asia Strategic Income Fund and Matthews Asia Credit Opportunities Fund pays Matthews an annual fee of 0.65% of such Fund’s annual average daily net assets pursuant to the Advisory Agreement. Each of the Matthews Emerging Asia Fund, Matthews Asia Small Companies Fund, and the Matthews China Small Companies Fund pays Matthews an annual fee of 1.00% of the average daily net assets of such Fund up to $1 billion and 0.95% of the average daily net assets of such Fund over $1 billion pursuant to the Advisory Agreement. Each Fund pays Matthews a monthly fee at the annual rate using the applicable management fee calculated based on the actual number of days of that month and based on the Fund’s average daily net asset value for the month.
Pursuant to a fee waiver letter agreement, effective as of September 1, 2014, between the Trust, on behalf of the Family-Priced Funds, and Matthews (as amended from time to time, the “Fee Waiver Agreement”), for each Family-Priced Fund, Matthews has agreed to waive a portion of the fee payable under the Advisory Agreement and a portion of the fee payable under the Administration and Shareholder Services Agreement, if any Family-Priced Fund’s average daily net assets are over $3 billion, as follows: for every $2.5 billion average daily net assets of a Family-Priced Fund that are over $3 billion, the fee rates that otherwise would be applied for calculating fees payable under the Advisory Agreement and the Administration and Shareholder Services Agreement for such Family-Priced Fund with respect to such excess average daily net assets will be each reduced by 0.01%, in each case without reducing such fee rate below 0.00%.
Under a written agreement between the Funds and Matthews (the “Operating Expense Agreement”), Matthews agrees to waive fees and reimburse expenses to a Fund if its expense ratio exceeds a certain percentage level. Effective April 28, 2017 for all Funds, except Matthews Asia Strategic Income Fund, Matthews Asia Credit Opportunities Fund, and Matthews China Small Companies Fund, this level is 1.25% for the Institutional Class. Matthews agrees to reduce the expense ratio by waiving an equal amount of non-class specific expenses for the Investor Class. Because certain expenses of the Investor Class may be higher than those of the Institutional Class and because class specific expenses may be waived solely for the Institutional Class, total annual Fund expenses for the Investor Class may exceed 1.25%. For Matthews Asia Strategic Income Fund and Matthews Asia Credit Opportunities Fund this level is 0.90% for the Institutional Class. Matthews agrees to reduce the expense ratio by waiving an equal amount of non-class specific expenses for the Investor Class. Because certain expenses of the Investor Class may be higher than those of the Institutional Class and because class specific expenses may be waived solely for the Institutional Class, total annual Fund expenses for the Investor Class may exceed 0.90%. For Matthews China Small Companies Fund this level is 1.50% for the Investor Class. Effective November 30, 2017, for the Matthews China Small Companies Fund, this level is 1.25% for the Institutional Class. Matthews agrees to reduce the expense ratio by waiving an equal amount of non-class specific expenses for the Investor Class. Because certain expenses of the Investor Class may be higher than those of the Institutional Class and because class specific expenses may be waived solely for the Institutional Class, total annual Fund expenses for the Investor Class of the Matthews China Small Companies Fund may exceed 1.25%. In turn, if a Fund’s expenses fall below the level noted within three years after Matthews has made such a reimbursement, the Fund may reimburse Matthews up to an amount of the recoupment available not to exceed the lesser of (i) the expense limitation applicable at the time of that fee waiver and/or expense reimbursement or (ii) the expense limitation in effect at the time of recoupment. This agreement will continue through April 30, 2019, may be extended for additional periods not exceeding one year, and may be terminated at any time by the Board of Trustees on behalf of the Fund on 60 days’ written notice to Matthews. Matthews may decline to renew this agreement by written notice to the Trust at least 30 days before its annual expiration date.
On December 31, 2017, the amounts subject to possible future recoupment under the expense limitation agreement are as follows:
| | | | | | | | | | | | |
| | | Expiring December 31 | |
| | | 2018 | | | 2019 | | | 2020 | |
| Matthews Asia Strategic Income Fund | | | $113,621 | | | | $123,474 | | | | $121,164 | |
| Matthews Asia Credit Opportunities Fund | | | — | | | | 110,447 | | | | 149,157 | |
| Matthews Asia Value Fund | | | 41,279 | | | | 211,035 | | | | 119,683 | |
| Matthews Asia Focus Fund | | | 87,252 | | | | 111,801 | | | | 119,705 | |
| Matthews Asia ESG Fund | | | 183,985 | | | | 163,853 | | | | 156,429 | |
| Matthews Emerging Asia Fund | | | 452,048 | | | | 553,167 | | | | 878,171 | |
| Matthews Asia Small Companies Fund | | | 113,037 | | | | 252,008 | | | | 272,597 | |
| Matthews China Small Companies Fund | | | 133,327 | | | | 142,295 | | | | 184,162 | |
Matthews Asia Strategic Income Fund, Matthews Asia Focus Fund, Matthews Emerging Asia Fund, Matthews Asia Small Companies Fund and Matthews China Small Companies Fund had $79,504, $62,897, $152,283, $15,270 and $63,212, respectively, of recoupment that expired on December 31, 2017. Matthews Asian Growth and Income Fund, Matthews Asia Dividend Fund, Matthews China Dividend Fund, Mathews Asia Growth Fund, Matthews Pacific Tiger Fund, Matthews Asia Innovators Fund, Matthews China Fund, Matthews India Fund, Matthews Japan Fund and Matthews Korea Fund had no amounts available for recoupment and no amounts recouped during the year ended December 31, 2017.
Investment advisory fees charged, waived fees and reimbursed additional expenses for the year ended December 31, 2017, were as follows:
| | | | | | | | | | | | |
| | | Gross Advisory Fees | | | Advisory Fees
Waived and
Reimbursed in
Excess of the
Expense Limitation | | | Net Advisory Fee/
Reimbursement | |
| Matthews Asia Strategic Income Fund | | | $515,422 | | | | ($121,164 | ) | | | $394,258 | |
| Matthews Asia Credit Opportunities Fund | | | 135,246 | | | | (149,157 | ) | | | (13,911 | ) |
| Matthews Asian Growth and Income Fund | | | 18,612,020 | | | | — | | | | 18,612,020 | |
| Matthews Asia Dividend Fund | | | 39,070,331 | | | | (344,184 | ) | | | 38,726,147 | |
| | | | | | | | | | | | |
| | | Gross Advisory Fees | | | Advisory Fees
Waived and
Reimbursed in
Excess of the
Expense Limitation | | | Net Advisory Fee/
Reimbursement | |
| Matthews China Dividend Fund | | | $1,616,495 | | | | $— | | | | $1,616,495 | |
| Matthews Asia Value Fund | | | 95,878 | | | | (119,683 | ) | | | (23,805 | ) |
| Matthews Asia Focus Fund | | | 79,915 | | | | (119,705 | ) | | | (39,790 | ) |
| Matthews Asia Growth Fund | | | 4,745,493 | | | | — | | | | 4,745,493 | |
| Matthews Pacific Tiger Fund | | | 54,037,849 | | | | (825,034 | ) | | | 53,212,815 | |
| Matthews Asia ESG Fund | | | 88,213 | | | | (156,429 | ) | | | (68,216 | ) |
| Matthews Emerging Asia Fund | | | 3,573,026 | | | | (878,171 | ) | | | 2,694,855 | |
| Matthews Asia Innovators Fund | | | 973,613 | | | | — | | | | 973,613 | |
| Matthews China Fund | | | 4,563,241 | | | | — | | | | 4,563,241 | |
| Matthews India Fund | | | 13,638,302 | | | | — | | | | 13,638,302 | |
| Matthews Japan Fund | | | 23,243,975 | | | | (51,124 | ) | | | 23,192,851 | |
| Matthews Korea Fund | | | 1,301,570 | | | | — | | | | 1,301,570 | |
| Matthews Asia Small Companies Fund | | | 4,121,027 | | | | (272,597 | ) | | | 3,848,430 | |
| Matthews China Small Companies Fund | | | 219,991 | | | | (184,162 | ) | | | 35,829 | |
The Funds have an Administration and Shareholder Services Agreement dated August 13, 2004, as amended (the “Shareholder Services Agreement” or “Services Agreement”), in which the Funds pay an annual administration and shareholder servicing fee to Matthews, as a percentage of the average daily net assets of each Fund in aggregate, computed and prorated on a daily basis. Under the Shareholder Services Agreement, the Funds in the aggregate pay Matthews 0.25% of their aggregate average daily net assets up to $2 billion, 0.1834% of their aggregate average daily net assets over $2 billion up to $5 billion, 0.15% of their aggregate average daily net assets over $5 billion up to $7.5 billion, 0.125% of their aggregate average daily net assets over $7.5 billion up to $15 billion, 0.11% of their aggregate average daily net assets over $15 billion up to $22.5 billion, 0.10% of their aggregate average daily net assets over $22.5 billion up to $25 billion, 0.09% of their aggregate average daily net assets over $25 billion up to $30 billion, 0.08% of their aggregate average daily net assets over $30 billion up to $35 billion, 0.07% of their aggregate average daily net assets over $35 billion up to $40 billion, 0.06% of their aggregate average daily net assets over $40 billion up to $45 billion, and 0.05% of their aggregate average daily net assets over $45 billion.
Administration and shareholder servicing fees charged, for the year ended December 31, 2017, were as follows:
| | | | | | | | | | | | |
| | | Gross
Administration and
Shareholder
Servicing Fees | | | Administration and
Shareholder
Servicing Fees
Waived in Excess of
Expense Limitation | | | Net
Administration and
Shareholder
Servicing Fees | |
| Matthews Asia Strategic Income Fund | | | $108,149 | | | | $— | | | | $108,149 | |
| Matthews Asia Credit Opportunities Fund | | | 28,321 | | | | — | | | | 28,321 | |
| Matthews Asian Growth and Income Fund | | | 3,842,449 | | | | — | | | | 3,842,449 | |
| Matthews Asia Dividend Fund | | | 8,047,481 | | | | (344,184 | ) | | | 7,703,297 | |
| Matthews China Dividend Fund | | | 332,574 | | | | — | | | | 332,574 | |
| Matthews Asia Value Fund | | | 19,450 | | | | — | | | | 19,450 | |
| Matthews Asia Focus Fund | | | 16,471 | | | | — | | | | 16,471 | |
| Matthews Asia Growth Fund | | | 978,261 | | | | — | | | | 978,261 | |
| Matthews Pacific Tiger Fund | | | 11,136,774 | | | | (825,034 | ) | | | 10,311,740 | |
| Matthews Asia ESG Fund | | | 18,131 | | | | — | | | | 18,131 | |
| Matthews Emerging Asia Fund | | | 486,176 | | | | — | | | | 486,176 | |
| Matthews Asia Innovators Fund | | | 200,013 | | | | — | | | | 200,013 | |
| Matthews China Fund | | | 938,535 | | | | — | | | | 938,535 | |
| Matthews India Fund | | | 2,809,954 | | | | — | | | | 2,809,954 | |
| Matthews Japan Fund | | | 4,789,166 | | | | (51,124 | ) | | | 4,738,042 | |
| Matthews Korea Fund | | | 268,228 | | | | — | | | | 268,228 | |
| Matthews Asia Small Companies Fund | | | 563,760 | | | | — | | | | 563,760 | |
| Matthews China Small Companies Fund | | | 29,900 | | | | — | | | | 29,900 | |
In addition to the fees paid to the Funds’ transfer agent, the Funds bear the cost of fees paid to certain service providers or intermediaries, including supermarkets, which provide transfer agency, record-keeping and shareholder servicing to certain shareholders. These fees are referred to as intermediary service fees on the Statements of Assets and Liabilities as well as the Statements of Operations. Additional information concerning these services and fees is contained in the Funds’ prospectuses.
| | | | |
| matthewsasia.com | 800.789.ASIA | | | 151 | |
Notes to Financial Statements (continued)
BNY Mellon Investment Servicing (US) Inc. (“BNY Mellon”), an indirect wholly owned subsidiary of The Bank of New York Mellon Corporation, serves as the Funds’ administrator, and in that capacity, performs various administrative and accounting services for each Fund. BNY Mellon also serves as the Funds’ transfer agent, dividend disbursing agent and registrar. An officer of BNY Mellon serves as Assistant Treasurer to the Funds. Total fees accrued by the Funds for administration and accounting services for the year ended December 31, 2017 were as follows:
| | | | |
| | | Administration and
Accounting fees | |
| Matthews Asia Strategic Income Fund | | | $6,344 | |
| Matthews Asia Credit Opportunities Fund | | | 1,665 | |
| Matthews Asian Growth and Income Fund | | | 224,907 | |
| Matthews Asia Dividend Fund | | | 472,231 | |
| Matthews China Dividend Fund | | | 19,547 | |
| Matthews Asia Value Fund | | | 1,160 | |
| Matthews Asia Focus Fund | | | 966 | |
| Matthews Asia Growth Fund | | | 57,352 | |
| Matthews Pacific Tiger Fund | | | 653,337 | |
| Matthews Asia ESG Fund | | | 1,170 | |
| Matthews Emerging Asia Fund | | | 28,583 | |
| Matthews Asia Innovators Fund | | | 11,773 | |
| Matthews China Fund | | | 55,187 | |
| Matthews India Fund | | | 164,822 | |
| Matthews Japan Fund | | | 280,885 | |
| Matthews Korea Fund | | | 15,731 | |
| Matthews Asia Small Companies Fund | | | 32,979 | |
| Matthews China Small Companies Fund | | | 1,761 | |
Brown Brothers Harriman & Co. serves as the Funds’ custodian. Foreside Funds Distributors LLC, serves as the Funds’ distributor in the United States pursuant to an Underwriting Agreement. Matthews Asia Funds are distributed in Latin America by HMC Partners.
Cross trades for the year ended December 31, 2017, were executed by the Funds pursuant to Rule 17a-7 under the 1940 Act. Cross trading is the buying or selling of portfolio securities between funds to which Matthews International Capital Management, LLC serves as investment advisor. At its regularly scheduled quarterly meetings, the Board reviews such transactions as of the most recent calendar quarter for compliance with the requirements and restrictions set forth by Rule 17a-7. For the year ended December 31, 2017, the purchase and sale transactions with an affiliated fund in compliance with Rule 17a-7 under the 1940 Act were as follows:
| | | | | | | | |
| | | Purchases | | | Sales | |
| Matthews Asia Dividend Fund | | | $6,715,506 | | | | $— | |
| Matthews Japan Fund | | | — | | | | 6,715,506 | |
As of December 31, 2017, Matthews and its affiliates held significant shares in the Funds as follows:
| | | | | | | | |
| | | Shares held by Matthews
and its Affiliates | | | Percentage of
Outstanding Shares | |
| Matthews Asia Strategic Income Fund | | | 1,508,551 | | | | 17% | |
| Matthews Asia Credit Opportunities Fund | | | 1,247,484 | | | | 41% | |
| Matthews Asia Value Fund | | | 158,187 | | | | 7% | |
| Matthews Asia Focus Fund | | | 153,259 | | | | 12% | |
| Matthews Asia ESG Fund | | | 408,203 | | | | 26% | |
| Matthews Asia China Small Companies Fund | | | 505,523 | | | | 17% | |
Certain officers and Trustees of the Funds are also officers and directors of Matthews. All officers serve without compensation from the Funds. The Funds paid the Independent Trustees $1,047,000 in aggregate for regular compensation during the year ended December 31, 2017.
The value of investment transactions made for affiliated and unaffiliated holdings for the year ended December 31, 2017 were as follows:
| | | | | | | | | | | | | | | | |
| | | Affiliated Purchases | | | Proceeds from
Affiliated Sales | | | Unaffiliated Purchases | | | Proceeds from
Unaffiliated Sales | |
| Matthews Asia Strategic Income Fund | | | $— | | | | $— | | | | $46,723,456 | | | | $27,624,228 | |
| Matthews Asia Credit Opportunities Fund | | | — | | | | — | | | | 16,748,016 | | | | 5,210,267 | |
| Matthews Asian Growth and Income Fund | | | — | | | | — | | | | 623,491,355 | | | | 812,225,250 | |
| Matthews Asia Dividend Fund | | | 59,110,331 | | | | 8,019,776 | | | | 2,354,794,771 | | | | 1,627,370,909 | |
| Matthews China Dividend Fund | | | — | | | | — | | | | 215,190,524 | | | | 163,052,767 | |
| Matthews Asia Value Fund | | | — | | | | — | | | | 25,836,146 | | | | 4,171,979 | |
| Matthews Asia Focus Fund | | | — | | | | — | | | | 5,106,188 | | | | 3,295,191 | |
| Matthews Asia Growth Fund | | | — | | | | — | | | | 162,229,100 | | | | 194,279,683 | |
| Matthews Pacific Tiger Fund | | | 120,630,468 | | | | 90,511,870 | | | | 902,665,855 | | | | 637,589,647 | |
| Matthews Asia ESG Fund | | | — | | | | — | | | | 9,424,517 | | | | 3,765,395 | |
| Matthews Emerging Asia Fund | | | — | | | | — | | | | 207,216,744 | | | | 26,453,405 | |
| | | | | | | | | | | | | | | | |
| | | Affiliated Purchases | | | Proceeds from
Affiliated Sales | | | Unaffiliated Purchases | | | Proceeds from
Unaffiliated Sales | |
| Matthews Asia Innovators Fund | | $ | — | | | $ | — | | | | $136,422,486 | | | $ | 95,855,682 | |
| Matthews China Fund | | | — | | | | — | | | | 613,797,180 | | | | 535,684,139 | |
| Matthews India Fund | | | — | | | | 1,343,611 | | | | 500,209,466 | | | | 336,239,850 | |
| Matthews Japan Fund | | | 13,484,156 | | | | 18,121,404 | | | | 1,571,623,009 | | | | 1,503,414,779 | |
| Matthews Korea Fund | | | — | | | | — | | | | 54,096,611 | | | | 48,958,965 | |
| Matthews Asia Small Companies Fund | | | — | | | | — | | | | 265,824,512 | | | | 371,411,974 | |
| Matthews China Small Companies Fund | | | — | | | | — | | | | 23,221,018 | | | | 14,463,324 | |
| 7. | HOLDINGS OF 5% VOTING SHARES OF PORTFOLIO COMPANIES |
The 1940 Act defines “affiliated companies” to include investments in portfolio companies in which a fund owns 5% or more of the outstanding voting shares. During the year ended December 31, 2017, the Funds below held 5% or more of the outstanding voting shares of the noted portfolio companies. During this period, other Funds in the Trust may also have held voting shares of the issuers at levels below 5%.
Investments in affiliates:
A summary of transactions in securities of issuers affiliated with a Fund for the year ended December 31, 2017 is as follows:
| | | | | | | | | | | | | | | | | | | | | | | | | | | | | | | | |
| | | Shares Held at Dec. 31, 2016 | | | Shares Purchased | | | Shares Sold | | | Shares Held at Dec. 31, 2017 | | | Value at Dec. 31, 2017 | | | Dividend Income Jan. 1, 2017–
Dec. 31, 2017 | | | Net Realized Gain (Loss) Jan. 1, 2017– Dec. 31, 2017 | | | Change in
Unrealized
Appreciation
(Depreciation) | |
| | | | | | |
| MATTHEWS ASIA DIVIDEND FUND | | | | | | | | | | | | | | | | | | | | | | | | | |
| Name of Issuer: | | | | | | | | | | | | | | | | | | | | | | | | | | | | | | | | |
Anritsu Corp. | | | 6,321,500 | | | | 3,063,200 | | | | — | | | | 9,384,700 | | | | $105,649,400 | | | | $1,009,284 | | | | $— | | | | $48,308,959 | |
Ascendas India Trust | | | 53,470,700 | | | | — | | | | — | | | | 53,470,700 | | | | 45,976,526 | | | | 2,239,294 | | | | — | | | | 8,588,080 | |
Breville Group, Ltd. | | | 10,644,019 | | | | — | | | | — | | | | 10,644,019 | | | | 104,301,304 | | | | 2,527,282 | | | | — | | | | 37,876,534 | |
CapitaLand Retail China Trust | | | 43,232,400 | | | | 6,567,600 | | | | — | | | | 49,800,000 | | | | 60,320,760 | | | | 4,862,370 | | | | — | | | | 11,736,177 | |
Minth Group, Ltd. | | | 57,963,000 | | | | 5,894,000 | | | | 3,182,000 | | | | 60,675,000 | | | | 364,868,612 | | | | 5,162,870 | | | | 9,835,536 | | | | 160,108,172 | |
Yuexiu Transport Infrastructure, Ltd. | | | 100,968,000 | | | | — | | | | 8,322,000 | | | | 92,646,000 | | | | 68,005,900 | | | | 3,922,481 | | | | 686,574 | | | | 9,609,931 | |
| | | | | | | | | | | | | | | | | | | | |
Total Affiliates | | | | | | | | | | | | | | | | | | | $749,122,502 | | | | $19,723,581 | | | | $10,522,110 | | | | $276,227,853 | |
| | | | | | | | | | | | | | | | | | | | |
| | | | | | |
| MATTHEWS PACIFIC TIGER FUND | | | | | | | | | | | | | | | | | | | | | | | | | |
| Name of Issuer: | | | | | | | | | | | | | | | | | | | | | | | | | | | | | | | | |
Cheil Worldwide, Inc. | | | 6,504,297 | | | | 450,000 | | | | 400,000 | | | | 6,554,297 | | | | $129,794,121 | | | | $1,533,523 | | | | $4,458,552 | | | | $41,219,511 | |
Fuyao Glass Industry Group Co. Ltd. H Shares | | | 34,836,000 | | | | 1,140,400 | | | | 3,000,000 | | | | 32,976,400 | | | | 138,728,638 | | | | 3,514,861 | | | | 2,745,465 | | | | 34,268,309 | |
Green Cross Corp. | | | 776,872 | | | | — | | | | 156,087 | | | | 620,785 | | | | 130,938,011 | | | | 605,193 | | | | 8,787,292 | | | | 49,246,596 | |
Just Dial, Ltd. | | | 3,557,718 | | | | — | | | | — | | | | 3,557,718 | | | | 29,107,208 | | | | — | | | | — | | | | 11,387,658 | |
Orion Holdings Corp. | | | 217,080 | | | | 5,544,797 | †† | | | 95,339 | | | | 5,666,538 | | | | 141,061,359 | | | | 2,651,624 | | | | (17,082,414 | ) | | | (46,231,082 | ) |
Sinopharm Group Co., Ltd. H Shares | | | 35,984,400 | | | | 25,155,200 | | | | — | | | | 61,139,600 | | | | 263,376,635 | | | | 3,307,181 | | | | — | | | | 6,231,713 | |
Synnex Technology International Corp. | | | 103,100,921 | | | | — | | | | 7,500,000 | | | | 95,600,921 | | | | 130,031,465 | | | | 2,529,543 | | | | (1,174,468 | ) | | | 35,326,516 | |
Tata Power Co., Ltd. | | | 171,620,436 | | | | — | | | | 7,000,000 | | | | 164,620,436 | | | | 240,910,125 | | | | 3,352,233 | | | | (7,732,825 | ) | | | 66,089,237 | |
| | | | | | | | | | | | | | | | | | | | |
Total Affiliates | | | | | | | | | | | | | | | | | | | $1,203,947,562 | | | | $17,494,158 | | | | ($9,998,398 | ) | | | $197,538,458 | |
| | | | | | | | | | | | | | | | | | | | |
| | | | | | |
| MATTHEWS EMERGING ASIA FUND | | | | | | | | | | | | | | | | | | | | | | | | | |
| Name of Issuer: | | | | | | | | | | | | | | | | | | | | | | | | | | | | | | | | |
National Seed JSC | | | 979,585 | | | | — | | | | — | | | | 979,585 | | | | $4,671,674 | | | | $129,408 | | | | $— | | | | $685,903 | |
| | | | | | |
| MATTHEWS INDIA FUND | | | | | | | | | | | | | | | | | | | | | | | | | |
| Name of Issuer: | | | | | | | | | | | | | | | | | | | | | | | | | | | | | | | | |
eClerx Services, Ltd. | | | 2,751,931 | | | | — | | | | 50,000 | | | | 2,701,931 | | | | $66,292,305 | | | | $42,181 | | | | $202,048 | | | | $10,368,995 | |
VST Industries, Ltd. | | | 1,185,704 | | | | — | | | | 18,529 | | | | 1,167,175 | | | | 58,602,396 | | | | 1,382,396 | | | | 473,328 | | | | 17,084,012 | |
| | | | | | | | | | | | | | | | | | | | |
Total Affiliates | | | | | | | | | | | | | | | | | | | $124,894,701 | | | | $1,424,577 | | | | $675,376 | | | | $27,453,007 | |
| | | | | | | | | | | | | | | | | | | | |
| | | | | | |
| MATTHEWS JAPAN FUND | | | | | | | | | | | | | | | | | | | | | | | | | |
| Name of Issuer: | | | | | | | | | | | | | | | | | | | | | | | | | | | | | | | | |
Daiken Medical Co., Ltd.† | | | 1,755,200 | | | | — | | | | 767,900 | | | | 987,300 | | | | $— | | | | $— | | | | $— | | | | $— | |
Doshisha Co., Ltd.† | | | 1,989,400 | | | | — | | | | 1,989,400 | | | | — | | | | — | | | | — | | | | — | | | | — | |
Infomart Corp. | | | 6,539,000 | | | | 1,476,100 | | | | 317,800 | | | | 7,697,300 | | | | 45,805,360 | | | | 386,940 | | | | 614,546 | | | | (1,099,476 | ) |
Septeni Holdings Co., Ltd.† | | | 7,039,100 | | | | — | | | | 7,039,100 | | | | — | | | | — | | | | — | | | | — | | | | — | |
TechnoPro Holdings, Inc. | | | 2,045,800 | | | | 71,400 | | | | 397,700 | | | | 1,719,500 | | | | 93,223,119 | | | | 1,695,715 | | | | 3,784,047 | | | | 36,789,155 | |
W-Scope Corp. | | | 2,315,300 | | | | — | | | | 267,700 | | | | 2,047,600 | | | | 42,311,292 | | | | 40,686 | | | | 614,878 | | | | 12,046,381 | |
| | | | | | | | | | | | | | | | | | | | |
Total Affiliates | | | | | | | | | | | | | | | | | | | $181,339,771 | | | | $2,123,341 | | | | $5,013,471 | | | | $47,736,060 | |
| | | | | | | | | | | | | | | | | | | | |
| † | Issuer was not an affiliated company as of December 31, 2017. |
| †† | Includes stock spin-off and stock dividend during the period. |
| | | | |
| matthewsasia.com | 800.789.ASIA | | | 153 | |
Notes to Financial Statements (continued)
It is the policy of the Funds to comply with all requirements of the Internal Revenue Code of 1986, as amended (“the Code”), applicable to regulated investment companies and to distribute substantially all of their taxable income to their shareholders. The Funds have met the requirements of the Code applicable to regulated investment companies for the year ended December 31, 2017. Therefore, no federal income tax provision is required.
Management has analyzed the Funds’ tax positions taken on federal income tax returns for all open tax years (current and prior three tax years), and has concluded that no provision for federal income tax is required in the Funds’ financial statements. The Funds’ federal and state income and federal excise tax returns for tax years for which the applicable statutes of limitations have not expired are subject to examination by the Internal Revenue Service and state departments of revenue.
As of December 31, 2017, the components of accumulated earnings/deficit on tax basis were as follows:
| | | | | | | | | | | | |
| | | Undistributed
Ordinary Income | | | Undistributed
Long-Term
Capital Gains | | | Capital Loss Carryforwards | |
| Matthews Asia Strategic Income Fund | | | $200,732 | | | | $— | | | | ($1,646,348 | ) |
| Matthews Asia Credit Opportunities Fund | | | 308 | | | | — | | | | — | |
| Matthews Asian Growth and Income Fund | | | 10,729,977 | | | | 73,770,050 | | | | — | |
| Matthews Asia Dividend Fund | | | 21,779,499 | | | | — | | | | — | |
| Matthews China Dividend Fund | | | 3,396,261 | | | | 2,083,770 | | | | — | |
| Matthews Asia Value Fund | | | 352,546 | | | | 158,118 | | | | — | |
| Matthews Asia Focus Fund | | | 67,097 | | | | — | | | | (641,455 | ) |
| Matthews Asia Growth Fund | | | 8,510,896 | | | | 5,826,631 | | | | — | |
| Matthews Pacific Tiger Fund | | | 95,997,249 | | | | 68,296,687 | | | | — | |
| Matthews Asia ESG Fund | | | 110,309 | | | | 222,116 | | | | — | |
| Matthews Emerging Asia Fund | | | — | | | | 7,589 | | | | — | |
| Matthews Asia Innovators Fund | | | 1,092,195 | | | | 5,534,303 | | | | — | |
| Matthews China Fund | | | — | | | | 13,795,818 | | | | — | |
| Matthews India Fund | | | — | | | | 51,309,970 | | | | — | |
| Matthews Japan Fund | | | 18,678,111 | | | | 25,816,033 | | | | — | |
| Matthews Korea Fund | | | 1,195,657 | | | | 8,413,978 | | | | — | |
| Matthews Asia Small Companies Fund | | | 1,110,647 | | | | 9,767,047 | | | | — | |
| Matthews China Small Companies Fund | | | — | | | | 670,904 | | | | — | |
| | | | | | | | | | | | | | | | |
| | | Late Year Losses* | | | Other Temporary Differences | | | Unrealized Appreciation (Depreciation)** | | | Total Accumulated Earnings/(Deficit) | |
| Matthews Asia Strategic Income Fund | | | $— | | | | $— | | | | $3,015,958 | | | | $1,570,342 | |
| Matthews Asia Credit Opportunities Fund | | | — | | | | — | | | | 490,232 | | | | 490,540 | |
| Matthews Asian Growth and Income Fund | | | — | | | | — | | | | 401,072,809 | | | | 485,572,836 | |
| Matthews Asia Dividend Fund | | | (82,668,298 | ) | | | (17,768 | ) | | | 1,912,517,212 | | | | 1,851,610,645 | |
| Matthews China Dividend Fund | | | — | | | | — | | | | 47,889,611 | | | | 53,369,642 | |
| Matthews Asia Value Fund | | | — | | | | — | | | | 1,264,117 | | | | 1,774,781 | |
| Matthews Asia Focus Fund | | | — | | | | — | | | | 2,447,545 | | | | 1,873,187 | |
| Matthews Asia Growth Fund | | | — | | | | — | | | | 275,871,478 | | | | 290,209,005 | |
| Matthews Pacific Tiger Fund | | | — | | | | — | | | | 3,642,809,338 | | | | 3,807,103,274 | |
| Matthews Asia ESG Fund | | | — | | | | — | | | | 2,566,223 | | | | 2,898,648 | |
| Matthews Emerging Asia Fund | | | — | | | | — | | | | 79,720,784 | | | | 79,728,373 | |
| Matthews Asia Innovators Fund | | | — | | | | (229 | ) | | | 58,507,939 | | | | 65,134,208 | |
| Matthews China Fund | | | — | | | | (606 | ) | | | 200,646,730 | | | | 214,441,942 | |
| Matthews India Fund | | | (29,724 | ) | | | (6,469 | ) | | | 721,069,760 | | | | 772,343,537 | |
| Matthews Japan Fund | | | — | | | | — | | | | 941,523,086 | | | | 986,017,230 | |
| Matthews Korea Fund | | | — | | | | — | | | | 85,469,833 | | | | 95,079,468 | |
| Matthews Asia Small Companies Fund | | | — | | | | — | | | | 73,727,996 | | | | 84,605,690 | |
| Matthews China Small Companies Fund | | | — | | | | — | | | | 6,811,224 | | | | 7,482,128 | |
| * | The Funds have elected to defer certain qualified late-year losses and recognize such losses in the next fiscal year. |
| ** | The differences between book-basis and tax-basis unrealized appreciation/depreciation is attributable primarily to the tax deferral of losses on wash sales and passive foreign investment company (PFIC) mark to market adjustments. |
As of December 31, 2017, the Funds have capital loss carryforwards available to offset future realized capital gains through the indicated expiration dates as follows:
| | | | | | | | | | | | |
| | | Amount With No Expiration* | | | | |
| | | Short-term
Losses | | | Long-term
Losses | | | Total | |
| Matthews Asia Strategic Income Fund | | | $1,593,006 | | | | $53,342 | | | | $1,646,348 | |
| Matthews Asia Focus Fund | | | 110,658 | | | | 530,797 | | | | 641,455 | |
| * | Post-Enactment Losses. Must be utilized prior to losses subject to expiration. |
The following Funds utilized capital loss carryforwards in the current year:
| | | | |
| | | Utilized Capital Loss Carryforwards | |
| Matthews Asia Strategic Income Fund | | | $557,191 | |
| Matthews Asia Focus Fund | | | 252,725 | |
| Matthews Asia ESG Fund | | | 42,774 | |
| Matthews Asia Small Companies Fund | | | 1,481,217 | |
Under the Regulated Investment Company Modernization Act of 2010, the Funds are permitted to carry forward capital losses incurred in taxable years beginning after December 22, 2010 for an unlimited period. However, any losses incurred during those future taxable years will be required to be utilized prior to any losses incurred in pre-enactment taxable years, which generally expire after eight years from when they are incurred. Additionally, post-enactment capital losses that are carried forward will retain their character as either short-term or long-term capital losses rather than being considered all short-term as under previous law.
U.S. GAAP requires that certain components of net assets be reclassified between financial and tax reporting. These reclassifications have no effect on net assets or NAV. The permanent differences are primarily attributable to investments in PFICs, non-deductible expenses, foreign currency reclassification, NOL (net operating loss) adjustments, capital gains tax, distributions in excess of current earnings and profits, re-characterization of distributions, investment in swaps, adjustments on distributions related to taxable spinoffs and the utilization of accumulated earnings and profits distributed to shareholders on redemptions of shares as part of the dividends paid deduction for income tax purposes. For the year ended December 31, 2017, permanent differences in book and tax accounting have been reclassified to paid-in capital, undistributed net investment income (loss) and accumulated realized gain (loss) as follows:
| | | | | | | | | | | | |
| | | Increase/ (Decrease) Paid-in-Capital | | | Increase/(Decrease) Undistributed Net
Investment Income/(Loss) | | | Increase/
(Decrease)
Accumulated Realized Gain/(Loss) | |
| Matthews Asia Strategic Income Fund | | | $— | | | | ($26,922 | ) | | | $26,922 | |
| Matthews Asia Credit Opportunities Fund | | | (33,230 | ) | | | 28,402 | | | | 4,828 | |
| Matthews Asian Growth and Income Fund | | | — | | | | 45,637,671 | | | | (45,637,671 | ) |
| Matthews Asia Dividend Fund | | | — | | | | 111,963,909 | | | | (111,963,909 | ) |
| Matthews China Dividend Fund | | | 2,293,142 | | | | (473,092 | ) | | | (1,820,050 | ) |
| Matthews Asia Value Fund | | | 42,867 | | | | (21,113 | ) | | | (21,754 | ) |
| Matthews Asia Focus Fund | | | — | | | | 1,751 | | | | (1,751 | ) |
| Matthews Asia Growth Fund | | | 2,530,582 | | | | 1,917,321 | | | | (4,447,903 | ) |
| Matthews Pacific Tiger Fund | | | — | | | | 486,761 | | | | (486,761 | ) |
| Matthews Asia ESG Fund | | | — | | | | 13,434 | | | | (13,434 | ) |
| Matthews Emerging Asia Fund | | | (2,809 | ) | | | (260,240 | ) | | | 263,049 | |
| Matthews Asia Innovators Fund | | | 203,130 | | | | 4,792,085 | | | | (4,995,215 | ) |
| Matthews China Fund | | | 8,263,465 | | | | 1,843,910 | | | | (10,107,375 | ) |
| Matthews India Fund | | | (4,927,142 | ) | | | 4,400,141 | | | | 527,001 | |
| Matthews Japan Fund | | | — | | | | 1,273,535 | | | | (1,273,535 | ) |
| Matthews Korea Fund | | | 475,868 | | | | 4,701,352 | | | | (5,177,220 | ) |
| Matthews Asia Small Companies Fund | | | 2,609,859 | | | | (60,903 | ) | | | (2,548,956 | ) |
| Matthews China Small Companies Fund | | | 269,337 | | | | (68,844 | ) | | | (200,493 | ) |
| | | | |
| matthewsasia.com | 800.789.ASIA | | | 155 | |
Notes to Financial Statements (continued)
As of December 31, 2017, the tax cost of investments, including derivatives, and the related net unrealized appreciation and depreciation were as follows:
| | | | | | | | | | | | | | | | |
| | | Tax Cost | | | Gross
Unrealized
Appreciation | | | Gross
Unrealized
Depreciation | | | Net Unrealized
Appreciation | |
| Matthews Asia Strategic Income Fund | | | $85,419,545 | | | | $3,696,295 | | | | ($614,851 | ) | | | $3,081,444 | |
| Matthews Asia Credit Opportunities Fund | | | 27,266,358 | | | | 675,234 | | | | (185,542 | ) | | | 489,692 | |
| Matthews Asian Growth and Income Fund | | | 2,359,613,964 | | | | 562,079,905 | | | | (160,921,337 | ) | | | 401,158,568 | |
| Matthews Asia Dividend Fund | | | 5,058,381,441 | | | | 2,085,210,072 | | | | (168,428,862 | ) | | | 1,916,781,210 | |
| Matthews China Dividend Fund | | | 257,003,435 | | | | 56,471,600 | | | | (8,730,978 | ) | | | 47,740,622 | |
| Matthews Asia Value Fund | | | 25,818,944 | | | | 2,219,751 | | | | (956,531 | ) | | | 1,263,220 | |
| Matthews Asia Focus Fund | | | 12,742,765 | | | | 2,871,548 | | | | (416,628 | ) | | | 2,454,920 | |
| Matthews Asia Growth Fund | | | 533,209,623 | | | | 300,435,711 | | | | (22,707,110 | ) | | | 277,728,601 | |
| Matthews Pacific Tiger Fund | | | 5,859,210,329 | | | | 4,155,501,126 | | | | (510,002,183 | ) | | | 3,645,498,943 | |
| Matthews Asia ESG Fund | | | 15,278,575 | | | | 3,382,587 | | | | (749,309 | ) | | | 2,633,278 | |
| Matthews Emerging Asia Fund | | | 387,113,579 | | | | 129,072,914 | | | | (44,973,196 | ) | | | 84,099,718 | |
| Matthews Asia Innovators Fund | | | 139,915,688 | | | | 59,108,150 | | | | (187,075 | ) | | | 58,921,075 | |
| Matthews China Fund | | | 691,113,691 | | | | 221,725,054 | | | | (21,125,445 | ) | | | 200,599,609 | |
| Matthews India Fund | | | 1,522,279,307 | | | | 763,763,906 | | | | (33,129,154 | ) | | | 730,634,752 | |
| Matthews Japan Fund | | | 3,064,282,233 | | | | 966,944,085 | | | | (25,428,765 | ) | | | 941,515,320 | |
| Matthews Korea Fund | | | 133,881,468 | | | | 86,712,561 | | | | (1,256,534 | ) | | | 85,456,027 | |
| Matthews Asia Small Companies Fund | | | 344,705,128 | | | | 91,152,672 | | | | (16,947,024 | ) | | | 74,205,648 | |
| Matthews China Small Companies Fund | | | 27,397,160 | | | | 7,372,148 | | | | (560,928 | ) | | | 6,811,220 | |
Management has evaluated the impact of all subsequent events on the Funds through the date the financial statements were issued, and has determined that there were no subsequent events that require recognition or disclosure in the financial statements.
Report of Independent Registered Public Accounting Firm
To the Board of Trustees of Matthews Asia Funds and Shareholders of Matthews Asia Strategic Income Fund, Matthews Asia Credit Opportunities Fund, Matthews Asian Growth and Income Fund, Matthews Asia Dividend Fund, Matthews China Dividend Fund, Matthews Asia Value Fund, Matthews Asia Focus Fund, Matthews Asia Growth Fund, Matthews Pacific Tiger Fund, Matthews Asia ESG Fund, Matthews Emerging Asia Fund, Matthews Asia Innovators Fund, Matthews China Fund, Matthews India Fund, Matthews Japan Fund, Matthews Korea Fund, Matthews Asia Small Companies Fund, and Matthews China Small Companies Fund
Opinions on the Financial Statements
We have audited the accompanying statements of assets and liabilities, including the schedules of investments, of Matthews Asia Strategic Income Fund, Matthews Asia Credit Opportunities Fund, Matthews Asian Growth and Income Fund, Matthews Asia Dividend Fund, Matthews China Dividend Fund, Matthews Asia Value Fund, Matthews Asia Focus Fund, Matthews Asia Growth Fund, Matthews Pacific Tiger Fund, Matthews Asia ESG Fund, Matthews Emerging Asia Fund, Matthews Asia Innovators Fund, Matthews China Fund, Matthews India Fund, Matthews Japan Fund, Matthews Korea Fund, Matthews Asia Small Companies Fund and Matthews China Small Companies Fund (constituting Matthews Asia Funds, hereafter collectively referred to as the “Funds”) as of December 31, 2017, the related statements of operations for the year ended December 31, 2017, the statements of changes in net assets for each of the two years in the period ended December 31, 2017, or for Matthews Asia Credit Opportunities Fund, for the year ended December 31, 2017 and for the period April 29, 2016 (commencement of operations) through December 31, 2016, including the related notes, and the financial highlights for each of the periods indicated therein (collectively referred to as the “financial statements”). In our opinion, the financial statements present fairly, in all material respects, the financial position of each of the Funds as of December 31, 2017, the results of each of their operations for the year then ended, the changes in each of their net assets for each of the two years in the period ended December 31, 2017, or for Matthews Asia Credit Opportunities Fund, for the year ended December 31, 2017 and for the period April 29, 2016 (commencement of operations) through December 31, 2016 and the financial highlights for each of the periods indicated therein in conformity with accounting principles generally accepted in the United States of America.
Basis for Opinions
These financial statements are the responsibility of the Funds’ management. Our responsibility is to express an opinion on the Funds’ financial statements based on our audits. We are a public accounting firm registered with the Public Company Accounting Oversight Board (United States) (“PCAOB”) and are required to be independent with respect to the Funds in accordance with the U.S. federal securities laws and the applicable rules and regulations of the Securities and Exchange Commission and the PCAOB.
We conducted our audits of these financial statements in accordance with the standards of the PCAOB. Those standards require that we plan and perform the audit to obtain reasonable assurance about whether the financial statements are free of material misstatement, whether due to error or fraud.
Our audits included performing procedures to assess the risks of material misstatement of the financial statements, whether due to error or fraud, and performing procedures that respond to those risks. Such procedures included examining, on a test basis, evidence regarding the amounts and disclosures in the financial statements. Our audits also included evaluating the accounting principles used and significant estimates made by management, as well as evaluating the overall presentation of the financial statements. Our procedures included confirmation of securities owned as of December 31, 2017 by correspondence with the custodian and brokers; when replies were not received from brokers, we performed other auditing procedures. We believe that our audits provide a reasonable basis for our opinions.
PricewaterhouseCoopers LLP
San Francisco, CA
February 26, 2018
We have served as the auditor of one or more investment companies in Matthews Asia Funds since 2007.
| | | | |
| matthewsasia.com | 800.789.ASIA | | | 157 | |
Tax Information (unaudited)
For shareholders who do not have a December 31, 2017 tax year-end, this notice is for informational purposes. For the period January 1, 2017 to December 31, 2017, the Funds report the following items with regard to distributions paid during the period. All reports are based on financial information available as of the date of this annual report and, accordingly, are subject to change. For each item, it is the intention of each Fund to report the maximum amount permitted under the Internal Revenue Code and the regulations thereunder.
1. Qualified Dividend Income
The Funds report a portion of the ordinary income distributed during the year ended December 31, 2017 as Qualified Dividend Income (“QDI”) as defined in the Internal Revenue code as follows:
| | | | |
| | | QDI Portion | |
| Matthews Asia Strategic Income Fund | | | 0.00% | |
| Matthews Asia Credit Opportunities Fund | | | 0.00% | |
| Matthews Asian Growth and Income Fund | | | 43.15% | |
| Matthews Asia Dividend Fund | | | 82.56% | |
| Matthews China Dividend Fund | | | 20.02% | |
| Matthews Asia Value Fund | | | 11.89% | |
| Matthews Asia Focus Fund | | | 80.17% | |
| Matthews Asia Growth Fund | | | 54.85% | |
| Matthews Pacific Tiger Fund | | | 52.03% | |
| Matthews Asia ESG Fund | | | 21.96% | |
| Matthews Emerging Asia Fund | | | 100.00% | |
| Matthews Asia Innovators Fund | | | 74.43% | |
| Matthews China Fund | | | 19.20% | |
| Matthews India Fund | | | 100.00% | |
| Matthews Japan Fund | | | 73.21% | |
| Matthews Korea Fund | | | 73.69% | |
| Matthews Asia Small Companies Fund | | | 22.66% | |
| Matthews China Small Companies Fund | | | 11.94% | |
2. Dividends Received Deduction
The Funds report a Dividend Received Deduction pursuant to Section 854 of the Internal Revenue Code for the year ended December 31, 2017 as follows:
| | | | |
| Matthews Asia Strategic Income Fund | | | 0.00% | |
| Matthews Asia Credit Opportunities Fund | | | 0.00% | |
| Matthews Asian Growth and Income Fund | | | 2.06% | |
| Matthews Asia Dividend Fund | | | 0.00% | |
| Matthews China Dividend Fund | | | 0.00% | |
| Matthews Asia Value Fund | | | 0.44% | |
| Matthews Asia Focus Fund | | | 8.35% | |
| Matthews Asia Growth Fund | | | 0.00% | |
| Matthews Pacific Tiger Fund | | | 1.12% | |
| Matthews Asia ESG Fund | | | 0.00% | |
| Matthews Emerging Asia Fund | | | 0.00% | |
| Matthews Asia Innovators Fund | | | 0.00% | |
| Matthews China Fund | | | 0.00% | |
| Matthews India Fund | | | 0.00% | |
| Matthews Japan Fund | | | 0.00% | |
| Matthews Korea Fund | | | 0.00% | |
| Matthews Asia Small Companies Fund | | | 0.00% | |
| Matthews China Small Companies Fund | | | 0.00% | |
3. Long-Term Capital Gain Distributions
The Funds report Long-Term Capital Gain distributions pursuant to Section 852(b)(3) of the Internal Revenue Code for the year ended December 31, 2017 as follows:
| | | | |
| | | Long-Term Capital Gains | |
| Matthews Asia Credit Opportunities Fund | | | $111,284 | |
| Matthews Asian Growth and Income Fund | | | 42,640,486 | |
| Matthews Asia Dividend Fund | | | 144,064,822 | |
| Matthews China Dividend Fund | | | 12,048,945 | |
| Matthews Asia Value Fund | | | 265,211 | |
| Matthews Asia Growth Fund | | | 45,847,848 | |
| Matthews Pacific Tiger Fund | | | 54,354,798 | |
| Matthews Asia ESG Fund | | | 142,064 | |
| Matthews Emerging Asia Fund | | | 910,694 | |
| Matthews Asia Innovators Fund | | | 13,051,975 | |
| Matthews China Fund | | | 33,489,520 | |
| Matthews Japan Fund | | | 118,095,898 | |
| Matthews India Fund | | | 32,428,674 | |
| Matthews Korea Fund | | | 10,189,013 | |
| Matthews Asia Small Companies Fund | | | 20,779,556 | |
| Matthews China Small Companies Fund | | | 842,837 | |
4. Foreign Taxes Paid
The Funds have elected to pass through to their shareholders the foreign taxes paid for year ended December 31, 2017 as follows:
| | | | | | | | |
| | | Foreign Source Income | | | Foreign Taxes Paid | |
| Matthews Asia Strategic Income Fund | | | $4,668,061 | | | | $151,034 | |
| Matthews Asia Credit Opportunities Fund | | | — | | | | — | |
| Matthews Asian Growth and Income Fund | | | 84,512,767 | | | | 4,471,716 | |
| Matthews Asia Dividend Fund | | | 282,665,113 | | | | 9,338,802 | |
| Matthews China Dividend Fund | | | 8,446,829 | | | | 156,326 | |
| Matthews Asia Value Fund | | | 407,031 | | | | 39,621 | |
| Matthews Asia Focus Fund | | | 313,558 | | | | 16,567 | |
| Matthews Asia Growth Fund | | | 9,933,982 | | | | 818,711 | |
| Matthews Pacific Tiger Fund | | | 148,448,492 | | | | 12,292,642 | |
| Matthews Asia ESG Fund | | | 295,996 | | | | 36,687 | |
| Matthews Emerging Asia Fund | | | 7,635,353 | | | | 701,392 | |
| Matthews Asia Innovators Fund | | | 4,180,448 | | | | 211,860 | |
| Matthews China Fund | | | 15,455,927 | | | | 344,485 | |
| Matthews Japan Fund | | | 50,574,337 | | | | 4,116,658 | |
| Matthews Korea Fund | | | 7,897,567 | | | | 780,392 | |
| Matthews Asia Small Companies Fund | | | 7,030,767 | | | | 619,209 | |
| Matthews China Small Companies Fund | | | 492,731 | | | | 15,918 | |
| | | | |
| matthewsasia.com | 800.789.ASIA | | | 159 | |
Tax Information (unaudited) (continued)
5. Qualified Interest Income
The Funds report a portion of the net income dividends distributed during the year ended December 31, 2017, as Qualified Interest Income (QII), as defined in the Internal Revenue Code as follows:
| | | | |
| | | QII Portion | |
| Matthews Asia Strategic Income Fund | | | 2.60% | |
| Matthews Asia Credit Opportunities Fund | | | 0.98% | |
| Matthews Asian Growth and Income Fund | | | 0.45% | |
| Matthews Asia Dividend Fund | | | 0.07% | |
| Matthews China Dividend Fund | | | 0.28% | |
| Matthews Asia Value Fund | | | 1.14% | |
| Matthews Asia Focus Fund | | | 0.22% | |
| Matthews Asia Growth Fund | | | 0.24% | |
| Matthews Pacific Tiger Fund | | | 0.97% | |
| Matthews Asia ESG Fund | | | 0.30% | |
| Matthews Emerging Asia Fund | | | 0.27% | |
| Matthews Asia Innovators Fund | | | 0.16% | |
| Matthews China Fund | | | 0.25% | |
| Matthews India Fund | | | 0.23% | |
| Matthews Japan Fund | | | 0.54% | |
| Matthews Korea Fund | | | 0.13% | |
| Matthews Asia Small Companies Fund | | | 1.80% | |
| Matthews China Small Companies Fund | | | 0.76% | |
6. Qualified Short-Term Capital Gain Dividends
The Funds report a portion of the short term capital gain dividends distributed during the year ended December 31, 2017, as Qualified Short-Term Gain, as defined in the Internal Revenue Code as follows:
| | | | |
| | | Short-Term Gains | |
| Matthews Asia Strategic Income Fund | | | 0.00% | |
| Matthews Asia Credit Opportunities Fund | | | 100.00% | |
| Matthews Asian Growth and Income Fund | | | 100.00% | |
| Matthews Asia Dividend Fund | | | 0.00% | |
| Matthews China Dividend Fund | | | 100.00% | |
| Matthews Asia Value Fund | | | 100.00% | |
| Matthews Asia Focus Fund | | | 0.00% | |
| Matthews Asia Growth Fund | | | 100.00% | |
| Matthews Pacific Tiger Fund | | | 100.00% | |
| Matthews Asia ESG Fund | | | 100.00% | |
| Matthews Emerging Asia Fund | | | 100.00% | |
| Matthews Asia Innovators Fund | | | 0.00% | |
| Matthews China Fund | | | 100.00% | |
| Matthews India Fund | | | 0.00% | |
| Matthews Japan Fund | | | 100.00% | |
| Matthews Korea Fund | | | 0.00% | |
| Matthews Asia Small Companies Fund | | | 100.00% | |
| Matthews China Small Companies Fund | | | 100.00% | |
Approval of Advisory Agreement (unaudited)
The Funds, which are series of the Trust, have retained Matthews International Capital Management, LLC (“Matthews”) to manage their assets pursuant to an Investment Advisory Agreement dated as of February 1, 2016, as amended (the “Advisory Agreement”), which has been approved by the Board of Trustees of the Funds, including all of the Trustees who are not “interested persons,” as that term is defined in the of the Investment Company Act of 1940, as amended (the “1940 Act”) (“Independent Trustees”), as well as by the existing shareholders or the initial shareholder of each Fund. Following an initial two-year term with respect to each Fund upon its commencement of operations, the Advisory Agreement continues in effect from year-to-year provided that the continuance is specifically approved at least annually by the vote of the holders of at least a majority of the outstanding shares of the Funds, or by the Board of Trustees, and, in either event, by a majority of the Independent Trustees of the Trust casting votes in person at a meeting called for that purpose (the “Annual 15(c) Process”).
At a meeting held on August 23 and 24, 2017 (the “Meeting”), the Board, including the Independent Trustees of the Trust, approved the continuation of the Advisory Agreement for an additional one-year term beginning February 1, 2018 with respect to each Fund.
At the Meeting and at prior meetings, the Board received and considered information (both written and oral) provided to assist it in the review of the Advisory Agreement and made assessments with respect to each Fund. The Independent Trustees were advised by independent legal counsel with respect to these matters. In addition, the Board received in-person presentations about the Funds throughout the year. Among the information considered by the Board were responses to a detailed information request sent on behalf of the Independent Trustees by their independent legal counsel. Matthews furnished extensive information in response to this request with respect to many subjects relating to the Advisory Agreement and intended to address many of the factors discussed below, including but not limited to information about the services provided by Matthews, its structure, organization, operations and personnel, the financial condition of Matthews and the profitability to Matthews from the Advisory Agreement, compliance procedures and resources, investment performance of the Funds, expenses of the Funds, brokerage and portfolio transactions, distribution and marketing of the Funds, shareholder services and relationships with intermediaries, and other information considered relevant.
In considering information relating to advisory fee levels, the Board considered, among other things, information provided by Matthews as to Fund advisory services and fees as compared to advisory services and fees charged by Matthews to its institutional clients and pooled vehicles organized outside of the United States. The Trustees also considered information provided by an independent data provider, Broadridge, comparing the investment performance and the fee and expense levels of each Fund to appropriate peer groups of mutual funds. The Independent Trustees also retained an independent consultant (“Independent Consultant”), with
substantial industry experience in providing fund boards with analysis to assist them in their Annual 15(c) Process, to assist them in their review of this information. Furthermore, throughout the course of the year, the Board received a wide variety of materials relating to the services provided by Matthews, including reports on each Fund’s investment results, portfolio composition, portfolio trading practices, shareholder services, and other information relating to the nature, extent, and quality of services provided by Matthews to the Funds. The Board also took into account that, under the Administration and Shareholder Services Agreement, Matthews provides additional services to the Funds that are essential to the operation of the Funds and that, although Matthews is separately compensated under that agreement, these additional services are provided in connection with Matthews’ advisory relationship with the Funds.
In addition to the information furnished by Matthews, the Trustees were provided with a legal memorandum from their independent legal counsel discussing their fiduciary duties related to their approval of the continuation of the Advisory Agreement and discussed these matters with their counsel.
Prior to the Meeting, the Independent Trustees had met separately with the Independent Consultant and their independent legal counsel to review the information provided in connection with the Annual 15(c) Process. At this session, the Independent Trustees asked Matthews to provide certain additional information and to respond to certain additional questions at the Meeting. The Independent Trustees then reviewed this supplemental information at the Meeting. The Independent Trustees discussed the renewal of the Advisory Agreement with representatives of Matthews and among themselves in private sessions on various occasions at which no representatives of Matthews were present.
The Trustees’ determinations at the Meeting were made on the basis of each Trustee’s business judgment after consideration of all the information presented. In deciding to recommend the renewal of the Advisory Agreement with respect to each Fund, the Independent Trustees did not identify any single or particular piece of information that, in isolation, was the controlling factor. Each Independent Trustee may also have weighed factors differently. This summary describes the most important, but not all, of the factors considered by the Board and the Independent Trustees.
| 1. | The nature, extent and quality of the services provided by Matthews under the Advisory Agreement. The Trustees considered the overall financial strength and stability of Matthews and its ability to provide a high level and quality of services to the Funds. The Trustees considered the experience and qualifications of the executive and portfolio management personnel at Matthews who are responsible for providing services to the Funds and who are responsible for the daily management of the Funds’ portfolios. The Trustees noted that Matthews has expanded its professional staff at both senior and junior levels over the past several years, and has enjoyed relative stability of its senior executives and portfolio management. They also reviewed Matthews’ recent |
| | | | |
| matthewsasia.com | 800.789.ASIA | | | 161 | |
Approval of Investment Advisory Agreement (unaudited) (continued)
| | hiring to further strengthen or maintain current capabilities and to support future potential growth of assets and the expansion of its business. Among other improved capabilities over the past several years are enhanced risk analytical resources and related professionals. The Trustees noted in this regard the appointment of a new Global Head of Risk and Compliance and further noted on-going enhancements to compliance, risk management, technology, business infrastructure, operations, marketing and client service, as well as enhancements to financial intermediary oversight and valuation practices. |
The Trustees viewed Matthews as well positioned to continue to provide high quality services to the Funds under various market conditions, as demonstrated by past periods of volatile and challenging securities markets that have caused either contracting revenues or rapidly expanding assets at different times. The Trustees attributed much of that past stability to Matthews’ emphasis on preserving and enhancing portfolio management team resources, careful business planning and management, as well as its solid financial condition and strong cash reserves.
As in past years, the Trustees considered the technical capabilities of Matthews, including design and implementation of a disaster recovery and business continuity infrastructure. The Trustees also considered the Chief Compliance Officer’s report regarding Matthews’ compliance resources, risk assessment and other compliance initiatives and programs. The Trustees concluded that Matthews has implemented a robust and diligent compliance process, and demonstrates a strong commitment to a culture of compliance. The Independent Trustees took into consideration Matthews’ description of its supervision of the activities of the Funds’ various service providers, as well as supporting the Independent Trustees’ responsibilities and requests and its responsiveness to questions and/or concerns raised by the Trustees throughout the year. The Trustees noted the significant role played by Matthews with respect to the valuation of portfolio securities, including research and analysis related to fair valued securities and due diligence and oversight of pricing vendors.
The Trustees concluded that Matthews had the quality of personnel and other investment resources essential to performing its duties under the Advisory Agreement, and that the nature, overall quality, cost and extent of such management services are fully satisfactory.
| 2. | The investment performance of the Funds. The Trustees reviewed the short-term and long-term performance of each Fund on both an absolute basis and in comparison to appropriate peer funds and benchmark indices for various periods ending June 30, 2017. The Trustees considered investment results in light of each Funds’ objective, strategies and market conditions, noting periods during which there were challenging investment conditions in various Asian markets. The Trustees also noted the difficulty of fairly benchmarking performance for certain of the Funds as well as the difficulty of establishing appropriate peer |
| | groups for certain of the Funds due to the lack of other funds with a similar investment focus. The Independent Trustees reviewed information as to peer group selections presented by Broadridge and reviewed by their Independent Consultant. After consultation with Matthews and their Independent Consultant, the Trustees determined to broadly consider comparative peer performance for each Fund against the universe identified as the “PUSH Universe” by Broadridge (“Selected Performance Peer Group” or the “peer group”). |
The Trustees reviewed each Fund’s performance on a case-by-case basis and noted that some Funds had outperformed their Selected Performance Peer Group over certain periods and/or exceeded the return of their respective benchmark while others underperformed their Selected Performance Peer Group over certain periods and/or trailed the return of their respective benchmark. In considering each Fund’s investment results, the Board placed greater emphasis on each Fund’s long-term performance track record rather than shorter-term performance. The Board also took into account that each Fund’s track record is measured as of a specific date, and that track records can vary as of different measurement dates. Therefore, in reviewing a Fund that is currently underperforming, the Trustees also considered the broader perspective of the Fund’s performance over varying time periods, the market conditions experienced during the periods under review, as well as the outlook for the Fund going forward in light of expected future market conditions.
The Trustees discussed with Matthews the fact that certain periods of underperformance may be transitory while other periods of underperformance may be caused by factors that warrant further consideration. To the extent of any concerns about performance with respect to any particular period for a Fund, the Trustees noted that Matthews had provided an explanation for that performance and explained its reasons for maintaining a consistent investment philosophy. In addition, the Trustees recognized actions taken by Matthews from time to time in response to performance concerns, such as changes to members of a portfolio management team. A summary of each Fund’s performance track record is provided below.
For Matthews Pacific Tiger Fund, the Trustees noted that the Fund’s performance was very strong in the three-year, five-year and ten-year periods, ranking in the first quintile for those periods against the peer group (and first of two funds in the peer group for the since-inception period), but well below the median for the shorter one-year period.
For Matthews Asian Growth and Income Fund, the Trustees noted that the Fund ranked in the first quintile of its peer group for the ten-year period and first of two funds in the peer group for the since-inception period, but was below the median for the one-year, three-year and five-year periods. The Trustees noted Matthews’ explanation that much of the recent underperformance was the result of a relatively weak 2016 and that other periods of performance have been strong.
Approval of Advisory Agreement (unaudited) (continued)
For Matthews Korea Fund, the Trustees noted that the Fund had enjoyed favorable relative performance for the three-, five-, ten-year and since-inception periods, but below the median for the one-year period. The Trustees took into account, however, that the peer universe for the Fund was very small, with only a few comparable funds and that therefore relative peer performance was of less utility than if the peer universe were larger. The Trustees also considered the performance of the Fund compared to a Korean-focused benchmark index despite various limitations with respect to that comparison (such as the large single-issuer concentration of the index).
For Matthews China Fund, the Trustees noted that the Fund had outperformed the median of its peer funds over the one-year, three-year, ten-year and since-inception periods, ranking in the first or second quintile for those periods. The Trustees discussed the reasons for the Fund’s below-median performance for the five-year period and noted past changes to the portfolio management team for this Fund as well as Matthews’ explanation of its investment strategy and process.
For Matthews Japan Fund, the Trustees noted that the Fund’s performance was favorable compared to its peer funds over the three-year, five-year, ten-year and since-inception periods, ranking above the median, but in the bottom quintile for the one-year period. The Trustees took into account however, that the peer universe for the Fund was very small, with only a few comparable funds and that therefore relative peer performance was of less utility than if the peer universe were larger.
For Matthews Asia Innovators Fund, the Trustees noted that the Fund’s performance was either at or above the median of its peer funds over the one-year, three-year, five-year and ten-year periods, but less favorable than the median of its peer funds for the period since inception. The Trustees noted the absence of a directly comparable peer group with the same Asia focused industry concentration even though the Fund slightly expanded its investment focus starting in 2016. The Trustees also acknowledged Matthews’ explanation about the volatile asset class in which the Fund invests, which can produce variable relative results.
For Matthews Asia Growth Fund, the Trustees noted that the Fund’s performance compared favorably against the median of its peers for the five-year, ten-year and since-inception periods. The Trustees also noted that the Fund performed below the median of its peer group for the one-year period and near the median for the three-year period.
For Matthews India Fund, the Trustees noted that the Fund had outperformed the median of its peer funds over the three-year, five-year, ten-year and since inception periods, ranking in the first or second quintile for those periods, but lagged the median for the peer group for the one-year period.
For Matthews Asia Dividend Fund, the Trustees noted that the Fund had performed well against its peer group during the three-year, ten-year and since inception periods, ranking above the median for those periods, but lagged the median for the peer group for the one-year and five-year periods with positive performance that was still strong.
For Matthews Asia Small Companies Fund, the Trustees noted that the Fund ranked above the median for the three-year period (and was the only fund in the peer group for the since-inception period), but lagged the peer group median for the one-year and five-year periods. The Trustees took into account however, that the peer universe for the Fund was very small, with only a few comparable funds and that therefore relative peer performance was of less utility than if the peer universe were larger. A possible larger peer group was reviewed and determined not to be sufficiently similar to the Fund. The Trustees considered further that most of the peer group funds were not focused on Asian small cap investments and, therefore, were considered to be of limited use in evaluating the Fund’s performance.
For Matthews China Dividend Fund, the Trustees noted that the Fund had ranked in the first quintile of its peer group for the three-year, five-year and since inception periods, but was below the median for the one-year period with strong positive performance.
For Matthews China Small Companies Fund, the Trustees noted that the Fund’s performance exceeded the median for its peer group for the one-year, five-year and since-inception periods, and was the median fund for the three-year period. The Trustees took into account, however, that the peer universe for the Fund was very small, with only a few comparable funds and that therefore relative peer performance was of less utility than if the peer universe were larger. The Trustees further recognized that small capitalization strategies, particularly for a China-focused fund, can produce highly variable results. The Trustees regarded the peer group of China funds as less useful because of the small capitalization mandate for this Fund within a broader China-focused peer group. The Trustees also noted changes to the portfolio management team for this Fund in a prior period.
For Matthews Asia Strategic Income Fund, the Trustees noted that the Fund’s performance had ranked in the second quintile for the one-year, three-year and five-year periods, but below the median for the period since inception. The Trustees recognized that the peer groups included mostly broader emerging market hard currency debt funds not focused on Asia, making the peer group less useful in comparing relative performance than if they were more closely aligned with the Fund’s investment focus.
For Matthews Asia Focus Fund, the Trustees noted that the Fund performance had ranked below the median of its peer group for all relevant periods. The Fund enjoyed strong positive performance for the one-year period. The
| | | | |
| matthewsasia.com | 800.789.ASIA | | | 163 | |
Approval of Investment Advisory Agreement (unaudited) (continued)
Trustees have discussed the Fund’s performance with Matthews, noting an additional portfolio manager, and have determined that it would be appropriate to provide the Fund with additional time in order to fully evaluate its performance, particularly given its stronger recent performance.
For Matthews Emerging Asia Fund, the Trustees noted that the Fund’s performance had ranked well above the median of its peer group for the three-year period and the period since inception, ranking in the first quintile, but below the median for the one-year period. The Fund has enjoyed strong positive performance for that one-year period, and the Trustees have discussed with Matthews the reasons for the underperformance over the short term.
For Matthews Asia ESG Fund, the Trustees noted that the Fund’s performance had ranked slightly above the peer group median for the one-year period, and slightly below the median for the period since inception. The Trustees noted that the Fund was a newer Fund, without a long term record at this time.
For Matthews Asia Value Fund, the Trustees noted that the Fund’s performance had ranked in the first quintile for the one-year period and the period since inception. The Trustees noted that the Fund was a newer Fund, without a long-term record at this time.
For Matthews Credit Opportunities Funds, the Trustees noted that the Fund’s performance had ranked in the second quintile for the one-year period and the period since inception. The Trustees noted that the Fund was a newer Fund, without a long-term record at this time.
After review, the Trustees concluded that each Fund’s overall performance records were satisfactory or were being addressed as needed. The Trustees also reviewed Matthews’ trading policies and efforts to obtain best overall execution for the Funds in the various markets in which the Funds trade securities. The Trustees noted the relatively low turnover rates in the various equity Funds and Matthews’ consistent adherence to its long-standing investment approach, which emphasizes fundamental bottom-up driven investment selection in light of its view of regional economic conditions.
| 3. | The extent to which Matthews realizes economies of scale as the Funds grow larger and whether Fund investors benefit from any economies of scale. The Trustees first noted the substantial work done over recent years between the Board and Matthews to establish fee structures for both the Advisory Agreement and other agreements that recognize the sharing of economies of scale that can arise as assets in the Funds grow through the use of breakpoints. In particular, they noted that the advisory fee structure contains breakpoints for the group-priced Funds as well as for certain individually priced Funds which enhances the ability of the Funds and their shareholders to benefit from past and future potential economies of scale. They discussed the structure and level of these breakpoints and concluded that they continue to be appropriate given the sizes of the |
| | Funds. The Trustees further noted that additional economies of scale are shared with shareholders of the Funds through fee waivers and/or expense reimbursements pursuant to the Operating Expenses Agreement, fee waivers pursuant to the Fee Waiver Agreement, and the breakpoints in the fees payable under the Services Agreement. |
The Trustees next discussed Matthews’ ongoing investment in its technology, systems, staffing and other aspects of its business that can benefit the Funds, noting that all these endeavors are a means by which Matthews is sharing economies of scale with the Funds and their shareholders through reinvestment in products and services that are designed to benefits the Funds and their shareholders. The Trustees considered the new personnel hired over recent years, as well as planned hiring, and the extent to which that hiring could be expected to benefit shareholders. The Trustees also recognize that the Funds’ total assets have fluctuated over the past few years, especially in certain strategies, which has also affected any economies of scale that could be enjoyed. As a result, the Trustees remain satisfied about the extent to which economies of scale have been and will continue to be shared with the Funds and their shareholders.
| 4. | The costs of the services provided by Matthews and others. The Trustees considered the advisory fees and total fees and expenses of each Fund in comparison to the advisory fees and other fees and expenses of other funds in each Fund’s relevant peer group. The Trustees reviewed information developed by Broadridge and reviewed by the Independent Consultant as to appropriate peer groups for each Fund for these purposes. After discussion, the Trustees determined to consider the comparison provided by Broadridge titled “Expense Group” for each Fund, as well as the broader “Expense Universe.” |
The Trustees considered both the gross advisory fee rates charged by Matthews, as well as the effective advisory fee rates after taking into consideration the fees waived and expenses reimbursed pursuant to the Operating Expenses Agreement and the Fee Waiver Agreement. The Trustees found that the contractual advisory rates (excluding administrative services) for the Funds were very competitive and generally lower than those of the relevant peer group averages for most of the Funds. The Trustees also found that the total expense ratios paid by shareholders of the Funds, which are most representative of a shareholder’s net investment results, were also very competitive, with all but the relatively newer or smaller Funds ranking below the peer group averages. The Trustees considered various specific Fund expenses, including the custody fees and transfer agent fees. The Trustees noted that Matthews’ continued efforts in recent years had resulted in, for many of the Funds, reduced expenses in some categories.
The Trustees also compared Matthews’ advisory fees with those of Matthews’ separate accounts and other investment products, noting that the Funds’ advisory expenses were not disadvantageous (not being substantially higher than the separate accounts’ rates). The Trustees agreed that total expenses appeared to be appropriate in comparison and taking
Approval of Advisory Agreement (unaudited) (continued)
into account the services differences between these products and the Funds, including the differences in the frequency of net asset value calculations and other operational and compliance activities.
The Trustees’ overall assessment with respect to each Fund was that, subject to the considerations and exceptions noted below, the contractual advisory fee rates, the total expense ratio, and the effective or net advisory fee rates were all at or near the median with the funds in each Fund’s peer group. For the Matthews Asia Strategic Income Fund, the Trustees noted that the other funds in the relevant peer group tend to be fixed income funds with lower advisory fees and total expenses but are not as specialized as the Fund and a few are larger and have more scale than the Fund. For the Matthews Asia Credit Opportunities Fund, the Trustees noted that all funds in the relatively small peer group appeared to be waiving all of their advisory fees and that therefore this comparative information was of limited utility. For the Matthews China Small Companies Fund, the Trustees noted the Fund’s small size. In all cases, the Trustees recognized that, even for the smaller Funds, Matthews has agreed to limit total expenses to a level considered by the Trustees to be reasonable. The Trustees concluded that Matthews’ advisory fee rates and the Funds’ expense ratios are reasonable in light of comparative performance and expense and advisory fee information for each of the Funds
| 5. | The profits to be realized by Matthews and its affiliates from the relationships with the Funds. The Trustees reviewed information provided by Matthews regarding the costs of sponsoring and operating the Funds and information regarding the profitability to Matthews of the Advisory Agreement both on a fund-by-fund basis and overall for the family of Funds. In considering profitability, the Trustees discussed and considered the methodology employed by Matthews in calculating profit margins but also considered other elements relevant to discussions of profitability, such as the entrepreneurial risk undertaken by Matthews in sponsoring and maintaining the Funds and risks associated with commitments to maintain Fund expense ratios. The Trustees also reviewed information provided regarding the structure and manner in which Matthews’ investment professionals were compensated and their respective views of the relationship of such compensation to the attraction and retention of quality personnel. The Trustees considered Matthews’ willingness to invest in technology, infrastructure and staff to reinforce and offer new services and to accommodate changing regulatory requirements. |
The Trustees noted that Matthews appeared to be sufficiently profitable to operate as a viable investment management firm,
able to honor its obligations as a sponsor of the Funds, including the Funds that did not generate a profit for Matthews, without earning excessive profits from any particular Fund or from the overall relationship with the Funds. The Trustees noted that, with fluctuations in asset levels in some prior years, volatility in revenues and profitability could be expected from time to time, but also noted the continued expenditures on personnel and other resources. The Board also considered information relating to the profitability of a limited number of publicly traded investment advisers, although the Board noted that this information was of limited utility because it was comprised of a limited universe of advisers, did not provide any information as to how profitability was determined and did not limit profitability analysis to the performance of advisory services to registered investment companies. The Board further noted that these advisers differed significantly from Matthews as they were not solely dedicated to investment in the Asian markets.
Based on information received, the Trustees noted that Matthews’ overall profitability from the Advisory Agreement appeared reasonable at the current time, whether considered inclusive or exclusive of distribution costs.
| 6. | Ancillary benefits The Trustees requested and received from Matthews information concerning other benefits received by Matthews as a result of its respective relationship with the Funds, including various service arrangements with Matthews and the use of soft-dollars. |
The Board concluded that such benefits were consistent with those generally derived by investment advisers to mutual funds or were otherwise not unusual.
| 7. | Conclusions. Based on their review, including their consideration of each of the factors referred to above, and assisted by the advice of the Independent Consultant and independent counsel to the Independent Trustees, the Board, including the Independent Trustees, concluded that the Advisory Agreement was fair and reasonable with respect to each Fund and its shareholders, and that the renewal of the Advisory Agreement would be in the best interests of each Fund and its shareholders. The Board did not indicate that any single factor was determinative of its decision to approve the Advisory Agreement, but indicated that the Board based its determination on the total mix of information available to it. |
The Advisory Agreement may be terminated by the Trustees on behalf of the Funds or by Matthews upon 60 days’ prior written notice without penalty. The Advisory Agreement will also terminate automatically in the event of its assignment, as defined in the 1940 Act.
| | | | |
| matthewsasia.com | 800.789.ASIA | | | 165 | |
Trustees and Officers of the Funds (unaudited)
The operations of each Fund are under the direction of the Board of Trustees. The Board of Trustees establishes each Fund’s policies and oversees and reviews the management of each Fund. The Board meets regularly to review the activities of the officers, who are responsible for the day-to-day operations of the Funds. The Statement of Additional Information, which includes additional information about Fund Trustees, is available without charge by calling 800.789.2742 or by visiting the Funds’ website, matthewsasia.com. The Trustees and executive officers of the Funds, their year of birth, business address and principal occupations during the past five years are set forth below:
| | | | | | | | |
Name, Year of Birth, Address and Position(s) Held with Trust | | Term of Office and Length of Time Served1 | | Principal Occupation(s) During Past 5 Years | | Number of Portfolios in Fund Complex Overseen by Trustee | | Other Trusteeships/Directorships (number of portfolios) Held by Trustee |
| INDEPENDENT TRUSTEES | | | | | | | | |
| | | | |
JONATHAN F. ZESCHIN Born 1953 Four Embarcadero Center Suite 550 San Francisco, CA 94111 Chairman of the Board of Trustees and Trustee | | Trustee since 2007 and Chairman of the Board since 2014 | | Partner (since 2009), Essential Investment Partners, LLC (investment advisory and wealth management). | | 18 | | Trustee and Chairman of the Board, DCA Total Return Fund (2005–2011) (1 Portfolio) and DCW Total Return Fund (2007–2010) (1 Portfolio). |
| | | | |
TOSHI SHIBANO Born 1950 Four Embarcadero Center Suite 550 San Francisco, CA 94111 Trustee | | Since 2003 | | Faculty (since 2000), General Electric’s John F. Welch Leadership Center; President (since 1988), Executive Financial Literacy, Inc. (financial executive development programs); Faculty Director and Executive Education Lecturer (1995–2016), Center for Executive Education, Haas School of Business, UC Berkeley; Adjunct Professor (2000–2011), Columbia Graduate School of Business; Associate Professor (2001–2005), Thunderbird School of Global Management; Visiting Assistant Professor (2000), Stanford Graduate School of Business; Assistant Professor (1995–2000), University of Chicago Graduate School of Business; Assistant Professor (1988–1995), Haas School of Business, UC Berkeley. | | 18 | | |
| | | | |
RHODA ROSSMAN Born 1958 Four Embarcadero Center Suite 550 San Francisco, CA 94111 Trustee | | Since 2006 | | Vice President, Corporate Investment Officer (2007–2010); Senior Vice President and Treasurer (2003–2007), The PMI Group, Inc. (mortgage insurer). | | 18 | | |
| | | | |
RICHARD K. LYONS Born 1961 Four Embarcadero Center Suite 550 San Francisco, CA 94111 Trustee | | Since 2010 | | Dean (since 2008), Haas School of Business, UC Berkeley; Chief Learning Officer (2006–2008), Goldman Sachs (investment banking and investment management); Executive Associate Dean (2005–2006), Acting Dean (2004–2005), Professor (2000–2004), Associate Professor (1996–2000), Assistant Professor (1993–1996), Haas School of Business, UC Berkeley. | | 18 | | Trustee (2001–2006), Barclays Global Investor Funds and Master Investment Portfolios (15 Portfolios); Director (2000–2006), iShares, Inc. (24 Portfolios) and iShares Trust (over 70 Portfolios); Trustee (1994–2006) and Chairman of the Board (2000–2006), Matthews Asia Funds (9 Portfolios) |
| 1 | Each Trustee serves for an indefinite term, until retirement age or until his/her successor is elected. Officers serve at the pleasure of the Board of Trustees. |
| | | | | | | | |
Name, Year of Birth, Address and Position(s) Held with Trust | | Term of Office and Length of Time Served1 | | Principal Occupation(s) During Past 5 Years | | Number of Portfolios in Fund Complex Overseen by Trustee | | Other Trusteeships/Directorships (number of portfolios) Held by Trustee |
| INDEPENDENT TRUSTEES | | | | | | | | |
| | | | |
CHRISTOPHER LEE Born 1967 Four Embarcadero Center Suite 550 San Francisco, CA 94111 Trustee | | Since 2015 | | Lecturer (part-time) (since 2013), The Chinese University of Hong Kong; Private Investor and Partner (since 2012), FAA Investments (financial holding company); Managing Director, Asia Region, and Head of Global Markets Investment Products & db-X (2010–2012), Deutsche Bank AG (financial services); Managing Director, Equity Risk Management Products, and Head of Intermediary Business (2002–2010), UBS AG (financial services); Vice President, Global Markets & Investment Bank (2000–2002), Vice President, International Private Clients Group (1997–2000), Associate, Debt and Equity Markets Group (1995–1997), Merrill Lynch & Co., Inc. (brokerage and investment management). | | 18 | | Director (since 2013), Asian Masters Fund (Australia) (1 Portfolio); Trustee (since 2013), African Wildlife Foundation; Trustee (2010–2016), Oakland Museum of California; Director (since 2017), Hong Kong Securities and Investment Institute. |
| | | | |
GALE K. CARUSO Born 1957 Four Embarcadero Center Suite 550 San Francisco, CA 94111 Trustee | | Since 2015 | | Formerly President and Chief Executive Officer (1999–2003), Zurich Kemper Life (life insurance and annuities); Chairman, President and Chief Executive Officer (1994–1999), Scudder Canada Investor Services, Ltd. (investment management); Managing Director (1986–1999), Scudder Kemper Investments, Inc. (investment management). | | 18 | | Trustee (since 2006), Pacific Select Fund (58 Portfolios) and Pacific Funds Series Trust (33 Portfolios); Director (2005–2012), Make-A-Wish Foundation of Maine; Director (2005–2009), LandAmerica Financial Group, Inc.; Director (2001–2003), Make-A-Wish of Northern Illinois; former member of the Board of Directors, Illinois Life Insurance Council. |
| | | | |
Name, Year of Birth, Address and Position(s) Held with Trust | | Term of Office and Length of Time Served1 | | Principal Occupation(s) During Past 5 Years | | Number of Portfolios in Fund Complex Overseen by Trustee | | Other Trusteeships/Directorships (number of portfolios) Held by Trustee |
| INTERESTED TRUSTEES2 | | | | | | | | |
| | | | |
G. PAUL MATTHEWS Born 1956 Four Embarcadero Center Suite 550 San Francisco, CA 94111 Trustee | | Since 2007 | | Director (since 1996), Chairman (1996– 2009), Managing Member (1996–2016), Portfolio Manager (1996–2012), Chief Investment Officer (1991–2007), Matthews (investment management); President (1994–2007), Matthews Asia Funds (registered investment company). | | 18 | | Director (since 2004), Matthews Asian Selections Funds PLC (Ireland) (1 Portfolio); Trustee (2001–2004) and Trustee and Chairman of Board (1994–1998), Matthews Asia Funds (7 Portfolios). |
| | | | |
WILLIAM J. HACKETT Born 1967 Four Embarcadero Center Suite 550 San Francisco, CA 94111 Trustee and President | | President since 2008 and Trustee since 2015 | | Director (since 2016), Chief Executive Officer (since 2009), President and Secretary (since 2007), Matthews (investment management); President (2013-2017), Matthews A Share Selections Fund, LLC (registered investment company); Director (since 2010), Matthews Global Investors S.à r.l. (Luxembourg) (investment management); Director (since 2010), Matthews Global Investors (Hong Kong) Limited (investment management); Partner (2002–2007), Deloitte & Touche, LLP (accounting). | | 18 | | Chairman (since 2010), Matthews Asia Funds SICAV (Luxembourg) (12 Portfolios); Director (since 2009), Matthews Asian Selections Funds, PLC (Ireland) (1 Portfolio). |
| 1 | Each trustee serves for an indefinite term, until retirement age or until his/her successor is elected. Officers serve at the pleasure of the Board of Trustees. |
| 2 | A trustee is considered an “interested person” of the Trust as defined under the 1940 Act because of an ownership interest in the Advisor or an office held with the Trust or the Advisor. |
| | | | |
| matthewsasia.com | 800.789.ASIA | | | 167 | |
| | | | | | |
Name, Year of Birth, Address and Position(s) Held with Trust | | Term of Office and Length of Time Served1 | | Principal Occupation(s) During Past 5 Years | | Other Trusteeships/ Directorships (number of portfolios) Held by Officer |
| OFFICERS WHO ARE NOT TRUSTEES | | |
| | | |
ROBERT J. HORROCKS, PhD Born 1968 Four Embarcadero Center Suite 550 San Francisco, CA 94111 Vice President | | Since 2009 | | Chief Investment Officer (since 2009), Director of Research (2008–2009), Matthews (investment management); Head of Research (2006–2008), Mirae Asset Management (investment management); Chief Investment Officer (2003–2006), Everbright Pramerica (investment management). | | None |
| | | |
JOHN P. McGOWAN Born 1964 Four Embarcadero Center Suite 550 San Francisco, CA 94111 Vice President and Secretary | | Since 2005 | | Head of Fund Administration (since 2009), Chief Administrative Officer (2007–2008), Chief Operating Officer (2004–2007), Matthews (investment management); Vice President and Secretary (2013-2017), Matthews A Share Selections Fund, LLC (registered investment company); Director (since 2010), Matthews Asia Funds SICAV (Luxembourg) (investments); Director (since 2010), Matthews Global Investors S.à r.l. (Luxembourg) (investment management); Director (since 2004), Matthews Asian Selections Funds, PLC (Ireland) (investments). | | Director, Matthews Asian Selections Funds Plc (1 Portfolio); Director, Matthews Asia Funds SICAV (Luxembourg) (12 Portfolios). |
| | | |
SHAI A. MALKA Born 1973 Four Embarcadero Center Suite 550 San Francisco, CA 94111 Treasurer | | Since 2005 | | Vice President of Fund Accounting and Operations (since 2010), Senior Manager of Fund Accounting and Operations (2004–2009), Matthews (investment management); Treasurer (2013-2017), Matthews A Share Selections Fund, LLC (registered investment company). | | None |
| | | |
DAVID MONROE Born 1963 Four Embarcadero Center Suite 550 San Francisco, CA 94111 Vice President | | Since 2014 | | General Counsel (since 2015), Deputy General Counsel (2014), Matthews (investment management); Chief Legal Officer (2006–2013), Nikko Asset Management Co., Ltd. (investment management). | | None |
| | | |
MANOJ K. POMBRA Born 1964 Four Embarcadero Center Suite 550 San Francisco, CA 94111 Chief Compliance Officer and Anti-Money Laundering Officer | | Since 2005 | | Chief Compliance Officer and Anti-Money Laundering Officer (since 2005), Matthews (investment management); Senior Manager, Mutual Fund Compliance/Manager Portfolio Compliance (2001–2005), Franklin Templeton Investments (investment management). | | None |
| 1 | Each trustee serves for an indefinite term, until retirement age or until his/her successor is elected. Officers serve at the pleasure of the Board of Trustees. |
Matthews Asia Funds
INVESTMENT ADVISOR
Matthews International Capital Management, LLC
Four Embarcadero Center, Suite 550
San Francisco, CA 94111
800.789.ASIA
CUSTODIAN
Brown Brothers Harriman & Co.
50 Milk Street
Boston, MA 02109
ACCOUNT SERVICES
Matthews Asia Funds
P.O. Box 9791
Providence, RI 02940
800.789.ASIA
LEGAL COUNSEL
Paul Hastings LLP
101 California Street, 48th Floor
San Francisco, CA 94111
| | | | |
| matthewsasia.com | 800.789.ASIA | | | | |

P.O. Box 9791 | Providence, RI 02940 | matthewsasia.com | 800.789.ASIA (2742)
Matthews Asia Funds are distributed in the United States by Foreside Funds Distributors LLC, Berwyn, Pennsylvania
Matthews Asia Funds are distributed in Latin America by HMC Partners

AR-1217-212M
Item 2. Code of Ethics.
| | (a) | The registrant, as of the end of the period covered by this report, has adopted a code of ethics that applies to the registrant’s principal executive officer, principal financial officer, principal accounting officer or controller, or persons performing similar functions, regardless of whether these individuals are employed by the registrant or a third party. |
| | (c) | There have been no amendments, during the period covered by this report, to a provision of the code of ethics that applies to the registrant’s principal executive officer, principal financial officer, principal accounting officer or controller, or persons performing similar functions, regardless of whether these individuals are employed by the registrant or a third party, and that relates to any element of the code of ethics description. |
| | (d) | The registrant has not granted any waivers, including an implicit waiver, from a provision of the code of ethics that applies to the registrant’s principal executive officer, principal financial officer, principal accounting officer or controller, or persons performing similar functions, regardless of whether these individuals are employed by the registrant or a third party, that relates to one or more of the items set forth in paragraph (b) of this item’s instructions. |
Item 3. Audit Committee Financial Expert.
| | (a) | As of the end of the period covered by the report, the registrant’s board of directors has determined that the registrant has two audit committee financial experts serving on its audit committee, Toshi Shibano and Jonathan F. Zeschin, and that both are “independent.” |
| | (b) | Prof. Shibano is a member of the Faculty of the General Electric Corporate Leadership Development Center and also serves as Executive Education Lecturer at the Haas School of Business at the University of California, Berkeley. He was an Adjunct Professor at the Columbia Graduate School of Business and has served on the faculties of Thunderbird American Graduate School of International Management, Stanford Graduate School of Business, the University of Chicago School of Business and the Australian Graduate School of Management at the University of New South Wales. He regularly reviews current research in accounting both for use in instruction of courses and for internal faculty evaluation. He has experience analyzing and evaluating financial statements at the appropriate level of complexity through his professional activities on the educational |
| | faculties referenced above. |
Prof. Shibano also has extensive experience in executive education worldwide (Hong Kong, Taiwan, Singapore, Finland, Italy, Mexico, India) and has developed innovative new programs in financial analysis, management control systems and strategy implementation. Prof. Shibano has published in the Journal of Accounting Research, the Journal of Accounting and Economics, the Rand Journal of Economics, and the Journal of Applied Corporate Finance, on the topics of strategic audit risk, accounting standard setting, international accounting standards, tax minimization, foreign currency risk management, and organizational structure. Prof. Shibano received his MBA from the Haas School at UC Berkeley and earned his PhD at the Stanford Graduate School of Business, earning the highest academic honors in both programs. Prof. Shibano has gained additional accounting expertise as the Audit Committee Chair of Matthews International Funds.
Mr. Zeschin is Partner of Essential Investment Partners, LLC, a wealth management and investment advisory firm. He is also the portfolio manager for that firm’s Essential Growth Portfolio. Essential Investment Partners, LLC succeeded to the business of Essential Advisers, Inc. Prior to forming Essential Advisers, Inc., Mr. Zeschin held senior executive positions with Founders Asset Management, Inc., Invesco Funds Group, and Stein Roe & Farnham, Inc. Mr. Zeschin holds a Masters of Management from the Kellogg School at Northwestern University, with majors in Finance and Marketing, and a Bachelor in Business Administration in Accounting with distinction from the University of Michigan. He holds a Certified Public Accountant license from the state of Colorado and is a Certified Financial Planner certificant. Mr. Zeschin is a former chair of the ICI’s Accounting Treasurer’s Committee and a former member of the AICPA Investment Companies committee. Mr. Zeschin was previously the chairman of the Board of Trustees of two NYSE listed closed-end funds. He has served on the audit committees of mutual fund boards since 2002. He has experience analyzing and evaluating financial statements at the appropriate level of complexity through his professional activities referenced above. Mr. Zeschin has gained additional expertise as a member of the Audit Committee of Matthews International Funds.
Item 4. Principal Accountant Fees and Services.
Audit Fees
| | (a) | The aggregate fees billed for each of the last two fiscal years for professional services rendered by the principal accountant for the audit of the registrant’s annual financial statements or services that are normally provided by the accountant in connection with statutory and regulatory filings or engagements for those fiscal years are $566,854 in 2016 and $641,574 in 2017. |
Audit-Related Fees
| | (b) | The aggregate fees billed in each of the last two fiscal years for assurance and related services by the principal accountant that are reasonably related to the performance of the audit of the registrant’s financial statements and are not reported under paragraph (a) of this Item are $0 in 2016 and $0 in 2017. |
Tax Fees
| | (c) | The aggregate fees billed in each of the last two fiscal years for professional services rendered by the principal accountant for tax compliance, tax advice, and tax planning are $139,406 in 2016 and $146,250 in 2017. Tax fees include services provided by the principal accountant for tax return preparations. |
All Other Fees
| | (d) | The aggregate fees billed in each of the last two fiscal years for products and services provided by the principal accountant, other than the services reported in paragraphs (a) through (c) of this Item are $0 in 2016 and $0 in 2017. |
| | (e)(1) | Disclose the audit committee’s pre-approval policies and procedures described in paragraph (c)(7) of Rule 2-01 of Regulation S-X. |
Pre-Approval of Auditor Services.
Pre-Approval Requirements. Before the Auditor is engaged by the Trust to render audit related or permissible non-audit services, either:
| | (i) | The Audit Committee shall pre-approve all audit related services and permissible non-audit services (e.g., tax services) to be provided to the Trust; or |
| | (ii) | The Audit Committee shall establish policies and procedures governing the Auditor’s engagement. Any such policies and procedures must (1) be detailed as to the particular service and (2) not involve any delegation of the Audit Committee’s responsibilities to the Adviser. The Audit Committee may delegate to one or more of its members the authority to grant pre-approvals. The pre-approval policies and procedures shall include the requirement that the decisions |
| | of any member to whom authority is delegated under this Section 4(e) shall be presented to the full Audit Committee at its next scheduled meeting. |
De Minimis Exceptions to Pre-Approval Requirements. Pre-approval for a service provided to the Trust other than audit, review or attest services is not required if: (1) the aggregate amount of all such non-audit services provided to the Trust constitutes not more than 5 percent of the total amount of revenues paid by the Trust to the Auditor during the fiscal year in which the non-audit services are provided; (2) such services were not recognized by the Trust at the time of the engagement to be non-audit services; and (3) such services are promptly brought to the attention of the Audit Committee and are approved by the Audit Committee or by one or more members of the Audit Committee to whom authority to grant such approvals has been delegated by the Audit Committee.
Pre-Approval of Non-Audit Services Provided to the Adviser and Certain Control Persons. With respect to services that have a direct impact on the operations or financial reporting of the Trust, the Audit Committee shall pre-approve all such non-audit services proposed to be provided by the Auditor to (i) the Adviser and (ii) any entity controlling, controlled by, or under common control with the Adviser that provides ongoing services to the Trust.
Application of De Minimis Exception: The de minimis exceptions set forth above under Section 4(e)(ii) apply to pre-approvals under this Section 4(e)(iii) as well, except that the “total amount of revenues” calculation for Section 4(e)(iii) services is based on the total amount of revenues paid to the Auditor by the Trust and any other entity that has its services approved under this Section (i.e., the Adviser or any control person).
| | (e)(2) | The percentage of services described in each of paragraphs (b) through (d) of this Item that were approved by the audit committee pursuant to paragraph (c)(7)(i)(C) of Rule 2-01 of Regulation S-X are as follows: |
| | (f) | The percentage of hours expended on the principal accountant’s engagement to audit the registrant’s financial statements for the most recent fiscal year that were attributed to work performed by persons other than the principal accountant’s full-time, permanent employees was 0%. |
| | (g) | The aggregate non-audit fees billed by the registrant’s accountant for services rendered to the registrant, and rendered to the registrant’s investment adviser (not including any sub-adviser whose role is primarily portfolio management and is subcontracted with or overseen by another investment adviser), and any entity controlling, controlled by, or under common control with the adviser that provides ongoing services to the registrant for each of the last two fiscal years of the registrant was $443,621 in 2016 and $296,800 in 2017. |
| | (h) | The registrant’s audit committee of the board of directors has considered whether the provision of non-audit services that were rendered to the registrant’s investment adviser (not including any sub-adviser whose role is primarily portfolio management and is subcontracted with or overseen by another investment adviser), and any entity controlling, controlled by, or under common control with the investment adviser that provides ongoing services to the registrant that were not pre-approved pursuant to paragraph (c)(7)(ii) of Rule 2-01 of Regulation S-X is compatible with maintaining the principal accountant’s independence. |
Item 5. Audit Committee of Listed Registrants.
Not applicable.
Item 6. Investments.
| (a) | Schedule of Investments in securities of unaffiliated issuers as of the close of the reporting period is included as part of the report to shareholders filed under Item 1 of this form. |
| Item 7. | Disclosure of Proxy Voting Policies and Procedures for Closed-End Management Investment Companies. |
Not applicable.
Item 8. Portfolio Managers of Closed-End Management Investment Companies.
Not applicable.
| Item 9. | Purchases of Equity Securities by Closed-End Management Investment Company and Affiliated Purchasers. |
Not applicable.
Item 10. Submission of Matters to a Vote of Security Holders.
There have been no material changes to the procedures by which the shareholders may recommend nominees to the registrant’s board of directors, where those changes were implemented after the registrant last provided disclosure in response to the requirements of Item 407(c)(2)(iv) of Regulation S-K (17 CFR 229.407) (as required by Item 22(b)(15) of Schedule 14A (17 CFR 240.14a-101)), or this Item.
Item 11. Controls and Procedures.
| | (a) | The registrant’s principal executive and principal financial officers, or persons performing similar functions, have concluded that the registrant’s disclosure controls and procedures (as defined in Rule 30a-3(c) under the Investment Company Act of 1940, as amended (the “1940 Act”) (17 CFR 270.30a-3(c))) are effective, as of a date within 90 days of the filing date of the report that includes the disclosure required by this paragraph, based on their evaluation of these |
| | controls and procedures required by Rule 30a-3(b) under the 1940 Act (17 CFR 270.30a-3(b)) and Rules 13a-15(b) or 15d-15(b) under the Securities Exchange Act of 1934, as amended (17 CFR 240.13a-15(b) or 240.15d-15(b)). |
| | (b) | There were no changes in the registrant’s internal control over financial reporting (as defined in Rule 30a-3(d) under the 1940 Act (17 CFR 270.30a-3(d))) that occurred during the registrant’s last fiscal quarter that has materially affected, or is reasonably likely to materially affect, the registrant’s internal control over financial reporting. |
| Item 12. | Disclosure of Securities Lending Activities for Closed-End Management Investment Companies. |
Not applicable.
Item 13. Exhibits.
| | (a)(1) | Code of ethics, or any amendment thereto, that is the subject of disclosure required by Item 2 is attached hereto. |
| | (a)(2) | Certifications pursuant to Rule 30a-2(a) under the 1940 Act and Section 302 of the Sarbanes-Oxley Act of 2002 are attached hereto. |
| | (b) | Certifications pursuant to Rule 30a-2(b) under the 1940 Act and Section 906 of the Sarbanes-Oxley Act of 2002 are attached hereto. |
SIGNATURES
Pursuant to the requirements of the Securities Exchange Act of 1934 and the Investment Company Act of 1940, the registrant has duly caused this report to be signed on its behalf by the undersigned, thereunto duly authorized.
| | | | |
(Registrant) | | Matthews International Funds | | |
| | | | |
By (Signature and Title)* | | /s/ William J. Hackett | | |
| | William J. Hackett, President | | |
| | (principal executive officer) | | |
Pursuant to the requirements of the Securities Exchange Act of 1934 and the Investment Company Act of 1940, this report has been signed below by the following persons on behalf of the registrant and in the capacities and on the dates indicated.
| | | | |
By (Signature and Title)* | | /s/ William J. Hackett | | |
| | | | |
| | William J. Hackett, President | | |
| | (principal executive officer) | | |
| | | | |
By (Signature and Title)* | | /s/ Shai Malka | | |
| | | | |
| | Shai Malka, Treasurer | | |
| | (principal financial officer) | | |
* Print the name and title of each signing officer under his or her signature.