UNITED STATES
SECURITIES AND EXCHANGE COMMISSION
Washington, D.C. 20549
FORM N-CSR
CERTIFIED SHAREHOLDER REPORT OF REGISTERED MANAGEMENT
INVESTMENT COMPANIES
| Investment Company Act file number | 811-08510 | |
| | |
| Matthews International Funds | |
| (Exact name of registrant as specified in charter) | |
| | |
| Four Embarcadero Center, Suite 550 | |
| San Francisco, CA 94111 | |
| (Address of principal executive offices) (Zip code) | |
| | |
| William J. Hackett, President | |
| Four Embarcadero Center, Suite 550 | |
| San Francisco, CA 94111 | |
| (Name and address of agent for service) | |
| | |
| Registrant’s telephone number, including area code: 415-788-7553 | |
| | |
| Date of fiscal year end: December 31 | |
| | |
| Date of reporting period: December 31, 2014 | |
Form N-CSR is to be used by management investment companies to file reports with the Commission not later than 10 days after the transmission to stockholders of any report that is required to be transmitted to stockholders under Rule 30e-1 under the Investment Company Act of 1940 (17 CFR 270.30e-1). The Commission may use the information provided on Form N-CSR in its regulatory, disclosure review, inspection, and policymaking roles.
A registrant is required to disclose the information specified by Form N-CSR, and the Commission will make this information public. A registrant is not required to respond to the collection of information contained in Form N-CSR unless the Form displays a currently valid Office of Management and Budget (“OMB”) control number. Please direct comments concerning the accuracy of the information collection burden estimate and any suggestions for reducing the burden to Secretary, Securities and Exchange Commission, 100 F Street, NE, Washington, DC 20549. The OMB has reviewed this collection of information under the clearance requirements of 44 U.S.C. § 3507.
Item 1. Reports to Stockholders.
The Report to Shareholders is attached herewith.
Performance and Expenses (December 31, 2014)
| | | | | Average Annual Total Return | | | | 2014
Annual | | 2014 Annual
Operating
Expenses after
Fee Waiver | | Prospectus | | Prospectus
Expense Ratios
after Fee Waiver | |
| | 1 year | | 5 years | | 10 years | | Since
Inception | | Inception
Date | | Operating
Expenses | | and Expense
Reimbursement | | Expense
Ratios* | | and Expense
Reimbursement* | |
Matthews Asia Strategic Income Fund | |
Investor Class (MAINX) | | | 2.54 | % | | | n.a. | | | | n.a. | | | | 4.73 | % | | | 11/30/11 | | | | 1.27 | % | | | 1.13 | %1 | | | 1.28 | % | | | 1.10 | %1 | |
Institutional Class (MINCX) | | | 2.64 | % | | | n.a. | | | | n.a. | | | | 4.90 | % | | | 11/30/11 | | | | 1.07 | % | | | 0.93 | %1 | | | 1.09 | % | | | 0.90 | %1 | |
Matthews Asian Growth and Income Fund | |
Investor Class (MACSX) | | | -0.65 | % | | | 7.08 | % | | | 8.91 | % | | | 10.15 | % | | | 9/12/94 | | | | 1.08 | % | | | n.a. | | | | 1.08 | % | | | n.a. | | |
Institutional Class (MICSX) | | | -0.48 | % | | | n.a. | | | | n.a. | | | | 4.84 | % | | | 10/29/10 | | | | 0.92 | % | | | n.a. | | | | 0.93 | % | | | n.a. | | |
Matthews Asia Dividend Fund† | |
Investor Class (MAPIX) | | | -0.32 | % | | | 8.32 | % | | | n.a. | | | | 9.35 | % | | | 10/31/06 | | | | 1.06 | % | | | 1.05 | % | | | 1.06 | % | | | n.a. | | |
Institutional Class (MIPIX) | | | -0.18 | % | | | n.a. | | | | n.a. | | | | 5.60 | % | | | 10/29/10 | | | | 0.93 | % | | | n.a. | | | | 0.93 | % | | | n.a. | | |
Matthews China Dividend Fund | |
Investor Class (MCDFX) | | | 0.93 | % | | | 8.92 | % | | | n.a. | | | | 9.15 | % | | | 11/30/09 | | | | 1.19 | % | | | n.a. | | | | 1.24 | % | | | n.a. | | |
Institutional Class (MICDX) | | | 1.11 | % | | | n.a. | | | | n.a. | | | | 6.70 | % | | | 10/29/10 | | | | 1.01 | % | | | n.a. | | | | 1.08 | % | | | n.a. | | |
Matthews Asia Focus Fund | |
Investor Class (MAFSX) | | | 4.38 | % | | | n.a. | | | | n.a. | | | | 0.98 | % | | | 4/30/13 | | | | 2.16 | % | | | 1.57 | %2 | | | 3.50 | % | | | 1.46 | %2 | |
Institutional Class (MIFSX) | | | 4.77 | % | | | n.a. | | | | n.a. | | | | 1.29 | % | | | 4/30/13 | | | | 1.94 | % | | | 1.31 | %2 | | | 3.32 | % | | | 1.25 | %2 | |
Matthews Asia Growth Fund | |
Investor Class (MPACX) | | | 1.49 | % | | | 9.52 | % | | | 8.34 | % | | | 9.71 | % | | | 10/31/03 | | | | 1.11 | % | | | n.a. | | | | 1.12 | % | | | n.a. | | |
Institutional Class (MIAPX) | | | 1.63 | % | | | n.a. | | | | n.a. | | | | 6.19 | % | | | 10/29/10 | | | | 0.91 | % | | | n.a. | | | | 0.93 | % | | | n.a. | | |
Matthews Pacific Tiger Fund† | |
Investor Class (MAPTX) | | | 11.79 | % | | | 8.72 | % | | | 11.57 | % | | | 9.03 | % | | | 9/12/94 | | | | 1.09 | % | | | 1.08 | % | | | 1.09 | % | | | n.a. | | |
Institutional Class (MIPTX) | | | 12.03 | % | | | n.a. | | | | n.a. | | | | 5.67 | % | | | 10/29/10 | | | | 0.92 | % | | | 0.91 | % | | | 0.92 | % | | | n.a. | | |
Matthews Emerging Asia Fund | |
Investor Class (MEASX) | | | 17.39 | % | | | n.a. | | | | n.a. | | | | 9.67 | % | | | 4/30/13 | | | | 1.78 | % | | | 1.58 | %2 | | | 2.39 | % | | | 1.48 | %2 | |
Institutional Class (MIASX) | | | 17.68 | % | | | n.a. | | | | n.a. | | | | 9.87 | % | | | 4/30/13 | | | | 1.59 | % | | | 1.33 | %2 | | | 2.21 | % | | | 1.25 | %2 | |
Matthews China Fund | |
Investor Class (MCHFX) | | | -4.42 | % | | | 1.42 | % | | | 11.34 | % | | | 9.80 | % | | | 2/19/98 | | | | 1.11 | % | | | n.a. | | | | 1.09 | % | | | n.a. | | |
Institutional Class (MICFX) | | | -4.22 | % | | | n.a. | | | | n.a. | | | | -2.02 | % | | | 10/29/10 | | | | 0.95 | % | | | n.a. | | | | 0.92 | % | | | n.a. | | |
Matthews India Fund | |
Investor Class (MINDX) | | | 63.71 | % | | | 11.27 | % | | | n.a. | | | | 13.59 | % | | | 10/31/05 | | | | 1.12 | % | | | n.a. | | | | 1.13 | % | | | n.a. | | |
Institutional Class (MIDNX) | | | 63.80 | % | | | n.a. | | | | n.a. | | | | 5.89 | % | | | 10/29/10 | | | | 0.94 | % | | | n.a. | | | | 0.95 | % | | | n.a. | | |
Matthews Japan Fund | |
Investor Class (MJFOX) | | | -2.60 | % | | | 9.31 | % | | | 1.64 | % | | | 5.01 | % | | | 12/31/98 | | | | 1.03 | % | | | n.a. | | | | 1.10 | % | | | n.a. | | |
Institutional Class (MIJFX) | | | -2.47 | % | | | n.a. | | | | n.a. | | | | 9.45 | % | | | 10/29/10 | | | | 0.90 | % | | | n.a. | | | | 0.96 | % | | | n.a. | | |
Matthews Korea Fund | |
Investor Class (MAKOX) | | | -0.73 | % | | | 9.10 | % | | | 9.78 | % | | | 5.87 | % | | | 1/3/95 | | | | 1.11 | % | | | n.a. | | | | 1.13 | % | | | n.a. | | |
Institutional Class (MIKOX) | | | -0.39 | % | | | n.a. | | | | n.a. | | | | 8.13 | % | | | 10/29/10 | | | | 0.93 | % | | | n.a. | | | | 0.97 | % | | | n.a. | | |
Matthews Asia Small Companies Fund | |
Investor Class (MSMLX) | | | 11.39 | % | | | 9.91 | % | | | n.a. | | | | 16.19 | % | | | 9/15/08 | | | | 1.47 | % | | | n.a. | | | | 1.47 | % | | | n.a. | | |
Institutional Class (MISMX) | | | 11.65 | % | | | n.a. | | | | n.a. | | | | 6.90 | % | | | 4/30/13 | | | | 1.27 | % | | | 1.26 | % | | | 1.25 | % | | | n.a. | | |
Matthews China Small Companies Fund | |
Investor Class (MCSMX) | | | -3.33 | % | | | n.a. | | | | n.a. | | | | -0.83 | % | | | 5/31/11 | | | | 1.90 | % | | | 1.67 | %3 | | | 2.04 | % | | | 1.50 | %3 | |
Matthews Asia Science and Technology Fund | |
Investor Class (MATFX) | | | 9.24 | % | | | 11.56 | % | | | 9.78 | % | | | 2.57 | % | | | 12/27/99 | | | | 1.16 | % | | | n.a. | | | | 1.18 | % | | | n.a. | | |
Institutional Class (MITEX) | | | 9.54 | % | | | n.a. | | | | n.a. | | | | 20.68 | % | | | 4/30/13 | | | | 0.95 | % | | | n.a. | | | | 1.00 | % | | | n.a. | | |
* These figures are from the Funds' prospectus dated as of April 30, 2014, and may differ from the actual expense ratios for fiscal year 2014, as shown in the financial highlights section of this report.
† Fund is closed to most new investors.
1. Effective May 1, 2014, Matthews has contractually agreed to waive fees and reimburse expenses until August 31, 2015 to the extent needed to limit Total Annual Fund Operating Expenses to 0.90% by waiving class specific and non-class specific expenses for the Institutional Class and agreed to reduce the expense ratio by waiving an equal amount of non-class specific expenses for the Investor Class. Because certain expenses of the Investor Class may be higher than the Institutional Class and class specific expenses may be waived solely for the Institutional Class, the Total Annual Fund Operating Expenses After Fee Waiver and Expense Reimbursement for the Investor Class may exceed 0.90%. If the expenses fall below the expense limitation in a year within three years after Matthews has made such a waiver or reimbursement, the Fund may reimburse Matthews up to an amount not to cause the expenses for that year to exceed the expense limitation. The fee waiver and expense reimbursement may be terminated at any time by the Board of Trustees or the Trust on behalf of the Fund on 60 days' written notice.
2. Effective May 1, 2014, Matthews has contractually agreed to waive fees and reimburse expenses until August 31, 2015 to the extent needed to limit Total Annual Fund Operating Expenses to 1.25% by waiving class specific and non-class specific expenses for the Institutional Class and agreed to reduce the expense ratio by waiving an equal amount of non-class specific expenses for the Investor Class. Because certain expenses of the Investor Class may be higher than the Institutional Class and class specific expenses may be waived solely for the Institutional Class, the Total Annual Fund Operating Expenses After Fee Waiver and Expense Reimbursement for the Investor Class may exceed 1.25%. If the expenses fall below the expense limitation in a year within three years after Matthews has made such a waiver or reimbursement, the Fund may reimburse Matthews up to an amount not to cause the expenses for that year to exceed the expense limitation. The fee waiver and expense reimbursement may be terminated at any time by the Board of Trustees or the Trust on behalf of the Fund on 60 days' written notice.
3. Effective May 1, 2014, Matthews has contractually agreed to waive fees and reimburse expenses until August 31, 2015 to the extent needed to limit Total Annual Fund Operating Expenses to 1.50%. If the expenses fall below the expense limitation in a year within three years after Matthews has made such a waiver or reimbursement, the Fund may reimburse Matthews up to an amount not to cause the expenses for that year to exceed the expense limitation. The fee waiver and expense reimbursement may be terminated at any time by the Board of Trustees or the Trust on behalf of the Fund on 60 days' written notice.
Past Performance: All performance quoted in this report is past performance and is no guarantee of future results. Investment return and principal value will fluctuate with changing market conditions so that when redeemed, shares may be worth more or less than their original cost. Current performance may be lower or higher than the returns quoted. If certain of the Funds' fees and expenses had not been waived, returns would have been lower. For the Funds' most recent month-end performance, please call 800.789.ASIA (2742) or visit matthewsasia.com.
Message from the President of the Matthews Asia Funds | | | 2 | | |
Message to Shareholders | | | 3 | | |
Manager Commentaries, Fund Characteristics and Schedules of Investments: | |
ASIA FIXED INCOME STRATEGY | |
Matthews Asia Strategic Income Fund | | | 4 | | |
ASIA GROWTH AND INCOME STRATEGIES | |
Matthews Asian Growth and Income Fund | | | 9 | | |
Matthews Asia Dividend Fund | | | 14 | | |
Matthews China Dividend Fund | | | 19 | | |
ASIA GROWTH STRATEGIES | |
Matthews Asia Focus Fund | | | 24 | | |
Matthews Asia Growth Fund | | | 28 | | |
Matthews Pacific Tiger Fund | | | 33 | | |
Matthews Emerging Asia Fund | | | 38 | | |
Matthews China Fund | | | 43 | | |
Matthews India Fund | | | 48 | | |
Matthews Japan Fund | | | 53 | | |
Matthews Korea Fund | | | 59 | | |
ASIA SMALL COMPANY STRATEGIES | |
Matthews Asia Small Companies Fund | | | 64 | | |
Matthews China Small Companies Fund | | | 69 | | |
ASIA SPECIALTY STRATEGY | |
Matthews Asia Science and Technology Fund | | | 74 | | |
Disclosures | | | 78 | | |
Index Definitions | | | 79 | | |
Disclosure of Fund Expenses | | | 80 | | |
Statements of Assets and Liabilities | | | 82 | | |
Statements of Operations | | | 90 | | |
Statements of Changes in Net Assets | | | 94 | | |
Financial Highlights | | | 102 | | |
Notes to Financial Statements | | | 117 | | |
Report of Independent Registered Public Accounting Firm | | | 137 | | |
Tax Information | | | 138 | | |
Approval of Investment Advisory Agreement | | | 141 | | |
Trustees and Officers of the Funds | | | 146 | | |
Cover photo: Ancient Architecture, China
This report has been prepared for Matthews Asia Funds shareholders. It is not authorized for distribution to prospective investors unless accompanied or preceded by a current Matthews Asia Funds prospectus, which contains more complete information about the Funds' investment objectives, risks and expenses. Additional copies of the prospectus or summary prospectus may be obtained at matthewsasia.com. Please read the prospectus carefully before you invest or send money.
The views and opinions in this report were current as of December 31, 2014. They are not guarantees of performance or investment results and should not be taken as investment advice. Investment decisions reflect a variety of factors, and the managers reserve the right to change their views about individual stocks, sectors and the markets at any time. As a result, the views expressed should not be relied upon as a forecast of a Fund's future investment intent. Current and future portfolio holdings are subject to risk.
Statements of fact are from sources considered reliable, but neither the Funds nor the Investment Advisor makes any representation or guarantee as to their completeness or accuracy.
Investment Risk: Mutual fund shares are not deposits or obligations of, or guaranteed by, any depositary institution. Shares are not insured by the FDIC, Federal Reserve Board or any government agency and are subject to investment risks, including possible loss of principal amount invested. Investing in international and emerging markets may involve additional risks, such as social and political instability, market illiquidity, exchange-rate fluctuations, a high level of volatility and limited regulation. Fixed income investments are subject to additional risks, including, but not limited to, interest rate, credit and inflation risks. In addition, single-country and sector funds may be subject to a higher degree of market risk than diversified funds because of concentration in a specific industry, sector or geographic location. Investing in small and mid-size companies is more risky than investing in large companies as they may be more volatile and less liquid than larger companies. Please see the Funds' prospectus and Statement of Additional Information for more risk disclosure.

Message to Shareholders from the
President of the Matthews Asia Funds
Dear Shareholders,
As President of the Matthews Asia Funds and CEO of Matthews International Capital Management, LLC ("Matthews Asia"), Advisor to Matthews Asia Funds, I am delighted to offer an annual review of the Funds for the year ended 2014.
Notable Events of 2014
2014 was an important year for Matthews Asia Funds shareholders. During the year we completed the first fund merger in our history, with the merger of The Japan Fund, a series of Nomura Partners Funds, Inc., into the Matthews Japan Fund. Since the launch of our first two regional Asia equity strategies over 20 years ago, Japan has been a core part of our portfolios and a dedicated equity Fund since 1998. We are delighted to welcome the former shareholders of The Japan Fund to Matthews Asia.
At Matthews Asia, we believe fees and expenses should be held at reasonable levels for all shareholders. In this regard, effective May 01, 2014, we made a number of changes to the expense cap structure of the Matthews Asia Funds to standardize the expense cap across the Fund family. This had a direct benefit to the shareholders of a number of our growing Funds. In addition, we put in place additional fee reductions in anticipation of the continued growth of our Funds, which will further benefit our valued shareholders.
And finally, on July 19, 2014, we lost a friend and very well-respected member of our Matthews Asia family, Geoff Bobroff, Chairman of the Board of Trustees of the Matthews Asia Funds, who passed unexpectedly. Geoff led the Board of Trustees with the highest standards of integrity, professionalism and thoughtfulness, and he tirelessly worked toward improving the experience that investors receive from their mutual fund investments. Geoff is missed and remembered with fondness by the entire Matthews Asia team.
Performance
Despite a challenging start to the year, I am pleased with the results that have been achieved for our shareholders. On the following page, Matthews Asia Chief Investment Officer Robert Horrocks will provide additional color on the performance of the region as well as our various strategies. The one aspect I will highlight here is our continued belief in the importance of taking an active approach to investing in Asia and the ability to be selective about the companies we add to the portfolios. We believe that focusing on what is occurring at the company level as opposed to following headlines and short-term economic data points provides the best opportunity to benefit from Asia's growing economy and add value to our portfolios over the long term.
New Strategies
We have always endeavored to offer investors new strategies as the market grows, and new and compelling opportunities present themselves. We also recognize that as economies in Asia continue to evolve, so do investors, a growing number of whom seek to align their investments with their personal values. Given the rising importance of sustainable and responsible business practices in the region, we look forward to exciting announcements in the coming months about how we can provide investors with a strategy that places sustainable and responsible practices at the heart of the investment process.
Finally, thank you for your continued confidence in the Matthews Asia Funds and, as always, we welcome your comments.

William J. Hackett
President of the Matthews Asia Funds
Chief Executive Officer, Matthews Asia
2 MATTHEWS ASIA FUNDS
Message to Shareholders from the Investment Advisor
Dear Valued Investors,
A couple years ago, I expressed a concern over the chase for yield in markets and remarked, "There are times when there is actually safety in growth!" Such has been the story this year. Higher-yielding equities have struggled somewhat. Companies with faster growth profiles have done well. "Developing Asia" has outperformed "Developed Asia" and small-capitalization stocks have outperformed large-caps. In our dividend-focused portfolios, these have largely concentrated in growth in dividends, rather than yield and that has helped deal with the headwinds for such strategies. Elsewhere, our focus on high return-on-capital businesses with secular (if not always remarkable) growth has done well. Of course, we are not trying to rotate across different styles—we are convinced that both ways of looking at the region can provide good long-term, risk-adjusted returns. But the volatilities inherent in the portfolios are different, and they can suit different periods in the markets. But what is common across all our portfolios is a belief that Asia's long-term growth prospects remain strong, and investing in businesses that grow with the development of the region's middle-class lifestyles provides a good backdrop for returns. This year, despite all the concerns over slowing headline growth rates in China and a strengthening U.S. dollar, our conviction that Asia will continue to press for growth-oriented reforms has been further buttressed.
This has certainly been India's year—at least according to the short-term verdict of the markets. There has been plenty of excitement generated by, first, the appointment in September of 2013, of Raghuram Rajan to be the Governor of India's central bank. Part of India's Achilles heel, in the eyes of foreign investors at least, has been fiscal and monetary irresponsibility. Governor Rajan, as a Chicago Booth School of Business economist, exudes the kind of sensible, apolitical expertise that reassures foreign investors. In addition, India's politics have often appeared hopelessly divided and a clear political "win" for a single candidate has given investors further reassurance. The fact that the winner was the reform candidate has added further spice to the story. And if that wasn't enough, India began the year at what appeared to be the turning point, i.e., the trough of a credit and earnings cycle.
All of this means that the main India market benchmarks are up about 30% year-to-date. There has surely been some earnings growth, but valuations have risen quickly. None of which is to say that the rise in India is unjustified. If we are going to be able to look back on Prime Minister Narendra Modi's reforms as a success in about a decade's time, the markets have not yet fully reflected this. Current valuations are surely not discounting much more than a strong rebound in short-term earnings and at least a successful start to the reform process. India remains a country where much can be achieved over the next decade to improve people's standards of living, spending power and productivity. If it can achieve better rates of savings and more efficient mobilization of those savings into much-needed infrastructure projects, why can't it mimic the growth of its giant neighbor China?
But it is still an open question. Now more than ever, investors interested in India should decide if they are in it for the long haul. There may be plenty of opportunities for disappointment either on the political front or in terms of short-run earnings momentum.
These days, the media would have us believe China is not for the faint of heart. Yet, China has initiated its own reform process. Its leaders have also become comfortable with the slower rates of real GDP growth demanded by the markets as a sign of responsible economic management. Have earnings in China not compounded at 12% in U.S. dollar terms since December 2010 as the markets have derated? All of this leaves China trading at the lows last seen during crises past.
Japan has also impressed with its aggressive monetary easing. There are plenty of Abenomics critics in financial circles, but for those that believe economies "can get stuck in a rut" when policy rates are at or near zero, aggressive central banking is what is needed to set the economy back on course. Neither has Abenomics always achieved great popularity in Japan, but the recent snap election seems to have boosted Abe's mandate and at least been a vote of confidence in the monetary and other reforms that appear to be starting to show results in an improved labor market and strong profitability in corporate Japan.
The one cloud this year has been the strengthening U.S. dollar. But, as we wrote earlier this year, this does seem to have been a case of dollar strength, not Asian weakness. So, we reach the end of the year with the momentum still behind the U.S. markets in terms of rising prices and rising valuations. Asia, on the other hand, has been more listless, but has started to see better operational results as margins have stabilized and sales growth remains robust. Who knows what will happen next year, but the momentum still seems to be behind the "growthier" elements of the markets in Asia. But there is real relative value emerging in Asia, where portfolios with growth far in excess of the broad market indices in the U.S. and Europe can be had for the same valuations or even discounts of 20% or 30%. Periods of tighter money (a strong U.S. dollar) and weaker growth (e.g. China, Europe) have typically been harder times for Asia's stock markets—and this is what we have been facing for the past year or more. But Asia's markets have been resilient and, furthermore, continue to lay the groundwork for future growth in its reform plans. I remain optimistic based on the region's long-term growth that can still be accessed at reasonable valuations.
It is a privilege to serve as your advisor for Asia investments.

Robert Horrocks, PhD
Chief Investment Officer
Matthews International Capital Management, LLC

ASIA FIXED INCOME STRATEGY
PORTFOLIO MANAGERS
Teresa Kong, CFA | | | |
Lead Manager | | | |
Gerald M. Hwang, CFA | | Satya Patel | |
Co-Manager | | Co-Manager | |
FUND FACTS
| | | Investor Class | | Institutional Class | |
Ticker | | MAINX | | MINCX | |
CUSIP | | 577125503 | | 577125602 | |
Inception | | 11/30/11 | | 11/30/11 | |
NAV | | $10.31 | | $10.30 | |
Initial Investment | | $2,500 | | $3 million | |
Gross Expense Ratio1 | | 1.27% | | 1.07% | |
After fee waiver and
Reimbursement2 | | 1.13% | | 0.93% | |
Portfolio Statistics
Total # of Positions | | 58 | |
Net Assets | | $66.4 million | |
Modified Duration | | 2.93 | |
Portfolio Turnover | | 34.28%4 | |
Benchmark
HSBC Asian Local Bond Index
Redemption Fee
2% within first 90 calendar days of purchase
OBJECTIVE
Total return over the long term with an emphasis on income.
STRATEGY
Under normal market conditions, the Fund seeks to achieve its investment objective by investing at least 80% of its total assets, which include borrowings for investment purposes, in income-producing securities including, but not limited to, debt and debt-related instruments issued by governments, quasi-governmental entities, supra-national institutions, and companies in Asia. Asia consists of all countries and markets in Asia and includes developed, emerging, and frontier countries and markets in the Asian region. Investments may be denominated in any currency, and may represent any part of a company's capital structure from debt to equity or with features of both.
1 Actual 2014 expense ratios.
2 Effective May 1, 2014, Matthews has contractually agreed to waive fees and reimburse expenses until August 31, 2015 to the extent needed to limit Total Annual Fund Operating Expenses to 0.90% by waiving class specific and non-class specific expenses for the Institutional Class and agreed to reduce the expense ratio by waiving an equal amount of non-class specific expenses for the Investor Class. Because certain expenses of the Investor Class may be higher than the Institutional Class and class specific expenses may be waived solely for the Institutional Class, the Total Annual Fund Operating Expenses After Fee Waiver and Expense Reimbursement for the Investor Class may exceed 0.90%. If the expenses fall below the expense limitation in a year within three years after Matthews has made such a waiver or reimbursement, the Fund may reimburse Matthews up to an amount not to cause the expenses for that year to exceed the expense limitation. The fee waiver and expense reimbursement may be terminated at any time by the Board of Trustees or the Trust on behalf of the Fund on 60 days' written notice.
3 Modified duration measures the percent change in value of the fixed income portion of the portfolio in response to a 1% change in interest rates. In a multi-currency denominated portfolio with sensitivities to different interest rate regimes, modified duration will not accurately reflect the change in value of the overall portfolio from a change in any one interest rate regime.
4 The lesser of fiscal year 2014 long-term purchase costs or sales proceeds divided by the average monthly market value of long-term securities.
Matthews Asia Strategic Income Fund
Portfolio Manager Commentary
For the year ending December 31, 2014, the Matthews Asia Strategic Income Fund returned 2.54% (Investor Class) and 2.64% (Institutional Class), while its benchmark, the HSBC Asian Local Bond Index (ALBI) gained 4.36%. For the fourth quarter, the Fund returned –0.92% (Investor Class), and –0.86% (Institutional Class) versus –0.08% for the benchmark.
Market Environment:
The year 2014 was one of surprises and transition for Asia's credit, currency and interest rate markets. The decline in U.S. Treasury yields caught most market participants by surprise and led rates down for most world markets. On the back of expectations of rate differentials between the U.S. and Europe, the U.S. dollar (USD) strengthened, outperforming not only the Euro but also most Asian currencies. Finally, the relatively unchanged credit spreads year-on-year masked a relatively volatile year and an increasing divergence between investment grade and high yield credit spreads. Credit spreads in investment grade tightened while high yield spreads widened during the year. Finally, almost every major Asian currency depreciated relative to the USD in 2014, notably the Japanese yen, the Australian dollar (AUD) and the Malaysian ringgit. The best-performing currency, the Hong Kong dollar, managed a flat year against the USD only because it is pegged to the U.S. dollar.
Performance Contributors and Detractors:
Given the dynamics described above, the Fund underperformed its benchmark for both the fourth quarter and one-year periods. This was primarily based on our under-allocation to U.S. dollar investment grade bonds. This position reflected our view that interest rates had a higher probability of rising than falling, and as such, we wanted the least exposure to USD investment grade bonds, which would suffer most in a rising rate environment. Given the fall in U.S. interest rates, both our under-allocation to USD investment grade bonds as well as our short U.S. Treasury position contributed to our underperformance. Lastly, our investments in hybrid securities—specifically, the preferred shares of two Korean chaebol, which are large conglomerates—contributed negatively to returns. We have since cut both these positions.
Amongst the biggest contributors to returns were our investments in Sri Lankan government bonds, Indonesian government bonds and the USD-denominated debt of South Asian banks, including ICICI and DFCC banks. Sri Lankan interest rates fell during the year, while the currency remained stable, contributing strongly to performance. Our Indonesian government bonds did well as interest rates fell, even though the currency depreciated slightly versus the USD. Rates declined as inflation fell throughout most of the year. In fact, core inflation dropped, enabling the newly elected Jokowi administration to push through diesel price hikes. This led to higher headline inflation at the end of the year, but core inflation remained low. Our positions in the Tier 2 capital bonds of Indian banks issued under the Basel II regulatory regime did well on scarcity value and positive sentiment surrounding Prime Minister Narendra Modi's election victory. Lastly, DFCC bank bonds did well as credit spreads tightened with other Sri Lankan banks, as well as on the progress of its merger with the National Development Bank (NDB) of Sri Lanka.
4 MATTHEWS ASIA FUNDS
PERFORMANCE AS OF DECEMBER 31, 2014
| | | | | | Average Annual
Total Returns | | | |
| | 3 Months | | 1 Year | | 3 Years | | Since
Inception | |
Inception Date | |
Investor Class (MAINX) | | | -0.92 | % | | | 2.54 | % | | | 5.05 | % | | | 4.73 | % | | 11/30/11 | |
Institutional Class (MINCX) | | | -0.86 | % | | | 2.64 | % | | | 5.23 | % | | | 4.90 | % | | 11/30/11 | |
HSBC Asian Local Bond Index5 | | | -0.08 | % | | | 4.36 | % | | | 2.34 | % | | | 2.53 | % | | | | | |
Lipper Emerging Markets Hard Currency Debt Category Average6 | | | -3.45 | % | | | 1.36 | % | | | 4.21 | % | | | 4.43 | % | | | | | |
| Performance assumes reinvestment of all dividends and/or distributions before taxes. All performance quoted represents past performance and is no guarantee of future results. Investment return and principal value will fluctuate with market conditions so that when redeemed, shares may be worth more or less than their original cost. Current performance may be lower or higher than the return figures quoted. Returns would have been lower if certain of the Fund's fees and expenses had not been waived. For the Fund's most recent month-end performance visit matthewsasia.com. | |
INCOME DISTRIBUTION HISTORY
| | 2014 | | 2013 | |
| | Q1 | | Q2 | | Q3 | | Q4 | | Total | | Q1 | | Q2 | | Q3 | | Q4 | | Total | |
Investor (MAINX) | | $ | 0.10 | | | $ | 0.09 | | | $ | 0.07 | | | $ | 0.10 | | | $ | 0.38 | | | $ | 0.11 | | | $ | 0.10 | | | $ | 0.03 | | | $ | 0.11 | | | $ | 0.35 | | |
Inst'l (MINCX) | | $ | 0.11 | | | $ | 0.10 | | | $ | 0.08 | | | $ | 0.11 | | | $ | 0.40 | | | $ | 0.12 | | | $ | 0.11 | | | $ | 0.03 | | | $ | 0.12 | | | $ | 0.38 | | |
Note: This table does not include capital gains distributions. Totals may differ by $0.02 due to rounding. For income distribution history, visit matthewsasia.com.
30-DAY YIELD:
Investor Class: 4.35% (4.24% excluding expense waiver)
Inst'l Class: 4.66% (4.55% excluding expense waiver)
The 30-Day Yield represents net investment income earned by the Fund over the 30-day period ended 12/31/14, expressed as an annual percentage rate based on the Fund's share price at the end of the 30-day period. The 30-Day Yield should be regarded as an estimate of the Fund's rate of investment income, and it may not equal the Fund's actual income distribution rate.
Source: BNY Mellon Investment Servicing (US) Inc.
YIELD TO WORST:
5.67%
Yield to worst is the lowest yield that can be received on a bond assuming that the issuer does not default. It is calculated by utilizing the worst case assumptions for a bond with respect to certain income-reducing factors, including prepayment, call or sinking fund provisions. It does not represent the yield that an investor should expect to receive. Past yields are no guarantee of future yields.
Source: FactSet Research Systems
GROWTH OF A $10,000 INVESTMENT SINCE INCEPTION—INVESTOR CLASS
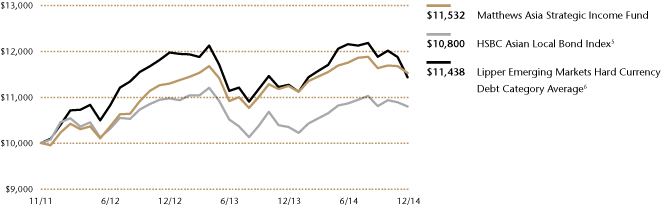
Plotted monthly. The performance data and graph do not reflect the deduction of taxes that a shareholder would pay on dividends, capital gains distributions or redemption of Fund shares. Values are in US$.
5 It is not possible to invest directly in an index. Source: Index data from HSBC, and Bloomberg; total return calculations performed by BNY Mellon Investment Servicing (US) Inc. Please see page 79 for index definitions.
6 The Lipper Category Average does not reflect sales charges and is based on total return, including reinvestment of dividends and capital gains for the stated periods.
TOP TEN POSITIONS7
| | Sector | | Currency | | % of Net Assets | |
DFCC Bank, 9.625%, 10/31/2018 | | Financials | | U.S. Dollar | | | 4.3 | % | |
Home Inns & Hotels Management, Inc., Cnv., 2.000%, 12/15/2015 | | Consumer Discretionary | | U.S. Dollar | | | 4.1 | % | |
Housing Development Finance Corp., 9.580%, 8/29/2015 | | Financials | | Indian Rupee | | | 3.6 | % | |
SINA Corp., 1.000%, 12/01/18 | | Information Technology | | U.S. Dollar | | | 3.5 | % | |
Bank of Baroda, 6.625%, 5/25/2022 | | Financials | | U.S. Dollar | | | 3.1 | % | |
ICICI Bank, Ltd., 6.375%, 4/30/2022 | | Financials | | U.S. Dollar | | | 3.1 | % | |
Longfor Properties Co., Ltd., 6.875%, 10/18/2019 | | Financials | | U.S. Dollar | | | 3.0 | % | |
Global Logistic Properties, Ltd., 3.375%, 5/11/2016 | | Financials | | Chinese Renminbi | | | 3.0 | % | |
National Savings Bank, 5.150%, 9/10/2019 | | Financials | | U.S. Dollar | | | 3.0 | % | |
PT Bank Rakyat Indonesia Persero, 2.950%, 3/28/2018 | | Financials | | U.S. Dollar | | | 3.0 | % | |
| % OF ASSETS IN TOP 10 | | | | | | | 33.7 | % | |
7 Holdings may combine more than one security from same issuer and related depositary receipts.
matthewsasia.com | 800.789.ASIA 5
CURRENCY ALLOCATION (%)8,9
U.S. Dollar (USD) | | | 51.3 | | |
Indian Rupee (INR) | | | 9.6 | | |
Singapore Dollar (SGD) | | | 6.6 | | |
Indonesian Rupiah (IDR) | | | 6.2 | | |
Sri Lanka Rupee (LKR) | | | 6.1 | | |
Chinese Renminbi (CNY) | | | 5.9 | | |
South Korean Won (KRW) | | | 4.2 | | |
Malaysian Ringgit (MYR) | | | 3.6 | | |
Hong Kong Dollar (HKD) | | | 1.5 | | |
Thai Baht (THB) | | | 0.9 | | |
New Zealand Dollar (NZD) | | | 0.6 | | |
Philippine Peso (PHP) | | | 0.6 | | |
Cash and Other Assets, Less Liabilities | | | 2.9 | | |
COUNTRY ALLOCATION (%)9,10
China/Hong Kong | | | 27.5 | | |
India | | | 18.4 | | |
Indonesia | | | 15.7 | | |
Sri Lanka | | | 14.3 | | |
Singapore | | | 5.0 | | |
South Korea | | | 4.2 | | |
Malaysia | | | 3.6 | | |
Australia | | | 3.4 | | |
Philippines | | | 2.3 | | |
Supranational | | | 1.2 | | |
Thailand | | | 0.9 | | |
New Zealand | | | 0.6 | | |
Cash and Other Assets, Less Liabilities | | | 2.9 | | |
SECTOR ALLOCATION (%)9
Financials | | | 49.4 | | |
Foreign Government Bonds | | | 18.7 | | |
Consumer Discretionary | | | 15.4 | | |
Telecommunication Services | | | 4.1 | | |
Information Technology | | | 3.9 | | |
Utilities | | | 2.4 | | |
Industrials | | | 2.3 | | |
Consumer Staples | | | 0.9 | | |
Cash and Other Assets, Less Liabilities | | | 2.9 | | |
Please note: Foreign Government Bonds category includes Supranationals.
ASSET TYPE BREAKDOWN (%)8,9
Non-Convertible Corporate Bonds | | | 62.5 | | |
Government Bonds | | | 18.7 | | |
Convertible Corporate Bonds | | | 9.1 | | |
Common Equities and ADRs | | | 5.4 | | |
Preferred Equities | | | 1.4 | | |
Cash and Other Assets, Less Liabilities | | | 2.9 | | |
8 Source: FactSet Research Systems. Percentage values in data are rounded to the nearest tenth of one percent; the values may not sum to 100% due to rounding.
9 Cash and other assets may include forward currency exchange contracts and certain derivative instruments that have been marked-to-market.
10 Not all countries where the Fund may invest are included in the benchmark index.
Matthews Asia Strategic Income Fund
Portfolio Manager Commentary (continued)
Notable Portfolio Changes:
Over the fourth quarter, we increased our exposure to USD-denominated debt. We sold local currency bonds, including AUD-denominated corporates and KRW-denominated government bonds, to fund purchases of USD-denominated corporate bonds.
Outlook:
If we were to draw lessons from 2014, one important take-away is that markets are unlikely to end a year looking the same way as they did at the start of it. While the U.S. dollar may continue to outperform Asian currencies as the U.S. economy strengthens relative to rest of the world, this appreciation may run out of steam without an actual rise in U.S. rates, given that nominal rates between German Bunds and U.S. Treasuries have again begun to narrow. The other consensus is one of stable-to-rising rates in the U.S. and stable-to-falling rates in Asia, especially given the continued slowdown in China. However, with deteriorating fundamentals in Europe, and a slowing, albeit rebalancing, China driving down aggregate demand, could the U.S. afford to tighten monetary policy? Lastly, the simultaneous plunge in commodity prices across the energy, agricultural and metals sectors in the last quarter has been fast and furious. Lower oil prices will certainly ease the fiscal budgets of governments providing fuel subsidies, including India, Sri Lanka and Indonesia. However, lower oil prices will negatively impact higher cost producers, leading to potential liquidity issues. These higher cost producers include some of the largest emerging market and U.S. high yield borrowers. If investors sell out of emerging and U.S. high yield, this could lead to a risk-off contagion across the broader emerging and credit markets, causing a sell-off in Asia debt. With these unpredictable cross currents, we are rebalancing our portfolio, on the margin, toward U.S. dollar investment grade credits with strong competitive advantages, ample liquidity on the balance sheet and relatively low operating leverage.
Fixed income investments are subject to additional risks, including, but not limited to, interest rate, credit and inflation risks. Investing in emerging markets involves different and greater risks, as these countries are substantially smaller, less liquid and more volatile than securities markets in more developed markets.
6 MATTHEWS ASIA FUNDS
Matthews Asia Strategic Income Fund December 31, 2014
Schedule of Investmentsa
NON-CONVERTIBLE CORPORATE BONDS: 62.5%
| | | Face Amount* | | Value | |
INDIA: 18.4% | |
Housing Development Finance Corp., Ltd.
9.580%, 08/29/15 | | INR | 150,000,000 | | | $ | 2,385,116 | | |
Bank of Baroda
6.625%b, 05/25/22 | | | 2,000,000 | | | | 2,065,780 | | |
ICICI Bank, Ltd.
6.375%b, 04/30/22 | | | 2,000,000 | | | | 2,055,000 | | |
Power Grid Corp. of India, Ltd.
9.250%, 12/26/15 | | INR | 100,000,000 | | | | 1,585,948 | | |
TML Holdings Pte, Ltd.
4.250%, 05/16/18 | | SGD | 2,000,000 | | | | 1,508,951 | | |
Axis Bank, Ltd.
7.250%b, 08/12/21 | | | 1,000,000 | | | | 1,051,081 | | |
Rural Electrification Corp., Ltd.
9.020%, 06/18/19 | | INR | 50,000,000 | | | | 802,139 | | |
Housing Development Finance Corp., Ltd.
9.350%, 03/04/16 | | INR | 50,000,000 | | | | 800,293 | | |
Total India | | | | | 12,254,308 | | |
CHINA/HONG KONG: 16.8% | |
Longfor Properties Co., Ltd.
6.875%, 10/18/19 | | | 2,000,000 | | | | 2,007,500 | | |
Value Success International, Ltd.
4.750%, 11/04/18 | | CNY | 12,000,000 | | | | 1,949,050 | | |
Shimao Property Holdings, Ltd.
6.625%, 01/14/20 | | | 2,000,000 | | | | 1,941,000 | | |
MCE Finance, Ltd.
5.000%, 02/15/21 | | | 2,000,000 | | | | 1,870,000 | | |
Wynn Macau, Ltd.
5.250%, 10/15/21 | | | 1,480,000 | | | | 1,391,200 | | |
FPT Finance, Ltd.
6.375%, 09/28/20 | | | 1,050,000 | | | | 1,147,125 | | |
Wheelock Finance, Ltd.
4.500%, 09/02/21 | | SGD | 750,000 | | | | 588,813 | | |
Alibaba Group Holding, Ltd.
3.600%, 11/28/24c | | | 300,000 | | | | 297,553 | | |
Total China/Hong Kong | | | | | 11,192,241 | | |
INDONESIA: 10.1% | |
PT Bank Rakyat Indonesia Persero
2.950%, 03/28/18 | | | 2,000,000 | | | | 1,982,500 | | |
Theta Capital Pte, Ltd.
7.000%, 05/16/19 | | | 1,500,000 | | | | 1,542,390 | | |
Alam Synergy Pte, Ltd.
6.950%, 03/27/20c | | | 1,500,000 | | | | 1,376,250 | | |
TBG Global Pte, Ltd.
4.625%, 04/03/18c | | | 1,000,000 | | | | 982,500 | | |
Alam Synergy Pte, Ltd.
6.950%, 03/27/20 | | | 500,000 | | | | 458,750 | | |
PT Astra Sedaya Finance
8.600%, 02/21/17 | | IDR | 5,000,000,000 | | | | 391,975 | | |
Total Indonesia | | | | | 6,734,365 | | |
SRI LANKA: 8.2% | |
DFCC Bank PLC
9.625%, 10/31/18 | | | 2,650,000 | | | | 2,879,146 | | |
National Savings Bank
5.150%, 09/10/19 | | | 2,000,000 | | | | 1,985,000 | | |
National Savings Bank
8.875%, 09/18/18 | | | 500,000 | | | | 556,250 | | |
Total Sri Lanka | | | | | 5,420,396 | | |
| | | Face Amount* | | Value | |
SINGAPORE: 3.9% | |
Global Logistic Properties, Ltd.
3.375%, 05/11/16 | | CNY | 12,500,000 | | | $ | 1,988,407 | | |
Olam International, Ltd.
6.000%, 10/25/22 | | SGD | 750,000 | | | | 579,360 | | |
Total Singapore | | | | | 2,567,767 | | |
AUSTRALIA: 3.4% | |
Macquarie Bank, Ltd.
6.625%, 04/07/21 | | | 1,100,000 | | | | 1,269,843 | | |
Lend Lease Finance, Ltd.
4.625%, 07/24/17 | | SGD | 1,250,000 | | | | 975,302 | | |
Total Australia | | | | | 2,245,145 | | |
PHILIPPINES: 1.7% | |
Alliance Global Group, Inc.
6.500%, 08/18/17 | | | 1,050,000 | | | | 1,123,500 | | |
Total Philippines | | | | | 1,123,500 | | |
TOTAL NON-CONVERTIBLE CORPORATE BONDS | | | | | 41,537,722 | | |
(Cost $42,355,907) | | | | | | | |
FOREIGN GOVERNMENT OBLIGATIONS: 18.7%
SRI LANKA: 6.1% | |
Sri Lanka Government Bond
8.500%, 06/01/18 | | LKR | 200,000,000 | | | | 1,589,140 | | |
Sri Lanka Government Bond
8.500%, 04/01/18 | | LKR | 110,000,000 | | | | 871,504 | | |
Sri Lanka Government Bond
8.500%, 07/15/18 | | LKR | 100,000,000 | | | | 793,807 | | |
Sri Lanka Government Bond
8.000%, 11/15/18 | | LKR | 100,000,000 | | | | 782,874 | | |
Total Sri Lanka | | | | | 4,037,325 | | |
INDONESIA: 5.6% | |
Indonesia Treasury Bond
7.875%, 04/15/19 | | IDR | 20,000,000,000 | | | | 1,624,950 | | |
Indonesia Treasury Bond
6.125%, 05/15/28 | | IDR | 16,000,000,000 | | | | 1,071,193 | | |
Indonesia Treasury Bond
9.000%, 03/15/29 | | IDR | 12,000,000,000 | | | | 1,037,707 | | |
Total Indonesia | | | | | 3,733,850 | | |
MALAYSIA: 3.0% | |
Malaysian Government Bond
3.492%, 03/31/20 | | MYR | 5,000,000 | | | | 1,399,399 | | |
Malaysian Government Bond
3.580%, 09/28/18 | | MYR | 1,000,000 | | | | 283,221 | | |
Malaysia Investment Issue
3.309%, 08/30/17 | | MYR | 1,000,000 | | | | 282,780 | | |
Total Malaysia | | | | | 1,965,400 | | |
matthewsasia.com | 800.789.ASIA 7
Matthews Asia Strategic Income Fund December 31, 2014
Schedule of Investmentsa (continued)
FOREIGN GOVERNMENT OBLIGATIONS: (continued)
| | | Face Amount* | | Value | |
SOUTH KOREA: 2.8% | |
Korea Treasury Bond
3.500%, 09/10/16 | | KRW | 1,000,000,000 | | | $ | 937,905 | | |
Korea Treasury Bond
3.500%, 03/10/24 | | KRW | 400,000,000 | | | | 394,188 | | |
Korea Treasury Bond
4.000%, 09/10/15 | | KRW | 300,000,000 | | | | 278,511 | | |
Korea Treasury Bond
3.250%, 06/10/15 | | KRW | 300,000,000 | | | | 276,348 | | |
Total South Korea | | | | | 1,886,952 | | |
SUPRANATIONAL: 1.2% | |
International Finance Corp.
7.750%, 12/03/16 | | INR | 50,000,000 | | | | 821,499 | | |
Total Supranational | | | | | 821,499 | | |
TOTAL FOREIGN GOVERNMENT OBLIGATIONS | | | | | 12,445,026 | | |
(Cost $12,464,186) | | | | | | | |
CONVERTIBLE CORPORATE BONDS: 9.1%
CHINA/HONG KONG: 9.1% | |
Homeinns Hotel Group, Cnv.
2.000%, 12/15/15 | | | 2,800,000 | | | | 2,737,000 | | |
SINA Corp., Cnv.
1.000%, 12/01/18 | | | 2,500,000 | | | | 2,304,687 | | |
Ctrip.com International, Ltd., Cnv.
1.250%, 10/15/18 | | | 1,000,000 | | | | 975,000 | | |
Total China/Hong Kong | | | | | 6,016,687 | | |
TOTAL CONVERTIBLE CORPORATE BONDS | | | | | 6,016,687 | | |
(Cost $5,977,771) | | | | | | | |
COMMON EQUITIES: 5.4%
| | | Shares | | | |
CHINA/HONG KONG: 1.6% | |
HSBC Holdings PLC | | | 40,000 | | | | 380,358 | | |
Prosperity REIT | | | 1,000,000 | | | | 339,315 | | |
China Mobile, Ltd. | | | 25,000 | | | | 292,819 | | |
Total China/Hong Kong | | | | | 1,012,492 | | |
SINGAPORE: 1.1% | |
StarHub, Ltd. | | | 140,000 | | | | 437,411 | | |
Ascendas REIT | | | 170,000 | | | | 304,938 | | |
Total Singapore | | | | | 742,349 | | |
THAILAND: 0.9% | |
Advanced Info Service Public Co., Ltd. | | | 80,000 | | | | 606,653 | | |
Total Thailand | | | | | 606,653 | | |
| | | Shares | | Value | |
NEW ZEALAND: 0.6% | |
SKY Network Television, Ltd. | | | 86,000 | | | $ | 403,741 | | |
Total New Zealand | | | | | 403,741 | | |
MALAYSIA: 0.6% | |
Axiata Group BHD | | | 200,000 | | | | 402,543 | | |
Total Malaysia | | | | | 402,543 | | |
PHILIPPINES: 0.6% | |
Alliance Global Group, Inc. | | | 780,000 | | | | 389,638 | | |
Total Philippines | | | | | 389,638 | | |
TOTAL COMMON EQUITIES | | | | | 3,557,416 | | |
(Cost $3,512,124) | | | | | | | |
PREFERRED EQUITIES: 1.4%
SOUTH KOREA: 1.4% | |
Hyundai Motor Co., Ltd., Pfd. | | | 8,000 | | | | 920,273 | | |
Total South Korea | | | | | 920,273 | | |
TOTAL PREFERRED EQUITIES | | | | | 920,273 | | |
(Cost $1,216,916) | | | | | | | |
TOTAL INVESTMENTS: 97.1% | | | | | 64,477,124 | | |
(Cost $65,526,904d) | | | | | | | |
CASH AND OTHER ASSETS,
LESS LIABILITIES: 2.9% | | | | | 1,957,550 | | |
NET ASSETS: 100.0% | | | | $ | 66,434,674 | | |
a Certain securities were fair valued under the valuation polices approved by the Board of Trustees (Note 2-A).
b Variable rate security. The rate represents the rate in effect at December 31, 2014.
c Security exempt from registration under Rule 144A of the Securities Act of 1933, as amended. The security may be resold in transactions exempt from registration normally to qualified institutional buyers. The security has been determined to be liquid in accordance with procedures adopted by the Fund's Board of Directors.
d Cost for federal income tax purposes is $65,558,420 and net unrealized depreciation consists of:
Gross unrealized appreciation | | $ | 1,077,905 | | |
Gross unrealized depreciation | | | (2,159,201 | ) | |
Net unrealized depreciation | | ( | $1,081,296 | ) | |
* All values are in USD unless otherwise noted.
BHD Berhad
Cnv. Convertible
CNY Chinese Renminbi (Yuan)
IDR Indonesian Rupiah
INR Indian Rupee
KRW Korean Won
LKR Sri Lankan Rupee
MYR Malaysian Ringgit
REIT Real Estate Investment Trust
SGD Singapore Dollar
USD U.S. Dollar
FINANCIAL FUTURES CONTRACTS SOLD SHORT AS OF DECEMBER 31, 2014 WERE AS FOLLOWS:
Contracts | | Issue | | Exchange | | Expiration | | Notional Value | | Unrealized
Appreciation | |
| | 25 | | | U.S. Treasury Notes (10 Year) | | Chicago Board of Trade | | March, 2015 | | $ | 3,169,922 | | | $ | 12,891 | | |
See accompanying notes to financial statements.
8 MATTHEWS ASIA FUNDS

ASIA GROWTH AND INCOME STRATEGIES
PORTFOLIO MANAGERS
Robert J. Horrocks, PhD
Lead Manager
Kenneth Lowe, CFA
Lead Manager
FUND FACTS
| | | Investor Class | | Institutional Class | |
Ticker | | MACSX | | MICSX | |
CUSIP | | 577130206 | | 577130842 | |
Inception | | 9/12/94 | | 10/29/10 | |
NAV | | $18.01 | | $18.00 | |
Initial Investment | | $2,500 | | $3 million | |
Gross Expense Ratio1 | | 1.08% | | 0.92% | |
Portfolio Statistics
Total # of Positions | | 59 | |
Net Assets | | $4.2 billion | |
Weighted Average Market Cap | | $32.3 billion | |
Portfolio Turnover | | 16.79%2 | |
Benchmark
MSCI AC Asia ex Japan Index
Redemption Fee
2% within first 90 calendar days of purchase
OBJECTIVE
Long-term capital appreciation. The Fund also seeks to provide some current income.
STRATEGY
Under normal market conditions, the Fund seeks to achieve its investment objective by investing at least 80% of its total net assets, which include borrowings for investment purposes, in dividend-paying common stock, preferred stock and other equity securities, and convertible securities as well as fixed-income securities, of any duration or quality, of companies located in Asia, which consists of all countries and markets in Asia, including developed, emerging and frontier countries and markets in the Asian region.
1 Actual 2014 expense ratios.
2 The lesser of fiscal year 2014 long-term purchase costs or sales proceeds divided by the average monthly market value of long-term securities.
Matthews Asian Growth and Income Fund
Portfolio Manager Commentary
For the year ending December 31, 2014, the Matthews Asian Growth and Income Fund fell –0.65% (Investor Class) and –0.48% (Institutional Class), underperforming its benchmark, the MSCI All Country Asia ex Japan Index, which gained 5.11%. For the fourth quarter of the year, the Fund fell –3.49% (Investor Class) and –3.40% (Institutional Class) versus a 0.17% increase for the Index.
Market Environment:
Monetary policy, politics and commodity prices have been the largest drivers of market sentiment during 2014, with the plunge in oil prices over the fourth quarter being the latest in a lengthening line of macroeconomic swings. From an Asian investor's standpoint, much of the region may well benefit from such moves in oil prices, given that they appear to be more supply-driven in nature and many Asian nations are oil importers. Arguably, the more important changes in Asia over the preceding twelve months have come from supply-side reforms. Elections in India and Indonesia have put into place pro-reform governments in two major economies, whilst China has made moderate progress in areas such as financial sector reform. These shifts set the stage for the secular growth markets of India and Indonesia to become some of the region's best performers over the year, outperforming the North Asian markets of Korea and Hong Kong.
Performance Contributors and Detractors:
The largest detractor to returns during the year came from our exposure to commodities. The Fund does not generally invest heavily within the sector, nor does it invest in entities that tend to be driven only by commodity prices. Despite this, our holdings in service operators such as Orica, the mining explosives manufacturer, Keppel Corporation, a Singaporean rig builder and newer addition China Oilfield Services Limited, the driller and support services company, struggled. This can largely be attributed to the plummet in prices across commodities such as iron ore, coal and oil. All of this has led to various capital expenditure cuts in the customers of these companies, prospectively affecting future earnings.
Another weak spot for the portfolio, throughout the year, came from our consumer staples holdings. Part of this underperformance was currency related, as the Japanese yen and Australia dollar both depreciated. The former has been driven down further by the aggressive, ongoing monetary easing by the Bank of Japan, whilst the Australian dollar has struggled amid a weak domestic economy and waning demand from China for the country's resources. This was further compounded by some weaker stock selection in Australia with bottler Coca-Cola Amatil struggling, given an increase in pricing pressure from the competition, alongside waning demand for carbonated soft drinks. We have since exited this position.
Although it was a challenging year, our holdings in Hong Kong were our largest contributors. This included companies such as regional conglomerate Jardine Matheson, information technology company VTech Holdings and life insurer AIA Group. All performed strongly throughout the year, as they delivered solid operational results.
matthewsasia.com | 800.789.ASIA 9
PERFORMANCE AS OF DECEMBER 31, 2014
| | | | | | | Average Annual Total Returns | | | |
| | | 3 Months | | 1 Year | | 3 Years | | 5 Years | | 10 Years | | Since
Inception | | Inception
Date | |
Investor Class (MACSX) | | | -3.49 | % | | | -0.65 | % | | | 9.74 | % | | | 7.08 | % | | | 8.91 | % | | | 10.15 | % | | 9/12/94 | |
Institutional Class (MICSX) | | | -3.40 | % | | | -0.48 | % | | | 9.93 | % | | | n.a. | | | | n.a. | | | | 4.84 | % | | 10/29/10 | |
MSCI AC Asia ex Japan Index3 | | | 0.17 | % | | | 5.11 | % | | | 10.05 | % | | | 5.80 | % | | | 9.72 | % | | | 4.15 | %4 | | | | | |
Lipper Pacific Region Funds Category Average5 | | | -2.39 | % | | | 0.60 | % | | | 10.43 | % | | | 5.43 | % | | | 5.91 | % | | | 4.01 | %4 | | | | | |
Performance assumes reinvestment of all dividends and/or distributions before taxes. All performance quoted represents past performance and is no guarantee of future results. Investment return and principal value will fluctuate with market conditions so that when redeemed, shares may be worth more or less than their original cost. Current performance may be lower or higher than the return figures quoted. For the Fund's most recent month-end performance, visit matthewsasia.com.
INCOME DISTRIBUTION HISTORY
| | 2014 | | 2013 | |
| | | June | | December | | Total | | June | | December | | Total | |
Investor (MACSX) | | $ | 0.15 | | | $ | 0.20 | | | $ | 0.35 | | | $ | 0.24 | | | $ | 0.22 | | | $ | 0.46 | | |
Inst'l (MICSX) | | $ | 0.16 | | | $ | 0.21 | | | $ | 0.38 | | | $ | 0.26 | | | $ | 0.24 | | | $ | 0.50 | | |
Note: This table does not include capital gains distributions. Totals may differ by $0.01 due to rounding. For income distribution history, visit matthewsasia.com.
30-DAY YIELD:
1.38% (Investor Class) 1.54% (Institutional Class)
The 30-Day Yield represents net investment income earned by the Fund over the 30-day period ended 12/31/14, expressed as an annual percentage rate based on the Fund's share price at the end of the 30-day period. The 30-Day Yield should be regarded as an estimate of the Fund's rate of investment income, and it may not equal the Fund's actual income distribution rate.
Source: BNY Mellon Investment Servicing (US) Inc.
DIVIDEND YIELD: 3.44%
The dividend yield (trailing) for the portfolio is the weighted average sum of the dividends paid by each equity security held by the Fund over the 12 months ended 12/31/2014 divided by the current price of each equity as of 12/31/2014. The annualized dividend yield for the Fund is for the equity-only portion of the portfolio. Please note that this is based on gross equity portfolio holdings and does not reflect the actual yield an investor in the Fund would receive. Past yields are no guarantee of future yields.
Source: FactSet Research Systems, Bloomberg, MICM
GROWTH OF A $10,000 INVESTMENT SINCE INCEPTION—INVESTOR CLASS
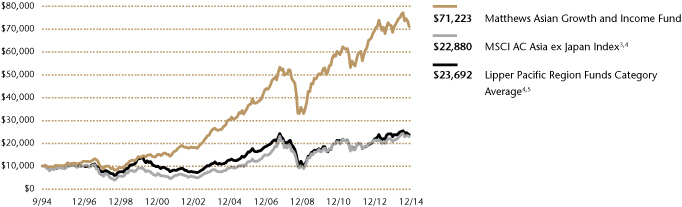
Plotted monthly. The performance data and graph do not reflect the deduction of taxes that a shareholder would pay on dividends, capital gains distributions or redemption of Fund shares. Values are in US$.
3 It is not possible to invest directly in an index. Source: Index data from Morgan Stanley Capital International and Bloomberg; total return calculations performed by BNY Mellon Investment Servicing (US) Inc. Please see page 79 for index definition.
4 Calculated from 8/31/94.
5 The Lipper Category Average does not reflect sales charges and is based on total return, including reinvestment of dividends and capital gains for the stated periods.
TOP TEN POSITIONS6
| | | Sector | | Country | | % of Net Assets | |
Taiwan Semiconductor Manufacturing Co., Ltd. | | Information Technology | | Taiwan | | | 3.7 | % | |
Jardine Matheson Holdings, Ltd. | | Industrials | | China/Hong Kong | | | 3.4 | % | |
AIA Group, Ltd. | | Financials | | China/Hong Kong | | | 3.4 | % | |
Singapore Technologies Engineering, Ltd. | | Industrials | | Singapore | | | 2.9 | % | |
Hong Kong Exchanges and Clearing, Ltd., Cnv., 0.500%, 10/23/2017 | | Financials | | China/Hong Kong | | | 2.7 | % | |
United Overseas Bank, Ltd. | | Financials | | Singapore | | | 2.5 | % | |
Television Broadcasts, Ltd. | | Consumer Discretionary | | China/Hong Kong | | | 2.5 | % | |
Ascendas REIT | | Financials | | Singapore | | | 2.3 | % | |
Lawson, Inc. | | Consumer Staples | | Japan | | | 2.2 | % | |
AMMB Holdings BHD | | Financials | | Malaysia | | | 2.2 | % | |
| % OF ASSETS IN TOP 10 | | | | | | | 27.8 | % | |
6 Holdings may combine more than one security from same issuer and related depositary receipts.
10 MATTHEWS ASIA FUNDS
Matthews Asian Growth and Income Fund
Portfolio Manager Commentary (continued)
Notable Portfolio Changes:
The Fund added two new holdings during the quarter ended December 2014, a convertible bond in Shine Power International, Ltd. (a subsidiary of Beijing Enterprises Holdings) and an equity position in Hutchison Whampoa. Beijing Enterprises is a Chinese state-owned, utility company that engages in the transmission and distribution of natural gas. We entered into the Shine Power International convertible bond position, as we believe that the terms offered were quite attractive, with a 1.85% yield (yield to worst), combined with a fairly strong credit quality. The underlying equity also appears attractively priced at 12.9x price-to-earnings. Further, the company has multiple growth opportunities, as demand for cleaner natural gas replaces historical coal consumption in Beijing.
Hutchison Whampoa is a regional industrial conglomerate that has high quality assets across retail, telecommunications, infrastructure, ports and energy. Almost all of these segments have attractive sustainable growth drivers, to accompany a management team that has a strong track record in capital allocation. Despite this, short term concerns over oil and exposure to Europe gave us an opportunity to buy a good business at a price-to-earnings ratio of only 11x and approximately a 36% discount to net asset value.
Outlook:
As we have noted in past commentaries, the supply side reform regimes that are being put into place across much of the region will prove to be pivotal in order for long-term growth potential to be fully realized. Improving institutional frameworks, labor and tax law simplification, greater market liberalization, amongst many other structural changes, will help to preserve and perhaps even enhance Asia's long-term track record of impressive productivity gains. Whilst this long-term outlook is of paramount importance, it should also be noted that these transitions are rarely smooth and we should expect equity market volatility to continue. China's move toward a more domestically oriented economy poses many challenges, and expansionary monetary policy continues in Europe and Japan in the midst of deflationary pressures. Further, interest rate hikes in the U.S. may well have negative implications for capital flows into riskier asset classes like emerging markets.
These risks are real and likely to create volatility but it is this kind of environment that creates opportunities for investors. We will continue to focus on trying to utilize these opportunities and provide shareholders with upside participation in the growth of Asia, but always with a keen eye on protecting capital in tougher time periods.
COUNTRY ALLOCATION (%)7
China/Hong Kong | | | 35.5 | | |
Singapore | | | 15.6 | | |
South Korea | | | 9.5 | | |
Malaysia | | | 8.1 | | |
Thailand | | | 5.9 | | |
Taiwan | | | 4.9 | | |
Australia | | | 4.8 | | |
Japan | | | 4.3 | | |
Indonesia | | | 3.6 | | |
New Zealand | | | 3.2 | | |
Philippines | | | 1.9 | | |
Vietnam | | | 1.4 | | |
United Kingdom | | | 1.3 | | |
Cash and Other Assets, Less Liabilities | | | 0.0 | | |
SECTOR ALLOCATION (%)
Financials | | | 20.5 | | |
Industrials | | | 16.7 | | |
Consumer Discretionary | | | 16.2 | | |
Consumer Staples | | | 14.1 | | |
Telecommunication Services | | | 12.8 | | |
Information Technology | | | 7.3 | | |
Utilities | | | 5.3 | | |
Materials | | | 2.8 | | |
Energy | | | 2.6 | | |
Health Care | | | 1.7 | | |
Cash and Other Assets, Less Liabilities | | | 0.0 | | |
MARKET CAP EXPOSURE (%)8
Large Cap (over $5B) | | | 72.5 | | |
Mid Cap ($1B–$5B) | | | 27.0 | | |
Small Cap (under $1B) | | | 0.5 | | |
Cash and Other Assets, Less Liabilities | | | 0.0 | | |
ASSET TYPE BREAKDOWN (%)9
Common Equities and ADRs | | | 87.7 | | |
Convertible Corporate Bonds | | | 8.8 | | |
Preferred Equities | | | 3.5 | | |
Cash and Other Assets, Less Liabilities | | | 0.0 | | |
7 Not all countries where the Fund may invest are included in the benchmark index.
8 Source: FactSet Research Systems. Percentage values in data are rounded to the nearest tenth of one percent; the values may not sum to 100% due to rounding.
9 Bonds are not included in the MSCI All Country Asia ex Japan Index.
matthewsasia.com | 800.789.ASIA 11
Matthews Asian Growth and Income Fund December 31, 2014
Schedule of Investmentsa
COMMON EQUITIES: 87.7%
| | | Shares | | Value | |
CHINA/HONG KONG: 28.7% | |
Jardine Matheson Holdings, Ltd. | | | 2,402,000 | | | $ | 145,956,005 | | |
AIA Group, Ltd. | | | 26,252,800 | | | | 144,796,472 | | |
Television Broadcasts, Ltd. | | | 17,876,700 | | | | 103,883,487 | | |
China Mobile, Ltd. ADR | | | 1,555,700 | | | | 91,506,274 | | |
Yum! Brands, Inc. | | | 1,251,500 | | | | 91,171,775 | | |
VTech Holdings, Ltd. | | | 6,218,000 | | | | 88,971,284 | | |
CLP Holdings, Ltd. | | | 10,253,700 | | | | 88,790,963 | | |
HSBC Holdings PLC ADR | | | 1,679,433 | | | | 79,319,621 | | |
Vitasoy International Holdings, Ltd. | | | 51,771,000 | | | | 74,869,459 | | |
CITIC Telecom International
Holdings, Ltd.† | | | 188,818,250 | | | | 70,604,266 | | |
Hang Lung Properties, Ltd. | | | 24,970,920 | | | | 69,661,555 | | |
Café de Coral Holdings, Ltd. | | | 18,352,000 | | | | 63,494,638 | | |
China Oilfield Services, Ltd. H Shares | | | 30,342,000 | | | | 52,390,267 | | |
Hutchison Whampoa, Ltd. | | | 4,245,000 | | | | 48,527,008 | | |
Total China/Hong Kong | | | | | 1,213,943,074 | | |
SINGAPORE: 13.6% | |
Singapore Technologies Engineering, Ltd. | | | 48,017,125 | | | | 122,904,447 | | |
United Overseas Bank, Ltd. | | | 5,797,000 | | | | 106,978,152 | | |
Ascendas REIT | | | 53,925,000 | | | | 96,728,134 | | |
Keppel Corp., Ltd. | | | 12,825,900 | | | | 85,489,472 | | |
SIA Engineering Co., Ltd. | | | 21,019,000 | | | | 66,783,281 | | |
Singapore Post, Ltd. | | | 38,209,000 | | | | 55,277,014 | | |
ARA Asset Management, Ltd. | | | 31,219,210 | | | | 39,962,309 | | |
Total Singapore | | | | | 574,122,809 | | |
MALAYSIA: 8.1% | |
AMMB Holdings BHD | | | 49,147,900 | | | | 92,299,250 | | |
Genting Malaysia BHD | | | 75,188,700 | | | | 87,310,714 | | |
Axiata Group BHD | | | 31,516,923 | | | | 63,434,574 | | |
British American Tobacco Malaysia BHD | | | 3,368,900 | | | | 62,394,912 | | |
Telekom Malaysia BHD | | | 20,245,551 | | | | 39,744,909 | | |
Total Malaysia | | | | | 345,184,359 | | |
SOUTH KOREA: 6.0% | |
KT&G Corp. | | | 1,104,197 | | | | 77,242,257 | | |
Samsung Electronics Co., Ltd. | | | 54,642 | | | | 66,184,998 | | |
GS Home Shopping, Inc. | | | 298,935 | | | | 60,129,581 | | |
KEPCO Plant Service &
Engineering Co., Ltd. | | | 722,668 | | | | 52,769,213 | | |
Total South Korea | | | | | 256,326,049 | | |
THAILAND: 5.9% | |
Advanced Info Service Public Co., Ltd. | | | 9,595,700 | | | | 72,765,810 | | |
BEC World Public Co., Ltd. | | | 40,566,000 | | | | 62,781,669 | | |
Glow Energy Public Co., Ltd. | | | 21,887,400 | | | | 58,853,152 | | |
PTT Public Co., Ltd. | | | 5,833,500 | | | | 57,145,972 | | |
Total Thailand | | | | | 251,546,603 | | |
| | | Shares | | Value | |
TAIWAN: 4.9% | |
Taiwan Semiconductor
Manufacturing Co., Ltd. | | | 18,706,187 | | | $ | 82,409,572 | | |
Taiwan Semiconductor
Manufacturing Co., Ltd. ADR | | | 3,295,924 | | | | 73,762,779 | | |
Chunghwa Telecom Co., Ltd. ADR | | | 1,747,125 | | | | 51,417,889 | | |
Total Taiwan | | | | | 207,590,240 | | |
AUSTRALIA: 4.8% | |
CSL, Ltd. | | | 1,044,381 | | | | 73,363,312 | | |
Woolworths, Ltd. | | | 2,620,734 | | | | 65,124,231 | | |
Orica, Ltd. | | | 4,227,825 | | | | 64,785,473 | | |
Total Australia | | | | | 203,273,016 | | |
JAPAN: 4.3% | |
Lawson, Inc. | | | 1,536,200 | | | | 92,829,683 | | |
Japan Tobacco, Inc. | | | 3,264,600 | | | | 89,850,893 | | |
Total Japan | | | | | 182,680,576 | | |
INDONESIA: 3.6% | |
PT Perusahaan Gas Negara Persero | | | 159,343,000 | | | | 77,109,756 | | |
PT Telekomunikasi Indonesia Persero ADR | | | 1,638,000 | | | | 74,086,740 | | |
Total Indonesia | | | | | 151,196,496 | | |
NEW ZEALAND: 3.2% | |
SKY Network Television, Ltd. | | | 15,123,711 | | | | 71,000,719 | | |
SKYCITY Entertainment Group, Ltd. | | | 21,703,820 | | | | 65,571,801 | | |
Total New Zealand | | | | | 136,572,520 | | |
PHILIPPINES: 1.9% | |
Globe Telecom, Inc. | | | 2,065,510 | | | | 79,306,880 | | |
Total Philippines | | | | | 79,306,880 | | |
VIETNAM: 1.4% | |
Vietnam Dairy Products JSC | | | 13,033,926 | | | | 58,105,595 | | |
Total Vietnam | | | | | 58,105,595 | | |
UNITED KINGDOM: 1.3% | |
BHP Billiton PLC | | | 2,588,378 | | | | 55,472,514 | | |
Total United Kingdom | | | | | 55,472,514 | | |
TOTAL COMMON EQUITIES | | | | | 3,715,320,731 | | |
(Cost $3,185,794,801) | | | | | |
PREFERRED EQUITIES: 3.5%
SOUTH KOREA: 3.5% | |
Hyundai Motor Co., Ltd., Pfd. | | | 355,983 | | | | 40,950,172 | | |
Hyundai Motor Co., Ltd., 2nd Pfd. | | | 318,246 | | | | 39,000,852 | | |
Samsung Fire & Marine Insurance
Co., Ltd., Pfd. | | | 253,272 | | | | 38,711,460 | | |
LG Household & Health Care, Ltd., Pfd. | | | 121,855 | | | | 30,290,017 | | |
Total South Korea | | | | | 148,952,501 | | |
TOTAL PREFERRED EQUITIES | | | | | 148,952,501 | | |
(Cost $58,615,961) | | | | | |
12 MATTHEWS ASIA FUNDS
Matthews Asian Growth and Income Fund December 31, 2014
Schedule of Investmentsa (continued)
CONVERTIBLE CORPORATE BONDS: 8.8%
| | | Face Amount* | | Value | |
CHINA/HONG KONG: 6.8% | |
Hong Kong Exchanges and
Clearing, Ltd., Cnv.
0.500%, 10/23/17 | | | 96,000,000 | | | $ | 113,760,000 | | |
Shine Power International,
Ltd., Cnv.
0.000%, 07/28/19 | | HKD | 446,000,000 | | | | 55,357,108 | | |
Johnson Electric Holdings,
Ltd., Cnv.
1.000%, 04/02/21 | | | 49,750,000 | | | | 51,988,750 | | |
Hengan International
Group Co., Ltd., Cnv.
0.000%, 06/27/18 | | HKD | 339,000,000 | | | | 44,699,310 | | |
PB Issuer No. 2, Ltd., Cnv.
1.750%, 04/12/16 | | | 21,820,000 | | | | 20,919,925 | | |
Total China/Hong Kong | | | | | 286,725,093 | | |
SINGAPORE: 2.0% | |
CapitaLand, Ltd., Cnv.
1.950%, 10/17/23 | | SGD | 110,250,000 | | | | 84,207,479 | | |
Total Singapore | | | | | 84,207,479 | | |
TOTAL CONVERTIBLE CORPORATE BONDS | | | | | 370,932,572 | | |
(Cost $366,304,713) | | | | | |
TOTAL INVESTMENTS: 100.0% | | | | | 4,235,205,804 | | |
(Cost $3,610,715,475b) | |
CASH AND OTHER ASSETS,
LESS LIABILITIES: 0.0% | | | | | 48,977 | | |
NET ASSETS: 100.0% | | | | $ | 4,235,254,781 | | |
a Certain securities were fair valued under the valuation polices approved by the Board of Trustees (Note 2-A).
b Cost for federal income tax purposes is $3,628,016,039 and net unrealized appreciation consists of:
Gross unrealized appreciation | | $ | 796,234,281 | | |
Gross unrealized depreciation | | | (189,044,516 | ) | |
Net unrealized appreciation | | $ | 607,189,765 | | |
† Affiliated Issuer, as defined under the Investment Company Act of 1940 (ownership of 5% or more of the outstanding voting securities of this issuer)
* All values are in USD unless otherwise noted.
ADR American Depositary Receipt
BHD Berhad
Cnv. Convertible
HKD Hong Kong Dollar
JSC Joint Stock Co.
Pfd. Preferred
REIT Real Estate Investment Trust
SGD Singapore Dollar
USD U.S. Dollar
See accompanying notes to financial statements.
matthewsasia.com | 800.789.ASIA 13

ASIA GROWTH AND INCOME STRATEGIES
PORTFOLIO MANAGERS
Yu Zhang, CFA | | Robert Horrocks, PhD | |
Lead Manager | | Lead Manager | |
Vivek Tanneeru | | | |
Co-Manager | | | |
FUND FACTS
| | | Investor Class | | Institutional Class | |
Ticker | | MAPIX | | MIPIX | |
CUSIP | | 577125107 | | 577130750 | |
Inception | | 10/31/06 | | 10/29/10 | |
NAV | | $15.26 | | $15.26 | |
Initial Investment | | $2,500 | | $3 million | |
Gross Expense Ratio1 | | 1.06% | | 0.93% | |
Portfolio Statistics
Total # of Positions | | 66 | |
Net Assets | | $5.0 billion | |
Weighted Average Market Cap | | $27.6 billion | |
Portfolio Turnover | | 20.06%2 | |
Benchmark
MSCI AC Asia Pacific Index
Redemption Fee
2% within first 90 calendar days of purchase
OBJECTIVE
Total return with an emphasis on providing current income.
STRATEGY
Under normal market conditions, the Fund seeks to achieve its investment objective by investing at least 80% of its total net assets, which include borrowings for investment purposes, in dividend-paying equity securities of companies located in Asia. Asia consists of all countries and markets in Asia, and includes developed, emerging and frontier countries and markets in the Asian region. The Fund may also invest in convertible debt and equity securities.
1 Actual 2014 expense ratios.
2 The lesser of fiscal year 2014 long-term purchase costs or sales proceeds divided by the average monthly market value of long-term securities.
Matthews Asia Dividend Fund*
Portfolio Manager Commentary
For the year ending December 31, 2014, the Matthews Asia Dividend Fund returned –0.32% (Investor Class) and –0.18% (Institutional Class) while its benchmark, the MSCI All Country Asia Pacific Index, returned 0.29%. For the fourth quarter of the year, the Fund returned –3.36% (Investor Class) and –3.30% (Institutional Class) versus –1.38% for the Index. For the most recent year-end, there was no ordinary income distribution for the Fund. While the Fund received dividend and other income from holdings within the portfolio during the quarter, it was not able to distribute this income because of the Fund's tax treatment of certain of its holdings known as Passive Foreign Investment Companies, or "PFICs." During the fourth quarter, the PFICs held by the Matthews Asia Dividend Fund fell in value to a greater extent than the dividends received by the Fund, and consequently, eliminated the Fund's ability to distribute income. Generally, the Fund's PFIC holdings are real estate investment trusts, or REITs.
Market Environment:
While the Asia Pacific region generally experienced somewhat slower growth during 2014, performance among individual equity markets varied. Emerging Asia—most notably India and Indonesia—delivered solid outperformance as investor sentiment turned positive on expectations that newly elected governments there would kick start structural market reforms. Japan, on the other hand, struggled to sustain its economic growth momentum following a consumption tax hike in April. Its solid local equity market returns were significantly offset by the depreciating yen, which was driven in part by the Bank of Japan's renewed efforts at quantitative easing to meet its 2% inflation target. Resource-dependent economies, such as Australia and Malaysia, faced some headwinds as energy and commodity prices corrected significantly. The sell-off in those currencies also exacerbated the underperformance of their local equity markets.
The biggest surprise of 2014 came from China as market reforms there began to take shape. Despite the slowing economy, its domestic A-share market was the best-performing market globally during the year. This was driven by several factors, including a shift in domestic liquidity away from real estate and wealth management products, and toward the A-share market.
Performance Contributors and Detractors:
The Fund's Indian holdings were the top performance contributors for the year. As Indian firms tend to retain cash flow for reinvestments, India has traditionally been a somewhat challenging market in which to pick dividend stocks. However, the market sell-off during the "taper tantrum" of the second half of 2013 created an attractive entry point for the Fund. Early in 2014, we initiated new positions in Indian consumer and telecommunications infrastructure holdings. Despite some short-term market volatility—more frequently a reflection of investor sentiment rather than company fundamentals—these holdings showed impressive performance as the year unfolded.
* Closed to most new investors as of June 14, 2013.
14 MATTHEWS ASIA FUNDS
PERFORMANCE AS OF DECEMBER 31, 2014
| | | | | | | Average Annual Total Returns | | | |
| | | 3 Months | | 1 Year | | 3 Years | | 5 Years | | Since
Inception | | Inception
Date | |
Investor Class (MAPIX) | | | -3.36 | % | | | -0.32 | % | | | 10.50 | % | | | 8.32 | % | | | 9.35 | % | | 10/31/06 | |
Institutional Class (MIPIX) | | | -3.30 | % | | | -0.18 | % | | | 10.62 | % | | | n.a. | | | | 5.60 | % | | 10/29/10 | |
MSCI AC Asia Pacific Index3 | | | -1.38 | % | | | 0.29 | % | | | 9.61 | % | | | 5.61 | % | | | 3.17 | %4 | | | |
Lipper Pacific Region Funds Category Average5 | | | -2.39 | % | | | 0.60 | % | �� | | 10.43 | % | | | 5.43 | % | | | 3.44 | %4 | | | |
Performance assumes reinvestment of all dividends and/or distributions before taxes. All performance quoted represents past performance and is no guarantee of future results. Investment return and principal value will fluctuate with market conditions so that when redeemed, shares may be worth more or less than their original cost. Current performance may be lower or higher than the return figures quoted. For the Fund's most recent month-end performance, visit matthewsasia.com.
DISTRIBUTION HISTORY
| | 2014 | | 2013 | |
| | Q1 | | Q2 | | Q3 | | Q4 | | Total | | Q1 | | Q2 | | Q3 | | Q4 | | Total | |
Investor (MAPIX) | | $ | 0.03 | | | $ | 0.11 | | | $ | 0.17 | | | $ | 0.00 | | | $ | 0.30 | | | $ | 0.14 | | | $ | 0.13 | | | $ | 0.12 | | | $ | 0.22 | | | $ | 0.60 | | |
Inst'l (MIPIX) | | $ | 0.03 | | | $ | 0.11 | | | $ | 0.17 | | | $ | 0.00 | | | $ | 0.32 | | | $ | 0.14 | | | $ | 0.14 | | | $ | 0.12 | | | $ | 0.22 | | | $ | 0.62 | | |
Note: This table does not include capital gains distributions but does include return of capital totaling $0.065 (Investor Class) and $0.068 (Institutional Class) for 2014. Totals may differ by $0.01 due to rounding. For distribution history please visit matthewsasia.com.
30-DAY YIELD:
1.57% (Investor Class) 1.68% (Institutional Class)
The 30-Day Yield represents net investment income earned by the Fund over the 30-day period ended 12/31/14, expressed as an annual percentage rate based on the Fund's share price at the end of the 30-day period. The 30-Day Yield should be regarded as an estimate of the Fund's rate of investment income, and it may not equal the Fund's actual income distribution rate.
Source: BNY Mellon Investment Servicing (US) Inc.
DIVIDEND YIELD: 2.95%
The dividend yield (trailing) for the portfolio is the weighted average sum of the dividends paid by each equity security held by the Fund over the 12 months ended 12/31/2014 divided by the current price of each equity as of 12/31/2014. The annualized dividend yield for the Fund is for the equity-only portion of the portfolio. Please note that this is based on gross equity portfolio holdings and does not reflect the actual yield an investor in the Fund would receive. Past yields are no guarantee of future yields.
Source: FactSet Research Systems, Bloomberg, MICM.
GROWTH OF A $10,000 INVESTMENT SINCE INCEPTION—INVESTOR CLASS
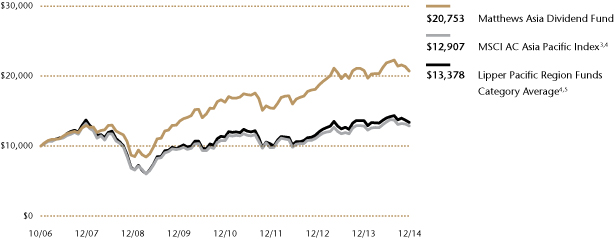
Plotted monthly. The performance data and graph do not reflect the deduction of taxes that a shareholder would pay on dividends, capital gains distributions or redemption of Fund shares. Values are in US$.
3 It is not possible to invest directly in an index. Source: Index data from Morgan Stanley Capital International and Bloomberg; total return calculations performed by BNY Mellon Investment Servicing (US) Inc. Please see page 79 for index definition.
4 Calculated from 10/31/06.
5 The Lipper Category Average does not reflect sales charges and is based on total return, including reinvestment of dividends and capital gains for the stated periods.
TOP TEN POSITIONS6
| | | Sector | | Country | | % of Net Assets | |
Japan Tobacco, Inc. | | Consumer Staples | | Japan | | | 3.9 | % | |
Suntory Beverage & Food, Ltd. | | Consumer Staples | | Japan | | | 2.9 | % | |
Toyota Motor Corp. | | Consumer Discretionary | | Japan | | | 2.8 | % | |
Hoya Corp. | | Information Technology | | Japan | | | 2.8 | % | |
Pigeon Corp. | | Consumer Staples | | Japan | | | 2.8 | % | |
Tata Motors, Ltd.—A—DVR | | Consumer Discretionary | | India | | | 2.6 | % | |
Minth Group, Ltd. | | Consumer Discretionary | | China/Hong Kong | | | 2.5 | % | |
Shenzhou International Group Holdings, Ltd. | | Consumer Discretionary | | China/Hong Kong | | | 2.5 | % | |
Yum! Brands, Inc. | | Consumer Discretionary | | China/Hong Kong | | | 2.3 | % | |
LG Chem, Ltd., Pfd. | | Materials | | South Korea | | | 2.3 | % | |
| % OF ASSETS IN TOP 10 | | | | | | | 27.4 | % | |
6 Holdings may combine more than one security from same issuer and related depositary receipts.
matthewsasia.com | 800.789.ASIA 15
COUNTRY ALLOCATION (%)7
China/Hong Kong | | | 26.5 | | |
Japan | | | 25.4 | | |
Singapore | | | 8.7 | | |
Indonesia | | | 7.7 | | |
India | | | 5.9 | | |
South Korea | | | 5.6 | | |
Taiwan | | | 5.2 | | |
Australia | | | 4.3 | | |
Thailand | | | 3.4 | | |
Luxembourg | | | 1.8 | | |
Malaysia | | | 1.4 | | |
Philippines | | | 1.2 | | |
Vietnam | | | 1.0 | | |
Cash and Other Assets, Less Liabilities | | | 1.9 | | |
SECTOR ALLOCATION (%)
Consumer Discretionary | | | 23.7 | | |
Consumer Staples | | | 22.6 | | |
Financials | | | 12.9 | | |
Telecommunication Services | | | 11.0 | | |
Industrials | | | 10.2 | | |
Information Technology | | | 6.5 | | |
Health Care | | | 4.0 | | |
Utilities | | | 3.8 | | |
Materials | | | 3.4 | | |
Cash and Other Assets, Less Liabilities | | | 1.9 | | |
MARKET CAP EXPOSURE (%)8
Large Cap (over $5B) | | | 61.3 | | |
Mid Cap ($1B–$5B) | | | 30.6 | | |
Small Cap (under $1B) | | | 6.2 | | |
Cash and Other Assets, Less Liabilities | | | 1.9 | | |
7 Not all countries where the Fund may invest are included in the benchmark index.
8 Source: FactSet Research Systems. Percentage values in data are rounded to the nearest tenth of one percent; the values may not sum to 100% due to rounding.
Matthews Asia Dividend Fund
Portfolio Manager Commentary (continued)
The Fund's Japanese holdings, on the flip side, detracted most from performance. Specifically, Japan Tobacco (JT), our largest Fund holding by allocation, witnessed a significant correction—especially in the fourth quarter. This was due largely to its business exposure to Russia, whose energy-dependent economy suffered a severe setback due to collapsing oil prices and the impact of economic sanctions. JT generates about 20% of its operating profit from Russia. While recognizing this near-term uncertainty, we think that JT continues to retain strong pricing power because of the unique price firmness of the tobacco business. For example, JT raised prices in Russia three times last year. Together with a strong balance sheet and steadily improving dividend payout ratio, we believe JT remains an appealing investment.
Notable Portfolio Changes:
During the fourth quarter, we made our first foray into China's domestic A-share market via our newly awarded status as qualified foreign institutional investors, and initiated small positions: one in Shanghai International Airport and the other in Hangzhou Hikvision Digital Technology, a video surveillance system manufacturer—both of which are listed only on China's A-share market.
We believe that Shanghai International, which owns and operates Pudong International Airport in Shanghai, may see its cash flow expand significantly to support a higher dividend payout, as the firm has been benefiting from both its newly completed airport expansion as well as China's ongoing travel boom. Its stock is trading at a meaningful discount to some of its global peers. Hangzhou Hikvision Digital Technology, already a domestic market leader, is aggressively expanding overseas. Given its strong cost competitiveness and deep R&D resources, the company is gaining market share. Despite a modest dividend payout, there is scope for the company to grow its dividends, considering its healthy balance sheet and the alignment of the parent company's interest given its reliance on such dividends.
We exited two Japanese holdings during the fourth quarter, ORIX and Miraca Holdings, as we believe their valuations already fully reflected underlying business fundamentals. We re-deployed the capital to fund new additions including Toyota, whose export-driven business is likely to continue benefiting from the depreciating yen, and supporting a higher dividend.
Outlook:
In the new year, several external uncertainties could pose challenges to Asia's equity investors, including a potential interest rate hike by the U.S. Federal Reserve and the attendant expectation of a stronger U.S. dollar, the collapse of global energy and resource prices and potentially prolonged Euro-zone weakness. Therefore, we believe it is important for investors to focus on long-term fundamentals, instead of being swayed by short-term market volatility. For dividend-focused investors such as ourselves, the key issue is whether Asian companies today offer us attractive dividend yield, and whether those dividends can grow over time in a sustainable fashion through business cycles. Asia still offers investors a higher dividend yield compared with some developed markets. With ongoing improvement in the region's shareholder return policies, driven in particular by Japan and Korea, together with the potential for structural reforms in major economies (China, India, Indonesia and Japan) strong companies in Asia are also well-positioned to deliver on faster dividend growth to shareholders.
16 MATTHEWS ASIA FUNDS
Matthews Asia Dividend Fund December 31, 2014
Consolidated Schedule of Investmentsa
COMMON EQUITIES: 95.9%
| | | Shares | | Value | |
CHINA/HONG KONG: 26.5% | |
Minth Group, Ltd.† | | | 61,267,000 | | | $ | 126,421,940 | | |
Shenzhou International Group
Holdings, Ltd. | | | 37,491,000 | | | | 123,551,218 | | |
Yum! Brands, Inc. | | | 1,586,600 | | | | 115,583,810 | | |
Television Broadcasts, Ltd. | | | 18,932,500 | | | | 110,018,858 | | |
Guangdong Investment, Ltd. | | | 81,330,000 | | | | 105,927,798 | | |
China Mobile, Ltd. ADR | | | 1,454,200 | | | | 85,536,044 | | |
Far East Horizon, Ltd. | | | 78,331,000 | | | | 76,989,596 | | |
The Link REIT | | | 11,680,500 | | | | 72,913,293 | | |
HSBC Holdings PLC ADR | | | 1,519,991 | | | | 71,789,175 | | |
Yuexiu Transport Infrastructure, Ltd.† | | | 109,490,000 | | | | 66,573,136 | | |
Haitian International Holdings, Ltd. | | | 30,970,000 | | | | 64,909,824 | | |
Café de Coral Holdings, Ltd. | | | 17,614,000 | | | | 60,941,290 | | |
Greatview Aseptic Packaging Co., Ltd.† | | | 110,945,000 | | | | 56,989,060 | | |
Jiangsu Expressway Co., Ltd. H Shares | | | 41,640,000 | | | | 49,577,162 | | |
Springland International Holdings, Ltd.† | | | 138,171,000 | | | | 47,824,790 | | |
Shanghai International Airport Co., Ltd.
Class Ab | | | 10,236,917 | | | | 32,425,607 | | |
Xingda International Holdings, Ltd.
H Shares† | | | 87,141,000 | | | | 30,959,656 | | |
Hangzhou Hikvision Digital
Technology Co., Ltd. Class Ab | | | 7,699,923 | | | | 27,690,787 | | |
Hopewell Holdings, Ltd. | | | 1,040,000 | | | | 3,785,733 | | |
Total China/Hong Kong | | | | | 1,330,408,777 | | |
JAPAN: 25.4% | |
Japan Tobacco, Inc. | | | 7,120,700 | | | | 195,981,515 | | |
Suntory Beverage & Food, Ltd. | | | 4,148,300 | | | | 143,320,816 | | |
Hoya Corp. | | | 4,116,600 | | | | 139,243,323 | | |
Pigeon Corp.† | | | 2,377,800 | | | | 138,640,241 | | |
Toyota Motor Corp. | | | 1,900,000 | | | | 118,403,050 | | |
Bridgestone Corp. | | | 3,263,000 | | | | 113,167,187 | | |
ITOCHU Corp. | | | 9,399,100 | | | | 100,336,321 | | |
Toyo Suisan Kaisha, Ltd. | | | 2,795,000 | | | | 89,995,913 | | |
NTT DoCoMo, Inc. | | | 4,857,000 | | | | 70,732,772 | | |
Lawson, Inc. | | | 815,100 | | | | 49,254,963 | | |
Anritsu Corp. | | | 6,853,300 | | | | 47,675,435 | | |
Recruit Holdings Co., Ltd.c | | | 1,551,800 | | | | 44,566,639 | | |
Toyota Motor Corp. ADR | | | 194,721 | | | | 24,433,591 | | |
Total Japan | | | | | 1,275,751,766 | | |
SINGAPORE: 8.7% | |
United Overseas Bank, Ltd. | | | 5,669,000 | | | | 104,616,034 | | |
Singapore Technologies Engineering, Ltd. | | | 30,906,000 | | | | 79,106,878 | | |
Ascendas REIT | | | 42,912,000 | | | | 76,973,532 | | |
CapitaRetail China Trust, REIT† | | | 52,179,400 | | | | 63,458,604 | | |
Super Group, Ltd. | | | 47,679,000 | | | | 41,104,146 | | |
ARA Asset Management, Ltd. | | | 29,964,660 | | | | 38,356,416 | | |
Ascendas India Trust† | | | 55,065,000 | | | | 34,007,402 | | |
Total Singapore | | | | | 437,623,012 | | |
| | | Shares | | Value | |
INDONESIA: 7.7% | |
PT Perusahaan Gas Negara Persero | | | 179,997,000 | | | $ | 87,104,703 | | |
PT Indofood Sukses Makmur | | | 150,159,000 | | | | 81,864,425 | | |
PT United Tractors | | | 50,193,000 | | | | 70,099,764 | | |
PT Telekomunikasi Indonesia Persero | | | 254,438,500 | | | | 58,477,282 | | |
PT Telekomunikasi Indonesia
Persero ADR | | | 1,140,834 | | | | 51,599,922 | | |
PT Bank Rakyat Indonesia Persero | | | 41,611,746 | | | | 39,114,234 | | |
Total Indonesia | | | | | 388,260,330 | | |
INDIA: 5.9% | |
Tata Motors, Ltd. - A - DVR | | | 24,859,606 | | | | 131,513,442 | | |
ITC, Ltd. | | | 13,250,000 | | | | 77,186,122 | | |
Bharti Infratel, Ltd. | | | 8,846,586 | | | | 47,109,035 | | |
Titan Co., Ltd. | | | 7,088,678 | | | | 42,689,837 | | |
Total India | | | | | 298,498,436 | | |
TAIWAN: 5.2% | |
Chunghwa Telecom Co., Ltd. ADR | | | 3,653,301 | | | | 107,516,648 | | |
Taiwan Semiconductor
Manufacturing Co., Ltd. ADR | | | 4,005,040 | | | | 89,632,795 | | |
St. Shine Optical Co., Ltd.† | | | 2,674,000 | | | | 43,625,380 | | |
Taiwan Semiconductor
Manufacturing Co., Ltd. | | | 4,646,469 | | | | 20,469,886 | | |
Total Taiwan | | | | | 261,244,709 | | |
AUSTRALIA: 4.3% | |
Ansell, Ltd. | | | 5,072,085 | | | | 92,801,948 | | |
Primary Health Care, Ltd. | | | 17,584,772 | | | | 67,284,058 | | |
Breville Group, Ltd.† | | | 10,847,453 | | | | 56,742,466 | | |
Total Australia | | | | | 216,828,472 | | |
THAILAND: 3.4% | |
Thai Beverage Public Co., Ltd. | | | 189,811,000 | | | | 98,520,886 | | |
Total Access Communications
Public Co., Ltd. NVDR | | | 25,421,000 | | | | 74,079,276 | | |
Total Thailand | | | | | 172,600,162 | | |
SOUTH KOREA: 3.4% | |
KT&G Corp. | | | 1,526,000 | | | | 106,748,782 | | |
BGF Retail Co., Ltd.c | | | 493,516 | | | | 34,375,156 | | |
GS Retail Co., Ltd. | | | 1,288,580 | | | | 30,190,620 | | |
Total South Korea | | | | | 171,314,558 | | |
LUXEMBOURG: 1.8% | |
L'Occitane International SA | | | 36,075,000 | | | | 90,778,484 | | |
Total Luxembourg | | | | | 90,778,484 | | |
MALAYSIA: 1.4% | |
AMMB Holdings BHD | | | 36,387,400 | | | | 68,335,163 | | |
Total Malaysia | | | | | 68,335,163 | | |
PHILIPPINES: 1.2% | |
Globe Telecom, Inc. | | | 1,503,820 | | | | 57,740,351 | | |
Total Philippines | | | | | 57,740,351 | | |
matthewsasia.com | 800.789.ASIA 17
Matthews Asia Dividend Fund December 31, 2014
Consolidated Schedule of Investmentsa (continued)
COMMON EQUITIES: (continued)
| | | Shares | | Value | |
VIETNAM: 1.0% | |
Vietnam Dairy Products JSC | | | 11,158,882 | | | $ | 49,746,598 | | |
Total Vietnam | | | | | 49,746,598 | | |
TOTAL COMMON EQUITIES | | | | | 4,819,130,818 | | |
(Cost $4,149,484,996) | | | | | |
PREFERRED EQUITIES: 2.2%
SOUTH KOREA: 2.2% | |
LG Chem, Ltd., Pfd. | | | 881,161 | | | | 113,348,388 | | |
Total South Korea | | | | | 113,348,388 | | |
TOTAL PREFERRED EQUITIES | | | | | 113,348,388 | | |
(Cost $77,316,611) | |
TOTAL INVESTMENTS: 98.1% | | | | | 4,932,479,206 | | |
(Cost $4,226,801,607d) | | | | | |
CASH AND OTHER ASSETS,
LESS LIABILITIES: 1.9% | | | | | 93,119,537 | | |
NET ASSETS: 100.0% | | | | $ | 5,025,598,743 | | |
a Certain securities were fair valued under the valuation polices approved by the Board of Trustees (Note 2-A).
b Security held by Matthews ADF-U Series.
c Non-income producing security.
d Cost for federal income tax purposes is $4,282,973,684 and net unrealized appreciation consists of:
Gross unrealized appreciation | | $ | 896,366,787 | | |
Gross unrealized depreciation | | | (246,861,265 | ) | |
Net unrealized appreciation | | $ | 649,505,522 | | |
† Affiliated Issuer, as defined under the Investment Company Act of 1940 (ownership of 5% or more of the outstanding voting securities of this issuer)
ADR American Depositary Receipt
BHD Berhad
DVR Differential Voting Right
JSC Joint Stock Co.
NVDR Non-voting Depositary Receipt
Pfd. Preferred
REIT Real Estate Investment Trust
See accompanying notes to financial statements.
18 MATTHEWS ASIA FUNDS

ASIA GROWTH AND INCOME STRATEGIES
PORTFOLIO MANAGERS
Yu Zhang, CFA
Lead Manager
Sherwood Zhang, CFA
Co-Manager
FUND FACTS
| | | Investor Class | | Institutional Class | |
Ticker | | MCDFX | | MICDX | |
CUSIP | | 577125305 | | 577130735 | |
Inception | | 11/30/09 | | 10/29/10 | |
NAV | | $13.37 | | $13.37 | |
Initial Investment | | $2,500 | | $3 million | |
Gross Expense Ratio1 | | 1.19% | | 1.01% | |
Portfolio Statistics
Total # of Positions | | 40 | |
Net Assets | | $147.6 million | |
Weighted Average Market Cap | | $24.9 billion | |
Portfolio Turnover | | 25.43%2 | |
Benchmark
MSCI China Index
Redemption Fee
2% within first 90 calendar days of purchase
OBJECTIVE
Total return with an emphasis on providing current income.
STRATEGY
Under normal market conditions, the Fund seeks to achieve its investment objective by investing at least 80% of its total net assets, which include borrowings for investment purposes, in dividend-paying equity securities of companies located in China. China includes its administrative and other districts, such as Hong Kong. The Fund may also invest in convertible debt and equity securities.
1 Actual 2014 expense ratios.
2 The lesser of fiscal year 2014 long-term purchase costs or sales proceeds divided by the average monthly market value of long-term securities.
Matthews China Dividend Fund
Portfolio Manager Commentary
For the year ending December 31, 2014, the Matthews China Dividend Fund returned 0.93% (Investor Class) and 1.11% (Institutional Class) while its benchmark, the MSCI China Index, returned 8.26%. For the fourth quarter of the year, the Fund returned –0.99% (Investor Class) and –0.91% (Institutional Class) versus 7.17% for the Index.
The Fund began 2014 with a share price of US$13.74 for both the Investor and Institutional Classes, and shareholders who were invested throughout the year would have received income distributions totaling approximately 0.50 cents (Investor Class) or 0.52 cents (Institutional Class) per share.
Market Environment:
The year 2014 will certainly be remembered as an eventful year for China's equity market. Although China's GDP growth did slow further compared with previous years, we believe that many global investors have come to realize that the Chinese economy is not experiencing a hard landing. This sentiment change became more apparent after the U.S. public listing of China's largest e-commerce company, Alibaba. Domestically in China, investors finally took to the notion of investing in its stock market again, after its domestic A-share market suffered a prolonged multi-year decline. Chinese investors seemed awakened by the successful start of the Hong Kong—Shanghai Mutual Market Access plan. Although few foreign investors have made many purchases in China's domestic A shares through this mechanism, domestic A-share prices were quickly pushed up from discount levels to premium, compared with its H-share counterparts on Hong Kong's exchange.
During the fourth quarter, China's central bank also made its first interest rate cut since 2012. Investors seem convinced that China has started to fully loosen its monetary policy. A liquidity-driven rally quickly spread from the domestic A-share market to the Hong Kong market. Chinese financials, such as banks, insurance companies and securities firms led the rally, as they are perceived as key beneficiaries of a loosening monetary environment.
Performance Contributors and Detractors:
Guangdong Investment, a conglomerate with a majority of its revenues and profits derived from water businesses, was the top performance contributor during 2014. The market continued to reward its highly stable business model, and the company won a renewed water supply contract with the Hong Kong government during the year, with even higher prices for its water imports.
By sector, industrials stood out as the top contributor for the Fund. Voltronic Power Technology, an original equipment manufacturer for uninterruptible power supply, which we added to the portfolio early in the year, led the sector's contribution as one of the largest contributors to Fund performance for the one-year period. The financials sector was a close second in terms of sector contribution. Within our financials holdings, Link REIT, the largest shopping center owner in Hong Kong, and Far East Horizon, a leading third-party financial leasing company based in China, were both among our top contributors to Fund performance.
Shanghai Jinjiang International Hotels Development was the Fund's second-largest performance contributor in 2014. The market seemed to awaken to its potential after this state-owned enterprise brought on a
matthewsasia.com | 800.789.ASIA 19
PERFORMANCE AS OF DECEMBER 31, 2014
| | | | | | Average Annual Total Returns | | | |
| | | 3 Months | | 1 Year | | 3 Year | | 5 Year | | Since
Inception | | Inception Date | |
Investor Class (MCDFX) | | | -0.99 | % | | | 0.93 | % | | | 13.50 | % | | | 8.92 | % | | | 9.15 | % | | 11/30/09 | |
Institutional Class (MICDX) | | | -0.91 | % | | | 1.11 | % | | | 13.72 | % | | | n.a. | | | | 6.70 | % | | 10/29/10 | |
MSCI China Index3 | | | 7.17 | % | | | 8.26 | % | | | 11.48 | % | | | 3.50 | % | | | 3.53 | %4 | | | | | |
Lipper China Region Funds Category Average5 | | | 4.88 | % | | | 3.43 | % | | | 10.84 | % | | | 3.71 | % | | | 4.09 | %4 | | | | | |
Performance assumes reinvestment of all dividends and/or distributions before taxes. All performance quoted represents past performance and is no guarantee of future results. Investment return and principal value will fluctuate with market conditions so that when redeemed, shares may be worth more or less than their original cost. Current performance may be lower or higher than the return figures quoted. For the Fund's most recent month-end performance, visit matthewsasia.com.
INCOME DISTRIBUTION HISTORY
| | 2014 | | 2013 | |
| | | June | | December | | Total | | June | | December | | Total | |
Investor (MCDFX) | | $ | 0.16 | | | $ | 0.20 | | | $ | 0.36 | | | $ | 0.18 | | | $ | 0.05 | | | $ | 0.23 | | |
Inst'l (MICDX) | | $ | 0.17 | | | $ | 0.21 | | | $ | 0.38 | | | $ | 0.20 | | | $ | 0.06 | | | $ | 0.26 | | |
Note: This table does not include capital gains distributions. Totals may differ by $0.01 due to rounding. For income distribution history, visit matthewsasia.com.
30-DAY YIELD:
1.55% (Investor Class) 1.76% (Institutional Class)
The 30-Day Yield represents net investment income earned by the Fund over the 30-day period ended 12/31/14, expressed as an annual percentage rate based on the Fund's share price at the end of the 30-day period. The 30-Day Yield should be regarded as an estimate of the Fund's rate of investment income, and it may not equal the Fund's actual income distribution rate.
Source: BNY Mellon Investment Servicing (US) Inc.
DIVIDEND YIELD: 3.22%
The dividend yield (trailing) for the portfolio is the weighted average sum of the dividends paid by each equity security held by the Fund over the 12 months ended 12/31/2014 divided by the current price of each equity as of 12/31/2014. The annualized dividend yield for the Fund is for the equity-only portion of the portfolio. Please note that this is based on gross equity portfolio holdings and does not reflect the actual yield an investor in the Fund would receive. Past yields are no guarantee of future yields.
Source: FactSet Research Systems, Bloomberg, MICM.
GROWTH OF A $10,000 INVESTMENT SINCE INCEPTION—INVESTOR CLASS
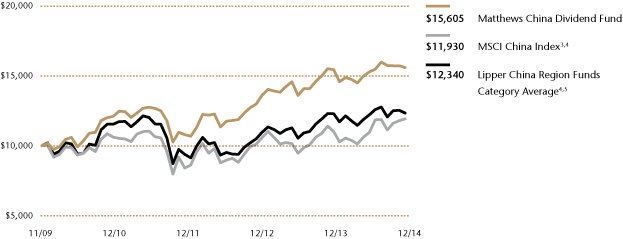
Plotted monthly. The performance data does not reflect the deduction of taxes that a shareholder would pay on dividends, capital gains distributions or redemption of Fund shares. Values are in US$.
3 It is not possible to invest directly in an index. Source: Index data from Morgan Stanley Capital International and Bloomberg; total return calculations performed by BNY Mellon Investment Servicing (US) Inc. Please see page 79 for index definition.
4 Calculated from 11/30/09.
5 The Lipper Category Average does not reflect sales charges and is based on total return, including reinvestment of dividends and capital gains for the stated periods.
TOP TEN POSITIONS6
| | | Sector | | % of Net Assets | |
Shanghai Jinjiang International Hotels Development Co., Ltd. | | Consumer Discretionary | | | 4.1 | % | |
Minth Group, Ltd. | | Consumer Discretionary | | | 3.9 | % | |
Guangshen Railway Co., Ltd. | | Industrials | | | 3.8 | % | |
Far East Horizon, Ltd. | | Financials | | | 3.8 | % | |
Guangdong Investment, Ltd. | | Utilities | | | 3.8 | % | |
Yantai Changyu Pioneer Wine Co., Ltd. | | Consumer Staples | | | 3.4 | % | |
HSBC Holdings PLC | | Financials | | | 3.3 | % | |
Shenzhou International Group Holdings, Ltd. | | Consumer Discretionary | | | 3.2 | % | |
Shenzhen Chiwan Petroleum | | Industrials | | | 3.2 | % | |
Sporton International, Inc. | | Industrials | | | 3.2 | % | |
| % OF ASSETS IN TOP 10 | | | | | 35.7 | % | |
6 Holdings may combine more than one security from same issuer and related depositary receipts.
20 MATTHEWS ASIA FUNDS
Matthews China Dividend Fund
Portfolio Manager Commentary (continued)
leading private equity fund as a strategic investor during the year. However, the overall consumer discretionary sector continued to be the worst-performing sector for the Fund. This occurred as traditional consumer discretionary retailers and product companies have continued to be challenged by e-commerce players and intensified competition within their industries as Chinese consumer incomes grow at a slower pace.
Health care was another poorly performing sector for the Fund during the year. We are disappointed to see two of our long-time holdings, St. Shine Optical of Taiwan and Pacific Hospital Supply placed in the top three performance detractors for the year. These two Taiwan-based contract manufacturers of medical instruments have met major road blocks after enjoying a long period of smooth sailing along the growth curve. Although we continue to believe these are good businesses, we are cautiously keeping track of management's strategic plan and execution.
Notable Portfolio Changes:
Among the few new names we added to the portfolio during the fourth quarter was China Everbright, a financial holding company with significant stakes in the commercial banking and securities brokerage business within the larger China Everbright Group, a state-run financial conglomerate.
Outside these legacy investments, the company's management team has been growing its asset management business in recent years with fast-growing assets under management and a successful track record of private equity and venture capital investing in China. We believe that the potential of China Everbright's asset management business has not yet been fully realized by the market.
China Machinery Engineering, a leading infrastructure contractor focused on overseas emerging markets, was another new addition to the portfolio. The company has built a reputation for designing and building power plants for budget-constrained emerging market countries. At one point last year, its share price was aggressively sold down due to safety concerns for its business operations in Iraq. We think the market largely overlooked the company's risk mitigation efforts, and that the firm should benefit from China's strategic plan to boost exports of capital equipment to developing economies.
Outlook:
Looking into 2015, stabilizing GDP growth appears again to be a top priority for the Chinese government. We understand the government has brought forward some major investment projects to counter the slowdown of fixed asset investments, led by real estate development. Some speculators have concluded that these programs could well exceed the 4 trillion renminbi stimulus package (roughly US$645 billion) that the government carried out after the Global Financial Crisis. The ways in which these new projects are financed will be a litmus test for how serious China will be about letting the market play a decisive role in allocating economic resources. Investors will certainly be disappointed if the government reverts back to executive orders to get these investments funded through state-owned commercial banks. After all, the market has just begun to get a clear picture of how much local government debt has been accumulated, largely due to the last round of economic stimulus.
On a positive note, with global commodity prices dropping, and inflation well below the government's target, China may enter a declining interest rate cycle, which should increase the yield attractiveness of dividend-paying stocks in China.
COUNTRY ALLOCATION (%)7
China/Hong Kong | | | 80.9 | | |
Taiwan | | | 13.1 | | |
Singapore | | | 2.9 | | |
Cash and Other Assets, Less Liabilities | | | 3.1 | | |
SECTOR ALLOCATION (%)
Consumer Discretionary | | | 25.2 | | |
Industrials | | | 24.8 | | |
Financials | | | 15.3 | | |
Consumer Staples | | | 6.1 | | |
Information Technology | | | 6.1 | | |
Health Care | | | 5.8 | | |
Telecommunication Services | | | 4.6 | | |
Utilities | | | 3.8 | | |
Materials | | | 3.0 | | |
Energy | | | 2.2 | | |
Cash and Other Assets, Less Liabilities | | | 3.1 | | |
MARKET CAP EXPOSURE (%)8
Large Cap (over $5B) | | | 21.4 | | |
Mid Cap ($1B–$5B) | | | 52.2 | | |
Small Cap (under $1B) | | | 23.3 | | |
Cash and Other Assets, Less Liabilities | | | 3.1 | | |
7 Not all countries where the Fund may invest are included in the benchmark index.
8 Source: FactSet Research Systems. Percentage values in data are rounded to the nearest tenth of one percent; the values may not sum to 100% due to rounding.
matthewsasia.com | 800.789.ASIA 21
Matthews China Dividend Fund December 31, 2014
Schedule of Investmentsa
COMMON EQUITIES: 96.9%
| | | Shares | | Value | |
CONSUMER DISCRETIONARY: 25.2% | |
Hotels, Restaurants & Leisure: 9.8% | |
Shanghai Jinjiang International Hotels
Development Co., Ltd. B Sharesb | | | 2,825,490 | | | $ | 5,999,103 | | |
Yum! Brands, Inc. | | | 58,800 | | | | 4,283,580 | | |
Café de Coral Holdings, Ltd. | | | 1,216,000 | | | | 4,207,143 | | |
| | | | | | 14,489,826 | | |
Auto Components: 3.9% | |
Minth Group, Ltd. | | | 2,756,000 | | | | 5,686,893 | | |
Textiles, Apparel & Luxury Goods: 3.2% | |
Shenzhou International Group
Holdings, Ltd. | | | 1,431,000 | | | | 4,715,846 | | |
Media: 2.5% | |
Television Broadcasts, Ltd. | | | 646,600 | | | | 3,757,464 | | |
Multiline Retail: 2.5% | |
Springland International Holdings, Ltd. | | | 10,466,000 | | | | 3,622,571 | | |
Diversified Consumer Services: 2.4% | |
New Oriental Education & Technology
Group, Inc. ADRc | | | 172,200 | | | | 3,514,602 | | |
Household Durables: 0.9% | |
Airmate Cayman International Co., Ltd. | | | 1,330,000 | | | | 1,371,524 | | |
Total Consumer Discretionary | | | | | 37,158,726 | | |
INDUSTRIALS: 24.8% | |
Machinery: 4.9% | |
Haitian International Holdings, Ltd. | | | 1,838,000 | | | | 3,852,252 | | |
Shanghai Mechanical and Electrical
Industry Co., Ltd. B Shares | | | 1,583,560 | | | | 3,357,147 | | |
| | | | | | 7,209,399 | | |
Electrical Equipment: 4.5% | |
Voltronic Power Technology Corp. | | | 375,850 | | | | 3,372,710 | | |
Boer Power Holdings, Ltd. | | | 3,707,000 | | | | 3,301,843 | | |
| | | | | | 6,674,553 | | |
Road & Rail: 3.8% | |
Guangshen Railway Co., Ltd. H Shares | | | 9,432,000 | | | | 4,562,895 | | |
Guangshen Railway Co., Ltd. ADR | | | 44,300 | | | | 1,068,959 | | |
| | | | | | 5,631,854 | | |
Air Freight & Logistics: 3.2% | |
Shenzhen Chiwan Petroleum B Sharesb,c | | | 1,861,968 | | | | 4,694,035 | | |
Professional Services: 3.1% | |
Sporton International, Inc. | | | 951,070 | | | | 4,657,446 | | |
Transportation Infrastructure: 2.4% | |
Yuexiu Transport Infrastructure, Ltd. | | | 4,874,000 | | | | 2,963,535 | | |
Jiangsu Expressway Co., Ltd. H Shares | | | 528,000 | | | | 628,644 | | |
| | | | | | 3,592,179 | | |
| | | Shares | | Value | |
Construction & Engineering: 2.0% | |
China Machinery Engineering Corp. H Shares | | | 3,803,000 | | | $ | 2,904,799 | | |
Industrial Conglomerates: 0.9% | |
Hopewell Holdings, Ltd. | | | 347,000 | | | | 1,263,124 | | |
Total Industrials | | | | | 36,627,389 | | |
FINANCIALS: 15.3% | |
Real Estate Investment Trusts (REITS): 5.9% | |
The Link REIT | | | 701,500 | | | | 4,378,980 | | |
CapitaRetail China Trust, REIT | | | 3,548,800 | | | | 4,315,916 | | |
| | | | | | 8,694,896 | | |
Diversified Financial Services: 3.8% | |
Far East Horizon, Ltd. | | | 5,652,000 | | | | 5,555,211 | | |
Banks: 3.2% | |
HSBC Holdings PLC ADR | | | 101,600 | | | | 4,798,568 | | |
Capital Markets: 2.4% | |
China Everbright, Ltd. | | | 1,490,000 | | | | 3,525,899 | | |
Total Financials | | | | | 22,574,574 | | |
CONSUMER STAPLES: 6.1% | |
Beverages: 3.3% | |
Yantai Changyu Pioneer Wine Co., Ltd.
B Shares | | | 1,499,027 | | | | 4,947,734 | | |
Food Products: 2.8% | |
Vitasoy International Holdings, Ltd. | | | 2,850,000 | | | | 4,121,573 | | |
Total Consumer Staples | | | | | 9,069,307 | | |
INFORMATION TECHNOLOGY: 6.1% | |
Software: 3.0% | |
Shanghai Baosight Software Co., Ltd.
B Sharesb | | | 1,405,044 | | | | 3,526,660 | | |
BAIOO Family Interactive, Ltd.c | | | 10,790,000 | | | | 882,818 | | |
| | | | | | 4,409,478 | | |
Internet Software & Services: 1.8% | |
Pacific Online, Ltd. | | | 5,890,000 | | | | 2,742,027 | | |
Semiconductors & Semiconductor Equipment: 1.3% | |
Taiwan Semiconductor
Manufacturing Co., Ltd. | | | 424,000 | | | | 1,867,920 | | |
Total Information Technology | | | | | 9,019,425 | | |
HEALTH CARE: 5.8% | |
Health Care Equipment & Supplies: 3.5% | |
Pacific Hospital Supply Co., Ltd. | | | 1,467,000 | | | | 3,237,544 | | |
St. Shine Optical Co., Ltd. | | | 123,811 | | | | 2,019,933 | | |
| | | | | | 5,257,477 | | |
Pharmaceuticals: 2.3% | |
Tianjin ZhongXin Pharmaceutical Group
Corp., Ltd. S Shares | | | 3,571,000 | | | | 3,343,492 | | |
Total Health Care | | | | | 8,600,969 | | |
22 MATTHEWS ASIA FUNDS
Matthews China Dividend Fund December 31, 2014
Schedule of Investmentsa (continued)
COMMON EQUITIES: (continued)
| | | Shares | | Value | |
TELECOMMUNICATION SERVICES: 4.6% | |
Wireless Telecommunication Services: 2.6% | |
China Mobile, Ltd. ADR | | | 64,730 | | | $ | 3,807,419 | | |
Diversified Telecommunication Services: 2.0% | |
Chunghwa Telecom Co., Ltd. ADR | | | 99,704 | | | | 2,934,289 | | |
Total Telecommunication Services | | | | | 6,741,708 | | |
UTILITIES: 3.8% | |
Water Utilities: 3.8% | |
Guangdong Investment, Ltd. | | | 4,254,000 | | | | 5,540,598 | | |
Total Utilities | | | | | 5,540,598 | | |
MATERIALS: 3.0% | |
Containers & Packaging: 3.0% | |
Greatview Aseptic Packaging Co., Ltd. | | | 8,688,000 | | | | 4,462,760 | | |
Total Materials | | | | | 4,462,760 | | |
ENERGY: 2.2% | |
Oil, Gas & Consumable Fuels: 2.2% | |
PetroChina Co., Ltd. H Shares | | | 2,964,000 | | | | 3,290,297 | | |
Total Energy | | | | | 3,290,297 | | |
TOTAL INVESTMENTS: 96.9% | | | | | 143,085,753 | | |
(Cost $131,505,011d) | |
CASH AND OTHER ASSETS,
LESS LIABILITIES: 3.1% | | | | | 4,531,090 | | |
NET ASSETS: 100.0% | | | | $ | 147,616,843 | | |
a Certain securities were fair valued under the valuation polices approved by the Board of Trustees (Note 2-A).
b Illiquid security, trading was halted at 12/31/14.
c Non-income producing security.
d Cost for federal income tax purposes is $133,632,446 and net unrealized appreciation consists of:
Gross unrealized appreciation | | $ | 21,446,217 | | |
Gross unrealized depreciation | | | (11,992,910 | ) | |
Net unrealized appreciation | | $ | 9,453,307 | | |
ADR American Depositary Receipt
REIT Real Estate Investment Trust
See accompanying notes to financial statements.
matthewsasia.com | 800.789.ASIA 23

PORTFOLIO MANAGERS
Kenneth Lowe, CFA | | | | | |
Lead Manager | | | | | |
J. Michael Oh, CFA | | Sharat Shroff, CFA | | | |
Co-Manager | | Co-Manager | | | |
FUND FACTS
| | | Investor | | Institutional | |
Ticker | | MAFSX | | MIFSX | |
CUSIP | | 577125701 | | 577125800 | |
Inception | | 4/30/13 | | 4/30/13 | |
NAV | | $10.01 | | $10.04 | |
Initial Investment | | $2,500 | | $3 million | |
Gross Expense Ratio1 | | 2.16% | | 1.94% | |
After Fee Waiver and
Reimbursement2 | | 1.57% | | 1.31% | |
Portfolio Statistics
Total # of Positions | | 28 | |
Net Assets | | $15.0 million | |
Weighted Average Market Cap | | $44.3 billion | |
Portfolio Turnover | | 24.12%3 | |
Benchmark
MSCI AC Asia ex Japan Index
Redemption Fee
2% within first 90 calendar days of purchase
OBJECTIVE
Long term capital appreciation.
STRATEGY
Under normal market conditions, the Fund seeks to achieve its investment objective by investing at least 80% of its total assets, which include borrowings for investment purposes, in the common and preferred stocks of companies located in Asia excluding Japan, but including all other developed, emerging and frontier countries and markets in the Asian region.
1 Actual 2014 expense ratios.
2 Effective May 1, 2014, Matthews has contractually agreed to waive fees and reimburse expenses until August 31, 2015 to the extent needed to limit Total Annual Fund Operating Expenses to 1.25% by waiving class specific and non-class specific expenses for the Institutional Class and agreed to reduce the expense ratio by waiving an equal amount of non-class specific expenses for the Investor Class. Because certain expenses of the Investor Class may be higher than the Institutional Class and class specific expenses may be waived solely for the Institutional Class, the Total Annual Fund Operating Expenses After Fee Waiver and Expense Reimbursement for the Investor Class may exceed 1.25%. If the expenses fall below the expense limitation in a year within three years after Matthews has made such a waiver or reimbursement, the Fund may reimburse Matthews up to an amount not to cause the expenses for that year to exceed the expense limitation. The fee waiver and expense reimbursement may be terminated at any time by the Board of Trustees or the Trust on behalf of the Fund on 60 days' written notice.
3 The lesser of fiscal year 2014 long-term purchase costs or sales proceeds divided by the average monthly market value of long-term securities.
Matthews Asia Focus Fund
Portfolio Manager Commentary
For the year ending December 31, 2014, the Matthews Asia Focus Fund returned 4.38% (Investor Class) and 4.77% (Institutional Class) while its benchmark, the MSCI All Country Asia ex Japan Index, returned 5.11%. For the fourth quarter of the year, the Fund returned 0.33% (Investor Class) and 0.50% (Institutional Class) versus 0.17% for the Index.
Market Environment:
Following the "taper tantrum" of 2013, both monetary policy shifts across the globe and plunging commodity prices played key roles in market sentiment throughout 2014. In the U.S., we witnessed the end of quantitative easing, whilst Europe and Japan engaged in a further deepening of their unconventional policies. For Asia, it has been a year of political change as new governments took hold in Indonesia, India and Thailand. The former two major economies have elected fairly well-regarded, pro-reform regimes in Joko Widodo and Narendra Modi, respectively—both of whom will hopefully drive supply side reform that is required for these countries to enjoy longer-term sustainable growth. With this backdrop, these three markets were the region's best performers over the year, outperforming many North Asian markets, such as Hong Kong and South Korea.
Performance Contributors and Detractors:
Pleasingly for a high-conviction strategy, stock selection was the primary driver of returns for the Fund during the year. The year's largest contributor came from our holdings in Southeast Asian financial companies with Bank Rakyat Indonesia and Kasikornbank performing well. Entering the year, concerns for both abounded as investors worried over Indonesia's current account position and Thailand's political instability. Although not to be dismissed, both banks proved fundamentally resilient as they continued to deliver earnings that suggest "business as usual." Part of this can be attributed to their superior capital and liquidity bases, alongside their strong market positions.
The Fund's holdings within information technology also benefited the strategy with both hardware and software companies contributing positively. In particular, Taiwan Semiconductor Manufacturing performed strongly as the increased demand for silicon content within smartphones and industrial-related products, as well as improving manufacturing yields, provided the company with attractive earnings growth. Chinese search engine Baidu also performed well as it continues to enhance monetization of its ever-improving mobile offerings.
In the fourth quarter, the largest detractor to Fund performance came from our Malaysian holdings as investors shunned a market and currency that is an oil exporter during the second half of the year. Additionally, Guinness Anchor, a local brewer, stuttered as it suffered its first decline in earnings since 2007. Weak consumer sentiment, a drop in tourism, bad weather and an increase in contraband products all played a role here. Exposure to miner BHP Billiton and mining explosive company Orica also hurt performance as commodity prices plunged.
24 MATTHEWS ASIA FUNDS
PERFORMANCE AS OF DECEMBER 31, 2014
| | | | | | Average Annual
Total Returns | |
| |
| | 3 Months | | 1 Year | | Since
Inception | | Inception
Date | |
Investor Class (MAFSX) | | | 0.33 | % | | | 4.38 | % | | | 0.98 | % | | 4/30/13 | |
Institutional Class (MIFSX) | | | 0.50 | % | | | 4.77 | % | | | 1.29 | % | | 4/30/13 | |
MSCI AC Asia ex Japan Index4 | | | 0.17 | % | | | 5.11 | % | | | 4.24 | % | | | | | |
Lipper Pacific ex Japan Funds Category Average5 | | | -2.11 | % | | | 3.65 | % | | | 1.56 | % | | | | | |
Performance assumes reinvestment of all dividends and/or distributions before taxes. All performance quoted represents past performance and is no guarantee of future results. Investment return and principal value will fluctuate with market conditions so that when redeemed, shares may be worth more or less than their original cost. Current performance may be lower or higher than the return figures quoted. Returns would have been lower if certain of the Fund's fees and expenses had not been waived. For the Fund's most recent month-end performance visit matthewsasia.com.
GROWTH OF A $10,000 INVESTMENT SINCE INCEPTION—INVESTOR CLASS
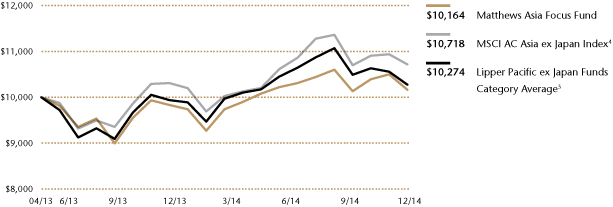
Plotted monthly. The performance data does not reflect the deduction of taxes that a shareholder would pay on dividends, capital gain distributions or redemption of Fund shares. Values are in US$.
4 It is not possible to invest directly in an index. Source: Index data from Morgan Stanley Capital International and Bloomberg; total return calculations performed by BNY Mellon Investment Servicing (US) Inc. Please see page 79 for index definition.
5 The Lipper Category Average does not reflect sales charges and is based on total return, including reinvestment of dividends and capital gains for the stated periods.
TOP TEN POSITIONS6
| | | Sector | | Country | | % of Net Assets | |
Jardine Matheson Holdings, Ltd. | | Industrials | | China/Hong Kong | | | 6.5 | % | |
AIA Group, Ltd. | | Financials | | China/Hong Kong | | | 6.5 | % | |
Yum! Brands, Inc. | | Consumer Discretionary | | China/Hong Kong | | | 4.2 | % | |
Samsung Electronics Co., Ltd. | | Information Technology | | South Korea | | | 4.2 | % | |
Singapore Telecommunications, Ltd. | | Telecom Services | | Singapore | | | 3.9 | % | |
VTech Holdings, Ltd. | | Information Technology | | China/Hong Kong | | | 3.8 | % | |
Samsonite International SA | | Consumer Discretionary | | China/Hong Kong | | | 3.7 | % | |
Cie Financiere Richemont SA | | Consumer Discretionary | | Switzerland | | | 3.7 | % | |
Taiwan Semiconductor Manufacturing Co., Ltd. | | Information Technology | | Taiwan | | | 3.6 | % | |
Mead Johnson Nutrition Co. | | Consumer Staples | | USA | | | 3.6 | % | |
| % OF ASSETS IN TOP 10 | | | | | | | 43.7 | % | |
6 Holdings may combine more than one security from same issuer and related depositary receipts.
matthewsasia.com | 800.789.ASIA 25
COUNTRY ALLOCATION (%)7
China/Hong Kong | | | 35.6 | | |
Malaysia | | | 11.6 | | |
Singapore | | | 9.6 | | |
Australia | | | 8.2 | | |
Indonesia | | | 6.0 | | |
South Korea | | | 4.2 | | |
Switzerland | | | 3.7 | | |
Taiwan | | | 3.6 | | |
United States | | | 3.6 | | |
Thailand | | | 2.8 | | |
India | | | 2.7 | | |
United Kingdom | | | 1.9 | | |
Cash and Other Assets, Less Liabilities | | | 6.5 | | |
SECTOR ALLOCATION (%)
Financials | | | 27.0 | | |
Consumer Discretionary | | | 17.4 | | |
Information Technology | | | 14.6 | | |
Industrials | | | 11.6 | | |
Consumer Staples | | | 9.2 | | |
Telecommunication Services | | | 6.6 | | |
Materials | | | 3.8 | | |
Health Care | | | 3.3 | | |
Cash and Other Assets, Less Liabilities | | | 6.5 | | |
MARKET CAP EXPOSURE (%)8
Large Cap (over $5B) | | | 77.0 | | |
Mid Cap ($1B–$5B) | | | 16.5 | | |
Small Cap (under $1B) | | | 0.0 | | |
Cash and Other Assets, Less Liabilities | | | 6.5 | | |
7 Not all countries where the Fund may invest are included in the benchmark index.
8 Source: FactSet Research Systems. Percentage values in data are rounded to the nearest tenth of one percent; the values may not sum to 100% due to rounding.
Matthews Asia Focus Fund
Portfolio Manager Commentary (continued)
Notable Portfolio Changes:
During the fourth quarter, the Fund added Hutchison Whampoa, one of the most established regional industrial conglomerates in Asia. The company has a fairly high quality set of assets that span retail, telecommunications, infrastructure, ports, property and energy—alongside a management team with a strong pedigree in allocating capital well. Additionally, we see some attractive drivers of sustainable growth across the majority of these assets. The Fund strives to add quality businesses such as this at price points that we believe are below their intrinsic value, and concerns around oil and European exposure allowed us such an entry point in Hutchison Whampoa at 11x price-to-earnings and a 36% discount to net asset value.
This position was funded through the sale of our holding in Thai Union Frozen Products. The stock had performed fairly well after a spree of acquisitions that were viewed positively by the market. Although these may make operational sense, they have taken the debt position of the company to a challenging level in its ambitions for growth. An appropriate capital structure is one of our hallmarks for quality companies and this change, alongside a valuation that was no longer attractive, led us to exit our position in the firm.
Outlook:
From an Asian investor's perspective, this coming year will be pivotal in the development of many of the region's economies. As we have noted previously, there are a number of reformist governments that have taken hold in Asia, with a renewed focus on productivity gains to drive real economic growth. Asia's two most populous countries—India and China—are at the forefront of these changes, and the latter's shift away from fixed asset investment, export and credit-led growth toward more domestic demand-driven growth will prove vital as China strives for higher quality economic development. Elsewhere, interest rate hikes in the U.S. may have negative implications for capital flows in emerging markets, whilst Europe and Japan continue to battle their deflationary issues.
All of these changes will likely create uncertainty for markets globally. Within the Matthews Asia Focus Fund, we will continue to strive to take advantage of divergences between long-term fundamentals and shorter-term fluctuations in share prices, buying into high-quality companies that create economic value at price points that we believe are cheaper than their intrinsic value.
26 MATTHEWS ASIA FUNDS
Matthews Asia Focus Fund December 31, 2014
Schedule of Investmentsa
COMMON EQUITIES: 93.5%
| | | Shares | | Value | |
CHINA/HONG KONG: 35.6% | |
Jardine Matheson Holdings, Ltd. | | | 16,000 | | | $ | 972,230 | | |
AIA Group, Ltd. | | | 175,800 | | | | 969,619 | | |
Yum! Brands, Inc. | | | 8,650 | | | | 630,153 | | |
VTech Holdings, Ltd. | | | 40,200 | | | | 575,208 | | |
Samsonite International SA | | | 186,900 | | | | 553,868 | | |
Baidu, Inc. ADRb | | | 1,937 | | | | 441,578 | | |
HSBC Holdings PLC | | | 45,600 | | | | 433,609 | | |
Hang Lung Group, Ltd. | | | 88,000 | | | | 399,045 | | |
Hutchison Whampoa, Ltd. | | | 32,000 | | | | 365,810 | | |
Total China/Hong Kong | | | | | 5,341,120 | | |
MALAYSIA: 11.6% | |
Genting Malaysia BHD | | | 399,200 | | | | 463,560 | | |
AMMB Holdings BHD | | | 233,100 | | | | 437,759 | | |
Axiata Group BHD | | | 206,300 | | | | 415,223 | | |
Guinness Anchor BHD | | | 118,400 | | | | 414,953 | | |
Total Malaysia | | | | | 1,731,495 | | |
SINGAPORE: 9.6% | |
Singapore Telecommunications, Ltd. | | | 197,000 | | | | 578,255 | | |
United Overseas Bank, Ltd. | | | 25,000 | | | | 461,351 | | |
Singapore Technologies Engineering, Ltd. | | | 155,000 | | | | 396,737 | | |
Total Singapore | | | | | 1,436,343 | | |
AUSTRALIA: 8.2% | |
Ansell, Ltd. | | | 27,266 | | | | 498,875 | | |
Insurance Australia Group, Ltd. | | | 86,364 | | | | 438,515 | | |
Orica, Ltd. | | | 18,592 | | | | 284,896 | | |
Total Australia | | | | | 1,222,286 | | |
INDONESIA: 6.0% | |
PT Bank Rakyat Indonesia Persero | | | 506,600 | | | | 476,194 | | |
PT Indofood Sukses Makmur | | | 779,000 | | | | 424,699 | | |
Total Indonesia | | | | | 900,893 | | |
SOUTH KOREA: 4.2% | |
Samsung Electronics Co., Ltd. | | | 516 | | | | 625,004 | | |
Total South Korea | | | | | 625,004 | | |
SWITZERLAND: 3.7% | |
Cie Financiere Richemont SA | | | 6,182 | | | | 548,088 | | |
Total Switzerland | | | | | 548,088 | | |
TAIWAN: 3.6% | |
Taiwan Semiconductor
Manufacturing Co., Ltd. | | | 124,000 | | | | 546,279 | | |
Total Taiwan | | | | | 546,279 | | |
UNITED STATES: 3.6% | |
Mead Johnson Nutrition Co. | | | 5,368 | | | | 539,699 | | |
Total United States | | | | | 539,699 | | |
| | | Shares | | Value | |
THAILAND: 2.8% | |
Kasikornbank Public Co., Ltd. | | | 61,200 | | | $ | 423,274 | | |
Total Thailand | | | | | 423,274 | | |
INDIA: 2.7% | |
Tata Motors, Ltd. | | | 52,232 | | | | 408,587 | | |
Total India | | | | | 408,587 | | |
UNITED KINGDOM: 1.9% | |
BHP Billiton PLC | | | 13,563 | | | | 290,674 | | |
Total United Kingdom | | | | | 290,674 | | |
TOTAL INVESTMENTS: 93.5% | | | | | 14,013,742 | | |
(Cost $13,991,503c) | | | | | |
CASH AND OTHER ASSETS,
LESS LIABILITIES: 6.5% | | | | | 973,189 | | |
NET ASSETS: 100.0% | | | | $ | 14,986,931 | | |
a Certain securities were fair valued under the valuation policies approved by the Board of Trustees (Note 2-A).
b Non-income producing security.
c Cost for federal income tax purposes is $14,068,777 and net unrealized depreciation consists of:
Gross unrealized appreciation | | $ | 822,194 | | |
Gross unrealized depreciation | | | (877,229 | ) | |
Net unrealized depreciation | | $ | (55,035 | ) | |
ADR American Depositary Receipt
BHD Berhad
See accompanying notes to financial statements.
matthewsasia.com | 800.789.ASIA 27

PORTFOLIO MANAGERS
Taizo Ishida
Lead Manager
Sharat Shroff, CFA
Co-Manager
FUND FACTS
| | | Investor Class | | Institutional Class | |
Ticker | | MPACX | | MIAPX | |
CUSIP | | 577130867 | | 577130776 | |
Inception | | 10/31/03 | | 10/29/10 | |
NAV | | $21.10 | | $21.19 | |
Initial Investment | | $2,500 | | $3 million | |
Gross Expense Ratio1 | | 1.11% | | 0.91% | |
Portfolio Statistics
Total # of Positions | | 72 | |
Net Assets | | $849.2 million | |
Weighted Average Market Cap | | $27.1 billion | |
Portfolio Turnover | | 22.24%2 | |
Benchmark
MSCI AC Asia Pacific Index
Redemption Fee
2% within first 90 calendar days of purchase
OBJECTIVE
Long-term capital appreciation.
STRATEGY
Under normal market conditions, the Fund seeks to achieve its investment objective by investing at least 80% of its total net assets, which include borrowings for investment purposes, in the common and preferred stocks of companies located in Asia. Asia consists of all countries and markets in Asia, and includes developed, emerging and frontier countries and markets in the Asian region. The Fund may also invest in the convertible securities, of any duration or quality, of Asian companies.
1 Actual 2014 expense ratios.
2 The lesser of fiscal year 2014 long-term purchase costs or sales proceeds divided by the average monthly market value of long-term securities.
Matthews Asia Growth Fund
Portfolio Manager Commentary
For the year ending December 31, 2014, the Matthews Asia Growth Fund rose 1.49% (Investor Class) and 1.63% (Institutional Class) while its benchmark, the MSCI All Country Asia Pacific Index, returned 0.29%. For the fourth quarter of the year, the Fund returned –2.21% (Investor Class) and –2.19% (Institutional Class) versus –1.38% for the Index.
Market Environment:
If 2013 was all about Japan and weak equity markets throughout Asia, we saw a reversal of that in 2014. Indian markets led the region, prompted by the reform efforts of Prime Minister Narendra Modi. Indonesia's new leader also boosted optimism and helped its markets regain some ground lost in 2013.
Meanwhile, developed economies, such as Japan and Australia, met with headwinds that led to market weakness. China's markets managed to rally toward the end of the year, but ultimately performance for the year was again mediocre. One surprise during the year was the decline in oil prices, which dropped by more than 40% for the second half of the year. The resilience of the Thai market despite a weakening economy and political uncertainty also surprised markets during the year.
Performance Contributors and Detractors:
During the year, a combination of our overweight and good stock selection in the consumer staples and industrials sectors helped Fund performance, while telecommunication services and consumer discretionary sectors were among the biggest detractors. However, highlighting top detractors by country or sector is basically a moot point as, in almost every case, these categories are defined by just a few individual stocks.
For example, the portfolio's sole holding in the telecommunication services for the fourth quarter was Japan's Softbank, which fell around 30% from its high a year ago, leading telecoms to be the second-worst sector for the quarter. Softbank had gained nearly 200% in U.S. dollars over the previous two years, but more recently, investors took profits after the IPO of Chinese Internet giant Alibaba in September; Softbank had long been regarded as an Alibaba proxy due to its large stake in the e-commerce firm. We also participated in the Alibaba IPO, and the information technology firm was among our top contributors to Fund performance for the year.
Two of the portfolio's information technology holdings—Kakaku.com and Yokogawa Electric—were among the biggest detractors to Fund performance following significant gains in the previous two years. However, these two holdings remain in our portfolio as we believe their fundamentals are still solid. Sands China and St. Shine Optical, which have both been major, long-term contributors to the Fund, stumbled during the year for different reasons. Sands China suffered following tighter crackdowns amid China's anti-corruption efforts, and thus lowered revenue growth among Macau's VIP casino gaming set. However, our thesis in Macau remains intact as we expect the territory's transformation to continue to be a major leisure destination of mainland Chinese travelers, particularly as it builds out its infrastructure. In the case of St. Shine Optical of Taiwan, the short-term outlook is less certain as demand for contact lenses
28 MATTHEWS ASIA FUNDS
PERFORMANCE AS OF DECEMBER 31, 2014
| | | | | | Average Annual Total Returns | | | |
| | 3 Months | | 1 Year | | 3 Years | | 5 Years | | 10 Years | | Since
Inception | | Inception
Date | |
Investor Class (MPACX) | | | -2.21 | % | | | 1.49 | % | | | 12.47 | % | | | 9.52 | % | | | 8.34 | % | | | 9.71 | % | | 10/31/03 | |
Institutional Class (MIAPX) | | | -2.19 | % | | | 1.63 | % | | | 12.67 | % | | | n.a. | | | | n.a. | | | | 6.19 | % | | 10/29/10 | |
MSCI AC Asia Pacific Index3 | | | -1.38 | % | | | 0.29 | % | | | 9.61 | % | | | 5.61 | % | | | 5.77 | % | | | 7.20 | %4 | | | | | |
Lipper Pacific Region Funds Category Average5 | | | -2.39 | % | | | 0.60 | % | | | 10.43 | % | | | 5.43 | % | | | 5.91 | % | | | 7.16 | %4 | | | |
Performance assumes reinvestment of all dividends and/or distributions before taxes. All performance quoted represents past performance and is no guarantee of future results. Investment return and principal value will fluctuate with market conditions so that when redeemed, shares may be worth more or less than their original cost. Current performance may be lower or higher than the return figures quoted. For the Fund's most recent month-end performance, visit matthewsasia.com.
GROWTH OF A $10,000 INVESTMENT SINCE INCEPTION—INVESTOR CLASS
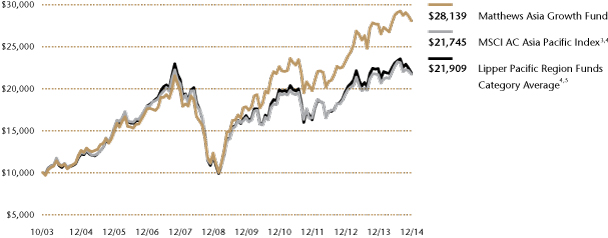
Plotted monthly. The performance data and graph do not reflect the deduction of taxes that a shareholder would pay on dividends, capital gains distributions or redemption of Fund shares. Values are in US$.
3 It is not possible to invest directly in an index. Source: Index data from Morgan Stanley Capital International and Bloomberg; total return calculations performed by BNY Mellon Investment Servicing (US) Inc. Please see page 79 for index definition.
4 Calculated from 10/31/03.
5 The Lipper Category Average does not reflect sales charges and is based on total return, including reinvestment of dividends and capital gains for the stated periods.
TOP TEN POSITIONS6
| | | Sector | | Country | | % of Net Assets | |
ORIX Corp. | | Financials | | Japan | | | 3.4 | % | |
Sysmex Corp. | | Health Care | | Japan | | | 3.0 | % | |
Alibaba Group Holding, Ltd. | | Information Technology | | China/Hong Kong | | | 2.5 | % | |
John Keells Holdings PLC | | Industrials | | Sri Lanka | | | 2.5 | % | |
PT Indofood CBP Sukses Makmur | | Consumer Staples | | Indonesia | | | 2.3 | % | |
Emami, Ltd. | | Consumer Staples | | India | | | 2.3 | % | |
Vista Land & Lifescapes, Inc. | | Financials | | Philippines | | | 2.2 | % | |
SoftBank Corp. | | Telecom Services | | Japan | | | 2.1 | % | |
Daikin Industries, Ltd. | | Industrials | | Japan | | | 2.1 | % | |
ITC, Ltd. | | Consumer Staples | | India | | | 2.0 | % | |
| % OF ASSETS IN TOP 10 | | | | | | | 24.4 | % | |
6 Holdings may combine more than one security from same issuer and related depositary receipts.
matthewsasia.com | 800.789.ASIA 29
COUNTRY ALLOCATION (%)7
Japan | | | 38.3 | | |
China/Hong Kong | | | 15.4 | | |
India | | | 10.0 | | |
Indonesia | | | 8.0 | | |
Philippines | | | 5.5 | | |
Sri Lanka | | | 5.0 | | |
Australia | | | 3.2 | | |
Taiwan | | | 2.8 | | |
South Korea | | | 2.3 | | |
Malaysia | | | 1.8 | | |
Thailand | | | 1.8 | | |
Vietnam | | | 0.9 | | |
Singapore | | | 0.7 | | |
Cash and Other Assets, Less Liabilities | | | 4.3 | | |
SECTOR ALLOCATION (%)
Consumer Staples | | | 20.1 | | |
Industrials | | | 16.9 | | |
Financials | | | 16.0 | | |
Consumer Discretionary | | | 15.6 | | |
Information Technology | | | 11.4 | | |
Health Care | | | 8.4 | | |
Materials | | | 2.6 | | |
Energy | | | 2.6 | | |
Telecommunication Services | | | 2.1 | | |
Cash and Other Assets, Less Liabilities | | | 4.3 | | |
MARKET CAP EXPOSURE (%)8
Large Cap (over $5B) | | | 57.7 | | |
Mid Cap ($1B–$5B) | | | 28.1 | | |
Small Cap (under $1B) | | | 9.9 | | |
Cash and Other Assets, Less Liabilities | | | 4.3 | | |
7 Not all countries where the Fund may invest are included in the benchmark index.
8 Source: FactSet Research Systems. Percentage values in data are rounded to the nearest tenth of one percent; the values may not sum to 100% due to rounding.
Matthews Asia Growth Fund
Portfolio Manager Commentary (continued)
outside of Japan, and especially in China, does not appear to be gaining momentum as quickly as expected. However, we found its stock valuations to be attractive as a result of a price correction, and expect the long-term demand outlook to remain healthy.
Notable Portfolio Changes:
In the fourth quarter, we substantially reduced the position sizes of our Japanese large-capitalization companies as the yen weakened against the U.S. dollar. We exited our positions in Honda Motor and Sumitomo Mitsui Financial Group, and substantially trimmed our position in Toyota Motor. We purchased Omron, a mid-sized Japanese factory automation company with an established global health care franchise. And also added Recruit Holdings—Japan's largest human resource company that has good overseas growth potential—upon its IPO offering.
Outlook:
The slump in oil prices has left the world looking quite different from how it appeared over the past few years. The usual concern with oil prices is that its movements are tied to inflationary moves. However, for oil importing countries, such as India, Sri Lanka and Indonesia, high oil prices have had further consequences—these countries have historically struggled with the high dollar costs of imported oil (contributing to a trade deficit) as well as the burden of fuel subsidies (fiscal deficit). Lower oil prices would shrink subsidies, and spell good news for such markets. However, for countries like Japan, South Korea and perhaps even China, the impact of lower oil prices may be much more muted than the "twin deficit" countries with a smaller exporting base. On aggregate, economic growth in Asia has been slowing and a lack of exporting markets may be a prime factor. However, even in this environment, the region still holds more compelling growth opportunities—particularly in the smaller and less developed countries that we frequently explore—when compared to other areas of the world.
30 MATTHEWS ASIA FUNDS
Matthews Asia Growth Fund December 31, 2014
Schedule of Investmentsa
COMMON EQUITIES: 95.6%
| | | Shares | | Value | |
JAPAN: 38.3% | |
ORIX Corp. | | | 2,305,600 | | | $ | 29,010,898 | | |
Sysmex Corp. | | | 568,600 | | | | 25,235,888 | | |
SoftBank Corp. | | | 295,900 | | | | 17,612,942 | | |
Daikin Industries, Ltd. | | | 274,000 | | | | 17,569,997 | | |
FANUC Corp. | | | 98,600 | | | | 16,257,207 | | |
Kakaku.com, Inc. | | | 1,058,400 | | | | 15,142,218 | | |
Omron Corp. | | | 330,600 | | | | 14,789,553 | | |
Suntory Beverage & Food, Ltd. | | | 418,200 | | | | 14,448,513 | | |
Seven & I Holdings Co., Ltd. | | | 393,400 | | | | 14,151,128 | | |
Nidec Corp. | | | 218,800 | | | | 14,131,342 | | |
Nitto Denko Corp. | | | 251,300 | | | | 14,041,517 | | |
Glory, Ltd. | | | 480,100 | | | | 12,934,421 | | |
Toyota Motor Corp. | | | 205,500 | | | | 12,806,225 | | |
Tokio Marine Holdings, Inc. | | | 386,400 | | | | 12,549,383 | | |
Komatsu, Ltd. | | | 501,400 | | | | 11,084,917 | | |
Unicharm Corp. | | | 457,800 | | | | 10,973,053 | | |
Pigeon Corp. | | | 167,800 | | | | 9,783,763 | | |
Yokogawa Electric Corp. | | | 849,500 | | | | 9,321,606 | | |
Calbee, Inc. | | | 263,500 | | | | 9,076,735 | | |
Rinnai Corp. | | | 132,100 | | | | 8,876,089 | | |
Recruit Holdings Co., Ltd.b | | | 291,200 | | | | 8,363,066 | | |
Mitsubishi UFJ Financial Group, Inc. | | | 1,489,100 | | | | 8,181,457 | | |
Benefit One, Inc. | | | 623,600 | | | | 6,732,530 | | |
COOKPAD, Inc. | | | 190,200 | | | | 6,477,107 | | |
M3, Inc. | | | 361,300 | | | | 6,045,274 | | |
Total Japan | | | | | 325,596,829 | | |
CHINA/HONG KONG: 15.4% | |
Alibaba Group Holding, Ltd. ADRb | | | 203,600 | | | | 21,162,184 | | |
Haitian International Holdings, Ltd. | | | 8,247,000 | | | | 17,284,834 | | |
Shenzhou International Group
Holdings, Ltd. | | | 4,792,000 | | | | 15,791,988 | | |
Baidu, Inc. ADRb | | | 61,300 | | | | 13,974,561 | | |
China Lodging Group, Ltd. ADSb | | | 526,600 | | | | 13,839,048 | | |
Sands China, Ltd. | | | 2,632,000 | | | | 12,812,959 | | |
Galaxy Entertainment Group, Ltd. | | | 1,958,000 | | | | 10,880,048 | | |
Autohome, Inc. ADRb | | | 202,400 | | | | 7,359,264 | | |
Dairy Farm International Holdings, Ltd. | | | 727,554 | | | | 6,547,986 | | |
Tingyi (Cayman Islands) Holding Corp. | | | 1,888,000 | | | | 4,290,548 | | |
Luk Fook Holdings International, Ltd. | | | 968,000 | | | | 3,630,126 | | |
Hang Lung Group, Ltd. | | | 742,000 | | | | 3,364,676 | | |
Total China/Hong Kong | | | | | 130,938,222 | | |
INDIA: 10.0% | |
Emami, Ltd. | | | 1,551,001 | | | | 19,332,519 | | |
ITC, Ltd. | | | 2,970,516 | | | | 17,304,348 | | |
HDFC Bank, Ltd. | | | 1,007,795 | | | | 15,135,775 | | |
Sun Pharmaceutical Industries, Ltd. | | | 793,374 | | | | 10,368,009 | | |
Castrol India, Ltd. | | | 1,075,755 | | | | 8,535,003 | | |
Lupin, Ltd. | | | 324,130 | | | | 7,323,219 | | |
Multi Commodity Exchange of India, Ltd. | | | 516,163 | | | | 6,875,152 | | |
Total India | | | | | 84,874,025 | | |
| | | Shares | | Value | |
INDONESIA: 8.0% | |
PT Indofood CBP Sukses Makmur | | | 18,435,000 | | | $ | 19,441,052 | | |
PT Astra International | | | 26,794,800 | | | | 15,980,004 | | |
PT Bank Rakyat Indonesia Persero | | | 15,890,900 | | | | 14,937,138 | | |
PT Ace Hardware Indonesia | | | 194,172,500 | | | | 12,275,414 | | |
PT Arwana Citramulia | | | 79,852,000 | | | | 5,582,855 | | |
Total Indonesia | | | | | 68,216,463 | | |
PHILIPPINES: 5.5% | |
Vista Land & Lifescapes, Inc. | | | 117,224,100 | | | | 18,841,084 | | |
Universal Robina Corp. | | | 2,873,600 | | | | 12,528,570 | | |
Jollibee Foods Corp. | | | 2,007,890 | | | | 9,598,638 | | |
Emperador, Inc. | | | 23,128,600 | | | | 5,324,923 | | |
Total Philippines | | | | | 46,293,215 | | |
SRI LANKA: 4.9% | |
John Keells Holdings PLC | | | 11,026,735 | | | | 21,011,309 | | |
Sampath Bank PLC | | | 7,166,493 | | | | 12,887,883 | | |
Lanka Orix Leasing Co. PLCb | | | 12,121,473 | | | | 8,130,256 | | |
Total Sri Lanka | | | | | 42,029,448 | | |
AUSTRALIA: 3.2% | |
Oil Search, Ltd. | | | 2,632,693 | | | | 16,882,383 | | |
CSL, Ltd. | | | 152,216 | | | | 10,692,525 | | |
Total Australia | | | | | 27,574,908 | | |
TAIWAN: 2.8% | |
St. Shine Optical Co., Ltd. | | | 711,000 | | | | 11,599,718 | | |
Sinmag Equipment Corp. | | | 1,196,740 | | | | 7,215,551 | | |
Synnex Technology International Corp. | | | 3,133,000 | | | | 4,537,486 | | |
Total Taiwan | | | | | 23,352,755 | | |
SOUTH KOREA: 2.3% | |
Samsung Electronics Co., Ltd. | | | 8,725 | | | | 10,568,136 | | |
Orion Corp. | | | 9,402 | | | | 8,745,942 | | |
Total South Korea | | | | | 19,314,078 | | |
MALAYSIA: 1.8% | |
7-Eleven Malaysia Holdings BHDb | | | 14,263,700 | | | | 6,119,133 | | |
SapuraKencana Petroleum BHD | | | 7,729,800 | | | | 5,113,964 | | |
Oldtown BHD | | | 9,908,125 | | | | 4,230,269 | | |
Total Malaysia | | | | | 15,463,366 | | |
THAILAND: 1.8% | |
Major Cineplex Group Public Co., Ltd. | | | 11,921,000 | | | | 10,000,278 | | |
SNC Former Public Co., Ltd. | | | 11,599,900 | | | | 4,926,315 | | |
Total Thailand | | | | | 14,926,593 | | |
VIETNAM: 0.9% | |
Vietnam Dairy Products JSC | | | 1,803,584 | | | | 8,040,426 | | |
Total Vietnam | | | | | 8,040,426 | | |
SINGAPORE: 0.7% | |
Keppel Land, Ltd. | | | 2,204,000 | | | | 5,677,781 | | |
Total Singapore | | | | | 5,677,781 | | |
TOTAL COMMON EQUITIES | | | | | 812,298,109 | | |
(Cost $646,149,773) | | | | | |
matthewsasia.com | 800.789.ASIA 31
Matthews Asia Growth Fund December 31, 2014
Schedule of Investmentsa (continued)
WARRANTS: 0.1%
| | | Shares | | Value | |
SRI LANKA: 0.1% | |
John Keells Holdings PLC, expires 11/11/16 | | | 490,094 | | | $ | 270,822 | | |
John Keells Holdings PLC, expires 11/12/15 | | | 490,094 | | | | 254,012 | | |
Total Sri Lanka | | | | | 524,834 | | |
TOTAL WARRANTS | | | | | 524,834 | | |
(Cost $0) | | | | | |
TOTAL INVESTMENTS: 95.7% | | | | | 812,822,943 | | |
(Cost $646,149,773c) | | | | | |
CASH AND OTHER ASSETS,
LESS LIABILITIES: 4.3% | | | | | 36,361,037 | | |
NET ASSETS: 100.0% | | | | $ | 849,183,980 | | |
a Certain securities were fair valued under the valuation polices approved by the Board of Trustees (Note 2-A).
b Non-income producing security.
c Cost for federal income tax purposes is $654,784,522 and net unrealized appreciation consists of:
Gross unrealized appreciation | | $ | 182,563,878 | | |
Gross unrealized depreciation | | | (24,525,457 | ) | |
Net unrealized appreciation | | $ | 158,038,421 | | |
ADR American Depositary Receipt
ADS American Depositary Share
BHD Berhad
JSC Joint Stock Co.
See accompanying notes to financial statements.
32 MATTHEWS ASIA FUNDS

PORTFOLIO MANAGERS
Lead Manager
Richard H. Gao | | In-Bok Song | |
Co-Manager | | Co-Manager | |
FUND FACTS
| | | Investor Class | | Institutional Class | |
Ticker | | MAPTX | | MIPTX | |
CUSIP | | 577130107 | | 577130834 | |
Inception | | 9/12/94 | | 10/29/10 | |
NAV | | $26.57 | | $26.56 | |
Initial Investment | | $2,500 | | $3 million | |
Gross Expense Ratio1 | | 1.09% | | 0.92% | |
Portfolio Statistics
Total # of Positions | | 67 | |
Net Assets | | $8.1 billion | |
Weighted Average Market Cap | | $29.4 billion | |
Portfolio Turnover | | 11.38%2 | |
Benchmark
MSCI AC Asia ex Japan Index
Redemption Fee
2% within first 90 calendar days of purchase
OBJECTIVE
Long-term capital appreciation.
STRATEGY
Under normal market conditions, the Fund seeks to achieve its investment objective by investing at least 80% of its total net assets, which include borrowings for investment purposes, in the common and preferred stocks of companies located in Asia ex Japan, which consists of all countries and markets in Asia excluding Japan, but including all other developed, emerging and frontier countries and markets in the Asian region.
1 Actual 2014 expense ratios.
2 The lesser of fiscal year 2014 long-term purchase costs or sales proceeds divided by the average monthly market value of long-term securities.
Matthews Pacific Tiger Fund*
Portfolio Manager Commentary
For the year ending December 31, 2014, the Matthews Pacific Tiger Fund returned 11.79% (Investor Class) and 12.03% (Institutional Class), outperforming its benchmark, the MSCI All Country Asia ex Japan Index, which returned 5.11%. For the fourth quarter of the year, performance fell by –1.19% (Investor Class) and –1.12% (Institutional Class) versus a 0.17% increase by the Index.
Market Environment:
The health of the Chinese economy, expectations around rising rates in the U.S., and the prospects of structural reforms in India and Indonesia were the key factors affecting the capital markets in Asia. The Chinese government continues to focus on improving the allocation of capital within the economy and slowing investment growth while, at the same time, enhancing the quality of growth. In the short run, that has translated into weaker economic activity as both investment- and export-related growth suffered in 2014. The asymmetric interest rate reductions in November, which saw the lending rate fall more than the deposit rate, and the partial opening up of the Shanghai Stock Exchange (SSE) to overseas investors, catalyzed a strong recovery, boosting the SSE Composite Index to be a top performer, globally in 2014.
The interest rates in the U.S. did not eventually rise as some analysts expected; although the prospect of an increase was enough of a wake-up call for countries like India and Indonesia to take corrective action by holding interest rates steady even in the face of falling inflation. These countries reduced energy subsidies, while embarking on structural reforms that have the potential of improving productivity within their economies.
Throughout the year, the MSCI Asia ex Japan Index's gains were muted by widespread currency depreciation in Asia, versus the U.S. dollar. The Malaysian ringgit was the worst performing currency during 2014, as concerns over high levels of debt and the impact of falling oil prices on tax revenues caused the currency to weaken (Malaysia is one of the few countries in Asia that is an exporter of oil).
Performance Contributors and Detractors:
For the full year, the portfolio's outperformance was led by holdings in South Korea and India. For example, the Korean beauty products company, Amorepacific's, continuing traction with consumers in China became much more evident during the course of 2014, as some of their prior marketing initiatives began to translate into market share gains for their skin care products. Meanwhile, in India, the prospect of a recovery in growth led by the government's reform initiatives was a primary factor behind the recovery in valuation for some of the portfolio's holdings.
On the flip side, some of the Taiwanese holdings proved to be detractors to relative performance. In Taiwan, the free cash flow yields across several of the holdings have compressed over the past year, and as investors start to anticipate higher rates globally, the constricted yields are less attractive. One of the worst performing stocks for the portfolio was Cheil
* Closed to most new investors as of October 25, 2013.
matthewsasia.com | 800.789.ASIA 33
PERFORMANCE AS OF DECEMBER 31, 2014
| | | | | | Average Annual Total Returns | | | |
| | 3 Months | | 1 Year | | 3 Years | | 5 Years | | 10 Years | | Since
Inception | | Inception
Date | |
Investor Class (MAPTX) | | | -1.19 | % | | | 11.79 | % | | | 11.91 | % | | | 8.72 | % | | | 11.57 | % | | | 9.03 | % | | 9/12/94 | |
Institutional Class (MIPTX) | | | -1.12 | % | | | 12.03 | % | | | 12.12 | % | | | n.a. | | | | n.a. | | | | 5.67 | % | | 10/29/10 | |
MSCI AC Asia ex Japan Index3 | | | 0.17 | % | | | 5.11 | % | | | 10.05 | % | | | 5.80 | % | | | 9.72 | % | | | 4.15 | %4 | | | | | |
Lipper Pacific ex Japan Funds Category Average5 | | | -2.11 | % | | | 3.65 | % | | | 9.78 | % | | | 5.40 | % | | | 8.85 | % | | | 4.84 | %4 | | | | | |
Performance assumes reinvestment of all dividends and/or distributions before taxes. All performance quoted represents past performance and is no guarantee of future results. Investment return and principal value will fluctuate with market conditions so that when redeemed, shares may be worth more or less than their original cost. Current performance may be lower or higher than the return figures quoted. For the Fund's most recent month-end performance, visit matthewsasia.com.
GROWTH OF A $10,000 INVESTMENT SINCE INCEPTION—INVESTOR CLASS
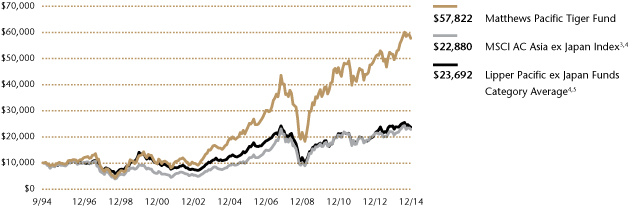
Plotted monthly. The performance data and graph do not reflect the deduction of taxes that a shareholder would pay on dividends, capital gains distributions or redemption of Fund shares. Values are in US$.
3 It is not possible to invest directly in an index. Source: Index data from Morgan Stanley Capital International and Bloomberg; total return calculations performed by BNY Mellon Investment Servicing (US) Inc. Please see page 79 for index definition.
4 Calculated from 8/31/94.
5 The Lipper Category Average does not reflect sales charges and is based on total return, including reinvestment of dividends and capital gains for the stated periods.
TOP TEN POSITIONS6
| | | Sector | | Country | | % of Net Assets | |
Amorepacific Corp. | | Consumer Staples | | South Korea | | | 3.9 | % | |
Ping An Insurance Group Co. of China, Ltd. | | Financials | | China/Hong Kong | | | 3.5 | % | |
Kotak Mahindra Bank, Ltd. | | Financials | | India | | | 3.0 | % | |
Tata Power Co., Ltd. | | Utilities | | India | | | 2.6 | % | |
President Chain Store Corp. | | Consumer Staples | | Taiwan | | | 2.6 | % | |
Dongbu Insurance Co., Ltd. | | Financials | | South Korea | | | 2.5 | % | |
DKSH Holding, Ltd. | | Industrials | | Switzerland | | | 2.4 | % | |
Baidu, Inc. | | Information Technology | | China/Hong Kong | | | 2.4 | % | |
Central Pattana Public Co., Ltd. | | Financials | | Thailand | | | 2.4 | % | |
Sinopharm Group Co., Ltd. | | Health Care | | China/Hong Kong | | | 2.4 | % | |
| % OF ASSETS IN TOP 10 | | | | | | | 27.7 | % | |
6 Holdings may combine more than one security from same issuer and related depositary receipts.
34 MATTHEWS ASIA FUNDS
Matthews Pacific Tiger Fund
Portfolio Manager Commentary (continued)
Worldwide, a Korean advertising agency. Weaker handset sales from Cheil's major client, Samsung Electronics led to decreased advertising revenues. This, along with a tough economic environment in Europe, offset the company's progress in China. We are taking advantage of the sell-off by increasing the allocation, as the opportunity to help companies with their branding initiatives in China can become meaningful in a few years' time.
Notable Portfolio Changes:
We have taken advantage of lower market valuations to acquire new positions in sectors like health care and the consumer sector. One of the newer additions is Yum! Brands, which is continuing to solidify its position as a premier eating destination for Chinese consumers. The recent setbacks at Yum! Brands around food quality are an opportunity for the management team to establish better controls, and distinguish their offerings from the competition.
Separately, there were some positions that were eliminated from the portfolio, one of them being Megastudy, a provider of education services in South Korea. Although we appreciated management's efforts to enhance shareholder value, the continuous changes in the regulatory environment eventually had the effect of impairing the company's business model.
Outlook:
This past year was a test of endurance for several Asian economies, and while some progress was achieved, there is a lot more that needs to be done. The fall in oil prices is a positive, as it lowers inflation expectation and input costs for most of Asia, and may also lead to a more relaxed monetary environment. More importantly, oil price reductions cement Asia's position as a deeper and broader economic region that is not reliant upon commodity exports for progress. This may translate into favorable capital flows, but there is a risk that this may reduce the impetus to pursue the tough economic reforms that are vital for long-term growth.
The attempts at deregulating supply-side bottlenecks, like land acquisition, are being pursued by the governments in India and Indonesia, although actual progress has been erratic, raising questions over the real impact of these efforts. Meanwhile, in China, the emphasis is on better capital allocation, but the pressure to accelerate investment spending as a way to revive short-term economic growth is building. Ultimately, 2015 is likely to be a test of resolve for policy makers to stay the course on longer term initiatives.
COUNTRY ALLOCATION (%)7
China/Hong Kong | | | 29.2 | | |
India | | | 20.6 | | |
South Korea | | | 15.8 | | |
Indonesia | | | 8.2 | | |
Taiwan | | | 7.7 | | |
Thailand | | | 5.3 | | |
Malaysia | | | 3.6 | | |
Philippines | | | 2.6 | | |
Switzerland | | | 2.4 | | |
Singapore | | | 1.6 | | |
Vietnam | | | 1.3 | | |
United States | | | 0.9 | | |
Cash and Other Assets, Less Liabilities | | | 0.8 | | |
SECTOR ALLOCATION (%)
Financials | | | 28.5 | | |
Consumer Staples | | | 20.7 | | |
Information Technology | | | 16.3 | | |
Consumer Discretionary | | | 8.6 | | |
Health Care | | | 7.6 | | |
Utilities | | | 6.8 | | |
Industrials | | | 5.3 | | |
Telecommunication Services | | | 3.6 | | |
Materials | | | 1.8 | | |
Cash and Other Assets, Less Liabilities | | | 0.8 | | |
MARKET CAP EXPOSURE (%)8
Large Cap (Over $5B) | | | 78.7 | | |
Mid Cap ($1B–$5B) | | | 20.0 | | |
Small Cap (under $1B) | | | 0.5 | | |
Cash and Other Assets, Less Liabilities | | | 0.8 | | |
7 Not all countries where the Fund may invest are included in the benchmark index.
8 Source: FactSet Research Systems. Percentage values in data are rounded to the nearest tenth of one percent; the values may not sum to 100% due to rounding.
matthewsasia.com | 800.789.ASIA 35
Matthews Pacific Tiger Fund December 31, 2014
Schedule of Investmentsa
COMMON EQUITIES: 99.1%
| | | Shares | | Value | |
CHINA/HONG KONG: 29.2% | |
Ping An Insurance Group Co. of
China, Ltd. H Shares | | | 28,166,000 | | | $ | 285,196,062 | | |
Baidu, Inc. ADRb | | | 847,500 | | | | 193,204,575 | | |
Sinopharm Group Co., Ltd. H Shares | | | 54,363,200 | | | | 191,295,959 | | |
Hengan International Group Co., Ltd. | | | 17,333,500 | | | | 180,722,721 | | |
China Mobile, Ltd. ADR | | | 2,653,701 | | | | 156,090,693 | | |
Dairy Farm International
Holdings, Ltd. | | | 16,892,946 | | | | 152,036,514 | | |
Hang Lung Group, Ltd. | | | 32,614,000 | | | | 147,891,579 | | |
Lenovo Group, Ltd. | | | 110,642,000 | | | | 144,455,678 | | |
China Resources Land, Ltd. | | | 50,688,000 | | | | 133,208,978 | | |
China Resources Enterprise, Ltd. | | | 51,802,000 | | | | 108,218,541 | | |
Tingyi (Cayman Islands) Holding Corp. | | | 39,646,000 | | | | 90,096,971 | | |
Dongfeng Motor Group Co.,
Ltd. H Shares | | | 62,440,000 | | | | 87,342,502 | | |
China Vanke Co., Ltd. H Shares | | | 39,141,304 | | | | 86,828,976 | | |
Tencent Holdings, Ltd. | | | 5,886,500 | | | | 85,171,360 | | |
Hong Kong Exchanges and
Clearing, Ltd. | | | 3,664,500 | | | | 80,900,185 | | |
Swire Pacific, Ltd. A Shares Class | | | 5,683,500 | | | | 73,774,555 | | |
Yum! Brands, Inc. | | | 945,000 | | | | 68,843,250 | | |
Alibaba Group Holding, Ltd. ADRb | | | 392,600 | | | | 40,806,844 | | |
Digital China Holdings, Ltd. | | | 33,948,000 | | | | 31,388,236 | | |
WuXi PharmaTech Cayman, Inc. ADRb | | | 846,186 | | | | 28,491,083 | | |
Total China/Hong Kong | | | | | 2,365,965,262 | | |
INDIA: 20.6% | |
Kotak Mahindra Bank, Ltd. | | | 12,350,816 | | | | 245,960,755 | | |
Tata Power Co., Ltd.† | | | 162,545,436 | | | | 210,766,521 | | |
GAIL India, Ltd. | | | 24,282,108 | | | | 170,418,373 | | |
Titan Co., Ltd. | | | 27,457,503 | | | | 165,356,126 | | |
Container Corp. of India, Ltd. | | | 6,836,659 | | | | 145,956,297 | | |
ITC, Ltd. | | | 24,735,000 | | | | 144,090,470 | | |
Housing Development Finance Corp. | | | 8,010,685 | | | | 143,650,455 | | |
Sun Pharmaceutical Industries, Ltd. | | | 10,103,630 | | | | 132,036,751 | | |
HDFC Bank, Ltd. | | | 7,960,920 | | | | 119,562,705 | | |
Dabur India, Ltd. | | | 25,308,038 | | | | 93,403,496 | | |
Thermax, Ltd. | | | 5,310,034 | | | | 89,462,165 | | |
HDFC Bank, Ltd. ADR | | | 119,500 | | | | 6,064,625 | | |
Total India | | | | | 1,666,728,739 | | |
SOUTH KOREA: 15.8% | |
Amorepacific Corp. | | | 154,373 | | | | 313,991,677 | | |
Dongbu Insurance Co., Ltd.† | | | 4,020,500 | | | | 202,278,518 | | |
Samsung Electronics Co., Ltd. | | | 141,754 | | | | 171,699,209 | | |
Naver Corp. | | | 264,015 | | | | 170,350,678 | | |
Orion Corp. | | | 150,278 | | | | 139,791,823 | | |
Green Cross Corp.† | | | 1,008,655 | | | | 126,540,568 | | |
Cheil Worldwide, Inc.b† | | | 6,420,440 | | | | 100,836,195 | | |
Yuhan Corp. | | | 360,201 | | | | 55,767,546 | | |
Total South Korea | | | | | 1,281,256,214 | | |
| | | Shares | | Value | |
INDONESIA: 8.2% | |
PT Indofood CBP Sukses Makmur | | | 131,813,000 | | | $ | 139,006,425 | | |
PT Astra International | | | 227,099,300 | | | | 135,438,505 | | |
PT Perusahaan Gas Negara Persero | | | 272,552,100 | | | | 131,894,253 | | |
PT Bank Central Asia | | | 115,688,500 | | | | 122,715,166 | | |
PT Telekomunikasi Indonesia Persero | | | 507,302,500 | | | | 116,592,699 | | |
PT Telekomunikasi Indonesia
Persero ADR | | | 375,700 | | | | 16,992,911 | | |
Total Indonesia | | | | | 662,639,959 | | |
TAIWAN: 7.7% | |
President Chain Store Corp. | | | 26,989,608 | | | | 208,462,982 | | |
Delta Electronics, Inc. | | | 30,170,000 | | | | 178,281,681 | | |
Synnex Technology International Corp.† | | | 102,065,354 | | | | 147,820,020 | | |
Taiwan Semiconductor
Manufacturing Co., Ltd. | | | 19,423,513 | | | | 85,569,731 | | |
Total Taiwan | | | | | 620,134,414 | | |
THAILAND: 5.3% | |
Central Pattana Public Co., Ltd. | | | 139,457,600 | | | | 191,304,074 | | |
The Siam Cement Public Co., Ltd. | | | 9,478,500 | | | | 128,657,284 | | |
Kasikornbank Public Co., Ltd. NVDR | | | 13,427,700 | | | | 92,869,204 | | |
The Siam Cement Public Co., Ltd. NVDR | | | 1,250,000 | | | | 16,966,989 | | |
Kasikornbank Public Co., Ltd. | | | 385,000 | | | | 2,662,753 | | |
Total Thailand | | | | | 432,460,304 | | |
MALAYSIA: 3.5% | |
Genting BHD | | | 49,915,500 | | | | 126,447,489 | | |
Public Bank BHD | | | 14,954,994 | | | | 78,129,363 | | |
IHH Healthcare BHD | | | 44,446,700 | | | | 61,210,015 | | |
IHH Healthcare BHD | | | 11,543,000 | | | | 15,948,415 | | |
Total Malaysia | | | | | 281,735,282 | | |
PHILIPPINES: 2.6% | |
SM Prime Holdings, Inc. | | | 314,854,571 | | | | 119,186,052 | | |
GT Capital Holdings, Inc. | | | 3,847,540 | | | | 88,128,646 | | |
Total Philippines | | | | | 207,314,698 | | |
SWITZERLAND: 2.4% | |
DKSH Holding, Ltd. | | | 2,560,879 | | | | 194,957,524 | | |
Total Switzerland | | | | | 194,957,524 | | |
SINGAPORE: 1.6% | |
Keppel Land, Ltd. | | | 34,212,000 | | | | 88,134,415 | | |
Hyflux, Ltd.† | | | 65,284,280 | | | | 41,475,884 | | |
Total Singapore | | | | | 129,610,299 | | |
VIETNAM: 1.3% | |
Vietnam Dairy Products JSC | | | 23,547,368 | | | | 104,974,804 | | |
Total Vietnam | | | | | 104,974,804 | | |
UNITED STATES: 0.9% | |
Cognizant Technology Solutions
Corp. Class Ab | | | 1,382,600 | | | | 72,807,716 | | |
Total United States | | | | | 72,807,716 | | |
TOTAL COMMON EQUITIES | | | | | 8,020,585,215 | | |
(Cost $5,557,023,093) | | | | | |
36 MATTHEWS ASIA FUNDS
Matthews Pacific Tiger Fund December 31, 2014
Schedule of Investmentsa (continued)
WARRANTS: 0.1%
| | | Shares | | Value | |
MALAYSIA: 0.1% | |
Genting BHD, expires 12/18/18 | | | 12,253,875 | | | $ | 9,777,867 | | |
Total Malaysia | | | | | 9,777,867 | | |
TOTAL WARRANTS | | | | | 9,777,867 | | |
(Cost $5,593,674) | | | | | |
TOTAL INVESTMENTS: 99.2% | | | | | 8,030,363,082 | | |
(Cost $5,562,616,767c) | | | | | |
CASH AND OTHER ASSETS,
LESS LIABILITIES: 0.8% | | | | | 66,356,503 | | |
NET ASSETS: 100.0% | | | | $ | 8,096,719,585 | | |
a Certain securities were fair valued under the valuation polices approved by the Board of Trustees (Note 2-A).
b Non-income producing security.
c Cost for federal income tax purposes is $5,563,879,170 and net unrealized appreciation consists of:
Gross unrealized appreciation | | $ | 2,689,165,958 | | |
Gross unrealized depreciation | | | (222,682,046 | ) | |
Net unrealized appreciation | | $ | 2,466,483,912 | | |
† Affiliated Issuer, as defined under the Investment Company Act of 1940 (ownership of 5% or more of the outstanding voting securities of this issuer)
ADR American Depositary Receipt
BHD Berhad
JSC Joint Stock Co.
NVDR Non-voting Depositary Receipt
See accompanying notes to financial statements.
matthewsasia.com | 800.789.ASIA 37

PORTFOLIO MANAGERS
Taizo Ishida | | Robert Harvey, CFA | | | |
Lead Manager | | Co-Manager | | | |
FUND FACTS
| | | Investor | | Institutional | |
Ticker | | MEASX | | MIASX | |
CUSIP | | 577125883 | | 577125875 | |
Inception | | 4/30/13 | | 4/30/13 | |
NAV | | $11.60 | | $11.60 | |
Initial Investment | | $2,500 | | $3 million | |
Gross Expense Ratio1 | | 1.78% | | 1.59% | |
After Fee Waiver and
Reimbursement2 | | 1.58% | | 1.33% | |
Portfolio Statistics
Total # of Positions | | 92 | |
Net Assets | | $131.7 million | |
Weighted Average Market Cap | | $9.7 billion | |
Portfolio Turnover | | 8.21%3 | |
Benchmark
MSCI Emerging Markets Asia Index
Redemption Fee
2% within first 90 calendar days of purchase
OBJECTIVE
Long term capital appreciation.
STRATEGY
Under normal market conditions, the Fund seeks to achieve its investment objective by investing at least 80% of its total assets, which include borrowings for investment purposes, in the common and preferred stocks of companies located in Asia excluding Japan, South Korea, Hong Kong and Singapore. The Fund may also invest in the convertible securities, of any duration or quality of companies located in Asia excluding Japan, South Korea, Hong Kong and Singapore. Once fully invested and under normal market conditions, the Fund is expected to invest a substantial portion of its net assets in the emerging countries and markets in the Asian region, including, but not limited to, Bangladesh, Cambodia, China (including Taiwan, but excluding Hong Kong), India, Indonesia, Laos, Malaysia, Mongolia, Myanmar, Pakistan, Papua New Guinea, Philippines, Sri Lanka, Thailand, and Vietnam.
1 Actual 2014 expense ratios.
2 Effective May 1, 2014, Matthews has contractually agreed to waive fees and reimburse expenses until August 31, 2015 to the extent needed to limit Total Annual Fund Operating Expenses to 1.25% by waiving class specific and non-class specific expenses for the Institutional Class and agreed to reduce the expense ratio by waiving an equal amount of non-class specific expenses for the Investor Class. Because certain expenses of the Investor Class may be higher than the Institutional Class and class specific expenses may be waived solely for the Institutional Class, the Total Annual Fund Operating Expenses After Fee Waiver and Expense Reimbursement for the Investor Class may exceed 1.25%. If the expenses fall below the expense limitation in a year within three years after Matthews has made such a waiver or reimbursement, the Fund may reimburse Matthews up to an amount not to cause the expenses for that year to exceed the expense limitation. The fee waiver and expense reimbursement may be terminated at any time by the Board of Trustees or the Trust on behalf of the Fund on 60 days' written notice.
3 The lesser of fiscal year 2014 long-term purchase costs or sales proceeds divided by the average monthly market value of long-term securities.
Matthews Emerging Asia Fund
Portfolio Manager Commentary
For the year ending December 31, 2014, the Fund increased by 17.39% (Investor Class) and 17.68% (Institutional Class) while its benchmark, the MSCI Emerging Markets Asia Index returned 5.27%. For the fourth quarter of the year, the Fund advanced 0.06% (Investor Class) and 0.21% (Institutional Class) versus a fall of –0.23% for the benchmark.
Market Environment:
It was a mixed year for emerging markets in Asia. After a weak January, markets rose relatively steadily until peaking in early September, as indicated by the MSCI Emerging Markets Asia Index. At that point, the index reversed based on weak global economic data, especially from Japan, China and Europe. The ongoing conflict in the Ukraine also impacted market sentiment. The second half of the year saw oil prices weaken, declining most sharply in the last quarter. On the whole, lower oil prices are materially positive for markets in Emerging Asia, and especially for the frontier markets. However, frontier market sentiment cooled globally during the second half of the year as markets in Nigeria and the Middle East came under pressure. Despite this tough environment, the Matthews Emerging Asia Fund delivered solid performance in the second half of 2014.
The quarter was rather challenging for smaller markets in Emerging Asia, as investors digested the Russian ruble crisis, renewed concerns over slow global growth and the mixed impact of falling oil prices. Weak global growth generally does not bode well for emerging market exports or commodity prices. The sharp fall in oil prices weighed on emerging and frontier market sentiment due to the prominence of oil in many Middle Eastern and African economies. In Asia, the impact of lower prices is mixed but generally positive for the broader economies—and very positive for most of ASEAN and the frontier countries. Vietnam and Malaysia are two exceptions where lower oil revenues stand to impact fiscal budgets and government spending. Vietnam is offsetting some of this impact by increasing taxes at the pump.
Smaller markets in Asia are protected, to an extent, by rising foreign direct investment and a rising share of global exports. Looking back at the year as a whole there were many challenging factors but smaller markets weathered the storm rather well, delivering an overall positive return for the year.
Performance Contributors and Detractors:
The Fund delivered a positive return for the year, primarily driven by strong returns from Bangladesh, India, Vietnam and Sri Lanka. The Fund's lack of an allocation to South Korea, compared to a 24.25% weighting for the country in the benchmark, also contributed to the relative return over the MSCI Emerging Markets Asia Index. We must reiterate that we are absolutely benchmark agnostic and only focus on delivering investors exposure to Asia's true emerging and frontier markets. We do not believe Korea fits well into the category.
For the year, notable performance contributions came from portfolio heavyweights British American Tobacco Bangladesh, Vinh Hoan Corp. from Vietnam and Square Pharmaceuticals of Bangladesh, all of which demonstrated solid performance. Our successful application for shares in
38 MATTHEWS ASIA FUNDS
PERFORMANCE AS OF DECEMBER 31, 2014
| | | | | | Average Annual
Total Return | | | |
| | 3 Months | | 1 Year | | Since
Inception | | Inception
Date | |
Investor Class (MEASX) | | | 0.06 | % | | | 17.39 | % | | | 9.67 | % | | 4/30/13 | |
Institutional Class (MIASX) | | | 0.21 | % | | | 17.68 | % | | | 9.87 | % | | 4/30/13 | |
MSCI Emerging Markets Asia Index4 | | | -0.23 | % | | | 5.27 | % | | | 4.43 | % | | | | | |
Lipper Emerging Markets Funds Category Average5 | | | -5.32 | % | | | -3.23 | % | | | -2.85 | % | | | | | |
Performance assumes reinvestment of all dividends and/or distributions before taxes. All performance quoted represents past performance and is no guarantee of future results. Investment return and principal value will fluctuate with market conditions so that when redeemed, shares may be worth more or less than their original cost. Current performance may be lower or higher than the return figures quoted. Returns would have been lower if certain of the Fund's fees and expenses had not been waived. For the Fund's most recent month-end performance visit matthewsasia.com.
GROWTH OF A $10,000 INVESTMENT SINCE INCEPTION—INVESTOR CLASS
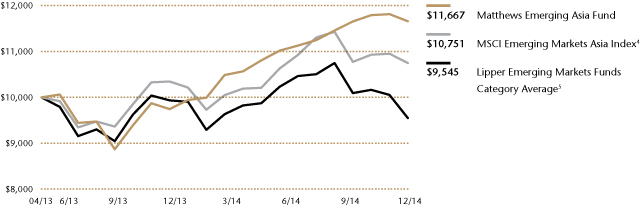
Plotted monthly. The performance data does not reflect the deduction of taxes that a shareholder would pay on dividends, capital gain distributions or redemption of Fund shares. Values are in US$.
4 It is not possible to invest directly in an index. Source: Index data from Morgan Stanley Capital International and Bloomberg; total return calculations performed by BNY Mellon Investment Servicing (US) Inc. Please see page 79 for index definition.
5 The Lipper Category Average does not reflect sales charges and is based on total return, including reinvestment of dividends and capital gains for the stated periods.
TOP TEN POSITIONS6
| | | Sector | | Country | | % of Net Assets | |
Square Pharmaceuticals, Ltd. | | Health Care | | Bangladesh | | | 2.7 | % | |
Sampath Bank PLC | | Financials | | Sri Lanka | | | 2.6 | % | |
Olympic Industries, Ltd. | | Consumer Staples | | Bangladesh | | | 2.5 | % | |
National Development Bank PLC | | Financials | | Sri Lanka | | | 2.4 | % | |
British American Tobacco Bangladesh Co., Ltd. | | Consumer Staples | | Bangladesh | | | 2.3 | % | |
Alibaba Group Holding, Ltd. | | Information Technology | | China/Hong Kong | | | 2.3 | % | |
PT Matahari Department Store | | Consumer Discretionary | | Indonesia | | | 2.2 | % | |
CIMC Enric Holdings, Ltd. | | Industrials | | China/Hong Kong | | | 2.1 | % | |
Future Bright Holdings, Ltd. | | Consumer Discretionary | | China/Hong Kong | | | 2.1 | % | |
PT Gudang Garam | | Consumer Staples | | Indonesia | | | 2.1 | % | |
| % OF ASSETS IN TOP 10 | | | | | | | 23.3 | % | |
6 Holdings may combine more than one security from same issuer and related depositary receipts.
matthewsasia.com | 800.789.ASIA 39
COUNTRY ALLOCATION (%)7
Bangladesh | | | 13.9 | | |
India | | | 13.7 | | |
China/Hong Kong | | | 13.5 | | |
Pakistan | | | 11.9 | | |
Vietnam | | | 9.1 | | |
Sri Lanka | | | 9.0 | | |
Indonesia | | | 8.2 | | |
Philippines | | | 7.2 | | |
Thailand | | | 1.9 | | |
Cambodia | | | 1.7 | | |
Taiwan | | | 1.7 | | |
Australia | | | 1.7 | | |
Singapore | | | 1.1 | | |
Malaysia | | | 0.6 | | |
Cash and Other Assets, Less Liabilities | | | 4.8 | | |
SECTOR ALLOCATION (%)
Consumer Staples | | | 24.2 | | |
Consumer Discretionary | | | 18.5 | | |
Financials | | | 16.9 | | |
Health Care | | | 10.8 | | |
Industrials | | | 8.6 | | |
Materials | | | 5.6 | | |
Information Technology | | | 4.7 | | |
Energy | | | 4.3 | | |
Telecommunication Services | | | 1.1 | | |
Utilities | | | 0.5 | | |
Cash and Other Assets, Less Liabilities | | | 4.8 | | |
MARKET CAP EXPOSURE (%)8
Large Cap (over $5B) | | | 15.6 | | |
Mid Cap ($1B–$5B) | | | 34.6 | | |
Small Cap (under $1B) | | | 45.0 | | |
Cash and Other Assets, Less Liabilities | | | 4.8 | | |
7 Not all countries where the Fund may invest are included in the benchmark index.
8 Source: FactSet Research Systems. Percentage values in data are rounded to the nearest tenth of one percent; the values may not sum to 100% due to rounding.
Matthews Emerging Asia Fund
Portfolio Manager Commentary (continued)
the Alibaba Group Holding initial public offering (IPO) also contributed positively, as the price appreciated materially after listing. We closed out the year reducing our position to lock in the healthy returns achieved in that stock.
The single largest area of negative performance, during the quarter, came from the Macau-related names and casino holdings, including restaurant operator Future Bright Holdings. The Chinese government's tougher stance on corruption, along with much tighter visa procedures, has negatively impacted Macau's gross gaming revenues; so investor sentiment has suffered surrounding this sector. Oil-related names, such as Pakistan Petroleum and SapuraKencana both performed poorly, in line with weak oil prices. U.S.-listed Chinese Internet and media company, Sina Corp. and electronics retailer, Electronic City Indonesia both declined materially. We continue to watch these names closely and still believe there is a fundament reason to own them. For instance, Electronic City's aggressive new store openings have resulted in rising costs which have affected profitability. But given the stock's now very low valuations, we expect new stores' rising sales volumes to positively impact profitability.
Notable Portfolio Changes:
Our on-the-ground research has continued to uncover new, interesting names that are suitable for the portfolio. In Pakistan, we added an additional pharmaceutical name and started a new position in Pak Suzuki Motor Company in order to gain exposure to the passenger car sector. We think demand for inexpensive automobiles could grow substantially over the next decade. The Fund also added a few consumer companies, including Hemas in Sri Lanka and United Commercial Bank in Bangladesh, among others. With this newest addition, Bangladesh now becomes our single largest country allocation, larger than that of India. As mentioned, we reduced the size of our Alibaba position, after its valuation rose sharply from its IPO price. We removed a small position in Islami Bank in order to redeploy the funds into United Commercial Bank, due to improved outlook, based on new management.
Outlook:
Over the very short term, markets seem focused on the economic issues in Europe, weak global demand and falling oil prices. It is always possible this negativity might result in market outflows and a period of weakness; although it is also possible this news has been discounted by investors already.
Over the long term we remain optimistic that Asia's smaller economies should continue to develop and grow, driven by a combination of foreign direct investment, growing remittances and domestic investment and consumption. As always, local politics remains as a potential risk, but the diversified nature of the portfolio should help mitigate the impact of any single-country event. We remain cautiously optimistic about the outlook for emerging and frontier markets in Asia. With real growth potential, they have a relatively low correlation to each other, or to developed markets and remain a fertile ground for stock picking.
40 MATTHEWS ASIA FUNDS
Matthews Emerging Asia Fund December 31, 2014
Schedule of Investmentsa
COMMON EQUITIES: 95.2%
| | | Shares | | Value | |
BANGLADESH: 13.9% | |
Square Pharmaceuticals, Ltd. | | | 1,059,636 | | | $ | 3,515,122 | | |
Olympic Industries, Ltd. | | | 1,117,860 | | | | 3,260,694 | | |
British American Tobacco Bangladesh Co., Ltd. | | | 89,850 | | | | 3,055,880 | | |
United Commercial Bank, Ltd. | | | 6,639,603 | | | | 2,483,939 | | |
Marico Bangladesh, Ltd. | | | 112,900 | | | | 1,627,325 | | |
GrameenPhone, Ltd. | | | 320,200 | | | | 1,492,331 | | |
Bata Shoe Co. Bangladesh, Ltd. | | | 75,700 | | | | 1,138,633 | | |
Berger Paints Bangladesh, Ltd. | | | 62,292 | | | | 1,135,422 | | |
Apex Footwear, Ltd. | | | 113,800 | | | | 645,664 | | |
Total Bangladesh | | | | | 18,355,010 | | |
INDIA: 13.7% | |
PC Jeweller, Ltd. | | | 626,499 | | | | 2,128,223 | | |
Supreme Industries, Ltd. | | | 223,468 | | | | 2,114,578 | | |
GRUH Finance, Ltd. | | | 464,286 | | | | 2,007,634 | | |
Info Edge India, Ltd. | | | 124,174 | | | | 1,668,051 | | |
Emami, Ltd. | | | 126,978 | | | | 1,582,723 | | |
VST Industries, Ltd. | | | 49,694 | | | | 1,497,256 | | |
Shriram City Union Finance, Ltd. | | | 41,454 | | | | 1,271,195 | | |
Lupin, Ltd. | | | 54,293 | | | | 1,226,667 | | |
Shriram Transport Finance Co., Ltd. | | | 63,223 | | | | 1,107,623 | | |
Shalimar Paints, Ltd.b | | | 406,890 | | | | 973,868 | | |
Praj Industries, Ltd. | | | 736,614 | | | | 702,954 | | |
Cipla India, Ltd. | | | 60,053 | | | | 594,056 | | |
Castrol India, Ltd. | | | 57,613 | | | | 457,099 | | |
Multi Commodity Exchange of India, Ltd. | | | 32,155 | | | | 428,296 | | |
Jubilant Foodworks, Ltd.b | | | 11,592 | | | | 251,747 | | |
Total India | | | | | 18,011,970 | | |
CHINA/HONG KONG: 13.5% | |
Alibaba Group Holding, Ltd. ADRb | | | 29,300 | | | | 3,045,442 | | |
CIMC Enric Holdings, Ltd. | | | 3,574,000 | | | | 2,820,009 | | |
Future Bright Holdings, Ltd. | | | 8,934,000 | | | | 2,791,294 | | |
Shenzhou International Group Holdings, Ltd. | | | 689,000 | | | | 2,270,592 | | |
Haitian International Holdings, Ltd. | | | 618,000 | | | | 1,295,262 | | |
Melco Crown Entertainment, Ltd. ADR | | | 49,500 | | | | 1,257,300 | | |
Tencent Holdings, Ltd. | | | 59,500 | | | | 860,901 | | |
Louis XIII Holdings, Ltd.b | | | 1,923,000 | | | | 836,003 | | |
Luk Fook Holdings International, Ltd. | | | 219,000 | | | | 821,278 | | |
Melco Crown Entertainment, Ltd. | | | 93,900 | | | | 795,290 | | |
Sina Corp.b | | | 15,800 | | | | 591,078 | | |
Sun Art Retail Group, Ltd. | | | 371,000 | | | | 367,901 | | |
Total China/Hong Kong | | | | | 17,752,350 | | |
PAKISTAN: 11.9% | |
Abbott Laboratories Pakistan, Ltd. | | | 347,100 | | | | 2,446,905 | | |
GlaxoSmithKline Pakistan, Ltd. | | | 1,021,540 | | | | 2,228,639 | | |
Pakistan Petroleum, Ltd. | | | 1,270,800 | | | | 2,226,012 | | |
ICI Pakistan, Ltd. | | | 452,600 | | | | 2,082,163 | | |
The Searle Pakistan, Ltd.b | | | 737,100 | | | | 1,773,293 | | |
PAK Suzuki Motor Co., Ltd. | | | 431,100 | | | | 1,591,543 | | |
National Foods, Ltd. | | | 347,250 | | | | 1,358,862 | | |
Engro Foods, Ltd.b | | | 1,237,100 | | | | 1,335,736 | | |
K-Electric, Ltd. | | | 7,226,500 | | | | 662,803 | | |
Total Pakistan | | | | | 15,705,956 | | |
| | | Shares | | Value | |
VIETNAM: 9.1% | |
Tien Phong Plastic JSC | | | 1,012,970 | | | $ | 2,538,175 | | |
Vinh Hoan Corp. | | | 1,367,620 | | | | 2,423,509 | | |
Mobile World Investment Corp.b | | | 263,850 | | | | 1,339,888 | | |
National Seed JSC | | | 334,315 | | | | 1,243,312 | | |
Masan Group Corp.b | | | 273,360 | | | | 1,063,007 | | |
Dinh Vu Port Investment &
Development JSC | | | 441,460 | | | | 953,615 | | |
Saigon Securities, Inc. | | | 621,840 | | | | 795,041 | | |
DHG Pharmaceutical JSC | | | 146,320 | | | | 656,772 | | |
Phu Nhuan Jewelry JSC | | | 320,440 | | | | 597,805 | | |
Phuoc Hoa Rubber JSC | | | 304,000 | | | | 380,933 | | |
Total Vietnam | | | | | 11,992,057 | | |
SRI LANKA: 9.0% | |
Sampath Bank PLC | | | 1,938,144 | | | | 3,485,467 | | |
National Development Bank PLC | | | 1,632,190 | | | | 3,110,118 | | |
Aitken Spence Hotel Holdings PLC | | | 1,973,457 | | | | 1,180,765 | | |
John Keells Holdings PLC | | | 556,003 | | | | 1,059,457 | | |
Chevron Lubricants Lanka PLC | | | 260,863 | | | | 794,519 | | |
Ceylon Tobacco Co. PLC | | | 85,424 | | | | 690,228 | | |
Cargills Ceylon PLC | | | 400,705 | | | | 467,286 | | |
Lanka Orix Leasing Co. PLCb | | | 573,466 | | | | 384,642 | | |
Ceylinco Insurance Co. PLC | | | 35,056 | | | | 368,409 | | |
Hemas Holdings PLC | | | 476,145 | | | | 269,646 | | |
Total Sri Lanka | | | | | 11,810,537 | | |
INDONESIA: 8.2% | |
PT Matahari Department Store | | | 2,378,700 | | | | 2,866,241 | | |
PT Gudang Garam | | | 552,000 | | | | 2,704,203 | | |
PT Bank Mandiri Persero | | | 3,015,900 | | | | 2,622,742 | | |
PT Indofood CBP Sukses Makmur | | | 1,301,700 | | | | 1,372,738 | | |
PT Mayora Indah | | | 480,600 | | | | 810,863 | | |
PT Electronic City Indonesia | | | 4,989,600 | | | | 434,675 | | |
Total Indonesia | | | | | 10,811,462 | | |
PHILIPPINES: 7.2% | |
Puregold Price Club, Inc. | | | 3,024,000 | | | | 2,590,401 | | |
Vista Land & Lifescapes, Inc. | | | 15,064,700 | | | | 2,421,305 | | |
Universal Robina Corp. | | | 311,110 | | | | 1,356,404 | | |
RFM Corp. | | | 11,430,400 | | | | 1,279,290 | | |
GT Capital Holdings, Inc. | | | 40,630 | | | | 930,638 | | |
Emperador, Inc. | | | 3,767,600 | | | | 867,419 | | |
Total Philippines | | | | | 9,445,457 | | |
THAILAND: 1.9% | |
Major Cineplex Group Public Co., Ltd. | | | 981,500 | | | | 823,360 | | |
Beauty Community Public Co., Ltd. | | | 714,200 | | | | 728,553 | | |
The Siam Cement Public Co., Ltd. | | | 43,400 | | | | 589,094 | | |
SNC Former Public Co., Ltd. | | | 809,700 | | | | 343,868 | | |
Total Thailand | | | | | 2,484,875 | | |
matthewsasia.com | 800.789.ASIA 41
Matthews Emerging Asia Fund December 31, 2014
Schedule of Investmentsa (continued)
COMMON EQUITIES: (continued)
| | | Shares | | Value | |
CAMBODIA: 1.7% | |
NagaCorp, Ltd. | | | 2,828,000 | | | $ | 2,304,554 | | |
Total Cambodia | | | | | 2,304,554 | | |
TAIWAN: 1.7% | |
Ginko International Co., Ltd. | | | 96,000 | | | | 1,013,069 | | |
ScinoPharm Taiwan, Ltd. | | | 420,616 | | | | 742,338 | | |
King Slide Works Co., Ltd. | | | 38,000 | | | | 484,014 | | |
Total Taiwan | | | | | 2,239,421 | | |
AUSTRALIA: 1.7% | |
Oil Search, Ltd. | | | 349,221 | | | | 2,239,411 | | |
Total Australia | | | | | 2,239,411 | | |
SINGAPORE: 1.1% | |
Yoma Strategic Holdings, Ltd.b | | | 1,700,000 | | | | 844,206 | | |
Petra Foods, Ltd. | | | 218,000 | | | | 624,775 | | |
Total Singapore | | | | | 1,468,981 | | |
MALAYSIA: 0.6% | |
SapuraKencana Petroleum BHD | | | 617,900 | | | | 408,797 | | |
Oldtown BHD | | | 885,625 | | | | 378,117 | | |
Total Malaysia | | | | | 786,914 | | |
TOTAL COMMON EQUITIES | | | | | 125,408,955 | | |
(Cost $114,996,426) | | | | | |
WARRANTS: 0.0%
SRI LANKA: 0.0% | |
John Keells Holdings PLC, expires 11/11/16 | | | 24,712 | | | | 13,656 | | |
John Keells Holdings PLC, expires 11/12/15 | | | 24,712 | | | | 12,808 | | |
Total Sri Lanka | | | | | 26,464 | | |
TOTAL WARRANTS | | | | | 26,464 | | |
(Cost $0) | | | | | |
TOTAL INVESTMENTS: 95.2% | | | | | 125,435,419 | | |
(Cost $114,996,426c) | | | | | |
CASH AND OTHER ASSETS,
LESS LIABILITIES: 4.8% | | | | | 6,277,284 | | |
NET ASSETS: 100.0% | | | | $ | 131,712,703 | | |
a Certain securities were fair valued under the valuation polices approved by the Board of Trustees (Note 2-A).
b Non-income producing security.
c Cost for federal income tax purposes is $115,208,457 and net unrealized appreciation consists of:
Gross unrealized appreciation | | $ | 17,407,853 | | |
Gross unrealized depreciation | | | (7,180,891 | ) | |
Net unrealized appreciation | | $ | 10,226,962 | | |
ADR American Depositary Receipt
BHD Berhad
JSC Joint Stock Co.
See accompanying notes to financial statements.
42 MATTHEWS ASIA FUNDS

PORTFOLIO MANAGERS
Richard H. Gao
Lead Manager
Henry Zhang, CFA | | Winnie Chwang | |
Co-Manager | | Co-Manager | |
FUND FACTS
| | | Investor Class | | Institutional Class | |
Ticker | | MCHFX | | MICFX | |
CUSIP | | 577130701 | | 577130818 | |
Inception | | 2/19/98 | | 10/29/10 | |
NAV | | $21.46 | | $21.44 | |
Initial Investment | | $2,500 | | $3 million | |
Gross Expense Ratio1 | | 1.11% | | 0.95% | |
Portfolio Statistics
Total # of Positions | | 57 | |
Net Assets | | $1.0 billion | |
Weighted Average Market Cap | | $38.2 billion | |
Portfolio Turnover | | 10.23%2 | |
Benchmark
MSCI China Index
Redemption Fee
2% within first 90 calendar days of purchase
OBJECTIVE
Long-term capital appreciation.
STRATEGY
Under normal market conditions, the Fund seeks to achieve its investment objective by investing at least 80% of its total net assets, which include borrowings for investment purposes, in the common and preferred stocks of companies located in China. China includes its administrative and other districts, such as Hong Kong.
1 Actual 2014 expense ratios.
2 The lesser of fiscal year 2014 long-term purchase costs or sales proceeds divided by the average monthly market value of long-term securities.
Matthews China Fund
Portfolio Manager Commentary
For the year ending December 31, 2014, the Matthews China Fund fell –4.42% (Investor Class) and –4.22% (Institutional Class) while its benchmark, the MSCI China Index, returned 8.26%. For the fourth quarter of the year, the Fund returned 2.11% (Investor Class) and 2.18% (Institutional Class) versus 7.17% for the Index.
Market Environment:
The year 2014 was a challenging one for the Chinese economy. The country has continued efforts to rebalance its economy, shifting toward further development of its domestic consumption and services, and away from a reliance on more traditional exports, infrastructure and fixed asset investments. Meanwhile, top line growth rates have slowed amid this transition.
During the fourth quarter, China's central bank surprised financial markets by lowering the one-year renminbi benchmark interest rates for the first time in over two years, cutting its one-year lending rate by 0.4% to 5.6%. China has already taken more measured steps to stimulate its slowing economy, supporting select areas, such as small and rural businesses as well as government property projects for low income housing. However, these measures have not been sufficient. Economic indicators, from investment growth to factory production to retail sales, continued to be weak, indicating that China would likely miss its annual growth rate target of 7.5%. The latest interest rate cut boosted expectations that China would begin a new monetary easing cycle with more cuts in its interest rates and reserve ratio going forward.
Performance Contributors and Detractors:
For both the fourth quarter and the full year, the financial sector performed very well, and Fund performance was helped by our portfolio holdings in Chinese banks, insurance and property companies. However, compared with the benchmark's nearly 42% weighting in the financial sector, the Fund had a significantly lower weighting of about 20%, which was a primary reason for its relative underperformance. While we believe China's overall banking system does not generally pose major systemic risks, we do have concerns over the potential deterioration of the asset quality of the banks.
Detractors to performance over the fourth quarter included oil and gas-related holdings such as China Oilfield Services and Kunlun Energy. Significant oil price declines during the quarter negatively impacted these companies.
During the one-year period, the consumer discretionary and consumer staples sectors were underperformers as China has yet to see any meaningful improvement to overall weak consumer sentiment. For example, budget-focused hotel operator Homeinns Hotel Group underperformed on concerns of a supply glut and weaker pricing power. Sands China, the largest mass market gaming operator in Macau, also underperformed given more government scrutiny on gambling activity in Macau. Overall, we have been consolidating our holdings over the year, and continue to retain what we believe are best-in-class companies.
matthewsasia.com | 800.789.ASIA 43
PERFORMANCE AS OF DECEMBER 31, 2014
| | | | | | Average Annual Total Returns | | | |
| | 3 Months | | 1 Year | | 3 Years | | 5 Years | | 10 Years | | Since
Inception | | Inception
Date | |
Investor Class (MCHFX) | | | 2.11 | % | | | -4.42 | % | | | 4.56 | % | | | 1.42 | % | | | 11.34 | % | | | 9.80 | % | | 2/19/98 | |
Institutional Class (MICFX) | | | 2.18 | % | | | -4.22 | % | | | 4.76 | % | | | n.a. | | | | n.a. | | | | -2.02 | % | | 10/29/10 | |
MSCI China Index3 | | | 7.17 | % | | | 8.26 | % | | | 11.48 | % | | | 3.50 | % | | | 13.21 | % | | | 3.95 | %4 | | | | | |
Lipper China Region Funds Category Average5 | | | 4.88 | % | | | 3.43 | % | | | 10.84 | % | | | 3.71 | % | | | 9.19 | % | | | 7.50 | %4 | | | | | |
Performance assumes reinvestment of all dividends and/or distributions before taxes. All performance quoted represents past performance and is no guarantee of future results. Investment return and principal value will fluctuate with market conditions so that when redeemed, shares may be worth more or less than their original cost. Current performance may be lower or higher than the return figures quoted. For the Fund's most recent month-end performance, visit matthewsasia.com.
GROWTH OF A $10,000 INVESTMENT SINCE INCEPTION—INVESTOR CLASS
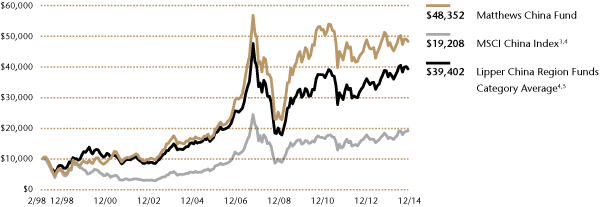
Plotted monthly. The performance data and graph do not reflect the deduction of taxes that a shareholder would pay on dividends, capital gains distributions or redemption of Fund shares. Values are in US$.
3 It is not possible to invest directly in an index. Source: Index data from Morgan Stanley Capital International and Bloomberg; total return calculations performed by BNY Mellon Investment Servicing (US) Inc. Please see page 79 for index definition.
4 Calculated from 2/28/98.
5 The Lipper Category Average does not reflect sales charges and is based on total return, including reinvestment of dividends and capital gains for the stated periods.
TOP TEN POSITIONS6
| | | Sector | | % of Net Assets | |
Tencent Holdings, Ltd. | | Information Technology | | | 4.0 | % | |
CSR Corp., Ltd. | | Industrials | | | 3.5 | % | |
China Mobile, Ltd. | | Telecom Services | | | 3.3 | % | |
Ping An Insurance Group Co. of China, Ltd. | | Financials | | | 3.1 | % | |
China Vanke Co., Ltd. | | Financials | | | 3.0 | % | |
Sinopharm Group Co., Ltd. | | Health Care | | | 2.7 | % | |
China Merchants Bank Co., Ltd. | | Financials | | | 2.7 | % | |
China Resources Land, Ltd. | | Financials | | | 2.6 | % | |
Café de Coral Holdings, Ltd. | | Consumer Discretionary | | | 2.5 | % | |
Yuexiu Transport Infrastructure, Ltd. | | Industrials | | | 2.4 | % | |
| % OF ASSETS IN TOP 10 | | | | | 29.8 | % | |
6 Holdings may combine more than one security from same issuer and related depositary receipts.
44 MATTHEWS ASIA FUNDS
Matthews China Fund
Portfolio Manager Commentary (continued)
Notable Portfolio Changes:
During the fourth quarter, we continued to build positions in China's A-share market. We added two more new names to this space, Jiangsu Hengrui Medicine and Kweichow Moutai. While Jiangsu Hengrui is the market leader in Chinese pharmaceuticals, Moutai—China's most well-recognized premier brand of white liquor—saw challenges.
Jiangsu Hengrui possesses strong R&D capabilities and operates in the country's attractive and rapidly growing oncology drug space. For Moutai, sales volumes recently contracted due to the government's anti-extravagance campaign. However, its strong brand positioning has enabled it to maintain its overall profitability. We expect that sale volumes have now troughed, and look forward to any opportunities for recovery.
In the fourth quarter, we exited China Life Insurance, which has been highly correlated with the A-share market due to its investment exposure in the market. However, its core business in the life insurance sector has lagged behind that of another of our portfolio holdings, Ping An Insurance. Given our new capability to invest directly in the A-share market as qualified institutional investors, we exited the position in order to focus on the life insurance industry's stronger players.
Outlook:
While Chinese equities rallied strongly toward the end of the year amid expectations of further monetary easing, we continue to seek more concrete evidence of an earnings recovery across sectors that will support a more sustained rally. China seems determined to continue its process of economic rebalancing, and while this may translate into slower top line growth, the quality of growth should be more solid and sustainable. We are encouraged by some initial achievements in this structural transition and continue to focus on finding good long-term investment opportunities that will benefit from this shift.
SECTOR ALLOCATION (%)
Information Technology | | | 19.7 | | |
Financials | | | 19.6 | | |
Consumer Discretionary | | | 13.5 | | |
Industrials | | | 13.4 | | |
Consumer Staples | | | 9.6 | | |
Health Care | | | 8.9 | | |
Utilities | | | 5.9 | | |
Telecommunication Services | | | 4.3 | | |
Energy | | | 3.8 | | |
Cash and Other Assets, Less Liabilities | | | 1.3 | | |
MARKET CAP EXPOSURE (%)7
Large Cap (over $5B) | | | 76.2 | | |
Mid Cap ($1B–$5B) | | | 20.1 | | |
Small Cap (under $1B) | | | 2.4 | | |
Cash and Other Assets, Less Liabilities | | | 1.3 | | |
7 Source: FactSet Research Systems. Percentage values in data are rounded to the nearest tenth of one percent; the values may not sum to 100% due to rounding.
matthewsasia.com | 800.789.ASIA 45
Matthews China Fund December 31, 2014
Consolidated Schedule of Investmentsa
COMMON EQUITIES: 98.7%
| | | Shares | | Value | |
INFORMATION TECHNOLOGY: 19.7% | |
Internet Software & Services: 11.2% | |
Tencent Holdings, Ltd. | | | 2,754,000 | | | $ | 39,847,435 | | |
Baidu, Inc. ADRb | | | 106,100 | | | | 24,187,617 | | |
NetEase, Inc. ADR | | | 222,600 | | | | 22,068,564 | | |
Alibaba Group Holding, Ltd. ADRb | | | 132,800 | | | | 13,803,232 | | |
Sina Corp.b | | | 337,400 | | | | 12,622,134 | | |
| | | | | | 112,528,982 | | |
Electronic Equipment, Instruments & Components: 3.1% | |
Hangzhou Hikvision Digital
Technology Co., Ltd. Class Ac | | | 4,604,359 | | | | 16,558,390 | | |
Hollysys Automation Technologies, Ltd.b | | | 590,900 | | | | 14,435,687 | | |
| | | | | | 30,994,077 | | |
Communications Equipment: 2.0% | |
ZTE Corp. H Shares | | | 9,116,704 | | | | 19,725,654 | | |
Technology Hardware, Storage & Peripherals: 1.8% | |
Lenovo Group, Ltd. | | | 13,416,000 | | | | 17,516,110 | | |
Software: 1.6% | |
Kingdee International Software
Group Co., Ltd.b | | | 55,298,800 | | | | 16,315,829 | | |
Total Information Technology | | | | | 197,080,652 | | |
FINANCIALS: 19.6% | |
Real Estate Management & Development: 8.4% | |
China Vanke Co., Ltd. H Shares | | | 13,607,368 | | | | 30,185,858 | | |
China Resources Land, Ltd. | | | 9,972,000 | | | | 26,206,596 | | |
Hang Lung Group, Ltd. | | | 3,357,000 | | | | 15,222,666 | | |
Swire Pacific, Ltd. A Shares Class | | | 940,500 | | | | 12,208,141 | | |
| | | | | | 83,823,261 | | |
Banks: 6.5% | |
China Merchants Bank Co., Ltd.
H Shares | | | 10,732,143 | | | | 26,789,078 | | |
China Construction Bank Corp.
H Shares | | | 25,203,660 | | | | 20,585,914 | | |
BOC Hong Kong Holdings, Ltd. | | | 5,366,500 | | | | 17,881,933 | | |
| | | | | | 65,256,925 | | |
Insurance: 3.1% | |
Ping An Insurance Group Co. of
China, Ltd. H Shares | | | 3,086,000 | | | | 31,247,428 | | |
Diversified Financial Services: 1.6% | |
Hong Kong Exchanges and Clearing, Ltd. | | | 725,400 | | | | 16,014,462 | | |
Total Financials | | | | | 196,342,076 | | |
CONSUMER DISCRETIONARY: 13.5% | |
Hotels, Restaurants & Leisure: 7.1% | |
Café de Coral Holdings, Ltd. | | | 7,278,100 | | | | 25,180,924 | | |
Homeinns Hotel Group ADRb | | | 707,285 | | | | 21,232,696 | | |
Sands China, Ltd. | | | 3,876,800 | | | | 18,872,826 | | |
Shangri-La Asia, Ltd. | | | 3,989,400 | | | | 5,466,605 | | |
| | | | | | 70,753,051 | | |
| | | Shares | | Value | |
Textiles, Apparel & Luxury Goods: 1.5% | |
Belle International Holdings, Ltd. | | | 13,217,000 | | | $ | 14,845,987 | | |
Media: 1.3% | |
Television Broadcasts, Ltd. | | | 2,249,900 | | | | 13,074,418 | | |
Automobiles: 1.2% | |
Dongfeng Motor Group Co., Ltd.
H Shares | | | 8,906,000 | | | | 12,457,917 | | |
Diversified Consumer Services: 1.1% | |
New Oriental Education & Technology
Group, Inc. ADRb | | | 539,700 | | | | 11,015,277 | | |
Multiline Retail: 0.9% | |
Golden Eagle Retail Group, Ltd. | | | 8,461,000 | | | | 9,486,948 | | |
Internet & Catalog Retail: 0.4% | |
Jumei International Holding, Ltd. ADRb | | | 270,200 | | | | 3,680,124 | | |
Total Consumer Discretionary | | | | | 135,313,722 | | |
INDUSTRIALS: 13.4% | |
Machinery: 4.8% | |
CSR Corp., Ltd. H Shares | | | 25,752,000 | | | | 34,669,634 | | |
Airtac International Group | | | 1,494,000 | | | | 13,407,442 | | |
| | | | | | 48,077,076 | | |
Transportation Infrastructure: 4.2% | |
Yuexiu Transport Infrastructure, Ltd. | | | 40,233,000 | | | | 24,462,846 | | |
China Merchants Holdings
International Co., Ltd. | | | 5,252,581 | | | | 17,642,874 | | |
| | | | | | 42,105,720 | | |
Airlines: 1.7% | |
Air China, Ltd. H Shares | | | 21,121,900 | | | | 17,042,163 | | |
Industrial Conglomerates: 1.4% | |
NWS Holdings, Ltd. | | | 7,806,914 | | | | 14,319,748 | | |
Construction & Engineering: 1.3% | |
China State Construction International
Holdings, Ltd. | | | 8,966,000 | | | | 12,539,230 | | |
Total Industrials | | | | | 134,083,937 | | |
CONSUMER STAPLES: 9.6% | |
Food Products: 3.9% | |
China Mengniu Dairy Co., Ltd. | | | 4,958,000 | | | | 20,415,204 | | |
Tingyi (Cayman Islands) Holding Corp. | | | 8,057,000 | | | | 18,309,824 | | |
| | | | | | 38,725,028 | | |
Beverages: 3.0% | |
Kweichow Moutai Co., Ltd. Class Ac | | | 599,028 | | | | 18,346,792 | | |
Tsingtao Brewery Co., Ltd. H Shares | | | 1,763,000 | | | | 11,891,516 | | |
| | | | | | 30,238,308 | | |
Personal Products: 1.7% | |
Hengan International Group Co., Ltd. | | | 1,610,500 | | | | 16,791,412 | | |
Food & Staples Retailing: 1.0% | |
Sun Art Retail Group, Ltd. | | | 9,820,500 | | | | 9,738,481 | | |
Total Consumer Staples | | | | | 95,493,229 | | |
46 MATTHEWS ASIA FUNDS
Matthews China Fund December 31, 2014
Consolidated Schedule of Investmentsa (continued)
COMMON EQUITIES: (continued)
| | | Shares | | Value | |
HEALTH CARE: 8.9% | |
Pharmaceuticals: 3.6% | |
Sino Biopharmaceutical, Ltd. | | | 21,100,000 | | | $ | 19,013,332 | | |
Jiangsu Hengrui Medicine Co., Ltd.
Class Ac | | | 2,811,630 | | | | 16,973,310 | | |
| | | | | | 35,986,642 | | |
Health Care Providers & Services: 2.7% | |
Sinopharm Group Co., Ltd. H Shares | | | 7,670,000 | | | | 26,989,581 | | |
Health Care Equipment & Supplies: 2.6% | |
Mindray Medical International, Ltd. ADR | | | 667,668 | | | | 17,626,435 | | |
Ginko International Co., Ltd. | | | 748,000 | | | | 7,893,496 | | |
| | | | | | 25,519,931 | | |
Total Health Care | | | | | 88,496,154 | | |
UTILITIES: 5.9% | |
Independent Power and Renewable Electricity Producers: 2.3% | |
China Longyuan Power Group Corp.
H Shares | | | 22,495,000 | | | | 23,196,852 | | |
CGN Power Co., Ltd. H Sharesb | | | 475,000 | | | | 206,425 | | |
| | | | | | 23,403,277 | | |
Electric Utilities: 2.3% | |
Cheung Kong Infrastructure
Holdings, Ltd. | | | 3,111,500 | | | | 22,881,249 | | |
Gas Utilities: 1.3% | |
Hong Kong & China Gas Co., Ltd. | | | 5,614,643 | | | | 12,792,085 | | |
Total Utilities | | | | | 59,076,611 | | |
TELECOMMUNICATION SERVICES: 4.3% | |
Wireless Telecommunication Services: 3.3% | |
China Mobile, Ltd. ADR | | | 302,700 | | | | 17,804,814 | | |
China Mobile, Ltd. | | | 1,265,583 | | | | 14,823,453 | | |
| | | | | | 32,628,267 | | |
Diversified Telecommunication Services: 1.0% | |
China Communications Services Corp., Ltd.
H Shares | | | 21,808,800 | | | | 10,197,735 | | |
Total Telecommunication Services | | | | | 42,826,002 | | |
| | | Shares | | Value | |
ENERGY: 3.8% | |
Oil, Gas & Consumable Fuels: 2.6% | |
CNOOC, Ltd. | | | 9,921,000 | | | $ | 13,414,871 | | |
Kunlun Energy Co., Ltd. | | | 13,118,000 | | | | 12,380,030 | | |
| | | | | | 25,794,901 | | |
Energy Equipment & Services: 1.2% | |
China Oilfield Services, Ltd. H Shares | | | 7,294,000 | | | | 12,594,246 | | |
Total Energy | | | | | 38,389,147 | | |
TOTAL INVESTMENTS: 98.7% | | | | | 987,101,530 | | |
(Cost $805,757,349d) | |
CASH AND OTHER ASSETS,
LESS LIABILITIES: 1.3% | | | | | 13,117,015 | | |
NET ASSETS: 100.0% | | | | $ | 1,000,218,545 | | |
a Certain securities were fair valued under the valuation polices approved by the Board of Trustees (Note 2-A).
b Non-income producing security.
c Security held by Matthews CF-U Series.
d Cost for federal income tax purposes is $806,416,205 and net unrealized appreciation consists of:
Gross unrealized appreciation | | $ | 239,926,258 | | |
Gross unrealized depreciation | | | (59,240,933 | ) | |
Net unrealized appreciation | | $ | 180,685,325 | | |
ADR American Depositary Receipt
See accompanying notes to financial statements.
matthewsasia.com | 800.789.ASIA 47

PORTFOLIO MANAGERS
Sunil Asnani
Lead Manager
Sharat Shroff, CFA
Co-Manager
FUND FACTS
| | | Investor Class | | Institutional Class | |
Ticker | | MINDX | | MIDNX | |
CUSIP | | 577130859 | | 577130768 | |
Inception | | 10/31/05 | | 10/29/10 | |
NAV | | $26.46 | | $26.49 | |
Initial Investment | | $2,500 | | $3 million | |
Gross Expense Ratio1 | | 1.12% | | 0.94% | |
Portfolio Statistics
Total # of Positions | | 46 | |
Net Assets | | $1.1 billion | |
Weighted Average Market Cap | | $8.8 billion | |
Portfolio Turnover | | 14.86%2 | |
Benchmark
S&P Bombay Stock Exchange 100 Index
Redemption Fee
2% within first 90 calendar days of purchase
OBJECTIVE
Long-term capital appreciation.
STRATEGY
Under normal market conditions, the Fund seeks to achieve its investment objective by investing at least 80% of its total net assets, which include borrowings for investment purposes, in publicly traded common stocks, preferred stocks and convertible securities of companies located in India.
1 Actual 2014 expense ratios.
2 The lesser of fiscal year 2014 long-term purchase costs or sales proceeds divided by the average monthly market value of long-term securities.
Matthews India Fund
Portfolio Manager Commentary
For the year ending December 31, 2014, the Matthews India Fund returned 63.71% (Investor Class) and 63.80% (Institutional Class) while its benchmark, the S&P Bombay Stock Exchange 100 Index, returned 31.40%. For the fourth quarter of the year, the Fund returned 8.03% (Investor Class) and 8.07% (Institutional Class) versus 2.37% for the Index.
Market Environment:
The majority of the market gains, during 2014, came during the run-up to the national elections held in first half of the year. First, in anticipation, and then through the formation, of a strong central government that is both business- and governance-friendly, market gains were very strong. During the second half of the year, however, markets were comparatively flat. Perhaps investors transitioned into a "wait-and-see" mode over how the new government would execute on highly anticipated economic reforms. So far, the government has succeeded in making incremental reforms such as improving bureaucratic efficiency and accountability, and it has been able to clear many previously stalled projects that were in need of government approval. But more structural, legislative reforms, such as those that pertain to land, labor and taxation may be more difficult to achieve over the short term. The ruling party lacks a majority in the Upper House of Parliament and in various state legislatures, making consensus over complex reforms more challenging.
Performance Contributors and Detractors:
The portfolio's relative outperformance during both the year and the fourth quarter was primarily due to the strategy's sizeable allocation to small- and mid-capitalization holdings, as well as due to the Fund's limited exposure to reform-dependent sectors. Small- and mid-cap stocks have generally traded at a discount to large-caps, in part due to a differential in fundamentals; but in recent years, this gap had widened beyond what is normal. Over the past year, we have witnessed a correction of this anomaly. The Fund has had a significant allocation to small- and mid-cap companies; and historically, we have found many good companies available in this universe at fair valuations.
The Fund has also had limited exposure to sectors such as utilities, metals and energy. These sectors have seen reduced capital expenditures, been hurt by falling commodity prices, and tend to be policy-dependent. We tend to prefer companies with management that has more control over the companies' destinies and can better navigate headwinds in the macro environment. Such companies do tend to benefit from growth sparked by reforms. But these companies are not necessarily uprooted if reforms do not take place.
Notable Portfolio Changes:
During the year, we added to a number of stocks across a variety of sectors, such as health care, industrial, financials, consumer and technology. One notable addition was IndusInd Bank, a private sector bank that—after experiencing a management change a few years ago has improved profitability while maintaining asset quality—all while enduring a tough credit and interest rate environment.
48 MATTHEWS ASIA FUNDS
PERFORMANCE AS OF DECEMBER 31, 2014
| | | | | Average Annual Total Returns | | | |
| | | 3 Months | | 1 Year | | 3 Years | | 5 Years | | Since
Inception | | Inception
Date | |
Investor Class (MINDX) | | | 8.03 | % | | | 63.71 | % | | | 26.54 | % | | | 11.27 | % | | | 13.59 | % | | 10/31/05 | |
Institutional Class (MIDNX) | | | 8.07 | % | | | 63.80 | % | | | 26.73 | % | | | n.a. | | | | 5.89 | % | | 10/29/10 | |
S&P Bombay Stock Exchange 100 Index3 | | | 2.37 | % | | | 31.40 | % | | | 17.06 | % | | | 4.38 | % | | | 11.90 | %4 | | | | | |
Lipper India Region Funds Category Average5 | | | 4.59 | % | | | 40.31 | % | | | 18.60 | % | | | 4.46 | % | | | 9.55 | %4 | | | | | |
Performance assumes reinvestment of all dividends and/or distributions before taxes. All performance quoted represents past performance and is no guarantee of future results. Investment return and principal value will fluctuate with market conditions so that when redeemed, shares may be worth more or less than their original cost. Current performance may be lower or higher than the return figures quoted. For the Fund's most recent month-end performance, visit matthewsasia.com.
GROWTH OF A $10,000 INVESTMENT SINCE INCEPTION—INVESTOR CLASS
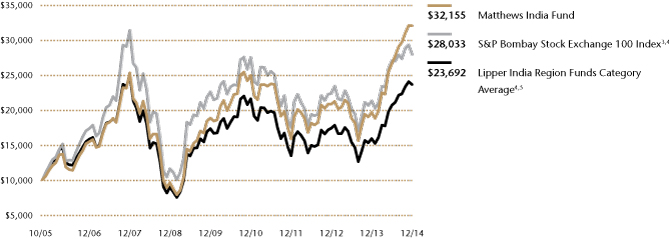
Plotted monthly. The performance data and graph do not reflect the deduction of taxes that a shareholder would pay on dividends, capital gains distributions or redemption of Fund shares. Values are in US$.
3 It is not possible to invest directly in an index. Source: Index data from Morgan Stanley Capital International and Bloomberg; total return calculations performed by BNY Mellon Investment Servicing (US) Inc. Please see page 79 for index definition.
4 Calculated from 10/31/05.
5 The Lipper Category Average does not reflect sales charges and is based on total return, including reinvestment of dividends and capital gains for the stated periods.
TOP TEN POSITIONS6
| | | Sector | | % of Net Assets | |
Shriram City Union Finance, Ltd. | | Financials | | | 5.0 | % | |
ITC, Ltd. | | Consumer Staples | | | 4.6 | % | |
Emami, Ltd. | | Consumer Staples | | | 4.3 | % | |
Kotak Mahindra Bank, Ltd. | | Financials | | | 4.2 | % | |
Mindtree, Ltd. | | Information Technology | | | 3.9 | % | |
Cognizant Technology Solutions Corp. | | Information Technology | | | 3.7 | % | |
Ajanta Pharma, Ltd. | | Health Care | | | 3.6 | % | |
AIA Engineering, Ltd. | | Industrials | | | 3.6 | % | |
IndusInd Bank, Ltd. | | Financials | | | 3.4 | % | |
Symphony, Ltd. | | Consumer Discretionary | | | 3.2 | % | |
| % OF ASSETS IN TOP 10 | | | | | 39.5 | % | |
6 Holdings may combine more than one security from same issuer and related depositary receipts.
matthewsasia.com | 800.789.ASIA 49
SECTOR ALLOCATION (%)
Financials | | | 25.5 | | |
Consumer Staples | | | 19.7 | | |
Industrials | | | 14.9 | | |
Information Technology | | | 12.8 | | |
Consumer Discretionary | | | 9.9 | | |
Materials | | | 8.7 | | |
Health Care | | | 7.2 | | |
Cash and Other Assets, Less Liabilities | | | 1.3 | | |
MARKET CAP EXPOSURE (%)7
Large Cap (over $5B) | | | 34.1 | | |
Mid Cap ($1B–$5B) | | | 50.4 | | |
Small Cap (under $1B) | | | 14.2 | | |
Cash and Other Assets, Less Liabilities | | | 1.3 | | |
7 Source: FactSet Research Systems. Percentage values in data are rounded to the nearest tenth of one percent; the values may not sum to 100% due to rounding.
Matthews India Fund
Portfolio Manager Commentary (continued)
One of the cornerstones of our investment process is to keep a keen eye on corporate governance. During the year, we exited a few positions in companies in which we had been losing conviction, in this regard. One company, for instance, still had fundamentals in line with peers but its management compensation was increasing to levels that were higher than average.
Outlook:
Looking ahead, we feel that the market may be placing too much emphasis on the extent and speed of reforms. We are watching a number of other factors for the market over the short term: First, investors may face disappointment if reforms are not implemented within the timeframe that the market has anticipated. The current government may need more time before achieving a majority in the Upper House, and in the meantime, a number of reforms may be left on hold. For now, the ruling party has resorted to promulgating ordinances for certain bills, which passed some measures into law. But these changes may only be temporary, as they will need approval in the next parliamentary session. The incremental benefits of an efficient and accountable bureaucracy could have some impact on accelerating growth. Second, falling commodity prices have led to moderating inflation during the year, but real rates remain relatively high. Conversely, if this situation continues, there is a possibility that the Reserve Bank of India could further ease its stance on monetary policy. Third, short-term global factors may be mixed for India. Falling oil prices, for instance, would be largely positive considering that India imports the majority of its oil. Conversely, if the U.S. Federal Reserve intends to tighten interest rates, we expect a neutral to negative impact on India's equity markets.
But over the long term, company fundamentals should prevail, which is why we continue to focus on bottom-up fundamentals, and why we remain benchmark-agnostic, long-term investors in India.
50 MATTHEWS ASIA FUNDS
Matthews India Fund December 31, 2014
Schedule of Investmentsa
COMMON EQUITIES: 98.7%
| | | Shares | | Value | |
FINANCIALS: 25.5% | |
Banks: 10.3% | |
Kotak Mahindra Bank, Ltd. | | | 2,295,000 | | | $ | 45,703,857 | | |
IndusInd Bank, Ltd. | | | 2,928,000 | | | | 37,081,983 | | |
HDFC Bank, Ltd. | | | 1,840,165 | | | | 27,636,894 | | |
HDFC Bank, Ltd. ADR | | | 30,922 | | | | 1,569,292 | | |
| | | | | 111,992,026 | | |
Consumer Finance: 5.8% | |
Shriram City Union Finance, Ltd. | | | 1,750,081 | | | | 53,666,586 | | |
Sundaram Finance, Ltd. | | | 461,931 | | | | 9,481,212 | | |
| | | | | 63,147,798 | | |
Diversified Financial Services: 4.2% | |
CRISIL, Ltd. | | | 789,224 | | | | 23,744,549 | | |
IDFC, Ltd. | | | 7,731,855 | | | | 19,139,256 | | |
Multi Commodity Exchange of India, Ltd. | | | 159,509 | | | | 2,124,617 | | |
| | | | | 45,008,422 | | |
Thrifts & Mortgage Finance: 4.0% | |
Housing Development Finance Corp. | | | 1,792,048 | | | | 32,135,643 | | |
GRUH Finance, Ltd. | | | 2,649,768 | | | | 11,457,946 | | |
| | | | | 43,593,589 | | |
Real Estate Management & Development: 1.2% | |
Ascendas India Trust | | | 21,140,000 | | | | 13,055,779 | | |
Total Financials | | | | | 276,797,614 | | |
CONSUMER STAPLES: 19.7% | |
Personal Products: 10.7% | |
Emami, Ltd. | | | 3,724,801 | | | | 46,427,944 | | |
Bajaj Corp., Ltd. | | | 5,619,447 | | | | 31,379,583 | | |
Dabur India, Ltd. | | | 6,499,430 | | | | 23,987,220 | | |
Marico, Ltd. | | | 2,669,050 | | | | 13,710,135 | | |
| | | | | 115,504,882 | | |
Tobacco: 7.0% | |
ITC, Ltd. | | | 8,640,000 | | | | 50,331,177 | | |
VST Industries, Ltd.† | | | 855,933 | | | | 25,788,842 | | |
| | | | | 76,120,019 | | |
Food Products: 2.0% | |
Zydus Wellness, Ltd. | | | 1,670,471 | | | | 21,534,740 | | |
Total Consumer Staples | | | | | 213,159,641 | | |
INDUSTRIALS: 14.9% | |
Machinery: 7.5% | |
AIA Engineering, Ltd. | | | 2,306,467 | | | | 39,372,993 | | |
Thermax, Ltd. | | | 1,598,128 | | | | 26,924,873 | | |
Ashok Leyland, Ltd.b | | | 18,856,152 | | | | 15,240,814 | | |
| | | | | 81,538,680 | | |
Transportation Infrastructure: 3.1% | |
Gujarat Pipavav Port, Ltd.b | | | 10,373,564 | | | | 33,920,080 | | |
Road & Rail: 2.6% | |
Container Corp. of India, Ltd. | | | 1,291,324 | | | | 27,568,564 | | |
| | | Shares | | Value | |
Air Freight & Logistics: 1.7% | |
Blue Dart Express, Ltd. | | | 185,570 | | | $ | 18,647,106 | | |
Total Industrials | | | | | 161,674,430 | | |
INFORMATION TECHNOLOGY: 12.8% | |
IT Services: 10.4% | |
Mindtree, Ltd. | | | 2,053,814 | | | | 41,739,222 | | |
Cognizant Technology Solutions Corp.
Class Ab | | | 752,000 | | | | 39,600,320 | | |
eClerx Services, Ltd. | | | 1,189,293 | | | | 24,628,996 | | |
CMC, Ltd. | | | 220,000 | | | | 6,747,340 | | |
| | | | | 112,715,878 | | |
Internet Software & Services: 2.4% | |
Info Edge India, Ltd. | | | 1,967,978 | | | | 26,436,186 | | |
Total Information Technology | | | | | 139,152,064 | | |
CONSUMER DISCRETIONARY: 9.9% | |
Textiles, Apparel & Luxury Goods: 4.4% | |
Titan Co., Ltd. | | | 5,037,153 | | | | 30,335,028 | | |
Page Industries, Ltd. | | | 47,500 | | | | 8,829,415 | | |
Vaibhav Global, Ltd.b | | | 500,000 | | | | 4,972,474 | | |
Kewal Kiran Clothing, Ltd. | | | 108,802 | | | | 3,334,128 | | |
| | | | | 47,471,045 | | |
Household Durables: 3.2% | |
Symphony, Ltd. | | | 1,126,560 | | | | 34,704,776 | | |
Media: 1.3% | |
Jagran Prakashan, Ltd. | | | 6,350,124 | | | | 13,736,931 | | |
Auto Components: 1.0% | |
Exide Industries, Ltd. | | | 3,878,554 | | | | 10,880,780 | | |
Total Consumer Discretionary | | | | | 106,793,532 | | |
MATERIALS: 8.7% | |
Chemicals: 5.0% | |
Asian Paints, Ltd. | | | 1,578,000 | | | | 18,704,584 | | |
Supreme Industries, Ltd. | | | 1,895,000 | | | | 17,931,538 | | |
Castrol India, Ltd. | | | 2,139,063 | | | | 16,971,251 | | |
| | | | | 53,607,373 | | |
Metals & Mining: 2.8% | |
NMDC, Ltd. | | | 13,215,772 | | | | 30,329,920 | | |
Construction Materials: 0.9% | |
Grasim Industries, Ltd. | | | 183,459 | | | | 9,816,297 | | |
Total Materials | | | | | 93,753,590 | | |
HEALTH CARE: 7.2% | |
Pharmaceuticals: 6.6% | |
Ajanta Pharma, Ltd. | | | 1,073,400 | | | | 39,573,255 | | |
Sun Pharmaceutical Industries, Ltd. | | | 1,981,559 | | | | 25,895,506 | | |
Taro Pharmaceutical Industries, Ltd.b | | | 39,396 | | | | 5,838,093 | | |
| | | | | 71,306,854 | | |
matthewsasia.com | 800.789.ASIA 51
Matthews India Fund December 31, 2014
Schedule of Investmentsa (continued)
COMMON EQUITIES: (continued)
| | | Shares | | Value | |
Health Care Equipment & Supplies: 0.6% | |
Poly Medicure, Ltd. | | | 500,693 | | | $ | 7,100,009 | | |
Total Health Care | | | | | 78,406,863 | | |
TOTAL INVESTMENTS: 98.7% | | | | | 1,069,737,734 | | |
(Cost $764,949,771c) | |
CASH AND OTHER ASSETS,
LESS LIABILITIES: 1.3% | | | | | 14,430,970 | | |
NET ASSETS: 100.0% | | $ | 1,084,168,704 | | |
a Certain securities were fair valued under the valuation polices approved by the Board of Trustees (Note 2-A).
b Non-income producing security.
c Cost for federal income tax purposes is $765,124,217 and net unrealized appreciation consists of:
Gross unrealized appreciation | | $ | 337,518,406 | | |
Gross unrealized depreciation | | | (32,904,889 | ) | |
Net unrealized appreciation | | $ | 304,613,517 | | |
† Affiliated Issuer, as defined under the Investment Company Act of 1940 (ownership of 5% or more of the outstanding voting securities of this issuer)
ADR American Depositary Receipt
See accompanying notes to financial statements.
52 MATTHEWS ASIA FUNDS

PORTFOLIO MANAGERS
Taizo Ishida
Lead Manager
Kenichi Amaki
Co-Manager
FUND FACTS
| | | Investor Class | | Institutional Class | |
Ticker | | MJFOX | | MIJFX | |
CUSIP | | 577130800 | | 577130792 | |
Inception | | 12/31/98 | | 10/29/10 | |
NAV | | $15.70 | | $15.71 | |
Initial Investment | | $2,500 | | $3 million | |
Gross Expense Ratio1 | | 1.03% | | 0.90% | |
Portfolio Statistics
Total # of Positions | | 105* | |
Net Assets | | $622.6 million | |
Weighted Average Market Cap | | $20.8 billion | |
Portfolio Turnover | | 42.52%2 | |
Benchmarks
MSCI Japan Index
Tokyo Stock Price Index (TOPIX)
Redemption Fee
2% within first 90 calendar days of purchase
OBJECTIVE
Long-term capital appreciation.
STRATEGY
Under normal market conditions, the Fund seeks to achieve its investment objective by investing at least 80% of its total net assets, which include borrowings for investment purposes, in the common and preferred stocks of companies located in Japan.
* There was an increase in the number of securities due to the merger of The Japan Fund, a series of Nomura Partners Funds, Inc. with the Matthews Japan Fund. For more information on the fund merger please see Note 3 in the Notes to Financials.
1 Actual 2014 expense ratios.
2 The lesser of fiscal year 2014 long-term purchase costs or sales proceeds divided by the average monthly market value of long-term securities.
Matthews Japan Fund
Portfolio Manager Commentary
For the year ending December 31, 2014, the Matthews Japan Fund returned –2.60% (Investor Class) and –2.47% (Institutional Class) while its benchmark, the MSCI Japan Index, returned –3.72%. For the fourth quarter of the year, the Fund returned –4.19% (Investor Class) and –4.18% (Institutional Class) versus –2.40% for the Index.
Market Environment:
2014 was a mixed year for U.S. dollar-based Japanese equity investors. The MSCI Japan index notched gains of 9.83% in local currency terms, buoyed by robust corporate earnings growth despite weak macroeconomic figures. However, such gains were negated by the rapid decline in the Japanese yen, which fell 12.02%. The drop was seen particularly in the latter half of the year as the Bank of Japan expanded its already aggressive monetary policies. Inflation rates have been slowing due to soft commodity prices, particularly oil, and weak household consumption, prompting the central bank to respond in order to meet its inflation goals.
Meanwhile in December, Prime Minister Shinzo Abe and his Liberal Democratic Party clinched a landslide victory in a key Lower House election to secure four more years during which they may further advance reform policies. As a result, the plan for a second round of consumption tax increases, originally scheduled for October 2015, was postponed to April 2017.
Performance Contributors and Detractors:
Our holdings in the health care sector were leading contributors to performance in 2014. Long-term holding Sysmex, a global leader in hematology equipment, performed well on the back of solid growth globally, particularly in China where growing household incomes are driving demand for health care services. Medical device company Asahi Intecc and medical information firm M3 also delivered solid performance, driven by revenue growth through new products and services.
On the other hand, non-bank financial company ORIX was the biggest detractor to Fund performance, despite delivering solid earnings returns. The poor performance likely had more to do with the weak macroeconomic environment, rather than any individual issues with the business. Internet and telecom giant SoftBank ended the year on a sour note despite the successful IPO of its largest investment—Chinese e-commerce giant Alibaba. Poor performance of SoftBank's U.S. telecom unit, Sprint, also weighed on investor sentiment.
Notable Portfolio Changes:
As a result of the merger of the Nomura Japan Fund into the Matthews Japan Fund in October, the number of holdings increased beyond its typical range. However, we intend to manage the Fund so that over time, the number of holdings will return to its typical range of approximately 50 to 75 holdings.
Over the course of the year, we significantly reduced our exposure to Japanese banks. Earnings at the country's major banks have been solid on
matthewsasia.com | 800.789.ASIA 53
PERFORMANCE AS OF DECEMBER 31, 2014
| | | | | | | Average Annual Total Returns | | | |
| | 3 Months | | 1 Year | | 3 Years | | 5 Years | | 10 Years | | Since
Inception | | Inception
Date | |
Investor Class (MJFOX) | | | -4.19 | % | | | -2.60 | % | | | 12.24 | % | | | 9.31 | % | | | 1.64 | % | | | 5.01 | % | | 12/31/98 | |
Institutional Class (MIJFX) | | | -4.18 | % | | | -2.47 | % | | | 12.41 | % | | | n.a. | | | | n.a. | | | | 9.45 | % | | 10/29/10 | |
MSCI Japan Index3 | | | -2.40 | % | | | -3.72 | % | | | 9.93 | % | | | 5.68 | % | | | 2.44 | % | | | 2.51 | %4 | | | | | |
Tokyo Stock Price Index3 | | | -2.48 | % | | | -3.03 | % | | | 9.87 | % | | | 5.92 | % | | | 2.40 | % | | | 2.90 | %4 | | | | | |
Lipper Japanese Funds Category Average5 | | | -1.76 | % | | | -2.99 | % | | | 10.26 | % | | | 7.38 | % | | | 2.38 | % | | | 3.45 | %4 | | | | | |
Performance assumes reinvestment of all dividends and/or distributions before taxes. All performance quoted represents past performance and is no guarantee of future results. Investment return and principal value will fluctuate with market conditions so that when redeemed, shares may be worth more or less than their original cost. Current performance may be lower or higher than the return figures quoted. For the Fund's most recent month-end performance, visit matthewsasia.com.
GROWTH OF A $10,000 INVESTMENT SINCE INCEPTION—INVESTOR CLASS
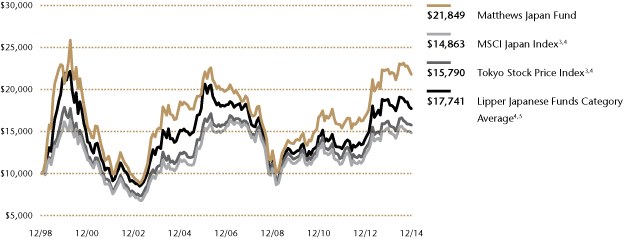
Plotted montly. The performance data and graph do not reflect the deduction of taxes that a shareholder would pay on dividends, capital gains distributions or redemption of Fund shares. Values are in US$.
3 It is not possible to invest directly in an index. Source: Index data from Morgan Stanley Capital International and Bloomberg; total return calculations performed by BNY Mellon Investment Servicing (US) Inc. Please see page 79 for index definitions.
4 Calculated from 12/31/98.
5 The Lipper Category Average does not reflect sales charges and is based on total return, including reinvestment of dividends and capital gains for the stated periods.
TOP TEN POSITIONS6
| | | Sector | | % of Net Assets | |
Toyota Motor Corp. | | Consumer Discretionary | | | 3.6 | % | |
ORIX Corp. | | Financials | | | 2.8 | % | |
Seven & I Holdings Co., Ltd. | | Consumer Staples | | | 2.5 | % | |
M3, Inc. | | Health Care | | | 2.5 | % | |
Sysmex Corp. | | Health Care | | | 2.4 | % | |
SoftBank Corp. | | Telecom Services | | | 2.4 | % | |
Kao Corp. | | Consumer Staples | | | 2.3 | % | |
Unicharm Corp. | | Consumer Staples | | | 2.3 | % | |
Keyence Corp. | | Information Technology | | | 2.3 | % | |
Mazda Motor Corp. | | Consumer Discretionary | | | 2.2 | % | |
| % OF ASSETS IN TOP 10 | | | | | 25.3 | % | |
6 Holdings may combine more than one security from same issuer and related depositary receipts.
54 MATTHEWS ASIA FUNDS
Matthews Japan Fund
Portfolio Manager Commentary (continued)
the back of increased overseas lending, low credit costs and robust fee revenue. There has also been some improvement in shareholder return policies. However, already low interest rates in Japan have been even lower due to the flood of money being supplied by the Bank of Japan. Given these extraordinary and aggressive monetary measures, interest rates in Japan are likely to remain low over the medium term. Low rates combined with more stringent regulatory requirements on capital adequacy will limit the ability of banks to generate sufficient returns on capital. Therefore, we sought to redeploy the funds elsewhere.
Outlook:
Lower oil prices and the postponement of a second consumption tax hike should be a relief for households that have seen real incomes decline. Nominal base wage growth has remained positive for the past several quarters, and the pace of wage growth may accelerate following spring wage negotiations. Abe's administration has announced plans to cut the corporate tax rate and introduce incentives for companies that increase wages or hire more workers. Though import cost inflation may remain a challenge for importers and households, in general, we expect the consumption environment to stabilize. Additionally, the government is in the final stages of implementing a Corporate Governance Code, which will effectively require listed companies to appoint multiple independent directors and publish financial targets, such as a return on equity. Such measures may not have an immediate effect on corporate earnings or stock price performance, but we believe it will lead to a gradual change in corporate mindsets, benefiting Japan investors over the long term. Given this background, we remain bullish on the outlook for select Japanese companies.
SECTOR ALLOCATION (%)
Industrials | | | 25.8 | | |
Consumer Discretionary | | | 19.1 | | |
Information Technology | | | 14.6 | | |
Consumer Staples | | | 12.6 | | |
Health Care | | | 12.0 | | |
Financials | | | 9.1 | | |
Telecommunication Services | | | 3.1 | | |
Materials | | | 2.4 | | |
Cash and Other Assets, Less Liabilities | | | 1.3 | | |
MARKET CAP EXPOSURE (%)7
Large Cap (over $5B) | | | 55.7 | | |
Mid Cap ($1B–$5B) | | | 28.3 | | |
Small Cap (under $1B) | | | 14.7 | | |
Cash and Other Assets, Less Liabilities | | | 1.3 | | |
7 Source: FactSet Research Systems. Percentage values in data are rounded to the nearest tenth of one percent; the values may not sum to 100% due to rounding.
matthewsasia.com | 800.789.ASIA 55
Matthews Japan Fund December 31, 2014
Schedule of Investmentsa
COMMON EQUITIES: JAPAN: 98.7%
| | | Shares | | Value | |
INDUSTRIALS: 25.8% | |
Machinery: 9.8% | |
Mitsubishi Heavy Industries, Ltd. | | | 2,160,000 | | | $ | 11,920,151 | | |
Nabtesco Corp. | | | 481,800 | | | | 11,644,455 | | |
FANUC Corp. | | | 70,200 | | | | 11,574,604 | | |
Harmonic Drive Systems, Inc. | | | 508,200 | | | | 7,391,530 | | |
Komatsu, Ltd. | | | 287,400 | | | | 6,353,820 | | |
SMC Corp. | | | 23,400 | | | | 6,136,044 | | |
Freund Corp. | | | 436,000 | | | | 3,780,594 | | |
Ebara Corp. | | | 204,000 | | | | 835,905 | | |
Minebea Co., Ltd. | | | 47,000 | | | | 694,091 | | |
Makita Corp. | | | 13,200 | | | | 594,818 | | |
| | | | | | 60,926,012 | | |
Professional Services: 4.3% | |
Nihon M&A Center, Inc. | | | 403,800 | | | | 12,164,865 | | |
Benefit One, Inc. | | | 706,000 | | | | 7,622,140 | | |
Recruit Holdings Co., Ltd.b | | | 246,400 | | | | 7,076,440 | | |
| | | | | | 26,863,445 | | |
Building Products: 3.8% | |
Daikin Industries, Ltd. | | | 172,000 | | | | 11,029,341 | | |
Aica Kogyo Co., Ltd. | | | 327,800 | | | | 6,769,417 | | |
Nihon Flush Co., Ltd. | | | 245,500 | | | | 5,784,406 | | |
| | | | | | 23,583,164 | | |
Electrical Equipment: 3.7% | |
Nidec Corp. | | | 170,100 | | | | 10,986,020 | | |
Mabuchi Motor Co., Ltd. | | | 243,400 | | | | 9,661,134 | | |
Mitsubishi Electric Corp. | | | 227,000 | | | | 2,696,319 | | |
| | | | | | 23,343,473 | | |
Road & Rail: 1.5% | |
Trancom Co., Ltd. | | | 232,300 | | | | 9,368,406 | | |
Trading Companies & Distributors: 1.5% | |
ITOCHU Corp. | | | 569,200 | | | | 6,076,266 | | |
Mitsui & Co., Ltd. | | | 144,900 | | | | 1,940,665 | | |
Mitsubishi Corp. | | | 59,100 | | | | 1,081,537 | | |
| | | | | | 9,098,468 | | |
Air Freight & Logistics: 0.7% | |
AIT Corp. | | | 678,700 | | | | 4,450,268 | | |
Industrial Conglomerates: 0.3% | |
Toshiba Corp. | | | 533,000 | | | | 2,247,822 | | |
Commercial Services & Supplies: 0.1% | |
Sohgo Security Services Co., Ltd. | | | 14,800 | | | | 357,968 | | |
Sato Holdings Corp. | | | 9,400 | | | | 213,673 | | |
| | | | | | 571,641 | | |
Construction & Engineering: 0.1% | |
JGC Corp. | | | 17,000 | | | | 349,976 | | |
Total Industrials | | | | | 160,802,675 | | |
| | | Shares | | Value | |
CONSUMER DISCRETIONARY: 19.1% | |
Automobiles: 7.7% | |
Toyota Motor Corp. | | | 360,900 | | | $ | 22,490,348 | | |
Mazda Motor Corp. | | | 569,200 | | | | 13,669,668 | | |
Fuji Heavy Industries, Ltd. | | | 306,800 | | | | 10,856,420 | | |
Isuzu Motors, Ltd. | | | 52,400 | | | | 638,248 | | |
Mitsubishi Motors Corp. | | | 34,300 | | | | 313,346 | | |
| | | | | | 47,968,030 | | |
Specialty Retail: 3.7% | |
VT Holdings Co., Ltd. | | | 2,086,000 | | | | 8,213,851 | | |
Sac's Bar Holdings, Inc. | | | 611,750 | | | | 7,856,797 | | |
Workman Co., Ltd. | | | 121,300 | | | | 5,589,633 | | |
Fast Retailing Co., Ltd. | | | 3,000 | | | | 1,091,685 | | |
United Arrows, Ltd. | | | 4,300 | | | | 120,087 | | |
ABC-Mart, Inc. | | | 2,000 | | | | 96,776 | | |
| | | | | | 22,968,829 | | |
Auto Components: 2.6% | |
Nifco, Inc. | | | 382,800 | | | | 12,382,253 | | |
NGK Spark Plug Co., Ltd. | | | 49,800 | | | | 1,513,194 | | |
Bridgestone Corp. | | | 39,400 | | | | 1,366,469 | | |
Koito Manufacturing Co., Ltd. | | | 17,100 | | | | 523,119 | | |
Denso Corp. | | | 9,300 | | | | 433,453 | | |
| | | | | | 16,218,488 | | |
Media: 1.8% | |
COOKPAD, Inc. | | | 321,000 | | | | 10,931,395 | | |
CyberAgent, Inc. | | | 11,000 | | | | 412,395 | | |
| | | | | | 11,343,790 | | |
Hotels, Restaurants & Leisure: 1.2% | |
Hiday Hidaka Corp. | | | 103,800 | | | | 3,250,684 | | |
Ride On Express Co., Ltd.b | | | 99,200 | | | | 2,319,486 | | |
Oriental Land Co., Ltd. | | | 9,000 | | | | 2,075,526 | | |
| | | | | | 7,645,696 | | |
Household Durables: 1.1% | |
Rinnai Corp. | | | 101,900 | | | | 6,846,885 | | |
Diversified Consumer Services: 0.8% | |
ESCRIT, Inc. | | | 552,200 | | | | 4,629,717 | | |
Leisure Products: 0.1% | |
Shimano, Inc. | | | 5,700 | | | | 738,274 | | |
Internet & Catalog Retail: 0.1% | |
Rakuten, Inc. | | | 43,700 | | | | 607,684 | | |
Total Consumer Discretionary | | | | | 118,967,393 | | |
56 MATTHEWS ASIA FUNDS
Matthews Japan Fund December 31, 2014
Schedule of Investmentsa (continued)
COMMON EQUITIES: JAPAN: (continued)
| | | Shares | | Value | |
INFORMATION TECHNOLOGY: 14.6% | |
Electronic Equipment, Instruments & Components: 10.9% | |
Keyence Corp. | | | 31,800 | | | $ | 14,169,914 | | |
Hoya Corp. | | | 387,000 | | | | 13,090,212 | | |
Murata Manufacturing Co., Ltd. | | | 118,700 | | | | 12,952,663 | | |
Yokogawa Electric Corp. | | | 860,700 | | | | 9,444,504 | | |
Anritsu Corp. | | | 938,300 | | | | 6,527,346 | | |
Omron Corp. | | | 138,600 | | | | 6,200,339 | | |
Hitachi, Ltd. | | | 496,000 | | | | 3,660,860 | | |
TDK Corp. | | | 22,200 | | | | 1,307,479 | | |
Japan Aviation Electronics Industry, Ltd. | | | 12,000 | | | | 262,166 | | |
Hamamatsu Photonics, K.K. | | | 3,200 | | | | 152,330 | | |
| | | | | | 67,767,813 | | |
Semiconductors & Semiconductor Equipment: 1.9% | |
Rohm Co., Ltd. | | | 199,900 | | | | 12,044,627 | | |
Internet Software & Services: 1.6% | |
Kakaku.com, Inc. | | | 689,100 | | | | 9,858,751 | | |
Technology Hardware, Storage & Peripherals: 0.1% | |
Seiko Epson Corp. | | | 14,500 | | | | 606,741 | | |
Toshiba TEC Corp. | | | 47,000 | | | | 322,163 | | |
| | | | | | 928,904 | | |
IT Services: 0.1% | |
Fujitsu, Ltd. | | | 93,000 | | | | 495,845 | | |
Total Information Technology | | | | | 91,095,940 | | |
CONSUMER STAPLES: 12.6% | |
Food & Staples Retailing: 4.4% | |
Seven & I Holdings Co., Ltd. | | | 435,800 | | | | 15,676,313 | | |
Cosmos Pharmaceutical Corp. | | | 82,000 | | | | 11,203,300 | | |
Lawson, Inc. | | | 5,200 | | | | 314,226 | | |
| | | | | | 27,193,839 | | |
Household Products: 4.1% | |
Unicharm Corp. | | | 594,400 | | | | 14,247,232 | | |
Pigeon Corp. | | | 196,100 | | | | 11,433,826 | | |
| | | | | | 25,681,058 | | |
Personal Products: 2.3% | |
Kao Corp. | | | 366,700 | | | | 14,460,654 | | |
Food Products: 1.6% | |
Calbee, Inc. | | | 238,500 | | | | 8,215,564 | | |
MEIJI Holdings Co., Ltd. | | | 13,900 | | | | 1,264,611 | | |
Ajinomoto Co., Inc. | | | 22,000 | | | | 409,572 | | |
| | | | | | 9,889,747 | | |
Tobacco: 0.2% | |
Japan Tobacco, Inc. | | | 47,100 | | | | 1,296,323 | | |
Total Consumer Staples | | | | | 78,521,621 | | |
| | | Shares | | Value | |
HEALTH CARE: 12.0% | |
Health Care Equipment & Supplies: 6.2% | |
Sysmex Corp. | | | 337,000 | | | $ | 14,956,901 | | |
Asahi Intecc Co., Ltd. | | | 259,600 | | | | 12,650,679 | | |
Daiken Medical Co., Ltd. | | | 711,600 | | | | 6,614,906 | | |
CYBERDYNE, Inc.b | | | 145,100 | | | | 3,685,147 | | |
Hogy Medical Co., Ltd. | | | 9,500 | | | | 433,249 | | |
| | | | | | 38,340,882 | | |
Health Care Technology: 2.4% | |
M3, Inc. | | | 913,600 | | | | 15,286,362 | | |
Pharmaceuticals: 1.9% | |
Rohto Pharmaceutical Co., Ltd. | | | 738,600 | | | | 9,228,037 | | |
Astellas Pharma, Inc. | | | 129,900 | | | | 1,808,481 | | |
Chugai Pharmaceutical Co., Ltd. | | | 32,300 | | | | 793,073 | | |
| | | | | | 11,829,591 | | |
Health Care Providers & Services: 1.5% | |
Message Co., Ltd. | | | 203,000 | | | | 5,575,900 | | |
N Field Co., Ltd.b | | | 276,800 | | | | 3,920,367 | | |
| | | | | | 9,496,267 | | |
Total Health Care | | | | | 74,953,102 | | |
FINANCIALS: 9.1% | |
Diversified Financial Services: 5.1% | |
ORIX Corp. | | | 1,363,200 | | | | 17,152,869 | | |
Zenkoku Hosho Co., Ltd. | | | 295,600 | | | | 8,388,384 | | |
eGuarantee, Inc. | | | 401,000 | | | | 5,846,266 | | |
Mitsubishi UFJ Lease & Finance Co., Ltd. | | | 76,400 | | | | 359,296 | | |
| | | | | | 31,746,815 | | |
Insurance: 2.7% | |
Tokio Marine Holdings, Inc. | | | 388,000 | | | | 12,601,347 | | |
The Dai-ichi Life Insurance Co., Ltd. | | | 281,800 | | | | 4,277,682 | | |
| | | | | | 16,879,029 | | |
Capital Markets: 0.7% | |
Matsui Securities Co., Ltd. | | | 516,400 | | | | 4,468,305 | | |
Banks: 0.6% | |
Mitsubishi UFJ Financial Group, Inc. | | | 625,400 | | | | 3,436,091 | | |
Total Financials | | | | | 56,530,240 | | |
TELECOMMUNICATION SERVICES: 3.1% | |
Wireless Telecommunication Services: 2.7% | |
SoftBank Corp. | | | 250,200 | | | | 14,892,728 | | |
KDDI Corp. | | | 32,900 | | | | 2,066,911 | | |
| | | | | | 16,959,639 | | |
Diversified Telecommunication Services: 0.4% | |
Nippon Telegraph & Telephone Corp. | | | 39,900 | | | | 2,038,197 | | |
Total Telecommunication Services | | | | | 18,997,836 | | |
matthewsasia.com | 800.789.ASIA 57
Matthews Japan Fund December 31, 2014
Schedule of Investmentsa (continued)
COMMON EQUITIES: JAPAN: (continued)
| | | Shares | | Value | |
MATERIALS: 2.4% | |
Chemicals: 2.3% | |
MORESCO Corp. | | | 400,300 | | | $ | 6,225,566 | | |
Shin-Etsu Chemical Co., Ltd. | | | 94,100 | | | | 6,125,888 | | |
Toray Industries, Inc. | | | 182,000 | | | | 1,454,177 | | |
Nitto Denko Corp. | | | 8,300 | | | | 463,767 | | |
| | | | | | 14,269,398 | | |
Metals & Mining: 0.1% | |
Hitachi Metals, Ltd. | | | 21,000 | | | | 356,809 | | |
Total Materials | | | | | 14,626,207 | | |
TOTAL INVESTMENTS: 98.7% | | | | | 614,495,014 | | |
(Cost $569,787,622c) | |
CASH AND OTHER ASSETS,
LESS LIABILITIES: 1.3% | | | | | 8,108,791 | | |
NET ASSETS: 100.0% | | | | $ | 622,603,805 | | |
a Certain securities were fair valued under the valuation polices approved by the Board of Trustees (Note 2-A).
b Non-income producing security.
c Cost for federal income tax purposes is $574,286,255 and net unrealized appreciation consists of:
Gross unrealized appreciation | | $ | 64,578,813 | | |
Gross unrealized depreciation | | | (24,370,054 | ) | |
Net unrealized appreciation | | $ | 40,208,759 | | |
See accompanying notes to financial statements.
58 MATTHEWS ASIA FUNDS

PORTFOLIO MANAGERS
J. Michael Oh, CFA
Lead Manager
Michael B. Han, CFA
Co-Manager
FUND FACTS
| | | Investor Class | | Institutional Class | |
Ticker | | MAKOX | | MIKOX | |
CUSIP | | 577130305 | | 577130826 | |
Inception | | 1/3/95 | | 10/29/10 | |
NAV | | $5.65 | | $5.68 | |
Initial Investment | | $2,500 | | $3 million | |
Gross Expense Ratio1 | | 1.11% | | 0.93% | |
Portfolio Statistics
Total # of Positions | | 57 | |
Net Assets | | $219.2 million | |
Weighted Average Market Cap | | $22.9 billion | |
Portfolio Turnover | | 17.37%2 | |
Benchmark
Korea Composite Stock Price Index
Redemption Fee
2% within first 90 calendar days of purchase
OBJECTIVE
Long-term capital appreciation.
STRATEGY
Under normal market conditions, the Fund seeks to achieve its investment objective by investing at least 80% of its total net assets, which include borrowings for investment purposes, in the common and preferred stocks of companies located in South Korea.
1 Actual 2014 expense ratios.
2 The lesser of fiscal year 2014 long-term purchase costs or sales proceeds divided by the average monthly market value of long-term securities.
Matthews Korea Fund
Portfolio Manager Commentary
For the year ending December 31, 2014, the Matthews Korea Fund fell –0.73% (Investor Class) and –0.39% (Institutional Class) while its benchmark, the Korea Composite Stock Price Index, declined by –8.30%. For the fourth quarter of the year, the Fund returned –7.13% (Investor Class) and –6.94% (Institutional Class) versus a –8.48% decline for the Index.
Market Environment:
During the year, the stock market in South Korea remained volatile along with its currency. Amid speculation over key macroeconomic factors such as the highly anticipated U.S. Federal Reserve's rate hike and slowing Chinese economy, the Korean won depreciated along with the equity market.
The weak Korean currency was generally not helpful to share prices for exporting firms because the Japanese yen depreciated more than the won. This raised concerns over exporters' ability to compete in certain sectors, like the auto industry, that directly compete against Japanese companies.
During the year, preferred share classes performed well overall along with select consumer companies in cosmetics and tourism that benefited from strong demand growth among Chinese consumers. Conversely, companies in the industrial sector suffered due to the drop in oil prices, combined with a slowdown in China's industrial activity.
After winning the mid-term election, President Park's administration came out with a new economic policy focused on boosting domestic demand by incentivizing the cash-hoarding corporate sector to increase dividend payouts and investment into domestic facilities.
Performance Contributors and Detractors:
Amorepacific's common shares were top contributors to performance after the market cheered strong sales, led by rising popularity among Asian consumers. The company also benefited from restructuring efforts in its domestic distribution channel that sought to turn around sluggish sales in South Korea.
Share price performance of E-Mart suffered during the fourth quarter, as a long-expected rebound in sales did not take place. The Fund increased holdings in E-Mart in mid-2013 after a share price correction, due to a regulatory change that required big box retailers to close their stores two Sundays a month. While the bet worked favorably until recently, the share price dropped in the fourth quarter of 2014 as the company's operational results remained sluggish.
Notable Portfolio Changes:
During the quarter, the Fund added two new names to the portfolio, Cheil industries and DGB Financial Group.
The Fund participated in the public offering of Cheil Industries, a subsidiary of the Samsung Group. Recently, a number of Samsung companies have been restructured and formerly privately-held shares have been made public by the founding families, for estate planning purposes. In lieu of this restructuring, Cheil Industries was the second company in South Korea to go public this year. A share offering is a great vehicle to
matthewsasia.com | 800.789.ASIA 59
PERFORMANCE AS OF DECEMBER 31, 2014
| | | | | | | Average Annual Total Returns | | | |
| | 3 Months | | 1 Year | | 3 Years | | 5 Years | | 10 Years | | Since
Inception | | Inception
Date | |
Investor Class (MAKOX) | | | -7.13 | % | | | -0.73 | % | | | 10.68 | % | | | 9.10 | % | | | 9.78 | % | | | 5.87 | % | | 1/3/95 | |
Institutional Class (MIKOX) | | | -6.94 | % | | | -0.39 | % | | | 10.76 | % | | | n.a. | | | | n.a. | | | | 8.13 | % | | 10/29/10 | |
Korea Composite Stock Price Index3 | | | -8.48 | % | | | -8.30 | % | | | 4.30 | % | | | 4.98 | % | | | 8.85 | % | | | 2.95 | %4 | | | | | |
Lipper Pacific ex Japan Funds Category Average5 | | | -2.11 | % | | | 3.65 | % | | | 9.78 | % | | | 5.40 | % | | | 8.85 | % | | | 6.38 | %4 | |
| |
Performance assumes reinvestment of all dividends and/or distributions before taxes. All performance quoted represents past performance and is no guarantee of future results. Investment return and principal value will fluctuate with market conditions so that when redeemed, shares may be worth more or less than their original cost. Current performance may be lower or higher than the return figures quoted. For the Fund's most recent month-end performance, visit matthewsasia.com.
GROWTH OF A $10,000 INVESTMENT SINCE INCEPTION—INVESTOR CLASS
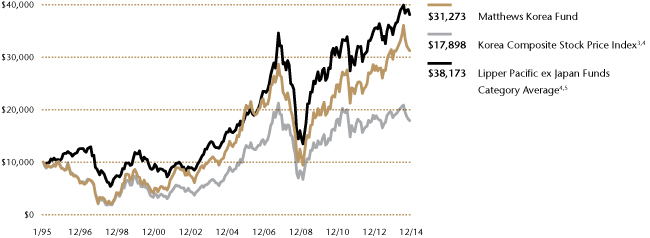
Plotted monthly. The performance data and graph do not reflect the deduction of taxes that a shareholder would pay on dividends, capital gains distributions or redemption of Fund shares. Values are in US$.
3 It is not possible to invest directly in an index. Source: Index data from Morgan Stanley Capital International and Bloomberg; total return calculations performed by BNY Mellon Investment Servicing (US) Inc. Please see page 79 for index definition.
4 Calculated from 1/3/95.
5 The Lipper Category Average does not reflect sales charges and is based on total return, including reinvestment of dividends and capital gains for the stated periods.
TOP TEN POSITIONS6
| | | Sector | | % of Net Assets | |
Samsung Electronics Co., Ltd. | | Information Technology | | | 4.7 | % | |
Shinhan Financial Group Co., Ltd. | | Financials | | | 4.6 | % | |
Samsung Fire & Marine Insurance Co., Ltd., Pfd. | | Financials | | | 3.8 | % | |
SK Telecom Co., Ltd. | | Telecom Services | | | 3.3 | % | |
Hyundai Motor Co., Ltd., 2nd Pfd. | | Consumer Discretionary | | | 3.1 | % | |
Orion Corp. | | Consumer Staples | | | 3.0 | % | |
Hankook Tire Co., Ltd. | | Consumer Discretionary | | | 2.8 | % | |
Amorepacific Corp. | | Consumer Staples | | | 2.8 | % | |
E-Mart Co., Ltd. | | Consumer Staples | | | 2.8 | % | |
Dongbu Insurance Co., Ltd. | | Financials | | | 2.7 | % | |
| % OF ASSETS IN TOP 10 | | | | | 33.6 | % | |
6 Holdings may combine more than one security from same issuer and related depositary receipts.
60 MATTHEWS ASIA FUNDS
Matthews Korea Fund
Portfolio Manager Commentary (continued)
align minority shareholders' interests with those of controlling shareholders. We thought that the price offered for Cheil was an attractive entry-point.
DGB Financial Group is a very well-run regional lender that has generated a loyal customer base by offering lower funding costs than its peers. While we believe the stock's valuation had been fairly priced, it corrected significantly upon the announcement of a rights offering to increase equity capital by about 20%. After hearing about the company's plan to use capital for growth, we added the name. This was a good opportunity to add a quality franchise at a relatively low price.
Outlook:
During the year, the Korean economy grew reasonably well despite negative consumer sentiment after the Sewol ferry disaster. The current account surplus remained intact as exports remained strong. Going forward, we believe that the Korean economy will remain resilient, given strong fiscal and corporate balance sheets. Despite sluggish consumer sentiment stemming from high levels of household debt, along with continued weak property markets, we are optimistic about the Korean government's ability to manage household leverage.
With her party occupying the majority of seats in the National Assembly, we believe that President Geun-hye Park will push forward with the new economic policy that was set forth by her recently appointed economic team. The policy, focused on structural reforms in the Korean economy, including balancing exports with domestic consumption and investment, improved shareholder returns and wage increases along with expansionary fiscal policy. In our view, this should be effective in revitalizing the economy.
SECTOR ALLOCATION (%)
Consumer Discretionary | | | 23.5 | | |
Consumer Staples | | | 22.6 | | |
Financials | | | 19.2 | | |
Information Technology | | | 11.9 | | |
Industrials | | | 6.1 | | |
Telecommunication Services | | | 5.5 | | |
Materials | | | 4.3 | | |
Health Care | | | 2.6 | | |
Energy | | | 2.3 | | |
Cash and Other Assets, Less Liabilities | | | 2.0 | | |
MARKET CAP EXPOSURE (%)7
Large Cap (over $5B) | | | 61.5 | | |
Mid Cap ($1B–$5B) | | | 23.1 | | |
Small Cap (under $1B) | | | 13.4 | | |
Cash and Other Assets, Less Liabilities | | | 2.0 | | |
7 Source: FactSet Research Systems. Percentage values in data are rounded to the nearest tenth of one percent; the values may not sum to 100% due to rounding.
matthewsasia.com | 800.789.ASIA 61
Matthews Korea Fund December 31, 2014
Schedule of Investmentsa
COMMON EQUITIES: SOUTH KOREA: 82.0%
| | | Shares | | Value | |
CONSUMER DISCRETIONARY: 19.7% | |
Hotels, Restaurants & Leisure: 5.6% | |
Kangwon Land, Inc. | | | 165,855 | | | $ | 4,605,708 | | |
Modetour Network, Inc. | | | 176,304 | | | | 3,896,462 | | |
Shinsegae Food Co., Ltd. | | | 37,780 | | | | 3,688,033 | | |
| | | | | | 12,190,203 | | |
Auto Components: 4.7% | |
Hankook Tire Co., Ltd. | | | 127,565 | | | | 6,107,488 | | |
Hyundai Mobis Co., Ltd. | | | 18,876 | | | | 4,068,703 | | |
| | | | | | 10,176,191 | | |
Media: 3.1% | |
CJ CGV Co., Ltd. | | | 68,331 | | | | 3,369,595 | | |
Cheil Worldwide, Inc.b | | | 144,118 | | | | 2,263,445 | | |
SBS Media Holdings Co., Ltd. | | | 342,022 | | | | 1,244,048 | | |
| | | | | | 6,877,088 | | |
Specialty Retail: 2.2% | |
Hotel Shilla Co., Ltd. | | | 58,092 | | | | 4,854,604 | | |
Multiline Retail: 1.4% | |
Hyundai Department Store Co., Ltd. | | | 28,026 | | | | 3,140,528 | | |
Automobiles: 1.4% | |
Kia Motors Corp. | | | 62,242 | | | | 2,979,638 | | |
Internet & Catalog Retail: 1.3% | |
Hyundai Home Shopping Network Corp. | | | 23,081 | | | | 2,914,885 | | |
Total Consumer Discretionary | | | | | 43,133,137 | | |
CONSUMER STAPLES: 19.0% | |
Food & Staples Retailing: 7.3% | |
E-Mart Co., Ltd. | | | 32,572 | | | | 6,072,828 | | |
BGF Retail Co., Ltd.b | | | 79,927 | | | | 5,567,202 | | |
Hyundai Greenfood Co., Ltd. | | | 245,440 | | | | 4,246,641 | | |
| | | | | | 15,886,671 | | |
Food Products: 6.4% | |
Orion Corp. | | | 7,082 | | | | 6,587,829 | | |
Ottogi Corp. | | | 9,154 | | | | 4,077,842 | | |
Binggrae Co., Ltd. | | | 50,105 | | | | 3,460,513 | | |
| | | | | | 14,126,184 | | |
Personal Products: 2.8% | |
Amorepacific Corp. | | | 2,986 | | | | 6,073,466 | | |
Household Products: 2.0% | |
LG Household & Health Care, Ltd. | | | 7,852 | | | | 4,483,855 | | |
Tobacco: 0.5% | |
KT&G Corp. | | | 15,762 | | | | 1,102,604 | | |
Total Consumer Staples | | | | | 41,672,780 | | |
| | | Shares | | Value | |
FINANCIALS: 15.4% | |
Banks: 7.6% | |
Shinhan Financial Group Co., Ltd. | | | 247,698 | | | $ | 10,030,809 | | |
KB Financial Group, Inc. | | | 132,692 | | | | 4,370,726 | | |
DGB Financial Group, Inc. | | | 212,226 | | | | 2,197,837 | | |
| | | | | | 16,599,372 | | |
Insurance: 5.0% | |
Dongbu Insurance Co., Ltd. | | | 117,285 | | | | 5,900,817 | | |
Samsung Fire & Marine Insurance Co., Ltd. | | | 19,611 | | | | 5,061,679 | | |
| | | | | | 10,962,496 | | |
Capital Markets: 2.8% | |
Kiwoom Securities Co., Ltd. | | | 63,974 | | | | 2,676,101 | | |
Shinyoung Securities Co., Ltd. | | | 43,142 | | | | 2,234,070 | | |
Samsung Securities Co., Ltd. | | | 31,754 | | | | 1,286,423 | | |
| | | | | | 6,196,594 | | |
Total Financials | | | | | 33,758,462 | | |
INFORMATION TECHNOLOGY: 9.6% | |
Technology Hardware, Storage & Peripherals: 4.7% | |
Samsung Electronics Co., Ltd. | | | 8,555 | | | | 10,362,224 | | |
Internet Software & Services: 2.3% | |
Naver Corp. | | | 7,911 | | | | 5,104,423 | | |
Semiconductors & Semiconductor Equipment: 2.1% | |
SK Hynix, Inc.b | | | 105,008 | | | | 4,521,167 | | |
Electronic Equipment, Instruments & Components: 0.5% | |
Bixolon Co., Ltd. | | | 100,068 | | | | 967,681 | | |
Total Information Technology | | | | | 20,955,495 | | |
INDUSTRIALS: 6.1% | |
Commercial Services & Supplies: 1.7% | |
KEPCO Plant Service & Engineering Co., Ltd. | | | 51,773 | | | | 3,780,464 | | |
Industrial Conglomerates: 1.6% | |
Cheil Industries, Inc.b | | | 24,901 | | | | 3,606,260 | | |
Machinery: 1.6% | |
Hy-Lok Corp. | | | 115,387 | | | | 3,399,756 | | |
Professional Services: 1.2% | |
SaraminHR Co., Ltd. | | | 250,420 | | | | 2,561,035 | | |
Total Industrials | | | | | 13,347,515 | | |
TELECOMMUNICATION SERVICES: 5.5% | |
Wireless Telecommunication Services: 3.3% | |
SK Telecom Co., Ltd. ADR | | | 269,900 | | | | 7,289,999 | | |
Diversified Telecommunication Services: 2.2% | |
KT Corp. ADR | | | 343,800 | | | | 4,854,456 | | |
Total Telecommunication Services | | | | | 12,144,455 | | |
62 MATTHEWS ASIA FUNDS
Matthews Korea Fund December 31, 2014
Schedule of Investmentsa (continued)
COMMON EQUITIES: SOUTH KOREA: (continued)
| | | Shares | | Value | |
HEALTH CARE: 2.6% | |
Pharmaceuticals: 2.6% | |
Yuhan Corp. | | | 16,617 | | | $ | 2,572,701 | | |
Dong-A ST Co., Ltd. | | | 16,404 | | | | 1,377,093 | | |
DongKook Pharmaceutical Co., Ltd. | | | 29,138 | | | | 920,649 | | |
Dong-A Socio Holdings Co., Ltd. | | | 7,854 | | | | 877,295 | | |
Total Health Care | | | | | 5,747,738 | | |
MATERIALS: 2.4% | |
Chemicals: 2.0% | |
LG Chem, Ltd. | | | 15,198 | | | | 2,503,826 | | |
KPX Chemical Co., Ltd. | | | 35,730 | | | | 1,919,655 | | |
| | | | | | 4,423,481 | | |
Metals & Mining: 0.4% | |
POSCO ADR | | | 14,400 | | | | 918,864 | | |
Total Materials | | | | | 5,342,345 | | |
ENERGY: 1.7% | |
Oil, Gas & Consumable Fuels: 1.7% | |
SK Innovation Co., Ltd. | | | 26,347 | | | | 2,044,461 | | |
S-Oil Corp. | | | 37,722 | | | | 1,669,910 | | |
Total Energy | | | | | 3,714,371 | | |
TOTAL COMMON EQUITIES | | | | | 179,816,298 | | |
(Cost $136,313,775) | | | | | | | |
PREFERRED EQUITIES: SOUTH KOREA: 16.0%
CONSUMER DISCRETIONARY: 3.8% | |
Automobiles: 3.1% | |
Hyundai Motor Co., Ltd., 2nd Pfd. | | | 55,338 | | | | 6,781,638 | | |
Specialty Retail: 0.7% | |
Hotel Shilla Co., Ltd., Pfd. | | | 29,595 | | | | 1,641,285 | | |
Total Consumer Discretionary | | | | | 8,422,923 | | |
FINANCIALS: 3.8% | |
Insurance: 3.8% | |
Samsung Fire & Marine
Insurance Co., Ltd., Pfd. | | | 53,998 | | | | 8,253,346 | | |
Capital Markets: 0.0% | |
Shinyoung Securities Co., Ltd., Pfd. | | | 2,298 | | | | 108,186 | | |
Total Financials | | | | | 8,361,532 | | |
CONSUMER STAPLES: 3.6% | |
Household Products: 2.0% | |
LG Household & Health Care, Ltd., Pfd. | | | 17,959 | | | | 4,464,145 | | |
Personal Products: 1.6% | |
Amorepacific Corp., Pfd. | | | 3,441 | | | | 3,395,509 | | |
Total Consumer Staples | | | | | 7,859,654 | | |
| | | Shares | | Value | |
INFORMATION TECHNOLOGY: 2.3% | |
Technology Hardware, Storage & Peripherals: 2.3% | |
Samsung Electronics Co., Ltd., Pfd. | | | 5,338 | | | $ | 5,058,364 | | |
Total Information Technology | | | | | 5,058,364 | | |
MATERIALS: 1.9% | |
Chemicals: 1.9% | |
LG Chem, Ltd., Pfd. | | | 31,936 | | | | 4,108,096 | | |
Total Materials | | | | | 4,108,096 | | |
ENERGY: 0.6% | |
Oil, Gas & Consumable Fuels: 0.6% | |
S-Oil Corp., Pfd. | | | 43,425 | | | | 1,243,607 | | |
Total Energy | | | | | 1,243,607 | | |
TOTAL PREFERRED EQUITIES | | | | | 35,054,176 | | |
(Cost $22,912,146) | | | | | | | |
TOTAL INVESTMENTS: 98.0% | | | | | 214,870,474 | | |
(Cost $159,225,921c) | | | | | |
CASH AND OTHER ASSETS,
LESS LIABILITIES: 2.0% | | | | | 4,333,902 | | |
NET ASSETS: 100.0% | | | | $ | 219,204,376 | | |
a Certain securities were fair valued under the valuation polices approved by the Board of Trustees (Note 2-A).
b Non-income producing security.
c Cost for federal income tax purposes is $160,653,134 and net unrealized appreciation consists of:
Gross unrealized appreciation | | $ | 60,212,026 | | |
Gross unrealized depreciation | | | (5,994,686 | ) | |
Net unrealized appreciation | | $ | 54,217,340 | | |
ADR American Depositary Receipt
Pfd. Preferred
See accompanying notes to financial statements.
matthewsasia.com | 800.789.ASIA 63

ASIA SMALL COMPANY STRATEGIES
PORTFOLIO MANAGERS
Lydia So, CFA
Lead Manager
Kenichi Amaki | | Beini Zhou, CFA | |
Co-Manager | | Co-Manager | |
FUND FACTS
| | | Investor Class | | Institutional Class | |
Ticker | | MSMLX | | MISMX | |
CUSIP | | 577125206 | | 577125867 | |
Inception | | 9/15/08 | | 4/30/13 | |
NAV | | $21.46 | | $21.46 | |
Initial Investment | | $2,500 | | $3 million | |
Gross Expense Ratio1 | | 1.47% | | 1.27% | |
Portfolio Statistics
Total # of Positions | | 79 | |
Net Assets | | $676.3 million | |
Weighted Average Market Cap | | $1.2 billion | |
Portfolio Turnover | | 21.70%2 | |
Benchmark
MSCI AC Asia ex Japan Small Cap Index
Redemption Fee
2% within first 90 calendar days of purchase
OBJECTIVE
Long-term capital appreciation.
STRATEGY
Under normal market conditions, the Fund seeks to achieve its investment objective by investing at least 80% of its total net assets, which include borrowings for investment purposes, in the common and preferred stocks of Small Companies located in Asia ex Japan, which consists of all countries and markets in Asia excluding Japan, but including all other developed, emerging and frontier countries and markets in the Asian region.
1 Prospectus expense ratios.
2 The lesser of fiscal year 2014 long-term purchase costs or sales proceeds divided by the average monthly market value of long-term securities.
Matthews Asia Small Companies Fund
Portfolio Manager Commentary
For the year ending December 31, 2014, the Matthews Asia Small Companies Fund returned 11.39% (Investor Class) and 11.65% (Institutional Class), outperforming its benchmark, the MSCI All Country Asia ex Japan Small Cap Index, which returned 2.56%. For the fourth quarter of the year, the Fund's performance fell –1.95% (Investor Class) and –1.86% (Institutional Class), versus a fall of –5.04% for the Index.
Market Environment:
Asia small capitalization equities started off strong in the first half of the year. However, various macroeconomic factors, such as concerns over the potential increase in U.S. interest rates, renewed worries over moderating global growth, and sharp corrections in commodity prices, somewhat dampened the risk appetite in Asian markets toward the second half of the year. Political developments dictated market movements, most noticeably in India where the victory of its Narendra Modi-led government propelled strong gains in the equity markets. Conversely in China, equities were still somewhat out of favor, due to the government's choice to focus on the long-term rebalancing of the economy over stimulating for short-term growth. Thailand, despite the May coup, was one the best performing markets in Asia. In Indonesia, the reform-minded Joko Widodo was elected to lead the country. While some uncertainties in the market have been removed, the broader direction as to which public policies will shift has yet to crystalize.
Performance Contributors and Detractors:
During the year, our overall stock selection along with an overweight in India, contributed the bulk of absolute performance to the portfolio. India's outperformance was due to a combination of improving company fundamentals, along with an overarching bullish sentiment thanks to the perception that the new political landscape would be conducive to investments and reforms. For example, Gujarat Pipavav Port and AIA Engineering, both industrial holdings, performed well thanks to impressive operational and profitability improvements, hence their valuation multiples expanded sharply. Another company-specific performance contributor was Sunny Optical Technology Group in China. The stock performed well, due to strong demand in camera modules for handsets and lens components installed in automobiles.
Broadly, almost all sectors performed well and contributed positively toward the Fund's performance. Our holdings in the consumer staples sector detracted from performance in an otherwise strong year. One of our long-term holdings, Super Group, a Singapore-based instant coffee manufacturer, underperformed due to intense competition and short-term operational issues that disrupted its production. While the stock was penalized by investors, we continue to hold the company due to its ongoing efforts to invest in its various brands and its distribution network, which should sustain its competitive positioning in the market.
Notable Portfolio Changes:
After the run-up in valuations in our holdings in India during the year, we have trimmed our positions in order to take profits. We believe that
64 MATTHEWS ASIA FUNDS
PERFORMANCE AS OF DECEMBER 31, 2014
| | | | | | | Average Annual Total Returns | | | |
| | 3 Months | | 1 Year | | 3 Years | | 5 Years | | Since
Inception | | Inception
Date | |
Investor Class (MSMLX) | | | -1.95 | % | | | 11.39 | % | | | 13.95 | % | | | 9.91 | % | | | 16.19 | % | | 9/15/08 | |
Institutional Class (MISMX) | | | -1.86 | % | | | 11.65 | % | | | n.a. | | | | n.a. | | | | 6.90 | % | | 4/30/13 | |
MSCI AC Asia ex Japan Small Cap Index3 | | | -5.04 | % | | | 2.56 | % | | | 10.50 | % | | | 4.28 | % | | | 9.85 | %4 | | | | | |
Lipper Pacific ex Japan Funds Category Average5 | | | -2.11 | % | | | 3.65 | % | | | 9.78 | % | | | 5.40 | % | | | 9.49 | %6 | | | | | |
Performance assumes reinvestment of all dividends and/or distributions before taxes. All performance quoted represents past performance and is no guarantee of future results. Investment return and principal value will fluctuate with market conditions so that when redeemed, shares may be worth more or less than their original cost. Current performance may be lower or higher than the return figures quoted. For the Fund's most recent month-end performance, visit matthewsasia.com.
GROWTH OF A $10,000 INVESTMENT SINCE INCEPTION—INVESTOR CLASS
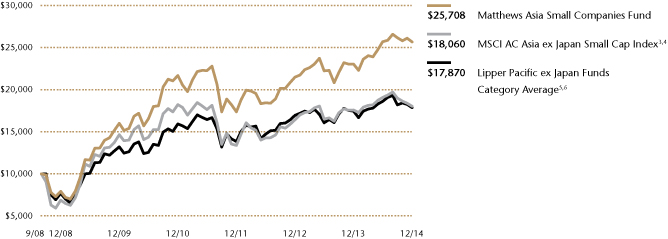
Plotted monthly. The performance data does not reflect the deduction of taxes that a shareholder would pay on dividends, capital gains distributions or redemption of Fund shares. Values are in US$.
3 It is not possible to invest directly in an index. Source: Index data from Morgan Stanley Capital International and Bloomberg; total return calculations performed by BNY Mellon Investment Servicing (US) Inc. Please see page 79 for index definition.
4 Calculated from 9/15/08.
5 The Lipper Category Average does not reflect sales charges and is based on total return, including reinvestment of dividends and capital gains for the stated periods.
6 Calculated from 9/30/08.
TOP TEN POSITIONS7
| | | Sector | | Country | | % of Net Assets | |
PChome Online, Inc. | | Information Technology | | Taiwan | | | 2.6 | % | |
Towngas China Co., Ltd. | | Utilities | | China/Hong Kong | | | 2.2 | % | |
Sunny Optical Technology Group Co., Ltd. | | Information Technology | | China/Hong Kong | | | 2.2 | % | |
Lee's Pharmaceutical Holdings, Ltd. | | Health Care | | China/Hong Kong | | | 2.2 | % | |
Vitasoy International Holdings, Ltd. | | Consumer Staples | | China/Hong Kong | | | 1.9 | % | |
Yungtay Engineering Co., Ltd. | | Industrials | | Taiwan | | | 1.8 | % | |
i-SENS, Inc. | | Health Care | | South Korea | | | 1.8 | % | |
Security Bank Corp. | | Financials | | Philippines | | | 1.7 | % | |
TSC Auto ID Technology Co., Ltd. | | Information Technology | | Taiwan | | | 1.7 | % | |
Kerry Logistics Network, Ltd. | | Industrials | | China/Hong Kong | | | 1.7 | % | |
| % OF ASSETS IN TOP 10 | | | | | | | 19.8 | % | |
7 Holdings may combine more than one security from same issuer and related depositary receipts.
matthewsasia.com | 800.789.ASIA 65
COUNTRY ALLOCATION (%)8
China/Hong Kong | | | 25.0 | | |
India | | | 15.0 | | |
Taiwan | | | 13.1 | | |
South Korea | | | 9.3 | | |
Indonesia | | | 7.7 | | |
Singapore | | | 6.9 | | |
Thailand | | | 6.9 | | |
Malaysia | | | 5.3 | | |
Philippines | | | 5.1 | | |
Japan | | | 0.8 | | |
Vietnam | | | 0.0 | | |
Cash and Other Assets, Less Liabilities | | | 4.9 | | |
SECTOR ALLOCATION (%)
Industrials | | | 19.9 | | |
Consumer Staples | | | 16.9 | | |
Consumer Discretionary | | | 14.0 | | |
Financials | | | 13.5 | | |
Information Technology | | | 13.2 | | |
Health Care | | | 12.6 | | |
Materials | | | 2.8 | | |
Utilities | | | 2.2 | | |
Cash and Other Assets, Less Liabilities | | | 4.9 | | |
MARKET CAP EXPOSURE (%)9,10
Large Cap (over $5B) | | | 0.0 | | |
Mid Cap ($1B–$5B) | | | 49.9 | | |
Small Cap (under $1B) | | | 45.2 | | |
Cash and Other Assets, Less Liabilities | | | 4.9 | | |
8 Not all countries where the Fund may invest are included in the benchmark index.
9 Source: FactSet Research Systems. Percentage values in data are rounded to the nearest tenth of one percent; the values may not sum to 100% due to rounding.
10 The Fund defines Small Companies as companies with market capitalization generally between $100 million and $3 billion or the largest company included in the Fund's primary benchmark, the MSCI All Country Asia ex Japan Small Cap Index. The Portfolio's market cap exposure breakdown presented is used for comparison purposes and the definition of the capitalization breakdown is from MSCI.
Matthews Asia Small Companies Fund
Portfolio Manager Commentary (continued)
the company fundamentals of our holdings in India remain strong. However, valuations might be stretched as much optimism is attached to the newly elected government's potential reforms to re-ignite the country's growth momentum. After short-term share price weakness, we added to several existing positions, such as Malaysian convenience store operator, 7-Eleven Malaysia Holdings. We like the company's ability to enhance store efficiencies and profitability. We believe that its business model is well-positioned to capitalize on changing consumption patterns among the middle class. Toward the end of the year, we initiated a position in Ezwelfare in Korea, an online benefits package management company. We believe that the company's growth will be driven by increased adoption of its services for employees by the private sector in Korea. We have witnessed similar industry evolution in other advanced countries.
Outlook:
Looking ahead, uncertainties over the direction of monetary policy by various central banks might continue to affect investor sentiment. To be sure, certain economies in Asia such as Indonesia and to some extent India could be more vulnerable to tighter U.S monetary policy. On the other hand, lower commodity prices might provide tailwinds for some businesses, which in turn may be favorable for company profitability. As always, we continue to seek out businesses that have strong franchises, which can withstand the varying phases within business cycles, and are well positioned to adapt to Asia's dynamic economic landscape. Our approach to selecting companies remains the same; we maintain a commitment to identifying companies that are capable of expanding sensibly while focusing on sustainable return on capital. This approach will continue to be core to our strategy.
Investing in small- and mid-size companies is more risky than investing in large companies as they may be more volatile and less liquid than larger companies.
66 MATTHEWS ASIA FUNDS
Matthews Asia Small Companies Fund December 31, 2014
Schedule of Investmentsa
COMMON EQUITIES: 95.1%
| | | Shares | | Value | |
CHINA/HONG KONG: 25.0% | |
Towngas China Co., Ltd. | | | 14,735,000 | | | $ | 14,894,290 | | |
Sunny Optical Technology Group Co., Ltd. | | | 8,609,000 | | | | 14,782,665 | | |
Lee's Pharmaceutical Holdings, Ltd. | | | 10,010,000 | | | | 14,570,889 | | |
Vitasoy International Holdings, Ltd. | | | 8,862,000 | | | | 12,815,923 | | |
Kerry Logistics Network, Ltd. | | | 7,131,500 | | | | 11,266,666 | | |
Airtac International Group | | | 1,221,520 | | | | 10,962,155 | | |
Fairwood Holdings, Ltd. | | | 4,440,500 | | | | 10,845,502 | | |
Minth Group, Ltd. | | | 5,122,000 | | | | 10,569,037 | | |
Pacific Online, Ltd. | | | 21,297,000 | | | | 9,914,592 | | |
51job, Inc. ADRb | | | 247,800 | | | | 8,883,630 | | |
Haitian International Holdings, Ltd. | | | 4,079,000 | | | | 8,549,150 | | |
Stelux Holdings International, Ltd. | | | 34,119,000 | | | | 7,895,395 | | |
China Biologic Products, Inc.b | | | 115,154 | | | | 7,741,803 | | |
Convenience Retail Asia, Ltd. | | | 11,292,000 | | | | 7,295,354 | | |
Goldpac Group, Ltd. | | | 10,045,000 | | | | 6,895,951 | | |
YGM Trading, Ltd. | | | 3,495,000 | | | | 6,336,804 | | |
Lifetech Scientific Corp.b | | | 3,946,000 | | | | 5,058,405 | | |
Total China/Hong Kong | | | | | 169,278,211 | | |
INDIA: 15.0% | |
GRUH Finance, Ltd. | | | 2,565,409 | | | | 11,093,166 | | |
Mindtree, Ltd. | | | 518,747 | | | | 10,542,384 | | |
Bajaj Corp., Ltd. | | | 1,791,087 | | | | 10,001,618 | | |
Emami, Ltd. | | | 770,282 | | | | 9,601,213 | | |
Gujarat Pipavav Port, Ltd.b | | | 2,887,879 | | | | 9,442,954 | | |
Supreme Industries, Ltd. | | | 989,886 | | | | 9,366,849 | | |
Berger Paints India, Ltd. | | | 1,462,571 | | | | 9,298,720 | | |
AIA Engineering, Ltd. | | | 543,758 | | | | 9,282,326 | | |
Ipca Laboratories, Ltd. | | | 697,251 | | | | 8,048,475 | | |
Page Industries, Ltd. | | | 43,016 | | | | 7,995,918 | | |
CRISIL, Ltd. | | | 217,039 | | | | 6,529,823 | | |
Total India | | | | | 101,203,446 | | |
TAIWAN: 13.1% | |
PChome Online, Inc. | | | 1,617,841 | | | | 17,369,112 | | |
Yungtay Engineering Co., Ltd. | | | 4,815,000 | | | | 12,039,416 | | |
TSC Auto ID Technology Co., Ltd. | | | 1,411,000 | | | | 11,390,912 | | |
Sinmag Equipment Corp. | | | 1,841,253 | | | | 11,101,538 | | |
Voltronic Power Technology Corp. | | | 1,185,600 | | | | 10,639,043 | | |
Sporton International, Inc. | | | 2,061,660 | | | | 10,096,072 | | |
St. Shine Optical Co., Ltd. | | | 470,492 | | | | 7,675,913 | | |
Addcn Technology Co., Ltd. | | | 601,000 | | | | 6,325,420 | | |
Aerospace Industrial Development Corp.b | | | 1,344,000 | | | | 1,551,426 | | |
Total Taiwan | | | | | 88,188,852 | | |
| | | Shares | | Value | |
SOUTH KOREA: 9.3% | |
i-SENS, Inc.b | | | 207,375 | | | $ | 11,931,891 | | |
Hy-Lok Corp. | | | 356,290 | | | | 10,497,707 | | |
Pyeong Hwa Automotive Co., Ltd. | | | 577,224 | | | | 9,500,857 | | |
Binggrae Co., Ltd. | | | 121,501 | | | | 8,391,492 | | |
SaraminHR Co., Ltd.† | | | 682,434 | | | | 6,979,225 | | |
Ezwelfare Co., Ltd.† | | | 742,858 | | | | 6,928,528 | | |
Hanssem Co., Ltd. | | | 48,843 | | | | 5,114,918 | | |
Medy-Tox, Inc. | | | 11,920 | | | | 3,471,120 | | |
Total South Korea | | | | | 62,815,738 | | |
INDONESIA: 7.7% | |
PT Bank Tabungan Pensiunan Nasionalb | | | 23,670,000 | | | | 7,527,960 | | |
PT Selamat Sempurna | | | 18,236,600 | | | | 6,978,814 | | |
PT Astra Otoparts | | | 19,902,125 | | | | 6,747,459 | | |
PT AKR Corporindo | | | 20,237,600 | | | | 6,725,365 | | |
PT Arwana Citramulia | | | 90,542,900 | | | | 6,330,309 | | |
PT Wismilak Inti Makmur† | | | 107,640,100 | | | | 5,425,934 | | |
PT Modern Internasional | | | 86,889,100 | | | | 4,735,579 | | |
PT Ultrajaya Milk Industry & Trading Co. | | | 13,694,500 | | | | 4,125,050 | | |
PT Sumber Alfaria Trijaya | | | 88,890,000 | | | | 3,580,643 | | |
Total Indonesia | | | | | 52,177,113 | | |
THAILAND: 6.9% | |
Supalai Public Co., Ltd. | | | 12,090,800 | | | | 8,796,591 | | |
Bangkok Chain Hospital Public Co., Ltd. | | | 36,818,675 | | | | 8,790,811 | | |
PTG Energy Public Co., Ltd. | | | 38,782,100 | | | | 6,942,497 | | |
Tisco Financial Group Public Co., Ltd. | | | 4,931,510 | | | | 6,358,008 | | |
Aeon Thana Sinsap Thailand
Public Co., Ltd. | | | 1,782,700 | | | | 5,867,744 | | |
Siam Global House Public Co., Ltd. | | | 17,623,417 | | | | 5,814,350 | | |
Oishi Group Public Co., Ltd. | | | 1,176,400 | | | | 2,484,415 | | |
Aeon Thana Sinsap Thailand
Public Co., Ltd. NVDR | | | 492,800 | | | | 1,622,048 | | |
Total Thailand | | | | | 46,676,464 | | |
SINGAPORE: 6.9% | |
Raffles Medical Group, Ltd. | | | 3,672,000 | | | | 10,769,476 | | |
ARA Asset Management, Ltd. | | | 8,009,000 | | | | 10,251,961 | | |
Petra Foods, Ltd. | | | 3,396,000 | | | | 9,732,731 | | |
Super Group, Ltd. | | | 9,772,000 | | | | 8,424,458 | | |
OSIM International, Ltd. | | | 5,021,000 | | | | 7,469,079 | | |
Total Singapore | | | | | 46,647,705 | | |
MALAYSIA: 5.3% | |
Alliance Financial Group BHD | | | 8,179,100 | | | | 10,994,357 | | |
7-Eleven Malaysia Holdings BHDb | | | 24,525,100 | | | | 10,521,278 | | |
KPJ Healthcare BHD | | | 6,341,293 | | | | 6,686,835 | | |
Karex BHD | | | 4,474,800 | | | | 4,325,704 | | |
Oldtown BHD | | | 8,166,625 | | | | 3,486,737 | | |
Total Malaysia | | | | | 36,014,911 | | |
matthewsasia.com | 800.789.ASIA 67
Matthews Asia Small Companies Fund December 31, 2014
Schedule of Investmentsa (continued)
COMMON EQUITIES: (continued)
| | | Shares | | Value | |
PHILIPPINES: 5.1% | |
Security Bank Corp. | | | 3,409,327 | | | $ | 11,548,187 | | |
Vista Land & Lifescapes, Inc. | | | 67,208,600 | | | | 10,802,240 | | |
RFM Corp. | | | 82,429,500 | | | | 9,225,507 | | |
Philippine Seven Corp. | | | 1,454,751 | | | | 2,757,471 | | |
Total Philippines | | | | | 34,333,405 | | |
JAPAN: 0.8% | |
econtext Asia, Ltd.b | | | 15,162,000 | | | | 5,393,911 | | |
Total Japan | | | | | 5,393,911 | | |
VIETNAM: 0.0% | |
DHG Pharmaceutical JSC | | | 50,000 | | | | 224,430 | | |
Total Vietnam | | | | | 224,430 | | |
TOTAL COMMON EQUITIES | | | | | 642,954,186 | | |
(Cost $538,800,741) | | | | | |
WARRANTS: 0.0%
| | | Shares | | Value | |
MALAYSIA: 0.0% | |
KPJ Healthcare BHD, expires 1/23/19 | | | 415,786 | | | $ | 56,485 | | |
Total Malaysia | | | | | 56,485 | | |
TOTAL WARRANTS | | | | | 56,485 | | |
(Cost $0) | | | | | |
TOTAL INVESTMENTS: 95.1% | | | | | 643,010,671 | | |
(Cost $538,800,741c) | |
CASH AND OTHER ASSETS,
LESS LIABILITIES: 4.9% | | | | | 33,239,610 | | |
NET ASSETS: 100.0% | | | | $ | 676,250,281 | | |
a Certain securities were fair valued under the valuation polices approved by the Board of Trustees (Note 2-A).
b Non-income producing security.
c Cost for federal income tax purposes is $538,800,741 and net unrealized appreciation consists of:
Gross unrealized appreciation | | $ | 137,597,270 | | |
Gross unrealized depreciation | | | (33,387,340 | ) | |
Net unrealized appreciation | | $ | 104,209,930 | | |
† Affiliated Issuer, as defined under the Investment Company Act of 1940 (ownership of 5% or more of the outstanding voting securities of this issuer)
ADR American Depositary Receipt
BHD Berhad
JSC Joint Stock Co.
NVDR Non-voting Depositary Receipt
See accompanying notes to financial statements.
68 MATTHEWS ASIA FUNDS

ASIA SMALL COMPANY STRATEGIES
PORTFOLIO MANAGERS
Richard H. Gao
Lead Manager
Henry Zhang, CFA
Co-Manager
FUND FACTS
| | | Investor Class | |
Ticker | | MCSMX | |
CUSIP | | 577125404 | |
Inception | | 5/31/11 | |
NAV | | $9.21 | |
Initial Investment | | $2,500 | |
Gross Expense Ratio1 | | 1.90% | |
After Fee Waiver and
Reimbursement2 | | 1.67% | |
Portfolio Statistics
Total # of Positions | | 48 | |
Net Assets | | $22.1 million | |
Weighted Average Market Cap | | $1.9 billion | |
Portfolio Turnover | | 32.42%3 | |
Benchmark
MSCI China Small Cap Index
Redemption Fee
2% within first 90 calendar days of purchase
OBJECTIVE
Long-term capital appreciation.
STRATEGY
Under normal market conditions, the Fund seeks to achieve its investment objective by investing at least 80% of its total net assets, which include borrowings for investment purposes, in the common and preferred stocks of Small Companies located in China. China includes its administrative and other districts, such as Hong Kong.
1 Actual 2014 expense ratios.
2 Effective May 1, 2014, Matthews has contractually agreed to waive fees and reimburse expenses until August 31, 2015 to the extent needed to limit Total Annual Fund Operating Expenses to 1.50%. If the expenses fall below the expense limitation in a year within three years after Matthews has made such a waiver or reimbursement, the Fund may reimburse Matthews up to an amount not to cause the expenses for that year to exceed the expense limitation. The fee waiver and expense reimbursement may be terminated at any time by the Board of Trustees or the Trust on behalf of the Fund on 60 days' written notice.
3 The lesser of fiscal year 2014 long-term purchase costs or sales proceeds divided by the average monthly market value of long-term securities.
Matthews China Small Companies Fund
Portfolio Manager Commentary
For the year ending December 31, 2014, the Matthews China Small Companies Fund was down –3.33%, while its benchmark, the MSCI China Small Cap Index, declined –0.34%. For the fourth quarter of the year, the Fund lost –1.63% versus –4.33% for the Index.
Market Environment:
China's economic growth decelerated in 2014 as its drivers gradually shift from manufacturing to services, and from fixed asset investment to domestic consumption. However, the government has made it clear that its priority is slow and sustainable growth, to benefit the country over the long-run. It has also indicated that employment and income growth are more important than headline GDP growth.
During the fourth quarter, China's economy remained sluggish, while service industries showed continued resilience in the face of weak manufacturing activity. The much-anticipated Shanghai-Hong Kong Connect program was launched in mid-November, enabling overseas and Mainland China investors mutual access between the Mainland and Hong Kong equity markets. In late November, China's central bank cut both deposit and lending rates for the first time in over two years in an effort to boost growth. China's A-share markets staged a strong rally following these two significant events, while Hong Kong-listed companies remained relatively flat.
Performance Contributors and Detractors:
For both the fourth quarter and for the full year, electronic payment solution provider PAX Global Technology was the top contributor to Fund performance. PAX has maintained its leadership position in China and has gained strongholds in several large developing markets. Through its innovative products and technology, the firm continues to break into new markets and benefit from the growing penetration of electronic payment.
Conversely, contact lens provider Ginko International was one of the largest detractors to Fund performance for both the last quarter and 2014. The health care company experienced a sharp slowdown in growth during the second half of the year due to the firm's tightening credit terms to its distributors. In addition, Ginko's business was negatively impacted following stronger government enforcement over regulations for the contact lens market and a prolonged license renewal process for retail outlets for contact lenses. We believe such issues are short term and, therefore, continue to hold the company, while keeping a close watch on its future operational results.
Notable Portfolio Changes:
During the quarter, we exited Goodbaby and Digital China as these two companies failed to deliver satisfactory results for several reporting periods. On the other hand, we initiated a position in China Biologic Products, a producer of plasma products. The plasma industry is heavily regulated with very high entry barriers. As a result, China Biologic's key products have experienced a supply shortage in the market. We believe China Biologic will continue to benefit from increasing capacity,
matthewsasia.com | 800.789.ASIA 69
PERFORMANCE AS OF DECEMBER 31, 2014
| | | | | | | Average Annual
Total Returns | |
| |
| | | 3 Months | | 1 Year | | 3 Years | | Since
Inception | | Inception
date | |
Investor Class (MCSMX) | | | -1.63 | % | | | -3.33 | % | | | 11.25 | % | | | -0.83 | % | | 5/31/11 | |
MSCI China Small Cap Index4 | | | -4.33 | % | | | -0.34 | % | | | 13.30 | % | | | -1.55 | % | | | | | |
Lipper China Region Funds Category Average5 | | | 4.88 | % | | | 3.43 | % | | | 10.84 | % | | | 0.80 | % | | | | | |
Performance assumes reinvestment of all dividends and/or distributions before taxes. All performance quoted represents past performance and is no guarantee of future results. Investment return and principal value will fluctuate with market conditions so that when redeemed, shares may be worth more or less than their original cost. Current performance may be lower or higher than the return figures quoted. Returns would have been lower if certain of the Fund's fees and expenses had not been waived. For the Fund's most recent month-end performance, visit matthewsasia.com.
GROWTH OF A $10,000 INVESTMENT SINCE INCEPTION—INVESTOR CLASS
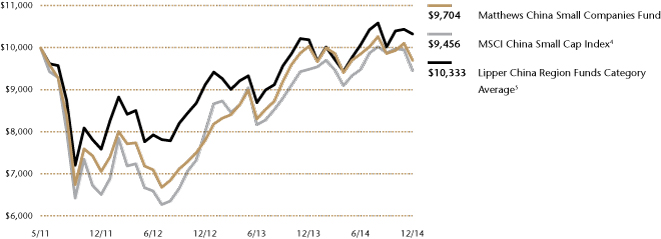
Plotted monthly. The performance data does not reflect the deduction of taxes that a shareholder would pay on dividends, capital gains distributions or redemption of Fund shares. Values are in US$.
4 It is not possible to invest directly in an index. Source: Index data from Morgan Stanley Capital International and Bloomberg; total return calculations performed by BNY Mellon Investment Servicing (US) Inc. Please see page 79 for index definition.
5 The Lipper Category Average does not reflect sales charges and is based on total return, including reinvestment of dividends and capital gains for the stated periods.
TOP TEN POSITIONS6
| | | Sector | | % of Net Assets | |
Towngas China Co., Ltd. | | Utilities | | | 6.6 | % | |
Lee's Pharmaceutical Holdings, Ltd. | | Health Care | | | 5.3 | % | |
Sino Biopharmaceutical, Ltd. | | Health Care | | | 5.0 | % | |
Sunny Optical Technology Group Co., Ltd. | | Information Technology | | | 4.9 | % | |
Minth Group, Ltd. | | Consumer Discretionary | | | 4.2 | % | |
PAX Global Technology, Ltd. | | Information Technology | | | 4.2 | % | |
Airtac International Group | | Industrials | | | 4.1 | % | |
Shenzhen Chiwan Petroleum | | Industrials | | | 4.1 | % | |
Franshion Properties China, Ltd. | | Financials | | | 3.6 | % | |
Lijun International Pharmaceutical Holding Co., Ltd. | | Health Care | | | 3.5 | % | |
| % OF ASSETS IN TOP 10 | | | | | 45.5 | % | |
6 Holdings may combine more than one security from same issuer and related depositary receipts.
70 MATTHEWS ASIA FUNDS
Matthews China Small Companies Fund
Portfolio Manager Commentary (continued)
improving operating efficiency and new plasma product development. We trimmed positions in a few select consumer companies where we believe valuations have run ahead of their fundamentals. The Fund remains significantly overweight in the health care sector compared to the benchmark, expressing our strong conviction in the long-term growth of the sector.
Outlook:
While China may continue to experience modest growth in 2015, the services sector is likely to remain robust. The sharp drop in commodity prices has been largely positive for China, given that the country is the world's largest importer of commodities, such as crude oil, soybeans and iron ore. In light of the low-inflation environment, the government has more flexibility in stimulating the economy. Despite the November interest rate cut, the government has been fairly cautious in providing only targeted stimulus for certain sectors. We believe health care, education, e-commerce and other services-related businesses will continue to be the fastest-growing areas of the Chinese economy, and these are areas of the economy in which smaller companies, run by entrepreneurs, have an opportunity to thrive. We remain focused on finding small companies with sustainable growth and quality management teams.
Investing in small- and mid-size companies is more risky than investing in large companies as they may be more volatile and less liquid than larger companies.
COUNTRY ALLOCATION (%)
China/Hong Kong | | | 86.7 | | |
Taiwan | | | 11.2 | | |
Cash and Other Assets, Less Liabilities | | | 2.1 | | |
SECTOR ALLOCATION (%)
Industrials | | | 27.4 | | |
Health Care | | | 22.6 | | |
Consumer Discretionary | | | 21.0 | | |
Information Technology | | | 10.2 | | |
Financials | | | 8.7 | | |
Utilities | | | 6.6 | | |
Materials | | | 0.6 | | |
Energy | | | 0.5 | | |
Consumer Staples | | | 0.3 | | |
Cash and Other Assets, Less Liabilities | | | 2.1 | | |
MARKET CAP EXPOSURE (%)7,8
Large Cap (over $5B) | | | 3.8 | | |
Mid Cap ($1B–$5B) | | | 65.0 | | |
Small Cap (under $1B) | | | 29.1 | | |
Cash and Other Assets, Less Liabilities | | | 2.1 | | |
7 Source: FactSet Research Systems. Percentage values in data are rounded to the nearest tenth of one percent; the values may not sum to 100% due to rounding.
8 The Fund defines Small Companies as companies with market capitalization generally between $100 million and $3 billion or the largest company included in the Fund's primary benchmark, the MSCI China Small Cap Index. The Portfolio's market cap exposure breakdown presented is used for comparison purposes and the definition of the capitalization breakdown is from MSCI.
matthewsasia.com | 800.789.ASIA 71
Matthews China Small Companies Fund December 31, 2014
Schedule of Investmentsa
COMMON EQUITIES: 97.9%
| | | Shares | | Value | |
INDUSTRIALS: 27.4% | |
Machinery: 7.7% | |
Airtac International Group | | | 102,010 | | | $ | 915,457 | | |
Haitian International Holdings, Ltd. | | | 181,000 | | | | 379,357 | | |
Yungtay Engineering Co., Ltd. | | | 117,000 | | | | 292,547 | | |
CIMC Enric Holdings, Ltd. | | | 134,000 | | | | 105,731 | | |
| | | | | | 1,693,092 | | |
Electrical Equipment: 5.8% | |
Voltronic Power Technology Corp. | | | 59,200 | | | | 531,234 | | |
Boer Power Holdings, Ltd. | | | 567,000 | | | | 505,030 | | |
Zhuzhou CSR Times Electric Co., Ltd.
H Shares | | | 41,500 | | | | 242,161 | | |
| | | | | | 1,278,425 | | |
Professional Services: 5.7% | |
51job, Inc. ADRb | | | 19,224 | | | | 689,180 | | |
Sporton International, Inc. | | | 116,100 | | | | 568,549 | | |
| | | | | | 1,257,729 | | |
Air Freight & Logistics: 4.1% | |
Shenzhen Chiwan Petroleum B Sharesb,c | | | 356,584 | | | | 898,951 | | |
Transportation Infrastructure: 2.8% | |
Yuexiu Transport Infrastructure, Ltd. | | | 1,042,000 | | | | 633,566 | | |
Marine: 1.3% | |
SITC International Holdings Co., Ltd. | | | 540,000 | | | | 294,574 | | |
Total Industrials | | | | | 6,056,337 | | |
HEALTH CARE: 22.6% | |
Pharmaceuticals: 17.4% | |
Lee's Pharmaceutical Holdings, Ltd. | | | 800,000 | | | | 1,164,507 | | |
Sino Biopharmaceutical, Ltd. | | | 1,216,000 | | | | 1,095,745 | | |
Lijun International Pharmaceutical
Holding Co., Ltd. | | | 1,666,000 | | | | 762,004 | | |
CSPC Pharmaceutical Group, Ltd. | | | 686,000 | | | | 602,970 | | |
Luye Pharma Group, Ltd.b | | | 106,500 | | | | 136,129 | | |
Tianjin ZhongXin Pharmaceutical Group
Corp., Ltd. S Shares | | | 79,000 | | | | 73,967 | | |
| | | | | | 3,835,322 | | |
Life Sciences Tools & Services: 2.9% | |
WuXi PharmaTech Cayman, Inc. ADRb | | | 19,200 | | | | 646,464 | | |
Health Care Equipment & Supplies: 1.6% | |
Ginko International Co., Ltd. | | | 33,000 | | | | 348,242 | | |
Biotechnology: 0.7% | |
China Biologic Products, Inc.b | | | 2,200 | | | | 147,906 | | |
Total Health Care | | | | | 4,977,934 | | |
CONSUMER DISCRETIONARY: 21.0% | |
Diversified Consumer Services: 6.0% | |
China Distance Education Holdings, Ltd. ADR | | | 42,660 | | | | 699,197 | | |
New Oriental Education & Technology
Group, Inc. ADRb | | | 16,600 | | | | 338,806 | | |
TAL Education Group ADRb | | | 10,400 | | | | 292,136 | | |
| | | | | | 1,330,139 | | |
| | | Shares | | Value | |
Hotels, Restaurants & Leisure: 5.3% | |
China Lodging Group, Ltd. ADSb | | | 21,600 | | | $ | 567,648 | | |
Tao Heung Holdings, Ltd. | | | 514,000 | | | | 239,656 | | |
Homeinns Hotel Group ADRb | | | 6,100 | | | | 183,122 | | |
Future Bright Holdings, Ltd. | | | 582,000 | | | | 181,837 | | |
| | | | | | 1,172,263 | | |
Auto Components: 4.2% | |
Minth Group, Ltd. | | | 452,000 | | | | 932,683 | | |
Multiline Retail: 2.1% | |
Springland International Holdings, Ltd. | | | 1,334,000 | | | | 461,734 | | |
Specialty Retail: 2.1% | |
Formosa Optical Technology Co., Ltd. | | | 172,000 | | | | 457,198 | | |
Textiles, Apparel & Luxury Goods: 1.0% | |
ANTA Sports Products, Ltd. | | | 109,000 | | | | 191,609 | | |
China Dongxiang Group Co., Ltd. | | | 179,000 | | | | 31,722 | | |
| | | | | | 223,331 | | |
Internet & Catalog Retail: 0.3% | |
Jumei International Holding, Ltd. ADRb | | | 3,800 | | | | 51,756 | | |
Total Consumer Discretionary | | | | | 4,629,104 | | |
INFORMATION TECHNOLOGY: 10.2% | |
Electronic Equipment, Instruments & Components: 9.1% | |
Sunny Optical Technology Group Co., Ltd. | | | 625,000 | | | | 1,073,198 | | |
PAX Global Technology, Ltd.b | | | 896,000 | | | | 917,778 | | |
China High Precision Automation
Group, Ltd. b,c | | | 195,000 | | | | 7,544 | | |
| | | | | | 1,998,520 | | |
Internet Software & Services: 0.9% | |
Sina Corp.b | | | 4,000 | | | | 149,640 | | |
HC International, Inc.b | | | 62,000 | | | | 57,805 | | |
| | | | | | 207,445 | | |
Technology Hardware, Storage & Peripherals: 0.2% | |
Goldpac Group, Ltd. | | | 63,000 | | | | 43,250 | | |
Total Information Technology | | | | | 2,249,215 | | |
FINANCIALS: 8.7% | |
Real Estate Management & Development: 7.5% | |
Franshion Properties China, Ltd. | | | 2,776,000 | | | | 792,218 | | |
KWG Property Holding, Ltd. | | | 724,000 | | | | 493,010 | | |
K Wah International Holdings, Ltd. | | | 688,000 | | | | 363,122 | | |
| | | | | | 1,648,350 | | |
Diversified Financial Services: 1.2% | |
Chailease Holding Co., Ltd. | | | 109,890 | | | | 272,157 | | |
Total Financials | | | | | 1,920,507 | | |
72 MATTHEWS ASIA FUNDS
Matthews China Small Companies Fund December 31, 2014
Schedule of Investmentsa (continued)
COMMON EQUITIES: (continued)
| | | Shares | | Value | |
UTILITIES: 6.6% | |
Gas Utilities: 6.6% | |
Towngas China Co., Ltd. | | | 1,451,000 | | | $ | 1,466,686 | | |
Total Utilities | | | | | 1,466,686 | | |
MATERIALS: 0.6% | |
Containers & Packaging: 0.6% | |
Greatview Aseptic Packaging Co., Ltd. | | | 236,000 | | | | 121,226 | | |
Total Materials | | | | | 121,226 | | |
ENERGY: 0.5% | |
Energy Equipment & Services: 0.5% | |
Hilong Holding, Ltd. | | | 438,000 | | | | 101,481 | | |
Total Energy | | | | | 101,481 | | |
CONSUMER STAPLES: 0.3% | |
Food Products: 0.3% | |
China Modern Dairy Holdings, Ltd.b | | | 270,000 | | | | 76,514 | | |
Total Consumer Staples | | | | | 76,514 | | |
TOTAL INVESTMENTS: 97.9% | | | | | 21,599,004 | | |
(Cost $17,816,405d) | | | | | |
CASH AND OTHER ASSETS,
LESS LIABILITIES: 2.1% | | | | | 468,908 | | |
NET ASSETS: 100.0% | | | | $ | 22,067,912 | | |
a Certain securities were fair valued under the valuation polices approved by the Board of Trustees (Note 2-A).
b Non-income producing security.
c Illiquid security, trading was halted at 12/31/14.
d Cost for federal income tax purposes is $17,957,002 and net unrealized appreciation consists of:
Gross unrealized appreciation | | $ | 5,283,087 | | |
Gross unrealized depreciation | | | (1,641,085 | ) | |
Net unrealized appreciation | | $ | 3,642,002 | | |
ADR American Depositary Receipt
ADS American Depositary Share
See accompanying notes to financial statements.
matthewsasia.com | 800.789.ASIA 73

PORTFOLIO MANAGERS
J. Michael Oh, CFA
Lead Manager
Lydia So, CFA
Co-Manager
FUND FACTS
| | | Investor Class | | Institutional Class | |
Ticker | | MATFX | | MITEX | |
CUSIP | | 577130883 | | 577125859 | |
Inception | | 12/27/99 | | 4/30/13 | |
NAV | | $13.61 | | $13.61 | |
Initial Investment | | $2,500 | | $3 million | |
| Gross Expense Ratio1 | | 1.16% | | 0.95% | |
Portfolio Statistics
Total # of Positions | | 53 | |
Net Assets | | $186.7 million | |
Weighted Average Market Cap | | $38.6 billion | |
Portfolio Turnover | | 62.99%2 | |
Benchmark
MSCI AC Asia Index
MSCI AC Asia Information Technology Index
Redemption Fee
2% within first 90 calendar days of purchase
OBJECTIVE
Long-term capital appreciation.
STRATEGY
Under normal market conditions, the Fund seeks to achieve its investment objective by investing at least 80% of its total net assets, which include borrowings for investment purposes, in the common and preferred stocks of companies located in Asia that derive more than 50% of their revenues from the sale of products or services in science- and technology-related industries and services. Asia consists of all countries and markets in Asia, including developed, emerging, and frontier countries and markets in the Asian region.
1 Actual 2014 expense ratios.
2 The lesser of fiscal year 2014 long-term purchase costs or sales proceeds divided by the average monthly market value of long-term securities.
Matthews Asia Science and Technology Fund
Portfolio Manager Commentary
For the year ending December 31, 2014, the Matthews Asia Science and Technology Fund gained 9.24% (Investor Class) and 9.54% (Institutional Class), outperforming its primary benchmark, the MSCI All Country Asia Index and its secondary benchmark, the MSCI All Country Asia Information Technology Index, which returned 0.84% and 8.19%, respectively. For the fourth quarter of the year, the Fund gained 0.02% (Investor Class) and 0.15% (Institutional Class), outperforming its primary benchmark, which fell by –1.03% but underperforming its secondary benchmark, which returned 0.54%.
Market Environment:
Toward the end of the fourth quarter, Internet companies, especially in China, saw some correction, despite having delivered strong performance for the year. This has been a record year for new listings in the Internet space in Asia, which has broadened the opportunity set for the sector. Science and technology continued to outperform the broader region's markets, during the year. We believe that an attractive supply-and-demand environment in semiconductors, and strong fundamentals within the Internet industry contributed to the sector's outperformance for the year.
Performance Contributors and Detractors:
During the year, the Fund outperformed its primary benchmark, the MSCI All Country Asia Index mostly due to the strong performance of Chinese Internet companies, despite their correction during the fourth quarter. Baidu was the biggest contributor to Fund performance, followed by Info Edge India. Baidu continues to focus on its core products, widening its competitive advantage in the search business, and remains the largest holding in the Fund. Info Edge is currently India's largest Internet company. Its main line of business continues to be a job-listings portal. But the company has been investing in various other Internet businesses and has built a strong portfolio of Internet companies in India.
XL Axiata, a major telecommunications service provider in Indonesia, was the largest detractor during the fourth quarter. While sales have been increasing in the country, rising competition has contributed to the company's weak performance. Ctrip.com International was another weak performer during the quarter. Competition is heating up in China as companies race to dominate the online travel industry. Ctrip.com reported strong topline growth but delivered weak profit growth. The company increased investments to meet higher spending among its competition in an effort to maintain its dominant position in the marketplace. We continue to believe Ctrip.com will become one of the biggest beneficiaries of China's fast-growing travel industry—which is still in the early stages of development. For the year, Softbank was the worst-performing stock in the Fund. Softbank's stock corrected as the company's U.S. investments did not fare as well as investors had expected. We exited this position in order to use the cash to participate in the Alibaba initial public offering.
74 MATTHEWS ASIA FUNDS
PERFORMANCE AS OF DECEMBER 31, 2014
| | | | | | | Average Annual Total Returns | | | |
| | 3 Months | | 1 Year | | 3 Years | | 5 Years | | 10 Years | | Since
Inception | | Inception
Date | |
Investor Class (MATFX) | | | 0.02 | % | | | 9.24 | % | | | 19.12 | % | | | 11.56 | % | | | 9.78 | % | | | 2.57 | % | | 12/27/99 | |
Institutional Class (MITEX) | | | 0.15 | % | | | 9.54 | % | | | n.a. | | | | n.a. | | | | n.a. | | | | 20.68 | % | | 4/30/13 | |
MSCI AC Asia Index3 | | | -1.03 | % | | | 0.84 | % | | | 9.97 | % | | | 5.71 | % | | | 5.29 | % | | | 1.90 | %4 | | | | | |
MSCI AC Asia Information Technology Index3 | | | 0.54 | % | | | 8.19 | % | | | 13.71 | % | | | 7.35 | % | | | 5.72 | % | | | -1.48 | %4 | | | | | |
Lipper Global Science and Technology Funds
Category Average5 | | | 2.93 | % | | | 11.37 | % | | | 19.05 | % | | | 13.00 | % | | | 9.57 | % | | | 1.58 | %4 | | | | | |
Performance assumes reinvestment of all dividends and/or distributions before taxes. All performance quoted represents past performance and is no guarantee of future results. Investment return and principal value will fluctuate with market conditions so that when redeemed, shares may be worth more or less than their original cost. Current performance may be lower or higher than the return figures quoted. For the Fund's most recent month-end performance, visit matthewsasia.com.
GROWTH OF A $10,000 INVESTMENT SINCE INCEPTION—INVESTOR CLASS
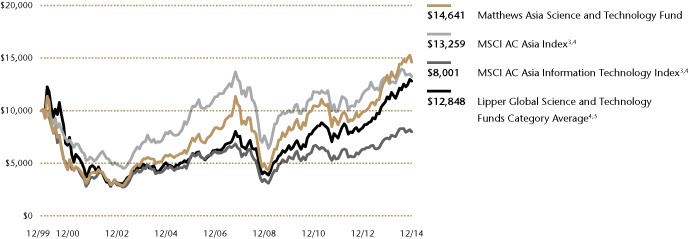
Plotted monthly. The performance data and graph do not reflect the deduction of taxes that a shareholder would pay on dividends, capital gains distributions or redemption of Fund shares. Values are in US$.
3 It is not possible to invest directly in an index. Source: Index data from Morgan Stanley Capital International and Bloomberg; total return calculations performed by BNY Mellon Investment Servicing (US) Inc. Please see page 79 for index definition.
4 Calculated from 12/31/99.
5 The Lipper Category Average does not reflect sales charges and is based on total return, including reinvestment of dividends and capital gains for the stated periods.
TOP TEN POSITIONS6
| | | Sector | | Country | | % of Net Assets | |
Baidu, Inc. | | Information Technology | | China/Hong Kong | | | 10.3 | % | |
Alibaba Group Holding, Ltd. | | Information Technology | | China/Hong Kong | | | 3.9 | % | |
Taiwan Semiconductor Manufacturing Co., Ltd. | | Information Technology | | Taiwan | | | 2.9 | % | |
Info Edge India, Ltd. | | Information Technology | | India | | | 2.9 | % | |
Samsung Electronics Co., Ltd. | | Information Technology | | South Korea | | | 2.7 | % | |
SK Hynix, Inc. | | Information Technology | | South Korea | | | 2.5 | % | |
51job, Inc. | | Industrials | | China/Hong Kong | | | 2.4 | % | |
WuXi PharmaTech Cayman, Inc. | | Health Care | | China/Hong Kong | | | 2.3 | % | |
PChome Online, Inc. | | Information Technology | | Taiwan | | | 2.2 | % | |
Ctrip.com International, Ltd. | | Consumer Discretionary | | China/Hong Kong | | | 2.2 | % | |
| % OF ASSETS IN TOP 10 | | | | | | | 34.3 | % | |
6 Holdings may combine more than one security from same issuer and related depositary receipts.
matthewsasia.com | 800.789.ASIA 75
COUNTRY ALLOCATION (%)7
China/Hong Kong | | | 39.6 | | |
Japan | | | 13.9 | | |
South Korea | | | 13.6 | | |
Taiwan | | | 11.8 | | |
India | | | 9.8 | | |
Indonesia | | | 3.0 | | |
Singapore | | | 2.6 | | |
United States | | | 2.1 | | |
Malaysia | | | 1.2 | | |
Cash and Other Assets, Less Liabilities | | | 2.4 | | |
SECTOR ALLOCATION (%)
Information Technology | | | 60.6 | | |
Health Care | | | 15.1 | | |
Industrials | | | 8.8 | | |
Consumer Discretionary | | | 7.0 | | |
Telecommunication Services | | | 4.6 | | |
Consumer Staples | | | 1.5 | | |
Cash and Other Assets, Less Liabilities | | | 2.4 | | |
MARKET CAP EXPOSURE (%)8
Large Cap (over $5B) | | | 54.6 | | |
Mid Cap ($1B–$5B) | | | 34.5 | | |
Small Cap (under $1B) | | | 8.5 | | |
Cash and Other Assets, Less Liabilities | | | 2.4 | | |
7 Not all countries are included in the benchmark index(es).
8 Source: FactSet Research Systems. Percentage values in data are rounded to the nearest tenth of one percent; the values may not sum to 100% due to rounding.
Matthews Asia Science and Technology Fund
Portfolio Manager Commentary (continued)
Notable Changes:
During the fourth quarter, we added three new positions—SouFun Holdings, China Biologic Products and momo.com. Beijing-based SouFun operates a real estate Internet portal, providing marketing for new developments and listing services for properties in major cities across China. The recent share price correction provided an attractive entry point. Also based in Beijing, China Biologic Products produces and manufactures human plasma-based pharmaceutical products. The plasma industry has relatively high barriers to entry and China is currently experiencing a shortage of plasma-related products. We, therefore, expect the plasma industry in China to see solid growth, going forward. Lastly, Taipei-based momo.com operates Internet shopping portals in Taiwan, and we believe this company should benefit from its rising domestic e-commerce sales.
Outlook:
We continue to expect solid growth from Internet companies in Asia, as the penetration rate remains relatively low, especially in the region's emerging countries. Overall, valuations for Internet firms have become more attractive after the recent correction. We expect fundamentals in this segment to remain solid as user growth should continue to be strong on the back of cheaper mobile computing devices. The Internet is still one of the best secular, growth industries in the region and we continue to have a significant allocation to it in the portfolio.
We continue to focus on companies that will likely benefit from Asia's productivity growth and higher penetration of health care products and services. We believe science and technology companies are well-positioned as the region's growth drivers continue to shift productivity from traditional capital and labor growth to service-driven growth.
76 MATTHEWS ASIA FUNDS
Matthews Asia Science and Technology Fund December 31, 2014
Schedule of Investmentsa
COMMON EQUITIES: 94.5%
| | | Shares | | Value | |
CHINA/HONG KONG: 39.6% | |
Baidu, Inc. ADRb | | | 84,100 | | | $ | 19,172,277 | | |
Alibaba Group Holding, Ltd. ADRb | | | 70,700 | | | | 7,348,558 | | |
51job, Inc. ADRb | | | 124,918 | | | | 4,478,311 | | |
WuXi PharmaTech Cayman, Inc. ADRb | | | 125,800 | | | | 4,235,686 | | |
Ctrip.com International, Ltd. ADRb | | | 90,500 | | | | 4,117,750 | | |
Airtac International Group | | | 441,220 | | | | 3,959,593 | | |
NetEase, Inc. ADR | | | 36,600 | | | | 3,628,524 | | |
CITIC Telecom International Holdings, Ltd. | | | 9,036,000 | | | | 3,378,806 | | |
Sunny Optical Technology Group Co., Ltd. | | | 1,929,000 | | | | 3,312,320 | | |
PAX Global Technology, Ltd.b | | | 3,203,000 | | | | 3,280,850 | | |
Hollysys Automation Technologies, Ltd.b | | | 118,400 | | | | 2,892,512 | | |
21Vianet Group, Inc. ADRb | | | 178,900 | | | | 2,767,583 | | |
Pacific Online, Ltd. | | | 5,577,000 | | | | 2,596,313 | | |
JD.com, Inc. ADRb | | | 111,500 | | | | 2,580,110 | | |
China Biologic Products, Inc.b | | | 33,800 | | | | 2,272,374 | | |
Luye Pharma Group, Ltd.b | | | 1,766,000 | | | | 2,257,322 | | |
SouFun Holdings, Ltd. ADR | | | 221,700 | | | | 1,638,363 | | |
Total China/Hong Kong | | | | | 73,917,252 | | |
JAPAN: 13.9% | |
Murata Manufacturing Co., Ltd. | | | 35,200 | | | | 3,841,059 | | |
Olympus Corp.b | | | 109,400 | | | | 3,832,320 | | |
Hoya Corp. | | | 108,200 | | | | 3,659,847 | | |
Asahi Intecc Co., Ltd. | | | 63,700 | | | | 3,104,192 | | |
FANUC Corp. | | | 17,900 | | | | 2,951,359 | | |
Rohm Co., Ltd. | | | 48,600 | | | | 2,928,309 | | |
Keyence Corp. | | | 6,500 | | | | 2,896,366 | | |
Omron Corp. | | | 60,800 | | | | 2,719,918 | | |
Total Japan | | | | | 25,933,370 | | |
TAIWAN: 11.8% | |
Taiwan Semiconductor Manufacturing
Co., Ltd. | | | 1,230,933 | | | | 5,422,840 | | |
PChome Online, Inc. | | | 387,174 | | | | 4,156,693 | | |
MediaTek, Inc. | | | 251,000 | | | | 3,648,895 | | |
Delta Electronics, Inc. | | | 545,000 | | | | 3,220,534 | | |
momo.com, Inc. | | | 213,000 | | | | 2,261,297 | | |
Ginko International Co., Ltd. | | | 192,000 | | | | 2,026,138 | | |
Largan Precision Co., Ltd. | | | 17,000 | | | | 1,272,557 | | |
Total Taiwan | | | | | 22,008,954 | | |
SOUTH KOREA: 10.5% | |
Samsung Electronics Co., Ltd. | | | 4,127 | | | | 4,998,819 | | |
SK Hynix, Inc.b | | | 107,877 | | | | 4,644,693 | | |
Hana Tour Service, Inc. | | | 57,127 | | | | 4,069,309 | | |
Naver Corp. | | | 4,766 | | | | 3,075,171 | | |
SaraminHR Co., Ltd. | | | 197,138 | | | | 2,016,123 | | |
SK Telecom Co., Ltd. ADR | | | 32,800 | | | | 885,928 | | |
Total South Korea | | | | | 19,690,043 | | |
INDIA: 9.8% | |
Info Edge India, Ltd. | | | 402,704 | | | | 5,409,592 | | |
Mindtree, Ltd. | | | 197,829 | | | | 4,020,436 | | |
Lupin, Ltd. | | | 137,532 | | | | 3,107,324 | | |
Ipca Laboratories, Ltd. | | | 203,446 | | | | 2,348,408 | | |
Blue Dart Express, Ltd. | | | 19,875 | | | | 1,997,151 | | |
Just Dial, Ltd. | | | 68,145 | | | | 1,452,090 | | |
Total India | | | | | 18,335,001 | | |
| | | Shares | | Value | |
INDONESIA: 3.0% | |
PT Tempo Scan Pacific | | | 10,174,900 | | | $ | 2,348,344 | | |
PT XL Axiata | | | 5,575,100 | | | | 2,186,182 | | |
PT Astra Graphia | | | 6,396,300 | | | | 980,397 | | |
Total Indonesia | | | | | 5,514,923 | | |
SINGAPORE: 2.6% | |
Raffles Medical Group, Ltd. | | | 886,000 | | | | 2,598,517 | | |
Singapore Telecommunications, Ltd. | | | 763,000 | | | | 2,239,638 | | |
Total Singapore | | | | | 4,838,155 | | |
UNITED STATES: 2.1% | |
Cognizant Technology Solutions Corp. Class Ab | | | 75,300 | | | | 3,965,298 | | |
Total United States | | | | | 3,965,298 | | |
MALAYSIA: 1.2% | |
Silverlake Axis, Ltd. | | | 2,329,000 | | | | 2,198,840 | | |
Total Malaysia | | | | | 2,198,840 | | |
TOTAL COMMON EQUITIES | | | | | 176,401,836 | | |
(Cost $119,657,173) | | | | | |
PREFERRED EQUITIES: 3.1%
SOUTH KOREA: 3.1% | |
Samsung Electronics Co., Ltd., Pfd. | | | 3,221 | | | | 3,052,265 | | |
LG Household & Health Care, Ltd., Pfd. | | | 11,281 | | | | 2,804,166 | | |
Total South Korea | | | | | 5,856,431 | | |
TOTAL PREFERRED EQUITIES | | | | | 5,856,431 | | |
(Cost $5,619,444) | | | | | |
TOTAL INVESTMENTS: 97.6% | | | | | 182,258,267 | | |
(Cost $125,276,617c) | | | | | |
CASH AND OTHER ASSETS,
LESS LIABILITIES: 2.4% | | | | | 4,441,917 | | |
NET ASSETS: 100.0% | | | | $ | 186,700,184 | | |
a Certain securities were fair valued under the valuation polices approved by the Board of Trustees (Note 2-A).
b Non-income producing security.
c Cost for federal income tax purposes is $125,361,869 and net unrealized appreciation consists of:
Gross unrealized appreciation | | $ | 59,638,996 | | |
Gross unrealized depreciation | | | (2,742,598 | ) | |
Net unrealized appreciation | | $ | 56,896,398 | | |
ADR American Depositary Receipt
Pfd. Preferred
See accompanying notes to financial statements.
matthewsasia.com | 800.789.ASIA 77
Fund Holdings: The Fund holdings shown in this report are as of December 31, 2014. Holdings are subject to change at any time, so holdings shown in this report may not reflect current Fund holdings. The Funds file complete schedules of portfolio holdings with the Securities and Exchange Commission (the "SEC") for the first and third quarters of each fiscal year on Form N-Q. The Funds' Form N-Q is filed with the SEC within 60 days of the end of the quarter to which it relates, and is available on the SEC's website at www.sec.gov. It may also be reviewed and copied at the Commission's Public Reference Room in Washington, D.C. Information on the operation of the Public Reference Room may be obtained by calling 800-SEC-0330. Complete schedules of investments are also available without charge, upon request, from the Funds by calling us at 800.789.ASIA (2472).
Proxy Voting Record: The Funds' Statement of Additional Information containing a description of the policies and procedures that the Funds have used to vote proxies relating to portfolio securities, along with each Fund's proxy voting record relating to portfolio securities held during the most recent 12-month period ended December 31, is available upon request, at no charge, at the Funds' website at matthewsasia.com or by calling 800.789.ASIA (2742), or on the SEC's website at www.sec.gov.
Shareholder Reports and Prospectuses: To reduce the Funds' expenses, we try to identify related shareholders in a household and send only one copy of the Funds' prospectus and financial reports to that address. This process, called "householding," will continue indefinitely unless you instruct us otherwise. At any time you may view the Funds' current prospectus, summary prospectus and financial reports on our website. If you prefer to receive individual copies of the Funds' prospectus or financial reports, please call us at 800.789.ASIA (2742).
Redemption Fee Policy: The Funds assess a redemption fee of 2.00% on the total redemption proceeds on most sales or exchanges of shares that take place within 90 calendar days after their purchase as part of the Funds' efforts to discourage and minimize the impact of any short-term trading and market timing activity. This fee is payable directly to the Funds. For purposes of determining whether the redemption fee applies, the shares that have been held longest will be redeemed first. The Funds may grant exemptions from the redemption fee in certain circumstances. For more information on this policy, please see the Funds' prospectus.
78 MATTHEWS ASIA FUNDS
The HSBC Asian Local Bond Index (ALBI) tracks the total return performance of a bond portfolio consisting of local-currency denominated, high quality and liquid bonds in Asia ex-Japan. The ALBI includes bonds from the following countries: Korea, Hong Kong, India, Singapore, Taiwan, Malaysia, Thailand, Philippines, Indonesia and China.
The MSCI All Country Asia ex Japan Index is a free float–adjusted market capitalization–weighted index of the stock markets of China, Hong Kong, India, Indonesia, Malaysia, Philippines, Singapore, South Korea, Taiwan and Thailand.
The MSCI All Country Asia Pacific Index is a free float– adjusted market capitalization–weighted index of the stock markets of Australia, China, Hong Kong, India, Indonesia, Japan, Malaysia, New Zealand, Philippines, Singapore, South Korea, Taiwan and Thailand.
The MSCI Emerging Markets (EM) Asia Index is a free float-adjusted market capitalization weighted index of the stock markets of China, India, Indonesia, Korea, Malaysia, the Philippines, Taiwan and Thailand.
The MSCI China Index is a free float–adjusted market capitalization–weighted index of Chinese equities that includes China-affiliated corporations and H shares listed on the Hong Kong exchange, and B shares listed on the Shanghai and Shenzhen exchanges.
The S&P Bombay Stock Exchange (BSE) 100 Index is a free float–adjusted market capitalization–weighted index of the 100 stocks listed on the Bombay Stock Exchange.
The MSCI Japan Index is a free float–adjusted market capitalization–weighted index of Japanese equities listed in Japan.
The Tokyo Stock Price Index (TOPIX) is a market capitalization–weighted index of all companies listed on the First Section of the Tokyo Stock Exchange.
The Korea Composite Stock Price Index (KOSPI) is a market capitalization–weighted index of all common stocks listed on the Korea Stock Exchange.
The MSCI All Country Asia ex Japan Small Cap Index is a free float–adjusted market capitalization–weighted small cap index of the stock markets of China, Hong Kong, India, Indonesia, Malaysia, Philippines, Singapore, South Korea, Taiwan and Thailand.
The MSCI China Small Cap Index is a free float–adjusted market capitalization–weighted small cap index of the Chinese equity securities markets, including H shares listed on the Hong Kong exchange, B shares listed on the Shanghai and Shenzhen exchanges, and Hong Kong-listed securities known as Red Chips (issued by entities owned by national or local governments in China) and P Chips (issued by companies controlled by individuals in China and deriving substantial revenues in China).
The MSCI All Country Asia Index is a free float–adjusted market capitalization–weighted index of the stock markets of China, Hong Kong, India, Indonesia, Japan, Malaysia, Philippines, Singapore, South Korea, Taiwan and Thailand.
The MSCI All Country Asia Information Technology Index is a free float–adjusted market capitalization–weighted index designed to measure the combined equity market performance of companies in the information technology sector of developed and emerging markets countries in Asia. Component companies include those of software and services, technology hardware and equipment, and semiconductors and semiconductor equipment.
matthewsasia.com | 800.789.ASIA 79
Disclosure of Fund Expenses (Unaudited)
We believe it is important for you to understand the impact of fees regarding your investment. All mutual funds have operating expenses. As a shareholder of a mutual fund, you incur ongoing costs, which include costs for portfolio management, administrative services, and shareholder reports (like this one), among others. Operating expenses, which are deducted from a fund's gross income, directly reduce the investment return of the fund. A fund's operating expenses are expressed as a percentage of its average net assets. This figure is known as the expense ratio. The following examples are intended to help you understand the ongoing fees (in dollars) of investing in your fund and to compare these costs with those of other mutual funds. The examples are based on an investment of $1,000 made at the beginning of the period shown and held for the entire period.
This table illustrates your fund's costs in two ways:
Actual Fund Return: This section helps you to estimate the actual operating expenses, after any applicable fee waivers, that you paid over the period. The "Ending Account Value" shown is derived from the fund's actual return for the past six month period, the "Expense Ratio" column shows the period's annualized expense ratio, and the "Operating Expenses Paid During Period" column shows the dollar amount that would have been paid by an investor who started with $1,000 in the fund at the beginning of the period. You may use the information here, together with your account value, to estimate the expenses that you paid over the period. To do so, simply divide your account value by $1,000 (for example, an $8,600 account value divided by $1,000 = 8.6), then multiply the result by the number given for your fund in the first line under the heading entitled "Operating Expenses Paid During Period."
Hypothetical 5% Return: This section is intended to help you compare your fund's costs with those of other mutual funds. It assumes that the fund had an annual return of 5% before operating expenses, but that the
expense ratio is unchanged. In this case, because the return used is not the fund's actual return, the results do not apply to your investment. This example is useful in making comparisons to other mutual funds because the Securities and Exchange Commission requires all mutual funds to calculate expenses based on an assumed 5% annual return. You can assess your fund's costs by comparing this hypothetical example with the hypothetical examples that appear in shareholder reports of other funds.
Please note that the operating expenses shown in the table are meant to highlight and help you compare your ongoing costs only and do not reflect any transactional costs such as sales charges (loads), redemption fees, or exchange fees. The Funds generally assess a redemption fee of 2.00% of the total redemption proceeds if you sell or exchange your shares within 90 calendar days after purchasing them. The redemption fee is paid directly to the Funds and is designed to discourage frequent short-term trading and market timing activity, and to minimize the impact of any such trading of Fund shares. For purposes of determining whether the redemption fee applies, the shares that have been held the longest will be redeemed first. The Funds may grant exemption from the redemption fee when the Funds have previously received assurances that transactions do not involve market timing activity. The Funds may also waive the imposition of redemption fees in certain circumstances.
For more information on this policy, please see the Funds' prospectus.
The Matthews Asia Funds does not charge any sales loads, exchange fees, or 12b-1 fees, but these may be present in other funds to which you compare this data. Therefore, the hypothetical portions of the table are useful in comparing ongoing costs only, and will not help you determine the relative total costs of owning different funds.
80 MATTHEWS ASIA FUNDS
December 31, 2014
| | | INVESTOR CLASS | | INSTITUTIONAL CLASS | |
| | | Beginning
Account
Value
7/1/14 | | Ending
Account
Value
12/31/14 | | Expense
Ratio1 | | Operating
Expenses
Paid During
Period
7/1/14–
12/31/142 | | Beginning
Account
Value
7/1/14 | | Ending
Account
Value
12/31/14 | | Expense
Ratio1 | | Operating
Expenses
Paid During
Period
7/1/14–
12/31/142 | |
ASIA FIXED INCOME STRATEGY | |
Matthews Asia Strategic Income Fund | |
Actual Fund Return | | $ | 1,000.00 | | | $ | 980.90 | | | | 1.12 | % | | $ | 5.59 | | | $ | 1,000.00 | | | $ | 981.90 | | | | 0.90 | % | | $ | 4.50 | | |
Hypothetical 5% Return | | $ | 1,000.00 | | | $ | 1,019.56 | | | | 1.12 | % | | $ | 5.70 | | | $ | 1,000.00 | | | $ | 1,020.67 | | | | 0.90 | % | | $ | 4.58 | | |
ASIA GROWTH AND INCOME STRATEGIES | |
Matthews Asian Growth and Income Fund | |
Actual Fund Return | | $ | 1,000.00 | | | $ | 947.00 | | | | 1.07 | % | | $ | 5.25 | | | $ | 1,000.00 | | | $ | 947.80 | | | | 0.91 | % | | $ | 4.47 | | |
Hypothetical 5% Return | | $ | 1,000.00 | | | $ | 1,019.81 | | | | 1.07 | % | | $ | 5.45 | | | $ | 1,000.00 | | | $ | 1,020.62 | | | | 0.91 | % | | $ | 4.63 | | |
Matthews Asia Dividend Fund | |
Actual Fund Return | | $ | 1,000.00 | | | $ | 946.60 | | | | 1.03 | % | | $ | 5.05 | | | $ | 1,000.00 | | | $ | 947.50 | | | | 0.92 | % | | $ | 4.52 | | |
Hypothetical 5% Return | | $ | 1,000.00 | | | $ | 1,020.01 | | | | 1.03 | % | | $ | 5.24 | | | $ | 1,000.00 | | | $ | 1,020.57 | | | | 0.92 | % | | $ | 4.69 | | |
Matthews China Dividend Fund | |
Actual Fund Return | | $ | 1,000.00 | | | $ | 1,019.50 | | | | 1.16 | % | | $ | 5.90 | | | $ | 1,000.00 | | | $ | 1,020.40 | | | | 0.99 | % | | $ | 5.04 | | |
Hypothetical 5% Return | | $ | 1,000.00 | | | $ | 1,019.36 | | | | 1.16 | % | | $ | 5.90 | | | $ | 1,000.00 | | | $ | 1,020.21 | | | | 0.99 | % | | $ | 5.04 | | |
ASIA GROWTH STRATEGIES | |
Matthews Asia Focus Fund | |
Actual Fund Return | | $ | 1,000.00 | | | $ | 985.60 | | | | 1.47 | % | | $ | 7.36 | | | $ | 1,000.00 | | | $ | 988.30 | | | | 1.26 | % | | $ | 6.31 | | |
Hypothetical 5% Return | | $ | 1,000.00 | | | $ | 1,017.80 | | | | 1.47 | % | | $ | 7.48 | | | $ | 1,000.00 | | | $ | 1,018.85 | | | | 1.26 | % | | $ | 6.41 | | |
Matthews Asia Growth Fund | |
Actual Fund Return | | $ | 1,000.00 | | | $ | 977.50 | | | | 1.10 | % | | $ | 5.48 | | | $ | 1,000.00 | | | $ | 978.10 | | | | 0.90 | % | | $ | 4.49 | | |
Hypothetical 5% Return | | $ | 1,000.00 | | | $ | 1,019.66 | | | | 1.10 | % | | $ | 5.60 | | | $ | 1,000.00 | | | $ | 1,020.67 | | | | 0.90 | % | | $ | 4.58 | | |
Matthews Pacific Tiger Fund | |
Actual Fund Return | | $ | 1,000.00 | | | $ | 1,011.80 | | | | 1.06 | % | | $ | 5.38 | | | $ | 1,000.00 | | | $ | 1,012.80 | | | | 0.89 | % | | $ | 4.52 | | |
Hypothetical 5% Return | | $ | 1,000.00 | | | $ | 1,019.86 | | | | 1.06 | % | | $ | 5.40 | | | $ | 1,000.00 | | | $ | 1,020.72 | | | | 0.89 | % | | $ | 4.53 | | |
Matthews Emerging Asia Fund | |
Actual Fund Return | | $ | 1,000.00 | | | $ | 1,048.30 | | | | 1.50 | % | | $ | 7.74 | | | $ | 1,000.00 | | | $ | 1,048.90 | | | | 1.26 | % | | $ | 6.51 | | |
Hypothetical 5% Return | | $ | 1,000.00 | | | $ | 1,017.64 | | | | 1.50 | % | | $ | 7.63 | | | $ | 1,000.00 | | | $ | 1,018.85 | | | | 1.26 | % | | $ | 6.41 | | |
Matthews China Fund | |
Actual Fund Return | | $ | 1,000.00 | | | $ | 1,007.90 | | | | 1.09 | % | | $ | 5.52 | | | $ | 1,000.00 | | | $ | 1,008.60 | | | | 0.94 | % | | $ | 4.76 | | |
Hypothetical 5% Return | | $ | 1,000.00 | | | $ | 1,019.71 | | | | 1.09 | % | | $ | 5.55 | | | $ | 1,000.00 | | | $ | 1,020.47 | | | | 0.94 | % | | $ | 4.79 | | |
Matthews India Fund | |
Actual Fund Return | | $ | 1,000.00 | | | $ | 1,204.40 | | | | 1.12 | % | | $ | 6.22 | | | $ | 1,000.00 | | | $ | 1,205.60 | | | | 0.94 | % | | $ | 5.23 | | |
Hypothetical 5% Return | | $ | 1,000.00 | | | $ | 1,019.56 | | | | 1.12 | % | | $ | 5.70 | | | $ | 1,000.00 | | | $ | 1,020.47 | | | | 0.94 | % | | $ | 4.79 | | |
Matthews Japan Fund | |
Actual Fund Return | | $ | 1,000.00 | | | $ | 946.00 | | | | 1.01 | % | | $ | 4.95 | | | $ | 1,000.00 | | | $ | 946.70 | | | | 0.88 | % | | $ | 4.32 | | |
Hypothetical 5% Return | | $ | 1,000.00 | | | $ | 1,020.11 | | | | 1.01 | % | | $ | 5.14 | | | $ | 1,000.00 | | | $ | 1,020.77 | | | | 0.88 | % | | $ | 4.48 | | |
Matthews Korea Fund | |
Actual Fund Return | | $ | 1,000.00 | | | $ | 942.00 | | | | 1.09 | % | | $ | 5.34 | | | $ | 1,000.00 | | | $ | 943.90 | | | | 0.91 | % | | $ | 4.46 | | |
Hypothetical 5% Return | | $ | 1,000.00 | | | $ | 1,019.71 | | | | 1.09 | % | | $ | 5.55 | | | $ | 1,000.00 | | | $ | 1,020.62 | | | | 0.91 | % | | $ | 4.63 | | |
ASIA SMALL COMPANY STRATEGIES | |
Matthews Asia Small Companies Fund | |
Actual Fund Return | | $ | 1,000.00 | | | $ | 998.70 | | | | 1.47 | % | | $ | 7.41 | | | $ | 1,000.00 | | | $ | 1,000.10 | | | | 1.25 | % | | $ | 6.30 | | |
Hypothetical 5% Return | | $ | 1,000.00 | | | $ | 1,017.80 | | | | 1.47 | % | | $ | 7.48 | | | $ | 1,000.00 | | | $ | 1,018.90 | | | | 1.25 | % | | $ | 6.36 | | |
Matthews China Small Companies Fund | |
Actual Fund Return | | $ | 1,000.00 | | | $ | 984.70 | | | | 1.50 | % | | $ | 7.50 | | | | | | | | | | |
Hypothetical 5% Return | | $ | 1,000.00 | | | $ | 1,017.64 | | | | 1.50 | % | | $ | 7.63 | | | | | | | | | | |
ASIA SPECIALTY STRATEGY | |
Matthews Asia Science and Technology Fund | |
Actual Fund Return | | $ | 1,000.00 | | | $ | 1,012.70 | | | | 1.15 | % | | $ | 5.83 | | | $ | 1,000.00 | | | $ | 1,014.00 | | | | 0.93 | % | | $ | 4.72 | | |
Hypothetical 5% Return | | $ | 1,000.00 | | | $ | 1,019.41 | | | | 1.15 | % | | $ | 5.85 | | | $ | 1,000.00 | | | $ | 1,020.52 | | | | 0.93 | % | | $ | 4.74 | | |
1 Annualized, based on the Fund's most recent fiscal half-year expenses.
2 Operating expenses are equal to the Fund's annualized expense ratio multiplied by the average account value over the period, multiplied by 184 days, then divided by 365.
matthewsasia.com | 800.789.ASIA 81
Statements of Assets and Liabilities December 31, 2014
| | | Matthews Asia
Strategic
Income Fund | | Matthews Asian
Growth and
Income Fund | | Matthews Asia
Dividend Fund1 | | Matthews China
Dividend Fund | |
ASSETS: | |
Investments at value (A) (Note 2-A and 8): | |
Unaffiliated issuers | | $ | 64,477,124 | | | $ | 4,164,601,538 | | | $ | 4,267,236,531 | | | $ | 143,085,753 | | |
Affiliated issuers | | | — | | | | 70,604,266 | | | | 665,242,675 | | | | — | | |
Total investments | | | 64,477,124 | | | | 4,235,205,804 | | | | 4,932,479,206 | | | | 143,085,753 | | |
Cash | | | 415,631 | | | | — | | | | 89,791,965 | | | | 3,083,893 | | |
Cash pledged as collateral for financial futures contracts | | | 33,000 | | | | — | | | | — | | | | — | | |
Segregated foreign currency at value | | | — | | | | — | | | | 66,303 | | | | — | | |
Foreign currency at value (B) | | | — | | | | 1,317,545 | | | | 2,048,765 | | | | 11,761 | | |
Dividends, interest and other receivable—Unaffiliated issuers | | | 1,001,925 | | | | 8,953,249 | | | | 11,629,503 | | | | — | | |
Dividends receivable—Affiliated issuers | | | — | | | | — | | | | — | | | | — | | |
Receivable for securities sold | | | 440,236 | | | | 15,180,086 | | | | 7,287,480 | | | | 1,877,287 | | |
Receivable for capital shares sold | | | 535,088 | | | | 8,393,806 | | | | 14,154,159 | | | | 438,384 | | |
Due from Advisor (Note 6) | | | — | | | | — | | | | — | | | | — | | |
Prepaid expenses and other assets | | | 15,710 | | | | 26,488 | | | | 30,639 | | | | 17,174 | | |
TOTAL ASSETS | | | 66,918,714 | | | | 4,269,076,978 | | | | 5,057,488,020 | | | | 148,514,252 | | |
LIABILITIES: | |
Payable for securities purchased | | | — | | | | — | | | | 389,264 | | | | 424,152 | | |
Payable for capital shares redeemed | | | 366,244 | | | | 19,873,297 | | | | 19,412,540 | | | | 300,048 | | |
Payable for daily variation margin on financial futures contracts | | | 5,469 | | | | — | | | | — | | | | — | | |
Cash overdraft | | | — | | | | 9,831,398 | | | | — | | | | — | | |
Deferred foreign capital gains tax liability (Note 2-G) | | | 19,368 | | | | — | | | | 7,302,449 | | | | — | | |
Due to Advisor (Note 6) | | | 29,182 | | | | 2,383,876 | | | | 2,804,673 | | | | 82,200 | | |
Administration and accounting fees payable | | | 454 | | | | 29,414 | | | | 34,661 | | | | 1,010 | | |
Accounting out-of-pocket fees payable | | | 4,204 | | | | 8,335 | | | | 8,296 | | | | 4,044 | | |
Administration and shareholder servicing fees payable | | | 11,384 | | | | 752,476 | | | | 808,900 | | | | 25,162 | | |
Professional fees payable | | | 38,788 | | | | 47,872 | | | | 48,997 | | | | 38,911 | | |
Transfer agent fees payable | | | 7,386 | | | | 517,787 | | | | 499,304 | | | | 16,654 | | |
Offering costs (Note 2-E) | | | — | | | | — | | | | 35,476 | | | | — | | |
Distributions Payable | | | — | | | | 4,085 | | | | — | | | | — | | |
Trustees fees payable | | | 68 | | | | 5,354 | | | | 6,358 | | | | 163 | | |
Accrued other expenses payable | | | 1,493 | | | | 368,303 | | | | 538,359 | | | | 5,065 | | |
TOTAL LIABILITIES | | | 484,040 | | | | 33,822,197 | | | | 31,889,277 | | | | 897,409 | | |
NET ASSETS | | $ | 66,434,674 | | | $ | 4,235,254,781 | | | $ | 5,025,598,743 | | | $ | 147,616,843 | | |
NET ASSETS: | |
Investor Class | | $ | 58,594,308 | | | $ | 3,052,565,088 | | | $ | 2,918,227,801 | | | $ | 116,954,390 | | |
Institutional Class | | | 7,840,366 | | | | 1,182,689,693 | | | | 2,107,370,942 | | | | 30,662,453 | | |
TOTAL | | $ | 66,434,674 | | | $ | 4,235,254,781 | | | $ | 5,025,598,743 | | | $ | 147,616,843 | | |
SHARES OUTSTANDING: | |
(shares of beneficial interest issued and outstanding, respectively,
unlimited number of shares authorized with a $0.001 par value) | |
Investor Class | | | 5,683,223 | | | | 169,484,563 | | | | 191,188,660 | | | | 8,746,706 | | |
Institutional Class | | | 760,976 | | | | 65,710,670 | | | | 138,100,468 | | | | 2,293,427 | | |
TOTAL | | | 6,444,199 | | | | 235,195,233 | | | | 329,289,128 | | | | 11,040,133 | | |
1 Consolidated Statements of Assets and Liabilities.
See accompanying notes to financial statements.
82 MATTHEWS ASIA FUNDS
| | | Matthews Asia
Focus Fund | | Matthews Asia
Growth Fund | | Matthews Pacific
Tiger Fund | | Matthews Emerging
Asia Fund | |
ASSETS: | |
Investments at value (A) (Note 2-A and 8): | |
Unaffiliated issuers | | $ | 14,013,742 | | | $ | 812,822,943 | | | $ | 7,200,645,876 | | | $ | 125,435,419 | | |
Affiliated issuers | | | — | | | | — | | | | 829,717,206 | | | | — | | |
Total investments | | | 14,013,742 | | | | 812,822,943 | | | | 8,030,363,082 | | | | 125,435,419 | | |
Cash | | | 963,506 | | | | 40,969,602 | | | | 71,191,833 | | | | 6,926,848 | | |
Cash pledged as collateral for financial futures contracts | | | — | | | | — | | | | — | | | | — | | |
Segregated foreign currency at value | | | — | | | | — | | | | — | | | | — | | |
Foreign currency at value (B) | | | 13,605 | | | | 74,773 | | | | 2,300,655 | | | | 483,249 | | |
Dividends, interest and other receivable—Unaffiliated issuers | | | 19,355 | | | | 247,937 | | | | 3,167,941 | | | | 127,828 | | |
Dividends receivable—Affiliated issuers | | | — | | | | — | | | | 4,045,593 | | | | — | | |
Receivable for securities sold | | | — | | | | — | | | | 5,920,255 | | | | 1,671,661 | | |
Receivable for capital shares sold | | | 15,565 | | | | 2,531,220 | | | | 18,307,122 | | | | 1,134,211 | | |
Due from Advisor (Note 6) | | | 2,542 | | | | — | | | | — | | | | — | | |
Prepaid expenses and other assets | | | 13,594 | | | | 30,853 | | | | 27,651 | | | | 8,788 | | |
TOTAL ASSETS | | | 15,041,909 | | | | 856,677,328 | | | | 8,135,324,132 | | | | 135,788,004 | | |
LIABILITIES: | |
Payable for securities purchased | | | — | | | | 4,988,289 | | | | 19,877,770 | | | | 2,953,059 | | |
Payable for capital shares redeemed | | | 19,997 | | | | 1,444,805 | | | | 5,862,602 | | | | 55,269 | | |
Payable for daily variation margin on financial futures contracts | | | — | | | | — | | | | — | | | | — | | |
Cash overdraft | | | — | | | | — | | | | — | | | | — | | |
Deferred foreign capital gains tax liability (Note 2-G) | | | 982 | | | | 262,534 | | | | 5,827,625 | | | | 929,954 | | |
Due to Advisor (Note 6) | | | — | | | | 468,432 | | | | 4,412,622 | | | | 66,682 | | |
Administration and accounting fees payable | | | 101 | | | | 5,753 | | | | 54,991 | | | | 841 | | |
Accounting out-of-pocket fees payable | | | 3,818 | | | | 8,210 | | | | 8,745 | | | | 7,617 | | |
Administration and shareholder servicing fees payable | | | 752 | | | | 135,355 | | | | 1,168,801 | | | | 20,370 | | |
Professional fees payable | | | 29,317 | | | | 40,210 | | | | 59,357 | | | | 29,415 | | |
Transfer agent fees payable | | | — | | | | 74,166 | | | | 613,742 | | | | 12,008 | | |
Offering costs (Note 2-E) | | | — | | | | — | | | | — | | | | — | | |
Distributions Payable | | | — | | | | — | | | | — | | | | — | | |
Trustees fees payable | | | 11 | | | | 960 | | | | 9,243 | | | | 86 | | |
Accrued other expenses payable | | | — | | | | 64,634 | | | | 709,049 | | | | — | | |
TOTAL LIABILITIES | | | 54,978 | | | | 7,493,348 | | | | 38,604,547 | | | | 4,075,301 | | |
NET ASSETS | | $ | 14,986,931 | | | $ | 849,183,980 | | | $ | 8,096,719,585 | | | $ | 131,712,703 | | |
NET ASSETS: | |
Investor Class | | $ | 7,838,586 | | | $ | 561,921,855 | | | $ | 3,047,077,085 | | | $ | 110,362,601 | | |
Institutional Class | | | 7,148,345 | | | | 287,262,125 | | | | 5,049,642,500 | | | | 21,350,102 | | |
TOTAL | | $ | 14,986,931 | | | $ | 849,183,980 | | | $ | 8,096,719,585 | | | $ | 131,712,703 | | |
SHARES OUTSTANDING: | |
(shares of beneficial interest issued and outstanding, respectively,
unlimited number of shares authorized with a $0.001 par value) | |
Investor Class | | | 782,706 | | | | 26,635,458 | | | | 114,673,755 | | | | 9,512,789 | | |
Institutional Class | | | 712,266 | | | | 13,554,513 | | | | 190,157,677 | | | | 1,840,365 | | |
TOTAL | | | 1,494,972 | | | | 40,189,971 | | | | 304,831,432 | | | | 11,353,154 | | |
matthewsasia.com | 800.789.ASIA 83
Statements of Assets and Liabilities (continued) December 31, 2014
| | | Matthews Asia
Strategic
Income Fund | | Matthews Asian
Growth and
Income Fund | | Matthews Asia
Dividend Fund1 | | Matthews China
Dividend Fund | |
NET ASSET VALUE: | |
Investor Class, offering price and redemption price | | $ | 10.31 | | | $ | 18.01 | | | $ | 15.26 | | | $ | 13.37 | | |
Institutional Class, offering price and redemption price | | $ | 10.30 | | | $ | 18.00 | | | $ | 15.26 | | | $ | 13.37 | | |
NET ASSETS CONSIST OF: | |
Capital paid-in | | $ | 69,063,371 | | | $ | 3,602,111,520 | | | $ | 4,566,137,296 | | | $ | 137,837,956 | | |
Undistributed (distributions in excess of) net investment income (loss) | | | (241,167 | ) | | | (13,412,958 | ) | | | (55,629,552 | ) | | | (1,285,165 | ) | |
Undistributed/accumulated net realized gain (loss) on investments,
financial futures contracts, and foreign currency related transactions | | | (1,322,509 | ) | | | 22,018,993 | | | | (183,353,252 | ) | | | (516,651 | ) | |
Net unrealized appreciation (depreciation) on investments, financial
futures contracts, foreign currency translations and deferred foreign
capital gains taxes | | | (1,065,021 | ) | | | 624,537,226 | | | | 698,444,251 | | | | 11,580,703 | | |
NET ASSETS | | $ | 66,434,674 | | | $ | 4,235,254,781 | | | $ | 5,025,598,743 | | | $ | 147,616,843 | | |
(A) Investments at cost: | |
Unaffiliated issuers | | $ | 65,526,904 | | | $ | 3,551,167,856 | | | $ | 3,696,302,279 | | | $ | 131,505,011 | | |
Affiliated issuers | | | — | | | | 59,547,619 | | | | 530,499,328 | | | | — | | |
Total investments at cost | | $ | 65,526,904 | | | $ | 3,610,715,475 | | | $ | 4,226,801,607 | | | $ | 131,505,011 | | |
(B) Foreign currency at cost | | $ | — | | | $ | 1,317,551 | | | $ | 2,048,753 | | | $ | 11,761 | | |
1 Consolidated Statements of Assets and Liabilities.
See accompanying notes to financial statements.
84 MATTHEWS ASIA FUNDS
| | | Matthews Asia
Focus Fund | | Matthews Asia
Growth Fund | | Matthews Pacific
Tiger Fund | | Matthews Emerging
Asia Fund | |
NET ASSET VALUE: | |
Investor Class, offering price and redemption price | | $ | 10.01 | | | $ | 21.10 | | | $ | 26.57 | | | $ | 11.60 | | |
Institutional Class, offering price and redemption price | | $ | 10.04 | | | $ | 21.19 | | | $ | 26.56 | | | $ | 11.60 | | |
NET ASSETS CONSIST OF: | |
Capital paid-in | | $ | 14,980,904 | | | $ | 721,065,779 | | | $ | 5,599,598,803 | | | $ | 122,121,284 | | |
Undistributed (distributions in excess of) net investment income (loss) | | | 1,023 | | | | (11,816,062 | ) | | | 12,414 | | | | (349,313 | ) | |
Undistributed/accumulated net realized gain (loss) on investments,
financial futures contracts, and foreign currency related transactions | | | (16,109 | ) | | | (26,469,129 | ) | | | 35,160,684 | | | | 432,972 | | |
Net unrealized appreciation (depreciation) on investments, financial
futures contracts, foreign currency translations and deferred foreign
capital gains taxes | | | 21,113 | | | | 166,403,392 | | | | 2,461,947,684 | | | | 9,507,760 | | |
NET ASSETS | | $ | 14,986,931 | | | $ | 849,183,980 | | | $ | 8,096,719,585 | | | $ | 131,712,703 | | |
(A) Investments at cost: | |
Unaffiliated issuers | | $ | 13,991,503 | | | $ | 646,149,773 | | | $ | 4,704,703,558 | | | $ | 114,996,426 | | |
Affiliated issuers | | | — | | | | — | | | | 857,913,209 | | | | — | | |
Total investments at cost | | $ | 13,991,503 | | | $ | 646,149,773 | | | $ | 5,562,616,767 | | | $ | 114,996,426 | | |
(B) Foreign currency at cost | | $ | 13,605 | | | $ | 74,773 | | | $ | 2,297,990 | | | $ | 483,173 | | |
matthewsasia.com | 800.789.ASIA 85
Statements of Assets and Liabilities (continued) December 31, 2014
| | | Matthews
China Fund1 | | Matthews
India Fund | | Matthews
Japan Fund | | Matthews
Korea Fund | |
ASSETS: | |
Investments at value (A) (Note 2-A and 8): | |
Unaffiliated issuers | | $ | 987,101,530 | | | $ | 1,043,948,892 | | | $ | 614,495,014 | | | $ | 214,870,474 | | |
Affiliated issuers | | | — | | | | 25,788,842 | | | | — | | | | — | | |
Total investments | | | 987,101,530 | | | | 1,069,737,734 | | | | 614,495,014 | | | | 214,870,474 | | |
Cash | | | 6,722,698 | | | | 19,182,709 | | | | 6,501,909 | | | | 5,083,347 | | |
Segregated foreign currency at value (B) | | | 67,822 | | | | — | | | | — | | | | — | | |
Foreign currency at value (B) | | | 3,394,596 | | | | 48,837 | | | | 2 | | | | — | | |
Dividends, interest and other receivable—Unaffiliated issuers | | | — | | | | 376,374 | | | | 291,008 | | | | 2,201,126 | | |
Dividends receivable—Affiliated issuers | | | — | | | | — | | | | — | | | | — | | |
Receivable for securities sold | | | 9,407,580 | | | | — | | | | 155,037 | | | | 5,326,171 | | |
Receivable for capital shares sold | | | 460,049 | | | | 17,809,215 | | | | 4,833,954 | | | | 83,810 | | |
Prepaid expenses and other assets | | | 31,433 | | | | 30,946 | | | | 10,110 | | | | 12,543 | | |
TOTAL ASSETS | | | 1,007,185,708 | | | | 1,107,185,815 | | | | 626,287,034 | | | | 227,577,471 | | |
LIABILITIES: | |
Payable for securities purchased | | | — | | | | 11,377,161 | | | | — | | | | 1,072,328 | | |
Payable for capital shares redeemed | | | 5,781,809 | | | | 2,013,484 | | | | 3,110,879 | | | | 7,067,697 | | |
Deferred foreign capital gains tax liability (Note 2-G) | | | 4,990 | | | | 8,627,059 | | | | — | | | | — | | |
Due to Advisor (Note 6) | | | 567,461 | | | | 566,723 | | | | 354,701 | | | | 125,431 | | |
Administration and accounting fees payable | | | 6,969 | | | | 6,960 | | | | 4,357 | | | | 1,540 | | |
Administration and shareholder servicing fees payable | | | 187,340 | | | | 165,233 | | | | 87,953 | | | | 33,664 | | |
Professional fees payable | | | 41,958 | | | | 44,515 | | | | 41,960 | | | | 39,166 | | |
Offering costs (Note 2-E) | | | 35,476 | | | | — | | | | — | | | | — | | |
Distributions Payable | | | — | | | | — | | | | 814 | | | | — | | |
Trustees fees payable | | | 1,369 | | | | 733 | | | | 566 | | | | 230 | | |
Accrued other expenses payable | | | 339,791 | | | | 215,243 | | | | 81,999 | | | | 33,039 | | |
TOTAL LIABILITIES | | | 6,967,163 | | | | 23,017,111 | | | | 3,683,229 | | | | 8,373,095 | | |
NET ASSETS | | $ | 1,000,218,545 | | | $ | 1,084,168,704 | | | $ | 622,603,805 | | | $ | 219,204,376 | | |
NET ASSETS: | |
Investor Class | | $ | 947,740,415 | | | $ | 974,837,756 | | | $ | 467,853,843 | | | $ | 127,773,688 | | |
Institutional Class | | | 52,478,130 | | | | 109,330,948 | | | | 154,749,962 | | | | 91,430,688 | | |
TOTAL | | $ | 1,000,218,545 | | | $ | 1,084,168,704 | | | $ | 622,603,805 | | | $ | 219,204,376 | | |
SHARES OUTSTANDING: | |
(shares of beneficial interest issued and outstanding, respectively,
unlimited number of shares authorized with a $0.001 par value) | |
Investor Class | | | 44,159,411 | | | | 36,842,274 | | | | 29,803,424 | | | | 22,598,599 | | |
Institutional Class | | | 2,447,855 | | | | 4,126,700 | | | | 9,850,911 | | | | 16,103,286 | | |
TOTAL | | | 46,607,266 | | | | 40,968,974 | | | | 39,654,335 | | | | 38,701,885 | | |
1 Consolidated Statements of Assets and Liabilities.
See accompanying notes to financial statements.
86 MATTHEWS ASIA FUNDS
| | | Matthews Asia
Small Companies
Fund | | Matthews China
Small Companies
Fund | | Matthews Asia
Science and
Technology Fund | |
ASSETS: | |
Investments at value (A) (Note 2-A and 8): | |
Unaffiliated issuers | | $ | 623,676,984 | | | $ | 21,599,004 | | | $ | 182,258,267 | | |
Affiliated issuers | | | 19,333,687 | | | | — | | | | — | | |
Total investments | | | 643,010,671 | | | | 21,599,004 | | | | 182,258,267 | | |
Cash | | | 34,676,008 | | | | 87,347 | | | | 3,447,627 | | |
Segregated foreign currency at value (B) | | | — | | | | — | | | | — | | |
Foreign currency at value (B) | | | 2,640,181 | | | | — | | | | 633,000 | | |
Dividends, interest and other receivable—Unaffiliated issuers | | | 505,841 | | | | — | | | | 216,884 | | |
Dividends receivable—Affiliated issuers | | | 58,021 | | | | — | | | | — | | |
Receivable for securities sold | | | 3,771,258 | | | | 477,517 | | | | 940,451 | | |
Receivable for capital shares sold | | | 1,612,953 | | | | 13,342 | | | | 283,062 | | |
Prepaid expenses and other assets | | | 28,070 | | | | 5,036 | | | | 12,989 | | |
TOTAL ASSETS | | | 686,303,003 | | | | 22,182,246 | | | | 187,792,280 | | |
LIABILITIES: | |
Payable for securities purchased | | | 7,148,252 | | | | 43,336 | | | | 618,322 | | |
Payable for capital shares redeemed | | | 1,614,753 | | | | 15,510 | | | | 269,667 | | |
Deferred foreign capital gains tax liability (Note 2-G) | | | 434,925 | | | | — | | | | — | | |
Due to Advisor (Note 6) | | | 551,401 | | | | 12,410 | | | | 104,321 | | |
Administration and accounting fees payable | | | 4,494 | | | | 156 | | | | 1,281 | | |
Administration and shareholder servicing fees payable | | | 114,341 | | | | 4,173 | | | | 29,441 | | |
Professional fees payable | | | 40,362 | | | | 38,721 | | | | 39,244 | | |
Offering costs (Note 2-E) | | | — | | | | — | | | | — | | |
Distributions Payable | | | — | | | | — | | | | — | | |
Trustees fees payable | | | 660 | | | | 28 | | | | 205 | | |
Accrued other expenses payable | | | 143,534 | | | | — | | | | 29,615 | | |
TOTAL LIABILITIES | | | 10,052,722 | | | | 114,334 | | | | 1,092,096 | | |
NET ASSETS | | $ | 676,250,281 | | | $ | 22,067,912 | | | $ | 186,700,184 | | |
NET ASSETS: | |
Investor Class | | $ | 599,082,496 | | | $ | 22,067,912 | | | $ | 125,612,117 | | |
Institutional Class | | | 77,167,785 | | | | — | | | | 61,088,067 | | |
TOTAL | | $ | 676,250,281 | | | $ | 22,067,912 | | | $ | 186,700,184 | | |
SHARES OUTSTANDING: | |
(shares of beneficial interest issued and outstanding, respectively,
unlimited number of shares authorized with a $0.001 par value) | |
Investor Class | | | 27,910,014 | | | | 2,395,197 | | | | 9,227,412 | | |
Institutional Class | | | 3,595,886 | | | | — | | | | 4,489,750 | | |
TOTAL | | | 31,505,900 | | | | 2,395,197 | | | | 13,717,162 | | |
matthewsasia.com | 800.789.ASIA 87
Statements of Assets and Liabilities (continued) December 31, 2014
| | | Matthews
China Fund1 | | Matthews
India Fund | | Matthews
Japan Fund | | Matthews
Korea Fund | |
NET ASSET VALUE: | |
Investor Class, offering price and redemption price | | $ | 21.46 | | | $ | 26.46 | | | $ | 15.70 | | | $ | 5.65 | | |
Institutional Class, offering price and redemption price | | $ | 21.44 | | | $ | 26.49 | | | $ | 15.71 | | | $ | 5.68 | | |
NET ASSETS CONSIST OF: | |
Capital paid-in | | $ | 804,976,210 | | | $ | 783,302,336 | | | $ | 671,478,019 | | | $ | 158,304,635 | | |
Undistributed (distributions in excess of) net investment income (loss) | | | 73,913 | | | | 1,797,278 | | | | (3,723,660 | ) | | | 342,932 | | |
Undistributed/accumulated net realized gain (loss) on investments,
financial futures contracts, and foreign currency related transactions | | | 13,857,494 | | | | 3,011,873 | | | | (89,858,388 | ) | | | 4,870,906 | | |
Net unrealized appreciation (depreciation) on investments, financial
futures contracts, foreign currency translations and deferred foreign
capital gains taxes | | | 181,310,928 | | | | 296,057,217 | | | | 44,707,834 | | | | 55,685,903 | | |
NET ASSETS | | $ | 1,000,218,545 | | | $ | 1,084,168,704 | | | $ | 622,603,805 | | | $ | 219,204,376 | | |
(A) Investments at cost: | |
Unaffiliated issuers | | $ | 805,757,349 | | | $ | 742,077,614 | | | $ | 569,787,622 | | | $ | 159,225,921 | | |
Affiliated issuers | | | — | | | | 22,872,157 | | | | — | | | | — | | |
Total investments at cost | | $ | 805,757,349 | | | $ | 764,949,771 | | | $ | 569,787,622 | | | $ | 159,225,921 | | |
(B) Foreign currency at cost | | $ | 3,425,892 | | | $ | 48,660 | | | $ | 2 | | | $ | — | | |
1 Consolidated Statements of Assets and Liabilities
See accompanying notes to financial statements.
88 MATTHEWS ASIA FUNDS
| | | Matthews Asia
Small Companies
Fund | | Matthews China
Small Companies
Fund | | Matthews Asia
Science and
Technology Fund | |
NET ASSET VALUE: | |
Investor Class, offering price and redemption price | | $ | 21.46 | | | $ | 9.21 | | | $ | 13.61 | | |
Institutional Class, offering price and redemption price | | $ | 21.46 | | | $ | — | | | $ | 13.61 | | |
NET ASSETS CONSIST OF: | |
Capital paid-in | | $ | 576,436,034 | | | $ | 19,193,128 | | | $ | 120,746,415 | | |
Undistributed (distributions in excess of) net investment income (loss) | | | 1,500,466 | | | | (38,540 | ) | | | (787 | ) | |
Undistributed/accumulated net realized gain (loss) on investments,
financial futures contracts, and foreign currency related transactions | | | (5,443,681 | ) | | | (870,101 | ) | | | 8,970,985 | | |
Net unrealized appreciation (depreciation) on investments, financial
futures contracts, foreign currency translations and deferred foreign
capital gains taxes | | | 103,757,462 | | | | 3,783,425 | | | | 56,983,571 | | |
NET ASSETS | | $ | 676,250,281 | | | $ | 22,067,912 | | | $ | 186,700,184 | | |
(A) Investments at cost: | |
Unaffiliated issuers | | $ | 515,421,421 | | | $ | 17,816,405 | | | $ | 125,276,617 | | |
Affiliated issuers | | | 23,379,320 | | | | — | | | | — | | |
Total investments at cost | | $ | 538,800,741 | | | $ | 17,816,405 | | | $ | 125,276,617 | | |
(B) Foreign currency at cost | | $ | 2,638,060 | | | $ | — | | | $ | 633,000 | | |
matthewsasia.com | 800.789.ASIA 89
Statements of Operations Year Ended December 31, 2014
| | | Matthews Asia
Strategic
Income Fund | | Matthews Asian
Growth and
Income Fund | | Matthews Asia
Dividend Fund1 | | Matthews China
Dividend Fund | |
INVESTMENT INCOME: | |
Dividends—Unaffiliated Issuers | | $ | 153,407 | | | $ | 136,255,677 | | | $ | 140,051,123 | | | $ | 4,475,585 | | |
Dividends—Affiliated Issuers (Note 8) | | | — | | | | 2,541,640 | | | | 27,866,038 | | | | — | | |
Interest | | | 3,108,311 | | | | 7,773,669 | | | | 3,740 | | | | 11 | | |
Foreign withholding tax | | | (69,352 | ) | | | (7,726,015 | ) | | | (10,917,336 | ) | | | (203,178 | ) | |
TOTAL INVESTMENT INCOME | | | 3,192,366 | | | | 138,844,971 | | | | 157,003,565 | | | | 4,272,418 | | |
EXPENSES: | |
Investment advisory fees (Note 6) | | | 377,748 | | | | 29,679,830 | | | | 35,424,853 | | | | 925,316 | | |
Administration and accounting fees (Note 6) | | | 4,653 | | | | 357,585 | | | | 449,380 | | | | 11,147 | | |
Administration and shareholder servicing fees (Note 6) | | | 117,275 | | | | 8,950,373 | | | | 9,952,628 | | | | 281,559 | | |
Accounting out-of-pocket fees | | | 35,318 | | | | 45,378 | | | | 46,381 | | | | 26,812 | | |
Custodian fees | | | 22,927 | | | | 1,113,620 | | | | 1,446,972 | | | | 61,595 | | |
Printing fees | | | 4,957 | | | | 383,088 | | | | 455,828 | | | | 17,004 | | |
Professional fees | | | 46,564 | | | | 103,651 | | | | 179,461 | | | | 41,242 | | |
Registration fees | | | 35,837 | | | | 113,028 | | | | 101,517 | | | | 42,020 | | |
Transfer agent fees | | | 72,257 | | | | 5,283,065 | | | | 5,206,701 | | | | 178,206 | | |
Trustees fees | | | 2,067 | | | | 172,226 | | | | 212,449 | | | | 5,384 | | |
Offering costs (Note 2-E) | | | — | | | | — | | | | 35,476 | | | | — | | |
Other expenses | | | 2,377 | | | | 138,219 | | | | 178,317 | | | | 10,440 | | |
TOTAL EXPENSES | | | 721,980 | | | | 46,340,063 | | | | 53,689,963 | | | | 1,600,725 | | |
Advisory fees waived and expenses waived or reimbursed (Note 6) | | | (79,504 | ) | | | (51,372 | ) | | | (73,450 | ) | | | — | | |
Administration fees waived (Note 6) | | | — | | | | (51,372 | ) | | | (73,450 | ) | | | — | | |
NET EXPENSES | | | 642,476 | | | | 46,237,319 | | | | 53,543,063 | | | | 1,600,725 | | |
NET INVESTMENT INCOME (LOSS) | | | 2,549,890 | | | | 92,607,652 | | | | 103,460,502 | | | | 2,671,693 | | |
REALIZED AND UNREALIZED GAIN (LOSS) ON INVESTMENTS,
FINANCIAL FUTURES CONTRACTS, FOREIGN CURRENCY RELATED
TRANSACTIONS AND DEFERRED CAPITAL GAINS TAXES: | |
Net realized gain (loss) on investments—Unaffiliated Issuers | | | (245,038 | ) | | | 118,851,114 | | | | 98,683,107 | | | | 2,603,622 | | |
Net realized gain (loss) on investments—Affiliated Issuers | | | — | | | | 25,014 | | | | 19,030,204 | | | | — | | |
Net realized gain (loss) on financial futures contracts | | | (222,426 | ) | | | — | | | | — | | | | — | | |
Net realized foreign capital gains tax | | | — | | | | — | | | | — | | | | — | | |
Net realized gain (loss) on foreign currency related transactions | | | (881,680 | ) | | | (977,253 | ) | | | (1,469,976 | ) | | | (8,901 | ) | |
Net change in unrealized appreciation/depreciation on investments | | | (145,408 | ) | | | (247,596,237 | ) | | | (236,066,357 | ) | | | (5,176,973 | ) | |
Net change in deferred foreign capital gains taxes on unrealized
appreciation | | | (15,022 | ) | | | — | | | | (5,021,270 | ) | | | — | | |
Net change in unrealized appreciation/depreciation on financial
futures contracts | | | (52,031 | ) | | | — | | | | — | | | | — | | |
Net change in unrealized appreciation/depreciation on foreign
currency related translations | | | (42,714 | ) | | | 23,955 | | | | 50,149 | | | | (39 | ) | |
Net realized and unrealized gain (loss) on investments, financial
futures contracts, foreign currency related transactions and
deferred capital gains taxes | | | (1,604,319 | ) | | | (129,673,407 | ) | | | (124,794,143 | ) | | | (2,582,291 | ) | |
NET INCREASE (DECREASE) IN NET ASSETS FROM OPERATIONS | | $ | 945,571 | | | ($ | 37,065,755 | ) | | ($ | 21,333,641 | ) | | $ | 89,402 | | |
1 Consolidated Statements of Operations
See accompanying notes to financial statements.
90 MATTHEWS ASIA FUNDS
| | | Matthews Asia
Focus Fund | | Matthews Asia
Growth Fund | | Matthews Pacific
Tiger Fund | | Matthews Emerging
Asia Fund | |
INVESTMENT INCOME: | |
Dividends—Unaffiliated Issuers | | $ | 252,269 | | | $ | 14,758,020 | | | $ | 118,148,919 | | | $ | 1,584,997 | | |
Dividends—Affiliated Issuers (Note 8) | | | — | | | | — | | | | 17,556,917 | | | | — | | |
Interest | | | 4 | | | | 46 | | | | 143 | | | | 2 | | |
Foreign withholding tax | | | (7,346 | ) | | | (1,318,167 | ) | | | (11,917,919 | ) | | | (110,401 | ) | |
TOTAL INVESTMENT INCOME | | | 244,927 | | | | 13,439,899 | | | | 123,788,060 | | | | 1,474,598 | | |
EXPENSES: | |
Investment advisory fees (Note 6) | | | 68,308 | | | | 5,382,448 | | | | 51,603,486 | | | | 764,865 | | |
Administration and accounting fees (Note 6) | | | 824 | | | | 64,855 | | | | 621,913 | | | | 6,135 | | |
Administration and shareholder servicing fees (Note 6) | | | 20,452 | | | | 1,566,295 | | | | 13,862,791 | | | | 162,034 | | |
Accounting out-of-pocket fees | | | 24,183 | | | | 42,642 | | | | 50,748 | | | | 43,692 | | |
Custodian fees | | | 15,866 | | | | 342,077 | | | | 2,986,045 | | | | 159,318 | | |
Printing fees | | | 1,353 | | | | 57,842 | | | | 349,477 | | | | 9,304 | | |
Professional fees | | | 21,876 | | | | 54,070 | | | | 158,003 | | | | 32,005 | | |
Registration fees | | | 27,125 | | | | 58,458 | | | | 83,061 | | | | 30,566 | | |
Transfer agent fees | | | 13,307 | | | | 856,318 | | | | 6,149,671 | | | | 110,814 | | |
Trustees fees | | | 335 | | | | 30,624 | | | | 294,138 | | | | 2,211 | | |
Offering costs (Note 2-E) | | | 19,582 | | | | — | | | | — | | | | 19,781 | | |
Other expenses | | | 1,535 | | | | 30,669 | | | | 241,900 | | | | 4,046 | | |
TOTAL EXPENSES | | | 214,746 | | | | 8,486,298 | | | | 76,401,233 | | | | 1,344,771 | | |
Advisory fees waived and expenses waived or reimbursed (Note 6) | | | (62,897 | ) | | | — | | | | (272,316 | ) | | | (152,283 | ) | |
Administration fees waived (Note 6) | | | — | | | | — | | | | (272,316 | ) | | | — | | |
NET EXPENSES | | | 151,849 | | | | 8,486,298 | | | | 75,856,601 | | | | 1,192,488 | | |
NET INVESTMENT INCOME (LOSS) | | | 93,078 | | | | 4,953,601 | | | | 47,931,459 | | | | 282,110 | | |
REALIZED AND UNREALIZED GAIN (LOSS) ON INVESTMENTS,
FINANCIAL FUTURES CONTRACTS, FOREIGN CURRENCY RELATED
TRANSACTIONS AND DEFERRED CAPITAL GAINS TAXES: | |
Net realized gain (loss) on investments—Unaffiliated Issuers | | | 89,462 | | | | 15,710,202 | | | | 293,673,124 | | | | 585,134 | | |
Net realized gain (loss) on investments—Affiliated Issuers | | | — | | | | — | | | | 8,573,408 | | | | — | | |
Net realized gain (loss) on financial futures contracts | | | — | | | | — | | | | — | | | | — | | |
Net realized foreign capital gains tax | | | (1,715 | ) | | | — | | | | — | | | | — | | |
Net realized gain (loss) on foreign currency related transactions | | | 2,901 | | | | (360,465 | ) | | | (1,072,492 | ) | | | (64,656 | ) | |
Net change in unrealized appreciation/depreciation on investments | | | 65,804 | | | | (9,368,955 | ) | | | 479,192,307 | | | | 9,875,547 | | |
Net change in deferred foreign capital gains taxes on unrealized
appreciation | | | 8,519 | | | | (262,534 | ) | | | (4,638,516 | ) | | | (757,162 | ) | |
Net change in unrealized appreciation/depreciation on financial
futures contracts | | | — | | | | — | | | | — | | | | — | | |
Net change in unrealized appreciation/depreciation on foreign
currency related translations | | | (206 | ) | | | (22,256 | ) | | | 3,178 | | | | 191 | | |
Net realized and unrealized gain (loss) on investments, financial
futures contracts, foreign currency related transactions and
deferred capital gains taxes | | | 164,765 | | | | 5,695,992 | | | | 775,731,009 | | | | 9,639,054 | | |
NET INCREASE (DECREASE) IN NET ASSETS FROM OPERATIONS | | $ | 257,843 | | | $ | 10,649,593 | | | $ | 823,662,468 | | | $ | 9,921,164 | | |
matthewsasia.com | 800.789.ASIA 91
Statements of Operations (continued) Year Ended December 31, 2014
| | | Matthews
China Fund1 | | Matthews
India Fund | | Matthews
Japan Fund | | Matthews
Korea Fund | |
INVESTMENT INCOME: | |
Dividends—Unaffiliated Issuers | | $ | 26,307,389 | | | $ | 9,304,658 | | | $ | 7,698,745 | | | $ | 3,126,917 | | |
Dividends—Affiliated Issuers (Note 8) | | | — | | | | 115,032 | | | | — | | | | — | | |
Interest | | | 50 | | | | 15,048 | | | | 8 | | | | — | | |
Foreign withholding tax | | | (1,027,096 | ) | | | — | | | | (760,892 | ) | | | (513,679 | ) | |
TOTAL INVESTMENT INCOME | | | 25,280,343 | | | | 9,434,738 | | | | 6,937,861 | | | | 2,613,238 | | |
EXPENSES: | |
Investment advisory fees (Note 6) | | | 7,626,920 | | | | 4,339,849 | | | | 3,346,472 | | | | 1,291,732 | | |
Administration and accounting fees (Note 6) | | | 114,536 | | | | 52,403 | | | | 40,332 | | | | 15,577 | | |
Administration and shareholder servicing fees (Note 6) | | | 2,407,056 | | | | 1,357,200 | | | | 913,654 | | | | 357,924 | | |
Accounting out-of-pocket fees | | | 38,216 | | | | 30,344 | | | | 41,730 | | | | 37,376 | | |
Custodian fees | | | 303,473 | | | | 359,956 | | | | 83,677 | | | | 66,748 | | |
Printing fees | | | 166,773 | | | | 88,973 | | | | 34,483 | | | | 16,689 | | |
Professional fees | | | 116,085 | | | | 62,962 | | | | 57,798 | | | | 42,470 | | |
Registration fees | | | 45,810 | | | | 40,437 | | | | 50,591 | | | | 33,897 | | |
Transfer agent fees | | | 1,664,565 | | | | 938,513 | | | | 430,984 | | | | 185,478 | | |
Trustees fees | | | 47,782 | | | | 19,701 | | | | 16,994 | | | | 6,834 | | |
Offering costs (Note 2-E) | | | 35,476 | | | | — | | | | — | | | | — | | |
Other expenses | | | 43,031 | | | | 23,098 | | | | 17,565 | | | | 7,716 | | |
TOTAL EXPENSES | | | 12,609,723 | | | | 7,313,436 | | | | 5,034,280 | | | | 2,062,441 | | |
Advisory fees waived and expenses waived or reimbursed (Note 6) | | | — | | | | — | | | | — | | | | — | | |
NET EXPENSES | | | 12,609,723 | | | | 7,313,436 | | | | 5,034,280 | | | | 2,062,441 | | |
NET INVESTMENT INCOME (LOSS) | | | 12,670,620 | | | | 2,121,302 | | | | 1,903,581 | | | | 550,797 | | |
REALIZED AND UNREALIZED GAIN (LOSS) ON INVESTMENTS, FOREIGN CURRENCY
RELATED TRANSACTIONS AND DEFERRED CAPITAL GAINS TAXES: | |
Net realized gain (loss) on investments—Unaffiliated Issuers | | | 19,349,756 | | | | 6,409,172 | | | | 13,911,220 | | | | 5,909,119 | | |
Net realized gain (loss) on foreign currency related transactions | | | 41,330 | | | | (289,568 | ) | | | (547,425 | ) | | | (201,238 | ) | |
Net change in unrealized appreciation/depreciation on investments | | | (96,750,918 | ) | | | 298,056,872 | | | | (29,307,512 | ) | | | (9,339,610 | ) | |
Net change in deferred foreign capital gains taxes on unrealized appreciation | | | (4,990 | ) | | | (8,627,059 | ) | | | — | | | | — | | |
Net change in unrealized appreciation/depreciation on foreign currency related translations | | | (28,263 | ) | | | (8,946 | ) | | | 1,558 | | | | 34,317 | | |
Net realized and unrealized gain (loss) on investments, foreign currency related
transactions and deferred capital gains taxes | | | (77,393,085 | ) | | | 295,540,471 | | | | (15,942,159 | ) | | | (3,597,412 | ) | |
NET INCREASE (DECREASE) IN NET ASSETS FROM OPERATIONS | | ($ | 64,722,465 | ) | | $ | 297,661,773 | | | ($ | 14,038,578 | ) | | ($ | 3,046,615 | ) | |
1 Consolidated Statements of Operations
See accompanying notes to financial statements.
92 MATTHEWS ASIA FUNDS
| | | Matthews Asia
Small Companies
Fund | | Matthews China
Small Companies
Fund | | Matthews Asia
Science and
Technology Fund | |
INVESTMENT INCOME: | |
Dividends—Unaffiliated Issuers | | $ | 11,321,223 | | | $ | 452,150 | | | $ | 2,194,427 | | |
Dividends—Affiliated Issuers (Note 8) | | | 258,635 | | | | — | | | | — | | |
Interest | | | 2,250 | | | | — | | | | 2 | | |
Foreign withholding tax | | | (854,708 | ) | | | (16,981 | ) | | | (204,820 | ) | |
TOTAL INVESTMENT INCOME | | | 10,727,400 | | | | 435,169 | | | | 1,989,609 | | |
EXPENSES: | |
Investment advisory fees (Note 6) | | | 5,593,655 | | | | 240,755 | | | | 1,151,709 | | |
Administration and accounting fees (Note 6) | | | 44,799 | | | | 1,925 | | | | 13,881 | | |
Administration and shareholder servicing fees (Note 6) | | | 1,170,452 | | | | 52,900 | | | | 329,571 | | |
Accounting out-of-pocket fees | | | 44,529 | | | | 35,109 | | | | 33,430 | | |
Custodian fees | | | 295,519 | | | | 21,392 | | | | 77,238 | | |
Printing fees | | | 49,123 | | | | 3,160 | | | | 16,105 | | |
Professional fees | | | 59,228 | | | | 39,444 | | | | 47,615 | | |
Registration fees | | | 44,222 | | | | 18,295 | | | | 37,823 | | |
Transfer agent fees | | | 769,209 | | | | 40,519 | | | | 182,342 | | |
Trustees fees | | | 19,421 | | | | 963 | | | | 6,347 | | |
Offering costs (Note 2-E) | | | — | | | | — | | | | — | | |
Other expenses | | | 23,525 | | | | 3,827 | | | | 6,523 | | |
TOTAL EXPENSES | | | 8,113,682 | | | | 458,289 | | | | 1,902,584 | | |
Advisory fees waived and expenses waived or reimbursed (Note 6) | | | (15,271 | ) | | | (55,868 | ) | | | — | | |
NET EXPENSES | | | 8,098,411 | | | | 402,421 | | | | 1,902,584 | | |
NET INVESTMENT INCOME (LOSS) | | | 2,628,989 | | | | 32,748 | | | | 87,025 | | |
REALIZED AND UNREALIZED GAIN (LOSS) ON INVESTMENTS, FOREIGN CURRENCY
RELATED TRANSACTIONS AND DEFERRED CAPITAL GAINS TAXES: | |
Net realized gain (loss) on investments—Unaffiliated Issuers | | | 2,824,217 | | | | 727,880 | | | | 15,207,481 | | |
Net realized gain (loss) on foreign currency related transactions | | | (131,793 | ) | | | (2,038 | ) | | | (22,204 | ) | |
Net change in unrealized appreciation/depreciation on investments | | | 48,531,013 | | | | (1,528,627 | ) | | | (365,237 | ) | |
Net change in deferred foreign capital gains taxes on unrealized appreciation | | | 458,859 | | | | — | | | | 201,559 | | |
Net change in unrealized appreciation/depreciation on foreign currency related translations | | | (3,838 | ) | | | 842 | | | | 2,473 | | |
Net realized and unrealized gain (loss) on investments, foreign currency related
transactions and deferred capital gains taxes | | | 51,678,458 | | | | (801,943 | ) | | | 15,024,072 | | |
NET INCREASE (DECREASE) IN NET ASSETS FROM OPERATIONS | | $ | 54,307,447 | | | ($ | 769,195 | ) | | $ | 15,111,097 | | |
matthewsasia.com | 800.789.ASIA 93
Statements of Changes in Net Assets
MATTHEWS ASIA STRATEGIC INCOME FUND | | Year Ended
December 31, 2014 | | Year Ended
December 31, 2013 | |
OPERATIONS: | |
Net investment income (loss) | | $ | 2,549,890 | | | $ | 1,994,476 | | |
Net realized gain (loss) on investments, financial futures contracts and foreign currency
related transactions | | | (1,349,144 | ) | | | (686,231 | ) | |
Net change in unrealized appreciation/depreciation on investments and foreign currency
related translations | | | (188,122 | ) | | | (2,845,630 | ) | |
Net change on deferred foreign capital gains taxes on unrealized appreciation | | | (15,022 | ) | | | 2,295 | | |
Net change in unrealized appreciation/depreciation on financial future contracts | | | (52,031 | ) | | | 64,922 | | |
Net increase (decrease) in net assets resulting from operations | | | 945,571 | | | | (1,470,168 | ) | |
DISTRIBUTIONS TO SHAREHOLDERS FROM: | |
Net investment income: | |
Investor Class | | | (1,819,452 | ) | | | (1,589,709 | ) | |
Institutional Class | | | (294,936 | ) | | | (258,124 | ) | |
Realized gains on investments: | |
Investor Class | | | — | | | | (36,733 | ) | |
Institutional Class | | | — | | | | (7,098 | ) | |
Net decrease in net assets resulting from distributions | | | (2,114,388 | ) | | | (1,891,664 | ) | |
CAPITAL SHARE TRANSACTIONS (net) (Note 5) | | | 21,884,520 | | | | 13,276,778 | | |
REDEMPTION FEES | | | 6,087 | | | | 114,081 | | |
Total increase (decrease) in net assets | | | 20,721,790 | | | | 10,029,027 | | |
NET ASSETS: | |
Beginning of year | | | 45,712,884 | | | | 35,683,857 | | |
End of year (including undistributed/(distributions in excess of) net investment income
of ($241,167) and $6,710, respectively) | | $ | 66,434,674 | | | $ | 45,712,884 | | |
MATTHEWS ASIAN GROWTH AND INCOME FUND | | Year Ended
December 31, 2014 | | Year Ended
December 31, 2013 | |
OPERATIONS: | |
Net investment income (loss) | | $ | 92,607,652 | | | $ | 98,019,078 | | |
Net realized gain (loss) on investments and foreign currency related transactions | | | 117,898,875 | | | | 42,085,019 | | |
Net change in unrealized appreciation/depreciation on investments and foreign currency
related translations | | | (247,572,282 | ) | | | 58,566,154 | | |
Net change on deferred foreign capital gains taxes on unrealized appreciation | | | — | | | | 1,468,703 | | |
Net increase (decrease) in net assets resulting from operations | | | (37,065,755 | ) | | | 200,138,954 | | |
DISTRIBUTIONS TO SHAREHOLDERS FROM: | |
Net investment income: | |
Investor Class | | | (58,176,498 | ) | | | (81,799,391 | ) | |
Institutional Class | | | (24,675,840 | ) | | | (28,309,395 | ) | |
Realized gains on investments: | |
Investor Class | | | (73,703,258 | ) | | | (20,324,691 | ) | |
Institutional Class | | | (28,748,112 | ) | | | (7,044,765 | ) | |
Net decrease in net assets resulting from distributions | | | (185,303,708 | ) | | | (137,478,242 | ) | |
CAPITAL SHARE TRANSACTIONS (net) (Note 5) | | | 58,477,140 | | | | 263,721,884 | | |
REDEMPTION FEES | | | 343,294 | | | | 560,563 | | |
Total increase (decrease) in net assets | | | (163,549,029 | ) | | | 326,943,159 | | |
NET ASSETS: | |
Beginning of year | | | 4,398,803,810 | | | | 4,071,860,651 | | |
End of year (including distributions in excess of net investment income of ($13,412,958)
and ($32,982,969), respectively) | | $ | 4,235,254,781 | | | $ | 4,398,803,810 | | |
See accompanying notes to financial statements.
94 MATTHEWS ASIA FUNDS
MATTHEWS ASIA DIVIDEND FUND | | Year Ended
December 31, 20141 | | Year Ended
December 31, 2013 | |
OPERATIONS: | |
Net investment income (loss) | | $ | 103,460,502 | | | $ | 108,909,756 | | |
Net realized gain (loss) on investments and foreign currency related transactions | | | 116,243,335 | | | | (64,491,059 | ) | |
Net change in unrealized appreciation/depreciation on investments and foreign currency
related translations | | | (236,016,208 | ) | | | 443,462,578 | | |
Net change on deferred foreign capital gains taxes on unrealized appreciation | | | (5,021,270 | ) | | | (793,218 | ) | |
Net increase (decrease) in net assets resulting from operations | | | (21,333,641 | ) | | | 487,088,057 | | |
DISTRIBUTIONS TO SHAREHOLDERS FROM: | |
Net investment income: | |
Investor Class | | | (47,911,397 | ) | | | (140,503,427 | ) | |
Institutional Class | | | (32,066,176 | ) | | | (71,771,090 | ) | |
Return of Capital: | |
Investor Class | | | (13,172,130 | ) | | | — | | |
Institutional Class | | | (8,815,853 | ) | | | — | | |
Net decrease in net assets resulting from distributions | | | (101,965,556 | ) | | | (212,274,517 | ) | |
CAPITAL SHARE TRANSACTIONS (net) (Note 5) | | | (645,503,365 | ) | | | 1,815,678,058 | | |
REDEMPTION FEES | | | 497,372 | | | | 808,032 | | |
Total increase (decrease) in net assets | | | (768,305,190 | ) | | | 2,091,299,630 | | |
NET ASSETS: | |
Beginning of year | | | 5,793,903,933 | | | | 3,702,604,303 | | |
End of year (including distributions in excess of net investment income of ($55,629,552)
and ($163,945,391), respectively) | | $ | 5,025,598,743 | | | $ | 5,793,903,933 | | |
1 Consolidated Statements of Changes in Net Assets.
MATTHEWS CHINA DIVIDEND FUND | | Year Ended
December 31, 2014 | | Year Ended
December 31, 2013 | |
OPERATIONS: | |
Net investment income (loss) | | $ | 2,671,693 | | | $ | 2,412,931 | | |
Net realized gain (loss) on investments and foreign currency related transactions | | | 2,594,721 | | | | 850,798 | | |
Net change in unrealized appreciation/depreciation on investments and foreign currency
related translations | | | (5,177,012 | ) | | | 10,206,363 | | |
Net increase (decrease) in net assets resulting from operations | | | 89,402 | | | | 13,470,092 | | |
DISTRIBUTIONS TO SHAREHOLDERS FROM: | |
Net investment income: | |
Investor Class | | | (2,935,482 | ) | | | (1,996,260 | ) | |
Institutional Class | | | (817,023 | ) | | | (381,714 | ) | |
Realized gains on investments: | |
Investor Class | | | (1,191,973 | ) | | | — | | |
Institutional Class | | | (314,911 | ) | | | — | | |
Net decrease in net assets resulting from distributions | | | (5,259,389 | ) | | | (2,377,974 | ) | |
CAPITAL SHARE TRANSACTIONS (net) (Note 5) | | | 1,987,255 | | | | 79,790,869 | | |
REDEMPTION FEES | | | 45,150 | | | | 135,085 | | |
Total increase (decrease) in net assets | | | (3,137,582 | ) | | | 91,018,072 | | |
NET ASSETS: | |
Beginning of year | | | 150,754,425 | | | | 59,736,353 | | |
End of year (including distributions in excess of net investment income of ($1,285,165)
and ($492,556), respectively) | | $ | 147,616,843 | | | $ | 150,754,425 | | |
See accompanying notes to financial statements.
matthewsasia.com | 800.789.ASIA 95
Statements of Changes in Net Assets (continued)
MATTHEWS ASIA FOCUS FUND | | Year Ended
December 31, 2014 | | Period Ended
December 31, 20131 | |
OPERATIONS: | |
Net investment income (loss) | | $ | 93,078 | | | $ | 32,814 | | |
Net realized gain (loss) on investments and foreign currency related transactions | | | 90,648 | | | | (109,556 | ) | |
Net change in unrealized appreciation/depreciation on investments and foreign currency
related translations | | | 65,598 | | | | (43,503 | ) | |
Net change on deferred foreign capital gains taxes on unrealized appreciation | | | 8,519 | | | | (9,501 | ) | |
Net increase (decrease) in net assets resulting from operations | | | 257,843 | | | | (129,746 | ) | |
DISTRIBUTIONS TO SHAREHOLDERS FROM: | |
Net investment income: | |
Investor Class | | | (55,443 | ) | | | (50,059 | ) | |
Institutional Class | | | (57,082 | ) | | | (19,682 | ) | |
Net decrease in net assets resulting from distributions | | | (112,525 | ) | | | (69,741 | ) | |
CAPITAL SHARE TRANSACTIONS (net) (Note 5) | | | 6,463,284 | | | | 8,573,304 | | |
REDEMPTION FEES | | | 2,548 | | | | 1,964 | | |
Total increase (decrease) in net assets | | | 6,611,150 | | | | 8,375,781 | | |
NET ASSETS: | |
Beginning of period | | | 8,375,781 | | | | — | | |
End of period (including undistributed/(distributions in excess of) net investment income of $1,023
and ($298), respectively) | | $ | 14,986,931 | | | $ | 8,375,781 | | |
1 Matthews Asia Focus Fund commenced operations on April 30, 2013.
MATTHEWS ASIA GROWTH FUND | | Year Ended
December 31, 2014 | | Year Ended
December 31, 2013 | |
OPERATIONS: | |
Net investment income (loss) | | $ | 4,953,601 | | | $ | 3,853,432 | | |
Net realized gain (loss) on investments and foreign currency related transactions | | | 15,349,737 | | | | 7,923,392 | | |
Net change in unrealized appreciation/depreciation on investments and foreign currency
related translations | | | (9,391,211 | ) | | | 88,166,202 | | |
Net change on deferred foreign capital gains taxes on unrealized appreciation | | | (262,534 | ) | | | 356,319 | | |
Net increase (decrease) in net assets resulting from operations | | | 10,649,593 | | | | 100,299,345 | | |
DISTRIBUTIONS TO SHAREHOLDERS FROM: | |
Net investment income: | |
Investor Class | | | (10,002,000 | ) | | | (8,514,779 | ) | |
Institutional Class | | | (5,438,617 | ) | | | (3,834,235 | ) | |
Net decrease in net assets resulting from distributions | | | (15,440,617 | ) | | | (12,349,014 | ) | |
CAPITAL SHARE TRANSACTIONS (net) (Note 5) | | | 67,553,705 | | | | 274,137,238 | | |
REDEMPTION FEES | | | 162,173 | | | | 145,542 | | |
Total increase (decrease) in net assets | | | 62,924,854 | | | | 362,233,111 | | |
NET ASSETS: | |
Beginning of year | | | 786,259,126 | | | | 424,026,015 | | |
End of year (including distributions in excess of net investment income of ($11,816,062)
and ($4,691,410), respectively) | | $ | 849,183,980 | | | $ | 786,259,126 | | |
See accompanying notes to financial statements.
96 MATTHEWS ASIA FUNDS
MATTHEWS PACIFIC TIGER FUND | | Year Ended
December 31, 2014 | | Year Ended
December 31, 2013 | |
OPERATIONS: | |
Net investment income (loss) | | $ | 47,931,459 | | | $ | 55,952,538 | | |
Net realized gain (loss) on investments and foreign currency related transactions | | | 301,174,040 | | | | 139,017,233 | | |
Net change in unrealized appreciation/depreciation on investments and foreign currency
related translations | | | 479,195,485 | | | | 67,110,361 | | |
Net change on deferred foreign capital gains taxes on unrealized appreciation | | | (4,638,516 | ) | | | 1,887,327 | | |
Net increase (decrease) in net assets resulting from operations | | | 823,662,468 | | | | 263,967,459 | | |
DISTRIBUTIONS TO SHAREHOLDERS FROM: | |
Net investment income: | |
Investor Class | | | (14,427,716 | ) | | | (18,386,626 | ) | |
Institutional Class | | | (32,970,946 | ) | | | (37,413,781 | ) | |
Realized gains on investments: | |
Investor Class | | | (134,989,408 | ) | | | (18,776,931 | ) | |
Institutional Class | | | (226,070,336 | ) | | | (29,778,886 | ) | |
Net decrease in net assets resulting from distributions | | | (408,458,406 | ) | | | (104,356,224 | ) | |
CAPITAL SHARE TRANSACTIONS (net) (Note 5) | | | 48,148,464 | | | | 708,410,077 | | |
REDEMPTION FEES | | | 220,012 | | | | 531,715 | | |
Total increase (decrease) in net assets | | | 463,572,538 | | | | 868,553,027 | | |
NET ASSETS: | |
Beginning of year | | | 7,633,147,047 | | | | 6,764,594,020 | | |
End of year (including undistributed net investment income of $12,414 and $554,843, respectively) | | $ | 8,096,719,585 | | | $ | 7,633,147,047 | | |
| MATTHEWS EMERGING ASIA FUND | | Year Ended
December 31, 2014 | | Period Ended
December 31, 20131 | |
OPERATIONS: | |
Net investment income (loss) | | $ | 282,110 | | | ($ | 14,137 | ) | |
Net realized gain (loss) on investments and foreign currency related transactions | | | 520,478 | | | | (137,948 | ) | |
Net change in unrealized appreciation/depreciation on investments and foreign currency
related translations | | | 9,875,738 | | | | 561,976 | | |
Net change on deferred foreign capital gains taxes on unrealized appreciation | | | (757,162 | ) | | | (172,792 | ) | |
Net increase (decrease) in net assets resulting from operations | | | 9,921,164 | | | | 237,099 | | |
DISTRIBUTIONS TO SHAREHOLDERS FROM: | |
Net investment income: | |
Investor Class | | | (518,224 | ) | | | (1,843 | ) | |
Institutional Class | | | (105,103 | ) | | | (283 | ) | |
Return of capital: | |
Investor Class | | | — | | | | (30,975 | ) | |
Institutional Class | | | — | | | | (4,757 | ) | |
Net decrease in net assets resulting from distributions | | | (623,327 | ) | | | (37,858 | ) | |
CAPITAL SHARE TRANSACTIONS (net) (Note 5) | | | 82,361,403 | | | | 39,826,472 | | |
REDEMPTION FEES | | | 14,452 | | | | 13,298 | | |
Total increase (decrease) in net assets | | | 91,673,692 | | | | 40,039,011 | | |
NET ASSETS: | |
Beginning of period | | | 40,039,011 | | | | — | | |
End of period (including distributions in excess of net investment income of ($349,313)
and ($1,820), respectively) | | $ | 131,712,703 | | | $ | 40,039,011 | | |
1 Matthews Emerging Asia Fund commenced operations on April 30, 2013.
See accompanying notes to financial statements.
matthewsasia.com | 800.789.ASIA 97
Statements of Changes in Net Assets (continued)
MATTHEWS CHINA FUND | | Year Ended
December 31, 20141 | | Year Ended
December 31, 2013 | |
OPERATIONS: | |
Net investment income (loss) | | $ | 12,670,620 | | | $ | 17,648,808 | | |
Net realized gain (loss) on investments and foreign currency related transactions | | | 19,391,086 | | | | 125,883,315 | | |
Net change in unrealized appreciation/depreciation on investments and foreign currency
related translations | | | (96,779,181 | ) | | | (75,323,757 | ) | |
Net change on deferred foreign capital gains taxes on unrealized appreciation | | | (4,990 | ) | | | — | | |
Net increase (decrease) in net assets resulting from operations | | | (64,722,465 | ) | | | 68,208,366 | | |
DISTRIBUTIONS TO SHAREHOLDERS FROM: | |
Net investment income: | |
Investor Class | | | (11,939,433 | ) | | | (14,160,927 | ) | |
Institutional Class | | | (897,946 | ) | | | (1,500,281 | ) | |
Realized gains on investments: | |
Investor Class | | | (4,591,640 | ) | | | (104,225,815 | ) | |
Institutional Class | | | (303,495 | ) | | | (9,564,766 | ) | |
Net decrease in net assets resulting from distributions | | | (17,732,514 | ) | | | (129,451,789 | ) | |
CAPITAL SHARE TRANSACTIONS (net) (Note 5) | | | (321,454,659 | ) | | | (567,939,044 | ) | |
REDEMPTION FEES | | | 141,324 | | | | 335,544 | | |
Total decrease in net assets | | | (403,768,314 | ) | | | (628,846,923 | ) | |
NET ASSETS: | |
Beginning of year | | | 1,403,986,859 | | | | 2,032,833,782 | | |
End of year (including undistributed net investment income of $73,913 and $164,220, respectively) | | $ | 1,000,218,545 | | | $ | 1,403,986,859 | | |
1 Consolidated Statements of Changes in Net Assets.
MATTHEWS INDIA FUND | | Year Ended
December 31, 2014 | | Year Ended
December 31, 2013 | |
OPERATIONS: | |
Net investment income (loss) | | $ | 2,121,302 | | | $ | 2,574,277 | | |
Net realized gain (loss) on investments and foreign currency related transactions | | | 6,119,604 | | | | 6,730,985 | | |
Net change in unrealized appreciation/depreciation on investments and foreign currency
related translations | | | 298,047,926 | | | | (56,771,054 | ) | |
Net change on deferred foreign capital gains taxes on unrealized appreciation | | | (8,627,059 | ) | | | — | | |
Net increase (decrease) in net assets resulting from operations | | | 297,661,773 | | | | (47,465,792 | ) | |
DISTRIBUTIONS TO SHAREHOLDERS FROM: | |
Net investment income: | |
Investor Class | | | (1,672,358 | ) | | | (4,840,984 | ) | |
Institutional Class | | | (176,254 | ) | | | (41,650 | ) | |
Realized gains on investments: | |
Investor Class | | | (5,267,446 | ) | | | (369,552 | ) | |
Institutional Class | | | (320,352 | ) | | | (2,745 | ) | |
Net decrease in net assets resulting from distributions | | | (7,436,410 | ) | | | (5,254,931 | ) | |
CAPITAL SHARE TRANSACTIONS (net) (Note 5) | | | 362,428,175 | | | | (160,379,740 | ) | |
REDEMPTION FEES | | | 420,708 | | | | 229,028 | | |
Total increase (decrease) in net assets | | | 653,074,246 | | | | (212,871,435 | ) | |
NET ASSETS: | |
Beginning of year | | | 431,094,458 | | | | 643,965,893 | | |
End of year (including undistributed net investment income of $1,797,278 and
$1,813,280, respectively) | | $ | 1,084,168,704 | | | $ | 431,094,458 | | |
See accompanying notes to financial statements.
98 MATTHEWS ASIA FUNDS
MATTHEWS JAPAN FUND | | Year Ended
December 31, 2014 | | Year Ended
December 31, 2013 | |
OPERATIONS: | |
Net investment income (loss) | | $ | 1,903,581 | | | $ | 578,163 | | |
Net realized gain (loss) on investments and foreign currency related transactions | | | 13,363,795 | | | | 9,951,653 | | |
Net change in unrealized appreciation/depreciation on investments and foreign currency
related translations | | | (29,305,954 | ) | | | 41,658,083 | | |
Net increase (decrease) in net assets resulting from operations | | | (14,038,578 | ) | | | 52,187,899 | | |
DISTRIBUTIONS TO SHAREHOLDERS FROM: | |
Net investment income: | |
Investor Class | | | (2,432,405 | ) | | | (4,541,567 | ) | |
Institutional Class | | | (893,149 | ) | | | (927,799 | ) | |
Net decrease in net assets resulting from distributions | | | (3,325,554 | ) | | | (5,469,366 | ) | |
CAPITAL SHARE TRANSACTIONS (net) (Note 5) | | | 267,055,762 | | | | 220,891,495 | | |
REDEMPTION FEES | | | 221,547 | | | | 384,672 | | |
Total increase (decrease) in net assets | | | 249,913,177 | | | | 267,994,700 | | |
NET ASSETS: | |
Beginning of year | | | 372,690,628 | | | | 104,695,928 | | |
End of year (including distributions in excess of net investment income of ($3,723,660)
and ($2,984,878), respectively) | | $ | 622,603,805 | | | $ | 372,690,628 | | |
MATTHEWS KOREA FUND | | Year Ended
December 31, 2014 | | Year Ended
December 31, 2013 | |
OPERATIONS: | |
Net investment income (loss) | | $ | 550,797 | | | $ | 15,592 | | |
Net realized gain (loss) on investments and foreign currency related transactions | | | 5,707,881 | | | | 11,461,228 | | |
Net change in unrealized appreciation/depreciation on investments and foreign currency
related translations | | | (9,305,293 | ) | | | 2,118,216 | | |
Net increase (decrease) in net assets resulting from operations | | | (3,046,615 | ) | | | 13,595,036 | | |
DISTRIBUTIONS TO SHAREHOLDERS FROM: | |
Net investment income: | |
Investor Class | | | — | | | | (405,628 | ) | |
Institutional Class | | | — | | | | (57,142 | ) | |
Realized gains on investments: | |
Investor Class | | | (5,528,243 | ) | | | (5,378,606 | ) | |
Institutional Class | | | (4,268,341 | ) | | | (486,472 | ) | |
Net decrease in net assets resulting from distributions | | | (9,796,584 | ) | | | (6,327,848 | ) | |
CAPITAL SHARE TRANSACTIONS (net) (Note 5) | | | 80,886,069 | | | | (6,062,003 | ) | |
REDEMPTION FEES | | | 48,449 | | | | 64,006 | | |
Total increase (decrease) in net assets | | | 68,091,319 | | | | 1,269,191 | | |
NET ASSETS: | |
Beginning of year | | | 151,113,057 | | | | 149,843,866 | | |
End of year (including undistributed/(distributions in excess of) net investment income of
$342,932 and ($530,537), respectively) | | $ | 219,204,376 | | | $ | 151,113,057 | | |
See accompanying notes to financial statements.
matthewsasia.com | 800.789.ASIA 99
Statements of Changes in Net Assets (continued)
MATTHEWS ASIA SMALL COMPANIES FUND | | Year Ended
December 31, 2014 | | Year Ended
December 31, 2013 | |
OPERATIONS: | |
Net investment income (loss) | | $ | 2,628,989 | | | $ | 2,529,900 | | |
Net realized gain (loss) on investments and foreign currency related transactions | | | 2,692,424 | | | | 8,712,684 | | |
Net change in unrealized appreciation/depreciation on investments and foreign currency
related translations | | | 48,527,175 | | | | 17,450,640 | | |
Net change on deferred foreign capital gains taxes on unrealized appreciation | | | 458,859 | | | | (893,784 | ) | |
Net increase (decrease) in net assets resulting from operations | | | 54,307,447 | | | | 27,799,440 | | |
DISTRIBUTIONS TO SHAREHOLDERS FROM: | |
Net investment income: | |
Investor Class | | | (2,240,054 | ) | | | (1,895,218 | ) | |
Institutional Class | | | (425,758 | ) | | | (259,608 | ) | |
Net decrease in net assets resulting from distributions | | | (2,665,812 | ) | | | (2,154,826 | ) | |
CAPITAL SHARE TRANSACTIONS (net) (Note 5) | | | 172,402,487 | | | | 59,667,066 | | |
REDEMPTION FEES | | | 85,734 | | | | 56,198 | | |
Total increase (decrease) in net assets | | | 224,129,856 | | | | 85,367,878 | | |
NET ASSETS: | |
Beginning of year | | | 452,120,425 | | | | 366,752,547 | | |
End of year (including undistributed net investment income of $1,500,466 and
$1,663,283, respectively) | | $ | 676,250,281 | | | $ | 452,120,425 | | |
MATTHEWS CHINA SMALL COMPANIES FUND | | Year Ended
December 31, 2014 | | Year Ended
December 31, 2013 | |
OPERATIONS: | |
Net investment income (loss) | | $ | 32,748 | | | $ | 33,687 | | |
Net realized gain (loss) on investments and foreign currency related transactions | | | 725,842 | | | | (181,593 | ) | |
Net change in unrealized appreciation/depreciation on investments and foreign currency
related translations | | | (1,527,785 | ) | | | 4,876,415 | | |
Net increase (decrease) in net assets resulting from operations | | | (769,195 | ) | | | 4,728,509 | | |
DISTRIBUTIONS TO SHAREHOLDERS FROM: | |
Net investment income: | |
Investor Class | | | (50,571 | ) | | | (278,033 | ) | |
Return of Capital: | |
Investor Class | | | (828,820 | ) | | | — | | |
Net decrease in net assets resulting from distributions | | | (879,391 | ) | | | (278,033 | ) | |
CAPITAL SHARE TRANSACTIONS (net) (Note 5) | | | (2,960,536 | ) | | | 11,950,924 | | |
REDEMPTION FEES | | | 2,817 | | | | 6,383 | | |
Total increase (decrease) in net assets | | | (4,606,305 | ) | | | 16,407,783 | | |
NET ASSETS: | |
Beginning of year | | | 26,674,217 | | | | 10,266,434 | | |
End of year (including distributions in excess of net investment income of ($38,540) and
($228,652), respectively) | | $ | 22,067,912 | | | $ | 26,674,217 | | |
See accompanying notes to financial statements.
100 MATTHEWS ASIA FUNDS
MATTHEWS ASIA SCIENCE AND TECHNOLOGY FUND | | Year Ended
December 31, 2014 | | Year Ended
December 31, 2013 | |
OPERATIONS: | |
Net investment income (loss) | | $ | 87,025 | | | $ | 234,791 | | |
Net realized gain (loss) on investments and foreign currency related transactions | | | 15,185,277 | | | | 7,165,943 | | |
Net change in unrealized appreciation/depreciation on investments and foreign currency
related translations | | | (362,764 | ) | | | 35,540,932 | | |
Net change on deferred foreign capital gains taxes on unrealized appreciation | | | 201,559 | | | | (201,559 | ) | |
Net increase (decrease) in net assets resulting from operations | | | 15,111,097 | | | | 42,740,107 | | |
DISTRIBUTIONS TO SHAREHOLDERS FROM: | |
Net investment income: | |
Investor Class | | | (545,161 | ) | | | (68,138 | ) | |
Institutional Class | | | (384,106 | ) | | | (119,153 | ) | |
Realized gains on investments: | |
Investor Class | | | (769,763 | ) | | | — | | |
Institutional Class | | | (372,799 | ) | | | — | | |
Net decrease in net assets resulting from distributions | | | (2,071,829 | ) | | | (187,291 | ) | |
CAPITAL SHARE TRANSACTIONS (net) (Note 5) | | | 12,612,113 | | | | (13,205,251 | ) | |
REDEMPTION FEES | | | 61,504 | | | | 11,048 | | |
Total increase (decrease) in net assets | | | 25,712,885 | | | | 29,358,613 | | |
NET ASSETS: | |
Beginning of year | | | 160,987,299 | | | | 131,628,686 | | |
End of year (including undistributed/(distributions in excess of) net investment
income of ($787) and $92,541, respectively) | | $ | 186,700,184 | | | $ | 160,987,299 | | |
See accompanying notes to financial statements.
matthewsasia.com | 800.789.ASIA 101
Matthews Asia Strategic Income Fund
The tables below set forth financial data for a share of beneficial interest outstanding throughout each period presented.
| | | Year Ended Dec. 31 | | Period Ended | |
INVESTOR CLASS | | 2014 | | 2013 | | 2012 | | Dec. 31, 20111 | |
Net Asset Value, beginning of period | | $ | 10.42 | | | $ | 10.84 | | | $ | 9.93 | | | $ | 10.00 | | |
INCOME (LOSS) FROM INVESTMENT OPERATIONS: | |
Net investment income (loss)2 | | | 0.46 | | | | 0.40 | | | | 0.37 | | | | 0.02 | | |
Net realized gain (loss) and unrealized appreciation/depreciation
on investments, financial futures contracts and foreign currency | | | (0.19 | ) | | | (0.48 | ) | | | 0.95 | | | | (0.07 | ) | |
Total from investment operations | | | 0.27 | | | | (0.08 | ) | | | 1.32 | | | | (0.05 | ) | |
LESS DISTRIBUTIONS FROM: | |
Net investment income | | | (0.38 | ) | | | (0.35 | ) | | | (0.42 | ) | | | (0.02 | ) | |
Net realized gains on investments | | | — | | | | (0.01 | ) | | | — | | | | — | | |
Total distributions | | | (0.38 | ) | | | (0.36 | ) | | | (0.42 | ) | | | (0.02 | ) | |
Paid-in capital from redemption fees (Note 5) | | | —3 | | | | 0.02 | | | | 0.01 | | | | — | | |
Net Asset Value, end of period | | $ | 10.31 | | | $ | 10.42 | | | $ | 10.84 | | | $ | 9.93 | | |
TOTAL RETURN | | | 2.54 | % | | | (0.50 | %) | | | 13.62 | % | | | (0.52 | %)4 | |
RATIOS/SUPPLEMENTAL DATA | |
Net assets, end of period (in 000's) | | $ | 58,594 | | | $ | 38,051 | | | $ | 29,479 | | | $ | 7,746 | | |
Ratio of expenses to average net assets before any reimbursement,
waiver or recapture of expenses by Advisor and Administrator (Note 6) | | | 1.27 | % | | | 1.28 | % | | | 1.85 | % | | | 3.20 | %5 | |
Ratio of expenses to average net assets after any reimbursement,
waiver or recapture of expenses by Advisor and Administrator | | | 1.13 | % | | | 1.20 | % | | | 1.17 | % | | | 1.00 | %5 | |
Ratio of net investment income (loss) to average net assets | | | 4.36 | % | | | 3.75 | % | | | 3.58 | % | | | 2.06 | %5 | |
Portfolio turnover6 | | | 34.28 | % | | | 48.71 | % | | | 18.45 | % | | | 3.66 | %4 | |
| | | Year Ended Dec. 31 | | Period Ended | |
INSTITUTIONAL CLASS | | 2014 | | 2013 | | 2012 | | Dec. 31, 20111 | |
Net Asset Value, beginning of period | | $ | 10.42 | | | $ | 10.83 | | | $ | 9.93 | | | $ | 10.00 | | |
INCOME (LOSS) FROM INVESTMENT OPERATIONS: | |
Net investment income (loss)2 | | | 0.48 | | | | 0.42 | | | | 0.39 | | | | 0.02 | | |
Net realized gain (loss) and unrealized appreciation/depreciation
on investments, financial futures contracts, and foreign currency | | | (0.20 | ) | | | (0.46 | ) | | | 0.94 | | | | (0.07 | ) | |
Total from investment operations | | | 0.28 | | | | (0.04 | ) | | | 1.33 | | | | (0.05 | ) | |
LESS DISTRIBUTIONS FROM: | |
Net investment income | | | (0.40 | ) | | | (0.38 | ) | | | (0.44 | ) | | | (0.02 | ) | |
Net realized gains on investments | | | — | | | | (0.01 | ) | | | — | | | | — | | |
Total distributions | | | (0.40 | ) | | | (0.39 | ) | | | (0.44 | ) | | | (0.02 | ) | |
Paid-in capital from redemption fees (Note 5) | | | —3 | | | | 0.02 | | | | 0.01 | | | | — | | |
Net Asset Value, end of period | | $ | 10.30 | | | $ | 10.42 | | | $ | 10.83 | | | $ | 9.93 | | |
TOTAL RETURN | | | 2.64 | % | | | (0.20 | %) | | | 13.74 | % | | | (0.52 | %)4 | |
RATIOS/SUPPLEMENTAL DATA | |
Net assets, end of period (in 000's) | | $ | 7,840 | | | $ | 7,662 | | | $ | 6,205 | | | $ | 5,266 | | |
Ratio of expenses to average net assets before any reimbursement,
waiver or recapture of expenses by Advisor and Administrator (Note 6) | | | 1.07 | % | | | 1.09 | % | | | 1.70 | % | | | 3.20 | %5 | |
Ratio of expenses to average net assets after any reimbursement,
waiver or recapture of expenses by Advisor and Administrator | | | 0.93 | % | | | 1.00 | % | | | 1.00 | % | | | 1.00 | %5 | |
Ratio of net investment income (loss) to average net assets | | | 4.55 | % | | | 3.99 | % | | | 3.70 | % | | | 1.96 | %5 | |
Portfolio turnover6 | | | 34.28 | % | | | 48.71 | % | | | 18.45 | % | | | 3.66 | %4 | |
1 Commencement of operations on November 30, 2011.
2 Calculated using the average daily shares method.
3 Less than $0.01 per share.
4 Not annualized.
5 Annualized.
6 The portfolio turnover rate is calculated on the Fund as a whole without distinguishing between classes of shares issued.
See accompanying notes to financial statements.
102 MATTHEWS ASIA FUNDS
Matthews Asian Growth and Income Fund
The tables below set forth financial data for a share of beneficial interest outstanding throughout each period presented.
| | | Year Ended Dec. 31 | |
INVESTOR CLASS | | 2014 | | 2013 | | 2012 | | 2011 | | 2010 | |
Net Asset Value, beginning of year | | $ | 18.91 | | | $ | 18.61 | | | $ | 15.07 | | | $ | 18.04 | | | $ | 15.77 | | |
INCOME (LOSS) FROM INVESTMENT OPERATIONS: | |
Net investment income (loss)1 | | | 0.39 | | | | 0.41 | | | | 0.43 | | | | 0.47 | | | | 0.41 | | |
Net realized gain (loss) and unrealized appreciation/depreciation
on investments and foreign currency | | | (0.50 | ) | | | 0.47 | | | | 3.58 | | | | (2.36 | ) | | | 2.57 | | |
Total from investment operations | | | (0.11 | ) | | | 0.88 | | | | 4.01 | | | | (1.89 | ) | | | 2.98 | | |
LESS DISTRIBUTIONS FROM: | |
Net investment income | | | (0.35 | ) | | | (0.46 | ) | | | (0.47 | ) | | | (0.47 | ) | | | (0.47 | ) | |
Net realized gains on investments | | | (0.44 | ) | | | (0.12 | ) | | | — | | | | (0.61 | ) | | | (0.24 | ) | |
Total distributions | | | (0.79 | ) | | | (0.58 | ) | | | (0.47 | ) | | | (1.08 | ) | | | (0.71 | ) | |
Paid-in capital from redemption fees (Note 5)2 | | | — | | | | — | | | | — | | | | — | | | | — | | |
Net Asset Value, end of year | | $ | 18.01 | | | $ | 18.91 | | | $ | 18.61 | | | $ | 15.07 | | | $ | 18.04 | | |
TOTAL RETURN | | | (0.65 | %) | | | 4.83 | % | | | 26.90 | % | | | (10.62 | %) | | | 19.18 | % | |
RATIOS/SUPPLEMENTAL DATA | |
Net assets, end of year (in 000's) | | $ | 3,052,565 | | | $ | 3,278,586 | | | $ | 3,214,984 | | | $ | 2,340,606 | | | $ | 3,926,253 | | |
Ratio of expenses to average net assets before any reimbursement or
waiver or recapture of expenses by Advisor and Administrator (Note 6) | | | 1.08 | % | | | 1.08 | % | | | 1.11 | % | | | 1.12 | % | | | 1.13 | % | |
Ratio of net investment income (loss) to average net assets | | | 2.03 | % | | | 2.14 | % | | | 2.52 | % | | | 2.71 | % | | | 2.47 | % | |
Portfolio turnover3 | | | 16.79 | % | | | 15.27 | % | | | 17.43 | % | | | 16.54 | % | | | 19.84 | % | |
| | | Year Ended Dec. 31 | | Period Ended | |
INSTITUTIONAL CLASS | | 2014 | | 2013 | | 2012 | | 2011 | | Dec. 31, 20104 | |
Net Asset Value, beginning of period | | $ | 18.90 | | | $ | 18.60 | | | $ | 15.06 | | | $ | 18.04 | | | $ | 18.13 | | |
INCOME (LOSS) FROM INVESTMENT OPERATIONS: | |
Net investment income (loss)1 | | | 0.42 | | | | 0.44 | | | | 0.45 | | | | 0.52 | | | | 0.07 | | |
Net realized gain (loss) and unrealized appreciation/depreciation
on investments and foreign currency | | | (0.50 | ) | | | 0.48 | | | | 3.58 | | | | (2.39 | ) | | | 0.37 | | |
Total from investment operations | | | (0.08 | ) | | | 0.92 | | | | 4.03 | | | | (1.87 | ) | | | 0.44 | | |
LESS DISTRIBUTIONS FROM: | |
Net investment income | | | (0.38 | ) | | | (0.50 | ) | | | (0.49 | ) | | | (0.50 | ) | | | (0.29 | ) | |
Net realized gains on investments | | | (0.44 | ) | | | (0.12 | ) | | | — | | | | (0.61 | ) | | | (0.24 | ) | |
Total distributions | | | (0.82 | ) | | | (0.62 | ) | | | (0.49 | ) | | | (1.11 | ) | | | (0.53 | ) | |
Paid-in capital from redemption fees (Note 5) | | | —2 | | | | —2 | | | | —2 | | | | —2 | | | | — | | |
Net Asset Value, end of period | | $ | 18.00 | | | $ | 18.90 | | | $ | 18.60 | | | $ | 15.06 | | | $ | 18.04 | | |
TOTAL RETURN | | | (0.48 | %) | | | 5.04 | % | | | 27.09 | % | | | (10.54 | %) | | | 2.49 | %5 | |
RATIOS/SUPPLEMENTAL DATA | |
Net assets, end of period (in 000's) | | $ | 1,182,690 | | | $ | 1,120,218 | | | $ | 856,876 | | | $ | 531,493 | | | $ | 128,417 | | |
Ratio of expenses to average net assets before any reimbursement or
waiver or recapture of expenses by Advisor and Administrator (Note 6) | | | 0.92 | % | | | 0.93 | % | | | 0.97 | % | | | 0.99 | % | | | 0.93 | %6 | |
Ratio of expenses to average net assets after any reimbursement or
waiver or recapture of expenses by Advisor and Administrator | | | 0.92 | % | | | 0.93 | % | | | 0.97 | % | | | 0.99 | % | | | 0.93 | %6 | |
Ratio of net investment income (loss) to average net assets | | | 2.19 | % | | | 2.30 | % | | | 2.69 | % | | | 3.05 | % | | | 2.46 | %6 | |
Portfolio turnover3 | | | 16.79 | % | | | 15.27 | % | | | 17.43 | % | | | 16.54 | % | | | 19.84 | %5 | |
1 Calculated using the average daily shares method.
2 Less than $0.01 per share.
3 The portfolio turnover rate is calculated on the Fund as a whole without distinguishing between classes of shares issued.
4 Institutional Class commenced operations on October 29, 2010.
5 Not annualized.
6 Annualized.
See accompanying notes to financial statements.
matthewsasia.com | 800.789.ASIA 103
Financial Highlights (continued)
Matthews Asia Dividend Fund
The tables below set forth financial data for a share of beneficial interest outstanding throughout each period presented.
| | | Year Ended Dec. 31 | |
INVESTOR CLASS | | 20141 | | 2013 | | 2012 | | 2011 | | 2010 | |
Net Asset Value, beginning of year | | $ | 15.60 | | | $ | 14.58 | | | $ | 12.48 | | | $ | 14.33 | | | $ | 12.06 | | |
INCOME (LOSS) FROM INVESTMENT OPERATIONS: | |
Net investment income (loss)2 | | | 0.30 | | | | 0.32 | | | | 0.36 | | | | 0.36 | | | | 0.31 | | |
Net realized gain (loss) and unrealized appreciation/depreciation
on investments and foreign currency | | | (0.34 | ) | | | 1.30 | | | | 2.30 | | | | (1.78 | ) | | | 2.40 | | |
Total from investment operations | | | (0.04 | ) | | | 1.62 | | | | 2.66 | | | | (1.42 | ) | | | 2.71 | | |
LESS DISTRIBUTIONS FROM: | |
Net investment income | | | (0.23 | ) | | | (0.60 | ) | | | (0.56 | ) | | | (0.37 | ) | | | (0.41 | ) | |
Return of capital | | | (0.07 | ) | | | — | | | | — | | | | — | | | | — | | |
Net realized gains on investments | | | — | | | | — | | | | — | | | | (0.06 | ) | | | (0.04 | ) | |
Total distributions | | | (0.30 | ) | | | (0.60 | ) | | | (0.56 | ) | | | (0.43 | ) | | | (0.45 | ) | |
Paid-in capital from redemption fees (Note 5) | | | —3 | | | | —3 | | | | —3 | | | | —3 | | | | 0.01 | | |
Net Asset Value, end of year | | $ | 15.26 | | | $ | 15.60 | | | $ | 14.58 | | | $ | 12.48 | | | $ | 14.33 | | |
TOTAL RETURN | | | (0.32 | %) | | | 11.27 | % | | | 21.63 | % | | | (10.02 | %) | | | 22.83 | % | |
RATIOS/SUPPLEMENTAL DATA | |
Net assets, end of year (in 000's) | | $ | 2,918,228 | | | $ | 3,669,690 | | | $ | 2,780,043 | | | $ | 1,930,363 | | | $ | 1,933,383 | | |
Ratio of expenses to average net assets before any reimbursement,
waiver or recapture of expenses by Advisor and Administrator (Note 6) | | | 1.06 | % | | | 1.06 | % | | | 1.09 | % | | | 1.10 | % | | | 1.14 | % | |
Ratio of expenses to average net assets after any reimbursement,
waiver or recapture of expenses by Advisor and Administrator | | | 1.05 | % | | | 1.06 | % | | | 1.09 | % | | | 1.10 | % | | | 1.15 | % | |
Ratio of net investment income (loss) to average net assets | | | 1.89 | % | | | 2.04 | % | | | 2.65 | % | | | 2.61 | % | | | 2.31 | % | |
Portfolio turnover4 | | | 20.06 | % | | | 14.06 | % | | | 9.17 | % | | | 16.48 | % | | | 10.48 | % | |
| | | Year Ended Dec. 31 | | Period Ended | |
INSTITUTIONAL CLASS | | 20141 | | 2013 | | 2012 | | 2011 | | Dec. 31, 20105 | |
Net Asset Value, beginning of period | | $ | 15.59 | | | $ | 14.57 | | | $ | 12.48 | | | $ | 14.33 | | | $ | 14.13 | | |
INCOME (LOSS) FROM INVESTMENT OPERATIONS: | |
Net investment income (loss)2 | | | 0.32 | | | | 0.34 | | | | 0.37 | | | | 0.41 | | | | 0.09 | | |
Net realized gain (loss) and unrealized appreciation/depreciation
on investments and foreign currency | | | (0.33 | ) | | | 1.30 | | | | 2.29 | | | | (1.82 | ) | | | 0.32 | | |
Total from investment operations | | | (0.01 | ) | | | 1.64 | | | | 2.66 | | | | (1.41 | ) | | | 0.41 | | |
LESS DISTRIBUTIONS FROM: | |
Net investment income | | | (0.25 | ) | | | (0.62 | ) | | | (0.57 | ) | | | (0.38 | ) | | | (0.17 | ) | |
Return of capital | | | (0.07 | ) | | | — | | | | — | | | | — | | | | — | | |
Net realized gains on investments | | | — | | | | — | | | | — | | | | (0.06 | ) | | | (0.04 | ) | |
Total distributions | | | (0.32 | ) | | | (0.62 | ) | | | (0.57 | ) | | | (0.44 | ) | | | (0.21 | ) | |
Paid-in capital from redemption fees (Note 5)3 | | | — | | | | — | | | | — | | | | — | | | | — | | |
Net Asset Value, end of period | | $ | 15.26 | | | $ | 15.59 | | | $ | 14.57 | | | $ | 12.48 | | | $ | 14.33 | | |
TOTAL RETURN | | | (0.18 | %) | | | 11.43 | % | | | 21.70 | % | | | (9.93 | %) | | | 2.95 | %6 | |
RATIOS/SUPPLEMENTAL DATA | |
Net assets, end of period (in 000's) | | $ | 2,107,371 | | | $ | 2,124,214 | | | $ | 922,561 | | | $ | 344,502 | | | $ | 48,293 | | |
Ratio of expenses to average net assets before any reimbursement,
waiver or recapture of expenses by Advisor and Administrator (Note 6) | | | 0.93 | % | | | 0.93 | % | | | 0.97 | % | | | 1.00 | % | | | 1.02 | %7 | |
Ratio of expenses to average net assets after any reimbursement,
waiver or recapture of expenses by Advisor and Administrator | | | 0.93 | % | | | 0.93 | % | | | 0.97 | % | | | 1.00 | % | | | 1.02 | %7 | |
Ratio of net investment income (loss) to average net assets | | | 2.02 | % | | | 2.17 | % | | | 2.72 | % | | | 3.03 | % | | | 3.86 | %7 | |
Portfolio turnover4 | | | 20.06 | % | | | 14.06 | % | | | 9.17 | % | | | 16.48 | % | | | 10.48 | %6 | |
1 Consolidated Financial Highlights.
2 Calculated using the average daily shares method.
3 Less than $0.01 per share.
4 The portfolio turnover rate is calculated on the Fund as a whole without distinguishing between classes of share issues.
5 Institutional Class commenced operations on October 29, 2010.
6 Not annualized.
7 Annualized.
See accompanying notes to financial statements.
104 MATTHEWS ASIA FUNDS
Matthews China Dividend Fund
The tables below set forth financial data for a share of beneficial interest outstanding throughout each period presented.
| | | Year Ended Dec. 31 | |
INVESTOR CLASS | | 2014 | | 2013 | | 2012 | | 2011 | | 2010 | |
Net Asset Value, beginning of year | | $ | 13.74 | | | $ | 12.35 | | | $ | 10.06 | | | $ | 12.17 | | | $ | 10.18 | | |
INCOME (LOSS) FROM INVESTMENT OPERATIONS: | |
Net investment income (loss)1 | | | 0.25 | | | | 0.25 | | | | 0.25 | | | | 0.29 | | | | 0.17 | | |
Net realized gain (loss) and unrealized appreciation/depreciation
on investments and foreign currency | | | (0.12 | ) | | | 1.35 | | | | 2.49 | | | | (2.04 | ) | | | 2.09 | | |
Total from investment operations | | | 0.13 | | | | 1.60 | | | | 2.74 | | | | (1.75 | ) | | | 2.26 | | |
LESS DISTRIBUTIONS FROM: | |
Net investment income | | | (0.36 | ) | | | (0.23 | ) | | | (0.46 | ) | | | (0.35 | ) | | | (0.24 | ) | |
Net realized gains on investments | | | (0.14 | ) | | | — | | | | — | | | | (0.02 | ) | | | (0.04 | ) | |
Total distributions | | | (0.50 | ) | | | (0.23 | ) | | | (0.46 | ) | | | (0.37 | ) | | | (0.28 | ) | |
Paid-in capital from redemption fees (Note 5) | | | —2 | | | | 0.02 | | | | 0.01 | | | | 0.01 | | | | 0.01 | | |
Net Asset Value, end of year | | $ | 13.37 | | | $ | 13.74 | | | $ | 12.35 | | | $ | 10.06 | | | $ | 12.17 | | |
TOTAL RETURN | | | 0.93 | % | | | 13.35 | % | | | 27.81 | % | | | (14.44 | %) | | | 22.53 | % | |
RATIOS/SUPPLEMENTAL DATA | |
Net assets, end of year (in 000's) | | $ | 116,954 | | | $ | 125,965 | | | $ | 59,535 | | | $ | 26,467 | | | $ | 45,364 | | |
Ratio of expenses to average net assets before any reimbursement or
waiver or recapture of expenses by Advisor and Administrator (Note 6) | | | 1.19 | % | | | 1.24 | % | | | 1.47 | % | | | 1.52 | % | | | 1.95 | % | |
Ratio of expenses to average net assets after any reimbursement or
waiver or recapture of expenses by Advisor and Administrator | | | 1.19 | % | | | 1.34 | % | | | 1.50 | % | | | 1.50 | % | | | 1.50 | % | |
Ratio of net investment income (loss) to average net assets | | | 1.88 | % | | | 1.94 | % | | | 2.24 | % | | | 2.47 | % | | | 1.49 | % | |
Portfolio turnover3 | | | 25.43 | % | | | 20.52 | % | | | 21.40 | % | | | 22.31 | % | | | 6.84 | % | |
| | | Year Ended Dec. 31 | | Period Ended | |
INSTITUTIONAL CLASS | | 2014 | | 2013 | | 2012 | | 2011 | | Dec. 31, 20104 | |
Net Asset Value, beginning of period | | $ | 13.74 | | | $ | 12.34 | | | $ | 10.06 | | | $ | 12.17 | | | $ | 11.87 | | |
INCOME (LOSS) FROM INVESTMENT OPERATIONS: | |
Net investment income (loss)1 | | | 0.28 | | | | 0.33 | | | | 0.22 | | | | 0.30 | | | | —2 | | |
Net realized gain (loss) and unrealized appreciation/depreciation
on investments and foreign currency | | | (0.13 | ) | | | 1.32 | | | | 2.53 | | | | (2.01 | ) | | | 0.47 | | |
Total from investment operations | | | 0.15 | | | | 1.65 | | | | 2.75 | | | | (1.71 | ) | | | 0.47 | | |
LESS DISTRIBUTIONS FROM: | |
Net investment income | | | (0.38 | ) | | | (0.26 | ) | | | (0.48 | ) | | | (0.38 | ) | | | (0.13 | ) | |
Net realized gains on investments | | | (0.14 | ) | | | — | | | | — | | | | (0.02 | ) | | | (0.04 | ) | |
Total distributions | | | (0.52 | ) | | | (0.26 | ) | | | (0.48 | ) | | | (0.40 | ) | | | (0.17 | ) | |
Paid-in capital from redemption fees (Note 5) | | | —2 | | | | 0.01 | | | | 0.01 | | | | —2 | | | | — | | |
Net Asset Value, end of period | | $ | 13.37 | | | $ | 13.74 | | | $ | 12.34 | | | $ | 10.06 | | | $ | 12.17 | | |
TOTAL RETURN | | | 1.11 | % | | | 13.72 | % | | | 27.90 | % | | | (14.22 | %) | | | 3.91 | %5 | |
RATIOS/SUPPLEMENTAL DATA | |
Net assets, end of period (in 000's) | | $ | 30,662 | | | $ | 24,790 | | | $ | 201 | | | $ | 12 | | | $ | 4 | | |
Ratio of expenses to average net assets | | | 1.01 | % | | | 1.08 | % | | | 1.29 | % | | | 1.31 | % | | | 1.24 | %6 | |
Ratio of net investment income (loss) to average net assets | | | 2.06 | % | | | 2.54 | % | | | 1.87 | % | | | 2.61 | % | | | (0.06 | %)6 | |
Portfolio turnover3 | | | 25.43 | % | | | 20.52 | % | | | 21.40 | % | | | 22.31 | % | | | 6.84 | %5 | |
1 Calculated using the average daily shares method.
2 Less than $0.01 per share.
3 The portfolio turnover rate is calculated on the Fund as a whole without distinguishing between classes of shares issued.
4 Institutional Class commenced operations on October 29, 2010.
5 Not annualized.
6 Annualized.
See accompanying notes to financial statements.
matthewsasia.com | 800.789.ASIA 105
Financial Highlights (continued)
Matthews Asia Focus Fund
The tables below set forth financial data for a share of beneficial interest outstanding throughout each period presented.
INVESTOR CLASS | | Year Ended
Dec. 31, 2014 | | Period Ended
Dec. 31, 20131 | |
Net Asset Value, beginning of period | | $ | 9.66 | | | $ | 10.00 | | |
INCOME (LOSS) FROM INVESTMENT OPERATIONS: | |
Net investment income (loss)2 | | | 0.09 | | | | 0.04 | | |
Net realized gain (loss) and unrealized appreciation/depreciation
on investments and foreign currency | | | 0.33 | | | | (0.30 | ) | |
Total from investment operations | | | 0.42 | | | | (0.26 | ) | |
LESS DISTRIBUTIONS FROM: | |
Net investment income | | | (0.07 | ) | | | (0.08 | ) | |
Total distributions | | | (0.07 | ) | | | (0.08 | ) | |
Paid-in capital from redemption fees (Note 5)3 | | | — | | | | — | | |
Net Asset Value, end of period | | $ | 10.01 | | | $ | 9.66 | | |
TOTAL RETURN | | | 4.38 | % | | | (2.63 | %)4 | |
RATIOS/SUPPLEMENTAL DATA | |
Net assets, end of period (in 000's) | | $ | 7,839 | | | $ | 6,258 | | |
Ratio of expenses to average net assets before any reimbursement,
waiver or recapture of expenses by Advisor and Administrator (Note 6) | | | 2.16 | % | | | 3.50 | %5 | |
Ratio of expenses to average net assets after any reimbursement,
waiver or recapture of expenses by Advisor and Administrator | | | 1.57 | % | | | 1.71 | %5 | |
Ratio of net investment income (loss) to average net assets | | | 0.87 | % | | | 0.64 | %5 | |
Portfolio turnover6 | | | 24.12 | % | | | 16.23 | %4 | |
INSTITUTIONAL CLASS | | Year Ended
Dec. 31, 2014 | | Period Ended
Dec. 31, 20131 | |
Net Asset Value, beginning of period | | $ | 9.66 | | | $ | 10.00 | | |
INCOME (LOSS) FROM INVESTMENT OPERATIONS: | |
Net investment income (loss)2 | | | 0.10 | | | | 0.05 | | |
Net realized gain (loss) and unrealized appreciation/depreciation
on investments and foreign currency | | | 0.36 | | | | (0.30 | ) | |
Total from investment operations | | | 0.46 | | | | (0.25 | ) | |
LESS DISTRIBUTIONS FROM: | |
Net investment income | | | (0.08 | ) | | | (0.09 | ) | |
Total distributions | | | (0.08 | ) | | | (0.09 | ) | |
Paid-in capital from redemption fees (Note 5)3 | | | — | | | | — | | |
Net Asset Value, end of period | | $ | 10.04 | | | $ | 9.66 | | |
TOTAL RETURN | | | 4.77 | % | | | (2.48 | %)4 | |
RATIOS/SUPPLEMENTAL DATA | |
Net assets, end of period (in 000's) | | $ | 7,148 | | | $ | 2,118 | | |
Ratio of expenses to average net assets before any reimbursement,
waiver or recapture of expenses by Advisor and Administrator (Note 6) | | | 1.94 | % | | | 3.32 | %5 | |
Ratio of expenses to average net assets after any reimbursement,
waiver or recapture of expenses by Advisor and Administrator | | | 1.31 | % | | | 1.50 | %5 | |
Ratio of net investment income (loss) to average net assets | | | 0.96 | % | | | 0.79 | %5 | |
Portfolio turnover6 | | | 24.12 | % | | | 16.23 | %4 | |
1 Commenced operations on April 30, 2013.
2 Calculated using the average daily shares method.
3 Less than $0.01 per share.
4 Not annualized.
5 Annualized.
6 The portfolio turnover rate is calculated on the Fund as a whole without distinguishing between classes of shares issued.
See accompanying notes to financial statements.
106 MATTHEWS ASIA FUNDS
Matthews Asia Growth Fund
The tables below set forth financial data for a share of beneficial interest outstanding throughout each period presented.
| | | Year Ended Dec. 31 | |
INVESTOR CLASS | | 2014 | | 2013 | | 2012 | | 2011 | | 2010 | |
Net Asset Value, beginning of year | | $ | 21.17 | | | $ | 18.02 | | | $ | 15.34 | | | $ | 17.97 | | | $ | 14.29 | | |
INCOME (LOSS) FROM INVESTMENT OPERATIONS: | |
Net investment income (loss)1 | | | 0.12 | | | | 0.11 | | | | 0.15 | | | | 0.11 | | | | 0.10 | | |
Net realized gain (loss) and unrealized appreciation/depreciation
on investments and foreign currency | | | 0.19 | | | | 3.37 | | | | 2.53 | | | | (2.41 | ) | | | 3.72 | | |
Total from investment operations | | | 0.31 | | | | 3.48 | | | | 2.68 | | | | (2.30 | ) | | | 3.82 | | |
LESS DISTRIBUTIONS FROM: | |
Net investment income | | | (0.38 | ) | | | (0.33 | ) | | | — | | | | (0.35 | ) | | | (0.15 | ) | |
Total distributions | | | (0.38 | ) | | | (0.33 | ) | | | — | | | | (0.35 | ) | | | (0.15 | ) | |
Paid-in capital from redemption fees (Note 5) | | | —2 | | | | —2 | | | | —2 | | | | 0.02 | | | | 0.01 | | |
Net Asset Value, end of year | | $ | 21.10 | | | $ | 21.17 | | | $ | 18.02 | | | $ | 15.34 | | | $ | 17.97 | | |
TOTAL RETURN | | | 1.49 | % | | | 19.35 | % | | | 17.47 | % | | | (12.70 | %) | | | 26.85 | % | |
RATIOS/SUPPLEMENTAL DATA | |
Net assets, end of year (in 000's) | | $ | 561,922 | | | $ | 558,407 | | | $ | 276,884 | | | $ | 259,166 | | | $ | 335,429 | | |
Ratio of expenses to average net assets | | | 1.11 | % | | | 1.12 | % | | | 1.16 | % | | | 1.19 | % | | | 1.19 | % | |
Ratio of net investment income (loss) to average net assets | | | 0.55 | % | | | 0.55 | % | | | 0.92 | % | | | 0.63 | % | | | 0.63 | % | |
Portfolio turnover3 | | | 22.24 | % | | | 10.77 | % | | | 44.76 | % | | | 28.06 | % | | | 26.33 | % | |
| | | Year Ended Dec. 31 | | Period Ended | |
INSTITUTIONAL CLASS | | 2014 | | 2013 | | 2012 | | 2011 | | Dec. 31, 20104 | |
Net Asset Value, beginning of period | | $ | 21.26 | | | $ | 18.08 | | | $ | 15.37 | | | $ | 17.98 | | | $ | 17.65 | | |
INCOME (LOSS) FROM INVESTMENT OPERATIONS: | |
Net investment income (loss)1 | | | 0.16 | | | | 0.15 | | | | 0.17 | | | | 0.14 | | | | 0.01 | | |
Net realized gain (loss) and unrealized appreciation/depreciation
on investments and foreign currency | | | 0.19 | | | | 3.39 | | | | 2.54 | | | | (2.42 | ) | | | 0.47 | | |
Total from investment operations | | | 0.35 | | | | 3.54 | | | | 2.71 | | | | (2.28 | ) | | | 0.48 | | |
LESS DISTRIBUTIONS FROM: | |
Net investment income | | | (0.42 | ) | | | (0.36 | ) | | | — | | | | (0.35 | ) | | | (0.15 | ) | |
Total distributions | | | (0.42 | ) | | | (0.36 | ) | | | — | | | | (0.35 | ) | | | (0.15 | ) | |
Paid-in capital from redemption fees (Note 5) | | | —2 | | | | —2 | | | | —2 | | | | 0.02 | | | | — | | |
Net Asset Value, end of period | | $ | 21.19 | | | $ | 21.26 | | | $ | 18.08 | | | $ | 15.37 | | | $ | 17.98 | | |
TOTAL RETURN | | | 1.63 | % | | | 19.63 | % | | | 17.63 | % | | | (12.58 | %) | | | 2.76 | %5 | |
RATIOS/SUPPLEMENTAL DATA | |
Net assets, end of period (in 000's) | | $ | 287,262 | | | $ | 227,852 | | | $ | 147,142 | | | $ | 84,302 | | | $ | 8,853 | | |
Ratio of expenses to average net assets | | | 0.91 | % | | | 0.93 | % | | | 0.98 | % | | | 1.03 | % | | | 0.99 | %6 | |
Ratio of net investment income (loss) to average net assets | | | 0.74 | % | | | 0.73 | % | | | 1.02 | % | | | 0.84 | % | | | 0.37 | %6 | |
Portfolio turnover3 | | | 22.24 | % | | | 10.77 | % | | | 44.76 | % | | | 28.06 | % | | | 26.33 | %5 | |
1 Calculated using the average daily shares method.
2 Less than $0.01 per share.
3 The portfolio turnover rate is calculated on the Fund as a whole without distinguishing between classes of shares issued.
4 Institutional Class commenced operations on October 29, 2010.
5 Not annualized.
6 Annualized.
See accompanying notes to financial statements.
matthewsasia.com | 800.789.ASIA 107
Financial Highlights (continued)
Matthews Pacific Tiger Fund
The tables below set forth financial data for a share of beneficial interest outstanding throughout each period presented.
| | | Year Ended Dec. 31 | |
INVESTOR CLASS | | 2014 | | 2013 | | 2012 | | 2011 | | 2010 | |
Net Asset Value, beginning of year | | $ | 24.99 | | | $ | 24.42 | | | $ | 20.33 | | | $ | 23.44 | | | $ | 19.23 | | |
INCOME (LOSS) FROM INVESTMENT OPERATIONS: | |
Net investment income (loss)1 | | | 0.14 | | | | 0.17 | | | | 0.18 | | | | 0.10 | | | | 0.09 | | |
Net realized gain (loss) and unrealized appreciation/depreciation
on investments and foreign currency | | | 2.80 | | | | 0.72 | | | | 4.09 | | | | (2.78 | ) | | | 4.20 | | |
Total from investment operations | | | 2.94 | | | | 0.89 | | | | 4.27 | | | | (2.68 | ) | | | 4.29 | | |
LESS DISTRIBUTIONS FROM: | |
Net investment income | | | (0.13 | ) | | | (0.16 | ) | | | (0.16 | ) | | | (0.11 | ) | | | (0.08 | ) | |
Net realized gains on investments | | | (1.23 | ) | | | (0.16 | ) | | | (0.02 | ) | | | (0.33 | ) | | | — | | |
Total distributions | | | (1.36 | ) | | | (0.32 | ) | | | (0.18 | ) | | | (0.44 | ) | | | (0.08 | ) | |
Paid-in capital from redemption fees (Note 5) | | | —2 | | | | —2 | | | | —2 | | | | 0.01 | | | | —2 | | |
Net Asset Value, end of year | | $ | 26.57 | | | $ | 24.99 | | | $ | 24.42 | | | $ | 20.33 | | | $ | 23.44 | | |
TOTAL RETURN | | | 11.79 | % | | | 3.63 | % | | | 21.00 | % | | | (11.41 | %) | | | 22.30 | % | |
RATIOS/SUPPLEMENTAL DATA | |
Net assets, end of year (in 000's) | | $ | 3,047,077 | | | $ | 2,954,108 | | | $ | 2,994,026 | | | $ | 2,780,640 | | | $ | 5,196,743 | | |
Ratio of expenses to average net assets before any reimbursement or
waiver or recapture of expenses by Advisor and Administrator (Note 6) | | | 1.09 | % | | | 1.09 | % | | | 1.11 | % | | | 1.11 | % | | | 1.09 | % | |
Ratio of expenses to average net assets after any reimbursement or
waiver or recapture of expenses by Advisor and Administrator | | | 1.08 | % | | | 1.09 | % | | | 1.11 | % | | | 1.11 | % | | | 1.09 | % | |
Ratio of net investment income (loss) to average net assets | | | 0.52 | % | | | 0.67 | % | | | 0.82 | % | | | 0.44 | % | | | 0.43 | % | |
Portfolio turnover3 | | | 11.38 | % | | | 7.73 | % | | | 6.53 | % | | | 10.51 | % | | | 11.43 | % | |
| | | Year Ended Dec. 31 | | Period Ended | |
INSTITUTIONAL CLASS | | 2014 | | 2013 | | 2012 | | 2011 | | Dec. 31, 20104 | |
Net Asset Value, beginning of period | | $ | 24.97 | | | $ | 24.41 | | | $ | 20.32 | | | $ | 23.44 | | | $ | 23.37 | | |
INCOME (LOSS) FROM INVESTMENT OPERATIONS: | |
Net investment income (loss)1 | | | 0.18 | | | | 0.21 | | | | 0.21 | | | | 0.23 | | | | 0.01 | | |
Net realized gain (loss) and unrealized appreciation/depreciation
on investments and foreign currency | | | 2.82 | | | | 0.71 | | | | 4.10 | | | | (2.87 | ) | | | 0.15 | | |
Total from investment operations | | | 3.00 | | | | 0.92 | | | | 4.31 | | | | (2.64 | ) | | | 0.16 | | |
LESS DISTRIBUTIONS FROM: | |
Net investment income | | | (0.18 | ) | | | (0.20 | ) | | | (0.20 | ) | | | (0.15 | ) | | | (0.09 | ) | |
Net realized gains on investments | | | (1.23 | ) | | | (0.16 | ) | | | (0.02 | ) | | | (0.33 | ) | | | — | | |
Total distributions | | | (1.41 | ) | | | (0.36 | ) | | | (0.22 | ) | | | (0.48 | ) | | | (0.09 | ) | |
Paid-in capital from redemption fees (Note 5)2 | | | — | | | | — | | | | — | | | | — | | | | — | | |
Net Asset Value, end of period | | $ | 26.56 | | | $ | 24.97 | | | $ | 24.41 | | | $ | 20.32 | | | $ | 23.44 | | |
TOTAL RETURN | | | 12.03 | % | | | 3.78 | % | | | 21.24 | % | | | (11.28 | %) | | | 0.67 | %5 | |
RATIOS/SUPPLEMENTAL DATA | |
Net assets, end of period (in 000's) | | $ | 5,049,643 | | | $ | 4,679,039 | | | $ | 3,770,568 | | | $ | 2,029,091 | | | $ | 540,469 | | |
Ratio of expenses to average net assets before any reimbursement or
waiver or recapture of expenses by Advisor and Administrator (Note 6) | | | 0.92 | % | | | 0.92 | % | | | 0.95 | % | | | 0.95 | % | | | 0.95 | %6 | |
Ratio of expenses to average net assets after any reimbursement or
waiver or recapture of expenses by Advisor and Administrator | | | 0.91 | % | | | 0.92 | % | | | 0.95 | % | | | 0.95 | % | | | 0.95 | %6 | |
Ratio of net investment income (loss) to average net assets | | | 0.68 | % | | | 0.83 | % | | | 0.95 | % | | | 1.03 | % | | | 0.38 | %6 | |
Portfolio turnover3 | | | 11.38 | % | | | 7.73 | % | | | 6.53 | % | | | 10.51 | % | | | 11.43 | %5 | |
1 Calculated using the average daily shares method.
2 Less than $0.01 per share.
3 The portfolio turnover rate is calculated on the Fund as a whole without distinguishing between classes of shares issued.
4 Institutional Class commenced operations on October 29, 2010.
5 Not annualized.
6 Annualized.
See accompanying notes to financial statements.
108 MATTHEWS ASIA FUNDS
Matthews Emerging Asia Fund
The tables below set forth financial data for a share of beneficial interest outstanding throughout each period presented.
INVESTOR CLASS | | Year Ended
Dec. 31, 2014 | | Period Ended
Dec. 31, 20131 | |
Net Asset Value, beginning of period | | $ | 9.93 | | | $ | 10.00 | | |
INCOME (LOSS) FROM INVESTMENT OPERATIONS: | |
Net investment income (loss)2 | | | 0.04 | | | | (0.01 | ) | |
Net realized gain (loss) and unrealized appreciation/depreciation
on investments and foreign currency | | | 1.69 | | | | (0.05 | ) | |
Total from investment operations | | | 1.73 | | | | (0.06 | ) | |
LESS DISTRIBUTIONS FROM: | |
Net investment income | | | (0.06 | ) | | | —3 | | |
Return of capital | | | — | | | | (0.01 | ) | |
Total distributions | | | (0.06 | ) | | | (0.01 | ) | |
Paid-in capital from redemption fees (Note 5)3 | | | — | | | | — | | |
Net Asset Value, end of period | | $ | 11.60 | | | $ | 9.93 | | |
TOTAL RETURN | | | 17.39 | % | | | (0.61 | %)4 | |
RATIOS/SUPPLEMENTAL DATA | |
Net assets, end of period (in 000's) | | $ | 110,363 | | | $ | 38,022 | | |
Ratio of expenses to average net assets before any reimbursement,
waiver or recapture of expenses by Advisor and Administrator (Note 6) | | | 1.78 | % | | | 2.39 | %5 | |
Ratio of expenses to average net assets after any reimbursement,
waiver or recapture of expenses by Advisor and Administrator | | | 1.58 | % | | | 1.98 | %5 | |
Ratio of net investment income (loss) to average net assets | | | 0.34 | % | | | (0.08 | %)5 | |
Portfolio turnover6 | | | 8.21 | % | | | 1.66 | %4 | |
INSTITUTIONAL CLASS | | Year Ended
Dec. 31, 2014 | | Period Ended
Dec.31, 20131 | |
Net Asset Value, beginning of period | | $ | 9.92 | | | $ | 10.00 | | |
INCOME (LOSS) FROM INVESTMENT OPERATIONS: | |
Net investment income (loss)2 | | | 0.06 | | | | 0.01 | | |
Net realized gain (loss) and unrealized appreciation/depreciation
on investments and foreign currency | | | 1.69 | | | | (0.07 | ) | |
Total from investment operations | | | 1.75 | | | | (0.06 | ) | |
LESS DISTRIBUTIONS FROM: | |
Net investment income | | | (0.07 | ) | | | —3 | | |
Return of capital | | | — | | | | (0.02 | ) | |
Total distributions | | | (0.07 | ) | | | (0.02 | ) | |
Paid-in capital from redemption fees (Note 5)3 | | | — | | | | — | | |
Net Asset Value, end of period | | $ | 11.60 | | | $ | 9.92 | | |
TOTAL RETURN | | | 17.68 | % | | | (0.55 | %)4 | |
RATIOS/SUPPLEMENTAL DATA | |
Net assets, end of period (in 000's) | | $ | 21,350 | | | $ | 2,017 | | |
Ratio of expenses to average net assets before any reimbursement,
waiver or recapture of expenses by Advisor and Administrator (Note 6) | | | 1.59 | % | | | 2.21 | %5 | |
Ratio of expenses to average net assets after any reimbursement,
waiver or recapture of expenses by Advisor and Administrator | | | 1.33 | % | | | 1.75 | %5 | |
Ratio of net investment income (loss) to average net assets | | | 0.55 | % | | | 0.19 | %5 | |
Portfolio turnover6 | | | 8.21 | % | | | 1.66 | %4 | |
1 Commenced operations on April 30, 2013.
2 Calculated using the average daily shares method.
3 Less than $0.01 per share.
4 Not annualized.
5 Annualized.
6 The portfolio turnover rate is calculated on the Fund as a whole without distinguishing between classes of shares issued.
See accompanying notes to financial statements.
matthewsasia.com | 800.789.ASIA 109
Financial Highlights (continued)
Matthews China Fund
The tables below set forth financial data for a share of beneficial interest outstanding throughout each period presented.
| | | Year Ended Dec. 31 | |
INVESTOR CLASS | | 20141 | | 2013 | | 2012 | | 2011 | | 2010 | |
Net Asset Value, beginning of year | | $ | 22.84 | | | $ | 23.47 | | | $ | 21.51 | | | $ | 29.36 | | | $ | 25.50 | | |
INCOME (LOSS) FROM INVESTMENT OPERATIONS: | |
Net investment income (loss)2 | | | 0.24 | | | | 0.25 | | | | 0.30 | | | | 0.26 | | | | 0.15 | | |
Net realized gain (loss) and unrealized appreciation/depreciation
on investments and foreign currency | | | (1.25 | ) | | | 1.33 | | | | 2.26 | | | | (5.78 | ) | | | 3.86 | | |
Total from investment operations | | | (1.01 | ) | | | 1.58 | | | | 2.56 | | | | (5.52 | ) | | | 4.01 | | |
LESS DISTRIBUTIONS FROM: | |
Net investment income | | | (0.27 | ) | | | (0.26 | ) | | | (0.35 | ) | | | (0.28 | ) | | | (0.15 | ) | |
Net realized gains on investments | | | (0.10 | ) | | | (1.95 | ) | | | (0.25 | ) | | | (2.06 | ) | | | (0.02 | ) | |
Total distributions | | | (0.37 | ) | | | (2.21 | ) | | | (0.60 | ) | | | (2.34 | ) | | | (0.17 | ) | |
Paid-in capital from redemption fees (Note 5) | | | —3 | | | | —3 | | | | —3 | | | | 0.01 | | | | 0.02 | | |
Net Asset Value, end of year | | $ | 21.46 | | | $ | 22.84 | | | $ | 23.47 | | | $ | 21.51 | | | $ | 29.36 | | |
TOTAL RETURN | | | (4.42 | %) | | | 6.84 | % | | | 11.96 | % | | | (18.93 | %) | | | 15.77 | % | |
RATIOS/SUPPLEMENTAL DATA | |
Net assets, end of year (in 000's) | | $ | 947,740 | | | $ | 1,286,309 | | | $ | 1,642,090 | | | $ | 1,836,333 | | | $ | 2,939,638 | | |
Ratio of expenses to average net assets | | | 1.11 | % | | | 1.08 | % | | | 1.12 | % | | | 1.13 | % | | | 1.15 | % | |
Ratio of net investment income (loss) to average net assets | | | 1.09 | % | | | 1.06 | % | | | 1.33 | % | | | 0.93 | % | | | 0.54 | % | |
Portfolio turnover4 | | | 10.23 | % | | | 6.29 | % | | | 9.61 | % | | | 8.43 | % | | | 9.98 | % | |
| | | Year Ended Dec. 31 | | Period Ended | |
INSTITUTIONAL CLASS | | 20141 | | 2013 | | 2012 | | 2011 | | Dec. 31, 20105 | |
Net Asset Value, beginning of period | | $ | 22.81 | | | $ | 23.45 | | | $ | 21.49 | | | $ | 29.36 | | | $ | 30.02 | | |
INCOME (LOSS) FROM INVESTMENT OPERATIONS: | |
Net investment income (loss)2 | | | 0.28 | | | | 0.26 | | | | 0.36 | | | | 0.26 | | | | (0.04 | ) | |
Net realized gain (loss) and unrealized appreciation/depreciation
on investments and foreign currency | | | (1.25 | ) | | | 1.36 | | | | 2.25 | | | | (5.73 | ) | | | (0.44 | ) | |
Total from investment operations | | | (0.97 | ) | | | 1.62 | | | | 2.61 | | | | (5.47 | ) | | | (0.48 | ) | |
LESS DISTRIBUTIONS FROM: | |
Net investment income | | | (0.30 | ) | | | (0.31 | ) | | | (0.40 | ) | | | (0.34 | ) | | | (0.16 | ) | |
Net realized gains on investments | | | (0.10 | ) | | | (1.95 | ) | | | (0.25 | ) | | | (2.06 | ) | | | (0.02 | ) | |
Total distributions | | | (0.40 | ) | | | (2.26 | ) | | | (0.65 | ) | | | (2.40 | ) | | | (0.18 | ) | |
Paid-in capital from redemption fees (Note 5) | | | —3 | | | | —3 | | | | —3 | | | | —3 | | | | — | | |
Net Asset Value, end of period | | $ | 21.44 | | | $ | 22.81 | | | $ | 23.45 | | | $ | 21.49 | | | $ | 29.36 | | |
TOTAL RETURN | | | (4.22 | %) | | | 6.97 | % | | | 12.22 | % | | | (18.80 | %) | | | (1.62 | %)6 | |
RATIOS/SUPPLEMENTAL DATA | |
Net assets, end of period (in 000's) | | $ | 52,478 | | | $ | 117,678 | | | $ | 390,744 | | | $ | 288,277 | | | $ | 41,545 | | |
Ratio of expenses to average net assets | | | 0.95 | % | | | 0.91 | % | | | 0.91 | % | | | 0.96 | % | | | 0.97 | %7 | |
Ratio of net investment income (loss) to average net assets | | | 1.27 | % | | | 1.13 | % | | | 1.58 | % | | | 0.99 | % | | | (0.74 | %)7 | |
Portfolio turnover4 | | | 10.23 | % | | | 6.29 | % | | | 9.61 | % | | | 8.43 | % | | | 9.98 | %6 | |
1 Consolidated Financial Highlights.
2 Calculated using the average daily shares method.
3 Less than $0.01 per share.
4 The portfolio turnover rate is calculated on the Fund as a whole without distinguishing between classes of shares issued.
5 Institutional Class commenced operations on October 29, 2010.
6 Not annualized.
7 Annualized.
See accompanying notes to financial statements.
110 MATTHEWS ASIA FUNDS
Matthews India Fund
The tables below set forth financial data for a share of beneficial interest outstanding throughout each period presented.
| | | Year Ended Dec. 31 | |
INVESTOR CLASS | | 2014 | | 2013 | | 2012 | | 2011 | | 2010 | |
Net Asset Value, beginning of year | | $ | 16.28 | | | $ | 17.51 | | | $ | 13.59 | | | $ | 21.49 | | | $ | 16.29 | | |
INCOME (LOSS) FROM INVESTMENT OPERATIONS: | |
Net investment income (loss)1 | | | 0.07 | | | | 0.08 | | | | 0.11 | | | | 0.11 | | | | 0.05 | | |
Net realized gain (loss) and unrealized appreciation/depreciation
on investments and foreign currency | | | 10.29 | | | | (1.13 | ) | | | 4.17 | | | | (7.96 | ) | | | 5.22 | | |
Total from investment operations | | | 10.36 | | | | (1.05 | ) | | | 4.28 | | | | (7.85 | ) | | | 5.27 | | |
LESS DISTRIBUTIONS FROM: | |
Net investment income | | | (0.05 | ) | | | (0.18 | ) | | | (0.09 | ) | | | (0.07 | ) | | | (0.09 | ) | |
Net realized gains on investments | | | (0.14 | ) | | | (0.01 | ) | | | (0.27 | ) | | | — | | | | — | | |
Total distributions | | | (0.19 | ) | | | (0.19 | ) | | | (0.36 | ) | | | (0.07 | ) | | | (0.09 | ) | |
Paid-in capital from redemption fees (Note 5) | | | 0.01 | | | | 0.01 | | | | —2 | | | | 0.02 | | | | 0.02 | | |
Net Asset Value, end of year | | $ | 26.46 | | | $ | 16.28 | | | $ | 17.51 | | | $ | 13.59 | | | $ | 21.49 | | |
TOTAL RETURN | | | 63.71 | % | | | (5.90 | %) | | | 31.54 | % | | | (36.48 | %) | | | 32.53 | % | |
RATIOS/SUPPLEMENTAL DATA | |
Net assets, end of year (in 000's) | | $ | 974,838 | | | $ | 427,861 | | | $ | 607,800 | | | $ | 559,337 | | | $ | 1,388,892 | | |
Ratio of expenses to average net assets | | | 1.12 | % | | | 1.13 | % | | | 1.18 | % | | | 1.18 | % | | | 1.18 | % | |
Ratio of net investment income (loss) to average net assets | | | 0.32 | % | | | 0.48 | % | | | 0.65 | % | | | 0.58 | % | | | 0.25 | % | |
Portfolio turnover3 | | | 14.86 | % | | | 8.70 | % | | | 7.03 | % | | | 3.51 | % | | | 6.14 | % | |
| | | Year Ended Dec. 31 | | Period Ended | |
INSTITUTIONAL CLASS | | 2014 | | 2013 | | 2012 | | 2011 | | Dec. 31, 20104 | |
Net Asset Value, beginning of period | | $ | 16.31 | | | $ | 17.53 | | | $ | 13.61 | | | $ | 21.48 | | | $ | 22.03 | | |
INCOME (LOSS) FROM INVESTMENT OPERATIONS: | |
Net investment income (loss)1 | | | 0.09 | | | | 0.10 | | | | 0.14 | | | | 0.16 | | | | (0.02 | ) | |
Net realized gain (loss) and unrealized appreciation/depreciation
on investments and foreign currency | | | 10.29 | | | | (1.11 | ) | | | 4.17 | | | | (7.96 | ) | | | (0.43 | ) | |
Total from investment operations | | | 10.38 | | | | (1.01 | ) | | | 4.31 | | | | (7.80 | ) | | | (0.45 | ) | |
LESS DISTRIBUTIONS FROM: | |
Net investment income | | | (0.08 | ) | | | (0.21 | ) | | | (0.12 | ) | | | (0.07 | ) | | | (0.10 | ) | |
Net realized gains on investments | | | (0.14 | ) | | | (0.01 | ) | | | (0.27 | ) | | | — | | | | — | | |
Total distributions | | | (0.22 | ) | | | (0.22 | ) | | | (0.39 | ) | | | (0.07 | ) | | | (0.10 | ) | |
Paid-in capital from redemption fees (Note 5) | | | 0.02 | | | | 0.01 | | | | —2 | | | | —2 | | | | — | | |
Net Asset Value, end of period | | $ | 26.49 | | | $ | 16.31 | | | $ | 17.53 | | | $ | 13.61 | | | $ | 21.48 | | |
TOTAL RETURN | | | 63.80 | % | | | (5.67 | %) | | | 31.74 | % | | | (36.35 | %) | | | (2.01 | %)5 | |
RATIOS/SUPPLEMENTAL DATA | |
Net assets, end of period (in 000's) | | $ | 109,331 | | | $ | 3,234 | | | $ | 36,166 | | | $ | 26,920 | | | $ | 48,119 | | |
Ratio of expenses to average net assets | | | 0.94 | % | | | 0.95 | % | | | 0.98 | % | | | 0.99 | % | | | 0.99 | %6 | |
Ratio of net investment income (loss) to average net assets | | | 0.38 | % | | | 0.61 | % | | | 0.87 | % | | | 0.86 | % | | | (0.51 | %)6 | |
Portfolio turnover3 | | | 14.86 | % | | | 8.70 | % | | | 7.03 | % | | | 3.51 | % | | | 6.14 | %5 | |
1 Calculated using the average daily shares method.
2 Less than $0.01 per share.
3 The portfolio turnover rate is calculated on the Fund as a whole without distinguishing between classes of shares issued.
4 Institutional Class commenced operations on October 29, 2010.
5 Not annualized.
6 Annualized.
See accompanying notes to financial statements.
matthewsasia.com | 800.789.ASIA 111
Financial Highlights (continued)
Matthews Japan Fund
The tables below set forth financial data for a share of beneficial interest outstanding throughout each period presented.
| | | Year Ended Dec. 31 | |
INVESTOR CLASS | | 2014 | | 2013 | | 2012 | | 2011 | | 2010 | |
Net Asset Value, beginning of year | | $ | 16.20 | | | $ | 12.27 | | | $ | 11.34 | | | $ | 12.53 | | | $ | 10.91 | | |
INCOME (LOSS) FROM INVESTMENT OPERATIONS: | |
Net investment income (loss)1 | | | 0.05 | | | | 0.03 | | | | 0.10 | | | | 0.07 | | | | 0.02 | | |
Net realized gain (loss) and unrealized appreciation/depreciation
on investments and foreign currency | | | (0.48 | ) | | | 4.12 | | | | 0.84 | | | | (1.06 | ) | | | 2.09 | | |
Total from investment operations | | | (0.43 | ) | | | 4.15 | | | | 0.94 | | | | (0.99 | ) | | | 2.11 | | |
LESS DISTRIBUTIONS FROM: | |
Net investment income | | | (0.08 | ) | | | (0.24 | ) | | | (0.01 | ) | | | (0.22 | ) | | | (0.49 | ) | |
Total distributions | | | (0.08 | ) | | | (0.24 | ) | | | (0.01 | ) | | | (0.22 | ) | | | (0.49 | ) | |
Paid-in capital from redemption fees (Note 5) | | | 0.01 | | | | 0.02 | | | | —2 | | | | 0.02 | | | | —2 | | |
Net Asset Value, end of year | | $ | 15.70 | | | $ | 16.20 | | | $ | 12.27 | | | $ | 11.34 | | | $ | 12.53 | | |
TOTAL RETURN | | | (2.60 | %) | | | 34.03 | % | | | 8.32 | % | | | (7.72 | %) | | | 19.58 | % | |
RATIOS/SUPPLEMENTAL DATA | |
Net assets, end of year (in 000's) | | $ | 467,854 | | | $ | 312,988 | | | $ | 82,463 | | | $ | 101,369 | | | $ | 67,805 | | |
Ratio of expenses to average net assets | | | 1.03 | % | | | 1.10 | % | | | 1.20 | % | | | 1.22 | % | | | 1.30 | % | |
Ratio of net investment income (loss) to average net assets | | | 0.32 | % | | | 0.19 | % | | | 0.81 | % | | | 0.54 | % | | | 0.13 | % | |
Portfolio turnover3 | | | 42.52 | % | | | 22.72 | % | | | 48.58 | % | | | 34.94 | % | | | 46.29 | % | |
| | | Year Ended Dec. 31 | | Period Ended | |
INSTITUTIONAL CLASS | | 2014 | | 2013 | | 2012 | | 2011 | | Dec. 31, 20104 | |
Net Asset Value, beginning of period | | $ | 16.20 | | | $ | 12.26 | | | $ | 11.34 | | | $ | 12.53 | | | $ | 11.73 | | |
INCOME (LOSS) FROM INVESTMENT OPERATIONS: | |
Net investment income (loss)1 | | | 0.09 | | | | 0.06 | | | | 0.12 | | | | 0.06 | | | | (0.01 | ) | |
Net realized gain (loss) and unrealized appreciation/depreciation
on investments and foreign currency | | | (0.50 | ) | | | 4.12 | | | | 0.84 | | | | (1.04 | ) | | | 1.30 | | |
Total from investment operations | | | (0.41 | ) | | | 4.18 | | | | 0.96 | | | | (0.98 | ) | | | 1.29 | | |
LESS DISTRIBUTIONS FROM: | |
Net investment income | | | (0.09 | ) | | | (0.26 | ) | | | (0.04 | ) | | | (0.22 | ) | | | (0.49 | ) | |
Total distributions | | | (0.09 | ) | | | (0.26 | ) | | | (0.04 | ) | | | (0.22 | ) | | | (0.49 | ) | |
Paid-in capital from redemption fees (Note 5) | | | 0.01 | | | | 0.02 | | | | —2 | | | | 0.01 | | | | — | | |
Net Asset Value, end of period | | $ | 15.71 | | | $ | 16.20 | | | $ | 12.26 | | | $ | 11.34 | | | $ | 12.53 | | |
TOTAL RETURN | | | (2.47 | %) | | | 34.27 | % | | | 8.47 | % | | | (7.72 | %) | | | 11.22 | %5 | |
RATIOS/SUPPLEMENTAL DATA | |
Net assets, end of period (in 000's) | | $ | 154,750 | | | $ | 59,702 | | | $ | 22,233 | | | $ | 30,302 | | | $ | 4 | | |
Ratio of expenses to average net assets | | | 0.90 | % | | | 0.96 | % | | | 1.04 | % | | | 1.07 | % | | | 1.08 | %6 | |
Ratio of net investment income (loss) to average net assets | | | 0.58 | % | | | 0.41 | % | | | 0.99 | % | | | 0.46 | % | | | (0.51 | %)6 | |
Portfolio turnover3 | | | 42.52 | % | | | 22.72 | % | | | 48.58 | % | | | 34.94 | % | | | 46.29 | %5 | |
1 Calculated using the average daily shares method.
2 Less than $0.01 per share.
3 The portfolio turnover rate is calculated on the Fund as a whole without distinguishing between classes of shares issued.
4 Institutional Class commenced operations on October 29, 2010.
5 Not annualized.
6 Annualized.
See accompanying notes to financial statements.
112 MATTHEWS ASIA FUNDS
Matthews Korea Fund
The tables below set forth financial data for a share of beneficial interest outstanding throughout each period presented.
| | | Year Ended Dec. 31 | |
INVESTOR CLASS | | 2014 | | 2013 | | 2012 | | 2011 | | 2010 | |
Net Asset Value, beginning of year | | $ | 5.95 | | | $ | 5.64 | | | $ | 4.59 | | | $ | 5.14 | | | $ | 4.31 | | |
INCOME (LOSS) FROM INVESTMENT OPERATIONS: | |
Net investment income (loss)1 | | | —2 | | | | —2 | | | | —2 | | | | (0.01 | ) | | | 0.01 | | |
Net realized gain (loss) and unrealized appreciation/depreciation
on investments and foreign currency | | | (0.05 | ) | | | 0.57 | | | | 1.10 | | | | (0.31 | ) | | | 0.93 | | |
Total from investment operations | | | (0.05 | ) | | | 0.57 | | | | 1.10 | | | | (0.32 | ) | | | 0.94 | | |
LESS DISTRIBUTIONS FROM: | |
Net investment income | | | — | | | | (0.02 | ) | | | — | | | | (0.01 | ) | | | — | | |
Net realized gains on investments | | | (0.25 | ) | | | (0.24 | ) | | | (0.05 | ) | | | (0.22 | ) | | | (0.11 | ) | |
Total distributions | | | (0.25 | ) | | | (0.26 | ) | | | (0.05 | ) | | | (0.23 | ) | | | (0.11 | ) | |
Paid-in capital from redemption fees (Note 5)2 | | | — | | | | — | | | | — | | | | — | | | | — | | |
Net Asset Value, end of year | | $ | 5.65 | | | $ | 5.95 | | | $ | 5.64 | | | $ | 4.59 | | | $ | 5.14 | | |
TOTAL RETURN | | | (0.73 | %) | | | 10.11 | % | | | 24.05 | % | | | (6.45 | %) | | | 21.86 | % | |
RATIOS/SUPPLEMENTAL DATA | |
Net assets, end of year (in 000's) | | $ | 127,774 | | | $ | 138,830 | | | $ | 141,247 | | | $ | 141,590 | | | $ | 166,990 | | |
Ratio of expenses to average net assets | | | 1.11 | % | | | 1.13 | % | | | 1.16 | % | | | 1.18 | % | | | 1.21 | % | |
Ratio of net investment income (loss) to average net assets | | | 0.04 | % | | | 0.02 | % | | | 0.01 | % | | | (0.18 | %) | | | 0.16 | % | |
Portfolio turnover3 | | | 17.37 | % | | | 46.20 | % | | | 34.84 | % | | | 30.13 | % | | | 39.05 | % | |
| | | Year Ended Dec. 31 | | Period Ended | |
INSTITUTIONAL CLASS | | 2014 | | 2013 | | 2012 | | 2011 | | Dec. 31, 20104 | |
Net Asset Value, beginning of period | | $ | 5.96 | | | $ | 5.67 | | | $ | 4.61 | | | $ | 5.14 | | | $ | 4.84 | | |
INCOME (LOSS) FROM INVESTMENT OPERATIONS: | |
Net investment income (loss)1 | | | 0.05 | | | | —2 | | | | —2 | | | | 0.17 | | | | 0.03 | | |
Net realized gain (loss) and unrealized appreciation/depreciation
on investments and foreign currency | | | (0.08 | ) | | | 0.56 | | | | 1.11 | | | | (0.47 | ) | | | 0.38 | | |
Total from investment operations | | | (0.03 | ) | | | 0.56 | | | | 1.11 | | | | (0.30 | ) | | | 0.41 | | |
LESS DISTRIBUTIONS FROM: | |
Net investment income | | | — | | | | (0.03 | ) | | | — | | | | (0.01 | ) | | | — | | |
Net realized gains on investments | | | (0.25 | ) | | | (0.24 | ) | | | (0.05 | ) | | | (0.22 | ) | | | (0.11 | ) | |
Total distributions | | | (0.25 | ) | | | (0.27 | ) | | | (0.05 | ) | | | (0.23 | ) | | | (0.11 | ) | |
Paid-in capital from redemption fees (Note 5) | | | —2 | | | | —2 | | | | —2 | | | | —2 | | | | — | | |
Net Asset Value, end of period | | $ | 5.68 | | | $ | 5.96 | | | $ | 5.67 | | | $ | 4.61 | | | $ | 5.14 | | |
TOTAL RETURN | | | (0.39 | %) | | | 9.87 | % | | | 24.16 | % | | | (6.05 | %) | | | 8.51 | %5 | |
RATIOS/SUPPLEMENTAL DATA | |
Net assets, end of period (in 000's) | | $ | 91,431 | | | $ | 12,283 | | | $ | 8,597 | | | $ | 15,109 | | | $ | 4 | | |
Ratio of expenses to average net assets | | | 0.93 | % | | | 0.97 | % | | | 1.00 | % | | | 1.07 | % | | | 0.91 | %6 | |
Ratio of net investment income (loss) to average net assets | | | 0.87 | % | | | (0.03 | %) | | | (0.07 | %) | | | 3.37 | % | | | 3.74 | %6 | |
Portfolio turnover3 | | | 17.37 | % | | | 46.20 | % | | | 34.84 | % | | | 30.13 | % | | | 39.05 | %5 | |
1 Calculated using the average daily shares method.
2 Less than $0.01 per share.
3 The portfolio turnover rate is calculated on the Fund as a whole without distinguishing between classes of shares issued.
4 Institutional Class commenced operations on October 29, 2010.
5 Not annualized.
6 Annualized.
See accompanying notes to financial statements.
matthewsasia.com | 800.789.ASIA 113
Financial Highlights (continued)
Matthews Asia Small Companies Fund
The tables below set forth financial data for a share of beneficial interest outstanding throughout each period presented.
| | | Year Ended Dec. 31 | |
INVESTOR CLASS | | 2014 | | 2013 | | 2012 | | 2011 | | 2010 | |
Net Asset Value, beginning of year | | $ | 19.34 | | | $ | 18.13 | | | $ | 14.77 | | | $ | 21.16 | | | $ | 15.79 | | |
INCOME (LOSS) FROM INVESTMENT OPERATIONS: | |
Net investment income (loss)1 | | | 0.09 | | | | 0.11 | | | | 0.17 | | | | 0.15 | | | | 0.04 | | |
Net realized gain (loss) and unrealized appreciation/depreciation
on investments and foreign currency | | | 2.11 | | | | 1.19 | | | | 3.36 | | | | (4.35 | ) | | | 5.55 | | |
Total from investment operations | | | 2.20 | | | | 1.30 | | | | 3.53 | | | | (4.20 | ) | | | 5.59 | | |
LESS DISTRIBUTIONS FROM: | |
Net investment income | | | (0.08 | ) | | | (0.09 | ) | | | (0.09 | ) | | | (0.17 | ) | | | (0.09 | ) | |
Net realized gains on investments | | | — | | | | — | | | | (0.08 | ) | | | (2.04 | ) | | | (0.15 | ) | |
Total distributions | | | (0.08 | ) | | | (0.09 | ) | | | (0.17 | ) | | | (2.21 | ) | | | (0.24 | ) | |
Paid-in capital from redemption fees (Note 5) | | | —2 | | | | —2 | | | | —2 | | | | 0.02 | | | | 0.02 | | |
Net Asset Value, end of year | | $ | 21.46 | | | $ | 19.34 | | | $ | 18.13 | | | $ | 14.77 | | | $ | 21.16 | | |
TOTAL RETURN | | | 11.39 | % | | | 7.19 | % | | | 23.92 | % | | | (20.03 | %) | | | 35.54 | % | |
RATIOS/SUPPLEMENTAL DATA | |
Net assets, end of year (in 000's) | | $ | 599,082 | | | $ | 407,352 | | | $ | 366,753 | | | $ | 258,944 | | | $ | 547,094 | | |
Ratio of expenses to average net assets before any reimbursement,
waiver or recapture of expenses by Advisor and Administrator (Note 6) | | | 1.47 | % | | | 1.47 | % | | | 1.50 | % | | | 1.52 | % | | | 1.59 | % | |
Ratio of expenses to average net assets after any reimbursement,
waiver or recapture of expenses by Advisor and Administrator | | | 1.47 | % | | | 1.47 | % | | | 1.50 | % | | | 1.52 | % | | | 1.63 | % | |
Ratio of net investment income (loss) to average net assets | | | 0.44 | % | | | 0.58 | % | | | 1.06 | % | | | 0.76 | % | | | 0.24 | % | |
Portfolio turnover | | | 21.70 | %3 | | | 37.01 | %3 | | | 27.95 | % | | | 19.97 | % | | | 23.99 | % | |
INSTITUTIONAL CLASS | | Year Ended
Dec. 31, 2014 | | Period Ended
Dec. 31, 20134 | |
Net Asset Value, beginning of period | | $ | 19.33 | | | $ | 19.44 | | |
INCOME (LOSS) FROM INVESTMENT OPERATIONS: | |
Net investment income (loss)1 | | | 0.15 | | | | 0.18 | | |
Net realized gain (loss) and unrealized appreciation/depreciation
on investments and foreign currency | | | 2.10 | | | | (0.16 | ) | |
Total from investment operations | | | 2.25 | | | | 0.02 | | |
LESS DISTRIBUTIONS FROM: | |
Net investment income | | | (0.12 | ) | | | (0.13 | ) | |
Net realized gains on investments | | | — | | | | — | | |
Total distributions | | | (0.12 | ) | | | (0.13 | ) | |
Paid-in capital from redemption fees (Note 5)2 | | | — | | | | — | | |
Net Asset Value, end of period | | $ | 21.46 | | | $ | 19.33 | | |
TOTAL RETURN | | | 11.65 | % | | | 0.13 | %5 | |
RATIOS/SUPPLEMENTAL DATA | |
Net assets, end of period (in 000's) | | $ | 77,168 | | | $ | 44,769 | | |
Ratio of expenses to average net assets before any reimbursement,
waiver or recapture of expenses by Advisor and Administrator (Note 6) | | | 1.27 | % | | | 1.25 | %6 | |
Ratio of expenses to average net assets after any reimbursement,
waiver or recapture of expenses by Advisor and Administrator | | | 1.26 | % | | | 1.25 | %6 | |
Ratio of net investment income (loss) to average net assets | | | 0.70 | % | | | 1.39 | %6 | |
Portfolio turnover3 | | | 21.70 | % | | | 37.01 | %5 | |
1 Calculated using the average daily shares method.
2 Less than $0.01 per share.
3 The portfolio turnover rate is calculated on the Fund as a whole without distinguishing between classes of shares issued.
4 Institutional Class commenced operations on April 30, 2013.
5 Not annualized.
6 Annualized.
See accompanying notes to financial statements.
114 MATTHEWS ASIA FUNDS
Matthews China Small Companies Fund
The table below sets forth financial data for a share of beneficial interest outstanding throughout each period presented.
| | | Year Ended Dec. 31 | | Period Ended | |
INVESTOR CLASS | | 2014 | | 2013 | | 2012 | | Dec. 31, 20111 | |
Net Asset Value, beginning of period | | $ | 9.89 | | | $ | 7.76 | | | $ | 7.04 | | | $ | 10.00 | | |
INCOME (LOSS) FROM INVESTMENT OPERATIONS: | |
Net investment income (loss)2 | | | 0.01 | | | | 0.02 | | | | 0.03 | | | | (0.02 | ) | |
Net realized gain (loss) and unrealized appreciation/depreciation
on investments and foreign currency | | | (0.33 | ) | | | 2.22 | | | | 0.68 | | | | (2.96 | ) | |
Total from investment operations | | | (0.32 | ) | | | 2.24 | | | | 0.71 | | | | (2.98 | ) | |
LESS DISTRIBUTIONS FROM: | |
Net investment income | | | (0.02 | ) | | | (0.11 | ) | | | (0.02 | ) | | | (0.01 | ) | |
Return of capital | | | (0.34 | ) | | | — | | | | — | | | | — | | |
Total distributions | | | (0.36 | ) | | | (0.11 | ) | | | (0.02 | ) | | | (0.01 | ) | |
Paid-in capital from redemption fees (Note 5) | | | —3 | | | | —3 | | | | 0.03 | | | | 0.03 | | |
Net Asset Value, end of period | | $ | 9.21 | | | $ | 9.89 | | | $ | 7.76 | | | $ | 7.04 | | |
TOTAL RETURN | | | (3.33 | %) | | | 28.85 | % | | | 10.53 | % | | | (29.51 | %)4 | |
RATIOS/SUPPLEMENTAL DATA | |
Net assets, end of period (in 000's) | | $ | 22,068 | | | $ | 26,674 | | | $ | 10,266 | | | $ | 4,493 | | |
Ratio of expenses to average net assets before any reimbursement,
waiver or recapture of expenses by Advisor and Administrator (Note 6) | | | 1.90 | % | | | 2.04 | % | | | 3.26 | % | | | 5.32 | %5 | |
Ratio of expenses to average net assets after any reimbursement,
waiver or recapture of expenses by Advisor and Administrator | | | 1.67 | % | | | 2.00 | % | | | 2.00 | % | | | 2.00 | %5 | |
Ratio of net investment income (loss) to average net assets | | | 0.14 | % | | | 0.17 | % | | | 0.40 | % | | | (0.53 | %)5 | |
Portfolio turnover | | | 32.42 | % | | | 10.28 | % | | | 34.01 | % | | | 6.08 | %4 | |
1 Investor Class commenced operations on May 31, 2011.
2 Calculated using the average daily shares method.
3 Less than $0.01 per share.
4 Not annualized.
5 Annualized.
See accompanying notes to financial statements.
matthewsasia.com | 800.789.ASIA 115
Financial Highlights (continued)
Matthews Asia Science and Technology Fund
The tables below set forth financial data for a share of beneficial interest outstanding throughout each period presented.
| | | Year Ended Dec. 31 | |
INVESTOR CLASS | | 2014 | | 2013 | | 2012 | | 2011 | | 2010 | |
Net Asset Value, beginning of year | | $ | 12.59 | | | $ | 9.29 | | | $ | 8.16 | | | $ | 9.89 | | | $ | 8.02 | | |
INCOME (LOSS) FROM INVESTMENT OPERATIONS: | |
Net investment income (loss)1 | | | —2 | | | | 0.01 | | | | 0.03 | | | | 0.02 | | | | 0.03 | | |
Net realized gain (loss) and unrealized appreciation/depreciation
on investments and foreign currency | | | 1.16 | | | | 3.30 | | | | 1.12 | | | | (1.74 | ) | | | 1.86 | | |
Total from investment operations | | | 1.16 | | | | 3.31 | | | | 1.15 | | | | (1.72 | ) | | | 1.89 | | |
LESS DISTRIBUTIONS FROM: | |
Net investment income | | | (0.06 | ) | | | (0.01 | ) | | | (0.02 | ) | | | (0.02 | ) | | | (0.02 | ) | |
Net realized gains on investments | | | (0.08 | ) | | | — | | | | — | | | | — | | | | — | | |
Total distributions | | | (0.14 | ) | | | (0.01 | ) | | | (0.02 | ) | | | (0.02 | ) | | | (0.02 | ) | |
Paid-in capital from redemption fees (Note 5) | | | —2 | | | | —2 | | | | —2 | | | | 0.01 | | | | —2 | | |
Net Asset Value, end of year | | $ | 13.61 | | | $ | 12.59 | | | $ | 9.29 | | | $ | 8.16 | | | $ | 9.89 | | |
TOTAL RETURN | | | 9.24 | % | | | 35.61 | % | | | 14.11 | % | | | (17.26 | %) | | | 23.58 | % | |
RATIOS/SUPPLEMENTAL DATA | |
Net assets, end of year (in 000's) | | $ | 125,612 | | | $ | 111,751 | | | $ | 131,629 | | | $ | 153,349 | | | $ | 190,436 | | |
Ratio of expenses to average net assets | | | 1.16 | % | | | 1.18 | % | | | 1.18 | % | | | 1.21 | % | | | 1.26 | % | |
Ratio of net investment income (loss) to average net assets | | | (0.02 | %) | | | 0.07 | % | | | 0.30 | % | | | 0.23 | % | | | 0.35 | % | |
Portfolio turnover | | | 62.99 | %3 | | | 62.04 | %3 | | | 45.76 | % | | | 65.47 | % | | | 61.61 | % | |
INSTITUTIONAL CLASS | | Year Ended
Dec. 31, 2014 | | Period Ended
Dec. 31, 20134 | |
Net Asset Value, beginning of period | | $ | 12.58 | | | $ | 10.09 | | |
INCOME (LOSS) FROM INVESTMENT OPERATIONS: | |
Net investment income (loss)1 | | | 0.03 | | | | 0.04 | | |
Net realized gain (loss) and unrealized appreciation/depreciation
on investments and foreign currency | | | 1.17 | | | | 2.48 | | |
Total from investment operations | | | 1.20 | | | | 2.52 | | |
LESS DISTRIBUTIONS FROM: | |
Net investment income | | | (0.09 | ) | | | (0.03 | ) | |
Net realized gains on investments | | | (0.08 | ) | | | — | | |
Total distributions | | | (0.17 | ) | | | (0.03 | ) | |
Paid-in capital from redemption fees (Note 5)2 | | | — | | | | — | | |
Net Asset Value, end of period | | $ | 13.61 | | | $ | 12.58 | | |
TOTAL RETURN | | | 9.54 | % | | | 24.99 | %5 | |
RATIOS/SUPPLEMENTAL DATA | |
Net assets, end of period (in 000's) | | $ | 61,088 | | | $ | 49,236 | | |
Ratio of expenses to average net assets | | | 0.95 | % | | | 1.00 | %6 | |
Ratio of net investment income (loss) to average net assets | | | 0.21 | % | | | 0.56 | %6 | |
Portfolio turnover3 | | | 62.99 | % | | | 62.04 | %5 | |
1 Calculated using the average daily shares method.
2 Less than $0.01 per share.
3 The portfolio turnover rate is calculated on the Fund as a whole without distinguishing between classes of share issues.
4 Institutional Class commenced operations on April 30, 2013.
5 Not annualized.
6 Annualized.
See accompanying notes to financial statements.
116 MATTHEWS ASIA FUNDS
Notes to Financial Statements
1. ORGANIZATION
Matthews Asia Funds (the "Trust") is an open-end management investment company registered under the Investment Company Act of 1940, as amended (the "1940 Act"). The Trust currently issues fifteen separate series of shares (each a "Fund" and collectively, the "Funds"): Matthews Asia Strategic Income Fund, Matthews Asian Growth and Income Fund, Matthews Asia Dividend Fund, Matthews China Dividend Fund, Matthews Asia Focus Fund, Matthews Asia Growth Fund, Matthews Pacific Tiger Fund, Matthews Emerging Asia Fund, Matthews China Fund, Matthews India Fund, Matthews Japan Fund, Matthews Korea Fund, Matthews Asia Small Companies Fund, Matthews China Small Companies Fund and Matthews Asia Science and Technology Fund. Each Fund except for Matthews China Small Companies Fund currently offers two classes of shares: Investor Class and Institutional Class. Matthews China Small Companies Fund currently offers only Investor Class shares. Each class of shares has identical voting, dividend, liquidation and other rights and the same terms and conditions, except each class may be subject to different class expenses as outlined in the relevant prospectus and each class has exclusive voting rights with respect to matters solely affecting such class. Effective June 14, 2013 and October 25, 2013, the Matthews Asia Dividend Fund and Matthews Pacific Tiger Fund, respectively, were closed to new investors, but will continue to accept investments from existing shareholders.
2. SIGNIFICANT ACCOUNTING POLICIES
The following is a summary of significant accounting policies consistently followed by the Funds in preparation of their financial statements.
A. SECURITY VALUATION: The value of the Funds' securities is based on market quotations for those securities, or on their fair value determined by the valuation policies approved by the Funds' Board of Trustees (the "Board"). Market quotations and valuation information are provided by commercial pricing services or securities dealers that are independent of the Funds and Matthews International Capital Management, LLC ("Matthews"), in accordance with procedures established by the Funds' Board. Foreign exchange-traded securities are valued as of the close of trading on the primary exchange on which they trade. Securities that trade in over-the-counter markets, including most debt securities (bonds), may be valued by other third-party vendors or by using indicative bid quotations from dealers or market makers, or other available market information. Market values for securities are determined based on quotations, market data or other information from the principal (or most advantageous) market on which the security is traded. Market quotations for equity securities used by the Funds include last reported sale prices, or, if such prices are not reported or available, bid and ask prices. Financial futures contracts traded on exchanges are valued at their settlement price. Foreign currency exchange contracts are valued at the mean between the bid and ask prices and are determined at the close of business on the New York Stock Exchange ("NYSE"). Interpolated values are derived when the settlement date of the contract is an interim date for which quotations are not available. The Funds may also utilize independent pricing services to assist them in determining a current market value for each security based on sources believed to be reliable.
The Board has delegated the responsibility of making fair value determinations to the Funds' Valuation Committee (the "Valuation Committee") subject to the Funds' pricing policies. When fair value pricing is employed, the prices of securities used by a Fund to calculate its Net Asset Value ("NAV") may differ from any quoted or published prices for the same securities for that day. All fair value determinations are made subject to the Board's oversight. Events affecting the value of foreign investments may occur between the time at which they are determined and when the Funds calculate their NAV, which is normally the close of trading on the NYSE. If such events render market quotations unreliable, and the impact of such events can be reasonably determined, the investments will be valued at their fair value in accordance with pricing policies. The fair value of a security held by the Funds may be determined using the services of third-party pricing services to assist in this process.
The books and records of the Funds are maintained in U.S. dollars. Transactions, portfolio securities, and assets and liabilities denominated in a foreign currency are translated and recorded in U.S. dollars at the prevailing exchange rate as of the close of trading on the NYSE. Translation gains or losses resulting from changes in the exchange rate during the reporting period and realized gains and losses on the settlement of foreign currency transactions are reported in the results of operations for the current period. The Funds do not isolate that portion of gains and losses on investments in equity securities that is due to changes in foreign exchange rate from that which is due to changes in market prices of securities.
Foreign securities held by the Funds may be traded on days and at times when the NYSE is closed. Accordingly, the NAV of the Funds may be significantly affected on days when shareholders have no access to the Funds.
B. FAIR VALUE MEASUREMENTS: In accordance with the guidance on fair value measurements and disclosures under generally accepted accounting principles in the United States ("U.S. GAAP"), the Funds disclose the fair value of their investments and derivative financial instruments in a hierarchy that prioritizes the inputs to valuation techniques used to measure the fair value. The hierarchy gives the highest priority to valuations based upon unadjusted quoted prices in active markets for identical assets or liabilities (Level 1 measurement) and the lowest priority to valuations based upon unobservable inputs that are significant to the valuation (Level 3 measurements). Various inputs are used in determining the fair value of investments and derivative financial instruments, which are as follows:
Level 1: Quoted prices in active markets for identical securities.
Level 2: Other significant observable inputs (including quoted prices for similar securities, interest rates, prepayment speeds, credit risk, etc.).
Level 3: Significant unobservable inputs (including the Fund's own assumptions in determining the fair value of investments and derivative financial instruments).
Level 3 securities consisted of equities that, as of December 31, 2014, were either suspended from trading or had not traded for a period of time. As described in Note 2-A, these securities are valued based on their fair value as determined under the direction of the Board. The significant unobservable inputs, the methodology used for valuing such securities, and the characterization of such securities as Level 3 securities are not necessarily an indication of liquidity, or the risk associated with investing in these securities. A significant change in the unobservable inputs could result in a significantly lower or higher value in such Level 3 securities and could impact overall Fund performance. Level 2 equity securities consist primarily of securities that have been fair valued by third-party pricing services (see Note 2-A).
matthewsasia.com | 800.789.ASIA 117
Notes to Financial Statements (continued)
The summary of inputs used to determine the fair valuation of the Fund's investments and derivative financial instruments as of December 31, 2014 is as follows:
| | | Matthews Asia
Strategic
Income Fund | | Matthews Asian
Growth and
Income Fund | | Matthews Asia
Dividend Fund | | Matthews Asia
Focus Fund | | Matthews Asia
Growth Fund | |
Assets: | |
Investments: | |
Level 1: Quoted Prices | |
China/Hong Kong | | $ | — | | | $ | 261,997,670 | | | $ | 378,836,827 | | | $ | 1,071,731 | | | $ | 62,883,043 | | |
Indonesia | | | — | | | | 74,086,740 | | | | 51,599,922 | | | | — | | | | — | | |
Japan | | | — | | | | — | | | | 69,000,230 | | | | — | | | | 8,363,066 | | |
Malaysia | | | — | | | | — | | | | — | | | | — | | | | 6,119,133 | | |
Sri Lanka | | | — | | | | — | | | | — | | | | — | | | | 29,141,565 | | |
Taiwan | | | — | | | | 125,180,668 | | | | 197,149,443 | | | | — | | | | — | | |
United States | | | — | | | | — | | | | — | | | | 539,699 | | | | — | | |
Warrants: | |
Sri Lanka | | | — | | | | — | | | | — | | | | — | | | | 524,834 | | |
Level 2: Other Significant Observable Inputs | |
Foreign Government Obligationsa | | | 12,445,026 | | | | — | | | | — | | | | — | | | | — | | |
Non-Convertible Corporate Bondsa | | | 41,537,722 | | | | — | | | | — | | | | — | | | | — | | |
Convertible Corporate Bondsa | | | 6,016,687 | | | | 370,932,572 | | | | — | | | | — | | | | — | | |
Common Equities: | |
Australia | | | — | | | | 203,273,016 | | | | 216,828,472 | | | | 1,222,286 | | | | 27,574,908 | | |
China/Hong Kong | | | 1,012,492 | | | | 951,945,404 | | | | 951,571,950 | | | | 4,269,389 | | | | 68,055,179 | | |
India | | | — | | | | — | | | | 298,498,436 | | | | 408,587 | | | | 84,874,025 | | |
Indonesia | | | — | | | | 77,109,756 | | | | 336,660,408 | | | | 900,893 | | | | 68,216,463 | | |
Japan | | | — | | | | 182,680,576 | | | | 1,206,751,536 | | | | — | | | | 317,233,763 | | |
Luxembourg | | | — | | | | — | | | | 90,778,484 | | | | — | | | | — | | |
Malaysia | | | 402,543 | | | | 345,184,359 | | | | 68,335,163 | | | | 1,731,495 | | | | 9,344,233 | | |
New Zealand | | | 403,741 | | | | 136,572,520 | | | | — | | | | — | | | | — | | |
Philippines | | | 389,638 | | | | 79,306,880 | | | | 57,740,351 | | | | — | | | | 46,293,215 | | |
Singapore | | | 742,349 | | | | 574,122,809 | | | | 437,623,012 | | | | 1,436,343 | | | | 5,677,781 | | |
South Korea | | | — | | | | 256,326,049 | | | | 171,314,558 | | | | 625,004 | | | | 19,314,078 | | |
Sri Lanka | | | — | | | | — | | | | — | | | | — | | | | 12,887,883 | | |
Switzerland | | | — | | | | — | | | | — | | | | 548,088 | | | | — | | |
Taiwan | | | — | | | | 82,409,572 | | | | 64,095,266 | | | | 546,279 | | | | 23,352,755 | | |
Thailand | | | 606,653 | | | | 251,546,603 | | | | 172,600,162 | | | | 423,274 | | | | 14,926,593 | | |
United Kingdom | | | — | | | | 55,472,514 | | | | — | | | | 290,674 | | | | — | | |
Vietnam | | | — | | | | 58,105,595 | | | | 49,746,598 | | | | — | | | | 8,040,426 | | |
Preferred Equities: | |
South Korea | | | 920,273 | | | | 148,952,501 | | | | 113,348,388 | | | | — | | | | — | | |
Total Market Value of Investments | | $ | 64,477,124 | | | $ | 4,235,205,804 | | | $ | 4,932,479,206 | | | $ | 14,013,742 | | | $ | 812,822,943 | | |
a Industry, countries, or security types are disclosed on the Schedule of Investments.
| | | Matthews Asia
Strategic Income
Fund | |
Derivative Financial Instruments1 | |
Assets: | |
Level 1: Quoted Prices | |
Interest Rate Futures Contracts | | $ | 12,891 | | |
Total Market Value of Derivative Financial Instruments | | $ | 12,891 | | |
1 Derivative financial instruments are financial futures contracts. Financial futures contracts are valued at the unrealized appreciation/depreciation on the instrument.
118 MATTHEWS ASIA FUNDS
| | | Matthews China
Dividend Fund | | Matthews
China Fund | | Matthews
India Fund | | Matthews
Japan Fund | | Matthews
Korea Fund | | Matthews
China Small
Companies
Fund | |
Assets: | |
Investments: | |
Level 1: Quoted Prices | |
Common Equities: | |
Consumer Discretionary | | $ | 7,798,182 | | | $ | 35,928,097 | | | $ | 53,414,181 | | | $ | — | | | $ | 3,688,033 | | | $ | 2,132,665 | | |
Consumer Staples | | | — | | | | — | | | | 25,788,842 | | | | — | | | | 8,561,697 | | | | — | | |
Financials | | | 4,798,568 | | | | — | | | | 46,252,999 | | | | — | | | | — | | | | — | | |
Health Care | | | — | | | | 17,626,435 | | | | 52,511,357 | | | | — | | | | — | | | | 794,370 | | |
Industrials | | | 4,426,106 | | | | 34,669,634 | | | | 18,647,106 | | | | 7,076,440 | | | | 3,606,260 | | | | 931,341 | | |
Information Technology | | | — | | | | 87,117,234 | | | | 70,976,656 | | | | — | | | | — | | | | 207,445 | | |
Materials | | | — | | | | — | | | | 17,931,538 | | | | — | | | | 918,864 | | | | — | | |
Telecommunication Services | | | 6,741,708 | | | | 17,804,814 | | | | — | | | | — | | | | 12,144,455 | | | | — | | |
Utilities | | | 5,540,598 | | | | 206,425 | | | | — | | | | — | | | | — | | | | — | | |
Level 2: Other Significant Observable Inputs | |
Common Equities: | |
Consumer Discretionary | | | 23,361,441 | | | | 99,385,625 | | | | 53,379,351 | | | | 118,967,393 | | | | 39,445,104 | | | | 2,496,439 | | |
Consumer Staples | | | 9,069,307 | | | | 95,493,229 | | | | 187,370,799 | | | | 78,521,621 | | | | 33,111,083 | | | | 76,514 | | |
Energy | | | 3,290,297 | | | | 38,389,147 | | | | — | | | | — | | | | 3,714,371 | | | | 101,481 | | |
Financials | | | 17,776,006 | | | | 196,342,076 | | | | 230,544,615 | | | | 56,530,240 | | | | 33,758,462 | | | | 1,920,507 | | |
Health Care | | | 8,600,969 | | | | 70,869,719 | | | | 25,895,506 | | | | 74,953,102 | | | | 5,747,738 | | | | 4,183,564 | | |
Industrials | | | 27,507,248 | | | | 99,414,303 | | | | 143,027,324 | | | | 153,726,235 | | | | 9,741,255 | | | | 4,226,045 | | |
Information Technology | | | 5,492,765 | | | | 109,963,418 | | | | 68,175,408 | | | | 91,095,940 | | | | 20,955,495 | | | | 2,034,226 | | |
Materials | | | 4,462,760 | | | | — | | | | 75,822,052 | | | | 14,626,207 | | | | 4,423,481 | | | | 121,226 | | |
Telecommunication Services | | | — | | | | 25,021,188 | | | | — | | | | 18,997,836 | | | | — | | | | — | | |
Utilities | | | — | | | | 58,870,186 | | | | — | | | | — | | | | — | | | | 1,466,686 | | |
Preferred Equities: | |
Consumer Discretionary | | | — | | | | — | | | | — | | | | — | | | | 8,422,923 | | | | — | | |
Consumer Staples | | | — | | | | — | | | | — | | | | — | | | | 7,859,654 | | | | — | | |
Energy | | | — | | | | — | | | | — | | | | — | | | | 1,243,607 | | | | — | | |
Financials | | | — | | | | — | | | | — | | | | — | | | | 8,361,532 | | | | — | | |
Information Technology | | | — | | | | — | | | | — | | | | — | | | | 5,058,364 | | | | — | | |
Materials | | | — | | | | — | | | | — | | | | — | | | | 4,108,096 | | | | — | | |
Level 3: Significant Unobservable Inputs | |
Common Equities: | |
Consumer Discretionary | | | 5,999,103 | | | | — | | | | — | | | | — | | | | — | | | | — | | |
Industrials | | | 4,694,035 | | | | — | | | | — | | | | — | | | | — | | | | 898,951 | | |
Information Technology | | | 3,526,660 | | | | — | | | | — | | | | — | | | | — | | | | 7,544 | | |
Total Market Value of Investments | | $ | 143,085,753 | | | $ | 987,101,530 | | | $ | 1,069,737,734 | | | $ | 614,495,014 | | | $ | 214,870,474 | | | $ | 21,599,004 | | |
matthewsasia.com | 800.789.ASIA 119
Notes to Financial Statements (continued)
| | | Matthews
Pacific Tiger
Fund | | Matthews
Emerging Asia
Fund | | Matthews Asia
Small Companies
Fund | | Matthews Asia
Science and
Technology Fund | |
Assets: | |
Investments: | |
Level 1: Quoted Prices | |
Common Equities: | |
Bangladesh | | $ | — | | | $ | 12,597,654 | | | $ | — | | | $ | — | | |
China/Hong Kong | | | 639,472,959 | | | | 4,893,820 | | | | 41,103,093 | | | | 55,132,048 | | |
India | | | 6,064,625 | | | | 5,619,468 | | | | 26,989,838 | | | | 1,997,151 | | |
Indonesia | | | 16,992,911 | | | | — | | | | 4,735,579 | | | | — | | |
Malaysia | | | — | | | | — | | | | 25,841,339 | | | | — | | |
Pakistan | | | — | | | | 9,674,177 | | | | — | | | | — | | |
South Korea | | | — | | | | — | | | | — | | | | 885,928 | | |
Sri Lanka | | | — | | | | 8,325,070 | | | | — | | | | — | | |
Taiwan | | | — | | | | — | | | | — | | | | 2,261,297 | | |
United States | | | 72,807,716 | | | | — | | | | — | | | | 3,965,298 | | |
Vietnam | | | — | | | | 5,012,634 | | | | 224,430 | | | | — | | |
Warrants: | |
Malaysia | | | 9,777,867 | | | | — | | | | 56,485 | | | | — | | |
Sri Lanka | | | — | | | | 26,464 | | | | — | | | | — | | |
Level 2: Other Significant Observable Inputs | |
Common Equities: | |
Australia | | | — | | | | 2,239,411 | | | | — | | | | — | | |
Bangladesh | | | — | | | | 5,757,356 | | | | — | | | | — | | |
Cambodia | | | — | | | | 2,304,554 | | | | — | | | | — | | |
China/Hong Kong | | | 1,726,492,303 | | | | 12,858,530 | | | | 128,175,118 | | | | 18,785,204 | | |
India | | | 1,660,664,114 | | | | 12,392,502 | | | | 74,213,608 | | | | 16,337,850 | | |
Indonesia | | | 645,647,048 | | | | 10,811,462 | | | | 47,441,534 | | | | 5,514,923 | | |
Japan | | | — | | | | — | | | | 5,393,911 | | | | 25,933,370 | | |
Malaysia | | | 281,735,282 | | | | 786,914 | | | | 10,173,572 | | | | 2,198,840 | | |
Pakistan | | | — | | | | 6,031,779 | | | | — | | | | — | | |
Philippines | | | 207,314,698 | | | | 9,445,457 | | | | 34,333,405 | | | | — | | |
Singapore | | | 129,610,299 | | | | 1,468,981 | | | | 46,647,705 | | | | 4,838,155 | | |
South Korea | | | 1,281,256,214 | | | | — | | | | 62,815,738 | | | | 18,804,115 | | |
Sri Lanka | | | — | | | | 3,485,467 | | | | — | | | | — | | |
Switzerland | | | 194,957,524 | | | | — | | | | — | | | | — | | |
Taiwan | | | 620,134,414 | | | | 2,239,421 | | | | 88,188,852 | | | | 19,747,657 | | |
Thailand | | | 432,460,304 | | | | 2,484,875 | | | | 46,676,464 | | | | — | | |
Vietnam | | | 104,974,804 | | | | 6,979,423 | | | | — | | | | — | | |
Preferred Equities: | |
South Korea | | | — | | | | — | | | | — | | | | 5,856,431 | | |
Total Market Value of Investments | | $ | 8,030,363,082 | | | $ | 125,435,419 | | | $ | 643,010,671 | | | $ | 182,258,267 | | |
120 MATTHEWS ASIA FUNDS
Foreign securities that are valued based on market quotations are categorized as Level 1 in the fair value hierarchy (see Note 2-B). Certain foreign securities may be fair valued by external pricing services when the Funds determine that events affecting the value of foreign securities which occur between the time at which they are determined and the close of trading on the NYSE render market quotations unreliable. Such fair valuations are typically categorized as Level 2 in the fair value hierarchy. The Funds' policy is to recognize transfers in and transfers out as of the beginning of the reporting period. At December 31, 2014, the Funds utilized third party pricing services to fair value certain markets which were different than markets which utilized third party pricing services at December 31, 2013. As a result, certain securities held by the Funds were transferred from Level 2 into Level 1 and certain securities held by the Funds were transferred from Level 1 to Level 2 with beginning of period values as follows:
| | | Transfer to Level 1
from Level 2 | | Transfer to Level 2
from Level 1 | |
Matthews Asia Strategic Income Fund | | $ | — | | | $ | 1,193,608 | | |
Matthews Asian Growth and Income Fund | | | — | | | | 1,529,257,237 | | |
Matthews Asia Dividend Fund | | | 90,664,779 | | | | 1,506,564,774 | | |
Matthews China Dividend Fund | | | 5,284,768 | | | | 41,029,193 | | |
Matthews Asia Focus Fund | | | — | | | | 3,509,956 | | |
Matthews Asia Growth Fund | | | — | | | | 153,037,766 | | |
Matthews Pacific Tiger Fund | | | — | | | | 2,454,356,802 | | |
Matthews Emerging Asia Fund | | | 1,090,130 | | | | 12,877,614 | | |
Matthews China Fund | | | 30,393,025 | | | | 9,467,747 | | |
Matthews India Fund | | | — | | | | 354,817,519 | | |
Matthews Japan Fund | | | — | | | | 951,657 | | |
Matthews Korea Fund | | | 4,697,567 | | | | 1,698,299 | | |
Matthews Asia Small Companies Fund | | | 6,114,102 | | | | 169,133,677 | | |
Matthews China Small Companies Fund | | | 259,694 | | | | 5,170,160 | | |
Matthews Asia Science and Technology Fund | | | — | | | | 34,359,493 | | |
A reconciliation of Level 3 investments for which significant unobservable inputs were used to determine value are as follows:
| | | Matthews
Asia Small
Companies Fund | | Matthews
China Small
Companies Fund | | Matthews
China Small
Companies Fund | | Matthews
China Dividend
Fund | | Matthews
China Dividend
Fund | | Matthews
China Dividend
Fund | |
| | | Common
Equities —
China | | Common
Equities —
Industrials | | Common
Equities —
Information
Technology | | Common
Equities —
Consumer
Discretionary | | Common
Equities —
Industrials | | Common
Equities —
Information
Technology | |
Balance as of 12/31/13 (market value) | | $ | 514 | | | $ | — | | | $ | 7,544 | | | $ | — | | | $ | — | | | $ | — | | |
Accrued discounts/premiums | | | — | | | | — | | | | — | | | | — | | | | — | | | | — | | |
Realized gain/(loss) | | | (6,985,011 | ) | | | — | | | | — | | | | 10,603 | | | | — | | | | — | | |
Change in unrealized (depreciation) | | | 8,495,772 | | | | 172,122 | | | | — | | | | 1,478,169 | | | | 864,530 | | | | 727,248 | | |
Purchases | | | — | | | | 211,661 | | | | — | | | | — | | | | — | | | | 2,799,412 | | |
Sales | | | (1,511,275 | ) | | | — | | | | — | | | | (452,234 | ) | | | — | | | | — | | |
Transfers in to Level 3* | | | — | | | | 515,168 | | | | — | | | | 4,962,565 | | | | 3,829,505 | | | | — | | |
Transfers out of Level 3* | | | — | | | | — | | | | — | | | | — | | | | — | | | | — | | |
Balance as of 12/31/14 (market value) | | $ | — | | | $ | 898,951 | | | $ | 7,544 | | | $ | 5,999,103 | | | $ | 4,694,035 | | | $ | 3,526,660 | | |
Net change in unrealized appreciation/
depreciation on Level 3 investments held
as of 12/31/14** | | $ | — | | | $ | 172,122 | | | $ | — | | | $ | 1,478,169 | | | $ | 864,530 | | | $ | 727,248 | | |
* The Fund's policy is to recognize transfers in and transfer out as of the beginning of the reporting period.
** Included in the related amounts on the Statements of Operations.
Certain foreign securities, for which market quotations are not readily available, may be fair valued and classified as either Level 2 or Level 3. When the underlying inputs include significant observable inputs obtained from sources independent of the Funds, the securities are classified as Level 2. When the underlying inputs include significant unobservable inputs and reflect assumptions of market participants, the securities are classified as Level 3. As of December 31st, 2014, the Funds that previously used observable inputs now also utilize significant unobservable inputs for certain securities. These inputs include evaluated prices from the Funds' pricing vendors, day-on-day price changes, primary and ancillary pricing sources, and other available independent market indicators of value. As a result, certain securities held by the Funds that were previously classified as Level 2 were transferred to Level 3.
matthewsasia.com | 800.789.ASIA 121
Notes to Financial Statements (continued)
The following table summarizes the valuation techniques used and unobservable inputs developed by the Valuation Committee to determine the fair value of certain, material Level 3 investments:
| | Value | | Valuation
Technique | | Range of
Unobservable
Input1 | | Unobservable
Inputs | |
Matthews China Dividend Fund Assets: | |
| Common Equity | | $ | 14,219,798 | | | Last Price4
Multiplied by
Proxy factor2 | | Proxy factor2 | | | 0-21 | %3 | |
Matthews China Small Companies Fund Assets: | |
| Common Equity | | $ | 898,951 | | | Last Price4
Multiplied by
Proxy factor2 | | Proxy factor2 | | | 21 | % | |
1 Increase in unobservable input may result in a significant increase to value, while a decrease in unobservable input may result in a significant decrease to value.
2 Proxy factor considers movement of the Shenzhen or Shanghai Stock Exchange B Share Index, as applicable.
3 Weighted average proxy factor is 11%.
4 Last Price could include closing price, last reported sales price, or last fair valued price as described in Note 2-A.
C. BASIS OF CONSOLIDATION: The accompanying consolidated financial statements of Matthews China Fund and Matthews Asia Dividend Fund (the "Investing Funds") includes the accounts of the Matthews CF-U Series and Matthews ADF-U Series (the "U Series Funds"), respectively. The U Series Funds are series of the Matthews A Share Selections Fund, LLC, a Delaware limited liability company registered under the 1940 Act. All of the interests offered by U Series Funds are exclusively owned by the Investing Funds. The U Series Funds primarily invest in the stocks of Chinese companies listed on Mainland China Stock Exchanges, and traded and denominated in the currency of China, the Renminbi. To allow U Series Funds to invest in China A Shares Matthews has applied for and received a license from the China Securities Regulatory Commission as a Qualified Foreign Institutional Investor and has been allocated by the State Administration of Foreign Exchange of China a quota of up to $100 million, representing the equivalent value in Renminbi of China A Shares that the U Series Funds may purchase. Access to the quota will be subject to Matthews' trade allocation procedures and access allocation procedures. The U Series Funds are subject to the same investment policies and restrictions that apply to Investing Funds. The net assets of Matthews CF-U Series and Matthews ADF-U Series at December 31, 2014, were $54,237,763 and $59,807,840, respectively. Intercompany accounts and transactions, if any, have been eliminated in the consolidation process. The U Series Funds are intended to be disregarded entities for tax purposes. Therefore, no federal tax provision is required. Consolidated financial statements include expenses that are accrued for and paid by the Investing Funds. These include on-going operational costs as well as costs in connection with the launching of the U series funds (see offering cost, note E).
D. RISKS ASSOCIATED WITH NON-U.S. COMPANIES: Investments by the Funds in the securities of non-U.S. companies may involve investment risks not typically associated with investments in U.S. issuers. These risks include possible political, economic, social and religious instability, inadequate investor protection; changes in laws or regulations of countries within the Asia Pacific region (including both in countries where you invest, as well as in the broader region); international relations with other nations; natural disasters; corruption; and military activity. Foreign securities may be subject to greater fluctuations in price than securities of domestic corporations or the U.S. government. Foreign investing may also include the risk of expropriation or confiscatory taxation, limitation on the removal or funds or other assets, currency crises and exchange controls, the imposition of foreign withholding tax on the interest income payable on such instruments, the possible seizure or nationalization of foreign deposits or assets, or the adoption of other foreign government restrictions that might adversely affect the foreign securities held by the Funds. Additionally, Asia Pacific countries may utilize formal or informal currency exchange controls or "capital controls" that may limit the ability to repatriate investments or income or adversely affect the value of portfolio investments. The economies of many Asia Pacific countries differ from the economies of more developed countries in many respects, such as their rate of growth, inflation, capital reinvestment, resource self-sufficiency and dependence on other economies, financial system stability, the national balance of payments position and sensitivity to changes in global trade. Certain Asia Pacific countries are highly dependent upon and may be affected by developments in the economies of other countries. Non-U.S. companies are subject to different accounting, auditing, and financial reporting standards, practices, and requirements than U.S. companies. There is generally less government regulation of stock exchanges, brokers, and listed companies abroad than in the United States, which may result in less transparency with respect to a company's operations, and make obtaining information about them more difficult (or such information may be unavailable).
Foreign stock markets may not be as developed or efficient as those in the United States, and the absence of negotiated brokerage commissions in certain countries may result in higher brokerage fees. The time between the trade and settlement dates of securities transactions on foreign exchanges ranges from one day to four weeks or longer and may result in higher custody charges. Custodial arrangements may be less well developed than in the United States. Foreign securities are generally denominated and pay distributions in foreign currencies, exposing the Funds to changes in foreign currency exchange rates. Investing in any country in the Asia Pacific region will also entail risks specific and unique to that country, and these risks can be significant and change rapidly.
Currently, Chinese law permits a Qualified Foreign Institutional Investor (QFII), such as Matthews, to repatriate an Investment Quota (including the proceeds of the Investment Quota) once every seven days. In the recent past, repatriation by a QFII was limited to once every 30 days (and other types of QFIIs may operate under greater or different repatriation restrictions). As a result of this restriction, the Company sought and has been granted by the U.S. Securities and Exchange Commission an exemption (the "Exemptive Order") from the provisions of Section 22(e) of the 1940 Act and Rule 22c-1 thereunder to the extent necessary to permit the Company to operate as an "extended payment fund." As extended payment funds, the U Series Funds (see Note 2-C) will only redeem Interests on a periodic basis, which, pursuant to the Exemptive Order, shall be no less frequent than on one day each month. Currently, the Funds redeem Interests once each seven days.
E. OFFERING COSTS: Offering costs are amortized on a straight-line basis over one year from each Fund's respective commencement of operations. In the event that any of the initial shares are redeemed during the period of amortization of the Fund's offering costs, the
122 MATTHEWS ASIA FUNDS
redemption proceeds will be reduced by any such unamortized offering costs in the same proportion as the number of shares being redeemed bears to the number of those shares outstanding at the time of redemption.
F. DISTRIBUTIONS TO SHAREHOLDERS: It is the policy of Matthews Asian Growth and Income Fund and Matthews China Dividend Fund to distribute net investment income on a semi-annual basis and capital gains, if any, annually. It is the policy of Matthews Asia Dividend Fund and Matthews Asia Strategic Income Fund to distribute net investment income on a quarterly basis and capital gains, if any, annually. Each of the other Funds distributes a net investment income and capital gains, if any, annually. Distributions to shareholders are recorded on the ex-dividend date. Income and capital gain distributions are determined in accordance with income tax regulations which may differ from U.S. GAAP.
The tax character of distributions paid for the fiscal year ended December 31, 2014 and December 31, 2013 were as follows:
| YEAR ENDED DECEMBER 31, 2014 | | Ordinary Income | | Net Long-Term
Capital Gains | | Return of
Capital | | Total Taxable
Distributions | |
Matthews Asia Strategic Income Fund | | $ | 2,114,388 | | | $ | — | | | $ | — | | | $ | 2,114,388 | | |
Matthews Asian Growth and Income Fund | | | 82,852,338 | | | | 102,451,370 | | | | — | | | | 185,303,708 | | |
Matthews Asia Dividend Fund | | | 79,977,573 | | | | — | | | | 21,987,983 | | | | 101,965,556 | | |
Matthews China Dividend Fund | | | 4,550,194 | | | | 709,195 | | | | — | | | | 5,259,389 | | |
Matthews Asia Focus Fund | | | 112,525 | | | | — | | | | — | | | | 112,525 | | |
Matthews Asia Growth Fund | | | 15,440,617 | | | | — | | | | — | | | | 15,440,617 | | |
Matthews Pacific Tiger Fund | | | 47,680,793 | | | | 360,777,613 | | | | — | | �� | | 408,458,406 | | |
Matthews Emerging Asia Fund | | | 618,186 | | | | 5,141 | | | | — | | | | 623,327 | | |
Matthews China Fund | | | 12,883,867 | | | | 4,848,647 | | | | — | | | | 17,732,514 | | |
Matthews India Fund | | | 1,848,612 | | | | 5,587,798 | | | | — | | | | 7,436,410 | | |
Matthews Japan Fund | | | 3,325,554 | | | | — | | | | — | | | | 3,325,554 | | |
Matthews Korea Fund | | | — | | | | 9,796,584 | | | | — | | | | 9,796,584 | | |
Matthews Asia Small Companies Fund | | | 2,665,812 | | | | — | | | | — | | | | 2,665,812 | | |
Matthews China Small Companies Fund | | | 50,571 | | | | — | | | | 828,820 | | | | 879,391 | | |
Matthews Asia Science and Technology Fund | | | 929,241 | | | | 1,142,588 | | | | — | | | | 2,071,829 | | |
| YEAR ENDED DECEMBER 31, 2013 | | Ordinary Income | | Net Long-Term
Capital Gains | | Return of
Capital | | Total Taxable
Distributions | |
Matthews Asia Strategic Income Fund | | $ | 1,861,692 | | | $ | 29,972 | | | $ | — | | | $ | 1,891,664 | | |
Matthews Asian Growth and Income Fund | | | 110,108,786 | | | | 27,369,456 | | | | — | | | | 137,478,242 | | |
Matthews Asia Dividend Fund | | | 212,274,517 | | | | — | | | | — | | | | 212,274,517 | | |
Matthews China Dividend Fund | | | 2,377,974 | | | | — | | | | — | | | | 2,377,974 | | |
Matthews Asia Focus Fund | | | 69,741 | | | | — | | | | — | | | | 69,741 | | |
Matthews Asia Growth Fund | | | 12,349,014 | | | | — | | | | — | | | | 12,349,014 | | |
Matthews Pacific Tiger Fund | | | 56,207,775 | | | | 48,148,449 | | | | — | | | | 104,356,224 | | |
Matthews Emerging Asia Fund | | | 2,126 | | | | — | | | | 35,732 | | | | 37,858 | | |
Matthews China Fund | | | 15,661,208 | | | | 113,790,581 | | | | — | | | | 129,451,789 | | |
Matthews India Fund | | | 4,882,634 | | | | 372,297 | | | | — | | | | 5,254,931 | | |
Matthews Japan Fund | | | 5,469,366 | | | | — | | | | — | | | | 5,469,366 | | |
Matthews Korea Fund | | | 462,570 | | | | 5,865,278 | | | | — | | | | 6,327,848 | | |
Matthews Asia Small Companies Fund | | | 2,154,826 | | | | — | | | | — | | | | 2,154,826 | | |
Matthews China Small Companies Fund | | | 278,033 | | | | — | | | | — | | | | 278,033 | | |
Matthews Asia Science and Technology Fund | | | 187,291 | | | | — | | | | — | | | | 187,291 | | |
G. INVESTMENT TRANSACTIONS AND INCOME: Securities transactions are accounted for on the date the securities are purchased or sold. Gains or losses on the sale of securities are determined on the identified cost basis. Interest income is recorded on the accrual basis. Dividend income is generally recorded on the ex-dividend date. Dividend income for certain issuers headquartered in countries which the Funds invest may not be recorded until approved by the shareholders (which may occur after the ex-dividend date) if, in the judgment of management, such dividends are not reasonably determined as of the ex-dividend date. Income and realized and unrealized gains or losses on investments are allocated to each class of shares based on its relative net assets.
The Funds may be subject to foreign taxation related to income received, capital gains on the sale of securities and certain foreign currency transactions in the foreign jurisdictions in which they invest. Foreign taxes, if any, are recorded based on the tax regulations and rates that exist in the foreign markets in which the Funds invest. When a capital gain tax is determined to apply the Funds record an estimated deferred tax liability in an amount that may be payable if the securities were disposed of on the valuation date.
matthewsasia.com | 800.789.ASIA 123
Notes to Financial Statements (continued)
H. FUND EXPENSE ALLOCATIONS: The Funds account separately for the assets, liabilities and operations of each Fund. Direct expenses of each Fund or class are charged to that Fund or class while general expenses are allocated pro-rata among the Funds based on net assets or other appropriate methods.
I. CASH, CASH OVERDRAFTS, AND FOREIGN CURRENCY: The U Series Funds are required by the local market to maintain a cash reserve. The cash reserve is based upon a fixed ratio of the QFII's approved investment quota, which is defined as the amount remitted into its special renminbi (RMB) cash account. The fixed ratio is set at 0.08 percent for the Shanghai and 0.06 percent for the Shenzhen market. When any of the Funds' cash balances are overdrawn, a Fund is charged an overdraft fee by the custodian of 1.00% above the 30-day LIBOR rate on outstanding balances. These amounts, if any, are included in "Other expenses" on the Statements of Operations.
J. USE OF ESTIMATES: The preparation of financial statements in conformity with U.S. GAAP requires management to make estimates and assumptions that affect the amounts reported in the financial statements and accompanying notes. Actual results may differ from those estimates.
3. FUND MERGER
On October 2, 2014 the Board of Directors and shareholders of Nomura Partners Funds, Inc. approved the reorganization of the The Japan Fund (the "Target Fund"). On October 17, 2014 the Matthews Japan Fund acquired all the assets and assumed the liabilities of the Target Fund in exchange for shares of the Matthews Japan Fund. The transaction was as a result of Nomura Asset Management U.S.A. Inc.'s decision to exit the U.S. open-end mutual fund business. The acquisition was accomplished by a tax-free exchange of shares on October 17, 2014. For financial reporting purposes, assets were received at fair value; however the cost basis of the investments received from the Target Fund was carried forward to align ongoing reporting of Matthews Japan Fund's realized and unrealized gains and losses with amounts distributed to shareholders for tax purposes.
Each shareholder of the Target Fund received shares of Matthews Japan Fund, as determined at close of business on October 17, 2014 according to the table below.
Target Fund's
Share Class | | Shares Prior to
Reorganization | | Conversion
Ratio | | Matthews Japan
Class | | Matthews
Japan Fund
Shares Issued | |
A | | | 314,066 | | | | 0.739546 | | | Investor | | | 232,266 | | |
C | | | 510,770 | | | | 0.717761 | | | Investor | | | 366,611 | | |
S | | | 11,694,034 | | | | 0.744459 | | | Investor | | | 8,705,729 | | |
I | | | 160,398 | | | | 0.735254 | | | Institutional | | | 117,933 | | |
The Target Fund's net assets and composition of net assets on October 17, 2014, the date of the reorganization, were as follows:
Paid in Capital | | Distributions in Excess of
Net Investment Income | | Realized
Loss | | Unrealized
Appreciation | | Net
Assets | |
| $ | 163,432,401 | | | ($ | 1,155,343 | ) | | ($ | 43,285,042 | ) | | $ | 25,829,276 | | | $ | 144,821,292 | | |
The net assets of Matthews Japan Fund before the acquisition were $508,467,019. The aggregate net assets of Matthews Japan Fund immediately after the acquisition were $653,288,311. The Target Fund's fair value and cost of investments and currency prior to the reorganization were $143,979,876 and $118,168,598, respectively.
Assuming the acquisition had been completed on January 1, 2014, the beginning of the reporting period for the Matthews Japan Fund, the pro-forma results for the fiscal year ended December 31, 2014 was as follows:
Net investment income | | $ | 2,085,005 | | |
Net realized and change in unrealized loss on investments | | ($ | 28,825,674 | ) | |
Net increase (decrease) in net assets from operations | | ($ | 26,740,669 | ) | |
Because the combined investment portfolios have been managed as a single portfolio since the acquisition was completed, it is not practicable to separate the amounts of revenue and earnings of the Target Fund that have been included in Matthews Japan Fund since October 17, 2014. Since the Target Fund and Matthews Japan Fund sold and redeemed shares throughout the period, it is not practicable to provide pro-forma information on a per-share basis.
4. DERIVATIVE FINANCIAL INSTRUMENTS
Matthews Asia Strategic Income Fund engages in derivative transactions for a variety of purposes, including managing interest rate, currency and credit exposure. In particular, the Fund may seek to take on currency exposure by using derivatives such as currency forwards, and the Fund may also employ a currency overlay strategy in an effort to enhance returns and moderate volatility. Derivative financial instruments and transactions in which the Fund may engage include financial futures contracts and/or forward foreign currency exchange contracts. The currency overlay strategy involves long and short positions on one or more currencies. As a result, the Fund's exposure to a currency could exceed the value of the Fund's assets and could be exposed to currency risk whether or not it holds a bond or other instrument denominated in that currency. The gross notional value of derivative financial instruments and transactions could exceed the value of the Fund's net assets, although the net market value of these instruments and transactions, on a marked-to-market basis, at most times, is expected to be substantially lower. The primary risks associated with the use of derivative financial instruments are: (i) Matthews may not correctly predict the direction of currency exchange rates, interest rates, security prices, or other economic factors; (ii) Matthews may not correctly predict changes in the value of derivative financial instruments and related underlying instruments or assets, which may result in disproportionately increased losses and/or reduced opportunities for gains; (iii) imperfect correlation between the change in market value of the securities held by the Fund and the price of financial futures contracts; (iv) the lack of, or a reduction in the liquidity of, any secondary market for the instrument, and the resulting inability to close position (or exit the position) when desired; (v) losses, which
124 MATTHEWS ASIA FUNDS
are potentially unlimited, due to unanticipated market movements; (vi) the value of the instrument may change unfavorably due to movements in the value of the referenced foreign currencies; (vii) the Fund may suffer disproportionately heavy losses relative to the amount invested; (viii) changes in the value of the derivatives may not match or fully offset changes in the value of hedged or related portfolio securities, thereby failing to achieve the hedging or investment purpose for the derivative transaction; and (ix) the other party to the instrument may fail to fulfill its obligation.
Financial Futures Contracts: Financial futures contracts are agreements between the Fund and a counterparty to buy or sell a specific quantity of an underlying instrument at a specified price and at a specified date. Depending on the terms of the particular contract, futures contracts are settled either through physical delivery of the underlying instrument on the settlement date or by payment of a cash settlement amount on settlement date. Pursuant to the contract, the Fund agrees to receive from or pay an amount of cash equal to the daily fluctuation in value of the contract. Such receipts or payments are known as variation margin and are recorded by the Fund as unrealized appreciation or depreciation. When the contract is closed, the Fund records a realized gain or loss equal to the difference between the value of the contract at the time it was opened and the value at the time it was closed.
Forward Foreign Currency Exchange Contracts: A forward foreign currency exchange contract is an agreement between two parties to buy and sell a currency at a set exchange rate on a future date. The contract is marked-to-market daily and the change in market value is recorded by the Fund as an unrealized gain or loss. When the contract is closed, the Fund records a realized gain or loss equal to the difference between the value at the time it was opened and the value at the time it was closed.
Derivative Financial Instruments Categorized by Risk Exposure:
As of December 31, 2014, the fair values of derivative financial instruments were as follows:
| | | Statement of Assets and Liabilities Location | | Matthews Asia
Strategic Income
Fund | |
| | | Asset Derivatives | |
Interest rate contracts | | Unrealized appreciation on financial futures contracts* | | $ | 12,891 | | |
Total | | | | $ | 12,891 | | |
* Includes cumulative appreciation/depreciation of financial futures contracts as reported in the Schedule of Investments. Only current day's margin variation is reported within the Statement of Assets and Liabilities.
For the year ended December 31, 2014, the effect of derivative financial instruments on the Statements of Operations were as follows:
Derivative type | | Statement of Operations Location | | Matthews Asia
Strategic Income
Fund | |
Net Realized Gain (Loss) | |
Interest rate contracts: | |
Financial futures contracts | | Net realized gain (loss) on financial futures contracts | | ($ | 222,426 | ) | |
Foreign currency contracts: | |
Foreign currency exchange contracts | | Net realized gain (loss) on foreign currency related transactions | | ( | $83,224 | ) | |
Net Change in Unrealized Appreciation (Depreciation) | |
Interest rate contracts: | |
Financial futures contracts | | Net change in unrealized appreciation/depreciation on
financial futures contracts | | ($ | 52,031 | ) | |
Foreign currency contracts: | |
Foreign currency exchange contracts | | Net change in unrealized appreciation/depreciation on
foreign currency related translations | | ($ | 37,595 | ) | |
For the year ended December 31, 2014, the end of quarter average balances of outstanding derivative financial instruments were as follows:
| | | Matthews Asia
Strategic Income
Fund | |
Financial Futures Contracts (Interest Rate Risk): | |
Average number of contracts sold | | | 29 | | |
Average total notional value of contracts sold | | $ | 3,592,324 | | |
Forward Foreign Currency Exchange Contracts (Foreign Currency Exchange Risk): | |
Average number of contracts—U.S. dollars purchased | | | 1 | | |
Average total U.S. dollar amounts purchased | | $ | 250,000 | | |
Average number of contracts—U.S. dollars sold | | | 1 | | |
Average total U.S. dollar amounts sold | | $ | 250,000 | | |
matthewsasia.com | 800.789.ASIA 125
Notes to Financial Statements (continued)
5. CAPITAL SHARE TRANSACTIONS
Each Fund is authorized to issue an unlimited number of shares of beneficial interest with a par value of $0.001 per share.
| | | Year Ended December 31, 2014 | | Year Ended December 31, 2013 | |
| | | Shares | | Amount | | Shares | | Amount | |
MATTHEWS ASIA STRATEGIC INCOME FUND | |
Investor Class | |
Shares sold | | | 2,868,763 | | | $ | 30,387,264 | | | | 3,745,840 | | | $ | 40,829,249 | | |
Shares issued through reinvestment of distributions | | | 170,890 | | | | 1,792,188 | | | | 150,938 | | | | 1,585,049 | | |
Shares redeemed | | | (1,006,520 | ) | | | (10,564,074 | ) | | | (2,967,175 | ) | | | (30,908,607 | ) | |
Net increase (decrease) | | | 2,033,133 | | | $ | 21,615,378 | | | | 929,603 | | | $ | 11,505,691 | | |
Institutional Class | |
Shares sold | | | 8,500 | | | $ | 90,318 | | | | 152,518 | | | $ | 1,666,843 | | |
Shares issued through reinvestment of distributions | | | 28,064 | | | | 294,191 | | | | 25,259 | | | | 264,495 | | |
Shares redeemed | | | (11,064 | ) | | | (115,367 | ) | | | (15,229 | ) | | | (160,251 | ) | |
Net increase (decrease) | | | 25,500 | | | $ | 269,142 | | | | 162,548 | | | $ | 1,771,087 | | |
MATTHEWS ASIAN GROWTH AND INCOME FUND | |
Investor Class | |
Shares sold | | | 42,335,422 | | | $ | 806,641,528 | | | | 50,910,142 | | | $ | 975,445,062 | | |
Shares issued through reinvestment of distributions | | | 6,792,538 | | | | 123,896,096 | | | | 5,201,327 | | | | 95,757,860 | | |
Shares redeemed | | | (53,031,955 | ) | | | (997,653,204 | ) | | | (55,522,506 | ) | | | (1,058,702,543 | ) | |
Net increase (decrease) | | | (3,903,995 | ) | | ($ | 67,115,580 | ) | | | 588,963 | | | $ | 12,500,379 | | |
Institutional Class | |
Shares sold | | | 17,734,558 | | | $ | 339,731,302 | | | | 24,431,571 | | | $ | 465,841,409 | | |
Shares issued through reinvestment of distributions | | | 2,873,664 | | | | 52,402,976 | | | | 1,836,588 | | | | 33,834,591 | | |
Shares redeemed | | | (14,176,690 | ) | | | (266,541,558 | ) | | | (13,055,475 | ) | | | (248,454,495 | ) | |
Net increase (decrease) | | | 6,431,532 | | | $ | 125,592,720 | | | | 13,212,684 | | | $ | 251,221,505 | | |
MATTHEWS ASIA DIVIDEND FUND | |
Investor Class | |
Shares sold | | | 27,074,172 | | | $ | 421,810,410 | | | | 99,621,023 | | | $ | 1,546,841,400 | | |
Shares issued through reinvestment of distributions | | | 3,452,211 | | | | 55,280,782 | | | | 8,220,277 | | | | 125,957,575 | | |
Shares redeemed | | | (74,520,827 | ) | | | (1,151,165,817 | ) | | | (63,387,585 | ) | | | (985,525,489 | ) | |
Net increase (decrease) | | | (43,994,444 | ) | | ($ | 674,074,625 | ) | | | 44,453,715 | | | $ | 687,273,486 | | |
Institutional Class | |
Shares sold | | | 47,197,289 | | | $ | 735,042,714 | | | | 85,294,760 | | | $ | 1,322,202,668 | | |
Shares issued through reinvestment of distributions | | | 1,435,590 | | | | 22,955,772 | | | | 2,778,193 | | | | 42,599,649 | | |
Shares redeemed | | | (46,762,733 | ) | | | (729,427,226 | ) | | | (15,174,466 | ) | | | (236,397,745 | ) | |
Net increase (decrease) | | | 1,870,146 | | | $ | 28,571,260 | | | | 72,898,487 | | | $ | 1,128,404,572 | | |
MATTHEWS CHINA DIVIDEND FUND | |
Investor Class | |
Shares sold | | | 3,469,549 | | | $ | 46,973,569 | | | | 8,605,528 | | | $ | 110,622,425 | | |
Shares issued through reinvestment of distributions | | | 293,612 | | | | 3,935,098 | | | | 151,856 | | | | 1,870,520 | | |
Shares redeemed | | | (4,184,807 | ) | | | (55,511,036 | ) | | | (4,410,569 | ) | | | (55,811,935 | ) | |
Net increase (decrease) | | | (421,646 | ) | | ($ | 4,602,369 | ) | | | 4,346,815 | | | $ | 56,681,010 | | |
Institutional Class | |
Shares sold | | | 1,028,815 | | | $ | 13,795,976 | | | | 1,904,137 | | | $ | 24,649,821 | | |
Shares issued through reinvestment of distributions | | | 84,509 | | | | 1,131,935 | | | | 30,796 | | | | 381,714 | | |
Shares redeemed | | | (624,547 | ) | | | (8,338,287 | ) | | | (146,558 | ) | | | (1,921,676 | ) | |
Net increase (decrease) | | | 488,777 | | | $ | 6,589,624 | | | | 1,788,375 | | | $ | 23,109,859 | | |
126 MATTHEWS ASIA FUNDS
| | | Year Ended December 31, 2014 | | Year Ended December 31, 2013 | |
| | | Shares | | Amount | | Shares | | Amount | |
MATTHEWS ASIA FOCUS FUND | |
Investor Class | |
Shares sold | | | 435,111 | | | $ | 4,372,718 | | | | 846,121 | | | $ | 8,348,637 | | |
Shares issued through reinvestment of distributions | | | 5,515 | | | | 55,145 | | | | 5,290 | | | | 49,775 | | |
Shares redeemed | | | (305,685 | ) | | | (2,951,262 | ) | | | (203,646 | ) | | | (1,913,944 | ) | |
Net increase (decrease) | | | 134,941 | | | $ | 1,476,601 | | | | 647,765 | | | $ | 6,484,468 | | |
Institutional Class | |
Shares sold | | | 562,972 | | | $ | 5,679,393 | | | | 244,995 | | | $ | 2,335,477 | | |
Shares issued through reinvestment of distributions | | | 5,697 | | | | 57,082 | | | | 2,092 | | | | 19,683 | | |
Shares redeemed | | | (75,633 | ) | | | (749,792 | ) | | | (27,857 | ) | | | (266,324 | ) | |
Net increase (decrease) | | | 493,036 | | | $ | 4,986,683 | | | | 219,230 | | | $ | 2,088,836 | | |
MATTHEWS ASIA GROWTH FUND | |
Investor Class | |
Shares sold | | | 8,352,421 | | | $ | 176,815,714 | | | | 14,878,768 | | | $ | 299,712,557 | | |
Shares issued through reinvestment of distributions | | | 364,634 | | | | 7,679,192 | | | | 295,056 | | | | 6,163,723 | | |
Shares redeemed | | | (8,456,299 | ) | | | (177,869,893 | ) | | | (4,166,027 | ) | | | (84,404,359 | ) | |
Net increase (decrease) | | | 260,756 | | | $ | 6,625,013 | | | | 11,007,797 | | | $ | 221,471,921 | | |
Institutional Class | |
Shares sold | | | 3,166,264 | | | $ | 68,111,071 | | | | 3,098,066 | | | $ | 63,221,456 | | |
Shares issued through reinvestment of distributions | | | 233,352 | | | | 4,937,721 | | | | 182,774 | | | | 3,832,779 | | |
Shares redeemed | | | (564,454 | ) | | | (12,120,100 | ) | | | (698,970 | ) | | | (14,388,918 | ) | |
Net increase (decrease) | | | 2,835,162 | | | $ | 60,928,692 | | | | 2,581,870 | | | $ | 52,665,317 | | |
MATTHEWS PACIFIC TIGER FUND | |
Investor Class | |
Shares sold | | | 13,461,553 | | | $ | 362,907,557 | | | | 27,012,739 | | | $ | 672,355,297 | | |
Shares issued through reinvestment of distributions | | | 5,254,231 | | | | 139,026,894 | | | | 1,385,477 | | | | 34,498,321 | | |
Shares redeemed | | | (22,276,690 | ) | | | (585,489,213 | ) | | | (32,772,349 | ) | | | (809,094,334 | ) | |
Net increase (decrease) | | | (3,560,906 | ) | | ($ | 83,554,762 | ) | | | (4,374,133 | ) | | ($ | 102,240,716 | ) | |
Institutional Class | |
Shares sold | | | 41,237,653 | | | $ | 1,119,555,511 | | | | 64,636,522 | | | $ | 1,596,651,346 | | |
Shares issued through reinvestment of distributions | | | 5,592,016 | | | | 147,852,921 | | | | 1,387,312 | | | | 34,516,325 | | |
Shares redeemed | | | (44,056,685 | ) | | | (1,135,705,206 | ) | | | (33,128,054 | ) | | | (820,516,878 | ) | |
Net increase (decrease) | | | 2,772,984 | | | $ | 131,703,226 | | | | 32,895,780 | | | $ | 810,650,793 | | |
MATTHEWS EMERGING ASIA FUND | |
Investor Class | |
Shares sold | | | 6,358,977 | | | $ | 71,447,277 | | | | 4,251,615 | | | $ | 41,780,099 | | |
Shares issued through reinvestment of distributions | | | 44,331 | | | | 513,799 | | | | 3,360 | | | | 32,761 | | |
Shares redeemed | | | (719,405 | ) | | | (7,920,065 | ) | | | (426,089 | ) | | | (4,022,586 | ) | |
Net increase (decrease) | | | 5,683,903 | | | $ | 64,041,011 | | | | 3,828,886 | | | $ | 37,790,274 | | |
Institutional Class | |
Shares sold | | | 1,672,829 | | | $ | 18,713,467 | | | | 214,207 | | | $ | 2,140,969 | | |
Shares issued through reinvestment of distributions | | | 9,076 | | | | 105,103 | | | | 517 | | | | 5,040 | | |
Shares redeemed | | | (44,825 | ) | | | (498,178 | ) | | | (11,439 | ) | | | (109,811 | ) | |
Net increase (decrease) | | | 1,637,080 | | | $ | 18,320,392 | | | | 203,285 | | | $ | 2,036,198 | | |
matthewsasia.com | 800.789.ASIA 127
Notes to Financial Statements (continued)
| | | Year Ended December 31, 2014 | | Year Ended December 31, 2013 | |
| | | Shares | | Amount | | Shares | | Amount | |
MATTHEWS CHINA FUND | |
Investor Class | |
Shares sold | | | 4,652,101 | | | $ | 101,501,385 | | | | 9,603,494 | | | $ | 227,616,931 | | |
Shares issued through reinvestment of distributions | | | 752,109 | | | | 16,034,960 | | | | 5,068,913 | | | | 114,658,721 | | |
Shares redeemed | | | (17,574,642 | ) | | | (379,926,583 | ) | | | (28,310,189 | ) | | | (648,793,241 | ) | |
Net increase (decrease) | | | (12,170,432 | ) | | ($ | 262,390,238 | ) | | | (13,637,782 | ) | | ($ | 306,517,589 | ) | |
Institutional Class | |
Shares sold | | | 572,587 | | | $ | 12,475,109 | | | | 2,060,633 | | | $ | 48,716,752 | | |
Shares issued through reinvestment of distributions | | | 55,031 | | | | 1,172,155 | | | | 407,596 | | | | 9,211,677 | | |
Shares redeemed | | | (3,338,212 | ) | | | (72,711,685 | ) | | | (13,975,418 | ) | | | (319,349,884 | ) | |
Net increase (decrease) | | | (2,710,594 | ) | | ($ | 59,064,421 | ) | | | (11,507,189 | ) | | ($ | 261,421,455 | ) | |
MATTHEWS INDIA FUND | |
Investor Class | |
Shares sold | | | 18,378,382 | | | $ | 428,347,047 | | | | 4,172,828 | | | $ | 68,392,848 | | |
Shares issued through reinvestment of distributions | | | 251,419 | | | | 6,614,834 | | | | 309,531 | | | | 4,998,780 | | |
Shares redeemed | | | (8,069,436 | ) | | | (172,617,142 | ) | | | (12,908,744 | ) | | | (209,732,996 | ) | |
Net increase (decrease) | | | 10,560,365 | | | $ | 262,344,739 | | | | (8,426,385 | ) | | ($ | 136,341,368 | ) | |
Institutional Class | |
Shares sold | | | 4,119,011 | | | $ | 103,116,285 | | | | 40,050 | | | $ | 699,162 | | |
Shares issued through reinvestment of distributions | | | 4,649 | | | | 122,448 | | | | 2,746 | | | | 44,395 | | |
Shares redeemed | | | (195,207 | ) | | | (3,155,297 | ) | | | (1,907,618 | ) | | | (24,781,929 | ) | |
Net increase (decrease) | | | 3,928,453 | | | $ | 100,083,436 | | | | (1,864,822 | ) | | ($ | 24,038,372 | ) | |
MATTHEWS JAPAN FUND | |
Investor Class | |
Shares sold | | | 14,683,754 | | | $ | 236,544,033 | | | | 18,828,332 | | | $ | 287,144,412 | | |
Merger | | | 9,304,606 | | | | 143,006,665 | | | | — | | | | — | | |
Shares issued through reinvestment of distributions | | | 136,979 | | | | 2,162,925 | | | | 254,335 | | | | 4,076,983 | | |
Shares redeemed | | | (13,641,932 | ) | | | (216,980,228 | ) | | | (6,485,310 | ) | | | (97,714,790 | ) | |
Net increase (decrease) | | | 10,483,407 | | | $ | 164,733,395 | | | | 12,597,357 | | | $ | 193,506,605 | | |
Institutional Class | |
Shares sold | | | 7,921,739 | | | $ | 130,732,643 | | | | 1,963,683 | | | $ | 28,804,131 | | |
Merger | | | 117,933 | | | | 1,814,627 | | | | — | | | | — | | |
Shares issued through reinvestment of distributions | | | 27,262 | | | | 430,732 | | | | 44,482 | | | | 713,048 | | |
Shares redeemed | | | (1,901,165 | ) | | | (30,655,635 | ) | | | (136,248 | ) | | | (2,132,289 | ) | |
Net increase (decrease) | | | 6,165,769 | | | $ | 102,322,367 | | | | 1,871,917 | | | $ | 27,384,890 | | |
MATTHEWS KOREA FUND | |
Investor Class | |
Shares sold | | | 2,855,980 | | | $ | 17,811,596 | | | | 3,278,133 | | | $ | 18,476,568 | | |
Shares issued through reinvestment of distributions | | | 958,127 | | | | 5,298,441 | | | | 958,600 | | | | 5,569,465 | | |
Shares redeemed | | | (4,561,112 | ) | | | (27,333,556 | ) | | | (5,922,961 | ) | | | (32,598,761 | ) | |
Net increase (decrease) | | | (747,005 | ) | | ($ | 4,223,519 | ) | | | (1,686,228 | ) | | ($ | 8,552,728 | ) | |
Institutional Class | |
Shares sold | | | 15,224,562 | | | $ | 92,211,027 | | | | 7,577,356 | | | $ | 41,070,000 | | |
Shares issued through reinvestment of distributions | | | 294,354 | | | | 1,633,663 | | | | — | | | | — | | |
Shares redeemed | | | (1,475,555 | ) | | | (8,735,102 | ) | | | (7,034,105 | ) | | | (38,579,275 | ) | |
Net increase (decrease) | | | 14,043,361 | | | $ | 85,109,588 | | | | 543,251 | | | $ | 2,490,725 | | |
128 MATTHEWS ASIA FUNDS
| | | Year Ended December 31, 2014 | | Year Ended December 31, 2013 | |
| | | Shares | | Amount | | Shares | | Amount | |
MATTHEWS ASIA SMALL COMPANIES FUND | |
Investor Class | |
Shares sold | | | 12,269,745 | | | $ | 256,739,667 | | | | 8,112,960 | | | $ | 153,340,855 | | |
Shares issued through reinvestment of distributions | | | 91,722 | | | | 1,980,278 | | | | 95,242 | | | | 1,826,741 | | |
Shares redeemed | | | (5,510,122 | ) | | | (113,024,665 | ) | | | (7,380,126 | ) | | | (140,788,302 | ) | |
Net increase (decrease) | | | 6,851,345 | | | $ | 145,695,280 | | | | 828,076 | | | $ | 14,379,294 | | |
Institutional Class | |
Shares sold | | | 1,637,024 | | | $ | 34,046,110 | | | | 2,625,749 | | | $ | 51,018,053 | | |
Shares issued through reinvestment of distributions | | | 11,551 | | | | 249,394 | | | | 4,794 | | | | 91,895 | | |
Shares redeemed | | | (368,351 | ) | | | (7,588,297 | ) | | | (314,881 | ) | | | (5,822,176 | ) | |
Net increase (decrease) | | | 1,280,224 | | | $ | 26,707,207 | | | | 2,315,662 | | | $ | 45,287,772 | | |
MATTHEWS CHINA SMALL COMPANIES FUND | |
Investor Class | |
Shares sold | | | 1,079,235 | | | $ | 10,536,592 | | | | 1,988,275 | | | $ | 17,263,500 | | |
Shares issued through reinvestment of distributions | | | 91,585 | | | | 856,321 | | | | 28,896 | | | | 277,117 | | |
Shares redeemed | | | (1,472,901 | ) | | | (14,353,449 | ) | | | (643,558 | ) | | | (5,589,693 | ) | |
Net increase (decrease) | | | (302,081 | ) | | ($ | 2,960,536 | ) | | | 1,373,613 | | | $ | 11,950,924 | | |
MATTHEWS ASIA SCIENCE AND TECHNOLOGY FUND | |
Investor Class | |
Shares sold | | | 2,001,250 | | | $ | 26,712,471 | | | | 979,122 | | | $ | 10,756,975 | | |
Shares issued through reinvestment of distributions | | | 92,181 | | | | 1,261,036 | | | | 5,373 | | | | 65,713 | | |
Shares redeemed | | | (1,740,481 | ) | | | (22,680,601 | ) | | | (6,280,700 | ) | | | (64,340,033 | ) | |
Net increase (decrease) | | | 352,950 | | | $ | 5,292,906 | | | | (5,296,205 | ) | | ($ | 53,517,345 | ) | |
Institutional Class | |
Shares sold | | | 533,868 | | | $ | 6,731,909 | | | | 3,902,817 | | | $ | 40,192,941 | | |
Shares issued through reinvestment of distributions | | | 55,365 | | | | 756,846 | | | | 9,751 | | | | 119,153 | | |
Shares redeemed | | | (12,051 | ) | | | (169,548 | ) | | | — | | | | — | | |
Net increase (decrease) | | | 577,182 | | | $ | 7,319,207 | | | | 3,912,568 | | | $ | 40,312,094 | | |
The Funds generally assess a redemption fee of 2.00% of the total redemption proceeds if shareholders sell or exchange their shares within 90 calendar days after purchasing them. The redemption fee is paid directly to the Funds and is designed to discourage frequent short-term trading and market timing activity, and to minimize the impact of any such trading of Fund shares. For purposes of determining whether the redemption fee applies, the shares that have been held the longest will be redeemed first. The Funds may grant an exemption from the redemption fee when the Funds have previously received assurances that transactions do not involve a substantial risk of the type of harm that the policy is designed to avoid. The Funds may also waive the imposition of redemption fees in certain circumstances. For more information on this policy, please see the Funds' prospectuses. The redemption fees returned to the assets of the Funds are stated in the Statements of Changes in Net Assets.
6. INVESTMENT ADVISORY FEES AND OTHER TRANSACTIONS WITH AFFILIATES
Matthews, a registered investment advisor under the 1940 Act, provides the Funds with investment management services. Pursuant to an Investment Advisory Agreement dated August 13, 2004, as amended (the "Advisory Agreement"), the Funds pay Matthews (i) for management and advisory services; and (ii) for certain administrative services, an annual fee as a percentage of average daily net assets. Under the Advisory Agreement each of the Funds, other than Matthews Asia Strategic Income Fund, Matthews Emerging Asia Fund, Matthews Asia Small Companies Fund, and Matthews China Small Companies Fund (the "Family-Priced Funds"), pays Matthews 0.75% of their aggregate average daily net assets up to $2 billion, 0.6834% of their aggregate average daily net assets over $2 billion up to $5 billion, 0.65% of their aggregate average daily net assets over $5 billion up to $25 billion, 0.64% of their aggregate average daily net assets over $25 billion up to $30 billion, 0.63% of their aggregate average daily net assets over $30 billion up to $35 billion, 0.62% of their aggregate average daily net assets over $35 billion up to $40 billion, 0.61% of their aggregate average daily net assets over $40 billion up to $45 billion, and 0.60% of their aggregate average daily net assets over $45 billion. Matthews Asia Strategic Income Fund pays Matthews an annual fee of 0.65% of its annual average daily net assets pursuant to the Advisory Agreement. Each of the Matthews Emerging Asia Fund, Matthews Asia Small Companies Fund, and the Matthews China Small Companies Fund pays Matthews an annual fee of 1.00% of the average daily net assets of such Fund up to $1 billion and 0.95% of the average daily net assets of such Fund over $1 billion pursuant to the Advisory Agreement. Each Fund pays Matthews a monthly fee of one-twelfth (1/12) of the management fee of the Fund's average daily net asset value.
Pursuant to a fee waiver letter agreement, effective as of September 1, 2014, between the Trust, on behalf of the Family-Priced Funds, and Matthews, for each Family-Priced Fund, Matthews has agreed to waive a portion of the fee payable under the Advisory Agreement and a portion of the fee payable under the Administration and Shareholder Services Agreement, if any Family-Priced Fund's average daily net assets are over $3 billion, as follows: for every $2.5 billion average daily net assets of a Family-Priced Fund that are over $3 billion, the fee rates that otherwise would be applied for calculating fees payable under the Advisory Agreement and the Administration and Shareholder Services Agreement for such Family-Priced Fund with respect to such excess average daily net assets will be each reduced by 0.01%, in each case without reducing such fee rate below 0.00%.
matthewsasia.com | 800.789.ASIA 129
Notes to Financial Statements (continued)
Under a written agreement between the Funds and Matthews, Matthews agrees to waive fees and reimburse expenses to a Fund if its expense ratio exceeds a certain percentage level. Effective May 1, 2014 for all Funds, except Matthews Asia Strategic Income Fund and Matthews China Small Companies Fund, this level is 1.25% for the Institutional Class. Matthews agrees to reduce the expense ratio by waiving an equal amount of non-class specific expenses for the Investor Class. Because certain expenses of the Investor Class may be higher than Institutional Class and class specific expenses may be waived solely for the Institutional Class, total annual Fund expenses for the Investor Class may exceed 1.25%. For Matthews Asia Strategic Income Fund this level is 0.90% for Institutional Class. Matthews agrees to reduce the expense ratio by waiving an equal amount of non-class expenses for the Investor Class. Because certain expenses of the Investor Class may be higher that the Institutional Class and class specific expenses may be waived solely for the Institutional Class, total annual Fund expenses for the Investor Class may exceed 0.90%. For Matthews China Small Companies Fund this level is 1.50% for the Investor Class. Prior to May 1, 2014 for Matthews China Fund, Matthews India Fund, Matthews Japan Fund, Matthews Korea Fund, Matthews Asia Small Companies Fund, Matthews China Small Companies Fund and Matthews Asia Science and Technology Fund, this level was 2.00%. For Matthews Asian Growth and Income Fund, Matthews Asia Growth Fund and Matthews Pacific Tiger Fund, this level was 1.90%. For Matthews Asia Dividend Fund and Matthews China Dividend Fund, this level was 1.50%. For Matthews Asia Strategic Income Fund, Matthews Asia Focus Fund and Matthews Emerging Asia Fund, Matthews agreed to waive fees and reimburse expenses to each Fund if its expense ratio exceeded 1.25%, 1.75%, 2.00%, respectively, for the Institutional Class and agreed to reduce the expense ratio by an equal amount for the Investor Class. In turn, if a Fund's expenses fall below the level noted within three years after Matthews has made such a reimbursement, the Fund may reimburse Matthews up to an amount of the recoupment available not to exceed its expense limitation. This agreement will continue through at least August 31, 2015 for the Funds. This agreement may be extended for additional periods for each of the Funds.
On December 31, 2014, the amounts subject to possible future recoupment under the expense limitation agreement are as follows:
| | | Expiring December 31, | |
| | 2015 | | 2016 | | 2017 | |
Matthews Asia Strategic Income Fund | | $ | 161,965 | | | $ | 41,268 | | | $ | 79,504 | | |
Matthews Asia Focus Fund | | | — | | | | 87,951 | | | | 62,897 | | |
Matthews Emerging Asia Fund | | | — | | | | 85,828 | | | | 152,283 | | |
Matthews Asia Small Companies Fund | | | — | | | | — | | | | 15,271 | | |
Matthews China Small Companies Fund | | | 76,425 | | | | 7,801 | | | | 55,868 | | |
Matthews Asia Strategic Income Fund and Matthews China Small Companies Fund had $22,795 and $69,601, respectively, of recoupment that expired on December 31, 2014 Matthews Asian Growth and Income Fund, Matthews Asia Dividend Fund, Matthews China Dividend Fund, Matthews Asia Growth Fund, Matthews Pacific Tiger Fund, Matthews China Fund, Matthews India Fund, Matthews Japan Fund, Matthews Korea Fund, Matthews Asia Science and Technology Fund had no amounts available for recoupment and no amounts recouped during the year ended December 31, 2014.
Prior to May 1, 2014 Matthews agreed to waive fees and reimburse additional expenses for the Institutional Class of Matthews Asia Strategic Income Fund, Matthews Asia Focus Fund and Matthews Emerging Asia Fund on a voluntary basis if its expense ratio exceeded 1.00%, 1.50%, 1.75%, respectively. Furthermore, any amounts voluntarily waived by Matthews with respect to the Institutional Class of Matthews Asia Strategic Income Fund, Matthews Asia Focus Fund and Matthews Emerging Asia Fund, excluding any voluntary waiver of class-specific shareholder servicing fees, were also waived for the Investor Class of Matthews Asia Strategic Income Fund, Matthews Asia Focus Fund and Matthews Emerging Asia Fund.
Investment advisory fees charged, waived fees and reimbursed additional expenses for the year ended December 31, 2014, were as follows:
| | | Gross Advisory Fees | | Advisory Fees
Waived and
Reimbursed in
Excess of the
Expense Limitation | | Net Advisory Fee/
Reimbursement | |
Matthews Asia Strategic Income Fund | | $ | 377,748 | | | ($ | 79,504 | ) | | $ | 298,244 | | |
Matthews Asian Growth and Income Fund | | | 29,679,830 | | | | (51,372 | ) | | | 29,628,458 | | |
Matthews Asia Dividend Fund | | | 35,424,853 | | | | (73,450 | ) | | | 35,351,403 | | |
Matthews China Dividend Fund | | | 925,316 | | | | — | | | | 925,316 | | |
Matthews Asia Focus Fund | | | 68,308 | | | | (62,897 | ) | | | 5,411 | | |
Matthews Asia Growth Fund | | | 5,382,448 | | | | — | | | | 5,382,448 | | |
Matthews Pacific Tiger Fund | | | 51,603,486 | | | | (272,316 | ) | | | 51,331,170 | | |
Matthews Emerging Asia Fund | | | 764,865 | | | | (152,283 | ) | | | 612,582 | | |
Matthews China Fund | | | 7,626,920 | | | | — | | | | 7,626,920 | | |
Matthews India Fund | | | 4,339,849 | | | | — | | | | 4,339,849 | | |
Matthews Japan Fund | | | 3,346,472 | | | | — | | | | 3,346,472 | | |
Matthews Korea Fund | | | 1,291,732 | | | | — | | | | 1,291,732 | | |
Matthews Asia Small Companies Fund | | | 5,593,655 | | | | (15,271 | ) | | | 5,578,384 | | |
Matthews China Small Companies Fund | | | 240,755 | | | | (55,868 | ) | | | 184,887 | | |
Matthews Asia Science and Technology Fund | | | 1,151,709 | | | | — | | | | 1,151,709 | | |
130 MATTHEWS ASIA FUNDS
Certain officers and Trustees of the Funds are also officers and directors of Matthews. All officers serve without compensation from the Funds. The Funds paid the Independent Trustees $778,083 in aggregate for regular compensation during the year ended December 31, 2014.
The Funds have an Administration and Shareholder Services Agreement dated August 13, 2004, as amended (the "Shareholder Services Agreement" or "Services Agreement"), in which the Funds pay an annual administration and shareholder servicing fee to Matthews, as a percentage of the average daily net assets of each Fund in aggregate, computed and prorated on a daily basis. Under the Shareholder Services Agreement, the Funds in the aggregate pay Matthews 0.25% of their aggregate average daily net assets up to $2 billion, 0.1834% of their aggregate average daily net assets over $2 billion up to $5 billion, 0.15% of their aggregate average daily net assets over $5 billion up to $7.5 billion, 0.125% of their aggregate average daily net assets over $7.5 billion up to $15 billion, 0.11% of their aggregate average daily net assets over $15 billion up to $22.5 billion, 0.10% of their aggregate average daily net assets over $22.5 billion up to $25 billion, 0.09% of their aggregate average daily net assets over $25 billion up to $30 billion, 0.08% of their aggregate average daily net assets over $30 billion up to $35 billion, 0.07% of their aggregate average daily net assets over $35 billion up to $40 billion, 0.06% of their aggregate average daily net assets over $40 billion up to $45 billion, and 0.05% of their aggregate average daily net assets over $45 billion.
Pursuant to a fee waiver letter agreement, effective as of September 1, 2014, between the Trust, on behalf of the Family-Priced Funds, and Matthews, for each Family-Priced Fund, Matthews has agreed to waive a portion of the fee payable under the Advisory Agreement and a portion of the fee payable under the Services Agreement, if any Family-Priced Fund's average daily net assets are over $3 billion, as follows: for every $2.5 billion average daily net assets of a Family-Priced Fund that are over $3 billion, the fee rates that otherwise would be applied for calculating fees payable under the Advisory Agreement and the Services Agreement for such Family-Priced Fund with respect to such excess average daily net assets will be each reduced by 0.01%, in each case without reducing such fee rate below 0.00%.
Administration and shareholder servicing fees charged, for the year ended December 31, 2014, were as follows:
| | | Gross
Administration and
Shareholder
Servicing Fees | | Administration and
Shareholder
Servicing Fees
Waived in Excess of
Expenses Limitation | | Net
Administration and
Shareholder
Servicing Fees | |
Matthews Asia Strategic Income Fund | | $ | 82,715 | | | $ | — | | | $ | 82,715 | | |
Matthews Asian Growth and Income Fund | | | 6,365,716 | | | | (51,372 | ) | | | 6,314,344 | | |
Matthews Asia Dividend Fund | | | 7,600,620 | | | | (73,450 | ) | | | 7,527,170 | | |
Matthews China Dividend Fund | | | 198,468 | | | | — | | | | 198,468 | | |
Matthews Asia Focus Fund | | | 14,629 | | | | — | | | | 14,629 | | |
Matthews Asia Growth Fund | | | 1,154,256 | | | | — | | | | 1,154,256 | | |
Matthews Pacific Tiger Fund | | | 11,065,138 | | | | (272,316 | ) | | | 10,792,822 | | |
Matthews Emerging Asia Fund | | | 108,693 | | | | — | | | | 108,693 | | |
Matthews China Fund | | | 1,636,853 | | | | — | | | | 1,636,853 | | |
Matthews India Fund | | | 928,678 | | | | — | | | | 928,678 | | |
Matthews Japan Fund | | | 717,043 | | | | — | | | | 717,043 | | |
Matthews Korea Fund | | | 276,779 | | | | — | | | | 276,779 | | |
Matthews Asia Small Companies Fund | | | 796,089 | | | | — | | | | 796,089 | | |
Matthews China Small Companies Fund | | | 34,313 | | | | — | | | | 34,313 | | |
Matthews Asia Science and Technology Fund | | | 246,929 | | | | — | | | | 246,929 | | |
The Funds bear a portion of the fees paid to certain service providers (exclusive of the Funds' transfer agent) which provide transfer agency and shareholder servicing to certain shareholders. Additional information concerning these services and fees is contained in the Funds' prospectuses. Fees accrued to pay to such service providers for the year ended December 31, 2014 are a component of transfer agent fees and administration and shareholder servicing fees in the Statements of Operations as follows:
| | | Transfer Agent Fees | | Administration and
Shareholder
Servicing Fees | | Total | |
Matthews Asia Strategic Income Fund | | $ | 69,119 | | | $ | 34,560 | | | $ | 103,679 | | |
Matthews Asian Growth and Income Fund | | | 5,169,315 | | | | 2,584,657 | | | | 7,753,972 | | |
Matthews Asia Dividend Fund | | | 4,704,016 | | | | 2,352,008 | | | | 7,056,024 | | |
Matthews China Dividend Fund | | | 166,181 | | | | 83,091 | | | | 249,272 | | |
Matthews Asia Focus Fund | | | 11,645 | | | | 5,823 | | | | 17,468 | | |
Matthews Asia Growth Fund | | | 824,077 | | | | 412,039 | | | | 1,236,116 | | |
Matthews Pacific Tiger Fund | | | 5,595,307 | | | | 2,797,653 | | | | 8,392,960 | | |
Matthews Emerging Asia Fund | | | 106,682 | | | | 53,341 | | | | 160,023 | | |
Matthews China Fund | | | 1,540,406 | | | | 770,203 | | | | 2,310,609 | | |
Matthews India Fund | | | 857,044 | | | | 428,522 | | | | 1,285,566 | | |
Matthews Japan Fund | | | 393,221 | | | | 196,611 | | | | 589,832 | | |
Matthews Korea Fund | | | 162,289 | | | | 81,145 | | | | 243,434 | | |
Matthews Asia Small Companies Fund | | | 748,726 | | | | 374,363 | | | | 1,123,089 | | |
Matthews China Small Companies Fund | | | 37,174 | | | | 18,587 | | | | 55,761 | | |
Matthews Asia Science and Technology Fund | | | 165,285 | | | | 82,642 | | | | 247,927 | | |
matthewsasia.com | 800.789.ASIA 131
Notes to Financial Statements (continued)
BNY Mellon Investment Servicing (US) Inc. ("BNY Mellon"), an indirect wholly owned subsidiary of The Bank of New York Mellon Corporation, serves as the Funds' administrator, and in that capacity, performs various administrative and accounting services for each Fund. BNY Mellon also serves as the Funds' transfer agent, dividend disbursing agent and registrar. An officer of BNY Mellon serves as Assistant Treasurer to the Funds. Total fees accrued by the Funds for administration and accounting services for the year ended December 31, 2014 were as follows:
| | | Administration and
Accounting Fees | |
Matthews Asia Strategic Income Fund | | $ | 4,653 | | |
Matthews Asian Growth and Income Fund | | | 357,585 | | |
Matthews Asia Dividend Fund | | | 449,380 | | |
Matthews China Dividend Fund | | | 11,147 | | |
Matthews Asia Focus Fund | | | 824 | | |
Matthews Asia Growth Fund | | | 64,855 | | |
Matthews Pacific Tiger Fund | | | 621,913 | | |
Matthews Emerging Asia Fund | | | 6,135 | | |
Matthews China Fund | | | 114,536 | | |
Matthews India Fund | | | 52,403 | | |
Matthews Japan Fund | | | 40,332 | | |
Matthews Korea Fund | | | 15,577 | | |
Matthews Asia Small Companies Fund | | | 44,799 | | |
Matthews China Small Companies Fund | | | 1,925 | | |
Matthews Asia Science and Technology Fund | | | 13,881 | | |
Brown Brothers Harriman & Co. serves as the Funds' custodian. Foreside Funds Distributors LLC, serves as the Funds' distributor in the United States pursuant to an Underwriting Agreement. Matthews Asia Funds are distributed in Latin America by HMC Partners.
On November 30, 2011, Matthews invested $10 million in Matthews Asia Strategic Income Fund to provide the Fund with its initial investment assets. As of December 31, 2014, the Fund's net assets were $66,434,674 of which 1,121,968 shares held by Matthews represented 17%.
7. INVESTMENTS
The value of investment transactions made for affiliated and unaffiliated holdings for the year ended December 31, 2014 were as follows:
| | | Affiliated Purchases | | Proceeds from
Affiliated Sales | | Unaffiliated Purchases | | Proceeds from
Unaffiliated Sales | |
Matthews Asia Strategic Income Fund | | $ | — | | | $ | — | | | $ | 40,504,219 | | | $ | 19,335,018 | | |
Matthews Asian Growth and Income Fund | | | — | | | | 933,814 | | | | 822,182,295 | | | | 728,983,348 | | |
Matthews Asia Dividend Fund | | | 50,479,454 | | | | 41,720,779 | | | | 1,000,121,770 | | | | 1,600,168,981 | | |
Matthews China Dividend Fund | | | — | | | | — | | | | 37,445,439 | | | | 34,427,785 | | |
Matthews Asia Focus Fund | | | — | | | | — | | | | 7,906,817 | | | | 2,427,881 | | |
Matthews Asia Growth Fund | | | — | | | | — | | | | 218,885,444 | | | | 177,483,693 | | |
Matthews Pacific Tiger Fund | | | 87,793,737 | | | | 12,002,248 | | | | 790,193,497 | | | | 981,695,973 | | |
Matthews Emerging Asia Fund | | | — | | | | — | | | | 82,065,316 | | | | 6,028,439 | | |
Matthews China Fund | | | — | | | | — | | | | 116,341,501 | | | | 452,599,298 | | |
Matthews India Fund | | | 22,872,157 | | | | — | | | | 408,385,341 | | | | 97,899,204 | | |
Matthews Japan Fund | | | — | | | | — | | | | 519,012,935 | | | | 212,284,650 | * | |
Matthews Korea Fund | | | — | | | | — | | | | 102,222,852 | | | | 32,845,585 | | |
Matthews Asia Small Companies Fund | | | 10,910,363 | | | | — | | | | 264,386,693 | | | | 117,380,563 | | |
Matthews China Small Companies Fund | | | — | | | | — | | | | 7,570,770 | | | | 10,778,988 | | |
Matthews Asia Science and Technology Fund | | | — | | | | — | | | | 117,252,944 | | | | 106,226,921 | | |
* The amount of sales that were backed out due to merger with The Japan Fund, a series of Nomura Partners Funds, Inc. was $66,546,042.
8. HOLDINGS OF 5% VOTING SHARES OF PORTFOLIO COMPANIES
The 1940 Act defines "affiliated companies" to include investments in portfolio companies in which a fund owns 5% or more of the outstanding voting shares. During the year ended December 31, 2014, the Funds below held 5% or more of the outstanding voting shares of the noted portfolio companies. During this period, other Funds in the Trust may also have held voting shares of the issuers at levels below 5%.
132 MATTHEWS ASIA FUNDS
A summary of transactions in securities of issuers affiliated with a Fund for the year ended December 31, 2014 is as follows:
| | | Shares Held at
Dec. 31, 2013 | | Shares
Purchased | | Shares
Sold | | Shares Held at
Dec. 31, 2014 | | Value at
Dec. 31, 2014 | | Dividend
Income
Jan. 1, 2014–
Dec. 31, 2014 | | Net Realized
Gain/(Loss)
Jan. 1, 2014–
Dec. 31, 2014 | |
MATTHEWS ASIAN GROWTH AND INCOME FUND | |
Name of Issuer: | |
CITIC Telecom International
Holdings, Ltd. | | | 191,298,250 | | | | — | | | | 2,480,000 | | | | 188,818,250 | | | $ | 70,604,266 | | | $ | 2,541,640 | | | $ | 25,014 | | |
Vitasoy International Holdings, Ltd.† | | | 51,771,000 | | | | — | | | | — | | | | 51,771,000 | | | | — | | | | — | | | | — | | |
Total Affiliates | | | | | | | | | | $ | 70,604,266 | | | $ | 2,541,640 | | | $ | 25,014 | | |
MATTHEWS ASIA DIVIDEND FUND | |
Name of Issuer: | |
Ansell, Ltd.† | | | 9,815,000 | | | | — | | | | 4,742,915 | | | | 5,072,085 | | | $ | — | | | $ | — | | | $ | — | | |
Ascendas India Trust | | | 55,065,000 | | | | — | | | | — | | | | 55,065,000 | | | | 34,007,402 | | | | 2,041,870 | | | | — | | |
Breville Group, Ltd. | | | 8,427,453 | | | | 2,670,000 | | | | 250,000 | | | | 10,847,453 | | | | 56,742,466 | | | | 2,209,671 | | | | 393,752 | | |
CapitaRetail China Trust, REIT | | | 50,392,400 | | | | 1,787,000 | | | | — | | | | 52,179,400 | | | | 63,458,604 | | | | 3,810,901 | | | | — | | |
EPS Corp.† | | | 29,184 | | | | 2,136,717 | †† | | | 2,165,901 | | | | — | | | | — | | | | — | | | | — | | |
Greatview Aseptic Packaging
Co., Ltd. | | | 107,945,000 | | | | 3,000,000 | | | | — | | | | 110,945,000 | | | | 56,989,060 | | | | 2,782,708 | | | | — | | |
Jiangsu Expressway Co., Ltd.
H Shares† | | | 75,782,000 | | | | — | | | | 34,142,000 | | | | 41,640,000 | | | | — | | | | — | | | | — | | |
Johnson Health Tech Co., Ltd.† | | | 17,014,539 | | | | 1,442,500 | †† | | | 18,457,039 | | | | — | | | | — | | | | — | | | | — | | |
Minth Group, Ltd. | | | 59,807,000 | | | | 1,960,000 | | | | 500,000 | | | | 61,267,000 | | | | 126,421,940 | | | | 3,579,885 | | | | 703,264 | | |
Pigeon Corp. | | | 3,003,600 | | | | — | | | | 625,800 | | | | 2,377,800 | | | | 138,640,241 | | | | 2,729,746 | | | | 18,350,194 | | |
Primary Health Care, Ltd.† | | | 31,495,465 | | | | — | | | | 13,910,693 | | | | 17,584,772 | | | | — | | | | — | | | | — | | |
Springland International
Holdings, Ltd. | | | 115,950,000 | | | | 23,221,000 | | | | 1,000,000 | | | | 138,171,000 | | | | 47,824,790 | | | | 2,893,908 | | | | (215,182 | ) | |
St. Shine Optical Co., Ltd. | | | 1,911,000 | | | | 763,000 | | | | — | | | | 2,674,000 | | | | 43,625,380 | | | | 2,006,804 | | | | — | | |
Xingda International Holdings, Ltd.
H Shares | | | 104,704,000 | | | | — | | | | 17,563,000 | | | | 87,141,000 | | | | 30,959,656 | | | | 1,963,391 | | | | (249,176 | ) | |
Yuexiu Transport Infrastructure, Ltd. | | | 110,490,000 | | | | — | | | | 1,000,000 | | | | 109,490,000 | | | | 66,573,136 | | | | 3,847,154 | | | | 47,352 | | |
Total Affiliates | | | | | | | | | | $ | 665,242,675 | | | $ | 27,866,038 | | | $ | 19,030,204 | | |
MATTHEWS PACIFIC TIGER FUND | |
Name of Issuer: | |
Cheil Worldwide, Inc. | | | 6,561,880 | | | | 358,560 | | | | 500,000 | | | | 6,420,440 | | | $ | 100,836,195 | | | $ | — | | | $ | 8,573,408 | | |
Digital China Holdings, Ltd.† | | | 61,422,000 | | | | — | | | | 27,474,000 | | | | 33,948,000 | | | | — | | | | — | | | | — | | |
Dongbu Insurance Co., Ltd. | | | 3,950,500 | | | | 70,000 | | | | — | | | | 4,020,500 | | | | 202,278,518 | | | | 3,662,491 | | | | — | | |
Green Cross Corp. | | | 967,499 | | | | 41,156 | | | | — | | | | 1,008,655 | | | | 126,540,568 | | | | 1,148,548 | | | | — | | |
Hyflux, Ltd. | | | 65,284,280 | | | | — | | | | — | | | | 65,284,280 | | | | 41,475,884 | | | | 1,198,891 | | | | — | | |
MegaStudy Co., Ltd.† | | | 396,412 | | | | — | | | | 396,412 | | | | — | | | | — | | | | — | | | | — | | |
Sinopharm Group Co., Ltd.
H Shares† | | | 43,788,000 | | | | 10,575,200 | | | | — | | | | 54,363,200 | | | | — | | | | — | | | | — | | |
Synnex Technology
International Corp. | | | 84,022,354 | | | | 18,043,000 | | | | — | | | | 102,065,354 | | | | 147,820,020 | | | | 8,521,899 | | | | — | | |
Tata Power Co., Ltd. | | | 126,160,510 | | | | 36,384,926 | | | | — | | | | 162,545,436 | | | | 210,766,521 | | | | 3,025,088 | | | | — | | |
Total Affiliates | | | | | | | | | | $ | 829,717,706 | | | $ | 17,556,917 | | | $ | 8,573,408 | | |
MATTHEWS CHINA FUND | |
Name of Issuer: | |
Lianhua Supermarket Holdings
Co., Ltd. H Shares† | | | 20,198,800 | | | | — | | | | 20,198,800 | | | | — | | | $ | — | | | $ | — | | | $ | — | | |
Total Affiliates | | | | | | | | | | $ | — | | | $ | — | | | $ | — | | |
MATTHEWS INDIA FUND | |
Name of Issuer: | |
VST Industries, Ltd. | | | — | | | | 855,933 | | | | — | | | | 855,933 | | | $ | 25,788,842 | | | $ | 115,032 | | | $ | — | | |
Total Affiliates | | | | | | | | | | $ | 25,788,842 | | | $ | 115,032 | | | $ | — | | |
† Issuer was not an affiliated company as of December 31, 2014.
†† Includes stock split during the period.
matthewsasia.com | 800.789.ASIA 133
Notes to Financial Statements (continued)
| | | Shares Held at
Dec. 31, 2013 | | Shares
Purchased | | Shares
Sold | | Shares Held at
Dec. 31, 2014 | | Value at
Dec. 31, 2014 | | Dividend
Income
Jan. 1, 2014–
Dec. 31, 2014 | | Net Realized
Gain/(Loss)
Jan. 1, 2014–
Dec. 31, 2014 | |
MATTHEWS ASIA SMALL COMPANIES FUND | |
Name of Issuer: | |
Ezwelfare Co., Ltd. | | | — | | | | 742,858 | | | | — | | | | 742,858 | | | $ | 6,928,528 | | | $ | 31,699 | | | $ | — | | |
SaraminHR Co., Ltd. | | | 518,098 | | | | 164,336 | | | | — | | | | 682,434 | | | | 6,979,225 | | | | 85,987 | | | | — | | |
PT Wismilak Inti Makmur | | | 67,974,000 | | | | 39,666,100 | | | | — | | | | 107,640,100 | | | | 5,425,934 | | | | 140,949 | | | | — | | |
Total Affiliates | | | | | | | | | | $ | 19,333,687 | | | $ | 258,635 | | | $ | — | | |
9. INCOME TAX INFORMATION INCOME AND WITHHOLDING TAXES:
It is the policy of the Funds to comply with all requirements of the Internal Revenue Code of 1986, as amended ("the Code"), applicable to regulated investment companies and to distribute substantially all of their taxable income to their shareholders. The Funds have met the requirements of the Code applicable to regulated investment companies for the year ended December 31, 2014. Therefore, no federal income tax provision is required.
Management has analyzed the Funds' tax positions taken on federal income tax returns for all open tax years (current and prior three tax years), and has concluded that no provision for federal income tax is required in the Funds' financial statements. The Funds' federal and state income and federal excise tax returns for tax years for which the applicable statutes of limitations have not expired are subject to examination by the Internal Revenue Service and state departments of revenue.
As of December 31, 2014, the components of accumulated earnings/deficit on tax basis were as follows:
| | Undistributed
Ordinary Income | | Undistributed
Long-Term
Capital Gains | | Capital Loss
Carryforwards | |
Matthews Asia Strategic Income Fund | | $— | | $— | | ($1,309,618) | |
Matthews Asian Growth and Income Fund | | 6,557,612 | | 19,348,987 | | — | |
Matthews Asia Dividend Fund | | — | | — | | (182,779,099) | |
Matthews China Dividend Fund | | 911,671 | | — | | — | |
Matthews Asia Focus Fund | | 1,023 | | 61,165 | | — | |
Matthews Asia Growth Fund | | — | | — | | (26,429,909) | |
Matthews Pacific Tiger Fund | | 12,415 | | 36,423,086 | | — | |
Matthews Emerging Asia Fund | | — | | 432,972 | | — | |
Matthews China Fund | | 73,913 | | 14,516,350 | | — | |
Matthews India Fund | | 1,966,883 | | 3,030,959 | | — | |
Matthews Japan Fund | | — | | — | | (88,266,176) | |
Matthews Korea Fund | | 713,136 | | 5,927,915 | | — | |
Matthews Asia Small Companies Fund | | 1,500,466 | | — | | (5,443,681) | |
Matthews China Small Companies Fund | | — | | — | | (734,068) | |
Matthews Asia Science and Technology Fund | | — | | 9,056,237 | | — | |
| | Late Year
Losses* | | Other Temporary
Differences | | Unrealized
Appreciation
(Depreciation)** | | Total Accumulated
Earnings/Deficit | |
Matthews Asia Strategic Income Fund | | ($ | 209,651 | ) | | | — | | | ($ | 1,109,428 | ) | | ($ | 2,628,697 | ) | |
Matthews Asian Growth and Income Fund | | | — | | | | — | | | | 607,236,662 | | | | 633,143,261 | | |
Matthews Asia Dividend Fund | | | — | | | | (31,628 | ) | | | 642,272,174 | | | | 459,461,447 | | |
Matthews China Dividend Fund | | | (586,052 | ) | | | — | | | | 9,453,268 | | | | 9,778,887 | | |
Matthews Asia Focus Fund | | | — | | | | — | | | | (56,160 | ) | | | 6,028 | | |
Matthews Asia Growth Fund | | | (3,220,533 | ) | | | — | | | | 157,768,643 | | | | 128,118,201 | | |
Matthews Pacific Tiger Fund | | | — | | | | — | | | | 2,460,685,281 | | | | 2,497,120,782 | | |
Matthews Emerging Asia Fund | | | (137,282 | ) | | | — | | | | 9,295,729 | | | | 9,591,419 | | |
Matthews China Fund | | | — | | | | — | | | | 180,652,072 | | | | 195,242,335 | | |
Matthews India Fund | | | — | | | | (14,245 | ) | | | 295,882,771 | | | | 300,866,368 | | |
Matthews Japan Fund | | | (817,239 | ) | | | — | | | | 40,209,201 | | | | (48,874,214 | ) | |
Matthews Korea Fund | | | — | | | | — | | | | 54,258,690 | | | | 60,899,741 | | |
Matthews Asia Small Companies Fund | | | — | | | | — | | | | 103,757,462 | | | | 99,814,247 | | |
Matthews China Small Companies Fund | | | (33,976 | ) | | | — | | | | 3,642,828 | | | | 2,874,784 | | |
Matthews Asia Science and Technology Fund | | | (787 | ) | | | — | | | | 56,898,319 | | | | 65,953,769 | | |
* The Funds have elected to defer certain qualified late-year losses and recognize such losses in the next fiscal year.
** The differences between book-basis and tax-basis unrealized appreciation/depreciation is attributable primarily to the tax deferral of losses on wash sales and passive foreign investment company (PFIC) mark to market adjustments.
134 MATTHEWS ASIA FUNDS
As of December 31, 2014, the Funds have capital loss carryforwards available to offset future realized capital gains through the indicated expiration dates as follows:
| | | | | | | | Amount With No Expiration* | | | |
| LOSSES DEFERRED EXPIRING IN: | | 2016 | | 2017 | | 2018 | | Short-term
Losses | | Long-term
Losses | | Total | |
Matthews Asia Strategic Income Fund | | $ | — | | | $ | — | | | $ | — | | | $ | 1,178,601 | | | $ | 131,017 | | | $ | 1,309,618 | | |
Matthews Asia Dividend Fund | | | — | | | | — | | | | — | | | | 67,300,117 | | | | 115,478,982 | | | | 182,779,099 | | |
Matthews Asia Growth Fund | | | — | | | | 26,429,909 | | | | — | | | | — | | | | — | | | | 26,429,909 | | |
Matthews Japan Fund | | | 44,233,750 | | | | 44,032,426 | | | | — | | | | — | | | | — | | | | 88,266,176 | | |
Matthews Asia Small Companies Fund | | | — | | | | — | | | | — | | | | 5,443,681 | | | | — | | | | 5,443,681 | | |
Matthews China Small Companies Fund | | | — | | | | — | | | | — | | | | 734,068 | | | | — | | | | 734,068 | | |
* Post-Enactment Losses: Must be utilized prior to losses subject to expiration.
As a result of the mergers described in Note 3, pre-merger capital loss carryovers are subject to limitations under Internal Revenue Code Sections 381-384. As of the date of the merger the Nomura Japan Fund had accumulated capital losses of $41,427,986 which are subject to limitation and the Matthews Japan Fund had accumulated losses of $64,206,520 which are not subject to limitation.
The following Funds utilized capital loss carryforwards in the current year:
| | Utilized
Capital Loss
Carryforwards | |
Matthews Asia Dividend Fund | | $ | 33,551,861 | | |
Matthews China Dividend Fund | | | 1,304,904 | | |
Matthews Asia Focus Fund | | | 41,669 | | |
Matthews Asia Growth Fund | | | 15,749,423 | | |
Matthews Emerging Asia Fund | | | 113,563 | | |
Matthews Japan Fund | | | 11,493,332 | | |
Matthews Asia Small Companies Fund | | | 2,819,948 | | |
Matthews China Small Companies Fund | | | 591,567 | | |
Matthews Asia Science and Technology Fund | | | 4,165,322 | | |
Under the Regulated Investment Company Modernization Act of 2010, the Funds are permitted to carry forward capital losses incurred in taxable years beginning after December 22, 2010 for an unlimited period. However, any losses incurred during those future taxable years will be required to be utilized prior to any losses incurred in pre-enactment taxable years, which generally expire after eight years from when they are incurred. Additionally, post-enactment capital losses that are carried forward will retain their character as either short-term or long-term capital losses rather than being considered all short-term as under previous law.
matthewsasia.com | 800.789.ASIA 135
Notes to Financial Statements (continued)
U.S. GAAP requires that certain components of net assets be reclassified between financial and tax reporting. These reclassifications have no effect on net assets or NAV. The permanent differences are primarily attributable to investments in PFICs, non-deductible expenses, foreign currency reclassification, NOL (net operating loss) adjustments, capital gains tax, distributions in excess of current earnings and profits, re-characterization of distributions, and adjustments resulting from fund mergers. For the year ended December 31, 2014, permanent differences in book and tax accounting have been reclassified to paid-in capital, undistributed net investment income (loss) and accumulated realized gain (loss) as follows:
| | Increase/
(Decrease)
Paid-in-Capital | | Increase/(Decrease)
Undistributed Net
Investment
Income/(Loss) | | Increase/
(Decrease)
Accumulated
Realized Gain/(Loss) | |
Matthews Asia Strategic Income Fund | | $ | — | | | ($ | 683,379 | ) | | $ | 683,379 | | |
Matthews Asian Growth and Income Fund | | | — | | | | 9,814,697 | | | | (9,814,697 | ) | |
Matthews Asia Dividend Fund | | | (35,476 | ) | | | 84,832,910 | | | | (84,797,434 | ) | |
Matthews China Dividend Fund | | | — | | | | 288,203 | | | | (288,203 | ) | |
Matthews Asia Focus Fund | | | (19,582 | ) | | | 20,768 | | | | (1,186 | ) | |
Matthews Asia Growth Fund | | | (3,722,830 | ) | | | 3,362,364 | | | | 360,466 | | |
Matthews Pacific Tiger Fund | | | — | | | | (1,075,226 | ) | | | 1,075,226 | | |
Matthews Emerging Asia Fund | | | (19,781 | ) | | | (6,276 | ) | | | 26,055 | | |
Matthews China Fund | | | (35,976 | ) | | | 76,452 | | | | (40,476 | ) | |
Matthews India Fund | | | — | | | | (288,692 | ) | | | 288,692 | | |
Matthews Japan Fund | | | 38,206,559 | | | | 683,191 | | | | (38,889,750 | ) | |
Matthews Korea Fund | | | 1 | | | | 322,672 | | | | (322,673 | ) | |
Matthews Asia Small Companies Fund | | | (5,800 | ) | | | (125,994 | ) | | | 131,794 | | |
Matthews China Small Companies Fund | | | — | | | | 207,935 | | | | (207,935 | ) | |
Matthews Asia Science and Technology Fund | | | (771,093 | ) | | | 748,914 | | | | 22,179 | | |
10. SUBSEQUENT EVENTS
Management has evaluated the impact of all subsequent events on the Funds through the date the financial statements were issued, and has determined that there were no subsequent events that require recognition or disclosure in the financial statements.
136 MATTHEWS ASIA FUNDS
Report of Independent Registered Public Accounting Firm
To the Board of Trustees and Shareholders of
Matthews Asia Funds:
In our opinion, the accompanying statements of assets and liabilities, including the schedules of investments, and the related statements of operations and of changes in net assets and the financial highlights present fairly, in all material respects, the financial position of Matthews Asia Strategic Income Fund, Matthews Asian Growth and Income Fund, Matthews Asia Dividend Fund, Matthews China Dividend Fund, Matthews Asia Focus Fund, Matthews Asia Growth Fund, Matthews Pacific Tiger Fund, Matthews Emerging Asia Fund, Matthews China Fund, Matthews India Fund, Matthews Japan Fund, Matthews Korea Fund, Matthews Asia Small Companies Fund, Matthews China Small Companies Fund, and Matthews Asia Science and Technology Fund (hereinafter referred as the "Funds") at December 31, 2014, and the results of each of their operations, the changes in each of their net assets and the financial highlights for the periods presented, in conformity with accounting principles generally accepted in the United States of America. These financial statements and financial highlights (consolidated financial statements and consolidated financial highlights for Matthews China Fund and Matthews Asia Dividend Fund) (hereinafter referred to as "financial statements") are the responsibility of the Funds' management; our responsibility is to express an opinion on these financial statements based on our audits. We conducted our audits of these financial statements in accordance with the standards of the Public Company Accounting Oversight Board (United States). Those standards require that we plan and perform the audit to obtain reasonable assurance about whether the financial statements are free of material misstatement. An audit includes examining, on a test basis, evidence supporting the amounts and disclosures in the financial statements, assessing the accounting principles used and significant estimates made by management, and evaluating the overall financial statement presentation. We believe that our audits, which included confirmation of securities at December 31, 2014 by correspondence with the custodian and brokers, provide a reasonable basis for our opinion.
PricewaterhouseCoopers, LLP
San Francisco, California
February 27, 2015
matthewsasia.com | 800.789.ASIA 137
Tax Information (Unaudited)
For shareholders who do not have a December 31, 2014 tax year-end, this notice is for informational purposes. For the period January 1, 2014 to December 31, 2014, the Funds report the following items with regard to distributions paid during the period. All reportings are based on financial information available as of the date of this annual report and, accordingly, are subject to change. For each item, it is the intention of each Fund to report the maximum amount permitted under the Internal Revenue Code and the regulations thereunder.
1. Qualified Dividend Income
The Funds report a portion of the ordinary income distributed during the year ended December 31, 2014 as Qualified Dividend Income ("QDI") as defined in the Internal Revenue code as follows:
| | QDI Portion | |
Matthews Asia Strategic Income Fund | | | 3.67 | % | |
Matthews Asian Growth and Income Fund | | | 71.54 | % | |
Matthews Asia Dividend Fund | | | 93.72 | % | |
Matthews China Dividend Fund | | | 24.43 | % | |
Matthews Asia Focus Fund | | | 100.00 | % | |
Matthews Asia Growth Fund | | | 36.86 | % | |
Matthews Pacific Tiger Fund | | | 100.00 | % | |
Matthews Emerging Asia Fund | | | 100.00 | % | |
Matthews China Fund | | | 71.12 | % | |
Matthews India Fund | | | 100.00 | % | |
Matthews Japan Fund | | | 59.12 | % | |
Matthews Korea Fund | | | 0.00 | % | |
Matthews Asia Small Companies Fund | | | 100.00 | % | |
Matthews China Small Companies Fund | | | 11.22 | % | |
Matthews Asia Science and Technology Fund | | | 65.38 | % | |
2. Dividends Received Deduction
The Funds report a Dividend Received Deduction pursuant to Section 854 of the Internal Revenue Code for the year ended December 31, 2014 as follows:
Matthews Asia Strategic Income Fund | | | 0.00 | % | |
Matthews Asian Growth and Income Fund | | | 0.40 | % | |
Matthews Asia Dividend Fund | | | 2.57 | % | |
Matthews China Dividend Fund | | | 1.62 | % | |
Matthews Asia Focus Fund | | | 11.94 | % | |
Matthews Asia Growth Fund | | | 0.00 | % | |
Matthews Pacific Tiger Fund | | | 0.00 | % | |
Matthews Emerging Asia Fund | | | 0.00 | % | |
Matthews China Fund | | | 0.00 | % | |
Matthews India Fund | | | 0.00 | % | |
Matthews Japan Fund | | | 0.00 | % | |
Matthews Korea Fund | | | 0.00 | % | |
Matthews Asia Small Companies Fund | | | 0.00 | % | |
Matthews China Small Companies Fund | | | 0.00 | % | |
Matthews Asia Science and Technology Fund | | | 1.18 | % | |
138 MATTHEWS ASIA FUNDS
Tax Information (Unaudited) (continued)
3. Long-Term Capital Gain Distributions
The Funds report Long-Term Capital Gain distributions pursuant to Section 852(b)(3) of the Internal Revenue Code for the year ended December 31, 2014 as follows:
| | Long-Term Capital Gains | |
Matthews Asian Growth and Income Fund | | $ | 102,451,370 | | |
Matthews China Dividend Fund | | | 709,195 | | |
Matthews Pacific Tiger Fund | | | 360,777,613 | | |
Matthews Emerging Asia Fund | | | 5,141 | | |
Matthews China Fund | | | 4,848,647 | | |
Matthews India Fund | | | 5,587,798 | | |
Matthews Korea Fund | | | 9,796,584 | | |
Matthews Asia Science and Technology Fund | | | 1,142,588 | | |
4. Foreign Taxes Paid
The Funds have elected to pass through to their shareholders the foreign taxes paid for year ended December 31, 2014 as follows:
| | Foreign Source Income | | Foreign Taxes Paid | |
Matthews Asia Strategic Income Fund | | $ | 3,261,354 | | | $ | 64,511 | | |
Matthews Asian Growth and Income Fund | | | 146,144,918 | | | | 5,874,148 | | |
Matthews Asia Dividend Fund | | | 165,529,123 | | | | 9,088,033 | | |
Matthews China Dividend Fund | | | 4,384,763 | | | | 122,296 | | |
Matthews Asia Focus Fund | | | 243,526 | | | | 9,061 | | |
Matthews Asia Growth Fund | | | 14,753,870 | | | | 1,308,633 | | |
Matthews Pacific Tiger Fund | | | 135,682,697 | | | | 10,403,522 | | |
Matthews Emerging Asia Fund | | | 1,556,219 | | | | 109,170 | | |
Matthews China Fund | | | 26,304,582 | | | | 173,233 | | |
Matthews Japan Fund | | | 7,695,448 | | | | 760,892 | | |
Matthews Asia Small Companies Fund | | | 11,422,022 | | | | 835,903 | | |
Matthews China Small Companies Fund | | | 451,521 | | | | 16,279 | | |
Matthews Asia Science and Technology Fund | | | 2,184,050 | | | | 203,390 | | |
5. Qualified Interest Income
The Funds report a portion of the net income dividends distributed during the year ended December 31, 2014, as Qualified Interest Income (QII), as defined in the Internal Revenue Code as follows:
| | QII Portion | |
Matthews Asia Strategic Income Fund | | | 0.01 | % | |
Matthews Asian Growth and Income Fund | | | 0.03 | % | |
Matthews Asia Dividend Fund | | | 0.02 | % | |
Matthews China Dividend Fund | | | 0.02 | % | |
Matthews Asia Focus Fund | | | 0.07 | % | |
Matthews Asia Growth Fund | | | 0.02 | % | |
Matthews Pacific Tiger Fund | | | 0.02 | % | |
Matthews Emerging Asia Fund | | | 0.08 | % | |
Matthews China Fund | | | 0.01 | % | |
Matthews India Fund | | | 0.01 | % | |
Matthews Japan Fund | | | 0.03 | % | |
Matthews Korea Fund | | | 0.00 | % | |
Matthews Asia Small Companies Fund | | | 0.06 | % | |
Matthews China Small Companies Fund | | | 0.09 | % | |
Matthews Asia Science and Technology Fund | | | 0.03 | % | |
matthewsasia.com | 800.789.ASIA 139
Tax Information (Unaudited) (continued)
6. Qualified Short Term Capital Gain Dividends
The Funds report a portion of the short term capital gain dividends distributed during the year ended December 31, 2014, as Qualified Short-Term Gain, as defined in the Internal Revenue Code as follows:
| | Short-Term Gains | |
Matthews Asia Strategic Income Fund | | | 0.00 | % | |
Matthews Asian Growth and Income Fund | | | 0.00 | % | |
Matthews Asia Dividend Fund | | | 0.00 | % | |
Matthews China Dividend Fund | | | 100.00 | % | |
Matthews Asia Focus Fund | | | 0.00 | % | |
Matthews Asia Growth Fund | | | 0.00 | % | |
Matthews Pacific Tiger Fund | | | 100.00 | % | |
Matthews Emerging Asia Fund | | | 100.00 | % | |
Matthews China Fund | | | 100.00 | % | |
Matthews India Fund | | | 0.00 | % | |
Matthews Japan Fund | | | 0.00 | % | |
Matthews Korea Fund | | | 0.00 | % | |
Matthews Asia Small Companies Fund | | | 0.00 | % | |
Matthews China Small Companies Fund | | | 0.00 | % | |
Matthews Asia Science and Technology Fund | | | 0.00 | % | |
140 MATTHEWS ASIA FUNDS
Approval of Investment Advisory Agreement (Unaudited)
The Funds, which are series of the Trust, have retained Matthews International Capital Management, LLC ("Matthews") to manage their assets pursuant to the Advisory Agreement, which has been approved by the Board of Trustees of the Funds, including the Independent Trustees. Following an initial term with respect to each Fund upon its commencement of operations, the Advisory Agreement continues in effect from year-to-year provided that the continuance is specifically approved at least annually by the vote of the holders of at least a majority of the outstanding shares of the Funds, or by the Board of Trustees, and, in either event, by a majority of the Independent Trustees of the Trust casting votes in person at a meeting called for that purpose.
At a meeting held on August 27 and 28, 2014, the Board, including the Independent Trustees of the Trust, approved the continuance of the Advisory Agreement, with respect to each Fund, for an additional one-year period ending August 31, 2015.
Before those meetings, the Independent Trustees had requested detailed information from Matthews about the matters to be considered. This information, together with the information provided to the Independent Trustees throughout the course of year, formed the primary (but not exclusive) basis for the Board's determinations as summarized below. The Independent Trustees reviewed and discussed the extensive information provided by Matthews at a separate working session held on August 6, 2014 with a representative of the Independent Trustees and representatives of Matthews, and an executive session held on August 19, 2014. The Independent Trustees were assisted in their deliberations by their independent legal counsel. Below is a summary of the factors considered by the Board in approving the Advisory Agreement with respect to each Fund.
 The nature, extent and quality of the services provided by Matthews under the Advisory Agreement. The Trustees considered the experience and qualifications of the personnel at Matthews who are responsible for providing services to the Funds and who are responsible for the daily management of the Funds' portfolios. The Trustees noted that Matthews has continued to expand its professional staff at both senior and junior levels over the past several years, and has enjoyed relative stability of its senior executive and portfolio management. They also reviewed Matthews' recent hiring to further strengthen current capabilities and to support future potential growth of assets and the expansion of its business. Among other improved capabilities, the Trustees noted recent and planned enhancements to communications with intermediaries and investors, as well as various marketing efforts. The Trustees noted various initiatives such as implementation of an
innovative structure to access the China A-share market, investing in other emerging or frontier markets and continuing to develop greater access to other investors such as institutional retirement plans in Latin America. The Trustees have noted on-going enhancements to governance, risk and valuation practices. The Trustees viewed Matthews as well positioned to provide high quality services to the Funds under various market conditions, as demonstrated by the past volatile and challenging securities markets that have caused either contracting revenues or rapidly expanding assets at different times. The Trustees attributed much of that past stability to Matthews' emphasis on preserving and enhancing portfolio management team resources, careful business planning and management, as well as its solid financial condition and strong cash reserves. As in past years, the Trustees considered the technical capabilities of Matthews, including design and implementation of a disaster recovery and business continuity infrastructure. The Trustees also considered the Chief Compliance Officer's report regarding the compliance resources, risk assessment and other initiatives, programs and structures of Matthews, including its compliance record and its supervision of the Funds' service providers. The Trustees concluded that Matthews has high-quality compliance and a strong commitment to a culture of compliance. The Trustees concluded that Matthews had the quality of personnel and other investment resources essential to performing its duties under the Advisory Agreement, and that the nature, overall quality, cost and extent of such management services are fully satisfactory.
 The investment performance of Matthews. The Trustees reviewed the short-term and long-term performance of each Fund on both an absolute basis and in comparison to peer funds and benchmark indices. The Trustees noted the challenging conditions of various Asian markets in 2012 and part of 2013, but would expect the performance of certain Funds to lag the market averages in some short-term periods because of Matthews's emphasis on consistent long-term returns from investments in less cyclical companies. The Trustees also emphasized longer-term performance, which they believe is more important than short isolated periods for purposes of evaluating Matthews's success in meeting Fund and shareholder objectives. To the extent of any concerns about performance with respect to any particular period for a Fund, the Trustees noted that Matthews had provided a satisfactory explanation for the performance and explained its reasons for maintaining a consistent investment philosophy. The Trustees also reviewed both the Lipper peer
matthewsasia.com | 800.789.ASIA 141
Approval of Investment Advisory Agreement (Unaudited) (continued)
comparison measures and Morningstar ratings for each Fund for various periods ending June 30, 2014.
For Matthews Asia Growth Fund, the Trustees noted that the Fund's performance compared very favorably against its peers for the three-year, five-year, ten-year and since-inception periods. The Fund ranked in the top quintile against its peer group funds for those periods. Although the performance for the one-year period was below the median, it was still satisfactory and is less representative of the Fund's overall performance.
For Matthews Asia Dividend Fund, the Trustees noted that the Fund had performed well against its peer group during the three-year, five-year and since inception periods, ranking in the first quintile for those periods. Although the performance for the one-year period was below the median, it was still satisfactory and is less representative of the Fund's overall performance.
For Matthews Pacific Tiger Fund, the Trustees noted that the Fund's performance was favorable in the three-year, five-year, ten-year and since-inception periods, ranking in the first or second quintiles for those periods against the Lipper peer group, and slightly above the median for the one-year period.
For Matthews Asian Growth and Income Fund, the Trustees noted that the Fund outperformed its peer group during the three-year, five-year, ten-year and since-inception periods, ranking in the first or second quintile for those periods. Although the performance for the one-year period was below the median, it was still satisfactory and is less representative of the Fund's overall performance.
For Matthews Asia Science and Technology Fund, the Trustees noted that the Fund's performance was more favorable than the median return of its peer funds over the one-year, five-year, ten-year and since-inception periods, but less favorable than the average return of its peer funds over the three-year period. The Trustees noted the absence of a directly comparable peer group because the funds in the peer group invested globally, rather than being limited to Asia. The Trustees also acknowledged Matthews' explanation about the very volatile asset class in which the Fund invests, which can produce variable relative results. The Trustees remained satisfied with Matthews' explanation of its investment strategy and process for this Fund.
For Matthews China Fund, the Trustees noted that the Fund had outperformed the median of its peer funds over the ten-year and since-inception periods,
ranking in the second quintile for the ten-year and since inception periods. The Trustees expressed some concern about other periods, with the five-year period below median in the fourth quintile, and the one-year and three-year periods in the lowest quintile. The Trustees focused on the more recent weak performance, which had been discussed extensively with Matthews. The Trustees noted planned changes to the portfolio management team for this Fund as well as Matthews' explanation of its investment strategy and process. They will remain attentive to the Fund's progress in improving relative performance.
For Matthews India Fund, the Trustees noted that the Fund had outperformed its peer funds over the one-year, three-year, five-year, ten-year and since inception periods, ranking in the first or second quintile for those periods.
For Matthews Japan Fund, the Trustees noted that the Fund's performance was favorable compared to its peer funds over the one-year, three-year, five-year and since-inception periods, ranking in the first or second quintile. The performance for the ten-year period fell below the median, but was positive and satisfactory, and the performance for the one-year period was above the peer group median.
For Matthews Korea Fund, the Trustees noted that the Fund had enjoyed favorable performance, which was satisfactory as compared to its broader Lipper peer group for various periods except for the since inception period ranking slightly below median. They consider the broader peer group, which consists of Pacific-oriented funds excluding Japan, as much too broad to be a useful peer group for a Korea-focused fund.
For Matthews Asia Small Companies Fund, the Trustees noted that the Fund ranked in the top quintile among its peer groups for the five-year and since-inception periods, and in the second quintile for the three-year period. The performance for the one-year period was a little below the median, but favorable. The Trustees noted that the peer group consisted of global and international small cap funds, which the Trustees considered to be of limited use in evaluating the Fund's satisfactory performance.
For Matthews China Dividend Fund, the Trustees noted that the Fund had ranked in the first quintile of its peer group for the three-year and since inception periods, but was below the median for the one-year period with positive performance.
142 MATTHEWS ASIA FUNDS
Approval of Investment Advisory Agreement (Unaudited) (continued)
For Matthews China Small Companies Fund, the Trustees noted that the Fund's performance was below the median in its peer group for the three-year and since inception periods, and in the second quartile for the more recent one-year period. The Trustees recognized that small capitalization strategies, particularly for a China-focused fund, can produce highly variable results. The Trustees regarded the broader peer group of international small cap funds as less useful because of the country-specific investment mandate for this Fund.
For Matthews Asia Strategic Income Fund, the Trustees noted that the Fund had ranked below the median peer group performance for the one-year and since-inception periods, which are both relatively short. The Trustees recognized that the peer groups included mostly broader emerging market debt funds not focused on Asia, meaning the Fund's relative performance could be more dependent on the relative performance of the Asian debt markets than portfolio management activity. The Trustees regarded the Fund's performance as satisfactory.
For Matthews Emerging Asia Fund and Matthews Asia Focus Fund, the very brief period since inception has not afforded sufficient performance to conduct a meaningful comparison to any peer group. The Trustees believe, however, that the relative past performance of other Funds managed by Matthews' provides additional support for their renewal of the Advisory Agreement with respect to these two new Funds.
The Trustees noted the difficulty of fairly benchmarking certain of the Funds in terms of performance and noted that they were of the view that more weight should be given to Matthews's analysis of relative performance and comparability of the peer groups than to standard data provided by Lipper Inc. and Morningstar, Inc. The Trustees also gave more weight to each Fund's longer-term investment performance given the long-term investment philosophy of each Fund. On that basis, the Trustees concluded that they were satisfied with the Funds' overall performance records. The Trustees also reviewed Matthews's trading policies and efforts to obtain best overall execution for the Funds in the various markets in which the Funds trade securities. The Trustees noted the relatively low turnover rates in the various equity Funds and Matthews's consistent adherence to its long-standing investment approach, which emphasizes fundamental bottom-up driven investment selection in light of its view of regional economic conditions.
 The extent to which Matthews realizes economies of scale as the Funds grow larger and whether Fund investors benefit from any economies of scale. The Trustees discussed Matthews' ongoing investment in its technology, systems, staffing and other aspects of its business that can benefit the Funds, which is an acceptable way for Matthews to share economies of scale with the Funds and their shareholders. The Trustees considered the new personnel hired over the past year, as well as planned hiring, and the extent to which that hiring could be expected to benefit shareholders. The Trustees also recognize that the Funds' total assets have fluctuated over the past few years, especially in certain strategies, which has also affected any economies of scale that could be enjoyed. The Trustees concluded that the advisory fee structure with breakpoints for the Family-Priced Funds (other than the individually priced Funds, which are the two small company focused Funds, the Emerging Asia Fund and the fixed-income Fund), and the new breakpoint for most of those individually priced Funds, enhances the ability of the Funds and their shareholders to benefit from past and future potential economies of scale, and continues to be appropriate given the size and objectives of the Funds. Additional economies of scale are shared with the shareholders of the Funds through additional fee waivers on the largest Funds. In addition, after extensive discussions with the Independent Trustees, Matthews agreed to provide an additional 0.01% reduction in the advisory fee for each $5 billion of additional assets over $25 billion, up through total assets over $45 billion. An additional 0.05% reduction in the advisory fee was added for the individually priced Funds (other than the fixed-income Fund) for assets over $1 billion. Additional fee reductions were adopted under the Administration and Shareholder Services Agreement for each increment of $5 billion of additional assets over $25 billion, with the lowest fee rate on assets over $45 billion. Matthews also agreed to waive a portion of the fee payable under the Advisory Agreement and a portion of the fee payable under the Services Agreement, for any Family-Priced Fund's average daily net assets over $3 billion, with a reduction of 0.01% in the respective fees for every $2.5 billion of average daily net assets of a Fund that are over $3 billion. As a result, the Trustees remain satisfied about the extent to which economies of scale have been and will continue to be shared with the Funds and their shareholders.
 The costs of the services provided by Matthews and others. The Trustees considered the advisory fees and total fees and expenses of each Fund in comparison to the advisory fees and other fees and expenses of other funds in each Fund's relevant peer group. The Trustees
matthewsasia.com | 800.789.ASIA 143
Approval of Investment Advisory Agreement (Unaudited) (continued)
considered both the gross advisory fee rates charged by Matthews, as well as the effective advisory fee rates after taking into consideration the expense limitation arrangements and voluntary fee waivers. The Trustees found that the contractual advisory rates (excluding administrative services) for the Funds were very competitive and generally lower than the relevant peer group averages for most of the Funds. Also, the total expense ratios paid by investors in the Funds, which are most representative of an investor's net experience, were also very competitive, with all but the relatively newer or smaller Funds ranking below the peer group averages.
For each of Matthews Pacific Tiger Fund, Matthews Korea Fund, Matthews India Fund, Matthews Japan Fund, Matthews China Fund, Matthews Asia Science and Technology Fund, Matthews Asian Growth and Income Fund, Matthews Asia Dividend Fund and Matthews Asia Growth Fund, the Trustees noted that, with the limited exceptions noted below, the gross or contractual advisory fee rates, the gross management fee (including administration) rates, the total expense ratio, and the effective or net advisory fee rates were all lower than or equal to the median of the funds in each Fund's peer group. The effective advisory fee rate for the Matthews India Fund was higher than the median because of substantial waivers by other funds in the peer group, but the total expenses were lower than the median, which the Trustees consider to be more important than the effective advisory rate with respect to that peer group. The gross and net advisory fee rates for the Matthews Japan Fund were slightly higher than the peer group medians, and below the averages, but total expenses were below the median.
For Matthews Asia Small Companies Fund, the Trustees noted that the gross advisory fee rate, actual advisory fees and actual total expenses excluding Rule 12b-1 fees were higher than the peer group median. The Trustees were pleased to note, however, that the actual total expenses and non-management expenses were below the peer group medians. The Trustees expect that the Fund's comparative position should improve as the Fund grows.
For Matthews China Small Companies Fund, the Trustees noted that the gross advisory fee rate was equal to the median, but the actual advisory fees and total expenses were above the median. The Trustees expect that the Fund's comparative position should improve as the Fund grows.
For Matthews China Dividend Fund, the Trustees noted that the gross advisory fee rate, actual
advisory fees and total expenses were lower than the peer group average. The Trustees expect that the Fund's comparative position should improve further as the Fund grows.
For Matthews Asia Strategic Income Fund, the Trustees noted that the gross advisory fee rate, actual advisory fees and total expenses were lower than the peer group median, in part as the result of the expense limitation in effect.
For Matthews Emerging Asia Fund and Matthews Asia Focus Fund, the brief period since inception means that the Funds remain small and subject to subsidies under expense limitation agreements. For that reason there is not sufficient expense information to conduct a meaningful comparison to any peer group. The Trustees remain comfortable with the expense levels set under the expense limitation agreement for these Funds.
The Trustees also compared Matthews' advisory fees with those of Matthews' separate accounts and other investment products, noting that the Funds' advisory expenses were not disadvantageous (not being substantially higher than the separate accounts' rates). Total expenses appeared to be appropriate in comparison and taking into account the services differences between these products and the Funds, including the differences in the frequency of net asset value calculations and other operational and compliance activities. The Trustees considered various specific Fund expenses, including the custody fees and transfer agent fees. The Trustees noted Matthews's continued efforts in recent years had resulted in, for many of the Funds, reduced expenses in some categories. The Trustees noted, in particular, the new partial subsidy by Matthews of certain intermediary expenses for the Institutional Class shares. The Trustees concluded that Matthews' advisory fee rates and the Funds' expense ratios are reasonable in light of comparative performance and expense and advisory fee information for each of the Funds.
 The profits to be realized by Matthews and its affiliates from the relationships with the Funds. The Trustees reviewed the profitability of Matthews on both an absolute basis and in comparison to other investment advisers. The Trustees noted that Matthews's pretax profit margin appeared to be reasonable in relation to other advisors. The Trustees also noted that Matthews appeared to be sufficiently profitable to operate as a viable investment management firm, able to honor its obligations as a sponsor of the Funds, including the Funds that did not generate a profit for Matthews, without earning excessive profits from any particular Fund or from the
144 MATTHEWS ASIA FUNDS
Approval of Investment Advisory Agreement (Unaudited) (continued)
overall relationship with the Funds. The Trustees noted that, with fluctuations in asset levels in some prior years, volatility in revenues and profitability could be expected from time to time, but also noted the continued expenditures on personnel and other resources. The Trustees noted an increase in profitability recently, but they are aware of the continued volatility of markets and assets that can result in continued fluctuations of profitability. The Trustees further noted that Matthews's continued upgrading of its trading, research, compliance, and other technological systems should increase Matthews's capacity, speed and reliability in providing services to the Funds as they grow, which further supports the long-term viability of the Funds and Matthews. The Trustees also considered that the additional benefits derived by Matthews from its relationship with the Funds are limited solely to permissible research and brokerage benefits received in exchange for "soft dollars." After that review, the Trustees determined that the profitability rate to Matthews with respect to the Advisory Agreement is fair and reasonable in consideration of the services it provides to the Funds.
No single factor was determinative of the Board's decision to approve the Advisory Agreement, but rather the Trustees based their determination on the total mix of information available to them. After considering the factors described above, the Board concluded that the terms of the advisory arrangements are fair and reasonable to each Fund in light of the services that Matthews provides, its costs and reasonably foreseeable Fund asset levels, and that each Fund's shareholders received and would receive reasonable value in return for the advisory fees paid. The Independent Trustees concluded separately that continuance of the Advisory Agreement was supported by reasonable and impartial records and information, including the performance of the Funds in relation to their peer groups, the services provided by Matthews, and the competitive expense structure, and that the continuance of the Advisory Agreement with respect to each Fund would be in the best interests of each Fund and its shareholders.
The Advisory Agreement may be terminated by the Trustees on behalf of the Funds or by Matthews upon 60 days' prior written notice without penalty. The Advisory Agreement will also terminate automatically in the event of its assignment, as defined in the 1940 Act.
matthewsasia.com | 800.789.ASIA 145
Trustees and Officers of the Funds (Unaudited)
The operations of each Fund are under the direction of the Board of Trustees. The Board of Trustees establishes each Fund's policies and oversees and reviews the management of each Fund. The Board meets regularly to review the activities of the officers, who are responsible for the day-to-day operations of the Funds. The Statement of Additional Information, which includes additional information about Fund Trustees, is available without charge by calling 800.789.2742 or by visiting the Funds' website, matthewsasia.com. The Trustees and executive officers of the Funds, their year of birth, business address and principal occupations during the past five years are set forth below:
Name, Year of Birth,
Address and Position(s)
Held with Trust | | Term of
Office and
Length of
Time Served1 | | Principal Occupation(s)
During Past 5 Years | | Number of
Portfolios in
Fund Complex
Overseen by
Trustee | | Other Trusteeships/Directorships
(number of portfolios) Held by Trustee | |
INDEPENDENT TRUSTEES | |
JONATHAN F. ZESCHIN
Born 1953
Four Embarcadero Center
Suite 550
San Francisco, CA 94111
Chairman of the Board of
Trustees and Trustee | | Trustee since 2007 and Chairman of the Board since 2014 | | Partner (since 2009), Essential Investment Partners, LLC (investment advisory and wealth management); President (since 2000), Essential Advisers Inc. (financial holding company); Managing Partner (since 1998), JZ Partners LLC (consulting). | | | 17 | | | Trustee and Chairman of the Board, DCA Total Return Fund (2005–2011) (1 Portfolio) and DCW Total Return Fund (2007–2010) (1 Portfolio); Trustee (2002–2007), ICON Funds (17 Portfolios); Director (2002–2004), Wasatch Funds (10 Portfolios). | |
TOSHI SHIBANO
Born 1950
Four Embarcadero Center
Suite 550
San Francisco, CA 94111
Trustee | | Since 2003 | | Faculty (since 2000), General Electric's John F. Welch Leadership Center; President (since 1995), Strategic Value Creation, Inc. (executive development programs); Executive Education Lecturer (since 1995), Center for Executive Education, Haas School of Business, UC Berkeley; Adjunct Professor (2000–2011), Columbia Graduate School of Business; Associate Professor (2001–2005), Thunderbird School of Global Management; Visiting Assistant Professor (2000), Stanford Graduate School of Business; Assistant Professor (1995–2000), University of Chicago Graduate School of Business; Assistant Professor (1988–1995), Haas School of Business, UC Berkeley. | | | 17 | | | None | |
RHODA ROSSMAN
Born 1958
Four Embarcadero
Center Suite 550
San Francisco, CA 94111
Trustee | | Since 2006 | | Vice President, Corporate Investment Officer (2007–2010); Senior Vice President and Treasurer (2003–2007), The PMI Group, Inc. (mortgage insurer). | | | 17 | | | None | |
RICHARD K. LYONS
Born 1961
Four Embarcadero Center
Suite 550
San Francisco, CA 94111
Trustee | | Since 2010 | | Dean (since 2008), Haas School of Business, UC Berkeley; Chief Learning Officer (2006–2008), Goldman Sachs (investment banking and investment management); Executive Associate Dean (2005–2006), Acting Dean (2004–2005), Professor (2000–2004), Associate Professor (1996–2000), Assistant Professor (1993–1996), Haas School of Business, UC Berkeley. | | | 17 | | | Trustee (2001–2006), Barclays Global Investor Funds and Master Investment Portfolios (15 Portfolios); Director (2000–2006), iShares, Inc. (24 Portfolios) and iShares Trust (over 70 Portfolios); Trustee (1994–2006) and Chairman of the Board (2000–2006), Matthews International Funds (9 Portfolios) | |
1 Each Trustee serves for an indefinite term, until retirement age or until his/her successor is elected. Officers serve at the pleasure of the Board of Trustees.
146 MATTHEWS ASIA FUNDS
Name, Year of Birth,
Address and Position(s)
Held with Trust | | Term of
Office and
Length of
Time Served1 | | Principal Occupation(s)
During Past 5 Years | | Number of
Portfolios in
Fund Complex
Overseen by
Trustee | | Other Trusteeships/Directorships
(number of portfolios) Held by Trustee | |
INDEPENDENT TRUSTEES | |
CHRISTOPHER LEE
Born 1967
Four Embarcadero Center
Suite 550
San Francisco, CA 94111
Trustee | | Since 2015 | | Private Investor and Partner (since 2012), FAA Investments (financial holding company); Lecturer (part-time) (since 2013), The Chinese University of Hong Kong; Managing Director, Asia Region, and Head of Global Markets Investment Products & db-X (2010–2012), Deutsche Bank AG (financial services); Managing Director, Equity Risk Management Products, and Head of Intermediary Business (2002–2010), UBS AG (financial services); Vice President, Global Markets & Investment Bank (2000–2002), Vice President, International Private Clients Group (1997–2000), Associate, Debt and Equity Markets Group (1995–1997), Merrill Lynch & Co., Inc. (brokerage and investment management). | | | 17 | | | Director (since 2013), Asian Masters Fund (Australia) (1 Portfolio); Trustee (since 2013), African Wildlife Foundation; Trustee (since 2010), Oakland Museum of California. | |
GALE K. CARUSO
Born 1957
Four Embarcadero Center
Suite 550
San Francisco, CA 94111
Trustee | | Since 2015 | | Formerly President and Chief Executive Officer (1999–2003), Zurich Kemper Life (life insurance and annuities); Chairman, President and Chief Executive Officer (1994–1999), Scudder Canada Investor Services, Ltd. (investment management); Managing Director (1986–1999), Scudder Kemper Investments, Inc. (investment management). | | | 17 | | | Trustee (since 2006), Pacific Select Fund (58 Portfolios) and Pacific Life Funds (33 Portfolios); Director (2005–2012), Make-A-Wish Foundation of Maine; Director (2005–2009), LandAmerica Financial Group, Inc.; Director (2001–2003), Make-A-Wish of Northern Illinois; former member of the Board of Directors, Illinois Life Insurance Council. | |
Name, Year of Birth,
Address and Position(s)
Held with Trust | | Term of
Office and
Length of
Time Served1 | | Principal Occupation(s)
During Past 5 Years | | Number of
Portfolios in
Fund Complex
Overseen by
Trustee | | Other Trusteeships/Directorships
(number of portfolios) Held by Trustee | |
INTERESTED TRUSTEES2 | |
G. PAUL MATTHEWS
Born 1956
Four Embarcadero Center
Suite 550
San Francisco, CA 94111
Trustee | | Since 2007 | | Director (since 1996), Chairman (1996–2009), Managing Member (since 1996), Portfolio Manager (1996–2012), Chief Investment Officer (1991–2007), Matthews (investment management); President (1994–2007), Matthews International Funds (registered investment company). | | | 17 | | | Director (since 2004), Matthews Asian Selections Funds PLC (Ireland) (1 Portfolio); Trustee (2001–2004) and Trustee and Chairman of Board (1994–1998), Matthews International Funds (7 Portfolios). | |
WILLIAM J. HACKETT
Born 1967
Four Embarcadero Center
Suite 550
San Francisco, CA 94111
Trustee and
President (since 2008) | | Since 2015 | | President (since 2013), Matthews A Share Selections Fund, LLC (registered investment company); Director (since 2010), Matthews Global Investors S.à r.l. (Luxembourg) (investment management); Director (since 2010), Matthews Global Investors (Hong Kong) Limited (investment management); Chief Executive Officer (since 2009), President and Secretary (since 2007), Matthews (investment management); Partner (2002–2007), Deloitte & Touche, LLP (accounting). | | | 17 | | | Chairman (since 2010), Matthews Asia Funds SICAV (Luxembourg) (10 Portfolios); Director (since 2009), Matthews Asian Selections Funds, PLC (Ireland) (1 Portfolio). | |
1 Each trustee serves for an indefinite term, until retirement age or until his/her successor is elected. Officers serve at the pleasure of the Board of Trustees.
2 A trustee is considered an "interested person" of the Trust as defined under the 1940 Act because of an ownership interest in the Advisor or an office held with the Trust or the Advisor.
matthewsasia.com | 800.789.ASIA 147
Name, Year of Birth,
Address and Position(s)
Held with Trust | | Term of Office
and Length of
Time Served1 | | Principal Occupation(s) During Past 5 Years | | Other Trusteeships/
Directorships
(number of
portfolios)
Held by Officer | |
OFFICERS WHO ARE NOT TRUSTEES | |
ROBERT J. HORROCKS, PHD
Born 1968
Four Embarcadero Center
Suite 550
San Francisco, CA 94111
Vice President | | Since 2009 | | Chief Investment Officer (since 2009), Director of Research (2008–2009), Matthews (investment management); Head of Research (2006–2008), Mirae Asset Management (investment management); Chief Investment Officer (2003–2006), Everbright Pramerica (investment management). | | None | |
JOHN P. McGOWAN
Born 1964
Four Embarcadero Center
Suite 550
San Francisco, CA 94111
Vice President and
Secretary | | Since 2005 | | Vice President and Secretary (since 2013), Matthews A Share Selections Fund, LLC (registered investment company); Director (since 2010), Matthews Asia Funds SICAV (Luxembourg) (investments); Director (since 2010), Matthews Global Investors S.à r.l. (Luxembourg) (investment management); Senior Vice President of Business Administration (since 2009), Chief Administrative Officer (2007–2008), Chief Operating Officer (2004–2007), Matthews (investment management); Director (since 2004), Matthews Asian Selections Funds, PLC (Ireland) (investments). | | Director, Matthews Asian Selections Funds Plc (1 Portfolio); Director, Matthews Asia Funds S.I.C.A.V. (7 Portfolios). | |
SHAI A. MALKA
Born 1973
Four Embarcadero Center
Suite 550
San Francisco, CA 94111
Treasurer | | Since 2005 | | Treasurer (since 2013), Matthews A Share Selections Fund, LLC (registered investment company); Vice President of Fund Accounting and Operations (since 2010), Senior Manager of Fund Accounting and Operations (2004–2009), Matthews (investment management). | | None | |
DAVID MONROE
Born 1963
Four Embarcadero Center
Suite 550
San Francisco, CA 94111
Vice President | | Since 2014 | | General Counsel (since 2015), Deputy General Counsel (2014), Matthews International Capital Management, LLC, Chief Legal Officer (2006–2013), Nikko Asset Management Co., Ltd. | | None | |
TIMOTHY B. PARKER
Born 1958
Four Embarcadero Center
Suite 550
San Francisco, CA 94111
Vice President | | Since 2008 | | Vice President and Assistant Secretary (since 2013), Matthews A Share Selections Fund, LLC (registered investment company); Director (since 2013), Matthews Global Investors (UK) Ltd (investment management); Managing Member (since 2011), Matthews Global Investors (U.S.), LLC (investment management); Director and Conducting Officer (since 2010), Matthews Asia Funds SICAV (Luxembourg) (investments); Director (since 2010), Matthews Global Investors S.à r.l. (Luxembourg) (investment management); Director (since 2010), Matthews Global Investors (Hong Kong) Limited (investment management); Director, International Strategy, Product and Operations (since 2015), General Counsel (2005–2014), Matthews (investment management); Partner (2003–2005), Kirkpatrick & Lockhart Nicholson Graham LLP (law firm). | | Director, Matthews Asia Funds S.I.C.A.V. (7 Portfolios). | |
MANOJ K. POMBRA
Born 1964
Four Embarcadero Center
Suite 550
San Francisco, CA 94111
Chief Compliance Officer
and Anti-Money
Laundering Officer | | Since 2005 | | Chief Compliance Officer and Anti-Money Laundering Officer (since 2005), Matthews (investment management); Senior Manager, Mutual Fund Compliance/Manager Portfolio Compliance (2001–2005), Franklin Templeton Investments (investment management). | | None | |
1 Each trustee serves for an indefinite term, until retirement age or until his/her successor is elected. Officers serve at the pleasure of the Board of Trustees.
148 MATTHEWS ASIA FUNDS
Matthews Asia Funds
INVESTMENT ADVISOR
Matthews International Capital Management, LLC
Four Embarcadero Center, Suite 550
San Francisco, CA 94111
800.789.ASIA
CUSTODIAN
Brown Brothers Harriman & Co.
50 Milk Street
Boston, MA 02109
ACCOUNT SERVICES
Matthews Asia Funds
P.O. Box 9791
Providence, RI 02940
800.789.ASIA
LEGAL COUNSEL
Paul Hastings LLP
55 Second Street, 24th Floor
San Francisco, CA 94105
matthewsasia.com | 800.789.ASIA

P.O. Box 9791 | Providence, RI 02940 | matthewsasia.com | 800.789.ASIA (2742)
Matthews Asia Funds are distributed in the United States by Foreside Funds Distributors LLC, Berwyn, Pennsylvania
Matthews Asia Funds are distributed in Latin America by HMC Partners AR-1214-206M


Item 2. Code of Ethics.
(a) The registrant, as of the end of the period covered by this report, has adopted a code of ethics that applies to the registrant’s principal executive officer, principal financial officer, principal accounting officer or controller, or persons performing similar functions, regardless of whether these individuals are employed by the registrant or a third party.
(c) The code of ethics filed as an exhibit pursuant to Item 12(a) of this filing constitutes an amendment, during the period covered by this report, to a provision of the code of ethics that applies to the registrant’s principal executive officer, principal financial officer, principal accounting officer or controller, or persons performing similar functions, whether these individuals are employed by the registrant or a third party, and that relates to any element of the code of ethics description.
(d) The registrant has not granted any waivers, including an implicit waiver, from a provision of the code of ethics that applies to the registrant’s principal executive officer, principal financial officer, principal accounting officer or controller, or persons performing similar functions, regardless of whether these individuals are employed by the registrant or a third party, that relates to one or more of the items set forth in paragraph (b) of this item’s instructions.
Item 3. Audit Committee Financial Expert.
(a) | | As of the end of the period covered by the report, the registrant’s board of directors has determined that the registrant has two audit committee financial experts serving on its audit committee, Toshi Shibano and Jonathan F. Zeschin, and that both are “independent.” |
| | |
(b) | | Prof. Shibano is a member of the Faculty of the General Electric Corporate Leadership Development Center and also serves as Executive Education Lecturer at the Haas School of Business at the University of California, Berkeley. He was an Adjunct Professor at the Columbia Graduate School of Business and has served on the faculties of Thunderbird American Graduate School of International Management, Stanford Graduate School of Business, the University of Chicago School of Business and the Australian Graduate School of Management at the University of New South Wales. He regularly reviews current research in accounting both for use in instruction of courses and for internal faculty evaluation. He has experience analyzing and evaluating financial statements at the appropriate level of complexity through his professional activities on the educational faculties referenced above. Prof. Shibano also has extensive experience in executive education worldwide (Hong Kong, Taiwan, Singapore, Finland, Italy, Mexico, India) and has developed innovative new |
| | programs in financial analysis, management control systems and strategy implementation. Prof. Shibano has published in the Journal of Accounting Research, the Journal of Accounting and Economics, the Rand Journal of Economics, and the Journal of Applied Corporate Finance, on the topics of strategic audit risk, accounting standard setting, international accounting standards, tax minimization, foreign currency risk management, and organizational structure. Prof. Shibano received his MBA from the Haas School at UC Berkeley and earned his PhD at the Stanford Graduate School of Business, earning the highest academic honors in both programs. Prof. Shibano has gained additional accounting expertise as the Audit Committee Chair of Matthews International Funds. Mr. Zeschin is Partner of Essential Investment Partners, LLC, a wealth management and investment advisory firm. He is also the portfolio manager for that firm’s Essential Growth Portfolio. Essential Investment Partners, LLC succeeded to the business of Essential Advisers, Inc. He is Managing Partner of JZ Partners, LLC, a business consulting firm for investment managers. Prior to forming Essential Advisers, Inc., Mr. Zeschin held senior executive positions with Founders Asset Management, Inc., Invesco Fund Group, and Stein Roe & Farnham, Inc. Mr. Zeschin holds a Masters of Management from the Kellogg School at Northwestern University, with majors in Finance and Marketing, and a Bachelor in Business Administration in Accounting with distinction from the University of Michigan. He holds a Certified Public Accountant certificate from the state of Illinois and is a Certified Financial Planner certificant. Mr. Zeschin is a former chair of the ICI’s Accounting Treasurer’s Committee and a former member of the AICPA Investment Companies committee. Mr. Zeschin is currently the chairman of the Board of Trustees to two NYSE listed closed-end funds. He has served on the audit committees of mutual fund boards since 2002. He has experience analyzing and evaluating financial statements at the appropriate level of complexity through his professional activities on the educational faculties referenced above. Mr. Zeschin has gained additional expertise as a member of the Audit Committee of Matthews International Funds. |
Item 4. Principal Accountant Fees and Services.
Audit Fees
(a) The aggregate fees billed for each of the last two fiscal years for professional services rendered by the principal accountant for the audit of the registrant’s annual financial statements or services that are normally provided by the accountant in connection with statutory and regulatory filings or engagements for those fiscal years are $417,718 in 2013 and $446,520 in 2014.
Audit-Related Fees
(b) The aggregate fees billed in each of the last two fiscal years for assurance and related services by the principal accountant that are reasonably related to the performance of the audit of the registrant’s financial statements and are not reported under paragraph (a) of this Item are $0 in 2013 and $0 in 2014.
Tax Fees
(c) The aggregate fees billed in each of the last two fiscal years for professional services rendered by the principal accountant for tax compliance, tax advice, and tax planning are $105,098 in 2013 and $114,858 in 2014. Tax fees include services provided by the principal accountant for tax return preparations.
All Other Fees
(d) The aggregate fees billed in each of the last two fiscal years for products and services provided by the principal accountant, other than the services reported in paragraphs (a) through (c) of this Item are $0 in 2013 and $0 in 2014.
(e)(1) Disclose the audit committee’s pre-approval policies and procedures described in paragraph (c)(7) of Rule 2-01 of Regulation S-X.
Pre-Approval of Auditor Services.
Pre-Approval Requirements. Before the Auditor is engaged by the Trust to render audit related or permissible non-audit services, either:
(i) The Audit Committee shall pre-approve all audit related services and permissible non-audit services (e.g., tax services) to be provided to the Trust; or
(ii) The Audit Committee shall establish policies and procedures governing the Auditor’s engagement. Any such policies and procedures must (1) be detailed as to the particular service and (2) not involve any delegation of the Audit Committee’s responsibilities to the Adviser. The Audit Committee may delegate to one or more of its members the authority to grant pre-approvals. The pre-approval policies and procedures shall include the requirement that the decisions of any member to whom authority is delegated under this Section 4(e) shall be presented to the full Audit Committee at its next scheduled meeting.
De Minimis Exceptions to Pre-Approval Requirements. Pre-approval for a service provided to the Trust other than audit, review or attest services is not required if: (1) the aggregate amount of all such non-audit services provided to the Trust constitutes not more than 5 percent of the total amount of revenues paid by the Trust to the Auditor during the fiscal year in which the non-audit services are provided; (2) such services were not recognized by the Trust at the time of the engagement to be non-audit services; and (3) such services are promptly brought to the attention of the Audit Committee and are approved by the Audit Committee or by one or more members of the Audit Committee to whom authority to grant such approvals has been delegated by the Audit Committee.
Pre-Approval of Non-Audit Services Provided to the Adviser and Certain Control Persons. With respect to services that have a direct impact on the operations or financial reporting of the Trust, the Audit Committee shall pre-approve all such non-audit services proposed to be provided by the Auditor to (i) the Adviser and (ii) any entity controlling, controlled by, or under common control with the Adviser that provides ongoing services to the Trust.
Application of De Minimis Exception: The de minimis exceptions set forth above under Section 4(e)(ii) apply to pre-approvals under this Section 4(e)(iii) as well, except that the “total amount of revenues” calculation for Section 4(e)(iii) services is based on the total amount of revenues paid to the Auditor by the Trust and any other entity that has its services approved under this Section (i.e., the Adviser or any control person).
(e)(2) The percentage of services described in each of paragraphs (b) through (d) of this Item that were approved by the audit committee pursuant to paragraph (c)(7)(i)(C) of Rule 2-01 of Regulation S-X are as follows:
(b) Not applicable.
(c) 100%.
(d) Not applicable.
(f) The percentage of hours expended on the principal accountant’s engagement to audit the registrant’s financial statements for the most recent fiscal year that were attributed to work performed by persons other than the principal accountant’s full-time, permanent employees was 0%.
(g) The aggregate non-audit fees billed by the registrant’s accountant for services rendered to the registrant, and rendered to the registrant’s investment adviser (not including any sub-adviser whose role is primarily portfolio management and is subcontracted with or overseen by another investment adviser), and any entity controlling, controlled by, or under common control with the adviser that provides ongoing services to the registrant for each of the last two fiscal years of the registrant was $268,445 in 2013 and $466,862 in 2014.
(h) The registrant’s audit committee of the board of directors has considered whether the provision of non-audit services that were rendered to the registrant’s investment adviser (not including any sub-adviser whose role is primarily portfolio management and is subcontracted with or overseen by another investment adviser), and any entity controlling, controlled by, or under common control with the investment adviser that provides ongoing services to the registrant that were not pre-approved pursuant to paragraph (c)(7)(ii) of Rule 2-01 of Regulation S-X is compatible with maintaining the principal accountant’s independence.
Item 5. Audit Committee of Listed Registrants.
Not applicable.
Item 6. Investments.
(a) Schedule of Investments in securities of unaffiliated issuers as of the close of the reporting period is included as part of the report to shareholders filed under Item 1 of this form.
(b) Not applicable.
Item 7. Disclosure of Proxy Voting Policies and Procedures for Closed-End Management Investment Companies.
Not applicable.
Item 8. Portfolio Managers of Closed-End Management Investment Companies.
Not applicable.
Item 9. Purchases of Equity Securities by Closed-End Management Investment Company and Affiliated Purchasers.
Not applicable.
Item 10. Submission of Matters to a Vote of Security Holders.
There have been no material changes to the procedures by which the shareholders may recommend nominees to the registrant’s board of directors, where those changes were implemented after the registrant last provided disclosure in response to the requirements of Item 407(c)(2)(iv) of Regulation S-K (17 CFR 229.407) (as required by Item 22(b)(15) of Schedule 14A (17 CFR 240.14a-101)), or this Item.
Item 11. Controls and Procedures.
(a) The registrant’s principal executive and principal financial officers, or persons performing similar functions, have concluded that the registrant’s disclosure controls and procedures (as defined in Rule 30a-3(c) under the Investment Company Act of 1940, as amended (the “1940 Act”) (17 CFR 270.30a-3(c))) are effective, as of a date within 90 days of the filing date of the report that includes the disclosure required by this paragraph, based on their evaluation of these controls and procedures required by Rule 30a-3(b) under the 1940 Act (17 CFR 270.30a-3(b)) and Rules 13a-15(b) or 15d-15(b) under the Securities Exchange Act of 1934, as amended (17 CFR 240.13a-15(b) or 240.15d-15(b)).
(b) There were no changes in the registrant’s internal control over financial reporting (as defined in Rule 30a-3(d) under the 1940 Act (17 CFR 270.30a-3(d)) that occurred during the registrant’s second fiscal quarter of the period covered by this report that has materially affected, or is reasonably likely to materially affect, the registrant’s internal control over financial reporting.
Item 12. Exhibits.
(a)(1) Code of ethics, or any amendment thereto, that is the subject of disclosure required by Item 2 is attached hereto.
(a)(2) Certifications pursuant to Rule 30a-2(a) under the 1940 Act and Section 302 of the Sarbanes-Oxley Act of 2002 are attached hereto.
(a)(3) Not applicable.
(b) Certifications pursuant to Rule 30a-2(b) under the 1940 Act and Section 906 of the Sarbanes-Oxley Act of 2002 are attached hereto.
(12.other) Not applicable.
SIGNATURES
Pursuant to the requirements of the Securities Exchange Act of 1934 and the Investment Company Act of 1940, the registrant has duly caused this report to be signed on its behalf by the undersigned, thereunto duly authorized.
(Registrant) | | Matthews International Funds | |
| | |
| | |
By (Signature and Title)* | | /s/ William J. Hackett | |
| | William J. Hackett, President |
| | (principal executive officer) |
| | |
Date | | March 11, 2015 | |
| | | | | | |
Pursuant to the requirements of the Securities Exchange Act of 1934 and the Investment Company Act of 1940, this report has been signed below by the following persons on behalf of the registrant and in the capacities and on the dates indicated.
By (Signature and Title)* | | /s/ William J. Hackett | |
| | William J. Hackett, President |
| | (principal executive officer) |
| | |
Date | | March 11, 2015 | |
| | |
| | |
By (Signature and Title)* | | /s/ Shai Malka | |
| | Shai Malka, Treasurer |
| | (principal financial officer) |
| | |
Date | | March 11, 2015 | |
| | | | | |
* Print the name and title of each signing officer under his or her signature.