UNITED STATES
SECURITIES AND EXCHANGE COMMISSION
Washington, D.C. 20549
FORM N-CSR
CERTIFIED SHAREHOLDER REPORT OF REGISTERED MANAGEMENT
INVESTMENT COMPANIES
Investment Company Act file number 811-08510
Matthews International Funds
(Exact name of registrant as specified in charter)
Four Embarcadero Center, Suite 550
San Francisco, CA 94111
(Address of principal executive offices) (Zip code)
William J. Hackett, President
Four Embarcadero Center, Suite 550
San Francisco, CA 94111
(Name and address of agent for service)
Registrant’s telephone number, including area code: 415-788-7553
Date of fiscal year end: December 31
Date of reporting period: December 31, 2012
Form N-CSR is to be used by management investment companies to file reports with the Commission not later than 10 days after the transmission to stockholders of any report that is required to be transmitted to stockholders under Rule 30e-1 under the Investment Company Act of 1940 (17 CFR 270.30e-1). The Commission may use the information provided on Form N-CSR in its regulatory, disclosure review, inspection, and policymaking roles.
A registrant is required to disclose the information specified by Form N-CSR, and the Commission will make this information public. A registrant is not required to respond to the collection of information contained in Form N-CSR unless the Form displays a currently valid Office of Management and Budget ("OMB") control number. Please direct comments concerning the accuracy of the information collection burden estimate and any suggestions for reducing the burden to Secretary, Securities and Exchange Commission, 100 F Street, NE, Washington, DC 20549. The OMB has reviewed this collection of information under the clearance requirements of 44 U.S.C. § 3507.
Item 1. Reports to Stockholders.
The Report to Shareholders is attached herewith.
Performance and Expenses
| | | | | Average Annual Total Return | | | | 2012
Annual | | 2011
Annual | |
| | 1 year | | 5 years | | 10 years | | Since
Inception | | Inception
Date | | Operating
Expenses | | Operating
Expenses* | |
Matthews Asia Strategic Income Fund | |
Investor Class (MAINX) | | | 13.62 | % | | | n.a. | | | | n.a. | | | | 11.95 | % | | | 11/30/11 | | | | 1.85 | % | | | 1.93 | %1 | |
After Fee Waiver and Reimbursement | | | | | | | | | | | | | | | | | | | | | | | 1.17 | %2 | | | 1.40 | %2 | |
Institutional Class (MINCX) | | | 13.74 | % | | | n.a. | | | | n.a. | | | | 12.07 | % | | | 11/30/11 | | | | 1.70 | % | | | 1.78 | %1 | |
After Fee Waiver and Reimbursement | | | | | | | | | | | | | | | | | | | | | | | 1.00 | %2 | | | 1.25 | %2 | |
Matthews Asian Growth and Income Fund | |
Investor Class (MACSX) | | | 26.90 | % | | | 5.37 | % | | | 14.27 | % | | | 11.08 | % | | | 9/12/94 | | | | 1.11 | % | | | 1.12 | % | |
Institutional Class (MICSX) | | | 27.09 | % | | | n.a. | | | | n.a. | | | | 7.29 | % | | | 10/29/10 | | | | 0.97 | % | | | 0.99 | % | |
Matthews Asia Dividend Fund | |
Investor Class (MAPIX) | | | 21.63 | % | | | 7.99 | % | | | n.a. | | | | 10.69 | % | | | 10/31/06 | | | | 1.09 | % | | | 1.10 | % | |
Institutional Class (MIPIX) | | | 21.70 | % | | | n.a. | | | | n.a. | | | | 5.72 | % | | | 10/29/10 | | | | 0.97 | % | | | 1.00 | % | |
Matthews China Dividend Fund | |
Investor Class (MCDFX) | | | 27.81 | % | | | n.a. | | | | n.a. | | | | 10.59 | % | | | 11/30/09 | | | | 1.47 | % | | | 1.52 | % | |
After Fee Waiver, Reimbursement and Recapture | | | | | | | | | | | | | | | | | | | | | | | 1.50 | %3 | | | 1.50 | %3 | |
Institutional Class (MICDX) | | | 27.90 | % | | | n.a. | | | | n.a. | | | | 6.22 | % | | | 10/29/10 | | | | 1.29 | % | | | 1.31 | % | |
Matthews Asia Growth Fund | |
Investor Class (MPACX) | | | 17.47 | % | | | 3.34 | % | | | n.a. | | | | 9.63 | % | | | 10/31/03 | | | | 1.16 | % | | | 1.18 | % | |
Institutional Class (MIAPX) | | | 17.63 | % | | | n.a. | | | | n.a. | | | | 2.57 | % | | | 10/29/10 | | | | 0.98 | % | | | 1.03 | % | |
Matthews Pacific Tiger Fund | |
Investor Class (MAPTX) | | | 21.00 | % | | | 4.38 | % | | | 17.69 | % | | | 9.18 | % | | | 9/12/94 | | | | 1.11 | % | | | 1.11 | % | |
Institutional Class (MIPTX) | | | 21.24 | % | | | n.a. | | | | n.a. | | | | 3.73 | % | | | 10/29/10 | | | | 0.95 | % | | | 0.95 | % | |
Matthews China Fund | |
Investor Class (MCHFX) | | | 11.96 | % | | | -0.88 | % | | | 17.26 | % | | | 11.03 | % | | | 2/19/98 | | | | 1.12 | % | | | 1.13 | % | |
Institutional Class (MICFX) | | | 12.22 | % | | | n.a. | | | | n.a. | | | | -4.90 | % | | | 10/29/10 | | | | 0.91 | % | | | 0.96 | % | |
Matthews India Fund | |
Investor Class (MINDX) | | | 31.54 | % | | | -3.82 | % | | | n.a. | | | | 10.81 | % | | | 10/31/05 | | | | 1.18 | % | | | 1.18 | % | |
Institutional Class (MIDNX) | | | 31.74 | % | | | n.a. | | | | n.a. | | | | -8.64 | % | | | 10/29/10 | | | | 0.98 | % | | | 0.99 | % | |
Matthews Japan Fund | |
Investor Class (MJFOX) | | | 8.32 | % | | | -1.18 | % | | | 5.78 | % | | | 3.75 | % | | | 12/31/98 | | | | 1.20 | % | | | 1.21 | % | |
Institutional Class (MIJFX) | | | 8.47 | % | | | n.a. | | | | n.a. | | | | 5.06 | % | | | 10/29/10 | | | | 1.04 | % | | | 1.07 | % | |
Matthews Korea Fund | |
Investor Class (MAKOX) | | | 24.05 | % | | | 1.75 | % | | | 14.37 | % | | | 6.02 | % | | | 1/3/95 | | | | 1.16 | % | | | 1.18 | % | |
Institutional Class (MIKOX) | | | 24.16 | % | | | n.a. | | | | n.a. | | | | 11.46 | % | | | 10/29/10 | | | | 1.00 | % | | | 1.07 | % | |
Matthews Asia Small Companies Fund | |
Investor Class (MSMLX) | | | 23.92 | % | | | n.a. | | | | n.a. | | | | 19.56 | % | | | 9/15/08 | | | | 1.50 | % | | | 1.52 | % | |
Matthews China Small Companies Fund | |
Investor Class (MCSMX) | | | 10.53 | % | | | n.a. | | | | n.a. | | | | -14.56 | % | | | 5/31/11 | | | | 3.26 | % | | | 5.32 | %1 | |
After Fee Waiver and Reimbursement | | | | | | | | | | | | | | | | | | | | | | | 2.00 | %4 | | | 2.00 | %4 | |
Matthews Asia Science and Technology Fund | |
Investor Class (MATFX) | | | 14.11 | % | | | -0.92 | % | | | 12.32 | % | | | -0.09 | % | | | 12/27/99 | | | | 1.18 | % | | | 1.21 | % | |
* These figures are from the Funds' current prospectus and may differ from the actual expense ratios for 2011, as shown in the Financial Highlights section of this report.
1 Annual operating expenses for 2011 are annualized.
2 Matthews has contractually agreed to waive fees and reimburse expenses until August 31, 2014 to the extent needed to limit Total Annual Fund Operating Expenses to 1.25% for the Institutional Class and agreed to reduce the expense ratio by an equal amount for the Investor Class. Because certain expenses of the Investor Class may be higher than the Institutional Class, the Total Annual Fund Operating Expenses After Fee Waiver and Expense Reimbursement for the Investor Class may exceed 1.25%. Matthews has also agreed to waive fees and reimburse additional expenses for the Institutional Class on a voluntary basis if its expense ratio exceeds 1.00%. Furthermore, any amounts voluntarily waived by Matthews in respect of the Institutional Class, excluding any voluntary waiver of class-specific shareholder servicing fees, will also be waived for the Investor Class. For 2011, the amounts of the waivers and reimbursements are based on estimated Fund expenses.
3 The Advisor has contractually agreed to waive the Fund's fees and reimburse expenses until at least August 31, 2013 to the extent needed to limit total annual operating expenses to 1.50%.
4 The Advisor has contractually agreed to waive the Fund's fees and reimburse expenses until at least August 31, 2014 to the extent needed to limit total annual operating expenses to 2.00%.
Past Performance: All performance quoted in this report is past performance and is no guarantee of future results. Investment return and principal value will fluctuate with changing market conditions so that when redeemed, shares may be worth more or less than their original cost. Current performance may be lower or higher than the returns quoted. If certain of the Funds' fees and expenses had not been waived, returns would have been lower. For the Funds' most recent month-end performance, please call 800.789.ASIA (2742) or visit matthewsasia.com.
Investment Risk: Mutual fund shares are not deposits or obligations of, or guaranteed by, any depositary institution. Shares are not insured by the FDIC, Federal Reserve Board or any government agency and are subject to investment risks, including possible loss of principal amount invested. Investing in international and emerging markets may involve additional risks, such as social and political instability, market illiquidity, exchange-rate fluctuations, a high level of volatility and limited regulation. Fixed income investments are subject to additional risks, including, but not limited to, interest rate, credit and inflation risks. In addition, single-country and sector funds may be subject to a higher degree of market risk than diversified funds because of concentration in a specific industry, sector or geographic location. Investing in small and mid-size companies is more risky than investing in large companies as they may be more volatile and less liquid than larger companies. Please see the Funds' prospectus and Statement of Additional Information for more risk disclosure.
Message to Shareholders | | | 2 | | |
Manager Commentaries, Fund Characteristics and Schedules of Investments: | |
ASIA FIXED INCOME STRATEGY | |
Matthews Asia Strategic Income Fund | | | 4 | | |
ASIA GROWTH AND INCOME STRATEGIES | |
Matthews Asian Growth and Income Fund | | | 10 | | |
Matthews Asia Dividend Fund | | | 15 | | |
Matthews China Dividend Fund | | | 20 | | |
ASIA GROWTH STRATEGIES | |
Matthews Asia Growth Fund | | | 25 | | |
Matthews Pacific Tiger Fund | | | 30 | | |
Matthews China Fund | | | 35 | | |
Matthews India Fund | | | 40 | | |
Matthews Japan Fund | | | 45 | | |
Matthews Korea Fund | | | 50 | | |
ASIA SMALL COMPANY STRATEGIES | |
Matthews Asia Small Companies Fund | | | 55 | | |
Matthews China Small Companies Fund | | | 60 | | |
ASIA SPECIALTY STRATEGY | |
Matthews Asia Science and Technology Fund | | | 65 | | |
Disclosures | | | 70 | | |
Index Definitions | | | 71 | | |
Disclosure of Fund Expenses | | | 72 | | |
Statements of Assets and Liabilities | | | 74 | | |
Statements of Operations | | | 77 | | |
Statements of Changes in Net Assets | | | 80 | | |
Financial Highlights | | | 87 | | |
Notes to Financial Statements | | | 100 | | |
Report of Independent Registered Public Accounting Firm | | | 117 | | |
Tax Information | | | 118 | | |
Approval of Investment Advisory Agreement | | | 120 | | |
Trustees and Officers of the Funds | | | 124 | | |
Cover photo: Matsumoto Castle, Japan
This report has been prepared for Matthews Asia Funds shareholders. It is not authorized for distribution to prospective investors unless accompanied or preceded by a current Matthews Asia Funds prospectus, which contains more complete information about the Funds' investment objectives, risks and expenses. Additional copies of the prospectus may be obtained at matthewsasia.com. Please read the prospectus carefully before you invest or send money.
The views and opinions in this report were current as of December 31, 2012. They are not guarantees of performance or investment results and should not be taken as investment advice. Investment decisions reflect a variety of factors, and the managers reserve the right to change their views about individual stocks, sectors and the markets at any time. As a result, the views expressed should not be relied upon as a forecast of a Fund's future investment intent. Current and future portfolio holdings are subject to risk.
Statements of fact are from sources considered reliable, but neither the Funds nor the Investment Advisor makes any representation or guarantee as to their completeness or accuracy.
Matthews Asia Funds are distributed in the United States by Foreside Funds Distributors LLC, Berwyn, Pennsylvania
Matthews Asia Funds are distributed in Latin America by HMC Partners

"Our focus should remain on the long-term trends in Asian household and government consumption and the industries that are likely to benefit from the way Asia changes its patterns of consumption."
Message to Shareholders
from the Investment Advisor
Dear Fellow Shareholders,
It seems that 2012 was a year in which Asia's markets rallied without much conviction. Investors appeared more concerned about chasing yield; growth in earnings was something that just happened whilst they were looking the other way. Bonds and dividend-paying stocks performed relatively well, whereas companies that retained capital for long-term growth struggled against investors' fears over 12-month GDP numbers. I readily agree that yield is a good thing to demand; we often argue that reasonable dividend yields can be a symptom of strong corporate governance and sustainable earnings growth. But reaching for high yields without thinking about growth or financial risk can be just as dangerous as blindly chasing high growth. I believe there are times when there is actually safety in growth!
I say this not just because of recent economic trends, but also because of the different approaches to government policy that emerged in the world over the past year. 2012 saw elections in Europe, the U.S., and across Asia. The results of these elections were also a product of the different economic environments across the globe. In heavily indebted countries, such as France and the U.S., elections were won on a platform of redistribution of wealth; taxation of productivity and investment; and encouragement of consumption. In Asia, where the fiscal position of most countries is much healthier, governments in favor of promoting profits and investment won or retained power.
It is perhaps not surprising that the consumption argument won elections for the West. In a depressed economy, more consumption may increase the circular flow of incomes and grow the economy. During the Great Depression of the 1930s, British economist John Maynard Keynes scorned the "purposive man" who pursued the accumulation of wealth over time at the expense of consumption in the present: "For him jam is not jam unless it is a case of jam tomorrow and never jam today." But Keynes' "purposive man" is also the entrepreneur, the investor and the creator of long-term growth. In taxing him, policymakers risk permanently reducing investment. Despite this risk, the temptation to consume more today is often irresistible.
Much of Asia has a different view of Keynes's purposive man. With the fiscal demons of temptation for the most part at bay, Asia continues to champion entrepreneurship and investment and to try to lure both to its shores. Tax rates on income are for the most part lower than the West and so, too, are corporate taxes and capital gains taxes, the latter of which are zero in Hong Kong and Singapore. China modified its visa laws to encourage the immigration of more foreign talent to help run and transform its businesses. In Asia, the purposive man is a hero not a Scrooge!
Asia's immediate challenge, therefore, is to facilitate investment. Such investment will still include physical infrastructure. However, it will probably focus increasingly on capital goods—the equipment and machinery necessary for improvements in manufacturing productivity and to produce a consistent quality of manufactured goods. In addition, investment in software and virtual infrastructure will increase in importance. IT spending across the region is likely to increase as wages rise, in order to get the most out of a more skilled labor force. Wages will continue to rise as people invest in their own education to reap the benefits of acquiring greater skills. Of all the challenges facing Asia,
2 MATTHEWS ASIA FUNDS
developing capital markets and the institutions to attract and grow capital are among the most important. As Asian governments continue to support and champion entrepreneurs, so Asian assets are likely to be in demand from both foreign and domestic investors. These are the channels by which Asia will allow the purposive man to accumulate wealth.
But What of Asia's Jam Tomorrow?
Asia will continue to build up its wealth. But the ultimate point of economic activity is still consumption, and for Asia that means the ability to enjoy a middle-class lifestyle. These changes are underway and will take time. They will probably take the form of more efficient use of natural resources to protect the environment; more money spent on leisure and the redevelopment of cities from production centers to consumption centers; and higher quality, modern housing. And, yes, Asia is also building welfare states: Indonesia wants universal health insurance by 2014; universal pensions a year later. China has set up its own welfare system; richer economies, such as South Korea, have had systems in place for some time. Yet, Asia's welfare systems are likely to be more efficient than in the West and also less generous. According to the Asian Development Bank, Asia's spending on social welfare based on 2008 data averaged nearly 5% of GDP and ranges from approximately 2% in Indonesia, less than 5% in India and China; 8% in Korea and 16% in Japan. Data from the Organization for Economic Cooperation and Development, which measures public and private "social expenditure" suggests that governments in Europe and the U.S. spend between two and three times the amount than, for example, Korea.
I therefore remain confident that over the coming decade, Asia will retain its lead in terms of rates of investment and economic growth. Nevertheless, I also believe that our focus should remain on the long-term trends in Asian household and government consumption and the industries that are likely to benefit from the way Asia changes its patterns of consumption. In buoyant markets, there may be many short-term trades to make in distressed businesses—"cigar butt stocks" with "one last puff" in them. As tempting as these can be, trading on short-term market sentiment is not our way. We still believe in patience and we don't want to end up holding a business that we wished we had never bought into. As we look to the year ahead, the most attractive opportunities seem to be in businesses in which the long-term growth is undervalued, or where the short-term cyclicality of the business has frightened investors seeking instant returns, even if the business has a strong competitive position in its industry.
Patience and delayed gratification, traits of the purposive man, remain key to long-run accumulation of wealth.
As always, we feel privileged to be your investment advisor for Asia and thank you for your support.

Robert Horrocks, PhD
Chief Investment Officer
Matthews International Capital Management, LLC
matthewsasia.com | 800.789.ASIA 3

ASIA FIXED INCOME STRATEGY
PORTFOLIO MANAGERS
Teresa Kong, CFA
Lead Manager
Gerald M. Hwang, CFA, Robert J. Horrocks, PhD
Co-Managers
FUND FACTS
| | | Investor Class | | Institutional Class | |
Ticker | | MAINX | | MINCX | |
CUSIP | | 577125503 | | 577125602 | |
Inception | | 11/30/11 | | 11/30/11 | |
NAV | | $10.84 | | $10.83 | |
Initial Investment | | $2,500 | | $3 million | |
Gross Expense Ratio1 | | 1.85% | | 1.70% | |
After fee waiver and
Reimbursement | | 1.17% | | 1.00% | |
Portfolio Statistics
Total # of Positions | | 61 | |
Net Assets | | $35.7 million | |
Modified Duration | | 4.92 | |
Portfolio Turnover | | 18.45%3 | |
Benchmarks
HSBC Asian Local Bond Index
J.P. Morgan Asia Credit Index
Redemption Fee
2% within first 90 calendar days of purchase
OBJECTIVE
Total return over the long term with an emphasis on income.
STRATEGY
Under normal market conditions, the Fund seeks to achieve its investment objective by investing at least 80% of its total assets, which include borrowings for investment purposes, in income-producing securities including, but not limited to, debt and debt-related instruments issued by governments, quasi-governmental entities, supra-national institutions, and companies in Asia. Investments may be denominated in any currency, and may represent any part of a company's capital structure from debt to equity or with features of both.
1 The Advisor has contractually and voluntarily agreed to waive certain fees and reimburse certain expenses for Matthews Asia Strategic Income Fund. Please see page 111 for additional information. Matthews Asia Funds does not charge 12b-1 fees.
2 Modified duration measures the percent change in value of the fixed income portion of the portfolio in response to a 1% change in interest rates. In a multi-currency denominated portfolio with sensitivities to different interest rate regimes, modified duration will not accurately reflect the change in value of the overall portfolio from a change in any one interest rate regime.
3 The lesser of fiscal year 2012 long-term purchase costs or sales proceeds divided by the average monthly market value of long-term securities.
Matthews Asia Strategic Income Fund
Portfolio Manager Commentary
For the year ending December 31, 2012, the Matthews Asia Strategic Income Fund returned 13.62% (Investor Class) and 13.74% (Institutional Class), while its primary benchmark, the HSBC Asian Local Bond Index (ALBI) and its secondary benchmark, the J.P. Morgan Asia Credit Index (JACI), gained 8.93% and 14.27%, respectively. For the fourth quarter, the Fund returned 3.56% (Investor Class) and 3.53% (Institutional Class) versus 2.28% and 2.24% for its primary and secondary benchmarks, respectively.
2012 was a special year in that all three drivers of return—credit, currency, and interest rates—contributed positively. From a historical perspective, returns in local currency Asia bonds were positive while returns in U.S. dollar-denominated Asia bonds were exceptionally strong. The annual return for the U.S. dollar-denominated Asia bond was the second highest since the JACI was created in 2005 and easily beat the average of 8.59%. The ALBI's return for the year beat its historical average of 8.44% since the benchmark was created in 2001.
It is no surprise that the U.S. dollar-denominated positions outperformed our local currency holdings as the returns for the JACI were high. Despite having less than half of our portfolio allocated to U.S. dollar-denominated bonds, we were able to generate high overall returns because of our nearly 50% allocation to sub-investment grade credit, which generated an attractive 20.42% return in 2012 (as measured by the JACI Sub-Investment Grade Index).
Over the year, we steadily increased our allocation to corporate bonds and moved away from government bonds. This was largely driven by our bottom-up, security selection process. We started the year with an allocation of approximately 33% to corporates and ended the year with approximately 50% as we found more compelling opportunities in this sub-segment. One example was our decision to initiate positions in Chinese property companies in the second quarter. In the past, Chinese property bonds did not price in the full risk of the sector that included bondholders securing property in cases of distress, a sector dependent on capital markets to access liquidity. However, once the bonds reached double-digit yields we believed they priced in these risks and provided attractive total return opportunities. Over the course of the year, with respect to our interest rate exposures, we shifted our allocation away from the Indonesian rupiah, and toward Philippine peso-denominated bonds. Again, this decision was taken following a bottom up analysis of the fundamentals driving the countries. In this case, our view was that the Philippine economy was finally gaining traction, driven by falling interest rates, low inflation, rising business sentiment and increases in infrastructure spending.
Overall returns for Asia's currencies were also positive at 2.6% (using the spot return of the currencies in the ALBI index as proxy). The best performer was the Korean won, followed by the Philippine peso and the Singaporean dollar, returning approximately 8.3%, 7.0%, and 6.1% respectively. The biggest underperformers were the Japanese yen, the Indonesian rupiah, and the Indian rupee at –11.3%, –7.4%, and –3.5% respectively. Our portfolio benefited from having generally higher weights in the outperformers and lower weights in the underperformers.
The Philippine government was a top contributor to our performance by issuer selection, and the portfolio was overweight this issuer. Other top
4 MATTHEWS ASIA FUNDS
PERFORMANCE AS OF DECEMBER 31, 2012
| | | | | | Average Annual
Total Returns | | | |
| | 3 Months | | 1 Year | | Since
Inception | | Inception
Date | |
Investor Class (MAINX) | | | 3.56 | % | | | 13.62 | % | | | 11.95 | % | | 11/30/11 | |
Institutional Class (MINCX) | | | 3.53 | % | | | 13.74 | % | | | 12.07 | % | | 11/30/11 | |
HSBC Asian Local Bond Index4 | | | 2.28 | % | | | 8.93 | % | | | 8.96 | % | | | | | |
J.P. Morgan Asia Credit Index4 | | | 2.24 | % | | | 14.27 | % | | | 14.01 | % | | | | | |
Lipper Emerging Markets Debt Funds Category Average5 | | | 3.62 | % | | | 18.48 | % | | | 17.88 | % | | | | | |
Performance assumes reinvestment of all dividends and/or distributions before taxes. All performance quoted represents past performance and is no guarantee of future results. Investment return and principal value will fluctuate with market conditions so that when redeemed, shares may be worth more or less than their original cost. Current performance may be lower or higher than the return figures quoted. Returns would have been lower if certain of the Fund's fees and expenses had not been waived. For the Fund's most recent month-end performance visit matthewsasia.com.
INCOME DISTRIBUTION HISTORY
| | 2012 | | 2011 | |
| | Q1 | | Q2 | | Q3 | | Q4 | | Total | | Q1 | | Q2 | | Q3 | | Q4 | | Total | |
Investor (MAINX) | | $ | 0.09 | | | $ | 0.07 | | | $ | 0.11 | | | $ | 0.15 | | | $ | 0.42 | | | | n.a. | | | | n.a. | | | | n.a. | | | $ | 0.02 | | | $ | 0.02 | | |
Institutional (MINCX) | | $ | 0.10 | | | $ | 0.07 | | | $ | 0.12 | | | $ | 0.15 | | | $ | 0.44 | | | | n.a. | | | | n.a. | | | | n.a. | | | $ | 0.02 | | | $ | 0.02 | | |
Note: This table does not include capital gains distributions. Totals may differ by $0.01 due to rounding. For income distribution history, visit matthewsasia.com.
30-DAY YIELD:
3.15% (Investor Class) 3.35% (Institutional Class)
The 30-Day Yield represents net investment income earned by the Fund over the 30-day period ended 12/31/12, expressed as an annual percentage rate based on the Fund's share price at the end of the 30-day period. The 30-Day Yield should be regarded as an estimate of the Fund's rate of investment income, and it may not equal the Fund's actual income distribution rate.
Source: BNY Mellon Investment Servicing (US) Inc.
YIELD TO WORST:
4.35%
Yield to worst is the lowest yield that can be received on a bond assuming that the issuer does not default. It is calculated by utilizing the worst case assumptions for a bond with respect to certain income-reducing factors, including prepayment, call or sinking fund provisions. It does not represent the yield that an investor should expect to receive. Past yields are no guarantee of future yields.
Source: FactSet Research Systems
GROWTH OF A $10,000 INVESTMENT SINCE INCEPTION—INVESTOR CLASS

Plotted monthly. The performance data and graph do not reflect the deduction of taxes that a shareholder would pay on dividends, capital gains distributions or redemption of Fund shares. Values are in US$.
4 It is not possible to invest directly in an index. Source: Index data from HSBC, J.P. Morgan and Bloomberg; total return calculations performed by BNY Mellon Investment Servicing (US) Inc. Please see page 71 for index definitions.
5 The Lipper Category Average does not reflect sales charges and is based on total return, including reinvestment of dividends and capital gains for the stated periods.
TOP TEN POSITIONS6
| | Sector | | Currency | | % of Net Assets | |
Malaysian Government Bond, 4.160%, 7/15/2021 | | Government Bonds | | Malaysian Ringgit | | | 4.8 | % | |
KWG Property Holding, Ltd., 12.500%, 8/18/2017 | | Financials | | U.S. Dollar | | | 4.2 | % | |
Macquarie Bank, Ltd., 6.625%, 4/7/2021 | | Financials | | U.S. Dollar | | | 3.4 | % | |
Galaxy Entertainment Group, Ltd., 4.625%, 12/16/2013 | | Consumer Discretionary | | Chinese Renminbi | | | 3.4 | % | |
Republic of Philippines, 6.250%, 1/14/2036 | | Government Bonds | | Philippine Peso | | | 3.3 | % | |
Indonesia Government Bond, 8.250%, 7/15/2021 | | Government Bonds | | Indonesian Rupiah | | | 3.2 | % | |
Home Inns & Hotels Management, Inc., 2.000%, 12/15/2015 | | Consumer Discretionary | | U.S. Dollar | | | 3.1 | % | |
Malayan Banking BHD, 3.250%, 9/20/2022 | | Financials | | U.S. Dollar | | | 2.8 | % | |
Mongolia International Bond, 5.125%, 12/5/2022 | | Government Bonds | | U.S. Dollar | | | 2.7 | % | |
Korea Treasury Bond, 3.500%, 9/10/2016 | | Government Bonds | | Korean Won | | | 2.7 | % | |
% OF ASSETS IN TOP TEN | | | | | | | 33.6 | % | |
6 Holdings may combine more than one security from same issuer and related depositary receipts.
matthewsasia.com | 800.789.ASIA 5
CURRENCY ALLOCATION (%)7,8
U.S. Dollar (USD) | | | 48.0 | | |
Chinese Renminbi (CNY) | | | 8.9 | | |
Philippine Peso (PHP) | | | 7.6 | | |
Malaysian Ringgit (MYR) | | | 7.4 | | |
Korean Won (KRW) | | | 7.1 | | |
Australian Dollar (AUD) | | | 5.4 | | |
Thai Baht (THB) | | | 3.8 | | |
Singapore Dollar (SGD) | | | 3.7 | | |
Indonesian Rupiah (IDR) | | | 3.2 | | |
Hong Kong Dollar (HKD) | | | 2.2 | | |
Cash and Other Assets,
Less Liabilities | | | 2.7 | | |
COUNTRY ALLOCATION (%)8,9
(By issuer's country of risk)
China/Hong Kong | | | 24.6 | | |
Philippines | | | 12.3 | | |
Malaysia | | | 12.2 | | |
South Korea | | | 9.5 | | |
Australia | | | 9.4 | | |
Thailand | | | 8.3 | | |
Indonesia | | | 5.5 | | |
Singapore | | | 5.1 | | |
United Kingdom | | | 3.1 | | |
India | | | 2.8 | | |
Mongolia | | | 2.7 | | |
Sri Lanka | | | 1.1 | | |
Japan | | | 0.7 | | |
Cash and Other Assets, Less Liabilities | | | 2.7 | | |
SECTOR ALLOCATION (%)8
Government Bonds | | | 32.8 | | |
Financials | | | 30.9 | | |
Consumer Discretionary | | | 14.7 | | |
Industrials | | | 7.2 | | |
Telecommunication Services | | | 4.2 | | |
Energy | | | 3.3 | | |
Utilities | | | 3.1 | | |
Information Technology | | | 1.1 | | |
Cash and Other Assets, Less Liabilities | | | 2.7 | | |
ASSET TYPE BREAKDOWN (%)7,8
Corporate Bonds | | | 54.0 | | |
Government Bonds | | | 32.8 | | |
Common Equities and ADRs | | | 7.4 | | |
Convertible Bonds | | | 3.1 | | |
Cash and Other Assets, Less Liabilities | | | 2.7 | | |
7 Source: FactSet Research Systems. Percentage values in data are rounded to the nearest tenth of one percent; the values may not sum to 100% due to rounding.
8 Cash and other assets may include forward currency exchange contracts and certain derivative instruments that have been marked-to-market.
9 Not all countries are included in the benchmark index(es).
Matthews Asia Strategic Income Fund
Portfolio Manager Commentary (continued)
contributors were Korean government bonds, which benefited from both strong currency appreciation and falling interest rates, and KWG Property Group, a Chinese property company. The main detractors to performance came from our tactical U.S. Treasury hedge, Chunghwa Telecom and a Mongolia government bond. But just to put the magnitude of the performance in perspective, none of these detractors contributed more than –75 basis points (–0.75%) to overall returns.
When we launched this strategy in November of 2011, we sought to provide a fixed income fund with low volatility but high risk-adjusted returns to our investors. Based on our analysis, the most effective way to achieve this over multi-year periods is to take a blended approach with the flexibility to invest across currencies (both U.S. dollar and local currencies of Asia) as well as across the credit spectrum. Importantly, while returns were strong in 2012, they were also attractive on a risk-adjusted basis.
Looking forward, we expect returns may likely be less dependent on credit and falling interest rates and more on currency appreciation. While the magnitude of the spread tightening might not match the 111 basis points (1.11%) experienced in 2012, we still see potential for some credit spread tightening. Historically, one of the best predictors of high yield spread is the default rate. Moody's Global high yield rate reached a low of 1.8% in fourth quarter of December 2011 and has gradually risen to 3.0% as of October 2012. Given that credit cycles typically last about 8 to 10 years, defaults tend to stay at trough levels for several years before spiking, and since we are just over two years from the last peak in defaults, we expect defaults to remain low in 2013.
In terms of interest rates in Asia, we expect they will be driven less by regional events and influenced more by what happens in the U.S. and Europe. Our base case, therefore, is for a small rise in U.S. interest rates, reflecting continued slow growth. However, while we expect rates to rise, we believe this should not have a material impact on most Asian countries. In addition, by taking on greater interest rate exposure to Asian countries experiencing falling interesting rates, such as Malaysia and Korea, and less exposure to those with the highest likelihood to rise, such as Hong Kong and Singapore, we aim to cushion our portfolio returns from an overall rising interest rate environment.
Finally on the currency front, we expect most of Asia's currencies to continue on their slow, secular appreciation relative to the U.S. dollar. The primary exception is Japan's yen. Japan's ruling Liberal Democratic Party campaigned on looser monetary policies and won with an overwhelming majority. We are seeing a rare alignment of political will to undertake the difficult policies necessary to kick-start the Japanese economy. As for the rest of Asia's currencies, the key currency to watch is China's renminbi. With China's political leadership transition behind us, the country can carry on with the hard work of steering the economy toward more balanced growth, increasing services and consumption and away from being export dependent. One key to success is a greater liberalization of interest rates in China. By widening the band by which banks can lend, policymakers are slowly incentivizing banks to price loans based on risk. We welcome these small and measured steps to further allow markets to determine the price of its capital.
Fixed income investments are subject to additional risks, including, but not limited to, interest rate, credit and inflation risks. Investing in emerging markets involves different and greater risks, as these countries are substantially smaller, less liquid and more volatile than securities markets in more developed markets.
6 MATTHEWS ASIA FUNDS
Matthews Asia Strategic Income Fund December 31, 2012
Schedule of Investmentsa
FOREIGN GOVERNMENT OBLIGATIONS: 32.8%
| | | Face Amount* | | Value | |
SOUTH KOREA: 7.1% | |
Korea Treasury Bond
3.500%, 09/10/16 | | KRW | 1,000,000,000 | | | $ | 952,113 | | |
Korea Treasury Bond
5.750%, 09/10/18 | | KRW | 500,000,000 | | | | 532,968 | | |
Korea Treasury Bond
3.250%, 12/10/14 | | KRW | 500,000,000 | | | | 470,813 | | |
Korea Treasury Bond
4.000%, 09/10/15 | | KRW | 300,000,000 | | | | 288,479 | | |
Korea Treasury Bond
3.250%, 06/10/15 | | KRW | 300,000,000 | | | | 282,969 | | |
Total South Korea | | | | | 2,527,342 | | |
PHILIPPINES: 6.7% | |
Republic of Philippines
6.250%, 01/14/36 | | PHP | 40,000,000 | | | | 1,168,950 | | |
Republic of Philippines
3.900%, 11/26/22 | | PHP | 30,000,000 | | | | 756,164 | | |
Republic of Philippines
4.950%, 01/15/21 | | PHP | 18,000,000 | | | | 483,836 | | |
Total Philippines | | | | | 2,408,950 | | |
MALAYSIA: 6.6% | |
Malaysian Government Bond
4.160%, 07/15/21 | | MYR | 5,000,000 | | | | 1,708,278 | | |
Malaysian Government Bond
3.580%, 09/28/18 | | MYR | 1,000,000 | | | | 331,276 | | |
Malaysia Investment Issue
3.309%, 08/30/17 | | MYR | 1,000,000 | | | | 326,498 | | |
Total Malaysia | | | | | 2,366,052 | | |
INDONESIA: 4.0% | |
Indonesia Government Bond
8.250%, 07/15/21 | | IDR | 9,000,000,000 | | | | 1,128,670 | | |
Republic of Indonesia
5.875%, 03/13/20 | | | 250,000 | | | | 300,625 | | |
Total Indonesia | | | | | 1,429,295 | | |
THAILAND: 2.8% | |
Thailand Government Bond
3.250%, 06/16/17 | | THB | 15,000,000 | | | | 493,362 | | |
Thailand Government Bond
4.250%, 03/13/13 | | THB | 15,000,000 | | | | 491,688 | | |
Total Thailand | | | | | 985,050 | | |
MONGOLIA: 2.7% | |
Mongolia Government International Bond
5.125%, 12/05/22b | | | 1,000,000 | | | | 980,000 | | |
Total Mongolia | | | | | 980,000 | | |
AUSTRALIA: 1.8% | |
Australian Government Bond
5.750%, 07/15/22 | | AUD | 500,000 | | | | 626,032 | | |
Total Australia | | | | | 626,032 | | |
| | | Face Amount* | | Value | |
SRI LANKA: 1.1% | |
Republic of Sri Lanka
7.400%, 01/22/15 | | | 350,000 | | | $ | 376,250 | | |
Total Sri Lanka | | | | | 376,250 | | |
TOTAL FOREIGN GOVERNMENT OBLIGATIONS: | | | | | 11,698,971 | | |
(Cost $11,235,532) | | | | | |
CORPORATE BONDS: 57.2%
CHINA/HONG KONG: 22.4% | |
KWG Property Holding, Ltd.
12.500%, 08/18/17 | | | 1,300,000 | | | | 1,493,849 | | |
Galaxy Entertainment Group, Ltd.
4.625%, 12/16/13 | | CNY | 7,470,000 | | | | 1,201,519 | | |
Home Inns & Hotels Management, Inc.
2.000%, 12/15/15 | | | 1,300,000 | | | | 1,117,187 | | |
Longfor Properties Co., Ltd.
9.500%, 04/07/16 | | | 750,000 | | | | 826,875 | | |
Melco Crown Entertainment, Ltd.
3.750%, 05/09/13 | | CNY | 5,000,000 | | | | 799,532 | | |
FPT Finance, Ltd.
6.375%, 09/28/20 | | | 550,000 | | | | 617,454 | | |
Hutchison Whampoa International 11, Ltd.
4.625%, 01/13/22b | | | 500,000 | | | | 557,139 | | |
Wharf Finance No. 1, Ltd.
4.500%, 07/20/21 | | SGD | 500,000 | | | | 418,231 | | |
Tencent Holdings, Ltd.
4.625%, 12/12/16b | | | 350,000 | | | | 376,739 | | |
Fita International, Ltd.
7.000%, 02/10/20 | | | 300,000 | | | | 338,865 | | |
Beijing Enterprises Water Group, Ltd.
3.750%, 06/30/14 | | CNY | 1,500,000 | | | | 240,605 | | |
Total China/Hong Kong | | | | | 7,987,995 | | |
AUSTRALIA: 7.0% | |
Macquarie Bank, Ltd.
6.625%, 04/07/21 | | | 1,100,000 | | | | 1,214,779 | | |
SPI Electricity & Gas Australia Holdings Pty, Ltd.
5.750%, 06/28/22 | | AUD | 500,000 | | | | 535,130 | | |
Crown Group Finance, Ltd.
5.750%, 07/18/17 | | AUD | 500,000 | | | | 531,781 | | |
Lend Lease Financial International, Ltd.
4.625%, 07/24/17 | | SGD | 250,000 | | | | 212,844 | | |
Total Australia | | | | | 2,494,534 | | |
MALAYSIA: 4.9% | |
Malayan Banking BHD
3.250%c, 09/20/22 | | | 1,000,000 | | | | 997,314 | | |
Axiata SPV1 Labuan, Ltd.
5.375%, 04/28/20 | | | 650,000 | | | | 739,720 | | |
Total Malaysia | | | | | 1,737,034 | | |
matthewsasia.com | 800.789.ASIA 7
Matthews Asia Strategic Income Fund December 31, 2012
Schedule of Investmentsa (continued)
CORPORATE BONDS (continued)
| | | Face Amount* | | Value | |
PHILIPPINES: 4.8% | |
Alliance Global Group, Inc.
6.500%, 08/18/17 | | | 550,000 | | | $ | 605,773 | | |
International Container Terminal Services, Inc.
7.375%, 03/17/20 | | | 500,000 | | | | 587,617 | | |
SM Investments Corp.
5.500%, 10/13/17 | | | 500,000 | | | | 535,839 | | |
Total Philippines | | | | | 1,729,229 | | |
THAILAND: 4.4% | |
Bangkok Bank Public Co., Ltd.
9.025%, 03/15/29 | | | 500,000 | | | | 672,500 | | |
PTTEP Canada International Finance, Ltd.
6.350%, 06/12/42 | | | 500,000 | | | | 622,130 | | |
PTTEP Canada International Finance, Ltd.
5.692%, 04/05/21b | | | 250,000 | | | | 288,788 | | |
Total Thailand | | | | | 1,583,418 | | |
SINGAPORE: 3.2% | |
Global Logistic Properties, Ltd.
3.375%, 05/11/16 | | CNY | 4,500,000 | | | | 711,329 | | |
Oversea-Chinese Banking Corp., Ltd.
3.750%c, 11/15/22 | | | 400,000 | | | | 421,156 | | |
Total Singapore | | | | | 1,132,485 | | |
UNITED KINGDOM: 3.1% | |
Jaguar Land Rover PLC
7.750%, 05/15/18b | | | 500,000 | | | | 545,000 | | |
Jaguar Land Rover PLC
7.750%, 05/15/18, Reg S | | | 500,000 | | | | 545,000 | | |
Total United Kingdom | | | | | 1,090,000 | | |
INDIA: 2.8% | |
Axis Bank, Ltd.
7.250%c, 08/12/21 | | | 500,000 | | | | 510,109 | | |
Bank of Baroda
6.625%c, 05/25/22 | | | 500,000 | | | | 504,709 | | |
Total India | | | | | 1,014,818 | | |
SOUTH KOREA: 2.4% | |
Kia Motors Corp.
3.625%, 06/14/16 | | | 500,000 | | | | 523,985 | | |
Korea Hydro & Nuclear Power Co., Ltd.
4.750%, 07/13/21 | | | 300,000 | | | | 339,001 | | |
Total South Korea | | | | | 862,986 | | |
INDONESIA: 1.5% | |
Theta Capital Pte., Ltd.
7.000%, 05/16/19 | | | 500,000 | | | | 521,579 | | |
Total Indonesia | | | | | 521,579 | | |
| | | Face Amount* | | Value | |
JAPAN: 0.7% | |
ORIX Corp.
4.000%, 11/29/14 | | CNY | 1,500,000 | | | $ | 242,242 | | |
Total Japan | | | | | 242,242 | | |
TOTAL CORPORATE BONDS | | | | | 20,396,320 | | |
(Cost $19,471,524) | | | | | |
COMMON EQUITIES: 7.3%
| | | Shares | | | |
CHINA/HONG KONG: 2.2% | |
The Link REIT | | | 55,000 | | | | 275,446 | | |
HSBC Holdings PLC | | | 24,000 | | | | 254,383 | | |
Kunlun Energy Co., Ltd. | | | 120,000 | | | | 253,721 | | |
Total China/Hong Kong | | | | | 783,550 | | |
SINGAPORE: 1.9% | |
StarHub, Ltd. | | | 90,000 | | | | 281,898 | | |
Ascendas REIT | | | 110,000 | | | | 215,261 | | |
Mapletree Logistics Trust, REIT | | | 200,000 | | | | 188,228 | | |
Total Singapore | | | | | 685,387 | | |
THAILAND: 1.1% | |
Kasikornbank Public Co., Ltd. | | | 60,000 | | | | 381,811 | | |
Total Thailand | | | | | 381,811 | | |
PHILIPPINES: 0.8% | |
Alliance Global Group, Inc. | | | 700,000 | | | | 286,846 | | |
Total Philippines | | | | | 286,846 | | |
MALAYSIA: 0.7% | |
Axiata Group BHD | | | 120,000 | | | | 259,553 | | |
Total Malaysia | | | | | 259,553 | | |
AUSTRALIA: 0.6% | |
Telstra Corp., Ltd. | | | 50,000 | | | | 227,837 | | |
Total Australia | | | | | 227,837 | | |
TOTAL COMMON EQUITIES | | | | | 2,624,984 | | |
(Cost $2,038,735) | | | | | |
8 MATTHEWS ASIA FUNDS
Matthews Asia Strategic Income Fund December 31, 2012
Schedule of Investmentsa (continued)
| | | Value | |
TOTAL INVESTMENTS: 97.3% | | $ | 34,720,275 | | |
(Cost $32,745,791d) | | | |
CASH AND OTHER ASSETS,
LESS LIABILITIES: 2.7% | | | 963,582 | | |
NET ASSETS: 100.0% | | $ | 35,683,857 | | |
a Certain securities were fair valued under the discretion of the Board of Trustees (Note 2-A).
b Security exempt from registration under Rule 144A of the Securities Act of 1933, as amended. The security may be resold in transactions exempt from registration normally to qualified institutional buyers. The security has been determined to be liquid in accordance with procedures adopted by the Fund's Board of Directors.
c Variable rate security. The rate represents the rate in effect at December 31, 2012.
d Cost for federal income tax purposes is $32,879,848 and net unrealized appreciation consists of:
Gross unrealized appreciation | | $ | 1,932,007 | | |
Gross unrealized depreciation | | | (91,580 | ) | |
Net unrealized appreciation | | $ | 1,840,427 | | |
* All values are in USD unless otherwise noted
AUD Australian Dollar
CNY Chinese Renminbi (Yuan)
IDR Indonesian Rupiah
KRW Korean Won
MYR Malaysian Ringgit
PHP Philippine Peso
REIT Real Estate Investment Trust
SGD Singapore Dollar
THB Thai Baht
USD U.S. Dollar
See accompanying notes to financial statements.
matthewsasia.com | 800.789.ASIA 9

ASIA GROWTH AND INCOME STRATEGIES
PORTFOLIO MANAGERS
Robert J. Horrocks, PhD
Lead Manager
Kenneth Lowe, CFA
Co-Manager
FUND FACTS
| | | Investor Class | | Institutional Class | |
Ticker | | MACSX | | MICSX | |
CUSIP | | 577130206 | | 577130842 | |
Inception | | 9/12/94 | | 10/29/10 | |
NAV | | $18.61 | | $18.60 | |
Initial Investment | | $2,500 | | $3 million | |
Gross Expense Ratio1 | | 1.11% | | 0.97% | |
Portfolio Statistics
Total # of Positions | | 63 | |
Net Assets | | $4.1 billion | |
Weighted Average Market Cap | | $31.8 billion | |
Portfolio Turnover | | 17.43%2 | |
Benchmark
MSCI AC Asia ex Japan Index
Redemption Fee
2% within first 90 calendar days of purchase
OBJECTIVE
Long-term capital appreciation. The Fund also seeks to provide some current income.
STRATEGY
Under normal market conditions, the Fund seeks to achieve its investment objective by investing at least 80% of its total net assets, which include borrowings for investment purposes, in dividend-paying common stock, preferred stock and other equity securities, and convertible securities as well as fixed-income securities, of any duration or quality, of companies located in Asia, including developed, emerging and frontier countries and markets in the Asian region.
1 Matthews Asia Funds does not charge 12b-1 fees.
2 The lesser of fiscal year 2012 long-term purchase costs or sales proceeds divided by the average monthly market value of long-term securities.
Matthews Asian Growth and Income Fund
Portfolio Manager Commentary
For the year ending December 31, 2012, the Matthews Asian Growth and Income Fund gained 26.90% (Investor Class) and 27.09% (Institutional Class) while its benchmark, the MSCI All Country Asia ex Japan Index, gained 22.70%. For the fourth quarter of the year, the Fund returned 4.99% (Investor Class) and 4.94% (Institutional Class) versus 5.70% for the Index.
Much like the prior 12 months, 2012 was a year of much pessimism, uncertainty and a somewhat blinkered fixation by many market participants with the major macroeconomic issues of the day. These included not just political events such as the U.S. Presidential election, the ongoing power shift in China and yet another new prime minister in Japan, but also the continuation of unorthodox monetary policy that Western central banks appear keen to persist with for the foreseeable future. Given this volatile backdrop, many Asia investors gravitated, over the course of the year, toward those companies that displayed both sustainable and visible earnings growth as well as some form of current income. This naturally played into the Fund's core philosophy of trying to mitigate the region's inherently volatile markets by investing in quality companies with tangible asset bases and sustainable cash flow generation at attractive valuations. What resulted was strong performance for the strategy in both relative and absolute terms.
Somewhat unsurprisingly, these more predictable types of firms provided the largest contribution to performance over the Year of the Dragon. This is particularly true of higher return and market-leading companies within more economically sensitive sectors such as industrials, consumer discretionary and financials. As such, the Fund's largest contributor to performance was amongst Singaporean industrial companies—from those in the aerospace maintenance, repair and overhaul businesses to offshore marine equipment manufacturers. The top contributor was Singapore Technologies Engineering, which is the city state's largest aviation, defense and electronics contractor. A common denominator across the wide and varied divisions that ST Engineering operates in is that they are market leaders and thus, despite a tough macroeconomic backdrop for defense budgets and airplane overhauls, the firm has been able to continue to win orders at high incremental returns. This order flow, combined with the ability and willingness to distribute cash to shareholders, offered a potent combination for investors.
Within the financials sector, the firms that performed well were again those with more conservative balance sheets and strong management teams that remain focused on returns. These included companies such as HSBC and United Overseas Bank—both well-positioned to take advantage of the profitable and sustainable credit growth on offer across a number of Asian countries, given the relatively low leverage at the corporate and consumer levels. Within real estate, Thai property developer, Land & Houses Public, and the Singaporean real estate investment trust, Ascendas REIT, rallied during the year. This was driven by both core domestic demand and the backdrop of looser monetary policy in the West filtering into Asian countries, and boosting asset prices further helped by their already strong operations.
While we are pleased with the Fund's annual performance, the Fund did slightly underperform its benchmark during the fourth quarter. We have
10 MATTHEWS ASIA FUNDS
PERFORMANCE AS OF DECEMBER 31, 2012
| | | | | | | Average Annual Total Returns | | | |
| | 3 Months | | 1 Year | | 3 Years | | 5 Years | | 10 Years | | Since
Inception | | Inception
Date | |
Investor Class (MACSX) | | | 4.99 | % | | | 26.90 | % | | | 10.57 | % | | | 5.37 | % | | | 14.27 | % | | | 11.08 | % | | 9/12/94 | |
Institutional Class (MICSX) | | | 4.94 | % | | | 27.09 | % | | | n.a. | | | | n.a. | | | | n.a. | | | | 7.29 | % | | 10/29/10 | |
MSCI AC Asia ex Japan Index3 | | | 5.70 | % | | | 22.70 | % | | | 6.86 | % | | | 0.12 | % | | | 14.95 | % | | | 4.15 | %4 | | | |
Lipper Pacific Region Funds Category Average5 | | | 7.33 | % | | | 22.25 | % | | | 5.38 | % | | | -1.51 | % | | | 10.21 | % | | | 3.77 | %4 | | | |
Performance assumes reinvestment of all dividends and/or distributions before taxes. All performance quoted represents past performance and is no guarantee of future results. Investment return and principal value will fluctuate with market conditions so that when redeemed, shares may be worth more or less than their original cost. Current performance may be lower or higher than the return figures quoted. Returns would have been lower if certain of the Fund's fees and expenses had not been waived. For the Fund's most recent month-end performance, visit matthewsasia.com.
INCOME DISTRIBUTION HISTORY
| | 2012 | | 2011 | |
| | June | | December | | Total | | June | | December | | Total | |
Investor (MACSX) | | $ | 0.20 | | | $ | 0.27 | | | $ | 0.47 | | | $ | 0.27 | | | $ | 0.21 | | | $ | 0.48 | | |
Institutional (MICSX) | | $ | 0.21 | | | $ | 0.28 | | | $ | 0.49 | | | $ | 0.28 | | | $ | 0.22 | | | $ | 0.50 | | |
Note: This table does not include capital gains distributions. Totals may differ by $0.01 due to rounding. For income distribution history, visit matthewsasia.com.
30-DAY YIELD:
1.58% (Investor Class) 1.73% (Institutional Class)
The 30-Day Yield represents net investment income earned by the Fund over the 30-day period ended 12/31/12, expressed as an annual percentage rate based on the Fund's share price at the end of the 30-day period. The 30-Day Yield should be regarded as an estimate of the Fund's rate of investment income, and it may not equal the Fund's actual income distribution rate.
Source: BNY Mellon Investment Servicing (US) Inc.
DIVIDEND YIELD: 2.98%
The dividend yield (trailing) for the portfolio is the weighted average sum of the dividend paid per share during the last 12 months divided by the current price. The annualized dividend yield for the Fund is for the equity-only portion of the portfolio. Please note that this is based on gross portfolio holdings and does not reflect the actual yield an investor in the Fund would receive. Past yields are no guarantee of future yields.
Source: FactSet Research Systems, Bloomberg, MICM
GROWTH OF A $10,000 INVESTMENT SINCE INCEPTION—INVESTOR CLASS
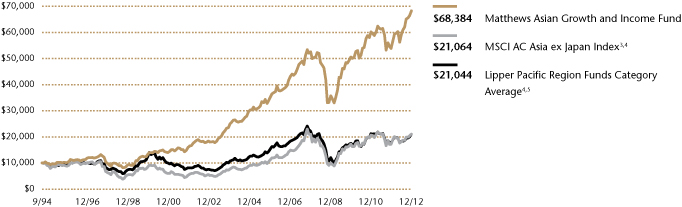
Plotted monthly. The performance data and graph do not reflect the deduction of taxes that a shareholder would pay on dividends, capital gains distributions or redemption of Fund shares. Values are in US$.
3 It is not possible to invest directly in an index. Source: Index data from Morgan Stanley Capital International and Bloomberg; total return calculations performed by BNY Mellon Investment Servicing (US) Inc. Please see page 71 for index definition.
4 Calculated from 8/31/94.
5 The Lipper Category Average does not reflect sales charges and is based on total return, including reinvestment of dividends and capital gains for the stated periods.
TOP TEN HOLDINGS6
| | Sector | | Country | | % of Net Assets | |
Singapore Technologies Engineering, Ltd. | | Industrials | | Singapore | | | 4.0 | % | |
Taiwan Semiconductor Manufacturing Co., Ltd. | | Information Technology | | Taiwan | | | 3.2 | % | |
HSBC Holdings PLC | | Financials | | China/Hong Kong | | | 2.9 | % | |
Keppel Corp., Ltd. | | Industrials | | Singapore | | | 2.8 | % | |
Ascendas REIT | | Financials | | Singapore | | | 2.6 | % | |
China Petroleum & Chemical Corp. (Sinopec), Cnv., 0.000%, 4/24/2014 | | Energy | | China/Hong Kong | | | 2.6 | % | |
AMMB Holdings BHD | | Financials | | Malaysia | | | 2.4 | % | |
CLP Holdings, Ltd. | | Utilities | | China/Hong Kong | | | 2.4 | % | |
Hisamitsu Pharmaceutical Co., Inc. | | Health Care | | Japan | | | 2.4 | % | |
PTT Public Co., Ltd. | | Energy | | Thailand | | | 2.3 | % | |
% OF ASSETS IN TOP TEN | | | | | | | 27.6 | % | |
6 Holdings may combine more than one security from same issuer and related depositary receipts.
matthewsasia.com | 800.789.ASIA 11
COUNTRY ALLOCATION (%)7
China/Hong Kong | | | 27.5 | | |
Singapore | | | 16.1 | | |
Japan | | | 8.5 | | |
Australia | | | 8.2 | | |
Thailand | | | 7.6 | | |
South Korea | | | 6.8 | | |
Malaysia | | | 5.0 | | |
India | | | 4.7 | | |
Taiwan | | | 4.3 | | |
Indonesia | | | 2.7 | | |
United Kingdom | | | 2.0 | | |
Philippines | | | 1.4 | | |
Vietnam | | | 0.9 | | |
Cash and Other Assets,
Less Liabilities | | | 4.3 | | |
SECTOR ALLOCATION (%)
Financials | | | 29.4 | | |
Industrials | | | 15.6 | | |
Telecommunication Services | | | 10.7 | | |
Consumer Staples | | | 7.9 | | |
Consumer Discretionary | | | 7.2 | | |
Utilities | | | 6.9 | | |
Energy | | | 5.9 | | |
Information Technology | | | 4.6 | | |
Health Care | | | 3.9 | | |
Materials | | | 3.6 | | |
Cash and Other Assets,
Less Liabilities | | | 4.3 | | |
MARKET CAP EXPOSURE (%)8
Large Cap (over $5B) | | | 68.5 | | |
Mid Cap ($1B–$5B) | | | 24.4 | | |
Small Cap (under $1B) | | | 2.8 | | |
Cash and Other Assets,
Less Liabilities | | | 4.3 | | |
ASSET TYPE BREAKDOWN (%)9
Common Equities and ADRs | | | 79.9 | | |
Corporate Bonds | | | 12.8 | | |
Preferred Equities | | | 3.0 | | |
Convertible Bonds | | | 0.0 | | |
Cash and Other Assets, Less Liabilities | | | 4.3 | | |
7 Not all countries are included in the benchmark index(es).
8 Source: FactSet Research Systems. Percentage values in data are rounded to the nearest tenth of one percent; the values may not sum to 100% due to rounding.
9 Bonds are not included in the MSCI All Country Asia ex Japan Index.
Matthews Asian Growth and Income Fund
Portfolio Manager Commentary (continued)
noted in commentaries past that we are comfortable not holding Chinese banking stocks due to their somewhat dubious capital positions, asset quality issues and potential for dividend cuts. While our conviction here has not waned, in a relative sense, this positioning hurt us as these stocks were strong performers late in the year. In addition, two of our health care stocks, Hisamitsu Pharmaceutical and Shandong Weigao Group Medical Polymer, disappointed. The former is the maker of leading pain relieving patches that struggled during the fourth quarter as it faced increasing raw material costs and pricing pressure that resulted from National Health Insurance price negotiations with the Japanese government. Despite these issues, we continue to believe that the company offers a defensive business model with growth opportunities in new drugs via their patented distribution methods. Shandong Weigao, however, is a holding that we exited over the fourth quarter as the Chinese medical consumables company announced weaker-than-expected results and guidance. Although the firm is still a fast grower, increasing competition at China's Tier 2 and Tier 3 city hospitals for products, such as needles, as well as higher raw material and labor costs led us to believe that the stock had become somewhat overvalued relative to future prospects.
Convertible bonds have always been a core part of this strategy and historically they have been able to provide the positive asymmetry in returns that we seek. However, the fourth quarter also demonstrated some of the difficulties associated with the riskier credit available in this asset class, as our holding in OLAM International saw some concerns raised by a well-known U.S.-based research firm. These worries revolved around the overstatement of earnings and of the valuation of certain assets. Whilst these allegations might have been overly aggressive, the opacity of certain elements of the firm and the potential for raising capital led us to exit this position. Despite this experience, we still believe that interesting opportunities exist within the sphere of convertible bonds.
During the fourth quarter we also added to our Japanese holdings with Japan Tobacco, a tobacco company with truly global brands and reach, and Lawson, one of Japan's three largest convenience store operators. Both companies offer not only growth opportunities outside their domestic market, but strong cash generation and, most importantly, management teams that appear to be re-engaged with the metrics that long-term minority shareholders like ourselves seek, notably return on capital and dividends.
We remain optimistic on the outlook for Asian equities as, despite lackluster growth in the developed world, supportive macroeconomic policy and healthy domestic demand should lead to sustained real income and GDP growth across the majority of the region. Further, valuations are trading at approximately 12x forward earnings and 1.6x book value, whilst idea generation from the team remains positive despite the rally in share prices over the preceding 12 months. We will continue to focus on those businesses that we believe are appropriate for a portfolio that seeks upside participation in these growth markets, whilst continuing to protect capital during more volatile times.
12 MATTHEWS ASIA FUNDS
Matthews Asian Growth and Income Fund December 31, 2012
Schedule of Investmentsa
COMMON EQUITIES: 79.9%
| | | Shares | | Value | |
CHINA/HONG KONG: 21.8% | |
HSBC Holdings PLC ADR | | | 2,230,333 | | | $ | 118,363,772 | | |
CLP Holdings, Ltd. | | | 11,771,700 | | | | 98,903,884 | | |
Jardine Matheson Holdings, Ltd. | | | 1,491,200 | | | | 93,046,137 | | |
AIA Group, Ltd. | | | 21,765,600 | | | | 86,329,668 | | |
Hang Lung Properties, Ltd. | | | 21,426,920 | | | | 86,230,890 | | |
China Pacific Insurance Group Co., Ltd.
H Shares | | | 20,355,800 | | | | 76,751,594 | | |
Television Broadcasts, Ltd. | | | 8,897,000 | | | | 66,894,657 | | |
China Mobile, Ltd. ADR | | | 1,077,500 | | | | 63,270,800 | | |
VTech Holdings, Ltd. | | | 5,029,400 | | | | 56,765,269 | | |
Vitasoy International Holdings, Ltd.† | | | 51,771,000 | | | | 53,265,796 | | |
Cafe' de Coral Holdings, Ltd. | | | 17,486,000 | | | | 49,865,600 | | |
Citic Telecom International
Holdings, Ltd.† | | | 139,126,000 | | | | 38,086,439 | | |
Total China/Hong Kong | | | | | 887,774,506 | | |
SINGAPORE: 13.9% | |
Singapore Technologies Engineering, Ltd. | | | 52,104,125 | | | | 164,451,333 | | |
Keppel Corp., Ltd. | | | 12,280,900 | | | | 112,143,814 | | |
Ascendas REIT | | | 53,925,000 | | | | 105,526,972 | | |
United Overseas Bank, Ltd. | | | 3,861,000 | | | | 63,336,008 | | |
SIA Engineering Co., Ltd. | | | 13,277,000 | | | | 47,874,902 | | |
ARA Asset Management, Ltd. | | | 28,381,100 | | | | 37,954,630 | | |
Singapore Post, Ltd. | | | 38,209,000 | | | | 36,005,824 | | |
Total Singapore | | | | | 567,293,483 | | |
JAPAN: 8.5% | |
Hisamitsu Pharmaceutical Co., Inc. | | | 1,983,600 | | | | 98,724,492 | | |
Japan Tobacco, Inc. | | | 2,796,800 | | | | 79,007,854 | | |
Japan Real Estate Investment Corp., REIT | | | 7,889 | | | | 77,723,472 | | |
Lawson, Inc. | | | 1,022,000 | | | | 69,327,505 | | |
NTT DoCoMo, Inc. | | | 13,623 | | | | 19,637,830 | | |
Total Japan | | | | | 344,421,153 | | |
THAILAND: 7.6% | |
PTT Public Co., Ltd. | | | 8,719,200 | | | | 95,321,164 | | |
BEC World Public Co., Ltd. | | | 30,807,800 | | | | 71,805,885 | | |
Glow Energy Public Co., Ltd. | | | 21,887,400 | | | | 55,524,022 | | |
Land & Houses Public Co., Ltd. NVDR | | | 145,090,300 | | | | 46,529,259 | | |
Banpu Public Co., Ltd. | | | 3,045,850 | | | | 41,340,144 | | |
Total Thailand | | | | | 310,520,474 | | |
AUSTRALIA: 6.5% | |
Telstra Corp., Ltd. | | | 16,073,997 | | | | 73,245,130 | | |
Macquarie Group, Ltd. | | | 1,879,326 | | | | 70,401,770 | | |
Orica, Ltd. | | | 2,358,586 | | | | 62,045,579 | | |
CSL, Ltd. | | | 1,044,381 | | | | 58,963,176 | | |
Total Australia | | | | | 264,655,655 | | |
| | | Shares | | Value | |
MALAYSIA: 5.0% | |
AMMB Holdings BHD | | | 44,727,600 | | | $ | 99,347,781 | | |
Axiata Group BHD | | | 29,634,423 | | | | 64,097,464 | | |
Telekom Malaysia BHD | | | 20,245,551 | | | | 39,987,943 | | |
Total Malaysia | | | | | 203,433,188 | | |
TAIWAN: 4.3% | |
Taiwan Semiconductor Manufacturing
Co., Ltd. | | | 20,673,187 | | | | 69,147,892 | | |
Taiwan Semiconductor Manufacturing
Co., Ltd. ADR | | | 3,558,724 | | | | 61,067,704 | | |
Chunghwa Telecom Co., Ltd. ADR | | | 1,277,525 | | | | 41,315,159 | | |
Taiwan Hon Chuan Enterprise Co., Ltd. | | | 1,533,875 | | | | 3,375,103 | | |
Total Taiwan | | | | | 174,905,858 | | |
SOUTH KOREA: 3.8% | |
KT&G Corp. | | | 805,633 | | | | 61,096,620 | | |
S1 Corp. | | | 771,922 | | | | 50,461,378 | | |
GS Home Shopping, Inc. | | | 298,935 | | | | 43,012,531 | | |
Total South Korea | | | | | 154,570,529 | | |
INDONESIA: 2.7% | |
PT Perusahaan Gas Negara Persero | | | 141,686,000 | | | | 67,845,347 | | |
PT Telekomunikasi Indonesia Persero ADR | | | 1,153,600 | | | | 42,625,520 | | |
Total Indonesia | | | | | 110,470,867 | | |
UNITED KINGDOM: 2.0% | |
BHP Billiton PLC | | | 2,296,898 | | | | 81,020,010 | | |
Total United Kingdom | | | | | 81,020,010 | | |
INDIA: 1.5% | |
Housing Development Finance Corp. | | | 3,875,750 | | | | 59,209,084 | | |
Total India | | | | | 59,209,084 | | |
PHILIPPINES: 1.4% | |
Globe Telecom, Inc. | | | 2,065,510 | | | | 55,112,293 | | |
Total Philippines | | | | | 55,112,293 | | |
VIETNAM: 0.9% | |
Vietnam Dairy Products JSC | | | 9,093,803 | | | | 38,494,291 | | |
Total Vietnam | | | | | 38,494,291 | | |
TOTAL COMMON EQUITIES | | | | | 3,251,881,391 | | |
(Cost $2,520,042,341) | | | | | |
matthewsasia.com | 800.789.ASIA 13
Matthews Asian Growth and Income Fund December 31, 2012
Schedule of Investmentsa (continued)
PREFERRED EQUITIES: 3.0%
| | | Shares | | Value | |
SOUTH KOREA: 3.0% | |
Samsung Fire & Marine Insurance Co.,
Ltd., Pfd. | | | 515,311 | | | $ | 39,323,917 | | |
Hyundai Motor Co., Ltd., Pfd. | | | 541,280 | | | | 35,381,076 | | |
Hyundai Motor Co., Ltd., 2nd Pfd. | | | 386,773 | | | | 27,442,447 | | |
LG Household & Health Care, Ltd., Pfd. | | | 121,855 | | | | 21,406,124 | | |
Total South Korea | | | | | 123,553,564 | | |
TOTAL PREFERRED EQUITIES | | | | | 123,553,564 | | |
(Cost $54,435,184) | | | | | |
CORPORATE BONDS: 12.8%
| | | Face Amount* | | | |
CHINA/HONG KONG: 5.7% | |
China Petroleum & Chemical Corp.
(Sinopec), Cnv.
0.000%, 04/24/14 | | HKD | 676,210,000 | | | | 104,168,542 | | |
Hong Kong Exchanges and
Clearing, Ltd., Cnv.
0.500%, 10/23/17 | | | 64,000,000 | | | | 69,280,000 | | |
Power Regal Group, Ltd., Cnv.
2.250%, 06/02/14 | | HKD | 234,020,000 | | | | 36,865,430 | | |
PB Issuer No. 2, Ltd., Cnv.
1.750%, 04/12/16 | | | 21,820,000 | | | | 21,361,780 | | |
Total China/Hong Kong | | | | | 231,675,752 | | |
INDIA: 3.2% | |
Tata Power Co., Ltd., Cnv.
1.750%, 11/21/14 | | | 56,200,000 | | | | 58,925,700 | | |
Larsen & Toubro, Ltd., Cnv.
3.500%, 10/22/14 | | | 41,200,000 | | | | 43,713,200 | | |
Sintex Industries, Ltd., Cnv.
0.000%, 03/13/13 | | | 22,700,000 | | | | 28,715,500 | | |
Total India | | | | | 131,354,400 | | |
SINGAPORE: 2.2% | |
CapitaLand, Ltd., Cnv.
3.125%, 03/05/18 | | SGD | 62,000,000 | | | | 54,625,271 | | |
CapitaLand, Ltd., Cnv.
2.875%, 09/03/16 | | SGD | 41,750,000 | | | | 36,630,152 | | |
Total Singapore | | | | | 91,255,423 | | |
AUSTRALIA: 1.7% | |
QBE Funding Trust, Cnv.
0.000%, 05/12/30 | | | 104,571,000 | | | | 67,971,150 | | |
Total Australia | | | | | 67,971,150 | | |
TOTAL CORPORATE BONDS | | | | | 522,256,725 | | |
(Cost $509,681,094) | | | | | |
| | | Value | |
TOTAL INVESTMENTS: 95.7% | | $ | 3,897,691,680 | | |
(Cost $3,084,158,619b) | | | |
CASH AND OTHER ASSETS,
LESS LIABILITIES: 4.3% | | | 174,168,971 | | |
NET ASSETS: 100.0% | | $ | 4,071,860,651 | | |
a Certain securities were fair valued under the discretion of the Board of Trustees (Note 2-A).
b Cost for federal income tax purposes is $3,121,303,675 and net unrealized appreciation consists of:
Gross unrealized appreciation | | $ | 818,972,346 | | |
Gross unrealized depreciation | | | (42,584,341 | ) | |
Net unrealized appreciation | | $ | 776,388,005 | | |
† Affiliated Issuer, as defined under the Investment Company Act of 1940 (ownership of 5% or more of the outstanding voting securities of this issuer)
* All values are in USD unless otherwise noted.
ADR American Depositary Receipt
BHD Berhad
Cnv. Convertible
HKD Hong Kong Dollar
JSC Joint Stock Co.
NVDR Non-voting Depositary Receipt
Pfd. Preferred
REIT Real Estate Investment Trust
SGD Singapore Dollar
USD U.S. Dollar
See accompanying notes to financial statements.
14 MATTHEWS ASIA FUNDS

ASIA GROWTH AND INCOME STRATEGIES
PORTFOLIO MANAGERS
Jesper O. Madsen, CFA
Lead Manager
Yu Zhang, CFA
Co-Manager
FUND FACTS
| | | Investor Class | | Institutional Class | |
Ticker | | MAPIX | | MIPIX | |
CUSIP | | 577125107 | | 577130750 | |
Inception | | 10/31/06 | | 10/29/10 | |
NAV | | $14.58 | | $14.57 | |
Initial Investment | | $2,500 | | $3 million | |
Gross Expense Ratio1 | | 1.09% | | 0.97% | |
Portfolio Statistics
Total # of Positions | | 61 | |
Net Assets | | $3.7 billion | |
Weighted Average Market Cap | | $29.4 billion | |
Portfolio Turnover | | 9.17%2 | |
Benchmark
MSCI AC Asia Pacific Index
Redemption Fee
2% within first 90 calendar days of purchase
OBJECTIVE
Total return with an emphasis on providing current income.
STRATEGY
Under normal market conditions, the Fund seeks to achieve its investment objective by investing at least 80% of its total net assets, which include borrowings for investment purposes, in income-paying equity securities of companies located in Asia, including developed, emerging and frontier countries and markets in the Asian region. The Fund may also invest in convertible debt and equity securities.
1 Matthews Asia Funds does not charge 12b-1 fees.
2 The lesser of fiscal year 2012 long-term purchase costs or sales proceeds divided by the average monthly market value of long-term securities.
Matthews Asia Dividend Fund
Portfolio Manager Commentary
For the year ending December 31, 2012, the Matthews Asia Dividend Fund rose 21.63% (Investor Class) and 21.70% (Institutional Class), outperforming its benchmark, the MSCI All Country Asia Pacific Index, which rose 17.05%. For the fourth quarter of the year, the Fund returned 4.99% (Investor Class) and 5.03% (Institutional Class) versus 5.92% for the Index.
The Fund began 2012 with a share price of $12.48, and shareholders who were invested throughout the year would have received income distributions totaling approximately 55.83 cents per share (Investor Class), or 4.47%. The fourth quarter distribution of 22.92 cents per share was substantially higher than 2011 due to the tax treatment of Passive Foreign Investment Companies (PFICs) held by the Fund. U.S. tax code requires investors under certain circumstances to distribute unrealized capital gain from PFICs as income. The Fund's PFIC holdings in real estate investment trusts (REITs) and ORIX all delivered positive performance for 2012 and unrealized capital gains from these PFICs accounted for the majority of the fourth quarter distribution. As illustrated in the fourth quarter, PFICs can increase the variability of distributions. However, we believe that the PFICs held by the Fund also offer an attractive yield combined with the potential for dividend growth and therefore continue to hold them in the Fund.
In general, the Fund's holdings delivered growing dividends: Of the 59 holdings in the portfolio that announced dividends as of year-end, 37 companies raised dividends on a year-over-year basis while 10 cut them. The most notable dividend grower was Johnson Health Tech (JHT), a Taiwanese manufacturer of gym equipment. The company grew its dividend by 300% year-over-year, exemplifying the Fund's dual aim of seeking not just yield, but also dividend growth. When we initiated the position in JHT in early 2011, the company was facing overcapacity issues after a sharp drop in demand during the global financial crisis, which depressed earnings and resulted in a dividend yield of just 0.7%. Much of JHT's costs are fixed so a recovery in sales is amplified in terms of earnings growth, and hence, dividend growth. While the yield was low when the position was initiated, the dividend has since expanded 566% and is today equivalent to a 4.7% yield on the original purchase price.
During the year, the Fund's Japanese holdings delivered the most impactful growth in dividend payments given the larger position sizes in companies such as Itochu and Japan Tobacco, which increased their dividends by 86% and 50%, respectively. However, not all holdings delivered positive performance with apparel makers Esprit and Li Ning, among others, slashing their dividends as a turnaround in their business fundamentals failed to materialize. Both positions in the portfolio were exited as they no longer met our requirements. Other notable firms which cut dividends were QBE Insurance Group and David Jones, both of Australia. The two firms remain portfolio holdings, albeit with lower weights.
Over the year, new additions to the Fund were generally businesses exposed to the economic cycle that held a strong competitive position within their respective industries. This may seem counter-intuitive at first glance since the outlook for global economic growth remains muted at best. However, risk aversion remains elevated in equity markets and, as a result, more cyclical businesses are selling at significant discounts compared to both historical valuation metrics as well as to companies believed to exhibit stable earnings growth. In an uncertain world, many investors prefer to invest in assets that deliver what is perceived to be a
matthewsasia.com | 800.789.ASIA 15
PERFORMANCE AS OF DECEMBER 31, 2012
| | | | | | | Average Annual Total Returns | | | |
| | 3 Months | | 1 Year | | 3 Years | | 5 Years | | Since
Inception | | Inception
Date | |
Investor Class (MAPIX) | | | 4.99 | % | | | 21.63 | % | | | 10.37 | % | | | 7.99 | % | | | 10.69 | % | | 10/31/06 | |
Institutional Class (MIPIX) | | | 5.03 | % | | | 21.70 | % | | | n.a. | | | | n.a. | | | | 5.72 | % | | 10/29/10 | |
MSCI AC Asia Pacific Index3 | | | 5.92 | % | | | 17.05 | % | | | 5.30 | % | | | -1.23 | % | | | 2.25 | %4 | | | |
Lipper Pacific Region Funds Category Average5 | | | 7.33 | % | | | 22.25 | % | | | 5.38 | % | | | -1.51 | % | | | 2.63 | %4 | | | |
Performance assumes reinvestment of all dividends and/or distributions before taxes. All performance quoted represents past performance and is no guarantee of future results. Investment return and principal value will fluctuate with market conditions so that when redeemed, shares may be worth more or less than their original cost. Current performance may be lower or higher than the return figures quoted. Returns would have been lower if certain of the Fund's fees and expenses had not been waived. For the Fund's most recent month-end performance, visit matthewsasia.com.
INCOME DISTRIBUTION HISTORY
| | 2012 | | 2011 | |
| | Q1 | | Q2 | | Q3 | | Q4 | | Total | | Q1 | | Q2 | | Q3 | | Q4 | | Total | |
Investor (MAPIX) | | $ | 0.06 | | | $ | 0.14 | | | $ | 0.13 | | | $ | 0.23 | | | $ | 0.56 | | | $ | 0.10 | | | $ | 0.11 | | | $ | 0.12 | | | $ | 0.03 | | | $ | 0.36 | | |
Institutional (MIPIX) | | $ | 0.06 | | | $ | 0.14 | | | $ | 0.13 | | | $ | 0.23 | | | $ | 0.56 | | | $ | 0.11 | | | $ | 0.12 | | | $ | 0.12 | | | $ | 0.03 | | | $ | 0.38 | | |
Note: This table does not include capital gains distributions. Totals may differ by $0.01 due to rounding. For income distribution history, visit matthewsasia.com.
30-DAY YIELD:
2.18% (Investor Class) 2.28% (Institutional Class)
The 30-Day Yield represents net investment income earned by the Fund over the 30-day period ended 12/31/12, expressed as an annual percentage rate based on the Fund's share price at the end of the 30-day period. The 30-Day Yield should be regarded as an estimate of the Fund's rate of investment income, and it may not equal the Fund's actual income distribution rate.
Source: BNY Mellon Investment Servicing (US) Inc.
DIVIDEND YIELD: 3.70%
The dividend yield (trailing) for the portfolio is the weighted average sum of the dividend paid per share during the last 12 months divided by the current price. The annualized dividend yield for the Fund is for the equity-only portion of the portfolio. Please note that this is based on gross portfolio holdings and does not reflect the actual yield an investor in the Fund would receive. Past yields are no guarantee of future yields.
Source: FactSet Research Systems, Bloomberg, MICM.
GROWTH OF A $10,000 INVESTMENT SINCE INCEPTION—INVESTOR CLASS
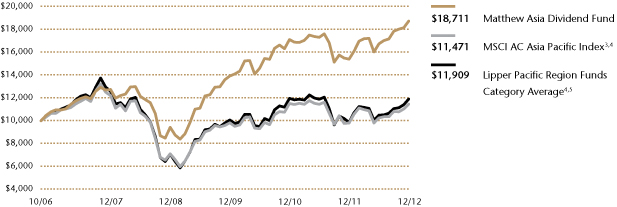
Plotted monthly. The performance data and graph do not reflect the deduction of taxes that a shareholder would pay on dividends, capital gains distributions or redemption of Fund shares. Values are in US$.
3 It is not possible to invest directly in an index. Source: Index data from Morgan Stanley Capital International and Bloomberg; total return calculations performed by BNY Mellon Investment Servicing (US) Inc. Please see page 71 for index definition.
4 Calculated from 10/31/06.
5 The Lipper Category Average does not reflect sales charges and is based on total return, including reinvestment of dividends and capital gains for the stated periods.
TOP TEN HOLDINGS6
| | Sector | | Country | | % of Net Assets | |
ITOCHU Corp. | | Industrials | | Japan | | | 4.0 | % | |
ORIX Corp. | | Financials | | Japan | | | 3.9 | % | |
Japan Tobacco, Inc. | | Consumer Staples | | Japan | | | 3.8 | % | |
HSBC Holdings PLC | | Financials | | China/Hong Kong | | | 3.5 | % | |
China Mobile, Ltd. | | Telecommunication Services | | China/Hong Kong | | | 3.4 | % | |
China Shenhua Energy Co., Ltd. | | Energy | | China/Hong Kong | | | 2.8 | % | |
Singapore Technologies Engineering, Ltd. | | Industrials | | Singapore | | | 2.6 | % | |
Television Broadcasts, Ltd. | | Consumer Discretionary | | China/Hong Kong | | | 2.5 | % | |
KT&G Corp. | | Consumer Staples | | South Korea | | | 2.4 | % | |
Shenzhou International Group Holdings, Ltd. | | Consumer Discretionary | | China/Hong Kong | | | 2.3 | % | |
% OF ASSETS IN TOP TEN | | | | | | | 31.2 | % | |
6 Holdings may combine more than one security from same issuer and related depositary receipts.
16 MATTHEWS ASIA FUNDS
Matthews Asia Dividend Fund
Portfolio Manager Commentary (continued)
predictable outcome. This has led many to pay a premium for stocks within the health care, consumer staples and utilities sectors. Unfortunately, successful investing may not be just about finding good companies, but also about buying future dividend payments at attractive prices. We believe there is nothing safe about buying overvalued assets; stable or not, gravity applies.
The inclusion of businesses exposed to a recovery in economic growth also serves as a potential hedge against higher interest rates. Monetary policies of the main central banks in developed economies are aimed at printing money to get the wheels of the global economy spinning again. These policies will likely affect Asia's economies, increasing inflationary pressures which will eventually push Asian central banks to raise interest rates or allow for their currencies to appreciate. Should interest rates move higher equities with stable, but slow growing dividends could become less attractive in comparison to alternatives such as fixed income securities. Higher inflation would in part be a result of higher input prices. This explains the initiation in Shenhua Energy and United Tractors during the year, both companies with exposure to coal. Tata Motors and Dongfeng Motors, both automobile manufacturers with strong brands, were added due to their cheap valuations and strong market positions. While dividend payments from cyclical businesses may tend to be more volatile from year to year we believe the above-mentioned companies are well-positioned to deliver growing dividends to long term investors through the economic cycle.
The Fund's holdings in Hong Kong and China combined were the main contributors to performance for the year, followed by our Singaporean holdings. At a sector level, financials were the main contributor to performance as yield-seeking investors bid up the prices on real estate investment trusts (REITs) due to their stable and above benchmark yields. We continue to have 6% invested in REITs and real estate-related trusts as these securities still offer wide yield spreads compared to their respective government bond yields, remain conservatively geared and continue to offer moderately growing income distributions. The Fund's bank and financial services holdings also posted solid performance led by ORIX and HSBC as both are getting back on their feet after the global financial crisis.
While the Fund's exposure to consumer staples remains significant at approximately 17%, the sector's portfolio weight was reduced to offset the increased weight in financials and industrials. The Fund's exposure to China has expanded significantly as valuations were cheap in relation to growth potential, especially for companies more exposed to the economic cycle and discretionary spending. The Fund's exposure to Japan, Australia and Taiwan was cut somewhat to fund the additional weight in China/Hong Kong. While the portfolio maintains an all-capitalization exposure, large-capitalization holdings expanded over the year. This was mainly due to better performance of large capitalization companies as investors preferred the safety of larger companies, but also due to the Fund exiting some smaller capitalization holdings.
Looking at the headlines as we enter 2013, there is a certain feeling of déjà vu. Europe's debt issues continue to linger and worries over an economic slowdown in China still prevail. While the U.S. economy has improved somewhat, it remains dependent on central bank policies. Uncertainty brings with it opportunity, especially for those with a contrarian view and a long-term investment approach. The Fund continues to be predominantly positioned with companies that we believe will be stable dividend-payers, while taking advantage of attractively priced cyclical businesses. As we enter the New Year, we feel fortunate to be dividend-focused investors in Asian equities. Long-term growth prospects remain solid, while yields on offer are significantly higher than those of U.S. equities.
COUNTRY ALLOCATION (%)
China/Hong Kong | | | 32.9 | | |
Japan | | | 21.2 | | |
Singapore | | | 11.8 | | |
Taiwan | | | 6.8 | | |
Australia | | | 5.8 | | |
Thailand | | | 4.8 | | |
Indonesia | | | 4.6 | | |
South Korea | | | 4.6 | | |
Malaysia | | | 2.0 | | |
Philippines | | | 1.2 | | |
India | | | 1.1 | | |
Cash and Other Assets,
Less Liabilities | | | 3.2 | | |
SECTOR ALLOCATION (%)
Financials | | | 23.9 | | |
Consumer Staples | | | 16.4 | | |
Consumer Discretionary | | | 15.0 | | |
Industrials | | | 12.9 | | |
Telecommunication Services | | | 8.2 | | |
Energy | | | 5.4 | | |
Utilities | | | 5.4 | | |
Health Care | | | 4.3 | | |
Information Technology | | | 3.2 | | |
Materials | | | 2.1 | | |
Cash and Other Assets,
Less Liabilities | | | 3.2 | | |
MARKET CAP EXPOSURE (%)7
Large Cap (over $5B) | | | 57.8 | | |
Mid Cap ($1B–$5B) | | | 26.9 | | |
Small Cap (under $1B) | | | 12.1 | | |
Cash and Other Assets,
Less Liabilities | | | 3.2 | | |
7 Source: FactSet Research Systems. Percentage values in data are rounded to the nearest tenth of one percent; the values may not sum to 100% due to rounding.
matthewsasia.com | 800.789.ASIA 17
Matthews Asia Dividend Fund December 31, 2012
Schedule of Investmentsa
COMMON EQUITIES: 95.4%
| | | Shares | | Value | |
CHINA/HONG KONG: 32.9% | |
HSBC Holdings PLC ADR | | | 2,449,791 | | | $ | 130,010,408 | | |
China Mobile, Ltd. ADR | | | 2,170,800 | | | | 127,469,376 | | |
China Shenhua Energy Co., Ltd. H Shares | | | 23,541,000 | | | | 105,447,637 | | |
Television Broadcasts, Ltd. | | | 12,470,000 | | | | 93,759,286 | | |
Shenzhou International Group
Holdings, Ltd. | | | 37,691,000 | | | | 85,596,755 | | |
Cheung Kong Holdings, Ltd. | | | 5,455,000 | | | | 84,876,568 | | |
Cheung Kong Infrastructure
Holdings, Ltd. | | | 12,468,000 | | | | 77,014,855 | | |
Jiangsu Expressway Co., Ltd. H Shares† | | | 65,104,000 | | | | 67,783,756 | | |
Minth Group, Ltd.† | | | 56,685,000 | | | | 65,882,241 | | |
Xingda International Holdings, Ltd.
H Shares† | | | 109,164,000 | | | | 57,239,943 | | |
Dongfeng Motor Group Co., Ltd.
H Shares | | | 34,700,000 | | | | 54,631,804 | | |
Guangdong Investment, Ltd. | | | 68,798,000 | | | | 54,489,887 | | |
The Link REIT | | | 10,220,000 | | | | 51,182,849 | | |
Cafe' de Coral Holdings, Ltd. | | | 16,750,000 | | | | 47,766,716 | | |
Yuexiu Transport Infrastructure, Ltd.† | | | 97,210,000 | | | | 47,257,529 | | |
Haitian International Holdings, Ltd. | | | 28,769,000 | | | | 34,333,428 | | |
Sichuan Expressway Co., Ltd. H Shares† | | | 74,946,000 | | | | 27,291,412 | | |
China Fishery Group, Ltd. | | | 13,477,000 | | | | 6,071,816 | | |
Total China/Hong Kong | | | | | 1,218,106,266 | | |
JAPAN: 21.2% | |
ITOCHU Corp. | | | 14,094,500 | | | | 148,966,192 | | |
ORIX Corp. | | | 1,285,720 | | | | 145,233,046 | | |
Japan Tobacco, Inc. | | | 5,026,400 | | | | 141,992,662 | | |
Pigeon Corp.† | | | 1,501,800 | | | | 71,871,215 | | |
NTT DoCoMo, Inc. | | | 44,250 | | | | 63,787,270 | | |
Lawson, Inc. | | | 815,100 | | | | 55,292,416 | | |
Hisamitsu Pharmaceutical Co., Inc. | | | 979,200 | | | | 48,735,140 | | |
Miraca Holdings, Inc. | | | 1,078,200 | | | | 43,473,863 | | |
EPS Corp.† | | | 14,592 | | | | 37,550,443 | | |
Shinko Plantech Co., Ltd.† | | | 3,760,200 | | | | 29,761,906 | | |
Total Japan | | | | | 786,664,153 | | |
SINGAPORE: 11.8% | |
Singapore Technologies Engineering, Ltd. | | | 30,906,000 | | | | 97,545,692 | | |
Ascendas REIT | | | 42,725,000 | | | | 83,609,455 | | |
United Overseas Bank, Ltd. | | | 4,925,000 | | | | 80,789,909 | | |
CapitaRetail China Trust, REIT† | | | 47,540,000 | | | | 64,348,195 | | |
Super Group, Ltd. | | | 15,097,000 | | | | 40,186,591 | | |
ARA Asset Management, Ltd. | | | 27,240,600 | | | | 36,429,416 | | |
Ascendas India Trust† | | | 55,065,000 | | | | 33,808,481 | | |
Total Singapore | | | | | 436,717,739 | | |
| | | Shares | | Value | |
TAIWAN: 6.8% | |
Taiwan Semiconductor Manufacturing
Co., Ltd. ADR | | | 4,005,040 | | | $ | 68,726,486 | | |
Johnson Health Tech Co., Ltd.† | | | 16,429,890 | | | | 42,196,664 | | |
TXC Corp.† | | | 21,549,524 | | | | 35,711,629 | | |
Chunghwa Telecom Co., Ltd. ADR | | | 985,701 | | | | 31,877,570 | | |
St. Shine Optical Co., Ltd. | | | 1,911,000 | | | | 29,228,034 | | |
Taiwan Hon Chuan Enterprise Co., Ltd. | | | 12,151,948 | | | | 26,738,866 | | |
Taiwan Semiconductor Manufacturing
Co., Ltd. | | | 4,646,469 | | | | 15,541,558 | | |
Total Taiwan | | | | | 250,020,807 | | |
AUSTRALIA: 5.8% | |
Metcash, Ltd. | | | 20,917,446 | | | | 72,515,489 | | |
Coca-Cola Amatil, Ltd. | | | 3,874,730 | | | | 54,453,091 | | |
QBE Insurance Group, Ltd. | | | 4,484,726 | | | | 51,385,829 | | |
David Jones, Ltd. | | | 14,887,739 | | | | 36,662,333 | | |
Total Australia | | | | | 215,016,742 | | |
THAILAND: 4.8% | |
PTT Exploration & Production Public
Co., Ltd. | | | 12,119,260 | | | | 65,372,571 | | |
Thai Beverage Public Co., Ltd. | | | 199,641,000 | | | | 64,904,285 | | |
Tisco Financial Group Public Co., Ltd. | | | 28,100,000 | | | | 48,079,418 | | |
Total Thailand | | | | | 178,356,274 | | |
INDONESIA: 4.6% | |
PT Perusahaan Gas Negara Persero | | | 142,302,000 | | | | 68,140,314 | | |
PT United Tractors | | | 27,440,000 | | | | 56,603,547 | | |
PT Telekomunikasi Indonesia Persero ADR | | | 717,634 | | | | 26,516,576 | | |
PT Indofood Sukses Makmur | | | 17,368,500 | | | | 10,565,324 | | |
PT Telekomunikasi Indonesia Persero | | | 9,036,500 | | | | 8,517,148 | | |
Total Indonesia | | | | | 170,342,909 | | |
SOUTH KOREA: 3.2% | |
KT&G Corp. | | | 1,159,000 | | | | 87,894,839 | | |
MegaStudy Co., Ltd. | | | 232,984 | | | | 17,186,392 | | |
Woongjin Thinkbig Co., Ltd.† | | | 2,079,870 | | | | 12,766,854 | | |
Total South Korea | | | | | 117,848,085 | | |
MALAYSIA: 2.0% | |
AMMB Holdings BHD | | | 33,200,000 | | | | 73,742,976 | | |
Total Malaysia | | | | | 73,742,976 | | |
PHILIPPINES: 1.2% | |
Globe Telecom, Inc. | | | 1,703,820 | | | | 45,461,618 | | |
Total Philippines | | | | | 45,461,618 | | |
INDIA: 1.1% | |
Tata Motors, Ltd. DVR A Shares | | | 12,900,000 | | | | 41,515,594 | | |
Total India | | | | | 41,515,594 | | |
TOTAL COMMON EQUITIES | | | | | 3,533,793,163 | | |
(Cost $3,039,059,360) | | | | | |
18 MATTHEWS ASIA FUNDS
Matthews Asia Dividend Fund December 31, 2012
Schedule of Investmentsa (continued)
PREFERRED EQUITIES: 1.4%
| | | Shares | | Value | |
SOUTH KOREA: 1.4% | |
LG Chem, Ltd., Pfd. | | | 525,654 | | | $ | 50,439,110 | | |
Total South Korea | | | | | 50,439,110 | | |
TOTAL PREFERRED EQUITIES | | | | | 50,439,110 | | |
(Cost $46,847,159) | | | | | |
TOTAL INVESTMENTS: 96.8% | | | 3,584,232,273 | | |
(Cost $3,085,906,519b) | | | |
CASH AND OTHER ASSETS,
LESS LIABILITIES: 3.2% | | | 118,372,030 | | |
NET ASSETS: 100.0% | | $ | 3,702,604,303 | | |
a Certain securities were fair valued under the discretion of the Board of Trustees (Note 2-A).
b Cost for federal income tax purposes is $3,178,241,782 and net unrealized appreciation consists of:
Gross unrealized appreciation | | $ | 564,197,385 | | |
Gross unrealized depreciation | | | (158,206,894 | ) | |
Net unrealized appreciation | | $ | 405,990,491 | | |
† Affiliated Issuer, as defined under the Investment Company Act of 1940 (ownership of 5% or more of the outstanding voting securities of this issuer)
ADR American Depositary Receipt
BHD Berhad
DVR Differential Voting Right
REIT Real Estate Investment Trust
Pfd. Preferred
See accompanying notes to financial statements.
matthewsasia.com | 800.789.ASIA 19

ASIA GROWTH AND INCOME STRATEGIES
PORTFOLIO MANAGERS
Jesper O. Madsen, CFA
Lead Manager
Yu Zhang, CFA
Co-Manager
FUND FACTS
| | | Investor Class | | Institutional Class | |
Ticker | | MCDFX | | MICDX | |
CUSIP | | 577125305 | | 577130735 | |
Inception | | 11/30/09 | | 10/29/10 | |
NAV | | $12.35 | | $12.34 | |
Initial Investment | | $2,500 | | $3 million | |
Gross Expense Ratio1 | | 1.47% | | 1.29% | |
After Fee Waiver,
Reimbursement
and Recapture | | 1.50% | | n.a. | |
Portfolio Statistics
Total # of Positions | | 36 | |
Net Assets | | $59.7 million | |
Weighted Average Market Cap | | $35.7 billion | |
Portfolio Turnover | | 21.40%2 | |
Benchmark
MSCI China Index
Redemption Fee
2% within first 90 calendar days of purchase
OBJECTIVE
Total return with an emphasis on providing current income.
STRATEGY
Under normal market conditions, the Fund seeks to achieve its investment objective by investing at least 80% of its total net assets, which include borrowings for investment purposes, in income-paying equity securities of companies located in China and Taiwan. The Fund may also invest in convertible debt and equity securities. China includes its administrative and other districts, such as Hong Kong.
1 The Advisor has contractually agreed to waive Matthews China Dividend Fund's fees and reimburse expenses until at least August 31, 2013 to the extent needed to limit total annual operating expenses to 1.50%. Please see page 111 for additional information. Matthews Asia Funds does not charge 12b-1 fees.
2 The lesser of fiscal year 2012 long-term purchase costs or sales proceeds divided by the average monthly market value of long-term securities.
Matthews China Dividend Fund
Portfolio Manager Commentary
For the year ending December 31, 2012, the Matthews China Dividend Fund gained 27.81% (Investor Class) and 27.90% (Institutional Class), outperforming its benchmark, the MSCI China Index, which rose 23.10%. For the fourth quarter of the year, the Fund rose 10.27% (Investor Class) and 10.32% (Institutional Class), versus 12.88% for the Index. The Fund distributed a total dividend of 45.75 cents per share for the Investor Class during the year. In November, the Fund reached its third anniversary since inception.
The year 2012 is expected to mark the end of China's 12-year streak of generating annual GDP growth in excess of 8%. Both fixed asset investments and exports, historically the two biggest engines of China's economic growth, continued to decelerate. Domestic consumption, another important pillar of growth, also experienced some slowdown, though it still outpaced the overall economy. Against this backdrop, investors generally turned more pessimistic toward the near-term earnings outlook of Chinese companies, and the equity market sold off aggressively during the first half of the year. However, as both the U.S. and Europe administered quantitative easing policies, the price of global equities, including Chinese equities, reversed their downward trend and staged a strong rally during the second half of 2012.
While we are starting to see early signs of an improving macroeconomic picture in China, we should not lose sight that there are risks in terms of the sustainability of a recovery. One potential risk is the rise of China's informal lending through its so-called "shadow banking" system. In many cases, informal lending is used to fund quite risky ventures, such as speculative real estate developments, or new infrastructure projects at the local government level, which tend to have economic returns that are difficult to estimate. Those loans tend to be packaged into high-yielding wealth management products and are sold to less sophisticated retail and corporate investors. It is hard to obtain an exact figure on the size of such informal lending; however, one estimate puts it at approximately US$2 trillion. While these loans stem largely from outside China's official banking system, many Chinese banks have played active roles in distributing these products. Our strategy has therefore continued to avoid such Chinese banks, despite their high dividends, as there remains poor disclosure over the potential impact to bank balance sheets should these loans default.
Amid the year's volatility, it was not surprising that investors sought out companies with defensive business models and high dividend yields, which outperformed the broad market. Among the top contributors to Fund performance for the year were our real estate investment trusts (REIT). CapitaRetail China Trust, a Singapore-listed REIT that owns a portfolio of mid-range shopping malls in mainland China, was the top performance contributor to the Fund for the year. Its business of leasing retail space in its shopping malls ties well into our investment philosophy that attempts to capitalize on the rising domestic consumption trend of China's rapidly growing middle class. The REIT also demonstrated higher yield relative to the Singapore market average, and is considered by investors to be a defensive investment. At a sector level, the Fund's holdings in consumer discretionary were the best performers for 2012. Most of the those holdings exhibited similar fundamental attributes, such as
20 MATTHEWS ASIA FUNDS
PERFORMANCE AS OF DECEMBER 31, 2012
| | | | | | Average Annual
Total Returns | | | |
| | 3 Months | | 1 Year | | 3 Years | | Since
Inception | | Inception
Date | |
Investor Class (MCDFX) | | | 10.27 | % | | | 27.81 | % | | | 10.24 | % | | | 10.59 | % | | 11/30/09 | |
Institutional Class (MICDX) | | | 10.32 | % | | | 27.90 | % | | | n.a. | | | | 6.22 | % | | 10/29/10 | |
MSCI China Index3 | | | 12.88 | % | | | 23.10 | % | | | 1.80 | % | | | 1.91 | %4 | | | |
Lipper China Region Funds Category Average5 | | | 10.80 | % | | | 18.46 | % | | | 0.59 | % | | | 1.26 | %4 | | | |
Performance assumes reinvestment of all dividends and/or distributions before taxes. All performance quoted represents past performance and is no guarantee of future results. Investment return and principal value will fluctuate with market conditions so that when redeemed, shares may be worth more or less than their original cost. Current performance may be lower or higher than the return figures quoted. Returns would have been lower if certain of the Fund's fees and expenses had not been waived. For the Fund's most recent month-end performance, visit matthewsasia.com.
INCOME DISTRIBUTION HISTORY
| | 2012 | | 2011 | |
| | June | | December | | Total | | June | | December | | Total | |
Investor (MCDFX) | | $ | 0.22 | | | $ | 0.23 | | | $ | 0.45 | | | $ | 0.15 | | | $ | 0.20 | | | $ | 0.35 | | |
Institutional (MICDX) | | $ | 0.23 | | | $ | 0.25 | | | $ | 0.48 | | | $ | 0.17 | | | $ | 0.21 | | | $ | 0.38 | | |
Note: This table does not include capital gains distributions. Totals may differ by $0.01 due to rounding. For income distribution history, visit matthewsasia.com.
30-DAY YIELD:
1.44% (Investor Class) 1.76% (Institutional Class)
The 30-Day Yield represents net investment income earned by the Fund over the 30-day period ended 12/31/12, expressed as an annual percentage rate based on the Fund's share price at the end of the 30-day period. The 30-Day Yield should be regarded as an estimate of the Fund's rate of investment income, and it may not equal the Fund's actual income distribution rate.
Source: BNY Mellon Investment Servicing (US) Inc.
DIVIDEND YIELD: 3.74%
The dividend yield (trailing) for the portfolio is the weighted average sum of the dividend paid per share during the last 12 months divided by the current price. The annualized dividend yield for the Fund is for the equity-only portion of the portfolio. Please note that this is based on gross portfolio holdings and does not reflect the actual yield an investor in the Fund would receive. Past yields are no guarantee of future yields.
Source: FactSet Research Systems, Bloomberg, MICM.
GROWTH OF A $10,000 INVESTMENT SINCE INCEPTION—INVESTOR CLASS
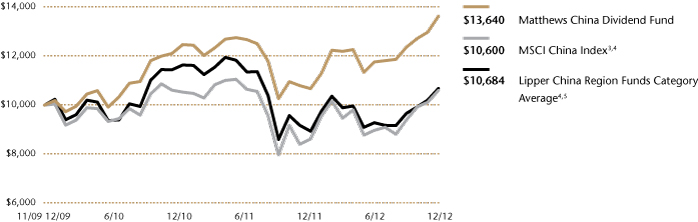
Plotted monthly. The performance data does not reflect the deduction of taxes that a shareholder would pay on dividends, capital gains distributions or redemption of Fund shares. Values are in US$.
3 It is not possible to invest directly in an index. Source: Index data from Morgan Stanley Capital International and Bloomberg; total return calculations performed by BNY Mellon Investment Servicing (US) Inc. Please see page 71 for index definition.
4 Calculated from 11/30/09.
5 The Lipper Category Average does not reflect sales charges and is based on total return, including reinvestment of dividends and capital gains for the stated periods.
TOP TEN HOLDINGS6
| | Sector | | % of Net Assets | |
China Mobile, Ltd. | | Telecommunication Services | | | 4.9 | % | |
HSBC Holdings PLC | | Financials | | | 4.4 | % | |
China Shenhua Energy Co., Ltd. | | Energy | | | 4.0 | % | |
Yantai Changyu Pioneer Wine Co. | | Consumer Staples | | | 3.7 | % | |
Television Broadcasts, Ltd. | | Consumer Discretionary | | | 3.5 | % | |
China Merchants Holdings International Co., Ltd. | | Industrials | | | 3.4 | % | |
Yuexiu Real Estate Investment Trust, REIT | | Financials | | | 3.4 | % | |
China Petroleum & Chemical Corp. | | Energy | | | 3.3 | % | |
CapitaRetail China Trust, REIT | | Financials | | | 3.3 | % | |
CNOOC, Ltd. | | Energy | | | 3.3 | % | |
% OF ASSETS IN TOP TEN | | | | | 37.2 | % | |
6 Holdings may combine more than one security from same issuer and related depositary receipts.
matthewsasia.com | 800.789.ASIA 21
COUNTRY ALLOCATION (%)7
China/Hong Kong | | | 73.9 | | |
Taiwan | | | 16.9 | | |
Singapore | | | 3.3 | | |
Cash and Other Assets,
Less Liabilities | | | 5.9 | | |
SECTOR ALLOCATION (%)
Consumer Discretionary | | | 21.8 | | |
Financials | | | 17.6 | | |
Industrials | | | 14.0 | | |
Energy | | | 10.6 | | |
Telecommunication Services | | | 7.7 | | |
Consumer Staples | | | 6.0 | | |
Information Technology | | | 5.3 | | |
Health Care | | | 4.8 | | |
Utilities | | | 4.5 | | |
Materials | | | 1.8 | | |
Cash and Other Assets,
Less Liabilities | | | 5.9 | | |
MARKET CAP EXPOSURE (%)8
Large Cap (over $5B) | | | 38.8 | | |
Mid Cap ($1B–$5B) | | | 34.9 | | |
Small Cap (under $1B) | | | 20.4 | | |
Cash and Other Assets,
Less Liabilities | | | 5.9 | | |
7 Not all countries are included in the benchmark index(es).
8 Source: FactSet Research Systems. Percentage values in data are rounded to the nearest tenth of one percent; the values may not sum to 100% due to rounding.
Matthews China Dividend Fund
Portfolio Manager Commentary (continued)
leading positions within their industries, conservatively managed balance sheet, strong cash flow generation and a consistent or rising dividend trend.
The Fund's holdings in more cyclical parts of the economy were among the top detractors to the performance during the year. E-House China, a real estate brokerage and online service company in China was hit especially hard. While the physical transaction volume in the residential property market bottomed out during the first half of the year—which benefited E-House's volume-driven brokerage business—the company had a delay in a meaningful turnaround of its profitability, mainly due to a lack of effective cost controls. However, we still believe that E-House's businesses should continue to see a gradual recovery as China's property market improves. With a net-cash balance sheet, the valuation should find support at the current level, and it still has the capacity to make ongoing dividend payments.
During the year, the Fund also exited positions in certain other cyclical names, including Yip's Chemical, Kingboard Laminate and Cyberlink as these companies faced more severe headwinds, either in terms of intensifying competition, or in their ability to adapt in a fast-changing environment. As a result, we believe their ability to maintain and grow dividends over the long run will become more challenging.
The gyrations in 2012 for China's market once again reminded us that when investing in such a developing economy, investors should be mindful of the underlying risks of owning equities and remember that valuations matter to long-term returns. In our view, a balanced dividend-investing approach that focuses on both dividend yield and dividend growth is an effective tool to remain disciplined and to capture potential growth in China's developing economy.
When we assess a company's prospects for increasing its dividends, we focus mainly on those companies that can fund both their business expansion plans and dividend payments with internally generated cash flow—telling signs for sustainable business models and higher earnings quality. During the year, all 36 companies in the Fund's portfolio declared dividends. Out of those, 22 holdings raised their dividends, 6 holdings maintained their dividends and 8 companies had a dividend cut. Equally important is our focus on dividend yield, an effective valuation gauge to minimize the risk of overpaying for growth. In addition, by receiving an adequate income stream in the form of dividends, investors can be partially compensated for the risk of owning the equity portion of a company. Such dividend income may seem trivial at times, but over the long run it could constitute a significant component of investors' total return. China, over the years, has grown both its dividend pool and the number of dividend-paying companies significantly. Total dividends surpassed US$71 billion in 2011, an 18% compound annual growth rate from US$8 billion in 1998. Out of that amount, US$51 billion, or 72% of the total pool, were paid by companies that have listed since 1998. As we enter 2013, we remain excited about the new opportunities in China for dividend investing.
22 MATTHEWS ASIA FUNDS
Matthews China Dividend Fund December 31, 2012
Schedule of Investmentsa
COMMON EQUITIES: 94.1%
| | | Shares | | Value | |
CONSUMER DISCRETIONARY: 21.8% | |
Auto Components: 6.8% | |
Xingda International Holdings, Ltd.
H Shares | | | 3,413,000 | | | $ | 1,789,600 | | |
Minth Group, Ltd. | | | 1,538,000 | | | | 1,787,543 | | |
Xinyi Glass Holdings, Ltd. | | | 812,000 | | | | 510,502 | | |
| | | | | | 4,087,645 | | |
Media: 3.5% | |
Television Broadcasts, Ltd. | | | 278,000 | | | | 2,090,223 | | |
Hotels, Restaurants & Leisure: 3.0% | |
Cafe' de Coral Holdings, Ltd. | | | 620,000 | | | | 1,768,081 | | |
Automobiles: 2.9% | |
Dongfeng Motor Group Co., Ltd. H Shares | | | 1,100,000 | | | | 1,731,844 | | |
Textiles, Apparel & Luxury Goods: 2.8% | |
Shenzhou International Group Holdings, Ltd. | | | 745,000 | | | | 1,691,905 | | |
Leisure Equipment & Products: 2.8% | |
Johnson Health Tech Co., Ltd. | | | 652,132 | | | | 1,674,862 | | |
Total Consumer Discretionary | | | | | 13,044,560 | | |
FINANCIALS: 17.6% | |
Real Estate Investment Trusts: 8.9% | |
Yuexiu, REIT | | | 4,250,000 | | | | 2,032,283 | | |
CapitaRetail China Trust, REIT | | | 1,456,000 | | | | 1,970,782 | | |
The Link REIT | | | 257,500 | | | | 1,289,587 | | |
| | | | | | 5,292,652 | | |
Commercial Banks: 4.4% | |
HSBC Holdings PLC ADR | | | 49,900 | | | | 2,648,193 | | |
Real Estate Management & Development: 4.3% | |
Cheung Kong Holdings, Ltd. | | | 95,000 | | | | 1,478,144 | | |
Swire Pacific, Ltd. A Shares | | | 53,000 | | | | 662,973 | | |
E-House China Holdings, Ltd. ADS | | | 104,000 | | | | 426,400 | | |
| | | | | | 2,567,517 | | |
Total Financials | | | | | 10,508,362 | | |
INDUSTRIALS: 14.0% | |
Transportation Infrastructure: 9.1% | |
China Merchants Holdings International
Co., Ltd. | | | 626,000 | | | | 2,044,355 | | |
Jiangsu Expressway Co., Ltd. H Shares | | | 1,496,000 | | | | 1,557,577 | | |
Yuexiu Transport Infrastructure, Ltd. | | | 2,778,000 | | | | 1,350,493 | | |
Sichuan Expressway Co., Ltd. H Shares | | | 1,356,000 | | | | 493,784 | | |
| | | | | | 5,446,209 | | |
Air Freight & Logistics: 2.5% | |
Shenzhen Chiwan Petroleum B Shares | | | 1,052,976 | | | | 1,503,892 | | |
Machinery: 2.4% | |
Haitian International Holdings, Ltd. | | | 1,193,000 | | | | 1,423,747 | | |
Total Industrials | | | | | 8,373,848 | | |
| | | Shares | | Value | |
ENERGY: 10.6% | |
Oil, Gas & Consumable Fuels: 10.6% | |
China Shenhua Energy Co., Ltd. H Shares | | | 529,000 | | | $ | 2,369,560 | | |
China Petroleum & Chemical Corp. ADR | | | 17,240 | | | | 1,981,221 | | |
CNOOC, Ltd. ADR | | | 8,950 | | | | 1,969,000 | | |
Total Energy | | | | | 6,319,781 | | |
TELECOMMUNICATION SERVICES: 7.7% | |
Wireless Telecommunication Services: 4.9% | |
China Mobile, Ltd. ADR | | | 49,730 | | | | 2,920,146 | | |
Diversified Telecommunication Services: 2.8% | |
Chunghwa Telecom Co., Ltd. ADR | | | 52,704 | | | | 1,704,447 | | |
Total Telecommunication Services | | | | | 4,624,593 | | |
CONSUMER STAPLES: 6.0% | |
Beverages: 3.7% | |
Yantai Changyu Pioneer Wine Co., Ltd.
B Shares | | | 378,356 | | | | 2,238,732 | | |
Food Products: 2.3% | |
Vitasoy International Holdings, Ltd. | | | 1,306,000 | | | | 1,343,708 | | |
Total Consumer Staples | | | | | 3,582,440 | | |
INFORMATION TECHNOLOGY: 5.3% | |
Electronic Equipment, Instruments & Components: 3.1% | |
TXC Corp. | | | 894,199 | | | | 1,481,857 | | |
Digital China Holdings, Ltd. | | | 222,000 | | | | 383,901 | | |
| | | | | | 1,865,758 | | |
Semiconductors & Semiconductor Equipment: 2.2% | |
Taiwan Semiconductor Manufacturing
Co., Ltd. | | | 388,000 | | | | 1,297,786 | | |
Total Information Technology | | | | | 3,163,544 | | |
HEALTH CARE: 4.8% | |
Health Care Equipment & Supplies: 4.8% | |
Pacific Hospital Supply Co., Ltd. | | | 619,000 | | | | 1,770,534 | | |
St. Shine Optical Co., Ltd. | | | 72,000 | | | | 1,101,213 | | |
Total Health Care | | | | | 2,871,747 | | |
UTILITIES: 4.5% | |
Water Utilities: 2.6% | |
Guangdong Investment, Ltd. | | | 1,936,000 | | | | 1,533,365 | | |
Electric Utilities: 1.9% | |
Cheung Kong Infrastructure Holdings, Ltd. | | | 182,000 | | | | 1,124,214 | | |
Total Utilities | | | | | 2,657,579 | | |
matthewsasia.com | 800.789.ASIA 23
Matthews China Dividend Fund December 31, 2012
Schedule of Investmentsa (continued)
COMMON EQUITIES (continued)
| | | Shares | | Value | |
MATERIALS: 1.8% | |
Containers & Packaging: 1.8% | |
Taiwan Hon Chuan Enterprise Co., Ltd. | | | 483,354 | | | $ | 1,063,562 | | |
Total Materials | | | | | 1,063,562 | | |
TOTAL INVESTMENTS: 94.1% | | | | | 56,210,016 | | |
(Cost $49,658,662b) | | | | | |
CASH AND OTHER ASSETS,
LESS LIABILITIES: 5.9% | | | | | 3,526,337 | | |
NET ASSETS: 100.0% | | | | $ | 59,736,353 | | |
a Certain securities were fair valued under the discretion of the Board of Trustees (Note 2-A).
b Cost for federal income tax purposes is $50,616,032 and net unrealized appreciation consists of:
Gross unrealized appreciation | | $ | 6,510,441 | | |
Gross unrealized depreciation | | | (916,457 | ) | |
Net unrealized appreciation | | $ | 5,593,984 | | |
ADR American Depositary Receipt
ADS American Depositary Share
REIT Real Estate Investment Trust
See accompanying notes to financial statements.
24 MATTHEWS ASIA FUNDS

PORTFOLIO MANAGERS
Taizo Ishida
Lead Manager
Sharat Shroff, CFA
Co-Manager
FUND FACTS
| | | Investor Class | | Institutional Class | |
Ticker | | MPACX | | MIAPX | |
CUSIP | | 577130867 | | 577130776 | |
Inception | | 10/31/03 | | 10/29/10 | |
NAV | | $18.02 | | $18.08 | |
Initial Investment | | $2,500 | | $3 million | |
Gross Expense Ratio1 | | 1.16% | | 0.98% | |
Portfolio Statistics
Total # of Positions | | 55 | |
Net Assets | | $424.0 million | |
Weighted Average Market Cap | | $18.5 billion | |
Portfolio Turnover | | 44.76%2 | |
Benchmark
MSCI AC Asia Pacific Index
Redemption Fee
2% within first 90 calendar days of purchase
OBJECTIVE
Long-term capital appreciation.
STRATEGY
Under normal market conditions, the Fund seeks to achieve its investment objective by investing at least 80% of its total net assets, which include borrowings for investment purposes, in the common and preferred stocks of companies located in Asia, including developed, emerging and frontier countries and markets in the Asian region. The Fund may also invest in the convertible securities, of any duration or quality, of Asian companies.
1 Matthews Asia Funds does not charge 12b-1 fees.
2 The lesser of fiscal year 2012 long-term purchase costs or sales proceeds divided by the average monthly market value of long-term securities.
Matthews Asia Growth Fund
Portfolio Manager Commentary
For the year ending December 31, 2012, the Matthews Asia Growth Fund rose 17.47% (Investor Class) and 17.63% (Institutional Class), while its benchmark, the MSCI All Country Asia Pacific Index, rose 17.05%. For the fourth quarter of the year, the Fund returned 2.44% (Investor Class) and 2.49% (Institutional Class) versus 5.92% for the benchmark Index.
Throughout 2012, consumer-facing industries, particularly the health care, consumer discretionary and consumer staples sectors performed well. During the fourth quarter, we added a new position in Sapurakencana Petroleum BHD, an integrated Malaysian oil and gas services provider—the only firm of its kind in Asia. We like this holding as the company is also quite competitive against larger "old world" rivals including those in Italy, France, U.K. and the U.S. The firm has consistently gained market share with its two advantages: low operating cost and new assets. Its strategy is to break into the high pricing environment, with more attractive bids when opportunities arise. This is a welcome addition as the portfolio holds only one other liquefied natural gas exploration company and we believe this a sector that has good growth prospects.
The fourth quarter was fairly eventful in terms of political leadership changes in China, South Korea and Japan. However, the most noteworthy event was the significant drop in the Japanese yen against the U.S. dollar—approximately 12%—which pushed the Nikkei Index over 10,000 for the first time since April 2012. The Index closed the year with a high single-digit return in U.S. dollar terms. The rally late in the year was also heavily influenced by the mid-November call for elections in Japan and further strengthened after Prime Minister Shinzo Abe secured a rare second term in office in mid-December. Abe had campaigned on a pledge to strengthen Japan's economy with a higher inflation target than that previously set by the Bank of Japan.
As we anticipated a weakening yen at the start of 2012, we positioned the portfolio accordingly, adding exporters that stood to benefit such as auto firms Toyota Motor and Fuji Heavy Industries, manufacturer of Subaru vehicles. While Japan saw a boost stemming from political developments, China's strong fourth quarter performance—with the MSCI China Index up nearly 13%—seemed to have less to do with its transition in political leadership than it had to do with an overall improvement in the macroeconomic environment.
While we are pleased with the Fund's annual return, we experienced a significant underperformance against the benchmark in the fourth quarter, mainly due to a softening in stock prices of our holdings in the financials and information technology sectors.
Contributors to performance by country, spanning developed and frontier markets, were mixed during the year. However, overall, we are pleased with this performance given our strategy aims to invest across a broad and diverse set of markets in the region. As always, our focus remains on bottom-up stock selection to determine the direction and performance of the portfolio. Poor performance among a handful names such as NIDEC, EVA Precision Industrial and Kingdee International Software negatively impacted returns for the year. EVA Precision Industrial is a Hong Kong-based die mold manufacturer. The company recently expanded into less profitable areas of business, including manufacturing printer
matthewsasia.com | 800.789.ASIA 25
PERFORMANCE AS OF DECEMBER 31, 2012
| | | | | | | Average Annual Total Returns | | | |
| | 3 Months | | 1 Year | | 3 Years | | 5 Years | | Since
Inception | | Inception
Date | |
Investor Class (MPACX) | | | 2.44 | % | | | 17.47 | % | | | 9.16 | % | | | 3.34 | % | | | 9.63 | % | | 10/31/03 | |
Institutional Class (MIAPX) | | | 2.49 | % | | | 17.63 | % | | | n.a. | | | | n.a. | | | | 2.57 | % | | 10/29/10 | |
MSCI AC Asia Pacific Index3 | | | 5.92 | % | | | 17.05 | % | | | 5.30 | % | | | -1.23 | % | | | 7.45 | %4 | | | |
Lipper Pacific Region Funds Category Average5 | | | 7.33 | % | | | 22.25 | % | | | 5.38 | % | | | -1.51 | % | | | 7.44 | %4 | | | |
Performance assumes reinvestment of all dividends and/or distributions before taxes. All performance quoted represents past performance and is no guarantee of future results. Investment return and principal value will fluctuate with market conditions so that when redeemed, shares may be worth more or less than their original cost. Current performance may be lower or higher than the return figures quoted. Returns would have been lower if certain of the Fund's fees and expenses had not been waived. For the Fund's most recent month-end performance, visit matthewsasia.com.
GROWTH OF A $10,000 INVESTMENT SINCE INCEPTION—INVESTOR CLASS
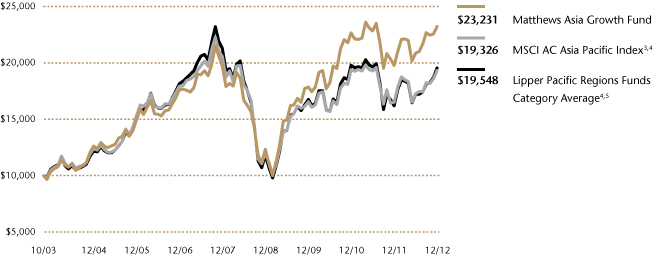
Plotted monthly. The performance data and graph do not reflect the deduction of taxes that a shareholder would pay on dividends, capital gains distributions or redemption of Fund shares. Values are in US$.
3 It is not possible to invest directly in an index. Source: Index data from Morgan Stanley Capital International and Bloomberg; total return calculations performed by BNY Mellon Investment Servicing (US) Inc. Please see page 71 for index definition.
4 Calculated from 10/31/03.
5 The Lipper Category Average does not reflect sales charges and is based on total return, including reinvestment of dividends and capital gains for the stated periods.
TOP TEN HOLDINGS6
| | Sector | | Country | | % of Net Assets | |
ORIX Corp. | | Financials | | Japan | | | 5.2 | % | |
Toyota Motor Corp. | | Consumer Discretionary | | Japan | | | 5.0 | % | |
PT Indofood CBP Sukses Makmur | | Consumer Staples | | Indonesia | | | 3.3 | % | |
John Keells Holdings PLC | | Industrials | | Sri Lanka | | | 2.8 | % | |
Mitsui & Co., Ltd. | | Industrials | | Japan | | | 2.8 | % | |
Vietnam Dairy Products JSC | | Consumer Staples | | Vietnam | | | 2.7 | % | |
St. Shine Optical Co., Ltd. | | Health Care | | Taiwan | | | 2.6 | % | |
Emami, Ltd. | | Consumer Staples | | India | | | 2.5 | % | |
Sinopharm Group Co., Ltd. | | Health Care | | China/Hong Kong | | | 2.4 | % | |
Oil Search, Ltd. | | Energy | | Australia | | | 2.3 | % | |
% OF ASSETS IN TOP TEN | | | | | | | 31.6 | % | |
6 Holdings may combine more than one security from same issuer and related depositary receipts.
26 MATTHEWS ASIA FUNDS
Matthews Asia Growth Fund
Portfolio Manager Commentary (continued)
components and auto parts. We exited this holding as we believe these moves may contribute to a decline in the firm's profitability, already impacted by a sluggish global economy. During the year, we also exited Kingdee International Software, an enterprise resource planning software firm in China, as we became concerned over its declining volume growth amid the slowdown in China's economy.
Looking ahead, fiscal uncertainties in Europe and the U.S. may pose more risk for Asia than any concerns that exist within the region. Economic growth in developing Asia is projected at 6.6% in 2013, compared with 6.0% in 2012, according to Asia Development Bank (ADB), and we believe developing Asia should continue to offer compelling growth opportunities for investors. Particularly encouraging is that levels of inflation are relatively low throughout the region, and currently pose little concern. Lower food prices should boost consumer spending power.
As disposable incomes continue to rise in the region, Asia should still benefit from rapid growth of its emerging middle class. As a result, two important trends to note are consumers trading up for better lifestyle products as they grow in affluence and that of a manufacturing shift from China to more Southeast Asian economies as wages rise along Chinese coastal areas. Global companies are increasingly sourcing from countries such as Bangladesh or Myanmar, which in turn increases employment in those nations. Consequently, as valuations have risen somewhat in Southeast Asian countries over the past few years, we continue to seek more compelling opportunities in the region's frontier markets.
COUNTRY ALLOCATION (%)7
Japan | | | 34.1 | | |
China/Hong Kong | | | 18.2 | | |
India | | | 8.4 | | |
Thailand | | | 7.5 | | |
Indonesia | | | 7.2 | | |
Taiwan | | | 5.4 | | |
Australia | | | 4.1 | | |
Malaysia | | | 3.4 | | |
Sri Lanka | | | 2.8 | | |
Singapore | | | 2.8 | | |
Vietnam | | | 2.7 | | |
Cambodia | | | 1.6 | | |
South Korea | | | 0.9 | | |
Cash and Other Assets,
Less Liabilities | | | 0.9 | | |
SECTOR ALLOCATION (%)
Consumer Discretionary | | | 25.7 | | |
Financials | | | 16.8 | | |
Industrials | | | 16.2 | | |
Consumer Staples | | | 14.8 | | |
Health Care | | | 11.8 | | |
Information Technology | | | 6.6 | | |
Energy | | | 4.8 | | |
Materials | | | 2.4 | | |
Cash and Other Assets,
Less Liabilities | | | 0.9 | | |
MARKET CAP EXPOSURE (%)8
Large Cap (over $5B) | | | 52.9 | | |
Mid Cap ($1B–$5B) | | | 35.0 | | |
Small Cap (under $1B) | | | 11.2 | | |
Cash and Other Assets,
Less Liabilities | | | 0.9 | | |
7 Not all countries are included in the benchmark index(es).
8 Source: FactSet Research Systems. Percentage values in data are rounded to the nearest tenth of one percent; the values may not sum to 100% due to rounding.
matthewsasia.com | 800.789.ASIA 27
Matthews Asia Growth Fund December 31, 2012
Schedule of Investmentsa
COMMON EQUITIES: 99.1%
| | | Shares | | Value | |
JAPAN: 34.1% | |
ORIX Corp. | | | 194,280 | | | $ | 21,945,584 | | |
Toyota Motor Corp. | | | 458,200 | | | | 21,396,174 | | |
Mitsui & Co., Ltd. | | | 792,500 | | | | 11,878,676 | | |
FANUC Corp. | | | 50,000 | | | | 9,302,480 | | |
Kakaku.com, Inc. | | | 264,600 | | | | 8,735,287 | | |
Rakuten, Inc. | | | 1,079,000 | | | | 8,414,531 | | |
Sysmex Corp. | | | 173,600 | | | | 7,994,074 | | |
Rinnai Corp. | | | 117,500 | | | | 7,983,407 | | |
Komatsu, Ltd. | | | 276,500 | | | | 7,095,101 | | |
Honda Motor Co., Ltd. | | | 174,100 | | | | 6,447,730 | | |
Nidec Corp. | | | 109,400 | | | | 6,388,837 | | |
Unicharm Corp. | | | 118,200 | | | | 6,142,214 | | |
Fuji Heavy Industries, Ltd. | | | 457,000 | | | | 5,762,917 | | |
Nitto Denko Corp. | | | 98,400 | | | | 4,846,067 | | |
Otsuka Holdings Co., Ltd. | | | 137,900 | | | | 3,884,820 | | |
Pigeon Corp. | | | 72,700 | | | | 3,479,183 | | |
Calbee, Inc. | | | 39,000 | | | | 2,748,043 | | |
Total Japan | | | | | 144,445,125 | | |
CHINA/HONG KONG: 18.2% | |
Sinopharm Group Co., Ltd. H Shares | | | 3,229,600 | | | | 10,255,660 | | |
Haitian International Holdings, Ltd. | | | 7,655,000 | | | | 9,135,611 | | |
China Lodging Group, Ltd. ADSb | | | 526,600 | | | | 8,978,530 | | |
Sands China, Ltd. | | | 1,895,200 | | | | 8,472,804 | | |
Shenzhou International Group
Holdings, Ltd. | | | 3,186,000 | | | | 7,235,448 | | |
Hang Lung Group, Ltd. | | | 1,164,000 | | | | 6,696,520 | | |
Dairy Farm International Holdings, Ltd. | | | 602,454 | | | | 6,576,356 | | |
Tingyi (Cayman Islands) Holding Corp. | | | 1,888,000 | | | | 5,311,826 | | |
Sany Heavy Equipment International
Holdings Co., Ltd. | | | 9,375,000 | | | | 4,963,081 | | |
Baidu, Inc. ADRb | | | 49,400 | | | | 4,954,326 | | |
Shandong Weigao Group Medical
Polymer Co., Ltd. H Shares | | | 4,800,000 | | | | 4,816,293 | | |
Total China/Hong Kong | | | | | 77,396,455 | | |
INDIA: 8.4% | |
Emami, Ltd. | | | 975,093 | | | | 10,784,683 | | |
HDFC Bank, Ltd. | | | 728,209 | | | | 9,078,525 | | |
Multi Commodity Exchange of India, Ltd. | | | 232,913 | | | | 6,303,962 | | |
Castrol India, Ltd. | | | 974,370 | | | | 5,351,109 | | |
Sun Pharmaceutical Industries, Ltd. | | | 313,520 | | | | 4,240,753 | | |
Total India | | | | | 35,759,032 | | |
THAILAND: 7.5% | |
SVI Public Co., Ltd.b | | | 63,593,700 | | | | 8,596,188 | | |
Siam Commercial Bank Public Co., Ltd. | | | 1,264,400 | | | | 7,545,455 | | |
Major Cineplex Group Public Co., Ltd. | | | 11,921,000 | | | | 7,437,866 | | |
Banpu Public Co., Ltd. | | | 331,800 | | | | 4,503,393 | | |
SNC Former Public Co., Ltd. | | | 4,570,300 | | | | 3,671,648 | | |
Total Thailand | | | | | 31,754,550 | | |
| | | Shares | | Value | |
INDONESIA: 7.2% | |
PT Indofood CBP Sukses Makmur | | | 16,995,000 | | | $ | 13,787,345 | | |
PT Bank Rakyat Indonesia Persero | | | 11,610,500 | | | | 8,420,563 | | |
PT Astra International | | | 10,295,500 | | | | 8,155,560 | | |
Total Indonesia | | | | | 30,363,468 | | |
TAIWAN: 5.4% | |
St. Shine Optical Co., Ltd. | | | 711,000 | | | | 10,874,480 | | |
Gourmet Master Co., Ltd. | | | 966,800 | | | | 6,357,546 | | |
Synnex Technology International Corp. | | | 3,133,000 | | | | 5,800,803 | | |
Total Taiwan | | | | | 23,032,829 | | |
AUSTRALIA: 4.1% | |
Oil Search, Ltd. | | | 1,305,704 | | | | 9,655,801 | | |
CSL, Ltd. | | | 137,045 | | | | 7,737,223 | | |
Total Australia | | | | | 17,393,024 | | |
MALAYSIA: 3.4% | |
SapuraKencana Petroleum BHDb | | | 6,092,700 | | | | 6,317,548 | | |
Parkson Holdings BHD | | | 3,093,969 | | | | 5,289,687 | | |
Oldtown BHD | | | 3,740,500 | | | | 2,787,231 | | |
Total Malaysia | | | | | 14,394,466 | | |
SRI LANKA: 2.8% | |
John Keells Holdings PLC | | | 6,931,681 | | | | 12,011,597 | | |
Total Sri Lanka | | | | | 12,011,597 | | |
SINGAPORE: 2.8% | |
Keppel Land, Ltd. | | | 2,204,000 | | | | 7,381,768 | | |
Goodpack, Ltd. | | | 2,919,000 | | | | 4,416,968 | | |
Total Singapore | | | | | 11,798,736 | | |
VIETNAM: 2.7% | |
Vietnam Dairy Products JSC | | | 2,662,643 | | | | 11,271,032 | | |
Total Vietnam | | | | | 11,271,032 | | |
CAMBODIA: 1.6% | |
NagaCorp, Ltd. | | | 11,436,000 | | | | 6,986,780 | | |
Total Cambodia | | | | | 6,986,780 | | |
SOUTH KOREA: 0.9% | |
Kiwoom Securities Co., Ltd. | | | 67,641 | | | | 3,747,968 | | |
Total South Korea | | | | | 3,747,968 | | |
28 MATTHEWS ASIA FUNDS
Matthews Asia Growth Fund December 31, 2012
Schedule of Investmentsa (continued)
| | | | | Value | |
TOTAL INVESTMENTS: 99.1% | | | | $ | 420,355,062 | | |
(Cost $332,473,262c) | | | | | |
CASH AND OTHER ASSETS,
LESS LIABILITIES: 0.9% | | | | | 3,670,953 | | |
NET ASSETS: 100.0% | | | | $ | 424,026,015 | | |
a Certain securities were fair valued under the discretion of the Board of Trustees (Note 2-A).
b Non-income producing security.
c Cost for federal income tax purposes is $338,609,533 and net unrealized appreciation consists of:
Gross unrealized appreciation | | $ | 98,668,523 | | |
Gross unrealized depreciation | | | (16,922,994 | ) | |
Net unrealized appreciation | | $ | 81,745,529 | | |
ADR American Depositary Receipt
ADS American Depositary Share
BHD Berhad
JSC Joint Stock Co.
See accompanying notes to financial statements.
matthewsasia.com | 800.789.ASIA 29

PORTFOLIO MANAGERS
Richard H. Gao
Lead Manager
Sharat Shroff, CFA
Lead Manager
Mark W. Headley
Co-Manager
FUND FACTS
| | | Investor Class | | Institutional Class | |
Ticker | | MAPTX | | MIPTX | |
CUSIP | | 577130107 | | 577130834 | |
Inception | | 9/12/94 | | 10/29/10 | |
NAV | | $24.42 | | $24.41 | |
Initial Investment | | $2,500 | | $3 million | |
Gross Expense Ratio1 | | 1.11% | | 0.95% | |
Portfolio Statistics
Total # of Positions | | 69 | |
Net Assets | | $6.8 billion | |
Weighted Average Market Cap | | $23.6 billion | |
Portfolio Turnover | | 6.53%2 | |
Benchmark
MSCI AC Asia ex Japan Index
Redemption Fee
2% within first 90 calendar days of purchase
OBJECTIVE
Long-term capital appreciation.
STRATEGY
Under normal market conditions, the Fund seeks to achieve its investment objective by investing at least 80% of its total net assets, which include borrowings for investment purposes, in the common and preferred stocks of companies located in Asia, including developed, emerging and frontier countries and markets in the Asian region, excluding Japan.
1 Matthews Asia Funds does not charge 12b-1 fees.
2 The lesser of fiscal year 2012 long-term purchase costs or sales proceeds divided by the average monthly market value of long-term securities.
Matthews Pacific Tiger Fund
Portfolio Manager Commentary
For the year ending December 31, 2012, the Matthews Pacific Tiger Fund returned 21.00% (Investor Class) and 21.24% (Institutional Class), while its benchmark, the MSCI All Country Asia ex Japan Index, returned 22.70%. For the fourth quarter of the year, the Fund returned 4.90% (Investor Class) and 4.92% (Institutional Class) versus 5.70% for the Index.
During the fourth quarter, Asia's equities recovered from their mid-year troubles to eclipse recent highs, with the notable exception of China's domestic A share markets, which continued to trade at low valuations. Macroeconomic forces continued to have a disproportionately higher impact on Asia's markets. However, it is worth noting that the trend in earnings progression has recently begun to turn more favorable.
Our investment approach is predicated on identifying growth that is sustainable across cycles. As such, the companies we invest in may not always keep pace with the sharp, valuation-driven rallies we saw in the fourth quarter. The portfolio's relative underperformance against the benchmark during the first nine months was driven by stock-specific issues stemming from our exposure to consumer discretionary holdings, particularly in China.
Another key element of our investment philosophy is to favor businesses that cater to domestic demand in the region, which we believe will continue to grow. As such, the portfolio has carried a larger allocation to sectors like consumer discretionary. This past year has been difficult for companies in this sector, as growth in discretionary spending showed signs of moderation. Some of the slowdown may be temporary, and in those instances we have taken advantage of the weakness in stock price to add to existing positions.
However, we also believe that there are structural forces at work that may leave a more lasting impact, as is the case with China's retail sector. There are signs of excess capacity, which is hard to measure, and reflects the flow of capital that has occurred over the past few years. Our investment in Li Ning earlier this year underscores this point. Despite the firm's attempts at improving its supply chain over the past two years, it still continued to struggle. Li Ning's capital raising plans pointed to more pain than we had anticipated, which led us to exit the position in the fourth quarter. The negative contribution from the consumer discretionary sector was further exacerbated when a long-time holding, New Oriental Education & Technology Group came under scrutiny by the Securities and Exchange Commission, possibly related to the consolidation of financial results from some of its subsidiaries in China. The experiences with Li Ning and New Oriental capture some of the challenges faced by smaller to mid-sized companies in China over the past year—rising competition, moderating growth and regulatory setbacks.
In general, our decision to add to smaller to mid-size companies in China over the past two years in the face of appealing valuations has yielded mixed results. However, the decision to selectively add to Indian securities in 2011 proved to be more favorable as the outlook for economic reforms seems to be improving, albeit ever so slowly. In evaluating investment opportunities, we tend to focus much more on the cash-generating ability of a business and the capital deployment policies of the management team, instead of trying to accurately predict the course of various
30 MATTHEWS ASIA FUNDS
PERFORMANCE AS OF DECEMBER 31, 2012
| | | | | | | Average Annual Total Returns | | | |
| | 3 Months | | 1 Year | | 3 Years | | 5 Years | | 10 Years | | Since
Inception | | Inception
Date | |
Investor Class (MAPTX) | | | 4.90 | % | | | 21.00 | % | | | 9.45 | % | | | 4.38 | % | | | 17.69 | % | | | 9.18 | % | | 9/12/94 | |
Institutional Class (MIPTX) | | | 4.92 | % | | | 21.24 | % | | | n.a. | | | | n.a. | | | | n.a. | | | | 3.73 | % | | 10/29/10 | |
MSCI AC Asia ex Japan Index3 | | | 5.70 | % | | | 22.70 | % | | | 6.86 | % | | | 0.12 | % | | | 14.95 | % | | | 4.15 | %4 | | | |
Lipper Pacific ex Japan Funds Category Average5 | | | 6.62 | % | | | 22.06 | % | | | 6.35 | % | | | -0.19 | % | | | 14.18 | % | | | 4.24 | %4 | | | |
Performance assumes reinvestment of all dividends and/or distributions before taxes. All performance quoted represents past performance and is no guarantee of future results. Investment return and principal value will fluctuate with market conditions so that when redeemed, shares may be worth more or less than their original cost. Current performance may be lower or higher than the return figures quoted. Returns would have been lower if certain of the Fund's fees and expenses had not been waived. For the Fund's most recent month-end performance, visit matthewsasia.com.
GROWTH OF A $10,000 INVESTMENT SINCE INCEPTION—INVESTOR CLASS
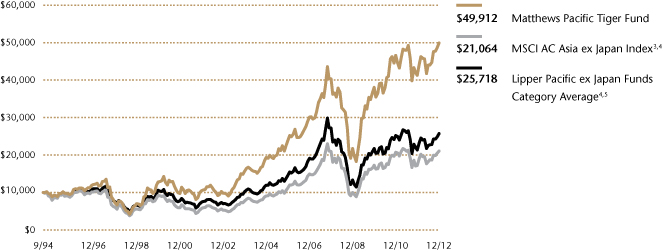
Plotted monthly. The performance data and graph do not reflect the deduction of taxes that a shareholder would pay on dividends, capital gains distributions or redemption of Fund shares. Values are in US$.
3 It is not possible to invest directly in an index. Source: Index data from Morgan Stanley Capital International and Bloomberg; total return calculations performed by BNY Mellon Investment Servicing (US) Inc. Please see page 71 for index definition.
4 Calculated from 8/31/94.
5 The Lipper Category Average does not reflect sales charges and is based on total return, including reinvestment of dividends and capital gains for the stated periods.
TOP TEN HOLDINGS6
| | Sector | | Country | | % of Net Assets | |
SM Prime Holdings, Inc. | | Financials | | Philippines | | | 2.8 | % | |
Delta Electronics, Inc. | | Information Technology | | Taiwan | | | 2.8 | % | |
Central Pattana Public Co., Ltd. | | Financials | | Thailand | | | 2.7 | % | |
Tata Power Co., Ltd. | | Utilities | | India | | | 2.7 | % | |
PT Perusahaan Gas Negara Persero | | Utilities | | Indonesia | | | 2.6 | % | |
Samsung Electronics Co., Ltd. | | Information Technology | | South Korea | | | 2.5 | % | |
Ping An Insurance Group Co. of China, Ltd. | | Financials | | China/Hong Kong | | | 2.4 | % | |
China Resources Land, Ltd. | | Financials | | China/Hong Kong | | | 2.3 | % | |
Dongbu Insurance Co., Ltd. | | Financials | | South Korea | | | 2.2 | % | |
Hang Lung Group, Ltd. | | Financials | | China/Hong Kong | | | 2.2 | % | |
% OF ASSETS IN TOP TEN | | | | | | | 25.2 | % | |
6 Holdings may combine more than one security from same issuer and related depositary receipts.
matthewsasia.com | 800.789.ASIA 31
COUNTRY ALLOCATION (%)7
China/Hong Kong | | | 28.6 | | |
India | | | 16.2 | | |
South Korea | | | 14.9 | | |
Indonesia | | | 8.9 | | |
Thailand | | | 8.8 | | |
Taiwan | | | 7.7 | | |
Malaysia | | | 5.1 | | |
Philippines | | | 2.8 | | |
Singapore | | | 2.8 | | |
Vietnam | | | 1.1 | | |
Switzerland | | | 0.4 | | |
Cash and Other Assets,
Less Liabilities | | | 2.7 | | |
SECTOR ALLOCATION (%)
Financials | | | 31.8 | | |
Information Technology | | | 14.6 | | |
Consumer Staples | | | 14.0 | | |
Consumer Discretionary | | | 11.7 | | |
Utilities | | | 7.7 | | |
Health Care | | | 7.6 | | |
Telecommunication Services | | | 3.1 | | |
Materials | | | 3.0 | | |
Industrials | | | 1.9 | | |
Energy | | | 1.9 | | |
Cash and Other Assets,
Less Liabilities | | | 2.7 | | |
MARKET CAP EXPOSURE (%)8
Large Cap (over $5B) | | | 76.1 | | |
Mid Cap ($1B–$5B) | | | 19.7 | | |
Small Cap (under $1B) | | | 1.5 | | |
Cash and Other Assets,
Less Liabilities | | | 2.7 | | |
7 Not all countries are included in the benchmark index(es).
8 Source: FactSet Research Systems. Percentage values in data are rounded to the nearest tenth of one percent; the values may not sum to 100% due to rounding.
Matthews Pacific Tiger Fund
Portfolio Manager Commentary (continued)
governmental policies. While we accumulated some Indian equities, we also decided to exit Sun TV Network as its capital deployment strategy was at odds with our views.
While the outlook for economic growth in China has been a topic of much debate over the past few years, the improving outlook for the economies of the Association of Southeast Asian Nations (ASEAN)—excluding Singapore—has become more apparent as of late. Several of these economies have undergone a painstaking process of deleveraging and an overhaul of their financial systems over the course of the last decade. We believe there is a clear opportunity for the investment cycle to pickup in both Indonesia and the Philippines as the availability of capital has improved, although it remains to be seen if the pace of capital accumulation is sustainable. As the pace of foreign direct investment into the region accelerates, just like China in the early 1990s, there needs to be a concerted effort to facilitate this investment through the build-out of proper infrastructure and institutional policies.
However, participating in investment-led growth as a minority shareholder is not always straightforward, and the investable universe remains small. We have taken the approach of investing in companies that aim to show clear governance structures, and a business model that benefits from investment spending in the ASEAN region. Siam Cement (SC), a recent addition to the Fund, has several diversified businesses that provide good exposure to a pickup in investment in Thailand as well as growing exposure to Indonesia and Vietnam. SC's biggest strength is the commitment of its management to aim to generate at least a 15% cash return on investment, and this is helped by a significant cost of capital advantage that the firm has in Thailand. The risks with SC are not related to lack of transparency, but to the vagaries of regulatory setbacks, which are harder to quantify but are real nonetheless. We believe management has the balance sheet, and the staying power to generate solid growth over the next several years.
Perhaps one of the more notable features of 2012 was the commitment displayed by Chinese authorities in accepting slower, but more balanced, growth. The risk of a rise in unemployment in the face of slowing growth is real, and may lead to some policy missteps as they may begin to shift their stance on growth. Across Asia, the flow of easy capital, in particular debt capital, also requires monitoring as it may lead to some bad habits as management teams may rely on financial engineering instead of productivity gains to drive growth. We remain alert for this possibility as we continue to strive for a long-term focus on investments, rather than trade for short-term gains.
Asia continues to offer fertile ground for entrepreneurs to build businesses that cater to the growing prosperity in the region. At the same time we acknowledge that the next wave of growth may be lower than it has been in the past, but perhaps may be more profitable. Management teams are shifting their thinking from delivering absolute growth to growing appropriately. Factors that did not matter before are becoming more relevant—concepts like quality, customer service and convenience are topics that are increasingly discussed by senior managers. The growing depth and breadth in capital markets allows us the opportunity to participate in this development. Valuations in ASEAN look relatively more expensive compared to, for example, Chinese equities, which was not the case five years ago. We continue to retain our flexibility in looking across the region for businesses that are well-placed to capture the growth in the region.
32 MATTHEWS ASIA FUNDS
Matthews Pacific Tiger Fund December 31, 2012
Schedule of Investmentsa
COMMON EQUITIES: 97.3%
| | | Shares | | Value | |
CHINA/HONG KONG: 28.6% | |
Ping An Insurance Group Co. of
China, Ltd. H Shares | | | 19,029,500 | | | $ | 162,316,095 | | |
China Resources Land, Ltd. | | | 54,976,000 | | | | 152,321,811 | | |
Hang Lung Group, Ltd. | | | 26,089,000 | | | | 150,090,636 | | |
Dairy Farm International Holdings, Ltd. | | | 12,901,446 | | | | 140,831,497 | | |
Sinopharm Group Co., Ltd. H Shares† | | | 43,788,000 | | | | 139,049,680 | | |
China Mobile, Ltd. ADR | | | 2,063,150 | | | | 121,148,168 | | |
Dongfeng Motor Group Co., Ltd.
H Shares | | | 71,940,000 | | | | 113,262,594 | | |
Tingyi (Cayman Islands) Holding Corp. | | | 36,846,000 | | | | 103,665,001 | | |
Digital China Holdings, Ltd.† | | | 55,828,000 | | | | 96,542,403 | | |
Lenovo Group, Ltd. | | | 97,092,000 | | | | 89,524,653 | | |
China Resources Enterprise, Ltd. | | | 23,204,000 | | | | 84,920,964 | | |
China Vanke Co., Ltd. B Shares | | | 48,875,258 | | | | 78,262,304 | | |
Hengan International Group Co., Ltd. | | | 7,996,000 | | | | 73,025,807 | | |
Swire Pacific, Ltd. A Shares | | | 5,683,500 | | | | 71,094,513 | | |
Tencent Holdings, Ltd. | | | 2,011,900 | | | | 65,983,695 | | |
Hong Kong Exchanges and Clearing, Ltd. | | | 3,664,500 | | | | 63,418,465 | | |
Shangri-La Asia, Ltd. | | | 31,457,333 | | | | 63,368,629 | | |
Baidu, Inc. ADRb | | | 575,700 | | | | 57,736,953 | | |
Li & Fung, Ltd. | | | 31,802,000 | | | | 57,386,275 | | |
China Merchants Bank Co., Ltd. H Shares | | | 22,182,350 | | | | 49,873,633 | | |
Total China/Hong Kong | | | | | 1,933,823,776 | | |
INDIA: 16.2% | |
Tata Power Co., Ltd. | | | 89,491,554 | | | | 182,227,009 | | |
Housing Development Finance Corp. | | | 7,485,685 | | | | 114,357,364 | | |
ITC, Ltd. | | | 21,185,000 | | | | 111,556,945 | | |
HDFC Bank, Ltd. | | | 8,635,920 | | | | 107,663,344 | | |
Kotak Mahindra Bank, Ltd. | | | 8,767,491 | | | | 104,920,913 | | |
Sun Pharmaceutical Industries, Ltd. | | | 7,001,815 | | | | 94,708,363 | | |
GAIL India, Ltd. | | | 14,327,827 | | | | 94,148,324 | | |
Titan Industries, Ltd. | | | 13,593,760 | | | | 71,252,067 | | |
Container Corp. of India, Ltd. | | | 4,188,081 | | | | 70,783,507 | | |
Dabur India, Ltd. | | | 25,308,038 | | | | 59,540,173 | | |
Infosys, Ltd. | | | 848,401 | | | | 35,934,324 | | |
Thermax, Ltd. | | | 2,713,957 | | | | 30,739,219 | | |
HDFC Bank, Ltd. ADR | | | 319,500 | | | | 13,010,040 | | |
Infosys, Ltd. ADR | | | 219,611 | | | | 9,289,545 | | |
Total India | | | | | 1,100,131,137 | | |
SOUTH KOREA: 14.9% | |
Samsung Electronics Co., Ltd. | | | 118,504 | | | | 170,266,529 | | |
Dongbu Insurance Co., Ltd. | | | 3,505,500 | | | | 151,445,230 | | |
NHN Corp. | | | 526,302 | | | | 111,798,526 | | |
Cheil Worldwide, Inc. | | | 5,510,440 | | | | 111,158,668 | | |
Green Cross Corp.† | | | 838,869 | | | | 108,742,174 | | |
Yuhan Corp.† | | | 584,138 | | | | 94,394,016 | | |
Hyundai Mobis | | | 317,719 | | | | 86,200,035 | | |
Amorepacific Corp. | | | 69,652 | | | | 78,958,491 | | |
POSCO | | | 195,584 | | | | 64,071,442 | | |
MegaStudy Co., Ltd.† | | | 396,412 | | | | 29,241,888 | | |
Total South Korea | | | | | 1,006,276,999 | | |
| | | Shares | | Value | |
INDONESIA: 8.9% | |
PT Perusahaan Gas Negara Persero | | | 364,396,500 | | | $ | 174,488,707 | | |
PT Astra International | | | 146,652,300 | | | | 116,170,323 | | |
PT Indofood CBP Sukses Makmur | | | 138,070,500 | | | | 112,010,925 | | |
PT Bank Central Asia | | | 115,688,500 | | | | 109,613,393 | | |
PT Telekomunikasi Indonesia Persero | | | 80,460,500 | | | | 75,836,221 | | |
PT Telekomunikasi Indonesia Persero ADR | | | 375,700 | | | | 13,882,115 | | |
Total Indonesia | | | | | 602,001,684 | | |
THAILAND: 8.8% | |
Central Pattana Public Co., Ltd. | | | 68,596,100 | | | | 183,739,594 | | |
Bank of Ayudhya Public Co., Ltd. | | | 138,106,700 | | | | 147,694,402 | | |
Siam Cement Public Co., Ltd. NVDR | | | 9,478,500 | | | | 136,798,661 | | |
PTT Exploration & Production Public
Co., Ltd. | | | 23,423,867 | | | | 126,350,817 | | |
Total Thailand | | | | | 594,583,474 | | |
TAIWAN: 7.7% | |
Delta Electronics, Inc. | | | 50,921,000 | | | | 187,665,797 | | |
President Chain Store Corp. | | | 19,939,608 | | | | 106,983,088 | | |
Synnex Technology International Corp. | | | 50,022,354 | | | | 92,617,244 | | |
Yuanta Financial Holding Co., Ltd. | | | 133,911,782 | | | | 69,456,300 | | |
Taiwan Semiconductor Manufacturing
Co., Ltd. | | | 20,423,513 | | | | 68,312,780 | | |
Total Taiwan | | | | | 525,035,209 | | |
MALAYSIA: 5.1% | |
Genting BHD | | | 47,065,500 | | | | 142,287,010 | | |
Public Bank BHD | | | 22,511,386 | | | | 120,114,175 | | |
Top Glove Corp. BHD | | | 25,175,960 | | | | 46,425,256 | | |
IHH Healthcare BHDb | | | 23,585,500 | | | | 26,125,800 | | |
IHH Healthcare BHDb | | | 7,518,000 | | | | 8,360,172 | | |
Total Malaysia | | | | | 343,312,413 | | |
PHILIPPINES: 2.8% | |
SM Prime Holdings, Inc. | | | 466,949,271 | | | | 188,224,832 | | |
Total Philippines | | | | | 188,224,832 | | |
SINGAPORE: 2.8% | |
Keppel Land, Ltd. | | | 35,212,000 | | | | 117,934,127 | | |
Hyflux, Ltd.† | | | 65,284,280 | | | | 69,089,425 | | |
Total Singapore | | | | | 187,023,552 | | |
VIETNAM: 1.1% | |
Vietnam Dairy Products JSC | | | 18,122,813 | | | | 76,714,314 | | |
Total Vietnam | | | | | 76,714,314 | | |
SWITZERLAND: 0.4% | |
DKSH Holding, Ltd.b | | | 386,901 | | | | 27,985,096 | | |
Total Switzerland | | | | | 27,985,096 | | |
matthewsasia.com | 800.789.ASIA 33
Matthews Pacific Tiger Fund December 31, 2012
Schedule of Investmentsa (continued)
| | | Value | |
TOTAL INVESTMENTS: 97.3% | | $ | 6,585,112,486 | | |
(Cost $4,663,657,282c) | | | |
CASH AND OTHER ASSETS,
LESS LIABILITIES: 2.7% | | | 179,481,534 | | |
NET ASSETS: 100.0% | | $ | 6,764,594,020 | | |
a Certain securities were fair valued under the discretion of the Board of Trustees (Note 2-A).
b Non-income producing security.
c Cost for federal income tax purposes is $4,665,480,008 and net unrealized appreciation consists of:
Gross unrealized appreciation | | $ | 2,031,033,459 | | |
Gross unrealized depreciation | | | (111,400,981 | ) | |
Net unrealized appreciation | | $ | 1,919,632,478 | | |
† Affiliated Issuer, as defined under the Investment Company Act of 1940 (ownership of 5% or more of the outstanding voting securities of this issuer)
ADR American Depositary Receipt
BHD Berhad
JSC Joint Stock Co.
NVDR Non-voting Depositary Receipt
See accompanying notes to financial statements.
34 MATTHEWS ASIA FUNDS

PORTFOLIO MANAGERS
Richard H. Gao
Lead Manager
Henry Zhang, CFA
Co-Manager
FUND FACTS
| | | Investor Class | | Institutional Class | |
Ticker | | MCHFX | | MICFX | |
CUSIP | | 577130701 | | 577130818 | |
Inception | | 2/19/98 | | 10/29/10 | |
NAV | | $23.47 | | $23.45 | |
Initial Investment | | $2,500 | | $3 million | |
Gross Expense Ratio1 | | 1.12% | | 0.91% | |
Portfolio Statistics
Total # of Positions | | 56 | |
Net Assets | | $2.0 billion | |
Weighted Average Market Cap | | $34.0 billion | |
Portfolio Turnover | | 9.61%2 | |
Benchmark
MSCI China Index
Redemption Fee
2% within first 90 calendar days of purchase
OBJECTIVE
Long-term capital appreciation.
STRATEGY
Under normal market conditions, the Fund seeks to achieve its investment objective by investing at least 80% of its total net assets, which include borrowings for investment purposes, in the common and preferred stocks of companies located in China and Taiwan. China includes its administrative and other districts, such as Hong Kong.
1 Matthews Asia Funds does not charge 12b-1 fees.
2 The lesser of fiscal year 2012 long-term purchase costs or sales proceeds divided by the average monthly market value of long-term securities.
Matthews China Fund
Portfolio Manager Commentary
For the year ending December 31, 2012, the Matthews China Fund rose 11.96% (Investor Class) and 12.22% (Institutional Class), while its benchmark, the MSCI China Index, rose 23.10%. For the fourth quarter of the year, the Fund returned 8.97% (Investor Class) and 9.03% (Institutional Class), versus 12.88% for the Index.
The year 2012 is expected to mark the end of China's 12-year streak of generating annual GDP growth in excess of 8%. Both fixed asset investments and exports, historically the two biggest engines of China's economic growth, continued to decelerate. Amid global economic uncertainties and China's reluctance to actively stimulate the economy, China's growth slowed during the first three quarters of the year. The government made it clear that its focus will be more on the quality of growth rather than pace of growth. Rebalancing growth to be more reliant upon domestic demand has become the central government's top priority in setting economic policy. During the fourth quarter, there were growing signs that China's macro economy may have reached the bottom and investors sentiments towards Chinese equities improved substantially. The overall market was driven by a sharp increase in liquidity, benefiting sectors across the board but particularly large capitalization, highly liquid companies.
The Fund lagged its benchmark during the year by a wide margin as the consumer discretionary and consumer staples sectors, in which we maintain overweight allocations and have traditionally seen strong growth, were among the worst performers. Our investment in the consumer sectors covers a wide range of industries, including department stores and other retailers, auto manufacturers and hotels. This year, however, China's domestic consumption faced some strong headwinds as economic growth slowed and consumer sentiment deteriorated. Profitability for these firms was squeezed further by rising labor costs and overcapacity. As a result, many of China's domestic consumer-facing companies came under considerable selling pressure, particularly as many traded at relatively high valuations given their strong growth in the past. However, these sectors remain key areas of investment for us as we believe the profound growth of China's middle class will continue to drive domestic consumption and the overall economy.
We expect that the slowing consumption levels and lower profitability represent only a near-term phenomenon, and that longer-term growth in China's domestic consumption is ongoing. The government's rebalancing efforts towards this goal during the year strengthened our conviction. During the fourth quarter, we added to consumer holdings, which we believe were under-valued. One example is Lianhua Supermarket, a retail chain that operates more than 5,000 hypermarkets, supermarkets and convenience stores. Its outlets are located mostly in China's affluent coastal areas, including Shanghai. While competition has been intensifying over the past few years and margins have been under pressure, Lianhua has maintained operations in some of the most attractive locations and has extensive networks throughout eastern China. We believe that the market remains preoccupied with the company's near-term earnings outlook and caused its stock to be heavily sold off. We believe that the company's initiatives in centralizing procurement and its internal restructuring to improve profitability bode well for its long-term growth.
matthewsasia.com | 800.789.ASIA 35
PERFORMANCE AS OF DECEMBER 31, 2012
| | | | | | | Average Annual Total Returns | | | |
| | 3 Months | | 1 Year | | 3 Years | | 5 Years | | 10 Years | | Since
Inception | | Inception
Date | |
Investor Class (MCHFX) | | | 8.97 | % | | | 11.96 | % | | | 1.67 | % | | | -0.88 | % | | | 17.26 | % | | | 11.03 | % | | 2/19/98 | |
Institutional Class (MICFX) | | | 9.03 | % | | | 12.22 | % | | | n.a. | | | | n.a. | | | | n.a. | | | | -4.90 | % | | 10/29/10 | |
MSCI China Index3 | | | 12.88 | % | | | 23.10 | % | | | 1.80 | % | | | -3.34 | % | | | 19.36 | % | | | 3.67 | %4 | | | |
Lipper China Region Funds Category Average5 | | | 10.80 | % | | | 18.46 | % | | | 0.59 | % | | | -4.31 | % | | | 14.23 | % | | | 8.47 | %4 | | | |
Performance assumes reinvestment of all dividends and/or distributions before taxes. All performance quoted represents past performance and is no guarantee of future results. Investment return and principal value will fluctuate with market conditions so that when redeemed, shares may be worth more or less than their original cost. Current performance may be lower or higher than the return figures quoted. Returns would have been lower if certain of the Fund's fees and expenses had not been waived. For the Fund's most recent month-end performance, visit matthewsasia.com.
GROWTH OF A $10,000 INVESTMENT SINCE INCEPTION—INVESTOR CLASS
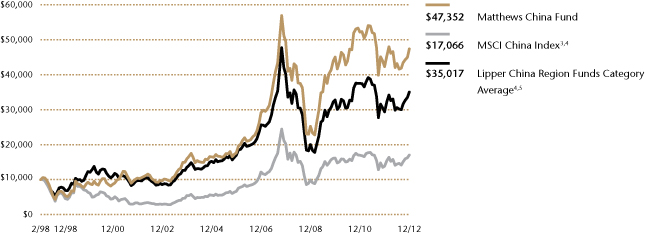
Plotted monthly. The performance data and graph do not reflect the deduction of taxes that a shareholder would pay on dividends, capital gains distributions or redemption of Fund shares. Values are in US$.
3 It is not possible to invest directly in an index. Source: Index data from Morgan Stanley Capital International and Bloomberg; total return calculations performed by BNY Mellon Investment Servicing (US) Inc. Please see page 71 for index definition.
4 Calculated from 2/28/98.
5 The Lipper Category Average does not reflect sales charges and is based on total return, including reinvestment of dividends and capital gains for the stated periods.
TOP TEN HOLDINGS6
| | Sector | | % of Net Assets | |
China Mobile, Ltd. | | Telecommunication Services | | | 3.7 | % | |
China Life Insurance Co., Ltd. | | Financials | | | 3.3 | % | |
China Merchants Bank Co., Ltd. | | Financials | | | 2.8 | % | |
Cheung Kong Infrastructure Holdings, Ltd. | | Utilities | | | 2.7 | % | |
Ping An Insurance Group Co. of China, Ltd. | | Financials | | | 2.7 | % | |
China Resources Land, Ltd. | | Financials | | | 2.6 | % | |
Digital China Holdings, Ltd. | | Information Technology | | | 2.6 | % | |
Mindray Medical International, Ltd. | | Health Care | | | 2.5 | % | |
China Vanke Co., Ltd. | | Financials | | | 2.4 | % | |
China Oilfield Services, Ltd. | | Energy | | | 2.4 | % | |
% OF ASSETS IN TOP TEN | | | | | 27.7 | % | |
6 Holdings may combine more than one security from same issuer and related depositary receipts.
36 MATTHEWS ASIA FUNDS
Matthews China Fund
Portfolio Manager Commentary (continued)
During the year, we consolidated some of our consumer holdings and also exited some names that did not meet our expectations. During the fourth quarter, we sold Ports Design, a local fashion designer and manufacturer. We had hoped that Ports Design would become a popular luxury brand in the local market, however, strong competition from international brands as well as some missteps in operations has thus far prevented that development.
Other consumer sector holdings we exited during the year included New Oriental Education & Technology Group and Ctrip.com International. While we believe that the fundamentals of New Oriental—an education service provider that had been a long-term portfolio holding—remained solid, we were not comfortable with the Securities and Exchange Commission's scrutiny of its accounting practices related to its variable interest entities. We also exited Ctrip, a tourism service provider, as we believed the firm was losing its competitive edge in China.
In terms of detractors to Fund performance for the year, the information technology sector was another disappointment. ZTE, one of China's major telecom equipment manufacturers, suffered from the industry's irrational pricing competition throughout most of the year. Kingdee International Software, which provides enterprise resource planning tools for small and medium enterprises, saw a significant slowdown in demand in China. Toward the end of the year, however, the operating environment for both companies showed signs of improvement, and we continue to hold these companies as we anticipate a brighter outlook for them in 2013.
In terms of contributors to Fund performance, we found positive results from two real estate developers focused on residential property developments in China: China Resources Land and China Vanke. Both firms benefited from a steady recovery in property transaction volumes and pricing. Other contributors to performance came from select holdings in the railway construction, tourism, health care and insurance industries.
Looking forward, China's macroeconomic environment is expected to continue on its path of recovery following more positive economic indicators during the fourth quarter of 2012. However, we do anticipate that China will see more modest growth rates than those we saw over the past two decades. As the government puts more effort into shifting away from an export-driven economy, growth should increasingly come from domestic consumption. Service-oriented industries are also of particular interest to us as we believe China's need for services will grow rapidly. We continue to position our portfolio toward less cyclical sectors and seek companies that can perform well throughout the economic cycle.
SECTOR ALLOCATION (%)
Financials | | | 24.7 | | |
Consumer Discretionary | | | 18.0 | | |
Information Technology | | | 11.4 | | |
Consumer Staples | | | 11.0 | | |
Industrials | | | 10.2 | | |
Energy | | | 7.6 | | |
Telecommunication Services | | | 5.9 | | |
Utilities | | | 5.4 | | |
Health Care | | | 4.7 | | |
Cash and Other Assets,
Less Liabilities | | | 1.1 | | |
MARKET CAP EXPOSURE (%)7
Large Cap (over $5B) | | | 76.1 | | |
Mid Cap ($1B–$5B) | | | 19.9 | | |
Small Cap (under $1B) | | | 2.9 | | |
Cash and Other Assets,
Less Liabilities | | | 1.1 | | |
7 Source: FactSet Research Systems. Percentage values in data are rounded to the nearest tenth of one percent; the values may not sum to 100% due to rounding.
matthewsasia.com | 800.789.ASIA 37
Matthews China Fund December 31, 2012
Schedule of Investmentsa
COMMON EQUITIES: CHINA/HONG KONG: 98.9%
| | | Shares | | Value | |
FINANCIALS: 24.7% | |
Real Estate Management & Development: 8.4% | |
China Resources Land, Ltd. | | | 18,954,000 | | | $ | 52,515,782 | | |
China Vanke Co., Ltd. B Shares | | | 30,999,168 | | | | 49,637,923 | | |
Hang Lung Group, Ltd. | | | 6,844,000 | | | | 39,373,694 | | |
Swire Pacific, Ltd. A Shares | | | 2,289,500 | | | | 28,639,199 | | |
| | | | | | 170,166,598 | | |
Commercial Banks: 8.3% | |
China Merchants Bank Co., Ltd. H Shares | | | 24,978,114 | | | | 56,159,483 | | |
China Construction Bank Corp. H Shares | | | 51,366,660 | | | | 41,977,453 | | |
Agricultural Bank of China, Ltd. H Shares | | | 71,103,000 | | | | 35,881,868 | | |
BOC Hong Kong Holdings, Ltd. | | | 10,880,000 | | | | 34,226,110 | | |
| | | | | | 168,244,914 | | |
Insurance: 6.0% | |
Ping An Insurance Group Co. of
China, Ltd. H Shares | | | 6,450,500 | | | | 55,020,887 | | |
China Life Insurance Co., Ltd. H Shares | | | 14,989,000 | | | | 49,644,502 | | |
China Life Insurance Co., Ltd. ADR | | | 352,100 | | | | 17,495,849 | | |
| | | | | | 122,161,238 | | |
Diversified Financial Services: 2.0% | |
Hong Kong Exchanges and Clearing, Ltd. | | | 2,395,600 | | | | 41,458,664 | | |
Total Financials | | | | | 502,031,414 | | |
CONSUMER DISCRETIONARY: 18.0% | |
Hotels, Restaurants & Leisure: 7.1% | |
Cafe' de Coral Holdings, Ltd. | | | 15,990,100 | | | | 45,599,676 | | |
Home Inns & Hotels Management,
Inc. ADRb | | | 1,167,246 | | | | 33,733,409 | | |
Shangri-La Asia, Ltd. | | | 16,049,400 | | | | 32,330,410 | | |
Sands China, Ltd. | | | 7,155,200 | | | | 31,988,500 | | |
| | | | | | 143,651,995 | | |
Multiline Retail: 2.6% | |
Golden Eagle Retail Group, Ltd. | | | 16,964,000 | | | | 42,251,142 | | |
Parkson Retail Group, Ltd. | | | 13,191,500 | | | | 10,721,687 | | |
| | | | | | 52,972,829 | | |
Specialty Retail: 2.3% | |
Belle International Holdings, Ltd. | | | 20,722,000 | | | | 45,828,259 | | |
Automobiles: 2.1% | |
Dongfeng Motor Group Co., Ltd.
H Shares | | | 27,242,000 | | | | 42,889,902 | | |
Distributors: 1.9% | |
Li & Fung, Ltd. | | | 21,516,400 | | | | 38,826,050 | | |
Media: 1.5% | |
Television Broadcasts, Ltd. | | | 4,082,000 | | | | 30,691,693 | | |
Textiles, Apparel & Luxury Goods: 0.5% | |
Li Ning Co., Ltd.b | | | 16,018,000 | | | | 10,576,166 | | |
Total Consumer Discretionary | | | | | 365,436,894 | | |
| | | Shares | | Value | |
INFORMATION TECHNOLOGY: 11.4% | |
Internet Software & Services: 4.2% | |
Tencent Holdings, Ltd. | | | 1,008,600 | | | $ | 33,078,759 | | |
Sina Corp.b | | | 562,100 | | | | 28,228,662 | | |
NetEase, Inc. ADRb | | | 556,500 | | | | 23,679,075 | | |
| | | | | | 84,986,496 | | |
Electronic Equipment, Instruments & Components: 2.5% | |
Digital China Holdings, Ltd. | | | 30,018,000 | | | | 51,909,613 | | |
Computers & Peripherals: 1.8% | |
Lenovo Group, Ltd. | | | 38,692,000 | | | | 35,676,347 | | |
Communications Equipment: 1.7% | |
ZTE Corp. H Shares | | | 20,708,504 | | | | 35,556,530 | | |
Software: 1.2% | |
Kingdee International Software Group
Co., Ltd.b | | | 123,524,800 | | | | 23,587,032 | | |
Total Information Technology | | | | | 231,716,018 | | |
CONSUMER STAPLES: 11.0% | |
Food & Staples Retailing: 4.0% | |
China Resources Enterprise, Ltd. | | | 9,728,000 | | | | 35,602,100 | | |
Lianhua Supermarket Holdings Co., Ltd.
H Shares† | | | 31,193,800 | | | | 30,077,120 | | |
Sun Art Retail Group, Ltd. | | | 9,443,000 | | | | 14,599,286 | | |
| | | | | | 80,278,506 | | |
Food Products: 3.6% | |
Tingyi (Cayman Islands) Holding Corp. | | | 15,821,000 | | | | 44,511,860 | | |
China Mengniu Dairy Co., Ltd. | | | 10,066,000 | | | | 28,772,303 | | |
| | | | | | 73,284,163 | | |
Beverages: 1.8% | |
Tsingtao Brewery Co., Ltd. H Shares | | | 6,171,000 | | | | 36,780,944 | | |
Personal Products: 1.6% | |
Hengan International Group Co., Ltd. | | | 3,662,500 | | | | 33,448,852 | | |
Total Consumer Staples | | | | | 223,792,465 | | |
INDUSTRIALS: 10.2% | |
Machinery: 3.9% | |
CSR Corp., Ltd. H Shares | | | 48,012,000 | | | | 42,749,650 | | |
Sany Heavy Equipment International
Holdings Co., Ltd. | | | 34,230,500 | | | | 18,121,468 | | |
China National Materials Co., Ltd.
H Shares | | | 55,910,000 | | | | 17,581,774 | | |
| | | | | | 78,452,892 | | |
Transportation Infrastructure: 3.1% | |
China Merchants Holdings International
Co., Ltd. | | | 11,594,581 | | | | 37,864,916 | | |
Yuexiu Transport Infrastructure, Ltd. | | | 50,775,000 | | | | 24,683,685 | | |
| | | | | | 62,548,601 | | |
Airlines: 1.8% | |
Air China, Ltd. H Shares | | | 43,555,900 | | | | 37,297,255 | | |
38 MATTHEWS ASIA FUNDS
Matthews China Fund December 31, 2012
Schedule of Investmentsa (continued)
COMMON EQUITIES: CHINA/HONG KONG (continued)
| | | Shares | | Value | |
Industrial Conglomerates: 1.4% | |
NWS Holdings, Ltd. | | | 16,914,914 | | | $ | 28,749,117 | | |
Total Industrials | | | | | 207,047,865 | | |
ENERGY: 7.6% | |
Oil, Gas & Consumable Fuels: 5.3% | |
China Shenhua Energy Co., Ltd. H Shares | | | 10,244,000 | | | | 45,886,139 | | |
CNOOC, Ltd. | | | 17,578,000 | | | | 38,724,564 | | |
Kunlun Energy Co., Ltd. | | | 10,856,000 | | | | 22,953,292 | | |
| | | | | | 107,563,995 | | |
Energy Equipment & Services: 2.3% | |
China Oilfield Services, Ltd. H Shares | | | 23,016,000 | | | | 48,259,206 | | |
Total Energy | | | | | 155,823,201 | | |
TELECOMMUNICATION SERVICES: 5.9% | |
Wireless Telecommunication Services: 3.7% | |
China Mobile, Ltd. | | | 3,871,083 | | | | 45,553,750 | | |
China Mobile, Ltd. ADR | | | 488,300 | | | | 28,672,976 | | |
| | | | | | 74,226,726 | | |
Diversified Telecommunication Services: 2.2% | |
China Communications Services Corp.,
Ltd. H Shares | | | 77,818,800 | | | | 45,475,532 | | |
Total Telecommunication Services | | | | | 119,702,258 | | |
UTILITIES: 5.4% | |
Electric Utilities: 2.7% | |
Cheung Kong Infrastructure Holdings, Ltd. | | | 8,940,500 | | | | 55,225,482 | | |
Gas Utilities: 2.0% | |
Hong Kong & China Gas Co., Ltd. | | | 14,568,739 | | | | 40,027,758 | | |
Independent Power Producers & Energy Traders: 0.7% | |
China Longyuan Power Group Corp.
H Shares | | | 20,724,000 | | | | 14,583,093 | | |
Total Utilities | | | | | 109,836,333 | | |
HEALTH CARE: 4.7% | |
Health Care Equipment & Supplies: 2.5% | |
Mindray Medical International, Ltd. ADR | | | 1,527,468 | | | | 49,948,204 | | |
Health Care Providers & Services: 2.2% | |
Sinopharm Group Co., Ltd. H Shares | | | 14,255,600 | | | | 45,268,946 | | |
Total Health Care | | | | | 95,217,150 | | |
| | | Value | |
TOTAL INVESTMENTS: 98.9% | | $ | 2,010,603,598 | | |
(Cost $1,657,184,741c) | | | |
CASH AND OTHER ASSETS,
LESS LIABILITIES: 1.1% | | | 22,230,184 | | |
NET ASSETS: 100.0% | | $ | 2,032,833,782 | | |
a Certain securities were fair valued under the discretion of the Board of Trustees (Note 2-A).
b Non-income producing security.
c Cost for federal income tax purposes is $1,658,560,603 and net unrealized appreciation consists of:
Gross unrealized appreciation | | $ | 468,280,303 | | |
Gross unrealized depreciation | | | (116,237,308 | ) | |
Net unrealized appreciation | | $ | 352,042,995 | | |
† Affiliated Issuer, as defined under the Investment Company Act of 1940 (ownership of 5% or more of the outstanding voting securities of this issuer)
ADR American Depositary Receipt
See accompanying notes to financial statements.
matthewsasia.com | 800.789.ASIA 39

PORTFOLIO MANAGERS
Sharat Shroff, CFA
Lead Manager
Sunil Asnani
Co-Manager
FUND FACTS
| | | Investor Class | | Institutional Class | |
Ticker | | MINDX | | MIDNX | |
CUSIP | | 577130859 | | 577130768 | |
Inception | | 10/31/05 | | 10/29/10 | |
NAV | | $17.51 | | $17.53 | |
Initial Investment | | $2,500 | | $3 million | |
Gross Expense Ratio1 | | 1.18% | | 0.98% | |
Portfolio Statistics
Total # of Positions | | 44 | |
Net Assets | | $644.0 million | |
Weighted Average Market Cap | | $8.7 billion | |
Portfolio Turnover | | 7.03%2 | |
Benchmark
Bombay Stock Exchange 100 Index
Redemption Fee
2% within first 90 calendar days of purchase
OBJECTIVE
Long-term capital appreciation.
STRATEGY
Under normal market conditions, the Fund seeks to achieve its investment objective by investing at least 80% of its total net assets, which include borrowings for investment purposes, in publicly traded common stocks, preferred stocks and convertible securities of companies located in India.
1 Matthews Asia Funds does not charge 12b-1 fees.
2 The lesser of fiscal year 2012 long-term purchase costs or sales proceeds divided by the average monthly market value of long-term securities.
Matthews India Fund
Portfolio Manager Commentary
For the year ending December 31 2012, the Matthews India Fund gained 31.54% (Investor Class) and 31.74% (Institutional Class), while its benchmark, the Bombay Stock Exchange 100 Index, appreciated by 28.62%. During the fourth quarter, the Fund returned 0.71% (Investor Class) and 0.79% (Institutional Class), against a benchmark return of 1.32%. The majority of gains and relative portfolio outperformance were achieved during the first quarter and once again highlights the need to take a patient, long-term approach.
The portfolio's limited exposure to metal and energy stocks, and its strategy of investing across the market cap spectrum helped its relative outperformance. Since the previous year's market correction, we have added to certain smaller companies after the valuation gaps with larger peers widened. That strategy paid off this year when smaller companies experienced a strong run. Thermax, an energy and environmental engineering firm, is one such example. Its business depends in part upon the industry's capital expenditure cycle and its competitive dynamics, both of which became adverse over the last two years. Some of Thermax's peers have tried to address the adversity by being less selective in their projects, and diversifying into areas in which they have less of a competitive edge in order to maintain growth. By contrast, Thermax remained focused on profitability without taking any short cuts to grow, even if that meant some near-term moderation in its fundamentals. Consequently, we not only remain invested in Thermax, we have also added to this position. While the investment cycle has not yet turned, we believe Thermax's prospects still appear healthy over the long term given its solid balance sheet and good positioning among industry peers.
India's often unfavorable policy environment has led some to eschew investing in India, and the past two years have been difficult given limited central government reforms. However, solid well-run businesses may still be in a better position to at least partly overcome these challenges. Developments in the banking sector have illustrated this point; over the past two years, public and private sector banks have shown marked deviation in their performance. Private sector banks achieved about 20% loan growth in 2012, and showed better management of balance sheets than public banks. However, even within private banks, there is a divergence in performance. Unlike some of its private sector peers, HDFC Bank, for example, has delivered consistently healthy returns with few nonperforming loans. The challenging macro environment is also a blessing in disguise, as it offers opportunities to find such solid businesses at fair valuations.
One of our key relative performance detractors was our strategic overweight in industrial stocks. This overweight did not payoff primarily because of certain company-specific factors. Gujarat Pipavav Port, the operator of a container and bulk port in western India, has been restructuring its operations over the past few years. This has included a change in ownership and its public listing two years ago. The management team is trying to balance further investments in enhancing the port facilities with the leverage on its balance sheet. Their challenges have been somewhat exacerbated by India's weak export and import trade volumes. However, we have taken some comfort in the relatively better levels of efficiency at this port compared to industry peers. Consequently, we have taken advantage of the continuing weakness in stock price and continued to accumulate this stock during the year.
40 MATTHEWS ASIA FUNDS
PERFORMANCE AS OF DECEMBER 31, 2012
| | | | | | | Average Annual Total Returns | | | |
| | 3 Months | | 1 Year | | 3 Years | | 5 Years | | Since
Inception | | Inception
Date | |
Investor Class (MINDX) | | | 0.71 | % | | | 31.54 | % | | | 3.46 | % | | | -3.82 | % | | | 10.81 | % | | 10/31/05 | |
Institutional Class (MIDNX) | | | 0.79 | % | | | 31.74 | % | | | n.a. | | | | n.a. | | | | -8.64 | % | | 10/29/10 | |
Bombay Stock Exchange 100 Index3 | | | 1.32 | % | | | 28.62 | % | | | 0.38 | % | | | -5.85 | % | | | 12.83 | %4 | | | |
Lipper India Region Funds Category Average5 | | | 1.97 | % | | | 28.78 | % | | | -0.70 | % | | | -7.61 | % | | | 7.90 | %4 | | | |
Performance assumes reinvestment of all dividends and/or distributions before taxes. All performance quoted represents past performance and is no guarantee of future results. Investment return and principal value will fluctuate with market conditions so that when redeemed, shares may be worth more or less than their original cost. Current performance may be lower or higher than the return figures quoted. Returns would have been lower if certain of the Fund's fees and expenses had not been waived. For the Fund's most recent month-end performance, visit matthewsasia.com.
GROWTH OF A $10,000 INVESTMENT SINCE INCEPTION—INVESTOR CLASS
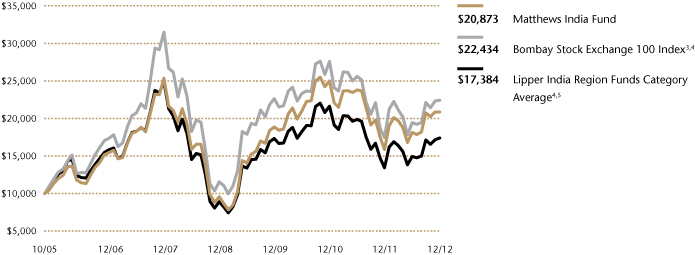
Plotted monthly. The performance data and graph do not reflect the deduction of taxes that a shareholder would pay on dividends, capital gains distributions or redemption of Fund shares. Values are in US$.
3 It is not possible to invest directly in an index. Source: Index data from Morgan Stanley Capital International and Bloomberg; total return calculations performed by BNY Mellon Investment Servicing (US) Inc. Please see page 71 for index definition.
4 Calculated from 10/31/05.
5 The Lipper Category Average does not reflect sales charges and is based on total return, including reinvestment of dividends and capital gains for the stated periods.
TOP TEN HOLDINGS6
| | Sector | | % of Net Assets | |
Emami, Ltd. | | Consumer Staples | | | 5.6 | % | |
Asian Paints, Ltd. | | Materials | | | 4.7 | % | |
ICICI Bank, Ltd. | | Financials | | | 4.5 | % | |
Exide Industries, Ltd. | | Consumer Discretionary | | | 4.5 | % | |
HDFC Bank, Ltd. | | Financials | | | 4.5 | % | |
Sun Pharmaceutical Industries, Ltd. | | Health Care | | | 4.0 | % | |
Kotak Mahindra Bank, Ltd. | | Financials | | | 3.9 | % | |
Dabur India, Ltd. | | Consumer Staples | | | 3.9 | % | |
ITC, Ltd. | | Consumer Staples | | | 3.4 | % | |
Info Edge India, Ltd. | | Information Technology | | | 3.2 | % | |
% OF ASSETS IN TOP TEN | | | | | 42.2 | % | |
6 Holdings may combine more than one security from same issuer and related depositary receipts.
matthewsasia.com | 800.789.ASIA 41
SECTOR ALLOCATION (%)
Financials | | | 25.3 | | |
Industrials | | | 18.2 | | |
Consumer Staples | | | 15.4 | | |
Materials | | | 12.9 | | |
Consumer Discretionary | | | 9.6 | | |
Information Technology | | | 6.5 | | |
Health Care | | | 5.2 | | |
Utilities | | | 4.4 | | |
Energy | | | 1.2 | | |
Cash and Other Assets,
Less Liabilities | | | 1.3 | | |
MARKET CAP EXPOSURE (%)7
Large Cap (over $5B) | | | 40.5 | | |
Mid Cap ($1B–$5B) | | | 38.6 | | |
Small Cap (under $1B) | | | 19.6 | | |
Liabilities in Excess of Cash
and Other Assets | | | 1.3 | | |
7 Source: FactSet Research Systems. Percentage values in data are rounded to the nearest tenth of one percent; the values may not sum to 100% due to rounding.
Matthews India Fund
Portfolio Manager Commentary (continued)
During the year, we continued to replace previously exited holdings across sectors with new ones. While our portfolio has become more concentrated, our sectoral diversification has not changed significantly. Our weighting in materials, however, now maintains a marginal overweight allocation relative to the benchmark. Within this space, we have tried to stay away from pure commodity-like stocks and invested more in companies that command pricing power and enjoy distribution strength. Asian Paints, India's market leader in decorative paints, is one such holding. The company has been able to grow 15% to 20% while maintaining returns on equity of more than 30% through varying investment cycles over the last decade.
Another noticeable development has been the increasing breadth in the Indian economy with the emergence of the rural consumer. Income levels in rural India have grown over the past few years, helped by some governmental programs, and the rise in prices of soft commodities. This rise in income is also reflected in the sustained growth of some consumer staple companies in our portfolio exposed to this segment. We also note that companies with strong brands, wide distribution and a reduced dependency on the government continue to hold up.
Looking ahead, a strong pickup in India's economic growth is dependent on greater impetus from policy making. However, this is an internal challenge, and is not contingent on the economic environment elsewhere in the world. The recent passage of a bill by the central government to allow foreign direct investment in the retail sector is illustrative in that the burden of implementing new forms is at least partly shifting from the central government to India's state governments. We are optimistic that this move should allow some state governments to take the lead and set a positive example for other local administrations to follow. While valuations are now approaching the historical five- and 10-year averages, we continue to find attractive investment opportunities using our bottom-up stock selection process.
42 MATTHEWS ASIA FUNDS
Matthews India Fund December 31, 2012
Schedule of Investmentsa
COMMON EQUITIES: 97.1%
| | | Shares | | Value | |
FINANCIALS: 25.3% | |
Commercial Banks: 11.8% | |
ICICI Bank, Ltd. | | | 1,150,000 | | | $ | 24,066,173 | | |
HDFC Bank, Ltd. | | | 1,830,165 | | | | 22,816,525 | | |
Allahabad Bank | | | 3,158,529 | | | | 9,879,448 | | |
Axis Bank, Ltd. | | | 333,532 | | | | 8,380,311 | | |
HDFC Bank, Ltd. ADR | | | 148,922 | | | | 6,064,104 | | |
ICICI Bank, Ltd. ADR | | | 113,283 | | | | 4,940,272 | | |
| | | | | | 76,146,833 | | |
Diversified Financial Services: 7.4% | |
Kotak Mahindra Bank, Ltd. | | | 2,100,000 | | | | 25,130,783 | | |
IDFC, Ltd. | | | 6,211,855 | | | | 19,702,166 | | |
Multi Commodity Exchange of India, Ltd. | | | 109,509 | | | | 2,963,942 | | |
| | | | | | 47,796,891 | | |
Real Estate Management & Development: 3.2% | |
Ascendas India Trust | | | 33,094,000 | | | | 20,318,857 | | |
Thrifts & Mortgage Finance: 2.9% | |
Housing Development Finance Corp. | | | 1,225,000 | | | | 18,714,088 | | |
Total Financials | | | | | 162,976,669 | | |
INDUSTRIALS: 18.2% | |
Machinery: 8.3% | |
Ashok Leyland, Ltd. | | | 40,022,554 | | | | 19,765,907 | | |
Thermax, Ltd. | | | 1,378,128 | | | | 15,609,156 | | |
AIA Engineering, Ltd. | | | 2,136,467 | | | | 12,831,435 | | |
Jain Irrigation Systems, Ltd. | | | 3,675,635 | | | | 5,090,413 | | |
| | | | | | 53,296,911 | | |
Industrial Conglomerates: 3.0% | |
MAX India, Ltd. | | | 4,388,102 | | | | 19,542,476 | | |
Road & Rail: 2.7% | |
Container Corp. of India, Ltd. | | | 1,039,216 | | | | 17,563,975 | | |
Transportation Infrastructure: 2.1% | |
Gujarat Pipavav Port, Ltd.b | | | 15,080,000 | | | | 13,856,236 | | |
Electrical Equipment: 2.1% | |
Crompton Greaves, Ltd. | | | 6,187,500 | | | | 13,239,730 | | |
Total Industrials | | | | | 117,499,328 | | |
CONSUMER STAPLES: 15.4% | |
Personal Products: 12.0% | |
Emami, Ltd. | | | 3,267,712 | | | | 36,141,413 | | |
Dabur India, Ltd. | | | 10,654,430 | | | | 25,065,815 | | |
Bajaj Corp., Ltd. | | | 3,803,615 | | | | 16,175,741 | | |
| | | | | | 77,382,969 | | |
Tobacco: 3.4% | |
ITC, Ltd. | | | 4,140,000 | | | | 21,800,602 | | |
Total Consumer Staples | | | | | 99,183,571 | | |
| | | Shares | | Value | |
MATERIALS: 12.5% | |
Chemicals: 9.0% | |
Asian Paints, Ltd. | | | 375,500 | | | $ | 30,586,044 | | |
Castrol India, Ltd. | | | 3,443,602 | | | | 18,911,800 | | |
Supreme Industries, Ltd. | | | 1,507,038 | | | | 8,148,229 | | |
| | | | | | 57,646,073 | | |
Construction Materials: 2.0% | |
Grasim Industries, Ltd. | | | 224,459 | | | | 13,064,777 | | |
Metals & Mining: 1.5% | |
NMDC, Ltd. | | | 3,145,923 | | | | 9,556,022 | | |
Total Materials | | | | | 80,266,872 | | |
CONSUMER DISCRETIONARY: 9.6% | |
Auto Components: 4.5% | |
Exide Industries, Ltd. | | | 10,906,722 | | | | 28,931,873 | | |
Media: 3.9% | |
Jagran Prakashan, Ltd. | | | 9,961,391 | | | | 19,433,459 | | |
Dish TV India, Ltd.b | | | 3,868,505 | | | | 5,394,285 | | |
| | | | | | 24,827,744 | | |
Textiles, Apparel & Luxury Goods: 1.2% | |
Titan Industries, Ltd. | | | 1,538,820 | | | | 8,065,767 | | |
Total Consumer Discretionary | | | | | 61,825,384 | | |
INFORMATION TECHNOLOGY: 6.5% | |
Internet Software & Services: 3.3% | |
Info Edge India, Ltd. | | | 3,324,978 | | | | 20,924,483 | | |
IT Services: 3.2% | |
Infosys, Ltd. ADR | | | 238,179 | | | | 10,074,972 | | |
Infosys, Ltd. | | | 119,281 | | | | 5,052,189 | | |
MindTree, Ltd. | | | 320,000 | | | | 3,988,173 | | |
CMC, Ltd. | | | 79,130 | | | | 1,732,223 | | |
| | | | | | 20,847,557 | | |
Total Information Technology | | | | | 41,772,040 | | |
HEALTH CARE: 5.2% | |
Pharmaceuticals: 5.2% | |
Sun Pharmaceutical Industries, Ltd. | | | 1,923,300 | | | | 26,015,054 | | |
Cipla India, Ltd. | | | 988,275 | | | | 7,520,351 | | |
Total Health Care | | | | | 33,535,405 | | |
UTILITIES: 3.2% | |
Gas Utilities: 3.0% | |
GAIL India, Ltd. | | | 2,944,751 | | | | 19,349,994 | | |
Electric Utilities: 0.2% | |
CESC, Ltd. | | | 248,149 | | | | 1,455,588 | | |
Total Utilities | | | | | 20,805,582 | | |
matthewsasia.com | 800.789.ASIA 43
Matthews India Fund December 31, 2012
Schedule of Investmentsa (continued)
COMMON EQUITIES (continued)
| | | Shares | | Value | |
ENERGY: 1.2% | |
Oil, Gas & Consumable Fuels: 1.2% | |
Reliance Industries, Ltd. | | | 480,742 | | | $ | 7,443,515 | | |
Total Energy | | | | | 7,443,515 | | |
TOTAL COMMON EQUITIES | | | | | 625,308,366 | | |
(Cost $560,557,775) | | | | | |
CORPORATE BONDS: 1.6%
| | | Face Amount | | | |
UTILITIES: 1.2% | |
Electric Utilities: 1.2% | |
Tata Power Co., Ltd., Cnv.
1.750%, 11/21/14 | | $ | 7,700,000 | | | | 8,073,450 | | |
Total Utilities | | | | | 8,073,450 | | |
MATERIALS: 0.4% | |
Metals & Mining: 0.4% | |
Welspun Corp., Ltd., Cnv.
4.500%, 10/17/14 | | | 2,400,000 | | | | 2,328,000 | | |
Total Materials | | | | | 2,328,000 | | |
TOTAL CORPORATE BONDS | | | | | 10,401,450 | | |
(Cost $11,617,750) | | | | | |
TOTAL INVESTMENTS: 98.7% | | | | | 635,709,816 | | |
(Cost $572,175,525c) | | | | | |
CASH AND OTHER ASSETS,
LESS LIABILITIES: 1.3% | | | | | 8,256,077 | | |
NET ASSETS: 100.0% | | | | $ | 643,965,893 | | |
a Certain securities were fair valued under the discretion of the Board of Trustees (Note 2-A).
b Non-income producing security.
c Cost for federal income tax purposes is $573,382,641 and net unrealized appreciation consists of:
Gross unrealized appreciation | | $ | 133,162,905 | | |
Gross unrealized depreciation | | | (70,835,730 | ) | |
Net unrealized appreciation | | $ | 62,327,175 | | |
ADR American Depositary Receipt
Cnv. Convertible
See accompanying notes to financial statements.
44 MATTHEWS ASIA FUNDS

PORTFOLIO MANAGERS
Taizo Ishida
Lead Manager
Kenichi Amaki
Co-Manager
FUND FACTS
| | | Investor Class | | Institutional Class | |
Ticker | | MJFOX | | MIJFX | |
CUSIP | | 577130800 | | 577130792 | |
Inception | | 12/31/98 | | 10/29/10 | |
NAV | | $12.27 | | $12.26 | |
Initial Investment | | $2,500 | | $3 million | |
Gross Expense Ratio1 | | 1.20% | | 1.04% | |
Portfolio Statistics
Total # of Positions | | 54 | |
Net Assets | | $104.7 million | |
Weighted Average Market Cap | | $19.0 billion | |
Portfolio Turnover | | 48.58%2 | |
Benchmarks
MSCI Japan Index
Tokyo Stock Price Index (TOPIX)
Redemption Fee
2% within first 90 calendar days of purchase
OBJECTIVE
Long-term capital appreciation.
STRATEGY
Under normal market conditions, the Fund seeks to achieve its investment objective by investing at least 80% of its total net assets, which include borrowings for investment purposes, in the common and preferred stocks of companies located in Japan.
1 Matthews Asia Funds does not charge 12b-1 fees.
2 The lesser of fiscal year 2012 long-term purchase costs or sales proceeds divided by the average monthly market value of long-term securities.
Matthews Japan Fund
Portfolio Manager Commentary
For the year ending December 31, 2012, the Matthews Japan Fund rose 8.32% (Investor Class) and 8.47% (Institutional Class) while its benchmark, the MSCI Japan Index, rose 8.36%. For the fourth quarter of the year, the Fund returned 0.52% (Investor Class) and 0.49% (Institutional Class) versus 5.79% for the Index.
2012 was a roller coaster year for Japan's equity markets. The year started off with double-digit gains in the first quarter, driven by the Bank of Japan's unexpected monetary easing measures. But such gains were quickly wiped out over the next two quarters, as investor focus shifted to Europe's debt woes and lackluster economic growth in most of the world's major markets. A flare-up in diplomatic tensions between Japan and China also weighed on sentiment. Markets changed direction again in November, when Prime Minister Yoshihiko Noda abruptly dissolved Parliament and called for general elections. Equities rallied hard into the end of the year, again posting double-digit gains as the Liberal Democratic Party—which campaigned on a platform of aggressive monetary easing—scored a landslide victory in the Lower House. Despite this volatile backdrop, the MSCI Japan Index ended on a high note, appreciating 18.85% for the year in local currency terms and posting its best performance since 2005.
There is an inverse relationship between the performance of Japan's equity market and the movement of the yen against the U.S. dollar. When the yen was strong, equities slumped. When the yen was weak, equities rallied. Though Japan's economy is not necessarily export-dependent (exports account for only about 15% of the economy), a stronger yen can diminish the cost-competitiveness of domestic manufacturing, undermining job creation and private capital investment. Hence, market participants have welcomed the prospects of monetary expansion and a weaker yen environment even though this may not immediately impact corporate fundamentals.
The Fund does not employ an active hedging strategy. We believe a currency hedge simply increases the level of volatility and does not necessarily deliver enough of a benefit to merit the additional risk. We do, however, implement a natural hedge within the portfolio by making adjustments to our exposure between exporters and domestically oriented companies. Nevertheless, we do not choose investments solely based on our outlook for the currency. Rather, we seek companies in which we detect fundamental business improvements.
The currency-driven nature of the markets posed a challenge for the Fund in 2012, given our focus on fundamental bottom-up stock picking. The Fund underperformed the benchmark significantly during the first and fourth quarter rallies as the portfolio was relatively more geared toward high quality names, including some small and medium-sized companies with limited currency benefit due to the domestic nature of their businesses. On the other hand, the Fund outperformed substantially during the second and third quarters. Stock selection continued to contribute positively to relative returns over the course of the year, but this was reduced somewhat by the negative effect from sector allocation.
By sector, information technology had the largest negative impact on absolute performance. While exporters got a boost from a weaker yen toward the end of the year, our holdings in domestic Internet-related names performed poorly. Particularly, online payment solution provider
matthewsasia.com | 800.789.ASIA 45
PERFORMANCE AS OF DECEMBER 31, 2012
| | | | | | | Average Annual Total Returns | | | |
| | 3 Months | | 1 Year | | 3 Years | | 5 Years | | 10 Years | | Since
Inception | | Inception
Date | |
Investor Class (MJFOX) | | | 0.52 | % | | | 8.32 | % | | | 6.12 | % | | | -1.18 | % | | | 5.78 | % | | | 3.75 | % | | 12/31/98 | |
Institutional Class (MIJFX) | | | 0.49 | % | | | 8.47 | % | | | n.a. | | | | n.a. | | | | n.a. | | | | 5.06 | % | | 10/29/10 | |
MSCI Japan Index3 | | | 5.79 | % | | | 8.36 | % | | | 2.44 | % | | | -4.11 | % | | | 5.06 | % | | | 1.38 | %4 | | | |
Tokyo Stock Price Index3 | | | 5.66 | % | | | 7.83 | % | | | 2.60 | % | | | -3.38 | % | | | 4.98 | % | | | 1.68 | %4 | | | |
Lipper Japanese Funds Category Average5 | | | 4.32 | % | | | 7.34 | % | | | 4.10 | % | | | -2.13 | % | | | 4.23 | % | | | 2.18 | %4 | | | |
Performance assumes reinvestment of all dividends and/or distributions before taxes. All performance quoted represents past performance and is no guarantee of future results. Investment return and principal value will fluctuate with market conditions so that when redeemed, shares may be worth more or less than their original cost. Current performance may be lower or higher than the return figures quoted. Returns would have been lower if certain of the Fund's fees and expenses had not been waived. For the Fund's most recent month-end performance, visit matthewsasia.com.
GROWTH OF A $10,000 INVESTMENT SINCE INCEPTION—INVESTOR CLASS
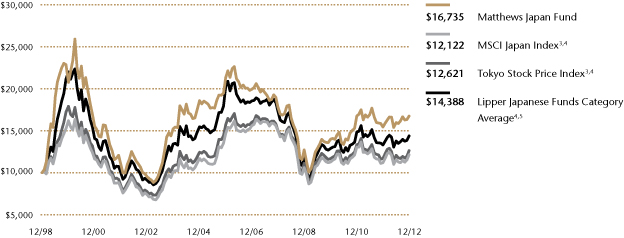
Plotted montly. The performance data and graph do not reflect the deduction of taxes that a shareholder would pay on dividends, capital gains distributions or redemption of Fund shares. Values are in US$.
3 It is not possible to invest directly in an index. Source: Index data from Morgan Stanley Capital International and Bloomberg; total return calculations performed by BNY Mellon Investment Servicing (US) Inc. Please see page 71 for index definitions.
4 Calculated from 12/31/98.
5 The Lipper Category Average does not reflect sales charges and is based on total return, including reinvestment of dividends and capital gains for the stated periods.
TOP TEN HOLDINGS6
| | Sector | | % of Net Assets | |
ORIX Corp. | | Financials | | | 4.4 | % | |
ITOCHU Corp. | | Industrials | | | 4.3 | % | |
Marubeni Corp. | | Industrials | | | 3.5 | % | |
Toyota Motor Corp. | | Consumer Discretionary | | | 3.4 | % | |
Mitsubishi UFJ Financial Group, Inc. | | Financials | | | 3.4 | % | |
Honda Motor Co., Ltd. | | Consumer Discretionary | | | 3.0 | % | |
Rinnai Corp. | | Consumer Discretionary | | | 3.0 | % | |
FANUC Corp. | | Industrials | | | 2.9 | % | |
Asahi Intecc Co., Ltd. | | Health Care | | | 2.8 | % | |
Tokio Marine Holdings, Inc. | | Financials | | | 2.7 | % | |
% OF ASSETS IN TOP TEN | | | | | 33.4 | % | |
6 Holdings may combine more than one security from same issuer and related depositary receipts.
46 MATTHEWS ASIA FUNDS
Matthews Japan Fund
Portfolio Manager Commentary (continued)
GMO Payment Gateway retreated as investors took profits after three years of strong performance. Still, the company has achieved sales and operating profit growth in excess of 20% over the past three years and has the potential to continue delivering solid results. Therefore, we have maintained our position in the stock.
On the other hand, the financials sector was the top contributor to absolute performance. Our real estate holdings in particular, such as real estate investment trust Industrial and Infrastructure Fund Investment and mid-sized developer Hulic, made notable contributions on the back of solid growth. Late in the year, we took profits and exited Industrial and Infrastructure Fund Investment. Additionally, banks and insurers benefited from the prospect of reflationary monetary policies that provided a boost to such holdings as Sony Financial Holdings and Mitsubishi UFJ Financial Group. However, due to our relative underweight position in the sector, financials was also the biggest detractor to performance relative to the benchmark.
Our position in precision motor company Nidec had the largest negative effect on performance over the year. Nidec is facing shrinking demand in its small precision motor business due to weakening demand for notebook PCs and hard disk drive products. The company had been transitioning the business to expand into automobile motors but the decline in PCs has been faster than management had expected. Though orders for its automobile-related business continue to increase, profit contribution has remained low due to high product development costs. We continue to have meetings with the management team and believe there are good prospects for future growth.
Meanwhile, Fuji Heavy Industries, manufacturer of the Subaru brand automobiles, was the top contributor to performance for both the year and the fourth quarter. Subaru sales in the U.S. have continued to grow, achieving record sales for four consecutive years. An improved product lineup and restructured dealer network combined with Subaru's unique brand image have been the drivers of growth. Strong sales performance has allowed Subaru to lower incentives per unit every year for the past five years, supporting profit margins. In fact, as of year-end 2012, Subaru had the lowest incentive cost per unit amongst major auto manufacturers in the U.S. market, a testament to its pricing power. Additionally, as an exporter with significant manufacturing based in Japan, the company benefits greatly from a weaker yen. Fuji Heavy is a good example of what we seek in an export company. It features solid fundamentals coupled with pricing power supported by a unique product offering.
Looking ahead, we take comfort in the significant weakening of the yen, which occurred toward the end of 2012. However, we remain cautious on the outlook for Japanese corporate earnings given weak economic growth. The weaker yen has helped to improve investor sentiment, but these levels will need to be maintained throughout the year in order to have a meaningful positive impact on corporate earnings. In that respect, we remain mindful of monetary policy implications from both Japan and the U.S. that may affect exchange rates over the medium-term. We continue to be encouraged by the results delivered by our portfolio holdings and intend to keep focusing on fundamentally sound businesses with attractive long-term growth prospects.
SECTOR ALLOCATION (%)
Industrials | | | 26.2 | | |
Financials | | | 20.6 | | |
Consumer Discretionary | | | 20.1 | | |
Information Technology | | | 14.0 | | |
Consumer Staples | | | 7.4 | | |
Health Care | | | 7.3 | | |
Materials | | | 1.4 | | |
Telecommunication Services | | | 1.1 | | |
Cash and Other Assets,
Less Liabilities | | | 1.9 | | |
MARKET CAP EXPOSURE (%)7
Large Cap (over $5B) | | | 59.1 | | |
Mid Cap ($1B–$5B) | | | 16.2 | | |
Small Cap (under $1B) | | | 22.8 | | |
Cash and Other Assets,
Less Liabilities | | | 1.9 | | |
7 Source: FactSet Research Systems. Percentage values in data are rounded to the nearest tenth of one percent; the values may not sum to 100% due to rounding.
matthewsasia.com | 800.789.ASIA 47
Matthews Japan Fund December 31, 2012
Schedule of Investmentsa
COMMON EQUITIES: 98.1%
| | | Shares | | Value | |
INDUSTRIALS: 26.2% | |
Trading Companies & Distributors: 9.9% | |
ITOCHU Corp. | | | 423,100 | | | $ | 4,471,787 | | |
Marubeni Corp. | | | 512,000 | | | | 3,673,724 | | |
Mitsui & Co., Ltd. | | | 149,600 | | | | 2,242,334 | | |
| | | | | | 10,387,845 | | |
Machinery: 9.0% | |
FANUC Corp. | | | 16,600 | | | | 3,088,424 | | |
Harmonic Drive Systems, Inc. | | | 101,700 | | | | 2,037,514 | | |
Mitsubishi Heavy Industries, Ltd. | | | 399,000 | | | | 1,930,054 | | |
Nabtesco Corp. | | | 56,100 | | | | 1,253,064 | | |
Komatsu, Ltd. | | | 43,600 | | | | 1,118,793 | | |
| | | | | | 9,427,849 | | |
Electrical Equipment: 2.6% | |
Nidec Corp. | | | 32,400 | | | | 1,892,124 | | |
Endo Lighting Corp. | | | 26,900 | | | | 804,756 | | |
| | | | | | 2,696,880 | | |
Commercial Services & Supplies: 2.3% | |
JP-Holdings, Inc. | | | 213,500 | | | | 2,336,057 | | |
Professional Services: 1.3% | |
Nihon M&A Center, Inc. | | | 41,200 | | | | 1,374,835 | | |
Construction & Engineering: 1.1% | |
JGC Corp. | | | 37,000 | | | | 1,152,974 | | |
Total Industrials | | | | | 27,376,440 | | |
FINANCIALS: 20.6% | |
Insurance: 6.2% | |
Tokio Marine Holdings, Inc. | | | 100,100 | | | | 2,788,713 | | |
Sony Financial Holdings, Inc. | | | 131,100 | | | | 2,356,950 | | |
Anicom Holdings, Inc.b | | | 168,400 | | | | 1,321,594 | | |
| | | | | | 6,467,257 | | |
Commercial Banks: 4.7% | |
Mitsubishi UFJ Financial Group, Inc. | | | 649,200 | | | | 3,512,895 | | |
Shinsei Bank, Ltd. | | | 727,000 | | | | 1,455,118 | | |
| | | | | | 4,968,013 | | |
Diversified Financial Services: 4.4% | |
ORIX Corp. | | | 41,180 | | | | 4,651,632 | | |
Real Estate Investment Trusts: 2.9% | |
Kenedix Realty Investment Corp., REIT | | | 558 | | | | 1,945,222 | | |
GLP J-REITb | | | 1,370 | | | | 1,046,852 | | |
| | | | | | 2,992,074 | | |
Real Estate Management & Development: 2.4% | |
Mitsui Fudosan Co., Ltd. | | | 68,000 | | | | 1,663,490 | | |
Hulic Co., Ltd. | | | 122,700 | | | | 832,508 | | |
| | | | | | 2,495,998 | | |
Total Financials | | | | | 21,574,974 | | |
| | | Shares | | Value | |
CONSUMER DISCRETIONARY: 20.1% | |
Automobiles: 8.4% | |
Toyota Motor Corp. | | | 75,600 | | | $ | 3,530,229 | | |
Honda Motor Co., Ltd. | | | 85,600 | | | | 3,170,165 | | |
Fuji Heavy Industries, Ltd. | | | 170,000 | | | | 2,143,755 | | |
| | | | | | 8,844,149 | | |
Household Durables: 3.9% | |
Rinnai Corp. | | | 45,800 | | | | 3,111,830 | | |
HAJIME CONSTRUCTION Co., Ltd. | | | 26,700 | | | | 992,753 | | |
| | | | | | 4,104,583 | | |
Auto Components: 2.8% | |
Nifco, Inc. | | | 69,900 | | | | 1,550,517 | | |
Bridgestone Corp. | | | 53,800 | | | | 1,400,498 | | |
| | | | | | 2,951,015 | | |
Internet & Catalog Retail: 1.4% | |
Rakuten, Inc. | | | 189,100 | | | | 1,474,688 | | |
Multiline Retail: 1.3% | |
H2O Retailing Corp. | | | 145,000 | | | | 1,355,227 | | |
Diversified Consumer Services: 1.2% | |
ESCRIT, Inc.b | | | 130,200 | | | | 1,213,807 | | |
Specialty Retail: 1.1% | |
VT Holdings Co., Ltd. | | | 115,600 | | | | 1,107,598 | | |
Total Consumer Discretionary | | | | | 21,051,067 | | |
INFORMATION TECHNOLOGY: 14.0% | |
Electronic Equipment, Instruments & Components: 7.2% | |
Murata Manufacturing Co., Ltd. | | | 43,400 | | | | 2,560,227 | | |
Kyocera Corp. | | | 28,100 | | | | 2,547,695 | | |
Hitachi, Ltd. | | | 414,000 | | | | 2,436,186 | | |
| | | | | | 7,544,108 | | |
IT Services: 3.1% | |
GMO Payment Gateway, Inc. | | | 130,800 | | | | 1,987,364 | | |
Bit-isle, Inc. | | | 120,000 | | | | 1,214,052 | | |
| | | | | | 3,201,416 | | |
Internet Software & Services: 2.5% | |
Kakaku.com, Inc. | | | 52,100 | | | | 1,719,987 | | |
Yahoo! Japan Corp. | | | 2,847 | | | | 921,846 | | |
| | | | | | 2,641,833 | | |
Software: 1.2% | |
Capcom Co., Ltd. | | | 84,500 | | | | 1,291,881 | | |
Total Information Technology | | | | | 14,679,238 | | |
CONSUMER STAPLES: 7.4% | |
Food & Staples Retailing: 3.2% | |
Daikokutenbussan Co., Ltd. | | | 66,600 | | | | 2,008,724 | | |
Ain Pharmaciez, Inc. | | | 23,800 | | | | 1,301,894 | | |
| | | | | | 3,310,618 | | |
48 MATTHEWS ASIA FUNDS
Matthews Japan Fund December 31, 2012
Schedule of Investmentsa (continued)
COMMON EQUITIES (continued)
| | | Shares | | Value | |
Household Products: 2.9% | |
Unicharm Corp. | | | 38,600 | | | $ | 2,005,833 | | |
Pigeon Corp. | | | 20,500 | | | | 981,063 | | |
| | | | | | 2,986,896 | | |
Food Products: 1.3% | |
Calbee, Inc. | | | 20,100 | | | | 1,416,299 | | |
Total Consumer Staples | | | | | 7,713,813 | | |
HEALTH CARE: 7.3% | |
Health Care Equipment & Supplies: 3.8% | |
Asahi Intecc Co., Ltd. | | | 75,800 | | | | 2,904,784 | | |
Sysmex Corp. | | | 22,900 | | | | 1,054,518 | | |
| | | | | | 3,959,302 | | |
Health Care Providers & Services: 2.5% | |
Message Co., Ltd. | | | 572 | | | | 1,324,718 | | |
Ship Healthcare Holdings, Inc. | | | 49,700 | | | | 1,320,937 | | |
| | | | | | 2,645,655 | | |
Pharmaceuticals: 1.0% | |
Otsuka Holdings Co., Ltd. | | | 36,700 | | | | 1,033,886 | | |
Total Health Care | | | | | 7,638,843 | | |
MATERIALS: 1.4% | |
Chemicals: 1.4% | |
Nitto Denko Corp. | | | 30,200 | | | | 1,487,309 | | |
Total Materials | | | | | 1,487,309 | | |
TELECOMMUNICATION SERVICES: 1.1% | |
Wireless Telecommunication Services: 1.1% | |
Softbank Corp. | | | 32,200 | | | | 1,179,848 | | |
Total Telecommunication Services | | | | | 1,179,848 | | |
TOTAL INVESTMENTS: 98.1% | | | | | 102,701,532 | | |
(Cost $96,169,947c) | | | | | |
CASH AND OTHER ASSETS,
LESS LIABILITIES: 1.9% | | | | | 1,994,396 | | |
NET ASSETS: 100.0% | | | | $ | 104,695,928 | | |
a Certain securities were fair valued under the discretion of the Board of Trustees (Note 2-A).
b Non-income producing security.
c Cost for federal income tax purposes is $97,292,369 and net unrealized appreciation consists of:
Gross unrealized appreciation | | $ | 10,050,412 | | |
Gross unrealized depreciation | | | (4,641,249 | ) | |
Net unrealized appreciation | | $ | 5,409,163 | | |
REIT Real Estate Investment Trust
See accompanying notes to financial statements.
matthewsasia.com | 800.789.ASIA 49

PORTFOLIO MANAGERS
J. Michael Oh, CFA
Lead Manager
Michael B. Han, CFA
Co-Manager
FUND FACTS
| | | Investor Class | | Institutional Class | |
Ticker | | MAKOX | | MIKOX | |
CUSIP | | 577130305 | | 577130826 | |
Inception | | 1/3/95 | | 10/29/10 | |
NAV | | $5.64 | | $5.67 | |
Initial Investment | | $2,500 | | $3 million | |
Gross Expense Ratio1 | | 1.16% | | 1.00% | |
Portfolio Statistics
Total # of Positions | | 55 | |
Net Assets | | $149.8 million | |
Weighted Average Market Cap | | $46.9 billion | |
Portfolio Turnover | | 34.84%2 | |
Benchmark
Korea Composite Stock Price Index
Redemption Fee
2% within first 90 calendar days of purchase
OBJECTIVE
Long-term capital appreciation.
STRATEGY
Under normal market conditions, the Fund seeks to achieve its investment objective by investing at least 80% of its total net assets, which include borrowings for investment purposes, in the common and preferred stocks of companies located in South Korea.
1 Matthews Asia Funds does not charge 12b-1 fees.
2 The lesser of fiscal year 2012 long-term purchase costs or sales proceeds divided by the average monthly market value of long-term securities.
Matthews Korea Fund
Portfolio Manager Commentary
For the year ending December 31, 2012, the Matthews Korea Fund gained 24.05% (Investor Class) and 24.16% (Institutional class) while its benchmark, the Korea Composite Stock Price Index, rose 18.54%. For the fourth quarter of the year, the Fund returned 5.83% (Investor Class) and 5.99% (Institutional Class) versus 4.30% for the benchmark.
The first half of the year was a volatile period as Europe's debt crisis heightened and expectations for a global economic recovery weakened. However, during the second half of the year Korea's equity market started to pick up as ongoing stimulus measures from Western governments helped to support markets. The Fund's outperformance against the benchmark was primarily due to its positions in consumer discretionary, consumer staples, and financials. What helped the Fund outperform this year was both our focus on stable business models that benefit from rising disposable income and our emphasis on companies with rising global competitiveness.
During the year, media and leisure-related companies outperformed the broader market as their growth outlook remained relatively stable. Korea's media industry was particularly strong as a result of increased attention to Korean pop music, known as K-pop. Holdings in the consumer staples sector that have demonstrated overseas growth potential performed well during the year.
Among the best-performing sectors during the year was health care, due to its defensive nature. Materials and industrials underperformed the broader benchmark during the year as most firms in these areas suffered from overcapacity and weakening demand during the year.
At a security level, Samsung Electronics was the largest contributor for the year, and a beneficiary of the ongoing growth of the smartphone industry. During the year, Samsung Electronics became the world's largest smartphone maker and its positioning in the semiconductor space also strengthened. We expect the smartphone industry to remain vibrant into 2013.
Other major contributors during the year included SBS Media Holdings and Modetour. SBS Media Holdings, a Seoul-based terrestrial television and cable broadcasting company, performed well as it was among the region's most attractively valued media companies. Modetour, a major travel firm, benefited from growth in overseas tourism as well as the strengthening Korean won. Snack manufacturer Orion was also a top contributor to Fund performance during the year. Orion entered China in early 2000 and has been successful at penetrating and building its brand there. In fact, its China-generated revenue has surpassed that in Korea. The company also maintains a strong presence in Russia and Vietnam.
Among the major detractors to Fund performance during the year was Kia Motors. Korea's auto industry in general was negatively affected by the strengthening currency, and we anticipate that pressure to continue in the near term as the currency is expected to further strengthen. However, we continue to be invested in Korean auto companies since we believe that the majority of their market share gains have come not from price cutting but from improved car design, quality and customer satisfaction. Korean auto firms have been also diversifying their manufacturing base, and over the past decade, these companies have been building additional capacity in the U.S., China and Europe to minimize currency risks.
50 MATTHEWS ASIA FUNDS
PERFORMANCE AS OF DECEMBER 31, 2012
| | | | | | | Average Annual Total Returns | | | |
| | 3 Months | | 1 Year | | 3 Years | | 5 Years | | 10 Years | | Since
Inception | | Inception
Date | |
Investor Class (MAKOX) | | | 5.83 | % | | | 24.05 | % | | | 12.24 | % | | | 1.75 | % | | | 14.37 | % | | | 6.02 | % | | 1/3/95 | |
Institutional Class (MIKOX) | | | 5.99 | % | | | 24.16 | % | | | n.a. | | | | n.a. | | | | n.a. | | | | 11.46 | % | | 10/29/10 | |
Korea Composite Stock Price Index3 | | | 4.30 | % | | | 18.54 | % | | | 9.51 | % | | | -0.67 | % | | | 15.34 | % | | | 3.49 | %4 | | | |
Lipper Pacific ex Japan Funds Category Average5 | | | 6.62 | % | | | 22.06 | % | | | 6.35 | % | | | -0.19 | % | | | 14.18 | % | | | 5.45 | %4 | | | |
Performance assumes reinvestment of all dividends and/or distributions before taxes. All performance quoted represents past performance and is no guarantee of future results. Investment return and principal value will fluctuate with market conditions so that when redeemed, shares may be worth more or less than their original cost. Current performance may be lower or higher than the return figures quoted. Returns would have been lower if certain of the Fund's fees and expenses had not been waived. For the Fund's most recent month-end performance, visit matthewsasia.com.
GROWTH OF A $10,000 INVESTMENT SINCE INCEPTION—INVESTOR CLASS
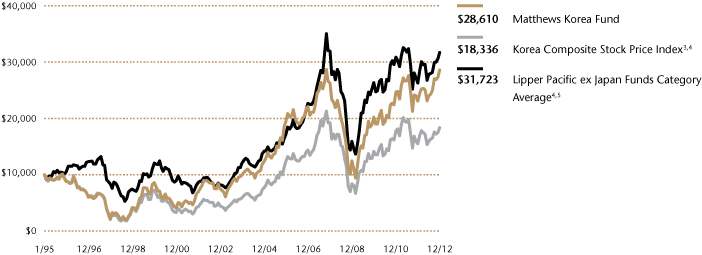
Plotted monthly. The performance data and graph do not reflect the deduction of taxes that a shareholder would pay on dividends, capital gains distributions or redemption of Fund shares. Values are in US$.
3 It is not possible to invest directly in an index. Source: Index data from Morgan Stanley Capital International and Bloomberg; total return calculations performed by BNY Mellon Investment Servicing (US) Inc. Please see page 71 for index definition.
4 Calculated from 12/31/94.
5 The Lipper Category Average does not reflect sales charges and is based on total return, including reinvestment of dividends and capital gains for the stated periods.
TOP TEN HOLDINGS6
| | Sector | | % of Net Assets | |
Samsung Electronics Co., Ltd. | | Information Technology | | | 15.2 | % | |
Shinhan Financial Group Co., Ltd. | | Financials | | | 3.9 | % | |
POSCO | | Materials | | | 3.0 | % | |
SBS Media Holdings Co., Ltd. | | Consumer Discretionary | | | 2.9 | % | |
LG Chem, Ltd. | | Materials | | | 2.9 | % | |
Hyundai Motor Co., Ltd., 2nd Pfd. | | Consumer Discretionary | | | 2.6 | % | |
Hyundai Motor Co. | | Consumer Discretionary | | | 2.5 | % | |
Dongbu Insurance Co., Ltd. | | Financials | | | 2.3 | % | |
SK Innovation Co., Ltd. | | Energy | | | 2.3 | % | |
LG Household & Health Care, Ltd. | | Consumer Staples | | | 2.3 | % | |
% OF ASSETS IN TOP TEN | | | | | 39.9 | % | |
6 Holdings may combine more than one security from same issuer and related depositary receipts.
matthewsasia.com | 800.789.ASIA 51
SECTOR ALLOCATION (%)
Consumer Discretionary | | | 27.3 | | |
Information Technology | | | 22.4 | | |
Financials | | | 16.7 | | |
Consumer Staples | | | 10.0 | | |
Materials | | | 8.8 | | |
Industrials | | | 5.5 | | |
Energy | | | 4.3 | | |
Health Care | | | 2.6 | | |
Telecommunication Services | | | 1.0 | | |
Cash and Other Assets,
Less Liabilities | | | 1.4 | | |
MARKET CAP EXPOSURE (%)7
Large Cap (over $5B) | | | 64.6 | | |
Mid Cap ($1B–$5B) | | | 24.9 | | |
Small Cap (under $1B) | | | 9.1 | | |
Cash and Other Assets,
Less Liabilities | | | 1.4 | | |
7 Source: FactSet Research Systems. Percentage values in data are rounded to the nearest tenth of one percent; the values may not sum to 100% due to rounding.
Matthews Korea Fund
Portfolio Manager Commentary (continued)
In December, Korea elected its first female president Park Geun Hye, who will take office in February. She is faced with solving issues of slowing economic growth and a widening wealth gap as well as ongoing threats from North Korea. We do not expect any drastic policy changes from the new government although spending on social welfare programs may increase over the next few years. Overall, we expect Korea's business environment to remain largely the same under Park.
In mid-December, North Korea carried out a controversial rocket launch, which surprised the international community. However, since that time, the secretive regime has softened its stance, and in the latest national address, North Korea's leader, Kim Jung Un, urged peace with the South. North Korea remains South Korea's biggest risk as well as its biggest potential for untapped opportunities. Should North Korea agree to open its economy to the South, it could offer Korean companies exciting opportunities. President-elect Park is believed to be more open to dialogue with North Korea compared to the country's outgoing president, and we will continue to monitor for any promising relations between the two nations.
During the year, Korea also reached a milestone when it joined the so called "20-50 Club," a reference to nations with more than US$20,000 in per capita income and a population of more than 50 million. Korea became the seventh country to join this club, following Japan, which met the criteria in 1987; the United States in 1988; France and Italy in 1990; Germany in 1991 and Britain joining in 1996. Still, Korea's GDP per capita level is around half of that of Japan and we continue to see further growth opportunities in Korea.
Korea's financial transparency also saw improvements in 2012 as the country adopted International Financial Report Standard (IFRS). All companies listed in Korea are now required to report financial statements using IFRS to increase transparency and ease of understanding for global investors.
We believe that Korea is well-positioned not only in a global context but also within the region, as its firms have demonstrated the ability to capture dominant market shares in automotives, technology and consumer products in Asia, and particularly in China. The strengthening of the won could pose a threat to exporters but we believe that a moderate rise in the currency could be weathered given improvements in the overall quality and brand image of Korean products.
With improved financial transparency, stronger global competitiveness and reasonable valuations, we are optimistic over Korea's equity market heading into 2013.
52 MATTHEWS ASIA FUNDS
Matthews Korea Fund December 31, 2012
Schedule of Investmentsa
COMMON EQUITIES: 90.5%
| | | Shares | | Value | |
CONSUMER DISCRETIONARY: 24.7% | |
Hotels, Restaurants & Leisure: 5.7% | |
Shinsegae Food Co., Ltd. | | | 32,444 | | | $ | 3,060,826 | | |
Modetour Network, Inc. | | | 99,945 | | | | 2,837,110 | | |
Kangwon Land, Inc. | | | 98,660 | | | | 2,696,450 | | |
| | | | | | 8,594,386 | | |
Media: 5.4% | |
SBS Media Holdings Co., Ltd. | | | 537,060 | | | | 4,338,984 | | |
CJ CGV Co., Ltd. | | | 70,190 | | | | 2,116,161 | | |
Cheil Worldwide, Inc. | | | 82,040 | | | | 1,654,942 | | |
| | | | | | 8,110,087 | | |
Auto Components: 4.6% | |
Hyundai Mobis | | | 11,601 | | | | 3,147,456 | | |
Hankook Tire Co., Ltd.b | | | 68,451 | | | | 3,005,111 | | |
Motonic Corp. | | | 59,060 | | | | 699,155 | | |
| | | | | | 6,851,722 | | |
Automobiles: 4.5% | |
Hyundai Motor Co. | | | 18,237 | | | | 3,759,452 | | |
Kia Motors Corp. | | | 55,635 | | | | 2,958,313 | | |
| | | | | | 6,717,765 | | |
Multiline Retail: 3.0% | |
Hyundai Greenfood Co., Ltd. | | | 151,350 | | | | 2,417,023 | | |
Hyundai Department Store Co., Ltd. | | | 13,893 | | | | 2,066,949 | | |
| | | | | | 4,483,972 | | |
Internet & Catalog Retail: 1.5% | |
Hyundai Home Shopping Network Corp. | | | 19,809 | | | | 2,245,648 | | |
Total Consumer Discretionary | | | | | 37,003,580 | | |
INFORMATION TECHNOLOGY: 20.8% | |
Semiconductors & Semiconductor Equipment: 15.2% | |
Samsung Electronics Co., Ltd. | | | 15,850 | | | | 22,773,278 | | |
Internet Software & Services: 3.6% | |
NHN Corp. | | | 11,297 | | | | 2,399,740 | | |
Daum Communications Corp. | | | 26,784 | | | | 2,281,767 | | |
SBS Contents Hub Co., Ltd. | | | 61,913 | | | | 759,614 | | |
| | | | | | 5,441,121 | | |
Electronic Equipment, Instruments & Components: 1.3% | |
Samsung SDI Co., Ltd. | | | 13,347 | | | | 1,894,415 | | |
Software: 0.7% | |
Nexon Co., Ltd.b | | | 102,600 | | | | 1,039,136 | | |
Total Information Technology | | | | | 31,147,950 | | |
FINANCIALS: 14.7% | |
Insurance: 5.9% | |
Dongbu Insurance Co., Ltd. | | | 80,091 | | | | 3,460,105 | | |
Samsung Fire & Marine Insurance Co., Ltd. | | | 13,444 | | | | 2,731,116 | | |
Hyundai Marine & Fire Insurance Co., Ltd. | | | 86,100 | | | | 2,687,649 | | |
| | | | | | 8,878,870 | | |
| | | Shares | | Value | |
Commercial Banks: 5.3% | |
Shinhan Financial Group Co., Ltd. | | | 159,234 | | | $ | 5,827,570 | | |
KB Financial Group, Inc. | | | 58,756 | | | | 2,098,699 | | |
| | | | | | 7,926,269 | | |
Capital Markets: 2.7% | |
Samsung Securities Co., Ltd. | | | 42,190 | | | | 2,127,283 | | |
Kiwoom Securities Co., Ltd. | | | 35,003 | | | | 1,939,506 | | |
| | | | | | 4,066,789 | | |
Diversified Financial Services: 0.8% | |
NICE Information Service Co., Ltd. | | | 215,396 | | | | 1,104,823 | | |
Total Financials | | | | | 21,976,751 | | |
CONSUMER STAPLES: 10.0% | |
Food Products: 3.7% | |
Orion Corp. | | | 2,398 | | | | 2,459,690 | | |
Binggrae Co., Ltd. | | | 21,942 | | | | 2,304,530 | | |
Ottogi Corp. | | | 3,624 | | | | 742,371 | | |
| | | | | | 5,506,591 | | |
Household Products: 2.3% | |
LG Household & Health Care, Ltd. | | | 5,576 | | | | 3,415,919 | | |
Personal Products: 1.9% | |
Amorepacific Corp. | | | 2,575 | | | | 2,919,056 | | |
Tobacco: 1.1% | |
KT&G Corp. | | | 21,849 | | | | 1,656,958 | | |
Food & Staples Retailing: 1.0% | |
E-Mart Co., Ltd. | | | 6,740 | | | | 1,498,348 | | |
Total Consumer Staples | | | | | 14,996,872 | | |
MATERIALS: 7.4% | |
Metals & Mining: 3.8% | |
POSCO ADR | | | 54,600 | | | | 4,485,390 | | |
Poongsan Corp. | | | 36,650 | | | | 1,164,013 | | |
| | | | | | 5,649,403 | | |
Chemicals: 3.6% | |
LG Chem, Ltd. | | | 13,712 | | | | 4,285,710 | | |
KPX Chemical Co., Ltd. | | | 23,626 | | | | 1,094,078 | | |
| | | | | | 5,379,788 | | |
Total Materials | | | | | 11,029,191 | | |
INDUSTRIALS: 5.5% | |
Construction & Engineering: 2.3% | |
Hyundai Engineering & Construction Co., Ltd. | | | 26,375 | | | | 1,738,713 | | |
Samsung Engineering Co., Ltd. | | | 10,976 | | | | 1,710,032 | | |
| | | | | | 3,448,745 | | |
Commercial Services & Supplies: 1.0% | |
KEPCO Plant Service & Engineering Co., Ltd. | | | 26,365 | | | | 1,504,501 | | |
Industrial Conglomerates: 0.8% | |
Samsung Techwin Co., Ltd. | | | 20,309 | | | | 1,140,010 | | |
matthewsasia.com | 800.789.ASIA 53
Matthews Korea Fund December 31, 2012
Schedule of Investmentsa (continued)
COMMON EQUITIES (continued)
| | | Shares | | Value | |
Airlines: 0.7% | |
Asiana Airlines, Inc.b | | | 187,620 | | | $ | 1,092,047 | | |
Building Products: 0.7% | |
KCC Corp. | | | 3,716 | | | | 1,038,520 | | |
Total Industrials | | | | | 8,223,823 | | |
ENERGY: 3.8% | |
Oil, Gas & Consumable Fuels: 3.8% | |
SK Innovation Co., Ltd. | | | 20,821 | | | | 3,445,118 | | |
S-Oil Corp. | | | 23,253 | | | | 2,296,748 | | |
Total Energy | | | | | 5,741,866 | | |
HEALTH CARE: 2.6% | |
Pharmaceuticals: 2.6% | |
Yuhan Corp. | | | 13,278 | | | | 2,145,664 | | |
Dong-A Pharmaceutical Co., Ltd. | | | 17,895 | | | | 1,825,588 | | |
Total Health Care | | | | | 3,971,252 | | |
TELECOMMUNICATION SERVICES: 1.0% | |
Wireless Telecommunication Services: 1.0% | |
SK Telecom Co., Ltd. ADR | | | 98,700 | | | | 1,562,421 | | |
Total Telecommunication Services | | | | | 1,562,421 | | |
TOTAL COMMON EQUITIES | | | | | 135,653,706 | | |
(Cost $75,593,516) | | | | | |
PREFERRED EQUITIES: 8.1%
CONSUMER DISCRETIONARY: 2.6% | |
Automobiles: 2.6% | |
Hyundai Motor Co., Ltd., 2nd Pfd. | | | 55,218 | | | | 3,917,846 | | |
Total Consumer Discretionary | | | | | 3,917,846 | | |
FINANCIALS: 2.0% | |
Insurance: 2.0% | |
Samsung Fire & Marine Insurance Co.,
Ltd., Pfd. | | | 39,466 | | | | 3,011,691 | | |
Total Financials | | | | | 3,011,691 | | |
INFORMATION TECHNOLOGY: 1.6% | |
Semiconductors & Semiconductor Equipment: 1.6% | |
Samsung Electronics Co., Ltd., Pfd. | | | 3,003 | | | | 2,413,077 | | |
Total Information Technology | | | | | 2,413,077 | | |
MATERIALS: 1.4% | |
Chemicals: 1.4% | |
LG Chem, Ltd., Pfd. | | | 20,877 | | | | 2,003,252 | | |
Total Materials | | | | | 2,003,252 | | |
| | | Shares | | Value | |
ENERGY: 0.5% | |
Oil, Gas & Consumable Fuels: 0.5% | |
S-Oil Corp., Pfd. | | | 13,183 | | | $ | 733,461 | | |
Total Energy | | | | | 733,461 | | |
TOTAL PREFERRED EQUITIES | | | | | 12,079,327 | | |
(Cost $9,267,524) | | | | | |
TOTAL INVESTMENTS: 98.6% | | | | | 147,733,033 | | |
(Cost $84,861,040c) | | | | | |
CASH AND OTHER ASSETS,
LESS LIABILITIES: 1.4% | | | | | 2,110,833 | | |
NET ASSETS: 100.0% | | | | $ | 149,843,866 | | |
a Certain securities were fair valued under the discretion of the Board of Trustees (Note 2-A).
b Non-income producing security.
c Cost for federal income tax purposes is $86,003,747 and net unrealized appreciation consists of:
Gross unrealized appreciation | | $ | 63,386,013 | | |
Gross unrealized depreciation | | | (1,656,727 | ) | |
Net unrealized appreciation | | $ | 61,729,286 | | |
ADR American Depositary Receipt
Pfd. Preferred
See accompanying notes to financial statements.
54 MATTHEWS ASIA FUNDS

ASIA SMALL COMPANY STRATEGIES
PORTFOLIO MANAGERS
Lydia So, CFA
Lead Manager
Michael B. Han, CFA
Co-Manager
FUND FACTS
| | | Investor Class | |
Ticker | | MSMLX | |
CUSIP | | 577125206 | |
Inception | | 9/15/08 | |
NAV | | $18.13 | |
Initial Investment | | $2,500 | |
Gross Expense Ratio1 | | 1.50% | |
Portfolio Statistics
Total # of Positions | | 68 | |
Net Assets | | $366.8 million | |
Weighted Average Market Cap | | $1.2 billion | |
Portfolio Turnover | | 27.95%2 | |
Benchmark
MSCI AC Asia ex Japan Small Cap Index
Redemption Fee
2% within first 90 calendar days of purchase
OBJECTIVE
Long-term capital appreciation.
STRATEGY
Under normal market conditions, the Fund seeks to achieve its investment objective by investing at least 80% of its total net assets, which include borrowings for investment purposes, in the common and preferred stocks of small companies located in Asia, including developed, emerging and frontier countries and markets in the Asian region, excluding Japan.
1 Matthews Asia Funds does not charge 12b-1 fees.
2 The lesser of fiscal year 2012 long-term purchase costs or sales proceeds divided by the average monthly market value of long-term securities.
Matthews Asia Small Companies Fund
Portfolio Manager Commentary
For the year ending December 31, 2012, the Matthews Asia Small Companies Fund rose 23.92% while its benchmark, the MSCI All Country Asia ex Japan Small Cap Index, rose 22.76%. For the fourth quarter of the year, the Fund returned 6.60% versus 5.30% for the Index.
During the fourth quarter, Asia's small-capitalization stocks continued to perform well, following a strong preceding quarter. Chinese small caps were noticeably robust following a smooth leadership transition in the central government that sparked hope for expansionary economic policies to come. This was somewhat of a reversal of the subdued sentiment in the two previous quarters. Over the last months of the year, holdings in China and Hong Kong, particularly those that tend to be sensitive to macroeconomic policies, were the largest positive contributors to performance. These included tire cords manufacturer Xingda International and property developer KWG Property.
Our stock selection in Singapore during the fourth quarter also contributed positively to both the Fund's absolute and relative performance against the benchmark, owing to strong company fundamentals and good growth visibility. Singapore's Petra Foods and instant coffee maker Super Group were among the Fund's major contributors to Fund performance for both the fourth quarter as well as the year. Consumer demand for their products held up well due to increased consumption in packaged foods throughout the region.
Over the year, the investment environment was marked by much macro volatility and changing political scenarios. In this climate, investors turned to companies with more defensive revenue streams, and valuations for such firms rose higher than companies in more cyclical industries, such as information technology and industrials. For the year, our holdings in sectors with more domestically oriented income streams, such as consumer staples, consumer discretionary, financials and health care, did well.
We remained consistent with our core bottom-up approach and did not adjust our portfolio specifically in reaction to events such as the ongoing fiscal troubles of Europe and the U.S. We stayed fully invested and focused on companies with attributes such as good pricing power, sound capital structure and a steady growth profile.
Since the start of the year, we continued to identify more opportunities in Southeast Asia and continued to raise our exposure to this region. Countries such as Thailand, the Philippines and Indonesia, in particular, enjoy improving political stability, consumer confidence and foreign direct investment. Our biggest contributor to performance for the year was Indonesian packaged bread maker Nippon Indosari, a holding we have held for several years. Early in the year, we began a position in Indonesia's Selamat Sempurna, an auto component manufacturer. The company has a long operating history in its markets and enjoys a healthy market share in the auto parts replacement business. We believe that Selamat Sempurna is also positioned well to establish its presence in the original equipment manufacturer market.
In the first quarter of the year, we initiated the Fund's first position in a Philippine holding: Alliance Global, a conglomerate with businesses spanning from a food and beverage segment involved in distilled spirits, such as brandy, to other areas such as gaming, hospitality and real estate
matthewsasia.com | 800.789.ASIA 55
PERFORMANCE AS OF DECEMBER 31, 2012
| | | | | | | Average Annual Total Returns | |
| | 3 Months | | 1 Year | | 3 Years | | Inception
9/15/08 | |
Investor Class (MSMLX) | | | 6.60 | % | | | 23.92 | % | | | 10.33 | % | | | 19.56 | % | |
MSCI AC Asia ex Japan Small Cap Index3 | | | 5.30 | % | | | 22.76 | % | | | 3.91 | % | | | 12.26 | % | |
Lipper Pacific ex Japan Funds Category Average4 | | | 6.62 | % | | | 22.06 | % | | | 6.35 | % | | | 12.34 | %5 | |
Performance assumes reinvestment of all dividends and/or distributions before taxes. All performance quoted represents past performance and is no guarantee of future results. Investment return and principal value will fluctuate with market conditions so that when redeemed, shares may be worth more or less than their original cost. Current performance may be lower or higher than the return figures quoted. Returns would have been lower if certain of the Fund's fees and expenses had not been waived. For the Fund's most recent month-end performance, visit matthewsasia.com.
GROWTH OF A $10,000 INVESTMENT SINCE INCEPTION—INVESTOR CLASS
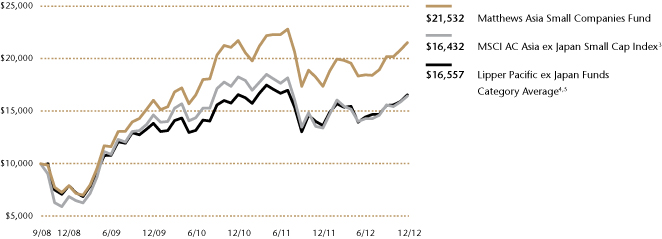
Plotted monthly. The performance data does not reflect the deduction of taxes that a shareholder would pay on dividends, capital gains distributions or redemption of Fund shares. Values are in US$.
3 It is not possible to invest directly in an index. Source: Index data from Morgan Stanley Capital International and Bloomberg; total return calculations performed by BNY Mellon Investment Servicing (US) Inc. Please see page 71 for index definition.
4 The Lipper Category Average does not reflect sales charges and is based on total return, including reinvestment of dividends and capital gains for the stated periods.
5 Calculated from 9/30/08.
TOP TEN HOLDINGS6
| | Sector | | Country | | % of Net Assets | |
St. Shine Optical Co., Ltd. | | Health Care | | Taiwan | | | 3.2 | % | |
Super Group, Ltd. | | Consumer Staples | | Singapore | | | 2.6 | % | |
Towngas China Co., Ltd. | | Utilities | | China/Hong Kong | | | 2.6 | % | |
Petra Foods, Ltd. | | Consumer Staples | | Singapore | | | 2.4 | % | |
Vinda International Holdings, Ltd. | | Consumer Staples | | China/Hong Kong | | | 2.2 | % | |
PT Bank Tabungan Pensiunan Nasional | | Financials | | Indonesia | | | 2.2 | % | |
Ipca Laboratories, Ltd. | | Health Care | | India | | | 2.1 | % | |
Emami, Ltd. | | Consumer Staples | | India | | | 2.1 | % | |
PT Nippon Indosari Corpindo | | Consumer Staples | | Indonesia | | | 2.0 | % | |
Xingda International Holdings, Ltd. | | Consumer Discretionary | | China/Hong Kong | | | 2.0 | % | |
% OF ASSETS IN TOP TEN | | | | | | | 23.4 | % | |
6 Holdings may combine more than one security from same issuer and related depositary receipts.
56 MATTHEWS ASIA FUNDS
Matthews Asia Small Companies Fund
Portfolio Manager Commentary (continued)
development. The performance of Alliance's various business segments has seen robust growth due to burgeoning middle class demand. Our conversations with many Philippine management teams have confirmed our thesis that consumer-facing business in the country are benefiting from rising disposable incomes, following increased job creation in tourism and in the back-office processing industries.
Among our more recent additions to the portfolio was Bangkok Chain Hospital, a Thai owner and operator of a chain of private hospitals across the country. From our on-the-ground research in these hospitals, we came away convinced that demand for private health care services has grown alongside rising income levels. We also like the company's dual-brand strategy to attract mid and high-end segments as patients' preferences became more differentiated.
During the year, we noted that Chinese small companies continued to experience challenges in accessing funding via official banking channels, and the uncertain political atmosphere earlier in the year may have dampened business and consumer sentiment. We exited some Chinese holdings that performed poorly such as Kingdee International Software Group, an enterprise resource planning (ERP) software company that suffered as small to medium enterprises cut spending on software products. We grew cautious over the pace of the recovery in demand and Kingdee's growth prospects over the medium term, and sought more attractive stocks elsewhere in the region. Comba Telecom Systems, a wireless coverage solution provider in China, was the Fund's worst performer in 2012. The firm saw slowing sales and increased margin pressure. While this performance is disappointing, this holding remains in the portfolio as we believe the company is still positioned to grow given China's improving telecom infrastructure and rising data usage.
During the year, we also exited a few Korean and Taiwanese holdings as we became concerned with rising competition and eroding pricing power. On the other hand, some of our longer-term holdings, such as Taiwan's St. Shine Optical, a contact lens manufacturer, did well. We have held a sizable position in St. Shine over the years and we continue to be pleased with its execution of its strategies. It was among the Fund's top contributors to performance for the year.
In Asia's vast small-cap universe, we continue to uncover companies with business models that can generate predictable cash flows and growth. We seek firms that show competitive advantages and sensible funding strategies, particularly those poised to benefit from rising consumer and corporate demand. However, we will continue to monitor for valuations in consumer-oriented sectors that may have become too rich. In addition, rising wages in such countries as Indonesia and Thailand may place additional pressure on corporate profitability. Despite the market volatilities and uncertainties over the past few years, we have continued to see Asia's smaller companies grow both revenues and assets as they increase in market capitalization. Selecting firms that are emerging as leaders in their industries remains core to this strategy.
COUNTRY ALLOCATION (%)
China/Hong Kong | | | 28.6 | | |
India | | | 15.5 | | |
Taiwan | | | 13.0 | | |
Indonesia | | | 9.4 | | |
South Korea | | | 9.2 | | |
Malaysia | | | 6.5 | | |
Singapore | | | 5.8 | | |
Thailand | | | 5.6 | | |
Philippines | | | 3.0 | | |
Cash and Other Assets,
Less Liabilities | | | 3.4 | | |
SECTOR ALLOCATION (%)
Consumer Discretionary | | | 17.7 | | |
Consumer Staples | | | 16.9 | | |
Industrials | | | 16.3 | | |
Financials | | | 15.4 | | |
Information Technology | | | 12.9 | | |
Health Care | | | 11.0 | | |
Materials | | | 3.8 | | |
Utilities | | | 2.6 | | |
Cash and Other Assets,
Less Liabilities | | | 3.4 | | |
MARKET CAP EXPOSURE (%)7,8
Large Cap (over $5B) | | | 0.0 | | |
Mid Cap ($1B–$5B) | | | 52.0 | | |
Small Cap (under $1B) | | | 44.6 | | |
Cash and Other Assets,
Less Liabilities | | | 3.4 | | |
7 Source: FactSet Research Systems. Percentage values in data are rounded to the nearest tenth of one percent; the values may not sum to 100% due to rounding.
8 The Fund defines Small Companies as companies with market capitalization generally between $100 million and $3 billion.
matthewsasia.com | 800.789.ASIA 57
Matthews Asia Small Companies Fund December 31, 2012
Schedule of Investmentsa
COMMON EQUITIES: 96.6%
| | | Shares | | Value | |
CHINA/HONG KONG: 28.6% | |
Towngas China Co., Ltd. | | | 11,357,000 | | | $ | 9,415,588 | | |
Vinda International Holdings, Ltd. | | | 5,794,000 | | | | 8,027,376 | | |
Xingda International Holdings, Ltd.
H Shares | | | 13,805,000 | | | | 7,238,626 | | |
Trinity, Ltd. | | | 10,782,000 | | | | 7,138,031 | | |
Lee's Pharmaceutical Holdings, Ltd. | | | 9,485,000 | | | | 6,407,994 | | |
Minth Group, Ltd. | | | 5,342,000 | | | | 6,208,749 | | |
Stella International Holdings, Ltd. | | | 2,212,000 | | | | 6,025,969 | | |
Yip's Chemical Holdings, Ltd. | | | 8,116,000 | | | | 5,803,820 | | |
KWG Property Holding, Ltd. | | | 7,206,000 | | | | 5,533,145 | | |
Dah Chong Hong Holdings, Ltd. | | | 5,082,000 | | | | 5,425,589 | | |
SITC International Holdings Co., Ltd. | | | 15,885,000 | | | | 5,393,610 | | |
Comba Telecom Systems Holdings, Ltd. | | | 14,476,011 | | | | 5,328,846 | | |
Airtac International Group | | | 877,000 | | | | 5,110,888 | | |
Singamas Container Holdings, Ltd. | | | 19,618,000 | | | | 4,798,614 | | |
Dorsett Hospitality International, Ltd. | | | 19,052,000 | | | | 4,676,591 | | |
Vitasoy International Holdings, Ltd. | | | 4,430,000 | | | | 4,557,908 | | |
AAC Technologies Holdings, Inc. | | | 1,136,000 | | | | 4,028,051 | | |
Pacific Online, Ltd. | | | 10,402,000 | | | | 3,691,796 | | |
Fook Woo Group Holdings, Ltd.b,c | | | 24,622,000 | | | | 190,601 | | |
Total China/Hong Kong | | | | | 105,001,792 | | |
INDIA: 15.5% | |
Ipca Laboratories, Ltd. | | | 808,208 | | | | 7,675,013 | | |
Emami, Ltd. | | | 690,319 | | | | 7,635,038 | | |
GlaxoSmithKline Consumer
Healthcare, Ltd. | | | 94,290 | | | | 6,634,816 | | |
Federal Bank, Ltd. | | | 603,251 | | | | 5,958,968 | | |
Page Industries, Ltd. | | | 95,185 | | | | 5,949,524 | | |
CRISIL, Ltd. | | | 275,483 | | | | 5,463,704 | | |
AIA Engineering, Ltd. | | | 734,103 | | | | 4,408,959 | | |
CMC, Ltd. | | | 201,335 | | | | 4,407,395 | | |
Castrol India, Ltd. | | | 797,362 | | | | 4,379,005 | | |
Gujarat Pipavav Port, Ltd.b | | | 4,649,254 | | | | 4,271,960 | | |
Total India | | | | | 56,784,382 | | |
TAIWAN: 13.0% | |
St. Shine Optical Co., Ltd. | | | 763,492 | | | | 11,677,326 | | |
Sinmag Equipment Corp. | | | 1,385,650 | | | | 5,990,522 | | |
PChome Online, Inc. | | | 1,225,642 | | | | 5,720,652 | | |
Pacific Hospital Supply Co., Ltd. | | | 1,857,670 | | | | 5,313,519 | | |
TXC Corp. | | | 3,204,792 | | | | 5,310,945 | | |
Wah Lee Industrial Corp. | | | 3,584,000 | | | | 4,895,934 | | |
Chroma ATE, Inc. | | | 2,142,081 | | | | 4,794,523 | | |
WT Microelectronics Co., Ltd. | | | 3,146,168 | | | | 3,930,688 | | |
Total Taiwan | | | | | 47,634,109 | | |
INDONESIA: 9.4% | |
PT Bank Tabungan Pensiunan Nasionalb | | | 14,671,500 | | | | 7,992,257 | | |
PT Nippon Indosari Corpindo | | | 10,171,000 | | | | 7,291,999 | | |
PT AKR Corporindo | | | 13,811,000 | | | | 5,980,824 | | |
PT Jasa Marga Persero | | | 8,199,500 | | | | 4,644,816 | | |
PT Sumber Alfaria Trijaya | | | 8,115,500 | | | | 4,420,895 | | |
PT Selamat Sempurna | | | 15,235,000 | | | | 3,996,309 | | |
Total Indonesia | | | | | 34,327,100 | | |
| | | Shares | | Value | |
SOUTH KOREA: 9.2% | |
Pyeong Hwa Automotive Co., Ltd. | | | 394,010 | | | $ | 5,851,097 | | |
Modetour Network, Inc. | | | 204,541 | | | | 5,806,248 | | |
Daum Communications Corp. | | | 62,275 | | | | 5,305,295 | | |
Cheil Worldwide, Inc. | | | 247,635 | | | | 4,995,386 | | |
Kiwoom Securities Co., Ltd. | | | 76,834 | | | | 4,257,349 | | |
Dongbu Insurance Co., Ltd. | | | 91,431 | | | | 3,950,018 | | |
POSCO Chemtech Co., Ltd. | | | 29,066 | | | | 3,608,667 | | |
Total South Korea | | | | | 33,774,060 | | |
MALAYSIA: 6.5% | |
Alliance Financial Group BHD | | | 3,828,000 | | | | 5,527,954 | | |
Dialog Group BHD | | | 6,995,205 | | | | 5,520,672 | | |
LPI Capital BHD | | | 1,111,000 | | | | 5,295,263 | | |
KPJ Healthcare BHD | | | 2,798,400 | | | | 5,252,719 | | |
Oldtown BHD | | | 2,966,200 | | | | 2,210,262 | | |
Total Malaysia | | | | | 23,806,870 | | |
SINGAPORE: 5.8% | |
Super Group, Ltd. | | | 3,626,000 | | | | 9,652,022 | | |
Petra Foods, Ltd. | | | 3,072,000 | | | | 8,666,171 | | |
Amtek Engineering, Ltd. | | | 7,700,000 | | | | 3,153,429 | | |
Total Singapore | | | | | 21,471,622 | | |
THAILAND: 5.6% | |
Tisco Financial Group Public Co., Ltd. | | | 4,198,900 | | | | 7,184,365 | | |
SNC Former Public Co., Ltd. | | | 5,492,400 | | | | 4,412,436 | | |
Bangkok Chain Hospital Public Co., Ltd. | | | 14,168,400 | | | | 4,201,343 | | |
Aeon Thana Sinsap Thailand Public
Co., Ltd. NVDR | | | 562,900 | | | | 1,716,959 | | |
Oishi Group Public Co., Ltd. | | | 300,900 | | | | 1,557,726 | | |
Dynasty Ceramic Public Co., Ltd. | | | 1,042,600 | | | | 1,556,591 | | |
Total Thailand | | | | | 20,629,420 | | |
PHILIPPINES: 3.0% | |
Alliance Global Group, Inc. | | | 10,215,000 | | | | 4,185,900 | | |
Security Bank Corp. | | | 1,000,030 | | | | 3,808,478 | | |
Philippine Seven Corp. | | | 1,265,000 | | | | 2,850,525 | | |
Total Philippines | | | | | 10,844,903 | | |
TOTAL COMMON EQUITIES | | | | | 354,274,258 | | |
(Cost $316,133,779) | | | | | |
WARRANTS: 0.0%
MALAYSIA: 0.0% | |
Dialog Group BHD, expires 02/12/17 | | | 582,933 | | | | 84,828 | | |
Total Malaysia | | | | | 84,828 | | |
TOTAL WARRANTS | | | | | 84,828 | | |
(Cost $0) | | | | | |
58 MATTHEWS ASIA FUNDS
Matthews Asia Small Companies Fund December 31, 2012
Schedule of Investmentsa (continued)
| | Value | |
TOTAL INVESTMENTS: 96.6% | | $ | 354,359,086 | | |
(Cost $316,133,779d) | | | |
CASH AND OTHER ASSETS,
LESS LIABILITIES: 3.4% | | | 12,393,461 | | |
NET ASSETS: 100.0% | | $ | 366,752,547 | | |
a Certain securities were fair valued under the discretion of the Board of Trustees (Note 2-A).
b Non-income producing security.
c Illiquid security.
d Cost for federal income tax purposes is $316,281,815 and net unrealized appreciation consists of:
Gross unrealized appreciation | | $ | 70,581,246 | | |
Gross unrealized depreciation | | | (32,503,975 | ) | |
Net unrealized appreciation | | $ | 38,077,271 | | |
BHD Berhad
NVDR Non-voting Depositary Receipt
See accompanying notes to financial statements.
matthewsasia.com | 800.789.ASIA 59

ASIA SMALL COMPANY STRATEGIES
PORTFOLIO MANAGERS
Richard H. Gao
Lead Manager
Henry Zhang, CFA
Co-Manager
FUND FACTS
| | | Investor Class | |
Ticker | | MCSMX | |
CUSIP | | 577125404 | |
Inception | | 5/31/11 | |
NAV | | $7.76 | |
Initial Investment | | $2,500 | |
Gross Expense Ratio1 | | 3.26% | |
After Fee Waiver and
Reimbursement | | 2.00% | |
Portfolio Statistics
Total # of Positions | | 45 | |
Net Assets | | $10.3 million | |
Weighted Average Market Cap | | $1.6 billion | |
Portfolio Turnover | | 34.01%2 | |
Benchmark
MSCI China Small Cap Index
Redemption Fee
2% within first 90 calendar days of purchase
OBJECTIVE
Long-term capital appreciation.
STRATEGY
Under normal market conditions, the Fund seeks to achieve its investment objective by investing at least 80% of its total net assets, which include borrowings for investment purposes, in the common and preferred stocks of small companies located in China and Taiwan. China includes its administrative and other districts, such as Hong Kong.
1 The Advisor has contractually agreed to waive Matthews China Small Companies Fund's fees and reimburse expenses until at least August 31, 2014 to the extent needed to limit total annual operating expenses to 2.00%. Please see page 111 for additional information. Matthews Asia Funds does not charge 12b-1 fees.
2 The lesser of fiscal year 2012 long-term purchase costs or sales proceeds divided by the average monthly market value of long-term securities.
Matthews China Small Companies Fund
Portfolio Manager Commentary
For the year ending December 31, 2012, the Matthews China Small Companies Fund rose 10.53% while its benchmark, the MSCI China Small Cap Index, gained 22.98%. For the fourth quarter of the year, the Fund returned 9.59% versus 20.37% for the Index.
Over the course of 2012, China's economic growth slowed during the first three quarters, extending the downward trend it had experienced since the beginning of 2010. However, economic activity finally began to turn around during the fourth quarter of the year as major economic indicators pointed to a broad-based recovery, and industrial production, retail sales and fixed asset investment all showed robust growth. Markets also appeared to be encouraged by the smooth transition of power in China's new leadership as well as the government's ongoing focus on the quality and sustainability of growth. As a result, most of the performance gains from 2012 were concentrated in the last three months of the year, and the market rally benefited all sectors. While China's exports and imports remained sluggish given the weak external demand, the country's inflation level at the end of the year remained well below the government's target of 4%.
During the fourth quarter, the Fund underperformed its benchmark due to several factors. The largest detractor to the Fund's relative performance against the benchmark was the financials sector, in which the Fund had a lower allocation compared to the benchmark. This sector, which is mostly composed of small real estate developers, surged approximately 45% in the fourth quarter alone as China's property market gained traction as both sales prices and transaction volumes rose. Within this sector, companies with higher financial leverage performed better as higher leverage tends to amplify effects from any change in market condition. Because the Fund focuses on the long-term growth potential of firms, its holdings tend to have lower financial leverage and stronger balance sheets. As a result, the Fund's relative performance was negatively affected.
The Fund also suffered from a U.S.—China dispute over disclosures in auditing documents. In December, the U.S. Securities and Exchange Commission initiated legal proceeding against five major accounting firms that had not disclosed auditing documents for nine Chinese companies under the SEC investigation. Authorities are looking into whether the refusal to disclose the information violates U.S. laws. However, some firms have argued that providing the documents may risk breaching China's state secrecy laws. As the ramifications of a failure to resolve this issue were unclear and could potentially affect all U.S.-listed Chinese companies as well as potentially some U.S. multinationals, Chinese companies listed in the U.S. slumped indiscriminately. The Fund's performance was negatively impacted as our portfolio contained approximately a 20% exposure to U.S.-listed Chinese companies versus none for the Index. We believe the probability for the U.S. and China to reach a compromise is high, although the process can be lengthy and there may be more short-term volatility. As part of our investment selection process, we seek holdings that we believe can demonstrate solid corporate governance and, as such, we did not drastically adjust the portfolio in reaction to these developments. We will continue to monitor this dispute closely.
Our holdings in Gourmet Master and 21Vianet were two major detractors to Fund performance during the fourth quarter. Gourmet Master, an
60 MATTHEWS ASIA FUNDS
PERFORMANCE AS OF DECEMBER 31, 2012
| | | | | | | Average
Annual
Total
Returns | |
| | 3 Months | | 1 Year | | Inception
5/31/11 | |
Investor Class (MCSMX) | | | 9.59 | % | | | 10.53 | % | | | -14.56 | % | |
MSCI China Small Cap Index3 | | | 20.37 | % | | | 22.98 | % | | | -13.16 | % | |
Lipper China Region Funds Category Average4 | | | 10.80 | % | | | 18.46 | % | | | -7.10 | % | |
Performance assumes reinvestment of all dividends and/or distributions before taxes. All performance quoted represents past performance and is no guarantee of future results. Investment return and principal value will fluctuate with market conditions so that when redeemed, shares may be worth more or less than their original cost. Current performance may be lower or higher than the return figures quoted. Returns would have been lower if certain of the Fund's fees and expenses had not been waived. For the Fund's most recent month-end performance, visit matthewsasia.com.
GROWTH OF A $10,000 INVESTMENT SINCE INCEPTION—INVESTOR CLASS
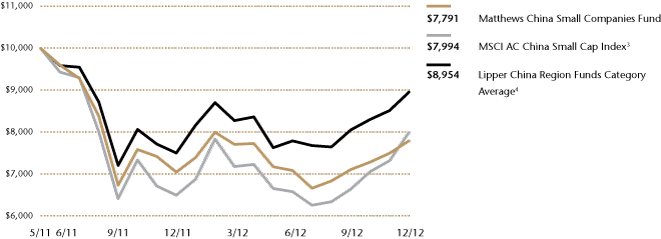
The performance data does not reflect the deduction of taxes that a shareholder would pay on dividends, capital gains distributions or redemption of Fund shares. Values are in US$.
3 It is not possible to invest directly in an index. Source: Index data from Morgan Stanley Capital International and Bloomberg; total return calculations performed by BNY Mellon Investment Servicing (US) Inc. Please see page 71 for index definition.
4 The Lipper Category Average does not reflect sales charges and is based on total return, including reinvestment of dividends and capital gains for the stated periods.
TOP TEN HOLDINGS5
| | Sector | | % of Net Assets | |
China Overseas Grand Oceans Group, Ltd. | | Financials | | | 5.1 | % | |
Towngas China Co., Ltd. | | Utilities | | | 4.9 | % | |
Franshion Properties China, Ltd. | | Financials | | | 3.8 | % | |
Television Broadcasts, Ltd. | | Consumer Discretionary | | | 3.5 | % | |
Zhuzhou CSR Times Electric Co., Ltd. | | Industrials | | | 3.4 | % | |
Digital China Holdings, Ltd. | | Information Technology | | | 3.2 | % | |
Sino Biopharmaceutical | | Health Care | | | 3.2 | % | |
Yuexiu Transport Infrastructure, Ltd. | | Industrials | | | 3.0 | % | |
Sany Heavy Equipment International Holdings Co., Ltd. | | Industrials | | | 3.0 | % | |
Yungtay Engineering Co., Ltd. | | Industrials | | | 2.8 | % | |
% OF ASSETS IN TOP TEN | | | | | 35.9 | % | |
5 Holdings may combine more than one security from same issuer and related depositary receipts.
matthewsasia.com | 800.789.ASIA 61
COUNTRY ALLOCATION (%)
China/Hong Kong | | | 85.5 | | |
Taiwan | | | 9.8 | | |
Cash and Other Assets,
Less Liabilities | | | 4.7 | | |
SECTOR ALLOCATION (%)
Industrials | | | 23.4 | | |
Consumer Discretionary | | | 22.9 | | |
Financials | | | 10.7 | | |
Information Technology | | | 10.4 | | |
Health Care | | | 9.7 | | |
Consumer Staples | | | 8.0 | | |
Utilities | | | 4.9 | | |
Materials | | | 4.4 | | |
Energy | | | 0.9 | | |
Cash and Other Assets,
Less Liabilities | | | 4.7 | | |
MARKET CAP EXPOSURE (%)6,7
Large Cap (over $5B) | | | 0.0 | | |
Mid Cap ($1B–$5B) | | | 64.5 | | |
Small Cap (under $1B) | | | 30.8 | | |
Cash and Other Assets,
Less Liabilities | | | 4.7 | | |
6 Source: FactSet Research Systems. Percentage values in data are rounded to the nearest tenth of one percent; the values may not sum to 100% due to rounding.
7 The Fund defines Small Companies as companies with market capitalization generally between $100 million and $3 billion.
Matthews China Small Companies Fund
Portfolio Manager Commentary (continued)
operator of coffee and bakery chain stores in mainland China, Taiwan and Hong Kong, experienced a heavy sell-off following lackluster consumer sentiment and rising labor costs. Despite the difficult operating environment, we continue to hold this position as we believe the company has a scalable business model and good brand equity. The company is also one of the most efficient operators in the industry. 21Vianet, a leading provider of Internet infrastructure services, also reported weak quarterly results as its utilization rate was negatively affected by the company's rapid expansion. 21Vianet's margins also declined as it ramped up its investment in cloud services through a partnership with Microsoft. We believe the company's business fundamentals remain intact in spite of these short-term volatilities.
In terms of chief contributors to performance, Zhuzhou CSR Times and China Overseas Grand Ocean helped the portfolio during both the fourth quarter and for the year. Zhuzhou CSR Times, a Hunan Province-based electric system provider for trains, benefited from the growing demand for locomotives and the continued localization process for train components. Although China's investment in railways and metro transportation tends to be cyclical, we believe China's mass transit system will experience long-term secular growth. The firm is well-positioned given the industry's high-entry barrier and the company's strong research and development capabilities. China Overseas Grand Oceans Group, a Hong Kong-based property developer, also performed well, having consistently delivered higher-than-expected results. With solid management and strong execution, we believe the company will continue to benefit from China's long-term trend of inland urbanization and increasing household income.
The Fund initiated several new positions, particularly late in the year, including a position in Ginko International, a Taiwan-listed provider of contact lenses and contact lens products. Ginko holds a dominant market share in China's contact lens market, and boasts an extensive sales and distribution network. In addition to the double-digit growth in China's contact lens market, Ginko has consistently gained market share in recent years. We believe that the company should continue to benefit from the rising penetration of contact lens usage and increasing economies of scale. Another new addition to the Fund is Sunny Optical Technology, one of the leading manufacturers of optical components and products in China. The company has a strong customer base among Chinese smartphone manufacturers and we expect it to continue to benefit as smartphones become more affordable.
China's economic growth appears to have stabilized, and by the end of 2012 had begun to show signs of recovery. The government has indicated it will remain focused on urbanization in order to promote domestic demand and narrow income gaps. We are confident that small companies will benefit from China's further shift to a market economy, and we will continue to seek companies with sustainable business models, a competitive edge and strong management.
62 MATTHEWS ASIA FUNDS
Matthews China Small Companies Fund December 31, 2012
Schedule of Investmentsa
COMMON EQUITIES: 95.3%
| | | Shares | | Value | |
INDUSTRIALS: 23.4% | |
Machinery: 9.8% | |
Sany Heavy Equipment International
Holdings Co., Ltd. | | | 580,000 | | | $ | 307,049 | | |
Yungtay Engineering Co., Ltd. | | | 158,000 | | | | 292,286 | | |
Airtac International Group | | | 37,000 | | | | 215,625 | | |
Haitian International Holdings, Ltd. | | | 157,000 | | | | 187,367 | | |
| | | | | | 1,002,327 | | |
Electrical Equipment: 6.2% | |
Zhuzhou CSR Times Electric Co., Ltd.
H Shares | | | 92,000 | | | | 349,170 | | |
Hangzhou Steam Turbine Co., Ltd. B Shares | | | 214,535 | | | | 290,338 | | |
| | | | | | 639,508 | | |
Transportation Infrastructure: 3.0% | |
Yuexiu Transport Infrastructure, Ltd. | | | 644,000 | | | | 313,073 | | |
Professional Services: 2.8% | |
51job, Inc. ADRb | | | 6,155 | | | | 287,746 | | |
Marine: 1.6% | |
SITC International Holdings Co., Ltd. | | | 472,000 | | | | 160,263 | | |
Total Industrials | | | | | 2,402,917 | | |
CONSUMER DISCRETIONARY: 22.9% | |
Leisure Equipment & Products: 4.9% | |
Goodbaby International Holdings, Ltd. | | | 689,000 | | | | 252,559 | | |
Sunny Optical Technology Group Co., Ltd. | | | 373,000 | | | | 247,620 | | |
| | | | | | 500,179 | | |
Hotels, Restaurants & Leisure: 3.9% | |
Gourmet Master Co., Ltd. | | | 34,970 | | | | 229,958 | | |
Home Inns & Hotels Management, Inc. ADRb | | | 6,100 | | | | 176,290 | | |
| | | | | | 406,248 | | |
Media: 3.5% | |
Television Broadcasts, Ltd. | | | 48,000 | | | | 360,902 | | |
Textiles, Apparel & Luxury Goods: 2.9% | |
Trinity, Ltd. | | | 312,000 | | | | 206,554 | | |
Anta Sports Products, Ltd. | | | 98,000 | | | | 88,177 | | |
| | | | | | 294,731 | | |
Auto Components: 2.7% | |
Minth Group, Ltd. | | | 236,000 | | | | 274,291 | | |
Specialty Retail: 2.5% | |
Hengdeli Holdings, Ltd. | | | 696,000 | | | | 255,308 | | |
Diversified Consumer Services: 1.6% | |
TAL Education Group ADR | | | 17,500 | | | | 168,000 | | |
Distributors: 0.9% | |
Dah Chong Hong Holdings, Ltd. | | | 85,000 | | | | 90,747 | | |
Total Consumer Discretionary | | | | | 2,350,406 | | |
| | | Shares | | Value | |
FINANCIALS: 10.7% | |
Real Estate Management & Development: 10.7% | |
China Overseas Grand Oceans Group, Ltd. | | | 429,750 | | | $ | 525,487 | | |
Franshion Properties China, Ltd. | | | 1,066,000 | | | | 388,553 | | |
KWG Property Holding, Ltd. | | | 235,500 | | | | 180,829 | | |
Total Financials | | | | | 1,094,869 | | |
INFORMATION TECHNOLOGY: 10.4% | |
Electronic Equipment, Instruments & Components: 4.5% | |
Digital China Holdings, Ltd. | | | 192,000 | | | | 332,022 | | |
PAX Global Technology, Ltd.b | | | 555,000 | | | | 115,214 | | |
China High Precision Automation
Group, Ltd.c | | | 195,000 | | | | 10,064 | | |
| | | | | | 457,300 | | |
Internet Software & Services: 3.6% | |
21Vianet Group, Inc. ADRb | | | 23,600 | | | | 226,796 | | |
Sina Corp.b | | | 2,900 | | | | 145,638 | | |
| | | | | | 372,434 | | |
Semiconductors & Semiconductor Equipment: 1.6% | |
Spreadtrum Communications, Inc. ADR | | | 5,800 | | | | 102,080 | | |
RDA Microelectronics, Inc. ADR | | | 6,200 | | | | 66,650 | | |
| | | | | | 168,730 | | |
Communications Equipment: 0.7% | |
Comba Telecom Systems Holdings, Ltd. | | | 186,000 | | | | 68,470 | | |
Total Information Technology | | | | | 1,066,934 | | |
HEALTH CARE: 9.7% | |
Health Care Equipment & Supplies: 3.8% | |
Ginko International Co., Ltd. | | | 20,000 | | | | 223,640 | | |
St. Shine Optical Co., Ltd. | | | 11,000 | | | | 168,241 | | |
| | | | | | 391,881 | | |
Pharmaceuticals: 3.2% | |
Sino Biopharmaceutical | | | 688,000 | | | | 331,774 | | |
Life Sciences Tools & Services: 2.7% | |
WuXi PharmaTech Cayman, Inc. ADRb | | | 17,500 | | | | 275,625 | | |
Total Health Care | | | | | 999,280 | | |
CONSUMER STAPLES: 8.0% | |
Food Products: 3.1% | |
Shenguan Holdings Group, Ltd. | | | 442,000 | | | | 240,683 | | |
Tenfu Cayman Holdings Co., Ltd. | | | 136,000 | | | | 78,912 | | |
| | | | | | 319,595 | | |
Food & Staples Retailing: 2.7% | |
Wumart Stores, Inc. H Shares | | | 96,000 | | | | 207,643 | | |
Lianhua Supermarket Holdings Co., Ltd.
H Shares | | | 75,000 | | | | 72,315 | | |
| | | | | | 279,958 | | |
matthewsasia.com | 800.789.ASIA 63
Matthews China Small Companies Fund December 31, 2012
Schedule of Investmentsa (continued)
COMMON EQUITIES (continued)
| | | Shares | | Value | |
Household Products: 2.2% | |
Vinda International Holdings, Ltd. | | | 163,000 | | | $ | 225,831 | | |
Total Consumer Staples | | | | | 825,384 | | |
UTILITIES: 4.9% | |
Gas Utilities: 4.9% | |
Towngas China Co., Ltd. | | | 609,000 | | | | 504,895 | | |
Total Utilities | | | | | 504,895 | | |
MATERIALS: 4.4% | |
Containers & Packaging: 3.7% | |
Greatview Aseptic Packaging Co., Ltd. | | | 525,000 | | | | 285,049 | | |
Taiwan Hon Chuan Enterprise Co., Ltd. | | | 42,535 | | | | 93,593 | | |
| | | | | | 378,642 | | |
Chemicals: 0.7% | |
Yip's Chemical Holdings, Ltd. | | | 96,000 | | | | 68,650 | | |
Total Materials | | | | | 447,292 | | |
ENERGY: 0.9% | |
Oil, Gas & Consumable Fuels: 0.9% | |
Sinopec Kantons Holdings, Ltd. | | | 142,000 | | | | 94,054 | | |
Total Energy | | | | | 94,054 | | |
TOTAL INVESTMENTS: 95.3% | | | | | 9,786,031 | | |
(Cost $9,351,236d) | | | | | |
CASH AND OTHER ASSETS,
LESS LIABILITIES: 4.7% | | | | | 480,403 | | |
NET ASSETS: 100.0% | | | | $ | 10,266,434 | | |
a Certain securities were fair valued under the discretion of the Board of Trustees (Note 2-A).
b Non-income producing security.
c Illiquid security.
d Cost for federal income tax purposes is $9,366,291 and net unrealized appreciation consists of:
Gross unrealized appreciation | | $ | 987,116 | | |
Gross unrealized depreciation | | | (567,376 | ) | |
Net unrealized appreciation | | $ | 419,740 | | |
ADR American Depositary Receipt
See accompanying notes to financial statements.
64 MATTHEWS ASIA FUNDS

PORTFOLIO MANAGERS
J. Michael Oh, CFA
Lead Manager
Lydia So, CFA
Co-Manager
FUND FACTS
| | | Investor Class | |
Ticker | | MATFX | |
CUSIP | | 577130883 | |
Inception | | 12/27/99 | |
NAV | | $9.29 | |
Initial Investment | | $2,500 | |
| Gross Expense Ratio1 | | 1.18% | |
Portfolio Statistics
Total # of Positions | | 54 | |
Net Assets | | $131.6 million | |
Weighted Average Market Cap | | $37.8 billion | |
Portfolio Turnover | | 45.76%2 | |
Benchmark
MSCI AC Asia IT and Telecom Services Index
Redemption Fee
2% within first 90 calendar days of purchase
OBJECTIVE
Long-term capital appreciation.
STRATEGY
Under normal market conditions, the Fund seeks to achieve its investment objective by investing at least 80% of its total net assets, which include borrowings for investment purposes, in the common and preferred stocks of companies located in Asia, including developed, emerging and frontier countries and markets in the Asian region, that derive more than 50% of their revenues from the sale of products or services in science- and technology-related industries and services.
1 Matthews Asia Funds does not charge 12b-1 fees.
2 The lesser of fiscal year 2012 long-term purchase costs or sales proceeds divided by the average monthly market value of long-term securities.
Matthews Asia Science and Technology Fund
Portfolio Manager Commentary
For the year ending December 31, 2012, the Matthews Asia Science and Technology Fund gained 14.11% while its benchmark, the MSCI AC Asia IT and Telecom Services Index, rose 15.18%. For the fourth quarter of the year, the Fund returned 0.55% versus 3.59% for the benchmark.
Asia's technology industries performed well in 2012 on the back of various policies by U.S. and European regulators that supported the market despite continued weak overall growth and demand. The Fund's relative performance against its benchmark was impacted during the year as most Internet companies, especially U.S.-listed Chinese Internet firms, underperformed. The Internet sector has been a key part of the Fund's strategy as we believe this segment is one of the best ways to tap into the growing wealth of Asia's consumers. U.S.-listed Chinese Internet companies faced several hurdles in 2012 as concerns grew over structures known as Variable Interest Entities (VIE). The potential delisting of certain firms due to an accounting-related dispute between U.S. and Chinese regulators heightened uncertainty during the second half of the year. While we continue to monitor this issue, we believe that the actual chance for any widespread de-listings of U.S.-listed Chinese companies is remote. Furthermore, VIE structures have long been in place and China's government has been well aware of such practices.
Fundamentals for China's Internet industry remain quite strong, and the country now has more than 500 million Internet users. China also now has more than 350 million mobile Internet users. During the year, growth in mobile Internet use outpaced that of desktop PC-based use for the first time. We expect the overall growth of the Internet sector to remain strong next year, and the Internet industry continues to be a key component of our strategy.
Globally, smartphones and tablets were the biggest growth stories in technology, and for Asia, this was no exception. China has become the largest market for smartphones by units sold and we expect further growth in this space next year. We also expect the smartphone penetration rate to increase in other emerging markets, such as India and Brazil, and we anticipate that the low to mid-range segment of products may lead that growth. We increased the portfolio's exposure to the smartphone industry over the course of the year as we see growth in the area, as well as in the tablet space, outpacing other hardware segments in 2013.
Samsung Electronics was a top performer during the year. The firm's positioning in the global smartphone and semiconductor industries have strengthened and Samsung is now one of very few smartphone manufacturers with a fully integrated in-house supply chain, which allows it to manufacture most of its essential components in-house. This strategy should benefit Samsung should the industry suffer from components shortages. We expect Samsung Electronics to remain among the major beneficiaries of growth in the smartphone and tablet market next year.
Another holding that performed well during the year was Sunny Optical Technology, a manufacturer of camera lens modules for smartphones that holds a dominant market share in China. Sunny Optical has been one of the biggest beneficiaries of the smartphone market growth in China and we expect the firm to maintain this leading position in 2013.
matthewsasia.com | 800.789.ASIA 65
PERFORMANCE AS OF DECEMBER 31, 2012
| | | | | | | Average Annual Total Returns | |
| | 3 Months | | 1 Year | | 3 Years | | 5 Years | | 10 Years | | Inception
12/27/99 | |
Investor Class (MATFX) | | | 0.55 | % | | | 14.11 | % | | | 5.27 | % | | | -0.92 | % | | | 12.32 | % | | | -0.09 | % | |
MSCI AC Asia IT and Telecom Services Index3 | | | 3.59 | % | | | 15.18 | % | | | 6.15 | % | | | 0.23 | % | | | 8.40 | % | | | -3.58 | %4 | |
Lipper Global Sciences and Technology
Funds Category Average5 | | | -0.62 | % | | | 13.23 | % | | | 7.33 | % | | | 2.51 | % | | | 10.77 | % | | | -1.46 | %4 | |
Performance assumes reinvestment of all dividends and/or distributions before taxes. All performance quoted represents past performance and is no guarantee of future results. Investment return and principal value will fluctuate with market conditions so that when redeemed, shares may be worth more or less than their original cost. Current performance may be lower or higher than the return figures quoted. Returns would have been lower if certain of the Fund's fees and expenses had not been waived. For the Fund's most recent month-end performance, visit matthewsasia.com.
GROWTH OF A $10,000 INVESTMENT SINCE INCEPTION—INVESTOR CLASS
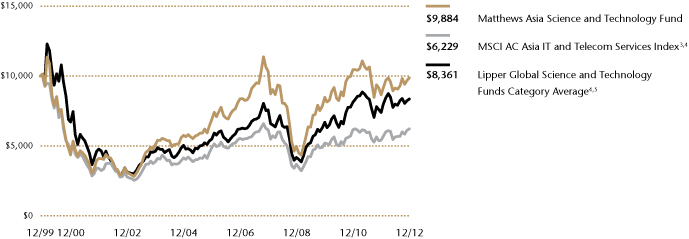
Plotted monthly. The performance data and graph do not reflect the deduction of taxes that a shareholder would pay on dividends, capital gains distributions or redemption of Fund shares. Values are in US$.
3 Formerly known as MSCI/Matthews Asian Technology Index. It is not possible to invest directly in an index. Source: Index data from Morgan Stanley Capital International and Bloomberg; total return calculations performed by BNY Mellon Investment Servicing (US) Inc. Please see page 71 for index definition.
4 Calculated from 12/31/99.
5 The Lipper Category Average does not reflect sales charges and is based on total return, including reinvestment of dividends and capital gains for the stated periods.
TOP TEN HOLDINGS6
| | Sector | | Country | | % of Net Assets | |
Samsung Electronics Co., Ltd. | | Information Technology | | South Korea | | | 8.4 | % | |
Baidu, Inc. | | Information Technology | | China/Hong Kong | | | 6.2 | % | |
Taiwan Semiconductor Manufacturing Co., Ltd. | | Information Technology | | Taiwan | | | 3.8 | % | |
Sunny Optical Technology Group Co., Ltd. | | Consumer Discretionary | | China/Hong Kong | | | 2.6 | % | |
St. Shine Optical Co., Ltd. | | Health Care | | Taiwan | | | 2.4 | % | |
21Vianet Group, Inc. | | Information Technology | | China/Hong Kong | | | 2.3 | % | |
Hitachi, Ltd. | | Information Technology | | Japan | | | 2.2 | % | |
MediaTek, Inc. | | Information Technology | | Taiwan | | | 2.2 | % | |
Cognizant Technology Solutions Corp. | | Information Technology | | USA | | | 2.1 | % | |
FANUC Corp. | | Industrials | | Japan | | | 2.1 | % | |
% OF ASSETS IN TOP TEN | | | | | | | 34.3 | % | |
6 Holdings may combine more than one security from same issuer and related depositary receipts.
66 MATTHEWS ASIA FUNDS
Matthews Asia Science and Technology Fund
Portfolio Manager Commentary (continued)
During the year, the health care industry grew, and the Fund benefited from our exposure to medical industries. Asia's health care sector remains underpenetrated compared to that of more developed regions, and we expect industry growth to remain stable over the long term.
Among medical technology companies, Asahi Intecc was one of the strongest contributors to Fund performance during the year. A Japan-based maker of guidewires used in medical treatments with catheters, Asahi Intecc is a small company with strong technology in a niche area. The high technological barrier to entry limits market competition. The demand for guidewires is expected to grow as the market expands in China and other emerging markets.
Among the detractors to Fund performance during the year was Chinese Internet services firm Baidu, which faced several headwinds. In addition to concerns over the listing structure that affected all U.S.-listed Chinese Internet companies, the firm faced increased industry competition. Despite these challenges, Baidu's fundamentals remain healthy. It continues to report strong top and bottom line growth, and has maintained its dominant market position. The correction in Baidu's share price makes its valuations more attractive and we expect the company to gradually recover as economic growth in China improves. We continue to believe that Baidu is one of China's best-managed Internet companies and is still well-positioned to benefit from the country's emerging middle class.
Risks for Asia's technology sector include inherent volatility in the supply and demand dynamics of its industries and the quick shifts in the competitive landscape. In addition, changing regulatory environments may pressure U.S.-listed Chinese Internet companies further in the near future.
As Asia's population growth slows, we believe that the region's next phase of growth will come from rising productivity helped by technological advances. This should drive more innovation and the demand for IT products and services should accelerate in the coming years. We are building the portfolio to capture this growth by focusing on companies that can benefit from the proliferation of technology products in Asia with an emphasis on Internet and software. We also continue to seek global and regional champions in electronic components, automation, medical technology and emerging communication devices.
Sector funds may be subject to a higher degree of market risk than diversified funds because of a concentration in a specific sector. The Fund's value may be affected by changes in the science and technology-related industries.
COUNTRY ALLOCATION (%)7
China/Hong Kong | | | 34.1 | | |
Japan | | | 20.5 | | |
Taiwan | | | 19.7 | | |
South Korea | | | 18.4 | | |
India | | | 2.8 | | |
United States | | | 2.2 | | |
Malaysia | | | 1.3 | | |
Cash and Other Assets,
Less Liabilities | | | 1.0 | | |
SECTOR ALLOCATION (%)
Information Technology | | | 65.1 | | |
Industrials | | | 10.4 | | |
Health Care | | | 9.8 | | |
Consumer Discretionary | | | 5.3 | | |
Materials | | | 4.8 | | |
Telecommunication Services | | | 3.6 | | |
Cash and Other Assets,
Less Liabilities | | | 1.0 | | |
MARKET CAP EXPOSURE (%)8
Large Cap (over $5B) | | | 52.4 | | |
Mid Cap ($1B–$5B) | | | 21.6 | | |
Small Cap (under $1B) | | | 25.0 | | |
Cash and Other Assets,
Less Liabilities | | | 1.0 | | |
7 Not all countries are included in the benchmark index(es).
8 Source: FactSet Research Systems. Percentage values in data are rounded to the nearest tenth of one percent; the values may not sum to 100% due to rounding.
matthewsasia.com | 800.789.ASIA 67
Matthews Asia Science and Technology Fund December 31, 2012
Schedule of Investmentsa
COMMON EQUITIES: 97.2%
| | | Shares | | Value | |
CHINA/HONG KONG: 34.1% | |
Baidu, Inc. ADRb | | | 81,800 | | | $ | 8,203,722 | | |
Sunny Optical Technology Group Co., Ltd. | | | 5,087,000 | | | | 3,377,065 | | |
21Vianet Group, Inc. ADRb | | | 315,601 | | | | 3,032,926 | | |
Airtac International Group | | | 468,000 | | | | 2,727,361 | | |
Sinopharm Group Co., Ltd. H Shares | | | 821,600 | | | | 2,609,007 | | |
51job, Inc. ADRb | | | 52,049 | | | | 2,433,291 | | |
Sina Corp.b | | | 44,400 | | | | 2,229,768 | | |
Xingda International Holdings, Ltd.
H Shares | | | 4,074,000 | | | | 2,136,194 | | |
ZTE Corp. H Shares | | | 1,235,144 | | | | 2,120,744 | | |
Pactera Technology International,
Ltd. ADRb | | | 259,677 | | | | 2,061,835 | | |
WuXi PharmaTech Cayman, Inc. ADRb | | | 125,200 | | | | 1,971,900 | | |
Spreadtrum Communications, Inc. ADR | | | 111,600 | | | | 1,964,160 | | |
Digital China Holdings, Ltd. | | | 1,094,000 | | | | 1,891,835 | | |
NetEase, Inc. ADRb | | | 42,800 | | | | 1,821,140 | | |
Lenovo Group, Ltd. | | | 1,916,000 | | | | 1,766,667 | | |
China Mobile, Ltd. ADR | | | 28,400 | | | | 1,667,648 | | |
AAC Technologies Holdings, Inc. | | | 445,500 | | | | 1,579,663 | | |
Citic Telecom International Holdings, Ltd. | | | 4,907,000 | | | | 1,343,316 | | |
Total China/Hong Kong | | | | | 44,938,242 | | |
JAPAN: 20.5% | |
Hitachi, Ltd. | | | 503,000 | | | | 2,959,908 | | |
FANUC Corp. | | | 15,100 | | | | 2,809,349 | | |
Murata Manufacturing Co., Ltd. | | | 47,200 | | | | 2,784,394 | | |
Asahi Intecc Co., Ltd. | | | 68,500 | | | | 2,625,036 | | |
Nitto Denko Corp. | | | 41,900 | | | | 2,063,518 | | |
Toshiba Corp. | | | 520,000 | | | | 2,058,276 | | |
Nabtesco Corp. | | | 88,500 | | | | 1,976,759 | | |
OSG Corp. | | | 142,300 | | | | 1,974,719 | | |
THK Co., Ltd. | | | 101,000 | | | | 1,816,556 | | |
Softbank Corp. | | | 47,000 | | | | 1,722,138 | | |
Rakuten, Inc. | | | 179,000 | | | | 1,395,923 | | |
Bit-isle, Inc. | | | 137,300 | | | | 1,389,078 | | |
Nexon Co., Ltd.b | | | 131,400 | | | | 1,330,823 | | |
Total Japan | | | | | 26,906,477 | | |
TAIWAN: 19.7% | |
Taiwan Semiconductor Manufacturing
Co., Ltd. | | | 1,483,933 | | | | 4,963,475 | | |
St. Shine Optical Co., Ltd. | | | 203,000 | | | | 3,104,809 | | |
MediaTek, Inc. | | | 260,000 | | | | 2,908,641 | | |
Delta Electronics, Inc. | | | 738,000 | | | | 2,719,848 | | |
TXC Corp. | | | 1,476,198 | | | | 2,446,339 | | |
PChome Online, Inc. | | | 421,732 | | | | 1,968,423 | | |
Hon Hai Precision Industry Co., Ltd. | | | 594,000 | | | | 1,838,620 | | |
Kinsus Interconnect Technology Corp. | | | 579,000 | | | | 1,829,246 | | |
Chroma ATE, Inc. | | | 667,360 | | | | 1,493,722 | | |
Largan Precision Co., Ltd. | | | 53,000 | | | | 1,427,615 | | |
AU Optronics Corp. ADRb | | | 281,000 | | | | 1,264,500 | | |
Total Taiwan | | | | | 25,965,238 | | |
| | | Shares | | Value | |
SOUTH KOREA: 16.6% | |
Samsung Electronics Co., Ltd. | | | 7,707 | | | $ | 11,073,416 | | |
LG Chem, Ltd. | | | 7,154 | | | | 2,235,996 | | |
NHN Corp. | | | 10,032 | | | | 2,131,025 | | |
Daum Communications Corp. | | | 23,644 | | | | 2,014,266 | | |
Cheil Industries, Inc. | | | 22,388 | | | | 1,979,028 | | |
Samsung SDI Co., Ltd. | | | 13,530 | | | | 1,920,389 | | |
SBS Contents Hub Co., Ltd. | | | 40,358 | | | | 495,154 | | |
Total South Korea | | | | | 21,849,274 | | |
INDIA: 2.8% | |
Info Edge India, Ltd. | | | 438,766 | | | | 2,761,207 | | |
Ipca Laboratories, Ltd. | | | 102,999 | | | | 978,113 | | |
Total India | | | | | 3,739,320 | | |
UNITED STATES: 2.2% | |
Cognizant Technology Solutions
Corp. Class Ab | | | 38,200 | | | | 2,828,710 | | |
Total United States | | | | | 2,828,710 | | |
MALAYSIA: 1.3% | |
KPJ Healthcare BHD | | | 891,800 | | | | 1,673,948 | | |
Total Malaysia | | | | | 1,673,948 | | |
TOTAL COMMON EQUITIES | | | | | 127,901,209 | | |
(Cost $106,598,995) | | | | | |
PREFERRED EQUITIES: 1.8%
SOUTH KOREA: 1.8% | |
Samsung Electronics Co., Ltd., Pfd. | | | 2,940 | | | | 2,362,453 | | |
Total South Korea | | | | | 2,362,453 | | |
TOTAL PREFERRED EQUITIES | | | | | 2,362,453 | | |
(Cost $1,858,037) | | | | | |
TOTAL INVESTMENTS: 99.0% | | | | | 130,263,662 | | |
(Cost $108,457,032c) | | | | | |
CASH AND OTHER ASSETS,
LESS LIABILITIES: 1.0% | | | | | 1,365,024 | | |
NET ASSETS: 100.0% | | | | $ | 131,628,686 | | |
a Certain securities were fair valued under the discretion of the Board of Trustees (Note 2-A).
b Non-income producing security.
c Cost for federal income tax purposes is $108,550,979 and net unrealized appreciation consists of:
Gross unrealized appreciation | | $ | 27,052,653 | | |
Gross unrealized depreciation | | | (5,339,970 | ) | |
Net unrealized appreciation | | $ | 21,712,683 | | |
ADR American Depositary Receipt
BHD Berhad
Pfd. Preferred
See accompanying notes to financial statements.
68 MATTHEWS ASIA FUNDS
This page intentionally left blank.
matthewsasia.com | 800.789.ASIA 69
Fund Holdings: The Fund holdings shown in this report are as of December 31, 2012. Holdings are subject to change at any time, so holdings shown in this report may not reflect current Fund holdings. The Funds file complete schedules of portfolio holdings with the Securities and Exchange Commission (the "SEC") for the first and third quarters of each fiscal year on Form N-Q. The Funds' Form N-Q is filed with the SEC within 60 days of the end of the quarter to which it relates, and is available on the SEC's website at www.sec.gov. It may also be reviewed and copied at the Commission's Public Reference Room in Washington, D.C. Information on the operation of the Public Reference Room may be obtained by calling 800-SEC-0330. Complete schedules of investments are also available without charge, upon request, from the Funds by calling us at 800.789.ASIA (2472).
Proxy Voting Record: The Funds' Statement of Additional Information containing a description of the policies and procedures that the Funds have used to vote proxies relating to portfolio securities, along with each Fund's proxy voting record relating to portfolio securities held during the most recent 12-month period ended June 30, is available upon request, at no charge, at the Funds' website at matthewsasia.com or by calling 800.789.ASIA (2742), or on the SEC's website at www.sec.gov.
Shareholder Reports and Prospectuses: To reduce the Funds' expenses, we try to identify related shareholders in a household and send only one copy of the Funds' prospectus and financial reports to that address. This process, called "householding," will continue indefinitely unless you instruct us otherwise. At any time you may view the Funds' current prospectus, summary prospectus and financial reports on our website. If you prefer to receive individual copies of the Funds' prospectus or financial reports, please call us at 800.789.ASIA (2742).
Redemption Fee Policy: The Funds assess a redemption fee of 2.00% on the total redemption proceeds on most sales or exchanges of shares that take place within 90 calendar days after their purchase as part of the Funds' efforts to discourage short-term trading activity. This fee is payable directly to the Funds. For purposes of determining whether the redemption fee applies, the shares that have been held longest will be redeemed first. The Funds may grant exemptions from the redemption fee in certain circumstances. For more information on this policy, please see the Funds' prospectus.
70 MATTHEWS ASIA FUNDS
The HSBC Asian Local Bond Index (ALBI) tracks the total return performance of a bond portfolio consisting of local-currency denominated, high quality and liquid bonds in Asia ex-Japan. The ALBI includes bonds from the following countries: Korea, Hong Kong, India, Singapore, Taiwan, Malaysia, Thailand, Philippines, Indonesia and China.
The J.P. Morgan Asia Credit Index (JACI) tracks the total return performance of the Asia fixed-rate dollar bond market. JACI is a market cap-weighted index comprising sovereign, quasi-sovereign and corporate bonds and is partitioned by country, sector and credit rating. JACI includes bonds from the following countries: China, Hong Kong, India, Indonesia, Korea, Malaysia, Philippines, Thailand and Singapore.
The MSCI All Country Asia ex Japan Index is a free float–adjusted market capitalization–weighted index of the stock markets of China, Hong Kong, India, Indonesia, Malaysia, Philippines, Singapore, South Korea, Taiwan and Thailand.
The MSCI All Country Asia Pacific Index is a free float– adjusted market capitalization–weighted index of the stock markets of Australia, China, Hong Kong, India, Indonesia, Japan, Malaysia, New Zealand, Philippines, Singapore, South Korea, Taiwan and Thailand.
The MSCI China Index is a free float–adjusted market capitalization–weighted index of Chinese equities that includes China-affiliated corporations and H shares listed on the Hong Kong Exchange, and B shares listed on the Shanghai and Shenzhen exchanges.
The Bombay Stock Exchange (BSE) 100 Index is a free float–adjusted market capitalization–weighted index of the 100 stocks listed on the Bombay Stock Exchange.
The MSCI Japan Index is a free float–adjusted market capitalization–weighted index of Japanese equities listed in Japan.
The Tokyo Stock Price Index (TOPIX) is a market capitalization–weighted index of all companies listed on the First Section of the Tokyo Stock Exchange.
The Korea Composite Stock Price Index (KOSPI) is a market capitalization–weighted index of all common stocks listed on the Korea Stock Exchange.
The MSCI All Country Asia ex Japan Small Cap Index is a free float–adjusted market capitalization–weighted small cap index of the stock markets of China, Hong Kong, India, Indonesia, Malaysia, Philippines, Singapore, South Korea, Taiwan and Thailand.
The MSCI China Small Cap Index is a free float–adjusted market capitalization–weighted small cap index of the Chinese equity securities markets, including H shares listed on the Hong Kong Exchange, B shares listed on the Shanghai and Shenzhen exchanges, and Hong Kong-listed securities known as Red Chips (issued by entities owned by national or local governments in China) and P Chips (issued by companies controlled by individuals in China and deriving substantial revenues in China).
The MSCI AC Asia IT and Telecom Services Index is a free float–adjusted market capitalization–weighted index of Asian equities tracking a broad range of technology stocks including semiconductor equipment and products, communications equipment, computers and peripherals, electronic equipment and instruments, office electronics, software, IT consulting and services, Internet software and services, diversified telecommunications services, and wireless telecommunications services.
matthewsasia.com | 800.789.ASIA 71
Disclosure of Fund Expenses (Unaudited)
We believe it is important for you to understand the impact of fees regarding your investment. All mutual funds have operating expenses. As a shareholder of a mutual fund, you incur ongoing costs, which include costs for portfolio management, administrative services, and shareholder reports (like this one), among others. Operating expenses, which are deducted from a fund's gross income, directly reduce the investment return of the fund. A fund's operating expenses are expressed as a percentage of its average net assets. This figure is known as the expense ratio. The following examples are intended to help you understand the ongoing fees (in dollars) of investing in your fund and to compare these costs with those of other mutual funds. The examples are based on an investment of $1,000 made at the beginning of the period shown and held for the entire period.
This table illustrates your fund's costs in two ways:
Actual Fund Return: This section helps you to estimate the actual operating expenses, after any applicable fee waivers, that you paid over the period. The "Ending Account Value" shown is derived from the fund's actual return for the past six month period, the "Expense Ratio" column shows the period's annualized expense ratio, and the "Operating Expenses Paid During Period" column shows the dollar amount that would have been paid by an investor who started with $1,000 in the fund at the beginning of the period. You may use the information here, together with your account value, to estimate the expenses that you paid over the period. To do so, simply divide your account value by $1,000 (for example, an $8,600 account value divided by $1,000 = 8.6), then multiply the result by the number given for your fund in the first line under the heading entitled "Operating Expenses Paid During Period."
Hypothetical 5% Return: This section is intended to help you compare your fund's costs with those of other mutual funds. It assumes that the fund had an annual
return of 5% before operating expenses, but that the expense ratio is unchanged. In this case, because the return used is not the fund's actual return, the results do not apply to your investment. This example is useful in making comparisons to other mutual funds because the Securities and Exchange Commission requires all mutual funds to calculate expenses based on an assumed 5% annual return. You can assess your fund's costs by comparing this hypothetical example with the hypothetical examples that appear in shareholder reports of other funds.
Please note that the operating expenses shown in the table are meant to highlight and help you compare your ongoing costs only and do not reflect any transactional costs such as sales charges (loads), redemption fees, or exchange fees. The Funds generally assess a redemption fee of 2.00% of the total redemption proceeds if you sell or exchange your shares within 90 calendar days after purchasing them. The redemption fee is paid directly to the Funds and is designed to discourage frequent short-term trading and to offset transaction costs associated with such trading of Fund shares. For purposes of determining whether the redemption fee applies, the shares that have been held the longest will be redeemed first. The Funds may grant exemption from the redemption fee when the Funds have previously received assurances that transactions do not involve market timing activity. The Funds may also waive the imposition of redemption fees in certain circumstances.
For more information on this policy, please see the Funds' prospectus.
The Matthews Asia Funds does not charge any sales loads, exchange fees, or 12b-1 fees, but these may be present in other funds to which you compare this data. Therefore, the hypothetical portions of the table are useful in comparing ongoing costs only, and will not help you determine the relative total costs of owning different funds.
72 MATTHEWS ASIA FUNDS
December 31, 2012
| | INVESTOR CLASS | | INSTITUTIONAL CLASS | |
| | Beginning
Account
Value
7/1/12 | | Ending
Account
Value
12/31/12 | | Expense
Ratio1 | | Operating
Expenses
Paid During
Period
7/1/12–
12/31/122 | | Beginning
Account
Value
7/1/12 | | Ending
Account
Value
12/31/12 | | Expense
Ratio1 | | Operating
Expenses
Paid During
Period
7/1/12–
12/31/122 | |
ASIA FIXED INCOME STRATEGY | |
Matthews Asia Strategic Income Fund | |
Actual Fund Return | | $ | 1,000.00 | | | $ | 1,090.60 | | | | 1.20 | % | | $ | 6.27 | | | $ | 1,000.00 | | | $ | 1,090.90 | | | | 1.00 | % | | $ | 5.23 | | |
Hypothetical 5% Return | | $ | 1,000.00 | | | $ | 1,019.00 | | | | 1.20 | % | | $ | 6.06 | | | $ | 1,000.00 | | | $ | 1,020.00 | | | | 1.00 | % | | $ | 5.05 | | |
ASIA GROWTH AND INCOME STRATEGIES | |
Matthews Asian Growth and Income Fund | |
Actual Fund Return | | $ | 1,000.00 | | | $ | 1,158.70 | | | | 1.10 | % | | $ | 5.94 | | | $ | 1,000.00 | | | $ | 1,158.90 | | | | 0.95 | % | | $ | 5.13 | | |
Hypothetical 5% Return | | $ | 1,000.00 | | | $ | 1,019.50 | | | | 1.10 | % | | $ | 5.55 | | | $ | 1,000.00 | | | $ | 1,020.25 | | | | 0.95 | % | | $ | 4.80 | | |
Matthews Asia Dividend Fund | |
Actual Fund Return | | $ | 1,000.00 | | | $ | 1,118.30 | | | | 1.09 | % | | $ | 5.77 | | | $ | 1,000.00 | | | $ | 1,119.10 | | | | 0.97 | % | | $ | 5.14 | | |
Hypothetical 5% Return | | $ | 1,000.00 | | | $ | 1,019.55 | | | | 1.09 | % | | $ | 5.50 | | | $ | 1,000.00 | | | $ | 1,020.15 | | | | 0.97 | % | | $ | 4.90 | | |
Matthews China Dividend Fund | |
Actual Fund Return | | $ | 1,000.00 | | | $ | 1,159.50 | | | | 1.50 | % | | $ | 8.10 | | | $ | 1,000.00 | | | $ | 1,160.10 | | | | 1.25 | % | | $ | 6.75 | | |
Hypothetical 5% Return | | $ | 1,000.00 | | | $ | 1,017.50 | | | | 1.50 | % | | $ | 7.57 | | | $ | 1,000.00 | | | $ | 1,018.75 | | | | 1.25 | % | | $ | 6.31 | | |
ASIA GROWTH STRATEGIES | |
Matthews Asia Growth Fund | |
Actual Fund Return | | $ | 1,000.00 | | | $ | 1,113.00 | | | | 1.13 | % | | $ | 5.97 | | | $ | 1,000.00 | | | $ | 1,114.00 | | | | 0.96 | % | | $ | 5.07 | | |
Hypothetical 5% Return | | $ | 1,000.00 | | | $ | 1,019.35 | | | | 1.13 | % | | $ | 5.70 | | | $ | 1,000.00 | | | $ | 1,020.20 | | | | 0.96 | % | | $ | 4.85 | | |
Matthews Pacific Tiger Fund | |
Actual Fund Return | | $ | 1,000.00 | | | $ | 1,134.10 | | | | 1.10 | % | | $ | 5.87 | | | $ | 1,000.00 | | | $ | 1,135.20 | | | | 0.94 | % | | $ | 5.02 | | |
Hypothetical 5% Return | | $ | 1,000.00 | | | $ | 1,019.50 | | | | 1.10 | % | | $ | 5.55 | | | $ | 1,000.00 | | | $ | 1,020.30 | | | | 0.94 | % | | $ | 4.75 | | |
Matthews China Fund | |
Actual Fund Return | | $ | 1,000.00 | | | $ | 1,097.20 | | | | 1.10 | % | | $ | 5.77 | | | $ | 1,000.00 | | | $ | 1,098.20 | | | | 0.90 | % | | $ | 4.72 | | |
Hypothetical 5% Return | | $ | 1,000.00 | | | $ | 1,019.50 | | | | 1.10 | % | | $ | 5.55 | | | $ | 1,000.00 | | | $ | 1,020.50 | | | | 0.90 | % | | $ | 4.55 | | |
Matthews India Fund | |
Actual Fund Return | | $ | 1,000.00 | | | $ | 1,151.80 | | | | 1.15 | % | | $ | 6.19 | | | $ | 1,000.00 | | | $ | 1,152.30 | | | | 0.96 | % | | $ | 5.17 | | |
Hypothetical 5% Return | | $ | 1,000.00 | | | $ | 1,019.25 | | | | 1.15 | % | | $ | 5.81 | | | $ | 1,000.00 | | | $ | 1,020.20 | | | | 0.96 | % | | $ | 4.85 | | |
Matthews Japan Fund | |
Actual Fund Return | | $ | 1,000.00 | | | $ | 1,048.90 | | | | 1.15 | % | | $ | 5.89 | | | $ | 1,000.00 | | | $ | 1,049.50 | | | | 1.00 | % | | $ | 5.12 | | |
Hypothetical 5% Return | | $ | 1,000.00 | | | $ | 1,019.25 | | | | 1.15 | % | | $ | 5.81 | | | $ | 1,000.00 | | | $ | 1,020.00 | | | | 1.00 | % | | $ | 5.05 | | |
Matthews Korea Fund | |
Actual Fund Return | | $ | 1,000.00 | | | $ | 1,193.60 | | | | 1.13 | % | | $ | 6.20 | | | $ | 1,000.00 | | | $ | 1,194.90 | | | | 0.99 | % | | $ | 5.43 | | |
Hypothetical 5% Return | | $ | 1,000.00 | | | $ | 1,019.35 | | | | 1.13 | % | | $ | 5.70 | | | $ | 1,000.00 | | | $ | 1,020.05 | | | | 0.99 | % | | $ | 5.00 | | |
ASIA SMALL COMPANY STRATEGIES | |
Matthews Asia Small Companies Fund | |
Actual Fund Return | | $ | 1,000.00 | | | $ | 1,166.50 | | | | 1.48 | % | | $ | 8.02 | | | | | | | | | | |
Hypothetical 5% Return | | $ | 1,000.00 | | | $ | 1,017.60 | | | | 1.48 | % | | $ | 7.47 | | | | | | | | | | |
Matthews China Small Companies Fund | |
Actual Fund Return | | $ | 1,000.00 | | | $ | 1,099.00 | | | | 2.00 | % | | $ | 10.50 | | | | | | | | | | |
Hypothetical 5% Return | | $ | 1,000.00 | | | $ | 1,015.00 | | | | 2.00 | % | | $ | 10.08 | | | | | | | | | | |
ASIA SPECIALTY STRATEGY | |
Matthews Asia Science and Technology Fund | |
Actual Fund Return | | $ | 1,000.00 | | | $ | 1,080.20 | | | | 1.15 | % | | $ | 5.98 | | | | | | | | | | |
Hypothetical 5% Return | | $ | 1,000.00 | | | $ | 1,019.25 | | | | 1.15 | % | | $ | 5.81 | | | | | | | | | | |
1 Annualized, based on the Fund's most recent fiscal half-year expenses.
2 Operating expenses are equal to the Fund's annualized expense ratio multiplied by the average account value over the period, multiplied by 183 days, then divided by 366.
matthewsasia.com | 800.789.ASIA 73
Statements of Assets and Liabilities December 31, 2012
| | | Matthews Asia
Strategic
Income Fund | | Matthews Asian
Growth and
Income Fund | | Matthews Asia
Dividend Fund | | Matthews China
Dividend Fund | | Matthews Asia
Growth Fund | |
ASSETS: | |
Investments at value (A) (Note 2-A and 7): | |
Unaffiliated issuers | | $ | 34,720,275 | | | $ | 3,806,339,445 | | | $ | 2,990,762,005 | | | $ | 56,210,016 | | | $ | 420,355,062 | | |
Affiliated issuers | | | — | | | | 91,352,235 | | | | 593,470,268 | | | | — | | | | — | | |
Total investments | | | 34,720,275 | | | | 3,897,691,680 | | | | 3,584,232,273 | | | | 56,210,016 | | | | 420,355,062 | | |
Cash | | | 876,158 | | | | 185,468,637 | | | | 84,189,791 | | | | 2,340,606 | | | | 5,013,464 | | |
Foreign currency at value (B) | | | 14,928 | | | | 3,113,432 | | | | 367,379 | | | | 17,236 | | | | 66,557 | | |
Dividends, interest and other receivables—Unaffiliated issuers | | | 449,776 | | | | 6,360,058 | | | | 9,008,429 | | | | 23,614 | | | | 138,595 | | |
Dividends receivable—Affiliated issuers | | | — | | | | — | | | | 40,608 | | | | — | | | | — | | |
Receivable for securities sold | | | — | | | | 2,081,597 | | | | 9,337,799 | | | | — | | | | 1,228,122 | | |
Receivable for capital shares sold | | | 419,144 | | | | 18,850,267 | | | | 37,621,902 | | | | 1,803,692 | | | | 753,967 | | |
Prepaid expenses | | | 19,715 | | | | 33,726 | | | | 48,586 | | | | 20,493 | | | | 43,375 | | |
TOTAL ASSETS | | | 36,499,996 | | | | 4,113,599,397 | | | | 3,724,846,767 | | | | 60,415,657 | | | | 427,599,142 | | |
LIABILITIES: | |
Payable for securities purchased | | | 749,882 | | | | 29,783,117 | | | | 10,048,707 | | | | 384,053 | | | | 2,010,212 | | |
Payable for capital shares redeemed | | | 5,247 | | | | 6,588,192 | | | | 7,152,521 | | | | 186,622 | | | | 740,404 | | |
Deferred foreign capital gains tax liability (Note 2-D) | | | 6,641 | | | | 1,468,703 | | | | 1,487,961 | | | | — | | | | 356,319 | | |
Due to Advisor (Note 5) | | | 6,139 | | | | 2,185,359 | | | | 1,975,193 | | | | 41,500 | | | | 231,210 | | |
Administration and accounting fees payable | | | 431 | | | | 51,044 | | | | 46,371 | | | | 621 | | | | 5,433 | | |
Administration and shareholder servicing fees payable | | | 4,939 | | | | 698,177 | | | | 603,365 | | | | 8,091 | | | | 70,634 | | |
Accounting out-of-pocket fees payable | | | 1,895 | | | | 5,584 | | | | 5,006 | | | | 2,330 | | | | 4,877 | | |
Professional fees payable | | | 30,018 | | | | 46,530 | | | | 43,683 | | | | 37,795 | | | | 38,039 | | |
Accrued other expenses payable | | | 10,947 | | | | 912,040 | | | | 879,657 | | | | 18,292 | | | | 115,999 | | |
TOTAL LIABILITIES | | | 816,139 | | | | 41,738,746 | | | | 22,242,464 | | | | 679,304 | | | | 3,573,127 | | |
NET ASSETS | | $ | 35,683,857 | | | $ | 4,071,860,651 | | | $ | 3,702,604,303 | | | $ | 59,736,353 | | | $ | 424,026,015 | | |
NET ASSETS: | |
Investor Class | | $ | 29,478,991 | | | $ | 3,214,984,178 | | | $ | 2,780,042,971 | | | $ | 59,535,494 | | | $ | 276,884,271 | | |
Institutional Class | | | 6,204,866 | | | | 856,876,473 | | | | 922,561,332 | | | | 200,859 | | | | 147,141,744 | | |
TOTAL | | $ | 35,683,857 | | | $ | 4,071,860,651 | | | $ | 3,702,604,303 | | | $ | 59,736,353 | | | $ | 424,026,015 | | |
SHARES OUTSTANDING: | |
(shares of beneficial interest issued and outstanding, respectively,
unlimited number of shares authorized with a $0.001 par value) | |
Investor Class | | | 2,720,487 | | | | 172,799,595 | | | | 190,729,389 | | | | 4,821,537 | | | | 15,366,905 | | |
Institutional Class | | | 572,928 | | | | 46,066,454 | | | | 63,331,835 | | | | 16,275 | | | | 8,137,481 | | |
TOTAL | | | 3,293,415 | | | | 218,866,049 | | | | 254,061,224 | | | | 4,837,812 | | | | 23,504,386 | | |
NET ASSET VALUE: | |
Investor Class, offering price and redemption price | | $ | 10.84 | | | $ | 18.61 | | | $ | 14.58 | | | $ | 12.35 | | | $ | 18.02 | | |
Institutional Class, offering price and redemption price | | $ | 10.83 | | | $ | 18.60 | | | $ | 14.57 | | | $ | 12.34 | | | $ | 18.08 | | |
NET ASSETS CONSIST OF: | |
Capital paid-in | | $ | 33,781,905 | | | $ | 3,279,008,639 | | | $ | 3,416,680,658 | | | $ | 55,879,597 | | | $ | 382,789,951 | | |
Undistributed (distributions in excess of) net investment income (loss) | | | (110,372 | ) | | | (32,863,458 | ) | | | (62,410,638 | ) | | | (801,799 | ) | | | 2,902,963 | | |
Undistributed/accumulated net realized gain (loss) on investments, financial futures
contracts, foreign currency related transactions and foreign capital gains taxes | | | 43,757 | | | | 13,640,819 | | | | (148,478,086 | ) | | | (1,892,797 | ) | | | (49,201,515 | ) | |
Net unrealized appreciation (depreciation) on investments, foreign currency
translations and deferred foreign capital gains taxes | | | 1,968,567 | | | | 812,074,651 | | | | 496,812,369 | | | | 6,551,352 | | | | 87,534,616 | | |
NET ASSETS | | $ | 35,683,857 | | | $ | 4,071,860,651 | | | $ | 3,702,604,303 | | | $ | 59,736,353 | | | $ | 424,026,015 | | |
(A) Investments at cost: | |
Unaffiliated issuers | | $ | 32,745,791 | | | $ | 3,017,519,319 | | | $ | 2,512,546,259 | | | $ | 49,658,662 | | | $ | 332,473,262 | | |
Affiliated issuers | | | — | | | | 66,639,300 | | | | 573,360,260 | | | | — | | | | — | | |
Total investments at cost | | $ | 32,745,791 | | | $ | 3,084,158,619 | | | $ | 3,085,906,519 | | | $ | 49,658,662 | | | $ | 332,473,262 | | |
(B) Foreign currency at cost | | $ | 14,928 | | | $ | 3,111,663 | | | $ | 367,379 | | | $ | 17,236 | | | $ | 66,557 | | |
See accompanying notes to financial statements.
74 MATTHEWS ASIA FUNDS
| | | Matthews Pacific
Tiger Fund | | Matthews
China Fund | | Matthews
India Fund | | Matthews
Japan Fund | | Matthews
Korea Fund | |
ASSETS: | |
Investments at value (A) (Note 2-A and 7): | |
Unaffiliated issuers | | $ | 6,048,052,900 | | | $ | 1,980,526,478 | | | $ | 635,709,816 | | | $ | 102,701,532 | | | $ | 147,733,033 | | |
Affiliated issuers | | | 537,059,586 | | | | 30,077,120 | | | | — | | | | — | | | | — | | |
Total investments | | | 6,585,112,486 | | | | 2,010,603,598 | | | | 635,709,816 | | | | 102,701,532 | | | | 147,733,033 | | |
Cash | | | 187,728,679 | | | | 24,110,291 | | | | 9,472,911 | | | | 3,824,014 | | | | 664,690 | | |
Foreign currency at value (B) | | | 4,749,570 | | | | 1,104,976 | | | | — | | | | 3 | | | | — | | |
Dividends, interest and other receivables—Unaffiliated issuers | | | 2,483,214 | | | | — | | | | 821,738 | | | | 80,747 | | | | 1,261,261 | | |
Dividends receivable—Affiliated issuers | | | 2,481,674 | | | | — | | | | — | | | | — | | | | — | | |
Receivable for securities sold | | | — | | | | — | | | | — | | | | — | | | | 1,071,803 | | |
Receivable for capital shares sold | | | 27,097,872 | | | | 5,778,737 | | | | 923,661 | | | | 1,482,215 | | | | 95,968 | | |
Prepaid expenses | | | 34,204 | | | | 38,287 | | | | 31,091 | | | | 13,396 | | | | 15,608 | | |
TOTAL ASSETS | | | 6,809,687,699 | | | | 2,041,635,889 | | | | 646,959,217 | | | | 108,101,907 | | | | 150,842,363 | | |
LIABILITIES: | |
Payable for securities purchased | | | 19,701,709 | | | | — | | | | — | | | | 3,010,490 | | | | 371,624 | | |
Payable for capital shares redeemed | | | 16,013,364 | | | | 6,718,252 | | | | 2,196,633 | | | | 247,496 | | | | 427,959 | | |
Deferred foreign capital gains tax liability (Note 2-D) | | | 3,076,436 | | | | — | | | | — | | | | — | | | | — | | |
Due to Advisor (Note 5) | | | 3,609,889 | | | | 1,086,807 | | | | 359,538 | | | | 55,651 | | | | 81,852 | | |
Administration and accounting fees payable | | | 84,810 | | | | 25,810 | | | | 8,534 | | | | 1,336 | | | | 1,943 | | |
Administration and shareholder servicing fees payable | | | 1,058,595 | | | | 345,029 | | | | 118,946 | | | | 17,676 | | | | 25,402 | | |
Accounting out-of-pocket fees payable | | | 5,666 | | | | 4,762 | | | | 3,704 | | | | 4,544 | | | | 4,354 | | |
Professional fees payable | | | 44,226 | | | | 40,672 | | | | 47,274 | | | | 38,146 | | | | 37,976 | | |
Accrued other expenses payable | | | 1,498,984 | | | | 580,775 | | | | 258,695 | | | | 30,640 | | | | 47,387 | | |
TOTAL LIABILITIES | | | 45,093,679 | | | | 8,802,107 | | | | 2,993,324 | | | | 3,405,979 | | | | 998,497 | | |
NET ASSETS | | $ | 6,764,594,020 | | | $ | 2,032,833,782 | | | $ | 643,965,893 | | | $ | 104,695,928 | | | $ | 149,843,866 | | |
NET ASSETS: | |
Investor Class | | $ | 2,994,025,968 | | | $ | 1,642,089,807 | | | $ | 607,799,525 | | | $ | 82,462,998 | | | $ | 141,246,712 | | |
Institutional Class | | | 3,770,568,052 | | | | 390,743,975 | | | | 36,166,368 | | | | 22,232,930 | | | | 8,597,154 | | |
TOTAL | | $ | 6,764,594,020 | | | $ | 2,032,833,782 | | | $ | 643,965,893 | | | $ | 104,695,928 | | | $ | 149,843,866 | | |
SHARES OUTSTANDING: | |
(shares of beneficial interest issued and outstanding, respectively,
unlimited number of shares authorized with a $0.001 par value) | |
Investor Class | | | 122,608,794 | | | | 69,967,625 | | | | 34,708,294 | | | | 6,722,660 | | | | 25,031,832 | | |
Institutional Class | | | 154,488,913 | | | | 16,665,638 | | | | 2,063,069 | | | | 1,813,225 | | | | 1,516,674 | | |
TOTAL | | | 277,097,707 | | | | 86,633,263 | | | | 36,771,363 | | | | 8,535,885 | | | | 26,548,506 | | |
NET ASSET VALUE: | |
Investor Class, offering price and redemption price | | $ | 24.42 | | | $ | 23.47 | | | $ | 17.51 | | | $ | 12.27 | | | $ | 5.64 | | |
Institutional Class, offering price and redemption price | | $ | 24.41 | | | $ | 23.45 | | | $ | 17.53 | | | $ | 12.26 | | | $ | 5.67 | | |
NET ASSETS CONSIST OF: | |
Capital paid-in | | $ | 4,842,288,535 | | | $ | 1,665,637,822 | | | $ | 580,604,165 | | | $ | 170,547,260 | | | $ | 81,886,680 | | |
Undistributed (distributions in excess of) net investment income (loss) | | | 2,373,281 | | | | (3,835 | ) | | | 3,587,957 | | | | 1,481,000 | | | | (161,740 | ) | |
Undistributed/accumulated net realized gain (loss) on investments, financial futures
contracts, foreign currency related transactions and foreign capital gains taxes | | | 1,539,177 | | | | 13,780,939 | | | | (3,633,633 | ) | | | (73,858,761 | ) | | | 5,245,946 | | |
Net unrealized appreciation (depreciation) on investments, foreign currency
translations and deferred foreign capital gains taxes | | | 1,918,393,027 | | | | 353,418,856 | | | | 63,407,404 | | | | 6,526,429 | | | | 62,872,980 | | |
NET ASSETS | | $ | 6,764,594,020 | | | $ | 2,032,833,782 | | | $ | 643,965,893 | | | $ | 104,695,928 | | | $ | 149,843,866 | | |
(A) Investments at cost: | |
Unaffiliated issuers | | $ | 4,112,992,141 | | | $ | 1,630,259,647 | | | $ | 572,175,525 | | | $ | 96,169,947 | | | $ | 84,861,040 | | |
Affiliated issuers | | | 550,665,141 | | | | 26,925,094 | | | | — | | | | — | | | | — | | |
Total investments at cost | | $ | 4,663,657,282 | | | $ | 1,657,184,741 | | | $ | 572,175,525 | | | $ | 96,169,947 | | | $ | 84,861,040 | | |
(B) Foreign currency at cost | | $ | 4,742,281 | | | $ | 1,104,976 | | | $ | — | | | $ | 3 | | | $ | — | | |
matthewsasia.com | 800.789.ASIA 75
Statements of Assets and Liabilities (continued) December 31, 2012
| | | Matthews Asia
Small Companies
Fund | | Matthews China
Small Companies
Fund | | Matthews Asia
Science and
Technology Fund | |
ASSETS: | |
Investments at value (A) (Note 2-A and 7): | |
Unaffiliated issuers | | $ | 354,359,086 | | | $ | 9,786,031 | | | $ | 130,263,662 | | |
Cash | | | 12,645,339 | | | | 367,582 | | | | 1,035,575 | | |
Foreign currency at value (B) | | | 111,897 | | | | — | | | | 304,483 | | |
Dividends, interest and other receivables—Unaffiliated issuers | | | 365,879 | | | | 580 | | | | 170,789 | | |
Receivable for securities sold | | | 692,317 | | | | — | | | | 999,159 | | |
Receivable for capital shares sold | | | 2,962,710 | | | | 139,884 | | | | 84,898 | | |
Due from Advisor (Note 5) | | | — | | | | 3,025 | | | | — | | |
Prepaid expenses | | | 28,493 | | | | 7,162 | | | | 12,806 | | |
TOTAL ASSETS | | | 371,165,721 | | | | 10,304,264 | | | | 132,871,372 | | |
LIABILITIES: | |
Payable for securities purchased | | | 2,924,193 | | | | — | | | | 283,336 | | |
Payable for capital shares redeemed | | | 985,577 | | | | — | | | | 771,378 | | |
Due to Advisor (Note 5) | | | 284,508 | | | | — | | | | 72,948 | | |
Administration and accounting fees payable | | | 4,388 | | | | 116 | | | | 1,746 | | |
Administration and shareholder servicing fees payable | | | 61,995 | | | | 1,387 | | | | 23,105 | | |
Accounting out-of-pocket fees payable | | | 5,345 | | | | 2,424 | | | | 4,032 | | |
Professional fees payable | | | 42,235 | | | | 29,201 | | | | 37,848 | | |
Accrued other expenses payable | | | 104,933 | | | | 4,702 | | | | 48,293 | | |
TOTAL LIABILITIES | | | 4,413,174 | | | | 37,830 | | | | 1,242,686 | | |
NET ASSETS | | $ | 366,752,547 | | | $ | 10,266,434 | | | $ | 131,628,686 | | |
NET ASSETS: | |
Investor Class | | $ | 366,752,547 | | | $ | 10,266,434 | | | $ | 131,628,686 | | |
SHARES OUTSTANDING: | |
(shares of beneficial interest issued and outstanding, respectively,
unlimited number of shares authorized with a $0.001 par value) | |
Investor Class | | | 20,230,593 | | | | 1,323,665 | | | | 14,170,667 | | |
NET ASSET VALUE: | |
Investor Class, offering price and redemption price | | $ | 18.13 | | | $ | 7.76 | | | $ | 9.29 | | |
NET ASSETS CONSIST OF: | |
Capital paid-in | | $ | 344,230,457 | | | $ | 11,022,961 | | | $ | 122,039,846 | | |
Undistributed (distributions in excess of) net investment income (loss) | | | 1,522,985 | | | | 15,809 | | | | 131,430 | | |
Undistributed/accumulated net realized gain (loss) on investments,
foreign currency related transactions and foreign capital gains taxes | | | (17,215,467 | ) | | | (1,207,131 | ) | | | (12,347,993 | ) | |
Net unrealized appreciation (depreciation) on investments and foreign
currency translations | | | 38,214,572 | | | | 434,795 | | | | 21,805,403 | | |
NET ASSETS | | $ | 366,752,547 | | | $ | 10,266,434 | | | $ | 131,628,686 | | |
(A) Investments at cost: Unaffiliated issuers | | $ | 316,133,779 | | | $ | 9,351,236 | | | $ | 108,457,032 | | |
(B) Foreign currency at cost | | $ | 111,897 | | | $ | — | | | $ | 304,456 | | |
See accompanying notes to financial statements.
76 MATTHEWS ASIA FUNDS
Statements of Operations Year Ended December 31, 2012
| | | Matthews Asia
Strategic
Income Fund | | Matthews Asian
Growth and
Income Fund | | Matthews Asia
Dividend Fund | |
INVESTMENT INCOME: | |
Dividends—Unaffiliated Issuers | | $ | 77,272 | | | $ | 108,678,618 | | | $ | 94,797,552 | | |
Dividends—Affiliated Issuers (Note 7) | | | — | | | | 2,857,979 | | | | 20,785,883 | | |
Interest | | | 1,062,955 | | | | 17,991,648 | | | | 5,559 | | |
Foreign withholding tax | | | (28,740 | ) | | | (6,391,321 | ) | | | (7,217,768 | ) | |
TOTAL INVESTMENT INCOME | | | 1,111,487 | | | | 123,136,924 | | | | 108,371,226 | | |
EXPENSES: | |
Investment advisory fees (Note 5) | | | 152,448 | | | | 22,674,023 | | | | 19,471,948 | | |
Administration and accounting fees (Note 5) | | | 1,878 | | | | 271,181 | | | | 232,928 | | |
Administration and shareholder servicing fees (Note 5) | | | 45,975 | | | | 7,225,528 | | | | 6,021,017 | | |
Accounting out-of-pocket fees | | | 8,635 | | | | 40,361 | | | | 39,079 | | |
Custodian fees | | | 12,212 | | | | 1,007,467 | | | | 667,003 | | |
Insurance fees | | | 151 | | | | 36,526 | | | | 27,936 | | |
Printing fees | | | 7,661 | | | | 579,364 | | | | 584,133 | | |
Professional fees | | | 33,347 | | | | 89,525 | | | | 81,352 | | |
Registration fees | | | 18,797 | | | | 104,824 | | | | 170,877 | | |
Transfer agent fees | | | 22,145 | | | | 4,192,170 | | | | 3,386,023 | | |
Trustees fees | | | 979 | | | | 155,619 | | | | 130,301 | | |
Offering costs (Note 2-E) | | | 115,581 | | | | — | | | | — | | |
Other expenses | | | 6,744 | | | | 97,208 | | | | 96,967 | | |
TOTAL EXPENSES | | | 426,553 | | | | 36,473,796 | | | | 30,909,564 | | |
Advisory fees waived and expenses waived or reimbursed (Note 5) | | | (161,965 | ) | | | — | | | | — | | |
NET EXPENSES | | | 264,588 | | | | 36,473,796 | | | | 30,909,564 | | |
NET INVESTMENT INCOME (LOSS) | | | 846,899 | | | | 86,663,128 | | | | 77,461,662 | | |
REALIZED AND UNREALIZED GAIN (LOSS) ON INVESTMENTS,
FINANCIAL FUTURES CONTRACTS, FOREIGN CURRENCY
RELATED TRANSACTIONS AND DEFERRED CAPITAL GAINS TAXES: | |
Net realized gain (loss) on investments—Unaffiliated Issuers | | | 197,800 | | | | 30,289,634 | | | | (91,776,410 | ) | |
Net realized gain (loss) on financial futures contracts | | | (142,259 | ) | | | — | | | | — | | |
Net realized foreign capital gains tax | | | — | | | | (503,691 | ) | | | — | | |
Net realized gain (loss) on foreign currency related transactions | | | (14,911 | ) | | | (6,575,605 | ) | | | (123,601 | ) | |
Net change in unrealized appreciation/depreciation on investments | | | 2,038,715 | | | | 694,814,146 | | | | 581,457,647 | | |
Net change in deferred foreign capital gains taxes on unrealized appreciation | | | (5,392 | ) | | | (1,468,703 | ) | | | (1,487,960 | ) | |
Net change in unrealized appreciation/depreciation on foreign
currency related translations | | | 18,773 | | | | 18,263 | | | | (54,265 | ) | |
Net realized and unrealized gain (loss) on investments, financial futures
contracts, foreign currency related transactions and deferred capital gains taxes | | | 2,092,726 | | | | 716,574,044 | | | | 488,015,411 | | |
NET INCREASE (DECREASE) IN NET ASSETS FROM OPERATIONS | | $ | 2,939,625 | | | $ | 803,237,172 | | | $ | 565,477,073 | | |
See accompanying notes to financial statements.
matthewsasia.com | 800.789.ASIA 77
Statements of Operations (continued) Year Ended December 31, 2012
| | | Matthews China
Dividend Fund | | Matthews Asia
Growth Fund | | Matthews Pacific
Tiger Fund | | Matthews
China Fund | | Matthews
India Fund | |
INVESTMENT INCOME: | |
Dividends—Unaffiliated Issuers | | $ | 1,290,034 | | | $ | 8,319,806 | | | $ | 113,244,650 | | | $ | 53,949,734 | | | $ | 11,033,475 | | |
Dividends—Affiliated Issuers (Note 7) | | | — | | | | — | | | | 8,188,412 | | | | 914,962 | | | | — | | |
Interest | | | 2 | | | | 10,344 | | | | 62 | | | | 10 | | | | 791,254 | | |
Foreign withholding tax | | | (77,338 | ) | | | (530,329 | ) | | | (10,037,914 | ) | | | (2,301,678 | ) | | | — | | |
TOTAL INVESTMENT INCOME | | | 1,212,698 | | | | 7,799,821 | | | | 111,395,210 | | | | 52,563,028 | | | | 11,824,729 | | |
EXPENSES: | |
Investment advisory fees (Note 5) | | | 217,096 | | | | 2,539,982 | | | | 38,919,428 | | | | 14,332,399 | | | | 4,324,138 | | |
Administration and accounting fees (Note 5) | | | 2,598 | | | | 30,370 | | | | 465,449 | | | | 171,241 | | | | 51,668 | | |
Administration and shareholder servicing fees (Note 5) | | | 70,295 | | | | 778,084 | | | | 11,415,041 | | | | 4,543,824 | | | | 1,413,336 | | |
Accounting out-of-pocket fees | | | 23,515 | | | | 36,595 | | | | 44,522 | | | | 36,871 | | | | 30,777 | | |
Custodian fees | | | 28,691 | | | | 184,822 | | | | 2,355,926 | | | | 562,738 | | | | 379,932 | | |
Insurance fees | | | 329 | | | | 4,238 | | | | 59,487 | | | | 25,204 | | | | 7,843 | | |
Printing fees | | | 11,266 | | | | 75,627 | | | | 634,121 | | | | 486,505 | | | | 190,442 | | |
Professional fees | | | 38,300 | | | | 44,469 | | | | 117,950 | | | | 60,423 | | | | 74,519 | | |
Registration fees | | | 33,304 | | | | 42,739 | | | | 106,141 | | | | 63,429 | | | | 43,151 | | |
Transfer agent fees | | | 49,210 | | | | 428,094 | | | | 5,507,726 | | | | 2,704,803 | | | | 968,164 | | |
Trustees fees | | | 1,381 | | | | 17,735 | | | | 268,479 | | | | 105,962 | | | | 30,878 | | |
Offering costs (Note 2-E) | | | — | | | | — | | | | — | | | | — | | | | — | | |
Other expenses | | | 1,914 | | | | 11,528 | | | | 140,321 | | | | 68,032 | | | | 22,651 | | |
TOTAL EXPENSES | | | 477,899 | | | | 4,194,283 | | | | 60,034,591 | | | | 23,161,431 | | | | 7,537,499 | | |
Advisory fees waived or recaptured and expenses waived or reimbursed (Note 5) | | | 8,970 | | | | — | | | | — | | | | — | | | | — | | |
NET EXPENSES | | | 486,869 | | | | 4,194,283 | | | | 60,034,591 | | | | 23,161,431 | | | | 7,537,499 | | |
NET INVESTMENT INCOME (LOSS) | | | 725,829 | | | | 3,605,538 | | | | 51,360,619 | | | | 29,401,597 | | | | 4,287,230 | | |
REALIZED AND UNREALIZED GAIN (LOSS) ON INVESTMENTS,
FOREIGN CURRENCY RELATED TRANSACTIONS AND DEFERRED
CAPITAL GAINS TAXES: | |
Net realized gain (loss) on investments—Unaffiliated Issuers | | | (1,127,741 | ) | | | 18,201,128 | | | | 2,802,901 | | | | 69,807,410 | | | | 3,458,447 | | |
Net realized foreign capital gains tax refund | | | — | | | | — | | | | — | | | | — | | | | — | | |
Net realized gain (loss) on foreign currency related transactions | | | 1,880 | | | | (66,661 | ) | | | (750,716 | ) | | | 91,288 | | | | (299,837 | ) | |
Net change in unrealized appreciation/depreciation on investments | | | 8,841,143 | | | | 38,334,580 | | | | 1,049,131,706 | | | | 119,734,512 | | | | 162,979,411 | | |
Net change in deferred foreign capital gains taxes on unrealized appreciation | | | — | | | | (356,319 | ) | | | (3,076,436 | ) | | | — | | | | — | | |
Net change in unrealized appreciation/depreciation on foreign
currency related translations | | | (125 | ) | | | 9,640 | | | | (7,156 | ) | | | (4,306 | ) | | | (24,103 | ) | |
Net realized and unrealized gain (loss) on investments, foreign currency
related transactions and deferred capital gains taxes | | | 7,715,157 | | | | 56,122,368 | | | | 1,048,100,299 | | | | 189,628,904 | | | | 166,113,918 | | |
NET INCREASE (DECREASE) IN NET ASSETS FROM OPERATIONS | | $ | 8,440,986 | | | $ | 59,727,906 | | | $ | 1,099,460,918 | | | $ | 219,030,501 | | | $ | 170,401,148 | | |
See accompanying notes to financial statements.
78 MATTHEWS ASIA FUNDS
| | | Matthews
Japan Fund | | Matthews
Korea Fund | | Matthews Asia
Small Companies
Fund | | Matthews China
Small Companies
Fund | | Matthews Asia
Science and
Technology Fund | |
INVESTMENT INCOME: | |
Dividends—Unaffiliated Issuers | | $ | 2,471,721 | | | $ | 2,220,879 | | | $ | 8,782,257 | | | $ | 149,834 | | | $ | 2,376,584 | | |
Dividends—Affiliated Issuers (Note 7) | | | — | | | | — | | | | — | | | | — | | | | — | | |
Interest | | | 19 | | | | 115 | | | | 8,243 | | | | 1 | | | | 10 | | |
Foreign withholding tax | | | (171,062 | ) | | | (364,291 | ) | | | (682,680 | ) | | | (3,677 | ) | | | (273,525 | ) | |
TOTAL INVESTMENT INCOME | | | 2,300,678 | | | | 1,856,703 | | | | 8,107,820 | | | | 146,158 | | | | 2,103,069 | | |
EXPENSES: | |
Investment advisory fees (Note 5) | | | 766,223 | | | | 1,095,880 | | | | 3,164,318 | | | | 60,925 | | | | 950,584 | | |
Administration and accounting fees (Note 5) | | | 9,158 | | | | 13,091 | | | | 25,310 | | | | 487 | | | | 11,360 | | |
Administration and shareholder servicing fees (Note 5) | | | 236,990 | | | | 334,160 | | | | 699,597 | | | | 14,142 | | | | 297,124 | | |
Accounting out-of-pocket fees | | | 36,955 | | | | 37,168 | | | | 50,265 | | | | 26,560 | | | | 34,191 | | |
Custodian fees | | | 24,369 | | | | 59,178 | | | | 175,449 | | | | 16,183 | | | | 87,235 | | |
Insurance fees | | | 1,652 | | | | 1,927 | | | | 3,414 | | | | 56 | | | | 1,945 | | |
Printing fees | | | 24,475 | | | | 34,565 | | | | 65,468 | | | | 3,328 | | | | 37,405 | | |
Professional fees | | | 39,943 | | | | 38,482 | | | | 53,007 | | | | 29,403 | | | | 46,385 | | |
Registration fees | | | 38,426 | | | | 34,371 | | | | 29,386 | | | | 16,267 | | | | 20,928 | | |
Transfer agent fees | | | 138,140 | | | | 193,227 | | | | 464,862 | | | | 12,443 | | | | 180,818 | | |
Trustees fees | | | 5,771 | | | | 8,035 | | | | 14,838 | | | | 256 | | | | 7,040 | | |
Offering costs (Note 2-E) | | | — | | | | — | | | | — | | | | 16,363 | | | | — | | |
Other expenses | | | 7,927 | | | | 10,946 | | | | 9,477 | | | | 1,935 | | | | 6,150 | | |
TOTAL EXPENSES | | | 1,330,029 | | | | 1,861,030 | | | | 4,755,391 | | | | 198,348 | | | | 1,681,165 | | |
Advisory fees waived or recaptured and expenses waived or reimbursed (Note 5) | | | — | | | | — | | | | — | | | | (76,425 | ) | | | — | | |
NET EXPENSES | | | 1,330,029 | | | | 1,861,030 | | | | 4,755,391 | | | | 121,923 | | | | 1,681,165 | | |
NET INVESTMENT INCOME (LOSS) | | | 970,649 | | | | (4,327 | ) | | | 3,352,429 | | | | 24,235 | | | | 421,904 | | |
REALIZED AND UNREALIZED GAIN (LOSS) ON INVESTMENTS,
FOREIGN CURRENCY RELATED TRANSACTIONS AND DEFERRED
CAPITAL GAINS TAXES: | |
Net realized gain (loss) on investments—Unaffiliated Issuers | | | 6,320,877 | | | | 5,826,230 | | | | (17,180,184 | ) | | | (1,090,641 | ) | | | (1,121,748 | ) | |
Net realized foreign capital gains tax refund | | | — | | | | — | | | | 51,681 | | | | — | | | | — | | |
Net realized gain (loss) on foreign currency related transactions | | | (1,007 | ) | | | (195,724 | ) | | | (69,757 | ) | | | 28 | | | | (58,741 | ) | |
Net change in unrealized appreciation/depreciation on investments | | | 1,686,849 | | | | 23,187,388 | | | | 76,140,591 | | | | 1,689,475 | | | | 19,608,522 | | |
Net change in deferred foreign capital gains taxes on unrealized appreciation | | | — | | | | — | | | | — | | | | — | | | | — | | |
Net change in unrealized appreciation/depreciation on foreign
currency related translations | | | (6,787 | ) | | | (2,853 | ) | | | (11,328 | ) | | | (1 | ) | | | (2,020 | ) | |
Net realized and unrealized gain (loss) on investments, foreign currency
related transactions and deferred capital gains taxes | | | 7,999,932 | | | | 28,815,041 | | | | 58,931,003 | | | | 598,861 | | | | 18,426,013 | | |
NET INCREASE (DECREASE) IN NET ASSETS FROM OPERATIONS | | $ | 8,970,581 | | | $ | 28,810,714 | | | $ | 62,283,432 | | | $ | 623,096 | | | $ | 18,847,917 | | |
matthewsasia.com | 800.789.ASIA 79
Statements of Changes in Net Assets
MATTHEWS ASIA STRATEGIC INCOME FUND | | Year Ended
December 31, 2012 | | Period Ended
December 31, 20111 | |
OPERATIONS: | |
Net investment income (loss) | | $ | 846,899 | | | $ | 20,982 | | |
Net realized gain (loss) on investments, financial futures contracts and foreign currency
related transactions | | | 40,630 | | | | 380 | | |
Net change in unrealized appreciation/depreciation on investments and foreign currency
related translations | | | 2,057,488 | | | | (82,280 | ) | |
Net change on deferred foreign capital gains taxes on unrealized appreciation | | | (5,392 | ) | | | (1,249 | ) | |
Net increase (decrease) in net assets resulting from operations | | | 2,939,625 | | | | (62,167 | ) | |
DISTRIBUTIONS TO SHAREHOLDERS FROM: | |
Net investment income: | |
Investor Class | | | (826,795 | ) | | | (13,720 | ) | |
Institutional Class | | | (244,478 | ) | | | (9,676 | ) | |
Net decrease in net assets resulting from distributions | | | (1,071,273 | ) | | | (23,396 | ) | |
CAPITAL SHARE TRANSACTIONS (net) (Note 4) | | | 20,792,275 | | | | 13,096,972 | | |
REDEMPTION FEES | | | 11,821 | | | | — | | |
Total increase (decrease) in net assets | | | 22,672,448 | | | | 13,011,409 | | |
NET ASSETS: | |
Beginning of period | | | 13,011,409 | | | | — | | |
End of period (including undistributed/(distributions in excess of) net investment
income of ($110,372) and $1,933, respectively) | | $ | 35,683,857 | | | $ | 13,011,409 | | |
1 Matthews Asia Strategic Income Fund commenced operations on November 30, 2011.
MATTHEWS ASIAN GROWTH AND INCOME FUND | | Year Ended
December 31, 2012 | | Year Ended
December 31, 2011 | |
OPERATIONS: | |
Net investment income (loss) | | $ | 86,663,128 | | | $ | 99,815,175 | | |
Net realized gain (loss) on investments and foreign currency related transactions | | | 23,210,338 | | | | 75,127,361 | | |
Net change in unrealized appreciation/depreciation on investments and foreign currency
related translations | | | 694,832,409 | | | | (569,899,433 | ) | |
Net change on deferred foreign capital gains taxes on unrealized appreciation | | | (1,468,703 | ) | | | 2,051,108 | | |
Net increase (decrease) in net assets resulting from operations | | | 803,237,172 | | | | (392,905,789 | ) | |
DISTRIBUTIONS TO SHAREHOLDERS FROM: | |
Net investment income: | |
Investor Class | | | (76,159,190 | ) | | | (76,967,577 | ) | |
Institutional Class | | | (21,993,302 | ) | | | (19,206,528 | ) | |
Realized gains on investments: | |
Investor Class | | | — | | | | (93,455,486 | ) | |
Institutional Class | | | — | | | | (22,304,133 | ) | |
Net decrease in net assets resulting from distributions | | | (98,152,492 | ) | | | (211,933,724 | ) | |
CAPITAL SHARE TRANSACTIONS (net) (Note 4) | | | 494,377,253 | | | | (578,220,072 | ) | |
REDEMPTION FEES | | | 299,883 | | | | 487,841 | | |
Total increase (decrease) in net assets | | | 1,199,761,816 | | | | (1,182,571,744 | ) | |
NET ASSETS: | |
Beginning of year | | | 2,872,098,835 | | | | 4,054,670,579 | | |
End of year (including distributions in excess of net investment
income of ($32,863,458) and ($14,294,799), respectively) | | $ | 4,071,860,651 | | | $ | 2,872,098,835 | | |
See accompanying notes to financial statements.
80 MATTHEWS ASIA FUNDS
MATTHEWS ASIA DIVIDEND FUND | | Year Ended
December 31, 2012 | | Year Ended
December 31, 2011 | |
OPERATIONS: | |
Net investment income (loss) | | $ | 77,461,662 | | | $ | 62,460,078 | | |
Net realized gain (loss) on investments and foreign currency related transactions | | | (91,900,011 | ) | | | (46,007,986 | ) | |
Net change in unrealized appreciation/depreciation on investments and foreign currency
related translations | | | 581,403,382 | | | | (287,624,247 | ) | |
Net change on deferred foreign capital gains taxes on unrealized appreciation | | | (1,487,960 | ) | | | — | | |
Net increase (decrease) in net assets resulting from operations | | | 565,477,073 | | | | (271,172,155 | ) | |
DISTRIBUTIONS TO SHAREHOLDERS FROM: | |
Net investment income: | |
Investor Class | | | (97,249,044 | ) | | | (55,295,897 | ) | |
Institutional Class | | | (29,462,711 | ) | | | (9,863,378 | ) | |
Realized gains on investments: | |
Investor Class | | | — | | | | (9,863,184 | ) | |
Institutional Class | | | — | | | | (1,815,393 | ) | |
Net decrease in net assets resulting from distributions | | | (126,711,755 | ) | | | (76,837,852 | ) | |
CAPITAL SHARE TRANSACTIONS (net) (Note 4) | | | 988,608,171 | | | | 640,377,706 | | |
REDEMPTION FEES | | | 365,281 | | | | 821,527 | | |
Total increase (decrease) in net assets | | | 1,427,738,770 | | | | 293,189,226 | | |
NET ASSETS: | |
Beginning of year | | | 2,274,865,533 | | | | 1,981,676,307 | | |
End of year (including distributions in excess of net investment
income of ($62,410,638) and ($15,008,586), respectively) | | $ | 3,702,604,303 | | | $ | 2,274,865,533 | | |
MATTHEWS CHINA DIVIDEND FUND | | Year Ended
December 31, 2012 | | Year Ended
December 31, 2011 | |
OPERATIONS: | |
Net investment income (loss) | | $ | 725,829 | | | $ | 987,303 | | |
Net realized gain (loss) on investments and foreign currency related transactions | | | (1,125,861 | ) | | | (475,091 | ) | |
Net change in unrealized appreciation/depreciation on investments and foreign currency
related translations | | | 8,841,018 | | | | (7,111,732 | ) | |
Net increase (decrease) in net assets resulting from operations | | | 8,440,986 | | | | (6,599,520 | ) | |
DISTRIBUTIONS TO SHAREHOLDERS FROM: | |
Net investment income: | |
Investor Class | | | (1,503,223 | ) | | | (1,063,869 | ) | |
Institutional Class | | | (4,528 | ) | | | (425 | ) | |
Realized gains on investments: | |
Investor Class | | | — | | | | (51,420 | ) | |
Institutional Class | | | — | | | | (22 | ) | |
Net decrease in net assets resulting from distributions | | | (1,507,751 | ) | | | (1,115,736 | ) | |
CAPITAL SHARE TRANSACTIONS (net) (Note 4) | | | 26,295,804 | | | | (11,203,204 | ) | |
REDEMPTION FEES | | | 29,199 | | | | 28,586 | | |
Total increase (decrease) in net assets | | | 33,258,238 | | | | (18,889,874 | ) | |
NET ASSETS: | |
Beginning of year | | | 26,478,115 | | | | 45,367,989 | | |
End of year (including distributions in excess of net investment
income of ($801,799) and ($85,351), respectively) | | $ | 59,736,353 | | | $ | 26,478,115 | | |
See accompanying notes to financial statements.
matthewsasia.com | 800.789.ASIA 81
Statements of Changes in Net Assets (continued)
MATTHEWS ASIA GROWTH FUND | | Year Ended
December 31, 2012 | | Year Ended
December 31, 2011 | |
OPERATIONS: | |
Net investment income (loss) | | $ | 3,605,538 | | | $ | 2,302,379 | | |
Net realized gain (loss) on investments and foreign currency related transactions | | | 18,134,467 | | | | 3,999,688 | | |
Net change in unrealized appreciation/depreciation on investments and foreign currency
related translations | | | 38,344,220 | | | | (55,786,729 | ) | |
Net change on deferred foreign capital gains taxes on unrealized appreciation | | | (356,319 | ) | | | — | | |
Net increase (decrease) in net assets resulting from operations | | | 59,727,906 | | | | (49,484,662 | ) | |
DISTRIBUTIONS TO SHAREHOLDERS FROM: | |
Net investment income: | |
Investor Class | | | — | | | | (5,881,357 | ) | |
Institutional Class | | | — | | | | (1,854,156 | ) | |
Net decrease in net assets resulting from distributions | | | — | | | | (7,735,513 | ) | |
CAPITAL SHARE TRANSACTIONS (net) (Note 4) | | | 20,786,713 | | | | 56,083,400 | | |
REDEMPTION FEES | | | 43,244 | | | | 322,245 | | |
Total increase (decrease) in net assets | | | 80,557,863 | | | | (814,530 | ) | |
NET ASSETS: | |
Beginning of year | | | 343,468,152 | | | | 344,282,682 | | |
End of year (including undistributed/(distributions in excess of) net investment
income of $2,902,963 and ($3,166,202), respectively) | | $ | 424,026,015 | | | $ | 343,468,152 | | |
MATTHEWS PACIFIC TIGER FUND | | Year Ended
December 31, 2012 | | Year Ended
December 31, 2011 | |
OPERATIONS: | |
Net investment income (loss) | | $ | 51,360,619 | | | $ | 32,155,967 | | |
Net realized gain (loss) on investments and foreign currency related transactions | | | 2,052,185 | | | | 201,652,647 | | |
Net change in unrealized appreciation/depreciation on investments and foreign currency
related translations | | | 1,049,124,550 | | | | (873,676,041 | ) | |
Net change on deferred foreign capital gains taxes on unrealized appreciation | | | (3,076,436 | ) | | | 3,089,305 | | |
Net increase (decrease) in net assets resulting from operations | | | 1,099,460,918 | | | | (636,778,122 | ) | |
DISTRIBUTIONS TO SHAREHOLDERS FROM: | |
Net investment income: | |
Investor Class | | | (19,031,664 | ) | | | (15,129,147 | ) | |
Institutional Class | | | (29,138,401 | ) | | | (14,549,336 | ) | |
Realized gains on investments: | |
Investor Class | | | (2,495,226 | ) | | | (44,800,205 | ) | |
Institutional Class | | | (2,957,326 | ) | | | (31,562,381 | ) | |
Net decrease in net assets resulting from distributions | | | (53,622,617 | ) | | | (106,041,069 | ) | |
CAPITAL SHARE TRANSACTIONS (net) (Note 4) | | | 908,423,520 | | | | (185,753,267 | ) | |
REDEMPTION FEES | | | 600,987 | | | | 1,091,482 | | |
Total increase (decrease) in net assets | | | 1,954,862,808 | | | | (927,480,976 | ) | |
NET ASSETS: | |
Beginning of year | | | 4,809,731,212 | | | | 5,737,212,188 | | |
End of year (including undistributed/(distributions in excess of) net investment
income of $2,373,281 and ($66,557), respectively) | | $ | 6,764,594,020 | | | $ | 4,809,731,212 | | |
See accompanying notes to financial statements.
82 MATTHEWS ASIA FUNDS
MATTHEWS CHINA FUND | | Year Ended
December 31, 2012 | | Year Ended
December 31, 2011 | |
OPERATIONS: | |
Net investment income (loss) | | $ | 29,401,597 | | | $ | 24,114,210 | | |
Net realized gain (loss) on investments and foreign currency related transactions | | | 69,898,698 | | | | 145,213,641 | | |
Net change in unrealized appreciation/depreciation on investments and foreign currency
related translations | | | 119,730,206 | | | | (687,849,829 | ) | |
Net increase (decrease) in net assets resulting from operations | | | 219,030,501 | | | | (518,521,978 | ) | |
DISTRIBUTIONS TO SHAREHOLDERS FROM: | |
Net investment income: | |
Investor Class | | | (23,450,603 | ) | | | (22,545,562 | ) | |
Institutional Class | | | (6,100,821 | ) | | | (1,635,702 | ) | |
Realized gains on investments: | |
Investor Class | | | (16,894,676 | ) | | | (165,934,653 | ) | |
Institutional Class | | | (3,819,767 | ) | | | (9,954,863 | ) | |
Net decrease in net assets resulting from distributions | | | (50,265,867 | ) | | | (200,070,780 | ) | |
CAPITAL SHARE TRANSACTIONS (net) (Note 4) | | | (260,760,729 | ) | | | (138,886,741 | ) | |
REDEMPTION FEES | | | 220,100 | | | | 906,432 | | |
Total increase (decrease) in net assets | | | (91,775,995 | ) | | | (856,573,067 | ) | |
NET ASSETS: | |
Beginning of year | | | 2,124,609,777 | | | | 2,981,182,844 | | |
End of year (including distributions in excess of net investment
income of ($3,835) and $0, respectively) | | $ | 2,032,833,782 | | | $ | 2,124,609,777 | | |
MATTHEWS INDIA FUND | | Year Ended
December 31, 2012 | | Year Ended
December 31, 2011 | |
OPERATIONS: | |
Net investment income (loss) | | $ | 4,287,230 | | | $ | 5,816,036 | | |
Net realized gain (loss) on investments and foreign currency related transactions | | | 3,158,610 | | | | 102,093,230 | | |
Net change in unrealized appreciation/depreciation on investments and foreign currency
related translations | | | 162,955,308 | | | | (520,083,666 | ) | |
Net change on deferred foreign capital gains taxes on unrealized appreciation | | | — | | | | 4,120,779 | | |
Net increase (decrease) in net assets resulting from operations | | | 170,401,148 | | | | (408,053,621 | ) | |
DISTRIBUTIONS TO SHAREHOLDERS FROM: | |
Net investment income: | |
Investor Class | | | (3,145,386 | ) | | | (2,862,404 | ) | |
Institutional Class | | | (252,093 | ) | | | (132,371 | ) | |
Realized gains on investments: | |
Investor Class | | | (9,352,977 | ) | | | — | | |
Institutional Class | | | (547,723 | ) | | | — | | |
Net decrease in net assets resulting from distributions | | | (13,298,179 | ) | | | (2,994,775 | ) | |
CAPITAL SHARE TRANSACTIONS (net) (Note 4) | | | (99,540,038 | ) | | | (440,540,693 | ) | |
REDEMPTION FEES | | | 146,264 | | | | 835,135 | | |
Total increase (decrease) in net assets | | | 57,709,195 | | | | (850,753,954 | ) | |
NET ASSETS: | |
Beginning of year | | | 586,256,698 | | | | 1,437,010,652 | | |
End of year (including undistributed net investment
income of $3,587,957 and $2,998,043, respectively) | | $ | 643,965,893 | | | $ | 586,256,698 | | |
See accompanying notes to financial statements.
matthewsasia.com | 800.789.ASIA 83
Statements of Changes in Net Assets (continued)
MATTHEWS JAPAN FUND | | Year Ended
December 31, 2012 | | Year Ended
December 31, 2011 | |
OPERATIONS: | |
Net investment income (loss) | | $ | 970,649 | | | $ | 655,220 | | |
Net realized gain (loss) on investments and foreign currency related transactions | | | 6,319,870 | | | | (4,003,806 | ) | |
Net change in unrealized appreciation/depreciation on investments and foreign currency
related translations | | | 1,680,062 | | | | (8,805,446 | ) | |
Net increase (decrease) in net assets resulting from operations | | | 8,970,581 | | | | (12,154,032 | ) | |
DISTRIBUTIONS TO SHAREHOLDERS FROM: | |
Net investment income: | |
Investor Class | | | (80,356 | ) | | | (2,022,578 | ) | |
Institutional Class | | | (70,916 | ) | | | (583,768 | ) | |
Net decrease in net assets resulting from distributions | | | (151,272 | ) | | | (2,606,346 | ) | |
CAPITAL SHARE TRANSACTIONS (net) (Note 4) | | | (35,836,826 | ) | | | 78,411,635 | | |
REDEMPTION FEES | | | 42,650 | | | | 209,844 | | |
Total increase (decrease) in net assets | | | (26,974,867 | ) | | | 63,861,101 | | |
NET ASSETS: | |
Beginning of year | | | 131,670,795 | | | | 67,809,694 | | |
End of year (including undistributed/(distributions in excess of) net investment
income of $1,481,000 and ($612,266), respectively) | | $ | 104,695,928 | | | $ | 131,670,795 | | |
MATTHEWS KOREA FUND | | Year Ended
December 31, 2012 | | Year Ended
December 31, 2011 | |
OPERATIONS: | |
Net investment income (loss) | | ($ | 4,327 | ) | | ($ | 210,803 | ) | |
Net realized gain (loss) on investments and foreign currency related transactions | | | 5,630,506 | | | | 1,335,161 | | |
Net change in unrealized appreciation/depreciation on investments and foreign currency
related translations | | | 23,184,535 | | | | (14,446,852 | ) | |
Net increase (decrease) in net assets resulting from operations | | | 28,810,714 | | | | (13,322,494 | ) | |
DISTRIBUTIONS TO SHAREHOLDERS FROM: | |
Net investment income: | |
Investor Class | | | — | | | | (218,988 | ) | |
Institutional Class | | | — | | | | (23,737 | ) | |
Realized gains on investments: | |
Investor Class | | | (1,320,452 | ) | | | (6,521,874 | ) | |
Institutional Class | | | (80,111 | ) | | | (706,903 | ) | |
Net decrease in net assets resulting from distributions | | | (1,400,563 | ) | | | (7,471,502 | ) | |
CAPITAL SHARE TRANSACTIONS (net) (Note 4) | | | (34,290,287 | ) | | | 10,383,940 | | |
REDEMPTION FEES | | | 24,373 | | | | 115,820 | | |
Total increase (decrease) in net assets | | | (6,855,763 | ) | | | (10,294,236 | ) | |
NET ASSETS: | |
Beginning of year | | | 156,699,629 | | | | 166,993,865 | | |
End of year (including distributions in excess of net investment
loss of ($161,740) and ($10,635), respectively) | | $ | 149,843,866 | | | $ | 156,699,629 | | |
See accompanying notes to financial statements.
84 MATTHEWS ASIA FUNDS
MATTHEWS ASIA SMALL COMPANIES FUND | | Year Ended
December 31, 2012 | | Year Ended
December 31, 2011 | |
OPERATIONS: | |
Net investment income (loss) | | $ | 3,352,429 | | | $ | 3,154,642 | | |
Net realized gain (loss) on investments and foreign currency related transactions | | | (17,198,260 | ) | | | 35,003,030 | | |
Net change in unrealized appreciation/depreciation on investments and foreign currency
related translations | | | 76,129,263 | | | | (132,814,165 | ) | |
Net change on deferred foreign capital gains taxes on unrealized appreciation | | | — | | | | 1,174,891 | | |
Net increase (decrease) in net assets resulting from operations | | | 62,283,432 | | | | (93,481,602 | ) | |
DISTRIBUTIONS TO SHAREHOLDERS FROM: | |
Net investment income: | |
Investor Class | | | (1,711,401 | ) | | | (2,890,029 | ) | |
Realized gains on investments: | |
Investor Class | | | (1,439,994 | ) | | | (34,232,017 | ) | |
Net decrease in net assets resulting from distributions | | | (3,151,395 | ) | | | (37,122,046 | ) | |
CAPITAL SHARE TRANSACTIONS (net) (Note 4) | | | 48,592,420 | | | | (157,938,046 | ) | |
REDEMPTION FEES | | | 84,348 | | | | 391,117 | | |
Total increase (decrease) in net assets | | | 107,808,805 | | | | (288,150,577 | ) | |
NET ASSETS: | |
Beginning of year | | | 258,943,742 | | | | 547,094,319 | | |
End of year (including undistributed/(distributions in excess of) net investment
income of $1,522,985 and ($99,789), respectively) | | $ | 366,752,547 | | | $ | 258,943,742 | | |
MATTHEWS CHINA SMALL COMPANIES FUND | | Year Ended
December 31, 2012 | | Period Ended
December 31, 20111 | |
OPERATIONS: | |
Net investment income (loss) | | $ | 24,235 | | | ($ | 12,320 | ) | |
Net realized gain (loss) on investments and foreign currency related transactions | | | (1,090,613 | ) | | | (116,195 | ) | |
Net change in unrealized appreciation/depreciation on investments and foreign currency
related translations | | | 1,689,474 | | | | (1,254,679 | ) | |
Net increase (decrease) in net assets resulting from operations | | | 623,096 | | | | (1,383,194 | ) | |
DISTRIBUTIONS TO SHAREHOLDERS FROM: | |
Net investment income: | |
Investor Class | | | (24,817 | ) | | | (5,954 | ) | |
Net decrease in net assets resulting from distributions | | | (24,817 | ) | | | (5,954 | ) | |
CAPITAL SHARE TRANSACTIONS (net) (Note 4) | | | 5,152,371 | | | | 5,867,611 | | |
REDEMPTION FEES | | | 22,486 | | | | 14,835 | | |
Total increase (decrease) in net assets | | | 5,773,136 | | | | 4,493,298 | | |
NET ASSETS: | |
Beginning of period | | | 4,493,298 | | | | — | | |
End of period (including undistributed net investment
income of $15,809 and $0, respectively) | | $ | 10,266,434 | | | $ | 4,493,298 | | |
1 Matthews China Small Companies Fund commenced operations on May 31, 2011.
See accompanying notes to financial statements.
matthewsasia.com | 800.789.ASIA 85
Statements of Changes in Net Assets (continued)
MATTHEWS ASIA SCIENCE AND TECHNOLOGY FUND | | Year Ended
December 31, 2012 | | Year Ended
December 31, 2011 | |
OPERATIONS: | |
Net investment income (loss) | | $ | 421,904 | | | $ | 408,640 | | |
Net realized gain (loss) on investments and foreign currency related transactions | | | (1,180,489 | ) | | | 12,874,420 | | |
Net change in unrealized appreciation/depreciation on investments and foreign currency
related translations | | | 19,606,502 | | | | (45,054,729 | ) | |
Net increase (decrease) in net assets resulting from operations | | | 18,847,917 | | | | (31,771,669 | ) | |
DISTRIBUTIONS TO SHAREHOLDERS FROM: | |
Net investment income: | |
Investor Class | | | (297,871 | ) | | | (454,558 | ) | |
Net decrease in net assets resulting from distributions | | | (297,871 | ) | | | (454,558 | ) | |
CAPITAL SHARE TRANSACTIONS (net) (Note 4) | | | (40,279,638 | ) | | | (5,021,334 | ) | |
REDEMPTION FEES | | | 9,379 | | | | 160,697 | | |
Total increase (decrease) in net assets | | | (21,720,213 | ) | | | (37,086,864 | ) | |
NET ASSETS: | |
Beginning of year | | | 153,348,899 | | | | 190,435,763 | | |
End of year (including undistributed net investment
income of $131,430 and $66,138, respectively) | | $ | 131,628,686 | | | $ | 153,348,899 | | |
See accompanying notes to financial statements.
86 MATTHEWS ASIA FUNDS
Matthews Asia Strategic Income Fund
The tables below set forth financial data for a share of beneficial interest outstanding throughout each period presented.
INVESTOR CLASS | | Year Ended
Dec. 31, 2012 | | Period Ended
Dec. 31, 20111 | |
Net Asset Value, beginning of period | | $ | 9.93 | | | $ | 10.00 | | |
INCOME (LOSS) FROM INVESTMENT OPERATIONS: | |
Net investment income (loss)2 | | | 0.37 | | | | 0.02 | | |
Net realized gain (loss) and unrealized appreciation/depreciation
on investments, financial futures contracts and foreign currency | | | 0.95 | | | | (0.07 | ) | |
Total from investment operations | | | 1.32 | | | | (0.05 | ) | |
LESS DISTRIBUTIONS FROM: | |
Net investment income | | | (0.42 | ) | | | (0.02 | ) | |
Total distributions | | | (0.42 | ) | | | (0.02 | ) | |
Paid-in capital from redemption fees (Note 4) | | | 0.01 | | | | — | | |
Net Asset Value, end of period | | $ | 10.84 | | | $ | 9.93 | | |
TOTAL RETURN | | | 13.62 | % | | | (0.52 | %)3 | |
RATIOS/SUPPLEMENTAL DATA | |
Net assets, end of period (in 000's) | | $ | 29,479 | | | $ | 7,746 | | |
Ratio of expenses to average net assets before any reimbursement,
waiver or recapture of expenses by Advisor and Administrator (Note 5) | | | 1.85 | % | | | 3.20 | %4 | |
Ratio of expenses to average net assets after any reimbursement,
waiver or recapture of expenses by Advisor and Administrator | | | 1.17 | % | | | 1.00 | %4 | |
Ratio of net investment income (loss) to average net assets | | | 3.58 | % | | | 2.06 | %4 | |
Portfolio turnover5 | | | 18.45 | % | | | 3.66 | %3 | |
INSTITUTIONAL CLASS | | Year Ended
Dec. 31, 2012 | | Period Ended
Dec. 31, 20111 | |
Net Asset Value, beginning of period | | $ | 9.93 | | | $ | 10.00 | | |
INCOME (LOSS) FROM INVESTMENT OPERATIONS: | |
Net investment income (loss)2 | | | 0.39 | | | | 0.02 | | |
Net realized gain (loss) and unrealized appreciation/depreciation
on investments, financial futures contracts and foreign currency | | | 0.94 | | | | (0.07 | ) | |
Total from investment operations | | | 1.33 | | | | (0.05 | ) | |
LESS DISTRIBUTIONS FROM: | |
Net investment income | | | (0.44 | ) | | | (0.02 | ) | |
Total distributions | | | (0.44 | ) | | | (0.02 | ) | |
Paid-in capital from redemption fees (Note 4) | | | 0.01 | | | | — | | |
Net Asset Value, end of period | | $ | 10.83 | | | $ | 9.93 | | |
TOTAL RETURN | | | 13.74 | % | | | (0.52 | %)3 | |
RATIOS/SUPPLEMENTAL DATA | |
Net assets, end of period (in 000's) | | $ | 6,205 | | | $ | 5,266 | | |
Ratio of expenses to average net assets before any reimbursement,
waiver or recapture of expenses by Advisor and Administrator (Note 5) | | | 1.70 | % | | | 3.20 | %4 | |
Ratio of expenses to average net assets after any reimbursement,
waiver or recapture of expenses by Advisor and Administrator | | | 1.00 | % | | | 1.00 | %4 | |
Ratio of net investment income (loss) to average net assets | | | 3.70 | % | | | 1.96 | %4 | |
Portfolio turnover5 | | | 18.45 | % | | | 3.66 | %3 | |
1 Commencement of operations on November 30, 2011.
2 Calculated using the average daily shares method.
3 Not annualized.
4 Annualized.
5 The portfolio turnover rate is calculated on the Fund as a whole without distinguishing between classes of shares issued.
See accompanying notes to financial statements.
matthewsasia.com | 800.789.ASIA 87
Financial Highlights (continued)
Matthews Asian Growth and Income Fund
The tables below set forth financial data for a share of beneficial interest outstanding throughout each period presented.
| | | Year Ended Dec. 31 | |
INVESTOR CLASS | | 2012 | | 2011 | | 2010 | | 2009 | | 2008 | |
Net Asset Value, beginning of year | | $ | 15.07 | | | $ | 18.04 | | | $ | 15.77 | | | $ | 11.50 | | | $ | 19.78 | | |
INCOME (LOSS) FROM INVESTMENT OPERATIONS: | |
Net investment income (loss)1 | | | 0.43 | | | | 0.47 | | | | 0.41 | | | | 0.48 | | | | 0.54 | | |
Net realized gain (loss) and unrealized appreciation/depreciation
on investments and foreign currency | | | 3.58 | | | | (2.36 | ) | | | 2.57 | | | | 4.23 | | | | (6.73 | ) | |
Total from investment operations | | | 4.01 | | | | (1.89 | ) | | | 2.98 | | | | 4.71 | | | | (6.19 | ) | |
LESS DISTRIBUTIONS FROM: | |
Net investment income | | | (0.47 | ) | | | (0.47 | ) | | | (0.47 | ) | | | (0.44 | ) | | | (0.42 | ) | |
Net realized gains on investments | | | — | | | | (0.61 | ) | | | (0.24 | ) | | | — | | | | (1.67 | ) | |
Total distributions | | | (0.47 | ) | | | (1.08 | ) | | | (0.71 | ) | | | (0.44 | ) | | | (2.09 | ) | |
Paid-in capital from redemption fees (Note 4)2 | | | — | | | | — | | | | — | | | | — | | | | — | | |
Net Asset Value, end of year | | $ | 18.61 | | | $ | 15.07 | | | $ | 18.04 | | | $ | 15.77 | | | $ | 11.50 | | |
TOTAL RETURN | | | 26.90 | % | | | (10.62 | %) | | | 19.18 | % | | | 41.44 | % | | | (32.07 | %) | |
RATIOS/SUPPLEMENTAL DATA | |
Net assets, end of year (in 000's) | | $ | 3,214,984 | | | $ | 2,340,606 | | | $ | 3,926,253 | | | $ | 2,547,411 | | | $ | 1,089,712 | | |
Ratio of expenses to average net assets | | | 1.11 | % | | | 1.12 | % | | | 1.13 | % | | | 1.18 | % | | | 1.16 | % | |
Ratio of net investment income (loss) to average net assets | | | 2.52 | % | | | 2.71 | % | | | 2.47 | % | | | 3.47 | % | | | 3.19 | % | |
Portfolio turnover | | | 17.43 | %3 | | | 16.54 | %3 | | | 19.84 | %3 | | | 17.51 | % | | | 25.16 | % | |
| | | Year Ended Dec. 31 | | Period Ended | |
INSTITUTIONAL CLASS | | 2012 | | 2011 | | Dec. 31, 20104 | |
Net Asset Value, beginning of period | | $ | 15.06 | | | $ | 18.04 | | | $ | 18.13 | | |
INCOME (LOSS) FROM INVESTMENT OPERATIONS: | |
Net investment income (loss)1 | | | 0.45 | | | | 0.52 | | | | 0.07 | | |
Net realized gain (loss) and unrealized appreciation/depreciation
on investments and foreign currency | | | 3.58 | | | | (2.39 | ) | | | 0.37 | | |
Total from investment operations | | | 4.03 | | | | (1.87 | ) | | | 0.44 | | |
LESS DISTRIBUTIONS FROM: | |
Net investment income | | | (0.49 | ) | | | (0.50 | ) | | | (0.29 | ) | |
Net realized gains on investments | | | — | | | | (0.61 | ) | | | (0.24 | ) | |
Total distributions | | | (0.49 | ) | | | (1.11 | ) | | | (0.53 | ) | |
Paid-in capital from redemption fees (Note 4) | | | —2 | | | | —2 | | | | — | | |
Net Asset Value, end of period | | $ | 18.60 | | | $ | 15.06 | | | $ | 18.04 | | |
TOTAL RETURN | | | 27.09 | % | | | (10.54 | %) | | | 2.49 | %5 | |
RATIOS/SUPPLEMENTAL DATA | |
Net assets, end of period (in 000's) | | $ | 856,876 | | | $ | 531,493 | | | $ | 128,417 | | |
Ratio of expenses to average net assets | | | 0.97 | % | | | 0.99 | % | | | 0.93 | %6 | |
Ratio of net investment income (loss) to average net assets | | | 2.69 | % | | | 3.05 | % | | | 2.46 | %6 | |
Portfolio turnover3 | | | 17.43 | % | | | 16.54 | % | | | 19.84 | %5 | |
1 Calculated using the average daily shares method.
2 Less than $0.01 per share.
3 The portfolio turnover rate is calculated on the Fund as a whole without distinguishing between classes of shares issued.
4 Institutional Class commenced operations on October 29, 2010.
5 Not annualized.
6 Annualized.
See accompanying notes to financial statements.
88 MATTHEWS ASIA FUNDS
Matthews Asia Dividend Fund
The tables below set forth financial data for a share of beneficial interest outstanding throughout each period presented.
| | | Year Ended Dec. 31 | |
INVESTOR CLASS | | 2012 | | 2011 | | 2010 | | 2009 | | 2008 | |
Net Asset Value, beginning of year | | $ | 12.48 | | | $ | 14.33 | | | $ | 12.06 | | | $ | 8.61 | | | $ | 12.00 | | |
INCOME (LOSS) FROM INVESTMENT OPERATIONS: | |
Net investment income (loss)1 | | | 0.36 | | | | 0.36 | | | | 0.31 | | | | 0.32 | | | | 0.38 | | |
Net realized gain (loss) and unrealized appreciation/depreciation
on investments and foreign currency | | | 2.30 | | | | (1.78 | ) | | | 2.40 | | | | 3.67 | | | | (3.47 | ) | |
Total from investment operations | | | 2.66 | | | | (1.42 | ) | | | 2.71 | | | | 3.99 | | | | (3.09 | ) | |
LESS DISTRIBUTIONS FROM: | |
Net investment income | | | (0.56 | ) | | | (0.37 | ) | | | (0.41 | ) | | | (0.55 | ) | | | (0.30 | ) | |
Net realized gains on investments | | | — | | | | (0.06 | ) | | | (0.04 | ) | | | — | | | | (0.02 | ) | |
Total distributions | | | (0.56 | ) | | | (0.43 | ) | | | (0.45 | ) | | | (0.55 | ) | | | (0.32 | ) | |
Paid-in capital from redemption fees (Note 4) | | | —2 | | | | —2 | | | | 0.01 | | | | 0.01 | | | | 0.02 | | |
Net Asset Value, end of year | | $ | 14.58 | | | $ | 12.48 | | | $ | 14.33 | | | $ | 12.06 | | | $ | 8.61 | | |
TOTAL RETURN | | | 21.63 | % | | | (10.02 | %) | | | 22.83 | % | | | 47.59 | % | | | (25.97 | %) | |
RATIOS/SUPPLEMENTAL DATA | |
Net assets, end of year (in 000's) | | $ | 2,780,043 | | | $ | 1,930,363 | | | $ | 1,933,383 | | | $ | 322,003 | | | $ | 141,951 | | |
Ratio of expenses to average net assets before any reimbursement,
waiver or recapture of expenses by Advisor and Administrator (Note 5) | | | 1.09 | % | | | 1.10 | % | | | 1.14 | % | | | 1.28 | % | | | 1.35 | % | |
Ratio of expenses to average net assets after any reimbursement,
waiver or recapture of expenses by Advisor and Administrator | | | 1.09 | % | | | 1.10 | % | | | 1.15 | % | | | 1.30 | % | | | 1.32 | % | |
Ratio of net investment income (loss) to average net assets | | | 2.65 | % | | | 2.61 | % | | | 2.31 | % | | | 3.16 | % | | | 3.74 | % | |
Portfolio turnover | | | 9.17 | %3 | | | 16.48 | %3 | | | 10.48 | %3 | | | 32.41 | % | | | 25.07 | % | |
| | | Year Ended Dec. 31 | | Period Ended | |
INSTITUTIONAL CLASS | | 2012 | | 2011 | | Dec. 31, 20104 | |
Net Asset Value, beginning of period | | $ | 12.48 | | | $ | 14.33 | | | $ | 14.13 | | |
INCOME (LOSS) FROM INVESTMENT OPERATIONS: | |
Net investment income (loss)1 | | | 0.37 | | | | 0.41 | | | | 0.09 | | |
Net realized gain (loss) and unrealized appreciation/depreciation
on investments and foreign currency | | | 2.29 | | | | (1.82 | ) | | | 0.32 | | |
Total from investment operations | | | 2.66 | | | | (1.41 | ) | | | 0.41 | | |
LESS DISTRIBUTIONS FROM: | |
Net investment income | | | (0.57 | ) | | | (0.38 | ) | | | (0.17 | ) | |
Net realized gains on investments | | | — | | | | (0.06 | ) | | | (0.04 | ) | |
Total distributions | | | (0.57 | ) | | | (0.44 | ) | | | (0.21 | ) | |
Paid-in capital from redemption fees (Note 4)2 | | | — | | | | — | | | | — | | |
Net Asset Value, end of period | | $ | 14.57 | | | $ | 12.48 | | | $ | 14.33 | | |
TOTAL RETURN | | | 21.70 | % | | | (9.93 | %) | | | 2.95 | %5 | |
RATIOS/SUPPLEMENTAL DATA | |
Net assets, end of period (in 000's) | | $ | 922,561 | | | $ | 344,502 | | | $ | 48,293 | | |
Ratio of expenses to average net assets | | | 0.97 | % | | | 1.00 | % | | | 1.02 | %6 | |
Ratio of net investment income (loss) to average net assets | | | 2.72 | % | | | 3.03 | % | | | 3.86 | %6 | |
Portfolio turnover3 | | | 9.17 | % | | | 16.48 | % | | | 10.48 | %5 | |
1 Calculated using the average daily shares method.
2 Less than $0.01 per share.
3 The portfolio turnover rate is calculated on the Fund as a whole without distinguishing between classes of share issues.
4 Institutional Class commenced operations on October 29, 2010.
5 Not annualized.
6 Annualized.
See accompanying notes to financial statements.
matthewsasia.com | 800.789.ASIA 89
Financial Highlights (continued)
Matthews China Dividend Fund
The tables below set forth financial data for a share of beneficial interest outstanding throughout each period presented.
| | | Year Ended Dec. 31 | | Period Ended | |
INVESTOR CLASS | | 2012 | | 2011 | | 2010 | | Dec. 31, 20091 | |
Net Asset Value, beginning of period | | $ | 10.06 | | | $ | 12.17 | | | $ | 10.18 | | | $ | 10.00 | | |
INCOME (LOSS) FROM INVESTMENT OPERATIONS: | |
Net investment income (loss)2 | | | 0.25 | | | | 0.29 | | | | 0.17 | | | | (0.01 | ) | |
Net realized gain (loss) and unrealized appreciation/depreciation
on investments and foreign currency | | | 2.49 | | | | (2.04 | ) | | | 2.09 | | | | 0.19 | | |
Total from investment operations | | | 2.74 | | | | (1.75 | ) | | | 2.26 | | | | 0.18 | | |
LESS DISTRIBUTIONS FROM: | |
Net investment income | | | (0.46 | ) | | | (0.35 | ) | | | (0.24 | ) | | | — | | |
Net realized gains on investments | | | — | | | | (0.02 | ) | | | (0.04 | ) | | | — | | |
Total distributions | | | (0.46 | ) | | | (0.37 | ) | | | (0.28 | ) | | | — | | |
Paid-in capital from redemption fees (Note 4) | | | 0.01 | | | | 0.01 | | | | 0.01 | | | | —3 | | |
Net Asset Value, end of period | | $ | 12.35 | | | $ | 10.06 | | | $ | 12.17 | | | $ | 10.18 | | |
TOTAL RETURN | | | 27.81 | % | | | (14.44 | %) | | | 22.53 | % | | | 1.80 | %4 | |
RATIOS/SUPPLEMENTAL DATA | |
Net assets, end of period (in 000's) | | $ | 59,535 | | | $ | 26,467 | | | $ | 45,364 | | | $ | 7,134 | | |
Ratio of expenses to average net assets before any reimbursement or
waiver or recapture of expenses by Advisor and Administrator (Note 5) | | | 1.47 | % | | | 1.52 | % | | | 1.95 | % | | | 10.50 | %5 | |
Ratio of expenses to average net assets after any reimbursement or
waiver or recapture of expenses by Advisor and Administrator | | | 1.50 | % | | | 1.50 | % | | | 1.50 | % | | | 1.50 | %5 | |
Ratio of net investment income (loss) to average net assets | | | 2.24 | % | | | 2.47 | % | | | 1.49 | % | | | (0.81 | %)5 | |
Portfolio turnover | | | 21.40 | %6 | | | 22.31 | %6 | | | 6.84 | %6 | | | 0.00 | %4 | |
| | | Year Ended Dec. 31 | | Period Ended | |
INSTITUTIONAL CLASS | | 2012 | | 2011 | | Dec. 31, 20107 | |
Net Asset Value, beginning of period | | $ | 10.06 | | | $ | 12.17 | | | $ | 11.87 | | |
INCOME (LOSS) FROM INVESTMENT OPERATIONS: | |
Net investment income (loss)2 | | | 0.22 | | | | 0.30 | | | | —3 | | |
Net realized gain (loss) and unrealized appreciation/depreciation
on investments and foreign currency | | | 2.53 | | | | (2.01 | ) | | | 0.47 | | |
Total from investment operations | | | 2.75 | | | | (1.71 | ) | | | 0.47 | | |
LESS DISTRIBUTIONS FROM: | |
Net investment income | | | (0.48 | ) | | | (0.38 | ) | | | (0.13 | ) | |
Net realized gains on investments | | | — | | | | (0.02 | ) | | | (0.04 | ) | |
Total distributions | | | (0.48 | ) | | | (0.40 | ) | | | (0.17 | ) | |
Paid-in capital from redemption fees (Note 4) | | | 0.01 | | | | —3 | | | | — | | |
Net Asset Value, end of period | | $ | 12.34 | | | $ | 10.06 | | | $ | 12.17 | | |
TOTAL RETURN | | | 27.90 | % | | | (14.22 | %) | | | 3.91 | %4 | |
RATIOS/SUPPLEMENTAL DATA | |
Net assets, end of period (in 000's) | | $ | 201 | | | $ | 12 | | | $ | 4 | | |
Ratio of expenses to average net assets | | | 1.29 | % | | | 1.31 | % | | | 1.24 | %5 | |
Ratio of net investment income (loss) to average net assets | | | 1.87 | % | | | 2.61 | % | | | (0.06 | %)5 | |
Portfolio turnover6 | | | 21.40 | % | | | 22.31 | % | | | 6.84 | %4 | |
1 Investor Class commenced operations on November 30, 2009.
2 Calculated using the average daily shares method.
3 Less than $0.01 per share.
4 Not annualized.
5 Annualized.
6 The portfolio turnover rate is calculated on the Fund as a whole without distinguishing between classes of shares issued.
7 Institutional Class commenced operations on October 29, 2010.
See accompanying notes to financial statements.
90 MATTHEWS ASIA FUNDS
Matthews Asia Growth Fund
The tables below set forth financial data for a share of beneficial interest outstanding throughout each period presented.
| | | Year Ended Dec. 31 | |
INVESTOR CLASS | | 2012 | | 2011 | | 2010 | | 2009 | | 2008 | |
Net Asset Value, beginning of year | | $ | 15.34 | | | $ | 17.97 | | | $ | 14.29 | | | $ | 10.03 | | | $ | 17.29 | | |
INCOME (LOSS) FROM INVESTMENT OPERATIONS: | |
Net investment income (loss)1 | | | 0.15 | | | | 0.11 | | | | 0.10 | | | | 0.06 | | | | 0.13 | | |
Net realized gain (loss) and unrealized appreciation/depreciation
on investments and foreign currency | | | 2.53 | | | | (2.41 | ) | | | 3.72 | | | | 4.44 | | | | (6.64 | ) | |
Total from investment operations | | | 2.68 | | | | (2.30 | ) | | | 3.82 | | | | 4.50 | | | | (6.51 | ) | |
LESS DISTRIBUTIONS FROM: | |
Net investment income | | | — | | | | (0.35 | ) | | | (0.15 | ) | | | (0.24 | ) | | | — | | |
Net realized gains on investments | | | — | | | | — | | | | — | | | | — | | | | (0.76 | ) | |
Total distributions | | | — | | | | (0.35 | ) | | | (0.15 | ) | | | (0.24 | ) | | | (0.76 | ) | |
Paid-in capital from redemption fees (Note 4) | | | —2 | | | | 0.02 | | | | 0.01 | | | | —2 | | | | 0.01 | | |
Net Asset Value, end of year | | $ | 18.02 | | | $ | 15.34 | | | $ | 17.97 | | | $ | 14.29 | | | $ | 10.03 | | |
TOTAL RETURN | | | 17.47 | % | | | (12.70 | %) | | | 26.85 | % | | | 44.82 | % | | | (37.44 | %) | |
RATIOS/SUPPLEMENTAL DATA | |
Net assets, end of year (in 000's) | | $ | 276,884 | | | $ | 259,166 | | | $ | 335,429 | | | $ | 227,651 | | | $ | 168,031 | | |
Ratio of expenses to average net assets | | | 1.16 | % | | | 1.19 | % | | | 1.19 | % | | | 1.28 | % | | | 1.23 | % | |
Ratio of net investment income (loss) to average net assets | | | 0.92 | % | | | 0.63 | % | | | 0.63 | % | | | 0.50 | % | | | 0.93 | % | |
Portfolio turnover | | | 44.76 | %3 | | | 28.06 | %3 | | | 26.33 | %3 | | | 58.10 | % | | | 37.10 | % | |
| | | Year Ended Dec. 31 | | Period Ended | |
INSTITUTIONAL CLASS | | 2012 | | 2011 | | Dec. 31, 20104 | |
Net Asset Value, beginning of period | | $ | 15.37 | | | $ | 17.98 | | | $ | 17.65 | | |
INCOME (LOSS) FROM INVESTMENT OPERATIONS: | |
Net investment income (loss)1 | | | 0.17 | | | | 0.14 | | | | 0.01 | | |
Net realized gain (loss) and unrealized appreciation/depreciation
on investments and foreign currency | | | 2.54 | | | | (2.42 | ) | | | 0.47 | | |
Total from investment operations | | | 2.71 | | | | (2.28 | ) | | | 0.48 | | |
LESS DISTRIBUTIONS FROM: | |
Net investment income | | | — | | | | (0.35 | ) | | | (0.15 | ) | |
Total distributions | | | — | | | | (0.35 | ) | | | (0.15 | ) | |
Paid-in capital from redemption fees (Note 4) | | | —2 | | | | 0.02 | | | | — | | |
Net Asset Value, end of period | | $ | 18.08 | | | $ | 15.37 | | | $ | 17.98 | | |
TOTAL RETURN | | | 17.63 | % | | | (12.58 | %) | | | 2.76 | %5 | |
RATIOS/SUPPLEMENTAL DATA | |
Net assets, end of period (in 000's) | | $ | 147,142 | | | $ | 84,302 | | | $ | 8,853 | | |
Ratio of expenses to average net assets | | | 0.98 | % | | | 1.03 | % | | | 0.99 | %6 | |
Ratio of net investment income (loss) to average net assets | | | 1.02 | % | | | 0.84 | % | | | 0.37 | %6 | |
Portfolio turnover3 | | | 44.76 | % | | | 28.06 | % | | | 26.33 | %5 | |
1 Calculated using the average daily shares method.
2 Less than $0.01 per share.
3 The portfolio turnover rate is calculated on the Fund as a whole without distinguishing between classes of shares issued.
4 Institutional Class commenced operations on October 29, 2010.
5 Not annualized.
6 Annualized.
See accompanying notes to financial statements.
matthewsasia.com | 800.789.ASIA 91
Financial Highlights (continued)
Matthews Pacific Tiger Fund
The tables below set forth financial data for a share of beneficial interest outstanding throughout each period presented.
| | | Year Ended Dec. 31 | |
INVESTOR CLASS | | 2012 | | 2011 | | 2010 | | 2009 | | 2008 | |
Net Asset Value, beginning of year | | $ | 20.33 | | | $ | 23.44 | | | $ | 19.23 | | | $ | 11.05 | | | $ | 27.86 | | |
INCOME (LOSS) FROM INVESTMENT OPERATIONS: | |
Net investment income (loss)1 | | | 0.18 | | | | 0.10 | | | | 0.09 | | | | 0.06 | | | | 0.24 | | |
Net realized gain (loss) and unrealized appreciation/depreciation
on investments and foreign currency | | | 4.09 | | | | (2.78 | ) | | | 4.20 | | | | 8.27 | | | | (13.31 | ) | |
Total from investment operations | | | 4.27 | | | | (2.68 | ) | | | 4.29 | | | | 8.33 | | | | (13.07 | ) | |
LESS DISTRIBUTIONS FROM: | |
Net investment income | | | (0.16 | ) | | | (0.11 | ) | | | (0.08 | ) | | | (0.15 | ) | | | (0.30 | ) | |
Net realized gains on investments | | | (0.02 | ) | | | (0.33 | ) | | | — | | | | — | | | | (3.44 | ) | |
Total distributions | | | (0.18 | ) | | | (0.44 | ) | | | (0.08 | ) | | | (0.15 | ) | | | (3.74 | ) | |
Paid-in capital from redemption fees (Note 4) | | | —2 | | | | 0.01 | | | | —2 | | | | — | | | | —2 | | |
Net Asset Value, end of year | | $ | 24.42 | | | $ | 20.33 | | | $ | 23.44 | | | $ | 19.23 | | | $ | 11.05 | | |
TOTAL RETURN | | | 21.00 | % | | | (11.41 | %) | | | 22.30 | % | | | 75.37 | % | | | (46.12 | %) | |
RATIOS/SUPPLEMENTAL DATA | |
Net assets, end of year (in 000's) | | $ | 2,994,026 | | | $ | 2,780,640 | | | $ | 5,196,743 | | | $ | 3,565,745 | | | $ | 1,202,441 | | |
Ratio of expenses to average net assets | | | 1.11 | % | | | 1.11 | % | | | 1.09 | % | | | 1.13 | % | | | 1.12 | % | |
Ratio of net investment income (loss) to average net assets | | | 0.82 | % | | | 0.44 | % | | | 0.43 | % | | | 0.41 | % | | | 1.10 | % | |
Portfolio turnover | | | 6.53 | %3 | | | 10.51 | %3 | | | 11.43 | %3 | | | 13.22 | % | | | 16.76 | % | |
| | | Year Ended Dec. 31 | | Period Ended | |
INSTITUTIONAL CLASS | | 2012 | | 2011 | | Dec. 31, 20104 | |
Net Asset Value, beginning of period | | $ | 20.32 | | | $ | 23.44 | | | $ | 23.37 | | |
INCOME (LOSS) FROM INVESTMENT OPERATIONS: | |
Net investment income (loss)1 | | | 0.21 | | | | 0.23 | | | | 0.01 | | |
Net realized gain (loss) and unrealized appreciation/depreciation
on investments and foreign currency | | | 4.10 | | | | (2.87 | ) | | | 0.15 | | |
Total from investment operations | | | 4.31 | | | | (2.64 | ) | | | 0.16 | | |
LESS DISTRIBUTIONS FROM: | |
Net investment income | | | (0.20 | ) | | | (0.15 | ) | | | (0.09 | ) | |
Net realized gains on investments | | | (0.02 | ) | | | (0.33 | ) | | | — | | |
Total distributions | | | (0.22 | ) | | | (0.48 | ) | | | (0.09 | ) | |
Paid-in capital from redemption fees (Note 4)2 | | | — | | | | — | | | | — | | |
Net Asset Value, end of period | | $ | 24.41 | | | $ | 20.32 | | | $ | 23.44 | | |
TOTAL RETURN | | | 21.24 | % | | | (11.28 | %) | | | 0.67 | %5 | |
RATIOS/SUPPLEMENTAL DATA | |
Net assets, end of period (in 000's) | | $ | 3,770,568 | | | $ | 2,029,091 | | | $ | 540,469 | | |
Ratio of expenses to average net assets | | | 0.95 | % | | | 0.95 | % | | | 0.95 | %6 | |
Ratio of net investment income (loss) to average net assets | | | 0.95 | % | | | 1.03 | % | | | 0.38 | %6 | |
Portfolio turnover3 | | | 6.53 | % | | | 10.51 | % | | | 11.43 | %5 | |
1 Calculated using the average daily shares method.
2 Less than $0.01 per share.
3 The portfolio turnover rate is calculated on the Fund as a whole without distinguishing between classes of shares issued.
4 Institutional Class commenced operations on October 29, 2010.
5 Not annualized.
6 Annualized.
See accompanying notes to financial statements.
92 MATTHEWS ASIA FUNDS
Matthews China Fund
The tables below set forth financial data for a share of beneficial interest outstanding throughout each period presented.
| | | Year Ended Dec. 31 | |
INVESTOR CLASS | | 2012 | | 2011 | | 2010 | | 2009 | | 2008 | |
Net Asset Value, beginning of year | | $ | 21.51 | | | $ | 29.36 | | | $ | 25.50 | | | $ | 14.34 | | | $ | 39.73 | | |
INCOME (LOSS) FROM INVESTMENT OPERATIONS: | |
Net investment income (loss)1 | | | 0.30 | | | | 0.26 | | | | 0.15 | | | | 0.09 | | | | 0.30 | | |
Net realized gain (loss) and unrealized appreciation/depreciation
on investments and foreign currency | | | 2.26 | | | | (5.78 | ) | | | 3.86 | | | | 11.12 | | | | (19.78 | ) | |
Total from investment operations | | | 2.56 | | | | (5.52 | ) | | | 4.01 | | | | 11.21 | | | | (19.48 | ) | |
LESS DISTRIBUTIONS FROM: | |
Net investment income | | | (0.35 | ) | | | (0.28 | ) | | | (0.15 | ) | | | (0.07 | ) | | | (0.33 | ) | |
Net realized gains on investments | | | (0.25 | ) | | | (2.06 | ) | | | (0.02 | ) | | | — | | | | (5.62 | ) | |
Total distributions | | | (0.60 | ) | | | (2.34 | ) | | | (0.17 | ) | | | (0.07 | ) | | | (5.95 | ) | |
Paid-in capital from redemption fees (Note 4) | | | —2 | | | | 0.01 | | | | 0.02 | | | | 0.02 | | | | 0.04 | | |
Net Asset Value, end of year | | $ | 23.47 | | | $ | 21.51 | | | $ | 29.36 | | | $ | 25.50 | | | $ | 14.34 | | |
TOTAL RETURN | | | 11.96 | % | | | (18.93 | %) | | | 15.77 | % | | | 78.30 | % | | | (48.95 | %) | |
RATIOS/SUPPLEMENTAL DATA | |
Net assets, end of year (in 000's) | | $ | 1,642,090 | | | $ | 1,836,333 | | | $ | 2,939,638 | | | $ | 2,566,005 | | | $ | 781,104 | | |
Ratio of expenses to average net assets | | | 1.12 | % | | | 1.13 | % | | | 1.15 | % | | | 1.21 | % | | | 1.23 | % | |
Ratio of net investment income (loss) to average net assets | | | 1.33 | % | | | 0.93 | % | | | 0.54 | % | | | 0.46 | % | | | 1.03 | % | |
Portfolio turnover | | | 9.61 | %3 | | | 8.43 | %3 | | | 9.98 | %3 | | | 5.28 | % | | | 7.91 | % | |
| | | Year Ended Dec. 31 | | Period Ended | |
INSTITUTIONAL CLASS | | 2012 | | 2011 | | Dec. 31, 20104 | |
Net Asset Value, beginning of period | | $ | 21.49 | | | $ | 29.36 | | | $ | 30.02 | | |
INCOME (LOSS) FROM INVESTMENT OPERATIONS: | |
Net investment income (loss)1 | | | 0.36 | | | | 0.26 | | | | (0.04 | ) | |
Net realized gain (loss) and unrealized appreciation/depreciation
on investments and foreign currency | | | 2.25 | | | | (5.73 | ) | | | (0.44 | ) | |
Total from investment operations | | | 2.61 | | | | (5.47 | ) | | | (0.48 | ) | |
LESS DISTRIBUTIONS FROM: | |
Net investment income | | | (0.40 | ) | | | (0.34 | ) | | | (0.16 | ) | |
Net realized gains on investments | | | (0.25 | ) | | | (2.06 | ) | | | (0.02 | ) | |
Total distributions | | | (0.65 | ) | | | (2.40 | ) | | | (0.18 | ) | |
Paid-in capital from redemption fees (Note 4) | | | —2 | | | | —2 | | | | — | | |
Net Asset Value, end of period | | $ | 23.45 | | | $ | 21.49 | | | $ | 29.36 | | |
TOTAL RETURN | | | 12.22 | % | | | (18.80 | %) | | | (1.62 | %)5 | |
RATIOS/SUPPLEMENTAL DATA | |
Net assets, end of period (in 000's) | | $ | 390,744 | | | $ | 288,277 | | | $ | 41,545 | | |
Ratio of expenses to average net assets | | | 0.91 | % | | | 0.96 | % | | | 0.97 | %6 | |
Ratio of net investment income (loss) to average net assets | | | 1.58 | % | | | 0.99 | % | | | (0.74 | %)6 | |
Portfolio turnover3 | | | 9.61 | % | | | 8.43 | % | | | 9.98 | %5 | |
1 Calculated using the average daily shares method.
2 Less than $0.01 per share.
3 The portfolio turnover rate is calculated on the Fund as a whole without distinguishing between classes of shares issued.
4 Institutional Class commenced operations on October 29, 2010.
5 Not annualized.
6 Annualized.
See accompanying notes to financial statements.
matthewsasia.com | 800.789.ASIA 93
Financial Highlights (continued)
Matthews India Fund
The tables below set forth financial data for a share of beneficial interest outstanding throughout each period presented.
| | | Year Ended Dec. 31 | |
INVESTOR CLASS | | 2012 | | 2011 | | 2010 | | 2009 | | 2008 | |
Net Asset Value, beginning of year | | $ | 13.59 | | | $ | 21.49 | | | $ | 16.29 | | | $ | 8.37 | | | $ | 24.44 | | |
INCOME (LOSS) FROM INVESTMENT OPERATIONS: | |
Net investment income (loss)1 | | | 0.11 | | | | 0.11 | | | | 0.05 | | | | 0.07 | | | | 0.03 | | |
Net realized gain (loss) and unrealized appreciation/depreciation
on investments and foreign currency | | | 4.17 | | | | (7.96 | ) | | | 5.22 | | | | 8.06 | | | | (15.33 | ) | |
Total from investment operations | | | 4.28 | | | | (7.85 | ) | | | 5.27 | | | | 8.13 | | | | (15.30 | ) | |
LESS DISTRIBUTIONS FROM: | |
Net investment income | | | (0.09 | ) | | | (0.07 | ) | | | (0.09 | ) | | | (0.10 | ) | | | (0.11 | ) | |
Net realized gains on investments | | | (0.27 | ) | | | — | | | | — | | | | (0.12 | ) | | | (0.69 | ) | |
Total distributions | | | (0.36 | ) | | | (0.07 | ) | | | (0.09 | ) | | | (0.22 | ) | | | (0.80 | ) | |
Paid-in capital from redemption fees (Note 4) | | | —2 | | | | 0.02 | | | | 0.02 | | | | 0.01 | | | | 0.03 | | |
Net Asset Value, end of year | | $ | 17.51 | | | $ | 13.59 | | | $ | 21.49 | | | $ | 16.29 | | | $ | 8.37 | | |
TOTAL RETURN | | | 31.54 | % | | | (36.48 | %) | | | 32.53 | % | | | 97.25 | % | | | (62.32 | %) | |
RATIOS/SUPPLEMENTAL DATA | |
Net assets, end of year (in 000's) | | $ | 607,800 | | | $ | 559,337 | | | $ | 1,388,892 | | | $ | 720,925 | | | $ | 317,516 | | |
Ratio of expenses to average net assets | | | 1.18 | % | | | 1.18 | % | | | 1.18 | % | | | 1.27 | % | | | 1.29 | % | |
Ratio of net investment income (loss) to average net assets | | | 0.65 | % | | | 0.58 | % | | | 0.25 | % | | | 0.59 | % | | | 0.16 | % | |
Portfolio turnover | | | 7.03 | %3 | | | 3.51 | %3 | | | 6.14 | %3 | | | 18.09 | % | | | 26.68 | % | |
| | | Year Ended Dec. 31 | | Period Ended | |
INSTITUTIONAL CLASS | | 2012 | | 2011 | | Dec. 31, 20104 | |
Net Asset Value, beginning of period | | $ | 13.61 | | | $ | 21.48 | | | $ | 22.03 | | |
INCOME (LOSS) FROM INVESTMENT OPERATIONS: | |
Net investment income (loss)1 | | | 0.14 | | | | 0.16 | | | | (0.02 | ) | |
Net realized gain (loss) and unrealized appreciation/depreciation
on investments and foreign currency | | | 4.17 | | | | (7.96 | ) | | | (0.43 | ) | |
Total from investment operations | | | 4.31 | | | | (7.80 | ) | | | (0.45 | ) | |
LESS DISTRIBUTIONS FROM: | |
Net investment income | | | (0.12 | ) | | | (0.07 | ) | | | (0.10 | ) | |
Net realized gains on investments | | | (0.27 | ) | | | — | | | | — | | |
Total distributions | | | (0.39 | ) | | | (0.07 | ) | | | (0.10 | ) | |
Paid-in capital from redemption fees (Note 4) | | | —2 | | | | —2 | | | | — | | |
Net Asset Value, end of period | | $ | 17.53 | | | $ | 13.61 | | | $ | 21.48 | | |
TOTAL RETURN | | | 31.74 | % | | | (36.35 | %) | | | (2.01 | %)5 | |
RATIOS/SUPPLEMENTAL DATA | |
Net assets, end of period (in 000's) | | $ | 36,166 | | | $ | 26,920 | | | $ | 48,119 | | |
Ratio of expenses to average net assets | | | 0.98 | % | | | 0.99 | % | | | 0.99 | %6 | |
Ratio of net investment income (loss) to average net assets | | | 0.87 | % | | | 0.86 | % | | | (0.51 | %)6 | |
Portfolio turnover3 | | | 7.03 | % | | | 3.51 | % | | | 6.14 | %5 | |
1 Calculated using the average daily shares method.
2 Less than $0.01 per share.
3 The portfolio turnover rate is calculated on the Fund as a whole without distinguishing between classes of shares issued.
4 Institutional Class commenced operations on October 29, 2010.
5 Not annualized.
6 Annualized.
See accompanying notes to financial statements.
94 MATTHEWS ASIA FUNDS
Matthews Japan Fund
The tables below set forth financial data for a share of beneficial interest outstanding throughout each period presented.
| | | Year Ended Dec. 31 | |
INVESTOR CLASS | | 2012 | | 2011 | | 2010 | | 2009 | | 2008 | |
Net Asset Value, beginning of year | | $ | 11.34 | | | $ | 12.53 | | | $ | 10.91 | | | $ | 10.19 | | | $ | 14.55 | | |
INCOME (LOSS) FROM INVESTMENT OPERATIONS: | |
Net investment income (loss)1 | | | 0.10 | | | | 0.07 | | | | 0.02 | | | | 0.10 | | | | 0.11 | | |
Net realized gain (loss) and unrealized appreciation/depreciation
on investments and foreign currency | | | 0.84 | | | | (1.06 | ) | | | 2.09 | | | | 0.92 | | | | (4.26 | ) | |
Total from investment operations | | | 0.94 | | | | (0.99 | ) | | | 2.11 | | | | 1.02 | | | | (4.15 | ) | |
LESS DISTRIBUTIONS FROM: | |
Net investment income | | | (0.01 | ) | | | (0.22 | ) | | | (0.49 | ) | | | (0.31 | ) | | | — | | |
Net realized gains on investments | | | — | | | | — | | | | — | | | | — | | | | (0.22 | ) | |
Total distributions | | | (0.01 | ) | | | (0.22 | ) | | | (0.49 | ) | | | (0.31 | ) | | | (0.22 | ) | |
Paid-in capital from redemption fees (Note 4) | | | —2 | | | | 0.02 | | | | —2 | | | | 0.01 | | | | 0.01 | | |
Net Asset Value, end of year | | $ | 12.27 | | | $ | 11.34 | | | $ | 12.53 | | | $ | 10.91 | | | $ | 10.19 | | |
TOTAL RETURN | | | 8.32 | % | | | (7.72 | %) | | | 19.58 | % | | | 10.06 | % | | | (28.38 | %) | |
RATIOS/SUPPLEMENTAL DATA | |
Net assets, end of year (in 000's) | | $ | 82,463 | | | $ | 101,369 | | | $ | 67,805 | | | $ | 88,334 | | | $ | 123,674 | | |
Ratio of expenses to average net assets | | | 1.20 | % | | | 1.22 | % | | | 1.30 | % | | | 1.31 | % | | | 1.23 | % | |
Ratio of net investment income (loss) to average net assets | | | 0.81 | % | | | 0.54 | % | | | 0.13 | % | | | 0.97 | % | | | 0.84 | % | |
Portfolio turnover | | | 48.58 | %3 | | | 34.94 | %3 | | | 46.29 | %3 | | | 126.75 | % | | | 88.97 | % | |
| | | Year Ended Dec. 31 | | Period Ended | |
INSTITUTIONAL CLASS | | 2012 | | 2011 | | Dec. 31, 20104 | |
Net Asset Value, beginning of period | | $ | 11.34 | | | $ | 12.53 | | | $ | 11.73 | | |
INCOME (LOSS) FROM INVESTMENT OPERATIONS: | |
Net investment income (loss)1 | | | 0.12 | | | | 0.06 | | | | (0.01 | ) | |
Net realized gain (loss) and unrealized appreciation/depreciation
on investments and foreign currency | | | 0.84 | | | | (1.04 | ) | | | 1.30 | | |
Total from investment operations | | | 0.96 | | | | (0.98 | ) | | | 1.29 | | |
LESS DISTRIBUTIONS FROM: | |
Net investment income | | | (0.04 | ) | | | (0.22 | ) | | | (0.49 | ) | |
Total distributions | | | (0.04 | ) | | | (0.22 | ) | | | (0.49 | ) | |
Paid-in capital from redemption fees (Note 4) | | | —2 | | | | 0.01 | | | | — | | |
Net Asset Value, end of period | | $ | 12.26 | | | $ | 11.34 | | | $ | 12.53 | | |
TOTAL RETURN | | | 8.47 | % | | | (7.72 | %) | | | 11.22 | %5 | |
RATIOS/SUPPLEMENTAL DATA | |
Net assets, end of period (in 000's) | | $ | 22,233 | | | $ | 30,302 | | | $ | 4 | | |
Ratio of expenses to average net assets | | | 1.04 | % | | | 1.07 | % | | | 1.08 | %6 | |
Ratio of net investment income (loss) to average net assets | | | 0.99 | % | | | 0.46 | % | | | (0.51 | %)6 | |
Portfolio turnover3 | | | 48.58 | % | | | 34.94 | % | | | 46.29 | %5 | |
1 Calculated using the average daily shares method.
2 Less than $0.01 per share.
3 The portfolio turnover rate is calculated on the Fund as a whole without distinguishing between classes of shares issued.
4 Institutional Class commenced operations on October 29, 2010.
5 Not annualized.
6 Annualized.
See accompanying notes to financial statements.
matthewsasia.com | 800.789.ASIA 95
Financial Highlights (continued)
Matthews Korea Fund
The tables below set forth financial data for a share of beneficial interest outstanding throughout each period presented.
| | | Year Ended Dec. 31 | |
INVESTOR CLASS | | 2012 | | 2011 | | 2010 | | 2009 | | 2008 | |
Net Asset Value, beginning of year | | $ | 4.59 | | | $ | 5.14 | | | $ | 4.31 | | | $ | 2.75 | | | $ | 6.56 | | |
INCOME (LOSS) FROM INVESTMENT OPERATIONS: | |
Net investment income (loss)1 | | | —2 | | | | (0.01 | ) | | | 0.01 | | | | (0.01 | ) | | | (0.02 | ) | |
Net realized gain (loss) and unrealized appreciation/depreciation
on investments and foreign currency | | | 1.10 | | | | (0.31 | ) | | | 0.93 | | | | 1.74 | | | | (3.48 | ) | |
Total from investment operations | | | 1.10 | | | | (0.32 | ) | | | 0.94 | | | | 1.73 | | | | (3.50 | ) | |
LESS DISTRIBUTIONS FROM: | |
Net investment income | | | — | | | | (0.01 | ) | | | — | | | | — | | | | (0.06 | ) | |
Net realized gains on investments | | | (0.05 | ) | | | (0.22 | ) | | | (0.11 | ) | | | (0.17 | ) | | | (0.25 | ) | |
Total distributions | | | (0.05 | ) | | | (0.23 | ) | | | (0.11 | ) | | | (0.17 | ) | | | (0.31 | ) | |
Paid-in capital from redemption fees (Note 4)2 | | | — | | | | — | | | | — | | | | — | | | | — | | |
Net Asset Value, end of year | | $ | 5.64 | | | $ | 4.59 | | | $ | 5.14 | | | $ | 4.31 | | | $ | 2.75 | | |
TOTAL RETURN | | | 24.05 | % | | | (6.45 | %) | | | 21.86 | % | | | 62.92 | % | | | (52.66 | %) | |
RATIOS/SUPPLEMENTAL DATA | |
Net assets, end of year (in 000's) | | $ | 141,247 | | | $ | 141,590 | | | $ | 166,990 | | | $ | 138,371 | | | $ | 87,253 | | |
Ratio of expenses to average net assets | | | 1.16 | % | | | 1.18 | % | | | 1.21 | % | | | 1.30 | % | | | 1.27 | % | |
Ratio of net investment income (loss) to average net assets | | | 0.01 | % | | | (0.18 | %) | | | 0.16 | % | | | (0.36 | %) | | | (0.34 | %) | |
Portfolio turnover | | | 34.84 | %3 | | | 30.13 | %3 | | | 39.05 | %3 | | | 52.47 | % | | | 28.70 | % | |
| | | Year Ended Dec. 31 | | Period Ended | |
INSTITUTIONAL CLASS | | 2012 | | 2011 | | Dec. 31, 20104 | |
Net Asset Value, beginning of period | | $ | 4.61 | | | $ | 5.14 | | | $ | 4.84 | | |
INCOME (LOSS) FROM INVESTMENT OPERATIONS: | |
Net investment income (loss)1 | | | —2 | | | | 0.17 | | | | 0.03 | | |
Net realized gain (loss) and unrealized appreciation/depreciation
on investments and foreign currency | | | 1.11 | | | | (0.47 | ) | | | 0.38 | | |
Total from investment operations | | | 1.11 | | | | (0.30 | ) | | | 0.41 | | |
LESS DISTRIBUTIONS FROM: | |
Net investment income | | | — | | | | (0.01 | ) | | | — | | |
Net realized gains on investments | | | (0.05 | ) | | | (0.22 | ) | | | (0.11 | ) | |
Total distributions | | | (0.05 | ) | | | (0.23 | ) | | | (0.11 | ) | |
Paid-in capital from redemption fees (Note 4) | | | —2 | | | | —2 | | | | — | | |
Net Asset Value, end of period | | $ | 5.67 | | | $ | 4.61 | | | $ | 5.14 | | |
TOTAL RETURN | | | 24.16 | % | | | (6.05 | %) | | | 8.51 | %5 | |
RATIOS/SUPPLEMENTAL DATA | |
Net assets, end of period (in 000's) | | $ | 8,597 | | | $ | 15,109 | | | $ | 4 | | |
Ratio of expenses to average net assets | | | 1.00 | % | | | 1.07 | % | | | 0.91 | %6 | |
Ratio of net investment income (loss) to average net assets | | | (0.07 | %) | | | 3.37 | % | | | 3.74 | %6 | |
Portfolio turnover3 | | | 34.84 | % | | | 30.13 | % | | | 39.05 | %5 | |
1 Calculated using the average daily shares method.
2 Less than $0.01 per share.
3 The portfolio turnover rate is calculated on the Fund as a whole without distinguishing between classes of share issued.
4 Institutional Class commenced operations on October 29, 2010.
5 Not annualized.
6 Annualized.
See accompanying notes to financial statements.
96 MATTHEWS ASIA FUNDS
Matthews Asia Small Companies Fund
The table below sets forth financial data for a share of beneficial interest outstanding throughout each period presented.
| | | Year Ended Dec. 31 | | Period Ended | |
INVESTOR CLASS | | 2012 | | 2011 | | 2010 | | 2009 | | Dec. 31, 20081 | |
Net Asset Value, beginning of period | | $ | 14.77 | | | $ | 21.16 | | | $ | 15.79 | | | $ | 7.89 | | | $ | 10.00 | | |
INCOME (LOSS) FROM INVESTMENT OPERATIONS: | |
Net investment income (loss)2 | | | 0.17 | | | | 0.15 | | | | 0.04 | | | | 0.02 | | | | 0.01 | | |
Net realized gain (loss) and unrealized appreciation/depreciation
on investments and foreign currency | | | 3.36 | | | | (4.35 | ) | | | 5.55 | | | | 8.04 | | | | (2.16 | ) | |
Total from investment operations | | | 3.53 | | | | (4.20 | ) | | | 5.59 | | | | 8.06 | | | | (2.15 | ) | |
LESS DISTRIBUTIONS FROM: | |
Net investment income | | | (0.09 | ) | | | (0.17 | ) | | | (0.09 | ) | | | (0.05 | ) | | | (0.02 | ) | |
Net realized gains on investments | | | (0.08 | ) | | | (2.04 | ) | | | (0.15 | ) | | | (0.15 | ) | | | — | | |
Total distributions | | | (0.17 | ) | | | (2.21 | ) | | | (0.24 | ) | | | (0.20 | ) | | | (0.02 | ) | |
Paid-in capital from redemption fees (Note 4) | | | —3 | | | | 0.02 | | | | 0.02 | | | | 0.04 | | | | 0.06 | | |
Net Asset Value, end of period | | $ | 18.13 | | | $ | 14.77 | | | $ | 21.16 | | | $ | 15.79 | | | $ | 7.89 | | |
TOTAL RETURN | | | 23.92 | % | | | (20.03 | %) | | | 35.54 | % | | | 103.00 | % | | | (21.03 | %)4 | |
RATIOS/SUPPLEMENTAL DATA | |
Net assets, end of period (in 000's) | | $ | 366,753 | | | $ | 258,944 | | | $ | 547,094 | | | $ | 109,726 | | | $ | 3,173 | | |
Ratio of expenses to average net assets before any reimbursement,
waiver or recapture of expenses by Advisor and Administrator (Note 5) | | | 1.50 | % | | | 1.52 | % | | | 1.59 | % | | | 2.90 | % | | | 14.31 | %5 | |
Ratio of expenses to average net assets after any reimbursement,
waiver or recapture of expenses by Advisor and Administrator | | | 1.50 | % | | | 1.52 | % | | | 1.63 | % | | | 2.00 | % | | | 2.00 | %5 | |
Ratio of net investment income (loss) to average net assets | | | 1.06 | % | | | 0.76 | % | | | 0.24 | % | | | 0.13 | % | | | 0.15 | %5 | |
Portfolio turnover | | | 27.95 | % | | | 19.97 | % | | | 23.99 | % | | | 21.39 | % | | | 3.10 | %4 | |
1 Investor Class commenced operations on September 15, 2008.
2 Calculated using the average daily shares method.
3 Less than $0.01 per share.
4 Not annualized.
5 Annualized.
See accompanying notes to financial statements.
matthewsasia.com | 800.789.ASIA 97
Financial Highlights (continued)
Matthews China Small Companies Fund
The table below sets forth financial data for a share of beneficial interest outstanding throughout each period presented.
INVESTOR CLASS | | Year Ended
Dec. 31, 2012 | | Period Ended
Dec. 31, 20111 | |
Net Asset Value, beginning of period | | $ | 7.04 | | | $ | 10.00 | | |
INCOME (LOSS) FROM INVESTMENT OPERATIONS: | |
Net investment income (loss)2 | | | 0.03 | | | | (0.02 | ) | |
Net realized gain (loss) and unrealized appreciation/depreciation
on investments and foreign currency | | | 0.68 | | | | (2.96 | ) | |
Total from investment operations | | | 0.71 | | | | (2.98 | ) | |
LESS DISTRIBUTIONS FROM: | |
Net investment income | | | (0.02 | ) | | | (0.01 | ) | |
Total distributions | | | (0.02 | ) | | | (0.01 | ) | |
Paid-in capital from redemption fees (Note 4) | | | 0.03 | | | | 0.03 | | |
Net Asset Value, end of period | | $ | 7.76 | | | $ | 7.04 | | |
TOTAL RETURN | | | 10.53 | % | | | (29.51 | %)3 | |
RATIOS/SUPPLEMENTAL DATA | |
Net assets, end of period (in 000's) | | $ | 10,266 | | | $ | 4,493 | | |
Ratio of expenses to average net assets before any reimbursement,
waiver or recapture of expenses by Advisor and Administrator (Note 5) | | | 3.26 | % | | | 5.32 | %4 | |
Ratio of expenses to average net assets after any reimbursement,
waiver or recapture of expenses by Advisor and Administrator | | | 2.00 | % | | | 2.00 | %4 | |
Ratio of net investment income (loss) to average net assets | | | 0.40 | % | | | (0.53 | %)4 | |
Portfolio turnover | | | 34.01 | % | | | 6.08 | %3 | |
1 Investor Class commenced operations on May 31, 2011.
2 Calculated using the average daily shares method.
3 Not annualized.
4 Annualized.
See accompanying notes to financial statements.
98 MATTHEWS ASIA FUNDS
Matthews Asia Science and Technology Fund
The table below sets forth financial data for a share of beneficial interest outstanding throughout each period presented.
| | | Year Ended Dec. 31 | |
INVESTOR CLASS | | 2012 | | 2011 | | 2010 | | 2009 | | 2008 | |
Net Asset Value, beginning of year | | $ | 8.16 | | | $ | 9.89 | | | $ | 8.02 | | | $ | 4.71 | | | $ | 9.80 | | |
INCOME (LOSS) FROM INVESTMENT OPERATIONS: | |
Net investment income (loss)1 | | | 0.03 | | | | 0.02 | | | | 0.03 | | | | —2 | | | | 0.01 | | |
Net realized gain (loss) and unrealized appreciation/depreciation
on investments and foreign currency | | | 1.12 | | | | (1.74 | ) | | | 1.86 | | | | 3.31 | | | | (5.11 | ) | |
Total from investment operations | | | 1.15 | | | | (1.72 | ) | | | 1.89 | | | | 3.31 | | | | (5.10 | ) | |
LESS DISTRIBUTIONS FROM: | |
Net investment income | | | (0.02 | ) | | | (0.02 | ) | | | (0.02 | ) | | | — | | | | — | | |
Total distributions | | | (0.02 | ) | | | (0.02 | ) | | | (0.02 | ) | | | — | | | | — | | |
Paid-in capital from redemption fees (Note 4) | | | —2 | | | | 0.01 | | | | —2 | | | | —2 | | | | 0.01 | | |
Net Asset Value, end of year | | $ | 9.29 | | | $ | 8.16 | | | $ | 9.89 | | | $ | 8.02 | | | $ | 4.71 | | |
TOTAL RETURN | | | 14.11 | % | | | (17.26 | %) | | | 23.58 | % | | | 70.28 | % | | | (51.94 | %) | |
RATIOS/SUPPLEMENTAL DATA | |
Net assets, end of year (in 000's) | | $ | 131,629 | | | $ | 153,349 | | | $ | 190,436 | | | $ | 130,367 | | | $ | 74,476 | | |
Ratio of expenses to average net assets | | | 1.18 | % | | | 1.21 | % | | | 1.26 | % | | | 1.40 | % | | | 1.33 | % | |
Ratio of net investment income (loss) to average net assets | | | 0.30 | % | | | 0.23 | % | | | 0.35 | % | | | 0.30 | % | | | 0.08 | % | |
Portfolio turnover | | | 45.76 | % | | | 65.47 | % | | | 61.61 | % | | | 83.27 | % | | | 44.84 | % | |
1 Calculated using the average daily shares method.
2 Less than $0.01 per share.
See accompanying notes to financial statements.
matthewsasia.com | 800.789.ASIA 99
Notes to Financial Statements
1. ORGANIZATION
Matthews Asia Funds (the "Trust") is an open-end management investment company registered under the Investment Company Act of 1940, as amended (the "1940 Act"). The Trust currently issues thirteen separate series of shares (each a "Fund" and collectively, the "Funds"): Matthews Asia Strategic Income Fund, Matthews Asian Growth and Income Fund, Matthews Asia Dividend Fund, Matthews China Dividend Fund, Matthews Asia Growth Fund, Matthews Pacific Tiger Fund, Matthews China Fund, Matthews India Fund, Matthews Japan Fund, Matthews Korea Fund, Matthews Asia Small Companies Fund, Matthews China Small Companies Fund and Matthews Asia Science and Technology Fund. Each Fund except for Matthews Asia Small Companies Fund, Matthews China Small Companies Fund and Matthews Asia Science and Technology Fund currently offers two classes of shares: Investor Class and Institutional Class. Matthews Asia Small Companies Fund, Matthews China Small Companies Fund and Matthews Asia Science and Technology Fund currently offer only Investor Class shares. In accordance with a preliminary prospectus filed with the SEC on February 14, 2013, Matthews Asia Small Companies Fund and Matthews Asia Science and Technology Fund intend to offer Institutional Class shares later this year. Each class of shares has identical voting, dividend, liquidation and other rights and the same terms and conditions, except each class may be subject to different class expenses as outlined in the relevant prospectus and each class has exclusive voting rights with respect to matters solely affecting such class.
2. SIGNIFICANT ACCOUNTING POLICIES
The following is a summary of significant accounting policies consistently followed by the Funds in preparation of their financial statements.
A. SECURITY VALUATION: The value of the Funds' securities is based on market quotations for those securities, or on their fair value determined by or under the direction of the Funds' Board of Trustees (the "Board"). Market quotations and valuation information are provided by commercial pricing services or securities dealers that are independent of the Funds and Matthews International Capital Management, LLC ("Matthews"), in accordance with procedures established by the Funds' Board. Foreign exchange-traded securities are valued as of the close of trading on the primary exchange on which they trade. Securities that trade in over-the-counter markets, including most debt securities (bonds), may be valued by other third-party vendors or by using indicative bid quotations from dealers or market makers, or other available market information. Market values for securities are determined based on quotations, market data or other information from the principal (or most advantageous) market on which the security is traded. Market quotations for equity securities used by the Funds include last reported sale prices, or, if such prices are not reported or available, bid and ask prices. Financial futures contracts traded on exchanges are valued at their settlement price. Foreign currency exchange contracts are valued at the mean between the bid and ask prices and are determined at the close of business on the New York Stock Exchange ("NYSE"). Interpolated values are derived when the settlement date of the contract is an interim date for which quotations are not available. The Funds may also utilize independent pricing services to assist them in determining a current market value for each security based on sources believed to be reliable.
The Board has delegated the responsibility of making fair value determinations to the Funds' Valuation Committee (the "Valuation Committee") subject to the Funds' Pricing Policies. When fair value pricing is employed, the prices of securities used by a Fund to calculate its Net Asset Value ("NAV") may differ from any quoted or published prices for the same securities for that day. All fair value determinations are made subject to the Board's oversight. Events affecting the value of foreign investments may occur between the time at which they are determined and when the Funds calculate their NAV, which is normally the close of trading on the NYSE. If such events render market quotations unreliable, and the impact of such events can be reasonably determined, the investments will be valued at their fair value in accordance with pricing policies. The fair value of a security held by the Funds may be determined using the services of third-party pricing services to assist in this process.
The books and records of the Funds are maintained in U.S. dollars. Transactions, portfolio securities, and assets and liabilities denominated in a foreign currency are translated and recorded in U.S. dollars at the prevailing exchange rate as of the close of trading on the NYSE. Translation gains or losses resulting from changes in the exchange rate during the reporting period and realized gains and losses on the settlement of foreign currency transactions are reported in the results of operations for the current period. The Funds do not isolate that portion of gains and losses on investments in equity securities that is due to changes in foreign exchange rate from that which is due to changes in market prices of equity securities.
Foreign securities held by the Funds may be traded on days and at times when the NYSE is closed. Accordingly, the NAV of the Funds may be significantly affected on days when shareholders have no access to the Funds.
B. FAIR VALUE MEASUREMENTS: In accordance with the guidance on fair value measurements and disclosures under generally accepted accounting principles in the United States ("U.S. GAAP"), the Funds disclose the fair value of their investments in a hierarchy that prioritizes the inputs to valuation techniques used to measure the fair value. The hierarchy gives the highest priority to valuations based upon unadjusted quoted prices in active markets for identical assets or liabilities (Level 1 measurement) and the lowest priority to valuations based upon unobservable inputs that are significant to the valuation (Level 3 measurements). Various inputs are used in determining the fair value of investments and derivative financial instruments, which are as follows:
Level 1: Quoted prices in active markets for identical securities.
Level 2: Other significant observable inputs (including quoted prices for similar securities, interest rates, prepayment speeds, credit risk, etc.).
Level 3: Significant unobservable inputs (including the Fund's own assumptions in determining the fair value of investments).
As of December 31, 2012, Level 3 securities consist primarily of equities that, as of December 31, 2012, were suspended from trading. As described in Note 2-A, these securities are valued based on their fair value as determined under the direction of the Board. The significant unobservable inputs, the methodology used for valuing such securities, and the characterization of such securities as Level 3 securities are not necessarily an indication of liquidity, or the risk associated with investing in these securities. Certain of the Funds' securities categorized as Level 3 were valued utilizing third party pricing information which is based on unobservable inputs. A significant change in the unobservable inputs could result in a significantly lower or higher value in such Level 3 securities. Level 2 equity securities consist primarily of securities that have been fair valued by third-party pricing services (see Note 2-A).
100 MATTHEWS ASIA FUNDS
The summary of inputs used to determine the fair valuation of the Fund's investments financial instruments as of December 31, 2012 is as follows:
| | | Matthews Asia
Strategic
Income Fund | | Matthews Asian
Growth and
Income Fund | | Matthews Asia
Dividend Fund | | Matthews Asia
Growth Fund | | Matthews Pacific
Tiger Fund | |
Level 1: Quoted Prices | |
Common Equities: | |
China/Hong Kong | | $ | — | | | $ | 181,634,572 | | | $ | 291,813,212 | | | $ | 23,068,467 | | | $ | 178,885,121 | | |
India | | | — | | | | — | | | | — | | | | — | | | | 81,839,758 | | |
Indonesia | | | — | | | | 42,625,520 | | | | 26,516,576 | | | | — | | | | 13,882,115 | | |
Malaysia | | | — | | | | 39,987,943 | | | | — | | | | — | | | | — | | |
Singapore | | | — | | | | — | | | | 33,808,481 | | | | — | | | | — | | |
South Korea | | | — | | | | — | | | | — | | | | — | | | | 94,394,016 | | |
Taiwan | | | — | | | | 102,382,863 | | | | 100,604,056 | | | | — | | | | — | | |
Level 2: Other Significant Observable Inputs | |
Foreign Government Obligationsa | | | 11,698,971 | | | | — | | | | — | | | | — | | | | — | | |
Corporate Bondsa | | | 20,183,476 | | | | 522,256,725 | | | | — | | | | — | | | | — | | |
Common Equities: | |
Australia | | | 227,837 | | | | 264,655,655 | | | | 215,016,742 | | | | 17,393,024 | | | | — | | |
Cambodia | | | — | | | | — | | | | — | | | | 6,986,780 | | | | — | | |
China/Hong Kong | | | 783,550 | | | | 706,139,934 | | | | 926,293,054 | | | | 54,327,988 | | | | 1,754,938,655 | | |
India | | | — | | | | 59,209,084 | | | | 41,515,594 | | | | 35,759,032 | | | | 1,018,291,379 | | |
Indonesia | | | — | | | | 67,845,347 | | | | 143,826,333 | | | | 30,363,468 | | | | 588,119,569 | | |
Japan | | | — | | | | 344,421,153 | | | | 786,664,153 | | | | 144,445,125 | | | | — | | |
Malaysia | | | 259,553 | | | | 163,445,245 | | | | 73,742,976 | | | | 14,394,466 | | | | 343,312,413 | | |
Philippines | | | 286,846 | | | | 55,112,293 | | | | 45,461,618 | | | | — | | | | 188,224,832 | | |
Singapore | | | 685,387 | | | | 567,293,483 | | | | 402,909,258 | | | | 11,798,736 | | | | 187,023,552 | | |
South Korea | | | — | | | | 154,570,529 | | | | 117,848,085 | | | | 3,747,968 | | | | 911,882,983 | | |
Sri Lanka | | | — | | | | — | | | | — | | | | 12,011,597 | | | | — | | |
Switzerland | | | — | | | | — | | | | — | | | | — | | | | 27,985,096 | | |
Taiwan | | | — | | | | 72,522,995 | | | | 149,416,751 | | | | 23,032,829 | | | | 525,035,209 | | |
Thailand | | | 381,811 | | | | 310,520,474 | | | | 178,356,274 | | | | 31,754,550 | | | | 594,583,474 | | |
United Kingdom | | | — | | | | 81,020,010 | | | | — | | | | — | | | | — | | |
Vietnam | | | — | | | | 38,494,291 | | | | — | | | | 11,271,032 | | | | 76,714,314 | | |
Preferred Equities: | |
South Korea | | | — | | | | 123,553,564 | | | | 50,439,110 | | | | — | | | | — | | |
Level 3: Significant Unobservable Inputs | |
Corporate Bondsa | | | 212,844 | | | | — | | | | — | | | | — | | | | — | | |
Total Market Value of Investments | | $ | 34,720,275 | | | $ | 3,897,691,680 | | | $ | 3,584,232,273 | | | $ | 420,355,062 | | | $ | 6,585,112,486 | | |
a Industry, countries, or security types are disclosed on the Schedule of Investments.
matthewsasia.com | 800.789.ASIA 101
Notes to Financial Statements (continued)
| | | Matthews China
Dividend Fund | | Matthews
China Fund | | Matthews
India Fund | | Matthews
Japan Fund | | Matthews
Korea Fund | | Matthews
China Small
Companies
Fund | |
Investments | |
Level 1: Quoted Prices | |
Common Equities: | |
Consumer Discretionary | | $ | — | | | $ | 33,733,409 | | | $ | — | | | $ | — | | | $ | 6,065,937 | | | $ | 344,290 | | |
Consumer Staples | | | — | | | | — | | | | 25,065,815 | | | | 2,008,724 | | | | — | | | | — | | |
Energy | | | 3,950,221 | | | | — | | | | — | | | | — | | | | — | | | | — | | |
Financials | | | 3,074,593 | | | | 17,495,849 | | | | 31,323,233 | | | | 1,046,852 | | | | — | | | | — | | |
Health Care | | | — | | | | 49,948,204 | | | | — | | | | 2,904,784 | | | | 2,145,664 | | | | 275,625 | | |
Industrials | | | 2,927,639 | | | | — | | | | — | | | | — | | | | — | | | | 475,113 | | |
Information Technology | | | — | | | | 51,907,737 | | | | 36,719,851 | | | | — | | | | — | | | | 541,164 | | |
Materials | | | — | | | | — | | | | — | | | | — | | | | 4,485,390 | | | | — | | |
Telecommunication Services | | | 4,624,593 | | | | 28,672,976 | | | | — | | | | — | | | | 1,562,421 | | | | — | | |
Level 2: Other Significant Observable Inputs | |
Common Equities: | |
Consumer Discretionary | | | 13,044,560 | | | | 331,703,485 | | | | 61,825,384 | | | | 21,051,067 | | | | 30,937,643 | | | | 2,006,116 | | |
Consumer Staples | | | 3,582,440 | | | | 223,792,465 | | | | 74,117,756 | | | | 5,705,089 | | | | 14,996,872 | | | | 825,384 | | |
Energy | | | 2,369,560 | | | | 155,823,201 | | | | 7,443,515 | | | | — | | | | 5,741,866 | | | | 94,054 | | |
Financials | | | 7,433,769 | | | | 484,535,565 | | | | 131,653,436 | | | | 20,528,122 | | | | 21,976,751 | | | | 1,094,869 | | |
Health Care | | | 2,871,747 | | | | 45,268,946 | | | | 33,535,405 | | | | 4,734,059 | | | | 1,825,588 | | | | 723,655 | | |
Industrials | | | 5,446,209 | | | | 207,047,865 | | | | 117,499,328 | | | | 27,376,440 | | | | 8,223,823 | | | | 1,927,804 | | |
Information Technology | | | 3,163,544 | | | | 179,808,281 | | | | 5,052,189 | | | | 14,679,238 | | | | 31,147,950 | | | | 515,706 | | |
Materials | | | 1,063,562 | | | | — | | | | 80,266,872 | | | | 1,487,309 | | | | 6,543,801 | | | | 447,292 | | |
Telecommunication Services | | | — | | | | 91,029,282 | | | | — | | | | 1,179,848 | | | | — | | | | — | | |
Utilities | | | 2,657,579 | | | | 109,836,333 | | | | 20,805,582 | | | | — | | | | — | | | | 504,895 | | |
Preferred Equities: | |
Consumer Discretionary | | | — | | | | — | | | | — | | | | — | | | | 3,917,846 | | | | — | | |
Energy | | | — | | | | — | | | | — | | | | — | | | | 733,461 | | | | — | | |
Financials | | | — | | | | — | | | | — | | | | — | | | | 3,011,691 | | | | — | | |
Information Technology | | | — | | | | — | | | | — | | | | — | | | | 2,413,077 | | | | — | | |
Materials | | | — | | | | — | | | | — | | | | — | | | | 2,003,252 | | | | — | | |
Corporate Bondsa | | | — | | | | — | | | | 10,401,450 | | | | — | | | | — | | | | — | | |
Level 3: Significant Unobservable Inputs | |
Common Equities: | |
Information Technology | | | — | | | | — | | | | — | | | | — | | | | — | | | | 10,064 | | |
Total Market Value of Investments | | $ | 56,210,016 | | | $ | 2,010,603,598 | | | $ | 635,709,816 | | | $ | 102,701,532 | | | $ | 147,733,033 | | | $ | 9,786,031 | | |
a Industry, countries, or security types are disclosed on the Schedule of Investments.
102 MATTHEWS ASIA FUNDS
| | | Matthews Asia
Small Companies
Fund | | Matthews Asia
Science and
Technology Fund | |
Level 1: Quoted Prices | |
Common Equities: | |
China/Hong Kong | | $ | — | | | $ | 25,386,390 | | |
India | | | 4,407,395 | | | | 2,761,207 | | |
Indonesia | | | 12,413,152 | | | | — | | |
Japan | | | — | | | | 2,625,036 | | |
Malaysia | | | 5,252,719 | | | | 1,673,948 | | |
Taiwan | | | — | | | | 1,264,500 | | |
United States | | | — | | | | 2,828,710 | | |
Warrants: | |
Malaysia | | | 84,828 | | | | — | | |
Level 2: Other Significant Observable Inputs | |
Common Equities: | |
China/Hong Kong | | | 104,811,191 | | | | 19,551,852 | | |
India | | | 52,376,987 | | | | 978,113 | | |
Indonesia | | | 21,913,948 | | | | — | | |
Japan | | | — | | | | 24,281,441 | | |
Malaysia | | | 18,554,151 | | | | — | | |
Philippines | | | 10,844,903 | | | | — | | |
Singapore | | | 21,471,622 | | | | — | | |
South Korea | | | 33,774,060 | | | | 21,849,274 | | |
Taiwan | | | 47,634,109 | | | | 24,700,738 | | |
Thailand | | | 20,629,420 | | | | — | | |
Preferred Equities: | |
South Korea | | | — | | | | 2,362,453 | | |
Level 3: Significant Unobservable Inputs | |
Common Equities: | |
China/Hong Kong | | | 190,601 | | | | — | | |
Total Market Value of Investments | | $ | 354,359,086 | | | $ | 130,263,662 | | |
Certain foreign securities may be fair valued by external pricing services when the Funds determine that events affecting the value of foreign securities which occur between the time at which they are determined and the close of trading on the NYSE render market quotations unreliable. Such fair valuations are categorized as Level 2 in the fair value hierarchy. Foreign securities that are valued based on market quotations are categorized as Level 1 in the fair value hierarchy (see Note 2-A). The Funds' policy is to recognize transfers in and transfers out as of the beginning of the reporting period. At December 31, 2012, the Funds utilized third party pricing services to fair value certain markets which were different than markets which utilized third party pricing services at December 31, 2011. As a result, certain securities held by the Funds were transferred from Level 2 into Level 1 and certain securities held by the Funds were transferred from Level 1 into Level 2 with beginning of period values as follows:
| | | Transfer to Level 1
from Level 2 | | Transfer to Level 2
from Level 1 | |
Matthews Asia Strategic Income Fund | | $ | — | | | $ | 741,971 | | |
Matthews Asian Growth and Income Fund | | | — | | | | 1,428,306,331 | | |
Matthews Asia Dividend Fund | | | — | | | | 1,610,523,049 | | |
Matthews China Dividend Fund | | | — | | | | 18,098,816 | | |
Matthews Asia Growth Fund | | | — | | | | 190,782,194 | | |
Matthews Pacific Tiger Fund | | | 64,689,901 | | | | 3,048,498,664 | | |
Matthews China Fund | | | — | | | | 1,784,493,670 | | |
Matthews India Fund | | | — | | | | 418,950,852 | | |
Matthews Japan Fund | | | — | | | | 70,961,919 | | |
Matthews Korea Fund | | | 4,741,158 | | | | 11,041,073 | | |
Matthews Asia Small Companies Fund | | | — | | | | 135,564,408 | | |
Matthews China Small Companies Fund | | | — | | | | 2,726,978 | | |
Matthews Asia Science and Technology Fund | | | — | | | | 48,611,857 | | |
matthewsasia.com | 800.789.ASIA 103
Notes to Financial Statements (continued)
A reconciliation of Level 3 investments for which significant unobservable inputs were used to determine value are as follows:
| | | Matthews Asia
Strategic
Income Fund | | Matthews Asia
Strategic
Income Fund | | Matthews Asian
Growth and
Income Fund | | Matthews
India Fund | | Matthews
Asia Small
Companies Fund | | Matthews
China Small
Companies Fund | |
| | | Corporate Bonds | | Foreign
Government
Obligations | | Corporate Bonds | | Corporate Bonds | | Common
Equities —
China | | Common
Equities —
Information
Technology | |
Balance as of 12/31/11
(market value) | | $ | 4,268,354 | | | $ | 6,569,135 | | | $ | 468,582,867 | | | $ | 40,219,200 | | | $ | 3,040,262 | | | $ | 37,218 | | |
Accrued discounts/premiums | | | — | | | | — | | | | — | | | | — | | | | — | | | | — | | |
Realized gain/(loss) | | | — | | | | — | | | | — | | | | — | | | | — | | | | — | | |
Change in unrealized
appreciation/depreciation | | | (1,997 | ) | | | — | | | | — | | | | — | | | | (2,849,661 | ) | | | (27,154 | ) | |
Purchases | | | 214,841 | | | | — | | | | — | | | | — | | | | — | | | | — | | |
Sales | | | — | | | | — | | | | — | | | | — | | | | — | | | | — | | |
Transfers in to Level 3* | | | — | | | | — | | | | — | | | | — | | | | — | | | | — | | |
Transfers out of Level 3* | | | (4,268,354 | ) | | | (6,569,135 | ) | | | (468,582,867 | ) | | | (40,219,200 | ) | | | — | | | | — | | |
Balance as of 12/31/12
(market value) | | $ | 212,844 | | | $ | — | | | $ | — | | | $ | — | | | $ | 190,601 | | | $ | 10,064 | | |
Net change in unrealized
appreciation/depreciation
on Level 3 investments
held as of 12/31/12** | | ($ | 1,997 | ) | | $ | — | | | $ | — | | | $ | — | | | ($ | 2,849,661 | ) | | ($ | 27,154 | ) | |
* The Fund's policy is to recognize transfers in and transfer out as of the beginning of the reporting period.
** Included in the related amounts on the Statements of Operations.
Certain foreign securities, for which market quotations are not readily available, may be fair valued and classified as either Level 2 or Level 3. When the underlying inputs include significant observable inputs obtained from sources independent of the Funds, the securities are classified as Level 2. When the underlying inputs include significant unobservable inputs and reflect assumptions of market participants, the securities are classified as Level 3. As of December 31, 2012, the Funds utilized significant observable inputs including evaluated prices from the Funds' pricing vendors, day-on-day price changes, primary and ancillary pricing sources, and other available independent market indicators of value. As a result, certain securities held by the Funds that were previously classified as Level 3 were transferred to Level 2.
C. RISKS ASSOCIATED WITH NON-U.S. COMPANIES: Investments by the Funds in the securities of non-U.S. companies may involve investment risks not typically associated with investments in U.S. issuers. These risks include possible political, economic, social and religious instability, inadequate investor protection; changes in laws or regulations of countries within the Asia Pacific region (including both in countries where you invest, as well as in the broader region); international relations with other nations; natural disasters; corruption; and military activity. Foreign securities may be subject to greater fluctuations in price than securities of domestic corporations or the U.S. government. Foreign investing may also include the risk of expropriation or confiscatory taxation, limitation on the removal or funds or other assets, currency crises and exchange controls, the imposition of foreign withholding tax on the interest income payable on such instruments, the possible seizure or nationalization of foreign deposits or assets, or the adoption of other foreign government restrictions that might adversely affect the foreign securities held by the Funds. Additionally, Asia Pacific countries may utilize formal or informal currency exchange controls or "capital controls" that may limit the ability to repatriate investments or income or adversely affect the value of portfolio investments. The economies of many Asia Pacific countries differ from the economies of more developed countries in many respects, such as their rate of growth, inflation, capital reinvestment, resource self-sufficiency and dependence on other economies, financial system stability, the national balance of payments position and sensitivity to changes in global trade. Certain Asia Pacific countries are highly dependent upon and may be affected by developments in the economies of other countries. Non-U.S. companies are subject to different accounting, auditing, and financial reporting standards, practices, and requirements than U.S. companies. There is generally less government regulation of stock exchanges, brokers, and listed companies abroad than in the United States, which may result in less transparency with respect to a company's operations, and make obtaining information about them more difficult (or such information may be unavailable).
Foreign stock markets may not be as developed or efficient as those in the United States, and the absence of negotiated brokerage commissions in certain countries may result in higher brokerage fees. The time between the trade and settlement dates of securities transactions on foreign exchanges ranges from one day to four weeks or longer and may result in higher custody charges. Custodial arrangements may be less well developed than in the United States. Foreign securities are generally denominated and pay distributions in foreign currencies, exposing the Funds to changes in foreign currency exchange rates. Investing in any country in the Asia Pacific region will also entail risks specific and unique to that country, and these risks can be significant and change rapidly.
D. INCOME AND WITHHOLDING TAXES: It is the policy of the Funds to comply with all requirements of the Internal Revenue Code of 1986, as amended ("the Code"), applicable to regulated investment companies and to distribute substantially all of their taxable income to their shareholders. The Funds have met the requirements of the Code applicable to regulated investment companies for year ended December 31, 2012. Therefore, no federal income tax provision is required. Income and capital gains of the Funds are determined in accordance with both tax regulations and U.S. GAAP.
104 MATTHEWS ASIA FUNDS
Management has analyzed the Funds' tax positions taken on federal income tax returns for all open tax years (current and prior three tax years), and has concluded that no provision for federal income tax is required in the Funds' financial statements. The Funds' federal and state income and federal excise tax returns for tax years for which the applicable statutes of limitations have not expired are subject to examination by the Internal Revenue Service and state departments of revenue.
The Funds may be subject to foreign taxation related to income received, capital gains on the sale of securities and certain foreign currency transactions in the foreign jurisdictions in which they invest. Foreign taxes, if any, are recorded based on the tax regulations and rates that exist in the foreign markets in which the Funds invest. When a capital gain tax is determined to apply the Funds record an estimated deferred tax liability in an amount that may be payable if the securities were disposed of on the valuation date.
E. OFFERING COSTS: Offering costs are amortized on a straight-line basis over one year from each Fund's respective commencement of operations. In the event that any of the initial shares are redeemed during the period of amortization of the Fund's offering costs, the redemption proceeds will be reduced by any such unamortized offering costs in the same proportion as the number of shares being redeemed bears to the number of those shares outstanding at the time of redemption.
F. DISTRIBUTIONS TO SHAREHOLDERS: It is the policy of Matthews Asian Growth and Income Fund and Matthews China Dividend Fund to distribute net investment income on a semi-annual basis and capital gains, if any, annually. It is the policy of Matthews Asia Dividend Fund and Matthews Asia Strategic Income Fund to distribute net investment income on a quarterly basis and capital gains, if any, annually. Each of the other Funds distribute net investment income and capital gains, if any, annually. Distributions to shareholders are recorded on the ex-dividend date. Income and capital gain distributions are determined in accordance with income tax regulations which may differ from U.S. GAAP.
The tax character of distributions paid for the fiscal years ended December 31, 2012 and December 31, 2011 were as follows:
| YEAR ENDED DECEMBER 31, 2012 | | Ordinary Income | | Net Long-Term
Capital Gains | | Total Taxable
Distributions | |
Matthews Asia Strategic Income Fund | | $ | 1,071,273 | | | $ | — | | | $ | 1,071,273 | | |
Matthews Asian Growth and Income Fund | | | 98,152,492 | | | | — | | | | 98,152,492 | | |
Matthews Asia Dividend Fund | | | 126,711,755 | | | | — | | | | 126,711,755 | | |
Matthews China Dividend Fund | | | 1,507,751 | | | | — | | | | 1,507,751 | | |
Matthews Pacific Tiger Fund | | | 48,170,065 | | | | 5,452,552 | | | | 53,622,617 | | |
Matthews China Fund | | | 29,496,720 | | | | 20,769,147 | | | | 50,265,867 | | |
Matthews India Fund | | | 3,397,479 | | | | 9,900,700 | | | | 13,298,179 | | |
Matthews Japan Fund | | | 151,272 | | | | — | | | | 151,272 | | |
Matthews Korea Fund | | | — | | | | 1,400,563 | | | | 1,400,563 | | |
Matthews Asia Small Companies Fund | | | 1,711,579 | | | | 1,439,816 | | | | 3,151,395 | | |
Matthews China Small Companies Fund | | | 24,817 | | | | — | | | | 24,817 | | |
Matthews Asia Science and Technology Fund | | | 297,871 | | | | — | | | | 297,871 | | |
YEAR ENDED DECEMBER 31, 2011 | | Ordinary Income | | Net Long-Term
Capital Gains | | Total Taxable
Distributions | |
Matthews Asia Strategic Income Fund | | $ | 23,396 | | | $ | — | | | $ | 23,396 | | |
Matthews Asian Growth and Income Fund | | | 99,386,784 | | | | 112,546,940 | | | | 211,933,724 | | |
Matthews Asia Dividend Fund | | | 65,160,891 | | | | 11,676,961 | | | | 76,837,852 | | |
Matthews China Dividend Fund | | | 1,087,962 | | | | 27,774 | | | | 1,115,736 | | |
Matthews Asia Growth Fund | | | 7,735,513 | | | | — | | | | 7,735,513 | | |
Matthews Pacific Tiger Fund | | | 28,983,044 | | | | 77,058,025 | | | | 106,041,069 | | |
Matthews China Fund | | | 25,170,852 | | | | 174,899,928 | | | | 200,070,780 | | |
Matthews India Fund | | | 2,994,775 | | | | — | | | | 2,994,775 | | |
Matthews Japan Fund | | | 2,606,346 | | | | — | | | | 2,606,346 | | |
Matthews Korea Fund | | | 1,792,530 | | | | 5,678,972 | | | | 7,471,502 | | |
Matthews Asia Small Companies Fund | | | 2,884,834 | | | | 34,237,212 | | | | 37,122,046 | | |
Matthews China Small Companies Fund | | | 5,954 | | | | — | | | | 5,954 | | |
Matthews Asia Science and Technology Fund | | | 454,558 | | | | — | | | | 454,558 | | |
G. INVESTMENT TRANSACTIONS AND INCOME: Securities transactions are accounted for on the date the securities are purchased or sold. Gains or losses on the sale of securities are determined on the identified cost basis. Interest income is recorded on the accrual basis. Dividend income is generally recorded on the ex-dividend date. Dividend income for certain issuers headquartered in countries which the Funds invest may not be recorded until approved by the shareholders (which may occur after the ex-dividend date) if, in the judgment of management, such dividends are not reasonably determined as of the ex-dividend date. Income and realized and unrealized gains or losses on investments are allocated to each class of shares based on its relative net assets.
H. FUND EXPENSE ALLOCATIONS: The Funds account separately for the assets, liabilities and operations of each Fund. Direct expenses of each Fund or class are charged to that Fund or class while general expenses are allocated pro-rata among the Funds based on net assets or other appropriate methods.
matthewsasia.com | 800.789.ASIA 105
Notes to Financial Statements (continued)
I. CASH OVERDRAFTS: When cash balances are overdrawn, a Fund is charged an overdraft fee by the custodian of 1.00% above the 30-day LIBOR rate on outstanding balances. These amounts, if any, are included in "Other expenses" on the Statements of Operations.
J. USE OF ESTIMATES: The preparation of financial statements in conformity with U.S. GAAP requires management to make estimates and assumptions that affect the amounts reported in the financial statements and accompanying notes. Actual results may differ from those estimates.
3. DERIVATIVE FINANCIAL INSTRUMENTS
Matthews Asia Strategic Income Fund engages in various portfolio investment strategies using derivative contracts to hedge its exposure to foreign currency exchange rate risk. Losses may arise if the value of the contract decreases due to an unfavorable change in the market rates or values of the underlying instrument or if the counterparty does not perform under the contract. The Fund's primary risks associated with the use of derivatives include the other party to the derivative contract may fail to fulfill its obligation, reduced liquidity, the Fund may suffer disproportionate heavy losses relative to the amount invested, and changes in the value of the derivatives may not match or fully offset changes in the value of the hedged portfolio securities, thereby failing to achieve the original purpose for using the derivative.
Financial Futures Contracts: Matthews Asia Strategic Income Fund may purchase financial futures contracts for hedging purposes or to maintain liquidity. Financial futures contracts are agreements between the Fund and a counterparty to buy or sell a specific quantity of an underlying instrument at a specified price and at a specified date. Depending on the terms of the particular contract, futures contracts are settled either through physical delivery of the underlying instrument on the settlement date or by payment of a cash settlement amount on settlement date. Pursuant to the contract, the Fund agrees to receive from or pay an amount of cash equal to the daily fluctuation in value of the contract. Such receipts or payments are known as variation margin and are recorded by the Fund as unrealized appreciation or depreciation. When the contract is closed, the Fund records a realized gain or loss equal to the difference between the value of the contract at the time it was opened and the value at the time it was closed. The primary risks associated with the use of futures contracts are: (i) imperfect correlation between the change in market value of the securities held by the Fund and the price of futures contracts; (ii) possible lack of a liquid secondary market for a futures contract and the resulting inability to close a futures contract when desired; (iii) losses, which are potentially unlimited, due to unanticipated market movements; and (iv) Matthews' ability to predict correctly the direction of security prices, interest rates and other economic factors.
Forward Foreign Currency Exchange Contracts: Matthews Asia Strategic Income entered into forward foreign currency exchange contracts as a hedge against either specific transactions or portfolio instruments or to obtain exposure to foreign currencies (foreign currency exchange rate risk). Forward foreign currency exchange contracts, when used by the Fund, may also help to manage the overall exposure to the currencies (currency risk) in which some of the investments held by the Fund are denominated. A forward foreign currency exchange contract is an agreement between two parties to buy and sell a currency at a set exchange rate on a future date. The contract is marked-to-market daily and the change in market value is recorded by the Fund as an unrealized gain or loss. When the contract is closed, the Fund records a realized gain or loss equal to the difference between the value at the time it was opened and the value at the time it was closed. The use of forward foreign currency exchange contracts involves the risk that the value of a forward foreign currency exchange contract changes unfavorably due to movements in the value of the referenced foreign currencies and the risk that the counterparty to the contract does not perform its obligations under the agreement.
The Effect of Derivative Instruments on the Statements of Operations
Year Ended December 31, 2012
| Derivative type | | Statement of Operations
Location | | Matthews Asia
Strategic Income
Fund | |
Net Realized Gain (Loss) | |
Interest Rate Contracts: | |
| Financial futures contracts | | Net realized gain (loss) on financial futures contracts | | ($ | 142,259 | ) | |
Foreign Currency Contracts: | |
| Foreign currency contracts | | Net realized gain (loss) on foreign currency related transactions | | $ | 23,836 | | |
Net Change in Unrealized Appreciation (Depreciation) | |
Foreign Currency Exchange Contracts: | |
| Foreign currency contracts | | Net change in unrealized appreciation/depreciation on
foreign currency related transactions | | $ | 16,948 | | |
For the year ended December 31, 2012, the average quarterly balances of outstanding derivative financial instruments were as follows:
| | | Matthews Asia
Strategic Income
Fund | |
Financial Futures Contracts (Interest Rate Risk): | |
Average number of contracts purchased | | | 8 | | |
Average notional value of contracts purchased | | $ | 980,860 | | |
Forward Foreign Currency Exchange Contracts (Foreign Currency Exchange Risk): | |
Average number of contracts—U.S. dollars purchased | | | 1 | | |
Average U.S. dollar amounts purchased | | $ | 588,437 | | |
Average number of contracts—U.S. dollars sold | | | 1 | | |
Average U.S. dollar amounts sold | | $ | 394,463 | | |
106 MATTHEWS ASIA FUNDS
4. CAPITAL SHARE TRANSACTIONS
Each Fund is authorized to issue an unlimited number of shares of beneficial interest with a par value of $0.001 per share.
| | | Year Ended December 31, 2012 | | Period Ended December 31, 2011 | |
MATTHEWS ASIA STRATEGIC INCOME FUND* | | Shares | | Amount | | Shares | | Amount | |
Investor Class | |
Shares sold | | | 2,220,740 | | | $ | 23,251,177 | | | | 778,753 | | | $ | 7,781,032 | | |
Shares issued through reinvestment of distributions | | | 76,233 | | | | 804,134 | | | | 1,377 | | | | 13,650 | | |
Shares redeemed | | | (356,564 | ) | | | (3,708,303 | ) | | | (52 | ) | | | (519 | ) | |
Net increase (decrease) | | | 1,940,409 | | | $ | 20,347,008 | | | | 780,078 | | | $ | 7,794,163 | | |
| | | Year Ended December 31, 2012 | | Period Ended December 31, 2011 | |
| | | Shares | | Amount | | Shares | | Amount | |
Institutional Class | |
Shares sold | | | 23,391 | | | $ | 243,178 | | | | 529,314 | | | $ | 5,293,133 | | |
Shares issued through reinvestment of distributions | | | 23,315 | | | | 244,478 | | | | 976 | | | | 9,676 | | |
Shares redeemed | | | (4,068 | ) | | | (42,389 | ) | | | — | | | | — | | |
Net increase (decrease) | | | 42,638 | | | $ | 445,267 | | | | 530,290 | | | $ | 5,302,809 | | |
* Investor Class and Institutional Class commencement of operations on November 30, 2011.
| | | Year Ended December 31, 2012 | | Year Ended December 31, 2011 | |
MATTHEWS ASIAN GROWTH AND INCOME FUND | | Shares | | Amount | | Shares | | Amount | |
Investor Class | |
Shares sold | | | 48,595,863 | | | $ | 838,808,054 | | | | 32,060,064 | | | $ | 559,112,796 | | |
Shares issued through reinvestment of distributions | | | 4,151,037 | | | | 71,385,411 | | | | 10,068,790 | | | | 158,200,819 | | |
Shares redeemed | | | (35,314,194 | ) | | | (596,940,180 | ) | | | (104,375,074 | ) | | | (1,819,398,166 | ) | |
Net increase (decrease) | | | 17,432,706 | | | $ | 313,253,285 | | | | (62,246,220 | ) | | ($ | 1,102,084,551 | ) | |
| | | Year Ended December 31, 2012 | | Year Ended December 31, 2011 | |
| | | Shares | | Amount | | Shares | | Amount | |
Institutional Class | |
Shares sold | | | 17,034,591 | | | $ | 287,562,186 | | | | 42,908,389 | | | $ | 768,482,507 | | |
Shares issued through reinvestment of distributions | | | 1,181,732 | | | | 20,331,566 | | | | 2,445,888 | | | | 38,413,987 | | |
Shares redeemed | | | (7,436,624 | ) | | | (126,769,784 | ) | | | (17,185,882 | ) | | | (283,032,015 | ) | |
Net increase (decrease) | | | 10,779,699 | | | $ | 181,123,968 | | | | 28,168,395 | | | $ | 523,864,479 | | |
| | | Year Ended December 31, 2012 | | Year Ended December 31, 2011 | |
MATTHEWS ASIA DIVIDEND FUND | | Shares | | Amount | | Shares | | Amount | |
Investor Class | |
Shares sold | | | 77,762,477 | | | $ | 1,065,544,525 | | | | 110,243,475 | | | $ | 1,519,475,047 | | |
Shares issued through reinvestment of distributions | | | 6,181,131 | | | | 85,229,647 | | | | 4,409,967 | | | | 57,884,041 | | |
Shares redeemed | | | (47,838,310 | ) | | | (650,928,607 | ) | | | (94,904,591 | ) | | | (1,294,339,749 | ) | |
Net increase (decrease) | | | 36,105,298 | | | $ | 499,845,565 | | | | 19,748,851 | | | $ | 283,019,339 | | |
| | | Year Ended December 31, 2012 | | Year Ended December 31, 2011 | |
| | | Shares | | Amount | | Shares | | Amount | |
Institutional Class | |
Shares sold | | | 41,658,452 | | | $ | 570,550,284 | | | | 37,459,944 | | | $ | 527,212,815 | | |
Shares issued through reinvestment of distributions | | | 1,317,635 | | | | 18,233,019 | | | | 394,869 | | | | 5,170,880 | | |
Shares redeemed | | | (7,254,225 | ) | | | (100,020,697 | ) | | | (13,615,599 | ) | | | (175,025,328 | ) | |
Net increase (decrease) | | | 35,721,862 | | | $ | 488,762,606 | | | | 24,239,214 | | | $ | 357,358,367 | | |
matthewsasia.com | 800.789.ASIA 107
Notes to Financial Statements (continued)
| | | Year Ended December 31, 2012 | | Year Ended December 31, 2011 | |
MATTHEWS CHINA DIVIDEND FUND | | Shares | | Amount | | Shares | | Amount | |
Investor Class | |
Shares sold | | | 3,176,426 | | | $ | 37,085,392 | | | | 1,578,670 | | | $ | 18,586,260 | | |
Shares issued through reinvestment of distributions | | | 122,584 | | | | 1,396,131 | | | | 98,443 | | | | 1,066,240 | | |
Shares redeemed | | | (1,107,850 | ) | | | (12,362,523 | ) | | | (2,774,075 | ) | | | (30,866,410 | ) | |
Net increase (decrease) | | | 2,191,160 | | | $ | 26,119,000 | | | | (1,096,962 | ) | | ($ | 11,213,910 | ) | |
| | | Year Ended December 31, 2012 | | Year Ended December 31, 2011 | |
| | | Shares | | Amount | | Shares | | Amount | |
Institutional Class | |
Shares sold | | | 16,213 | | | $ | 189,562 | | | | 1,623 | | | $ | 20,100 | | |
Shares issued through reinvestment of distributions | | | 387 | | | | 4,528 | | | | 42 | | | | 446 | | |
Shares redeemed | | | (1,474 | ) | | | (17,286 | ) | | | (815 | ) | | | (9,840 | ) | |
Net increase (decrease) | | | 15,126 | | | $ | 176,804 | | | | 850 | | | $ | 10,706 | | |
| | | Year Ended December 31, 2012 | | Year Ended December 31, 2011 | |
MATTHEWS ASIA GROWTH FUND | | Shares | | Amount | | Shares | | Amount | |
Investor Class | |
Shares sold | | | 3,721,046 | | | $ | 63,331,425 | | | | 5,632,916 | | | $ | 97,848,412 | | |
Shares issued through reinvestment of distributions | | | — | | | | — | | | | 348,624 | | | | 5,393,217 | | |
Shares redeemed | | | (5,248,807 | ) | | | (88,329,897 | ) | | | (7,753,246 | ) | | | (132,663,366 | ) | |
Net increase (decrease) | | | (1,527,761 | ) | | ($ | 24,998,472 | ) | | | (1,771,706 | ) | | ($ | 29,421,737 | ) | |
| | | Year Ended December 31, 2012 | | Year Ended December 31, 2011 | |
| | | Shares | | Amount | | Shares | | Amount | |
Institutional Class | |
Shares sold | | | 4,863,307 | | | $ | 83,083,414 | | | | 7,003,033 | | | $ | 119,247,333 | | |
Shares issued through reinvestment of distributions | | | — | | | | — | | | | 118,577 | | | | 1,837,939 | | |
Shares redeemed | | | (2,211,230 | ) | | | (37,298,229 | ) | | | (2,128,608 | ) | | | (35,580,135 | ) | |
Net increase (decrease) | | | 2,652,077 | | | $ | 45,785,185 | | | | 4,993,002 | | | $ | 85,505,137 | | |
| | | Year Ended December 31, 2012 | | Year Ended December 31, 2011 | |
MATTHEWS PACIFIC TIGER FUND | | Shares | | Amount | | Shares | | Amount | |
Investor Class | |
Shares sold | | | 27,777,515 | | | $ | 621,796,389 | | | | 41,532,204 | | | $ | 934,343,952 | | |
Shares issued through reinvestment of distributions | | | 811,853 | | | | 19,598,132 | | | | 2,676,956 | | | | 55,278,364 | | |
Shares redeemed | | | (42,748,798 | ) | | | (959,086,345 | ) | | | (129,175,269 | ) | | | (2,984,869,324 | ) | |
Net increase (decrease) | | | (14,159,430 | ) | | ($ | 317,691,824 | ) | | | (84,966,109 | ) | | ($ | 1,995,247,008 | ) | |
| | | Year Ended December 31, 2012 | | Year Ended December 31, 2011 | |
| | | Shares | | Amount | | Shares | | Amount | |
Institutional Class | |
Shares sold | | | 79,998,608 | | | $ | 1,801,060,227 | | | | 91,157,431 | | | $ | 2,125,434,487 | | |
Shares issued through reinvestment of distributions | | | 597,916 | | | | 14,421,744 | | | | 1,088,887 | | | | 22,463,738 | | |
Shares redeemed | | | (25,944,049 | ) | | | (589,366,627 | ) | | | (15,469,797 | ) | | | (338,404,484 | ) | |
Net increase (decrease) | | | 54,652,475 | | | $ | 1,226,115,344 | | | | 76,776,521 | | | $ | 1,809,493,741 | | |
108 MATTHEWS ASIA FUNDS
| | | Year Ended December 31, 2012 | | Year Ended December 31, 2011 | |
MATTHEWS CHINA FUND | | Shares | | Amount | | Shares | | Amount | |
Investor Class | |
Shares sold | | | 13,170,343 | | | $ | 300,777,524 | | | | 16,475,470 | | | $ | 462,682,408 | | |
Shares issued through reinvestment of distributions | | | 1,706,904 | | | | 38,849,124 | | | | 8,291,580 | | | | 182,081,269 | | |
Shares redeemed | | | (30,279,030 | ) | | | (679,455,872 | ) | | | (39,534,640 | ) | | | (1,062,621,657 | ) | |
Net increase (decrease) | | | (15,401,783 | ) | | ($ | 339,829,224 | ) | | | (14,767,590 | ) | | ($ | 417,857,980 | ) | |
| | | Year Ended December 31, 2012 | | Year Ended December 31, 2011 | |
| | | Shares | | Amount | | Shares | | Amount | |
Institutional Class | |
Shares sold | | | 11,827,474 | | | $ | 270,914,455 | | | | 12,452,573 | | | $ | 289,794,029 | | |
Shares issued through reinvestment of distributions | | | 89,313 | | | | 2,030,100 | | | | 254,874 | | | | 5,591,931 | | |
Shares redeemed | | | (8,663,672 | ) | | | (193,876,060 | ) | | | (709,945 | ) | | | (16,414,721 | ) | |
Net increase (decrease) | | | 3,253,115 | | | $ | 79,068,495 | | | | 11,997,502 | | | $ | 278,971,239 | | |
| | | Year Ended December 31, 2012 | | Year Ended December 31, 2011 | |
MATTHEWS INDIA FUND | | Shares | | Amount | | Shares | | Amount | |
Investor Class | |
Shares sold | | | 5,201,385 | | | $ | 85,925,731 | | | | 10,457,996 | | | $ | 199,418,664 | | |
Shares issued through reinvestment of distributions | | | 681,987 | | | | 11,818,835 | | | | 182,527 | | | | 2,717,658 | | |
Shares redeemed | | | (12,325,063 | ) | | | (198,687,083 | ) | | | (34,128,620 | ) | | | (639,558,369 | ) | |
Net increase (decrease) | | | (6,441,691 | ) | | ($ | 100,942,517 | ) | | | (23,488,097 | ) | | ($ | 437,422,047 | ) | |
| | | Year Ended December 31, 2012 | | Year Ended December 31, 2011 | |
| | | Shares | | Amount | | Shares | | Amount | |
Institutional Class | |
Shares sold | | | 93,829 | | | $ | 1,552,011 | | | | 371,582 | | | $ | 7,299,291 | | |
Shares issued through reinvestment of distributions | | | 46,125 | | | | 799,816 | | | | 8,878 | | | | 132,371 | | |
Shares redeemed | | | (55,380 | ) | | | (949,348 | ) | | | (641,677 | ) | | | (10,550,308 | ) | |
Net increase (decrease) | | | 84,574 | | | $ | 1,402,479 | | | | (261,217 | ) | | ($ | 3,118,646 | ) | |
| | | Year Ended December 31, 2012 | | Year Ended December 31, 2011 | |
MATTHEWS JAPAN FUND | | Shares | | Amount | | Shares | | Amount | |
Investor Class | |
Shares sold | | | 2,552,518 | | | $ | 30,321,153 | | | | 9,300,532 | | | $ | 114,703,172 | | |
Shares issued through reinvestment of distributions | | | 6,087 | | | | 72,984 | | | | 167,878 | | | | 1,900,379 | | |
Shares redeemed | | | (4,778,502 | ) | | | (56,073,619 | ) | | | (5,937,057 | ) | | | (71,506,114 | ) | |
Net increase (decrease) | | | (2,219,897 | ) | | ($ | 25,679,482 | ) | | | 3,531,353 | | | $ | 45,097,437 | | |
| | | Year Ended December 31, 2012 | | Year Ended December 31, 2011 | |
| | | Shares | | Amount | | Shares | | Amount | |
Institutional Class | |
Shares sold | | | 490,430 | | | $ | 5,822,798 | | | | 2,679,969 | | | $ | 33,412,230 | | |
Shares issued through reinvestment of distributions | | | 3,074 | | | | 36,828 | | | | 34,653 | | | | 392,273 | | |
Shares redeemed | | | (1,352,621 | ) | | | (16,016,970 | ) | | | (42,618 | ) | | | (490,305 | ) | |
Net increase (decrease) | | | (859,117 | ) | | ($ | 10,157,344 | ) | | | 2,672,004 | | | $ | 33,314,198 | | |
matthewsasia.com | 800.789.ASIA 109
Notes to Financial Statements (continued)
| | | Year Ended December 31, 2012 | | Year Ended December 31, 2011 | |
MATTHEWS KOREA FUND | | Shares | | Amount | | Shares | | Amount | |
Investor Class | |
Shares sold | | | 3,004,174 | | | $ | 15,405,145 | | | | 9,980,437 | | | $ | 52,613,715 | | |
Shares issued through reinvestment of distributions | | | 227,370 | | | | 1,261,906 | | | | 1,372,595 | | | | 6,464,876 | | |
Shares redeemed | | | (9,016,025 | ) | | | (45,221,382 | ) | | | (13,035,214 | ) | | | (65,292,520 | ) | |
Net increase (decrease) | | | (5,784,481 | ) | | ($ | 28,554,331 | ) | | | (1,682,182 | ) | | ($ | 6,213,929 | ) | |
| | | Year Ended December 31, 2012 | | Year Ended December 31, 2011 | |
| | | Shares | | Amount | | Shares | | Amount | |
Institutional Class | |
Shares sold | | | 8,618,940 | | | $ | 42,519,900 | | | | 3,273,646 | | | $ | 16,597,460 | | |
Shares issued through reinvestment of distributions | | | — | | | | — | | | | 21,797 | | | | 102,882 | | |
Shares redeemed | | | (10,380,179 | ) | | | (48,255,856 | ) | | | (18,269 | ) | | | (102,473 | ) | |
Net increase (decrease) | | | (1,761,239 | ) | | ($ | 5,735,956 | ) | | | 3,277,174 | | | $ | 16,597,869 | | |
| | | Year Ended December 31, 2012 | | Year Ended December 31, 2011 | |
MATTHEWS ASIA SMALL COMPANIES FUND | | Shares | | Amount | | Shares | | Amount | |
Investor Class | |
Shares sold | | | 9,095,379 | | | $ | 152,711,909 | | | | 7,391,135 | | | $ | 149,600,807 | | |
Shares issued through reinvestment of distributions | | | 161,312 | | | | 2,845,544 | | | | 2,209,203 | | | | 33,557,805 | | |
Shares redeemed | | | (6,558,137 | ) | | | (106,965,033 | ) | | | (17,921,097 | ) | | | (341,096,658 | ) | |
Net increase (decrease) | | | 2,698,554 | | | $ | 48,592,420 | | | | (8,320,759 | ) | | ($ | 157,938,046 | ) | |
| | | Year Ended December 31, 2012 | | Period Ended December 31, 2011 | |
MATTHEWS CHINA SMALL COMPANIES FUND* | | Shares | | Amount | | Shares | | Amount | |
Investor Class | |
Shares sold | | | 1,094,940 | | | $ | 8,135,914 | | | | 850,982 | | | $ | 7,444,714 | | |
Shares issued through reinvestment of distributions | | | 3,294 | | | | 24,605 | | | | 824 | | | | 5,923 | | |
Shares redeemed | | | (413,179 | ) | | | (3,008,148 | ) | | | (213,196 | ) | | | (1,583,026 | ) | |
Net increase (decrease) | | | 685,055 | | | $ | 5,152,371 | | | | 638,610 | | | $ | 5,867,611 | | |
* The Investor Class commenced operations on May 31, 2011.
| | | Year Ended December 31, 2012 | | Year Ended December 31, 2011 | |
MATTHEWS ASIA SCIENCE AND TECHNOLOGY FUND | | Shares | | Amount | | Shares | | Amount | |
Investor Class | |
Shares sold | | | 667,622 | | | $ | 5,929,115 | | | | 8,443,941 | | | $ | 78,551,775 | | |
Shares issued through reinvestment of distributions | | | 29,966 | | | | 274,795 | | | | 50,284 | | | | 420,876 | | |
Shares redeemed | | | (5,327,248 | ) | | | (46,483,548 | ) | | | (8,950,512 | ) | | | (83,993,985 | ) | |
Net increase (decrease) | | | (4,629,660 | ) | | ($ | 40,279,638 | ) | | | (456,287 | ) | | ($ | 5,021,334 | ) | |
The Funds generally assess a redemption fee of 2.00% of the total redemption proceeds if shareholders sell or exchange their shares within 90 calendar days after purchasing them. The redemption fee is paid directly to the Funds and is designed to offset transaction costs associated with short-term trading of Fund shares. For purposes of determining whether the redemption fee applies, the shares that have been held the longest will be redeemed first. The Funds may grant an exemption from the redemption fee when the Funds have previously received assurances that transactions do not involve a substantial risk of the type of harm that the policy is designed to avoid. The Funds may also waive the imposition of redemption fees in certain circumstances. For more information on this policy, please see the Funds' prospectuses. The redemption fees returned to the assets of the Funds are stated in the Statements of Changes in Net Assets.
5. INVESTMENT ADVISORY FEES AND OTHER TRANSACTIONS WITH AFFILIATES
Matthews, a registered investment advisor under the 1940 Act, provides the Funds with investment management services. Pursuant to an Investment Advisory Agreement dated August 13, 2004, as amended (the "Advisory Agreement"), the Funds pay Matthews (i) for management and advisory services; and (ii) for certain administrative services, an annual fee as a percentage of average daily net assets. Under the
110 MATTHEWS ASIA FUNDS
Advisory Agreement each of the Funds, other than Matthews Asia Strategic Income Fund, Matthews Asia Small Companies Fund and Matthews China Small Companies Fund pays Matthews 0.75% of their annual aggregate average daily net assets up to $2 billion, 0.6834% of the annual aggregate average daily net assets between $2 billion and $5 billion, and 0.65% of the annual aggregate average daily net assets over $5 billion. Matthews Asia Strategic Income Fund pays Matthews an annual fee of 0.65% of its annual average daily net assets pursuant to the Advisory Agreement. Matthews Asia Small Companies Fund and Matthews China Small Companies Fund pay Matthews an annual fee of 1.00% of their annual average daily net assets pursuant to the Advisory Agreement. Each Fund pays Matthews a monthly fee of one-twelfth (1/12) of the management fee of the Fund's average daily net asset value.
Under a written agreement between the Funds and Matthews, Matthews agrees to waive fees and reimburse money to a Fund if its expense ratio exceeds a certain percentage level. For Matthews Asia Science and Technology Fund, Matthews China Fund, Matthews India Fund, Matthews Japan Fund, Matthews Korea Fund, Matthews Asia Small Companies Fund and Matthews China Small Companies Fund, this level is 2.00%. For Matthews Asia Growth Fund, Matthews Pacific Tiger Fund and Matthews Asian Growth and Income Fund, this level is 1.90%. For Matthews Asia Dividend Fund and Matthews China Dividend Fund, this level is 1.50%. For Matthews Asia Strategic Income Fund, Matthews agrees to waive fees and reimburse money to the Fund if its expense ratio exceeds 1.25% for the Institutional Class and agrees to reduce the expense ratio by an equal amount for the Investor Class. Because certain expenses of the Investor Class of Matthews Asia Strategic Income Fund may be higher than the Institutional Class, the expense ratio of the Investor Class may exceed 1.25%. In turn, if a Fund's expenses fall below the level noted within three years after Matthews has made such a reimbursement, the Fund may reimburse Matthews up to an amount of the recoupment available not to exceed its expense limitation. For each Fund other than Matthews China Small Companies Fund and Matthews Asia Strategic Income Fund, this agreement will continue through at least August 31, 2013. For Matthews China Small Companies Fund and Matthews Asia Strategic Income Fund, this agreement will continue through at least August 31, 2014. These agreements may be extended for additional periods for each of the Funds.
Matthews has also agreed to waive fees and reimburse additional expenses for the Institutional Class of Matthews Asia Strategic Income Fund on a voluntary basis if its expense ratio exceeds 1.00%. Furthermore, any amounts voluntarily waived by Matthews in respect of the Institutional Class of Matthews Asia Strategic Income Fund, excluding any voluntary waiver of class-specific shareholder servicing fees, will also be waived for the Investor Class of Matthews Asia Strategic Income Fund. These voluntary waivers and/or reimbursements may be terminated at any time in the sole and absolute discretion of Matthews.
On December 31, 2012, the amounts subject to possible future recoupment under the expense limitation agreement are as follows:
| | | Expiring December 31, | |
| | | 2013 | | 2014 | | 2015 | |
Matthews Asia Strategic Income Fund | | $ | — | | | $ | 22,796 | | | $ | 161,965 | | |
Matthews China Dividend Fund | | | 96,407 | | | | 8,122 | | | | — | | |
Matthews China Small Companies Fund | | | — | | | | 76,945 | | | | 76,425 | | |
Matthews China Dividend Fund had $21,691 recoupment that expired on December 31, 2012. Matthews Asian Growth and Income Fund, Matthews Asia Dividend Fund, Matthews Asia Growth Fund, Matthews Pacific Tiger Fund, Matthews China Fund, Matthews India Fund, Matthews Japan Fund, Matthews Korea Fund, Matthews Asia Small Companies Fund, Matthews Asia Science and Technology Fund had no amounts available for recoupment and no amounts recouped during the year.
Investment advisory fees charged, waived and reimbursed for the year ended December 31, 2012, were as follows:
| | | Gross Advisory Fees | | Advisory Fees
Waived and
Reimbursed in
Excess of the
Expense Limitation | | Recapture
of Previously
Waived Fees | | Net Advisory Fee/
Reimbursement | |
Matthews Asia Strategic Income Fund | | $ | 152,448 | | | ($ | 161,965 | ) | | $ | — | | | ($ | 9,517 | ) | |
Matthews Asian Growth and Income Fund | | | 22,674,023 | | | | — | | | | — | | | | 22,674,023 | | |
Matthews Asia Dividend Fund | | | 19,471,948 | | | | — | | | | — | | | | 19,471,948 | | |
Matthews China Dividend Fund | | | 217,096 | | | | — | | | | 8,970 | | | | 226,066 | | |
Matthews Asia Growth Fund | | | 2,539,982 | | | | — | | | | — | | | | 2,539,982 | | |
Matthews Pacific Tiger Fund | | | 38,919,428 | | | | — | | | | — | | | | 38,919,428 | | |
Matthews China Fund | | | 14,332,399 | | | | — | | | | — | | | | 14,332,399 | | |
Matthews India Fund | | | 4,324,138 | | | | — | | | | — | | | | 4,324,138 | | |
Matthews Japan Fund | | | 766,223 | | | | — | | | | — | | | | 766,223 | | |
Matthews Korea Fund | | | 1,095,880 | | | | — | | | | — | | | | 1,095,880 | | |
Matthews Asia Small Companies Fund | | | 3,164,318 | | | | — | | | | — | | | | 3,164,318 | | |
Matthews China Small Companies Fund | | | 60,925 | | | | (76,425 | ) | | | — | | | | (15,500 | ) | |
Matthews Asia Science and Technology Fund | | | 950,584 | | | | — | | | | — | | | | 950,584 | | |
Certain officers and Trustees of the Funds are also officers and directors of Matthews. All officers serve without compensation from the Funds. The Funds paid the Independent Trustees $676,000 in aggregate for regular compensation during the year ended December 31, 2012.
The Funds have a Shareholder Services Agreement, in which the Funds pay an annual administration and shareholder servicing fee to Matthews, as a percentage of the average daily net assets of each Fund in aggregate, computed and prorated on a daily basis. Under the Shareholder Services Agreement, the Funds pay 0.25% of their aggregate average daily net assets between $0 and $2 billion, 0.1834% of their aggregate average daily net assets between $2 billion and $5 billion, 0.15% of their aggregate average daily net assets between $5 billion and $7.5 billion, 0.125% of their aggregate average daily net assets between $7.5 billion and $15 billion and 0.11% of their aggregate average daily net assets over $15 billion.
matthewsasia.com | 800.789.ASIA 111
Notes to Financial Statements (continued)
Administration and shareholder servicing fees charged, for the year ended December 31, 2012, were as follows:
| | | Administration and
Shareholder
Servicing Fees | |
Matthews Asia Strategic Income Fund | | $ | 36,097 | | |
Matthews Asian Growth and Income Fund | | | 5,226,011 | | |
Matthews Asia Dividend Fund | | | 4,485,723 | | |
Matthews China Dividend Fund | | | 49,966 | | |
Matthews Asia Growth Fund | | | 585,677 | | |
Matthews Pacific Tiger Fund | | | 8,971,705 | | |
Matthews China Fund | | | 3,309,187 | | |
Matthews India Fund | | | 997,600 | | |
Matthews Japan Fund | | | 176,952 | | |
Matthews Korea Fund | | | 253,005 | | |
Matthews Asia Small Companies Fund | | | 488,239 | | |
Matthews China Small Companies Fund | | | 9,381 | | |
Matthews Asia Science and Technology Fund | | | 219,439 | | |
The Funds bear a portion of the fees paid to certain service providers (exclusive of the Funds' transfer agent) which provide transfer agency and shareholder servicing to certain shareholders. Additional information concerning these services and fees is contained in the Funds' prospectuses. Fees accrued to pay to such service providers for the year ended December 31, 2012 are a component of Transfer Agent fees and Administration and Shareholder Servicing Fees in the Statements of Operations as follows:
| | | Transfer Agent Fees | | Administration &
Shareholder
Servicing Fees | | Total | |
Matthews Asia Strategic Income Fund | | $ | 19,757 | | | $ | 9,878 | | | $ | 29,635 | | |
Matthews Asian Growth and Income Fund | | | 3,999,034 | | | | 1,999,517 | | | | 5,998,551 | | |
Matthews Asia Dividend Fund | | | 3,070,588 | | | | 1,535,294 | | | | 4,605,882 | | |
Matthews China Dividend Fund | | | 40,659 | | | | 20,329 | | | | 60,988 | | |
Matthews Asia Growth Fund | | | 384,814 | | | | 192,407 | | | | 577,221 | | |
Matthews Pacific Tiger Fund | | | 4,886,672 | | | | 2,443,336 | | | | 7,330,008 | | |
Matthews China Fund | | | 2,469,274 | | | | 1,234,637 | | | | 3,703,911 | | |
Matthews India Fund | | | 831,473 | | | | 415,736 | | | | 1,247,209 | | |
Matthews Japan Fund | | | 120,077 | | | | 60,038 | | | | 180,115 | | |
Matthews Korea Fund | | | 162,310 | | | | 81,155 | | | | 243,465 | | |
Matthews Asia Small Companies Fund | | | 422,717 | | | | 211,358 | | | | 634,075 | | |
Matthews China Small Companies Fund | | | 9,523 | | | | 4,761 | | | | 14,284 | | |
Matthews Asia Science and Technology Fund | | | 155,369 | | | | 77,685 | | | | 233,054 | | |
112 MATTHEWS ASIA FUNDS
BNY Mellon Investment Servicing (US) Inc. ("BNY Mellon"), an indirect wholly owned subsidiary of The Bank of New York Mellon Corporation, serves as the Funds' administrator, and in that capacity, performs various administrative and accounting services for each Fund. BNY Mellon also serves as the Funds' transfer agent, dividend disbursing agent and registrar. An officer of BNY Mellon serves as Assistant Treasurer to the Funds. Total fees accrued by the Funds for administration and accounting services for the year ended December 31, 2012 were as follows:
| | | Administration and
Accounting Fees | |
Matthews Asia Strategic Income Fund | | $ | 1,878 | | |
Matthews Asian Growth and Income Fund | | | 271,181 | | |
Matthews Asia Dividend Fund | | | 232,928 | | |
Matthews China Dividend Fund | | | 2,598 | | |
Matthews Asia Growth Fund | | | 30,370 | | |
Matthews Pacific Tiger Fund | | | 465,449 | | |
Matthews China Fund | | | 171,241 | | |
Matthews India Fund | | | 51,668 | | |
Matthews Japan Fund | | | 9,158 | | |
Matthews Korea Fund | | | 13,091 | | |
Matthews Asia Small Companies Fund | | | 25,310 | | |
Matthews China Small Companies Fund | | | 487 | | |
Matthews Asia Science and Technology Fund | | | 11,360 | | |
Brown Brothers Harriman & Co. serves as the Funds' custodian. Foreside Funds Distributors LLC, serves as the Funds' distributor in the United States pursuant to an Underwriting Agreement. Matthews Asia Funds are distributed in Latin America by HMC Partners.
On November 30, 2011, Matthews invested $10 million in Matthews Asia Strategic Income Fund to provide the Fund with its initial investment assets. As of December 31, 2012, the Fund's net assets were $35,683,857, of which 1,043,785 shares held by Matthews represented 32%.
The Funds entered into transactions with J.P. Morgan Chase Bank, N.A., including its subsidiaries and affiliates ("J.P. Morgan") acting as a broker-dealer in the purchase and sale of portfolio investments on an agency basis. The aggregate value of such transactions with J.P. Morgan by the Funds in 2012 was $381,859. In addition, pursuant to an Administrative Fee Agreement dated July 1, 2009, the Funds received certain shareholder, administrative and sub-transfer agency services from J.P. Morgan (including transmission of purchase and redemption orders in accordance with the Funds' prospectuses; maintenance of separate records for its clients; mailing of shareholder confirmations and periodic statements; processing dividend payments; and shareholder information and support). Pursuant to the agreement with J.P. Morgan, the Funds paid J.P. Morgan $1,102,828 for such services.
6. INVESTMENTS
The value of investment transactions made for affiliated and unaffiliated holdings for the year ended December 31, 2012, excluding short-term investments, were as follows:
| | | Affiliated Purchases | | Unaffiliated Purchases | | Proceeds from
Unaffiliated Sales | |
Matthews Asia Strategic Income Fund | | $ | — | | | $ | 24,799,092 | | | $ | 4,207,122 | | |
Matthews Asian Growth and Income Fund | | | 1,300,365 | | | | 956,215,355 | | | | 578,734,756 | | |
Matthews Asia Dividend Fund | | | 158,560,699 | | | | 968,021,811 | | | | 259,836,081 | | |
Matthews China Dividend Fund | | | — | | | | 29,067,974 | | | | 6,943,132 | | |
Matthews Asia Growth Fund | | | — | | | | 195,628,157 | | | | 166,518,371 | | |
Matthews Pacific Tiger Fund | | | 130,576,049 | | | | 1,091,084,477 | | | | 370,627,488 | | |
Matthews China Fund | | | 2,033,834 | | | | 201,017,472 | | | | 469,707,917 | | |
Matthews India Fund | | | — | | | | 44,812,080 | | | | 163,860,779 | | |
Matthews Japan Fund | | | — | | | | 55,553,600 | | | | 92,586,923 | | |
Matthews Korea Fund | | | — | | | | 55,864,019 | | | | 91,488,618 | | |
Matthews Asia Small Companies Fund | | | — | | | | 127,899,238 | | | | 86,619,198 | | |
Matthews China Small Companies Fund | | | — | | | | 6,863,585 | | | | 2,031,996 | | |
Matthews Asia Science and Technology Fund | | | — | | | | 64,027,771 | | | | 104,384,777 | | |
7. HOLDINGS OF 5% VOTING SHARES OF PORTFOLIO COMPANIES
The 1940 Act defines "affiliated companies" to include investments in portfolio companies in which a fund owns 5% or more of the outstanding voting shares. During the year ended December 31, 2012, the Funds below held 5% or more of the outstanding voting shares of the noted portfolio companies. During this period, other Funds in the Trust may also have held voting shares of the issuers at levels below 5%.
matthewsasia.com | 800.789.ASIA 113
Notes to Financial Statements (continued)
Investments in affiliates:
A summary of transactions in securities of issuers affiliated with a Fund for the year ended December 31, 2012 is set forth below:
| | | Shares Held at
Dec. 31, 2011 | | Shares
Purchased | | Shares
Sold | | Shares Held at
Dec. 31, 2012 | | Value at
Dec. 31, 2012 | | Dividend
Income
Jan. 1, 2012–
Dec. 31, 2012 | |
MATTHEWS ASIAN GROWTH AND INCOME FUND | |
Name of Issuer: | |
Citic Telecom International Holdings, Ltd. | | | 132,231,000 | | | | 6,895,000 | | | | — | | | | 139,126,000 | | | $ | 38,086,439 | | | $ | 1,636,330 | | |
Vitasoy International Holdings, Ltd. | | | 51,771,000 | | | | — | | | | — | | | | 51,771,000 | | | | 53,265,796 | | | | 1,221,649 | | |
Total Affiliates | | | | | | | | | | $ | 91,352,235 | | | $ | 2,857,979 | | |
MATTHEWS ASIA DIVIDEND FUND | |
Name of Issuer: | |
Ascendas India Trust | | | 46,280,000 | | | | 8,785,000 | | | | — | | | | 55,065,000 | | | $ | 33,808,481 | | | $ | 2,078,451 | | |
CapitaRetail China Trust, REIT | | | 38,501,000 | | | | 9,039,000 | | | | — | | | | 47,540,000 | | | | 64,348,195 | | | | 4,289,584 | | |
EPS Corp. | | | 14,592 | | | | — | | | | — | | | | 14,592 | | | | 37,550,443 | | | | 638,116 | | |
Jiangsu Expressway Co., Ltd. H Shares | | | 34,444,000 | | | | 30,660,000 | | | | — | | | | 65,104,000 | | | | 67,783,756 | | | | 2,531,541 | | |
Johnson Health Tech Co., Ltd. | | | 11,713,100 | | | | 4,716,791 | † | | | 1 | | | | 16,429,890 | | | | 42,196,664 | | | | 916,919 | | |
Minth Group, Ltd. | | | 26,921,000 | | | | 29,764,000 | | | | — | | | | 56,685,000 | | | | 65,882,241 | | | | 1,108,002 | | |
Pigeon Corp. | | | 1,381,300 | | | | 120,500 | | | | — | | | | 1,501,800 | | | | 71,871,215 | | | | 1,632,422 | | |
Shinko Plantech Co., Ltd. | | | 2,400,200 | | | | 1,360,000 | | | | — | | | | 3,760,200 | | | | 29,761,906 | | | | 919,954 | | |
Sichuan Expressway Co., Ltd. H Shares | | | 65,612,000 | | | | 9,334,000 | | | | — | | | | 74,946,000 | | | | 27,291,412 | | | | 1,065,449 | | |
TXC Corp. | | | 21,549,524 | | | | — | | | | — | | | | 21,549,524 | | | | 35,711,629 | | | | 1,579,719 | | |
Woongjin Thinkbig Co., Ltd. | | | 2,079,870 | | | | — | | | | — | | | | 2,079,870 | | | | 12,766,854 | | | | 48,497 | | |
Xingda International Holdings, Ltd. | | | — | | | | 109,164,000 | | | | — | | | | 109,164,000 | | | | 57,239,943 | | | | 1,370,620 | | |
Yuexiu Transport Infrastructure, Ltd. | | | 69,730,000 | | | | 27,480,000 | | | | — | | | | 97,210,000 | | | | 47,257,529 | | | | 2,606,609 | | |
Total Affiliates | | | | | | | | | | $ | 593,470,268 | | | $ | 20,785,883 | | |
MATTHEWS PACIFIC TIGER FUND | |
Name of Issuer: | |
| Cheil Worldwide, Inc.†† | | | 5,916,350 | | | | — | | | | 405,910 | | | | 5,510,440 | | | $ | — | | | $ | — | | |
Digital China Holdings, Ltd. | | | 43,173,000 | | | | 12,655,000 | | | | — | | | | 55,828,000 | | | | 96,542,403 | | | | 2,762,261 | | |
Green Cross Corp. | | | 684,049 | | | | 154,820 | | | | — | | | | 838,869 | | | | 108,742,174 | | | | 1,173,599 | | |
Hyflux, Ltd. | | | 28,487,280 | | | | 36,797,000 | | | | — | | | | 65,284,280 | | | | 69,089,425 | | | | 1,232,490 | | |
MegaStudy Co., Ltd. | | | 396,412 | | | | — | | | | — | | | | 396,412 | | | | 29,241,888 | | | | 1,109,181 | | |
Sinopharm Group Co., Ltd. H Shares | | | 25,328,800 | | | | 18,459,200 | | | | — | | | | 43,788,000 | | | | 139,049,680 | | | | 1,229,861 | | |
Yuhan Corp. | | | 584,138 | | | | — | | | | — | | | | 584,138 | | | | 94,394,016 | | | | 681,020 | | |
Total Affiliates | | | | | | | | | | $ | 537,059,586 | | | $ | 8,188,412 | | |
MATTHEWS CHINA FUND | |
Name of Issuer: | |
Lianhua Supermarket Holdings Co., Ltd. H Shares | | | 28,947,800 | | | | 2,246,000 | | | | — | | | | 31,193,800 | | | $ | 30,077,120 | | | $ | 914,962 | | |
Total Affiliates | | | | | | | | | | $ | 30,077,120 | | | $ | 914,962 | | |
† Includes stock dividend during the period.
†† Issuer was not an affiliated company as of December 31, 2012.
114 MATTHEWS ASIA FUNDS
8. FEDERAL INCOME TAX INFORMATION
As of December 31, 2012, the components of accumulated earnings/(deficit) on tax basis were as follows:
| | Undistributed
Ordinary Income | | Undistributed
Long-Term
Capital Gains | | Capital Loss
Carryforwards | |
Matthews Asia Strategic Income Fund | | $ | 37,470 | | | $ | 29,972 | | | $ | — | | |
Matthews Asian Growth and Income Fund | | | 1,423,608 | | | | 16,498,809 | | | | — | | |
Matthews Asia Dividend Fund | | | 29,178,249 | | | | — | | | | (143,682,891 | ) | |
Matthews China Dividend Fund | | | 155,571 | | | | — | | | | (1,892,797 | ) | |
Matthews Asia Growth Fund | | | 9,039,231 | | | | — | | | | (47,329,141 | ) | |
Matthews Pacific Tiger Fund | | | 2,446,015 | | | | 3,361,902 | | | | — | | |
Matthews China Fund | | | — | | | | 15,156,801 | | | | — | | |
Matthews India Fund | | | 4,882,588 | | | | 372,059 | | | | — | | |
Matthews Japan Fund | | | 2,603,419 | | | | — | | | | (73,312,856 | ) | |
Matthews Korea Fund | | | 462,570 | | | | 5,864,743 | | | | — | | |
Matthews Asia Small Companies Fund | | | 1,558,380 | | | | — | | | | (15,975,692 | ) | |
Matthews China Small Companies Fund | | | 15,862 | | | | — | | | | (1,127,425 | ) | |
Matthews Asia Science and Technology Fund | | | 152,329 | | | | — | | | | (11,744,049 | ) | |
| | Late Year
Losses* | | Other Temporary
Differences | | Unrealized
Appreciation** | | Total Accumulated
Earnings/(Deficit) | |
Matthews Asia Strategic Income Fund | | $ | — | | | $ | — | | | $ | 1,834,510 | | | $ | 1,901,952 | | |
Matthews Asian Growth and Income Fund | | | — | | | | — | | | | 774,929,595 | | | | 792,852,012 | | |
Matthews Asia Dividend Fund | | | (4,007,951 | ) | | | (40,868 | ) | | | 404,477,106 | | | | 285,923,645 | | |
Matthews China Dividend Fund | | | — | | | | — | | | | 5,593,982 | | | | 3,856,756 | | |
Matthews Asia Growth Fund | | | (1,872,371 | ) | | | — | | | | 81,398,345 | | | | 41,236,064 | | |
Matthews Pacific Tiger Fund | | | (72,733 | ) | | | — | | | | 1,916,570,301 | | | | 1,922,305,485 | | |
Matthews China Fund | | | (3,835 | ) | | | — | | | | 352,042,994 | | | | 367,195,960 | | |
Matthews India Fund | | | (4,073,778 | ) | | | (19,429 | ) | | | 62,200,288 | | | | 63,361,728 | | |
Matthews Japan Fund | | | (545,902 | ) | | | — | | | | 5,404,007 | | | | (65,851,332 | ) | |
Matthews Korea Fund | | | (100,400 | ) | | | — | | | | 61,730,273 | | | | 67,957,186 | | |
Matthews Asia Small Companies Fund | | | (1,127,134 | ) | | | — | | | | 38,066,536 | | | | 22,522,090 | | |
Matthews China Small Companies Fund | | | (64,704 | ) | | | — | | | | 419,740 | | | | (756,527 | ) | |
Matthews Asia Science and Technology Fund | | | (530,896 | ) | | | — | | | | 21,711,456 | | | | 9,588,840 | | |
* The Funds have elected to defer certain qualified late-year losses and recognize such losses in the next fiscal year.
** The differences between book-basis and tax-basis unrealized appreciation/depreciation is attributable primarily to the tax deferral of losses on wash sales and passive foreign investment company (PFIC) mark to market adjustments.
As of December 31, 2012, the Funds have capital loss carryforwards available to offset future realized capital gains through the indicated expiration dates as follows:
| | | | | | Amount With No Expiration* | | | |
| LOSSES DEFERRED EXPIRING IN: | | 2016 | | 2017 | | Short-term
Losses | | Long-term
Losses | | Total | |
Matthews Asia Dividend Fund | | $ | — | | | $ | — | | | $ | 50,197,337 | | | $ | 93,485,554 | | | $ | 143,682,891 | | |
Matthews China Dividend Fund | | | — | | | | — | | | | 749,904 | | | | 1,142,893 | | | | 1,892,797 | | |
Matthews Asia Growth Fund | | | — | | | | 47,329,141 | | | | — | | | | — | | | | 47,329,141 | | |
Matthews Japan Fund | | | 29,280,430 | | | | 44,032,426 | | | | — | | | | — | | | | 73,312,856 | | |
Matthews Asia Small Companies Fund | | | — | | | | — | | | | 4,921,090 | | | | 11,054,602 | | | | 15,975,692 | | |
Matthews China Small Companies Fund | | | — | | | | — | | | | 834,812 | | | | 292,613 | | | | 1,127,425 | | |
Matthews Asia Science and Technology Fund | | | — | | | | 10,329,226 | | | | 1,414,823 | | | | — | | | | 11,744,049 | | |
* Post-Enactment Losses: Must be utilized prior to losses subject to expiration.
matthewsasia.com | 800.789.ASIA 115
Notes to Financial Statements (continued)
Matthews Asia Growth Fund and Matthews Japan Fund utilized capital loss carryforwards of $11,920,217 and $2,181,538, respectively.
Under the Regulated Investment Company Modernization Act of 2010, the Funds are permitted to carry forward capital losses incurred in taxable years beginning after December 22, 2010 for an unlimited period. However, any losses incurred during those future taxable years will be required to be utilized prior to any losses incurred in pre-enactment taxable years, which generally expire after eight years from when they are incurred. Additionally, post-enactment capital losses that are carried forward will retain their character as either short-term or long-term capital losses rather than being considered all short-term as under previous law.
U.S. GAAP requires that certain components of net assets be reclassified between financial and tax reporting. These reclassifications have no effect on net assets or NAV. The permanent differences are primarily attributable to net realized gains on PFICs, non-deductible expenses, foreign currency reclassification, application of foreign tax credit to short-term gain and recharacterization of distributions. For the year ended December 31, 2012, permanent differences in book and tax accounting have been reclassified to paid-in capital, undistributed net investment income (loss) and accumulated realized gain (loss) as follows:
| | | Decrease
Paid-in-Capital | | Increase/(Decrease)
Undistributed Net
Investment
Income/(Loss) | | Increase/
(Decrease)
Accumulated
Realized Gain/(Loss) | |
Matthews Asia Strategic Income Fund | | ($ | 115,606 | ) | | $ | 112,069 | | | $ | 3,537 | | |
Matthews Asian Growth and Income Fund | | | — | | | | (7,079,295 | ) | | | 7,079,295 | | |
Matthews Asia Dividend Fund | | | — | | | | 1,848,041 | | | | (1,848,041 | ) | |
Matthews China Dividend Fund | | | — | | | | 65,474 | | | | (65,474 | ) | |
Matthews Asia Growth Fund | | | — | | | | 2,463,627 | | | | (2,463,627 | ) | |
Matthews Pacific Tiger Fund | | | — | | | | (750,716 | ) | | | 750,716 | | |
Matthews China Fund | | | — | | | | 145,992 | | | | (145,992 | ) | |
Matthews India Fund | | | — | | | | (299,837 | ) | | | 299,837 | | |
Matthews Japan Fund | | | — | | | | 1,273,889 | | | | (1,273,889 | ) | |
Matthews Korea Fund | | | — | | | | (146,778 | ) | | | 146,778 | | |
Matthews Asia Small Companies Fund | | | — | | | | (18,254 | ) | | | 18,254 | | |
Matthews China Small Companies Fund | | | (16,363 | ) | | | 16,391 | | | | (28 | ) | |
Matthews Asia Science and Technology Fund | | | — | | | | (58,741 | ) | | | 58,741 | | |
9. SUBSEQUENT EVENTS
Management has evaluated the impact of all subsequent events on the Funds through the date the financial statements were issued, and has determined that there no additional subsequent events that require recognition or disclosure in the financial statements.
116 MATTHEWS ASIA FUNDS
Report of Independent Registered Public Accounting Firm
To the Board of Trustees and Shareholders of Matthews Asia Funds:
In our opinion, the accompanying statements of assets and liabilities, including the schedules of investments, and the related statements of operations and of changes in net assets and the financial highlights present fairly, in all material respects, the financial position of Matthews Asia Strategic Income Fund, Matthews Asian Growth and Income Fund, Matthews Asia Dividend Fund, Matthews China Dividend Fund, Matthews Asia Growth Fund, Matthews Pacific Tiger Fund, Matthews China Fund, Matthews India Fund, Matthews Japan Fund, Matthews Korea Fund, Matthews Asia Small Companies Fund, Matthews China Small Companies Fund and Matthews Asia Science and Technology Fund (each a portfolio comprising the Matthews Asia Funds, hereafter referred as the "Funds") at December 31, 2012, and the results of each of their operations for the year then ended and the changes in each of their net assets and the financial highlights for the periods presented, in conformity with accounting principles generally accepted in the United States of America. These financial statements and financial highlights (hereafter referred to as "financial statements") are the responsibility of the Funds' management; our responsibility is to express an opinion on these financial statements based on our audits. We conducted our audits of these financial statements in accordance with the standards of the Public Company Accounting Oversight Board (United States). Those standards require that we plan and perform the audit to obtain reasonable assurance about whether the financial statements are free of material misstatement. An audit includes examining, on a test basis, evidence supporting the amounts and disclosures in the financial statements, assessing the accounting principles used and significant estimates made by management, and evaluating the overall financial statement presentation. We believe that our audits, which included confirmation of securities at December 31, 2012 by correspondence with the custodian and brokers, provide a reasonable basis for our opinion.
PricewaterhouseCoopers LLP
San Francisco, California
February 22, 2013
matthewsasia.com | 800.789.ASIA 117
Tax Information (Unaudited)
For shareholders who do not have a December 31, 2012 tax year-end, this notice is for informational purposes. For the period January 1, 2012 to December 31, 2012, the Funds report the following items with regard to distributions paid during the period. All reportings are based on financial information available as of the date of this annual report and, accordingly, are subject to change. For each item, it is the intention of each Fund to report the maximum amount permitted under the Internal Revenue Code and the regulations thereunder.
1. Qualified Dividend Income
The Funds report a portion of the ordinary income distributed during the year ended December 31, 2012 as Qualified Dividend Income ("QDI") as defined in the Internal Revenue code as follows:
| | | QDI Portion | |
Matthews Asia Strategic Income Fund | | | 2.37 | % | |
Matthews Asian Growth and Income Fund | | | 51.85 | % | |
Matthews Asia Dividend Fund | | | 42.82 | % | |
Matthews China Dividend Fund | | | 21.90 | % | |
Matthews Pacific Tiger Fund | | | 98.39 | % | |
Matthews China Fund | | | 68.59 | % | |
Matthews India Fund | | | 100.00 | % | |
Matthews Japan Fund | | | 88.87 | % | |
Matthews Asia Small Companies Fund | | | 61.91 | % | |
Matthews China Small Companies Fund | | | 89.91 | % | |
Matthews Asia Science and Technology Fund | | | 100.00 | % | |
2. Long-Term Capital Gain Distributions
The Funds report Long-Term Capital Gain distributions pursuant to Section 852(b)(3) of the Internal Revenue Code for the year ended December 31, 2012 as follows:
| | | Long-Term Capital Gains | |
Matthews Pacific Tiger Fund | | $ | 5,452,552 | | |
Matthews China Fund | | | 20,769,147 | | |
Matthews India Fund | | | 9,900,700 | | |
Matthews Korea Fund | | | 1,400,563 | | |
Matthews Asia Small Companies Fund | | | 1,439,816 | | |
3. Foreign Taxes Paid
The Funds have elected to pass through to their shareholders the foreign taxes paid for year ended December 31, 2012 as follows:
| | | Foreign Source Income | | Foreign Taxes Paid | |
Matthews Asia Strategic Income Fund | | $ | 1,139,027 | | | $ | 26,377 | | |
Matthews Asian Growth and Income Fund | | | 129,498,716 | | | | 5,937,344 | | |
Matthews Asia Dividend Fund | | | 115,556,127 | | | | 5,755,906 | | |
Matthews China Dividend Fund | | | 1,289,727 | | | | 56,028 | | |
Matthews Pacific Tiger Fund | | | 121,388,170 | | | | 9,011,176 | | |
Matthews China Fund | | | 54,859,042 | | | | 135,198 | | |
Matthews Japan Fund | | | 2,471,461 | | | | 171,062 | | |
Matthews Asia Small Companies Fund | | | 8,832,005 | | | | 657,967 | | |
Matthews China Small Companies Fund | | | 149,760 | | | | 2,432 | | |
Matthews Asia Science and Technology Fund | | | 2,375,921 | | | | 250,171 | | |
118 MATTHEWS ASIA FUNDS
Tax Information (Unaudited) (continued)
4. Qualified Interest Income
The Funds report a portion of the net income dividends distributed during the year ended December 31, 2012, as Qualified Interest Income (QII), as defined in the Internal Revenue Code as follows:
| | | QII Portion | |
Matthews Asia Strategic Income Fund | | | 0.02 | % | |
Matthews Asian Growth and Income Fund | | | 0.02 | % | |
Matthews Asia Dividend Fund | | | 0.02 | % | |
Matthews China Dividend Fund | | | 0.01 | % | |
Matthews Pacific Tiger Fund | | | 0.04 | % | |
Matthews China Fund | | | 0.01 | % | |
Matthews India Fund | | | 0.01 | % | |
Matthews Japan Fund | | | 0.05 | % | |
Matthews Asia Small Companies Fund | | | 0.12 | % | |
Matthews China Small Companies Fund | | | 0.05 | % | |
Matthews Asia Science and Technology Fund | | | 0.02 | % | |
matthewsasia.com | 800.789.ASIA 119
Approval of Investment Advisory Agreement (Unaudited)
The Funds, which are series of the Trust, have retained Matthews International Capital Management, LLC ("Matthews") to manage their assets pursuant to the Advisory Agreement, which has been approved by the Board of Trustees of the Funds, including the Independent Trustees. Following an initial term with respect to each Fund upon its commencement of operations, the Advisory Agreement continues in effect from year-to-year provided that the continuance is specifically approved at least annually by the vote of the holders of at least a majority of the outstanding shares of the Funds, or by the Board of Trustees, and, in either event, by a majority of the Independent Trustees of the Trust casting votes in person at a meeting called for that purpose.
At a meeting held on August 20 and 21, 2012, the Board, including the Independent Trustees of the Trust, approved the continuance of the Advisory Agreement, with respect to each Fund, for an additional one-year period ending August 31, 2013.
Before those meetings, the Independent Trustees had requested detailed information from Matthews about the matters to be considered. This information, together with the information provided to the Independent Trustees throughout the course of year, formed the primary (but not exclusive) basis for the Board's determinations as summarized below. The Independent Trustees reviewed and discussed the extensive information provided by Matthews at separate executive sessions held on August 8 (among a smaller working group), 16 and 21, 2012. The Independent Trustees were assisted in their deliberations by their independent legal counsel. Below is a summary of the factors considered by the Board in approving the Advisory Agreement with respect to each Fund.
 The nature, extent and quality of the services provided by Matthews under the Advisory Agreement. The Trustees considered the experience and qualifications of the personnel at Matthews who are responsible for providing services to the Funds and who are responsible for the daily management of the Funds' portfolios. The Trustees noted that Matthews has expanded and deepened its professional staff over the past several years, and has enjoyed stability of its senior executive and portfolio management. They also reviewed Matthews' recent and planned hiring to further strengthen current resources and to support future expected growth of assets and products. In particular, the Trustees noted the addition of over twenty individuals since June 2011, and Matthews' plans for some additional hiring. The Trustees viewed Matthews as well positioned to provide high quality services to the Funds under various market conditions, as demonstrated by the past volatile and challenging securities markets, including significant asset and
revenue contractions in 2008 and 2009 and a dramatic increase in assets later in 2009 and in 2010. The Trustees attributed much of that past stability to Matthews' emphasis on preserving and enhancing portfolio management team resources, careful business planning and management, as well as its solid financial condition and strong cash reserves. As in past years, the Trustees considered the design and implementation of Matthews' disaster recovery and business continuity plan. The Trustees also considered the Chief Compliance Officer's report regarding the compliance resources, risk assessment and other initiatives, programs and structures of Matthews, including its compliance record and its supervision of the Funds' service providers. The Trustees concluded that Matthews has high-quality compliance and a strong commitment to a culture of compliance. The Trustees recognized the extent of Matthews' on-going commitment to marketing and distribution, particularly long-term strategic projects pursued over the past year, and support for the launch of new funds, as well as resources devoted to continually improved industry-leading investor education publications and website content, design and function. The Trustees concluded that Matthews had the quality and depth of personnel and investment methods essential to performing its duties under the Advisory Agreement, and that the nature, overall quality, cost and extent of such management services are satisfactory and reliable.
 The investment performance of Matthews. The Trustees reviewed the short-term and long-term performance of each Fund on both an absolute basis and in comparison to peer funds and benchmark indices. The Trustees noted the challenging conditions of various Asian markets in 2012, but would expect the performance of certain Funds to lag the market averages in some subsequent short-term periods because of Matthews's emphasis on consistent long-term returns from investments in less cyclical companies. The Trustees emphasized longer-term performance, which they believe is more important than short isolated periods for purposes of evaluating Matthews's success in meeting Fund and shareholder objectives. To the extent of any concerns about performance with respect to any particular period for a Fund, the Trustees noted that Matthews had provided a satisfactory explanation for the performance and explained its reasons for maintaining a consistent investment philosophy. The Trustees also reviewed both the Lipper peer comparison measures and Morningstar ratings for each Fund for various periods ending June 30, 2012.
120 MATTHEWS ASIA FUNDS
Approval of Investment Advisory Agreement (Unaudited) (continued)
For Matthews Asia Growth Fund, the Trustees noted that the Fund's performance compared very favorably against its peers for the three-year, five-year and since-inception periods. The Fund ranked in the top quintile for those more important longer term periods in its Pacific region peer group, and above the median for the most recent one-year period.
For Matthews Asia Dividend Fund, the Trustees noted that the Fund had outperformed its peer group during the one-year, three-year, five-year and since inception periods, ranking in the top quintile for those periods.
For Matthews Pacific Tiger Fund, the Trustees noted that the Fund's performance was favorable in the one-year, three-year, five-year, ten-year and since-inception periods, ranking in the first or second quintiles for those periods against the Lipper peer group.
For Matthews Asian Growth and Income Fund, the Trustees noted that the Fund outperformed its peer group during the one-year, three-year, five-year, ten-year and since-inception periods, ranking in the first quartile for most of those periods.
For Matthews Asia Science and Technology Fund, the Trustees noted that the Fund's performance was more favorable than the median return of its peer funds over the ten-year and since-inception periods, but less favorable than the average return of its peer funds over the one-year, three-year and five-year periods. The Trustees also observed that the funds in the peer group invested globally, rather than being limited to Asia as the Fund's investment strategy is. The Lipper information also showed more favorable performance against the two Asia-focused technology funds in the peer group and against the Fund's more specific Asia technology benchmark for the one-year period, which demonstrates the satisfactory quality of advisory services for this specific strategy. The Trustees acknowledged Matthews' explanation about the very volatile asset class in which the Fund invests.
For Matthews China Fund, the Trustees noted that the Fund had outperformed the median of its peer funds over the one-year, three-year, five-year, ten-year and since-inception periods, ranking in the top quintile for the three-year, five-year, ten-year and since inception periods.
For Matthews India Fund, the Trustees noted that the Fund had outperformed its peer funds over the three-year, five-year and since inception periods, ranking as the top fund in its peer group for those
periods, but slightly underperforming its peer group average for the one-year period.
For Matthews Japan Fund, the Trustees noted that the Fund's performance was more favorable than the median return of its peer funds over the three-year, five-year, ten-year and since-inception periods, and ranked in the top quartile for the three-year period. For the one-year period, the Fund's performance was slightly above or below the median performance of its peer funds depending on the peer group selected.
For Matthews Korea Fund, the Trustees noted that the Fund had performed better than the median performance for its narrower peer group over the one-year, three-year, five-year, ten-year and since inception periods, and ranked as the top fund for the five-year, ten-year and since-inception periods within that peer group. The Trustees noted that the Fund's performance varied considerably against its broader Lipper peer group for various periods, but they consider the broader peer group, which consists of Pacific-oriented funds excluding Japan, as much too broad to be a useful for a Korea-focused fund. The more limited peer group contains funds with 50% or more of their assets in Korea.
For Matthews Asia Small Companies Fund, the Trustees noted that the Fund was the top fund in a very small peer group for the three-year and since-inception periods, but at the bottom in a still very small group for the one-year period. The Trustees recognized that small capitalization strategies can produce highly variable results and they emphasized the longer-term results. The Fund experienced varied performance against a broader Lipper peer group consisting of Pacific-oriented funds excluding Japan, which the Trustees regarded as too broad to be useful because the market capitalization of the peer funds' portfolio investments was not used to select funds.
For Matthews China Dividend Fund, the Trustees noted that the Fund had ranked near the top of its peer group for the short one-year and since inception periods, with rankings in the first quintile.
For Matthews China Small Companies Fund, the Trustees noted that the Fund was the top fund in a very small peer group for the one-year and since-inception periods, but below the median of a broader peer group for those same periods. The Trustees recognized that small capitalization strategies can produce highly variable results and they emphasized the longer-term results, which are not yet available for this Fund. The Trustees regarded the broader peer group as less useful
matthewsasia.com | 800.789.ASIA 121
Approval of Investment Advisory Agreement (Unaudited) (continued)
because the market capitalization of the peer funds' portfolio investments was not used to select funds.
For Matthews Asia Strategic Income Fund, the Trustees noted that the Fund had ranked below the median peer group performance for the very short period of less than one year. The Trustees recognized that the peer groups included mostly broader emerging market debt funds not focused on Asia and that the Fund's performance was more comparable to the very few funds with a greater focus on Asian debt.
The Trustees noted the difficulty of fairly benchmarking certain of the Funds in terms of performance and noted that they were of the view that more weight should be given to Matthews's analysis of relative performance and comparability of the peer groups than to standard data provided by Lipper Inc. and Morningstar, Inc. The Trustees also gave more weight to each Fund's longer-term investment performance given the long-term investment philosophy of each Fund. On that basis, the Trustees concluded that they were satisfied with the Funds' overall performance records. The Trustees also reviewed Matthews's trading policies and efforts to obtain best overall execution for the Funds in the various markets in which the Funds trade securities. The Trustees noted the relatively low turnover rates in the various Funds and Matthews's consistent adherence to its long-standing investment approach, which emphasizes fundamental bottom-up driven investment selection.
 The extent to which Matthews realizes economies of scale as the Funds grow larger and whether Fund investors benefit from any economies of scale. The Trustees discussed Matthews's ongoing investment in its business and personnel, which is an acceptable way for Matthews to share economies of scale with the Funds and their shareholders. The Trustees considered the new personnel hired over the past year, as well as planned hiring, and the extent to which that hiring could be expected to benefit shareholders. The Trustees also recognize that the Funds' total assets have fluctuated over the past several years, especially in certain strategies, which has also affected any economies of scale that could be enjoyed. The Trustees concluded that the current advisory fee structure with breakpoints for the Funds other than the two small company focused Funds and the fixed-income Fund enhances the ability of the Funds and their shareholders to benefit from past and future potential economies of scale, and continues to be appropriate given the size and objectives of the Funds. In addition, Matthews previously agreed to provide an additional breakpoint under its Administration and
Shareholder Services Agreement, which has the effect of further sharing those economies. The Trustees have continued their discussions with Matthews about further breakpoints as assets increase.
 The costs of the services provided by Matthews and others. The Trustees considered the advisory fees and total fees and expenses of each Fund in comparison to the advisory fees and other fees and expenses of other funds in each Fund's relevant peer group. The Trustees considered both the gross advisory fee rates charged by Matthews, as well as the effective advisory fee rates after taking into consideration the expense limitation arrangements and voluntary fee waivers. The Trustees found that the contractual advisory rates (excluding administrative services) for the Funds were very competitive and generally lower than the relevant peer group averages. Also, the total expense ratios paid by investors in the Funds, which are most representative of an investor's net experience, were also very competitive, with all but the newest Funds ranking below the peer group averages.
For each of Matthews Korea Fund, Matthews India Fund, Matthews China Fund, Matthews Asia Science and Technology Fund, Matthews Asian Growth and Income Fund, Matthews Asia Dividend Fund and Matthews Asia Growth Fund, the Trustees noted that the gross advisory fee rates, the gross management fee (including administration) rates, the total expense ratio, the effective advisory fee rates and the actual nonmanagement fee rates (which include transfer agent and custodian fees) are all lower than or equal to the median of the funds in each Fund's peer group.
For Matthews Pacific Tiger Fund and Matthews Japan Fund, the Trustees noted that the total expense ratio, the effective advisory fee rates and the actual nonmanagement expense rates (which include transfer agent and custodian fees) are lower than most of the funds in these Funds' peer groups. The Trustees were less concerned that the gross advisory fees were only slightly higher than the peer group averages given the overall competitive posture of these Funds.
For Matthews Asia Small Companies Fund, the Trustees noted that the gross advisory fee rate, actual advisory fees and actual total expenses excluding Rule 12b-1 fees are higher than the peer group median. The Trustees were pleased to note, however, that the actual total expenses and non-management expenses were below the peer group medians. The Trustees expect that the Fund's comparative position should improve as the Fund grows.
122 MATTHEWS ASIA FUNDS
Approval of Investment Advisory Agreement (Unaudited) (continued)
For Matthews China Small Companies Fund, the Trustees noted that the gross advisory fee rate and actual total and non-management expenses are higher than the peer group median. The Trustees expect that the Fund's comparative position should improve as the Fund grows.
For Matthews China Dividend Fund, the Trustees noted that the gross advisory fee rate, actual advisory fees and total expenses are lower than the peer group average. The Trustees expect that given the Fund's relatively recent inception, its comparative position should improve further as the Fund grows.
For Matthews Asia Strategic Income Fund, the Trustees noted that the gross advisory fee rate and total expenses excluding Rule 12b-1 fees are higher than the peer group median, but the actual total expenses are below the median because of the expense limitation in effect. The Trustees expect that given the Fund's relatively recent inception, its comparative position should improve further as the Fund grows.
The Trustees also compared Matthews's advisory fees with those of Matthews's separate accounts and other investment products, noting that the Funds' advisory expenses were not disadvantageous (not being substantially higher than the separate accounts' rates). Total expenses appeared to be appropriate in comparison and taking into account the services differences between these products and the Funds, including the differences in the frequency of net asset value calculations. The Trustees considered various specific Fund expenses, including the custody fees and transfer agent fees. The Trustees noted Matthews's efforts in recent years had resulted in, for each of the Funds, (a) reduced expenses under the administration and shareholders services plan, (b) reduced custodian expenses, and (c) reduced transfer agency fees. The Trustees concluded that Matthews's advisory fee rates and the Funds' expense ratios are reasonable in light of comparative performance and expense and advisory fee information for each of the Funds.
 The profits to be realized by Matthews and its affiliates from the relationships with the Funds. The Trustees reviewed the profitability of Matthews on both an absolute basis and in comparison to other investment advisers. The Trustees noted that Matthews's pretax profit margin appeared to be reasonable in relation to other advisors. The Trustees also noted that Matthews appeared to be sufficiently profitable to operate as a viable investment management firm, able to honor its obligations as a
sponsor of the Funds, including the Funds that did not generate a profit for Matthews, without earning excessive profits from any particular Fund or from the overall relationship with the Funds. The Trustees noted that, with declines in asset levels in some prior years, volatility in revenues and profitability could be expected from time to time, but also noted the continued expenditures on technology and personnel. The Trustees noted a recent modest decline in profitability, but expect that profitability can improve as asset levels grow. The Trustees further noted that Matthews's continued upgrading of its trading, research, compliance, and other technological systems should increase Matthews's capacity, speed and reliability in providing services to the Funds as they grow, which further supports the long-term viability of the Funds and Matthews. The Trustees also considered that the additional benefits derived by Matthews from its relationship with the Funds are limited solely to research benefits received in exchange for "soft dollars." After that review, the Trustees determined that the profitability rate to Matthews with respect to the Advisory Agreement is fair and reasonable in consideration of the services it provides to the Funds.
No single factor was determinative of the Board's decision to approve the Advisory Agreement, but rather the Trustees based their determination on the total mix of information available to them. After considering the factors described above, the Board concluded that the terms of the advisory arrangements are fair and reasonable to each Fund in light of the services that Matthews provides, its costs and reasonably foreseeable Fund asset levels, and that each Fund's shareholders received and would receive reasonable value in return for the advisory fees paid. The Board agreed that the continuance of the Advisory Agreement with respect to each Fund would be in the best interests of the Funds and their shareholders. The Independent Trustees concluded separately that continuance of the Advisory Agreement was supported by reasonable and impartial records and information, including the performance of the Funds in relation to their peer groups, the services provided by Matthews, and the competitive expense structure, and that the continuance of the Advisory Agreement with respect to each Fund would be in the best interests of each Fund and its shareholders.
The Advisory Agreement may be terminated by the Trustees on behalf of the Funds or Matthews upon 60 days' prior written notice without penalty. The Advisory Agreement will also terminate automatically in the event of its assignment, as defined in the 1940 Act.
matthewsasia.com | 800.789.ASIA 123
Trustees and Officers of the Funds (Unaudited)
The operations of each Fund are under the direction of the Board of Trustees. The Board of Trustees establishes each Fund's policies and oversees and reviews the management of each Fund. The Board meets regularly to review the activities of the officers, who are responsible for the day-to-day operations of the Funds. The Statement of Additional Information, which includes additional information about Fund Trustees, is available without charge by calling 800.789.2742 or by visiting the Funds' website, matthewsasia.com. The Trustees and executive officers of the Funds, their year of birth, business address and principal occupations during the past five years are set forth below:
Name, Year of Birth,
Address and Position(s)
Held with Trust | | Term of
Office and
Length of
Time Served1 | | Principal Occupation(s)
During Past 5 Years | | Number of
Portfolios in
Fund Complex
Overseen by
Trustee | | Other Trusteeships/Directorships
(number of portfolios) Held by Trustee | |
INDEPENDENT TRUSTEES | |
GEOFFREY H. BOBROFF
Born 1944
Four Embarcadero Center
Suite 550
San Francisco, CA 94111
Chairman of the Board of
Trustees and Trustee | | Since 2006 | | President, Bobroff Consulting, Inc. (since 1993). | | | 13 | | | Director (since February 2013), Matthews A Share Selections Fund, LLC (1 Portfolio). | |
TOSHI SHIBANO
Born 1950
Four Embarcadero Center
Suite 550
San Francisco, CA 94111
Trustee | | Since 2003 | | President, Strategic Financial Literacy, Inc. (since 1995); Faculty, General Electric's John F. Welch Leadership Center (since 2000); Executive Education Lecturer, Center for Executive Education, Haas School of Business, UC Berkeley (since 1995); Adjunct Professor, Columbia Graduate School of Business (2000–2011); Associate Professor, Thunderbird Graduate School of Management (2001-2005), Visiting Assistant Professor, Stanford Graduate School of Business (2000); Assistant Professor, University of Chicago Graduate School of Business (1995-2000); Assistant Professor, Haas School of Business, UC Berkeley (1988-1995). | | | 13 | | | Director (since February 2013), Matthews A Share Selections Fund, LLC (1 Portfolio). | |
RHODA ROSSMAN
Born 1958
Four Embarcadero Center
Suite 550
San Francisco, CA 94111
Trustee | | Since 2006 | | Vice President, Corporate Investment Officer (2007–2010); and Senior Vice President and Treasurer (2003–2007), The PMI Group, Inc. | | | 13 | | | Director (since February 2013), Matthews A Share Selections Fund, LLC (1 Portfolio). | |
JONATHAN F. ZESCHIN
Born 1953
Four Embarcadero Center
Suite 550
San Francisco, CA 94111
Trustee | | Since 2007 | | Partner, Essential Investment Partners, LLC (since 2009); President, Essential Advisers Inc. (since 2000); Managing Partner, JZ Partners LLC (since 1998). | | | 13 | | | Director (since February 2013), Matthews A Share Selections Fund, LLC (1 Portfolio); Independent Chairman of the Board of Trustees, DCA Total Return Fund (2005–2011) (1 Portfolio) and DCW Total Return Fund (2007–2010) (1 Portfolio); Independent Trustee, ICON Funds (2002–2007) (17 Portfolios); Independent Director, Wasatch Funds (2002–2004) (10 Portfolios). | |
RICHARD K. LYONS
Born 1961
Four Embarcadero Center
Suite 550
San Francisco, CA 94111
Trustee | | Since 2010 | | Dean (since 2008), Haas School of Business, UC Berkeley; Chief Learning Officer (2006–2008), Goldman Sachs; Executive Associate Dean (2005–2006), Acting Dean (2004–2005), Professor (2000–2004), Associate Professor (1996–2000), Assistant Professor (1993–1996), Haas School of Business, UC Berkeley. | | | 13 | | | Director (since February 2013), Matthews A Share Selections Fund, LLC (1 Portfolio); Director (2000–2006), iShares Fund Complex, consisting of iShares, Inc. (24 Portfolios) and iShares Trust (over 70 Portfolios) managed by Barclays Global Investors; Trustee (2001–2006), Barclays Global Investor Fund Complex, consisting of Barclays Global Investor Funds and Barclays Master Investment Portfolios (15 Portfolios); Independent Trustee, Matthews Asia Funds (1994–2006) (9 Portfolios). | |
124 MATTHEWS ASIA FUNDS
Name, Year of Birth,
Address and Position(s)
Held with Trust | | Term of
Office and
Length of
Time Served1 | | Principal Occupation(s)
During Past 5 Years | | Number of
Portfolios in
Fund Complex
Overseen by
Trustee | | Other Trusteeships/Directorships
(number of portfolios) Held by Trustee | |
INTERESTED TRUSTEES2 | |
G. PAUL MATTHEWS
Born 1956
Four Embarcadero Center
Suite 550
San Francisco, CA 94111
Trustee | | Since 2007 | | Managing Member and Chairman (1996–2009), Portfolio Manager (1996–2012), Director (since 2009), Chief Investment Officer (1991–2007), Matthews International Capital Management, LLC; President of the Funds (1994–2007). | | | 13 | | | Director (since February 2013), Matthews A Share Selections Fund, LLC (1 Portfolio); Director, Matthews Asian Selections Funds Plc (1 Portfolio). | |
Name, Year of Birth,
Address and Position(s)
Held with Trust | | Term of Office
and Length of
Time Served1 | | Principal Occupation(s) During Past 5 Years | | Other Trusteeships/
Directorships
(number of
portfolios)
Held by Officer | |
OFFICERS WHO ARE NOT TRUSTEES | |
WILLIAM J. HACKETT
Born 1967
Four Embarcadero Center
Suite 550
San Francisco, CA 94111
President | | Since 2008 | | Chief Executive Officer (since 2009), President and Secretary (since 2007), Matthews International Capital Management, LLC; Partner (2002–2007), Deloitte & Touche, LLP. | | Director, Matthews Asian Selections Funds Plc (1 Portfolio); Director, Matthews Asia Funds S.I.C.A.V. (6 Portfolios). | |
ROBERT J. HORROCKS, PHD
Born 1968
Four Embarcadero Center
Suite 550
San Francisco, CA 94111
Vice President | | Since 2009 | | Chief Investment Officer (Since 2009), Director of Research (2008–2009), Matthews International Capital Management, LLC; Head of Research, Mirae Asset Management (2006–2008); Chief Investment Officer, Everbright Pramerica (2003–2006). | | None | |
JOHN P. McGOWAN
Born 1964
Four Embarcadero Center
Suite 550
San Francisco, CA 94111
Vice President and
Secretary | | Since 2005 | | Senior Vice President of Business Administration (since 2009), Chief Administrative Officer (2007–2008), Chief Operating Officer (2004–2007), Matthews International Capital Management, LLC; Chief Operating Officer, Treasurer and Chief Compliance Officer, Forward Management LLC (1998–2004). | | Director, Matthews Asian Selections Funds Plc (1 Portfolio); Director, Matthews Asia Funds S.I.C.A.V. (6 Portfolios). | |
SHAI A. MALKA
Born 1973
Four Embarcadero Center
Suite 550
San Francisco, CA 94111
Treasurer | | Since 2005 | | Vice President of Fund Accounting and Operations (since 2010), Senior Manager of Fund Accounting and Operations (2004–2009), Matthews International Capital Management, LLC. | | None | |
TIMOTHY B. PARKER
Born 1958
Four Embarcadero Center
Suite 550
San Francisco, CA 94111
Vice President | | Since 2008 | | General Counsel (since 2005), Matthews International Capital Management, LLC; Partner, Kirkpatrick & Lockhart Nicholson Graham LLP (2003–2005); Global Head of Compliance and Risk Management, Allianz Dresdner Asset Management (2001–2003); Managing Director, RCM Global Investors (1993–2001). | | Director, Matthews Asia Funds S.I.C.A.V. (6 Portfolios). | |
MANOJ K. POMBRA
Born 1964
Four Embarcadero Center
Suite 550
San Francisco, CA 94111
Chief Compliance Officer | | Since 2005 | | Chief Compliance Officer, Matthews International Capital Management, LLC (since 2005); Senior Manager, Mutual Fund Compliance/Manager Portfolio Compliance, Franklin Templeton Investments (2001–2005). | | None | |
1 Each trustee serves for an indefinite term, until retirement age or until his/her successor is elected. Officers serve at the pleasure of the Board of Trustees.
2 This trustee is considered an "interested person" of the Trust as defined under the 1940 Act because of an ownership interest in the Advisor and an office held with the Advisor.
matthewsasia.com | 800.789.ASIA 125
INVESTMENT ADVISOR
Matthews International Capital Management, LLC
Four Embarcadero Center, Suite 550
San Francisco, CA 94111
800.789.ASIA
CUSTODIAN
Brown Brothers Harriman & Co.
50 Milk Street
Boston, MA 02109
ACCOUNT SERVICES
Matthews Asia Funds
P.O. Box 9791
Providence, RI 02940
800.789.ASIA
LEGAL COUNSEL
Paul Hastings LLP
55 Second Street, 24th Floor
San Francisco, CA 94105
P.O. Box 9791 | Providence, RI 02940 | matthewsasia.com | 800.789.ASIA (2742)
AR-1212-249M


Item 2. Code of Ethics.
(a) The registrant, as of the end of the period covered by this report, has adopted a code of ethics that applies to the registrant’s principal executive officer, principal financial officer, principal accounting officer or controller, or persons performing similar functions, regardless of whether these individuals are employed by the registrant or a third party.
(c) There have been no amendments, during the period covered by this report, to a provision of the code of ethics that applies to the registrant’s principal executive officer, principal financial officer, principal accounting officer or controller, or persons performing similar functions, regardless of whether these individuals are employed by the registrant or a third party, and that relates to any element of the code of ethics description.
(d) The registrant has not granted any waivers, including an implicit waiver, from a provision of the code of ethics that applies to the registrant’s principal executive officer, principal financial officer, principal accounting officer or controller, or persons performing similar functions, regardless of whether these individuals are employed by the registrant or a third party, that relates to one or more of the items set forth in paragraph (b) of this item’s instructions.
Item 3. Audit Committee Financial Expert.
(a) | | As of the end of the period covered by the report, the registrant’s board of directors has determined that the registrant has two audit committee financial experts serving on its audit committee, Toshi Shibano and Jonathan F. Zeschin, and that both are “independent.” |
| | |
(b) | | Prof. Shibano is an Adjunct Professor at the Columbia Graduate School of Business and a member of the Faculty of the General Electric Corporate Leadership Development Center. He also serves as Executive Education Lecturer at the Haas School of Business at the University of California, Berkeley, and has served on the faculties of Thunderbird American Graduate School of International Management, Stanford Graduate School of Business, the University of Chicago School of Business and the Australian Graduate School of Management at the University of New South Wales. He regularly reviews current research in accounting both for use in instruction of courses and for internal faculty evaluation. He has experience analyzing and evaluating financial statements at the appropriate level of complexity through his professional activities on the educational faculties referenced above. Prof. Shibano also has extensive experience in executive education worldwide (Hong Kong, Taiwan, Singapore, Finland, Italy, Mexico, India) and has developed innovative new programs in financial analysis, management control systems and strategy implementation. |
| | Prof. Shibano has published in the Journal of Accounting Research, the Journal of Accounting and Economics, the Rand Journal of Economics, and the Journal of Applied Corporate Finance, on the topics of strategic audit risk, accounting standard setting, international accounting standards, tax minimization, foreign currency risk management, and organizational structure. Prof. Shibano received his MBA from the Haas School at UC Berkeley and earned his PhD at the Stanford Graduate School of Business, earning the highest academic honors in both programs. Prof. Shibano has gained additional accounting expertise as the Audit Committee Chair of Matthews International Funds. |
| | |
| | Mr. Zeschin is Partner of Essential Investment Partners, LLC, a wealth management and investment advisory firm. He is also the portfolio manager for that firm’s Essential Growth Portfolio. Essential Investment Partners, LLC succeeded to the business of Essential Advisers, Inc. He is Managing Partner of JZ Partners, LLC, a business consulting firm for investment managers. Prior to forming Essential Advisers, Inc., Mr. Zeschin held senior executive positions with Founders Asset Management, Inc., Invesco Fund Group, and Stein Roe & Farnham, Inc. Mr. Zeschin holds a Masters of Management from the Kellogg School at Northwestern University, with majors in Finance and Marketing, and a Bachelor in Business Administration in Accounting with distinction from the University of Michigan. He holds a Certified Public Accountant certificate from the state of Illinois and is a Certified Financial Planner certificant. Mr. Zeschin is a former chair of the ICI’s Accounting Treasurer’s Committee and a former member of the AICPA Investment Companies committee. Mr. Zeschin is currently the chairman of the Board of Trustees to two NYSE listed closed-end funds. He has served on the audit committees of mutual fund boards since 2002. He has experience analyzing and evaluating financial statements at the appropriate level of complexity through his professional activities on the educational faculties referenced above. Mr. Zeschin has gained additional expertise as a member of the Audit Committee of Matthews International Funds. |
Item 4. Principal Accountant Fees and Services.
Audit Fees
(a) The aggregate fees billed for each of the last two fiscal years for professional services rendered by the principal accountant for the audit of the registrant’s annual financial statements or services that are normally provided by the accountant in connection with statutory and regulatory filings or engagements for those fiscal years are $297,280 in 2011 and $371,580 in 2012.
Audit-Related Fees
(b) The aggregate fees billed in each of the last two fiscal years for assurance and related services by the principal accountant that are reasonably related to the performance of the audit of the registrant’s financial statements and are not reported under paragraph (a) of this Item are $0 in 2011 and $0 in 2012.
Tax Fees
(c) The aggregate fees billed in each of the last two fiscal years for professional services rendered by the principal accountant for tax compliance, tax advice, and tax planning are $103,210 in 2011 and $95,680 in 2012. Tax fees include services provided by PWC for tax return preparations.
All Other Fees
(d) The aggregate fees billed in each of the last two fiscal years for products and services provided by the principal accountant, other than the services reported in paragraphs (a) through (c) of this Item are $0 in 2011 and $0 in 2012.
(e)(1) Disclose the audit committee’s pre-approval policies and procedures described in paragraph (c)(7) of Rule 2-01 of Regulation S-X.
Pre-Approval of Auditor Services.
Pre-Approval Requirements. Before the Auditor is engaged by the Trust to render audit related or permissible non-audit services, either:
(i) The Audit Committee shall pre-approve all audit related services and permissible non-audit services (e.g., tax services) to be provided to the Trust; or
(ii) The Audit Committee shall establish policies and procedures governing the Auditor’s engagement. Any such policies and procedures must (1) be detailed as to the particular service and (2) not involve any delegation of the Audit Committee’s responsibilities to the Adviser. The Audit Committee may delegate to one or more of its members the authority to grant pre-approvals. The pre-approval policies and procedures shall include the requirement that the decisions of any member to whom authority is delegated under this Section 4(e) shall be presented to the full Audit Committee at its next scheduled meeting.
De Minimis Exceptions to Pre-Approval Requirements. Pre-approval for a service provided to the Trust other than audit, review or attest services is not required if: (1) the aggregate amount of all such non-audit services provided to the Trust constitutes not more than 5 percent of the total amount of revenues paid by the Trust to the Auditor during the fiscal year in which the non-audit services are provided; (2) such services were not recognized by the Trust at the time of the engagement to be non-audit services; and (3) such services are promptly brought to the attention of the Audit Committee and are approved by the Audit Committee or by one or more members of the Audit Committee to whom authority to grant such approvals has been delegated by the Audit Committee.
Pre-Approval of Non-Audit Services Provided to the Adviser and Certain Control Persons. With respect to services that have a direct impact on the operations or financial reporting of the Trust, the Audit Committee shall pre-approve all such non-audit services proposed to be provided by the Auditor to (i) the Adviser and (ii) any entity controlling, controlled by, or under common control with the Adviser that provides ongoing services to the Trust.
Application of De Minimis Exception: The de minimis exceptions set forth above under Section 4(e)(ii) apply to pre-approvals under this Section 4(e)(iii) as well, except that the “total amount of revenues” calculation for Section 4(e)(iii) services is based on the total
amount of revenues paid to the Auditor by the Trust and any other entity that has its services approved under this Section (i.e., the Adviser or any control person).
(e)(2) The percentage of services described in each of paragraphs (b) through (d) of this Item that were approved by the audit committee pursuant to paragraph (c)(7)(i)(C) of Rule 2-01 of Regulation S-X are as follows:
(b) 100%
(c) 100%
(d) 100%
(f) The percentage of hours expended on the principal accountant’s engagement to audit the registrant’s financial statements for the most recent fiscal year that were attributed to work performed by persons other than the principal accountant’s full-time, permanent employees was 100%.
(g) The aggregate non-audit fees billed by the registrant’s accountant for services rendered to the registrant, and rendered to the registrant’s investment adviser (not including any sub-adviser whose role is primarily portfolio management and is subcontracted with or overseen by another investment adviser), and any entity controlling, controlled by, or under common control with the adviser that provides ongoing services to the registrant for each of the last two fiscal years of the registrant was $172,450 in 2011 and $368,627 in 2012.
(h) The registrant’s audit committee of the board of directors has considered whether the provision of non-audit services that were rendered to the registrant’s investment adviser (not including any sub-adviser whose role is primarily portfolio management and is subcontracted with or overseen by another investment adviser), and any entity controlling, controlled by, or under common control with the investment adviser that provides ongoing services to the registrant that were not pre-approved pursuant to paragraph (c)(7)(ii) of Rule 2-01 of Regulation S-X is compatible with maintaining the principal accountant’s independence.
Item 5. Audit Committee of Listed registrants.
Not applicable.
Item 6. Investments.
(a) Schedule of Investments in securities of unaffiliated issuers as of the close of the reporting period is included as part of the report to shareholders filed under Item 1 of this form.
(b) Not applicable.
Item 7. Disclosure of Proxy Voting Policies and Procedures for Closed-End Management Investment Companies.
Not applicable.
Item 8. Portfolio Managers of Closed-End Management Investment Companies.
Not applicable.
Item 9. Purchases of Equity Securities by Closed-End Management Investment Company and Affiliated Purchasers.
Not applicable.
Item 10. Submission of Matters to a Vote of Security Holders.
There have been no material changes to the procedures by which the shareholders may recommend nominees to the registrant’s board of directors, where those changes were implemented after the registrant last provided disclosure in response to the requirements of Item 407(c)(2)(iv) of Regulation S-K (17 CFR 229.407) (as required by Item 22(b)(15) of Schedule 14A (17 CFR 240.14a-101)), or this Item.
Item 11. Controls and Procedures.
(a) The registrant’s principal executive and principal financial officers, or persons performing similar functions, have concluded that the registrant’s disclosure controls and procedures (as defined in Rule 30a-3(c) under the Investment Company Act of 1940, as amended (the “1940 Act”) (17 CFR 270.30a-3(c))) are effective, as of a date within 90 days of the filing date of the report that includes the disclosure required by this paragraph, based on their evaluation of these controls and procedures required by Rule 30a-3(b) under the 1940 Act (17 CFR 270.30a-3(b)) and Rules 13a-15(b) or 15d-15(b) under the Securities Exchange Act of 1934, as amended (17 CFR 240.13a-15(b) or 240.15d-15(b)).
(b) There were no changes in the registrant’s internal control over financial reporting (as defined in Rule 30a-3(d) under the 1940 Act (17 CFR 270.30a-3(d)) that occurred during the registrant’s second fiscal quarter of the period covered by this report that has materially affected, or is reasonably likely to materially affect, the registrant’s internal control over financial reporting.
Item 12. Exhibits.
(a)(1) Code of ethics, or any amendment thereto, that is the subject of disclosure required by Item 2 is attached hereto.
(a)(2) Certifications pursuant to Rule 30a-2(a) under the 1940 Act and Section 302 of the Sarbanes-Oxley Act of 2002 are attached hereto.
(a)(3) Not applicable.
(b) Certifications pursuant to Rule 30a-2(b) under the 1940 Act and Section 906 of the Sarbanes-Oxley Act of 2002 are attached hereto.
SIGNATURES
Pursuant to the requirements of the Securities Exchange Act of 1934 and the Investment Company Act of 1940, the registrant has duly caused this report to be signed on its behalf by the undersigned, thereunto duly authorized.
(Registrant) | Matthews International Funds | |
| | | |
By (Signature and Title)* | /s/ William J. Hackett | |
| William J. Hackett, President | |
| (principal executive officer) | |
| | |
Date | March 6, 2013 | |
| | | | |
Pursuant to the requirements of the Securities Exchange Act of 1934 and the Investment Company Act of 1940, this report has been signed below by the following persons on behalf of the registrant and in the capacities and on the dates indicated.
By (Signature and Title)* | /s/ William J. Hackett | |
| William J. Hackett, President | |
| (principal executive officer) | |
| | |
Date | March 6, 2013 | |
| | | |
By (Signature and Title)* | /s/ Shai Malka | |
| Shai Malka, Treasurer | |
| (principal financial officer) | |
| | |
Date | March 6, 2013 | |
| | | |
* Print the name and title of each signing officer under his or her signature.