UNITED STATES
SECURITIES AND EXCHANGE COMMISSION
Washington, D.C. 20549
FORM N-CSR
CERTIFIED SHAREHOLDER REPORT OF REGISTERED
MANAGEMENT INVESTMENT COMPANIES
Investment Company Act file number | 811-08510 |
|
Matthews International Funds |
(Exact name of registrant as specified in charter) |
|
Four Embarcadero Center, Suite 550
San Francisco, CA 94111 |
(Address of principal executive offices) (Zip code) |
|
William J. Hackett, President
Four Embarcadero Center, Suite 550
San Francisco, CA 94111 |
(Name and address of agent for service) |
|
Registrant’s telephone number, including area code: | 415-788-6036 | |
|
Date of fiscal year end: | December 31 | |
|
Date of reporting period: | December 31, 2010 | |
| | | | | | |
Form N-CSR is to be used by management investment companies to file reports with the Commission not later than 10 days after the transmission to stockholders of any report that is required to be transmitted to stockholders under Rule 30e-1 under the Investment Company Act of 1940 (17 CFR 270.30e-1). The Commission may use the information provided on Form N-CSR in its regulatory, disclosure review, inspection, and policymaking roles.
A registrant is required to disclose the information specified by Form N-CSR, and the Commission will make this information public. A registrant is not required to respond to the collection of information contained in Form N-CSR unless the Form displays a currently valid Office of Management and Budget ("OMB") control number. Please direct comments concerning the accuracy of the information collection burden estimate and any suggestions for reducing the burden to Secretary, Securities and Exchange Commission, 100 F Street, NE, Washington, DC 20549. The OMB has reviewed this collection of information under the clearance requirements of 44 U.S.C. § 3507.
Item 1. Reports to Stockholders.
The Report to Shareholders is attached herewith.
Matthews Asia Funds | Annual Report
December 31, 2010 | matthewsasia.com
Performance and Expenses
Through December 31, 2010
Institutional Class Shares were first offered on October 29, 2010. For performance since that date, please see each Fund's performance table in the report. Performance for the Institutional Class Shares prior to its inception is based on the performance of the Investor Class. Performance differences between the Institutional Class and Investor Class may arise due to differences in fees charged to each class.
| | | | |
Average Annual Total Return | | 2010 Gross
Annual | | 2009 Gross
Annual | |
| | | Inception
Date | | 1 year | | 5 years | | 10 years | | Since
Inception | | Operating
Expenses1 | | Operating
Expenses | |
| Matthews Asian Growth and Income Fund | |
| Investor Class (MACSX) | | 9/12/94 | | | 19.18 | % | | | 11.42 | % | | | 15.35 | % | | | 11.65 | % | | | 1.13 | % | | | 1.18 | % | |
| Institutional Class (MICSX) | | 10/29/10 | | | 19.23 | % | | | 11.43 | % | | | 15.35 | % | | | 11.65 | % | | | 0.93 | % | | | n.a. | | |
| Matthews Asia Dividend Fund | |
| Investor Class (MAPIX) | | 10/31/06 | | | 22.83 | % | | | n.a. | | | | n.a. | | | | 13.73 | % | | | 1.14 | % | | | 1.28 | % | |
| After Fee Waiver, Reimbursement and Recoupment | | | | | | | | | | 1.15%2 | | 1.30%2 | |
| Institutional Class (MIPIX) | | 10/29/10 | | | 22.88 | % | | | n.a. | | | | n.a. | | | | 13.74 | % | | | 1.02 | % | | | n.a. | | |
| Matthews China Dividend Fund | |
| Investor Class (MCDFX) | | 11/30/09 | | | 22.53 | % | | | n.a. | | | | n.a. | | | | 22.60 | % | | | 1.95 | % | | | 10.05 | % | |
| After Fee Waiver, Reimbursement and Recoupment | | | | | | | | | | 1.50%3 | | 1.50%3 | |
| Institutional Class (MICDX) | | 10/29/10 | | | 22.58 | % | | | n.a. | | | | n.a. | | | | 22.64 | % | | | 1.24 | % | | | n.a. | | |
| Matthews Asia Pacific Fund | |
| Investor Class (MPACX) | | 10/31/03 | | | 26.85 | % | | | 8.59 | % | | | n.a. | | | | 12.09 | % | | | 1.19 | % | | | 1.28 | % | |
| Institutional Class (MIAPX) | | 10/29/10 | | | 26.92 | % | | | 8.60 | % | | | n.a. | | | | 12.09 | % | | | 0.99 | % | | | n.a. | | |
| Matthews Pacific Tiger Fund | |
| Investor Class (MAPTX) | | 9/12/94 | | | 22.30 | % | | | 14.47 | % | | | 16.98 | % | | | 9.90 | % | | | 1.09 | % | | | 1.13 | % | |
| Institutional Class (MIPTX) | | 10/29/10 | | | 22.35 | % | | | 14.48 | % | | | 16.99 | % | | | 9.90 | % | | | 0.95 | % | | | n.a. | | |
| Matthews China Fund | |
| Investor Class (MCHFX) | | 2/19/98 | | | 15.77 | % | | | 24.20 | % | | | 19.73 | % | | | 13.70 | % | | | 1.15 | % | | | 1.21 | % | |
| Institutional Class (MICFX) | | 10/29/10 | | | 15.82 | % | | | 24.21 | % | | | 19.74 | % | | | 13.71 | % | | | 0.97 | % | | | n.a. | | |
| Matthews India Fund | |
| Investor Class (MINDX) | | 10/31/05 | | | 32.53 | % | | | 17.15 | % | | | n.a. | | | | 19.38 | % | | | 1.18 | % | | | 1.27 | % | |
| Institutional Class (MIDNX) | | 10/29/10 | | | 32.52 | % | | | 17.15 | % | | | n.a. | | | | 19.38 | % | | | 0.99 | % | | | n.a. | | |
| Matthews Japan Fund | |
| Investor Class (MJFOX) | | 12/31/98 | | | 19.58 | % | | | -4.72 | % | | | 0.75 | % | | | 4.39 | % | | | 1.30 | % | | | 1.31 | % | |
| Institutional Class (MIJFX) | | 10/29/10 | | | 19.58 | % | | | -4.72 | % | | | 0.75 | % | | | 4.39 | % | | | 1.08 | % | | | n.a. | | |
| Matthews Korea Fund | |
| Investor Class (MAKOX) | | 1/3/95 | | | 21.86 | % | | | 4.77 | % | | | 19.83 | % | | | 5.80 | % | | | 1.21 | % | | | 1.30 | % | |
| Institutional Class (MIKOX) | | 10/29/10 | | | 21.86 | % | | | 4.77 | % | | | 19.83 | % | | | 5.80 | % | | | 0.91 | % | | | n.a. | | |
| Matthews Asia Small Companies Fund | |
| Investor Class (MSMLX) | | 9/15/08 | | | 35.54 | % | | | n.a. | | | | n.a. | | | | 40.27 | % | | | 1.59 | % | | | 2.09 | % | |
| After Fee Waiver, Reimbursement and Recoupment | | | | | | | | | | | | | | | | | | | | | 1.63 | %4 | | | 2.00 | %4 | |
| Matthews Asia Science and Technology Fund | |
| Investor Class (MATFX) | | 12/27/99 | | | 23.58 | % | | | 8.70 | % | | | 9.16 | % | | | 0.42 | % | | | 1.26 | % | | | 1.40 | % | |
1 Gross annual operating expenses for Institutional Class Shares are annualized.
2 The Advisor has contractually agreed to waive Matthews Asia Dividend Fund's fees and reimburse expenses until at least April 30, 2012 to the extent needed to limit total annual operating expenses to 1.50%.
3 The Advisor has contractually agreed to waive Matthews China Dividend Fund's fees and reimburse expenses until at least November 30, 2012 to the extent needed to limit total annual operating expenses to 1.50%.
4 The Advisor has contractually agreed to waive Matthews Asia Small Companies Fund's fees and reimburse expenses until at least April 30, 2012 to the extent needed to limit total annual operating expenses to 2.00%.
Investor Disclosure
Past Performance: All performance quoted in this report is past performance and is no guarantee of future results. Investment return and principal value will fluctuate with changing market conditions so that when redeemed, shares may be worth more or less than their original cost. Current performance may be lower or higher than the returns quoted. If certain of the Funds' fees and expenses had not been waived, returns would have been lower. For the Funds' most recent month-end performance, please call 800.789.ASIA (2742) or visit matthewsasia.com.
Investment Risk: Mutual fund shares are not deposits or obligations of, or guaranteed by, any depositary institution. Shares are not insured by the FDIC, Federal Reserve Board or any government agency and are subject to investment risks, including possible loss of principal amount invested. Investing in international markets may involve additional risks, such as social and political instability, market illiquidity, exchange-rate fluctuations, a high level of volatility and limited regulation. In addition, single-country and sector funds may be subject to a higher degree of market risk than diversified funds because of concentration in a specific industry, sector or geographic location. Investing in small and mid-size companies is more risky than investing in large companies as they may be more volatile and less liquid than larger companies. Please see the Funds' prospectus and Statement of Additional Information for more risk disclosure.
Contents
| Messages to Shareholders | | | 2 | | |
|
| Manager Commentaries, Fund Characteristics and Schedules of Investments: | |
|
| ASIA GROWTH AND INCOME STRATEGIES | |
|
| Matthews Asian Growth and Income Fund | | | 4 | | |
|
| Matthews Asia Dividend Fund | | | 10 | | |
|
| Matthews China Dividend Fund | | | 15 | | |
|
| ASIA GROWTH STRATEGIES | |
|
| Matthews Asia Pacific Fund | | | 20 | | |
|
| Matthews Pacific Tiger Fund | | | 25 | | |
|
| Matthews China Fund | | | 30 | | |
|
| Matthews India Fund | | | 35 | | |
|
| Matthews Japan Fund | | | 40 | | |
|
| Matthews Korea Fund | | | 45 | | |
|
| ASIA SMALL COMPANY STRATEGY | |
|
| Matthews Asia Small Companies Fund | | | 50 | | |
|
| ASIA SPECIALTY STRATEGY | |
|
| Matthews Asia Science and Technology Fund | | | 55 | | |
|
| Disclosures and Index Definitions | | | 59 | | |
|
| Disclosure of Fund Expenses | | | 60 | | |
|
| Statements of Assets and Liabilities | | | 62 | | |
|
| Statements of Operations | | | 64 | | |
|
| Statements of Changes in Net Assets | | | 66 | | |
|
| Financial Highlights | | | 72 | | |
|
| Notes to Financial Statements | | | 83 | | |
|
| Report of Independent Registered Public Accounting Firm | | | 97 | | |
|
| Tax Information | | | 98 | | |
|
| Approval of Investment Advisory Agreement | | | 99 | | |
|
| Trustees and Officers of the Funds | | | 103 | | |
|
Cover Photo: Baha'i Lotus Temple, New Delhi, India
This report has been prepared for Matthews Asia Funds shareholders. It is not authorized for distribution to prospective investors unless accompanied or preceded by a current Matthews Asia Funds prospectus, which contains more complete information about the Funds' investment objectives, risks and expenses. Additional copies of the prospectus may be obtained at matthewsasia.com. Please read the prospectus carefully before you invest or send money.
The views and opinions in this report were current as of December 31, 2010. They are not guarantees of performance or investment results and should not be taken as investment advice. Investment decisions reflect a variety of factors, and the managers reserve the right to change their views about individual stocks, sectors and the markets at any time. As a result, the views expressed should not be relied upon as a forecast of a Fund's future investment intent.
Statements of fact are from sources considered reliable, but neither the Funds nor the Investment Advisor makes any representation or guarantee as to their completeness or accuracy.
Matthews Asia Funds are distributed by:
BNY Mellon Distributors Inc. | 760 Moore Road | King of Prussia, PA 19406

"We set out to invest 'through the cycle.' That means we are looking for profit opportunities that depend on solid financials and sustainable business advantages, rather than being driven by the short-term ebbs and flows of the stream of spending in an economy."
Message to Shareholders
from the Investment Advisor
Dear Fellow Shareholders,
2010 was the year that the global economy steadied itself, but was not revitalized. Growth rates were positive in most large economies. However, growth for the most part was not sufficient enough to lift employment rates. This situation has been described as the "new normal." And yet, it is surely abnormal to have nearly 10% unemployment in the U.S. and Europe as a whole, as well as 20% of people out of work in large economies such as Spain. As one might expect in such an environment, overall prices were subdued, rising 1.6% in both the U.S. and Europe, despite policymakers' attempts to "jump start" their economies through aggressive fiscal expansion, monetary stimulus, or both. Those attempts have, to general consensus, produced lackluster results—although the argument rages as to whether that was because the efforts were too little or whether they were of the kind that would fail even more disastrously if they were tried on a larger scale. The experience in Asia, of course, has been very different. Asian economies were revitalized in 2010, and reached new heights of production and income. Accordingly, policymakers in Asia are stepping on the brakes to try to rein in prices and credit growth for fear that they might be in danger of igniting the same kind of bubbles that have brought the West's economies to a crawl.
How investors will react depends very much on what they want from the markets. If they seek fast profits, then the current environment may seem an exciting one. What is the possibility of an Asian equity bubble? Will the demand for raw materials in Asia push commodity prices to new highs in the very near future? Will the great wall of liquidity—created by the West's policy response to stagnant growth—push asset prices to historic highs? Will it also be further accommodated by Asian government efforts to hold down currencies that should appreciate by increasing the quantity of currency in circulation? However, if an investor's commitment to the markets is longer-term in nature, as ours is at Matthews, then these issues become distinctly less enticing—for what we are witnessing is a distortion in pricing. The degrees of relative price changes are not being determined by the underlying changes to domestic demand, and can be misleading. Put another way, if the price changes that are directing true profit opportunities are being overwhelmed by speculative trading, then the investment waters are being muddied.
This makes it a peculiar and difficult time for Matthews' style of investing. We set out to invest "through the cycle." That means we are looking for profit opportunities that depend on solid financials and sustainable business advantages, rather than being driven by the short-term ebbs and flows of the stream of spending in an economy. We try to train ourselves to set our sights over the kind of time horizon that would take into account a complete business cycle. We, therefore, anticipate seeing temporary fluctuations in industries and in our own performance within that timeframe. Trying to remain true to our essential philosophy and beliefs in investing has therefore been a key test for our investment team over the past year—and one in which, I believe, our portfolio managers performed admirably. Looking ahead in what we expect may be a volatile environment, it will be even more important to stay true to our principles, and to properly manage portfolios for market risks, than to accurately predict each sway and twist of the markets.
2 MATTHEWS ASIA FUNDS
An Eye for New Trends
We have to guard against many errors, but in this context, one is more apparent than any other—that is mistaking the beginning of a new trend for just another cyclical quirk. Industries have in the past morphed from cyclical to secular growth. Being mindful of these opportunities is paramount. One example of the past is the information technology industry. Certainly overhyped in the late 1990s and very dependent on corporate capital expenditure cycles, the IT industry has become more exposed over time to consumer demand and growth. As technologies and research and development have coalesced around a core set of platforms, the industry has moderated its cycles and become more transparent. We believe there are similar opportunities across the Asian markets. In the financials sector, industries such as wealth management have in the past been very cyclical, as they have lacked a deep client base or a diverse enough pool of assets in which to invest. As financial markets deepen and savings behavior changes, these businesses could change as well. The same could be said across many other emergent industries in the services and consumer sectors, such as marketing and advertising. Properly assessing these opportunities is a task for our analysts and portfolio managers.
Foremost in our minds is the energy and materials sector. Talk of commodity supercycles is always quick to surface whenever higher liquidity or a lower U.S. dollar drives prices in these sectors—and yet the key catalyst has remained monetary, despite the underlying demand in Asia's economies. Nevertheless, at some point there will be a structural shift in the way that Asia manages its energy needs, driven partly by costs in traditional raw commodities and partly—perhaps more sustainably—by an ongoing desire to change the quality of life.
Our investment process remains informed ultimately by our confidence in the underlying business investment. But when we do try to pierce the murky future and identify broad themes and attractive industries, we do so with the knowledge that these are driven by forces and demands that are more widespread and enduring than the actions of politicians and central bankers. In so doing, we hope that we are continuing to place emphasis on stock selection, whilst neither ignoring the macroeconomic environment, nor placing too much faith in short-term forecasts of overly broad indicators such as GDP and interest rates.
Finally, Matthews continuously monitors capacity and asset flows on each of its investment strategies. If we believe the pace of inflows and/or a Fund's asset levels could impede the Firm's ability to achieve its investment objectives, Matthews considers strategy closures. Recently, two Funds were closed to most new investors—the Matthews Asia Small Companies and Matthews Asian Growth and Income Funds closed on November 12, 2010 and January 7, 2011, respectively. The Funds' closures apply to both Investor and Institutional Class shares. We believe that limiting access to these Funds is a prudent step toward maintaining the integrity of our investment process.
As always, it is an honor to serve as your investment advisor.

Robert Horrocks, PhD
Chief Investment Officer
Matthews International Capital Management, LLC
matthewsasia.com | 800.789.ASIA 3

ASIA GROWTH AND INCOME STRATEGIES
PORTFOLIO MANAGERS
Andrew Foster
Lead Manager
Robert J. Horrocks, PhD
Co-Manager
FUND FACTS
| | | Investor Class | | Institutional Class | |
| Ticker | | MACSX | | MICSX | |
| CUSIP | | 577130206 | | 577130842 | |
| Inception | | 9/12/94 | | 10/29/10 | |
| NAV | | $18.04 | | $18.04 | |
| Initial Investment | | $2,500 | | $3 million | |
| Gross Expense Ratio1 | | 1.13% | | 0.93% | |
Portfolio Statistics
| Total # of Positions | | 85 | |
| Net Assets | | $4.1 billion | |
| Weighted Average Market Cap | | $22.3 billion | |
| Portfolio Turnover | | 19.84%2 | |
Benchmark
MSCI AC Asia ex Japan Index
Redemption Fee
2% within first 90 calendar days of purchase
OBJECTIVE
Long-term capital appreciation. The Fund also seeks to provide some current income.
STRATEGY
Under normal market conditions, the Fund seeks to achieve its investment objective by investing at least 80% of its total net assets, which include borrowings for investment purposes, in dividend-paying equity securities and the convertible securities, of any duration or quality, of companies located in Asia.
1 Gross expense ratio for Institutional Class is annualized. Matthews Asia Funds does not charge 12b-1 fees.
2 The lesser of fiscal year 2010 long-term purchase costs or sales proceeds divided by the average monthly market value of long-term securities.
Matthews Asian Growth and Income Fund
Portfolio Manager Commentary
For the year ending December 31, 2010, the Matthews Asian Growth and Income Fund returned 19.18% (Investor Class) and 19.23% (Institutional Class), while its benchmark, the MSCI All Country Asia ex Japan Index, rose 19.93%. By way of broader comparison, the U.S. S&P 500 Index rose 15.08% during the year, and the international MSCI EAFE Index climbed 8.21%. During the fourth quarter, the Fund gained 4.70% (Investor Class) and 4.75% (Institutional Class), versus a 6.72% increase in the benchmark. The Fund began 2010 with a share price of $15.77, and shareholders who were invested throughout the year would have received income distributions totaling approximately 47 cents (Investor Class), or 3.0%, of the share price at the start of the year.
During the latter half of 2010, stock markets around the world performed exceedingly well, casting a rosy tint over perceptions of the year as a whole. However, the year was punctuated by sharp volatility, prompted by concerns over the solvency of several European nations, and by the tepid recovery of the U.S. economy. Though now only an afterthought, six months ago markets were mired in losses. Against this backdrop of falling stocks, the Fund held up better than market averages, and exhibited reduced volatility. As markets rose, the Fund outpaced its benchmark for most of the year, though sustained gains in markets meant the Fund's performance was eclipsed by the index in the final week of 2010. Since its inception, the Fund has sought to participate in the region's long-term growth potential, balanced by a desire to mitigate excess volatility and to offer a degree of downside protection. Amid a rocky year that proved profitable only near its end, the Fund's stability and steady gains meant that it performed as it intended.
The Fund's gains during the year had less-obvious origins: namely, its exposure to industrials, and its holdings in Japan. The Fund has historically sought to minimize exposure to cyclical elements; this has meant that industrials have not always played a large role in the portfolio. However, in recent years, we have determined that a number of industrials—particularly larger issuers in technology, industrial services and specialized manufacturing—have exhibited characteristics associated with maturation. As growth in these areas has moderated, their need for investment and capital expenditure has been tempered, as has the cyclicality associated with their businesses.
Happily, this has meant these issuers have enjoyed higher levels of residual cash profits that can be used to fortify their balance sheets, or to expand dividend payments. With improved prospects for dividend payment, and often-underappreciated growth, such industrials include some of the Fund's largest holdings: Singapore Technologies Engineering, Taiwan Semiconductor Manufacturing and Keppel. All three of these positions paid ample dividends during the year, exhibited relatively steady stock performance during market declines, and most importantly, saw their growth prospects surpass market expectations, leading to large gains for the Fund.
Perhaps even less expected is the contribution of the Fund's Japanese holdings to performance. Though bolstered by substantial strength in the yen during the year, the Japanese holdings nevertheless generated gains that, on average, handily surpassed the Fund's overall return. During the past several years, the Fund has increased its allocation to Japanese equities and real estate investment trusts (REITs), but not because of an overall belief that the Japanese market might rally. Instead, we have discovered select companies that offer stable business models, and which present balance sheets replete with substantial levels of liquid cash, typically accompanied by little or no
(continued)
Closed to most new investors as of January 7, 2011.
4 MATTHEWS ASIA FUNDS
PERFORMANCE AS OF DECEMBER 31, 2010
Institutional Class Shares were first offered on October 29, 2010. Performance since that date was 2.49%. Performance for the Institutional Class shares prior to its inception is based on the performance of the Investor Class. Performance differences between the Institutional Class and Investor Class may arise due to differences in fees charged to each class.
| | | | | | | Average Annual Total Returns | |
| | | Inception Date | | 3 Months | | 1 Year | | 3 Years | | 5 Years | | 10 Years | | Since
Inception | |
| Investor Class (MACSX) | | 9/12/94 | | | 4.70 | % | | | 19.18 | % | | | 4.62 | % | | | 11.42 | % | | | 15.35 | % | | | 11.65 | % | |
| Institutional Class (MICSX) | | 10/29/10 | | | 4.75 | % | | | 19.23 | % | | | 4.63 | % | | | 11.43 | % | | | 15.35 | % | | | 11.65 | % | |
| MSCI AC Asia ex Japan Index3 | | | | | 6.72 | % | | | 19.93 | % | | | -0.38 | % | | | 13.19 | % | | | 13.31 | % | | | 4.56 | %4 | |
| Lipper Pacific Region Funds Category Average5 | | | | | 9.11 | % | | | 16.87 | % | | | -3.10 | % | | | 4.94 | % | | | 8.17 | % | | | 4.32 | %4 | |
Performance assumes reinvestment of all dividends and/or distributions before taxes. All performance quoted represents past performance and is no guarantee of future results. Investment return and principal value will fluctuate with market conditions so that when redeemed, shares may be worth more or less than their original cost. Current performance may be lower or higher than the return figures quoted. Returns would have been lower if certain of the Fund's fees and expenses had not been waived. For the Fund's most recent month-end performance visit matthewsasia.com.
2010 INCOME DISTRIBUTION HISTORY
| | | June | | December | | Total | |
| Investor Class (MACSX) | | $ | 0.19 | | | $ | 0.28 | | | $ | 0.47 | | |
| Institutional Class (MICSX) | | | — | | | $ | 0.29 | | | $ | 0.29 | | |
Note: This table does not include capital gains distributions. Institutional Class Shares were first offered on October 29, 2010. For income distribution history, visit matthewsasia.com.
30-DAY YIELD:
0.93% (Investor Class) 1.18% (Institutional Class)
The 30-Day Yield represents net investment income earned by the Fund over the 30-day period ended 12/31/10, expressed as an annual percentage rate based on the Fund's share price at the end of the 30-day period. The 30-Day Yield should be regarded as an estimate of the Fund's rate of investment income, and it may not equal the Fund's actual income distribution rate.
Source: BNY Mellon Investment Servicing (US) Inc.
DIVIDEND YIELD: 3.75%
The dividend yield (trailing) for the portfolio is the weighted average sum of the dividend paid per share during the last 12 months divided by the current price. The annualized dividend yield for the Fund is for the equity-only portion of the portfolio. Please note that this is based on gross portfolio holdings and does not reflect the actual yield an investor in the Fund would receive. Past yields are no guarantee of future yields.
Source: FactSet Research Systems
GROWTH OF A $10,000 INVESTMENT SINCE INCEPTION—INVESTOR CLASS
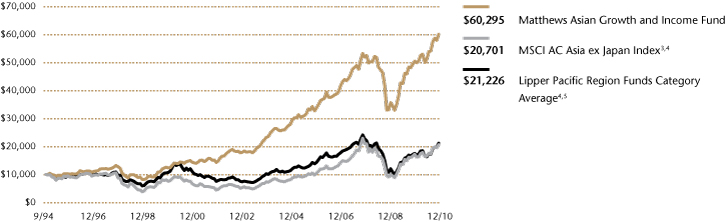
Plotted monthly. The performance data and graph do not reflect the deduction of taxes that a shareholder would pay on dividends, capital gain distributions or redemption of Fund shares. Values are in US$.
3 It is not possible to invest directly in an index. Source: Index data from Morgan Stanley Capital International and Bloomberg; total return calculations performed by BNY Mellon Investment Servicing (US) Inc. Please see page 59 for index definitions.
4 Calculated from 8/31/94.
5 The Lipper Category Average does not reflect sales charges and is based on total return, including reinvestment of dividends and capital gains for the stated periods.
TOP TEN HOLDINGS6
| | | Country | | % of Net Assets | |
| Singapore Technologies Engineering, Ltd. | | Singapore | | | 3.5 | % | |
| Taiwan Semiconductor Manufacturing Co., Ltd. | | Taiwan | | | 3.1 | % | |
| Telstra Corp., Ltd. | | Australia | | | 2.8 | % | |
| Keppel Corp., Ltd. | | Singapore | | | 2.7 | % | |
| CLP Holdings, Ltd. | | China/Hong Kong | | | 2.6 | % | |
| Hisamitsu Pharmaceutical Co., Inc. | | Japan | | | 2.6 | % | |
| China Petroleum & Chemical Corp. (Sinopec), Cnv., 0.000%, 04/24/2014 | | China/Hong Kong | | | 2.3 | % | |
| Trend Micro, Inc. | | Japan | | | 2.3 | % | |
| HSBC Holdings PLC | | United Kingdom | | | 2.3 | % | |
| PTT Public Co., Ltd. | | Thailand | | | 2.2 | % | |
| % OF ASSETS IN TOP TEN | | | | | 26.4 | % | |
6 Holdings may combine more than one security from same issuer and related depositary receipts.
matthewsasia.com | 800.789.ASIA 5
COUNTRY ALLOCATION (%)7
| China/Hong Kong | | | 26.0 | | |
| Singapore | | | 15.0 | | |
| Japan | | | 12.2 | | |
| South Korea | | | 8.0 | | |
| India | | | 7.3 | | |
| Taiwan | | | 6.5 | | |
| Malaysia | | | 5.7 | | |
| Thailand | | | 5.1 | | |
| Australia | | | 3.9 | | |
| United Kingdom | | | 2.3 | | |
| Vietnam | | | 2.1 | | |
| Indonesia | | | 1.1 | | |
| Philippines | | | 1.0 | | |
Cash and Other Assets,
Less Liabilities | | | 3.8 | | |
SECTOR ALLOCATION (%)
| Financials | | | 25.9 | | |
| Telecommunication Services | | | 15.4 | | |
| Industrials | | | 14.6 | | |
| Information Technology | | | 13.5 | | |
| Consumer Discretionary | | | 6.2 | | |
| Utilities | | | 5.7 | | |
| Consumer Staples | | | 4.8 | | |
| Energy | | | 4.6 | | |
| Health Care | | | 4.2 | | |
| Non Classified | | | 0.8 | | |
| Materials | | | 0.5 | | |
Cash and Other Assets,
Less Liabilities | | | 3.8 | | |
MARKET CAP EXPOSURE (%)8
| Large Cap (over $5B) | | | 60.2 | | |
| Mid Cap ($1B–$5B) | | | 27.8 | | |
| Small Cap (under $1B) | | | 7.5 | | |
| Non Classified | | | 0.7 | | |
Cash and Other Assets,
Less Liabilities | | | 3.8 | | |
BREAKDOWN BY SECURITY TYPE (%)8,9
| Common Equities | | | 71.4 | | |
| Convertible Bonds | | | 20.2 | | |
| Preferred Equities | | | 2.5 | | |
| Corporate Bonds | | | 1.1 | | |
| Government Bonds | | | 0.7 | | |
| Warrants | | | 0.4 | | |
Cash and Other Assets,
Less Liabilities | | | 3.8 | | |
7 Australia, United Kingdom and Japan are not included in the MSCI All Country Asia ex Japan Index.
8 Source: FactSet Research Systems. Percentage values in data are rounded to the nearest tenth of one percent; the values may not sum to 100% due to rounding.
9 Bonds are not included in the MSCI All Country Asia ex Japan Index.
Matthews Asian Growth and Income Fund
Portfolio Manager Commentary (continued)
borrowings. Perhaps surprising to some, these same companies are capable of producing admirable growth amid a moribund and deflationary economy. As these companies are located in a market burdened by sustained negative perception, their performance has gone less noticed, and equities have been reasonably priced, with attractive dividends. Though the Fund's allocation is not permanent in any sense, it is likely to maintain a tactical allocation to the Japanese market for some time.
Looking forward, aggregate valuation levels in Asia appear challenging, though not unworkable. Currently forecasted price-to-earnings multiples for stocks are not unreasonable—set at approximately 13 times estimated future earnings. However, this ratio is dependant on corporate profits expanding at a relatively robust pace. This assumption may be at odds with the global economic environment, which may see sluggish growth in developed markets, and more moderate growth in China. Convertible bonds have often proven attractive as an alternative asset class for the Fund; however, such bonds have been subject to aggressive valuations throughout the year, limiting their immediate attraction. Still, issuance in the convertible market has begun to expand dramatically, and with it, the possibility the Fund may find new avenues for investment in that asset class. In the meantime, we are favoring investment in the large-capitalization stocks of business with stable prospects and elevated dividend yields, particularly such as those found in the telecommunications industry.
The year ahead will present several challenges for investors in the Asian region, including burgeoning inflation. Inflationary pressures have escalated to the extent that policy reaction appears unavoidable. Already the region has seen higher interest rates, heightened administrative controls over the commercial banking sector, and restrictions on the free-flow of capital across borders. The unpredictable consequence of these policies will likely create headwinds for stocks, at least in the near-term. Another challenge stems from the threat of military conflict or violence within the region.
The third major challenge stems from the growing misperception over China's long-term growth potential. After several decades of successful and rapid expansion, public consensus has assigned an elevated expectation for China's growth. Forecasts are underpinned by assumptions that the country will sidestep major shocks to its domestic economy. Along the way, forecasters expect that China should grow its economy from US$5.8 trillion today, to well over US$18 trillion a decade later. Yet such forecasts ignore the fact that as China's economy grows, its challenges will also grow exponentially. It is far more straightforward to expand from a small base than it is to compound growth from a much larger one.
To be clear, we remain positive about China's long-term growth prospects. Yet our evidence indicates that the economy is entering a period of structural transition, one in which its growth should moderate, even as the quality and sustainability of that growth may improve. China's economy may not realize the substantial scale that some have predicted unless it promotes growth in its service industries; it must curtail and reverse damage to its natural environment; and it must undertake difficult public and private reforms. This may not happen in a smooth, straight line as has been forecast. Yet we continue to invest in the market on the premise that it will indeed occur, but only over a horizon that will benefit investors who possess patience, persistence and time.
We would also like to note that the Fund closed to most new investors on January 7, 2011 in order to limit the pace of inflows. We believe that limiting access to the Fund at this time is a prudent step toward maintaining the integrity of our investment process. We thank you for your investment in the Fund.
6 MATTHEWS ASIA FUNDS
Matthews Asian Growth and Income Fund December 31, 2010
Schedule of Investments
COMMON EQUITIES: 71.3%
| | | Shares | | Value | |
| CHINA/HONG KONG: 18.4% | |
| CLP Holdings, Ltd. | | | 13,196,700 | | | $ | 107,131,506 | | |
| Hang Seng Bank, Ltd. | | | 5,417,500 | | | | 89,074,272 | | |
China Pacific Insurance Group Co., Ltd.
H Shares | | | 19,906,800 | | | | 82,723,039 | | |
| Hang Lung Properties, Ltd. | | | 14,525,920 | | | | 67,931,401 | | |
Shandong Weigao Group Medical
Polymer Co., Ltd. H Shares | | | 23,340,000 | | | | 66,211,275 | | |
| China Mobile, Ltd. ADR | | | 1,199,400 | | | | 59,514,228 | | |
| Television Broadcasts, Ltd. | | | 9,622,000 | | | | 51,992,075 | | |
China Communications Services
Corp., Ltd. H Shares | | | 84,998,000 | | | | 50,630,499 | | |
| Vitasoy International Holdings, Ltd.† | | | 51,771,000 | | | | 43,160,261 | | |
| VTech Holdings, Ltd. | | | 3,430,300 | | | | 40,358,807 | | |
Citic Telecom International
Holdings, Ltd. | | | 110,763,000 | | | | 35,340,192 | | |
| Inspur International, Ltd.† | | | 299,510,000 | | | | 26,202,501 | | |
| I-CABLE Communications, Ltd.a† | | | 128,079,000 | | | | 15,983,511 | | |
| SinoCom Software Group, Ltd.† | | | 83,028,000 | | | | 9,400,041 | | |
| Total China/Hong Kong | | | | | 745,653,608 | | |
| JAPAN: 12.2% | |
| Hisamitsu Pharmaceutical Co., Inc. | | | 2,513,600 | | | | 105,881,414 | | |
| Trend Micro, Inc. | | | 2,832,700 | | | | 93,539,459 | | |
| Rohm Co., Ltd. | | | 1,249,100 | | | | 81,539,968 | | |
| Japan Real Estate Investment Corp., REIT | | | 7,113 | | | | 73,767,040 | | |
| Nintendo Co., Ltd. | | | 214,300 | | | | 62,898,990 | | |
| Hamamatsu Photonics, K.K. | | | 1,624,700 | | | | 59,392,901 | | |
| Nippon Building Fund, Inc., REIT | | | 1,701 | | | | 17,452,063 | | |
| Total Japan | | | | | 494,471,835 | | |
| SINGAPORE: 11.7% | |
| Singapore Technologies Engineering, Ltd. | | | 52,627,125 | | | | 140,246,050 | | |
| Keppel Corp., Ltd. | | | 12,239,000 | | | | 107,956,115 | | |
| Ascendas REIT | | | 40,920,000 | | | | 66,002,571 | | |
| Hong Leong Finance, Ltd. | | | 14,950,000 | | | | 35,297,074 | | |
| Singapore Post, Ltd. | | | 38,209,000 | | | | 35,131,975 | | |
| ARA Asset Management, Ltd. | | | 25,801,000 | | | | 31,161,842 | | |
| Cerebos Pacific, Ltd. | | | 7,740,000 | | | | 29,733,276 | | |
| Fraser and Neave, Ltd. | | | 5,801,100 | | | | 28,974,988 | | |
| Total Singapore | | | | | 474,503,891 | | |
| TAIWAN: 6.5% | |
Taiwan Semiconductor Manufacturing
Co., Ltd. | | | 29,923,187 | | | | 72,866,986 | | |
| Cathay Financial Holding Co., Ltd. | | | 31,056,902 | | | | 55,069,773 | | |
Taiwan Semiconductor Manufacturing
Co., Ltd. ADR | | | 4,055,624 | | | | 50,857,525 | | |
| Chunghwa Telecom Co., Ltd. ADR | | | 1,596,907 | | | | 40,353,840 | | |
| CyberLink Corp.† | | | 5,990,128 | | | | 22,599,217 | | |
| Taiwan Hon Chuan Enterprise Co., Ltd. | | | 9,282,000 | | | | 21,170,339 | | |
| Total Taiwan | | | | | 262,917,680 | | |
| | | Shares | | Value | |
| THAILAND: 5.1% | |
| PTT Public Co., Ltd. | | | 8,557,300 | | | $ | 90,838,812 | | |
| BEC World Public Co., Ltd. | | | 34,557,800 | | | | 36,397,749 | | |
| Land & Houses Public Co., Ltd. NVDR | | | 164,864,400 | | | | 35,275,349 | | |
| Glow Energy Public Co., Ltd. | | | 21,887,400 | | | | 34,306,839 | | |
| Thai Reinsurance Public Co., Ltd. NVDR | | | 44,014,435 | | | | 9,417,585 | | |
| Thai Reinsurance Public Co., Ltd. | | | 8,066,665 | | | | 1,725,991 | | |
| Home Product Center Public Co., Ltd. | | | 2,241,200 | | | | 654,257 | | |
| Total Thailand | | | | | 208,616,582 | | |
| SOUTH KOREAb: 5.0% | |
| S1 Corp. | | | 973,615 | | | | 48,027,664 | | |
| KT Corp. ADR | | | 2,016,405 | | | | 41,941,224 | | |
| GS Home Shopping, Inc.† | | | 430,049 | | | | 41,327,663 | | |
| SK Telecom Co., Ltd. ADR | | | 1,736,333 | | | | 32,347,884 | | |
| SK Telecom Co., Ltd. | | | 211,862 | | | | 32,319,974 | | |
| Daehan City Gas Co., Ltd. | | | 346,870 | | | | 8,919,566 | | |
| Total South Korea | | | | | 204,883,975 | | |
| AUSTRALIA: 3.9% | |
| Telstra Corp., Ltd. | | | 40,441,233 | | | | 115,403,362 | | |
| AXA Asia Pacific Holdings, Ltd. | | | 6,513,015 | | | | 42,034,057 | | |
| Total Australia | | | | | 157,437,419 | | |
| UNITED KINGDOM: 2.3% | |
| HSBC Holdings PLC ADR | | | 1,795,633 | | | | 91,649,108 | | |
| Total United Kingdom | | | | | 91,649,108 | | |
| MALAYSIA: 1.8% | |
| AMMB Holdings BHD | | | 22,022,100 | | | | 50,207,674 | | |
| YTL Power International BHD | | | 30,167,418 | | | | 23,871,737 | | |
| Total Malaysia | | | | | 74,079,411 | | |
| VIETNAM: 1.3% | |
| Baoviet Holdings | | | 10,449,101 | | | | 32,108,777 | | |
| Vietnam Dairy Products JSC | | | 2,835,060 | | | | 11,615,712 | | |
| Kinh Do Corp. | | | 4,466,000 | | | | 10,957,490 | | |
| Total Vietnam | | | | | 54,681,979 | | |
| INDONESIA: 1.1% | |
| PT Telekomunikasi Indonesia ADR | | | 1,217,800 | | | | 43,414,570 | | |
| Total Indonesia | | | | | 43,414,570 | | |
| INDIA: 1.0% | |
| Oriental Bank of Commerce | | | 4,536,984 | | | | 41,123,552 | | |
| Total India | | | | | 41,123,552 | | |
| PHILIPPINES: 1.0% | |
| Globe Telecom, Inc. | | | 2,125,510 | | | | 38,813,239 | | |
| Total Philippines | | | | | 38,813,239 | | |
| TOTAL COMMON EQUITIES | | | | | 2,892,246,849 | | |
| (Cost $2,360,684,902) | | | | | | | |
matthewsasia.com | 800.789.ASIA 7
Matthews Asian Growth and Income Fund December 31, 2010
Schedule of Investments (continued)
PREFERRED EQUITIES: 2.5%
| | | Shares | | Value | |
| SOUTH KOREAb: 2.5% | |
Samsung Fire & Marine Insurance
Co., Ltd., Pfd. | | | 507,311 | | | $ | 39,123,038 | | |
| Hyundai Motor Co., Ltd., Pfd. | | | 566,280 | | | | 29,397,401 | | |
| LG Household & Health Care, Ltd., Pfd. | | | 210,290 | | | | 17,395,529 | | |
| Hyundai Motor Co., Ltd., 2nd Pfd. | | | 305,760 | | | | 17,071,852 | | |
| Total South Korea | | | | | 102,987,820 | | |
| TOTAL PREFERRED EQUITIES | | | | | 102,987,820 | | |
| (Cost $49,628,944) | | | | | | | |
WARRANTS: 0.4%
| INDIA: 0.4% | |
Housing Development Finance Corp.,
expires 08/23/12 | | | 3,875,750 | | | | 15,554,139 | | |
| Total India | | | | | 15,554,139 | | |
| TOTAL WARRANTS | | | | | 15,554,139 | | |
| (Cost $6,834,750) | | | | | | | |
INTERNATIONAL BONDS: 22.0%
| | | Face Amount | | | |
| CHINA/HONG KONG: 7.6% | |
China Petroleum & Chemical Corp.
(Sinopec), Cnv.
0.000%, 04/24/14 | | HKD | 638,940,000 | | | | 94,326,838 | | |
Hongkong Land CB 2005, Ltd., Cnv.
2.750%, 12/21/12 | | | 41,400,000 | | | | 77,625,000 | | |
China High Speed Transmission
Equipment Group Co., Ltd., Cnv.
0.000%, 05/14/11 | | CNY | 247,700,000 | | | | 40,737,040 | | |
Yue Yuen Industrial Holdings, Ltd., Cnv.
0.000%, 11/17/11 | | HKD | 246,300,000 | | | | 37,549,596 | | |
Power Regal Group, Ltd., Cnv.
2.250%, 06/02/14 | | HKD | 207,640,000 | | | | 33,557,710 | | |
PB Issuer No. 2, Ltd.,Cnv.
1.750%, 04/12/16 | | | 13,200,000 | | | | 13,411,200 | | |
PB Issuer, Ltd., Cnv.
3.300%, 02/01/13 | | | 11,880,000 | | | | 11,897,820 | | |
| Total China/Hong Kong | | | | | 309,105,204 | | |
| | | Face Amount | | Value | |
| INDIA: 5.9% | |
Tata Power Co., Ltd., Cnv.
1.750%, 11/21/14 | | $ | 47,700,000 | | | $ | 55,498,950 | | |
Reliance Communications, Ltd., Cnv.
0.000%, 05/10/11 | | | 35,315,000 | | | | 43,923,031 | | |
Housing Development Finance Corp.
0.000%, 08/24/12 | | INR | 1,800,000,000 | | | | 43,618,249 | | |
Larsen & Toubro, Ltd., Cnv.
3.500%, 10/22/14 | | | 27,000,000 | | | | 33,750,000 | | |
Sintex Industries, Ltd., Cnv.
0.000%, 03/13/13 | | | 28,400,000 | | | | 32,589,000 | | |
Financial Technologies India, Ltd., Cnv.
0.000%, 12/21/11 | | | 20,114,000 | | | | 27,757,320 | | |
| Total India | | | | | 237,136,550 | | |
| MALAYSIA: 3.9% | |
Rafflesia Capital, Ltd., Cnv.
1.250%c, 10/04/11 | | | 48,100,000 | | | | 69,865,250 | | |
Cherating Capital, Ltd., Cnv.
2.000%c, 07/05/12 | | | 50,000,000 | | | | 65,375,000 | | |
Paka Capital, Ltd., Cnv.
0.000%, 03/12/13 | | | 22,300,000 | | | | 22,885,375 | | |
| Total Malaysia | | | | | 158,125,625 | | |
| SINGAPORE: 3.3% | |
CapitaLand, Ltd., Cnv.
3.125%, 03/05/18 | | SGD | 67,000,000 | | | | 53,838,587 | | |
Wilmar International, Ltd., Cnv.
0.000%, 12/18/12 | | | 36,100,000 | | | | 46,298,250 | | |
Olam International, Ltd., Cnv.
6.000%, 10/15/16 | | | 25,300,000 | | | | 35,040,500 | | |
| Total Singapore | | | | | 135,177,337 | | |
| VIETNAM: 0.8% | |
Socialist Republic of Vietnam
6.875%, 01/15/16 | | | 28,611,000 | | | | 29,970,023 | | |
| Total Vietnam | | | | | 29,970,023 | | |
| SOUTH KOREAb: 0.5% | |
LG Uplus Corp., Cnv.
5.000%c, 09/29/12 | | | 20,400,000 | | | | 21,471,000 | | |
| Total South Korea | | | | | 21,471,000 | | |
8 MATTHEWS ASIA FUNDS
Matthews Asian Growth and Income Fund December 31, 2010
Schedule of Investments (continued)
INTERNATIONAL BONDS (continued)
| | | Value | |
TOTAL INTERNATIONAL BONDS
(Cost $796,139,481) | | $ | 890,985,739 | | |
TOTAL INVESTMENTS: 96.2%
(Cost $3,213,288,077d) | | | 3,901,774,547 | | |
CASH AND OTHER ASSETS,
LESS LIABILITIES: 3.8% | | | 152,896,032 | | |
| NET ASSETS: 100.0% | | $ | 4,054,670,579 | | |
a Non–income producing security.
b Certain securities were fair valued under the discretion of the Board of Trustees (Note 2-A).
c Variable rate security. The rate represents the rate in effect at December 31, 2010.
d Cost for federal income tax purposes is $3,243,052,978 and net unrealized appreciation consists of:
| Gross unrealized appreciation | | $ | 737,080,209 | | |
| Gross unrealized depreciation | | | (78,358,640 | ) | |
| Net unrealized appreciation | | $ | 658,721,569 | | |
† Affiliated Issuer, as defined under the Investment Company Act of 1940 (ownership of 5% or more of the outstanding voting securities of this issuer)
ADR American Depositary Receipt
BHD Berhad
CNY Chinese Renminbi (Yuan)
Cnv. Convertible
HKD Hong Kong Dollar
INR Indian Rupee
JSC Joint Stock Co.
NVDR Non-voting Depositary Receipt
Pfd. Preferred
REIT Real Estate Investment Trust
SGD Singapore Dollar
See accompanying notes to financial statements.
matthewsasia.com | 800.789.ASIA 9

ASIA GROWTH AND INCOME STRATEGIES
PORTFOLIO MANAGERS
Jesper O. Madsen, CFA
Lead Manager
Andrew Foster
Co-Manager
FUND FACTS
| | | Investor Class | | Institutional Class | |
| Ticker | | MAPIX | | MIPIX | |
| CUSIP | | 577125107 | | 577130750 | |
| Inception | | 10/31/06 | | 10/29/10 | |
| NAV | | $14.33 | | $14.33 | |
| Initial Investment | | $2,500 | | $3 million | |
| Gross Expense Ratio1 | | 1.14% | | 1.02% | |
After Fee Waiver,
Reimbursement and
Recoupment | | 1.15% | | n.a. | |
Portfolio Statistics
| Total # of Positions | | 74 | |
| Net Assets | | $2.0 billion | |
| Weighted Average Market Cap | | $21.3 billion | |
| Portfolio Turnover | | 10.48%2 | |
Benchmark
MSCI AC Asia Pacific Index
Redemption Fee
2% within first 90 calendar days of purchase
OBJECTIVE
Total return with an emphasis on providing current income.
STRATEGY
Under normal market conditions, the Fund seeks to achieve its investment objective by investing at least 80% of its total net assets, which include borrowings for investment purposes, in income-paying equity securities of companies located in the Asia region.
1 Gross expense ratio for Institutional Class is annualized. The Advisor has contractually agreed to waive certain fees and reimburse certain expenses for Matthews Asia Dividend Fund. Please see page 91 for additional information. Matthews Asia Funds does not charge 12b-1 fees.
2 The lesser of fiscal year 2010 long-term purchase costs or sales proceeds divided by the average monthly market value of long-term securities.
Matthews Asia Dividend Fund
Portfolio Manager Commentary
For the year ending December 31, 2010, the Matthews Asia Dividend Fund gained 22.83% (Investor Class) and 22.88% (Institutional Class), outperforming its benchmark, the MSCI All Country Asia Pacific Index, which rose 17.25%. For the fourth quarter, the Fund rose 4.62% (Investor Class) and 4.66% (Institutional Class), while the benchmark gained 9.30%. The Fund began 2010 with a share price of $12.06, and shareholders who were invested throughout the year would have received income distributions totaling approximately 41 cents (Investor and Institutional Class), or 3.4%, of the share price at the start of the year.
The objective of the Matthews Asia Dividend Fund is total return with an emphasis on providing current income. Since its inception, dividends reinvested have accounted for roughly a third of the Fund's total return, with the remainder derived from capital appreciation. Every company is evaluated based on its ability to deliver a combination of current dividend yield and potential for dividend growth. The Fund's benchmark does not dictate our bottom-up stock selection process or portfolio weights and, therefore, the portfolio will often diverge significantly from the Index. The Fund, for instance, did not make a single investment in India during 2010, even though the country accounted for 5% of the Index as of December 31, 2010. Thai companies on the other hand were given a substantial overweight relative to the Index. The rationale was simple. While India has a host of great growth companies, they tend to pay less of their earnings in dividends and are generally trading on high multiples to earnings, resulting in some of the lowest dividend yields in Asia. Thai companies, on the other hand, began 2010 with some of the highest yields in Asia. By our assessment, these companies could deliver attractive rates of dividend growth on top of the already high dividend yields, making them attractive candidates from a total return perspective. During the year, Thailand continued to grapple with unresolved internal political struggles, culminating in fatal riots on the streets of Bangkok. Not surprisingly, companies have tended to trade at a discount to the region. While India dominates more headlines than Thailand does due to the scale of the country and its longer-term growth potential, in terms of stock market performance, the Stock Exchange of Thailand Index returned 62.79%, compared to 24.36% for Bombay Stock Exchange Sensitive Index during the year, making Thailand a substantial contributor to performance in 2010.
The Fund's Japanese holdings were the main contributors to performance over the year. Not only was this due to the nearly 15% appreciation in the yen, but also due to the performance of the portfolio's individual holdings, which outperformed the Japanese market. Japanese securities continue to play an important role in the Fund, first and foremost because we continue to find companies that offer the potential for dividend growth at attractive valuations. Exposure to Japanese equities and currency also allows for greater diversification.
By sector, the Fund's information technology holdings were the main contributors to performance. This was mainly due to HTC of Taiwan. As a leading maker of smartphones, the company experienced rapid growth as consumers increasingly upgraded to more sophisticated handsets. HTC is also one of the few Asian companies with a growing global brand presence. The combination of exposure to a rapidly expanding market segment, along with a focus on building a longer-lasting brand presence attracted us to the company. Lastly, at a dividend yield of 8% when we initiated our
(continued)
10 MATTHEWS ASIA FUNDS
PERFORMANCE AS OF DECEMBER 31, 2010
Institutional Class Shares were first offered on October 29, 2010. Performance since that date was 2.95%. Performance for the Institutional Class shares prior to its inception is based on the performance of the Investor Class. Performance differences between the Institutional Class and Investor Class may arise due to differences in fees charged to each class.
| | | | | | | Average Annual Total Returns | |
| | | Inception Date | | 3 Months | | 1 Year | | 3 Years | | Since
Inception | |
| Investor Class (MAPIX) | | 10/31/06 | | | 4.62 | % | | | 22.83 | % | | | 10.31 | % | | | 13.73 | % | |
| Institutional Class (MIPIX) | | 10/29/10 | | | 4.66 | % | | | 22.88 | % | | | 10.32 | % | | | 13.74 | % | |
| MSCI AC Asia Pacific Index3 | | | | | | | 9.30 | % | | | 17.25 | % | | | -1.91 | % | | | 3.45 | % | |
| Lipper Pacific Region Funds Category Average4 | | | | | | | 9.11 | % | | | 16.87 | % | | | -3.10 | % | | | 3.55 | % | |
Performance assumes reinvestment of all dividends and/or distributions before taxes. All performance quoted represents past performance and is no guarantee of future results. Investment return and principal value will fluctuate with market conditions so that when redeemed, shares may be worth more or less than their original cost. Current performance may be lower or higher than the return figures quoted. Returns would have been lower if certain of the Fund's fees and expenses had not been waived. For the Fund's most recent month-end performance visit matthewsasia.com.
2010 INCOME DISTRIBUTION HISTORY
| | | Q1 | | Q2 | | Q3 | | Q4 | | Total | |
| Investor Class (MAPIX) | | $ | 0.05 | | | $ | 0.08 | | | $ | 0.11 | | | $ | 0.17 | | | $ | 0.41 | | |
| Institutional Class (MIPIX) | | | — | | | | — | | | | — | | | $ | 0.17 | | | $ | 0.17 | | |
Note: This table does not include capital gains distributions. Institutional Class Shares were first offered on October 29, 2010. For income distribution history, visit matthewsasia.com.
30-DAY YIELD:
2.05% (Investor Class) 2.29% (Institutional Class)
The 30-Day Yield represents net investment income earned by the Fund over the 30-day period ended 12/31/10, expressed as an annual percentage rate based on the Fund's share price at the end of the 30-day period. The 30-Day Yield should be regarded as an estimate of the Fund's rate of investment income, and it may not equal the Fund's actual income distribution rate.
Source: BNY Mellon Investment Servicing (US) Inc.
DIVIDEND YIELD: 3.82%
The dividend yield (trailing) for the portfolio is the weighted average sum of the dividend paid per share during the last 12 months divided by the current price. The annualized dividend yield for the Fund is for the equity-only portion of the portfolio. Please note that this is based on gross portfolio holdings and does not reflect the actual yield an investor in the Fund would receive. Past yields are no guarantee of future yields.
Source: FactSet Research Systems.
GROWTH OF A $10,000 INVESTMENT SINCE INCEPTION—INVESTOR CLASS
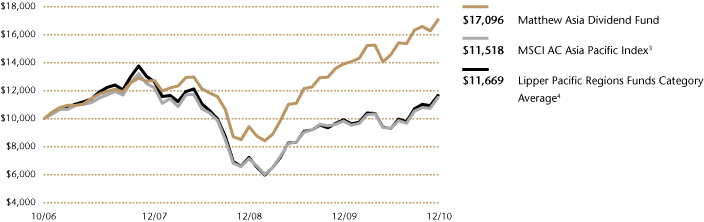
Plotted monthly. The performance data and graph do not reflect the deduction of taxes that a shareholder would pay on dividends, capital gain distributions or redemption of Fund shares. Values are in US$.
3 It is not possible to invest directly in an index. Source: Index data from Morgan Stanley Capital International and Bloomberg; total return calculations performed by BNY Mellon Investment Servicing (US) Inc. Please see page 59 for index definition.
4 The Lipper Category Average does not reflect sales charges and is based on total return, including reinvestment of dividends and capital gains for the stated periods.
TOP TEN HOLDINGS5
| | | Country | | % of Net Assets | |
| China Mobile, Ltd. | | China/Hong Kong | | | 3.3 | % | |
| HSBC Holdings PLC | | United Kingdom | | | 3.3 | % | |
| Metcash, Ltd | | Australia | | | 3.2 | % | |
| Taiwan Semiconductor Manufacturing Co., Ltd. | | Taiwan | | | 3.2 | % | |
| ITOCHU Corp. | | Japan | | | 3.1 | % | |
| Cheung Kong Infrastructure Holdings, Ltd. | | China/Hong Kong | | | 3.0 | % | |
| PT Perusahaan Gas Negara | | Indonesia | | | 2.8 | % | |
| QBE Insurance Group, Ltd. | | Australia | | | 2.6 | % | |
| PTT Exploration & Production Public Co., Ltd. | | Thailand | | | 2.4 | % | |
| ORIX Corp. | | Japan | | | 2.3 | % | |
| % OF ASSETS IN TOP TEN | | | | | 29.2 | % | |
5 Holdings may combine more than one security from same issuer and related depositary receipts.
matthewsasia.com | 800.789.ASIA 11
COUNTRY ALLOCATION (%)6
| China/Hong Kong | | | 23.3 | | |
| Japan | | | 23.2 | | |
| Taiwan | | | 11.2 | | |
| South Korea | | | 8.9 | | |
| Australia | | | 8.0 | | |
| Thailand | | | 6.5 | | |
| Indonesia | | | 5.0 | | |
| Singapore | | | 4.2 | | |
| United Kingdom | | | 3.3 | | |
| Philippines | | | 1.5 | | |
| Malaysia | | | 0.6 | | |
Cash and Other Assets,
Less Liabilities | | | 4.3 | | |
SECTOR ALLOCATION (%)
| Financials | | | 16.4 | | |
| Consumer Discretionary | | | 15.7 | | |
| Consumer Staples | | | 15.3 | | |
| Telecommunication Services | | | 12.4 | | |
| Information Technology | | | 10.9 | | |
| Health Care | | | 6.7 | | |
| Utilities | | | 6.6 | | |
| Industrials | | | 6.0 | | |
| Energy | | | 3.6 | | |
| Materials | | | 2.1 | | |
Cash and Other Assets,
Less Liabilities | | | 4.3 | | |
MARKET CAP EXPOSURE (%)7
| Large Cap (over $5B) | | | 45.2 | | |
| Mid Cap ($1B–$5B) | | | 28.2 | | |
| Small Cap (under $1B) | | | 22.3 | | |
Cash and Other Assets,
Less Liabilities | | | 4.3 | | |
6 The United Kingdom is not included in the MSCI All Country Asia Pacific Index.
7 Source: FactSet Research Systems. Percentage values in data are rounded to the nearest tenth of one percent; the values may not sum to 100% due to rounding.
Matthews Asia Dividend Fund
Portfolio Manager Commentary (continued)
investment, the valuation was attractive. Our holdings within the financials and health care sectors were also significant contributors to performance. Within financials, the Fund predominantly focused on companies with real estate exposure, such as developers or real estate investment trusts, rather than banks. These real estate-related holdings generally offer higher dividend yields, exposure to hard assets and often greater transparency in terms of the underlying assets.
Some of the Fund's main detractors to performance were its apparel-related holdings. Esprit Holdings of Hong Kong, Billabong International of Australia and Point of Japan all posted negative returns for the year. Esprit, with its reliance on European sales, faced ongoing uncertainty given the macroeconomic climate in Europe. Billabong faced headwinds from a strong Australian dollar that reduced the value of overseas sales once converted into Australian dollars. More fundamentally, the company is exposed to consumers in developed markets. Investors are also not yet convinced that ongoing restructuring efforts as well as the integration of recent acquisitions will be successful. Point operated in a sluggish retail environment in Japan while undertaking restructuring of its procurement and in-house design capabilities to better match its current scale. We continuously monitor operational performance and remain invested with all of the above, given current valuations and longer-term growth potential.
The threat of higher rates of inflation in the region is causing investors much angst as we enter 2011. Over longer periods, inflation can wipe out a significant portion of people's real wealth, which is why a long-term investment should be judged on its ability to generate returns after accounting for inflation. Investing with companies that pay a growing dividend is one way to counter the effects of inflation. During the year, 68% of the Fund's holdings increased their dividend per share, while 16% reduced theirs. For a company to have the ability to sustainably grow dividends at a faster rate than inflation it must have the ability to pass cost increases on to customers. This ability can take many shapes. We focus our investments with companies that exhibit at least one of the following traits: a dominant competitive position within an industry resulting in better pricing power; brand power, which allows for premium pricing disconnected from input costs; operations in a regulated industry, which allows for costs to be passed through as in the case with some utilities; or ownership of assets that will maintain "real value" such as commodities or real estate.
Being invested with companies that have the above traits does not insure against the broader macro risk to equities posed by policy intervention, especially as it pertains to monetary tightening, price controls and/or capital controls. As we enter 2011, Asian central banks are trying to tackle inflationary pressures, but have so far generally been slow to raise interest rates. There is a real risk that central banks will have to become more aggressive in terms of interest rate hikes. However, since Asian central bankers have one eye on their respective currencies, they may resort to other tools such as capital controls to counter potential inflows of "hot money" and currency appreciation. This heightens the risk that equity markets in Asia may increasingly move to the tune of policymakers and central bankers rather than to the performance of the region's companies.
We believe Asia continues to offer attractive opportunities to dividend-focused investors, when compared to fixed-income yields or other regional equity markets globally. For long-term investors, we believe that companies in Asia continue to offer an attractive combination of current yield, dividend growth and diversification opportunities.
12 MATTHEWS ASIA FUNDS
Matthews Asia Dividend Fund December 31, 2010
Schedule of Investments
COMMON EQUITIES: 95.5%
| | | Shares | | Value | |
| CHINA/HONG KONG: 23.3% | |
| China Mobile, Ltd. ADR | | | 1,333,300 | | | $ | 66,158,346 | | |
Cheung Kong Infrastructure
Holdings, Ltd. | | | 12,768,000 | | | | 58,478,386 | | |
| Esprit Holdings, Ltd. | | | 8,510,000 | | | | 40,509,212 | | |
Shenzhou International Group
Holdings, Ltd. | | | 34,891,000 | | | | 40,444,616 | | |
| Television Broadcasts, Ltd. | | | 7,150,000 | | | | 38,634,726 | | |
| Kingboard Laminates Holdings, Ltd. | | | 29,549,000 | | | | 30,032,562 | | |
| China Fishery Group, Ltd. | | | 16,779,000 | | | | 29,286,601 | | |
| The Link REIT | | | 8,990,000 | | | | 27,931,826 | | |
China Communications Services
Corp., Ltd. H Shares | | | 46,740,000 | | | | 27,841,473 | | |
| Jiangsu Expressway Co., Ltd. H Shares | | | 21,474,000 | | | | 24,588,128 | | |
| Sichuan Expressway Co., Ltd. H Shares | | | 34,912,000 | | | | 22,457,801 | | |
| Yip's Chemical Holdings, Ltd. | | | 14,912,000 | | | | 18,321,531 | | |
| Cafe' de Coral Holdings, Ltd. | | | 6,722,000 | | | | 16,621,660 | | |
| Minth Group, Ltd. | | | 4,933,000 | | | | 8,098,122 | | |
| VTech Holdings, Ltd. | | | 557,000 | | | | 6,553,320 | | |
| Guangdong Investment, Ltd. | | | 12,038,000 | | | | 6,194,936 | | |
| Total China/Hong Kong | | | | | 462,153,246 | | |
| JAPAN: 23.0% | |
| ITOCHU Corp. | | | 6,148,000 | | | | 62,244,808 | | |
| ORIX Corp. | | | 468,000 | | | | 46,056,411 | | |
| Point, Inc. | | | 851,080 | | | | 37,370,368 | | |
| Pigeon Corp.† | | | 1,069,300 | | | | 36,350,142 | | |
| Hisamitsu Pharmaceutical Co., Inc. | | | 838,200 | | | | 35,307,846 | | |
| Monex Group, Inc. | | | 109,059 | | | | 32,211,292 | | |
| EPS Co., Ltd.† | | | 12,504 | | | | 30,601,611 | | |
| Lawson, Inc. | | | 527,100 | | | | 26,066,098 | | |
| Hamamatsu Photonics, K.K. | | | 687,700 | | | | 25,139,717 | | |
| Shinko Plantech Co., Ltd.† | | | 2,555,600 | | | | 23,607,587 | | |
| Miraca Holdings, Inc. | | | 535,700 | | | | 21,575,797 | | |
| Hokuto Corp. | | | 922,500 | | | | 21,440,541 | | |
| Nintendo Co., Ltd. | | | 60,400 | | | | 17,727,947 | | |
| Ship Healthcare Holdings, Inc. | | | 1,285,300 | | | | 16,859,767 | | |
| United Urban Investment Corp., REIT | | | 11,100 | | | | 14,191,157 | | |
| FANUC CORP. | | | 61,100 | | | | 9,384,370 | | |
| Total Japan | | | | | 456,135,459 | | |
| TAIWAN: 11.2% | |
Taiwan Semiconductor Manufacturing
Co., Ltd. ADR | | | 4,005,040 | | | | 50,223,202 | | |
| Chunghwa Telecom Co., Ltd. ADR | | | 1,607,127 | | | | 40,612,099 | | |
| TXC Corp.† | | | 15,450,000 | | | | 29,515,374 | | |
| HTC Corp. | | | 764,400 | | | | 23,595,425 | | |
| Taiwan Hon Chuan Enterprise Co., Ltd. | | | 9,881,000 | | | | 22,536,536 | | |
| St. Shine Optical Co., Ltd. | | | 1,611,000 | | | | 21,438,376 | | |
| CyberLink Corp. | | | 4,313,513 | | | | 16,273,779 | | |
Taiwan Semiconductor Manufacturing
Co., Ltd. | | | 5,346,469 | | | | 13,019,371 | | |
| Chunghwa Telecom Co., Ltd. | | | 1,403,705 | | | | 3,567,456 | | |
| Total Taiwan | | | | | 220,781,618 | | |
| | | Shares | | Value | |
| SOUTH KOREAa: 8.9% | |
| KT&G Corp. | | | 803,000 | | | $ | 45,783,524 | | |
| Woongjin Thinkbig Co., Ltd.† | | | 1,475,030 | | | | 28,323,011 | | |
| SK Telecom Co., Ltd. ADR | | | 1,513,250 | | | | 28,191,848 | | |
| Grand Korea Leisure Co., Ltd. | | | 1,533,580 | | | | 27,881,052 | | |
| MegaStudy Co., Ltd. | | | 165,847 | | | | 25,676,007 | | |
| SK Telecom Co., Ltd. | | | 99,414 | | | | 15,165,806 | | |
| Cheil Worldwide, Inc. | | | 441,450 | | | | 5,379,589 | | |
| Total South Korea | | | | | 176,400,837 | | |
| AUSTRALIA: 8.0% | |
| Metcash, Ltd | | | 15,263,162 | | | | 64,161,751 | | |
| QBE Insurance Group, Ltd. | | | 2,745,000 | | | | 50,957,586 | | |
| Coca-Cola Amatil, Ltd. | | | 2,134,730 | | | | 23,711,698 | | |
| Billabong International, Ltd. | | | 2,388,728 | | | | 19,911,968 | | |
| Total Australia | | | | | 158,743,003 | | |
| THAILAND: 6.5% | |
PTT Exploration & Production Public
Co., Ltd. | | | 8,625,000 | | | | 48,067,673 | | |
| Thai Beverage Public Co., Ltd. | | | 177,295,000 | | | | 39,372,794 | | |
| Glow Energy Public Co., Ltd. | | | 7,783,800 | | | | 12,200,516 | | |
| LPN Development Public Co., Ltd. | | | 33,126,300 | | | | 9,780,198 | | |
| Major Cineplex Group Public Co., Ltd. | | | 22,100,900 | | | | 9,530,990 | | |
| Land & Houses Public Co., Ltd. NVDR | | | 38,358,200 | | | | 8,207,344 | | |
| Land & Houses Public Co., Ltd. | | | 10,267,400 | | | | 2,196,873 | | |
| Total Thailand | | | | | 129,356,388 | | |
| INDONESIA: 5.0% | |
| PT Perusahaan Gas Negara | | | 111,585,000 | | | | 54,801,734 | | �� |
| PT Telekomunikasi Indonesia ADR | | | 717,634 | | | | 25,583,652 | | |
| PT Telekomunikasi Indonesia | | | 11,036,500 | | | | 9,738,088 | | |
| PT Ramayana Lestari Sentosa | | | 87,700,000 | | | | 8,273,585 | | |
| Total Indonesia | | | | | 98,397,059 | | |
| SINGAPORE: 4.2% | |
| CapitaRetail China Trust, REIT | | | 30,418,000 | | | | 29,390,517 | | |
| ARA Asset Management, Ltd. | | | 23,096,000 | | | | 27,894,807 | | |
| Super Group, Ltd. | | | 14,868,000 | | | | 16,335,279 | | |
| Parkway Life REIT | | | 4,695,868 | | | | 6,037,466 | | |
| Venture Corp., Ltd. | | | 542,000 | | | | 3,910,796 | | |
| Total Singapore | | | | | 83,568,865 | | |
| UNITED KINGDOM: 3.3% | |
| HSBC Holdings PLC ADR | | | 1,217,791 | | | | 62,156,053 | | |
| HSBC Holdings PLC | | | 256,133 | | | | 2,626,312 | | |
| Total United Kingdom | | | | | 64,782,365 | | |
| PHILIPPINES: 1.5% | |
| Globe Telecom, Inc. | | | 1,598,820 | | | | 29,195,526 | | |
| Total Philippines | | | | | 29,195,526 | | |
matthewsasia.com | 800.789.ASIA 13
Matthews Asia Dividend Fund December 31, 2010
Schedule of Investments (continued)
COMMON EQUITIES (continued)
| | | Shares | | Value | |
| MALAYSIA: 0.6% | |
| Top Glove Corp. BHD | | | 4,891,400 | | | $ | 7,899,845 | | |
| Media Prima BHD | | | 4,931,200 | | | | 4,157,976 | | |
| Total Malaysia | | | | | 12,057,821 | | |
| TOTAL COMMON EQUITIES | | | | | 1,891,572,187 | | |
| (Cost $1,688,611,953) | | | | | | | |
INTERNATIONAL BONDS: 0.2%
| | | Face Amount | | | |
| JAPAN: 0.2% | |
ORIX Corp., Cnv.
1.000%, 03/31/14 | | JPY | 310,000,000 | | | | 4,869,165 | | |
| Total Japan | | | | | 4,869,165 | | |
| TOTAL INTERNATIONAL BONDS | | | | | 4,869,165 | | |
| (Cost $3,377,082) | | | | | | | |
| TOTAL INVESTMENTS: 95.7% | | | | | 1,896,441,352 | | |
| (Cost $1,691,989,035b) | | | | | | | |
CASH AND OTHER ASSETS,
LESS LIABILITIES: 4.3% | | | | | 85,234,955 | | |
| NET ASSETS: 100.0% | | | | $ | 1,981,676,307 | | |
a Certain securities were fair valued under the discretion of the Board of Trustees (Note 2-A).
b Cost for federal income tax purposes is $1,717,394,207 and net unrealized appreciation consists of:
| Gross unrealized appreciation | | $ | 241,710,533 | | |
| Gross unrealized depreciation | | | (62,663,388 | ) | |
| Net unrealized appreciation | | $ | 179,047,145 | | |
† Affiliated Issuer, as defined under the Investment Company Act of 1940 (ownership of 5% or more of the outstanding voting securities of this issuer)
ADR American Depositary Receipt
BHD Berhad
Cnv. Convertible
JPY Japanese Yen
NVDR Non-voting Depositary Receipt
REIT Real Estate Investment Trust
See accompanying notes to financial statements.
14 MATTHEWS ASIA FUNDS

ASIA GROWTH AND INCOME STRATEGIES
PORTFOLIO MANAGERS
Jesper O. Madsen, CFA
Lead Manager
Richard H. Gao
Co-Manager
FUND FACTS
| | | Investor Class | | Institutional Class | |
| Ticker | | MCDFX | | MICDX | |
| CUSIP | | 577125305 | | 577130735 | |
| Inception | | 11/30/09 | | 10/29/10 | |
| NAV | | $12.17 | | $12.17 | |
| Initial Investment | | $2,500 | | $3 million | |
| Gross Expense Ratio1 | | 1.95% | | 1.24% | |
After Fee Waiver,
Reimbursement and
Recoupment | | 1.50% | | n.a. | |
Portfolio Statistics
| Total # of Positions | | 39 | |
| Net Assets | | $45.4 million | |
| Weighted Average Market Cap | | $29.2 billion | |
| Portfolio Turnover | | 6.84%2 | |
Benchmark
MSCI China Index
Redemption Fee
2% within first 90 calendar days of purchase
OBJECTIVE
Total return with an emphasis on providing current income.
STRATEGY
Under normal market conditions, the Fund seeks to achieve its investment objective by investing at least 80% of its total net assets, which include borrowings for investment purposes, in income-paying equity securities of companies located in China and Taiwan. China includes its administrative and other districts, such as Hong Kong.
1 Gross expense ratio for Institutional Class is annualized. The Advisor has contractually agreed to waive certain fees and reimburse certain expenses for Matthews China Dividend Fund. Please see page 91 for additional information. Matthews Asia Funds does not charge 12b-1 fees.
2 The lesser of fiscal year 2010 long-term purchase costs or sales proceeds divided by the average monthly market value of long-term securities.
Matthews China Dividend Fund
Portfolio Manager Commentary
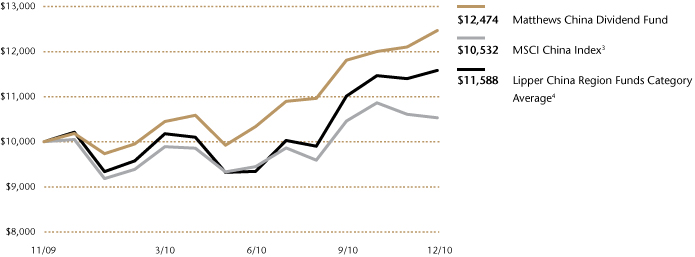
For the year ending December 31, 2010, the Matthews China Dividend Fund gained 22.53% (Investor Class) and 22.58% (Institutional Class), outperforming its benchmark, the MSCI China Index, which rose 4.83%. For the fourth quarter, the Fund rose 5.57% (Investor Class) and 5.60% (Institutional Class), while the benchmark gained 0.70%. The Fund began 2010 with a share price of $10.18 and shareholders who were invested throughout the year would have received income distributions totaling approximately 24 cents (Investor Class), or 2.4%, of the share price at the start of the year.
Now that a little more than a year has passed since the Fund's inception, it seems appropriate to review not just the past year, but also the rationale for the Matthews China Dividend Fund. Similar to the longer-running Matthews Asia Dividend Fund, the Matthews China Dividend Fund has an objective of total return with an emphasis on providing current income. We seek to invest primarily in companies we believe offer attractive current dividend yield and growth in dividends.
We based our decision to launch an additional China-focused fund on our belief that when investing in China, strategy matters. Furthermore, China's equity markets have developed to a point in which it is possible for investors to pursue various strategies within the same geographic region, just as they would in the U.S. The Fund's distinct focus on yield and dividend growth results in a relatively high allocation to conservative business models like those found in the utilities and telecommunication sectors, which exhibit strong balance sheets and stable cash flows. Anchoring the Fund in these larger, more stable dividend-paying companies allows the Fund to maintain a significant allocation of 51% to faster-growing companies with a market capitalization of less than US$5 billion. These companies help raise the overall level of dividend growth for the portfolio. While the track record remains short, the returns of the Fund have been delivered with significantly less volatility than the overall market. This seems to support the notion that it is possible to pursue various investment strategies when investing in China and as one would expect, that the risk and return profile will vary by strategy.
While mostly overlooked, dividends are an essential component of total shareholder return for long-term investors in China. Since 1992, about 68% of the total return for the MSCI China Index has been derived from reinvested dividends. Even though the universe of dividend-paying companies in Asia Pacific, in general, has expanded significantly over the past decade, the growth in Chinese dividend payments stands out. Aggregate dividend payments grew from close to US$8 billion in 1998 to US$81 billion by 2009. Importantly, US$65 billion of the total dividend payment in 2009 was accounted for by companies that became publicly listed after 1998, a reflection of the expanding number of dividend-paying companies.
The health care sector was the main contributor to Fund performance during 2010, predominantly due to the strong performance of Hong Kong's United Laboratories International Holdings, one of the world's largest and lowest-cost manufacturers of antibiotics. St. Shine Optical of Taiwan, the world's largest contract manufacturer of contact lenses mainly for Japanese companies, also greatly contributed to performance. The firm sells its own branded lenses mainly in its home market of Taiwan. The global contact lens industry is broadly speaking two-tiered, with 96% of the market accounted for by the top four branded manufacturers, including
(continued)
matthewsasia.com | 800.789.ASIA 15
PERFORMANCE AS OF DECEMBER 31, 2010
Institutional Class Shares were first offered on October 29, 2010. Performance since that date was 3.91%. Performance for the Institutional Class shares prior to its inception is based on the performance of the Investor Class. Performance differences between the Institutional Class and Investor Class may arise due to differences in fees charged to each class.
| | | | | | | Average Annual Total Returns | |
| | | Inception Date | | 3 Months | | 1 Year | | Since
Inception | |
| Investor Class (MCDFX) | | 11/30/09 | | | 5.57 | % | | | 22.53 | % | | | 22.60 | % | |
| Institutional Class (MICDX) | | 10/29/10 | | | 5.60 | % | | | 22.58 | % | | | 22.64 | % | |
| MSCI China Index3 | | | | | | | 0.70 | % | | | 4.83 | % | | | 4.89 | % | |
| Lipper China Region Funds Category Average4 | | | | | | | 5.28 | % | | | 13.66 | % | | | 14.56 | % | |
Performance assumes reinvestment of all dividends and/or distributions before taxes. All performance quoted represents past performance and is no guarantee of future results. Investment return and principal value will fluctuate with market conditions so that when redeemed, shares may be worth more or less than their original cost. Current performance may be lower or higher than the return figures quoted. Returns would have been lower if certain of the Fund's fees and expenses had not been waived. For the Fund's most recent month-end performance visit matthewsasia.com.
2010 INCOME DISTRIBUTION HISTORY
| | | June | | December | | Total | |
| Investor Class (MCDFX) | | $ | 0.12 | | | $ | 0.12 | | | $ | 0.24 | | |
| Institutional Class (MICDX) | | | — | | | $ | 0.13 | | | $ | 0.13 | | |
Note: This table does not include capital gains distributions. Institutional Class Shares were first offered on October 29, 2010. For income distribution history, visit matthewsasia.com.
30-DAY YIELD:
1.47% (Investor Class) 1.77% (Institutional Class)
The 30-Day Yield represents net investment income earned by the Fund over the 30-day period ended 12/31/10, expressed as an annual percentage rate based on the Fund's share price at the end of the 30-day period. The 30-Day Yield should be regarded as an estimate of the Fund's rate of investment income, and it may not equal the Fund's actual income distribution rate.
Source: BNY Mellon Investment Servicing (US) Inc.
DIVIDEND YIELD: 3.65%
The dividend yield (trailing) for the portfolio is the weighted average sum of the dividend paid per share during the last 12 months divided by the current price. The annualized dividend yield for the Fund is for the equity-only portion of the portfolio. Please note that this is based on gross portfolio holdings and does not reflect the actual yield an investor in the Fund would receive. Past yields are no guarantee of future yields.
Source: FactSet Research Systems.
GROWTH OF A $10,000 INVESTMENT SINCE INCEPTION—INVESTOR CLASS
Plotted monthly. The performance data does not reflect the deduction of taxes that a shareholder would pay on dividends, capital gain distributions or redemption of Fund shares. Values are in US$.
3 It is not possible to invest directly in an index. Source: Index data from Morgan Stanley Capital International and Bloomberg; total return calculations performed by BNY Mellon Investment Servicing (US) Inc. Please see page 59 for index definition.
4 The Lipper Category Average does not reflect sales charges and is based on total return, including reinvestment of dividends and capital gains for the stated periods.
TOP TEN HOLDINGS5
| | | Sector | | % of Net Assets | |
| China Mobile, Ltd. | | Telecommunication Services | | | 4.9 | % | |
| Cheung Kong Infrastructure Holdings, Ltd. | | Utilities | | | 4.6 | % | |
| Taiwan Semiconductor Manufacturing Co., Ltd. | | Information Technology | | | 4.3 | % | |
| Chunghwa Telecom Co., Ltd. | | Telecommunication Services | | | 3.9 | % | |
| HSBC Holdings PLC | | Financials | | | 3.9 | % | |
| Hang Seng Bank, Ltd. | | Financials | | | 3.6 | % | |
| CapitaRetail China Trust, REIT | | Financials | | | 3.5 | % | |
| Shenzhou International Group Holdings, Ltd. | | Consumer Discretionary | | | 3.5 | % | |
| Guangdong Investment, Ltd. | | Utilities | | | 3.4 | % | |
| Jiangsu Expressway Co., Ltd. | | Industrials | | | 3.3 | % | |
| % OF ASSETS IN TOP TEN | | | | | 38.9 | % | |
5 Holdings may combine more than one security from same issuer and related depositary receipts.
16 MATTHEWS ASIA FUNDS
Matthews China Dividend Fund
Portfolio Manager Commentary (continued)
Johnson & Johnson. However, the remaining 4% of the market remains fragmented and it is within this space that St. Shine has been gaining market share. While the company continues to invest in new production lines it still has the financial capacity to pay out the majority of its earnings as dividends. The company's reliance and predominant focus on Asian sales, both as a contract manufacturer and through its in-house branded lenses, combined with its proven ability to take market share over time continue to make this an appropriate holding for the Fund.
The Fund's holdings within the financials sector accounted for the second-largest contribution to performance, predominantly driven by real estate-related holdings based in Hong Kong and Singapore. The Link REIT (real estate investment trust), Hong Kong's first and largest listed REIT, with about 11 million square feet of retail space, was the main contributor to performance within financials. The company has derived growth in earnings from ongoing enhancements to its portfolio of properties that had been run inefficiently by the government prior to the company's public listing in 2005. Because the tenant mix and property locations cater to the daily needs of Hong Kong residents, revenues and, by extension, dividend payments tend to exhibit low volatility.
Some of the Fund's holdings in the information technology sector related to IT-services and software/online gaming were the main detractors to performance over the year. The Fund sold its stake in Kingsoft, a Chinese software company, which primarily derives its sales from online gaming and security software, after the company failed to meet our expectations regarding its ability to migrate its online gamers, which account for 65% of sales, to its next generation game. While we continue to find the R&D culture of the company attractive and believe in the long-term potential of the software services sector, this was a lesson in the difficulties of picking winners in rapidly evolving industries.
Entering 2011, investors are once again worried about the extent and effects of actions taken by the central government to manage China's economic growth, especially as it relates to the government's ability to rein in inflationary pressures without pushing the economy into a "hard landing." Inflationary pressures have been building, while measures to dampen property price appreciation have had mixed success. Interest rates were hiked at the tail-end of 2010 after reserve requirements for the country's banks were raised six times over the year to drain liquidity from the banking system. Historically, during times of inflation the government has often intervened with direct price controls within specific industries, resulting in policy-induced market volatility. While not always possible given the government's sway over much of the economy, we try to steer our investments toward privately held companies in which policy risk may be lessened. This is why we currently do not invest with any of the mainland banks or independent power producers even though they are significant dividend payers.
While investors tend to blow hot and cold on China, there is little doubt the country continues to develop with every passing year. The Matthews China Dividend Fund seeks to invest with the companies that aid in this development or cater to the rising household wealth created in the process. We can expect that economic development on the scale and in the fashion seen in China will continue to cause volatile equity markets. We hope that a strategy focused on investing with dividend-paying companies that can deliver sustainable dividend growth will give shareholders a way to participate in and profit from China's economic development, with less of the volatility typically experienced by investors in Chinese equities.
SECTOR ALLOCATION (%)
| Financials | | | 18.5 | | |
| Information Technology | | | 15.1 | | |
| Consumer Discretionary | | | 12.8 | | |
| Telecommunication Services | | | 11.4 | | |
| Utilities | | | 10.8 | | |
| Industrials | | | 8.3 | | |
| Consumer Staples | | | 5.3 | | |
| Materials | | | 5.1 | | |
| Energy | | | 4.8 | | |
| Health Care | | | 4.3 | | |
Cash and Other Assets,
Less Liabilities | | | 3.6 | | |
MARKET CAP EXPOSURE (%)6
| Large Cap (over $5B) | | | 45.4 | | |
| Mid Cap ($1B–$5B) | | | 30.1 | | |
| Small Cap (Under $1B) | | | 20.9 | | |
Cash and Other Assets,
Less Liabilities | | | 3.6 | | |
6 Source: FactSet Research Systems. Percentage values in data are rounded to the nearest tenth of one percent; the values may not sum to 100% due to rounding.
matthewsasia.com | 800.789.ASIA 17
Matthews China Dividend Fund December 31, 2010
Schedule of Investments
COMMON EQUITIES: 96.4%
| | | Shares | | Value | |
| FINANCIALS: 18.5% | |
| Commercial Banks: 7.5% | |
| HSBC Holdings PLC ADR | | | 34,500 | | | $ | 1,760,880 | | |
| Hang Seng Bank, Ltd. | | | 98,600 | | | | 1,621,176 | | |
| | | | | | 3,382,056 | | |
| Real Estate Investment Trusts: 6.1% | |
| CapitaRetail China Trust, REIT | | | 1,630,000 | | | | 1,574,941 | | |
| The Link REIT | | | 382,500 | | | | 1,188,423 | | |
| | | | | | 2,763,364 | | |
| Capital Markets: 2.5% | |
| Yuanta Financial Holding Co., Ltd. | | | 1,538,000 | | | | 1,149,946 | | |
| Real Estate Management & Development: 2.4% | |
| Swire Pacific, Ltd. A Shares | | | 43,000 | | | | 707,004 | | |
| Hang Lung Properties, Ltd. | | | 86,000 | | | | 402,185 | | |
| | | | | | 1,109,189 | | |
| Total Financials | | | | | 8,404,555 | | |
| INFORMATION TECHNOLOGY: 15.1% | |
| Electronic Equipment, Instruments & Components: 7.2% | |
| Kingboard Laminates Holdings, Ltd. | | | 1,329,500 | | | | 1,351,257 | | |
| TXC Corp. | | | 690,000 | | | | 1,318,162 | | |
| Digital China Holdings, Ltd. | | | 314,000 | | | | 587,376 | | |
| | | | | | 3,256,795 | | |
| Semiconductors & Semiconductor Equipment: 4.3% | |
Taiwan Semiconductor Manufacturing
Co., Ltd. | | | 628,000 | | | | 1,529,264 | | |
Taiwan Semiconductor Manufacturing
Co., Ltd. ADR | | | 32,800 | | | | 411,312 | | |
| | | | | | 1,940,576 | | |
| Software: 2.1% | |
| CyberLink Corp. | | | 253,608 | | | | 956,798 | | |
| IT Services: 1.5% | |
| SinoCom Software Group, Ltd. | | | 6,212,000 | | | | 703,294 | | |
| Total Information Technology | | | | | 6,857,463 | | |
| CONSUMER DISCRETIONARY: 12.8% | |
| Textiles, Apparel & Luxury Goods: 5.3% | |
Shenzhou International Group
Holdings, Ltd. | | | 1,351,000 | | | | 1,566,039 | | |
| Ports Design, Ltd. | | | 298,500 | | | | 823,748 | | |
| | | | | | 2,389,787 | | |
| Media: 3.3% | |
| Television Broadcasts, Ltd. | | | 277,000 | | | | 1,496,758 | | |
| Auto Components: 2.2% | |
| Xinyi Glass Holdings Co., Ltd. | | | 1,212,000 | | | | 997,942 | | |
| Hotels, Restaurants & Leisure: 2.0% | |
| Cafe' de Coral Holdings, Ltd. | | | 378,000 | | | | 934,690 | | |
| Total Consumer Discretionary | | | | | 5,819,177 | | |
| | | Shares | | Value | |
| TELECOMMUNICATION SERVICES: 11.4% | |
| Diversified Telecommunication Services: 6.5% | |
| Chunghwa Telecom Co., Ltd. ADR | | | 70,005 | | | $ | 1,769,026 | | |
China Communications Services
Corp., Ltd. H Shares | | | 1,958,000 | | | | 1,166,316 | | |
| | | | | | 2,935,342 | | |
| Wireless Telecommunication Services: 4.9% | |
| China Mobile, Ltd. ADR | | | 45,230 | | | | 2,244,313 | | |
| Total Telecommunication Services | | | | | 5,179,655 | | |
| UTILITIES: 10.8% | |
| Electric Utilities: 6.1% | |
| Cheung Kong Infrastructure Holdings, Ltd. | | | 453,000 | | | | 2,074,774 | | |
| CLP Holdings, Ltd. | | | 81,500 | | | | 661,621 | | |
| | | | | | 2,736,395 | | |
| Water Utilities: 3.4% | |
| Guangdong Investment, Ltd. | | | 2,996,000 | | | | 1,541,787 | | |
| Gas Utilities: 1.3% | |
| Hong Kong & China Gas Co., Ltd. | | | 252,200 | | | | 594,419 | | |
| Total Utilities | | | | | 4,872,601 | | |
| INDUSTRIALS: 8.3% | |
| Transportation Infrastructure: 7.3% | |
| Jiangsu Expressway Co., Ltd. H Shares | | | 1,316,000 | | | | 1,506,844 | | |
| Sichuan Expressway Co., Ltd. H Shares | | | 1,506,000 | | | | 968,763 | | |
China Merchants Holdings International
Co., Ltd. | | | 206,000 | | | | 813,632 | | |
| | | | | | 3,289,239 | | |
| Electrical Equipment: 1.0% | |
| Hangzhou Steam Turbine Co., Ltd. B Shares | | | 223,140 | | | | 461,908 | | |
| Total Industrials | | | | | 3,751,147 | | |
| CONSUMER STAPLES: 5.3% | |
| Food Products: 5.3% | |
| China Fishery Group, Ltd. | | | 782,000 | | | | 1,364,928 | | |
| Vitasoy International Holdings, Ltd. | | | 1,262,000 | | | | 1,052,100 | | |
| Total Consumer Staples | | | | | 2,417,028 | | |
| MATERIALS: 5.1% | |
| Chemicals: 2.6% | |
| Yip's Chemical Holdings, Ltd. | | | 950,000 | | | | 1,167,211 | | |
| Containers & Packaging: 2.5% | |
| Taiwan Hon Chuan Enterprise Co., Ltd. | | | 500,000 | | | | 1,140,397 | | |
| Total Materials | | | | | 2,307,608 | | |
18 MATTHEWS ASIA FUNDS
Matthews China Dividend Fund December 31, 2010
Schedule of Investments (continued)
COMMON EQUITIES (continued)
| | | Shares | | Value | |
| ENERGY: 4.8% | |
| Oil, Gas & Consumable Fuels: 4.8% | |
| CNOOC, Ltd. ADR | | | 4,550 | | | $ | 1,084,583 | | |
| China Shenhua Energy Co., Ltd. H Shares | | | 133,000 | | | | 557,817 | | |
| China Petroleum & Chemical Corp. ADR | | | 5,440 | | | | 520,554 | | |
| Total Energy | | | | | 2,162,954 | | |
| HEALTH CARE: 4.3% | |
| Health Care Equipment & Supplies: 2.5% | |
| St. Shine Optical Co., Ltd. | | | 84,000 | | | | 1,117,830 | | |
| Pharmaceuticals: 1.8% | |
The United Laboratories International
Holdings, Ltd. | | | 406,000 | | | | 833,646 | | |
| Total Health Care | | | | | 1,951,476 | | |
| TOTAL INVESTMENTS: 96.4% | | | | | 43,723,664 | | |
| (Cost $38,901,584a) | | | | | | | |
CASH AND OTHER ASSETS,
LESS LIABILITIES: 3.6% | | | | | 1,644,325 | | |
| NET ASSETS: 100.0% | | | | $ | 45,367,989 | | |
a Cost for federal income tax purposes is $39,139,822 and net unrealized appreciation consists of:
| Gross unrealized appreciation | | $ | 5,262,710 | | |
| Gross unrealized depreciation | | | (678,868 | ) | |
| Net unrealized appreciation | | $ | 4,583,842 | | |
ADR American Depositary Receipt
REIT Real Estate Investment Trust
See accompanying notes to financial statements.
matthewsasia.com | 800.789.ASIA 19

ASIA GROWTH STRATEGIES
PORTFOLIO MANAGERS
Taizo Ishida
Lead Manager
Sharat Shroff, CFA
Co-Manager
FUND FACTS
| | | Investor Class | | Institutional Class | |
| Ticker | | MPACX | | MIAPX | |
| CUSIP | | 577130867 | | 577130776 | |
| Inception | | 10/31/03 | | 10/29/10 | |
| NAV | | $17.97 | | $17.98 | |
| Initial Investment | | $2,500 | | $3 million | |
| Gross Expense Ratio1 | | 1.19% | | 0.99% | |
Portfolio Statistics
| Total # of Positions | | 73 | |
| Net Assets | | $344.3 million | |
| Weighted Average Market Cap | | $17.7 billion | |
| Portfolio Turnover | | 26.33%2 | |
Benchmark
MSCI AC Asia Pacific Index
Redemption Fee
2% within first 90 calendar days of purchase
OBJECTIVE
Long-term capital appreciation.
STRATEGY
Under normal market conditions, the Fund seeks to achieve its investment objective by investing at least 80% of its total net assets, which include borrowings for investment purposes, in the common and preferred stocks of companies located in the Asia Pacific region. The Fund may also invest in the convertible securities, of any duration or quality, of Asia Pacific companies.
1 Gross expense ratio for Institutional Class is annualized. Matthews Asia Funds does not charge 12b-1 fees.
2 The lesser of fiscal year 2010 long-term purchase costs or sales proceeds divided by the average monthly market value of long-term securities.
Matthews Asia Pacific Fund
Portfolio Manager Commentary
For the year ending December 31, 2010, the Matthews Asia Pacific Fund gained 26.85% (Investor Class) and 26.92% (Institutional Class), outperforming its benchmark, the MSCI All Country Asia Pacific Index, which returned 17.25%. For the fourth quarter, the Fund returned 6.63% (Investor Class) and 6.69% (Institutional Class), while the benchmark advanced 9.30%. The Fund benefited mainly from good bottom-up stock selection. During 2010, the number of portfolio holdings increased as we made new allocations in such countries as Vietnam and saw an increase in attractive stocks that captured growth in such areas as Macau.
Japan, Taiwan and Thailand were the best performers in Asia Pacific in 2010, while Vietnam, South Korea and Malaysia were the worst. The portfolio's overweight in Thailand and Indonesia helped performance, while our overweight in China was a detractor.
The year was a strong one for ASEAN markets, while Chinese markets cooled off somewhat after several years of strong growth. After performing well for most of the year, Indian markets struggled in the last quarter, following corruption scandals related to the country's wireless telecommunications sector. These scandals served to remind investors of emerging market risks. While global investors in recent years seemed to have grown more comfortable with the idea of investing in emerging markets, it does come with a higher risk premium to more established markets, especially in such "policy sensitive" sectors as telecom.
Unlike 2009, when equity markets around the world rebounded strongly from the global financial crisis, 2010 was somewhat steadier for Asian markets as a whole. Valuations in markets such as Japan, Korea, Taiwan and Hong Kong rose toward the end of the year though they still remain at reasonable levels. We should note that the materials and energy sectors did not perform well despite the fact that gold prices recorded an all-time high in 2010. As the Fund is underweight its benchmark in these sectors, this benefited performance.
Our all-capitalization and country agnostic investment approach served the Fund well in 2010. Japanese holdings, which were the biggest contributors to performance, may be categorized in two ways: first there are global companies with significant exposure to Asian markets, such as FANUC, an electromechanical manufacturer specializing in robotics, and Komatsu, a mining and construction equipment manufacturer. The second category involves undervalued domestic stocks such as Japanese real estate investment trusts (J-REITs) and more niche firms that target the domestic market such as financial services firm ORIX and Kenedix, a major Japanese real estate asset manager.
Since we are able to mine the entire region for the best growth companies, the location of a company's headquarters does not generally pose a concern to us. For example, the fortunes of HTC, a leading Taiwanese maker of smartphones, are not tied to Taiwan's economy or politics. The company manufactures Android-powered smartphones used worldwide and was the portfolio's best-performing stock in 2010. Another example from Taiwan is St. Shine Optical, the world's largest contract manufacturer of contact lenses. The firm sells its own branded lenses in Taiwan, but its main earnings driver is its growing customer base in Japan. The Chinese market may be the next driver for the firm, though this will not likely happen soon.
(continued)
20 MATTHEWS ASIA FUNDS
PERFORMANCE AS OF DECEMBER 31, 2010
Institutional Class Shares were first offered on October 29, 2010. Performance since that date was 2.76%. Performance for the Institutional Class shares prior to its inception is based on the performance of the Investor Class. Performance differences between the Institutional Class and Investor Class may arise due to differences in fees charged to each class.
| | | | | | | Average Annual Total Returns | |
| | | Inception Date | | 3 Months | | 1 Year | | 3 Years | | 5 Years | | Since
Inception | |
| Investor Class (MPACX) | | 10/31/03 | | | 6.63 | % | | | 26.85 | % | | | 4.74 | % | | | 8.59 | % | | | 12.09 | % | |
| Institutional Class (MIAPX) | | 10/29/10 | | | 6.69 | % | | | 26.92 | % | | | 4.76 | % | | | 8.60 | % | | | 12.09 | % | |
| MSCI AC Asia Pacific Index3 | | | | | | | 9.30 | % | | | 17.25 | % | | | -1.91 | % | | | 4.80 | % | | | 9.69 | % | |
| Lipper Pacific Regions Fund Category Average4 | | | | | | | 9.11 | % | | | 16.87 | % | | | -3.10 | % | | | 4.94 | % | | | 9.82 | % | |
Performance assumes reinvestment of all dividends and/or distributions before taxes. All performance quoted represents past performance and is no guarantee of future results. Investment return and principal value will fluctuate with market conditions so that when redeemed, shares may be worth more or less than their original cost. Current performance may be lower or higher than the return figures quoted. Returns would have been lower if certain of the Fund's fees and expenses had not been waived. For the Fund's most recent month-end performance visit matthewsasia.com.
GROWTH OF A $10,000 INVESTMENT SINCE INCEPTION—INVESTOR CLASS
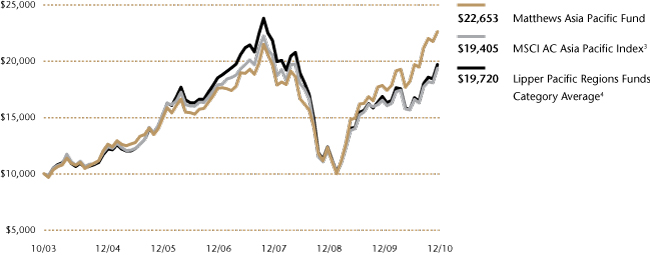
Plotted monthly. The performance data and graph do not reflect the deduction of taxes that a shareholder would pay on dividends, capital gain distributions or redemption of Fund shares. Values are in US$.
3 It is not possible to invest directly in an index. Source: Index data from Morgan Stanley Capital International and Bloomberg; total return calculations performed by BNY Mellon Investment Servicing (US) Inc. Please see page 59 for index definition.
4 The Lipper Category Average does not reflect sales charges and is based on total return, including reinvestment of dividends and capital gains for the stated periods.
TOP TEN HOLDINGS5
| | | Country | | % of Net Assets | |
| ORIX Corp. | | Japan | | | 3.7 | % | |
| Softbank Corp. | | Japan | | | 3.0 | % | |
| Nidec Corp. | | Japan | | | 2.5 | % | |
| Ctrip.com International, Ltd. | | China/Hong Kong | | | 2.4 | % | |
| Kingdee International Software Group Co., Ltd. | | China/Hong Kong | | | 2.2 | % | |
| PT Bank Rakyat Indonesia Persero | | Indonesia | | | 2.2 | % | |
| St. Shine Optical Co., Ltd. | | Taiwan | | | 2.1 | % | |
| Sysmex Corp. | | Japan | | | 2.1 | % | |
| Kenedix, Inc. | | Japan | | | 2.0 | % | |
| HTC Corp. | | Taiwan | | | 2.0 | % | |
| % OF ASSETS IN TOP TEN | | | | | 24.2 | % | |
5 Holdings may combine more than one security from same issuer and related depositary receipts.
matthewsasia.com | 800.789.ASIA 21
COUNTRY ALLOCATION (%)
| Japan | | | 32.6 | | |
| China/Hong Kong | | | 26.0 | | |
| Australia | | | 5.9 | | |
| Taiwan | | | 5.9 | | |
| South Korea | | | 5.7 | | |
| Indonesia | | | 5.4 | | |
| India | | | 4.6 | | |
| Singapore | | | 4.2 | | |
| Thailand | | | 2.2 | | |
| Malaysia | | | 1.9 | | |
| Vietnam | | | 1.4 | | |
Cash and Other Assets,
Less Liabilities | | | 4.2 | | |
SECTOR ALLOCATION (%)
| Financials | | | 27.7 | | |
| Consumer Discretionary | | | 17.4 | | |
| Industrials | | | 11.9 | | |
| Health Care | | | 11.8 | | |
| Information Technology | | | 10.1 | | |
| Consumer Staples | | | 9.0 | | |
| Telecommunication Services | | | 4.0 | | |
| Materials | | | 2.0 | | |
| Energy | | | 1.9 | | |
Cash and Other Assets,
Less Liabilities | | | 4.2 | | |
MARKET CAP EXPOSURE (%)6
| Large Cap (over $5B) | | | 55.8 | | |
| Mid Cap ($1B–$5B) | | | 23.8 | | |
| Small Cap (under $1B) | | | 16.2 | | |
Cash and Other Assets,
Less Liabilities | | | 4.2 | | |
6 Source: FactSet Research Systems. Percentage values in data are rounded to the nearest tenth of one percent; the values may not sum to 100% due to rounding.
Matthews Asia Pacific Fund
Portfolio Manager Commentary (continued)
The Fund's second-largest positive contributor for the year was long-term holding Kingdee International Software Group, which provides Enterprise Resources Planning (ERP) solutions to a vast number of enterprises in China. Despite slower growth and inflationary concerns in China, the corporate appetite for low-cost ERP systems among small and medium enterprises in China remained robust as they have a strong desire to improve their operating efficiency.
With a market capitalization of US$23 billion, Astra International of Indonesia is a prime example of a domestic consumption-focused firm. In Thailand, Major Cineplex, another long-term holding, was a major beneficiary of a rising trend in digital and 3D movies played in upscale Bangkok movie theaters. The company is uniquely positioned as it has 80% of the market share in Thailand's movie operations business. This leading position also enables Major Cineplex to engage in the profitable on-screen advertising business during movie previews.
While Japan performed strongly during the year, there were also individual disappointments, including Pigeon, a long-term Japanese holding that caters to China's infant care market. The company had some challenges with its distribution channels in China during the year, but we expect the firm to resolve these issues soon. Pigeon remains a premier provider of mid- to high-end baby care products for China's more affluent families. Another detractor to the Fund during the year was Japan Steel Works, which saw earnings drop after several years of strong performance. However, we believe Japan Steel Works remains well-positioned in the growing nuclear power plant industry worldwide.
We are optimistic about opportunities in 2011 as valuations are generally not unreasonable and a global economic recovery should be a tailwind for many Asian companies. Food and energy-related inflationary concerns, however, may become more acute, particularly for Asia's less developed nations. Chinese companies continue to see margins come under pressure due to rising labor and material costs. Despite the uncertainties, Asian consumers appear increasingly more confident and selective in their lifestyle choices in areas such as health care, education and leisure.
We would also like to inform you that effective April 29, 2011, the Matthews Asia Pacific Fund will be renamed the Matthews Asia Growth Fund to better reflect its investment objective. This new name will better reflect the growth objective of the Fund and the Fund's slightly narrower focus on companies in Asia rather than the entire Asia Pacific region.
22 MATTHEWS ASIA FUNDS
Matthews Asia Pacific Fund December 31, 2010
Schedule of Investments
COMMON EQUITIES: 94.1%
| | | Shares | | Value | |
| JAPAN: 32.6% | |
| ORIX Corp. | | | 128,390 | | | $ | 12,635,006 | | |
| Softbank Corp. | | | 295,200 | | | | 10,220,559 | | |
| Nidec Corp. | | | 85,800 | | | | 8,676,167 | | |
| Sysmex Corp. | | | 102,100 | | | | 7,079,973 | | |
| Kenedix, Inc.a | | | 22,945 | | | | 6,986,087 | | |
| The Japan Steel Works, Ltd. | | | 661,000 | | | | 6,903,904 | | |
| Pigeon Corp. | | | 179,300 | | | | 6,095,184 | | |
| Komatsu, Ltd. | | | 188,900 | | | | 5,716,557 | | |
| Nintendo Co., Ltd. | | | 19,100 | | | | 5,606,023 | | |
| MID REIT, Inc. | | | 1,832 | | | | 5,460,574 | | |
| Asahi Breweries, Ltd. | | | 276,800 | | | | 5,362,808 | | |
| FANUC CORP. | | | 33,800 | | | | 5,191,354 | | |
| Benesse Holdings, Inc. | | | 100,900 | | | | 4,647,937 | | |
| Keyence Corp. | | | 14,930 | | | | 4,325,084 | | |
| FamilyMart Co., Ltd. | | | 98,200 | | | | 3,701,096 | | |
| Fast Retailing Co., Ltd. | | | 21,300 | | | | 3,392,154 | | |
| Monex Group, Inc. | | | 9,218 | | | | 2,722,597 | | |
| Otsuka Holdings Co., Ltd.a | | | 82,600 | | | | 2,034,733 | | |
| GCA Savvian Group Corp.a | | | 1,785 | | | | 1,939,118 | | |
| Mori Trust Sogo REIT, Inc. | | | 188 | | | | 1,840,867 | | |
| Mitsubishi UFJ Financial Group, Inc. ADR | | | 339,700 | | | | 1,837,777 | | |
| Total Japan | | | | | 112,375,559 | | |
| CHINA/HONG KONG: 26.0% | |
| Ctrip.com International, Ltd. ADRa | | | 201,700 | | | | 8,158,765 | | |
Kingdee International Software Group
Co., Ltd. | | | 13,466,000 | | | | 7,553,489 | | |
| Shangri-La Asia, Ltd. | | | 2,096,000 | | | | 5,689,790 | | |
| Hang Lung Group, Ltd. | | | 782,000 | | | | 5,141,030 | | |
| Tingyi (Cayman Islands) Holding Corp. | | | 1,888,000 | | | | 4,833,676 | | |
| China Kanghui Holdings, Inc. ADRa | | | 260,700 | | | | 4,825,557 | | |
| China Life Insurance Co., Ltd. H Shares | | | 1,160,000 | | | | 4,738,318 | | |
| China Vanke Co., Ltd. B Shares | | | 3,789,587 | | | | 4,680,429 | | |
| Dairy Farm International Holdings, Ltd. | | | 477,354 | | | | 4,434,619 | | |
| Hong Kong Exchanges and Clearing, Ltd. | | | 189,000 | | | | 4,286,834 | | |
| Sinopharm Group Co., Ltd. H Shares | | | 1,180,800 | | | | 4,116,879 | | |
| PCD Stores, Ltd. | | | 13,686,000 | | | | 4,102,560 | | |
| China Mobile, Ltd. | | | 375,000 | | | | 3,724,526 | | |
| Baoye Group Co., Ltd. H Shares | | | 5,952,000 | | | | 3,675,587 | | |
Sany Heavy Equipment International
Holdings Co., Ltd. | | | 2,300,000 | | | | 3,391,056 | | |
| Sands China, Ltd.a | | | 1,532,400 | | | | 3,367,305 | | |
| China Merchants Bank Co., Ltd. H Shares | | | 1,160,950 | | | | 2,930,455 | | |
Shandong Weigao Group Medical Polymer
Co., Ltd. H Shares | | | 1,008,000 | | | | 2,859,510 | | |
Shenzhou International Group
Holdings, Ltd. | | | 2,339,000 | | | | 2,711,300 | | |
| Dongfeng Motor Group Co., Ltd. H Shares | | | 1,478,000 | | | | 2,548,014 | | |
| China Lodging Group, Ltd.a | | | 82,000 | | | | 1,786,780 | | |
| Total China/Hong Kong | | | | | 89,556,479 | | |
| | | Shares | | Value | |
| AUSTRALIA: 5.9% | |
| BHP Billiton, Ltd. | | | 149,344 | | | $ | 6,911,881 | | |
| CSL, Ltd. | | | 184,497 | | | | 6,848,038 | | |
| Oil Search, Ltd. | | | 899,999 | | | | 6,480,441 | | |
| Total Australia | | | | | 20,240,360 | | |
| TAIWAN: 5.9% | |
| St. Shine Optical Co., Ltd. | | | 533,000 | | | | 7,092,895 | | |
| HTC Corp. | | | 224,400 | | | | 6,926,757 | | |
| Polaris Securities Co., Ltd. | | | 4,888,000 | | | | 3,185,293 | | |
| Richtek Technology Corp. | | | 360,517 | | | | 3,004,669 | | |
| Total Taiwan | | | | | 20,209,614 | | |
| INDONESIA: 5.4% | |
| PT Bank Rakyat Indonesia Persero | | | 6,401,500 | | | | 7,460,128 | | |
| PT Indofood CBP Sukses Makmura | | | 12,429,000 | | | | 6,449,009 | | |
| PT Astra International | | | 782,500 | | | | 4,737,555 | | |
| Total Indonesia | | | | | 18,646,692 | | |
| INDIA: 4.6% | |
| HDFC Bank, Ltd. | | | 91,332 | | | | 4,792,504 | | |
| Sun Pharmaceutical Industries, Ltd. | | | 313,520 | | | | 3,400,235 | | |
| Jain Irrigation Systems, Ltd. | | | 699,751 | | | | 3,289,448 | | |
| Unitech, Ltd. | | | 1,831,738 | | | | 2,715,962 | | |
| Hindustan Media Ventures, Ltd.a | | | 344,829 | | | | 1,422,039 | | |
| Coal India, Ltd.a | | | 23,441 | | | | 165,002 | | |
| Total India | | | | | 15,785,190 | | |
| SINGAPORE: 4.2% | |
| CapitaCommercial Trust, REIT | | | 5,456,000 | | | | 6,377,060 | | |
| Goodpack, Ltd. | | | 2,564,000 | | | | 4,095,687 | | |
| Keppel Land, Ltd. | | | 1,074,000 | | | | 4,016,987 | | |
| Total Singapore | | | | | 14,489,734 | | |
| SOUTH KOREAb: 4.0% | |
| Kiwoom Securities Co., Ltd. | | | 89,246 | | | | 4,553,440 | | |
| LG Electronics, Inc.a | | | 38,100 | | | | 3,952,531 | | |
| NHN Corp.a | | | 19,788 | | | | 3,950,066 | | |
| Gamevil, Inc.a | | | 54,227 | | | | 1,303,935 | | |
| Total South Korea | | | | | 13,759,972 | | |
| THAILAND: 2.2% | |
| Siam Commercial Bank Public Co., Ltd. | | | 1,264,400 | | | | 4,341,198 | | |
| Major Cineplex Group Public Co., Ltd. | | | 7,670,800 | | | | 3,308,025 | | |
| Total Thailand | | | | | 7,649,223 | | |
| MALAYSIA: 1.9% | |
| Parkson Holdings BHD | | | 2,515,469 | | | | 4,397,074 | | |
| Supermax Corp. BHD | | | 1,716,300 | | | | 2,215,299 | | |
| Total Malaysia | | | | | 6,612,373 | | |
matthewsasia.com | 800.789.ASIA 23
Matthews Asia Pacific Fund December 31, 2010
Schedule of Investments (continued)
COMMON EQUITIES (continued)
| | | Shares | | Value | |
| VIETNAM: 1.4% | |
| Saigon Securities, Inc. | | | 1,718,300 | | | $ | 2,619,595 | | |
| FPT Corp. | | | 678,640 | | | | 2,085,376 | | |
| Vietnam Dairy Products JSC | | | 35,350 | | | | 144,835 | | |
| Total Vietnam | | | | | 4,849,806 | | |
| TOTAL COMMON EQUITIES | | | | | 324,175,002 | | |
| (Cost $222,906,468) | | | | | | | | | |
PREFERRED EQUITIES: 1.7%
| SOUTH KOREAb: 1.7% | |
| Hyundai Motor Co., Ltd., Pfd. | | | 111,193 | | | | 5,772,383 | | |
| Total South Korea | | | | | 5,772,383 | | |
| TOTAL PREFERRED EQUITIES | | | | | 5,772,383 | | |
| (Cost $1,713,094) | | | | | | | | | |
| TOTAL INVESTMENTS: 95.8% | | | | | 329,947,385 | | |
| (Cost $224,619,562c) | | | | | | | | | |
CASH AND OTHER ASSETS,
LESS LIABILITIES: 4.2% | | | | | 14,335,297 | | |
| NET ASSETS: 100.0% | | | | $ | 344,282,682 | | |
a Non-income producing security.
b Certain securities were fair valued under the discretion of the Board of Trustees (Note 2-A).
c Cost for federal income tax purposes is $233,592,518 and net unrealized appreciation consists of:
| Gross unrealized appreciation | | $ | 115,087,666 | | |
| Gross unrealized depreciation | | | (18,732,799 | ) | |
| Net unrealized appreciation | | $ | 96,354,867 | | |
ADR American Depositary Receipt
BHD Berhad
JSC Joint Stock Co.
Pfd. Preferred
REIT Real Estate Investment Trust
See accompanying notes to financial statements.
24 MATTHEWS ASIA FUNDS

ASIA GROWTH STRATEGIES
PORTFOLIO MANAGERS
Richard H. Gao
Lead Manager
Sharat Shroff, CFA
Lead Manager
Mark W. Headley
Co-Manager
FUND FACTS
| | | Investor Class | | Institutional Class | |
| Ticker | | MAPTX | | MIPTX | |
| CUSIP | | 577130107 | | 577130834 | |
| Inception | | 9/12/94 | | 10/29/10 | |
| NAV | | $23.44 | | $23.44 | |
| Initial Investment | | $2,500 | | $3 million | |
| Gross Expense Ratio1 | | 1.09% | | 0.95% | |
Portfolio Statistics
| Total # of Positions | | 76 | |
| Net Assets | | $5.7 billion | |
| Weighted Average Market Cap | | $20.9 billion | |
| Portfolio Turnover | | 11.43%2 | |
Benchmark
MSCI AC Asia ex Japan Index
Redemption Fee
2% within first 90 calendar days of purchase
OBJECTIVE
Long-term capital appreciation.
STRATEGY
Under normal market conditions, the Fund seeks to achieve its investment objective by investing at least 80% of its total net assets, which include borrowings for investment purposes, in the common and preferred stocks of companies located in Asia, excluding Japan.
1 Gross expense ratio for Institutional Class is annualized. Matthews Asia Funds does not charge 12b-1 fees.
2 The lesser of fiscal year 2010 long-term purchase costs or sales proceeds divided by the average monthly market value of long-term securities.
Matthews Pacific Tiger Fund
Portfolio Manager Commentary
For the year ending December 31, 2010, the Matthews Pacific Tiger Fund gained 22.30% (Investor Class) and 22.35% (Institutional Class) while its benchmark, the MSCI All Country Asia ex Japan Index, returned 19.93%. In the fourth quarter, the Fund underperformed its benchmark, returning 1.94% (Investor Class) and 1.98% (Institutional Class), while the benchmark gained 6.72%. The fourth quarter marked a reversal of many of the drivers that contributed to the portfolio's absolute and relative gains earlier in the year. For instance, financials were the biggest driver of Fund performance during the first nine months, but they ended the year on a weak note, and were among the biggest detractors from performance in the fourth quarter. Stocks in countries like India and Indonesia also started to weaken in the fourth quarter—particularly financials—as the threat of inflation continued to grow.
Consumer companies, especially consumer staples, face the risk of eroding margins in the period ahead, due to higher commodity costs. Demand may also slow as rising interest rates crimp the ability of households to enjoy more discretionary spending. The market's anticipation of these headwinds led some of the portfolio's consumer-oriented stocks to suffer a weak fourth quarter—one of their weakest quarterly performances in the last two years. On the flip side, commodity-oriented stocks in broader markets had one of their best quarters of the last two years as prospects for a global recovery pushed commodity prices higher. Taken together, these factors led the portfolio to a weak relative finish to the year.
Looking at valuations across the region, it seems more instructive to compare metrics across industries rather than countries. Even after adjusting for changes to stock prices in the fourth quarter, many commodity-related stocks are still trading at the lower end of historical ranges. Given that the core of our investment approach emphasizes a business' sustainability and generation of cash flows, we typically steer away from many segments of the commodities food chain. We do not consider it a sustainable strategy to take on price-to-earnings risk at the expense of business risk.
Conversely, consumer stocks across Asia ex-Japan are still at the higher end of their relative historic valuations, as there is considerable investor interest in the Asian consumer—whether they be in China, India or Indonesia. The portfolio's focus on domestic consumption, including consumer-oriented stocks, has been central to our investment approach for the past several years. We continue to aim for different channels of consumer spending across the region, whether they are the rapidly expanding leisure and tourism industries in China, luxury jewelry retailers in India or items of daily necessity in Indonesia. Our goal is to find companies that enjoy good brand equity with consumers and are able to maintain profitability across cycles.
While we are aware of the cyclical pressures that stem from inflation, we continue to believe that sustained consumer demand and supply disruptions are behind the recent spike in prices, particularly food items. Strategically, we favor consumer-oriented businesses that may benefit from rising prices. Dairy Farm International, an operator of supermarket chains across Asia, is one such holding. Companies like Dairy Farm are in a better position to pass on increases in food costs to end consumers. In fact, the stock was one of the best-performing holdings in the Fund in 2010, even in the fourth quarter. Dairy Farm has demonstrated an ability
(continued)
matthewsasia.com | 800.789.ASIA 25
PERFORMANCE AS OF DECEMBER 31, 2010
Institutional Class Shares were first offered on October 29, 2010. Performance since that date was 0.67%. Performance for the Institutional Class shares prior to its inception is based on the performance of the Investor Class. Performance differences between the Institutional Class and Investor Class may arise due to differences in fees charged to each class.
| | | | | | | Average Annual Total Returns | |
| | | Inception Date | | 3 Months | | 1 Year | | 3 Years | | 5 Years | | 10 Years | | Since
Inception | |
| Investor Class (MAPTX) | | 9/12/94 | | | 1.94 | % | | | 22.30 | % | | | 4.94 | % | | | 14.47 | % | | | 16.98 | % | | | 9.90 | % | |
| Institutional Class (MIPTX) | | 10/29/10 | | | 1.98 | % | | | 22.35 | % | | | 4.95 | % | | | 14.48 | % | | | 16.99 | % | | | 9.90 | % | |
| MSCI AC Asia ex Japan Index3 | | | | | | | 6.72 | % | | | 19.93 | % | | | -0.38 | % | | | 13.19 | % | | | 13.31 | % | | | 4.56 | %4 | |
| Lipper Pacific ex Japan Fund Category Average5 | | | | | | | 5.80 | % | | | 20.57 | % | | | -0.16 | % | | | 12.50 | % | | | 13.24 | % | | | 5.64 | %4 | |
Performance assumes reinvestment of all dividends and/or distributions before taxes. All performance quoted represents past performance and is no guarantee of future results. Investment return and principal value will fluctuate with market conditions so that when redeemed, shares may be worth more or less than their original cost. Current performance may be lower or higher than the return figures quoted. Returns would have been lower if certain of the Fund's fees and expenses had not been waived. For the Fund's most recent month-end performance visit matthewsasia.com.
GROWTH OF A $10,000 INVESTMENT SINCE INCEPTION—INVESTOR CLASS
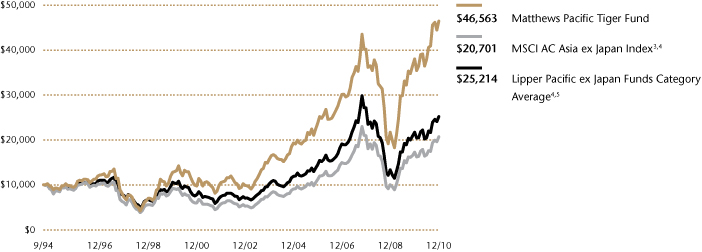
Plotted monthly. The performance data and graph do not reflect the deduction of taxes that a shareholder would pay on dividends, capital gain distributions or redemption of Fund shares. Values are in US$.
3 It is not possible to invest directly in an index. Source: Index data from Morgan Stanley Capital International and Bloomberg; total return calculations performed by BNY Mellon Investment Servicing (US) Inc. Please see page 59 for index definitions.
4 Calculated from 8/31/94.
5 The Lipper Category Average does not reflect sales charges and is based on total return, including reinvestment of dividends and capital gains for the stated periods.
TOP TEN HOLDINGS6
| | | Country | | % of Net Assets | |
| Hyundai Mobis | | South Korea | | | 2.4 | % | |
| Ping An Insurance Group Co. of China, Ltd. | | China/Hong Kong | | | 2.4 | % | |
| Swire Pacific, Ltd. | | China/Hong Kong | | | 2.3 | % | |
| Hang Lung Group, Ltd. | | China/Hong Kong | | | 2.3 | % | |
| Genting BHD | | Malaysia | | | 2.3 | % | |
| Bank of Ayudhya Public Co., Ltd. | | Thailand | | | 2.1 | % | |
| HDFC Bank, Ltd. | | India | | | 2.0 | % | |
| Dongbu Insurance Co., Ltd. | | South Korea | | | 2.0 | % | |
| China Mobile, Ltd. | | China/Hong Kong | | | 2.0 | % | |
| Samsung Electronics Co., Ltd. | | South Korea | | | 1.9 | % | |
| % OF ASSETS IN TOP TEN | | | | | 21.7 | % | |
6 Holdings may combine more than one security from same issuer and related depositary receipts.
26 MATTHEWS ASIA FUNDS
Matthews Pacific Tiger Fund
Portfolio Manager Commentary (continued)
to build its supermarket business profitably across many parts of Asia, including in emerging economies such as Malaysia, Indonesia and Vietnam. We believe the firm is an attractive long-term investment for the Fund.
Beyond cyclical factors, there is still concern over the medium- to longer-term outlook for GDP growth in China, particularly as labor and capital are priced more appropriately. Rather than fret over the absolute level of growth, it is clear to us that, over the next decade, wages should be a more significant component of China's GDP. For corporate profits to keep pace with increasing wages, management teams will need to invest in productivity-enhancing tools and systems. We continue to position the portfolio to benefit from a pickup in some of the "softer" areas of the Chinese economy, such as software and business services, that may help drive corporate productivity gains.
As the year progressed, we witnessed some divergence in the drivers of investment cycles, and a shift in the drivers of growth across the region. Most notably, as China is investing in the services sector, India and Indonesia are pushing ahead with much-needed investment plans to bolster infrastructure. The recent acceleration in foreign direct investment to India and Indonesia, if sustained, can at least partly overcome some of the institutional challenges that both these countries have previously faced. 2010 was the biggest year for inbound merger and acquisition activity in India, highlighting the long-term attractiveness of that market. There are reasons to be optimistic about the outlook for both these economies but there are several challenges that remain, including potential policy missteps in addressing inflationary pressures or capital inflows. Given the run-up in equities over the past two years, we approach these markets with some caution and defensive positioning.
Changes made to the portfolio during the year include a shift in the makeup of Korean holdings, placing greater emphasis on health care and information technology at the expense of financial services. Benefits from the consolidation of capital markets, initiated in 2007, have been slow to accrue, and the pace of change in client-centric service offerings, such as wealth management, has been disappointing. The last two years have been fairly hectic for capital-raising with a spate of initial public offerings across the region. While we are encouraged to see expanding capital markets, we have participated in very few of these IPOs, as we remain wary of the pace and the method in which capital has been raised.
Valuations across the region, while slightly above long-term averages, are not at levels that we believe will detract from the longer-term performance of the equity markets. That said, investors may be disappointed if expectations are formed based on the shorter-term performance of these markets. As some of Asia's economies attempt to rebalance their growth, we are pleased to see early signs of diversifying economic drivers. The Fund remains committed to scouring for businesses and management teams that can benefit from these trends and deliver profitable growth over time without having to overpay for these assets.
COUNTRY ALLOCATION (%)
| China/Hong Kong | | | 31.9 | | |
| South Korea | | | 17.0 | | |
| India | | | 15.9 | | |
| Taiwan | | | 8.4 | | |
| Indonesia | | | 7.6 | | |
| Thailand | | | 6.4 | | |
| Malaysia | | | 4.8 | | |
| Singapore | | | 2.0 | | |
| Philippines | | | 1.5 | | |
| Vietnam | | | 0.5 | | |
Cash and Other Assets,
Less Liabilities | | | 4.0 | | |
SECTOR ALLOCATION (%)
| Financials | | | 32.3 | | |
| Consumer Discretionary | | | 15.6 | | |
| Information Technology | | | 15.0 | | |
| Consumer Staples | | | 11.6 | | |
| Health Care | | | 7.2 | | |
| Utilities | | | 4.0 | | |
| Industrials | | | 3.8 | | |
| Telecommunication Services | | | 3.5 | | |
| Energy | | | 1.5 | | |
| Materials | | | 1.5 | | |
Cash and Other Assets,
Less Liabilities | | | 4.0 | | |
MARKET CAP EXPOSURE (%)7
| Large Cap (over $5B) | | | 69.0 | | |
| Mid Cap ($1B–$5B) | | | 25.2 | | |
| Small Cap (under $1B) | | | 1.8 | | |
Cash and Other Assets,
Less Liabilities | | | 4.0 | | |
7 Source: FactSet Research Systems. Percentage values in data are rounded to the nearest tenth of one percent; the values may not sum to 100% due to rounding.
matthewsasia.com | 800.789.ASIA 27
Matthews Pacific Tiger Fund December 31, 2010
Schedule of Investments
COMMON EQUITIES: 96.0%
| | | Shares | | Value | |
| CHINA/HONG KONG: 31.9% | |
Ping An Insurance Group Co. of China,
Ltd. H Shares | | | 12,304,500 | | | $ | 137,564,462 | | |
| Swire Pacific, Ltd. A Shares | | | 8,136,500 | | | | 133,779,938 | | |
| Hang Lung Group, Ltd. | | | 20,164,000 | | | | 132,562,320 | | |
| China Mobile, Ltd. ADR | | | 2,268,150 | | | | 112,545,603 | | |
| Dairy Farm International Holdings, Ltd. | | | 10,898,046 | | | | 101,242,847 | | |
| Sinopharm Group Co., Ltd. H Shares | | | 26,916,400 | | | | 93,844,488 | | |
| Ctrip.com International, Ltd. ADRa | | | 2,265,350 | | | | 91,633,407 | | |
Hong Kong Exchanges and
Clearing, Ltd. | | | 4,014,500 | | | | 91,055,520 | | |
| Shangri-La Asia, Ltd. | | | 31,576,000 | | | | 85,716,035 | | |
| Lenovo Group, Ltd. | | | 126,568,000 | | | | 81,091,581 | | |
| Tingyi (Cayman Islands) Holding Corp. | | | 30,096,000 | | | | 77,052,079 | | |
| China Resources Enterprise, Ltd. | | | 18,002,000 | | | | 73,765,400 | | |
| Baidu, Inc. ADRa | | | 755,600 | | | | 72,938,068 | | |
| Hengan International Group Co., Ltd. | | | 7,996,000 | | | | 68,975,376 | | |
| China Vanke Co., Ltd. B Shares | | | 48,875,258 | | | | 60,364,666 | | |
Dongfeng Motor Group Co., Ltd.
H Shares | | | 33,440,000 | | | | 57,649,238 | | |
| Digital China Holdings, Ltd. | | | 30,567,000 | | | | 57,179,418 | | |
New Oriental Education & Technology
Group, Inc. ADRa | | | 539,400 | | | | 56,761,062 | | |
China Merchants Bank Co., Ltd.
H Shares | | | 22,182,350 | | | | 55,992,397 | | |
| Tencent Holdings, Ltd. | | | 2,469,800 | | | | 53,667,818 | | |
| China Resources Land, Ltd. | | | 29,044,000 | | | | 53,060,004 | | |
| NetEase.com, Inc. ADRa | | | 1,032,350 | | | | 37,319,452 | | |
| Mindray Medical International, Ltd. ADR | | | 966,697 | | | | 25,520,801 | | |
Shenzhen Chiwan Wharf Holdings, Ltd.
B Shares | | | 11,949,117 | | | | 21,045,622 | | |
| Total China/Hong Kong | | | | | 1,832,327,602 | | |
| SOUTH KOREAb: 17.0% | |
| Hyundai Mobis | | | 555,000 | | | | 138,958,774 | | |
| Dongbu Insurance Co., Ltd. | | | 2,876,690 | | | | 113,885,055 | | |
| Samsung Electronics Co., Ltd. | | | 131,904 | | | | 110,157,808 | | |
| Yuhan Corp.† | | | 584,137 | | | | 89,228,686 | | |
| LS Corp. | | | 944,781 | | | | 88,554,637 | | |
| POSCO | | | 195,584 | | | | 83,551,649 | | |
| Cheil Worldwide, Inc.† | | | 6,291,350 | | | | 76,667,519 | | |
| Green Cross Corp.† | | | 610,295 | | | | 74,658,924 | | |
| NHN Corp.a | | | 359,802 | | | | 71,823,405 | | |
| Amorepacific Corp. | | | 65,152 | | | | 65,432,471 | | |
| MegaStudy Co., Ltd.† | | | 398,753 | | | | 61,733,916 | | |
| Total South Korea | | | | | 974,652,844 | | |
| | | Shares | | Value | |
| INDIA: 15.9% | |
| HDFC Bank, Ltd. | | | 1,997,184 | | | $ | 104,799,121 | | |
| Sun Pharmaceutical Industries, Ltd. | | | 8,326,815 | | | | 90,307,256 | | |
| Housing Development Finance Corp. | | | 5,435,685 | | | | 88,540,337 | | |
| ITC, Ltd. | | | 19,060,000 | | | | 74,445,466 | | |
| Infosys Technologies, Ltd. | | | 948,401 | | | | 73,020,408 | | |
| Tata Power Co., Ltd. | | | 2,295,014 | | | | 70,087,361 | | |
| Titan Industries, Ltd. | | | 832,044 | | | | 66,893,807 | | |
| Kotak Mahindra Bank, Ltd. | | | 6,345,882 | | | | 64,381,290 | | |
| Unitech, Ltd. | | | 36,774,406 | | | | 54,526,291 | | |
| Larsen & Toubro, Ltd. | | | 1,219,599 | | | | 53,983,928 | | |
| Container Corp. of India, Ltd. | | | 1,842,937 | | | | 52,223,761 | | |
| Dabur India, Ltd. | | | 20,061,776 | | | | 44,978,040 | | |
| Sun TV Network, Ltd. | | | 3,602,590 | | | | 42,370,616 | | |
| Infosys Technologies, Ltd. ADR | | | 219,611 | | | | 16,708,005 | | |
| HDFC Bank, Ltd. ADR | | | 63,900 | | | | 10,678,329 | | |
| Coal India, Ltd.a | | | 426,201 | | | | 3,000,039 | | |
| Total India | | | | | 910,944,055 | | |
| TAIWAN: 8.4% | |
| Yuanta Financial Holding Co., Ltd. | | | 145,400,000 | | | | 108,714,009 | | |
| Synnex Technology International Corp. | | | 38,222,354 | | | | 103,170,794 | | |
| President Chain Store Corp. | | | 18,737,608 | | | | 86,437,270 | | |
Taiwan Semiconductor Manufacturing
Co., Ltd. | | | 34,923,513 | | | | 85,043,453 | | |
| Hon Hai Precision Industry Co., Ltd. | | | 19,157,031 | | | | 77,202,378 | | |
| Delta Electronics, Inc. | | | 4,034,000 | | | | 19,715,844 | | |
| Total Taiwan | | | | | 480,283,748 | | |
| INDONESIA: 7.6% | |
| PT Perusahaan Gas Negara | | | 222,200,000 | | | | 109,127,081 | | |
| PT Bank Central Asia | | | 146,868,000 | | | | 104,323,552 | | |
| PT Astra International | | | 14,665,230 | | | | 88,788,934 | | |
| PT Telekomunikasi Indonesia | | | 85,460,500 | | | | 75,406,324 | | |
| PT Indofood CBP Sukses Makmura | | | 87,648,000 | | | | 45,477,736 | | |
| PT Telekomunikasi Indonesia ADR | | | 375,700 | | | | 13,393,705 | | |
| Total Indonesia | | | | | 436,517,332 | | |
| THAILAND: 6.4% | |
| Bank of Ayudhya Public Co., Ltd. | | | 141,168,600 | | | | 120,586,878 | | |
PTT Exploration & Production Public
Co., Ltd. | | | 15,475,000 | | | | 86,243,158 | | |
| Central Pattana Public Co., Ltd. | | | 72,096,100 | | | | 63,976,470 | | |
| Land & Houses Public Co., Ltd. | | | 254,719,500 | | | | 54,501,270 | | |
| Land & Houses Public Co., Ltd. NVDR | | | 130,450,000 | | | | 27,911,843 | | |
| Bank of Ayudhya Public Co., Ltd. NVDR | | | 17,813,300 | | | | 15,216,204 | | |
| Total Thailand | | | | | 368,435,823 | | |
| MALAYSIA: 4.8% | |
| Genting BHD | | | 36,107,700 | | | | 130,917,492 | | |
| Public Bank BHD | | | 24,411,386 | | | | 103,076,454 | | |
| Top Glove Corp. BHD | | | 25,175,960 | | | | 40,660,380 | | |
| Total Malaysia | | | | | 274,654,326 | | |
28 MATTHEWS ASIA FUNDS
Matthews Pacific Tiger Fund December 31, 2010
Schedule of Investments (continued)
COMMON EQUITIES (continued)
| | | Shares | | Value | |
| SINGAPORE: 2.0% | |
| Keppel Land, Ltd. | | | 17,737,000 | | | $ | 66,340,125 | | |
| Hyflux, Ltd. | | | 26,985,280 | | | | 48,783,145 | | |
| Total Singapore | | | | | 115,123,270 | | |
| PHILIPPINES: 1.5% | |
| SM Prime Holdings, Inc. | | | 341,950,817 | | | | 88,824,476 | | |
| Total Philippines | | | | | 88,824,476 | | |
| VIETNAM: 0.5% | |
| Vietnam Dairy Products JSC | | | 6,474,580 | | | | 26,527,430 | | |
| Total Vietnam | | | | | 26,527,430 | | |
| TOTAL INVESTMENTS: 96.0% | | | | | 5,508,290,906 | | |
| (Cost $3,762,274,960c) | | | | | | | |
CASH AND OTHER ASSETS,
LESS LIABILITIES: 4.0% | | | | | 228,921,282 | | |
| NET ASSETS: 100.0% | | | | $ | 5,737,212,188 | | |
a Non-income producing security.
b Certain securities were fair valued under the discretion of the Board of Trustees (Note 2-A).
c Cost for federal income tax purposes is $3,783,424,939 and net unrealized appreciation consists of:
| Gross unrealized appreciation | | $ | 1,778,325,481 | | |
| Gross unrealized depreciation | | | (53,459,514 | ) | |
| Net unrealized appreciation | | $ | 1,724,865,967 | | |
† Affiliated Issuer, as defined under the Investment Company Act of 1940 (ownership of 5% or more of the outstanding voting securities of this issuer)
ADR American Depositary Receipt
BHD Berhad
JSC Joint Stock Co.
NVDR Non-voting Depositary Receipt
See accompanying notes to financial statements.
matthewsasia.com | 800.789.ASIA 29

ASIA GROWTH STRATEGIES
PORTFOLIO MANAGERS
Richard H. Gao
Lead Manager
Henry Zhang, CFA
Co-Manager
FUND FACTS
| | | Investor Class | | Institutional Class | |
| Ticker | | MCHFX | | MICFX | |
| CUSIP | | 577130701 | | 577130818 | |
| Inception | | 2/19/98 | | 10/29/10 | |
| NAV | | $29.36 | | $29.36 | |
| Initial Investment | | $2,500 | | $3 million | |
| Gross Expense Ratio1 | | 1.15% | | 0.97% | |
Portfolio Statistics
| Total # of Positions | | 62 | |
| Net Assets | | $3.0 billion | |
| Weighted Average Market Cap | | $28.5 billion | |
| Portfolio Turnover | | 9.98%2 | |
Benchmark
MSCI China Index
Redemption Fee
2% within first 90 calendar days of purchase
OBJECTIVE
Long-term capital appreciation.
STRATEGY
Under normal market conditions, the Fund seeks to achieve its investment objective by investing at least 80% of its total net assets, which include borrowings for investment purposes, in the common and preferred stocks of companies located in China and Taiwan. China includes its administrative and other districts, such as Hong Kong.
1 Gross expense ratio for Institutional Class is annualized. Matthews Asia Funds does not charge 12b-1 fees.
2 The lesser of fiscal year 2010 long-term purchase costs or sales proceeds divided by the average monthly market value of long-term securities.
Matthews China Fund
Portfolio Manager Commentary
For the year ending December 31, 2010, the Matthews China Fund gained 15.77% (Investor Class) and 15.82% (Institutional Class), outperforming its benchmark, the MSCI China Index, which gained 4.83%. For the fourth quarter, the Fund gained 0.52% (Investor Class) and 0.56% (Institutional Class) while the benchmark gained 0.70%. Overall, the Fund benefited most from its traditional focus on sectors that capture domestic consumption during the year. However, in the fourth quarter, consumer stocks corrected due to concerns over rising inflation, while commodity-related stocks rallied following the U.S. Federal Reserve's second round of quantitative easing which created abundant liquidity.
2010 was a year in which we observed China trying to maintain its economic growth amid Europe's debt crisis and uncertainties in the U.S. recovery. As its economy continued to grow rapidly in the face of such global uncertainties, China took action against the signs of overheating that were emerging. In the second half of the year, fighting inflation became the government's top priority as the consumer price index (CPI) rose from 1.5% at the beginning of the year to 5.1% in November. While food-related items were mostly to blame for the rising inflation, non-food core CPI growth has also been accelerating. In the meantime, wage growth has become an increasing burden for some companies in China, especially those with labor-intensive manufacturing that have seen wages climb. We are of the view that wage growth will ultimately boost China's domestic consumption and service-oriented companies stand to benefit. In selecting our portfolio holdings, we have avoided low-end manufacturers and focused more on service-oriented areas such as health care, insurance, software and education.
During the past year, broader Chinese equities underperformed most markets elsewhere in Asia. The Fund achieved better relative returns by focusing on domestic-oriented consumer areas. Stock selection in the consumer discretionary, financials, industrials and information technology sectors provided the best relative returns for the year. Our bottom-up approach and focus on companies with strong long-term corporate fundamentals that can deliver consistent earnings growth have resulted in a portfolio we believe can withstand a volatile environment better than the overall market.
The main contributors to performance during the year included Kingdee International Software Group, a company that provides Enterprise Resources Planning (ERP) solutions to a vast number of smaller companies as well as large enterprises in China. Taking advantage of its strong market position and increased product offerings, the company has benefited from a rapid growth in China's IT software spending. CSR Corp., a major manufacturer of high-speed locomotives and a key beneficiary of the rapid expansion in China's high-speed railway networks, was another strong performer. In addition, Lianhua Supermarket Holdings, which continued to deliver solid earnings growth and strengthened its leading industry position in eastern China during the year, also helped Fund performance.
The main detractors to Fund performance included sportswear retailer Li Ning and China High Speed Transmission Equipment Group, a wind power equipment maker. In recent years, Li Ning has expanded rapidly and now faces issues related to distribution. The company has been
(continued)
30 MATTHEWS ASIA FUNDS
PERFORMANCE AS OF DECEMBER 31, 2010
Institutional Class Shares were first offered on October 29, 2010. Performance since that date was -1.62%. Performance for the Institutional Class shares prior to its inception is based on the performance of the Investor Class. Performance differences between the Institutional Class and Investor Class may arise due to differences in fees charged to each class.
| | | | | | | Average Annual Total Returns | |
| | | Inception Date | | 3 Months | | 1 Year | | 3 Years | | 5 Years | | 10 Years | | Since
Inception | |
| Investor Class (MCHFX) | | 2/19/98 | | | 0.52 | % | | | 15.77 | % | | | 1.76 | % | | | 24.20 | % | | | 19.73 | % | | | 13.70 | % | |
| Institutional Class (MICFX) | | 10/29/10 | | | 0.56 | % | | | 15.82 | % | | | 1.78 | % | | | 24.21 | % | | | 19.74 | % | | | 13.71 | % | |
| MSCI China Index3 | | | | | 0.70 | % | | | 4.83 | % | | | -5.71 | % | | | 20.58 | % | | | 14.21 | % | | | 4.20 | %4 | |
| Lipper China Region Funds Category Average5 | | | | | 5.28 | % | | | 13.66 | % | | | -3.63 | % | | | 17.18 | % | | | 12.97 | % | | | 10.34 | %4 | |
Performance assumes reinvestment of all dividends and/or distributions before taxes. All performance quoted represents past performance and is no guarantee of future results. Investment return and principal value will fluctuate with market conditions so that when redeemed, shares may be worth more or less than their original cost. Current performance may be lower or higher than the return figures quoted. Returns would have been lower if certain of the Fund's fees and expenses had not been waived. For the Fund's most recent month-end performance visit matthewsasia.com.
GROWTH OF A $10,000 INVESTMENT SINCE INCEPTION—INVESTOR CLASS
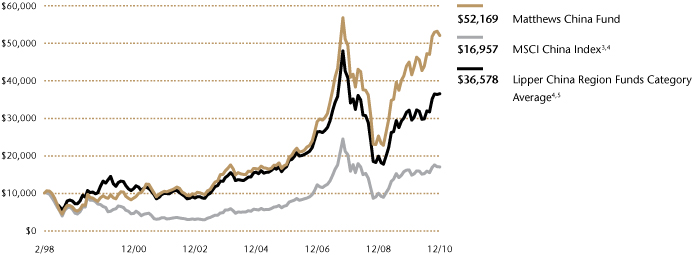
Plotted monthly. The performance data and graph do not reflect the deduction of taxes that a shareholder would pay on dividends, capital gain distributions or redemption of Fund shares. Values are in US$.
3 It is not possible to invest directly in an index. Source: Index data from Morgan Stanley Capital International and Bloomberg; total return calculations performed by BNY Mellon Investment Servicing (US) Inc. Please see page 59 for index definition.
4 Calculated from 2/28/98.
5 The Lipper Category Average does not reflect sales charges and is based on total return, including reinvestment of dividends and capital gains for the stated periods.
TOP TEN HOLDINGS6
| | | Sector | | % of Net
Assets | |
| China Mobile, Ltd. | | Telecommunication Services | | | 2.9 | % | |
| CSR Corp., Ltd. | | Industrials | | | 2.8 | % | |
| CNOOC, Ltd. | | Energy | | | 2.8 | % | |
| Lianhua Supermarket Holdings Co., Ltd. | | Consumer Staples | | | 2.7 | % | |
| Ping An Insurance Group Co. of China, Ltd. | | Financials | | | 2.5 | % | |
| BOC Hong Kong Holdings, Ltd. | | Financials | | | 2.5 | % | |
| Cheung Kong Infrastructure Holdings, Ltd. | | Utilities | | | 2.4 | % | |
| China Merchants Holdings International Co., Ltd. | | Industrials | | | 2.3 | % | |
| Li & Fung, Ltd. | | Consumer Discretionary | | | 2.3 | % | |
| Kingdee International Software Group Co., Ltd. | | Information Technology | | | 2.3 | % | |
| % OF ASSETS IN TOP TEN | | | | | 25.5 | % | |
CHINA EXPOSURE7
| SAR (Hong Kong) | | | 41.9 | % | |
| H Share | | | 30.5 | % | |
| China-affiliated Corporations | | | 17.1 | % | |
| Overseas Listed | | | 8.1 | % | |
| B Share | | | 1.4 | % | |
| Cash and Other Assets, Less Liabilities | | | 0.9 | % | |
6 Holdings may combine more than one security from same issuer and related depositary receipts.
7 SAR (Hong Kong) companies are companies that conduct business in Hong Kong and/or mainland China. H Shares are mainland China companies listed on the Hong Kong exchange but incorporated in mainland China. China-affiliated corporations (CAC), also known as "Red Chips," are mainland China companies with partial state ownership listed in Hong Kong, and incorporated in Hong Kong. Overseas Listed (OL) companies are companies that conduct business in mainland China but listed in overseas markets such as Japan, Singapore, Taiwan and the United States. B Shares are mainland Chinese companies listed on the Shanghai and Shenzhen stock exchanges, available to both Chinese and non-Chinese investors.
matthewsasia.com | 800.789.ASIA 31
SECTOR ALLOCATION (%)
| Consumer Discretionary | | | 22.6 | | |
| Financials | | | 19.8 | | |
| Information Technology | | | 13.4 | | |
| Industrials | | | 12.5 | | |
| Consumer Staples | | | 12.2 | | |
| Energy | | | 7.3 | | |
| Utilities | | | 4.8 | | |
| Telecommunication Services | | | 4.3 | | |
| Health Care | | | 2.2 | | |
Cash and Other Assets,
Less Liabilities | | | 0.9 | | |
MARKET CAP EXPOSURE (%)8
| Large Cap (over $5B) | | | 73.8 | | |
| Mid Cap ($1B–$5B) | | | 23.8 | | |
| Small Cap (under $1B) | | | 1.5 | | |
Cash and Other Assets,
Less Liabilities | | | 0.9 | | |
8 Source: FactSet Research Systems. Percentage values in data are rounded to the nearest tenth of one percent; the values may not sum to 100% due to rounding.
Matthews China Fund
Portfolio Manager Commentary (continued)
restructuring its distribution platform, however, and we believe it should be able to overcome these issues.
While China High Speed Transmission benefits from China's push for alternative energy growth, the market became more crowded and competitive and resulted in some challenges for the company. However, we continue to be attracted to the firm's key strengths: its technology and scale of operations.
The Fund continues to maintain a low turnover approach as we focus on the long-term growth prospects of Chinese companies. During the year, we consolidated our portfolio and exited positions in such firms as Huaneng Power, Beijing Capital International Airport and Air Media, mainly due to uncertainties related to their growth outlook. We are placing greater emphasis on service-oriented companies that stand to benefit from increasing demand for services in China. Two of our Hong Kong holdings demonstrate how companies positioned to provide financial services to the mainland can substantially benefit from this trend. Hong Kong Exchanges and Clearing, Ltd., a long-term holding in the portfolio and the holding company for the Hong Kong Stock Exchange, had some notable achievements in 2010. Not only did the exchange see a major increase in stock trading volume, it also became the largest listing market based on fundraising size in the world, with a record high of US$57 billion raised in 2010. The majority of the newly listed companies were from mainland China. It is expected that Hong Kong will again be among the top IPO markets in 2011 with many mainland companies already waiting to be listed. Meanwhile, the Bank of China Hong Kong (BOC HK) is in a solid position to profit from the internationalization of the renminbi (RMB). China has recently demonstrated its determination to use Hong Kong as a base to offer more offshore RMB products in preparation for the internationalization of the currency. BOC HK is the sole RMB clearing bank in Hong Kong and is actively expanding RMB-related new businesses in Hong Kong. The company plays an important role in connecting the financial markets of Hong Kong and mainland China. We believe the bank's profits resulting from providing financial services to the mainland should see substantial growth going forward.
Looking ahead, some near-term economic uncertainties still exist. Policy risks related to reining in inflation and controlling overheating in the real estate market are two areas we are watching closely. In the meantime, the overall valuation of Chinese equities is currently slightly lower than historical averages. This partly reflects investors' concern over the uncertainties in the market.
2011 is the first year of China's 12th "Five-Year Plan." The government has laid out that over the next five years, it intends to shift more resources toward accelerating the transformation of its economy to become more reliant on domestic consumption. In addition, China aims to be more focused on the quality and sustainability of its growth. This bodes well for our long-term investment philosophy and we believe our portfolio is well-positioned to benefit from this major shift.
32 MATTHEWS ASIA FUNDS
Matthews China Fund December 31, 2010
Schedule of Investments
COMMON EQUITIES: CHINA/HONG KONG: 99.1%
| | | Shares | | Value | |
| CONSUMER DISCRETIONARY: 22.6% | |
| Hotels, Restaurants & Leisure: 7.3% | |
| Sands China, Ltd.a | | | 25,269,200 | | | $ | 55,526,700 | | |
| Ctrip.com International, Ltd. ADRa | | | 1,335,700 | | | | 54,029,065 | | |
| Cafe' de Coral Holdings, Ltd. | | | 17,914,100 | | | | 44,296,650 | | |
| Shangri-La Asia, Ltd. | | | 15,453,600 | | | | 41,950,257 | | |
Home Inns & Hotels Management,
Inc. ADRa | | | 507,300 | | | | 20,779,008 | | |
| | | | | | 216,581,680 | | |
| Multiline Retail: 3.5% | |
| Golden Eagle Retail Group, Ltd. | | | 26,496,000 | | | | 65,312,804 | | |
| Parkson Retail Group, Ltd. | | | 26,044,500 | | | | 40,141,662 | | |
| | | | | | 105,454,466 | | |
| Textiles, Apparel & Luxury Goods: 2.8% | |
| Ports Design, Ltd. | | | 14,983,500 | | | | 41,348,816 | | |
| Li Ning Co., Ltd. | | | 12,019,000 | | | | 25,482,853 | | |
| Glorious Sun Enterprises, Ltd. | | | 33,994,000 | | | | 15,700,708 | | |
| | | | | | 82,532,377 | | |
| Distributors: 2.3% | |
| Li & Fung, Ltd. | | | 11,809,200 | | | | 68,520,343 | | |
| Automobiles: 2.2% | |
Dongfeng Motor Group Co., Ltd.
H Shares | | | 38,822,000 | | | | 66,927,594 | | |
| Specialty Retail: 2.1% | |
| Belle International Holdings, Ltd. | | | 37,766,000 | | | | 63,843,819 | | |
| Diversified Consumer Services: 1.8% | |
New Oriental Education & Technology
Group, Inc. ADRa | | | 505,200 | | | | 53,162,196 | | |
| Media: 0.6% | |
| Television Broadcasts, Ltd. | | | 3,270,000 | | | | 17,669,308 | | |
| Total Consumer Discretionary | | | | | 674,691,783 | | |
| FINANCIALS: 19.8% | |
| Real Estate Management & Development: 6.8% | |
| Swire Pacific, Ltd. A Shares | | | 4,071,500 | | | | 66,943,405 | | |
| Hang Lung Group, Ltd. | | | 9,166,000 | | | | 60,259,186 | | |
| China Vanke Co., Ltd. B Shares | | | 34,264,750 | | | | 42,319,576 | | |
| China Resources Land, Ltd. | | | 17,222,000 | | | | 31,462,587 | | |
| | | | | | 200,984,754 | | |
| Commercial Banks: 6.3% | |
| BOC Hong Kong Holdings, Ltd. | | | 21,662,000 | | | | 73,713,449 | | |
China Merchants Bank Co., Ltd.
H Shares | | | 20,739,614 | | | | 52,350,662 | | |
China Construction Bank Corp.
H Shares | | | 43,482,660 | | | | 38,991,630 | | |
Bank of Communications Co., Ltd.
H Shares | | | 22,548,050 | | | | 22,713,981 | | |
| | | | | | 187,769,722 | | |
| | | Shares | | Value | |
| Insurance: 4.6% | |
Ping An Insurance Group Co. of China,
Ltd. H Shares | | | 6,700,500 | | | $ | 74,911,673 | | |
| China Life Insurance Co., Ltd. H Shares | | | 12,671,000 | | | | 51,757,957 | | |
| China Life Insurance Co., Ltd. ADR | | | 181,300 | | | | 11,090,121 | | |
| | | | | | 137,759,751 | | |
| Diversified Financial Services: 2.1% | |
Hong Kong Exchanges and
Clearing, Ltd. | | | 2,762,700 | | | | 62,662,620 | | |
| Total Financials | | | | | 589,176,847 | | |
| INFORMATION TECHNOLOGY: 13.4% | |
| Internet Software & Services: 4.7% | |
| Sina Corp.a | | | 849,200 | | | | 58,441,944 | | |
| Tencent Holdings, Ltd. | | | 2,334,900 | | | | 50,736,493 | | |
| NetEase.com, Inc. ADRa | | | 851,400 | | | | 30,778,110 | | |
| | | | | | 139,956,547 | | |
| Computers & Peripherals: 2.8% | |
| Lenovo Group, Ltd. | | | 83,732,000 | | | | 53,646,737 | | |
| TPV Technology, Ltd. | | | 45,168,000 | | | | 28,822,725 | | |
| | | | | | 82,469,462 | | |
| Software: 2.2% | |
Kingdee International Software Group
Co., Ltd.† | | | 120,330,000 | | | | 67,496,758 | | |
| Communications Equipment: 2.0% | |
| ZTE Corp. H Shares | | | 15,079,254 | | | | 59,946,087 | | |
| Electronic Equipment, Instruments & Components: 1.7% | |
| Digital China Holdings, Ltd. | | | 27,026,000 | | | | 50,555,532 | | |
| Total Information Technology | | | | | 400,424,386 | | |
| INDUSTRIALS: 12.5% | |
| Machinery: 4.4% | |
| CSR Corp., Ltd. H Shares | | | 64,391,000 | | | | 84,663,959 | | |
China National Materials Co., Ltd.
H Shares | | | 47,003,000 | | | | 37,915,399 | | |
Sany Heavy Equipment International
Holdings Co., Ltd. | | | 5,281,000 | | | | 7,786,159 | | |
| | | | | | 130,365,517 | | |
| Transportation Infrastructure: 3.3% | |
China Merchants Holdings International
Co., Ltd. | | | 17,418,581 | | | | 68,797,658 | | |
| GZI Transport, Ltd. | | | 49,687,000 | | | | 28,765,889 | | |
| | | | | | 97,563,547 | | |
| Airlines: 1.9% | |
| Air China, Ltd. H Sharesa | | | 49,583,900 | | | | 55,690,028 | | |
| Electrical Equipment: 1.3% | |
China High Speed Transmission
Equipment Group Co., Ltd. | | | 24,750,000 | | | | 38,337,536 | | |
| Construction & Engineering: 0.8% | |
China Railway Construction Corp., Ltd.
H Shares | | | 20,975,500 | | | | 25,258,682 | | |
matthewsasia.com | 800.789.ASIA 33
Matthews China Fund December 31, 2010
Schedule of Investments (continued)
COMMON EQUITIES: CHINA/HONG KONG (continued)
| | | Shares | | Value | |
| Industrial Conglomerates: 0.8% | |
| NWS Holdings, Ltd. | | | 16,525,914 | | | $ | 25,088,229 | | |
| Total Industrials | | | | | 372,303,539 | | |
| CONSUMER STAPLES: 12.2% | |
| Food & Staples Retailing: 4.6% | |
Lianhua Supermarket Holdings Co., Ltd.
H Shares† | | | 16,796,000 | | | | 80,276,271 | | |
| China Resources Enterprise, Ltd. | | | 13,782,000 | | | | 56,473,433 | | |
| | | | | | 136,749,704 | | |
| Food Products: 4.0% | |
| Tingyi (Cayman Islands) Holding Corp. | | | 25,185,000 | | | | 64,478,888 | | |
| China Yurun Food Group, Ltd. | | | 16,901,000 | | | | 55,555,340 | | |
| | | | | | 120,034,228 | | |
| Household & Personal Products: 1.9% | |
| Hengan International Group Co., Ltd. | | | 6,610,500 | | | | 57,023,727 | | |
| Beverages: 1.7% | |
| Tsingtao Brewery Co., Ltd. H Shares | | | 9,707,000 | | | | 50,827,874 | | |
| Total Consumer Staples | | | | | 364,635,533 | | |
| ENERGY: 7.3% | |
| Oil, Gas & Consumable Fuels: 5.6% | |
| CNOOC, Ltd. | | | 34,656,000 | | | | 82,217,044 | | |
China Shenhua Energy Co., Ltd.
H Shares | | | 12,503,000 | | | | 52,438,992 | | |
China Petroleum & Chemical Corp.
(Sinopec) H Shares | | | 32,904,000 | | | | 31,495,183 | | |
| | | | | | 166,151,219 | | |
| Energy Equipment & Services: 1.7% | |
| China Oilfield Services, Ltd. H Shares | | | 24,186,000 | | | | 52,399,681 | | |
| Total Energy | | | | | 218,550,900 | | |
| UTILITIES: 4.8% | |
| Electric Utilities: 2.4% | |
Cheung Kong Infrastructure
Holdings, Ltd. | | | 15,431,500 | | | | 70,677,414 | | |
| Gas Utilities: 1.8% | |
| Hong Kong & China Gas Co., Ltd. | | | 23,045,653 | | | | 54,317,153 | | |
| Independent Power Producers & Energy Traders: 0.6% | |
China Longyuan Power Group Corp.
H Sharesa | | | 19,836,000 | | | | 18,144,550 | | |
| Total Utilities | | | | | 143,139,117 | | |
| TELECOMMUNICATION SERVICES: 4.3% | |
| Wireless Telecommunication Services: 2.9% | |
| China Mobile, Ltd. | | | 6,223,583 | | | | 61,813,067 | | |
| China Mobile, Ltd. ADR | | | 489,600 | | | | 24,293,952 | | |
| | | | | | 86,107,019 | | |
| | | Shares | | Value | |
| Diversified Telecommunication Services: 1.4% | |
China Communications Services Corp.,
Ltd. H Shares | | | 68,376,000 | | | $ | 40,729,323 | | |
| Total Telecommunication Services | | | | | 126,836,342 | | |
| HEALTH CARE: 2.2% | |
| Health Care Providers & Services: 1.3% | |
| Sinopharm Group Co., Ltd. H Shares | | | 10,978,400 | | | | 38,276,379 | | |
| Health Care Equipment & Supplies: 0.9% | |
| Mindray Medical International, Ltd. ADR | | | 973,268 | | | | 25,694,275 | | |
| Total Health Care | | | | | 63,970,654 | | |
| TOTAL INVESTMENTS: 99.1% | | | | | 2,953,729,101 | | |
| (Cost $2,032,190,622b) | | | | | | | |
CASH AND OTHER ASSETS,
LESS LIABILITIES: 0.9% | | | | | 27,453,743 | | |
| NET ASSETS: 100.0% | | | | $ | 2,981,182,844 | | |
a Non-income producing security.
b Cost for federal income tax purposes is $2,035,321,792 and net unrealized appreciation consists of:
| Gross unrealized appreciation | | $ | 971,870,832 | | |
| Gross unrealized depreciation | | | (53,463,523 | ) | |
| Net unrealized appreciation | | $ | 918,407,309 | | |
† Affiliated Issuer, as defined under the Investment Company Act of 1940 (ownership of 5% or more of the outstanding voting securities of this issuer)
ADR American Depositary Receipt
See accompanying notes to financial statements.
34 MATTHEWS ASIA FUNDS

ASIA GROWTH STRATEGIES
PORTFOLIO MANAGERS
Sharat Shroff, CFA
Lead Manager
Andrew Foster
Co-Manager
Sunil Asnani
Co-Manager
FUND FACTS
| | | Investor Class | | Institutional Class | |
| Ticker | | MINDX | | MIDNX | |
| CUSIP | | 577130859 | | 577130768 | |
| Inception | | 10/31/05 | | 10/29/10 | |
| NAV | | $21.49 | | $21.48 | |
| Initial Investment | | $2,500 | | $3 million | |
| Gross Expense Ratio1 | | 1.18% | | 0.99% | |
Portfolio Statistics
| Total # of Positions | | 59 | |
| Net Assets | | $1.4 billion | |
| Weighted Average Market Cap | | $11.0 billion | |
| Portfolio Turnover | | 6.14%2 | |
Benchmark
Bombay Stock Exchange 100 Index
Redemption Fee
2% within first 90 calendar days of purchase
OBJECTIVE
Long-term capital appreciation.
STRATEGY
Under normal market conditions, the Fund seeks to achieve its investment objective by investing at least 80% of its total net assets, which include borrowings for investment purposes, in publicly traded common stocks, preferred stocks and convertible securities of companies located in India.
1 Gross expense ratio for Institutional Class is annualized. Matthews Asia Funds does not charge 12b-1 fees.
2 The lesser of fiscal year 2010 long-term purchase costs or sales proceeds divided by the average monthly market value of long-term securities.
Matthews India Fund
Portfolio Manager Commentary
For the year ending December 31, 2010, the Matthews India Fund gained 32.53% (Investor Class) and 32.52% (Institutional Class), while its benchmark, the Bombay Stock Exchange (BSE) 100 Index rose 21.89%, with most of the gains recorded in September. The Fund's relative outperformance during the year was driven by a broad selection of stocks weighted heavily in favor of higher quality small- and mid-size holdings across a broad spectrum of sectors, including financials, consumer discretionary and health care. For the first nine months of the year, stock-specific factors seemed to drive equity performance; however, toward the end of the year there was a rising correlation in individual stock returns as market-specific factors began gaining traction. That said, during the fourth quarter, the Fund returned –0.15% (Investor and Institutional Class) while its benchmark increased by 1.23%.
The factors that worked to the benefit of the portfolio during the first nine months of the year seemed to reverse course in the fourth quarter when larger-sized companies outperformed smaller ones. During the quarter, the Bombay Stock Exchange Small Cap Index lost –4.9%, compared to a gain of 2.5% for the NIFTY, an index of 50 stocks dominated by larger companies. The second half of the year also saw a string of scandals and allegations about opaque dealings between elected Indian officials and business leaders. In this skittish environment, investors seemed to favor the perceived safety of larger, more established companies.
The portfolio continues to maintain an all-capitalization approach, focusing on underlying fundamentals as the source of long-term returns. The Fund's investment in Exide Industries, a manufacturer of batteries used in various sectors, articulates our bottom-up approach to stock picking. Exide is the largest supplier of storage batteries to several Indian industries, including the automotive sector. We were attracted to Exide for its corporate transparency and higher degree of recurring revenues and cash flow—which are often hard to achieve via investments in infrastructure firms. The challenge for Exide's management actually lies in deploying the excess cash it generates from its underlying business, and this is something that we continue to monitor closely.
During the year, financials were a significant contributor to the absolute and relative performance of the portfolio. Much of the gains were driven by a re-rating of public sector banks in recognition of the better-than-expected resilience of their operating metrics. As the year progressed, the sustained pace of monetary tightening by India's central bank raised questions about net interest margins at many of these banks. Following an appreciation in stock prices and the prospect of a pickup in nonperforming loans, we are selectively favoring banks with stronger liability franchises.
The portfolio continues to maintain an overweight in the industrials and consumer discretionary sectors. Our allocation to industrials has increased over the past two years, as we have uncovered increasing evidence of supply constraints, which would support a pickup in investment spending. Furthermore, multinational companies are increasingly looking to India for an attractive manufacturing destination for products such as small cars. This raises the possibility of a steady rise in the country's investment to GDP ratio. Foreign direct investments have recently risen to about 2% of GDP from less than 1% a decade ago. Within industrials, our focus has been on companies that can generate sustainable returns from growth in
(continued)
matthewsasia.com | 800.789.ASIA 35
PERFORMANCE AS OF DECEMBER 31, 2010
Institutional Class Shares were first offered on October 29, 2010. Performance since that date was -2.01%. Performance for the Institutional Class shares prior to its inception is based on the performance of the Investor Class. Performance differences between the Institutional Class and Investor Class may arise due to differences in fees charged to each class.
| | | | | | | Average Annual Total Returns | |
| | | Inception Date | | 3 Months | | 1 Year | | 3 Years | | 5 Years | | Since
Inception | |
| Investor Class (MINDX) | | 10/31/05 | | | -0.15 | % | | | 32.53 | % | | | -0.50 | % | | | 17.15 | % | | | 19.38 | % | |
| Institutional Class (MIDNX) | | 10/29/10 | | | -0.15 | % | | | 32.52 | % | | | -0.50 | % | | | 17.15 | % | | | 19.38 | % | |
| Bombay Stock Exchange 100 Index3 | | | | | | | 1.23 | % | | | 21.89 | % | | | -4.33 | % | | | 18.26 | % | | | 21.69 | % | |
| Lipper Emerging Markets Funds Category Average4 | | | | | | | 6.97 | % | | | 19.54 | % | | | -2.61 | % | | | 10.81 | % | | | 13.27 | % | |
Performance assumes reinvestment of all dividends and/or distributions before taxes. All performance quoted represents past performance and is no guarantee of future results. Investment return and principal value will fluctuate with market conditions so that when redeemed, shares may be worth more or less than their original cost. Current performance may be lower or higher than the return figures quoted. Returns would have been lower if certain of the Fund's fees and expenses had not been waived. For the Fund's most recent month-end performance visit matthewsasia.com.
GROWTH OF A $10,000 INVESTMENT SINCE INCEPTION—INVESTOR CLASS
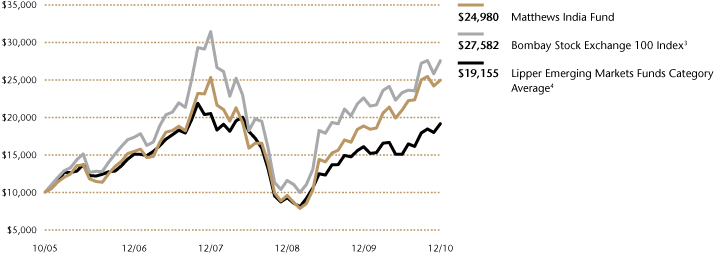
Plotted monthly. The performance data and graph do not reflect the deduction of taxes that a shareholder would pay on dividends, capital gain distributions or redemption of Fund shares. Values are in US$.
3 It is not possible to invest directly in an index. Source: Index data from Morgan Stanley Capital International and Bloomberg; total return calculations performed by BNY Mellon Investment Servicing (US) Inc. Please see page 59 for index definition.
4 The Lipper Category Average does not reflect sales charges and is based on total return, including reinvestment of dividends and capital gains for the stated periods.
TOP TEN HOLDINGS5
| | | Sector | | % of Net Assets | |
| Exide Industries, Ltd. | | Consumer Discretionary | | | 3.6 | % | |
| Gail India, Ltd. | | Utilities | | | 3.6 | % | |
| Infosys Technologies, Ltd. | | Information Technology | | | 3.5 | % | |
| HDFC Bank, Ltd. | | Financials | | | 3.2 | % | |
| Sun Pharmaceutical Industries, Ltd. | | Health Care | | | 3.2 | % | |
| Container Corp. of India, Ltd. | | Industrials | | | 2.9 | % | |
| ITC, Ltd. | | Consumer Staples | | | 2.9 | % | |
| Tata Power Co., Ltd., Cnv., 1.750%, 11/21/2014 | | Utilities | | | 2.8 | % | |
| Crompton Greaves, Ltd. | | Industrials | | | 2.8 | % | |
| ICICI Bank, Ltd. | | Financials | | | 2.8 | % | |
| % OF ASSETS IN TOP TEN | | | | | 31.3 | % | |
5 Holdings may combine more than one security from same issuer and related depositary receipts.
36 MATTHEWS ASIA FUNDS
Matthews India Fund
Portfolio Manager Commentary (continued)
infrastructure investments and capital expenditures. In general, the Fund's holdings in this segment contributed to positive returns in 2010. A common theme was superior fundamental performance from mid-sized (rather than larger) companies, led by faster growth and higher profitability.
Within consumer-related sectors, we have invested in companies with solid brands and wide distribution reach. Many of these companies are small or mid-sized, and have substantial room to grow profitably. With modern retailing still not significant throughout the country, a good distribution network continues to serve as a barrier to entry. A good brand with scale and distribution can sustain profitability even during periods of commodity price hikes and heightened competition. That said, stocks in the consumer staples sector generated lackluster gains in 2010, reflecting investor concerns over the impact of inflation on corporate profitability.
Inflationary pressures continue to persist although it is important to note that the situation is most acute with food prices. Over time, the government's continuing efforts to provide incentives to farmers, such as subsidies for investing in irrigation facilities, are welcome steps that may ease the impact of weather-related disruptions. One of the portfolio's holdings, Jain Irrigation Systems is a likely beneficiary of this trend as it maintains its standing as the largest provider of irrigation facilities in India.
Toward the end of the year, oil prices began to rise, posing a real threat to companies and consumers in India, where 70% of oil demand is satisfied by imports. As we have written previously, even though the drivers of economic growth are domestic, the funding of this growth is precariously dependent on foreign capital, in particular, potentially erratic portfolio inflows. In 2010, foreign institutional investors poured about US$29 billion into India's equity markets, easily surpassing the previous high of nearly US$18 billion in 2007. There was also a negative outflow of approximately US$12 billion as recently as 2008.
Capital inflows into India are dependent on changes in the global risk appetite or disappointments in corporate earnings. After considering the progression of corporate earnings in 2009 with the first half of 2010, the outlook is for relatively more labored and sluggish growth. Rising interest rates and commodity prices, and higher-than-average valuations leave less room for shocks, and we approach the new year with some caution. Selectively, we are including foreign currency convertible bonds in the portfolio as we are attracted by the combination of yield and equity risk premium they offer. We believe they may offset an anticipated pickup in volatility in the Indian markets. At the same time, we continue to find smaller to mid-sized companies that are more appropriately priced, yet offer good longer-term growth opportunities. It is our view that the Indian economy remains one of the few globally with the potential to sustain, and even accelerate economic growth. In that context, any sharp declines may provide attractive entry points for patient long-term investors.
SECTOR ALLOCATION (%)
| Financials | | | 22.3 | | |
| Industrials | | | 17.4 | | |
| Consumer Discretionary | | | 10.6 | | |
| Information Technology | | | 9.5 | | |
| Materials | | | 9.0 | | |
| Utilities | | | 7.9 | | |
| Consumer Staples | | | 7.8 | | |
| Health Care | | | 7.0 | | |
| Energy | | | 3.0 | | |
| Telecommunication Services | | | 2.9 | | |
Cash and Other Assets,
Less Liabilities | | | 2.6 | | |
MARKET CAP EXPOSURE (%)6
| Large Cap (over $5B) | | | 41.6 | | |
| Mid Cap ($1B–$5B) | | | 40.8 | | |
| Small Cap (under $1B) | | | 15.0 | | |
Cash and Other Assets,
Less Liabilities | | | 2.6 | | |
6 Source: FactSet Research Systems. Percentage values in data are rounded to the nearest tenth of one percent; the values may not sum to 100% due to rounding.
matthewsasia.com | 800.789.ASIA 37
Matthews India Fund December 31, 2010
Schedule of Investments
COMMON EQUITIES: 89.7%
| | | Shares | | Value | |
| FINANCIALS: 22.3% | |
| Commercial Banks: 13.0% | |
| ICICI Bank, Ltd. | | | 1,195,000 | | | $ | 30,602,583 | | |
| Allahabad Bank | | | 5,619,668 | | | | 28,390,540 | | |
| HDFC Bank, Ltd. | | | 488,033 | | | | 25,608,772 | | |
| Axis Bank, Ltd. | | | 845,032 | | | | 25,514,429 | | |
| Corporation Bank | | | 1,719,331 | | | | 24,462,448 | | |
| Oriental Bank of Commerce | | | 2,471,834 | | | | 22,404,882 | | |
| HDFC Bank, Ltd. ADR | | | 122,227 | | | | 20,425,354 | | |
| ICICI Bank, Ltd. ADR | | | 178,283 | | | | 9,028,251 | | |
| | | | | | 186,437,259 | | |
| Real Estate Management & Development: 3.1% | |
| Ascendas India Trust | | | 35,540,000 | | | | 25,754,627 | | |
| Unitech, Ltd. | | | 12,903,178 | | | | 19,131,851 | | |
| | | | | | 44,886,478 | | |
| Diversified Financial Services: 3.0% | |
| Kotak Mahindra Bank, Ltd. | | | 2,150,000 | | | | 21,812,535 | | |
Infrastructure Development
Finance Co., Ltd. | | | 5,156,034 | | | | 21,055,391 | | |
| | | | | | 42,867,926 | | |
| Consumer Finance: 1.8% | |
| Shriram Transport Finance Co., Ltd. | | | 1,497,977 | | | | 26,165,603 | | |
| Thrifts & Mortgage Finance: 1.4% | |
| Housing Development Finance Corp. | | | 1,225,000 | | | | 19,953,679 | | |
| Total Financials | | | | | 320,310,945 | | |
| INDUSTRIALS: 17.4% | |
| Machinery: 6.2% | |
| Jain Irrigation Systems, Ltd. | | | 5,830,635 | | | | 27,409,135 | | |
| Ashok Leyland, Ltd. | | | 18,511,277 | | | | 26,494,951 | | |
| Thermax, Ltd. | | | 1,078,128 | | | | 21,014,032 | | |
| AIA Engineering, Ltd. | | | 1,540,836 | | | | 13,992,093 | | |
| | | | | | 88,910,211 | | |
| Road & Rail: 2.9% | |
| Container Corp. of India, Ltd. | | | 1,465,386 | | | | 41,525,005 | | |
| Electrical Equipment: 2.8% | |
| Crompton Greaves, Ltd. | | | 5,857,500 | | | | 40,602,306 | | |
| Building Products: 1.8% | |
| Sintex Industries, Ltd. | | | 6,366,502 | | | | 25,934,437 | | |
| Construction & Engineering: 1.6% | |
| Larsen & Toubro, Ltd. | | | 501,660 | | | | 22,205,313 | | |
| Industrial Conglomerates: 1.1% | |
| MAX India, Ltd.a | | | 4,813,102 | | | | 15,887,596 | | |
| Transportation Infrastructure: 1.0% | |
| Gujarat Pipavav Port, Ltd.a | | | 10,550,000 | | | | 14,569,216 | | |
| Total Industrials | | | | | 249,634,084 | | |
| | | Shares | | Value | |
| CONSUMER DISCRETIONARY: 10.6% | |
| Media: 4.4% | |
| Sun TV Network, Ltd. | | | 2,405,127 | | | $ | 28,287,069 | | |
| Jagran Prakashan, Ltd. | | | 5,908,207 | | | | 17,520,480 | | |
| HT Media, Ltd. | | | 3,018,943 | | | | 9,857,222 | | |
| Dish TV India, Ltd.a | | | 4,737,097 | | | | 7,537,615 | | |
| | | | | | 63,202,386 | | |
| Auto Components: 3.7% | |
| Exide Industries, Ltd. | | | 14,001,491 | | | | 52,260,960 | | |
| Textiles, Apparel & Luxury Goods: 1.4% | |
| Titan Industries, Ltd. | | | 254,691 | | | | 20,476,382 | | |
| Hotels, Restaurants & Leisure: 1.1% | |
| Indian Hotels Co., Ltd. | | | 7,524,840 | | | | 16,256,280 | | |
| Total Consumer Discretionary | | | | | 152,196,008 | | |
| INFORMATION TECHNOLOGY: 9.2% | |
| IT Services: 5.8% | |
| CMC, Ltd. | | | 557,827 | | | | 33,605,599 | | |
| Infosys Technologies, Ltd. | | | 413,281 | | | | 31,819,818 | | |
| Infosys Technologies, Ltd. ADR | | | 238,179 | | | | 18,120,658 | | |
| | | | | | 83,546,075 | | |
| Internet Software & Services: 2.1% | |
| Info Edge India, Ltd. | | | 2,013,454 | | | | 29,757,153 | | |
| Software: 1.3% | |
| Polaris Software Lab, Ltd. | | | 3,700,318 | | | | 14,444,605 | | |
| Financial Technologies India, Ltd. | | | 240,752 | | | | 4,812,079 | | |
| | | | | | 19,256,684 | | |
| Total Information Technology | | | | | 132,559,912 | | |
| CONSUMER STAPLES: 7.8% | |
| Personal Products: 4.9% | |
| Dabur India, Ltd. | | | 13,879,430 | | | | 31,117,362 | | |
| Emami, Ltd. | | | 3,077,712 | | | | 27,783,036 | | |
| Marico, Ltd. | | | 4,549,720 | | | | 12,179,391 | | |
| | | | | | 71,079,789 | | |
| Tobacco: 2.9% | |
| ITC, Ltd. | | | 10,630,000 | | | | 41,519,166 | | |
| Total Consumer Staples | | | | | 112,598,955 | | |
| HEALTH CARE: 7.0% | |
| Pharmaceuticals: 7.0% | |
| Sun Pharmaceutical Industries, Ltd. | | | 4,202,300 | | | | 45,575,431 | | |
| Glenmark Pharmaceuticals, Ltd. | | | 3,653,091 | | | | 29,582,562 | | |
| Cipla India, Ltd. | | | 3,003,275 | | | | 24,837,551 | | |
| Total Health Care | | | | | 99,995,544 | | |
38 MATTHEWS ASIA FUNDS
Matthews India Fund December 31, 2010
Schedule of Investments (continued)
COMMON EQUITIES (continued)
| | | Shares | | Value | |
| MATERIALS: 6.1% | |
| Chemicals: 4.9% | |
| Asian Paints, Ltd. | | | 547,500 | | | $ | 35,247,417 | | |
| Castrol India, Ltd. | | | 2,216,098 | | | | 22,711,102 | | |
| Grasim Industries, Ltd. | | | 224,459 | | | | 11,759,814 | | |
| | | | | | 69,718,333 | | |
| Metals & Mining: 1.2% | |
| NMDC, Ltd. | | | 2,820,923 | | | | 17,575,962 | | |
| Total Materials | | | | | 87,294,295 | | |
| UTILITIES: 5.1% | |
| Gas Utilities: 3.5% | |
| Gail India, Ltd. | | | 4,469,751 | | | | 51,244,948 | | |
| Electric Utilities: 1.6% | |
| CESC, Ltd. | | | 2,765,920 | | | | 22,580,769 | | |
| Total Utilities | | | | | 73,825,717 | | |
| ENERGY: 3.0% | |
| Oil, Gas & Consumable Fuels: 3.0% | |
| Reliance Industries, Ltd. | | | 1,325,742 | | | | 31,389,088 | | |
| Chennai Petroleum Corp., Ltd. | | | 2,064,744 | | | | 11,416,928 | | |
| Coal India, Ltd.a | | | 106,550 | | | | 750,008 | | |
| Total Energy | | | | | 43,556,024 | | |
| TELECOMMUNICATION SERVICES: 1.2% | |
| Wireless Telecommunication Services: 1.2% | |
| Bharti Airtel, Ltd. | | | 2,194,382 | | | | 17,608,057 | | |
| Total Telecommunication Services | | | | | 17,608,057 | | |
| TOTAL COMMON EQUITIES | | | | | 1,289,579,541 | | |
| (Cost $869,360,062) | | | | | | | |
INTERNATIONAL BONDS: 7.7%
| | | Face Amount | | Value | |
| MATERIALS: 2.9% | |
| Metals & Mining: 2.9% | |
Sesa Goa, Ltd., Cnv.
5.000%, 10/31/14 | | $ | 19,000,000 | | | $ | 21,707,500 | | |
Welspun Corp., Ltd., Cnv.
4.500%, 10/17/14 | | | 20,500,000 | | | | 19,833,750 | | |
| Total Materials | | | | | 41,541,250 | | |
| UTILITIES: 2.8% | |
| Electric Utilities: 2.8% | |
Tata Power Co., Ltd., Cnv.
1.750%, 11/21/14 | | | 35,000,000 | | | | 40,722,500 | | |
| Total Utilities | | | | | 40,722,500 | | |
| TELECOMMUNICATION SERVICES: 1.7% | |
| Wireless Telecommunication Services: 1.7% | |
Reliance Communications, Ltd., Cnv.
0.000%, 03/01/12 | | | 20,500,000 | | | | 24,113,125 | | |
| Total Telecommunication Services | | | | | 24,113,125 | | |
| INFORMATION TECHNOLOGY: 0.3% | |
| Software: 0.3% | |
Financial Technologies India, Ltd., Cnv.
0.000%, 12/21/11 | | | 2,500,000 | | | | 3,450,000 | | |
| Total Information Technology | | | | | 3,450,000 | | |
| TOTAL INTERNATIONAL BONDS | | | | | 109,826,875 | | |
| (Cost $109,545,102) | | | | | | | |
| TOTAL INVESTMENTS: 97.4% | | | | | 1,399,406,416 | | |
| (Cost $978,905,164b) | | | | | | | |
CASH AND OTHER ASSETS,
LESS LIABILITIES: 2.6% | | | | | 37,604,236 | | |
| NET ASSETS: 100.0% | | | | $ | 1,437,010,652 | | |
a Non-income producing security.
b Cost for federal income tax purposes is $990,064,476 and net unrealized appreciation consists of:
| Gross unrealized appreciation | | $ | 446,888,468 | | |
| Gross unrealized depreciation | | | (37,546,528 | ) | |
| Net unrealized appreciation | | $ | 409,341,940 | | |
ADR American Depositary Receipt
Cnv. Convertible
See accompanying notes to financial statements.
matthewsasia.com | 800.789.ASIA 39

ASIA GROWTH STRATEGIES
PORTFOLIO MANAGERS
Taizo Ishida
Lead Manager
Kenichi Amaki
Co-Manager
FUND FACTS
| | | Investor Class | | Institutional Class | |
| Ticker | | MJFOX | | MIJFX | |
| CUSIP | | 577130800 | | 577130792 | |
| Inception | | 12/31/98 | | 10/29/10 | |
| NAV | | $12.53 | | $12.53 | |
| Initial Investment | | $2,500 | | $3 million | |
| Gross Expense Ratio1 | | 1.30% | | 1.08% | |
Portfolio Statistics
| Total # of Positions | | 58 | |
| Net Assets | | $67.8 million | |
| Weighted Average Market Cap | | $12.9 billion | |
| Portfolio Turnover | | 46.29%2 | |
Benchmarks
MSCI Japan Index
Tokyo Stock Price Index
Redemption Fee
2% within first 90 calendar days of purchase
OBJECTIVE
Long-term capital appreciation.
STRATEGY
Under normal market conditions, the Fund seeks to achieve its investment objective by investing at least 80% of its total net assets, which include borrowings for investment purposes, in the common and preferred stocks of companies located in Japan.
1 Gross expense ratio for Institutional Class is annualized. Matthews Asia Funds does not charge 12b-1 fees.
2 The lesser of fiscal year 2010 long-term purchase costs or sales proceeds divided by the average monthly market value of long-term securities.
Matthews Japan Fund
Portfolio Manager Commentary
For the year ending December 31, 2010, the Matthews Japan Fund gained 19.58% (Investor and Institutional Class), while its benchmark, the MSCI Japan Index rose 15.59%. For the fourth quarter, the Fund returned 13.74% (Investor and Institutional Class), compared with 12.13% for the benchmark.
Japan's stock market got off to a good start in 2010, performing on par with other major global markets during the first half of the year. But by the middle of the year, we saw a weakening of the U.S. dollar against the yen, which dealt a blow to the Japanese market. The prevailing theory has been that a strong yen weakens the earnings power of Japanese exporters. While a strengthened yen was indeed a concern for the market during the year, many observers were surprised to find an improved earnings outlook for many Japanese companies. We believe this resulted mainly from rigorous corporate cost-cutting aimed at combating the rising yen. For example, Nissan Motor aggressively cut operating expenses during the year. Previously, one of Nissan's popular passenger cars had been manufactured exclusively in Japan for sale in Japan. But in 2010 the company began manufacturing this model in Thailand for sale in Japan—a new approach not taken before by a Japanese automaker. This greatly benefited Nissan's profit margin.
During the year, the Fund's all-capitalization strategy served it well as both larger global and smaller domestic firms contributed to performance. In particular, the Fund continued to benefit primarily from stock selection and the performance of smaller and mid-sized holdings. As we have continued to seek domestically oriented, small-cap companies with strong growth prospects, we have found compelling investment cases in the Internet and mobile telecommunications industries. Dena and Gree, both social networking service providers, are two such companies in which we have seen impressive growth. Dena owns and operates a social networking platform that offers interactive mobile games, cell phone novels and other applications. Gree, which boasts more than 20 million users, offers similar services. Though both firms have seen growth come mainly from Japanese users, opportunities for overseas growth have come as new applications for smartphones have developed.
Internet media company Kakaku.com, is another domestic growth company and one of the portfolio's largest holdings. The firm operates websites including a restaurant and gourmet food review site, which attracts more than 22 million users. Within the past two years, the site has attracted 5 million new mobile phone users and the growing popularity of smartphones should offer Kakaku.com further growth opportunities. The company has grown well on the back of an ongoing shift from traditional to online advertising. In the past two years, the firm's market capitalization has doubled and earnings have grown 30% to 40% a year since 2008.
Another highlight for the year was the sharp recovery of Japan's real estate investment trusts (J-REITs), which are attracting more of Japan's retirees due to their relatively high dividend yield and medium risk profile. The bulk of our J-REIT holdings, in particular United Urban Investment and Advance Residence Investment, positively contributed to performance.
(continued)
40 MATTHEWS ASIA FUNDS
PERFORMANCE AS OF DECEMBER 31, 2010
Institutional Class Shares were first offered on October 29, 2010. Performance since that date was 11.22%. Performance for the Institutional Class shares prior to its inception is based on the performance of the Investor Class. Performance differences between the Institutional Class and Investor Class may arise due to differences in fees charged to each class.
| | | | | | | Average Annual Total Returns | |
| | | Inception Date | | 3 Months | | 1 Year | | 3 Years | | 5 Years | | 10 Years | | Since
Inception | |
| Investor Class (MJFOX) | | 12/31/98 | | | 13.74 | % | | | 19.58 | % | | | -1.95 | % | | | -4.72 | % | | | 0.75 | % | | | 4.39 | % | |
| Institutional Class (MIJFX) | | 10/29/10 | | | 13.74 | % | | | 19.58 | % | | | -1.95 | % | | | -4.72 | % | | | 0.75 | % | | | 4.39 | % | |
| MSCI Japan Index3 | | | | | | | 12.13 | % | | | 15.59 | % | | | -4.47 | % | | | -2.33 | % | | | 1.14 | % | | | 2.23 | % | |
| Tokyo Stock Price Index3 | | | | | | | 10.73 | % | | | 13.86 | % | | | -3.89 | % | | | -3.26 | % | | | 1.04 | % | | | 2.42 | % | |
| Lipper Japanese Funds Category Average4 | | | | | | | 12.73 | % | | | 12.43 | % | | | -7.69 | % | | | -8.92 | % | | | -3.12 | % | | | 2.90 | % | |
Performance assumes reinvestment of all dividends and/or distributions before taxes. All performance quoted represents past performance and is no guarantee of future results. Investment return and principal value will fluctuate with market conditions so that when redeemed, shares may be worth more or less than their original cost. Current performance may be lower or higher than the return figures quoted. Returns would have been lower if certain of the Fund's fees and expenses had not been waived. For the Fund's most recent month-end performance visit matthewsasia.com.
GROWTH OF A $10,000 INVESTMENT SINCE INCEPTION—INVESTOR CLASS
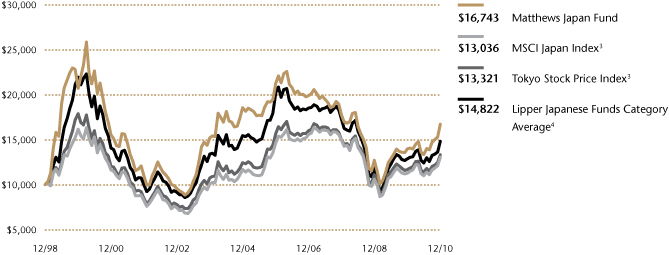
Plotted montly. The performance data and graph do not reflect the deduction of taxes that a shareholder would pay on dividends, capital gain distributions or redemption of Fund shares. Values are in US$.
3 It is not possible to invest directly in an index. Source: Index data from Morgan Stanley Capital International and Bloomberg; total return calculations performed by BNY Mellon Investment Servicing (US) Inc. Please see page 59 for index definitions.
4 The Lipper Category Average does not reflect sales charges and is based on total return, including reinvestment of dividends and capital gains for the stated periods.
TOP TEN HOLDINGS5
| | | Sector | | % of Net Assets | |
| ITOCHU Corp. | | Industrials | | | 3.7 | % | |
| ORIX Corp. | | Financials | | | 3.0 | % | |
| Nissan Motor Co., Ltd. | | Consumer Discretionary | | | 3.0 | % | |
| Yamaha Motor Co., Ltd. | | Consumer Discretionary | | | 2.7 | % | |
| Japan Tobacco, Inc. | | Consumer Staples | | | 2.6 | % | |
| Nidec Corp. | | Industrials | | | 2.6 | % | |
| Kakaku.com, Inc. | | Information Technology | | | 2.6 | % | |
| Komatsu, Ltd. | | Industrials | | | 2.5 | % | |
| Goldcrest Co., Ltd. | | Financials | | | 2.5 | % | |
| Pigeon Corp. | | Consumer Staples | | | 2.4 | % | |
| % OF ASSETS IN TOP TEN | | | | | 27.6 | % | |
5 Holdings may combine more than one security from same issuer and related depositary receipts.
matthewsasia.com | 800.789.ASIA 41
SECTOR ALLOCATION (%)
| Industrials | | | 22.1 | | |
| Financials | | | 20.0 | | |
| Information Technology | | | 16.1 | | |
| Consumer Discretionary | | | 15.1 | | |
| Health Care | | | 7.4 | | |
| Consumer Staples | | | 7.0 | | |
| Materials | | | 6.2 | | |
| Telecommunication Services | | | 4.1 | | |
Cash and Other Assets,
Less Liabilities | | | 2.0 | | |
MARKET CAP EXPOSURE (%)6
| Large Cap (over $5B) | | | 45.0 | | |
| Mid Cap ($1B–$5B) | | | 30.0 | | |
| Small Cap (under $1B) | | | 23.0 | | |
Cash and Other Assets,
Less Liabilities | | | 2.0 | | |
6 Source: FactSet Research Systems. Percentage values in data are rounded to the nearest tenth of one percent; the values may not sum to 100% due to rounding.
Matthews Japan Fund
Portfolio Manager Commentary (continued)
During the year, we also noted a trend among some Japanese companies toward becoming less reliant on the domestic economy. They sought new growth strategies, with some investing aggressively overseas, particularly elsewhere in Asia. We saw record highs in cross-border merger and acquisition activity, fueled by these new corporate initiatives. One such company, Nabtesco—a manufacturer of hydraulic equipment, aircraft components and braking systems for railways—was the Fund's main contributor to performance during the year. As a long-time supplier of components to China's rail network, this small-capitalization firm has benefited from the rapid expansion of China's high-speed railways. In December, Nabtesco announced plans to establish a joint venture in China's Jiangsu Province to manufacture railcar brake and door systems for Chinese high-speed trains. Nabtesco already supplies a dominant share of the brake and door systems used in Japan's bullet trains, and believes that establishing a local presence in China will help it win supply contracts for high-speed-rail and subway equipment as the Chinese government has aggressive plans to expand its urban transport networks.
Among the portfolio's worst performers for the year were three of our long-term holdings, which are also some of our largest holdings—Japan Steel Works, Pigeon and Toshiba. We find Toshiba, which owns Westinghouse Electric Company, compelling as a major player in the nuclear power industry. However, financial troubles that hampered U.S. nuclear projects during the year also impacted Toshiba. While it was disappointing to see some of the portfolio's top holdings among the major detractors, their combined negative contribution was far less than the total contribution made by our three top contributors.
Looking ahead, we are optimistic about the direction of select Japanese companies. Japanese stocks rallied strongly from mid-year lows, and we expect this momentum should continue for the near-term as corporate earnings strengthen. We are also very encouraged to see companies establishing themselves abroad in an effort to be less tied to the domestic economy. We have been seeing a shift in Japan's corporate mindset from low-margin, low-growth models to higher margin growth opportunities.
Perhaps discouraged from Japan's prolonged stagnation, Japanese companies during the year seemed to be pushed to dramatically change their mindset and come up with new proactive growth strategies. We will continue to look for companies with this new mindset and clear growth agendas, and are optimistic that we will find more companies undergoing this transition.
42 MATTHEWS ASIA FUNDS
Matthews Japan Fund December 31, 2010
Schedule of Investments
COMMON EQUITIES: JAPAN: 98.0%
| | | Shares | | Value | |
| INDUSTRIALS: 22.1% | |
| Machinery: 11.1% | |
| Komatsu, Ltd. | | | 56,300 | | | $ | 1,703,770 | | |
| Nabtesco Corp. | | | 60,000 | | | | 1,279,961 | | |
| Kubota Corp. | | | 132,000 | | | | 1,250,252 | | |
| Hoshizaki Electric Co., Ltd. | | | 66,100 | | | | 1,225,280 | | |
| The Japan Steel Works, Ltd. | | | 106,000 | | | | 1,107,131 | | |
| FANUC CORP. | | | 6,400 | | | | 982,978 | | |
| | | | | | 7,549,372 | | |
| Trading Companies & Distributors: 5.6% | |
| ITOCHU Corp. | | | 246,200 | | | | 2,492,627 | | |
| Marubeni Corp. | | | 188,000 | | | | 1,322,183 | | |
| | | | | | 3,814,810 | | |
| Electrical Equipment: 2.6% | |
| Nidec Corp. | | | 17,300 | | | | 1,749,390 | | |
| Construction & Engineering: 1.8% | |
| Toshiba Plant Systems & Services Corp. | | | 86,000 | | | | 1,235,078 | | |
| Commercial Services & Supplies: 1.0% | |
| JP-Holdings, Inc. | | | 32,600 | | | | 644,853 | | |
| Total Industrials | | | | | 14,993,503 | | |
| FINANCIALS: 20.0% | |
| Diversified Financial Services: 4.9% | |
| ORIX Corp. | | | 20,720 | | | | 2,039,079 | | |
| IBJ Leasing Co., Ltd. | | | 52,100 | | | | 1,312,286 | | |
| | | | | | 3,351,365 | | |
| Real Estate Management & Development: 4.6% | |
| Goldcrest Co., Ltd. | | | 64,800 | | | | 1,694,425 | | |
| Kenedix, Inc.a | | | 4,725 | | | | 1,438,625 | | |
| | | | | | 3,133,050 | | |
| Real Estate Investment Trusts: 4.5% | |
| United Urban Investment Corp., REIT | | | 1,102 | | | | 1,408,888 | | |
| Advance Residence Investment Corp., REITa | | | 363 | | | | 812,827 | | |
| BLife Investment Corp., REIT | | | 109 | | | | 808,203 | | |
| | | | | | 3,029,918 | | |
| Capital Markets: 3.0% | |
| Jafco Co., Ltd. | | | 47,400 | | | | 1,377,805 | | |
| Nomura Holdings, Inc. | | | 98,500 | | | | 624,800 | | |
| | | | | | 2,002,605 | | |
| Commercial Bank: 2.1% | |
| Mitsubishi UFJ Financial Group, Inc. | | | 263,100 | | | | 1,422,600 | | |
| Insurance: 0.9% | |
| Anicom Holdings, Inc.a | | | 16,300 | | | | 614,337 | | |
| Total Financials | | | | | 13,553,875 | | |
| | | Shares | | Value | |
| INFORMATION TECHNOLOGY: 16.1% | |
| Electronic Equipment, Instruments & Components: 9.0% | |
| Hamamatsu Photonics, K.K. | | | 40,100 | | | $ | 1,465,905 | | |
| Murata Manufacturing Co., Ltd. | | | 18,500 | | | | 1,296,527 | | |
| Kyocera Corp. | | | 11,400 | | | | 1,164,010 | | |
| Keyence Corp. | | | 3,797 | | | | 1,099,956 | | |
| Nippon Electric Glass Co., Ltd. | | | 75,000 | | | | 1,082,646 | | |
| | | | | | 6,109,044 | | |
| Internet Software & Services: 3.6% | |
| Kakaku.com, Inc. | | | 293 | | | | 1,743,060 | | |
| Gree, Inc. | | | 52,000 | | | | 661,609 | | |
| | | | | | 2,404,669 | | |
| Computers & Peripherals: 1.8% | |
| Toshiba Corp. | | | 219,000 | | | | 1,192,240 | | |
| IT Services: 1.3% | |
| GMO Payment Gateway, Inc. | | | 370 | | | | 910,987 | | |
| Software: 0.4% | |
| Nintendo Co., Ltd. | | | 1,000 | | | | 293,509 | | |
| Total Information Technology | | | | | 10,910,449 | | |
| CONSUMER DISCRETIONARY: 15.1% | |
| Automobiles: 7.0% | |
| Nissan Motor Co., Ltd. | | | 212,200 | | | | 2,020,330 | | |
| Yamaha Motor Co., Ltd.a | | | 112,200 | | | | 1,828,311 | | |
| Honda Motor Co., Ltd. | | | 22,800 | | | | 902,845 | | |
| | | | | | 4,751,486 | | |
| Specialty Retail: 2.9% | |
| Point, Inc. | | | 21,620 | | | | 949,320 | | |
| Asahi Co., Ltd. | | | 49,800 | | | | 674,714 | | |
| Fast Retailing Co., Ltd. | | | 2,300 | | | | 366,289 | | |
| | | | | | 1,990,323 | | |
| Household Durables: 1.9% | |
| Rinnai Corp. | | | 20,500 | | | | 1,252,371 | | |
| Auto Components: 1.1% | |
| Koito Manufacturing Co., Ltd. | | | 48,000 | | | | 750,831 | | |
| Diversified Consumer Services: 1.1% | |
| Benesse Holdings, Inc. | | | 16,100 | | | | 741,643 | | |
| Internet & Catalog Retail: 1.1% | |
| Dena Co., Ltd. | | | 20,300 | | | | 728,090 | | |
| Total Consumer Discretionary | | | | | 10,214,744 | | |
| HEALTH CARE: 7.4% | |
| Health Care Equipment & Supplies: 5.2% | |
| Asahi Intecc Co., Ltd. | | | 70,800 | | | | 1,263,569 | | |
| Sysmex Corp. | | | 17,900 | | | | 1,241,249 | | |
| Mani, Inc. | | | 27,500 | | | | 1,043,232 | | |
| | | | | | 3,548,050 | | |
matthewsasia.com | 800.789.ASIA 43
Matthews Japan Fund December 31, 2010
Schedule of Investments (continued)
COMMON EQUITIES: JAPAN (continued)
| | | Shares | | Value | |
| Health Care Providers & Services: 1.6% | |
| Ship Healthcare Holdings, Inc. | | | 81,400 | | | $ | 1,067,755 | | |
| Pharmaceuticals: 0.6% | |
| Otsuka Holdings Co., Ltd.a | | | 15,600 | | | | 384,284 | | |
| Total Health Care | | | | | 5,000,089 | | |
| CONSUMER STAPLES: 7.0% | |
| Tobacco: 2.6% | |
| Japan Tobacco, Inc. | | | 483 | | | | 1,787,677 | | |
| Household Products: 2.4% | |
| Pigeon Corp. | | | 48,700 | | | | 1,655,524 | | |
| Food & Staples Retailing: 1.0% | |
| Daikokutenbussan Co., Ltd. | | | 19,200 | | | | 669,008 | | |
| Food Products: 1.0% | |
| Hokuto Corp. | | | 27,800 | | | | 646,121 | | |
| Total Consumer Staples | | | | | 4,758,330 | | |
| MATERIALS: 6.2% | |
| Chemicals: 5.4% | |
| Denki Kagaku Kogyo, K.K. | | | 315,000 | | | | 1,497,598 | | |
| Kanto Denka Kogyo Co., Ltd. | | | 141,000 | | | | 1,134,044 | | |
| Kansai Paint Co., Ltd. | | | 107,000 | | | | 1,035,866 | | |
| | | | | | 3,667,508 | | |
| Metals & Mining: 0.8% | |
| Hitachi Metals, Ltd. | | | 48,000 | | | | 576,426 | | |
| Total Materials | | | | | 4,243,934 | | |
| TELECOMMUNICATION SERVICES: 4.1% | |
| Wireless Telecommunication Services: 4.1% | |
| NTT DoCoMo, Inc. | | | 693 | | | | 1,210,339 | | |
| Softbank Corp. | | | 28,100 | | | | 972,892 | | |
| KDDI Corp. | | | 105 | | | | 606,540 | | |
| Total Telecommunication Services | | | | | 2,789,771 | | |
| TOTAL INVESTMENTS: 98.0% | | | | | 66,464,695 | | |
| (Cost $52,814,247b) | | | | | | | |
CASH AND OTHER ASSETS,
LESS LIABILITIES: 2.0% | | | | | 1,344,999 | | |
| NET ASSETS: 100.0% | | | | $ | 67,809,694 | | |
a Non-income producing security.
b Cost for federal income tax purposes is $54,871,123 and net unrealized appreciation consists of:
| Gross unrealized appreciation | | $ | 14,785,045 | | |
| Gross unrealized depreciation | | | (3,191,473 | ) | |
| Net unrealized appreciation | | $ | 11,593,572 | | |
REIT Real Estate Investment Trust
See accompanying notes to financial statements.
44 MATTHEWS ASIA FUNDS

ASIA GROWTH STRATEGIES
PORTFOLIO MANAGERS
J. Michael Oh
Lead Manager
Michael B. Han, CFA
Co-Manager
FUND FACTS
| | | Investor Class | | Institutional Class | |
| Ticker | | MAKOX | | MIKOX | |
| CUSIP | | 577130305 | | 577130826 | |
| Inception | | 1/3/95 | | 10/29/10 | |
| NAV | | $5.14 | | $5.14 | |
| Initial Investment | | $2,500 | | $3 million | |
| Gross Expense Ratio1 | | 1.21% | | 0.91% | |
Portfolio Statistics
| Total # of Positions | | 56 | |
| Net Assets | | $167.0 million | |
| Weighted Average Market Cap | | $21.4 billion | |
| Portfolio Turnover | | 39.05%2 | |
Benchmark
Korea Composite Stock Price Index
Redemption Fee
2% within first 90 calendar days of purchase
OBJECTIVE
Long-term capital appreciation.
STRATEGY
Under normal market conditions, the Fund seeks to achieve its investment objective by investing at least 80% of its total net assets, which include borrowings for investment purposes, in the common and preferred stocks of companies located in South Korea.
1 Gross expense ratio for Institutional Class is annualized. Matthews Asia Funds does not charge 12b-1 fees.
2 The lesser of fiscal year 2010 long-term purchase costs or sales proceeds divided by the average monthly market value of long-term securities.
Matthews Korea Fund
Portfolio Manager Commentary
For year ending December 31, 2010, the Matthews Korea Fund gained 21.86% (Investor and Institutional Class), while its benchmark, the Korea Composite Stock Price Index (KOSPI), returned 25.95%. The Fund largely underperformed the benchmark due to its significant underweight in cyclical industrials, such as shipbuilding, which performed well during the year. In the fourth quarter, the Fund rose 10.34% (Investor and Institutional Class) while its benchmark returned 10.04%.
The Fund seeks opportunities in Korean companies, primarily in the consumer discretionary, information technology and financial sectors, and will continue to underweight industrials due to their tendency for cyclicality and swings in earnings. We also continue to be wary of heavy industrials due to rising competition from China. While the year was one of general recovery, it was not without volatility. Some of the region's most unsettling political news in 2010 involved attacks on South Korea—first in March when a naval ship was sunk in disputed waters, and again in November when the South Korean island of Yeonpyeong was hit by 100 rounds of artillery fire from the North. While markets initially reacted negatively following each attack, they regained momentum quickly and overall market impact was limited. North Korea has been seeking to transition its leadership as its ailing, longtime ruler, Kim Jong Il, prepares to hand control of the regime over to his son Kim Jeong Un. Some officials and commentators believe the high profile attacks in 2010 may have been an attempt to draw attention to Kim's succession plans. Since the Korean War ended in armistice in 1953, South Korea has suffered various attacks from North Korea—each one deemed worse than the last. Should conditions on the Korean peninsula further worsen, both sides stand to lose much. However, the possibility that the North's succession plans may lead to different policies also offers a glimmer of hope, particularly if North Korea should decide to follow in the paths of China and Vietnam and reform and open its economy. The potential benefit of such a move to the South Korean economy could be enormous. South Korean companies could gain access to cheaper labor as well as to a new consumer market. For the time being, however, the North Korean regime remains unpredictable and threats to the South remain among the biggest risks to both the South Korean economy and the region.
During the year, companies continued to see earnings recover following the global financial crisis. Some firms even saw earnings climb higher than pre-crisis levels, and we saw encouraging developments across the board from companies of all sizes. Large Korean conglomerates, such as Hyundai Motor and Kia Motors, continued to gain global market share, backed by improved product quality and brand image. Both car companies also maintained lower sales incentives than the industry average. Notably, Kia Motors made great strides and gained market share domestically becoming the number two car company in Korea after Hyundai Motor. Although some in the U.S. still view Hyundai and Kia vehicles as cheaper alternatives to Japanese and European brands, Hyundai's reputation for quality and design has risen; it continued to lead sales in the passenger car segments of both China and India. Newer models of Hyundai and Kia vehicles received solid reviews during the year from both industry experts and consumers.
(continued)
matthewsasia.com | 800.789.ASIA 45
PERFORMANCE AS OF DECEMBER 31, 2010
Institutional Class Shares were first offered on October 29, 2010. Performance since that date was 8.51%. Performance for the Institutional Class shares prior to its inception is based on the performance of the Investor Class. Performance differences between the Institutional Class and Investor Class may arise due to differences in fees charged to each class.
| | | | | | | Average Annual Total Returns | |
| | | Inception Date | | 3 Months | | 1 Year | | 3 Years | | 5 Years | | 10 Years | | Since
Inception | |
| Investor Class (MAKOX) | | 1/3/95 | | | 10.34 | % | | | 21.86 | % | | | -2.05 | % | | | 4.77 | % | | | 19.83 | % | | | 5.80 | % | |
| Institutional Class (MIKOX) | | 10/29/10 | | | 10.34 | % | | | 21.86 | % | | | -2.05 | % | | | 4.77 | % | | | 19.83 | % | | | 5.80 | % | |
| Korea Composite Stock Price Index3 | | | | | | | 10.04 | % | | | 25.95 | % | | | -2.49 | % | | | 7.41 | % | | | 18.52 | % | | | 3.66 | % | |
| Lipper Pacific ex Japan Funds Category Average4 | | | | | | | 5.80 | % | | | 20.57 | % | | | -0.16 | % | | | 12.50 | % | | | 13.24 | % | | | 7.00 | %5 | |
Performance assumes reinvestment of all dividends and/or distributions before taxes. All performance quoted represents past performance and is no guarantee of future results. Investment return and principal value will fluctuate with market conditions so that when redeemed, shares may be worth more or less than their original cost. Current performance may be lower or higher than the return figures quoted. Returns would have been lower if certain of the Fund's fees and expenses had not been waived. For the Fund's most recent month-end performance visit matthewsasia.com.
GROWTH OF A $10,000 INVESTMENT SINCE INCEPTION—INVESTOR CLASS
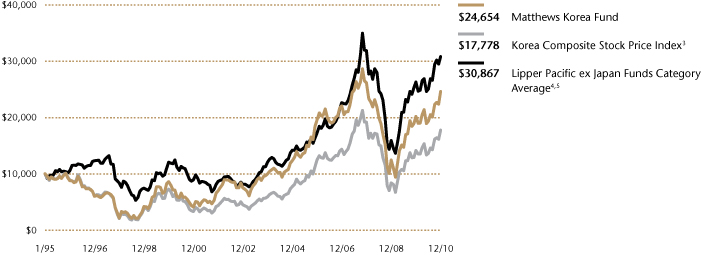
Plotted monthly. The performance data and graph do not reflect the deduction of taxes that a shareholder would pay on dividends, capital gain distributions or redemption of Fund shares. Values are in US$.
3 It is not possible to invest directly in an index. Source: Index data from Morgan Stanley Capital International and Bloomberg; total return calculations performed by BNY Mellon Investment Servicing (US) Inc. Please see page 59 for index definition.
4 The Lipper Category Average does not reflect sales charges and is based on total return, including reinvestment of dividends and capital gains for the stated periods.
5 Calculated from 12/31/94.
TOP TEN HOLDINGS6
| | | Sector | | % of Net Assets | |
| Samsung Electronics Co., Ltd. | | Information Technology | | | 13.1 | % | |
| Shinhan Financial Group Co., Ltd. | | Financials | | | 3.3 | % | |
| POSCO | | Materials | | | 3.3 | % | |
| Kia Motors Corp. | | Consumer Discretionary | | | 3.1 | % | |
| Dongbu Insurance Co., Ltd. | | Financials | | | 2.9 | % | |
| KB Financial Group, Inc. | | Financials | | | 2.9 | % | |
| LG Chem, Ltd. | | Materials | | | 2.8 | % | |
| Kiwoom Securities Co., Ltd. | | Financials | | | 2.7 | % | |
| SK Telecom Co., Ltd. | | Telecommunication Services | | | 2.5 | % | |
| Hyundai Mobis | | Consumer Discretionary | | | 2.5 | % | |
| % OF ASSETS IN TOP TEN | | | | | 39.1 | % | |
6 Holdings may combine more than one security from same issuer and related depositary receipts.
46 MATTHEWS ASIA FUNDS
Matthews Korea Fund
Portfolio Manager Commentary (continued)
During the year, we continued to see encouraging developments from smaller Korean companies that have been building strong positions in emerging countries, particularly China, just as Korea's larger companies have long done. Amorepacific, for example, a long-time holding of the Fund and a leading cosmetics firm in Korea, has successfully penetrated China's market. It began building its presence in China many years ago and during the year we have seen its efforts finally making a meaningful contribution to the company's growth. Amorepacific is expected to launch a high-end herbal line early next year in China as well, where it already has an established mid-range line, and the company also received a license to operate sales door-to-door in China's major urban areas. The firm is just one example of many smaller Korean companies making successful inroads into China's vast market. We expect this trend to continue, particularly since Korean and Chinese consumers tend to share similar cultural and consumer tastes, and Korean products are perceived by Chinese consumers to have better image than Chinese brands.
On a sector basis, the Fund's consumer discretionary holdings, helped by automobile-related firms, were the biggest contributors to Fund performance. Consumer stocks in general were helped by an increase in domestic consumer spending—department store sales recorded positive year-over-year growth—and robust exports, particularly to emerging countries. Korea's information technology sector also performed well, benefiting from the overall global recovery. In particular, fast-growth segments such as smartphones and rechargeable batteries, helped technology holdings in the portfolio. Non-banking financials holdings also performed well, especially brokerage firms and non-life insurance companies, on the back of a strong stock market and attractive valuations, respectively.
Pharmaceutical firms within the health care sector, on the other hand, underperformed relative to the benchmark and detracted from Fund performance. Korean pharmaceutical companies have generally been making a shift to become more research and development focused to increase sales from new drugs, whereas they were previously more focused on sales and marketing of generic drugs, and we continue to believe in their long-term growth. Korea's banking industry also underperformed this year due to uncertainties regarding government-led restructuring. Valuations for Korean banks, however, remain low relative to other banks in the region and we continue to hold them in our portfolio.
During the year, Korea's currency, the won, also strengthened against the U.S. dollar but remained lower than its pre-financial crisis level. Barring any further global financial troubles, the market consensus is for the won to appreciate. However, a rapid appreciation of the won could harm the competitiveness of exporters and adversely impact the market. Higher-than-expected rates of inflation may also pose near-term risks. In order to help stabilize Korea's currency we believe a further deepening of the domestic credit market is needed. An over-dependence on foreign credit markets can lead to higher relative volatility in the currency, particularly during times of crisis.
The Fund's overall strategy remains largely unchanged, and we will continue to focus on sustainability and steady earnings growth as well as generating long-term total return for shareholders.
SECTOR ALLOCATION (%)
| Consumer Discretionary | | | 23.1 | | |
| Financials | | | 21.0 | | |
| Information Technology | | | 20.7 | | |
| Materials | | | 9.7 | | |
| Industrials | | | 7.7 | | |
| Consumer Staples | | | 6.9 | | |
| Telecommunication Services | | | 3.7 | | |
| Health Care | | | 3.3 | | |
| Energy | | | 2.2 | | |
Cash and Other Assets,
Less Liabilities | | | 1.7 | | |
MARKET CAP EXPOSURE (%)7
| Large Cap (over $5B) | | | 62.9 | | |
| Mid Cap ($1B–$5B) | | | 24.9 | | |
| Small Cap (under $1B) | | | 10.5 | | |
Cash and Other Assets,
Less Liabilities | | | 1.7 | | |
7 Source: FactSet Research Systems. Percentage values in data are rounded to the nearest tenth of one percent; the values may not sum to 100% due to rounding.
matthewsasia.com | 800.789.ASIA 47
Matthews Korea Fund December 31, 2010
Schedule of Investmentsa
COMMON EQUITIES: SOUTH KOREA: 94.9%
| | | Shares | | Value | |
| CONSUMER DISCRETIONARY: 20.9% | |
| Automobiles: 5.3% | |
| Kia Motors Corp. | | | 116,280 | | | $ | 5,179,584 | | |
| Hyundai Motor Co. | | | 23,833 | | | | 3,638,811 | | |
| | | | | | 8,818,395 | | |
| Hotels, Restaurants & Leisure: 4.6% | |
| Shinsegae Food Co., Ltd. | | | 36,886 | | | | 3,149,399 | | |
| Modetour Network, Inc. | | | 82,298 | | | | 2,569,239 | | |
| Grand Korea Leisure Co., Ltd. | | | 111,360 | | | | 2,024,566 | | |
| | | | | | 7,743,204 | | |
| Auto Components: 3.9% | |
| Hyundai Mobis | | | 16,724 | | | | 4,187,291 | | |
| Hankook Tire Co., Ltd. | | | 85,150 | | | | 2,380,691 | | |
| | | | | | 6,567,982 | | |
| Multiline Retail: 2.3% | |
| Hyundai Department Store Co., Ltd. | | | 31,508 | | | | 3,872,741 | | |
| Media: 1.6% | |
| Cheil Worldwide, Inc. | | | 215,750 | | | | 2,629,168 | | |
| Household Durables: 1.6% | |
| LG Electronics, Inc.b | | | 25,084 | | | | 2,602,238 | | |
| Internet & Catalog Retail: 1.1% | |
| Hyundai Home Shopping Network Corp.b | | | 19,947 | | | | 1,801,540 | | |
| Diversified Consumer Services: 0.5% | |
| MegaStudy Co., Ltd. | | | 5,809 | | | | 899,335 | | |
| Total Consumer Discretionary | | | | | 34,934,603 | | |
| INFORMATION TECHNOLOGY: 20.7% | |
| Semiconductors & Semiconductor Equipment: 13.1% | |
| Samsung Electronics Co., Ltd. | | | 26,224 | | | | 21,900,612 | | |
| Electronic Equipment, Instruments & Components: 4.4% | |
| LG Display Co., Ltd. ADR | | | 151,100 | | | | 2,682,025 | | |
| Uju Electronics Co., Ltd. | | | 86,724 | | | | 2,531,032 | | |
| Samsung Electro-Mechanics Co., Ltd. | | | 19,074 | | | | 2,079,320 | | |
| | | | | | 7,292,377 | | |
| Internet Software & Services: 3.2% | |
| NHN Corp.b | | | 16,825 | | | | 3,358,594 | | |
| Daum Communications Corp.b | | | 29,573 | | | | 2,007,516 | | |
| | | | | | 5,366,110 | | |
| Total Information Technology | | | | | 34,559,099 | | |
| FINANCIALS: 19.8% | |
| Commercial Banks: 7.8% | |
| Shinhan Financial Group Co., Ltd. | | | 120,138 | | | | 5,586,299 | | |
| Hana Financial Group, Inc. | | | 68,900 | | | | 2,622,283 | | |
| KB Financial Group, Inc. | | | 47,099 | | | | 2,477,144 | | |
| KB Financial Group, Inc. ADR | | | 43,853 | | | | 2,319,385 | | |
| | | | | | 13,005,111 | | |
| | | Shares | | Value | |
| Insurance: 6.4% | |
| Dongbu Insurance Co., Ltd. | | | 123,980 | | | $ | 4,908,234 | | |
| Samsung Fire & Marine Insurance Co., Ltd. | | | 19,200 | | | | 3,799,102 | | |
| Hyundai Marine & Fire Insurance Co., Ltd. | | | 85,560 | | | | 1,969,336 | | |
| | | | | | 10,676,672 | | |
| Capital Markets: 4.6% | |
| Kiwoom Securities Co., Ltd. | | | 87,287 | | | | 4,453,489 | | |
| Samsung Securities Co., Ltd. | | | 41,530 | | | | 3,213,752 | | |
| | | | | | 7,667,241 | | |
| Diversified Financial Services: 1.0% | |
| NICE Information Service Co., Ltd. | | | 62,489 | | | | 1,701,392 | | |
| Total Financials | | | | | 33,050,416 | | |
| MATERIALS: 9.7% | |
| Chemicals: 5.5% | |
| LG Chem, Ltd. | | | 13,423 | | | | 4,621,688 | | |
| Hyosung Corp. | | | 27,709 | | | | 2,583,209 | | |
| OCI Materials Co., Ltd. | | | 21,729 | | | | 1,960,482 | | |
| | | | | | 9,165,379 | | |
| Metals & Mining: 3.7% | |
| POSCO ADR | | | 40,300 | | | | 4,339,907 | | |
| POSCO | | | 2,586 | | | | 1,104,715 | | |
| Poongsan Corp. | | | 19,320 | | | | 815,450 | | |
| | | | | | 6,260,072 | | |
| Containers & Packaging: 0.5% | |
| Lock & Lock Co., Ltd. | | | 24,740 | | | | 786,312 | | |
| Total Materials | | | | | 16,211,763 | | |
| INDUSTRIALS: 7.7% | |
| Construction & Engineering: 3.7% | |
| Samsung Engineering Co., Ltd. | | | 16,905 | | | | 2,857,210 | | |
| Hyundai Engineering & Construction Co., Ltd. | | | 30,047 | | | | 1,913,565 | | |
| HanmiParsons Co., Ltd. | | | 120,600 | | | | 1,448,451 | | |
| | | | | | 6,219,226 | | |
| Industrial Conglomerates: 1.3% | |
| Samsung Techwin Co., Ltd. | | | 23,864 | | | | 2,174,016 | | |
| Commercial Services & Supplies: 1.3% | |
| KEPCO Plant Service & Engineering Co., Ltd. | | | 32,958 | | | | 1,522,825 | | |
| S1 Corp. | | | 12,442 | | | | 613,754 | | |
| | | | | | 2,136,579 | | |
| Building Products: 0.7% | |
| LG Hausys, Ltd.b | | | 15,983 | | | | 1,226,234 | | |
| Electrical Equipment: 0.7% | |
| LS Corp. | | | 12,492 | | | | 1,170,879 | | |
| Total Industrials | | | | | 12,926,934 | | |
48 MATTHEWS ASIA FUNDS
Matthews Korea Fund December 31, 2010
Schedule of Investmentsa (continued)
COMMON EQUITIES: SOUTH KOREA (continued)
| | | Shares | | Value | |
| CONSUMER STAPLES: 6.9% | |
| Household Products: 1.6% | |
| LG Household & Health Care, Ltd. | | | 7,703 | | | $ | 2,648,609 | | |
| Personal Products: 1.5% | |
| Amorepacific Corp. | | | 2,553 | | | | 2,563,990 | | |
| Food Products: 1.5% | |
| Orion Corp. | | | 7,399 | | | | 2,514,450 | | |
| Food & Staples Retailing: 1.2% | |
| Shinsegae Co., Ltd. | | | 3,588 | | | | 1,941,168 | | |
| Tobacco: 1.1% | |
| KT&G Corp. | | | 32,948 | | | | 1,878,550 | | |
| Total Consumer Staples | | | | | 11,546,767 | | |
| TELECOMMUNICATION SERVICES: 3.7% | |
| Wireless Telecommunication Services: 2.5% | |
| SK Telecom Co., Ltd. ADR | | | 119,700 | | | | 2,230,011 | | |
| SK Telecom Co., Ltd. | | | 12,990 | | | | 1,981,651 | | |
| | | | | | 4,211,662 | | |
| Diversified Telecommunication Services: 1.2% | |
| KT Corp. | | | 48,404 | | | | 1,965,812 | | |
| Total Telecommunication Services | | | | | 6,177,474 | | |
| HEALTH CARE: 3.3% | |
| Pharmaceuticals: 3.3% | |
| Yuhan Corp. | | | 20,600 | | | | 3,146,704 | | |
| Dong-A Pharmaceutical Co., Ltd. | | | 21,186 | | | | 2,296,130 | | |
| Total Health Care | | | | | 5,442,834 | | |
| ENERGY: 2.2% | |
| Oil, Gas & Consumable Fuels: 2.2% | |
| SK Energy Co., Ltd. | | | 21,588 | | | | 3,685,283 | | |
| Total Energy | | | | | 3,685,283 | | |
| TOTAL COMMON EQUITIES | | | | | 158,535,173 | | |
| (Cost $105,970,597) | | | | | | | |
PREFERRED EQUITIES: SOUTH KOREA: 3.4%
| | | Shares | | Value | |
| CONSUMER DISCRETIONARY: 2.2% | |
| Automobiles: 2.2% | |
| Hyundai Motor Co., Ltd., 2nd Pfd. | | | 65,704 | | | $ | 3,668,528 | | |
| Total Consumer Discretionary | | | | | 3,668,528 | | |
| FINANCIALS: 1.2% | |
| Insurance: 1.2% | |
Samsung Fire & Marine Insurance Co.,
Ltd., Pfd. | | | 24,840 | | | | 1,915,622 | | |
| Total Financials | | | | | 1,915,622 | | |
| TOTAL PREFERRED EQUITIES | | | | | 5,584,150 | | |
| (Cost $4,024,327) | | | | | | | |
| TOTAL INVESTMENTS: 98.3% | | | | | 164,119,323 | | |
| (Cost $109,994,924c) | | | | | | | |
CASH AND OTHER ASSETS,
LESS LIABILITIES: 1.7% | | | | | 2,874,542 | | |
| NET ASSETS: 100.0% | | | | $ | 166,993,865 | | |
a Certain securities were fair valued under the discretion of the Board of Trustees (Note 2-A).
b Non-income producing security.
c Cost for federal income tax purposes is $110,459,348 and net unrealized appreciation consists of:
| Gross unrealized appreciation | | $ | 55,351,082 | | |
| Gross unrealized depreciation | | | (1,691,107 | ) | |
| Net unrealized appreciation | | $ | 53,659,975 | | |
ADR American Depositary Receipt
Pfd. Preferred
See accompanying notes to financial statements.
matthewsasia.com | 800.789.ASIA 49

ASIA SMALL COMPANY STRATEGY
PORTFOLIO MANAGERS
Lydia So
Lead Manager
Michael B. Han, CFA
Co-Manager
FUND FACTS
| | | Investor Class | |
| Ticker | | MSMLX | |
| CUSIP | | 577125206 | |
| Inception | | 9/15/08 | |
| NAV | | $21.16 | |
| Initial Investment | | $2,500 | |
| Gross Expense Ratio | | 1.59% | |
After Fee Waiver,
Reimbursement and
Recoupment1 | | 1.63% | |
Portfolio Statistics
| Total # of Positions | | 79 | |
| Net Assets | | $547.1 million | |
| Weighted Average Market Cap | | $1.4 billion | |
| Portfolio Turnover | | 23.99%2 | |
Benchmark
MSCI AC Asia ex Japan Small Cap Index
Redemption Fee
2% within first 90 calendar days of purchase
OBJECTIVE
Long-term capital appreciation.
STRATEGY
Under normal market conditions, the Fund seeks to achieve its investment objective by investing at least 80% of its total net assets, which include borrowings for investment purposes, in the common and preferred stocks of small companies located in Asia, excluding Japan.
1 The Advisor has contractually agreed to waive certain fees and reimburse certain expenses for Matthews Asia Small Companies Fund. Please see page 91 for additional information. Matthews Asia Funds does not charge 12b-1 fees.
2 The lesser of fiscal year 2010 long-term purchase costs or sales proceeds divided by the average monthly market value of long-term securities.
Matthews Asia Small Companies Fund
Portfolio Manager Commentary
For the year ending December 31, 2010, the Matthews Asia Small Companies Fund gained 35.54%, outperforming its benchmark, the MSCI All Country Asia ex Japan Small Cap Index, which returned 24.61%. For the fourth quarter, the Fund rose 6.80% while the index returned 6.39%.
Asian equity markets ended the year with a strong fourth quarter, during which liquidity and capital flows to the region remained buoyant and IPO activity surged. The debate over the potential effects of the U.S. Federal Reserve's quantitative easing moves remained in the spotlight, with particular regard to its implications on the U.S. dollar, rising commodity prices and global inflation. From Asia's perspective, inflationary pressures may be further exacerbated by an influx of capital inflows, and some Asian nations have grown increasingly vocal about curbing inflation and enacting monetary tightening policies.
For the most part, Asian markets were also impacted by the volatility in the global macroeconomic environment during the year. Concerns over Europe's debt crisis led to panic and sharp market corrections in May and November. To be sure, Asia suffered its own setbacks. In April, there was a sudden escalation in Thailand's ongoing political unrest; in November, North and South Korea exchanged military fire, and late in the year, a series of corruption scandals involving Indian politicians and officials also highlighted risks and challenges for the region. However, despite these external forces, Asia's underlying economic fundamentals and growth prospects remained resilient due to strong corporate and household balance sheets.
The Fund has maintained an emphasis on investing in high quality companies that we believe can show consistent growth by taking advantage of the region's rising long-term consumption. Identifying companies with strong fundamentals and a sustainable competitive advantage helped drive the Fund's outperformance relative to its benchmark during the year. This approach has also helped the Fund weather market downturns. As small-capitalization companies tend to have fewer resources to cope with external shocks, we believe that selecting solid business operators is, and will continue to be, an essential step in mitigating risk.
That said, valuations for quality companies—particularly in consumer-related industries—have risen to slightly above historical averages. While we do not believe that valuations are in "bubble" territory, we became more critical of valuations toward the second half of the year. We have sold out of holdings with high earnings multiples that have grown larger in capitalization, in exchange for smaller companies with more attractive valuations, given their long-term growth prospects. One such example was the replacement of Shandong Weigao Group Medical Polymer with China Kanghui. Shandong Weigao is a leading Chinese medical consumables manufacturer, and a holding in the Fund since its inception. Over the years, Shandong Weigao has demonstrated consistent growth and a broadening of its product portfolio. As a result, the stock's earnings multiple has expanded substantially to the point that its valuations are not as attractive relative to peers. Meanwhile, China Kanghui, a manufacturer of orthopedic implant products, is compelling as we believe that it offers exposure to China's growing health care spending at more attractive valuations. China Kanghui has a history of being an original equipment manufacturer for global orthopedic device makers, which helps ensure its
(continued)
Closed to most new investors as of November 12, 2010.
50 MATTHEWS ASIA FUNDS
PERFORMANCE AS OF DECEMBER 31, 2010
| | | | | Average Annual Total Returns | |
| | | 3 Months | | 1 Year | | Inception
9/15/08 | |
| Investor Class (MSMLX) | | | 6.80 | % | | | 35.54 | % | | | 40.27 | % | |
| MSCI AC Asia ex Japan Small Cap Index3 | | | 6.39 | % | | | 24.61 | % | | | 30.00 | % | |
| Lipper Pacific ex Japan Funds Category Average4 | | | 5.80 | % | | | 20.57 | % | | | 24.82 | %5 | |
Performance assumes reinvestment of all dividends and/or distributions before taxes. All performance quoted represents past performance and is no guarantee of future results. Investment return and principal value will fluctuate with market conditions so that when redeemed, shares may be worth more or less than their original cost. Current performance may be lower or higher than the return figures quoted. Returns would have been lower if certain of the Fund's fees and expenses had not been waived. For the Fund's most recent month-end performance visit matthewsasia.com.
GROWTH OF A $10,000 INVESTMENT SINCE INCEPTION
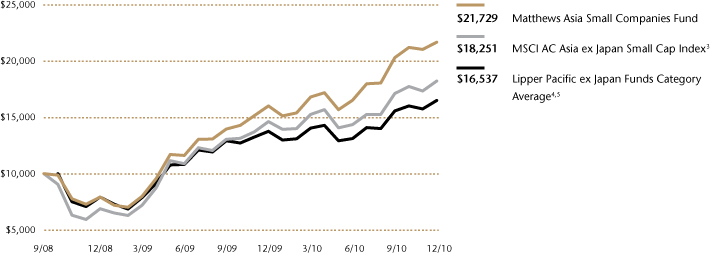
The performance data does not reflect the deduction of taxes that a shareholder would pay on dividends, capital gain distributions or redemption of Fund shares. Values are in US$.
3 It is not possible to invest directly in an index. Source: Index data from Morgan Stanley Capital International and Bloomberg; total return calculations performed by BNY Mellon Investment Servicing (US) Inc. Please see page 59 for index definition.
4 The Lipper Category Average does not reflect sales charges and is based on total return, including reinvestment of dividends and capital gains for the stated periods.
5 Calculated from 9/30/08.
TOP TEN HOLDINGS6
| | | Country | | % of Net Assets | |
| St. Shine Optical Co., Ltd. | | Taiwan | | | 3.0 | % | |
| SATS, Ltd. | | Singapore | | | 2.5 | % | |
| Synnex Technology International Corp. | | Taiwan | | | 1.9 | % | |
| Pacific Hospital Supply Co., Ltd. | | Taiwan | | | 1.9 | % | |
| Ipca Laboratories, Ltd. | | India | | | 1.9 | % | |
| Dongbu Insurance Co., Ltd. | | South Korea | | | 1.9 | % | |
| GlaxoSmithKline Consumer Healthcare, Ltd. | | India | | | 1.8 | % | |
| Comba Telecom Systems Holdings, Ltd. | | China/Hong Kong | | | 1.8 | % | |
| Fook Woo Group Holdings, Ltd. | | China/Hong Kong | | | 1.7 | % | |
| Yip's Chemical Holdings, Ltd. | | China/Hong Kong | | | 1.7 | % | |
| % OF ASSETS IN TOP TEN | | | | | 20.1 | % | |
6 Holdings may combine more than one security from same issuer and related depositary receipts.
matthewsasia.com | 800.789.ASIA 51
COUNTRY ALLOCATION (%)
| China/Hong Kong | | | 30.6 | | |
| India | | | 18.7 | | |
| Taiwan | | | 15.4 | | |
| South Korea | | | 12.1 | | |
| Singapore | | | 8.9 | | |
| Malaysia | | | 6.1 | | |
| Thailand | | | 2.8 | | |
| Indonesia | | | 2.7 | | |
Cash and Other Assets,
Less Liabilities | | | 2.7 | | |
SECTOR ALLOCATION (%)
| Consumer Discretionary | | | 18.6 | | |
| Information Technology | | | 18.2 | | |
| Industrials | | | 17.9 | | |
| Financials | | | 14.2 | | |
| Materials | | | 10.0 | | |
| Health Care | | | 9.9 | | |
| Consumer Staples | | | 6.8 | | |
| Utilities | | | 1.7 | | |
Cash and Other Assets,
Less Liabilities | | | 2.7 | | |
MARKET CAP EXPOSURE (%)7,8
| Large Cap (over $5B) | | | 1.2 | | |
| Mid Cap ($1B–$5B) | | | 54.0 | | |
| Small Cap (under $1B) | | | 42.1 | | |
Cash and Other Assets,
Less Liabilities | | | 2.7 | | |
7 Source: FactSet Research Systems. Percentage values in data are rounded to the nearest tenth of one percent; the values may not sum to 100% due to rounding.
8 The Fund defines Small Companies as companies with market capitalization generally between $100 million and $3 billion.
Matthews Asia Small Companies Fund
Portfolio Manager Commentary (continued)
superior product quality. We believe that the firm also has the potential to offer competitive pricing in China's growing health care market.
The absolute performance of the Fund during the year was driven by a broad base of holdings across all markets. In terms of individual markets, the Fund has consistently maintained an overweight in faster-growing economies, such as China and India, and an underweight in Taiwan and (to a lesser degree) Korea. On the margin, we have placed more emphasis on Southeast Asian countries than we have in the past as we became increasingly impressed by their resilience and positive structural developments. On a bottom-up basis, we are encouraged to find companies with sufficient financial resources to expand domestically, as well as regionally, in markets we have not yet accessed directly, such as Cambodia and Vietnam.
The Fund's holdings in the consumer discretionary, information technology and health care sectors were the major contributors to performance as the market generally favored companies benefiting from Asia's strong domestic demand. Taiwanese contact lens maker St. Shine Optical; China's Kingdee International Software Group and Xinyi Glass Holdings, an automotive glass manufacturer; and Ipca Laboratories, a generic pharmaceutical drug manufacturer in India are long-term portfolio holdings that have been beneficiaries of the trend of strong consumption in Asia. Newer positions we added to the portfolio during the latter part of the year from the ASEAN region include Bank Tabungan Pensiunan Nasional in Indonesia, a bank that focuses on consumer lending to Indonesia's civil servants, and KFC Holdings Malaysia, the country's dominant fast food restaurant chain. Both performed well due to their strong domestic growth profile. Our most recent addition to the portfolio, Thailand's Dynasty Ceramic Public, is a producer and retailer of ceramic tiles used in new construction and renovations. We were attracted to the firm as a way to gain exposure to consumer spending in rural Thailand where the income levels of farmers have risen considerably.
As we have stated in previous commentaries, we believe that the fundamentals of Asia's economies and corporations, by and large, remain sound, and it is encouraging to note that consumer demand is underpinned by rising incomes. However, we also anticipate that inflationary pressure and macro tightening may start to negatively impact corporate profitability in the near to medium term. Given such challenges facing many companies, we will continue to monitor risks such as rising cost pressures and an increase in the cost of funding. At the same time, we are hopeful that companies with pricing power and sound expansion disciplines should emerge in a better position within their respective industries.
We would also like to note that the Fund limited sales of its shares on November 12, 2010 because we believe continued unlimited sales may adversely affect the Fund's ability to achieve its investment objective. We continue to see new and attractive investment opportunities surfacing throughout the region, and thank you for your ongoing support.
52 MATTHEWS ASIA FUNDS
Matthews Asia Small Companies Fund December 31, 2010
Schedule of Investments
COMMON EQUITIES: 97.3%
| | | Shares | | Value | |
| CHINA/HONG KONG: 30.6% | |
| Comba Telecom Systems Holdings, Ltd. | | | 8,633,510 | | | $ | 9,752,241 | | |
| Fook Woo Group Holdings, Ltd.a | | | 24,106,000 | | | | 9,521,076 | | |
| Yip's Chemical Holdings, Ltd. | | | 7,710,000 | | | | 9,472,841 | | |
| Towngas China Co., Ltd. | | | 19,388,000 | | | | 9,303,885 | | |
| Hengdeli Holdings, Ltd. | | | 15,576,000 | | | | 9,278,108 | | |
| Xinyi Glass Holdings Co., Ltd. | | | 10,446,000 | | | | 8,601,070 | | |
| Xingda International Holdings, Ltd. | | | 7,879,000 | | | | 8,514,769 | | |
| Vinda International Holdings, Ltd. | | | 7,636,000 | | | | 8,438,817 | | |
| KWG Property Holding, Ltd. | | | 10,284,500 | | | | 7,832,987 | | |
Zhuzhou CSR Times Electric Co., Ltd.
H Shares | | | 1,988,000 | | | | 7,813,581 | | |
| Minth Group, Ltd. | | | 4,750,000 | | | | 7,797,705 | | |
| PCD Stores, Ltd. | | | 25,154,900 | | | | 7,540,515 | | |
| AAC Acoustic Technologies Holdings, Inc. | | | 2,764,000 | | | | 7,378,680 | | |
| Dalian Port PDA Co., Ltd. H Shares | | | 16,970,000 | | | | 7,051,912 | | |
Kingdee International Software
Group Co., Ltd. | | | 12,462,000 | | | | 6,990,315 | | |
| Singamas Container Holdings, Ltd.a | | | 20,904,000 | | | | 6,696,552 | | |
| Trinity, Ltd. | | | 6,284,000 | | | | 6,621,290 | | |
| Silver Base Group Holdings, Ltd. | | | 6,297,000 | | | | 5,598,017 | | |
| Ming Fai International Holdings, Ltd. | | | 10,636,000 | | | | 4,378,757 | | |
| Lee's Pharmaceutical Holdings, Ltd. | | | 9,290,000 | | | | 4,219,033 | | |
| Wasion Group Holdings, Ltd. | | | 6,250,000 | | | | 4,133,002 | | |
Longtop Financial Technologies,
Ltd. ADRa | | | 104,322 | | | | 3,774,370 | | |
| TAL Education Group ADRa | | | 210,289 | | | | 3,385,653 | | |
| China Kanghui Holdings, Inc. ADRa | | | 171,600 | | | | 3,176,316 | | |
| Total China/Hong Kong | | | | | 167,271,492 | | |
| INDIA: 18.7% | |
| Ipca Laboratories, Ltd. | | | 1,313,867 | | | | 10,151,874 | | |
GlaxoSmithKline Consumer
Healthcare, Ltd. | | | 193,085 | | | | 10,097,074 | | |
| Gujarat Pipavav Port, Ltd.a | | | 5,790,559 | | | | 7,996,579 | | |
| CMC, Ltd. | | | 126,700 | | | | 7,632,885 | | |
| Exide Industries, Ltd. | | | 2,017,303 | | | | 7,529,640 | | |
| Castrol India, Ltd. | | | 713,965 | | | | 7,316,884 | | |
| Federal Bank, Ltd. | | | 677,162 | | | | 6,015,937 | | |
| Jyothy Laboratories, Ltd. | | | 951,915 | | | | 5,741,507 | | |
| Thermax, Ltd. | | | 287,575 | | | | 5,605,188 | | |
| Usha Martin, Ltd. | | | 3,362,264 | | | | 5,289,842 | | |
| CRISIL, Ltd. | | | 36,912 | | | | 4,957,757 | | |
| AIA Engineering, Ltd. | | | 508,212 | | | | 4,614,995 | | |
| Emami, Ltd. | | | 436,059 | | | | 3,936,380 | | |
| Bajaj Electricals, Ltd. | | | 717,688 | | | | 3,868,116 | | |
| Page Industries, Ltd. | | | 105,710 | | | | 3,598,254 | | |
| Sun TV Network, Ltd. | | | 246,636 | | | | 2,900,724 | | |
| Jain Irrigation Systems, Ltd. | | | 556,965 | | | | 2,618,228 | | |
| India Infoline, Ltd. | | | 1,268,196 | | | | 2,329,918 | | |
| Total India | | | | | 102,201,782 | | |
| | | Shares | | Value | |
| TAIWAN: 15.4% | |
| St. Shine Optical Co., Ltd. | | | 1,241,492 | | | $ | 16,521,150 | | |
| Synnex Technology International Corp. | | | 3,894,523 | | | | 10,512,200 | | |
| Pacific Hospital Supply Co., Ltd. | | | 2,494,967 | | | | 10,482,515 | | |
| Simplo Technology Co., Ltd. | | | 1,267,100 | | | | 9,213,218 | | |
| Chroma ATE, Inc. | | | 3,001,078 | | | | 8,965,201 | | |
| TXC Corp. | | | 4,326,799 | | | | 8,265,831 | | |
| Richtek Technology Corp. | | | 856,550 | | | | 7,138,774 | | |
| Wah Lee Industrial Corp. | | | 3,508,000 | | | | 7,014,436 | | |
| Formosa International Hotels Corp. | | | 362,470 | | | | 6,414,848 | | |
| Total Taiwan | | | | | 84,528,173 | | |
| SOUTH KOREAb: 12.1% | |
| Dongbu Insurance Co., Ltd. | | | 255,990 | | | | 10,134,368 | | |
| Cheil Worldwide, Inc. | | | 654,715 | | | | 7,978,474 | | |
| OCI Materials Co., Ltd. | | | 76,644 | | | | 6,915,145 | | |
| Pyeong Hwa Automotive Co., Ltd. | | | 510,354 | | | | 6,764,021 | | |
| Modetour Network, Inc. | | | 201,526 | | | | 6,291,384 | | |
| Sung Kwang Bend Co., Ltd. | | | 293,944 | | | | 6,084,912 | | |
KEPCO Plant Service &
Engineering Co., Ltd. | | | 129,829 | | | | 5,998,750 | | |
| POSCO Chemtech Co., Ltd. | | | 42,603 | | | | 5,617,976 | | |
| Kiwoom Securities Co., Ltd. | | | 100,554 | | | | 5,130,388 | | |
| Korea Zinc Co., Ltd. | | | 20,726 | | | | 5,047,831 | | |
| Total South Korea | | | | | 65,963,249 | | |
| SINGAPORE: 8.9% | |
| SATS, Ltd. | | | 6,172,000 | | | | 13,850,750 | | |
| CSE Global, Ltd. | | | 8,655,000 | | | | 8,767,289 | | |
| Ascendas India Trust | | | 10,335,000 | | | | 7,489,422 | | |
| Keppel Land, Ltd. | | | 1,748,000 | | | | 6,537,889 | | |
| Allgreen Properties, Ltd. | | | 6,973,000 | | | | 6,411,454 | | |
| Armstrong Industrial Corp., Ltd. | | | 16,833,000 | | | | 5,640,075 | | |
| Total Singapore | | | | | 48,696,879 | | |
| MALAYSIA: 6.1% | |
| Dialog Group BHD | | | 14,594,838 | | | | 8,472,437 | | |
| Alliance Financial Group BHD | | | 8,063,000 | | | | 7,949,252 | | |
| KFC Holdings Malaysia BHD | | | 6,074,760 | | | | 7,525,728 | | |
| KPJ Healthcare BHD | | | 4,612,900 | | | | 5,565,101 | | |
| Faber Group BHD | | | 4,550,500 | | | | 3,748,425 | | |
| Total Malaysia | | | | | 33,260,943 | | |
| THAILAND: 2.8% | |
| Dynasty Ceramic Public Co., Ltd. | | | 2,976,300 | | | | 6,516,364 | | |
| Tisco Financial Group Public Co., Ltd. | | | 3,777,700 | | | | 5,106,693 | | |
| Quality Houses Public Co., Ltd. | | | 49,983,400 | | | | 3,482,008 | | |
| Tisco Financial Group Public Co., Ltd. NVDR | | | 254,800 | | | | 344,439 | | |
| Total Thailand | | | | | 15,449,504 | | |
matthewsasia.com | 800.789.ASIA 53
Matthews Asia Small Companies Fund December 31, 2010
Schedule of Investments (continued)
COMMON EQUITIES (continued)
| | | Shares | | Value | |
| INDONESIA: 2.7% | |
| PT Jasa Marga | | | 16,463,000 | | | $ | 6,258,133 | | |
| PT Nippon Indosari Corpindoa | | | 15,434,500 | | | | 4,539,559 | | |
| PT Bank Tabungan Pensiunan Nasionala | | | 2,775,000 | | | | 4,065,483 | | |
| Total Indonesia | | | | | 14,863,175 | | |
| TOTAL INVESTMENTS: 97.3% | | | | | 532,235,197 | | |
| (Cost $437,337,356c) | | | | | | | |
CASH AND OTHER ASSETS,
LESS LIABILITIES: 2.7% | | | | | 14,859,122 | | |
| NET ASSETS: 100.0% | | | | $ | 547,094,319 | | |
a Non-income producing security.
b Certain securities were fair valued under the discretion of the Board of Trustees (Note 2-A).
c Cost for federal income tax purposes is $439,227,492 and net unrealized appreciation consists of:
| Gross unrealized appreciation | | $ | 98,879,572 | | |
| Gross unrealized depreciation | | | (5,871,867 | ) | |
| Net unrealized appreciation | | $ | 93,007,705 | | |
ADR American Depositary Receipt
BHD Berhad
NVDR Non-voting Depositary Receipt
See accompanying notes to financial statements.
54 MATTHEWS ASIA FUNDS

ASIA SPECIALTY STRATEGY
PORTFOLIO MANAGERS
J. Michael Oh
Lead Manager
Lydia So
Co-Manager
FUND FACTS
| | | Investor Class | |
| Ticker | | MATFX | |
| CUSIP | | 577130883 | |
| Inception | | 12/27/99 | |
| NAV | | $9.89 | |
| Initial Investment | | $2,500 | |
| Gross Expense Ratio1 | | 1.26% | |
Portfolio Statistics
| Total # of Positions | | 61 | |
| Net Assets | | $190.4 million | |
| Weighted Average Market Cap | | $21.9 billion | |
| Portfolio Turnover | | 61.61%2 | |
Benchmark
MSCI/Matthews Asian Technology Index
Redemption Fee
2% within first 90 calendar days of purchase
OBJECTIVE
Long-term capital appreciation.
STRATEGY
Under normal market conditions, the Fund seeks to achieve its investment objective by investing at least 80% of its total net assets, which include borrowings for investment purposes, in the common and preferred stocks of companies located in Asia that derive more than 50% of their revenues from the sale of products or services in science- and technology-related industries and services.
1 Matthews Asia Funds does not charge 12b-1 fees.
2 The lesser of fiscal year 2010 long-term purchase costs or sales proceeds divided by the average monthly market value of long-term securities.
Matthews Asia Science and Technology Fund
Portfolio Manager Commentary
For the year ending December 31, 2010, the Matthews Asia Science and Technology Fund gained 23.58% outperforming its benchmark, the MSCI/Matthews Asian Technology Index, which returned 18.40%. During the fourth quarter, the Fund gained 9.03%, compared to 11.15% for the benchmark.
2010 was another solid year for Asia's technology industries, helped by the emergence of new consumer devices such as smartphones and tablet PCs. Demand among Asian domestic markets for information technology products and services remained robust. General consumer sentiment continued to recover, and while the demand for consumer electronics remained strong, the traditional PC market remained relatively weak.
Asian technology companies were at the forefront of developments in smartphones, which have been one of the strongest growth areas in the global technology space. HTC, a manufacturer of Android-powered smartphones, was one of the top five contributors to Fund performance. Samsung Electronics—despite being a latecomer to the smartphone space—became an instant leader with the release of its new "Galaxy" series of phones. Asian component makers, which supply parts to both Android and Apple-powered smartphones, also benefited from this growth, and helped Fund performance.
The biggest contributor to performance during the year, however, came from companies that are well-positioned to take advantage of the rising retail and corporate demand for IT products and services in their domestic markets. Baidu, a leading Chinese Internet search provider, was the Fund's top contributor to performance. Baidu has been among the most notable beneficiaries of proliferating Chinese Internet usage and growing e-commerce. Another top contributor was Kingdee International Software Group, a leading Chinese Enterprise Resource Planning solution provider with a strong market position and increased product offerings. The company continues to benefit from a rapid growth in IT software spending among small to medium-sized Chinese companies.
Health care-related technology firms also performed well during the year. St. Shine Optical, a contact lens manufacturer and one of the Fund's Taiwanese health care holdings was the second-biggest contributor to performance during the year. Currently, Asia's health care spending per capita remains significantly lower than that of Western Europe and the U.S. As income levels in Asia rise, and lifestyles improve, spending on health care should also increase. Within this sector, the Fund is focusing on medical equipment, medical supply and distribution firms.
On a country basis, Japanese technology companies rebounded during the last quarter of the year. In particular, Japanese firms that specialize in factory automation performed well during the year and contributed to Fund performance. Currently, Japan is the leader in factory automation and as wage growth accelerates in Asia—especially in emerging Asia—the demand for factory automation should remain robust. Additionally, as smartphones become more sophisticated, they will increasingly require high-end components, a trend which should benefit electronic component makers in Japan.
(continued)
matthewsasia.com | 800.789.ASIA 55
PERFORMANCE AS OF DECEMBER 31, 2010
| | | | | Average Annual Total Returns | |
| | | 3 Months | | 1 Year | | 3 Years | | 5 Years | | 10 Years | | Inception
12/27/99 | |
| Investor Class (MATFX) | | | 9.03 | % | | | 23.58 | % | | | 0.38 | % | | | 8.70 | % | | | 9.16 | % | | | 0.42 | % | |
| MSCI/Matthews Asian Technology Index3 | | | 11.15 | % | | | 18.40 | % | | | 0.04 | % | | | 4.80 | % | | | 3.13 | % | | | -4.30 | %4 | |
Lipper Global Sciences and Technology Funds
Category Average5 | | | 10.33 | % | | | 19.97 | % | | | 2.83 | % | | | 7.50 | % | | | 0.82 | % | | | -2.75 | %4 | |
Performance assumes reinvestment of all dividends and/or distributions before taxes. All performance quoted represents past performance and is no guarantee of future results. Investment return and principal value will fluctuate with market conditions so that when redeemed, shares may be worth more or less than their original cost. Current performance may be lower or higher than the return figures quoted. Returns would have been lower if certain of the Fund's fees and expenses had not been waived. For the Fund's most recent month-end performance visit matthewsasia.com.
GROWTH OF A $10,000 INVESTMENT SINCE INCEPTION
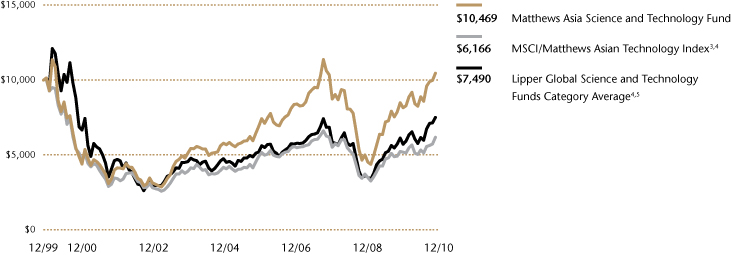
Plotted monthly. The performance data and graph do not reflect the deduction of taxes that a shareholder would pay on dividends, capital gain distributions or redemption of Fund shares. Values are in US$.
3 It is not possible to invest directly in an index. Source: Index data from Morgan Stanley Capital International and Bloomberg; total return calculations performed by BNY Mellon Investment Servicing (US) Inc. Please see page 59 for index definition.
4 Calculated from 12/31/99.
5 The Lipper Category Average does not reflect sales charges and is based on total return, including reinvestment of dividends and capital gains for the stated periods.
TOP TEN HOLDINGS6
| | | Country | | % of Net Assets | |
| Baidu, Inc. | | China/Hong Kong | | | 5.6 | % | |
| Samsung Electronics Co., Ltd. | | South Korea | | | 4.3 | % | |
| Taiwan Semiconductor Manufacturing Co., Ltd. | | Taiwan | | | 2.5 | % | |
| St. Shine Optical Co., Ltd. | | Taiwan | | | 2.4 | % | |
| Canon, Inc. | | Japan | | | 2.4 | % | |
| China Mobile, Ltd. | | China/Hong Kong | | | 2.3 | % | |
| Hon Hai Precision Industry Co., Ltd. | | Taiwan | | | 2.3 | % | |
| Kakaku.com, Inc. | | Japan | | | 2.2 | % | |
| Infosys Technologies, Ltd. | | India | | | 2.2 | % | |
| Murata Manufacturing Co., Ltd. | | Japan | | | 2.1 | % | |
| % OF ASSETS IN TOP TEN | | | | | 28.3 | % | |
6 Holdings may combine more than one security from same issuer and related depositary receipts.
56 MATTHEWS ASIA FUNDS
Matthews Asia Science and Technology Fund
Portfolio Manager Commentary (continued)
The Fund's holdings in China and India also performed well during the year, specifically, Internet and software companies that derive most of their earnings from their domestic markets. Most investors are well aware of China's robust Internet industry and while India's Internet industry is less developed, the growth potential remains promising.
Korean companies currently lead in new panel display technology and rechargeable battery technology, which is a core component in hybrid and electric cars, and are well-positioned to benefit from emergence of these new trends. While tablet PCs are gaining popularity, Taiwan's traditional PC-related companies suffered; the Fund's underweight in PC companies helped performance.
During the year, we also saw a wave of new IPOs in the technology space—many domestically oriented companies went public this year. The valuation of these IPOs, however, became significantly less attractive during the year. Nevertheless, a deepening universe of technology companies that are focused on the domestic market is a positive development for the sector overall. We will continue to watch these companies closely.
Looking ahead, smartphones and tablet PCs are expected to lead growth again in 2011. Smartphone penetration rates remain low even in developed markets and have not yet taken off in emerging countries, such as China and India. Tablet PCs are just gaining popularity in the U.S. Many traditional PC makers and existing smartphone manufacturers are expected to launch new products next year which could lead to another period of high growth. The Fund maintains exposure to both smartphone and tablet PC device makers and to manufacturers who supply components for these products.
The rise in both wages and raw material costs was a hurdle for Asian technology companies in 2010, and will likely remain a challenge in 2011. As wages continue to rise, especially in emerging areas of Asia, demand for factory automation should remain robust. In China, many firms have started to move their production bases further west where labor is cheaper; they have also started to replace human labor with robots and machines. We expect this trend to continue over the next several years.
The Fund's strategy remains unchanged; we continue to seek opportunities in Asia that will benefit from growth in both consumer and corporate IT demand. The Fund remains focused on finding local companies that are gaining share in the domestic market with unique strategies. In addition, as incomes rise in Asia so should the demand for health care and IT services and the Fund hopes to benefit from this structural trend.
COUNTRY ALLOCATION (%)7
| China/Hong Kong | | | 27.7 | | |
| Japan | | | 23.3 | | |
| Taiwan | | | 19.5 | | |
| South Korea | | | 15.2 | | |
| India | | | 6.3 | | |
| United States | | | 1.8 | | |
| Indonesia | | | 1.5 | | |
| Philippines | | | 1.2 | | |
| Malaysia | | | 0.8 | | |
| Vietnam | | | 0.4 | | |
Cash and Other Assets,
Less Liabilities | | | 2.3 | | |
SECTOR ALLOCATION (%)
| Information Technology | | | 67.8 | | |
| Telecommunication Services | | | 7.8 | | |
| Health Care | | | 7.6 | | |
| Consumer Discretionary | | | 7.4 | | |
| Industrials | | | 5.5 | | |
| Materials | | | 1.6 | | |
Cash and Other Assets,
Less Liabilities | | | 2.3 | | |
MARKET CAP EXPOSURE (%)8
| Large Cap (over $5B) | | | 55.7 | | |
| Mid Cap ($1B–$5B) | | | 29.4 | | |
| Small Cap (under $1B) | | | 12.6 | | |
Cash and Other Assets,
Less Liabilities | | | 2.3 | | |
7 The United States is not included in the MSCI/Matthews Asian Technology Index.
8 Source: FactSet Research Systems. Percentage values in data are rounded to the nearest tenth of one percent; the values may not sum to 100% due to rounding.
matthewsasia.com | 800.789.ASIA 57
Matthews Asia Science and Technology Fund December 31, 2010
Schedule of Investments
COMMON EQUITIES: 97.7%
| | | Shares | | Value | |
| CHINA/HONG KONG: 27.7% | |
| Baidu, Inc. ADRa | | | 110,700 | | | $ | 10,685,871 | | |
| China Mobile, Ltd. ADR | | | 87,900 | | | | 4,361,598 | | |
Kingdee International Software Group
Co., Ltd. | | | 6,282,000 | | | | 3,523,765 | | |
| AAC Acoustic Technologies Holdings, Inc. | | | 1,218,000 | | | | 3,251,531 | | |
| Sina Corp.a | | | 45,800 | | | | 3,151,956 | | |
| ZTE Corp. H Shares | | | 713,320 | | | | 2,835,733 | | |
China Communications Services Corp., Ltd.
H Shares | | | 4,642,000 | | | | 2,765,086 | | |
| Digital China Holdings, Ltd. | | | 1,466,000 | | | | 2,742,337 | | |
| Sinopharm Group Co., Ltd. H Shares | | | 749,200 | | | | 2,612,099 | | |
| Kingboard Laminates Holdings, Ltd. | | | 2,565,000 | | | | 2,606,976 | | |
| Sunny Optical Technology Group Co., Ltd. | | | 8,893,000 | | | | 2,574,265 | | |
| Ctrip.com International, Ltd. ADRa | | | 63,426 | | | | 2,565,582 | | |
| Mindray Medical International, Ltd. ADR | | | 81,200 | | | | 2,143,680 | | |
| Longtop Financial Technologies, Ltd. ADRa | | | 58,460 | | | | 2,115,083 | | |
New Oriental Education & Technology
Group, Inc. ADRa | | | 17,800 | | | | 1,873,094 | | |
| Tencent Holdings, Ltd. | | | 73,600 | | | | 1,599,300 | | |
Shandong Weigao Group Medical Polymer
Co., Ltd. H Shares | | | 352,000 | | | | 998,559 | | |
| China Kanghui Holdings, Inc. ADRa | | | 23,700 | | | | 438,687 | | |
| Total China/ Hong Kong | | | | | 52,845,202 | | |
| JAPAN: 23.3% | |
| Canon, Inc. | | | 86,900 | | | | 4,506,084 | | |
| Kakaku.com, Inc. | | | 716 | | | | 4,259,490 | | |
| Murata Manufacturing Co., Ltd. | | | 57,900 | | | | 4,057,778 | | |
| Omron Corp. | | | 145,400 | | | | 3,852,142 | | |
| Hamamatsu Photonics, K.K. | | | 94,400 | | | | 3,450,908 | | |
| FANUC CORP. | | | 22,300 | | | | 3,425,065 | | |
| Nidec Corp. | | | 32,700 | | | | 3,306,651 | | |
| Keyence Corp. | | | 11,300 | | | | 3,273,507 | | |
| Toshiba Corp. | | | 533,000 | | | | 2,901,663 | | |
| Ibiden Co., Ltd. | | | 87,200 | | | | 2,751,649 | | |
| Nintendo Co., Ltd. | | | 8,300 | | | | 2,436,125 | | |
| Asahi Intecc Co., Ltd. | | | 126,900 | | | | 2,264,788 | | |
| Nabtesco Corp. | | | 91,800 | | | | 1,958,340 | | |
| Hoya Corp. | | | 77,800 | | | | 1,889,661 | | |
| Total Japan | | | | | 44,333,851 | | |
| TAIWAN: 19.5% | |
Taiwan Semiconductor Manufacturing
Co., Ltd. | | | 1,930,933 | | | | 4,702,082 | | |
| St. Shine Optical Co., Ltd. | | | 339,000 | | | | 4,511,241 | | |
| Hon Hai Precision Industry Co., Ltd. | | | 1,072,893 | | | | 4,323,733 | | |
| Delta Electronics, Inc. | | | 756,000 | | | | 3,694,888 | | |
| Synnex Technology International Corp. | | | 1,296,447 | | | | 3,499,404 | | |
| Simplo Technology Co., Ltd. | | | 452,800 | | | | 3,292,357 | | |
| TXC Corp. | | | 1,679,098 | | | | 3,207,716 | | |
| HTC Corp. | | | 92,200 | | | | 2,846,021 | | |
| Acer, Inc. | | | 912,642 | | | | 2,820,265 | | |
| Nan Ya Printed Circuit Board Corp. | | | 641,000 | | | | 2,385,351 | | |
| Richtek Technology Corp. | | | 219,308 | | | | 1,827,786 | | |
| Total Taiwan | | | | | 37,110,844 | | |
| | | Shares | | Value | |
| SOUTH KOREAb: 15.2% | |
| Samsung Electronics Co., Ltd. | | | 9,891 | | | $ | 8,260,332 | | |
| NHN Corp.a | | | 15,717 | | | | 3,137,416 | | |
| LG Chem, Ltd. | | | 9,048 | | | | 3,115,327 | | |
| LG Display Co., Ltd. ADR | | | 164,200 | | | | 2,914,550 | | |
| Samsung Electro-Mechanics Co., Ltd. | | | 25,906 | | | | 2,824,099 | | |
| SK Telecom Co., Ltd. ADR | | | 142,400 | | | | 2,652,912 | | |
| Uju Electronics Co., Ltd. | | | 83,893 | | | | 2,448,410 | | |
| MegaStudy Co., Ltd. | | | 11,995 | | | | 1,857,035 | | |
| JVM Co., Ltd.a | | | 77,006 | | | | 1,740,640 | | |
| Total South Korea | | | | | 28,950,721 | | |
| INDIA: 6.3% | |
| Infosys Technologies, Ltd. | | | 53,880 | | | | 4,148,392 | | |
| Info Edge India, Ltd. | | | 179,986 | | | | 2,660,041 | | |
| Exide Industries, Ltd. | | | 698,480 | | | | 2,607,096 | | |
| Sun TV Network, Ltd. | | | 218,902 | | | | 2,574,540 | | |
| Total India | | | | | 11,990,069 | | |
| UNITED STATES: 1.8% | |
Cognizant Technology Solutions Corp.,
Class Aa | | | 47,000 | | | | 3,444,630 | | |
| Total United States | | | | | 3,444,630 | | |
| INDONESIA: 1.5% | |
| PT Telekomunikasi Indonesia ADR | | | 78,200 | | | | 2,787,830 | | |
| Total Indonesia | | | | | 2,787,830 | | |
| PHILIPPINES: 1.2% | |
| Globe Telecom, Inc. | | | 124,880 | | | | 2,280,393 | | |
| Total Philippines | | | | | 2,280,393 | | |
| MALAYSIA: 0.8% | |
| KPJ Healthcare BHD | | | 1,279,500 | | | | 1,543,616 | | |
| Total Malaysia | | | | | 1,543,616 | | |
| VIETNAM: 0.4% | |
| FPT Corp. | | | 270,100 | | | | 829,983 | | |
| Total Vietnam | | | | | 829,983 | | |
| TOTAL INVESTMENTS: 97.7% | | | | | 186,117,139 | | |
| (Cost $138,864,486c) | |
CASH AND OTHER ASSETS,
LESS LIABILITIES: 2.3% | | | | | 4,318,624 | | |
| NET ASSETS: 100.0% | | | | $ | 190,435,763 | | |
a Non-income producing security.
b Certain securities were fair valued under the discretion of the Board of Trustees (Note 2-A).
c Cost for federal income tax purposes is $139,671,206 and net unrealized appreciation consists of:
| Gross unrealized appreciation | | $ | 51,473,543 | | |
| Gross unrealized depreciation | | | (5,027,610 | ) | |
| Net unrealized appreciation | | $ | 46,445,933 | | |
ADR American Depositary Receipt
BHD Berhad
See accompanying notes to financial statements.
58 MATTHEWS ASIA FUNDS
Disclosures and Index Definitions
Disclosures
Fund Holdings: The Fund holdings shown in this report are as of December 31, 2010. Holdings are subject to change at any time, so holdings shown in this report may not reflect current Fund holdings. The Funds file complete schedules of portfolio holdings with the Securities and Exchange Commission (the "SEC") for the first and third quarters of each fiscal year on Form N-Q. The Funds' Form N-Q is filed with the SEC within 60 days of the end of the quarter to which it relates, and is available on the SEC's website at www.sec.gov. It may also be reviewed and copied at the Commission's Public Reference Room in Washington, D.C. Information on the operation of the Public Reference Room may be obtained by calling 800-SEC-0330. Complete schedules of investment are also available without charge, upon request, from the Funds by calling us at 800.789.ASIA (2472).
Proxy Voting Record: The Funds' Statement of Additional Information containing a description of the policies and procedures that the Funds have used to vote proxies relating to portfolio securities, along with each Fund's proxy voting record relating to portfolio securities held during the 12-month period ended June 30, 2010, is available upon request, at no charge, at the Funds' website at matthewsasia.com or by calling 1.800.789.ASIA (2742), or on the SEC's website at www.sec.gov.
Shareholder Reports and Prospectuses: To reduce the Funds' expenses, we try to identify related shareholders in a household and send only one copy of the Funds' prospectus and financial reports to that address. This process, called "householding," will continue indefinitely unless you instruct us otherwise. At any time you may view the Funds' current prospectus and financial reports on our website. If you prefer to receive individual copies of the Funds' prospectus or financial reports, please call us at 1.800.789.ASIA (2742).
Redemption Fee Policy: The Funds assess a redemption fee of 2.00% on the total redemption proceeds on most sales or exchanges of shares that take place within 90 calendar days after their purchase as part of the Funds' efforts to discourage market timing activity. This fee is payable directly to the Funds. For purposes of determining whether the redemption fee applies, the shares that have been held longest will be redeemed first. The Funds may grant exemptions from the redemption fee in certain circumstances. For more information on this policy, please see the Funds' prospectus.
Index Definitions
The MSCI All Country Asia ex Japan Index is a free float–adjusted market capitalization–weighted index of the stock markets of China, Hong Kong, India, Indonesia, Malaysia, Philippines, Singapore, South Korea, Taiwan and Thailand.
The MSCI All Country Asia Pacific Index is a free float–adjusted market capitalization–weighted index of the stock markets of Australia, China, Hong Kong, India, Indonesia, Japan, Malaysia, New Zealand, Philippines, Singapore, South Korea, Taiwan and Thailand.
The MSCI China Index is a free float–adjusted market capitalization–weighted index of Chinese equities that includes China-affiliated corporations and H shares listed on the Hong Kong Exchange, and B shares listed on the Shanghai and Shenzhen exchanges.
The Bombay Stock Exchange (BSE) 100 Index is a free float–adjusted market capitalization–weighted index of the 100 stocks listed on the Bombay Stock Exchange.
The MSCI Japan Index is a free float–adjusted market capitalization–weighted index of Japanese equities listed in Japan.
The Tokyo Stock Price Index (TOPIX) is a market capitalization–weighted index of all companies listed on the First Section of the Tokyo Stock Exchange.
The Korea Composite Stock Price Index (KOSPI) is a market capitalization–weighted index of all common stocks listed on the Korea Stock Exchange.
The MSCI All Country Asia ex Japan Small Cap Index is a free float–adjusted market capitalization–weighted small cap index of the stock markets of China, Hong Kong, India, Indonesia, Malaysia, Philippines, Singapore, South Korea, Taiwan and Thailand.
The MSCI/Matthews Asian Technology Index is a free float–adjusted market capitalization–weighted index of Asian equities tracking a broad range of technology stocks including semiconductor equipment and products, communications equipment, computers and peripherals, electronic equipment and instruments, office electronics, software, IT consulting and services, Internet software and services, diversified telecommunications services, and wireless telecommunications services.
matthewsasia.com | 800.789.ASIA 59
Disclosure of Fund Expenses (Unaudited)
We believe it is important for you to understand the impact of fees regarding your investment. All mutual funds have operating expenses. As a shareholder of a mutual fund, you incur ongoing costs, which include costs for portfolio management, administrative services, and shareholder reports (like this one), among others. Operating expenses, which are deducted from a fund's gross income, directly reduce the investment return of the fund. A fund's operating expenses are expressed as a percentage of its average net assets. This figure is known as the expense ratio. The following examples are intended to help you understand the ongoing fees (in dollars) of investing in your fund and to compare these costs with those of other mutual funds. The examples are based on an investment of $1,000 made at the beginning of the period shown and held for the entire period.
This table illustrates your fund's costs in two ways:
Actual Fund Return: This section helps you to estimate the actual operating expenses, after any applicable fee waivers, that you paid over the period. The "Ending Account Value" shown is derived from the fund's actual return for the past six month period, the "Expense Ratio" column shows the period's annualized expense ratio, and the "Operating Expenses Paid During Period" column shows the dollar amount that would have been paid by an investor who started with $1,000 in the fund at the beginning of the period. You may use the information here, together with your account value, to estimate the expenses that you paid over the period. To do so, simply divide your account value by $1,000 (for example, an $8,600 account value divided by $1,000 = 8.6), then multiply the result by the number given for your fund in the first line under the heading entitled "Operating Expenses Paid During Period."
Hypothetical 5% Return: This section is intended to help you compare your fund's costs with those of other mutual funds. It assumes that the fund had an annual return of 5% before operating expenses, but that the expense ratio is unchanged. In this case, because the return used is not the fund's actual return, the results do not apply to your investment. This example is useful in making comparisons to other mutual funds because the Securities and Exchange Commission requires all mutual funds to calculate expenses based on an assumed 5% annual return. You can assess your fund's costs by comparing this hypothetical example with the hypothetical examples that appear in shareholder reports of other funds.
Please note that the operating expenses shown in the table are meant to highlight and help you compare your ongoing costs only and do not reflect any transactional costs such as sales charges (loads), redemption fees, or exchange fees. The Funds generally assess a redemption fee of 2.00% of the total redemption proceeds if you sell or exchange your shares within 90 calendar days after purchasing them. The redemption fee is paid directly to the Funds and is designed to discourage frequent short-term trading and to offset transaction costs associated with such trading of Fund shares. For purposes of detemining whether the redemption fee applies, the shares that have been held the longest will be redeemed first. The Funds may grant exemption from the redemption fee when the Funds have previously received assurances that transactions do not involve market timing activity. The Funds may also waive the imposition of redemption fees in certain circumstances.
For more information on this policy, please see the Funds' prospectus.
The Matthews Asia Funds do not charge any sales loads, exchange fees, or 12b-1 fees, but these may be present in other funds to which you compare this data. Therefore, the hypothetical portions of the table are useful in comparing ongoing costs only, and will not help you determine the relative total costs of owning different funds.
60 MATTHEWS ASIA FUNDS
December 31, 2010
| | | INVESTOR CLASS | | INSTITUTIONAL CLASS* | |
| | | Beginning
Account
Value
7/01/10 | | Ending
Account
Value
12/31/10 | | Expense
Ratio1 | | Operating
Expenses
Paid During
Period
7/1/10–
12/31/102 | | Beginning
Account
Value
10/29/10 | | Ending
Account
Value
12/31/10 | | Expense
Ratio1 | | Operating
Expenses
Paid During
Period
10/29/10–
12/31/103 | |
| ASIA GROWTH AND INCOME STRATEGIES | |
| Matthews Asian Growth and Income Fund | |
| Actual Fund Return | | $ | 1,000.00 | | | $ | 1,174.10 | | | | 1.12 | % | | $ | 6.14 | | | $ | 1,000.00 | | | $ | 1,174.60 | | | | 0.93 | % | | $ | 5.10 | | |
| Hypothetical 5% Return | | $ | 1,000.00 | | | $ | 1,050.00 | | | | 1.12 | % | | $ | 5.79 | | | $ | 1,000.00 | | | $ | 1,050.00 | | | | 0.93 | % | | $ | 4.81 | | |
| Matthews Asia Dividend Fund | |
| Actual Fund Return | | $ | 1,000.00 | | | $ | 1,171.90 | | | | 1.15 | % | | $ | 6.30 | | | $ | 1,000.00 | | | $ | 1,172.30 | | | | 1.02 | % | | $ | 5.58 | | |
| Hypothetical 5% Return | | $ | 1,000.00 | | | $ | 1,050.00 | | | | 1.15 | % | | $ | 5.94 | | | $ | 1,000.00 | | | $ | 1,050.00 | | | | 1.02 | % | | $ | 5.27 | | |
| Matthews China Dividend Fund | |
| Actual Fund Return | | $ | 1,000.00 | | | $ | 1,206.50 | | | | 1.50 | % | | $ | 8.34 | | | $ | 1,000.00 | | | $ | 1,206.90 | | | | 1.24 | % | | $ | 6.90 | | |
| Hypothetical 5% Return | | $ | 1,000.00 | | | $ | 1,050.00 | | | | 1.50 | % | | $ | 7.75 | | | $ | 1,000.00 | | | $ | 1,050.00 | | | | 1.24 | % | | $ | 6.41 | | |
| ASIA GROWTH STRATEGIES | |
| Matthews Asia Pacific Fund | |
| Actual Fund Return | | $ | 1,000.00 | | | $ | 1,242.40 | | | | 1.18 | % | | $ | 6.67 | | | $ | 1,000.00 | | | $ | 1,243.10 | | | | 0.99 | % | | $ | 5.60 | | |
| Hypothetical 5% Return | | $ | 1,000.00 | | | $ | 1,050.00 | | | | 1.18 | % | | $ | 6.10 | | | $ | 1,000.00 | | | $ | 1,050.00 | | | | 0.99 | % | | $ | 5.12 | | |
| Matthews Pacific Tiger Fund | |
| Actual Fund Return | | $ | 1,000.00 | | | $ | 1,226.20 | | | | 1.09 | % | | $ | 6.12 | | | $ | 1,000.00 | | | $ | 1,226.70 | | | | 0.95 | % | | $ | 5.33 | | |
| Hypothetical 5% Return | | $ | 1,000.00 | | | $ | 1,050.00 | | | | 1.09 | % | | $ | 5.63 | | | $ | 1,000.00 | | | $ | 1,050.00 | | | | 0.95 | % | | $ | 4.91 | | |
| Matthews China Fund | |
| Actual Fund Return | | $ | 1,000.00 | | | $ | 1,188.00 | | | | 1.14 | % | | $ | 6.29 | | | $ | 1,000.00 | | | $ | 1,188.50 | | | | 0.97 | % | | $ | 5.35 | | |
| Investor Share | | $ | 1,000.00 | | | $ | 1,050.00 | | | | 1.14 | % | | $ | 5.89 | | | $ | 1,000.00 | | | $ | 1,050.00 | | | | 0.97 | % | | $ | 5.01 | | |
| Matthews India Fund | |
| Actual Fund Return | | $ | 1,000.00 | | | $ | 1,189.50 | | | | 1.16 | % | | $ | 6.40 | | | $ | 1,000.00 | | | $ | 1,189.40 | | | | 0.99 | % | | $ | 5.46 | | |
| Hypothetical 5% Return | | $ | 1,000.00 | | | $ | 1,050.00 | | | | 1.16 | % | | $ | 5.99 | | | $ | 1,000.00 | | | $ | 1,050.00 | | | | 0.99 | % | | $ | 5.12 | | |
| Matthews Japan Fund | |
| Actual Fund Return | | $ | 1,000.00 | | | $ | 1,253.20 | | | | 1.27 | % | | $ | 7.21 | | | $ | 1,000.00 | | | $ | 1,253.20 | | | | 1.08 | % | | $ | 6.13 | | |
| Investor Share | | $ | 1,000.00 | | | $ | 1,050.00 | | | | 1.27 | % | | $ | 6.56 | | | $ | 1,000.00 | | | $ | 1,050.00 | | | | 1.08 | % | | $ | 5.58 | | |
| Matthews Korea Fund | |
| Actual Fund Return | | $ | 1,000.00 | | | $ | 1,271.70 | | | | 1.19 | % | | $ | 6.81 | | | $ | 1,000.00 | | | $ | 1,271.70 | | | | 0.91 | % | | $ | 5.21 | | |
| Hypothetical 5% Return | | $ | 1,000.00 | | | $ | 1,050.00 | | | | 1.19 | % | | $ | 6.15 | | | $ | 1,000.00 | | | $ | 1,050.00 | | | | 0.91 | % | | $ | 4.70 | | |
| ASIA SMALL COMPANY STRATEGY | |
| Matthews Asia Small Companies Fund | |
| Actual Fund Return | | $ | 1,000.00 | | | $ | 1,312.20 | | | | 1.57 | % | | $ | 9.15 | | | | | | | | | | | | | | | | | | |
| Hypothetical 5% Return | | $ | 1,000.00 | | | $ | 1,050.00 | | | | 1.57 | % | | $ | 8.11 | | | | | | | | | | | | | | | | | | |
| ASIA SPECIALTY STRATEGY | |
| Matthews Asia Science and Technology Fund | |
| Actual Fund Return | | $ | 1,000.00 | | | $ | 1,269.00 | | | | 1.25 | % | | $ | 7.15 | | | | | | | | | | | | | | | | | | |
| Hypothetical 5% Return | | $ | 1,000.00 | | | $ | 1,050.00 | | | | 1.25 | % | | $ | 6.46 | | | | | | | | | | | | | | | | | | |
* Institutional Shares commenced operations on October 29, 2010.
1 Annualized, based on the Fund's most recent fiscal half-year expenses.
2 Operating expenses are equal to the Fund's annualized expense ratio multiplied by the average account value over the period, multiplied by 184 days, then divided by 365.
3 Operating expenses are equal to the Fund's annualized expense ratio multiplied by the average account value since the class was open, multiplied by 61 days, then divided by 365.
matthewsasia.com | 800.789.ASIA 61
Statements of Assets and Liabilities December 31, 2010
| | | Matthews Asian
Growth and
Income Fund | | Matthews Asia
Dividend Fund | | Matthews China
Dividend Fund | | Matthews Asia
Pacific Fund | | Matthews Pacific
Tiger Fund | | Matthews
China Fund | |
| ASSETS: | |
| Investments at value (A) (Note 2-A and 6): | |
| Unaffiliated issuers | | $ | 3,743,101,353 | | | $ | 1,748,043,627 | | | $ | 43,723,664 | | | $ | 329,947,385 | | | $ | 5,206,001,861 | | | $ | 2,805,956,072 | | |
| Affiliated issuers | | | 158,673,194 | | | | 148,397,725 | | | | — | | | | — | | | | 302,289,045 | | | | 147,773,029 | | |
| Total investments | | | 3,901,774,547 | | | | 1,896,441,352 | | | | 43,723,664 | | | | 329,947,385 | | | | 5,508,290,906 | | | | 2,953,729,101 | | |
| Cash | | | 141,432,656 | | | | 83,915,246 | | | | 1,188,966 | | | | 15,036,132 | | | | 232,392,133 | | | | 32,136,739 | | |
| Segregated foreign currency at value (B) | | | 635,908 | | | | — | | | | — | | | | 89,617 | | | | 8,329,515 | | | | — | | |
| Foreign currency at value (B) | | | 3 | | | | 1,126,705 | | | | — | | | | 27,738 | | | | 4,646,883 | | | | — | | |
| Dividends, interest and other receivables | | | 14,151,858 | | | | 9,193,703 | | | | 38,333 | | | | 393,581 | | | | 7,234,606 | | | | — | | |
| Receivable for securities sold | | | 5,439,639 | | | | 8,864,237 | | | | — | | | | — | | | | 2,677,165 | | | | — | | |
| Receivable for capital shares sold | | | 17,848,261 | | | | 21,117,500 | | | | 498,597 | | | | 2,909,799 | | | | 15,735,152 | | | | 6,837,152 | | |
| Prepaid expenses | | | 77,295 | | | | 95,570 | | | | 33,180 | | | | 32,279 | | | | 69,052 | | | | 63,331 | | |
| TOTAL ASSETS | | | 4,081,360,167 | | | | 2,020,754,313 | | | | 45,482,740 | | | | 348,436,531 | | | | 5,779,375,412 | | | | 2,992,766,323 | | |
| LIABILITIES: | |
| Payable for securities purchased | | | 13,716,705 | | | | 35,940,292 | | | | 47,653 | | | | 3,513,901 | | | | 30,703,427 | | | | — | | |
| Payable for capital shares redeemed | | | 6,927,326 | | | | 1,202,582 | | | | 8,900 | | | | 285,285 | | | | 3,009,603 | | | | 8,368,689 | | |
| Deferred tax liability (Note 2-D) | | | 2,051,108 | | | | — | | | | — | | | | — | | | | 3,089,305 | | | | — | | |
| Due to Advisor (Note 4) | | | 2,178,755 | | | | 1,026,715 | | | | 19,401 | | | | 184,697 | | | | 3,083,406 | | | | 1,684,990 | | |
| Administration and accounting fees payable | | | 52,184 | | | | 24,581 | | | | 581 | | | | 4,423 | | | | 73,839 | | | | 40,353 | | |
| Administration and shareholder servicing fees payable | | | 741,877 | | | | 339,109 | | | | 8,590 | | | | 62,691 | | | | 942,723 | | | | 587,930 | | |
| Professional fees payable | | | 16,227 | | | | 13,839 | | | | 8,416 | | | | 13,259 | | | | 17,922 | | | | 13,721 | | |
| Trustees fees payable | | | 421 | | | | 119 | | | | 3 | | | | 35 | | | | 557 | | | | 515 | | |
| Transfer agent fees payable | | | 523,400 | | | | 228,729 | | | | 7,720 | | | | 49,373 | | | | 569,411 | | | | 458,814 | | |
| Accrued other expenses payable | | | 481,585 | | | | 302,040 | | | | 13,487 | | | | 40,185 | | | | 673,031 | | | | 428,467 | | |
| TOTAL LIABILITIES | | | 26,689,588 | | | | 39,078,006 | | | | 114,751 | | | | 4,153,849 | | | | 42,163,224 | | | | 11,583,479 | | |
| NET ASSETS | | $ | 4,054,670,579 | | | $ | 1,981,676,307 | | | $ | 45,367,989 | | | $ | 344,282,682 | | | $ | 5,737,212,188 | | | $ | 2,981,182,844 | | |
| NET ASSETS | |
| Investor Shares | | $ | 3,926,253,202 | | | $ | 1,933,382,902 | | | $ | 45,364,352 | | | $ | 335,429,339 | | | $ | 5,196,742,695 | | | $ | 2,939,637,890 | | |
| Institutional Shares | | | 128,417,377 | | | | 48,293,405 | | | | 3,637 | | | | 8,853,343 | | | | 540,469,493 | | | | 41,544,954 | | |
| TOTAL | | $ | 4,054,670,579 | | | $ | 1,981,676,307 | | | $ | 45,367,989 | | | $ | 344,282,682 | | | $ | 5,737,212,188 | | | $ | 2,981,182,844 | | |
| SHARES OUTSTANDING: | |
(shares of beneficial interest issued and outstanding,
respectively, unlimited number of shares authorized
with a $0.001 par value) | |
| Investor Shares | | | 217,613,109 | | | | 134,875,240 | | | | 3,727,339 | | | | 18,666,372 | | | | 221,734,333 | | | | 100,136,998 | | |
| Institutional Shares | | | 7,118,360 | | | | 3,370,759 | | | | 299 | | | | 492,402 | | | | 23,059,917 | | | | 1,415,021 | | |
| TOTAL | | | 224,731,469 | | | | 138,245,999 | | | | 3,727,638 | | | | 19,158,774 | | | | 244,794,250 | | | | 101,552,019 | | |
| NET ASSET VALUE | |
| Investor Shares, offering price and redemption price | | $ | 18.04 | | | $ | 14.33 | | | $ | 12.17 | | | $ | 17.97 | | | $ | 23.44 | | | $ | 29.36 | | |
| Institutional Shares, offering price and redemption price | | $ | 18.04 | | | $ | 14.33 | | | $ | 12.17 | * | | $ | 17.98 | | | $ | 23.44 | | | $ | 29.36 | | |
| NET ASSETS CONSIST OF: | |
| Capital paid-in | | $ | 3,362,898,857 | | | $ | 1,786,507,973 | | | $ | 40,729,212 | | | $ | 306,861,172 | | | $ | 4,117,925,813 | | | $ | 2,064,213,532 | | |
Undistributed (distributions in excess of) net
investment income (loss) | | | (20,902,803 | ) | | | (19,822,734 | ) | | | (234,687 | ) | | | (1,243,198 | ) | | | (22,666,002 | ) | | | (14,747 | ) | |
Undistributed/accumulated net realized gain (loss) on
investments and foreign currency related transactions | | | 26,115,255 | | | | 10,469,874 | | | | 51,398 | | | | (66,668,736 | ) | | | (100,979,272 | ) | | | (4,554,420 | ) | |
Net unrealized appreciation (depreciation) on investments,
foreign currency transactions and deferred taxes | | | 686,559,270 | | | | 204,521,194 | | | | 4,822,066 | | | | 105,333,444 | | | | 1,742,931,649 | | | | 921,538,479 | | |
| NET ASSETS | | $ | 4,054,670,579 | | | $ | 1,981,676,307 | | | $ | 45,367,989 | | | $ | 344,282,682 | | | $ | 5,737,212,188 | | | $ | 2,981,182,844 | | |
| (A) Investments at cost: | |
| Unaffiliated issuers | | $ | 3,060,245,170 | | | $ | 1,542,870,325 | | | $ | 38,901,584 | | | $ | 224,619,562 | | | $ | 3,491,490,516 | | | $ | 1,992,756,597 | | |
| Affiliated issuers | | | 153,042,907 | | | | 149,118,710 | | | | — | | | | — | | | | 270,784,444 | | | | 39,434,025 | | |
| Total investments at cost | | $ | 3,213,288,077 | | | $ | 1,691,989,035 | | | $ | 38,901,584 | | | $ | 224,619,562 | | | $ | 3,762,274,960 | | | $ | 2,032,190,622 | | |
| (B) Foreign currency at cost | | $ | 637,658 | | | $ | 1,128,117 | | | $ | — | | | $ | 117,576 | | | $ | 13,014,170 | | | $ | — | | |
* The Matthews China Dividend and Matthews Japan Fund net asset value for Institutional Shares is calculated using unrounded net assets of $3,636.87 and $4,242.33 divided by the
unrounded shares of 298.849 and 338.473, respectively.
See accompanying notes to financial statements.
62 MATTHEWS ASIA FUNDS
| | | Matthews
India Fund | | Matthews
Japan Fund | | Matthews
Korea Fund | | Matthews Asia
Small Companies
Fund | | Matthews Asia
Science and
Technology Fund | |
| ASSETS: | |
| Investments at value (A) (Note 2-A and 6): | |
| Unaffiliated issuers | | $ | 1,399,406,416 | | | $ | 66,464,695 | | | $ | 164,119,323 | | | $ | 532,235,197 | | | $ | 186,117,139 | | |
| Affiliated issuers | | | — | | | | — | | | | — | | | | — | | | | — | | |
| Total investments | | | 1,399,406,416 | | | | 66,464,695 | | | | 164,119,323 | | | | 532,235,197 | | | | 186,117,139 | | |
| Cash | | | 37,406,514 | | | | 972,589 | | | | 1,740,121 | | | | 12,654,374 | | | | 3,303,359 | | |
| Segregated foreign currency at value (B) | | | — | | | | — | | | | — | | | | — | | | | 323,346 | | |
| Foreign currency at value (B) | | | 53,267 | | | | — | | | | — | | | | 1,923,509 | | | | 766 | | |
| Dividends, interest and other receivables | | | 1,542,144 | | | | 57,602 | | | | 1,247,475 | | | | 482,566 | | | | 320,645 | | |
| Receivable for securities sold | | | — | | | | — | | | | — | | | | 2,316,482 | | | | — | | |
| Receivable for capital shares sold | | | 6,294,667 | | | | 485,786 | | | | 116,038 | | | | 2,182,690 | | | | 780,533 | | |
| Prepaid expenses | | | 73,020 | | | | 21,229 | | | | 27,047 | | | | 62,293 | | | | 26,151 | | |
| TOTAL ASSETS | | | 1,444,776,028 | | | | 68,001,901 | | | | 167,250,004 | | | | 551,857,111 | | | | 190,871,939 | | |
| LIABILITIES: | |
| Payable for securities purchased | | | — | | | | — | | | | — | | | | 2,457,371 | | | | — | | |
| Payable for capital shares redeemed | | | 2,136,627 | | | | 111,557 | | | | 77,936 | | | | 367,198 | | | | 221,681 | | |
| Deferred tax liability (Note 2-D) | | | 4,120,779 | | | | — | | | | — | | | | 1,174,891 | | | | — | | |
| Due to Advisor (Note 4) | | | 779,012 | | | | 35,870 | | | | 89,825 | | | | 449,713 | | | | 103,046 | | |
| Administration and accounting fees payable | | | 18,652 | | | | 859 | | | | 2,151 | | | | 7,192 | | | | 2,468 | | |
| Administration and shareholder servicing fees payable | | | 262,859 | | | | 11,407 | | | | 29,152 | | | | 106,984 | | | | 35,225 | | |
| Professional fees payable | | | 23,293 | | | | 11,691 | | | | 11,814 | | | | 13,681 | | | | 15,762 | | |
| Trustees fees payable | | | 41 | | | | 23 | | | | 31 | | | | 37 | | | | 30 | | |
| Transfer agent fees payable | | | 197,082 | | | | 10,146 | | | | 23,972 | | | | 81,194 | | | | 29,290 | | |
| Accrued other expenses payable | | | 227,031 | | | | 10,654 | | | | 21,258 | | | | 104,531 | | | | 28,674 | | |
| TOTAL LIABILITIES | | | 7,765,376 | | | | 192,207 | | | | 256,139 | | | | 4,762,792 | | | | 436,176 | | |
| NET ASSETS | | $ | 1,437,010,652 | | | $ | 67,809,694 | | | $ | 166,993,865 | | | $ | 547,094,319 | | | $ | 190,435,763 | | |
| NET ASSETS | |
| Investor Shares | | $ | 1,388,892,072 | | | $ | 67,805,452 | | | $ | 166,990,068 | | | $ | 547,094,319 | | | $ | 190,435,763 | | |
| Institutional Shares | | | 48,118,580 | | | | 4,242 | | | | 3,797 | | | | — | | | | — | | |
| TOTAL | | $ | 1,437,010,652 | | | $ | 67,809,694 | | | $ | 166,993,865 | | | $ | 547,094,319 | | | $ | 190,435,763 | | |
| SHARES OUTSTANDING: | |
(shares of beneficial interest issued and outstanding,
respectively, unlimited number of shares authorized
with a $0.001 par value) | |
| Investor Shares | | | 64,638,082 | | | | 5,411,204 | | | | 32,498,495 | | | | 25,852,798 | | | | 19,256,614 | | |
| Institutional Shares | | | 2,239,712 | | | | 338 | | | | 739 | | | | — | | | | — | | |
| TOTAL | | | 66,877,794 | | | | 5,411,542 | | | | 32,499,234 | | | | 25,852,798 | | | | 19,256,614 | | |
| NET ASSET VALUE | |
| Investor Shares, offering price and redemption price | | $ | 21.49 | | | $ | 12.53 | | | $ | 5.14 | | | $ | 21.16 | | | $ | 9.89 | | |
| Institutional Shares, offering price and redemption price | | $ | 21.48 | | | $ | 12.53 | * | | $ | 5.14 | | | $ | — | | | $ | — | | |
| NET ASSETS CONSIST OF: | |
| Capital paid-in | | $ | 1,119,703,497 | | | $ | 127,719,957 | | | $ | 105,857,885 | | | $ | 453,100,618 | | | $ | 167,170,742 | | |
Undistributed (distributions in excess of) net
investment income (loss) | | | (5,284,949 | ) | | | 606,804 | | | | 236,840 | | | | (1,827,088 | ) | | | 131,538 | | |
Undistributed/accumulated net realized gain (loss) on
investments and foreign currency related transactions | | | (93,822,879 | ) | | | (74,168,880 | ) | | | 6,763,843 | | | | 2,096,206 | | | | (24,120,147 | ) | |
Net unrealized appreciation (depreciation) on investments,
foreign currency transactions and deferred taxes | | | 416,414,983 | | | | 13,651,813 | | | | 54,135,297 | | | | 93,724,583 | | | | 47,253,630 | | |
| NET ASSETS | | $ | 1,437,010,652 | | | $ | 67,809,694 | | | $ | 166,993,865 | | | $ | 547,094,319 | | | $ | 190,435,763 | | |
| (A) Investments at cost: | |
| Unaffiliated issuers | | $ | 978,905,164 | | | $ | 52,814,247 | | | $ | 109,994,924 | | | $ | 437,337,356 | | | $ | 138,864,486 | | |
| Affiliated issuers | | | — | | | | — | | | | — | | | | — | | | | — | | |
| Total investments at cost | | $ | 978,905,164 | | | $ | 52,814,247 | | | $ | 109,994,924 | | | $ | 437,337,356 | | | $ | 138,864,486 | | |
| (B) Foreign currency at cost | | $ | 53,265 | | | $ | — | | | $ | — | | | $ | 1,921,972 | | | $ | 324,985 | | |
matthewsasia.com | 800.789.ASIA 63
Statements of Operations Year Ended December 31, 2010
| | | Matthews Asian
Growth and
Income Fund | | Matthews Asia
Dividend Fund | | Matthews China
Dividend Fund | | Matthews Asia
Pacific Fund | | Matthews Pacific
Tiger Fund | | Matthews
China Fund | |
| INVESTMENT INCOME: | |
| Dividends—Unaffiliated Issuers | | $ | 79,379,313 | | | $ | 36,204,760 | | | $ | 681,599 | | | $ | 5,145,476 | | | $ | 69,889,833 | | | $ | 45,662,541 | | |
| Dividends—Affiliated Issuers (Note 6) | | | 4,550,711 | | | | 2,287,931 | | | | — | | | | — | | | | 3,777,656 | | | | 1,104,972 | | |
| Interest | | | 34,111,597 | | | | 127,281 | | | | 395 | | | | — | | | | — | | | | — | | |
| Foreign withholding tax | | | (6,404,703 | ) | | | (3,651,701 | ) | | | (36,898 | ) | | | (428,700 | ) | | | (7,137,308 | ) | | | (1,658,213 | ) | |
| TOTAL INVESTMENT INCOME | | | 111,636,918 | | | | 34,968,271 | | | | 645,096 | | | | 4,716,776 | | | | 66,530,181 | | | | 45,109,300 | | |
| EXPENSES: | |
| Investment advisory fees (Note 4) | | | 20,866,236 | | | | 6,759,893 | | | | 144,360 | | | | 1,745,528 | | | | 29,376,374 | | | | 18,044,591 | | |
| Administration and accounting fees (Note 4) | | | 508,071 | | | | 163,692 | | | | 3,485 | | | | 42,509 | | | | 715,092 | | | | 439,919 | | |
| Administration and shareholder servicing fees (Note 4) | | | 7,197,945 | | | | 2,237,298 | | | | 49,601 | | | | 594,462 | | | | 9,427,457 | | | | 6,267,843 | | |
| Custodian fees | | | 934,444 | | | | 321,594 | | | | 37,269 | | | | 95,104 | | | | 1,786,915 | | | | 712,382 | | |
| Insurance fees | | | 39,558 | | | | 4,691 | | | | 67 | | | | 3,597 | | | | 54,892 | | | | 39,328 | | |
| Printing fees | | | 383,391 | | | | 210,022 | | | | 7,511 | | | | 62,434 | | | | 368,560 | | | | 591,250 | | |
| Professional fees | | | 58,049 | | | | 44,882 | | | | 30,294 | | | | 38,342 | | | | 70,452 | | | | 54,310 | | |
| Registration fees | | | 207,135 | | | | 281,310 | | | | 21,378 | | | | 31,686 | | | | 211,060 | | | | 144,217 | | |
| Transfer agent fees | | | 4,596,689 | | | | 1,422,697 | | | | 45,294 | | | | 413,948 | | | | 5,395,447 | | | | 4,208,167 | | |
| Trustees fees | | | 114,448 | | | | 27,800 | | | | 565 | | | | 9,668 | | | | 160,584 | | | | 104,358 | | |
| Offering costs (Note 2-E) | | | — | | | | — | | | | 43,344 | | | | — | | | | — | | | | — | | |
| Other expenses | | | 126,169 | | | | 70,039 | | | | 36,428 | | | | 52,778 | | | | 138,955 | | | | 118,670 | | |
| TOTAL EXPENSES | | | 35,032,135 | | | | 11,543,918 | | | | 419,596 | | | | 3,090,056 | | | | 47,705,788 | | | | 30,725,035 | | |
| Advisory fees waived or recaptured (Note 4) | | | — | | | | 34,648 | | | | (96,407 | ) | | | — | | | | — | | | | — | | |
| NET EXPENSES | | | 35,032,135 | | | | 11,578,566 | | | | 323,189 | | | | 3,090,056 | | | | 47,705,788 | | | | 30,725,035 | | |
| NET INVESTMENT INCOME | | | 76,604,783 | | | | 23,389,705 | | | | 321,907 | | | | 1,626,720 | | | | 18,824,393 | | | | 14,384,265 | | |
REALIZED AND UNREALIZED GAIN (LOSS) ON INVESTMENTS,
FOREIGN CURRENCY RELATED TRANSACTIONS AND
DEFERRED TAXES: | |
| Net realized gain (loss) on investments—Unaffiliated Issuers | | | 150,127,745 | | | | 35,381,864 | | | | 181,668 | | | | 16,161,751 | | | | 94,637,325 | | | | 44,235,781 | | |
| Net realized gain on investments—Affiliated Issuers | | | 114,437 | | | | — | | | | — | | | | — | | | | 6 | | | | 770,595 | | |
| Net realized capital gain tax or refund | | | (135,996 | ) | | | (138 | ) | | | — | | | | 9,408 | | | | — | | | | — | | |
| Net realized gain (loss) on foreign currency related transactions | | | 392,248 | | | | 87,570 | | | | (8,092 | ) | | | (114,967 | ) | | | (3,242,814 | ) | | | (108,331 | ) | |
Net change in unrealized appreciation/depreciation
on investments | | | 343,463,309 | | | | 147,712,255 | | | | 4,708,100 | | | | 45,547,936 | | | | 830,613,648 | | | | 303,710,299 | | |
| Net change in deferred taxes on unrealized appreciation | | | (2,046,819 | ) | | | — | | | | — | | | | — | | | | 8,914,553 | | | | — | | |
Net change in unrealized appreciation/depreciation on
foreign currency related transactions | | | 114,964 | | | | 76,528 | | | | (43 | ) | | | 8,336 | | | | (15,776 | ) | | | 226 | | |
Net realized and unrealized gain (loss) on investments,
foreign currency related transactions and deferred taxes | | | 492,029,888 | | | | 183,258,079 | | | | 4,881,633 | | | | 61,612,464 | | | | 930,906,942 | | | | 348,608,570 | | |
| NET INCREASE IN NET ASSETS FROM OPERATIONS | | $ | 568,634,671 | | | $ | 206,647,784 | | | $ | 5,203,540 | | | $ | 63,239,184 | | | $ | 949,731,335 | | | $ | 362,992,835 | | |
See accompanying notes to financial statements.
64 MATTHEWS ASIA FUNDS
| | | Matthews
India Fund | | Matthews
Japan Fund | | Matthews
Korea Fund | | Matthews Asia
Small Companies
Fund | | Matthews Asia
Science and
Technology Fund | |
| INVESTMENT INCOME: | |
| Dividends—Unaffiliated Issuers | | $ | 12,140,586 | | | $ | 1,048,850 | | | $ | 2,338,037 | | | $ | 4,998,316 | | | $ | 2,894,437 | | |
| Dividends—Affiliated Issuers (Note 6) | | | — | | | | — | | | | — | | | | — | | | | — | | |
| Interest | | | 2,415,884 | | | | 222 | | | | — | | | | 791 | | | | — | | |
| Foreign withholding tax | | | — | | | | (73,402 | ) | | | (393,753 | ) | | | (318,613 | ) | | | (446,009 | ) | |
| TOTAL INVESTMENT INCOME | | | 14,556,470 | | | | 975,670 | | | | 1,944,284 | | | | 4,680,494 | | | | 2,448,428 | | |
| EXPENSES: | |
| Investment advisory fees (Note 4) | | | 6,861,287 | | | | 460,632 | | | | 956,336 | | | | 2,490,870 | | | | 1,027,540 | | |
| Administration and accounting fees (Note 4) | | | 166,783 | | | | 11,257 | | | | 23,324 | | | | 40,429 | | | | 25,052 | | |
| Administration and shareholder servicing fees (Note 4) | | | 2,360,984 | | | | 151,547 | | | | 314,273 | | | | 591,695 | | | | 354,396 | | |
| Custodian fees | | | 576,815 | | | | 17,634 | | | | 46,273 | | | | 202,075 | | | | 82,574 | | |
| Insurance fees | | | 11,232 | | | | 1,408 | | | | 2,150 | | | | 1,554 | | | | 1,991 | | |
| Printing fees | | | 197,704 | | | | 24,431 | | | | 33,583 | | | | 43,653 | | | | 51,248 | | |
| Professional fees | | | 40,847 | | | | 33,991 | | | | 34,622 | | | | 31,569 | | | | 37,041 | | |
| Registration fees | | | 68,479 | | | | 25,634 | | | | 36,489 | | | | 84,977 | | | | 30,321 | | |
| Transfer agent fees | | | 1,641,462 | | | | 109,347 | | | | 218,008 | | | | 431,716 | | | | 257,997 | | |
| Trustees fees | | | 35,298 | | | | 2,840 | | | | 5,566 | | | | 6,900 | | | | 5,719 | | |
| Offering costs (Note 2-E) | | | — | | | | — | | | | — | | | | — | | | | — | | |
| Other expenses | | | 65,762 | | | | 45,986 | | | | 42,697 | | | | 55,871 | | | | 44,322 | | |
| TOTAL EXPENSES | | | 12,026,653 | | | | 884,707 | | | | 1,713,321 | | | | 3,981,309 | | | | 1,918,201 | | |
| Advisory fees waived or recaptured (Note 4) | | | — | | | | — | | | | — | | | | 94,607 | | | | — | | |
| NET EXPENSES | | | 12,026,653 | | | | 884,707 | | | | 1,713,321 | | | | 4,075,916 | | | | 1,918,201 | | |
| NET INVESTMENT INCOME | | | 2,529,817 | | | | 90,963 | | | | 230,963 | | | | 604,578 | | | | 530,227 | | |
REALIZED AND UNREALIZED GAIN (LOSS) ON INVESTMENTS,
FOREIGN CURRENCY RELATED TRANSACTIONS AND
DEFERRED TAXES: | |
| Net realized gain (loss) on investments—Unaffiliated Issuers | | | (5,275,664 | ) | | | 8,318,216 | | | | 10,135,169 | | | | 6,329,357 | | | | 13,845,060 | | |
| Net realized gain on investments—Affiliated Issuers | | | — | | | | — | | | | — | | | | — | | | | — | | |
| Net realized capital gain tax or refund | | | — | | | | — | | | | — | | | | (127,310 | ) | | | 2,282 | | |
| Net realized gain (loss) on foreign currency related transactions | | | (469,636 | ) | | | (374 | ) | | | 12,100 | | | | (169,768 | ) | | | 2,042 | | |
Net change in unrealized appreciation/depreciation
on investments | | | 271,472,211 | | | | 2,529,424 | | | | 19,667,776 | | | | 73,988,713 | | | | 18,113,265 | | |
| Net change in deferred taxes on unrealized appreciation | | | (4,120,779 | ) | | | — | | | | — | | | | (535,102 | ) | | | — | | |
Net change in unrealized appreciation/depreciation on
foreign currency related transactions | | | 32,255 | | | | 13,254 | | | | 9,004 | | | | 3,028 | | | | 1,389 | | |
Net realized and unrealized gain (loss) on investments,
foreign currency related transactions and deferred taxes | | | 261,638,387 | | | | 10,860,520 | | | | 29,824,049 | | | | 79,488,918 | | | | 31,964,038 | | |
| NET INCREASE IN NET ASSETS FROM OPERATIONS | | $ | 264,168,204 | | | $ | 10,951,483 | | | $ | 30,055,012 | | | $ | 80,093,496 | | | $ | 32,494,265 | | |
matthewsasia.com | 800.789.ASIA 65
Statements of Changes in Net Assets
| MATTHEWS ASIAN GROWTH AND INCOME FUND | | Year Ended
December 31, 2010 | | Year Ended
December 31, 2009 | |
| OPERATIONS: | |
| Net investment income (loss) | | $ | 76,604,783 | | | $ | 58,935,074 | | |
| Net realized gain (loss) on investments and foreign currency related transactions | | | 150,498,434 | | | | (37,269,074 | ) | |
Net change in unrealized appreciation/depreciation on investments and foreign currency
related transactions | | | 343,578,273 | | | | 553,007,216 | | |
| Net change on deferred taxes on unrealized appreciation | | | (2,046,819 | ) | | | (4,289 | ) | |
| Net increase in net assets resulting from operations | | | 568,634,671 | | | | 574,668,927 | | |
| DISTRIBUTIONS TO SHAREHOLDERS FROM: | |
| Net investment income: | |
| Investor Shares | | | (92,191,837 | ) | | | (60,961,205 | ) | |
| Institutional Shares | | | (1,997,268 | ) | | | — | | |
| Realized gains on investments: | |
| Investor Shares | | | (50,024,267 | ) | | | — | | |
| Institutional Shares | | | (1,658,347 | ) | | | — | | |
| Net decrease in net assets resulting from distributions | | | (145,871,719 | ) | | | (60,961,205 | ) | |
| CAPITAL SHARE TRANSACTIONS (net) (Note 3) | | | 1,083,951,101 | | | | 943,643,994 | | |
| REDEMPTION FEES | | | 545,556 | | | | 347,176 | | |
| Total increase in net assets | | | 1,507,259,609 | | | | 1,457,698,892 | | |
| NET ASSETS: | |
| Beginning of year | | | 2,547,410,970 | | | | 1,089,712,078 | | |
End of year (including distributions in excess of net investment
income of ($20,902,803) and ($7,490,172), respectively) | | $ | 4,054,670,579 | | | $ | 2,547,410,970 | | |
| MATTHEWS ASIA DIVIDEND FUND | | Year Ended
December 31, 2010 | | Year Ended
December 31, 2009 | |
| OPERATIONS: | |
| Net investment income (loss) | | $ | 23,389,705 | | | $ | 5,662,564 | | |
| Net realized gain (loss) on investments and foreign currency related transactions | | | 35,469,296 | | | | (13,062,275 | ) | |
Net change in unrealized appreciation/depreciation on investments and foreign currency
related transactions | | | 147,788,783 | | | | 72,559,686 | | |
| Net increase in net assets resulting from operations | | | 206,647,784 | | | | 65,159,975 | | |
| DISTRIBUTIONS TO SHAREHOLDERS FROM: | |
| Net investment income: | |
| Investor Shares | | | (39,874,887 | ) | | | (10,189,013 | ) | |
| Institutional Shares | | | (412,958 | ) | | | — | | |
| Realized gains on investments: | |
| Investor Shares | | | (4,928,956 | ) | | | — | | |
| Institutional Shares | | | (93,543 | ) | | | — | | |
| Net decrease in net assets resulting from distributions | | | (45,310,344 | ) | | | (10,189,013 | ) | |
| CAPITAL SHARE TRANSACTIONS (net) (Note 3) | | | 1,497,425,914 | | | | 124,976,685 | | |
| REDEMPTION FEES | | | 909,607 | | | | 104,220 | | |
| Total increase in net assets | | | 1,659,672,961 | | | | 180,051,867 | | |
| NET ASSETS: | |
| Beginning of year | | | 322,003,346 | | | | 141,951,479 | | |
End of year (including distributions in excess of net investment
income of ($19,822,734) and ($4,122,176), respectively) | | $ | 1,981,676,307 | | | $ | 322,003,346 | | |
See accompanying notes to financial statements.
66 MATTHEWS ASIA FUNDS
| MATTHEWS CHINA DIVIDEND FUND | | Year Ended
December 31, 2010 | | Period Ended
December 31, 2009* | |
| OPERATIONS: | |
| Net investment income (loss) | | $ | 321,907 | | | $ | (2,899 | ) | |
| Net realized gain (loss) on investments and foreign currency related transactions | | | 173,576 | | | | 747 | | |
Net change in unrealized appreciation/depreciation on investments and foreign currency
related transactions | | | 4,708,057 | | | | 114,009 | | |
| Net increase in net assets resulting from operations | | | 5,203,540 | | | | 111,857 | | |
| DISTRIBUTIONS TO SHAREHOLDERS FROM: | |
| Net investment income: | |
| Investor Shares | | | (592,422 | ) | | | — | | |
| Institutional Shares | | | (37 | ) | | | — | | |
| Realized gains on investments: | |
| Investor Shares | | | (130,259 | ) | | | — | | |
| Institutional Shares | | | (11 | ) | | | — | | |
| Net decrease in net assets resulting from distributions | | | (722,729 | ) | | | — | | |
| CAPITAL SHARE TRANSACTIONS (net) (Note 3) | | | 33,729,256 | | | | 7,022,503 | | |
| REDEMPTION FEES | | | 23,464 | | | | 98 | | |
| Total increase in net assets | | | 38,233,531 | | | | 7,134,458 | | |
| NET ASSETS: | |
| Beginning of period | | | 7,134,458 | | | | — | | |
End of period (including undistributed/(distributions in excess of) net investment
income of ($234,687) and $613, respectively) | | $ | 45,367,989 | | | $ | 7,134,458 | | |
* The Matthews China Dividend Fund commenced operations on November 30, 2009.
| MATTHEWS ASIA PACIFIC FUND | | Year Ended
December 31, 2010 | | Year Ended
December 31, 2009 | |
| OPERATIONS: | |
| Net investment income (loss) | | $ | 1,626,720 | | | $ | 876,695 | | |
| Net realized gain (loss) on investments and foreign currency related transactions | | | 16,056,192 | | | | (38,793,121 | ) | |
Net change in unrealized appreciation/depreciation on investments and foreign currency
related transactions | | | 45,556,272 | | | | 98,158,273 | | |
| Net increase in net assets resulting from operations | | | 63,239,184 | | | | 60,241,847 | | |
| DISTRIBUTIONS TO SHAREHOLDERS FROM: | |
| Net investment income: | |
| Investor Shares | | | (2,780,209 | ) | | | (3,712,448 | ) | |
| Institutional Shares | | | (75,117 | ) | | | — | | |
| Net decrease in net assets resulting from distributions | | | (2,855,326 | ) | | | (3,712,448 | ) | |
| CAPITAL SHARE TRANSACTIONS (net) (Note 3) | | | 56,161,288 | | | | 3,023,527 | | |
| REDEMPTION FEES | | | 87,020 | | | | 66,709 | | |
| Total increase in net assets | | | 116,632,166 | | | | 59,619,635 | | |
| NET ASSETS: | |
| Beginning of year | | | 227,650,516 | | | | 168,030,881 | | |
End of year (including undistributed/(distributions in excess of) net investment
income of ($1,243,198) and $90,967, respectively) | | $ | 344,282,682 | | | $ | 227,650,516 | | |
See accompanying notes to financial statements.
matthewsasia.com | 800.789.ASIA 67
Statements of Changes in Net Assets
| MATTHEWS PACIFIC TIGER FUND | | Year Ended
December 31, 2010 | | Year Ended
December 31, 2009 | |
| OPERATIONS: | |
| Net investment income (loss) | | $ | 18,824,393 | | | $ | 9,137,790 | | |
| Net realized gain (loss) on investments and foreign currency related transactions | | | 91,394,517 | | | | (24,529,624 | ) | |
Net change in unrealized appreciation/depreciation on investments and foreign currency
related transactions | | | 830,597,872 | | | | 1,192,679,495 | | |
| Net change on deferred taxes on unrealized appreciation | | | 8,914,553 | | | | (11,832,470 | ) | |
| Net increase in net assets resulting from operations | | | 949,731,335 | | | | 1,165,455,191 | | |
| DISTRIBUTIONS TO SHAREHOLDERS FROM: | |
| Net investment income: | |
| Investor Shares | | | (17,017,887 | ) | | | (26,580,408 | ) | |
| Institutional Shares | | | (1,651,056 | ) | | | — | | |
| Net decrease in net assets resulting from distributions | | | (18,668,943 | ) | | | (26,580,408 | ) | |
| CAPITAL SHARE TRANSACTIONS (net) (Note 3) | | | 1,239,784,297 | | | | 1,223,811,012 | | |
| REDEMPTION FEES | | | 620,488 | | | | 618,672 | | |
| Total increase in net assets | | | 2,171,467,177 | | | | 2,363,304,467 | | |
| NET ASSETS: | |
| Beginning of year | | | 3,565,745,011 | | | | 1,202,440,544 | | |
End of year (including distributions in excess of net investment
income of ($22,666,002) and ($19,578,638), respectively) | | $ | 5,737,212,188 | | | $ | 3,565,745,011 | | |
| MATTHEWS CHINA FUND | | Year Ended
December 31, 2010 | | Year Ended
December 31, 2009 | |
| OPERATIONS: | |
| Net investment income (loss) | | $ | 14,384,265 | | | $ | 7,039,626 | | |
| Net realized gain (loss) on investments and foreign currency related transactions | | | 44,898,045 | | | | (29,260,718 | ) | |
Net change in unrealized appreciation/depreciation on investments and foreign currency
related transactions | | | 303,710,525 | | | | 862,559,099 | | |
| Net increase in net assets resulting from operations | | | 362,992,835 | | | | 840,338,007 | | |
| DISTRIBUTIONS TO SHAREHOLDERS FROM: | |
| Net investment income: | |
| Investor Shares | | | (14,473,429 | ) | | | (6,595,986 | ) | |
| Institutional Shares | | | (168,791 | ) | | | — | | |
| Realized gains on investments: | |
| Investor Shares | | | (2,087,326 | ) | | | — | | |
| Institutional Shares | | | (22,416 | ) | | | — | | |
| Net decrease in net assets resulting from distributions | | | (16,751,962 | ) | | | (6,595,986 | ) | |
| CAPITAL SHARE TRANSACTIONS (net) (Note 3) | | | 67,411,208 | | | | 949,569,226 | | |
| REDEMPTION FEES | | | 1,525,454 | | | | 1,589,585 | | |
| Total increase in net assets | | | 415,177,535 | | | | 1,784,900,832 | | |
| NET ASSETS: | |
| Beginning of year | | | 2,566,005,309 | | | | 781,104,477 | | |
End of year (including undistributed/(distributions in excess of) net investment
income of ($14,747) and $318,992, respectively) | | $ | 2,981,182,844 | | | $ | 2,566,005,309 | | |
See accompanying notes to financial statements.
68 MATTHEWS ASIA FUNDS
| MATTHEWS INDIA FUND | | Year Ended
December 31, 2010 | | Year Ended
December 31, 2009 | |
| OPERATIONS: | |
| Net investment income (loss) | | $ | 2,529,817 | | | $ | 2,833,094 | | |
| Net realized gain (loss) on investments and foreign currency related transactions | | | (5,745,300 | ) | | | (42,336,542 | ) | |
Net change in unrealized appreciation/depreciation on investments and foreign currency
related transactions | | | 271,504,466 | | | | 359,067,162 | | |
| Net change on deferred taxes on unrealized appreciation | | | (4,120,779 | ) | | | — | | |
| Net increase in net assets resulting from operations | | | 264,168,204 | | | | 319,563,714 | | |
| DISTRIBUTIONS TO SHAREHOLDERS FROM: | |
| Net investment income: | |
| Investor Shares | | | (5,993,112 | ) | | | (4,170,390 | ) | |
| Institutional Shares | | | (227,962 | ) | | | — | | |
| Realized gains on investments: | |
| Investor Shares | | | — | | | | (5,361,117 | ) | |
| Net decrease in net assets resulting from distributions | | | (6,221,074 | ) | | | (9,531,507 | ) | |
| CAPITAL SHARE TRANSACTIONS (net) (Note 3) | | | 457,321,120 | | | | 93,020,027 | | |
| REDEMPTION FEES | | | 817,039 | | | | 357,124 | | |
| Total increase in net assets | | | 716,085,289 | | | | 403,409,358 | | |
| NET ASSETS: | |
| Beginning of year | | | 720,925,363 | | | | 317,516,005 | | |
End of year (including distributions in excess of net investment
income of ($5,284,949) and ($1,124,056), respectively) | | $ | 1,437,010,652 | | | $ | 720,925,363 | | |
| MATTHEWS JAPAN FUND | | Year Ended
December 31, 2010 | | Year Ended
December 31, 2009 | |
| OPERATIONS: | |
| Net investment income (loss) | | $ | 90,963 | | | $ | 1,039,780 | | |
| Net realized gain (loss) on investments and foreign currency related transactions | | | 8,317,842 | | | | (25,080,335 | ) | |
Net change in unrealized appreciation/depreciation on investments and foreign currency
related transactions | | | 2,542,678 | | | | 34,352,192 | | |
| Net increase in net assets resulting from operations | | | 10,951,483 | | | | 10,311,637 | | |
| DISTRIBUTIONS TO SHAREHOLDERS FROM: | |
| Net investment income: | |
| Investor Shares | | | (2,536,351 | ) | | | (2,466,218 | ) | |
| Institutional Shares | | | (146 | ) | | | — | | |
| Net decrease in net assets resulting from distributions | | | (2,536,497 | ) | | | (2,466,218 | ) | |
| CAPITAL SHARE TRANSACTIONS (net) (Note 3) | | | (28,960,845 | ) | | | (43,296,044 | ) | |
| REDEMPTION FEES | | | 21,817 | | | | 110,632 | | |
| Total decrease in net assets | | | (20,524,042 | ) | | | (35,339,993 | ) | |
| NET ASSETS: | |
| Beginning of year | | | 88,333,736 | | | | 123,673,729 | | |
End of year (including undistributed net investment
income of $606,804 and $1,174,149, respectively) | | $ | 67,809,694 | | | $ | 88,333,736 | | |
See accompanying notes to financial statements.
matthewsasia.com | 800.789.ASIA 69
Statements of Changes in Net Assets
| MATTHEWS KOREA FUND | | Year Ended
December 31, 2010 | | Year Ended
December 31, 2009 | |
| OPERATIONS: | |
| Net investment income (loss) | | $ | 230,963 | | | $ | (383,266 | ) | |
| Net realized gain (loss) on investments and foreign currency related transactions | | | 10,147,269 | | | | 1,204,933 | | |
Net change in unrealized appreciation/depreciation on investments and foreign currency
related transactions | | | 19,676,780 | | | | 51,583,156 | | |
| Net increase in net assets resulting from operations | | | 30,055,012 | | | | 52,404,823 | | |
| DISTRIBUTIONS TO SHAREHOLDERS FROM: | |
| Realized gains on investments: | |
| Investor Shares | | | (3,500,097 | ) | | | (5,234,879 | ) | |
| Institutional Shares | | | (78 | ) | | | — | | |
| Net decrease in net assets resulting from distributions | | | (3,500,175 | ) | | | (5,234,879 | ) | |
| CAPITAL SHARE TRANSACTIONS (net) (Note 3) | | | 2,032,660 | | | | 3,895,556 | | |
| REDEMPTION FEES | | | 35,800 | | | | 51,933 | | |
| Total increase in net assets | | | 28,623,297 | | | | 51,117,433 | | |
| NET ASSETS: | |
| Beginning of year | | | 138,370,568 | | | | 87,253,135 | | |
End of year (including undistributed/(distributions in excess of) net investment
income of $236,840 and ($6,223), respectively) | | $ | 166,993,865 | | | $ | 138,370,568 | | |
| MATTHEWS ASIA SMALL COMPANIES FUND | | Year Ended
December 31, 2010 | | Year Ended
December 31, 2009 | |
| OPERATIONS: | |
| Net investment income (loss) | | $ | 604,578 | | | $ | 46,377 | | |
| Net realized gain (loss) on investments and foreign currency related transactions | | | 6,032,279 | | | | 1,067,704 | | |
Net change in unrealized appreciation/depreciation on investments and foreign currency
related transactions | | | 73,991,741 | | | | 21,072,949 | | |
| Net change on deferred taxes on unrealized appreciation | | | (535,102 | ) | | | (635,975 | ) | |
| Net increase in net assets resulting from operations | | | 80,093,496 | | | | 21,551,055 | | |
| DISTRIBUTIONS TO SHAREHOLDERS FROM: | |
| Net investment income: | |
| Investor Shares | | | (2,294,432 | ) | | | (303,466 | ) | |
| Realized gains on investments: | |
| Investor Shares | | | (3,830,305 | ) | | | (947,544 | ) | |
| Net decrease in net assets resulting from distributions | | | (6,124,737 | ) | | | (1,251,010 | ) | |
| CAPITAL SHARE TRANSACTIONS (net) (Note 3) | | | 363,169,767 | | | | 86,137,752 | | |
| REDEMPTION FEES | | | 230,232 | | | | 114,406 | | |
| Total increase in net assets | | | 437,368,758 | | | | 106,552,203 | | |
| NET ASSETS: | |
| Beginning of year | | | 109,725,561 | | | | 3,173,358 | | |
End of year (including distributions in excess of net investment
income of ($1,827,088) and ($365,943), respectively) | | $ | 547,094,319 | | | $ | 109,725,561 | | |
See accompanying notes to financial statements.
70 MATTHEWS ASIA FUNDS
| MATTHEWS ASIA SCIENCE AND TECHNOLOGY FUND | | Year Ended
December 31, 2010 | | Year Ended
December 31, 2009 | |
| OPERATIONS: | |
| Net investment income (loss) | | $ | 530,227 | | | $ | 24,355 | | |
| Net realized gain (loss) on investments and foreign currency related transactions | | | 13,849,384 | | | | (9,852,216 | ) | |
Net change in unrealized appreciation/depreciation on investments and foreign currency
related transactions | | | 18,114,654 | | | | 58,604,586 | | |
| Net increase in net assets resulting from operations | | | 32,494,265 | | | | 48,776,725 | | |
| DISTRIBUTIONS TO SHAREHOLDERS FROM: | |
| Net investment income: | |
| Investor Shares | | | (394,719 | ) | | | — | | |
| Net decrease in net assets resulting from distributions | | | (394,719 | ) | | | — | | |
| CAPITAL SHARE TRANSACTIONS (net) (Note 3) | | | 27,882,481 | | | | 7,072,491 | | |
| REDEMPTION FEES | | | 86,625 | | | | 41,571 | | |
| Total increase in net assets | | | 60,068,652 | | | | 55,890,787 | | |
| NET ASSETS: | |
| Beginning of year | | | 130,367,111 | | | | 74,476,324 | | |
End of year (including undistributed/(distributions in excess of) net investment
income of $131,538 and ($8,293), respectively) | | $ | 190,435,763 | | | $ | 130,367,111 | | |
See accompanying notes to financial statements.
matthewsasia.com | 800.789.ASIA 71
Financial Highlights
Matthews Asian Growth and Income Fund
The tables below set forth financial data for a share of beneficial interest outstanding throughout each period presented.
| | | Year ended Dec. 31 | |
| INVESTOR SHARES | | 2010 | | 2009 | | 2008 | | 2007 | | 2006 | |
| Net Asset Value, beginning of year | | $ | 15.77 | | | $ | 11.50 | | | $ | 19.78 | | | $ | 18.68 | | | $ | 17.14 | | |
| INCOME (LOSS) FROM INVESTMENT OPERATIONS: | |
| Net investment income (loss) | | | 0.411 | | | | 0.481 | | | | 0.541 | | | | 1.07 | | | | 0.46 | | |
Net realized gain (loss) and unrealized appreciation/depreciation
on investments and foreign currency | | | 2.57 | | | | 4.23 | | | | (6.73 | ) | | | 2.93 | | | | 3.47 | | |
| Total from investment operations | | | 2.98 | | | | 4.71 | | | | (6.19 | ) | | | 4.00 | | | | 3.93 | | |
| LESS DISTRIBUTIONS FROM: | |
| Net investment income | | | (0.47 | ) | | | (0.44 | ) | | | (0.42 | ) | | | (0.90 | ) | | | (0.62 | ) | |
| Net realized gains on investments | | | (0.24 | ) | | | — | | | | (1.67 | ) | | | (2.00 | ) | | | (1.77 | ) | |
| Total distributions | | | (0.71 | ) | | | (0.44 | ) | | | (2.09 | ) | | | (2.90 | ) | | | (2.39 | ) | |
| Paid-in capital from redemption fees (Note 3) | | | —2 | | | | —2 | | | | —2 | | | | —2 | | | | —2 | | |
| Net Asset Value, end of year | | $ | 18.04 | | | $ | 15.77 | | | $ | 11.50 | | | $ | 19.78 | | | $ | 18.68 | | |
| TOTAL RETURN | | | 19.18 | % | | | 41.44 | % | | | (32.07 | %) | | | 21.54 | % | | | 23.38 | % | |
| RATIOS/SUPPLEMENTAL DATA | |
| Net assets, end of year (in 000's) | | $ | 3,926,253 | | | $ | 2,547,411 | | | $ | 1,089,712 | | | $ | 2,273,408 | | | $ | 2,021,363 | | |
Ratio of expenses to average net assets before any reimbursement,
waiver or recapture of expenses by Advisor and Administrator (Note 4) | | | 1.13 | % | | | 1.18 | % | | | 1.16 | % | | | 1.16 | % | | | 1.20 | % | |
Ratio of expenses to average net assets after any reimbursement,
waiver or recapture of expenses by Advisor and Administrator | | | 1.13 | % | | | 1.18 | % | | | 1.16 | % | | | 1.15 | % | | | 1.19 | % | |
| Ratio of net investment income (loss) to average net assets | | | 2.47 | % | | | 3.47 | % | | | 3.19 | % | | | 2.59 | % | | | 2.27 | % | |
| Portfolio turnover | | | 19.84 | %3 | | | 17.51 | % | | | 25.16 | % | | | 27.93 | % | | | 28.37 | % | |
| INSTITUTIONAL SHARES | | Period Ended
Dec. 31, 20104 | |
| Net Asset Value, beginning of period | | $ | 18.13 | | |
| INCOME (LOSS) FROM INVESTMENT OPERATIONS: | |
| Net investment income (loss)1 | | | 0.07 | | |
Net realized gain (loss) and unrealized appreciation/depreciation
on investments and foreign currency | | | 0.37 | | |
| Total from investment operations | | | 0.44 | | |
| LESS DISTRIBUTIONS FROM: | |
| Net investment income | | | (0.29 | ) | |
| Net realized gains on investments | | | (0.24 | ) | |
| Total distributions | | | (0.53 | ) | |
| Paid-in capital from redemption fees (Note 3) | | | — | | |
| Net Asset Value, end of period | | $ | 18.04 | | |
| TOTAL RETURN | | | 2.49 | %5 | |
| RATIOS/SUPPLEMENTAL DATA | |
| Net assets, end of period (in 000's) | | $ | 128,417 | | |
Ratio of expenses to average net assets before any reimbursement,
waiver or recapture of expenses by Advisor and Administrator (Note 4) | | | 0.93 | %6 | |
| Ratio of net investment income to average net assets | | | 2.46 | %6 | |
| Portfolio turnover | | | 19.84 | %3,5 | |
1 Calculated using the average daily shares method.
2 Less than $0.01 per share.
3 The portfolio turnover rate is calculated on the Fund as a whole without distinguishing between classes of share issues.
4 Institutional Shares commenced operations on October 29, 2010.
5 Not annualized.
6 Annualized.
See accompanying notes to financial statements.
72 MATTHEWS ASIA FUNDS
Matthews Asia Dividend Fund
The tables below set forth financial data for a share of beneficial interest outstanding throughout each period presented.
| | | Year ended Dec. 31 | | Period Ended | |
| INVESTOR SHARES | | 2010 | | 2009 | | 2008 | | 2007 | | Dec. 31, 20061 | |
| Net Asset Value, beginning of period | | $ | 12.06 | | | $ | 8.61 | | | $ | 12.00 | | | $ | 10.77 | | | $ | 10.00 | | |
| INCOME (LOSS) FROM INVESTMENT OPERATIONS: | |
| Net investment income (loss) | | | 0.312 | | | | 0.322 | | | | 0.382 | | | | 0.27 | | | | 0.02 | | |
Net realized gain (loss) and unrealized appreciation/depreciation
on investments and foreign currency | | | 2.40 | | | | 3.67 | | | | (3.47 | ) | | | 1.67 | | | | 0.77 | | |
| Total from investment operations | | | 2.71 | | | | 3.99 | | | | (3.09 | ) | | | 1.94 | | | | 0.79 | | |
| LESS DISTRIBUTIONS FROM: | |
| Net investment income | | | (0.41 | ) | | | (0.55 | ) | | | (0.30 | ) | | | (0.27 | ) | | | (0.02 | ) | |
| Net realized gains on investments | | | (0.04 | ) | | | — | | | | (0.02 | ) | | | (0.45 | ) | | | — | | |
| Total distributions | | | (0.45 | ) | | | (0.55 | ) | | | (0.32 | ) | | | (0.72 | ) | | | (0.02 | ) | |
| Paid-in capital from redemption fees (Note 3) | | | 0.01 | | | | 0.01 | | | | 0.02 | | | | 0.01 | | | | —3 | | |
| Net Asset Value, end of period | | $ | 14.33 | | | $ | 12.06 | | | $ | 8.61 | | | $ | 12.00 | | | $ | 10.77 | | |
| TOTAL RETURN | | | 22.83 | % | | | 47.59 | % | | | (25.97 | %) | | | 18.05 | % | | | 7.90 | %4 | |
| RATIOS/SUPPLEMENTAL DATA | |
| Net assets, end of period (in 000's) | | $ | 1,933,383 | | | $ | 322,003 | | | $ | 141,951 | | | $ | 81,624 | | | $ | 25,740 | | |
Ratio of expenses to average net assets before any reimbursement,
waiver or recapture of expenses by Advisor and Administrator (Note 4) | | | 1.14 | % | | | 1.28 | % | | | 1.35 | % | | | 1.42 | % | | | 2.93 | %5 | |
Ratio of expenses to average net assets after any reimbursement,
waiver or recapture of expenses by Advisor and Administrator | | | 1.15 | % | | | 1.30 | % | | | 1.32 | % | | | 1.39 | % | | | 1.50 | %5 | |
| Ratio of net investment income (loss) to average net assets | | | 2.31 | % | | | 3.16 | % | | | 3.74 | % | | | 2.66 | % | | | 1.34 | %5 | |
| Portfolio turnover | | | 10.48 | %6 | | | 32.41 | % | | | 25.07 | % | | | 26.95 | % | | | 0.00 | %4 | |
| INSTITUTIONAL SHARES | | Period Ended
Dec. 31, 20107 | |
| Net Asset Value, beginning of period | | $ | 14.13 | | |
| INCOME (LOSS) FROM INVESTMENT OPERATIONS: | |
| Net investment income (loss)2 | | | 0.09 | | |
Net realized gain (loss) and unrealized appreciation/depreciation
on investments and foreign currency | | | 0.32 | | |
| Total from investment operations | | | 0.41 | | |
| LESS DISTRIBUTIONS FROM: | |
| Net investment income | | | (0.17 | ) | |
| Net realized gains on investments | | | (0.04 | ) | |
| Total distributions | | | (0.21 | ) | |
| Paid-in capital from redemption fees (Note 3) | | | —3 | | |
| Net Asset Value, end of period | | $ | 14.33 | | |
| TOTAL RETURN | | | 2.95 | %4 | |
| RATIOS/SUPPLEMENTAL DATA | |
| Net assets, end of period (in 000's) | | $ | 48,293 | | |
Ratio of expenses to average net assets before any reimbursement,
waiver or recapture of expenses by Advisor and Administrator (Note 4) | | | 1.02 | %5 | |
| Ratio of net investment income (loss) to average net assets | | | 3.86 | %5 | |
| Portfolio turnover | | | 10.48 | %4,6 | |
1 Investor Shares commenced operations on October 31, 2006.
2 Calculated using the average daily shares method.
3 Less than $0.01 per share.
4 Not annualized.
5 Annualized.
6 The portfolio turnover rate is calculated on the Fund as a whole without distinguishing between classes of share issues.
7 Institutional Shares commenced operations on October 29, 2010.
See accompanying notes to financial statements.
matthewsasia.com | 800.789.ASIA 73
Financial Highlights
Matthews China Dividend Fund
The tables below set forth financial data for a share of beneficial interest outstanding throughout each period presented.
| INVESTOR SHARES | | Year Ended
Dec. 31, 2010 | | Period Ended
Dec. 31, 20091 | |
| Net Asset Value, beginning of period | | $ | 10.18 | | | $ | 10.00 | | |
| INCOME (LOSS) FROM INVESTMENT OPERATIONS: | |
| Net investment income (loss)2 | | | 0.17 | | | | (0.01 | ) | |
Net realized gain (loss) and unrealized appreciation/depreciation
on investments and foreign currency | | | 2.09 | | | | 0.19 | | |
| Total from investment operations | | | 2.26 | | | | 0.18 | | |
| LESS DISTRIBUTIONS FROM: | |
| Net investment income | | | (0.24 | ) | | | — | | |
| Net realized gains on investments | | | (0.04 | ) | | | — | | |
| Total distributions | | | (0.28 | ) | | | — | | |
| Paid-in capital from redemption fees (Note 3) | | | 0.01 | | | | —3 | | |
| Net Asset Value, end of period | | $ | 12.17 | | | $ | 10.18 | | |
| TOTAL RETURN | | | 22.53 | % | | | 1.80 | %4 | |
| RATIOS/SUPPLEMENTAL DATA | |
| Net assets, end of year (in 000's) | | $ | 45,364 | | | $ | 7,134 | | |
Ratio of expenses to average net assets before any reimbursement
or waiver of expenses by Advisor (Note 4) | | | 1.95 | % | | | 10.50 | %5 | |
Ratio of expenses to average net assets after any reimbursement
or waiver of expenses by Advisor | | | 1.50 | % | | | 1.50 | %5 | |
| Ratio of net investment income (loss) to average net assets | | | 1.49 | % | | | (0.81 | %)5 | |
| Portfolio turnover | | | 6.84 | %6 | | | 0.00 | %4 | |
| INSTITUTIONAL SHARES | | Period Ended
Dec. 31, 20107 | |
| Net Asset Value, beginning of period | | $ | 11.87 | | |
| INCOME (LOSS) FROM INVESTMENT OPERATIONS: | |
| Net investment income (loss)2 | | | —3 | | |
Net realized gain (loss) and unrealized appreciation/depreciation
on investments and foreign currency | | | 0.47 | | |
| Total from investment operations | | | 0.47 | | |
| LESS DISTRIBUTIONS FROM: | |
| Net investment income | | | (0.13 | ) | |
| Net realized gains on investments | | | (0.04 | ) | |
| Total distributions | | | (0.17 | ) | |
| Paid-in capital from redemption fees (Note 3) | | | — | | |
| Net Asset Value, end of period | | $ | 12.17 | | |
| TOTAL RETURN | | | 3.91 | %4 | |
| RATIOS/SUPPLEMENTAL DATA | |
| Net assets, end of period (in 000's) | | $ | 4 | | |
Ratio of expenses to average net assets before any reimbursement
or waiver of expenses by Advisor (Note 4) | | | 1.24 | %5 | |
| Ratio of net investment income (loss) to average net assets | | | (0.06 | %)5 | |
| Portfolio turnover | | | 6.84 | %4,6 | |
1 Investor Shares commenced operations on November 30, 2009.
2 Calculated using the average daily shares method.
3 Less than $0.01 per share.
4 Not annualized.
5 Annualized.
6 The portfolio turnover rate is calculated on the Fund as a whole without distinguishing between classes of share issues.
7 Institutional Shares commenced operations on October 29, 2010.
See accompanying notes to financial statements.
74 MATTHEWS ASIA FUNDS
Matthews Asia Pacific Fund
The tables below set forth financial data for a share of beneficial interest outstanding throughout each period presented.
| | | Year ended Dec. 31 | |
| INVESTOR SHARES | | 2010 | | 2009 | | 2008 | | 2007 | | 2006 | |
| Net Asset Value, beginning of year | | $ | 14.29 | | | $ | 10.03 | | | $ | 17.29 | | | $ | 16.92 | | | $ | 14.89 | | |
| INCOME (LOSS) FROM INVESTMENT OPERATIONS: | |
| Net investment income (loss) | | | 0.101 | | | | 0.061 | | | | 0.131 | | | | 0.09 | | | | 0.07 | | |
Net realized gain (loss) and unrealized appreciation/depreciation
on investments and foreign currency | | | 3.72 | | | | 4.44 | | | | (6.64 | ) | | | 2.02 | | | | 2.50 | | |
| Total from investment operations | | | 3.82 | | | | 4.50 | | | | (6.51 | ) | | | 2.11 | | | | 2.57 | | |
| LESS DISTRIBUTIONS FROM: | |
| Net investment income | | | (0.15 | ) | | | (0.24 | ) | | | — | | | | (0.09 | ) | | | (0.07 | ) | |
| Net realized gains on investments | | | — | | | | — | | | | (0.76 | ) | | | (1.66 | ) | | | (0.48 | ) | |
| Total distributions | | | (0.15 | ) | | | (0.24 | ) | | | (0.76 | ) | | | (1.75 | ) | | | (0.55 | ) | |
| Paid-in capital from redemption fees (Note 3) | | | 0.01 | | | | —2 | | | | 0.01 | | | | 0.01 | | | | 0.01 | | |
| Net Asset Value, end of year | | $ | 17.97 | | | $ | 14.29 | | | $ | 10.03 | | | $ | 17.29 | | | $ | 16.92 | | |
| TOTAL RETURN | | | 26.85 | % | | | 44.82 | % | | | (37.44 | %) | | | 11.92 | % | | | 17.39 | % | |
| RATIOS/SUPPLEMENTAL DATA | |
| Net assets, end of year (in 000's) | | $ | 335,429 | | | $ | 227,651 | | | $ | 168,031 | | | $ | 471,054 | | | $ | 449,699 | | |
Ratio of expenses to average net assets before any reimbursement,
waiver or recapture of expenses by Advisor and Administrator (Note 4) | | | 1.19 | % | | | 1.28 | % | | | 1.23 | % | | | 1.20 | % | | | 1.26 | % | |
Ratio of expenses to average net assets after any reimbursement,
waiver or recapture of expenses by Advisor and Administrator | | | 1.19 | % | | | 1.28 | % | | | 1.23 | % | | | 1.20 | % | | | 1.24 | % | |
| Ratio of net investment income (loss) to average net assets | | | 0.63 | % | | | 0.50 | % | | | 0.93 | % | | | 0.60 | % | | | 0.47 | % | |
| Portfolio turnover | | | 26.33 | %3 | | | 58.10 | % | | | 37.10 | % | | | 40.49 | % | | | 40.45 | % | |
| INSTITUTIONAL SHARES | | Period Ended
Dec. 31, 20104 | |
| Net Asset Value, beginning of period | | $ | 17.65 | | |
| INCOME (LOSS) FROM INVESTMENT OPERATIONS: | |
| Net investment income (loss)1 | | | 0.01 | | |
Net realized gain (loss) and unrealized appreciation/depreciation
on investments and foreign currency | | | 0.47 | | |
| Total from investment operations | | | 0.48 | | |
| LESS DISTRIBUTIONS FROM: | |
| Net investment income | | | (0.15 | ) | |
| Total distributions | | | (0.15 | ) | |
| Paid-in capital from redemption fees (Note 3) | | | — | | |
| Net Asset Value, end of period | | $ | 17.98 | | |
| TOTAL RETURN | | | 2.76 | %5 | |
| RATIOS/SUPPLEMENTAL DATA | |
| Net assets, end of period (in 000's) | | $ | 8,853 | | |
Ratio of expenses to average net assets before any reimbursement,
waiver or recapture of expenses by Advisor and Administrator (Note 4) | | | 0.99 | %6 | |
| Ratio of net investment income (loss) to average net assets | | | 0.37 | %6 | |
| Portfolio turnover | | | 26.33 | %3,5 | |
1 Calculated using the average daily shares method.
2 Less than $0.01 per share.
3 The portfolio turnover rate is calculated on the Fund as a whole without distinguishing between classes of share issues.
4 Institutional Shares commenced operations on October 29, 2010.
5 Not annualized.
6 Annualized.
See accompanying notes to financial statements.
matthewsasia.com | 800.789.ASIA 75
Financial Highlights
Matthews Pacific Tiger Fund
The tables below set forth financial data for a share of beneficial interest outstanding throughout each period presented.
| | | Year ended Dec. 31 | |
| INVESTOR SHARES | | 2010 | | 2009 | | 2008 | | 2007 | | 2006 | |
| Net Asset Value, beginning of year | | $ | 19.23 | | | $ | 11.05 | | | $ | 27.86 | | | $ | 23.71 | | | $ | 19.27 | | |
| INCOME (LOSS) FROM INVESTMENT OPERATIONS: | |
| Net investment income (loss) | | | 0.091 | | | | 0.061 | | | | 0.241 | | | | 0.30 | | | | 0.22 | | |
Net realized gain (loss) and unrealized appreciation/depreciation
on investments and foreign currency | | | 4.20 | | | | 8.27 | | | | (13.31 | ) | | | 7.78 | | | | 5.01 | | |
| Total from investment operations | | | 4.29 | | | | 8.33 | | | | (13.07 | ) | | | 8.08 | | | | 5.23 | | |
| LESS DISTRIBUTIONS FROM: | |
| Net investment income | | | (0.08 | ) | | | (0.15 | ) | | | (0.30 | ) | | | (0.31 | ) | | | (0.21 | ) | |
| Net realized gains on investments | | | — | | | | — | | | | (3.44 | ) | | | (3.62 | ) | | | (0.58 | ) | |
| Total distributions | | | (0.08 | ) | | | (0.15 | ) | | | (3.74 | ) | | | (3.93 | ) | | | (0.79 | ) | |
| Paid-in capital from redemption fees (Note 3) | | | —2 | | | | — | | | | —2 | | | | —2 | | | | —2 | | |
| Net Asset Value, end of year | | $ | 23.44 | | | $ | 19.23 | | | $ | 11.05 | | | $ | 27.86 | | | $ | 23.71 | | |
| TOTAL RETURN | | | 22.30 | % | | | 75.37 | % | | | (46.12 | %) | | | 33.66 | % | | | 27.22 | % | |
| RATIOS/SUPPLEMENTAL DATA | |
| Net assets, end of year (in 000's) | | $ | 5,196,743 | | | $ | 3,565,745 | | | $ | 1,202,441 | | | $ | 3,806,714 | | | $ | 3,303,717 | | |
Ratio of expenses to average net assets before any reimbursement,
waiver or recapture of expenses by Advisor and Administrator (Note 4) | | | 1.09 | % | | | 1.13 | % | | | 1.12 | % | | | 1.11 | % | | | 1.18 | % | |
Ratio of expenses to average net assets after any reimbursement,
waiver or recapture of expenses by Advisor and Administrator | | | 1.09 | % | | | 1.13 | % | | | 1.12 | % | | | 1.10 | % | | | 1.16 | % | |
| Ratio of net investment income (loss) to average net assets | | | 0.43 | % | | | 0.41 | % | | | 1.10 | % | | | 1.12 | % | | | 1.12 | % | |
| Portfolio turnover | | | 11.43 | %3 | | | 13.22 | % | | | 16.76 | % | | | 24.09 | % | | | 18.80 | % | |
| INSTITUTIONAL SHARES | | Period Ended
Dec. 31, 20104 | |
| Net Asset Value, beginning of period | | $ | 23.37 | | |
| INCOME (LOSS) FROM INVESTMENT OPERATIONS: | |
| Net investment income (loss)1 | | | 0.01 | | |
Net realized gain (loss) and unrealized appreciation/depreciation
on investments and foreign currency | | | 0.15 | | |
| Total from investment operations | | | 0.16 | | |
| LESS DISTRIBUTIONS FROM: | |
| Net investment income | | | (0.09 | ) | |
| Total distributions | | | (0.09 | ) | |
| Paid-in capital from redemption fees (Note 3) | | | —2 | | |
| Net Asset Value, end of period | | $ | 23.44 | | |
| TOTAL RETURN | | | 0.67 | %5 | |
| RATIOS/SUPPLEMENTAL DATA | |
| Net assets, end of period (in 000's) | | $ | 540,469 | | |
Ratio of expenses to average net assets before any reimbursement,
waiver or recapture of expenses by Advisor and Administrator (Note 4) | | | 0.95 | %6 | |
| Ratio of net investment income (loss) to average net assets | | | 0.38 | %6 | |
| Portfolio turnover | | | 11.43 | %3,5 | |
1 Calculated using the average daily shares method.
2 Less than $0.01 per share.
3 The portfolio turnover rate is calculated on the Fund as a whole without distinguishing between classes of share issues.
4 Institutional Shares commenced operations on October 29, 2010.
5 Not annualized.
6 Annualized.
See accompanying notes to financial statements.
76 MATTHEWS ASIA FUNDS
Matthews China Fund
The tables below set forth financial data for a share of beneficial interest outstanding throughout each period presented.
| | | Year ended Dec. 31 | |
| INVESTOR SHARES | | 2010 | | 2009 | | 2008 | | 2007 | | 2006 | |
| Net Asset Value, beginning of year | | $ | 25.50 | | | $ | 14.34 | | | $ | 39.73 | | | $ | 24.16 | | | $ | 14.76 | | |
| INCOME (LOSS) FROM INVESTMENT OPERATIONS: | |
| Net investment income (loss) | | | 0.151 | | | | 0.091 | | | | 0.301 | | | | 0.12 | | | | 0.15 | | |
Net realized gain (loss) and unrealized appreciation/depreciation
on investments and foreign currency | | | 3.86 | | | | 11.12 | | | | (19.78 | ) | | | 16.85 | | | | 9.39 | | |
| Total from investment operations | | | 4.01 | | | | 11.21 | | | | (19.48 | ) | | | 16.97 | | | | 9.54 | | |
| LESS DISTRIBUTIONS FROM: | |
| Net investment income | | | (0.15 | ) | | | (0.07 | ) | | | (0.33 | ) | | | (0.11 | ) | | | (0.15 | ) | |
| Net realized gains on investments | | | (0.02 | ) | | | — | | | | (5.62 | ) | | | (1.37 | ) | | | — | | |
| Return of capital | | | — | | | | — | | | | — | | | | — | | | | —2 | | |
| Total distributions | | | (0.17 | ) | | | (0.07 | ) | | | (5.95 | ) | | | (1.48 | ) | | | (0.15 | ) | |
| Paid-in capital from redemption fees (Note 3) | | | 0.02 | | | | 0.02 | | | | 0.04 | | | | 0.08 | | | | 0.01 | | |
| Net Asset Value, end of year | | $ | 29.36 | | | $ | 25.50 | | | $ | 14.34 | | | $ | 39.73 | | | $ | 24.16 | | |
| TOTAL RETURN | | | 15.77 | % | | | 78.30 | % | | | (48.95 | %) | | | 70.14 | % | | | 64.81 | % | |
| RATIOS/SUPPLEMENTAL DATA | |
| Net assets, end of year (in 000's) | | $ | 2,939,638 | | | $ | 2,566,005 | | | $ | 781,104 | | | $ | 2,335,402 | | | $ | 966,528 | | |
Ratio of expenses to average net assets before any reimbursement,
waiver or recapture of expenses by Advisor and Administrator (Note 4) | | | 1.15 | % | | | 1.21 | % | | | 1.23 | % | | | 1.18 | % | | | 1.27 | % | |
Ratio of expenses to average net assets after any reimbursement,
waiver or recapture of expenses by Advisor and Administrator | | | 1.15 | % | | | 1.21 | % | | | 1.23 | % | | | 1.17 | % | | | 1.26 | % | |
| Ratio of net investment income (loss) to average net assets | | | 0.54 | % | | | 0.46 | % | | | 1.03 | % | | | 0.49 | % | | | 0.96 | % | |
| Portfolio turnover | | | 9.98 | %3 | | | 5.28 | % | | | 7.91 | % | | | 22.13 | % | | | 11.65 | % | |
| INSTITUTIONAL SHARES | | Period Ended
Dec. 31, 20104 | |
| Net Asset Value, beginning of period | | $ | 30.02 | | |
| INCOME (LOSS) FROM INVESTMENT OPERATIONS: | |
| Net investment income (loss)1 | | | (0.04 | ) | |
Net realized gain (loss) and unrealized appreciation/depreciation
on investments and foreign currency | | | (0.44 | ) | |
| Total from investment operations | | | (0.48 | ) | |
| LESS DISTRIBUTIONS FROM: | |
| Net investment income | | | (0.16 | ) | |
| Net realized gains on investments | | | (0.02 | ) | |
| Total distributions | | | (0.18 | ) | |
| Paid-in capital from redemption fees (Note 3) | | | — | | |
| Net Asset Value, end of period | | $ | 29.36 | | |
| TOTAL RETURN | | | (1.62 | %)5 | |
| RATIOS/SUPPLEMENTAL DATA | |
| Net assets, end of period (in 000's) | | $ | 41,545 | | |
Ratio of expenses to average net assets before any reimbursement,
waiver or recapture of expenses by Advisor and Administrator (Note 4) | | | 0.97 | %6 | |
| Ratio of net investment income loss to average net assets | | | (0.74 | %)6 | |
| Portfolio turnover | | | 9.98 | %3,5 | |
1 Calculated using the average daily shares method.
2 Less than $0.01 per share.
3 The portfolio turnover rate is calculated on the Fund as a whole without distinguishing between classes of share issues.
4 Institutional Shares commenced operations on October 29, 2010.
5 Not annualized.
6 Annualized.
See accompanying notes to financial statements.
matthewsasia.com | 800.789.ASIA 77
Financial Highlights
Matthews India Fund
The tables below set forth financial data for a share of beneficial interest outstanding throughout each period presented.
| | | Year ended Dec. 31 | |
| INVESTOR SHARES | | 2010 | | 2009 | | 2008 | | 2007 | | 2006 | |
| Net Asset Value, beginning of year | | $ | 16.29 | | | $ | 8.37 | | | $ | 24.44 | | | $ | 15.45 | | | $ | 11.32 | | |
| INCOME (LOSS) FROM INVESTMENT OPERATIONS: | |
| Net investment income (loss) | | | 0.051 | | | | 0.071 | | | | 0.031 | | | | (0.01 | ) | | | (0.01 | ) | |
Net realized gain (loss) and unrealized appreciation/depreciation
on investments and foreign currency | | | 5.22 | | | | 8.06 | | | | (15.33 | ) | | | 9.87 | | | | 4.11 | | |
| Total from investment operations | | | 5.27 | | | | 8.13 | | | | (15.30 | ) | | | 9.86 | | | | 4.10 | | |
| LESS DISTRIBUTIONS FROM: | |
| Net investment income | | | (0.09 | ) | | | (0.10 | ) | | | (0.11 | ) | | | (0.21 | ) | | | — | | |
| Net realized gains on investments | | | — | | | | (0.12 | ) | | | (0.69 | ) | | | (0.68 | ) | | | — | | |
| Total distributions | | | (0.09 | ) | | | (0.22 | ) | | | (0.80 | ) | | | (0.89 | ) | | | — | | |
| Paid-in capital from redemption fees (Note 3) | | | 0.02 | | | | 0.01 | | | | 0.03 | | | | 0.02 | | | | 0.03 | | |
| Net Asset Value, end of year | | $ | 21.49 | | | $ | 16.29 | | | $ | 8.37 | | | $ | 24.44 | | | $ | 15.45 | | |
| TOTAL RETURN | | | 32.53 | % | | | 97.25 | % | | | (62.32 | %) | | | 64.13 | % | | | 36.48 | % | |
| RATIOS/SUPPLEMENTAL DATA | |
| Net assets, end of year (in 000's) | | $ | 1,388,892 | | | $ | 720,925 | | | $ | 317,516 | | | $ | 1,311,072 | | | $ | 669,643 | | |
Ratio of expenses to average net assets before any reimbursement,
waiver or recapture of expenses by Advisor and Administrator (Note 4) | | | 1.18 | % | | | 1.27 | % | | | 1.29 | % | | | 1.29 | % | | | 1.41 | % | |
Ratio of expenses to average net assets after any reimbursement,
waiver or recapture of expenses by Advisor and Administrator | | | 1.18 | % | | | 1.27 | % | | | 1.29 | % | | | 1.28 | % | | | 1.41 | % | |
| Ratio of net investment income (loss) to average net assets | | | 0.25 | % | | | 0.59 | % | | | 0.16 | % | | | (0.04 | %) | | | (0.08 | %) | |
| Portfolio turnover | | | 6.14 | %2 | | | 18.09 | % | | | 26.68 | % | | | 25.59 | % | | | 21.57 | % | |
| INSTITUTIONAL SHARES | | Period Ended
Dec. 31, 20103 | |
| Net Asset Value, beginning of period | | $ | 22.03 | | |
| INCOME (LOSS) FROM INVESTMENT OPERATIONS: | |
| Net investment income (loss)1 | | | (0.02 | ) | |
Net realized gain (loss) and unrealized appreciation/depreciation
on investments and foreign currency | | | (0.43 | ) | |
| Total from investment operations | | | (0.45 | ) | |
| LESS DISTRIBUTIONS FROM: | |
| Net investment income | | | (0.10 | ) | |
| Total distributions | | | (0.10 | ) | |
| Paid-in capital from redemption fees (Note 3) | | | — | | |
| Net Asset Value, end of period | | $ | 21.48 | | |
| TOTAL RETURN | | | (2.01 | %)4 | |
| RATIOS/SUPPLEMENTAL DATA | |
| Net assets, end of period (in 000's) | | $ | 48,119 | | |
Ratio of expenses to average net assets before any reimbursement,
waiver or recapture of expenses by Advisor and Administrator (Note 4) | | | 0.99 | %5 | |
| Ratio of net investment income (loss) to average net assets | | | (0.51 | %)5 | |
| Portfolio turnover | | | 6.14 | %2,4 | |
1 Calculated using the average daily shares method.
2 The portfolio turnover rate is calculated on the Fund as a whole without distinguishing between classes of share issues.
3 Institutional Shares commenced operations on October 29, 2010.
4 Not annualized.
5 Annualized.
See accompanying notes to financial statements.
78 MATTHEWS ASIA FUNDS
Matthews Japan Fund
The tables below set forth financial data for a share of beneficial interest outstanding throughout each period presented.
| | | Year ended Dec. 31 | |
| INVESTOR SHARES | | 2010 | | 2009 | | 2008 | | 2007 | | 2006 | |
| Net Asset Value, beginning of year | | $ | 10.91 | | | $ | 10.19 | | | $ | 14.55 | | | $ | 17.29 | | | $ | 18.48 | | |
| INCOME (LOSS) FROM INVESTMENT OPERATIONS: | |
| Net investment income (loss) | | | 0.021 | | | | 0.101 | | | | 0.111 | | | | 0.03 | | | | (0.08 | ) | |
Net realized gain (loss) and unrealized appreciation/depreciation
on investments and foreign currency | | | 2.09 | | | | 0.92 | | | | (4.26 | ) | | | (1.86 | ) | | | (1.12 | ) | |
| Total from investment operations | | | 2.11 | | | | 1.02 | | | | (4.15 | ) | | | (1.83 | ) | | | (1.20 | ) | |
| LESS DISTRIBUTIONS FROM: | |
| Net investment income | | | (0.49 | ) | | | (0.31 | ) | | | — | | | | (0.01 | ) | | | — | | |
| Net realized gains on investments | | | — | | | | — | | | | (0.22 | ) | | | (0.91 | ) | | | — | | |
| Total distributions | | | (0.49 | ) | | | (0.31 | ) | | | (0.22 | ) | | | (0.92 | ) | | | — | | |
| Paid-in capital from redemption fees (Note 3) | | | —2 | | | | 0.01 | | | | 0.01 | | | | 0.01 | | | | 0.01 | | |
| Net Asset Value, end of year | | $ | 12.53 | | | $ | 10.91 | | | $ | 10.19 | | | $ | 14.55 | | | $ | 17.29 | | |
| TOTAL RETURN | | | 19.58 | % | | | 10.06 | % | | | (28.38 | %) | | | (10.96 | %) | | | (6.44 | %) | |
| RATIOS/SUPPLEMENTAL DATA | |
| Net assets, end of year (in 000's) | | $ | 67,805 | | | $ | 88,334 | | | $ | 123,674 | | | $ | 166,860 | | | $ | 276,656 | | |
Ratio of expenses to average net assets before any reimbursement,
waiver or recapture of expenses by Advisor and Administrator (Note 4) | | | 1.30 | % | | | 1.31 | % | | | 1.23 | % | | | 1.24 | % | | | 1.25 | % | |
Ratio of expenses to average net assets after any reimbursement,
waiver or recapture of expenses by Advisor and Administrator | | | 1.30 | % | | | 1.31 | % | | | 1.23 | % | | | 1.23 | % | | | 1.24 | % | |
| Ratio of net investment income (loss) to average net assets | | | 0.13 | % | | | 0.97 | % | | | 0.84 | % | | | (0.01 | %) | | | (0.29 | %) | |
| Portfolio turnover | | | 46.29 | %3 | | | 126.75 | % | | | 88.97 | % | | | 45.51 | % | | | 59.95 | % | |
| INSTITUTIONAL SHARES | | Period Ended
Dec. 31, 20104 | |
| Net Asset Value, beginning of period | | $ | 11.73 | | |
| INCOME (LOSS) FROM INVESTMENT OPERATIONS: | |
| Net investment income (loss)1 | | | (0.01 | ) | |
Net realized gain (loss) and unrealized appreciation/depreciation
on investments and foreign currency | | | 1.30 | | |
| Total from investment operations | | | 1.29 | | |
| LESS DISTRIBUTIONS FROM: | |
| Net investment income | | | (0.49 | ) | |
| Total distributions | | | (0.49 | ) | |
| Paid-in capital from redemption fees (Note 3) | | | — | | |
| Net Asset Value, end of period | | $ | 12.53 | | |
| TOTAL RETURN | | | 11.22 | %5 | |
| RATIOS/SUPPLEMENTAL DATA | |
| Net assets, end of period (in 000's) | | $ | 4 | | |
Ratio of expenses to average net assets before any reimbursement,
waiver or recapture of expenses by Advisor and Administrator (Note 4) | | | 1.08 | %6 | |
| Ratio of net investment income (loss) to average net assets | | | (0.51 | %)6 | |
| Portfolio turnover | | | 46.29 | %3,5 | |
1 Calculated using the average daily shares method.
2 Less than $0.01 per share.
3 The portfolio turnover rate is calculated on the Fund as a whole without distinguishing between classes of share issues.
4 Institutional Shares commenced operations on October 29, 2010.
5 Not annualized.
6 Annualized.
See accompanying notes to financial statements.
matthewsasia.com | 800.789.ASIA 79
Financial Highlights
Matthews Korea Fund
The tables below set forth financial data for a share of beneficial interest outstanding throughout each period presented.
| | | Year ended Dec. 31 | |
| INVESTOR SHARES | | 2010 | | 2009 | | 2008 | | 2007 | | 2006 | |
| Net Asset Value, beginning of year | | $ | 4.31 | | | $ | 2.75 | | | $ | 6.56 | | | $ | 6.23 | | | $ | 6.37 | | |
| INCOME (LOSS) FROM INVESTMENT OPERATIONS: | |
| Net investment income (loss) | | | 0.011 | | | | (0.01 | )1 | | | (0.02 | )1 | | | 0.07 | | | | 0.01 | | |
Net realized gain (loss) and unrealized appreciation/depreciation
on investments and foreign currency | | | 0.93 | | | | 1.74 | | | | (3.48 | ) | | | 1.15 | | | | 0.80 | | |
| Total from investment operations | | | 0.94 | | | | 1.73 | | | | (3.50 | ) | | | 1.22 | | | | 0.81 | | |
| LESS DISTRIBUTIONS FROM: | |
| Net investment income | | | — | | | | — | | | | (0.06 | ) | | | (0.02 | ) | | | (0.01 | ) | |
| Net realized gains on investments | | | (0.11 | ) | | | (0.17 | ) | | | (0.25 | ) | | | (0.87 | ) | | | (0.95 | ) | |
| Total distributions | | | (0.11 | ) | | | (0.17 | ) | | | (0.31 | ) | | | (0.89 | ) | | | (0.96 | ) | |
| Paid-in capital from redemption fees (Note 3) | | | —2 | | | | —2 | | | | —2 | | | | —2 | | | | 0.01 | | |
| Net Asset Value, end of year | | $ | 5.14 | | | $ | 4.31 | | | $ | 2.75 | | | $ | 6.56 | | | $ | 6.23 | | |
| TOTAL RETURN | | | 21.86 | % | | | 62.92 | % | | | (52.66 | %) | | | 18.90 | % | | | 12.99 | % | |
| Net assets, end of year (in 000's) | |
| Net assets, end of year (in 000's) | | $ | 166,990 | | | $ | 138,371 | | | $ | 87,253 | | | $ | 250,421 | | | $ | 241,003 | | |
Ratio of expenses to average net assets before any reimbursement,
waiver or recapture of expenses by Advisor and Administrator (Note 4) | | | 1.21 | % | | | 1.30 | % | | | 1.27 | % | | | 1.21 | % | | | 1.30 | % | |
Ratio of expenses to average net assets after any reimbursement,
waiver or recapture of expenses by Advisor and Administrator | | | 1.21 | % | | | 1.30 | % | | | 1.27 | % | | | 1.21 | % | | | 1.28 | % | |
| Ratio of net investment income (loss) to average net assets | | | 0.16 | % | | | (0.36 | %) | | | (0.34 | %) | | | 1.17 | % | | | (0.09 | %) | |
| Portfolio turnover | | | 39.05 | %3 | | | 52.47 | % | | | 28.70 | % | | | 24.20 | % | | | 25.82 | % | |
| INSTITUTIONAL SHARES | | Period Ended
Dec. 31, 20104 | |
| Net Asset Value, beginning of period | | $ | 4.84 | | |
| INCOME (LOSS) FROM INVESTMENT OPERATIONS: | |
| Net investment income (loss)1 | | | 0.03 | | |
Net realized gain (loss) and unrealized appreciation/depreciation
on investments and foreign currency | | | 0.38 | | |
| Total from investment operations | | | 0.41 | | |
| LESS DISTRIBUTIONS FROM: | |
| Net realized gains on investments | | | (0.11 | ) | |
| Total distributions | | | (0.11 | ) | |
| Paid-in capital from redemption fees (Note 3) | | | — | | |
| Net Asset Value, end of period | | $ | 5.14 | | |
| TOTAL RETURN | | | 8.51 | %5 | |
| RATIOS/SUPPLEMENTAL DATA | |
| Net assets, end of period (in 000's) | | $ | 4 | | |
Ratio of expenses to average net assets before any reimbursement,
waiver or recapture of expenses by Advisor and Administrator (Note 4) | | | 0.91 | %6 | |
| Ratio of net investment income (loss) to average net assets | | | 3.74 | %6 | |
| Portfolio turnover | | | 39.05 | %3,5 | |
1 Calculated using the average daily shares method.
2 Less than $0.01 per share.
3 The portfolio turnover rate is calculated on the Fund as a whole without distinguishing between classes of share issues.
4 Institutional Shares commenced operations on October 29, 2010.
5 Not annualized.
6 Annualized.
See accompanying notes to financial statements.
80 MATTHEWS ASIA FUNDS
Matthews Asia Small Companies Fund
The table below sets forth financial data for a share of beneficial interest outstanding throughout each period presented.
| | | Year ended Dec. 31 | | Period Ended | |
| INVESTOR SHARES | | 2010 | | 2009 | | Dec. 31, 20081 | |
| Net Asset Value, beginning of period | | $ | 15.79 | | | $ | 7.89 | | | $ | 10.00 | | |
| INCOME (LOSS) FROM INVESTMENT OPERATIONS: | |
| Net investment income (loss)2 | | | 0.04 | | | | 0.02 | | | | 0.01 | | |
Net realized gain (loss) and unrealized appreciation/depreciation
on investments and foreign currency | | | 5.55 | | | | 8.04 | | | | (2.16 | ) | |
| Total from investment operations | | | 5.59 | | | | 8.06 | | | | (2.15 | ) | |
| LESS DISTRIBUTIONS FROM: | |
| Net investment income | | | (0.09 | ) | | | (0.05 | ) | | | (0.02 | ) | |
| Net realized gains on investments | | | (0.15 | ) | | | (0.15 | ) | | | — | | |
| Total distributions | | | (0.24 | ) | | | (0.20 | ) | | | (0.02 | ) | |
| Paid-in capital from redemption fees (Note 3) | | | 0.02 | | | | 0.04 | | | | 0.06 | | |
| Net Asset Value, end of period | | $ | 21.16 | | | $ | 15.79 | | | $ | 7.89 | | |
| TOTAL RETURN | | | 35.54 | % | | | 103.00 | % | | | (21.03 | %)3 | |
| RATIOS/SUPPLEMENTAL DATA | |
| Net assets, end of year (in 000's) | | $ | 547,094 | | | $ | 109,726 | | | $ | 3,173 | | |
Ratio of expenses to average net assets before any reimbursement,
waiver or recapture of expenses by Advisor and Administrator (Note 4) | | | 1.59 | % | | | 2.09 | % | | | 14.31 | %4 | |
Ratio of expenses to average net assets after any reimbursement,
waiver or recapture of expenses by Advisor and Administrator | | | 1.63 | % | | | 2.00 | % | | | 2.00 | %4 | |
| Ratio of net investment income (loss) to average net assets | | | 0.24 | % | | | 0.13 | % | | | 0.15 | %4 | |
| Portfolio turnover | | | 23.99 | % | | | 21.39 | % | | | 3.10 | %3 | |
1 Investor Shares commenced operations on September 15, 2008.
2 Calculated using the average daily shares method.
3 Not annualized.
4 Annualized.
See accompanying notes to financial statements.
matthewsasia.com | 800.789.ASIA 81
Financial Highlights
Matthews Asia Science and Technology Fund
The table below sets forth financial data for a share of beneficial interest outstanding throughout each period presented.
| | | Year ended Dec. 31 | |
| INVESTOR SHARES | | 2010 | | 2009 | | 2008 | | 2007 | | 2006 | |
| Net Asset Value, beginning of year | | $ | 8.02 | | | $ | 4.71 | | | $ | 9.80 | | | $ | 7.92 | | | $ | 6.53 | | |
| INCOME (LOSS) FROM INVESTMENT OPERATIONS: | |
| Net investment income (loss) | | | 0.031 | | | | —1,2 | | | | 0.011 | | | | —2 | | | | (0.02 | ) | |
Net realized gain (loss) and unrealized appreciation/depreciation
on investments and foreign currency | | | 1.86 | | | | 3.31 | | | | (5.11 | ) | | | 1.87 | | | | 1.40 | | |
| Total from investment operations | | | 1.89 | | | | 3.31 | | | | (5.10 | ) | | | 1.87 | | | | 1.38 | | |
| LESS DISTRIBUTIONS FROM: | |
| Net investment income | | | (0.02 | ) | | | — | | | | — | | | | — | | | | — | | |
| Total distributions | | | (0.02 | ) | | | — | | | | — | | | | — | | | | — | | |
| Paid-in capital from redemption fees (Note 3) | | | —2 | | | | —2 | | | | 0.01 | | | | 0.01 | | | | 0.01 | | |
| Net Asset Value, end of year | | $ | 9.89 | | | $ | 8.02 | | | $ | 4.71 | | | $ | 9.80 | | | $ | 7.92 | | |
| TOTAL RETURN | | | 23.58 | % | | | 70.28 | % | | | (51.94 | %) | | | 23.74 | % | | | 21.29 | % | |
| Net assets, end of year (in 000's) | |
| Net assets, end of year (in 000's) | | $ | 190,436 | | | $ | 130,367 | | | $ | 74,476 | | | $ | 252,304 | | | $ | 129,819 | | |
Ratio of expenses to average net assets before any reimbursement,
waiver or recapture of expenses by Advisor and Administrator (Note 4) | | | 1.26 | % | | | 1.40 | % | | | 1.33 | % | | | 1.26 | % | | | 1.41 | % | |
Ratio of expenses to average net assets after any reimbursement,
waiver or recapture of expenses by Advisor and Administrator | | | 1.26 | % | | | 1.40 | % | | | 1.33 | % | | | 1.25 | % | | | 1.39 | % | |
| Ratio of net investment income (loss) to average net assets | | | 0.35 | % | | | 0.30 | % | | | 0.08 | % | | | (0.30 | %) | | | (0.29 | %) | |
| Portfolio turnover | | | 61.61 | % | | | 83.27 | % | | | 44.84 | % | | | 33.21 | % | | | 34.77 | % | |
1 Calculated using the average daily shares method.
2 Less than $0.01 per share.
See accompanying notes to financial statements.
82 MATTHEWS ASIA FUNDS
Notes to Financial Statements
1. ORGANIZATION
Matthews Asia Funds (the "Trust") is an open-end management investment company registered under the Investment Company Act of 1940, as amended (the "Act"). The Trust currently issues eleven separate series of shares (each a "Fund" and collectively, the "Funds"): Matthews Asian Growth and Income Fund, Matthews Asia Dividend Fund, Matthews China Dividend Fund, Matthews Asia Pacific Fund, Matthews Pacific Tiger Fund, Matthews China Fund, Matthews India Fund, Matthews Japan Fund, Matthews Korea Fund, Matthews Asia Small Companies Fund and Matthews Asia Science and Technology Fund (formerly known as Matthews Asian Technology Fund). Each Fund, except for Matthews Asia Small Companies Fund and Matthews Asia Science and Technology Fund, currently offers two classes of shares: Investor Class and Institutional Class. Institutional Class shares commenced operations on October 29, 2010. Matthews Asia Small Companies Fund and Matthews Asia Science and Technology Fund currently offer only Investor Class shares. Each class of shares has identical voting, dividend, liquidation and other rights and the same terms and conditions, except each class may be subject to different class expenses as outlined in the relevant prospectus and each class has exclusive voting rights with respect to matters solely affecting such class. Effective November 12, 2010, the Matthews Asia Small Companies Fund was closed to new investors. The Fund will continue to accept investments from existing shareholders.
2. SIGNIFICANT ACCOUNTING POLICIES
The following is a summary of significant accounting policies consistently followed by the Funds in preparation of their financial statements.
A. SECURITY VALUATION: The Funds' equity securities are valued based on market quotations, or at fair value as determined in good faith by or under the direction of the Board of Trustees (the "Board") when no market quotations are available or when market quotations have become unreliable. Securities that trade in over-the-counter markets, including most debt securities (bonds), may be valued using indicative bid and ask quotations from bond dealers or market makers, or other available market information, or at their fair value as determined by or under the direction of the Board.
The books and records of the Funds are maintained in U.S. dollars. Transactions, portfolio securities, and assets and liabilities denominated in a foreign currency are translated and recorded in U.S. dollars at the prevailing exchange rate as of the close of trading on the New York Stock Exchange ("NYSE"). Translation gains or losses resulting from changes in the exchange rate during the reporting period and realized gains and losses on the settlement of foreign currency transactions are reported in the results of operations for the current period. The Funds do not isolate that portion of gains and losses on investments in equity securities that is due to changes in foreign exchange rate from that which is due to changes in market prices of equity securities.
Market values for equity securities are determined based on quotations from the principal (or most advantageous) market on which the security is traded. Market quotations used by the Funds include last reported sale prices, or, if such prices are not reported or available, bid and ask prices. Securities are valued through valuations obtained from a commercial pricing service or by securities dealers in accordance with procedures established by the Board.
The Board has delegated the responsibility of making fair value determinations to the Funds' Valuation Committee (the "Valuation Committee") subject to the Funds' Pricing Policies. When fair value pricing is employed, the prices of securities used by a Fund to calculate its NAV differ from any quoted or published prices for the same securities for that day. All fair value determinations are made subject to the Board's oversight. Events affecting the value of foreign investments occur between the time at which they are determined and the close of trading on the NYSE. If the Funds believe that such events render market quotations unreliable, and the impact of such events can be reasonably determined, the investments will be valued at their fair value. The fair value of a security held by the Funds may be determined using the services of third-party pricing services retained by the Funds or by the Valuation Committee, in either case subject to the Board's oversight.
Foreign securities held by the Funds may be traded on days and at times when the NYSE is closed. Accordingly, the NAV of the Funds may be significantly affected on days when shareholders have no access to the Funds.
B. FAIR VALUE MEASUREMENTS: In accordance with the guidance on fair value measurements and disclosures under generally accepted accounting principles ("GAAP"), the Funds disclose the fair value of their investments in a hierarchy that prioritizes the inputs to valuation techniques used to measure the fair value. The hierarchy gives the highest priority to valuations based upon unadjusted quoted prices in active markets for identical assets or liabilities (level 1 measurement) and the lowest priority to valuations based upon unobservable inputs that are significant to the valuation (level 3 measurements). Various inputs are used in determining the fair value of investments, which are as follows:
Level 1: Quoted prices in active markets for identical securities.
Level 2: Other significant observable inputs (including quoted prices for similar securities, interest rates, prepayment speeds, credit risk, etc.).
Level 3: Significant unobservable inputs (including the Fund's own assumptions in determining the fair value of investments).
As of December 31, 2010, Level 3 Securities consist of international bonds that trade in over-the-counter markets. As described in Note 2-A, these securities are valued using indicative bid and ask quotations from bond dealers and market makers, or at their fair value as determined under the direction of the Board. Indicative quotations and other information used by the Funds may not always be directly observable in the marketplace due to the nature of these markets and the manner of execution. These inputs, the methodology used for valuing such securities, and the characterization of such securities as Level 3 Securities are not necessarily an indication of liquidity, or the risk associated with investing in these securities.
matthewsasia.com | 800.789.ASIA 83
Notes to Financial Statements (continued)
The summary of inputs used to determine the fair valuation of the Fund's investments as of December 31, 2010 is as follows:
| | | Matthews Asian
Growth and
Income Fund | | Matthews Asia
Dividend Fund | | Matthews
Asia Pacific Fund | | Matthews
Pacific Tiger Fund | |
| Level 1: Quoted Prices | |
| Common Equities: | |
| Australia | | $ | 157,437,419 | | | $ | 158,743,003 | | | $ | 20,240,360 | | | $ | — | | |
| China/Hong Kong | | | 745,653,608 | | | | 462,153,246 | | | | 89,556,479 | | | | 1,832,327,602 | | |
| India | | | 41,123,552 | | | | — | | | | 15,785,190 | | | | 910,944,055 | | |
| Indonesia | | | 43,414,570 | | | | 98,397,059 | | | | 18,646,692 | | | | 436,517,332 | | |
| Japan | | | 494,471,835 | | | | 456,135,459 | | | | 112,375,559 | | | | — | | |
| Malaysia | | | 74,079,411 | | | | 12,057,821 | | | | 6,612,373 | | | | 274,654,326 | | |
| Philippines | | | 38,813,239 | | | | 29,195,526 | | | | — | | | | 88,824,476 | | |
| Singapore | | | 474,503,891 | | | | 83,568,865 | | | | 14,489,734 | | | | 115,123,270 | | |
| South Korea | | | 74,289,108 | | | | 28,191,848 | | | | — | | | | — | | |
| Taiwan | | | 262,917,680 | | | | 220,781,618 | | | | 20,209,614 | | | | 480,283,748 | | |
| Thailand | | | 44,692,934 | | | | 49,777,011 | | | | — | | | | 97,629,317 | | |
| United Kingdom | | | 91,649,108 | | | | 64,782,365 | | | | — | | | | — | | |
| Vietnam | | | 54,681,979 | | | | — | | | | 4,849,806 | | | | 26,527,430 | | |
| Warrants: | |
| India | | | 15,554,139 | | | | — | | | | — | | | | — | | |
| Level 2: Other Significant Observable Inputs | |
| Common Equities: | |
| South Korea | | | 130,594,867 | | | | 148,208,989 | | | | 13,759,972 | | | | 974,652,844 | | |
| Thailand | | | 163,923,648 | | | | 79,579,377 | | | | 7,649,223 | | | | 270,806,506 | | |
| Preferred Equities: | |
| South Korea | | | 102,987,820 | | | | — | | | | 5,772,383 | | | | — | | |
| Level 3: Significant Unobservable Inputs | |
| International Bonds | | | 890,985,739 | | | | 4,869,165 | | | | — | | | | — | | |
| Total Market Value of Investments | | $ | 3,901,774,547 | | | $ | 1,896,441,352 | | | $ | 329,947,385 | | | $ | 5,508,290,906 | | |
84 MATTHEWS ASIA FUNDS
| | | Matthews China
Dividend Fund | | Matthews
China Fund | | Matthews
India Fund | | Matthews
Japan Fund | | Matthews
Korea Fund | |
| Level 1: Quoted Prices | |
| Common Equities: | |
| Consumer Discretionary | | $ | 5,819,177 | | | $ | 674,691,783 | | | $ | 152,196,008 | | | $ | 10,214,744 | | | $ | 4,950,939 | | |
| Consumer Staples | | | 2,417,028 | | | | 364,635,533 | | | | 112,598,955 | | | | 4,758,330 | | | | 1,941,168 | | |
| Energy | | | 2,162,954 | | | | 218,550,900 | | | | 43,556,024 | | | | — | | | | — | | |
| Financials | | | 8,404,555 | | | | 589,176,847 | | | | 320,310,945 | | | | 13,553,875 | | | | 4,020,777 | | |
| Health Care | | | 1,951,476 | | | | 63,970,654 | | | | 99,995,544 | | | | 5,000,089 | | | | 2,296,130 | | |
| Industrials | | | 3,751,147 | | | | 372,303,539 | | | | 249,634,084 | | | | 14,993,503 | | | | — | | |
| Information Technology | | | 6,857,463 | | | | 400,424,386 | | | | 132,559,912 | | | | 10,910,449 | | | | 2,682,025 | | |
| Materials | | | 2,307,608 | | | | — | | | | 87,294,295 | | | | 4,243,934 | | | | 4,339,907 | | |
| Telecommunication Services | | | 5,179,655 | | | | 126,836,342 | | | | 17,608,057 | | | | 2,789,771 | | | | 2,230,011 | | |
| Utilities | | | 4,872,601 | | | | 143,139,117 | | | | 73,825,717 | | | | — | | | | — | | |
| Level 2: Other Significant Observable Inputs | |
| Common Equities: | |
| Consumer Discretionary | | | — | | | | — | | | | — | | | | — | | | | 29,983,664 | | |
| Consumer Staples | | | — | | | | — | | | | — | | | | — | | | | 9,605,599 | | |
| Energy | | | — | | | | — | | | | — | | | | — | | | | 3,685,283 | | |
| Financials | | | — | | | | — | | | | — | | | | — | | | | 29,029,639 | | |
| Health Care | | | — | | | | — | | | | — | | | | — | | | | 3,146,704 | | |
| Industrials | | | — | | | | — | | | | — | | | | — | | | | 12,926,934 | | |
| Information Technology | | | — | | | | — | | | | — | | | | — | | | | 31,877,074 | | |
| Materials | | | — | | | | — | | | | — | | | | — | | | | 11,871,856 | | |
| Telecommunication Services | | | — | | | | — | | | | — | | | | — | | | | 3,947,463 | | |
| Preferred Equities: | |
| Consumer Discretionary | | | — | | | | — | | | | — | | | | — | | | | 3,668,528 | | |
| Financials | | | — | | | | — | | | | — | | | | — | | | | 1,915,622 | | |
| Level 3: Significant Unobservable Inputs | |
| International Bonds | | | — | | | | — | | | | 109,826,875 | | | | — | | | | — | | |
| Total Market Value of Investments | | $ | 43,723,664 | | | $ | 2,953,729,101 | | | $ | 1,399,406,416 | | | $ | 66,464,695 | | | $ | 164,119,323 | | |
| | | Matthews Asia
Small Companies
Fund | | Matthews Asia
Science and
Technology Fund | |
| Level 1: Quoted Prices | |
| Common Equities: | |
| China/Hong Kong | | $ | 167,271,492 | | | $ | 52,845,202 | | |
| India | | | 102,201,782 | | | | 11,990,069 | | |
| Indonesia | | | 14,863,175 | | | | 2,787,830 | | |
| Japan | | | — | | | | 44,333,851 | | |
| Malaysia | | | 33,260,943 | | | | 1,543,616 | | |
| Philippines | | | — | | | | 2,280,393 | | |
| Singapore | | | 48,696,879 | | | | — | | |
| South Korea | | | — | | | | 5,567,462 | | |
| Taiwan | | | 84,528,173 | | | | 37,110,844 | | |
| Thailand | | | 344,439 | | | | — | | |
| United States | | | — | | | | 3,444,630 | | |
| Vietnam | | | — | | | | 829,983 | | |
| Level 2: Other Significant Observable Inputs | |
| Common Equities: | |
| South Korea | | | 65,963,249 | | | | 23,383,259 | | |
| Thailand | | | 15,105,065 | | | | — | | |
| Level 3: Significant Unobservable Inputs | | | — | | | | — | | |
| Total Market Value of Investments | | $ | 532,235,197 | | | $ | 186,117,139 | | |
matthewsasia.com | 800.789.ASIA 85
Notes to Financial Statements (continued)
Certain foreign securities may be fair valued by external pricing services when the Funds determine that events affecting the value of foreign securities which occur between the time at which they are determined and the close of trading on the NYSE render market quotations unreliable. Such fair valuations are categorized as Level 2 in the hierarchy. Many market quotations were not deemed to be unreliable at 12/31/10, and therefore, the Funds did not utilize the third party pricing services (See Note 2-A Securities Valuation). As a result, securities still held by the Funds were transferred from Level 2 into Level 1 with beginning of period values as follows:
| Matthews Asian Growth and Income Fund | | $ | 1,492,463,864 | | |
| Matthews Asia Dividend Fund | | | 269,360,565 | | |
| Matthews China Dividend Fund | | | 5,390,376 | | |
| Matthews Asia Pacific Fund | | | 209,090,640 | | |
| Matthews Pacific Tiger Fund | | | 3,089,557,793 | | |
| Matthews China Fund | | | 2,280,973,974 | | |
| Matthews India Fund | | | 639,790,118 | | |
| Matthews Japan Fund | | | 87,639,849 | | |
| Matthews Korea Fund | | | 116,711,151 | | |
| Matthews Asia Small Companies Fund | | | 103,769,710 | | |
| Matthews Asia Science and Technology Fund | | | 100,365,001 | | |
Following is a reconciliation of Level 3 investments for which significant unobservable inputs were used to determine value:
| | | Matthews Asian
Growth and
Income Fund | | Matthews Asia
Dividend Fund | | Matthews
India Fund | | Matthews
India Fund | | Matthews
Asia Small
Companies
Fund | |
| | | International
Bonds | | International
Bonds | | International
Bonds | | Common
Equities —
Financials | | Common
Equities —
India | |
| Balance as of 12/31/09 (market value) | | $ | 745,395,183 | | | $ | 8,325,971 | | | $ | 20,755,640 | | | $ | 326,609 | | | $ | 53,889 | | |
| Accrued discounts/premiums | | | 22,842,972 | | | | 54,446 | | | | 1,340,899 | | | | — | | | | — | | |
| Realized gain/(loss) | | | 18,337,918 | | | | 1,191,725 | | | | (1,027,233 | ) | | | 203,807 | | | | 23,447 | | |
| Change in unrealized appreciation/depreciation | | | 51,875,805 | | | | 158,756 | | | | 79,251 | | | | (66,793 | ) | | | (9,478 | ) | |
| Purchases | | | 219,069,991 | | | | — | | | | 101,757,225 | | | | — | | | | — | | |
| Sales | | | (166,536,130 | ) | | | (4,861,733 | ) | | | (13,078,907 | ) | | | (463,623 | ) | | | (67,858 | ) | |
| Transfers in of Level 3* | | | — | | | | — | | | | — | | | | — | | | | — | | |
| Transfers out of Level 3* | | | — | | | | — | | | | — | | | | — | | | | — | | |
| Balance as of 12/31/10 (market value) | | $ | 890,985,739 | | | $ | 4,869,165 | | | $ | 109,826,875 | | | $ | — | | | $ | — | | |
Net change in unrealized appreciation/depreciation
on Level 3 investments held as of 12/31/10** | | $ | 59,902,648 | | | $ | 1,216,937 | | | $ | (525,805 | ) | | $ | — | | | $ | — | | |
* The Fund's policy is to recognize transfers in and transfer out as of the beginning of the reporting period.
** Included in the related amounts on the Statements of Operations.
C. RISKS ASSOCIATED WITH NON-U.S. COMPANIES: Investments by the Funds in the securities of non-U.S. companies may involve investment risks not typically associated with investments in U.S. issuers. These risks include possible political, economic, social and religious instability, inadequate investor protection; changes in laws or regulations of countries within the Asia Pacific region (including both in countries where you invest, as well as in the broader region); international relations with other nations; natural disasters; corruption; and military activity. Foreign securities may be subject to greater fluctuations in price than securities of domestic corporations or the U.S. government. Foreign investing may also include the risk of expropriation or confiscatory taxation, limitation on the removal or funds or other assets, currency crises and exchange controls, the imposition of foreign withholding tax on the interest income payable on such instruments, the possible seizure or nationalization of foreign deposits or assets, or the adoption of other foreign government restrictions that might adversely affect the foreign securities held by the Funds. Additionally, Asia Pacific countries may utilize formal or informal currency-exchange controls or "capital controls" that may limit the ability to repatriate investments or income or adversely affect the value of portfolio investments. The economies of many Asia Pacific countries differ from the economies of more developed countries in many respects, such as their rate of growth, inflation, capital reinvestment, resource self-sufficiency and dependence on other economies, financial system stability, the national balance of payments position and sensitivity to changes in global trade. Certain Asia Pacific countries are highly dependent upon and may be affected by developments in the economies of other countries. Non-U.S. companies are subject to different accounting, auditing, and financial reporting standards, practices, and requirements than U.S. companies. There is generally less government regulation of stock exchanges, brokers, and listed companies abroad than in the U.S., which may result in less transparency with respect to a company's operations, and make obtaining information about them more difficult (or such information may be unavailable). Foreign stock markets may not be as developed or efficient as those in the United States, and the absence of negotiated brokerage commissions in certain countries may result in higher brokerage fees. The time between the trade and settlement dates of securities transactions on foreign exchanges ranges from one day to four weeks or longer and may result in higher custody charges. Custodial arrangements may be less well developed than in the United States. Foreign securities are generally denominated and pay distributions in foreign currencies, exposing the Funds to changes in foreign currency exchange rates. Investing in any country in the Asia Pacific region will also entail risks specific and unique to that country, and these risks can be significant and change rapidly.
86 MATTHEWS ASIA FUNDS
D. INCOME AND WITHHOLDING TAXES: It is the policy of the Funds to comply with all requirements of the Internal Revenue Code of 1986, as amended ("the Code"), applicable to regulated investment companies and to distribute substantially all of their taxable income to their shareholders. The Funds have met the requirements of the Code applicable to regulated investment companies for the fiscal year ended December 31, 2010. Therefore, no federal income tax provision is required. Income and capital gains of the Funds are determined in accordance with both tax regulations and GAAP. Such treatment may result in temporary and permanent differences between tax basis earnings and earnings reported for financial statement purposes. These reclassifications, which have no impact on the net asset value of the Funds, are primarily attributable to certain differences in computation of distributable income and capital gains under federal tax rules versus GAAP, and the use of the tax accounting practice known as equalization.
Management has analyzed the Funds' tax positions taken on federal income tax returns for all open tax years (current and prior three tax years), and has concluded that no provision for federal income tax is required in the Funds' financial statements. The Funds' federal and state income and federal excise tax returns for tax years for which the applicable statutes of limitations have not expired are subject to examination by the Internal Revenue Service and state departments of revenue.
In addition to the requirements of the Code, the Funds may be subject to foreign withholding taxes on distributions by or capital gains associated with portfolio holdings. The Funds consider the impact of a country's tax laws and regulations, as well as withholding, when considering investment decisions. The Funds may be subject to short-term capital gains tax in India on gains realized upon disposition of Indian securities held less than one year. The tax is computed on net realized gains; any realized losses in excess of gains may be carried forward for a period of up to eight years to offset future gains. Any net taxes payable must be remitted to the Indian government prior to repatriation of sales proceeds. The Funds that invest in Indian securities accrue a liability for the estimated potential future Indian tax liability for unrealized short-term gains in excess of available carryforwards on Indian securities. This accrual may reduce a Fund's net asset value. As of December 31, 2010, the Matthews Asian Growth and Income Fund, Matthews Pacific Tiger Fund, Matthews India Fund and Matthews Asia Small Companies Fund have recorded a payable of $2,051,108, $3,089,305, $4,120,779 and $1,174,891 respectively, as an estimate for such potential future India capital gains taxes.
In addition, China has recently adopted certain revisions to its tax laws and regulations that generally result in holdings of the Funds in companies headquartered in China (whether A shares, B shares, H shares or shares traded in depository receipt form) being subject to withholding taxes on dividends and other income. To the extent that such withholding taxes are imposed on holdings of the Funds in companies headquartered in China, the Funds' returns will be adversely impacted.
E. OFFERING COSTS: Offering costs are amortized on a straight-line basis over one year from each Fund's respective commencement of operations. In the event that any of the initial shares are redeemed during the period of amortization of the Fund's offering costs, the redemption proceeds will be reduced by any such unamortized offering costs in the same proportion as the number of shares being redeemed bears to the number of those shares outstanding at the time of redemption.
F. DISTRIBUTIONS TO SHAREHOLDERS: It is the policy of Matthews Asian Growth and Income Fund and Matthews China Dividend Fund to distribute net investment income on a semi-annual basis and capital gains, if any, annually. It is the policy of Matthews Asia Dividend Fund to distribute net investment income on a quarterly basis and capital gains, if any, annually. Each of the other Funds distribute net investment income and capital gains, if any, annually. Distributions to shareholders are recorded on the ex-dividend date. Income and capital gain distributions are determined in accordance with income tax regulations which may differ from GAAP. Net investment losses may not be utilized to offset net investment income in future periods for tax purposes.
The tax character of distributions paid for the fiscal years ended December 31, 2010 and December 31, 2009 were as follows:
| YEAR ENDED DECEMBER 31, 2010 | | Ordinary Income | | Net Long-Term
Capital Gains | | Total Taxable
Distributions | |
| Matthews Asian Growth and Income Fund | | $ | 94,189,105 | | | $ | 51,682,614 | | | $ | 145,871,719 | | |
| Matthews Asia Dividend Fund | | | 40,287,845 | | | | 5,022,499 | | | | 45,310,344 | | |
| Matthews China Dividend Fund | | | 722,729 | | | | — | | | | 722,729 | | |
| Matthews Asia Pacific Fund | | | 2,855,326 | | | | — | | | | 2,855,326 | | |
| Matthews Pacific Tiger Fund | | | 18,668,943 | | | | — | | | | 18,668,943 | | |
| Matthews China Fund | | | 14,642,220 | | | | 2,109,742 | | | | 16,751,962 | | |
| Matthews India Fund | | | 6,221,074 | | | | — | | | | 6,221,074 | | |
| Matthews Japan Fund | | | 2,536,497 | | | | — | | | | 2,536,497 | | |
| Matthews Korea Fund | | | — | | | | 3,500,175 | | | | 3,500,175 | | |
| Matthews Asia Small Companies Fund | | | 2,373,718 | | | | 3,751,019 | | | | 6,124,737 | | |
| Matthews Asia Science and Technology Fund | | | 394,719 | | | | — | | | | 394,719 | | |
| YEAR ENDED DECEMBER 31, 2009 | | Ordinary Income | | Net Long-Term
Capital Gains | | Total Taxable
Distributions | |
| Matthews Asian Growth and Income Fund | | $ | 60,961,205 | | | $ | — | | | $ | 60,961,205 | | |
| Matthews Asia Dividend Fund | | | 10,189,013 | | | | — | | | | 10,189,013 | | |
| Matthews Asia Pacific Fund | | | 3,712,448 | | | | — | | | | 3,712,448 | | |
| Matthews Pacific Tiger Fund | | | 26,580,408 | | | | — | | | | 26,580,408 | | |
| Matthews China Fund | | | 6,595,986 | | | | — | | | | 6,595,986 | | |
| Matthews India Fund | | | 4,170,406 | | | | 5,361,101 | | | | 9,531,507 | | |
| Matthews Japan Fund | | | 2,466,218 | | | | — | | | | 2,466,218 | | |
| Matthews Korea Fund | | | — | | | | 5,234,879 | | | | 5,234,879 | | |
| Matthews Asia Small Companies Fund | | | 1,251,010 | | | | — | | | | 1,251,010 | | |
matthewsasia.com | 800.789.ASIA 87
Notes to Financial Statements (continued)
G. INVESTMENT TRANSACTIONS AND INCOME: Securities transactions are accounted for on the date the securities are purchased or sold. Gains or losses on the sale of securities are determined on the identified cost basis. Interest income is recorded on the accrual basis. Dividend income is generally recorded on the ex-dividend date. Dividend income for certain issuers headquartered in countries which the Funds invest may not be recorded until approved by the shareholders (which may occur after the ex-dividend date) if, in the judgment of Matthews, such dividends are not reasonably determined as of the ex-dividend date. Income and realized and unrealized gains or losses on investments are allocated to each class of shares based on its relative net assets or another appropriate basis.
H. FUND EXPENSE ALLOCATIONS: The Funds account separately for the assets, liabilities and operations of each Fund. Direct expenses of each Fund or class are charged to the Fund or class while general expenses are allocated pro-rata among the Funds and each class based on net assets or other appropriate methods.
I. CASH OVERDRAFTS: When cash balances are overdrawn, a Fund is charged an overdraft fee by the custodian of 1.00% above the 30-day LIBOR rate on outstanding balances. These amounts, if any, are included in Other expenses on the Statements of Operations.
J. USE OF ESTIMATES: The preparation of financial statements in conformity with GAAP requires management to make estimates and assumptions that affect the amounts reported in the financial statements and accompanying notes. Actual results may differ from those estimates.
3. CAPITAL SHARE TRANSACTIONS
Each Fund is authorized to issue an unlimited number of shares of beneficial interest with a par value of $0.001 per share.
| | | Year Ended December 31, 2010 | | Year Ended December 31, 2009 | |
| MATTHEWS ASIAN GROWTH AND INCOME FUND | | Shares | | Amount | | Shares | | Amount | |
| Investor Shares | |
| Shares sold | | | 94,537,711 | | | $ | 1,599,476,355 | | | | 90,611,648 | | | $ | 1,251,164,099 | | |
| Shares issued through reinvestment of distributions | | | 7,642,437 | | | | 131,851,386 | | | | 3,866,007 | | | | 56,619,667 | | |
| Shares redeemed | | | (46,104,373 | ) | | | (777,329,497 | ) | | | (27,730,103 | ) | | | (364,139,772 | ) | |
| Net increase (decrease) | | | 56,075,775 | | | $ | 953,998,244 | | | | 66,747,552 | | | $ | 943,643,994 | | |
| | | Period Ended December 31, 2010* | |
| | | Shares | | Amount | |
| Institutional Shares | |
| Shares sold | | | 7,042,986 | | | $ | 128,638,654 | | |
| Shares issued through reinvestment of distributions | | | 117,858 | | | | 2,080,203 | | |
| Shares redeemed | | | (42,484 | ) | | | (766,000 | ) | |
| Net increase (decrease) | | | 7,118,360 | | | $ | 129,952,857 | | |
* Institutional Shares commenced operations on October 29, 2010
| | | Year Ended December 31, 2010 | | Year Ended December 31, 2009 | |
| MATTHEWS ASIA DIVIDEND FUND | | Shares | | Amount | | Shares | | Amount | |
| Investor Shares | |
| Shares sold | | | 128,134,506 | | | $ | 1,717,991,718 | | | | 18,522,977 | | | $ | 197,768,100 | | |
| Shares issued through reinvestment of distributions | | | 2,948,816 | | | | 40,367,703 | | | | 892,613 | | | | 9,454,356 | | |
| Shares redeemed | | | (22,899,869 | ) | | | (309,075,964 | ) | | | (9,206,330 | ) | | | (82,245,771 | ) | |
| Net increase (decrease) | | | 108,183,453 | | | $ | 1,449,283,457 | | | | 10,209,260 | | | $ | 124,976,685 | | |
| | | Period Ended December 31, 2010* | |
| | | Shares | | Amount | |
| Institutional Shares | |
| Shares sold | | | 3,344,908 | | | $ | 47,780,952 | | |
| Shares issued through reinvestment of distributions | | | 28,296 | | | | 396,147 | | |
| Shares redeemed | | | (2,445 | ) | | | (34,642 | ) | |
| Net increase (decrease) | | | 3,370,759 | | | $ | 48,142,457 | | |
* Institutional Shares commenced operations on October 29, 2010
88 MATTHEWS ASIA FUNDS
| | | Year Ended December 31, 2010 | | Period Ended December 31, 2009* | |
| MATTHEWS CHINA DIVIDEND FUND | | Shares | | Amount | | Shares | | Amount | |
| Investor Shares | |
| Shares sold | | | 3,571,723 | | | $ | 39,885,783 | | | | 701,503 | | | $ | 7,027,389 | | |
| Shares issued through reinvestment of distributions | | | 60,501 | | | | 704,296 | | | | — | | | | — | | |
| Shares redeemed | | | (605,891 | ) | | | (6,864,371 | ) | | | (497 | ) | | | (4,886 | ) | |
| Net increase (decrease) | | | 3,026,333 | | | $ | 33,725,708 | | | | 701,006 | | | $ | 7,022,503 | | |
| | | Period Ended December 31, 2010** | |
| | | Shares | | Amount | |
| Institutional Shares | |
| Shares sold | | | 295 | | | $ | 3,500 | | |
| Shares issued through reinvestment of distributions | | | 4 | | | | 48 | | |
| Net increase (decrease) | | | 299 | | | $ | 3,548 | | |
* Investor Shares commenced operations on November 30, 2009
** Institutional Shares commenced operations on October 29, 2010
| | | Year Ended December 31, 2010 | | Year Ended December 31, 2009 | |
| MATTHEWS ASIA PACIFIC FUND | | Shares | | Amount | | Shares | | Amount | |
| Investor Shares | |
| Shares sold | | | 8,704,678 | | | $ | 140,765,266 | | | | 8,060,298 | | | $ | 99,703,728 | | |
| Shares issued through reinvestment of distributions | | | 145,454 | | | | 2,570,173 | | | | 235,615 | | | | 3,411,707 | | |
| Shares redeemed | | | (6,116,339 | ) | | | (95,865,175 | ) | | | (9,119,800 | ) | | | (100,091,908 | ) | |
| Net increase (decrease) | | | 2,733,793 | | | $ | 47,470,264 | | | | (823,887 | ) | | $ | 3,023,527 | | |
| | | Period Ended December 31, 2010* | |
| | | Shares | | Amount | |
| Institutional Shares | |
| Shares sold | | | 488,153 | | | $ | 8,615,907 | | |
| Shares issued through reinvestment of distributions | | | 4,249 | | | | 75,117 | | |
| Net increase (decrease) | | | 492,402 | | | $ | 8,691,024 | | |
* Institutional Shares commenced operations on October 29, 2010
| | | Year Ended December 31, 2010 | | Year Ended December 31, 2009 | |
| MATTHEWS PACIFIC TIGER FUND | | Shares | | Amount | | Shares | | Amount | |
| Investor Shares | |
| Shares sold | | | 90,705,702 | | | $ | 1,866,772,078 | | | | 110,513,779 | | | $ | 1,710,149,408 | | |
| Shares issued through reinvestment of distributions | | | 478,835 | | | | 11,085,031 | | | | 964,998 | | | | 18,306,012 | | |
| Shares redeemed | | | (54,878,994 | ) | | | (1,177,894,101 | ) | | | (34,894,575 | ) | | | (504,644,408 | ) | |
| Net increase (decrease) | | | 36,305,543 | | | $ | 699,963,008 | | | | 76,584,202 | | | $ | 1,223,811,012 | | |
| | | Period Ended December 31, 2010* | |
| | | Shares | | Amount | |
| Institutional Shares | |
| Shares sold | | | 23,498,689 | | | $ | 549,829,526 | | |
| Shares issued through reinvestment of distributions | | | 46,628 | | | | 1,079,444 | | |
| Shares redeemed | | | (485,400 | ) | | | (11,087,681 | ) | |
| Net increase (decrease) | | | 23,059,917 | | | $ | 539,821,289 | | |
* Institutional Shares commenced operations on October 29, 2010
matthewsasia.com | 800.789.ASIA 89
Notes to Financial Statements (continued)
| | | Year Ended December 31, 2010 | | Year Ended December 31, 2009 | |
| MATTHEWS CHINA FUND | | Shares | | Amount | | Shares | | Amount | |
| Investor Shares | |
| Shares sold | | | 39,102,492 | | | $ | 1,059,207,053 | | | | 67,632,449 | | | $ | 1,395,811,306 | | |
| Shares issued through reinvestment of distributions | | | 531,634 | | | | 16,009,843 | | | | 253,434 | | | | 6,406,676 | | |
| Shares redeemed | | | (40,119,722 | ) | | | (1,051,404,806 | ) | | | (21,738,238 | ) | | | (452,648,756 | ) | |
| Net increase (decrease) | | | (485,596 | ) | | $ | 23,812,090 | | | | 46,147,645 | | | $ | 949,569,226 | | |
| | | Period Ended December 31, 2010* | |
| | | Shares | | Amount | |
| Institutional Shares | |
| Shares sold | | | 1,408,673 | | | $ | 43,407,912 | | |
| Shares issued through reinvestment of distributions | | | 6,348 | | | | 191,206 | | |
| Net increase (decrease) | | | 1,415,021 | | | $ | 43,599,118 | | |
* Institutional Shares commenced operations on October 29, 2010
| | | Year Ended December 31, 2010 | | Year Ended December 31, 2009 | |
| MATTHEWS INDIA FUND | | Shares | | Amount | | Shares | | Amount | |
| Investor Shares | |
| Shares sold | | | 38,736,300 | | | $ | 763,615,269 | | | | 16,867,471 | | | $ | 216,332,772 | | |
| Shares issued through reinvestment of distributions | | | 282,822 | | | | 5,758,266 | | | | 569,533 | | | | 9,186,402 | | |
| Shares redeemed | | | (18,646,862 | ) | | | (362,758,685 | ) | | | (11,092,885 | ) | | | (132,499,147 | ) | |
| Net increase (decrease) | | | 20,372,260 | | | $ | 406,614,850 | | | | 6,344,119 | | | $ | 93,020,027 | | |
| | | Period Ended December 31, 2010* | |
| | | Shares | | Amount | |
| Institutional Shares | |
| Shares sold | | | 2,228,517 | | | $ | 50,478,328 | | |
| Shares issued through reinvestment of distributions | | | 11,196 | | | | 227,962 | | |
| Shares redeemed | | | (1 | ) | | | (20 | ) | |
| Net increase (decrease) | | | 2,239,712 | | | $ | 50,706,270 | | |
* Institutional Shares commenced operations on October 29, 2010
| | | Year Ended December 31, 2010 | | Year Ended December 31, 2009 | |
| MATTHEWS JAPAN FUND | | Shares | | Amount | | Shares | | Amount | |
| Investor Shares | |
| Shares sold | | | 1,834,692 | | | $ | 20,963,464 | | | | 4,372,850 | | | $ | 41,047,221 | | |
| Shares issued through reinvestment of distributions | | | 189,010 | | | | 2,247,332 | | | | 196,404 | | | | 2,164,373 | | |
| Shares redeemed | | | (4,708,347 | ) | | | (52,175,630 | ) | | | (8,609,002 | ) | | | (86,507,638 | ) | |
| Net increase (decrease) | | | (2,684,645 | ) | | ($ | 28,964,834 | ) | | | (4,039,748 | ) | | ($ | 43,296,044 | ) | |
| | | Period Ended December 31, 2010* | |
| | | Shares | | Amount | |
| Institutional Shares | |
| Shares sold | | | 326 | | | $ | 3,843 | | |
| Shares issued through reinvestment of distributions | | | 12 | | | | 146 | | |
| Net increase (decrease) | | | 338 | | | $ | 3,989 | | |
* Institutional Shares commenced operations on October 29, 2010
90 MATTHEWS ASIA FUNDS
| | | Year Ended December 31, 2010 | | Year Ended December 31, 2009 | |
| MATTHEWS KOREA FUND | | Shares | | Amount | | Shares | | Amount | |
| Investor Shares | |
| Shares sold | | | 9,620,502 | | | $ | 42,717,495 | | | | 6,981,091 | | | $ | 25,016,110 | | |
| Shares issued through reinvestment of distributions | | | 675,600 | | | | 3,344,222 | | | | 1,182,569 | | | | 5,014,485 | | |
| Shares redeemed | | | (9,884,616 | ) | | | (44,032,635 | ) | | | (7,765,520 | ) | | | (26,135,039 | ) | |
| Net increase (decrease) | | | 411,486 | | | $ | 2,029,082 | | | | 398,140 | | | $ | 3,895,556 | | |
| | | Period Ended December 31, 2010* | |
| | | Shares | | Amount | |
| Institutional Shares | |
| Shares sold | | | 723 | | | $ | 3,500 | | |
| Shares issued through reinvestment of distributions | | | 16 | | | | 78 | | |
| Net increase (decrease) | | | 739 | | | $ | 3,578 | | |
* Institutional Shares commenced operations on October 29, 2010
| | | Year Ended December 31, 2010 | | Year Ended December 31, 2009 | |
| MATTHEWS ASIA SMALL COMPANIES FUND | | Shares | | Amount | | Shares | | Amount | |
| Investor Shares | |
| Shares sold | | | 24,922,951 | | | $ | 470,842,960 | | | | 7,498,692 | | | $ | 97,918,511 | | |
| Shares issued through reinvestment of distributions | | | 280,894 | | | | 5,887,541 | | | | 78,594 | | | | 1,216,628 | | |
| Shares redeemed | | | (6,298,522 | ) | | | (113,560,734 | ) | | | (1,032,135 | ) | | | (12,997,387 | ) | |
| Net increase (decrease) | | | 18,905,323 | | | $ | 363,169,767 | | | | 6,545,151 | | | $ | 86,137,752 | | |
| | | Year Ended December 31, 2010 | | Year Ended December 31, 2009 | |
| MATTHEWS ASIA SCIENCE AND TECHNOLOGY FUND | | Shares | | Amount | | Shares | | Amount | |
| Investor Shares | |
| Shares sold | | | 9,428,497 | | | $ | 81,860,804 | | | | 4,939,270 | | | $ | 33,834,530 | | |
| Shares issued through reinvestment of distributions | | | 38,191 | | | | 373,511 | | | | — | | | | — | | |
| Shares redeemed | | | (6,466,992 | ) | | | (54,351,834 | ) | | | (4,484,328 | ) | | | (26,762,039 | ) | |
| Net increase (decrease) | | | 2,999,696 | | | $ | 27,882,481 | | | | 454,942 | | | $ | 7,072,491 | | |
The Funds generally assess a redemption fee of 2.00% of the total redemption proceeds if shareholders sell or exchange their shares within 90 calendar days after purchasing them. The redemption fee is paid directly to the Funds and is designed to offset transaction costs associated with short-term trading of Fund shares. For purposes of determining whether the redemption fee applies, the shares that have been held the longest will be redeemed first. The Funds may grant an exemption from the redemption fee when the Funds have previously received assurances that transactions do not involve a substantial risk of the type of harm that the policy is designed to avoid. The Funds may also waive the imposition of redemption fees in certain circumstances. For more information on this policy, please see the Funds' prospectus. The redemption fees returned to the assets of the Funds are stated in the Statements of Changes in Net Assets.
4. INVESTMENT ADVISORY FEES AND OTHER TRANSACTIONS WITH AFFILIATES
Matthews International Capital Management, LLC ("Matthews"), a registered investment advisor under the Investment Advisers Act of 1940, as amended, provides the Funds with investment management services. Pursuant to an Investment Advisory Agreement dated August 13, 2004, as amended (the "Advisory Agreement"), the Funds pay Matthews (i) for management and advisory services; and (ii) for certain administrative services, an annual fee as a percentage of average daily net assets. Under the Advisory Agreement each of the Funds, other than the Matthews Asia Small Companies Fund, pays Matthews 0.75% of their annual aggregate average daily net assets from $0 to $2 billion, 0.6834% on their annual aggregate average daily net assets between $2 billion and $5 billion, and 0.65% on their annual aggregate average daily net assets over $5 billion. The Matthews Asia Small Companies Fund pays Matthews an annual fee of 1.00% of its annual average daily net assets pursuant to the Advisory Agreement. Each Fund pays Matthews a monthly fee of one-twelfth (1/12) of the management fee of the Fund's average daily net asset value for each month in arrears.
Under a written agreement between the Funds and Matthews, Matthews agrees to reimburse money to a Fund if its expense ratio exceeds a certain percentage level. For Matthews China Fund, Matthews India Fund, Matthews Japan Fund, Matthews Korea Fund, Matthews Asia Small Companies Fund and Matthews Asia Science and Technology Fund, the level is 2.00%. For Matthews Asian Growth and Income Fund, Matthews Asia Pacific Fund and Matthews Pacific Tiger Fund, the level is 1.90%. For Matthews Asia Dividend Fund and Matthews China Dividend Fund, the level is 1.50%. In turn, if a Fund's expenses fall below the level noted within three years after Matthews has made such a reimbursement, the Fund may reimburse Matthews up to an amount not to exceed its expense limitation. For each Fund,
matthewsasia.com | 800.789.ASIA 91
Notes to Financial Statements (continued)
other than Matthews Asia Small Companies Fund and Matthews China Dividend Fund, this agreement will continue through at least August 31, 2011. For the Matthews Asia Small Companies Fund and Matthews China Dividend Fund, this agreement will continue through at least April 30, 2012 and November 30, 2012, respectively. These agreements may be extended for additional periods for each of the Funds. At December 31, 2010, Matthews China Dividend Fund had $127,069 available for recoupment, of which $30,662 expires in 2012 and $96,407 expires in 2013.
Investment advisory fees charged and waived and fees recaptured for the year ended December 31, 2010, were as follows:
| | | Gross Advisory Fees | | Advisory Fees
Waived and
Reimbursed in
Excess of the
Expense Limitation | | Recapture of
Previously
Waived Fees | | Net Advisory Fee | |
| Matthews Asian Growth and Income Fund | | $ | 20,866,236 | | | $ | — | | | $ | — | | | $ | 20,866,236 | | |
| Matthews Asia Dividend Fund | | | 6,759,893 | | | | — | | | | 34,648 | | | | 6,794,541 | | |
| Matthews China Dividend Fund | | | 144,360 | | | | (96,407 | ) | | | — | | | | 47,953 | | |
| Matthews Asia Pacific Fund | | | 1,745,528 | | | | — | | | | — | | | | 1,745,528 | | |
| Matthews Pacific Tiger Fund | | | 29,376,374 | | | | — | | | | — | | | | 29,376,374 | | |
| Matthews China Fund | | | 18,044,591 | | | | — | | | | — | | | | 18,044,591 | | |
| Matthews India Fund | | | 6,861,287 | | | | — | | | | — | | | | 6,861,287 | | |
| Matthews Japan Fund | | | 460,632 | | | | — | | | | — | | | | 460,632 | | |
| Matthews Korea Fund | | | 956,336 | | | | — | | | | — | | | | 956,336 | | |
| Matthews Asia Small Companies Fund | | | 2,490,870 | | | | — | | | | 94,607 | | | | 2,585,477 | | |
| Matthews Asia Science and Technology Fund | | | 1,027,540 | | | | — | | | | — | | | | 1,027,540 | | |
Certain officers and Trustees of the Funds are also officers and directors of Matthews. All officers serve without compensation from the Funds. The Funds paid the Independent Trustees $455,000 in aggregate for regular compensation during the year ended December 31, 2010.
The Funds have an administration and shareholder servicing agreement, pursuant to which the Funds pay Matthews for administration and shareholder servicing activities based on each Fund's aggregate average daily net assets. The fee is charged at a rate of 0.25% of the aggregate average daily net assets in the Trust between $0 and $2 billion, 0.1834% of aggregate average daily net assets in the Trust between $2 billion and $5 billion, 0.15% of the aggregate average daily net assets in the Trust between $5 billion and $7.5 billion, 0.125% of aggregate average daily net assets in the Trust between $7.5 billion and 15 billion, and 0.11% of aggregate average daily net assets in the Trust over $15 billion.
Administration and shareholder servicing fees charged, for the year ended December 31, 2010, were as follows:
| | | Administration and
Shareholder
Servicing Fees | |
| Matthews Asian Growth and Income Fund | | $ | 5,029,908 | | |
| Matthews Asia Dividend Fund | | | 1,610,803 | | |
| Matthews China Dividend Fund | | | 34,276 | | |
| Matthews Asia Pacific Fund | | | 420,812 | | |
| Matthews Pacific Tiger Fund | | | 7,075,983 | | |
| Matthews China Fund | | | 4,361,280 | | |
| Matthews India Fund | | | 1,648,388 | | |
| Matthews Japan Fund | | | 112,048 | | |
| Matthews Korea Fund | | | 231,234 | | |
| Matthews Asia Small Companies Fund | | | 397,608 | | |
| Matthews Asia Science and Technology Fund | | | 248,299 | | |
The Funds bear a portion of the fees paid to certain service providers (exclusive of the Funds' Transfer Agent) which provide transfer agency and shareholder servicing to certain shareholders. Additional information concerning these services and fees is contained in the Fund's prospectus. Fees accrued to pay to such service providers for the year ended December 31, 2010 are a component of Transfer Agent fees and Administration and Shareholder Servicing Fees in the Statements of Operations as follows:
| | | Transfer Agent Fees | | Administration &
Shareholder
Servicing Fees | | Total | |
| Matthews Asian Growth and Income Fund | | $ | 4,336,075 | | | $ | 2,168,037 | | | $ | 6,504,112 | | |
| Matthews Asia Dividend Fund | | | 1,252,989 | | | | 626,495 | | | | 1,879,484 | | |
| Matthews China Dividend Fund | | | 30,651 | | | | 15,325 | | | | 45,976 | | |
| Matthews Asia Pacific Fund | | | 347,301 | | | | 173,650 | | | | 520,951 | | |
92 MATTHEWS ASIA FUNDS
| | | Transfer Agent Fees | | Administration &
Shareholder
Servicing Fees | | Total | |
| Matthews Pacific Tiger Fund | | $ | 4,702,947 | | | $ | 2,351,474 | | | $ | 7,054,421 | | |
| Matthews China Fund | | | 3,813,126 | | | | 1,906,563 | | | | 5,719,689 | | |
| Matthews India Fund | | | 1,425,193 | | | | 712,596 | | | | 2,137,789 | | |
| Matthews Japan Fund | | | 78,998 | | | | 39,499 | | | | 118,497 | | |
| Matthews Korea Fund | | | 166,079 | | | | 83,039 | | | | 249,118 | | |
| Matthews Asia Small Companies Fund | | | 388,175 | | | | 194,087 | | | | 582,262 | | |
| Matthews Asia Science and Technology Fund | | | 212,193 | | | | 106,097 | | | | 318,290 | | |
BNY Mellon Investment Servicing (US) Inc. ("BNY Mellon"), formerly PNC Global Investment Servicing (U.S.) Inc., serves as the Trust's administrator, and in that capacity, performs various administrative and accounting services for each Fund. BNY Mellon also serves as the Trust's transfer agent, dividend disbursing agent and registrar. An officer of BNY Mellon serves as Assistant Treasurer to the Trust. Total fees accrued by the Funds for administration and accounting services for the year ended December 31, 2010 were as follows:
| | | Administration and
Accounting Fees | |
| Matthews Asian Growth and Income Fund | | $ | 508,071 | | |
| Matthews Asia Dividend Fund | | | 163,692 | | |
| Matthews China Dividend Fund | | | 3,485 | | |
| Matthews Asia Pacific Fund | | | 42,509 | | |
| Matthews Pacific Tiger Fund | | | 715,092 | | |
| Matthews China Fund | | | 439,919 | | |
| Matthews India Fund | | | 166,783 | | |
| Matthews Japan Fund | | | 11,257 | | |
| Matthews Korea Fund | | | 23,324 | | |
| Matthews Asia Small Companies Fund | | | 40,429 | | |
| Matthews Asia Science and Technology Fund | | | 25,052 | | |
Brown Brothers Harriman & Co. serves as custodian to the Trust. BNY Mellon Distributors, Inc. formerly PFPC Distributions, Inc. (the "Distributor"), serves as the Fund's Distributor pursuant to an Underwriting Agreement.
The Funds entered into transactions with JP Morgan Chase Bank, N.A., including its subsidiaries and affiliates ("JP Morgan") acting as a broker-dealer in the purchase or sale of securities in market transactions. The aggregate value of such transactions with JP Morgan by the Funds in 2010 was $24,429,392. In addition, pursuant to an Administrative Fee Agreement dated July 1, 2009, the Funds received certain administrative services from JP Morgan (including transmission of purchase and redemption orders in accordance with the Funds' prospectus; maintenance of separate records for its clients; mailing of shareholder confirmations and periodic statements; processing dividend payments; and shareholder information and support). Pursuant to the agreement with JP Morgan, the Funds paid JP Morgan $1,487,831 for such services.
5. INVESTMENT TRANSACTIONS
The value of investment transactions made for affiliated and unaffiliated holdings for the year ended December 31, 2010, excluding short-term investments, were as follows:
| | | Affiliated Purchases | | Proceeds from
Affiliated Sales | | Unaffiliated Purchases | | Proceeds from
Unaffiliated Sales | |
| Matthews Asian Growth and Income Fund | | $ | 58,807,091 | | | $ | 235,745 | | | $ | 1,448,226,220 | | | $ | 597,621,666 | | |
| Matthews Asia Dividend Fund | | | 152,331,231 | | | | — | | | | 1,354,211,353 | | | | 103,110,380 | | |
| Matthews China Dividend Fund | | | — | | | | — | | | | 33,510,447 | | | | 1,451,922 | | |
| Matthews Asia Pacific Fund | | | — | | | | — | | | | 109,441,507 | | | | 66,884,132 | | |
| Matthews Pacific Tiger Fund | | | 279,137,281 | | | | — | | | | 1,282,107,358 | | | | 484,169,922 | | |
| Matthews China Fund | | | — | | | | 1,173,701 | | | | 345,088,057 | | | | 261,050,250 | | |
| Matthews India Fund | | | — | | | | — | | | | 488,620,944 | | | | 60,078,000 | | |
| Matthews Japan Fund | | | — | | | | — | | | | 31,057,554 | | | | 63,080,350 | | |
| Matthews Korea Fund | | | — | | | | — | | | | 54,210,716 | | | | 55,464,715 | | |
| Matthews Asia Small Companies Fund | | | — | | | | — | | | | 404,568,385 | | | | 58,844,560 | | |
| Matthews Asia Science and Technology Fund | | | — | | | | — | | | | 117,435,386 | | | | 91,808,989 | | |
matthewsasia.com | 800.789.ASIA 93
Notes to Financial Statements (continued)
6. HOLDINGS OF 5% VOTING SHARES OF PORTFOLIO COMPANIES
The Act defines "affiliated companies" to include investments in portfolio companies in which a fund owns 5% or more of the outstanding voting shares. During the year ended December 31, 2010, the Funds below held 5% or more of the outstanding voting shares of the noted portfolio companies. During this period, other Funds in the Trust may also have held voting shares of the issuers at levels below 5%.
Investments in affiliates:
A summary of transactions in securities of issuers affiliated with a Fund for the year ended December 31, 2010 is set forth below:
| | | Shares Held at
Dec. 31, 2009 | | Shares
Purchased | | Shares
Sold | | Shares Held at
Dec. 31, 2010 | | Value at
Dec. 31, 2010 | | Dividend
Income
Jan. 1, 2010 -
Dec. 31, 2010 | | Net Realized
Gain
Jan. 1, 2010 -
Dec. 31, 2010 | |
| MATTHEWS ASIAN GROWTH AND INCOME FUND | |
| Name of Issuer: | |
| CyberLink Corp. | | | 5,464,938 | | | | 525,190 | † | | | — | | | | 5,990,128 | | | $ | 22,599,217 | | | $ | 1,198,767 | | | $ | — | | |
| GS Home Shopping, Inc. | | | 388,299 | | | | 44,120 | | | | 2,370 | | | | 430,049 | | | | 41,327,663 | | | | 1,125,439 | | | | 114,437 | | |
| I-CABLE Communications, Ltd. | | | 128,079,000 | | | | — | | | | — | | | | 128,079,000 | | | | 15,983,511 | | | | — | | | | — | | |
| Inspur International, Ltd. | | | 150,205,000 | | | | 149,305,000 | | | | — | | | | 299,510,000 | | | | 26,202,501 | | | | 234,005 | | | | — | | |
| SinoCom Software Group, Ltd. | | | — | | | | 83,028,000 | | | | — | | | | 83,028,000 | | | | 9,400,041 | | | | 224,141 | | | | — | | |
| Vitasoy International Holdings, Ltd. | | | 51,297,000 | | | | 474,000 | | | | — | | | | 51,771,000 | | | | 43,160,261 | | | | 1,768,359 | | | | — | | |
| Total Affiliates | | | | | | | | | | $ | 158,673,194 | | | $ | 4,550,711 | | | $ | 114,437 | | |
| MATTHEWS ASIA DIVIDEND FUND | |
| Name of Issuer: | |
| EPS Co., Ltd. | | | — | | | | 12,504 | † | | | — | | | | 12,504 | | | $ | 30,601,611 | | | $ | 194,340 | | | $ | — | | |
| Pigeon Corp. | | | — | | | | 1,069,300 | | | | — | | | | 1,069,300 | | | | 36,350,142 | | | | 228,418 | | | | — | | |
| Shinko Plantech Co., Ltd. | | | 541,300 | | | | 2,014,300 | | | | — | | | | 2,555,600 | | | | 23,607,587 | | | | 391,880 | | | | — | | |
| TXC Corp. | | | — | | | | 15,450,000 | | | | — | | | | 15,450,000 | | | | 29,515,374 | | | | — | | | | — | | |
| Woongjin Thinkbig Co., Ltd. | | | — | | | | 1,475,030 | | | | — | | | | 1,475,030 | | | | 28,323,011 | | | | 1,473,293 | | | | — | | |
| Total Affiliates | | | | | | | | | | $ | 148,397,725 | | | $ | 2,287,931 | | | $ | — | | |
| MATTHEWS PACIFIC TIGER FUND | |
| Name of Issuer: | |
| Cheil Worldwide, Inc. | | | 177,154 | | | | 6,114,196 | † | | | — | | | | 6,291,350 | | | $ | 76,667,519 | | | $ | 1,865,974 | | | $ | — | | |
| Green Cross Corp. | | | — | | | | 610,295 | | | | — | | | | 610,295 | | | | 74,658,924 | | | | 649,449 | | | | — | | |
| MegaStudy Co., Ltd. | | | 193,231 | | | | 205,522 | | | | — | | | | 398,753 | | | | 61,733,916 | | | | 800,045 | | | | — | | |
| Yuhan Corp. | | | 289,321 | | | | 294,816 | †† | | | — | ††† | | | 584,137 | | | | 89,228,686 | | | | 462,188 | | | | 6 | | |
| Total Affiliates | | | | | | | | | | $ | 302,289,045 | | | $ | 3,777,656 | | | $ | 6 | | |
| MATTHEWS CHINA FUND | |
| Name of Issuer: | |
Kingdee International Software
Group Co., Ltd. | | | 120,330,000 | | | | — | | | | — | | | | 120,330,000 | | | $ | 67,496,758 | | | $ | 340,845 | | | $ | — | | |
Lianhua Supermarket Holdings Co.,
Ltd. H Shares | | | 17,150,000 | | | | — | | | | 354,000 | | | | 16,796,000 | | | | 80,276,271 | | | | 764,127 | | | | 770,595 | | |
| Total Affiliates | | | | | | | | | | $ | 147,773,029 | | | $ | 1,104,972 | | | $ | 770,595 | | |
† Increase includes stock split during the period.
†† Increase includes stock dividend during the period.
††† Sale of a fractional share.
94 MATTHEWS ASIA FUNDS
7. FEDERAL INCOME TAX INFORMATION
As of December 31, 2010, the components of accumulated earnings/(deficit) on tax basis were as follows:
| | | Undistributed
Ordinary Income | | Undistributed
Long-Term
Capital Gains | | Capital Loss
Carryforwards | | Post October
Capital Losses* | |
| Matthews Asian Growth and Income Fund | | $ | 4,357,302 | | | $ | 30,620,051 | | | $ | — | | | $ | — | | |
| Matthews Asia Dividend Fund | | | 4,507,666 | | | | 11,676,961 | | | | — | | | | — | | |
| Matthews China Dividend Fund | | | 29,497 | | | | 27,774 | | | | — | | | | — | | |
| Matthews Asia Pacific Fund | | | 7,735,305 | | | | — | | | | (66,618,414 | ) | | | — | | |
| Matthews Pacific Tiger Fund | | | 129,367 | | | | — | | | | (100,409,052 | ) | | | — | | |
| Matthews China Fund | | | — | | | | — | | | | — | | | | (1,423,251 | ) | |
| Matthews India Fund | | | 2,994,487 | | | | — | | | | (87,473,985 | ) | | | (3,173,623 | ) | |
| Matthews Japan Fund | | | 2,606,250 | | | | — | | | | (74,111,450 | ) | | | — | | |
| Matthews Korea Fund | | | 1,792,530 | | | | 5,678,455 | | | | — | | | | — | | |
| Matthews Asia Small Companies Fund | | | 45,070 | | | | 2,161,296 | | | | — | | | | — | | |
| Matthews Asia Science and Technology Fund | | | 131,538 | | | | — | | | | (23,313,427 | ) | | | — | | |
| | | Post October
Currency Losses* | | Other Temporary
Differences | | Unrealized
Appreciation** | | Total Accumulated
Earnings/Deficit | |
| Matthews Asian Growth and Income Fund | | $ | — | | | $ | — | | | $ | 656,794,369 | | | $ | 691,771,722 | | |
| Matthews Asia Dividend Fund | | | (82,207 | ) | | | (50,108 | ) | | | 179,116,022 | | | | 195,168,334 | | |
| Matthews China Dividend Fund | | | (2,322 | ) | | | — | | | | 4,583,828 | | | | 4,638,777 | | |
| Matthews Asia Pacific Fund | | | (55,869 | ) | | | — | | | | 96,360,488 | | | | 37,421,510 | | |
| Matthews Pacific Tiger Fund | | | (2,215,610 | ) | | | — | | | | 1,721,781,670 | | | | 1,619,286,375 | | |
| Matthews China Fund | | | (14,746 | ) | | | — | | | | 918,407,309 | | | | 916,969,312 | | |
| Matthews India Fund | | | (270,782 | ) | | | (24,613 | ) | | | 405,255,671 | | | | 317,307,155 | | |
| Matthews Japan Fund | | | — | | | | — | | | | 11,594,937 | | | | (59,910,263 | ) | |
| Matthews Korea Fund | | | (5,878 | ) | | | — | | | | 53,670,873 | | | | 61,135,980 | | |
| Matthews Asia Small Companies Fund | | | (47,112 | ) | | | — | | | | 91,834,447 | | | | 93,993,701 | | |
| Matthews Asia Science and Technology Fund | | | — | | | | — | | | | 46,446,910 | | | | 23,265,021 | | |
* Under current federal tax law, capital and currency losses realized after October 31 and prior to the Funds' fiscal year end may be deferred as occurring on the first day of the following fiscal year.
** The differences between book-basis and tax-basis unrealized appreciation/(depreciation) is attributable primarily to the tax deferral of losses on wash sales and passive foreign investment company (PFIC) mark to market adjustments.
For federal income tax purposes, the Funds indicated below have capital loss carryforwards, which expire in the year indicated, as of December 31, 2010, which are available to offset future capital gains, if any:
| EXPIRING IN: | | 2016 | | 2017 | | 2018 | | Total | |
| Matthews Asia Pacific Fund | | $ | 8,369,439 | | | $ | 58,248,975 | | | $ | — | | | $ | 66,618,414 | | |
| Matthews Pacific Tiger Fund | | | — | | | | 100,409,052 | | | | — | | | | 100,409,052 | | |
| Matthews India Fund | | | — | | | | 84,698,767 | | | | 2,775,218 | | | | 87,473,985 | | |
| Matthews Japan Fund | | | 30,079,024 | | | | 44,032,426 | | | | — | | | | 74,111,450 | | |
| Matthews Asia Science and Technology Fund | | | 8,256,365 | | | | 15,057,062 | | | | — | | | | 23,313,427 | | |
Matthews Asian Growth and Income Fund, Matthews Asia Dividend Fund, Matthews Asia Pacific Fund, Matthews Pacific Tiger Fund, Matthews China Fund, Matthews Japan Fund and Matthews Asia Science and Technology Fund utilized capital loss carryforwards of $64,043,804, $17,572,254, $15,721,078, $94,038,245, $44,320,615, $6,416,354 and $12,698,246, respectively.
matthewsasia.com | 800.789.ASIA 95
Notes to Financial Statements (continued)
Accounting principles generally accepted in the United States require that certain components of net assets be reclassified between financial and tax reporting. These reclassifications have no effect on net assets or net asset value per share. The permanent differences are primarily attributable to net realized gains on PFICs, foreign currency gain reclassification, and recharacterization of distributions. For the year ended December 31, 2010, permanent differences in book and tax accounting have been reclassified to paid-in capital, undistributed net investment income (loss) and accumulated realized gain (loss) as follows:
| | | Increase/
(Decrease)
Paid-in-Capital | | Increase/(Decrease)
Undistributed Net
Investment
Income/(Loss) | | Increase/
(Decrease)
Accumulated
Realized Gain/(Loss) | |
| Matthews Asian Growth and Income Fund | | $ | — | | | $ | 4,171,691 | | | ( | $4,171,691 | ) | |
| Matthews Asia Dividend Fund | | | — | | | | 1,197,582 | | | | (1,197,582 | ) | |
| Matthews China Dividend Fund | | | (43,344 | ) | | | 35,252 | | | | 8,092 | | |
| Matthews Asia Pacific Fund | | | — | | | | (105,559 | ) | | | 105,559 | | |
| Matthews Pacific Tiger Fund | | | — | | | | (3,242,814 | ) | | | 3,242,814 | | |
| Matthews China Fund | | | (33,277 | ) | | | (75,784 | ) | | | 109,061 | | |
| Matthews India Fund | | | — | | | | (469,636 | ) | | | 469,636 | | |
| Matthews Japan Fund | | | — | | | | 1,878,189 | | | | (1,878,189 | ) | |
| Matthews Korea Fund | | | — | | | | 12,100 | | | | (12,100 | ) | |
| Matthews Asia Small Companies Fund | | | — | | | | 228,709 | | | | (228,709 | ) | |
| Matthews Asia Science and Technology Fund | | | — | | | | 4,323 | | | | (4,323 | ) | |
8. SUBSEQUENT EVENTS
Effective January 7, 2011, the Matthews Asian Growth and Income Fund was closed to most new investors. The Fund will continue to accept investments from existing shareholders. Management has evaluated the impact of all subsequent events on the Funds through the date the financial statements were issued, and has determined that there were no additional subsequent events that require recognition or disclosure in the financial statements.
96 MATTHEWS ASIA FUNDS
Report of Independent Registered Public Accounting Firm
To the Board of Trustees and Shareholders of Matthews Asia Funds:
In our opinion, the accompanying statements of assets and liabilities, including the schedules of investments, and the related statements of operations and of changes in net assets and the financial highlights present fairly, in all material respects, the financial position of Matthews Asian Growth and Income Fund, Matthews Asia Dividend Fund, Matthews China Dividend Fund, Matthews Asia Pacific Fund, Matthews Pacific Tiger Fund, Matthews China Fund, Matthews India Fund, Matthews Japan Fund, Matthews Korea Fund, Matthews Asia Small Companies Fund, and Matthews Asia Science and Technology Fund (each a portfolio comprising the Matthews Asia Funds, hereafter referred as the "Funds") at December 31, 2010, and the results of each of their operations for the year then ended, the changes in net assets for the two years in the period then ended, and the financial highlights for the four years in the period then ended for Matthews Asian Growth and Income Fund, Matthews Asia Dividend Fund, Matthews Asia Pacific Fund, Matthews Pacific Tiger Fund, Matthews China Fund, Matthews India Fund, Matthews Japan Fund, Matthews Korea Fund, and Matthews Asia Science and Technology Fund, the financial highlights for the three years in the period then ended for Matthews Asia Small Companies Fund, and the financial highlights for the two years in the period then ended for Matthews China Dividend Fund, in conformity with accounting principles generally accepted in the United States of America. These financial statements and financial highlights (hereafter referred to as "financial statements") are the responsibility of the Funds' management; our responsibility is to express an opinion on these financial statements based on our audits. We conducted our audits of these financial statements in accordance with the standards of the Public Company Accounting Oversight Board (United States). Those standards require that we plan and perform the audit to obtain reasonable assurance about whether the financial statements are free of material misstatement. An audit includes examining, on a test basis, evidence supporting the amounts and disclosures in the financial statements, assessing the accounting principles used and significant estimates made by management, and evaluating the overall financial statement presentation. We believe that our audits, which included confirmation of securities at December 31, 2010 by correspondence with the custodian and brokers, provide a reasonable basis for our opinion.
Prior to January 1, 2007, the financial highlights for each of the periods presented through December 31, 2006 were audited by another independent registered public accounting firm whose report dated February 12, 2007 expressed an unqualified opinion on those statements and financial highlights.
PricewaterhouseCoopers LLP
February 24, 2011
matthewsasia.com | 800.789.ASIA 97
Tax Information (Unaudited)
For shareholders who do not have a December 31, 2010 tax year-end, this notice is for informational purposes.
For the period January 1, 2010 to December 31, 2010, the Funds designate the following items with regard to distributions paid during the period. All designations are based on financial information available as of the date of this annual report and, accordingly, are subject to change. For each item, it is the intention of each Fund to designate the maximum amount permitted under the Internal Revenue Code and the regulations thereunder.
1. Qualified Dividend Income
The Funds designate a portion of the ordinary income distributed during the year ended December 31, 2010 as Qualified Dividend Income ("QDI") as defined in the Internal Revenue code as follows:
| | | QDI Portion | |
| Matthews Asian Growth and Income Fund | | | 41.87 | % | |
| Matthews Asia Dividend Fund | | | 53.80 | % | |
| Matthews China Dividend Fund | | | 20.80 | % | |
| Matthews Asia Pacific Fund | | | 57.27 | % | |
| Matthews Pacific Tiger Fund | | | 98.57 | % | |
| Matthews China Fund | | | 86.91 | % | |
| Matthews India Fund | | | 55.29 | % | |
| Matthews Japan Fund | | | 41.66 | % | |
| Matthews Asia Small Companies Fund | | | 55.47 | % | |
| Matthews Asia Science and Technology Fund | | | 100.00 | % | |
2. Long-Term Capital Gain Distributions
The Funds designate Long-Term Capital Gain distributions pursuant to Section 852(b)(3) of the Internal Revenue Code for the year ended December 31, 2010 as follows:
| | | Long-Term Capital Gains | |
| Matthews Asian Growth and Income Fund | | $ | 51,682,614 | | |
| Matthews Asia Dividend Fund | | | 5,022,499 | | |
| Matthews China Fund | | | 2,109,742 | | |
| Matthews Korea Fund | | | 3,500,175 | | |
| Matthews Asia Small Companies Fund | | | 3,751,019 | | |
3. Foreign Taxes Paid
The Funds have elected to pass through to their shareholders the foreign taxes paid for year ended December 31, 2010 as follows:
| | | Foreign Source Income | | Foreign Taxes Paid | |
| Matthews Asian Growth and Income Fund | | $ | 118,014,354 | | | $ | 6,058,099 | | |
| Matthews Asia Dividend Fund | | | 38,607,830 | | | | 3,434,435 | | |
| Matthews China Dividend Fund | | | 681,392 | | | | 26,517 | | |
| Matthews Asia Pacific Fund | | | 5,153,204 | | | | 383,010 | | |
| Matthews Pacific Tiger Fund | | | 73,631,041 | | | | 6,120,143 | | |
| Matthews China Fund | | | 46,757,645 | | | | 187,865 | | |
| Matthews Japan Fund | | | 1,048,594 | | | | 73,402 | | |
| Matthews Asia Small Companies Fund | | | 4,995,267 | | | | 299,298 | | |
| Matthews Asia Science and Technology Fund | | | 2,895,983 | | | | 412,859 | | |
98 MATTHEWS ASIA FUNDS
Approval of Investment Advisory Agreement (Unaudited)
The Funds, which are series of the Trust, have retained Matthews International Capital Management, LLC (the "Advisor") to manage their assets pursuant to the Advisory Agreement, which has been approved by the Board of Trustees of the Funds, including the Independent Trustees. Following an initial term of two years with respect to each Fund upon its commencement of operations, the Advisory Agreement continues in effect from year-to-year provided that the continuance is specifically approved at least annually by the vote of the holders of at least a majority of the outstanding shares of the Funds, or by the Board of Trustees, and, in either event, by a majority of the Independent Trustees of the Trust casting votes in person at a meeting called for that purpose.
At a meeting held on August 25 and 26, 2010, the Board, including the Independent Trustees of the Trust, approved the continuance of the Advisory Agreement, with respect to each Fund, for an additional one-year period ending August 31, 2011. (The initial term of the Advisory Agreement with respect to the new China Dividend Fund will continue through November 30, 2011 and, therefore, was not subject to renewal at that meeting.)
Before those meetings, the Independent Trustees had requested detailed information from the Advisor about the matters to be considered. This information, together with the information provided to the Independent Trustees throughout the course of year, formed the primary (but not exclusive) basis for the Board's determinations as summarized below. The Independent Trustees reviewed and discussed the extensive information provided by the Advisor at separate executive sessions held on August 5 (among a working group), 17 and 26, 2010. The Independent Trustees were assisted in their deliberations by their independent legal counsel. Below is a summary of the factors considered by the Board in approving the Advisory Agreement with respect to each Fund.
 The nature, extent and quality of the services provided by the Advisor under the Advisory Agreement. The Trustees considered the experience and qualifications of the personnel at the Advisor who are responsible for providing services to the Funds and who are responsible for the daily management of the Funds' portfolios. The Trustees noted that the Advisor has expanded and deepened its management team over the past several years, and has further plans in that regard. They also reviewed applicable changes to the Advisor's portfolio management personnel and their responsibilities, reflecting a long-term vision for the Advisor's business and for the Funds. In particular, the Trustees noted the addition of five individuals since June 2009, three of which have analytical roles supporting portfolio management activities. The Trustees viewed the Advisor as having been successful in continuing to provide high quality services to the Funds while both weathering very challenging securities markets as well as asset and revenue contractions in 2008 and 2009, and while addressing the pressures of investing a dramatic increase in assets later in 2009 and in 2010. The Trustees attributed much of that success to the Advisor's emphasis of preserving and enhancing portfolio management team resources, careful business planning and management, as well as its solid financial condition and strong cash reserves. As in past years, the Trustees considered the Advisor's succession plan to address situations where key personnel are no longer available, and the design and implementation of the Advisor's disaster recovery and business continuity plan. The Trustees also considered the Chief Compliance Officer's report regarding the compliance resources, initiatives, programs and structures of the Advisor, including the compliance record of the Advisor and the Advisor's supervision of the Funds' service providers. The Trustees concluded that the Advisor has high-quality compliance and commitment to a culture of compliance. The Trustees recognized the extent of the Advisor's on-going commitment to marketing and distribution, particularly new marketing initiatives, enhancement to client retention efforts, as well as resources devoted to investor education publications and website content, design and function. Other initiatives observed by the Trustees included significant efforts related to relationships with broker-dealers, independent advisors, and other financial institutions. The Trustees concluded that the Advisor had the quality and depth of personnel and investment methods essential to performing its duties under the Advisory Agreement, and that the nature, overall quality, cost and extent of such management services are satisfactory and reliable.
 The investment performance of the Advisor. The Trustees reviewed the short-term and long-term performance of each Fund on both an absolute basis and in comparison to peer funds and benchmark indices. The Trustees emphasized longer-term performance, which they believe is more important than short isolated periods for purposes of evaluating the Advisor's success in meeting shareholder objectives. They also noted largely favorable recent relative performance trends. To the extent of any concerns about performance with respect to any particular period for a Fund, the Trustees noted that the Advisor had articulated and taken credible plans to address performance and explained its reasons for maintaining a consistent investment philosophy. The Trustees also reviewed both the Lipper peer comparison measures and Morningstar ratings for each of the Funds for various periods ending June 30, 2010.
matthewsasia.com | 800.789.ASIA 99
Approval of Investment Advisory Agreement (Unaudited) (continued)
For Matthews Asia Pacific Fund, the Trustees noted that the Fund's performance compared very favorably against its peers for the one-year, three-year, five-year and since-inception periods. The Fund ranked in the top quintile for those periods in its Pacific region peer group.
For Matthews Asia Dividend Fund, the Trustees noted that the Fund had outperformed its peer group during the one-year and since inception periods, again ranking in the top quintile for those periods.
For Matthews Pacific Tiger Fund, the Trustees noted that the Fund's performance was favorable in the one-year, three-year, five-year, ten-year and since-inception periods, ranking in the first or second quintiles for those periods against the Lipper peer group.
For Matthews Asian Growth and Income Fund, the Trustees noted that the Fund is the top-performing fund for the ten-year and since-inception periods in its Lipper peer group, but underperformed with respect to the one-year and five-year periods with a ranking below the peer group average (but still positive performance, notably over 20% for the one-year period).
For Matthews Asia Science and Technology Fund, the Trustees noted that the Fund's performance was much more favorable than the median return of its peer funds over the one-year, five-year, ten-year and since-inception periods (ranking first), but less favorable than the average return of its peer funds over the three-year period and that absolute performance was negative like its peers for some of those periods. The Trustees also observed that the funds in the peer group invested globally, rather than being limited to Asia as the Fund's investment strategy is.
For Matthews China Fund, the Trustees noted that the Fund had outperformed the median of its peer funds over the one-year, three-year, five-year, ten-year and since-inception periods, ranking in the top quintile for all of those periods. The Trustees also noted the Fund's positive absolute performance over those periods.
For Matthews India Fund, the Trustees noted that the Fund had outperformed its peer funds over the one-year, three-year and since inception periods, ranking in the first quintile. The Trustees also noted that most of the Fund's peers do not focus on India, but instead invest more generally across emerging markets.
For Matthews Japan Fund, the Trustees noted that the Fund's performance was more favorable than the median return of its peer funds over the one-year, three-year, ten-year and since-inception periods, but had substantially lagged its peer funds for the five-year period. The Trustees noted that the underperformance concerns had been addressed to the Trustees' satisfaction by the Advisor and the more-recent performance trends showed preliminary signs that actions taken by the Advisor had the potential to be effective.
For Matthews Korea Fund, the Trustees noted that the Fund had underperformed its peer group over the three-year, five-year and since inception periods, but that the Fund was the best performing fund in its broader peer group for the one-year and ten-year periods. The Trustees noted that the broader Lipper peer group consists of Pacific-oriented funds excluding Japan, which is too broad to be a useful peer group. A more limited peer group of funds with 50% or more of their assets in Korea shows the Fund ranked favorably above the average for those time periods.
For Matthews Asia Small Companies Fund, the Trustees noted that the Fund had exceeded the average performance of its peer group for the very short one-year and since inception periods, ranking first.
The Trustees noted the difficulty of fairly benchmarking certain of the Funds in terms of performance and noted that they were of the view that more weight should be given to the Advisor's analysis of relative performance and comparability of the peer groups than to standard data provided by Lipper, Inc. and Morningstar, Inc. The Trustees also gave more weight to each Fund's longer-term investment performance given the long-term investment philosophy of each Fund. On that basis, the Trustees concluded that they were satisfied with the Funds' overall performance records. The Trustees also reviewed the Advisor's trading policies and efforts to obtain best overall execution for the Funds in the various markets in which the Funds trade securities. The Trustees noted the relatively low turnover rates in the various Funds and the Advisor's consistent adherence to its long-standing investment approach, which emphasizes fundamental bottom-up driven investment selection.
 The extent to which the Advisor realizes economies of scale as the Funds grow larger and whether fee levels reflect these economies of scale for the benefit of Fund investors. The Trustees discussed the Advisor's ongoing investment in its business and personnel, which is an acceptable way for the Funds
100 MATTHEWS ASIA FUNDS
Approval of Investment Advisory Agreement (Unaudited) (continued)
to share indirectly in realizing economies of scale. The Trustees considered the personnel, technology and other infrastructure investments by the Advisor that could be expected to benefit shareholders. The Trustees also recognize that, in 2008 and early 2009, the Funds' economies of scale had diminished as total assets declined, but that market conditions and asset growth improved later in 2009 and dramatically in 2010, which was consistent with industry-wide trends. The Trustees concluded that the current fee structure enhances the ability of the Funds and their shareholders to benefit from past and future potential economies of scale, and continues to be appropriate given the size and objectives of the Funds. In addition to some further economies of scale in expenses as assets have grown, based on discussions with the Independent Trustees during the renewal process, the Advisor later agreed to provide an additional fee reduction breakpoint under its Administration and Shareholder Services Agreement, which has the effect of further sharing those economies.
 The costs of the services provided by the Advisor and others. The Trustees considered the advisory fees and total fees and expenses of each Fund in comparison to the advisory fees and other fees and expenses of other funds in each Fund's relevant peer group. The Trustees considered both the gross advisory fee rates charged by the Advisor, as well as the effective advisory fee rates after taking into consideration the expense limitation arrangements and voluntary fee waivers. The Trustees found that the contractual advisory rates (excluding administrative services) for the Funds were very competitive and generally lower than the relevant peer group averages. Also, the total expense ratios paid by investors in the Funds, which are most representative of an investor's net experience, were also very competitive, with all but the newest (Small Companies) Fund ranking below the peer group averages.
For each of Matthews Korea Fund, Matthews India Fund, Matthews China Fund, Matthews Japan Fund, Matthews Asia Science and Technology Fund, Matthews Asian Growth and Income Fund and Matthews Asia Dividend Fund, the Trustees noted that the gross advisory fee rates, the gross management fee (including administration) rates, the total expense ratio, the effective advisory fee rates and the actual nonmanagement fee rates (which include transfer agent and custodian fees) are all lower than most of the funds in each Fund's peer group.
For Matthews Pacific Tiger Fund, the Trustees noted that the gross advisory fee rates, the total expense ratio, the effective advisory fee rates and the actual nonmanagement expense rates (which include transfer agent and custodian fees) are lower than most of the funds in that Fund's peer group while the gross management fee (including administration) rate is slightly higher than the average of the Fund's peer group.
For Matthews Asia Pacific Fund, the Trustees noted that the gross advisory fee rates, the gross management fee (including administration) rates, the total expense ratio, the effective advisory fee rates and the actual nonmanagement expense rates (which include transfer agent and custodian fees) are all lower than most of the funds in that Fund's peer group.
For Matthews Asia Small Companies Fund, the Trustees noted that the gross advisory fee rate and actual advisory fees are higher that the peer group funds, and its total expense ratio are above median of the Fund's peer group, which in part is the result of its relatively recent inception, but its actual non-management fee rates (which include transfer agent and custodian fees) are slightly below the Fund's peer group. The Trustees expect that the Fund's comparative position should improve as the Fund grows.
The Trustees also compared the Advisor's advisory fees with those of the Advisor's separate accounts and other investment products, noting that the Funds' advisory expenses were not disadvantageous (not being substantially higher than the separate accounts' rates). Total expenses appeared to be appropriate in comparison and taking into account the services differences between these products and the Funds, including the differences in the frequency of net asset value calculations. The Trustees considered various specific Fund expenses, including the custody fees and transfer agent fees. The Trustees noted the Advisor's efforts in early in recent years had resulted in, for each of the Funds, (a) reduced expenses under the administration and shareholders services plan, (b) reduced custodian expenses, and (c) reduced transfer agency fees. The Trustees also observed the generally lower commission rates enjoyed by the Funds. The Trustees concluded that the Advisor's advisory fee ratio and the Funds' expense ratios are reasonable in light of comparative performance and expense and advisory fee information for each of the Funds.
 The profits to be realized by the Advisor and its affiliates from the relationships with the Funds. The Trustees reviewed the profitability of the Advisor on both an absolute basis and in comparison to other investment advisers. The Trustees noted that the
matthewsasia.com | 800.789.ASIA 101
Approval of Investment Advisory Agreement (Unaudited) (continued)
Advisor's pretax profit margin appeared to be reasonable in relation to other advisors. The Trustees also noted that the Advisor appeared to be sufficiently profitable to operate as a viable investment management firm, able to honor its obligations as a sponsor of the Funds, including the Funds that did not generate a profit for the Advisor, without earning excessive profits from any particular Fund or from the overall relationship with the Funds. The Trustees noted that, with declines in asset levels in some prior years, declines in profitability could be expected, but also noted the continued expenditures on information technology and personnel. The Trustees expect that profitability will continue to improve as asset levels continue to grow. The Trustees further noted that the Advisor's continued upgrading of its trading, research, compliance, disaster recovery and other technological systems should increase the Advisor's capacity, speed and reliability in providing services to the Funds as they grow, which further supports the long-term viability of the Funds and the Advisor. The Trustees also considered that the additional benefits derived by the Advisor from its relationship with the Funds are limited solely to research benefits received in exchange for "soft dollars." After such review, the Trustees determined that the profitability rate to the Advisor with respect to the Advisory Agreement is fair and reasonable in consideration of the services it provides to the Funds.
No single factor was determinative of the Board's decision to approve the Advisory Agreement, but rather the Trustees based their determination on the total mix of information available to them. After considering the factors described above, the Board concluded that the terms of the advisory arrangements are fair and reasonable to each Fund in light of the services that the Advisor provides, its costs and reasonably foreseeable Fund asset levels, and that each Fund's shareholders received and would receive reasonable value in return for the advisory fees paid. The Board agreed that the continuance of the Advisory Agreement with respect to each Fund would be in the best interests of the Funds and their shareholders. The Independent Trustees concluded separately that continuance of the Advisory Agreement was supported by reasonable and impartial records and information, including the performance of the Funds in relation to their peer groups, the services provided by the Advisor, and the competitive expense structure, and that the continuance of the Advisory Agreement with respect to each Fund would be in the best interests of each Fund and its shareholders.
The Advisory Agreement may be terminated by the Trustees on behalf of the Funds or the Advisor upon 60 days' prior written notice without penalty. The Advisory Agreement will also terminate automatically in the event of its assignment, as defined in the 1940 Act.
102 MATTHEWS ASIA FUNDS
Trustees and Officers of the Funds (Unaudited)
The operations of each Fund are under the direction of the Board of Trustees. The Board of Trustees establishes each Fund's policies and oversees and reviews the management of each Fund. The Board meets regularly to review the activities of the officers, who are responsible for the day-to-day operations of the Funds. The Statement of Additional Information, which includes additional information about Fund Trustees, is available without charge by calling 800.789.2742 or by visiting the Funds' website, matthewsasia.com. The Trustees and executive officers of the Funds, their year of birth, business address and principal occupations during the past five years are set forth below:
Name, Year of Birth,
Address and Position(s)
Held with Trust | | Term of
Office and
Length of
Time Served1 | | Principal Occupation(s)
During Past 5 Years | | Number of
Portfolios in
Fund Complex
Overseen by
Trustee | | Other Trusteeships/Directorships
(number of portfolios) Held by Trustee | |
| INDEPENDENT TRUSTEES | |
|
GEOFFREY H. BOBROFF
Born 1944
Four Embarcadero Center
Suite 550
San Francisco, CA 94111
Chairman of the Board of
Trustees and Trustee | | Since 2006 | | President, Bobroff Consulting, Inc. (since 1993). | | | 11 | | | None | |
|
TOSHI SHIBANO
Born 1950
Four Embarcadero Center
Suite 550
San Francisco, CA 94111
Trustee | | Since 2003 | | President, Strategic Financial Literacy, Inc. (since 1995); Adjunct Professor, Columbia Graduate School of Business (since 2000); Faculty, General Electric John F. Welch Leadership Development Center (since 2000); Executive Education Lecturer, Center for Executive Education, Haas School of Business, UC Berkeley (since 1994); Visiting Assistant Professor, Stanford Graduate School of Business (2000); Assistant Professor, University of Chicago Graduate School of Business (1995-2000); Assistant Professor, Haas School of Business, UC Berkeley (1988-1995). | | | 11 | | | None | |
|
RHODA ROSSMAN
Born 1958
Four Embarcadero Center
Suite 550
San Francisco, CA 94111
Trustee | | Since 2006 | | Vice President, Corporate Investment Officer (2007–2010); and Senior Vice President and Treasurer (2003–2007), The PMI Group, Inc. | | | 11 | | | None | |
|
JONATHAN F. ZESCHIN
Born 1953
Four Embarcadero Center
Suite 550
San Francisco, CA 94111
Trustee | | Since 2007 | | Partner, Essential Investment Partners, LLC (since 2009); President, Essential Advisers Inc. (since 2000); Managing Partner, JZ Partners LLC (since 1998). | | | 11 | | | Independent Chairman of the Board of Trustees, DCA Total Return Fund (since 2005) (1 Portfolio) and DCW Total Return Fund (2007–2010) (1 Portfolio); Independent Trustee, ICON Funds (2002–2007) (17 Portfolios); Independent Director, Wasatch Funds (2002–2004) (10 Portfolios). | |
|
RICHARD K. LYONS
Born 1961
Four Embarcadero Center
Suite 550
San Francisco, CA 94111
Trustee | | Since 2010 | | Dean (since 2008), Haas School of Business, UC Berkeley; Chief Learning Officer (2006–2008), Goldman Sachs; Executive Associate Dean (2005–2006), Acting Dean (2004–2005), Professor (2000–2004), Associate Professor (1996–2000), Assistant Professor (1993–1996), Haas School of Business, UC Berkeley. | | | 11 | | | Director (2000–2006), iShares Fund Complex, consisting of iShares, Inc. (24 Portfolios) and iShares Trust (over 70 Portfolios) managed by Barclays Global Investors; Trustee (2001–2006), Barclays Global Investor Fund Complex, consisting of Barclays Global Investor Funds and Barclays Master Investment Portfolios (15 Portfolios); Independent Trustee, Matthews Asia Funds (1994–2006) (9 Portfolios). | |
|
matthewsasia.com | 800.789.ASIA 103
Name, Year of Birth,
Address and Position(s)
Held with Trust | | Term of
Office and
Length of
Time Served1 | | Principal Occupation(s)
During Past 5 Years | | Number of
Portfolios in
Fund Complex
Overseen by
Trustee | | Other Trusteeships/Directorships
(number of portfolios) Held by Trustee | |
| INTERESTED TRUSTEES2 | |
|
G. PAUL MATTHEWS
Born 1956
Four Embarcadero Center
Suite 550
San Francisco, CA 94111
Trustee | | Since 2007 | | Director and Portfolio Manager (Since 2009), Chairman and Portfolio Manager (1991–2009), Chief Investment Officer (1991–2007), Matthews International Capital Management, LLC; President of the Funds (1994–2007). | | | 11 | | | Director, Matthews Asian Selections Funds Plc (1 Portfolio). | |
|
Name, Year of Birth,
Address and Position(s)
Held with Trust | | Term of Office
and Length of
Time Served1 | | Principal Occupation(s) During Past 5 Years | | Other Trusteeships/
Directorships
(number of
portfolios)
Held by Officer | |
| OFFICERS WHO ARE NOT TRUSTEES | |
|
WILLIAM J. HACKETT
Born 1967
Four Embarcadero Center
Suite 550
San Francisco, CA 94111
President | | Since 2008 | | Chief Executive Officer (since 2009), President and Secretary (since 2007), Matthews International Capital Management, LLC; Partner (2002–2007), Deloitte & Touche, LLP. | | Director, Matthews Asian Selections Funds Plc (1 Portfolio); Director, Matthews Asia Funds S.I.C.A.V. (3 Portfolios). | |
|
ROBERT J. HORROCKS, PHD
Born 1968
Four Embarcadero Center
Suite 550
San Francisco, CA 94111
Vice President | | Since 2009 | | Chief Investment Officer (Since 2009), Director of Research (2008–2009), Matthews International Capital Management, LLC; Head of Research, Mirae Asset Management (2006–2008); Chief Investment Officer, Everbright Pramerica (2003–2006). | | None | |
|
JOHN P. McGOWAN
Born 1964
Four Embarcadero Center
Suite 550
San Francisco, CA 94111
Vice President and
Secretary | | Since 2005 | | Senior Vice President of Business Administration (since 2009), Chief Administrative Officer (2007–2008), Chief Operating Officer (2004–2007), Matthews International Capital Management, LLC; Chief Operating Officer, Treasurer and Chief Compliance Officer, Forward Management LLC (1998–2004). | | Director, Matthews Asian Selections Funds Plc (1 Portfolio); Director, Matthews Asia Funds S.I.C.A.V. (3 Portfolios). | |
|
SHAI A. MALKA
Born 1973
Four Embarcadero Center
Suite 550
San Francisco, CA 94111
Treasurer | | Since 2005 | | Vice President of Fund Accounting and Operations (since 2010), Senior Manager of Fund Accounting and Operations (2004–2009), Matthews International Capital Management, LLC. | | None | |
|
TIMOTHY B. PARKER
Born 1958
Four Embarcadero Center
Suite 550
San Francisco, CA 94111
Vice President | | Since 2008 | | General Counsel (since 2005), Matthews International Capital Management, LLC; Partner, Kirkpatrick & Lockhart Nicholson Graham LLP (2003–2005); Global Head of Compliance and Risk Management, Allianz Dresdner Asset Management (2001–2003); Managing Director, RCM Global Investors (1993–2001). | | Director, Matthews Asia Funds S.I.C.A.V. (3 Portfolios). | |
|
MANOJ K. POMBRA
Born 1964
Four Embarcadero Center
Suite 550
San Francisco, CA 94111
Chief Compliance Officer | | Since 2005 | | Chief Compliance Officer, Matthews International Capital Management, LLC (since 2005); Senior Manager, Mutual Fund Compliance/Manager Portfolio Compliance, Franklin Templeton Investments (2001–2005). | | None | |
|
1 Each trustee serves for an indefinite term, until retirement age or until his/her successor is elected. Officers serve at the pleasure of the Board of Trustees.
2 This trustee is considered an "interested person" of the Trust as defined under the 1940 Act because of an ownership interest in the Advisor and an office held with the Advisor.
104 MATTHEWS ASIA FUNDS
Matthews Asia Funds
INVESTMENT ADVISOR
Matthews International Capital Management, LLC
Four Embarcadero Center, Suite 550
San Francisco, CA 94111
800.789.ASIA
CUSTODIAN
Brown Brothers Harriman & Co.
50 Milk Street
Boston, MA 02109
ACCOUNT SERVICES
Matthews Asia Funds
P.O. Box 9791
Providence, RI 02940
800.789.ASIA
LEGAL COUNSEL
Paul, Hastings, Janofsky & Walker LLP
55 Second Street, 24th Floor
San Francisco, CA 94105
matthewsasia.com | 800.789.ASIA 105
P.O. Box 9791 | Providence, RI 02940 | matthewsasia.com | 800.789.ASIA (2742)
© 2011 Matthews Asia Funds AR-1210-310M


Item 2. Code of Ethics.
(a) The registrant, as of the end of the period covered by this report, has adopted a code of ethics that applies to the registrant’s principal executive officer, principal financial officer, principal accounting officer or controller, or persons performing similar functions, regardless of whether these individuals are employed by the registrant or a third party.
(c) There have been no amendments, during the period covered by this report, to a provision of the code of ethics that applies to the registrant’s principal executive officer, principal financial officer, principal accounting officer or controller, or persons performing similar functions, regardless of whether these individuals are employed by the registrant or a third party, and that relates to any element of the code of ethics description.
(d) The registrant has not granted any waivers, including an implicit waiver, from a provision of the code of ethics that applies to the registrant’s principal executive officer, principal financial officer, principal accounting officer or controller, or persons performing similar functions, regardless of whether these individuals are employed by the registrant or a third party, that relates to one or more of the items set forth in paragraph (b) of this item’s instructions.
Item 3. Audit Committee Financial Expert.
(a) As of the end of the period covered by the report, the registrant’s board of directors has determined that the registrant has two audit committee financial experts serving on its audit committee, Toshi Shibano and Jonathan F. Zeschin, and that both are “independent.”
(b) Prof. Shibano is an Adjunct Professor at the Columbia Graduate School of Business and a member of the Faculty of the General Electric Corporate Leadership Development Center. He also serves as Executive Education Lecturer at the Haas School of Business at the University of California, Berkeley, and has served on the faculties of Thunderbird American Graduate School of International Management, Stanford Graduate School of Business, the University of Chicago School of Business and the Australian Graduate School of Management at the University of New South Wales. He regularly reviews current research in accounting both for use in instruction of courses and for internal faculty evaluation. He has experience analyzing and evaluating financial statements at the appropriate level of complexity through his professional activities on the educational faculties referenced above.
Prof. Shibano also has extensive experience in executive education worldwide (Hong Kong, Taiwan, Singapore, Finland, Italy, Mexico, India) and has developed innovative new programs in financial analysis, management control systems and strategy implementation.
Prof. Shibano has published in the Journal of Accounting Research, the Journal of Accounting and Economics, the Rand Journal of Economics, and the Journal of Applied Corporate Finance, on the topics of strategic audit risk, accounting standard setting, international accounting standards, tax minimization, foreign currency risk management, and organizational structure. Prof. Shibano received his MBA from the Haas School at UC Berkeley and earned his PhD at the Stanford Graduate School of Business, earning the highest academic honors in both programs. Prof. Shibano has gained additional accounting expertise as the Audit Committee Chair of Matthews Asian Funds.
Mr. Zeschin is Partner of Essential Investment Partners, LLC, a wealth management and investment advisory firm. He is also the portfolio manager for that firm’s Essential Growth Portfolio. Essential Investment Partners, LLC succeeded to the business of Essential Advisers, Inc. He is Managing Partner of JZ Partners, LLC, a business consulting firm for investment managers. Prior to forming Essential Advisers, Inc., Mr. Zeschin held senior executive positions with Founders Asset Management, Inc., Invesco Fund Group, and Stein Roe & Farnham, Inc. Mr. Zeschin holds a Masters of Management from the Kellogg School at Northwestern University, with majors in Finance and Marketing, and a Bachelor in Business Administration in Accounting with distinction from the University of Michigan. He holds a Certified Public Accountant certificate from the state of Illinois and is a Certified Financial Planner certificant. Mr. Zeschin is a former chair of the ICI’s Accounting Treasurer’s Committee and a former member of the AICPA Investment Companies committee. Mr. Zeschin is currently the chairman of the Board of Trustees to two NYSE listed closed-end funds. He has served on the audit committees of mutual fund boards since 2002. He has experience analyzing and evaluating financial statements at the appropriate level of complexity through his professional activities on the educational faculties referenced above. Mr. Zeschin has gained additional expertise as a member of the Audit Committee of Matthews Asian Funds.
Item 4. Principal Accountant Fees and Services.
Audit Fees
(a) The aggregate fees billed for each of the last two fiscal years for professional services rendered by the principal accountant for the audit of the registrant’s annual financial statements or services that are normally provided by the accountant in connection with statutory and regulatory filings or engagements for those fiscal years are $280,800 in 2009 and $297,278 in 2010.
Audit-Related Fees
(b) The aggregate fees billed in each of the last two fiscal years for assurance and related services by the principal accountant that are reasonably related to the performance of the audit of the registrant’s financial statements and are not reported under paragraph (a) of this Item are $0 in 2009 and $0 in 2010.
Tax Fees
(c) The aggregate fees billed in each of the last two fiscal years for professional services rendered by the principal accountant for tax compliance, tax advice, and tax planning are $69,113 in 2009 and $78,210 in 2010. Tax fees include services provided by PWC for tax return preparations.
All Other Fees
(d) The aggregate fees billed in each of the last two fiscal years for products and services provided by the principal accountant, other than the services reported in paragraphs (a) through (c) of this Item are $0 in 2009 and $0 in 2010.
(e)(1) Disclose the audit committee’s pre-approval policies and procedures described in paragraph (c)(7) of Rule 2-01 of Regulation S-X.
Pre-Approval of Auditor Services.
Pre-Approval Requirements. Before the Auditor is engaged by the Trust to render audit related or permissible non-audit services, either:
(i) The Audit Committee shall pre-approve all audit related services and permissible non-audit services (e.g., tax services) to be provided to the Trust; or
(ii) The Audit Committee shall establish policies and procedures governing the Auditor’s engagement. Any such policies and procedures must (1) be detailed as to the particular service and (2) not involve any delegation of the Audit Committee’s responsibilities to the Adviser. The Audit Committee may delegate to one or more of its members the authority to grant pre-approvals. The pre-approval policies and procedures shall include the requirement that the decisions of any member to whom authority is delegated under this Section 4(e) shall be presented to the full Audit Committee at its next scheduled meeting.
De Minimis Exceptions to Pre-Approval Requirements. Pre-approval for a service provided to the Trust other than audit, review or attest services is not required if: (1) the aggregate amount of all such non-audit services provided to the Trust constitutes not more than 5 percent of the total amount of revenues paid by the Trust to the Auditor during the fiscal year in which the non-audit services are provided; (2) such services were not recognized by the Trust at the time of the engagement to be non-audit services; and (3) such services are promptly brought to the attention of the Audit Committee and are approved by the Audit Committee or by one or more members of the Audit Committee to whom authority to grant such approvals has been delegated by the Audit Committee.
Pre-Approval of Non-Audit Services Provided to the Adviser and Certain Control Persons. With respect to services that have a direct impact on the operations or financial reporting of the Trust, the Audit Committee shall pre-approve all such non-audit services proposed to be provided by the Auditor to (i) the Adviser and (ii) any entity controlling, controlled by, or under common control with the Adviser that provides ongoing services to the Trust.
Application of De Minimis Exception: The de minimis exceptions set forth above under Section 4(e)(ii) apply to pre-approvals under this Section 4(e)(iii) as well, except that the “total amount of revenues” calculation for Section 4(e)(iii) services is based on the total
amount of revenues paid to the Auditor by the Trust and any other entity that has its services approved under this Section (i.e., the Adviser or any control person).
(e)(2) The percentage of services described in each of paragraphs (b) through (d) of this Item that were approved by the audit committee pursuant to paragraph (c)(7)(i)(C) of Rule 2-01 of Regulation S-X are as follows:
(b) 100%
(c) 100%
(d) N/A
(f) The percentage of hours expended on the principal accountant’s engagement to audit the registrant’s financial statements for the most recent fiscal year that were attributed to work performed by persons other than the principal accountant’s full-time, permanent employees was 0%.
(g) The aggregate non-audit fees billed by the registrant’s accountant for services rendered to the registrant, and rendered to the registrant’s investment adviser (not including any sub-adviser whose role is primarily portfolio management and is subcontracted with or overseen by another investment adviser), and any entity controlling, controlled by, or under common control with the adviser that provides ongoing services to the registrant for each of the last two fiscal years of the registrant was $96,663 for fiscal year ended December 31, 2009 and $129,644 for the fiscal year ended December 31, 2010.
(h) The registrant’s audit committee of the board of directors has considered whether the provision of non-audit services that were rendered to the registrant’s investment adviser (not including any sub-adviser whose role is primarily portfolio management and is subcontracted with or overseen by another investment adviser), and any entity controlling, controlled by, or under common control with the investment adviser that provides ongoing services to the registrant that were not pre-approved pursuant to paragraph (c)(7)(ii) of Rule 2-01 of Regulation S-X is compatible with maintaining the principal accountant’s independence.
Item 5. Audit Committee of Listed registrants.
Not applicable.
Item 6. Investments.
(a) Schedule of Investments in securities of unaffiliated issuers as of the close of the reporting period is included as part of the report to shareholders filed under Item 1 of this form.
(b) Not applicable.
Item 7. Disclosure of Proxy Voting Policies and Procedures for Closed-End Management Investment Companies.
Not applicable.
Item 8. Portfolio Managers of Closed-End Management Investment Companies.
Not applicable.
Item 9. Purchases of Equity Securities by Closed-End Management Investment Company and Affiliated Purchasers.
Not applicable.
Item 10. Submission of Matters to a Vote of Security Holders.
There have been no material changes to the procedures by which the shareholders may recommend nominees to the registrant’s board of directors, where those changes were implemented after the registrant last provided disclosure in response to the requirements of Item 407(c)(2)(iv) of Regulation S-K (17 CFR 229.407) (as required by Item 22(b)(15) of Schedule 14A (17 CFR 240.14a-101)), or this Item.
Item 11. Controls and Procedures.
(a) The registrant’s principal executive and principal financial officers, or persons performing similar functions, have concluded that the registrant’s disclosure controls and procedures (as defined in Rule 30a-3(c) under the Investment Company Act of 1940, as amended (the “1940 Act”) (17 CFR 270.30a-3(c))) are effective, as of a date within 90 days of the filing date of the report that includes the disclosure required by this paragraph, based on their evaluation of these controls and procedures required by Rule 30a-3(b) under the 1940 Act (17 CFR 270.30a-3(b)) and Rules 13a-15(b) or 15d-15(b) under the Securities Exchange Act of 1934, as amended (17 CFR 240.13a-15(b) or 240.15d-15(b)).
(b) There were no changes in the registrant’s internal control over financial reporting (as defined in Rule 30a-3(d) under the 1940 Act (17 CFR 270.30a-3(d)) that occurred during the registrant’s second fiscal quarter of the period covered by this report that has materially affected, or is reasonably likely to materially affect, the registrant’s internal control over financial reporting.
Item 12. Exhibits.
(a)(1) Code of ethics, or any amendment thereto, that is the subject of disclosure required by Item 2 is attached hereto.
(a)(2) Certifications pursuant to Rule 30a-2(a) under the 1940 Act and Section 302 of the Sarbanes-Oxley Act of 2002 are attached hereto.
(a)(3) Not applicable.
(b) Certifications pursuant to Rule 30a-2(b) under the 1940 Act and Section 906 of the Sarbanes- Oxley Act of 2002 are attached hereto.
SIGNATURES
Pursuant to the requirements of the Securities Exchange Act of 1934 and the Investment Company Act of 1940, the registrant has duly caused this report to be signed on its behalf by the undersigned, thereunto duly authorized.
(registrant) | | Matthews International Funds | |
| | |
By (Signature and Title)* | | /s/ William J. Hackett | |
| William J. Hackett, President | |
| (principal executive officer) | |
| | |
Date | March 7, 2011 | | |
| | |
|
Pursuant to the requirements of the Securities Exchange Act of 1934 and the Investment Company Act of 1940, this report has been signed below by the following persons on behalf of the registrant and in the capacities and on the dates indicated. |
|
| | |
By (Signature and Title)* | | /s/ William J. Hackett | |
| William J. Hackett, President | |
| (principal executive officer) | |
| | |
Date | March 7, 2011 | | |
| | |
| | |
By (Signature and Title)* | | /s/ Shai Malka | |
| Shai Malka, Treasurer | |
| (principal financial officer) | |
| | |
Date | March 7, 2011 | | |
| | | | | | |
* Print the name and title of each signing officer under his or her signature.