UNITED STATES
SECURITIES AND EXCHANGE COMMISSION
Washington, D.C. 20549
FORM N-CSR
CERTIFIED SHAREHOLDER REPORT OF REGISTERED
MANAGEMENT INVESTMENT COMPANIES
Investment Company Act file number | 811-08510 |
|
Matthews International Funds |
(Exact name of registrant as specified in charter) |
|
Four Embarcadero Center, Suite 550
San Francisco, CA 94111 |
(Address of principal executive offices) (Zip code) |
|
William J. Hackett, President
Four Embarcadero Center, Suite 550
San Francisco, CA 94111 |
(Name and address of agent for service) |
|
Registrant’s telephone number, including area code: | 415-788-7553 | |
|
Date of fiscal year end: | December 31 | |
|
Date of reporting period: | December 31, 2011 | |
| | | | | | |
Form N-CSR is to be used by management investment companies to file reports with the Commission not later than 10 days after the transmission to stockholders of any report that is required to be transmitted to stockholders under Rule 30e-1 under the Investment Company Act of 1940 (17 CFR 270.30e-1). The Commission may use the information provided on Form N-CSR in its regulatory, disclosure review, inspection, and policymaking roles.
A registrant is required to disclose the information specified by Form N-CSR, and the Commission will make this information public. A registrant is not required to respond to the collection of information contained in Form N-CSR unless the Form displays a currently valid Office of Management and Budget (“OMB”) control number. Please direct comments concerning the accuracy of the information collection burden estimate and any suggestions for reducing the burden to Secretary, Securities and Exchange Commission, 100 F Street, NE, Washington, DC 20549. The OMB has reviewed this collection of information under the clearance requirements of 44 U.S.C. § 3507.
Item 1. Reports to Stockholders.
The Report to Shareholders is attached herewith.
Matthews Asia Funds | Annual Report
December 31, 2011 | matthewsasia.com
ASIA FIXED INCOME STRATEGY | 
|
|
Matthews Asia Strategic Income Fund |
|
ASIA GROWTH AND INCOME STRATEGIES |
|
Matthews Asian Growth and Income Fund |
Matthews Asia Dividend Fund |
Matthews China Dividend Fund |
|
ASIA GROWTH STRATEGIES |
|
Matthews Asia Growth Fund |
Matthews Pacific Tiger Fund |
Matthews China Fund |
Matthews India Fund |
Matthews Japan Fund |
Matthews Korea Fund |
|
ASIA SMALL COMPANY STRATEGIES |
|
Matthews Asia Small Companies Fund |
Matthews China Small Companies Fund |
|
ASIA SPECIALTY STRATEGY |
|
Matthews Asia Science and Technology Fund |

Performance and Expenses Through December 31, 2011
| | | | | Average Annual Total Return | | | | 2011 Gross
Annual | | 2010 Gross
Annual | |
| | | 1 year | | 5 years | | 10 years | | Since
Inception | | Inception
Date | | Operating
Expenses | | Operating
Expenses1 | |
| Matthews Asia Strategic Income Fund | |
| Investor Class (MAINX) | | | n.a. | | | | n.a. | | | | n.a. | | | | -0.52 | %2 | | | 11/30/11 | | | | 3.20 | %3 | | | n.a. | | |
| After Fee Waiver, Reimbursement and Recoupment | | | | | | | | | | | | | | | | | | | | | | | 1.00 | %4 | | | n.a. | | |
| Institutional Class (MINCX) | | | n.a. | | | | n.a. | | | | n.a. | | | | -0.52 | %2 | | | 11/30/11 | | | | 3.20 | %3 | | | n.a. | | |
| After Fee Waiver, Reimbursement and Recoupment | | | | | | | | | | | | | | | | | | | | | | | 1.00 | %4 | | | n.a. | | |
| Matthews Asian Growth & Income Fund | |
| Investor Class (MACSX) | | | -10.62 | % | | | 4.46 | % | | | 12.55 | % | | | 10.23 | % | | | 9/12/94 | | | | 1.12 | % | | | 1.13 | % | |
| Institutional Class (MICSX) | | | -10.54 | % | | | n.a. | | | | n.a. | | | | -7.13 | % | | | 10/29/10 | | | | 0.99 | % | | | 0.93 | % | |
| Matthews Asia Dividend Fund | |
| Investor Class (MAPIX) | | | -10.02 | % | | | 7.35 | % | | | n.a. | | | | 8.69 | % | | | 10/31/06 | | | | 1.10 | % | | | 1.14 | % | |
| After Fee Waiver, Reimbursement and Recoupment | | | | | | | | | | | | | | | | | | | | | | | n.a. | | | | 1.15 | %5 | |
| Institutional Class (MIPIX) | | | -9.93 | % | | | n.a. | | | | n.a. | | | | -6.23 | % | | | 10/29/10 | | | | 1.00 | % | | | 1.02 | % | |
| Matthews China Dividend Fund | |
| Investor Class (MCDFX) | | | -14.44 | % | | | n.a. | | | | n.a. | | | | 3.17 | % | | | 11/30/09 | | | | 1.52 | % | | | 1.95 | % | |
| After Fee Waiver, Reimbursement and Recoupment | | | | | | | | | | | | | 1.50 | %6 | | | 1.50 | %6 | |
| Institutional Class (MICDX) | | | -14.22 | % | | | n.a. | | | | n.a. | | | | -9.34 | % | | | 10/29/10 | | | | 1.31 | % | | | 1.24 | % | |
| Matthews Asia Growth Fund | |
| Investor Class (MPACX) | | | -12.70 | % | | | 2.34 | % | | | n.a. | | | | 8.71 | % | | | 10/31/03 | | | | 1.19 | % | | | 1.19 | % | |
| Institutional Class (MIAPX) | | | -12.58 | % | | | n.a. | | | | n.a. | | | | -8.74 | % | | | 10/29/10 | | | | 1.03 | % | | | 0.99 | % | |
| Matthews Pacific Tiger Fund | |
| Investor Class (MAPTX) | | | -11.41 | % | | | 6.47 | % | | | 14.70 | % | | | 8.54 | % | | | 9/12/94 | | | | 1.11 | % | | | 1.09 | % | |
| Institutional Class (MIPTX) | | | -11.28 | % | | | n.a. | | | | n.a. | | | | -9.19 | % | | | 10/29/10 | | | | 0.95 | % | | | 0.95 | % | |
| Matthews China Fund | |
| Investor Class (MCHFX) | | | -18.93 | % | | | 7.77 | % | | | 15.04 | % | | | 10.96 | % | | | 2/19/98 | | | | 1.13 | % | | | 1.15 | % | |
| Institutional Class (MICFX) | | | -18.80 | % | | | n.a. | | | | n.a. | | | | -17.43 | % | | | 10/29/10 | | | | 0.96 | % | | | 0.97 | % | |
| Matthews India Fund | |
| Investor Class (MINDX) | | | -36.48 | % | | | 0.54 | % | | | n.a. | | | | 7.77 | % | | | 10/31/05 | | | | 1.18 | % | | | 1.18 | % | |
| Institutional Class (MIDNX) | | | -36.35 | % | | | n.a. | | | | n.a. | | | | -33.14 | % | | | 10/29/10 | | | | 0.99 | % | | | 0.99 | % | |
| Matthews Japan Fund | |
| Investor Class (MJFOX) | | | -7.72 | % | | | -4.98 | % | | | 3.44 | % | | | 3.40 | % | | | 12/31/98 | | | | 1.22 | % | | | 1.30 | % | |
| Institutional Class (MIJFX) | | | -7.72 | % | | | n.a. | | | | n.a. | | | | 2.24 | % | | | 10/29/10 | | | | 1.07 | % | | | 1.08 | % | |
| Matthews Korea Fund | |
| Investor Class (MAKOX) | | | -6.45 | % | | | 0.89 | % | | | 12.81 | % | | | 5.04 | % | | | 1/3/95 | | | | 1.18 | % | | | 1.21 | % | |
| Institutional Class (MIKOX) | | | -6.05 | % | | | n.a. | | | | n.a. | | | | 1.66 | % | | | 10/29/10 | | | | 1.07 | % | | | 0.91 | % | |
| Matthews Asia Small Companies Fund | |
| Investor Class (MSMLX) | | | -20.03 | % | | | n.a. | | | | n.a. | | | | 18.27 | % | | | 9/15/08 | | | | 1.52 | % | | | 1.59 | % | |
| After Fee Waiver, Reimbursement and Recoupment | | | | | | | | | | | | | | | | | | | | | | | n.a. | | | | 1.63 | %7 | |
| Matthews China Small Companies Fund | |
| Investor Class (MCSMX) | | | n.a. | | | | n.a. | | | | n.a. | | | | -29.51 | %8 | | | 5/31/11 | | | | 5.32 | %3 | | | n.a. | | |
| After Fee Waiver, Reimbursement and Recoupment | | | | | | | | | | | | | | | | | | | | | | | 2.00 | %9 | | | n.a. | | |
| Matthews Asia Science and Technology Fund | |
| Investor Class (MATFX) | | | -17.26 | % | | | 0.70 | % | | | 7.72 | % | | | -1.19 | % | | | 12/27/99 | | | | 1.21 | % | | | 1.26 | % | |
1 Gross annual operating expenses for Institutional Class Shares are annualized.
2 Actual return for fiscal period beginning 11/30/11 through 12/31/11, not annualized.
3 Gross annual operating expenses for 2011 are annualized.
4 Matthews has contractually agreed to waive fees and reimburse expenses until August 31, 2014 to the extent needed to limit Total Annual Fund Operating Expenses to 1.25% for the Institutional Class and agreed to reduce the expense ratio by an equal amount for the Investor Class. Because certain expenses of the Investor Class are higher than the Institutional Class, the Total Annual Fund Operating Expenses After Fee Waiver and Expense Reimbursement for the Investor Class will exceed 1.25%. The amounts of the waivers and reimbursements are based on estimated Fund expenses. The fee waiver and expense reimbursement may be terminated at any time by the Fund on 60 days' written notice.
5 The Advisor has contractually agreed to waive the Fund's fees and reimburse expenses until at least August 31, 2012 to the extent needed to limit total annual operating expenses to 1.50%.
6 The Advisor has contractually agreed to waive the Fund's fees and reimburse expenses until at least August 31, 2013 to the extent needed to limit total annual operating expenses to 1.50%.
7 The Advisor has contractually agreed to waive the Fund's fees and reimburse expenses until at least August 31, 2012 to the extent needed to limit total annual operating expenses to 2.00%.
8 Actual return for fiscal period beginning 5/31/11 through 12/31/11, not annualized.
9 The Advisor has contractually agreed to waive the Fund's fees and reimburse expenses until at least August 31, 2014 to the extent needed to limit total annual operating expenses to 2.00%.
Past Performance: All performance quoted in this report is past performance and is no guarantee of future results. Investment return and principal value will fluctuate with changing market conditions so that when redeemed, shares may be worth more or less than their original cost. Current performance may be lower or higher than the returns quoted. If certain of the Funds' fees and expenses had not been waived, returns would have been lower. For the Funds' most recent month-end performance, please call 800.789.ASIA (2742) or visit matthewsasia.com.
Investment Risk: Mutual fund shares are not deposits or obligations of, or guaranteed by, any depositary institution. Shares are not insured by the FDIC, Federal Reserve Board or any government agency and are subject to investment risks, including possible loss of principal amount invested. Investing in international and emerging markets may involve additional risks, such as social and political instability, market illiquidity, exchange-rate fluctuations, a high level of volatility and limited regulation. Fixed income investments are subject to additional risks, including, but not limited to, interest rate, credit and inflation risks. In addition, single-country and sector funds may be subject to a higher degree of market risk than diversified funds because of concentration in a specific industry, sector or geographic location. Investing in small and mid-size companies is more risky than investing in large companies as they may be more volatile and less liquid than larger companies. Please see the Funds' prospectus and Statement of Additional Information for more risk disclosure.
Contents
| Message to Shareholders | | | 2 | | |
|
| Manager Commentaries, Fund Characteristics and Schedules of Investments: | |
|
| ASIA FIXED INCOME STRATEGY | |
|
| Matthews Asia Strategic Income Fund | | | 4 | | |
|
| ASIA GROWTH AND INCOME STRATEGIES | |
|
| Matthews Asian Growth and Income Fund | | | 9 | | |
|
| Matthews Asia Dividend Fund | | | 14 | | |
|
| Matthews China Dividend Fund | | | 19 | | |
|
| ASIA GROWTH STRATEGIES | |
|
| Matthews Asia Growth Fund | | | 24 | | |
|
| Matthews Pacific Tiger Fund | | | 29 | | |
|
| Matthews China Fund | | | 34 | | |
|
| Matthews India Fund | | | 39 | | |
|
| Matthews Japan Fund | | | 44 | | |
|
| Matthews Korea Fund | | | 49 | | |
|
| ASIA SMALL COMPANY STRATEGIES | |
|
| Matthews Asia Small Companies Fund | | | 54 | | |
|
| Matthews China Small Companies Fund | | | 59 | | |
|
| ASIA SPECIALTY STRATEGY | |
|
| Matthews Asia Science and Technology Fund | | | 64 | | |
|
| Disclosures | | | 68 | | |
|
| Index Definitions | | | 69 | | |
|
| Disclosure of Fund Expenses | | | 70 | | |
|
| Statements of Assets and Liabilities | | | 72 | | |
|
| Statements of Operations | | | 75 | | |
|
| Statements of Changes in Net Assets | | | 78 | | |
|
| Financial Highlights | | | 85 | | |
|
| Notes to Financial Statements | | | 98 | | |
|
| Report of Independent Registered Public Accounting Firm | | | 114 | | |
|
| Tax Information | | | 115 | | |
|
| Approval of Investment Advisory Agreements | | | 117 | | |
|
| Trustees and Officers of the Funds | | | 123 | | |
|
Cover photo: Open umbrella under tree, Kyoto, Japan
This report has been prepared for Matthews Asia Funds shareholders. It is not authorized for distribution to prospective investors unless accompanied or preceded by a current Matthews Asia Funds prospectus, which contains more complete information about the Funds' investment objectives, risks and expenses. Additional copies of the prospectus may be obtained at matthewsasia.com. Please read the prospectus carefully before you invest or send money.
The views and opinions in this report were current as of December 31, 2011. They are not guarantees of performance or investment results and should not be taken as investment advice. Investment decisions reflect a variety of factors, and the managers reserve the right to change their views about individual stocks, sectors and the markets at any time. As a result, the views expressed should not be relied upon as a forecast of a Fund's future investment intent. Current and future portfolio holdings are subject to risk.
Statements of fact are from sources considered reliable, but neither the Funds nor the Investment Advisor makes any representation or guarantee as to their completeness or accuracy.
Matthews Asia Funds are distributed in the United States by BNY Mellon Distributors Inc., 760 Moore Road, King of Prussia, PA 19406
Matthews Asia Funds are distributed in Latin America by HMC Partners

"It is undeniable that markets as a whole appear cheap relative to their history and to the U.S."
Message to Shareholders
from the Investment Advisor
Dear Fellow Shareholders,
2011 was a difficult year for Asia's markets. It began, if not with euphoria then, at least on a high note as investment inflows into the region were strong, and stocks in cyclical and commodity-related segments had been riding high at the end of 2010. Markets had appeared to be putting behind them the shock of the financial crisis and were once again looking forward more confidently to years of uninterrupted growth. Valuations reflected this and, though they were not as egregiously expensive as they were in 2007, they certainly afforded much less room for markets to shrug off any shocks.
The shocks were aplenty. Some of the largest shocks resulted perhaps from the complacency of U.S. and European policymakers that saw both fiscal and monetary policy withdrawn. Authorities seemed to feel they had done enough to support growth and were wary of creating inflation. But gradually, inflation expectations and bond yields began to decline as investors fretted over growth prospects. The approximately 30% return on U.S. Treasuries from already low yields at the start of the year made a mockery not only of these policy actions but also of those who worried that the economic recovery of 2009 to 2010 was about to ignite inflation. Faltering growth began to create pressure on European bond yields as investors doubted the ability of previously "safer" governments (like Spain or Italy) to pay off their debt. In Asia, inflationary pressure was much more of a reality. The region—not for the first time in the recent past—found its rates of growth in domestic demand at odds with what was happening in the West, and started to tighten monetary policy by raising interest rates and reserve requirements, and implementing administrative and price controls on certain industries and markets. The steady drumbeat of commentary questioning the health of China's financial system and property markets only intensified as monetary conditions put stress on funding property developers.
Tighter lending conditions across the region make life difficult for Asia's smaller companies. State-controlled businesses in China, India's public sector or Korea's industrial giants, for example, all tend to soak up more than their fair share of capital, leaving small-scale entrepreneurs to rely on internally generated cash flow or less formal financial markets. Even worse for small companies was a string of corporate governance issues, centered among U.S. and Canadian-listed Chinese small-capitalization stocks that shook confidence further. Many of these firms had listed via reverse mergers or takeovers: that is they bought into listed shell companies in order to avoid more strenuous public listing requirements set by exchanges. Nevertheless, in the environment of nervousness, and given the stresses on business performance caused by rising costs and limited access to funds, investors were understandably inclined to sell first and ask questions later.
Throughout all this turmoil, however, few investors seemed to question the long-term potential of the Asian region. Nor do we believe most investors would disagree that Asia's growth is likely to outpace that of the West over the next decade. This did not, however, prevent some capital from leaving the region and being sucked into the U.S. For however fragile the U.S. may seem, it enjoys a safe haven status. By the end of 2011, stocks with stable earnings that were able to profit from Asia's long-term growth held up very well compared to the rest of the market. Materials, exporters and domestic industrials all did
2 MATTHEWS ASIA FUNDS
poorly. Small companies were hit hard and companies with more distressed financial profiles or less-seasoned management teams were also aggressively sold down.
Throughout the year, this caused volatility in fund performance, particularly relative to benchmarks. The Funds generally outperformed during periods when the market fell and often underperformed during rallies as the cyclical sectors bounced back. For the year as a whole, most Funds held up versus their respective benchmarks, driven by three main factors: their focus on buying businesses with more stable revenue or cash flow growth; a focus on domestic demand as the driving force for that growth over long periods; and in the case of some Funds, an emphasis on dividend-paying equities. Indeed, these factors have held the Funds in good stead for much of the past three or four years.
As the dust settled on the markets at the end of the year, what was immediately apparent was that a wide dispersion in valuations had grown between different sectors and styles. This poses some challenges for stock selection and portfolio management. It is undeniable that markets as a whole appear cheap relative to their history and to the U.S. However, many of the sectors we have favored over the last few years, and the kinds of growth that we prefer to focus on, are now noticeably more expensive than much of the rest of the market.
We do not attempt to trade in and out of the market cycles because rather than correctly "playing" sector rotations, we would likely get whipsawed by the markets, buying near the top and selling near the bottom. Nevertheless, we are cognizant of valuation differentials, and are deploying more research efforts in these areas to uncover what we consider to be long-term value—that is, businesses we would be happy to hold for the long run.
Other areas of investigation present themselves to us in the form of smaller companies, particularly in China, which bore the brunt of a credit squeeze and corporate governance scandals during the year. India, too, offers opportunities. For most of the past few years, it has been among the region's more expensive markets but has become, after a nearly 40% decline, one of the more attractively priced markets. Again, the challenge will be to stick to our knitting, and make use of opportunities that make long-term sense for the Funds.
Finally, we recently re-opened two strategies: the Matthews Asian Growth and Income and the Matthews Asia Small Companies Funds. We believe the Funds now have the capacity to accept new assets while maintaining the integrity of their investment process. We also feel confident that the portfolios can be managed efficiently, even if the pace of flows should increase.
It is always a privilege to act as your investment advisor. I wish you all a prosperous 2012.

Robert Horrocks, PhD
Chief Investment Officer
Matthews International Capital Management, LLC
matthewsasia.com | 800.789.ASIA 3

ASIA FIXED INCOME STRATEGY
PORTFOLIO MANAGERS
Teresa Kong, CFA
Lead Manager
Gerald M. Hwang, CFA
Co-Manager
Robert J. Horrocks, PhD
Co-Manager
FUND FACTS
| | | Investor Class | | Institutional Class | |
| Ticker | | MAINX | | MINCX | |
| CUSIP | | 577125503 | | 577125602 | |
| Inception | | 11/30/11 | | 11/30/11 | |
| NAV | | $9.93 | | $9.93 | |
| Initial Investment | | $2,500 | | $3 million | |
| Gross Expense Ratio1 | | 3.20% | | 3.20% | |
After fee waiver,
Reimbursement and
Recoupment | | 1.00% | | 1.00% | |
Portfolio Statistics
| Total # of Positions | | 31 | |
| Net Assets | | $13.0 million | |
| Modified Duration | | 5.3 years2 | |
| Portfolio Turnover | | 3.66%3 | |
Benchmarks
HSBC Asian Local Bond Index
J.P. Morgan Asia Credit Index
Redemption Fee
2% within first 90 calendar days of purchase
OBJECTIVE
Total return over the long term with an emphasis on income.
STRATEGY
Under normal market conditions, the Fund seeks to achieve its investment objective by investing at least 80% of its total assets, which include borrowings for investment purposes, in income-producing securities including, but not limited to, debt and debt-related instruments issued by governments, quasi-governmental entities, supra-national institutions, and companies in Asia. Investments may be denomiated in any currency, and may represent any part of a company's capital structure from debt to equity or with features of both.
1 Gross annual operating expenses for the Fund for 2011 are annualized. The Advisor has contractually agreed to waive certain fees and reimburse certain expenses for Matthews Asia Strategic Income Fund. Please see page 108 for additional information. Matthews Asia Funds does not charge 12b-1 fees.
2 Modified duration measures the change in the value of a security in response to a change in interest rates. In a multi-currency denominated portfolio with sensitivities to different interest rate regimes, modified duration will not accurately reflect the change in value of the overall portfolio from a change in any one interest rate regime.
3 Not annualized. The Fund commenced operations on November 30, 2011. The lesser of fiscal year 2011 long-term purchase costs or sales proceeds divided by the average monthly market value of long-term securities.
Matthews Asia Strategic Income Fund
Portfolio Manager Commentary
Matthews aims to launch new strategies when we identify compelling investment opportunities in Asia, and as such, our first dedicated fixed income investment strategy, the Matthews Asia Strategic Income Fund, was launched on November 30, 2011. Today, the enhanced breadth and depth of Asia's bond markets, coupled with their strong fundamentals, make Asia bonds a bona fide asset class.
For the month ending December 31, 2011, the Fund returned –0.52% (Investor and Institutional Class), underperforming its primary and secondary benchmarks, the HSBC Asian Local Bond Index and the J.P. Morgan Asia Credit Index, which gained 0.76% and 0.89%, respectively. As we built the portfolio in the early part of December, the markets were rising in the aftermath of the coordinated action by central banks to inject liquidity into financial markets globally. The Fund's underperformance against its benchmarks for the one-month period was primarily the result of having large cash levels during our initial construction of the portfolio.
Asia has two distinct bond markets—local currency-denominated and U.S. dollar-denominated bonds. The local currency-denominated bond market is about US$1.24 trillion (larger than the entire U.S. high yield bond market) and offers currency diversification. It also offers local interest rate exposure across markets with varied credit quality. The U.S. dollar bond market in Asia is about US$295 billion, and typically offers attractive yields over its U.S. counterpart. These two markets provide compelling investment opportunities across credit, currencies and interest rates.
The Fund seeks total return over the long term, with an emphasis on income. More specifically, the Fund seeks total return through credit, currencies and interest rates via a fundamental, bottom-up investment process. It invests primarily in bonds and other debt securities of Asian corporate and sovereign issuers in both local and hard currencies. The Fund may also selectively hold some income-generating securities across currencies and the capital structure, including convertibles and equities. We aim to add value through individual security selection based on that security's credit, currency of denomination and underlying interest rate.
Investors should understand our view of how the three dimensions of return and risk—credit, currency, and rates—may unfold over the medium term. Macroeconomic uncertainties continue to drive volatility in Asia bonds, especially in the region's currencies. In the medium term, we believe currencies will contribute less to returns than they have in the previous three years primarily due to three factors. First, inflation is stabilizing in most Asian countries, and as such, the need to have a strong currency to combat inflation is less important. Second, as inflation risks have given way to recessionary risks, central banks are likely to ease monetary policy, leading to lower interest rates, which tend to dampen currency appreciation. Third, as growth slows in the European Union (China's single-largest export partner), we expect demand for Asian exports to fall as well. We believe these factors will increase pressure to keep the currencies of Asian countries relatively undervalued in order to promote exports. Given these factors, the Fund will seek to overweight currencies that are relatively less volatile and underweight currencies with higher volatility and exposure to global growth.
(continued)
4 MATTHEWS ASIA FUNDS
PERFORMANCE AS OF DECEMBER 31, 2011
| | | Actual Return, Not Annualized | |
| | | Since Inception
11/30/11 | |
| Investor Class (MAINX) | | | -0.52 | % | |
| Institutional Class (MINCX) | | | -0.52 | % | |
| HSBC Asian Local Bond Index4 | | | 0.76 | % | |
| J.P. Morgan Asia Credit Index4 | | | 0.89 | % | |
| Lipper Emerging Market Debt Category Average5 | | | 0.02 | % | |
Performance assumes reinvestment of all dividends and/or distributions before taxes. All performance quoted represents past performance and is no guarantee of future results. Investment return and principal value will fluctuate with market conditions so that when redeemed, shares may be worth more or less than their original cost. Current performance may be lower or higher than the return figures quoted. Returns would have been lower if certain of the Fund's fees and expenses had not been waived. For the Fund's most recent month-end performance visit matthewsasia.com.
The performance data does not reflect the deduction of taxes that a shareholder would pay on dividends, capital gains distributions or redemption of Fund shares. Values are in US$.
4 It is not possible to invest directly in an index. Source: Index data from HSBC and J.P. Morgan; total return calculations performed by BNY Mellon Investment Servicing (US) Inc. Please see page 69 for index definition.
5 The Lipper Category Average does not reflect sales charges and is based on total return, including reinvestment of dividends and capital gains for the stated periods.
30-DAY YIELD:
2.83% (Investor Class) 2.74% (Institutional Class)
The 30-Day Yield represents net investment income earned by the Fund over the 30-day period ended 12/31/11, expressed as an annual percentage rate based on the Fund's share price at the end of the 30-day period. The 30-Day Yield should be regarded as an estimate of the Fund's rate of investment income, and it may not equal the Fund's actual income distribution rate.
Source: BNY Mellon Investment Servicing (US) Inc
YIELD TO WORST:
4.23%
Yield to worst is the lowest yield that can be received on a bond assuming that the issuer does not default. It is calculated by utilizing the worst case assumptions for a bond with respect to certain income-reducing factors, including prepayment, call or sinking fund provisions. It does not represent the yield that an investor should expect to receive. Past yields are no guarantee of future yields.
Source: FactSet Research Systems
TOP TEN POSITIONS6
| | | Sector | | Currency | | % of Net Assets | |
| Indonesia Government, 8.250%, 07/15/2021 | | Government Bonds | | IDR | | | 8.8 | % | |
| Malaysian Government, 4.160%, 07/15/2021 | | Government Bonds | | MYR | | | 7.6 | % | |
| Korea Treasury Bond, 3.500%, 09/10/2016 | | Government Bonds | | KRW | | | 6.7 | % | |
| Indonesia Government, 8.375%, 09/15/2026 | | Government Bonds | | IDR | | | 4.6 | % | |
| Republic of Philippines, 6.375%, 01/15/2032 | | Government Bonds | | USD | | | 4.5 | % | |
| Kia Motors Corp., 3.625%, 06/14/2016 | | Consumer Discretionary | | USD | | | 3.8 | % | |
| Korea Treasury Bond, 5.750%, 09/10/2018 | | Government Bonds | | KRW | | | 3.7 | % | |
| Thailand Government Bond, 4.250%, 03/13/2013 | | Government Bonds | | THB | | | 3.7 | % | |
| Republic of Philippines, 4.950%, 01/15/2021 | | Government Bonds | | PHP | | | 3.2 | % | |
| Standard Chartered Bank Hong Kong, Ltd., 4.150%, 10/27/2021 | | Financials | | SGD | | | 3.0 | % | |
| % OF ASSETS IN TOP TEN | | | | | | | 49.6 | % | |
6 Holdings may combine more than one security from same issuer and related depositary receipts.
CURRENCY ALLOCATION (%)7,8
| U.S. Dollar (USD) | | | 32.2 | | |
| Indonesian Rupiah (IDR) | | | 13.4 | | |
| Korean Won (KRW) | | | 10.4 | | |
| Malaysian Ringgit (MYR) | | | 7.6 | | |
| Chinese Renminbi (CNY) | | | 7.1 | | |
| Philippine Peso (PHP) | | | 5.9 | | |
| Singapore Dollar (SGD) | | | 5.8 | | |
| Hong Kong Dollar (HKD) | | | 4.4 | | |
| Thai Bhat (THB) | | | 3.7 | | |
| New Taiwan Dollar (TWD) | | | 1.3 | | |
| Cash and Other Assets, Less Liabilities | | | 8.3 | | |
7 Source: FactSet Research Systems. Percentage values in data are rounded to the nearest tenth of one percent; the values may not sum to 100% due to rounding.
8 Cash and other assets may include forward currency exchange contracts and certain derivative instruments that have been marked-to-market.
COUNTRY ALLOCATION (%)8
(By issuer's country of risk)
| Indonesia | | | 19.4 | | |
| South Korea | | | 16.6 | | |
| China/Hong Kong | | | 16.3 | | |
| Philippines | | | 10.4 | | |
| Malaysia | | | 10.4 | | |
| Singapore | | | 7.4 | | |
| Thailand | | | 5.7 | | |
| Sri Lanka | | | 2.8 | | |
| United Kingdom | | | 1.4 | | |
| Taiwan | | | 1.3 | | |
| Cash And Other Assets, Less Liabilities | | | 8.3 | | |
matthewsasia.com | 800.789.ASIA 5
SECTOR ALLOCATION (%)9
| Government Bonds | | | 50.5 | | |
| Financials | | | 14.2 | | |
| Consumer Discretionary | | | 7.3 | | |
| Energy | | | 5.8 | | |
| Telecommunication Services | | | 5.7 | | |
| Utilities | | | 5.6 | | |
| Information Technology | | | 2.6 | | |
Cash And Other Assets,
Less Liabilities | | | 8.3 | | |
ASSET TYPE BREAKDOWN (%)9,10
| Government Bonds | | | 50.5 | % | |
| Corporate Bonds | | | 32.8 | % | |
| Common Equities and ADRs | | | 8.4 | % | |
Cash and Other Assets,
Less Liabilities7 | | | 8.3 | % | |
9 Cash and other assets may include forward currency exchange contracts and certain derivative instruments that have been marked-to-market.
10 Source: FactSet Research Systems. Percentage values in data are rounded to the nearest tenth of one percent; the values may not sum to 100% due to rounding.
Matthews Asia Strategic Income Fund
Portfolio Manager Commentary (continued)
From an interest rate perspective, we believe falling interest rates will be a larger contributor to relative returns than last year as inflation risks give way to recessionary risks in most Asian economies. For our U.S. dollar-denominated bonds which have exposure to U.S. interest rates, we expect U.S. interest rates to be stable due to the Federal Reserve's commitment to keep interest rates low as long as U.S. growth remains tepid.
Finally, we will focus on credit selection as we believe the market will continue to reward top-tier credits and punish poor ones, driving increased dispersion. In other words, we believe credit spread differentials should likely continue to widen between the best and worst companies—instead of narrowing. In this environment, the Matthews Asia Strategic Income Fund will seek to overweight credits of higher quality issuers relative to lower quality issuers as they will likely experience relatively less spread widening risk. The Fund will also seek to limit exposure to issuers with near-term financing needs as overall tight liquidity conditions might shut some issuers completely out of the market.
The Matthews Asia Strategic Income Fund is intended as a lower volatility product than our other Funds, and seeks to offer investors the potential for attractive yield; a mix of local currency and hard currency exposure. Because of the low correlation between Asian fixed income and developed Western fixed income markets, the Fund's approach should address the potential diminishing purchasing power of the U.S. dollar, augmenting diversification benefits. We look forward to adding value to the Fund and its shareholders.
Fixed income investments are subject to additional risks, including, but not limited to, interest rate, credit and inflation risks. Investing in emerging markets involves different and greater risks, as these countries are substantially smaller, less liquid and more volatile than securities markets in more developed markets.
6 MATTHEWS ASIA FUNDS
Matthews Asia Strategic Income Fund December 31, 2011
Schedule of Investments
FOREIGN GOVERNMENT OBLIGATIONS: 50.5%
| | | Face Amount* | | Value | |
| INDONESIA: 15.6% | |
Indonesia Government Bond
8.250%, 07/15/21 | | IDR | 9,000,000,000 | | | $ | 1,142,154 | | |
Indonesia Government Bond
8.375%, 09/15/26 | | IDR | 4,700,000,000 | | | | 600,571 | | |
Republic of Indonesia
5.875%, 03/13/20 | | | 250,000 | | | | 283,125 | | |
| Total Indonesia | | | | | 2,025,850 | | |
| SOUTH KOREA: 10.4% | |
Korea Treasury Bond
3.500%, 09/10/16 | | KRW | 1,000,000,000 | | | | 869,822 | | |
Korea Treasury Bond
5.750%, 09/10/18 | | KRW | 500,000,000 | | | | 487,285 | | |
| Total South Korea | | | | | 1,357,107 | | |
| PHILIPPINES: 10.4% | |
Republic of Philippines
6.375%, 01/15/32 | | | 500,000 | | | | 591,875 | | |
Republic of Philippines
4.950%, 01/15/21 | | PHP | 18,000,000 | | | | 416,600 | | |
Republic of Philippines
6.250%, 01/14/36 | | PHP | 15,000,000 | | | | 347,167 | | |
| Total Philippines | | | | | 1,355,642 | | |
| MALAYSIA: 7.6% | |
Malaysian Government Bond
4.160%, 07/15/21 | | MYR | 3,000,000 | | | | 982,752 | | |
| Total Malaysia | | | | | 982,752 | | |
| THAILAND: 3.7% | |
Thailand Government Bond
4.250%, 03/13/13 | | THB | 15,000,000 | | | | 481,596 | | |
| Total Thailand | | | | | 481,596 | | |
| SRI LANKA: 2.8% | |
Republic of Sri Lanka
7.400%, 01/22/15 | | | 350,000 | | | | 366,188 | | |
| Total Sri Lanka | | | | | 366,188 | | |
| TOTAL FOREIGN GOVERNMENT OBLIGATIONS: | | | | | 6,569,135 | | |
| (Cost $6,617,925) | | | |
CORPORATE BONDS: 32.8%
| | | Face Amount* | | Value | |
| CHINA/HONG KONG: 13.3% | |
Standard Chartered Bank Hong Kong, Ltd.
4.150% b, 10/27/21 | | SGD | 500,000 | | | $ | 393,121 | | |
Tencent Holdings, Ltd.
4.625%, 12/12/16 a | | | 350,000 | | | | 341,567 | | |
Fita International, Ltd.
7.000%, 02/10/20 | | | 300,000 | | | | 298,986 | | |
Beijing Enterprises Water Group, Ltd.
3.750%, 06/30/14 | | CNY | 1,500,000 | | | | 236,527 | | |
Galaxy Entertainment Group, Ltd.
4.625%, 12/16/13 | | CNY | 1,500,000 | | | | 231,207 | | |
Melco Crown Entertainment, Ltd.
3.750%, 05/09/13 | | CNY | 1,500,000 | | | | 229,089 | | |
| Total China/Hong Kong | | | | | 1,730,497 | | |
| SOUTH KOREA: 6.2% | |
Kia Motors Corp.
3.625%, 06/14/16 | | | 500,000 | | | | 495,678 | | |
Korea Hydro & Nuclear Power Co., Ltd.
4.750%, 07/13/21 | | | 300,000 | | | | 304,059 | | |
| Total South Korea | | | | | 799,737 | | |
| SINGAPORE: 4.7% | |
Oversea-Chinese Banking Corp., Ltd.
3.750%b, 11/15/22 | | | 400,000 | | | | 382,699 | | |
Global Logistic Properties, Ltd.
3.375%, 05/11/16 | | CNY | 1,500,000 | | | | 231,363 | | |
| Total Singapore | | | | | 614,062 | | |
| INDONESIA: 3.8% | |
PT Adaro Indonesia
7.625%, 10/22/19a | | | 250,000 | | | | 271,575 | | |
Berau Capital Resources Pte., Ltd.
12.500%, 07/08/15 | | | 200,000 | | | | 222,000 | | |
| Total Indonesia | | | | | 493,575 | | |
| MALAYSIA: 2.8% | |
Axiata SPV1 Labuan, Ltd.
5.375%, 04/28/20 | | | 350,000 | | | | 369,008 | | |
| Total Malaysia | | | | | 369,008 | | |
| THAILAND: 2.0% | |
PTTEP Canada International Finance, Ltd.
5.692%, 04/05/21a | | | 250,000 | | | | 261,475 | | |
| Total Thailand | | | | | 261,475 | | |
| TOTAL CORPORATE BONDS | | | | | 4,268,354 | | |
| (Cost $4,268,150) | | | |
matthewsasia.com | 800.789.ASIA 7
Matthews Asia Strategic Income Fund December 31, 2011
Schedule of Investments (continued)
COMMON EQUITIES: 8.4%
| | | Shares | | Value | |
| CHINA/HONG KONG: 3.0% | |
| The Link REIT | | | 55,000 | | | $ | 202,534 | | |
| Power Assets Holdings, Ltd. | | | 25,000 | | | | 184,927 | | |
| Total China/Hong Kong | | | | | 387,461 | | |
| SINGAPORE: 2.7% | |
| StarHub, Ltd. | | | 90,000 | | | | 201,920 | | |
| Ascendas REIT | | | 110,000 | | | | 155,198 | | |
| Total Singapore | | | | | 357,118 | | |
| UNITED KINGDOM: 1.4% | |
| HSBC Holdings PLC | | | 24,000 | | | | 182,319 | | |
| Total United Kingdom | | | | | 182,319 | | |
| TAIWAN: 1.3% | |
| Chunghwa Telecom Co., Ltd. | | | 50,000 | | | | 165,131 | | |
| Total Taiwan | | | | | 165,131 | | |
| TOTAL COMMON EQUITIES | | | | | 1,092,029 | | |
| (Cost $1,107,674) | | | |
| TOTAL INVESTMENTS: 91.7% | | | | | 11,929,518 | | |
| (Cost $11,993,749c) | |
CASH AND OTHER ASSETS,
LESS LIABILITIES: 8.3% | | | | | 1,081,891 | | |
| NET ASSETS: 100.0% | | | | $ | 13,011,409 | | |
a Security exempt from registration under Rule 144A of the Securities Act of 1933, as amended. The security may be resold in transactions exempt from registration normally to qualified institutional buyers. The security has been determined to be liquid in accordance with procedures adopted by the Fund's Board of Directors.
b Variable rate security. The rate represents the rate in effect at December 31, 2011.
c Cost for federal income tax purposes is $12,004,180 and net unrealized depreciation consists of:
| Gross unrealized appreciation | | $ | 37,743 | | |
| Gross unrealized depreciation | | | (112,405 | ) | |
| Net unrealized depreciation | | ( | $74,662 | ) | |
* All values are in USD unless otherwise noted.
CNY Chinese Renminbi (Yuan)
IDR Indonesian Rupiah
KRW Korean Won
MYR Malaysian Ringgit
PHP Philippine Peso
REIT Real Estate Investment Trust
SGD Singapore Dollar
THB Thai Baht
FORWARD FOREIGN CURRENCY EXCHANGE CONTRACTS:
| Currency Purchased | | Currency Sold | | Counterparty | | Settlement Date | | Unrealized
Appreciation
(Depreciation) | |
| LONG | | | |
| SGD | 1,000,000 | | | USD | 778,950 | | | Brown Brothers Harriman | | 03/08/12 | | $ | (8,012 | ) | |
| INR | 15,000,000 | | | USD | 286,971 | | | Brown Brothers Harriman | | 03/07/12 | | | (10,303 | ) | |
| | | $ | (18,315 | ) | |
| SHORT | | | |
| USD | 278,035 | | | INR | 15,000,000 | | | Brown Brothers Harriman | | 03/07/12 | | $ | 1,367 | | |
See accompanying notes to financial statements.
8 MATTHEWS ASIA FUNDS

ASIA GROWTH AND INCOME STRATEGIES
PORTFOLIO MANAGERS
Robert J. Horrocks, PhD
Lead Manager
Jesper O. Madsen, CFA
Lead Manager
Kenneth Lowe, CFA
Co-Manager
FUND FACTS
| | | Investor Class | | Institutional Class | |
| Ticker | | MACSX | | MICSX | |
| CUSIP | | 577130206 | | 577130842 | |
| Inception | | 9/12/94 | | 10/29/10 | |
| NAV | | $15.07 | | $15.06 | |
| Initial Investment | | $2,500 | | $3 million | |
| Gross Expense Ratio1 | | 1.12% | | 0.99% | |
Portfolio Statistics
| Total # of Positions | | 71 | |
| Net Assets | | $2.9 billion | |
| Weighted Average Market Cap | | $22.0 billion | |
| Portfolio Turnover | | 16.54%2 | |
Benchmark
MSCI AC Asia ex Japan Index
Redemption Fee
2% within first 90 calendar days of purchase
OBJECTIVE
Long-term capital appreciation. The Fund also seeks to provide some current income.
STRATEGY
Under normal market conditions, the Fund seeks to achieve its investment objective by investing at least 80% of its total net assets, which include borrowings for investment purposes, in dividend-paying equity securities and the convertible securities, of any duration or quality, of companies located in Asia.
1 Matthews Asia Funds does not charge 12b-1 fees.
2 The lesser of fiscal year 2011 long-term purchase costs or sales proceeds divided by the average monthly market value of long-term securities.
Matthews Asian Growth and Income Fund
Portfolio Manager Commentary
For the year ending December 31, 2011, the Matthews Asian Growth and Income Fund declined –10.62% (Investor Class) and –10.54% (Institutional Class), while its benchmark, the MSCI All Country Asia ex Japan Index declined –17.07%. For the fourth quarter of the year, the Fund returned 1.17% (Investor and Institutional Class) versus 3.30% for the Index.
The key element determining portfolio performance is the kinds of businesses we buy and the dividend yields we target. This strategy imparts country and sector biases. During the year, our sector allocation helped the Fund's relative performance. Stock selection in particular added even more value—achieving the Fund's goal of offering downside protection in difficult markets. The portfolio tries to tread a middle path through volatile markets by selecting firms with a high proportion of tangible assets, from which we can extract near-term income. Such protection lessens some of the risks (and opportunities) in the higher-priced stocks of fast-growing, non-dividend-paying businesses.
In the fourth quarter, short-term movements in sentiment rather than any significant change in underlying medium-term fundamentals caused many cyclical sectors to rally, and this proved a difficult environment for the Fund. This was the case with Chinese banks, which the Fund does not own. We have previously highlighted Chinese banks as a key area of relative risk. These were a major detractor from relative performance for the quarter.
Over the past two years, the health of the Chinese banking sector and property markets has been the subject of much public discussion, including in our own commentaries on the subject. This portfolio, in particular, takes a conservative stance toward Chinese banks because we are skeptical about their ability to maintain current levels of dividend payments in the short run, given issues of asset quality, property market exposure, weakening deposit growth and the need to raise capital. We are positioned more bearishly than the market, and our view can be undermined by short-term rallies if the market decides it has taken too negative a stance on these companies.
In the fourth quarter, China's major banks rallied by an average of 19%. Areas such as Chinese real estate development and insurance in which the portfolio has some holdings (and which might have been expected to move in tandem with the banks) did not perform nearly as well. This divergence between performance among banks, insurance and property firms may be partly because investor concerns had focused mainly on the banks. The divergence may also be because increased liquidity, while marginally positive for the banks, may not help property markets where administrative controls have been kept tight.
Other cyclical businesses rallied during the quarter, including such holdings as Macquarie Group, an Australian investment bank; Singapore's Keppel, the world's largest manufacturer of offshore oil rigs; and Taiwan Semiconductor Manufacturing, the world's leading semiconductor outsourcing business. However, rebounds in cyclical sectors tend to be negative for the Fund's relative performance as we are generally underweight in this area. The cyclical stocks that are held in the portfolio tend to have a greater focus on quality. Higher quality industrials (while they outperformed the market on average) rebounded less than other industrials whose cheaper valuations reflected greater risk in the sustainability of their business models or cash flow. Over the year, the Fund's stock selection in industrials helped, including Singaporean defense contractor, Singapore Technologies Engineering, and some
(continued)
matthewsasia.com | 800.789.ASIA 9
PERFORMANCE AS OF DECEMBER 31, 2011
| | | | | | | Average Annual Total Returns | | | |
| | | 3 Months | | 1 Year | | 3 Years | | 5 Years | | 10 Years | | Since
Inception | | Inception
Date | |
| Investor Class (MACSX) | | | 1.17 | % | | | -10.62 | % | | | 14.64 | % | | | 4.46 | % | | | 12.55 | % | | | 10.23 | % | | 9/12/94 | |
| Institutional Class (MICSX) | | | 1.17 | % | | | -10.54 | % | | | n.a. | | | | n.a. | | | | n.a. | | | | -7.13 | % | | 10/29/10 | |
| MSCI AC Asia ex Japan Index3 | | | 3.30 | % | | | -17.07 | % | | | 19.72 | % | | | 2.87 | % | | | 11.65 | % | | | 3.17 | %4 | | | |
| Lipper Pacific Region Funds Category Average5 | | | 2.07 | % | | | -16.90 | % | | | 10.29 | % | | | -2.34 | % | | | 7.47 | % | | | 2.88 | %4 | | | |
Performance assumes reinvestment of all dividends and/or distributions before taxes. All performance quoted represents past performance and is no guarantee of future results. Investment return and principal value will fluctuate with market conditions so that when redeemed, shares may be worth more or less than their original cost. Current performance may be lower or higher than the return figures quoted. Returns would have been lower if certain of the Fund's fees and expenses had not been waived. For the Fund's most recent month-end performance, visit matthewsasia.com.
INCOME DISTRIBUTION HISTORY
| | | 2011 | | 2010 | |
| | | June | | December | | Total | | June | | December | | Total | |
| Investor Class (MACSX) | | $ | 0.27 | | | $ | 0.21 | | | $ | 0.48 | | | $ | 0.19 | | | $ | 0.28 | | | $ | 0.47 | | |
| Institutional Class (MICSX) | | $ | 0.28 | | | $ | 0.22 | | | $ | 0.50 | | | | — | | | $ | 0.29 | | | $ | 0.29 | | |
Note: This table does not include capital gains distributions. Institutional Class Shares were first offered on October 29, 2010. For income distribution history, visit matthewsasia.com.
30-DAY YIELD:
2.78% (Investor Class) 2.89% (Institutional Class)
The 30-Day Yield represents net investment income earned by the Fund over the 30-day period ended 12/31/11, expressed as an annual percentage rate based on the Fund's share price at the end of the 30-day period. The 30-Day Yield should be regarded as an estimate of the Fund's rate of investment income, and it may not equal the Fund's actual income distribution rate.
Source: BNY Mellon Investment Servicing (US) Inc.
DIVIDEND YIELD: 3.66%
The dividend yield (trailing) for the portfolio is the weighted average sum of the dividend paid per share during the last 12 months divided by the current price. The annualized dividend yield for the Fund is for the equity-only portion of the portfolio. Please note that this is based on gross portfolio holdings and does not reflect the actual yield an investor in the Fund would receive. Past yields are no guarantee of future yields.
Source: FactSet Research Systems, Bloomberg, MICM
GROWTH OF A $10,000 INVESTMENT SINCE INCEPTION—INVESTOR CLASS
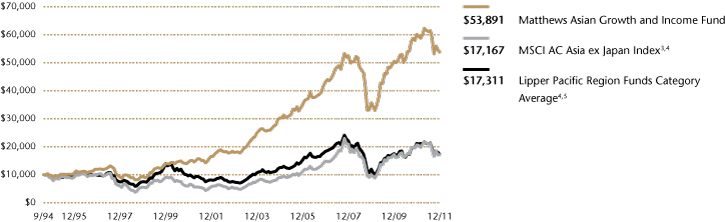
Plotted monthly. The performance data and graph do not reflect the deduction of taxes that a shareholder would pay on dividends, capital gains distributions or redemption of Fund shares. Values are in US$.
3 It is not possible to invest directly in an index. Source: Index data from Morgan Stanley Capital International and Bloomberg; total return calculations performed by BNY Mellon Investment Servicing (US) Inc. Please see page 69 for index definition.
4 Calculated from 8/31/94.
5 The Lipper Category Average does not reflect sales charges and is based on total return, including reinvestment of dividends and capital gains for the stated periods.
TOP TEN HOLDINGS6
| | | Country | | % of Net Assets | |
| Taiwan Semiconductor Manufacturing Co., Ltd. | | Taiwan | | | 3.8 | % | |
| Singapore Technologies Engineering, Ltd. | | Singapore | | | 3.8 | % | |
| Telstra Corp., Ltd. | | Australia | | | 3.7 | % | |
| CLP Holdings, Ltd. | | China/Hong Kong | | | 3.5 | % | |
| China Petroleum & Chemical Corp. (Sinopec), Cnv., 0.000%, 04/24/2014 | | China/Hong Kong | | | 3.5 | % | |
| Hisamitsu Pharmaceutical Co., Inc. | | Japan | | | 3.1 | % | |
| PTT Public Co., Ltd. | | Thailand | | | 3.1 | % | |
| HSBC Holdings PLC | | United Kingdom | | | 2.7 | % | |
| Ascendas REIT | | Singapore | | | 2.6 | % | |
| AMMB Holdings BHD | | Malaysia | | | 2.6 | % | |
| % OF ASSETS IN TOP TEN | | | | | 32.4 | % | |
6 Holdings may combine more than one security from same issuer and related depositary receipts.
10 MATTHEWS ASIA FUNDS
Matthews Asian Growth and Income Fund
Portfolio Manager Commentary (continued)
convertible bonds in Malaysia and India. We have increasingly found value in the higher quality industrials—ones offering good dividend yields that also have good returns on capital, solid market positions and more recurrent business.
For the year, our large allocation to telecommunication services was a major contributor to performance, primarily due to holdings in Australia and the Philippines. These are natural holdings for the strategy, given the monopolistic, cash-generative nature of the business and generous dividend yields. Like the portfolio's underweight in industrials, its overweight in telecom was a consequence of security selection. The fourth quarter saw strong performances from telecom companies, particularly in the Philippines, Malaysia and Australia.
The two biggest detractors to performance this year were due to our underweighting in both South Korea and Indonesia. Again, this was driven by strategy—many Korean companies pay small dividends and Indonesia is a relatively expensive market. Both markets performed well relative to the rest of the region. These were two markets in which stock selection also suffered: in Korea, SK Telecom announced a poorly received bid for a large stake in Korea's number two semiconductor manufacturer. Subsequently, the Fund exited its positions in SK Telecom. In Indonesia, regulatory issues concerning gas distribution impacted the stock Perusahaan Gas Negara. Those regulatory issues remain a concern across the region in industries such as telecommunications and utilities, particularly during an election year. In Indonesia, slowing revenue growth in the major telecommunications company also caused investors to sell down its stock.
Perhaps the biggest disappointment for the year was the performance of our software holdings. This was particularly so with companies trying to sell software and resource planning services to China's state-owned enterprises. These positions have now been exited. We remain interested in the industry but are still searching for the right businesses to own in this segment.
Positive contributions to performance this year came from underweight allocation to India and stock selection in Taiwan. In the case of India, there are relatively few companies of good quality that have acceptable dividend yields; much of the portfolio's exposure to India has been gained through convertible bonds and some straight debt. Though underperformers in a regional sense, these positions tended to outperform a very weak Indian market. As Taiwan's market is dominated by the cyclical information technology hardware industry, the Fund concentrates its holdings in more stable monopolistic IT businesses, telecommunications, and packaging.
Looking forward, the Fund will continue to tread the middle path. We will continue to look at higher quality industrials as well as the convertible bond universe, which—despite lackluster issuance—has at least started to show better valuations. Such bonds offered little in the way of downside protection last year, and the Fund's allocation to them decreased. We are now looking more closely at this asset class. Toward the end of the year, Kenneth Lowe, CFA, was named Co-Manager of the Matthews Asian Growth and Income Fund. Kenneth joined Matthews as a research analyst in 2010. He has deep knowledge of both the region and the strategy, and has been a key resource for new ideas. In addition, we also recently welcomed Siddharth Bhargava as an analyst to the team who has both equity and debt experience.
The Fund reopened to most new investors on January 4, 2012, as we believe the Fund now has the capacity to accept new assets while maintaining the integrity of its investment process. We feel confident that the portfolio can be managed efficiently, even if the pace of flows should increase.
COUNTRY ALLOCATION (%)7
| China/Hong Kong | | | 21.6 | | |
| Singapore | | | 18.1 | | |
| Japan | | | 8.3 | | |
| South Korea | | | 8.0 | | |
| Thailand | | | 7.1 | | |
| Australia | | | 7.1 | | |
| Taiwan | | | 6.2 | | |
| Malaysia | | | 6.2 | | |
| India | | | 5.4 | | |
| Indonesia | | | 3.0 | | |
| United Kingdom | | | 2.7 | | |
| Philippines | | | 1.9 | | |
| Vietnam | | | 1.7 | | |
Cash and Other Assets,
Less Liabilities | | | 2.7 | | |
SECTOR ALLOCATION (%)
| Financials | | | 25.0 | | |
| Telecommunication Services | | | 17.1 | | |
| Industrials | | | 12.9 | | |
| Consumer Discretionary | | | 8.8 | | |
| Utilities | | | 8.4 | | |
| Information Technology | | | 7.0 | | |
| Energy | | | 6.5 | | |
| Consumer Staples | | | 5.8 | | |
| Health Care | | | 5.2 | | |
| Materials | | | 0.6 | | |
Cash and Other Assets,
Less Liabilities | | | 2.7 | | |
MARKET CAP EXPOSURE (%)8
| Large Cap (over $5B) | | | 59.6 | | |
| Mid Cap ($1B–$5B) | | | 29.6 | | |
| Small Cap (under $1B) | | | 8.1 | | |
Cash and Other Assets,
Less Liabilities | | | 2.7 | | |
ASSET TYPE BREAKDOWN (%)9
| Common Equities and ADRs | | | 77.5 | | |
| Convertible Bonds | | | 14.9 | | |
| Preferred Equities | | | 3.3 | | |
| Corporate Bonds | | | 1.4 | | |
| Warrants/Rights | | | 0.2 | | |
Cash and Other Assets,
Less Liabilities | | | 2.7 | | |
7 Australia, United Kingdom and Japan are not included in the MSCI All Country Asia ex Japan Index.
8 Source: FactSet Research Systems. Percentage values in data are rounded to the nearest tenth of one percent; the values may not sum to 100% due to rounding.
9 Bonds are not included in the MSCI All Country Asia ex Japan Index.
matthewsasia.com | 800.789.ASIA 11
Matthews Asian Growth and Income Fund December 31, 2011
Schedule of Investmentsa
COMMON EQUITIES: 77.6%
| | | Shares | | Value | |
| CHINA/HONG KONG: 16.3% | |
| CLP Holdings, Ltd. | | | 11,771,700 | | | $ | 100,110,832 | | |
China Pacific Insurance Group Co., Ltd.
H Shares | | | 20,355,800 | | | | 57,922,795 | | |
| Hang Lung Properties, Ltd. | | | 19,139,920 | | | | 54,462,987 | | |
| Television Broadcasts, Ltd. | | | 8,897,000 | | | | 53,955,231 | | |
| China Mobile, Ltd. ADR | | | 905,500 | | | | 43,907,695 | | |
Shandong Weigao Group Medical
Polymer Co., Ltd. H Shares | | | 43,012,000 | | | | 38,711,132 | | |
| Vitasoy International Holdings, Ltd.† | | | 51,771,000 | | | | 38,128,669 | | |
| VTech Holdings, Ltd. | | | 3,405,300 | | | | 34,111,753 | | |
Citic Telecom International
Holdings, Ltd.† | | | 132,231,000 | | | | 27,240,955 | | |
| Cafe' de Coral Holdings, Ltd. | | | 6,726,000 | | | | 15,415,085 | | |
| I-CABLE Communications, Ltd.b | | | 90,215,000 | | | | 4,646,306 | | |
| Total China/Hong Kong | | | | | 468,613,440 | | |
| SINGAPORE: 14.1% | |
Singapore Technologies
Engineering, Ltd. | | | 52,104,125 | | | | 108,060,673 | | |
| Ascendas REIT | | | 53,925,000 | | | | 76,082,456 | | |
| Keppel Corp., Ltd. | | | 8,415,900 | | | | 60,342,986 | | |
| United Overseas Bank, Ltd. | | | 3,861,000 | | | | 45,455,048 | | |
| Cerebos Pacific, Ltd. | | | 7,740,000 | | | | 29,598,242 | | |
| Singapore Post, Ltd. | | | 38,209,000 | | | | 27,543,591 | | |
| ARA Asset Management, Ltd. | | | 28,381,100 | | | | 26,804,555 | | |
| SIA Engineering Co., Ltd. | | | 6,200,000 | | | | 16,395,667 | | |
| Hong Leong Finance, Ltd. | | | 8,172,000 | | | | 13,230,947 | | |
| Total Singapore | | | | | 403,514,165 | | |
| JAPAN: 8.3% | |
| Hisamitsu Pharmaceutical Co., Inc. | | | 2,083,600 | | | | 88,249,136 | | |
| Japan Real Estate Investment Corp., REIT | | | 7,889 | | | | 61,496,687 | | |
| Hamamatsu Photonics, K.K. | | | 1,464,700 | | | | 51,246,422 | | |
| NTT DoCoMo, Inc. | | | 20,750 | | | | 38,146,356 | | |
| Total Japan | | | | | 239,138,601 | | |
| THAILAND: 7.1% | |
| PTT Public Co., Ltd. | | | 8,719,200 | | | | 87,882,903 | | |
| BEC World Public Co., Ltd. | | | 30,807,800 | | | | 43,941,395 | | |
| Glow Energy Public Co., Ltd. | | | 21,887,400 | | | | 39,543,005 | | |
| Land & Houses Public Co., Ltd. NVDR | | | 145,090,300 | | | | 28,282,261 | | |
| Thai Reinsurance Public Co., Ltd. NVDR | | | 35,095,635 | | | | 3,804,345 | | |
| Thai Reinsurance Public Co., Ltd. | | | 11,748,765 | | | | 1,273,559 | | |
| Total Thailand | | | | | 204,727,468 | | |
| AUSTRALIA: 7.1% | |
| Telstra Corp., Ltd. | | | 31,377,088 | | | | 106,867,768 | | |
| Macquarie Group, Ltd. | | | 1,679,326 | | | | 40,861,972 | | |
| David Jones, Ltd. | | | 13,955,460 | | | | 33,828,471 | | |
| CSL, Ltd. | | | 700,000 | | | | 22,910,675 | | |
| Total Australia | | | | | 204,468,886 | | |
| | | Shares | | Value | |
| TAIWAN: 6.2% | |
Taiwan Semiconductor
Manufacturing Co., Ltd. ADR | | | 4,420,624 | | | $ | 57,070,256 | | |
Taiwan Semiconductor
Manufacturing Co., Ltd. | | | 20,673,187 | | | | 51,752,950 | | |
| Chunghwa Telecom Co., Ltd. ADR | | | 1,277,525 | | | | 42,516,032 | | |
| Taiwan Hon Chuan Enterprise Co., Ltd. | | | 9,901,193 | | | | 18,246,526 | | |
| CyberLink Corp. | | | 3,882,717 | | | | 8,104,221 | | |
| Total Taiwan | | | | | 177,689,985 | | |
| MALAYSIA: 5.4% | |
| AMMB Holdings BHD | | | 40,175,100 | | | | 75,407,522 | | |
| Axiata Group BHD | | | 29,634,423 | | | | 48,050,768 | | |
| Telekom Malaysia BHD | | | 20,245,551 | | | | 31,677,582 | | |
| Total Malaysia | | | | | 155,135,872 | | |
| SOUTH KOREA: 3.8% | |
| S1 Corp. | | | 771,922 | | | | 38,812,512 | | |
| KT Corp. ADR | | | 2,089,505 | | | | 32,679,858 | | |
| GS Home Shopping, Inc. | | | 298,935 | | | | 30,146,026 | | |
| Daehan City Gas Co., Ltd. | | | 325,280 | | | | 8,444,934 | | |
| Total South Korea | | | | | 110,083,330 | | |
| INDONESIA: 3.0% | |
| PT Perusahaan Gas Negara | | | 141,686,000 | | | | 49,611,585 | | |
| PT Telekomunikasi Indonesia ADR | | | 1,153,600 | | | | 35,461,664 | | |
| Total Indonesia | | | | | 85,073,249 | | |
| UNITED KINGDOM: 2.7% | |
| HSBC Holdings PLC ADR | | | 2,050,333 | | | | 78,117,687 | | |
| Total United Kingdom | | | | | 78,117,687 | | |
| PHILIPPINES: 1.9% | |
| Globe Telecom, Inc. | | | 2,065,510 | | | | 53,406,724 | | |
| Total Philippines | | | | | 53,406,724 | | |
| VIETNAM: 1.7% | |
| Vietnam Dairy Products JSC | | | 5,792,535 | | | | 23,510,926 | | |
| Bao Viet Holdings | | | 10,333,281 | | | | 19,879,573 | | |
| Kinh Do Corp. | | | 3,655,830 | | | | 4,460,097 | | |
| Total Vietnam | | | | | 47,850,596 | | |
| TOTAL COMMON EQUITIES | | | | | 2,227,820,003 | | |
| (Cost $2,121,861,559) | | | | | |
12 MATTHEWS ASIA FUNDS
Matthews Asian Growth and Income Fund December 31, 2011
Schedule of Investmentsa (continued)
PREFERRED EQUITIES: 3.2%
| | | Shares | | Value | |
| SOUTH KOREA: 3.2% | |
Samsung Fire & Marine Insurance
Co., Ltd., Pfd. | | | 515,311 | | | $ | 32,877,916 | | |
| Hyundai Motor Co., Ltd., Pfd. | | | 541,280 | | | | 29,879,983 | | |
| Hyundai Motor Co., Ltd., 2nd Pfd. | | | 305,760 | | | | 17,841,321 | | |
LG Household &
Health Care, Ltd., Pfd. | | | 121,855 | | | | 12,960,286 | | |
| Total South Korea | | | | | 93,559,506 | | |
| TOTAL PREFERRED EQUITIES | | | | | 93,559,506 | | |
| (Cost $48,826,622) | | | | | |
WARRANTS: 0.2%
| INDIA: 0.2% | |
Housing Development
Finance Corp., expires 08/23/12 | | | 3,875,750 | | | | 5,283,953 | | |
| Total India | | | | | 5,283,953 | | |
| TOTAL WARRANTS | | | | | 5,283,953 | | |
| (Cost $6,834,750) | | | | | |
CORPORATE BONDS: 16.3%
| | | Face Amount* | | | |
| CHINA/HONG KONG: 5.3% | |
China Petroleum & Chemical Corp.
(Sinopec), Cnv.
0.000%, 04/24/14 | | HKD | 676,210,000 | | | | 99,691,042 | | |
Power Regal Group, Ltd., Cnv.
2.250%, 06/02/14 | | HKD | 234,020,000 | | | | 36,037,381 | | |
PB Issuer No. 2, Ltd., Cnv.
1.750%, 04/12/16 | | | 21,820,000 | | | | 18,165,150 | | |
| Total China/Hong Kong | | | | | 153,893,573 | | |
| INDIA: 5.2% | |
Tata Power Co., Ltd., Cnv.
1.750%, 11/21/14 | | | 48,600,000 | | | | 43,667,100 | | |
Housing Development
Finance Corp.
0.000%, 08/24/12 | | INR | 1,800,000,000 | | | | 39,945,391 | | |
Larsen & Toubro, Ltd., Cnv.
3.500%, 10/22/14 | | | 35,700,000 | | | | 34,611,150 | | |
Sintex Industries, Ltd., Cnv.
0.000%, 03/13/13 | | | 26,900,000 | | | | 30,262,500 | | |
| Total India | | | | | 148,486,141 | | |
| | | Face Amount* | | Value | |
| SINGAPORE: 4.0% | |
CapitaLand, Ltd., Cnv.
3.125%, 03/05/18 | | SGD | 62,000,000 | | | $ | 48,442,122 | | |
Wilmar International, Ltd., Cnv.
0.000%, 12/18/12 | | | 26,500,000 | | | | 31,535,000 | | |
Olam International, Ltd., Cnv.
6.000%, 10/15/16 | | | 24,300,000 | | | | 25,454,250 | | |
CapitaLand, Ltd., Cnv.
2.875%, 09/03/16 | | SGD | 12,250,000 | | | | 8,674,781 | | |
| Total Singapore | | | | | 114,106,153 | | |
| SOUTH KOREA: 1.0% | |
LG Uplus Corp., Cnv.
0.000%, 09/29/12 | | | 30,400,000 | | | | 30,020,000 | | |
| Total South Korea | | | | | 30,020,000 | | |
| MALAYSIA: 0.8% | |
Paka Capital, Ltd., Cnv.
0.000%, 03/12/13 | | | 22,300,000 | | | | 22,077,000 | | |
| Total Malaysia | | | | | 22,077,000 | | |
| TOTAL CORPORATE BONDS | | | | | 468,582,867 | | |
| (Cost $499,004,483) | | | | | |
| TOTAL INVESTMENTS: 97.3% | | | | | 2,795,246,329 | | |
| (Cost $2,676,527,414c) | |
CASH AND OTHER ASSETS,
LESS LIABILITIES: 2.7% | | | | | 76,852,506 | | |
| NET ASSETS: 100.0% | | | | $ | 2,872,098,835 | | |
a Certain securities were fair valued under the discretion of the Board of Trustees (Note 2-A).
b Non-income producing security.
c Cost for federal income tax purposes is $2,686,336,524 and net unrealized appreciation consists of:
| Gross unrealized appreciation | | $ | 375,853,521 | | |
| Gross unrealized depreciation | | | (266,943,716 | ) | |
| Net unrealized appreciation | | $ | 108,909,805 | | |
† Affiliated Issuer, as defined under the Investment Company Act of 1940 (ownership of 5% or more of the outstanding voting securities of this issuer)
* All values are in USD unless otherwise noted.
ADR American Depositary Receipt
BHD Berhad
Cnv. Convertible
HKD Hong Kong Dollar
INR Indian Rupee
JSC Joint Stock Co.
NVDR Non-voting Depositary Receipt
Pfd. Preferred
REIT Real Estate Investment Trust
SGD Singapore Dollar
See accompanying notes to financial statements.
matthewsasia.com | 800.789.ASIA 13

ASIA GROWTH AND INCOME STRATEGIES
PORTFOLIO MANAGERS
Jesper O. Madsen, CFA
Lead Manager
Yu Zhang, CFA
Co-Manager
FUND FACTS
| | | Investor Class | | Institutional Class | |
| Ticker | | MAPIX | | MIPIX | |
| CUSIP | | 577125107 | | 577130750 | |
| Inception | | 10/31/06 | | 10/29/10 | |
| NAV | | $12.48 | | $12.48 | |
| Initial Investment | | $2,500 | | $3 million | |
| Gross Expense Ratio1 | | 1.10% | | 1.00% | |
Portfolio Statistics
| Total # of Positions | | 61 | |
| Net Assets | | $2.3 billion | |
| Weighted Average Market Cap | | $20.6 billion | |
| Portfolio Turnover | | 16.48%2 | |
Benchmark
MSCI AC Asia Pacific Index
Redemption Fee
2% within first 90 calendar days of purchase
OBJECTIVE
Total return with an emphasis on providing current income.
STRATEGY
Under normal market conditions, the Fund seeks to achieve its investment objective by investing at least 80% of its total net assets, which include borrowings for investment purposes, in income-paying equity securities of companies located in the Asia region.
1 Matthews Asia Funds does not charge 12b-1 fees.
2 The lesser of fiscal year 2011 long-term purchase costs or sales proceeds divided by the average monthly market value of long-term securities.
Matthews Asia Dividend Fund
Portfolio Manager Commentary
For the year ending December 31, 2011, the Matthews Asia Dividend Fund declined –10.02% (Investor Class) and –9.93% (Institutional Class), outperforming its benchmark, the MSCI All Country Asia Pacific Index, which lost –14.92%. For the fourth quarter, the Fund rose 1.76% (Investor and Institutional Class), while the benchmark gained 0.98%.
The Fund began 2011 with a share price of $14.33, and shareholders who were invested throughout the year would have received income distributions totaling approximately 37 cents (Investor Class), or 2.6%, of the share price at the start of the year. The fourth quarter distribution was lower than it was last year due to the tax treatment of Passive Foreign Investment Companies (PFICs), and is not an indication of a change in how the portfolio is managed. U.S. tax code requires investors under certain circumstances to deduct from the distributable income unrealized capital losses stemming from holdings in companies deemed to be PFICs. The Fund's holdings in real estate investment trusts (REITs) are all deemed PFICs. And while our inclusion of REITs in the portfolio can result in higher variability—both negatively and positively—in the income distribution, we continue to find them attractive for their significant yield premium to other equities.
2011 was a tough year for most asset managers—not because of volatile markets, per se, but because of the whipsaw nature of the volatility, which was fed by fleeting worries over both natural and man-made disasters in Japan, Europe's debt crisis and slowing global growth. More pertinent to Asia, China's moderating growth outlook weighed on the share prices of companies historically tied to the country's investment-led expansion, such as those in the financials, materials and industrials sectors. While the year was challenging for the Fund, we believe the strategy of investing in dividend-paying companies that exhibit healthy dividend growth helped lower volatility and dampen losses to shareholders relative to the benchmark. In spite of the market volatility, we remained focused on our aim of investing with companies that grow dividends. Of the portfolio's 58 companies as of year-end, 35 increased dividends, 13 were maintained and 10 cut them.
Given the ongoing angst in capital markets, it was little surprise that companies with stable business models and a greater degree of predictability in earnings and dividends marked the portfolio's best-performing areas during the year. As a result, the Fund's holdings in the consumer staples, utilities, telecommunication services and health care sectors delivered positive performance. The Fund's main contributor to performance was Cheung Kong Infrastructure, a Hong Kong-listed utility company with assets mainly in developed economies with better regulatory frameworks. The high dividend yield relative to low interest rates in Hong Kong, combined with yield-accretive acquisitions offered an attractive combination of growth and dividend income. The Fund's holdings in KT&G and Japan Tobacco were also strong performers as investors found the cash-generative nature of the tobacco business attractive.
The Fund did face several challenges throughout the year, predominantly within the consumer discretionary sector. Our holdings within branded apparel retailers continued to negatively impact performance. Esprit Holdings, Li Ning and Billabong International all posted steep losses for the year. We reduced our exposure to the first two companies and outright exited the third. We generally aim to be long-term shareholders of our holdings. However, all three of these retailers fell short of our initial expectations as additional information regarding the length of time and amount of investment needed to turn around these respective businesses became apparent. It
(continued)
14 MATTHEWS ASIA FUNDS
PERFORMANCE AS OF DECEMBER 31, 2011
| | | | | | | Average Annual Total Returns | | | |
| | | 3 Months | | 1 Year | | 3 Years | | 5 Years | | Since
Inception | | Inception
Date | |
| Investor Class (MAPIX) | | | 1.76 | % | | | -10.02 | % | | | 17.72 | % | | | 7.35 | % | | | 8.69 | % | | 10/31/06 | |
| Institutional Class (MIPIX) | | | 1.76 | % | | | -9.93 | % | | | n.a. | | | | n.a. | | | | -6.23 | % | | 10/29/10 | |
| MSCI AC Asia Pacific Index3 | | | 0.98 | % | | | -14.92 | % | | | 11.21 | % | | | -1.64 | % | | | -0.39 | %4 | | | |
| Lipper Pacific Region Funds Category Average5 | | | 2.07 | % | | | -16.90 | % | | | 10.29 | % | | | -2.34 | % | | | -0.93 | %4 | | | |
Performance assumes reinvestment of all dividends and/or distributions before taxes. All performance quoted represents past performance and is no guarantee of future results. Investment return and principal value will fluctuate with market conditions so that when redeemed, shares may be worth more or less than their original cost. Current performance may be lower or higher than the return figures quoted. Returns would have been lower if certain of the Fund's fees and expenses had not been waived. For the Fund's most recent month-end performance, visit matthewsasia.com.
INCOME DISTRIBUTION HISTORY
| | | 2011 | | 2010 | |
| | | Q1 | | Q2 | | Q3 | | Q4 | | Total | | Q1 | | Q2 | | Q3 | | Q4 | | Total | |
| Investor Class (MAPIX) | | $ | 0.10 | | | $ | 0.11 | | | $ | 0.12 | | | $ | 0.03 | | | $ | 0.36 | | | $ | 0.05 | | | $ | 0.08 | | | $ | 0.11 | | | $ | 0.17 | | | $ | 0.41 | | |
| Institutional Class (MIPIX) | | $ | 0.11 | | | $ | 0.12 | | | $ | 0.12 | | | $ | 0.03 | | | $ | 0.38 | | | | — | | | | — | | | | — | | | $ | 0.17 | | | $ | 0.17 | | |
Note: This table does not include capital gains distributions. Institutional Class Shares were first offered on October 29, 2010. For income distribution history, visit matthewsasia.com.
30-DAY YIELD:
2.95% (Investor Class) 3.06% (Institutional Class)
The 30-Day Yield represents net investment income earned by the Fund over the 30-day period ended 12/31/11, expressed as an annual percentage rate based on the Fund's share price at the end of the 30-day period. The 30-Day Yield should be regarded as an estimate of the Fund's rate of investment income, and it may not equal the Fund's actual income distribution rate.
Source: BNY Mellon Investment Servicing (US) Inc.
DIVIDEND YIELD: 4.43%
The dividend yield (trailing) for the portfolio is the weighted average sum of the dividend paid per share during the last 12 months divided by the current price. The annualized dividend yield for the Fund is for the equity-only portion of the portfolio. Please note that this is based on gross portfolio holdings and does not reflect the actual yield an investor in the Fund would receive. Past yields are no guarantee of future yields.
Source: FactSet Research Systems, Bloomberg, MICM.
GROWTH OF A $10,000 INVESTMENT SINCE INCEPTION—INVESTOR CLASS
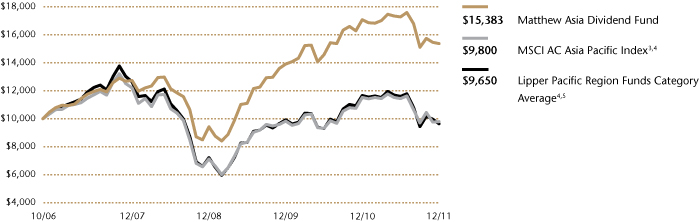
Plotted monthly. The performance data and graph do not reflect the deduction of taxes that a shareholder would pay on dividends, capital gains distributions or redemption of Fund shares. Values are in US$.
3 It is not possible to invest directly in an index. Source: Index data from Morgan Stanley Capital International and Bloomberg; total return calculations performed by BNY Mellon Investment Servicing (US) Inc. Please see page 69 for index definition.
4 Calculated from 10/31/06.
5 The Lipper Category Average does not reflect sales charges and is based on total return, including reinvestment of dividends and capital gains for the stated periods.
TOP TEN HOLDINGS6
| | | Country | | % of Net Assets | |
| Metcash, Ltd. | | Australia | | | 3.9 | % | |
| Japan Tobacco, Inc. | | Japan | | | 3.7 | % | |
| ITOCHU Corp. | | Japan | | | 3.6 | % | |
| KT&G Corp. | | South Korea | | | 3.3 | % | |
| Cheung Kong Infrastructure Holdings, Ltd. | | China/Hong Kong | | | 3.2 | % | |
| NTT DoCoMo, Inc. | | Japan | | | 3.1 | % | |
| China Mobile, Ltd. | | China/Hong Kong | | | 3.1 | % | |
| ORIX Corp. | | Japan | | | 2.9 | % | |
| Taiwan Semiconductor Manufacturing Co., Ltd. | | Taiwan | | | 2.8 | % | |
| Pigeon Corp. | | Japan | | | 2.5 | % | |
| % OF ASSETS IN TOP TEN | | | | | 32.1 | % | |
6 Holdings may combine more than one security from same issuer and related depositary receipts.
matthewsasia.com | 800.789.ASIA 15
COUNTRY ALLOCATION (%)7
| Japan | | | 25.8 | | |
| China/Hong Kong | | | 24.8 | | |
| Australia | | | 9.1 | | |
| Taiwan | | | 9.0 | | |
| Singapore | | | 8.6 | | |
| Thailand | | | 6.9 | | |
| South Korea | | | 5.6 | | |
| Indonesia | | | 3.5 | | |
| United Kingdom | | | 2.4 | | |
| Philippines | | | 1.9 | | |
| Malaysia | | | 0.3 | | |
Cash and Other Assets,
Less Liabilities | | | 2.1 | | |
SECTOR ALLOCATION (%)
| Consumer Staples | | | 22.0 | | |
| Financials | | | 16.6 | | |
| Consumer Discretionary | | | 15.3 | | |
| Telecommunication Services | | | 11.5 | | |
| Industrials | | | 9.8 | | |
| Utilities | | | 7.7 | | |
| Health Care | | | 5.2 | | |
| Information Technology | | | 5.1 | | |
| Energy | | | 3.2 | | |
| Materials | | | 1.5 | | |
Cash and Other Assets,
Less Liabilities | | | 2.1 | | |
MARKET CAP EXPOSURE (%)8
| Large Cap (over $5B) | | | 47.7 | | |
| Mid Cap ($1B–$5B) | | | 25.8 | | |
| Small Cap (under $1B) | | | 24.5 | | |
Cash and Other Assets,
Less Liabilities | | | 2.1 | | |
7 The United Kingdom is not included in the MSCI All Country Asia Pacific Index.
8 Source: FactSet Research Systems. Percentage values in data are rounded to the nearest tenth of one percent; the values may not sum to 100% due to rounding.
Matthews Asia Dividend Fund
Portfolio Manager Commentary (continued)
was also a challenging year for the portfolio's small- and mid-capitalization companies. The Fund maintained a sizable allocation to this segment, on the premise that these firms can deliver better growth in dividends over time, even if this means greater volatility over the short term. However, in volatile markets like 2011, investors showed little regard for the growth potential of smaller companies as they instead fled for the perceived safety of large companies or fixed income securities. We will remain invested with small- and mid-sized companies as long as we believe they have the fundamentals to deliver attractive dividend growth.
During the fourth quarter, the Fund exited some smaller holdings to take profit in firms that had experienced significant appreciation, and to consolidate the portfolio. Ship Healthcare is an example of a holding we exited predominantly because of a lower dividend yield due to strong share price appreciation. We also exited SK Telecom after it disclosed its intention to make a bid for a company unrelated to telecommunications. We did not believe this acquisition would be in the interest of minority shareholders, and believed it would not improve the company's ability to pay higher dividends going forward.
During the fourth quarter, the Fund reached its five-year anniversary. It has grown not just in terms of assets, but also in terms of investment team members dedicated to supporting our bottom-up dividend-focused stock picking. We welcomed Vivek Tanneeru who recently joined the team as a dedicated analyst to support the Asia Dividend strategy.
As we enter the Year of the Dragon, worries over a drawn-out resolution to Europe's debt crisis and a slowdown in China's economic growth, will likely continue. While Asian equity markets on the whole look cheap compared to history, it masks the fact that companies with better structural growth prospects, stronger balance sheets and less volatile business models—such as consumer staples, health care and utilities—now trade at a significant premium to the market's more cyclical components. Given our ongoing underweight to cyclical businesses, this does pose a risk to the Fund in terms of relative performance, vis-à-vis its benchmark, should the equities of cyclical businesses experience a rally. That said, we are committed to our basic investment philosophy despite the risk of temporary relative underperformance. We will continue to invest in companies that we believe offer our investors an attractive combination of income and dividend growth. From that perspective, we believe companies in Asia continue to deliver on both.
16 MATTHEWS ASIA FUNDS
Matthews Asia Dividend Fund December 31, 2011
Schedule of Investmentsa
COMMON EQUITIES: 97.9%
| | | Shares | | Value | |
| JAPAN: 25.8% | |
| Japan Tobacco, Inc. | | | 17,900 | | | $ | 84,186,046 | | |
| ITOCHU Corp. | | | 8,033,000 | | | | 81,613,694 | | |
| NTT DoCoMo, Inc. | | | 38,650 | | | | 71,053,332 | | |
| ORIX Corp. | | | 805,140 | | | | 66,528,393 | | |
| Pigeon Corp.† | | | 1,381,300 | | | | 56,260,563 | | |
| Lawson, Inc. | | | 815,100 | | | | 50,884,182 | | |
| Point, Inc. | | | 1,018,080 | | | | 43,252,197 | | |
| Hisamitsu Pharmaceutical Co., Inc. | | | 979,200 | | | | 41,473,197 | | |
| EPS Corp.† | | | 14,592 | | | | 28,095,809 | | |
| Miraca Holdings, Inc. | | | 618,200 | | | | 24,617,163 | | |
| Shinko Plantech Co., Ltd.† | | | 2,400,200 | | | | 19,396,186 | | |
| Hokuto Corp. | | | 848,200 | | | | 18,535,435 | | |
| Total Japan | | | | | 585,896,197 | | |
| CHINA/HONG KONG: 24.8% | |
Cheung Kong Infrastructure
Holdings, Ltd. | | | 12,468,000 | | | | 73,042,773 | | |
| China Mobile, Ltd. ADR | | | 1,463,300 | | | | 70,955,417 | | |
| Television Broadcasts, Ltd. | | | 8,815,000 | | | | 53,457,948 | | |
Shenzhou International Group
Holdings, Ltd. | | | 35,791,000 | | | | 48,571,722 | | |
| Guangdong Investment, Ltd. | | | 68,798,000 | | | | 41,722,064 | | |
| The Link REIT | | | 10,220,000 | | | | 37,634,486 | | |
| Cafe' de Coral Holdings, Ltd. | | | 16,350,000 | | | | 37,471,995 | | |
| Jiangsu Expressway Co., Ltd. H Shares | | | 34,444,000 | | | | 31,709,448 | | |
| Yuexiu Transport Infrastructure, Ltd. | | | 69,730,000 | | | | 30,525,841 | | |
| Sichuan Expressway Co., Ltd. H Shares† | | | 65,612,000 | | | | 26,357,665 | | |
| Minth Group, Ltd. | | | 26,921,000 | | | | 25,268,984 | | |
| China Fishery Group, Ltd. | | | 35,225,000 | | | | 24,713,581 | | |
| Li Ning Co., Ltd. | | | 25,225,500 | | | | 20,039,829 | | |
| Kingboard Laminates Holdings, Ltd. | | | 43,763,000 | | | | 19,947,084 | | |
| Esprit Holdings, Ltd. | | | 8,974,700 | | | | 11,578,618 | | |
| Yip's Chemical Holdings, Ltd. | | | 14,912,000 | | | | 11,232,096 | | |
| Total China/Hong Kong | | | | | 564,229,551 | | |
| AUSTRALIA: 9.1% | |
| Metcash, Ltd. | | | 21,642,243 | | | | 89,427,997 | | |
| QBE Insurance Group, Ltd. | | | 3,665,000 | | | | 48,543,783 | | |
| Coca-Cola Amatil, Ltd. | | | 2,994,730 | | | | 35,255,174 | | |
| David Jones, Ltd. | | | 14,187,739 | | | | 34,391,523 | | |
| Total Australia | | | | | 207,618,477 | | |
| TAIWAN: 9.0% | |
Taiwan Semiconductor
Manufacturing Co., Ltd. ADR | | | 4,005,040 | | | | 51,705,066 | | |
| Chunghwa Telecom Co., Ltd. ADR | | | 1,285,701 | | | | 42,788,129 | | |
| TXC Corp.† | | | 21,549,524 | | | | 24,695,944 | | |
| Johnson Health Tech Co., Ltd.† | | | 11,713,100 | | | | 23,984,022 | | |
| Taiwan Hon Chuan Enterprise Co., Ltd. | | | 12,151,948 | | | | 22,394,356 | | |
| St. Shine Optical Co., Ltd. | | | 1,611,000 | | | | 17,025,661 | | |
Taiwan Semiconductor
Manufacturing Co., Ltd. | | | 4,646,469 | | | | 11,631,902 | | |
| CyberLink Corp. | | | 3,451,973 | | | | 7,205,149 | | |
| Chunghwa Telecom Co., Ltd. | | | 1,122,964 | | | | 3,708,722 | | |
| Total Taiwan | | | | | 205,138,951 | | |
| | | Shares | | Value | |
| SINGAPORE: 8.6% | |
Singapore Technologies
Engineering, Ltd. | | | 25,256,000 | | | $ | 52,379,353 | | |
| United Overseas Bank, Ltd. | | | 3,375,000 | | | | 39,733,434 | | |
| CapitaRetail China Trust, REIT† | | | 38,501,000 | | | | 34,136,039 | | |
| Ascendas India Trust† | | | 46,280,000 | | | | 24,619,868 | | |
| ARA Asset Management, Ltd. | | | 25,405,600 | | | | 23,994,341 | | |
| Super Group, Ltd. | | | 20,514,000 | | | | 20,797,895 | | |
| Total Singapore | | | | | 195,660,930 | | |
| THAILAND: 6.9% | |
PTT Exploration & Production
Public Co., Ltd. | | | 10,135,000 | | | | 54,128,288 | | |
| Thai Beverage Public Co., Ltd. | | | 239,819,000 | | | | 45,299,453 | | |
| Tisco Financial Group Public Co., Ltd. | | | 28,100,000 | | | | 33,844,691 | | |
| LPN Development Public Co., Ltd. | | | 33,126,300 | | | | 13,439,513 | | |
| Glow Energy Public Co., Ltd. | | | 6,305,300 | | | | 11,391,509 | | |
| Total Thailand | | | | | 158,103,454 | | |
| SOUTH KOREA: 5.6% | |
| KT&G Corp. | | | 1,067,000 | | | | 75,393,924 | | |
| Woongjin Thinkbig Co., Ltd.† | | | 2,079,870 | | | | 28,754,287 | | |
| MegaStudy Co., Ltd. | | | 232,984 | | | | 22,269,802 | | |
| Total South Korea | | | | | 126,418,013 | | |
| INDONESIA: 3.5% | |
| PT Perusahaan Gas Negara | | | 142,302,000 | | | | 49,827,279 | | |
| PT Telekomunikasi Indonesia ADR | | | 717,634 | | | | 22,060,069 | | |
| PT Telekomunikasi Indonesia | | | 9,036,500 | | | | 7,025,897 | | |
| Total Indonesia | | | | | 78,913,245 | | |
| UNITED KINGDOM: 2.4% | |
| HSBC Holdings PLC ADR | | | 1,418,791 | | | | 54,055,937 | | |
| Total United Kingdom | | | | | 54,055,937 | | |
| PHILIPPINES: 1.9% | |
| Globe Telecom, Inc. | | | 1,703,820 | | | | 44,054,710 | | |
| Total Philippines | | | | | 44,054,710 | | |
| MALAYSIA: 0.3% | |
| Top Glove Corp. BHD | | | 4,891,400 | | | | 7,715,142 | | |
| Total Malaysia | | | | | 7,715,142 | | |
matthewsasia.com | 800.789.ASIA 17
Matthews Asia Dividend Fund December 31, 2011
Schedule of Investmentsa (continued)
COMMON EQUITIES (continued)
| | | Value | |
| TOTAL INVESTMENTS: 97.9% | | $ | 2,227,804,607 | | |
| (Cost $2,310,936,500b) | |
CASH AND OTHER ASSETS,
LESS LIABILITIES: 2.1% | | | 47,060,926 | | |
| NET ASSETS: 100.0% | | $ | 2,274,865,533 | | |
a Certain securities were fair valued under the discretion of the Board of Trustees (Note 2-A).
b Cost for federal income tax purposes is $2,326,892,598 and net unrealized depreciation consists of:
| Gross unrealized appreciation | | $ | 204,411,427 | | |
| Gross unrealized depreciation | | | (303,499,418 | ) | |
| Net unrealized depreciation | | ( | $99,087,991 | ) | |
† Affiliated Issuer, as defined under the Investment Company Act of 1940 (ownership of 5% or more of the outstanding voting securities of this issuer)
ADR American Depositary Receipt
BHD Berhad
REIT Real Estate Investment Trust
See accompanying notes to financial statements.
18 MATTHEWS ASIA FUNDS

ASIA GROWTH AND INCOME STRATEGIES
PORTFOLIO MANAGERS
Jesper O. Madsen, CFA
Lead Manager
Richard H. Gao
Co-Manager
FUND FACTS
| | | Investor Class | | Institutional Class | |
| Ticker | | MCDFX | | MICDX | |
| CUSIP | | 577125305 | | 577130735 | |
| Inception | | 11/30/09 | | 10/29/10 | |
| NAV | | $10.06 | | $10.06 | |
| Initial Investment | | $2,500 | | $3 million | |
| Gross Expense Ratio1 | | 1.52% | | 1.31% | |
After Fee Waiver,
Reimbursement and
Recoupment | | 1.50% | | n.a. | |
Portfolio Statistics
| Total # of Positions | | 32 | |
| Net Assets | | $26.5 million | |
| Weighted Average Market Cap | | $26.4 billion | |
| Portfolio Turnover | | 22.31%2 | |
Benchmark
MSCI China Index
Redemption Fee
2% within first 90 calendar days of purchase
OBJECTIVE
Total return with an emphasis on providing current income.
STRATEGY
Under normal market conditions, the Fund seeks to achieve its investment objective by investing at least 80% of its total net assets, which include borrowings for investment purposes, in income-paying equity securities of companies located in China and Taiwan. China includes its administrative and other districts, such as Hong Kong.
1 The Advisor has contractually agreed to waive certain fees and reimburse certain expenses for Matthews China Dividend Fund. Please see page 108 for additional information. Matthews Asia Funds does not charge 12b-1 fees.
2 The lesser of fiscal year 2011 long-term purchase costs or sales proceeds divided by the average monthly market value of long-term securities.
Matthews China Dividend Fund
Portfolio Manager Commentary
For the year ending December 31, 2011, the Matthews China Dividend Fund fell –14.44% (Investor Class) and –14.22% (Institutional Class) while its benchmark, the MSCI China Index, lost –18.24%. For the fourth quarter, the Fund rose 3.97% (Investor Class) and 3.98% (Institutional Class), underperforming the benchmark, which gained 8.11%.
2011 was yet another volatile year for equity markets in China, Hong Kong and Taiwan. During the first half of the year, rising inflationary pressures presented headwinds. But as inflation peaked in the middle of the year, questions regarding the severity of a potential economic slowdown in China instead came to the fore. These growth concerns were fueled by the deepening debt crisis in Europe, China's largest trading partner, and the cooling of the domestic housing market—since investments for this sector account for about 12% of GDP. China's banking system continued to face challenges during the first three quarters of the year as policymakers maintained a hawkish stance, particularly in relation to the real estate sector. These worries were somewhat dispelled in December as the central bank lowered the required reserve ratio (a measure of the proportion of the deposit base that a bank needs to keep on hand) for the first time in nearly three years. The reduction, which gave the banks the ability to extend additional loans, was viewed by market participants as an indication that the central government was shifting its monetary policy to be more accommodating.
The Fund continues to have no ownership in any mainland financials, in spite of the risk of what we view as short-term relative underperformance. This risk was particularly apparent in the fourth quarter after policy measures to support banks helped the sector. As a result, the sector, which had otherwise posted significant underperformance, delivered a strong rally late in the year. We continue to find the outlook for dividend growth murky given the lack of transparency related to the potential buildup of nonperforming loans after China's stimulus-induced lending that started in 2009. Given the systemic importance of the banking system in the allocation of capital within the Chinese economy, there is little doubt that policymakers will backstop larger banks to ease any significant levels of nonperforming loans within the system. In October, this was somewhat hinted at by the symbolic purchase of shares in the four biggest lenders by one of the state-run investment companies. However, while the monetary policy may have become more accommodating, helping overall liquidity, it does not address the potential solvency issues that the banks face. The final cost to minority shareholders, in terms of share dilution and the extent of potential cuts in dividends to retain more capital or repair balance sheets, remains difficult to gauge. We are proponents of dividend payments and look for companies that can sustain those payments; currently, Chinese banks simply do not meet this criterion.
In spite of the market volatility, we remained focused on our aim of investing with companies that grow dividends. Of the portfolio's 32 companies as of year-end, 26 increased dividends, three maintained them and three cut dividends.
Given the ongoing angst in capital markets, it was little surprise that companies with stable business models and a greater degree of predictability in earnings and dividends marked the portfolio's best-performing areas.
(continued)
matthewsasia.com | 800.789.ASIA 19
PERFORMANCE AS OF DECEMBER 31, 2011
| | | | | | | Average Annual
Total Returns | | | |
| | | 3 Months | | 1 Year | | Since
Inception | | Inception
Date | |
| Investor Class (MCDFX) | | | 3.97 | % | | | -14.44 | % | | | 3.17 | % | | 11/30/09 | |
| Institutional Class (MICDX) | | | 3.98 | % | | | -14.22 | % | | | -9.34 | % | | 10/29/10 | |
| MSCI China Index3 | | | 8.11 | % | | | -18.24 | % | | | -6.92 | %4 | | | |
| Lipper China Region Funds Category Average5 | | | 4.41 | % | | | -24.00 | % | | | -6.09 | %4 | | | |
Performance assumes reinvestment of all dividends and/or distributions before taxes. All performance quoted represents past performance and is no guarantee of future results. Investment return and principal value will fluctuate with market conditions so that when redeemed, shares may be worth more or less than their original cost. Current performance may be lower or higher than the return figures quoted. Returns would have been lower if certain of the Fund's fees and expenses had not been waived. For the Fund's most recent month-end performance, visit matthewsasia.com.
INCOME DISTRIBUTION HISTORY
| | | 2011 | | 2010 | |
| | | June | | December | | Total | | June | | December | | Total | |
| Investor Class (MCDFX) | | $ | 0.15 | | | $ | 0.20 | | | $ | 0.35 | | | $ | 0.12 | | | $ | 0.12 | | | $ | 0.24 | | |
| Institutional Class (MICDX) | | $ | 0.17 | | | $ | 0.21 | | | $ | 0.38 | | | | — | | | $ | 0.13 | | | $ | 0.13 | | |
Note: This table does not include capital gains distributions. Institutional Class Shares were first offered on October 29, 2010. For income distribution history, visit matthewsasia.com.
30-DAY YIELD:
2.16% (Investor Class) 2.15% (Institutional Class)
The 30-Day Yield represents net investment income earned by the Fund over the 30-day period ended 12/31/11, expressed as an annual percentage rate based on the Fund's share price at the end of the 30-day period. The 30-Day Yield should be regarded as an estimate of the Fund's rate of investment income, and it may not equal the Fund's actual income distribution rate.
Source: BNY Mellon Investment Servicing (US) Inc.
DIVIDEND YIELD: 4.28%
The dividend yield (trailing) for the portfolio is the weighted average sum of the dividend paid per share during the last 12 months divided by the current price. The annualized dividend yield for the Fund is for the equity-only portion of the portfolio. Please note that this is based on gross portfolio holdings and does not reflect the actual yield an investor in the Fund would receive. Past yields are no guarantee of future yields.
Source: FactSet Research Systems, Bloomberg, MICM.
GROWTH OF A $10,000 INVESTMENT SINCE INCEPTION—INVESTOR CLASS
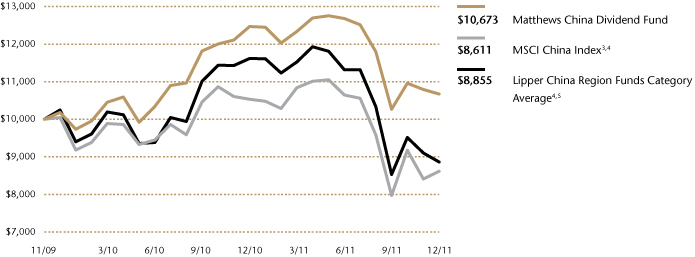
Plotted monthly. The performance data does not reflect the deduction of taxes that a shareholder would pay on dividends, capital gains distributions or redemption of Fund shares. Values are in US$.
3 It is not possible to invest directly in an index. Source: Index data from Morgan Stanley Capital International and Bloomberg; total return calculations performed by BNY Mellon Investment Servicing (US) Inc. Please see page 69 for index definition.
4 Calculated from 11/30/09.
5 The Lipper Category Average does not reflect sales charges and is based on total return, including reinvestment of dividends and capital gains for the stated periods.
TOP TEN HOLDINGS6
| | | Sector | | % of Net Assets | |
| Cheung Kong Infrastructure Holdings, Ltd. | | Utilities | | | 5.0 | % | |
| China Mobile, Ltd. | | Telecommunication Services | | | 5.0 | % | |
| The Link REIT | | Financials | | | 4.8 | % | |
| Chunghwa Telecom Co., Ltd. | | Telecommunication Services | | | 4.7 | % | |
| Taiwan Semiconductor Manufacturing Co., Ltd. | | Information Technology | | | 4.2 | % | |
| Vitasoy International Holdings, Ltd. | | Consumer Staples | | | 4.1 | % | |
| HSBC Holdings PLC | | Financials | | | 4.1 | % | |
| Cafe' de Coral Holdings, Ltd. | | Consumer Discretionary | | | 4.0 | % | |
| Television Broadcasts, Ltd. | | Consumer Discretionary | | | 4.0 | % | |
| Guangdong Investment, Ltd. | | Utilities | | | 3.9 | % | |
| % OF ASSETS IN TOP TEN | | | | | 43.8 | % | |
6 Holdings may combine more than one security from same issuer and related depositary receipts.
20 MATTHEWS ASIA FUNDS
Matthews China Dividend Fund
Portfolio Manager Commentary (continued)
As a result, the Fund's holdings in the utilities and telecommunication services sectors delivered positive performance during the year. The Fund's main contributor to performance was Cheung Kong Infrastructure, a Hong Kong-listed utility company with assets mainly in developed economies that have better regulatory frameworks. The high dividend yield relative to low interest rates in Hong Kong, combined with yield-accretive acquisitions, offered an attractive combination of growth and dividend income.
The Fund faced several challenges throughout the year, predominantly within the information technology and consumer discretionary sectors. Kingboard Laminates Holdings, TXC Corp. and CyberLink all posted significant losses for the year. These three companies are all small- or mid-capitalization companies with more cyclical business models. Our holdings within branded apparel retailers continued to negatively impact performance. Esprit Holdings and Li Ning posted steep losses for the year. We exited both holdings as they fell short of our initial expectations and because it became apparent that the length of time and amount of investment needed to turn around these respective businesses was more than originally forecast.
In general, it was a challenging year for the portfolio's small- and mid-cap firms. The Fund maintained a sizable allocation to this segment, on the premise that these firms can deliver better growth in dividends over time, even if this means greater volatility over the short term. However, in volatile markets like last year, investors showed little regard for the growth potential of smaller companies as they instead head for the perceived safety of large companies. We will remain invested with small- and mid-sized companies as long as we believe they have the fundamentals to deliver attractive dividend growth.
As we enter the Year of the Dragon, markets may continue to oscillate between worries related to the extent of an economic slowdown in China, on the one hand, and the policy measures implemented in response to a slowdown by the central government on the other. 2012 will also see the current leadership hand over the reins to the next generation of leaders. Demand from Europe could be impacted by an ongoing lack of resolution to its debt crisis. It remains to be seen whether policymakers will focus on further tackling the lack of transparency within the banking sector to instill more confidence. While there is plenty to worry about as we enter 2012, we still believe companies in China, Hong Kong and Taiwan offer an attractive combination of dividend yield and strong potential for dividend growth. We also believe the long-term economic growth potential remains intact, especially given the secular rise of household wealth. Chinese leaders have indicated that rebalancing the economy away from one anchored around fixed asset investments, to one more reliant on domestic consumption, is a priority. We would welcome this long-term structural shift, and continue to seek dividend-paying companies that can grow with the expected expansion in consumption.
COUNTRY ALLOCATION (%)7
| China/Hong Kong | | | 68.4 | | |
| Taiwan | | | 23.7 | | |
| United Kingdom | | | 4.1 | | |
| Singapore | | | 3.1 | | |
Cash and Other Assets,
Less Liabilities | | | 0.7 | | |
SECTOR ALLOCATION (%)
| Consumer Discretionary | | | 19.5 | | |
| Financials | | | 14.4 | | |
| Information Technology | | | 12.6 | | |
| Utilities | | | 11.4 | | |
| Telecommunication Services | | | 9.7 | | |
| Industrials | | | 9.1 | | |
| Consumer Staples | | | 6.8 | | |
| Energy | | | 6.8 | | |
| Materials | | | 6.1 | | |
| Health Care | | | 2.9 | | |
Cash and Other Assets,
Less Liabilities | | | 0.7 | | |
MARKET CAP EXPOSURE (%)8
| Large Cap (over $5B) | | | 41.4 | | |
| Mid Cap ($1B–$5B) | | | 28.9 | | |
| Small Cap (under $1B) | | | 29.0 | | |
Cash and Other Assets,
Less Liabilities | | | 0.7 | | |
7 The United Kingdom is not included in the MSCI China Index
8 Source: FactSet Research Systems. Percentage values in data are rounded to the nearest tenth of one percent; the values may not sum to 100% due to rounding.
matthewsasia.com | 800.789.ASIA 21
Matthews China Dividend Fund December 31, 2011
Schedule of Investments
COMMON EQUITIES: 99.3%
| | | Shares | | Value | |
| CONSUMER DISCRETIONARY: 19.5% | |
| Auto Components: 4.8% | |
| Minth Group, Ltd. | | | 848,000 | | | $ | 795,962 | | |
| Xinyi Glass Holdings, Ltd. | | | 812,000 | | | | 466,294 | | |
| | | | | | 1,262,256 | | |
| Hotels, Restaurants & Leisure: 4.0% | |
| Cafe' de Coral Holdings, Ltd. | | | 458,000 | | | | 1,049,674 | | |
| Media: 3.9% | |
| Television Broadcasts, Ltd. | | | 173,000 | | | | 1,049,146 | | |
| Leisure Equipment & Products: 3.7% | |
| Johnson Health Tech Co., Ltd. | | | 478,425 | | | | 979,634 | | |
| Textiles, Apparel & Luxury Goods: 3.1% | |
Shenzhou International Group
Holdings, Ltd. | | | 609,000 | | | | 826,470 | | |
| Total Consumer Discretionary | | | | | 5,167,180 | | |
| FINANCIALS: 14.4% | |
| Real Estate Investment Trusts: 7.9% | |
| The Link REIT | | | 342,500 | | | | 1,261,234 | | |
| CapitaRetail China Trust, REIT | | | 930,000 | | | | 824,564 | | |
| | | | | | 2,085,798 | | |
| Commercial Banks: 4.1% | |
| HSBC Holdings PLC ADR | | | 28,500 | | | | 1,085,850 | | |
| Real Estate Management & Development: 2.4% | |
| Swire Pacific, Ltd. A Shares | | | 53,000 | | | | 639,759 | | |
| Total Financials | | | | | 3,811,407 | | |
| INFORMATION TECHNOLOGY: 12.6% | |
| Electronic Equipment, Instruments & Components: 6.6% | |
| TXC Corp. | | | 685,199 | | | | 785,244 | | |
| Kingboard Laminates Holdings, Ltd. | | | 1,354,500 | | | | 617,378 | | |
| Digital China Holdings, Ltd. | | | 222,000 | | | | 344,151 | | |
| | | | | | 1,746,773 | | |
| Semiconductors & Semiconductor Equipment: 4.2% | |
Taiwan Semiconductor Manufacturing
Co., Ltd. | | | 443,000 | | | | 1,109,000 | | |
| Software: 1.8% | |
| CyberLink Corp. | | | 226,963 | | | | 473,730 | | |
| Total Information Technology | | | | | 3,329,503 | | |
| UTILITIES: 11.4% | |
| Electric Utilities: 5.1% | |
| Cheung Kong Infrastructure Holdings, Ltd. | | | 228,000 | | | | 1,335,720 | | |
| Water Utilities: 3.9% | |
| Guangdong Investment, Ltd. | | | 1,716,000 | | | | 1,040,656 | | |
| Gas Utilities: 2.4% | |
| Hong Kong & China Gas Co., Ltd. | | | 277,420 | | | | 642,953 | | |
| Total Utilities | | | | | 3,019,329 | | |
| | | Shares | | Value | |
| TELECOMMUNICATION SERVICES: 9.7% | |
| Wireless Telecommunication Services: 5.0% | |
| China Mobile, Ltd. ADR | | | 27,230 | | | $ | 1,320,383 | | |
| Diversified Telecommunication Services: 4.7% | |
| Chunghwa Telecom Co., Ltd. ADR | | | 37,604 | | | | 1,251,461 | | |
| Total Telecommunication Services | | | | | 2,571,844 | | |
| INDUSTRIALS: 9.1% | |
| Transportation Infrastructure: 9.1% | |
| Jiangsu Expressway Co., Ltd. H Shares | | | 996,000 | | | | 916,926 | | |
| Sichuan Expressway Co., Ltd. H Shares | | | 1,356,000 | | | | 544,733 | | |
China Merchants Holdings International
Co., Ltd. | | | 182,000 | | | | 528,429 | | |
| Yuexiu Transport Infrastructure, Ltd. | | | 982,000 | | | | 429,892 | | |
| Total Industrials | | | | | 2,419,980 | | |
| CONSUMER STAPLES: 6.8% | |
| Food Products: 6.8% | |
| Vitasoy International Holdings, Ltd. | | | 1,486,000 | | | | 1,094,420 | | |
| China Fishery Group, Ltd. | | | 1,025,000 | | | | 719,132 | | |
| Total Consumer Staples | | | | | 1,813,552 | | |
| ENERGY: 6.8% | |
| Oil, Gas & Consumable Fuels: 6.8% | |
| CNOOC, Ltd. ADR | | | 4,550 | | | | 794,794 | | |
| China Petroleum & Chemical Corp. ADR | | | 5,440 | | | | 571,472 | | |
| China Shenhua Energy Co., Ltd. H Shares | | | 98,000 | | | | 425,231 | | |
| Total Energy | | | | | 1,791,497 | | |
| MATERIALS: 6.1% | |
| Containers & Packaging: 3.4% | |
| Taiwan Hon Chuan Enterprise Co., Ltd. | | | 483,354 | | | | 890,754 | | |
| Chemicals: 2.7% | |
| Yip's Chemical Holdings, Ltd. | | | 950,000 | | | | 715,564 | | |
| Total Materials | | | | | 1,606,318 | | |
| HEALTH CARE: 2.9% | |
| Health Care Equipment & Supplies: 2.9% | |
| St. Shine Optical Co., Ltd. | | | 72,000 | | | | 760,923 | | |
| Total Health Care | | | | | 760,923 | | |
22 MATTHEWS ASIA FUNDS
Matthews China Dividend Fund December 31, 2011
Schedule of Investments (continued)
COMMON EQUITIES (continued)
| | | Value | |
| TOTAL INVESTMENTS: 99.3% | | $ | 26,291,533 | | |
| (Cost $28,581,322a) | |
CASH AND OTHER ASSETS,
LESS LIABILITIES: 0.7% | | | 186,582 | | |
| NET ASSETS: 100.0% | | $ | 26,478,115 | | |
a Cost for federal income tax purposes is $28,797,309 and net unrealized depreciation consists of:
| Gross unrealized appreciation | | $ | 2,260,309 | | |
| Gross unrealized depreciation | | | (4,766,085 | ) | |
| Net unrealized depreciation | | ( | $2,505,776 | ) | |
ADR American Depositary Receipt
REIT Real Estate Investment Trust
See accompanying notes to financial statements.
matthewsasia.com | 800.789.ASIA 23

ASIA GROWTH STRATEGIES
PORTFOLIO MANAGERS
Taizo Ishida
Lead Manager
Sharat Shroff, CFA
Co-Manager
FUND FACTS
| | | Investor Class | | Institutional Class | |
| Ticker | | MPACX | | MIAPX | |
| CUSIP | | 577130867 | | 577130776 | |
| Inception | | 10/31/03 | | 10/29/10 | |
| NAV | | $15.34 | | $15.37 | |
| Initial Investment | | $2,500 | | $3 million | |
| Gross Expense Ratio1 | | 1.19% | | 1.03% | |
Portfolio Statistics
| Total # of Positions | | 71 | |
| Net Assets | | $343.5 million | |
| Weighted Average Market Cap | | $10.8 billion | |
| Portfolio Turnover | | 28.06%2 | |
Benchmark
MSCI AC Asia Pacific Index
Redemption Fee
2% within first 90 calendar days of purchase
OBJECTIVE
Long-term capital appreciation.
STRATEGY
Under normal market conditions, the Fund seeks to achieve its investment objective by investing at least 80% of its total net assets, which include borrowings for investment purposes, in the common and preferred stocks of companies located in Asia. The Fund may also invest in the convertible securities, of any duration or quality, of Asian companies.
1 Matthews Asia Funds does not charge 12b-1 fees.
2 The lesser of fiscal year 2011 long-term purchase costs or sales proceeds divided by the average monthly market value of long-term securities.
Matthews Asia Growth Fund
Portfolio Manager Commentary
For the year ending December 31, 2011, the Matthews Asia Growth Fund declined –12.70% (Investor Class) and –12.58% (Institutional Class), while its benchmark, the MSCI All Country Asia Pacific Index declined –14.92%. For the fourth quarter, the Fund returned 1.28% (Investor Class) and 1.34% (Institutional Class), compared with 0.98% for the benchmark.
During the year, the region was plagued by several large-scale natural disasters. First there was Japan's devastating earthquake and tsunami in March. Later in the year, businesses were impacted by severe flooding in Thailand, a production base for an increasing number of Japanese manufacturers. Europe's sovereign debt crisis and the sluggish U.S. recovery served as the backdrop to depressed equity markets around the globe. Despite slow growth, high rates of inflation—mainly in food and energy industries—put downward pressure on Asian countries with weaker trade balances, including Vietnam and India. In addition, Asian currencies, such as Korea's won, which have generally trended upward against the U.S. dollar over the past two years, reversed course in 2011. Most notably, the Indian rupee showed considerable depreciation of 15.8% for the year.
Nearly all of the markets in which the Fund invests showed double-digit declines, with only a few smaller markets ending the year in positive territory. Despite the harsh environment, the Fund's relative outperformance was helped by good stock selection in Japan, Indonesia and Hong Kong. While India was the worst performing market in the region during the year, our low allocation to the country minimized its negative impact on the portfolio. Conversely, our overweight in China detracted from Fund performance.
Investors were clearly drawn to defensive sectors, including consumer staples, health care, telecommunication services and utilities. While the Fund benefited from holdings in consumer staples companies, our Chinese health care holdings performed poorly as investors became increasingly concerned over government pricing policies related to various drugs and medical devices. The negative sentiment hurt stocks such as Sinopharm Group, China's largest distributor of pharmaceuticals. However, we believe the government's moves to put price caps on a growing list of certain "essential drugs" should not greatly impact its business. The company's challenges during the year came instead from higher costs of financing that resulted from China's tighter monetary policy. However, we maintain this holding as we are attracted to Sinopharm's dominance in China's pharmaceutical industry and potential for growth.
Throughout the year, we actively invested in smaller markets, including ASEAN and frontier markets. This focus has partly been driven by a shift in the manufacture of such items as apparel and footwear from China to lower-cost countries in Southeast Asia. Our focus has also come partly due to the steady rise of middle class consumers in larger ASEAN countries, such as Indonesia and Thailand. Finding compelling investment opportunities in frontier markets is certainly challenging, but we have identified a few such investments in Cambodia and Sri Lanka.
For example, we initiated a position in NagaCorp, Cambodia's largest hotel, gaming and leisure operator. NagaCorp's casino attracts many visitors from
(continued)
24 MATTHEWS ASIA FUNDS
PERFORMANCE AS OF DECEMBER 31, 2011
| | | | | | | Average Annual Total Returns | | | |
| | | 3 Months | | 1 Year | | 3 Years | | 5 Years | | Since
Inception | | Inception
Date | |
| Investor Class (MPACX) | | | 1.28 | % | | | -12.70 | % | | | 17.05 | % | | | 2.34 | % | | | 8.71 | % | | 10/31/03 | |
| Institutional Class (MIAPX) | | | 1.34 | % | | | -12.58 | % | | | n.a. | | | | n.a. | | | | -8.74 | % | | 10/29/10 | |
| MSCI AC Asia Pacific Index3 | | | 0.98 | % | | | -14.92 | % | | | 11.21 | % | | | -1.64 | % | | | 6.33 | %4 | | | |
| Lipper Pacific Region Funds Category Average5 | | | 2.07 | % | | | -16.90 | % | | | 10.29 | % | | | -2.34 | % | | | 5.95 | %4 | | | |
Performance assumes reinvestment of all dividends and/or distributions before taxes. All performance quoted represents past performance and is no guarantee of future results. Investment return and principal value will fluctuate with market conditions so that when redeemed, shares may be worth more or less than their original cost. Current performance may be lower or higher than the return figures quoted. Returns would have been lower if certain of the Fund's fees and expenses had not been waived. For the Fund's most recent month-end performance, visit matthewsasia.com.
GROWTH OF A $10,000 INVESTMENT SINCE INCEPTION—INVESTOR CLASS
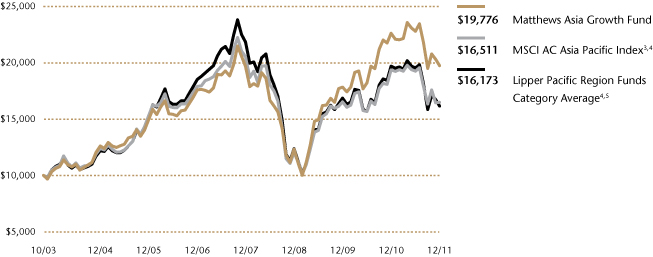
Plotted monthly. The performance data and graph do not reflect the deduction of taxes that a shareholder would pay on dividends, capital gains distributions or redemption of Fund shares. Values are in US$.
3 It is not possible to invest directly in an index. Source: Index data from Morgan Stanley Capital International and Bloomberg; total return calculations performed by BNY Mellon Investment Servicing (US) Inc. Please see page 69 for index definition.
4 Calculated from 10/31/03.
5 The Lipper Category Average does not reflect sales charges and is based on total return, including reinvestment of dividends and capital gains for the stated periods.
TOP TEN HOLDINGS6
| | | Country | | % of Net Assets | |
| ORIX Corp. | | Japan | | | 3.4 | % | |
| Nidec Corp. | | Japan | | | 2.8 | % | |
| Sinopharm Group Co., Ltd. | | China/Hong Kong | | | 2.6 | % | |
| PT Astra International | | Indonesia | | | 2.5 | % | |
| Gree, Inc. | | Japan | | | 2.4 | % | |
| Mitsui & Co., Ltd. | | Japan | | | 2.3 | % | |
| Oil Search, Ltd. | | Australia | | | 2.3 | % | |
| Rakuten, Inc. | | Japan | | | 2.3 | % | |
| Rinnai Corp. | | Japan | | | 2.3 | % | |
| PT Bank Rakyat Indonesia Persero | | Indonesia | | | 2.3 | % | |
| % OF ASSETS IN TOP TEN | | | | | 25.2 | % | |
6 Holdings may combine more than one security from same issuer and related depositary receipts.
matthewsasia.com | 800.789.ASIA 25
COUNTRY ALLOCATION (%)
| Japan | | | 31.4 | | |
| China/Hong Kong | | | 25.5 | | |
| Indonesia | | | 7.0 | | |
| Thailand | | | 5.9 | | |
| Australia | | | 4.9 | | |
| Taiwan | | | 4.7 | | |
| South Korea | | | 3.9 | | |
| India | | | 3.9 | | |
| Malaysia | | | 2.7 | | |
| Singapore | | | 2.5 | | |
| Vietnam | | | 2.0 | | |
| Cambodia | | | 1.6 | | |
| Sri Lanka | | | 1.4 | | |
Cash and Other Assets,
Less Liabilities | | | 2.6 | | |
SECTOR ALLOCATION (%)
| Consumer Discretionary | | | 27.5 | | |
| Financials | | | 15.8 | | |
| Industrials | | | 15.6 | | |
| Consumer Staples | | | 12.4 | | |
| Health Care | | | 12.4 | | |
| Information Technology | | | 7.9 | | |
| Energy | | | 3.6 | | |
| Materials | | | 1.2 | | |
| Telecommunication Services | | | 1.0 | | |
Cash and Other Assets,
Less Liabilities | | | 2.6 | | |
MARKET CAP EXPOSURE (%)7
| Large Cap (over $5B) | | | 51.5 | | |
| Mid Cap ($1B–$5B) | | | 25.4 | | |
| Small Cap (under $1B) | | | 20.5 | | |
Cash and Other Assets,
Less Liabilities | | | 2.6 | | |
7 Source: FactSet Research Systems. Percentage values in data are rounded to the nearest tenth of one percent; the values may not sum to 100% due to rounding.
Matthews Asia Growth Fund
Portfolio Manager Commentary (continued)
nearby Thailand, Vietnam and Malaysia. Compared with other casinos in Asia, the company is small in both its revenues and asset base. However, it has steady free cash flow with no debt, thanks to a very tight capital spending program. Customers are attracted to this low-cost leisure destination for deals on everything from transportation and accommodations to food and beverage. We believe the company is well positioned to benefit from the rising income of consumers around the region.
We also added Sri Lanka's John Keells—one of the country's largest leisure and tourism-related conglomerates—to the Fund. The country has been on the upswing ever since its 25-year civil war ended in 2009. Among the government's top priorities has been a rebuilding of its tourism industry. Given its long period of internal strife, the country is grossly underinvested in infrastructure, and has seen a very low percentage of foreign visitors over the last three decades. Its capital, Colombo, has only 3,200 hotel rooms, compared to 63,000 in Bangkok. The good news is that Sri Lanka welcomed 856,000 foreign visitors in 2011, a 30% increase from 2010. The government is aiming to attract 2.5 million visitors annually to its beautiful beaches and cities by 2016, which will require a vast build-up of accommodations over the next several years. John Keells is uniquely positioned in this environment as it is the largest landlord of Colombo real estate, and the owner and operator of Cinnamon Grand Hotel, a 5-star hotel in downtown Colombo.
In terms of growth and expectations, 2011 was in some senses a transitional year for Asia. China has matured from its long-time role as a cheap manufacturing base and India struggled with slow progress in its reform efforts and policy risk appears to have increased. Asia is, however, bigger than just China and India, with vibrant economies in Southeast Asia and the emergence of innovative companies in Japan and Northeast Asia. Our approach is simple: we look for profitable companies with strong long-term growth prospects, regardless of country and sector. We will continue to keep an eye on new markets including such reaches as Bangladesh and Mongolia, and will explore these areas with the same standards we employ for the rest of our portfolio. We are optimistic about the ongoing potential for growth and the investment opportunities to be uncovered in the region.
26 MATTHEWS ASIA FUNDS
Matthews Asia Growth Fund December 31, 2011
Schedule of Investmentsa
COMMON EQUITIES: 95.5%
| | | Shares | | Value | |
| JAPAN: 31.4% | |
| ORIX Corp. | | | 140,180 | | | $ | 11,583,017 | | |
| Nidec Corp. | | | 109,400 | | | | 9,508,718 | | |
| Gree, Inc. | | | 242,800 | | | | 8,365,670 | | |
| Mitsui & Co., Ltd. | | | 516,300 | | | | 8,029,246 | | |
| Rakuten, Inc. | | | 7,217 | | | | 7,763,643 | | |
| Rinnai Corp. | | | 108,400 | | | | 7,759,958 | | |
| Fast Retailing Co., Ltd. | | | 38,900 | | | | 7,075,484 | | |
| Pigeon Corp. | | | 161,000 | | | | 6,557,555 | | |
| FANUC Corp. | | | 38,500 | | | | 5,892,296 | | |
| Sysmex Corp. | | | 173,500 | | | | 5,653,345 | | |
| Benesse Holdings, Inc. | | | 100,900 | | | | 4,883,104 | | |
| Asahi Group Holdings, Ltd. | | | 201,200 | | | | 4,417,669 | | |
| Komatsu, Ltd. | | | 188,900 | | | | 4,415,111 | | |
| Otsuka Holdings Co., Ltd. | | | 134,300 | | | | 3,775,824 | | |
| NTT DoCoMo, Inc. | | | 1,931 | | | | 3,549,909 | | |
| FamilyMart Co., Ltd. | | | 87,500 | | | | 3,535,468 | | |
| Mori Trust Sogo REIT, Inc. | | | 347 | | | | 2,831,181 | | |
| Kenedix, Inc.b | | | 18,308 | | | | 2,380,968 | | |
| Total Japan | | | | | 107,978,166 | | |
| CHINA/HONG KONG: 25.5% | |
| Sinopharm Group Co., Ltd. H Shares | | | 3,658,000 | | | | 8,788,695 | | |
| Tingyi (Cayman Islands) Holding Corp. | | | 1,888,000 | | | | 5,736,976 | | |
| Dairy Farm International Holdings, Ltd. | | | 602,454 | | | | 5,620,896 | | |
Sany Heavy Equipment International
Holdings Co., Ltd. | | | 6,730,000 | | | | 5,485,142 | | |
| Dongfeng Motor Group Co., Ltd. H Shares | | | 3,184,000 | | | | 5,460,675 | | |
| Sands China, Ltd.b | | | 1,692,400 | | | | 4,783,069 | | |
| China Lodging Group, Ltd. ADRb | | | 335,500 | | | | 4,764,100 | | |
| China Kanghui Holdings, Inc. ADRb | | | 305,800 | | | | 4,507,492 | | |
Shenzhou International Group
Holdings, Ltd. | | | 3,319,000 | | | | 4,504,192 | | |
| Ctrip.com International, Ltd. ADRb | | | 188,000 | | | | 4,399,200 | | |
| Hang Lung Group, Ltd. | | | 782,000 | | | | 4,284,256 | | |
| EVA Precision Industrial Holdings, Ltd. | | | 17,394,000 | | | | 4,210,429 | | |
| Shangri-La Asia, Ltd. | | | 2,270,666 | | | | 3,917,663 | | |
| China Vanke Co., Ltd. B Shares | | | 3,789,587 | | | | 3,747,332 | | |
| Hong Kong Exchanges and Clearing, Ltd. | | | 189,000 | | | | 3,019,970 | | |
Kingdee International Software Group
Co., Ltd. | | | 10,725,600 | | | | 2,886,270 | | |
| Spreadtrum Communications, Inc. ADR | | | 134,200 | | | | 2,802,096 | | |
| Baoye Group Co., Ltd. H Shares | | | 5,906,000 | | | | 2,729,964 | | |
| PCD Stores Group, Ltd. | | | 17,794,000 | | | | 2,451,469 | | |
Shandong Weigao Group Medical Polymer
Co., Ltd. H Shares | | | 2,016,000 | | | | 1,814,416 | | |
| Haitian International Holdings, Ltd. | | | 2,056,000 | | | | 1,768,352 | | |
| Total China/Hong Kong | | | | | 87,682,654 | | |
| INDONESIA: 7.0% | |
| PT Astra International | | | 1,063,000 | | | | 8,675,159 | | |
| PT Bank Rakyat Indonesia Persero | | | 10,420,500 | | | | 7,757,196 | | |
| PT Indofood CBP Sukses Makmur | | | 13,349,000 | | | | 7,655,341 | | |
| Total Indonesia | | | | | 24,087,696 | | |
| | | Shares | | Value | |
| THAILAND: 5.9% | |
| Major Cineplex Group Public Co., Ltd. | | | 11,921,000 | | | $ | 5,403,179 | | |
| Siam Commercial Bank Public Co., Ltd. | | | 1,264,400 | | | | 4,668,862 | | |
| Banpu Public Co., Ltd. | | | 261,150 | | | | 4,519,426 | | |
| SVI Public Co., Ltd. | | | 29,845,200 | | | | 3,027,088 | | |
| SNC Former Public Co., Ltd. | | | 3,723,800 | | | | 2,584,825 | | |
| Total Thailand | | | | | 20,203,380 | | |
| AUSTRALIA: 4.9% | |
| Oil Search, Ltd. | | | 1,233,276 | | | | 7,883,701 | | |
| CSL, Ltd. | | | 137,045 | | | | 4,485,419 | | |
| BHP Billiton, Ltd. | | | 120,697 | | | | 4,249,103 | | |
| Total Australia | | | | | 16,618,223 | | |
| TAIWAN: 4.7% | |
| St. Shine Optical Co., Ltd. | | | 577,000 | | | | 6,097,956 | | |
| Synnex Technology International Corp. | | | 2,227,000 | | | | 5,376,456 | | |
| HTC Corp. | | | 200,970 | | | | 3,298,725 | | |
| Richtek Technology Corp. | | | 360,517 | | | | 1,494,266 | | |
| Total Taiwan | | | | | 16,267,403 | | |
| INDIA: 3.9% | |
| HDFC Bank, Ltd. | | | 456,660 | | | | 3,670,564 | | |
| Emami, Ltd. | | | 496,522 | | | | 3,189,222 | | |
| Sun Pharmaceutical Industries, Ltd. | | | 313,520 | | | | 2,938,014 | | |
| Sun TV Network, Ltd. | | | 429,670 | | | | 2,218,943 | | |
| Jain Irrigation Systems, Ltd. | | | 857,608 | | | | 1,397,721 | | |
| Total India | | | | | 13,414,464 | | |
| MALAYSIA: 2.7% | |
| Supermax Corp. BHD | | | 3,808,900 | | | | 4,601,920 | | |
| Parkson Holdings BHD | | | 2,515,469 | | | | 4,491,342 | | |
| Total Malaysia | | | | | 9,093,262 | | |
| SINGAPORE: 2.5% | |
| CapitaCommercial Trust, REIT | | | 5,038,000 | | | | 4,097,830 | | |
| Goodpack, Ltd. | | | 2,564,000 | | | | 2,727,975 | | |
| Keppel Land, Ltd. | | | 1,074,000 | | | | 1,838,233 | | |
| Total Singapore | | | | | 8,664,038 | | |
| VIETNAM: 2.0% | |
| Vietnam Dairy Products JSC | | | 1,431,830 | | | | 5,811,557 | | |
| Saigon Securities, Inc. | | | 1,718,300 | | | | 1,104,599 | | |
| Total Vietnam | | | | | 6,916,156 | | |
| SOUTH KOREA: 2.0% | |
| LG Electronics, Inc.b | | | 54,925 | | | | 3,554,510 | | |
| Kiwoom Securities Co., Ltd. | | | 67,641 | | | | 3,219,511 | | |
| Total South Korea | | | | | 6,774,021 | | |
| CAMBODIA: 1.6% | |
| NagaCorp, Ltd. | | | 22,078,000 | | | | 5,571,663 | | |
| Total Cambodia | | | | | 5,571,663 | | |
matthewsasia.com | 800.789.ASIA 27
Matthews Asia Growth Fund December 31, 2011
Schedule of Investmentsa (continued)
COMMON EQUITIES (continued)
| | | Shares | | Value | |
| SRI LANKA: 1.4% | |
| John Keells Holdings PLC | | | 3,220,100 | | | $ | 4,811,774 | | |
| Total Sri Lanka | | | | | 4,811,774 | | |
| TOTAL COMMON EQUITIES | | | | | 328,082,900 | | |
| (Cost $282,261,242) | | | | | | | | | |
PREFERRED EQUITIES: 1.9%
| SOUTH KOREA: 1.9% | |
| Hyundai Motor Co., Ltd., Pfd. | | | 120,043 | | | | 6,626,668 | | |
| Total South Korea | | | | | 6,626,668 | | |
| TOTAL PREFERRED EQUITIES | | | | | 6,626,668 | | |
| (Cost $2,901,106) | | | | | | | | | |
| TOTAL INVESTMENTS: 97.4% | | | | | 334,709,568 | | |
| (Cost $285,162,348c) | |
CASH AND OTHER ASSETS,
LESS LIABILITIES: 2.6% | | | | | 8,758,584 | | |
| NET ASSETS: 100.0% | | | | $ | 343,468,152 | | |
a Certain securities were fair valued under the discretion of the Board of Trustees (Note 2-A).
b Non-income producing security.
c Cost for federal income tax purposes is $287,520,815 and net unrealized appreciation consists of:
| Gross unrealized appreciation | | $ | 72,659,735 | | |
| Gross unrealized depreciation | | | (25,470,982 | ) | |
| Net unrealized appreciation | | $ | 47,188,753 | | |
ADR American Depositary Receipt
BHD Berhad
JSC Joint Stock Co.
Pfd. Preferred
REIT Real Estate Investment Trust
See accompanying notes to financial statements.
28 MATTHEWS ASIA FUNDS

ASIA GROWTH STRATEGIES
PORTFOLIO MANAGERS
Richard H. Gao
Lead Manager
Sharat Shroff, CFA
Lead Manager
Mark W. Headley
Co-Manager
FUND FACTS
| | | Investor Class | | Institutional Class | |
| Ticker | | MAPTX | | MIPTX | |
| CUSIP | | 577130107 | | 577130834 | |
| Inception | | 9/12/94 | | 10/29/10 | |
| NAV | | $20.33 | | $20.32 | |
| Initial Investment | | $2,500 | | $3 million | |
| Gross Expense Ratio1 | | 1.11% | | 0.95% | |
Portfolio Statistics
| Total # of Positions | | 70 | |
| Net Assets | | $4.8 billion | |
| Weighted Average Market Cap | | $18.5 billion | |
| Portfolio Turnover | | 10.51%2 | |
Benchmark
MSCI AC Asia ex Japan Index
Redemption Fee
2% within first 90 calendar days of purchase
OBJECTIVE
Long-term capital appreciation.
STRATEGY
Under normal market conditions, the Fund seeks to achieve its investment objective by investing at least 80% of its total net assets, which include borrowings for investment purposes, in the common and preferred stocks of companies located in Asia, excluding Japan.
1 Matthews Asia Funds does not charge 12b-1 fees.
2 The lesser of fiscal year 2011 long-term purchase costs or sales proceeds divided by the average monthly market value of long-term securities.
Matthews Pacific Tiger Fund
Portfolio Manager Commentary
For the year ending December 31, 2011, the Matthews Pacific Tiger Fund declined –11.41% (Investor Class) and –11.28% (Institutional Class) while its benchmark, the MSCI All Country Asia ex Japan Index, fell –17.07%. In the fourth quarter, the Fund returned 3.62% (Investor and Institutional Class), while the benchmark gained 3.30%. The performance of Asian capital markets was dominated by macroeconomic events with correlation across different asset classes running at relatively high levels, and weakened currencies such as the Indian rupee had an exaggerated impact on Fund returns. Some of the portfolio's holdings in the region's consumer staples sector provided a rare bright spot of positive returns, and were important drivers of relative performance. The Fund's Korean holdings were also important drivers of relative returns, helped by a variety of stocks across different industries—most notably, consumer-related and life insurance.
As the year progressed, business conditions particularly for small and medium enterprises became increasingly tough. Just a few years ago, liquidity was plentiful and capital was starting to flow across many of the Asian economies with greater abundance. Those dynamics appear to be quickly reversing—a significant change for mediocre business models—which may lead to future consolidation. The ability of a business model to endure difficult conditions, without frequently having to resort to markets to raise capital, remains an important test we employ as a part of our investment process.
A big disappointment for the year was the performance of Indian stocks. At the start of the year, it was our view that the largely domestically driven Indian economy had the potential to differentiate itself in a world of slowing growth. All that was needed was a continuation of the reform process initiated two decades ago and the avoidance of policy missteps. A spate of governance-related debacles and the onset of key elections in 2012 have forced a deferral of longer-term reforms and provoked some shorter-term, populist measures. At best, these policies may stimulate consumption in the rural economy but over the long-term may worsen the fiscal deficit.
Some of the worst-hit stocks in the Indian market were those related to infrastructure, like Tata Power, a recent addition to the Fund. The company has been one of the more disciplined bidders for power generation projects in the past with a keen focus on economic returns. In spite of this discipline, the company stumbled due to sharp volatility in the price of imported coal and the uncertain supply of domestic coal in part due to political indecision and regulatory setbacks. We believe that even with just a bit of regulatory support, companies with better access to capital, like Tata Power, should be better-placed to gain share in a recovery. At the start of 2011, the portfolio was defensively positioned in India but we have started to accumulate a few Indian equities spread across the consumer, financial and infrastructure sectors.
Even as the turn of events in India was unforeseen, the challenges facing China have been lurking for sometime—although the extent of these challenges remains unknown. In particular, the cost of servicing the surge in debt, both via formal and informal banking channels, may become amplified in an environment of slowing growth. Among the many issues that confront the Chinese economy, two have had the biggest impact on
(continued)
matthewsasia.com | 800.789.ASIA 29
PERFORMANCE AS OF DECEMBER 31, 2011
| | | | | | | Average Annual Total Returns | | | |
| | | 3 Months | | 1 Year | | 3 Years | | 5 Years | | 10 Years | | Since
Inception | | Inception
Date | |
| Investor Class (MAPTX) | | | 3.62 | % | | | -11.41 | % | | | 23.86 | % | | | 6.47 | % | | | 14.70 | % | | | 8.54 | % | | 9/12/94 | |
| Institutional Class (MIPTX) | | | 3.62 | % | | | -11.28 | % | | | n.a. | | | | n.a. | | | | n.a. | | | | -9.19 | % | | 10/29/10 | |
| MSCI AC Asia ex Japan Index3 | | | 3.30 | % | | | -17.07 | % | | | 19.72 | % | | | 2.87 | % | | | 11.65 | % | | | 3.17 | %4 | | | |
| Lipper Pacific ex Japan Funds Category Average5 | | | 4.84 | % | | | -17.17 | % | | | 19.63 | % | | | 2.72 | % | | | 10.98 | % | | | 3.41 | %4 | | | |
Performance assumes reinvestment of all dividends and/or distributions before taxes. All performance quoted represents past performance and is no guarantee of future results. Investment return and principal value will fluctuate with market conditions so that when redeemed, shares may be worth more or less than their original cost. Current performance may be lower or higher than the return figures quoted. Returns would have been lower if certain of the Fund's fees and expenses had not been waived. For the Fund's most recent month-end performance, visit matthewsasia.com.
GROWTH OF A $10,000 INVESTMENT SINCE INCEPTION—INVESTOR CLASS
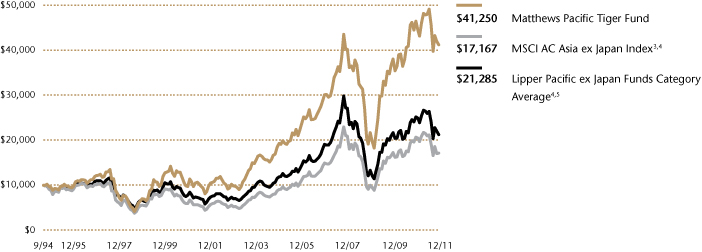
Plotted monthly. The performance data and graph do not reflect the deduction of taxes that a shareholder would pay on dividends, capital gains distributions or redemption of Fund shares. Values are in US$.
3 It is not possible to invest directly in an index. Source: Index data from Morgan Stanley Capital International and Bloomberg; total return calculations performed by BNY Mellon Investment Servicing (US) Inc. Please see page 69 for index definition.
4 Calculated from 8/31/94.
5 The Lipper Category Average does not reflect sales charges and is based on total return, including reinvestment of dividends and capital gains for the stated periods.
TOP TEN HOLDINGS6
| | | Country | | % of Net Assets | |
| Genting BHD | | Malaysia | | | 3.0 | % | |
| Dongbu Insurance Co., Ltd. | | South Korea | | | 2.8 | % | |
| PT Astra International | | Indonesia | | | 2.5 | % | |
| Dairy Farm International Holdings, Ltd. | | China/Hong Kong | | | 2.5 | % | |
| Bank of Ayudhya Public Co., Ltd. | | Thailand | | | 2.4 | % | |
| SM Prime Holdings, Inc. | | Philippines | | | 2.4 | % | |
| Samsung Electronics Co., Ltd. | | South Korea | | | 2.3 | % | |
| President Chain Store Corp. | | Taiwan | | | 2.2 | % | |
| Hyundai Mobis | | South Korea | | | 2.2 | % | |
| Synnex Technology International Corp. | | Taiwan | | | 2.2 | % | |
| % OF ASSETS IN TOP TEN | | | | | 24.5 | % | |
6 Holdings may combine more than one security from same issuer and related depositary receipts.
30 MATTHEWS ASIA FUNDS
Matthews Pacific Tiger Fund
Portfolio Manager Commentary (continued)
the portfolio. Firstly, there are some early signs that property prices are starting to correct, and a gradual, controlled decline is one desired outcome. However, such a controlled moderation is difficult to accomplish, even for Chinese authorities. There is a risk that in the absence of real buyers, prices fall rather precipitously, sending a ripple through the banking system. Consequently, the portfolio's holdings in Chinese real estate have endured a weak environment, although they possess the balance sheet strength to take advantage of the situation in acquiring land or incomplete projects and consolidate their position in the industry. Secondly, there has been a noticeable slowdown across many segments of the Chinese economy with the impact being more exaggerated on export-oriented entities. Leisure and travel-related stocks, such as Ctrip.com International, have suffered from weaker demand conditions that have been further exacerbated by rising competition as capital still continues to flow to Internet-related businesses. The portfolio remains defensively positioned in China, but we are also alert to the possibility of acquiring attractive businesses that may be experiencing a temporary setback.
Amid a difficult global economic environment, the cluster of economies in the ASEAN region delivered relatively robust performance, led by Indonesia. The Indonesian economy continues to benefit from urbanization and an expanding middle class. The recent upgrade of Indonesia's sovereign debt rating is another meaningful development that may help sustain the availability of capital at reasonable prices. Notably, foreign direct investment has continued to increase, and there is anecdotal evidence that companies across a variety of sectors, like natural resources, financial services and industrials, are starting to invest in the country. Most of the portfolio's Indonesian holdings have continued to see steady improvements in their operating performance.
Compared to the generally constructive tone at the start of the year, the capital markets finished 2011 with several outstanding concerns that were increasingly centered within the region, notably in China and India. Even though there is widespread anticipation of a slowdown in China, few expect a sharp decline in the rate of growth. This raises the odds of a surprise. Furthermore, the process of economic rebalancing in China will need to involve a more appropriate pricing of labor and capital that will test many businesses. The outlook for the region is further complicated by political transitions across many countries including China, India, South Korea and Taiwan. Political uncertainty is already acting as a drag on the market in India with steady downgrades to forward expectations, and these transitions may delay some tough decisions just when they are needed the most.
Considering that overall leverage across most of Asia is still manageable, we believe that households are better-placed to withstand external shocks, and to recover faster than the rest of the world. In the near term, the pressures from monetary tightening may abate as inflationary conditions seem to be easing at the margin. The current environment is also an opportunity to start a path toward more transparent and responsive government finances, such as Shanghai's new municipal bond issuance. Additionally, valuations in many instances are at levels not seen since the onset of global financial crisis in 2008. We continue to try to capture long-term opportunities, even as the near term looks somewhat challenging.
COUNTRY ALLOCATION (%)
| China/Hong Kong | | | 30.1 | | |
| South Korea | | | 17.6 | | |
| India | | | 13.8 | | |
| Indonesia | | | 9.7 | | |
| Taiwan | | | 8.6 | | |
| Thailand | | | 7.1 | | |
| Malaysia | | | 5.8 | | |
| Philippines | | | 2.3 | | |
| Singapore | | | 1.2 | | |
| Vietnam | | | 1.0 | | |
Cash and Other Assets,
Less Liabilities | | | 2.8 | | |
SECTOR ALLOCATION (%)
| Financials | | | 30.6 | | |
| Consumer Discretionary | | | 17.8 | | |
| Consumer Staples | | | 15.6 | | |
| Information Technology | | | 14.2 | | |
| Health Care | | | 6.7 | | |
| Utilities | | | 4.2 | | |
| Telecommunication Services | | | 3.6 | | |
| Energy | | | 1.8 | | |
| Materials | | | 1.4 | | |
| Industrials | | | 1.3 | | |
Cash and Other Assets,
Less Liabilities | | | 2.8 | | |
MARKET CAP EXPOSURE (%)7
| Large Cap (over $5B) | | | 63.6 | | |
| Mid Cap ($1B–$5B) | | | 31.4 | | |
| Small Cap (under $1B) | | | 2.2 | | |
Cash and Other Assets,
Less Liabilities | | | 2.8 | | |
7 Source: FactSet Research Systems. Percentage values in data are rounded to the nearest tenth of one percent; the values may not sum to 100% due to rounding.
matthewsasia.com | 800.789.ASIA 31
Matthews Pacific Tiger Fund December 31, 2011
Schedule of Investmentsa
COMMON EQUITIES: 97.2%
| | | Shares | | Value | |
| CHINA/HONG KONG: 30.1% | |
| Dairy Farm International Holdings, Ltd. | | | 12,770,946 | | | $ | 119,152,926 | | |
| Hang Lung Group, Ltd. | | | 18,314,000 | | | | 100,334,857 | | |
| China Mobile, Ltd. ADR | | | 2,063,150 | | | | 100,042,143 | | |
| Tingyi (Cayman Islands) Holding Corp. | | | 30,096,000 | | | | 91,451,291 | | |
Ping An Insurance Group Co. of
China, Ltd. H Shares | | | 12,304,500 | | | | 81,115,340 | | |
| Hengan International Group Co., Ltd. | | | 7,996,000 | | | | 74,795,844 | | |
| Lenovo Group, Ltd. | | | 105,568,000 | | | | 70,409,476 | | |
| Digital China Holdings, Ltd. | | | 43,173,000 | | | | 66,927,989 | | |
| Swire Pacific, Ltd. A Shares | | | 5,433,500 | | | | 65,587,339 | | |
| China Resources Enterprise, Ltd. | | | 18,852,000 | | | | 64,687,997 | | |
| Sinopharm Group Co., Ltd. H Shares | | | 25,328,800 | | | | 60,854,867 | | |
| Hong Kong Exchanges and Clearing, Ltd. | | | 3,664,500 | | | | 58,553,865 | | |
New Oriental Education & Technology
Group, Inc. ADRb | | | 2,427,600 | | | | 58,383,780 | | |
| Baidu, Inc. ADRb | | | 497,700 | | | | 57,967,119 | | |
| China Resources Land, Ltd. | | | 35,544,000 | | | | 57,114,969 | | |
| Shangri-La Asia, Ltd. | | | 31,457,333 | | | | 54,274,491 | | |
| Dongfeng Motor Group Co., Ltd. H Shares | | | 30,440,000 | | | | 52,205,701 | | |
| Ctrip.com International, Ltd. ADRb | | | 2,190,350 | | | | 51,254,190 | | |
| China Vanke Co., Ltd. B Shares | | | 48,875,258 | | | | 48,330,284 | | |
| China Merchants Bank Co., Ltd. H Shares | | | 22,182,350 | | | | 44,841,101 | | |
| Tencent Holdings, Ltd. | | | 2,011,900 | | | | 40,436,947 | | |
| Li & Fung, Ltd. | | | 16,052,000 | | | | 29,720,568 | | |
| Total China/Hong Kong | | | | | 1,448,443,084 | | |
| SOUTH KOREA: 17.6% | |
| Dongbu Insurance Co., Ltd. | | | 2,876,690 | | | | 133,680,521 | | |
| Samsung Electronics Co., Ltd. | | | 119,904 | | | | 110,292,251 | | |
| Hyundai Mobis | | | 412,719 | | | | 104,860,326 | | |
| Cheil Worldwide, Inc.† | | | 5,916,350 | | | | 97,417,950 | | |
| Green Cross Corp.† | | | 684,049 | | | | 86,777,171 | | |
| POSCO | | | 195,584 | | | | 64,804,069 | | |
| Yuhan Corp.† | | | 584,138 | | | | 64,689,901 | | |
| Amorepacific Corp. | | | 67,652 | | | | 61,779,438 | | |
| NHN Corp.b | | | 239,802 | | | | 43,949,774 | | |
| Himart Co., Ltd.b | | | 550,939 | | | | 38,793,009 | | |
| MegaStudy Co., Ltd.† | | | 396,412 | | | | 37,891,085 | | |
| Total South Korea | | | | | 844,935,495 | | |
| INDIA: 13.8% | |
| ITC, Ltd. | | | 21,185,000 | | | | 80,303,936 | | |
| Tata Power Co., Ltd. | | | 45,550,140 | | | | 74,837,581 | | |
| Sun Pharmaceutical Industries, Ltd. | | | 7,476,815 | | | | 70,065,662 | | |
| HDFC Bank, Ltd. | | | 8,635,920 | | | | 69,414,226 | | |
| Kotak Mahindra Bank, Ltd. | | | 8,542,491 | | | | 69,258,441 | | |
| Housing Development Finance Corp. | | | 5,560,685 | | | | 68,276,898 | | |
| Infosys, Ltd. | | | 848,401 | | | | 44,215,743 | | |
| Container Corp. of India, Ltd. | | | 2,788,081 | | | | 44,048,582 | | |
| Titan Industries, Ltd. | | | 13,593,760 | | | | 43,772,394 | | |
| Dabur India, Ltd. | | | 20,061,776 | | | | 37,569,789 | | |
| Sun TV Network, Ltd. | | | 4,752,590 | | | | 24,543,787 | | |
| Larsen & Toubro, Ltd. | | | 1,094,599 | | | | 20,501,702 | | |
| Infosys, Ltd. ADR | | | 219,611 | | | | 11,283,613 | | |
| HDFC Bank, Ltd. ADR | | | 319,500 | | | | 8,396,460 | | |
| Total India | | | | | 666,488,814 | | |
| | | Shares | | Value | |
| INDONESIA: 9.7% | |
| PT Astra International | | | 14,665,230 | | | $ | 119,683,156 | | |
| PT Bank Central Asia | | | 115,688,500 | | | | 102,068,707 | | |
| PT Perusahaan Gas Negara | | | 288,646,500 | | | | 101,070,045 | | |
| PT Indofood CBP Sukses Makmur | | | 118,570,500 | | | | 67,997,419 | | |
| PT Telekomunikasi Indonesia | | | 80,460,500 | | | | 62,558,205 | | |
| PT Telekomunikasi Indonesia ADR | | | 375,700 | | | | 11,549,018 | | |
| Total Indonesia | | | | | 464,926,550 | | |
| TAIWAN: 8.6% | |
| President Chain Store Corp. | | | 19,439,608 | | | | 105,932,670 | | |
| Synnex Technology International Corp. | | | 43,147,354 | | | | 104,166,966 | | |
| Delta Electronics, Inc. | | | 34,496,000 | | | | 82,027,544 | | |
| Yuanta Financial Holding Co., Ltd.b | | | 133,911,782 | | | | 68,329,107 | | |
Taiwan Semiconductor Manufacturing
Co., Ltd. | | | 20,423,513 | | | | 51,127,920 | | |
| Total Taiwan | | | | | 411,584,207 | | |
| THAILAND: 7.1% | |
| Bank of Ayudhya Public Co., Ltd. | | | 163,168,600 | | | | 114,812,771 | | |
| Central Pattana Public Co., Ltd. | | | 81,096,100 | | | | 97,032,576 | | |
PTT Exploration & Production Public
Co., Ltd. | | | 16,225,000 | | | | 86,653,328 | | |
| Land & Houses Public Co., Ltd. | | | 184,186,600 | | | | 35,903,252 | | |
| Land & Houses Public Co., Ltd. NVDR | | | 41,810,900 | | | | 8,150,144 | | |
| Total Thailand | | | | | 342,552,071 | | |
| MALAYSIA: 5.8% | |
| Genting BHD | | | 41,440,500 | | | | 143,799,842 | | |
| Public Bank BHD | | | 22,511,386 | | | | 95,016,513 | | |
| Top Glove Corp. BHD | | | 25,175,960 | | | | 39,709,716 | | |
| Total Malaysia | | | | | 278,526,071 | | |
| PHILIPPINES: 2.3% | |
| SM Prime Holdings, Inc. | | | 373,559,417 | | | | 113,350,006 | | |
| Total Philippines | | | | | 113,350,006 | | |
| SINGAPORE: 1.2% | |
| Keppel Land, Ltd. | | | 17,737,000 | | | | 30,358,228 | | |
| Hyflux, Ltd. | | | 28,487,280 | | | | 26,465,574 | | |
| Total Singapore | | | | | 56,823,802 | | |
| VIETNAM: 1.0% | |
| Vietnam Dairy Products JSC | | | 11,404,435 | | | | 46,288,684 | | |
| Total Vietnam | | | | | 46,288,684 | | |
32 MATTHEWS ASIA FUNDS
Matthews Pacific Tiger Fund December 31, 2011
Schedule of Investmentsa (continued)
COMMON EQUITIES (continued)
| | | | | Value | |
| TOTAL INVESTMENTS: 97.2% | | | | $ | 4,673,918,784 | | |
| (Cost $3,801,595,285c) | | | | | | | | | |
CASH AND OTHER ASSETS,
LESS LIABILITIES: 2.8% | | | | | 135,812,428 | | |
| NET ASSETS: 100.0% | | | | $ | 4,809,731,212 | | |
a Certain securities were fair valued under the discretion of the Board of Trustees (Note 2-A).
b Non-income producing security.
c Cost for federal income tax purposes is $3,802,857,887 and net unrealized appreciation consists of:
| Gross unrealized appreciation | | $ | 1,190,489,244 | | |
| Gross unrealized depreciation | | | (319,428,347 | ) | |
| Net unrealized appreciation | | $ | 871,060,897 | | |
† Affiliated Issuer, as defined under the Investment Company Act of 1940 (ownership of 5% or more of the outstanding voting securities of this issuer)
ADR American Depositary Receipt
BHD Berhad
JSC Joint Stock Co.
NVDR Non-voting Depositary Receipt
See accompanying notes to financial statements.
matthewsasia.com | 800.789.ASIA 33

ASIA GROWTH STRATEGIES
PORTFOLIO MANAGERS
Richard H. Gao
Lead Manager
Henry Zhang, CFA
Co-Manager
FUND FACTS
| | | Investor Class | | Institutional Class | |
| Ticker | | MCHFX | | MICFX | |
| CUSIP | | 577130701 | | 577130818 | |
| Inception | | 2/19/98 | | 10/29/10 | |
| NAV | | $21.51 | | $21.49 | |
| Initial Investment | | $2,500 | | $3 million | |
| Gross Expense Ratio1 | | 1.13% | | 0.96% | |
Portfolio Statistics
| Total # of Positions | | 61 | |
| Net Assets | | $2.1 billion | |
| Weighted Average Market Cap | | $27.2 billion | |
| Portfolio Turnover | | 8.43%2 | |
Benchmark
MSCI China Index
Redemption Fee
2% within first 90 calendar days of purchase
OBJECTIVE
Long-term capital appreciation.
STRATEGY
Under normal market conditions, the Fund seeks to achieve its investment objective by investing at least 80% of its total net assets, which include borrowings for investment purposes, in the common and preferred stocks of companies located in China and Taiwan. China includes its administrative and other districts, such as Hong Kong.
1 Matthews Asia Funds does not charge 12b-1 fees.
2 The lesser of fiscal year 2011 long-term purchase costs or sales proceeds divided by the average monthly market value of long-term securities.
Matthews China Fund
Portfolio Manager Commentary
For the year ending December 31, 2011, the Matthews China Fund declined –18.93% (Investor Class) and –18.80% (Institutional Class), while its benchmark, the MSCI China Index, declined –18.24%. For the fourth quarter, the Fund gained 6.21% (Investor Class) and 6.24% (Institutional Class), while the benchmark returned 8.11%.
2011 was a tough year for China. The country faced challenges in trying to prevent high rates of inflation from impacting the overall economy while, at the same time, maintaining growth at a reasonable rate. Europe's worsening sovereign debt crisis as well as the uncertainties in the U.S. economic recovery added to difficulties for policymakers. China's equity market fell sharply during the year in response to the declining operating environment at both the macroeconomic and corporate level.
China's economic conditions began seeing improvements in the fourth quarter, with inflation trending down after it peaked in August. The consumer price index declined to 4.2% in November, from 6.5% in August. This easing of inflation gave the government some much-needed room to loosen its monetary policy. The central bank subsequently cut its reserve ratio by 50 basis points (0.50%)—its first reduction since December of 2008—ending a nearly three-year tightening cycle.
Throughout the year, China managed to keep its economy from overheating and set the stage for a soft landing. Despite this achievement, banking and property sectors face a number of issues. Banks are expected to see a sharp rise in nonperforming loans as a result of rapid loan growth from prior years and the lack of proper risk management. On the property side, prices and transaction volumes began declining in major Chinese cities, beginning in the fourth quarter. We expect that this may significantly impact the overall economy as the sector plays a critical role in China.
Given the volatile market conditions and economic uncertainties, the Fund turned slightly more defensive during the year by increasing exposure to sectors such as utilities and telecom, which provided the portfolio with some cushion. Cheung Kong Infrastructure Holdings, a Hong Kong-based infrastructure company with investments ranging from toll roads and power plants to energy and cement, was the top contributor to portfolio performance. The company's strong cash flow from its various infrastructure projects has served as a good stabilizer for the portfolio.
Meanwhile, growth companies are still our main focus, and we continue to find growth even in this bearish environment. Our position in Sands China, a Macau casino and gaming company, has benefited from Macau's booming travel and leisure business. Macau's gaming revenue has become number one in the world as it is China's only legal gambling destination. As Macau's largest casino resort, Sands China is attracting an increasing influx of mainland Chinese tourists, and we believe these growth prospects are sustainable.
By sector, we maintained a lower weighting in financials (which includes banks and property-related firms) than the benchmark. Although banks reported strong earnings in 2011, we believe bank asset quality will decline in 2012, and the property sector will continue to slow to a more comfortable level for authorities. We are also aware that the valuations of the banks and property companies have come down to attractive levels,
(continued)
34 MATTHEWS ASIA FUNDS
PERFORMANCE AS OF DECEMBER 31, 2011
| | | | | | | Average Annual Total Returns | | | |
| | | 3 Months | | 1 Year | | 3 Years | | 5 Years | | 10 Years | | Since
Inception | | Inception
Date | |
| Investor Class (MCHFX) | | | 6.21 | % | | | -18.93 | % | | | 18.72 | % | | | 7.77 | % | | | 15.04 | % | | | 10.96 | % | | 2/19/98 | |
| Institutional Class (MICFX) | | | 6.24 | % | | | -18.80 | % | | | n.a. | | | | n.a. | | | | n.a. | | | | -17.43 | % | | 10/29/10 | |
| MSCI China Index3 | | | 8.11 | % | | | -18.24 | % | | | 11.71 | % | | | 2.64 | % | | | 15.15 | % | | | 2.39 | %4 | | | |
| Lipper China Region Funds Category Average5 | | | 4.41 | % | | | -24.00 | % | | | 12.62 | % | | | 0.75 | % | | | 10.51 | % | | | 7.40 | %4 | | | |
Performance assumes reinvestment of all dividends and/or distributions before taxes. All performance quoted represents past performance and is no guarantee of future results. Investment return and principal value will fluctuate with market conditions so that when redeemed, shares may be worth more or less than their original cost. Current performance may be lower or higher than the return figures quoted. Returns would have been lower if certain of the Fund's fees and expenses had not been waived. For the Fund's most recent month-end performance, visit matthewsasia.com.
GROWTH OF A $10,000 INVESTMENT SINCE INCEPTION—INVESTOR CLASS
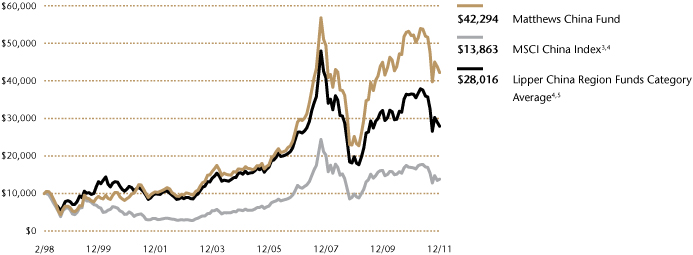
Plotted monthly. The performance data and graph do not reflect the deduction of taxes that a shareholder would pay on dividends, capital gains distributions or redemption of Fund shares. Values are in US$.
3 It is not possible to invest directly in an index. Source: Index data from Morgan Stanley Capital International and Bloomberg; total return calculations performed by BNY Mellon Investment Servicing (US) Inc. Please see page 69 for index definition.
4 Calculated from 2/28/98.
5 The Lipper Category Average does not reflect sales charges and is based on total return, including reinvestment of dividends and capital gains for the stated periods.
TOP TEN HOLDINGS6
| | | Sector | | % of Net Assets | |
| China Mobile, Ltd. | | Telecommunication Services | | | 3.9 | % | |
| Cheung Kong Infrastructure Holdings, Ltd. | | Utilities | | | 3.3 | % | |
| Tingyi (Cayman Islands) Holding Corp. | | Consumer Staples | | | 3.2 | % | |
| Digital China Holdings, Ltd. | | Information Technology | | | 2.6 | % | |
| ZTE Corp. | | Information Technology | | | 2.5 | % | |
| New Oriental Education & Technology Group, Inc. | | Consumer Discretionary | | | 2.4 | % | |
| Hong Kong & China Gas Co., Ltd. | | Utilities | | | 2.4 | % | |
| Hengan International Group Co., Ltd. | | Consumer Staples | | | 2.4 | % | |
| Li & Fung, Ltd. | | Consumer Discretionary | | | 2.2 | % | |
| Tsingtao Brewery Co., Ltd. | | Consumer Staples | | | 2.2 | % | |
| % OF ASSETS IN TOP TEN | | | | | 27.1 | % | |
6 Holdings may combine more than one security from same issuer and related depositary receipts.
matthewsasia.com | 800.789.ASIA 35
SECTOR ALLOCATION (%)
| Consumer Discretionary | | | 23.1 | | |
| Financials | | | 18.3 | | |
| Consumer Staples | | | 13.2 | | |
| Information Technology | | | 12.4 | | |
| Industrials | | | 8.8 | | |
| Energy | | | 7.7 | | |
| Utilities | | | 6.5 | | |
| Telecommunication Services | | | 5.4 | | |
| Health Care | | | 2.7 | | |
Cash and Other Assets,
Less Liabilities | | | 1.9 | | |
MARKET CAP EXPOSURE (%)8
| Large Cap (over $5B) | | | 71.1 | | |
| Mid Cap ($1B–$5B) | | | 22.6 | | |
| Small Cap (under $1B) | | | 4.4 | | |
Cash and Other Assets,
Less Liabilities | | | 1.9 | | |
8 Source: FactSet Research Systems. Percentage values in data are rounded to the nearest tenth of one percent; the values may not sum to 100% due to rounding.
Matthews China Fund
Portfolio Manager Commentary (continued)
which in some cases reflects more than the underlying risks. We will continue to evaluate the sector and consider emerging opportunities.
Some of the biggest detractors to performance during the year came from the portfolio's small- and mid-capitalization holdings—an area in which the Fund has traditionally been overweight. Smaller companies are particularly sensitive to cost increases and margin squeezes. The operating environment for small- and medium-sized enterprises was among the worst we have seen in recent years. Smaller firms were impacted by rising raw material prices and labor costs, while at the same time their ability to increase product prices was often capped by government regulations and weaker demand. This occurred across many different sectors during the year, and affected the performance of smaller companies across the entire portfolio. We will maintain our approach of seeking growth companies in their initial stages of development, and believe that solid companies can survive this challenging stage to become even stronger over the long term.
During the year, we remained fully invested and focused on domestic consumer-related areas. We trimmed the financial sector holdings in the portfolio and added select consumer companies as their valuations became attractive. As previously mentioned, we increased our weightings in the telecommunication services and utilities sectors to offset market volatility. The portfolio's weighting in the industrial sector has lessened as we exited some positions in this area.
Looking forward, we believe that China is on track to achieve a soft landing. As inflationary pressures subside, the government will be better able to loosen monetary policy and guide the economy to a stable growth stage. However, policy risk is still a main concern, as it has become increasingly difficult for policymakers to adopt efficient monetary and fiscal policies given the situation in the property market and uncertainties in the global economy. On the corporate side, we believe companies should start to see a more favorable operating environment compared to last year. Overall, China's growth should gradually become less dependent on fixed asset investments and exports, and increasingly reliant on domestic consumption, especially from services-oriented areas, and we will continue to position the portfolio to benefit from this trend.
36 MATTHEWS ASIA FUNDS
Matthews China Fund December 31, 2011
Schedule of Investments
COMMON EQUITIES: CHINA/HONG KONG: 98.1%
| | | Shares | | Value | |
| CONSUMER DISCRETIONARY: 23.1% | |
| Hotels, Restaurants & Leisure: 7.6% | |
| Cafe' de Coral Holdings, Ltd. | | | 18,286,100 | | | $ | 41,909,276 | | |
| Sands China, Ltd.a | | | 12,995,600 | | | | 36,728,223 | | |
| Shangri-La Asia, Ltd. | | | 18,365,400 | | | | 31,686,499 | | |
Home Inns & Hotels
Management, Inc. ADRa | | | 1,028,646 | | | | 26,539,067 | | |
| Ctrip.com International, Ltd. ADRa | | | 1,032,000 | | | | 24,148,800 | | |
| | | | | | 161,011,865 | | |
| Multiline Retail: 3.7% | |
| Golden Eagle Retail Group, Ltd. | | | 22,334,000 | | | | 47,218,124 | | |
| Parkson Retail Group, Ltd. | | | 25,515,000 | | | | 31,275,307 | | |
| | | | | | 78,493,431 | | |
| Diversified Consumer Services: 2.4% | |
New Oriental Education & Technology
Group, Inc. ADRa | | | 2,163,100 | | | | 52,022,555 | | |
| Distributors: 2.2% | |
| Li & Fung, Ltd. | | | 25,750,400 | | | | 47,677,330 | | |
| Automobiles: 2.2% | |
Dongfeng Motor Group Co., Ltd.
H Shares | | | 27,500,000 | | | | 47,163,495 | | |
| Specialty Retail: 2.1% | |
| Belle International Holdings, Ltd. | | | 25,710,000 | | | | 44,821,853 | | |
| Textiles, Apparel & Luxury Goods: 1.7% | |
| Ports Design, Ltd. | | | 14,983,500 | | | | 22,649,073 | | |
| Li Ning Co., Ltd. | | | 12,019,000 | | | | 9,548,223 | | |
| Glorious Sun Enterprises, Ltd. | | | 12,108,000 | | | | 3,710,380 | | |
| | | | | | 35,907,676 | | |
| Media: 1.2% | |
| Television Broadcasts, Ltd. | | | 4,082,000 | | | | 24,755,002 | | |
| Total Consumer Discretionary | | | | | 491,853,207 | | |
| FINANCIALS: 18.3% | |
| Real Estate Management & Development: 6.6% | |
| Hang Lung Group, Ltd. | | | 7,779,000 | | | | 42,617,934 | | |
| China Vanke Co., Ltd. B Shares | | | 35,309,598 | | | | 34,915,885 | | |
| China Resources Land, Ltd. | | | 21,384,000 | | | | 34,361,538 | | |
| Swire Pacific, Ltd. A Shares | | | 2,411,500 | | | | 29,109,021 | | |
| | | | | | 141,004,378 | | |
| Commercial Banks: 6.0% | |
| China Merchants Bank Co., Ltd. H Shares | | | 20,530,614 | | | | 41,502,155 | | |
| BOC Hong Kong Holdings, Ltd. | | | 14,555,500 | | | | 34,483,712 | | |
| China Construction Bank Corp. H Shares | | | 48,747,660 | | | | 34,019,045 | | |
| Agricultural Bank of China, Ltd. H Shares | | | 39,880,000 | | | | 17,150,259 | | |
| | | | | | 127,155,171 | | |
| | | Shares | | Value | |
| Insurance: 4.0% | |
Ping An Insurance Group Co. of
China, Ltd. H Shares | | | 6,711,500 | | | $ | 44,244,431 | | |
| China Life Insurance Co., Ltd. H Shares | | | 13,332,000 | | | | 32,958,360 | | |
| China Life Insurance Co., Ltd. ADR | | | 181,300 | | | | 6,702,661 | | |
| | | | | | 83,905,452 | | |
| Diversified Financial Services: 1.7% | |
| Hong Kong Exchanges and Clearing, Ltd. | | | 2,268,200 | | | | 36,242,837 | | |
| Total Financials | | | | | 388,307,838 | | |
| CONSUMER STAPLES: 13.2% | |
| Food & Staples Retailing: 4.4% | |
| China Resources Enterprise, Ltd. | | | 13,032,000 | | | | 44,717,483 | | |
Lianhua Supermarket Holdings Co., Ltd.
H Shares† | | | 28,947,800 | | | | 37,011,260 | | |
| Sun Art Retail Group, Ltd.a | | | 9,443,000 | | | | 11,805,878 | | |
| | | | | | 93,534,621 | | |
| Food Products: 4.2% | |
| Tingyi (Cayman Islands) Holding Corp. | | | 22,209,000 | | | | 67,485,438 | | |
| China Yurun Food Group, Ltd. | | | 16,111,000 | | | | 21,158,834 | | |
| | | | | | 88,644,272 | | |
| Household & Personal Products: 2.4% | |
| Hengan International Group Co., Ltd. | | | 5,351,000 | | | | 50,054,097 | | |
| Beverages: 2.2% | |
| Tsingtao Brewery Co., Ltd. H Shares | | | 8,609,000 | | | | 47,663,971 | | |
| Total Consumer Staples | | | | | 279,896,961 | | |
| INFORMATION TECHNOLOGY: 12.4% | |
| Internet Software & Services: 3.6% | |
| NetEase.com, Inc. ADRa | | | 644,700 | | | | 28,914,795 | | |
| Tencent Holdings, Ltd. | | | 1,399,500 | | | | 28,128,390 | | |
| Sina Corp.a | | | 392,900 | | | | 20,430,800 | | |
| | | | | | 77,473,985 | | |
| Electronic Equipment, Instruments & Components: 2.6% | |
| Digital China Holdings, Ltd. | | | 35,162,000 | | | | 54,509,113 | | |
| Communications Equipment: 2.5% | |
| ZTE Corp. H Shares | | | 16,751,104 | | | | 52,518,397 | | |
| Computers & Peripherals: 2.2% | |
| Lenovo Group, Ltd. | | | 65,394,000 | | | | 43,615,085 | | |
| TPV Technology, Ltd. | | | 18,960,000 | | | | 3,466,536 | | |
| | | | | | 47,081,621 | | |
| Software: 1.5% | |
Kingdee International Software Group
Co., Ltd. | | | 117,728,800 | | | | 31,680,940 | | |
| Total Information Technology | | | | | 263,264,056 | | |
matthewsasia.com | 800.789.ASIA 37
Matthews China Fund December 31, 2011
Schedule of Investments (continued)
COMMON EQUITIES: CHINA/HONG KONG (continued)
| | | Shares | | Value | |
| INDUSTRIALS: 8.8% | |
| Machinery: 3.3% | |
| CSR Corp., Ltd. H Shares | | | 51,450,000 | | | $ | 29,412,870 | | |
Sany Heavy Equipment International
Holdings Co., Ltd. | | | 26,607,500 | | | | 21,685,870 | | |
China National Materials Co., Ltd.
H Shares | | | 55,910,000 | | | | 19,868,617 | | |
| | | | | | 70,967,357 | | |
| Transportation Infrastructure: 2.7% | |
China Merchants Holdings International
Co., Ltd. | | | 12,340,581 | | | | 35,830,364 | | |
| Yuexiu Transport Infrastructure, Ltd. | | | 50,775,000 | | | | 22,227,873 | | |
| | | | | | 58,058,237 | | |
| Airlines: 1.6% | |
| Air China, Ltd. H Shares | | | 45,027,900 | | | | 33,278,416 | | |
| Industrial Conglomerates: 1.2% | |
| NWS Holdings, Ltd. | | | 16,914,914 | | | | 24,915,229 | | |
| Total Industrials | | | | | 187,219,239 | | |
| ENERGY: 7.7% | |
| Oil, Gas & Consumable Fuels: 5.8% | |
China Shenhua Energy Co., Ltd.
H Shares | | | 10,233,500 | | | | 44,404,109 | | |
| CNOOC, Ltd. | | | 24,068,000 | | | | 42,083,208 | | |
China Petroleum & Chemical Corp.
(Sinopec) H Shares | | | 34,312,000 | | | | 36,094,178 | | |
| | | | | | 122,581,495 | | |
| Energy Equipment & Services: 1.9% | |
| China Oilfield Services, Ltd. H Shares | | | 26,168,000 | | | | 41,307,610 | | |
| Total Energy | | | | | 163,889,105 | | |
| UTILITIES: 6.5% | |
| Electric Utilities: 3.3% | |
| Cheung Kong Infrastructure Holdings, Ltd. | | | 11,956,500 | | | | 70,046,191 | | |
| Gas Utilities: 2.4% | |
| Hong Kong & China Gas Co., Ltd. | | | 22,147,218 | | | | 51,328,757 | | |
| Independent Power Producers & Energy Traders: 0.8% | |
China Longyuan Power Group Corp.
H Shares | | | 20,724,000 | | | | 16,196,879 | | |
| Total Utilities | | | | | 137,571,827 | | |
| TELECOMMUNICATION SERVICES: 5.4% | |
| Wireless Telecommunication Services: 3.9% | |
| China Mobile, Ltd. | | | 5,666,583 | | | | 55,377,340 | | |
| China Mobile, Ltd. ADR | | | 570,500 | | | | 27,663,545 | | |
| | | | | | 83,040,885 | | |
| Diversified Telecommunication Services: 1.5% | |
China Communications Services Corp.,
Ltd. H Shares | | | 71,554,000 | | | | 32,245,642 | | |
| Total Telecommunication Services | | | | | 115,286,527 | | |
| | | Shares | | Value | |
| HEALTH CARE: 2.7% | |
| Health Care Providers & Services: 1.5% | |
| Sinopharm Group Co., Ltd. H Shares | | | 12,780,400 | | | $ | 30,706,134 | | |
| Health Care Equipment & Supplies: 1.2% | |
| Mindray Medical International, Ltd. ADR | | | 1,016,868 | | | | 26,072,496 | | |
| Total Health Care | | | | | 56,778,630 | | |
| TOTAL INVESTMENTS: 98.1% | | | | | 2,084,067,390 | | |
| (Cost $1,850,383,046b) | | | | | | | | | |
CASH AND OTHER ASSETS,
LESS LIABILITIES: 1.9% | | | | | 40,542,387 | | |
| NET ASSETS: 100.0% | | | | $ | 2,124,609,777 | | |
a Non-income producing security.
b Cost for federal income tax purposes is $1,852,627,595 and net unrealized appreciation consists of:
| Gross unrealized appreciation | | $ | 420,233,705 | | |
| Gross unrealized depreciation | | | (188,793,910 | ) | |
| Net unrealized appreciation | | $ | 231,439,795 | | |
† Affiliated Issuer, as defined under the Investment Company Act of 1940 (ownership of 5% or more of the outstanding voting securities of this issuer)
ADR American Depositary Receipt
See accompanying notes to financial statements.
38 MATTHEWS ASIA FUNDS

ASIA GROWTH STRATEGIES
PORTFOLIO MANAGERS
Sharat Shroff, CFA
Lead Manager
Sunil Asnani
Co-Manager
FUND FACTS
| | | Investor Class | | Institutional Class | |
| Ticker | | MINDX | | MIDNX | |
| CUSIP | | 577130859 | | 577130768 | |
| Inception | | 10/31/05 | | 10/29/10 | |
| NAV | | $13.59 | | $13.61 | |
| Initial Investment | | $2,500 | | $3 million | |
| Gross Expense Ratio1 | | 1.18% | | 0.99% | |
Portfolio Statistics
| Total # of Positions | | 47 | |
| Net Assets | | $586.3 million | |
| Weighted Average Market Cap | | $7.2 billion | |
| Portfolio Turnover | | 3.51%2 | |
Benchmark
Bombay Stock Exchange 100 Index
Redemption Fee
2% within first 90 calendar days of purchase
OBJECTIVE
Long-term capital appreciation.
STRATEGY
Under normal market conditions, the Fund seeks to achieve its investment objective by investing at least 80% of its total net assets, which include borrowings for investment purposes, in publicly traded common stocks, preferred stocks and convertible securities of companies located in India.
1 Matthews Asia Funds does not charge 12b-1 fees.
2 The lesser of fiscal year 2011 long-term purchase costs or sales proceeds divided by the average monthly market value of long-term securities.
Matthews India Fund
Portfolio Manager Commentary
For the year ending December 31 2011, the Matthews India Fund declined by –36.48% (Investor Class) and –36.35% (Institutional Class), while its benchmark, the Bombay Stock Exchange 100 Index fell –36.66%—its second-largest yearly decline in the past two decades. During the fourth quarter, the Fund returned –17.06% (Investor Class) and –16.99% (Institutional Class), while the benchmark fell –15.04%. Relative to the U.S. dollar, the Indian rupee was among the weakest currencies in Asia, depreciating by 15.8% in 2011. Concerns over a worsening fiscal deficit, and the impending maturity of more than an estimated US$100 billion in external debt are likely to continue to be an overhang for the rupee over the medium term.
No doubt these are disappointing results, but we remain optimistic over the long-term opportunities India presents. India's decline during the year could not be blamed largely on weakness in Europe or elsewhere. Its decline was driven primarily by the country's internal problems including the government's inability to emphatically deal with recent governance debacles or to take the lead in implementing a second phase of reforms. These issues have created risks for India's long-term growth prospects. The promise of initial reforms that began two decades ago led to expectations that the economy could achieve double-digit growth. Now, in contrast, there are widespread concerns of a structural decline sending the growth rate back to mid-single digits. The change in perception was enough to squeeze India's valuation premium, and the most pronounced declines were seen in smaller to mid-sized equities.
While the Fund is agnostic to the size of a company, we have long found better risk-reward characteristics within smaller to mid-sized Indian companies. The portfolio's greater relative allocation to these companies was a significant source of negative returns during the year.
The biggest source of negative returns during the year was the portfolio's exposure to the financials sector, most notably to public sector banks. Rising interest rates, delays in infrastructure project completions and some unhealthy lending practices were the primary reasons for the increase in nonperforming loans. While many of the challenges facing the banking sector are widespread, it is important to underscore that two of the portfolio's holdings, HDFC Bank and Kotak Mahindra Bank, have been relatively successful in avoiding the surge in nonperforming loans. The Fund's allocation to financials is largely unchanged although our holdings in this area are more concentrated as we believe that stronger balance sheets may yield better pricing power in a more rational operating environment. In spite of their relative premiums in valuation, the stocks of HDFC and Kotak Mahindra performed better than the rest of the banking sector in 2011. This was a common theme across the rest of the market: cheaper valuations did not provide the protection that may have been expected when compared to more expensive stocks.
Over the past three years, the Fund's allocation to India's industrials sector has risen, and this increase has been predicated on the belief that infrastructure as a percentage of GDP is likely to inch up. In spite of delays and interruptions, the pickup in investment spending has been favorable until recently. The cycle of monetary tightening is only one of the factors slowing progress. In our discussions with management teams, they cite lack of regulatory clarity as a bigger obstacle in undertaking long-gestation infrastructure projects like building roads or erecting power plants. Approvals for basic inputs to a thermal power plant, such as the availability of coal, take much longer as different parts of the government are slow to sign off.
(continued)
matthewsasia.com | 800.789.ASIA 39
PERFORMANCE AS OF DECEMBER 31, 2011
| | | | | | | Average Annual Total Returns | | | |
| | | 3 Months | | 1 Year | | 3 Years | | 5 Years | | Since
Inception | | Inception
Date | |
| Investor Class (MINDX) | | | -17.06 | % | | | -36.48 | % | | | 18.42 | % | | | 0.54 | % | | | 7.77 | % | | 10/31/05 | |
| Institutional Class (MIDNX) | | | -16.99 | % | | | -36.35 | % | | | n.a. | | | | n.a. | | | | -33.14 | % | | 10/29/10 | |
| Bombay Stock Exchange 100 Index3 | | | -15.04 | % | | | -36.66 | % | | | 14.78 | % | | | 0.12 | % | | | 9.47 | %4 | | | |
| Lipper India Region Funds Category Average5 | | | -16.00 | % | | | -37.65 | % | | | 13.79 | % | | | -3.57 | % | | | 4.76 | %4 | | | |
Performance assumes reinvestment of all dividends and/or distributions before taxes. All performance quoted represents past performance and is no guarantee of future results. Investment return and principal value will fluctuate with market conditions so that when redeemed, shares may be worth more or less than their original cost. Current performance may be lower or higher than the return figures quoted. Returns would have been lower if certain of the Fund's fees and expenses had not been waived. For the Fund's most recent month-end performance, visit matthewsasia.com.
GROWTH OF A $10,000 INVESTMENT SINCE INCEPTION—INVESTOR CLASS
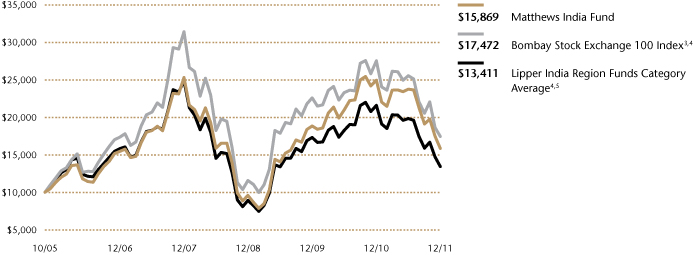
Plotted monthly. The performance data and graph do not reflect the deduction of taxes that a shareholder would pay on dividends, capital gains distributions or redemption of Fund shares. Values are in US$.
3 It is not possible to invest directly in an index. Source: Index data from Morgan Stanley Capital International and Bloomberg; total return calculations performed by BNY Mellon Investment Servicing (US) Inc. Please see page 69 for index definition.
4 Calculated from 10/31/05.
5 The Lipper Category Average does not reflect sales charges and is based on total return, including reinvestment of dividends and capital gains for the stated periods.
TOP TEN HOLDINGS6
| | | Sector | | % of Net Assets | |
| Sun Pharmaceutical Industries, Ltd. | | Health Care | | | 4.9 | % | |
| Exide Industries, Ltd. | | Consumer Discretionary | | | 4.2 | % | |
| Infosys, Ltd. | | Information Technology | | | 4.0 | % | |
| GAIL India, Ltd. | | Utilities | | | 3.8 | % | |
| HDFC Bank, Ltd. | | Financials | | | 3.8 | % | |
| ITC, Ltd. | | Consumer Staples | | | 3.7 | % | |
| Emami, Ltd. | | Consumer Staples | | | 3.5 | % | |
| Asian Paints, Ltd. | | Materials | | | 3.5 | % | |
| Dabur India, Ltd. | | Consumer Staples | | | 3.3 | % | |
| Container Corp. of India, Ltd. | | Industrials | | | 3.1 | % | |
| % OF ASSETS IN TOP TEN | | | | | 37.8 | % | |
6 Holdings may combine more than one security from same issuer and related depositary receipts.
40 MATTHEWS ASIA FUNDS
Matthews India Fund
Portfolio Manager Commentary (continued)
The problem is compounded by the fact that, emboldened by the availability of capital, several companies secured precious resources like coal and land through ambitious bids in 2006 and 2007. Many of these companies have little to no expertise in these areas. Hence, there is a risk that these resources may be wasted or that projects be delayed. Taken together, these developments pose challenges to India's industrial growth, and also risks to the banking sector as cash flows from the projects are likely to be deferred or cancelled. We have added to some of the portfolio's holdings in the infrastructure segment where there have been tangible improvements in operating results.
In the middle of 2010, we gradually began increasing the strategy's allocation to foreign currency convertible bonds (FCCBs) as we believed equity valuations were starting to get extended. The portfolio's FCCB holdings provided some shelter in the downturn. One such holding was repaid in full toward the end of the year, and another holding is approaching maturity in the first quarter of 2012. With the continuing decline in equity prices, we have been trimming our position in FCCBs to allocate to other parts of the portfolio.
Looking ahead, the outlook appears to be difficult on several fronts and there is a growing perception that Indian authorities are slow to take corrective actions. The recent reform of the distribution system for electrical power in an important southern Indian state was carried out after the state-owned utility defaulted on its loan obligations. This kind of brinkmanship is unfortunate, but it also suggests that the government is not completely intransigent. Even some of the less wealthy regions, like the state of Bihar, have shown a willingness to embark on a path of greater accountability to improve living standards for the masses. It remains to be seen if these individual instances of economic reform can seep through the rest of the country.
While inflation in India is moderating, it is still among the highest in Asia, and may prevent the central bank from loosening aggressively should demand conditions taper off sharply. Amid the current environment, it is tempting to eschew investment in India, but that is likely to be shortsighted. It is important to note that several of these aspects are self-inflicted, and can be resolved internally. In spite of the turmoil in Europe, and a weak global environment, there has not been a sharp reversal in capital flows. In fact, foreign direct investment to India continues to grow. The underlying demand remains healthy although it has decreased sequentially. Leverage is still not excessive for households, which means they should be able to absorb external shocks better than many other parts of the world. Valuations are also starting to look attractive again, particularly amid smaller and mid-sized companies. It is a time to invest cautiously, but not fearfully, given an economy with attractive long-term opportunities.
SECTOR ALLOCATION (%)
| Financials | | | 22.1 | | |
| Industrials | | | 16.7 | | |
| Materials | | | 12.6 | | |
| Information Technology | | | 11.7 | | |
| Consumer Staples | | | 10.5 | | |
| Consumer Discretionary | | | 10.4 | | |
| Utilities | | | 6.3 | | |
| Health Care | | | 6.0 | | |
| Telecommunication Services | | | 2.5 | | |
| Energy | | | 1.5 | | |
Liabilities in Excess of Cash
and Other Assets | | | -0.3 | | |
MARKET CAP EXPOSURE (%)7
| Large Cap (over $5B) | | | 34.9 | | |
| Mid Cap ($1B–$5B) | | | 37.9 | | |
| Small Cap (under $1B) | | | 27.5 | | |
Liabilities in Excess of Cash
and Other Assets | | | -0.3 | | |
7 Source: FactSet Research Systems. Percentage values in data are rounded to the nearest tenth of one percent; the values may not sum to 100% due to rounding.
matthewsasia.com | 800.789.ASIA 41
Matthews India Fund December 31, 2011
Schedule of Investments
COMMON EQUITIES: 93.5%
| | | Shares | | Value | |
| FINANCIALS: 22.1% | |
| Commercial Banks: 11.6% | |
| HDFC Bank, Ltd. | | | 1,890,165 | | | $ | 15,192,862 | | |
| ICICI Bank, Ltd. | | | 1,150,000 | | | | 14,826,240 | | |
| Allahabad Bank | | | 6,111,668 | | | | 13,223,438 | | |
| Corporation Bank | | | 1,489,775 | | | | 9,820,087 | | |
| HDFC Bank, Ltd. ADR | | | 264,635 | | | | 6,954,608 | | |
| Axis Bank, Ltd. | | | 333,532 | | | | 5,075,364 | | |
| ICICI Bank, Ltd. ADR | | | 113,283 | | | | 2,994,070 | | |
| | | | | | 68,086,669 | | |
| Diversified Financial Services: 4.8% | |
| Kotak Mahindra Bank, Ltd. | | | 2,150,000 | | | | 17,431,174 | | |
| Infrastructure Development Finance Co., Ltd. | | | 6,211,855 | | | | 10,720,582 | | |
| | | | | | 28,151,756 | | |
| Real Estate Management & Development: 2.6% | |
| Ascendas India Trust | | | 29,043,000 | | | | 15,450,191 | | |
| Thrifts & Mortgage Finance: 2.6% | |
| Housing Development Finance Corp. | | | 1,225,000 | | | | 15,041,168 | | |
| Consumer Finance: 0.5% | |
| Shriram Transport Finance Co., Ltd. | | | 372,977 | | | | 2,955,793 | | |
| Total Financials | | | | | 129,685,577 | | |
| INDUSTRIALS: 16.7% | |
| Machinery: 7.1% | |
| Ashok Leyland, Ltd. | | | 38,022,554 | | | | 16,324,531 | | |
| AIA Engineering, Ltd. | | | 1,902,091 | | | | 9,708,347 | | |
| Thermax, Ltd. | | | 1,253,128 | | | | 9,283,129 | | |
| Jain Irrigation Systems, Ltd. | | | 3,675,635 | | | | 5,990,513 | | |
| | | | | | 41,306,520 | | |
| Road & Rail: 3.1% | |
| Container Corp. of India, Ltd. | | | 1,144,180 | | | | 18,076,773 | | |
| Electrical Equipment: 2.5% | |
| Crompton Greaves, Ltd. | | | 6,187,500 | | | | 14,692,473 | | |
| Industrial Conglomerates: 2.1% | |
| MAX India, Ltd.a | | | 4,538,102 | | | | 12,489,287 | | |
| Transportation Infrastructure: 1.9% | |
| Gujarat Pipavav Port, Ltd.a | | | 11,300,000 | | | | 11,362,772 | | |
| Total Industrials | | | | | 97,927,825 | | |
| INFORMATION TECHNOLOGY: 11.7% | |
| IT Services: 6.5% | |
| CMC, Ltd. | | | 970,418 | | | | 14,503,733 | | |
| Infosys, Ltd. ADR | | | 238,179 | | | | 12,237,637 | | |
| Infosys, Ltd. | | | 218,281 | | | | 11,376,055 | | |
| | | | | | 38,117,425 | | |
| Internet Software & Services: 3.0% | |
| Info Edge India, Ltd. | | | 1,662,489 | | | | 17,761,287 | | |
| | | Shares | | Value | |
| Software: 2.2% | |
| Polaris Financial Technology, Ltd. | | | 4,400,318 | | | $ | 10,258,156 | | |
| Financial Technologies India, Ltd. | | | 240,752 | | | | 2,405,933 | | |
| | | | | | 12,664,089 | | |
| Total Information Technology | | | | | 68,542,801 | | |
| CONSUMER STAPLES: 10.5% | |
| Personal Products: 6.8% | |
| Emami, Ltd. | | | 3,202,712 | | | | 20,571,416 | | |
| Dabur India, Ltd. | | | 10,404,430 | | | | 19,484,428 | | |
| | | | | | 40,055,844 | | |
| Tobacco: 3.7% | |
| ITC, Ltd. | | | 5,720,000 | | | | 21,682,252 | | |
| Total Consumer Staples | | | | | 61,738,096 | | |
| CONSUMER DISCRETIONARY: 10.4% | |
| Media: 5.2% | |
| Sun TV Network, Ltd. | | | 2,745,127 | | | | 14,176,652 | | |
| Jagran Prakashan, Ltd. | | | 6,595,207 | | | | 12,083,865 | | |
| Dish TV India, Ltd.a | | | 3,868,505 | | | | 4,283,365 | | |
| | | | | | 30,543,882 | | |
| Auto Components: 4.2% | |
| Exide Industries, Ltd. | | | 12,511,491 | | | | 24,749,687 | | |
| Textiles, Apparel & Luxury Goods: 1.0% | |
| Titan Industries, Ltd. | | | 1,738,820 | | | | 5,599,063 | | |
| Total Consumer Discretionary | | | | | 60,892,632 | | |
| MATERIALS: 9.5% | |
| Chemicals: 6.2% | |
| Asian Paints, Ltd. | | | 421,000 | | | | 20,551,348 | | |
| Castrol India, Ltd. | | | 1,976,301 | | | | 15,513,060 | | |
| | | | | | 36,064,408 | | |
| Construction Materials: 1.8% | |
| Grasim Industries, Ltd. | | | 224,459 | | | | 10,519,204 | | |
| Metals & Mining: 1.5% | |
| NMDC, Ltd. | | | 2,995,923 | | | | 9,077,187 | | |
| Total Materials | | | | | 55,660,799 | | |
| HEALTH CARE: 6.0% | |
| Pharmaceuticals: 6.0% | |
| Sun Pharmaceutical Industries, Ltd. | | | 3,092,300 | | | | 28,978,121 | | |
| Cipla India, Ltd. | | | 988,275 | | | | 5,953,285 | | |
| Total Health Care | | | | | 34,931,406 | | |
| UTILITIES: 5.1% | |
| Gas Utilities: 3.8% | |
| GAIL India, Ltd. | | | 3,094,751 | | | | 22,357,616 | | |
| Electric Utilities: 1.3% | |
| CESC, Ltd. | | | 2,037,015 | | | | 7,725,352 | | |
| Total Utilities | | | | | 30,082,968 | | |
42 MATTHEWS ASIA FUNDS
Matthews India Fund December 31, 2011
Schedule of Investments (continued)
COMMON EQUITIES (continued)
| | | Shares | | Value | |
| ENERGY: 1.5% | |
| Oil, Gas & Consumable Fuels: 1.5% | |
| Reliance Industries, Ltd. | | | 650,742 | | | $ | 8,491,322 | | |
| Total Energy | | | | | 8,491,322 | | |
| TOTAL COMMON EQUITIES | | | | | 547,953,426 | | |
| (Cost $636,914,073) | | | | | | | |
CORPORATE BONDS: 6.8%
| | | Face Amount | | Value | |
| MATERIALS: 3.1% | |
| Metals & Mining: 3.1% | |
Welspun Corp., Ltd., Cnv.
4.500%, 10/17/14 | | $ | 15,200,000 | | | $ | 11,856,000 | | |
Sesa Goa, Ltd., Cnv.
5.000%, 10/31/14 | | | 8,500,000 | | | | 6,698,000 | | |
| Total Materials | | | | | 18,554,000 | | |
| TELECOMMUNICATION SERVICES: 2.5% | |
| Wireless Telecommunication Services: 2.5% | |
Reliance Communications, Ltd., Cnv.
0.000%, 03/01/12 | | | 12,200,000 | | | | 14,746,750 | | |
| Total Telecommunication Services | | | | | 14,746,750 | | |
| UTILITIES: 1.2% | |
| Electric Utilities: 1.2% | |
Tata Power Co., Ltd., Cnv.
1.750%, 11/21/14 | | | 7,700,000 | | | | 6,918,450 | | |
| Total Utilities | | | | | 6,918,450 | | |
| TOTAL CORPORATE BONDS | | | | | 40,219,200 | | |
| (Cost $50,703,673) | | | | | | | |
| TOTAL INVESTMENTS: 100.3% | | | | | 588,172,626 | | |
| (Cost $687,617,746b) | |
LIABILITIES IN EXCESS OF CASH AND
OTHER ASSETS: (0.3%) | | | | | (1,915,928 | ) | |
| NET ASSETS: 100.0% | | | | $ | 586,256,698 | | |
a Non-income producing security.
b Cost for federal income tax purposes is $688,646,744 and net unrealized depreciation consists of:
| Gross unrealized appreciation | | $ | 58,066,436 | | |
| Gross unrealized depreciation | | | (158,540,554 | ) | |
| Net unrealized depreciation | | ($ | 100,474,118 | ) | |
ADR American Depositary Receipt
Cnv. Convertible
See accompanying notes to financial statements.
matthewsasia.com | 800.789.ASIA 43

ASIA GROWTH STRATEGIES
PORTFOLIO MANAGERS
Taizo Ishida
Lead Manager
Kenichi Amaki
Co-Manager
FUND FACTS
| | | Investor Class | | Institutional Class | |
| Ticker | | MJFOX | | MIJFX | |
| CUSIP | | 577130800 | | 577130792 | |
| Inception | | 12/31/98 | | 10/29/10 | |
| NAV | | $11.34 | | $11.34 | |
| Initial Investment | | $2,500 | | $3 million | |
| Gross Expense Ratio1 | | 1.22% | | 1.07% | |
Portfolio Statistics
| Total # of Positions | | 56 | |
| Net Assets | | $131.7 million | |
| Weighted Average Market Cap | | $13.2 billion | |
| Portfolio Turnover | | 34.94%2 | |
Benchmarks
MSCI Japan Index
Tokyo Stock Price Index
Redemption Fee
2% within first 90 calendar days of purchase
OBJECTIVE
Long-term capital appreciation.
STRATEGY
Under normal market conditions, the Fund seeks to achieve its investment objective by investing at least 80% of its total net assets, which include borrowings for investment purposes, in the common and preferred stocks of companies located in Japan.
1 Matthews Asia Funds does not charge 12b-1 fees.
2 The lesser of fiscal year 2011 long-term purchase costs or sales proceeds divided by the average monthly market value of long-term securities.
Matthews Japan Fund
Portfolio Manager Commentary
For the year ending December 31, 2011, the Matthews Japan Fund declined –7.72% (Investor and Institutional Class), while its benchmark, the MSCI Japan Index lost –14.19%. For the fourth quarter, the Fund returned –3.16% (Investor and Institutional Class), compared with –3.85% for the benchmark.
For Japan, the year 2011 will be remembered as one plagued by natural disasters. The catastrophic damages triggered by the Tohoku region earthquake and tsunami in March claimed the lives of close to 20,000 people, destroyed over 350,000 homes, inflicted damage estimated at US$200 to 300 billion and triggered a serious nuclear crisis. In the fall, Japanese manufacturing took a major hit from massive floods in Thailand that forced the closure of many Japanese manufacturing plants based there. In recent years, Thailand has become an increasingly important production hub for a number of Japanese manufacturers, especially in the automotive and technology sectors. The natural disasters that battered these areas remind us of how vulnerable modern economies can be to such uncommon yet severe risks.
External uncertainties also greatly impacted markets in 2011. The prolonged European debt crisis and inconsistent recovery in the U.S. economy placed serious constraints on global demand. Tighter monetary policy in China also put the brakes on Asia's growth engine. Such uncertainties led investors to seek out Japan's yen as a safe haven, given the relatively mature nature of the Japanese economy combined with its enormous external credit position and ample market liquidity. During the year, the yen appreciated more than 5% against the U.S. dollar and nearly 9% against the euro. Currency strength supports returns for U.S. dollar-based investors, but it also cuts into the competitiveness of domestic manufacturing. On the other hand, Japanese companies, well-known for their cash-rich balance sheets, utilized the strong currency to execute a record US$86 billion worth of cross-border mergers and acquisitions. Though the task of integrating these acquisitions remains, these are a positive step toward better utilization of excess capital.
The Fund's primary focus is to generate excess returns from bottom-up stock picking. We believe that a select group of Japanese companies with unique business models, innovative technologies or distinctive brands can achieve growth and deliver attractive returns despite an adverse macroeconomic environment in the domestic market. Our research process is centered on identifying individual investment opportunities on a bottom-up basis, rather than making bets based on sectors.
In terms of relative performance against the benchmark, our investment approach worked well over the course of the year. Stock selection was the primary driver, accounting for the majority of this outperformance. Our strategic decision to avoid investments in the utilities sector, which was punished severely in the aftermath of the March earthquake and subsequent nuclear issues, also helped Fund performance.
By sector, health care was the top contributor to Fund performance. Small-capitalization medical device firm Asahi Intecc maintained healthy growth due to rising demand for its innovative products. Eisai, a pharmaceutical company well-known as the developer of the Alzheimer's
(continued)
44 MATTHEWS ASIA FUNDS
PERFORMANCE AS OF DECEMBER 31, 2011
| | | | | | | Average Annual Total Returns | | | |
| | | 3 Months | | 1 Year | | 3 Years | | 5 Years | | 10 Years | | Since
Inception | | Inception
Date | |
| Investor Class (MJFOX) | | | -3.16 | % | | | -7.72 | % | | | 6.69 | % | | | -4.98 | % | | | 3.44 | % | | | 3.40 | % | | 12/31/98 | |
| Institutional Class (MIJFX) | | | -3.16 | % | | | -7.72 | % | | | n.a. | | | | n.a. | | | | n.a. | | | | 2.24 | % | | 10/29/10 | |
| MSCI Japan Index3 | | | -3.85 | % | | | -14.19 | % | | | 1.81 | % | | | -6.43 | % | | | 3.12 | % | | | 0.87 | %4 | | | |
| Tokyo Stock Price Index3 | | | -3.98 | % | | | -12.05 | % | | | 1.78 | % | | | -6.06 | % | | | 3.26 | % | | | 1.23 | %4 | | | |
| Lipper Japanese Funds Category Average5 | | | -3.24 | % | | | -9.81 | % | | | 3.75 | % | | | -5.42 | % | | | 3.17 | % | | | 2.25 | %4 | | | |
Performance assumes reinvestment of all dividends and/or distributions before taxes. All performance quoted represents past performance and is no guarantee of future results. Investment return and principal value will fluctuate with market conditions so that when redeemed, shares may be worth more or less than their original cost. Current performance may be lower or higher than the return figures quoted. Returns would have been lower if certain of the Fund's fees and expenses had not been waived. For the Fund's most recent month-end performance, visit matthewsasia.com.
GROWTH OF A $10,000 INVESTMENT SINCE INCEPTION—INVESTOR CLASS
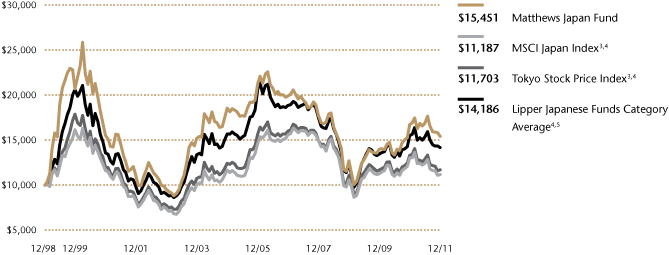
Plotted montly. The performance data and graph do not reflect the deduction of taxes that a shareholder would pay on dividends, capital gains distributions or redemption of Fund shares. Values are in US$.
3 It is not possible to invest directly in an index. Source: Index data from Morgan Stanley Capital International and Bloomberg; total return calculations performed by BNY Mellon Investment Servicing (US) Inc. Please see page 69 for index definitions.
4 Calculated from 12/31/98.
5 The Lipper Category Average does not reflect sales charges and is based on total return, including reinvestment of dividends and capital gains for the stated periods.
TOP TEN HOLDINGS6
| | | Sector | | % of Net Assets | |
| ITOCHU Corp. | | Industrials | | | 4.1 | % | |
| Rinnai Corp. | | Consumer Discretionary | | | 3.7 | % | |
| Nissan Motor Co., Ltd. | | Consumer Discretionary | | | 3.5 | % | |
| Rakuten, Inc. | | Consumer Discretionary | | | 3.3 | % | |
| Marubeni Corp. | | Industrials | | | 3.1 | % | |
| Nidec Corp. | | Industrials | | | 3.1 | % | |
| ORIX Corp. | | Financials | | | 3.0 | % | |
| Toyota Motor Corp. | | Consumer Discretionary | | | 2.8 | % | |
| Osaka Securities Exchange Co., Ltd. | | Financials | | | 2.7 | % | |
| NTT DoCoMo, Inc. | | Telecommunication Services | | | 2.7 | % | |
| % OF ASSETS IN TOP TEN | | | | | 32.0 | % | |
6 Holdings may combine more than one security from same issuer and related depositary receipts.
matthewsasia.com | 800.789.ASIA 45
SECTOR ALLOCATION (%)
| Consumer Discretionary | | | 26.0 | | |
| Industrials | | | 22.0 | | |
| Information Technology | | | 17.5 | | |
| Financials | | | 12.1 | | |
| Health Care | | | 9.8 | | |
| Materials | | | 4.6 | | |
| Telecommunication Services | | | 4.1 | | |
| Consumer Staples | | | 3.9 | | |
Cash and Other Assets,
Less Liabilities | | | 0.0 | | |
MARKET CAP EXPOSURE (%)7
| Large Cap (over $5B) | | | 51.8 | | |
| Mid Cap ($1B–$5B) | | | 21.5 | | |
| Small Cap (under $1B) | | | 26.8 | | |
Cash and Other Assets,
Less Liabilities | | | 0.0 | | |
7 Source: FactSet Research Systems. Percentage values in data are rounded to the nearest tenth of one percent; the values may not sum to 100% due to rounding.
Matthews Japan Fund
Portfolio Manager Commentary (continued)
treatment Aricept, also performed well thanks to stronger-than-expected demand for another product—a new breast cancer treatment.
On the other hand, the financial sector was the largest detractor to Fund performance in 2011. The global financial sector in general struggled due to the challenges arising from the European debt crisis. Japanese financial institutions have historically had little exposure to Europe and are fundamentally quite insulated from sovereign debt issues, but stocks performed poorly nonetheless. Additionally, real estate stocks were also weak in the aftermath of the earthquake and rising concerns that rents may fall again as a result of a large supply of new office space that will likely become available in early 2012. Real estate asset manager Kenedix performed poorly because of such concerns, and we continue to monitor the situation closely.
Our position in Elpida Memory, the world's third-largest dynamic random-access memory (DRAM) manufacturer had the largest negative effect on performance over the year. Our investment thesis was that Elpida could overcome the challenges it faced in its conventional DRAM business by making an aggressive shift into mobile DRAM, which commands a higher price and where Elpida has industry-leading technology. However, the external environment turned decisively negative as the yen strengthened significantly over the summer, while at the same time, Elpida's main competitors in Korea enjoyed the benefits of a weak currency. Given the change in the external environment, we deemed that our investment thesis was unachievable and thus, exited this position toward the end of the year.
Our strategic allocation to Internet stocks was a large positive contributor in 2011. We believe that Internet companies represent a new breed of Japanese companies, achieving growth by developing unique services and creating value by realizing operational efficiencies. Given the size of the Japanese economy and low penetration rate of such services, we believe Japanese Internet companies can sustain growth over the mid-term. Social gaming company Gree, online payment solution provider GMO Payment Gateway and e-commerce company Kakaku.com were among the top contributors to Fund performance during the year.
Trading companies ITOCHU and Marubeni remain prominent long-term positions within the portfolio. Japanese trading companies have evolved in quite a unique way, given the purpose they served over the past century as the facilitator of trade, finance and investment on a global scale. Over the past decade, they have adapted their business models and balance sheets to better serve the growth in Asia by procuring resources such as minerals, energy and food. Combined with historically low valuations, we believe trading companies can be an attractive way to gain exposure to the long-term growth of Asia.
Looking forward, we are encouraged with the progress and the pace of the progress that Japanese companies have made in overcoming the major disasters of 2011. We remain optimistic that we can identify attractive investment opportunities among select Japanese companies that exhibit the ability to find new avenues of growth. Although we remain sensitive to the challenges posed by the strong yen and Europe's debt issues, the long-term fundamentals for select Japanese companies remain strong.
46 MATTHEWS ASIA FUNDS
Matthews Japan Fund December 31, 2011
Schedule of Investments
COMMON EQUITIES: 100.0%
| | | Shares | | Value | |
| CONSUMER DISCRETIONARY: 26.0% | |
| Automobiles: 6.2% | |
| Nissan Motor Co., Ltd. | | | 512,300 | | | $ | 4,605,841 | | |
| Toyota Motor Corp. | | | 109,000 | | | | 3,632,389 | | |
| | | | | | 8,238,230 | | |
| Household Durables: 5.3% | |
| Rinnai Corp. | | | 67,700 | | | | 4,846,395 | | |
| HAJIME CONSTRUCTION Co., Ltd. | | | 102,200 | | | | 2,100,564 | | |
| | | | | | 6,946,959 | | |
| Specialty Retail: 5.3% | |
| Fast Retailing Co., Ltd. | | | 16,300 | | | | 2,964,791 | | |
| Asahi Co., Ltd. | | | 106,100 | | | | 2,271,701 | | |
| Point, Inc. | | | 40,140 | | | | 1,705,311 | | |
| | | | | | 6,941,803 | | |
| Internet & Catalog Retail: 4.4% | |
| Rakuten, Inc. | | | 3,987 | | | | 4,288,991 | | |
| Start Today Co., Ltd. | | | 62,300 | | | | 1,457,741 | | |
| | | | | | 5,746,732 | | |
| Auto Components: 1.7% | |
| Nifco, Inc. | | | 78,800 | | | | 2,202,141 | | |
| Diversified Consumer Services: 1.7% | |
| Benesse Holdings, Inc. | | | 45,500 | | | | 2,201,994 | | |
| Media: 1.4% | |
| COOKPAD, Inc. | | | 87,000 | | | | 1,921,528 | | |
| Total Consumer Discretionary | | | | | 34,199,387 | | |
| INDUSTRIALS: 22.0% | |
| Trading Companies & Distributors: 7.2% | |
| ITOCHU Corp. | | | 532,800 | | | | 5,413,143 | | |
| Marubeni Corp. | | | 667,000 | | | | 4,064,220 | | |
| | | | | | 9,477,363 | | |
| Machinery: 5.8% | |
| Harmonic Drive Systems, Inc. | | | 97,900 | | | | 1,882,448 | | |
| EVA Precision Industrial Holdings, Ltd. | | | 7,104,000 | | | | 1,719,610 | | |
| FANUC Corp. | | | 10,900 | | | | 1,668,208 | | |
| Komatsu, Ltd. | | | 56,300 | | | | 1,315,885 | | |
| Nabtesco Corp. | | | 60,000 | | | | 1,093,673 | | |
| | | | | | 7,679,824 | | |
| Commercial Services & Supplies: 3.2% | |
| JP-Holdings, Inc. | | | 267,800 | | | | 2,626,855 | | |
| Oyo Corp. | | | 144,800 | | | | 1,666,790 | | |
| | | | | | 4,293,645 | | |
| Electrical Equipment: 3.1% | |
| Nidec Corp. | | | 46,500 | | | | 4,041,640 | | |
| Construction & Engineering: 2.7% | |
| JGC Corp. | | | 83,000 | | | | 1,992,776 | | |
| Toshiba Plant Systems & Services Corp. | | | 154,000 | | | | 1,562,609 | | |
| | | | | | 3,555,385 | | |
| Total Industrials | | | | | 29,047,857 | | |
| | | Shares | | Value | |
| INFORMATION TECHNOLOGY: 17.5% | |
| Electronic Equipment, Instruments & Components: 8.3% | |
| Kyocera Corp. | | | 35,200 | | | $ | 2,830,817 | | |
| Murata Manufacturing Co., Ltd. | | | 55,000 | | | | 2,826,101 | | |
| Keyence Corp. | | | 8,097 | | | | 1,952,453 | | |
| Hitachi, Ltd. | | | 367,000 | | | | 1,926,309 | | |
| Hamamatsu Photonics, K.K. | | | 40,100 | | | | 1,403,005 | | |
| | | | | | 10,938,685 | | |
| Internet Software & Services: 5.5% | |
| Gree, Inc. | | | 85,200 | | | | 2,935,565 | | |
| Kakaku.com, Inc. | | | 58,600 | | | | 2,148,489 | | |
| Dena Co., Ltd. | | | 69,700 | | | | 2,090,909 | | |
| | | | | | 7,174,963 | | |
| IT Services: 2.0% | |
| GMO Payment Gateway, Inc. | | | 654 | | | | 2,672,249 | | |
| Computers & Peripherals: 1.7% | |
| Toshiba Corp. | | | 544,000 | | | | 2,226,322 | | |
| Total Information Technology | | | | | 23,012,219 | | |
| FINANCIALS: 12.1% | |
| Diversified Financial Services: 5.7% | |
| ORIX Corp. | | | 47,990 | | | | 3,965,394 | | |
| Osaka Securities Exchange Co., Ltd. | | | 621 | | | | 3,566,091 | | |
| | | | | | 7,531,485 | | |
| Insurance: 2.7% | |
| Sony Financial Holdings, Inc. | | | 151,700 | | | | 2,234,998 | | |
| Anicom Holdings, Inc.a | | | 194,000 | | | | 1,330,804 | | |
| | | | | | 3,565,802 | | |
| Real Estate Investment Trusts: 2.6% | |
| United Urban Investment Corp., REIT | | | 1,747 | | | | 1,981,462 | | |
Industrial & Infrastructure Fund
Investment Corp., REIT | | | 282 | | | | 1,390,399 | | |
| | | | | | 3,371,861 | | |
| Real Estate Management & Development: 1.1% | |
| Kenedix, Inc.a | | | 11,562 | | | | 1,503,646 | | |
| Total Financials | | | | | 15,972,794 | | |
| HEALTH CARE: 9.8% | |
| Health Care Equipment & Supplies: 3.5% | |
| Sysmex Corp. | | | 75,700 | | | | 2,466,618 | | |
| Asahi Intecc Co., Ltd. | | | 93,200 | | | | 2,112,953 | | |
| | | | | | 4,579,571 | | |
| Pharmaceuticals: 3.2% | |
| Eisai Co., Ltd. | | | 66,100 | | | | 2,735,202 | | |
| Otsuka Holdings Co., Ltd. | | | 53,900 | | | | 1,515,390 | | |
| | | | | | 4,250,592 | | |
matthewsasia.com | 800.789.ASIA 47
Matthews Japan Fund December 31, 2011
Schedule of Investments (continued)
COMMON EQUITIES (continued)
| | | Shares | | Value | |
| Health Care Providers & Services: 3.1% | |
| Ship Healthcare Holdings, Inc. | | | 125,100 | | | $ | 2,733,769 | | |
| Message Co., Ltd. | | | 418 | | | | 1,308,796 | | |
| | | | | | 4,042,565 | | |
| Total Health Care | | | | | 12,872,728 | | |
| MATERIALS: 4.6% | |
| Chemicals: 3.1% | |
| JSR Corp. | | | 86,800 | | | | 1,601,351 | | |
| Denki Kagaku Kogyo, K.K. | | | 419,000 | | | | 1,551,448 | | |
| Kanto Denka Kogyo Co., Ltd. | | | 266,000 | | | | 978,017 | | |
| | | | | | 4,130,816 | | |
| Metals & Mining: 1.5% | |
| Hitachi Metals, Ltd. | | | 177,000 | | | | 1,924,763 | | |
| Total Materials | | | | | 6,055,579 | | |
| TELECOMMUNICATION SERVICES: 4.1% | |
| Wireless Telecommunication Services: 4.1% | |
| NTT DoCoMo, Inc. | | | 1,911 | | | | 3,513,141 | | |
| KDDI Corp. | | | 301 | | | | 1,935,754 | | |
| Total Telecommunication Services | | | | | 5,448,895 | | |
| CONSUMER STAPLES: 3.9% | |
| Food & Staples Retailing: 1.5% | |
| Daikokutenbussan Co., Ltd. | | | 66,600 | | | | 1,920,904 | | |
| Household Products: 1.4% | |
| Pigeon Corp. | | | 45,000 | | | | 1,832,857 | | |
| Tobacco: 1.0% | |
| Japan Tobacco, Inc. | | | 290 | | | | 1,363,908 | | |
| Total Consumer Staples | | | | | 5,117,669 | | |
| TOTAL INVESTMENTS: 100.0% | | | | | 131,727,128 | | |
| (Cost $126,882,393b) | |
CASH AND OTHER ASSETS,
LESS LIABILITIES: (0.0%) | | | | | (56,333 | ) | |
| NET ASSETS: 100.0% | | | | $ | 131,670,795 | | |
a Non-income producing security.
b Cost for federal income tax purposes is $127,683,940 and net unrealized appreciation consists of:
| Gross unrealized appreciation | | $ | 15,394,074 | | |
| Gross unrealized depreciation | | | (11,350,886 | ) | |
| Net unrealized appreciation | | $ | 4,043,188 | | |
REIT Real Estate Investment Trust
See accompanying notes to financial statements.
48 MATTHEWS ASIA FUNDS

ASIA GROWTH STRATEGIES
PORTFOLIO MANAGERS
J. Michael Oh, CFA
Lead Manager
Michael B. Han, CFA
Co-Manager
FUND FACTS
| | | Investor Class | | Institutional Class | |
| Ticker | | MAKOX | | MIKOX | |
| CUSIP | | 577130305 | | 577130826 | |
| Inception | | 1/3/95 | | 10/29/10 | |
| NAV | | $4.59 | | $4.61 | |
| Initial Investment | | $2,500 | | $3 million | |
| Gross Expense Ratio1 | | 1.18% | | 1.07% | |
Portfolio Statistics
| Total # of Positions | | 54 | |
| Net Assets | | $156.7 million | |
| Weighted Average Market Cap | | $24.8 billion | |
| Portfolio Turnover | | 30.13%2 | |
Benchmark
Korea Composite Stock Price Index
Redemption Fee
2% within first 90 calendar days of purchase
OBJECTIVE
Long-term capital appreciation.
STRATEGY
Under normal market conditions, the Fund seeks to achieve its investment objective by investing at least 80% of its total net assets, which include borrowings for investment purposes, in the common and preferred stocks of companies located in South Korea.
1 Matthews Asia Funds does not charge 12b-1 fees.
2 The lesser of fiscal year 2011 long-term purchase costs or sales proceeds divided by the average monthly market value of long-term securities.
Matthews Korea Fund
Portfolio Manager Commentary
For the year ending December 31, 2011, the Matthews Korea Fund declined –6.45% (Investor Class) and –6.05% (Institutional Class), while its benchmark, the Korea Composite Stock Price Index, fell –13.01%. During the fourth quarter, the Fund gained 8.55% (Investor Class) and 8.77% (Institutional Class) while the benchmark returned 5.37%.
2011 was a challenging year for Korea as its equity market was affected by a series of external events. During the first half of the year, the market was hurt by upheavals in the Middle East and a devastating earthquake and nuclear crisis in Japan. During the second half, the Korean market remained volatile as a result of Europe's ongoing sovereign debt crisis, which is likely to continue impacting the market in 2012. The domestic market remained relatively healthy despite shocks to investor sentiment from these external factors. Consumer sentiment continued to improve throughout the year with high-end product segments experiencing healthy growth in consumption.
By sector, industrials performed poorly during the year. In particular, the shipbuilding industry saw a severe downturn as global demand for ships remained low. Demand in this area will likely continue to be weak over the short term given uncertainties in the global economy. The portfolio's underweight in industrial sector holdings is the primary reason for the Fund's relative outperformance against the benchmark.
Our focus on consumer-related and technology businesses also helped Fund performance for the year. In fact, the largest contribution came from consumer discretionary and consumer staples, as businesses that derive the majority of their revenue from Korea's domestic market performed relatively well. During the year, we saw strong performance by Korean automakers that did well on the back of increasing global market share—largely the result of improved product quality and brand image. Kia Motors, for example, was one of the top contributors to Fund performance during the year. Once nearly bankrupt during the Asia Financial Crisis of 1997-1998, Kia underwent corporate restructuring after its acquisition by Hyundai Motor. Since then, the firm has increasingly gained market share both domestically and globally by rolling out new products with progressive designs and improved quality. The weakness of the Korean won in 2011 also helped the company's competitiveness in the global market.
In 2011, we saw Korean companies advance their brands in the international marketplace as uncertainties over the global economy, especially in Europe and other developed countries, created opportunities as consumers became more value-conscious. Those in developed markets who have traditionally shunned Korean brands have begun to look at Korean products in a new light. Even in the Japanese market, where Korean companies previously had little to no success in marketing consumer electronics, they have made inroads. Samsung Electronics, which pulled out of Japan's TV market in 2007, is reportedly planning to re-enter the market next year, helped by its success in Japan's smartphone market.
One notable trend we have seen is the strong performance of small- to medium-sized Korean companies in the international market place, especially in emerging countries. Korea's major conglomerates, known as chaebol, have long enjoyed global market success, but we are now seeing
(continued)
matthewsasia.com | 800.789.ASIA 49
PERFORMANCE AS OF DECEMBER 31, 2011
| | | | | | | Average Annual Total Returns | | | |
| | | 3 Months | | 1 Year | | 3 Years | | 5 Years | | 10 Years | | Since
Inception | | Inception
Date | |
| Investor Class (MAKOX) | | | 8.55 | % | | | -6.45 | % | | | 22.92 | % | | | 0.89 | % | | | 12.81 | % | | | 5.04 | % | | 1/3/95 | |
| Institutional Class (MIKOX) | | | 8.77 | % | | | -6.05 | % | | | n.a. | | | | n.a. | | | | n.a. | | | | 1.66 | % | | 10/29/10 | |
| Korea Composite Stock Price Index3 | | | 5.37 | % | | | -13.01 | % | | | 23.22 | % | | | 1.77 | % | | | 13.73 | % | | | 2.67 | %4 | | | |
| Lipper Pacific ex Japan Funds Category Average5 | | | 4.84 | % | | | -17.17 | % | | | 19.63 | % | | | 2.72 | % | | | 10.98 | % | | | 4.65 | %4 | | | |
Performance assumes reinvestment of all dividends and/or distributions before taxes. All performance quoted represents past performance and is no guarantee of future results. Investment return and principal value will fluctuate with market conditions so that when redeemed, shares may be worth more or less than their original cost. Current performance may be lower or higher than the return figures quoted. Returns would have been lower if certain of the Fund's fees and expenses had not been waived. For the Fund's most recent month-end performance, visit matthewsasia.com.
GROWTH OF A $10,000 INVESTMENT SINCE INCEPTION—INVESTOR CLASS
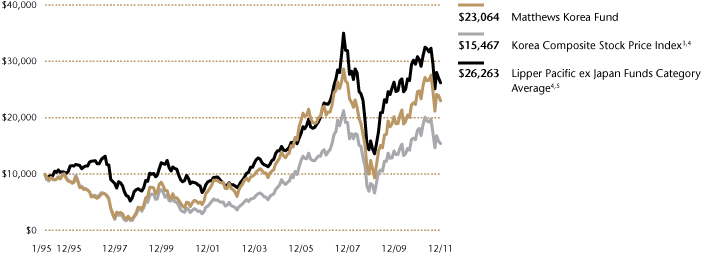
Plotted monthly. The performance data and graph do not reflect the deduction of taxes that a shareholder would pay on dividends, capital gains distributions or redemption of Fund shares. Values are in US$.
3 It is not possible to invest directly in an index. Source: Index data from Morgan Stanley Capital International and Bloomberg; total return calculations performed by BNY Mellon Investment Servicing (US) Inc. Please see page 69 for index definition.
4 Calculated from 12/31/94.
5 The Lipper Category Average does not reflect sales charges and is based on total return, including reinvestment of dividends and capital gains for the stated periods.
TOP TEN HOLDINGS6
| | | Sector | | % of Net Assets | |
| Samsung Electronics Co., Ltd. | | Information Technology | | | 15.1 | % | |
| Kia Motors Corp. | | Consumer Discretionary | | | 3.8 | % | |
| Dongbu Insurance Co., Ltd. | | Financials | | | 3.1 | % | |
| Hyundai Mobis | | Consumer Discretionary | | | 2.9 | % | |
| POSCO | | Materials | | | 2.8 | % | |
| Hyundai Motor Co., Ltd., 2nd Pfd. | | Consumer Discretionary | | | 2.8 | % | |
| Shinhan Financial Group Co., Ltd. | | Financials | | | 2.6 | % | |
| LG Chem, Ltd. | | Materials | | | 2.5 | % | |
| Orion Corp. | | Consumer Staples | | | 2.4 | % | |
| Hyundai Motor Co. | | Consumer Discretionary | | | 2.3 | % | |
| % OF ASSETS IN TOP TEN | | | | | 40.3 | % | |
6 Holdings may combine more than one security from same issuer and related depositary receipts.
50 MATTHEWS ASIA FUNDS
Matthews Korea Fund
Portfolio Manager Commentary (continued)
many smaller firms also gaining traction overseas. For example, Orion, a dominant domestic snack and confectionery maker, was a top contributor to Fund performance during the year. The firm has been successful in entering and building a sizable presence in emerging markets such as Russia, Vietnam and China.
Korean banks were among the biggest detractors to Fund performance during the year due to the instability in Europe—a key source for U.S. dollar funding for these banks. Korean banks were also impacted by a heightened regulatory environment and weak loan growth. As a result, we trimmed some positions in this segment during the year. However, we maintain an exposure to Korean banks due to their attractive valuations, and will continue to monitor developments in the country's financial regulatory environment.
In December, long-time North Korea ruler Kim Jong Il died from a heart attack, leaving control of the country to his son, Kim Jong Un. As North Korea remains one of the world's most secretive regimes, little is known about Kim Jong Un and it is still unclear how this transfer of power will impact the contentious relationship between North and South Korea. North Korea has long posed a key risk not only to South Korean markets, but to the world. While we hope the new leadership will mark the start of a more open approach to the country's relations in the region, as well as to its economic policy, it is still unclear what, if any, changes may occur. Any positive sign of policy change toward a more open North Korean economy could provide a significant boost to the region's stability and to the Korean peninsula.
Looking ahead, uncertainties related to both North Korea and the situation in Europe remain key risks. Higher-than-expected inflation is also a possibility. Additionally, two major upcoming elections in South Korea—including the presidential election—will be closely watched for any changes to the country's economic policy that may impact its equity market.
While the year was challenging not only for Korea but for equity markets globally, Korea appeared to weather the storm relatively better than others in the region. We believe this is partly due to Korea's experience of having undergone its own past economic crisis and painful restructuring to become more efficient and focused on research and development. We believe that Korean companies can maintain and continue to improve their global competitiveness. The Fund will continue to seek sustainable growth opportunities primarily among the consumer, financials and technology sectors.
SECTOR ALLOCATION (%)
| Consumer Discretionary | | | 27.7 | | |
| Information Technology | | | 21.3 | | |
| Financials | | | 18.2 | | |
| Materials | | | 9.5 | | |
| Consumer Staples | | | 8.7 | | |
| Industrials | | | 8.2 | | |
| Health Care | | | 2.3 | | |
| Energy | | | 1.8 | | |
| Telecommunication Services | | | 0.8 | | |
Cash and Other Assets,
Less Liabilities | | | 1.5 | | |
MARKET CAP EXPOSURE (%)7
| Large Cap (over $5B) | | | 58.2 | | |
| Mid Cap ($1B–$5B) | | | 26.6 | | |
| Small Cap (under $1B) | | | 13.7 | | |
Cash and Other Assets,
Less Liabilities | | | 1.5 | | |
7 Source: FactSet Research Systems. Percentage values in data are rounded to the nearest tenth of one percent; the values may not sum to 100% due to rounding.
matthewsasia.com | 800.789.ASIA 51
Matthews Korea Fund December 31, 2011
Schedule of Investmentsa
COMMON EQUITIES: SOUTH KOREA: 93.6%
| | | Shares | | Value | |
| CONSUMER DISCRETIONARY: 24.9% | |
| Automobiles: 6.1% | |
| Kia Motors Corp. | | | 103,191 | | | $ | 5,987,940 | | |
| Hyundai Motor Co. | | | 19,084 | | | | 3,534,885 | | |
| | | | | | 9,522,825 | | |
| Auto Components: 5.0% | |
| Hyundai Mobis | | | 17,635 | | | | 4,480,559 | | |
| Hankook Tire Co., Ltd. | | | 75,650 | | | | 2,975,038 | | |
| Motonic Corp. | | | 64,140 | | | | 395,921 | | |
| | | | | | 7,851,518 | | |
| Hotels, Restaurants & Leisure: 4.1% | |
| Shinsegae Food Co., Ltd. | | | 48,757 | | | | 3,318,317 | | |
| Modetour Network, Inc. | | | 121,727 | | | | 2,555,552 | | |
| Grand Korea Leisure Co., Ltd. | | | 38,920 | | | | 616,055 | | |
| | | | | | 6,489,924 | | |
| Multiline Retail: 3.4% | |
| Hyundai Department Store Co., Ltd. | | | 21,169 | | | | 3,000,250 | | |
| Hyundai Greenfood Co., Ltd. | | | 107,530 | | | | 1,509,476 | | |
| Shinsegae Co., Ltd. | | | 3,605 | | | | 767,518 | | |
| | | | | | 5,277,244 | | |
| Media: 3.0% | |
| Cheil Worldwide, Inc. | | | 147,400 | | | | 2,427,072 | | |
| CJ CGV Co., Ltd.b | | | 95,010 | | | | 2,200,651 | | |
| | | | | | 4,627,723 | | |
| Internet & Catalog Retail: 2.1% | |
| Hyundai Home Shopping Network Corp. | | | 29,102 | | | | 3,365,815 | | |
| Specialty Retail: 1.2% | |
| Himart Co., Ltd.b | | | 27,206 | | | | 1,915,643 | | |
| Total Consumer Discretionary | | | | | 39,050,692 | | |
| INFORMATION TECHNOLOGY: 21.3% | |
| Semiconductors & Semiconductor Equipment: 15.1% | |
| Samsung Electronics Co., Ltd. | | | 25,776 | | | | 23,709,743 | | |
| Internet Software & Services: 3.5% | |
| NHN Corp.b | | | 18,127 | | | | 3,322,231 | | |
| Daum Communications Corp. | | | 20,239 | | | | 2,111,061 | | |
| | | | | | 5,433,292 | | |
| Electronic Equipment, Instruments & Components: 2.4% | |
| Samsung Electro-Mechanics Co., Ltd. | | | 31,392 | | | | 2,122,296 | | |
| Uju Electronics Co., Ltd.b | | | 81,898 | | | | 1,656,698 | | |
| | | | | | 3,778,994 | | |
| Software: 0.3% | |
| Neowiz Games Corp.b | | | 10,390 | | | | 390,139 | | |
| Total Information Technology | | | | | 33,312,168 | | |
| | | Shares | | Value | |
| FINANCIALS: 16.6% | |
| Insurance: 7.0% | |
| Dongbu Insurance Co., Ltd. | | | 105,574 | | | $ | 4,906,051 | | |
| Samsung Fire & Marine Insurance Co., Ltd. | | | 16,514 | | | | 3,028,337 | | |
| Hyundai Marine & Fire Insurance Co., Ltd. | | | 100,220 | | | | 3,006,474 | | |
| | | | | | 10,940,862 | | |
| Commercial Banks: 5.6% | |
| Shinhan Financial Group Co., Ltd. | | | 118,134 | | | | 4,085,100 | | |
| Hana Financial Group, Inc. | | | 81,800 | | | | 2,534,762 | | |
| KB Financial Group, Inc. | | | 66,416 | | | | 2,097,218 | | |
| | | | | | 8,717,080 | | |
| Capital Markets: 3.3% | |
| Kiwoom Securities Co., Ltd. | | | 73,593 | | | | 3,502,808 | | |
| Samsung Securities Co., Ltd. | | | 39,559 | | | | 1,702,195 | | |
| | | | | | 5,205,003 | | |
| Diversified Financial Services: 0.7% | |
| NICE Information Service Co., Ltd. | | | 58,009 | | | | 1,179,883 | | |
| Total Financials | | | | | 26,042,828 | | |
| MATERIALS: 9.0% | |
| Chemicals: 5.5% | |
| LG Chem, Ltd. | | | 14,419 | | | | 3,976,128 | | |
| OCI Materials Co., Ltd. | | | 36,680 | | | | 2,536,345 | | |
| KPX Chemical Co., Ltd. | | | 26,763 | | | | 1,342,041 | | |
| Hyosung Corp. | | | 15,864 | | | | 738,896 | | |
| | | | | | 8,593,410 | | |
| Metals & Mining: 3.5% | |
| POSCO ADR | | | 53,500 | | | | 4,392,350 | | |
| Poongsan Corp. | | | 48,870 | | | | 1,114,520 | | |
| | | | | | 5,506,870 | | |
| Total Materials | | | | | 14,100,280 | | |
| CONSUMER STAPLES: 8.7% | |
| Food Products: 3.7% | |
| Orion Corp. | | | 6,414 | | | | 3,774,906 | | |
| Binggrae Co., Ltd. | | | 38,038 | | | | 1,968,441 | | |
| | | | | | 5,743,347 | | |
| Household Products: 2.0% | |
| LG Household & Health Care, Ltd. | | | 7,574 | | | | 3,205,620 | | |
| Personal Products: 1.9% | |
| Amorepacific Corp. | | | 3,248 | | | | 2,966,056 | | |
| Tobacco: 1.1% | |
| KT&G Corp. | | | 25,024 | | | | 1,768,189 | | |
| Total Consumer Staples | | | | | 13,683,212 | | |
52 MATTHEWS ASIA FUNDS
Matthews Korea Fund December 31, 2011
Schedule of Investmentsa (continued)
COMMON EQUITIES: SOUTH KOREA (continued)
| | | Shares | | Value | |
| INDUSTRIALS: 8.2% | |
| Construction & Engineering: 3.4% | |
| Samsung Engineering Co., Ltd. | | | 16,051 | | | $ | 2,810,607 | | |
| Hyundai Engineering & Construction Co., Ltd. | | | 40,892 | | | | 2,504,400 | | |
| | | | | | 5,315,007 | | |
| Building Products: 1.5% | |
| KCC Corp. | | | 9,584 | | | | 2,377,720 | | |
| Commercial Services & Supplies: 1.5% | |
| KEPCO Plant Service & Engineering Co., Ltd. | | | 63,968 | | | | 2,293,371 | | |
| Industrial Conglomerates: 1.1% | |
| Samsung Techwin Co., Ltd. | | | 37,016 | | | | 1,712,676 | | |
| Electrical Equipment: 0.7% | |
| LS Corp. | | | 16,737 | | | | 1,106,339 | | |
| Total Industrials | | | | | 12,805,113 | | |
| HEALTH CARE: 2.3% | |
| Pharmaceuticals: 2.3% | |
| Dong-A Pharmaceutical Co., Ltd. | | | 28,095 | | | | 2,166,376 | | |
| Yuhan Corp. | | | 12,848 | | | | 1,422,842 | | |
| Total Health Care | | | | | 3,589,218 | | |
| ENERGY: 1.8% | |
| Oil, Gas & Consumable Fuels: 1.8% | |
| SK Innovation Co., Ltd. | | | 23,074 | | | | 2,848,919 | | |
| Total Energy | | | | | 2,848,919 | | |
| TELECOMMUNICATION SERVICES: 0.8% | |
| Diversified Telecommunication Services: 0.8% | |
| KT Corp. | | | 39,384 | | | | 1,221,283 | | |
| Total Telecommunication Services | | | | | 1,221,283 | | |
| TOTAL COMMON EQUITIES | | | | | 146,653,713 | | |
| (Cost $108,193,414) | | | | | | | |
PREFERRED EQUITIES: SOUTH KOREA: 4.9%
| | | Shares | | Value | |
| CONSUMER DISCRETIONARY: 2.8% | |
| Automobiles: 2.8% | |
| Hyundai Motor Co., Ltd., 2nd Pfd. | | | 74,665 | | | $ | 4,356,758 | | |
| Total Consumer Discretionary | | | | | 4,356,758 | | |
| FINANCIALS: 1.6% | |
| Insurance: 1.6% | |
Samsung Fire & Marine
Insurance Co., Ltd., Pfd. | | | 39,684 | | | | 2,531,922 | | |
| Total Financials | | | | | 2,531,922 | | |
| MATERIALS: 0.5% | |
| Chemicals: 0.5% | |
| LG Chem, Ltd., Pfd. | | | 8,580 | | | | 801,622 | | |
| Total Materials | | | | | 801,622 | | |
| TOTAL PREFERRED EQUITIES | | | | | 7,690,302 | | |
| (Cost $6,465,996) | | | | | | | |
| TOTAL INVESTMENTS: 98.5% | | | 154,344,015 | | |
| (Cost $114,659,410c) | |
CASH AND OTHER ASSETS,
LESS LIABILITIES: 1.5% | | | 2,355,614 | | |
| NET ASSETS: 100.0% | | $ | 156,699,629 | | |
a Certain securities were fair valued under the discretion of the Board of Trustees (Note 2-A).
b Non-income producing security.
c Cost for federal income tax purposes is $115,190,514 and net unrealized appreciation consists of:
| Gross unrealized appreciation | | $ | 46,492,168 | | |
| Gross unrealized depreciation | | | (7,338,667 | ) | |
| Net unrealized appreciation | | $ | 39,153,501 | | |
ADR American Depositary Receipt
Pfd. Preferred
See accompanying notes to financial statements.
matthewsasia.com | 800.789.ASIA 53

ASIA SMALL COMPANY STRATEGIES
PORTFOLIO MANAGERS
Lydia So
Lead Manager
Michael B. Han, CFA
Co-Manager
FUND FACTS
| | | Investor Class | |
| Ticker | | MSMLX | |
| CUSIP | | 577125206 | |
| Inception | | 9/15/08 | |
| NAV | | $14.77 | |
| Initial Investment | | $2,500 | |
| Gross Expense Ratio1 | | 1.52% | |
Portfolio Statistics
| Total # of Positions | | 72 | |
| Net Assets | | $258.9 million | |
| Weighted Average Market Cap | | $1.1 billion | |
| Portfolio Turnover | | 19.97%2 | |
Benchmark
MSCI AC Asia ex Japan Small Cap Index
Redemption Fee
2% within first 90 calendar days of purchase
OBJECTIVE
Long-term capital appreciation.
STRATEGY
Under normal market conditions, the Fund seeks to achieve its investment objective by investing at least 80% of its total net assets, which include borrowings for investment purposes, in the common and preferred stocks of small companies located in Asia, excluding Japan.
1 Matthews Asia Funds does not charge 12b-1 fees.
2 The lesser of fiscal year 2011 long-term purchase costs or sales proceeds divided by the average monthly market value of long-term securities.
Matthews Asia Small Companies Fund
Portfolio Manager Commentary
For the year ending December 31, 2011, the Matthews Asia Small Companies Fund declined –20.03%, while its benchmark, the MSCI All Country Asia ex Japan Small Cap Index, fell –26.66%. For the fourth quarter, the Fund was nearly flat at 0.01% while its benchmark slipped –0.72%.
The performance of Asian equity markets was somewhat muted during the fourth quarter following the severe sell-off in the previous quarter as investors remained wary of Europe's sovereign debt issues and depressed economic outlook. In addition, fears of an ongoing slowdown in China and the deterioration of India's macroeconomics conditions hurt investor sentiment, especially in the small-cap universe. With the decreased risk appetite, IPO activity subsided compared to the same period in 2010. Concerns over access to funding and a pullback in consumer demand also further intensified. Small-cap companies in the MSCI All Country Asia ex Japan Small Cap Index continued to underperform their large-cap counterparts, as represented by the MSCI All Country Asia ex Japan Large Cap Index, throughout the year.
For most of the year, as Europe's woes were the main cause of market volatility globally, the effects of aggressive monetary tightening in China dominated the tone of the marketplace. Asia's own internal issues included political scandals in India, economic devastation from severe flooding in Thailand and uncertainties surrounding the political succession in North Korea. Conversely, several Southeast Asian nations, such as Indonesia, the Philippines and Malaysia, attracted more domestic and foreign investments due to constructive administrative measures—a bright spot amid the region's lackluster performance during the year.
Our portfolio is positioned to invest in more domestically oriented consumer stocks. However, the Fund was not immune to broad-based sell-offs, particularly in the third quarter, which accounted for the bulk of the absolute negative performance in 2011. On a country basis, China and India were the Fund's worst performers for the year. The sell-off in India was comprehensive as many companies increasingly found themselves in a more challenging operating environment with rising input and financing costs. The portfolio's long-standing overweight in India along with the sharp depreciation of the Indian currency, starting from about mid-year, hurt Fund performance. The performance of our holdings in China was weakened due to similar concerns as well as negative investor sentiment following scandals involving Chinese companies listed through reverse mergers on U.S. and Canadian exchanges. However, the Fund's bottom-up stock selection accounted for the Fund's relative outperformance against the benchmark.
By sector, the portfolio's technology-related names were the worst performers due to margin pressure and a gloomy outlook for demand in electronic products globally. Two Taiwanese holdings, Wah Lee, a distributor of upstream technology materials and components, and TXC Corp., a passive component manufacturer, performed poorly, mainly as a result of the poor macroeconomic uncertainty. Other performance detractors included holdings in economically sensitive areas, such as automotives, industrials, and fixed asset investments, on concerns over slower consumer spending and business investment. In addition, our only
(continued)
54 MATTHEWS ASIA FUNDS
PERFORMANCE AS OF DECEMBER 31, 2011
| | | | | | | Average Annual Total Returns | |
| | | 3 Months | | 1 Year | | 3 Years | | Since Inception
9/15/08 | |
| Investor Class (MSMLX) | | | 0.01 | % | | | -20.03 | % | | | 30.06 | % | | | 18.27 | % | |
| MSCI AC Asia ex Japan Small Cap Index3 | | | -0.72 | % | | | -26.66 | % | | | 24.95 | % | | | 9.26 | % | |
| Lipper Pacific ex Japan Funds Category Average4 | | | 4.84 | % | | | -17.17 | % | | | 19.63 | % | | | 9.53 | %5 | |
Performance assumes reinvestment of all dividends and/or distributions before taxes. All performance quoted represents past performance and is no guarantee of future results. Investment return and principal value will fluctuate with market conditions so that when redeemed, shares may be worth more or less than their original cost. Current performance may be lower or higher than the return figures quoted. Returns would have been lower if certain of the Fund's fees and expenses had not been waived. For the Fund's most recent month-end performance, visit matthewsasia.com.
GROWTH OF A $10,000 INVESTMENT SINCE INCEPTION—INVESTOR CLASS
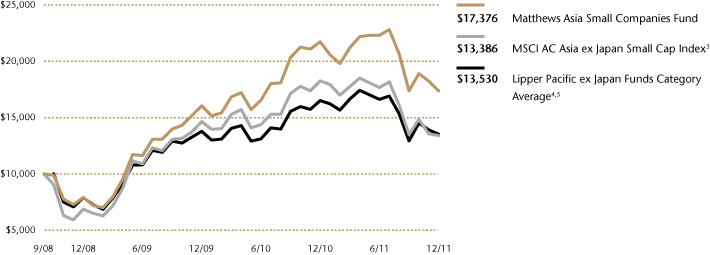
Plotted monthly. The performance data does not reflect the deduction of taxes that a shareholder would pay on dividends, capital gains distributions or redemption of Fund shares. Values are in US$.
3 It is not possible to invest directly in an index. Source: Index data from Morgan Stanley Capital International and Bloomberg; total return calculations performed by BNY Mellon Investment Servicing (US) Inc. Please see page 69 for index definition.
4 The Lipper Category Average does not reflect sales charges and is based on total return, including reinvestment of dividends and capital gains for the stated periods.
5 Calculated from 9/30/08.
TOP TEN HOLDINGS6
| | | Country | | % of Net Assets | |
| St. Shine Optical Co., Ltd. | | Taiwan | | | 3.1 | % | |
| Towngas China Co., Ltd. | | China/Hong Kong | | | 2.2 | % | |
| Dongbu Insurance Co., Ltd. | | South Korea | | | 2.2 | % | |
| Yip's Chemical Holdings, Ltd. | | China/Hong Kong | | | 2.0 | % | |
| Trinity, Ltd. | | China/Hong Kong | | | 2.0 | % | |
| Pacific Hospital Supply Co., Ltd. | | Taiwan | | | 2.0 | % | |
| KFC Holdings Malaysia BHD | | Malaysia | | | 2.0 | % | |
| Vinda International Holdings, Ltd. | | China/Hong Kong | | | 2.0 | % | |
| Dialog Group BHD | | Malaysia | | | 1.9 | % | |
| PT Nippon Indosari Corpindo | | Indonesia | | | 1.9 | % | |
| % OF ASSETS IN TOP TEN | | | | | 21.3 | % | |
6 Holdings may combine more than one security from same issuer and related depositary receipts.
matthewsasia.com | 800.789.ASIA 55
COUNTRY ALLOCATION (%)
| China/Hong Kong | | | 30.2 | | |
| India | | | 15.7 | | |
| Taiwan | | | 15.7 | | |
| South Korea | | | 13.0 | | |
| Malaysia | | | 8.3 | | |
| Indonesia | | | 7.7 | | |
| Thailand | | | 4.6 | | |
| Singapore | | | 2.9 | | |
Cash and Other Assets,
Less Liabilities | | | 1.9 | | |
SECTOR ALLOCATION (%)
| Consumer Discretionary | | | 21.4 | | |
| Information Technology | | | 16.8 | | |
| Industrials | | | 16.5 | | |
| Financials | | | 13.8 | | |
| Health Care | | | 10.5 | | |
| Consumer Staples | | | 8.7 | | |
| Materials | | | 8.2 | | |
| Utilities | | | 2.2 | | |
Cash and Other Assets,
Less Liabilities | | | 1.9 | | |
MARKET CAP EXPOSURE (%)7,8
| Large Cap (over $5B) | | | 0.0 | | |
| Mid Cap ($1B–$5B) | | | 44.0 | | |
| Small Cap (under $1B) | | | 54.1 | | |
Cash and Other Assets,
Less Liabilities | | | 1.9 | | |
7 Source: FactSet Research Systems. Percentage values in data are rounded to the nearest tenth of one percent; the values may not sum to 100% due to rounding.
8 The Fund defines Small Companies as companies with market capitalization generally between $100 million and $3 billion.
Matthews Asia Small Companies Fund
Portfolio Manager Commentary (continued)
Chinese real estate holding, KWG Property Holdings, fell along with the severe sell-off of the Chinese real estate sector due to well-publicized concerns over this market.
Investors also sold off Xingda International Holdings, a Chinese manufacturer of radial tire cords, in anticipation of a slowdown in industrial activity and lower near-term demand for both commercial and passenger vehicles in China. Despite these concerns, we continue to hold our position in Xingda as its competitive positioning in the marketplace has remained intact and the firm should be poised to benefit from the anticipated ongoing growth of auto ownership in China.
Our holdings in Indonesia, Malaysia and Korea contributed positively during this challenging year. AKR Corporindo, an Indonesian distributor of chemical products; Dialog Group, a Malaysian oil and gas service provider; and Cheil Worldwide, Korea's largest advertising agency, all generated sizable gains. These companies are examples of stock selection helping relative performance. In general, these companies share similar attributes, including strong balance sheets, a consistency in execution and sustained competitive advantage in the marketplace. We continue to seek quality companies, preferably with domestically oriented revenue streams, and to diversify our industry exposure across the region. This strategy has been our core approach since the Fund's inception and we believe this has helped navigate through the volatile investment universe.
Unfortunately, not all of our longer-term holdings performed in line with our initial investment thesis. We exited Ming Fai International Holdings, a Hong Kong manufacturer of hotel and airline amenity products, due to concerns over the diversification from their core business. The company expanded into cosmetics retailing in China via an acquisition about midway through 2011. While the firm's growth potential may likely be vast, we are concerned that Ming Fai's management lacks the bandwidth and expertise to manage a retail franchise in a rather competitive landscape.
Looking ahead, we believe that the operating environment will become more challenging as consumers and businesses are turning more cautious. At this juncture, weaker companies will have a hard time competing and sustaining growth. We believe that quality companies with solid track records and financial strength will be beneficiaries of market consolidation and become stronger over time. There remain structural growth opportunities in areas such as the development of the region's service industries. Identifying companies with sound business models and financial discipline will continue to be critical to our long-term strategy.
56 MATTHEWS ASIA FUNDS
Matthews Asia Small Companies Fund December 31, 2011
Schedule of Investmentsa
COMMON EQUITIES: 98.1%
| | | Shares | | Value | |
| CHINA/HONG KONG: 30.2% | |
| Towngas China Co., Ltd. | | | 10,342,000 | | | $ | 5,592,718 | | |
| Yip's Chemical Holdings, Ltd. | | | 7,020,000 | | | | 5,287,642 | | |
| Trinity, Ltd. | | | 7,310,000 | | | | 5,270,775 | | |
| Vinda International Holdings, Ltd. | | | 3,977,000 | | | | 5,105,283 | | |
| Dah Chong Hong Holdings, Ltd. | | | 3,713,000 | | | | 4,374,366 | | |
| Comba Telecom Systems Holdings, Ltd. | | | 5,376,011 | | | | 4,333,148 | | |
| Lee's Pharmaceutical Holdings, Ltd. | | | 9,485,000 | | | | 3,480,577 | | |
| Dalian Port PDA Co., Ltd. H Shares | | | 12,828,000 | | | | 3,121,690 | | |
| Xingda International Holdings, Ltd. | | | 6,922,000 | | | | 3,119,383 | | |
| Minth Group, Ltd. | | | 3,276,000 | | | | 3,074,967 | | |
| Fook Woo Group Holdings, Ltd.b,c | | | 24,622,000 | | | | 3,040,262 | | |
| AAC Technologies Holdings, Inc. | | | 1,352,000 | | | | 3,035,933 | | |
| Hengdeli Holdings, Ltd. | | | 9,000,000 | | | | 2,943,373 | | |
| Kosmopolito Hotels International, Ltd. | | | 19,052,000 | | | | 2,919,151 | | |
| Xinyi Glass Holdings, Ltd. | | | 5,056,000 | | | | 2,903,427 | | |
| Silver Base Group Holdings, Ltd. | | | 3,394,000 | | | | 2,753,097 | | |
| PCD Stores Group, Ltd. | | | 18,274,900 | | | | 2,517,722 | | |
| Singamas Container Holdings, Ltd. | | | 13,176,000 | | | | 2,493,848 | | |
| KWG Property Holding, Ltd. | | | 7,206,000 | | | | 2,430,886 | | |
Kingdee International Software
Group Co., Ltd. | | | 8,083,600 | | | | 2,175,305 | | |
| China Kanghui Holdings, Inc. ADRb | | | 147,400 | | | | 2,172,676 | | |
| TAL Education Group ADRb | | | 172,362 | | | | 1,721,896 | | |
| Wasion Group Holdings, Ltd. | | | 5,652,000 | | | | 1,673,783 | | |
| Shenguan Holdings Group, Ltd. | | | 2,798,000 | | | | 1,621,173 | | |
| E-Commerce China Dangdang, Inc. ADRb | | | 241,700 | | | | 1,063,480 | | |
| Total China/Hong Kong | | | | | 78,226,561 | | |
| INDIA: 15.7% | |
GlaxoSmithKline Consumer
Healthcare, Ltd. | | | 94,290 | | | | 4,510,845 | | |
| Page Industries, Ltd. | | | 95,185 | | | | 4,290,808 | | |
| Ipca Laboratories, Ltd. | | | 808,208 | | | | 4,198,177 | | |
| CRISIL, Ltd. | | | 243,954 | | | | 4,069,651 | | |
| Gujarat Pipavav Port, Ltd.b | | | 3,539,124 | | | | 3,558,784 | | |
| CMC, Ltd. | | | 220,478 | | | | 3,295,234 | | |
| Federal Bank, Ltd. | | | 479,245 | | | | 3,039,445 | | |
| Emami, Ltd. | | | 463,360 | | | | 2,976,219 | | |
| Castrol India, Ltd. | | | 368,744 | | | | 2,894,472 | | |
| Polaris Financial Technology, Ltd. | | | 1,138,850 | | | | 2,654,922 | | |
| AIA Engineering, Ltd. | | | 500,705 | | | | 2,555,618 | | |
| Exide Industries, Ltd. | | | 829,267 | | | | 1,640,420 | | |
| India Infoline, Ltd. | | | 1,268,196 | | | | 1,040,014 | | |
| Total India | | | | | 40,724,609 | | |
| TAIWAN: 15.7% | |
| St. Shine Optical Co., Ltd. | | | 763,492 | | | | 8,068,874 | | |
| Pacific Hospital Supply Co., Ltd. | | | 2,079,155 | | | | 5,266,726 | | |
| Simplo Technology Co., Ltd. | | | 785,310 | | | | 4,590,636 | | |
| Synnex Technology International Corp. | | | 1,861,523 | | | | 4,494,116 | | |
| Wah Lee Industrial Corp. | | | 3,689,000 | | | | 4,386,010 | | |
| TXC Corp. | | | 3,784,792 | | | | 4,337,405 | | |
| Chroma ATE, Inc. | | | 1,969,081 | | | | 3,862,856 | | |
| Formosa International Hotels Corp. | | | 284,717 | | | | 3,686,022 | | |
| WT Microelectronics Co., Ltd. | | | 1,559,000 | | | | 2,013,174 | | |
| Total Taiwan | | | | | 40,705,819 | | |
| | | Shares | | Value | |
| SOUTH KOREA: 13.0% | |
| Dongbu Insurance Co., Ltd. | | | 119,833 | | | $ | 5,568,670 | | |
| Cheil Worldwide, Inc. | | | 265,635 | | | | 4,373,916 | | |
| POSCO Chemtech Co., Ltd. | | | 25,812 | | | | 4,118,435 | | |
| KEPCO Plant Service & Engineering Co., Ltd. | | | 111,147 | | | | 3,984,825 | | |
| Pyeong Hwa Automotive Co., Ltd. | | | 270,521 | | | | 3,696,408 | | |
| OCI Materials Co., Ltd. | | | 51,861 | | | | 3,586,080 | | |
| Modetour Network, Inc. | | | 142,281 | | | | 2,987,065 | | |
| Kiwoom Securities Co., Ltd. | | | 62,505 | | | | 2,975,052 | | |
| Korea Zinc Co., Ltd. | | | 8,661 | | | | 2,287,127 | | |
| Total South Korea | | | | | 33,577,578 | | |
| MALAYSIA: 8.3% | |
| KFC Holdings Malaysia BHD | | | 4,263,860 | | | | 5,165,054 | | |
| Dialog Group BHD | | | 5,829,338 | | | | 4,836,328 | | |
| Alliance Financial Group BHD | | | 3,609,900 | | | | 4,498,140 | | |
| KPJ Healthcare BHD | | | 2,689,800 | | | | 3,988,032 | | |
| LPI Capital BHD | | | 737,500 | | | | 3,145,426 | | |
| Total Malaysia | | | | | 21,632,980 | | |
| INDONESIA: 7.7% | |
| PT Nippon Indosari Corpindo | | | 13,130,500 | | | | 4,814,879 | | |
| PT Bank Tabungan Pensiunan Nasionalb | | | 12,828,500 | | | | 4,810,245 | | |
| PT Jasa Marga | | | 9,869,000 | | | | 4,571,249 | | |
| PT AKR Corporindo | | | 12,888,000 | | | | 4,299,553 | | |
| PT Sumber Alfaria Trijaya | | | 3,540,500 | | | | 1,542,319 | | |
| Total Indonesia | | | | | 20,038,245 | | |
| THAILAND: 4.6% | |
| Dynasty Ceramic Public Co., Ltd. | | | 2,445,800 | | | | 4,690,044 | | |
| Tisco Financial Group Public Co., Ltd. | | | 3,535,100 | | | | 4,257,807 | | |
| SNC Former Public Co., Ltd. | | | 4,103,900 | | | | 2,848,666 | | |
| Total Thailand | | | | | 11,796,517 | | |
| SINGAPORE: 2.9% | |
| Amtek Engineering, Ltd. | | | 6,245,000 | | | | 2,840,715 | | |
| CSE Global, Ltd. | | | 4,514,000 | | | | 2,610,154 | | |
| Petra Foods, Ltd. | | | 1,378,000 | | | | 1,965,460 | | |
| Total Singapore | | | | | 7,416,329 | | |
matthewsasia.com | 800.789.ASIA 57
Matthews Asia Small Companies Fund December 31, 2011
Schedule of Investmentsa (continued)
COMMON EQUITIES (continued)
| | | Value | |
| TOTAL INVESTMENTS: 98.1% | | $ | 254,118,638 | | |
| (Cost $292,033,922d) | | | |
CASH AND OTHER ASSETS,
LESS LIABILITIES: 1.9% | | | 4,825,104 | | |
| NET ASSETS: 100.0% | | $ | 258,943,742 | | |
a Certain securities were fair valued under the discretion of the Board of Trustees (Note 2-A).
b Non-income producing security.
c Illiquid security.
d Cost for federal income tax purposes is $292,069,205 and net unrealized depreciation consists of:
| Gross unrealized appreciation | | $ | 23,796,708 | | |
| Gross unrealized depreciation | | | (61,747,275 | ) | |
| Net unrealized depreciation | | ( | $37,950,567 | ) | |
ADR American Depositary Receipt
BHD Berhad
See accompanying notes to financial statements.
58 MATTHEWS ASIA FUNDS

ASIA SMALL COMPANY STRATEGIES
PORTFOLIO MANAGERS
Richard H. Gao
Lead Manager
Henry Zhang, CFA
Co-Manager
FUND FACTS
| | | Investor Class | |
| Ticker | | MCSMX | |
| CUSIP | | 577125404 | |
| Inception | | 5/31/11 | |
| NAV | | $7.04 | |
| Initial Investment | | $2,500 | |
| Gross Expense Ratio1 | | 5.32% | |
After Fee Waiver,
Reimbursement and
Recoupment | | 2.00% | |
Portfolio Statistics
| Total # of Positions | | 46 | |
| Net Assets | | $4.5 million | |
| Weighted Average Market Cap | | $1.3 billion | |
| Portfolio Turnover | | 6.08%2 | |
Benchmark
MSCI China Small Cap Index
Redemption Fee
2% within first 90 calendar days of purchase
OBJECTIVE
Long-term capital appreciation.
STRATEGY
Under normal market conditions, the Fund seeks to achieve its investment objective by investing at least 80% of its total net assets, which include borrowings for investment purposes, in the common and preferred stocks of small companies located in China and Taiwan. China includes its administrative and other districts, such as Hong Kong.
1 Gross annual operating expenses for the Fund for 2011 are annualized. The Advisor has contractually agreed to waive certain fees and reimburse certain expenses for Matthews China Small Companies Fund. Please see page 108 for additional information. Matthews Asia Funds does not charge 12b-1 fees.
2 Not annualized. The Fund commenced operations on May 31, 2011.
Matthews China Small Companies Fund
Portfolio Manager Commentary
The Matthews China Small Companies Fund was launched on May 31, 2011. From its inception through December 31, 2011, the Fund declined –29.51%, while its benchmark, the MSCI China Small Cap Index, dropped –35.00%. For the fourth quarter, the Fund rose 4.58%, while the benchmark gained 1.32%.
Over the course of 2011, China's economy faced some challenges. Although domestic retail sales and fixed-asset investments demonstrated robust growth, exports suffered due to the global economic slowdown. Investors were cautious over China's growth prospects, especially in light of the weakness in the property market, potential issues regarding bank loan quality and prolonged troubles stemming from Europe.
During the fourth quarter, the market rebounded modestly as China's inflation subsided significantly from its high in July, and the central bank announced its first cut of the bank reserve requirement ratio since December 2008. The government's tightening policies appeared to have been effective, evidenced by lower inflation and a slowdown in the property market. While China's monetary policy remained restrictive, policymakers started to shift focus from fighting inflation to maintaining steady economic growth.
Economically sensitive sectors, including industrials and consumer discretionary, staged a strong rebound during the fourth quarter. Their valuations had become attractive relative to their long-term fundamentals following a heavy sell-off in the third quarter. The Fund's overweight in the consumer discretionary sector therefore benefited Fund performance.
Health care was the worst-performing sector for the Fund during the fourth quarter as investors became increasingly concerned over the government's pricing policy for drugs and medical equipment. China Kanghui Holdings, a New York Stock Exchange-listed orthopedic device manufacturer, was among the worst performers, despite its solid operating performance in the past. While it is difficult to predict the real impact from potential government policy changes, we continue to hold this position because of the firm's strong product pipeline, competitive product offerings and solid management.
Amid such a volatile market environment, the Fund remained focused on companies poised to benefit from China's long-term trend of rising household income and growing domestic consumption. Vinda International Holdings, a Hong Kong company that produces various tissue paper products, was one of the top contributors both during the final quarter of the year as well as since the Fund's inception. The company, established in 1985, has an extensive distribution network with approximately 220,000 points of sale, and is one of China's most recognized tissue brands. Given China's currently low per capita tissue usage and rising disposable personal income, the firm is continuing to expand its distribution network and production capacity, and we believe it is well-positioned to benefit from the country's growing tissue paper market.
During the fourth quarter, the Fund initiated a new position in Zhuzhou CSR Times Electric, a Hunan-based electric control equipment manufacturer for trains. The company's stock suffered from a heavy sell-off after the government cut back on investment for high-speed rail construction
(continued)
matthewsasia.com | 800.789.ASIA 59
PERFORMANCE AS OF DECEMBER 31, 2011
| | | | | Actual Return, Not Annualized | |
| | | 3 Months | | Since Inception
5/31/11 | |
| Investor Class (MCSMX) | | | 4.58 | % | | | -29.51 | % | |
| MSCI China Small Cap Index3 | | | 1.32 | % | | | -35.00 | % | |
| Lipper China Funds Category Average4 | | | 4.41 | % | | | -25.35 | % | |
Performance assumes reinvestment of all dividends and/or distributions before taxes. All performance quoted represents past performance and is no guarantee of future results. Investment return and principal value will fluctuate with market conditions so that when redeemed, shares may be worth more or less than their original cost. Current performance may be lower or higher than the return figures quoted. Returns would have been lower if certain of the Fund's fees and expenses had not been waived. For the Fund's most recent month-end performance, visit matthewsasia.com.
The performance data does not reflect the deduction of taxes that a shareholder would pay on dividends, capital gains distributions or redemption of Fund shares. Values are in US$.
3 It is not possible to invest directly in an index. Source: Index data from Morgan Stanley Capital International and Bloomberg; total return calculations performed by BNY Mellon Investment Servicing (US) Inc. Please see page 69 for index definition.
4 The Lipper Category Average does not reflect sales charges and is based on total return, including reinvestment of dividends and capital gains for the stated periods.
TOP TEN HOLDINGS5
| | | Sector | | % of Net Assets | |
| Digital China Holdings, Ltd. | | Information Technology | | | 4.3 | % | |
| Television Broadcasts, Ltd. | | Consumer Discretionary | | | 3.6 | % | |
| Dah Chong Hong Holdings, Ltd. | | Consumer Discretionary | | | 3.6 | % | |
| Towngas China Co., Ltd. | | Utilities | | | 3.5 | % | |
| Wumart Stores, Inc. | | Consumer Staples | | | 3.3 | % | |
| Vinda International Holdings, Ltd. | | Consumer Staples | | | 3.3 | % | |
| Sany Heavy Equipment International Holdings Co., Ltd. | | Industrials | | | 3.1 | % | |
| Trinity, Ltd. | | Consumer Discretionary | | | 3.1 | % | |
| Ajisen China Holdings, Ltd. | | Consumer Discretionary | | | 3.1 | % | |
| Yuexiu Transport Infrastructure, Ltd. | | Industrials | | | 3.0 | % | |
| % OF ASSETS IN TOP TEN | | | | | 33.9 | % | |
5 Holdings may combine more than one security from same issuer and related depositary receipts.
60 MATTHEWS ASIA FUNDS
Matthews China Small Companies Fund
Portfolio Manager Commentary (continued)
in the aftermath of a fatal train collision in the eastern city of Wenzhou. Company valuations became attractive relative to its long-term business fundamentals. While there are some short-term uncertainties related to policies involving China's railway development, we believe the company should benefit from the growing demand for locomotives and the continued process of localization for train components. The firm is well-positioned in the industry given the high barriers to entry in the market and its strong research and development abilities.
Looking ahead, China's economic growth appears to be moderating at a steady pace, and inflation seems to be well contained. In December 2011, China's top leaders set general economic policies for 2012 and emphasized boosting domestic demand to offset export weakness. The government plans to maintain a proactive fiscal policy and prudent monetary policy in the foreseeable future. While long-term wage inflation may pressure businesses, higher wages should help to stimulate domestic consumption and narrow the income gap between the rich and the poor. We believe companies with a sustainable business model, competitive edge and outstanding management will ultimately emerge stronger as weak competitors are consolidated, and we are confident that small companies will continue to benefit from China's ongoing shift to a market economy.
COUNTRY ALLOCATION (%)
| China/Hong Kong | | | 93.4 | | |
| Taiwan | | | 3.5 | | |
Cash and Other Assets,
Less Liabilities | | | 3.1 | | |
SECTOR ALLOCATION (%)
| Consumer Discretionary | | | 26.3 | | |
| Industrials | | | 19.9 | | |
| Consumer Staples | | | 15.7 | | |
| Information Technology | | | 14.4 | | |
| Health Care | | | 7.9 | | |
| Materials | | | 6.3 | | |
| Utilities | | | 3.5 | | |
| Financials | | | 2.9 | | |
Cash and Other Assets,
Less Liabilities | | | 3.1 | | |
MARKET CAP EXPOSURE (%)6,7
| Large Cap (over $5B) | | | 0.0 | | |
| Mid Cap ($1B–$5B) | | | 58.3 | | |
| Small Cap (under $1B) | | | 38.6 | | |
Cash and Other Assets,
Less Liabilities | | | 3.1 | | |
6 Source: FactSet Research Systems. Percentage values in data are rounded to the nearest tenth of one percent; the values may not sum to 100% due to rounding.
7 The Fund defines Small Companies as companies with market capitalization generally between $100 million and $3 billion.
matthewsasia.com | 800.789.ASIA 61
Matthews China Small Companies Fund December 31, 2011
Schedule of Investmentsa
COMMON EQUITIES: 96.9%
| | | Shares | | Value | |
| CONSUMER DISCRETIONARY: 26.3% | |
| Hotels, Restaurants & Leisure: 6.8% | |
| Ajisen China Holdings, Ltd. | | | 125,000 | | | $ | 137,608 | | |
| Home Inns & Hotels Management, Inc. ADRb | | | 4,300 | | | | 110,940 | | |
| Gourmet Master Co., Ltd. | | | 8,400 | | | | 56,316 | | |
| | | | | | 304,864 | | |
| Distributors: 5.5% | |
| Dah Chong Hong Holdings, Ltd. | | | 136,000 | | | | 160,225 | | |
| Sparkle Roll Group, Ltd. | | | 912,000 | | | | 88,069 | | |
| | | | | | 248,294 | | |
| Textiles, Apparel & Luxury Goods: 4.8% | |
| Trinity, Ltd. | | | 192,000 | | | | 138,439 | | |
| Anta Sports Products, Ltd. | | | 63,000 | | | | 74,871 | | |
| | | | | | 213,310 | | |
| Media: 3.6% | |
| Television Broadcasts, Ltd. | | | 27,000 | | | | 163,740 | | |
| Specialty Retail: 2.6% | |
| Hengdeli Holdings, Ltd. | | | 352,000 | | | | 115,119 | | |
| Diversified Consumer Services: 1.9% | |
| TAL Education Group ADRb | | | 8,600 | | | | 85,914 | | |
| Leisure Equipment & Products: 0.6% | |
| Goodbaby International Holdings, Ltd. | | | 98,000 | | | | 26,750 | | |
| Multiline Retail: 0.5% | |
| PCD Stores Group, Ltd. | | | 168,000 | | | | 23,145 | | |
| Total Consumer Discretionary | | | | | 1,181,136 | | |
| INDUSTRIALS: 19.9% | |
| Machinery: 8.9% | |
Sany Heavy Equipment International
Holdings Co., Ltd. | | | 172,000 | | | | 140,185 | | |
| Haitian International Holdings, Ltd. | | | 146,000 | | | | 125,574 | | |
| China National Materials Co., Ltd. H Shares | | | 217,000 | | | | 77,115 | | |
| EVA Precision Industrial Holdings, Ltd. | | | 228,000 | | | | 55,190 | | |
| | | | | | 398,064 | | |
| Transportation Infrastructure: 4.5% | |
| Yuexiu Transport Infrastructure, Ltd. | | | 312,000 | | | | 136,585 | | |
| Dalian Port PDA Co., Ltd. H Shares | | | 270,000 | | | | 65,704 | | |
| | | | | | 202,289 | | |
| Electrical Equipment: 4.2% | |
Zhuzhou CSR Times Electric
Co., Ltd. H Shares | | | 56,000 | | | | 122,720 | | |
| Hangzhou Steam Turbine Co., Ltd. B Shares | | | 60,523 | | | | 63,978 | | |
| | | | | | 186,698 | | |
| Industrial Conglomerates: 1.2% | |
Chongqing Machinery &
Electric Co., Ltd. H Shares | | | 332,000 | | | | 54,716 | | |
| Marine: 1.1% | |
| SITC International Holdings Co., Ltd. | | | 200,000 | | | | 51,503 | | |
| Total Industrials | | | | | 893,270 | | |
| | | Shares | | Value | |
| CONSUMER STAPLES: 15.7% | |
| Household Products: 6.4% | |
| Vinda International Holdings, Ltd. | | | 117,000 | | | $ | 150,193 | | |
| NVC Lighting Holdings, Ltd. | | | 365,000 | | | | 134,879 | | |
| | | | | | 285,072 | | |
| Food & Staples Retailing: 5.2% | |
| Wumart Stores, Inc. H Shares | | | 72,000 | | | | 150,367 | | |
Lianhua Supermarket
Holdings Co., Ltd. H Shares | | | 65,000 | | | | 83,106 | | |
| | | | | | 233,473 | | |
| Food Products: 4.1% | |
| Shenguan Holdings Group, Ltd. | | | 126,000 | | | | 73,005 | | |
| Tenfu Cayman Holdings Co., Ltd.b | | | 80,000 | | | | 56,653 | | |
| China Fishery Group, Ltd. | | | 80,000 | | | | 56,127 | | |
| | | | | | 185,785 | | |
| Total Consumer Staples | | | | | 704,330 | | |
| INFORMATION TECHNOLOGY: 14.4% | |
| Electronic Equipment, Instruments & Components: 5.1% | |
| Digital China Holdings, Ltd. | | | 124,000 | | | | 192,228 | | |
China High Precision Automation
Group, Ltd.c | | | 195,000 | | | | 37,218 | | |
| | | | | | 229,446 | | |
| Semiconductors & Semiconductor Equipment: 4.1% | |
| Spreadtrum Communications, Inc. ADR | | | 5,900 | | | | 123,192 | | |
| RDA Microelectronics, Inc. ADRb | | | 5,600 | | | | 61,208 | | |
| | | | | | 184,400 | | |
| Communications Equipment: 2.3% | |
| Comba Telecom Systems Holdings, Ltd. | | | 130,500 | | | | 105,185 | | |
| Internet Software & Services: 2.0% | |
| 21Vianet Group, Inc. ADRb | | | 9,700 | | | | 88,755 | | |
| Software: 0.9% | |
Kingdee International Software
Group Co., Ltd. | | | 146,000 | | | | 39,289 | | |
| Total Information Technology | | | | | 647,075 | | |
| HEALTH CARE: 7.9% | |
| Pharmaceuticals: 3.4% | |
| Sino Biopharmaceutical | | | 444,000 | | | | 132,058 | | |
The United Laboratories International
Holdings, Ltd. | | | 36,000 | | | | 20,720 | | |
| | | | | | 152,778 | | |
| Life Sciences Tools & Services: 2.3% | |
| WuXi PharmaTech Cayman, Inc. ADRb | | | 9,600 | | | | 105,984 | | |
| Health Care Equipment & Supplies: 2.2% | |
| China Kanghui Holdings, Inc. ADRb | | | 6,700 | | | | 98,758 | | |
| Total Health Care | | | | | 357,520 | | |
62 MATTHEWS ASIA FUNDS
Matthews China Small Companies Fund December 31, 2011
Schedule of Investmentsa (continued)
COMMON EQUITIES (continued)
| | | Shares | | Value | |
| MATERIALS: 6.3% | |
| Containers & Packaging: 3.3% | |
| Taiwan Hon Chuan Enterprise Co., Ltd. | | | 54,535 | | | $ | 100,500 | | |
| Greatview Aseptic Packaging Co., Ltd.b | | | 148,000 | | | | 49,545 | | |
| | | | | | 150,045 | | |
| Chemicals: 2.1% | |
| Yip's Chemical Holdings, Ltd. | | | 126,000 | | | | 94,906 | | |
| Metals & Mining: 0.9% | |
| Sinoref Holdings, Ltd. | | | 544,000 | | | | 38,524 | | |
| Total Materials | | | | | 283,475 | | |
| UTILITIES: 3.5% | |
| Gas Utilities: 3.5% | |
| Towngas China Co., Ltd. | | | 292,000 | | | | 157,907 | | |
| Total Utilities | | | | | 157,907 | | |
| FINANCIALS: 2.9% | |
| Real Estate Management & Development: 2.9% | |
| China Overseas Grand Oceans Group, Ltd. | | | 149,500 | | | | 130,894 | | |
| Total Financials | | | | | 130,894 | | |
| TOTAL INVESTMENTS: 96.9% | | | | | 4,355,607 | | |
| (Cost $5,610,287d) | | | | | |
CASH AND OTHER ASSETS,
LESS LIABILITIES: 3.1% | | | 137,691 | | |
| NET ASSETS: 100.0% | | $ | 4,493,298 | | |
a Certain securities were fair valued under the discretion of the Board of Trustees (Note 2-A).
b Non-income producing security.
c Illiquid security.
d Cost for federal income tax purposes is $5,610,287 and net unrealized depreciation consists of:
| Gross unrealized appreciation | | $ | 54,982 | | |
| Gross unrealized depreciation | | | (1,309,662 | ) | |
| Net unrealized depreciation | | ($ | 1,254,680 | ) | |
ADR American Depositary Receipt
See accompanying notes to financial statements.
matthewsasia.com | 800.789.ASIA 63

ASIA SPECIALTY STRATEGY
PORTFOLIO MANAGERS
J. Michael Oh, CFA
Lead Manager
Lydia So
Co-Manager
FUND FACTS
| | | Investor Class | |
| Ticker | | MATFX | |
| CUSIP | | 577130883 | |
| Inception | | 12/27/99 | |
| NAV | | $8.16 | |
| Initial Investment | | $2,500 | |
| Gross Expense Ratio1 | | 1.21% | |
Portfolio Statistics
| Total # of Positions | | 60 | |
| Net Assets | | $153.3 million | |
| Weighted Average Market Cap | | $22.3 billion | |
| Portfolio Turnover | | 65.47%2 | |
Benchmark
MSCI AC Asia IT and Telecom Services Index
Redemption Fee
2% within first 90 calendar days of purchase
OBJECTIVE
Long-term capital appreciation.
STRATEGY
Under normal market conditions, the Fund seeks to achieve its investment objective by investing at least 80% of its total net assets, which include borrowings for investment purposes, in the common and preferred stocks of companies located in Asia that derive more than 50% of their revenues from the sale of products or services in science- and technology-related industries and services.
1 Matthews Asia Funds does not charge 12b-1 fees.
2 The lesser of fiscal year 2011 long-term purchase costs or sales proceeds divided by the average monthly market value of long-term securities.
Matthews Asia Science and Technology Fund
Portfolio Manager Commentary
For the year ending December 31, 2011, the Matthews Asia Science and Technology Fund declined –17.26%, underperforming its benchmark, the MSCI Asia IT and Telecom Services Index, which lost –12.30%. During the fourth quarter, the Fund gained 2.16%, compared to 2.49% for the benchmark.
2011 was a challenging period for Asia's science and technology industries, which were battered by a variety of factors throughout the year. We began with social unrest in the Middle East dampening investor sentiment early in the year, followed by Japan's devastating natural disasters and nuclear incident. The latter had a more direct impact on the technology sector as the problems disrupted not only regional, but also global technology supply chains. The disruption was most notable in the semiconductor industry in which Japanese companies supply the majority of the world's wafers—the basic material for semiconductor products. Instability resulting from Europe's sovereign debt crisis also hurt information technology demand as well as investor sentiment for the remainder of the year, and the situation is likely to continue to negatively impact the sector into 2012.
The Fund underperformed the benchmark primarily due to its underweight in the telecommunication services sector. In 2011, the telecom services sector outperformed the information technology sector by more than 20%. Telecom services companies tend to perform better in uncertain times due to their stable earnings structure and relatively high dividend yields. However, we continue to maintain an underweight as we do not see substantial long-term growth potential in this sector. We continue to seek more compelling growth opportunities elsewhere.
2011 was a difficult year for Chinese technology companies amid concerns over the country's moderating growth and accounting irregularities at some Chinese firms. While the Fund's Chinese holdings hurt performance, we maintain our overweight in the country as we believe China continues to represent one of the strongest growth prospects in the region, especially in the Internet sector.
The personal computer (PC) industry, which makes up a large part of the Asian technology sector, also had a difficult year and a slowdown in PC sales negatively impacted the sector. Taiwanese technology companies were particularly hurt since Taiwan dominates the manufacture of PCs globally. One of the worst performers in the portfolio during the year was Taiwan's Delta Electronics, which had significant exposure to the PC industry. Despite its recent weakness, Delta Electronics is still one of the most competitive players within the power supply systems segment and should perform well when the PC industry recovers.
Smartphones and tablets were among the few bright spots in the hardware space during the year. The global smartphone market continued to expand rapidly throughout the year, benefiting some component and smartphone makers in Asia. The tablet market also grew with new entrants such as Amazon.com. However, these markets were not big enough to counter the overall slowdown in the technology hardware segment.
(continued)
64 MATTHEWS ASIA FUNDS
PERFORMANCE AS OF DECEMBER 31, 2011
| | | | | | | Average Annual Total Returns | |
| | | 3 Months | | 1 Year | | 3 Years | | 5 Years | | 10 Years | | Since Inception
12/27/99 | |
| Investor Class (MATFX) | | | 2.16 | % | | | -17.26 | % | | | 20.30 | % | | | 0.70 | % | | | 7.72 | % | | | -1.19 | % | |
| MSCI AC Asia IT and Telecom Services Index3 | | | 2.49 | % | | | -12.30 | % | | | 13.44 | % | | | -0.51 | % | | | 4.76 | % | | | -4.99 | %4 | |
Lipper Global Sciences and Technology
Funds Category Average5 | | | 4.80 | % | | | -8.72 | % | | | 19.96 | % | | | 3.68 | % | | | 4.36 | % | | | -3.01 | %4 | |
Performance assumes reinvestment of all dividends and/or distributions before taxes. All performance quoted represents past performance and is no guarantee of future results. Investment return and principal value will fluctuate with market conditions so that when redeemed, shares may be worth more or less than their original cost. Current performance may be lower or higher than the return figures quoted. Returns would have been lower if certain of the Fund's fees and expenses had not been waived. For the Fund's most recent month-end performance, visit matthewsasia.com.
GROWTH OF A $10,000 INVESTMENT SINCE INCEPTION—INVESTOR CLASS
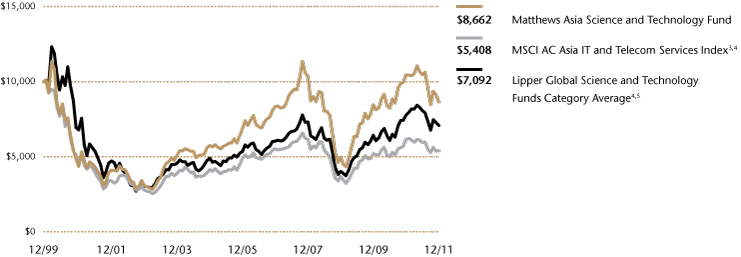
Plotted monthly. The performance data and graph do not reflect the deduction of taxes that a shareholder would pay on dividends, capital gains distributions or redemption of Fund shares. Values are in US$.
3 Formerly known as MSCI/Matthews Asian Technology Index. It is not possible to invest directly in an index. Source: Index data from Morgan Stanley Capital International and Bloomberg; total return calculations performed by BNY Mellon Investment Servicing (US) Inc. Please see page 69 for index definition.
4 Calculated from 12/31/99.
5 The Lipper Category Average does not reflect sales charges and is based on total return, including reinvestment of dividends and capital gains for the stated periods.
TOP TEN HOLDINGS6
| | | Country | | % of Net Assets | |
| Baidu, Inc. | | China/Hong Kong | | | 6.9 | % | |
| Samsung Electronics Co., Ltd. | | South Korea | | | 6.3 | % | |
| Spreadtrum Communications, Inc. | | China/Hong Kong | | | 3.1 | % | |
| Taiwan Semiconductor Manufacturing Co., Ltd. | | Taiwan | | | 2.7 | % | |
| China Mobile, Ltd. | | China/Hong Kong | | | 2.6 | % | |
| Synnex Technology International Corp. | | Taiwan | | | 2.4 | % | |
| Digital China Holdings, Ltd. | | China/Hong Kong | | | 2.3 | % | |
| St. Shine Optical Co., Ltd. | | Taiwan | | | 2.3 | % | |
| Toshiba Corp. | | Japan | | | 2.2 | % | |
| NHN Corp. | | South Korea | | | 2.2 | % | |
| % OF ASSETS IN TOP TEN | | | | | 33.0 | % | |
6 Holdings may combine more than one security from same issuer and related depositary receipts.
matthewsasia.com | 800.789.ASIA 65
COUNTRY ALLOCATION (%)7
| China/Hong Kong | | | 32.2 | | |
| South Korea | | | 19.1 | | |
| Taiwan | | | 19.0 | | |
| Japan | | | 18.6 | | |
| India | | | 4.0 | | |
| United States | | | 2.2 | | |
| Indonesia | | | 1.8 | | |
| Malaysia | | | 1.6 | | |
| Vietnam | | | 0.7 | | |
Cash and Other Assets,
Less Liabilities | | | 0.8 | | |
SECTOR ALLOCATION (%)
| Information Technology | | | 58.8 | | |
| Health Care | | | 10.3 | | |
| Industrials | | | 9.9 | | |
| Consumer Discretionary | | | 7.6 | | |
| Telecommunication Services | | | 6.1 | | |
| Materials | | | 5.2 | | |
| Financials | | | 1.3 | | |
Cash and Other Assets,
Less Liabilities | | | 0.8 | | |
MARKET CAP EXPOSURE (%)8
| Large Cap (over $5B) | | | 48.3 | | |
| Mid Cap ($1B–$5B) | | | 20.5 | | |
| Small Cap (under $1B) | | | 30.4 | | |
Cash and Other Assets,
Less Liabilities | | | 0.8 | | |
7 The United States is not included in the MSCI AC Asia IT and Telecom Services Index.
8 Source: FactSet Research Systems. Percentage values in data are rounded to the nearest tenth of one percent; the values may not sum to 100% due to rounding.
Matthews Asia Science and Technology Fund
Portfolio Manager Commentary (continued)
Regionally, Internet-related industries performed relatively well during the year. Since these businesses tend to be domestic in nature, they can generally withstand global macroeconomic shocks fairly well. The Internet industry has also benefited from the recent expansion of broadband in the region. In addition, e-commerce has continued to expand in Asia, taking market share away from traditional physical retail formats—an ongoing trend. The increasing adoption of smartphones and tablets is expected to benefit Internet-related firms since most mobile users are spending an increasing amount of time online.
On a company basis, two Chinese Internet services firms were the main contributors to Fund performance: Baidu and Sina. China's Internet industry kept up its fast growth during the year despite some concerns over regulatory and corporate governance issues. The Chinese Internet sector remains a core component of the portfolio. During the first half of the year, we exited our position in Sina as its share price experienced significant appreciation.
Going forward, ongoing instability in Europe and any potential volatility stemming from a shift in leadership in North Korea, following Kim Jung Il's death late last year, are likely to be among the key risks for the science and technology sector. Despite the challenging climate, we continue to be optimistic about the long-term outlook for Asia's technology sector. In the past decade, much of Asia's growth was led by capital and labor inputs. We believe that over the next decade, Asia's firms will focus on increasing productivity by employing more technology. For example, with higher-than-expected wage inflation in China, we are seeing more investment in factory automation to replace human labor with robotics. The Fund will continue to look for opportunities in this area, in addition to watching other trends. We will also continue to focus on the expansion of services industries such as new media, IT services and medical technology.
Sector funds may be subject to a higher degree of market risk than diversified funds because of a concentration in a specific sector. The Fund's value may be affected by changes in the science and technology-related industries.
66 MATTHEWS ASIA FUNDS
Matthews Asia Science and Technology Fund December 31, 2011
Schedule of Investmentsa
COMMON EQUITIES: 99.2%
| | | Shares | | Value | |
| CHINA/HONG KONG: 32.2% | |
| Baidu, Inc. ADRb | | | 91,400 | | | $ | 10,645,358 | | |
| Spreadtrum Communications, Inc. ADR | | | 230,200 | | | | 4,806,576 | | |
| China Mobile, Ltd. ADR | | | 83,800 | | | | 4,063,462 | | |
| Digital China Holdings, Ltd. | | | 2,320,000 | | | | 3,596,529 | | |
| ZTE Corp. H Shares | | | 983,544 | | | | 3,083,627 | | |
| Sunny Optical Technology Group Co., Ltd. | | | 11,102,000 | | | | 2,701,669 | | |
| 21Vianet Group, Inc. ADRb | | | 282,701 | | | | 2,586,714 | | |
| Sinopharm Group Co., Ltd. H Shares | | | 964,000 | | | | 2,316,102 | | |
| AAC Technologies Holdings, Inc. | | | 822,000 | | | | 1,845,812 | | |
| Airtac International Group | | | 444,000 | | | | 1,840,285 | | |
| WuXi PharmaTech Cayman, Inc. ADRb | | | 160,900 | | | | 1,776,336 | | |
| NetEase.com, Inc. ADRb | | | 38,300 | | | | 1,717,755 | | |
| EVA Precision Industrial Holdings, Ltd. | | | 6,274,000 | | | | 1,518,698 | | |
Kingdee International Software Group
Co., Ltd. | | | 5,176,000 | | | | 1,392,867 | | |
| Ctrip.com International, Ltd. ADRb | | | 58,226 | | | | 1,362,488 | | |
Sany Heavy Equipment International
Holdings Co., Ltd. | | | 1,643,000 | | | | 1,339,092 | | |
| 51job, Inc. ADRb | | | 29,800 | | | | 1,249,812 | | |
| TAL Education Group ADRb | | | 107,900 | | | | 1,077,921 | | |
| Kingboard Laminates Holdings, Ltd. | | | 1,065,000 | | | | 485,425 | | |
| Total China/Hong Kong | | | | | 49,406,528 | | |
| SOUTH KOREA: 19.1% | |
| Samsung Electronics Co., Ltd. | | | 10,444 | | | | 9,606,788 | | |
| NHN Corp.b | | | 18,296 | | | | 3,353,204 | | |
| Cheil Industries, Inc. | | | 36,419 | | | | 3,198,219 | | |
| OCI Materials Co., Ltd. | | | 36,176 | | | | 2,501,495 | | |
| JVM Co., Ltd.b | | | 66,542 | | | | 2,484,390 | | |
| Samsung Electro-Mechanics Co., Ltd. | | | 36,611 | | | | 2,475,134 | | |
| LG Chem, Ltd. | | | 8,525 | | | | 2,350,821 | | |
| Kiwoom Securities Co., Ltd. | | | 41,029 | | | | 1,952,859 | | |
| CJ CGV Co., Ltd.b | | | 58,110 | | | | 1,345,962 | | |
| Total South Korea | | | | | 29,268,872 | | |
| TAIWAN: 19.0% | |
Taiwan Semiconductor Manufacturing
Co., Ltd. | | | 1,637,933 | | | | 4,100,377 | | |
| Synnex Technology International Corp. | | | 1,503,447 | | | | 3,629,644 | | |
| St. Shine Optical Co., Ltd. | | | 337,000 | | | | 3,561,544 | | |
| Hon Hai Precision Industry Co., Ltd. | | | 1,043,982 | | | | 2,858,288 | | |
| TXC Corp. | | | 2,274,198 | | | | 2,606,251 | | |
| Chroma ATE, Inc. | | | 1,134,360 | | | | 2,225,337 | | |
| Simplo Technology Co., Ltd. | | | 344,980 | | | | 2,016,627 | | |
| Foxconn Technology Co., Ltd. | | | 553,350 | | | | 1,765,369 | | |
| Largan Precision Co., Ltd. | | | 91,000 | | | | 1,701,047 | | |
| Pacific Hospital Supply Co., Ltd. | | | 654,000 | | | | 1,656,653 | | |
| PChome Online, Inc. | | | 256,000 | | | | 1,576,802 | | |
| Delta Electronics, Inc. | | | 631,000 | | | | 1,500,446 | | |
| Total Taiwan | | | | | 29,198,385 | | |
| | | Shares | | Value | |
| JAPAN: 18.6% | |
| Toshiba Corp. | | | 833,000 | | | $ | 3,409,055 | | |
| Rakuten, Inc. | | | 2,549 | | | | 2,742,071 | | |
| Hitachi, Ltd. | | | 513,000 | | | | 2,692,633 | | |
| Yahoo! Japan Corp. | | | 8,127 | | | | 2,617,492 | | |
| Asahi Intecc Co., Ltd. | | | 112,100 | | | | 2,541,438 | | |
| NTT DoCoMo, Inc. | | | 1,311 | | | | 2,410,114 | | |
| FANUC Corp. | | | 15,000 | | | | 2,295,700 | | |
| Kakaku.com, Inc. | | | 61,500 | | | | 2,254,814 | | |
| Nabtesco Corp. | | | 123,000 | | | | 2,242,029 | | |
| SMC Corp. | | | 13,500 | | | | 2,178,381 | | |
| Murata Manufacturing Co., Ltd. | | | 30,400 | | | | 1,562,063 | | |
| Miraca Holdings, Inc. | | | 38,200 | | | | 1,521,151 | | |
| Total Japan | | | | | 28,466,941 | | |
| INDIA: 4.0% | |
| Info Edge India, Ltd. | | | 250,840 | | | | 2,679,862 | | |
| Exide Industries, Ltd. | | | 623,432 | | | | 1,233,246 | | |
| MakeMyTrip, Ltd.b | | | 46,900 | | | | 1,127,476 | | |
| Polaris Financial Technology, Ltd. | | | 456,702 | | | | 1,064,678 | | |
| Total India | | | | | 6,105,262 | | |
| UNITED STATES: 2.2% | |
Cognizant Technology Solutions Corp.
Class Ab | | | 52,000 | | | | 3,344,120 | | |
| Total United States | | | | | 3,344,120 | | |
| INDONESIA: 1.8% | |
| PT Telekomunikasi Indonesia ADR | | | 92,400 | | | | 2,840,376 | | |
| Total Indonesia | | | | | 2,840,376 | | |
| MALAYSIA: 1.6% | |
| KPJ Healthcare BHD | | | 1,674,100 | | | | 2,482,104 | | |
| Total Malaysia | | | | | 2,482,104 | | |
| VIETNAM: 0.7% | |
| FPT Corp. | | | 437,940 | | | | 1,021,306 | | |
| Total Vietnam | | | | | 1,021,306 | | |
| TOTAL INVESTMENTS: 99.2% | | | | | 152,133,894 | | |
| (Cost $149,935,786c) | | | | | |
CASH AND OTHER ASSETS,
LESS LIABILITIES: 0.8% | | | 1,215,005 | | |
| NET ASSETS: 100.0% | | $ | 153,348,899 | | |
a Certain securities were fair valued under the discretion of the Board of Trustees (Note 2-A).
b Non-income producing security.
c Cost for federal income tax purposes is $150,570,591 and net unrealized appreciation consists of:
| Gross unrealized appreciation | | $ | 21,383,040 | | |
| Gross unrealized depreciation | | | (19,819,737 | ) | |
| Net unrealized appreciation | | $ | 1,563,303 | | |
ADR American Depositary Receipt
BHD Berhad
See accompanying notes to financial statements.
matthewsasia.com | 800.789.ASIA 67
Disclosures
Fund Holdings: The Fund holdings shown in this report are as of December 31, 2011. Holdings are subject to change at any time, so holdings shown in this report may not reflect current Fund holdings. The Funds file complete schedules of portfolio holdings with the Securities and Exchange Commission (the "SEC") for the first and third quarters of each fiscal year on Form N-Q. The Funds' Form N-Q is filed with the SEC within 60 days of the end of the quarter to which it relates, and is available on the SEC's website at www.sec.gov. It may also be reviewed and copied at the Commission's Public Reference Room in Washington, D.C. Information on the operation of the Public Reference Room may be obtained by calling 800-SEC-0330. Complete schedules of investments are also available without charge, upon request, from the Funds by calling us at 800.789.ASIA (2472).
Proxy Voting Record: The Funds' Statement of Additional Information containing a description of the policies and procedures that the Funds have used to vote proxies relating to portfolio securities, along with each Fund's proxy voting record relating to portfolio securities held during the most recent 12-month period ended June 30, is available upon request, at no charge, at the Funds' website at matthewsasia.com or by calling 800.789.ASIA (2742), or on the SEC's website at www.sec.gov.
Shareholder Reports and Prospectuses: To reduce the Funds' expenses, we try to identify related shareholders in a household and send only one copy of the Funds' prospectus and financial reports to that address. This process, called "householding," will continue indefinitely unless you instruct us otherwise. At any time you may view the Funds' current prospectus, summary prospectus and financial reports on our website. If you prefer to receive individual copies of the Funds' prospectus or financial reports, please call us at 800.789.ASIA (2742).
Redemption Fee Policy: The Funds assess a redemption fee of 2.00% on the total redemption proceeds on most sales or exchanges of shares that take place within 90 calendar days after their purchase as part of the Funds' efforts to discourage short-term trading activity. This fee is payable directly to the Funds. For purposes of determining whether the redemption fee applies, the shares that have been held longest will be redeemed first. The Funds may grant exemptions from the redemption fee in certain circumstances. For more information on this policy, please see the Funds' prospectus.
68 MATTHEWS ASIA FUNDS
Index Definitions
The HSBC Asian Local Bond Index (ALBI) tracks the total return performance of a bond portfolio consisting of local-currency denominated, high quality and liquid bonds in Asia ex-Japan. The ALBI includes bonds from the following countries: Korea, Hong Kong, India, Singapore, Taiwan, Malaysia, Thailand, Philippines, Indonesia and China.
The J.P. Morgan Asia Credit Index (JACI) tracks the total return performance of the Asia fixed-rate dollar bond market. JACI is a market cap-weighted index comprising sovereign, quasi-sovereign and corporate bonds and is partitioned by country, sector and credit rating. JACI includes bonds from the following countries: China, Hong Kong, India, Indonesia, Korea, Malaysia, Philippines, Thailand and Singapore.
The MSCI All Country Asia ex Japan Index is a free float–adjusted market capitalization–weighted index of the stock of markets of China, Hong Kong, India, Indonesia, Malaysia, Philippines, Singapore, South Korea, Taiwan and Thailand.
The MSCI All Country Asia Pacific Index is a free float– adjusted market capitalization–weighted index of the stock markets of Australia, China, Hong Kong, India, Indonesia, Japan, Malaysia, New Zealand, Philippines, Singapore, South Korea, Taiwan and Thailand.
The MSCI China Index is a free float–adjusted market capitalization–weighted index of Chinese equities that includes China-affiliated corporations and H shares listed on the Hong Kong Exchange, and B shares listed on the Shanghai and Shenzhen exchanges.
The Bombay Stock Exchange (BSE) 100 Index is a free float–adjusted market capitalization–weighted index of the 100 stocks listed on the Bombay Stock Exchange.
The MSCI Japan Index is a free float–adjusted market capitalization–weighted index of Japanese equities listed in Japan.
The Tokyo Stock Price Index (TOPIX) is a market capitalization–weighted index of all companies listed on the First Section of the Tokyo Stock Exchange.
The Korea Composite Stock Price Index (KOSPI) is a market capitalization–weighted index of all common stocks listed on the Korea Stock Exchange.
The MSCI All Country Asia ex Japan Small Cap Index is a free float–adjusted market capitalization–weighted small cap index of the stock markets of China, Hong Kong, India, Indonesia, Malaysia, Philippines, Singapore, South Korea, Taiwan and Thailand.
The MSCI China Small Cap Index is a free float–adjusted market capitalization–weighted small cap index of the Chinese equity securities markets, including H shares listed on the Hong Kong Exchange, B shares listed on the Shanghai and Shenzhen exchanges, and Hong Kong-listed securities known as Red Chips (issued by entities owned by national or local governments in China) and P Chips (issued by companies controlled by individuals in China and deriving substantial revenues in China).
The MSCI AC Asia IT and Telecom Services Index (formerly known as MSCI/Matthews Asian Technology Index) is a free float–adjusted market capitalization–weighted index of Asian equities tracking a broad range of technology stocks including semiconductor equipment and products, communications equipment, computers and peripherals, electronic equipment and instruments, office electronics, software, IT consulting and services, Internet software and services, diversified telecommunications services, and wireless telecommunications services.
matthewsasia.com | 800.789.ASIA 69
Disclosure of Fund Expenses (Unaudited)
We believe it is important for you to understand the impact of fees regarding your investment. All mutual funds have operating expenses. As a shareholder of a mutual fund, you incur ongoing costs, which include costs for portfolio management, administrative services, and shareholder reports (like this one), among others. Operating expenses, which are deducted from a fund's gross income, directly reduce the investment return of the fund. A fund's operating expenses are expressed as a percentage of its average net assets. This figure is known as the expense ratio. The following examples are intended to help you understand the ongoing fees (in dollars) of investing in your fund and to compare these costs with those of other mutual funds. The examples are based on an investment of $1,000 made at the beginning of the period shown and held for the entire period.
This table illustrates your fund's costs in two ways:
Actual Fund Return: This section helps you to estimate the actual operating expenses, after any applicable fee waivers, that you paid over the period. The "Ending Account Value" shown is derived from the fund's actual return for the past six month period, the "Expense Ratio" column shows the period's annualized expense ratio, and the "Operating Expenses Paid During Period" column shows the dollar amount that would have been paid by an investor who started with $1,000 in the fund at the beginning of the period. You may use the information here, together with your account value, to estimate the expenses that you paid over the period. To do so, simply divide your account value by $1,000 (for example, an $8,600 account value divided by $1,000 = 8.6), then multiply the result by the number given for your fund in the first line under the heading entitled "Operating Expenses Paid During Period."
Hypothetical 5% Return: This section is intended to help you compare your fund's costs with those of other mutual funds. It assumes that the fund had an annual return of 5% before operating expenses, but that the expense ratio is unchanged. In this case, because the return used is not the fund's actual return, the results do not apply to your investment. This example is useful in making comparisons to other mutual funds because the Securities and Exchange Commission requires all mutual funds to calculate expenses based on an assumed 5% annual return. You can assess your fund's costs by comparing this hypothetical example with the hypothetical examples that appear in shareholder reports of other funds.
Please note that the operating expenses shown in the table are meant to highlight and help you compare your ongoing costs only and do not reflect any transactional costs such as sales charges (loads), redemption fees, or exchange fees. The Funds generally assess a redemption fee of 2.00% of the total redemption proceeds if you sell or exchange your shares within 90 calendar days after purchasing them. The redemption fee is paid directly to the Funds and is designed to discourage frequent short-term trading and to offset transaction costs associated with such trading of Fund shares. For purposes of determining whether the redemption fee applies, the shares that have been held the longest will be redeemed first. The Funds may grant exemption from the redemption fee when the Funds have previously received assurances that transactions do not involve market timing activity. The Funds may also waive the imposition of redemption fees in certain circumstances.
For more information on this policy, please see the Funds' prospectus.
The Matthews Asia Funds do not charge any sales loads, exchange fees, or 12b-1 fees, but these may be present in other funds to which you compare this data. Therefore, the hypothetical portions of the table are useful in comparing ongoing costs only, and will not help you determine the relative total costs of owning different funds.
70 MATTHEWS ASIA FUNDS
December 31, 2011
| | | INVESTOR CLASS | | INSTITUTIONAL CLASS | |
| | | Beginning
Account
Value
7/1/11 | | Ending
Account
Value
12/31/11 | | Expense
Ratio1 | | Operating
Expenses
Paid During
Period
7/1/11–
12/31/112 | | Beginning
Account
Value
7/1/11 | | Ending
Account
Value
12/31/11 | | Expense
Ratio1 | | Operating
Expenses
Paid During
Period
7/1/11–
12/31/112 | |
| ASIA FIXED INCOME STRATEGY | |
| Matthews Asia Strategic Income Fund* | |
| Actual Fund Return | | $ | 1,000.00 | | | $ | 994.80 | | | | 1.00 | % | | $ | 0.853 | | | $ | 1,000.00 | | | $ | 994.80 | | | | 1.00 | % | | $ | 0.853 | | |
| Hypothetical 5% Return | | $ | 1,000.00 | | | $ | 1,003.40 | | | | 1.00 | % | | $ | 0.853 | | | $ | 1,000.00 | | | $ | 1,003.40 | | | | 1.00 | % | | $ | 0.853 | | |
| ASIA GROWTH AND INCOME STRATEGIES | |
| Matthews Asian Growth and Income Fund | |
| Actual Fund Return | | $ | 1,000.00 | | | $ | 879.50 | | | | 1.12 | % | | $ | 5.31 | | | $ | 1,000.00 | | | $ | 879.50 | | | | 1.00 | % | | $ | 4.74 | | |
| Hypothetical 5% Return | | $ | 1,000.00 | | | $ | 1,019.56 | | | | 1.12 | % | | $ | 5.70 | | | $ | 1,000.00 | | | $ | 1,020.16 | | | | 1.00 | % | | $ | 5.09 | | |
| Matthews Asia Dividend Fund | |
| Actual Fund Return | | $ | 1,000.00 | | | $ | 889.10 | | | | 1.10 | % | | $ | 5.24 | | | $ | 1,000.00 | | | $ | 890.00 | | | | 1.02 | % | | $ | 4.86 | | |
| Hypothetical 5% Return | | $ | 1,000.00 | | | $ | 1,019.66 | | | | 1.10 | % | | $ | 5.60 | | | $ | 1,000.00 | | | $ | 1,020.06 | | | | 1.02 | % | | $ | 5.19 | | |
| Matthews China Dividend Fund | |
| Actual Fund Return | | $ | 1,000.00 | | | $ | 841.50 | | | | 1.50 | % | | $ | 6.96 | | | $ | 1,000.00 | | | $ | 843.10 | | | | 1.33 | % | | $ | 6.18 | | |
| Hypothetical 5% Return | | $ | 1,000.00 | | | $ | 1,017.64 | | | | 1.50 | % | | $ | 7.63 | | | $ | 1,000.00 | | | $ | 1,018.50 | | | | 1.33 | % | | $ | 6.77 | | |
| ASIA GROWTH STRATEGIES | |
| Matthews Asia Growth Fund | |
| Actual Fund Return | | $ | 1,000.00 | | | $ | 866.20 | | | | 1.20 | % | | $ | 5.64 | | | $ | 1,000.00 | | | $ | 866.90 | | | | 1.02 | % | | $ | 4.80 | | |
| Hypothetical 5% Return | | $ | 1,000.00 | | | $ | 1,019.16 | | | | 1.20 | % | | $ | 6.11 | | | $ | 1,000.00 | | | $ | 1,020.06 | | | | 1.02 | % | | $ | 5.19 | | |
| Matthews Pacific Tiger Fund | |
| Actual Fund Return | | $ | 1,000.00 | | | $ | 859.10 | | | | 1.13 | % | | $ | 5.30 | | | $ | 1,000.00 | | | $ | 859.70 | | | | 0.97 | % | | $ | 4.55 | | |
| Hypothetical 5% Return | | $ | 1,000.00 | | | $ | 1,019.51 | | | | 1.13 | % | | $ | 5.75 | | | $ | 1,000.00 | | | $ | 1,020.32 | | | | 0.97 | % | | $ | 4.94 | | |
| Matthews China Fund | |
| Actual Fund Return | | $ | 1,000.00 | | | $ | 812.10 | | | | 1.13 | % | | $ | 5.16 | | | $ | 1,000.00 | | | $ | 812.80 | | | | 0.97 | % | | $ | 4.43 | | |
| Hypothetical 5% Return | | $ | 1,000.00 | | | $ | 1,019.51 | | | | 1.13 | % | | $ | 5.75 | | | $ | 1,000.00 | | | $ | 1,020.32 | | | | 0.97 | % | | $ | 4.94 | | |
| Matthews India Fund | |
| Actual Fund Return | | $ | 1,000.00 | | | $ | 666.60 | | | | 1.18 | % | | $ | 4.96 | | | $ | 1,000.00 | | | $ | 667.20 | | | | 1.01 | % | | $ | 4.24 | | |
| Hypothetical 5% Return | | $ | 1,000.00 | | | $ | 1,019.26 | | | | 1.18 | % | | $ | 6.01 | | | $ | 1,000.00 | | | $ | 1,020.11 | | | | 1.01 | % | | $ | 5.14 | | |
| Matthews Japan Fund | |
| Actual Fund Return | | $ | 1,000.00 | | | $ | 913.30 | | | | 1.24 | % | | $ | 5.98 | | | $ | 1,000.00 | | | $ | 914.00 | | | | 1.08 | % | | $ | 5.21 | | |
| Hypothetical 5% Return | | $ | 1,000.00 | | | $ | 1,018.95 | | | | 1.24 | % | | $ | 6.31 | | | $ | 1,000.00 | | | $ | 1,019.76 | | | | 1.08 | % | | $ | 5.50 | | |
| Matthews Korea Fund | |
| Actual Fund Return | | $ | 1,000.00 | | | $ | 863.30 | | | | 1.21 | % | | $ | 5.68 | | | $ | 1,000.00 | | | $ | 865.40 | | | | 1.07 | % | | $ | 5.03 | | |
| Hypothetical 5% Return | | $ | 1,000.00 | | | $ | 1,019.11 | | | | 1.21 | % | | $ | 6.16 | | | $ | 1,000.00 | | | $ | 1,019.81 | | | | 1.07 | % | | $ | 5.45 | | |
| ASIA SMALL COMPANY STRATEGIES | |
| Matthews Asia Small Companies Fund | |
| Actual Fund Return | | $ | 1,000.00 | | | $ | 779.10 | | | | 1.51 | % | | $ | 6.77 | | | | | | | | | | | | | | | | | | |
| Hypothetical 5% Return | | $ | 1,000.00 | | | $ | 1,017.59 | | | | 1.51 | % | | $ | 7.68 | | | | | | | | | | | | | | | | | | |
| Matthews China Small Companies Fund | |
| Actual Fund Return | | $ | 1,000.00 | | | $ | 734.20 | | | | 2.00 | % | | $ | 8.74 | | | | | | | | | | | | | | | | | | |
| Hypothetical 5% Return | | $ | 1,000.00 | | | $ | 1,015.12 | | | | 2.00 | % | | $ | 10.16 | | | | | | | | | | | | | | | | | | |
| ASIA SPECIALTY STRATEGY | |
| Matthews Asia Science and Technology Fund | |
| Actual Fund Return | | $ | 1,000.00 | | | $ | 826.60 | | | | 1.23 | % | | $ | 5.66 | | | | | | | | | | | | | | | | | | |
| Hypothetical 5% Return | | $ | 1,000.00 | | | $ | 1,019.00 | | | | 1.23 | % | | $ | 6.26 | | | | | | | | | | | | | | | | | | |
* Matthews Asia Strategic Income Fund commenced operations on November 30, 2011.
1 Annualized, based on the Fund's most recent fiscal half-year expenses, except Matthews Asia Strategic Income Fund, which is based on expenses from November 30, 2011.
2 Operating expenses are equal to the Fund's annualized expense ratio multiplied by the average account value over the period, multiplied by 184 days, then divided by 365.
3 Operating expenses are equal to the Fund's annualized expense ratio multiplied by the average account value over the period, multiplied by 31 days, then divided by 365.
matthewsasia.com | 800.789.ASIA 71
Statements of Assets and Liabilities December 31, 2011
| | | Matthews Asia
Strategic
Income Fund | | Matthews Asian
Growth and
Income Fund | | Matthews Asia
Dividend Fund | | Matthews China
Dividend Fund | | Matthews Asia
Growth Fund | |
| ASSETS: | |
| Investments at value (A) (Note 2-A and 7): | | | | | | | | | | | |
| Unaffiliated issuers | | $ | 11,929,518 | | | $ | 2,729,876,705 | | | $ | 1,961,504,224 | | | $ | 26,291,533 | | | $ | 334,709,568 | | |
| Affiliated issuers | | | — | | | | 65,369,624 | | | | 266,300,383 | | | | — | | | | — | | |
| Total investments | | | 11,929,518 | | | | 2,795,246,329 | | | | 2,227,804,607 | | | | 26,291,533 | | | | 334,709,568 | | |
| Cash | | | 1,207,273 | | | | 83,930,052 | | | | 35,519,729 | | | | 252,045 | | | | 8,714,865 | | |
| Foreign currency at value (B) | | | — | | | | 477,915 | | | | 435,757 | | | | 16,147 | | | | 607,114 | | |
| Dividends, interest and other receivables—Unaffiliated issuers | | | 192,380 | | | | 7,203,477 | | | | 6,760,513 | | | | 42,688 | | | | 255,936 | | |
| Dividends receivable—Affiliated issuers | | | — | | | | — | | | | 1,119,574 | | | | — | | | | — | | |
| Receivable for securities sold | | | — | | | | 423,260 | | | | 2,832,426 | | | | — | | | | 83,538 | | |
| Receivable for capital shares sold | | | 279,706 | | | | 6,804,894 | | | | 16,385,014 | | | | 8,765 | | | | 433,920 | | |
| Due from Advisor (Note 5) | | | 16,168 | | | | — | | | | — | | | | 1,091 | | | | — | | |
| Deferred offering costs (Note 2-E) | | | 39,060 | | | | — | | | | — | | | | — | | | | — | | |
| Unrealized appreciation on forward foreign currency exchange contracts | | | 1,367 | | | | — | | | | — | | | | — | | | | — | | |
| Prepaid expenses | | | 2,211 | | | | 52,394 | | | | 42,453 | | | | 17,553 | | | | 22,450 | | |
| TOTAL ASSETS | | | 13,667,683 | | | | 2,894,138,321 | | | | 2,290,900,073 | | | | 26,629,822 | | | | 344,827,421 | | |
| LIABILITIES: | |
| Payable for securities purchased | | | 577,371 | | | | — | | | | 486,711 | | | | — | | | | — | | |
| Payable for capital shares redeemed | | | — | | | | 18,954,885 | | | | 13,301,132 | | | | 101,712 | | | | 963,565 | | |
| Unrealized depreciation on forward foreign currency exchange contracts | | | 18,315 | | | | — | | | | — | | | | — | | | | — | | |
| Cash overdraft | | | — | | | | — | | | | — | | | | — | | | | — | | |
| Deferred foreign capital gains tax liability (Note 2-D) | | | 1,249 | | | | — | | | | — | | | | — | | | | — | | |
| Due to Advisor (Note 5) | | | — | | | | 1,656,798 | | | | 1,267,160 | | | | — | | | | 192,256 | | |
| Administration and accounting fees payable | | | 168 | | | | 82,462 | | | | 61,689 | | | | 742 | | | | 9,447 | | |
| Administration and shareholder servicing fees payable | | | 1,635 | | | | 572,520 | | | | 408,587 | | | | 5,210 | | | | 63,410 | | |
| Professional fees payable | | | 9,207 | | | | 30,683 | | | | 27,355 | | | | 22,076 | | | | 24,527 | | |
| Trustees fees payable | | | — | | | | 167 | | | | 105 | | | | 2 | | | | 16 | | |
| Offering costs | | | 42,618 | | | | — | | | | — | | | | — | | | | — | | |
| Accrued other expenses payable | | | 5,711 | | | | 741,971 | | | | 481,801 | | | | 21,965 | | | | 106,048 | | |
| TOTAL LIABILITIES | | | 656,274 | | | | 22,039,486 | | | | 16,034,540 | | | | 151,707 | | | | 1,359,269 | | |
| NET ASSETS | | $ | 13,011,409 | | | $ | 2,872,098,835 | | | $ | 2,274,865,533 | | | $ | 26,478,115 | | | $ | 343,468,152 | | |
| NET ASSETS | |
| Investor Shares | | $ | 7,745,908 | | | $ | 2,340,605,936 | | | $ | 1,930,363,267 | | | $ | 26,466,554 | | | $ | 259,166,091 | | |
| Institutional Shares | | | 5,265,501 | | | | 531,492,899 | | | | 344,502,266 | | | | 11,561 | | | | 84,302,061 | | |
| TOTAL | | $ | 13,011,409 | | | $ | 2,872,098,835 | | | $ | 2,274,865,533 | | | $ | 26,478,115 | | | $ | 343,468,152 | | |
| SHARES OUTSTANDING: | |
(shares of beneficial interest issued and outstanding, respectively,
unlimited number of shares authorized with a $0.001 par value) | | | | | | | | | | | |
| Investor Shares | | | 780,078 | | | | 155,366,889 | | | | 154,624,091 | | | | 2,630,377 | | | | 16,894,666 | | |
| Institutional Shares | | | 530,290 | | | | 35,286,755 | | | | 27,609,973 | | | | 1,149 | | | | 5,485,404 | | |
| TOTAL | | | 1,310,368 | | | | 190,653,644 | | | | 182,234,064 | | | | 2,631,526 | | | | 22,380,070 | | |
| NET ASSET VALUE | |
| Investor Shares, offering price and redemption price | | $ | 9.93 | | | $ | 15.07 | | | $ | 12.48 | | | $ | 10.06 | | | $ | 15.34 | | |
| Institutional Shares, offering price and redemption price | | $ | 9.93 | | | $ | 15.06 | | | $ | 12.48 | | | $ | 10.06 | | | $ | 15.37 | | |
| NET ASSETS CONSIST OF: | |
| Capital paid-in | | $ | 13,093,415 | | | $ | 2,784,331,503 | | | $ | 2,427,707,206 | | | $ | 29,554,594 | | | $ | 361,959,994 | | |
| Undistributed (distributions in excess of) net investment income (loss) | | | 1,933 | | | | (14,294,799 | ) | | | (15,008,586 | ) | | | (85,351 | ) | | | (3,166,202 | ) | |
Undistributed/accumulated net realized gain (loss) on
investments and foreign currency related transactions | | | (410 | ) | | | (16,648,814 | ) | | | (54,730,034 | ) | | | (701,462 | ) | | | (64,872,355 | ) | |
Net unrealized appreciation (depreciation) on investments,
foreign currency transactions and deferred foreign capital gains taxes | | | (83,529 | ) | | | 118,710,945 | | | | (83,103,053 | ) | | | (2,289,666 | ) | | | 49,546,715 | | |
| NET ASSETS | | $ | 13,011,409 | | | $ | 2,872,098,835 | | | $ | 2,274,865,533 | | | $ | 26,478,115 | | | $ | 343,468,152 | | |
| (A) Investments at cost: | |
| Unaffiliated issuers | | $ | 11,993,749 | | | $ | 2,611,188,478 | | | $ | 1,998,643,912 | | | $ | 28,581,322 | | | $ | 285,162,348 | | |
| Affiliated issuers | | | — | | | | 65,338,936 | | | | 312,292,588 | | | | — | | | | — | | |
| Total investments at cost | | $ | 11,993,749 | | | $ | 2,676,527,414 | | | $ | 2,310,936,500 | | | $ | 28,581,322 | | | $ | 285,162,348 | | |
| (B) Foreign currency at cost | | $ | — | | | $ | 477,235 | | | $ | 435,213 | | | $ | 16,120 | | | $ | 607,144 | | |
See accompanying notes to financial statements.
72 MATTHEWS ASIA FUNDS
| | | Matthews Pacific
Tiger Fund | | Matthews
China Fund | | Matthews
India Fund | | Matthews
Japan Fund | | Matthews
Korea Fund | |
| ASSETS: | |
| Investments at value (A) (Note 2-A and 7): | | | | | | | | | | | |
| Unaffiliated issuers | | $ | 4,387,142,677 | | | $ | 2,047,056,130 | | | $ | 588,172,626 | | | $ | 131,727,128 | | | $ | 154,344,015 | | |
| Affiliated issuers | | | 286,776,107 | | | | 37,011,260 | | | | — | | | | — | | | | — | | |
| Total investments | | | 4,673,918,784 | | | | 2,084,067,390 | | | | 588,172,626 | | | | 131,727,128 | | | | 154,344,015 | | |
| Cash | | | 148,917,084 | | | | 51,607,036 | | | | — | | | | 449,019 | | | | 913,599 | | |
| Foreign currency at value (B) | | | 4,177,120 | | | | 1,365,017 | | | | 571,960 | | | | — | | | | — | | |
| Dividends, interest and other receivables—Unaffiliated issuers | | | 2,212,467 | | | | — | | | | 1,039,153 | | | | 120,476 | | | | 1,290,764 | | |
| Dividends receivable—Affiliated issuers | | | 3,503,911 | | | | — | | | | — | | | | — | | | | — | | |
| Receivable for securities sold | | | — | | | | 447,363 | | | | 3,078,909 | | | | — | | | | 620,174 | | |
| Receivable for capital shares sold | | | 20,908,277 | | | | 994,095 | | | | 651,807 | | | | 190,486 | | | | 105,942 | | |
| Due from Advisor (Note 5) | | | — | | | | — | | | | — | | | | — | | | | — | | |
| Deferred offering costs (Note 2-E) | | | — | | | | — | | | | — | | | | — | | | | — | | |
| Unrealized appreciation on forward foreign currency exchange contracts | | | — | | | | — | | | | — | | | | — | | | | — | | |
| Prepaid expenses | | | 34,697 | | | | 41,791 | | | | 31,035 | | | | 11,282 | | | | 13,336 | | |
| TOTAL ASSETS | | | 4,853,672,340 | | | | 2,138,522,692 | | | | 593,545,490 | | | | 132,498,391 | | | | 157,287,830 | | |
| LIABILITIES: | |
| Payable for securities purchased | | | 7,951,038 | | | | 356,387 | | | | 91,694 | | | | — | | | | — | | |
| Payable for capital shares redeemed | | | 31,163,672 | | | | 11,382,627 | | | | 5,494,469 | | | | 661,240 | | | | 393,513 | | |
| Unrealized depreciation on forward foreign currency exchange contracts | | | — | | | | — | | | | — | | | | — | | | | — | | |
| Cash overdraft | | | — | | | | — | | | | 933,504 | | | | — | | | | — | | |
| Deferred foreign capital gains tax liability (Note 2-D) | | | — | | | | — | | | | — | | | | — | | | | — | | |
| Due to Advisor (Note 5) | | | 2,698,327 | | | | 1,143,225 | | | | 355,729 | | | | 74,944 | | | | 87,394 | | |
| Administration and accounting fees payable | | | 130,900 | | | | 55,898 | | | | 18,251 | | | | 3,677 | | | | 4,157 | | |
| Administration and shareholder servicing fees payable | | | 878,710 | | | | 395,233 | | | | 119,964 | | | | 24,930 | | | | 29,498 | | |
| Professional fees payable | | | 34,224 | | | | 27,269 | | | | 31,037 | | | | 23,014 | | | | 22,334 | | |
| Trustees fees payable | | | 232 | | | | 121 | | | | 47 | | | | 5 | | | | 8 | | |
| Offering costs | | | — | | | | — | | | | — | | | | — | | | | — | | |
| Accrued other expenses payable | | | 1,084,025 | | | | 552,155 | | | | 244,097 | | | | 39,786 | | | | 51,297 | | |
| TOTAL LIABILITIES | | | 43,941,128 | | | | 13,912,915 | | | | 7,288,792 | | | | 827,596 | | | | 588,201 | | |
| NET ASSETS | | $ | 4,809,731,212 | | | $ | 2,124,609,777 | | | $ | 586,256,698 | | | $ | 131,670,795 | | | $ | 156,699,629 | | |
| NET ASSETS | |
| Investor Shares | | $ | 2,780,639,891 | | | $ | 1,836,333,014 | | | $ | 559,336,524 | | | $ | 101,368,884 | | | $ | 141,590,270 | | |
| Institutional Shares | | | 2,029,091,321 | | | | 288,276,763 | | | | 26,920,174 | | | | 30,301,911 | | | | 15,109,359 | | |
| TOTAL | | $ | 4,809,731,212 | | | $ | 2,124,609,777 | | | $ | 586,256,698 | | | $ | 131,670,795 | | | $ | 156,699,629 | | |
| SHARES OUTSTANDING: | |
(shares of beneficial interest issued and outstanding, respectively,
unlimited number of shares authorized with a $0.001 par value) | | | | | | | | | | | |
| Investor Shares | | | 136,768,224 | | | | 85,369,408 | | | | 41,149,985 | | | | 8,942,557 | | | | 30,816,313 | | |
| Institutional Shares | | | 99,836,438 | | | | 13,412,523 | | | | 1,978,495 | | | | 2,672,342 | | | | 3,277,913 | | |
| TOTAL | | | 236,604,662 | | | | 98,781,931 | | | | 43,128,480 | | | | 11,614,899 | | | | 34,094,226 | | |
| NET ASSET VALUE | |
| Investor Shares, offering price and redemption price | | $ | 20.33 | | | $ | 21.51 | | | $ | 13.59 | | | $ | 11.34 | | | $ | 4.59 | | |
| Institutional Shares, offering price and redemption price | | $ | 20.32 | | | $ | 21.49 | | | $ | 13.61 | | | $ | 11.34 | | | $ | 4.61 | | |
| NET ASSETS CONSIST OF: | |
| Capital paid-in | | $ | 3,933,264,028 | | | $ | 1,926,178,451 | | | $ | 679,997,939 | | | $ | 206,341,436 | | | $ | 116,152,594 | | |
| Undistributed (distributions in excess of) net investment income (loss) | | | (66,557 | ) | | | — | | | | 2,998,043 | | | | (612,266 | ) | | | (10,635 | ) | |
Undistributed/accumulated net realized gain (loss) on
investments and foreign currency related transactions | | | 4,188,828 | | | | (35,257,324 | ) | | | 2,808,620 | | | | (78,904,742 | ) | | | 869,225 | | |
Net unrealized appreciation (depreciation) on investments,
foreign currency transactions and deferred foreign capital gains taxes | | | 872,344,913 | | | | 233,688,650 | | | | (99,547,904 | ) | | | 4,846,367 | | | | 39,688,445 | | |
| NET ASSETS | | $ | 4,809,731,212 | | | $ | 2,124,609,777 | | | $ | 586,256,698 | | | $ | 131,670,795 | | | $ | 156,699,629 | | |
| (A) Investments at cost: | |
| Unaffiliated issuers | | $ | 3,523,490,690 | | | $ | 1,825,491,786 | | | $ | 687,617,746 | | | $ | 126,882,393 | | | $ | 114,659,410 | | |
| Affiliated issuers | | | 278,104,595 | | | | 24,891,260 | | | | — | | | | — | | | | — | | |
| Total investments at cost | | $ | 3,801,595,285 | | | $ | 1,850,383,046 | | | $ | 687,617,746 | | | $ | 126,882,393 | | | $ | 114,659,410 | | |
| (B) Foreign currency at cost | | $ | 4,173,278 | | | $ | 1,360,711 | | | $ | 571,972 | | | $ | — | | | $ | — | | |
matthewsasia.com | 800.789.ASIA 73
Statements of Assets and Liabilities (continued) December 31, 2011
| | | Matthews Asia
Small Companies
Fund | | Matthews China
Small Companies
Fund | | Matthews Asia
Science and
Technology Fund | |
| ASSETS: | |
| Investments at value (A) (Note 2-A and 7): | | | | | | | |
| Unaffiliated issuers | | $ | 254,118,638 | | | $ | 4,355,607 | | | $ | 152,133,894 | | |
| Cash | | | 1,044,013 | | | | 190,050 | | | | 998,160 | | |
| Foreign currency at value (B) | | | 441,305 | | | | — | | | | 194,192 | | |
| Dividends, interest and other receivables—Unaffiliated issuers | | | 333,851 | | | | 587 | | | | 147,731 | | |
| Receivable for securities sold | | | 4,913,546 | | | | — | | | | 682,048 | | |
| Receivable for capital shares sold | | | 1,023,261 | | | | 27,565 | | | | 85,973 | | |
| Due from Advisor (Note 5) | | | — | | | | 724 | | | | — | | |
| Deferred offering costs (Note 2-E) | | | — | | | | 16,363 | | | | — | | |
| Prepaid expenses | | | 25,983 | | | | 1,975 | | | | 12,918 | | |
| TOTAL ASSETS | | | 261,900,597 | | | | 4,592,871 | | | | 154,254,916 | | |
| LIABILITIES: | |
| Payable for securities purchased | | | — | | | | 37,335 | | | | — | | |
| Payable for capital shares redeemed | | | 2,527,485 | | | | 9,025 | | | | 706,728 | | |
| Due to Advisor (Note 5) | | | 230,468 | | | | — | | | | 88,172 | | |
| Administration and accounting fees payable | | | 8,171 | | | | 123 | | | | 4,332 | | |
| Administration and shareholder servicing fees payable | | | 54,758 | | | | 845 | | | | 30,213 | | |
| Professional fees payable | | | 24,468 | | | | 9,255 | | | | 23,113 | | |
| Trustees fees payable | | | 20 | | | | — | | | | 8 | | |
| Offering costs | | | — | | | | 33,179 | | | | — | | |
| Accrued other expenses payable | | | 111,485 | | | | 9,811 | | | | 53,451 | | |
| TOTAL LIABILITIES | | | 2,956,855 | | | | 99,573 | | | | 906,017 | | |
| NET ASSETS | | $ | 258,943,742 | | | $ | 4,493,298 | | | $ | 153,348,899 | | |
| NET ASSETS | |
| Investor Shares | | $ | 258,943,742 | | | $ | 4,493,298 | | | $ | 153,348,899 | | |
| TOTAL | | $ | 258,943,742 | | | $ | 4,493,298 | | | $ | 153,348,899 | | |
| SHARES OUTSTANDING: | |
(shares of beneficial interest issued and outstanding, respectively,
unlimited number of shares authorized with a $0.001 par value) | | | | | | | |
| Investor Shares | | | 17,532,039 | | | | 638,610 | | | | 18,800,327 | | |
| TOTAL | | | 17,532,039 | | | | 638,610 | | | | 18,800,327 | | |
| NET ASSET VALUE | |
| Investor Shares, offering price and redemption price | | $ | 14.77 | | | $ | 7.04 | | | $ | 8.16 | | |
| NET ASSETS CONSIST OF: | |
| Capital paid-in | | $ | 295,553,689 | | | $ | 5,864,467 | | | $ | 162,310,105 | | |
| Undistributed (distributions in excess of) net investment income (loss) | | | (99,789 | ) | | | — | | | | 66,138 | | |
Undistributed/accumulated net realized gain (loss) on
investments and foreign currency related transactions | | | 1,404,533 | | | | (116,490 | ) | | | (11,226,245 | ) | |
Net unrealized appreciation (depreciation) on investments,
foreign currency transactions and deferred taxes | | | (37,914,691 | ) | | | (1,254,679 | ) | | | 2,198,901 | | |
| NET ASSETS | | $ | 258,943,742 | | | $ | 4,493,298 | | | $ | 153,348,899 | | |
| (A) Investments at cost: Unaffiliated issuers | | $ | 292,033,922 | | | $ | 5,610,287 | | | $ | 149,935,786 | | |
| (B) Foreign currency at cost | | $ | 441,213 | | | $ | — | | | $ | 194,175 | | |
See accompanying notes to financial statements.
74 MATTHEWS ASIA FUNDS
Statements of Operations Year Ended December 31, 2011
| | | Matthews Asia
Strategic
Income Fund* | | Matthews Asian
Growth and
Income Fund | | Matthews Asia
Dividend Fund | |
| INVESTMENT INCOME: | |
| Dividends—Unaffiliated Issuers | | $ | 78 | | | $ | 120,145,041 | | | $ | 83,424,581 | | |
| Dividends—Affiliated Issuers (Note 7) | | | — | | | | 2,830,268 | | | | 11,112,363 | | |
| Interest | | | 32,975 | | | | 24,288,133 | | | | 42,774 | | |
| Foreign withholding tax | | | (1,631 | ) | | | (7,790,470 | ) | | | (6,751,175 | ) | |
| TOTAL INVESTMENT INCOME | | | 31,422 | | | | 139,472,972 | | | | 87,828,543 | | |
| EXPENSES: | |
| Investment advisory fees (Note 5) | | | 6,628 | | | | 24,156,540 | | | | 15,675,930 | | |
| Administration and accounting fees (Note 5) | | | 168 | | | | 571,748 | | | | 371,743 | | |
| Administration and shareholder servicing fees (Note 5) | | | 1,635 | | | | 7,775,865 | | | | 4,879,633 | �� | |
| Custodian fees | | | 1,492 | | | | 1,144,763 | | | | 599,315 | | |
| Professional fees | | | 15,368 | | | | 89,712 | | | | 80,588 | | |
| Registration fees | | | 169 | | | | 257,650 | | | | 202,421 | | |
| Transfer agent fees | | | 280 | | | | 4,711,272 | | | | 2,889,386 | | |
| Trustees fees | | | — | | | | 141,763 | | | | 86,611 | | |
| Offering costs (Note 2-E) | | | 3,557 | | | | — | | | | — | | |
| Other expenses | | | 3,939 | | | | 808,484 | | | | 582,838 | | |
| TOTAL EXPENSES | | | 33,236 | | | | 39,657,797 | | | | 25,368,465 | | |
| Advisory fees waived and expenses waived or reimbursed (Note 5) | | | (22,796 | ) | | | — | | | | — | | |
| NET EXPENSES | | | 10,440 | | | | 39,657,797 | | | | 25,368,465 | | |
| NET INVESTMENT INCOME (LOSS) | | | 20,982 | | | | 99,815,175 | | | | 62,460,078 | | |
REALIZED AND UNREALIZED GAIN (LOSS) ON INVESTMENTS,
FOREIGN CURRENCY RELATED TRANSACTIONS AND DEFERRED TAXES: | |
| Net realized gain (loss) on investments—Unaffiliated Issuers | | | (410 | ) | | | 75,589,520 | | | | (46,666,605 | ) | |
| Net realized gain (loss) on investments—Affiliated Issuers | | | — | | | | — | | | | 139,050 | | |
| Net realized gain (loss) on foreign currency related transactions | | | 790 | | | | (462,159 | ) | | | 519,569 | | |
| Net change in unrealized appreciation/depreciation on investments | | | (64,231 | ) | | | (569,767,554 | ) | | | (287,584,209 | ) | |
| Net change in deferred foreign capital gains taxes on unrealized appreciation | | | (1,249 | ) | | | 2,051,108 | | | | — | | |
Net change in unrealized appreciation/depreciation on foreign
currency related transactions | | | (18,049 | ) | | | (131,879 | ) | | | (40,038 | ) | |
Net realized and unrealized gain (loss) on investments, foreign currency
related transactions and deferred taxes | | | (83,149 | ) | | | (492,720,964 | ) | | | (333,632,233 | ) | |
| NET INCREASE (DECREASE) IN NET ASSETS FROM OPERATIONS | | ($ | 62,167 | ) | | ($ | 392,905,789 | ) | | ($ | 271,172,155 | ) | |
* Matthews Asia Strategic Income Fund commenced operations on November 30, 2011.
See accompanying notes to financial statements.
matthewsasia.com | 800.789.ASIA 75
Statements of Operations (continued) Year Ended December 31, 2011
| | | Matthews China
Dividend Fund | | Matthews Asia
Growth Fund | | Matthews Pacific
Tiger Fund | | Matthews
China Fund | | Matthews
India Fund | |
| INVESTMENT INCOME: | |
| Dividends—Unaffiliated Issuers | | $ | 1,705,619 | | | $ | 6,901,356 | | | $ | 92,037,712 | | | $ | 54,224,290 | | | $ | 13,959,553 | | |
| Dividends—Affiliated Issuers (Note 7) | | | — | | | | — | | | | 4,196,300 | | | | 793,401 | | | | — | | |
| Interest | | | — | | | | 3,578 | | | | 4,781 | | | | 8,052 | | | | 3,318,074 | | |
| Foreign withholding tax | | | (118,434 | ) | | | (529,431 | ) | | | (9,531,123 | ) | | | (1,940,017 | ) | | | (4,764 | ) | |
| TOTAL INVESTMENT INCOME | | | 1,587,185 | | | | 6,375,503 | | | | 86,707,670 | | | | 53,085,726 | | | | 17,272,863 | | |
| EXPENSES: | |
| Investment advisory fees (Note 5) | | | 267,471 | | | | 2,342,151 | | | | 34,384,304 | | | | 17,300,295 | | | | 6,533,378 | | |
| Administration and accounting fees (Note 5) | | | 6,327 | | | | 55,530 | | | | 814,758 | | | | 409,226 | | | | 154,480 | | |
| Administration and shareholder servicing fees (Note 5) | | | 89,462 | | | | 750,793 | | | | 10,462,664 | | | | 5,748,803 | | | | 2,129,432 | | |
| Custodian fees | | | 24,744 | | | | 158,631 | | | | 2,014,607 | | | | 631,139 | | | | 550,230 | | |
| Professional fees | | | 40,634 | | | | 49,957 | | | | 113,442 | | | | 67,685 | | | | 81,646 | | |
| Registration fees | | | 49,590 | | | | 65,641 | | | | 114,927 | | | | 105,521 | | | | 123,901 | | |
| Transfer agent fees | | | 71,168 | | | | 488,802 | | | | 5,729,371 | | | | 3,920,640 | | | | 1,486,254 | | |
| Trustees fees | | | 1,614 | | | | 13,060 | | | | 197,036 | | | | 102,734 | | | | 41,438 | | |
| Offering costs (Note 2-E) | | | — | | | | — | | | | — | | | | — | | | | — | | |
| Other expenses | | | 56,994 | | | | 148,559 | | | | 720,594 | | | | 685,473 | | | | 356,068 | | |
| TOTAL EXPENSES | | | 608,004 | | | | 4,073,124 | | | | 54,551,703 | | | | 28,971,516 | | | | 11,456,827 | | |
| Advisory fees waived and expenses waived or reimbursed (Note 5) | | | (8,122 | ) | | | — | | | | — | | | | — | | | | — | | |
| NET EXPENSES | | | 599,882 | | | | 4,073,124 | | | | 54,551,703 | | | | 28,971,516 | | | | 11,456,827 | | |
| NET INVESTMENT INCOME (LOSS) | | | 987,303 | | | | 2,302,379 | | | | 32,155,967 | | | | 24,114,210 | | | | 5,816,036 | | |
REALIZED AND UNREALIZED GAIN (LOSS) ON INVESTMENTS,
FOREIGN CURRENCY RELATED TRANSACTIONS AND DEFERRED TAXES: | |
| Net realized gain (loss) on investments—Unaffiliated Issuers | | | (473,023 | ) | | | 4,055,902 | | | | 199,407,534 | | | | 141,898,302 | | | | 102,638,828 | | |
| Net realized gain (loss) on investments—Affiliated Issuers | | | — | | | | — | | | | 3,398,349 | | | | 3,288,899 | | | | — | | |
| Net realized foreign capital gain tax or refund | | | — | | | | — | | | | — | | | | — | | | | 600 | | |
| Net realized gain (loss) on foreign currency related transactions | | | (2,068 | ) | | | (56,214 | ) | | | (1,153,236 | ) | | | 26,440 | | | | (546,198 | ) | |
| Net change in unrealized appreciation/depreciation on investments | | | (7,111,870 | ) | | | (55,780,603 | ) | | | (873,692,448 | ) | | | (687,854,135 | ) | | | (519,946,372 | ) | |
| Net change in deferred foreign capital gains taxes on unrealized appreciation | | | — | | | | — | | | | 3,089,305 | | | | — | | | | 4,120,779 | | |
Net change in unrealized appreciation/depreciation on foreign
currency related transactions | | | 138 | | | | (6,126 | ) | | | 16,407 | | | | 4,306 | | | | (137,294 | ) | |
Net realized and unrealized gain (loss) on investments, foreign currency
related transactions and deferred taxes | | | (7,586,823 | ) | | | (51,787,041 | ) | | | (668,934,089 | ) | | | (542,636,188 | ) | | | (413,869,657 | ) | |
| NET INCREASE (DECREASE) IN NET ASSETS FROM OPERATIONS | | ($ | 6,599,520 | ) | | ($ | 49,484,662 | ) | | ($ | 636,778,122 | ) | | ($ | 518,521,978 | ) | | ($ | 408,053,621 | ) | |
* Matthews China Small Companies Fund commenced operations on May 31, 2011.
See accompanying notes to financial statements.
76 MATTHEWS ASIA FUNDS
| | | Matthews
Japan Fund | | Matthews
Korea Fund | | Matthews Asia
Small Companies
Fund | | Matthews China
Small Companies
Fund* | | Matthews Asia
Science and
Technology Fund | |
| INVESTMENT INCOME: | |
| Dividends—Unaffiliated Issuers | | $ | 2,303,500 | | | $ | 2,207,783 | | | $ | 10,429,161 | | | $ | 34,911 | | | $ | 2,949,227 | | |
| Dividends—Affiliated Issuers (Note 7) | | | — | | | | — | | | | — | | | | — | | | | — | | |
| Interest | | | — | | | | — | | | | 47 | | | | — | | | | — | | |
| Foreign withholding tax | | | (159,352 | ) | | | (374,307 | ) | | | (928,352 | ) | | | (911 | ) | | | (405,169 | ) | |
| TOTAL INVESTMENT INCOME | | | 2,144,148 | | | | 1,833,476 | | | | 9,500,856 | | | | 34,000 | | | | 2,544,058 | | |
| EXPENSES: | |
| Investment advisory fees (Note 5) | | | 831,674 | | | | 1,162,425 | | | | 4,166,270 | | | | 23,013 | | | | 1,178,002 | | |
| Administration and accounting fees (Note 5) | | | 19,773 | | | | 27,539 | | | | 65,968 | | | | 370 | | | | 27,888 | | |
| Administration and shareholder servicing fees (Note 5) | | | 262,148 | | | | 372,467 | | | | 933,458 | | | | 5,212 | | | | 385,446 | | |
| Custodian fees | | | 27,251 | | | | 52,546 | | | | 233,389 | | | | 35,480 | | | | 93,007 | | |
| Professional fees | | | 39,640 | | | | 38,939 | | | | 54,300 | | | | 15,648 | | | | 41,818 | | |
| Registration fees | | | 53,474 | | | | 47,890 | | | | 81,880 | | | | 571 | | | | 39,895 | | |
| Transfer agent fees | | | 171,943 | | | | 254,503 | | | | 653,413 | | | | 5,320 | | | | 267,885 | | |
| Trustees fees | | | 4,257 | | | | 6,495 | | | | 17,098 | | | | 63 | | | | 6,728 | | |
| Offering costs (Note 2-E) | | | — | | | | — | | | | — | | | | 16,817 | | | | — | | |
| Other expenses | | | 78,768 | | | | 81,475 | | | | 140,438 | | | | 20,771 | | | | 94,749 | | |
| TOTAL EXPENSES | | | 1,488,928 | | | | 2,044,279 | | | | 6,346,214 | | | | 123,265 | | | | 2,135,418 | | |
| Advisory fees waived and expenses waived or reimbursed (Note 5) | | | — | | | | — | | | | — | | | | (76,945 | ) | | | — | | |
| NET EXPENSES | | | 1,488,928 | | | | 2,044,279 | | | | 6,346,214 | | | | 46,320 | | | | 2,135,418 | | |
| NET INVESTMENT INCOME (LOSS) | | | 655,220 | | | | (210,803 | ) | | | 3,154,642 | | | | (12,320 | ) | | | 408,640 | | |
REALIZED AND UNREALIZED GAIN (LOSS) ON INVESTMENTS,
FOREIGN CURRENCY RELATED TRANSACTIONS AND DEFERRED TAXES: | |
| Net realized gain (loss) on investments—Unaffiliated Issuers | | | (4,002,094 | ) | | | 1,334,166 | | | | 35,159,572 | | | | (116,490 | ) | | | 12,893,903 | | |
| Net realized gain (loss) on investments—Affiliated Issuers | | | — | | | | — | | | | — | | | | — | | | | — | | |
| Net realized foreign capital gain tax or refund | | | — | | | | — | | | | (9,150 | ) | | | — | | | | — | | |
| Net realized gain (loss) on foreign currency related transactions | | | (1,712 | ) | | | 995 | | | | (147,392 | ) | | | 295 | | | | (19,483 | ) | |
| Net change in unrealized appreciation/depreciation on investments | | | (8,805,712 | ) | | | (14,439,793 | ) | | | (132,813,125 | ) | | | (1,254,680 | ) | | | (45,054,545 | ) | |
| Net change in deferred foreign capital gains taxes on unrealized appreciation | | | — | | | | — | | | | 1,174,891 | | | | — | | | | — | | |
Net change in unrealized appreciation/depreciation on foreign
currency related transactions | | | 266 | | | | (7,059 | ) | | | (1,040 | ) | | | 1 | | | | (184 | ) | |
Net realized and unrealized gain (loss) on investments, foreign currency
related transactions and deferred taxes | | | (12,809,252 | ) | | | (13,111,691 | ) | | | (96,636,244 | ) | | | (1,370,874 | ) | | | (32,180,309 | ) | |
| NET INCREASE (DECREASE) IN NET ASSETS FROM OPERATIONS | | ($ | 12,154,032 | ) | | ($ | 13,322,494 | ) | | ($ | 93,481,602 | ) | | ($ | 1,383,194 | ) | | ($ | 31,771,669 | ) | |
matthewsasia.com | 800.789.ASIA 77
Statements of Changes in Net Assets
| MATTHEWS ASIA STRATEGIC INCOME FUND | | Period Ended
December 31, 20111 | |
| OPERATIONS: | |
| Net investment income (loss) | | $ | 20,982 | | |
| Net realized gain (loss) on investments and foreign currency related transactions | | | 380 | | |
Net change in unrealized appreciation/depreciation on investments and foreign currency
related transactions | | | (82,280 | ) | |
| Net change on deferred foreign capital gains taxes on unrealized appreciation | | | (1,249 | ) | |
| Net increase (decrease) in net assets resulting from operations | | | (62,167 | ) | |
| DISTRIBUTIONS TO SHAREHOLDERS FROM: | |
| Net investment income: | |
| Investor Shares | | | (13,720 | ) | |
| Institutional Shares | | | (9,676 | ) | |
| Net decrease in net assets resulting from distributions | | | (23,396 | ) | |
| CAPITAL SHARE TRANSACTIONS (net) (Note 4) | | | 13,096,972 | | |
| Total increase (decrease) in net assets | | | 13,011,409 | | |
| NET ASSETS: | |
| Beginning of period | | | — | | |
| End of period (including undistributed net investment income of $1,933) | | $ | 13,011,409 | | |
1 Matthews Asia Strategic Income Fund commenced operations on November 30, 2011.
| MATTHEWS ASIAN GROWTH AND INCOME FUND | | Year Ended
December 31, 2011 | | Year Ended
December 31, 2010 | |
| OPERATIONS: | |
| Net investment income (loss) | | $ | 99,815,175 | | | $ | 76,604,783 | | |
| Net realized gain (loss) on investments and foreign currency related transactions | | | 75,127,361 | | | | 150,498,434 | | |
Net change in unrealized appreciation/depreciation on investments and foreign currency
related transactions | | | (569,899,433 | ) | | | 343,578,273 | | |
| Net change on deferred foreign capital gains taxes on unrealized appreciation | | | 2,051,108 | | | | (2,046,819 | ) | |
| Net increase (decrease) in net assets resulting from operations | | | (392,905,789 | ) | | | 568,634,671 | | |
| DISTRIBUTIONS TO SHAREHOLDERS FROM: | |
| Net investment income: | |
| Investor Shares | | | (76,967,577 | ) | | | (92,191,837 | ) | |
| Institutional Shares | | | (19,206,528 | ) | | | (1,997,268 | ) | |
| Realized gains on investments: | |
| Investor Shares | | | (93,455,486 | ) | | | (50,024,267 | ) | |
| Institutional Shares | | | (22,304,133 | ) | | | (1,658,347 | ) | |
| Net decrease in net assets resulting from distributions | | | (211,933,724 | ) | | | (145,871,719 | ) | |
| CAPITAL SHARE TRANSACTIONS (net) (Note 4) | | | (578,220,072 | ) | | | 1,083,951,101 | | |
| REDEMPTION FEES | | | 487,841 | | | | 545,556 | | |
| Total increase (decrease) in net assets | | | (1,182,571,744 | ) | | | 1,507,259,609 | | |
| NET ASSETS: | |
| Beginning of year | | | 4,054,670,579 | | | | 2,547,410,970 | | |
End of year (including distributions in excess of net investment
income of ($14,294,799) and ($20,902,803), respectively) | | $ | 2,872,098,835 | | | $ | 4,054,670,579 | | |
See accompanying notes to financial statements.
78 MATTHEWS ASIA FUNDS
| MATTHEWS ASIA DIVIDEND FUND | | Year Ended
December 31, 2011 | | Year Ended
December 31, 2010 | |
| OPERATIONS: | |
| Net investment income (loss) | | $ | 62,460,078 | | | $ | 23,389,705 | | |
| Net realized gain (loss) on investments and foreign currency related transactions | | | (46,007,986 | ) | | | 35,469,296 | | |
Net change in unrealized appreciation/depreciation on investments and foreign currency
related transactions | | | (287,624,247 | ) | | | 147,788,783 | | |
| Net increase (decrease) in net assets resulting from operations | | | (271,172,155 | ) | | | 206,647,784 | | |
| DISTRIBUTIONS TO SHAREHOLDERS FROM: | |
| Net investment income: | |
| Investor Shares | | | (55,295,897 | ) | | | (39,874,887 | ) | |
| Institutional Shares | | | (9,863,378 | ) | | | (412,958 | ) | |
| Realized gains on investments: | |
| Investor Shares | | | (9,863,184 | ) | | | (4,928,956 | ) | |
| Institutional Shares | | | (1,815,393 | ) | | | (93,543 | ) | |
| Net decrease in net assets resulting from distributions | | | (76,837,852 | ) | | | (45,310,344 | ) | |
| CAPITAL SHARE TRANSACTIONS (net) (Note 4) | | | 640,377,706 | | | | 1,497,425,914 | | |
| REDEMPTION FEES | | | 821,527 | | | | 909,607 | | |
| Total increase (decrease) in net assets | | | 293,189,226 | | | | 1,659,672,961 | | |
| NET ASSETS: | |
| Beginning of year | | | 1,981,676,307 | | | | 322,003,346 | | |
End of year (including distributions in excess of net investment
income of ($15,008,586) and ($19,822,734), respectively) | | $ | 2,274,865,533 | | | $ | 1,981,676,307 | | |
| MATTHEWS CHINA DIVIDEND FUND | | Year Ended
December 31, 2011 | | Year Ended
December 31, 2010 | |
| OPERATIONS: | |
| Net investment income (loss) | | $ | 987,303 | | | $ | 321,907 | | |
| Net realized gain (loss) on investments and foreign currency related transactions | | | (475,091 | ) | | | 173,576 | | |
Net change in unrealized appreciation/depreciation on investments and foreign currency
related transactions | | | (7,111,732 | ) | | | 4,708,057 | | |
| Net increase (decrease) in net assets resulting from operations | | | (6,599,520 | ) | | | 5,203,540 | | |
| DISTRIBUTIONS TO SHAREHOLDERS FROM: | |
| Net investment income: | |
| Investor Shares | | | (1,063,869 | ) | | | (592,422 | ) | |
| Institutional Shares | | | (425 | ) | | | (37 | ) | |
| Realized gains on investments: | |
| Investor Shares | | | (51,420 | ) | | | (130,259 | ) | |
| Institutional Shares | | | (22 | ) | | | (11 | ) | |
| Net decrease in net assets resulting from distributions | | | (1,115,736 | ) | | | (722,729 | ) | |
| CAPITAL SHARE TRANSACTIONS (net) (Note 4) | | | (11,203,204 | ) | | | 33,729,256 | | |
| REDEMPTION FEES | | | 28,586 | | | | 23,464 | | |
| Total increase (decrease) in net assets | | | (18,889,874 | ) | | | 38,233,531 | | |
| NET ASSETS: | |
| Beginning of year | | | 45,367,989 | | | | 7,134,458 | | |
End of year (including distributions in excess of net investment
income of ($85,351) and ($234,687), respectively) | | $ | 26,478,115 | | | $ | 45,367,989 | | |
See accompanying notes to financial statements.
matthewsasia.com | 800.789.ASIA 79
Statements of Changes in Net Assets
| MATTHEWS ASIA GROWTH FUND | | Year Ended
December 31, 2011 | | Year Ended
December 31, 2010 | |
| OPERATIONS: | |
| Net investment income (loss) | | $ | 2,302,379 | | | $ | 1,626,720 | | |
| Net realized gain (loss) on investments and foreign currency related transactions | | | 3,999,688 | | | | 16,056,192 | | |
Net change in unrealized appreciation/depreciation on investments and foreign currency
related transactions | | | (55,786,729 | ) | | | 45,556,272 | | |
| Net increase (decrease) in net assets resulting from operations | | | (49,484,662 | ) | | | 63,239,184 | | |
| DISTRIBUTIONS TO SHAREHOLDERS FROM: | |
| Net investment income: | |
| Investor Shares | | | (5,881,357 | ) | | | (2,780,209 | ) | |
| Institutional Shares | | | (1,854,156 | ) | | | (75,117 | ) | |
| Net decrease in net assets resulting from distributions | | | (7,735,513 | ) | | | (2,855,326 | ) | |
| CAPITAL SHARE TRANSACTIONS (net) (Note 4) | | | 56,083,400 | | | | 56,161,288 | | |
| REDEMPTION FEES | | | 322,245 | | | | 87,020 | | |
| Total increase (decrease) in net assets | | | (814,530 | ) | | | 116,632,166 | | |
| NET ASSETS: | |
| Beginning of year | | | 344,282,682 | | | | 227,650,516 | | |
End of year (including distributions in excess of net investment
income of ($3,166,202) and ($1,243,198), respectively) | | $ | 343,468,152 | | | $ | 344,282,682 | | |
| MATTHEWS PACIFIC TIGER FUND | | Year Ended
December 31, 2011 | | Year Ended
December 31, 2010 | |
| OPERATIONS: | |
| Net investment income (loss) | | $ | 32,155,967 | | | $ | 18,824,393 | | |
| Net realized gain (loss) on investments and foreign currency related transactions | | | 201,652,647 | | | | 91,394,517 | | |
Net change in unrealized appreciation/depreciation on investments and foreign currency
related transactions | | | (873,676,041 | ) | | | 830,597,872 | | |
| Net change on deferred foreign capital gains taxes on unrealized appreciation | | | 3,089,305 | | | | 8,914,553 | | |
| Net increase (decrease) in net assets resulting from operations | | | (636,778,122 | ) | | | 949,731,335 | | |
| DISTRIBUTIONS TO SHAREHOLDERS FROM: | |
| Net investment income: | |
| Investor Shares | | | (15,129,147 | ) | | | (17,017,887 | ) | |
| Institutional Shares | | | (14,549,336 | ) | | | (1,651,056 | ) | |
| Realized gains on investments: | |
| Investor Shares | | | (44,800,205 | ) | | | — | | |
| Institutional Shares | | | (31,562,381 | ) | | | — | | |
| Net decrease in net assets resulting from distributions | | | (106,041,069 | ) | | | (18,668,943 | ) | |
| CAPITAL SHARE TRANSACTIONS (net) (Note 4) | | | (185,753,267 | ) | | | 1,239,784,297 | | |
| REDEMPTION FEES | | | 1,091,482 | | | | 620,488 | | |
| Total increase (decrease) in net assets | | | (927,480,976 | ) | | | 2,171,467,177 | | |
| NET ASSETS: | |
| Beginning of year | | | 5,737,212,188 | | | | 3,565,745,011 | | |
End of year (including distributions in excess of net investment
income of ($66,557) and ($22,666,002), respectively) | | $ | 4,809,731,212 | | | $ | 5,737,212,188 | | |
See accompanying notes to financial statements.
80 MATTHEWS ASIA FUNDS
| MATTHEWS CHINA FUND | | Year Ended
December 31, 2011 | | Year Ended
December 31, 2010 | |
| OPERATIONS: | |
| Net investment income (loss) | | $ | 24,114,210 | | | $ | 14,384,265 | | |
| Net realized gain (loss) on investments and foreign currency related transactions | | | 145,213,641 | | | | 44,898,045 | | |
Net change in unrealized appreciation/depreciation on investments and foreign currency
related transactions | | | (687,849,829 | ) | | | 303,710,525 | | |
| Net increase (decrease) in net assets resulting from operations | | | (518,521,978 | ) | | | 362,992,835 | | |
| DISTRIBUTIONS TO SHAREHOLDERS FROM: | |
| Net investment income: | |
| Investor Shares | | | (22,545,562 | ) | | | (14,473,429 | ) | |
| Institutional Shares | | | (1,635,702 | ) | | | (168,791 | ) | |
| Realized gains on investments: | |
| Investor Shares | | | (165,934,653 | ) | | | (2,087,326 | ) | |
| Institutional Shares | | | (9,954,863 | ) | | | (22,416 | ) | |
| Net decrease in net assets resulting from distributions | | | (200,070,780 | ) | | | (16,751,962 | ) | |
| CAPITAL SHARE TRANSACTIONS (net) (Note 4) | | | (138,886,741 | ) | | | 67,411,208 | | |
| REDEMPTION FEES | | | 906,432 | | | | 1,525,454 | | |
| Total increase (decrease) in net assets | | | (856,573,067 | ) | | | 415,177,535 | | |
| NET ASSETS: | |
| Beginning of year | | | 2,981,182,844 | | | | 2,566,005,309 | | |
End of year (including distributions in excess of net investment
income of $0 and ($14,747), respectively) | | $ | 2,124,609,777 | | | $ | 2,981,182,844 | | |
| MATTHEWS INDIA FUND | | Year Ended
December 31, 2011 | | Year Ended
December 31, 2010 | |
| OPERATIONS: | |
| Net investment income (loss) | | $ | 5,816,036 | | | $ | 2,529,817 | | |
| Net realized gain (loss) on investments and foreign currency related transactions | | | 102,093,230 | | | | (5,745,300 | ) | |
Net change in unrealized appreciation/depreciation on investments and foreign currency
related transactions | | | (520,083,666 | ) | | | 271,504,466 | | |
| Net change on deferred foreign capital gains taxes on unrealized appreciation | | | 4,120,779 | | | | (4,120,779 | ) | |
| Net increase (decrease) in net assets resulting from operations | | | (408,053,621 | ) | | | 264,168,204 | | |
| DISTRIBUTIONS TO SHAREHOLDERS FROM: | |
| Net investment income: | |
| Investor Shares | | | (2,862,404 | ) | | | (5,993,112 | ) | |
| Institutional Shares | | | (132,371 | ) | | | (227,962 | ) | |
| Net decrease in net assets resulting from distributions | | | (2,994,775 | ) | | | (6,221,074 | ) | |
| CAPITAL SHARE TRANSACTIONS (net) (Note 4) | | | (440,540,693 | ) | | | 457,321,120 | | |
| REDEMPTION FEES | | | 835,135 | | | | 817,039 | | |
| Total increase (decrease) in net assets | | | (850,753,954 | ) | | | 716,085,289 | | |
| NET ASSETS: | |
| Beginning of year | | | 1,437,010,652 | | | | 720,925,363 | | |
End of year (including undistributed/(distributions in excess of) net investment
income of $2,998,043 and ($5,284,949), respectively) | | $ | 586,256,698 | | | $ | 1,437,010,652 | | |
See accompanying notes to financial statements.
matthewsasia.com | 800.789.ASIA 81
Statements of Changes in Net Assets
| MATTHEWS JAPAN FUND | | Year Ended
December 31, 2011 | | Year Ended
December 31, 2010 | |
| OPERATIONS: | |
| Net investment income (loss) | | $ | 655,220 | | | $ | 90,963 | | |
| Net realized gain (loss) on investments and foreign currency related transactions | | | (4,003,806 | ) | | | 8,317,842 | | |
Net change in unrealized appreciation/depreciation on investments and foreign currency
related transactions | | | (8,805,446 | ) | | | 2,542,678 | | |
| Net increase (decrease) in net assets resulting from operations | | | (12,154,032 | ) | | | 10,951,483 | | |
| DISTRIBUTIONS TO SHAREHOLDERS FROM: | |
| Net investment income: | |
| Investor Shares | | | (2,022,578 | ) | | | (2,536,351 | ) | |
| Institutional Shares | | | (583,768 | ) | | | (146 | ) | |
| Net decrease in net assets resulting from distributions | | | (2,606,346 | ) | | | (2,536,497 | ) | |
| CAPITAL SHARE TRANSACTIONS (net) (Note 4) | | | 78,411,635 | | | | (28,960,845 | ) | |
| REDEMPTION FEES | | | 209,844 | | | | 21,817 | | |
| Total increase (decrease) in net assets | | | 63,861,101 | | | | (20,524,042 | ) | |
| NET ASSETS: | |
| Beginning of year | | | 67,809,694 | | | | 88,333,736 | | |
End of year (including undistributed/(distributions in excess of) net investment
income of ($612,266) and $606,804, respectively) | | $ | 131,670,795 | | | $ | 67,809,694 | | |
| MATTHEWS KOREA FUND | | Year Ended
December 31, 2011 | | Year Ended
December 31, 2010 | |
| OPERATIONS: | |
| Net investment income (loss) | | ($ | 210,803 | ) | | $ | 230,963 | | |
| Net realized gain (loss) on investments and foreign currency related transactions | | | 1,335,161 | | | | 10,147,269 | | |
Net change in unrealized appreciation/depreciation on investments and foreign currency
related transactions | | | (14,446,852 | ) | | | 19,676,780 | | |
| Net increase (decrease) in net assets resulting from operations | | | (13,322,494 | ) | | | 30,055,012 | | |
| DISTRIBUTIONS TO SHAREHOLDERS FROM: | |
| Net investment income: | |
| Investor Shares | | | (218,988 | ) | | | — | | |
| Institutional Shares | | | (23,737 | ) | | | — | | |
| Realized gains on investments: | |
| Investor Shares | | | (6,521,874 | ) | | | (3,500,097 | ) | |
| Institutional Shares | | | (706,903 | ) | | | (78 | ) | |
| Net decrease in net assets resulting from distributions | | | (7,471,502 | ) | | | (3,500,175 | ) | |
| CAPITAL SHARE TRANSACTIONS (net) (Note 4) | | | 10,383,940 | | | | 2,032,660 | | |
| REDEMPTION FEES | | | 115,820 | | | | 35,800 | | |
| Total increase (decrease) in net assets | | | (10,294,236 | ) | | | 28,623,297 | | |
| NET ASSETS: | |
| Beginning of year | | | 166,993,865 | | | | 138,370,568 | | |
End of year (including undistributed/(distributions in excess of) net investment
income of ($10,635) and $236,840, respectively) | | $ | 156,699,629 | | | $ | 166,993,865 | | |
See accompanying notes to financial statements.
82 MATTHEWS ASIA FUNDS
| MATTHEWS ASIA SMALL COMPANIES FUND | | Year Ended
December 31, 2011 | | Year Ended
December 31, 2010 | |
| OPERATIONS: | |
| Net investment income (loss) | | $ | 3,154,642 | | | $ | 604,578 | | |
| Net realized gain (loss) on investments and foreign currency related transactions | | | 35,003,030 | | | | 6,032,279 | | |
Net change in unrealized appreciation/depreciation on investments and foreign currency
related transactions | | | (132,814,165 | ) | | | 73,991,741 | | |
| Net change on deferred foreign capital gains taxes on unrealized appreciation | | | 1,174,891 | | | | (535,102 | ) | |
| Net increase (decrease) in net assets resulting from operations | | | (93,481,602 | ) | | | 80,093,496 | | |
| DISTRIBUTIONS TO SHAREHOLDERS FROM: | |
| Net investment income: | |
| Investor Shares | | | (2,890,029 | ) | | | (2,294,432 | ) | |
| Realized gains on investments: | |
| Investor Shares | | | (34,232,017 | ) | | | (3,830,305 | ) | |
| Net decrease in net assets resulting from distributions | | | (37,122,046 | ) | | | (6,124,737 | ) | |
| CAPITAL SHARE TRANSACTIONS (net) (Note 4) | | | (157,938,046 | ) | | | 363,169,767 | | |
| REDEMPTION FEES | | | 391,117 | | | | 230,232 | | |
| Total increase (decrease) in net assets | | | (288,150,577 | ) | | | 437,368,758 | | |
| NET ASSETS: | |
| Beginning of year | | | 547,094,319 | | | | 109,725,561 | | |
End of year (including distributions in excess of net investment
income of ($99,789) and ($1,827,088), respectively) | | $ | 258,943,742 | | | $ | 547,094,319 | | |
| MATTHEWS CHINA SMALL COMPANIES FUND | | Period Ended
December 31, 20111 | |
| OPERATIONS: | |
| Net investment income (loss) | | ($ | 12,320 | ) | |
| Net realized gain (loss) on investments and foreign currency related transactions | | | (116,195 | ) | |
Net change in unrealized appreciation/depreciation on investments and foreign currency
related transactions | | | (1,254,679 | ) | |
| Net increase (decrease) in net assets resulting from operations | | | (1,383,194 | ) | |
| DISTRIBUTIONS TO SHAREHOLDERS FROM: | |
| Net investment income: | |
| Investor Shares | | | (5,954 | ) | |
| Net decrease in net assets resulting from distributions | | | (5,954 | ) | |
| CAPITAL SHARE TRANSACTIONS (net) (Note 4) | | | 5,867,611 | | |
| REDEMPTION FEES | | | 14,835 | | |
| Total increase (decrease) in net assets | | | 4,493,298 | | |
| NET ASSETS: | |
| Beginning of period | | | — | | |
| End of period | | $ | 4,493,298 | | |
1 Matthews China Small Companies Fund commenced operations on May 31, 2011.
See accompanying notes to financial statements.
matthewsasia.com | 800.789.ASIA 83
Statements of Changes in Net Assets
| MATTHEWS ASIA SCIENCE AND TECHNOLOGY FUND | | Year Ended
December 31, 2011 | | Year Ended
December 31, 2010 | |
| OPERATIONS: | |
| Net investment income (loss) | | $ | 408,640 | | | $ | 530,227 | | |
| Net realized gain (loss) on investments and foreign currency related transactions | | | 12,874,420 | | | | 13,849,384 | | |
Net change in unrealized appreciation/depreciation on investments and foreign currency
related transactions | | | (45,054,729 | ) | | | 18,114,654 | | |
| Net increase (decrease) in net assets resulting from operations | | | (31,771,669 | ) | | | 32,494,265 | | |
| DISTRIBUTIONS TO SHAREHOLDERS FROM: | |
| Net investment income: | |
| Investor Shares | | | (454,558 | ) | | | (394,719 | ) | |
| Net decrease in net assets resulting from distributions | | | (454,558 | ) | | | (394,719 | ) | |
| CAPITAL SHARE TRANSACTIONS (net) (Note 4) | | | (5,021,334 | ) | | | 27,882,481 | | |
| REDEMPTION FEES | | | 160,697 | | | | 86,625 | | |
| Total increase (decrease) in net assets | | | (37,086,864 | ) | | | 60,068,652 | | |
| NET ASSETS: | |
| Beginning of year | | | 190,435,763 | | | | 130,367,111 | | |
End of year (including undistributed net investment
income of $66,138 and $131,538, respectively) | | $ | 153,348,899 | | | $ | 190,435,763 | | |
See accompanying notes to financial statements.
84 MATTHEWS ASIA FUNDS
Financial Highlights
Matthews Asia Strategic Income Fund
The tables below set forth financial data for a share of beneficial interest outstanding throughout the period presented.
| INVESTOR SHARES | | Period Ended
Dec. 31, 20111 | |
| Net Asset Value, beginning of period | | $ | 10.00 | | |
| INCOME (LOSS) FROM INVESTMENT OPERATIONS: | |
| Net investment income (loss)2 | | | 0.02 | | |
Net realized gain (loss) and unrealized appreciation/depreciation
on investments and foreign currency | | | (0.07 | ) | |
| Total from investment operations | | | (0.05 | ) | |
| LESS DISTRIBUTIONS FROM: | |
| Net investment income | | | (0.02 | ) | |
| Total distributions | | | (0.02 | ) | |
| Net Asset Value, end of period | | $ | 9.93 | | |
| TOTAL RETURN | | | (0.52 | %)3 | |
| RATIOS/SUPPLEMENTAL DATA | |
| Net assets, end of period (in 000's) | | $ | 7,746 | | |
Ratio of expenses to average net assets before any reimbursement,
waiver or recapture of expenses by Advisor and Administrator (Note 5) | | | 3.20 | %4 | |
Ratio of expenses to average net assets after any reimbursement,
waiver or recapture of expenses by Advisor and Administrator | | | 1.00 | %4 | |
| Ratio of net investment income (loss) to average net assets | | | 2.06 | %4 | |
| Portfolio turnover5 | | | 3.66 | %3 | |
| INSTITUTIONAL SHARES | | Period Ended
Dec. 31, 20111 | |
| Net Asset Value, beginning of period | | $ | 10.00 | | |
| INCOME (LOSS) FROM INVESTMENT OPERATIONS: | |
| Net investment income (loss)2 | | | 0.02 | | |
Net realized gain (loss) and unrealized appreciation/depreciation
on investments and foreign currency | | | (0.07 | ) | |
| Total from investment operations | | | (0.05 | ) | |
| LESS DISTRIBUTIONS FROM: | |
| Net investment income | | | (0.02 | ) | |
| Total distributions | | | (0.02 | ) | |
| Net Asset Value, end of period | | $ | 9.93 | | |
| TOTAL RETURN | | | (0.52 | %)3 | |
| RATIOS/SUPPLEMENTAL DATA | |
| Net assets, end of period (in 000's) | | $ | 5,266 | | |
Ratio of expenses to average net assets before any reimbursement,
waiver or recapture of expenses by Advisor and Administrator (Note 5) | | | 3.20 | %4 | |
Ratio of expenses to average net assets after any reimbursement,
waiver or recapture of expenses by Advisor and Administrator | | | 1.00 | %4 | |
| Ratio of net investment income (loss) to average net assets | | | 1.96 | %4 | |
| Portfolio turnover5 | | | 3.66 | %3 | |
1 Commencement of operations on November 30, 2011.
2 Calculated using the average daily shares method.
3 Not annualized.
4 Annualized.
5 The portfolio turnover rate is calculated on the Fund as a whole without distinguishing between classes of shares issued.
See accompanying notes to financial statements.
matthewsasia.com | 800.789.ASIA 85
Financial Highlights
Matthews Asian Growth and Income Fund
The tables below set forth financial data for a share of beneficial interest outstanding throughout each period presented.
| | | Year ended Dec. 31 | |
| INVESTOR SHARES | | 2011 | | 2010 | | 2009 | | 2008 | | 2007 | |
| Net Asset Value, beginning of year | | $ | 18.04 | | | $ | 15.77 | | | $ | 11.50 | | | $ | 19.78 | | | $ | 18.68 | | |
| INCOME (LOSS) FROM INVESTMENT OPERATIONS: | |
| Net investment income (loss) | | | 0.471 | | | | 0.411 | | | | 0.481 | | | | 0.541 | | | | 1.07 | | |
Net realized gain (loss) and unrealized appreciation/depreciation
on investments and foreign currency | | | (2.36 | ) | | | 2.57 | | | | 4.23 | | | | (6.73 | ) | | | 2.93 | | |
| Total from investment operations | | | (1.89 | ) | | | 2.98 | | | | 4.71 | | | | (6.19 | ) | | | 4.00 | | |
| LESS DISTRIBUTIONS FROM: | |
| Net investment income | | | (0.47 | ) | | | (0.47 | ) | | | (0.44 | ) | | | (0.42 | ) | | | (0.90 | ) | |
| Net realized gains on investments | | | (0.61 | ) | | | (0.24 | ) | | | — | | | | (1.67 | ) | | | (2.00 | ) | |
| Total distributions | | | (1.08 | ) | | | (0.71 | ) | | | (0.44 | ) | | | (2.09 | ) | | | (2.90 | ) | |
| Paid-in capital from redemption fees (Note 4) | | | —2 | | | | —2 | | | | —2 | | | | —2 | | | | —2 | | |
| Net Asset Value, end of year | | $ | 15.07 | | | $ | 18.04 | | | $ | 15.77 | | | $ | 11.50 | | | $ | 19.78 | | |
| TOTAL RETURN | | | (10.62 | %) | | | 19.18 | % | | | 41.44 | % | | | (32.07 | %) | | | 21.54 | % | |
| RATIOS/SUPPLEMENTAL DATA | |
| Net assets, end of year (in 000's) | | $ | 2,340,606 | | | $ | 3,926,253 | | | $ | 2,547,411 | | | $ | 1,089,712 | | | $ | 2,273,408 | | |
Ratio of expenses to average net assets before any reimbursement,
waiver or recapture of expenses by Advisor and Administrator (Note 5) | | | 1.12 | % | | | 1.13 | % | | | 1.18 | % | | | 1.16 | % | | | 1.16 | % | |
Ratio of expenses to average net assets after any reimbursement,
waiver or recapture of expenses by Advisor and Administrator | | | 1.12 | % | | | 1.13 | % | | | 1.18 | % | | | 1.16 | % | | | 1.15 | % | |
| Ratio of net investment income (loss) to average net assets | | | 2.71 | % | | | 2.47 | % | | | 3.47 | % | | | 3.19 | % | | | 2.59 | % | |
| Portfolio turnover | | | 16.54 | %3 | | | 19.84 | %3 | | | 17.51 | % | | | 25.16 | % | | | 27.93 | % | |
INSTITUTIONAL SHARES | | Year Ended
Dec. 31, 2011 | | Period Ended
Dec. 31, 20104 | |
| Net Asset Value, beginning of period | | $ | 18.04 | | | $ | 18.13 | | |
| INCOME (LOSS) FROM INVESTMENT OPERATIONS: | |
| Net investment income (loss)1 | | | 0.52 | | | | 0.07 | | |
Net realized gain (loss) and unrealized appreciation/depreciation
on investments and foreign currency | | | (2.39 | ) | | | 0.37 | | |
| Total from investment operations | | | (1.87 | ) | | | 0.44 | | |
| LESS DISTRIBUTIONS FROM: | |
| Net investment income | | | (0.50 | ) | | | (0.29 | ) | |
| Net realized gains on investments | | | (0.61 | ) | | | (0.24 | ) | |
| Total distributions | | | (1.11 | ) | | | (0.53 | ) | |
| Paid-in capital from redemption fees (Note 4) | | | —2 | | | | — | | |
| Net Asset Value, end of period | | $ | 15.06 | | | $ | 18.04 | | |
| TOTAL RETURN | | | (10.54 | %) | | | 2.49 | %5 | |
| RATIOS/SUPPLEMENTAL DATA | |
| Net assets, end of period (in 000's) | | $ | 531,493 | | | $ | 128,417 | | |
| Ratio of expenses to average net assets | | | 0.99 | % | | | 0.93 | %6 | |
| Ratio of net investment income (loss) to average net assets | | | 3.05 | % | | | 2.46 | %6 | |
| Portfolio turnover3 | | | 16.54 | % | | | 19.84 | %5 | |
1 Calculated using the average daily shares method.
2 Less than $0.01 per share.
3 The portfolio turnover rate is calculated on the Fund as a whole without distinguishing between classes of shares issued.
4 Institutional Shares commenced operations on October 29, 2010.
5 Not annualized.
6 Annualized.
See accompanying notes to financial statements.
86 MATTHEWS ASIA FUNDS
Matthews Asia Dividend Fund
The tables below set forth financial data for a share of beneficial interest outstanding throughout each period presented.
| | | Year ended Dec. 31 | |
| INVESTOR SHARES | | 2011 | | 2010 | | 2009 | | 2008 | | 2007 | |
| Net Asset Value, beginning of year | | $ | 14.33 | | | $ | 12.06 | | | $ | 8.61 | | | $ | 12.00 | | | $ | 10.77 | | |
| INCOME (LOSS) FROM INVESTMENT OPERATIONS: | |
| Net investment income (loss) | | | 0.361 | | | | 0.311 | | | | 0.321 | | | | 0.381 | | | | 0.27 | | |
Net realized gain (loss) and unrealized appreciation/depreciation
on investments and foreign currency | | | (1.78 | ) | | | 2.40 | | | | 3.67 | | | | (3.47 | ) | | | 1.67 | | |
| Total from investment operations | | | (1.42 | ) | | | 2.71 | | | | 3.99 | | | | (3.09 | ) | | | 1.94 | | |
| LESS DISTRIBUTIONS FROM: | |
| Net investment income | | | (0.37 | ) | | | (0.41 | ) | | | (0.55 | ) | | | (0.30 | ) | | | (0.27 | ) | |
| Net realized gains on investments | | | (0.06 | ) | | | (0.04 | ) | | | — | | | | (0.02 | ) | | | (0.45 | ) | |
| Total distributions | | | (0.43 | ) | | | (0.45 | ) | | | (0.55 | ) | | | (0.32 | ) | | | (0.72 | ) | |
| Paid-in capital from redemption fees (Note 4) | | | —2 | | | | 0.01 | | | | 0.01 | | | | 0.02 | | | | 0.01 | | |
| Net Asset Value, end of year | | $ | 12.48 | | | $ | 14.33 | | | $ | 12.06 | | | $ | 8.61 | | | $ | 12.00 | | |
| TOTAL RETURN | | | (10.02 | %) | | | 22.83 | % | | | 47.59 | % | | | (25.97 | %) | | | 18.05 | % | |
| RATIOS/SUPPLEMENTAL DATA | |
| Net assets, end of year (in 000's) | | $ | 1,930,363 | | | $ | 1,933,383 | | | $ | 322,003 | | | $ | 141,951 | | | $ | 81,624 | | |
Ratio of expenses to average net assets before any reimbursement,
waiver or recapture of expenses by Advisor and Administrator (Note 5) | | | 1.10 | % | | | 1.14 | % | | | 1.28 | % | | | 1.35 | % | | | 1.42 | % | |
Ratio of expenses to average net assets after any reimbursement,
waiver or recapture of expenses by Advisor and Administrator | | | 1.10 | % | | | 1.15 | % | | | 1.30 | % | | | 1.32 | % | | | 1.39 | % | |
| Ratio of net investment income (loss) to average net assets | | | 2.61 | % | | | 2.31 | % | | | 3.16 | % | | | 3.74 | % | | | 2.66 | % | |
| Portfolio turnover | | | 16.48 | %3 | | | 10.48 | %3 | | | 32.41 | % | | | 25.07 | % | | | 26.95 | % | |
| INSTITUTIONAL SHARES | | Year Ended
Dec. 31, 2011 | | Period Ended
Dec. 31, 20104 | |
| Net Asset Value, beginning of period | | $ | 14.33 | | | $ | 14.13 | | |
| INCOME (LOSS) FROM INVESTMENT OPERATIONS: | |
| Net investment income (loss)1 | | | 0.41 | | | | 0.09 | | |
Net realized gain (loss) and unrealized appreciation/depreciation
on investments and foreign currency | | | (1.82 | ) | | | 0.32 | | |
| Total from investment operations | | | (1.41 | ) | | | 0.41 | | |
| LESS DISTRIBUTIONS FROM: | |
| Net investment income | | | (0.38 | ) | | | (0.17 | ) | |
| Net realized gains on investments | | | (0.06 | ) | | | (0.04 | ) | |
| Total distributions | | | (0.44 | ) | | | (0.21 | ) | |
| Paid-in capital from redemption fees (Note 4)2 | | | — | | | | — | | |
| Net Asset Value, end of period | | $ | 12.48 | | | $ | 14.33 | | |
| TOTAL RETURN | | | (9.93 | %) | | | 2.95 | %5 | |
| RATIOS/SUPPLEMENTAL DATA | |
| Net assets, end of period (in 000's) | | $ | 344,502 | | | $ | 48,293 | | |
| Ratio of expenses to average net assets | | | 1.00 | % | | | 1.02 | %6 | |
| Ratio of net investment income (loss) to average net assets | | | 3.03 | % | | | 3.86 | %6 | |
| Portfolio turnover3 | | | 16.48 | % | | | 10.48 | %5 | |
1 Calculated using the average daily shares method.
2 Less than $0.01 per share.
3 The portfolio turnover rate is calculated on the Fund as a whole without distinguishing between classes of shares issued.
4 Institutional Shares commenced operations on October 29, 2010.
5 Not annualized.
6 Annualized.
See accompanying notes to financial statements.
matthewsasia.com | 800.789.ASIA 87
Financial Highlights
Matthews China Dividend Fund
The tables below set forth financial data for a share of beneficial interest outstanding throughout each period presented.
| | | Year ended Dec. 31 | | Period Ended | |
| INVESTOR SHARES | | 2011 | | 2010 | | Dec. 31, 20091 | |
| Net Asset Value, beginning of period | | $ | 12.17 | | | $ | 10.18 | | | $ | 10.00 | | |
| INCOME (LOSS) FROM INVESTMENT OPERATIONS: | |
| Net investment income (loss)2 | | | 0.29 | | | | 0.17 | | | | (0.01 | ) | |
Net realized gain (loss) and unrealized appreciation/depreciation
on investments and foreign currency | | | (2.04 | ) | | | 2.09 | | | | 0.19 | | |
| Total from investment operations | | | (1.75 | ) | | | 2.26 | | | | 0.18 | | |
| LESS DISTRIBUTIONS FROM: | |
| Net investment income | | | (0.35 | ) | | | (0.24 | ) | | | — | | |
| Net realized gains on investments | | | (0.02 | ) | | | (0.04 | ) | | | — | | |
| Total distributions | | | (0.37 | ) | | | (0.28 | ) | | | — | | |
| Paid-in capital from redemption fees (Note 4) | | | 0.01 | | | | 0.01 | | | | —3 | | |
| Net Asset Value, end of period | | $ | 10.06 | | | $ | 12.17 | | | $ | 10.18 | | |
| TOTAL RETURN | | | (14.44 | %) | | | 22.53 | % | | | 1.80 | %4 | |
| RATIOS/SUPPLEMENTAL DATA | |
| Net assets, end of period (in 000's) | | $ | 26,467 | | | $ | 45,364 | | | $ | 7,134 | | |
Ratio of expenses to average net assets before any reimbursement or
waiver or recapture of expenses by Advisor and Administrator (Note 5) | | | 1.52 | % | | | 1.95 | % | | | 10.50 | %5 | |
Ratio of expenses to average net assets after any reimbursement or
waiver or recapture of expenses by Advisor and Administrator | | | 1.50 | % | | | 1.50 | % | | | 1.50 | %5 | |
| Ratio of net investment income (loss) to average net assets | | | 2.47 | % | | | 1.49 | % | | | (0.81 | %)5 | |
| Portfolio turnover | | | 22.31 | %6 | | | 6.84 | %6 | | | 0.00 | %4 | |
| INSTITUTIONAL SHARES | | Year Ended
Dec. 31, 2011 | | Period Ended
Dec 31, 20107 | |
| Net Asset Value, beginning of period | | $ | 12.17 | | | $ | 11.87 | | |
| INCOME (LOSS) FROM INVESTMENT OPERATIONS: | |
| Net investment income (loss)2 | | | 0.30 | | | | —3 | | |
Net realized gain (loss) and unrealized appreciation/depreciation
on investments and foreign currency | | | (2.01 | ) | | | 0.47 | | |
| Total from investment operations | | | (1.71 | ) | | | 0.47 | | |
| LESS DISTRIBUTIONS FROM: | |
| Net investment income | | | (0.38 | ) | | | (0.13 | ) | |
| Net realized gains on investments | | | (0.02 | ) | | | (0.04 | ) | |
| Total distributions | | | (0.40 | ) | | | (0.17 | ) | |
| Paid-in capital from redemption fees (Note 4) | | | —3 | | | | — | | |
| Net Asset Value, end of period | | $ | 10.06 | | | $ | 12.17 | | |
| TOTAL RETURN | | | (14.22 | %) | | | 3.91 | %4 | |
| RATIOS/SUPPLEMENTAL DATA | |
| Net assets, end of period (in 000's) | | $ | 12 | | | $ | 4 | | |
| Ratio of expenses to average net assets | | | 1.31 | % | | | 1.24 | %5 | |
| Ratio of net investment income (loss) to average net assets | | | 2.61 | % | | | (0.06 | %)5 | |
| Portfolio turnover6 | | | 22.31 | % | | | 6.84 | %4 | |
1 Investor Shares commenced operations on November 30, 2009.
2 Calculated using the average daily shares method.
3 Less than $0.01 per share.
4 Not annualized.
5 Annualized.
6 The portfolio turnover rate is calculated on the Fund as a whole without distinguishing between classes of shares issued.
7 Institutional Shares commenced operations on October 29, 2010.
See accompanying notes to financial statements.
88 MATTHEWS ASIA FUNDS
Matthews Asia Growth Fund
The tables below set forth financial data for a share of beneficial interest outstanding throughout each period presented.
| | | Year ended Dec. 31 | |
| INVESTOR SHARES | | 2011 | | 2010 | | 2009 | | 2008 | | 2007 | |
| Net Asset Value, beginning of year | | $ | 17.97 | | | $ | 14.29 | | | $ | 10.03 | | | $ | 17.29 | | | $ | 16.92 | | |
| INCOME (LOSS) FROM INVESTMENT OPERATIONS: | |
| Net investment income (loss) | | | 0.111 | | | | 0.101 | | | | 0.061 | | | | 0.131 | | | | 0.09 | | |
Net realized gain (loss) and unrealized appreciation/depreciation
on investments and foreign currency | | | (2.41 | ) | | | 3.72 | | | | 4.44 | | | | (6.64 | ) | | | 2.02 | | |
| Total from investment operations | | | (2.30 | ) | | | 3.82 | | | | 4.50 | | | | (6.51 | ) | | | 2.11 | | |
| LESS DISTRIBUTIONS FROM: | |
| Net investment income | | | (0.35 | ) | | | (0.15 | ) | | | (0.24 | ) | | | — | | | | (0.09 | ) | |
| Net realized gains on investments | | | — | | | | — | | | | — | | | | (0.76 | ) | | | (1.66 | ) | |
| Total distributions | | | (0.35 | ) | | | (0.15 | ) | | | (0.24 | ) | | | (0.76 | ) | | | (1.75 | ) | |
| Paid-in capital from redemption fees (Note 4) | | | 0.02 | | | | 0.01 | | | | —2 | | | | 0.01 | | | | 0.01 | | |
| Net Asset Value, end of year | | $ | 15.34 | | | $ | 17.97 | | | $ | 14.29 | | | $ | 10.03 | | | $ | 17.29 | | |
| TOTAL RETURN | | | (12.70 | %) | | | 26.85 | % | | | 44.82 | % | | | (37.44 | %) | | | 11.92 | % | |
| RATIOS/SUPPLEMENTAL DATA | |
| Net assets, end of year (in 000's) | | $ | 259,166 | | | $ | 335,429 | | | $ | 227,651 | | | $ | 168,031 | | | $ | 471,054 | | |
| Ratio of expenses to average net assets | | | 1.19 | % | | | 1.19 | % | | | 1.28 | % | | | 1.23 | % | | | 1.20 | % | |
| Ratio of net investment income (loss) to average net assets | | | 0.63 | % | | | 0.63 | % | | | 0.50 | % | | | 0.93 | % | | | 0.60 | % | |
| Portfolio turnover | | | 28.06 | %3 | | | 26.33 | %3 | | | 58.10 | % | | | 37.10 | % | | | 40.49 | % | |
| INSTITUTIONAL SHARES | | Year Ended
Dec. 31, 2011 | | Period Ended
Dec. 31, 20104 | |
| Net Asset Value, beginning of period | | $ | 17.98 | | | $ | 17.65 | | |
| INCOME (LOSS) FROM INVESTMENT OPERATIONS: | |
| Net investment income (loss)1 | | | 0.14 | | | | 0.01 | | |
Net realized gain (loss) and unrealized appreciation/depreciation
on investments and foreign currency | | | (2.42 | ) | | | 0.47 | | |
| Total from investment operations | | | (2.28 | ) | | | 0.48 | | |
| LESS DISTRIBUTIONS FROM: | |
| Net investment income | | | (0.35 | ) | | | (0.15 | ) | |
| Total distributions | | | (0.35 | ) | | | (0.15 | ) | |
| Paid-in capital from redemption fees (Note 4) | | | 0.02 | | | | — | | |
| Net Asset Value, end of period | | $ | 15.37 | | | $ | 17.98 | | |
| TOTAL RETURN | | | (12.58 | %) | | | 2.76 | %5 | |
| RATIOS/SUPPLEMENTAL DATA | |
| Net assets, end of period (in 000's) | | $ | 84,302 | | | $ | 8,853 | | |
| Ratio of expenses to average net assets | | | 1.03 | % | | | 0.99 | %6 | |
| Ratio of net investment income (loss) to average net assets | | | 0.84 | % | | | 0.37 | %6 | |
| Portfolio turnover3 | | | 28.06 | % | | | 26.33 | %5 | |
1 Calculated using the average daily shares method.
2 Less than $0.01 per share.
3 The portfolio turnover rate is calculated on the Fund as a whole without distinguishing between classes of shares issued.
4 Institutional Shares commenced operations on October 29, 2010.
5 Not annualized.
6 Annualized.
See accompanying notes to financial statements.
matthewsasia.com | 800.789.ASIA 89
Financial Highlights
Matthews Pacific Tiger Fund
The tables below set forth financial data for a share of beneficial interest outstanding throughout each period presented.
| | | Year ended Dec. 31 | |
| INVESTOR SHARES | | 2011 | | 2010 | | 2009 | | 2008 | | 2007 | |
| Net Asset Value, beginning of year | | $ | 23.44 | | | $ | 19.23 | | | $ | 11.05 | | | $ | 27.86 | | | $ | 23.71 | | |
| INCOME (LOSS) FROM INVESTMENT OPERATIONS: | |
| Net investment income (loss) | | | 0.101 | | | | 0.091 | | | | 0.061 | | | | 0.241 | | | | 0.30 | | |
Net realized gain (loss) and unrealized appreciation/depreciation
on investments and foreign currency | | | (2.78 | ) | | | 4.20 | | | | 8.27 | | | | (13.31 | ) | | | 7.78 | | |
| Total from investment operations | | | (2.68 | ) | | | 4.29 | | | | 8.33 | | | | (13.07 | ) | | | 8.08 | | |
| LESS DISTRIBUTIONS FROM: | |
| Net investment income | | | (0.11 | ) | | | (0.08 | ) | | | (0.15 | ) | | | (0.30 | ) | | | (0.31 | ) | |
| Net realized gains on investments | | | (0.33 | ) | | | — | | | | — | | | | (3.44 | ) | | | (3.62 | ) | |
| Total distributions | | | (0.44 | ) | | | (0.08 | ) | | | (0.15 | ) | | | (3.74 | ) | | | (3.93 | ) | |
| Paid-in capital from redemption fees (Note 4) | | | 0.01 | | | | —2 | | | | — | | | | —2 | | | | —2 | | |
| Net Asset Value, end of year | | $ | 20.33 | | | $ | 23.44 | | | $ | 19.23 | | | $ | 11.05 | | | $ | 27.86 | | |
| TOTAL RETURN | | | (11.41 | %) | | | 22.30 | % | | | 75.37 | % | | | (46.12 | %) | | | 33.66 | % | |
| RATIOS/SUPPLEMENTAL DATA | |
| Net assets, end of year (in 000's) | | $ | 2,780,640 | | | $ | 5,196,743 | | | $ | 3,565,745 | | | $ | 1,202,441 | | | $ | 3,806,714 | | |
Ratio of expenses to average net assets before any reimbursement,
waiver or recapture of expenses by Advisor and Administrator (Note 5) | | | 1.11 | % | | | 1.09 | % | | | 1.13 | % | | | 1.12 | % | | | 1.11 | % | |
Ratio of expenses to average net assets after any reimbursement,
waiver or recapture of expenses by Advisor and Administrator | | | 1.11 | % | | | 1.09 | % | | | 1.13 | % | | | 1.12 | % | | | 1.10 | % | |
| Ratio of net investment income (loss) to average net assets | | | 0.44 | % | | | 0.43 | % | | | 0.41 | % | | | 1.10 | % | | | 1.12 | % | |
| Portfolio turnover | | | 10.51 | %3 | | | 11.43 | %3 | | | 13.22 | % | | | 16.76 | % | | | 24.09 | % | |
| INSTITUTIONAL SHARES | | Year Ended
Dec. 31, 2011 | | Period Ended
Dec. 31, 20104 | |
| Net Asset Value, beginning of period | | $ | 23.44 | | | $ | 23.37 | | |
| INCOME (LOSS) FROM INVESTMENT OPERATIONS: | |
| Net investment income (loss)1 | | | 0.23 | | | | 0.01 | | |
Net realized gain (loss) and unrealized appreciation/depreciation
on investments and foreign currency | | | (2.87 | ) | | | 0.15 | | |
| Total from investment operations | | | (2.64 | ) | | | 0.16 | | |
| LESS DISTRIBUTIONS FROM: | |
| Net investment income | | | (0.15 | ) | | | (0.09 | ) | |
| Net realized gains on investments | | | (0.33 | ) | | | — | | |
| Total distributions | | | (0.48 | ) | | | (0.09 | ) | |
| Paid-in capital from redemption fees (Note 4)2 | | | — | | | | — | | |
| Net Asset Value, end of period | | $ | 20.32 | | | $ | 23.44 | | |
| TOTAL RETURN | | | (11.28 | %) | | | 0.67 | %5 | |
| RATIOS/SUPPLEMENTAL DATA | |
| Net assets, end of period (in 000's) | | $ | 2,029,091 | | | $ | 540,469 | | |
| Ratio of expenses to average net assets | | | 0.95 | % | | | 0.95 | %6 | |
| Ratio of net investment income (loss) to average net assets | | | 1.03 | % | | | 0.38 | %6 | |
| Portfolio turnover3 | | | 10.51 | % | | | 11.43 | %5 | |
1 Calculated using the average daily shares method.
2 Less than $0.01 per share.
3 The portfolio turnover rate is calculated on the Fund as a whole without distinguishing between classes of shares issued.
4 Institutional Shares commenced operations on October 29, 2010.
5 Not annualized.
6 Annualized.
See accompanying notes to financial statements.
90 MATTHEWS ASIA FUNDS
Matthews China Fund
The tables below set forth financial data for a share of beneficial interest outstanding throughout each period presented.
| | | Year ended Dec. 31 | |
| INVESTOR SHARES | | 2011 | | 2010 | | 2009 | | 2008 | | 2007 | |
| Net Asset Value, beginning of year | | $ | 29.36 | | | $ | 25.50 | | | $ | 14.34 | | | $ | 39.73 | | | $ | 24.16 | | |
| INCOME (LOSS) FROM INVESTMENT OPERATIONS: | |
| Net investment income (loss) | | | 0.261 | | | | 0.151 | | | | 0.091 | | | | 0.301 | | | | 0.12 | | |
Net realized gain (loss) and unrealized appreciation/depreciation
on investments and foreign currency | | | (5.78 | ) | | | 3.86 | | | | 11.12 | | | | (19.78 | ) | | | 16.85 | | |
| Total from investment operations | | | (5.52 | ) | | | 4.01 | | | | 11.21 | | | | (19.48 | ) | | | 16.97 | | |
| LESS DISTRIBUTIONS FROM: | |
| Net investment income | | | (0.28 | ) | | | (0.15 | ) | | | (0.07 | ) | | | (0.33 | ) | | | (0.11 | ) | |
| Net realized gains on investments | | | (2.06 | ) | | | (0.02 | ) | | | — | | | | (5.62 | ) | | | (1.37 | ) | |
| Total distributions | | | (2.34 | ) | | | (0.17 | ) | | | (0.07 | ) | | | (5.95 | ) | | | (1.48 | ) | |
| Paid-in capital from redemption fees (Note 4) | | | 0.01 | | | | 0.02 | | | | 0.02 | | | | 0.04 | | | | 0.08 | | |
| Net Asset Value, end of year | | $ | 21.51 | | | $ | 29.36 | | | $ | 25.50 | | | $ | 14.34 | | | $ | 39.73 | | |
| TOTAL RETURN | | | (18.93 | %) | | | 15.77 | % | | | 78.30 | % | | | (48.95 | %) | | | 70.14 | % | |
| RATIOS/SUPPLEMENTAL DATA | |
| Net assets, end of year (in 000's) | | $ | 1,836,333 | | | $ | 2,939,638 | | | $ | 2,566,005 | | | $ | 781,104 | | | $ | 2,335,402 | | |
Ratio of expenses to average net assets before any reimbursement,
waiver or recapture of expenses by Advisor and Administrator (Note 5) | | | 1.13 | % | | | 1.15 | % | | | 1.21 | % | | | 1.23 | % | | | 1.18 | % | |
Ratio of expenses to average net assets after any reimbursement,
waiver or recapture of expenses by Advisor and Administrator | | | 1.13 | % | | | 1.15 | % | | | 1.21 | % | | | 1.23 | % | | | 1.17 | % | |
| Ratio of net investment income (loss) to average net assets | | | 0.93 | % | | | 0.54 | % | | | 0.46 | % | | | 1.03 | % | | | 0.49 | % | |
| Portfolio turnover | | | 8.43 | %2 | | | 9.98 | %2 | | | 5.28 | % | | | 7.91 | % | | | 22.13 | % | |
| INSTITUTIONAL SHARES | | Year Ended
Dec. 31, 2011 | | Period Ended
Dec. 31, 20103 | |
| Net Asset Value, beginning of period | | $ | 29.36 | | | $ | 30.02 | | |
| INCOME (LOSS) FROM INVESTMENT OPERATIONS: | |
| Net investment income (loss)1 | | | 0.26 | | | | (0.04 | ) | |
Net realized gain (loss) and unrealized appreciation/depreciation
on investments and foreign currency | | | (5.73 | ) | | | (0.44 | ) | |
| Total from investment operations | | | (5.47 | ) | | | (0.48 | ) | |
| LESS DISTRIBUTIONS FROM: | |
| Net investment income | | | (0.34 | ) | | | (0.16 | ) | |
| Net realized gains on investments | | | (2.06 | ) | | | (0.02 | ) | |
| Total distributions | | | (2.40 | ) | | | (0.18 | ) | |
| Paid-in capital from redemption fees (Note 4) | | | —4 | | | | — | | |
| Net Asset Value, end of period | | $ | 21.49 | | | $ | 29.36 | | |
| TOTAL RETURN | | | (18.80 | %) | | | (1.62 | %)5 | |
| RATIOS/SUPPLEMENTAL DATA | |
| Net assets, end of period (in 000's) | | $ | 288,277 | | | $ | 41,545 | | |
| Ratio of expenses to average net assets | | | 0.96 | % | | | 0.97 | %6 | |
| Ratio of net investment income (loss) to average net assets | | | 0.99 | % | | | (0.74 | %)6 | |
| Portfolio turnover2 | | | 8.43 | % | | | 9.98 | %5 | |
1 Calculated using the average daily shares method.
2 The portfolio turnover rate is calculated on the Fund as a whole without distinguishing between classes of shares issued.
3 Institutional Shares commenced operations on October 29, 2010.
4 Less than $0.01 per share.
5 Not annualized.
6 Annualized.
See accompanying notes to financial statements.
matthewsasia.com | 800.789.ASIA 91
Financial Highlights
Matthews India Fund
The tables below set forth financial data for a share of beneficial interest outstanding throughout each period presented.
| | | Year ended Dec. 31 | |
| INVESTOR SHARES | | 2011 | | 2010 | | 2009 | | 2008 | | 2007 | |
| Net Asset Value, beginning of year | | $ | 21.49 | | | $ | 16.29 | | | $ | 8.37 | | | $ | 24.44 | | | $ | 15.45 | | |
| INCOME (LOSS) FROM INVESTMENT OPERATIONS: | |
| Net investment income (loss) | | | 0.111 | | | | 0.051 | | | | 0.071 | | | | 0.031 | | | | (0.01 | ) | |
Net realized gain (loss) and unrealized appreciation/depreciation
on investments and foreign currency | | | (7.96 | ) | | | 5.22 | | | | 8.06 | | | | (15.33 | ) | | | 9.87 | | |
| Total from investment operations | | | (7.85 | ) | | | 5.27 | | | | 8.13 | | | | (15.30 | ) | | | 9.86 | | |
| LESS DISTRIBUTIONS FROM: | |
| Net investment income | | | (0.07 | ) | | | (0.09 | ) | | | (0.10 | ) | | | (0.11 | ) | | | (0.21 | ) | |
| Net realized gains on investments | | | — | | | | — | | | | (0.12 | ) | | | (0.69 | ) | | | (0.68 | ) | |
| Total distributions | | | (0.07 | ) | | | (0.09 | ) | | | (0.22 | ) | | | (0.80 | ) | | | (0.89 | ) | |
| Paid-in capital from redemption fees (Note 4) | | | 0.02 | | | | 0.02 | | | | 0.01 | | | | 0.03 | | | | 0.02 | | |
| Net Asset Value, end of year | | $ | 13.59 | | | $ | 21.49 | | | $ | 16.29 | | | $ | 8.37 | | | $ | 24.44 | | |
| TOTAL RETURN | | | (36.48 | %) | | | 32.53 | % | | | 97.25 | % | | | (62.32 | %) | | | 64.13 | % | |
| RATIOS/SUPPLEMENTAL DATA | |
| Net assets, end of year (in 000's) | | $ | 559,337 | | | $ | 1,388,892 | | | $ | 720,925 | | | $ | 317,516 | | | $ | 1,311,072 | | |
Ratio of expenses to average net assets before any reimbursement,
waiver or recapture of expenses by Advisor and Administrator (Note 5) | | | 1.18 | % | | | 1.18 | % | | | 1.27 | % | | | 1.29 | % | | | 1.29 | % | |
Ratio of expenses to average net assets after any reimbursement,
waiver or recapture of expenses by Advisor and Administrator | | | 1.18 | % | | | 1.18 | % | | | 1.27 | % | | | 1.29 | % | | | 1.28 | % | |
| Ratio of net investment income (loss) to average net assets | | | 0.58 | % | | | 0.25 | % | | | 0.59 | % | | | 0.16 | % | | | (0.04 | %) | |
| Portfolio turnover | | | 3.51 | %2 | | | 6.14 | %2 | | | 18.09 | % | | | 26.68 | % | | | 25.59 | % | |
| INSTITUTIONAL SHARES | | Year Ended
Dec. 31, 2011 | | Period Ended
Dec. 31, 20103 | |
| Net Asset Value, beginning of period | | $ | 21.48 | | | $ | 22.03 | | |
| INCOME (LOSS) FROM INVESTMENT OPERATIONS: | |
| Net investment income (loss)1 | | | 0.16 | | | | (0.02 | ) | |
Net realized gain (loss) and unrealized appreciation/depreciation
on investments and foreign currency | | | (7.96 | ) | | | (0.43 | ) | |
| Total from investment operations | | | (7.80 | ) | | | (0.45 | ) | |
| LESS DISTRIBUTIONS FROM: | |
| Net investment income | | | (0.07 | ) | | | (0.10 | ) | |
| Total distributions | | | (0.07 | ) | | | (0.10 | ) | |
| Paid-in capital from redemption fees (Note 4) | | | —4 | | | | — | | |
| Net Asset Value, end of period | | $ | 13.61 | | | $ | 21.48 | | |
| TOTAL RETURN | | | (36.35 | %) | | | (2.01 | %)5 | |
| RATIOS/SUPPLEMENTAL DATA | |
| Net assets, end of period (in 000's) | | $ | 26,920 | | | $ | 48,119 | | |
| Ratio of expenses to average net assets | | | 0.99 | % | | | 0.99 | %6 | |
| Ratio of net investment income (loss) to average net assets | | | 0.86 | % | | | (0.51 | %)6 | |
| Portfolio turnover2 | | | 3.51 | % | | | 6.14 | %5 | |
1 Calculated using the average daily shares method.
2 The portfolio turnover rate is calculated on the Fund as a whole without distinguishing between classes of shares issued.
3 Institutional Shares commenced operations on October 29, 2010.
4 Less than $0.01 per share.
5 Not annualized.
6 Annualized.
See accompanying notes to financial statements.
92 MATTHEWS ASIA FUNDS
Matthews Japan Fund
The tables below set forth financial data for a share of beneficial interest outstanding throughout each period presented.
| | | Year ended Dec. 31 | |
| INVESTOR SHARES | | 2011 | | 2010 | | 2009 | | 2008 | | 2007 | |
| Net Asset Value, beginning of year | | $ | 12.53 | | | $ | 10.91 | | | $ | 10.19 | | | $ | 14.55 | | | $ | 17.29 | | |
| INCOME (LOSS) FROM INVESTMENT OPERATIONS: | |
| Net investment income (loss) | | | 0.071 | | | | 0.021 | | | | 0.101 | | | | 0.111 | | | | 0.03 | | |
Net realized gain (loss) and unrealized appreciation/depreciation
on investments and foreign currency | | | (1.06 | ) | | | 2.09 | | | | 0.92 | | | | (4.26 | ) | | | (1.86 | ) | |
| Total from investment operations | | | (0.99 | ) | | | 2.11 | | | | 1.02 | | | | (4.15 | ) | | | (1.83 | ) | |
| LESS DISTRIBUTIONS FROM: | |
| Net investment income | | | (0.22 | ) | | | (0.49 | ) | | | (0.31 | ) | | | — | | | | (0.01 | ) | |
| Net realized gains on investments | | | — | | | | — | | | | — | | | | (0.22 | ) | | | (0.91 | ) | |
| Total distributions | | | (0.22 | ) | | | (0.49 | ) | | | (0.31 | ) | | | (0.22 | ) | | | (0.92 | ) | |
| Paid-in capital from redemption fees (Note 4) | | | 0.02 | | | | —2 | | | | 0.01 | | | | 0.01 | | | | 0.01 | | |
| Net Asset Value, end of year | | $ | 11.34 | | | $ | 12.53 | | | $ | 10.91 | | | $ | 10.19 | | | $ | 14.55 | | |
| TOTAL RETURN | | | (7.72 | %) | | | 19.58 | % | | | 10.06 | % | | | (28.38 | %) | | | (10.96 | %) | |
| RATIOS/SUPPLEMENTAL DATA | |
| Net assets, end of year (in 000's) | | $ | 101,369 | | | $ | 67,805 | | | $ | 88,334 | | | $ | 123,674 | | | $ | 166,860 | | |
Ratio of expenses to average net assets before any reimbursement,
waiver or recapture of expenses by Advisor and Administrator (Note 5) | | | 1.22 | % | | | 1.30 | % | | | 1.31 | % | | | 1.23 | % | | | 1.24 | % | |
Ratio of expenses to average net assets after any reimbursement,
waiver or recapture of expenses by Advisor and Administrator | | | 1.22 | % | | | 1.30 | % | | | 1.31 | % | | | 1.23 | % | | | 1.23 | % | |
| Ratio of net investment income (loss) to average net assets | | | 0.54 | % | | | 0.13 | % | | | 0.97 | % | | | 0.84 | % | | | (0.01 | %) | |
| Portfolio turnover | | | 34.94 | %3 | | | 46.29 | %3 | | | 126.75 | % | | | 88.97 | % | | | 45.51 | % | |
| INSTITUTIONAL SHARES | | Year Ended
Dec. 31, 2011 | | Period Ended
Dec. 31, 20104 | |
| Net Asset Value, beginning of period | | $ | 12.53 | | | $ | 11.73 | | |
| INCOME (LOSS) FROM INVESTMENT OPERATIONS: | |
| Net investment income (loss)1 | | | 0.06 | | | | (0.01 | ) | |
Net realized gain (loss) and unrealized appreciation/depreciation
on investments and foreign currency | | | (1.04 | ) | | | 1.30 | | |
| Total from investment operations | | | (0.98 | ) | | | 1.29 | | |
| LESS DISTRIBUTIONS FROM: | |
| Net investment income | | | (0.22 | ) | | | (0.49 | ) | |
| Total distributions | | | (0.22 | ) | | | (0.49 | ) | |
| Paid-in capital from redemption fees (Note 4) | | | 0.01 | | | | — | | |
| Net Asset Value, end of period | | $ | 11.34 | | | $ | 12.53 | | |
| TOTAL RETURN | | | (7.72 | %) | | | 11.22 | %5 | |
| RATIOS/SUPPLEMENTAL DATA | |
| Net assets, end of period (in 000's) | | $ | 30,302 | | | $ | 4 | | |
| Ratio of expenses to average net assets | | | 1.07 | % | | | 1.08 | %6 | |
| Ratio of net investment income (loss) to average net assets | | | 0.46 | % | | | (0.51 | %)6 | |
| Portfolio turnover3 | | | 34.94 | % | | | 46.29 | %5 | |
1 Calculated using the average daily shares method.
2 Less than $0.01 per share.
3 The portfolio turnover rate is calculated on the Fund as a whole without distinguishing between classes of shares issued.
4 Institutional Shares commenced operations on October 29, 2010.
5 Not annualized.
6 Annualized.
See accompanying notes to financial statements.
matthewsasia.com | 800.789.ASIA 93
Financial Highlights
Matthews Korea Fund
The tables below set forth financial data for a share of beneficial interest outstanding throughout each period presented.
| | | Year ended Dec. 31 | |
| INVESTOR SHARES | | 2011 | | 2010 | | 2009 | | 2008 | | 2007 | |
| Net Asset Value, beginning of year | | $ | 5.14 | | | $ | 4.31 | | | $ | 2.75 | | | $ | 6.56 | | | $ | 6.23 | | |
| INCOME (LOSS) FROM INVESTMENT OPERATIONS: | |
| Net investment income (loss) | | | (0.01 | )1 | | | 0.011 | | | | (0.01 | )1 | | | (0.02 | )1 | | | 0.07 | | |
Net realized gain (loss) and unrealized appreciation/depreciation
on investments and foreign currency | | | (0.31 | ) | | | 0.93 | | | | 1.74 | | | | (3.48 | ) | | | 1.15 | | |
| Total from investment operations | | | (0.32 | ) | | | 0.94 | | | | 1.73 | | | | (3.50 | ) | | | 1.22 | | |
| LESS DISTRIBUTIONS FROM: | |
| Net investment income | | | (0.01 | ) | | | — | | | | — | | | | (0.06 | ) | | | (0.02 | ) | |
| Net realized gains on investments | | | (0.22 | ) | | | (0.11 | ) | | | (0.17 | ) | | | (0.25 | ) | | | (0.87 | ) | |
| Total distributions | | | (0.23 | ) | | | (0.11 | ) | | | (0.17 | ) | | | (0.31 | ) | | | (0.89 | ) | |
| Paid-in capital from redemption fees (Note 4) | | | —2 | | | | —2 | | | | —2 | | | | —2 | | | | —2 | | |
| Net Asset Value, end of year | | $ | 4.59 | | | $ | 5.14 | | | $ | 4.31 | | | $ | 2.75 | | | $ | 6.56 | | |
| TOTAL RETURN | | | (6.45 | %) | | | 21.86 | % | | | 62.92 | % | | | (52.66 | %) | | | 18.90 | % | |
| RATIOS/SUPPLEMENTAL DATA | |
| Net assets, end of year (in 000's) | | $ | 141,590 | | | $ | 166,990 | | | $ | 138,371 | | | $ | 87,253 | | | $ | 250,421 | | |
| Ratio of expenses to average net assets | | | 1.18 | % | | | 1.21 | % | | | 1.30 | % | | | 1.27 | % | | | 1.21 | % | |
| Ratio of net investment income (loss) to average net assets | | | (0.18 | %) | | | 0.16 | % | | | (0.36 | %) | | | (0.34 | %) | | | 1.17 | % | |
| Portfolio turnover | | | 30.13 | %3 | | | 39.05 | %3 | | | 52.47 | % | | | 28.70 | % | | | 24.20 | % | |
| INSTITUTIONAL SHARES | | Year Ended
Dec. 31, 2011 | | Period Ended
Dec. 31, 20104 | |
| Net Asset Value, beginning of period | | $ | 5.14 | | | $ | 4.84 | | |
| INCOME (LOSS) FROM INVESTMENT OPERATIONS: | |
| Net investment income (loss)1 | | | 0.17 | | | | 0.03 | | |
Net realized gain (loss) and unrealized appreciation/depreciation
on investments and foreign currency | | | (0.47 | ) | | | 0.38 | | |
| Total from investment operations | | | (0.30 | ) | | | 0.41 | | |
| LESS DISTRIBUTIONS FROM: | |
| Net investment income | | | (0.01 | ) | | | — | | |
| Net realized gains on investments | | | (0.22 | ) | | | (0.11 | ) | |
| Total distributions | | | (0.23 | ) | | | (0.11 | ) | |
| Paid-in capital from redemption fees (Note 4) | | | —2 | | | | — | | |
| Net Asset Value, end of period | | $ | 4.61 | | | $ | 5.14 | | |
| TOTAL RETURN | | | (6.05 | %) | | | 8.51 | %5 | |
| RATIOS/SUPPLEMENTAL DATA | |
| Net assets, end of period (in 000's) | | $ | 15,109 | | | $ | 4 | | |
| Ratio of expenses to average net assets | | | 1.07 | % | | | 0.91 | %6 | |
| Ratio of net investment income (loss) to average net assets | | | 3.37 | % | | | 3.74 | %6 | |
| Portfolio turnover3 | | | 30.13 | % | | | 39.05 | %5 | |
1 Calculated using the average daily shares method.
2 Less than $0.01 per share.
3 The portfolio turnover rate is calculated on the Fund as a whole without distinguishing between classes of share issued.
4 Institutional Shares commenced operations on October 29, 2010.
5 Not annualized.
6 Annualized.
See accompanying notes to financial statements.
94 MATTHEWS ASIA FUNDS
Matthews Asia Small Companies Fund
The table below sets forth financial data for a share of beneficial interest outstanding throughout each period presented.
| | | Year ended Dec. 31 | | Period Ended | |
| INVESTOR SHARES | | 2011 | | 2010 | | 2009 | | Dec. 31, 20081 | |
| Net Asset Value, beginning of period | | $ | 21.16 | | | $ | 15.79 | | | $ | 7.89 | | | $ | 10.00 | | |
| INCOME (LOSS) FROM INVESTMENT OPERATIONS: | |
| Net investment income (loss)2 | | | 0.15 | | | | 0.04 | | | | 0.02 | | | | 0.01 | | |
Net realized gain (loss) and unrealized appreciation/depreciation
on investments and foreign currency | | | (4.35 | ) | | | 5.55 | | | | 8.04 | | | | (2.16 | ) | |
| Total from investment operations | | | (4.20 | ) | | | 5.59 | | | | 8.06 | | | | (2.15 | ) | |
| LESS DISTRIBUTIONS FROM: | |
| Net investment income | | | (0.17 | ) | | | (0.09 | ) | | | (0.05 | ) | | | (0.02 | ) | |
| Net realized gains on investments | | | (2.04 | ) | | | (0.15 | ) | | | (0.15 | ) | | | — | | |
| Total distributions | | | (2.21 | ) | | | (0.24 | ) | | | (0.20 | ) | | | (0.02 | ) | |
| Paid-in capital from redemption fees (Note 4) | | | 0.02 | | | | 0.02 | | | | 0.04 | | | | 0.06 | | |
| Net Asset Value, end of period | | $ | 14.77 | | | $ | 21.16 | | | $ | 15.79 | | | $ | 7.89 | | |
| TOTAL RETURN | | | (20.03 | %) | | | 35.54 | % | | | 103.00 | % | | | (21.03 | %)3 | |
| RATIOS/SUPPLEMENTAL DATA | |
| Net assets, end of period (in 000's) | | $ | 258,944 | | | $ | 547,094 | | | $ | 109,726 | | | $ | 3,173 | | |
Ratio of expenses to average net assets before any reimbursement,
waiver or recapture of expenses by Advisor and Administrator (Note 5) | | | 1.52 | % | | | 1.59 | % | | | 2.90 | % | | | 14.31 | %4 | |
Ratio of expenses to average net assets after any reimbursement,
waiver or recapture of expenses by Advisor and Administrator | | | 1.52 | % | | | 1.63 | % | | | 2.00 | % | | | 2.00 | %4 | |
| Ratio of net investment income (loss) to average net assets | | | 0.76 | % | | | 0.24 | % | | | 0.13 | % | | | 0.15 | %4 | |
| Portfolio turnover | | | 19.97 | % | | | 23.99 | % | | | 21.39 | % | | | 3.10 | %3 | |
1 Investor Shares commenced operations on September 15, 2008.
2 Calculated using the average daily shares method.
3 Not annualized.
4 Annualized.
See accompanying notes to financial statements.
matthewsasia.com | 800.789.ASIA 95
Financial Highlights
Matthews China Small Companies Fund
The table below sets forth financial data for a share of beneficial interest outstanding throughout the period presented.
| INVESTOR SHARES | | Period Ended
Dec. 31, 20111 | |
| Net Asset Value, beginning of period | | $ | 10.00 | | |
| INCOME (LOSS) FROM INVESTMENT OPERATIONS: | |
| Net investment income (loss)2 | | | (0.02 | ) | |
Net realized gain (loss) and unrealized appreciation/depreciation
on investments and foreign currency | | | (2.96 | ) | |
| Total from investment operations | | | (2.98 | ) | |
| LESS DISTRIBUTIONS FROM: | |
| Net investment income | | | (0.01 | ) | |
| Total distributions | | | (0.01 | ) | |
| Paid-in capital from redemption fees (Note 4) | | | 0.03 | | |
| Net Asset Value, end of period | | $ | 7.04 | | |
| TOTAL RETURN | | | (29.51 | %)3 | |
| RATIOS/SUPPLEMENTAL DATA | |
| Net assets, end of period (in 000's) | | $ | 4,493 | | |
Ratio of expenses to average net assets before any reimbursement,
waiver or recapture of expenses by Advisor and Administrator (Note 5) | | | 5.32 | %4 | |
Ratio of expenses to average net assets after any reimbursement,
waiver or recapture of expenses by Advisor and Administrator | | | 2.00 | %4 | |
| Ratio of net investment income (loss) to average net assets | | | (0.53 | %)4 | |
| Portfolio turnover | | | 6.08 | %3 | |
1 Investor Shares commenced operations on May 31, 2011.
2 Calculated using the average daily shares method.
3 Not annualized.
4 Annualized.
See accompanying notes to financial statements.
96 MATTHEWS ASIA FUNDS
Matthews Asia Science and Technology Fund
The table below sets forth financial data for a share of beneficial interest outstanding throughout each period presented.
| | | Year ended Dec. 31 | |
| INVESTOR SHARES | | 2011 | | 2010 | | 2009 | | 2008 | | 2007 | |
| Net Asset Value, beginning of year | | $ | 9.89 | | | $ | 8.02 | | | $ | 4.71 | | | $ | 9.80 | | | $ | 7.92 | | |
| INCOME (LOSS) FROM INVESTMENT OPERATIONS: | |
| Net investment income (loss) | | | 0.021 | | | | 0.031 | | | | —1,2 | | | | 0.011 | | | | —2 | | |
Net realized gain (loss) and unrealized appreciation/depreciation
on investments and foreign currency | | | (1.74 | ) | | | 1.86 | | | | 3.31 | | | | (5.11 | ) | | | 1.87 | | |
| Total from investment operations | | | (1.72 | ) | | | 1.89 | | | | 3.31 | | | | (5.10 | ) | | | 1.87 | | |
| LESS DISTRIBUTIONS FROM: | |
| Net investment income | | | (0.02 | ) | | | (0.02 | ) | | | — | | | | — | | | | — | | |
| Total distributions | | | (0.02 | ) | | | (0.02 | ) | | | — | | | | — | | | | — | | |
| Paid-in capital from redemption fees (Note 4) | | | 0.01 | | | | —2 | | | | —2 | | | | 0.01 | | | | 0.01 | | |
| Net Asset Value, end of year | | $ | 8.16 | | | $ | 9.89 | | | $ | 8.02 | | | $ | 4.71 | | | $ | 9.80 | | |
| TOTAL RETURN | | | (17.26 | %) | | | 23.58 | % | | | 70.28 | % | | | (51.94 | %) | | | 23.74 | % | |
| RATIOS/SUPPLEMENTAL DATA | |
| Net assets, end of year (in 000's) | | $ | 153,349 | | | $ | 190,436 | | | $ | 130,367 | | | $ | 74,476 | | | $ | 252,304 | | |
Ratio of expenses to average net assets before any reimbursement,
waiver or recapture of expenses by Advisor and Administrator (Note 5) | | | 1.21 | % | | | 1.26 | % | | | 1.40 | % | | | 1.33 | % | | | 1.26 | % | |
Ratio of expenses to average net assets after any reimbursement,
waiver or recapture of expenses by Advisor and Administrator | | | 1.21 | % | | | 1.26 | % | | | 1.40 | % | | | 1.33 | % | | | 1.25 | % | |
| Ratio of net investment income (loss) to average net assets | | | 0.23 | % | | | 0.35 | % | | | 0.30 | % | | | 0.08 | % | | | (0.30 | %) | |
| Portfolio turnover | | | 65.47 | % | | | 61.61 | % | | | 83.27 | % | | | 44.84 | % | | | 33.21 | % | |
1 Calculated using the average daily shares method.
2 Less than $0.01 per share.
See accompanying notes to financial statements.
matthewsasia.com | 800.789.ASIA 97
Notes to Financial Statements
1. ORGANIZATION
Matthews Asia Funds (the "Trust") is an open-end management investment company registered under the Investment Company Act of 1940, as amended (the "1940 Act"). The Trust currently issues thirteen separate series of shares (each a "Fund" and collectively, the "Funds"): Matthews Asia Strategic Income Fund, Matthews Asian Growth and Income Fund, Matthews Asia Dividend Fund, Matthews China Dividend Fund, Matthews Asia Growth Fund, Matthews Pacific Tiger Fund, Matthews China Fund, Matthews India Fund, Matthews Japan Fund, Matthews Korea Fund, Matthews Asia Small Companies Fund, Matthews China Small Companies Fund and Matthews Asia Science and Technology Fund. Each Fund except for Matthews Asia Small Companies Fund, Matthews China Small Companies Fund and Matthews Asia Science and Technology Fund currently offers two classes of shares: Investor Class and Institutional Class. Matthews Asia Small Companies Fund, Matthews China Small Companies Fund and Matthews Asia Science and Technology Fund currently offer only Investor Class shares. Each class of shares has identical voting, dividend, liquidation and other rights and the same terms and conditions, except each class may be subject to different class expenses as outlined in the relevant prospectus and each class has exclusive voting rights with respect to matters solely affecting such class.
2. SIGNIFICANT ACCOUNTING POLICIES
The following is a summary of significant accounting policies consistently followed by the Funds in preparation of their financial statements.
A. SECURITY VALUATION: The value of the Funds' exchange-traded securities is based on market quotations for those securities, or on their fair value determined by or under the direction of the Funds' Board of Trustees (the "Board"). Market quotations are provided by pricing services that are independent of the Funds and Matthews. Foreign exchange-traded securities are valued as of the close of trading on the primary exchange on which they trade. Securities that trade in over-the-counter markets, including most debt securities (bonds), may be valued by other third-party vendors or by using indicative bid quotations from bond dealers or market makers, or other available market information, or on their fair value as determined by or under the direction of the Board. Prior to November 30, 2011, debt securities were valued using indicative bid and ask quotations from bond dealers or market makers, or other available information, or at their fair value as determined by or under the direction of the Board. Foreign currency exchange contracts are valued at the mean between the bid and ask prices and are determined at the close of business on the NYSE. Interpolated values are derived when the settlement date of the contract is an interim date for which quotations are not available. The Funds may also utilize independent pricing services to assist them in determining a current market value for each security based on sources believed to be reliable.
The books and records of the Funds are maintained in U.S. dollars. Transactions, portfolio securities, and assets and liabilities denominated in a foreign currency are translated and recorded in U.S. dollars at the prevailing exchange rate as of the close of trading on the New York Stock Exchange ("NYSE"). Translation gains or losses resulting from changes in the exchange rate during the reporting period and realized gains and losses on the settlement of foreign currency transactions are reported in the results of operations for the current period. The Funds do not isolate that portion of gains and losses on investments in equity securities that is due to changes in foreign exchange rate from that which is due to changes in market prices of equity securities.
Market values for equity securities are determined based on quotations from the principal (or most advantageous) market on which the security is traded. Market quotations used by the Funds include last reported sale prices, or, if such prices are not reported or available, bid and ask prices. Securities are valued through valuations obtained from a commercial pricing service or by securities dealers in accordance with procedures established by the Board.
The Board has delegated the responsibility of making fair value determinations to the Funds' Valuation Committee (the "Valuation Committee") subject to the Funds' Pricing Policies. When fair value pricing is employed, the prices of securities used by a Fund to calculate its Net Asset Value ("NAV") may differ from any quoted or published prices for the same securities for that day. All fair value determinations are made subject to the Board's oversight. Events affecting the value of foreign investments may occur between the time at which they are determined and when the Funds calculate their NAV, which is normally the close of trading on the NYSE. If such events render market quotations unreliable, and the impact of such events can be reasonably determined, the investments will be valued at their fair value. The fair value of a security held by the Funds may be determined using the services of third-party pricing services retained by the Funds or by the Valuation Committee, in either case subject to the Board's oversight.
Foreign securities held by the Funds may be traded on days and at times when the NYSE is closed. Accordingly, the NAV of the Funds may be significantly affected on days when shareholders have no access to the Funds.
B. FAIR VALUE MEASUREMENTS: In accordance with the guidance on fair value measurements and disclosures under generally accepted accounting principles in the United States ("U.S. GAAP"), the Funds disclose the fair value of their investments in a hierarchy that prioritizes the inputs to valuation techniques used to measure the fair value. The hierarchy gives the highest priority to valuations based upon unadjusted quoted prices in active markets for identical assets or liabilities (Level 1 measurement) and the lowest priority to valuations based upon unobservable inputs that are significant to the valuation (Level 3 measurements). Various inputs are used in determining the fair value of investments and derivative financial instruments, which are as follows:
Level 1: Quoted prices in active markets for identical securities.
Level 2: Other significant observable inputs (including quoted prices for similar securities, interest rates, prepayment speeds, credit risk, etc.).
Level 3: Significant unobservable inputs (including the Fund's own assumptions in determining the fair value of investments).
As of December 31, 2011, Level 3 securities consist primarily of international bonds that trade in over-the-counter markets. As described in Note 2-A, these securities are valued by other third-party vendors or by using indicative bid quotations from bond dealers and market makers, or on their fair value as determined under the direction of the Board. Indicative quotations and other information used by the Funds may not always be directly observable in the marketplace due to the nature of these markets and the manner of execution. These inputs, the methodology used for valuing such securities, and the characterization of such securities as Level 3 securities are not necessarily an indication of liquidity, or the risk associated with investing in these securities. Level 2 equity securities consist primarily of securities that have been fair valued by third-party pricing services (see Note A).
98 MATTHEWS ASIA FUNDS
The summary of inputs used to determine the fair valuation of the Fund's investments and derivative financial instruments as of December 31, 2011 is as follows:
| | | Matthews Asia
Strategic Income
Fund | | Matthews Asian
Growth and
Income Fund | | Matthews Asia
Dividend Fund | | Matthews Asia
Growth Fund | | Matthews Pacific
Tiger Fund | |
| Level 1: Quoted Prices | |
| Common Equities: | |
| Australia | | $ | — | | | $ | 204,468,886 | | | $ | 207,618,477 | | | $ | 16,618,223 | | | $ | — | | |
| Cambodia | | | — | | | | — | | | | — | | | | 5,571,663 | | | | — | | |
| China/Hong Kong | | | 387,461 | | | | 468,613,440 | | | | 564,229,551 | | | | 87,682,654 | | | | 1,448,443,084 | | |
| India | | | — | | | | — | | | | — | | | | 13,414,464 | | | | 666,488,814 | | |
| Indonesia | | | — | | | | 85,073,249 | | | | 78,913,245 | | | | 24,087,696 | | | | 464,926,550 | | |
| Japan | | | — | | | | 239,138,601 | | | | 585,896,197 | | | | 107,978,166 | | | | — | | |
| Malaysia | | | — | | | | 155,135,872 | | | | 7,715,142 | | | | 9,093,262 | | | | 278,526,071 | | |
| Singapore | | | 357,118 | | | | 403,514,165 | | | | 195,660,930 | | | | 8,664,038 | | | | 56,823,802 | | |
| South Korea | | | — | | | | 32,679,858 | | | | 75,393,924 | | | | — | | | | 61,779,438 | | |
| Sri Lanka | | | — | | | | — | | | | — | | | | 4,811,774 | | | | — | | |
| Taiwan | | | 165,131 | | | | 177,689,985 | | | | 205,138,951 | | | | 16,267,403 | | | | 411,584,207 | | |
| Thailand | | | — | | | | 32,086,606 | | | | 45,299,453 | | | | 4,519,426 | | | | 158,866,167 | | |
| United Kingdom | | | 182,319 | | | | 78,117,687 | | | | 54,055,937 | | | | — | | | | — | | |
| Vietnam | | | — | | | | 47,850,596 | | | | — | | | | 6,916,156 | | | | 46,288,684 | | |
| Preferred Equities: | |
| South Korea | | | — | | | | 32,877,916 | | | | — | | | | — | | | | — | | |
| Warrants: | |
| India | | | — | | | | 5,283,953 | | | | — | | | | — | | | | — | | |
| Level 2: Other Significant Observable Inputs | |
| Common Equities: | |
| Philippines | | | — | | | | 53,406,724 | | | | 44,054,710 | | | | — | | | | 113,350,006 | | |
| South Korea | | | — | | | | 77,403,472 | | | | 51,024,089 | | | | 6,774,021 | | | | 783,156,057 | | |
| Thailand | | | — | | | | 172,640,862 | | | | 112,804,001 | | | | 15,683,954 | | | | 183,685,904 | | |
| Preferred Equities: | |
| South Korea | | | — | | | | 60,681,590 | | | | — | | | | 6,626,668 | | | | — | | |
| Level 3: Significant Unobservable Inputs | |
| Corporate Bonds | | | 4,268,354 | | | | 468,582,867 | | | | | | | | |
| Foreign Government Obligations | | | 6,569,135 | | | | — | | | | — | | | | — | | | | — | | |
| Total Market Value of Investments | | $ | 11,929,518 | | | $ | 2,795,246,329 | | | $ | 2,227,804,607 | | | $ | 334,709,568 | | | $ | 4,673,918,784 | | |
| | | Matthews Asia
Strategic Income
Fund | |
| Derivative Financial Instruments | |
| Assets | |
| Level 2: Other Significant Observable Inputs | |
| Foreign Currency Exchange Contracts | | $ | 1,367 | | |
| Liabilities | |
| Level 2: Other Significant Observable Inputs | |
| Foreign Currency Exchange Contracts | | ($ | 18,315 | ) | |
| Total Market Value of Derivative Financial Instruments | | ($ | 16,948 | ) | |
matthewsasia.com | 800.789.ASIA 99
Notes to Financial Statements (continued)
| | | Matthews China
Dividend Fund | | Matthews
China Fund | | Matthews
India Fund | | Matthews
Japan Fund | | Matthews
Korea Fund | | Matthews
China Small
Companies
Fund | |
| Investments | |
| Level 1: Quoted Prices | |
| Common Equities: | |
| Consumer Discretionary | | $ | 5,167,180 | | | $ | 491,853,207 | | | $ | 60,892,632 | | | $ | 34,199,387 | | | $ | — | | | $ | 1,181,136 | | |
| Consumer Staples | | | 1,813,552 | | | | 279,896,961 | | | | 61,738,096 | | | | 5,117,669 | | | | 8,509,151 | | | | 704,330 | | |
| Energy | | | 1,791,497 | | | | 163,889,105 | | | | 8,491,322 | | �� | | — | | | | — | | | | — | | |
| Financials | | | 3,811,407 | | | | 388,307,838 | | | | 129,685,577 | | | | 15,972,794 | | | | — | | | | 130,894 | | |
| Health Care | | | 760,923 | | | | 56,778,630 | | | | 34,931,406 | | | | 12,872,728 | | | | — | | | | 357,520 | | |
| Industrials | | | 2,419,980 | | | | 187,219,239 | | | | 97,927,825 | | | | 29,047,857 | | | | — | | | | 893,270 | | |
| Information Technology | | | 3,329,503 | | | | 263,264,056 | | | | 68,542,801 | | | | 23,012,219 | | | | — | | | | 609,857 | | |
| Materials | | | 1,606,318 | | | | — | | | | 55,660,799 | | | | 6,055,579 | | | | 4,392,350 | | | | 283,475 | | |
| Telecommunication Services | | | 2,571,844 | | | | 115,286,527 | | | | — | | | | 5,448,895 | | | | — | | | | — | | |
| Utilities | | | 3,019,329 | | | | 137,571,827 | | | | 30,082,968 | | | | — | | | | — | | | | 157,907 | | |
| Preferred Equities: | |
| Financials | | | — | | | | — | | | | — | | | | — | | | | 2,531,922 | | | | — | | |
| Level 2: Other Significant Observable Inputs | |
| Common Equities: | |
| Consumer Discretionary | | | — | | | | — | | | | — | | | | — | | | | 39,050,692 | | | | — | | |
| Consumer Staples | | | — | | | | — | | | | — | | | | — | | | | 5,174,061 | | | | — | | |
| Energy | | | — | | | | — | | | | — | | | | — | | | | 2,848,919 | | | | — | | |
| Financials | | | — | | | | — | | | | — | | | | — | | | | 26,042,828 | | | | — | | |
| Health Care | | | — | | | | — | | | | — | | | | — | | | | 3,589,218 | | | | — | | |
| Industrials | | | — | | | | — | | | | — | | | | — | | | | 12,805,113 | | | | — | | |
| Information Technology | | | — | | | | — | | | | — | | | | — | | | | 33,312,168 | | | | — | | |
| Materials | | | — | | | | — | | | | — | | | | — | | | | 9,707,930 | | | | — | | |
| Telecommunication Services | | | — | | | | — | | | | — | | | | — | | | | 1,221,283 | | | | — | | |
| Preferred Equities: | |
| Consumer Discretionary | | | — | | | | — | | | | — | | | | — | | | | 4,356,758 | | | | — | | |
| Materials | | | — | | | | — | | | | — | | | | — | | | | 801,622 | | | | — | | |
| Level 3: Significant Unobservable Inputs | |
| Common Equities: | |
| Information Technology | | | — | | | | — | | | | — | | | | — | | | | — | | | | 37,218 | | |
| Corporate Bonds | | | — | | | | — | | | | 40,219,200 | | | | — | | | | — | | | | — | | |
| Total Market Value of Investments | | $ | 26,291,533 | | | $ | 2,084,067,390 | | | $ | 588,172,626 | | | $ | 131,727,128 | | | $ | 154,344,015 | | | $ | 4,355,607 | | |
| | | Matthews Asia
Small Companies
Fund | | Matthews Asia
Science and
Technology Fund | |
| Level 1: Quoted Prices | |
| Common Equities: | |
| China/Hong Kong | | $ | 75,186,299 | | | $ | 49,406,528 | | |
| India | | | 40,724,609 | | | | 6,105,262 | | |
| Indonesia | | | 20,038,245 | | | | 2,840,376 | | |
| Singapore | | | 7,416,329 | | | | — | | |
| Japan | | | — | | | | 28,466,941 | | |
| Malaysia | | | 21,632,980 | | | | 2,482,104 | | |
| Taiwan | | | 40,705,819 | | | | 29,198,385 | | |
| United States | | | — | | | | 3,344,120 | | |
| Vietnam | | | — | | | | 1,021,306 | | |
| Level 2: Other Significant Observable Inputs | |
| Common Equities: | |
| South Korea | | | 33,577,578 | | | | 29,268,872 | | |
| Thailand | | | 11,796,517 | | | | — | | |
| Level 3: Significant Unobservable Inputs | |
| Common Equities: | |
| China/Hong Kong | | | 3,040,262 | | | | — | | |
| Total Market Value of Investments | | $ | 254,118,638 | | | $ | 152,133,894 | | |
100 MATTHEWS ASIA FUNDS
Certain foreign securities may be fair valued by external pricing services when the Funds determine that events affecting the value of foreign securities which occur between the time at which they are determined and the close of trading on the NYSE render market quotations unreliable. Such fair valuations are categorized as Level 2 in the fair value hierarchy. Foreign securities that are valued based on market quotations are categorized as Level 1 in the fair value hierarchy (See Note 2-A Securities Valuation). At December 31, 2011, the Funds utilized third party pricing services to fair value certain markets which were different than markets which utilized third party pricing services at December 31, 2010. As a result, certain securities held by the Funds were transferred from Level 2 into Level 1 and certain securities held by the Funds were transferred from Level 1 into Level 2 with beginning of period values as follows:
| | | Transfer to Level 1
from Level 2 | | Transfer to Level 2
from Level 1 | |
| Matthews Asian Growth and Income Fund | | $ | 39,123,038 | | | $ | 38,813,239 | | |
| Matthews Asia Dividend Fund | | | 45,783,524 | | | | 29,195,526 | | |
| Matthews Pacific Tiger Fund | | | 186,019,349 | | | | 88,824,476 | | |
| Matthews Korea Fund | | | 8,872,612 | | | | 10,889,630 | | |
Following is a reconciliation of Level 3 investments for which significant unobservable inputs were used to determine value:
| | | Matthews Asia
Strategic Income
Fund | | Matthews Asia
Strategic Income
Fund | | Matthews Asian
Growth and
Income Fund | | Matthews Asia
Dividend Fund | | Matthews
India Fund | |
| | | Corporate
Bonds | | Foreign
Government
Obligations | | Corporate
Bonds | | Corporate
Bonds | | Corporate
Bonds | |
| Balance as of 12/31/10 (market value) | | $ | — | | | $ | — | | | $ | 890,985,739 | | | $ | 4,869,165 | | | $ | 109,826,875 | | |
| Accrued discounts/premiums | | | 66 | | | | (2,920 | ) | | | 15,128,504 | | | | 2,879 | | | | 1,603,554 | | |
| Realized gain/(loss) | | | — | | | | (7,061 | ) | | | 34,430,415 | | | | 793,658 | | | | (1,425,858 | ) | |
| Change in unrealized appreciation/depreciation | | | 204 | | | | (48,790 | ) | | | (125,267,874 | ) | | | (1,492,083 | ) | | | (10,766,246 | ) | |
| Net purchases | | | 4,268,084 | | | | 7,064,307 | | | | 67,659,110 | | | | — | | | | 3,163,250 | | |
| Net sales | | | — | | | | (436,401 | ) | | | (414,353,027 | ) | | | (4,173,619 | ) | | | (62,182,375 | ) | |
| Transfers in to Level 3* | | | — | | | | — | | | | — | | | | — | | | | — | | |
| Transfers out of Level 3* | | | — | | | | — | | | | — | | | | — | | | | — | | |
| Balance as of 12/31/11 (market value) | | $ | 4,268,354 | | | $ | 6,569,135 | | | $ | 468,582,867 | | | $ | — | | | $ | 40,219,200 | | |
Net change in unrealized appreciation/depreciation
on Level 3 investments held as of 12/31/11** | | $ | 204 | | | ($ | 48,790 | ) | | ($ | 61,196,226 | ) | | $ | — | | | ($ | 10,432,883 | ) | |
| | | Matthews Asia
Small Companies
Fund | | Matthews China
Small Companies
Fund | |
| | | Common
Equities —
China | | Common
Equities —
Information
Technology | |
| Balance as of 12/31/10 (market value) | | $ | — | | | $ | — | | |
| Accrued discounts/premiums | | | — | | | | — | | |
| Realized gain/(loss) | | | (344,868 | ) | | | — | | |
| Change in unrealized appreciation/depreciation | | | (6,648,267 | ) | | | (27,465 | ) | |
| Net Purchases | | | 2,545,402 | | | | 64,683 | | |
| Net Sales | | | (2,033,081 | ) | | | — | | |
| Transfers in to Level 3* | | | 9,521,076 | | | | — | | |
| Transfers out of Level 3* | | | — | | | | — | | |
| Balance as of 12/31/11 (market value) | | $ | 3,040,262 | | | $ | 37,218 | | |
Net change in unrealized appreciation/depreciation on
Level 3 investments held as of 12/31/11** | | ($ | 6,648,267 | ) | | ($ | 27,465 | ) | |
* The Fund's policy is to recognize transfers in and transfer out as of the beginning of the reporting period.
** Included in the related amounts on the Statements of Operations.
In May 2011, the Financial Accounting Standards Board issued Accounting Standards Update ("ASU") No. 2011-04 Amendments to Achieve Common Fair Value Measurement and Disclosure Requirements in U.S. GAAP and International Financial Reporting Standards ("IFRS").
matthewsasia.com | 800.789.ASIA 101
Notes to Financial Statements (continued)
ASU No. 2011-04 includes common requirements for measurement of and disclosure about fair value between U.S. GAAP and IFRS. ASU No. 2011-04 will require reporting entities to disclose the following information for fair value measurements categorized within Level 3 of the fair value hierarchy: quantitative information about the unobservable inputs used in the fair value measurement, the valuation processes used by the reporting entity and a narrative description of the sensitivity of the fair value measurement to changes in unobservable inputs and the interrelationships between those unobservable inputs. In addition, ASU No. 2011-04 will require reporting entities to make disclosures about amounts and reasons for all transfers in and out of Level 1 and Level 2 fair value measurements. The new and revised disclosures are effective for interim and annual reporting periods beginning after December 15, 2011. At this time, management is evaluating the implications of ASU No. 2011-04 and its impact on the financial statements.
C. RISKS ASSOCIATED WITH NON-U.S. COMPANIES: Investments by the Funds in the securities of non-U.S. companies may involve investment risks not typically associated with investments in U.S. issuers. These risks include possible political, economic, social and religious instability, inadequate investor protection; changes in laws or regulations of countries within the Asia Pacific region (including both in countries where you invest, as well as in the broader region); international relations with other nations; natural disasters; corruption; and military activity. Foreign securities may be subject to greater fluctuations in price than securities of domestic corporations or the U.S. government. Foreign investing may also include the risk of expropriation or confiscatory taxation, limitation on the removal or funds or other assets, currency crises and exchange controls, the imposition of foreign withholding tax on the interest income payable on such instruments, the possible seizure or nationalization of foreign deposits or assets, or the adoption of other foreign government restrictions that might adversely affect the foreign securities held by the Funds. Additionally, Asia Pacific countries may utilize formal or informal currency exchange controls or "capital controls" that may limit the ability to repatriate investments or income or adversely affect the value of portfolio investments. The economies of many Asia Pacific countries differ from the economies of more developed countries in many respects, such as their rate of growth, inflation, capital reinvestment, resource self-sufficiency and dependence on other economies, financial system stability, the national balance of payments position and sensitivity to changes in global trade. Certain Asia Pacific countries are highly dependent upon and may be affected by developments in the economies of other countries. Non-U.S. companies are subject to different accounting, auditing, and financial reporting standards, practices, and requirements than U.S. companies. There is generally less government regulation of stock exchanges, brokers, and listed companies abroad than in the United States, which may result in less transparency with respect to a company's operations, and make obtaining information about them more difficult (or such information may be unavailable). Foreign stock markets may not be as developed or efficient as those in the United States, and the absence of negotiated brokerage commissions in certain countries may result in higher brokerage fees. The time between the trade and settlement dates of securities transactions on foreign exchanges ranges from one day to four weeks or longer and may result in higher custody charges. Custodial arrangements may be less well developed than in the United States. Foreign securities are generally denominated and pay distributions in foreign currencies, exposing the Funds to changes in foreign currency exchange rates. Investing in any country in the Asia Pacific region will also entail risks specific and unique to that country, and these risks can be significant and change rapidly.
D. INCOME AND WITHHOLDING TAXES: It is the policy of the Funds to comply with all requirements of the Internal Revenue Code of 1986, as amended ("the Code"), applicable to regulated investment companies and to distribute substantially all of their taxable income to their shareholders. The Funds have met the requirements of the Code applicable to regulated investment companies for fiscal year ended December 31, 2011. Therefore, no federal income tax provision is required. Income and capital gains of the Funds are determined in accordance with both tax regulations and U.S. GAAP. Such treatment may result in temporary and permanent differences between tax basis earnings and earnings reported for financial statement purposes. These reclassifications, which have no impact on the net asset value of the Funds, are primarily attributable to certain differences in computation of distributable income and capital gains under federal tax rules versus U.S. GAAP, and the use of the tax accounting practice known as equalization.
Management has analyzed the Funds' tax positions taken on federal income tax returns for all open tax years (current and prior three tax years), and has concluded that no provision for federal income tax is required in the Funds' financial statements. The Funds' federal and state income and federal excise tax returns for tax years for which the applicable statutes of limitations have not expired are subject to examination by the Internal Revenue Service and state departments of revenue.
In addition to the requirements of the Code, the Funds may be subject to foreign withholding taxes on distributions by or capital gains associated with portfolio holdings. The Funds consider the impact of a country's tax laws and regulations, as well as withholding, when considering investment decisions. The Funds may be subject to short-term capital gains tax in India on gains realized upon disposition of Indian securities held less than one year. The tax is computed on net realized gains; any realized losses in excess of gains may be carried forward for a period of up to eight years to offset future gains. Any net taxes payable must be remitted to the Indian government prior to repatriation of sales proceeds. The Funds that invest in Indian securities accrue a liability for the estimated potential future Indian tax liability for unrealized short-term gains in excess of available carryforwards on Indian securities. This accrual may reduce a Fund's net asset value. As of December 31, 2011, the Funds may also be subject to capital gains tax on fixed income securities in Indonesia. Matthews Asia Strategic Income Fund has recorded a payable of $1,249 as an estimate for such potential future Indonesia capital gains taxes.
In addition, China has recently adopted certain revisions to its tax laws and regulations that generally result in holdings of the Funds in companies headquartered in China (whether A shares, B shares, H shares or shares traded in depository receipt form) being subject to withholding taxes on dividends and other income. To the extent that such withholding taxes are imposed on holdings of the Funds in companies headquartered in China, the Funds' returns will be adversely impacted.
E. OFFERING COSTS: Offering costs are amortized on a straight-line basis over one year from each Fund's respective commencement of operations. In the event that any of the initial shares are redeemed during the period of amortization of the Fund's offering costs, the redemption proceeds will be reduced by any such unamortized offering costs in the same proportion as the number of shares being redeemed bears to the number of those shares outstanding at the time of redemption.
F. DISTRIBUTIONS TO SHAREHOLDERS: It is the policy of Matthews Asian Growth and Income Fund and Matthews China Dividend Fund to distribute net investment income on a semi-annual basis and capital gains, if any, annually. It is the policy of Matthews Asia Dividend Fund and Matthews Asia Strategic Income Fund to distribute net investment income on a quarterly basis and capital gains, if any, annually. Each of the other Funds distribute net investment income and capital gains, if any, annually. Distributions to shareholders are recorded on the ex-dividend date. Income and capital gain distributions are determined in accordance with income tax regulations which may differ from U.S. GAAP. Net investment losses may not be utilized to offset net investment income in future periods for tax purposes.
102 MATTHEWS ASIA FUNDS
The tax character of distributions paid for the fiscal years ended December 31, 2011 and December 31, 2010 were as follows:
| YEAR ENDED DECEMBER 31, 2011 | | Ordinary Income | | Net Long-Term
Capital Gains | | Total Taxable
Distributions | |
| Matthews Asia Strategic Income Fund | | $ | 23,396 | | | $ | — | | | $ | 23,396 | | |
| Matthews Asian Growth and Income Fund | | | 99,386,784 | | | | 112,546,940 | | | | 211,933,724 | | |
| Matthews Asia Dividend Fund | | | 65,160,891 | | | | 11,676,961 | | | | 76,837,852 | | |
| Matthews China Dividend Fund | | | 1,087,962 | | | | 27,774 | | | | 1,115,736 | | |
| Matthews Asia Growth Fund | | | 7,735,513 | | | | — | | | | 7,735,513 | | |
| Matthews Pacific Tiger Fund | | | 28,983,044 | | | | 77,058,025 | | | | 106,041,069 | | |
| Matthews China Fund | | | 25,170,852 | | | | 174,899,928 | | | | 200,070,780 | | |
| Matthews India Fund | | | 2,994,775 | | | | — | | | | 2,994,775 | | |
| Matthews Japan Fund | | | 2,606,346 | | | | — | | | | 2,606,346 | | |
| Matthews Korea Fund | | | 1,792,530 | | | | 5,678,972 | | | | 7,471,502 | | |
| Matthews Asia Small Companies Fund | | | 2,884,834 | | | | 34,237,212 | | | | 37,122,046 | | |
| Matthews China Small Companies Fund | | | 5,954 | | | | — | | | | 5,954 | | |
| Matthews Asia Science and Technology Fund | | | 454,558 | | | | — | | | | 454,558 | | |
| YEAR ENDED DECEMBER 31, 2010 | | Ordinary Income | | Net Long-Term
Capital Gains | | Total Taxable
Distributions | |
| Matthews Asian Growth and Income Fund | | $ | 94,189,105 | | | $ | 51,682,614 | | | $ | 145,871,719 | | |
| Matthews Asia Dividend Fund | | | 40,287,845 | | | | 5,022,499 | | | | 45,310,344 | | |
| Matthews China Dividend Fund | | | 722,729 | | | | — | | | | 722,729 | | |
| Matthews Asia Growth Fund | | | 2,855,326 | | | | — | | | | 2,855,326 | | |
| Matthews Pacific Tiger Fund | | | 18,668,943 | | | | — | | | | 18,668,943 | | |
| Matthews China Fund | | | 14,642,220 | | | | 2,109,742 | | | | 16,751,962 | | |
| Matthews India Fund | | | 6,221,074 | | | | — | | | | 6,221,074 | | |
| Matthews Japan Fund | | | 2,536,497 | | | | — | | | | 2,536,497 | | |
| Matthews Korea Fund | | | — | | | | 3,500,175 | | | | 3,500,175 | | |
| Matthews Asia Small Companies Fund | | | 2,373,718 | | | | 3,751,019 | | | | 6,124,737 | | |
| Matthews Asia Science and Technology Fund | | | 394,719 | | | | — | | | | 394,719 | | |
G. INVESTMENT TRANSACTIONS AND INCOME: Securities transactions are accounted for on the date the securities are purchased or sold. Gains or losses on the sale of securities are determined on the identified cost basis. Interest income is recorded on the accrual basis. Dividend income is generally recorded on the ex-dividend date. Dividend income for certain issuers headquartered in countries which the Funds invest may not be recorded until approved by the shareholders (which may occur after the ex-dividend date) if, in the judgment of management, such dividends are not reasonably determined as of the ex-dividend date. Income and realized and unrealized gains or losses on investments are allocated to each class of shares based on its relative net assets or another appropriate basis.
H. FUND EXPENSE ALLOCATIONS: The Funds account separately for the assets, liabilities and operations of each Fund. Direct expenses of each Fund or class are charged to that Fund or class while general expenses are allocated pro-rata among the Funds based on net assets or other appropriate methods.
I. CASH OVERDRAFTS: When cash balances are overdrawn, a Fund is charged an overdraft fee by the custodian of 1.00% above the 30-day LIBOR rate on outstanding balances. These amounts, if any, are included in "Other expenses" on the Statements of Operations.
J. USE OF ESTIMATES: The preparation of financial statements in conformity with U.S. GAAP requires management to make estimates and assumptions that affect the amounts reported in the financial statements and accompanying notes. Actual results may differ from those estimates.
3. DERIVATIVE FINANCIAL INSTRUMENTS
Matthews Asia Strategic Income Fund engages in various portfolio investment strategies using derivative contracts to economically hedge its exposure to foreign currency exchange rate risk. Losses may arise if the value of the contract decreases due to an unfavorable change in the market rates or values of the underlying instrument or if the counterparty does not perform under the contract. The Fund's primary risks associated with the use of derivatives include the other party to the derivative contract may fail to fulfill its obligation, reduced liquidity, the Fund may suffer disproportionate heavy losses relative to the amount invested, and changes in the value of the derivatives may not match or fully offset changes in the value of the hedged portfolio securities, thereby failing to achieve the original purpose for using the derivative.
Forward Foreign Currency Exchange Contracts: Matthews Asia Strategic Income Fund enters into forward foreign currency exchange contracts as an economic hedge against either specific transactions or portfolio instruments or to obtain exposure to foreign currencies (foreign currency exchange rate risk). A forward foreign currency exchange contract is an agreement between two parties to buy and sell a currency at a set exchange rate on a future date. Forward foreign currency exchange contracts, when used by the Fund, help to manage the overall exposure to the currencies in which some of the investments held by the Fund are denominated. The contract is marked-to-market daily and the change in market value is recorded by the Fund as an unrealized gain or loss. When the contract is closed, the Fund records a
matthewsasia.com | 800.789.ASIA 103
Notes to Financial Statements (continued)
realized gain or loss equal to the difference between the value at the time it was opened and the value at the time it was closed. The use of forward foreign currency exchange contracts involves the risk that the value of a forward foreign currency exchange contract changes unfavorably due to movements in the value of the referenced foreign currencies and the risk that the counterparty to the contract does not perform its obligations under the agreement.
Derivative Financial Instruments Categorized by Risk Exposure:
| Fair Values of Derivative Financial Instruments as of December 31, 2011 | |
| | | Statements of Assets and Liabilities Location | | Matthews Asia
Strategic Income
Fund | |
| | | Assets | |
| Forward foreign currency exchange contracts | | Unrealized appreciation on forward foreign currency
exchange contracts | | $ | 1,367 | | |
| | | Liabilities | |
| Forward foreign currency exchange contracts | | Unrealized depreciation on forward foreign currency
exchange contracts | | $ | 18,315 | | |
The Effect of Derivative Instruments on the Statements of Operations
Year Ended December 31, 2011 | |
| | | Matthews Asia
Strategic Income
Fund | |
| Net Change in Unrealized Appreciation/Depreciation on | |
| Foreign currency related transactions | | ($ | 16,948 | ) | |
For the year ended December 31, 2011, the average monthly balances of outstanding derivative financial instruments were as follows:
| | | Matthews Asia
Strategic Income
Fund | |
| Forward Foreign Currency Exchange Contracts (Foreign Currency Exchange Risk): | |
| Average number of contracts—U.S. dollars purchased | | | 1 | | |
| Average U.S. dollar amounts purchased | | $ | 278,035 | | |
| Average number of contracts—U.S. dollars sold | | | 2 | | |
| Average U.S. dollar amounts sold | | $ | 1,065,921 | | |
4. CAPITAL SHARE TRANSACTIONS
Each Fund is authorized to issue an unlimited number of shares of beneficial interest with a par value of $0.001 per share.
| | | Period Ended December 31, 2011 | |
| MATTHEWS ASIA STRATEGIC INCOME FUND* | | Shares | | Amount | |
| Investor Shares | |
| Shares sold | | | 778,753 | | | $ | 7,781,032 | | |
| Shares issued through reinvestment of distributions | | | 1,377 | | | | 13,650 | | |
| Shares redeemed | | | (52 | ) | | | (519 | ) | |
| Net increase (decrease) | | | 780,078 | | | $ | 7,794,163 | | |
| | | Period Ended December 31, 2011 | |
| | | Shares | | Amount | |
| Institutional Shares | |
| Shares sold | | | 529,314 | | | $ | 5,293,133 | | |
| Shares issued through reinvestment of distributions | | | 976 | | | | 9,676 | | |
| Net increase (decrease) | | | 530,290 | | | $ | 5,302,809 | | |
* Investor Shares and Institutional Shares commenced operations on November 30, 2011.
104 MATTHEWS ASIA FUNDS
| | | Year Ended December 31, 2011 | | Year Ended December 31, 2010 | |
| MATTHEWS ASIAN GROWTH AND INCOME FUND | | Shares | | Amount | | Shares | | Amount | |
| Investor Shares | |
| Shares sold | | | 32,060,064 | | | $ | 559,112,796 | | | | 94,537,711 | | | $ | 1,599,476,355 | | |
| Shares issued through reinvestment of distributions | | | 10,068,790 | | | | 158,200,819 | | | | 7,642,437 | | | | 131,851,386 | | |
| Shares redeemed | | | (104,375,074 | ) | | | (1,819,398,166 | ) | | | (46,104,373 | ) | | | (777,329,497 | ) | |
| Net increase (decrease) | | | (62,246,220 | ) | | ($ | 1,102,084,551 | ) | | | 56,075,775 | | | $ | 953,998,244 | | |
| | | Year Ended December 31, 2011 | | Period Ended December 31, 2010* | |
| | | Shares | | Amount | | Shares | | Amount | |
| Institutional Shares | |
| Shares sold | | | 42,908,389 | | | $ | 768,482,507 | | | | 7,042,986 | | | $ | 128,638,654 | | |
| Shares issued through reinvestment of distributions | | | 2,445,888 | | | | 38,413,987 | | | | 117,858 | | | | 2,080,203 | | |
| Shares redeemed | | | (17,185,882 | ) | | | (283,032,015 | ) | | | (42,484 | ) | | | (766,000 | ) | |
| Net increase (decrease) | | | 28,168,395 | | | $ | 523,864,479 | | | | 7,118,360 | | | $ | 129,952,857 | | |
* Institutional Shares commenced operations on October 29, 2010.
| | | Year Ended December 31, 2011 | | Year Ended December 31, 2010 | |
| MATTHEWS ASIA DIVIDEND FUND | | Shares | | Amount | | Shares | | Amount | |
| Investor Shares | |
| Shares sold | | | 110,243,475 | | | $ | 1,519,475,047 | | | | 128,134,506 | | | $ | 1,717,991,718 | | |
| Shares issued through reinvestment of distributions | | | 4,409,967 | | | | 57,884,041 | | | | 2,948,816 | | | | 40,367,703 | | |
| Shares redeemed | | | (94,904,591 | ) | | | (1,294,339,749 | ) | | | (22,899,869 | ) | | | (309,075,964 | ) | |
| Net increase (decrease) | | | 19,748,851 | | | $ | 283,019,339 | | | | 108,183,453 | | | $ | 1,449,283,457 | | |
| | | Year Ended December 31, 2011 | | Period Ended December 31, 2010* | |
| | | Shares | | Amount | | Shares | | Amount | |
| Institutional Shares | |
| Shares sold | | | 37,459,944 | | | $ | 527,212,815 | | | | 3,344,908 | | | $ | 47,780,952 | | |
| Shares issued through reinvestment of distributions | | | 394,869 | | | | 5,170,880 | | | | 28,296 | | | | 396,147 | | |
| Shares redeemed | | | (13,615,599 | ) | | | (175,025,328 | ) | | | (2,445 | ) | | | (34,642 | ) | |
| Net increase (decrease) | | | 24,239,214 | | | $ | 357,358,367 | | | | 3,370,759 | | | $ | 48,142,457 | | |
* Institutional Shares commenced operations on October 29, 2010.
| | | Year Ended December 31, 2011 | | Year Ended December 31, 2010 | |
| MATTHEWS CHINA DIVIDEND FUND | | Shares | | Amount | | Shares | | Amount | |
| Investor Shares | |
| Shares sold | | | 1,578,670 | | | $ | 18,586,260 | | | | 3,571,723 | | | $ | 39,885,783 | | |
| Shares issued through reinvestment of distributions | | | 98,443 | | | | 1,066,240 | | | | 60,501 | | | | 704,296 | | |
| Shares redeemed | | | (2,774,075 | ) | | | (30,866,410 | ) | | | (605,891 | ) | | | (6,864,371 | ) | |
| Net increase (decrease) | | | (1,096,962 | ) | | ($ | 11,213,910 | ) | | | 3,026,333 | | | $ | 33,725,708 | | |
| | | Year Ended December 31, 2011 | | Period Ended December 31, 2010* | |
| | | Shares | | Amount | | Shares | | Amount | |
| Institutional Shares | |
| Shares sold | | | 1,623 | | | $ | 20,100 | | | | 295 | | | $ | 3,500 | | |
| Shares issued through reinvestment of distributions | | | 42 | | | | 446 | | | | 4 | | | | 48 | | |
| Shares redeemed | | | (815 | ) | | | (9,840 | ) | | | — | | | | — | | |
| Net increase (decrease) | | | 850 | | | $ | 10,706 | | | | 299 | | | $ | 3,548 | | |
* Institutional Shares commenced operations on October 29, 2010.
matthewsasia.com | 800.789.ASIA 105
Notes to Financial Statements (continued)
| | | Year Ended December 31, 2011 | | Year Ended December 31, 2010 | |
| MATTHEWS ASIA GROWTH FUND | | Shares | | Amount | | Shares | | Amount | |
| Investor Shares | |
| Shares sold | | | 5,632,916 | | | $ | 97,848,412 | | | | 8,704,678 | | | $ | 140,765,266 | | |
| Shares issued through reinvestment of distributions | | | 348,624 | | | | 5,393,217 | | | | 145,454 | | | | 2,570,173 | | |
| Shares redeemed | | | (7,753,246 | ) | | | (132,663,366 | ) | | | (6,116,339 | ) | | | (95,865,175 | ) | |
| Net increase (decrease) | | | (1,771,706 | ) | | ($ | 29,421,737 | ) | | | 2,733,793 | | | $ | 47,470,264 | | |
| | | Year Ended December 31, 2011 | | Period Ended December 31, 2010* | |
| | | Shares | | Amount | | Shares | | Amount | |
| Institutional Shares | |
| Shares sold | | | 7,003,033 | | | $ | 119,247,333 | | | | 488,153 | | | $ | 8,615,907 | | |
| Shares issued through reinvestment of distributions | | | 118,577 | | | | 1,837,939 | | | | 4,249 | | | | 75,117 | | |
| Shares redeemed | | | (2,128,608 | ) | | | (35,580,135 | ) | | | — | | | | — | | |
| Net increase (decrease) | | | 4,993,002 | | | $ | 85,505,137 | | | | 492,402 | | | $ | 8,691,024 | | |
* Institutional Shares commenced operations on October 29, 2010.
| | | Year Ended December 31, 2011 | | Year Ended December 31, 2010 | |
| MATTHEWS PACIFIC TIGER FUND | | Shares | | Amount | | Shares | | Amount | |
| Investor Shares | |
| Shares sold | | | 41,532,204 | | | $ | 934,343,952 | | | | 90,705,702 | | | $ | 1,866,772,078 | | |
| Shares issued through reinvestment of distributions | | | 2,676,956 | | | | 55,278,364 | | | | 478,835 | | | | 11,085,031 | | |
| Shares redeemed | | | (129,175,269 | ) | | | (2,984,869,324 | ) | | | (54,878,994 | ) | | | (1,177,894,101 | ) | |
| Net increase (decrease) | | | (84,966,109 | ) | | ($ | 1,995,247,008 | ) | | | 36,305,543 | | | $ | 699,963,008 | | |
| | | Year Ended December 31, 2011 | | Period Ended December 31, 2010* | |
| | | Shares | | Amount | | Shares | | Amount | |
| Institutional Shares | |
| Shares sold | | | 91,157,431 | | | $ | 2,125,434,487 | | | | 23,498,689 | | | $ | 549,829,526 | | |
| Shares issued through reinvestment of distributions | | | 1,088,887 | | | | 22,463,738 | | | | 46,628 | | | | 1,079,444 | | |
| Shares redeemed | | | (15,469,797 | ) | | | (338,404,484 | ) | | | (485,400 | ) | | | (11,087,681 | ) | |
| Net increase (decrease) | | | 76,776,521 | | | $ | 1,809,493,741 | | | | 23,059,917 | | | $ | 539,821,289 | | |
* Institutional Shares commenced operations on October 29, 2010.
| | | Year Ended December 31, 2011 | | Year Ended December 31, 2010 | |
| MATTHEWS CHINA FUND | | Shares | | Amount | | Shares | | Amount | |
| Investor Shares | |
| Shares sold | | | 16,475,470 | | | $ | 462,682,408 | | | | 39,102,492 | | | $ | 1,059,207,053 | | |
| Shares issued through reinvestment of distributions | | | 8,291,580 | | | | 182,081,269 | | | | 531,634 | | | | 16,009,843 | | |
| Shares redeemed | | | (39,534,640 | ) | | | (1,062,621,657 | ) | | | (40,119,722 | ) | | | (1,051,404,806 | ) | |
| Net increase (decrease) | | | (14,767,590 | ) | | ($ | 417,857,980 | ) | | | (485,596 | ) | | $ | 23,812,090 | | |
| | | Year Ended December 31, 2011 | | Period Ended December 31, 2010* | |
| | | Shares | | Amount | | Shares | | Amount | |
| Institutional Shares | |
| Shares sold | | | 12,452,573 | | | $ | 289,794,029 | | | | 1,408,673 | | | $ | 43,407,912 | | |
| Shares issued through reinvestment of distributions | | | 254,874 | | | | 5,591,931 | | | | 6,348 | | | | 191,206 | | |
| Shares redeemed | | | (709,945 | ) | | | (16,414,721 | ) | | | — | | | | — | | |
| Net increase (decrease) | | | 11,997,502 | | | $ | 278,971,239 | | | | 1,415,021 | | | $ | 43,599,118 | | |
* Institutional Shares commenced operations on October 29, 2010.
106 MATTHEWS ASIA FUNDS
| | | Year Ended December 31, 2011 | | Year Ended December 31, 2010 | |
| MATTHEWS INDIA FUND | | Shares | | Amount | | Shares | | Amount | |
| Investor Shares | |
| Shares sold | | | 10,457,996 | | | $ | 199,418,664 | | | | 38,736,300 | | | $ | 763,615,269 | | |
| Shares issued through reinvestment of distributions | | | 182,527 | | | | 2,717,658 | | | | 282,822 | | | | 5,758,266 | | |
| Shares redeemed | | | (34,128,620 | ) | | | (639,558,369 | ) | | | (18,646,862 | ) | | | (362,758,685 | ) | |
| Net increase (decrease) | | | (23,488,097 | ) | | ($ | 437,422,047 | ) | | | 20,372,260 | | | $ | 406,614,850 | | |
| | | Year Ended December 31, 2011 | | Period Ended December 31, 2010* | |
| | | Shares | | Amount | | Shares | | Amount | |
| Institutional Shares | |
| Shares sold | | | 371,582 | | | $ | 7,299,291 | | | | 2,228,517 | | | $ | 50,478,328 | | |
| Shares issued through reinvestment of distributions | | | 8,878 | | | | 132,371 | | | | 11,196 | | | | 227,962 | | |
| Shares redeemed | | | (641,677 | ) | | | (10,550,308 | ) | | | (1 | ) | | | (20 | ) | |
| Net increase (decrease) | | | (261,217 | ) | | ($ | 3,118,646 | ) | | | 2,239,712 | | | $ | 50,706,270 | | |
* Institutional Shares commenced operations on October 29, 2010.
| | | Year Ended December 31, 2011 | | Year Ended December 31, 2010 | |
| MATTHEWS JAPAN FUND | | Shares | | Amount | | Shares | | Amount | |
| Investor Shares | |
| Shares sold | | | 9,300,532 | | | $ | 114,703,172 | | | | 1,834,692 | | | $ | 20,963,464 | | |
| Shares issued through reinvestment of distributions | | | 167,878 | | | | 1,900,379 | | | | 189,010 | | | | 2,247,332 | | |
| Shares redeemed | | | (5,937,057 | ) | | | (71,506,114 | ) | | | (4,708,347 | ) | | | (52,175,630 | ) | |
| Net increase (decrease) | | | 3,531,353 | | | $ | 45,097,437 | | | | (2,684,645 | ) | | ($ | 28,964,834 | ) | |
| | | Year Ended December 31, 2011 | | Period Ended December 31, 2010* | |
| | | Shares | | Amount | | Shares | | Amount | |
| Institutional Shares | |
| Shares sold | | | 2,679,969 | | | $ | 33,412,230 | | | | 326 | | | $ | 3,843 | | |
| Shares issued through reinvestment of distributions | | | 34,653 | | | | 392,273 | | | | 12 | | | | 146 | | |
| Shares redeemed | | | (42,618 | ) | | | (490,305 | ) | | | — | | | | — | | |
| Net increase (decrease) | | | 2,672,004 | | | $ | 33,314,198 | | | | 338 | | | $ | 3,989 | | |
* Institutional Shares commenced operations on October 29, 2010.
| | | Year Ended December 31, 2011 | | Year Ended December 31, 2010 | |
| MATTHEWS KOREA FUND | | Shares | | Amount | | Shares | | Amount | |
| Investor Shares | |
| Shares sold | | | 9,980,437 | | | $ | 52,613,715 | | | | 9,620,502 | | | $ | 42,717,495 | | |
| Shares issued through reinvestment of distributions | | | 1,372,595 | | | | 6,464,876 | | | | 675,600 | | | | 3,344,222 | | |
| Shares redeemed | | | (13,035,214 | ) | | | (65,292,520 | ) | | | (9,884,616 | ) | | | (44,032,635 | ) | |
| Net increase (decrease) | | | (1,682,182 | ) | | ($ | 6,213,929 | ) | | | 411,486 | | | $ | 2,029,082 | | |
| | | Year Ended December 31, 2011 | | Period Ended December 31, 2010* | |
| | | Shares | | Amount | | Shares | | Amount | |
| Institutional Shares | |
| Shares sold | | | 3,273,646 | | | $ | 16,597,460 | | | | 723 | | | $ | 3,500 | | |
| Shares issued through reinvestment of distributions | | | 21,797 | | | | 102,882 | | | | 16 | | | | 78 | | |
| Shares redeemed | | | (18,269 | ) | | | (102,473 | ) | | | — | | | | — | | |
| Net increase (decrease) | | | 3,277,174 | | | $ | 16,597,869 | | | | 739 | | | $ | 3,578 | | |
* Institutional Shares commenced operations on October 29, 2010.
matthewsasia.com | 800.789.ASIA 107
Notes to Financial Statements (continued)
| | | Year Ended December 31, 2011 | | Year Ended December 31, 2010 | |
| MATTHEWS ASIA SMALL COMPANIES FUND | | Shares | | Amount | | Shares | | Amount | |
| Investor Shares | |
| Shares sold | | | 7,391,135 | | | $ | 149,600,807 | | | | 24,922,951 | | | $ | 470,842,960 | | |
| Shares issued through reinvestment of distributions | | | 2,209,203 | | | | 33,557,805 | | | | 280,894 | | | | 5,887,541 | | |
| Shares redeemed | | | (17,921,097 | ) | | | (341,096,658 | ) | | | (6,298,522 | ) | | | (113,560,734 | ) | |
| Net increase (decrease) | | | (8,320,759 | ) | | ($ | 157,938,046 | ) | | | 18,905,323 | | | $ | 363,169,767 | | |
| | | Period Ended December 31, 2011 | |
| MATTHEWS CHINA SMALL COMPANIES FUND* | | Shares | | Amount | |
| Investor Shares | |
| Shares sold | | | 850,982 | | | $ | 7,444,714 | | |
| Shares issued through reinvestment of distributions | | | 824 | | | | 5,923 | | |
| Shares redeemed | | | (213,196 | ) | | | (1,583,026 | ) | |
| Net increase (decrease) | | | 638,610 | | | $ | 5,867,611 | | |
* Investor Shares commenced operations on May 31, 2011.
| | | Year Ended December 31, 2011 | | Year Ended December 31, 2010 | |
| MATTHEWS ASIA SCIENCE AND TECHNOLOGY FUND | | Shares | | Amount | | Shares | | Amount | |
| Investor Shares | |
| Shares sold | | | 8,443,941 | | | $ | 78,551,775 | | | | 9,428,497 | | | $ | 81,860,804 | | |
| Shares issued through reinvestment of distributions | | | 50,284 | | | | 420,876 | | | | 38,191 | | | | 373,511 | | |
| Shares redeemed | | | (8,950,512 | ) | | | (83,993,985 | ) | | | (6,466,992 | ) | | | (54,351,834 | ) | |
| Net increase (decrease) | | | (456,287 | ) | | ($ | 5,021,334 | ) | | | 2,999,696 | | | $ | 27,882,481 | | |
The Funds generally assess a redemption fee of 2.00% of the total redemption proceeds if shareholders sell or exchange their shares within 90 calendar days after purchasing them. The redemption fee is paid directly to the Funds and is designed to offset transaction costs associated with short-term trading of Fund shares. For purposes of determining whether the redemption fee applies, the shares that have been held the longest will be redeemed first. The Funds may grant an exemption from the redemption fee when the Funds have previously received assurances that transactions do not involve a substantial risk of the type of harm that the policy is designed to avoid. The Funds may also waive the imposition of redemption fees in certain circumstances. For more information on this policy, please see the Funds' prospectuses. The redemption fees returned to the assets of the Funds are stated in the Statements of Changes in Net Assets.
5. INVESTMENT ADVISORY FEES AND OTHER TRANSACTIONS WITH AFFILIATES
Matthews International Capital Management, LLC ("Matthews"), a registered investment advisor under the 1940 Act, provides the Funds with investment management services. Pursuant to an Investment Advisory Agreement dated August 13, 2004, as amended (the "Advisory Agreement"), the Funds pay Matthews (i) for management and advisory services; and (ii) for certain administrative services, an annual fee as a percentage of average daily net assets. Under the Advisory Agreement each of the Funds, other than Matthews Asia Strategic Income Fund, Matthews Asia Small Companies Fund and Matthews China Small Companies Fund pays Matthews 0.75% of their annual aggregate average daily net assets up to $2 billion, 0.6834% of the annual aggregate average daily net assets between $2 billion and $5 billion, and 0.65% of the annual aggregate average daily net assets over $5 billion. Matthews Asia Strategic Income Fund pays Matthews an annual fee of 0.65% of its annual average daily net assets pursuant to the Advisory Agreement. Matthews Asia Small Companies Fund and Matthews China Small Companies Fund pay Matthews an annual fee of 1.00% of its annual average daily net assets pursuant to the Advisory Agreement. Each Fund pays Matthews a monthly fee of one-twelfth (1/12) of the management fee of the Fund's average daily net asset value.
Under a written agreement between the Funds and Matthews, Matthews agrees to waive fees and reimburse money to a Fund if its expense ratio exceeds a certain percentage level. For Matthews Asia Science and Technology Fund, Matthews China Fund, Matthews India Fund, Matthews Japan Fund, Matthews Korea Fund, Matthews Asia Small Companies Fund and Matthews China Small Companies Fund, this level is 2.00%. For Matthews Asia Growth Fund, Matthews Pacific Tiger Fund and Matthews Asian Growth and Income Fund, this level is 1.90%. For Matthews Asia Dividend Fund and Matthews China Dividend Fund, this level is 1.50%. For Matthews Asia Strategic Income Fund, Matthews agrees to waive fees and reimburse money to the Fund if its expense ratio exceeds 1.25% for the Institutional Class and agrees to reduce the expense ratio by an equal amount for the Investor Class. In turn, if a Fund's expenses fall below the level noted within three years after Matthews has made such a reimbursement, the Fund may reimburse Matthews up to an amount of the recoupment available not to exceed its expense limitation. For each Fund other than Matthews China Dividend Fund, Matthews China Small Companies Fund and Matthews Asia Strategic Income Fund, this agreement will continue through at least August 31, 2012. For Matthews China Dividend Fund, this agreement will continue through at least August 31, 2013. For Matthews China Small Companies Fund and Matthews Asia Strategic Income Fund, this agreement will continue through at least August 31, 2014. These agreements may be extended for additional periods for each of the Funds.
Matthews has also agreed to waive fees and reimburse additional expenses for the Institutional Class of Matthews Asia Strategic Income Fund on a voluntary basis if its expense ratio exceeds 1.00%. Furthermore, any amounts voluntarily waived by Matthews in respect of the
108 MATTHEWS ASIA FUNDS
Institutional Class of Matthews Asia Strategic Income Fund, excluding any voluntary waiver of class-specific shareholder servicing fees, will also be waived for the Investor Class of Matthews Asia Strategic Income Fund. These voluntary waivers and/or reimbursements may be terminated at any time in the sole and absolute discretion of Matthews. At December 31, 2011, Matthews China Dividend Fund had $135,190 available for recoupment, of which $30,661 expires in 2012, $96,407 expires in 2013 and $8,122 expires in 2014. Matthews China Small Companies Fund had $76,945 available for recoupment, which expires in 2014. Matthews Asia Strategic Income Fund had $22,796 available for recoupment, which expires in 2014. Matthews Asian Growth and Income Fund, Matthews Asia Dividend Fund, Matthews Asia Growth Fund, Matthews Pacific Tiger Fund, Matthews China Fund, Matthews India Fund, Matthews Japan Fund, Matthews Korea Fund, Matthews Asia Small Companies Fund, Matthews Asia Science and Technology Fund had no amounts available for recoupment and no amounts recouped during the year.
Investment advisory fees changed, waived and reimbursed for the year ended December 31, 2011, were as follows:
| | | Gross Advisory Fees | | Advisory Fees
Waived and
Reimbursed in
Excess of the
Expense Limitation | | Net Advisory Fee/
Reimbursement | |
| Matthews Asia Strategic Income Fund | | $ | 6,628 | | | ($ | 22,796 | ) | | ($ | 16,168 | ) | |
| Matthews Asian Growth and Income Fund | | | 24,156,540 | | | | — | | | | 24,156,540 | | |
| Matthews Asia Dividend Fund | | | 15,675,930 | | | | — | | | | 15,675,930 | | |
| Matthews China Dividend Fund | | | 267,471 | | | | (8,122 | ) | | | 259,349 | | |
| Matthews Asia Growth Fund | | | 2,342,151 | | | | — | | | | 2,342,151 | | |
| Matthews Pacific Tiger Fund | | | 34,384,304 | | | | — | | | | 34,384,304 | | |
| Matthews China Fund | | | 17,300,295 | | | | — | | | | 17,300,295 | | |
| Matthews India Fund | | | 6,533,378 | | | | — | | | | 6,533,378 | | |
| Matthews Japan Fund | | | 831,674 | | | | — | | | | 831,674 | | |
| Matthews Korea Fund | | | 1,162,425 | | | | — | | | | 1,162,425 | | |
| Matthews Asia Small Companies Fund | | | 4,166,270 | | | | — | | | | 4,166,270 | | |
| Matthews China Small Companies Fund | | | 23,013 | | | | (76,945 | ) | | | (53,932 | ) | |
| Matthews Asia Science and Technology Fund | | | 1,178,002 | | | | — | | | | 1,178,002 | | |
Certain officers and Trustees of the Funds are also officers and directors of Matthews. All officers serve without compensation from the Funds. The Funds paid the Independent Trustees $601,000 in aggregate for regular compensation during the year ended December 31, 2011.
The Funds have a Shareholder Services Agreement, in which the Funds pay an annual administration and shareholder servicing fee to Matthews, as a percentage of the average daily net assets of each Fund in aggregate, computed and prorated on a daily basis. Under the Shareholder Services Agreement, the Funds pay 0.25% of their aggregate average daily net assets between $0 and $2 billion, 0.1834% of their aggregate average daily net assets over $2 billion to $5 billion, 0.15% of their aggregate average daily net assets over $5 billion to $7.5 billion, 0.125% of their aggregate average daily net assets over $7.5 billion to $15 billion and 0.11% of their aggregate average daily net assets over $15 billion.
Administration and shareholder servicing fees charged, for the year ended December 31, 2011, were as follows:
| | | Administration and
Shareholder
Servicing Fees | |
| Matthews Asia Strategic Income Fund | | $ | 1,635 | | |
| Matthews Asian Growth and Income Fund | | | 5,575,256 | | |
| Matthews Asia Dividend Fund | | | 3,624,744 | | |
| Matthews China Dividend Fund | | | 61,675 | | |
| Matthews Asia Growth Fund | | | 541,516 | | |
| Matthews Pacific Tiger Fund | | | 7,941,808 | | |
| Matthews China Fund | | | 3,989,677 | | |
| Matthews India Fund | | | 1,505,291 | | |
| Matthews Japan Fund | | | 192,622 | | |
| Matthews Korea Fund | | | 268,405 | | |
| Matthews Asia Small Companies Fund | | | 642,739 | | |
| Matthews China Small Companies Fund | | | 3,608 | | |
| Matthews Asia Science and Technology Fund | | | 271,967 | | |
matthewsasia.com | 800.789.ASIA 109
Notes to Financial Statements (continued)
The Funds bear a portion of the fees paid to certain service providers (exclusive of the Funds' Transfer Agent) which provide transfer agency and shareholder servicing to certain shareholders. Additional information concerning these services and fees is contained in the Funds' prospectuses. Fees accrued to pay to such service providers for the year ended December 31, 2011 are a component of Transfer Agent Fees and Administration and Shareholder Servicing Fees in the Statements of Operations as follows:
| | | Transfer Agent Fees | | Administration &
Shareholder
Servicing Fees | | Total | |
| Matthews Asian Growth and Income Fund | | $ | 4,401,218 | | | $ | 2,200,609 | | | $ | 6,601,827 | | |
| Matthews Asia Dividend Fund | | | 2,509,779 | | | | 1,254,889 | | | | 3,764,668 | | |
| Matthews China Dividend Fund | | | 55,575 | | | | 27,787 | | | | 83,362 | | |
| Matthews Asia Growth Fund | | | 418,554 | | | | 209,277 | | | | 627,831 | | |
| Matthews Pacific Tiger Fund | | | 5,041,712 | | | | 2,520,856 | | | | 7,562,568 | | |
| Matthews China Fund | | | 3,518,251 | | | | 1,759,126 | | | | 5,277,377 | | |
| Matthews India Fund | | | 1,248,283 | | | | 624,141 | | | | 1,872,424 | | |
| Matthews Japan Fund | | | 139,053 | | | | 69,526 | | | | 208,579 | | |
| Matthews Korea Fund | | | 208,123 | | | | 104,062 | | | | 312,185 | | |
| Matthews Asia Small Companies Fund | | | 581,438 | | | | 290,719 | | | | 872,157 | | |
| Matthews China Small Companies Fund | | | 3,208 | | | | 1,604 | | | | 4,812 | | |
| Matthews Asia Science and Technology Fund | | | 226,957 | | | | 113,479 | | | | 340,436 | | |
BNY Mellon Investment Servicing (US) Inc. ("BNY Mellon"), an indirect wholly owned subsidiary of The Bank of New York Mellon Corporation, serves as the Funds' administrator, and in that capacity, performs various administrative and accounting services for each Fund. BNY Mellon also serves as the Funds' transfer agent, dividend disbursing agent and registrar. An officer of BNY Mellon serves as Assistant Treasurer to the Funds. Total fees accrued by the Funds for administration and accounting services for the year ended December 31, 2011 were as follows:
| | | Administration and
Accounting Fees | |
| Matthews Asia Strategic Income Fund | | $ | 168 | | |
| Matthews Asian Growth and Income Fund | | | 571,748 | | |
| Matthews Asia Dividend Fund | | | 371,743 | | |
| Matthews China Dividend Fund | | | 6,327 | | |
| Matthews Asia Growth Fund | | | 55,530 | | |
| Matthews Pacific Tiger Fund | | | 814,758 | | |
| Matthews China Fund | | | 409,226 | | |
| Matthews India Fund | | | 154,480 | | |
| Matthews Japan Fund | | | 19,773 | | |
| Matthews Korea Fund | | | 27,539 | | |
| Matthews Asia Small Companies Fund | | | 65,968 | | |
| Matthews China Small Companies Fund | | | 370 | | |
| Matthews Asia Science and Technology Fund | | | 27,888 | | |
Brown Brothers Harriman & Co. serves as the Funds' custodian. BNY Mellon Distributors Inc., serves as the Funds' distributor in the United States pursuant to an Underwriting Agreement. Matthews Asia Funds are distributed in Latin America by HMC Partners.
On November 30, 2011 Matthews invested USD$10 million in the Matthews Asia Strategic Income Fund to provide the Fund with its initial investment assets. As of December 31, 2011, the Fund's net assets were $13,011,409, of which 1,000,000 shares held by Matthews represented 76%.
The Funds entered into transactions with J.P. Morgan Chase Bank, N.A., including its subsidiaries and affiliates ("J.P. Morgan") acting as a broker-dealer for the purchase and sale of portfolio investments on an agency basis. The aggregate value of such transactions with J.P. Morgan by the Funds in 2011 was $379,862. In addition, pursuant to an Administrative Fee Agreement dated July 1, 2009, the Funds received certain shareholder, administrative and sub-transfer agency services from J.P. Morgan (including transmission of purchase and redemption orders in accordance with the Funds' prospectuses; maintenance of separate records for its clients; mailing of shareholder confirmations and periodic statements; processing dividend payments; and shareholder information and support). Pursuant to the agreement with J.P. Morgan, the Funds paid J.P. Morgan $1,005,669 for such services.
110 MATTHEWS ASIA FUNDS
6. INVESTMENTS
The value of investment transactions made for affiliated and unaffiliated holdings for the year ended December 31, 2011, excluding short-term investments, were as follows:
| | | Affiliated Purchases | | Proceeds from
Affiliated Sales | | Unaffiliated Purchases | | Proceeds from
Unaffiliated Sales | |
| Matthews Asia Strategic Income Fund | | $ | — | | | $ | — | | | $ | 12,440,065 | | | $ | 436,401 | | |
| Matthews Asian Growth and Income Fund | | | 7,011,957 | | | | — | | | | 580,653,369 | | | | 1,215,946,989 | | |
| Matthews Asia Dividend Fund | | | 118,925,442 | | | | 3,327,980 | | | | 921,798,930 | | | | 372,714,620 | | |
| Matthews China Dividend Fund | | | — | | | | — | | | | 8,671,719 | | | | 18,518,958 | | |
| Matthews Asia Growth Fund | | | — | | | | — | | | | 150,985,864 | | | | 95,875,552 | | |
| Matthews Pacific Tiger Fund | | | 11,174,691 | | | | 7,271,526 | | | | 523,050,060 | | | | 690,438,782 | | |
| Matthews China Fund | | | 613,438 | | | | 4,421,922 | | | | 216,552,546 | | | | 539,738,839 | | |
| Matthews India Fund | | | — | | | | — | | | | 34,355,549 | | | | 429,885,349 | | |
| Matthews Japan Fund | | | — | | | | — | | | | 120,354,904 | | | | 42,284,663 | | |
| Matthews Korea Fund | | | — | | | | — | | | | 55,257,236 | | | | 51,926,759 | | |
| Matthews Asia Small Companies Fund | | | — | | | | — | | | | 81,372,855 | | | | 261,835,861 | | |
| Matthews China Small Companies Fund | | | — | | | | — | | | | 5,973,659 | | | | 246,882 | | |
| Matthews Asia Science and Technology Fund | | | — | | | | — | | | | 113,529,624 | | | | 115,352,227 | | |
7. HOLDINGS OF 5% VOTING SHARES OF PORTFOLIO COMPANIES
The 1940 Act defines "affiliated companies" to include investments in portfolio companies in which a fund owns 5% or more of the outstanding voting shares. During the year ended December 31, 2011, the Funds below held 5% or more of the outstanding voting shares of the noted portfolio companies. During this period, other Funds in the Trust may also have held voting shares of the issuers at levels below 5%.
Investments in affiliates:
A summary of transactions in securities of issuers affiliated with a Fund for the year ended December 31, 2011 is set forth below:
| | | Shares Held at
Dec. 31, 2010 | | Shares
Purchased | | Shares
Sold | | Shares Held at
Dec. 31, 2011 | | Value at
Dec. 31, 2011 | | Dividend
Income
Jan. 1, 2011–
Dec. 31, 2011 | | Net Realized
Gain (Loss)
Jan. 1, 2011–
Dec. 31, 2011 | |
| MATTHEWS ASIAN GROWTH AND INCOME FUND | |
| Name of Issuer: | |
Citic Telecom International
Holdings, Ltd. | | | 110,763,000 | | | | 21,468,000 | | | | — | | | | 132,231,000 | | | $ | 27,240,955 | | | $ | 1,614,528 | | | $ | — | | |
| CyberLink Corp.† | | | 5,990,128 | | | | — | | | | 2,107,411 | | | | 3,882,717 | | | | — | | | | — | | | | — | | |
| GS Home Shopping, Inc.† | | | 430,049 | | | | — | | | | 131,114 | | | | 298,935 | | | | — | | | | — | | | | — | | |
| I-CABLE Communications, Ltd.† | | | 128,079,000 | | | | — | | | | 37,864,000 | | | | 90,215,000 | | | | — | | | | — | | | | — | | |
| Inspur International, Ltd.† | | | 299,510,000 | | | | — | | | | 299,510,000 | | | | — | | | | — | | | | — | | | | — | | |
| SinoCom Software Group, Ltd.† | | | 83,028,000 | | | | 5,458,000 | | | | 88,486,000 | | | | — | | | | — | | | | — | | | | — | | |
| Vitasoy International Holdings, Ltd. | | | 51,771,000 | | | | — | | | | — | | | | 51,771,000 | | | | 38,128,669 | | | | 1,215,740 | | | | — | | |
| Total Affiliates | | | | | | | | | | $ | 65,369,624 | | | $ | 2,830,268 | | | $ | — | | |
| MATTHEWS ASIA DIVIDEND FUND | |
| Name of Issuer: | |
| Ascendas India Trust | | | — | | | | 46,280,000 | | | | — | | | | 46,280,000 | | | $ | 24,619,868 | | | $ | 2,074,122 | | | $ | — | | |
| CapitaRetail China Trust, REIT | | | 30,418,000 | | | | 8,553,000 | | | | 470,000 | | | | 38,501,000 | | | | 34,136,039 | | | | 2,386,712 | | | | 256,885 | | |
| EPS Corp. | | | 12,504 | | | | 2,088 | | | | — | | | | 14,592 | | | | 28,095,809 | | | | 612,927 | | | | — | | |
| Johnson Health Tech Co., Ltd. | | | — | | | | 11,713,100 | †† | | | — | | | | 11,713,100 | | | | 23,984,022 | | | | 104,325 | | | | — | | |
| Pigeon Corp. | | | 1,069,300 | | | | 352,000 | | | | 40,000 | | | | 1,381,300 | | | | 56,260,563 | | | | 1,405,624 | | | | (6,378 | ) | |
Sichuan Expressway Co., Ltd.
H Shares | | | 34,912,000 | | | | 30,700,000 | | | | — | | | | 65,612,000 | | | | 26,357,665 | | | | 584,220 | | | | — | | |
| Shinko Plantech Co., Ltd. | | | 2,555,600 | | | | — | | | | 155,400 | | | | 2,400,200 | | | | 19,396,186 | | | | 775,788 | | | | (111,457 | ) | |
| TXC Corp. | | | 15,450,000 | | | | 6,099,524 | †† | | | — | ††† | | | 21,549,524 | | | | 24,695,944 | | | | 1,827,838 | | | | — | | |
| Woongjin Thinkbig Co., Ltd. | | | 1,475,030 | | | | 604,840 | | | | — | | | | 2,079,870 | | | | 28,754,287 | | | | 1,340,807 | | | | — | | |
| Total Affiliates | | | | | | | | | | $ | 266,300,383 | | | $ | 11,112,363 | | | $ | 139,050 | | |
matthewsasia.com | 800.789.ASIA 111
Notes to Financial Statements (continued)
| | | Shares Held at
Dec. 31, 2010 | | Shares
Purchased | | Shares
Sold | | Shares Held at
Dec. 31, 2011 | | Value at
Dec. 31, 2011 | | Dividend
Income
Jan. 1, 2011–
Dec. 31, 2011 | | Net Realized
Gain
Jan. 1, 2011–
Dec. 31, 2011 | |
| MATTHEWS PACIFIC TIGER FUND | |
| Name of Issuer: | |
| Cheil Worldwide, Inc. | | | 6,291,350 | | | | 175,000 | | | | 550,000 | | | | 5,916,350 | | | $ | 97,417,950 | | | $ | 1,945,410 | | | $ | 3,361,818 | | |
| Green Cross Corp. | | | 610,295 | | | | 73,754 | | | | — | | | | 684,049 | | | | 86,777,171 | | | | 887,875 | | | | — | | |
| MegaStudy Co., Ltd. | | | 398,753 | | | | — | | | | 2,341 | | | | 396,412 | | | | 37,891,085 | | | | 857,552 | | | | 36,531 | | |
| Yuhan Corp. | | | 584,137 | | | | 1 | † | | | — | | | | 584,138 | | | | 64,689,901 | | | | 505,463 | | | | — | | |
| Total Affiliates | | | | | | | | | | $ | 286,776,107 | | | $ | 4,196,300 | | | $ | 3,398,349 | | |
| MATTHEWS CHINA FUND | |
| Name of Issuer: | |
| Kingdee International Software†† | | | 120,330,000 | | | | 20,106,800 | ††† | | | 22,708,000 | | | | 117,728,800 | | | $ | — | | | $ | — | | | $ | — | | |
Lianhua Supermarket
Holdings Co., Ltd. H Shares | | | 16,796,000 | | | | 13,146,800 | ††† | | | 995,000 | | | | 28,947,800 | | | | 37,011,260 | | | | 793,401 | | | | 3,288,899 | | |
| Total Affiliates | | | | | | | | | | $ | 37,011,260 | | | $ | 793,401 | | | $ | 3,288,899 | | |
† Purchase of a fractional share.
†† Issuer was not an affiliated company as of December 31, 2011.
††† Increase due to stock dividend during the period.
8. FEDERAL INCOME TAX INFORMATION
As of December 31, 2011, the components of accumulated earnings/(deficit) on tax basis were as follows:
| | | Undistributed
Ordinary Income | | Undistributed
Long-Term
Capital Gains | | Capital Loss
Carryforwards | | Post October
Capital Losses** | |
| Matthews Asia Strategic Income Fund | | $ | 12,364 | | | $ | — | | | $ | — | | | ($ | 410 | ) | |
| Matthews Asian Growth and Income Fund | | | — | | | | — | | | | — | | | | (13,790,791 | ) | |
| Matthews Asia Dividend Fund | | | 318,495 | | | | — | | | | (54,055,529 | ) | | | — | | |
| Matthews China Dividend Fund | | | 130,636 | | | | — | | | | (701,462 | ) | | | — | | |
| Matthews Asia Growth Fund | | | — | | | | — | | | | (59,249,358 | ) | | | (5,622,994 | ) | |
| Matthews Pacific Tiger Fund | | | — | | | | 5,451,429 | | | | — | | | | — | | |
| Matthews China Fund | | | — | | | | — | | | | — | | | | (33,012,775 | ) | |
| Matthews India Fund | | | 3,397,115 | | | | 3,551,398 | | | | — | | | | — | | |
| Matthews Japan Fund | | | 151,266 | | | | — | | | | (75,494,394 | ) | | | (3,352,918 | ) | |
| Matthews Korea Fund | | | — | | | | 1,400,329 | | | | — | | | | — | | |
| Matthews Asia Small Companies Fund | | | — | | | | 1,439,816 | | | | — | | | | — | | |
| Matthews China Small Companies Fund | | | — | | | | — | | | | (87,134 | ) | | | (29,356 | ) | |
| Matthews Asia Science and Technology Fund | | | 66,539 | | | | — | | | | (10,329,226 | ) | | | (262,214 | ) | |
| | |
Late Year
Ordinary Losses** | |
Other Temporary
Differences | | Unrealized
Appreciation
(Depreciation)*** | | Total Accumulated
Earnings/Deficit | |
| Matthews Asia Strategic Income Fund | | $ | — | | | $ | — | | | ($ | 93,960 | ) | | ($ | 82,006 | ) | |
| Matthews Asian Growth and Income Fund | | | (7,343,712 | ) | | | — | | | | 108,901,835 | | | | 87,767,332 | | |
| Matthews Asia Dividend Fund | | | — | | | | (45,488 | ) | | | (99,059,151 | ) | | | (152,841,673 | ) | |
| Matthews China Dividend Fund | | | — | | | | — | | | | (2,505,653 | ) | | | (3,076,479 | ) | |
| Matthews Asia Growth Fund | | | (807,738 | ) | | | — | | | | 47,188,248 | | | | (18,491,842 | ) | |
| Matthews Pacific Tiger Fund | | | (66,556 | ) | | | — | | | | 871,082,311 | | | | 876,467,184 | | |
| Matthews China Fund | | | — | | | | — | | | | 231,444,101 | | | | 198,431,326 | | |
| Matthews India Fund | | | (90,831 | ) | | | (22,021 | ) | | | (100,576,902 | ) | | | (93,741,241 | ) | |
| Matthews Japan Fund | | | (19,415 | ) | | | — | | | | 4,044,820 | | | | (74,670,641 | ) | |
| Matthews Korea Fund | | | (10,635 | ) | | | — | | | | 39,157,341 | | | | 40,547,035 | | |
| Matthews Asia Small Companies Fund | | | (99,789 | ) | | | — | | | | (37,949,974 | ) | | | (36,609,947 | ) | |
| Matthews China Small Companies Fund | | | — | | | | — | | | | (1,254,679 | ) | | | (1,371,169 | ) | |
| Matthews Asia Science and Technology Fund | | | (401 | ) | | | — | | | | 1,564,096 | | | | (8,961,206 | ) | |
** The Funds have elected to defer certain qualified late-year losses and recognize such losses in the next fiscal year.
*** The differences between book-basis and tax-basis unrealized appreciation/depreciation is attributable primarily to the tax deferral of losses on wash sales and passive foreign investment company (PFIC) mark to market adjustments.
112 MATTHEWS ASIA FUNDS
As of December 31, 2011, the Funds have capital loss carryforwards available to offset future realized capital gains through the indicated expiration dates as follows:
| LOSSES DEFERRED EXPIRING IN: | |
2016 | |
2017 | | With No
Expiration* | |
Total | |
| Matthews Asia Dividend Fund | | $ | — | | | $ | — | | | $ | 54,055,529 | | | $ | 54,055,529 | | |
| Matthews China Dividend Fund | | | — | | | | — | | | | 701,462 | | | | 701,462 | | |
| Matthews Asia Growth Fund | | | 1,000,383 | | | | 58,248,975 | | | | — | | | | 59,249,358 | | |
| Matthews Japan Fund | | | 30,079,024 | | | | 44,032,426 | | | | 1,382,944 | | | | 75,494,394 | | |
| Matthews China Small Companies Fund | | | — | | | | — | | | | 87,134 | | | | 87,134 | | |
| Matthews Asia Science and Technology Fund | | | — | | | | 10,329,226 | | | | — | | | | 10,329,226 | | |
* Post-Enactment Losses: Must be utilized prior to losses subject to expiration. All losses are short-term.
Matthews Asia Growth Fund, Matthews Pacific Tiger Fund, Matthews India Fund and Matthews Asia Science and Technology Fund utilized capital loss carryforwards of $7,369,056, $100,409,052, $87,473,985 and $12,984,202, respectively.
Under the Regulated Investment Company Modernization Act of 2010, the Funds are permitted to carry forward capital losses incurred in taxable years beginning after December 22, 2010 for an unlimited period. However, any losses incurred during those future taxable years will be required to be utilized prior to any losses incurred in pre-enactment taxable years, which generally expire after eight years from when they are incurred. Additionally, post-enactment capital losses that are carried forward will retain their character as either short-term or long-term capital losses rather than being considered all short-term as under previous law.
U.S. GAAP requires that certain components of net assets be reclassified between financial and tax reporting. These reclassifications have no effect on net assets or NAV. The permanent differences are primarily attributable to net realized gains on PFICs, non-deductible expenses, foreign currency reclassification, write-off of net operating losses, application of foreign tax credit to short-term gain and recharacterization of distributions. For the year ended December 31, 2011, permanent differences in book and tax accounting have been reclassified to paid-in capital, undistributed net investment income (loss) and accumulated realized gain (loss) as follows:
| | | Decrease
Paid-In-Capital | | Increase/(Decrease)
Undistributed Net
Investment
Income/(Loss) | | Increase/
(Decrease)
Accumulated
Realized Gain/(Loss) | |
| Matthews Asia Strategic Income Fund | | ($ | 3,557 | ) | | $ | 4,347 | | | ($ | 790 | ) | |
| Matthews Asian Growth and Income Fund | | | (835,123 | ) | | | 2,966,934 | | | | (2,131,811 | ) | |
| Matthews Asia Dividend Fund | | | — | | | | 7,513,345 | | | | (7,513,345 | ) | |
| Matthews China Dividend Fund | | | — | | | | 226,327 | | | | (226,327 | ) | |
| Matthews Asia Growth Fund | | | (1,306,823 | ) | | | 3,510,130 | | | | (2,203,307 | ) | |
| Matthews Pacific Tiger Fund | | | — | | | | 20,121,961 | | | | (20,121,961 | ) | |
| Matthews China Fund | | | (54,772 | ) | | | 81,801 | | | | (27,029 | ) | |
| Matthews India Fund | | | — | | | | 5,461,731 | | | | (5,461,731 | ) | |
| Matthews Japan Fund | | | — | | | | 732,056 | | | | (732,056 | ) | |
| Matthews Korea Fund | | | (205,051 | ) | | | 206,053 | | | | (1,002 | ) | |
| Matthews Asia Small Companies Fund | | | — | | | | 1,462,686 | | | | (1,462,686 | ) | |
| Matthews China Small Companies Fund | | | (17,979 | ) | | | 18,274 | | | | (295 | ) | |
| Matthews Asia Science and Technology Fund | | | — | | | | (19,482 | ) | | | 19,482 | | |
9. SUBSEQUENT EVENTS
The Bank of New York Mellon Corporation recently announced that it has agreed to sell BNY Mellon Distributors LLC and its four subsidiaries ("Distributor") to Foreside Distributors, a subsidiary of Foreside Financial Group (the "Transaction"). Subject to any necessary approvals, the Transaction is anticipated to close in the first half of 2012. Upon the closing of the Transaction, Distributor will become an indirect, wholly owned subsidiary of Foreside Financial Group, and it is anticipated will be named Foreside Funds Distributors LLC.
Effective January 4, 2012, Matthews Asian Growth and Income Fund and Matthews Asia Small Companies Fund were opened to new investors.
Management has evaluated the impact of all subsequent events on the Funds through the date the financial statements were issued, and has determined that there no additional subsequent events that require recognition or disclosure in the financial statements.
matthewsasia.com | 800.789.ASIA 113
Report of Independent Registered Public Accounting Firm
To the Board of Trustees and Shareholders of Matthews Asia Funds:
In our opinion, the accompanying statements of assets and liabilities, including the schedules of investments, and the related statements of operations and of changes in net assets and the financial highlights present fairly, in all material respects, the financial position of Matthews Asia Strategic Income Fund, Matthews Asian Growth and Income Fund, Matthews Asia Dividend Fund, Matthews China Dividend Fund, Matthews Asia Growth Fund, Matthews Pacific Tiger Fund, Matthews China Fund, Matthews India Fund, Matthews Japan Fund, Matthews Korea Fund, Matthews Asia Small Companies Fund, Matthews China Small Companies Fund and Matthews Asia Science and Technology Fund (each a portfolio comprising the Matthews Asia Funds, hereafter referred as the "Funds") at December 31, 2011, and the results of each of their operations, the changes in each of their net assets and the financial highlights for the periods presented, in conformity with accounting principles generally accepted in the United States of America. These financial statements and financial highlights (hereafter referred to as "financial statements") are the responsibility of the Funds' management. Our responsibility is to express an opinion on these financial statements based on our audits. We conducted our audits of these financial statements in accordance with the standards of the Public Company Accounting Oversight Board (United States). Those standards require that we plan and perform the audit to obtain reasonable assurance about whether the financial statements are free of material misstatement. An audit includes examining, on a test basis, evidence supporting the amounts and disclosures in the financial statements, assessing the accounting principles used and significant estimates made by management, and evaluating the overall financial statement presentation. We believe that our audits, which included confirmation of securities at December 31, 2011 by correspondence with the custodian and brokers, provide a reasonable basis for our opinion.
PricewaterhouseCoopers LLP
San Francisco, California
February 24, 2012
114 MATTHEWS ASIA FUNDS
Tax Information (Unaudited)
For shareholders who do not have a December 31, 2011 tax year-end, this notice is for informational purposes.
For the period January 1, 2011 to December 31, 2011, the Funds report the following items with regard to distributions paid during the period. All reportings are based on financial information available as of the date of this annual report and, accordingly, are subject to change. For each item, it is the intention of each Fund to report the maximum amount permitted under the Internal Revenue Code and the regulations thereunder.
1. Qualified Dividend Income
The Funds report a portion of the ordinary income distributed during the year ended December 31, 2011 as Qualified Dividend Income ("QDI") as defined in the Internal Revenue code as follows:
| | | QDI Portion | |
| Matthews Asian Growth and Income Fund | | | 59.55 | % | |
| Matthews Asia Dividend Fund | | | 90.65 | % | |
| Matthews China Dividend Fund | | | 38.33 | % | |
| Matthews Asia Growth Fund | | | 35.62 | % | |
| Matthews Pacific Tiger Fund | | | 100.00 | % | |
| Matthews China Fund | | | 60.89 | % | |
| Matthews India Fund | | | 100.00 | % | |
| Matthews Japan Fund | | | 32.68 | % | |
| Matthews Korea Fund | | | 100.00 | % | |
| Matthews Asia Small Companies Fund | | | 94.74 | % | |
| Matthews China Small Companies Fund | | | 37.32 | % | |
| Matthews Asia Science and Technology Fund | | | 100.00 | % | |
2. Long-Term Capital Gain Distributions
The Funds report Long-Term Capital Gain distributions pursuant to Section 852(b)(3) of the Internal Revenue Code for the year ended December 31, 2011 as follows:
| | | Long-Term Capital Gains | |
| Matthews Asian Growth and Income Fund | | $ | 112,546,940 | | |
| Matthews Asia Dividend Fund | | | 11,676,961 | | |
| Matthews China Dividend Fund | | | 27,774 | | |
| Matthews Pacific Tiger Fund | | | 77,058,025 | | |
| Matthews China Fund | | | 174,899,928 | | |
| Matthews Korea Fund | | | 5,678,972 | | |
| Matthews Asia Small Companies Fund | | | 34,237,212 | | |
3. Foreign Taxes Paid
The Funds have elected to pass through to their shareholders the foreign taxes paid for year ended December 31, 2011 as follows:
| | | Foreign Source Income | | Foreign Taxes Paid | |
| Matthews Asia Strategic Income Fund | | $ | 27,785 | | | $ | 1,567 | | |
| Matthews Asian Growth and Income Fund | | | 100,934,519 | | | | 6,740,160 | | |
| Matthews Asia Dividend Fund | | | 66,725,743 | | | | 5,754,023 | | |
| Matthews China Dividend Fund | | | 1,135,253 | | | | 83,975 | | |
| Matthews Asia Growth Fund | | | 4,154,726 | | | | 453,888 | | |
| Matthews Pacific Tiger Fund | | | 36,685,973 | | | | 7,832,296 | | |
| Matthews China Fund | | | 24,780,121 | | | | 146,791 | | |
| Matthews India Fund | | | 3,401,567 | | | | 4,164 | | |
| Matthews Japan Fund | | | 310,714 | | | | 159,352 | | |
| Matthews Korea Fund | | | 169,466 | | | | 374,517 | | |
| Matthews Asia Small Companies Fund | | | 3,741,655 | | | | 901,891 | | |
| Matthews China Small Companies Fund | | | 5,648 | | | | 911 | | |
| Matthews Asia Science and Technology Fund | | | 752,186 | | | | 362,628 | | |
matthewsasia.com | 800.789.ASIA 115
Tax Information (Unaudited) (continued)
4. Qualified Interest Income
The Funds report a portion of the net income dividends distributed during the year ended December 31, 2011, as Qualified Interest Income (QII), as defined in the Internal Revenue Code as follows:
| | | QII Portion | |
| Matthews Asia Strategic Income Fund | | | 0.18 | % | |
| Matthews Asian Growth and Income Fund | | | 0.02 | % | |
| Matthews Asia Dividend Fund | | | 0.03 | % | |
| Matthews China Dividend Fund | | | 0.01 | % | |
| Matthews Asia Growth Fund | | | 0.01 | % | |
| Matthews Pacific Tiger Fund | | | 0.03 | % | |
| Matthews China Fund | | | 0.02 | % | |
| Matthews India Fund | | | 0.07 | % | |
| Matthews Japan Fund | | | 0.01 | % | |
| Matthews Korea Fund | | | 0.03 | % | |
| Matthews Asia Small Companies Fund | | | 0.03 | % | |
| Matthews China Small Companies Fund | | | 0.13 | % | |
| Matthews Asia Science and Technology Fund | | | 0.01 | % | |
5. Qualified Short Term Capital Gain Dividends
The Funds report a portion of the short term capital gain dividends distributed during the year ended December 31, 2011, as Qualified Short Term Gain, as defined in the Internal Revenue Code as follows:
| | | Short-Term Gains | |
| Matthews Asia Strategic Income Fund | | | 0.00 | % | |
| Matthews Asian Growth and Income Fund | | | 100.00 | % | |
| Matthews Asia Dividend Fund | | | 0.00 | % | |
| Matthews China Dividend Fund | | | 100.00 | % | |
| Matthews Asia Growth Fund | | | 0.00 | % | |
| Matthews Pacific Tiger Fund | | | 0.00 | % | |
| Matthews China Fund | | | 100.00 | % | |
| Matthews India Fund | | | 0.00 | % | |
| Matthews Japan Fund | | | 0.00 | % | |
| Matthews Korea Fund | | | 100.00 | % | |
| Matthews Asia Small Companies Fund | | | 100.00 | % | |
| Matthews China Small Companies Fund | | | 0.00 | % | |
| Matthews Asia Science and Technology Fund | | | 0.00 | % | |
116 MATTHEWS ASIA FUNDS
Approval of Investment Advisory Agreements (Unaudited)
The Funds, which are series of the Trust, have retained Matthews International Capital Management, LLC (the "Advisor") to manage their assets pursuant to the Advisory Agreement, which has been approved by the Board of Trustees of the Funds, including the Independent Trustees. Following an initial term with respect to each Fund upon its commencement of operations, the Advisory Agreement continues in effect from year-to-year provided that the continuance is specifically approved at least annually by the vote of the holders of at least a majority of the outstanding shares of the Funds, or by the Board of Trustees, and, in either event, by a majority of the Independent Trustees of the Trust casting votes in person at a meeting called for that purpose.
At a meeting held on August 24 and 25, 2011, the Board, including the Independent Trustees of the Trust, approved the continuance of the Advisory Agreement, with respect to each Fund, for an additional one-year period ending August 31, 2012.
Before those meetings, the Independent Trustees had requested detailed information from the Advisor about the matters to be considered. This information, together with the information provided to the Independent Trustees throughout the course of year, formed the primary (but not exclusive) basis for the Board's determinations as summarized below. The Independent Trustees reviewed and discussed the extensive information provided by the Advisor at separate executive sessions held on August 4 (among a working group), 15 and 25, 2011. The Independent Trustees were assisted in their deliberations by their independent legal counsel. Below is a summary of the factors considered by the Board in approving the Advisory Agreement with respect to each Fund.
 The nature, extent and quality of the services provided by the Advisor under the Advisory Agreement. The Trustees considered the experience and qualifications of the personnel at the Advisor who are responsible for providing services to the Funds and who are responsible for the daily management of the Funds' portfolios. The Trustees noted that the Advisor has expanded and deepened its management team over the past several years. They also reviewed applicable changes to the Advisor's portfolio management personnel and their responsibilities, reflecting a long-term vision for the Advisor's business and for the Funds. In particular, the Trustees noted the addition of nineteen individuals since June 2010, including two senior positions (one of which is the Chief Financial Officer), a fixed-income portfolio manager, six research analysts, and various supporting and administrative positions. The Trustees viewed the Advisor as having been successful in continuing to provide high quality services to the Funds while both weathering volatile and challenging securities markets, including significant asset and revenue contractions in 2008 and 2009, handling a dramatic increase in assets later in 2009 and in 2010, and continued volatility in 2011. The Trustees attributed much of that success to the Advisor's emphasis of preserving and enhancing portfolio management team resources, careful business planning and management, as well as its solid financial condition and strong cash reserves. As in past years, the Trustees considered the Advisor's succession plan to address situations where key personnel are no longer available, and the design and implementation of the Advisor's disaster recovery and business continuity plan. The Trustees also considered the Chief Compliance Officer's report regarding the compliance resources, initiatives, programs and structures of the Advisor, including the compliance record of the Advisor and the Advisor's supervision of the Funds' service providers. The Trustees concluded that the Advisor has high-quality compliance and commitment to a culture of compliance. The Trustees recognized the extent of the Advisor's on-going commitment to marketing and distribution, particularly long-term strategic projects, enhanced brand awareness and client retention efforts, as well as resources devoted to investor education publications and website content, design and function. Other initiatives observed by the Trustees included significant efforts related to expanded relationships with financial institutions, their associated investment advisors, and other institutional decision-makers. The Trustees concluded that the Advisor had the quality and depth of personnel and investment methods essential to performing its duties under the Advisory Agreement, and that the nature, overall quality, cost and extent of such management services are satisfactory and reliable.
 The investment performance of the Advisor. The Trustees reviewed the short-term and long-term performance of each Fund on both an absolute basis and in comparison to peer funds and benchmark indices. The Trustees noted the strong performance of various Asian markets in 2010, but would expect the Funds' performance to lag the market averages in some subsequent short-term periods because of the Advisor's emphasis on consistent long-term returns from investments in less cyclical companies. The Trustees emphasized longer-term performance, which they believe is more important than short isolated periods for purposes of evaluating the Advisor's success in meeting Fund and shareholder objectives. To the extent of any concerns about performance with respect to any particular period for a Fund, the Trustees noted that the Advisor had provided a satisfactory explanation for the performance and
matthewsasia.com | 800.789.ASIA 117
Approval of Investment Advisory Agreements (Unaudited) (continued)
explained its reasons for maintaining a consistent investment philosophy. The Trustees also reviewed both the Lipper peer comparison measures and Morningstar ratings for each Fund for various periods ending June 30, 2011.
For Matthews Asia Growth Fund, the Trustees noted that the Fund's performance compared very favorably against its peers for the three-year, five-year and since-inception periods. The Fund ranked in the top quintile for those more important longer term periods in its Pacific region peer group, and above the median for the most recent one-year period.
For Matthews Asia Dividend Fund, the Trustees noted that the Fund had outperformed its peer group during the three-year and since inception periods, ranking in the top quintile for those periods. The Fund lagged its peer group for the one-year period, but the Trustees were not concerned given the Fund's favorable positive performance for that period and given its investment strategy compared to typical funds in its peer group.
For Matthews Pacific Tiger Fund, the Trustees noted that the Fund's performance was favorable in the three-year, five-year, ten-year and since-inception periods, ranking in the first or second quintiles for those periods against the Lipper peer group while lagging its peer group only in the one-year period, noting that the Fund still enjoyed favorable positive returns during that shorter period.
For Matthews Asian Growth and Income Fund, the Trustees noted that the Fund is among the very top-performing fund for the three-year, five-year, ten-year and since-inception periods in its Lipper peer group, but underperformed with respect to the one-year period with a ranking at the low end of the peer group average (but still positive performance of over 19% for the one-year period).
For Matthews Asia Science and Technology Fund, the Trustees noted that the Fund's performance was much more favorable than the median return of its peer funds over the ten-year and since-inception periods (in the first quintile), but less favorable than the average return of its peer funds over the one-year, three-year and five-year periods despite positive absolute performance. The Trustees also observed that the funds in the peer group invested globally, rather than being limited to Asia as the Fund's investment strategy is. The Trustees acknowledge the Advisor's explanation about the very volatile asset class in which the Fund invests.
For Matthews China Fund, the Trustees noted that the Fund had outperformed the median of its peer funds over the three-year, five-year, ten-year and since-inception periods, ranking in the top quintile for the three-year and five-year periods, but had lagged the median in the most recent one-year period despite positive performance of over 18%.
For Matthews India Fund, the Trustees noted that the Fund had outperformed its peer funds over the one-year, three-year, five-year and since inception periods, ranking in the first quintile in one peer group for the one-year and three-year periods, and first in its peer group for the five-year and since-inception periods.
For Matthews Japan Fund, the Trustees noted that the Fund's performance was equal to or more favorable than the median return of its peer funds over the one-year, three-year, five-year, ten-year and since-inception periods, and ranked in the top quartile for the one-year period.
For Matthews Korea Fund, the Trustees noted that the Fund had performed in line with its narrower peer group over the one-year, three-year, five-year, ten-year and since inception periods, but that the Fund was the best performing fund in its broader peer group for the ten-year periods. The Trustees noted that the broader Lipper peer group consists of Asia Pacific-oriented funds excluding Japan, which is too broad to be a useful peer group. A more limited peer group of funds with 50% or more of their assets in Korea shows the Fund ranked favorably above the average for those time periods except for the one-year period where its positive performance was still very favorable at over 37%.
For Matthews Asia Small Companies Fund, the Trustees noted that the Fund had exceeded the average performance of its peer group for the short one-year and since inception periods, ranking first.
For Matthews China Dividend Fund, the Trustees noted that the Fund had exceeded the average performance of its peer group for the short one-year and since inception periods, with a ranking in the first quintile for the period since inception.
For Matthews China Small Companies Fund, the Trustees noted that the Fund's performance was approximately the same or slightly better than the median and average returns of its peer group for the very short one-month period since its inception.
The Trustees noted the difficulty of fairly benchmarking certain of the Funds in terms of performance and noted that they were of the view that more weight should be given to the Advisor's analysis of relative performance and comparability of the peer groups than to standard data provided by
118 MATTHEWS ASIA FUNDS
Approval of Investment Advisory Agreements (Unaudited) (continued)
Lipper Inc. and Morningstar, Inc. The Trustees also gave more weight to each Fund's longer-term investment performance given the long-term investment philosophy of each Fund. On that basis, the Trustees concluded that they were satisfied with the Funds' overall performance records. The Trustees also reviewed the Advisor's trading policies and efforts to obtain best overall execution for the Funds in the various markets in which the Funds trade securities. The Trustees noted the relatively low turnover rates in the various Funds and the Advisor's consistent adherence to its long-standing investment approach, which emphasizes fundamental bottom-up driven investment selection.
 The extent to which the Advisor realizes economies of scale as the Funds grow larger and whether fee levels reflect these economies of scale for the benefit of Fund investors. The Trustees discussed the Advisor's ongoing investment in its business and personnel, which is an acceptable way for the Funds to share indirectly in realizing economies of scale. The Trustees considered the significant increase in experienced personnel over the past year and the extent to which that hiring could be expected to benefit shareholders. The Trustees also recognize that, in 2008 and early 2009, the Funds' economies of scale had diminished as total assets declined, but that market conditions and asset growth improved later in 2009 and dramatically in 2010, with some reductions again in 2011, which was consistent with industry-wide trends for Asia-related assets. The Trustees concluded that the current advisory fee structure with breakpoints for the Funds other than the two small company focused Funds enhances the ability of the Funds and their shareholders to benefit from past and future potential economies of scale, and continues to be appropriate given the size and objectives of the Funds. In addition, the Advisor previously agreed to provide an additional breakpoint under its Administration and Shareholder Services Agreement, which has the effect of further sharing those economies.
 The costs of the services provided by the Advisor and others. The Trustees considered the advisory fees and total fees and expenses of each Fund in comparison to the advisory fees and other fees and expenses of other funds in each Fund's relevant peer group. The Trustees considered both the gross advisory fee rates charged by the Advisor, as well as the effective advisory fee rates after taking into consideration the expense limitation arrangements and voluntary fee waivers. The Trustees found that the contractual advisory rates (excluding administrative services) for the Funds were very competitive and generally lower than the relevant peer group averages. Also, the total expense ratios paid by investors in the Funds, which are most representative of an investor's net experience, were also very competitive, with all but the newest Funds ranking below the peer group averages.
For each of Matthews Korea Fund, Matthews India Fund, Matthews China Fund, Matthews Japan Fund, Matthews Asia Science and Technology Fund, Matthews Asian Growth and Income Fund and Matthews Asia Dividend Fund, the Trustees noted that the gross advisory fee rates, the gross management fee (including administration) rates, the total expense ratio, the effective advisory fee rates and the actual nonmanagement fee rates (which include transfer agent and custodian fees) are all lower than most of the funds in each Fund's peer group.
For Matthews Pacific Tiger Fund, the Trustees noted that the gross advisory fee rates, the total expense ratio, the effective advisory fee rates and the actual nonmanagement expense rates (which include transfer agent and custodian fees) are lower than most of the funds in that Fund's peer group.
For Matthews Asia Growth Fund, the Trustees noted that the total expense ratio, the effective advisory fee rates and the actual nonmanagement expense rates (which include transfer agent and custodian fees) are all lower than most of the funds in that Fund's peer group, and the gross advisory fee rate was at the median rate.
For Matthews Asia Small Companies Fund and China Small Companies Fund, the Trustees noted that the gross advisory fee rate, actual advisory fees and total expenses (excluding 12b-1 distribution fees) are higher than the peer group average, which in part is the result of their relatively recent inception. The Trustees expect that the Funds' comparative position should improve as the Funds grow.
For Matthews China Dividend Fund, the Trustees noted that the gross advisory fee rate, actual advisory fees and total expenses are lower than the peer group average, but actual nonmanagement expenses are slightly higher than the peer group average, which is the result of its relatively recent inception. The Trustees expect that the Fund's comparative position should improve as the Fund grows.
The Trustees also compared the Advisor's advisory fees with those of the Advisor's separate accounts and other investment products, noting that the Funds' advisory expenses were not disadvantageous (not being substantially higher than the separate accounts' rates). Total expenses appeared to be appropriate in
matthewsasia.com | 800.789.ASIA 119
Approval of Investment Advisory Agreements (Unaudited) (continued)
comparison and taking into account the services differences between these products and the Funds, including the differences in the frequency of net asset value calculations. The Trustees considered various specific Fund expenses, including the custody fees and transfer agent fees. The Trustees noted the Advisor's efforts in recent years had resulted in, for each of the Funds, (a) reduced expenses under the administration and shareholders services plan, (b) reduced custodian expenses, and (c) reduced transfer agency fees. The Trustees concluded that the Advisor's advisory fee rates and the Funds' expense ratios are reasonable in light of comparative performance and expense and advisory fee information for each of the Funds. Separately, the Trustees observed the generally lower commission rates enjoyed by the Funds over recent years.
 The profits to be realized by the Advisor and its affiliates from the relationships with the Funds. The Trustees reviewed the profitability of the Advisor on both an absolute basis and in comparison to other investment advisers. The Trustees noted that the Advisor's pretax profit margin appeared to be reasonable in relation to other advisors. The Trustees also noted that the Advisor appeared to be sufficiently profitable to operate as a viable investment management firm, able to honor its obligations as a sponsor of the Funds, including the Funds that did not generate a profit for the Advisor, without earning excessive profits from any particular Fund or from the overall relationship with the Funds. The Trustees noted that, with declines in asset levels in some prior years, declines in profitability could be expected from time to time, but also noted the continued expenditures on technology and personnel. The Trustees noted recent modest improvement in profitability, expect that profitability can further improve as asset levels grow. The Trustees further noted that the Advisor's continued upgrading of its trading, research, compliance, and other technological systems should increase the Advisor's capacity, speed and reliability in providing services to the Funds as they grow, which further supports the long-term viability of the Funds and the Advisor. The Trustees also considered that the additional benefits derived by the Advisor from its relationship with the Funds are limited solely to research benefits received in exchange for "soft dollars." After such review, the Trustees determined that the profitability rate to the Advisor with respect to the Advisory Agreement is fair and reasonable in consideration of the services it provides to the Funds.
No single factor was determinative of the Board's decision to approve the Advisory Agreement, but rather the Trustees based their determination on the total mix of information available to them. After considering the factors described above, the Board concluded that the terms of the advisory arrangements are fair and reasonable to each Fund in light of the services that the Advisor provides, its costs and reasonably foreseeable Fund asset levels, and that each Fund's shareholders received and would receive reasonable value in return for the advisory fees paid. The Board agreed that the continuance of the Advisory Agreement with respect to each Fund would be in the best interests of the Funds and their shareholders. The Independent Trustees concluded separately that continuance of the Advisory Agreement was supported by reasonable and impartial records and information, including the performance of the Funds in relation to their peer groups, the services provided by the Advisor, and the competitive expense structure, and that the continuance of the Advisory Agreement with respect to each Fund would be in the best interests of each Fund and its shareholders.
The Advisory Agreement may be terminated by the Trustees on behalf of the Funds or the Advisor upon 60 days' prior written notice without penalty. The Advisory Agreement will also terminate automatically in the event of its assignment, as defined in the 1940 Act.
Matthews Asia Strategic Income Fund (the "Strategic Income Fund"), which is a series of the Trust, has retained Matthews International Capital Management, LLC (the "Advisor") to manage its assets pursuant to the Advisory Agreement, which has been approved by the Board of Trustees of the Strategic Income Fund, including the Independent Trustees. The Advisory Agreement will continue in effect from year-to-year provided that the continuance is specifically approved at least annually by the vote of the holders of at least a majority of the outstanding shares of the Strategic Income Fund, or by the Board of Trustees, and, in either event, by a majority of the Independent Trustees of the Trust casting votes in person at a meeting called for that purpose.
At a meeting held on November 18, 2011, the Board, including the Independent Trustees of the Trust, approved the Advisory Agreement with respect to the Strategic Income Fund, for an initial two year term.
Before those meetings, the Independent Trustees had requested detailed information from the Advisor about the matters to be considered and had received certain information regarding the Strategic Income Fund at a meeting held on August 25, 2011. This information, together with the information provided to the Independent Trustees about the Strategic Income Fund since that meeting, formed the primary (but not exclusive)
120 MATTHEWS ASIA FUNDS
Approval of Investment Advisory Agreements (Unaudited) (continued)
basis for the Board's determinations as summarized below. The Independent Trustees reviewed and discussed the extensive information provided by the Advisor at a separate executive session held on November 18, 2011. The Independent Trustees were assisted in their deliberations by their independent legal counsel. Below is a summary of the factors considered by the Board in approving the Advisory Agreement with respect to the Strategic Income Fund.
 The nature, extent and quality of the services provided by the Advisor under the Advisory Agreement. The Trustees considered the experience and qualifications of the personnel at the Advisor who will be responsible for providing services to the Strategic Income Fund and who will be responsible for the daily management of the Strategic Income Fund's portfolio. The Trustees considered the Advisor's capabilities and preparations for trading the emerging markets debt securities expected to be held by the Strategic Income Fund. The Trustees noted that the Advisor has expanded and deepened its management team over the past several years. They also reviewed applicable changes to the Advisor's portfolio management personnel and their responsibilities, reflecting a long-term vision for the Advisor's business and for the Strategic Income Fund. In particular, the Trustees noted the addition of nineteen individuals since June 2010, including two senior positions (one of which is the Chief Financial Officer), a fixed-income portfolio manager, six research analysts, and various supporting and administrative positions. The Trustees viewed the Advisor as having been successful in continuing to provide high quality services to its other funds while both weathering volatile and challenging securities markets, including significant asset and revenue contractions in 2008 and 2009, handling a dramatic increase in assets later in 2009 and in 2010, and continued volatility in 2011. The Trustees attributed much of that success to the Advisor's emphasis of preserving and enhancing portfolio management team resources, careful business planning and management, as well as its solid financial condition and strong cash reserves. As in past years, the Trustees considered the Advisor's succession plan to address situations where key personnel are no longer available, and the design and implementation of the Advisor's disaster recovery and business continuity plan. The Trustees also considered the Chief Compliance Officer's report regarding the compliance resources, initiatives, programs and structures of the Advisor, including the compliance record of the Advisor and the Advisor's supervision of service providers. The Trustees concluded that the Advisor has high-quality compliance and commitment to a culture of compliance. The Trustees recognized the extent of the Advisor's on-going commitment to marketing and distribution, particularly long-term strategic projects, enhanced brand awareness and client retention efforts, as well as resources devoted to investor education publications and website content, design and function. Other initiatives observed by the Trustees included significant efforts related to expanded relationships with financial institutions, their associated investment advisors, and other institutional decision-makers. The Trustees concluded that the Advisor had the personnel and resources needed to perform its duties under the Advisory Agreement with respect to this new Strategic Income Fund, and that the nature, overall quality, cost and extent of such management services are expected to be satisfactory.
 The investment performance of the Advisor. The Trustees reviewed the short-term and long-term performance of the Advisor's other funds and the performance of model portfolios utilized by the Advisor during the Strategic Income Fund's planning stages. The Trustees also reviewed the Advisor's trading policies and efforts to obtain best overall execution for its other funds in the various markets in which the funds trade securities. The Trustees concluded that the Adviser has the potential to generate acceptable long-term performance for the Strategic Income Fund.
 The extent to which the Advisor realizes economies of scale as the Strategic Income Fund grows larger and whether fee levels reflect these economies of scale for the benefit of Strategic Income Fund investors. Because the Strategic Income Fund is new, it is not expected to recognize economies of scale for some time, particularly because of the specialized emerging markets fixed income strategy. The Trustees discussed the Advisor's past and ongoing investment in its business and personnel, which is an acceptable way for the Strategic Income Fund to share indirectly in realizing economies of scale. The Trustees will monitor the Strategic Income Fund's growth and evaluate economies of scale with respect to future renewals of the Advisory Agreement, especially as the Strategic Income Fund grows.
 The costs of the services provided by the Advisor and others. The Trustees considered the proposed advisory fees and the expected total fees and expenses of the Strategic Income Fund in comparison to the advisory fees and other fees and expenses of other funds in the Strategic Income Fund's peer group. The Trustees recognized the absence of a directly applicable peer group for such a highly specialized Asia bond and income strategy. That means they could use that peer information as only a general
matthewsasia.com | 800.789.ASIA 121
Approval of Investment Advisory Agreements (Unaudited) (continued)
guideline. The Trustees considered both the gross advisory fee rates charged by the Advisor, as well as the effective advisory fee rate expected to apply after taking into consideration the expense limitation arrangements. The Trustees found that the proposed contractual advisory rate (excluding administrative services) for the Strategic Income Fund was competitive, taking into consideration the contractual limitation on overall expenses.
The Trustees noted that the Advisor does not provide investment advisory services for this strategy to any separate account. That means there are no other advisory fees of the Advisor to compare.
 The profits to be realized by the Advisor and its affiliates from the relationship with the Strategic Income Fund. The Trustees recognize that, as a new Strategic Income Fund with an expense limitation in place, it is not likely to generate profits for the Advisor initially, and until the Strategic Income Fund has experienced some growth. Although the Trustees are familiar with the profitability of the Advisor on both an absolute basis and in comparison to other investment advisers in connection with their review of other mutual funds managed by the Advisor, the profitability for this Strategic Income Fund is likely to be non-existent or very low for the foreseeable future given its much smaller size, and may detract to some limited extent from the Adviser's overall profitability.
No single factor was determinative of the Board's decision to approve the Advisory Agreement, but rather the Trustees based their determination on the total mix of information available to them. After considering the factors described above, the Board concluded that the terms of the advisory arrangements are fair and reasonable to the Strategic Income Fund in light of the services that the Advisor will provide, its costs and reasonably foreseeable Strategic Income Fund asset levels, and that the Strategic Income Fund's shareholders would receive reasonable value in return for the advisory fees paid. The Board agreed that the approval of the Advisory Agreement with respect to the Strategic Income Fund would be in the best interests of the Strategic Income Fund and its shareholders. The Independent Trustees concluded separately that approval of the Advisory Agreement was supported by reasonable and impartial records and information, including the services to be provided by the Advisor and the competitive expense structure, and that the approval of the Advisory Agreement with respect to the Strategic Income Fund would be in the best interests of the Strategic Income Fund and its shareholders.
The Advisory Agreement may be terminated by the Trustees on behalf of the Strategic Income Fund or the Advisor upon 60 days' prior written notice without penalty. The Advisory Agreement will also terminate automatically in the event of its assignment, as defined in the 1940 Act.
122 MATTHEWS ASIA FUNDS
Trustees and Officers of the Funds (Unaudited)
The operations of each Fund are under the direction of the Board of Trustees. The Board of Trustees establishes each Fund's policies and oversees and reviews the management of each Fund. The Board meets regularly to review the activities of the officers, who are responsible for the day-to-day operations of the Funds. The Statement of Additional Information, which includes additional information about Fund Trustees, is available without charge by calling 800.789.2742 or by visiting the Funds' website, matthewsasia.com. The Trustees and executive officers of the Funds, their year of birth, business address and principal occupations during the past five years are set forth below:
Name, Year of Birth,
Address and Position(s)
Held with Trust | | Term of
Office and
Length of
Time Served1 | | Principal Occupation(s)
During Past 5 Years | | Number of
Portfolios in
Fund Complex
Overseen by
Trustee | | Other Trusteeships/Directorships
(number of portfolios) Held by Trustee | |
| INDEPENDENT TRUSTEES | |
|
GEOFFREY H. BOBROFF
Born 1944
Four Embarcadero Center
Suite 550
San Francisco, CA 94111
Chairman of the Board of
Trustees and Trustee | | Since 2006 | | President, Bobroff Consulting, Inc. (since 1993). | | | 13 | | | None | |
|
TOSHI SHIBANO
Born 1950
Four Embarcadero Center
Suite 550
San Francisco, CA 94111
Trustee | | Since 2003 | | President, Strategic Financial Literacy, Inc. (since 1995); Adjunct Professor, Columbia Graduate School of Business (since 2000); Faculty, General Electric John F. Welch Leadership Development Center (since 2000); Executive Education Lecturer, Center for Executive Education, Haas School of Business, UC Berkeley (since 1995); Visiting Assistant Professor, Stanford Graduate School of Business (2000); Assistant Professor, University of Chicago Graduate School of Business (1995-2000); Assistant Professor, Haas School of Business, UC Berkeley (1988-1995). | | | 13 | | | None | |
|
RHODA ROSSMAN
Born 1958
Four Embarcadero Center
Suite 550
San Francisco, CA 94111
Trustee | | Since 2006 | | Vice President, Corporate Investment Officer (2007–2010); and Senior Vice President and Treasurer (2003–2007), The PMI Group, Inc. | | | 13 | | | None | |
|
JONATHAN F. ZESCHIN
Born 1953
Four Embarcadero Center
Suite 550
San Francisco, CA 94111
Trustee | | Since 2007 | | Partner, Essential Investment Partners, LLC (since 2009); President, Essential Advisers Inc. (since 2000); Managing Partner, JZ Partners LLC (since 1998). | | | 13 | | | Independent Chairman of the Board of Trustees, DCA Total Return Fund (2005–2011) (1 Portfolio) and DCW Total Return Fund (2007–2010) (1 Portfolio); Independent Trustee, ICON Funds (2002–2007) (17 Portfolios); Independent Director, Wasatch Funds (2002–2004) (10 Portfolios). | |
|
RICHARD K. LYONS
Born 1961
Four Embarcadero Center
Suite 550
San Francisco, CA 94111
Trustee | | Since 2010 | | Dean (since 2008), Haas School of Business, UC Berkeley; Chief Learning Officer (2006–2008), Goldman Sachs; Executive Associate Dean (2005–2006), Acting Dean (2004–2005), Professor (2000–2004), Associate Professor (1996–2000), Assistant Professor (1993–1996), Haas School of Business, UC Berkeley. | | | 13 | | | Director (2000–2006), iShares Fund Complex, consisting of iShares, Inc. (24 Portfolios) and iShares Trust (over 70 Portfolios) managed by Barclays Global Investors; Trustee (2001–2006), Barclays Global Investor Fund Complex, consisting of Barclays Global Investor Funds and Barclays Master Investment Portfolios (15 Portfolios); Independent Trustee, Matthews Asia Funds (1994–2006) (9 Portfolios). | |
|
matthewsasia.com | 800.789.ASIA 123
Name, Year of Birth,
Address and Position(s)
Held with Trust | | Term of
Office and
Length of
Time Served1 | | Principal Occupation(s)
During Past 5 Years | | Number of
Portfolios in
Fund Complex
Overseen by
Trustee | | Other Trusteeships/Directorships
(number of portfolios) Held by Trustee | |
| INTERESTED TRUSTEES2 | |
|
G. PAUL MATTHEWS
Born 1956
Four Embarcadero Center
Suite 550
San Francisco, CA 94111
Trustee | | Since 2007 | | Director and Portfolio Manager (Since 2009), Chairman and Portfolio Manager (1991–2009), Chief Investment Officer (1991–2007), Matthews International Capital Management, LLC; President of the Funds (1994–2007). | | | 13 | | | Director, Matthews Asian Selections Funds Plc (1 Portfolio). | |
|
Name, Year of Birth,
Address and Position(s)
Held with Trust | | Term of Office
and Length of
Time Served1 | | Principal Occupation(s) During Past 5 Years | | Other Trusteeships/
Directorships
(number of
portfolios)
Held by Officer | |
| OFFICERS WHO ARE NOT TRUSTEES | |
|
WILLIAM J. HACKETT
Born 1967
Four Embarcadero Center
Suite 550
San Francisco, CA 94111
President | | Since 2008 | | Chief Executive Officer (since 2009), President and Secretary (since 2007), Matthews International Capital Management, LLC; Partner (2002–2007), Deloitte & Touche, LLP. | | Director, Matthews Asian Selections Funds Plc (1 Portfolio); Director, Matthews Asia Funds S.I.C.A.V. (4 Portfolios). | |
|
ROBERT J. HORROCKS, PHD
Born 1968
Four Embarcadero Center
Suite 550
San Francisco, CA 94111
Vice President | | Since 2009 | | Chief Investment Officer (Since 2009), Director of Research (2008–2009), Matthews International Capital Management, LLC; Head of Research, Mirae Asset Management (2006–2008); Chief Investment Officer, Everbright Pramerica (2003–2006). | | None | |
|
JOHN P. McGOWAN
Born 1964
Four Embarcadero Center
Suite 550
San Francisco, CA 94111
Vice President and
Secretary | | Since 2005 | | Senior Vice President of Business Administration (since 2009), Chief Administrative Officer (2007–2008), Chief Operating Officer (2004–2007), Matthews International Capital Management, LLC; Chief Operating Officer, Treasurer and Chief Compliance Officer, Forward Management LLC (1998–2004). | | Director, Matthews Asian Selections Funds Plc (1 Portfolio); Director, Matthews Asia Funds S.I.C.A.V. (4 Portfolios). | |
|
SHAI A. MALKA
Born 1973
Four Embarcadero Center
Suite 550
San Francisco, CA 94111
Treasurer | | Since 2005 | | Vice President of Fund Accounting and Operations (since 2010), Senior Manager of Fund Accounting and Operations (2004–2009), Matthews International Capital Management, LLC. | | None | |
|
TIMOTHY B. PARKER
Born 1958
Four Embarcadero Center
Suite 550
San Francisco, CA 94111
Vice President | | Since 2008 | | General Counsel (since 2005), Matthews International Capital Management, LLC; Partner, Kirkpatrick & Lockhart Nicholson Graham LLP (2003–2005); Global Head of Compliance and Risk Management, Allianz Dresdner Asset Management (2001–2003); Managing Director, RCM Global Investors (1993–2001). | | Director, Matthews Asia Funds S.I.C.A.V. (4 Portfolios). | |
|
MANOJ K. POMBRA
Born 1964
Four Embarcadero Center
Suite 550
San Francisco, CA 94111
Chief Compliance Officer | | Since 2005 | | Chief Compliance Officer, Matthews International Capital Management, LLC (since 2005); Senior Manager, Mutual Fund Compliance/Manager Portfolio Compliance, Franklin Templeton Investments (2001–2005). | | None | |
|
1 Each trustee serves for an indefinite term, until retirement age or until his/her successor is elected. Officers serve at the pleasure of the Board of Trustees.
2 This trustee is considered an "interested person" of the Trust as defined under the 1940 Act because of an ownership interest in the Advisor and an office held with the Advisor.
124 MATTHEWS ASIA FUNDS
Matthews Asia Funds
INVESTMENT ADVISOR
Matthews International Capital Management, LLC
Four Embarcadero Center, Suite 550
San Francisco, CA 94111
800.789.ASIA
CUSTODIAN
Brown Brothers Harriman & Co.
50 Milk Street
Boston, MA 02109
ACCOUNT SERVICES
Matthews Asia Funds
P.O. Box 9791
Providence, RI 02940
800.789.ASIA
LEGAL COUNSEL
Paul Hastings LLP
55 Second Street, 24th Floor
San Francisco, CA 94105
matthewsasia.com | 800.789.ASIA 125
P.O. Box 9791 | Providence, RI 02940 | matthewsasia.com | 800.789.ASIA (2742) | AR-1211-240M |
Item 2. Code of Ethics.
(a) The registrant, as of the end of the period covered by this report, has adopted a code of ethics that applies to the registrant’s principal executive officer, principal financial officer, principal accounting officer or controller, or persons performing similar functions, regardless of whether these individuals are employed by the registrant or a third party.
(c) There have been no amendments, during the period covered by this report, to a provision of the code of ethics that applies to the registrant’s principal executive officer, principal financial officer, principal accounting officer or controller, or persons performing similar functions, regardless of whether these individuals are employed by the registrant or a third party, and that relates to any element of the code of ethics description.
(d) The registrant has not granted any waivers, including an implicit waiver, from a provision of the code of ethics that applies to the registrant’s principal executive officer, principal financial officer, principal accounting officer or controller, or persons performing similar functions, regardless of whether these individuals are employed by the registrant or a third party, that relates to one or more of the items set forth in paragraph (b) of this item’s instructions.
Item 3. Audit Committee Financial Expert.
(a) As of the end of the period covered by the report, the registrant’s board of directors has determined that the registrant has two audit committee financial experts serving on its audit committee, Toshi Shibano and Jonathan F. Zeschin, and that both are “independent.”
(b) Prof. Shibano is an Adjunct Professor at the Columbia Graduate School of Business and a member of the Faculty of the General Electric Corporate Leadership Development Center. He also serves as Executive Education Lecturer at the Haas School of Business at the University of California, Berkeley, and has served on the faculties of Thunderbird American Graduate School of International Management, Stanford Graduate School of Business, the University of Chicago School of Business and the Australian Graduate School of Management at the University of New South Wales. He regularly reviews current research in accounting both for use in instruction of courses and for internal faculty evaluation. He has experience analyzing and evaluating financial statements at the appropriate level of complexity through his professional activities on the educational faculties referenced above.
Prof. Shibano also has extensive experience in executive education worldwide (Hong Kong, Taiwan, Singapore, Finland, Italy, Mexico, India) and has developed innovative new programs in financial analysis, management control systems and strategy implementation.
Prof. Shibano has published in the Journal of Accounting Research, the Journal of Accounting and Economics, the Rand Journal of Economics, and the Journal of Applied Corporate Finance, on the topics of strategic audit risk, accounting standard setting, international accounting standards, tax minimization, foreign currency risk management, and organizational structure. Prof. Shibano received his MBA from the Haas School at UC Berkeley and earned his PhD at the Stanford Graduate School of Business, earning the highest academic honors in both programs. Prof. Shibano has gained additional accounting expertise as the Audit Committee Chair of Matthews Asian Funds.
Mr. Zeschin is Partner of Essential Investment Partners, LLC, a wealth management and investment advisory firm. He is also the portfolio manager for that firm’s Essential Growth Portfolio. Essential Investment Partners, LLC succeeded to the business of Essential Advisers, Inc. He is Managing Partner of JZ Partners, LLC, a business consulting firm for investment managers. Prior to forming Essential Advisers, Inc., Mr. Zeschin held senior executive positions with Founders Asset Management, Inc., Invesco Fund Group, and Stein Roe & Farnham, Inc. Mr. Zeschin holds a Masters of Management from the Kellogg School at Northwestern University, with majors in Finance and Marketing, and a Bachelor in Business Administration in Accounting with distinction from the University of Michigan. He holds a Certified Public Accountant certificate from the state of Illinois and is a Certified Financial Planner certificant. Mr. Zeschin is a former chair of the ICI’s Accounting Treasurer’s Committee and a former member of the AICPA Investment Companies committee. Mr. Zeschin is currently the chairman of the Board of Trustees to two NYSE listed closed-end funds. He has served on the audit committees of mutual fund boards since 2002. He has experience analyzing and evaluating financial statements at the appropriate level of complexity through his professional activities on the educational faculties referenced above. Mr. Zeschin has gained additional expertise as a member of the Audit Committee of Matthews Asian Funds.
Item 4. Principal Accountant Fees and Services.
Audit Fees
(a) The aggregate fees billed for each of the last two fiscal years for professional services rendered by the principal accountant for the audit of the registrant’s annual financial statements or services that are normally provided by the accountant in connection with statutory and regulatory filings or engagements for those fiscal years are $297,278 in 2010 and $297,280 in 2011.
Audit-Related Fees
(b) The aggregate fees billed in each of the last two fiscal years for assurance and related services by the principal accountant that are reasonably related to the performance of the audit of the registrant’s financial statements and are not reported under paragraph (a) of this Item are $0 in 2010 and $0 in 2011.
Tax Fees
(c) The aggregate fees billed in each of the last two fiscal years for professional services rendered by the principal accountant for tax compliance, tax advice, and tax planning are $78,210 in 2010 and $103,210 in 2011. Tax fees include services provided by PWC for tax return preparations.
All Other Fees
(d) The aggregate fees billed in each of the last two fiscal years for products and services provided by the principal accountant, other than the services reported in paragraphs (a) through (c) of this Item are $0 in 2010 and $0 in 2011.
(e)(1) Disclose the audit committee’s pre-approval policies and procedures described in paragraph (c)(7) of Rule 2-01 of Regulation S-X.
Pre-Approval of Auditor Services.
Pre-Approval Requirements. Before the Auditor is engaged by the Trust to render audit related or permissible non-audit services, either:
(i) The Audit Committee shall pre-approve all audit related services and permissible non-audit services (e.g., tax services) to be provided to the Trust; or
(ii) The Audit Committee shall establish policies and procedures governing the Auditor’s engagement. Any such policies and procedures must (1) be detailed as to the particular service and (2) not involve any delegation of the Audit Committee’s responsibilities to the Adviser. The Audit Committee may delegate to one or more of its members the authority to grant pre-approvals. The pre-approval policies and procedures shall include the requirement that the decisions of any member to whom authority is delegated under this Section 4(e) shall be presented to the full Audit Committee at its next scheduled meeting.
De Minimis Exceptions to Pre-Approval Requirements. Pre-approval for a service provided to the Trust other than audit, review or attest services is not required if: (1) the aggregate amount of all such non-audit services provided to the Trust constitutes not more than 5 percent of the total amount of revenues paid by the Trust to the Auditor during the fiscal year in which the non-audit services are provided; (2) such services were not recognized by the Trust at the time of the engagement to be non-audit services; and (3) such services are promptly brought to the attention of the Audit Committee and are approved by the Audit Committee or by one or more members of the Audit Committee to whom authority to grant such approvals has been delegated by the Audit Committee.
Pre-Approval of Non-Audit Services Provided to the Adviser and Certain Control Persons. With respect to services that have a direct impact on the operations or financial reporting of the Trust, the Audit Committee shall pre-approve all such non-audit services proposed to be provided by the Auditor to (i) the Adviser and (ii) any entity controlling, controlled by, or under common control with the Adviser that provides ongoing services to the Trust.
Application of De Minimis Exception: The de minimis exceptions set forth above under Section 4(e)(ii) apply to pre-approvals under this Section 4(e)(iii) as well, except that the “total amount of revenues” calculation for Section 4(e)(iii) services is based on the total
amount of revenues paid to the Auditor by the Trust and any other entity that has its services approved under this Section (i.e., the Adviser or any control person).
(e)(2) The percentage of services described in each of paragraphs (b) through (d) of this Item that were approved by the audit committee pursuant to paragraph (c)(7)(i)(C) of Rule 2-01 of Regulation S-X are as follows:
(b) 100%
(c) 100%
(d) 100%
(f) The percentage of hours expended on the principal accountant’s engagement to audit the registrant’s financial statements for the most recent fiscal year that were attributed to work performed by persons other than the principal accountant’s full-time, permanent employees was 100%.
(g) The aggregate non-audit fees billed by the registrant’s accountant for services rendered to the registrant, and rendered to the registrant’s investment adviser (not including any sub-adviser whose role is primarily portfolio management and is subcontracted with or overseen by another investment adviser), and any entity controlling, controlled by, or under common control with the adviser that provides ongoing services to the registrant for each of the last two fiscal years of the registrant was $129,644 in 2010 and $172,450 in 2011.
(h) The registrant’s audit committee of the board of directors has considered whether the provision of non-audit services that were rendered to the registrant’s investment adviser (not including any sub-adviser whose role is primarily portfolio management and is subcontracted with or overseen by another investment adviser), and any entity controlling, controlled by, or under common control with the investment adviser that provides ongoing services to the registrant that were not pre-approved pursuant to paragraph (c)(7)(ii) of Rule 2-01 of Regulation S-X is compatible with maintaining the principal accountant’s independence.
Item 5. Audit Committee of Listed registrants.
Not applicable.
Item 6. Investments.
(a) Schedule of Investments in securities of unaffiliated issuers as of the close of the reporting period is included as part of the report to shareholders filed under Item 1 of this form.
(b) Not applicable.
Item 7. Disclosure of Proxy Voting Policies and Procedures for Closed-End Management Investment Companies.
Not applicable.
Item 8. Portfolio Managers of Closed-End Management Investment Companies.
Not applicable.
Item 9. Purchases of Equity Securities by Closed-End Management Investment Company and Affiliated Purchasers.
Not applicable.
Item 10. Submission of Matters to a Vote of Security Holders.
There have been no material changes to the procedures by which the shareholders may recommend nominees to the registrant’s board of directors, where those changes were implemented after the registrant last provided disclosure in response to the requirements of Item 407(c)(2)(iv) of Regulation S-K (17 CFR 229.407) (as required by Item 22(b)(15) of Schedule 14A (17 CFR 240.14a-101)), or this Item.
Item 11. Controls and Procedures.
(a) The registrant’s principal executive and principal financial officers, or persons performing similar functions, have concluded that the registrant’s disclosure controls and procedures (as defined in Rule 30a-3(c) under the Investment Company Act of 1940, as amended (the “1940 Act”) (17 CFR 270.30a-3(c))) are effective, as of a date within 90 days of the filing date of the report that includes the disclosure required by this paragraph, based on their evaluation of these controls and procedures required by Rule 30a-3(b) under the 1940 Act (17 CFR 270.30a-3(b)) and Rules 13a-15(b) or 15d-15(b) under the Securities Exchange Act of 1934, as amended (17 CFR 240.13a-15(b) or 240.15d-15(b)).
(b) There were no changes in the registrant’s internal control over financial reporting (as defined in Rule 30a-3(d) under the 1940 Act (17 CFR 270.30a-3(d)) that occurred during the registrant’s second fiscal quarter of the period covered by this report that has materially affected, or is reasonably likely to materially affect, the registrant’s internal control over financial reporting.
Item 12. Exhibits.
(a)(1) Code of ethics, or any amendment thereto, that is the subject of disclosure required by Item 2 is attached hereto.
(a)(2) Certifications pursuant to Rule 30a-2(a) under the 1940 Act and Section 302 of the Sarbanes-Oxley Act of 2002 are attached hereto.
(a)(3) Not applicable.
(b) Certifications pursuant to Rule 30a-2(b) under the 1940 Act and Section 906 of the Sarbanes- Oxley Act of 2002 are attached hereto.
SIGNATURES
Pursuant to the requirements of the Securities Exchange Act of 1934 and the Investment Company Act of 1940, the registrant has duly caused this report to be signed on its behalf by the undersigned, thereunto duly authorized.
(registrant) | | Matthews International Funds | |
| | |
By (Signature and Title)* | | /s/ William J. Hackett | |
| William J. Hackett, President | |
| (principal executive officer) | |
| | |
Date | March 1, 2012 | | |
| | |
|
Pursuant to the requirements of the Securities Exchange Act of 1934 and the Investment Company Act of 1940, this report has been signed below by the following persons on behalf of the registrant and in the capacities and on the dates indicated. |
|
| | |
By (Signature and Title)* | | /s/ William J. Hackett | |
| William J. Hackett, President | |
| (principal executive officer) | |
| | |
Date | March 1, 2012 | | |
| | |
| | |
By (Signature and Title)* | | /s/ Shai Malka | |
| Shai Malka, Treasurer | |
| (principal financial officer) | |
| | |
Date | March 1, 2012 | | |
| | | | | | |
* Print the name and title of each signing officer under his or her signature.