UNITED STATES
SECURITIES AND EXCHANGE COMMISSION
Washington, D.C. 20549
FORM N-CSR
CERTIFIED SHAREHOLDER REPORT OF REGISTERED MANAGEMENT
INVESTMENT COMPANIES
Investment Company Act file number 811-08510
Matthews International Funds
(Exact name of registrant as specified in charter)
Four Embarcadero Center, Suite 550
San Francisco, CA 94111
(Address of principal executive offices) (Zip code)
William J. Hackett, President
Four Embarcadero Center, Suite 550
San Francisco, CA 94111
(Name and address of agent for service)
Registrant’s telephone number, including area code: 415-788-6036
Date of fiscal year end: December 31
Date of reporting period: December 31, 2008
Form N-CSR is to be used by management investment companies to file reports with the Commission not later than 10 days after the transmission to stockholders of any report that is required to be transmitted to stockholders under Rule 30e-1 under the Investment Company Act of 1940 (17 CFR 270.30e-1). The Commission may use the information provided on Form N-CSR in its regulatory, disclosure review, inspection, and policymaking roles.
A registrant is required to disclose the information specified by Form N-CSR, and the Commission will make this information public. A registrant is not required to respond to the collection of information contained in Form N-CSR unless the Form displays a currently valid Office of Management and Budget (“OMB”) control number. Please direct comments concerning the accuracy of the information collection burden estimate and any suggestions for reducing the burden to Secretary, Securities and Exchange Commission, 100 F Street, NE, Washington, DC 20549. The OMB has reviewed this collection of information under the clearance requirements of 44 U.S.C. § 3507.
Item 1. Reports to Stockholders.
The Report to Shareholders is attached herewith.
Performance and Expenses
Through December 31, 2008
| | | | | | | | | | | | | | | | | | | | |
| | | Average Annual Total Returns | | | Inception
Date | | 2008 Gross
Annual
Operating
Expenses | | | 2007 Gross
Annual
Operating
Expenses1 | |
| | | 1 year | | | 5 years | | | 10 years | | | Since
Inception | | | | |
ASIA GROWTH AND INCOME STRATEGIES | | | | | | | | | | | | | | | | | | | | |
Matthews Asian Growth and Income Fund | | -32.07 | % | | 7.45 | % | | 14.34 | % | | 9.32 | % | | 9/12/94 | | 1.16 | % | | 1.15 | % |
Matthews Asia Pacific Equity Income Fund | | -25.97 | % | | n.a. | | | n.a. | | | -2.67 | % | | 10/31/06 | | 1.35 | % | | 1.41 | % |
After Contractual Fee Waiver | | | | | | | | | | | | | | | | 1.32 | %2 | | | |
| | | | | | | |
ASIA GROWTH STRATEGIES | | | | | | | | | | | | | | | | | | | | |
Matthews Asia Pacific Fund | | -37.44 | % | | 3.63 | % | | n.a. | | | 4.14 | % | | 10/31/03 | | 1.23 | % | | 1.20 | % |
Matthews Pacific Tiger Fund | | -46.12 | % | | 6.72 | % | | 12.02 | % | | 5.57 | % | | 9/12/94 | | 1.12 | % | | 1.10 | % |
Matthews China Fund | | -48.95 | % | | 9.71 | % | | 14.95 | % | | 8.91 | % | | 2/19/98 | | 1.23 | % | | 1.17 | % |
Matthews India Fund | | -62.32 | % | | n.a. | | | n.a. | | | -1.42 | % | | 10/31/05 | | 1.29 | % | | 1.28 | % |
Matthews Japan Fund | | -28.38 | % | | -3.52 | % | | 2.44 | % | | 2.44 | % | | 12/31/98 | | 1.23 | % | | 1.23 | % |
Matthews Korea Fund | | -52.66 | % | | 4.51 | % | | 11.68 | % | | 1.56 | % | | 1/3/95 | | 1.27 | % | | 1.21 | % |
| | | | | | | |
ASIA SMALL COMPANY STRATEGY | | | | | | | | | | | | | | | | | | | | |
Matthews Asia Small Companies Fund | | n.a. | | | n.a. | | | n.a. | | | -21.03 | %3 | | 9/15/08 | | 14.31 | %4 | | n.a. | |
After Contractual Fee Waiver | | | | | | | | | | | | | | | | 2.00 | %4 | | n.a. | |
| | | | | | | |
ASIA SPECIALTY STRATEGY | | | | | | | | | | | | | | | | | | | | |
Matthews Asian Technology Fund | | -51.94 | % | | -0.50 | % | | n.a. | | | -7.46 | % | | 12/27/99 | | 1.33 | % | | 1.25 | % |
| 1 | Ratio has been restated to reflect current management and administrative and shareholder servicing fees expected to be incurred by the Funds and paid to the Advisor. |
| 2 | The Advisor has contractually agreed to waive certain fees and reimburse certain expenses for Matthews Asia Pacific Equity Income Fund. Please see page 77 for additional information. |
| 3 | Actual Return, Not Annualized. |
| 4 | The Advisor has contractually agreed to waive Matthews Asia Small Companies Fund’s fees and reimburse expenses until August 31, 2010 to the extent needed to limit total annual operating expenses to 2.00%. |
Investor Disclosure
Past Performance: All performance quoted in this report is past performance and is no guarantee of future results. Investment return and principal value will fluctuate with changing market conditions so that when redeemed, shares may be worth more or less than their original cost. Current performance may be lower or higher than the returns quoted. If certain of the Funds’ fees and expenses had not been waived, returns would have been lower. For the Funds’ most recent month-end performance, please call 800.789.ASIA (2742) or visit matthewsasia.com.
Investment Risk: Mutual fund shares are not deposits or obligations of, or guaranteed by, any depositary institution. Shares are not insured by the FDIC, Federal Reserve Board or any government agency and are subject to investment risks, including possible loss of principal amount invested. Investing in international markets may involve additional risks, such as social and political instability, market illiquidity, exchange-rate fluctuations, a high level of volatility and limited regulation. In addition, single-country and sector funds may be subject to a higher degree of market risk than diversified funds because of concentration in a specific industry, sector or geographic location. Investing in small and mid-size companies is more risky than investing in large companies as they may be more volatile and less liquid than larger companies. Please see the Funds’ prospectus and Statement of Additional Information for more risk disclosure.
Redemption Fee Policy
The Funds assess a redemption fee of 2.00% on the total redemption proceeds on most sales or exchanges of shares that take place within 90 calendar days after their purchase as part of the Funds’ efforts to discourage market timing activity. This fee is payable directly to the Funds. For purposes of determining whether the redemption fee applies, the shares that have been held longest will be redeemed first. The Funds may grant exemptions from the redemption fee in certain circumstances. For more information on this policy, please see the Funds’ prospectus.
Cover photo: River by the Esplanade, Singapore
Contents
This report has been prepared for Matthews Asia Funds shareholders. It is not authorized for distribution to prospective investors unless accompanied or preceded by a current Matthews Asia Funds prospectus, which contains more complete information about the Funds’ investment objectives, risks and expenses. Additional copies of the prospectus may be obtained at matthewsasia.com. Please read the prospectus carefully before you invest or send money.
The views and opinions in this report were current as of December 31, 2008. They are not guarantees of performance or investment results and should not be taken as investment advice. Investment decisions reflect a variety of factors, and the managers reserve the right to change their views about individual stocks, sectors and the markets at any time. As a result, the views expressed should not be relied upon as a forecast of a Fund’s future investment intent.
Statements of fact are from sources considered reliable, but neither the Funds nor the Investment Advisor makes any representation or guarantee as to their completeness or accuracy.
Matthews Asia Funds are distributed by:
PFPC Distributors, Inc. | 760 Moore Road | King of Prussia, PA 19406
| | |

“the notion that markets can be classified as either “developed” or “emerging” in a binary fashion has always been questionable. The present crisis has rendered the distinction obsolete.” | | Message to Shareholders from the Investment Advisor Dear Fellow Shareholders, 2008 was a year of extremes. The extent and breadth of collapse of the global financial order exceeded all but the direst prediction. Everyone was left wondering: How did this happen? What does it all mean? We would not pretend to be able to answer such complex questions. However, as wrenching as markets have been, their recent convulsions are unfortunately not outside the scope of expectation. The history of markets is a long one, and it is replete with fantastic booms and devastating busts. As we at Matthews know from experience, crisis is a constant interloper in the marketplace. Volatility, and the swings in fortune that accompany it, are inevitable and immutable qualities of financial markets. Amid the current environment, one might be tempted to discontinue investment. Yet yielding to such temptation would be shortsighted. Investors have recently experienced the downside of risk; but having done so, they cannot lose sight of the potential upside: namely, that their portfolios might capture some small share of the world’s march toward growth and progress. Our experience at Matthews suggests that the market’s collapse belies material gains made over the past two decades. During that time, productivity has risen in almost every corner of the globe; scientific achievement has leapt forward; trade has flourished; and markets have been deregulated and opened to greater competition. Most importantly, hundreds of millions of people in East and Central Asia have clawed their way out of abject poverty. Asian incomes have grown, and households enjoy improved living standards. This is no small feat given where the region began, and it represents growth of the most authentic kind. It is this same progress that investors should try to harvest in their portfolios, especially as some share of it is ultimately reflected in financial terms. Faulty Premises and Artificial Labels Many would expect that as a regulated, modern and developed market, the U.S. would have been the last sort of place where catastrophic risk might manifest itself. It was only five years ago that some prominent strategists warned of an imminent demise of the Chinese banking system, calling it a “house of cards.” Chinese banks have indeed suffered amid the current correction, but the fundamentals have held relatively stable during the downturn. Thus, events have confounded those who would predict that the next world crisis would arise from the “emerging” world, rather than the “developed” one. In our view, this disconnected logic arises from a faulty premise—that the labels “developed market” and “emerging market” have much meaning for investors. To be sure, countries around the world are in various stages of development; yet even as substantial differences exist, the notion that markets can be classified as either “developed” or “emerging” in a binary fashion has always been questionable. The present crisis has rendered the distinction obsolete. Regulatory and financial systems are subject to failure even in the world’s most advanced countries. Meanwhile, the capital markets and financial systems of the so-called emerging world may not be as precarious as believed. Investors must anticipate material risk in every investment, regardless of its origin or pedigree. |
| |
2 MATTHEWS ASIA FUNDS
| | |
A Measure of Progress So what did the year hold for China, Asia’s central economic power? Its experience is emblematic of the region’s struggle to advance from emerging to developed status. During the year, China was tested on many fronts: it saw deadly blizzards; a devastating earthquake that killed tens of thousands; food price inflation that threatened social stability; a deadly consumer scandal from tainted milk formula; and a domestic economy that faced headwinds arising from the downturn of the U.S. economy. Except for the Olympic Games, most external observers would struggle to find much about the year that was positive. However, a closer reading of events would suggest that China made a fair measure of progress. Not in recent memory has China’s media had such freedom to report on scandals and civil unrest; nor has the nation engaged in such open dialogue over its hardships. The country’s leadership does not allow for free debate in the country; yet high-ranking officials were repeatedly and publicly brought to task for corruption or failure to address the nation’s woes. This suggests that a new sort of social structure has begun to emerge in China—one characterized by a higher degree of openness. Still, China will face further tests in the year ahead. The domestic banking system has largely avoided the collapse of global financial markets. This is no small feat, given that less than a decade ago most of the country’s banking sector was technically insolvent. However, growth in the country is slowing, and banks will likely face pressure from the central government to stimulate credit markets. How the banks respond will test their independence, as well as the health of the industry as a whole. Meanwhile, the government will face challenges of its own, as slower growth will strain the social compact that has underwritten the ruling party’s status. The country’s social safety net likely needs expansion. In 2008, China’s leadership demonstrated that it was responsive and adaptive—and if it can do so again in 2009, it may fend off the threat of stagnation. What Worked, and What Did Not 2008 was a difficult year for China, and so too for the Matthews Asia Funds. We were pleased to note that nearly all of the Funds fared better in their performance than their peers and benchmarks. Nevertheless, it is the absolute performance of the Funds that was the obvious casualty during the year. The steep decline in shareholders’ assets was reminiscent of previous crises, and we found it every bit as painful. As a firm, we managed to avoid some of the worst-hit areas during the downturn by de-emphasizing investment in commodity-driven and cyclical industries. We also attempted to shun steep valuations on high-growth | | stocks, particularly because we were skeptical as to whether the popular notion of “decoupling” would persist. When it did not, some stocks saw their premium valuations falter. Yet even as such actions avoided the worst of the financial fallout, the Funds still suffered steep losses in absolute terms. In hindsight, we underestimated the severity of the dislocation in markets. As a firm, we tended to “trust in the fundamentals,” believing that strong underlying balance sheets and steady growth prospects would allow individual companies to avoid the worst of the downturn. Instead, 2008 was characterized by bouts of distressed selling that we have not seen since the Asian financial crisis of just over a decade ago. As a consequence, the quality of a company’s fundamentals mattered little as large swathes of assets were sold off quickly and indiscriminately. We are confident that as markets stabilize, long-term fundamentals will assert themselves again, but for the time being the market appears unwilling to extend its forecast horizon beyond the next two quarters. In an environment such as this, the only practical step to avoid losses would have been to make greater use of cash and cash-like instruments within the Funds. However, such a move would run counter to Matthews’ philosophy. In all our portfolios, we strive to maintain near-full investment, rather than attempt to time markets. Our goal is to maximize long-term performance. We believe that the best way to pursue that goal efficiently is by adhering to an investment discipline that emphasizes fundamentals and avoids excessive, costly turnover. Of course, after declines of such magnitude, we are all looking in the mirror to see how we can modify and improve our investment approach without abandoning this core discipline. A New Notion of Decoupling Though the concept of “decoupling” was popularly bandied about a year ago, we did not subscribe to the theory. Much of the growth in East and Central Asia over the past two decades has come about precisely because of greater economic coupling and “globalization,” and not the opposite. True “decoupling” is not a desirable state—witness Pakistan and Thailand, where severe political disorder has strained these countries’ linkages to the rest of the world, to their detriment. However, as 2009 dawns there is a new notion of decoupling that is beginning to emerge in Asia. Even though economic growth may be slowing, Asia enjoys a relatively strong “balance sheet,” which should allow it to have less reliance on the rest of the world. Asia’s economies enjoy high rates of saving, both among households and governments. Higher savings means a stronger financial position, which in turn will give Asia’s economies more room to maneuver. Specifically, |
matthewsasia.com | 800.789.ASIA 3
| | |
| “Asia’s economies enjoy high rates of saving, both among households and governments. Higher savings means a stronger financial position, which in turn will give Asia’s economies more room to maneuver.” | | households have the flexibility to dip into savings to consume—or, as is more likely the case, Asian governments will engage in expansionary deficit spending. Late in 2008, China announced a massive fiscal package, committing to spend nearly half a trillion dollars on physical infrastructure over two years. Meanwhile, Asia’s tight credit conditions gave Asian central banks more room for monetary stimulus, especially by further dropping rates. In the past, Asian central bankers looked to the U.S. Federal Reserve for cues on rates; but amid the current environment, Asia’s monetary conditions may take a different course. This may not constitute decoupling, but it does mean that Asia can contemplate fiscal and monetary measures separately from the rest of the world. Where do the challenges lie in the year ahead? There are many, and obviously most are tied to the contraction in global credit markets and the decline in consumer demand. However, there are two challenges that are particularly acute within Asia. First, credit markets within the region have been disrupted for an extended period because of ongoing financial instability. Even relatively secure, short-term financing options (e.g., letters of credit) have been less available to Asian companies. As a consequence, normal commercial and trade flows in the region have been hampered, even where end demand has been relatively resilient. Until order is restored in short-term financial markets, Asia’s growth will remain vulnerable. The second and more subtle challenge for the region is the propensity for “backsliding”: that is the risk that Asian policy makers, having witnessed the frailties of capitalism, will shun further market reforms. Asia has grown over the past two decades because it has deregulated and liberalized, and opened its markets. If Asia turns its back on this progress in a concerted fashion, it will stultify the growth that we associate with the region. However, to believe that is to go against the trends of past decades. As always, we remain confident that Asia will continue to give rise to new opportunities for further growth. We thank you for your investment in the Matthews Asia Funds, and we are honored to serve as your Asia investment specialists. |
| |
| |  |
| | Andrew T. Foster |
| | Acting Chief Investment Officer |
| | Matthews International Capital Management, LLC |
| |
| |  |
| | Robert J. Horrocks, PhD |
| | Director of Research |
| | Matthews International Capital Management, LLC |
4 MATTHEWS ASIA FUNDS
| | |
Message to Shareholders from Mark W. Headley Dear Fellow Shareholders, As many of you know, at the end of 2007, I was diagnosed with an aggressive Large B-Cell Lymphoma. I spent most of the winter in the hospital going through intensive rounds of chemotherapy, followed by radiation in the spring. Although recovery from the treatment has been long and sometimes painful, at this time I am very thankfully cancer free. The support that my family and I received was nothing short of amazing. I need to take a moment to thank all the friends, even friends I have not met, who sent their wishes and prayers. Many of the letters written were very personal and meaningful, and I deeply appreciate them. I also need to acknowledge the tremendous efforts of the team at Matthews that filled the gap in a time of great challenge. For many years, Paul Matthews and I have striven to build a team that did not overly rely on any one individual, and 2008 was the year that effort was put to the test. I am proud of how the individuals at Matthews, acting as a team, not only held the company together but drove it to new levels of effectiveness in both managing assets in Asia and serving our shareholders in the Matthews Asia Funds. It was a job well done and an exceptional demonstration of leadership in some of modern history’s most dangerous financial conditions. Global conditions remain uniquely uncertain and the damage to Asian economies and markets is significant, but I am profoundly optimistic about the future of Asia. In a world of debtors, the tired old line about Asian savers takes on new meaning. 2009 will most likely be another wild year, but when fear reigns, long-term investors act. Great change is in the wind, yet the potential of Asia is undiminished. With Much Gratitude, 
Mark W. Headley Chief Executive Officer and Portfolio Manager Matthews International Capital Management, LLC | | Matthews Asia Shareholder Conference Call 2009 marks the 15th anniversary of the Matthews Asia Funds. This milestone falls amidst a period of unprecedented global market volatility. With that in mind, we wanted to thank you for your continued support of our long-term investment philosophy and invite you to join us for a conference call for clients and shareholders of the Matthews Asia Funds. During the call, you will hear from members of our investment team who will provide their thoughts on the current market environment. But perhaps most importantly, there will be ample opportunity for you to pose questions to Matthews’ Portfolio Managers. EVENT DETAILS: Wednesday, April 8 4 p.m. Eastern Time 1 p.m. Pacific Time TO PARTICIPATE: matthewsasia.com/call The conference call will be broadcast over the Internet. For information on how to participate in the call or submit your questions in advance, please visit matthewsasia.com/call. If you have questions regarding the call, or if you require additional information, please call us at 800.789.ASIA (2742). We hope that you will be able to attend; however, if you are unable join us, a transcript and audio replay of the call will be available on our website. The conference call will be conducted by Matthews Asia Funds. The Funds’ distributor is not involved with the event. |
| |
| |  |
matthewsasia.com | 800.789.ASIA 5
| | | | |

PORTFOLIO MANAGERS Andrew T. Foster Lead Manager G. Paul Matthews Co-Manager FUND FACTS | | Matthews Asian Growth and Income Fund Portfolio Manager Commentary For the year ending December 31, 2008, the Matthews Asian Growth and Income Fund fell –32.07%, while its benchmark, the MSCI All Country Asia ex Japan Index, declined –52.23%. During the fourth quarter of 2008, the Fund declined –14.41%, versus a –21.48% drop in its benchmark. 2008 was a difficult year for the Fund. Unfortunately, the fourth quarter was no exception, particularly as the Asian convertible bond market came under stress. It has always been the Fund’s aim to participate in a portion of the long-term growth of the Asian region; along the way, the Fund has also attempted to mitigate some of the volatility that has been inherent to the region’s financial markets. In order to do this, the portfolio has made use of different types of securities, such as equities, preferred equities, fixed income and convertible bonds. The common denominator has been the search for relatively high and secure income yields. In the past, convertible bonds have been of particular interest to the Fund, given that such instruments typically provide a degree of equity participation in conjunction with some bond-like security. Despite such features, convertible bonds have played a relatively small role in the Fund over the past five years. The portfolio has typically carried less than a 25% weight in such bonds, largely because the Asian markets saw relatively scant issuance during that period, mostly from lower-quality issuers. Issuance picked up again in 2006 and 2007; however, strong demand for bonds—particularly from hedge fund investors—meant that few convertibles were available to the Fund at attractive valuations. However, 2008 brought marked change to Asia’s bond markets. As conditions in financial markets worsened throughout the world, convertible markets in the region slumped in the summer, and collapsed in the autumn. Over a handful of months spanning the third and fourth quarters, the markets were under heavy duress, apparently subject to some distressed selling; reportedly, a number of arbitrage portfolios were liquidated during the period. Unfortunately for the Fund, this meant that convertibles were not the safe haven that they had been in the past. However, we believe this represented an attractive opportunity for the Fund to rebuild its position in such bonds, particularly as yields quickly rose to levels not seen for roughly one decade. Convertibles now make up 33.8% of the portfolio, offering shareholders exposure to a number of geographies and industries. Another notable shift in the Fund’s construction has been to place greater weight on technology shares within the portfolio. Historically, the portfolio had little exposure to the semiconductor industry, given its sharp cyclicality and its heavy capital requirements (meaning there was rarely much cash left over for shareholder dividends). However, the technology industry in Asia has matured to a degree, leading to a smoother business cycle and less capital expenditure. Meanwhile, the industry’s expansion has slowed from its headiest levels, but over the long term, growth should remain respectable. Ultimately, this has allowed companies to enjoy steadier cash flow margins, which in turn have translated to a higher propensity to pay dividends. The Fund has also found a degree of success with two newer holdings in the software sector: Taiwan-listed Cyberlink and Japan-listed Trend Micro. Though both companies have revenue streams closely linked to the personal computer industry—and thus are subject to its swings—the two companies nonetheless enjoy substantial free cash flow, good top-line growth and secure balance (continued) |
Ticker | | MACSX | |
Inception Date | | 9/12/94 | |
Assets | | $1.1 billion | |
NAV | | $11.50 | |
| Total # of Positions | | 72 | |
Fiscal Year 2008 Ratios | |
| Portfolio Turnover | | 25.16%1 | |
| Gross Expense Ratio | | 1.16%2 | |
Benchmarks | |
| MSCI AC Asia ex Japan Index | |
| MSCI AC Far East ex Japan Index | |
Redemption Fee | |
| 2% within first 90 calendar days of purchase | |
OBJECTIVE | |
| Long-term capital appreciation. The Fund also seeks to provide some current income. | |
STRATEGY | |
Under normal market conditions, the Fund seeks to achieve its investment objective by investing at least 80% of its total net assets, which include borrowings for investment purposes, in dividend-paying equity securities and the convertible securities, of any duration or quality, of companies located in Asia. | |
1 The lesser of fiscal year 2008 long-term purchase costs or sales proceeds divided by the average monthly market value of long-term securities. 2 Matthews Asia Funds does not charge 12b-1 fees. | |
6 MATTHEWS ASIA FUNDS
PERFORMANCE AS OF DECEMBER 31, 2008
| | | | | | | | | | | | | | | | | | |
| | | 3 Months | | | Average Annual Total Returns | |
| | | 1 Year | | | 3 Years | | | 5 Years | | | 10 Years | | | Inception
9/12/94 | |
Matthews Asian Growth and Income Fund | | -14.41 | % | | -32.07 | % | | 0.62 | % | | 7.45 | % | | 14.34 | % | | 9.32 | % |
MSCI AC Asia ex Japan Index3 | | -21.48 | % | | -52.23 | % | | -3.53 | % | | 5.42 | % | | 6.05 | % | | 0.00 | %4 |
MSCI AC Far East ex Japan Index3 | | -20.42 | % | | -50.39 | % | | -3.52 | % | | 5.17 | % | | 5.44 | % | | -0.26 | %4 |
Lipper Pacific ex Japan Funds Category Average5 | | -20.73 | % | | -50.11 | % | | -3.02 | % | | 5.36 | % | | 7.59 | % | | 1.86 | %4 |
Performance assumes reinvestment of all dividends and/or distributions before taxes. All performance quoted represents past performance and is no guarantee of future results. Investment return and principal value will fluctuate with market conditions so that when redeemed, shares may be worth more or less than their original cost. Current performance may be lower or higher than the return figures quoted. Returns would have been lower if certain of the Fund’s fees and expenses had not been waived. For the Fund’s most recent month-end performance visit matthewsasia.com.
INCOME DISTRIBUTION HISTORY
| | | | | | |
| | | June | | December | | Total |
2008 | | 24.82¢ | | 16.66¢ | | 41.48¢ |
2007 | | 21.51¢ | | 68.91¢ | | 90.42¢ |
2006 | | 21.89¢ | | 39.85¢ | | 61.74¢ |
1994–2005 | | $1.88 | | $2.07 | | $3.95 |
Note: This table does not include capital gains distributions.
| | |
| 30-DAY YIELD: 7.00% | | DIVIDEND Y IELD: 6.55% |
| |
| The 30-Day Yield represents net investment income earned by the Fund over the 30-day period ended 12/31/08, expressed as an annual percentage rate based on the Fund’s share price at the end of the 30-day period. The 30-Day Yield should be regarded as an estimate of the Fund’s rate of investment income, and it may not equal the Fund’s actual income distribution rate. | | The dividend yield (trailing) for the portfolio is the weighted average sum of the dividend paid per share during the last 12 months divided by the current price. The annualized dividend yield for the Fund is for the equity-only portion of the portfolio. Please note that this is based on gross portfolio holdings and does not reflect the actual yield an investor in the Fund would receive. Past yields are no guarantee of future yields. |
Source: PNC Global Investment Servicing (U.S.) Inc. | | Source: FactSet Research Systems |
GROWTH OF A $10,000 INVESTMENT SINCE INCEPTION
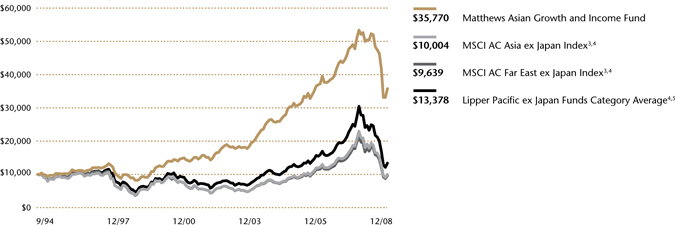
Plotted monthly. The performance data and graph do not reflect the deduction of taxes that a shareholder would pay on dividends, capital gain distributions or redemption of Fund shares. Values are in US$.
| 3 | It is not possible to invest directly in an index. Source: Index data from Morgan Stanley Capital Management; total return calculations performed by PNC Global Investment Servicing (U.S.) Inc. Please see page 87 for index definitions. |
| 4 | Calculated from 8/31/94. |
| 5 | The Lipper Category Average does not reflect sales charges and is based on total return, including reinvestment of dividends and capital gains for the stated periods. |
TOP TEN HOLDINGS6
| | | | | | | |
| | | Security Type | | Country | | % of Net Assets | |
| Hongkong Land CB 2005, Ltd., Cnv., 2.750%, 12/21/12 | | Convertible Bond | | China/Hong Kong | | 3.9 | % |
| Cherating Capital, Ltd., Cnv., 2.000%, 07/05/12 | | Convertible Bond | | Malaysia | | 3.3 | % |
| Taiwan Semiconductor Manufacturing Co., Ltd. | | Equity | | Taiwan | | 3.2 | % |
| Rafflesia Capital, Ltd., Cnv., 1.250%, 10/04/11 | | Convertible Bond | | Malaysia | | 3.2 | % |
| China Petroleum & Chemical Corp. (Sinopec), Cnv., 0.000%, 04/24/14 | | Convertible Bond | | China/Hong Kong | | 2.8 | % |
| SK Telecom Co., Ltd., Cnv., 0.000%, 05/27/09 | | Convertible Bond | | South Korea | | 2.7 | % |
| Yue Yuen Industrial Holdings, Ltd., Cnv., 0.000%, 11/17/11 | | Convertible Bond | | China/Hong Kong | | 2.5 | % |
| Reliance Communications, Ltd., Cnv., 0.000%, 05/10/11 | | Convertible Bond | | India | | 2.5 | % |
| Nippon Building Fund, Inc., REIT | | Equity | | Japan | | 2.3 | % |
| Advanced Info Service Public Co., Ltd. | | Equity | | Thailand | | 2.1 | % |
% OF ASSETS IN TOP TEN | | | | | | 28.5 | % |
| 6 | Holdings may combine more than one security from same issuer and related depositary receipts. |
matthewsasia.com | 800.789.ASIA 7
COUNTRY ALLOCATION (%) 7
| | | | |
China/Hong Kong | | 37.7 | | Matthews Asian Growth and Income Fund Portfolio Manager Commentary (continued) sheets. This has translated to the ability to pay attractive, growing dividend streams, very much in keeping with the Fund’s strategy, even as the software industry is a relatively new addition to the Fund. Unfortunately, the Fund had no shortage of disappointments during the year as a number of securities with seemingly defensive characteristics slumped nevertheless. However, the biggest single tactical error for the Fund arose from its exposure to the media sector. We have historically favored the industry because we believe its long-term growth prospects have been underappreci-ated, especially given the low penetration of media in Asian households. This, in turn, has allowed us to purchase media shares at relatively low valuations. Meanwhile, such companies have generated stable cash flows and steadily growing dividends, with yields that were attractive relative to other alternatives. However, as markets around the world worsened, media shares in Asia suffered a substantial sell-off on the perception that discretionary expenditures, especially in advertising, would be quickly cut. We remain constructive on the fundamentals of the sector: so far the industry’s growth has remained fairly stable, somewhat contrasting the dramatic decline in share prices. As we look forward, we have reason to be a bit more positive about valuations for securities held in the portfolio. This optimism arises from the behavior of issuers in the region: a number of them have made tenders to repurchase their securities, often at what is now a steeply discounted price versus par value. During the latter half of the year, four of the Fund’s positions were subject to general tender offers from the original issuer. These issuers sought to acquire a large portion of their outstanding securities with the intent to either privatize or retire those issues from the market. Typically, issuers do this when they feel their securities are undervalued. We would note that we have not seen such conditions in quite some time. We appreciate your support of the Fund amid a difficult year and look forward to serving your interests in the year to come. |
Singapore | | 10.0 | |
Malaysia | | 8.7 | |
Taiwan | | 8.5 | |
India | | 8.4 | |
South Korea | | 8.1 | |
Japan | | 5.9 | |
Thailand | | 4.1 | |
United Kingdom | | 1.9 | |
Indonesia | | 1.7 | |
Australia | | 1.5 | |
Philippines | | 1.3 | |
Cash and Other Assets, | | | |
Less Liabilities | | 2.2 | |
SECTOR ALLOCATION (%) | |
Financials | | 24.9 | |
Telecom Services | | 18.2 | |
Consumer Discretionary | | 17.0 | |
Information Technology | | 11.7 | |
Industrials | | 9.5 | |
Consumer Staples | | 5.8 | |
Utilities | | 5.5 | |
Energy | | 2.8 | |
Health Care | | 2.4 | |
Cash and Other Assets, | | | |
Less Liabilities | | 2.2 | |
MARKET CAP EXPOSURE (%) 8 | |
Large Cap (over $5B) | | 28.2 | |
Mid Cap ($1B–$5B) | | 32.9 | |
Small Cap (under $1B) | | 36.7 | |
Cash and Other Assets, | | | |
Less Liabilities | | 2.2 | |
BREAKDOWN BY SECURITY TYPE (%) | | |
Common Equities | | 61.7 | | |
Convertible Bonds9 | | 33.8 | | |
Preferred Equities | | 2.2 | | |
Rights | | 0.1 | | |
Cash and Other Assets, | | | | |
Less Liabilities | | 2.2 | | |
7 Australia, The United Kingdom and Japan are not included in the MSCI All Country Asia ex Japan Index. 8 Source: FactSet Research Systems. Percentage values in data are rounded to the nearest tenth of one percent; the values may not sum to 100% due to rounding. 9 Convertible bonds are not included in the MSCI All Country Asia ex Japan Index. | | | | |
8 MATTHEWS ASIA FUNDS
| | | | |
| Matthews Asian Growth and Income Fund | | December 31, 2008 |
Schedule of Investmentsa
COMMON EQUITIES: 61.7%
| | | | |
| | | Shares | | Value |
CHINA/HONG KONG: 24.2% | | | | |
PCCW, Ltd. | | 46,799,000 | | $22,468,526 |
CLP Holdings, Ltd. | | 3,292,700 | | 22,386,170 |
Television Broadcasts, Ltd. | | 6,642,000 | | 21,774,257 |
Hang Lung Properties, Ltd. | | 8,903,920 | | 19,549,162 |
VTech Holdings, Ltd. | | 4,596,300 | | 19,471,863 |
Vitasoy International Holdings, Ltd. | | 41,197,000 | | 18,378,517 |
Café de Coral Holdings, Ltd. | | 7,943,100 | | 16,115,306 |
Hang Seng Bank, Ltd. | | 1,164,700 | | 15,377,079 |
Hang Lung Group, Ltd. | | 4,976,000 | | 15,200,922 |
Bank of Communications Co., Ltd. H Shares | | 20,083,000 | | 14,596,909 |
Shandong Weigao Group Medical Polymer Co., Ltd. H Shares | | 9,076,000 | | 13,814,530 |
Giordano International, Ltd. | | 52,249,000 | | 13,182,514 |
HongKong Electric Holdings, Ltd. | | 2,243,000 | | 12,628,070 |
ASM Pacific Technology, Ltd. | | 3,163,500 | | 10,426,611 |
Next Media, Ltd. | | 88,398,000 | | 10,320,217 |
I-CABLE Communications, Ltd.† | | 129,832,000 | | 9,716,209 |
Hong Kong & China Gas Co., Ltd. | | 5,321,490 | | 8,069,862 |
China-Hong Kong Photo Products | | | | |
Holdings, Ltd. | | 14,998,003 | | 707,448 |
| | | | |
Total China/Hong Kong | | | | 264,184,172 |
| | | | |
| | | | | |
SINGAPORE: 9.4% | | | | |
Ascendas REIT | | 20,987,000 | | 20,190,171 |
Cerebos Pacific, Ltd. | | 7,920,000 | | 16,787,492 |
Fraser and Neave, Ltd. | | 6,908,100 | | 14,283,117 |
Parkway Holdings, Ltd. | | 14,326,093 | | 12,415,599 |
Singapore Press Holdings, Ltd. | | 4,735,500 | | 10,268,086 |
Parkway Life REIT | | 17,661,110 | | 9,356,521 |
Hong Leong Finance, Ltd. | | 5,421,000 | | 7,773,562 |
Singapore Post, Ltd. | | 11,567,000 | | 6,400,086 |
DBS Group Holdings, Ltd. | | 721,000 | | 4,246,964 |
Yellow Pages Singapore, Ltd. | | 6,423,000 | | 900,397 |
| | | | |
Total Singapore | | | | 102,621,995 |
| | | | |
| | | | | |
TAIWAN: 8.5% | | | | |
Taiwan Semiconductor Manufacturing Co., Ltd. | | 23,359,469 | | 31,873,529 |
Cathay Financial Holding Co., Ltd. | | 16,893,240 | | 19,032,956 |
President Chain Store Corp. | | 5,968,000 | | 14,333,400 |
Cyberlink Corp. | | 3,873,889 | | 13,813,370 |
Chunghwa Telecom Co., Ltd. ADR | | 677,510 | | 10,569,156 |
Taiwan Semiconductor Manufacturing Co., Ltd. ADR | | 391,708 | | 3,094,493 |
| | | | |
Total Taiwan | | | | 92,716,904 |
| | | | |
| | | | | |
JAPAN: 5.9% | | | | |
Nippon Building Fund, Inc., REIT | | 2,260 | | 24,841,389 |
Trend Micro, Inc.b | | 603,000 | | 21,179,142 |
Japan Real Estate Investment Corp., REIT | | 1,991 | | 17,785,886 |
| | | | |
Total Japan | | | | 63,806,417 |
| | | | |
| | | | |
| | | Shares | | Value |
| THAILAND: 4.1% | | | | |
Advanced Info Service Public Co., Ltd. | | 9,791,300 | | 22,754,581 |
| BEC World Public Co., Ltd. | | 31,595,500 | | 18,155,067 |
| Thai Reinsurance Public Co., Ltd. | | 25,672,800 | | 3,665,092 |
| | | | |
Total Thailand | | | | 44,574,740 |
| | | | |
| | | | | |
SOUTH KOREA: 3.2% | | | | |
| SK Telecom Co., Ltd. ADR | | 742,540 | | $13,499,377 |
| Hana Financial Group, Inc. | | 747,039 | | 11,900,034 |
| Daehan City Gas Co., Ltd. | | 280,300 | | 5,331,471 |
| SK Telecom Co., Ltd. | | 26,443 | | 4,395,276 |
| | | | |
Total South Korea | | | | 35,126,158 |
| | | | |
| | | | | |
UNITED KINGDOM: 1.9% | | | | |
| HSBC Holdings PLC ADR | | 573,300 | | 20,246,720 |
| | | | |
Total United Kingdom | | | | 20,246,720 |
| | | | |
| | | | | |
INDONESIA: 1.7% | | | | |
| PT Telekomunikasi Indonesia ADR | | 733,200 | | 18,381,324 |
| | | | |
Total Indonesia | | | | 18,381,324 |
| | | | |
| | | | | |
| AUSTRALIA: 1.5% | | | | |
| AXA Asia Pacific Holdings, Ltd. | | 4,744,880 | | 16,492,482 |
| | | | |
| Total Australia | | | | 16,492,482 |
| | | | |
| | | | | |
PHILIPPINES: 1.3% | | | | |
| Globe Telecom, Inc. | | 900,840 | | 14,688,196 |
| | | | |
Total Philippines | | | | 14,688,196 |
| | | | |
| | | | | |
TOTAL COMMON EQUITIES | | | | 672,839,108 |
| | | | |
| (Cost $809,603,031) | | | | |
| | | | |
| | | | |
| PREFERRED EQUITIES: 2.2% | | | | |
| | | | | |
SOUTH KOREA: 2.2% | | | | |
Samsung Fire & Marine Insurance Co., Ltd., Pfd. | | 130,056 | | 7,812,154 |
LG Household & Health Care, Ltd., Pfd. | | 191,850 | | 6,408,240 |
| Hyundai Motor Co., Ltd., Pfd. | | 566,280 | | 5,865,696 |
Hyundai Motor Co., Ltd., 2nd Pfd. | | 305,760 | | 3,376,349 |
| | | | |
Total South Korea | | | | 23,462,439 |
| | | | |
| | | | | |
TOTAL PREFERRED EQUITIES | | | | 23,462,439 |
| | | | |
| (Cost $20,157,373) | | | | |
| | | | |
RIGHTS: 0.1% | | | | |
| | | | | |
SINGAPORE: 0.1% | | | | |
DBS Group Holdings, Ltd., expires 01/20/09 | | 360,500 | | 767,306 |
| Total Singapore | | | | 767,306 |
| | | | |
| | | | | |
| TOTAL RIGHTS | | | | 767,306 |
| | | | |
| (Cost $0) | | | | |
matthewsasia.com | 800.789.ASIA 9
| | | | |
| Matthews Asian Growth and Income Fund | | December 31, 2008 |
Schedule of Investmentsa (continued)
INTERNATIONAL DOLLAR BONDS: 33.8%
| | | | | |
| | | Face Value | | | Value |
CHINA/HONG KONG: 13.5% | | | | | |
Hongkong Land CB 2005, Ltd., Cnv. | | | | | |
2.750%, 12/21/12 | | $46,500,000 | | | $41,966,250 |
China Petroleum & Chemical Corp., | | | | | |
(Sinopec), Cnv. 0.000%, 04/24/14 | | 247,470,000 | c | | 30,998,410 |
Yue Yuen Industrial Holdings, Ltd., Cnv. | | | | | |
0.000%, 11/17/11 | | 210,800,000 | c | | 27,267,296 |
FU JI Food and Catering Services Holdings, Ltd., Cnv. | | | | | |
0.000%, 10/18/10 | | 191,500,000c | | | 17,471,603 |
Brilliance China Financial, Ltd., Cnv. | | | | | |
0.000%, 06/07/11 | | 13,600,000 | | | 14,076,000 |
PB Issuer, Ltd., Cnv. | | | | | |
3.300%, 02/01/13 | | 17,750,000 | | | 13,667,500 |
Hengan International Group Co., Ltd., | | | | | |
Cnv. 0.000%, 05/16/11 | | 12,780,000 | c | | 2,151,932 |
| | | | | |
Total China/Hong Kong | | | | | 147,598,991 |
| | | | | |
| | | | | | |
MALAYSIA: 8.7% | | | | | |
Cherating Capital, Ltd., Cnv. | | | | | |
2.000%d, 07/05/12 | | 39,400,000 | | | 35,806,720 |
Rafflesia Capital, Ltd., Cnv. | | | | | |
1.250%d, 10/04/11 | | 37,200,000 | | | 34,968,000 |
YTL Power Finance Cayman, Ltd., Cnv. | | | | | |
0.000%, 05/09/10 | | 11,000,000 | | | 12,116,500 |
Paka Capital, Ltd., Cnv. | | | | | |
0.000%, 03/12/13 | | 13,900,000 | | | 11,971,375 |
| | | | | |
Total Malaysia | | | | | 94,862,595 |
| | | | | |
| | | | | | |
INDIA: 8.4% | | | | | |
Reliance Communications, Ltd., Cnv. | | | | | |
0.000%, 05/10/11 | | 32,915,000 | | | 26,908,013 |
Tata Motors, Ltd., Cnv. | | | | | |
1.000%, 04/27/11 | | 27,349,000 | | | 17,811,035 |
Sintex Industries, Ltd., Cnv. | | | | | |
0.000%, 03/13/13 | | 25,400,000 | | | 14,605,000 |
Financial Technologies India, Ltd., Cnv. | | | | | |
0.000%, 12/21/11 | | 18,814,000 | | | 14,392,710 |
Rolta India, Ltd., Cnv. | | | | | |
0.000%, 06/29/12 | | 22,116,000 | | | 12,716,700 |
Educomp Solutions, Ltd., Cnv. | | | | | |
0.000%, 07/26/12 | | 5,915,000 | | | 5,116,475 |
| | | | | |
Total India | | | | | 91,549,933 |
| | | | | |
| | | | | | |
SOUTH KOREA: 2.7% | | | | | |
SK Telecom Co., Ltd. Cnv. | | | | | |
0.000%, 05/27/2009 | | 27,430,000 | | | 29,212,950 |
| | | | | |
Total South Korea | | | | | 29,212,950 |
| | | | | |
| | | | | | |
SINGAPORE: 0.5% | | | | | |
Olam International, Ltd., Cnv. | | | | | |
1.000%, 07/03/2013 | | 8,500,000 | | | 5,683,950 |
| | | | | |
Total Singapore | | | | | 5,683,950 |
| | | | | |
| | | | | |
| | | Value | |
TOTAL INTERNATIONAL | | | |
DOLLAR BONDS | | $368,908,419 | |
| | | | | |
| (Cost $444,191,313) | | | |
| | | | |
| TOTAL INVESTMENTS: 97.8% | | 1,065,977,272 | |
| (Cost $1,273,951,717e) | | | |
| CASH AND OTHER ASSETS, | | | |
| LESS LIABILITIES: 2.2% | | 23,736,806 | |
| | | | | |
NET ASSETS: 100.0% | | $1,089,714,078 | |
| | | | | |
| a | | Certain securities were fair valued under the discretion of the Board of Trustees | |
| | (Note 1-A). | |
| b | | Non–income producing security. | |
| c | | Face amount reflects principal in local currency. | |
| d | | Variable rate security. The rate reflects the rate in effect at December 31,2008. | |
| e | | Cost for Federal income tax purposes is $1,284,350,623 and net unrealized depreciation consists of: | |
| | Gross unrealized appreciation | | $65,762,512 | |
| | Gross unrealized depreciation | | (284,135,863 | ) |
| | | | | |
| | Net unrealized depreciation. | | ($218,373,351 | ) |
| | | | | |
| † | | Affiliated Issuer, as defined under the Investment Company Act of 1940 (ownership of 5% or more of the outstanding voting securities of this issuer) | |
| ADR | | American Depositary Receipt | |
| Cnv. | | Convertible | |
| Pfd. | | Preferred | |
| REIT | | Real Estate Investment Trust | |
See accompanying notes to financial statements. | |
10 MATTHEWS ASIA FUNDS
| | | | |
 | | Matthews Asia Pacific Equity Income Fund Portfolio Manager Commentary For the year ending December 31, 2008, the Matthews Asia Pacific Equity Income Fund fell –25.97%, ahead of its benchmark, the MSCI All Country Asia Pacific Index, which declined –41.62%. During the fourth quarter, the Fund declined –11.46%, while the benchmark declined –16.01%. The Fund began 2008 with a share price of $12.00, and shareholders who were invested in the Fund throughout the year would have received income distributions totaling approximately 30 cents, or 2.5% of that initial amount. While the sell-off throughout the year may have appeared indiscriminate at times, the relative outperformance of the Fund’s holdings compared with the benchmark suggested an increased and welcome focus on the quality and sustainability of company earnings. Dividend payments often act as one of the better indicators of earnings quality and corporate health, especially if a company has a history of maintaining or growing dividends even through difficult economic periods. In effect, information imbedded in the dividend history of a company may have greater relevance when assessing the ongoing health of a company than both quarterly earnings and share prices. Juxtaposed against the daily noise generated by the media and stock prices, the dividend becomes a useful tool to steer the focus away from the chatter. Instead, one can refocus on what matters—the long-term sustainability and growth of companies in Asia Pacific. Dividend payments have also historically exhibited less volatility than earnings. During the Asian crisis, earnings per share (EPS) fell by 73% for companies in the MSCI Asia Pacific ex Japan Index, while dividends per share (DPS) fell by 20% in comparison, according to Morgan Stanley. During the 2001–02 economic contraction in the region, EPS dropped by 37% while DPS fell just 1%. Though history may not necessarily be a guide for the future, it is worth noting that the ability of Asian companies to fund dividend payments, even if earnings should decline, has improved greatly compared to previous recessionary periods. With net debt-to-equity at a little less than 30% for companies in Asia excluding Japan, according to Citigroup, leverage in the region remains close to its lowest level of the past 25 years. Debt holders have a higher claim to the cash of a company than shareholders, and lower levels of debt therefore leave a greater portion of current earnings for dividend payments, even if earnings should contract. Less debt puts fewer constraints on dividend growth, and it is one of the rationales behind our ongoing belief that Asia will continue to be an attractive place to invest for both current income and growing dividends over the long term. Among the Fund’s holdings at year end, dividends increased for 38 companies relative to 2007, while four companies cut their dividends in 2008. The Fund’s focus on companies that marry the ability to pay sustainable and growing dividends with the willingness to do so underpins our stock selection process. However, we remain flexible in the implementation of this process depending on market conditions. For example, we consider how much the Fund has to pay today for the potential for future growth in the dividend. During the first three quarters of 2008, the Fund focused mainly on companies that offered higher dividend yields and greater assurance of a dividend payment, sometimes at the expense of growth in the DPS. This was mainly due to general market valuations that remained too demanding for income-oriented investors, especially for companies with the potential to offer solid growth in earnings and dividends. However, as markets sold off sharply in the fourth quarter, the Fund was able to initiate positions in some of these (continued) |
PORTFOLIO MANAGERS | |
Jesper O. Madsen, CFA | |
Lead Manager | |
Andrew T. Foster | |
Co-Manager | |
FUND FACTS | |
Ticker | | MAPIX | |
Inception Date | | 10/31/06 | |
Assets | | $142.0 million | |
NAV | | $8.61 | |
Total # of Positions | | 58 | |
Fiscal Year 2008 Ratios | | | |
Portfolio Turnover | | 25.07%1 | |
Gross Expense Ratio | | 1.35% | |
After Contractual | | | |
Fee Waiver | | 1.32%2 | |
Benchmark | |
MSCI AC Asia Pacific Index | |
Redemption Fee | |
2% within first 90 calendar days of purchase | |
OBJECTIVE | |
| Total return with an emphasis on providing current income. | |
STRATEGY | |
Under normal market conditions, the Fund seeks to achieve its investment objective by investing at least 80% of its total net assets, which include borrowings for investment purposes, in income-paying publicly traded common stock, preferred stocks, convertible preferred stock and other equity-related instruments of compa- nies located in the Asia Pacific region. | |
1 The lesser of fiscal year 2008 long-term purchase costs or sales proceeds divided by the average monthly market value of long-term securities. 2 The Advisor has contractually agreed to waive certain fees and reimburse certain expenses for Matthews Asia Pacific Equity Fund. Please see page 77 for additional information. Matthews Asia Funds does not charge 12b-1 fees. | |
matthewsasia.com | 800.789.ASIA 11
PERFORMANCE AS OF DECEMBER 31, 2008
| | | | | | | | | |
| | | 3 Months | | | Average Annual Total Returns | |
| | | 1 Year | | | Inception 10/31/06 | |
Matthews Asia Pacific Equity Income Fund | | -11.46 | % | | -25.97 | % | | -2.67 | % |
MSCI AC Asia Pacific Index3 | | -16.01 | % | | -41.62 | % | | -14.46 | % |
Lipper Pacific Region Funds Category Average4 | | -18.17 | % | | -42.92 | % | | -14.39 | % |
Performance assumes reinvestment of all dividends and/or distributions before taxes. All performance quoted represents past performance and is no guarantee of future results. Investment return and principal value will fluctuate with market conditions so that when redeemed, shares may be worth more or less than their original cost. Current performance may be lower or higher than the return figures quoted. Returns would have been lower if certain of the Fund’s fees and expenses had not been waived. For the Fund’s most recent month-end performance visit matthewsasia.com.
INCOME DISTRIBUTION HISTORY
| | | | | | | | | | | | | | | |
| | | Q1 | | | Q2 | | | Q3 | | | Q4 | | | Total | |
2008 | | 5.86 | ¢ | | 7.53 | ¢ | | 11.43 | ¢ | | 5.55 | ¢ | | 30.37 | ¢ |
2007 | | — | | | 10.30 | ¢ | | — | | | 17.12 | ¢ | | 27.42 | ¢ |
2006 (Fund inception: 10/31/06) | | | | | | | | | | | 1.97 | ¢ | | 1.97 | ¢ |
Note: This table does not include capital gains distributions. In March 2008, the Fund began to distribute investment income dividends on a quarterly rather than semi-annual basis. For additional details regarding Fund distributions, visit matthewsasia.com.
| | |
| 30-DAY YIELD: 3.35% | | DIVIDEND YIELD: 6.08% |
| |
| The 30-Day Yield represents net investment income earned by the Fund over the 30-day period ended 12/31/08, expressed as an annual percentage rate based on the Fund’s share price at the end of the 30-day period. The 30-Day Yield should be regarded as an estimate of the Fund’s rate of investment income, and it may not equal the Fund’s actual income distribution rate. | | The dividend yield (trailing) for the portfolio is the weighted average sum of the dividend paid per share during the last 12 months divided by the current price. The annualized dividend yield for the Fund is for the equity-only portion of the portfolio. Please note that this is based on gross portfolio holdings and does not reflect the actual yield an investor in the Fund would receive. Past yields are no guarantee of future yields. |
Source: PNC Global Investment Servicing (U.S.) Inc. | | Source: FactSet Research Systems. |
GROWTH OF A $10,000 INVESTMENT SINCE INCEPTION
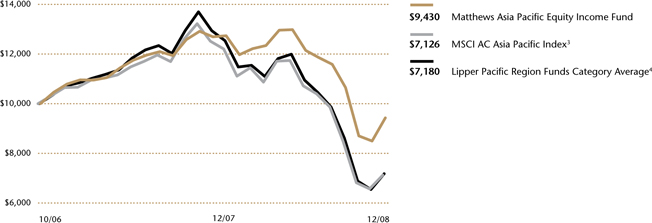
Plotted monthly. The performance data and graph do not reflect the deduction of taxes that a shareholder would pay on dividends, capital gain distributions or redemption of Fund shares. Values are in US$.
| 3 | It is not possible to invest directly in an index. Source: Index data from Morgan Stanley Capital Management; total return calculations performed by PNC Global Investment Servicing (U.S.) Inc. Please see page 87 for index definitions. |
| 4 | The Lipper Category Average does not reflect sales charges and is based on total return, including reinvestment of dividends and capital gains for the stated periods. |
TOP TEN HOLDINGS5
| | | | | |
| | | Country | | % of Net Assets | |
Taiwan Semiconductor Manufacturing Co., Ltd. | | Taiwan | | 4.8 | % |
SK Telecom Co., Ltd. | | South Korea | | 4.0 | % |
PT Telekomunikasi Indonesia | | Indonesia | | 3.6 | % |
Globe Telecom, Inc. | | Philippines | | 3.4 | % |
Lawson, Inc. | | Japan | | 3.1 | % |
Chunghwa Telecom Co., Ltd. | | Taiwan | | 2.8 | % |
HSBC Holdings PLC | | United Kingdom | | 2.6 | % |
AXA Asia Pacific Holdings, Ltd. | | Australia | | 2.5 | % |
CLP Holdings, Ltd. | | China/Hong Kong | | 2.4 | % |
Fanuc, Ltd. | | Japan | | 2.4 | % |
% OF ASSETS IN TOP TEN | | | | 31.6 | % |
| 5 | Holdings may combine more than one security from same issuer and related depositary receipts. |
12 MATTHEWS ASIA FUNDS
| | | | |
| Matthews Asia Pacific Equity Income Fund | | COUNTRY ALLOCATION (%) 6 |
Portfolio Manager Commentary (continued) previously richly valued companies, particularly in China. As we approached year end, the Fund’s focus tilted increasingly toward growth in DPS, even when this often meant investing in companies with lower dividend yields. Valuations had become more attractive relative to the dividend growth we believed could be offered. This reflects the Fund’s attention not just to current dividend yield, but to total return, which is often generated by the share price appreciation of companies that can deliver sustained dividend growth. Japanese convenience store operator Lawson Inc., which we wrote about in our Semi-Annual Report, has been at the forefront of capital management in Japan. During 2008, it was the primary contributor to Fund performance. In the fourth quarter, the Fund’s Chinese additions all delivered positive performance. China Resources Enterprises, one such addition, represents a broad proxy for growth in Chinese consumption. The firm generates about half of its revenues from its retail business that operates about 2,500 stores of various formats, from hypermarkets to convenience stores. The company also partners with and operates stores for international fashion brands seeking access to the Chinese market. About a third of its revenues are generated by its beverage business, through a joint venture with SABMiller Plc. The company sells about one-fifth of the beer consumed in China, mainly under the “Snow” brand. This makes it the number one selling beer in China and measured by volume sold, the largest stand-alone beer brand globally, according to some industry statistics. During the year, the Fund’s holdings in the consumer discretionary and financial sectors were the main detractors from performance. While the woes of financial institutions in Asia were less severe than their counterparts in Europe and the U.S., the sector sold off in sympathy. As we enter 2009, financial institutions worldwide have reported US$1 trillion in write-offs related to the financial crisis, US$30.5 billion of which were from institutions residing in Asia (US$63.5 billion including HSBC). Financial institutions across the region felt the dual impacts of write-offs on impaired investments and the global credit contraction, particularly of dollar-based liquidity. However, we believe the sector remains attractive for the longer term. A thriving financial sector, acting as an intermediary for capital allocation, will be a necessary cornerstone in the region’s ongoing economic development. This may come from basic banking services in China or wealth management services in Japan. The Fund, therefore, continues to be invested in the region’s banks, brokerages, insurance companies and Real Estate Investment Trusts (REITs). With equity markets facing severe losses in 2008, many market participants held a renewed focus and appreciation for the stability offered by dividends. However, investors still tend to overlook Asia when thinking of dividend investing. This is an unfortunate oversight since Asia offers a substantial and growing pool of dividends. Dividends in the MSCI All Country Asia Pacific Index have grown 18% on average annually since 2002, compared with 7% for the S&P 500 Index, if the constituents of both indices were equally weighted. In spite of the higher historical dividend growth, Asia has offered a positive dividend yield spread, with estimated 2008 dividend yields for the MSCI U.S. and MSCI All Country Asia Pacific Indices standing at 3.2% and 3.6%, respectively. It remains to be seen how long the worldwide economic slowdown will continue. Nonetheless, we believe that every crisis brings with it opportunity for those willing to look for it. And as such, we continue to strongly believe in Asia’s dividend payers. | | Japan | | 23.2 |
| | China/Hong Kong | | 21.2 |
| | Taiwan | | 12.9 |
| | Singapore | | 8.1 |
| | Australia | | 6.4 |
| | Thailand | | 5.8 |
| | Malaysia | | 4.7 |
| | South Korea | | 4.4 |
| | Indonesia | | 3.6 |
| | Philippines | | 3.4 |
| | United Kingdom | | 2.6 |
| | India | | 0.7 |
| | Cash and Other Assets, Less Liabilities | | 3.0 |
| | SECTOR ALLOCATION (%) |
| | Financials | | 20.2 |
| | Consumer Discretionary | | 15.6 |
| | Information Technology | | 15.6 |
| | Telecom Services | | 15.4 |
| | Consumer Staples | | 13.1 |
| | Industrials | | 6.3 |
| | Utilities | | 5.5 |
| | Health Care | | 5.1 |
| | Energy | | 0.2 |
| | Cash and Other Assets, | | |
| | Less Liabilities | | 3.0 |
| | MARKET CAP EXPOSURE (%)7 |
| | Large Cap (over $5B) | | 34.1 |
| | Mid Cap ($1B–$5B) | | 30.5 |
| | Small Cap (under $1B) | | 32.4 |
| | Cash and Other Assets, Less Liabilities | | 3.0 |
| | Source: FactSet Research Systems |
| | 6 The United Kingdom is not included in the MSCI All Country Asia Pacific Index. |
| | 7 Source: FactSet Research Systems. Percentage values in data are rounded to the nearest tenth of one percent; the values may not sum to 100% due to rounding. |
| | | | |
| | | | |
matthewsasia.com | 800.789.ASIA 13
| | | | |
| Matthews Asia Pacific Equity Income Fund | | December 31, 2008 |
Schedule of Investmentsa
COMMON EQUITIES: 93.1%
| | | | |
| | | Shares | | Value |
JAPAN: 21.3% | | | | |
Lawson, Inc. | | 75,700 | | $4,365,720 |
Fanuc, Ltd. | | 46,600 | | 3,339,905 |
Shiseido Co., Ltd. | | 160,000 | | 3,290,381 |
Monex Group, Inc. | | 9,794 | | 3,185,120 |
Nintendo Co., Ltd. | | 8,100 | | 3,095,429 |
Eisai Co., Ltd. | | 69,800 | | 2,912,726 |
MID REIT, Inc. | | 1,224 | | 2,351,835 |
The Sumitomo Trust & Banking Co., Ltd. | | 383,000 | | 2,264,007 |
United Urban Investment Corp., REIT | | 540 | | 2,135,230 |
Benesse Corp. | | 45,800 | | 2,004,261 |
Tokyu REIT, Inc. | | 155 | | 962,202 |
Takeda Pharmaceutical Co., Ltd. | | 7,700 | | 401,342 |
| | | | |
Total Japan | | | | 30,308,158 |
| | | | |
| | | | | |
CHINA/HONG KONG: 21.2% | | | | |
CLP Holdings, Ltd. | | 494,500 | | 3,361,971 |
Café de Coral Holdings, Ltd. | | 1,542,000 | | 3,128,476 |
VTech Holdings, Ltd. | | 732,000 | | 3,101,060 |
China Resources Enterprise, Ltd. | | 1,742,000 | | 3,063,407 |
Television Broadcasts, Ltd. | | 862,000 | | 2,825,867 |
Shenzhen International Holdings | | 59,682,500 | | 2,596,591 |
Xinao Gas Holdings, Ltd. | | 2,334,000 | | 2,475,902 |
ASM Pacific Technology, Ltd. | | 705,100 | | 2,323,946 |
Sa Sa International Holdings, Ltd. | | 9,400,000 | | 2,321,219 |
Minth Group, Ltd. | | 5,471,000 | | 2,200,410 |
BOC Hong Kong Holdings, Ltd. | | 1,486,000 | | 1,700,859 |
Shandong Weigao Group Medical | | | | |
Polymer Co., Ltd. H Shares | | 424,000 | | 645,367 |
Next Media, Ltd. | | 3,284,000 | | 383,398 |
| | | | |
Total China/Hong Kong | | | | 30,128,473 |
| | | | |
| | | | | |
TAIWAN: 12.9% | | | | |
Taiwan Semiconductor Manufacturing Co., Ltd. | | 4,731,313 | | 6,455,782 |
Cyberlink Corp. | | 923,343 | | 3,292,422 |
Taiwan Secom Co., Ltd. | | 2,097,000 | | 3,050,303 |
Chunghwa Telecom Co., Ltd. | | 1,769,849 | | 2,850,878 |
President Chain Store Corp. | | 485,000 | | 1,164,829 |
Chunghwa Telecom Co., Ltd. ADR | | 70,000 | | 1,092,000 |
Taiwan Semiconductor Manufacturing Co., Ltd. ADR | | 50,339 | | 397,678 |
| | | | |
Total Taiwan | | | | 18,303,892 |
| | | | |
| | | | | |
AUSTRALIA: 6.4% | | | | |
AXA Asia Pacific Holdings, Ltd. | | 1,008,439 | | 3,505,181 |
Coca-Cola Amatil, Ltd. | | 504,730 | | 3,243,444 |
Billabong International, Ltd. | | 435,951 | | 2,394,092 |
| | | | |
Total Australia | | | | 9,142,717 |
| | | | |
| | | | |
| | | Shares | | Value |
| SINGAPORE: 6.1% | | | | |
| Venture Corp., Ltd. | | 895,000 | | $2,737,380 |
Singapore Press Holdings, Ltd. | | 1,156,000 | | 2,506,579 |
CapitaRetail China Trust REIT | | 4,479,000 | | 1,872,292 |
| Parkway Life REIT | | 2,905,868 | | 1,539,474 |
| | | | |
Total Singapore | | | | 8,655,725 |
| | | | |
| | | | | |
THAILAND: 5.8% | | | | |
Advanced Info Service Public Co., Ltd. | | 1,030,600 | | 2,395,072 |
| Siam Makro Public Co., Ltd. | | 1,030,000 | | 2,036,113 |
Thai Tap Water Supply Public Co., Ltd. | | 16,629,500 | | 2,016,434 |
Thai Beverage Public Co., Ltd. | | 13,200,000 | | 1,788,961 |
| | | | |
Total Thailand | | | | 8,236,580 |
| | | | |
| | | | | |
MALAYSIA: 4.7% | | | | |
| Top Glove Corp. BHD | | 3,229,100 | | 3,273,330 |
| Public Bank BHD | | 826,000 | | 2,117,021 |
| Media Prima BHD | | 3,948,800 | | 1,274,280 |
| | | | |
Total Malaysia | | | | 6,664,631 |
| | | | |
| | | | | |
SOUTH KOREA: 4.4% | | | | |
SK Telecom Co., Ltd. ADR | | 161,300 | | 2,932,434 |
| SK Telecom Co., Ltd. | | 16,370 | | 2,720,972 |
| Hana Financial Group, Inc. | | 37,640 | | 599,590 |
| | | | |
Total South Korea | | | | 6,252,996 |
| | | | |
| | | | | |
INDONESIA: 3.6% | | | | |
PT Telekomunikasi Indonesia ADR | | 103,800 | | 2,602,266 |
| PT Telekomunikasi Indonesia | | 3,859,000 | | 2,466,373 |
| | | | |
Total Indonesia | | | | 5,068,639 |
| | | | |
| | | | | |
PHILIPPINES: 3.4% | | | | |
| Globe Telecom, Inc. | | 292,560 | | 4,770,191 |
| | | | |
Total Philippines | | | | 4,770,191 |
| | | | |
| | | | | |
UNITED KINGDOM: 2.6% | | | | |
| HSBC Holdings PLC ADR | | 37,900 | | 1,844,593 |
| HSBC Holdings PLC | | 180,800 | | 1,794,293 |
| | | | |
Total United Kingdom | | | | 3,638,886 |
| | | | |
| | | | | |
INDIA: 0.7% | | | | |
| HCL-Infosystems, Ltd. | | 340,167 | | 650,234 |
Chennai Petroleum Corp., Ltd. | | 105,000 | | 278,571 |
| | | | |
| Total India | | | | 928,805 |
| | | | |
| | | | | |
TOTAL COMMON EQUITIES | | | | 132,099,693 |
| | | | |
| (Cost $148,175,599) | | | | |
14 MATTHEWS ASIA FUNDS
| | | | |
| Matthews Asia Pacific Equity Income Fund | | December 31, 2008 |
Schedule of Investmentsa (continued)
| | | | |
PREFERRED EQUITIES: 1.9% |
| | | Shares | | Value |
JAPAN: 1.9% | | | | |
Ito En, Ltd., Pfd. | | 273,300 | | $2,729,906 |
| | | | |
Total Japan | | | | 2,729,906 |
| | | | |
| | | | | |
TOTAL PREFERRED EQ UITIES | | | | 2,729,906 |
| | | | |
(Cost $2,978,421) | | | | |
| | | | | | | |
INTERNATIONAL DOLLAR BONDS: 2.0% | |
| | | Face Amount | | Value | |
| SINGAPORE: 2.0% | | | | | |
| CapitaCommerical Trust, Cnv. | | | | | |
2.000%, 05/06/13 | | $4,500,000 | | $2,803,227 | |
| | | | | | | |
| Total Singapore | | | | 2,803,227 | |
| | | | | | | |
| | | | | | |
TOTAL INTERNATIONAL | | | | | |
| DOLLAR BONDS | | | | 2,803,227 | |
| | | | | | | |
| (Cost $2,315,186) | | | | | |
| | | | | |
| TOTAL INVESTMENTS: 97.0% | | | | 137,632,826 | |
| (Cost $153,469,206b) | | | | | |
| CASH AND OTHER ASSETS, LESS LIABILITIES: 3.0% | | | | 4,318,653 | |
| | | | | | | |
| NET ASSETS: 100.0% | | | | $141,951,479 | |
| | | | | | | |
| |
| a | | Certain securities were fair valued under the discretion of the Board of Trustees (Note 1-A). | |
| b | | Cost for Federal income tax purposes is $154,865,317 and net unrealized depreciation consists of: | |
| | Gross unrealized appreciation | | $7,119,011 | |
| | Gross unrealized depreciation | | (24,351,502 | ) |
| | | | | | | |
| | Net unrealized depreciation. | | ($17,232,491 | ) |
| | | | | | | |
| ADR | | American Depositary Receipt | |
| BHD | | Berhad | |
| Cnv. | | Convertible | |
| Pfd. | | Preferred | |
| REIT | | Real Estate Investment Trust | |
See accompanying notes to financial statements. | |
matthewsasia.com | 800.789.ASIA 15
| | | | |
 | | Matthews Asia Pacific Fund Portfolio Manager Commentary For the year ending December 31, 2008, the Matthews Asia Pacific Fund fell –37.44%, while its benchmark, the MSCI All Country Asia Pacific Index declined –41.62%. For the fourth quarter, the Fund fell –12.98%, compared to a –16.01% drop for the benchmark. Throughout the year, our holdings in the consumer staples sector were the largest contributors to the Fund, with positive absolute returns. 2008 was truly difficult for Asian investors: though the year began calmly, it ended up as one of the most challenging years we have seen in Asia Pacific equity markets. Fears over inflation were quickly replaced with concerns over a deflationary climate as oil and other major commodity prices collapsed. Meanwhile, the U.S. government was busy pumping money into its financial sector with a fiscal stimulus plan. The size and scope of the rescue has been reminiscent of what Japan underwent in the late 1990s. As harsh as it was for all investors in 2008, one could argue that a benefit to come from the turmoil is a gigantic shake-up across industries throughout the region. If we learned anything from the Asian financial crisis of 1997–98, it is that better and stronger companies will likely emerge—just as electronics giant Samsung did after Korea’s GDP contracted 6.9% in 1998. We are positioning the portfolio to generate value for shareholders by pursuing faster-than-average earnings growth. It is our belief that the current environment will test the acumen of management teams and lay the groundwork for the sustained outperformance of a few companies. These companies will have the potential to become a much bigger part of the economic landscape in years to come. During the course of the year, we consolidated the portfolio into what we believe to be such companies. As a consequence, we had 49 holdings at the end of 2008, compared to 71 positions at the end of 2007. We terminated positions in such blue chip firms as Toyota, Sony, Honda, China Mobile, Infosys, Dabur and Lenovo, preferring instead to focus on finding Asia’s next titans. By design, these companies should offer a higher growth profile than that of today’s blue chips. Although the Fund’s Japan weighting increased over the previous year, this increase was the result of the relative strength of the yen, rather than a strategic decision. Invariably, we have been drawn to mid-size companies, which we believe are likely to emerge and grow in stature within their respective industries. For example, we have invested in leading enterprise resource planning software provider Kingdee, based in China. We believe the company has substantial room to grow, as it currently has 500,000 clients among an estimated 42 million firms in the SME (small and medium enterprise) segment it serves. With annual sales of US$100 million, Kingdee is in the same space as global players Oracle and SAP. The company has the competitive advantage of a quick system installation with low operating costs. While Kingdee did not perform as well as expected in 2008, we believe the company has the potential to become the next SAP of China, if not the world. One detractor to Fund performance during the year was the portfolio’s lack of exposure to utilities. We have traditionally avoided utilities, in part, because we believe the sector does not offer the growth potential our strategy seeks. However, as markets worsened during the year, utility stocks performed well as investors turned to these defensive stocks. The Fund’s two key holdings in the Japanese consumer staples sector continued to be big positive contributors to performance: Pigeon and Unicharm (continued) |
PORTFOLIO MANAGERS | |
Taizo Ishida Lead Manager | |
Sharat Shroff, CFA Co-Manager | |
FUND FACTS | | | |
Ticker | | MPACX | |
| Inception Date | | 10/31/03 | |
| Assets | | $168.0 million | |
| NAV | | $10.03 | |
| Total # of Positions | | 49 | |
Fiscal Year 2008 Ratios | |
| Portfolio Turnover | | 37.10%1 | |
| Gross Expense Ratio | | 1.23%2 | |
Benchmark | | | |
| MSCI AC Asia Pacific Index | |
Redemption Fee | | | |
| 2% within first 90 calendar days of purchase | |
OBJECTIVE | |
| Long-term capital appreciation. | |
STRATEGY | |
| Under normal market conditions, the Fund seeks to achieve its investment objective by investing at least 80% of its total net assets, which include borrowings for investment purposes, in the common and preferred stocks of companies located in the Asia Pacific region. The Fund may also invest in the convertible securities, of any duration or quality, of Asia Pacific companies. | |
1 The lesser of fiscal year 2008 long-term purchase costs or sales proceeds divided by the average monthly market value of long-term securities. | |
2 Matthews Asia Funds does not charge 12b-1 fees. | |
16 MATTHEWS ASIA FUNDS
PERFORMANCE AS OF DECEMBER 31, 2008
| | | | | | | | | | | | | | | |
| | | 3 Months | | | Average Annual Total Returns | |
| | | | 1 Year | | | 3 Years | | | 5 Years | | | Inception
10/31/03 | |
Matthews Asia Pacific Fund | | -12.98 | % | | -37.44 | % | | -6.33 | % | | 3.63 | % | | 4.14 | % |
MSCI AC Asia Pacific Index3 | | -16.01 | % | | -41.62 | % | | -7.87 | % | | 2.79 | % | | 3.60 | % |
Lipper Pacific Region Funds Category Average4 | | -18.17 | % | | -42.92 | % | | -7.47 | % | | 3.06 | % | | 3.88 | % |
Performance assumes reinvestment of all dividends and/or distributions before taxes. All performance quoted represents past performance and is no guarantee of future results. Investment return and principal value will fluctuate with market conditions so that when redeemed, shares may be worth more or less than their original cost. Current performance may be lower or higher than the return figures quoted. Returns would have been lower if certain of the Fund’s fees and expenses had not been waived. For the Fund’s most recent month-end performance visit matthewsasia.com.
GROWTH OF A $10,000 INVESTMENT SINCE INCEPTION
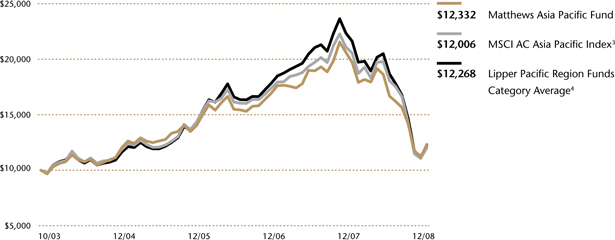
Plotted monthly. The performance data and graph do not reflect the deduction of taxes that a shareholder would pay on dividends, capital gain distributions or redemption of Fund shares. Values are in US$.
| 3 | It is not possible to invest directly in an index. Source: Index data from Morgan Stanley Capital Management; total return calculations performed by PNC Global Investment Servicing (U.S.) Inc. Please see page 87 for index definition. |
| 4 | The Lipper Category Average does not reflect sales charges and is based on total return, including reinvestment of dividends and capital gains for the stated periods. |
TOP TEN HOLDINGS5
| | | | | |
| | | Country | | % of Net Assets | |
Yahoo! Japan Corp. | | Japan | | 4.3 | % |
Nintendo Co., Ltd. | | Japan | | 4.3 | % |
Tingyi (Cayman Islands) Holding Corp. | | China/Hong Kong | | 3.8 | % |
Sysmex Corp. | | Japan | | 3.5 | % |
Benesse Corp. | �� | Japan | | 3.4 | % |
Pigeon Corp. | | Japan | | 3.2 | % |
Unicharm Petcare Corp. | | Japan | | 3.1 | % |
Kingdee International Software Group Co., Ltd. | | China/Hong Kong | | 2.9 | % |
Daibiru Corp. | | Japan | | 2.9 | % |
GCA Savvian Group Corp. | | Japan | | 2.9 | % |
% OF ASSETS IN TOP TEN | | | | 34.3 | % |
| 5 | Holdings may combine more than one security from same issuer and related depositary receipts. |
matthewsasia.com | 800.789.ASIA 17
| | | | |
| COUNTRY ALLOCATION (%) | | Matthews Asia Pacific Fund Portfolio Manager Commentary (continued) Petcare. In a very difficult environment, both companies continued to grow in their respective niche markets. Overall, our overweight positions in high conviction names were the single-largest differentiating factor from the bench-mark during the year. Our notable avoidance of the materials and energy sectors also helped Fund performance. China South Locomotive, one of the largest manufacturers of rail trains in China, was one of the few bright stars in the declining markets of 2008 and positively contributed to Fund performance. The company has a dominant market share in China’s growing high-speed electric train market, with a substantial backlog of orders. Railway infrastructure has been one of the main focuses of the Chinese government’s 11th five-year plan, which will end in 2010. New government fiscal spending of some US$588 billion, announced in November 2008, should further enhance the company’s growth potential. We like this company not only for its natural growth potential, but also because the company has adopted Toyota’s zero-inventory management system and has already acquired technology from world-leading bullet train companies in Japan, France and Germany. Company management is also cost-conscious and efficient with its staffing needs. The Fund initiated positions in two Japanese Real Estate Investment Trusts (J-REITs) in the second half of 2008: Mori Trust Sogo REIT and MID REIT. The entire J-REIT sector was under enormous distress due to a perceived credit crunch and apparent economic slowdown in Japan; thus, the sector was yielding more than a 9% dividend. We felt this sector was one that was simply oversold due to short-term fears over difficult re-financing and eventual bankruptcies. Mori Trust Sogo REIT is one of the largest J-REITs, with a very conservative management and a strong sponsor in Mori Trust. We believe that MID REIT, a mid-sized Osaka-based REIT, was greatly discounted at the time of our purchase. It has offered a double-digit dividend yield with a fairly stable rent outlook for its Class-A office buildings. As of October 31, 2008, the Fund marked its five-year anniversary. We appreciate your continued support over the long term. |
Japan | | 46.7 | |
China/Hong Kong | | 27.6 | |
India | | 7.6 | |
South Korea | | 4.6 | |
Australia | | 4.5 | |
Indonesia | | 3.4 | |
Taiwan | | 3.2 | |
Singapore | | 1.2 | |
Thailand | | 1.1 | |
Cash and Other Assets, Less Liabilities | | 0.1 | |
SECTOR ALLOCATION (%) | |
Financials | | 38.5 | |
Information Technology | | 15.8 | |
Consumer Staples | | 12.7 | |
Consumer Discretionary | | 11.6 | |
Industrials | | 10.9 | |
Health Care | | 8.5 | |
Telecom Services | | 1.9 | |
Cash and Other Assets, Less Liabilities | | 0.1 | |
MARKET CAP EXPOSURE (%)6 | |
Large Cap (over $5B) | | 36.6 | |
Mid Cap ($1B–$5B) | | 32.8 | |
Small Cap (under $1B) | | 30.5 | |
Cash and Other Assets, Less Liabilities | | 0.1 | |
6 Source: FactSet Research Systems. Percentage values in data are rounded to the nearest tenth of one percent; the values may not sum to 100% due to rounding. | |
18 MATTHEWS ASIA FUNDS
| | | | |
| Matthews Asia Pacific Fund | | December 31, 2008 |
Schedule of Investmentsa
COMMON EQUITIES: 99.9%
| | | | |
| | | Shares | | Value |
JAPAN: 46.7% | | | | |
Yahoo! Japan Corp. | | 17,612 | | $7,226,451 |
Nintendo Co., Ltd. | | 18,800 | | 7,184,452 |
Sysmex Corp. | | 159,800 | | 5,823,545 |
Benesse Corp. | | 131,900 | | 5,772,096 |
Pigeon Corp. | | 179,000 | | 5,350,266 |
Unicharm Petcare Corp. | | 139,400 | | 5,184,585 |
Daibiru Corp. | | 454,400 | | 4,848,459 |
GCA Savvian Group Corp. | | 2,007 | | 4,822,849 |
Monex Group, Inc. | | 10,629 | | 3,456,671 |
The Sumitomo Trust & Banking Co., Ltd. | | 581,000 | | 3,434,434 |
Fanuc, Ltd. | | 47,500 | | 3,404,410 |
Keyence Corp. | | 16,300 | | 3,349,845 |
Funai Zaisan Consultants Co., Ltd.† | | 7,081 | | 2,904,038 |
MID REIT, Inc. | | 1,510 | | 2,901,365 |
Mori Trust Sogo REIT, Inc. | | 308 | | 2,558,810 |
NGK Insulators, Ltd. | | 216,000 | | 2,447,653 |
ORIX Corp. | | 37,950 | | 2,166,979 |
Mitsubishi Estate Co., Ltd. | | 120,000 | | 1,982,266 |
Takeda Pharmaceutical Co., Ltd. | | 37,800 | | 1,970,223 |
Shiseido Co., Ltd. | | 81,000 | | 1,665,755 |
| | | | |
Total Japan | | | | 78,455,152 |
| | | | |
| | | | | |
CHINA/HONG KONG: 27.6% | | | | |
Tingyi (Cayman Islands) Holding Corp. | | 5,514,000 | | 6,413,126 |
Kingdee International Software Group Co., Ltd. | | 46,640,000 | | 4,853,010 |
| | | | |
China South Locomotive and Rolling Stock Corp., H Sharesb | | 8,334,900 | | 4,559,341 |
Ctrip.com International, Ltd. ADR | | 191,100 | | 4,548,180 |
China Life Insurance Co., Ltd. H Shares | | 1,294,000 | | 3,975,791 |
Dongfeng Motor Group Co., Ltd. H Shares | | 10,850,000 | | 3,542,403 |
Hang Lung Group, Ltd. | | 1,130,000 | | 3,451,978 |
China Vanke Co., Ltd. B Shares | | 4,339,987 | | 3,365,074 |
Shangri-La Asia, Ltd. | | 2,556,000 | | 2,956,496 |
China Merchants Bank Co., Ltd. H Shares | | 1,459,500 | | 2,730,832 |
Dairy Farm International Holdings, Ltd. | | 615,954 | | 2,639,372 |
Hong Kong Exchanges and Clearing, Ltd. | | 186,000 | | 1,785,774 |
China Merchants Holdings | | | | |
International Co., Ltd. | | 848,000 | | 1,656,087 |
| | | | |
Total China/Hong Kong | | | | 46,477,464 |
| | | | |
| | | | | |
INDIA: 7.6% | | | | |
Bharti Airtel, Ltd.b | | 221,237 | | 3,261,214 |
HDFC Bank, Ltd. | | 154,090 | | 3,184,793 |
Sun Pharmaceutical Industries, Ltd. | | 116,456 | | 2,561,893 |
Jain Irrigation Systems, Ltd. | | 352,960 | | 2,524,652 |
HDFC Bank, Ltd. ADR | | 17,700 | | 1,263,426 |
| | | | |
Total India | | | | 12,795,978 |
| | | | |
| | | | | |
SOUTH KOREA: 4.6% | | | | |
Kiwoom Securities Co., Ltd. | | 90,729 | | 2,851,569 |
Shinhan Financial Group Co., Ltd. | | 113,517 | | 2,701,061 |
NHN Corp.b | | 20,470 | | 2,163,972 |
| | | | |
Total South Korea | | | | 7,716,602 |
| | | | |
| | | | | | | |
| | | Shares | | Value | |
| AUSTRALIA: 4.5% | | | | | |
| CSL Australia, Ltd. | | 167,782 | | $3,956,606 | |
AXA Asia Pacific Holdings, Ltd. | | 1,030,663 | | 3,582,428 | |
| | | | | | | |
Total Australia | | | | 7,539,034 | |
| | | | | | | |
| | | | | | |
INDONESIA: 3.4% | | | | | |
| Bank Rakyat Indonesia | | 6,988,500 | | 2,971,869 | |
| PT Astra International | | 2,762,500 | | 2,714,997 | |
| | | | | | | |
Total Indonesia | | | | 5,686,866 | |
| | | | | | | |
| | | | | | |
TAIWAN: 3.2% | | | | | |
| Taiwan Secom Co., Ltd. | | 2,508,160 | | 3,648,378 | |
| Taiwan Semiconductor Manufacturing Co., Ltd. | | 1,233,135 | | 1,682,588 | |
| | | | | | | |
Total Taiwan | | | | 5,330,966 | |
| | | | | | | |
| | | | | | |
SINGAPORE: 1.2% | | | | | |
| Keppel Land, Ltd. | | 1,696,000 | | 2,015,428 | |
| | | | | | | |
Total Singapore | | | | 2,015,428 | |
| | | | | | | |
| | | | | | |
THAILAND: 1.1% | | | | | |
Siam Commercial Bank Public Co., Ltd. | | 1,264,400 | | 1,804,089 | |
| | | | | | | |
| Total Thailand | | | | 1,804,089 | |
| | | | | | | |
| | | | | | |
TOTAL INVESTMENTS: 99.9% | | 167,821,579 | |
| (Cost $206,203,068c) | | | |
| |
| CASH AND OTHER ASSETS, | | | |
| LESS LIABILITIES: 0.1% | | 209,302 | |
| | | | | | | |
NET ASSETS: 100.0% | | $168,030,881 | |
| | | | | | | |
| |
| a | | Certain securities were fair valued under the discretion of the Board of Trustees (Note 1-A). | |
| b | | Non–income producing security. | |
| c | | Cost for Federal income tax purposes is $207,402,112 and net unrealized depreciation consists of: | |
| | Gross unrealized appreciation | | $20,139,010 | |
| | Gross unrealized depreciation | | (59,719,543 | ) |
| | | | | | | |
| | Net unrealized depreciation. | | ($39,580,533 | ) |
| | | | | | | |
| † | | Affiliated Issuer, as defined under the Investment Company Act of 1940 (ownership of 5% or more of the outstanding voting securities of this issuer) | |
| ADR | | American Depositary Receipt | |
| REIT | | Real Estate Investment Trust | |
See accompanying notes to financial statements. | |
matthewsasia.com | 800.789.ASIA 19
| | | | |
 | | Matthews Pacific Tiger Fund Portfolio Manager Commentary For the year ending December 31, 2008, the Matthews Pacific Tiger Fund declined
–46.12%, while the benchmark MSCI All Country Asia ex Japan Index fell –52.23%. The sharp deterioration in currencies such as the Indian rupee and Korean won further exaggerated the declines, reflecting the weak fiscal position of these two economies. The weakness in equity markets of the Asia ex-Japan region worsened further in the fourth quarter—fundamentals of companies apparently did not matter as stocks fell across the board with the MSCI All Country Asia ex Japan Index slipping –21.48% while the Fund declined –20.11%. We are disappointed by the portfolio’s sharp decline in absolute values and appreciate your support of our long-term investment strategy during these tough times. For the full year, Fund performance relative to its benchmark was helped by a variety of stocks in the consumer staples and health care sectors. Meanwhile, the biggest detractors to absolute performance came from media and financial stocks. The linkages between the global credit crunch and some of the Asian financials, most notably in Korea, were deeper than expected. Derivative contracts on the Korean won, which were underwritten by many of the leading banks, have proven to be the bane of many Korean corporations and financial institutions given the currency’s rapid depreciation. Elsewhere in the financial landscape of Asia, excluding Japan, investors were primarily concerned with a potential uptick in loan delinquencies. We believe such an increase is likely to be cyclical in nature. To be sure, the current turbulence will test many of the region’s financial institutions, but it will also help refine the pricing of credit for those institutions that have been savvy with their risk assessment frameworks and capital positions. Strengthened balance sheets, increasing demand for banking services, and government actions and policies that are designed to stimulate consumption remain key drivers of long-term growth for Asia’s financial sector. We are looking to take advantage of sell-offs to maintain a significant allocation to financials, including commercial banks, real estate and insurance-related companies. In particular, we continue to emphasize investments in emerging financial sectors in which the business model is geared toward managing wealth for the domestic consumer. HDFC Bank, a mid-size Indian bank, reflects our approach of identifying banks with a solid deposit franchise. Compared to some of its peers, HDFC Bank has generally managed its loan growth to be somewhat consistent with the accretion in its deposits. In coming periods, there may very well be a deterioration in non-performing loan levels, but the bank is well-placed, in our view, to provide wealth management solutions to India’s growing middle class. The near-term outlook indeed appears challenging, and some industries such as technology may even suffer a contraction in earnings. However, stock price movements suggest too much fixation on shorter-term outcomes at the risk of ignoring secular trends. In the Fund, we give considerable importance to the sustainability of growth through cycles, and search across a broad spectrum of geographies and industries to meet our investment objective. It is worth stating that the portfolio is being managed to capture earnings growth over a longer-term horizon, especially when tied to rising household income levels. To that end, we continue to find growth opportunities throughout Asia in areas such as health care and education, which together account for about 15% of the portfolio—the highest allocation in the Fund’s history. (continued) |
PORTFOLIO MANAGERS | |
Richard H. Gao Lead Manager | |
Sharat Shroff, CFA Lead Manager | |
Mark W. Headley Co-Manager | |
FUND FACTS | |
Ticker | | MAPTX | |
Inception Date | | 9/12/94 | |
Assets | | $1.2 billion | |
NAV | | $11.05 | |
Total # of Positions | | 61 | |
Fiscal Year 2008 Ratios | |
Portfolio Turnover | | 16.76%1 | |
Gross Expense Ratio | | 1.12%2 | |
Benchmarks | |
MSCI AC Asia ex Japan Index | |
MSCI AC Far East ex Japan Index | |
Redemption Fee | |
2% within first 90 calendar days of purchase | |
OBJECTIVE | |
Long-term capital appreciation. | |
STRATEGY | |
| Under normal market conditions, the Fund seeks to achieve its investment objective by investing at least 80% of its total net assets, which include borrowings for investment purposes, in the common and preferred stocks of companies located in Asia, excluding Japan. | |
1 The lesser of fiscal year 2008 long-term purchase costs or sales proceeds divided by the average monthly market value of long-term securities. | |
2 Matthews Asia Funds does not charge 12b-1 fees. | |
20 MATTHEWS ASIA FUNDS
PERFORMANCE AS OF DECEMBER 31, 2008
| | | | | | | | | | | | | | | | | | |
| | | 3 Months | | | Average Annual Total Returns | |
| | | 1 Year | | | 3 Years | | | 5 Years | | | 10 Years | | | Inception
9/12/94 | |
Matthews Pacific Tiger Fund | | -20.11 | % | | -46.12 | % | | -2.87 | % | | 6.72 | % | | 12.02 | % | | 5.57 | % |
MSCI AC Asia ex Japan Index3 | | -21.48 | % | | -52.23 | % | | -3.53 | % | | 5.42 | % | | 6.05 | % | | 0.00 | %4 |
MSCI AC Far East ex Japan Index3 | | -20.42 | % | | -50.39 | % | | -3.52 | % | | 5.17 | % | | 5.44 | % | | -0.26 | %4 |
Lipper Pacific ex Japan Funds Category Average5 | | -20.73 | % | | -50.11 | % | | -3.02 | % | | 5.36 | % | | 7.59 | % | | 1.86 | %4 |
Performance assumes reinvestment of all dividends and/or distributions before taxes. All performance quoted represents past performance and is no guarantee of future results. Investment return and principal value will fluctuate with market conditions so that when redeemed, shares may be worth more or less than their original cost. Current performance may be lower or higher than the return figures quoted. Returns would have been lower if certain of the Fund’s fees and expenses had not been waived. For the Fund’s most recent month-end performance visit matthewsasia.com.
GROWTH OF A $10,000 INVESTMENT SINCE INCEPTION
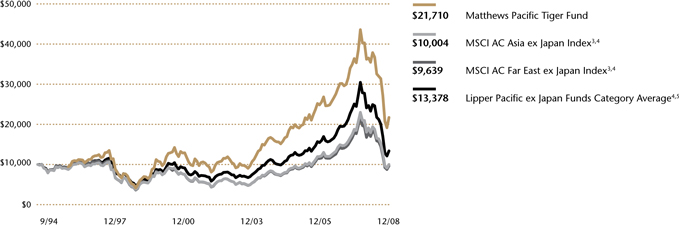
Plotted monthly. The performance data and graph do not reflect the deduction of taxes that a shareholder would pay on dividends, capital gain distributions or redemption of Fund shares. Values are in US$.
| 3 | It is not possible to invest directly in an index. Source: Index data from Morgan Stanley Capital Management; total return calculations performed by PNC Global Investment Servicing (U.S.) Inc. Please see page 87 for index definitions. |
| 4 | Calculated from 8/31/94. |
| 5 | The Lipper Category Average does not reflect sales charges and is based on total return, including reinvestment of dividends and capital gains for the stated periods. |
TOP TEN HOLDINGS6
| | | | | |
| | | Country | | % of Net Assets | |
NHN Corp. | | South Korea | | 3.2 | % |
NWS Holdings, Ltd. | | China/Hong Kong | | 2.9 | % |
PT Bank Central Asia | | Indonesia | | 2.7 | % |
Hang Lung Group, Ltd. | | China/Hong Kong | | 2.7 | % |
Tencent Holdings, Ltd. | | China/Hong Kong | | 2.6 | % |
HDFC Bank, Ltd. | | India | | 2.6 | % |
PT Telekomunikasi Indonesia | | Indonesia | | 2.4 | % |
Yuhan Corp. | | South Korea | | 2.4 | % |
MegaStudy Co., Ltd. | | South Korea | | 2.4 | % |
Bharti Airtel, Ltd. | | India | | 2.3 | % |
% OF ASSETS IN TOP TEN | | | | 26.2 | % |
| 6 | Holdings may combine more than one security from same issuer and related depositary receipts. |
matthewsasia.com | 800.789.ASIA 21
| | | | |
| COUNTRY ALLOCATION (%) | | Matthews Pacific Tiger Fund |
China/Hong Kong South Korea India Indonesia Malaysia Singapore Taiwan Thailand Philippines Cash and Other Assets, Less Liabilities SECTOR ALLOCATION (%) Financials Consumer Discretionary Information Technology Health Care Consumer Staples Telecom Services Industrials Utilities Cash and Other Assets, Less Liabilities MARKET CAP EXPOSURE (%) 7 Large Cap (over $5B) Mid Cap ($1B–$5B) Small Cap (under $1B) Cash and Other Assets, Less Liabilities 7 Source: FactSet Research Systems. Percentage values in data are rounded to the nearest tenth of one percent; the values may not sum to 100% due to rounding. | | 36.2 18.8 17.5 6.3 5.2 5.1 5.0 4.3 0.9 0.7 29.4 19.7 13.0 10.9 8.9 8.0 7.0 2.4 0.7 25.8 46.4 27.1 0.7 | | Portfolio Manager Commentary (continued) We do not question the ability of Asian consumers to spend money, but their willingness to spend may take some time to change. We have previously written that China’s gradual shift from producer to consumer is likely to be one of the biggest transitions to unfold over the coming years. Even a mild pick-up in personal credit will go a long way toward facilitating this shift. This rebalancing of growth could take considerable time, but recent policy moves— including the firming of private property rights in China—are encouraging. It is also important to note that while wage growth may start to slow in coastal cities, it has gained momentum in rural China in recent months. More importantly, the strengthening of social infrastructure, not just in China but elsewhere across Asia, should spur the development of a mass consumption society. New Oriental Education, the largest provider of English language training for Chinese students is a clear beneficiary of this trend. The “one child policy” in China has meant that parents try doubly hard to provide the best education for their children, and as a result education is the second-largest spending category for Chinese. Although rising unemployment may crimp the ability of families to purchase New Oriental’s services, we believe it is likely to be one of the last expenses to be eliminated. New Oriental’s decision to initiate a share repurchase program in early 2008 suggests as much, and attests to the fact that the company’s cash flows are real. The ferocity of the correction in some markets of Asia is unprecedented and, in some instances, suggests that underlying companies and business models are unlikely to create any economic value in the future. Even as their own capital markets have widened and deepened, companies in Asia have unfortunately been too reliant on overseas investors for risk capital. The sudden withdrawal of foreign investors can often lead to a dislocation between fundamentals and stock market prices. Even though concerns over an economic slowdown are legitimate, we believe there is a risk that investors are too focused on the short term. For the first half of the year, one of the big challenges for many corporates in Asia was rising commodity costs. That headwind abated in the second half of 2008. Across the region, governments are utilizing fiscal and monetary levers to stimulate their economies, some more successfully than others. It is hard to predict the macro outcomes of these policies at this point. Meanwhile, we have taken the opportunity to consolidate the portfolio with firms in which we hold the highest conviction for long-term potential. |
| | |
| | |
| | |
| | |
| | |
| | |
| | |
| | |
| | |
| | |
| | |
| | |
| | |
| | |
| | |
| | |
| | |
| | |
| | |
| | |
| | |
| | |
| | |
| | |
| | |
| | |
| | |
| | |
| | |
22 MATTHEWS ASIA FUNDS
| | | | |
| Matthews Pacific Tiger Fund | | December 31, 2008 |
Schedule of Investmentsa
COMMON EQUITIES: 99.3%
| | | | |
| | | Shares | | Value |
CHINA/HONG KONG: 36.2% | | | | |
NWS Holdings, Ltd. | | 23,188,636 | | $34,737,613 |
Hang Lung Group, Ltd. | | 10,492,000 | | 32,051,461 |
Tencent Holdings, Ltd. | | 4,887,200 | | 31,755,702 |
Dongfeng Motor Group Co., Ltd. H Shares | | 82,864,000 | | 27,054,163 |
China Vanke Co., Ltd. B Shares | | 33,472,360 | | 25,953,297 |
Shangri-La Asia, Ltd. | | 21,336,000 | | 24,679,108 |
New Oriental Education & Technology Group, Inc. ADRb | | 442,400 | | 24,292,184 |
Dairy Farm International Holdings, Ltd. | | 5,467,446 | | 23,428,088 |
Ping An Insurance (Group) Co. of China, Ltd. H Shares | | 4,746,000 | | 23,323,355 |
Swire Pacific, Ltd. A Shares | | 3,309,500 | | 22,925,631 |
China Resources Enterprise, Ltd. | | 12,650,000 | | 22,245,750 |
Ctrip.com International, Ltd. ADR | | 903,275 | | 21,497,945 |
China Merchants Bank Co., Ltd. H Shares | | 11,084,500 | | 20,739,913 |
China Mobile, Ltd. ADR | | 385,550 | | 19,605,218 |
Lenovo Group, Ltd. | | 64,868,000 | | 17,819,826 |
NetEase.com, Inc. ADRb | | 557,800 | | 12,327,380 |
Mindray Medical International, Ltd. ADR | | 671,797 | | 12,092,346 |
China Yurun Food Group, Ltd. | | 10,018,000 | | 11,849,803 |
Television Broadcasts, Ltd. | | 3,492,700 | | 11,450,007 |
Glorious Sun Enterprises, Ltd. | | 41,262,000 | | 10,204,111 |
Towngas China Co., Ltd.b | | 24,857,000 | | 4,938,853 |
| | | | |
Total China/Hong Kong | | | | 434,971,754 |
| | | | |
| | | | | |
SOUTH KOREA: 18.8% | | | | |
NHN Corp.b | | 360,902 | | 38,152,506 |
Yuhan Corp. | | 163,192 | | 28,652,108 |
MegaStudy Co., Ltd.b | | 193,231 | | 28,607,135 |
Amorepacific Corp. | | 50,634 | | 26,479,030 |
Samsung Securities Co., Ltd. | | 514,989 | | 25,982,198 |
Hanmi Pharmaceutical Co., Ltd. | | 281,645 | | 24,620,666 |
S1 Korea Corp. | | 566,228 | | 24,474,952 |
Hana Financial Group, Inc. | | 957,923 | | 15,259,333 |
Hyundai Development Co. | | 541,382 | | 14,333,672 |
| | | | |
Total South Korea | | | | 226,561,600 |
| | | | |
| | | | |
INDIA: 17.5% | | | | |
Bharti Airtel, Ltd.b | | 1,906,740 | | 28,106,903 |
HDFC Bank, Ltd. | | 1,302,184 | | 26,914,055 |
Dabur India, Ltd. | | 12,680,888 | | 21,992,342 |
Sun Pharmaceutical Industries, Ltd. | | 943,363 | | 20,752,858 |
Infosys Technologies, Ltd. | | 883,401 | | 20,473,848 |
Titan Industries, Ltd. | | 837,895 | | 16,078,991 |
Bank of Baroda | | 2,758,605 | | 15,926,554 |
Kotak Mahindra Bank, Ltd. | | 1,927,941 | | 14,238,336 |
Sintex Industries, Ltd. | | 2,835,014 | | 11,084,277 |
Sun TV Network, Ltd. | | 2,912,590 | | 10,829,852 |
Glenmark Pharmaceuticals, Ltd.b | | 1,500,757 | | 9,218,025 |
Unitech, Ltd. | | 7,800,000 | | 6,563,539 |
| | | | |
HDFC Bank, Ltd. ADR | | 63,900 | | 4,561,182 |
ICICI Bank, Ltd. ADR | | 201,500 | | 3,878,875 |
| | | | |
Total India | | | | 210,619,637 |
| | | | |
| | | | |
| | | Shares | | Value |
INDONESIA: 6.3% | | | | |
PT Bank Central Asia | | 109,025,000 | | $32,968,390 |
PT Telekomunikasi Indonesia | | 36,860,500 | | 23,558,363 |
PT Astra International | | 14,665,230 | | 14,413,051 |
PT Telekomunikasi Indonesia ADR | | 209,500 | | 5,252,165 |
| | | | |
Total Indonesia | | | | 76,191,969 |
| | | | |
| | | | |
MALAYSIA: 5.2% | | | | |
Resorts World BHD | | 39,371,200 | | 25,827,189 |
Public Bank BHD | | 9,293,800 | | 23,819,821 |
Top Glove Corp. BHD | | 12,587,980 | | 12,760,403 |
| | | | |
Total Malaysia | | | | 62,407,413 |
| | | | |
| | | | |
SINGAPORE: 5.1% | | | | |
Hyflux, Ltd. | | 18,840,187 | | 23,557,446 |
Parkway Holdings, Ltd. | | 26,144,540 | | 22,657,966 |
Keppel Land, Ltd. | | 12,582,000 | | 14,951,721 |
| | | | |
Total Singapore | | | | 61,167,133 |
| | | | |
| | | | |
TAIWAN: 5.0% | | | | |
Taiwan Semiconductor Manufacturing Co., Ltd. | | 18,381,362 | | 25,081,001 |
President Chain Store Corp. | | 9,853,000 | | 23,664,040 |
Hon Hai Precision Industry Co., Ltd. | | 5,751,950 | | 11,341,471 |
| | | | |
Total Taiwan | | | | 60,086,512 |
| | | | |
| | | | | |
THAILAND: 4.3% | | | | |
Advanced Info Service Public Co., Ltd. | | 8,222,300 | | 19,108,290 |
Land & Houses Public Co., Ltd. | | 144,102,800 | | 16,026,030 |
Bank of Ayudhya Public Co., Ltd. NVDR | | 58,968,600 | | 15,960,167 |
| | | | |
Total Thailand | | | | 51,094,487 |
| | | | |
| | | | |
PHILIPPINES: 0.9% | | | | |
SM Prime Holdings, Inc. | | 68,769,117 | | 11,141,021 |
| | | | |
Total Philippines | | | | 11,141,021 |
| | | | |
| | | | |
TOTAL INVESTMENTS: 99.3% | | 1,194,241,526 |
(Cost $1,471,509,797c) | | | | |
| |
CASH AND OTHER ASSETS, LESS LIABILITIES: 0.7% | | 8,199,018 |
| | | | |
NET ASSETS: 100.0% | | | | $1,202,440,544 |
| | | | |
|
a Certain securities were fair valued under the discretion of the Board of Trustees (Note 1-A). |
b Non–income producing security. |
c Cost for Federal income tax purposes is $1,472,609,146 and net unrealized depreciation consists of: |
| | |
Gross unrealized appreciation | | | | $128,612,265 |
Gross unrealized depreciation | | | | (406,979,885) |
| | | | |
Net unrealized depreciation | | | | ($278,367,620) |
| | | | |
|
| ADR American Depositary Receipt |
|
| NVDR Non-voting Depositary Receipt |
See accompanying notes to financial statements.
matthewsasia.com | 800.789.ASIA 23
| | | | |
 | | Matthews China Fund Portfolio Manager Commentary For the year ending December 31, 2008, the Matthews China Fund declined
–48.95%, slightly ahead of its benchmark MSCI China Index, which fell –50.83%. Chinese equities ended a five-year streak of gains as they corrected sharply along with other equity markets around the world in 2008. The decline for Chinese shares accelerated in the fourth quarter, when the global economic recession deepened, and the magnitude of its impact on the Chinese economy caught many investors by surprise. The Fund fell –16.77% in the fourth quarter, while the benchmark declined –10.75%. China began the challenging year facing growing inflation and a potential overheating of its economy. The government and central bank focused efforts on controlling the situation, but by the second half of the year the full-blown global recession hit China. The central government acted promptly to roll out measures to ensure that the economy could still grow at more than 8% over the coming year. These measures included steep interest rate cuts and a massive fiscal stimulus plan to spend US$590 billion over the next two years. While China’s growth momentum has been deteriorating quite substantially in recent months, it is worth noting that most of the impact comes from external factors: export growth fell from more than 20% in recent years to –2.2% in November. Exports are expected to fall even further as we head into 2009. Industrial production grew at its weakest pace in almost a decade, mainly due to the collapse in exports. On the other hand, retail sales, while slowing, still grew at roughly 20% in November, indicating that private consumption growth remains relatively healthy. As we have previously written, we became more cautious and concerned about the high valuations of Chinese equities toward the end of 2007. Accordingly, we trimmed down some high-flying financial and consumer sector stocks in the portfolio. Our increased positions in utilities and consumer staples served us well in 2008, and these two areas became the top contributors for the Fund. However, selling pressures were seen across all major sectors throughout the year. Hardest hit were holdings in the consumer discretionary, financial and industrial sectors. While we aim to keep a balance between growth and reasonable valuations among our holdings, the Fund’s key purpose is still to find sustainable growth companies and hold on to them for the long term. Even in this downward economic environment, we believe there are good growth industries and companies in which to invest. During the year, we increased our holdings in Internet-related companies, believing they can weather economic slowdowns and are able to provide sustainable future growth. One such company in our portfolio is Tencent Holdings, China’s leading online instant messaging service provider. China’s Internet industry has experienced explosive growth in recent years and the momentum continued in 2008. Tencent’s instant messaging service platform claims more than 200 million active users. Founded in 1998, the company has demonstrated an ability over the years to monetize its vast registered user base through three primary revenue streams: Internet value-added services, mobile value-added services and online advertising and gaming. Tencent has built a substantial virtual community and its users are loyal. We expect that the company has the potential to continue delivering strong earnings growth going forward. (continued) |
PORTFOLIO MANAGERS | |
Richard H. Gao | |
Lead Manager | |
Andrew T. Foster | |
Co-Manager | |
Note: Managers shown reflect changes effective January 1, 2009. | |
FUND FACTS | |
Ticker | | MCHFX | |
Inception Date | | 2/19/98 | |
Assets | | $781.1 million | |
NAV | | $14.34 | |
Total # of Positions | | 63 | |
Fiscal Year 2008 Ratios | |
Portfolio Turnover | | 7.91%1 | |
Gross Expense Ratio | | 1.23%2 | |
Benchmark | |
MSCI China Index | |
Redemption Fee | |
| 2% within first 90 calendar days of purchase | |
OBJECTIVE | |
Long-term capital appreciation. | |
STRATEGY | |
Under normal market conditions, the Fund seeks to achieve its investment objective by investing at least 80% of its total net assets, which include borrowings for investment purposes, in the common and preferred stocks of companies located in China. China includes its administrative and other districts, such as Hong Kong. | |
1 The lesser of fiscal year 2008 long-term purchase costs or sales proceeds divided by the average monthly market value of long-term securities. | |
2 Matthews Asia Funds does not charge 12b-1 fees. | | |
24 MATTHEWS ASIA FUNDS
PERFORMANCE AS OF DECEMBER 31, 2008
| | | | | | | | | | | | | |
| | | | | Average Annual Total Returns | |
| | | 3 Months | | 1 Year | | 3 Years | | 5 Years | | 10 Years | | Inception
2/19/98 | |
Matthews China Fund | | -16.77% | | -48.95% | | 12.70% | | 9.71% | | 14.95% | | 8.91% | |
MSCI China Index3 | | -10.75% | | -50.83% | | 14.34% | | 12.78% | | 5.82% | | -0.05% | 4 |
Lipper China Region Funds Category Average5 | | -16.88% | | -52.71% | | 5.40% | | 6.46% | | 9.75% | | 6.01% | 4 |
Performance assumes reinvestment of all dividends and/or distributions before taxes. All performance quoted represents past performance and is no guarantee of future results. Investment return and principal value will fluctuate with market conditions so that when redeemed, shares may be worth more or less than their original cost. Current performance may be lower or higher than the return figures quoted. Returns would have been lower if certain of the Fund’s fees and expenses had not been waived. For the Fund’s most recent month-end performance visit matthewsasia.com.
GROWTH OF A $10,000 INVESTMENT SINCE INCEPTION
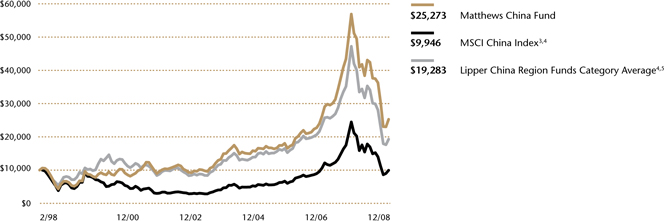
Plotted monthly. The performance data and graph do not reflect the deduction of taxes that a shareholder would pay on dividends, capital gain distributions or redemption of Fund shares. Values are in US$.
| 3 | It is not possible to invest directly in an index. Source: Index data from Morgan Stanley Capital Management; total return calculations performed by PNC Global Investment Servicing (U.S.) Inc. Please see page 87 for index definition. |
| 4 | Calculated from 2/28/98. |
| 5 | The Lipper Category Average does not reflect sales charges and is based on total return, including reinvestment of dividends and capital gains for the stated periods. |
| | | | | | | | | | |
TOP TEN HOLDINGS6 | | | | | | | | CHINA EXPOSURE 7 | | |
| | | | | |
| | | Sector | | % of Net
Assets | | | | | | |
China Mobile, Ltd. | | Telecom Services | | 4.7% | | | | SAR (Hong Kong) | | 36.3% |
Ping An Insurance (Group) Co. of China, Ltd. | | Financials | | 2.9% | | | | H Share | | 36.2% |
New Oriental Education & Technology Group, Inc. | | Consumer Discretionary | | 2.9% | | | | China-affiliated Corporations | | 12.9% |
Dongfeng Motor Group Co., Ltd. | | Consumer Discretionary | | 2.8% | | | | Overseas Listed | | 9.5% |
Cheung Kong Infrastructure Holdings, Ltd. | | Utilities | | 2.8% | | | | B Share | | 4.1% |
Huaneng Power International, Inc. | | Utilities | | 2.7% | | | | Cash and Other Assets, Less Liabilities | | 1.0% |
Café de Coral Holdings, Ltd. | | Consumer Discretionary | | 2.7% | | | | | | |
China Vanke Co., Ltd. | | Financials | | 2.7% | | | | | | |
China Life Insurance Co., Ltd. | | Financials | | 2.6% | | | | | | |
Tingyi (Cayman Islands) Holding Corp. | | Consumer Staples | | 2.6% | | | | | | |
% OF ASSETS IN TOP TEN | | | | 29.4% | | | | | | |
| 6 | Holdings may combine more than one security from same issuer and related depositary receipts. |
| 7 | SAR (Hong Kong) companies are companies that conduct business in Hong Kong and/or mainland China. H Shares are mainland China companies listed on the Hong Kong exchange but incorporated in mainland China. China-affiliated corporations (CAC), also known as “Red Chips,” are mainland China companies with partial state ownership listed in Hong Kong, and incorporated in Hong Kong. Overseas Listed (OL) companies are companies that conduct business in mainland China but listed in overseas markets such as Japan, Singapore, Taiwan and the United States. B Shares are mainland Chinese companies listed on the Shanghai and Shenzhen stock exchanges, available to both Chinese and non-Chinese investors. |
matthewsasia.com | 800.789.ASIA 25
| | | | |
| SECTOR ALLOCATION (%) | | | | Matthews China Fund |
Consumer Discretionary Financials Industrials Information Technology Utilities Consumer Staples Telecom Services Energy Materials Health Care Cash and Other Assets, Less Liabilities MARKET CAP EXPOSURE (%)8 Large Cap (over $5B) Mid Cap ($1B–$5B) Small Cap (under $1B) Cash and Other Assets, Less Liabilities 8 Source: FactSet Research Systems. Percentage values in data are rounded to the nearest tenth of one percent; the values may not sum to 100% due to rounding. | | 21.9 18.4 14.3 12.8 9.5 8.4 7.0 5.1 0.3 0.3 1.0 37.0 38.3 23.7 1.0 | | Portfolio Manager Commentary (continued) In addition to Internet companies, the Fund also increased its exposure to construction and engineering firms, which should benefit from the government’s spending program. The Fund added a new position in this sector: China Railway Construction Corporation—one of the few companies that handles railway project construction in China. Railway improvements make up one of the largest areas of investment in China. As a leading railway builder, China Railway Construction is expected to see sustainable growth opportunities over the long term. Looking forward, a deepening global recession will further impact China’s economy, and we believe that its growth will continue to slow in the near term. While measures had been taken to try to boost exports, the government is now focusing on encouraging domestic consumption to offset the sharp decline in exports. Various policies, such as cutting personal income tax, reducing property sales tax and lowering mortgage lending rates, have been aimed at stimulating consumption. During the year, the government also took further steps in its rural land reform in an effort to raise the living standards of farmers, who still account for the majority of the country’s population. As always, the Fund maintains a long-term perspective when making investment decisions. We believe China’s economic fundamentals remain attractive, although short-term growth will be hindered by negative external impact. China’s increasing moves to rely more on domestic consumption fit well with our view that domestic demand will be the key growth driver for the economy. The Fund continues to focus on bottom-up stock picking and seeks to find companies that may benefit most from this long-term trend. |
| | |
| | |
| | |
| | |
| | |
| | |
| | |
| | |
| | |
| | |
| | |
| | |
| | |
| | |
| | |
| | |
| | |
| | |
| | |
| | |
26 MATTHEWS ASIA FUNDS
| | |
| Matthews China Fund | | December 31, 2008 |
Schedule of Investmentsa
COMMON EQUITIES: CHINA/HONG KONG: 99.0%
| | | | |
| | | Shares | | Value |
CONSUMER DISCRETIONARY: 21.9% |
Hotels, Restaurants & Leisure: 5.8% |
Café de Coral Holdings, Ltd. | | 10,448,100 | | $21,197,559 |
Shangri-La Asia, Ltd. | | 8,241,600 | | 9,532,965 |
China Travel International Investment HK, Ltd. | | 44,508,000 | | 8,747,526 |
Ctrip.com International, Ltd. ADR | | 238,300 | | 5,671,540 |
| | | | |
| | | | 45,149,590 |
| | | | |
Diversified Consumer Services: 2.9% |
New Oriental Education & Technology Group, Inc. ADRb | | 411,800 | | 22,611,938 |
| | | | |
Automobiles: 2.8% | | |
Dongfeng Motor Group Co., Ltd. H Shares | | 67,352,000 | | 21,989,669 |
| | | | |
Distributors: 2.6% | | |
China Resources Enterprise, Ltd. | | 7,094,000 | | 12,475,206 |
Li & Fung, Ltd. | | 4,375,200 | | 7,561,203 |
| | | | |
| | | | 20,036,409 |
| | | | |
Textiles, Apparel & Luxury Goods: 2.2% |
Ports Design, Ltd. | | 7,461,500 | | 9,102,770 |
Glorious Sun Enterprises, Ltd. | | 33,994,000 | | 8,406,732 |
| | | | |
| | | | 17,509,502 |
| | | | |
Media: 1.7% | | |
Television Broadcasts, Ltd. | | 2,542,000 | | 8,333,358 |
AirMedia Group, Inc. ADRb | | 1,021,400 | | 4,902,720 |
Clear Media, Ltd.b | | 1,356,000 | | 175,295 |
| | | | |
| | | | 13,411,373 |
| | | | |
Multiline Retail: 1.6% | | |
Golden Eagle Retail Group, Ltd. | | 17,779,000 | | 12,512,177 |
| | | | |
Leisure Equipment & Products: 1.3% |
Li Ning Co., Ltd. | | 6,686,500 | | 10,535,858 |
| | | | |
Specialty Retail: 1.0% | | |
Belle International Holdings, Ltd. | | 16,709,000 | | 7,413,370 |
| | | | |
| | |
Total Consumer Discretionary | | | | 171,169,886 |
| | | | |
| | | | | |
FINANCIALS: 18.4% | | |
Real Estate Management & Development: 7.1% |
China Vanke Co., Ltd. B Shares | | 27,220,848 | | 21,106,093 |
Hang Lung Group, Ltd. | | 4,677,000 | | 14,287,522 |
Swire Pacific, Ltd. A Shares | | 1,825,000 | | 12,642,176 |
Agile Property Holdings, Ltd. | | 13,704,000 | | 7,237,550 |
| | | | |
| | | | 55,273,341 |
| | | | |
Commercial Banks: 5.8% |
China Merchants Bank Co., Ltd. H Shares | | 8,132,500 | | 15,216,504 |
China Construction Bank Corp. H Shares | | 20,082,000 | | 11,173,062 |
Bank of Communications Co., Ltd. H Shares | | 14,808,000 | | 10,762,886 |
BOC Hong Kong Holdings, Ltd. | | 7,107,500 | | 8,135,163 |
| | | | |
| | | | 45,287,615 |
| | | | |
Insurance: 5.5% | | |
Ping An Insurance (Group) Co. of China, Ltd. H Shares | | 4,619,500 | | 22,701,694 |
China Life Insurance Co., Ltd. H Shares | | 6,576,000 | | 20,204,639 |
| | | | |
| | | | 42,906,333 |
| | | | |
Total Financials | | | | 143,467,289 |
| | | | |
| | | | |
| | | Shares | | Value |
INDU STRIALS: 14.3% |
| Construction & Engineering: 3.8% |
China Railway Construction Corp., Ltd. H Sharesb | | 10,172,500 | | $15,229,349 |
China Communications Construction Co., Ltd. H Shares | | 11,809,000 | | 14,755,007 |
| | | | |
| | | | 29,984,356 |
| | | | |
Transportation Infrastructure: 3.6% |
GZI Transport, Ltd. | | 36,765,000 | | 10,959,392 |
Beijing Capital International Airport Co., Ltd. H Shares | | 13,332,000 | | 6,755,498 |
China Merchants Holdings International Co., Ltd. | | 3,046,581 | | 5,949,767 |
COSCO Pacific, Ltd. | | 4,614,000 | | 4,743,955 |
| | | | |
| | | | 28,408,612 |
| | | | |
Industrial Conglomerates: 2.1% |
NWS Holdings, Ltd. | | 11,017,276 | | 16,504,372 |
| | | | |
Electrical Equipment: 2.0% |
China High Speed Transmission Equipment Group Co., Ltd. | | 12,650,000 | | 15,435,972 |
| | | | |
Machinery: 2.0% | | |
Shanghai Zhenhua Port Machinery Co., Ltd. B Shares | | 16,339,273 | | 10,959,388 |
China South Locomotive and Rolling Stock Corp., H Sharesb | | 7,687,000 | | 4,204,928 |
| | | | |
| | | | 15,164,316 |
| | | | |
Airlines: 0.8% | | |
Air China, Ltd. H Shares | | 19,569,900 | | 6,141,894 |
| | | | |
Total Industrials | | | | 111,639,522 |
| | | | |
| | | | | |
| INFORMATION TECHNOLOGY: 12.8% |
Internet Software & Services: 6.3% |
Tencent Holdings, Ltd. | | 2,718,800 | | 17,666,026 |
Sina China Corp.b | | 761,700 | | 17,633,355 |
NetEase.com, Inc. ADRb | | 617,700 | | 13,651,170 |
| | | | |
| | | | 48,950,551 |
| | | | |
| Software: 2.5% | | |
Kingdee International Software Group Co., Ltd.† | | 120,330,000 | | 12,520,642 |
The9, Ltd. ADRb | | 532,300 | | 7,090,236 |
| | | | |
| | | | 19,610,878 |
| | | | |
Computers & Peripherals: 2.4% |
TPV Technology, Ltd. | | 31,868,000 | | 10,364,218 |
Lenovo Group, Ltd. | | 30,336,000 | | 8,333,573 |
| | | | |
| | | | 18,697,791 |
| | | | |
Communications Equipment: 1.6% |
ZTE Corp. H Shares | | 4,816,920 | | 12,725,780 |
| | | | |
Total Information Technology | | 99,985,000 |
| | | | |
matthewsasia.com | 800.789.ASIA 27
| | |
| Matthews China Fund | | December 31, 2008 |
Schedule of Investmentsa (continued)
COMMON EQUITIES: CHINA/HONG KONG (continued)
| | | | | |
| | | Shares | | Value |
UTILITIES: 9.5% |
Independent Power Producers & Energy Traders: 4.8% |
Datang International Power Generation Co., Ltd. H Shares | | 30,990,000 | | $ | 16,539,900 |
Huaneng Power International, Inc. H Shares | | 20,674,000 | | | 15,064,643 |
Huaneng Power International, Inc. ADR | | 213,400 | | | 6,227,012 |
| | | | | |
| | | | | 37,831,555 |
| | | | | |
Electric Utilities: 2.8% | | | |
Cheung Kong Infrastructure Holdings, Ltd. | | 5,752,500 | | | 21,723,528 |
| | | | | |
Gas Utilities: 1.9% | | | |
Hong Kong & China Gas Co., Ltd. | | 9,820,594 | | | 14,892,602 |
| | | | | |
Total Utilities | | | | | 74,447,685 |
| | | | | |
| | | | | | |
CONSUMER STAPLES: 8.4% | | | |
Food Products: 4.8% | | | |
Tingyi (Cayman Islands) Holding Corp. | | 17,291,000 | | | 20,110,511 |
China Yurun Food Group, Ltd. | | 14,361,000 | | | 16,986,925 |
| | | | | |
| | | | | 37,097,436 |
| | | | | |
Food & Staples Retailing: 2.1% | | | |
Lianhua Supermarket Holdings Co., Ltd. H Shares† | | 12,995,000 | | | 16,190,112 |
| | | | | |
Beverages: 1.5% | | | |
Tsingtao Brewery Co., Ltd. H Shares | | 5,727,000 | | | 12,034,457 |
| | | | | |
Total Consumer Staples | | | | | 65,322,005 |
| | | | | |
| | | | | | |
TELECOMMUNICATION SERVICES: 7.0% |
Wireless Telecommunication Services: 4.7% |
China Mobile, Ltd. | | 2,120,083 | | | 21,510,608 |
China Mobile, Ltd. ADR | | 303,400 | | | 15,427,890 |
| | | | | |
| | | | | 36,938,498 |
| | | | | |
Diversified Telecommunication Services: 2.3% |
China Communications Services Corp., Ltd. H Shares | | 27,878,000 | | | 17,619,650 |
| | | | | |
Total Telecommunication Services | | | | | 54,558,148 |
| | | | | |
| | | | | | |
ENERGY: 5.1% | | | |
Oil, Gas & Consumable Fuels: 4.0% | | | |
CNOOC, Ltd. | | 13,728,000 | | | 13,057,733 |
China Petroleum & Chemical Corp. (Sinopec) H Shares | | 16,242,000 | | | 9,983,364 |
China Shenhua Energy Co., Ltd. H Shares | | 4,141,500 | | | 8,878,791 |
| | | | | |
| | | | | 31,919,888 |
| | | | | |
Energy Equipment & Services: 1.1% | | | |
China Oilfield Services, Ltd. H Shares | | 10,266,000 | | | 8,381,426 |
| | | | | |
Total Energy | | | | | 40,301,314 |
| | | | | |
| | | | |
| | | Shares | | Value |
MATERIALS: 1.3% |
Construction Materials: 1.3% | | |
China National Building Material Co., Ltd. H Shares | | 8,606,000 | | $10,463,901 |
| | | | |
Total Materials | | | | 10,463,901 |
| | | | |
| | | | | |
HEALTH CARE: 0.3% | | |
Health Care Equipment & Supplies: 0.3% |
Mindray Medical International, Ltd. ADR | | 124,968 | | 2,249,424 |
| | | | |
Total Health Care | | | | 2,249,424 |
| | | | |
| | | | | |
TOTAL INVESTMENTS: 99.0% | | | | 773,604,174 |
| | |
| (Cost $1,018,335,463c) | | | | |
| | |
CASH AND OTHER ASSETS, LESS LIABILITIES: 1.0% | | | | 7,500,303 |
| | | | |
| | |
NET ASSETS: 100.0% | | | | $781,104,477 |
| | | | |
|
a Certainsecurities were fair valued under the discretion of the Board of Trustees (Note 1-A). |
b Non–incomeproducing security. |
c Costfor Federal income tax purposes is $1,020,914,548 and net unrealized depreciation consists of: |
| | | | |
| Gross unrealized appreciation | | $ | 50,286,523 | |
| Gross unrealized depreciation | | | (297,596,897 | ) |
| | | | |
| Net unrealized depreciation | | ($ | 247,310,374 | ) |
| | | | |
| | | | |
|
† AffiliatedIssuer, as defined under the Investment Company Act of 1940 (ownership of 5% or more of the outstanding voting securities of this issuer) |
| ADR American Depositary Receipt |
|
| See accompanying notes to financial statements. |
28 MATTHEWS ASIA FUNDS
| | | | |
| | | | Matthews India Fund Portfolio Manager Commentary For the year ending December 31, 2008, the Matthews India Fund fell
–62.32%, while its benchmark, the Bombay Stock Exchange 100 Index, declined –63.32%. During the fourth quarter of 2008, the Fund declined
–31.17%, while its benchmark fell –27.62%. Smaller and mid-size companies suffered disproportionately in the last quarter of the year, including some of the portfolio’s holdings, which dragged the Fund lower. The pace and ferocity of the fall in equity values was unprecedented in the recent history of Indian markets. The negative returns were further exacerbated by the near 25% depreciation of the Indian rupee’s value against the U.S. dollar in 2008. We are disappointed with the decline in performance that the portfolio has suffered over the course of the year and appreciate your long-term focus and ongoing support for the portfolio’s investment strategy. We have been cognizant of the risks of maintaining a significant allocation to India’s small and mid-size companies, in particular their ability to raise capital to fund growth. Indian companies have relied on retained profits to fund significant portions of their investments. This was sufficient when India’s GDP growth was in the low- to mid-single digits. However, the pick-up in GDP growth rates in recent years has been predicated on a more efficient intermediation of the financial resources available in the country and better availability of funds via the capital markets. On both these accounts, progress has been made but it remains inadequate when compared to the aspirations of many of the Indian corporates, most notably for smaller and mid-size companies. To be sure, the return on equity generated by a broad aggregate of Indian companies has averaged 20% for the last few years, so it isn’t for a lack of returns that the flow of capital has been patchy. Even though the domestic savings ratio has inched up to 35% of GDP in recent years, it falls short of the investment-to-GDP ratio, which is approaching 40%. To make matters worse, much of the savings are funneled into banks, which are obliged to help finance the government’s fiscal deficit. As far as foreign capital is concerned, it is important to note that as late as the first quarter of 2008, the Reserve Bank of India (RBI) was trying to combat inflation by stemming the tide of incoming foreign capital through various policy measures. If anything, the availability of foreign capital has primarily come through the equity market, sometimes chasing shorter-term performance. The onset of the global financial crisis has sparked a withdrawal, with foreign institutional investors (FIIs) selling US$13 billion of Indian equities in 2008—the first year of outflows, to our knowledge. Companies with the most leveraged balance sheets have invariably suffered severely in the downturn, and management teams have had to realign their growth plans to the realities of the current environment. The vast majority of the Fund’s holdings of smaller and mid-size companies have relatively healthier balance sheets, with some of them in a net cash position. Besides the faster growth dynamic exhibited by these companies in the past few years, what has attracted us is their potential for steady return on capital. Many of these holdings have modest dividend policies in place, adding another layer of comfort on the sustainability of the business. It is clear to us that the hectic pace of 20% earnings growth reported by Indian companies for the past few years is unlikely to be met in the near term. At an aggregate level, it is worth noting that Indian companies reported earnings growth still in the double-digit range for the quarter ending September 2008. However, growth may moderate further, and analysts’ expectations |

PORTFOLIO MANAGERS | | | |
Sharat Shroff, CFA | | | |
| Lead Manager | | | |
Andrew T. Foster | | | |
| Co-Manager | | | |
Noor Kamruddin | | | |
| Co-Manager | | | |
Note: Managers shown reflect changes effective January 1, 2009. | | | |
FUND FACTS | | | |
Ticker MINDX | | | |
| Inception Date 10/31/05 | | | |
| Assets $317.5 million | | | |
| NAV $8.37 | | | |
| Total # of Positions 56 | | | |
Fiscal Year 2008 Ratios | | | |
| Portfolio Turnover 26.68%1 | | | |
| Gross Expense Ratio 1.29%2 | | | |
Benchmark | | | |
| Bombay Stock Exchange (BSE) 100 Index | | | |
Redemption Fee | | | |
| 2% within first 90 calendar days of purchase | | | |
OBJECTIVE | | | |
Long-term capital appreciation. | | | |
STRATEGY | | | |
Under normal market conditions, the Fund seeks to achieve its investment objective by investing at least 80% of its total net assets, which include borrowings for investment purposes, in publicly traded common stocks, preferred stocks and convertible securities of companies located in India. | | | |
1 Thelesser of fiscal year 2008 long-term purchase costs or sales proceeds divided by the average monthly market value of long-term securities. 2 MatthewsAsia Funds does not charge 12b-1 fees. | | | |
| | | | (continued) |
matthewsasia.com | 800.789.ASIA 29
PERFORMANCE AS OF DECEMBER 31, 2008
| | | | | | | | |
| | | | | Average Annual Total Returns |
| | | 3 Months | | 1 Year | | 3 Years | | Inception
10/31/05 |
| | | | |
Matthews India Fund | | -31.17% | | -62.32% | | -5.49% | | -1.42% |
Bombay Stock Exchange (BSE) 100 Index3 | | -27.62% | | -63.32% | | -1.04% | | 4.67% |
Lipper Emerging Markets Funds Category Average4 | | -29.91% | | -55.47% | | -6.77% | | -2.45% |
Performance assumes reinvestment of all dividends and/or distributions before taxes. All performance quoted represents past performance and is no guarantee of future results. Investment return and principal value will fluctuate with market conditions so that when redeemed, shares may be worth more or less than their original cost. Current performance may be lower or higher than the return figures quoted. Returns would have been lower if certain of the Fund’s fees and expenses had not been waived. For the Fund’s most recent month-end performance visit matthewsasia.com.
GROWTH OF A $10,000 INVESTMENT SINCE INCEPTION
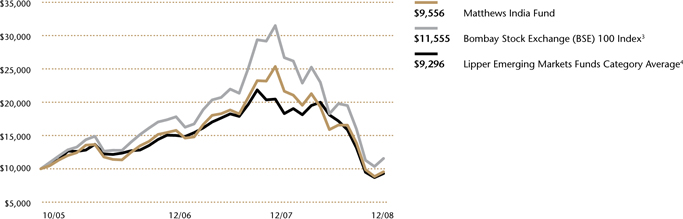
Plotted monthly. The performance data and graph do not reflect the deduction of taxes that a shareholder would pay on dividends, capital gain distributions or redemption of Fund shares. Values are in US$.
| 3 | It is not possible to invest directly in an index. Source: Index data from Morgan Stanley Capital Management; total return calculations performed by PNC Global Investment Servicing (U.S.) Inc. Please see page 87 for index definition. |
| 4 | The Lipper Category Average does not reflect sales charges and is based on total return, including reinvestment of dividends and capital gains for the stated periods. |
TOP TEN HOLDINGS5
| | | | |
| | | Sector | | % of Net Assets |
HDFC Bank, Ltd. | | Financials | | 5.3% |
Bharti Airtel, Ltd. | | Telecom Services | | 5.3% |
Infosys Technologies, Ltd. | | Information Technology | | 4.4% |
Dabur India, Ltd. | | Consumer Staples | | 4.4% |
Sun Pharmaceutical Industries, Ltd. | | Health Care | | 4.2% |
Glenmark Pharmaceuticals, Ltd. | | Health Care | | 3.9% |
Gail India, Ltd. | | Utilities | | 3.2% |
Jain Irrigation Systems, Ltd. | | Industrials | | 3.2% |
Axis Bank, Ltd. | | Financials | | 3.1% |
Cipla India, Ltd. | | Health Care | | 2.8% |
% OF ASSETS IN TOP TEN | | | | 39.8% |
| 5 | Holdings may combine more than one security from same issuer and related depositary receipts. |
30 MATTHEWS ASIA FUNDS
| | | | |
Matthews India Fund Portfolio Manager Commentary (continued) may be revised lower. That said, sharply lowered stock prices do not seem to be factoring any significant value creation in coming years, which we consider an unlikely outcome. As recently as the third quarter of 2008, the RBI was tightening monetary conditions to slow economic momentum and contain inflation, but more recently it has shifted gears to reverse those policies and ease liquidity conditions within the country. In addition to the monetary measures, two rounds of fiscal measures were announced: the first aimed at boosting government spending by US$4 billion, while the next package focused on reducing taxes and facilitating capital expenditure on infrastructure development. One encouraging development in recent years was the increase in equity inflows for domestic mutual funds, which bodes well for one of the Fund’s holdings, Kotak Mahindra Bank. Kotak Mahindra is a diversified financial conglomerate that started operations in the late 1980s and has gradually expanded into securities brokerage, investment banking, commercial banking, life insurance and other wealth management products. Among Indian banks, Kotak Mahindra’s business model is perhaps the most geared toward invest- ment banking and wealth management. In a sign of confidence in 2006, Kotak Mahindra’s management team bought out the 25% stake that Goldman Sachs had held for well over a decade. Near term, Kotak may likely suffer from a sharply negative impact on earnings, but the company is likely to benefit from India’s continued improvement in capi- tal market infrastructure. The recent turn of events surrounding one of India’s largest IT services com- panies has meant that investor focus on corporate governance will intensify, and rightly so. The attraction to investing in India has been driven by micro factors much more so than macro events, and the risk is that investors paint with the same brush without distinguishing between companies. In evaluating companies, we have placed considerable importance on our judgment of the quality of the management team, and that plays a significant role in the con- struction of the portfolio, particularly where we carry above-average weights. Looking ahead, we remain convinced of the merits of long-term investing in India: near-term earnings growth may be uninspiring due to cyclical factors, but India’s export dependency is low and the recent abatement in commod- ity prices should help margins. The regulatory constraints on the economy and capital markets continue to be lifted and the process can be slow but is generally consistent. Most importantly, the correction in equity values is start- ing to attract attention from strategic investors as was evident in the case of two Japanese companies in the health care and telecommunications sectors that acquired large stakes in Indian companies. Notwithstanding near-term headwinds from earnings results and the political elections in the first half of 2009, we believe India offers an attractive investing destination for patient, long-term investors. We are also excited to start 2009 with the addition of Noor Kamruddin as a Co-Manager of the Fund. Noor brings 10 years of investment experience and enhances the team’s capabilities. | | | | SECTOR ALLOCATION (%) Financials 20.6 Industrials 16.5 Information Technology 12.2 Consumer Discretionary 11.5 Health Care 10.9 Telecom Services 7.8 Consumer Staples 7.4 Utilities 7.3 Energy 5.1 Materials 1.0 Liabilities in Excess of Cash and Other Assets -0.3 MARKET CAP EXPOSURE (%)6 Large Cap (over $5B) 18.6 Mid Cap ($1B–$5B) 20.8 Small Cap (under $1B) 60.8 Liabilities in Excess of Cash and Other Assets -0.3 6 Source:FactSet Research Systems. Percentage values in data are rounded to the nearest tenth of one percent; the values may not sum to 100% due to rounding. |
matthewsasia.com | 800.789.ASIA 31
| | |
| Matthews India Fund | | December 31, 2008 |
Schedule of Investmentsa
COMMON EQUITIES: INDIA: 95.5%
| | | | |
| | | Shares | | Value |
FINANCIALS: 20.6% |
Commercial Banks: 14.1% | | | | |
HDFC Bank, Ltd. ADR | | 168,727 | | $12,043,733 |
Axis Bank, Ltd. | | 961,200 | | 9,968,994 |
Oriental Bank of Commerce | | 2,596,834 | | 8,261,671 |
Corporation Bank | | 1,719,331 | | 6,695,843 |
HDFC Bank, Ltd. | | 233,033 | | 4,816,418 |
ICICI Bank, Ltd. ADR | | 150,000 | | 2,887,500 |
| | | | |
| | | | 44,674,159 |
| | | | |
Diversified Financial Services: 2.9% | | |
Kotak Mahindra Bank, Ltd. | | 830,000 | | 6,129,762 |
SREI Infrastructure Finance, Ltd. | | 3,720,600 | | 3,011,997 |
| | | | |
| | | | 9,141,759 |
| | | | |
Consumer Finance: 1.8% | | | | |
Shriram Transport Finance Co., Ltd. | | 1,412,400 | | 5,700,211 |
| | | | |
Real Estate Management & Development: 1.1% |
Unitech, Ltd. | | 4,130,260 | | 3,475,529 |
| | | | |
Capital Markets: 0.7% | | | | |
IL&FS Investsmart, Ltd. | | 1,439,981 | | 2,284,602 |
| | | | |
Total Financials | | | | 65,276,260 |
| | | | |
| | | | |
INDUSTRIALS: 16.5% | | | | |
Machinery: 5.9% | | | | |
Jain Irrigation Systems, Ltd. | | 1,431,590 | | 10,239,877 |
Ashok Leyland, Ltd. | | 18,511,277 | | 5,750,854 |
Thermax, Ltd. | | 705,237 | | 2,618,408 |
| | | | |
| | | | 18,609,139 |
| | | | |
Building Products: 2.6% | | | | |
Sintex Industries, Ltd. | | 2,101,834 | | 8,217,705 |
| | | | |
| | | | |
Construction & Engineering: 2.4% |
Larsen & Toubro, Ltd. | | 481,660 | | 7,700,747 |
| | | | |
Road & Rail: 1.7% | | | | |
Container Corp. of India, Ltd. | | 435,386 | | 5,545,950 |
| | | | |
Industrial Conglomerates: 1.7% | | | | |
MAX India, Ltd.b | | 2,238,102 | | 5,360,774 |
| | | | |
Electrical Equipment: 1.2% | | | | |
Crompton Greaves, Ltd. | | 1,330,000 | | 3,709,522 |
| | | | |
| | | | |
Air Freight & Logistics: 1.0% | | | | |
Gati, Ltd. | | 3,606,339 | | 3,077,722 |
| | | | |
Total Industrials | | | | 52,221,559 |
| | | | |
| | | | |
INFORMATION TECHNOLOGY: 12.0% |
IT Services: 9.3% | | | | |
HCL-Infosystems, Ltd. | | 4,428,185 | | 8,464,540 |
Infosys Technologies, Ltd. | | 360,091 | | 8,345,529 |
Rolta India, Ltd. | | 2,893,990 | | 6,946,012 |
Infosys Technologies, Ltd. ADR | | 233,179 | | 5,729,208 |
| | | | |
| | | | 29,485,289 |
| | | | |
Internet Software & Services: 1.5% |
Info Edge India, Ltd. | | 566,727 | | 4,802,578 |
| | | | |
Software: 1.2% | | | | |
Financial Technologies India, Ltd. | | 369,855 | | 3,801,914 |
| | | | |
Total Information Technology | | | | 38,089,781 |
| | | | |
32 MATTHEWS ASIA FUNDS
| | | | |
| | | Shares | | Value |
HEALTH CARE: 10.9% |
Pharmaceuticals: 10.9% | | | | |
Sun Pharmaceutical Industries, Ltd. | | 599,260 | | $13,183,004 |
Glenmark Pharmaceuticals, Ltd.b | | 1,997,615 | | 12,269,852 |
Cipla India, Ltd. | | 2,329,657 | | 8,971,871 |
Sun Pharma Advanced Research Co., Ltd.b | | 183,174 | | 164,722 |
| | | | |
Total Health Care | | | | 34,589,449 |
| | | | |
| | | | |
CONSUMER DISCRETIONARY: 10.8% |
Media: 5.9% | | | | |
Sun TV Network, Ltd. | | 1,590,091 | | 5,912,418 |
Zee Entertainment Enterprises, Ltd. | | 1,693,908 | | 4,886,940 |
HT Media, Ltd. | | 2,952,688 | | 4,330,518 |
Dish TV India, Ltd.b | | 4,737,097 | | 1,960,831 |
Television Eighteen India, Ltd. | | 901,847 | | 1,654,537 |
| | | | |
| | | | 18,745,244 |
| | | | |
Textiles, Apparel & Luxury Goods: 1.3% |
Titan Industries, Ltd. | | 217,589 | | 4,175,477 |
| | | | |
Hotels, Restaurants & Leisure: 1.3% |
Indian Hotels Co., Ltd. | | 4,449,840 | | 4,143,311 |
| | | | |
Automobiles: 1.1% | | | | |
Mahindra & Mahindra, Ltd. | | 587,500 | | 3,346,711 |
| | | | |
| | | | |
Auto Components: 0.9% | | | | |
Bharat Forge, Ltd. | | 1,706,000 | | 2,950,368 |
| | | | |
Multiline Retail: 0.3% | | | | |
Vishal Retail, Ltd.b | | 511,436 | | 1,019,750 |
| | | | |
Total Consumer Discretionary | | | | 34,380,861 |
| | | | |
| | | | |
UTILITIES: 7.3% | | | | |
Gas Utilities: 4.8% | | | | |
Gail India, Ltd. | | 2,409,751 | | 10,261,396 |
Gujarat State Petronet, Ltd. | | 7,075,000 | | 4,907,186 |
| | | | |
| | | | 15,168,582 |
| | | | |
Electric Utilities: 2.5% | | | | |
CESC, Ltd. | | 1,656,117 | | 8,137,263 |
| | | | |
Total Utilities | | | | 23,305,845 |
| | | | |
| | | | |
CONSUMER STAPLES: 6.0% | | | | |
Personal Products: 6.0% | | | | |
Dabur India, Ltd. | | 8,024,779 | | 13,917,297 |
Marico, Ltd. | | 4,449,720 | | 5,098,139 |
| | | | |
Total Consumer Staples | | | | 19,015,436 |
| | | | |
| | | | |
TELECOMMUNICATION SER VICES: 5.3% |
Wireless Telecommunication Services: 5.3% |
Bharti Airtel, Ltd.b | | 1,136,191 | | 16,748,382 |
| | | | |
Total Telecommunication Services | | 16,748,382 |
| | | | |
| | | | |
ENERGY: 5.1% |
Oil, Gas & Consumable Fuels: 5.1% |
Reliance Industries, Ltd. | | 336,871 | | 8,578,566 |
Chennai Petroleum Corp., Ltd. | | 2,827,744 | | 7,502,158 |
| | | | |
Total Energy | | | | 16,080,724 |
| | | | |
| | |
| Matthews India Fund | | December 31, 2008 |
Schedule of Investmentsa (continued)
COMMON EQUITIES: INDIA (continued)
| | | | |
| | | Shares | | Value |
MATERIALS: 1.0% | | | | |
Chemicals: 1.0% | | | | |
Asian Paints, Ltd. | | 175,500 | | $3,235,743 |
| | | | |
Total Materials | | | | 3,235,743 |
| | | | |
| | | | |
TOTAL COMMON EQUITIES: INDIA | | 302,944,040 |
| | | | |
(Cost $509,774,547) | | | | |
| | |
RIGHTS: 0.0% | | | | |
| | | | |
CONSUMER DISCRETIONARY: 0.0% |
Media: 0.0% | | | | |
Dish TV India, Ltd., expires 12/31/49 | | 5,731,887 | | 0 |
| | | | |
Total Consumer Discretionary | | | | 0 |
| | | | |
| | | | |
TOTAL RIGHTS | | | | 0 |
(Cost $0) | | | | |
|
INTERNATIONAL DOLLAR BONDS: 4.8% |
| | |
| | | Face Amount | | |
TELECOMMUNICATION SERVICES: 2.5% |
Wireless Telecommunication Services: 2.1% |
Reliance Communications, Ltd., Cnv. | | | | |
0.000%, 03/01/12 | | $5,500,000 | | 3,795,000 |
Reliance Communications, Ltd., Cnv. | | | | |
0.000%, 05/10/11 | | 3,667,000 | | 2,997,773 |
| | | | |
| | | | 6,792,773 |
| | | | |
Diversified Telecommunication Services: 0.4% |
Tulip Telecom, Ltd., Cnv. | | | | |
0.000%, 08/26/12 | | 2,551,000 | | 1,275,500 |
| | | | |
Total Telecommunication Services | | 8,068,273 |
| | | | |
| | | | |
CONSUMER STAPLES: 1.4% | | | | |
Beverages: 1.4% | | | | |
Radico Khaitan, Ltd., Cnv. | | | | |
3.500%, 07/27/11 | | 7,000,000 | | 4,410,000 |
| | | | |
Total Consumer Staples | | | | 4,410,000 |
| | | | |
| | | | |
CONSUMER DISCRETIONARY: 0.7% |
Diversified Consumer Services: 0.7% | | | | |
Educomp Solutions, Ltd., Cnv. | | | | |
0.000%, 07/26/12 | | 2,500,000 | | 2,162,500 |
| | | | |
Total Consumer Discretionary | | | | 2,162,500 |
| | | | |
| | | | |
INFORMATION TECHNOLOGY: 0.2% |
Software: 0.2% | | | | |
Financial Technologies India, Ltd., Cnv. | | | | |
0.000%, 12/21/11 | | 1,000,000 | | 765,000 |
| | | | |
Total Information Technology | | | | 765,000 |
| | | | |
| | | | |
TOTAL INTERNATIONAL DOLLAR BONDS | | | | 15,405,773 |
| | | | |
(Cost $18,571,661) | | | | |
| | | | |
| | | | | Value |
TOTAL INVESTMENTS: 100.3% | | | | $318,349,813 |
Cost $528,346,208c) | | | | |
LIABILITIES IN EXCESS OF CASH AND OTHER ASSETS –0.3% | | | | (833,808) |
| | | | |
NET ASSETS: 100.0% | | | | $317,516,005 |
| | | | |
|
a Certain securities were fair valued under the discretion of the Board of Trustees (Note 1-A). |
b Non–income producing security. |
c Cost for Federal income tax purposes is $529,392,541 and net unrealized depreciation consists of: |
Gross unrealized appreciation | | | | $ 13,759,921 |
Gross unrealized depreciation | | | | (224,802,649) |
| | | | |
Net unrealized depreciation | | | | ($211,042,728) |
| | | | |
ADR American Depositary Receipt
Cnv. Convertible
See accompanying notes to financial statements.
matthewsasia.com | 800.789.ASIA 33
| | | | |
 | | | | Matthews Japan Fund Portfolio Manager Commentary For the year ending December 31, 2008, the Matthews Japan Fund declined
–28.38%, compared with –29.11% for its benchmark, the MSCI Japan Index. Our stock selection in both the consumer staples and consumer discretionary sectors helped performance, while our zero weighting in utilities and an overweight in financials detracted from Fund performance. In the fourth quarter, the Fund fell –9.70%, while the benchmark dropped –9.00%. The global financial crisis impacted Japan in 2008 more than investors expected it would, given that Japanese financial companies are not as leveraged as U.S. and European banks and their exposure to toxic collateralized debt obligations was a fraction of that of its counterparts in the West. Balance sheets for Japanese manufacturers are generally in good shape, often even holding too much cash—a criticism that foreign investors have held for years. Japanese consumers still hold US$15 trillion in financial assets, and 80% of their liquid assets (excluding insurance and pensions) are still in savings deposits. So why did the Japanese market decline in 2008 as much as other markets around the world? First, Japan’s growth still depends on exports, even though they make up only 15% of its GDP. In the absence of any significant increase in domestic consumption, exports were the country’s de-facto growth engine over the last several years. Second, manufacturers still make up 50% of the Japanese stock market, whereas they contribute only 20% of GDP. In addition, exports were hampered by a strong currency; the yen appreciated 15% against the U.S. dollar and more than 20% against the Euro during the year. In terms of the real effective exchange rate, the yen does not appear particularly strong against the dollar. Two consumer staples holdings, Pigeon and Unicharm Petcare, were big contributors to the Fund in 2008. Our stock picking in the consumer discretionary sector also did well despite Japan’s slowing consumer demand. Nitori, a Hokkaido-based furniture retail company with 185 stores nationwide, is one consumer company that helped performance. Despite the last several years of deflation, the company steadily expanded its operating margin with double-digit sales growth. The company also benefited from a strong yen as most of its products are made overseas. Nitori’s performance clearly demonstrates that there is a pocket of good growth to be found in Japanese domestic consumption. During the year, the Fund continued to decrease its positions in big exporters such as Sony, Canon, Toyota and Honda. These big exporters are U.S.–driven companies that have had great past success. However, they became risky investments as the U.S. economy slowed during the second half of the year. Many exporters are now shifting their focus and resources to Asia and other emerging markets. However, we believe that it will take several years for these companies to prosper while relying solely on developing countries. As one might expect, our overweight position in financials during the year hurt Fund performance, though the Fund focused less on banks and more on real estate and non-bank financials. In the fourth quarter, the Fund shifted a substantial portion of assets to the Japanese Real Estate Investment Trust (J-REIT) sector, which had been under tremendous stress due to the domestic credit crunch and weakening domestic economy. However, we believe that the sector still presents a very attractive investment opportunity and that its high dividend yield favors a risk-reward equation. (continued) |
PORTFOLIO MANAGERS | | | |
Taizo Ishida | | | |
| Lead Manager | | | |
Virgil Adams | | | |
| Co-Manager | | | |
Note: Managers shown reflect changes effective January 1, 2009. | | | |
FUND FACTS | | | |
Ticker MJFOX | | | |
| Inception Date 12/31/98 | | | |
| Assets $123.7 million | | | |
| NAV $10.19 | | | |
| Total # of Positions 65 | | | |
Fiscal Year 2008 Ratios | | | |
| Portfolio Turnover 88.97%1 | | | |
| Gross Expense Ratio 1.23%2 | | | |
Benchmarks | | | |
| MSCI Japan Index | | | |
| Tokyo Stock Price Index (TOPIX) | | | |
Redemption Fee | | | |
2% within first 90 calendar days of purchase | | | |
OBJECTIVE | | | |
Long-term capital appreciation. | | | |
STRATEGY | | | |
| Under normal market conditions, the Fund seeks to achieve its investment objective by investing at least 80% of its total net assets, which include bor- rowings for investment purposes, in the common and preferred stocks of companies located in Japan. | | | |
1 The lesser of fiscal year 2008 long-term purchase costs or sales proceeds divided by the average monthly market value of long-term securities. 2 Matthews Asia Funds does not charge 12b-1 fees. | | | |
34 MATTHEWS ASIA FUNDS
PERFORMANCE AS OF DECEMBER 31, 2008
| | | | | | | | | | | | |
| | | | | Average Annual Total Returns |
| | | 3 Months | | 1 Year | | 3 Years | | 5 Years | | 10 Years | | Inception
12/31/98 |
Matthews Japan Fund | | -9.70% | | -28.38% | | -15.81% | | -3.52% | | 2.44% | | 2.44% |
MSCI Japan Index3 | | -9.00% | | -29.11% | | -10.27% | | 1.03% | | 0.58% | | 0.58% |
Tokyo Stock Price Index3 | | -7.02% | | -25.96% | | -10.93% | | 0.65% | | 1.06% | | 1.06% |
Lipper Japanese Funds Category Average4 | | -12.66% | | -33.45% | | -18.84% | | -3.54% | | 0.73% | | 0.73% |
Performance assumes reinvestment of all dividends and/or distributions before taxes. All performance quoted represents past performance and is no guarantee of future results. Investment return and principal value will fluctuate with market conditions so that when redeemed, shares may be worth more or less than their original cost. Current performance may be lower or higher than the return figures quoted. Returns would have been lower if certain of the Fund’s fees and expenses had not been waived. For the Fund’s most recent month-end performance visit matthewsasia.com.
GROWTH OF A $10,000 INVESTMENT SINCE INCEPTION
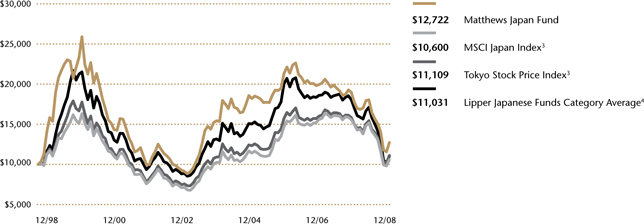
Plotted montly. The performance data and graph do not reflect the deduction of taxes that a shareholder would pay on dividends, capital gain distributions or redemption of Fund shares. Values are in US$.
| 3 | It is not possible to invest directly in an index. Source: Index data from Morgan Stanley Capital Management; total return calculations performed by PNC Global Investment Servicing (U.S.) Inc. Please see page 87 for index definitions. |
| 4 | The Lipper Category Average does not reflect sales charges and is based on total return, including reinvestment of dividends and capital gains for the stated periods. |
TOP TEN HOLDINGS5
| | | | |
| | | Sector | | % of Net Assets |
Nintendo Co., Ltd. | | Information Technology | | 4.4% |
Unicharm Petcare Corp. | | Consumer Staples | | 3.5% |
Pigeon Corp. | | Consumer Staples | | 3.2% |
Tsumura Co. | | Health Care | | 3.1% |
Fanuc, Ltd. | | Industrials | | 3.1% |
Gourmet Navigator, Inc. | | Information Technology | | 3.1% |
Keyence Corp. | | Information Technology | | 3.0% |
NTT DoCoMo, Inc. | | Telecom Services | | 2.6% |
Softbank Corp. | | Telecom Services | | 2.6% |
Yahoo! Japan Corp. | | Information Technology | | 2.5% |
% OF ASSETS IN TOP TEN | | | | 31.1% |
| 5 | Holdings may combine more than one security from same issuer and related depositary receipts. |
matthewsasia.com | 800.789.ASIA 35
| | | | | | |
| SECTOR ALLOCATION (%) | | | | | | Matthews Japan Fund |
Financials | | 24.5 | | | | Portfolio Manager Commentary (continued) |
Industrials | | 19.1 | | | | Looking ahead, it would not be unreasonable to expect some kind of market rally in the near term, triggered by economic stimulus packages from across the world. However, given the deep global economic slump, it is unclear whether such a rally would be sustainable. “Zero-interest rates” are no longer a Japan-only policy, and we are finding deflationary conditions and low-nominal interest rates around the world. A strong yen is bad for Japanese exporters, as it would introduce additional stress that may lead to layoffs and wage freezes. Japan’s workforce has thus far been very patient, having gone without meaningful wage increases for the past decade. On a positive note, historically good exporters have always adjusted their cost structure to fit new economic realities and emerged as winners. We are also pleased to note that the Fund marked its 10-year anniversary on December 31, 2008. We would like to thank our shareholders for their ongoing support, especially through some challenging markets. We are also excited to start 2009 with the addition of Virgil Adams as Co-Manager of the Fund. Virgil brings more than 10 years of Japanese investment experience to the Fund and his expertise enhances our bottom-up stock picking efforts. |
Information Technology | | 16.9 | | | |
Health Care | | 11.9 | | | |
Consumer Discretionary | | 11.6 | | | |
Consumer Staples | | 9.2 | | | |
Telecom Services | | 5.3 | | | |
Materials | | 1.3 | | | |
Cash and Other Assets, Less Liabilities | | 0.2 | | | |
| MARKET CAP EXPOSURE (%) 6 | | | | | |
Large Cap (over $5B) | | 42.1 | | | |
Mid Cap ($1B–$5B) | | 14.0 | | | |
Small Cap (under $1B) | | 43.7 | | | |
Cash and Other Assets, | | | | | |
Less Liabilities | | 0.2 | | | |
6 Source: FactSet Research Systems. Percentage values in data are rounded to the nearest tenth of one percent; the values may not sum to 100% due to rounding. | | | | | |
36 MATTHEWS ASIA FUNDS
| | |
| Matthews Japan Fund | | December 31, 2008 |
Schedule of Investmentsa
COMMON EQUITIES: JAPAN: 99.8%
| | | | |
| | | Shares | | Value |
FINANCIALS: 24.5% | | |
Real Estate Investment Trusts: 12.7% |
United Urban Investment Corp., REIT | | 528 | | $2,087,780 |
Tokyu REIT, Inc. | | 304 | | 1,887,157 |
Japan Logistics Fund, Inc., REIT | | 267 | | 1,620,807 |
Nomura Real Estate Office Fund, Inc., REIT | | 233 | | 1,516,048 |
Global One Real Estate Investment Corp., REIT | | 171 | | 1,430,794 |
MID REIT, Inc. | | 669 | | 1,285,439 |
Advance Residence Investment Corp., REIT | | 365 | | 1,141,948 |
LaSalle Japan REIT, Inc. | | 771 | | 684,986 |
Fukuoka REIT Corp. | | 152 | | 615,286 |
Premier Investment Corp., REIT | | 183 | | 579,480 |
BLife Investment Corp., REIT | | 287 | | 557,285 |
Starts Proceed Investment Corp., REIT | | 778 | | 538,478 |
Japan Single-Residence REIT, Inc. | | 704 | | 500,864 |
TGR Investment, Inc., REIT | | 438 | | 435,850 |
Prospect Residential Investment Corp., REIT | | 590 | | 392,233 |
LCP Investment Corp., REIT | | 616 | | 377,230 |
| | | | |
| | | | 15,651,665 |
| | | | |
Capital Markets: 4.0% | | |
GCA Savvian Group Corp. | | 1,306 | | 3,138,336 |
Monex Group, Inc. | | 3,302 | | 1,073,848 |
Nomura Holdings, Inc. | | 81,800 | | 681,093 |
| | | | |
| | | | 4,893,277 |
| | | | |
Real Estate Management & Development: 3.0% |
Daibiru Corp. | | 175,500 | | 1,872,589 |
Funai Zaisan Consultants Co., Ltd. | | 2,409 | | 987,972 |
Shoei Co., Ltd. | | 84,880 | | 877,938 |
| | | | |
| | | | 3,738,499 |
| | | | |
Commercial Banks: 2.9% |
Mitsubishi UFJ Financial Group, Inc. | | 360,100 | | 2,263,282 |
The Sumitomo Trust & Banking Co., Ltd. | | 134,000 | | 792,107 |
Chuo Mitsui Trust Holdings, Inc. | | 99,000 | | 486,754 |
| | | | |
| | | | 3,542,143 |
| | | | |
Consumer Finance: 1.4% | | |
ORIX Corp. | | 32,270 | | 1,842,646 |
| | | | |
Insurance: 0.5% | | | | |
The Fuji Fire & Marine Insurance Co., Ltd. | | 412,000 | | 618,566 |
| | | | |
Total Financials | | | | 30,286,796 |
| | | | |
| | | | |
| | | Shares | | Value |
INDU STRIALS: 19.1% |
Machinery: 10.3% | | |
Fanuc, Ltd. | | 53,400 | | $3,827,274 |
Mitsubishi Heavy Industries, Ltd. | | 542,000 | | 2,422,334 |
Aichi Corp. | | 619,300 | | 2,417,273 |
NGK Insulators, Ltd. | | 208,000 | | 2,356,999 |
Komatsu, Ltd. | | 131,900 | | 1,682,584 |
| | | | |
| | | | 12,706,464 |
| | | | |
Construction & Engineering: 3.8% |
Daimei Telecom Engineering Corp. | | 281,000 | | 2,624,035 |
Toshiba Plant Systems & Services Corp. | | 198,000 | | 2,028,235 |
| | | | |
| | | | 4,652,270 |
| | | | |
Commercial Services & Supplies: 1.8% |
Secom Co., Ltd. | | 42,800 | | 2,208,586 |
| | | | |
Road & Rail: 1.7% | | | | |
East Japan Railway Co.b | | 275 | | 2,147,702 |
| | | | |
Marine: 1.5% | | | | |
Mitsui OSK Lines, Ltd. | | 310,000 | | 1,915,889 |
| | | | |
Total Industrials | | | | 23,630,911 |
| | | | |
| | | | | |
INFORMATION TECHNOLOGY: 16.9% |
Internet Software & Services: 5.6% |
Gourmet Navigator, Inc. | | 1,422 | | 3,817,731 |
Yahoo! Japan Corp. | | 7,680 | | 3,151,212 |
| | | | |
| | | | 6,968,943 |
| | | | |
Electronic Equipment & Instruments: 5.2% |
Keyence Corp. | | 17,870 | | 3,672,499 |
Murata Manufacturing Co., Ltd. | | 37,800 | | 1,482,192 |
Hoya Corp. | | 73,800 | | 1,289,005 |
| | | | |
| | | | 6,443,696 |
| | | | |
Software: 4.4% | | |
Nintendo Co., Ltd. | | 14,090 | | 5,384,517 |
| | | | |
Office Electronics: 1.6% | | |
Ricoh Co., Ltd. | | 155,000 | | 1,986,592 |
| | | | |
Computers & Peripherals: 0.1% | | |
Melco Holdings, Inc. | | 8,700 | | 89,707 |
| | | | |
Total Information Technology | | | | 20,873,455 |
| | | | |
| | | | | |
HEALTH CARE: 11.9% |
Health Care Equipment & Supplies: 8.1% | | |
Sysmex Corp. | | 85,700 | | 3,123,140 |
So-net M3, Inc. | | 745 | | 2,552,971 |
Terumo Corp. | | 54,000 | | 2,529,654 |
Nakanishi, Inc. | | 28,300 | | 1,793,742 |
| | | | |
| | | | 9,999,507 |
| | | | |
Pharmaceuticals: 3.8% |
Tsumura & Co. | | 104,500 | | 3,878,820 |
Takeda Pharmaceutical Co., Ltd. | | 16,700 | | 870,443 |
| | | | |
| | | | 4,749,263 |
| | | | |
Total Health Care | | | | 14,748,770 |
| | | | |
| | |
| | matthewsasia.com | 800.789.ASIA 37 |
| | |
| Matthews Japan Fund | | December 31, 2008 |
Schedule of Investmentsa (continued)
COMMON EQUITIES (continued)
| | | | |
| | | Shares | | Value |
CONSUMER DISCRETIONARY: 11.6% |
Hotels, Restaurants & Leisure: 3.2% |
Doutor Nichires Holdings Co., Ltd. | | 121,000 | | $2,649,313 |
Pacific Golf Group International Holdings KK | | 3,774 | | 1,336,082 |
| | | | |
| | | | 3,985,395 |
| | | | |
Specialty Retail: 2.5% | | |
Nitori Co., Ltd. | | 39,300 | | 3,058,362 |
| | | | |
Diversified Consumer Services: 2.3% |
Benesse Corp. | | 65,700 | | 2,875,108 |
| | | | |
Media: 2.0% | | | | |
Toei Co., Ltd. | | 531,000 | | 2,419,284 |
| | | | |
Household Durables: 1.1% | | | | |
Panasonic Corp. | | 107,000 | | 1,315,269 |
| | | | |
Leisure Equipment & Products: 0.5% |
Noritsu Koki Co., Ltd. | | 92,500 | | 672,587 |
| | | | |
Total Consumer Discretionary | | | | 14,326,005 |
| | | | |
| | | | | |
CONSUMER STAPLES: 9.2% | | | | |
Food Products: 3.5% | | | | |
Unicharm Petcare Corp. | | 115,300 | | 4,288,254 |
| | | | |
| | | | |
Household Products: 3.2% | | | | |
Pigeon Corp. | | 134,400 | | 4,017,183 |
| | | | |
Personal Products: 2.5% | | | | |
Shiseido Co., Ltd. | | 151,000 | | 3,105,297 |
| | | | |
Total Consumer Staples | | | | 11,410,734 |
| | | | |
| | | | | |
TELECOMMUNICATION SERVICES: 5.3% |
Wireless Telecommunication Services: 5.3% |
NTT DoCoMo, Inc. | | 1,665 | | 3,277,246 |
Softbank Corp. | | 180,300 | | 3,274,463 |
| | | | |
Total Telecommunication Services | | 6,551,709 |
| | | | |
| | | | |
| | | Shares | | Value |
| MATERIALS: 1.3% | | | | |
| Chemicals: 1.3% | | | | |
Shin-Etsu Chemical Co., Ltd. | | 20,100 | | $927,647 |
OHARA, Inc. | | 76,300 | | 621,514 |
| | | | |
Total Materials | | | | 1,549,161 |
| | | | |
| | | | | |
TOTAL INVESTMENTS: 99.8% | | 123,377,541 |
(Cost $146,639,314c) | | | | |
| | | | |
CASH AND OTHER ASSETS, LESS LIABILITIES: 0.2% | | | | 296,188 |
| | | | |
| | |
NET ASSETS: 100.0% | | | | $123,673,729 |
| | | | |
| | | | |
a Certainsecurities were fair valued under the discretion of the Board of Trustees (Note 1-A). b Securitywas suspended from trading on December 31, 2008. c Costfor Federal income tax purposes is $148,366,745 and net unrealized depreciation consists of: | | | | |
| | | | | |
| Gross unrealized appreciation | | | | $11,101,723 | |
| Gross unrealized depreciation | | | | (36,090,927 | ) |
| | | | | |
| Net unrealized depreciation | | | | ($24,989,204 | ) |
| | | | | |
| | | | |
REIT Real Estate Investment Trust See accompanying notes to financial statements. | | | | |
38 MATTHEWS ASIA FUNDS
| | | | |
 | | Matthews Korea Fund Portfolio Manager Commentary For the year ending December 31, 2008, the Matthews Korea Fund fell –52.66%, while its benchmark the Korea Composite Stock Price Index (KOSPI) declined
–58.98%. The final quarter of the year was the worst for the Korean market with the KOSPI showing the year’s greatest decline. It dropped –31.46% in the fourth quarter, while the Matthews Korea Fund declined –18.05%. The Fund’s financial holdings helped it outperform the benchmark during the fourth quarter. As with most Asian markets in 2008, the year was a challenging one for Korean equities. High inflation, weak consumer spending and a weak currency were obstacles that plagued the country during the first half of the year. Korea’s currency, the won, stayed weak throughout the year, ending with about a 30% decline against the U.S. dollar to become one of the region’s worst performing currencies. The steep depreciation caused many investors to worry about the overall health of the Korean economy. Foreign selling during the year contributed to the won’s weakness and led to the KOSPI’s lowest level of foreign ownership since 2001. We believe that there were many factors that negatively influenced the won, including the year’s global credit crisis, Korea’s widening trade account deficit, high energy prices and weak confidence in the Korean government. The weak currency hurt some small companies in the Fund, which were exposed to currency hedging products that went against the currency movement during the year. Despite the rapid depreciation of the currency, we believe that the underlying health of the Korean economy remains sound. In addition, a weak currency could benefit the export sector, which makes up a large part of the Korean economy. During the first quarter, South Korea inaugurated Lee Myung Bak, the country’s first president with a business background. President Lee pledged to cut taxes and speed up deregulation to encourage investment and economic growth. The new government announced various policies, including favorable tax benefits on real estate transactions and a partial ban on short selling. However, the measures showed only limited impact on the market during the year, and conditions continued deteriorating into the second half as the credit crisis spread globally. During the year, our strategic decision to avoid cyclical sectors, which include industries such as machinery and shipbuilding, served the Fund well. In recent years, these industrial sector firms have led the Korean equity market, doing well in part due to limited supply capacity and increasing demand from emerging markets. While some of these firms showed impressive margin expansion two years ago, we believed these margins were not sustainable over the long term, especially given the increasing capacity within emerging countries. As a result, we largely avoided investing in such cyclical companies. When new orders slowed dramatically during 2008, especially in shipbuilding, our underweight position in industrials benefited the portfolio. During the year, telecommunication services made up the best performing sector, in part due to the defensive nature of the business. Less competition among wireless companies, following the rollout of third-generation (3G) wireless service, also benefited the sector. The Fund has added to the sector during the year as we expect it to remain defensive and margins to improve next year. Financial sector holdings were the worst performers during the year, affected by the global credit crisis. Korean banks were hurt the most as they struggled (continued) |
PORTFOLIO MANAGERS | |
J. Michael Oh | | | |
| Lead Manager | | | |
Michael B. Han, CFA | |
| Co-Manager | | | |
Mark W. Headley | | | |
| Co-Manager | | | |
FUND FACTS | | | |
Ticker | | MAKOX | |
| Inception Date | | 1/3/95 | |
| Assets | | $87.3 million | |
| NAV | | $2.75 | |
| Total # of Positions | | 46 | |
Fiscal Year 2008 Ratios | |
| Portfolio Turnover | | 28.70%1 | |
| Gross Expense Ratio | | 1.27%2 | |
Benchmark | |
Korean Composite Stock Price Index | |
(KOSPI) | |
Redemption Fee | |
| 2% within first 90 calendar days of purchase | |
OBJECTIVE | | | |
Long-term capital appreciation. | |
STRATEGY | | | |
Under normal market conditions, the Fund seeks to achieve its investment objective by investing at least 80% of its total net assets, which include borrowings for investment purposes, in the common and preferred stocks of companies located in South Korea. | |
1 The lesser of fiscal year 2008 long-term purchase costs or sales proceeds divided by the average monthly market value of long-term securities. 2 Matthews Asia Funds does not charge 12b-1 fees. | |
matthewsasia.com | 800.789.ASIA 39
PERFORMANCE AS OF DECEMBER 31, 2008
| | | | | | | | | | | | | | | | | | |
| | | | | | Average Annual Total Returns | |
| | | 3 Months | | | 1 Year | | | 3 Years | | | 5 Years | | | 10 Years | | | Inception
1/3/95 | |
Matthews Korea Fund | | -18.05 | % | | -52.66 | % | | -14.00 | % | | 4.51 | % | | 11.68 | % | | 1.56 | % |
Korean Composite Stock Price Index (KOSPI)3 | | -31.46 | % | | -58.98 | % | | -14.76 | % | | 4.60 | % | | 6.52 | % | | -2.62 | % |
Lipper Pacific ex Japan Funds Category Average5 | | -20.73 | % | | -50.11 | % | | -3.02 | % | | 5.36 | % | | 7.59 | % | | 3.72 | %4 |
Performance assumes reinvestment of all dividends and/or distributions before taxes. All performance quoted represents past performance and is no guarantee of future results. Investment return and principal value will fluctuate with market conditions so that when redeemed, shares may be worth more or less than their original cost. Current performance may be lower or higher than the return figures quoted. Returns would have been lower if certain of the Fund’s fees and expenses had not been waived. For the Fund’s most recent month-end performance visit matthewsasia.com.
GROWTH OF A $10,000 INVESTMENT SINCE INCEPTION

Plotted monthly. The performance data and graph do not reflect the deduction of taxes that a shareholder would pay on dividends, capital gain distributions or redemption of Fund shares. Values are in US$.
| 3 | It is not possible to invest directly in an index. Source: Index data from Morgan Stanley Capital Management; total return calculations performed by PNC Global Investment Servicing (U.S.) Inc. Please see page 87 for index definition. |
| 4 | Calculated from 12/31/94. |
| 5 | The Lipper Category Average does not reflect sales charges and is based on total return, including reinvestment of dividends and capital gains for the stated periods. |
TOP TEN HOLDINGS6
| | | | | |
| | | Sector | | % of Net Assets | |
| Samsung Electronics Co., Ltd. | | Information Technology | | 6.6 | % |
| Samsung Fire & Marine Insurance Co., Ltd. | | Financials | | 5.4 | % |
| NHN Corp. | | Information Technology | | 4.6 | % |
| S1 Korea Corp. | | Industrials | | 4.1 | % |
| Kiwoom Securities Co., Ltd. | | Financials | | 4.1 | % |
| Yuhan Corp. | | Health Care | | 4.1 | % |
| SK Telecom Co., Ltd. | | Telecom Services | | 3.9 | % |
| Samsung Securities Co., Ltd. | | Financials | | 3.8 | % |
| KB Financial Group, Inc. | | Financials | | 3.8 | % |
| Amorepacific Corp. | | Consumer Staples | | 3.7 | % |
% OF ASSETS IN TOP TEN | | | | 44.1 | % |
| 6 | Holdings may combine more than one security from same issuer and related depositary receipts. |
40 MATTHEWS ASIA FUNDS
| | | | |
| Matthews Korea Fund | | SECTOR ALLOCATION (%) |
Portfolio Manager Commentary (continued) to refinance debts while liquidity in the global debt market dried up. We believe further funding difficulties may persist over the next few quarters. However, Korean banks may be helped by a US$30 billion currency swap deal that South Korea struck with the U.S. Federal Reserve in late October. Two months later, Korea also announced that it would expand its bilateral currency swap facilities with Japan and China. While financials performed poorly for most of the year, the sector managed to pare back losses in the fourth quarter. It was the Fund’s financial holdings that helped it outperform its benchmark during that period, especially commercial banks and brokerage firms, which underperformed during the first half of the year. We believe that the overall valuations for the country’s banking segment remain more attractive than non-bank financial companies in the sector. On a company basis, education services firm MegaStudy was the Fund’s biggest contributor to performance. The company provides both online and in- classroom test-preparation courses to students in Korea. MegaStudy has been a pioneer in online educational services, with dominant market share in the high school and middle school segment. The education services sector has not been greatly impacted by the global credit crisis, and spending on education during the year remained relatively steady. NHN, a Korean online service provider, was the portfolio’s worst performer during the year. The company suffered as the risk appetite for high-growth firms waned and regulatory concerns over Internet portals in Korea increased. However, NHN is still a national leader in Internet search and other online services. It remained a core holding in the Fund as the company’s valuations became even more attractive during the year. Undoubtedly, the past year has been difficult. However, we remain focused on finding companies that will benefit from the long-term growth of the Korean economy. While we do not make short-term assumptions about the market, we do believe that Korea offers one of the region’s most attractive valuations and presents opportunities for long-term investors. We continue to avoid what we consider to be cyclical companies and to look for companies that can sus- tain growth and earnings. | | Financials Consumer Discretionary Information Technology Consumer Staples Health Care Industrials Telecom Services Materials Energy Cash and Other Assets, Less Liabilities MARKET CAP EXPOSURE (%) 7 Large Cap (over $5B) Mid Cap ($1B–$5B) Small Cap (under $1B) Cash and Other Assets, Less Liabilities 7 Source: FactSet Research Systems. Percentage values in data are rounded to the nearest tenth of one percent; the values may not sum to 100% due to rounding. | | 23.2 15.8 14.9 13.1 11.4 9.6 5.9 3.5 1.2 1.4 31.9 29.0 37.6 1.4 |
| | |
| | |
| | |
| | |
| | |
| | |
| | |
| | |
| | |
| | |
| | |
| | |
| | |
| | |
| | |
| | |
| | |
| | |
| | |
matthewsasia.com | 800.789.ASIA 41
| | |
| Matthews Korea Fund | | December 31, 2008 |
Schedule of Investmentsa
COMMON EQUITIES: SOUTH KOREA: 97.5%
| | | | |
| | | Shares | | Value |
FINANCIALS: 23.2% |
Commercial Banks: 8.8% | | | | |
Shinhan Financial Group Co., Ltd. | | 132,417 | | $3,150,774 |
KB Financial Group, Inc.b | | 97,337 | | 2,667,864 |
Hana Financial Group, Inc. | | 76,142 | | 1,212,912 |
KB Financial Group, Inc. ADRb | | 24,639 | | 645,542 |
| | | | |
| | | | 7,677,092 |
| | | | |
Capital Markets: 8.0% | | | | |
Kiwoom Securities Co., Ltd. | | 114,708 | | 3,605,218 |
Samsung Securities Co., Ltd. | | 66,251 | | 3,342,492 |
| | | | |
| | | | 6,947,710 |
| | | | |
Insurance: 6.4% | | | | |
Samsung Fire & Marine Insurance Co., Ltd. | | 30,900 | | 4,695,556 |
Meritz Fire & Marine Insurance Co., Ltd. | | 300,840 | | 890,433 |
| | | | |
| | | | 5,585,989 |
| | | | |
Total Financials | | | | 20,210,791 |
| | | | |
| | | | | |
CONSUMER DISCRETIONARY: 15.8% |
Auto Components: 3.3% | | | | |
Hankook Tire Co., Ltd. | | 153,370 | | 1,894,054 |
Hyundai Mobis | | 20,045 | | 1,022,342 |
| | | | |
| | | | 2,916,396 |
| | | | |
Media: 3.2% | | | | |
Cheil Worldwide, Inc. | | 11,720 | | 1,829,698 |
SBS Holdings Co., Ltd.b | | 65,870 | | 960,850 |
| | | | |
| | | | 2,790,548 |
| | | | |
Household Durables: 2.8% | | | | |
LG Electronics, Inc. | | 26,815 | | 1,628,285 |
Intelligent Digital Integrated Security Co., Ltd. | | 67,260 | | 829,670 |
| | | | |
| | | | 2,457,955 |
| | | | |
Multiline Retail: 2.5% | | | | |
Hyundai Department Store Co., Ltd. | | 43,460 | | 2,224,028 |
| | | | |
Diversified Consumer Services: 1.6% | | | | |
MegaStudy Co., Ltd. | | 9,197 | | 1,361,582 |
| | | | |
Hotels, Restaurants & Leisure: 1.4% |
Modetour Network, Inc. | | 146,089 | | 1,232,114 |
| | | | |
| | | | |
Automobiles: 1.0% | | | | |
Hyundai Motor Co. | | 26,253 | | 840,024 |
| | | | |
Total Consumer Discretionary | | | | 13,822,647 |
| | | | |
| | | | | |
INFORMATION TECHNOLOGY: 14.9% |
Semiconductors & | | | | |
Semiconductor Equipment: 6.6% | | | | |
Samsung Electronics Co., Ltd. | | 15,872 | | 5,786,778 |
| | | | |
Internet Software & Services: 6.2% |
NHN Corp.b | | 37,882 | | 4,004,670 |
Gmarket, Inc. ADRb | | 80,600 | | 1,390,350 |
| | | | |
| | | | 5,395,020 |
| | | | |
Electronic Equipment & Instruments: 2.1% |
LG Display Co., Ltd. ADR | | 116,700 | | 966,276 |
SFA Engineering Corp. | | 30,876 | | 828,957 |
| | | | |
| | | | 1,795,233 |
| | | | |
Total Information Technology | | | | 12,977,031 |
| | | | |
42 MATTHEWS ASIA FUNDS
| | | | |
| | | Shares | | Value |
CONSUMER STAPLES: 12.0% |
Food & Staples Retailing: 5.7% |
Shinsegae Co., Ltd. | | 7,448 | | $2,893,634 |
Shinsegae Food Co., Ltd. | | 65,581 | | 2,054,368 |
| | | | |
| | | | 4,948,002 |
| | | | |
Personal Products: 3.7% | | | | |
Amorepacific Corp. | | 6,188 | | 3,236,012 |
| | | | |
Beverages: 2.2% |
Hite Brewery Co., Ltd. | | 14,388 | | 1,910,318 |
| | | | |
Household Products: 0.4% |
LG Household & Health Care, Ltd.b | | 2,694 | | 410,557 |
| | | | |
Total Consumer Staples | | | | 10,504,889 |
| | | | |
| | | | | |
HEALTH CARE: 11.4% |
Pharmaceuticals: 11.4% |
Yuhan Corp. | | 20,219 | | 3,549,905 |
Hanmi Pharmaceutical Co., Ltd. | | 34,624 | | 3,026,721 |
Daewoong Pharmaceutical Co., Ltd. | | 57,114 | | 2,393,542 |
LG Life Sciences Service Ltd.b | | 30,234 | | 973,530 |
| | | | |
Total Health Care | | | | 9,943,698 |
| | | | |
| | | | | |
INDUSTRIALS: 9.6% |
Commercial Services & Supplies: 4.2% |
S1 Korea Corp. | | 83,677 | | 3,616,901 |
| | | | |
Industrial Conglomerates: 3.7% | | | | |
Orion Corp. | | 12,264 | | 1,803,654 |
Samsung Techwin Co., Ltd. | | 63,006 | | 1,459,903 |
| | | | |
| | | | 3,263,557 |
| | | | |
Machinery: 1.1% | | | | |
JVM Co., Ltd. | | 104,635 | | 948,092 |
| | | | |
Construction & Engineering: 0.6% | | | | |
Hyundai Development Co. | | 19,565 | | 518,004 |
| | | | |
Total Industrials | | | | 8,346,554 |
| | | | |
| | | | | |
TELECOMMUNICATION SERVICES: 5.9% |
Wireless Telecommunication Services: 5.2% |
SK Telecom Co., Ltd. | | 10,409 | | 1,730,153 |
SK Telecom Co., Ltd. ADR | | 94,400 | | 1,716,192 |
KT Freetel Co., Ltd.b | | 44,150 | | 1,106,227 |
| | | | |
| | | | 4,552,572 |
| | | | |
Diversified Telecommunication Services: 0.7% |
KT Corp. ADR | | 23,700 | | 347,679 |
KT Corp. | | 8,720 | | 260,100 |
| | | | |
| | | | 607,779 |
| | | | |
Total Telecommunication Services | | | | 5,160,351 |
| | | | |
| | | | | |
MATERIALS: 3.5% | | | | |
Metals & Mining: 1.9% |
POSCO ADR | | 21,900 | | 1,647,975 |
| | | | |
| | | | |
Chemicals: 1.6% | | | | |
LG Chem, Ltd. | | 23,856 | | 1,373,263 |
| | | | |
Total Materials | | | | 3,021,238 |
| | | | |
| | | | |
| | |
| Matthews Korea Fund | | December 31, 2008 |
Schedule of Investmentsa (continued)
COMMON EQUITIES: SOUTH KOREA (continued)
| | | | |
| | | Shares | | Value |
ENERGY: 1.2% | | | | |
Oil, Gas & Consumable Fuels: 1.2% |
GS Holdings Corp. | | 50,077 | | $1,095,948 |
| | | | |
Total Energy | | | | 1,095,948 |
| | | | |
| | | | | |
| | | | |
TOTAL COMMON EQUITIES | | | | 85,083,147 |
| | | | |
(Cost $101,532,462) | | | | |
|
PREFERRED EQUITIES: SOUTH KOREA: 1.1% |
| |
CONSUMER STAPLES: 1.1% |
Food Products: 1.1% | | | | |
CJ CheilJedang Corp., 2nd Pfd.b | | 6,893 | | 925,300 |
| | | | |
Total Consumer Staples | | | | 925,300 |
| | | | |
| | | | | |
TOTAL PREFERRED EQUITIES | | 925,300 |
| | | | |
(Cost $1,604,234) | | | | |
| | | | |
| | | Value | |
| TOTAL INVESTMENTS: 98.6% | | $ | 86,008,447 | |
| (Cost $103,136,696c) | | | | |
| CASH AND OTHER ASSETS, LESS LIABILITIES: 1.4% | | | 1,244,688 | |
| | | | |
| | | | |
| NET ASSETS: 100.0% | | $ | 87,253,135 | |
| | | | |
|
a Certain securities were fair valued under the discretion of the Board of Trustees (Note 1-A). | |
b Non–income producing security. | |
c Cost for Federal income tax purposes is $103,466,610 and net unrealized depreciation consists of: | |
Gross unrealized appreciation | | | $12,108,034 | |
Gross unrealized depreciation | | | (29,566,197 | ) |
| | | | |
Net unrealized depreciation | | | ($17,458,163 | ) |
| | | | |
| ADR American Depositary Receipt | |
| Pfd. Preferred | |
|
| See accompanying notes to financial statements. | |
matthewsasia.com | 800.789.ASIA 43
| | | | |
 | | Matthews Asia Small Companies Fund Portfolio Manager Commentary For the fourth quarter of 2008, the Matthews Asia Small Companies Fund declined –19.91%, while its benchmark, the MSCI All Country Asia ex Japan Small Cap Index, fell –24.16%. Since its inception on September 15, 2008, the Fund fell –21.03% while its benchmark declined –31.39%. As of year-end, the Fund had built out its portfolio to 52 holdings and was moving toward being fully invested. The Fund’s launch came at a challenging time in the midst of the year’s global financial turmoil. Toward the second half of the year, investor confidence waned and risk appetite diminished drastically across both developed and emerging markets with the deepening of the U.S. credit crisis. In addition, there were growing concerns over the resulting corporate failures, job losses and global recessionary pressures. Investors generally perceive small companies to be less capable of weathering economic shocks and accessing capital and credit to fund growth, and this perception contributed to sell-offs in small caps. Selling pressure in Asian markets was especially acute among the small-company universe; the MSCI All Country Asia ex Japan Small Cap Index was down –59.25% in 2008, marking a larger loss than in large caps, which declined –51.08%. Sell-offs were also indiscriminate—even quality small companies with strong fundamentals were battered. In general, Asia’s small-company universe is less leveraged than it was just over a decade ago during the Asian financial crisis. From the perspective of surviving a credit crunch, companies now seem less vulnerable. However, many companies are indeed faced with serious challenges ahead given the global economic slowdown, including overcapacity and a weakening demand for their products both domestically and abroad. In line with this, we saw massive cuts in earnings growth forecasts across sectors in the region during the year, as well as a few notable bankruptcies. During the launch of the Fund, we were mindful of the volatile market conditions but still set our sights on Asian companies with long-term, organic growth potential. The Fund’s approach is to seek companies with a domestic growth profile. We have a bias toward companies with strong balance sheets and the ability to generate cash flow. In 2008, our bottom-up stock picking process resulted in the Fund’s overweight in China and India, markets in which we tended to find a diverse selection of fast-growing companies. Since these markets have seen sharp corrections, valuations have become much more reasonable and attractive compared to 2007 levels. By sector, the Fund was overweight in industrials, consumer discretionary and health care. As regional household incomes grow, we believe that Asian consumers will be able to spend more on goods and services. In our view, companies that are positioned to supply services and related infrastructure to Asian consumers should benefit from this long-term trend. Conversely, the Fund has generally shied away from commodity-related sectors, which we believe have cyclical growth and volatile profitability profiles, as they tend to be tied to sharp movements in commodity prices. With such a sharp market correction during the fourth quarter of the year, there were few safe havens. At Matthews, we strongly believe that it is impractical to attempt to time market cycles, and thus we adopt a discipline of being fully invested over longer horizons, and try to stay focused on picking companies with strong fundamentals that can weather the storms and survive in difficult environments. The Fund’s outperformance relative to its benchmark (continued) |
PORTFOLIO MANAGERS | |
Lydia So | | | |
| Lead Manager | | | |
Noor Kamruddin | |
| Co-Manager | | | |
FUND FACTS | | | |
Ticker | | MSMLX | |
| Inception Date | | 9/15/08 | |
| Assets | | $3.2 million | |
| NAV | | $7.89 | |
| Total # of Positions | | 52 | |
Fiscal Year 2008 Ratios | |
| Portfolio Turnover | | 3.10%1 | |
| Gross Expense Ratio | | 14.31%2 | |
After Contractual Fee Waiver | | 2.00%2 | |
Benchmark | |
MSCI All Country Asia ex Japan | |
Small Cap Index | |
Redemption Fee | |
| 2% within first 90 calendar days of purchase | |
OBJECTIVE | | | |
Long-term capital appreciation. | |
STRATEGY | | | |
Under normal market conditions, the Fund seeks to achieve its investment objective by investing at least 80% of its total net assets, which include borrowings for investment purposes, in the common and preferred stocks of small companies located in Asia, excluding Japan. | |
1 The lesser of fiscal year 2008 long-term purchase costs or sales proceeds divided by the average monthly market value of long-term securities. 2 The Advisor has contractually agreed to waive Matthews Asia Small Companies Fund’s fees and reimburse expenses until August 31, 2010 to the extent needed to limit total annual operating expenses to 2.00%. Matthews Asia Funds does not charge 12b-1 fees. | |
44 MATTHEWS ASIA FUNDS
PERFORMANCE AS OF DECEMBER 31, 2008
| | | | |
| | | 3 Months | | Annual Return, Not Annualized |
| | | Since Inception 9/15/08 |
Matthews Asia Small Companies Fund | | -19.91% | | -21.03% |
MSCI All Country Asia ex Japan Small Cap Index3 | | -24.16% | | -31.39% |
Lipper Pacific ex Japan Funds Category Average4 | | -20.73% | | -20.73%5 |
Performance assumes reinvestment of all dividends and/or distributions before taxes. All performance quoted represents past performance and is no guarantee of future results. Investment return and principal value will fluctuate with market conditions so that when redeemed, shares may be worth more or less than their original cost. Current performance may be lower or higher than the return figures quoted. Returns would have been lower if certain of the Fund’s fees and expenses had not been waived. For the Fund’s most recent month-end performance visit matthewsasia.com.
The performance data does not reflect the deduction of taxes that a shareholder would pay on dividends, capital gain distributions or redemption of Fund shares. Values are in US$.
| 3 | It is not possible to invest directly in an index. Source: Index data from Morgan Stanley Capital Management; total return calculations performed by PNC Global Investment Servicing (U.S.) Inc. Please see page 87 for index definitions. |
| 4 | The Lipper Category Average does not reflect sales charges and is based on total return, including reinvestment of dividends and capital gains for the stated periods. |
| 5 | Calculated from 9/30/08. |
TOP TEN HOLDINGS6
| | | | |
| | | Country | | % of Net Assets |
MegaStudy Co., Ltd. | | South Korea | | 3.6% |
Shandong Weigao Group Medical Polymer Co., Ltd. | | China/Hong Kong | | 3.5% |
Asian Paints, Ltd. | | India | | 3.2% |
Zhuzhou CSR Times Electric Co., Ltd. | | China/Hong Kong | | 3.1% |
Towngas China Co., Ltd. | | China/Hong Kong | | 2.8% |
Hankook Tire Co., Ltd. | | South Korea | | 2.7% |
St. Shine Optical Co., Ltd. | | Taiwan | | 2.7% |
Kiwoom Securities Co., Ltd. | | South Korea | | 2.7% |
Sino-Ocean Land Holdings, Ltd. | | China/Hong Kong | | 2.5% |
New Oriental Education & Technology Group, Inc. | | China/Hong Kong | | 2.5% |
% OF ASSETS IN TOP TEN | | | | 29.3% |
| 6 | Holdings may combine more than one security from same issuer and related depositary receipts. |
matthewsasia.com | 800.789.ASIA 45
| | | | | | |
COUNTRY ALLOCATION (%) | | | | | | Matthews Asia Small Companies Fund |
China/Hong Kong | | 31.2 | | | | Portfolio Manager Commentary (continued) was due in part to a higher cash balance as we patiently built up positions in our holdings. Another positive factor was our stock selection in the consumer discretionary, industrials, financials and health care sectors. On a company basis, two holdings that illustrate our approach were Shandong Weigao in China and Asian Paints in India. One of China’s largest medical product companies, Shandong Weigao, focuses on single-use medical items such as syringes, blood bags and infusion sets. Currently, China spends only about 4.5% of GDP in health care, compared to 8–14% in other developed countries. As China continues to invest in and improve upon its health care infrastructure, this company should be well-positioned to benefit from increased demand for these medical products among China’s growing middle class. We believe the firm should also be less affected by global economic slowdowns. Asian Paints, which dominates the decorative paint market in India, has a long and strong track record. Compared to its competitors, it has excelled in branding and distribution, and enjoyed earnings growth north of 20% in the past several years. Paint consumption per capita in India is amongst the lowest in the world, and thus the company has ample headroom for growth in light of the country’s trend of urbanization. However, the company may face some short-term headwinds as India’s economic growth and consumer demand moderate. Nonetheless, we are still attracted to the company’s competitive advantage over its peers and its reach to the growing Indian consumer population. Looking ahead, we expect growth momentum among Asia’s small companies to moderate in the near term, and some firms may not manage to survive the downturn. However, we remain positive about the region’s small companies, especially those that are nimble and entrepreneurial. We believe that companies with strong fundamentals will emerge as winners as industries consolidate. It is our goal to seek opportunities in those companies likely to come out ahead rather than make short-term trading bets to drive performance. At its core, the Fund aims to identify companies with solid management teams capable of building value and delivering sustainable growth, especially within domestic markets. Investing in Asia’s small companies requires patience and conviction, but we are confident that the Fund is positioned to take advantage of the region’s long-term growth. |
India | | 21.1 | | | |
Taiwan | | 15.2 | | | |
South Korea | | 13.5 | | | |
Singapore | | 9.3 | | | |
Malaysia | | 1.4 | | | |
Cash and Other Assets, Less Liabilities | | 8.3 | | | |
| | | | | |
SECTOR ALLOCATION (%) | | | | | |
Industrials | | 24.0 | | | |
Consumer Discretionary | | 21.1 | | | |
Information Technology | | 13.3 | | | |
Financials | | 11.0 | | | |
Health Care | | 9.6 | | | |
Consumer Staples | | 6.6 | | | |
Materials | | 3.3 | | | |
Utilities | | 2.8 | | | |
Cash and Other Assets, Less Liabilities | | 8.3 | | | |
| | | | | |
MARKET CAP EXPOSURE(%)7,8 | | | | | |
Mid Cap ($1B–$5B) | | 19.6 | | | |
Small Cap (under $1B) | | 72.1 | | | |
Cash and Other Assets, Less Liabilities | | 8.3 | | | |
7 Source: FactSet Research Systems. Percentage values in data are rounded to the nearest tenth of one percent; the values may not sum to 100% due to rounding. | | | |
8 The Fund defines Small Companies as companies with market capitalization generally between $100 million and $3 billion. | | | |
| | | |
| | | |
| | | |
| | | |
| | | |
| | | |
| | | |
| | | |
| | | |
| | | |
| | | |
| | | |
46 MATTHEWS ASIA FUNDS
| | |
| Matthews Asia Small Companies Fund | | December 31, 2008 |
Schedule of Investmentsa
COMMON EQUITIES: 91.7%
| | | | | |
| | | Shares | | Value |
CHINA/HONG KONG: 31.2% | | | | | |
Shandong Weigao Group Medical Polymer Co., Ltd. H Shares | | 72,000 | | $ | 109,591 |
Zhuzhou CSR Times Electric Co., Ltd. H Shares | | 120,000 | | | 97,332 |
Towngas China Co., Ltd.b | | 453,000 | | | 90,007 |
Sino-Ocean Land Holdings, Ltd. | | 174,500 | | | 79,706 |
New Oriental Education & Technology Group, Inc. ADRb | | 1,450 | | | 79,619 |
Kingdee International Software Group Co., Ltd. | | 604,000 | | | 62,848 |
Ctrip.com International, Ltd. ADR | | 2,500 | | | 59,500 |
Dalian Port PDA Co., Ltd. H Shares | | 216,000 | | | 54,699 |
Uni-President China Holdings, Ltd.b | | 200,000 | | | 52,151 |
Times, Ltd. | | 196,000 | | | 51,979 |
Golden Eagle Retail Group, Ltd. | | 72,000 | | | 50,671 |
Minth Group, Ltd. | | 116,000 | | | 46,655 |
China Green Holdings, Ltd. | | 57,000 | | | 45,588 |
Sina China Corp.b | | 1,800 | | | 41,670 |
Mindray Medical International, Ltd. ADR | | 2,100 | | | 37,800 |
Ajisen China Holdings, Ltd. | | 68,000 | | | 31,830 |
| | | | | |
Total China/Hong Kong | | | | | 991,646 |
| | | | | |
| | | | | |
INDIA: 21.1% | | | | | |
Asian Paints, Ltd. | | 5,592 | | | 103,101 |
CRISIL, Ltd. | | 1,483 | | | 75,036 |
Glenmark Pharmaceuticals, Ltd.b | | 11,540 | | | 70,882 |
Container Corp. of India, Ltd. | | 4,817 | | | 61,359 |
Dabur India, Ltd. | | 34,269 | | | 59,432 |
Sintex Industries, Ltd. | | 13,785 | | | 53,896 |
Jain Irrigation Systems, Ltd. | | 6,906 | | | 49,397 |
Rolta India, Ltd. | | 16,253 | | | 39,010 |
Kotak Mahindra Bank, Ltd. | | 4,459 | | | 32,931 |
India Infoline, Ltd. | | 30,207 | | | 31,904 |
ICSA India, Ltd. | | 10,889 | | | 29,041 |
HT Media, Ltd. | | 18,279 | | | 26,809 |
Sun TV Network, Ltd. | | 6,579 | | | 24,463 |
Unitech, Ltd. | | 12,754 | | | 10,732 |
| | | | | |
Total India | | | | | 667,993 |
| | | | | |
| | | | | |
| TAIWAN: 15.2% | | | | | |
St. Shine Optical Co., Ltd. | | 26,000 | | | 85,084 |
Richtek Technology Corp. | | 19,000 | | | 76,319 |
Formosa International Hotels Corp. | | 6,000 | | | 60,079 |
Zinwell Corp. | | 47,000 | | | 52,451 |
Everlight Electronic Co., Ltd. | | 39,000 | | | 51,724 |
Synnex Technology International Corp. | | 46,000 | | | 47,971 |
Shin Zu Shing Co., Ltd. | | 17,000 | | | 42,832 |
104 Corp. | | 19,000 | | | 39,227 |
Chroma ATE, Inc. | | 44,000 | | | 27,933 |
| | | | | |
Total Taiwan | | | | | 483,620 |
| | | | | |
| | | | |
| | | Shares | | Value |
| SOUTH KOREA : 13.5% | | | | |
MegaStudy Co., Ltd. | | 772 | | $114,292 |
Hankook Tire Co., Ltd. | | 6,910 | | 85,335 |
Kiwoom Securities Co., Ltd. | | 2,683 | | 84,325 |
NICE e-Banking Services Co., Ltd. | | 28,126 | | 58,348 |
Gmarket, Inc. ADRb | | 2,700 | | 46,575 |
Modetour Network, Inc. | | 4,663 | | 39,328 |
| | | | |
Total South Korea | | | | 428,203 |
| | | | |
| | | | |
SINGAPORE: 9.3% | | | | |
Singapore Airport Terminal Services, Ltd. | | 78,000 | | 76,335 |
Tat Hong Holdings, Ltd. | | 151,000 | | 71,581 |
Armstrong Industrial Corp., Ltd. | | 667,000 | | 55,881 |
Riverstone Holdings, Ltd. | | 104,000 | | 36,162 |
Keppel Land, Ltd. | | 28,000 | | 33,274 |
Goodpack, Ltd. | | 35,000 | | 20,285 |
| | | | |
Total Singapore | | | | 293,518 |
| | | | |
| | | | |
MALAYSIA: 1.4% | | | | |
JobStreet Corp. BHD | | 120,300 | | 44,627 |
| | | | |
Total Malaysia | | | | 44,627 |
| | | | |
| | | | |
TOTAL INVESTMENTS: 91.7% | | | | 2,909,607 |
(Cost $3,074,817c) | | | | |
| | |
CASH AND OTHER ASSETS, LESS LIABILITIES: 8.3% | | | | 263,751 |
| | | | |
| | |
NET ASSETS: 100.0% | | | | $3,173,358 |
| | | | |
| a | Certain securities were fair valued under the discretion of the Board of Trustees (Note 1-A). |
| b | Non–income producing security. |
| c | Cost for Federal income tax purposes is $3,075,148 and net unrealized depreciation consists of: |
| | | | | | | |
| Gross unrealized appreciation | | | | $145,770 | | | |
| Gross unrealized depreciation | | | | (311,311 | ) | | |
| | | | | | | |
| Net unrealized depreciation | | | | ($165,541 | ) | | |
| | | | | | | |
| | | | | | |
| |
| ADR American Depositary Receipt | | |
| BHD Berhad | | |
See accompanying notes to financial statements.
matthewsasia.com | 800.789.ASIA 47
| | | | | | |
 | | | | Matthews Asian Technology Fund Portfolio Manager Commentary For the year ending December 31, 2008, the Matthews Asian Technology Fund fell –51.94%, while its benchmark, the MSCI/Matthews Asian Technology Index, declined –39.85%. For the fourth quarter, the Fund was down –24.40% while its benchmark fell –14.35%. The year marked a very difficult period for Asia’s technology firms, which were hurt by the global credit crisis and worsening U.S. demand outlook for IT products. We are obviously disappointed in the Fund’s performance this past year and appreciate the ongoing support of shareholders. However, we remain confident in our core belief that there are long-term opportunities in a broad range of technology industries that are poised to benefit from growing demand among Asian consumers. The Fund’s emphasis on Internet companies and relative lack of exposure to telecommunications firms were the main detractors from performance this year. While Internet companies have benefited the Fund in the past, the sector suffered in 2008 as investors sold off these stocks to capture gains. Additionally, the Fund has historically been underweight in the telecommunications sector. This hurt performance in 2008. Against this backdrop, Fund performance was hurt most by two Internet holdings: China’s Baidu and Korea’s NHN. Based in Beijing, Baidu is a leader in its field, but during the year investors took gains following the stock’s significant appreciation. The company also faced some headwinds after media reports suggested that it failed to prevent false medical information and controversial websites from reaching Internet users in China. We believe, however, that Baidu has a strong understanding of the domestic market. Baidu has since reacted more strongly than its foreign competition to concerns by regulators and the media over aggressive online marketing practices. Its understanding of these concerns, and the relationship the company has with the government, is potentially a competitive advantage for Baidu. NHN, Korea’s largest Internet company, also detracted from Fund performance. The firm was hurt by regulatory concerns over its online news service and slower-than-expected growth in its search business. However, the overall growth of the company remains healthy, and its other divisions, such as e-commerce and gaming, are performing well. As the domestic economy recovers, we believe that growth in the search industry should also rebound. As the first country in the region to commercialize online gaming, Korea has been a leader in the Internet industry and we continue to believe it will remain innovative. Although battered in 2008, Internet firms have traditionally been perceived to be less affected by global technology cycles and have benefited Fund performance in the past. We continue to believe in their long-term potential as online penetration in the region continues to improve. For example, the number of Internet users grew by about 40% in China last year to nearly 300 million. China’s Internet industry is still at an early stage compared to other developed countries in terms of its market size and full potential. Though penetration is still low in emerging markets, such as India and Indonesia, the growth has been solid. As fixed-line operators strongly outperformed the broad technology space in 2009, the Fund’s underweight in this sector hurt Fund performance. However, during the year, the Fund increased positions in high-yielding wireless (continued) |
PORTFOLIO MANAGERS J. Michael Oh Lead Manager Lydia So Co-Manager Note: Managers shown reflect changes effective January 1, 2009. | | | |
FUND FACTS | | | |
Ticker | | MATFX | | | |
Inception Date | | 12/27/99 | | | |
Assets | | $74.5 million | | | |
NAV | | $4.71 | | | |
Total # of Positions | | 50 | | | |
Fiscal Year 2008 Ratios | | | | | |
| Portfolio Turnover | | 44.84%1 | | | |
| Gross Expense Ratio | | 1.33%2 | | | |
Benchmark | | | |
| MSCI/Matthews Asian Technology Index | | | |
Redemption Fee | | | |
| 2% within first 90 calendar days of purchase | | | |
OBJECTIVE Long-term capital appreciation. | | | |
STRATEGY Under normal market conditions, the Fund seeks to achieve its investment objective by investing at least 80% of its total net assets, which include borrowings for investment purposes, in the common and preferred stocks of companies located in Asia that derive more than 50% of their revenues from the sale of products or services in technology-related industries and services. 1 The lesser of fiscal year 2008 long-term purchase costs or sales proceeds divided by the average monthly market value of long-term securities. 2 Matthews Asia Funds does not charge 12b-1 fees. | | | |
| | | |
48 MATTHEWS ASIA FUNDS
PERFORMANCE AS OF DECEMBER 31, 2008
| | | | | | | | | | |
| | | | | Average Annual Total Return |
| | | 3 Months | | 1 Year | | 3 Years | | 5 Years | | Since Inception
12/27/99 |
Matthews Asian Technology Fund | | -24.40% | | -51.94% | | -10.32% | | -0.50% | | -7.46% |
MSCI/Matthews Asian Technology Index3 | | -14.35% | | -39.85% | | -8.77% | | -0.90% | | -10.44%4 |
Lipper Science and Technology Funds Category Average5 | | -26.43% | | -47.83% | | -12.57% | | -5.87% | | -11.33%4 |
Performance assumes reinvestment of all dividends and/or distributions before taxes. All performance quoted represents past performance and is no guarantee of future results. Investment return and principal value will fluctuate with market conditions so that when redeemed, shares may be worth more or less than their original cost. Current performance may be lower or higher than the return figures quoted. Returns would have been lower if certain of the Fund’s fees and expenses had not been waived. For the Fund’s most recent month-end performance visit matthewsasia.com.
GROWTH OF A $10,000 INVESTMENT SINCE INCEPTION
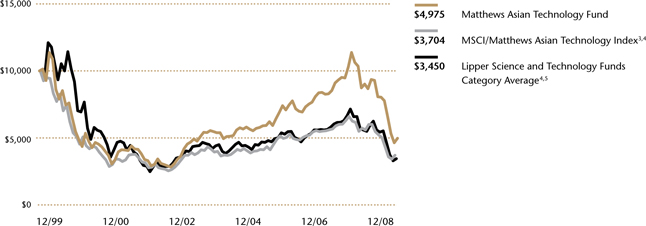
Plotted monthly. The performance data and graph do not reflect the deduction of taxes that a shareholder would pay on dividends, capital gain distributions or redemption of Fund shares. Values are in US$.
| 3 | It is not possible to invest directly in an index. Source: Index data from Morgan Stanley Capital Management; total return calculations performed by PNC Global Investment Servicing (U.S.) Inc. Please see page 87 for index definition. |
| 4 | Calculated from 12/31/99. |
| 5 | The Lipper Category Average does not reflect sales charges and is based on total return, including reinvestment of dividends and capital gains for the stated periods. |
TOP TEN HOLDINGS6
| | | | |
| | | Country | | % of Net Assets |
Baidu.com, Inc. | | China/Hong Kong | | 4.3% |
NHN Corp. | | South Korea | | 4.3% |
Nintendo Co., Ltd. | | Japan | | 3.8% |
China Mobile, Ltd. | | China/Hong Kong | | 3.8% |
Samsung Electronics Co., Ltd. | | South Korea | | 3.5% |
New Oriental Education & Technology Group, Inc. | | China/Hong Kong | | 3.5% |
Ctrip.com International, Ltd. | | China/Hong Kong | | 3.5% |
Tencent Holdings, Ltd. | | China/Hong Kong | | 3.3% |
Bharti Airtel, Ltd. | | India | | 3.1% |
Taiwan Semiconductor Manufacturing Co., Ltd. | | Taiwan | | 3.0% |
% OF ASSETS IN TOP TEN | | | | 36.1% |
| 6 | Holdings may combine more than one security from same issuer and related depositary receipts. |
matthewsasia.com | 800.789.ASIA 49
| | | | |
| COUNTRY ALLOCATION (%) | | Matthews Asian Technology Fund Portfolio Manager Commentary (continued) telecommunications based on the growth potential we see in wireless usage. In fact, the Fund’s two best performers were telecom firms Softbank and ZTE. Softbank, Japan’s third-largest wireless telecom services provider, gained market share with a good selection of mobile handsets and attractive pricing plans. ZTE, one of the largest telecom equipment manufacturers in China, benefited from expectations for increased capital spending as the country continued to restructure the sector. The Chinese government has been supporting a homegrown wireless communication technology known as Time Division- Synchronous Code Division Multiple Access (TD-SCDMA) and recently selected TD-SCDMA as one of China’s next wireless technologies. Domestic telecommunications equipment companies such as ZTE are well-positioned to benefit from the development of this new platform. Technology hardware and semiconductor sectors also suffered in 2008. Growth in U.S. demand for consumer electronics during the 2008 holiday season was the weakest in decades and worsened already negative sector sentiment. As the U.S. market is the largest market for technology products, the slowdown had a significant direct impact on Asian technology manufacturers. The slowing demand has also spread to other developed countries, adding to concerns that the downturn may deepen further. Semiconductor industries are also undergoing one of the worst cycles in recent years, and many companies are cutting capacity and capital expenditure. However, these recent cuts may enhance profitability in the short term, and the surviving semiconductor firms should be better positioned to be more efficient and benefit from a recovery. Overall, valuations in Asian technology are at levels we have not seen in years. Looking ahead, the depth of the global credit crisis and its full impact on the Asian technology sector remains to be seen. Nevertheless, we continue to see long-term growth prospects in the sector, particularly those related to domestic consumption in Asia. We hold firm to our belief that Asia offers exciting growth prospects for quality technology companies, and we remain focused on finding firms that can benefit from long-term growth opportunities in the region. We appreciate your ongoing support. |
China/Hong Kong | | 31.7 | |
| Japan | | 20.7 | |
| South Korea | | 19.1 | |
| Taiwan | | 14.0 | |
| India | | 10.2 | |
| Indonesia | | 2.4 | |
| Thailand | | 1.6 | |
| Cash and Other Assets, | | | |
| Less Liabilities | | 0.3 | |
SECTOR ALLOCATION (%) | | | |
Information Technology | | 55.7 | |
| Telecom Services | | 17.4 | |
| Consumer Discretionary | | 16.3 | |
| Health Care | | 5.0 | |
| Industrials | | 3.5 | |
| Materials | | 1.8 | |
| Cash and Other Assets, | | | |
| Less Liabilities | | 0.3 | |
MARKET CAP EXPOSURE (%)7 Large Cap (over $5B) | | 51.9 | |
| Mid Cap ($1B–$5B) | | 26.2 | |
| Small Cap (under $1B) | | 21.5 | |
| Cash and Other Assets, | | | |
| Less Liabilities | | 0.3 | |
7 Source: FactSet Research Systems. Percentage values in data are rounded to the nearest tenth of one percent; the values may not sum to 100% due to rounding. | | | |
| | | |
| | | |
| | | |
50 MATTHEWS ASIA FUNDS
| | |
| Matthews Asian Technology Fund | | December 31, 2008 |
Schedule of Investmentsa
COMMON EQUITIES: 99.7%
| | | | |
| | | Shares | | Value |
CHINA/HONG KONG: 31.7% | | | | |
Baidu.com, Inc. ADRb | | 24,300 | | $3,172,851 |
China Mobile, Ltd. ADR | | 55,000 | | 2,796,750 |
New Oriental Education & Technology Group, Inc. ADRb | | 47,800 | | 2,624,698 |
Ctrip.com International, Ltd. ADR | | 109,200 | | 2,598,960 |
Tencent Holdings, Ltd. | | 381,400 | | 2,478,234 |
Mindray Medical International, Ltd. ADR | | 99,100 | | 1,783,800 |
ZTE Corp. H Shares | | 569,400 | | 1,504,293 |
Kingdee International Software Group Co., Ltd. | | 11,940,000 | | 1,242,387 |
Perfect World Co., Ltd. ADRb | | 71,524 | | 1,233,789 |
China Communications Services Corp., Ltd. H Shares | | 1,858,000 | | 1,174,306 |
Sina China Corp.b | | 48,500 | | 1,122,775 |
Lenovo Group, Ltd. | | 3,554,000 | | 976,316 |
ASM Pacific Technology, Ltd. | | 281,400 | | 927,469 |
| | | | |
Total China/Hong Kong | | | | 23,636,628 |
| | | | |
| | | | |
JAPAN: 20.7% | | | | |
Nintendo Co., Ltd. | | 7,485 | | 2,860,405 |
Yahoo! Japan Corp. | | 5,278 | | 2,165,638 |
Softbank Corp. | | 88,700 | | 1,610,898 |
Fanuc, Ltd. | | 19,900 | | 1,426,269 |
Nikon Corp. | | 114,000 | | 1,368,293 |
Toray Industries, Inc. | | 265,000 | | 1,348,630 |
Rakuten, Inc.b | | 1,927 | | 1,226,910 |
Mixi, Inc.b | | 166 | | 1,018,958 |
Sony Corp. | | 40,300 | | 881,438 |
Ricoh Co., Ltd. | | 62,000 | | 794,637 |
Nakanishi, Inc. | | 11,900 | | 754,259 |
| | | | |
Total Japan | | | | 15,456,335 |
| | | | |
| | | | |
SOUTH KOREA: 19.1% | | | | |
NHN Corp.b | | 30,004 | | 3,171,852 |
Samsung Electronics Co., Ltd. | | 7,251 | | 2,643,645 |
MegaStudy Co., Ltd. | | 10,158 | | 1,503,854 |
Gmarket, Inc. ADRb | | 71,200 | | 1,228,200 |
LG Electronics, Inc. | | 19,579 | | 1,188,894 |
JVM Co., Ltd. | | 127,450 | | 1,154,818 |
SK Telecom Co., Ltd. ADR | | 62,900 | | 1,143,522 |
LG Display Co., Ltd. ADR | | 130,600 | | 1,081,368 |
SFA Engineering Corp. | | 29,315 | | 787,048 |
Hynix Semiconductor, Inc.b | | 60,050 | | 329,124 |
| | | | |
Total South Korea | | | | 14,232,325 |
| | | | |
| | | | |
| | | Shares | | Value |
TAIWAN: 14.0% | | | | |
Taiwan Semiconductor Manufacturing Co., Ltd. | | 1,649,854 | | $2,251,193 |
Hon Hai Precision Industry Co., Ltd. | | 1,008,550 | | 1,988,620 |
MediaTek, Inc. | | 241,789 | | 1,635,342 |
HTC Corp. | | 107,000 | | 1,074,050 |
Chunghwa Telecom Co., Ltd. | | 610,000 | | 982,590 |
Richtek Technology Corp. | | 239,000 | | 960,014 |
Synnex Technology International Corp. | | 893,000 | | 931,272 |
Wistron Corp. | | 772,000 | | 589,899 |
| | | | |
Total Taiwan | | | | 10,412,980 |
| | | | |
| | | | |
INDIA: 10.2% | | | | |
Bharti Airtel, Ltd.b | | 156,265 | | 2,303,473 |
Infosys Technologies, Ltd. | | 67,009 | | 1,553,012 |
Glenmark Pharmaceuticals, Ltd.b | | 194,368 | | 1,193,857 |
Rolta India, Ltd. | | 442,984 | | 1,063,228 |
Television Eighteen India, Ltd. | | 400,637 | | 735,012 |
Info Edge India, Ltd. | | 85,558 | | 725,039 |
| | | | |
Total India | | | | 7,573,621 |
| | | | |
| | | | |
INDONESIA: 2.4% | | | | |
PT Telekomunikasi Indonesia ADR | | 71,600 | | 1,795,012 |
| | | | |
Total Indonesia | | | | 1,795,012 |
| | | | |
| | | | |
THAILAND: 1.6% | | | | |
Advanced Info Service Public Co., Ltd. | | 506,100 | | 1,176,156 |
| | | | |
Total Thailand | | | | 1,176,156 |
| | | | |
| | | | |
TOTAL INVESTMENTS: 99.7% | | 74,283,057 |
(Cost $103,747,618c) | | | | |
| | |
CASH AND OTHER ASSETS, LESS LIABILITIES: 0.3% | | | | 193,267 |
| | | | |
NET ASSETS: 100.0% | | | | $74,476,324 |
| | | | |
| | | | | |
|
a Certain securities were fair valued under the discretion of the Board of Trustees (Note 1-A). | |
b Non–income producing security. | |
c Cost for Federal income tax purposes is $105,896,330 and net unrealized depreciation consists of: | |
Gross unrealized appreciation | | | | $ 4,870,773 | |
Gross unrealized depreciation | | | | (36,484,046 | ) |
| | | | | |
Net unrealized depreciation | | | | ($31,613,273 | ) |
| | | | | |
|
| ADR American Depositary Receipt | |
|
| See accompanying notes to financial statements. | |
matthewsasia.com | 800.789.ASIA 51
| | |
| Disclosure of Fund Expenses | | (Unaudited) |
| | |
We believe it is important for you to understand the impact of fees regarding your investment. All mutual funds have operating expenses. As a shareholder of a mutual fund, you incur ongoing costs, which include costs for portfolio management, administrative services, and shareholder reports (like this one), among others. Operating expenses, which are deducted from a fund’s gross income, directly reduce the investment return of the fund. A fund’s operating expenses are expressed as a percentage of its average net assets. This figure is known as the expense ratio. The following examples are intended to help you understand the ongoing fees (in dollars) of investing in your fund and to compare these costs with those of other mutual funds. The examples are based on an investment of $1,000 made at the beginning of the period shown and held for the entire period. This table illustrates your fund’s costs in two ways: Actual Fund Return: This section helps you to estimate the actual operating expenses, after any applicable fee waivers, that you paid over the period. The “Ending Account Value” shown is derived from the fund’s actual return for the past six month period, the “Expense Ratio” column shows the period’s annualized expense ratio, and the “Operating Expenses Paid During Period” column shows the dollar amount that would have been paid by an investor who started with $1,000 in the fund at the beginning of the period. You may use the information here, together with your account value, to estimate the expenses that you paid over the period. To do so, simply divide your account value by $1,000 (for example, an $8,600 account value divided by $1,000 = 8.6), then multiply the result by the number given for your fund in the first line under the heading entitled “Operating Expenses Paid During Period.” Hypothetical 5% Return: This section is intended to help you compare your fund’s costs with those of other mutual funds. It assumes that the fund had an annual | | return of 5% before operating expenses, but that the expense ratio is unchanged. In this case, because the return used is not the fund’s actual return, the results do not apply to your investment. This example is useful in making comparisons to other mutual funds because the Securities and Exchange Commission requires all mutual funds to calculate expenses based on an assumed 5% annual return. You can assess your fund’s costs by comparing this hypothetical example with the hypothetical examples that appear in shareholder reports of other funds. Please note that the operating expenses shown in the table are meant to highlight and help you compare your ongoing costs only and do not reflect any transactional costs such as sales charges (loads), redemption fees, or exchange fees. The Funds generally assess a redemption fee of 2.00% of the total redemption proceeds if you sell or exchange your shares within 90 calendar days after purchasing them. The redemption fee is paid directly to the Funds and is designed to discourage frequent short-term trading and to offset transaction costs associated with such trading of Fund shares. For purposes of detemining whether the redemption fee applies, the shares that have been held the longest will be redeemed first. The Funds may grant exemption from the redemption fee when the Funds have previously received assurances that transactions do not involve market timing activity. The Funds may also waive the imposition of redemption fees in certain circumstances. For more information on this policy, please see the Funds’ prospectus. The Matthews Asia Funds do not charge any sales loads, exchange fees, or 12b-1 fees, but these may be present in other funds to which you compare this data. Therefore, the hypothetical portions of the table are useful in comparing ongoing costs only, and will not help you determine the relative total costs of owning different funds. |
52 MATTHEWS ASIA FUNDS
December 31, 2008
| | | | | | | | |
| | | Beginning Account
Value 7/01/08 | | Ending Account
Value 12/31/08 | | Expense Ratio1 | | Operating Expenses
Paid During Period
7/1/08–12/31/082 |
ASIA GROWTH AND INCOME STRATEGIES | | | | | | | | |
Matthews Asian Growth and Income Fund | | | | | | | | |
Actual Fund Return | | $1,000.00 | | $738.70 | | 1.18% | | $5.16 |
Hypothetical 5% Return | | $1,000.00 | | $1,019.20 | | 1.18% | | $5.99 |
Matthews Asia Pacific Equity Income Fund | | | | | | | | |
Actual Fund Return | | $1,000.00 | | $776.50 | | 1.42% | | $6.34 |
Hypothetical 5% Return | | $1,000.00 | | $1,018.00 | | 1.42% | | $7.20 |
| | | | |
ASIA GROWTH STRATEGIES | | | | | | | | |
Matthews Asia Pacific Fund | | | | | | | | |
Actual Fund Return | | $1,000.00 | | $739.30 | | 1.22% | | $5.33 |
Hypothetical 5% Return | | $1,000.00 | | $1,019.00 | | 1.22% | | $6.19 |
Matthews Pacific Tiger Fund | | | | | | | | |
Actual Fund Return | | $1,000.00 | | $666.90 | | 1.12% | | $4.69 |
Hypothetical 5% Return | | $1,000.00 | | $1,019.51 | | 1.12% | | $5.69 |
Matthews China Fund | | | | | | | | |
Actual Fund Return | | $1,000.00 | | $671.70 | | 1.23% | | $5.17 |
Hypothetical 5% Return | | $1,000.00 | | $1,018.95 | | 1.23% | | $6.24 |
Matthews India Fund | | | | | | | | |
Actual Fund Return | | $1,000.00 | | $601.60 | | 1.30% | | $5.23 |
Hypothetical 5% Return | | $1,000.00 | | $1,018.60 | | 1.30% | | $6.60 |
Matthews Japan Fund | | | | | | | | |
Actual Fund Return | | $1,000.00 | | $772.50 | | 1.20% | | $5.35 |
Hypothetical 5% Return | | $1,000.00 | | $1,019.10 | | 1.20% | | $6.09 |
Matthews Korea Fund | | | | | | | | |
Actual Fund Return | | $1,000.00 | | $623.60 | | 1.32% | | $5.39 |
Hypothetical 5% Return | | $1,000.00 | | $1,018.50 | | 1.32% | | $6.70 |
| | | | |
ASIA SMALL COMPANY STRATEGY | | | | | | | | |
Matthews Asia Small Companies Fund | | | | | | | | |
Actual Fund Return3 | | $1,000.00 | | $789.70 | | 2.00% | | $5.23 |
Hypothetical 5% Return | | $1,000.00 | | $1,008.77 | | 2.00% | | $5.87 |
| | | | |
ASIA SPECIALTY STRATEGY | | | | | | | | |
Matthews Asian Technology Fund | | | | | | | | |
Actual Fund Return | | $1,000.00 | | $616.50 | | 1.44% | | $5.85 |
Hypothetical 5% Return | | $1,000.00 | | $1,017.90 | | 1.44% | | $7.30 |
| 1 | Annualized, based on the Fund’s most recent fiscal half-year expenses. |
| 2 | Operating expenses are equal to the Fund’s annualized expense ratio multiplied by the average acount value over the period, multiplied by the number of days in the most recent fiscal half-year, then divided by 366. |
matthewsasia.com | 800.789.ASIA 53
Statements of Assets and Liabilities
| | | | | | | | | |
| | | Matthews Asian
Growth and
Income Fund | | | Matthews Asia
Pacific Equity
Income Fund | | | Matthews Asia
Pacific Fund | |
ASSETS: | | | | | | | | | |
| | | |
Investments at value (A) (Note 1-A and 5): | | | | | | | | | |
| | | |
Unaffiliated issuers | | $1,056,261,063 | | | $137,632,826 | | | $164,917,541 | |
| | | |
Affiliated issuers | | 9,716,209 | | | — | | | 2,904,038 | |
| | | | |
Total investments | | 1,065,977,272 | | | 137,632,826 | | | 167,821,579 | |
| | | |
Cash | | 15,965,064 | | | 4,305,474 | | | — | |
| | | |
Foreign currency at value (B) | | — | | | — | | | — | |
| | | |
Dividends and interest receivable | | 3,871,333 | | | 592,199 | | | 337,524 | |
| | | |
Receivable for securities sold | | 5,711,763 | | | — | | | 1,025,328 | |
| | | |
Receivable for capital shares sold | | 9,424,523 | | | 1,263,324 | | | 612,298 | |
| | | |
Due from Advisor (Note 3) | | — | | | — | | | — | |
| | | |
Deferred offering costs (Note 1-E) | | — | | | — | | | — | |
| | | |
Prepaid expenses and other assets | | 23,286 | | | 21,123 | | | 17,528 | |
| | | | |
TOTAL ASSETS | | 1,100,973,241 | | | 143,814,946 | | | 169,814,257 | |
| | | | |
LIABILITIES: | | | | | | | | | |
| | | |
Payable for securities purchased | | 4,345,448 | | | 948,019 | | | — | |
| | | |
Payable for capital shares redeemed | �� | 5,650,620 | | | 755,248 | | | 1,298,146 | |
| | | |
Cash overdraft | | — | | | — | | | 201,452 | |
| | | |
Deferred tax liability (Note 1-D) | | — | | | — | | | — | |
| | | |
Due to Advisor (Note 3) | | 625,972 | | | 46,206 | | | 100,762 | |
| | | |
Administration and accounting fees payable | | 32,733 | | | 3,024 | | | 5,339 | |
| | | |
Administration and shareholder servicing fees payable | | 252,163 | | | 27,377 | | | 40,319 | |
| | | |
Custodian fees payable | | 59,787 | | | 13,227 | | | 13,449 | |
| | | |
Accrued expenses payable | | 294,440 | | | 70,366 | | | 123,909 | |
| | | | |
TOTAL LIABILITIES | | 11,261,163 | | | 1,863,467 | | | 1,783,376 | |
| | | | |
NET ASSETS | | $1,089,712,078 | | | $141,951,479 | | | $168,030,881 | |
| | | |
SHARES OUTSTANDING: | | | | | | | | | |
(shares of beneficial interest issued and outstanding, respectively, unlimited number of shares authorized with a $0.001 par value) | | 94,789,782 | | | 16,482,527 | | | 16,756,466 | |
Net asset value, offering price and redemption price | | $11.50 | | | $8.61 | | | $10.03 | |
| | | |
NET ASSETS CONSIST OF: | | | | | | | | | |
| | | |
Capital paid-in | | $1,334,411,030 | | | $163,013,181 | | | $247,522,628 | |
| | | |
Undistributed (distributions in excess of) net investment income | | (5,209,901 | ) | | 370,442 | | | 2,965,080 | |
| | | |
Undistributed/accumulated net realized gain (loss) on investments and foreign currency related transactions | | (31,513,940 | ) | | (5,604,869 | ) | | (44,075,726 | ) |
| | | |
Net unrealized depreciation on investments, foreign currency transactions and deferred taxes | | (207,975,111 | ) | | (15,827,275 | ) | | (38,381,101 | ) |
| | | | |
NET ASSETS | | $1,089,712,078 | | | $141,951,479 | | | $168,030,881 | |
| | | |
(A) Investments at cost: | | | | | | | | | |
| | | |
Unaffiliated issuers | | $1,237,900,043 | | | $153,469,206 | | | $191,688,428 | |
| | | |
Affiliated issuers | | 36,051,674 | | | — | | | 14,514,640 | |
| | | | |
Total investments at cost | | $1,273,951,717 | | | $153,469,206 | | | $206,203,068 | |
| | | | |
(B) Foreign currency at cost | | $— | | | $— | | | $— | |
See accompanying notes to financial statements.
54 MATTHEWS ASIA FUNDS
December 31, 2008
| | | | | | | | | | | | | | | | | | |
Matthews Pacific Tiger Fund | | Matthews China Fund | | | Matthews India Fund | | | Matthews
Japan Fund | | | Matthews
Korea Fund | | | Matthews Asia
Small Companies
Fund | | | Matthews Asian
Technology
Fund | |
| | | | | | |
$1,194,241,526 | | $744,893,419 | | | $318,349,813 | | | $123,377,541 | | | $86,008,447 | | | $2,909,607 | | | $74,283,057 | |
| | | | | | |
| — | | 28,710,755 | | | — | | | — | | | — | | | — | | | — | |
| | | | | | | |
| 1,194,241,526 | | 773,604,174 | | | 318,349,813 | | | 123,377,541 | | | 86,008,447 | | | 2,909,607 | | | 74,283,057 | |
| | | | | | |
| 2,736,137 | | 6,417,237 | | | — | | | — | | | 197,024 | | | 146,744 | | | 32,196 | |
| | | | | | |
| 686,276 | | 1 | | | 1,975,183 | | | — | | | — | | | 70,473 | | | 331,843 | |
| | | | | | |
| 2,758,414 | | 973,051 | | | 324,886 | | | 688,353 | | | 797,359 | | | 4,998 | | | 160,747 | |
| | | | | | |
| 7,539,806 | | 2,225,354 | | | 2,214,559 | | | 1,481,772 | | | 419,239 | | | — | | | 822,861 | |
| | | | | | |
| 5,967,122 | | 2,443,837 | | | 677,613 | | | 672,887 | | | 246,149 | | | 153,998 | | | 55,517 | |
| | | | | | |
| — | | — | | | — | | | — | | | — | | | 31,141 | | | — | |
| | | | | | |
| — | | — | | | — | | | — | | | — | | | 33,276 | | | — | |
| | | | | | |
| 11,976 | | 12,610 | | | 47,752 | | | 5,152 | | | 7,282 | | | 1,802 | | | 11,970 | |
| | | | | | | |
| 1,213,941,257 | | 785,676,264 | | | 323,589,806 | | | 126,225,705 | | | 87,675,500 | | | 3,352,039 | | | 75,698,191 | |
| | | | | | |
— | | — | | | — | | | 325,819 | | | — | | | 126,970 | | | 294,580 | |
| | | | | | |
| 9,844,972 | | 3,584,268 | | | 3,317,538 | | | 2,022,360 | | | 273,347 | | | 303 | | | 765,598 | |
| | | | | | |
| — | | — | | | 2,125,068 | | | 6,977 | | | — | | | — | | | — | |
| | | | | | |
| 171,388 | | — | | | — | | | — | | | — | | | 3,814 | | | — | |
| | | | | | |
| 699,761 | | 448,970 | | | 190,084 | | | 72,909 | | | 46,237 | | | — | | | 43,543 | |
| | | | | | |
| 39,180 | | 22,021 | | | 10,078 | | | 3,861 | | | 2,321 | | | 71 | | | 2,268 | |
| | | | | | |
| 261,092 | | 182,851 | | | 78,085 | | | 29,115 | | | 18,069 | | | 582 | | | 17,803 | |
| | | | | | |
| 106,268 | | 29,527 | | | 54,331 | | | 7,899 | | | 7,539 | | | 9,094 | | | 13,759 | |
| | | | | | |
| 378,052 | | 304,150 | | | 298,617 | | | 83,036 | | | 74,852 | | | 37,847 | | | 84,316 | |
| | | | | | | |
| 11,500,713 | | 4,571,787 | | | 6,073,801 | | | 2,551,976 | | | 422,365 | | | 178,681 | | | 1,221,867 | |
| | | | | | | |
| $1,202,440,544 | | $781,104,477 | | | $317,516,005 | | | $123,673,729 | | | $87,253,135 | | | $3,173,358 | | | $74,476,324 | |
| | | | | | |
108,844,588 | | 54,474,949 | | | 37,921,703 | | | 12,135,597 | | | 31,688,869 | | | 402,324 | | | 15,801,976 | |
| $11.05 | | $14.34 | | | $8.37 | | | $10.19 | | | $2.75 | | | $7.89 | | | $4.71 | |
| | | | | | |
$1,653,091,344 | | $1,044,151,336 | | | $568,188,187 | | | $199,844,397 | | | $100,307,656 | | | $3,391,611 | | | $138,107,093 | |
| | | | | | |
| (500,264) | | 58,882 | | | (71,501 | ) | | 1,213,496 | | | — | | | 6,470 | | | — | |
| | | | | | |
(172,722,735) | | (18,374,596 | ) | | (40,564,815 | ) | | (54,141,107 | ) | | 4,070,118 | | | (55,693 | ) | | (34,165,159 | ) |
| | | | | | |
(277,427,801) | | (244,731,145 | ) | | (210,035,866 | ) | | (23,243,057 | ) | | (17,124,639 | ) | | (169,030 | ) | | (29,465,610 | ) |
| | | | | | | |
| $1,202,440,544 | | $781,104,477 | | | $317,516,005 | | | $123,673,729 | | | $87,253,135 | | | $3,173,358 | | | $74,476,324 | |
| | | | | | |
$1,471,509,797 | | $988,462,216 | | | $528,346,208 | | | $146,639,314 | | | $103,136,696 | | | $3,074,817 | | | $103,747,618 | |
| | | | | | |
| — | | 29,873,247 | | | — | | | — | | | — | | | — | | | — | |
| | | | | | | |
| $1,471,509,797 | | $1,018,335,463 | | | $528,346,208 | | | $146,639,314 | | | $103,136,696 | | | $3,074,817 | | | $103,747,618 | |
| | | | | | | |
| $686,279 | | $1 | | | $1,976,196 | | | $— | | | $— | | | $70,922 | | | $333,271 | |
matthewsasia.com | 800.789.ASIA 55
Statements of Operations
| | | | | | | | | |
| | | Matthews Asian
Growth and
Income Fund | | | Matthews Asia
Pacific Equity
Income Fund | | | Matthews Asia
Pacific Fund | |
INVESTMENT INCOME: | | | | | | | | | |
| | | |
Dividends—Unaffiliated Issuers | | $66,872,320 | | | $4,982,035 | | | $7,674,372 | |
| | | |
Dividends—Affiliated Issuers (Note 5) | | 832,294 | | | — | | | 107,679 | |
| | | |
Interest | | 14,423,566 | | | 22,051 | | | — | |
| | | |
Foreign withholding tax | | (4,188,136 | ) | | (348,035 | ) | | (513,427 | ) |
| | | | |
TOTAL INVESTMENT INCOME | | 77,940,044 | | | 4,656,051 | | | 7,268,624 | |
| | | | |
EXPENSES: | | | | | | | | | |
| | | |
Investment advisory fees (Note 3) | | 12,362,781 | | | 636,250 | | | 2,324,677 | |
| | | |
Administration and accounting fees (Note 3) | | 323,267 | | | 16,724 | | | 60,755 | |
| | | |
Administration and shareholder servicing fees (Note 3) | | 4,500,879 | | | 222,553 | | | 829,397 | |
| | | |
Custodian fees | | 513,992 | | | 55,234 | | | 122,168 | |
| | | |
Insurance fees | | 38,971 | | | 1,361 | | | 8,287 | |
| | | |
Printing fees | | 237,806 | | | 31,535 | | | 112,689 | |
| | | |
Professional fees | | 121,144 | | | 49,397 | | | 64,049 | |
| | | |
Registration fees | | 50,085 | | | 52,821 | | | 41,021 | |
| | | |
Transfer agent fees | | 2,415,163 | | | 135,280 | | | 474,144 | |
| | | |
Trustees fees | | 86,463 | | | 4,011 | | | 16,725 | |
| | | |
Offering costs (Note 1-E) | | — | | | — | | | — | |
| | | |
Other expenses | | 167,780 | | | 35,965 | | | 84,999 | |
| | | | |
TOTAL EXPENSES | | 20,818,331 | | | 1,241,131 | | | 4,138,911 | |
| | | | |
Advisory fees waived and expenses waived or reimbursed (Note 3) | | — | | | (24,543 | ) | | — | |
| | | | |
NET EXPENSES | | 20,818,331 | | | 1,216,588 | | | 4,138,911 | |
| | | | |
NET INVESTMENT INCOME (LOSS) | | 57,121,713 | | | 3,439,463 | | | 3,129,713 | |
| | | |
REALIZED AND UNREALIZED (LOSS) ON INVESTMENTS, FOREIGN CURRENCY RELATED TRANSACTIONS AND DEFERRED TAXES: | | | | | | | | | |
| | | |
Net realized gain (loss) on investments—Unaffiliated Issuers | | 99,211,884 | | | (5,541,929 | ) | | (43,971,811 | ) |
| | | |
Net realized gain on investments—Affiliated Issuers | | — | | | — | | | — | |
| | | |
Net realized capital gains tax | | (282,950 | ) | | — | | | — | |
| | | |
Net realized gain (loss) on foreign currency-related transactions | | (1,802,329 | ) | | (25,011 | ) | | (164,474 | ) |
| | | |
Net change in unrealized appreciation/depreciation on investments | | (821,166,347 | ) | | (20,968,515 | ) | | (122,045,101 | ) |
| | | |
Net change in deferred taxes on unrealized appreciation | | — | | | — | | | — | |
| | | |
Net change in unrealized appreciation/depreciation on foreign currency-related transactions | | (90,154 | ) | | 8,637 | | | (2,520 | ) |
| | | | |
Net realized and unrealized loss on investments, foreign currency related transactions and deferred taxes | | (724,129,896 | ) | | (26,526,818 | ) | | (166,183,906 | ) |
| | | | |
NET DECREASE IN NET ASSETS FROM OPERATIONS | | ($667,008,183 | ) | | ($23,087,355 | ) | | ($163,054,193 | ) |
| 1 | The Matthews Asia Small Companies Fund commenced operations on September 15, 2008. |
See accompanying notes to financial statements.
56 MATTHEWS ASIA FUNDS
December 31, 2008
| | | | | | | | | | | | | | | | | | |
Matthews Pacific Tiger Fund | | Matthews China Fund | | | Matthews India Fund | | | Matthews Japan Fund | | | Matthews Korea Fund | | | Matthews Asia
Small Companies
Fund1 | | | Matthews Asian
Technology Fund | |
| | | | | | | | | | | | | | | | | | |
| | | | | | |
$61,451,276 | | $29,372,351 | | | $10,270,424 | | | $3,825,820 | | | $1,721,058 | | | $14,002 | | | $2,603,647 | |
| | | | | | |
| — | | 705,156 | | | — | | | — | | | — | | | — | | | — | |
| | | | | | |
| 39 | | — | | | 1,162,541 | | | 4 | | | — | | | — | | | 27 | |
| | | | | | |
| (3,226,639) | | (74,230 | ) | | (12,760 | ) | | (267,191 | ) | | (283,819 | ) | | (865 | ) | | (296,806 | ) |
| | | | | | | |
| 58,224,676 | | 30,003,277 | | | 11,420,205 | | | 3,558,633 | | | 1,437,239 | | | 13,137 | | | 2,306,868 | |
| | | | | | | |
| | | | | | | | | | | | | | | | | | |
| | | | | | |
| 18,120,660 | | 9,131,795 | | | 5,406,179 | | | 1,188,880 | | | 1,063,450 | | | 5,204 | | | 1,126,039 | |
| | | | | | |
| 473,270 | | 238,301 | | | 140,871 | | | 31,151 | | | 27,741 | | | 99 | | | 29,398 | |
| | | | | | |
| 6,061,612 | | 3,336,745 | | | 1,985,406 | | | 430,333 | | | 369,281 | | | 1,399 | | | 414,480 | |
| | | | | | |
| 1,028,013 | | 545,601 | | | 570,616 | | | 47,981 | | | 57,730 | | | 15,811 | | | 93,903 | |
| | | | | | |
| 65,537 | | 40,263 | | | 21,152 | | | 3,311 | | | 4,350 | | | — | | | 4,288 | |
| | | | | | |
| 313,680 | | 427,151 | | | 215,907 | | | 30,681 | | | 42,145 | | | 400 | | | 74,474 | |
| | | | | | |
| 121,218 | | 61,394 | | | 77,591 | | | 36,152 | | | 90,060 | | | 34,319 | | | 54,937 | |
| | | | | | |
| 40,853 | | 182,154 | | | 190,134 | | | 35,129 | | | 25,878 | | | 168 | | | 38,107 | |
| | | | | | |
| 2,720,195 | | 2,083,734 | | | 1,315,759 | | | 249,473 | | | 240,350 | | | 3,007 | | | 286,492 | |
| | | | | | |
| 130,517 | | 67,239 | | | 38,886 | | | 8,233 | | | 7,722 | | | 14 | | | 8,220 | |
| | | | | | |
| — | | — | | | — | | | — | | | — | | | 10,293 | | | — | |
| | | | | | |
| 310,902 | | 214,663 | | | 172,862 | | | 51,124 | | | 33,292 | | | 4,070 | | | 48,159 | |
| | | | | | | |
| 29,386,457 | | 16,329,040 | | | 10,135,363 | | | 2,112,448 | | | 1,961,999 | | | 74,784 | | | 2,178,497 | |
| | | | | | | |
| — | | — | | | — | | | — | | | — | | | (64,333 | ) | | — | |
| | | | | | | |
| 29,386,457 | | 16,329,040 | | | 10,135,363 | | | 2,112,448 | | | 1,961,999 | | | 10,451 | | | 2,178,497 | |
| | | | | | | |
| 28,838,219 | | 13,674,237 | | | 1,284,842 | | | 1,446,185 | | | (524,760 | ) | | 2,686 | | | 128,371 | |
| | | | | | |
| | | | | | | | | | | | | | | | | | |
| | | | | | |
676,234 | | 166,373,006 | | | (24,230,717 | ) | | (53,711,339 | ) | | 8,275,706 | | | (55,693 | ) | | (24,011,464 | ) |
| | | | | | |
| — | | 249,565 | | | — | | | — | | | — | | | — | | | — | |
| | | | | | |
| — | | — | | | (571,405 | ) | | — | | | — | | | — | | | — | |
| | | | | | |
| (1,891,171) | | (11,768 | ) | | (1,317,320 | ) | | 29,466 | | | (235,645 | ) | | (1,275 | ) | | (146,733 | ) |
| | | | | | |
| (1,663,536,444) | | (1,123,567,142 | ) | | (716,815,792 | ) | | (5,977,108 | ) | | (122,319,709 | ) | | (165,210 | ) | | (90,629,028 | ) |
| | | | | | |
| (171,388) | | — | | | 2,706,668 | | | — | | | — | | | (3,814 | ) | | — | |
| | | | | | |
(7,067) | | 992 | | | (57,173 | ) | | 16,023 | | | (6,964 | ) | | (6 | ) | | (1,587 | ) |
| | | | | | | |
(1,664,929,836) | | (956,955,347 | ) | | (740,285,739 | ) | | (59,642,958 | ) | | (114,286,612 | ) | | (225,998 | ) | | (114,788,812 | ) |
| | | | | | | |
| ($1,636,091,617) | | ($943,281,110 | ) | | ($739,000,897 | ) | | ($58,196,773 | ) | | ($114,811,372 | ) | | ($223,312 | ) | | ($114,660,441 | ) |
matthewsasia.com | 800.789.ASIA 57
Statements of Changes in Net Assets
| | | | | | |
| MATTHEWS ASIAN GROWTH AND INCOME FUND | | Year Ended
December 31, 2008 | | | Year Ended
December 31, 2007 | |
| | |
OPERATIONS: | | | | | | |
| | |
Net investment income (Note 1-G) | | $57,121,713 | | | $56,457,307 | |
| | |
Net realized gain on investments and foreign currency related transactions | | 97,126,605 | | | 278,910,606 | |
| | |
Net change in unrealized appreciation/depreciation on investments and foreign currency related transactions | | (821,256,501 | ) | | 90,739,295 | |
| | |
Net increase (decrease) in net assets resulting from operations | | (667,008,183 | ) | | 426,107,208 | |
| | |
DISTRIBUTIONS TO SHAREHOLDERS FROM: | | | | | | |
| | |
Net investment income | | (41,328,215 | ) | | (96,264,281 | ) |
| | |
Realized gains on investments | | (152,469,801 | ) | | (212,785,553 | ) |
| | |
Net decrease in net assets resulting from distributions | | (193,798,016 | ) | | (309,049,834 | ) |
| | |
CAPITAL SHARE TRANSACTIONS (net) (Note 2) | | (323,206,605 | ) | | 134,811,741 | |
| | |
REDEMPTION FEES | | 317,302 | | | 175,559 | |
| | |
Total increase (decrease) in net assets | | (1,183,695,502 | ) | | 252,044,674 | |
| | |
NET ASSETS: | | | | | | |
| | |
Beginning of year | | 2,273,407,580 | | | 2,021,362,906 | |
| | |
End of year (including distributions in excess of net investment income of ($5,209,901) and ($16,598,803), respectively) | | $1,089,712,078 | | | $2,273,407,580 | |
| | |
| MATTHEWS ASIA PACIFIC EQUITY INCOME FUND | | Year Ended
December 31, 2008 | | | Year Ended
December 31, 2007 | |
| | |
OPERATIONS: | | | | | | |
| | |
Net investment income (Note 1-G) | | $3,439,463 | | | $1,565,379 | |
| | |
Net realized gain (loss) on investments and foreign currency related transactions | | (5,566,940 | ) | | 3,363,363 | |
| | |
Net change in unrealized appreciation/depreciation on investments and foreign currency related transactions | | (20,959,878 | ) | | 4,107,245 | |
| | |
Net increase (decrease) in net assets resulting from operations | | (23,087,355 | ) | | 9,035,987 | |
| | |
DISTRIBUTIONS TO SHAREHOLDERS FROM: | | | | | | |
| | |
Net investment income | | (3,011,638 | ) | | (1,596,567 | ) |
| | |
Realized gains on investments | | (142,300 | ) | | (2,815,658 | ) |
| | |
Net decrease in net assets resulting from distributions | | (3,153,938 | ) | | (4,412,225 | ) |
| | |
CAPITAL SHARE TRANSACTIONS (net) (Note 2) | | 86,427,296 | | | 51,177,008 | |
| | |
REDEMPTION FEES | | 141,421 | | | 83,071 | |
| | |
Total increase in net assets | | 60,327,424 | | | 55,883,841 | |
| | |
NET ASSETS: | | | | | | |
| | |
Beginning of year | | 81,624,055 | | | 25,740,214 | |
| | |
End of year (including undistributed/(distributions in excess of) net investment income of $370,442 and ($40,415), respectively) | | $141,951,479 | | | $81,624,055 | |
See accompanying notes to financial statements.
58 MATTHEWS ASIA FUNDS
| | | | | | |
| MATTHEWS ASIA PACIFIC FUND | | Year Ended
December 31, 2008 | | | Year Ended
December 31, 2007 | |
| | |
OPERATIONS: | | | | | | |
| | |
Net investment income (Note 1-G) | | $3,129,713 | | | $2,836,437 | |
| | |
Net realized gain (loss) on investments and foreign currency related transactions | | (44,136,285 | ) | | 56,028,503 | |
| | |
Net change in unrealized appreciation/depreciation on investments and foreign currency related transactions | | (122,047,621 | ) | | (6,309,200 | ) |
| | |
Net increase (decrease) in net assets resulting from operations | | (163,054,193 | ) | | 52,555,740 | |
| | |
DISTRIBUTIONS TO SHAREHOLDERS FROM: | | | | | | |
| | |
Net investment income | | — | | | (2,370,383 | ) |
| | |
Realized gains on investments | | (12,659,661 | ) | | (42,227,483 | ) |
| | |
Net decrease in net assets resulting from distributions | | (12,659,661 | ) | | (44,597,866 | ) |
| | |
CAPITAL SHARE TRANSACTIONS (net) (Note 2) | | (127,465,358 | ) | | 13,108,865 | |
| | |
REDEMPTION FEES | | 155,627 | | | 289,043 | |
| | |
Total increase (decrease) in net assets | | (303,023,585 | ) | | 21,355,782 | |
| | |
NET ASSETS: | | | | | | |
| | |
Beginning of year | | 471,054,466 | | | 449,698,684 | |
| | |
End of year (including undistributed net investment income of $2,965,080 and $0, respectively) | | $168,030,881 | | | $471,054,466 | |
| | |
| MATTHEWS PACIFIC TIGER FUND | | Year Ended
December 31, 2008 | | | Year Ended
December 31, 2007 | |
| | |
OPERATIONS: | | | | | | |
| | |
Net investment income (Note 1-G) | | $28,838,219 | | | $40,633,130 | |
| | |
Net realized gain (loss) on investments and foreign currency related transactions | | (1,214,937 | ) | | 616,532,248 | |
| | |
Net change in unrealized appreciation/depreciation on investments and foreign currency related transactions | | (1,663,543,511 | ) | | 401,089,243 | |
| | |
Net change in deferred taxes on unrealized appreciation | | (171,388 | ) | | — | |
| | |
Net increase (decrease) in net assets resulting from operations | | (1,636,091,617 | ) | | 1,058,254,621 | |
| | |
DISTRIBUTIONS TO SHAREHOLDERS FROM: | | | | | | |
| | |
Net investment income | | (25,721,709 | ) | | (39,622,673 | ) |
| | |
Realized gains on investments | | (297,363,454 | ) | | (456,164,472 | ) |
| | |
Net decrease in net assets resulting from distributions | | (323,085,163 | ) | | (495,787,145 | ) |
| | |
CAPITAL SHARE TRANSACTIONS (net) (Note 2) | | (645,522,620 | ) | | (59,741,167 | ) |
| | |
REDEMPTION FEES | | 425,473 | | | 270,920 | |
| | |
Total increase (decrease) in net assets | | (2,604,273,927 | ) | | 502,997,229 | |
| | |
NET ASSETS: | | | | | | |
| | |
Beginning of year | | 3,806,714,471 | | | 3,303,717,242 | |
| | |
End of year (including distributions in excess of net investment income of ($500,264) and ($220,414), respectively) | | $1,202,440,544 | | | $3,806,714,471 | |
See accompanying notes to financial statements.
matthewsasia.com | 800.789.ASIA 59
Statements of Changes in Net Assets
| | | | | | |
| MATTHEWS CHINA FUND | | Year Ended
December 31, 2008 | | | Year Ended
December 31, 2007 | |
| | |
OPERATIONS: | | | | | | |
| | |
Net investment income | | $13,674,237 | | | $7,829,613 | |
| | |
Net realized gain on investments and foreign currency related transactions | | 166,610,803 | | | 227,250,534 | |
| | |
Net change in unrealized appreciation/depreciation on investments and foreign currency related transactions | | (1,123,566,150 | ) | | 511,274,206 | |
| | | |
Net increase (decrease) in net assets resulting from operations | | (943,281,110 | ) | | 746,354,353 | |
| | | |
DISTRIBUTIONS TO SHAREHOLDERS FROM: | | | | | | |
| | |
Net investment income | | (12,907,246 | ) | | (6,158,810 | ) |
| | |
Realized gains on investments | | (222,146,010 | ) | | (77,731,715 | ) |
| | | |
Net decrease in net assets resulting from distributions | | (235,053,256 | ) | | (83,890,525 | ) |
| | | |
CAPITAL SHARE TRANSACTIONS (net) (Note 2) | | (377,939,336 | ) | | 701,616,219 | |
| | | |
REDEMPTION FEES | | 1,976,040 | | | 4,794,051 | |
| | | |
Total increase (decrease) in net assets | | (1,554,297,662 | ) | | 1,368,874,098 | |
| | | |
NET ASSETS: | | | | | | |
| | |
Beginning of year | | 2,335,402,139 | | | 966,528,041 | |
| | | |
End of year (including undistributed net investment income of $58,882 and $668,271, respectively) | | $781,104,477 | | | $2,335,402,139 | |
| | |
| MATTHEWS INDIA FUND | | Year Ended
December 31, 2008 | | | Year Ended
December 31, 2007 | |
| | |
OPERATIONS: | | | | | | |
| | |
Net investment income (loss) | | $1,284,842 | | | ($333,161 | ) |
| | |
Net realized gain (loss) on investments and foreign currency related transactions | | (26,119,442 | ) | | 53,166,317 | |
| | |
Net change in unrealized appreciation/depreciation on investments and foreign currency related transactions | | (716,872,965 | ) | | 394,310,928 | |
| | |
Net change in deferred taxes on unrealized appreciation | | 2,706,668 | | | (2,706,668 | ) |
| | | |
Net increase (decrease) in net assets resulting from operations | | (739,000,897 | ) | | 444,437,416 | |
| | | |
DISTRIBUTIONS TO SHAREHOLDERS FROM: | | | | | | |
| | |
Net investment income | | (3,800,136 | ) | | (10,292,742 | ) |
| | |
Realized gains on investments | | (25,042,065 | ) | | (33,448,687 | ) |
| | | |
Net decrease in net assets resulting from distributions | | (28,842,201 | ) | | (43,741,429 | ) |
| | | |
CAPITAL SHARE TRANSACTIONS (net) (Note 2) | | (227,289,535 | ) | | 239,741,332 | |
| | | |
REDEMPTION FEES | | 1,576,948 | | | 991,445 | |
| | | |
Total increase (decrease) in net assets | | (993,555,685 | ) | | 641,428,764 | |
| | |
NET ASSETS: | | | | | | |
| | |
Beginning of year | | 1,311,071,690 | | | 669,642,926 | |
| | | |
End of year (including distributions in excess of net investment income of ($71,501) and ($11,651,777), respectively) | | $317,516,005 | | | $1,311,071,690 | |
See accompanying notes to financial statements.
60 MATTHEWS ASIA FUNDS
| | | | | | |
| MATTHEWS JAPAN FUND | | Year Ended
December 31, 2008 | | | Year Ended
December 31, 2007 | |
| | |
OPERATIONS: | | | | | | |
| | |
Net investment income (loss) | | $1,446,185 | | | ($33,074 | ) |
| | |
Net realized gain (loss) on investments and foreign currency related transactions | | (53,681,873 | ) | | 11,569,558 | |
| | |
Net change in unrealized appreciation/depreciation on investments and foreign currency related transactions | | (5,961,085 | ) | | (41,405,843 | ) |
| | | |
Net decrease in net assets resulting from operations | | (58,196,773 | ) | | (29,869,359 | ) |
| | | |
DISTRIBUTIONS TO SHAREHOLDERS FROM: | | | | | | |
| | |
Net investment income | | — | | | (82,767 | ) |
| | |
Realized gains on investments | | (2,681,675 | ) | | (11,302,469 | ) |
| | | |
Net decrease in net assets resulting from distributions | | (2,681,675 | ) | | (11,385,236 | ) |
| | | |
CAPITAL SHARE TRANSACTIONS (net) (Note 2) | | 17,520,852 | | | (68,606,284 | ) |
| | | |
REDEMPTION FEES | | 171,094 | | | 65,210 | |
| | | |
Total decrease in net assets | | (43,186,502 | ) | | (109,795,669 | ) |
| | | |
NET ASSETS: | | | | | | |
| | |
Beginning of year | | 166,860,231 | | | 276,655,900 | |
| | | |
End of year (including undistributed/(distributions in excess of) net investment income of $1,213,496 and ($287,607), respectively) | | $123,673,729 | | | $166,860,231 | |
| | |
| MATTHEWS KOREA FUND | | Year Ended
December 31, 2008 | | | Year Ended
December 31, 2007 | |
| | |
OPERATIONS: | | | | | | |
| | |
Net investment income (loss) (Note 1-G) | | ($524,760 | ) | | $2,792,938 | |
| | |
Net realized gain on investments and foreign currency related transactions | | 8,040,061 | | | 28,585,298 | |
| | |
Net change in unrealized appreciation/depreciation on investments and foreign currency related transactions | | (122,326,673 | ) | | 6,798,387 | |
| | | |
Net increase (decrease) in net assets resulting from operations | | (114,811,372 | ) | | 38,176,623 | |
| | | |
DISTRIBUTIONS TO SHAREHOLDERS FROM: | | | | | | |
| | |
Net investment income | | (1,673,455 | ) | | (627,099 | ) |
| | |
Realized gains on investments | | (7,207,688 | ) | | (30,040,481 | ) |
| | | |
Net decrease in net assets resulting from distributions | | (8,881,143 | ) | | (30,667,580 | ) |
| | | |
CAPITAL SHARE TRANSACTIONS (net) (Note 2) | | (39,546,578 | ) | | 1,773,202 | |
| | | |
REDEMPTION FEES | | 70,799 | | | 136,425 | |
| | | |
Total increase (decrease) in net assets | | (163,168,294 | ) | | 9,418,670 | |
| | | |
NET ASSETS: | | | | | | |
| | |
Beginning of year | | 250,421,429 | | | 241,002,759 | |
| | | |
End of year (including undistributed net investment income of $0 and $1,662,858, respectively) | | $87,253,135 | | | $250,421,429 | |
See accompanying notes to financial statements.
matthewsasia.com | 800.789.ASIA 61
Statements of Changes in Net Assets
| | | | | | |
| MATTHEWS ASIA SMALL COMPANIES FUND | | Period Ended
December 31, 20081 | | | | |
OPERATIONS: | | | | |
Net investment income | | $2,686 | | |
Net realized loss on investments and foreign currency related transactions | | (56,968 | ) | |
Net change in unrealized appreciation/depreciation on investments and foreign currency related transactions | | (165,216 | ) | |
Net change in deferred taxes on unrealized appreciation | | (3,814 | ) | |
Net decrease in net assets resulting from operations | | (223,312 | ) | |
DISTRIBUTIONS TO SHAREHOLDERS FROM: | | | | |
Net investment income | | (5,234 | ) | |
Net decrease in net assets resulting from distributions | | (5,234 | ) | |
CAPITAL SHARE TRANSACTIONS (net) (Note 2) | | 3,388,549 | | |
REDEMPTION FEES | | 13,355 | | |
Total increase in net assets | | 3,173,358 | | |
NET ASSETS: | | | | |
Beginning of period | | — | | |
End of period (including undistributed of net investment income of $6,470) | | $3,173,358 | | |
1 The Matthews Asia Small Companies Fund commenced operations on September 15, 2008. | | | | | | |
| MATTHEWS ASIAN TECHNOLOGY FUND | | Year Ended
December 31, 2008 | | | Year Ended
December 31, 2007 | |
| | |
OPERATIONS: | | | | | | |
| | |
Net investment income (loss) (Note 1-G) | | $128,371 | | | ($536,127 | ) |
| | |
Net realized gain (loss) on investments and foreign currency related transactions | | (24,158,197 | ) | | 908,230 | |
| | |
Net change in unrealized appreciation/depreciation on investments and foreign currency related transactions | | (90,630,615 | ) | | 33,855,661 | |
| | |
Net increase (decrease) in net assets resulting from operations | | (114,660,441 | ) | | 34,227,764 | |
| | |
CAPITAL SHARE TRANSACTIONS (net) (Note 2) | | (63,347,458 | ) | | 88,052,034 | |
| | |
REDEMPTION FEES | | 180,136 | | | 205,263 | |
| | |
Total increase (decrease) in net assets | | (177,827,763 | ) | | 122,485,061 | |
| | |
NET ASSETS: | | | | | | |
| | |
Beginning of year | | 252,304,087 | | | 129,819,026 | |
| | |
End of year (including undistributed net investment income of $0 and $0, respectively) | | $74,476,324 | | | $252,304,087 | |
See accompanying notes to financial statements.
62 MATTHEWS ASIA FUNDS
Financial Highlights
Matthews Asian Growth and Income Fund
The table below sets forth financial data for a share of beneficial interest outstanding throughout each period presented.
| | | | | | | | | | | | | | | | | | |
| | | Year Ended December 31, | | | | | | | |
| | | 2008 | | | 2007 | �� | | 2006 | | | 2005 | | | Four-Month
Period Ended
Dec. 31, 20041 | | | Year Ended
Aug. 31, 2004 | |
| | | | | | |
Net Asset Value, beginning of period | | $19.78 | | | $18.68 | | | $17.14 | | | $15.82 | | | $14.65 | | | $12.21 | |
| | | | | | |
INCOME (LOSS) FROM INVESTMENT OPERATIONS: | | | | | | | | | | | | | | | | | | |
| | | | | | |
Net investment income | | 0.54 | 2 | | 1.07 | | | 0.46 | | | 0.45 | | | 0.11 | | | 0.32 | |
| | | | | | |
Net realized gain (loss) and unrealized appreciation (depreciation) on investments and foreign currency | | (6.73 | ) | | 2.93 | | | 3.47 | | | 2.02 | | | 1.83 | | | 2.56 | |
| | | | | | |
Total from investment operations | | (6.19 | ) | | 4.00 | | | 3.93 | | | 2.47 | | | 1.94 | | | 2.88 | |
| | | | | | |
LESS DISTRIBUTIONS FROM: | | | | | | | | | | | | | | | | | | |
| | | | | | |
Net investment income | | (0.42 | ) | | (0.90 | ) | | (0.62 | ) | | (0.43 | ) | | (0.38 | ) | | (0.25 | ) |
| | | | | | |
Net realized gains on investments | | (1.67 | ) | | (2.00 | ) | | (1.77 | ) | | (0.72 | ) | | (0.39 | ) | | (0.20 | ) |
| | | | | | |
Total distributions | | (2.09 | ) | | (2.90 | ) | | (2.39 | ) | | (1.15 | ) | | (0.77 | ) | | (0.45 | ) |
| | | | | | |
Paid-in capital from redemption fees (Note 2) | | — | 3 | | — | 3 | | — | 3 | | — | 3 | | — | 3 | | 0.01 | |
| | | | | | |
Net Asset Value, end of period | | $11.50 | | | $19.78 | | | $18.68 | | | $17.14 | | | $15.82 | | | $14.65 | |
| | | | | | |
TOTAL RETURN | | (32.07% | ) | | 21.54% | | | 23.38% | | | 15.76% | | | 13.32% | 4 | | 23.99% | |
| | | | | | |
RATIOS/SUPPLEMENTAL DATA | | | | | | | | | | | | | | | | | | |
| | | | | | |
Net assets, end of period (in 000’s) | | $1,089,712 | | | $2,273,408 | | | $2,021,363 | | | $1,676,559 | | | $1,236,491 | | | $1,007,187 | |
| | | | | | |
Ratio of expenses to average net assets before reimbursement, waiver or recapture of expenses by Advisor and Administrator (Note 3) | | 1.16% | | | 1.16% | | | 1.20% | | | 1.28% | | | 1.35% | 5 | | 1.45% | |
| | | | | | |
Ratio of expenses to average net assets after reimbursement, waiver or recapture of expenses by Advisor and Administrator | | 1.16% | | | 1.15% | | | 1.19% | | | 1.27% | | | 1.31% | 5 | | 1.44% | |
| | | | | | |
Ratio of net investment income to average net assets | | 3.19% | | | 2.59% | | | 2.27% | | | 2.60% | | | 2.19% | 5 | | 2.28% | |
| | | | | | |
Portfolio turnover | | 25.16% | | | 27.93% | | | 28.37% | | | 20.16% | | | 7.32% | 4 | | 17.46% | |
| 1 | The Fund’s fiscal year end changed from August 31 to December 31, effective December 31, 2004. |
| 2 | Calculated using the average daily shares method. |
| 3 | Less than $0.01 per share. |
See accompanying notes to financial statements.
matthewsasia.com | 800.789.ASIA 63
Financial Highlights
Matthews Asia Pacific Equity Income Fund
The table below sets forth financial data for a share of beneficial interest outstanding throughout each period presented.
| | | | | | | | |
| | | Year Ended December 31, | | | |
| | | 2008 | | | 2007 | | Period Ended
Dec. 31, 20061 | |
| | | |
Net Asset Value, beginning of period | | $12.00 | | | $10.77 | | $10.00 | |
| | | |
INCOME (LOSS) FROM INVESTMENT OPERATIONS: | | | | | | | | |
| | | |
Net investment income | | 0.38 | 2 | | 0.27 | | 0.02 | |
| | | |
Net realized gain (loss) and unrealized appreciation (depreciation) on investments and foreign currency | | (3.47) | | | 1.67 | | 0.77 | |
| | | |
Total from investment operations | | (3.09) | | | 1.94 | | 0.79 | |
| | | |
LESS DISTRIBUTIONS FROM: | | | | | | | | |
| | | |
Net investment income | | (0.30) | | | (0.27) | | (0.02) | |
| | | |
Net realized gains on investments | | (0.02) | | | (0.45) | | — | |
| | | |
Total distributions | | (0.32) | | | (0.72) | | (0.02) | |
| | | |
Paid-in capital from redemption fees (Note 2) | | 0.02 | | | 0.01 | | — | 3 |
Net Asset Value, end of period | | $8.61 | | | $12.00 | | $10.77 | |
| | | |
TOTAL RETURN | | (25.97%) | | | 18.05% | | 7.90% | 4 |
| | | |
RATIOS/SUPPLEMENTAL DATA | | | | | | | | |
| | | |
Net assets, end of period (in 000’s) | | $141,951 | | | $81,624 | | $25,740 | |
| | | |
Ratio of expenses to average net assets before reimbursement, waiver or recapture of expenses by Advisor and Administrator (Note 3) | | 1.35% | | | 1.42% | | 2.93% | 5 |
| | | |
Ratio of expenses to average net assets after reimbursement, waiver or recapture of expenses by Advisor and Administrator | | 1.32% | | | 1.39% | | 1.50% | 5 |
| | | |
Ratio of net investment income to average net assets | | 3.74% | | | 2.66% | | 1.34% | 5 |
| | | |
Portfolio turnover | | 25.07% | | | 26.95% | | 0.00% | 4 |
| 1 | The Matthews Asia Pacific Equity Income Fund commenced operations on October 31, 2006. |
| 2 | Calculated using the average daily shares method. |
| 3 | Less than $0.01 per share. |
See accompanying notes to financial statements.
64 MATTHEWS ASIA FUNDS
Matthews Asia Pacific Fund
The table below sets forth financial data for a share of beneficial interest outstanding throughout each period presented.
| | | | | | | | | | | | | | | | |
| | | Year Ended December 31, | | | | | | | |
| | | 2008 | | | 2007 | | 2006 | | 2005 | | | Four-Month
Period Ended
Dec. 31, 20041 | | | Period Ended
Aug. 31, 20042 | |
| | | | | | |
Net Asset Value, beginning of period | | $17.29 | | | $16.92 | | $14.89 | | $12.58 | | | $10.70 | | | $10.00 | |
| | | | | | |
INCOME (LOSS) FROM INVESTMENT OPERATIONS: | | | | | | | | | | | | | | | | |
| | | | | | |
Net investment income (loss) | | 0.13 | 3 | | 0.09 | | 0.07 | | 0.07 | | | (0.01) | | | 0.02 | |
| | | | | | |
Net realized gain (loss) and unrealized appreciation (depreciation) on investments and foreign currency | | (6.64) | | | 2.02 | | 2.50 | | 2.30 | | | 1.93 | | | 0.66 | |
| | | | | | |
Total from investment operations | | (6.51) | | | 2.11 | | 2.57 | | 2.37 | | | 1.92 | | | 0.68 | |
| | | | | | |
LESS DISTRIBUTIONS FROM: | | | | | | | | | | | | | | | | |
| | | | | | |
Net investment income | | — | | | (0.09) | | (0.07) | | (0.06) | | | (0.02) | | | — | |
| | | | | | |
Net realized gains on investments | | (0.76) | | | (1.66) | | (0.48) | | — | | | (0.02) | | | — | |
| | | | | | |
Total distributions | | (0.76) | | | (1.75) | | (0.55) | | (0.06) | | | (0.04) | | | — | |
| | | | | | |
Paid-in capital from redemption fees (Note 2) | | 0.01 | | | 0.01 | | 0.01 | | — | 4 | | — | 4 | | 0.02 | |
| | | | | | |
Net Asset Value, end of period | | $10.03 | | | $17.29 | | $16.92 | | $14.89 | | | $12.58 | | | $10.70 | |
| | | | | | |
TOTAL RETURN | | (37.44%) | | | 11.92% | | 17.39% | | 18.84% | | | 18.00% | 5 | | 7.00% | 5 |
| | | | | | |
RATIOS/SUPPLEMENTAL DATA | | | | | | | | | | | | | | | | |
| | | | | | |
Net assets, end of period (in 000’s) | | $168,031 | | | $471,054 | | $449,699 | | $285,169 | | | $112,043 | | | $76,222 | |
| | | | | | |
Ratio of expenses to average net assets before reimbursement, waiver or recapture of expenses by Advisor and Administrator (Note 3) | | 1.23% | | | 1.20% | | 1.26% | | 1.35% | | | 1.52% | 6 | | 1.67% | 6 |
| | | | | | |
Ratio of expenses to average net assets after reimbursement, waiver or recapture of expenses by Advisor and Administrator | | 1.23% | | | 1.20% | | 1.24% | | 1.34% | | | 1.51% | 6 | | 1.66% | 6 |
| | | | | | |
Ratio of net investment income (loss) to average net assets | | 0.93% | | | 0.60% | | 0.47% | | 0.67% | | | (0.30%) | 6 | | 0.39% | 6 |
| | | | | | |
Portfolio turnover | | 37.10% | | | 40.49% | | 40.45% | | 15.84% | | | 1.28% | 5 | | 10.75% | 5 |
| 1 | The Fund’s fiscal year end changed from August 31 to December 31, effective December 31, 2004. |
| 2 | The Matthews Asia Pacific Fund commenced operations on October 31, 2003. |
| 3 | Calculated using the average daily shares method. |
| 4 | Less than $0.01 per share. |
See accompanying notes to financial statements.
matthewsasia.com | 800.789.ASIA 65
Financial Highlights
Matthews Pacific Tiger Fund
The table below sets forth financial data for a share of beneficial interest outstanding throughout each period presented.
| | | | | | | | | | | | | | | | |
| | | Year Ended December 31, | | | | | |
| | | 2008 | | | 2007 | | | 2006 | | | 2005 | | Four-Month
Period Ended
Dec. 31, 20041 | | | Year Ended
Aug. 31, 2004 |
| | | | | | |
Net Asset Value, beginning of period | | $27.86 | | | $23.71 | | | $19.27 | | | $15.90 | | $13.22 | | | $11.20 |
| | | | | | |
INCOME (LOSS) FROM INVESTMENT OPERATIONS: | | | | | | | | | | | | | | | | |
| | | | | | |
Net investment income (loss) | | 0.24 | 2 | | 0.30 | | | 0.22 | | | 0.14 | | (0.01) | | | 0.09 |
| | | | | | |
Net realized gain (loss) and unrealized appreciation (depreciation) on investments and foreign currency | | (13.31) | | | 7.78 | | | 5.01 | | | 3.43 | | 3.00 | | | 1.95 |
| | | | | | |
Total from investment operations | | (13.07) | | | 8.08 | | | 5.23 | | | 3.57 | | 2.99 | | | 2.04 |
| | | | | | |
LESS DISTRIBUTIONS FROM: | | | | | | | | | | | | | | | | |
| | | | | | |
Net investment income | | (0.30) | | | (0.31) | | | (0.21) | | | (0.12) | | (0.10) | | | (0.04) |
| | | | | | |
Net realized gains on investments | | (3.44) | | | (3.62) | | | (0.58) | | | (0.09) | | (0.21) | | | — |
| | | | | | |
Total distributions | | (3.74) | | | (3.93) | | | (0.79) | | | (0.21) | | (0.31) | | | (0.04) |
| | | | | | |
Paid-in capital from redemption fees (Note 2) | | — | 3 | | — | 3 | | — | 3 | | 0.01 | | — | 3 | | 0.02 |
| | | | | | |
Net Asset Value, end of period | | $11.05 | | | $27.86 | | | $23.71 | | | $19.27 | | $15.90 | | | $13.22 |
| | | | | | |
TOTAL RETURN | | (46.12%) | | | 33.66% | | | 27.22% | | | 22.51% | | 22.69% | 4 | | 18.45% |
| | | | | | |
RATIOS/SUPPLEMENTAL DATA | | | | | | | | | | | | | | | | |
| | | | | | |
Net assets, end of period (in 000’s) | | $1,202,441 | | | $3,806,714 | | | $3,303,717 | | | $2,031,995 | | $855,153 | | | $587,133 |
| | | | | | |
Ratio of expenses to average net assets before reimbursement, waiver or recapture of expenses by Advisor and Administrator (Note 3) | | 1.12% | | | 1.11% | | | 1.18% | | | 1.31% | | 1.39% | 5 | | 1.50% |
| | | | | | |
Ratio of expenses to average net assets after reimbursement, waiver or recapture of expenses by Advisor and Administrator | | 1.12% | | | 1.10% | | | 1.16% | | | 1.31% | | 1.36% | 5 | | 1.48% |
| | | | | | |
Ratio of net investment income (loss) to average net assets | | 1.10% | | | 1.12% | | | 1.12% | | | 1.10% | | (0.16%) | 5 | | 0.95% |
| | | | | | |
Portfolio turnover | | 16.76% | | | 24.09% | | | 18.80% | | | 3.03% | | 3.82% | 4 | | 15.16% |
| 1 | The Fund’s fiscal year end changed from August 31 to December 31, effective December 31, 2004. |
| 2 | Calculated using the average daily shares method. |
| 3 | Less than $0.01 per share. |
See accompanying notes to financial statements.
66 MATTHEWS ASIA FUNDS
Matthews China Fund
The table below sets forth financial data for a share of beneficial interest outstanding throughout each period presented.
| | | | | | | | | | | | | | | | | | |
| | | Year Ended December 31, | | | | | | Year Ended
Aug. 31, 2004 | |
| | | 2008 | | | 2007 | | | 2006 | | | 2005 | | | Four-Month
Period Ended
Dec. 31, 20041 | | |
| | | | | | |
Net Asset Value, beginning of period | | $39.73 | | | $24.16 | | | $14.76 | | | $14.01 | | | $13.26 | | | $11.54 | |
| | | | | | |
INCOME (LOSS) FROM INVESTMENT OPERATIONS: | | | | | | | | | | | | | | | | | | |
| | | | | | |
Net investment income | | 0.30 | 2 | | 0.12 | | | 0.15 | | | 0.22 | | | 0.03 | | | 0.08 | |
| | | | | | |
Net realized gain (loss) and unrealized appreciation (depreciation) on investments and foreign currency | | (19.78 | ) | | 16.85 | | | 9.39 | | | 0.74 | | | 1.38 | | | 1.67 | |
| | | | | | |
Total from investment operations | | (19.48 | ) | | 16.97 | | | 9.54 | | | 0.96 | | | 1.41 | | | 1.75 | |
| | | | | | |
LESS DISTRIBUTIONS FROM: | | | | | | | | | | | | | | | | | | |
| | | | | | |
Net investment income | | (0.33 | ) | | (0.11 | ) | | (0.15 | ) | | (0.22 | ) | | (0.14 | ) | | (0.07 | ) |
| | | | | | |
Net realized gains on investments | | (5.62 | ) | | (1.37 | ) | | — | | | — | | | (0.53 | ) | | — | |
| | | | | | |
Return of capital | | — | | | — | | | — | 3 | | — | | | — | | | — | |
| | | | | | |
Total distributions | | (5.95 | ) | | (1.48 | ) | | (0.15 | ) | | (0.22 | ) | | (0.67 | ) | | (0.07 | ) |
| | | | | | |
Paid-in capital from redemption fees (Note 2) | | 0.04 | | | 0.08 | | | 0.01 | | | 0.01 | | | 0.01 | | | 0.04 | |
| | | | | | |
Net Asset Value, end of period | | $14.34 | | | $39.73 | | | $24.16 | | | $14.76 | | | $14.01 | | | $13.26 | |
| | | | | | |
TOTAL RETURN | | (48.95% | ) | | 70.14% | | | 64.81% | | | 6.91% | | | 10.61% | 4 | | 15.48% | |
| | | | | | |
RATIOS/SUPPLEMENTAL DATA | | | | | | | | | | | | | | | | | | |
| | | | | | |
Net assets, end of period (in 000’s) | | $781,104 | | | $2,335,402 | | | $966,528 | | | $388,950 | | | $380,121 | | | $340,251 | |
| | | | | | |
Ratio of expenses to average net assets before reimbursement, waiver or recapture of expenses by Advisor and Administrator (Note 3) | | 1.23% | | | 1.18% | | | 1.27% | | | 1.31% | | | 1.47% | 5 | | 1.52% | |
| | | | | | |
Ratio of expenses to average net assets after reimbursement, waiver or recapture of expenses by Advisor and Administrator | | 1.23% | | | 1.17% | | | 1.26% | | | 1.30% | | | 1.43% | 5 | | 1.50% | |
| | | | | | |
Ratio of net investment income to average net assets | | 1.03% | | | 0.49% | | | 0.96% | | | 1.46% | | | 0.85% | 5 | | 1.04% | |
| | | | | | |
Portfolio turnover | | 7.91% | | | 22.13% | | | 11.65% | | | 11.82% | | | 4.99% | 4 | | 28.99% | |
| 1 | The Fund’s fiscal year end changed from August 31 to December 31, effective December 31, 2004. |
| 2 | Calculated using the average daily shares method. |
| 3 | Less than $0.01 per share. |
See accompanying notes to financial statements.
matthewsasia.com | 800.789.ASIA 67
Financial Highlights
Matthews India Fund
The table below sets forth financial data for a share of beneficial interest outstanding throughout each period presented.
| | | | | | | | | | | | |
| | | Year Ended December 31, | | | Period Ended
Dec. 31, 20051 | |
| | | 2008 | | | 2007 | | | 2006 | | |
| | | | |
Net Asset Value, beginning of period | | $24.44 | | | $15.45 | | | $11.32 | | | $10.00 | |
| | | | |
INCOME (LOSS) FROM INVESTMENT OPERATIONS: | | | | | | | | | | | | |
| | | | |
Net investment income (loss) | | 0.03 | 2 | | (0.01 | ) | | (0.01 | ) | | (0.01 | ) |
| | | | |
Net realized gain (loss) and unrealized appreciation (depreciation) on investments and foreign currency | | (15.33 | ) | | 9.87 | | | 4.11 | | | 1.33 | |
| | | | |
Total from investment operations | | (15.30 | ) | | 9.86 | | | 4.10 | | | 1.32 | |
| | | | |
LESS DISTRIBUTIONS FROM: | | | | | | | | | | | | |
| | | | |
Net investment income | | (0.11 | ) | | (0.21 | ) | | — | | | — | |
| | | | |
Net realized gains on investments | | (0.69 | ) | | (0.68 | ) | | — | | | — | |
| | | | |
Total distributions | | (0.80 | ) | | (0.89 | ) | | — | | | — | |
| | | | |
Paid-in capital from redemption fees (Note 2) | | 0.03 | | | 0.02 | | | 0.03 | | | — | 3 |
| | | | |
Net Asset Value, end of period | | $8.37 | | | $24.44 | | | $15.45 | | | $11.32 | |
| | | | |
TOTAL RETURN | | (62.32% | ) | | 64.13% | | | 36.48% | | | 13.20% | 4 |
| | | | |
RATIOS/SUPPLEMENTAL DATA | | | | | | | | | | | | |
| | | | |
Net assets, end of period (in 000’s) | | $317,516 | | | $1,311,072 | | | $669,643 | | | $80,897 | |
| | | | |
Ratio of expenses to average net assets before reimbursement, waiver or recapture of expenses by Advisor and Administrator (Note 3) | | 1.29% | | | 1.29% | | | 1.41% | | | 2.75% | 5 |
| | | | |
Ratio of expenses to average net assets after reimbursement, waiver or recapture of expenses by Advisor and Administrator | | 1.29% | | | 1.28% | | | 1.41% | | | 2.00% | 5 |
| | | | |
Ratio of net investment income (loss) to average net assets | | 0.16% | | | (0.04% | ) | | (0.08% | ) | | (1.17% | )5 |
| | | | |
Portfolio turnover | | 26.68% | | | 25.59% | | | 21.57% | | | 0.00% | 4 |
| 1 | The Matthews India Fund commenced operations on October 31, 2005. |
| 2 | Calculated using the average daily shares method. |
| 3 | Less than $0.01 per share. |
See accompanying notes to financial statements.
68 MATTHEWS ASIA FUNDS
Matthews Japan Fund
The table below sets forth financial data for a share of beneficial interest outstanding throughout each period presented.
| | | | | | | | | | | | | | | | | | |
| | | Year Ended December 31, | | | | | | | |
| | | 2008 | | | 2007 | | | 2006 | | | 2005 | | | Four-Month
Period Ended
Dec. 31, 20041 | | | Year Ended
Aug. 31, 2004 | |
| | | | | | |
Net Asset Value, beginning of period | | $14.55 | | | $17.29 | | | $18.48 | | | $16.12 | | | $14.73 | | | $10.90 | |
| | | | | | |
INCOME (LOSS) FROM INVESTMENT OPERATIONS: | | | | | | | | | | | | | | | | | | |
| | | | | | |
Net investment income (loss) | | 0.11 | 2 | | 0.03 | | | (0.08 | ) | | 0.02 | | | (0.02 | ) | | (0.05 | ) |
| | | | | | |
Net realized gain (loss) and unrealized appreciation (depreciation) on investments and foreign currency | | (4.26 | ) | | (1.86 | ) | | (1.12 | ) | | 2.36 | | | 1.40 | | | 3.82 | |
| | | | | | |
Total from investment operations | | (4.15 | ) | | (1.83 | ) | | (1.20 | ) | | 2.38 | | | 1.38 | | | 3.77 | |
| | | | | | |
LESS DISTRIBUTIONS FROM: | | | | | | | | | | | | | | | | | | |
| | | | | | |
Net investment income | | — | | | (0.01 | ) | | — | | | (0.03 | ) | | — | | | — | |
| | | | | | |
Net realized gains on investments | | (0.22 | ) | | (0.91 | ) | | — | | | — | | | — | | | — | |
| | | | | | |
Total distributions | | (0.22 | ) | | (0.92 | ) | | — | | | (0.03 | ) | | — | | | — | |
| | | | | | |
Paid-in capital from redemption fees (Note 2) | | 0.01 | | | 0.01 | | | 0.01 | | | 0.01 | | | 0.01 | | | 0.06 | |
| | | | | | |
Net Asset Value, end of period | | $10.19 | | | $14.55 | | | $17.29 | | | $18.48 | | | $16.12 | | | $14.73 | |
| | | | | | |
TOTAL RETURN | | (28.38% | ) | | (10.96% | ) | | (6.44% | ) | | 14.83% | | | 9.44% | 3 | | 35.14% | |
| | | | | | |
RATIOS/SUPPLEMENTAL DATA | | | | | | | | | | | | | | | | | | |
| | | | | | |
Net assets, end of period (in 000’s) | | $123,674 | | | $166,860 | | | $276,656 | | | $367,618 | | | $200,482 | | | $195,256 | |
| | | | | | |
Ratio of expenses to average net assets before reimbursement, waiver or recapture of expenses by Advisor and Administrator (Note 3) | | 1.23% | | | 1.24% | | | 1.25% | | | 1.29% | | | 1.40% | 4 | | 1.46% | |
| | | | | | |
Ratio of expenses to average net assets after reimbursement, waiver or recapture of expenses by Advisor and Administrator | | 1.23% | | | 1.23% | | | 1.24% | | | 1.28% | | | 1.38% | 4 | | 1.45% | |
| | | | | | |
Ratio of net investment income (loss) to average net assets | | 0.84% | | | (0.01% | ) | | (0.29% | ) | | (0.10% | ) | | (0.31% | )4 | | (0.71% | ) |
| | | | | | |
Portfolio turnover | | 88.97% | | | 45.51% | | | 59.95% | | | 20.88% | | | 5.30% | 3 | | 14.57% | |
| 1 | The Fund’s fiscal year end changed from August 31 to December 31, effective December 31, 2004. |
| 2 | Calculated using the average daily shares method. |
See accompanying notes to financial statements.
matthewsasia.com | 800.789.ASIA 69
Financial Highlights
Matthews Korea Fund
The table below sets forth financial data for a share of beneficial interest outstanding throughout each period presented.
| | | | | | | | | | | | | | | | | |
| | | Year Ended December 31, | | | | | | | |
| | | 2008 | | | 2007 | | | 2006 | | 2005 | | | Four-Month
Period Ended
Dec. 31, 20041 | | | Year Ended
Aug. 31, 2004 | |
| | | | | | |
Net Asset Value, beginning of period | | $6.56 | | | $6.23 | | | $6.37 | | $4.08 | | | $3.94 | | | $4.37 | |
| | | | | | |
INCOME (LOSS) FROM INVESTMENT OPERATIONS: | | | | | | | | | | | | | | | | | |
| | | | | | |
Net investment income (loss) | | (0.02) | 2 | | 0.07 | | | 0.01 | | 0.01 | | | — | | | 0.04 | |
| | | | | | |
Net realized gain (loss) and unrealized appreciation (depreciation) on investments and foreign currency | | (3.48) | | | 1.15 | | | 0.80 | | 2.39 | | | 0.78 | | | 0.34 | |
| | | | | | |
Total from investment operations | | (3.50) | | | 1.22 | | | 0.81 | | 2.40 | | | 0.78 | | | 0.38 | |
| | | | | | |
LESS DISTRIBUTIONS FROM: | | | | | | | | | | | | | | | | | |
| | | | | | |
Net investment income | | (0.06) | | | (0.02) | | | (0.01) | | — | | | (0.01) | | | — | 3 |
| | | | | | |
Net realized gains on investments | | (0.25) | | | (0.87) | | | (0.95) | | (0.11) | | | (0.63) | | | (0.82) | |
| | | | | | |
Total distributions | | (0.31) | | | (0.89) | | | (0.96) | | (0.11) | | | (0.64) | | | (0.82) | |
| | | | | | |
Paid-in capital from redemption fees (Note 2) | | — | 3 | | — | 3 | | 0.01 | | — | 3 | | — | 3 | | 0.01 | |
| | | | | | |
Net Asset Value, end of period | | $2.75 | | | $6.56 | | | $6.23 | | $6.37 | | | $4.08 | | | $3.94 | |
| | | | | | |
TOTAL RETURN | | (52.66%) | | | 18.90% | | | 12.99% | | 58.76% | | | 20.60% | 4 | | 9.91% | |
| | | | | | |
RATIOS/SUPPLEMENTAL DATA | | | | | | | | | | | | | | | | | |
| | | | | | |
Net assets, end of period (in 000’s) | | $87,253 | | | $250,421 | | | $241,003 | | $269,925 | | | $127,794 | | | $110,199 | |
| | | | | | |
Ratio of expenses to average net assets before reimbursement, waiver or recapture of expenses by Advisor and Administrator (Note 3) | | 1.27% | | | 1.21% | | | 1.30% | | 1.35% | | | 1.49% | 5 | | 1.51% | |
| | | | | | |
Ratio of expenses to average net assets after reimbursement, waiver or recapture of expenses by Advisor and Administrator | | 1.27% | | | 1.21% | | | 1.28% | | 1.35% | | | 1.31% | 5 | | 1.50% | |
| | | | | | |
Ratio of net investment income (loss) to average net assets | | (0.34%) | | | 1.17% | | | (0.09%) | | 0.27% | | | (0.69%) | 5 | | 0.29% | |
| | | | | | |
Portfolio turnover | | 28.70% | | | 24.20% | | | 25.82% | | 10.13% | | | 6.53% | 4 | | 18.40% | |
| 1 | The Fund’s fiscal year end changed from August 31 to December 31, effective December 31, 2004. |
| 2 | Calculated using the average daily shares method. |
| 3 | Less than $0.01 per share. |
See accompanying notes to financial statements.
70 MATTHEWS ASIA FUNDS
Matthews Asia Small Companies Fund
The table below sets forth financial data for a share of beneficial interest outstanding throughout the period presented.
| | | |
| | | Period Ended
December 31, 20081 | |
| |
Net Asset Value, beginning of period | | $10.00 | |
| |
LOSS FROM INVESTMENT OPERATIONS: | | | |
| |
Net investment income | | 0.01 | 2 |
| |
Net realized loss and unrealized depreciation on investments and foreign currency | | (2.16) | |
| |
Total from investment operations | | (2.15) | |
| |
LESS DISTRIBUTIONS FROM: | | | |
| |
Net investment income | | (0.02) | |
| |
Total distributions | | (0.02) | |
| |
Paid-in capital from redemption fees (Note 2) | | 0.06 | |
| |
Net Asset Value, end of period | | $7.89 | |
| |
TOTAL RETURN | | (21.03 | %)3 |
| |
RATIOS/SUPPLEMENTAL DATA | | | |
| |
Net assets, end of period (in 000’s) | | $3,173 | |
| |
Ratio of expenses to average net assets before reimbursement, or waiver of expenses by Advisor (Note 3) | | 14.31 | %4 |
| |
Ratio of expenses to average net assets after reimbursement, or waiver of expenses by Advisor | | 2.00 | %4 |
| |
Ratio of net investment income to average net assets | | 0.51 | %4 |
| |
Portfolio turnover | | 3.10 | %3 |
| 1 | The Matthews Asia Small Companies Fund commenced operations on September 15, 2008. |
| 2 | Calculated using the average daily shares method. |
See accompanying notes to financial statements.
matthewsasia.com | 800.789.ASIA 71
Financial Highlights
Matthews Asian Technology Fund
The table below sets forth financial data for a share of beneficial interest outstanding throughout each period presented.
| | | | | | | | | | | | | | | | |
| | | Year Ended December 31, | | | | | | |
| | | 2008 | | | 2007 | | | 2006 | | 2005 | | | Four-Month
Period Ended
Dec. 31, 20041 | | | Year Ended
Aug. 31, 2004 |
| | | | | | |
Net Asset Value, beginning of period | | $9.80 | | | $7.92 | | | $6.53 | | $5.45 | | | $4.83 | | | $4.30 |
| | | | | | |
INCOME (LOSS) FROM INVESTMENT OPERATIONS: | | | | | | | | | | | | | | | | |
| | | | | | |
Net investment income (loss) | | 0.01 | 2 | | — | 3 | | (0.02) | | — | 3 | | (0.02) | | | (0.02) |
| | | | | | |
Net realized gain (loss) and unrealized appreciation (depreciation) on investments and foreign currency | | (5.11) | | | 1.87 | | | 1.40 | | 1.08 | | | 0.64 | | | 0.53 |
| | | | | | |
Total from investment operations | | (5.10) | | | 1.87 | | | 1.38 | | 1.08 | | | 0.62 | | | 0.51 |
| | | | | | |
Paid-in capital from redemption fees (Note 2) | | 0.01 | | | 0.01 | | | 0.01 | | — | 3 | | — | 3 | | 0.02 |
| | | | | | |
Net Asset Value, end of period | | $4.71 | | | $9.80 | | | $7.92 | | $6.53 | | | $5.45 | | | $4.83 |
| | | | | | |
TOTAL RETURN | | (51.94%) | | | 23.74% | | | 21.29% | | 19.82% | | | 12.84% | 4 | | 12.40% |
| | | | | | |
RATIOS/SUPPLEMENTAL DATA | | | | | | | | | | | | | | | | |
| | | | | | |
Net assets, end of period (in 000’s) | | $74,476 | | | $252,304 | | | $129,819 | | $50,426 | | | $38,865 | | | $34,297 |
| | | | | | |
Ratio of expenses to average net assets before reimbursement, waiver or recapture of expenses by Advisor and Administrator (Note 3) | | 1.33% | | | 1.26% | | | 1.41% | | 1.49% | | | 1.64% | 5 | | 1.63% |
| | | | | | |
Ratio of expenses to average net assets after reimbursement, waiver or recapture of expenses by Advisor and Administrator | | 1.33% | | | 1.25% | | | 1.39% | | 1.48% | | | 1.60% | 5 | | 1.91% |
| | | | | | |
Ratio of net investment income (loss) to average net assets | | 0.08% | | | (0.30%) | | | (0.29%) | | 0.08% | | | (0.85%) | 5 | | (0.31%) |
| | | | | | |
Portfolio turnover | | 44.84% | | | 33.21% | | | 34.77% | | 29.76% | | | 7.36% | 4 | | 41.25% |
| 1 | The Fund’s fiscal year end changed from August 31 to December 31, effective December 31, 2004. |
| 2 | Calculated using the average daily shares method. |
| 3 | Less than $0.01 per share. |
See accompanying notes to financial statements.
72 MATTHEWS ASIA FUNDS
Notes to Financial Statements
| 1. | SIGNIFICANT ACCOUNTING POLICIES |
Matthews Asia Funds, formerly doing business as Matthews Asian Funds (the “Trust”), is an open-end management investment company registered under the Investment Company Act of 1940, as amended (the “Act”). The Trust currently issues ten separate series of shares (each a “Fund” and collectively, the “Funds”): Matthews Asian Growth and Income Fund, Matthews Asia Pacific Equity Income Fund, Matthews Asia Pacific Fund, Matthews Pacific Tiger Fund, Matthews China Fund, Matthews India Fund, Matthews Japan Fund, Matthews Korea Fund, Matthews Asia Small Companies Fund and Matthews Asian Technology Fund. Matthews Pacific Tiger Fund, Matthews China Fund and Matthews Korea Fund are authorized to offer two classes of shares: Class I shares and Class A shares. Currently, only Class I shares are offered. Effective December 31, 2004, the Funds fiscal year end changed from August 31 to December 31. The following is a summary of significant accounting policies consistently followed by the Funds in preparation of their financial statements.
| A. | SECURITY VALUATION: The Funds’ equity securities are valued based on market quotations, or at fair value as determined in good faith by or under the direction of the Board of Trustees (the “Board”) when no market quotations are available or when market quotations have become unreliable. Securities that trade in over-the-counter markets, including most debt securities (bonds), may be valued using indicative bid and ask quotations from bond dealers or market makers, or other available market information, or on their fair value as determined by or under the direction of the Board. The Board has delegated the responsibility of making fair value determinations to the Funds’ Valuation Committee (the “Valuation Committee”), subject to the Funds’ Pricing Policies. When fair value pricing is employed, the prices of securities used by a Fund to calculate its NAV differ from any quoted or published prices for the same securities for that day. All fair value determinations are made subject to the Board’s oversight. |
The books and records of the Funds are maintained in U.S. dollars. Transactions, portfolio securities, and assets and liabilities denominated in a foreign currency are translated and recorded in U.S. dollars at the prevailing exchange rate as of the close of trading on the New York Stock Exchange (“NYSE”). Translation gains or losses resulting from changes in the exchange rate during the reporting period and realized gains and losses on the settlement of foreign currency transactions are reported in the results of operations for the current period. The Funds do not isolate that portion of gains and losses on investments in equity securities that is due to changes in foreign exchange rate from that which is due to changes in market prices of equity securities.
Market values for equity securities are determined based on quotations from the principal (or most advantageous) market on which the security is traded. Market quotations used by the Funds include last reported sale prices, or, if such prices are not reported or available, bid and asked prices. Securities are valued through valuations obtained from a commercial pricing service or by investment dealers in accordance with procedures established by the Board.
Events affecting the value of foreign investments occur between the time at which they are determined and the close of trading on the NYSE. If the Funds believe that such events render market quotations unreliable, and the impact of such events can be reasonably determined, the investments will be valued at their fair value. The fair value of a security held by the Funds may be determined using the services of third-party pricing services retained by the Funds or by the Valuation Committee, in either case subject to the Board’s oversight.
Foreign securities held by the Funds may be traded on days and at times when the NYSE is closed. Accordingly, the NAV of the Funds may be significantly affected on days when shareholders have no access to the Funds.
| B. | ADOPTION OF STATEMENT OF FINANCIAL ACCOUNTING STANDARDS NO. 157 “FAIR VALUE MEASUREMENTS” (“SFAS NO. 157”): |
In September 2006, the Financial Accounting Standards Board issued Statement on Financial Accounting Standards No.157, “Fair Value Measurements” (“SFAS No. 157”) effective for fiscal years beginning after November 15, 2007. This standard clarifies the definition of fair value for financial reporting, establishes a framework for measuring fair value and requires additional disclosures about the use of fair value measurements. The Funds have adopted SFAS No. 157 as of January 1, 2008. The three levels of the fair value hierarchy under SFAS No. 157 are described below:
Level 1: Quoted prices in active markets for identical securities
Level 2: Other significant observable inputs (including quoted prices for similar securities, interest rates, prepayment speeds, credit risk, etc.)
Level 3: Significant unobservable inputs (including the Fund’s own assumptions in determining the fair value of investments) As of December 31, 2008, Level 3 Securities consist of convertible bonds that trade in over the counter markets.
As described in Note 1-A, these securities are valued using indicative bid and ask quotations from bond dealers and market makers, or on their fair value as determined under the direction of the Board. Indicative quotations and other information used by the Funds may not always be directly observable in the marketplace due to the nature of these markets and the manner of execution. These inputs, the methodology used for valuing such securities, and the characterization of such securities as Level 3 Securities are not necessarily an indication of liquidity, or the risk associated with investing in these securities.
The summary of inputs used to value the Fund’s net assets as of December 31, 2008 is as follows:
| | | | | | | | | | |
| | | Matthews Asian
Growth and
Income Fund | | Matthews Asia
Pacific Equity
Income Fund | | Matthews Asia
Pacific Fund | | Matthews Pacific
Tiger Fund | | Matthews
China Fund |
Level 1: Quoted Prices | | $75,507,279 | | $8,868,971 | | $5,811,606 | | $103,507,294 | | $95,465,285 |
Level 2: Other Significant Observable Inputs | | 621,561,574 | | 125,960,628 | | 162,009,973 | | 1,090,734,232 | | 678,138,889 |
Level 3: Significant Unobservable Inputs | | 368,908,419 | | 2,803,227 | | — | | — | | — |
Total Market Value of Investments | | $1,065,977,272 | | $137,632,826 | | $167,821,579 | | $1,194,241,526 | | $773,604,174 |
matthewsasia.com | 800.789.ASIA 73
Notes to Financial Statements (continued)
| | | | | | | | | | |
| | | Matthews India Fund | | Matthews
Japan Fund | | Matthews
Korea Fund | | Matthews Asia Small
Companies Fund | | Matthews Asian
Technology Fund |
Level 1: Quoted Prices | | $20,660,441 | | $— | | $6,714,014 | | $265,164 | | $20,581,725 |
Level 2: Other Significant Observable Inputs | | 282,283,599 | | 123,377,541 | | 79,294,433 | | 2,644,443 | | 53,701,332 |
Level 3: Significant Unobservable Inputs | | 15,405,773 | | — | | — | | — | | — |
Total Market Value of Investments | | $318,349,813 | | $123,377,541 | | $86,008,447 | | $2,909,607 | | $74,283,057 |
Following is a reconciliation of Level 3 investments for which significant unobservable inputs were used to determine fair value:
| | | | | | | | | |
| | | Matthews Asian
Growth and
Income Fund | | | Matthews Asia
Pacific Equity
Income Fund | | | Matthews India Fund | |
Balance as of 01/01/08 (market value) | | $522,269,199 | | | $2,115,979 | | | $50,803,000 | |
Accrued discounts/premiums | | 11,100,340 | | | 16,513 | | | 848,584 | |
Realized gain/(loss) | | 3,090,049 | | | — | | | (1,606,218 | ) |
Change in unrealized appreciation/(depreciation) | | (193,315,558 | ) | | 488,041 | | | (15,736,005 | ) |
Net purchases/(sales) | | 32,555,922 | | | 2,298,673 | | | (18,903,588 | ) |
Transfers in and/or out of Level 3 | | (6,791,533 | ) | | (2,115,979 | ) | | — | |
Balance as of 12/31/08 (market value) | | $368,908,419 | | | $2,803,227 | | | $15,405,773 | |
Net change in unrealized appreciation/depreciation on Level 3 investments held as of 12/31/08* | | ($130,326,632 | ) | | $488,041 | | | ($3,966,232 | ) |
| * | Included in the related amounts on the Statements of Operations. |
| C. | RISKS ASSOCIATED WITH NON-U.S. COMPANIES: Investments by the Funds in the securities of non-U.S. companies may involve investment risks different from those of U.S. issuers including possible political or economical instability of the country of the issuer, the possibility of disruption to international trade patterns, the possibility of currency crises and exchange controls, the possible imposition of foreign withholding tax on the interest income payable on such instruments, the possible establishment of foreign controls, the possible seizure or nationalization of foreign deposits or assets, or the adoption of other foreign government restrictions that might adversely affect the foreign securities held by the Funds. Foreign securities may also be subject to greater fluctuations in price than securities of domestic corporations or the U.S. government. There may be less publicly available information about a non-U.S. company than about a U.S. company. Sometimes non-U.S. companies are subject to different accounting, auditing, and financial reporting standards, practices, and requirements than U.S. companies. There is generally less government regulation of stock exchanges, brokers, and listed companies abroad than in the U.S., which may result in less transparency with respect to a company’s operations. The absence of negotiated brokerage commissions in certain countries may result in higher brokerage fees. With respect to certain non-U.S. countries, there is a possibility of expropriation, nationalization, confiscatory taxation, or diplomatic developments that could affect investments in those countries. |
| D. | FEDERAL INCOME TAXES: It is the policy of the Funds to comply with all requirements of the Internal Revenue Code of 1986, as amended (“the Code”), applicable to regulated investment companies and to distribute substantially all of their taxable income to their shareholders. The Funds have met the requirements of the Code applicable to regulated investment companies for the period ended December 31, 2008. Therefore, no federal income tax provision is required. Income and capital gains of the Funds are determined in accordance with both tax regulations and accounting principles generally accepted in the U.S. (GAAP). Such treatment may result in temporary and permanent differences between tax basis earnings and earnings reported for financial statement purposes. These reclassifications, which have no impact on the net asset value of the Funds, are primarily attributable to certain differences in computation of distributable income and capital gains under federal tax rules versus GAAP, and the use of the tax accounting practice known as equalization. |
In addition to the requirements of the Code, the Funds may be subject to short-term capital gains tax in India on gains realized upon disposition of Indian securities held less than one year. The tax is computed on net realized gains; any realized losses in excess of gains may be carried forward for a period of up to eight years to offset future gains. Any net taxes payable must be remitted to the Indian government prior to repatriation of sales proceeds. The Funds that invest in Indian securities accrue a deferred tax liability for net unrealized short-term gains in excess of available carryforwards on Indian securities. This accrual may reduce a Fund’s net asset value. As of December 31, 2008, the Matthews Pacific Tiger Fund and Matthews Asia Small Companies Fund have recorded a payable of $171,388 and $3,814, respectively as an estimate for potential future India capital gains taxes.
The Funds adopted the provisions of FASB Interpretation No. 48 (“FIN48”), Accounting for Uncertainty in Income Taxes, on June 29, 2007 and applied FIN48 to all open tax years as of the date of effectiveness. The implementation of FIN48 resulted in no material liability for unrecognized tax benefits and no material change to the beginning net asset value of the Funds. As of and during the period ended December 31, 2008, the Funds did not have a liability for any unrecognized tax benefits. The Funds recognize interest and penalties, if any, related to unrecognized tax benefits as income tax expense in the Statements of Operations. During the period, the Funds did not incur any interest or penalties. The Fund’s open tax years are 2005-2008.
| E. | OFFERING COSTS: Offering costs are amortized on a straight-line basis over one year from each Fund’s respective commencement of operations. In the event that any of the initial shares are redeemed during the period of amortization of the Fund’s offering costs, the redemption proceeds will be reduced by any such unamortized offering costs in the same proportion as the number of shares being redeemed bears to the number of those shares outstanding at the time of redemption. |
74 MATTHEWS ASIA FUNDS
| F. | DISTRIBUTIONS TO SHAREHOLDERS: It is the policy of Matthews Asian Growth and Income Fund to distribute net investment income on a semi-annual basis and capital gains, if any, annually. It is the policy of Matthews Asia Pacific Equity Income Fund to distribute net investment income on a quarterly basis and capital gains, if any, annually. Matthews Asia Pacific Fund, Matthews Pacific Tiger Fund, Matthews China Fund, Matthews India Fund, Matthews Japan Fund, Matthews Korea Fund, Matthews Asia Small Companies Fund and Matthews Asian Technology Fund distribute net investment income and capital gains, if any, annually. Distributions to shareholders are recorded on the ex-dividend date. Income and capital gain distributions are determined in accordance with income tax regulations which may differ from GAAP. Net investment losses may not be utilized to offset net investment income in future periods for tax purposes. |
The tax character of distributions paid for the fiscal years ended December 31, 2008 and December 31, 2007 were as follows:
| | | | | | |
| YEAR ENDED DECEMBER 31, 2008 | | Ordinary
Income | | Net Long-Term
Capital Gains | | Total Taxable
Distributions |
Matthews Asian Growth and Income Fund | | $46,939,388 | | $146,858,628 | | $193,798,016 |
Matthews Asia Pacific Equity Income Fund | | 3,061,632 | | 92,307 | | 3,153,939 |
Matthews Asia Pacific Fund | | 589,467 | | 12,070,194 | | 12,659,661 |
Matthews Pacific Tiger Fund | | 33,450,241 | | 289,634,922 | | 323,085,163 |
Matthews China Fund | | 13,004,926 | | 222,048,330 | | 235,053,256 |
Matthews India Fund | | 4,953,902 | | 23,888,299 | | 28,842,201 |
Matthews Japan Fund | | 29 | | 2,681,646 | | 2,681,675 |
Matthews Korea Fund | | 1,673,243 | | 7,207,898 | | 8,881,141 |
Matthews Asia Small Companies Fund | | 5,235 | | — | | 5,235 |
| | | |
| YEAR ENDED DECEMBER 31, 2007 | | Ordinary
Income | | Net Long-Term
Capital Gains | | Total Taxable
Distributions |
Matthews Asian Growth and Income Fund | | $113,973,409 | | $195,076,425 | | $309,049,834 |
Matthews Asia Pacific Equity Income Fund | | 4,412,225 | | — | | 4,412,225 |
Matthews Asia Pacific Fund | | 5,198,959 | | 39,398,907 | | 44,597,866 |
Matthews Pacific Tiger Fund | | 47,688,902 | | 448,098,243 | | 495,787,145 |
Matthews China Fund | | 6,158,810 | | 77,731,715 | | 83,890,525 |
Matthews India Fund | | 11,776,278 | | 31,965,151 | | 43,741,429 |
Matthews Japan Fund | | 82,727 | | 11,302,509 | | 11,385,236 |
Matthews Korea Fund | | 627,099 | | 30,040,481 | | 30,667,580 |
| G. | INVESTMENT TRANSACTIONS AND INCOME: Securities transactions are accounted for on the date the securities are purchased or sold. Gains or losses on the sale of securities are determined on the identified cost basis. Interest income is recorded on the accrual basis. Dividend income is recorded on the ex-dividend date. |
For the year ended December 31, 2007, the Funds changed the method by which they record and recognize dividend income for Korean equity securities held in the Funds as a result of, among other things, establishing a reasonable basis to estimate for Korean dividends at ex-date. Prior to 2007, it had been the policy of the Funds to record dividend income for certain Korean securities following the annual general meeting of shareholders of such companies. These dividends were recorded in the next fiscal year following the ex-date of these distributions. Dividend income is now recorded in the current fiscal year on ex-date based on estimated dividend rates. Estimated dividends are updated as additional information becomes available.
| H. | FUND EXPENSE ALLOCATIONS: The Funds account separately for the assets, liabilities and operations of each Fund. Direct expenses of each Fund are charged to the Fund while general expenses are allocated pro-rata among the Funds based on net assets. |
| I. | CASH OVERDRAFTS: When cash balances are overdrawn, a Fund is charged an overdraft fee by the custodian of 1.00% above the 30 day LIBOR rate on outstanding balances. These amounts, if any, are included in other expenses on the Statements of Operations. |
| J. | USE OF ESTIMATES: The preparation of financial statements in conformity with GAAP requires management to make estimates and assumptions that affect the amounts reported in the financial statements and accompanying notes. Actual results may differ from those estimates. |
| 2. | CAPITAL SHARE TRANSACTIONS: |
Each Fund is authorized to issue an unlimited number of shares of beneficial interest with a par value of $0.001 per share.
| | | | | | | | | | | | |
| | | Year Ended December 31, 2008 | | | Year Ended December 31, 2007 | |
| MATTHEWS ASIAN GROWTH AND INCOME FUND | | Shares | | | Amount | | | Shares | | | Amount | |
Shares sold | | 21,899,058 | | | $328,702,177 | | | 14,935,556 | | | $298,658,709 | |
Shares issued through reinvestment of distributions | | 14,082,294 | | | 183,071,148 | | | 14,482,732 | | | 291,967,013 | |
Shares redeemed | | (56,110,939 | ) | | (834,979,930 | ) | | (22,714,991 | ) | | (455,813,981 | ) |
Net increase (decrease) | | (20,129,587 | ) | | ($323,206,605 | ) | | 6,703,297 | | | $134,811,741 | |
matthewsasia.com | 800.789.ASIA 75
Notes to Financial Statements (continued)
| | | | | | | | | | | | |
| | | Year Ended December 31, 2008 | | | Year Ended December 31, 2007 | |
| MATTHEWS ASIA PACIFIC EQUITY INCOME FUND | | Shares | | | Amount | | | Shares | | | Amount | |
Shares sold | | 14,488,000 | | | $132,923,382 | | | 6,323,727 | | | $73,333,655 | |
Shares issued through reinvestment of distributions | | 301,620 | | | 2,985,343 | | | 344,963 | | | 4,244,205 | |
Shares redeemed | | (5,108,990 | ) | | (49,481,429 | ) | | (2,257,812 | ) | | (26,400,852 | ) |
Net increase | | 9,680,630 | | | $86,427,296 | | | 4,410,878 | | | $51,177,008 | |
| | |
| | | Year Ended December 31, 2008 | | | Year Ended December 31, 2007 | |
| MATTHEWS ASIA PACIFIC FUND | | Shares | | | Amount | | | Shares | | | Amount | |
Shares sold | | 4,889,230 | | | $68,077,616 | | | 9,065,758 | | | $160,241,353 | |
Shares issued through reinvestment of distributions | | 969,733 | | | 9,357,976 | | | 1,758,055 | | | 32,330,674 | |
Shares redeemed | | (16,349,415 | ) | | (204,900,950 | ) | | (10,147,960 | ) | | (179,463,162 | ) |
Net increase (decrease) | | (10,490,452 | ) | | ($127,465,358 | ) | | 675,853 | | | $13,108,865 | |
| | |
| | | Year Ended December 31, 2008 | | | Year Ended December 31, 2007 | |
| MATTHEWS PACIFIC TIGER FUND | | Shares | | | Amount | | | Shares | | | Amount | |
Shares sold | | 19,644,970 | | | $353,833,666 | | | 15,328,359 | | | $411,688,821 | |
Shares issued through reinvestment of distributions | | 25,829,966 | | | 269,180,612 | | | 12,817,908 | | | 367,232,760 | |
Shares redeemed | | (73,247,167 | ) | | (1,268,536,898 | ) | | (30,872,328 | ) | | (838,662,748 | ) |
Net decrease | | (27,772,231 | ) | | ($645,522,620 | ) | | (2,726,061 | ) | | ($59,741,167 | ) |
| | |
| | | Year Ended December 31, 2008 | | | Year Ended December 31, 2007 | |
| MATTHEWS CHINA FUND | | Shares | | | Amount | | | Shares | | | Amount | |
Shares sold | | 18,251,837 | | | $493,677,884 | | | 48,359,909 | | | $1,656,572,773 | |
Shares issued through reinvestment of distributions | | 15,859,820 | | | 227,429,542 | | | 1,903,538 | | | 81,509,428 | |
Shares redeemed | | (38,423,260 | ) | | (1,099,046,762 | ) | | (31,479,275 | ) | | (1,036,465,982 | ) |
Net increase (decrease) | | (4,311,603 | ) | | ($377,939,336 | ) | | 18,784,172 | | | $701,616,219 | |
| | |
| | | Year Ended December 31, 2008 | | | Year Ended December 31, 2007 | |
| MATTHEWS INDIA FUND | | Shares | | | Amount | | | Shares | | | Amount | |
Shares sold | | 17,545,512 | | | $335,946,623 | | | 30,843,762 | | | $585,830,908 | |
Shares issued through reinvestment of distributions | | 3,513,386 | | | 27,932,026 | | | 1,800,066 | | | 42,355,560 | |
Shares redeemed | | (36,786,710 | ) | | (591,168,184 | ) | | (22,324,006 | ) | | (388,445,136 | ) |
Net increase (decrease) | | (15,727,812 | ) | | ($227,289,535 | ) | | 10,319,822 | | | $239,741,332 | |
| | |
| | | Year Ended December 31, 2008 | | | Year Ended December 31, 2007 | |
| MATTHEWS JAPAN FUND | | Shares | | | Amount | | | Shares | | | Amount | |
Shares sold | | 10,668,491 | | | $133,481,261 | | | 7,269,785 | | | $122,963,016 | |
Shares issued through reinvestment of distributions | | 212,615 | | | 2,066,617 | | | 675,084 | | | 10,605,563 | |
Shares redeemed | | (10,211,602 | ) | | (118,027,026 | ) | | (12,481,836 | ) | | (202,174,863 | ) |
Net increase (decrease) | | 669,504 | | | $17,520,852 | | | (4,536,967 | ) | | ($68,606,284 | ) |
| | | |
| | | Year Ended December 31, 2008 | | | Year Ended December 31, 2007 | |
| MATTHEWS KOREA FUND | | Shares | | | Amount | | | Shares | | | Amount | |
Shares sold | | 6,335,159 | | | $27,007,960 | | | 11,259,470 | | | $78,007,171 | |
Shares issued through reinvestment of distributions | | 3,519,633 | | | 8,410,812 | | | 4,266,568 | | | 29,311,398 | |
Shares redeemed | | (16,351,965 | ) | | (74,965,350 | ) | | (16,053,299 | ) | | (105,545,367 | ) |
Net increase (decrease) | | (6,497,173 | ) | | ($39,546,578 | ) | | (527,261 | ) | | $1,773,202 | |
76 MATTHEWS ASIA FUNDS
| | | | | | |
| | | Period Ended December 31, 2008 | |
| MATTHEWS ASIA SMALL COMPANIES FUND* | | Shares | | | Amount | |
Shares sold | | 488,968 | | | $4,048,615 | |
Shares issued through reinvestment of distributions | | 655 | | | 4,960 | |
Shares redeemed | | (87,299 | ) | | (665,026 | ) |
Net increase | | 402,324 | | | $3,388,549 | |
| * | The Matthews Asia Small Companies Fund commenced operations on September 15, 2008. |
| | | | | | | | | | | | |
| | | Year Ended December 31, 2008 | | | Year Ended December 31, 2007 | |
| MATTHEWS ASIAN TECHNOLOGY FUND | | Shares | | | Amount | | | Shares | | | Amount | |
Shares sold | | 6,537,904 | | | $53,738,475 | | | 17,487,919 | | | $157,985,546 | |
Shares redeemed | | (16,482,244 | ) | | (117,085,933 | ) | | (8,141,399 | ) | | (69,933,512 | ) |
Net increase (decrease) | | (9,944,340 | ) | | ($63,347,458 | ) | | 9,346,520 | | | $88,052,034 | |
The Funds generally assess a redemption fee of 2.00% of the total redemption proceeds if shareholders sell or exchange their shares within 90 calendar days after purchasing them. The redemption fee is paid directly to the Funds and is designed to discourage frequent short-term trading and to offset transaction costs associated with such trading of Fund shares. For purposes of determining whether the redemption fee applies, the shares that have been held the longest will be redeemed first. The Funds may grant exemption from the redemption fee when the Funds have previously received assurances that transactions do not involve market timing activity. The Funds may also waive the imposition of redemption fees in certain circumstances. For more information on this policy, please see the Funds’ prospectus. The redemption fees returned to the assets of the Funds are stated in the Statements of Changes in Net Assets.
| 3. | INVESTMENT ADVISORY FEES AND OTHER TRANSACTIONS WITH AFFILIATES |
Matthews International Capital Management, LLC (the “Advisor”), a registered investment advisor under the Investment Advisers Act of 1940, as amended, provides the Funds with investment management services. The Funds, other than the Matthews Asia Small Companies Fund, pay the Advisor (i) for management and advisory services; and (ii) for certain administrative services, an annual fee as a percentage of average daily net assets. Under the Advisory Agreement, as amended on August 31, 2007, each of the Funds, other than the Matthews Asia Small Companies Fund, pays Matthews 0.75% of their aggregate average daily net assets from $0 to $2 billion, 0.6834% on their aggregate average daily net assets between $2 billion and $5 billion, and 0.65% on their aggregate average daily net assets over $5 billion. The Matthews Asia Small Companies Fund pays Matthews pursuant to an amendment to the Advisory Agreement dated as of September 15, 2008 (i) for management and advisory services; and (ii) for certain administrative services, an annual fee as a percentage of average daily net assets.
Under this amendment to the Advisory Agreement, this Fund pays Matthews 1.00% of its average daily net assets. Under a written agreement between the Funds and the Advisor, the Advisor agrees to reimburse money to a Fund if its expense ratio exceeds a certain percentage level. For Matthews Asian Technology Fund, Matthews China Fund, Matthews India Fund, Matthews Japan Fund, Matthews Korea Fund and Matthews Asia Small Companies Fund, this level is 2.00%. For Matthews Asia Pacific Fund, Matthews Pacific Tiger Fund and Matthews Asian Growth and Income Fund, the level is 1.90%. For Matthews Asia Pacific Equity Income Fund, this level is 1.50%. In turn, if a Fund’s expenses fall below the level noted within three years after Matthews has made such a reimbursement, the Fund may reimburse Matthews up to an amount not to exceed its expense limitation. For each Fund other than the Matthews Asia Pacific Equity Income Fund and the Matthews Asia Small Companies Fund, this agreement will continue through at least August 31, 2009. For the Matthews Asia Pacific Equity Income Fund, this agreement will continue through at least October 31, 2009. For the Matthews Asia Small Companies Fund, this agreement will continue through at least September 15, 2010. These agreements may be extended for additional periods for each of the Funds. At December 31, 2008, Matthews Asia Pacific Equity Income Fund had $64,808 available for recoupment, of which $30,160 expires in 2009, $10,105 expires in 2010, and $24,543 expires in 2011. At December 31, 2008, Matthews Asia Small Companies Fund had $64,333 available for recoupment, which expires in 2011.
Investment advisory fees charged and waived, for the year ended December 31, 2008, were as follows:
| | | | | | | |
| | | Gross Advisory Fees | | Advisory Fees
Waived and
Reimbursed in
Excess of the
Expense Limitation | | | Net Advisory Fee |
Matthews Asian Growth and Income Fund | | $12,362,781 | | $— | | | $12,362,781 |
Matthews Asia Pacific Equity Income Fund | | 636,250 | | (24,543 | ) | | 611,707 |
Matthews Asia Pacific Fund | | 2,324,677 | | — | | | 2,324,677 |
Matthews Pacific Tiger Fund | | 18,120,660 | | — | | | 18,120,660 |
Matthews China Fund | | 9,131,795 | | — | | | 9,131,795 |
Matthews India Fund | | 5,406,179 | | — | | | 5,406,179 |
matthewsasia.com | 800.789.ASIA 77
Notes to Financial Statements (continued)
| | | | | | | | |
| | | Gross Advisory Fees | | Advisory Fees
Waived and
Reimbursed in
Excess of the
Expense Limitation | | | Net Advisory Fee | |
Matthews Japan Fund | | $1,188,880 | | $— | | | $1,188,880 | |
Matthews Korea Fund | | 1,063,450 | | — | | | 1,063,450 | |
Matthews Asia Small Companies Fund | | 5,204 | | (64,333 | ) | | (59,129 | ) |
Matthews Asian Technology Fund | | 1,126,039 | | — | | | 1,126,039 | |
Certain officers and Trustees of the Funds are also officers and directors of the Advisor. All officers serve without compensation from the Funds. The Funds paid the Independent Trustees $368,030 in aggregate for regular compensation during the year ended December 31, 2008; no special compensation was paid during this period.
The Funds have an administration and shareholder servicing agreement, pursuant to which, the Funds pay the Advisor for administration and shareholder servicing activities based on each Fund’s average daily net assets. The fee is charged at a rate of 0.25% of the average daily net assets in the Trust between $0 and $2 billion, 0.1834% of average daily net assets in the Trust between $2 billion and $5 billion, 0.15% of the average daily net assets in the Trust between $5 billion and $7.5 billion, and 0.125% of average daily net assets in the Trust over $7.5 billion.
Administration and shareholder servicing fees charged, for the year ended December 31, 2008, were as follows:
| | |
| | | Administration and
Shareholder
Servicing Fees |
Matthews Asian Growth and Income Fund | | $3,357,765 |
Matthews Asia Pacific Equity Income Fund | | 175,537 |
Matthews Asia Pacific Fund | | 629,152 |
Matthews Pacific Tiger Fund | | 4,900,833 |
Matthews China Fund | | 2,467,959 |
Matthews India Fund | | 1,454,344 |
Matthews Japan Fund | | 324,805 |
Matthews Korea Fund | | 286,904 |
Matthews Asia Small Companies Fund | | 1,115 |
Matthews Asian Technology Fund | | 303,972 |
The Funds bear a portion of the fees paid to certain service providers (exclusive of the Funds’ Transfer Agent) which provide transfer agency and shareholder servicing to certain shareholders. Additional information concerning these services and fees is contained in the Fund’s prospectus. Fees accrued to pay to such service providers for the year ended December 31, 2008 are a component of Transfer Agent fees and Administration and Shareholder Servicing Fees in the Statements of Operations as follows:
| | | | | | |
| | | Transfer Agent Fees | | Administration snd
Shareholder
Servicing Fees | | Total |
Matthews Asian Growth and Income Fund | | $2,286,227 | | $1,143,114 | | $3,429,341 |
Matthews Asia Pacific Equity Income Fund | | 94,032 | | 47,016 | | 141,048 |
Matthews Asia Pacific Fund | | 400,489 | | 200,245 | | 600,734 |
Matthews Pacific Tiger Fund | | 2,321,557 | | 1,160,778 | | 3,482,335 |
Matthews China Fund | | 1,737,571 | | 868,785 | | 2,606,356 |
Matthews India Fund | | 1,062,125 | | 531,062 | | 1,593,187 |
Matthews Japan Fund | | 211,055 | | 105,528 | | 316,583 |
Matthews Korea Fund | | 164,754 | | 82,377 | | 247,131 |
Matthews Asia Small Companies Fund | | 568 | | 284 | | 852 |
Matthews Asian Technology Fund | | 221,017 | | 110,508 | | 331,525 |
PNC Global Investment Servicing (U.S.) Inc. (“PNC”), an indirect wholly owned subsidiary of The PNC Financial Services Group, serves as the Trust’s administrator, and in that capacity, performs various administrative and accounting services for each Fund. PNC also serves as the Trust’s transfer agent, dividend disbursing agent and registrar. An officer of PNC serves as
78 MATTHEWS ASIA FUNDS
Assistant Treasurer to the Trust. Total fees accrued by the Funds for administration and accounting services for the year ended December 31, 2008 were as follows:
| | |
| | | Administration and
Accounting Fees |
Matthews Asian Growth and Income Fund | | $323,267 |
Matthews Asia Pacific Equity Income Fund | | 16,724 |
Matthews Asia Pacific Fund | | 60,755 |
Matthews Pacific Tiger Fund | | 473,270 |
Matthews China Fund | | 238,301 |
Matthews India Fund | | 140,871 |
Matthews Japan Fund | | 31,151 |
Matthews Korea Fund | | 27,741 |
Matthews Asia Small Companies Fund | | 99 |
Matthews Asian Technology Fund | | 29,398 |
Brown Brothers Harriman & Co. serves as custodian to the Trust. PFPC Distributors, Inc., an indirect wholly owned subsidiary of The PNC Financial Services Group, (the “Distributor”), serves as the Fund’s Distributor pursuant to an Underwriting Agreement.
| 4. | INVESTMENT TRANSACTIONS |
The value of investment transactions made for affiliated and unaffiliated holdings for the year ended December 31, 2008, excluding short-term investments, were as follows:
| | | | | | | | |
| | | Affiliated Purchases | | Affiliated Proceeds
from Sales | | Unaffiliated Purchases | | Unaffiliated Proceeds
from Sales |
Matthews Asian Growth and Income Fund | | $101,841 | | $— | | $445,510,234 | | $929,091,559 |
Matthews Asia Pacific Equity Income Fund | | — | | — | | 107,870,473 | | 23,105,890 |
Matthews Asia Pacific Fund | | 2,615,959 | | — | | 123,297,718 | | 263,751,653 |
Matthews Pacific Tiger Fund | | — | | 90,000,638 | | 440,262,167 | | 1,290,172,238 |
Matthews China Fund | | 1,773,532 | | 993,147 | | 104,775,677 | | 672,678,537 |
Matthews India Fund | | — | | — | | 209,323,514 | | 433,154,582 |
Matthews Japan Fund | | — | | — | | 169,142,054 | | 152,015,055 |
Matthews Korea Fund | | — | | — | | 44,944,242 | | 93,339,554 |
Matthews Asia Small Companies Fund | | — | | — | | 3,187,213 | | 56,704 |
Matthews Asian Technology Fund | | — | | — | | 73,538,138 | | 133,985,049 |
| 5. | HOLDINGS OF 5% VOTING SHARES OF PORTFOLIO COMPANIES |
The Act defines “affiliated companies” to include investments in portfolio companies in which a fund owns 5% or more of the outstanding voting shares. During the year ended December 31, 2008, the Funds below held 5% or more of the outstanding voting shares of the noted portfolio companies listed below. During this period, other Funds in the Trust may also have held voting shares of the issuers at levels below 5%.
Investments in affiliates:
A summary of transactions in securities of issuers affiliated with a Fund for the period ended December 31, 2008 is set forth below:
| | | | | | | | | | | | | | |
| | | Shares Held at
Dec. 31, 2007 | | Shares
Purchased | | Shares
Sold | | Shares Held at
Dec. 31, 2008 | | Value at
Dec. 31, 2008 | | Dividend
Income
Jan.1, 2008–
Dec. 31, 2008 |
MATTHEWS ASIAN GROWTH AND INCOME FUND |
Name of Issuer: | | | | | | | | | | | | | | |
I-CABLE Communications, Ltd. | | 129,144,000 | | 688,000 | | — | | 129,832,000 | | $ | 9,716,209 | | $ | 832,294 |
Total Affiliates | | | | | | | | | | $ | 9,716,209 | | $ | 832,294 |
| | | | | | |
MATTHEWS ASIA PACIFIC FUND | | | | | | | | | | | | | | |
Name of Issuer: | | | | | | | | | | | | | | |
Funai Zaisan Consultants Co., Ltd. | | 5,310 | | 1,771 | | — | | 7,081 | | $ | 2,904,038 | | $ | 107,679 |
Total Affiliates | | | | | | | | | | $ | 2,904,038 | | $ | 107,679 |
matthewsasia.com | 800.789.ASIA 79
Notes to Financial Statements (continued)
| | | | | | | | | | | | | | |
| | | Shares Held at
Dec. 31, 2007 | | Shares
Purchased | | | Shares
Sold | | Shares Held at
Dec. 31, 2008 | | | Value at
Dec. 31, 2008 | | Dividend
Income
Jan.1, 2008–
Dec. 31, 2008 |
MATTHEWS PACIFIC TIGER FUND |
Name of Issuer: | | | | | | | | | | | | | | |
Amata Corp. Public Co., Ltd.* | | 59,894,900 | | — | | | 59,894,900 | | — | | | $— | | $— |
Dickson Concepts International, Ltd.* | | 32,715,400 | | — | | | 32,715,400 | | — | | | — | | — |
Dynasty Fine Wines Group, Ltd.* | | 89,260,000 | | — | | | 89,260,000 | | — | | | — | | — |
Hanmi Pharmaceutical Co., Ltd.* | | 462,747 | | — | | | 194,514 | | 281,645 | †† | | — | | — |
Hyflux, Ltd.* | | 33,427,187 | | — | | | 14,587,000 | | 18,840,187 | | | — | | — |
Top Glove Corp. BHD* | | 15,609,880 | | — | | | 3,021,900 | | 12,587,980 | | | — | | — |
Travelsky Technology, Ltd. H Shares* | | 40,812,000 | | — | | | 40,812,000 | | — | | | — | | — |
Total Affiliates | | | | | | | | | | | | $— | | $— |
| | | | | | |
MATTHEWS CHINA FUND | | | | | | | | | | | | | | |
| | | | | | |
Name of Issuer: | | | | | | | | | | | | | | |
Kingdee International Software Group Co., Ltd. | | 25,736,000 | | 94,594,000 | † | | — | | 120,330,000 | | | $12,520,642 | | $280,613 |
Lianhua Supermarket Holdings Co., Ltd. H Shares | | 13,648,000 | | — | | | 653,000 | | 12,995,000 | | | 16,190,113 | | 424,543 |
Total Affiliates | | | | | | | | | | | | $28,710,755 | | $705,156 |
* Issuer was not an affiliated company as of December 31, 2008.
† The increase was due to 4-for-1 stock split of 77,208,000 share during the period.
†† Ending share balance reflects a stock dividend of 13,412.
The Funds are a party to a $75,000,000 credit agreement with a group of lenders, which expires October 6, 2009. The Funds may borrow under the credit agreement to fund shareholder redemptions to allow the Funds to manage the sale of portfolio holdings at times that the Advisor believes such sales may be unfavorable to shareholders. Each Fund may borrow up to the maximum amount allowable under the Funds current Prospectus and Statement of Additional Information. The Funds pay a commitment fee of 0.12% per annum based on each Fund’s pro rata share of the unused portion of the credit agreement, which is included in Other expenses in the Statements of Operations as well as other certain related fees. Amounts borrowed under the credit agreement bear an interest rate equal to the Federal Funds Rate plus 0.50%. The Funds did not borrow under the credit agreement during the period ended December 31, 2008.
| 7. | FEDERAL INCOME TAX INFORMATION |
As of December 31, 2008, the components of distributable earnings on tax basis were as follows:
| | | | | | | | | | |
| | | Undistributed
Ordinary Income | | Undistributed
Long-Term
Capital Gains | | Capital Loss
Carryforwards | | | Post October
Capital Losses* | |
Matthews Asian Growth and Income Fund | | $948,364 | | $— | | $— | | | ($27,273,299 | ) |
Matthews Asia Pacific Equity Income Fund | | 1,483,369 | | — | | (1,466,788 | ) | | (3,795,549 | ) |
Matthews Asia Pacific Fund | | 3,712,321 | | — | | (24,090,517 | ) | | (19,533,406 | ) |
Matthews Pacific Tiger Fund | | — | | — | | — | | | (172,123,650 | ) |
Matthews China Fund | | 58,882 | | — | | — | | | (15,795,511 | ) |
Matthews India Fund | | — | | 5,361,101 | | — | | | (44,921,286 | ) |
Matthews Japan Fund | | 1,748,757 | | — | | (36,495,378 | ) | | (16,453,559 | ) |
Matthews Korea Fund | | — | | 5,234,664 | | — | | | (834,632 | ) |
Matthews Asia Small Companies Fund | | 7,763 | | — | | (7,715 | ) | | (47,978 | ) |
Matthews Asian Technology Fund | | — | | — | | (26,921,670 | ) | | (5,094,779 | ) |
80 MATTHEWS ASIA FUNDS
| | | | | | | | | | | | |
| | | Post October
Currency Losses** | | | Other Temporary
Differences | | | Unrealized
Depreciation*** | | | Total Accumulated
Deficit | |
Matthews Asian Growth and Income Fund | | $— | | | $— | | | ($218,374,017 | ) | | ($244,698,952 | ) |
Matthews Asia Pacific Equity Income Fund | | — | | | (59,348 | ) | | (17,223,386 | ) | | (21,061,702 | ) |
Matthews Asia Pacific Fund | | — | | | — | | | (39,580,145 | ) | | (79,491,747 | ) |
Matthews Pacific Tiger Fund | | — | | | — | | | (278,527,150 | ) | | (450,650,800 | ) |
Matthews China Fund | | — | | | — | | | (247,310,228 | ) | | (263,046,857 | ) |
Matthews India Fund | | — | | | (29,797 | ) | | (211,082,198 | ) | | (250,672,180 | ) |
Matthews Japan Fund | | — | | | — | | | (24,970,488 | ) | | (76,170,668 | ) |
Matthews Korea Fund | | — | | | — | | | (17,454,553 | ) | | (13,054,521 | ) |
Matthews Asia Small Companies Fund | | (963 | ) | | — | | | (169,360 | ) | | (218,253 | ) |
Matthews Asian Technology Fund | | — | | | — | | | (31,614,320 | ) | | (63,630,769 | ) |
** Under current tax law capital and currency losses realized after October 31 and prior to the Funds’ fiscal year end may be deferred as occurring on the first day of the following fiscal year.
*** The differences between book-basis and tax-basis unrealized appreciation/(depreciation) is attributable primarily to the tax deferral of losses on wash sales and passive foreign investment company (PFIC) mark to market adjustments.
For federal income tax purposes, the Funds indicated below have capital loss carryforwards, which expire in the year indicated, as of December 31, 2008, which are available to offset future capital gains, if any:
| | | | | | | | |
| LOSSES DEFERRED EXPIRING IN: | | 2009 | | 2010 | | 2016 | | Total |
Matthews Asia Pacific Equity Income Fund | | $— | | $— | | $1,466,788 | | $1,466,788 |
Matthews Asia Pacific Fund | | — | | — | | 24,090,517 | | 24,090,517 |
Matthews Japan Fund | | — | | — | | 36,495,378 | | 36,495,378 |
Matthews Asia Small Companies Fund | | — | | — | | 7,715 | | 7,715 |
Matthews Asian Technology Fund | | 5,967,059 | | 3,461,198 | | 17,493,413 | | 26,921,670 |
The Matthews Asian Technology Fund had $1,570,883 of capital loss carryforwards expire in 2008.
Accounting principles generally accepted in the United States require that certain components of net assets be reclassified between financial and tax reporting. These reclassifications have no effect on net assets or net asset value per share. The permanent differences are primarily attributable to net realized gains on PFICs, the utilization of accumulated earnings and profits distributed to shareholders on redemptions of shares as part of the dividends-paid deduction for income tax purposes, foreign currency gain or loss reclassification, write-off of net operating losses, application of foreign tax credit to short-term gain and recharacterization of distributions. For the year ended December 31, 2008, permanent differences in book and tax accounting have been reclassified to paid-in capital, undistributed net investment income (loss) and accumulated realized gain (loss) as follows:
| | | | | | | | | |
| | | Increase/
(Decrease)
Paid-In-Capital | | | Increase/(Decrease)
Undistributed Net
Investment
Income/(Loss) | | | Increase/ (Decrease)
Accumulated
Realized Gain/(Loss) | |
Matthews Asian Growth and Income Fund | | $27,789,257 | | | ($4,404,596 | ) | | ($23,384,661 | ) |
Matthews Asia Pacific Equity Income Fund | | — | | | (16,968 | ) | | 16,968 | |
Matthews Asia Pacific Fund | | — | | | (164,633 | ) | | 164,633 | |
Matthews Pacific Tiger Fund | | 41,240,496 | | | (3,396,360 | ) | | (37,844,136 | ) |
Matthews China Fund | | 71,113,706 | | | (1,376,380 | ) | | (69,737,326 | ) |
Matthews India Fund | | (13,016,826 | ) | | 14,095,570 | | | (1,078,744 | ) |
Matthews Japan Fund | | — | | | 54,918 | | | (54,918 | ) |
Matthews Korea Fund | | 3,272,498 | | | 535,357 | | | (3,807,855 | ) |
Matthews Asia Small Companies Fund | | (10,293 | ) | | 9,018 | | | 1,275 | |
Matthews Asian Technology Fund | | (1,589,245 | ) | | (128,371 | ) | | 1,717,616 | |
matthewsasia.com | 800.789.ASIA 81
| | |
| | Report of Independent Registered Public Accounting Firm To the Board of Trustees and Shareholders of Matthews Asia Funds: In our opinion, the accompanying statements of assets and liabilities, including the schedules of investments, and the related statements of operations and of changes in net assets and the financial highlights present fairly, in all material respects, the financial position of Matthews Asian Growth and Income Fund, Matthews Asia Pacific Equity Income Fund, Matthews Asia Pacific Fund, Matthews Pacific Tiger Fund, Matthews China Fund, Matthews India Fund, Matthews Japan Fund, Matthews Korea Fund, Matthews Asia Small Companies Fund, and Matthews Asian Technology Fund (each a portfolio comprising the Matthews Asia Funds, hereafter referred as the “Funds”) at December 31, 2008, and the results of each of their operations for the period then ended, the changes in net assets and the financial highlights for the two years in the period then ended for Matthews Asian Growth and Income Fund, Matthews Asia Pacific Equity Income Fund, Matthews Asia Pacific Fund, Matthews Pacific Tiger Fund, Matthews China Fund, Matthews India Fund, Matthews Japan Fund, Matthews Korea Fund, and Matthews Asian Technology Fund, and the changes in net assets and the financial highlights for the period then ended for Matthews Asia Small Companies Fund, in conformity with accounting principles generally accepted in the United States of America. These financial statements and financial highlights (hereafter referred to as “financial statements”) are the responsibility of the Funds’ management; our responsibility is to express an opinion on these financial statements based on our audits. We conducted our audits of these financial statements in accordance with the standards of the Public Company Accounting Oversight Board (United States). Those standards require that we plan and perform the audit to obtain reasonable assurance about whether the financial statements are free of material misstatement. An audit includes examining, on a test basis, evidence supporting the amounts and disclosures in the financial statements, assessing the accounting principles used and significant estimates made by management, and evaluating the overall financial statement presentation. We believe that our audits, which included confirmation of securities at December 31, 2008 by correspondence with the custodian and brokers, provide a reasonable basis for our opinion. Prior to January 1, 2007, the financial highlights for each of the periods presented through December 31, 2006 were audited by another independent registered public accounting firm whose report dated February 12, 2007 expressed an unqualified opinion on those statements and financial highlights. PricewaterhouseCoopers LLP San Francisco, California February 20, 2009 |
82 MATTHEWS ASIA FUNDS
Tax Information (Unaudited)
For shareholders who do not have a December 31, 2008 tax year-end, this notice is for informational purposes.
For the period January 1, 2008 to December 31, 2008, the Funds designate the following items with regard to distributions paid during the period. All designations are based on financial information available as of the date of this annual report and, accordingly, are subject to change. For each item, it is the intention of each Fund to designate the maximum amount permitted under the Internal Revenue Code and the regulations thereunder.
1. Qualified Dividend Income
The Funds designate a portion of the ordinary income distributed during the year ended December 31, 2008 as Qualified Dividend Income (“QDI”) as defined in the Internal Revenue Code as follows:
| | | | | |
| | | QDI Portion | | | |
Matthews Asian Growth and Income Fund | | 37.94 | % | | |
Matthews Asia Pacific Equity Income Fund | | 48.24 | % | | |
Matthews Asia Pacific Fund | | 80.41 | % | | |
Matthews Pacific Tiger Fund | | 83.78 | % | | |
Matthews China Fund | | 70.26 | % | | |
Matthews India Fund | | 67.77 | % | | |
Matthews Japan Fund | | 0.00 | % | | |
Matthews Korea Fund | | 100.00 | % | | |
Matthews Asia Small Companies Fund | | 50.58 | % | | |
2. Long-Term Capital Gain Distributions
The Funds designate Long-Term Capital Gain distributions pursuant to Section 852(b)(3) of the Internal Revenue Code for the year ended December 31, 2008 as follows:
| | | | |
| | | Long-Term Capital Gains | | |
Matthews Asian Growth and Income Fund | | $169,500,188 | | |
Matthews Asia Pacific Equity Income Fund | | 92,307 | | |
Matthews Asia Pacific Fund | | 12,070,194 | | |
Matthews Pacific Tiger Fund | | 329,370,230 | | |
Matthews China Fund | | 291,797,785 | | |
Matthews India Fund | | 26,855,473 | | |
Matthews Japan Fund | | 2,681,646 | | |
Matthews Korea Fund | | 11,251,187 | | |
3. Foreign Taxes Paid
The Funds have elected to pass through to their shareholders the foreign taxes paid for year ended December 31, 2008 as follows:
| | | | |
| | | Foreign Source Income | | Foreign Taxes Paid |
Matthews Asian Growth and Income Fund | | $81,876,114 | | $1,857,482 |
Matthews Asia Pacific Equity Income Fund | | 4,979,032 | | 184,119 |
Matthews Pacific Tiger Fund | | 61,275,680 | | 1,432,339 |
Matthews Asia Small Companies Fund | | 13,377 | | 815 |
matthewsasia.com | 800.789.ASIA 83
Approval of Investment Advisory Agreement (Unaudited)
| | |
The Funds, which are series of the Trust, have retained Matthews International Capital Management, LLC (the “Advisor”) to manage their assets pursuant to the Advisory Agreement, which has been approved by the Board of Trustees of the Funds, including the Independent Trustees. Following an initial term of two years, the Advisory Agreement continues in effect from year-to-year provided such continuance is specifically approved at least annually by the vote of the holders of at least a majority of the outstanding shares of the Funds, or by the Board of Trustees, and, in either event, by a majority of the Independent Trustees of the Trust casting votes in person at a meeting called for such purpose. At a meeting held on August 28, 2008, the Board, including the Independent Trustees of the Trust, approved the continuance of the Advisory Agreement, with respect to each Fund (other than the Matthews Asia Small Companies Fund), for an additional one-year period ending August 31, 2009. On such date the Board, including the Independent Trustees of the Trust, approved a separate Investment Advisory Agreement with respect to the Matthews Asia Small Companies Fund, dated as of September 15, 2008, for an initial period of two years. Prior to the meeting, the Independent Trustees had requested detailed information from the Advisor. This information, together with the information provided to the Independent Trustees throughout the course of year, formed the primary (but not exclusive) basis for the Board’s determinations as summarized below. Below is a summary of the factors considered by the Board in approving the continuance of the Advisory Agreement with respect to each Fund. T The nature, extent and quality of the services provided by the Advisor under the Advisory Agreement. The Trustees considered the experience and qualifications of the personnel at the Advisor who are responsible for providing services to the Funds and who are responsible for the daily management of the Funds’ investment objectives. They also reviewed significant recent additions to the Advisor’s personnel and planned key hirings. The Trustees considered the Advisor’s succession plan in the event that key personnel are no longer available, and the Advisor’s disaster recovery and business continuity plan, as well as additional efforts taken by the Advisor related to implementation of its disaster recovery plan. The Trustees also considered the Chief Compliance Officer’s report regarding the compliance resources, programs and structures of the Advisor, including the compliance record of the Advisor and the supervision of the Funds’ transfer agent by the Advisor. The Trustees concluded that the Advisor has high-quality compliance and a culture of compliance. The Trustees also noted that the extent of the Advisor’s resources committed to marketing and distribution was consistent with reasonable efforts to maintain asset levels. Additionally, the Trustees observed that the Advisor engages in thoughtful planning to address market challenges and asset contraction. The Trustees took note of the fact that the Advisor had added personnel in key positions and believes that hiring and retaining good personnel | | and top executives requires a long-term vision for the Funds. The Trustees concluded that the Advisor had the quality and depth of personnel and investment methods essential to performing its duties under the Advisory Agreement, and that the nature, overall quality, cost and extent of such management services are satisfactory and reliable. T The investment performance of the Advisor. The Trustees reviewed the short-term and long-term performance of each of the Funds on both an absolute basis and in comparison to peer funds and benchmark indices. The Trustees emphasized longer-term performance, which they believe is more important. To the extent of any concerns about shorter-term performance, the Trustees noted that the Advisor articulated credible plans to address performance and explained its reasons for maintaining a consistent investment philosophy. The Trustees also reviewed both the Lipper and Morningstar rankings for each of the Funds for various periods ending June 30, 2008. For Matthews Asia Pacific Fund, the Trustees noted that the Fund’s performance was below that of its benchmark index and the average performance of its peer funds in the one-year, three-year and since-inception periods. The Trustees noted the Fund had achieved positive absolute performance over the three-year and since-inception periods. For Matthews Asia Pacific Equity Income Fund, the Trustees noted that the Fund had positive absolute performance over the one-year and since-inception periods, and that the Fund had outperformed its benchmark during both of these periods. Additionally, the Trustees noted that the Fund had outperformed its peer group during the one-year period but had slightly underperformed its peer group over the since-inception period. For Matthews Pacific Tiger Fund, the Trustees noted that the Fund’s performance was less favorable than the average return of its peer funds over the one-year and three-year periods, but more favorable in the five-year, ten-year and since-inception periods. The Trustees noted that the Fund underperformed its benchmark indices in the one-year and three-year periods, but outperformed in the five-year, ten-year and since-inception periods. The Trustees also noted the Fund’s positive absolute performance over such longer periods. For Matthews Asian Growth and Income Fund, the Trustees noted that the Fund is the top-performing fund for the since-inception period in its peer group. The Trustees noted that the Fund outperformed the benchmark indices and the average performance of its peer funds in the one-year, ten-year and since-inception periods, although the Fund underperformed the benchmark indices and peer funds for the three-year and five- year periods. The Trustees also noted the Fund’s positive absolute performance over all such periods. |
84 MATTHEWS ASIA FUNDS
Approval of Investment Advisory Agreement (Unaudited) (Continued)
| | |
For Matthews Asian Technology Fund, the Trustees noted that the Fund’s performance was more favorable than the average return of its peer funds and benchmark index over the three-year, five-year and since-inception periods, but less favorable than the average return of its peer funds and the benchmark index over the one- year period. The Trustees also noted that the Fund had outperformed all of its peer funds over the five-year and since-inception periods. For Matthews China Fund, the Trustees noted that the Fund underperformed the benchmark index for the one- year, three-year and five-year periods, but had significantly outperformed the index over the ten-year period. The Trustees noted that the Fund had outperformed the average of its peer funds over the one-year, three-year, five-year, ten-year and since-inception periods. The Trustees also noted the Fund’s positive absolute performance over all such periods. For Matthews India Fund, the Trustees noted that, as a relatively new fund, there was less performance information available for analysis. Although this was the case, the Trustees noted that the Fund had positive performance over the since-inception period but negative performance over the one-year period. The Trustees also noted that the Fund had outperformed its benchmark index over the since-inception period, while underperforming its benchmark index over the one-year period. The Trustees also noted that most of the Fund’s peers do focus on India, but instead invest more generally across emerging markets. For Matthews Japan Fund, the Trustees noted that the Fund’s performance was more favorable than the average return of its peer funds over the since-inception period, and the Fund outperformed all of the benchmark indices for the since-inception period. However, the Trustees noted that the Fund also underperformed its peer funds and benchmark indices for the one-year, three-year and five-year periods. The Trustees noted that the underperformance had been addressed to the Trustees’ satisfaction by the Advisor. The Trustees noted the Fund’s positive absolute performance over the five-year and since-inception periods. For Matthews Korea Fund, the Trustees noted that the Fund had underperformed its peer group and its benchmark index over the one-year, three-year and five-year periods, but that the Fund was the best performing fund in its peer group for the ten-year period. The Trustees noted that the Fund’s short-term underperformance had been addressed to the Trustees’ satisfaction by the Advisor. The Trustees also noted that most of the Fund’s peers do not focus on Korea, but instead invest more generally across Asian markets. The Trustees took note of the difficulty of fairly benchmarking certain of the Funds in terms of performance | | and noted that they were of the view that more weight should be given to the Advisor’s attribution analysis than to data provided by Lipper, Inc. and Morningstar, Inc. The Trustees also gave more weight to each Fund’s longer-term investment performance given the long-term investment philosophy of each Fund. On that basis, the Trustees concluded that they were satisfied with the Funds’ overall performance records. The Trustees also reviewed the Advisor’s trading policies and efforts to obtain best overall execution for the Funds in the various markets in which the Funds trade securities. The Trustees took note of the relatively low turnover rates in the various Funds and the Advisor’s consistent adherence to its investment methodology (fundamental bottom-up driven investment selection). T The extent to which the Advisor realizes economies of scale as the Funds grow larger and whether fee levels reflect these economies of scale for the benefit of Fund investors. The Trustees discussed the Advisor’s ongoing investment in its infrastructure, which is an acceptable way of realizing economies of scale. The Trustees considered the personnel, technology and other infrastructure investments by the Advisor that could be expected to benefit shareholders. The Trustees further noted that the Advisor’s conservative growth in prior years of its personnel and information technology infrastructure relative to increasing asset levels had resulted in a need to make ongoing investments in these areas in order to maintain high-quality service to shareholders. The Trustees also recognize that economies of scale are less available as total assets have declined. The Trustees concluded that current fee structures continue to be appropriate given the size and objectives of the Funds. T The costs of the services provided by the Advisor and others. The Trustees considered the advisory fees and total fees and expenses of each Fund in comparison to the advisory fees and other fees and expenses of other funds in each Fund’s relevant peer group. The Trustees considered both the gross advisory fee rates charged by the Advisor, as well as the effective advisory fee rates after taking into consideration the expense limitation arrangements and voluntary fee waivers. For each of Matthews Korea Fund, Matthews Japan Fund, Matthews Asian Technology Fund and Matthews Asia Pacific Equity Income Fund, the Trustees noted that the gross advisory fee rates, the gross management fee (including administration) rates, the total expense ratio, the effective advisory fee rates and the actual nonmanagement fee rates (which include transfer agent and custodian fees) are all lower than most of the funds in each Fund’s peer group. For Matthews Pacific Tiger Fund, the Trustees noted that the gross advisory fee rates, the total expense ratio, the effective advisory fee rates and the actual nonmanagement expense rates (which include transfer agent and custodian fees) are lower than most of the funds in |
matthewsasia.com | 800.789.ASIA 85
Approval of Investment Advisory Agreement (Unaudited) (Continued)
| | |
that Fund’s peer group while the gross management fee (including administration) rates are slightly higher than the average of the Fund’s peer group. For Matthews Asian Growth and Income Fund, the Trustees noted that the gross advisory fee rates, the total expense ratio and the effective advisory fee rates are lower than most of the funds in that Fund’s peer group while the gross management fee (including administration) rates and the actual nonmanagement fee rates (which include transfer agent and custodian fees) are slightly less than the average of the Fund’s peer group. For Matthews China Fund, the Trustees noted that the gross advisory fee rates, the gross management fee (including administration) rates, the total expense ratio and the effective advisory fee rates are all lower than most of the funds in that Fund’s peer group while the actual nonmanagement fee rates (which include transfer agent and custodian fees) are equal to the average of the Fund’s peer group. For Matthews Asia Pacific Fund, the Trustees noted that the gross advisory fee rates, the gross management fee (including administration) rates, the total expense ratio and the effective advisory fee rates are all lower than most of the funds in that Fund’s peer group while the actual nonmanagement fee rates (which include transfer agent and custodian fees) are slightly less than the average of the Fund’s peer group. For Matthews India Fund, the Trustees noted that the gross advisory fee rates, the gross management fee (including administration) rates, the total expense ratio and the effective advisory fee rates are all lower than most of the funds in that Fund’s peer group while the actual nonmanagement fee rates (which include transfer agent and custodian fees) are slightly less than the average of the Fund’s peer group. The Trustees also compared the Advisor’s advisory fees with those of the Advisor’s separate accounts and other investment products, noting that the Funds’ expenses appeared to be appropriate in comparison and taking into account and services differences between these products and the Funds, including the differences in the frequency of net asset value calculations. The Trustees considered various specific Fund expenses, including the custody fees and transfer agent fees. The Trustees noted the Advisor’s efforts that resulted in, for each of the Funds, (a) reduced expenses under the administration and shareholders services plan, (b) reduced expenses under the voluntary fee waivers, (c) reduced custodian expenses, (d) reduced soft dollar credits, (e) lower commission rates, and (f) reduced transfer agency fees. The Trustees concluded that the Advisor’s advisory fee ratio and the Funds’ expense ratios are reasonable in light of comparative performance and expense and advisory fee information for each of the Funds. | | T The profits to be realized by the Advisor and its affiliates from the relationships with the Funds. The Trustees reviewed the profitability of the Advisor on both an absolute basis and in comparison to other investment advisers. The Trustees noted that the Advisor’s pretax profit margin appeared to be reasonable in relation to known industry standards. The Trustees also noted that the Advisor appeared to be sufficiently profitable to operate as a viable investment management firm, able to honor its obligations as a sponsor of the Funds, without being excessively profitable. The Trustees noted that, with more recent declines in asset levels, declines in profitability could be expected, but also noted the continued expenditures on information technology and personnel. The Trustees further noted that the Advisor’s continued upgrading of its trading, research, compliance, disaster recovery and other technological systems should increase the Advisor’s capacity, speed and reliability in providing services to the Funds, poising the Advisor and the Funds for the future. In assessing profitability, the Trustees took note of the compensation arrangements for the principals and the general ownership structure of the Advisor. The Trustees also considered that the additional benefits derived by the Advisor from its relationship with the Funds are limited solely to research benefits received in exchange for “soft dollars.” After such review, the Trustees determined that the profitability rate to the Advisor with respect to the Advisory Agreement is fair and reasonable in consideration of the services it provides to the Funds. No single factor was determinative of the Board’s decision to approve the Advisory Agreement, but rather the Trustees based their determination on the total mix of information available to them. After considering the factors described above, the Board concluded that the terms of the advisory arrangements are fair and reasonable to each Fund in light of the services that the Advisor provides, its costs and reasonably foreseeable Fund asset levels, and that each Fund’s shareholders received and would receive reasonable value in return for the advisory fees paid. The Board agreed that the continuance of the Advisory Agreement with respect to each Fund would be in the best interests of the Funds and their shareholders. The Independent Trustees concluded separately that continuance of the Advisory Agreement was supported by reasonable and impartial records and information, including the performance of the Funds in relation to their peer groups, the services provided by the Advisor, and the competitive expense structure, and that the continuance of the Advisory Agreement with respect to each other Fund would be in the best interests of each Fund and its shareholders. The Advisory Agreement may be terminated by the Trustees on behalf of the Funds or the Advisor upon 60 days’ written notice without penalty. The Advisory Agreement will also terminate automatically in the event of its assignment, as defined in the 1940 Act. |
86 MATTHEWS ASIA FUNDS
Disclosures and Index Definitions
| | |
Disclosures Fund Holdings: The Fund holdings shown in this report are as of December 31, 2008. Holdings are subject to change at any time, so holdings shown in this report may not reflect current Fund holdings. The Funds file complete schedules of portfolio holdings with the Securities and Exchange Commission (the “SEC”) for the first and third quarters of each fiscal year on Form N-Q. The Funds’ Form N-Q is filed with the SEC within 60 days of the end of the quarter to which it relates, and is available on the SEC’s website at www.sec.gov. It may also be reviewed and copied at the Commission’s Public Reference Room in Washington, D.C. Information on the operation of the Public Reference Room may be obtained by calling 800-SEC-0330. Proxy Voting Record: The Funds’ Statement of Additional Information containing a description of the policies and procedures that the Funds have used to vote proxies relating to portfolio securities, along with each Fund’s proxy voting record relating to portfolio securities held during the 12-month period ended June 30, 2008, is available upon request, at no charge, at the Funds’ website at matthewsasia.com or by calling 1.800.789.ASIA (2742), or on the SEC’s website at www.sec.gov. Shareholder Reports and Prospectuses: To reduce the Funds’ expenses, we try to identify related shareholders in a household and send only one copy of the Funds’ prospectus and financial reports to that address. This process, called “householding,” will continue indefinitely unless you instruct us otherwise. At any time you may view the Funds’ current prospectus and financial reports on our website. If you prefer to receive individual copies of the Funds’ prospectus or financial reports, please call us at 1.800.789.ASIA (2742). | | Index Definitions The MSCI All Country Asia ex Japan Index is a free float–adjusted market capitalization–weighted index of the stock of markets of China, Hong Kong, India, Indonesia, Malaysia, Philippines, Singapore, South Korea, Taiwan and Thailand. The MSCI All Country Far East ex Japan Index is a free float–adjusted market capitalization–weighted index of the stock markets of China, Hong Kong, Indonesia, Malaysia, Philippines, Singapore, South Korea, Taiwan and Thailand. The MSCI All Country Asia Pacific Index is a free float– adjusted market capitalization–weighted index of the stock markets of Australia, China, Hong Kong, India, Indonesia, Japan, Malaysia, New Zealand, Philippines, Singapore, South Korea, Taiwan and Thailand. The MSCI China Index is a free float–adjusted market capitalization–weighted index of Chinese equities that includes China-affiliated corporations and H shares listed on the Hong Kong Exchange, and B shares listed on the Shanghai and Shenzhen exchanges. The Bombay Stock Exchange 100 (BSE 100) Index is a free float–adjusted market capitalization–weighted index of the 100 stocks listed on the Bombay Stock Exchange. The MSCI Japan Index is a free float–adjusted market capitalization–weighted index of Japanese equities listed in Japan. The Tokyo Stock Price Index (TOPIX) is a market capitalization–weighted index of all companies listed on the First Section of the Tokyo Stock Exchange. The Korea Composite Stock Price Index (KOSPI) is a market capitalization–weighted index of all common stocks listed on the Korea Stock Exchange. The MSCI All Country Asia ex Japan Small Cap Index is a free float–adjusted market capitalization–weighted small cap index of the stock markets of China, Hong Kong, India, Indonesia, Malaysia, Philippines, Singapore, South Korea, Taiwan and Thailand. The MSCI/Matthews Asian Technology Index is a free float–adjusted market capitalization–weighted index of Asian equities tracking a broad range of technology stocks including semiconductor equipment and products, communications equipment, computers and peripherals, electronic equipment and instruments, office electronics, software, IT consulting and services, Internet software and services, diversified telecommunications services, and wireless telecommunications services. |
matthewsasia.com | 800.789.ASIA 87
Trustees and Officers of the Funds (Unaudited)
The operations of each Fund are under the direction of the Board of Trustees. The Board of Trustees establishes each Fund’s policies and oversees and reviews the management of each Fund. The Board meets regularly to review the activities of the officers, who are responsible for the day-to-day operations of the Funds. The Statement of Additional Information, which includes additional information about Fund Trustees, is available without charge by calling 800.789.2742 or by visiting the Funds’ website, matthewsasia.com. The Trustees and executive officers of the Funds, their year of birth, business address and principal occupations during the past five years are set forth below:
| | | | | | | | |
Name, Year of Birth, Address and Position(s) Held with Trust | | Term of
Office and
Length of
Time Served1 | | Principal Occupation(s) During Past 5 Years | | Number of
Portfolios in
Fund Complex
Overseen by
Trustee | | Other Trusteeships/Directorships
(number of portfolios) Held by Trustee |
INDEPENDENT TRUSTEES | | | | | | | | |
| | | | |
GEOFFREY H. BOBROFF Born 1944 Four Embarcadero Center Suite 550 San Francisco, CA 94111 Chairman of the Board of Trustees and Trustee | | Since
2006 | | President, Bobroff Consulting, Inc. (since 1993). | | 10 | | None |
| | | | |
TOSHI SHIBANO Born 1950 Four Embarcadero Center Suite 550 San Francisco, CA 94111 Trustee | | Since
2003 | | President, Toshi Shibano Consulting, Inc. (since 1995); Adjunct Associate Professor, Columbia Graduate School of Business (since 2001); Adjunct Professor, Thunderbird American Graduate School of International Management (2000–2005); Faculty, General Electric Corporate Leadership Development Center (since 2000); Executive Education Lecturer, Haas School of Business, University of California at Berkeley (since 1995). | | 10 | | None |
| | | | |
RHODA ROSSMAN Born 1958 Four Embarcadero Center Suite 550 San Francisco, CA 94111 Trustee | | Since
2006 | | Vice President, Corporate Investment Officer (since 2007); and Senior Vice President and Treasurer (2003–2007), The PMI Group, Inc. | | 10 | | None |
| | | | |
JONATHAN F. ZESCHIN Born 1953 Four Embarcadero Center Suite 550 San Francisco, CA 94111 Trustee | | Since
2007 | | President and Founder, Essential Advisers Inc. (since 2000); Managing Partner, JZ Partners LLC (since 1998). | | 10 | | Independent Chairman of the Board of Trustees, Dividend Capital Realty Income Allocation Fund (since 2005) and Dividend Capital Strategic Global Realty Fund (since 2007); Independent Trustee, ICON Funds (2002–2007); Independent Director, Wasatch Funds (2002–2004). |
INTERESTED TRUSTEES 2 | | | | | | | | |
| | | | |
G. PAUL MATTHEWS Born 1956 Four Embarcadero Center Suite 550 San Francisco, CA 94111 Trustee | | Since
2007 | | Chairman and Portfolio Manager, Matthews International Capital Management, LLC (“Matthews”) (since 1991); Chief Investment Officer, Matthews (1991–2007); President of the Funds (1994–2007). | | 10 | | Director, Matthews Asian Selection Funds Plc (1 Portfolio). |
88 MATTHEWS ASIA FUNDS
| | | | | | |
Name, Year of Birth, Address and Position(s) Held with Trust | | Term of
Office and
Length of
Time Served1 | | Principal Occupation(s) During Past 5 Years | | Other Trusteeships/
Directorships
(number of
portfolios) Held by Officer |
OFFICERS WHO ARE NOT TRUSTEES | | | | | | |
| | | |
WILLIAM J. HACKETT Born 1967 Four Embarcadero Center Suite 550 San Francisco, CA 94111 President | | Since 2008 | | President (since 2007), Matthews International Capital Management, LLC; Partner (2002–2007), Senior Manager (1997–2002), Manager (1995–1997), Senior/Associate (1990–1995), Deloitte & Touche, LLP. | | None |
| | | |
ANDREW T. FOSTER Born 1974 Four Embarcadero Center Suite 550 San Francisco, CA 94111 Vice President | | Since 2005 | | Acting Chief Investment Officer (since 2008), Director of Research (2003–2008) and Portfolio Manager (since 2005), Matthews International Capital Management, LLC. | | None |
| | | |
JOHN P. McGOWAN Born 1964 Four Embarcadero Center Suite 550 San Francisco, CA 94111 Vice President and Secretary | | Since 2005 | | Senior Vice President of Business Administration (since 2008), Chief Administrative Officer (2007–2008), Chief Operating Officer (2004–2007), Matthews International Capital Management, LLC; Chief Operating Officer, Treasurer and Chief Compliance Officer, Forward Management LLC (1998–2004). | | None |
| | | |
SHAI A. MALKA Born 1973 Four Embarcadero Center Suite 550 San Francisco, CA 94111 Treasurer | | Since 2005 | | Senior Manager of Fund Accounting and Operations (since 2004), Manager of Fund Accounting (2003–2004), Fund Accountant (2000–2003), Matthews International Capital Management, LLC. | | None |
| | | |
TIMOTHY B. PARKER Born 1958 Four Embarcadero Center Suite 550 San Francisco, CA 94111 Vice President | | Since 2008 | | General Counsel (since 2005), Matthews International Capital Management, LLC; Partner, Kirkpatrick & Lockhart Nicholson Graham LLP (2003–2005); Global Head of Compliance and Risk Management, Allianz Dresdner Asset Management (2001–2003); Managing director, RCM Global Investors (1993–2001). | | None |
| | | |
MANOJ K. POMBRA Born 1964 Four Embarcadero Center Suite 550 San Francisco, CA 94111 Chief Compliance Officer | | Since 2005 | | Chief Compliance Officer, Matthews International Capital Management, LLC (since 2005); Senior Manager, Mutual Fund Compliance/Manager Portfolio Compliance, Franklin Templeton Investments (2001–2005); Senior Financial Reporting Manager, InfoUSA.com (2000–2001). | | None |
| 1 | Each trustee serves for an indefinite term, until retirement age or until his/her successor is elected. Officers serve at the pleasure of the Board of Trustees. |
| 2 | This trustee is considered an “interested person” of the Trust as defined under the 1940 Act because of an ownership interest in the Advisor and an office held with the Advisor. |
Matthews Asia Funds
| | |
INVESTMENT ADVISOR | | ACCOUNT SERVICES |
Matthews International Capital Management, LLC | | PNC Global Investment Servicing (U.S.) Inc. |
Four Embarcadero Center, Suite 550 | | P.O. Box 9791 |
San Francisco, CA 94111 | | Providence, RI 02940 |
800-789-ASIA [2742] | | 800-789-ASIA [2742] |
| |
CUSTODIAN | | LEGAL COUNSEL |
Brown Brothers Harriman & Co. | | Paul, Hastings, Janofsky & Walker LLP |
40 Water Street | | 55 Second Street, 24th Floor |
Boston, MA 02109 | | San Francisco, CA 94105 |
matthewsasia.com | 800.789.ASIA

Item 2. Code of Ethics.
| | (a) | The registrant, as of the end of the period covered by this report, has adopted a code of ethics that applies to the registrant’s principal executive officer, principal financial officer, principal accounting officer or controller, or persons performing similar functions, regardless of whether these individuals are employed by the registrant or a third party. |
| | (c) | There have been no amendments, during the period covered by this report, to a provision of the code of ethics that applies to the registrant’s principal executive officer, principal financial officer, principal accounting officer or controller, or persons performing similar functions, regardless of whether these individuals are employed by the registrant or a third party, and that relates to any element of the code of ethics description. |
| | (d) | The registrant has not granted any waivers, including an implicit waiver, from a provision of the code of ethics that applies to the registrant’s principal executive officer, principal financial officer, principal accounting officer or controller, or persons performing similar functions, regardless of whether these individuals are employed by the registrant or a third party, that relates to one or more of the items set forth in paragraph (b) of this item’s instructions. |
Item 3. Audit Committee Financial Expert.
| | (a) | As of the end of the period covered by the report, the registrant’s board of directors has determined that the registrant has two audit committee financial experts serving on its audit committee, Toshi Shibano and Jonathan F. Zeschin, and that both are “independent.” |
| | (b) | Prof. Shibano an Adjunct Professor at the Columbia Graduate School of Business and a member of the Faculty of the General Electric Corporate Leadership Development Center. He also serves as Executive Education Lecturer at the Haas School of Business at the University of California, Berkeley, and has served on the faculties of Thunderbird American Graduate School of International Management, Stanford Graduate School of Business, the University of Chicago School of Business and the Australian Graduate School of Management at the University of New South Wales. He regularly reviews current research in accounting both for use in instruction of courses and for internal faculty evaluation. He has experience analyzing and evaluating financial statements at the appropriate level of complexity through his professional activities on the educational faculties referenced above. |
Prof. Shibano also has extensive experience in executive education worldwide (Hong Kong, Taiwan, Singapore, Finland, Italy, Mexico, India) and has developed innovative new programs in financial analysis, management control systems and strategy implementation.
Prof. Shibano has published in the Journal of Accounting Research, the Journal of Accounting and Economics, the Rand Journal of Economics, and the Journal of Applied Corporate Finance, on the topics of strategic audit risk, accounting standard setting, international accounting standards, tax minimization, foreign currency risk management, and organizational structure. Prof. Shibano received his MBA from the Haas School at UC Berkeley and earned his PhD at the Stanford Graduate School of Business, earning the highest academic honors in both programs. Prof. Shibano has gained additional accounting expertise as the Audit Committee Chair of Matthews Asian Funds.
Mr. Zeschin is President of Essential Advisers, Inc., a wealth management and investment advisory firm. He is also the portfolio manager for that firm’s Essential Growth Portfolio. He is Managing Partner of JZ Partners, LLC, a business consulting firm for investment managers. Prior to forming Essential Advisers, Inc., Mr. Zeschin held senior executive positions with Founders Asset Management, Inc., Invesco Fund Group, and Stein Roe & Farnham, Inc. Mr. Zeschin holds a Masters of Management from the Kellogg School at Northwestern University, with majors in Finance and Marketing, and a Bachelor in Business Administration in Accounting with distinction from the University of Michigan. He holds a Certified Public Accountant certificate from the state of Illinois and is a Certified Financial Planner certificant. Mr. Zeschin is a former chair of the ICI’s Accounting Treasurer’s Committee and a former member of the AICPA Investment Companies committee. Mr. Zeschin is currently the chairman of the Board of Trustees to two NYSE listed closed-end funds. He has served on the audit committees of mutual fund boards since 2002. He has experience analyzing and evaluating financial statements at the appropriate level of complexity through his professional activities on the educational faculties referenced above. Mr. Zeschin has gained additional expertise as a member of the Audit Committee of Matthews Asian Funds.
Item 4. Principal Accountant Fees and Services.
Audit Fees
| | (a) | The aggregate fees billed for each of the last two fiscal years for professional services rendered by the principal accountant for the audit of the registrant’s annual financial statements or services that are normally provided by the accountant in connection with statutory and regulatory filings or engagements for those fiscal years are $265,750 in 2007 and $261,300 in 2008. |
Audit-Related Fees
| | (b) | The aggregate fees billed in each of the last two fiscal years for assurance and related services by the principal accountant that are reasonably related to the performance of the audit of the registrant’s financial statements and are not reported under paragraph (a) of this Item are $0 for in 2007 and $0 in 2008. |
Tax Fees
| | (c) | The aggregate fees billed in each of the last two fiscal years for professional services rendered by the principal accountant for tax compliance, tax advice, and tax planning are $210,131 in 2007 |
and $69,000 in 2008. Tax fees include services provided by PWC for tax return preparations and India tax services.
All Other Fees
| | (d) | The aggregate fees billed in each of the last two fiscal years for products and services provided by the principal accountant, other than the services reported in paragraphs (a) through (c) of this Item are $0 in 2007 and $0 in 2008. |
| | (e)(1) | Disclose the audit committee’s pre-approval policies and procedures described in paragraph (c)(7) of Rule 2-01 of Regulation S-X. |
Pre-Approval of Auditor Services.
Pre-Approval Requirements. Before the Auditor is engaged by the Trust to render audit related or permissible non-audit services, either:
| | (i) | The Audit Committee shall pre-approve all audit related services and permissible non-audit services (e.g., tax services) to be provided to the Trust; or |
| | (ii) | The Audit Committee shall establish policies and procedures governing the Auditor’s engagement. Any such policies and procedures must (1) be detailed as to the particular service and (2) not involve any delegation of the Audit Committee’s responsibilities to the Adviser. The Audit Committee may delegate to one or more of its members the authority to grant pre-approvals. The pre-approval policies and procedures shall include the requirement that the decisions of any member to whom authority is delegated under this Section 4(e) shall be presented to the full Audit Committee at its next scheduled meeting. |
De Minimis Exceptions to Pre-Approval Requirements. Pre-approval for a service provided to the Trust other than audit, review or attest services is not required if: (1) the aggregate amount of all such non-audit services provided to the Trust constitutes not more than 5 percent of the total amount of revenues paid by the Trust to the Auditor during the fiscal year in which the non-audit services are provided; (2) such services were not recognized by the Trust at the time of the engagement to be non-audit services; and (3) such services are promptly brought to the attention of the Audit Committee and are approved by the Audit Committee or by one or more members of the Audit Committee to whom authority to grant such approvals has been delegated by the Audit Committee.
Pre-Approval of Non-Audit Services Provided to the Adviser and Certain Control Persons. With respect to services that have a direct impact on the operations or financial reporting of the Trust, the Audit Committee shall pre-approve all such non-audit services proposed to be provided by the Auditor to (i) the Adviser and (ii) any entity controlling, controlled by, or under common control with the Adviser that provides ongoing services to the Trust.
Application of De Minimis Exception: The de minimis exceptions set forth above under Section 4(e)(ii) apply to pre-approvals under this Section 4(e)(iii) as well, except that the “total amount of revenues” calculation for Section 4(e)(iii) services is based on the total amount of revenues paid to the Auditor by the Trust and any other entity that has its services approved under this Section (i.e., the Adviser or any control person)
| | (e)(2) | The percentage of services described in each of paragraphs (b) through (d) of this Item that were approved by the audit committee pursuant to paragraph (c)(7)(i)(C) of Rule 2-01 of Regulation S-X are as follows: |
| | (f) | The percentage of hours expended on the principal accountant’s engagement to audit the registrant’s financial statements for the most recent fiscal year that were attributed to work performed by persons other than the principal accountant’s full-time, permanent employees was 0% percent. |
| | (g) | The aggregate non-audit fees billed by the registrant’s accountant for services rendered to the registrant, and rendered to the registrant’s investment adviser (not including any sub-adviser whose role is primarily portfolio management and is subcontracted with or overseen by another investment adviser), and any entity controlling, controlled by, or under common control with the adviser that provides ongoing services to the registrant for each of the last two fiscal years of the registrant was $231,411 in 2007 and $91,300 in 2008. |
| | (h) | The registrant’s audit committee of the board of directors has considered whether the provision of non-audit services that were rendered to the registrant’s investment adviser (not including any sub-adviser whose role is primarily portfolio management and is subcontracted with or overseen by another investment adviser), and any entity controlling, controlled by, or under common control with the investment adviser that provides ongoing services to the registrant that were not pre-approved pursuant to paragraph (c)(7)(ii) of Rule 2-01 of Regulation S-X is compatible with maintaining the principal accountant’s independence. |
Item 5. Audit Committee of Listed registrants.
Not applicable.
Item 6. Investments.
| | (a) | Schedule of Investments in securities of unaffiliated issuers as of the close of the reporting period is included as part of the report to shareholders filed under Item 1 of this form. |
Item 7. Disclosure of Proxy Voting Policies and Procedures for Closed-End Management Investment Companies.
Not applicable.
Item 8. Portfolio Managers of Closed-End Management Investment Companies.
Not applicable.
Item 9. Purchases of Equity Securities by Closed-End Management Investment Company and Affiliated Purchasers.
Not applicable.
Item 10. Submission of Matters to a Vote of Security Holders.
There have been no material changes to the procedures by which the shareholders may recommend nominees to the registrant’s board of directors, where those changes were implemented after the registrant last provided disclosure in response to the requirements of Item 407(c)(2)(iv) of Regulation S-K (17 CFR 229.407) (as required by Item 22(b)(15) of Schedule 14A (17 CFR 240.14a-101)), or this Item.
Item 11. Controls and Procedures.
| | (a) | The registrant’s principal executive and principal financial officers, or persons performing similar functions, have concluded that the registrant’s disclosure controls and procedures (as defined in Rule 30a-3(c) under the Investment Company Act of 1940, as amended (the “1940 Act”) (17 CFR 270.30a-3(c))) are effective, as of a date within 90 days of the filing date of the report that includes the disclosure required by this paragraph, based on their evaluation of these controls and procedures required by Rule 30a-3(b) under the 1940 Act (17 CFR 270.30a-3(b)) and Rules 13a-15(b) or 15d-15(b) under the Securities Exchange Act of 1934, as amended (17 CFR 240.13a-15(b) or 240.15d-15(b)). |
| | (b) | There were no changes in the registrant’s internal control over financial reporting (as defined in Rule 30a-3(d) under the 1940 Act (17 CFR 270.30a-3(d)) that occurred during the registrant’s second fiscal quarter of the period covered by this report that has materially affected, or is reasonably likely to materially affect, the registrant’s internal control over financial reporting. |
Item 12. Exhibits.
| | (a)(1) | Code of ethics, or any amendment thereto, that is the subject of disclosure required by Item 2 is attached hereto. |
| | (a)(2) | Certifications pursuant to Rule 30a-2(a) under the 1940 Act and Section 302 of the Sarbanes-Oxley Act of 2002 are attached hereto. |
| | (b) | Certifications pursuant to Rule 30a-2(b) under the 1940 Act and Section 906 of the Sarbanes- Oxley Act of 2002 are attached hereto. |
SIGNATURES
Pursuant to the requirements of the Securities Exchange Act of 1934 and the Investment Company Act of 1940, the registrant has duly caused this report to be signed on its behalf by the undersigned, thereunto duly authorized.
| | | | |
(registrant) | | Matthews International Funds | | |
| | |
By (Signature and Title)* | | /s/ William J. Hackett | | |
| | William J. Hackett, President | | |
| | (principal executive officer) | | |
| |
Date 3/5/09 | | |
Pursuant to the requirements of the Securities Exchange Act of 1934 and the Investment Company Act of 1940, this report has been signed below by the following persons on behalf of the registrant and in the capacities and on the dates indicated.
| | | | |
By (Signature and Title)* | | /s/ William J. Hackett | | |
| | William J. Hackett, President | | |
| | (principal executive officer) | | |
| |
Date 3/5/09 | | |
| | |
By (Signature and Title)* | | /s/ Shai Malka | | |
| | Shai Malka, Treasurer | | |
| | (principal financial officer) | | |
| |
Date 3/5/09 | | |
| * | Print the name and title of each signing officer under his or her signature. |